02 Summary list of beneficiaries on Residential Patent for the ...
Upload
khangminh22Category
view
2download
0
Available online at www.centmapress.org Int. J. Food System Dynamics 8 (4), 2017, 298-316 DOI: http://dx.doi.org/10.18461/ijfsd.v8i4.844
298
Factors Affecting Beneficiaries’ Preference for Biannual Distribution of Food Grains in Public Distribution System of Punjab, India
Abhay Grover and Shweta Chopra
Iowa State University, USA [email protected]; [email protected] Received March 2017, accepted September 2017 available online October 2017
ABSTRACT
In 2014, to improve upon the existing scheme, the Punjab government launched a “new wheat -pulses scheme”
under the public distribution system. The state decided to distribute grains on a six-monthly basis instead of every
month. It claimed various benefits, whereas beneficiaries expressed concerns. The purpose of this research was to
identify and understand factors affecting beneficiaries’ preference for successful adoption of a biannual or six-
monthly distribution system. Factors affecting beneficiaries’ preference included monthly hassle, leakages in
system, storage challenges, interval of grain distribution, one-time down payment, trade of bulk grains by family,
exploitation by middle-men, communication of arrival of grains, gender, area, and nature of employment.
Key words: Biannual distribution, beneficiary, logistic-regression, Indian-Punjab
Abhay Grover and Shweta Chopra/ Int. J. Food System Dynamics 8 (4), 2017, 298-316
299
1 Introduction
There are 795 million food insecure people worldwide, and 98 percent of them are in developing countries like India (FAO, 2015). To support its below poverty line (BPL) citizens, the federal government, along with different state governments in India, run a public distribution system (PDS) (Kishore & Chakrabarti, 2015). With PDSs, an estimated 160 million beneficiary households purchase their subsidized monthly entitlement of food grains and other essential commodities through a network of 500,000 fair price shops (FPSs) (Ministry of Consumer Affairs, Food & Public Distribution, 2011). But the efficacy of a PDS as an enabler of food security has been hampered by various malpractices such as leakages, black marketing, and adulteration (Balani, 2013; Rajan et al., 2016). As a result, many states in India have tried to address these issues through different technological interventions and supply chain strategies such as digitization of transactions in Chhattisgarh and Madhya Pradesh and a universal PDS in Tamil Nadu (Balani, 2013).
The Indian state of Punjab, which contributes 43 percent of total wheat to the central pool (Economic & Statistical Organization, 2013), has been at forefront of PDS transformations. In 2014, building upon provisions of the National Food Security Act (NFSA) 2013, the Punjab government modified its existing PDS structure by launching the new atta-daal (wheat-pulses) scheme
1 (Dept. of Food Civil Supplies &
Consumer Affairs, 2014b). Some of the prominent features of the scheme include that (a) the eldest woman is considered head of family, (b) eligible beneficiaries are identified on the basis of a unique identification number, (c) wheat is distributed at $0.03 per kg, (d) every household member gets 5 kg of wheat per month without any upper cap, (e) unsatisfied beneficiaries can go to a consumer court, and (f) the entitlement of wheat is given to beneficiaries on a biannual or six-monthly basis. Specifically, the requirements of the biannual distribution system (hereafter referred to as six-monthly distribution system) overhauled the existing method of storage and distribution of wheat grains.
2 Particular
requirements of six-monthly distribution system include that (6a) the distribution of grains is conducted under the direct supervision of Department of Food Civil Supplies & Consumer Affairs and (6b) the wheat is distributed in 30-kg sealed bags equivalent to the six-month entitlement of the beneficiary (Dept. of Food Civil Supplies & Consumer Affairs, 2014b).
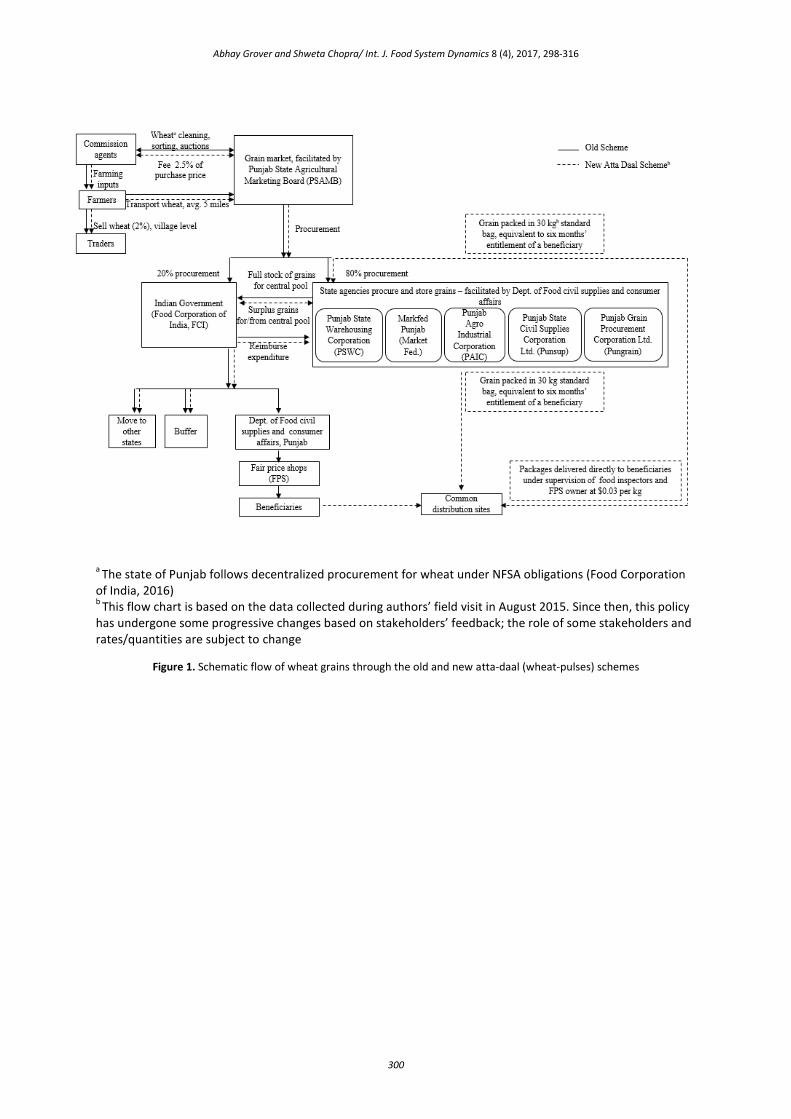
As illustrated in Fig. 1, prior to the six-monthly distribution system, farmers used to bring their produce to state-established markets, where commission agents facilitated the sale of wheat grains to procurement agencies. The state agencies, on behalf of central government, procured wheat from approximately 1,750 markets across Punjab and stored it (Economic & Statistical Organization, 2013). The central government released the state entitlement for the monthly requirement through the Food Corporation of India (FCI). These stocks were transported to FPSs, where beneficiaries would buy wheat on a monthly basis. With a six-monthly or biannual distribution system, instead of storing wheat in state agency warehouses for the long term, it is now packed in 30-kg bags and delivered to end users twice a year immediately after procurement (Puri, 2014) under the direct supervision of food inspectors.
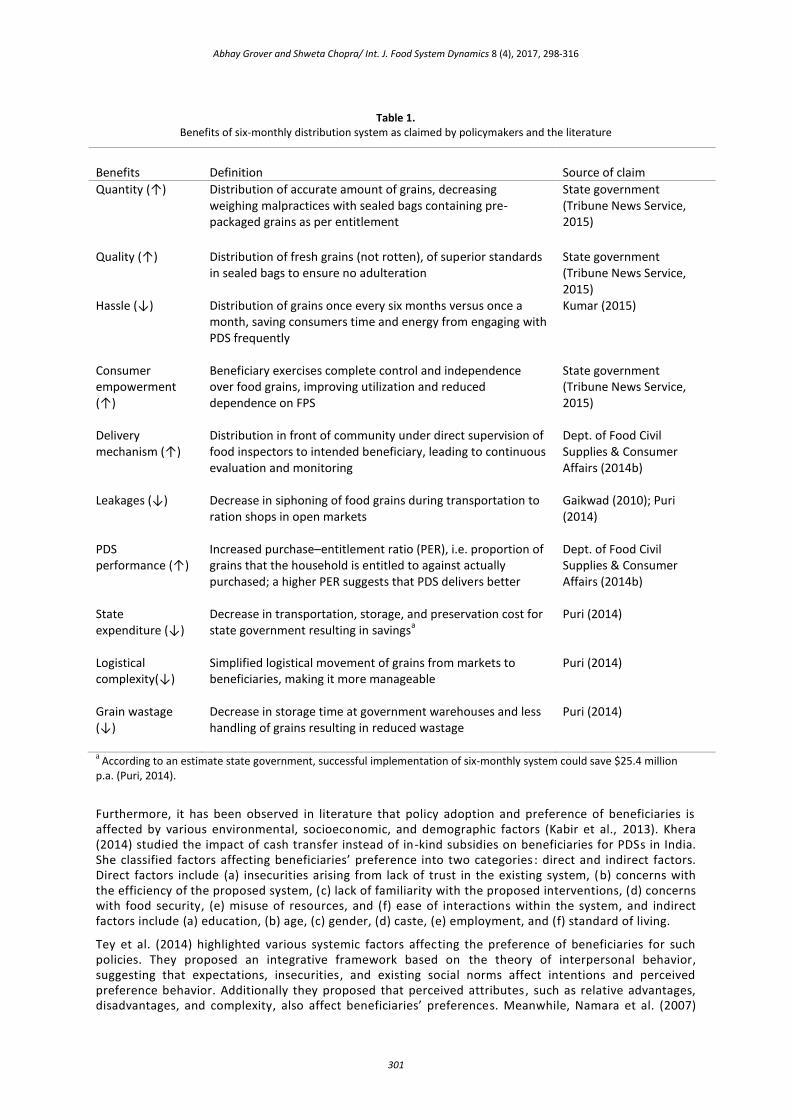
Despite several implementation challenges with the six-monthly distributions system, the state government and policymakers claimed numerous benefits for administration and beneficiaries alike (see Table 1). In spite of these claimed benefits, exploratory field visits by the authors suggested several concerns by beneficiaries regarding the new scheme (see Table 4).
1 The state government received criticism for the scheme from several stakeholders. Many believed this to be
a populist measure driven by upcoming state elections, and others thought that it would be a financial burden (Sharma, 2016), whereas the state government believed it would be beneficial (Puri, 2014). The authors do not endorse either the state government or other stakeholder views. This is an independent attempt to understand beneficiaries’ perception regarding change in such policies. 2Although black grams (pulses) are an integral part of the new the atta-daal (wheat-pulses) scheme, there is no
explicit mention of that in the provisions; therefore, the authors focus only on the wheat supply chain.
Abhay Grover and Shweta Chopra/ Int. J. Food System Dynamics 8 (4), 2017, 298-316
300
a The state of Punjab follows decentralized procurement for wheat under NFSA obligations (Food Corporation
of India, 2016) b
This flow chart is based on the data collected during authors’ field visit in August 2015. Since then, this policy has undergone some progressive changes based on stakeholders’ feedback; the role of some stakeholders and rates/quantities are subject to change
Figure 1. Schematic flow of wheat grains through the old and new atta-daal (wheat-pulses) schemes
Abhay Grover and Shweta Chopra/ Int. J. Food System Dynamics 8 (4), 2017, 298-316
301
Table 1.
Benefits of six-monthly distribution system as claimed by policymakers and the literature
Benefits Definition Source of claim
Quantity (↑) Distribution of accurate amount of grains, decreasing weighing malpractices with sealed bags containing pre-packaged grains as per entitlement
State government (Tribune News Service, 2015)
Quality (↑) Distribution of fresh grains (not rotten), of superior standards in sealed bags to ensure no adulteration
State government (Tribune News Service, 2015)
Hassle (↓) Distribution of grains once every six months versus once a month, saving consumers time and energy from engaging with PDS frequently
Kumar (2015)
Consumer empowerment (↑)
Beneficiary exercises complete control and independence over food grains, improving utilization and reduced dependence on FPS
State government (Tribune News Service, 2015)
Delivery mechanism (↑)
Distribution in front of community under direct supervision of food inspectors to intended beneficiary, leading to continuous evaluation and monitoring
Dept. of Food Civil Supplies & Consumer Affairs (2014b)
Leakages (↓) Decrease in siphoning of food grains during transportation to ration shops in open markets
Gaikwad (2010); Puri (2014)
PDS performance (↑)
Increased purchase–entitlement ratio (PER), i.e. proportion of grains that the household is entitled to against actually purchased; a higher PER suggests that PDS delivers better
Dept. of Food Civil Supplies & Consumer Affairs (2014b)
State expenditure (↓)
Decrease in transportation, storage, and preservation cost for state government resulting in savings
a
Puri (2014)
Logistical complexity(↓)
Simplified logistical movement of grains from markets to beneficiaries, making it more manageable
Puri (2014)
Grain wastage (↓)
Decrease in storage time at government warehouses and less handling of grains resulting in reduced wastage
Puri (2014)
a According to an estimate state government, successful implementation of six-monthly system could save $25.4 million
p.a. (Puri, 2014).
Furthermore, it has been observed in literature that policy adoption and preference of beneficiaries is affected by various environmental, socioeconomic, and demographic factors (Kabir et al., 2013). Khera (2014) studied the impact of cash transfer instead of in-kind subsidies on beneficiaries for PDSs in India. She classified factors affecting beneficiaries’ preference into two categories : direct and indirect factors. Direct factors include (a) insecurities arising from lack of trust in the existing system, (b) concerns with the efficiency of the proposed system, (c) lack of familiarity with the proposed interventions, (d) concerns with food security, (e) misuse of resources, and (f) ease of interactions within the system, and indirect factors include (a) education, (b) age, (c) gender, (d) caste, (e) employment, and (f) standard of living.
Tey et al. (2014) highlighted various systemic factors affecting the preference of beneficiaries for such policies. They proposed an integrative framework based on the theory of interpersonal behavior, suggesting that expectations, insecurities, and existing social norms affect intentions and perceived preference behavior. Additionally they proposed that perceived attributes, such as relative advantages, disadvantages, and complexity, also affect beneficiaries’ preferences. Meanwhile, Namara et al. (2007)

Abhay Grover and Shweta Chopra/ Int. J. Food System Dynamics 8 (4), 2017, 298-316
302
highlighted the role of institutional factors, such as trainings, participation in institutional arrangements, and social organizations, in influencing beneficiaries’ preferences. Namara et al. (2007) further grouped several factors into various categories, namely, demographic structure (family size, head of family, age of family members, gender distribution), human capital variables (age, education, employment), existing resources, and other socioeconomic variables (caste, social status, poverty index).
Jain and Polman (2003) elaborated on the importance of benefic iaries’ roles in effective policy implementation. They suggested that marginalized beneficiaries can be empowered by involving them in the planning and implementation of schemes that affect them directly. Their participation and feedback help in addressing concerns affecting their daily lives, which in turn help them appreciate the macro level constraints in policymaking. Lack of involvement of these critical stakeholder have often resulted in marginalization of several sections of rural poor, resulting in ineffective implementation of development programs (Jain & Polman, 2003). Therefore, understanding the importance of the role of beneficiaries, through this research the authors attempted to understand beneficiaries’ perspective and feedback.
Because beneficiaries’ inputs are essential and various factors affect their preferences, the purpose of this research was to identify and understand those factors. Further, these identified factors will help policymakers and researchers address beneficiaries’ concerns about effective implementation and provide critical indicators for evaluation of the scheme. Moreover, Punjab is one of the first states to implement the six-monthly distribution system (Puri, 2014), so a better understanding of the beneficiaries’ perspective will help extend the learning to other states. Also, there is limited or no research on policy preferences of beneficiaries for extended intervals of grain distribution. Accordingly, the authors attempt to fill the gap in the literature to understand beneficiaries’ preference by developing logistic regression models.
2 Methodology
This research was conducted in two stages: the first stage was an exploratory study, and the second stage was survey dissemination (see Fig. 2). The exploratory research helped authors gather preliminary information, define the research problem, formulate the research design, and finalize the data collection method (Stebbins, 2001). The authors conducted field visits, guided conversations, semi-structured interviews, and focus group discussions with several stakeholders in their natural settings. In the second stage, using snowball sampling, the authors conducted a survey among 300 household across several socioeconomic backgrounds in 14 different villages and localities in the district of Ludhiana . The survey provided primary data for further analysis. Three different logistic regression models were developed with facilitating, impeding, and demographic variables, respectively. This helped identify factors affecting beneficiaries’ preference for the six-monthly distribution system.
Figure 2. Methodological flow and timeline of the research study
2.1 Exploratory Research
After six months of preliminary study of existing literature, the authors visited Punjab from July to August, 2015. They spent over 40 days in the field conducting exploratory research in three districts of Punjab—Amritsar, Jalandhar, and Ludhiana—which were selected based on the number of FPSs and the volume of beneficiaries served (Economic & Statistical Organization, 2013). Authors coded the data, and emergent codes were grouped into three common themes, based on their underlying similarity: impeding, facilitating, and demographic factors (Grover et al., 2016). These themes were later used to
Abhay Grover and Shweta Chopra/ Int. J. Food System Dynamics 8 (4), 2017, 298-316
303
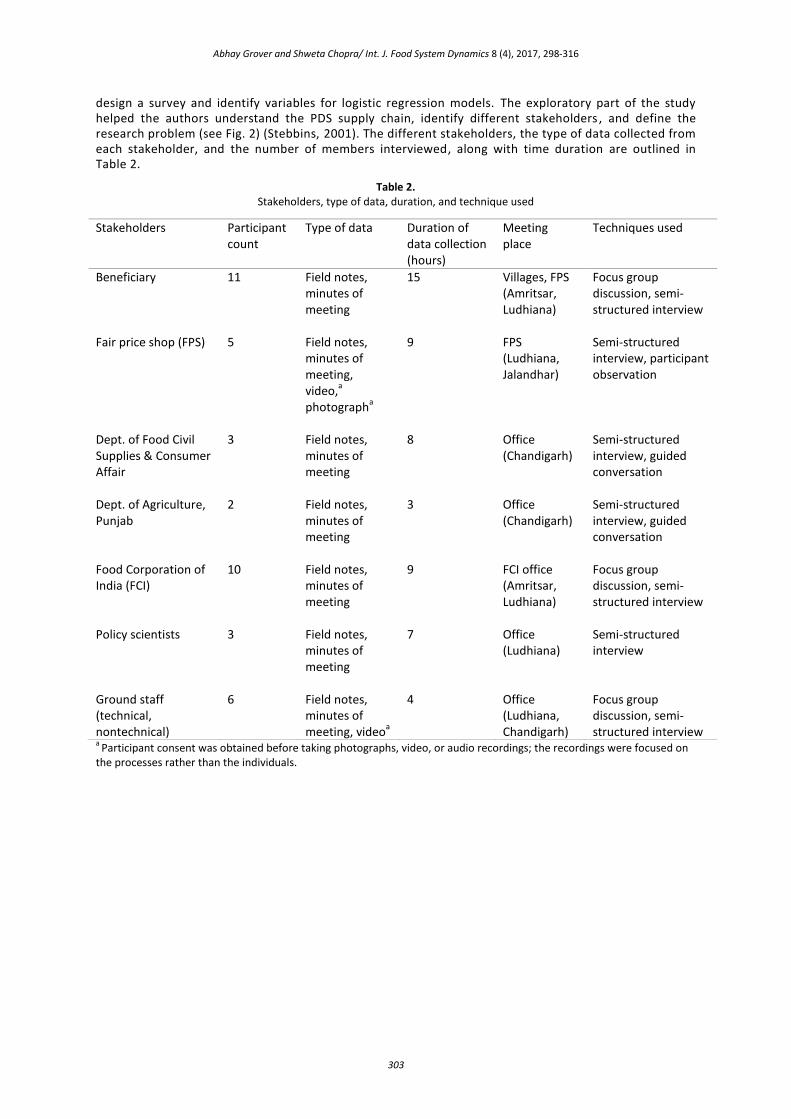
design a survey and identify variables for logistic regression models. The exploratory part of the study helped the authors understand the PDS supply chain, identify different stakeholders , and define the research problem (see Fig. 2) (Stebbins, 2001). The different stakeholders, the type of data collected from each stakeholder, and the number of members interviewed, along with time duration are outlined in Table 2.
Table 2. Stakeholders, type of data, duration, and technique used
a Participant consent was obtained before taking photographs, video, or audio recordings; the recordings were focused on
the processes rather than the individuals.
Stakeholders Participant count
Type of data Duration of data collection (hours)
Meeting place
Techniques used
Beneficiary 11 Field notes, minutes of meeting
15 Villages, FPS (Amritsar, Ludhiana)
Focus group discussion, semi-structured interview
Fair price shop (FPS) 5 Field notes, minutes of meeting, video,
a
photographa
9 FPS (Ludhiana, Jalandhar)
Semi-structured interview, participant observation
Dept. of Food Civil Supplies & Consumer Affair
3 Field notes, minutes of meeting
8 Office (Chandigarh)
Semi-structured interview, guided conversation
Dept. of Agriculture, Punjab
2 Field notes, minutes of meeting
3 Office (Chandigarh)
Semi-structured interview, guided conversation
Food Corporation of India (FCI)
10 Field notes, minutes of meeting
9 FCI office (Amritsar, Ludhiana)
Focus group discussion, semi-structured interview
Policy scientists 3 Field notes, minutes of meeting
7 Office (Ludhiana)
Semi-structured interview
Ground staff (technical, nontechnical)
6 Field notes, minutes of meeting, video
a
4 Office (Ludhiana, Chandigarh)
Focus group discussion, semi-structured interview

Abhay Grover and Shweta Chopra/ Int. J. Food System Dynamics 8 (4), 2017, 298-316
304
2.2 Survey
Design
Themes identified from the exploratory research data were used to design the survey. Survey guidelines used were adopted from the data collection instrument developed and validated by Khera (2014). The survey was divided into five parts: (a) household demographics, (b) PDS attributes, (c) six-monthly system attributes, and (d) advantages and (e) disadvantages of the six-monthly system. Responses to the survey items were given on a seven-point Likert-type scale ranging from –3 (strongly disagree) to +3 (strongly agree) to appropriately collect variations in participant responses (Neuendorf, 2002). The survey questionnaire was validated using face validity, wherein the feedback from field experts was used to improve the existing design (Chopra, 2014; Grover et al., 2016; Neuendorf, 2002). The survey was also pretested among 15 beneficiaries before dissemination.
Dissemination
As noted earlier, the authors again visited Punjab from July to August in 2016 to conduct the survey among eligible beneficiary households. Based on inputs from the exploratory research, Ludhiana was selected for survey dissemination, as it is Punjab’s largest district with a population of 1.7 million, and with over 400,000 registered beneficiary households, has the highest number of FPSs (Economic & Statistical Organization, 2013). The authors knew the local language well, which made it convenient to identify and gain access to eligible beneficiary households.
2.3 Participants
The authors used snowball sampling to recruit beneficiary households and then identified beneficiaries with specific attributes (Creswell, 2009). Beneficiary households who had registered with PDS recently and had no prior experience with the once-monthly distribution system were not considered. Please refer Table 3 for characteristics of survey respondents. Identification of PDS-eligible households is a state prerogative, and the state of Punjab identified the following as eligible under the new atta-daal (wheat-pulses) scheme: (a) households already identified under the Antyodaya Anna Yojna (AAY)
3 scheme, (b)
households already identified as BPL by latest census reports (BPL cards)4 or by the old state PDS scheme
(blue cards), (c) households with a disabled head of family, (d) landless daily paid workers or a single widowed head of the family, (e) farmer households having less than 2.5 acres of land, and (f) households with a gross annual income of less than $896 (Dept. of Food Civil Supplies & Consumer Affairs, 2014a).
3 The AAY scheme is sponsored by the government of India to support the poorest of the poor and was started
in December 2000 (Ministry of Consumer Affairs, Food & Public Distribution, 2016). 4According to the directives of NFSA 2013 the state of Punjab categorized all beneficiary households, except
AAY households, as priority households.
Abhay Grover and Shweta Chopra/ Int. J. Food System Dynamics 8 (4), 2017, 298-316
305
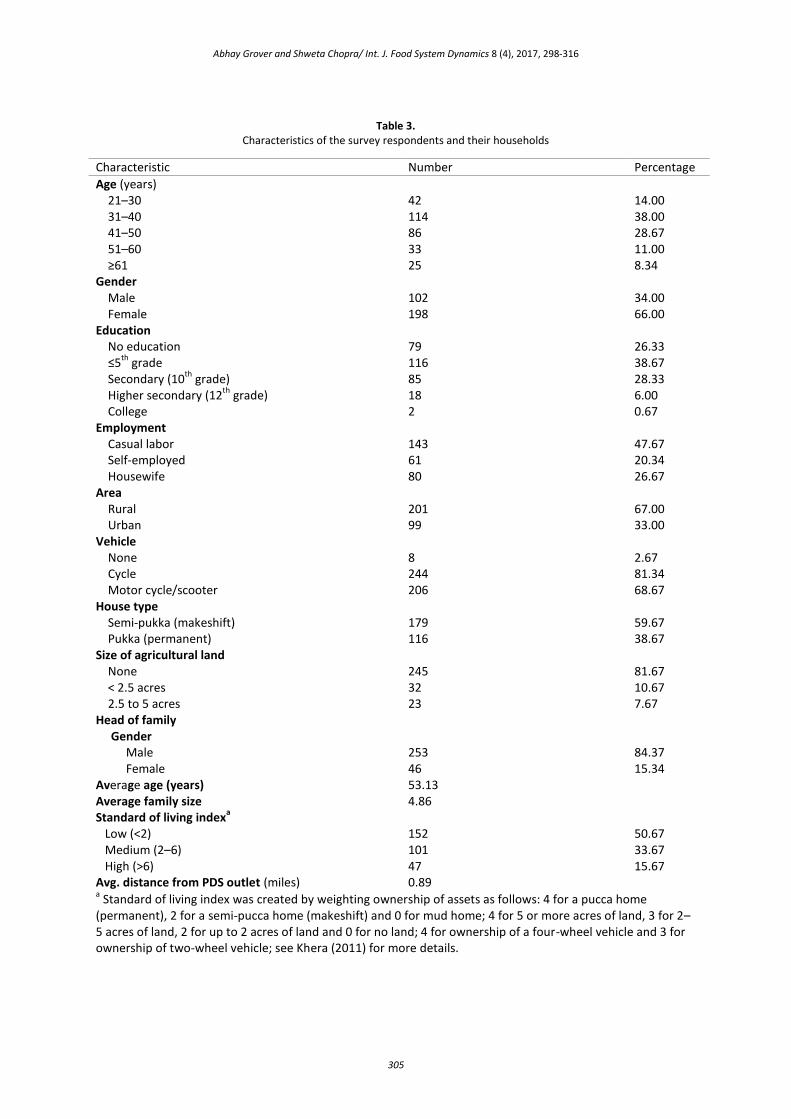
Table 3. Characteristics of the survey respondents and their households
a Standard of living index was created by weighting ownership of assets as follows: 4 for a pucca home
(permanent), 2 for a semi-pucca home (makeshift) and 0 for mud home; 4 for 5 or more acres of land, 3 for 2–5 acres of land, 2 for up to 2 acres of land and 0 for no land; 4 for ownership of a four-wheel vehicle and 3 for ownership of two-wheel vehicle; see Khera (2011) for more details.
Characteristic Number Percentage
Age (years) 21–30 42 14.00 31–40 114 38.00 41–50 86 28.67 51–60 33 11.00 ≥61 25 8.34 Gender Male 102 34.00 Female 198 66.00 Education No education 79 26.33 ≤5
th grade 116 38.67
Secondary (10th
grade) 85 28.33 Higher secondary (12
th grade) 18 6.00
College 2 0.67 Employment Casual labor 143 47.67 Self-employed 61 20.34 Housewife 80 26.67 Area Rural 201 67.00 Urban 99 33.00 Vehicle None 8 2.67 Cycle 244 81.34 Motor cycle/scooter 206 68.67 House type Semi-pukka (makeshift) 179 59.67 Pukka (permanent) 116 38.67 Size of agricultural land None 245 81.67 < 2.5 acres 32 10.67 2.5 to 5 acres 23 7.67 Head of family Gender Male 253 84.37 Female 46 15.34 Average age (years) 53.13 Average family size 4.86 Standard of living index
a
Low (<2) 152 50.67 Medium (2–6) 101 33.67 High (>6) 47 15.67 Avg. distance from PDS outlet (miles) 0.89
Abhay Grover and Shweta Chopra/ Int. J. Food System Dynamics 8 (4), 2017, 298-316
306
2.4 Multiple Logistic Regression
Different logistic regression models were developed to study facilitating, impeding , and demographic factors influencing the preference of beneficiary households toward the six-monthly distribution system. In this study, participants either preferred or did not prefer the six-monthly distribution system. So given a binary choice and computational convenience, logistic regression was an appropriate statistical tool (Greene, 2008; Long & Freese 2006; Tiwari et al., 2008).
Empirical Modelling
The authors followed a traditional approach of constructing the most parsimonious model as this helps in stabilizing the model numerically (Hosmer & Lemeshow, 2000). The model in terms of probability is specified as:
(1)
where is the probability of an event occurring for an observed set of variables , is the intercept term defined as the value of log odds of success when all are 0, are estimated parameters corresponding to each explanatory variable, and are explanatory variables.
Given that is the probability of a beneficiary preferring the six-monthly system, then is the probability of not preferring the six-monthly system. The odds for preference are , and its log odds (i.e., logit) is y = . This transforms the nonlinear equation Eq. 1 into a linear equation Eq. 2. The dependent variable y was modeled as: y = preference for the six -monthly system. So p(y) = {1 if the households preferred the six-monthly system, and 0 otherwise}. Thus, the logistic prediction model (Agresti, 2007; Kabir et al., 2013) is specified as:
. (2)
For the model with a two-group categorical explanatory variable
.
First, the data were checked for multi-collinearity5; the variance inflation factor was less than 5 for the
study. Variables were categorized as nominal or categorical depending upon the data. Data were also checked for outliers using box plots and residual statistics. A stepwise fit method was used for variable selection by applying mixed direction regression control. Finally , the model was checked for interactions, and a preliminary final model was generated (Hosmer & Lemeshow, 2000).
The specified model was tested for different parameters (Hosmer & Lemeshow, 2000). First, the model was tested for the whole model, and second, R
2 (U) also known as McFadden’s pseudo R
2 was checked to
verify the power of model in predicting the response variable. R2 values ranged from zero for no
improvement to one for a perfect fit. Lastly, a lack-of-fit test (or goodness of fit) was used to estimate whether more complex terms needed to be added to the model. A significant lack-of-fit test result suggests the need for higher order terms or interaction terms.
Variable Selection
The state government suggested several benefits6 of the six-monthly distribution system for
beneficiaries, as listed in Table 1. Beneficiaries reported several concerns with the system , as identified from the exploratory research data (see Table 4). Furthermore, a content analysis of the field notes also suggested several demographic factors that affected beneficiaries’ preferences (see Table 3). Therefore , based on the previously identified themes, the authors estimated three different logistic regression models:
5 Multicollinearity for categorical variables can be verified using the phi coefficient or tetrachoric correlation
(Ekstrom, n.d.). The authors verified multicollinearity for continuous variables only. 6Benefits for both the administration and beneficiaries are listed in Table 1, but only variables that are direct
benefit to beneficiaries were considered for model development.
Abhay Grover and Shweta Chopra/ Int. J. Food System Dynamics 8 (4), 2017, 298-316
307
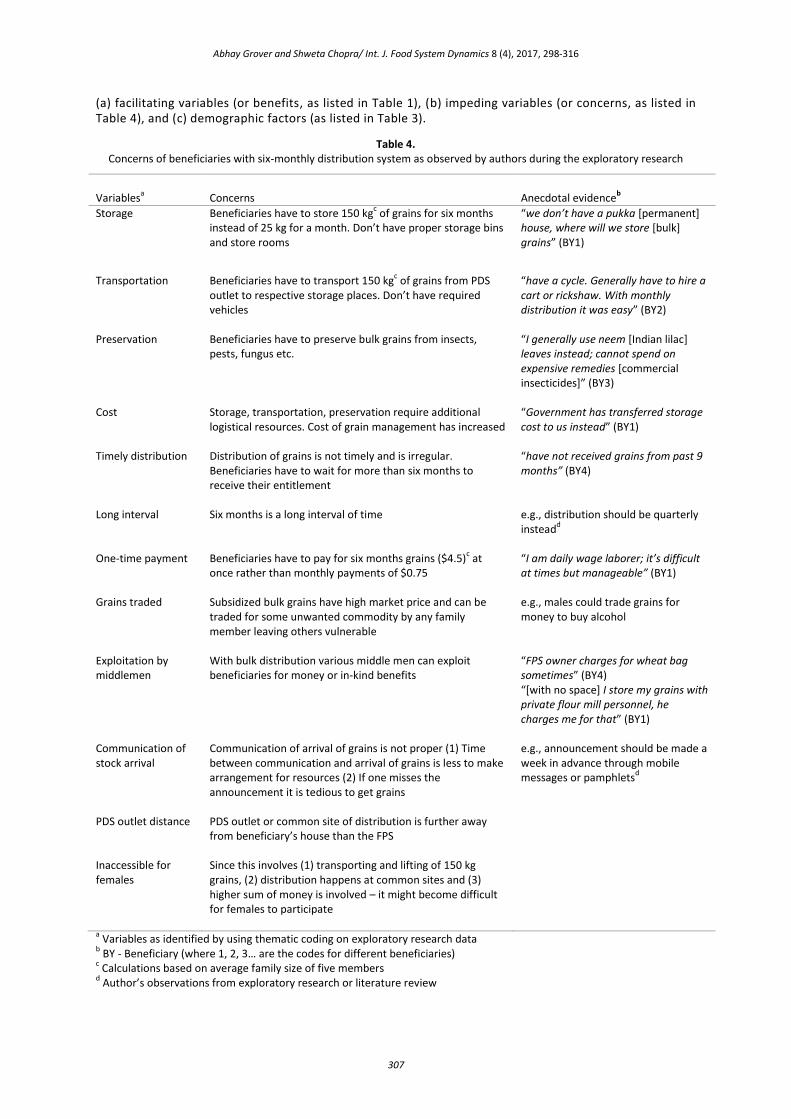
(a) facilitating variables (or benefits, as listed in Table 1), (b) impeding variables (or concerns, as listed in Table 4), and (c) demographic factors (as listed in Table 3).
Table 4. Concerns of beneficiaries with six-monthly distribution system as observed by authors during the exploratory research
Variablesa Concerns Anecdotal evidence
b
Storage Beneficiaries have to store 150 kgc of grains for six months
instead of 25 kg for a month. Don’t have proper storage bins and store rooms
“we don’t have a pukka [permanent] house, where will we store [bulk] grains” (BY1)
Transportation Beneficiaries have to transport 150 kgc of grains from PDS
outlet to respective storage places. Don’t have required vehicles
“have a cycle. Generally have to hire a cart or rickshaw. With monthly distribution it was easy” (BY2)
Preservation Beneficiaries have to preserve bulk grains from insects, pests, fungus etc.
“I generally use neem [Indian lilac] leaves instead; cannot spend on expensive remedies [commercial insecticides]” (BY3)
Cost Storage, transportation, preservation require additional logistical resources. Cost of grain management has increased
“Government has transferred storage cost to us instead” (BY1)
Timely distribution Distribution of grains is not timely and is irregular. Beneficiaries have to wait for more than six months to receive their entitlement
“have not received grains from past 9 months” (BY4)
Long interval Six months is a long interval of time e.g., distribution should be quarterly instead
d
One-time payment Beneficiaries have to pay for six months grains ($4.5)
c at
once rather than monthly payments of $0.75
“I am daily wage laborer; it’s difficult at times but manageable” (BY1)
Grains traded
Subsidized bulk grains have high market price and can be traded for some unwanted commodity by any family member leaving others vulnerable
e.g., males could trade grains for money to buy alcohol
Exploitation by middlemen
With bulk distribution various middle men can exploit beneficiaries for money or in-kind benefits
“FPS owner charges for wheat bag sometimes” (BY4) “[with no space] I store my grains with private flour mill personnel, he charges me for that” (BY1)
Communication of stock arrival
Communication of arrival of grains is not proper (1) Time between communication and arrival of grains is less to make arrangement for resources (2) If one misses the announcement it is tedious to get grains
e.g., announcement should be made a week in advance through mobile messages or pamphlets
d
PDS outlet distance
PDS outlet or common site of distribution is further away from beneficiary’s house than the FPS
Inaccessible for females
Since this involves (1) transporting and lifting of 150 kg grains, (2) distribution happens at common sites and (3) higher sum of money is involved – it might become difficult for females to participate
a Variables as identified by using thematic coding on exploratory research data
b BY - Beneficiary (where 1, 2, 3… are the codes for different beneficiaries)
c Calculations based on average family size of five members
d Author’s observations from exploratory research or literature review

Abhay Grover and Shweta Chopra/ Int. J. Food System Dynamics 8 (4), 2017, 298-316
308
3 Results
As discussed earlier, three sets of regression were carried out. The whole model test was statistically significant at p = 0.05 for all three models. Mc-Fadden’s pseudo R
2 values were between 0.2 and 0.4,
indicating good fit and predictive ability for all models (Clark & Hosking, 1986; Domencich & McFadden, 1975). The lack–of-fit test was not significant for facilitating and impeding models but was significant for the model containing demographic variables, indicating the need for interaction terms. Two-way interaction terms were added to the model for goodness of fit (Hosmer & Lemeshow, 2000). Overall results provided adequate support for reliability, predictive power, and goodness of fit for all three models.
After a step-wise selection procedure was applied on all facilitating variables listed in Table 1, only important variables were retained on the basis of significance. Refer to Table 5 for the list of variables included in the model. Out of these, only the variables “hassle” and “leakages” were significant at p = 0.01. The significant explanatory variable hassle had a coefficient estimate of 0.81 and exponent value of 2.24. This suggests that, if all other explanatory variables held constant, the odds of preferring six-monthly system when the beneficiaries perceived that hassle had decreased with the system was 2.24 times or 124 percent of the odds of preferring the six-monthly system when they perceived that hassle had not decreased. The other variable, leakages, was interpreted in the same way. These results suggest that hassle and leakages significantly affected beneficiaries’ preference for the six-monthly system, and as the perception of these variables decreased in the system, beneficiaries were more likely to prefer the six-monthly system.
Table 5. Facilitating factors regressed on the preference of beneficiary for six-monthly distribution system
a (N = 160)
Note: Whole model test: –log likelihood difference = 23.00, chi square = 46.00, prob>chisq < 0.0001; lack of fit (–log likelihood difference = 23.92, chi-square = 47.83, prob>chisq 0.09. a Preference for six-monthly system = 1 if respondents preferred the six-monthly distribution system over the monthly
system, otherwise = 0; hassle = 1 if the six-monthly system was less bothersome as compared to regular monthly visits, otherwise = 0; leakages = 1 if respondents believed that leakages had decreased with the six-monthly system as compared with monthly system, otherwise = 0. b
As per definition, consumer empowerment (Table 1) was further categorized into two variables: (a) independence to manage grains and (b) FPS dependence.
*** p = .01.
Variables Estimate Exponents Standard error Chi-square Prob>chisq
Quantity
0.07 1.08 0.29 0.07 0.80
Quality
0.24 1.27 0.28 0.72 0.40
Hassle
0.81 2.24 0.30 7.31 0.007***
Independence to manage grains
b
0.59 1.81 0.43 1.93 0.17
Delivery mechanism
0.09 1.09 0.22 0.16 0.70
Leakages
1.10 2.99 0.28 15.19 <0.0001***
PDS performance
0.08 1.08 0.27 0.77 0.77
FPS dependenceb
–0.30 0.78 0.55 0.21 0.65
Intercept
–0.13 0.88 0.41 0.75
McFadden’s pseudo R
2
0.22
Abhay Grover and Shweta Chopra/ Int. J. Food System Dynamics 8 (4), 2017, 298-316
309
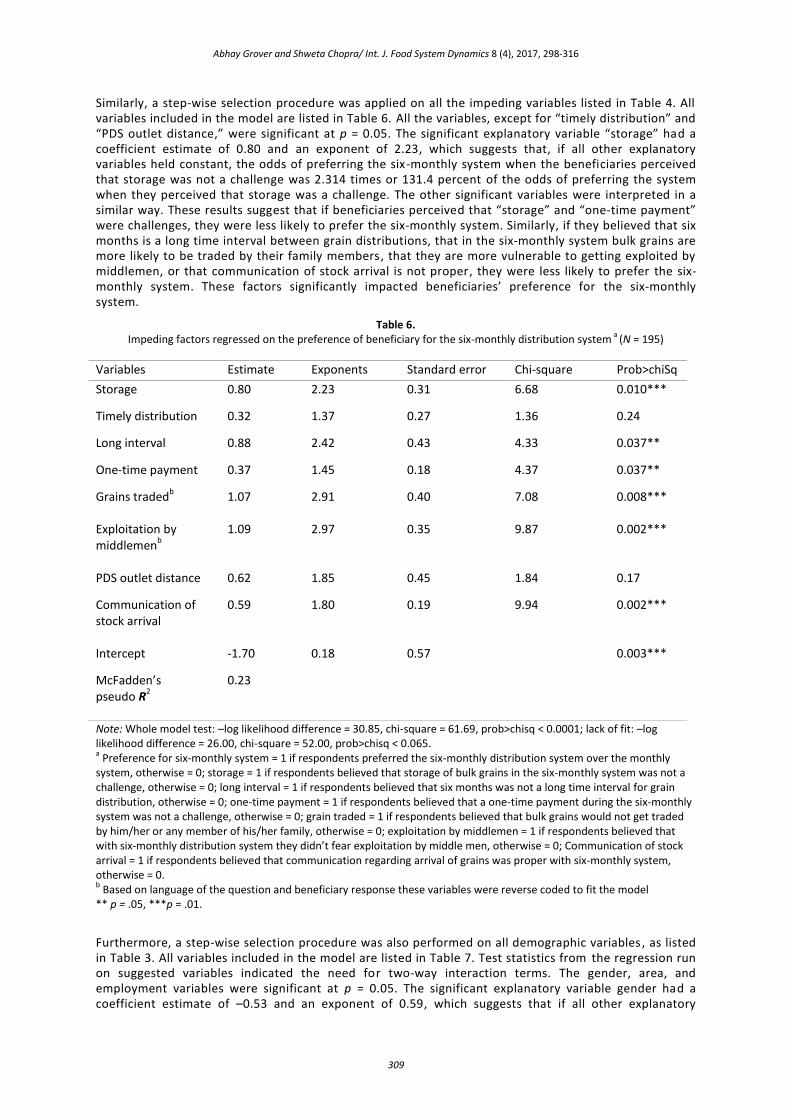
Similarly, a step-wise selection procedure was applied on all the impeding variables listed in Table 4. All variables included in the model are listed in Table 6. All the variables, except for “timely distribution” and “PDS outlet distance,” were significant at p = 0.05. The significant explanatory variable “storage” had a coefficient estimate of 0.80 and an exponent of 2.23, which suggests that, if all other explanatory variables held constant, the odds of preferring the six-monthly system when the beneficiaries perceived that storage was not a challenge was 2.314 times or 131.4 percent of the odds of preferring the system when they perceived that storage was a challenge. The other significant variables were interpreted in a similar way. These results suggest that if beneficiaries perceived that “storage” and “one-time payment” were challenges, they were less likely to prefer the six-monthly system. Similarly, if they believed that six months is a long time interval between grain distributions, that in the six-monthly system bulk grains are more likely to be traded by their family members, that they are more vulnerable to getting exploited by middlemen, or that communication of stock arrival is not proper, they were less likely to prefer the six-monthly system. These factors significantly impacted beneficiaries’ preference for the six-monthly system.
Table 6. Impeding factors regressed on the preference of beneficiary for the six-monthly distribution system
a (N = 195)
Note: Whole model test: –log likelihood difference = 30.85, chi-square = 61.69, prob>chisq < 0.0001; lack of fit: –log likelihood difference = 26.00, chi-square = 52.00, prob>chisq < 0.065. a Preference for six-monthly system = 1 if respondents preferred the six-monthly distribution system over the monthly
system, otherwise = 0; storage = 1 if respondents believed that storage of bulk grains in the six-monthly system was not a challenge, otherwise = 0; long interval = 1 if respondents believed that six months was not a long time interval for grain distribution, otherwise = 0; one-time payment = 1 if respondents believed that a one-time payment during the six-monthly system was not a challenge, otherwise = 0; grain traded = 1 if respondents believed that bulk grains would not get traded by him/her or any member of his/her family, otherwise = 0; exploitation by middlemen = 1 if respondents believed that with six-monthly distribution system they didn’t fear exploitation by middle men, otherwise = 0; Communication of stock arrival = 1 if respondents believed that communication regarding arrival of grains was proper with six-monthly system, otherwise = 0. b Based on language of the question and beneficiary response these variables were reverse coded to fit the model
** p = .05, ***p = .01.
Furthermore, a step-wise selection procedure was also performed on all demographic variables , as listed in Table 3. All variables included in the model are listed in Table 7. Test statistics from the regression run on suggested variables indicated the need for two-way interaction terms. The gender, area, and employment variables were significant at p = 0.05. The significant explanatory variable gender had a coefficient estimate of –0.53 and an exponent of 0.59, which suggests that if all other explanatory
Variables Estimate Exponents Standard error Chi-square Prob>chiSq
Storage 0.80 2.23 0.31 6.68 0.010***
Timely distribution 0.32 1.37 0.27 1.36 0.24
Long interval 0.88 2.42 0.43 4.33 0.037**
One-time payment 0.37 1.45 0.18 4.37 0.037**
Grains tradedb
1.07 2.91 0.40 7.08 0.008***
Exploitation by middlemen
b
1.09 2.97 0.35 9.87 0.002***
PDS outlet distance 0.62 1.85 0.45 1.84 0.17
Communication of stock arrival
0.59 1.80 0.19 9.94 0.002***
Intercept -1.70 0.18 0.57 0.003***
McFadden’s pseudo R
2
0.23

Abhay Grover and Shweta Chopra/ Int. J. Food System Dynamics 8 (4), 2017, 298-316
310
variables held constant, the odds of preferring the six-monthly system decreased by 41.2 percent between males and females, or with all other explanatory variables held constant, the odds of females choosing the six-monthly program were 0.59 times the odds of males of choosing the six-monthly program. The other significant variables of area and employment were interpreted in a similar way. These results suggest that females, beneficiaries from rural areas, and housewives are less likely to prefer the six-monthly system as compared to males, beneficiaries from urban areas, and beneficiaries employed as casual labors, respectively. Therefore gender, area, and employment significantly impact beneficiaries’ preference for the six-monthly system.
Table 7. Demographic factors regressed on the preference of beneficiary for six-monthly distribution system (N = 271)
Note: Whole model test: –log likelihood difference = 45.91, chi-square = 91.82, prob>chisq < 0.0001; lack of fit: –log likelihood difference = 130.35, chi-square = 260.70, prob>chisq < 0.23). a Categorical variables with base category in brackets.
b Employment was categorized into casual labor and housewives; data for self-employed were either excluded or included
case by case within the two categories. c Significant interactions, e.g., gender[Female] * education suggests that the slope for males and females are significantly
different from each other given years of schooling vs. log odds of success. To make any interpretation for interaction terms we needed to account for individual variables as well. Different significance tests can be performed, but this is beyond the scope of this paper. ** p = .05, ***p = .01.
To further evaluate the performance of six-monthly system, the authors analyzed all the significant
Variables Estimate Exponents Standard error Chi-square Prob>chiSq
Age
0.00 1.00 0.03 0.00 0.94
Gender[Female]a
-0.53 0.59 0.24 5.02 0.03**
Area[Rural]a
-3.51 0.03 0.96 13.32 0.0003***
Head of Family[Female]a
0.16 1.18 0.33 0.25 0.62
SLI
-0.38 0.68 0.20 3.72 0.05
Experience with six-monthly system
0.04 1.04 0.03 1.52 0.22
Education
0.11 1.11 0.08 1.88 0.17
Employment[Casual labor]a, b
0.88 2.41 0.34 6.82 0.009***
Age*Area[Rural]
-0.04 0.96 0.03 2.55 0.11
Gender[Female]*SLI
-0.21 0.81 0.13 2.55 0.11
Gender[Female]*experience with six-monthly system
0.05 1.05 0.03 2.3 0.13
Gender[Female]*educationc
-0.10 0.90 0.03 8.92 0.003***
Area[Rural]*SLI
0.38 1.45 0.21 3.19 0.07
Area[Rural]*educationc
-0.22 0.80 0.08 8.01 0.005***
Head of Family[Female]*employment
0.55 1.73 0.33 2.76 0.10
Intercept
3.73 1.62 5.27 0.02**
McFadden’s pseudo R2
0.25
Abhay Grover and Shweta Chopra/ Int. J. Food System Dynamics 8 (4), 2017, 298-316
311
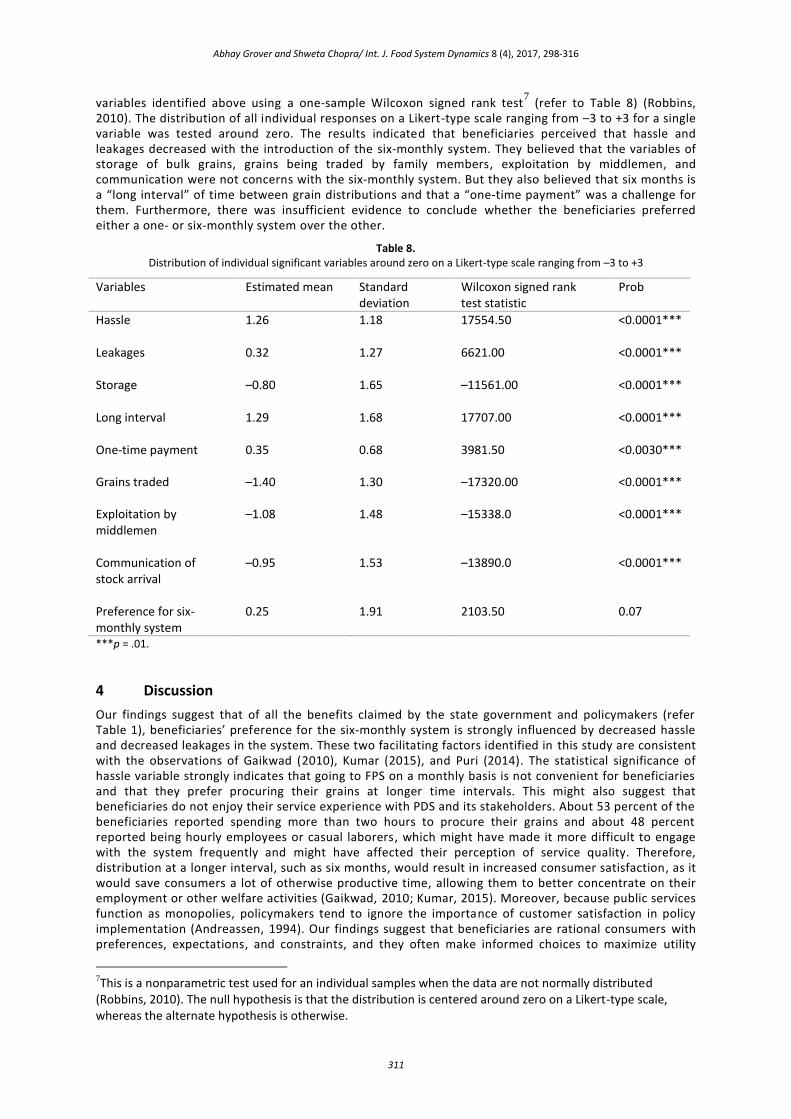
variables identified above using a one-sample Wilcoxon signed rank test7 (refer to Table 8) (Robbins,
2010). The distribution of all individual responses on a Likert-type scale ranging from –3 to +3 for a single variable was tested around zero. The results indicated that beneficiaries perceived that hassle and leakages decreased with the introduction of the six-monthly system. They believed that the variables of storage of bulk grains, grains being traded by family members, exploitation by middlemen, and communication were not concerns with the six-monthly system. But they also believed that six months is a “long interval” of time between grain distributions and that a “one-time payment” was a challenge for them. Furthermore, there was insufficient evidence to conclude whether the beneficiaries preferred either a one- or six-monthly system over the other.
Table 8. Distribution of individual significant variables around zero on a Likert-type scale ranging from –3 to +3
Variables Estimated mean Standard deviation
Wilcoxon signed rank test statistic
Prob
Hassle
1.26 1.18 17554.50 <0.0001***
Leakages
0.32 1.27 6621.00 <0.0001***
Storage
–0.80 1.65 –11561.00 <0.0001***
Long interval
1.29 1.68 17707.00 <0.0001***
One-time payment 0.35 0.68 3981.50 <0.0030***
Grains traded –1.40 1.30 –17320.00 <0.0001***
Exploitation by middlemen
–1.08 1.48 –15338.0 <0.0001***
Communication of stock arrival
–0.95 1.53 –13890.0 <0.0001***
Preference for six-monthly system
0.25 1.91 2103.50 0.07
***p = .01.
4 Discussion
Our findings suggest that of all the benefits claimed by the state government and policymakers (refer Table 1), beneficiaries’ preference for the six-monthly system is strongly influenced by decreased hassle and decreased leakages in the system. These two facilitating factors identified in this study are consistent with the observations of Gaikwad (2010), Kumar (2015), and Puri (2014). The statistical significance of hassle variable strongly indicates that going to FPS on a monthly basis is not convenient for beneficiaries and that they prefer procuring their grains at longer time intervals. This might also suggest that beneficiaries do not enjoy their service experience with PDS and its stakeholders. About 53 percent of the beneficiaries reported spending more than two hours to procure their grains and about 48 percent reported being hourly employees or casual laborers, which might have made it more difficult to engage with the system frequently and might have affected their perception of service quality. Therefore, distribution at a longer interval, such as six months, would result in increased consumer satisfaction, as it would save consumers a lot of otherwise productive time, allowing them to better concentrate on their employment or other welfare activities (Gaikwad, 2010; Kumar, 2015). Moreover, because public services function as monopolies, policymakers tend to ignore the importance of customer satisfaction in policy implementation (Andreassen, 1994). Our findings suggest that beneficiaries are rational consumers with preferences, expectations, and constraints, and they often make informed choices to maximize utility
7This is a nonparametric test used for an individual samples when the data are not normally distributed (Robbins, 2010). The null hypothesis is that the distribution is centered around zero on a Likert-type scale, whereas the alternate hypothesis is otherwise.
Abhay Grover and Shweta Chopra/ Int. J. Food System Dynamics 8 (4), 2017, 298-316
312
from the system. Their choice to productively participate in the system can make such policy initiatives very successful. Thus, a significant policy implication of the research findings is to integrate consumer satisfaction as an important performance indicator for such developmental policies.
Likewise, the current framework of the six-monthly distribution system increases the transparency within the system with the improved community distribution mechanism. Delivery of grains takes place at common sites such as local temples or playgrounds. So instead of interacting on an individual basis with FPS representatives, beneficiaries receive grains in front of other beneficiaries under direct supervision of food inspectors. Gaikwad (2010) suggested that this would decrease organized black marketing by middlemen, as the system would have increased monitoring by the government and beneficiaries. The decrease of leakages would have a direct positive impact on the quantity of grains being delivered to beneficiaries, improving their consumption pattern as well (Kishore & Chakrabarti, 2015; Rahman, 2016). So, our findings suggest that a perception of a decrease in leakages in the system translates into beneficiaries having more trust in the six-monthly distribution system; thus, beneficiaries’ preference for the policy greatly depends on their perception about the improvement in the system’s efficiency (Ramaswami & Balakrishnan, 2002). Furthermore, the trust established can increase beneficiaries’ willingness to accept the changes proposed by the new scheme and become a part of its successful implementation. Therefore, “trust in the system” should also be used as an important performance indicator for developmental policies in general.
Our research also identified that the variables of storage, interval of grain distribution, one-time payment, grains trade, exploitation by middlemen, and time between the communication and actual distribution of grains significantly influenced beneficiaries’ preference for the six-monthly distribution system. Though beneficiaries strongly suggested that storage was not a concern, it could significantly impact their preferences, which contradicts Gaikwad’s (2010) observations. Our results suggest that if beneficiaries believe that storage is a concern, they are less likely to adopt the six-monthly distribution system; in fact, 60 percent of beneficiaries stay in temporary or make-shift houses, so storing additional grains is a challenge for them. Further, Nayar (2015) and Sharma and Chandrasekhar (2016) suggested that beneficiaries either remain on the move or frequently migrate in search of stable jobs, which makes handling storage for six months impractical. Additionally, all the beneficiaries were earning less than $896 per annum, and proper storage of bulk grains requires new infrastructural investments such as bins, bags, or silos.
In terms of grain distribution interval, if the beneficiaries perceived that six months was a long interval of time, they were less likely to adopt the system. Our findings suggest that beneficiaries strongly believed that six months is a long interval of time for grain distribution, even more so because, on most occasions, the beneficiaries reported receiving grains after eight or nine months instead of six months. Moreover, about 82 percent of the households reported consuming their six-month entitlement in less than four months, leaving them with no food. Therefore, most of them believed that a longer interval would lead to an even greater gap between distributions, leaving them more vulnerable. At the same time, they did not want to engage with the system as frequently as on a monthly basis. Thus, if the system could efficiently deliver grains to them on a fixed pre-determined date on a six-monthly basis, most of beneficiaries might not have been as apprehensive about the distribution interval. Delivering as committed would increase customer trust and satisfaction with the system.
One-time payment is a critical factor because most of the beneficiaries were earning less than $2.50 per day. During the monthly system, payment for grains was distributed equally over 12 months, but with the six-monthly system, beneficiaries have to pay for six months at one time. More so, about 65 percent of beneficiaries reported having no formal education, which can make planning finances a challenge. Another related factor is the amount of time between communication of the arrival and actual distribution of grains. There is no fixed date of distribution, and the communication about distribution is received about 12 hours before the actual arrival of grains. About one third of respondents reported dissatisfaction with the time frame and found it difficult to arrange for money and other resources for procurement. Hence, the uncertainty in the grain distribution drastically impacted beneficiaries’ preference. Also, beneficiaries believed that grain trade by family members and exploitation by middlemen were not a concern for them in the present system. However, they also believed that if this were to happen it would strongly influence their preference for the system.
Furthermore, our research identified several demographic factors, such as gender, area, and employment that significantly impacted beneficiaries’ preference for the six-monthly system. Several researchers, such as Abebe et al. (2013) and Khera (2014), have identified similar demographic factors influencing policy adoption under different scenarios. Our findings suggest that females are less likely to prefer the six-monthly system as compared to male household members. Moreover, when the pattern of household
Abhay Grover and Shweta Chopra/ Int. J. Food System Dynamics 8 (4), 2017, 298-316
313
members participating in PDS prior to the six-monthly system was compared with the existing scenario it was found that the female engagement had decreased by about 54 percent. This may be because about 40 percent of the female respondents were housewives, who traditionally do not contribute directly toward household income (Rao, 2006); therefore, the six-monthly system decreases their overall control in planning for household food security and with less financial independence, it might be more convenient for them to procure the grains on a monthly basis. Additionally , 65 percent of female respondents had no formal education, which may make understanding and adopting the new system a challenge.
Contrary to Gaikwad’s (2010) study, our results suggest that beneficiaries in rural areas are less likely to adopt the six-monthly system as compared to urban beneficiaries. Because Gaikwad’s (2010) study was based in Maharashtra, where villages are not accessible by road and the average distance to market is 9–12 miles, the six-monthly system is more favorable for beneficiaries. However, the average distance to market in rural Punjab is 0.89 miles, indicating that access to the market is more convenient. The logistical resources, such as transportation, in urban areas are more costly than in rural areas. Moreover, employment patterns such as organized labor are different in urban as compared to rural areas (Sharma & Chandrasekhar, 2016). Our results suggest that employment in general affects beneficiaries’ preference for the six-monthly system. Casual laborer or daily wage workers are more likely to prefer the six-monthly system as compared to beneficiaries who are not employed. The respondents with no empl oyment are mostly housewives, as discussed before.
Study limitations and future work
We caution against generalizing the findings beyond the sites studied because of the substantial differences likely to exist between sites within Punjab and in other Indian states and beyond. This research was focused on just one aspect of the new atta-daal (wheat-pulses) scheme. The impacts of digitization of identification cards and of females being declared as the head of family still need further investigation. A survey of policymakers, FPS owners, FCI officials, and commission agents can add breadth to the research. Moreover, the data were collected after 18 months of the implementation of the policy (from July 2015 to August 2016). With new policy adoption, the initial few years are the “infant” or early acceptance stage during which the beneficiaries experience several “teething” issues.
Future work on this research may include an increased sample size spread across several districts. The effects of the identified factors (demographic, facilitating, impeding) need to be further studied to better understand the mechanism and the underlying reasons for them. Structure equation modelling and factor analysis may be used for understanding individual factors and the degree of influence of each variable. A techno-economic analysis of the six-monthly supply chain may yield a cost–benefit ratio and help better understand policy implementation. This would be critical to weigh ing the sustainability of the policy in the long term.
5 Policy Implications and Conclusion
This research identified facilitating, impeding, and demographic factors that affect beneficiaries’ preference for the six-monthly distribution system and also evaluated performance of the new system based on these identified factors. Further, we provided policy implications relative to the state and district under consideration. Findings of this research will be significant for other districts and states that run similar public food distribution systems.
Some of the important policy implications limited to the district under consideration and the state of Punjab are that (a) such interventions should not undermine the status of beneficiaries as rational consumers, and policymakers should realize the importance of consumer satisfaction in successful implementation of similar developmental policies; (2) beneficiaries’ trust in the system defines their willingness to accept the policy interventions and participate to make it successful; delivering on commitments by the administration can help strengthen beneficiaries’ trust in the system; and (3) communication with beneficiaries and other stakeholders regarding new developments is critical for policy’s success; ambiguity and uncertainty due to lack of transparency can be detr imental to such policy interventions (Schiefer & Deiters, 2015).
Specifically for the six-monthly distribution system in the district of Ludhiana, it is recommended that (a) beneficiary trust and satisfaction should be made key policy performance indicator s; (b) the government should provide logistical support to beneficiaries in form of bins or hermetic storages such as PICS (Purdue improved cowpea storage) bags for storing six-month entitlements; (c) the option of a cash
Abhay Grover and Shweta Chopra/ Int. J. Food System Dynamics 8 (4), 2017, 298-316
314
advance for monetary resilience of beneficiaries via FPS would be very useful; (d) because promoting females as head of the families is one of the primary objective of new atta-daal (wheat-pulses) scheme under NFSA 2013, gender-based incentives for females can increase their engagement with the system; (e) distribution of grains should happen on fixed pre-determined dates communicated well in advance; the state should make every effort to deliver grains on time; and (f) finally, this scheme should be implemented with an option to revert back to a monthly distribution system when desired by beneficiaries, and this should be clearly communicated to them.
References
Abebe, G. K., Bijman, J., Kemp, R., Omta, O., and Tsegaye, A. (2013). Contract farming configuration: Smallholders’ preferences for contract design attributes. Food Policy, 40: 14 – 24.
Agresti, A. (2007). An introduction to categorical data analysis. New Jersey, NJ: John Wiley & Sons, Inc.
Andreassen, W. T. (1994). Satisfaction, loyalty and reputation as indicators of customer orientation in the public sector. International Journal of Public Sector Management, 7: 16 – 34.
Balani, S. (2013). Functioning of the Public Distribution System, an analytical report. PRS Legislative Research. Retrieved January 21, 2017, from http://www.prsindia.org/administrator/uploads/general/1388728622~~TPDS%20Thematic%20Note.pdf
Chopra, S. (2014). Topics in food security: measuring performance and technology adoption in the public distribution system supply chain of Chhattisgarh, India (Doctoral dissertation). Retrieved from Purdue library. (AAI3668781)
Clark, W. A., Hosking, P. L. (1986). Statistical Methods for Geographers. New York: Wiley.
Creswell, J. W. (2009). Research design: Qualitative, quantitative, and mixed methods approaches. Sage.
Dept. of Food Civil Supplies & Consumer Affairs. (2014a). Eligibility Criteria. Government of Punjab. Retrieved January 21, 2017, from http://foodsuppb.nic.in/files/FSAct/Eligibility%20criteria.pdf
Dept. of Food Civil Supplies & Consumer Affairs. (2014b). New Atta Dal Scheme. Government of Punjab. Retrieved January 21, 2017, from http://foodsuppb.nic.in/newattadal.html
Domencich, T. A., McFadden, D. (1975). Urban travel demand: Behavioral analysis. Amsterdam: North-Holland.
Economic and Statistical Organization. (2013). Statistical Abstract of Punjab. Chandigarh, Punjab: Government of Punjab.
Ekstrom, J. (n.d.). The phi-coefficient, the tetrachoric correlation coefficient, and the Pearson-yule debate. Retrieved January 21, 2017, from The%20Phi-coefficient,%20the%20Tetr...d%20the%20Pearson-Yule%20Debate.pdf
FAO (2015). The state of food insecurity in the world. Retrieved January 21, 2017, from http://www.fao.org/3/a-i4646e.pdf
Food Corporation of India. (2016). Procurement – policy and system. Retrieved January 21, 2017, from http://fci.gov.in/procurements.php?view=86
Gaikwad, S. (2010). Scheme for home delivery of food grains – a successful experiment under public distribution system. Yashwantrao Chavan Academy of Development Administration, Best Practice Series One. Retrieved January 21, 2017, from http://sheetalkachare.ucoz.com/Scheme_for_Home_Delivery_of_Foodgrains.pdf
Greene, W. H., (2008). Econometric Analysis. Boston, MA: Pearson.
Grover, A. K., Chopra, S., and Mosher, G. A. (2016). Food safety modernization act: A quality management approach to identify and prioritize factors affecting adoption of preventive controls among small food facilities. Food Control, 66: 241 – 249.
Hosmer, D. W., Lemeshow, S. (2000). Applied Logistic Regression. New York, NY: John Wiley & Sons, Inc.
Abhay Grover and Shweta Chopra/ Int. J. Food System Dynamics 8 (4), 2017, 298-316
315
Jain, S. P., Polman, W. (2003). A handbook for trainers on participatory local development -The panchayati raj model in India. Food and Agriculture Organization. Retrieved January 21, 2017, from ftp://ftp.fao.org/docrep/fao/006/ad346e/ad346e00.pdf
Kabir, H., Yegbemey, R. N., and Bauer, S. (2013). Factors determinant of biogas adoption in Bangladesh. Renewable and Sustainable Energy Reviews, 28: 881 – 889.
Khera, R. (2011). Trends in diversion of PDS grain. Economic and Political Weekly, 46: 106 – 114.
Khera, R. (2014). Cash vs. in-kind transfers: Indian data meets theory. Food Policy, 46: 116 – 128.
Kishore, A., Chakrabarti, S. (2015). Is more inclusive more effective? The ‘New Style’ public distribution system in India. Food Policy, 55: 117 – 130.
Kumar, S. (2015). Report of the high level committee on re-orienting the role and restructuring of Food Corporation of India. Government of India. Retrieved January 21, 2017, from http://www.fci.gov.in/app2/webroot/upload/News/Report%20of%20the%20High%20Level%20Committee%20on%20Reorienting%20the%20Role%20and%20Restructuring%20of%20FCI_English_1.pdf
Long, S.T., Freese, J. (2006). Regression model for categorical dependent variables using stata. College Station, Texas: A Stata Press Publication.
Ministry of Consumer Affairs, Food & Public Distribution. (2011). Number of Ration Shops in the Country [Data file]. Government of India . Retrieved January 21, 2017, from http://pib.nic.in/newsite/PrintRelease.aspx?relid=74180
Ministry of Consumer Affairs, Food & Public Distribution, Government of India. (2016). Targeted Public Distribution System. Retrieved January 21, 2017, from http://dfpd.nic.in/public-distribution.htm
Namara, R.E, Nagar, R. K., and Upadhyay. B., (2007). Economics, adoption determinants, and impacts of micro-irrigation technologies: empirical results from India. Irrigation Science, 25: 283 – 297.
Nayar, L. (2015, January 27). Five important questions on food security. Outlook. Retrieved January 21, 2017, fromhttp://www.outlookindia.com/website/story/five-important-questions-on-food-security/293207
Neuendorf, K. A. (2002). The Content Analysis Guidebook. Thousand Oak, CA: Sage.
Puri, A. (2014, May 2). A grain of sense – how Punjab is making the best use of the flawed public distribution system. The Indian Express. Retrieved January 21, 2017, from http://indianexpress.com/article/opinion/columns/a-grain-of-sense/
Rahman, A. (2016). Universal food security program and nutritional intake: evidence from the hunger prone KBK districts in Odisha. Food Policy, 63: 73 – 86.
Rajan, P., Chopra, S., Somasekhar, A. K., and Laux, C. (2016). Designing for food security: portability and the expansion of user freedoms through theCOREPDS in Chhattisgarh, India. Information Technologies and International Development, 12: 1 – 18.
Ramaswami, B., Balakrishnan, P. (2002). Food prices and the efficiency of public intervention: the case of the public distribution system in India. Food Policy, 27: 419 – 436.
Rao, N. (2006). Land rights, gender equality and household food security: exploring the conceptual links in the case of India. Food Policy, 31: 180 – 193.
Robbins, B. H. (2010). Non parametric tests – scholar series. Retrieved January 21, 2017, from http://biostat.mc.vanderbilt.edu/wiki/pub/Main/AnesShortCourse/NonParametrics.pdf
Schiefer, G., Deiters, J. (2015). Moving towards sustainability in food chains: Dealing with costs and benefits. International Journal of Food System Dynamics, 6: 50 – 61.
Sharma, P. (2016, April 19). Punjab dug into central funds to bankroll atta-dal scheme. Hindustan Times. Retrieved January 21, 2017, from http://www.hindustantimes.com/punjab/punjab-dug-into-central-funds-to-bankroll-atta-dal-scheme/story-IumLMWW2hQcLb2mfxyEBwJ.html
Sharma, A., Chandrasekhar, S. (2016). Impact of commuting by workers on household dietary diversity in rural India. Food Policy, 59: 34 – 43.

Abhay Grover and Shweta Chopra/ Int. J. Food System Dynamics 8 (4), 2017, 298-316
316
Stebbins, R. A. (2001). Exploratory Research in Social Sciences. Thousand Oaks, CA: Sage Publications.
Tey, Y.S., Li, E., Bruwer, J., Abdullah, A.M., Brindal, M., Radam, A., Ismail, M.M., and Darham, S. (2014). The relative importance of factors influencing the adoption of sustainable agricultural practices: A factor approach for Malaysian vegetable farmers. Sustainability Science, 9: 17 – 29.
Tiwari, K. R., Sitaula, B. K., Nyborg, I.L.P., and Paudel, G. S. (2008). Determinants of farmers’ adoption of improved soil conservation technology in a middle mountain watershed of central Nepal. Environmental Management, 42: 210–222.
Tribune News Service. (2015, April 3). Food grains to be distributed to BPL families twice a year, says Kairon. The Tribune. Retrieved January 21, 2017, from http://www.tribuneindia.com/news/punjab/governance/foodgrain-to-be-distributed-to-bpl-families-twice-a-year-says-kairon/64285.html
Copyright © 2022 FDOKUMEN