Text-to-Speech Technology: A Survey of German Speech Synthesis Systems
Upload
khangminh22Category
view
3download
0
Original Article
Detection, Speech Recognition, Loudness,and Preference Outcomes With a DirectDrive Hearing Aid: Effects of Bandwidth
Paula Folkeard1 , Maaike Van Eeckhoutte2,3, Suzanne Levy4,Drew Dundas4, Parvaneh Abbasalipour1 , Danielle Glista1,5,Sumit Agrawal1,6,7,8, and Susan Scollie1,5
Abstract
Direct drive hearing devices, which deliver a signal directly to the middle ear by vibrating the tympanic membrane via a lens
placed in contact with the umbo, are designed to provide an extension of audible bandwidth, but there are few studies of the
effects of these devices on preference, speech intelligibility, and loudness. The current study is the first to compare aided
speech understanding between narrow and extended bandwidth conditions for listeners with hearing loss while fitted with a
direct drive hearing aid system. The study also explored the effect of bandwidth on loudness perception and investigated
subjective preference for bandwidth. Fifteen adult hearing aid users with symmetrical sensorineural hearing loss participated
in a prospective, within-subjects, randomized single-blind repeated-measures study. Participants wore the direct drive
hearing aids for 4 to 15weeks (average 6weeks) prior to outcome measurement. Outcome measures were completed
in various bandwidth conditions achieved by reducing the gain of the device above 5000Hz or by filtering the stimuli. Aided
detection thresholds provided evidence of amplification to 10000Hz. A significant improvement was found in high-frequency
consonant detection and recognition, as well as for speech in noise performance in the full versus narrow bandwidth
conditions. Subjective loudness ratings increased with provision of the full bandwidth available; however, real-world trials
showed most participants were able to wear the full bandwidth hearing aids with only small adjustments to the prescription
method. The majority of participants had either no preference or a preference for the full bandwidth setting.
Keywords
extended bandwidth, direct drive, hearing aids, loudness perception, speech perception
Received 20 January 2021; Revised 20 January 2021; accepted 1 February 2021
Direct drive hearing aid technology has been developed
that sends an amplified, processed signal into the umbo
of the tympanic membrane. This multicomponent
system by Earlens (Earlens Corporation, Menlo Park,
CA) is comprised of a lens, a sound processor, and an
emitter. The emitter, which is housed in a vented ear-tip,
couples to the sound processor which rests behind the
ear and sends the signal from the processor to the lens.
Earlier iterations of the device used light as the means to
send the signal; however, since April 2019, commercial
products have incorporated electromagnetic energy
which the company reports as providing more stability
of sound transference, with the transmission from the
1National Centre for Audiology, Western University, London, Ontario,
Canada2Technical University of Denmark, Lyngby, Denmark3Rigshospitalet, Copenhagen University Hospital, Denmark4Earlens Corporation, Menlo Park, California, United States5School of Communication Sciences & Disorders, Western University,
London, Ontario, Canada6Department of Otolaryngology-Head and Neck Surgery, Western
University, London, Ontario, Canada7Department of Medical Biophysics, Western University, London, Ontario,
Canada8Department of Electrical and Computer Engineering, Western University,
London, Ontario, Canada
Corresponding Author:
Paula Folkeard, National Centre for Audiology, Western University, 1201
Western Road, London, ON N6G 1H1, Canada.
Email: [email protected]
Trends in Hearing
Volume 25: 1–17
! The Author(s) 2021
DOI: 10.1177/2331216521999139
journals.sagepub.com/home/tia
Creative Commons CC BY: This article is distributed under the terms of the Creative Commons Attribution 4.0 License (https://
creativecommons.org/licenses/by/4.0/) which permits any use, reproduction and distribution of the work without further permission provided the
original work is attributed as specified on the SAGE and Open Access pages (https://us.sagepub.com/en-us/nam/open-access-at-sage).

processor to the lens being affected less by jaw and facialmovement (Dundas & Levy, 2020). The lens itselfincludes a perimeter platform, umbo platform, detector,and microactuator (Gantz et al., 2017) and is placed inthe ear canal such that the platform makes direct contactwith the umbo of the malleus. This device has beendesigned to deliver a signal directly to the middle earsystem, with the goal of transmitting a broad bandwidthof audible sound from 125 to 10000Hz for mild-to-severe sensorineural hearing losses while maintaininga vented fitting (Puria et al., 2016). The direct drive aidcan be adjusted for each user’s hearing and mechanicalcoupling using a modified version of the CambridgeMethod for Loudness Equalization 2—high-frequency(CAM2) prescription method (Arbogast et al., 2019;Moore et al., 2010) which provides targets for frequen-cies up to 10000Hz. In the present article, we considerthe usefulness of this extra bandwidth.
Bandwidth and Suprathreshold Hearing AidOutcome
Previous studies investigating the influence of bandwidthon suprathreshold measures of speech understandingand discrimination in quiet and noise in adults with sen-sorineural hearing loss have shown that providingextended high-frequency amplification to adults withhearing loss can improve speech understanding in bothquiet and noise (Baer et al., 2002; Fullgrabe et al., 2010;Hornsby et al., 2011; Hornsby & Ricketts, 2003; Levyet al., 2015; Seeto & Searchfield, 2018; Turner & Henry,2002; Van Eeckhoutte et al., 2020; Vickers et al., 2001).However, several studies found that an increasing sever-ity of hearing loss or the presence of cochlear deadregions can limit the benefit provided by the extendedhigh frequencies (Amos & Humes, 2007; Ching et al.,1998; Hogan & Turner, 1998; Hornsby et al., 2011;Vickers et al., 2001).
Studies have also shown that degree of hearing losscan influence sound quality and preference for extendedbandwidth. Most studies have shown either subjectivepreference and higher sound quality, or no significantaversion to the provision of extended high frequenciesin listeners with normal hearing and less severe hearinglosses (Arbogast et al., 2019; Brennan et al., 2014;Fullgrabe et al., 2010; Moore, 2012; Moore et al.,2011; Moore & Tan, 2003; Ricketts et al., 2008; Seeto& Searchfield, 2018; Van Eeckhoutte et al., 2020).However, there are some studies that suggest there canbe a negative impact of bandwidth on sound quality andpreference based on stimuli used or slope of hearing loss.Ricketts et al. (2008) found listeners with hearing losswith steeply sloping high-frequency hearing lossestended to prefer a more restricted bandwidth (5.5 kHzvs. 9 kHz). Using music stimuli, Moore (2012) found
that, for participants with hearing loss, there was vari-ability in bandwidth cutoff preference between 5, 7.5,and 10 kHz and that preference for the higher cutoffcorresponded to a shallow sloping high-frequency audio-gram. Brennan et al. (2014) found extended bandwidthto 11 kHz was preferred over both restricted bandwidth(5 kHz) and nonlinear frequency compression for adultparticipants regardless of degree of hearing loss forspeech stimuli; however, participants with more hearingloss were less likely to prefer the extended bandwidth formusic stimuli.
Loudness perception may also vary with audiblebandwidth. A recent study of loudness and bandwidthwith acoustic hearing aids fitted to the Desired SensationLevel v5.0 adult targets (Scollie et al., 2005) found thatimproved high-frequency audibility can increase loud-ness perception particularly for high-level sounds (VanEeckhoutte et al., 2020). This is in agreement with otherswho have studied the contributions of specific frequencybands on the perception of loudness (Jesteadt et al.,2017; Thrailkill et al., 2019) and who concluded thathigher-frequency components of broadband sounds,when audible, dominate loudness perception in adultswith sensorineural hearing loss.
Bandwidth and Hearing Aid Output
Previous evaluations of conventional air conductionhearing aids have revealed upper bandwidth limits of5000–6000Hz in the early 2000s (Moore et al., 2001)with more recent measures revealing the capability ofup to 7000–8000Hz (Van Eeckhoutte et al., 2020) and10000Hz (Seeto & Searchfield, 2018). Variability in theachieved bandwidth in a fitted device may depend onlimitations of the ear, degree of hearing loss, the fittedsettings, target prescription and fitting methods, mea-surement methods, or a combination of these factorsso that a hearing aid may have a nominal bandwidththat includes, for example, 100–10000Hz but not all ofthis energy is audible to the listener. Seeto andSearchfield (2018) suggest that the variability in out-comes with extended bandwidths may be attributableto the lack of a clear definition of the output frequencylimits of hearing aid fittings. One method used to quan-tify the fitted audibility provided to an acoustic hearingaid user for a speech signal using probe-tube microphonemeasures is the Maximum Audible Output Frequency(MAOF) range (Alexander, 2015; Kimlinger et al.,2015; McCreery et al., 2014). The MAOF range hasbeen used in several studies to quantify the upperlimits of audible bandwidth with commercially availablehearing aids (Scollie et al., 2016; Van Eeckhoutte et al.,2020) and was used in this study to determine the audiblebandwidth of the participants’ previously worn air con-duction hearing aids.
2 Trends in Hearing

Because the direct drive hearing device does not pro-duce acoustic output, electroacoustic measures used todetermine the bandwidth of a conventional hearing aidare not feasible. Puria et al. (2016) used temporal-bonemeasures to determine the maximum equivalent pressureoutput and stable gain of a direct drive system. Theirresults indicated that direct drive is expected to providea passband to the temporal bone from 100 to 10000Hz.The intended bandwidth of direct drive hearing aids, ifsuccessfully provided to patients, may provide moreaudibility than has been typically available from air con-duction hearing aids in the past, particularly for fittingsthat incorporate significant venting. The Earlens devicedrives the tympanic membrane lens via an emitterhoused in a vented ear-tip. No acoustic energy is deliv-ered from this system, so the typical feedback loop cre-ated by leakage from acoustic output of an airconduction hearing aid receiver through the vent to thehearing aid microphone does not occur. Feedback gen-erated as a result of mechanically stimulating the umbocan occur but tends to be significantly lower than thatfrom vented acoustic hearing aids and, as a result, thedirect drive system may result in less feedback than anacoustic sound source in the ear canal (Khaleghi &Puria, 2017).
This system also allows low-frequency output to betransmitted to the umbo without occluding the ear.Struck and Prusick (2017) compared the effective band-width and maximum gain before feedback of the Earlensversus six acoustic receiver-in-the-canal hearing aidsfitted to default settings in simulated conditions andfound that a broader bandwidth was achieved in boththe low and high frequencies for the direct drive device.Provision of this extended bandwidth in direct drive fit-tings has been confirmed by previous studies using meas-ures of aided in situ thresholds up to 10000Hz (Arbogastet al., 2019; Fay et al., 2013; Gantz et al., 2017).Measures of threshold-level responses to tonal test sig-nals, however, can only confirm audibility of low-levelsignals and do not provide a direct evaluation of thesuprathreshold sound from the direct drive system.Evaluation beyond that of aided functional gain is desir-able to consider aided outcomes such as loudness, speechrecognition, and/or sound quality of real-world signalssuch as speech and music (Humes, 2003; Stelmachowiczet al., 2002). Levy et al. (2015) suggested that moreresearch was needed to determine the benefits of extend-ed bandwidth above the range typically seen with acous-tic hearing aids. Gantz et al. (2017) reported aided versusunaided benefit using the direct drive hearing devices onmeasures of word recognition in quiet and sentence rec-ognition in noise; however, the effects of the potentiallyincreased bandwidth from fitted direct drive devices onspeech recognition, loudness, and preference have notbeen evaluated in previous studies. Benefit in contrasting
bandwidth conditions is considered indirect measures ofthe available frequency response, as an index of achiev-able gain and performance on an individual level (Levyet al., 2015; Seeto & Searchfield, 2018). Measures thatrelate to functional communication are important forunderstanding how performance with a direct drivesystem varies with aided bandwidth, and studies inusers of clinically available devices are necessary todetermine whether the speculative benefits of bandwidthfrom lab- and headphone-derived studies can beachieved in wearable devices.
The purposes of this study were (a) to assess the func-tional bandwidth of the Earlens direct drive hearing aidby measuring aided sound field thresholds; (b) evaluatesuprathreshold aided speech and loudness perceptionobtained with the Earlens device across bandwidth con-ditions that compare to past studies with acoustic hear-ing aids in listeners who had received a trial with theEarlens system; and (c) determine listener preferencefor restricted versus narrow bandwidth when wearingthe Earlens system. In these tasks, we compared out-comes with the full bandwidth condition comparedwith narrow bandwidth test conditions. This method isconsistent with previous studies of bandwidth (Brennanet al., 2014; Fullgrabe et al., 2010; Stelmachowicz et al.,2007; Van Eeckhoutte et al., 2020). In a companionstudy (Vaisberg et al., 2021), we investigated theEarlens device using sound quality ratings and foundthat the wider bandwidth that included both low- andhigh-frequency energy received higher sound quality rat-ings. The current study extends these results to examinemeasures of detection, benefit, loudness, and preference.
Methods
This study was approved by the Western UniversityHuman Research Ethics Board (109433) and LawsonHealth Research Institute (R-18-057).
Participants
Potential participants were screened for study inclusionand exclusion criteria (Fay et al., 2013) prior to enroll-ment (Table 1). Audiometric inclusion criteria followedArbogast et al. (2019) (i.e., mild-to-severe sensorineuralhearing loss with suprathreshold word recognition onthe NU-6 word list �60% and normal tympanometry).This study required these criteria bilaterally.
Twenty-eight participants from London, Ontario andthe surrounding area signed letters of informed consent.Thirteen of the 28 participants enrolled but did not com-plete the trial for the following reasons: small exostosisthat prevented inclusion and was not apparent until afterear cleaning (n¼ 1); visualization of a weak spot on thetympanic membrane at the time of ear cleaning (n¼ 1);
Folkeard et al. 3
voluntary withdrawal of permission prior to impression(n¼ 1); participant could not tolerate the impressionprocess (n¼ 1); initial impression was not successful
and participant declined to return (n¼ 2); impressionswere taken successfully, but a device could not be fabri-cated due to size and shape restrictions (n¼ 6); and
device was fitted but the participant withdrew due toautophony when singing (n¼ 1). The remaining 15 par-ticipants completed the entire protocol. Of these,
seven participants were female (mean age: 72 years,range: 66–78); eight were male (mean age: 72.4 years,range: 68–86).
Otologic Assessments
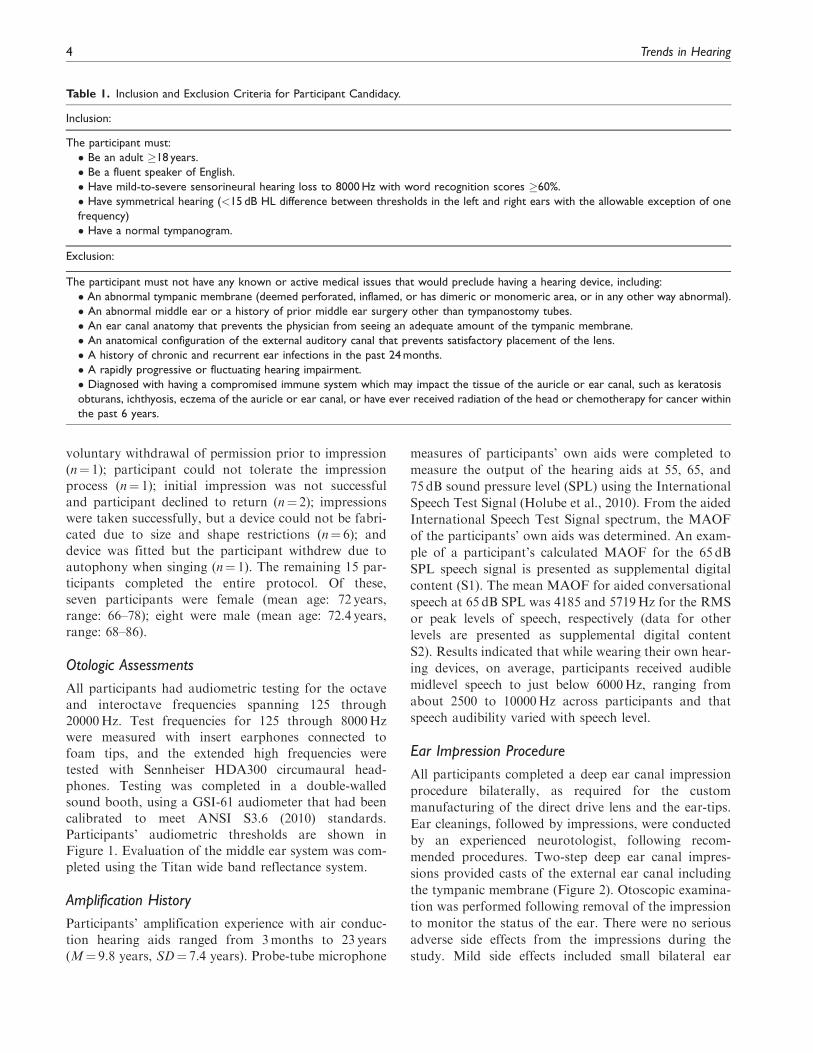
All participants had audiometric testing for the octaveand interoctave frequencies spanning 125 through
20000Hz. Test frequencies for 125 through 8000Hzwere measured with insert earphones connected tofoam tips, and the extended high frequencies were
tested with Sennheiser HDA300 circumaural head-phones. Testing was completed in a double-walledsound booth, using a GSI-61 audiometer that had been
calibrated to meet ANSI S3.6 (2010) standards.Participants’ audiometric thresholds are shown inFigure 1. Evaluation of the middle ear system was com-
pleted using the Titan wide band reflectance system.
Amplification History
Participants’ amplification experience with air conduc-
tion hearing aids ranged from 3months to 23 years(M¼ 9.8 years, SD¼ 7.4 years). Probe-tube microphone
measures of participants’ own aids were completed to
measure the output of the hearing aids at 55, 65, and
75 dB sound pressure level (SPL) using the International
Speech Test Signal (Holube et al., 2010). From the aided
International Speech Test Signal spectrum, the MAOF
of the participants’ own aids was determined. An exam-
ple of a participant’s calculated MAOF for the 65 dB
SPL speech signal is presented as supplemental digital
content (S1). The mean MAOF for aided conversational
speech at 65 dB SPL was 4185 and 5719Hz for the RMS
or peak levels of speech, respectively (data for other
levels are presented as supplemental digital content
S2). Results indicated that while wearing their own hear-
ing devices, on average, participants received audible
midlevel speech to just below 6000Hz, ranging from
about 2500 to 10000Hz across participants and that
speech audibility varied with speech level.
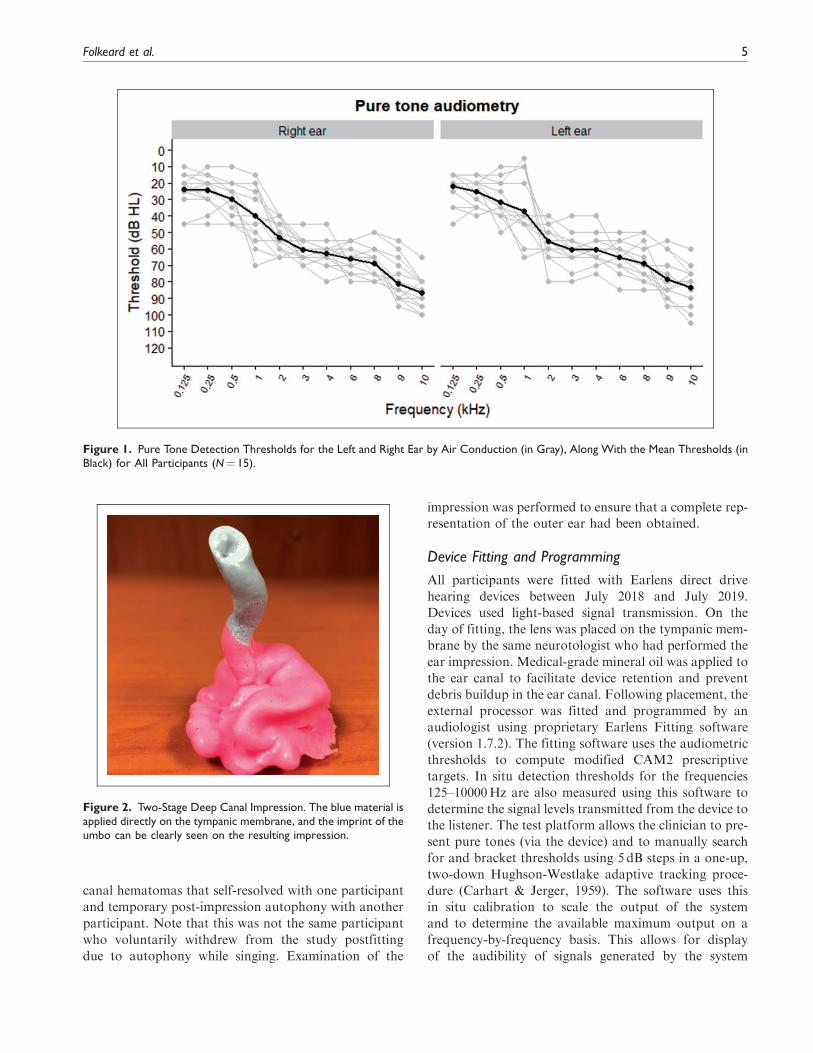
Ear Impression Procedure
All participants completed a deep ear canal impression
procedure bilaterally, as required for the custom
manufacturing of the direct drive lens and the ear-tips.
Ear cleanings, followed by impressions, were conducted
by an experienced neurotologist, following recom-
mended procedures. Two-step deep ear canal impres-
sions provided casts of the external ear canal including
the tympanic membrane (Figure 2). Otoscopic examina-
tion was performed following removal of the impression
to monitor the status of the ear. There were no serious
adverse side effects from the impressions during the
study. Mild side effects included small bilateral ear
Table 1. Inclusion and Exclusion Criteria for Participant Candidacy.
Inclusion:
The participant must:
� Be an adult �18 years.
� Be a fluent speaker of English.
� Have mild-to-severe sensorineural hearing loss to 8000Hz with word recognition scores �60%.
� Have symmetrical hearing (<15 dB HL difference between thresholds in the left and right ears with the allowable exception of one
frequency)
� Have a normal tympanogram.
Exclusion:
The participant must not have any known or active medical issues that would preclude having a hearing device, including:
� An abnormal tympanic membrane (deemed perforated, inflamed, or has dimeric or monomeric area, or in any other way abnormal).
� An abnormal middle ear or a history of prior middle ear surgery other than tympanostomy tubes.
� An ear canal anatomy that prevents the physician from seeing an adequate amount of the tympanic membrane.
� An anatomical configuration of the external auditory canal that prevents satisfactory placement of the lens.
� A history of chronic and recurrent ear infections in the past 24months.
� A rapidly progressive or fluctuating hearing impairment.
� Diagnosed with having a compromised immune system which may impact the tissue of the auricle or ear canal, such as keratosis
obturans, ichthyosis, eczema of the auricle or ear canal, or have ever received radiation of the head or chemotherapy for cancer within
the past 6 years.
4 Trends in Hearing
canal hematomas that self-resolved with one participant
and temporary post-impression autophony with another
participant. Note that this was not the same participant
who voluntarily withdrew from the study postfitting
due to autophony while singing. Examination of the
impression was performed to ensure that a complete rep-
resentation of the outer ear had been obtained.
Device Fitting and Programming
All participants were fitted with Earlens direct drive
hearing devices between July 2018 and July 2019.
Devices used light-based signal transmission. On the
day of fitting, the lens was placed on the tympanic mem-
brane by the same neurotologist who had performed the
ear impression. Medical-grade mineral oil was applied to
the ear canal to facilitate device retention and prevent
debris buildup in the ear canal. Following placement, the
external processor was fitted and programmed by an
audiologist using proprietary Earlens Fitting software
(version 1.7.2). The fitting software uses the audiometric
thresholds to compute modified CAM2 prescriptive
targets. In situ detection thresholds for the frequencies
125–10000Hz are also measured using this software to
determine the signal levels transmitted from the device to
the listener. The test platform allows the clinician to pre-
sent pure tones (via the device) and to manually search
for and bracket thresholds using 5 dB steps in a one-up,
two-down Hughson-Westlake adaptive tracking proce-
dure (Carhart & Jerger, 1959). The software uses this
in situ calibration to scale the output of the system
and to determine the available maximum output on a
frequency-by-frequency basis. This allows for display
of the audibility of signals generated by the system
Figure 2. Two-Stage Deep Canal Impression. The blue material isapplied directly on the tympanic membrane, and the imprint of theumbo can be clearly seen on the resulting impression.
Figure 1. Pure Tone Detection Thresholds for the Left and Right Ear by Air Conduction (in Gray), Along With the Mean Thresholds (inBlack) for All Participants (N¼ 15).
Folkeard et al. 5
relative to the available dynamic range achieved on theear. The devices were initially fitted to these targets by
the software while the participant was seated in a quietroom and fine-tuned to the participant’s preference if
necessary. Participants were provided with additionalhearing aid programs based on the frequency response
of the tuned-to-preference fitting but which varied inmicrophone directionality and noise reduction strengthas required for use in their daily lives (e.g., music pro-
gram). Participants also had access to a volume controlfor use in the real-world trial.
Because the application of oil during lens placement isknown to cause a damping effect on hearing that is
expected to subside after a few days, device program-ming was monitored and readjusted as follows.
Each participant was seen 1–2weeks postfitting toconfirm device function and use and to address any
questions. In situ calibration thresholds were reassessedat this and each subsequent appointment to ensure the
stability of the fitting and to reprogram the device and/or provide modified physical fits to ensure comfortableand stable fittings if needed. On average, the final fit-
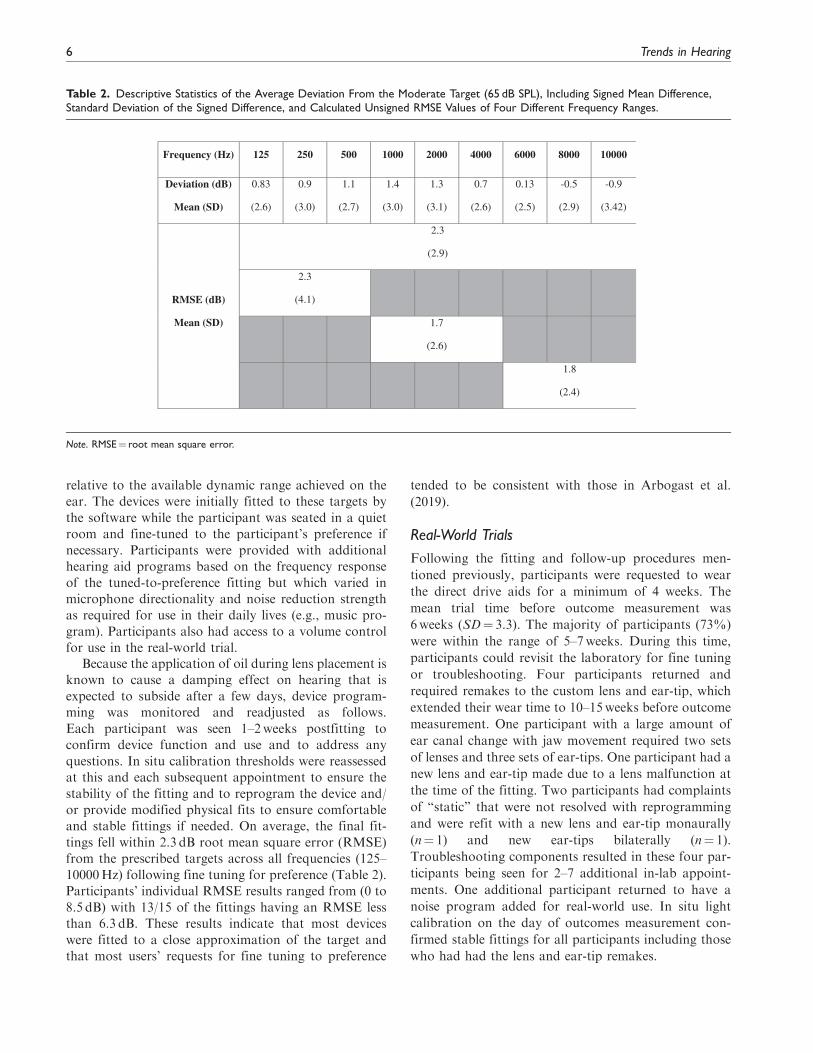
tings fell within 2.3 dB root mean square error (RMSE)from the prescribed targets across all frequencies (125–
10000Hz) following fine tuning for preference (Table 2).Participants’ individual RMSE results ranged from (0 to
8.5 dB) with 13/15 of the fittings having an RMSE lessthan 6.3 dB. These results indicate that most devices
were fitted to a close approximation of the target andthat most users’ requests for fine tuning to preference
tended to be consistent with those in Arbogast et al.
(2019).
Real-World Trials
Following the fitting and follow-up procedures men-
tioned previously, participants were requested to wear
the direct drive aids for a minimum of 4 weeks. The
mean trial time before outcome measurement was
6weeks (SD¼ 3.3). The majority of participants (73%)
were within the range of 5–7weeks. During this time,
participants could revisit the laboratory for fine tuning
or troubleshooting. Four participants returned and
required remakes to the custom lens and ear-tip, which
extended their wear time to 10–15weeks before outcome
measurement. One participant with a large amount of
ear canal change with jaw movement required two sets
of lenses and three sets of ear-tips. One participant had a
new lens and ear-tip made due to a lens malfunction at
the time of the fitting. Two participants had complaints
of “static” that were not resolved with reprogramming
and were refit with a new lens and ear-tip monaurally
(n¼ 1) and new ear-tips bilaterally (n¼ 1).
Troubleshooting components resulted in these four par-
ticipants being seen for 2–7 additional in-lab appoint-
ments. One additional participant returned to have a
noise program added for real-world use. In situ light
calibration on the day of outcomes measurement con-
firmed stable fittings for all participants including those
who had had the lens and ear-tip remakes.
Table 2. Descriptive Statistics of the Average Deviation From the Moderate Target (65 dB SPL), Including Signed Mean Difference,Standard Deviation of the Signed Difference, and Calculated Unsigned RMSE Values of Four Different Frequency Ranges.
Frequency (Hz) 125 250 500 1000 2000 4000 6000 8000 10000
Deviation (dB)
Mean (SD)
0.83
(2.6)
0.9
(3.0)
1.1
(2.7)
1.4
(3.0)
1.3
(3.1)
0.7
(2.6)
0.13
(2.5)
-0.5
(2.9)
-0.9
(3.42)
RMSE (dB)
Mean (SD)
2.3
(2.9)
2.3
(4.1)
1.7
(2.6)
1.8
(2.4)
Note. RMSE¼ root mean square error.
6 Trends in Hearing
Posttrial Outcome Measures
Following the trial period, outcome measures were
administered to assess the effects of extended bandwidth
on aided outcomes. The battery included aided tone
detection thresholds, speech recognition, aided loudness
perception, and preference. The hearing aids were set to
an omnidirectional mode with advanced signal process-
ing disabled. Two programs for this test battery were
created: (a) full bandwidth, with the participants’ real-
world trial frequency response and (b) narrow band-
width with a frequency response programmed to provide
no output above 5000Hz. All outcome measures except
loudness perception were completed in both hearing aid
programs. The 5000Hz cutoff for the narrow bandwidth
condition was chosen to be comparable to narrowband
conditions reported for acoustic hearing aid fittings
(Fullgrabe et al., 2010; Kimlinger et al., 2015;
McCreery et al., 2014). The test conditions (full band-
width versus narrow bandwidth) were not revealed to
the participant during outcome measures.For the loudness rating task, listeners wore the hear-
ing devices in the full bandwidth program, and the stim-
uli were filtered to create four different bandwidths: (a)
123–10869Hz; (b) 123–4455Hz; (c) 313–10869Hz; and
(d) 313–4455Hz. These filter conditions were selected to
match those used by Moore and Tan (2003). For this
measure, we filtered the stimuli with these filter condi-
tions rather than using the hearing aid programming in
an attempt to match Moore and Tan’s experimental con-
ditions. Sound quality ratings with these filter conditions
have been previously reported in a companion study
(Vaisberg et al., 2021).The order of tests and conditions was randomized
across listeners and test sessions. Testing was completed
in one or two test sessions depending on scheduling and
to prevent fatigue. If testing was completed on multiple
days, repeated tests were scheduled on the same day
to avoid differences in rest periods between conditions.
All aided testing was completed in a standard
283 cm� 305 cm double-walled sound booth with a
reverberation time (RT60) of 0.1 s. The participant
was seated with access to a computer monitor and
mouse. Seven loudspeakers surrounded the listener at
horizontal angles of 45�, 90�, 135�, 180�, 225�, 270�,and 315� relative to the look direction at a distance of
110 cm and a height of 120 cm (floor to speaker centre).
An eighth speaker at 0� was located at a distance of
115 cm and a height of 125 cm to accommodate condi-
tions that required both speech and noise from 0�. Inthose conditions, the 315� speaker was moved to be
directly in front of the 0� speaker. Listeners wore the
Earlens system in both ears while the test battery was
completed.
Detection Thresholds. Detection thresholds were con-ducted in a calibrated sound field using frequency-modulated tones from 125 to 10000Hz produced by aclinical audiometer (GSI-61). All detection thresholdswere bracketed using 5 dB steps and one-up, two-downadaptive tracking using the Hughson-Westlake proce-dure. Detection thresholds were measured unaided(i.e., pre-lens fitting with no devices in the ears) andaided (i.e., with lenses in place and hearing aids fittedand turned on). Aided thresholds were measured twice,once with the hearing aids set to the full bandwidth con-dition and also with the hearing aids set to the narrowbandwidth condition.
Speech Recognition. Speech recognition was assessed usingthree measures; one using sentences, one using nonsensesyllables, and one measuring word-final /s/ detection,described later. Each test was completed twice, withthe participant wearing the hearing devices in each ofthe full and narrow bandwidth programs.
Sentence recognition in noise was measured with theHearing in Speech Test (HIST). This test uses sentencesand bracketing procedures from the Hearing In NoiseTest (Nilsson et al., 1994), with rerecorded stimuli thatprovide bandwidth to 20000Hz and two-talker babblerather than steady-state background noise (Levy et al.,2015). Bracketing of the stimulus level was administeredwith software to measure the Reception Threshold forSentences at a 50% correct level. Masker level was heldconstant at 65 dB(A). Three loudspeaker configurationswere used: (a) target speech and two masking talkersfrom zero degrees azimuth; (b) target speech from zerodegrees and two masking talkers from �45 degrees; and(c) target speech from –45 degrees and two masking talk-ers from þ45 degrees. The third configuration used anasymmetric configuration in which the two types of stim-uli were spatially separated. This condition was includedbecause it has been shown to be sensitive to bandwidtheffects in a previous investigation in which listeners weretested with simulated amplification over headphones(Levy et al., 2015).
Consonant recognition in noise was measured withthe University of Western Ontario Distinctive FeaturesDifferences test (Cheesman & Jamieson, 1996). TheUniversity of Western Ontario Distinctive FeaturesDifferences test presents the 21 consonants of Englishfor two male and two female talkers. All test stimulibegin with the vowel sound /æ/ and end with /Il/. Themiddle consonants change during the task, and the lis-tener is asked to select the consonant that was heardfrom a computer display of 21 response choices (e.g.,If the participant heard /æbIl/, they would choose theletter B on the screen.). Stimuli were presented at a con-versational level of 60 dB SPL (ANSI, 2020; Pearsonset al., 1977) in a background of steady-state speech-
Folkeard et al. 7

shaped noise at a þ6 dB signal-to-noise ratio (SNR) atzero degrees azimuth. This or similar tests at similarlevels and SNRs have been used in evaluations ofextended bandwidth in air conduction hearing aids(McCreery et al., 2014; Van Eeckhoutte et al., 2020).Listeners selected the perceived medial consonant onthe computer screen, and responses were logged withinthe test software. The test was completed twice per con-dition (i.e., full bandwidth and narrow bandwidth) for atotal of four tests. An error matrix was generated toinvestigate specific patterns of individual consonant rec-ognition confusion between the two bandwidth condi-tions (Alexander & Rallapalli, 2017; Glista et al., 2012;Salorio-Corbetto et al., 2017; Van Eeckhoutte et al.,2020).
Aided fricative detection was measured with theUniversity of Western Ontario Plurals Test (Glista &Scollie, 2012), which measures detection of word-final/s/ using a list of nouns in singular and plural forms.The test was administered at 55 dB SPL with a maskernoise embedded in the test at 20 dB SNR, both from zerodegrees azimuth. This test was completed twice per con-dition (i.e., full bandwidth and narrow bandwidth) for atotal of four tests.
Aided Loudness Perception. The Contour Test of LoudnessPerception (Cox et al., 1997) was used to measure aidedloudness ratings, for sentences from the modifiedConnected Speech Test passages Ocean and Water(Saleh et al., 2020). With each sentence presentation,the listeners indicated their perceived loudness categoryon a computer screen. Seven loudness categories includ-ed the following: Very soft, Soft, Comfortable but slightlysoft, Comfortable, Comfortable but slightly loud, Loud,and Uncomfortably loud. Presentation levels rangedfrom 52 to 80 dB SPL and increased in steps of 4 dBuntil either the maximum level was reached or a ratingof Uncomfortably loud was given. At that point, the stim-ulus level reversed (descending run). Loudness ratingswere scored from 1 to 7. Ratings from the ascendingand descending run were averaged together to obtainone number for each stimulus level for a given test con-dition (Jenstad et al., 2007). Each condition was pre-sented twice, for a total of eight loudness tasks. Theloudness results for the two repetitions were averagedto obtain a single result for each test condition.
Preference. Subjective preference for either the full ornarrow bandwidth condition was measured using asingle-blind, unforced-choice, paired comparisons para-digm (Amlani & Schafer, 2009; Eisenberg et al., 1997;Punch et al., 2001). Listeners heard a broadband record-ing of the Dove Passage from the modified ConnectedSpeech Test (Saleh et al., 2020). The passage was pre-sented at 60 dB SPL from 0� azimuth. The tester
alternated the hearing devices between the full narrowbandwidth programs using the manufacturer’s software.Participants were asked to state their preference forProgram 1, Program 2, or declare no preference.Participants did not know the nature of the differencebetween the two programs. The procedure was repeatedtwice with the order of programs reversed on the secondtrial. Starting condition was counterbalanced across par-ticipants. For the analysis, the preference results werecoded as follows. If the listener had the same preferencein both trials, the response was coded as a strong pref-erence. If the listener indicated a preference for a condi-tion in one trial, and no preference in another trial, thiswas coded as a weak preference. No preference was codedif (a) the listener selected no preference on both trials or(b) the listener selected a preference for one condition inone trial and a preference for the other condition in theother trial. Correlation analyses were completed todetermine any relations between degree and slope ofhearing loss with bandwidth preference (Moore, 2012;Ricketts et al., 2008).
Results
Detection Thresholds
Unaided and aided detection thresholds are shown inFigure 3. In the unaided and narrow bandwidth condi-tions, there were several participants with thresholdsabove the limits of the audiometer at the higher testfrequencies: at 8000Hz (n¼ 1), 9000Hz (n¼ 7), and10000Hz (n¼ 8) in the unaided condition; and at6000Hz (n¼ 2) and 8000–10000Hz (n¼ 9) in thenarrow bandwidth condition. Thresholds above thelimits of the audiometer were coded as the maximumpresentation level for that frequency þ1 dB. In the fullbandwidth condition, all participants had measurableaided thresholds at all frequencies tested (125–10000Hz).
Detection thresholds were analyzed with a repeated-measures analysis of variance, using Greenhouse–Geisser corrections to adjust for lack of sphericity.Aided thresholds were the dependent variable, and testfrequency and bandwidth condition were repeated fac-tors. There was an overall effect of test frequency, F(3.62, 50.64)¼ 86.90, p� .001, ˛2¼ .85, and bandwidthcondition, F(1.37, 19.10)¼ 211.31, p< .001, ˛2¼ .94, aswell as an interaction between bandwidth condition andtest frequency, F(5.19,72.71)¼ 76.68, p< .001, ˛2¼ .85.Frequency-specific pairwise comparisons were complet-ed for (a) unaided versus full bandwidth to measureaided benefit and (b) narrow versus full bandwidth totest the impact of bandwidth. Aided full bandwidththresholds were better than unaided at 500Hz andabove, through 10000Hz (500Hz: p¼ .023; 1000Hz:
8 Trends in Hearing
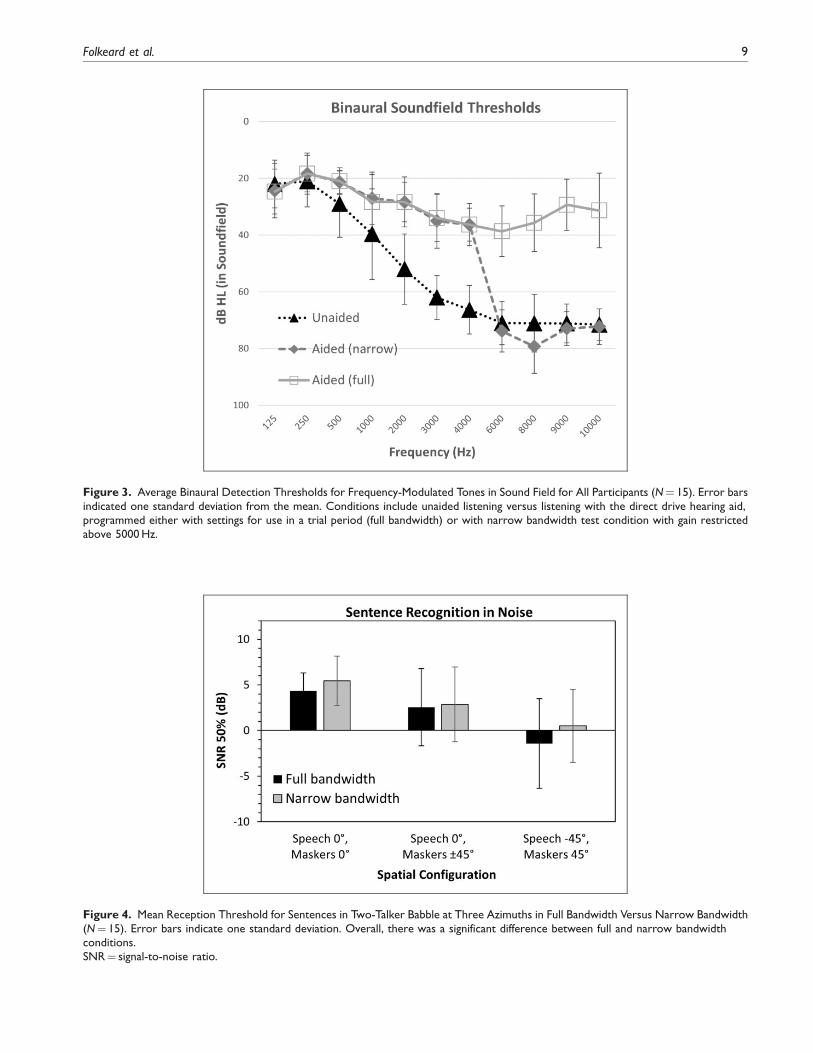
Figure 4. Mean Reception Threshold for Sentences in Two-Talker Babble at Three Azimuths in Full Bandwidth Versus Narrow Bandwidth(N¼ 15). Error bars indicate one standard deviation. Overall, there was a significant difference between full and narrow bandwidthconditions.SNR¼ signal-to-noise ratio.
Figure 3. Average Binaural Detection Thresholds for Frequency-Modulated Tones in Sound Field for All Participants (N¼ 15). Error barsindicated one standard deviation from the mean. Conditions include unaided listening versus listening with the direct drive hearing aid,programmed either with settings for use in a trial period (full bandwidth) or with narrow bandwidth test condition with gain restrictedabove 5000Hz.
Folkeard et al. 9
p¼ .001; all other frequencies p< .001). Narrowbandaided thresholds were poorer than full bandwidthaided thresholds at 6000Hz and above (p< .001). Atall other frequencies, narrow and full bandwidth thresh-olds did not differ significantly (125, 250, 500, 2000,4000Hz: p¼ 1.00; 1000Hz: p¼ .311; 3000Hz p¼ .813).
These results indicate that improved detection wasobserved in aided versus unaided conditions and alsothat the narrow bandwidth programming successfullyreduced high-frequency audibility, at least for the lowlevels tested in this task.
Speech Recognition: Sentences in Noise
Mean reception thresholds for sentences from the HISTare shown in Figure 4. An analysis of variance was com-
pleted to assess the effect of spatial configuration (i.e.,azimuths) and bandwidth (full, narrow) as repeatedmeasures. Results indicated a significant main effect ofspatial configuration, F(1.95, 27.34)¼ 27.34, p� .001,˛2¼ .66, and bandwidth, F(1, 14.00)¼ 4.98, p¼ .042,˛2¼ .26. The interaction between bandwidth and spatialconfiguration was nonsignificant, F(1.93, 27.01)¼ 3.10,p¼ .063, ˛2¼ .184. On average, participants were able torecognize HIST sentences with 1.1 dB more backgroundnoise in the full bandwidth condition versus the narrowbandwidth condition, averaged across spatialconfigurations.
Speech Recognition: Consonants in Noise
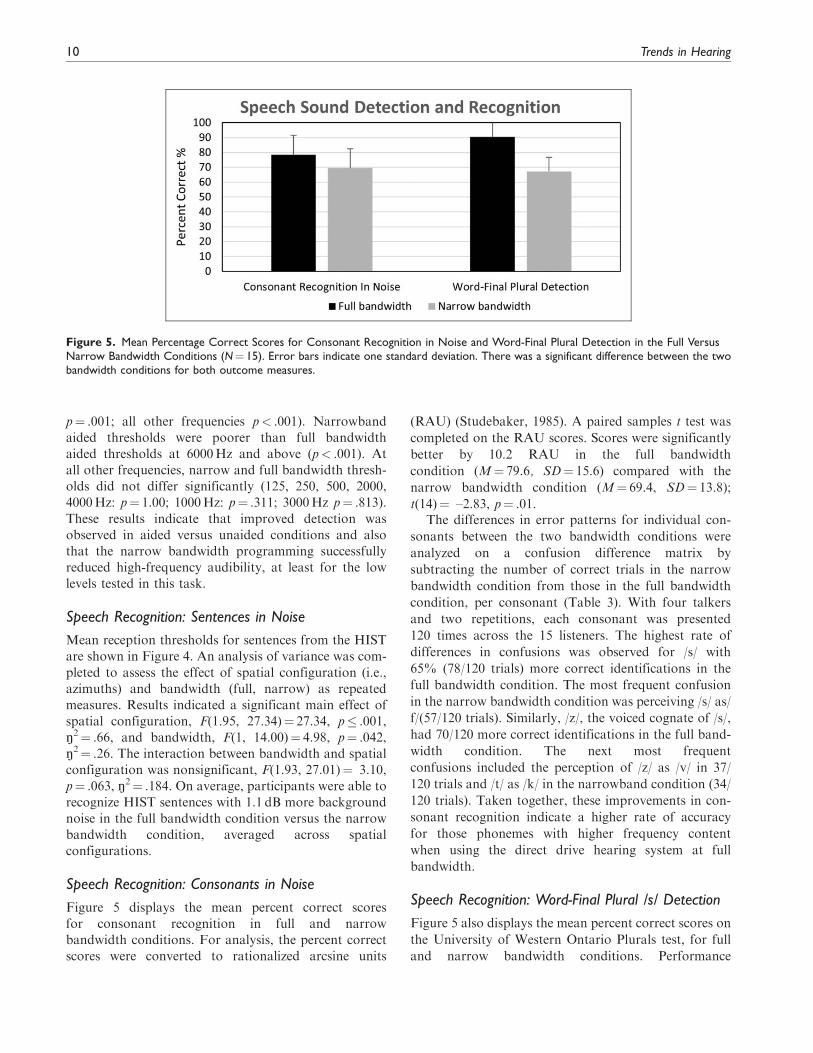
Figure 5 displays the mean percent correct scoresfor consonant recognition in full and narrowbandwidth conditions. For analysis, the percent correctscores were converted to rationalized arcsine units
(RAU) (Studebaker, 1985). A paired samples t test was
completed on the RAU scores. Scores were significantly
better by 10.2 RAU in the full bandwidth
condition (M¼ 79.6, SD¼ 15.6) compared with the
narrow bandwidth condition (M¼ 69.4, SD¼ 13.8);
t(14)¼ –2.83, p¼ .01.The differences in error patterns for individual con-
sonants between the two bandwidth conditions were
analyzed on a confusion difference matrix by
subtracting the number of correct trials in the narrow
bandwidth condition from those in the full bandwidth
condition, per consonant (Table 3). With four talkers
and two repetitions, each consonant was presented
120 times across the 15 listeners. The highest rate of
differences in confusions was observed for /s/ with
65% (78/120 trials) more correct identifications in the
full bandwidth condition. The most frequent confusion
in the narrow bandwidth condition was perceiving /s/ as/
f/(57/120 trials). Similarly, /z/, the voiced cognate of /s/,
had 70/120 more correct identifications in the full band-
width condition. The next most frequent
confusions included the perception of /z/ as /v/ in 37/
120 trials and /t/ as /k/ in the narrowband condition (34/
120 trials). Taken together, these improvements in con-
sonant recognition indicate a higher rate of accuracy
for those phonemes with higher frequency content
when using the direct drive hearing system at full
bandwidth.
Speech Recognition: Word-Final Plural /s/ Detection
Figure 5 also displays the mean percent correct scores on
the University of Western Ontario Plurals test, for full
and narrow bandwidth conditions. Performance
Figure 5. Mean Percentage Correct Scores for Consonant Recognition in Noise and Word-Final Plural Detection in the Full VersusNarrow Bandwidth Conditions (N¼ 15). Error bars indicate one standard deviation. There was a significant difference between the twobandwidth conditions for both outcome measures.
10 Trends in Hearing

improved by 25 percentage points in the full bandwidth
compared with the narrow bandwidth condition. For
analysis, percent correct scores were converted to
RAU, and a paired samples t test comparing bandwidth
conditions was completed. Results indicated a significant
improvement in the full bandwidth condition (M¼ 97.3,
SD¼ 16.4) compared with the narrow bandwidth condi-
tion (M¼ 65.4, SD¼ 9.5), t(14)¼ –6.2, p¼ .<001.
Loudness Ratings
Figure 6 displays a sigmoidal fit to the bilateral aided
loudness ratings from all participants for each condition.
Perceived loudness increased with increasing stimulus
level for all four conditions, with the largest bandwidth
condition generally having higher loudness judgments
than the other conditions. A linear mixed-effects model
was completed with participant as a random effect and
bandwidth and level as fixed effects. Adding an interac-
tion did not improve the model. This was tested by com-
paring the models with the log-likelihood. Adding level
and bandwidth to the model significantly improved it,
v2 (1)¼ 1087.08, p< .001 and v2 (3)¼ 27.75, p< .001,
respectively, while adding the interaction did not signif-
icantly further improve the model, v2 (3)¼ 4.04, p¼ .26.
The reference bandwidth was 123–10869Hz. Post hoc
paired t tests with Bonferroni correction were chosen
to further examine differences between pairs of band-
width conditions. Results showed that the reference
bandwidth condition (123–10869Hz) was significantly
Table 3. Difference in Consonant Confusions Between the Full Bandwidth Minus the Narrow Bandwidth Conditions.
V 1 0 -2 -2 -1 0 0 -1 0 1 0 0 0 0 0 6 0 -2 -1 0 1
W 0 0 0 0 -1 0 0 0 -1 1 0 0 -1 0 0 0 0 2 0 0 0
Y 0 -1 0 -1 1 -1 1 0 -3 0 -2 0 0 -1 0 0 0 1 2 4 0
Z -11 0 -15 -6 -1 -2 0 0 -1 -1 0 0 -1 0 6 0 0 -37 -1 0 70
Response Differences
B CH D F G H J K L M N P R SH S TH T V W Y Z
/b/ /t∫/ /d/ /f/ /g/ /h/ /dʒ/ /k/ /l/ /m/ /n/ /p/ /r/ /∫/ /s/ /θ/ /t/ /v/ /w/ /j/ /z/
Stimuli B -14 1 1 0 0 -1 0 0 0 0 0 0 1 0 0 1 0 12 0 -1 0
CH 0 -5 0 0 0 0 2 -1 1 1 0 0 1 0 1 0 0 0 0 0 0
D -2 0 0 0 2 0 0 0 0 0 0 1 0 0 0 0 0 -1 0 0 0
F 0 -1 -1 2 1 -4 0 -1 0 0 0 -5 0 1 -1 6 -1 4 0 0 0
G 2 1 -5 -1 2 0 1 0 0 0 0 0 0 0 0 0 0 0 0 0 0
H 0 0 -2 8 0 -2 0 -1 0 0 0 -1 0 0 0 0 0 -2 0 0 0
J 1 1 2 0 5 0 -4 -4 0 0 0 0 0 -1 0 0 -1 0 1 0 0
K 0 0 0 -1 -1 0 0 3 0 0 -1 2 0 0 0 0 -2 0 1 -1 0
L -1 -1 0 0 0 -1 0 1 -13 2 -1 0 1 0 0 0 0 2 12 -1 0
M 0 0 0 0 0 0 1 0 2 -1 -3 0 0 0 0 0 0 0 1 0 0
N 0 0 0 0 0 0 0 0 -1 -2 1 0 0 0 0 0 1 0 0 1 0
P -1 1 -1 -5 0 0 0 -4 -1 0 0 12 1 0 0 0 -1 -1 0 0 0
R -1 0 0 0 -1 0 0 0 -1 0 0 1 -6 1 0 0 0 -2 9 0 0
SH -1 -3 1 1 0 -1 -1 -1 0 0 0 2 1 6 -5 0 0 0 1 0 0
S -1 0 -1 -57 -2 -9 -2 -1 -1 1 0 -2 0 0 78 -1 -1 0 1 -1 -1
TH -7 -1 2 1 -1 1 0 0 -1 -1 0 -1 0 0 0 3 0 5 0 0 0
T -1 2 1 0 0 0 -1 -34 0 0 0 -3 0 0 -1 0 37 0 0 0 0
Note. Positive values on the diagonal indicate better performance in the full bandwidth condition. Negative values outside the diagonal indicate more
confusion between consonants in the narrowband condition.
Folkeard et al. 11

louder than the other three bandwidth conditions(p< .001). There was also a significant differencebetween the two narrowest bandwidth conditions(123–4455Hz vs. 313–4455Hz, p< .001), indicatingthat providing the low-frequency band yielded increasesin loudness judgments. There were no significant differ-ences found between the loudness judgments of theremaining conditions (p> .05).
The input level at which the categories “Comfortable,but slightly soft” and “Comfortable, but slightly loud”were reached for each of the conditions was computed tosummarize the functional magnitude of the differences inloudness judgment across conditions. The largest band-width condition (123–10869Hz) reached these loudnesscategories at input levels that were 2.2 and 3.4 dB lowerthan in the narrowband condition.
Figure 7. The Number of Listeners From the Group of 15 Who Indicated Whether They Preferred Full or Narrow Bandwidths, or HadNo Preference, in a Paired Comparison Task.
Figure 6. Fitted Sigmoidal Functions From Loudness Judgments in Four Different Bandwidths Ranging From Full to Narrow Conditions(N¼ 15). Condition 123–10869Hz was significantly louder than the other three bandwidth conditions. There was also a significantdifference between conditions 123–4455Hz and 313–4455Hz.SPL¼ sound pressure level.
12 Trends in Hearing

Preference
Paired comparisons testing (Figure 7) indicated that 8 ofthe 15 listeners had preference for the full bandwidthcondition, with 6 listeners having a weak preferenceand 2 having a strong preference. Of the remainder, 6listeners had no preference, and 1 listener had a strongpreference for the narrowband condition. A one-sampleShapiro–Wilk test for normality indicated a significantskew toward preference for the full bandwidth condition(p¼ .02). Further investigation was performed to deter-mine if audiometric pure-tone average (PTA) and/orslope were factors in preference. PTA did not relate sig-nificantly to preference, whether this was defined forfour frequency PTA (500, 1000, 2000, 4000Hz)(r¼ .35, p¼ .21) or three frequency PTA (500, 1000,2000Hz) (r¼ .38, p¼ .16) or PTA (1000, 2000,4000Hz) (r¼ .30, p¼ .28). For slope, we investigatedtwo definitions based on previous studies: (a) the differ-ence between 8000Hz thresholds and 4000Hz thresholds(Moore et al., 2011; Van Eeckhoutte et al., 2020) and (b)the difference between 12500Hz thresholds and 4000Hzthresholds (Ricketts et al., 2008; Van Eeckhoutte et al.,2020). Neither slope estimate was a significant predictorof preference (8000–4000Hz: r¼ –.13, p¼ .64; 12500–4000Hz: r¼ .14, p¼ .64).
Discussion
In the present study, the effects of bandwidth on speechperception, loudness, and preference were evaluated byfitting bilateral Earlens direct drive hearing devices toparticipants with sensorineural hearing loss.Participants in this study met recommended criteria foruse of the Earlens in terms of ear size and characteristics,medical history, and audiometric thresholds. The audi-bility of the extended bandwidth up to 10000Hz wasconfirmed with aided sound field audiometric testing,which demonstrated a significant improvement in high-frequency thresholds between the unaided and aidedconditions. In this study, we examined the effects ofextended bandwidth. For speech recognition and prefer-ence tasks, the bandwidth of the direct drive devices wasrestricted to 5000Hz, thereby creating two test condi-tions: (a) the full clinical bandwidth as fitted to the par-ticipants’ hearing loss using the CAM2 fitting methodand (b) a narrow bandwidth fitting. The 5000Hz cutofffor the narrow bandwidth condition was chosen to becomparable to narrowband conditions reported foracoustic hearing aid fittings (Fullgrabe et al., 2010;Kimlinger et al., 2015; McCreery et al., 2014).Although a few recent studies (Seeto & Searchfield,2018; Van Eeckhoutte et al., 2020) have shown thatmodern hearing aids can provide extended high-frequency bandwidths past 7000Hz in field trials,
measurements of our participants’ acoustic hearingaids which were from a variety of manufacturers,ranged in age from <1 year to 5 years old, and werefitted outside of the research context, in fact showedan average bandwidth range between 4185 and5719Hz for speech levels at 65 dB SPL, RMS or peakrespectively. In this study, the clinically provided band-width of the participants’ own acoustic aids was relative-ly well-approximated by the 5000Hz narrow bandwidthcondition tested with the direct drive devices.
As noted earlier, hearing tests in the sound field con-firmed improved audibility in the full versus narrowbandwidth condition for threshold of hearing with useof the direct drive devices. We also examined suprathres-hold outcomes with full versus narrow bandwidth fit-tings, including speech sound detection and recognitionand speech in noise understanding. Overall performanceof speech recognition for nonsense syllables in noise sig-nificantly improved in the full versus narrow bandwidthcondition, with improved recognition of consonantswith high-frequency content such as the phonemes /s/and /z/. Specifically, this improvement in fricative iden-tification is consistent with the results published in thedevelopment of the Plurals test, where high-frequency /s/in word-final position was detected with greater accura-cy in the broadband condition (Glista & Scollie, 2012).These results agree with previously reported results onsimilar tests with extended bandwidth amplification and/or frequency lowering signal processing (Baer et al.,2002; Fullgrabe et al., 2010; Glista & Scollie, 2012;McCreery et al., 2014; Salorio-Corbetto et al., 2017;Seeto & Searchfield, 2018; Stelmachowicz et al., 2007;Van Eeckhoutte et al., 2020). Taken together, theseresults indicate that the audible bandwidth of thedirect drive system supports improved recognition ofhigh-frequency speech sounds.
One of the most common challenges for those withhearing loss is understanding speech in backgroundnoise. There was an overall benefit of extended band-width for sentence recognition in speech noise usingthe HIST. These results are consistent with findingsreported by Levy et al. (2015), whose participants per-formed better when using a full bandwidth hearing aidsetting compared with a narrow bandwidth setting sim-ulated over headphones. The improvement in SNR 50%from the collocated condition compared with the spatial-ly separated conditions is generally in agreement withthe concept of spatial release of masking and resultsreported for the HIST by Levy et al. (2015), and withprevious studies indicating that audible bandwidthimproves spatial release from masking in listeners withhearing loss (Jakien et al., 2017).
To explore the interaction between the provision ofextended bandwidth and loudness perception, the effectof bandwidth on loudness perception was measured in
Folkeard et al. 13
this study using four bandwidth conditions. Consistentwith results from Van Eeckhoutte et al. (2020), perceivedloudness judgments were higher for the stimuli with thebroadest bandwidth and exceeded that of either the low-or high-frequency conditions. When low-frequencyenergy was added (e.g., comparing the 123–4455 vs.313–4455Hz conditions), a significant increase in loud-ness was observed, indicating low-frequency energy con-tributed to the loudness percept. This increased furtherwhen stimuli were extended in both low- and high-frequency bands (i.e., 123–10869Hz) which indicatesthat high-frequency energy also contributes to loudnessperception. This result is generally consistent with pre-vious work that found contribution of energy at bothlow and high frequencies depending upon sensationlevel (Jesteadt et al., 2017; Thrailkill et al., 2019). Wenote that when the low-frequency energy was not present(in the conditions 313–4455 and 313–10869), loudnessratings were not significantly different. It would appearthat the impact of high-frequency energy was reducedwhen the low-frequency band was filtered out of thesignal. Differences among other conditions, althoughstatistically significant, were within the observed rangeof clinically typical deviations from target (Dao et al.,2021) and were within one audiometric step size.Compared with these reference points, this difference(2.2–3.4 dB in input level) is unlikely to be consideredclinically significant and indicates that while the extend-ed bandwidth signal was perceived, it may not haveresulted in a large or problematic increase inloudness and might not affect fitting procedures basedon loudness which, in this study, used the CAM2 pre-scription method.
Preference ratings were consistent with previous liter-ature which found that access to extended bandwidthdid not degrade the perceived sound quality for speechstimuli for most participants (Arbogast et al., 2019;Brennan et al., 2014; Fullgrabe et al., 2010; Plyler &Fleck, 2006; Seeto & Searchfield, 2018; VanEeckhoutte et al., 2020). Results of the present studyfound that 8 of the 15 participants had some preferencefor the full bandwidth condition when listening to a run-ning passage of female speech. An additional six partic-ipants reported no clear preference for either bandwidthcondition. Preference was not correlated with hearingloss or audiometric slope in contrast with some previousstudies (Moore et al., 2011; Ricketts et al., 2008).The explanation for this discrepancy is not clear, butspeculatively could relate to the audiometric character-istics of the participants differing across studies or differ-ences in tasks. It is also unknown if these preferences forfull bandwidth of female speech in quiet would be main-tained with other more complex stimuli such speech innoise and babble, or in response to louder sounds likeparty noise.
Listeners’ preference ratings and their real-world trial
settings were within 6.3 dB RMSE from the CAM2 fit-
ting targets for most participants. This may suggest that
the direct drive system provided an acceptable fitting
using a strategy that aims for broad audible bandwidth.
The increase to perceived loudness from the signal pro-
duced by the full bandwidth fittings, although audible,
did not make a large change to sound levels associated
with functional loudness ratings. Coupled with the pos-
itive effects on speech recognition and the significantly
higher sound quality ratings in the full bandwidth con-
dition (Vaisberg et al., 2021), the battery of outcomes
measured in this study points toward the potential value
of the provision of full bandwidth fittings as achieved
with the direct drive system.
Study Limitations and Future Directions
A possible limitation to this study is that participants
had real-world trials with only the full bandwidth con-
dition without a corresponding narrow bandwidth trial.
This may have influenced their preference for the extend-
ed bandwidth condition. The goal of this trial was to
acclimatize the participants to gain in the extended
high frequencies, prior to completing the outcome meas-
ures as, on average, their own acoustic hearing aids pro-
vided a narrow bandwidth. Future studies could
incorporate a design where participants have real-
world trials wearing devices in both the narrow band-
width condition and the full bandwidth condition. In
addition, preference ratings were measured with speech
stimuli in quiet and may not generalize to other listening
situations.Earlens devices are fitted using vented ear-tips and as
such, low-frequency sound presented in the sound field
could enter the ear canal through this pathway for at
least some of the participants. Measurements of inser-
tion loss are included in supplemental material S3 and
indicate that significant vent-transmitted sound was pro-
vided for the majority of ears to approximately 800Hz.
Although the goal of this study was to evaluate out-
comes with the devices as fitted, future studies could
incorporate a design where filtered stimuli are sent to
the aids via streaming or direct audio input to determine
whether the low-frequency perceptual impacts are pro-
vided by the direct drive sound or via the vent, and how
this may interact with audiometric configuration.
Finally, we note that our outcome measures were com-
pleted using the aided conditions only with no unaided
comparison. Future studies could include both unaided
and aided conditions to demonstrate aided benefit of the
direct drive fittings.
14 Trends in Hearing

Conclusions
Participants with mild-to-severe sensorineural hearing
loss were fitted with the Earlens direct drive hearing
devices for a clinical trial period. Broadband fittings
were achievable without feedback, and devices were
wearable with average requested fine-tuning based on
user preference under 3 dB RMSE across frequencies.
Compared with a narrowband condition, provision of
full bandwidth was beneficial for high-frequency conso-
nant detection and recognition and for sentence recog-
nition in multitalker masking. There was a small but
perceivable increase in the loudness with the provision
of the full bandwidth. Preference results suggested that
the majority of participants either preferred the full
bandwidth setting or had no preference between the
two bandwidth conditions. These results provide further
evidence to support hearing aid fittings which include
the provision of extended bandwidth to those with sen-
sorineural hearing loss in the mild-to-severe range.
Data Availability
All authors, whether funded or not, had unrestricted access to
the data. The de-identified data set is available and will be
shared by the lead author via secure data transfer upon
request.
Acknowledgments
The authors thank Tanya Arbogast, Rana El-Naji, Frances
Richert, and Sandy Wanner for their assistance with hearing
device fittings, Judy Brimacombe for logistical support, and
Steve Beaulac for technical support. The authors also thank
Andreea Hajas, Bilal Sheikh, and Nicole Willis for their work
on the project as lab members of the Translational Research
Unit, and Lauren Siegel for article review. The authors thank
Brent Edwards for his contributions to the early stages of this
collaboration. The authors would also like to thank the
reviewers for their comments and suggestions.
Declaration of Conflicting Interests
The authors declared the following potential conflicts of inter-
est with respect to the research, authorship, and/or publication
of this article: Susan Scollie is a member of the audiology advi-
sory board for Earlens Corporation. Drew Dundas and
Suzanne Levy are employees of Earlens Corporation. No con-
flicts were declared for the remaining authors.
Funding
The authors disclosed receipt of the following financial support
for the research, authorship, and/or publication of this article:
The National Centre for Audiology received funding from
Earlens Corporation for the direct costs of this study.
ORCID iDs
Paula Folkeard https://orcid.org/0000-0003-3109-6730
Parvaneh Abbasalipour https://orcid.org/0000-0001-8771-
7618
Supplemental Material
Supplemental material for this article is available online.
References
Alexander, J. M. (2015). How to use probe microphone meas-
ures with frequency-lowering hearing aids. Audiology
Practices, 6(4), 8–13.Alexander, J. M., & Rallapalli, V. (2017). Acoustic and per-
ceptual effects of amplitude and frequency compression on
high-frequency speech. The Journal of the Acoustical Society
of America, 142(2), 908. https://doi.org/10.1121/1.4997938Amlani, A. M., & Schafer, E. C. (2009). Application of
paired-comparison methods to hearing aids. Trends in
Amplification, 13(4), 241–259. https://doi.org/10.1177/
1084713809352908Amos, N. E., & Humes, L. E. (2007). Contribution of high
frequencies to speech recognition in quiet and noise in lis-
teners with varying degrees of high-frequency sensorineural
hearing loss. Journal of Speech, Language, and Hearing
Research: JSLHR, 50(4), 819–834. https://doi.org/10.1044/
1092-4388(2007/057)ANSI. (2010). ANSI S3.6-2010, specifications for audiometers.
American National Standards Institute.ANSI. (2020). ANSI/ASA S3.5-1997 (R2020)—Methods for
calculation of the speech intelligibility index. American
National Standards Institute.Arbogast, T. L., Moore, B. C. J., Puria, S., Dundas, D.,
Brimacombe, J., Edwards, B., & Carr Levy, S. (2019).
Achieved gain and subjective outcomes for a wide-
bandwidth contact hearing aid fitted using CAM2. Ear
and Hearing, 40(3), 741–756. https://doi.org/10.1097/
AUD.0000000000000661Baer, T., Moore, B. C. J., & Kluk, K. (2002). Effects of low
pass filtering on the intelligibility of speech in noise for
people with and without dead regions at high frequencies.
The Journal of the Acoustical Society of America, 112(3 Pt
1), 1133–1144. https://doi.org/10.1121/1.1498853Brennan, M. A., McCreery, R., Kopun, J., Hoover, B.,
Alexander, J., Lewis, D., & Stelmachowicz, P. G. (2014).
Paired comparisons of nonlinear frequency compression,
extended bandwidth, and restricted bandwidth hearing-aid
processing for children and adults with hearing loss. Journal
of the American Academy of Audiology, 25(10), 983–998.
https://doi.org/10.3766/jaaa.25.10.7Carhart, R., & Jerger, J. F. (1959). Preferred method for clin-
ical determination of pure-tone thresholds. Journal of
Speech and Hearing Disorders, 24(4), 330–345. https://doi.
org/10.1044/jshd.2404.330Cheesman, M. F., & Jamieson, D. G. (1996). Development,
evaluation and scoring of a nonsense word test suitable
for use with speakers of Canadian English. Canadian
Acoustics, 24(1), 3–11.Ching, T. Y., Dillon, H., & Byrne, D. (1998). Speech recogni-
tion of hearing-impaired listeners: Predictions from audibil-
ity and the limited role of high-frequency amplification. The
Folkeard et al. 15

Journal of the Acoustical Society of America, 103(2),
1128–1140. https://doi.org/10.1121/1.421224Cox, R. M., Alexander, G. C., Taylor, I. M., & Gray, G. A.
(1997). The contour test of loudness perception. Ear and
Hearing, 18(5), 388–400. https://doi.org/10.1097/00003446-
199710000-00004Dao, A., Folkeard, P., Baker, S., Pumford, J., & Scollie, S.
(2021). Fit to targets and aided speech intelligibility index
values for hearing aids fitted to the DSL v5-adult prescrip-
tion. Journal of the American Academy of Audiology.
Advance online publication. https://doi.org/10.1055/s-
0040-1718707Dundas, D., & Levy, S. C. (2020). Earlens contact hearing
solution introduced with inductive coupling vs light-driven
coupling. Hearing Review, 27(4), 28–30.Eisenberg, L. S., Dirks, D. D., & Gornbein, J. A. (1997).
Subjective judgments of speech clarity measured by paired
comparisons and category rating. Ear and Hearing, 18(4),
294–306. https://doi.org/10.1097/00003446-199708000-
00004Fay, J. P., Perkins, R., Levy, S. C., Nilsson, M., & Puria, S.
(2013). Preliminary evaluation of a light-based contact
hearing device for the hearing impaired. Otology &
Neurotology, 34(5), 912–921. https://doi.org/10.1097/
MAO.0b013e31827de4b1Fullgrabe, C., Baer, T., Stone, M. A., & Moore, B. C. J. (2010).
Preliminary evaluation of a method for fitting hearing aids
with extended bandwidth. International Journal of
Audiology, 49(10), 741–753. https://doi.org/10.3109/
14992027.2010.495084Gantz, B. J., Perkins, R., Murray, M., Levy, S. C., & Puria, S.
(2017). Light-driven contact hearing aid for broad-spectrum
amplification: Safety and effectiveness pivotal study.
Otology & Neurotology, 38(3), 352–359. https://doi.org/10.
1097/MAO.0000000000001300Glista, D., & Scollie, S. (2012). Development and evaluation of
an English language measure of detection of word-final plu-
rality markers: The University of Western Ontario Plurals
Test. American Journal of Audiology, 21(1), 76–81. https://
doi.org/10.1044/1059-0889(2012/11-0036)Glista, D., Scollie, S., & Sulkers, J. (2012). Perceptual acclima-
tization post nonlinear frequency compression hearing aid
fitting in older children. Journal of Speech, Language, and
Hearing Research: JSLHR, 55(6), 1765–1787. https://doi.
org/10.1044/1092-4388(2012/11-0163)Hogan, C. A., & Turner, C. W. (1998). High-frequency audi-
bility: Benefits for hearing-impaired listeners. The Journal of
the Acoustical Society of America, 104(1), 432–441. https://
doi.org/10.1121/1.423247Holube, I., Fredelake, S., Vlaming, M., & Kollmeier, B. (2010).
Development and analysis of an International Speech Test
Signal (ISTS). International Journal of Audiology, 49(12),
891–903. https://doi.org/10.3109/14992027.2010.506889Hornsby, B. W. Y., Johnson, E. E., & Picou, E. (2011). Effects
of degree and configuration of hearing loss on the contri-
bution of high- and low-frequency speech information to
bilateral speech understanding. Ear and Hearing, 32(5),
543–555. https://doi.org/10.1097/AUD.0b013e31820e5028
Hornsby, B. W. Y., & Ricketts, T. A. (2003). The effects of
hearing loss on the contribution of high- and low-frequency
speech information to speech understanding. The Journal of
the Acoustical Society of America, 113(3), 1706–1717.
https://doi.org/10.1121/1.1553458Humes, L. E. (2003). Modeling and predicting hearing aid out-
come. Trends in Amplification, 7(2), 41–75. https://doi.org/
10.1177/108471380300700202Jakien, K. M., Kampel, S. D., Gordon, S. Y., & Gallun, F. J.
(2017). The benefits of increased sensation level and
bandwidth for spatial release from masking. Ear and
Hearing, 38(1), e13–e21. https://doi.org/10.1097/AUD.
0000000000000352Jenstad, L., Bagatto, M., Seewald, R., Scollie, S., Cornelisse,
L., & Scicluna, R. (2007). Evaluation of the desired sensa-
tion level [input/output] algorithm for adults with hearing
loss: The acceptable range for amplified conversational
speech. Ear and Hearing, 28(6), 793–811. https://doi.org/
10.1097/AUD.0b013e318157670a
Jesteadt, W., Walker, S. M., Ogun, O. A., Ohlrich, B.,
Brunette, K. E., Wr�oblewski, M., & Schmid, K. K.
(2017). Relative contributions of specific frequency bands
to the loudness of broadband sounds. Journal of the
Acoustical Society of America, 142(3), 1597–1610. https://
doi.org/10.1121/1.5003778Khaleghi, M., & Puria, S. (2017). Attenuating the ear canal
feedback pressure of a laser-driven hearing aid. The
Journal of the Acoustical Society of America, 141(3),
1683–1693. https://doi.org/10.1121/1.4976083Kimlinger, C., McCreery, R., & Lewis, D. (2015). High-fre-
quency audibility: The effects of audiometric configuration,
stimulus type, and device. Journal of the American Academy
of Audiology, 26(2), 128–137. https://doi.org/10.3766/jaaa.
26.2.3Levy, S. C., Freed, D. J., Nilsson, M., Moore, B. C. J., & Puria,
S. (2015). Extended high-frequency bandwidth improves
speech reception in the presence of spatially separated
masking speech. Ear and Hearing, 36(5), e214–e224.
https://doi.org/10.1097/AUD.0000000000000161McCreery, R. W., Alexander, J., Brennan, M. A., Hoover, B.,
Kopun, J., & Stelmachowicz, P. G. (2014). The influence of
audibility on speech recognition with nonlinear frequency
compression for children and adults with hearing loss. Ear
and Hearing, 35(4), 440–447. https://doi.org/10.1097/AUD.
0000000000000027Moore, B. C. J. (2012). Effects of bandwidth, compression
speed, and gain at high frequencies on preferences for
amplified music. Trends in Amplification, 16(3), 159–172.
https://doi.org/10.1177/1084713812465494Moore, B. C. J., Fullgrabe, C., & Stone, M. A. (2011).
Determination of preferred parameters for multichannel
compression using individually fitted simulated hearing
aids and paired comparisons. Ear and Hearing, 32(5),
556–568. https://doi.org/10.1097/AUD.0b013e31820b5f4cMoore, B. C. J., Glasberg, B. R., & Stone, M. A. (2010).
Development of a new method for deriving initial fittings
for hearing aids with multi-channel compression:
CAMEQ2-HF. International Journal of Audiology, 49(3),
216–227. https://doi.org/10.3109/14992020903296746
16 Trends in Hearing

Moore, B. C. J., Stone, M. A., & Alcantara, J. I. (2001).Comparison of the electroacoustic characteristics of fivehearing aids. British Journal of Audiology, 35(5), 307–325.https://doi.org/10.1080/00305364.2001.11745249
Moore, B. C. J., & Tan, C.-T. (2003). Perceived naturalness ofspectrally distorted speech and music. The Journal of the
Acoustical Society of America, 114(1), 408–419. https://doi.org/10.1121/1.1577552
Nilsson, M., Soli, S. D., & Sullivan, J. A. (1994). Developmentof the Hearing in Noise Test for the measurement of speechreception thresholds in quiet and in noise. The Journal of theAcoustical Society of America, 95(2), 1085–1099. https://doi.org/10.1121/1.408469
Pearsons, K., Bennett, R., & Fidell, S. (1977). Speech levels in
various noise environments. Project report on contract 68 01-
2466. US Environmental Protection Agency.Plyler, P. N., & Fleck, E. L. (2006). The effects of high-
frequency amplification on the objective and subjective per-formance of hearing instrument users with varying degreesof high-frequency hearing loss. JSLHR, 49(3), 616–627.https://doi.org/10.1044/1092-4388(2006/044)
Punch, J. L., Rakerd, B., & Amlani, A. M. (2001). Paired-com-
parison hearing aid preferences: Evaluation of an unforced-choice paradigm. Journal of the American Academy of
Audiology, 12(4), 190–201.Puria, S., Santa Maria, P. L., & Perkins, R. (2016). Temporal-
bone measurements of the maximum equivalent pressureoutput and maximum stable gain of a light driven hearingsystem that mechanically stimulates the umbo. Otology &
Neurotology, 37(2), 160–166. https://doi.org/10.1097/MAO.0000000000000941
Ricketts, T. A., Dittberner, A. B., & Johnson, E. E. (2008).High-frequency amplification and sound quality in listenerswith normal through moderate hearing loss. JSLHR, 51(1),160–172. https://doi.org/10.1044/1092-4388(2008/012)
Saleh, H., Folkeard, P., Macpherson, E., & Scollie S. (2020).Adaptation of the Connected Speech Test: Rerecording andpassage equivalency. American Journal of Audiology, 29(2),259–264. https://doi.org/10.1044/2019_AJA-19-00052
Salorio-Corbetto, M., Baer, T., & Moore, B. C. J. (2017).Evaluation of a frequency-lowering algorithm for adultswith high-frequency hearing loss. Trends in Hearing, 21,1–23. https://doi.org/10.1177/2331216517734455
Scollie, S., Glista, D., Seto, J., Dunn, A., Schuett, B., Hawkins,M., Pourmand, N., & Parsa, V. (2016). Fitting frequency-lowering signal processing applying the American Academyof Audiology pediatric amplification guideline: Updatesand protocols. Journal of the American Academy of
Audiology, 27(3), 219–236. https://doi.org/10.3766/jaaa.15059
Scollie, S., Seewald, R., Cornelisse, L., Moodie, S., Bagatto,
M., Laurnagaray, D., Beaulac, S., & Pumford, J. (2005).
The desired sensation level multistage input/output algo-
rithm. Trends in Amplification, 9(4), 159–197. https://doi.
org/10.1177/108471380500900403Seeto, A., & Searchfield, G. D. (2018). Investigation of extend-
ed bandwidth hearing aid amplification on speech intelligi-
bility and sound quality in adults with mild-to-moderate
hearing loss. Journal of the American Academy of
Audiology, 29(3), 243–254. https://doi.org/10.3766/jaaa.
16180Stelmachowicz, P., Hoover, B., Lewis, D., & Brennan, M. A.
(2002). Is functional gain really functional? The Hearing
Journal, 55(1), 38–42.Stelmachowicz, P., Lewis, D. E., Choi, S., & Hoover, B. (2007).
Effect of stimulus bandwidth on auditory skills in normal-
hearing and hearing-impaired children. Ear and Hearing,
28(4), 483–494. https://doi.org/10.1097/AUD.
0b013e31806dc265Struck, C., & Prusick, L. (2017). Comparison of real-world
bandwidth in hearing aids vs Earlens light-driven hearing
system. Hearing Review, 24(3), 24–29.Studebaker, G. A. (1985). A ‘rationalized’ arcsine transform.
Journal of Speech and Hearing Research, 28(3), 455–462.
https://doi.org/10.1044/jshr.2803.455Thrailkill, K. M., Brennan, M. A., & Jesteadt, W. (2019).
Effects of amplification and hearing aid experience on the
contribution of specific frequency bands to loudness. Ear
and Hearing, 40(1), 143–155. https://doi.org/10.1097/AUD.
0000000000000603Turner, C. W., & Henry, B. A. (2002). Benefits of amplification
for speech recognition in background noise. The Journal of
the Acoustical Society of America, 112(4), 1675–1680.
https://doi.org/10.1121/1.1506158Vaisberg, J., Folkeard, P., Levy, S., Dundas, D., Agrawal, S.,
& Scollie, S. (2021). Sound quality ratings of amplified
speech and music using a direct drive hearing aid: Effects
of bandwidth. Otology & Neurotology, 42(2), 227–234.
https://doi.org/10.1097/MAO.0000000000002915Van Eeckhoutte, M., Folkeard, P., Glista, D., & Scollie, S.
(2020). Speech recognition, loudness, and preference with
extended bandwidth hearing aids for adult hearing aid
users. International Journal of Audiology, 59(10), 780–791.
https://doi.org/10.1080/14992027.2020.1750718Vickers, D. A., Moore, B. C. J., & Baer, T. (2001). Effects of
low-pass filtering on the intelligibility of speech in quiet for
people with and without dead regions at high frequencies.
The Journal of the Acoustical Society of America, 110(2),
1164–1175. https://doi.org/10.1121/1.1381534
Folkeard et al. 17
Copyright © 2022 FDOKUMEN