Elderly poverty in EU25
24
Munich Personal RePEc Archive Elderly poverty in EU25 Aaron George Grech European Centre for Social Welfare Policy and Research July 2006 Online at http://mpra.ub.uni-muenchen.de/33618/ MPRA Paper No. 33618, posted 22. September 2011 13:10 UTC
-
Upload
centralbankmalta -
Category
Documents
-
view
0 -
download
0
Transcript of Elderly poverty in EU25

MPRAMunich Personal RePEc Archive
Elderly poverty in EU25
Aaron George Grech
European Centre for Social Welfare Policy and Research
July 2006
Online at http://mpra.ub.uni-muenchen.de/33618/MPRA Paper No. 33618, posted 22. September 2011 13:10 UTC

Elderly Poverty in EU25
Asghar Zaidi, Aaron Grech, Mattia Makovec, Michael Fuchs and Klaas de Vos
Paper prepared for the SPA Conference 2006 at
University of Birmingham
Abstract
The prevention of social exclusion and poverty of elderly people is one of the key objectives of the national social policies. Bearing in mind the variety and diversity of national pensions and social assistance systems, the Open Method of Coordination (OMC) in the field of pensions was introduced by the European Commission, principally to promote cooperation on national policies and to support transnational exchange of learning and good practices.
The research undertaken by researchers at the European Centre Vienna for the European Commission are presented in two reports: the first report provides a concise description of poverty risks faced by the current populations of elderly people in the enlarged EU25, and the second report analyses the possible impact of recent pensions reforms on the future populations of the elderly. This SPA-conference paper provides a synthesis of our findings in the two reports.
*Address for contact: Asghar Zaidi Director Research European Centre for Social Welfare Policy and Research, Berggasse 17, A-1090 Vienna AUSTRIA Tel: +43-1-319 45 05-26 Fax: +43-1-319 45 05-19 Email: [email protected] Web: www.euro.centre.org

2
Elderly Poverty in EU25
This paper reviews the situation with respect to poverty of current populations of elderly people living in 25 EU Member States. It sets out the base situation against which progress towards poverty reduction and social inclusion of the elderly is to monitored. The paper also provides an analyses of the possible impacts of recent pensions reforms on the future populations of the elderly.1
Part I: Poverty amongst current population of elderly people
How do we measure poverty amongst elderly?
We restrict ourselves to the ‘monetary’ aspects of personal well-being, using income as the measure of the financial personal resources. In order to achieve consistency and international comparability of poverty statistics, the EUROSTAT New CRONOS database has been our main data source for the statistics. The Eurostat database is constructed using the EU Statistics on Income and Living Conditions (EU-SILC) survey for the majority of countries and national household budget surveys for other countries. Box 1 below provide the data sources used across the countries. In spite the differences of data sources, Eurostat has made every effort to use harmonised methods so as to insure the maximum comparability between definitions and concepts used in the different countries, and thus these poverty statistics provide the best possible comparative information on elderly poverty at the EU25 level. Note, however, that these datasets include only private households, and exclude population groups such as those living in sheltered housing and institutions providing nursing and living care.2
What do we find?
In the early years of the 21st century, about 13.5 million elderly people are at risk of poverty in 25 EU member States, amounting to as many as 18% all elderly people living in EU. These results are calculated by using the 60% of median income poverty threshold for each respective country. As is shown in Table 1, Cyprus, Ireland, Spain, Portugal, Greece, and the United Kingdom are identified as the countries with the highest poverty risk for the elderly population. The new member States are largely countries with the lowest risk of elderly poverty – the average poverty risk for the elderly in EU15 (19%) is more than twice as high as that observed for the elderly of the new Member States (9%).
The above findings should be viewed with an understanding that the poverty thresholds against which poverty situation in a country is measured are derived from the value of the national median income (standardised so as to take account of composition of households). Thus, the low poverty risk for the elderly in the new member States is a reflection of the
1 Neither the European Commission nor the organisations with which researchers are affiliated with carry any responsibility towards data used and interpretations made here in this document. 2 For detailed discussion on concepts and methods used in measuring elderly poverty, see Zaidi et al. (2005) “Poverty of Elderly People in EU25”, Report submitted to the European Commission.

3
fact that the elderly income situation is not very different from that of the younger population. Another critical difference between the EU15 States and the 10 new Member States (NMS10) is that the life expectancy at birth in the NMS10 is about 6 years less than that in the EU15. While those aged 65+ are 17% of the population in the EU15 and just 13.6% in the EU10, the EU10 spend 10.9% of GDP on pensions, compared to 10.6% spent by the EU15. And, more crucially, the proportion of those aged 80+ is 2.6% in the NMS10 compared with 4.3% in the EU15.
Table 1: Proportion and number of elderly population (aged 65 and above) at risk of poverty in the Member States of EU, using 60% of median income as the poverty line
Country Income Year at-risk-of-poverty rate
(%)
Poor pop. (000)
Cyprus 2003 52 44
Ireland 2003 40 176
Spain 2003 30 2,112
Portugal 2003 29 504
Greece 2003 28 539
United Kingdom 2003 24 2,268
Belgium 2003 21 370
Malta 2000 20 9
Slovenia 2003 19 56
Austria 2003 17 213
Denmark 2003 17 135
Estonia 2003 17 37
Finland 2003 17 135
France 2003 16 1,561
Italy 2003 16 1,743
Germany 2003 15 2,167
Latvia 2003 14 52
Sweden 2003 14 215
Lithuania 2003 12 61
Slovakia 2003 11 68
Hungary 2003 10 156
Netherlands 2003 7 154
Luxembourg 2003 6 4
Poland 2003 6 294
Czech Republic 2002 4 57
EU 25 2003 18 13,514
EU 15 2003 19 12,301

4
New Member States 2003 9 908
Source: Eurostat’s New Cronos Database
What is the relative poverty risk for the elderly? The results reported in Figure 1 compare the poverty risk for the elderly (65+) and the working-age individuals (aged 16-64), using the 60% of median income threshold. It also shows the relative poverty risk ratio of the elderly, calculated by dividing the at-risk-of-poverty rate of the elderly by that of the population aged 16-64. In 14 out of all 25 member countries, the elderly populations are more often at risk of being poor in comparison to the working-age populations. The relative risk of elderly poverty is particularly high in Cyprus, Ireland and Slovenia; in these countries the at-risk-of-poverty rates for the elderly are more than twice as high as the at-risk-of-poverty rates for the population aged 16-64. In Spain, Denmark, Finland, Portugal, Greece, the United Kingdom, Malta, Belgium, and Malta, the elderly are between 1.5 and 2 times as likely to be at risk of poverty, compared to the population aged 16-64. In Poland, Latvia, the Czech Republic, Slovakia, Lithuania, Luxembourg and the Netherlands, the elderly are better protected against the risk of poverty than the working-age individuals. In all countries categorised as the highest at-risk-of-poverty rate for the elderly (in Table 1), the elderly are clearly more vulnerable than the working-age individuals in each country.

5
Figure 1: Proportion of elderly and working age populations at risk of poverty
PT 29 1.6
IT 16 0.9
SE 14 1.4
LU 6 0.515
0 5 10 15 20 25 30 35 40 45 50
Average EU 1516-64
19
Average EU 1565+
IE 40
elderly population65+
non elderly population16-64
2.4
2.0 65+ / 16-64 ratio
NL 7 0.6
FR 16 1.2
DE 15 1.1
FI 17 1.7
DK 17 1.7
BE 21 1.6
UK 24 1.7
1.6EL 28
ES 30 1.8
AT 17 1.5
15
SK 11 0.6
0 5 10 15 20 25 30 35 40 45 50
Average NMS16-64
9
Average NMS65+
CZ
PL
HU
LT
EE
SI
MT
CY
4
12
6
10
17
19
20
52
elderly population65+
non elderly population16-64
0.6
0.8
0.4
0.9
0.9
2.1
1.7
5.2
2.0 65+ / 16-64 ratio
LV 14 0.8

6
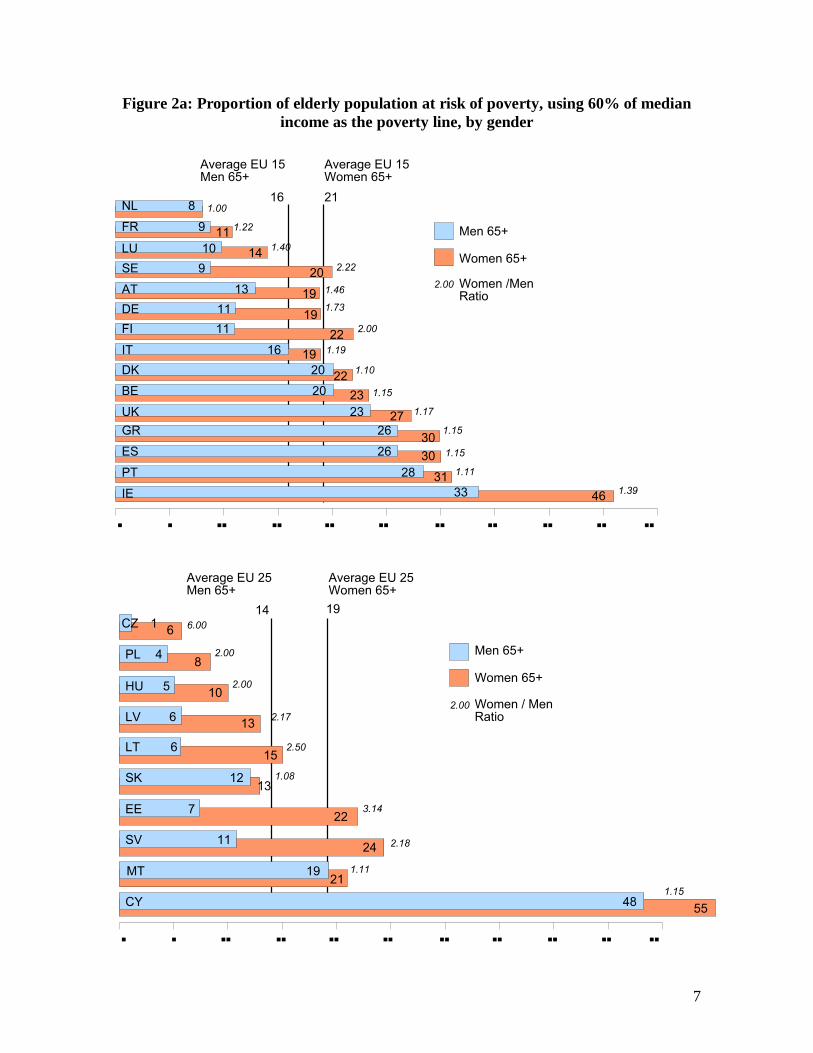
Are there any differences across elderly men and women? Results depicted in Figure 2a show the differential poverty risks of male and female elderly, and results in Figure 2a also subdivides men and women between those aged 65-74 and those aged 75+. The latter figure is only available for the EU15 countries. In the majority of countries, the poverty risk is clearly higher for female elderly, more so in EU15 (21%) than in the new member countries (11%). In general, it can be seen that the poverty risk is higher for female elderly than for male elderly, and that the females aged 75 and over show the highest at-risk-of-poverty rates. Female elderly are more than twice as often at risk of being poor than male elderly in Finland and Sweden and in the former eastern European member countries of Slovenia, Estonia, Lithuania, Latvia, Poland and the Czech Republic. With a 13 percentage point difference, Ireland also shows a considerable gap between the at-risk-of-poverty rates for elderly males and females. On the other hand, in Portugal, Belgium, Denmark, Italy, France and the Netherlands, the differences between the at-risk-of-poverty rates of male and female elderly are relatively small. On average, the at-risk-of-poverty rate for male elderly in the NMS10 is just 5%, compared to 11% for females in these Member States, 16% for male elderly in EU15 and 21% for female elderly in EU15. Note here that these and all the other results reported here are based on a country-specific relative poverty threshold, and the relative rankings of countries and population subgroups will change if a single poverty threshold is applied across all 25 countries. The females aged 75 or more show the highest at-risk-of-poverty rate of the four groups considered on the basis of gender and age. In all EU15 countries except for the Netherlands, the subgroup of females’ aged 75 or above shows the highest at-risk-of-poverty rate of the four groups considered. With 63% the at-risk-of-poverty rate for females aged 75+ is particularly high in Ireland. In addition, Greece, Portugal, United Kingdom, Austria and Finland show at-risk-of-poverty rates of at least 30% for females age 75+. Next to the Netherlands, Germany and Luxembourg show the lowest at-risk-of poverty rates in this group. For males aged 75+, at-risk-of-poverty rates of 30% or more are only found in Ireland, Greece and Portugal, of which only the former two also have high at-risk-of-poverty rates for females aged 65-74 and only Greece has an at-risk-of-poverty rate of 30% for males aged 65-74.
7
Figure 2a: Proportion of elderly population at risk of poverty, using 60% of median income as the poverty line, by gender
0 5 10 15 20 25 30 35 40 45 50
Average EU 15Men 65+
2116
Average EU 15Women 65+
46IE 33
PT 28
NL
FR
LU
SE
AT
DE
FI
IT
DK
BE
UK
GR
ES
8
11
9
10
9
13
11
16
20
20
23
26
26
Men 65+
Women 65+
31
22
11
14
20
19
19
19
22
23
27
30
30
46
1.00
1.22
1.40
2.22
1.46
1.73
2.00
1.19
1.10
1.15
1.17
1.15
1.15
1.11
1.39
2.00 Women /MenRatio
0 5 10 15 20 25 30 35 40 45 50
1914
Average EU 25Women 65+
CZ
PL
HU
LV
LT
SK
EE
SV
MT
CY
1
6
4
5
6
12
7
11
19
48
Men 65+
Women 65+
6
8
10
13
15
13
22
24
21
55
Average EU 25Men 65+
6.00
2.00
2.00
2.17
2.50
1.08
3.14
1.11
2.18
1.15
2.00 Women / MenRatio

8
Figure 2b: Proportion of elderly population at risk of poverty, using 60% of median income as the poverty line, by gender and age
At-risk-of-poverty rates (%)
Average EU 15Men 65-74
1514
Average EU 15Men 75+
Men 65-74
Men 75+
0 5 10 15 20 25 30 35 40 45 50
ES 18
AT
DE
FI
IT
BE
UK
GR
11
7
16
22
15
30
NL
FR
LU
8
17
5
12
PT
IE
25
29
9
17
29
23
22
32
45
Average EU 15Women 65-74
2217
Average EU 15Women 75+
Women 65-74
Women 75+
0 5 10 15 20 25 30 35 40 45 50
63
AT
DE
FI
IT
BE
UK
GR
ES
PT
23
12
18
24
19
33
21
28
NL
FR
LU
6
17
7
28
IE 40
9
23
10
31
30
30
36
39
27
36

9
The conclusions so far are ..… It can be surmised that the high poverty risk for females aged 75+ is related to the high proportion of widows in this age group. To the extent that younger cohorts of females will be more likely to be entitled to pensions related to their own earnings once they retire, the high poverty risk in this group may gradually become a thing of the past. Obviously, whether or not this will happen depends on the national pension systems as well as the long term trends in the country specific labour market participation patterns. These results also point to the problems linked with the adequacy of survivors’ benefits that are currently available in the national pensions systems. Moreover, the indexation of pension benefits with prices (instead of earnings) in the majority of countries also lead to an erosion of the value of pension benefits relative to the median. Since women live longer than men, the erosion of the value of pensions during old age will affect women more than men. One significant policy development is that many countries have recently embarked on a further strengthening of their targeted minimum pension and social assistance schemes – this will have a positive impact on the reduction of poverty amongst the elderly, although the stigma associated with the means-tested benefits often induce non-take-up of such benefits.
Part 2: PENSION POLICY AND ITS IMPACT ON ELDERLY POVERTY
Pension policy in EU countries: An overview The pensions landscape in Europe is continuously changing. At the broadest level the reforms that have taken place can be classified into two broad sets: parametric and systematic. The parametric reforms have maintained unchanged the pay-as-you-go (PAYG) nature of existing pension systems but made substantial changes to their underlying rules – such as those on the accrual of pension entitlements, the age at which benefits can be received, and the contribution periods required.3 Other countries have gone even further and opted for systematic reforms i.e. moving away from the PAYG defined-benefit (DB) structure and adopting new defined-contribution (DC) type schemes. For systematic reforms, one can discern two main types of reforms: World-Bank inspired multi-pillar reforms that set up systems of personal accounts (e.g. Slovak Republic, Estonia and Hungary) and the adoption of non-financial defined contribution (NDC) systems (e.g. Sweden, Italy, Poland and Latvia). The two biggest countries in Europe, Germany and France, have not shifted totally to NDC, but they have introduced features that mimic the rules of this system. France has introduced a link between the number of contribution years and life expectancy while Germany has adopted a sustainability factor that links the level of pension benefits to the dependency ratio. Austria has also significantly modified its public pension plan and could be said to now have a personal notional defined benefit account system4.
3 The impact of parametric reforms can be quite considerable. For instance, whereas in 2001, Germany was forecasting an increase of 5.5 percentage points in spending over the next half century, now it expects an increase of just 1.7 percentage points. 4 See Markuy Knell, “Demographic fluctuations, sustainability factors and intergenerational fairness – an assessment of Austria’s new pension system” , Monetary policy and the economy Q1/05, Oesterreichische Nationalbank, 2005.

10
The current period of pensions reforms are driven mainly by increased concerns for the impact of ageing and a need for fiscal consolidation. A common trend is that the pension benefits drawn from the public pension systems are on the decline, and thus the average public pension benefit ratio has dropped in the majority of the countries. Moreover systematic reforms have changed the nature of pension provision from defined benefit type provisions to defined contribution type provisions. In general, but with exceptions, this type of change links pension entitlements to contributions and it is likely to shift more risks towards individuals concerned (of the same generation), with a more restrictive redistribution in favour of the lower income individuals.
The recent EPC report on spending on the elderly indicated that the average public pension benefit ratio across the EU25 would drop from 22% in 2004 to 17% in 2050 – a decline of more than a fifth.5 The EU Commission´s synthesis report on pensions also confirms that theoretical replacement ratios will drop significantly.6 These declines are significantly more pronounced when looking at systematic reforms. For instance, the replacement ratio in Sweden is set to drop by nearly a fifth. Multi-pillar reforms have exposed individuals to market-return risk and investment-choice risk (e.g. in Hungary the returns achieved up to now, if they persist, would mean that benefits under the new system would be lower than under the old system).
The linking of benefits to contributions has also had negative implications for people with lower lifetime earnings, such as women. This linking has reduced the previous redistributive elements that was common in the majority of the public pension systems. Furthermore the high administrative costs of personal accounts are relatively more burdensome on lower income persons, who usually also do not have the level of financial education needed to make the right investment choices.
Note here that the in view of the rising longevity, the total cumulative pension wealth paid out to pensioners during the whole of the period of retirement may still be at least as generous after the reforms as before the reforms. Thus, the overall impact might on balance be neutral or even resulting in more generous sum of pensions over one’s lifetime. However, for the purpose of the research in this paper, our interest lies in how annual pension incomes may be affected by the reforms, mainly because the poverty risk calculations are based on pensioners’ annual incomes. Thus, our references to how the generosity of the pension systems have changed are viewed in terms of how annual pension benefits will change from pensions reforms.
Moreover, it can be expected that the policy reforms will be accompanied with behavioural changes by individual agents (such as a greater propensity to save, and possibly an extension of one’s working life). Without denying that there will be counteracting behavioural changes by the individuals, we tend to review the possible impact of pensions reform in a steady state scenario (i.e. if the generosity of pension benefits is on the decline, it is likely to increase risk of poverty
5 Economic Policy Committee/EU commission, ‘The impact of ageing on public expenditure: projections for the EU25 Member States on pensions, health care, long-term care, education and unemployment transfers (2004-2050), February 2006. 6 European Commission, ‘Synthesis report on adequate and sustainable pensions’, Commission Staff Working Document, February 2006.

11
for the future pensioners). Where necessary, we do refer to how behavioural changes of certain sort may reduce or enhance one’s chances of facing risks on poverty in old age, and also where a switch away from public pensions may generate enough private pensions to mitigate the impact of reduction in the generosity of public pensions.
Parametric Reforms: Scope and possible impact Most countries in the EU25 have opted to enact parametric reforms rather than systematic reforms. However, this does not necessarily mean that the former have a smaller impact on pensioner incomes than the latter. Although parametric reforms may seem less drastic than systematic ones, in practice their impact on the fiscal sustainability and pensioner welfare can be equally impressive, or even more in some instances (e.g. while the replacement ratio is expected to decline by 11% in Hungary, which has gone for systematic reform, that in France is set to fall by 26%). The main difference between parametric and systematic reform lies not on the financial impact on pensioners (or contributors) but in the shouldering of risk between the current generation and the State (who becomes a custodian of the future generations in this respect).
Parametric reforms, in fact, do not change public pension systems from a DB to a DC set-up. This has several important implications, such as the fact that longevity risk is still borne by the pension provider rather than the pensioner. Moreover redistribution is still possible under a DB system, something that is relatively impossible to achieve under a pure DC framework.
Parametric reforms may affect either the contribution side or the benefit side. Almost all countries in the EU25 have undertaken parametric reforms during the last decade, and in some cases this preceded systematic reforms. On the contribution side, countries may change the percentage of income that needs to be paid or the income thresholds that apply. They may change the number of contributions required to qualify for a pension, affecting the effective retirement age. The state pension age, or the minimum age at which a pension starts to be paid out, can also be modified, a measure that affects both revenue and expenditure at the same time. On the benefit side, an important parametric change is any change in the indexation or uprating of pension benefits. In the same vein, Governments may change the benefit formula by modifying the accrual rates or altering the pensionable earnings. Related to this, countries have also in many cases tried to rollback the early retirement schemes that they had introduced earlier and also sought to extend working lives by offering benefits to older people who continued to work or deferred their pensions.
Documenting all parametric changes that have taken place in European public pensions during the last decade is beyond the scope of this paper. Table 2 below summarises the main parametric reforms that have taken place, or are gradually being introduced, in the PAYG DB public pension schemes of the current Member States of the European Union. The parametric reforms are sub-divided into 5 categories. In some cases, some countries that have made systematic reforms are also listed in the Table, e.g. Italy. This is because in these countries the old schemes still apply to older cohorts of workers, and Governments have sought to reform these also. In general the parametric reforms have been driven by the objective of increasing revenue or decreasing generosity in terms of annual pensions benefits paid out.

12
Table 2: Countries that made parametric reforms between 1995/96 and 2005
Retirement
Age
Contribution
Rate
Contribution
Requirement
Benefit
Indexation
Pension
Formula
Austria
Belgium
Cyprus
Czech Rep.
Denmark
Estonia
Finland
Germany
Greece
Hungary
Italy
Latvia
Lithuania
Portugal
Slovak Rep.
U.K.
Czech Rep.
Denmark
Finland
Germany
Hungary
Ireland
Italy
Latvia
Lithuania
Malta
Netherlands
Portugal
Slovak Rep.
U.K.
Austria
Belgium
Czech Rep.
Denmark
Finland
France
Germany
Ireland
Italy
Slovak Rep.
Slovenia
Spain
Austria
Germany
Greece
Hungary
Spain
Slovak Rep.
Austria
Belgium
Czech Rep.
Finland
France
Greece
Hungary
Italy
France
Luxembourg
Portugal
Slovak Rep.
Slovenia
Spain
U.K.
Source: Based on analysis of ‘Social Programmes throughout the World’, various editions, and ‘MISSOC Tables’ , various years.
As can be seen from Table 2, the most frequent reform was changing the retirement age. Only Eastern European New Member State countries (Czech Republic, Estonia, Hungary, Latvia, Slovak Republic, Lithuania) and Italy have effectively increased the retirement age for both genders, while Denmark actually lowered it from 67 to 657. The coalition Government in Germany intends to raise the state pension age from 65 to 67. Similarly, independent Government-appointed pension commissions have recently recommended the extension of the retirement age in both the UK and Malta. The second most common reform during this decade was modifying the contribution rate. Given the PAYG-nature of public schemes, this reform, on its own, does not yield full benefits. In contrast, some countries, e.g., the Netherlands and Sweden have even set a cap on contributions. 7 A Government-appointed commission has, however, recently proposed for it to go back up to 66.

13
Another measure that impacts on both revenues and expenditures is changing the contribution requirements to be eligible for pension benefits. One of the most common changes across Europe has been a scaling back of the early retirement schemes that had been put in place in the 1970s and 1980s. Contribution requirements for early retirement, or deductions for taking up pensions before the legal retirement age, have gone up in Belgium, Denmark, Germany, France, Italy, Austria, Finland, the Czech and the Slovak Republics, Spain and Slovenia. More crucially, the period of minimum contributions needed to qualify for the maximum pension has been increased or is being raised in several countries, like Austria, Belgium, France and Italy. France has also introduced a significant reform under which after 2009, ‘ the number of contribution years will increase following the increase in life expectancy through a rule keeping constant the ratio of the number of contribution years and the number of years in pension to the level of 1.79 as in 2003’ 8.
This reform is interesting in that it introduces a form of automatic stabiliser in the public DB scheme that reduces the risk posed by longevity. The merit of this approach is that the individual, here, can still manage to qualify for a good benefit by working more. The reforms based on NDC or personal accounts also provide this opportunity to the individuals to undertake remedial action of this sort to qualify for more generous pension benefits.
On the benefit side, more countries moved away from earnings uprating of pensions in payment; most EU countries now uprate benefits with prices – implying that over time pensioner benefits will fall in relation to general incomes and thus they will lose out their relative position in their society.
The changes in indexation relate to the benefit side and, unless people are well aware of their implications, they could end up having pension benefits that are lower than what they were expecting without any possibility of taking remedial action. As can be seen, there have only been a handful of countries that have changed the way they index benefits after retirement. However, this may be somewhat deceptive, as most countries had already effected these changes at an earlier date. Contrary to the commonly held perception, most pension systems in Europe nowadays are not characterised by earnings uprating but rather by price uprating. This implies that replacement ratios of pensions gradually decline with time, as the income of pensioners grows at a much slower rate (inflation) than that of the rest of the population (earnings). This results in a continuous decline in the relative position of the elderly (especially the oldest old).
The countries shown in Table 2 present a few of those who had still earnings uprating in 1995, but since have moved away. Austria and Germany had at first moved towards net earnings, so that the burden of any increases in social security contributions would be shared between workers and pensioners. Now they have both moved to an even less generous indexation: Austria to price uprating and Germany has introduced the ‘sustainability factor’ to adjust pension benefit indexation. Other countries, like Hungary and the Slovak Republic, went for the Swiss formula (50% price uprating and 50% earnings uprating) and in this way reduced what were previously wage-indexed pensions.
8 Giuseppe Carone, ‘Long-term labour force projections for the 25 EU Member States: A set of data for assessing the economic impact of ageing’ , November 2005.

14
Changes in the pension benefit formula are rather more complex reforms, especially in terms of their implications being fully understood by the average citizen. There is a wide variety of pension benefit formulae and thus it is hard to synthesise the main changes. However, broadly speaking, the formulae can be divided into two parts – accrual of entitlements and pensionable salary. The accrual side determines how much of the pensionable salary, the pension benefit will be replacing. Thus, for instance, the scheme could be based on having an accrual of 2% of the final salary for every year of contributions. The other component, pensionable salary, amounts to the representative salary to which the earnings-related scheme is linked.
Typically DB schemes (particularly in the private sector) have accrual schedules that are linearly to the number of years in the system (i.e. same accrual rates for each year of contribution, irrespective of age and years already contributed for). In order to extend working lives, or alternatively to discourage early retirement, in recent years some Governments, such as Finland and Greece, have modified their accrual rates and tried to give higher entitlement to those who work after certain ages, or else have sought to make people work more by reducing accrual rates. In other cases, the accrual rate may differ on the basis of earnings (Czech Republic and Portugal have higher accrual rates on lower earnings, and lower accrual on higher earnings; France and Sweden has higher accrual rates on higher earnings). There are also differences in accrual rates across sectors (e.g. Firefighters’ pension schemes in the UK, and the pension schemes for police in Greece, have much higher accrual rates compared to other sectors in the economy; the French pension system has separate accrual regimes for executives and nonexecutives9).
A more readily understandable parametric reform involves changing the pensionable salary. Most countries used to have schemes that limited the determination of this salary to the final few years of a career, a period when someone would be near the top of his earnings history. However, in recent years, there has been a considerable lengthening of this period, so that the wage that is replaced is in many cases no longer very representative of the final salary of the person before he retires. Austria, for example, has moved away from using 15 best years to as many as the income earned during 40 to 45 years of working lives. Most notably, this kind of reform is likely to harm more those who had steep earnings career, and will be relatively beneficial to those on low income trajectory. Other countries, like Portugal and Hungary, have also gone towards calculating the pensionable income as the average lifetime salary, while others, such as France, have just increased this period to be more in line with the required contribution periods 9as for Austria). A new innovation made by Germany is the introduction of a ‘sustainability factor’ which links annual pension indexing to changes in the ratio of pensioners to workers supporting the system. German pensions are tied to a basic pension-point value component, which, in turn, is indexed to annual net wage growth. This pension-point value component is adjusted in line with the sustainability factor, so to lower pension payouts for all German retirees as the pensioner-to-worker ratio increases over time. Thus pension payments are expected to be on the decline, which in turn is likely to raise the risk of elderly falling into poverty.
9 Florence Legros, “NDCs: A comparison of the French and German point systems” , from ‘Pension Reform: Issues and Prospects for Non-financial defined contribution (NDC) schemes’ edited by Robert Holzmann and Edward Palmer, The World Bank, 2006.

15
Systematic reforms and their possible impact In essence there have been two broad types of systematic reforms – those inspired by the World-Bank multi-pillar model and those setting up NDC schemes. Though in both cases, the main difference with DB public schemes is that the structure of determination of pension benefits changes from DB to DC, there are some major differences between the two strands of reforms and their impact on pensioners’ incomes is also likely to be quite distinct.
Table 3: Countries that have made systematic reforms
NDC Funded Second Pillar NDC First Pillar
Italy
Sweden
Czech Rep. (voluntary)
Estonia
Hungary
Latvia
Lithuania
Poland
Slovak Rep.
Slovenia (supplement)
Sweden
Latvia
Poland
Source: Based on Commission Staff Working Document: Synthesis report on adequate and sustainable pensions (Feb 2006).
a). World-Bank Multi-pillar reforms Prior to accession, a number of countries opted to go for multi-pillar pension systems, often after assistance from the World Bank. These reforms, though they differ from that in Chile, were inspired by similar motives of moving towards a funded system and increasing the share in the economy of the private sector. The systems face serious challenges (quite similar to those faced by Chile), with major issues surrounding coverage, high fiscal costs of transition and negative impact on certain groups (such as women).
The review commissioned by the World Bank on its assistance on pension reform reports that eleven of 24 Bank-supported European and Central Asian countries implemented multi-pillar reforms.10 Poland, Estonia, Latvia, the Slovak Republic, Lithuania and Hungary all implemented multi-pillar reforms before they joined the EU (and three other applicant countries, Romania, Bulgaria and Croatia have also gone down this path).11 However reforms in this region differ from those in Latin America, as multi-pillar systems in Europe tend to include a fairly substantial contribution-based PAYG pillar, for instance Hungary and Latvia. Moreover reforms in
10 13 countries (of which only Slovenia is an EU Member State) also received small loans for parametric reforms. 11 Sweden, an existing Member State, also introduced a mandatory DC funded pillar, but this is minor contrasted to its main pillar.

16
European countries tended to be influenced by the NDC reforms of Sweden and Italy (particularly in cases when Sweden was also a donor country) and in some cases, namely Poland and Latvia, the first pillar was converted from PAYG to NDC.
In many cases the multi-pillar reforms are still too new for their long-term impacts to be evident. Yet, in some of the countries which went through the reform earlier than others, e.g. Hungary, there have been studies that have yielded some interesting insights. A working paper published by the Hungarian Central Bank12 notes that ‘ the pension system, in its present form, is unsustainable with net implicit public liabilities in the system around 240% of GDP’. More crucially it notes that ‘the returns recorded so far in the private pension funds fall short of expectations and, on the condition that these low returns persist, the second pillar is projected to provide annuities that do not make up for the reduction in benefits received from the public pillar’ . The Hungarian case is also interesting in that it shows that a move to fully funding does not automatically result in sustainability as after the reform several parametric changes contributed to reverse any improvements in sustainability. The net implicit liabilities of the system had been just 60% of GDP prior to the reform, but a cut in contribution rates, the levelling of benefits across pensioners who retired in different years and the introduction of a 13th month pension contributed to boost the burden of the system.
Shifting to a pure DC structure increases risks shouldered by individual contributors (instead of the State, or the employer), and it reduces the redistributive element present in public DB pension schemes. Given gender differentials in employment, it also tends to lead to greater gender inequality. Personal accounts reforms introduce two elements of risk to pensioner incomes – namely investment risk and administrative charges risk, and these may lead benefits to be significantly different from those available under the old regime of public DB-type pension schemes. The move to DC also implied that contributions and benefits of an individual became directly linked and this reduces the possibilities of effecting redistribution. Thus, such a move was negative for lower income individuals, as progressive elements in pension formulae were removed or decreased, cases in point being Hungary (1998) and Poland (1992 and 1999). Moreover the shift from DB to DC means that longevity risk is shifted squarely to the shoulders of individual contributors of the same generation (and not borne by the state). Taken together all these measures tend to disadvantage those with low lifetime earnings. To further complicate matters, though countries have tended to legislate that gender-neutral mortality tables are utilised, there have been practical problems of implementing these annuity regulations with insurance companies reluctant to offer them and the market proving to be difficult to kick-start. Thus, the net outcome of these reforms increases the risk that women will continue to have lower annual pension incomes.
A further complication arises when individuals are given the option to shift voluntarily into the personal accounts system. Evidence from Poland and Hungary indicates that many opted to shift without having recourse to enough information. In many cases, people had the option of staying within the old public DB-type PAYG system or move to the personal accounts pillar. Similar to
12 Gabor Orban & Daniel Palotai, ‘The sustainability of the Hungarian pension system: a reassessment’ , Magyar Nemzeti Bank, December 2005.

17
what happened in the UK with contracting-out, there is evidence that in many cases people who switched may have become less well off as a result. A World Bank study carried out in 200013 shows that surveys in Poland from the end of 1999 showed that ‘most people felt they were well informed and that information on the pension reform was readily available’ , but then surveys often showed ‘ that the knowledge of the pension system was limited to slogans rather than a deep understanding’ . Moreover while there are indications of rational switching, there is ‘some evidence that choices made were not based on a detailed understanding of the new system’. The study also notes that ‘a significant proportion of people simply joined the pension fund of the first agent they came across’ .
b. NDC schemes Whereas the personal account systems are based on investing funds in the market, the NDC systems involve just notional accounts and thus the investment risk faced by individuals is very different. The rate of return faced under an NDC is centrally determined and reflects the formula chosen, whereas under the personal accounts system the return depends on the choices made by individuals and the performance and stability of financial markets. This has significant implications in that all people face the same risks on return under the NDC scheme, and thus there is no income inequality that results because of better investment choices, something that could possibly be correlated to the income level of an individual. NDC schemes thus do not place lower income individuals at a relative disadvantage arising from their relatively lower level of financial education and experience in investment choice.
That said NDC schemes also have a form of ‘ investment’ risk for contributors. This relates to any fluctuations in the notional rate of return that differs from the return under the PAYG DB scheme, which amounted to the annual accrual of entitlements. The NDC schemes, in fact, attempt to make the PAYG schemes automatically stabilising so that the ‘assets’ and ‘ liabilities’ of the system balance out. For instance, in Sweden through the operation of the ‘automatic balance mechanism’, Government reviews annually the system and if the calculation reveals an unfunded liability, the notional account interest (set at the growth of average wages) and the indexing of annuities is reduced. Thus changes in the size of the contributing labour force are reflected in the rate of return earned on funds. With the NDC system, the financial risk of changing economic and demographic factors is shifted from the Government to current and future pensioners. Besides this, the system also adjusts for longevity increases through changes in the annuity divisor, which converts the notional account upon retirement into pension benefits. As retirees’ life span increases, the monthly benefit available to individuals declines unless they delay retirement. Capretta (2006) reports that “based on mid-range demographic and economic assumptions, the Government projects that the life span adjustment will cut average monthly benefits for those continuing to retire at age 65 by 14% by 2055”. However, it can be doubted whether there won’t be any behavioural adjustments (upwards) in the age at which people retire when faced with the prospect of low pensions benefits and rising life expectancy. Moreover, as mentioned by Capretta, “the Government expects the automatic balance mechanism to be
13 Agnieszka Chlon, ‘Pension reform and public information in Poland’, Social Protection Discussion Paper Series, World Bank, August 2000.

18
triggered only ‘a few times’ over the next 15 years, thus modestly cutting the rate of return applied to the notional accounts” .14
There is concern that the projections used by the Swedish Government may be optimistic (the current level of fertility and migration together with 2% permanent real wage growth) and the automatic balance mechanism will be used much more frequently than expected. In this case, the politically acceptability of the NDC system may be put under threat as its transparency means that individuals will be able to compare the rate of return on their notional accounts with that on market instruments (and ignoring the question of risk, charges, etc). This will put pressure on Governments to sustain the system by shouldering part of the change in economic and demographic factors itself. Furthermore as noted in Knell (2005)15 the NDC system leads to a securitisation of pension claims, making individual benefit levels difficult to modify whereas under the DB systems where benefits were determined at the end of the career, it was easier for Governments to fiddle with the formula and lower benefits. However, the shift to NDC in itself, due to move towards lifetime averaging and the shift of longevity risk, may lead to such a reduction in benefits that Governments may be willing to face these additional risks. For instance, Franco & Sartor (2006)16 reports that in the Italian system “under the baseline scenario, the average pension earned at the age of 60 is reduced by 34 percent…the reduction in benefits reaches 50 percent if the lifetime stream of pension benefits is taken into account” . These reductions in benefits, if not compensated by additional contributions, are likely to increase the risk of elderly poverty.
Another major difference of the NDC schemes is that they are less expensive to administer than multi-pillar pension systems. This is not to say that multi-pillar systems cannot be organised in a way that reduces the administrative charges faced by contributors. The Swedish pension systems also includes a relatively small personal account component (2.5 percentage points out of the total 18.5% contribution paid) which due to its centralised organisation faces significantly lower costs than the multi-pillar systems of CEECs, indicating that this type of risk can be reduced through reforms that decrease decentralisation.17 Nevertheless the personal account systems will always involve more administrative costs as they involve the actual investment of funds, and thus even if contributors are denied any rights of switching providers or given very little choice (both factors that could reduce administrative charges substantially) there would be the costs to effect investments, track them and administer them. Given that these are fixed costs, in a system of personal accounts these costs tend to disadvantage the lower income groups. The adoption of the gender-neutral annuity is arguably the most redistributive element of a DC-type system. However, this is true only when one looks at the overall cumulative sum of pensions
14 James C. Capretta, “Building automatic solvency into US Social Security: Insights from Sweden and Germany” , Policy Brief No.151, The Brookings Institution, March 2006. 15 Markus Knell, “Demographic fluctuations, sustainability factors and intergenerational fairness – an assessment of Austria’s new pension system’ , Monetary Policy and the Economy Q1/05, Oesterreichische Nationalbank, 2005. 16 Daniele Franco & Nicola Sartor, ‘NDCs in Italy: Unsatisfactory present, uncertain future’ , from ‘Pension Reform: Issues and Prospects for Non-financial defined contribution (NDC) schemes’ edited by Robert Holzmann and Edward Palmer, The World Bank, 2006. 17 It may be indicative that market forces left alone are also leading to a lot of mergers in the private pension providers in the CEECs.

19
payment. In terms of annual incomes, the gender specific risk of elderly poverty will not be affected by gender-neutral annuity rates.
One other critical element of the NDC pension system is how it credits absences from the labour market (such as those due to sickness and disability, and those for childcare). If the steady state scenario of a shorter working life career for women is assumed, the DC type pensions will reduce the annual benefits paid out to women.
The shift to DC, and the determination of benefits by the amount of funds accumulated, makes it crucial to have in place adequate crediting systems for periods during which an individual is prevented by circumstances, such as sickness, unemployment, training or child and adult caring, from contributing. However, there is evidence that in many cases this element of reform was ignored. Thus, Steinhilber (2004) reports that in Hungary contributors to the personal accounts system contribute 6% of their child care benefit to the pension system (instead of having credits as under the old system) and since this benefit is much less than wages, especially for middle and upper income earners, carers are worse off, and that in Poland the state pays a subsidy but this is based on the minimum wage and is ‘much less generous than it was before’ . By contrast in Sweden, the state gives extra pension rights to parents with children under four, though Sweden´s 2005 National Strategy Report for adequate and sustainable pensions still stated that while “ in principle, the national pension system gives everyone the same possibilities of building an adequate pension….many women still devote more time to unpaid work and less time to paid work than men, which results in lower average pensions for women.” .
Conclusions The analyses in this part of the paper has sought to describe briefly the pension reforms that have taken place during the last decade or so in the present 25 Member States of the European Union. While in 1995, nearly all the Member States of the EU had an earnings-related DB PAYG scheme as the main centrepiece of their pension system, by 2005 nearly half of the Member States had shifted towards other pension models, notably personal accounts or NDC schemes. Moreover all countries had, or considered, changes to their state pension schemes during this time. In most cases the reforms were mainly driven by fiscal sustainability concerns and the impact of these reforms on income adequacy and pensioner poverty do not appear to have been given significant consideration. In particular, the effects of systematic shifts on particular groups, such as women and lower income earners, have not been assessed in great depth. The current report takes a first step in that direction.
These issues point towards the need to reassess most of the reforms that have been carried out and outline those that are less likely to result in pensioner poverty. For instance, France’s reform to link the number of contribution years required to qualify for the state pension with longevity may be less socially risky than Germany’s policy to link the value of pension benefits to the dependency ratio. This is mainly because this policy sends clear signals to individuals that they need to work more to qualify for the same benefit, rather than simply giving them a smaller benefit and then possibly facing a political backlash and having to increase this benefit. Similarly the administrative structure adopted by the multi-pillar reforms in the CEECs needs to be looked at and reformed in a way as to reduce administrative costs and make the systems less burdensome

20
on low-income earners. Moreover policymakers need to ensure that individuals understand the choices before them, particularly the longevity risk, and that incentives for savings must increase. Policymakers need to remember that pensions were not introduced by chance, but were the result of social consensus that poverty amongst the elderly must be eliminated. If pension systems end up failing this main task, it is very probable that the social forces that combined to create pension systems may unravel the recent reforms that have taken place.

21
Box 1: Data sources used in poverty statistics for the elderly in this report
Country Source Survey year
Income year
Belgium EU-SILC 2004 2003
Czech Republic
Microcensus 2003 2002
Denmark EU-SILC 2004 2003
Germany GSOEP (Sozio-oekonomische Panel) 2004 2003
Estonia Household Budget Survey (LEU: Leibkonna Eelarve Uuring)
2003 2003
Greece EU-SILC 2004 2003
Spain EU-SILC 2004 2003
France EU-SILC 2004 2003
Ireland EU-SILC 2004 2003
Italy EU-SILC 2004 2003
Cyprus Family Expenditure Survey 2003 2003
Latvia Household Budget Survey (MBP: Majsaimniecibu Budzetu Petijums)
2003 2003
Lithuania Household Budget Survey (Namu ukiu biudzetu tyrimas) 2003 2003
Luxembourg EU-SILC 2004 2003
Hungary TARKI Household Monitor Survey 2003 2003
Malta Household Budget Survey 2000 2000
Netherlands Income Panel Survey (IPO: Inkomenspanelonderzoek) 2003 2003
Austria EU-SILC 2004 2003
Poland Household Budget Survey (Badania Bud etów Gospodarstw Domowych)
2003 2003
Portugal EU-SILC 2004 2003
Slovenia Household Budget Survey (Anketa o porabi v gospodinjstvih)
2003 2003
Microcensus 2003 2002 Slovakia
Extrapolation 2004 2003
Finland EU-SILC 2004 2003
Sweden EU-SILC 2004 2003
United Kingdom
FRS: Family Resources Survey 2003/4 2003/4
Notes: The shaded cells point to the fact that the latest 2004 EU-SILC data have been used;

22
References Capretta, James C. (2006) “Building automatic solvency into US Social Security: Insights from Sweden and Germany”, Policy Brief No.151, The Brookings Institution, March. Franco, Daniele and Nicola Sartor (2006) “NDCs in Italy: Unsatisfactory present, uncertain future” in ‘Pension Reform: Issues and Prospects for Non-financial defined contribution (NDC) schemes’ edited by Robert Holzmann and Edward Palmer, The World Bank. Knell, Markus (2005) “Demographic fluctuations, sustainability factors and intergenerational fairness – an assessment of Austria’s new pension system”, Monetary Policy and the Economy Q1/05, Oesterreichische Nationalbank. Steinhilber, Silke (2004) “The Gender Implications of Pension Reforms. General Remarks and Evidence from Selected Countries” , paper prepared for the UNRISD report ‘Gender Equality: Striving for Justice in an Unequal World’ , ILO. Zaidi, Asghar, Mattia Makovec, Michale Fuchs, Barbara Lipszyc, Orsolya Lelkes, Aaron Grech, Bernd Marin and Klaas de Vos (2006) “Poverty of Elderly People in EU25”, Report submitted to the European Commission, European Centre for Social Welfare Policy and Research, Vienna. Zaidi, Asghar, Bernd Marin and Michael Fuchs (2006) “Pension Policy in EU25 and Its Possible Impact on Elderly Poverty” , Report submitted to the European Commission, European Centre for Social Welfare Policy and Research, Vienna.