Nanded District MahaRASHTRA - Central Ground Water Board
280
i 2337/NQM/2021 कीय भूमि जल बोड जल संसाधन, नदी मिकास और गंगा संरण मिभाग जलशमि िंालय भारत सरकार CENTRAL GROUND WATER BOARD Ministry of Jalshakti Division of Water Resources, River Development & Ganga Rejuvenation Government of India AQUIFER MAPS AND GROUND WATER MANAGEMENT PLAN NANDED DISTRICT MAHARASHTRA (AAP 2019-2020) िये, नागपुर / Central Region, Nagpur अगत 2021 /August 2021
-
Upload
khangminh22 -
Category
Documents
-
view
5 -
download
0
Transcript of Nanded District MahaRASHTRA - Central Ground Water Board

i
2337/NQM/2021
कें द्रीय भूमि जल बोर्ड
जल संसाधन, नदी मिकास और गंगा संरक्षण मिभाग
जलशमि िंत्रालय
भारत सरकार
CENTRAL GROUND WATER BOARD Ministry of Jalshakti
Division of Water Resources, River Development &
Ganga Rejuvenation
Government of India
AQUIFER MAPS AND
GROUND WATER
MANAGEMENT PLAN
NANDED DISTRICT MAHARASHTRA
(AAP 2019-2020)
िध्यक्षेत्र, नागपुर / Central Region, Nagpur
अगस्त 2021 /August 2021

ii
CONTRIBUTORS
Principal Authors Anu V : Junior Hydrogeologist/
Scientist-B Supervision & Guidance Dr. P. K. Jain : Superintending
Hydrogeologist AbhayNivasarkar : Scientist-D S.K. Bhatnagar : Scientist-D Hydrogeology, GIS maps and Management Plan
Anu V : Junior Hydrogeologist/ Scientist-B
Groundwater Exploration AbhayNivasarkar : Scientist-D S.K.Bhatnagar : Junior Hydrogeologist/
Scientist-D Sandip Bhowal :
Senior Technical Assistant
Chemical Analysis Dr.DevsharanVerma : Scientist B (Chemist) Dr.Rajni Kant Sharma : Scientist B (Chemist) T. Dinesh Kumar : Assistant Chemist

i
NANDED DISTRICT AT A GLANCE 1. GENERAL INFORMATION Geographical Area (Sq. Km.) 10542 Administrative Divisions (2011)
16 Blocks Ardhapur, Bhokar, Biloli, Degloor, Dharmabad, Hadgaon, Himataytnagar, Kandhar, Kinwat, Loha, Mahur, Mudkhed, Mukhed, Naigaon, Nanded, Umari
Towns / Villages (Census 2011)
17 /1603
Population (Census 2011) 3361292 Annual Rainfall (2019) 1027.1 mm Normal Rainfall 827.25 mm Long Term Rainfall Analysis (1998-2019)
Falling Trend: 4.178 mm/year. Probability of Normal/Excess Rainfall-64% & 23%. Probability of Drought (Moderate/Severe / Acute)-: 14% Moderate.
2. GEOMORPHOLOGY, SOIL & DRAINAGE Major Physiographic Unit Major Drainage River Godavari and its tributaries, River Manar
and its tributaries, River Landi and its tributaries 3. LAND USE (2017-18) (Source: DSA 2018) Forest Area 1052.5 Sq. Km. Cultivable Area 9449Sq. Km. Net Sown Area 7561 Sq. Km. Area Sown more than Once 1898 Sq. Km. 5.PRINCIPAL CROPS (2018) Cotton 2697.79 Pulses 285.94 Cereals 88.92 Oil Seeds 3242.22 Sugarcane 362.95 Others 38.34 6. HORTICULTURAL CROPS Sugarcane 362.95 Others 38.34 7. GROUND WATER ABSTRACTION STRUCTURES (Reference Year: 2006-07) Dug Wells 38253 Bore Wells/Tube Wells 15531 8. GROUND WATER MONITORING WELLS (As on 31/03/2019) Dug Wells 59 Piezometers 02 9. GEOLOGY Recent Riverbed Alluvium, Basaltic lava flows of
Deccan traps belonging to Late Cretaceous to Early Eocene, Intertrappeans of Precambrian age and Peninsular granite-gneiss comples of Archean age.
ii
10. HYDROGEOLOGY Water Bearing Formation Alluvium-Sand and Gravel (Under Phreatic
condition) Deccan Traps: Under phreatic to semi-confined/confined Granite: Under phreatic to semi-confined/confined Gneiss: Under phreatic to semi-confined/confined
Depth to water Level in Shallow Aquifer
Premonsoon Depth to water level (May 2019)
1.55 to 31.7mbgl
Post monsoon Depth to water Level (Nov.2019)
0.01 to 13.8 mbgl
Depth to water Level in Deeper Aquifer
Premonsoon Depth to water level (May 2019)
2.07 to 30.35 mbgl
Post monsoon Depth to water Level (Nov.2019)
1.48 to 39.2 mbgl
11. GROUND WATER EXPLORATION (As on 31/03/2019) Wells Drilled EW-37, OW-26, PZ-03 Depth Range 54 to 208.00 m bgl Discharge Traces to 9.54 lps Transmissivity 6.15 to 83.53 m2/day Storativity 2.2 x 10⁻⁴ to 1 x 10⁻² 12.GROUND WATER QUALITY Ground Water is suitable for Drinking and Irrigation Purposes except in area where EC> 2250 µS/cm and areas of Fluoride and Nitrate Contamination Type of water Medium to High Saline water
13. GROUND WATER RESOURCES AVAILABILITY (2017) Net Annual Ground Water Availability (MCM)
1139.75
Existing Gross Ground Water Draft for All uses (MCM)
382.03
Annual GW Allocation for Domestic Use as on 2025
93.45
Stage of Ground Water Development %
35.44 %
Category SAFE Over Exploited Blocks None Semi-Critical Blocks None Notified Blocks None 14. GROUND WATER ISSUES LOW DEVELOPMENT: The stage of ground water development varies from 20.20 % in Ardhapur block to 60.50% in Dharmabad block. Thus, there is a low stage of ground water developmentnet in the district. DECLINING WATER LEVEL TREND: The declining trend of water level has been observed in the major parts of the district during both premonsoon and post

iii
monsoon. During Premonsoon, a falling trend @ 0.0 to 2.38 m/year is observed in about 6699.24 Sq Km area and a falling trend @ 0.0 to 0.84 m/year is observed in about 5106.56 Sq Km area LOW YIELDING AQUIFERS: The yield of the aquifer in major parts of the block ranges from 1 to 2 lps as given in Figure 6.3. This is due to limited extent of porosity and permeability evolved from secondary porosity and hence poor sustainability of aquifers. FLOURIDE CONTAMINAION: The Fluoride contamination in unconfined aquifers is observed in 3 sites in Kinwat, Himayatnagr and Biloli blocks and Nitrate contamination is observed in 3 sites of Himayatnagar block. In Semiconfined/confined aquifers, the presence of Flouride was obtained in 7 sites in Mahur, Mukhed, Kandhar, Mudkhed and Himayatnagar blocks and the nitrate contamination was obtained in 11 sites in Naigaon, Hadgaon, Mudkhed, Himayatnagar, Degloor, Biloli, Ardhapur blocks. 15. AQUIFER MANAGEMENT PLAN SUPPLY SIDE MANAGEMENT
Proposed AR structures-1181 Percolation Tank-307 Check Dam-874 Leading to Additional 65.69 MCM
DEMAND SIDE MANAGEMENT
Area proposed for Drip irrigation: Sugarcane Area:8.11 sq km Ground water saving:6.63 MCM
EXPECTED BENEFITS 711 Sq Km additional area proposed for irrigation through 27714 Dugwells and 4620Borewells

i
AQUIFER MAPPING AND MANAGEMENT PLAN NANDED DISTRICT, MAHARASHTRA
CONTENTS
1. INTRODUCTION ...................................................... 2
1.1 About the Area ....................................................................... 2
1.2 Geomorphology, Drainage, Soil Types, Land Use .................... 3
1.2.1 Geomorphology ................................................................................ 3
1.2.2 Drainage ............................................................................................ 4
1.2.3 Soil Types .......................................................................................... 5
1.2.4 Land Use ........................................................................................... 6
1.2.5 Cropping Pattern .............................................................................. 7
1.3 Climate & Rainfall ................................................................. 8
1.4 Geology ................................................................................ 12
2. HYDROGEOLOGY ................................................... 15
2.1 Major Aquifer System ........................................................... 15
2.2 Aquifer Parameters .............................................................. 16
2.3 3D and 2D Aquifer Disposition ............................................. 16
3. Water Level Scenario ............................................. 23
3.1 Depth to Water Level (Phreatic Aquifer/Aquifer I) ............... 23
3.1.1 Depth to Water Level (Semiconfined/Confined Aquifer-Aquifer II)23
3.2 Water Level Trend (2010-19) ................................................ 27
3.3 Hydrographs ........................................................... 27
4. GROUND WATER QUALITY ................................... 38
4.1 Electrical Conductivity ......................................................... 38
4.2 Suitability Of Ground Water for Drinking Purposes ............ 40
4.3 Suitability Of Ground Water for Irrigation Purposes ............ 41
5. GROUND WATER RESOURCES ............................. 43
5.1 Ground Water Resources-Aquifer I ...................................... 43
5.2 Ground Water Resources-Aquifer II ..................................... 44
6. GROUND WATER RELATED ISSUES ..................... 46
6.1 Low Development ................................................................. 46
6.2 Declining Water Level Trend ................................................ 46
7. GROUND WATER RESOURCE MANAGEMENT ..... 49
7.1 Supply Side Management ..................................................... 49
7.2 Demand Side Management ................................................... 51
7.3 Expected Benefits ................................................................. 53
7.4 Development Plan ................................................................ 54
8. SUM UP ................................................................... 57
9. AQUIFER MAPS AND GROUND WATER MANAGEMENT PLAN ............................................................................. 59
9.1 ARDHAPUR BLOCK, NANDED DISTRICT ............................ 59
9.2 BHOKAR BLOCK, NANDED DISTRICT ................................. 69
9.3 BILOLI BLOCK, NANDED DISTRICT .................................... 79
9.4 DEGLUR BLOCK, NANDED DISTRICT ................................ 90
9.5 DHARMABAD BLOCK, NANDED DISTRICT ....................... 100

ii
9.6 HADGAON BLOCK, NANDED DISTRICT ............................ 109
9.7 HIMAYATNAGAR BLOCK, NANDED DISTRICT .................. 119
9.8 KANDHAR BLOCK, NANDED DISTRICT ............................ 129
9.9 KINWAT BLOCK, NANDED DISTRICT ............................... 139
9.10 LOHA BLOCK, NANDED DISTRICT .................................... 150
9.11 MAHUR BLOCK, NANDED DISTRICT ................................ 160
9.12 MUDKHED BLOCK, NANDED DISTRICT ........................... 170
9.13 MUKHED BLOCK, NANDED DISTRICT .............................. 180
9.14 NAIGAON BLOCK, NANDED DISTRICT ............................. 190
9.15 NANDED BLOCK, NANDED DISTRICT ............................... 201
9.16 UMARI BLOCK, NANDED DISTRICT ................................... 211
10. ANNEXURES ......................................................... 222
LIST OF FIGURES Figure 1.1: Administrative Map ...................................................................................... 3
Figure 1.2: Index Map .................................................................................................... 3
Figure 1.3: Geomorphology of Nanded District ............................................................. 4
Figure 1.4: Drainage, Nanded District ........................................................................... 5
Figure 1.5: Soil Map, Nanded District ............................................................................ 6
Figure 1.6: Land Use, Nanded District .......................................................................... 7
Figure 1.7: Irrigation, Nanded District .......................................................................... 8
Figure 1.8: Decadal Annual Rainfall Analysis (2010-19) of Nanded District. .............. 9
Figure 1.9: Long term Rainfall Analysis (1998-19) of Nanded District. ........................ 9
Figure 1.10: Isohyetal Map of the district ..................................................................... 11
Figure 1.11: Geology of Nanded District ....................................................................... 13
Figure 1.12: Basaltic flow of Nanded District .............................................................. 13
Figure 2.1: Hydrogeology of Nanded ........................................................................... 15
Figure 2 2: 3D Diagram Aquifer Disposition ............................................................... 17
Figure 2.3: Aquifer-I, Depth of Occurrence and thickness ......................................... 18
Figure 2.4: Aquifer-II, Depth of Occurrence and thickness ........................................ 18
Figure 2.5: Aquifer-I, Yield Potential ........................................................................... 19
Figure 2.6: Aquifer-II, Yield Potential ......................................................................... 19
Figure 2.7: 3D Fence Diagram ..................................................................................... 20
Figure 2.8: 3D Bar Diagram ......................................................................................... 21
Figure 2.9 : Hydro-geological Cross Section A-A’ ....................................................... 22
Figure 2.10 : Hydro-geological Cross Section B-B’ ...................................................... 22
Figure 2.11 : Hydro-geological Cross Section C-C’ ....................................................... 22
Figure 2.12 : Hydro-geological Cross Section D-D’ ..................................................... 23
Figure 3.1 : Aquifer I, Pre-monsoon DTWL (May 2019) ............................................. 24
Figure 3.2 : Aquifer I, Post-monsoon DTWL (Nov. 2019) .......................................... 25
Figure 3.3: Aquifer II: Pre-monsoon Depth to Water Level (May 2019) .................... 26
Figure 3.4: Aquifer II: Post-monsoon Depth to Water Level (Nov. 2019) .................. 26
Figure 3.5: Premonsoon Water Level Trend (2010-2019) .......................................... 28
Figure 3.6: Postmonsoon Water Level Trend (2010-2019) ......................................... 28
Figure 3.7: Hydrograph of Malegaon, Ardhapur Block, Nanded District ................... 30

iii
Figure 3.8: Hydrograph of Nagapur, Bhokar block, Nanded District ........................ 30
Figure 3.9: Hydrograph of Nagapur, Biloli Block, Nanded District ............................ 31
Figure 3.10: Hydrograph of Atkali_PZ, Degloor Block, Nanded District ................... 31
Figure 3.11: Hydrograph of Dharmabad, Dharmabad block, Nanded District ........... 32
Figure 3.12: Hydrograph of Dhawari Buzurg, Hadgaon Block, Nanded District ....... 32
Figure 3.13: Hydrograph of HIMAYATNAGAR, Himayatnagar block, Nanded District
...................................................................................................................................... 33
Figure 3.14: Hydrograph of Malegaon, Loha Block, Nanded District ......................... 33
Figure 3.15: Hydrograph of Janapuri, Kandhar Block, Nanded District .................... 34
Figure 3.16: Hydrograph of Jhalakwadi, Kinwat block, Nanded District ................... 34
Figure 3.17: Hydrograph of Anjankhed, Mahur block, Nanded District ..................... 35
Figure 3.18: Hydrograph of Barad, Mudkhed Block, Nanded District ....................... 35
Figure 3.19: Hydrograph of Mukhed, Mukhed Block, Nanded District ...................... 36
Figure 3.20: Hydrograph of Naigaon, Naigaon block, Nanded District ..................... 36
Figure 3.21: Hydrograph of Sikarghat, Nanded block, Nanded District ..................... 37
Figure 3.22: Hydrograph of Umri Gortha, Umari Block, Nanded Block .................... 37
Figure 4.1: Aquifer I, Ground Water Quality ............................................................... 39
Figure 4.2: Aquifer II, Ground Water Quality ............................................................. 39
Figure 4.3: Percentage Distribution of Ground Water Samples as per BIS Drinking
Water Standards ........................................................................................................... 41
Figure 5.1: Block wise Net GW Availability and Draft for all Purposes ...................... 43
Figure 6.1: Pre-monsoon WL Trend ............................................................................ 46
Figure 6.2: Post-monsoon WL Trend .......................................................................... 46
Figure 6.3: GW Quality of Unconfined Aquifer ........................................................... 47
Figure 6.4: GW Quality of Semiconfined/ Confined Aquifers .................................... 47
Figure 6.5: Cumulative Yield Potential ........................................................................ 48
Figure 7.1: Proposed Artificial Recharge Structures.................................................... 50
Figure 7.2: Proposed Demand Side Interventions ...................................................... 53
Figure 7.3: Additional Area proposed for GW irrigation ............................................. 56
LIST OF TABLES Table 1.1: Land Use Details (Reference Year: 2017-18) ................................................. 7
Table 1.2: Annual rainfall data (2010-2019) (in mm) ................................................. 10
Table 1.3: Long Term Rainfall Analysis (1998 to 2019) of Nanded District ................ 11
Table 1.4: Geological succession of Nanded district .................................................... 12
Table 2.1: Basic Aquifer Characteristics of the major aquifers of the district. ............ 16
Table 4.1: Classification of Ground Water Samples as per BIS Drinking Water
Standards ......................................................................................................................40
Table 4.2: Classification of Ground Water Samples based on EC ............................... 42
Table 5.1: Ground Water Resources, 2017 (Unit in MCM) ......................................... 44
Table 5.2: Ground Water Resources of Semiconfined/Confined Aquifer ................... 44
Table 7.1: Proposed AR Structures and area feasible for recharge ............................. 49
Table 7.2: Volume of water expected to be recharged by Artificial Recharge structures
...................................................................................................................................... 51
Table 7.3: Volume of water expected to be recharged by Demand Side Intervention 52

iv
Table 7.4: Expected benefits after management options ............................................ 53
Table 7.5: Block wise additional area under Assured GW Irrigation .......................... 55
ANNEXURES ANNEXURE 1: SALIENT FEATURES OF GROUND WATER EXPLORATION ................... 222
ANNEXURE II: DETAILS OF GW EXPLORATION WELLS IN NANDED DISTRICT .......... 222
ANNEXURE III: DETAILS OF GW MONITORING WELLS IN NANDED DISTRICT ........... 222
ANNEXURE IV: CHEMICAL ANALYSIS OF GROUND WATER SAMPLES, AQUIFER-
1/SHALLOW AQUIFERS............................................................................................... 222
ANNEXURE V: CHEMICAL ANALYSIS OF GROUND WATER SAMPLES, AQUIFER-
II/DEEPER AQUIFERS ................................................................................................. 222
ANNEXURE VI: WATER LEVEL OF GROUND WATER MONITORING WELLS (2019)
WITH LONG TERM TREND (2010-19) ......................................................................... 222
ANNEXURE VII: LOCATION OF PERCOLATION TANK .................................................. 222
ANNEXURE VIII: LOCATION OF CHECK DAMS ............................................................. 222
ANNEXURE I: SALIENT FEATURES OF GROUND WATER EXPLORATION .................... 223
ANNEXURE II: DETAILS OF GW EXPLORATION WELLS IN NANDED DISTRICT .......... 224
ANNEXURE III: DETAILS OF GW MONITORING WELLS IN NANDED DISTRICT ........... 232
ANNEXURE IV: CHEMICAL ANALYSIS OF GROUND WATER SAMPLES, AQUIFER-
1/SHALLOW AQUIFERS............................................................................................... 241
ANNEXURE V: CHEMICAL ANALYSIS OF GROUND WATER SAMPLES, AQUIFER-
II/DEEPER AQUIFERS ................................................................................................. 244
ANNEXURE VI: WATER LEVEL OF GROUND WATER MONITORING WELLS (2019) WITH
LONG TERM TREND (2010-19) ...................................................................................248
ANNEXURE VII: LOCATION OF PERCOLATION TANK .................................................. 252
ANNEXURE VIII: LOCATION OF CHECK DAMS ............................................................. 256

i

2
AQUIFER MAPPING AND MANAGEMENT PLAN OF NANDED DISTRICT, MAHARASHTRA
1. INTRODUCTION In XII five-year Plan, National Aquifer Mapping (NAQUIM) had been taken
up by CGWB to carry out detailed hydrogeological investigation on topo-sheet scale of 1:50,000. The NAQUIM has been prioritized to study Over-exploited, Critical and Semi-Critical blocks as well as the other stress areas recommended by the State Govt.
The vagaries of rainfall, inherent heterogeneity & unsustainable nature of hard rock aquifers, over exploitation of once copious alluvial aquifers, lack of regulation mechanism has a detrimental effect on ground water scenario of the Country in last decade or so. Varied and diverse hydrogeological settings demand precise and comprehensive mapping of aquifers down to the optimum possible depth at appropriate scale to arrive at the robust and implementable ground water management plans.
Aquifer mapping is a process wherein a combination of geologic, geophysical, hydrologic and chemical analyses is applied to characterize the quantity, quality and sustainability of ground water in aquifers. The proposed management plans will provide the “Road Map” for ensuring sustainable management and equitable distribution of ground water resources, thereby primarily improving drinking water security and irrigation coverage. Thus, the crux of NAQUIM is not merely mapping, but reaching the goal-that of ground water management through community participation. The aquifer maps and management plans will be shared with the Administration of Amravati for its effective implementation.
The activities under NAQUIM are aimed at:
❖ identifying the aquifer geometry,
❖ aquifer characteristics and their yield potential
❖ quality of water occurring at various depths,
❖ aquifer wise assessment of ground water resources
❖ preparation of aquifer maps and
❖ Formulate ground water management plan.
1.1 About the Area
Nanded District is one of the eight districts of Marathwada region of Maharashtra State. It is situated in the eastern part of the Marathwada region of Maharashtra State and surrounded on the north by Yavatmal Ditsrict of Vidarbha Region, on the west by Parbhani, Nanded and Osmanabad districts, on the South by Bidar District of Karnataka and on the east by Nizamabad and Adilabad districts of Andhra Pradesh and lies between north latitudes 18°16’ and 19°55’ and east longitudes 76°56’ and 78°19’. The total area of the district is 10542 Sq. km. of which only 10178 Sq Km area is mappable and falls in Survey of India degree sheets 56/B, 56/C and 56/F. For administrative purposes, the district is divided into three sub-divisions and 16 blocks. Nanded subdivision includes Bhokar, Mudkhed, Nanded Ardhapur, Kandhar, Loha and Umri tehsils; Deglur subdivision includes Deglur, Biloli, Nigaon (Khairgaon), Mukhed and Dharmabad tehsils; Kinwat subdivision includes Kinwat, Mahur, Hadgaon and Himayatnagar tehsils (Figure 1.1). The

3
talukas are further divided into 17 towns and 1603 villages. The index map of the district is given in Figure 1.2.
Figure 1.1: Administrative Map Figure 1.2: Index Map
Based on the tehsil and district-wise statistics of population as per 2011 census, it has been estimated that the total population of the district is 3,361,292 out of which 73 % is rural population and 27 % is rural population with 1,73,0075 males and 1,189,234 females. The average density of population in the district is 319 persons per sq. Km.
The National Aquifer Mapping & Management Programme (NAQUIM) has been taken up in all the blocks of the district in a single phase of XIII five Year Plan in AAP 2019-20.
1.2 Geomorphology, Drainage, Soil Types, Land Use
1.2.1 Geomorphology
The district is situated on plateau’s having plain terrain with undulations. The main trend of the hills is from North-west to South-east in parallel ranges with offshoots generally running in a perpendicular direction. The Satmala Range enters the district after Penganga valley just after Mahur and rise in three distinct terraces of elevation; above 350 to 570 magl; 570 to 600 magl and more than 600 magl.
To the south of the Satmala ranges, the Nirmala Hills ranges run parallel to them and to the east of Penganga they are linked to the former by offshoot hills which are aligned more or less to the course of the river which in turn forms the district boundary. Generally, the hills occurring in the North and South side of the Godavari River are of lower elevation and are known as Wakhad in Bhokar and Hadgaon Tehsils and as Balaghat in Kandhar and Mukhed tehsils. Savargaon plateau hill ranges form the water divide between the Penganaga and Godavari rivers and runs continuously for 13 kms before they split into three main ranges extending

4
eastwars, south-east wards and southwards. The geomorphological map of Nanded district is depicted in Figure 1.3.
Figure 1.3: Geomorphology of Nanded District
1.2.2 Drainage
The principal rivers of the district are Penganaga, Godavari, Manjra and Mannar. The river Godavari runs for about 140 Kms through the district flows in northwest- southeast direction and confluences with Manjra. The Godavari River in the district has three tributaries namely Asna, Sita and Siddha.
The Manjra is the most important tributary of the Godavari and forms the district boundary on the southeast for about 40 Kms upto its confluence with the Godavari. The Manjra has two tributaries viz: the Mannar and the Lendi. The Mannar rising near Dharmapur in Beed District enters Nanded in a southwesterly direction at 3 kms south of Malegaon village.
The Lendi with its tributary Tiru drains southernmost parts of the district towards the Manjra and forms part of the district boundary after Hanuman Hipperga.
The Penganga River forms the northern boundary of the district with its long sinous course. The river flows from west to east with a big “S” shaped curve. The Penganga River has two tributaries viz; the Kayathu and the Tamsa nala. The drainage map of Nanded District is depicted in Figure 1.4.

5
Figure 1.4: Drainage, Nanded District
1.2.3 Soil Types
The soils are black and fertile. The best black soils, which are deep and clayey are found as narrow strips of land in the riverbanks of Godavari, Penganga and their tributaries. Soils are of light grey, brown to grey-brown in colour and appear on the surface with clayey and blockey structure. In Kandhar and watrn parts of Mukhed tehsils the soils though black are thin and stoney, as a result only kharif crop is gown. The soils occurring in Deglur and Biloli tehsils are the best soils in the district and are more fertile in nature. Hence in addition to Kharif crops, Rabi crops can also be grown.
The district can be divided into 4 different soil types based on the characteristics of soil as shown in Figure 1.5 and the basic physico-chemical property of the profile is:
❖ Coarse Shallow Soils: Occurs along hillslopes and elevated plains and are brown to grey in colour. They are less fertile with thickness ranging from between 0 to 15 cm. They comprise gravels, pieces of basaltic quartz, and calcareous nodules.
❖ Medium Black Soils: Occurs in undulating plains and depressions. It is dark brown in colour and contains clay, coarse grains of basalt quartz etc. The thickness varies from 15 to 20 cm.
❖ Deep Black Soils: Occurs along low plains, depressions and valley regions. These are dark, plastic, sticky and clayey in nature and are rich in plant matter

6
and are very fertile. They are also known as black cotton soils. The thickness varies from 50 to 200cm.
❖ Loamy Soils: These occur mainly in NE of Biloli town and SE of Deglur town where the parent rock is granite and consists of sand, silt and clay in roughly equal proportions. Lateritic soils occur around Mukhedtown.
Figure 1.5: Soil Map, Nanded District
1.2.4 Land Use
The total area of the district can be classified into cultivated and uncultivated land. In 2017-18, the total geographical area of the district was 10542 Sq Km. Out of this, the area under current fallow, other fallow and net sown area was grouped as cultivable area. It amounts to 79 percent of the total area of which 18% of cultivable area is sown more than twice. The area under forests, uncultivable land and land under non-agricultural use are grouped under area not available for cultivation. The proportion of the gross cropped area in the district is more than the cultivable area. The land use details of the district are given in Table 1.1 & Figure 1.6

7
Table 1.1: Land Use Details (Reference Year: 2017-18) District
Total Geographical Area
Forest
Uncultivated Area Cultivated Area
Fallow land
Land under Non-agricultural use
Current Fallow
Other fallow
Net sown area
Area sown more than once
Gross cropped area
Nanded 10542 1052.5 134.78 293.46 444 331 7561 1898 9449
Figure 1.6: Land Use, Nanded District
1.2.5 Cropping Pattern
The early monsoon crops are called kharif (June-October) and late monsoon crops are called rabi (November to March). The major Kharif crops are cotton, jowar, groundnut and the Rabbi crops are wheat, jowar, gram, kardi and groundnut. In addition to this sugarcane and banana are also grown in some parts of the district. The district is mainly dependent on ground water for irrigation than surface water and the map showing gross irrigated area by ground water and surface water is depicted in Figure 1.7.

8
Figure 1.7: Irrigation, Nanded District
1.3 Climate & Rainfall
The district has sub-tropical to tropical wet and dry climate characterized by a very hot summer and very cold winter. The mean minimum temperature during winter is 13 °C and the mean maximum temperature during summer is 42°C. The district receives south-west monsoon from middle of June to end of September.
Nanded District falls under the assured rainfall zone of Maharashtra receiving 700 to 900 mm of rainfall. The current average annual rainfall of the district is 1027 mm whereby the normal rainfall is 827.25 mm. The decadal annual rainfall (2010 to 2019) of the Nanded district ranges from 599 mm to 1125.8 mm with 50% normal rainfall, 20% moderate rainfall and 30% excess rainfall and falling trend @ 0.92 mm/year (Figure 1.8 & Table 1.2).
The aerial distribution of annual rainfall has been studied by preparing an isohyet map of the district for 22-year period (Figure 1.10). The monthly and annual averages were computed for those stations covering the full period of record and corresponding averages were computed for stations of shorter duration. The

9
isohyet maps indicate that there is a gradual decline in rainfall from eastern part of the district to western. The long-term rainfall analysis (1998 to 2019) indicates a falling trend @ -4.178 mm/year and standard deviation of 229.71 mm with 45 % of years showing positive departures and 55 % showing negative departures resulting in moderate droughts in 14 % of the years and normal (64%) to excess rainfall (23 %) (Figure 1.9 & Table 1.3).
Figure 1.8: Decadal Annual Rainfall Analysis (2010-19) of Nanded District.
Figure 1.9: Long term Rainfall Analysis (1998-19) of Nanded District.
y = -0.92x + 828.78
0
200
400
600
800
1000
1200
2010 2011 2012 2013 2014 2015 2016 2017 2018 2019
Decadal Rainfall Analysis of Nanded District (2010 to 2019
y = -4.1783x + 875.31
0
200
400
600
800
1000
1200
1400
1600
199
8
199
9
20
00
20
01
20
02
20
03
20
04
20
05
20
06
20
07
20
08
20
09
20
10
20
11
20
12
20
13
20
14
20
15
20
16
20
17
20
18
20
19Longterm Analysis of Nanded District (1998 to 2019)

10
Table 1.2: Annual rainfall data (2010-2019) (in mm) Sl No.
Taluka 2010 2011 2012 2013 2014 2015 2016 2017 2018 2019 Decadal Avg.
1 Ardhapur
1281 657 651 1070.3 391.2 498.3
1141.8 670.3 897.9 1045 830.41
2 Bhokar 1288 440 685 1316.5 473.5 668.2
1310.7 694 989.1 1041 890.58
3 Biloli 743 603 674 905.8 309 487.6
1129.3 617.8 607.9 945.9
702.33
4 Degloor 781 692 643.4
850 300.9 417.6 907.2 460.2 406.3 1030 648.81
5 Dharmabad
989 773 597 926.7 382.9 394.2
957.8 557.7 710.7 1055 734.41
6 Hadgaon
1154 674 685 1247.6 443 655.7 1114.6 643.3 943.5 931.3 849.2
7 Himayatnagar
1315 720 829 1384.2 479.1 773.4 954.5 536.8 984.7 773.8
875.05
8 Kandhar
1213 817 527 855.5 344.8 546 1067.2 614.3 856.8 1231 807.23
9 Kinwat 1335 835 1004 1367.9 635.1 780.7
1115.4 612.6 866.3 961.8
951.38
10 Loha 1031 674 389 871.4 450.9 538.9
1337.6 610 782.5 1193 787.81
11 Mahur 1149 923 886 1589.8 618.8 864.9
1319.6 543.7 1085.3 971 995.11
12 Mudkhed
1374 672 667 1062.6 373.9 654.8
961.2 840.7 1004.5 1231 884.18
13 Mukhed 879 737 745 1073.8 427.6 555.1 1142.7 657.2 557.7 1034 780.9
14 Naigaon 1271 581 506 1299.4 443.7 652.9
1242.1 860.7 899.6 992.1 874.85
15 Nanded 1271 581 506 1299.4 443.7 652.9
1242.1 860.7 899.6 992.1 874.85
16 Umari 1214 846 594 1070.8 482.6 511 984 655.6 820.6 1086 826.42
17 Grand Total
1143 701.5 661.7 1136.9 437.54 603.2
1120.4 652.22 832.06
1032 832.09

11
Figure 1.10: Isohyetal Map of the district
Table 1.3: Long Term Rainfall Analysis (1998 to 2019) of Nanded District
PERIOD = 1998 to 2019 No. of years = 22 YEAR ANNUA
L NORMAL
DEPARTURE
Normal Rainfall = 827.25mm
1998 1107.9 827.25 33.92566 Standard Deviation = 229.7 mm 1999 912.5 827.25 10.30523 COEFFICIENT OF VARIATION = 27.8
% 2000 732.5 827.25 -11.4536 MEAN=827.3 2001 840.9 827.25 1.650045 MEDIAN=766 2002 693.6 827.25 -16.1559 SLOPE= -4.178 mm/Year 2003 867.5 827.25 4.865518 INTERCEPT= 875.31 mm 2004 640.6 827.25 -22.5627 EQUATION OF TREND LINE= y = -
4.178x + 875.31

12
2005 1334.6 827.25 61.32971 CATEGORY NUMBER OF YEARS
%OF TOTAL YEARS
2006 910.1 827.25 10.01511 DEPARTURES 2007 711.6 827.25 -13.9801 POSITIVE 9 45 2008 641.7 827.25 -22.4297 NEGATIVE 11 55 2009 569 827.25 -31.2179 DROUGHTS
2010 1125.8 827.25 36.08945 MODERATE 3 15 2011 708.1 827.25 -14.4031 SEVERE 0 0 2012 662.7 827.25 -19.8912 ACUTE 0 0 2013 1111.9 827.25 34.40919 NORMAL &
EXCESS R/F
2014 436.5 827.25 -47.2348 NORMAL 14 70 2015 599 827.25 -27.5914 EXCESS 3 15 2016 1124.8 827.25 35.96857 NB: RAINFALL: EXCESS: > +25;
NORMAL: +25 TO -24 DEOUGHT: MODERATE: -25 TO -49; SEVERE: -50 TO -75; ACUTE: < -76
2017 641.8 827.25 -22.4176 2018 799.5 827.25 -3.35449 2019 1027.1 827.25 24.15836
1.4 Geology
The basic geologic succession of the rocks occurring in Nanded District is as follows:
Table 1.4: Geological succession of Nanded district
Geological Period Stratigraphic Units
Rock Units
Recent to Sub-recent (Holocene)
Alluvium Caly, silt, sand, gravel
Eocene to upper Cretaceous
Deccan Traps Basalt: Hard, Massive, Vesicular and Amygdaloidal with inter-trappeans
Pre-Cambrians (Inter-trappeans)
Vindhyans Sandstone and Limestone
Archean Archean Complex
Peninsular granite-gneiss complex, intrusive pink and grey granites, dolerites and quartz veins. Banded Hematite-Quartzites of Dharwar system.
Archaeans: Numerous small bands of banded Hematite-Quartzite and Epidiorites enclosed in the granites represent the rocks of Dharwar system. They are resistant to weathering and form small hillocks rising from 15 to 30 m above the ground level. Extensive out crops of granite are found in the south- eastern parts of the district along the border of Andhra Pradesh. Smaller outcrops are noticed in the north- east side near Kinwat. The gneisses are found as lenses within the granite. Amphibolite and Dolerite dykes, Pegmatite and Quartz vein of small dimension are seen in the granitic area of the district. There are two types of granites, the grey and the pink, with association of Pegmatite. The colour of the granite depends upon the

13
colour of the feldspar in it. With the increase or decrease of the pink or grey feldspar the granite also shows various gradations in colour. These granites vary in texture from fine to medium grained and even porphyritic.
Pre- Cambrians: - Limestones of Vindhyan Super-group are exposed in the nala near Pardi village in Kinwat tahsils. Out crops are few and scattered. At places about 20 Km West of Kinwat beds of thin nodular limestone and grey sandstone occur below the Deccan Traps.
Figure 1.11: Geology of Nanded District
Figure 1.52: Basaltic flow of Nanded District
Eocene to Upper Cretaceous: - Deccan traps occupy more than two-thirds of the district and overlay the granites. The traps are quite massive, fine-grained bluish grey to brown in colour. Only Labradorite feldspar is visible to the naked eye. Its contact with granite in the south -west varies in elevations of 350-m amsl near Betamogra to 396-m amsl near Sagruli. Both “aa” and “Pahoehoe” types of basalts are seen. The Pahoehoe type, which is dominant, is characterised by predominant vesicular basalt with very thin massive portions. The vesicles are highly irregular. The pipe amygdales and the ropy structure mark the basal portions of these flows. The amygdales are filled with chlorite, Calcite, Zeolites, and devitrified glass. The” aa” flow is characterised by lower thick massive basalt showing columnar jointing and spheroidal weathering and upper vesicular portions showing brecciation. In one section near Kinwat, out of seventeen basalt flows twelve are pahoehoe and others are” aa” type. The average thickness of each flow is 20 m. During the quiescence period of flow eruptions, terrestrial lakes came into existence. In these were

14
deposited sandstones and cherty limestone beds, which have fossils of gastropods, lamellibranchs and leaf impressions. These beds are known as Intertrappean beds. Such sedimentary beds of 1 to 1.5 mt. in thickness are seen between different basaltic flows near Kinwat, Matul, Ravangaon, Pimpaldhau, and Jhari. Some of the samples picked contained 80 to 92 % CaCo3. The clay beds are either interbedded in limestones, shales and cherts or occur as lenses in the trap without them. The clays are indurated and often pass into Flagstone or into compact cherty limestone. The clay beds vary in thickness and laterally form small lenses to extensive beds. They show sharp contact with the overlying traps. These clays are green, dirty grey, red and variegated in colours; they are non-plastic, gritty & greasy and calcareous to siliceous in nature.
Recent to Sub-Recent: - The transported recent deposits are confined to the valleys formed by rivers and their major tributaries viz.; Godavari, Penganga, Manjara, Asna, Lendi, Mannar, Siddha etc. The depth of alluvium ranges between 12 to 30 mts. It consists of round to sub-rounded gravels of basalts, chert, chalcedony, silt, sand and Kankar. The residual deposits depend upon the nature of the parent rock, climatic conditions, and configuration of the country rock from which it is derived. There are two main types of Soil, the black cotton soil or ‘regur’ and sandy loams. The sandy alluvium is locally referred as “Yesgi –Sagroli” alluvium which is highly productive for construction of shallow tube wells. However, Godavari alluvium which is mostly clayey is not productive for ground water potential.

15
2. HYDROGEOLOGY
2.1 Major Aquifer System
Aquifer System in the study area is governed by underlying geological formations, recharge conditions and level of ground water exploitation. Based on the existing data and the data collected from State Ground Water Department (GSDA), the hydrogeological map of the district is depicted Figure 2.1.
Occurrence of Water Ground water exists in coarse granular strata occurring below water table in
alluvium and in fractures, joints, sheared and weathered zones in granites, gneisses and massive basalts. In vesicular basalt it occurs in vesicles in addition to fractures, joints and weathered zones. The Ground Water in the district occurs under unconfined, semi-confined and confined conditions.
Figure 2.1: Hydrogeology of Nanded

16
2.2 Aquifer Parameters
The major aquifer systems of Nanded district are: River Alluvium (Aquifer I), Basalt (Aquifer I & II), Gneiss (Aquifer I), Granite (Aquifer-I & II). The basic characteristic of the major aquifer of the district is given Table 2.1 and is depicted in Figures 2.3 to 2.6.
Table 2.1: Basic Aquifer Characteristics of the major aquifers of the
district.
Major Aquifers Alluvium Basalt (Deccan Traps)
Gneiss Granite
Type of Aquifer (Phreatic/Semiconfined/Confined)
Aquifer-I (Phreatic)
Aquifer-II (Semi-confined/confined)
Aquifer-I (Phreatic)
Aquifer-II (Semiconfined/confined)
Aquifer-I (Phreatic)
Aquifer-II (Semiconfined/confined)
Aquifer-I (Phreatic)
Aquifer-II (Semiconfined/confined)
Depth to Bottom of Aquifer (mbgl)
10-35 Nil 8-35 28-188 10-14 Nil 8-16 28-108
Weathered/ Fractured rocks thickness (m)
8-26 Nil 5-26 2-24 8-10 Nil 7-13 2-15
Yield Potential 100-200 cu.m/ day
Nil 0 to 100 cu.m/day
0 to 2.5 lps 10-50 cu.m/ day
Nil 0 to 100 cu.m/ day
0.25 to 2.5 lps
Specific Yield (Sy)/ Storativity (S)
0.02 Nil 0.02 0.00029-0.01
0.02 Nil 0.02 0.00022-0.00074
Transmissivity (T) (m2 /day)
- - - 5.83 to 326.26
- - - 44-518.48
2.3 3D and 2D Aquifer Disposition
Based on the existing data and data generated, 3 D aquifer disposition (Figure 2.2) and several Hydrogeological cross sections has been prepared along the section lines as shown in Figure 2.7 to understand the sub surface disposition of aquifer system. Figure 2.8 depicts the 3D Bar Diagram and the cross sections A-A’ TO D-D’ is shown in Figure 2.9 to 2.12.

17
Figure 2 2: 3D Diagram Aquifer Disposition

18
Figure 2.3: Aquifer-I, Depth of Occurrence and thickness
Figure 2.4: Aquifer-II, Depth of Occurrence and thickness

19
Figure 2.5: Aquifer-I, Yield Potential Figure 2.6: Aquifer-II, Yield Potential

20
Figure 2.7: 3D Fence Diagram

21
Figure 2.8: 3D Bar Diagram

22
Figure 2.9 : Hydro-geological Cross Section A-A’
Figure 2.10 : Hydro-geological Cross Section B-B’
Figure 2.11 : Hydro-geological Cross Section C-C’

23
Figure 2.12 : Hydro-geological Cross Section D-D’
3. Water Level Scenario Central Ground Water Board periodically monitors 59 Dugwells and 02
Borewells as Ground Water Monitoring Wells (GWMW) in the district, four times a year i.e., in January, May (Premonsoon), August and November (Postmonsoon). In addition, Ground Water Monitoring well data from Ground Water Survey and Development Agency (GSDA) was utilized in the preparation of Water level maps in the NAQUIM undertaken areas.
3.1 Depth to Water Level (Phreatic Aquifer/Aquifer I)
The Pre-monsoon depth to water level of unconfined aquifer (Figure 3.1) ranges from 1.55 mbgl (Umri-Gortha, Umari taluka) to 31.7 mbgl (Nanded, Nanded taluka) as given in Annexure-III. The major parts of the district covering 5969 Sq Km area has water level in the range of 5 mbgl to 10 mbgl. The depth to water level less than 5 mbgl is obserbed in only 352.8 Sq Km area in isolated patches in Loha, Kandhar, Dharmabad, Umari, Himayatnagar, Hadgaon, Ardhapur, Kinwat and Mukhed blocks. The deepest water level of more than 20 mbgl is observed in small patches in Nanded and Mudkhed blocks in 48 Sq Km areas. The deeper depth to water level may be due to exploitation of ground water for irrigation during Rabi season.
The post-monsoon depth to water level of unconfined aquifer (Figure 3.2) ranges from 0.01 mbgl (Kuncheli, Biloli block) to 13.8 mbgl (Taroda, Nanded block) as shown in Annexure-III. The depth to water level between 2 mbgl and 5 mbgl is observed in major parts of the district covering 6477 Sq Km area. The shallow depth to water level less than 2 mbgl is observed in 544.7 Sq Km area in isolated patches in all the blocks. The depth to water level of more than 5 mbgl is observed in 3226 Sq Km area is observed in small parts in all the blocks.
3.1.1 Depth to Water Level (Semiconfined/Confined Aquifer-Aquifer II)
The Pre-monsoon depth to water level of semiconfined/confined aquifer (Figure 3.3) ranges from 2.07 mbgl (Shivani, Kinwat block) to 30.35 mbgl (islapur, Kinwat block) as given in Annexure II. The depth to water level between 2 mbgl and 5 mbgl is observed in 190.52 sq km area in part of Kinwat block. The major parts of the district covering 4970 Sq Km area has depth to water level between 5 mbgl and 10mbgl.The depth to water level between 10 mbgl and 20 mbgl is observed in 3330 Sq Km area in parts of Mukhed, Delur, Dharmabad, Umri, Bhokar, Himayatnagar,

24
Hadgaon and Kinwat blocks. The deeper depths to water level between 20 mbgl and 30 mbgl is observed in 1138 Sq Km area in parts of Mukhed, Deglur, Himayatnagar and Kinwat blocks whereas depths to water level more than 30 mbgl is observed 650 Sq Km area in Mahur and Kinwat blocks.
The post-monsoon depth to water level in Semiconfined/Confined aquifers (Figure 3.4) ranges from1.48 mbgl (Koli, Hadgaon block) to 39.2 mbgl (Talegaon, Bhokar block) (Annexure II). The depth to water level between 0 mbgl and 5 mbgl is observed in 428 Sq Km area in major parts of the district. The depths to water level between 5 mbgl and 10 mbgl are observed in 3682 Sq Km area in parts of Ardhapur, Hadgaon, Mudkhed, Bhokar, Umri, Dharmabad, Mahur, Kinwat, Biloli, Degloor, Naigaon, Kandhar and Loha blocks. The deeper depths to water level between 10 mbgl and 20 mbgl is observed in small parts in all the blocks except Dharmabad block. The deeper depths to water level between 20 mbgl and 30 mbgl are observed in 1611 sq km area in Kandhar, Mukhed, Naigaon, Himayatnagar Kinwat, Mahur and Hadgaon blocks whereas the depths between 30 mbgl and 40 mbgl is observed in Kandhar, Mukhed, Hadgaon and Kinwat blocks.
Figure 3.1 : Aquifer I, Pre-monsoon DTWL (May 2019)

25
Figure 3.2 : Aquifer I, Post-monsoon DTWL (Nov. 2019)

26
Figure 3.3: Aquifer II: Pre-monsoon Depth to Water Level (May 2019)
Figure 3.4: Aquifer II: Post-monsoon Depth to Water Level (Nov. 2019)

27
3.2 Water Level Trend (2010-19)
The Premonsoon decadal water level trend (2010-19) indicates a falling trend @ 0 to 2.38 m/year covering 6699.24 Sq Km areas (Annexure VI). The rising trend is observed in only about 3593 Sq Km area @ 0.0 to 0.57 m/year. The falling trend @ 0.0 m/year to 0.2 m/year is observed in 2368 SqKm areas in small parts in all the blocks of the district; the fall @ 0.2 to 0.4 m/year is observed in 1467.23 sq km area in all blocks in small proportion. The falling trend @ 0.4 to 0.6 m/yr is observed in all blocks except Loha and Kandhar blocks covering 1637.39 Sq Km area (Figure 3.5). In Biloli, Nanded, Mudkhed, Mahur, Hadgaon and Himayatnagar blocks, falling trend more than 0.6 m/year is observed covering 1226.6 Sq Km. The rising trend @ 0 to 0.2 m/year is observed in 2188.3 sq km area in all blocks of the district except in Mahur block. The rise in trend @ 0.2 to 0.4 m/year is observed in 951.82 sq km area in Mukhed, Kandhar, Degloor, Biloli, Naigaon, Hadgaon, Bhokar and Kinwat blocks. The rise @ 0.4 to 0.6 m/year is observed in 452.9 sq km area in Deglur, Mukhed and Kinwat blocks of the district.
The Postmonsoon decadal water level trend (2010-19) indicates a falling trend @ 0.0 to 0.8 m/year covering 5106.8 Sq Km areas (Annexure VI). The rising trend is observed in about 5175 Sq Km area @ 0.0 to >0.6 m/year. The falling trend @ 0.0 m/year to 0.2 m/year is observed in 2649.6 Sq Km area mostly in all the blocks of the district. The fall @ 0.2 to 0.4 m/year is observed in 1709.14 Sq Km area and fall @ 0.4 to 0.6 m/year covering 534.05 sq km area are observed as isolated patches in Mukhed, Dharmabad, Nanded, Ardhapur, Bhokar, Hadgaon, Himayatnagar, Mahur and Kinwat blocks. The fall between 0.6 m/year and 0.8 m/year is observed in only 213.8 Sq km area in Nanded, Ardhapur, Mahur, Kinwat, Hadgaon and Himayatnagar blocks of the district. The riding trend @0 to 0.2 m/year is observed in 1568.5 sq km area in small patches in all the blocks whereas trend @ 0.2 to 0.4 m/year is observed in 1311.83 sq km area in Deglur, Mukhed, Loha, Naigaon, Kandhar, Umri, Himayatnagar, Kinwat and Mahur blocks. The rise in trend @ 0.4 to 0.6 m/year is observed in 851.85 sq km area in Deglur, Mukhed, Loha, Naigaon, Kandhar, Umri, Himayatnagar, Kinwat and Mahur blocks. The rise more than 0.6 m/year is observed in 1443.15 sq km area in Deglur, Biloli, Kandhar, Naigaon, Loha,Bhokar and Himyatnagar blocks. (Figure 3.6).
3.3 Hydrographs
The hydrographs (time series) of selected locations indicating water level over the years (2010 to 2019) is depicted in Figure 3.7 (a) to 3.7 (j). The hydrograph indicates a rise in water level trend in most parts of the block.

28
Figure 3.4: Premonsoon Water Level Trend (2010-2019)
Figure 3.6: Postmonsoon Water Level Trend (2010-2019)

29

30
A rising trend during premonsoon@ 1.08 m/year and a falling trend
during postmonsoon @7.53 m/year respectively.
A rising trend during both pre-monsoon and postmonsoon @
0.0647 m/year and 0.1265 m/year respectively
Figure 3.5: Hydrograph of Malegaon, Ardhapur Block, Nanded District
Figure 3.6: Hydrograph of Nagapur, Bhokar block, Nanded District
RF: y = -0.1024x + 830.97Pre WL: y= 0.0903x + 9.5633
post WL: y = 0.6285x + 1.9333
0
2
4
6
8
10
12
140
200
400
600
800
1000
1200
1400
2010 2011 2012 2013 2014 2015 2016 2017 2018 2019
De
pth
to
wa
ter
le
ve
l (m
bg
l)
Ra
infa
ll (
mm
)
YearANNUAL RF Premonsson Wl Post monsoon Wl
Rainfall: y = 11.159x + 829.21Pre WL:y = 0.0647x + 10.007 Post WL: y = 0.1265x + 4.1713
0
2
4
6
8
10
12
140
200
400
600
800
1000
1200
1400
2010 2011 2012 2013 2014 2015 2016 2017 2018 2019
De
pth
to
wa
ter
le
ve
l (m
bg
l)
Ra
infa
ll (
mm
)
YearANNUAL RF Premonsson Wl Post monsoon Wl

31
A rising trend @ 0.2225 m/year during premonsoon and a fallling
trend @ 0.1025 m/year during postmonsoon.
A rising trend during premonsoon @ 1.28 m/year and falling trend
during postmonsoon @ 0.632 m/year
Figure 3.7: Hydrograph of Nagapur, Biloli Block, Nanded District
Figure 3.8: Hydrograph of Atkali_PZ, Degloor Block, Nanded District
Rainfall: y = 14.718x + 621.38PreWL: y = 0.2225x + 5.32Post WL: y = -0.1025x + 5.182
0
1
2
3
4
5
6
7
8
9
100
200
400
600
800
1000
1200
2010 2011 2012 2013 2014 2015 2016 2017 2018 2019
De
pth
to
wa
ter
le
ve
l (m
bg
l)
Ra
infa
ll (
mm
)
YearANNUAL RF Premonsson Wl Post monsoon Wl
Rainfall: y = -2.3703x + 661.85
Pre WL:y = 1.2869x + 14.166Post WL:y = -0.6324x + 20.093
0
5
10
15
20
25
30
350
200
400
600
800
1000
1200
2010 2011 2012 2013 2014 2015 2016 2017 2018 2019 De
pth
to
wa
ter
le
ve
l (m
bg
l)
Ra
infa
ll (
mm
)
Year
ANNUAL RF Premonsson Wl Post monsoon Wl

32
A rising trend during both premonsoon and postmonsoon @ 0.182
m/year and 0.315 m/year respectively.
A rising trend during both premonsoon and postmonsoon @ 0.145
m/year and 0.271 m/year respectively.
Figure 3.9: Hydrograph of Dharmabad, Dharmabad block, Nanded District
Figure 3.10: Hydrograph of Dhawari Buzurg, Hadgaon Block, Nanded District
Rainfall:y = 0.4055x + 732.18Pre WL:y = 0.1823x + 7.5333 Post WL: y = 0.3153x + 4.9807
0
2
4
6
8
10
120
200
400
600
800
1000
1200
2010 2011 2012 2013 2014 2015 2016 2017 2018 2019
De
pth
to
wa
ter
le
ve
l (m
bg
l)
Ra
infa
ll (
mm
)
YearANNUAL RF Premonsson Wl Post monsoon Wl
Rainfall:y = -3.1067x + 866.29Pre WL:y = 0.145x + 7.4347
Post WL: y = 0.2717x + 3.85870
2
4
6
8
10
120
200
400
600
800
1000
1200
1400
2010 2011 20122013201420152016 201720182019 De
pth
to
wa
ter
le
ve
l (m
bg
l)
Ra
infa
ll (
mm
)
YearANNUAL RF Premonsson Wl Post monsoon Wl

33
A rising trend during premonsoon @ 0.350 m/year and a falling
trend during postmonsoon @ 0.472 m/year respectively. A rising trend during both premonsoon and postmonsoon @
0.0059m/year and 0.0333 m/year respectively.
Figure 3.11: Hydrograph of HIMAYATNAGAR, Himayatnagar block, Nanded District
Figure 3.12: Hydrograph of Malegaon, Loha Block, Nanded District
Rainfall: y = -33.174x + 1057.5Pre WL:y = 0.3502x + 6.8307 Post WL:y = -0.4724x + 7.4333
0
2
4
6
8
10
120
200
400
600
800
1000
1200
1400
1600
2010 2011 2012 2013 2014 2015 2016 2017 2018 2019 De
pth
to
wa
ter
le
ve
l (m
bg
l)
Ra
infa
ll (
mm
)
YearANNUAL RF Premonsson Wl Post monsoon Wl
Rainfall:y = 29.135x + 627.57
Pre WL:y = 0.0059x + 4.0133Post WL:y = 0.0333x + 2.4467
0
1
2
3
4
5
60
200
400
600
800
1000
1200
1400
1600
20102011 20122013201420152016201720182019
De
pth
to
wa
ter
le
ve
l (m
bg
l)
Ra
infa
ll (
mm
)
YearANNUAL RF Premonsson Wl

34
A falling trend during both premonsoon and postmonsoon @
0.0141m/year and 0.537 m/year respectively.
A rising trend during both premonsoon and postmonsoon @ 0.064
m/year and 0.023 m/year respectively.
Figure 3.13: Hydrograph of Janapuri, Kandhar Block, Nanded District
Figure 3.14: Hydrograph of Jhalakwadi, Kinwat block, Nanded District
Rainfall:y = 10.368x + 750.21
Pre WL:y = -0.0141x + 11.621 Post WL:y = -0.5376x + 11.757
0246810121416180
200
400
600
800
1000
1200
1400
2010 2011 2012 2013 2014 2015 2016 2017 2018 2019
De
pth
to
wa
ter
le
ve
l (m
bg
l)
Ra
infa
ll (
mm
)
YearANNUAL RF Premonsson Wl Post monsoon Wl
Rainfall: y = -34.598x + 1141.7
Pre WL:y = 0.0645x + 5.65 Post WL:y = 0.0231x + 3.5767
0
1
2
3
4
5
6
7
80
200
400
600
800
1000
1200
1400
1600
2010 2011 2012 2013 2014 2015 2016 2017 2018 2019
De
pth
to
wa
ter
le
ve
l (m
bg
l)
Ra
infa
ll (
mm
)
Year
ANNUAL RF Premonsson Wl Post monsoon Wl

35
A rising trend during both premonsoon and postmonsoon @
0.0897m/year and 0.299 m/year respectively. A rising trend during premonsoon @ 0.047 m/year and a falling
trend postmonsoon @ 0.117 m/year respectively.
Figure 3.17: Hydrograph of Anjankhed, Mahur block, Nanded District
Figure 3.18: Hydrograph of Barad, Mudkhed Block, Nanded District
Rainfall: y = -16.618x + 1086.5
Pre WL: y = 0.0897x + 6.0367 Post WL: y = 0.299x + 3.0593
0
1
2
3
4
5
6
7
80
200
400
600
800
1000
1200
1400
1600
1800
2010 2011 2012 2013 2014 2015 2016 2017 2018 2019
De
pth
to
wa
ter
le
ve
l (m
bg
l)
Ra
infa
ll (
mm
)
Year
ANNUAL RF Premonsson Wl Post monsoon Wl
Rainfall:y = 11.434x + 821.29Pre WL:y = 0.0474x + 12.161
Post WL:y = -0.1172x + 6.5387
0
2
4
6
8
10
12
140
200
400
600
800
1000
1200
1400
1600
2010 2011 2012 2013 2014 2015 2016 2017 2018 2019
De
pth
to
wa
ter
le
ve
l (m
bg
l)
Ra
infa
ll (
mm
)
Year
ANNUAL RF Premonsson Wl Post monsoon Wl

36
A falling trend during premonsoon @ 0.377 m/year and a rising
trend during postmonsoon @ 0.331 m/year. A rising trend during both premonsoon and postmonsoon @ 0.296
m/year and 0.1107 m/year respectively.
Figure 3.19: Hydrograph of Mukhed, Mukhed Block, Nanded District
Figure 3.20: Hydrograph of Naigaon, Naigaon block, Nanded District
Rainfall:y = 0.2073x + 779.76
Pre WL:y = -0.3774x + 8.8187 Post WL:y = 0.3309x + 0.34
0
2
4
6
8
10
120
200
400
600
800
1000
1200
2010 2011 2012 2013 2014 2015 2016 2017 2018 2019 De
pth
to
wa
ter
le
ve
l (m
bg
l)
Ra
infa
ll (
mm
)
YearANNUAL RF Premonsson Wl Post monsoon Wl
Rainfall:y = 8.4382x + 653.8Pre WL:y = 0.296x + 6.92 Post WL:y = 0.1107x + 5.2935
0
2
4
6
8
10
120
200
400
600
800
1000
1200
2010 2011 2012 2013 2014 2015 2016 2017 2018 2019
De
pth
to
wa
ter
le
ve
l (m
bg
l)
Ra
infa
ll (
mm
)
Year
ANNUAL RF Premonsson Wl Post monsoon Wl

37
A falling trend during premonsoon @ 0.608 m/year and a rising
trend @ 0.0003 m/year during postmonsoon. A falling trend during both premonsoon and postmonsoon @
0.0339 m/year and 0.121 m/year respectively.
Figure 3.21: Hydrograph of Sikarghat, Nanded block, Nanded District
Figure 3.22: Hydrograph of Umri Gortha, Umari Block, Nanded Block
Rainfall:y = 8.4382x + 653.8
Pre WL:y = 0.6087x + 21.37 y = Post WL: -0.0003x + 3.1867
0
5
10
15
20
25
30
350
200
400
600
800
1000
1200
1400
2010 2011 2012 2013 2014 2015 2016 2017 2018 2019
De
pth
to
wa
ter
le
ve
l (m
bg
l)
Ra
infa
ll (
mm
)
Year
ANNUAL RF Premonsson Wl Post monsoon Wl
Rainfall:y = 9.2782x + 823.82
PreWL:y = -0.0399x + 3.2247 Post WL:y = -0.1216x + 3.496
0
1
2
3
4
5
6
70
200
400
600
800
1000
1200
1400
2010 2011 2012 2013 2014 2015 2016 2017 2018 2019
De
pth
to
wa
ter
le
ve
l (m
bg
l)
Ra
infa
ll (
mm
)
Year
ANNUAL RF Premonsson Wl Post monsoon Wl

38
4. GROUND WATER QUALITY The concentrations of various gases and ions dissolved in water from the
atmosphere, soil strata and minerals and rocks with which it comes are the characteristics of water. This ultimately decides the quality of ground water. The concentration of CO32-, HCO3-, OH- and H+ ions and dissolved CO2 gases in water decide the acidic or basic nature of water while the salts of ions like Ca2+ and Mg2+ in water makes it soft or hard. Water with high Na+ and Cl- concentration can make the water saline. Nitrate ions percolated from anthropogenic sources can become predominant major anion in ground water. The excess fluoride concentration in ground water from fluoride bearing minerals may be related to the concentration of Ca2+, Na+ and HCO3- ions present in ground water.
4.1 Electrical Conductivity
The ground water quality of unconfined aquifer inmajor parts of the district covering 9059 SqKm area has EC between 750 µS/cm and 2250 µS/cm (Figure 4.1) of brackish nature. This may be due to higher rate of evapotranspiration or higher residence time of ground water bringing more ions to ground water through water rock interaction. The Isolated patches in the district covering 234 Sq Km area has EC values ranging from 2250 to 5000 µS/cm. High concentration of nitrate (> 45 mg/l) is observed in 3 sites across the district. About 3 sites show fluoride contamination (>1.5 mg/l). Under natural geochemical condition, the nitrate rarely becomes a major ion in the ground water. The domestic waste, wastewater and sewage in the urban and rural parts of the district may help NO3 to percolate in ground water. The presence of Fluoride in water may be due to geogenic source or by excess use of pesticides in agriculture. The Annexure IV depicts the results of chemical analysis of ground water samples collected from unconfined aquifer during premonsoon, May 2018.
The ground water quality of semi-confined/confined aquifer inmajor parts of the district covering 7456 SqKm area has EC between 750 µS/cm and 2250 µS/cm (Figure 4.2). About 2451 sq km has fresh water with EC<750 µS/cm. The ground water quality varies from fresh to brackish. The Isolated patches in the district covering 29 Sq Km area has EC values more than 2250 µS/cm. High values of Nitrate>45 mg/l is found observed in 21 sites. The presence of Fluoride is also observed in 8 sites. Annexure V depicts the results of chemical analysis of ground water samples collected from confined/semiconfined aquifers.

39
Figure 4.1: Aquifer I, Ground Water Quality Figure 4.2: Aquifer II, Ground Water Quality

40
4.2 Suitability Of Ground Water for Drinking Purposes
The suitability of ground water for drinking purpose is determined keeping in view the effects of various chemical constituents in water on the biological system of human beings. The standards proposed by the Bureau of Indian Standards (BIS) for drinking water (IS-10500-91, Revised 2012) were used to decide the suitability of ground water for drinking purpose. The overall classification of ground water samples falling below desirable limit (<DL), in the range of desirable and maximum permissible limit (DL-MPL) and above maximum permissible limit (MPL) for drinking water purpose is shown in Table 4.1 and the graphical representation is shown in Figure 4.3.
Table 4.1: Classification of Ground Water Samples as per BIS Drinking
Water Standards
Parameter Drinking
water
Standards
Total Samples < DL Samples
between
Samples
(IS-10500-
12)
Samples DL and MPL > MPL
DL MPL Total % Total % Total %
Samples Samples Samples
pH 6.5-
8.5
- 47 0 0 47 100.0 0 0.0
TDS 500 2000 47 16 34.0 31 66.0 0 0.0
TH 300 600 47 19 40.4 23 48.9 5 10.6
Ca (mg/L) 75 200 47 25 53.2 22 46.8 0 0.0
Mg (mg/L) 30 100 47 5 10.6 24 51.1 18 38.3
Cl (mg/L) 250 1000 47 42 89.4 5 10.6 0 0.0
SO4(mg/L) 200 400 47 47 100.0 0 0.0 0 0.0
NO3(mg/L) 45 No
relax
47 44 93.6 0 0.0 3 6.4
F (mg/L) 1 1.5 47 41 87.2 3 6.4 3 6.4
DL-Desirable Limit, MPL-Maximum Permissible Limit.

41
Figure 4.2: Percentage Distribution of Ground Water Samples as per BIS Drinking Water Standards
4.3 Suitability Of Ground Water for Irrigation Purposes
The ground water used for irrigation is an important factor in productivity of crop, its yield and quality of irrigated crops. The quality of irrigation water depends primarily on the presence of dissolved salts and their concentrations. The Electrical Conductivity (EC), Sodium Absorption Ratio (SAR) and Residual Sodium Carbonate (RSC) are the most important quality criteria, which influence the water quality and its suitability for irrigation. The quality of GW based on EC is discussed in Table 4.2
CLASSIFICATION BASED ON EC
Low Salinity Water (EC: 100-250 µS/cm): This water can be used for irrigation with most crops on most soils with little likelihood that salinity will develop.
Medium Salinity Water (EC: 250 – 750 µS/cm): This water can be used if moderate amount of leaching occurs. Plants with moderate salt tolerance can be grown in most cases without special practices for salinity control.
High Salinity Water (EC: 750 – 2250 µS/cm): This water cannot be used on soils with restricted drainage. Even with adequate drainage, special management for salinity control may be required and plants with good salt tolerance should be selected.
Very High Salinity Water (EC: >2250 µS/cm): This water is not suitable for irrigation under ordinary condition. The soils must be permeable, drainage must be adequate, irrigation water must be applied in excess to provide considerable leaching and very salt tolerant crops should be selected.
0
20
40
60
80
100
120
% o
f d
istr
ibu
tio
n o
f s
am
ple
s
Parameters
Samples > MPL %
Samples between DL and MPL %
Samples < DL %

42
Table 4.2: Classification of Ground Water Samples based on EC
S.No. Water Quality Type EC in µS/cm No. of
samples
% of samples
1 Low Salinity Water < 250 0 0
2 Medium Salinity Water 250-750 10 21
3 High Salinity Water 750-2250 33 70
4 Very High Salinity Water > 2250 4 9
Total 138 100
Thus, it can be inferred that most parts of the district have medium to high saline water. Thus, salt tolerant crops shall be promoted to be grown in brackish water areas and saline areas along with management of Salinity in ground water.

43
5. GROUND WATER RESOURCES Central Ground Water Board and Groundwater Surveys and Development
Agency (GSDA), Govt. of Maharashtra, have jointly estimated the ground water resources of Nanded district based on GEC-97 methodology. The same is presented in Table 5.1 whereas the graphical representations of the resources are shown in Figure 5.1.
5.1 Ground Water Resources-Aquifer I
Ground water resource assessment for unconfined aquifers was carried out during GEC 2017-18 for 10542 sq. km. area of which 1244.99 sq. km. area is under command and 8932.71 sq. km. is under non-command area. The stage of ground water development varies from 20.20 % (Ardhapur) to 60.50 % (Dharmabad). The overall stage of ground water development for the district is 35.44 %. All the 16 blocks of the district, falls under “Safe” category.
Figure 5.1: Block wise Net GW Availability and Draft for all Purposes

44
Table 5.1: Ground Water Resources, 2017 (Unit in MCM)
Administrativ
e Unit
Net
Annual
GW
Availabili
ty
Existing
Gross
GW
Draft
for
irrigatio
n
Existing
Gross GW
Draft for
domestic
and
industrial
water
supply
Existin
g Gross
GW
Draft
for All
uses
Annual
GW
Allocatio
n for
Domesti
c Use as
on 2025
Net GW
Availabili
ty for
future
irrigation
develop
ment
Stage of
GW
Develop
ment %
Catego
ry
Ardhapur 39.07 22.94 0.70 23.64 1.87 14.73 60.50 Safe
Bhokar 70.97 20.90 1.02 21.92 3.00 47.10 30.89 Safe
Biloli 58.26 11.26 2.17 13.43 5.36 43.64 23.06 Safe
Degloor 64.11 18.45 5.13 23.58 14.28 31.40 36.79 Safe
Dharmabad 31.22 5.52 0.79 6.31 2.23 23.46 20.20 Safe
Hadgaon 121.09 48.50 2.89 51.38 8.26 64.60 42.43 Safe
Himataytnahar 51.31 19.52 0.85 20.37 3.12 28.70 39.70 Safe
Kandhar 98.82 24.26 2.00 26.26 5.83 69.13 26.57 Safe
Kinwat 156.41 34.88 2.93 37.81 8.98 112.58 24.17 Safe
Loha 106.49 30.93 2.01 32.94 5.87 69.74 30.93 Safe
Mahur 50.45 19.68 1.00 20.68 2.60 28.15 40.98 Safe
Mudkhed 36.91 20.63 0.58 21.21 1.77 14.48 57.47 Safe
Mukhed 92.20 20.46 2.99 23.45 9.69 61.97 25.43 Safe
Naigaon 62.55 18.71 1.56 20.28 3.66 38.45 32.42 Safe
Nanded 58.33 20.63 4.68 25.31 13.36 23.06 43.39 Safe
Umari 41.43 11.91 1.39 13.30 3.42 25.99 32.11 Safe
Total 1139.63 349.17 32.70 381.87 93.28 697.18
5.2 Ground Water Resources-Aquifer II
Ground water resources for Semi confined/confined aquifers of Nanded District for all the blocks of the district was calculated as per the data available from exploration and is given in Table 5.2.
Table 5.2: Ground Water Resources of Semiconfined/Confined Aquifer
S
No
Taluka Area (Sq
Km)
Mean
thickness
(m)
Peizometer
(macl)
S Sy Resources
above the
confining
layer
(MCM)
Resources
within
the
confining
layer
(MCM)
1 Ardhapur 298.15 4.000 4.0 0.00035 0.002 2.39 0.42
2 Bhokar 682.04 10.000 10.0 0.00074 0.002 13.64 5.05
3 Biloli 599.03 5.500 5.5 0.00035 0.002 6.59 1.15
4 Degloor 684.2 4.000 4.0 0.00065 0.002 5.47 1.78
5 Dharmabad 336.47 6.000 6.0 0.00022 0.002 4.04 0.44
6 Hadgaon 1036.92 10.000 10.0 0.00035 0.002 20.74 3.63
7 Himayatnagar 517.8 6.000 6.0 0.00035 0.002 6.21 1.09
8 Kandhar 815.02 13.600 14.0 0.00076 0.002 22.82 8.67

45
S
No
Taluka Area (Sq
Km)
Mean
thickness
(m)
Peizometer
(macl)
S Sy Resources
above the
confining
layer
(MCM)
Resources
within
the
confining
layer
(MCM)
9 Kinwat 1515.85 7.410 7.4 0.00029 0.002 22.46 3.26
10 Loha 865.4 6.000 6.0 0.00035 0.002 10.38 1.82
11 Mahur 517.41 8.000 8.0 0.0013 0.002 8.28 5.38
12 Mudkhed 338 6.000 6.0 0.0006 0.002 4.06 1.22
13 Mukhed 941.47 6.000 6.0 0.00086 0.002 11.30 4.86
14 Naigaon 580.08 8.000 8.0 0.00249 0.002 9.28 11.56
15 Nanded 406.8 6.000 6.0 0.0026 0.002 4.88 6.35
16 Umari 408.01 8.500 8.5 0.0024 0.002 6.94 8.32
Total 10542.65 115.01 115.41 0.01 0.002 159.48 64.98

46
6. GROUND WATER RELATED ISSUES
6.1 Low Development
The stage of ground water development varies from 20.20 % in Ardhapur block to 60.50% in Dharmabad block. Thus, there is a low stage of ground water development in the district.
6.2 Declining Water Level Trend
The declining trend of water level has been observed in the major parts of the district during both premonsoon and post monsoon. During Premonsoon, a falling trend @ 0.0 to 2.38 m/year is observed in about 6699.24 Sq Km area and a falling trend @ 0.0 to 0.84 m/year is observed in about 5106.56 Sq Km area (Figure 6.1 & 6.2).
Figure 6.1: Pre-monsoon WL Trend Figure 6.2: Post-monsoon WL Trend
6.3 FLUORIDE CONTAMINATION The Fluoride contamination in unconfined aquifers is observed in 3 sites in
Kinwat, Himayatnagr and Biloli blocks and Nitrate contamination is observed in 3 sites of Himayatnagar block. In Semiconfined/confined aquifers, the presence of Flouride was obtained in 7 sites in Mahur, Mukhed, Kandhar, Mudkhed and Himayatnagar blocks and the nitrate contamination was obtained in 11 sites in Naigaon, Hadgaon, Mudkhed, Himayatnagar, Degloor, Biloli, Ardhapur blocks.
The ground water in these sites is neither suitable for drinking nor for irrigation purposes. Figure 6.6 &6.7 depicts the Nitrate and Fluoride affected sites of phreatic and semiconfined/confined aquifers.

47
Figure 6.3: GW Quality of Unconfined Aquifer
Figure 6.4: GW Quality of Semiconfined/ Confined Aquifers
6.4 LOW YIELDING AQUIFERS
The yield of the aquifer in major parts of the block ranges from 1 to 2 lps as given in Figure 6.5. This is due to limited extent of porosity and permeability evolved from secondary porosity and hence poor sustainability of aquifers.

48
Figure 6.5: Cumulative Yield Potential

49
7. GROUND WATER RESOURCE MANAGEMENT The management plan has been proposed to manage the ground water
resources and to arrest further decline in water levels. The management plan comprises two components namely supply-side management and demand side management. The management Plan proposed in all blocks of Nanded District is discussed below.
7.1 Supply Side Management
The supply side management of ground water resources is proposed based on availability of surplus surface water within river sub basins and micro watersheds and their artificial recharge in unconfined aquifers. The feasibility of the area for recharge, specific yield of the aquifer, the unsaturated volume of the aquifer, the aquifer thickness as well as the unsaturated depth below 5 mbgl is also taken into consideration during AR.
A total of 307 Percolation Tanks and 874 Check dams to be constructed in 5674.34 Sq Km feasible area of Nanded district to arrest the decline in water levels. The Table 7.1 gives the blockwise volume of water available for recharge& the proposed number of structures. The area recommended for the construction of proposed structures is shown in Figure 7.1 & location of proposed percolation tanks is mentioned in Annexure VII.
Table 7.1: Proposed AR Structures and area feasible for recharge
Block Geographical
Area (sq.
km.)
Area feasible
for recharge
(sq. km.)
Unsaturated
Volume
(MCM)
Number of
Structures
PT CD
Ardhapur 298.15 105.95 211.908 6 18
Bhokar 682.04 480.93 961.86 28 81
Biloli 599.03 524.47 1048.944 31 88
Deglur 684.2 606.79 1213.588 36 102
Dharmabad 336.47 308.76 617.522 18 52
Hadgaon 1036.92 286.10 572.194 17 48
Himayatnagar 517.8 498.96 16.92 0 1
Kandhar 815.02 587.02 1174.03 35 99
Kinwat 1515.85 184.70 369.4 11 31
Loha 865.4 190.32 380.636 11 32
Mahur 517.41 114.76 229.514 7 19
Mudkhed 338 326.73 653.462 19 55
Mukhed 941.47 504.70 1009.39 30 85
Naigaon 580.08 323.27 646.546 19 54
Nanded 406.8 232.49 464.98 14 39
Umri 408.01 418.39 836.786 25 70
Total 10542.65 5694.34 10407.68 307 874

50
The volume of subsurface storage space available for AR storage is 208.15 MCM while the surplus availability is 116.35 MCM. The cumulative volume of water expected to be recharged by the Percolation Dams and Check Dams is 65.69 MCM as given in Table 7.2.
Figure 7.1: Proposed Artificial Recharge Structures
The rainwater harvesting in urban areas can be adopted in 25% of the household with 50 sq. km roof area. A total of 4.09 MCM potential can be generated by taking 80% runoff coefficient. However, it is not recommended as it is economically not viable.

51
Table 7.2: Volume of water expected to be recharged by Artificial
Recharge structures
Block Volume of
Sub-surface
storage
space
available
for AR
(MCM)
Surplus
Water
Availabl
e (MCM)
Volume of
Water
expected to be
conserved/rec
harged @ 75%
efficiency
(MCM) by
Percolation
Tank
Volume of
Water
expected to
be
conserved/
recharged
@ 75%
efficiency
(MCM) by
Check Dam
Total Volume
of Water
expected to
be
conserved/re
charged @
75%
efficiency
(MCM)
Ardhapur 4.24 2.37 0.9 0.41 1.31
Bhokar 19.24 10.75 4.2 1.82 6.02
Biloli 20.98 11.73 4.65 1.98 6.63
Deglur 24.27 13.57 5.4 2.29 7.69
Dharmabad 12.35 6.90 2.7 1.17 3.87
Hadgaon 11.44 6.40 2.55 1.08 3.63
Himayatnagar 0.34 0.19 0 0.0225 0.0225
Kandhar 23.48 13.12 5.25 2.23 7.48
Kinwat 7.39 4.13 1.65 0.69 2.34
Loha 7.61 4.26 1.65 0.72 2.37
Mahur 4.59 2.57 1.05 0.43 1.48
Mudkhed 13.07 7.30 2.85 1.23 4.08
Mukhed 20.19 11.28 4.50 1.91 6.41
Naigaon 12.93 7.23 2.85 1.21 4.06
Nanded 9.30 5.20 2.10 0.88 2.98
Umri 16.74 9.35 3.75 1.57 5.32
Total 208.15 116.35 46.05 19.64 65.69
7.2 Demand Side Management
The Demand Side Management is proposed in areas where the Stage of Ground Water Development is relatively high and adopting micro-irrigation techniques for water intensive crops or change in cropping pattern or both are required to save water. As the stage of ground water development is less than 60% in all the blocks of the district, no demand side interventions have been proposed in most of the blocks. However, demand side interventions are proposed in ground water irrigated sugarcane areas of Ardhapur and Mudkhed blocks. A total of 8.11 Sq Km area is proposed to be bought under drip irrigation thereby saving 6.63 MCM of ground water (Table 7.3 & Figure 7.2). The location of proposed check dams is mentioned in Annexure VIII.

52
Table 7.3: Volume of water expected to be recharged by Demand Side
Intervention
Block Ground water irrigated
sugarcane crop area
proposed to be brought
under drip) Sq Km)
Volume of water
expected to be
saved (MCM)
Ardhapur 2.8 1.6
Bhokar Nil Nil
Biloli Nil Nil
Deglur Nil Nil
Dharmabad Nil Nil
Hadgaon Nil Nil
Himayatnagar Nil Nil
Kandhar Nil Nil
Kinwat Nil Nil
Loha Nil Nil
Mahur Nil Nil
Mudkhed 5.31 5.03
Mukhed Nil Nil
Naigaon Nil Nil
Nanded Nil Nil
Umri Nil Nil
Total 8.11 6.63

53
Figure 7.2: Proposed Demand Side Interventions
7.3 Expected Benefits
The impact of groundwater management plans on the groundwater system in the district after its implementation is evaluated and the outcome shows significant improvement in groundwater scenario in all blocks as given in the Table 7.4.
Table 7.4: Expected benefits after management options
Block Net
Ground
Water
Availabi
lity
(MCM)
Additiona
l GW
resources
available
after
implemen
ting
above
measures
(MCM)
Ground
Water
Availabil
ity after
Supply
side
Interven
tion
(MCM)
Existing
Ground
Water
Draft
for All
Purpos
es
(MCM)
Saving
of
Ground
Water
throug
h
deman
d side
interve
ntion
(MCM)
GW draft
after
Demand
side
intervent
ions
(MCM)
Present
stage of
Ground
Water
Develop
ment (%)
Stage of
Ground
Water
Develop
ment
after
interventi
ons (%)
Ardhapur 39.07 1.31 40.38 23.64 1.6 22.04 60.50 54.5
Bhokar 70.97 6.02 76.99 21.92 0.00 21.92 30.89 28.5
Biloli 58.26 6.63 64.89 13.43 0.00 13.43 23.06 20.7

54
Block Net
Ground
Water
Availabi
lity
(MCM)
Additiona
l GW
resources
available
after
implemen
ting
above
measures
(MCM)
Ground
Water
Availabil
ity after
Supply
side
Interven
tion
(MCM)
Existing
Ground
Water
Draft
for All
Purpos
es
(MCM)
Saving
of
Ground
Water
throug
h
deman
d side
interve
ntion
(MCM)
GW draft
after
Demand
side
intervent
ions
(MCM)
Present
stage of
Ground
Water
Develop
ment (%)
Stage of
Ground
Water
Develop
ment
after
interventi
ons (%)
Deglur 64.11 7.69 71.80 23.58 0.00 23.58 36.79 32.8
Dharmab
ad
31.22 3.87 35.09 6.31 0.00 6.31 20.20 18.0
Hadgaon 121.09 3.63 124.72 51.38 0.00 51.38 42.43 41.2
Himayatn
agar
51.31 0.02 51.33 20.37 0.00 20.37 39.70 39.7
Kandhar 98.82 7.48 106.30 26.26 0.00 26.26 26.57 24.7
Kinwat 156.41 2.34 158.75 37.81 0.00 37.81 24.17 23.8
Loha 106.49 2.37 108.86 32.94 0.00 32.94 30.93 30.3
Mahur 50.45 1.48 51.93 20.68 0.00 20.68 40.98 39.8
Mudkhed 36.91 4.08 40.99 21.21 5.03 16.21 57.47 39.54
Mukhed 92.20 6.41 98.61 23.45 0.00 23.45 25.43 23.8
Naigaon 62.55 4.06 66.61 20.28 0.00 20.28 32.42 30.4
Nanded 58.33 2.98 61.31 25.31 0.00 25.31 43.39 41.3
Umri 41.43 5.32 46.75 13.30 0.00 13.30 32.11 28.5
Total 1139.63 65.69 1205 381.87 6.63 375.27 35.44 32.34
7.4 Development Plan
The ground water development plan has been proposed in the view of developing the addition ground water resources available after supply side interventions to bring the stage of ground water up to 70%. The 461.87 MCM of volume of ground water generated can bring 711 sq km additional area under assured ground water irrigation with average crop water requirement of 0.65 m by constructing 27,714 Dug wells and 4620 Borewells (Table:7.5). Figure7.3 depicts the additional area proposed for ground water irrigation after 70% GW development.

55
Table 7.5: Block wise additional area under Assured GW Irrigation
Block Additional Volume of Water Available for GWD to 70% (MCM)
Proposed No. of DW (@ 1.5 ham for 90% of GWR Available)
Proposed No. of BW (@ 1.5 ham for 10% of GWR Available)
Additional Area (Sq. Km.) proposed to be brought under assured GW irrigation with average CRW of 0.65 m
Ardhapur 4.63 278 46 7.00 Bhokar 31.97 1918 320 49.00 Biloli 31.98 1919 320 49.00 Deglur 26.68 1601 267 41.00 Dharmabad 18.26 1096 183 28.00 Hadgaon 35.92 2155 359 55.00 Himayatnagar 15.56 934 156 24.00 Kandhar 48.15 2889 481 74.00 Kinwat 73.32 4399 733 113.00 Loha 43.27 2596 433 67.00 Mahur 15.68 941 157 24.00 Mudkhed 7.48 449 75 12.00 Mukhed 45.58 2735 456 70.00 Naigaon 26.36 1582 264 41.00 Nanded 17.60 1056 176 27.00 Umri 19.43 1166 194 30.00 Total 461.87 27714.00 4620.00 711.00

56
Figure 7.3: Additional Area proposed for GW irrigation

57
8. SUM UP A thorough study was carried out based on data gap analysis, data generated
in-house; data acquired from State Govt. departments and GIS maps prepared for various themes. All the available data was brought on GIS platform and an integrated approach was adopted for preparation of block wise aquifer maps and aquifer management plans of Amravati district.
Nanded district covering an area of 7156.91 Sq Km has 521.43 sq km of which only 6635.48Sq Km area is mappable. Geologically, Basaltic lava flows of Deccan traps belonging to Late Cretaceous to Paleogene (68-62 million years in age) occupy the entire area of the district with a few inter-trappean beds. The stage of ground water development is 74.59 %. The area has witnessed Declining water level trend, Overexploitation, declining rainfall trend, fluoride and nitrate contamination and low yield potential aquifers, being the major issues in the district. Declining water level trend @ 0.0 to 0.7138 m/year is observed in about 5796 Sq Km areaduring pre-monsoon. During post monsoon. declining water level trend@ 0.0 to 0.79 m/year is observed in about 5637 Sq Km.
The management plan has been proposed for all theblocks of Nanded district to manage the ground water resources and to arrest further decline in water levels. The management plan comprises two components namely supply-side management and demand side management. As a part of Supply side Management, a total 307 Percolation tanks and 874 Check dams are proposed, which will augment ground water resources to the tune of 65.69 MCM (46.05MCM by Percolation tanks and 19.64 MCM by Check dams).
In Nanded District, a total 65.69 MCM ground water resources will be augmented after adopting artificial recharge
❖ As the stage of ground water development is less than 60% in all the blocks of the district, have been proposed in most of the blocks. However, demand side interventions are proposed in ground water irrigated sugarcane areas of Ardhapur and Mudkhed blocks. A total of 8.11 Sq Km area is proposed to be bought under drip irrigation thereby saving 6.63 MCM of ground water
❖ The ground water development plan has been proposed in the view of developing the addition ground water resources available after supply side interventions to bring the stage of ground water up to 70%. The 461.87 MCM volume of ground water generated can bring 711 sq km additional area under assured ground water irrigation with average crop water requirement of 0.65 m by constructing 27714 Dug wells and 4620 Borewells.
❖ These interventions also need to be supported by regulation of deeper aquifer and hence it is recommended to regulate/ban deeper tube wells/borewells of more than 60 m depth in these blocks, so that the deeper ground water resources are protected for future generation and also serve as ground water sanctuary in times of distress/drought. IEC activities and capacity building activities needs to be aggressively propagated to establish the institutional framework for participatory ground water management.

58
LOCKWISE AQUIFER MAP AND
MANAGEMENT PLAN
❖ ARDHAPUR BLOCK
❖ BHOKAR BLOCK
❖ BILOLI BLOCK
❖ DEGLUR BLOCK
❖ DHARMABAD BLOCK
❖ HADGAON BLOCK
❖ HIMAYATNAGAR BLOCK
❖ KANDHAR BLOCK
❖ KINWAT BLOCK
❖ LOHA BLOCK
❖ MAHUR BLOCK
❖ MUDKHED BLOCK
❖ MUKHED BLOCK
❖ NAIGAON KHURD BLOCK
❖ NANDED BLOCK
❖ UMARI BLOCK
B

59
9. AQUIFER MAPS AND GROUND WATER MANAGEMENT PLAN
9.1 ARDHAPUR BLOCK, NANDED DISTRICT
1. SALIENT INFORMATION 1.1. Introduction Block Name Ardhapur
Geographical Area (Sq. Km.) 298.15 Sq. Km.
Hilly Area (Sq. Km) 16.39 Sq. Km.
Poor Quality Area (Sq. Km.) Nil
Population (2011) 109,332
Climate Tropical climate
1.2. Rainfall Analysis
Normal Rainfall 828.5 mm
Annual Rainfall (2019) 1045.3 mm
Decadal Average Annual
Rainfall (2010-19)
830.41 mm
Long Term Rainfall Analysis
(1998-2019)
Rising Trend: 26.05 mm/year.
Probability of Normal/Excess Rainfall-47% & 37%.
Probability of Drought (Moderate/Severe / Acute)-: 16% Moderate
Frequency of occurance of Drought:1 in 6 years
RAINFALL TREND ANALYSIS (1951 to 2019)
1.3. Geomorphology, Soil &Geology
Geomorphic Unit ➢ Plateau Weathered-Canal Command
➢ Plateau slightly dissected, 0 to 1 m weathering
Soil ➢ Very shallow, somewhat excessively drained, loamy soils on
gently sloping rolling lands with mesas and buttes with severe
erosion
➢ Shallow, moderately well drained clayey soils on gently
sloping summits/spurs with moderate erosion.
➢ Deep, imperfectly drained, fine, calcareous soils on very
gently sloping plains and valleys with moderate erosion;
y = 26.054x + 431.1
0
200
400
600
800
1000
1200
1400
1600
1800
2000
199
8
199
9
20
00
20
01
20
02
20
03
20
04
20
05
20
06
20
07
20
08
20
09
20
10
20
11
20
12
20
13
20
14
20
15
20
16
20
17
20
18
20
19
Longterm Rainfall Analysis-Ardhapur Block

60
moderate salinity and slight sodicity
Geology Recent River Alluvium &Deccan Traps (Basalt) ofLate Cretaceous to
Early Eocene Age
1.4. Hydrology & Drainage
Drainage Penganga River and its tributaries form the main drainage system of
the block.
Hydrology
Major & Medium Irrigation
Projects (>250 Ha) (Reference Year: 2012-13)
Nil
Minor Irrigation Projects (0
to 250 Ha) (Reference Year: 2017-18)
No. of projects
completed till March
2017
24
No. of projects operating
till end
24
Command area of the
operating project (Sq.
Km.)
5
Net irrigated area under
Operating project (Sq.
Km.)
4.28
1.5.LAND USE, AGRICULTURE, IRRIGATION & CROPPING PATTERN
Geographical Area 298.15 Sq. Km.
Forest Area 15.26 Sq. Km.
Cultivable Area 320.82 Sq. Km.
Net Sown Area 238.63 Km.
Double Cropped Area 88.73 Sq. Km.
Area under
Irrigation (Reference
Year: 2016-17)
Surface
Water
120.80 Sq. Km.
Ground
Water
78.46 Sq. Km.
Principal Crops Crop Type Area (Sq. Km.)
Pulses 99.2
Cotton 48.60
Cereals 12.91
Oil Seeds 143.54
Horticultural Crops Sugarcane 28.01
Others 20.05
1.6.WATER LEVEL BEHAVIOUR
1.6.1. Aquifer-I/Shallow Aquifer (Phreatic Aquifer)
Pre-Monsoon (May-2019) Post-Monsoon (November-2019)
➢ Water Level of 10 to 20 mbgl is
observed in 85.6 Sq Km area in north-
eastern part of the block.
➢ About 212 Sq Km area of the remaining
parts of the block have depth to water
level in the range of 20 to 30 mbgl.
➢ Shallow water Level of 5 to 10 mbgl is
observed in 45.16 Sq Km area in eastern,
parts of the block.
➢ About 248.77 Sq Km area of the remaining
parts of the block have depth to water
level in the range of 10 to 20 mbgl
Water Level Map- Aquifer-I/Shallow Aquifer (Phreatic Aquifer)

61
Pre-Monsoon Water Level (May 2019)
Post-Monsoon Water Level (Nov.2019)
1.6.2. Aquifer-II/Deeper Aquifer (Semiconfined/Confined Aquifer)
Pre-Monsoon (May-2019) Post-Monsoon (November-2019)
Pre-Monsoon Water Level(May 2019) Post-Monsoon Water Level(November 2019)
➢ The whole block of 298 sq km has depth
to water level in the range of 10 to 20
mbgl.
➢ The depth to water level between 10 mbgl
and 20 mbgl is observed in 230Sq Km area
in major parts of the block.
➢ The depth to water level between 20 mbgl
and 30 mbgl is observed in about 63 Sq Km
area along western parts of the block
1.7. Hydrograph

62
The hydrograph of CGWB Monitoring site at Malegaon for the period 2010 to 2019 shows:
❖ A rising trend during premonsoon@ 1.08 m/year and a falling trend during postmonsoon @7.53
m/year respectively.
❖ The depth to water level during premonsoon ranges from 7.5 mbgl to 13 mbgl due to overdraft of
ground water in dry season.
❖ The depth to water level during postmonsoon ranges from 1 mbgl to 10.2 mbgl during
postmonsoon
1.8. Water Level Trend (2010-19)
Pre-Monsoon Trend (May 2010-19) Post-Monsoon Trend (November2010-19)
Rising Trend @ Falling Trend @ Rising Trend @ Falling Trend @
Nil 0.0 to 0.2 m/year in 165 Sq
Km area; 0.2 to 0.4 m/year
in 65.09 Sq Km area; 0.4 to
0.6 m/year in 24.44 Sq Km
area and > 0.6 m/year in
36 Sq Km area.
0 to 0.2 m/year in 36 Sq
Km area
0 to 0.2 m/year in
173.2 Sq Km area; 0.2
to 0.4 m/year in 58.11
Sq Km area and 0.4 to
0.6 m/year in 24.91 Sq
Km area
Pre-Monsoon WL Trend (May 2010-2019) Post-Monsoon WL Trend (Nov.2007-2016)
2. GROUND WATER ISSUES
1) Variation in Stage of Ground Water Development:
The stage of groundwater Development varies from 65.72 to 60.50 alongwith the decrease in Net
ground water availability from 45 MCM to 39 MCM.
RF: y = -0.1024x + 830.97Pre WL: y= 0.0903x + 9.5633
post WL: y = 0.6285x + 1.9333
0
2
4
6
8
10
12
140
200
400
600
800
1000
1200
1400
2010 2011 2012 2013 2014 2015 2016 2017 2018 2019 De
pth
to
wa
ter
le
ve
l (m
bg
l)
Ra
infa
ll (
mm
)
YearANNUAL RF Premonsson Wl Post monsoon Wl

63
2) Declining Water Level Trend: -
The decline in water level trend (2010-19) upto 0.6 m/year is observed in 290.53 sq km area of the
block during premonsoon and 256.2 sq km area during postmonsoon.
3. AQUIFER DISPOSITION
3.1. Number of Aquifers (Major) Two:
Basalt –Aquifer-I, Aquifer-II
3.2. LITHOLOGICAL DISPOSITION
3.3. CROSS SECTIONS
65.72 65.31 66.1460.50
0
10
20
30
40
50
60
70
2008 2011 2013 2017Net Annual Ground Water Availability
Existing Gross Ground Water Draft for irrigation

64
3.4 AQUIFER CHARACTERISTICS
Major Aquifer Basalt (Deccan Traps)
Type of Aquifer
(Phreatic/Semiconfined/Confined)
Aquifer-I (Phreatic) Aquifer-II (Semiconfined
/confined)
Depth to bottom of aquifer (mbgl) 10 to 16 88 to 148
Weathered/ Fractured rocks
thickness (m)
8 to 14 2 to 6
Yield Potential 15 to 100 m3/day 0.2 to 0.4 lps
Specific Yield (Sy)/ Storativity (S) 0.02 0.00035
Transmissivity (T) 126 to 156.46 m2/day
4.CHEMICAL QUALITY OF GROUND WATER &CONTAMINATION
4.1 Aquifer I/Shallow Aquifer
Suitability for Drinking Purposes Suitability for Irrigation Purposes
➢ The overall quality of Aquifer is
potable and useful for drinking and
domestic puposes.
➢ About 8.00 Sq Km area of the block
has EC well within the potable range
of 250 to 750 microsiemens/cm
whereas 285.67 sq Km area has EC
between 750 and 2250
microsiemens/cm.
➢ In major parts of the block covering 285.6 Sq
Km area where EC > 750 microsiemens/cm,
special management for salinity control may
be required and plants with good salt
tolerance should be selected.
➢ The SAR valuesofall the analysed samples in
the block have SAR value well within 0 to 10
types and are therefore good for irrigation.
➢ The RSC values of all the analysed samples
have values < 1.25 meq/l indicating that the
ground is good for irrigation. Hence, the
overall quality of ground water is suitable for
irrigation purposes.
➢ RSC value is less than 20% indicating that the
ground water is good for irrigation.
Hence, the overall quality of ground water is suitable
for irrigation purposes.
4.1 Aquifer II/Deeper Aquifer
Suitability for Drinking Purposes Suitability for Irrigation Purposes
➢ The overall quality of Aquifer is
potable and useful for drinking and
domestic puposes except in Nitrate
affected village (1 site)
➢ In major parts of the block covering 282 Sq Km
area, EC > 750 microsiemens/cm, special
management for salinity control may be
required and plants with good salt tolerance

65
➢ About 282 Sq Km area of the block
has EC EC between 750 and 2250
microsiemens/cm and 10.78 sq km
area has EC >2250 microsiemens/cm
.
➢ Nitrate contamination with nitrate
more than 45 mg/l is observed in
Loni Bk village
should be selected.
3.2.CHEMICAL QUALITY MAP
Phreatic Aquifer (Aquifer-I)
Semiconfined/Confined Aquifer (Aquifer II &III)
5. GROUND WATER RESOURCE & EXTRACTION
Aquifer-I/ Phreatic Aquifer (Basalt)
Ground Water Recharge Worthy Area (Sq. Km.) 281.76
Total Annual Ground Water Recharge (MCM) 41.12
Natural Discharge (MCM) 2.05
Net Annual Ground Water Availability (MCM) 39.07
Existing Gross Ground Water Draft for irrigation
(MCM)
22.96
Existing Gross Ground Water Draft for domestic
and industrial water supply (MCM)
0.70
Existing Gross Ground Water Draft for All uses
(MCM)
23.63
Net Ground Water Availability for future
irrigation development (MCM)
14.72
Provision for domestic and industrial
requirement supply to 2025(MCM)
1.86
Stage of Ground Water Development % 60.50
Category SAFE
Aquifer-II
Semiconfined/Confined Aquifer (Basalt)
Resources above the confining layer Resources within the confining layer
Total Area
(Sq. Km.)
Peizom
eter
(macl)
S Resources
above
confining
Total Area
(Sq. Km.)
Mean
aquifer
thickness
Sy Resources
within the
confining

66
layer
9MCM)
(m) layer (MCM)
298.15
92.6
0.00035 9.66
298.15
4.000
0.002 2.39
5.0. GROUND WATER RESOURCE ENHANCEMENT
Available Resource (MCM) 39.07
Gross Annual Draft (MCM) 23.63
5.1. SUPPLY SIDE MANAGEMENT
SUPPLY (MCM)
Agricultural Supply -GW 22.93
Agricultural Supply -SW 120.80
Domestic Supply - GW 0.70
Domestic Supply - SW 0.14
Total Supply 144.57
Area of Block (Sq. Km.) 298.15
Area suitable for Artificial recharge (Sq. Km) 281.76
Type of Aquifer Hard Rock Soft Rock
Area feasible for Artificial Recharge (WL >5mbgl)
(Sq. Km.) 105.95 -
Volume of Unsaturated Zone (MCM) 211.908 -
Average Specific Yield 0.02 -
Volume of Sub surface Storage Space available
for Artificial Recharge (MCM)
4.23
-
Surplus water Available (MCM) 2.373
-
Proposed Structures
Percolation Tank
(Av. Gross
Capacity-100
TCM*2 fillings =
200 TCM)
Check Dam (
Av. Gross
Capacity-10
TCM * 3
fillings = 30
TCM)
Recharge
shaft (Av.
Gross
Capacity-60
TCM )
Number of Structures 6 18 0
Volume of Water expected to be conserved /
recharged @ 75% efficiency (MCM)
0.9 0.405 0
Area of Saline Patch Nil
Proposed Structures Nil
No of farm pond proposed (size: 30m*30m*3)
with 3 filling= 0.0081 mcm capacity, 50%
available water may be utilized for harvesting
through farm ponds.
Nil
Volume of water available for harvesting Nil
Additional volume created by desilting Nil
RTRWH Structures – Urban Areas
Households to be covered (25% with 50 m2area) 4950
Total RWH potential (MCM) 0.205

67
Rainwater harvested / recharged @ 80% runoff
co-efficient
0.164 (Economically not viable & Not
Recommended)
5.2. DEMAND SIDE MANAGEMENT
Micro irrigation techniques
Remaining ground water irrigated Sugarcane
cropped area proposed through drip irrigation 2.8
Volume of Water expected to be saved (MCM).
(Surface Flooding req- 2.45 m. Drip Req. - 1.88,
WUE- 0.57 m)
1.6
Proposed Cropping Pattern change
Irrigated area under Water Intensive Crop(ha) Not proposed
Water Saving by Change in Cropping Pattern Nil
5.3.EXPECTED BENEFITS
Net Ground Water Availability (MCM) 39.07
Additional GW resources available after Supply
side interventions (MCM) 1.305
Ground Water Availability after Supply side
intervention 40.375
Existing Ground Water Draft for All Purposes
(MCM) 23.63
Saving of Ground Water through demand side
intervention (MCM) 1.6
GW draft after Demand Side Interventions
(MCM) 22.03
Present stage of Ground Water Development
(%) 60.5
Expected Stage of Ground Water Development
after interventions (%) 54.57 (SAFE)
Other Interventions Proposed, if any
Alternate Water Sources Available Nil
5.4.RECOMMENDATION
Ground water development is recommended to bring the stage of development from 60.5% to 70%
5.5.DEVELOPMENT PLAN
Volume of water available for GWD to 60%
(MCM) 4.6325
Proposed Number of DW( @ 1.5 ham for 90% of
GWR Available) 278
Proposed Number of BW( @ 1.5 ham for 10% of
GWR Available) 46
Additional Area (sq.km.) proposed to be brought
under assured GW irrigation with av. CWR of
0.65 m
7
Proposed Artificial Recharge Structure Additional Area proposed to be brought under
Assured Ground Water Irrigation

68

69
9.2 BHOKAR BLOCK, NANDED DISTRICT
1. SALIENT INFORMATION 1.1.Introduction Block Name Bhokar
Geographical Area (Sq. Km.) 682.04 Sq. Km.
Hilly Area (Sq. Km) 51.78
Poor Quality Area (Sq. Km.) -
Population (2011) 1,05,414
Climate Tropical climate
1.2. Rainfall Analysis
Normal Rainfall 1008.1 mm
Annual Rainfall (2019) 1040.8 mm
Decadal Average Annual Rainfall
(2010-19)
890.58 mm
Long Term Rainfall Analysis
(1971-2019)
Falling Trend: -4.215 mm/year.
Probability of Normal/Excess Rainfall-50% &21%.
Probability of Drought (Moderate/Severe / Acute)-: 23%
Moderate & 6% Severe.
Frequency of Drought: 1 in 3 years
RAINFALL TREND ANALYSIS (1998 to 2017)
1.3. Geomorphology,Soil&Geology
Geomorphic Unit ➢ Escarment Slope (ES)
➢ Plateau Highly Dissected (PLH)
➢ Plateau Moderately Dissected (PLM)
➢ Plateau Slightly Dissected (PLS), 0-1m weathering
➢ Plateau Undissected (PLU), 0-1m weathering
➢ Plateau Weathered (PLWS), 1-2m weathering
Soil ➢ Very shallow, well drained, loamy, moderately
calcareous soils on gently sloping undulating lands
with moderate erosion;
➢ Very shallow, somewhat excessively drained, loamy
y = -4.2149x + 1117.6
0
500
1000
1500
2000
2500
197
119
73
197
519
77
197
919
81
198
319
85
198
719
89
199
119
93
199
519
97
199
92
00
12
00
32
00
52
00
72
00
92
011
20
132
015
20
172
019
Longterm Rainfall Analysis-Bhokar Block

70
soils on gently sloping rolling lands with mesas and
buttes with severe erosion
➢ Shallow, well drained, clayey soils on gently sloping
lands with moderate erosion
➢ Deep, moderately well drained, fine soils on gently
sloping plains and valleys with moderate erosion
➢ Deep, imperfectly drained, fine, calcareous soils on
very gently sloping plains and valleys with moderate
erosion; moderate salinity and slight sodicity
➢ Moderately deep, moderately well drained, fine,
moderately calcareous soils on gently'sloping
summits/spurs with moderate erosion
Geology Deccan Trap-Sahyadri Group & Intertrappeans
1.4. Hydrology & Drainage
Drainage NIL
Hydrology(as on March 2017)
Major & Medium
Irrigation Projects
(>250 Ha) (Reference Year: 2012-
13)
01 Medium project
Net irrigated area under the
project:3.59 sq km
Minor Irrigation
Projects (0 to 250
Ha) (Reference Year: 2017-
18)
No. of projects completed
till March 2017
40
No. of projects operating
till end
39
Command area of the
operating project (Sq. Km.)
50.99
Net irrigated area under
Operating project (Sq. Km.)
22.78
1.5. LAND USE, AGRICULTURE, IRRIGATION & CROPPING PATTERN
Geographical Area 682.04 Sq. Km.
Forest Area 120.04 Sq. Km.
Cultivable Area 472.5 Sq. Km.
Net Sown Area 460.63 Sq. Km.
Double Cropped Area 80.54 Sq. Km.
Area under
Irrigation
Surface Water 2.73 Sq. Km
Ground Water 10.63 Sq. Km.
Principal Crops Crop Type Area (Sq. Km.)
Cereals 65.57
Pulses 93.62
cotton 262.70
Oil Seeds 105.73
Horticultural Crops Sugarcane 7.47
Others 7.26
1.6.WATER LEVEL BEHAVIOUR
1.6.1. Aquifer-I/Shallow Aquifer (Phreatic Aquifer)
Pre-Monsoon (May-2019) Post-Monsoon (November-2019)

71
➢ Shallow water Level between 5 mbgl
and 10 mbgl is observed in very small
isolated patch in 1.34 sq km area
➢ All the remaining area of 648.27 sq km
area has depth to water level between
10 mbgl and 20 mbgl.
➢ Shallow water Level less than 5 mbgl is
observed in 3.67 Sq Km area in a very
small isolated patch
➢ In about 114.4 Sq Km area, depth to
water level between 5 mbgl and 10 mbgl
is observed
➢ About 531.98 Sq Km area occupying the
major parts of the block has depth to
water level between 10 mbgl and 20
mbgl.
Water Level Map- Aquifer-I/Shallow Aquifer (Phreatic Aquifer)
Pre-Monsoon Water Level (May 2019)
Post-Monsoon Water Level (Nov.2019)
1.6.2. Aquifer-II/Deeper Aquifer (Semiconfined/Confined Aquifer)
Pre-Monsoon (May-2019) Post-Monsoon (November-2019)
➢ The depth to water Level between 5
mbgl and 10 mbgl is observed only in
242.4 Sq Km area in the western part of
the block.
➢ In about 407.9 Sq Km area, the depth to
water level in the range of 10 mbgl and
20 mbgl is observed.
➢ The depth to water Level between 5 mbgl
and 10 mbgl is observed only in 412.4 Sq
Km area in the central, southern and
eastern parts of the block.
➢ In about 239.17 Sq Km area, the depth to
water level in the range of 10 mbgl and 20
mbgl is observed.
Pre-Monsoon Water Level (May 2019) Post-Monsoon Water Level (November 2019)
1.7. Hydrograph

72
The hydrograph of CGWB Monitoring site at Nagapur for the period 2010 to 2019 shows:
❖ A rising trend during both pre-monsoon and postmonsoon @ 0.0647 m/year and 0.1265 m/year
respectively
❖ The depth to water level during premonsoon ranges from 8.05 mbgl to 11.84 mbgl with deeper
depths to water level during 2012, 2015 and 2018 respectively @ 11.7 mbgl, 11.8 mbgl and 11.84
mbgl
❖ The depth to water level during postmonsoon ranges from 1.52 mbgl to 8.7 mbgl during
postmonsoon due to increase in rainfall trend @ 11.159 mm/year.
❖ A rising trend @11.19mm/year is also observed during the period 2010 to 2019.
1.8. Water Level Trend (2010-19)
Pre-Monsoon Trend (May 2010-2019) Post-Monsoon Trend (November 2010-2019)
Rising Trend @ Falling Trend @ Rising Trend @ Falling Trend @
0.0 to 0.2 m/year
in 97.87 Sq Km
area and 0.2 to 0.4
m/year in 150.44
Sq Km area.
0.00 to 0.2 m/year in 327
Sq Km area and 0.2 to 0.4
m/year in 154.38 Sq Km
area,
0 to 0.2 m/year in 76.42
Sq Km area, @ 0.2 to
0.4 m/year in 40.32 Sq
Km area, 0.4 to 0.6
m/year in 38.11 Sq Km
area, 0.6 to 0.8 m/year
in 35.99 Sq Km area and
more than 0.8 m/year
in 44.40 Sq Km area.
0 to 0.2 m/year in 415
Sq Km area,
Pre-Monsoon WL Trend (May 2010-2019) Post-Monsoon WL Trend (Nov.2010-2019)
Rainfall: y = 11.159x + 829.21Pre WL:y = 0.0647x + 10.007 Post WL: y = 0.1265x + 4.1713
0
2
4
6
8
10
12
140
200
400
600
800
1000
1200
1400
2010 2011 2012 2013 2014 2015 2016 2017 2018 2019 De
pth
to
wa
ter
le
ve
l (m
bg
l)
Ra
infa
ll (
mm
)
YearANNUAL RF Premonsson Wl Post monsoon Wl

73
2. GROUND WATER ISSUES
1) Low Development: -Low Development of 30.89 % of Stage of Ground Water Development is
observed in the block
2) Low Yielding Aquifers: The yield of the aquifer in major parts of the block is less than 2 lps.
This is due to limited extent of porosity and permeability evolved from secondary porosity
and hence poor sustainability of aquifers.
3) Declining Water Level Trend:- About 415 Sq Km area show declining water level trend during
both the seasons over the decade.
3. AQUIFER DISPOSITION
3.1 Number of Aquifers (Major) One:
Basalt –Aquifer-I, Aquifer-II
3.2. LITHOLOGICAL DISPOSITION
3.3. CROSS SECTIONS

74
3.4 AQUIFER CHARACTERISTICS
Major Aquifer Basalt (Deccan Traps)
Type of Aquifer
(Phreatic/Semiconfined/Confined)
Aquifer-I (Phreatic) Aquifer-II(Semiconfined
/confined)
Depth of Occurrence (mbgl)of bottom
of aquifer
10 to 16 30 to 90
Granular/Weathered/ Fractured rocks
thickness (m)
8 to 12 2 to 20
Yield Potential 15 to 100 m3/day 0.2 to 0.4 lps
Specific Yield (Sy)/ Storativity (S) 0.02 0.00074
Transmissivity (T) - 126 to 156.46 m2/day
4.CHEMICAL QUALITY OF GROUND WATER &CONTAMINATION
4.1 Aquifer I/Shallow Aquifer
Suitability for Drinking Purposes Suitability for Irrigation Purposes
➢ The overall quality of Aquifer is potable
and useful for drinking and domestic
puposes
➢ All the block has EC between 750 and
2250 microsiemens/cm
➢ Since the block has EC > 750
microsiemens/cm, special management
for salinity control may be required and
plants with good salt tolerance should
be selected.
➢ The SAR values of the analysed samples
in the block are well within 0 to 10 types
and are therefore good for irrigation.
➢ The RSC values of all the analysed
samples except at 1 site (Bhokar), have
values < 1.25 meq/l indicating that the
ground water is good for irrigation.
➢ All the analysed samples have % Na
between 20 and 40 indicating that the
ground water is good for irrigation.
Hence, the overall quality of ground water is
suitable for irrigation purposes.
4.1 Aquifer II/ Deeper Aquifer
Suitability for Drinking Purposes Suitability for Irrigation Purposes
➢ The overall quality of Aquifer is potable
and useful for drinking and domestic
puposes
➢ About 266.7 Sq Km area of the block has
➢ In 266.7 Sq Km area, plants with
moderate salt tolerance can be grown.
However, in 383.3 sq Km area where EC
> 750 microsiemens/cm, special
management for salinity control may be

75
EC well within the potable range of 250
to 750 microsiemens/cmwhereas 383.3
sq Km area has EC between 750 and 2250
microsiemens/cm..
required and plants with good salt
tolerance should be selected.
➢ The SAR value of the analysed sample in
the block is well within 0 to 10 types and
is therefore good for irrigation.
➢ The RSC values of the analysed sample
has value < 1.25 meq/l indicating that
the ground water is good for irrigation.
➢ The analysed sample have %Na between
20 and 40 indicating that the ground
water is good for irrigation.
Hence, the overall quality of ground water is
suitable for irrigation purposes.
3.2.CHEMICAL QUALITY MAP
Phreatic Aquifer (Aquifer-I)
Semiconfined/Confined Aquifer (Aquifer II &III)
5. GROUND WATER RESOURCE & EXTRACTION
Aquifer-I/ Phreatic Aquifer (Basalt & Alluvium)
Ground Water Recharge Worthy Area (Sq. Km.) 281.76
Total Annual Ground Water Recharge (MCM) 74.70
Natural Discharge (MCM) 3.73
Net Annual Ground Water Availability (MCM) 70.96
Existing Gross Ground Water Draft for irrigation
(MCM)
20.90
Existing Gross Ground Water Draft for domestic
and industrial water supply(MCM)
1.02
Existing Gross Ground Water Draft for All
uses(MCM)
21.92
Net Ground Water Availability for future
irrigation development(MCM)
47.09
Provision for domestic and industrial
requirement supply to 2025(MCM)
2.99
Stage of Ground Water Development % 30.89
Category SAFE

76
Aquifer-II
Semiconfined/Confined Aquifer (Basalt)
Resources above the confining layer Resources within the confining layer
Total Area
(Sq. Km.)
Peizom
eter
(macl)
S Resources
above
confining layer
9MCM)
Total
Area (Sq.
Km.)
Mean
aquifer
thickness
(m)
Sy Resources
within the
confining
layer (MCM)
682.04 37.3 0.00074 9.66 682.04 4.0 0.002 13.64
5.0. GROUND WATER RESOURCE ENHANCEMENT
Available Resource (MCM) 70.96
Gross Annual Draft (MCM) 21.92
5.1.SUPPLY SIDE MANAGEMENT
SUPPLY (MCM)
Agricultural Supply -GW 20.90
Agricultural Supply -SW 2.73
Domestic Supply - GW 1.02
Domestic Supply - SW 0.20
Total Supply 24.85
Area of Block (Sq. Km.) 682.04
Area suitable for Artificial recharge
(Sq. Km)
630.26
Type of Aquifer Hard Rock Soft Rock
Area feasible for Artificial
Recharge(WL >5mbgl) (Sq. Km.)
480.93 0
Volume of Unsaturated Zone (MCM) 961.86 0
Average Specific Yield 0.020 0.070
Volume of Sub surface Storage Space
available for Artificial Recharge
(MCM)
19.24
0
Surplus water Available (MCM) 10.77 0
Proposed Structures Percolation Tank
(Av. Gross
Capacity-100
TCM*2 fillings =
200 TCM)
Check Dam ( Av.
Gross Capacity-10
TCM * 3 fillings = 30
TCM)
Recharge shaft
(Av. Gross
Capacity-60 TCM
)
Number of Structures 28 81 0
Volume of Water expected to be
conserved / recharged @ 75%
efficiency (MCM)
4.2 1.8225
0
Area of Saline Patch Nil
Proposed Structures Nil
No of farm pond proposed (size:
30m*30m*3) with 3 filling= 0.0081
mcm capacity, 50% available water
may be utilized for harvesting
through farm ponds.
Nil
Volume of water available for Nil

77
harvesting
Additional volume created by
desilting Nil
RTRWH Structures – Urban Areas
Households to be covered (25% with
50 m2area) 5328
Total RWH potential (MCM) 0.237
Rainwater harvested / recharged @
80% runoff co-efficient
0.190 (Economically not viable & Not Recommended)
5.2. DEMAND SIDE MANAGEMENT
Micro irrigation techniques
Remaining ground water irrigated
Sugarcane cropped area proposed
through drip irrigation
Nil
Volume of Water expected to be
saved (MCM).
(Surface Flooding req- 2.45 m. Drip
Req. - 1.88, WUE- 0.57 m)
Nil
Proposed Cropping Pattern change
Irrigated area under Water Intensive
Crop(ha)
Nil
Water Saving by Change in Cropping
Pattern
Nil
5.3.EXPECTED BENEFITS
Net Ground Water Availability
(MCM) 70.96
Additional GW resources available
after Supply side interventions
(MCM)
6.0225
Ground Water Availability after
Supply side intervention 76.9825
Existing Ground Water Draft for All
Purposes (MCM) 21.92
Saving of Ground Water through
demand side intervention (MCM) 0
GW draft after Demand Side
Interventions (MCM) 21.92
Present stage of Ground Water
Development (%) 30.9
Expected Stage of Ground Water
Development after interventions (%) 28.5
Other Interventions Proposed, if any
Alternate Water Sources Available Nil
5.4. RECOMMENDATION
Ground water development is recommended to bring the stage of development from 54.01% to 70%
5.5. DEVELOPMENT PLAN

78
Volume of water available for GWD
to 70% (MCM) 31.96
Proposed Number of DW( @ 1.5 ham
for 90% of GWR Available) 1918
Proposed Number of BW( @ 1.5 ham
for 10% of GWR Available) 320
Additional Area (sq.km.) proposed to
be brought under assured GW
irrigation with av. CWR of 0.65 m
49
Proposed Artificial Recharge Structure
Additional Area proposed to be brought under
Assured Ground Water Irrigation

79
9.3 BILOLI BLOCK, NANDED DISTRICT
3. SALIENT INFORMATION 1.1.Introduction Block Name Biloli
Geographical Area (Sq. Km.) 599.03Sq. Km.
Hilly Area (Sq. Km) 18.66 Sq. Km.
Poor Quality Area (Sq. Km.) Nil
Population (2011) 140476
Climate Tropical climate
1.2. Rainfall Analysis
Normal Rainfall 726.04 mm
Annual Rainfall (2019) 945.9 mm
Decadal Average Annual Rainfall
(2010-19)
702.33 mm
Long Term Rainfall Analysis
(1998-2019)
Falling Trend: -6.92 mm/year.
Probability of Normal/Excess Rainfall-54% & 27%.
Probability of Drought (Moderate/Severe/Acute)-: 14%
Moderate & 5% Severe
Frequency of occurrence of drought: 1 in 5 years
RAINFALL TREND ANALYSIS (1998 to 2019)
1.3. Geomorphology,Soil&Geology
Geomorphic Unit ➢ Pediment (PD)
➢ Butte (B)
➢ Escarment Slope (ES)
➢ Pediplain Moderate (PPM), 2-5m weathering
➢ Plateau Moderately Dissected (PLM)
➢ Plateau Slightly Dissected (PLS), 0-1m weathering
➢ Plateau Undissected (PLU), 0-1m weathering
➢ Plateau Weathered (PLWS), 1-2m weathering
y = -6.9282x + 805.72
0
200
400
600
800
1000
1200
199
8
199
9
20
00
20
01
20
02
20
03
20
04
20
05
20
06
20
07
20
08
20
09
20
10
20
11
20
12
20
13
20
14
20
15
20
16
20
17
20
18
20
19
Longterm Rainfall Analysis-Biloli Block

80
Soil ➢ Very shallow, somewhat excessively drained, loamy
soils on moderately sloping summits/spurs with
severe erosion
➢ Deep, moderately well drained, fine soils on gently
sloping plains and valleys with moderate erosion
➢ Shallow, well drained, clayey soils on gently sloping
lands with moderate erosion
Geology Deccan Trap-Sahyadri Group (Late Cretaceous to Early
Eocene) & Gneiss-Granitoid / Migmatite Complex (Archean
age)
1.4. Hydrology & Drainage
Drainage Godavari River and its tributaries
Hydrology(as on March 2017)
Major & Medium
Irrigation Projects
(>250 Ha) (Reference Year: 2012-
13)
Nil
Minor Irrigation
Projects (0 to 250
Ha) (Reference Year: 2017-
18)
No. of projects
completed till March
2017
61
No. of projects operating
till end
60
Command area of the
operating project (Sq.
Km.)
22.88
Net irrigated area under
Operating project (Sq.
Km.)
9.64
1.5. LAND USE, AGRICULTURE, IRRIGATION & CROPPING PATTERN
Geographical Area 599.03Sq. Km.
Forest Area 20.12 Sq. Km.
Cultivable Area 579 Sq. Km.
Net Sown Area 469.89 Sq. Km
Double Cropped Area 259.38 Sq. Km.
Area under
Irrigation
Surface Water Nil
Ground Water 10.46 Sq. Km.
Principal Crops Crop Type Area (Sq. Km.)
Cereals 79.52
Pulses 299.64
Cotton 75.63
Oil Seeds 269.41
Horticultural Crops Sugarcane 0.17
Others 2.32
1.6.WATER LEVEL BEHAVIOUR
1.6.1. Aquifer-I/Shallow Aquifer (Phreatic Aquifer)
Pre-Monsoon (May-2019) Post-Monsoon (November-2019)

81
➢ Depth to water Level between 5 mbgl
and 10 mbgl is observed in 249.9 Sq Km
area in the north-central, northwestern
and northeastern parts of the taluka.
➢ About 332 Sq. Km area of the remaining
parts of the block has depth to water
level in the range of 10 to 20 mbgl.
➢ Shallow water Level less than 2 mbgl is
observed in 47.13 Sq Km area in small
patch in the block.
➢ In 159.51 Sq Km area of the block covering
north-central parts, has depth to water
level between 2 mbgl and 5 mbgl.
➢ About, 138.2 Sq Km area along southern,
eastern and north-eastern parts has depth
to water level between 5 mbgl and 10
mbgl.
➢ Deeper depths to water level between 10
mbgl and 20 mbgl is observed in the south-
central part of the district in small patch.
Water Level Map- Aquifer-I/Shallow Aquifer (Phreatic Aquifer)
Pre-Monsoon Water Level (May 2019)
Post-Monsoon Water Level (Nov.2017)
1.6.2. Aquifer-II/Deeper Aquifer (Semiconfined/Confined Aquifer)
Pre-Monsoon (May-2019) Post-Monsoon (November-2019)
Pre-Monsoon Water Level (May 2019) Post-Monsoon Water Level (November 2019)
➢ The depth to water level between 5
mbgl and 10 mbgl is observed in 109.3
Sq Km area along the western and
north-westernpart of the block
➢ The shallow depth to water level less than
5 mbgl is observed in 94.11 Sq Km area of
the block along the eastern boundary of
the block.

82
➢ The deeper depth to water level
between 10 mgl and 20 mbgl is
observed in about 459.9 Sq Km area in
the remaining parts of the block.
➢ The depth to water level between 5 mbgl
and 10 mbgl is observed in 372.8 Sq Km
area in the major parts of the block.
➢ The depth to water level between 10 mbgl
and 20 mbgl is observed in about 100.6 Sq
Km area in the western sideof the block.
1.7. Hydrograph
The hydrograph of CGWB Monitoring site at Narsi for the period 2010 to 2019 shows:
❖ A rising trend @ 0.2225 m/year during premonsoon and a fallling trend @ 0.1025 m/year during
postmonsoon.
❖ The depth to water level during premonsoon ranges from 4.00 mbgl to 9.2 mbgl.
❖ The depth to water level during postmonsoon ranges from 1.85 mbgl to 7.05 mbgl during
postmonsoon due to increase in rainfall trend @ 14.718 mm/year.
1.8. Water Level Trend (2010-19)
Pre-Monsoon Trend (May 2010-2019) Post-Monsoon Trend (November 2010-2019)
Rising Trend @ Falling Trend @ Rising Trend @ Falling Trend @
0 to 0.2 m/year in
56.42 Sq Km area
and @ 0.2 to 0.4
m/year in 79.33 Sq
Km area.
0.02 to 0.20 m/year in
30.09 Sq Km area , 0.2 to
0.4 m/year in 25.26 Sq Km
area, 0.4 to 0.6 m/year in
31.74 Sq Km area and 0.6
to 0.8 m/year in 338.4 Sq
Km area.
0 to 0.2 m/year in 92.74
Sq Km area and 0.2 to
0.4 m/year in 139.3 Sq
Km area, 0.4 to 0.6
m/year in 64.19 Sq Km
area, 0.6 to 0.8 m/year
in 46 Sq Km area and
>0.8 m/year in 133.9 Sq
Km area
0 to 0.2 m/year in
88.97 Sq Km area
Pre-Monsoon WL Trend (May 2010-2019) Post-Monsoon WL Trend (Nov.2010-2019)
Rainfall: y = 14.718x + 621.38
PreWL: y = 0.2225x + 5.32Post WL: y = -0.1025x + 5.182
0
1
2
3
4
5
6
7
8
9
100
200
400
600
800
1000
1200
2010 2011 2012 2013 2014 2015 2016 2017 2018 2019
De
pth
to
wa
ter
le
ve
l (m
bg
l)
Ra
infa
ll (
mm
)
YearANNUAL RF Premonsson Wl Post monsoon Wl

83
2. GROUND WATER ISSUES
1) Declining Water Level Trend: - The decline in water level trendupto more than 0.6 m/year is
observed in major section of the block during both the seasons. This is due to the exploitation
of shallow aquifers as for the dependency in ground water for irrigation during both Kharif
and Rabi season due to lack of availability of surface water.
2) Low ground water yield Potential of the aquifers:The ground water yield potentiality of the
aquifers ranges from 0 to 1lps in major parts of the block. However, high yielding aquifers are
obtained only along the drainages, faults/ fractures or joints. The low potential zone in major
parts of the block is due to limited extent of porosity and permeability evolved from
secondary porosity and hence poor sustainability of aquifers.
3) Declining Rainfall Trend and Drought: The longterm rainfall analysis(1998 to 2019) indicates
a declining trend @6.92 mm/year with the probability of occurance of moderate drought in
14% of the years and severe drought in 5% of the years and the frequency of occurance of
drought being 1 in 5 years.
4) Deteriorated quality of Ground Water: The presence of Fluoride was observed in Bioili village
making it unsuitable for both drinking and irrigation purposes.
3. AQUIFER DISPOSITION
3.1. Number of Aquifers (Major) Two:
Basalt –Aquifer-I, Aquifer-II
Granite-Aquifer-I, Aquifer-II
3.2. LITHOLOGICAL DISPOSITION

84
3.3. CROSS SECTIONS
3.4 AQUIFER CHARACTERISTICS
Major Aquifer Basalt (Deccan Traps) Granite
Type of Aquifer
(Phreatic/Semiconfined/Confined)
Aquifer-I
(Phreatic)
Aquifer-
II(Semiconfin
ed/confined)
Aquifer-I
(Phreatic)
Aquifer-
II(Semiconfin
ed/confined)
Depth of Occurrence (mbgl) 9 to 17 28 to 68 8 to 16 28 to 88
Granular/Weathered/ Fractured
rocks thickness (m)
5 to 14 2 to 10 7 to 13 2 to 12
Yield Potential 0 to 100
m3/day
0 to 0.4 lps 0 to 100
m3/day
0 to 2.5 lps
Specific Yield (Sy)/ Storativity (S) 0.02 0.00035 0.02 0.00079
Transmissivity (T) - 126 to 56.46
m2/day
- 84.08 to 104
m2/day
4.CHEMICAL QUALITY OF GROUND WATER &CONTAMINATION
4.1 Aquifer I/Shallow Aquifer
Suitability for Drinking Purposes Suitability for Irrigation Purposes
➢ The overall quality of Aquifer is potable
and useful for drinking and domestic
puposes except in Flouride infested Biloli
village.
➢ All the block has EC between 750 and
2250 microsiemens/cm
➢ Since the block has EC > 750
microsiemens/cm, special management
for salinity control may be required and
plants with good salt tolerance should be
selected.
➢ The SAR values of the analysed samples

85
in the block are well within 0 to 10 types
and are therefore good for irrigation.
➢ The RSC values of all the analysed
samples except at 1 site (Bhokar), have
values < 1.25 meq/l indicating that the
ground water is good for irrigation.
➢ About 33% of analysed samples have %
Na less than 20, 67% have %Na between
20 and 40 indicating that the ground
water is good for irrigation.
Hence, the overall quality of ground water is
suitable for irrigation purposes.
4.1 Aquifer II/ Deeper Aquifer
Suitability for Drinking Purposes Suitability for Irrigation Purposes
➢ The overall quality of Aquifer is potable
and useful for drinking and domestic
purposes except in Nitrate affected
villages namely Biloli, Atklai, Arjapur,
Pachpimpli, Torna, Dugaon villages.
➢ About 241.8 Sq Km area of the block has
EC well within the potable range of 250
to 750microsiemens/cm whereas 324.3
sq Km area has EC between 750 and 2250
microsiemens/cm.
➢ In 241.8 Sq Km area of the block with
medium salinity water, the water can be
used if moderate amount of leaching
occurs. Plants with moderate salt
tolerance can be grown in most cases
without special practices for salinity
control. However, in 324.3 Sq Km area
where EC >750 micro siemens/cm, special
management for salinity control may be
required and plants with good salt
tolerance should be selected.
➢ The SAR value for all the analysed samples
in the block are well within 0 to 10 types
and are therefore good for irrigation.
➢ Most of the analysed samples have RSC
values > 1.25 meq/l indicating that the
ground is not good for irrigation.
➢ About 50% have %Na between 40 and
60and 50% have %Na more than 60.
Indicating that the ground water is
suitable for irrigation purposes except in
areas where %Na is more than 60.
3.2.CHEMICAL QUALITY MAP

86
Phreatic Aquifer (Aquifer-I)
Semiconfined/Confined Aquifer (Aquifer II &III)
5. GROUND WATER RESOURCE & EXTRACTION
Aquifer-I/ Phreatic Aquifer (Basalt & Alluvium)
Ground Water Recharge Worthy Area (Sq. Km.) 580.37
Total Annual Ground Water Recharge (MCM) 61.32
Natural Discharge (MCM) 3.06
Net Annual Ground Water Availability (MCM) 58.25
Existing Gross Ground Water Draft for irrigation
(MCM)
11.26
Existing Gross Ground Water Draft for domestic
and industrial water supply(MCM)
2.16
Existing Gross Ground Water Draft for All
uses(MCM)
13.43
Net Ground Water Availability for future
irrigation development(MCM)
43.63
Provision for domestic and industrial
requirement supply to 2025(MCM)
5.36
Stage of Ground Water Development % 23.06
Category SAFE
Aquifer-II
Semiconfined/Confined Aquifer (Basalt)
Total Area
(Sq. Km.)
Mean
aquife
r
thickn
ess
(m)
S Resource
s above
confining
layer
(MCM)
Total Area
(Sq. Km.)
Mean
aquifer
thickness
(m)
S Resources
within the
confining
layer (MCM)
599.09 4.6 0.00035 0.96 599.09 8 0.00035 1.677
5.0. GROUND WATER RESOURCE ENHANCEMENT
Available Resource (MCM) 58.25
Gross Annual Draft (MCM) 13.43
5.1.SUPPLY SIDE MANAGEMENT
SUPPLY (MCM)
Agricultural Supply -GW 11.26
Agricultural Supply -SW 0.00

87
Domestic Supply - GW 2.16
Domestic Supply - SW 0.43
Total Supply 13.85
Area of Block (Sq. Km.) 599.03
Area suitable for Artificial recharge
(Sq. Km)
580.37
Type of Aquifer Hard Rock Soft Rock
Area feasible for Artificial
Recharge(WL >5mbgl) (Sq. Km.) 524.47 -
Volume of Unsaturated Zone (MCM) 1048.944 -
Average Specific Yield 0.020 -
Volume of Sub surface Storage Space
available for Artificial Recharge
(MCM)
20.98
-
Surplus water Available (MCM) 11.75 -
Proposed Structures Percolation Tank
(Av. Gross
Capacity-100
TCM*2 fillings =
200 TCM)
Check Dam ( Av. Gross
Capacity-10 TCM * 3 fillings
= 30 TCM)
Recharge
shaft
(Av.
Gross
Capacity-
60 TCM )
Number of Structures 31 88 0
Volume of Water expected to be
conserved / recharged @ 75%
efficiency (MCM)
4.65 1.98
0
Area of Saline Patch Nil
Proposed Structures Nil
No of farm pond proposed (size:
30m*30m*3) with 3 filling= 0.0081
mcm capacity, 50% available water
may be utilized for harvesting
through farm ponds.
Nil
Volume of water available for
harvesting
Nil
Additional volume created by
desilting Nil
RTRWH Structures – Urban Areas
Households to be covered (25% with
50 m2area) 7270
Total RWH potential (MCM) 0.255
Rainwater harvested / recharged @
80% runoff co-efficient
0.204 (Economically not viable & Not Recommended)
5.2.DEMAND SIDE MANAGEMENT
Micro irrigation techniques
Remaining ground water irrigated
Sugarcane cropped area proposed
through drip irrigation
Nil

88
Volume of Water expected to be
saved (MCM).
(Surface Flooding req- 2.45 m. Drip
Req. - 1.88, WUE- 0.57 m)
Nil
Proposed Cropping Pattern change
Irrigated area under Water Intensive
Crop (ha)
Not proposed
Water Saving by Change in Cropping
Pattern
Nil
5.3.EXPECTED BENEFITS
Net Ground Water Availability (MCM) 58.25
Additional GW resources available
after Supply side interventions
(MCM)
6.63
Ground Water Availability after
Supply side intervention 64.88
Existing Ground Water Draft for All
Purposes (MCM) 13.43
Saving of Ground Water through
demand side intervention (MCM) 0
GW draft after Demand Side
Interventions (MCM) 13.43
Present stage of Ground Water
Development (%) 23.1
Expected Stage of Ground Water
Development after interventions (%) 20.7
Other Interventions Proposed, if any
Alternate Water Sources Available Nil
5.4.RECOMMENDATION
Ground water development is recommended to bring the stage of development from 44.43% to 70%
5.5.DEVELOPMENT PLAN
Volume of water available for GWD
to 70% (MCM) 31.986
Proposed Number of DW( @ 1.5 ham
for 90% of GWR Available) 1919
Proposed Number of BW( @ 1 ham
for 10% of GWR Available) 320
Additional Area (sq.km.) proposed to
be brought under assured GW
irrigation with av. CWR of 0.65 m
49
Proposed Artificial Recharge Structure Addditional Area proposed to be brought under
assured ground water irrigation

89

90
9.4 DEGLUR BLOCK, NANDED DISTRICT
1. SALIENT INFORMATION 1.1.Introduction Block Name Deglur
Geographical Area (Sq. Km.) 684.20 Sq. Km.
Hilly Area (Sq. Km) 18.30 Sq. Km.
Poor Quality Area (Sq. Km.) Nil
Population (2011) 173369
Climate Tropical climate
1.2. Rainfall Analysis
Normal Rainfall 722.42 mm
Annual Rainfall (2019) 1029.5 mm
Decadal Average Annual Rainfall
(2010-19)
648.81 mm
Long Term Rainfall Analysis
(1998-2019)
Falling Trend:-13.66 m/year.
Probability of Normal/Excess Rainfall:-45% & 27%.
Probability of Drought (Moderate/Severe / Acute):- 23%
Moderate & 5% Severe
Frequency of occurrence of Drought:- 1 in 4 Years
RAINFALL TREND ANALYSIS (1998 to 2019)
1.3. Geomorphology, Soil & Geology
Geomorphic Unit ➢ Butte (B)
➢ Pediplain Under Canal Command (PPC)
➢ Pediplain Moderate (PPM), 2-5m weathering
➢ Plateau Moderately Dissected (PLM)
➢ Plateau Slightly Dissected (PLS), 0-1m weathering
➢ Plateau Undissected (PLU), 0-1m weathering
➢ Plateau Weathered (PLWS), 1-2m weathering
➢ Plateau Weathered (PLW), 2-5m weathering
➢ Plateau Weathered-Canal Command (PLC)
y = -13.664x + 879.56
0
200
400
600
800
1000
1200
199
8
199
9
20
00
20
01
20
02
20
03
20
04
20
05
20
06
20
07
20
08
20
09
20
10
20
11
20
12
20
13
20
14
20
15
20
16
20
17
20
18
20
19
Longterm Ranfall Analysis-Deglur Block

91
Soil ➢ Very shallow, somewhat excessively drained, loamy
soils on gently sloping undulating lands with mesas
and buttes with moderate erosion
➢ Very shallow, well drained, loamy soils on gently
sloping rolling lands with mesas and buttes with
moderate erosion and moderate stoniness.
➢ Shallow, well drained, clayey soils on gently sloping
lands with moderate erosion
➢ Deep, moderately well drained, fine soils on gently
sloping plains and valleys with moderate erosion
Geology Deccan Trap-Sahyadri Group (Late Cretaceous to Early
Eocene) & Gneiss-Granitoid / Migmatite Complex (Archean)
1.4. Hydrology & Drainage
Drainage The Landi river and its tributaries
Hydrology (as on March 2017)
Major & Medium
Irrigation Projects (>250
Ha)
Nil
Minor Irrigation Projects
(0 to 250 Ha)
No. of projects
completed till March
2017
73
No. of projects
operating till end
73
Command area of the
operating project (Sq.
Km.)
48.09
Net irrigated area
under Operating
project (Sq. Km.)
22.54
1.5. LAND USE, AGRICULTURE, IRRIGATION & CROPPING PATTERN
Geographical Area 684.20 Sq. Km.
Forest Area 5.73 Sq. Km.
Cultivable Area 668.50 Sq. Km.
Net Sown Area 514.35 Km.
Double Cropped Area 170.75 Sq. Km.
Area under
Irrigation
Surface Water 0
Ground Water 18.89 sq. km.
Principal Crops Crop Type Area (Sq. Km.)
Pulses 289.62
Cotton 90.91
Cereals 54.63
Oil Seeds 196.50
Horticultural Crops Sugarcane 0.20
Others 5.52
1.6.WATER LEVEL BEHAVIOUR
1.6.1. Aquifer-I/Shallow Aquifer (Phreatic Aquifer)
Pre-Monsoon (May-2019) Post-Monsoon (November-2019)

92
❖ Depth to water level between 10 mbgl
and 20 mbgl is observed in 293.14 Sq
Km area in the southern parts of the
block.
❖ Depth to water level between 20 mbgl
and 30 mbgl observed in northern parts
of the block
❖ Isolated patches of 3.14 Sq Km area
show depth to water level more than 30
mbgl in the northeastern part of the
block.
❖ Shallow Depth to water level between 2
mbgl and 5 mbgl is observed in 57 Sq Km
area in the northeastern and north-
western parts of the block.
❖ Depth to water level between 5 mbgl and
10 mbgl is observed in 140.79 Sq Km area
in the north-central and central parts of
the block.
❖ Depth to water level between 10 mbgl and
20 mbgl is observed in the major parts of
the block.
❖ Isolated patch of 2.53 Sq Km area show
depth to water level more than 20 mbgl
Water Level Map- Aquifer-I/Shallow Aquifer (Phreatic Aquifer)
Pre-Monsoon Water Level (May 2019)
Post-Monsoon Water Level (Nov.2017)
1.6.2. Aquifer-II/Deeper Aquifer (Semiconfined/Confined Aquifer)
Pre-Monsoon (May-2019) Post-Monsoon (November-2019)
Pre-Monsoon Water Level(May 2019) Post-Monsoon Water Level(November 2019)
❖ The depth to water level between 10
mbgl and 20 mbgl is observed in 409.6
Sq Km area in the major parts of the
block.
❖ The deeper depth to water level
between 20 mbgl and 30 mbgl is
❖ The depth to water level between 10 mbgl
and 20 mbgl is observed in 208.96 Sq Km
area in the north-eastern parts of the
block.
❖ The deeper depth to water level between
20 mbgl and 30 mbgl is observed in 441.5

93
observed in 242 Sq Km area in the
southern parts of the block.
Sq Km area in the major parts of the block.
1.7. Hydrograph
The hydrograph of CGWB Monitoring site at Atkali_Pz village for the period 2010 to 2019 shows:
❖ A rising trend during premonsoon @ 1.28 m/year and falling trend during postmonsoon @ 0.632
m/year
❖ Thedepth to water level during premonsoon ranges from 13.01 mbgl to 29.4 mbgl
❖ The depth to water level ranges from 4.5 to 24.6 mbgl during postmonsoon due tofalling rainfall
trend @2.37 mm/year.
1.8. Water Level Trend (2010-19)
Pre-Monsoon Trend (May 2010-2019) Post-Monsoon Trend (November 2010-2019)
Rising Trend @ Falling Trend @ Rising Trend @ Falling Trend @
0.00 to 0.2m/year
in 18.87 Sq Km
area, 0.2 to 0.4
m/year in 31 sq km
area and 0.4 to 0.6
sq km area in 283.9
sq km area.
0.0 to 0.2 m/year in 14.16
Sq Km area, 0.2 to 0.4
m/year in 13.37Sq Km
area; 0.4 to 0.6 m/year in
10.56 sq Km area and 0.6
to 0.8 sq km area in 276.7
sq km area
0 to 0.2 m/year in 96.46
Sq Km area, 0.2 to 0.4
m/year in 101.5 sq km
area, 0.4 to 0.6 m/year
In 94.18 sq km area; 0.6
to 0.8 m/year in 129.8
sq km area and >0.8
m/year in 165.2 sq km
area
0.0 to 0.2 m/year in
7.21 Sq Km area
Pre-Monsoon WL Trend (May 2010-2019) Post-Monsoon WL Trend (Nov.2010-2019)
2. GROUND WATER ISSUES
1. Low Development:-Low Development of 36.79 % of Stage of Ground Water Development is
observed in the block
2. Declining Water Level Trend: -
The decline in water level trend (2010-19) more than 0.6 m/year is observed in major section
of the block during Pre-season. This is due to the exploitation of shallow aquifers as for the
Rainfall: y = -2.3703x + 661.85
Pre WL:y = 1.2869x + 14.166Post WL:y = -0.6324x + 20.093
0
5
10
15
20
25
30
350
200
400
600
800
1000
1200
2010 2011 2012 2013 2014 2015 2016 2017 2018 2019 De
pth
to
wa
ter
le
ve
l (m
bg
l)
Ra
infa
ll (
mm
)
Year
ANNUAL RF Premonsson Wl Post monsoon Wl

94
dependency in ground water for irrigation during both Kharif and Rabi season due to lack of
availability of surface water.
3. Low ground water yield Potential of the aquifers:
The ground water yield potentiality of the aquifers ranges from 0 to 1 lps in major parts of the block.
However, high yielding aquifers are obtained only along the drainages, faults/ fractures or joints. The
low potential zone in major parts of the block is due to limited extent of porosity and permeability
evolved from secondary porosity and hence poor sustainability of aquifers.
4. Declining Rainfall Trend and Drought: The longterm rainfall analysis(1998 to 2019) indicates
a declining trend @13.66 mm/year with the probability of occurance of moderate drought in
23% of the years and severe drought in 5% of the years and the frequency of occurance of
drought being 1 in 4 years.
5. Deteriorated quality of Ground Water: The presence of Nitrate was observed in both the
aquifers in some sites making it unsuitable for both drinking and irrigation purposes in those
areas.
3. AQUIFER DISPOSITION
3.1. Number of Aquifers (Major) Two:
Basalt –Aquifer-I, Aquifer-II
Granite-Aquifer-I, Aquifer-II
3.2. LITHOLOGICAL DISPOSITION

95
3.3. CROSS SECTIONS
3.4 AQUIFER CHARACTERISTICS
Major Aquifer Basalt (Deccan Traps)/Granite Granite
Type of Aquifer
(Phreatic/Semiconfine
d/Confined)
Aquifer-I
(Phreatic)
Aquifer-II
(Semiconfined/co
nfined)
Aquifer-I
(Phreatic)
Aquifer-II
(Semiconfined/co
nfined)
Depth tobottom of
aquifer (mbgl)
10 to 16 28 to 108 8 to 17 28 to 108
Weathered/ Fractured
rocks thickness (m)
7 to 12.8 2 to 6 5 to 14 2 to 6
Yield Potential 15 to 100
m3/day
0 to 1.25 lps 0 to 100 m3/day 0 to 2.5 lps
Specific Yield (Sy)/
Storativity (S)
0.02 0.00065 0.02 0.011 to 0.19
Transmissivity (T) - 212-209.5 m2/day - 143.25 to 209.5
m2/day
4.CHEMICAL QUALITY OF GROUND WATER &CONTAMINATION
4.1 Aquifer I/Shallow Aquifer
Suitability for Drinking Purposes Suitability for Irrigation Purposes
➢ The overall quality of Aquifer is potable
and useful for drinking and domestic
puposes except in Nitrate affected
areas.
➢ About 13 Sq Km area of the block has EC
well within the potable range of 250 to
750microsiemens/cm whereas 636.6 sq
Km area has EC between 750 and 2250
microsiemens/cm.
➢ In 13.8 sq km area of the block, plants with
moderate salt tolerance can be grown.
However, in 636.6 sq Km area where EC >
750 microsiemens/cm, special
management for salinity control may be
required and plants with good salt
tolerance should be selected.
➢ All the analysed samples in the block have
SAR value well within 0 to 10 types and are
therefore good for irrigation.
➢ The RSC values of all the analysed samples
have values < 1.25 meq/l except in ine site
(Umri) indicating that the ground water is

96
good for irrigation.
➢ All the analysed samples have %Na
between 20 and 40 indicating that the
ground water is good for irrigation.
Hence, the overall quality of ground water is
suitable for irrigation purposes.
4.1 Aquifer II/Deeper Aquifer
Suitability for Drinking Purposes Suitability for Irrigation Purposes
➢ The overall quality of Aquifer is potable
and useful for drinking and domestic
puposes except in Nitrate affected
Sangvi village
➢ About 242.45 Sq Km area of the block
has EC well within the potable range of
250 to 750microsiemens/cm whereas
404.7 sq Km area has EC between 750
and 2250 microsiemens/cm.
➢ In 242.5 Sq Km area, plants with moderate
salt tolerance can be grown. However, in
404.7 sq Km area where EC > 750
microsiemens/cm, special management for
salinity control may be required and plants
with good salt tolerance should be
selected.
➢ All the analysed samples in the block have
SAR value well within 0 to 10 types and are
therefore good for irrigation.
➢ The RSC values of all theanalysed samples
have values < 1.25 meq/l indicating that
the ground water is good for irrigation.
➢ The analyzed sample has %Na value
between 40 and 60 indicating that the
ground water is good for irrigation.
3.2.CHEMICAL QUALITY MAP
Phreatic Aquifer (Aquifer-I)
Semiconfined/Confined Aquifer (Aquifer II)
5. GROUND WATER RESOURCE & EXTRACTION
Aquifer-I/ Phreatic Aquifer (Basalt & Alluvium)
Ground Water Recharge Worthy Area (Sq. Km.) 665.9
Total Annual Ground Water Recharge (MCM) 67.48
Natural Discharge (MCM) 3.37
Net Annual Ground Water Availability (MCM) 64.11
Existing Gross Ground Water Draft for irrigation
(MCM)
18.45
Existing Gross Ground Water Draft for domestic 5.76

97
and industrial water supply(MCM)
Existing Gross Ground Water Draft for All
uses(MCM)
23.58
Net Ground Water Availability for future
irrigation development(MCM)
31.39
Provision for domestic and industrial
requirement supply to 2025(MCM)
14.27
Stage of Ground Water Development % 36.79
Category SAFE
Aquifer-II
Semiconfined/Confined Aquifer (Basalt)
Resources above the confining layer Resources within the confining layer
Total Area
(Sq. Km.)
Peizomete
r (macl)
S Resources
above
confining
layer
(MCM)
Total Area
(Sq. Km.)
Mean
aquifer
thickne
ss (m)
Sy Resources
within the
confining
layer (MCM)
684.2
45.1
0.00065
20.08
684.2 4.000
0.002
5.47
5.0. GROUND WATER RESOURCE ENHANCEMENT
Available Resource (MCM) 64.11
Gross Annual Draft (MCM) 23.58
5.1.SUPPLY SIDE MANAGEMENT
SUPPLY (MCM)
Agricultural Supply -GW 18..45
Agricultural Supply -SW 0.00
Domestic Supply - GW 5.12
Domestic Supply - SW 1.28
Total Supply 6.40
Area of Block (Sq. Km.) 684.2
Area suitable for Artificial recharge
(Sq. Km)
665.9
Type of Aquifer Hard Rock Soft Rock
Area feasible for Artificial
Recharge(WL >5mbgl) (Sq. Km.) 606.79 -
Volume of Unsaturated Zone (MCM) 1213.588 -
Average Specific Yield 0.020 -
Volume of Sub surface Storage Space
available for Artificial Recharge
(MCM)
24.27
-
Surplus water Available (MCM) 13.59 -
Proposed Structures Percolation Tank
(Av. Gross
Capacity-100
TCM*2 fillings =
200 TCM)
Check Dam
( Av. Gross
Capacity-10
TCM * 3
fillings = 30
Recharge shaft (Av.
Gross Capacity-60 TCM )

98
TCM)
Number of Structures 36 102 0
Volume of Water expected to be
conserved / recharged @ 75%
efficiency (MCM)
5.4 2.295
0
Area of Saline Patch Nil
Proposed Structures Nil
No of farm pond proposed (size:
30m*30m*3) with 3 filling= 0.0081
mcm capacity, 50% available water
may be utilized for harvesting
through farm ponds.
Nil
Volume of water available for
harvesting
Nil
Additional volume created by
desilting Nil
RTRWH Structures – Urban Areas
Households to be covered (25% with
50 m2area) 8993
Total RWH potential (MCM) 0.291
Rainwater harvested / recharged @
80% runoff co-efficient
0.233(Economically not viable & Not Recommended)
5.2.DEMAND SIDE MANAGEMENT
Micro irrigation techniques
Remaining ground water irrigated
Sugarcane cropped area proposed
through drip irrigation
Nil
Volume of Water expected to be
saved (MCM).
(Surface Flooding req- 2.45 m. Drip
Req. - 1.88, WUE- 0.57 m)
Nil
Proposed Cropping Pattern change
Irrigated area under Water Intensive
Crop(ha)
Not proposed
Water Saving by Change in Cropping
Pattern
Nil
5.3.EXPECTED BENEFITS
Net Ground Water Availability
(MCM) 64.11
Additional GW resources available
after Supply side interventions
(MCM)
7.695
Ground Water Availability after
Supply side intervention 71.805
Existing Ground Water Draft for All
Purposes (MCM) 23.58

99
Saving of Ground Water through
demand side intervention (MCM) 0
GW draft after Demand Side
Interventions (MCM) 23.58
Present stage of Ground Water
Development (%)
36.8
Expected Stage of Ground Water
Development after interventions (%)
32.8
Other Interventions Proposed, if any
Alternate Water Sources Available Nil
5.4.RECOMMENDATION
Ground water development is recommended, if additional ground water resources are available after
bringing the expected stage of development from 56.45% to 70%.
5.5.DEVELOPMENT PLAN
Additional Volume of water available
for GWD to 70% (MCM) 26.68
Proposed Number of DW( @ 1.5 ham
for 90% of GWR Available) 1601
Proposed Number of BW( @ 1.5 ham
for 10% of GWR Available) 267
Additional Area (sq.km.) proposed to
be brought under assured GW
irrigation with av. CWR of 0.65 m
41
Proposed Artificial Recharge Structure
Addditional Area proposed to be brought under
assured ground water irrigation

100
9.5 DHARMABAD BLOCK, NANDED DISTRICT
1. SALIENT INFORMATION 1.1.Introduction Block Name DHARMABAD
Geographical Area (Sq. Km.) 336.47 Sq. Km.
Hilly Area (Sq. Km) 1.10 Sq. Km.
Poor Quality Area (Sq. Km.) Nil
Population (2011) 12508
Climate Tropical climate
1.2. Rainfall Analysis
Normal Rainfall 774.83 mm
Annual Rainfall (2019) 1055.1 mm
Decadal Average Annual Rainfall
(2010-19)
734.41 mm
Long Term Rainfall Analysis
(1998-2019)
Falling Trend:-3.229 m/year.
Probability of Normal/Excess Rainfall:- 38% & 38%.
Probability of Drought (Moderate/Severe/ Acute):- 24%
Moderate
Frequency of occurrence of Drought:- 1 in 4 Years
RAINFALL TREND ANALYSIS (1998 to 2019)
1.3. Geomorphology, Soil & Geology
Geomorphic Unit ➢ Pediment (PD)
➢ Pediplain Moderate (PPM), 2-5m weathering
➢ Pediplain Shallow (PPS), 0-2m weathering
➢ Plateau Slightly Dissected (PLS), 0-1m weathering
Soil ➢ Very shallow, somewhat excessively drained, loamy
soils on moderately sloping summits/spurs with
severe erosion
➢ Deep, moderately well drained, fine soils on gently
sloping plains and valleys with moderate erosion
y = 3.2294x + 702.48
0
200
400
600
800
1000
1200
1400
1600
199
8
199
9
20
00
20
01
20
02
20
03
20
04
20
05
20
06
20
07
20
08
20
09
20
10
20
11
20
12
20
13
20
14
20
15
20
16
20
17
20
18
20
19
Longterm Rainfall (1998 to 2019) of Dharmabad block

101
➢ Shallow, well drained, clayey soils on gently sloping
lands with moderate erosion
Geology Deccan Trap-Sahyadri Group (Late Cretaceous to Early
Eocene) & Gneiss-Granitoid / Migmatite Complex (Archean)
1.4.Hydrology & Drainage
Drainage Godavari river
Hydrology(as on March 2017)
Major & Medium
Irrigation Projects
(>250 Ha)
1 Medium project
Minor Irrigation
Projects (0 to 250
Ha)
No. of projects
completed till
March 2017
46
No. of projects
operating till end
46
Command area of
the operating
project (Sq. Km.)
4.21
Net irrigated area
under Operating
project (Sq. Km.)
3.05
1.5.LAND USE, AGRICULTURE, IRRIGATION & CROPPING PATTERN
Geographical Area 336.47 Sq. Km.
Forest Area 35.34 Sq. Km.
Cultivable Area 332.62 Sq. Km.
Net Sown Area 254.97. Km.
Double Cropped Area 175.52 Sq. Km.
Area under Irrigation Surface Water 0
Ground Water 2.14 sq km
Principal Crops Crop Type Area (Sq. Km.)
Pulses 190.22
Cotton 113.21
Cereals 57.46
Oil Seeds 118.73
Horticultural Crops Sugarcane 0.33
Others 1.62
1.6.WATER LEVEL BEHAVIOUR
1.6.1. Aquifer-I/Shallow Aquifer (Phreatic Aquifer)
Pre-Monsoon (May-2019) Post-Monsoon (November-2019)
❖ The depth to water level between 5
mbgl and 10 mbgl is observed in 9 Sq
Km area in the southern parts of the
block
❖ The deeper depths to water level
between 10 mbgl and 20 mbgl is
observed in 103.16 Sq Km area in the
western parts.
❖ Th remaining parts of the block covering
❖ The shallow depth to water level below 5
mbgl is observed in 20.25 Sq Km area in an
isolated patch in the northern part of the
block.
❖ The depth to water level between 5 mbgl
and 10 mbgl is observed in 163 Sq Km area
in the western and north-western parts of
the block.
❖ The deeper depths to water level between

102
187.52 sq km area has depths to water
level between 20 mbgl and 30 mbgl.
10 mbgl and 20 mbgl is observed in 128.89
Sq Km area in the remaining parts of the
block
Water Level Map- Aquifer-I/Shallow Aquifer (Phreatic Aquifer)
Pre-Monsoon Water Level (May 2019)
Post-Monsoon Water Level (Nov.2019)
1.6.2. Aquifer-II/Deeper Aquifer (Semiconfined/Confined Aquifer)
Pre-Monsoon (May-2019) Post-Monsoon (November-2019)
Pre-Monsoon Water Level(May 2019) Post-Monsoon Water Level(November 2019)
❖ The deeper depth to water level
between 10 mbgl and 20 mbgl is
observed in 93.37 Sq Km area
coveringnorth-western part of the
block.
❖ The deeper depths to water level
between 20 mbgl and 30 mbgl is
observed in 215.6 Sq Km area in the
remaining parts of the block
❖ The depth to water level between 5 mbgl
and 10 mbgl is observed in the whole of
the block
1.7. Hydrograph

103
The hydrograph of CGWB Monitoring site at Dharmabad village for the period 2010 to 2019 shows:
❖ A rising trend during both premonsoon and postmonsoon @ 0.182 m/year and 0.315 m/year
respectively.
❖ The depth to water level during premonsoon ranges from 6.9 mbgl to 9.59 mbgl. The deeper
depths to water level indicates overdraft from the well during dry season.
❖ The depth to water level ranges from 4 mbgl to 8.75 mbgl during postmonsoon
❖ A rising trend of rainfall @ 0.4 mm/year was observed during the period
1.8. Water Level Trend (2010-19)
Pre-Monsoon Trend (May 2010-2019) Post-Monsoon Trend (November 2010-2019)
Rising Trend @ Falling Trend @ Rising Trend @ Falling Trend @
0.0 to 0.2 m/year
in 118.4 Sq Km
area & 0.2 to 0.4
m/year in 9.63 Sq
Km area.
0.0 to 0.2 m/year in 39.05
Sq Km area, 0.2 to 0.4
m/year in 38.19 Sq Km
area; 0.4 to 0.6 m/year in
54.15 Sq Km area and >0.6
m/year in 56.58 sq km
area.
Nil 0.0 to 0.2 m/year in
248.8 Sq Km area and
0.2 to 0.4 m/year in
67.27Sq Km area.
Pre-Monsoon WL Trend (May 2010-2019) Post-Monsoon WL Trend (Nov.2010-2019)
2. GROUND WATER ISSUES
1) Declining Water Level Trend: -
The decline in water level trend (2010-19) upto more than 0.6 m/year is observed in major section of
the block during both the seasons despite the increase in rainfall @3.2 mm/year. This is due to the
exploitation of shallow aquifers as for the dependency in ground water for irrigation during both
Kharif and Rabi.
2) Low ground water yield Potential of the aquifers:
The ground water yield potentiality of the aquifers ranges from 0 to 1 lps in major parts of the block.
However, high yielding aquifers are obtained only along the drainages, faults/ fractures or joints. The
low potential zone in major parts of the block is due to limited extent of porosity and permeability
Rainfall:y = 0.4055x + 732.18Pre WL:y = 0.1823x + 7.5333 Post WL: y = 0.3153x + 4.9807
0
2
4
6
8
10
120
200
400
600
800
1000
1200
2010 2011 2012 2013 2014 2015 2016 2017 2018 2019 De
pth
to
wa
ter
le
ve
l (m
bg
l)
Ra
infa
ll (
mm
)
YearANNUAL RF Premonsson Wl Post monsoon Wl

104
evolved from secondary porosity and hence poor sustainability of aquifers.
3. AQUIFER DISPOSITION
3.1. Number of Aquifers (Major) Two
1)Basalt –Aquifer-I, Aquifer-II
2)Granite-Aquifer-I, Aquifer-II
3.2. LITHOLOGICAL DISPOSITION
3.3. CROSS SECTIONS
3.4 AQUIFER CHARACTERISTICS
Major Aquifer Basalt (Deccan Traps) Granites
Type of Aquifer
(Phreatic/Semiconfin
ed/Confined)
Aquifer-I
(Phreatic)
Aquifer-II
(Semiconfined/co
nfined)
Aquifer-I
(Phreatic)
Aquifer-II
(Semiconfined/co
nfined)
Depth to bottom of
aquifer (mbgl)
10 to 16 48 to 88 8 to 16 28 to 68
Weathered/
Fractured rocks
thickness (m)
8 to 12 2 to 6 7 to 13 4 to 8
Yield Potential 0 to 50 m3/day 0 to 0.25 lps 10 to 50 m3/day 0 to 1.25 lps
Specific Yield (Sy)/
Storativity (S)
0.02 0.00022 0.02 0.00022
Transmissivity (T) - 85 to 281 m3/day - 104.09 to 143.25
m3/day
4.CHEMICAL QUALITY OF GROUND WATER &CONTAMINATION

105
4.1 Aquifer I/Shallow Aquifer
Suitability for Drinking Purposes Suitability for Irrigation Purposes
➢ The overall quality of Aquifer is
potable and useful for drinking and
domestic puposes The entire block
has EC between 750 and 2250
microsiemens/cm.
➢ Since the block has EC > 750
microsiemens/cm, special management for
salinity control may be required and plants
with good salt tolerance should be selected.
4.1 Aquifer II/Deeper Aquifer
Suitability for Drinking Purposes Suitability for Irrigation Purposes
➢ The overall quality of Aquifer is
potable and useful for drinking and
domestic puposes except in Nitrate
Karkheli village
➢ About 6.3 Sq Km area of the block has
EC well within the potable range of
250 to 750microsiemens/cm whereas
309 sq Km area has EC between 750
and 2250 microsiemens/cm.
➢ In major parts of the block covering 6 Sq Km
area, plants with moderate salt tolerance
can be grown. However, in 309 sq Km area
where EC > 750 microsiemens/cm, special
management for salinity control may be
required and plants with good salt tolerance
should be selected.
➢ The analysed sample in the block have SAR
value well within 0 to 10 types and are
therefore good for irrigation.
➢ The RSC values of the analysed sample haS
value > 1.25 meq/l indicating that the
ground water is not good for irrigation.
➢ The analysed sample has %Na value more
than 60% indicating that the ground water is
not good for irrigation in that area
3.2.CHEMICAL QUALITY MAP
Phreatic Aquifer (Aquifer-I)
Semiconfined/Confined Aquifer (Aquifer II)
5. GROUND WATER RESOURCE & EXTRACTION
Aquifer-I/ Phreatic Aquifer (Basalt)
Ground Water Recharge Worthy Area (Sq. Km.) 335.57
Total Annual Ground Water Recharge (MCM) 32.86
Natural Discharge (MCM) 1.64
Net Annual Ground Water Availability (MCM) 31.22
Existing Gross Ground Water Draft for irrigation 5.52

106
(MCM)
Existing Gross Ground Water Draft for domestic
and industrial water supply(MCM)
0.78
Existing Gross Ground Water Draft for All uses
(MCM)
6.30
Net Ground Water Availability for future
irrigation development (MCM)
23.46
Provision for domestic and industrial
requirement supply to 2025(MCM)
2.22
Stage of Ground Water Development % 20.20
Category SAFE
Aquifer-II
Semiconfined/Confined Aquifer (Basalt)
Resources above the confining layer Resources within the confining layer
Total
Area
(Sq.
Km.)
Peizometer
head
(macl)
S Resources
above
confining
layer(MCM)
Total Area
(Sq. Km.)
Mean
aquifer
thickness
(m)
Sy Resources
within the
confining layer
(MCM)
336.47
36.8
0.00022
2.72
336.47
6.000
0.002 4.04
5.0. GROUND WATER RESOURCE ENHANCEMENT
Available Resource (MCM) 31.22
Gross Annual Draft (MCM) 6.30
5.1.SUPPLY SIDE MANAGEMENT
SUPPLY (MCM)
Agricultural Supply -GW 5.51
Agricultural Supply -SW 2.19
Domestic Supply - GW 0.78
Domestic Supply - SW 0.20
Total Supply 8.68
Area of Block (Sq. Km.) 336.47
Area suitable for Artificial recharge
(Sq. Km)
335.37
Type of Aquifer Hard Rock Soft Rock
Area feasible for Artificial
Recharge(WL >5mbgl) (Sq. Km.) 308.76 -
Volume of Unsaturated Zone (MCM) 617.522 -
Average Specific Yield 0.020 -
Volume of Sub surface Storage Space
available for Artificial Recharge
(MCM)
12.35044
-
Surplus water Available (MCM) 12.35044 -
Proposed Structures Percolation Tank
(Av. Gross Capacity-
100 TCM*2 fillings =
200 TCM)
Check Dam ( Av. Gross Capacity-10
TCM * 3 fillings = 30 TCM)

107
Number of Structures 18 52
Volume of Water expected to be
conserved / recharged @ 75%
efficiency (MCM)
2.7 1.17
Area of Saline Patch Nil
Proposed Structures Nil
No of farm pond proposed (size:
30m*30m*3) with 3 filling= 0.0081
mcm capacity, 50% available water
may be utilized for harvesting
through farm ponds.
Nil
Volume of water available for
harvesting
Nil
Additional volume created by
desilting Nil
RTRWH Structures – Urban Areas
Households to be covered (25% with
50 m2area)
3127
Total RWH potential (MCM) 0.115
Rainwater harvested / recharged @
80% runoff co-efficient
0.092
(Economically not viable & Not Recommended)
5.2. DEMAND SIDE MANAGEMENT
Micro irrigation techniques
Remaining ground water irrigated
Sugarcane cropped area proposed
through drip irrigation
Nil
Volume of Water expected to be
saved (MCM).
(Surface Flooding req- 2.45 m. Drip
Req. - 1.88, WUE- 0.57 m)
Nil
Proposed Cropping Pattern change
Irrigated area under Water Intensive
Crop(ha)
Not proposed
Water Saving by Change in Cropping
Pattern
Nil
5.3. EXPECTED BENEFITS
Net Ground Water Availability
(MCM) 31.22
Additional GW resources available
after Supply side interventions
(MCM)
3.87
Ground Water Availability after
Supply side intervention 35.09
Existing Ground Water Draft for All
Purposes (MCM) 6.30

108
Saving of Ground Water through
demand side intervention (MCM) 0
GW draft after Demand Side
Interventions (MCM) 6.3
Present stage of Ground Water
Development (%) 20.2
Expected Stage of Ground Water
Development after interventions (%) 18.0
Other Interventions Proposed, if any
Alternate Water Sources Available Nil
5.4.RECOMMENDATION
Ground water development is recommended to bring the stage of development from 58.25% to 70%.
5.5.DEVELOPMENT PLAN
Additional Volume of water available
for GWD upto 70% (MCM) 18.26
Proposed Number of DW( @ 1.5 ham
for 90% of GWR Available) 1096
Proposed Number of BW( @ 1.5 ham
for 10% of GWR Available) 183
Additional Area (sq.km.) proposed to
be brought under assured GW
irrigation with av. CWR of 0.65 m
28
Proposed Artificial Recharge Structure
Additional Area proposed to be brought under
assured ground water irrigation

109
9.6 HADGAON BLOCK, NANDED DISTRICT
SALIENT INFORMATION 1.1. Introduction Block Name HADGAON
Geographical Area (Sq. Km.) 1036.92 Sq. Km.
Hilly Area (Sq. Km) 32.81 Sq. Km.
Poor Quality Area (Sq. Km.) Nil
Population (2011) 232553
Climate Tropical climate
1.2. Rainfall Analysis
Normal Rainfall 798.1 mm
Annual Rainfall (2019) 931.3 mm
Decadal Average Annual Rainfall
(2008-17)
849.2 mm
Long Term Rainfall Analysis
(1998-2019)
Rising Trend: 2.803 m/year.
Probability of Normal/Excess Rainfall: -54% & 23%.
Probability of Drought (Moderate/ Severe/ Acute):- 23%
Moderate
Frequency of occurrence of Drought:- 1 in 4 Years
RAINFALL TREND ANALYSIS (1998 to 2019)
1.3. Geomorphology, Soil & Geology Geomorphic Unit Butte (B)
Mesa (M)
Plateau Moderately Dissected (PLM)
Plateau Slightly Dissected (PLS), 0-1m weathering
Plateau Undissected (PLU), 0-1m weathering
Plateau Weathered (PLWS), 1-2m weathering
Plateau Weathered (PLW), 2-5m weathering
Plateau Weathered-Canal Command (PLC)
Soil Very shallow, well drained, loamy, moderately calcareous
soils on gently sloping undulating lands with moderate
y = 2.8027x + 765.96
0
200
400
600
800
1000
1200
1400
1600
199
8
199
9
20
00
20
01
20
02
20
03
20
04
20
05
20
06
20
07
20
08
20
09
20
10
20
11
20
12
20
13
20
14
20
15
20
16
20
17
20
18
20
19
Longterm Rainfall Analysis (1998 to 2019) of Hadgaon block

110
erosion
Very shallow, somewhat excessively drained, loamy soils
on gently sloping rolling lands with mesas and buttes
with severe erosion
Shallow, moderately well drained clayey soils on gently
sloping summits/spurs with moderate erosion.
Moderately deep, moderately well drained, fine,
moderately calcareous soils on gently sloping
summits/spurs with moderate erosion
Deep, imperfectly drained, fine, calcareous soils on very
gently sloping plains and valleys with moderate erosion;
moderate salinity and slight sodicity
Geology Deccan Trap-Sahyadri Group (Late Cretaceous to Early
Eocene Age)
1.4.Hydrology & Drainage Drainage Penganga River and its tributaries
Hydrology(as on March 2017)
Major & Medium
Irrigation Projects
(>250 Ha)
Nil
Minor Irrigation
Projects (0 to 250
Ha)
No. of projects
completed till
March 2017
60
No. of projects
operating till
end
60
Command area
of the operating
project (Sq.
Km.)
75.29
Net irrigated
area under
Operating
project (Sq.
Km.)
29.69
1.5.LAND USE, AGRICULTURE, IRRIGATION & CROPPING PATTERN Geographical Area 1036.92 Sq. Km.
Forest Area 27.95 Sq. Km.
Cultivable Area 812.73 Sq. Km.
Net Sown Area 752.38. Km.
Double Cropped Area 135.15 Sq. Km.
Area under
Irrigation
Surface Water 0.04 sq km
Ground Water 18.44 Sq. Km.
Principal Crops Crop Type Area (Sq. Km.)
Pulses 230.30
Cotton 346.05
Cereals 91.70
Oil Seeds 452.72
Horticultural Crops Sugarcane 42.91
Others 12.55

111
1.6.WATER LEVEL BEHAVIOUR 1.6.1. Aquifer-I/Shallow Aquifer (Phreatic Aquifer) Pre-Monsoon (May-2019) Post-Monsoon (November-2019)
small patches of 57 Sq Km area has depth to
water level between 5 mbgl and 10 mbgl
Depth to water level between 10 mbgl and 20
mbgl observed in 559.5 Sq Km area in the
major parts of the block
Depth to water level between 20 mbgl and 30
mbgl observed in 286 Sq Km area in the
soothe-eastern and south-central parts of the
block.
Very shallow Depth to water level between
less 2 mbgl is observed in 144.57 Sq Km area
along the southeastern parts of the block..
Depth to water level between 2 mbgl and 5
mbgl is observed in 655.7 Sq Km area in the
major parts of the block
Depth to water level between 10 mbgl and 20
mbgl is observed in 82.47 sq km area in the
small isolated portions distributed in the
north and southern parts of the block.
The shallow depths to water level may be
dueto recharge from rainfall.
Water Level Map- Aquifer-I/Shallow Aquifer (Phreatic Aquifer)
Pre-Monsoon Water Level (May 2019)
Post-Monsoon Water Level (Nov.2019)
1.6.2. Aquifer-II/Deeper Aquifer (Semiconfined/Confined Aquifer) Pre-Monsoon (May-2019) Post-Monsoon (November-2019)
Pre-Monsoon Water Level(May 2019) Post-Monsoon Water Level(November 2019)
Depth to water level between 5 mbgl and 10
mbgl observed in 522 Sq Km area in the
western, south-western parts of the block
The shallow depth to water level less than 2
mbgl is observed in 116.7 Sq Km areain the
north-western parts of the block.

112
Depth to water level between 10 mbgl and 20
mbgl observed in 502 Sq Km area in the
eastern and north-eastern parts of the block.
The shallow depth to water level between 2
mbgl and 5 mbgl is observed in 215.7 Sq Km
area in the north-western parts of the block.
Depth to water level between 5 mbgl and 10
mbgl is observed in 357.8 Sq Km area in the
central and southern parts of the block.
Depth to water level between 10 mbgl and 20
mbgl is observed in 146.2 Sq Km area in the
eastern parts of the block.
Deeper depths to water level between 20 mbgl
and 30 mbgl are observed in 181.48 Sq Km
area in the north-eastern parts of the block.
1.7. Hydrograph
The hydrograph ph of CGWB Monitoring site at Dhawari Buzurg for the period 2010 to 2019
shows:
A rising trend during both premonsoon and postmonsoon @ 0.145 m/year and 0.271 m/year
respectively.
The depth to water level during premonsoon ranges from 7.2 mbgl to 10.3 mbgl.
The depth to water level during postmonsoon ranges from 2.13mbgl to 9.4 mbgl with deeper
depths to water level of 21.7 mbgl and 21.9 mbgl
1.8. Water Level Trend (2010-19)
Pre-Monsoon Trend (May 2010-2019) Post-Monsoon Trend (November 2010-2019)
Rising Trend @ Falling Trend @ Rising Trend @ Falling Trend @
0 to 0.2 m/year
in 276.8 Sq Km
area, 0.2 to 0.4
m/year in 112.83
sq km area.
0.00 to 0.2 m/year in
193.4 Sq Km area, 0.2 to
0.4 m/year in 87.90 Sq
Km area, 0.4 to 0.6
m/year in 189.2 sq km
area and >0.6 m/year in
152.5 Sq Km area
0 to 0.2 m/year in
42.21Sq Km area
0 to 0.2 m/year in
833.5 Sq Km area;
0.2 to 0.4 m/year in
67.25 Sq Km area and
>04 m/year in 69.65
sq km
Pre-Monsoon WL Trend (May 2010-2019) Post-Monsoon WL Trend (Nov.2010-2019)
Rainfall:y = -3.1067x + 866.29Pre WL:y = 0.145x + 7.4347
Post WL: y = 0.2717x + 3.85870
2
4
6
8
10
120
200
400
600
800
1000
1200
1400
2010 2011 2012 2013 2014 2015 2016 2017 2018 2019 De
pth
to
wa
ter
le
ve
l (m
bg
l)
Ra
infa
ll (
mm
)
YearANNUAL RF Premonsson Wl Post monsoon Wl

113
2. GROUND WATER ISSUES Low development
Low Development: -Low Development of 42.43 % of Stage of Ground Water Development is
observed in the block
2) Declining Water Level Trend: -
The decline in water level trend (2010-19) upto 0.6 m/year is observed in major section of the
block during both the seasons despite the increase in rainfall @2.8 mm/year. This is due to
the exploitation of shallow aquifers as for the dependency in ground water for irrigation
during both Kharif and Rabi.
3) Low ground water yield Potential of the aquifers:
The ground water yield potentiality of the aquifers ranges from 0 to 1.5 lps in major parts of
the block. However, high yielding aquifers are obtained only along the drainages, faults/
fractures or joints. The low potential zone in major parts of the block is due to limited extent
of porosity and permeability evolved from secondary porosity and hence poor sustainability of
aquifers.
3. AQUIFER DISPOSITION
3.1. Number of Aquifers
(Major)
One:
Basalt –Aquifer-I, Aquifer-II
3.2. LITHOLOGICAL DISPOSITION

114
3.3. CROSS SECTIONS
3.4 AQUIFER CHARACTERISTICS Major Aquifer Basalt (Deccan Traps)
Type of Aquifer
(Phreatic/Semiconfined/Confined)
Aquifer-I
(Phreatic)
Aquifer-II(Semiconfined
/confined)
Depth of Occurrence bottom of aquifer
(mbgl)
9 to 21 30 to 201
Weathered/ Fractured rocks thickness
(m)
8 to 14 2 to 14
Yield Potential 10 to 100 m3/day 0 to 0.4 lps
Specific Yield (Sy)/ Storativity (S) 0.02 0.00035
Transmissivity (T) 546.11m2/day
4.CHEMICAL QUALITY OF GROUND WATER &CONTAMINATION 4.1 Aquifer I/Shallow Aquifer Suitability for Drinking Purposes Suitability for Irrigation Purposes
The overall quality of Aquifer is potable and
useful for drinking and domestic purposes
except in Nitrate affected areas.
About 179.09 Sq Km area of the block has EC
well within the potable range of 250 to
750microsiemens/cm; 723.9 sq Km area has
EC between 750 and 2250 microsiemens/cm
; 105.2 sq km area has EC between 2250 and
3000 microsiemens/cm and 9 sq km area has
EC between 3000 and 5000
microsiemens/cm
In 179.09 sq km area of the block covering,
plants with moderate salt tolerance can be
grown. However, in 723 sq Km area where EC
> 750 microsiemens/cm, special management
for salinity control may be required and
plants with good salt tolerance should be
selected. All the analysed samples in the block
have SAR value well within 0 to 10 types and
are therefore good for irrigation.
The RSC values of all the analysed samples
have values < 1.25 meq/l except in 2 sites
(Dhawari , Mathala) indicating that the
ground water is good for irrigation.
About 50% of the analysed samples have %
Na less than 20 and 50 % have %Na between
20 and 40 indicating that the ground water is
good for irrigation.
Hence, the overall quality of ground water is
suitable for irrigation purposes
4.1 Aquifer II/Deeper Aquifer Suitability for Drinking Purposes Suitability for Irrigation Purposes
The overall quality of Aquifer is potable and
useful for drinking and domestic purposes
In 337.96 Sq Km area, plants with moderate
salt tolerance can be grown. However, in 677

115
except in Nitrate affected Talegaon village
About 337.96 Sq Km area of the block has EC
well within the potable range of 250 to
750microsiemens/cm and 677 sq Km area
has EC between 750 and 2250
microsiemens/cm.
sq Km area where EC > 750
microsiemens/cm, special management for
salinity control may be required and plants
with good salt tolerance should be selected
All the analysed samples in the block have
SAR value well within 0 to 10 types and are
therefore good for irrigation.
The RSC values of the analysed samples have
values < 1.25 meq/l indicating that the
ground water is good for irrigation and 50%
of the samples except in Tamsa and Koli
villages.
Half of the analysed samples have %Naless
than 60% and 50% of the samples has % Na
more than 60%..
Hence, the overall quality of ground water is
suitable for irrigation purposes except in
villages with high RSC values and % Na
concentration more than 60%.
3.2. CHEMICAL QUALITY MAP Phreatic Aquifer (Aquifer-I)
Semiconfined/Confined Aquifer (Aquifer II)
5. GROUND WATER RESOURCE & EXTRACTION Aquifer-I/ Phreatic Aquifer (Basalt & Alluvium)
Ground Water Recharge Worthy Area (Sq.
Km.)
100.41
Total Annual Ground Water Recharge (MCM) 127.46
Natural Discharge (MCM) 6.37
Net Annual Ground Water Availability
(MCM)
121.09
Existing Gross Ground Water Draft for
irrigation (MCM)
48.49
Existing Gross Ground Water Draft for
domestic and industrial water supply (MCM)
0
Existing Gross Ground Water Draft for All
uses (MCM)
2.88

116
Net Ground Water Availability for future
irrigation development (MCM)
6.46
Provision for domestic and industrial
requirement supply to 2025(MCM)
8.25
Stage of Ground Water Development % 42.43
Category SAFE
Aquifer-II
Semiconfined/Confined Aquifer (Basalt)
Resources above the confining layer Resources within the confining layer
Total Area
(Sq. Km.)
Peizometer
head
(macl)
S Resource
s above
confinin
g layer
9MCM)
Total
Area (Sq.
Km.)
Mean
aquifer
thickne
ss (m)
Sy Resources
within the
confining
layer
(MCM)
1036.92
37.3
0.0003
5
13.54
1036.92
8.000
0.002
20.74
5.0. GROUND WATER RESOURCE ENHANCEMENT
Available Resource (MCM) 121.09
Gross Annual Draft (MCM) 51.38
5.1.SUPPLY SIDE MANAGEMENT
SUPPLY (MCM)
Agricultural Supply -GW 48.49
Agricultural Supply -SW 0.04
Domestic Supply - GW 2.88
Domestic Supply - SW 0.72
Total Supply 52.13
Area of Block (Sq. Km.) 1036.92
Area suitable for Artificial
recharge
(Sq. Km)
1004.11
Type of Aquifer Hard Rock Soft Rock
Area feasible for Artificial
Recharge(WL >5mbgl) (Sq. Km.)
286.10
-
Volume of Unsaturated Zone
(MCM)
572.19
-
Average Specific Yield 0.020 -
Volume of Sub surface Storage
Space available for Artificial
Recharge (MCM)
11.44
-
Surplus water Available (MCM) 6.41 -
Proposed Structures Percolation Tank
(Av. Gross
Capacity-100
TCM*2 fillings =
200 TCM)
Check Dam ( Av.
Gross Capacity-
10 TCM * 3
fillings = 30
TCM)
Recharge shaft
(Av. Gross
Capacity-60
TCM )
Number of Structures 17 48 0
Volume of Water expected to be 2.55 1.08 0

117
conserved / recharged @ 75%
efficiency (MCM)
Area of Saline Patch Nil
Proposed Structures Nil
No of farm pond proposed (size:
30m*30m*3) with 3 filling=
0.0081 mcm capacity, 50%
available water may be utilized for
harvesting through farm ponds.
Nil
Volume of water available for
harvesting
Nil
Additional volume created by
desilting Nil
RTRWH Structures – Urban
Areas
Households to be covered (25%
with 50 m2area)
11923
Total RWH potential (MCM) 0.506
Rainwater harvested / recharged
@ 80% runoff co-efficient
0.405
(Economically not viable & Not Recommended)
5.2.DEMAND SIDE MANAGEMENT
Micro irrigation techniques
Remaining ground water irrigated
Sugarcane cropped area proposed
through drip irrigation
Nil
Volume of Water expected to be
saved (MCM).
(Surface Flooding req- 2.45 m.
Drip Req. - 1.88, WUE- 0.57 m)
Nil
Proposed Cropping Pattern change
Irrigated area under Water
Intensive Crop(ha)
Not proposed
Water Saving by Change in
Cropping Pattern
Nil
5.3.EXPECTED BENEFITS
Net Ground Water Availability
(MCM) 121.09
Additional GW resources available
after Supply side interventions
(MCM)
3.63
Ground Water Availability after
Supply side intervention 124.72
Existing Ground Water Draft for
All Purposes (MCM) 51.38
Saving of Ground Water through
demand side intervention (MCM) 0
GW draft after Demand Side
Interventions (MCM) 51.38

118
Present stage of Ground Water
Development (%) 42.4
Expected Stage of Ground Water
Development after interventions
(%)
41.2
Other Interventions Proposed, if any
Alternate Water Sources Available Nil
5.4.RECOMMENDATION
Ground water development is recommended to bring the expected stage of development from
40.90% to 70%.
5.5.DEVELOPMENT PLAN
Volume of water available for
GWD to 70% (MCM) 35.92
Proposed Number of DW( @ 1.5
ham for 90% of GWR Available) 2155
Proposed Number of BW( @ 1.5
ham for 10% of GWR Available) 359
Additional Area (sq.km.)
proposed to be brought under
assured GW irrigation with av.
CWR of 0.65 m
55
Proposed Artificial Recharge Structure
Addditional Area proposed to be brought
under assured ground water irrigation

119
9.7 HIMAYATNAGAR BLOCK, NANDED DISTRICT
SALIENT INFORMATION 1.1.Introduction Block Name Himayat Nagar
Geographical Area (Sq. Km.) 517.80 Sq. Km.
Hilly Area (Sq. Km) 18.84 Sq. Km.
Poor Quality Area (Sq. Km.) Nil
Population (2011) 109727
Climate Tropical climate
1.2. Rainfall Analysis
Normal Rainfall 824 mm
Annual Rainfall (2019) 773.8 mm
Decadal Average Annual Rainfall
(2010-19)
870.5 mm
Long Term Rainfall Analysis
(1998-2019)
Rising Trend: 8.713 m/year.
Probability of Normal/Excess Rainfall: - 62% & 19%.
Probability of Drought (Moderate/ Severe/ Acute):- 14%
Moderate & 5% Severe
Frequency of occurance of Drought:- 1 in 5 Years
RAINFALL TREND ANALYSIS (1998 to 2019)
1.3. Geomorphology,Soil&Geology
Geomorphic Unit ➢ Butte (B)
➢ Escarment Slope (ES)
➢ Plateau Moderately Dissected (PLM)
➢ Plateau Slightly Dissected (PLS), 0-1m weathering
➢ Plateau Undissected (PLU), 0-1m weathering
➢ Plateau Weathered (PLW), 2-5m weathering
➢ Plateau Weathered (PLWS), 1-2m weathering
Soil ➢ Very shallow, well drained, loamy, moderately
y = 8.7131x + 723.89
0
500
1000
1500
2000
2500
199
8
199
9
20
00
20
01
20
02
20
03
20
04
20
05
20
06
20
07
20
08
20
09
20
10
20
11
20
12
20
13
20
14
20
15
20
16
20
17
20
18
20
19
Longterm Rainfall Analysis (1998 to 2019) of Himayatnagar Block

120
calcareous soils on gently sloping undulating lands
with moderate erosion
➢ Very shallow, somewhat excessively drained, loamy
soils on gently sloping rolling lands with mesas and
buttes with severe erosion
➢ Moderately deep, moderately well drained, fine,
moderately calcareous soils on gently'sloping
summits/spurs with moderate erosion
➢ Deep, imperfectly drained, fine, calcareous soils on
very gently sloping plains and valleys with moderate
erosion; moderate salinity and slight sodicity
Geology Deccan Trap-Sahyadri Group (Late Cretaceous to Early Eocene
Age)
1.4.Hydrology & Drainage
Drainage ManarRiverforms the main drainage system of the block.
Hydrology(as on March 2017)
Major & Medium
Irrigation Projects
(>250 Ha)
Nil
Minor Irrigation
Projects (0 to 250
Ha)
No. of projects
completed till
March 2017
22
No. of projects
operating till end
22
Command area
of the operating
project (Sq. Km.)
30.19
Net irrigated area
under Operating
project (Sq. Km.)
11.13
1.5.LAND USE, AGRICULTURE, IRRIGATION & CROPPING PATTERN
Geographical Area 517.80 Sq. Km.
Forest Area 28.02 Sq. Km.
Cultivable Area 436.16 Sq. Km.
Net Sown Area 395.23. Km.
Double Cropped Area 74.35 Sq. Km.
Area under
Irrigation
Surface Water 3.75 Sq Km
Ground Water 64.89 Sq. Km.
Principal Crops Crop Type Area (Sq. Km.)
Pulses 85.56
Cotton 188.29
Cereals 23.94
Oil Seeds 118.55
Horticultural Crops Sugarcane 14.83
Others 3.14
1.6.WATER LEVEL BEHAVIOUR
1.6.1. Aquifer-I/Shallow Aquifer (Phreatic Aquifer)

121
Pre-Monsoon (May-2019) Post-Monsoon (November-2019)
❖ Depth to water level between 5 mbgl
and 10 mbgl observed in 38.58 Sq Km
areas in the north-eastern and southern
parts of the block.
❖ Depth to water level between 10 mbgl
and 20 mbgl observed in 322.7 Sq Km
area in the major parts of the block
❖ Depth to water level between 20 mbgl
and 30 mbgl observed in 39.35 Sq Km
area in the south-western parts of the
block
❖ Depth to water level between 5 mbgl and
10 mbgl is observed in 275.6 Sq Km area in
the western and north-eastern parts of the
block
❖ Depth to water level between 10 mbgl and
20 mbgl is observed in 185 Sq Km area in
the south-eastern parts of the block.
Water Level Map- Aquifer-I/Shallow Aquifer (Phreatic Aquifer)
Pre-Monsoon Water Level (May 2019)
Post-Monsoon Water Level (Nov.2019)
1.6.2. Aquifer-II/Deeper Aquifer (Semiconfined/Confined Aquifer)
Pre-Monsoon (May-2019) Post-Monsoon (November-2019)
Pre-Monsoon Water Level(May 2019) Post-Monsoon Water Level(November 2019)
❖ The shallow depth to water level
between 10 mbgl and 20 mbgl observed
in 224.8 Sq Km area in the western part
of the block.
❖ Depth to water level between 20 mbgl
❖ The shallow depth to water level between
10 mbgl and 20 mbgl observed in 224.8 Sq
Km area in the western part of the block.
❖ Depth to water level between 20 mbgl and
40 mbgl observed in 247./8 Sq Km area in

122
and 30 mbgl observed in 242.2 Sq Km
area in the remaining parts of the block.
the remaining parts of the block.
1.7. Hydrograph
The hydrograph of CGWB Monitoring site at Himayatnagar for the period 2010 to 2019 shows:
❖ A rising trend during premonsoon @ 0.350 m/year and a falling trend during postmonsoon @
0.472 m/year respectively.
❖ The depth to water level during premonsoon ranges from 6.25 mbgl to 11.09 mbgl.
❖ The depth to water level during postmonsoon ranges from 1.2 mbgl to 8.5 mbgl.
❖ A falling rainfall trend for the period 2010 to 2019 is observed @ 33.174 mm/year
1.8. Water Level Trend (2010-19)
Pre-Monsoon Trend (May 2010-2019) Post-Monsoon Trend (November 2010-2019)
Rising Trend @ Falling Trend @ Rising Trend @ Falling Trend @
0.00 to 0.2 m/year
in 41 Sq Km area
and @ 0.2 to 0.4
m/year in 14.05 Sq
Km area.
0 to 0.2 m/year in 58.28 Sq
Km area, 0.2 to 0.4 m/year
in 120 Sq Km area, 0.4 to
0.6 m/year in 168.4 Sq Km
area and >0.6 m/year in
59.17 sq km area.
0 to 0.2 m/year in 296.6
Sq Km area; 0.2 to 0.4
m/year in 92.75 Sq Km
area; 0.4 to 0.6 m/year
in 34.56 sq km area and
>0.6 m/year in 7.5 sq
km area
0 to 0.2 m/year in
31.67 Sq Km area.
Pre-Monsoon WL Trend (May 2010-2019) Post-Monsoon WL Trend (Nov.2010-2019)
Rainfall: y = -33.174x + 1057.5Pre WL:y = 0.3502x + 6.8307 Post WL:y = -0.4724x + 7.4333
0
2
4
6
8
10
120
200
400
600
800
1000
1200
1400
1600
2010 2011 2012 2013 2014 2015 2016 2017 2018 2019
De
pth
to
wa
ter
le
ve
l (m
bg
l)
Ra
infa
ll (
mm
)
YearANNUAL RF Premonsson Wl Post monsoon Wl

123
2. GROUND WATER ISSUES
1) Increase in stage of ground water development
The stage of ground water development has increased from 38.83 % (2008) to 39.70% (2017).
2) Low ground water yield Potential of the aquifers:
The ground water yield potentiality of the aquifers ranges from 0 to 1 lps in major parts of the block.
However, high yielding aquifers are obtained only along the drainages, faults/ fractures or joints. The
low potential zone in major parts of the block is due to limited extent of porosity and permeability
evolved from secondary porosity and hence poor sustainability of aquifers.
3. AQUIFER DISPOSITION
3.1. Number of Aquifers (Major) One:Basalt –Aquifer-I, Aquifer-II
3.2. LITHOLOGICAL DISPOSITION
1.3. CROSS SECTIONS
38.83 40.37
31.06
39.70
0.00
10.00
20.00
30.00
40.00
50.00
60.00
70.00
2008 2011 2013 2017Net Annual Ground Water AvailabilityExisting Gross Ground Water Draft for all usesStage of Ground Water Development

124
3.4 AQUIFER CHARACTERISTICS
Major Aquifer Basalt (Deccan Traps)
Type of Aquifer
(Phreatic/Semiconfined/Confined)
Aquifer-I (Phreatic) Aquifer-II(Semiconfined
/confined)
Depth to bottom of aquifer (mbgl) 9 to 18 90 to 180
Weathered/ Fractured rocks thickness (m) 8 to 14.4 5 to 11
Yield Potential 15 to 100 m3/day 0 to 0.4 lps
Specific Yield (Sy)/ Storativity (S) 0.02 0.00035
Transmissivity (T) - 74.05 to 156 m2/day
4.CHEMICAL QUALITY OF GROUND WATER &CONTAMINATION
4.1 Aquifer I/Shallow Aquifer
Suitability for Drinking Purposes Suitability for Irrigation Purposes
➢ The overall quality of Aquifer is
potable and useful for drinking
and domestic puposes except in
Nitrate affected areas (Waghi,
Takral BK, Walkewadi) and
Flouride infested areas (Wadgaon
Kh))
➢ About 20.68 Sq Km area of the
block has EC well within the
potable range of 250 to
750microsiemens/cm, 431.9 sq
Km area has EC between 750 and
2250 microsiemens/cm and 13.81
Sq Km area has EC>2250
microsiemens/cm
➢ In 20 Sq Km area of the block, plants with
moderate salt tolerance can be grown. However,
in 431.9 sq Km area where EC > 750
microsiemens/cm, special management for
salinity control may be required and plants with
good salt tolerance should be selected.
➢ All the analysed samples in the block have SAR
value well within 0 to 10 types and are therefore
good for irrigation.
➢ The RSC values of all the analysed samples have
values < 1.25 meq/l indicating that the ground
water is good for irrigation.
➢ All analysed samples have % Na between 40 and
60.
Hence, the overall quality of ground water is suitable for
irrigation purposes except in areas with %Na value more
than 60%.
4.1 Aquifer II/Deeper Aquifer

125
Suitability for Drinking Purposes Suitability for Irrigation Purposes
➢ The overall quality of Aquifer is
potable and useful for drinking
and domestic puposes except in
Nitrate affected Kiramgan and
Daregaon villages and Fluoride
infested Parwa village.
➢ About 447.7 Sq Km area of the
block has EC between 750 and
2250 microsiemens/cm and
165.85 sq km area has EC more
than 2250 microsiemens/cm.
➢ In major parts of the block covering 447 Sq Km
area, where EC > 750 microsiemens/cm, special
management for salinity control may be required
and plants with good salt tolerance should be
selected.
3.2.CHEMICAL QUALITY MAP
Phreatic Aquifer (Aquifer-I)
Semiconfined/Confined Aquifer (Aquifer II)
5. GROUND WATER RESOURCE & EXTRACTION
Aquifer-I/ Phreatic Aquifer (Basalt)
Ground Water Recharge Worthy Area (Sq. Km.) 498.86
Total Annual Ground Water Recharge (MCM) 54
Natural Discharge (MCM) 2.70
Net Annual Ground Water Availability (MCM) 51.31
Existing Gross Ground Water Draft for irrigation
(MCM)
19.51
Existing Gross Ground Water Draft for domestic
and industrial water supply(MCM)
0.85
Existing Gross Ground Water Draft for All
uses(MCM)
20.36
Net Ground Water Availability for future
irrigation development(MCM)
28.69
Provision for domestic and industrial
requirement supply to 2025(MCM)
3.11
Stage of Ground Water Development % 39.7
Category SAFE
Aquifer-II
Semiconfined/Confined Aquifer (Basalt)

126
Resources above the confining layer Resources within the confining layer
Total Area
(Sq. Km.)
Mean
aquifer
thicknes
s (m)
S Resource
s above
confining
layer
9MCM)
Total
Area (Sq.
Km.)
Mean
aquifer
thicknes
s (m)
S Resources
within the
confining
layer
(MCM)
Total
Resource
s (MCM)
517.8
4
0.00
035 0.725
517.8
8
0.0003
5 1.45
2.175
5.0. GROUND WATER RESOURCE ENHANCEMENT
Available Resource (MCM) 51.31
Gross Annual Draft (MCM) 20.37
5.1.SUPPLY SIDE MANAGEMENT
SUPPLY (MCM)
Agricultural Supply -GW 19.52
Agricultural Supply -SW 3.75
Domestic Supply - GW 0.85
Domestic Supply - SW 0.21
Total Supply 24.33
Area of Block (Sq. Km.) 517.8
Area suitable for Artificial recharge
(Sq. Km)
498.96
Type of Aquifer Hard Rock Soft Rock
Area feasible for Artificial
Recharge(WL >5mbgl) (Sq. Km.)
8.46 -
Volume of Unsaturated Zone (MCM) 16.92 -
Average Specific Yield 0.020 -
Volume of Sub surface Storage Space
available for Artificial Recharge
(MCM)
0.34
-
Surplus water Available (MCM) 0.19
-
Proposed Structures Percolation Tank
(Av. Gross
Capacity-100
TCM*2 fillings =
200 TCM)
Check Dam ( Av.
Gross Capacity-10
TCM * 3 fillings = 30
TCM)
Recharge shaft
(Av. Gross
Capacity-60 TCM
)
Number of Structures 0 1 0
Volume of Water expected to be
conserved / recharged @ 75%
efficiency (MCM)
0 0.0225
0
Area of Saline Patch Nil
Proposed Structures Nil
No of farm pond proposed (size:
30m*30m*3) with 3 filling= 0.0081
mcm capacity, 50% available water
may be utilized for harvesting
Nil

127
through farm ponds.
Volume of water available for
harvesting
Nil
Additional volume created by
desilting Nil
RTRWH Structures – Urban Areas
Households to be covered (25% with
50 m2area)
5667
Total RWH potential (MCM) 0.241
Rainwater harvested / recharged @
80% runoff co-efficient
0.192 (Economically not viable & Not Recommended)
5.2.DEMAND SIDE MANAGEMENT
Micro irrigation techniques
Remaining ground water irrigated
Sugarcane cropped area proposed
through drip irrigation
Nil
Volume of Water expected to be
saved (MCM).
(Surface Flooding req- 2.45 m. Drip
Req. - 1.88, WUE- 0.57 m)
Nil
Proposed Cropping Pattern change
Irrigated area under Water Intensive
Crop(ha)
Not proposed
Water Saving by Change in Cropping
Pattern
Nil
5.3.EXPECTED BENEFITS
Net Ground Water Availability
(MCM) 51.31
Additional GW resources available
after Supply side interventions
(MCM)
0.0225
Ground Water Availability after
Supply side intervention 51.3325
Existing Ground Water Draft for All
Purposes (MCM) 20.37
Saving of Ground Water through
demand side intervention (MCM) 0
GW draft after Demand Side
Interventions (MCM) 20.37
Present stage of Ground Water
Development (%) 39.7
Expected Stage of Ground Water
Development after interventions (%) 39.7
Other Interventions Proposed, if any
Alternate Water Sources Available Nil
5.4.RECOMMENDATION

128
Nil
5.5.DEVELOPMENT PLAN
Additional Volume of water available
after stage of GWD is brought to
70% (MCM)
15.56
Proposed Number of DW( @ 1.5 ham
for 90% of GWR Available) 934
Proposed Number of BW( @ 1.5 ham
for 10% of GWR Available) 156
Additional Area (sq.km.) proposed to
be brought under assured GW
irrigation with av. CWR of 0.65 m
24
Proposed Artificial Recharge Structure
Addditional Area proposed to be brought under
assured ground water irrigation

129
9.8 KANDHAR BLOCK, NANDED DISTRICT
SALIENT INFORMATION 1.1.Introduction Block Name Kandhar
Geographical Area (Sq. Km.) 815.02 Sq. Km.
Hilly Area (Sq. Km) 35.40 Sq. Km.
Poor Quality Area (Sq. Km.) Nil
Population (2011) 224027
Climate Tropical climate
1.2. Rainfall Analysis
Normal Rainfall 936.7 mm
Annual Rainfall (2019) 1230.7 mm
Decadal Average Annual Rainfall
(2010-19)
807.23 mm
Long Term Rainfall Analysis
(1974-2019)
Falling Trend: -9.64 m/year.
Probability of Normal/Excess Rainfall: - 58% & 20%.
Probability of Drought (Moderate/ Severe/ Acute):- 15%
Moderate & 7% Severe
Frequency of occurance of Drought:- 1 in 5 Years
RAINFALL TREND ANALYSIS (1974 to 2019)
1.3. Geomorphology, Soil & Geology
Geomorphic Unit ➢ Butte (B)
➢ Plateau Moderately Dissected (PLM)
➢ Plateau Slightly Dissected (PLS), 0-1m weathering
➢ Plateau Undissected (PLU), 0-1m weathering
➢ Plateau Weathered (PLW), 2-5m weathering
➢ Plateau Weathered (PLWS), 1-2m weathering
➢ Plateau Weathered-Canal Command (PLC)
Soil ➢ Very shallow, well drained, loamy soils on gently
y = -9.6492x + 1163.5
0
500
1000
1500
2000
2500
197
4
197
6
197
8
198
0
198
2
198
4
198
6
198
8
199
0
199
2
199
4
199
6
199
8
20
00
20
02
20
04
20
06
20
08
20
10
20
12
20
14
20
16
20
18
Longterm Rainfall Analysis (1974 to 2019) of Kandhar Block

130
sloping rolling lands with mesas and buttes with
moderate erosion and moderate stoniness
➢ Shallow, well drained, clayey soils on gently sloping
lands with moderate erosion
➢ Deep, imperfectly drained, fine, calcareous soils on
very gently sloping plains and valleys with moderate
erosion; moderate salinity and slight sodicity
➢ Deep, moderately well drained, fine soils on gently
sloping plains and valleys with moderate erosion
➢ Slightly deep, moderately well drained, fine,
moderately calcareous soils on moderately sloping
undulating lands with moderate erosion
Geology Deccan Trap-Sahyadri Group (Late Cretaceous to Early Eocene
Age)
1.4. Hydrology & Drainage
Drainage Manar River and its tributaries forms the main drainage system
of the block.
Hydrology(as on March 2017)
Major & Medium
Irrigation Projects
(>250 Ha)
1 Major Project and 2 Medium
Projects
Minor Irrigation
Projects (0 to 250
Ha)
No. of projects
completed till
March 2017
102
No. of projects
operating till end
101
Command area
of the operating
project (Sq. Km.)
46.02
Net irrigated area
under Operating
project (Sq. Km.)
32.20
1.5.LAND USE, AGRICULTURE, IRRIGATION & CROPPING PATTERN
Geographical Area 815.02 Sq. Km.
Forest Area 63.45 Sq. Km.
Cultivable Area 708.37 Sq. Km.
Net Sown Area 701.42 Sq. Km.
Double Cropped Area 47.50 Sq. Km.
Area under
Irrigation
Surface Water 88.41 Sq. Km.
Ground Water 29.34 Sq. Km.
Principal Crops Crop Type Area (Sq. Km.)
Pulses 92.20
Cotton 195.50
Cereals 135.69
Oil Seeds 219.36
Horticultural Crops Sugarcane 3.24
Others 2.02

131
1.6.WATER LEVEL BEHAVIOUR
1.6.1. Aquifer-I/Shallow Aquifer (Phreatic Aquifer)
Pre-Monsoon (May-2019) Post-Monsoon (November-2019)
❖ Depth to water level between 5 mbgl
and 10 mbgl observed in 29.78 Sq Km
area in a small isolated part of the
block.
❖ Depth to water level between 10 mbgl
and 20 mbgl observed in 448.8 Sq Km
area in the major parrts of the block
❖ Depth to water level between 20 mbgl
and 30 mbgl is observed in about 325 Sq
Km area in the southern, northern and
eastern parts of the block
❖ The shallow depth to water level between
2 mbgl and 5 mbgl is observed in 21.93 Sq
Km area in small isolated patches in
northern parts of the block.
❖ Depth to water level between 5 mbgl and
10 mbgl is observed in 322.53 Sq Km area
in the northern, central parts of the block
and as isolated patch in the southern part.
❖ Depth to water level between 10 mbgl and
20 mbgl is observed in 459.2 Sq Km area in
the remaining parts of the block.
Water Level Map- Aquifer-I/Shallow Aquifer (Phreatic Aquifer)
Pre-Monsoon Water Level (May 2019)
Post-Monsoon Water Level (Nov.2019)
1.6.2. Aquifer-II/Deeper Aquifer (Semiconfined/Confined Aquifer)
Pre-Monsoon (May-2019) Post-Monsoon (November-2019)
Pre-Monsoon Water Level(May 2019) Post-Monsoon Water Level(November 2019)
❖ The depth to water level between 5
mbgl and 10 mbgl is observed in 665.1
❖ The depth to water level between 5 mbgl
and 10 mbgl is observed in 42.74 sq km

132
sq km area in the major parts of the
block.
❖ Depth to water level between 10 mbgl
and 20 mbgl is observed in 140.5 Sq Km
area in the southern parts of the block.
area in the north-eastern part of the block.
❖ Depth to water level between 10 mbgl and
20 mbgl is observed in 70.60 Sq Km area in
the northern part of the block.
❖ Depth to water level between 20 mbgl and
30 mbgl is observed in 152.5 Sq Km area in
the along the central parts of the block as a
fringe.
❖ Depth to water level between 30 mbgl and
40 mbgl is observed in 538.9 Sq Km area in
the southern and south-central parts of the
block.
1.7. Hydrograph
The hydrograph of CGWB Monitoring site at Janapuri for the period 2010 to 2019 shows:
❖ A falling trend during both premonsoon and postmonsoon @ 0.0141m/year and 0.537 m/year
respectively.
❖ The depth to water level during premonsoon ranges from 6.5 mbgl to 16.25 mbgl.
❖ The depth to water level during postmonsoon ranges from 2.3 mbgl to 14.05 mbgl.
❖ A rising rainfall trend @ 10.36 mm/year for a period of 2010-2019 is observed.
1.8. Water Level Trend (2010-19)
Pre-Monsoon Trend (May 2010-2019) Post-Monsoon Trend (November 2010-2019)
Rising Trend @ Falling Trend @ Rising Trend @ Falling Trend @
0.0 to 0.2 m/year
in 340.4 Sq Km
area and @ 0.2 to
0.4 m/year in 257.6
Sq Km area.
0.0 to 0.2 m/year in 121.1
Sq Km area, 0.2 to 0.4
m/year in 67.04 Sq Km
area and 0.4 to 0.6 m/year
in 17.87 Sq Km area
0 to 0.2 m/year in 45.17
Sq Km area, 0.2 to 0.4
m/year in 67.94 sq km
area; 0.4 to 0.6 m/year
in 174.8 sq km area; 0.6
to 0.8 m/year in 188.6
sq km area and >0.8
m/year in 309 sq km
area.
Nil
Rainfall:y = 10.368x + 750.21
Pre WL:y = -0.0141x + 11.621 Post WL:y = -0.5376x + 11.757
0
2
4
6
8
10
12
14
16
180
200
400
600
800
1000
1200
1400
2010 2011 2012 2013 2014 2015 2016 2017 2018 2019
De
pth
to
wa
ter
le
ve
l (m
bg
l)
Ra
infa
ll (
mm
)
YearANNUAL RF Premonsson Wl Post monsoon Wl

133
Pre-Monsoon WL Trend (May 2010-2019) Post-Monsoon WL Trend (Nov.2010-2019)
2. GROUND WATER ISSUES
1) Low Development: Low development of 26.57% of satge of Ground Water Development is
observed in the block.
2) Declining Water Level Trend: Declining Water Level Trend upto 0.6 m/year is observed in 206
sq km area in the Premonsoon season.
3) Low ground water yield Potential of the aquifers: The ground water yield potentiality of the
aquifers ranges from 0 to 1.5 lps in major parts of the block. However, high yielding aquifers
are obtained only along the drainages, faults/ fractures or joints. The low potential zone in
major parts of the block is due to limited extent of porosity and permeability evolved from
secondary porosity and hence poor sustainability of aquifers.
3. AQUIFER DISPOSITION
3.1. Number of Aquifers (Major) One:
Basalt –Aquifer-I, Aquifer-II
3.2. LITHOLOGICAL DISPOSITION
3.3. CROSS SECTIONS

134
3.4 AQUIFER CHARACTERISTICS
Major Aquifer Basalt (Deccan Traps)
Type of Aquifer
(Phreatic/Semiconfined/Confined)
Aquifer-I (Phreatic) Aquifer-II
(Semiconfined
/confined)
Depth to bottom of aquifer (mbgl) 10 to 16 90 to 180
Granular/Weathered/ Fractured
rocks thickness (m)
8 to 12.8 2 to 17
Yield Potential 0 to 100 m3/day 0.23 to 0.4 lps
Specific Yield (Sy)/ Storativity (S) 0.02 0.00076
Transmissivity (T) - 4.76 to 14.18 m2/day
4.CHEMICAL QUALITY OF GROUND WATER &CONTAMINATION
4.1 Aquifer I/Shallow Aquifer
Suitability for Drinking Purposes Suitability for Irrigation Purposes
➢ The overall quality of Aquifer is potable
and useful for drinking and domestic
puposes.
➢ The entire block has EC well within the
potable range of 250 to
750microsiemens/cm
➢ In the entire block, where EC > 750
microsiemens/cm, special management
for salinity control may be required and
plants with good salt tolerance should be
selected.
➢ All the analysed samples in the block
have SAR value well within 0 to 10 types
and are therefore good for irrigation.
➢ The RSC values of all the analysed
samples have values < 1.25 meq/l
indicating that the ground water is good
for irrigation.
➢ About 50 % of the analysed samples have
% Na less than 20; 50 % have %Na
between 20 and 40
Hence, the overall quality of ground water is
suitable for irrigation purposes except in areas
with %Na value more than 60%.
4.1 Aquifer II/Deeper Aquifer
Suitability for Drinking Purposes Suitability for Irrigation Purposes
➢ The overall quality of Aquifer is potable ➢ In major parts of the block covering 774.5

135
and useful for drinking and domestic
puposes except in Nitrate affected
Kautha village.
➢ About 28.59 Sq Km area of the block has
EC well within the potable range of 250
to 750microsiemens/cm, 774.5 sq Km
area has EC between 750 and 2250
microsiemens/cm.
Sq Km area, where EC > 750
microsiemens/cm, special management
for salinity control may be required and
plants with good salt tolerance should be
selected.
➢ All the analysed samples in the block
have SAR value well within 0 to 10 types
and are therefore good for irrigation.
➢ The RSC values of most of the analysed
samples have values > 1.25 meq/l
indicating that the ground water is not
good for irrigation.
➢ About 33% of the analysed samples have
% Na between 20 and 40 and 64% have
%Na more than 60.
Hence, the quality of ground water is suitable
for irrigation purposes except in areas with
high RSC values and %Na value more than
60%.
3.2.CHEMICAL QUALITY MAP
Phreatic Aquifer (Aquifer-I)
Semiconfined/Confined Aquifer (Aquifer II)
5. GROUND WATER RESOURCE & EXTRACTION
Aquifer-I/ Phreatic Aquifer (Basalt)
Ground Water Recharge Worthy Area (Sq. Km.) 779.62
Total Annual Ground Water Recharge (MCM) 104.02
Natural Discharge (MCM) 5.20
Net Annual Ground Water Availability (MCM) 98.82
Existing Gross Ground Water Draft for irrigation
(MCM)
24.25
Existing Gross Ground Water Draft for domestic
and industrial water supply(MCM)
2

136
Existing Gross Ground Water Draft for All
uses(MCM)
26.26
Net Ground Water Availability for future
irrigation development(MCM)
69.12
Provision for domestic and industrial
requirement supply to 2025(MCM)
5.82
Stage of Ground Water Development % 26.57
Category SAFE
Aquifer-II
Semiconfined/Confined Aquifer (Basalt)
Resources above the confining layer Resources within the confining layer
Total Area
(Sq. Km.)
Mean
aquife
r
thickn
ess
(m)
S Resource
s above
confining
layer
9MCM)
Total
Area (Sq.
Km.)
Mean
aquife
r
thickn
ess
(m)
S Resourc
es
within
the
confinin
g layer
(MCM)
Total
Resource
s (MCM)
815.02 5.91 0.00076 3.6 815.02 9.500 0.00076 5.9 9.545
5.0. GROUND WATER RESOURCE ENHANCEMENT
Available Resource (MCM) 98.82
Gross Annual Draft (MCM) 26.26
5.1.SUPPLY SIDE MANAGEMENt
SUPPLY (MCM)
Agricultural Supply -GW 24.25
Agricultural Supply -SW 88.41
Domestic Supply - GW 2.00
Domestic Supply - SW 0.50
Total Supply 115.16
Area of Block (Sq. Km.) 815.02
Area suitable for Artificial recharge
(Sq. Km)
779.62
Type of Aquifer Hard Rock Soft Rock
Area feasible for Artificial
Recharge(WL >5mbgl) (Sq. Km.)
587.02
-
Volume of Unsaturated Zone (MCM) 1174.03
-
Average Specific Yield 0.020 -
Volume of Sub surface Storage Space
available for Artificial Recharge
(MCM)
23.48
-
Surplus water Available (MCM) 13.14 -
Proposed Structures Percolation Tank
(Av. Gross
Capacity-100
TCM*2 fillings =
Check Dam ( Av.
Gross Capacity-10
TCM * 3 fillings = 30
TCM)
Recharge shaft
(Av. Gross
Capacity-60 TCM
)

137
200 TCM)
Number of Structures 35 99 0
Volume of Water expected to be
conserved / recharged @ 75%
efficiency (MCM)
5.25 2.2275
0
Area of Saline Patch Nil
Proposed Structures Nil
No of farm pond proposed (size:
30m*30m*3) with 3 filling= 0.0081
mcm capacity, 50% available water
may be utilized for harvesting
through farm ponds.
Nil
Volume of water available for
harvesting
Nil
Additional volume created by
desilting Nil
RTRWH Structures – Urban Areas
Households to be covered (25% with
50 m2area)
11049
Total RWH potential (MCM) 0.446
Rainwater harvested / recharged @
80% runoff co-efficient
0.357 (Economically not viable & Not Recommended)
5.2.DEMAND SIDE MANAGEMENT
Micro irrigation techniques
Remaining ground water irrigated
Sugarcane cropped area proposed
through drip irrigation
Nil
Volume of Water expected to be
saved (MCM).
(Surface Flooding req- 2.45 m. Drip
Req. - 1.88, WUE- 0.57 m)
Nil
Proposed Cropping Pattern change
Irrigated area under Water Intensive
Crop(ha)
Not proposed
Water Saving by Change in Cropping
Pattern
Nil
5.3.EXPECTED BENEFITS
Net Ground Water Availability
(MCM) 98.82
Additional GW resources available
after Supply side interventions
(MCM)
7.4775
Ground Water Availability after
Supply side intervention 106.2975
Existing Ground Water Draft for All 26.26

138
Purposes (MCM)
Saving of Ground Water through
demand side intervention (MCM) 0
GW draft after Demand Side
Interventions (MCM) 26.26
Present stage of Ground Water
Development (%) 26.6
Expected Stage of Ground Water
Development after interventions (%) 24.7
Other Interventions Proposed, if any
Alternate Water Sources Available Nil
5.4.RECOMMENDATION
Nil
5.5.DEVELOPMENT PLAN
Additional Volume of water available
after stage of GWD is brought to
70% (MCM)
48.15
Proposed Number of DW( @ 1.5 ham
for 90% of GWR Available) 2889
Proposed Number of BW( @ 1.5 ham
for 10% of GWR Available) 481
Additional Area (sq.km.) proposed to
be brought under assured GW
irrigation with av. CWR of 0.65 m
74
Proposed Artificial Recharge Structure
Addditional Area proposed to be brought under
assured ground water irrigation

139
9.9 KINWAT BLOCK, NANDED DISTRICT
1. SALIENT INFORMATION 1.1.Introduction Block Name Kinwat
Geographical Area (Sq. Km.) 1515.85 Sq Km
Hilly Area (Sq. Km) 40.23 Sq. Km.
Poor Quality Area (Sq. Km.) Nil
Population (2011) 219332
Climate Tropical climate
1.2. Rainfall Analysis
Normal Rainfall 1021.8 mm
Annual Rainfall (2019) 961.8 mm
Decadal Average Annual Rainfall
(2008-17)
951.38 mm
Long Term Rainfall Analysis
(1974-2019)
Falling Trend: -4.282 m/year.
Probability of Normal/Excess Rainfall:- 72% & 13%.
Probability of Drought (Moderate/ Severe/ Acute):- 13%
Moderate & 2% Severe
Frequency of occurance of Drought:- 1 in 7 Years
RAINFALL TREND ANALYSIS (1974 to 2019)
1.3. Geomorphology,Soil&Geology
Geomorphic Unit ➢ Butte (B)
➢ Mesa (M)
➢ Pediplain Moderate (PPM), 2-5m weathering
➢ Pediplain Shallow (PPS), 0-2m weathering
➢ Plateau Highly Dissected (PLH)
➢ Plateau Moderately Dissected (PLM)
➢ Plateau Slightly Dissected (PLS), 0-1m weathering
➢ Plateau Weathered (PLW), 2-5m weathering
y = -4.2821x + 1122.5
0
500
1000
1500
2000
2500
197
4
197
6
197
8
198
0
198
2
198
4
198
6
198
8
199
0
199
2
199
4
199
6
199
8
20
00
20
02
20
04
20
06
20
08
20
10
20
12
20
14
20
16
20
18
Longterm Rainfall Analysis (1974 to 2019) of Kinwat Block

140
➢ Plateau Weathered (PLWS), 1-2m weathering
Soil ➢ Very shallow, well drained, loamy, moderately
calcareous soils on gently sloping undulating lands
with moderate erosion
➢ Very shallow, somewhat excessively drained, loamy
soils on gently sloping isolated hillocks and pediments
with severe erosion
➢ Shallow, well drained, clayey soils on very gently
sloping rolling lands with mesas a'nd buttes and
moderate erosion
➢ Very deep, well drained, loamy soils on very gently
sloping dissected table lands with moderate erosion
➢ Extremely shallow, well drained, loamy soils on gently
sloping rolling lands with mesas and buttes with
severe erosion
➢ Very deep, moderately well drained, clayey soils on
very gently sloping lands with moderate erosion
➢ Deep, imperfectly drained, fine, calcareous soils on
very gently sloping plains and valleys with moderate
erosion; moderate salinity and slight sodicity
➢ Moderately deep, moderately well drained, fine,
moderately calcareous soils on gently sloping
summits/spurs with moderate erosion
Geology Deccan Trap-Sahyadri Group (Late Cretaceous to Early Eocene
Age) & Gneiss (Archeans)
1.4.Hydrology & Drainage
Drainage Penganga river and its tributaries
Hydrology(as on March 2017)
Major & Medium
Irrigation Projects
(>250 Ha)
3 Medium Projects
Minor Irrigation
Projects (0 to 250
Ha)
No. of projects
completed till
March 2017
122
No. of projects
operating till end
122
Command area
of the operating
project (Sq. Km.)
90.13
Net irrigated area
under Operating
project (Sq. Km.)
30.95
1.5.LAND USE, AGRICULTURE, IRRIGATION & CROPPING PATTERN
Geographical Area 1515.85 Sq Km
Forest Area 554.33 Sq. Km.
Cultivable Area 701.90 Sq. Km.
Net Sown Area 699.10 Sq. Km.

141
Double Cropped Area 134.23 Sq. Km.
Area under
Irrigation
Surface Water 32.50 Sq. Km.
Ground Water 50.00 Sq Km.
Principal Crops Crop Type Area (Sq. Km.)
Pulses 36.9
Cotton 157.84
Cereals 17.95
Oil Seeds 497.65
Horticultural Crops Sugarcane 40.87
Others 3.93
1.6.WATER LEVEL BEHAVIOUR
1.6.1. Aquifer-I/Shallow Aquifer (Phreatic Aquifer)
Pre-Monsoon (May-2019) Post-Monsoon (November-2019)
❖ Depth to water level between 2 mbgl
and 5 mbgl observed in 9 Sq Km area as
an isolated patch.
❖ Depth to water level between 5 mbgl
and 10 mbgl observed in 68.7 Sq Km
area in the south-western part of the
block
❖ Depth to water level between 10 mbgl
and 20 mbgl is observed in 1244 Sq Km
area in the major portions of the block
❖ Deeper depth to water level between
20 mbgl and 30 mbgl is observed in
137.34 sq km area in isolated patches in
distributed in the block.
❖ The shallow depth to water level less than
2 mbgl is observed only as isolated patches
in the block covering only 105 Sq Km area.
❖ The depth to water level between 2 mbgl
and 5 mbgl is observed in 1097.6 Sq Km
area in major parts of the block
❖ Depth to water level between 5 mbgl and
10 mbgl is observed in 269 Sq Km area in
patches in the eastern, north-western and
south-western partsof the block
Water Level Map- Aquifer-I/Shallow Aquifer (Phreatic Aquifer)
Pre-Monsoon Water Level (May 2019)
Post-Monsoon Water Level (Nov.2019)
1.6.2. Aquifer-II/Deeper Aquifer (Semiconfined/Confined Aquifer)
Pre-Monsoon (May-2019) Post-Monsoon (November-2019)

142
Pre-Monsoon Water Level(May 2019) Post-Monsoon Water Level(November 2019)
❖ Depth to water level between 2mbgl
and 5 mbgl observed in 182.3 Sq Km
area in the south-eastern parts of the
block.
❖ Depth to water level between 5 mbgl
and 10 mbgl is observed in 397.4 Sq Km
area in the eastern and south-central
parts of the block.
❖ Depth to water level between 10 mbgl
and 20 mbgl is observed in about 312.7
Sq Km area in the north-eastern and
south-western parts of the block.
❖ Depth to water level between 20 mbgl
and 30 mbgl is observed in380.2 sq km
area in the northern and south-western
parts of the block.
❖ Deeper depth to water level more than
30 mbgl is observed in 198.85 sq km
area in the north-western tip of the
block.
❖ The depth to water level between 5 mbgl
and 10 mbgl is observed in only 236.8 Sq
Km area in the northern fringe of the
block.
❖ Depth to water level between 10 mbgl and
20 mbgl is observed in 119.9 Sq Km area in
the northern part of the block
❖ Depth to water level between 20 mbgl and
30 mbgl is observed in 457.9 Sq Km area in
the southern and north-central parts of
the block
❖ The deeper deptht to water level of more
than 30 mbgl is observed in the central
parts of the block
1.7. Hydrograph

143
The hydrograph of CGWB Monitoring site at Jhalakwadi for the period 2010 to 2019 shows:
❖ A rising trend during both premonsoon and postmonsoon @ 0.064 m/year and 0.023 m/year
respectively.
❖ The depth to water level during premonsoon ranges from 5.4 mbgl to 6.8 mbgl.
❖ The depth to water level during postmonsoon ranges from 3.05 mbgl to 4.25 mbgl.
❖ A falling rainfall trend @34.59 mm/year is observed for a period of 2010-19
1.8. Water Level Trend (2010-19)
Pre-Monsoon Trend (May 2010-2019) Post-Monsoon Trend (November 2010-2019)
Rising Trend @ Falling Trend @ Rising Trend @ Falling Trend @
0.0 to 0.2 m/year
in 225.4 Sq Km
area; 0.2 to 0.4
m/year in 75.91 Sq
Km area and 0.4 to
0.6 m/year in 87.04
sq km area.
0.0 to 0.2 m/year in
331.39 Sq Km area, 0.2 to
0.4 m/year in 79.65 Sq Km
area and 0.4 to 0.6 m/year
in 659.5 Sq Km area
0.0 to 0.2 m/yr in
211.79 Sq Km area, 0.2
to 0.4 m/year in 116.3
Sq Km area and 0.4 to
0.6 m/year in 40.77 Sq
Km area.
0 to 0.2 m/year in
890.8 Sq Km areas, 0.2
to 0.4 m/year in 141.5
Sq Km area and 0.4 to
0.6 m/year in 63.40 Sq
Km area
Pre-Monsoon WL Trend (May 2010-2019) Post-Monsoon WL Trend (Nov.2010-2019)
2. GROUND WATER ISSUES
Rainfall: y = -34.598x + 1141.7
Pre WL:y = 0.0645x + 5.65 Post WL:y = 0.0231x + 3.5767
0
1
2
3
4
5
6
7
80
200
400
600
800
1000
1200
1400
1600
2010 2011 2012 2013 2014 2015 2016 2017 2018 2019
De
pth
to
wa
ter
le
ve
l (m
bg
l)
Ra
infa
ll (
mm
)
Year
ANNUAL RF Premonsson Wl Post monsoon Wl

144
6. Low Development:-Low Development of 24.17 % of Stage of Ground Water Development is
observed in the block
7. Declining Water Level Trend: -
The decline in water level trend (2010-19) upto 0.6 m/year is observed in 1050 sq km area of
the block during both the seasons
8. Low ground water yield Potential of the aquifers: The ground water yield potentiality of the
aquifers ranges from 0 to 1.5 lps in major parts of the block. However, high yielding aquifers
re obtained only along the drainages, faults/ fractures or joints. The low potential zone in
major parts of the block is due to limited extent of porosity and permeability evolved from
secondary porosity and hence poor sustainability of aquifers.
3. AQUIFER DISPOSITION
3.1. Number of Aquifers (Major) Two:
1)Basalt –Aquifer-I, Aquifer-II
2)Gneiss-Aquifer-I,
3)Granite-Aquifer-II
3.2. LITHOLOGICAL DISPOSITION
3.3. CROSS SECTIONS

145
3.4 AQUIFER CHARACTERISTICS
Major Aquifer Basalt (Deccan Traps) Gneiss Granite
Type of Aquifer
(Phreatic/Semiconfined/Co
nfined)
Aquifer-I
(Phreatic)
Aquifer-
II(Semiconfined/co
nfined)
Aquifer-I
(Phreatic)
Aquifer-
II(Semiconfine
d/confined)
Depth to bottom of aquifer
(mbgl)
9 to 15 28 to 128 10 to 14 28 to 88
Weathered/ Fractured
rocks thickness (m)
5 to 11 2 to 14 8 to 10 2 to 15
Yield Potential 0 to 100
m3/day
0 to 0.25 lps 0 to 50
m3/day
0 to 1.25
Specific Yield (Sy)/
Storativity (S)
0.02 0.0013 0.02 0.00029-
0.0014
Transmissivity (T) - 22.08 m2/day - 44.032 to
593.26
m2/day
4.CHEMICAL QUALITY OF GROUND WATER &CONTAMINATION
4.1 Aquifer I/Shallow Aquifer
Suitability for Drinking Purposes Suitability for Irrigation Purposes
➢ The overall quality of Aquifer is potable
and useful for drinking and domestic
puposes except in Flouride in fested area
(Gokunda village)
➢ About 248 Sq Km area of the block has EC
well within the potable range of 250 to
750microsiemens/cm and 1219 sq Km
area has EC between 750 and 2250
microsiemens/cm.
➢ In 248 Sq Km area of the block, plants
with moderate salt tolerance can be
grown. However, in 1219 sq Km area
where EC > 750 microsiemens/cm,
special management for salinity control
may be required and plants with good
salt tolerance should be selected.
➢ All the analysed samples in the block
have SAR value well within 0 to 10 types
and are therefore good for irrigation.
➢ The RSC values of all the analysed except
at one site (Islapur village) have values <
1.25 meq/l indicating that the ground
water is good for irrigation in almost the
major parts of the block.

146
➢ All the analysed samples have % Na less
than %Na between 20 and 40.
Hence, the overall quality of ground water is
suitable for irrigation purposes.
4.1 Aquifer II/Deeper Aquifer
Suitability for Drinking Purposes Suitability for Irrigation Purposes
➢ The overall quality of Aquifer is potable
and useful for drinking and domestic
puposes except in Nitrate affected
Bodhari village
➢ About 416.8 Sq Km area of the block has
EC well within the potable range of 250
to 750microsiemens/cm and 1045.8 sq
Km area has EC between 750 and 2250
microsiemens/cm
➢ In 416 Sq Km area, plants with moderate
salt tolerance can be grown. However, in
1045.8 sq Km area where EC > 750
microsiemens/cm, special management
for salinity control may be required and
plants with good salt tolerance should be
selected.
➢ All the analysed samples in the block
have SAR value well within 0 to 10 types
and are therefore good for irrigation.
➢ The RSC values of 40% of the analysed
samples have values > 1.25 meq/l and
60% has RSC < 1.25 meq/l
➢ About 20 % of the analysed samples have
% Na less than 20; 40% has % Na
between 20 nad 40 and 40% have %Na
more than 60.
Hence, the overall quality of ground water is
suitable for irrigation purposes except in areas
with %Na value more than 60.and RSC is more
than 1.25 meq/l
3.2.CHEMICAL QUALITY MAP
Phreatic Aquifer (Aquifer-I)
Semiconfined/Confined Aquifer (Aquifer II &III)
5. GROUND WATER RESOURCE & EXTRACTION
Aquifer-I/ Phreatic Aquifer (Basalt)
Ground Water Recharge Worthy Area (Sq. Km.) 1475.62
Total Annual Ground Water Recharge (MCM) 164.63

147
Natural Discharge (MCM) 8.23
Net Annual Ground Water Availability (MCM) 156.4
Existing Gross Ground Water Draft for irrigation
(MCM)
34.87
Existing Gross Ground Water Draft for domestic
and industrial water supply(MCM)
2.92
Existing Gross Ground Water Draft for All
uses(MCM)
37.80
Net Ground Water Availability for future
irrigation development(MCM)
112.58
Provision for domestic and industrial
requirement supply to 2025(MCM)
8.98
Stage of Ground Water Development % 24.17
Category SAFE
Aquifer-II
Resources above the confining layer Resources within the confining layer
Total Area
(Sq. Km.)
Mean
aquifer
thickness
(m)
S Resource
s above
confining
layer
(MCM)
Total
Area
(Sq.
Km.)
Mean
aquifer
thickness
(m)
S Resources
within the
confining
layer
(MCM)
Total
Resourc
es
(MCM)
1515.85
0.27
0.0
002
9
47 1515.85
9.5
0.0002
9 4.17 4.29
5.0. GROUND WATER RESOURCE ENHANCEMENT
Available Resource (MCM) 156.40
Gross Annual Draft (MCM) 37.80
5.1.SUPPLY SIDE MANAGEMENT
SUPPLY (MCM)
Agricultural Supply -GW 34.87
Agricultural Supply -SW 32.40
Domestic Supply - GW 2.92
Domestic Supply - SW 0.73
Total Supply 70.92
Area of Block (Sq. Km.) 1515.85
Area suitable for Artificial recharge
(Sq. Km)
1475.62
Type of Aquifer Hard Rock Soft Rock
Area feasible for Artificial
Recharge(WL >5mbgl) (Sq. Km.) 184.70 -
Volume of Unsaturated Zone (MCM) 369.4 -
Average Specific Yield 0.020 -
Volume of Sub surface Storage Space
available for Artificial Recharge
(MCM)
7.39
-
Surplus water Available (MCM) 4.14 -

148
Proposed Structures
Percolation Tank (Av.
Gross Capacity-100
TCM*2 fillings = 200
TCM)
Check Dam (
Av. Gross
Capacity-10
TCM * 3 fillings
= 30 TCM)
Recharge shaft
(Av. Gross
Capacity-60 TCM
)
Number of Structures 11 31 0
Volume of Water expected to be
conserved / recharged @ 75%
efficiency (MCM)
1.65 0.6975
0
Area of Saline Patch Nil
Proposed Structures Nil
No of farm pond proposed (size:
30m*30m*3) with 3 filling= 0.0081
mcm capacity, 50% available water
may be utilized for harvesting
through farm ponds.
Nil
Volume of water available for
harvesting
Nil
Additional volume created by
desilting Nil
RTRWH Structures – Urban Areas
Households to be covered (25% with
50 m2area)
11588
Total RWH potential (MCM) 0.551
Rainwater harvested / recharged @
80% runoff co-efficient
0.441 (Economically not viable & Not Recommended)
5.2.DEMAND SIDE MANAGEMENT
Micro irrigation techniques
Remaining ground water irrigated
Sugarcane cropped area proposed
through drip irrigation
Nil
Volume of Water expected to be
saved (MCM).
(Surface Flooding req- 2.45 m. Drip
Req. - 1.88, WUE- 0.57 m)
Nil
Proposed Cropping Pattern change
Irrigated area under Water Intensive
Crop(ha)
Not proposed
Water Saving by Change in Cropping
Pattern
Nil
5.3.EXPECTED BENEFITS
Net Ground Water Availability
(MCM) 156.40
Additional GW resources available
after Supply side interventions 2.3475

149
(MCM)
Ground Water Availability after
Supply side intervention 158.7475
Existing Ground Water Draft for All
Purposes (MCM) 37.80
Saving of Ground Water through
demand side intervention (MCM) 0
GW draft after Demand Side
Interventions (MCM) 37.8
Present stage of Ground Water
Development (%) 24.2
Expected Stage of Ground Water
Development after interventions (%)
23.8
Other Interventions Proposed, if any
Alternate Water Sources Available Nil
5.4.RECOMMENDATION
Nil
5.5.DEVELOPMENT PLAN
Additional Volume of water available
after stage of GWD is brought to
70% (MCM)
73.32
Proposed Number of DW( @ 1.5 ham
for 90% of GWR Available) 4399
Proposed Number of BW( @ 1.5 ham
for 10% of GWR Available) 733
Additional Area (sq.km.) proposed to
be brought under assured GW
irrigation with av. CWR of 0.65 m
113
Proposed Artificial Recharge Structure
Demand Side Interventions

150
9.10 LOHA BLOCK, NANDED DISTRICT
1. SALIENT INFORMATION 1.1.Introduction Block Name Loha
Geographical Area (Sq. Km.) 865.4 Sq. Km.
Hilly Area (Sq. Km) 15.85 Sq. Km.
Poor Quality Area (Sq. Km.) Nil
Population (2011) 217760
Climate Tropical climate
1.2. Rainfall Analysis
Normal Rainfall 796.9 mm
Annual Rainfall (2019) 1192.8 mm
Decadal Average Annual Rainfall
(2010-19)
787.8 mm
Long Term Rainfall Analysis
(1998-2019)
Falling Trend: -6.32 m/year.
Probability of Normal/Excess Rainfall: - 59% & 18%.
Probability of Drought (Moderate/ Severe/ Acute):- 18%
Moderate & 5% Severe
Frequency of occurrence of Drought:- 1 in 4 Years
RAINFALL TREND ANALYSIS (1998 to 2017)
1.3. Geomorphology,Soil&Geology
Geomorphic Unit ➢ Alluvial Plain - Deep (APD)
➢ Alluvial Plain - Older - Moderate (AYM)
➢ Butte (B)
➢ Escarment Slope (ES)
➢ Plateau Moderately Dissected (PLM)
➢ Plateau Slightly Dissected (PLS), 0-1m weathering
➢ Plateau Undissected (PLU), 0-1m weathering
➢ Plateau Weathered (PLW), 2-5m weathering
y = -6.3228x + 869.62
0
200
400
600
800
1000
1200
1400
1600
1800
199
8
199
9
20
00
20
01
20
02
20
03
20
04
20
05
20
06
20
07
20
08
20
09
20
10
20
11
20
12
20
13
20
14
20
15
20
16
20
17
20
18
20
19
Longterm Rainfall Analysis (1998 to 2019) of Loha Block

151
➢ Plateau Weathered (PLWS), 1-2m weathering
➢ Plateau Weathered-Canal Command (PLC)
Soil ➢ Very shallow, somewhat excessively drained, loamy
soils on moderately sloping summits/spurs with
severe erosion
➢ Shallow, well drained, clayey soils on gently sloping
lands with moderate erosion
➢ Very shallow, well drained, loamy, moderately
calcareous soils on gently sloping undulating lands
with moderate erosion
➢ Slightly deep, moderately well drained, fine,
moderately calcareous soils on moderately sloping
undulating lands with moderate erosion
➢ Deep, imperfectly drained, fine, calcareous soils on
very gently sloping plains and valleys with moderate
erosion; moderate salinity and slight sodicity
Geology Recent River Alluvium-sand/Clay dominant & Deccan Trap-
Sahyadri Group (Late Cretaceous to Early Eocene Age)
1.4.Hydrology & Drainage
Drainage Godavari river & its tributaries
Hydrology(as on March 2017)
Major & Medium
Irrigation Projects
(>250 Ha)
1 Medium Projects
Minor Irrigation
Projects (0 to 250
Ha)
No. of projects
completed till
March 2017
76
No. of projects
operating till end
74
Command area
of the operating
project (Sq. Km.)
45.08
Net irrigated area
under Operating
project (Sq. Km.)
21.37
1.5.LAND USE, AGRICULTURE, IRRIGATION & CROPPING PATTERN
Geographical Area 865.4 Sq. Km.
Forest Area 25.04 Sq. Km.
Cultivable Area 702.50 Sq. Km.
Net Sown Area 682.80 Sq. Km.
Double Cropped Area 129.06 Sq. Km.
Area under
Irrigation
Surface Water 34.05 Sq. Km.
Ground Water 69.70 Sq. Km.
Principal Crops Crop Type Area (Sq. Km.)
Pulses 146.91
Cotton 152.03
Cereals 112.26

152
Oil Seeds 372.45
Horticultural Crops Sugarcane 8.47
Others 3.87
1.6.WATER LEVEL BEHAVIOUR
1.6.1. Aquifer-I/Shallow Aquifer (Phreatic Aquifer)
Pre-Monsoon (May-2019) Post-Monsoon (November-2019)
❖ Isolated patch of 2.3 sq km area has
depth to water level less than 2 mbgl.
❖ Depth to water level between 2 mbgl
and 5 mbgl observed in 94.32 Sq Km
areas in the north-eastern part of the
block.
❖ Depth to water level between 5 mbgl
and 10 mbgl observed in 309.5 Sq Km
area in the north-eastern, northern and
southern parts of the block.
❖ Depth to water level between 10 mbgl
and 20 mbgl is observed in 426.39 sq km
area in the northern and north-eastern
parts of the block.
❖ The shallow depth to water level less than
2 mbgl is observed only as isolated patch
in 1.21 Sq Km area.
❖ The depth to water level between 2 mbgl
and 5 mbgl is observed in 462.3 Sq Km
area in the northern parts of the block.
❖ Depth to water level between 5 mbgl and
10 mbgl is observed in 368 Sq Km area in
the northern and southern parts of the
block.
Water Level Map- Aquifer-I/Shallow Aquifer (Phreatic Aquifer)
Pre-Monsoon Water Level (May 2019)
Post-Monsoon Water Level (Nov.2019)
1.6.2. Aquifer-II/Deeper Aquifer (Semiconfined/Confined Aquifer)
Pre-Monsoon (May-2019) Post-Monsoon (November-2019)

153
Pre-Monsoon Water Level(May 2019) Post-Monsoon Water Level(November 2019)
❖ Depth to water level between 5 mbgl
and 10 mbgl is observed in the whole of
the block.
❖ The depth to water level between 10 mbgl
and 20 mbgl is observed in 493.3 Sq Km
area in the major parts of the block.
❖ Deeper depth to water level between 20
mbgl and 30 mbgl is observed in 122.6 Sq
Km area in the southern parts of the block
1.7. Hydrograph
The hydrograph of CGWB Monitoring site at Malegaon for the period 2010 to 2019 shows:
❖ A rising trend during both premonsoon and postmonsoon @ 0.0059m/year and 0.0333 m/year
respectively.
❖ The depth to water level during premonsoon ranges from 2.9 mbgl to 5.7 mbgl.
❖ The depth to water level during postmonsoon ranges from 1.7 mbgl to 5.5 mbgl.
❖ A rising rainfall trend @ 29.13 mm/year for a period of 2010-2019 is observed.
1.8. Water Level Trend (2010-19)
Pre-Monsoon Trend (May 2010-2019) Post-Monsoon Trend (November 2010-2019)
Rising Trend @ Falling Trend @ Rising Trend @ Falling Trend @
0.0 to 0.2 m/year in 0.0 to 0.2 m/year in 0 to 0.2 m/year in 136.4 0 to 0.2 m/year in
Rainfall:y = 29.135x + 627.57
Pre WL:y = 0.0059x + 4.0133Post WL:y = 0.0333x + 2.4467
0
1
2
3
4
5
60
200
400
600
800
1000
1200
1400
1600
2010 2011 2012 2013 2014 2015 2016 2017 2018 2019 De
pth
to
wa
ter
le
ve
l (m
bg
l)
Ra
infa
ll (
mm
)
YearANNUAL RF Premonsson Wl Post monsoon Wl

154
347.4 Sq Km area and 0.2
to 0.4 m/year in 77.16 sq
km area.
279.1 Sq Km area,
0.2 to 0.4 m/year in
131 Sq Km area
Sq Km area, 0.2 to 0.4
m/year in 246.41 Sq Km
area, 0.4 to 0.6 m/year
in 200.3 Sq Km area and
> 0.6 m/year in 33.01 sq
km area
151.03 Sq Km area
Pre-Monsoon WL Trend (May 2010-2019) Post-Monsoon WL Trend (Nov.2010-2019)
2. GROUND WATER ISSUES
1. Low Development:-Low Development of 30.93 % of Stage of Ground Water Development is
observed in the block
2. Declining Water Level Trend: -
The decline in water level trend (2010-19) upto 0.4 m/year is observed in 410 sq km area of
the block during Pre-monsoon and 151 Sq Km areas during Postmonsoon.
3. Low ground water yield Potential of the aquifers: The ground water yield potentiality of the
aquifers ranges from 0 to 1 lps in major parts of the block. However, high yielding aquifers re
obtained only along the drainages, faults/ fractures or joints. The low potential zone in major
parts of the block is due to limited extent of porosity and permeability evolved from
secondary porosity and hence poor sustainability of aquifers.
3. AQUIFER DISPOSITION
3.1. Number of Aquifers (Major) Two
1)Alluvium-Aquifer-I
2)Basalt –Aquifer-I, Aquifer-II
3.2. LITHOLOGICAL DISPOSITION

155
3.3. CROSS SECTIONS
3.4 AQUIFER CHARACTERISTICS
Major Aquifer Alluvium Basalt (Deccan Traps)
Type of Aquifer
(Phreatic/Semiconfined/
Confined)
Aquifer-I (Phreatic) Aquifer-I
(Phreatic)
Aquifer-II
(Semiconfined/confined)
Depth to bottom of
aquifer (mbgl)
34 to 35 10 to 35 120 to 180
Weathered/ Fractured
rocks thickness (m)
23 to 26 8 to 25 5 to 8
Yield Potential 100 to 200 m3/day 15 to 100 m3/day 0.23 to 0.65 lps
Specific Yield (Sy)/
Storativity (S)
0.07 0.02 0.00035
Transmissivity (T) - - 22.96 to 73.57 m2/day
4.CHEMICAL QUALITY OF GROUND WATER &CONTAMINATION
4.1 Aquifer I/Shallow Aquifer
Suitability for Drinking Purposes Suitability for Irrigation Purposes
➢ The overall quality of Aquifer is potable
and useful for drinking and domestic
puposes
➢ In the entire block, where EC > 750
microsiemens/cm, special management
for salinity control may be required and

156
➢ The entire block has EC between 750 and
2250 microsiemens/cm
plants with good salt tolerance should be
selected.
➢ All the analysed samples in the block
have SAR value well within 0 to 10 types
and are therefore good for irrigation.
➢ The RSC values of all the analysed
samples have values < 1.25 meq/l
indicating that the ground water is good
for irrigation.
➢ All the analysed samples have % Na %Na
between 20 and 40
Hence, the overall quality of ground water is
suitable for irrigation purposes.
4.1 Aquifer II/Deeper Aquifer
Suitability for Drinking Purposes Suitability for Irrigation Purposes
➢ The overall quality of Aquifer is potable
and useful for drinking and domestic
puposes except in Nitrate affected
Ghugewadi and Madki villages..
➢ About 128.5 Sq Km area of the block has
EC well within the potable range of 250
to 750microsiemens/cm; 706.8 sq Km
area has EC between 750 and 2250
microsiemens/cm
➢ In 128.5 Sq Km area, plants with
moderate salt tolerance can be grown.
However, in 706.8 sq Km area where EC >
750 microsiemens/cm, special
management for salinity control may be
required and plants with good salt
tolerance should be selected.
3.2.CHEMICAL QUALITY MAP
Phreatic Aquifer (Aquifer-I)
Semiconfined/Confined Aquifer (Aquifer II)
5. GROUND WATER RESOURCE & EXTRACTION
Aquifer-I/ Phreatic Aquifer (Basalt)
Ground Water Recharge Worthy Area (Sq. Km.) 849.55
Total Annual Ground Water Recharge (MCM) 112.09
Natural Discharge (MCM) 5.60
Net Annual Ground Water Availability (MCM) 106.49
Existing Gross Ground Water Draft for irrigation
(MCM)
30.92

157
Existing Gross Ground Water Draft for domestic
and industrial water supply(MCM)
2.01
Existing Gross Ground Water Draft for All
uses(MCM)
32.93
Net Ground Water Availability for future
irrigation development(MCM)
69.73
Provision for domestic and industrial
requirement supply to 2025(MCM)
5.86
Stage of Ground Water Development % 30.93
Category SAFE
Aquifer-II
Semiconfined/Confined Aquifer (Basalt)
Resources above the confining layer Resources within the confining layer
Total Area
(Sq. Km.)
Mean
aquifer
thicknes
s (m)
S Resource
s above
confining
layer
(MCM)
Total Area
(Sq. Km.)
Mean
aquifer
thickness
(m)
S Resource
s within
the
confining
layer
(MCM)
Total
Resource
s (MCM)
865.4
22 0.00035
2.320
865.4
6.500
0.
0
0
0
3
5
1.96
4.28
5.0. GROUND WATER RESOURCE ENHANCEMENT
Available Resource (MCM) 106.49
Gross Annual Draft (MCM) 32.93
5.1.SUPPLY SIDE MANAGEMENt
SUPPLY (MCM)
Agricultural Supply -GW 30.92
Agricultural Supply -SW 37.05
Domestic Supply - GW 2.01
Domestic Supply - SW 0.50
Total Supply 70.48
Area of Block (Sq. Km.) 865.4
Area suitable for Artificial recharge
(Sq. Km)
849.55
Type of Aquifer Hard Rock Soft Rock
Area feasible for Artificial
Recharge(WL >5mbgl) (Sq. Km.) 190.32 -
Volume of Unsaturated Zone (MCM) 380.636 -
Average Specific Yield 0.020 -
Volume of Sub surface Storage Space
available for Artificial Recharge
7.61
-

158
(MCM)
Surplus water Available (MCM) 4.26 -
Proposed Structures Percolation Tank
(Av. Gross
Capacity-100
TCM*2 fillings =
200 TCM)
Check Dam ( Av.
Gross Capacity-10
TCM * 3 fillings = 30
TCM)
Recharge shaft
(Av. Gross
Capacity-60 TCM
)
Number of Structures 11 32 0
Volume of Water expected to be
conserved / recharged @ 75%
efficiency (MCM)
1.65 0.72
0
Area of Saline Patch Nil
Proposed Structures Nil
No of farm pond proposed (size:
30m*30m*3) with 3 filling= 0.0081
mcm capacity, 50% available water
may be utilized for harvesting
through farm ponds.
Nil
Volume of water available for
harvesting
Nil
Additional volume created by
desilting Nil
RTRWH Structures – Urban Areas
Households to be covered (25% with
50 m2area)
10627
Total RWH potential (MCM) 0.418
Rainwater harvested / recharged @
80% runoff co-efficient
0.335 (Economically not viable & Not Recommended)
5.2.DEMAND SIDE MANAGEMENT
Micro irrigation techniques
Remaining ground water irrigated
Sugarcane cropped area proposed
through drip irrigation
Nil
Volume of Water expected to be
saved (MCM).
(Surface Flooding req- 2.45 m. Drip
Req. - 1.88, WUE- 0.57 m)
Nil
Proposed Cropping Pattern change
Irrigated area under Water Intensive
Crop(ha)
Not proposed
Water Saving by Change in Cropping
Pattern
Nil
5.3.EXPECTED BENEFITS
Net Ground Water Availability (MCM) 106.49
Additional GW resources available
after Supply side interventions 2.37

159
(MCM)
Ground Water Availability after
Supply side intervention 108.86
Existing Ground Water Draft for All
Purposes (MCM) 32.93
Saving of Ground Water through
demand side intervention (MCM) 0
GW draft after Demand Side
Interventions (MCM) 32.93
Present stage of Ground Water
Development (%) 30.9
Expected Stage of Ground Water
Development after interventions (%) 30.2
Other Interventions Proposed, if any
Alternate Water Sources Available Nil
5.4.RECOMMENDATION
Ground water development is recommended to bring the stage of development from 59.76% to 70%
5.5.DEVELOPMENT PLAN
Volume of water available to bring
the stage of GWD is to 70% (MCM) 43.27
Proposed Number of DW( @ 1.5 ham
for 90% of GWR Available) 2596
Proposed Number of BW( @ 1.5 ham
for 10% of GWR Available) 433
Additional Area (sq.km.) proposed to
be brought under assured GW
irrigation with av. CWR of 0.65 m
67
Proposed Artificial Recharge Structure
Additional Area proposed to be brought under
assured ground water irrigation

160
9.11 MAHUR BLOCK, NANDED DISTRICT
1. SALIENT INFORMATION 1.1.Introduction Block Name Mahur
Geographical Area (Sq. Km.) 517.41 Sq. Km.
Hilly Area (Sq. Km) 19.23 Sq. Km.
Poor Quality Area (Sq. Km.) Nil
Population (2011) 22127
Climate Tropical climate
1.2. Rainfall Analysis
Normal Rainfall 1011.49 mm
Annual Rainfall (2019) 971 mm
Decadal Average Annual Rainfall
(2010-19)
995.1 mm
Long Term Rainfall Analysis
(1998-2019)
Falling Trend: -7.042 m/year.
Probability of Normal/Excess Rainfall: - 57% & 24%.
Probability of Drought (Moderate/ Severe/ Acute):- 19%
Moderate
Frequency of occurance of Drought:- 1 in 5 Years
RAINFALL TREND ANALYSIS (1998 to 2017)
1.3. Geomorphology,Soil&Geology
Geomorphic Unit ➢ Butte (B)
➢ Escarment Slope (ES)
➢ Plateau Highly Dissected (PLH)
➢ Plateau Moderately Dissected (PLM)
➢ Plateau Slightly Dissected (PLS), 0-1m weathering
➢ Plateau Undissected (PLU), 0-1m weathering
➢ Plateau Weathered (PLW), 2-5m weathering
➢ Plateau Weathered (PLWS), 1-2m weathering
y = -7.0429x + 1095.7
0
200
400
600
800
1000
1200
1400
1600
1800
199
8
199
9
20
00
20
01
20
02
20
03
20
04
20
05
20
06
20
07
20
08
20
09
20
10
20
11
20
12
20
13
20
14
20
15
20
16
20
17
20
18
20
19
Longterm Rainfall Analysis (1998 to 2019) of Mahur Block

161
Soil ➢ Extremely shallow, well drained, loamy soils on gently
sloping rolling lands with mesas and buttes with
severe erosion
➢ Very shallow, well drained, clayey soils on gently
sloping dissected lands with moderate erosion
➢ Very shallow, well drained, clayey soils on gently
sloping dissected lands with moderate erosion\
➢ Shallow, well drained, clayey soils on very gently
sloping dissected table lands with moderate erosion
➢ Slightly deep, moderately well drained, clayey soils on
very gently sloping lands with moderate erosion
➢ Very deep, moderately well drained, clayey soils on
very gently sloping lands with moderate erosion
Geology Deccan Trap-Sahyadri Group (Late Cretaceous to Early Eocene
Age)
1.4.Hydrology & Drainage
Drainage Penganga river & its tributaries
Hydrology(as on March 2017)
Major & Medium
Irrigation Projects
(>250 Ha)
Nil
Minor Irrigation
Projects (0 to 250
Ha)
No. of projects
completed till
March 2017
23
No. of projects
operating till end
23
Command area
of the operating
project (Sq. Km.)
21.34
Net irrigated area
under Operating
project (Sq. Km.)
6.39
1.5.LAND USE, AGRICULTURE, IRRIGATION & CROPPING PATTERN
Geographical Area 517.41 Sq. Km.
Forest Area 94.38 Sq. Km.
Cultivable Area 317.68 Sq. Km.
Net Sown Area 317.68 Sq. Km.
Double Cropped Area 19.37 Sq. Km.
Area under
Irrigation
Surface Water 0
Ground Water 45.70 Sq. Km.
Principal Crops Crop Type Area (Sq. Km.)
Pulses 54.53
Cotton 257.42
Cereals 10.57
Oil Seeds 95.84
Horticultural Crops Sugarcane 0.47
Others 2.96

162
1.6.WATER LEVEL BEHAVIOUR
1.6.1. Aquifer-I/Shallow Aquifer (Phreatic Aquifer)
Pre-Monsoon (May-2019) Post-Monsoon (November-2019)
❖ Depth to water level between 5 mbgl
and 10 mbgl observed in 458.4 Sq Km
areas in major parts of the block.
❖ Depth to water level between 10 mbgl
and 20 mbgl observed in 40.28 Sq Km
area in the north-western and eastern
parts as patches
❖ The depth to water level between 2 mbgl
and 5 mbgl is observed in 193.96 Sq Km
area in the northern and southern parts of
the block.
❖ Depth to water level between 5 mbgl and
10 mbgl is observed in 238 Sq Km area in
the northwestern, western and southern
parts of the block.
❖ Depth to water level between 10 mbgl and
20 mbgl is observed in only 307.17 Sq Km
area in the major parts of the block.
Water Level Map- Aquifer-I/Shallow Aquifer (Phreatic Aquifer)
Pre-Monsoon Water Level (May 2019)
Post-Monsoon Water Level (Nov.2019)
1.6.2. Aquifer-II/Deeper Aquifer (Semiconfined/Confined Aquifer)
Pre-Monsoon (May-2019) Post-Monsoon (November-2019)
Pre-Monsoon Water Level(May 2019) Post-Monsoon Water Level(November 2019)
❖ Depth to water level between 30 mbgl
and 40 mbgl is observed in the whole of
the block.
❖ Depth to water level between 5 mbgl and
10 mbgl is observed in 309.5 Sq Km area in
the northern part of the block.

163
❖ Depth to water level between 10 mbgl and
20 mbgl is observed in about 156.2 Sq Km
area aqlong the central part of the block.
❖ Deeper depth to water level more than 20
mbgl is observed in 37.46 sq km area in the
southern part of the block as fringes
1.7. Hydrograph
The hydrograph of CGWB Monitoring site at Anjankhed for the period 2010 to 2019 shows:
❖ A rising trend during both premonsoon and postmonsoon @ 0.0897m/year and 0.299 m/year
respectively.
❖ The depth to water level during premonsoon ranges from 5.1 mbgl to 7.2 mbgl.
❖ The depth to water level during postmonsoon ranges from 1.69 mbgl to 6.6 mbgl.
❖ A falling rainfall trend @ 16.6 mm/year is observed during the period 2010-19.
1.8. Water Level Trend (2010-19)
Pre-Monsoon Trend (May 2010-2019) Post-Monsoon Trend (November 2010-2019)
Rising Trend @ Falling Trend @ Rising Trend @ Falling Trend @
Nil 0.0 to 0.2 m/year in 149.2
Sq Km area, 0.2 to 0.4
m/year in 92.59 Sq Km
area, 0.4 to 0.6 m/year in
84.32 sq km area and >0.6
m/year in 175.3 sq km
area.
0 to 0.2 m/year in 60.79
Sq Km area and 0.2 to
0.4 m/year in 4.6 Sq Km
area
0 to 0.2 m/year in
405.3 Sq Km area
Pre-Monsoon WL Trend (May 2010-2019) Post-Monsoon WL Trend (Nov.2010-2019)
Rainfall: y = -16.618x + 1086.5
Pre WL: y = 0.0897x + 6.0367 Post WL: y = 0.299x + 3.0593
0
1
2
3
4
5
6
7
80
200
400
600
800
1000
1200
1400
1600
1800
2010 2011 2012 2013 2014 2015 2016 2017 2018 2019
De
pth
to
wa
ter
le
ve
l (m
bg
l)
Ra
infa
ll (
mm
)
Year
ANNUAL RF Premonsson Wl Post monsoon Wl

164
2. GROUND WATER ISSUES
1. Low Development:-Low Development of 40.98 % of Stage of Ground Water Development is
observed in the block
2. Declining Water Level Trend: -
The decline in water level trend (2010-19) upto 0.6 m/year is observed in 501 sq km area of
the block during premonsoon and 405 sq km area during postmonsoon.
3. Low ground water yield Potential of the aquifers: The ground water yield potentiality of the
aquifers ranges from 0 to 1 lps in major parts of the block. However, high yielding aquifers re
obtained only along the drainages, faults/ fractures or joints. The low potential zone in major
parts of the block is due to limited extent of porosity and permeability evolved from
secondary porosity and hence poor sustainability of aquifers.
3. AQUIFER DISPOSITION
3.1. Number of Aquifers (Major) One:Basalt –Aquifer-I, Aquifer-II
3.2. LITHOLOGICAL DISPOSITION
3.3. CROSS SECTIONS

165
3.4 AQUIFER CHARACTERISTICS
Major Aquifer Basalt (Deccan Traps)
Type of Aquifer
(Phreatic/Semiconfined/Confined)
Aquifer-I (Phreatic) Aquifer-II
(Semiconfined/confined)
Depth to bottom of aquifer (mbgl) 9 to 16 30 to 150
Weathered/ Fractured rocks thickness (m) 6.3 to 12 5 to 11
Yield Potential 0 to 100 m3/day 0 to 0.4 lps
Specific Yield (Sy)/ Storativity (S) 0.02 0.0013
Transmissivity (T) - 19 to 22.08 m2/day
4.CHEMICAL QUALITY OF GROUND WATER &CONTAMINATION
4.1 Aquifer I/Shallow Aquifer
Suitability for Drinking Purposes Suitability for Irrigation Purposes
➢ The overall quality of Aquifer is potable
and useful for drinking and domestic
puposes
➢ The entire block has EC between 750 and
2250 microsiemens/cm
➢ In the entire block, where EC > 750
microsiemens/cm, special management
for salinity control may be required and
plants with good salt tolerance should be
selected.
4.1 Aquifer II/Deeper Aquifer
Suitability for Drinking Purposes Suitability for Irrigation Purposes
➢ The overall quality of Aquifer is potable
and useful for drinking and domestic
puposes
➢ About 315.4 Sq Km area of the block has
EC well within the potable range of 250
to 750microsiemens/cm; 185 sq Km area
has EC between 750 and 2250
microsiemens/cm
➢ In 315 Sq Km area, plants with moderate
salt tolerance can be grown. However, in
185 sq Km area where EC > 750
microsiemens/cm, special management
for salinity control may be required and
plants with good salt tolerance should be
selected.
➢ All the analysed samples in the block
have SAR value well within 0 to 10 types
and are therefore good for irrigation.
➢ The RSC values of all the analysed
samples have values < 1.25 meq/l
indicating that the ground water is good

166
for irrigation. Except in Sindkhed villlage
➢ About 50 % of the analysed samples have
% Na less than between 40 and 60; 50%
have %Na more than 60
Hence, the overall quality of ground water is
suitable for irrigation purposes except in areas
where %Na is more than 60 and high RSC values.
3.2.CHEMICAL QUALITY MAP
Phreatic Aquifer (Aquifer-I)
Semiconfined/Confined Aquifer (Aquifer II)
5. GROUND WATER RESOURCE & EXTRACTION
Aquifer-I/ Phreatic Aquifer (Basalt)
Ground Water Recharge Worthy Area (Sq. Km.) 498.18
Total Annual Ground Water Recharge (MCM) 53.11
Natural Discharge (MCM) 2.65
Net Annual Ground Water Availability (MCM) 50.45
Existing Gross Ground Water Draft for irrigation
(MCM)
19.67
Existing Gross Ground Water Draft for domestic
and industrial water supply(MCM)
0.99
Existing Gross Ground Water Draft for All
uses(MCM)
20.67
Net Ground Water Availability for future
irrigation development(MCM)
28.15
Provision for domestic and industrial
requirement supply to 2025(MCM)
2.59
Stage of Ground Water Development % 40.98
Category SAFE
Aquifer-II
Semiconfined/Confined Aquifer (Basalt)
Resources above the confining layer Resources within the confining layer
Total
Area
(Sq.
Mean
aquifer
thickness
S Resources
above
confining
Total Area
(Sq. Km.)
Mean
aquifer
thicknes
S Resource
s within
the
Total
Resou
rces

167
Km.) (m) layer (
MCM)
s (m) confining
layer
(MCM)
(MCM
)
517.41
6.63
0.0013
4.460
517.41
8.000
0.001
3 5.38 9.84
5.0. GROUND WATER RESOURCE ENHANCEMENT
Available Resource (MCM) 50.45
Gross Annual Draft (MCM) 20.67
5.1.SUPPLY SIDE MANAGEMENt
SUPPLY (MCM)
Agricultural Supply -GW 19.67
Agricultural Supply -SW 0.00
Domestic Supply - GW 0.99
Domestic Supply - SW 0.25
Total Supply 20.91
Area of Block (Sq. Km.) 517.41
Area suitable for Artificial recharge
(Sq. Km)
498.18
Type of Aquifer Hard Rock Soft Rock
Area feasible for Artificial
Recharge(WL >5mbgl) (Sq. Km.) 114.76 -
Volume of Unsaturated Zone (MCM) 229.51 -
Average Specific Yield 0.020 -
Volume of Sub surface Storage Space
available for Artificial Recharge
(MCM)
4.59
-
Surplus water Available (MCM) 2.57 -
Proposed Structures Percolation Tank
(Av. Gross
Capacity-100
TCM*2 fillings =
200 TCM)
Check Dam ( Av.
Gross Capacity-10
TCM * 3 fillings = 30
TCM)
Recharge shaft
(Av. Gross
Capacity-60 TCM
)
Number of Structures 7 19 0
Volume of Water expected to be
conserved / recharged @ 75%
efficiency (MCM)
1.05 0.4275
0
Area of Saline Patch Nil
Proposed Structures Nil
No of farm pond proposed (size:
30m*30m*3) with 3 filling= 0.0081
mcm capacity, 50% available water
may be utilized for harvesting
through farm ponds.
Nil
Volume of water available for
harvesting
Nil
Additional volume created by Nil

168
desilting
RTRWH Structures – Urban Areas
Households to be covered (25% with
50 m2area)
5532
Total RWH potential (MCM) 0.275
Rainwater harvested / recharged @
80% runoff co-efficient
0.220 (Economically not viable & Not Recommended)
5.2.DEMAND SIDE MANAGEMENT
Micro irrigation techniques
Remaining ground water irrigated
Sugarcane cropped area proposed
through drip irrigation
Nil
Volume of Water expected to be
saved (MCM).
(Surface Flooding req- 2.45 m. Drip
Req. - 1.88, WUE- 0.57 m)
Nil
Proposed Cropping Pattern change
Irrigated area under Water Intensive
Crop(ha)
Not proposed
Water Saving by Change in Cropping
Pattern
Nil
5.3.EXPECTED BENEFITS
Net Ground Water Availability
(MCM) 50.45
Additional GW resources available
after Supply side interventions
(MCM)
1.4775
Ground Water Availability after
Supply side intervention 51.9275
Existing Ground Water Draft for All
Purposes (MCM) 20.67
Saving of Ground Water through
demand side intervention (MCM) 0
GW draft after Demand Side
Interventions (MCM) 20.67
Present stage of Ground Water
Development (%) 41.0
Expected Stage of Ground Water
Development after interventions (%) 39.8
Other Interventions Proposed, if any
Alternate Water Sources Available Nil
5.4.RECOMMENDATION
Ground water development is recommended to bring the stage of development from 41% to 70%
5.5.DEVELOPMENT PLAN
Volume of water available to bring
the stage of GWD is to 70% (MCM) 15.68

169
Proposed Number of DW( @ 1.5 ham
for 90% of GWR Available) 941
Proposed Number of BW( @ 1.5 ham
for 10% of GWR Available) 157
Additional Area (sq.km.) proposed to
be brought under assured GW
irrigation with av. CWR of 0.65 m
24
Proposed Artificial Recharge Structure
Addditional Area proposed to be brought under
assured ground water irrigation

170
9.12 MUDKHED BLOCK, NANDED DISTRICT
1. SALIENT INFORMATION 1.1. Introduction Block Name Mudkhed
Geographical Area (Sq. Km.) 338 Sq. Km.
Hilly Area (Sq. Km) 14.06 Sq. Km.
Poor Quality Area (Sq. Km.) Nil
Population (2011) 92179
Climate Tropical climate
1.2. Rainfall Analysis
Normal Rainfall 823.34 mm
Annual Rainfall (2019) 1231.1 mm
Decadal Average Annual Rainfall
(2010-19)
884.18 mm
Long Term Rainfall Analysis
(2000-2019)
Rising Trend: 17.921 m/year.
Probability of Normal/Excess Rainfall: - 55% & 25%.
Probability of Drought (Moderate/ Severe/ Acute):- 15%
Moderate & 5% Severe
Frequency of occurrence of Drought: - 1 in 5 Years
RAINFALL TREND ANALYSIS (2000 to 2017)
1.3. Geomorphology, Soil & Geology
Geomorphic Unit ➢ Butte (B)
➢ Escarpment Slope (ES)
➢ Mesa (M)
➢ Plateau Moderately Dissected (PLM)
➢ Plateau Slightly Dissected (PLS), 0-1m weathering
➢ Plateau Undissected (PLU), 0-1m weathering
➢ Plateau Weathered (PLWS), 1-2m weathering
➢ Plateau Weathered-Canal Command (PLC)
y = 8.3696x + 727.09
0
200
400
600
800
1000
1200
1400
1600
1800
199
9
20
00
20
01
20
02
20
03
20
04
20
05
20
06
20
07
20
08
20
09
20
10
20
11
20
12
20
13
20
14
20
15
20
16
20
17
20
18
20
19
Lonterm Rainfall Analysis (2000 to 2019) of Mudkhed Block

171
Soil ➢ Very shallow, well drained, loamy, moderately
calcareous soils on gently sloping undulating lands with
moderate erosion
➢ Deep, imperfectly drained, fine, calcareous soils on very
gently sloping plains and valleys with moderate erosion;
moderate salinity and slight sodicity
Geology Deccan Trap-Sahyadri Group (Late Cretaceous to Early Eocene
Age)
1.4.Hydrology & Drainage
Drainage Godavari River & its tributaries
Hydrology(as on March 2017)
Major & Medium
Irrigation Projects
(>250 Ha)
1 Major Project
Minor Irrigation
Projects (0 to 250
Ha)
No. of projects
completed till
March 2017
37
No. of projects
operating till end
37
Command area of
the operating
project (Sq. Km.)
12..39
Net irrigated area
under Operating
project (Sq. Km.)
8.06
1.5.LAND USE, AGRICULTURE, IRRIGATION & CROPPING PATTERN
Geographical Area 338 Sq. Km.
Forest Area 9.30 Sq. Km.
Cultivable Area 285.56 Sq. Km.
Net Sown Area 281.78 Sq. Km.
Double Cropped Area 49.41 Sq. Km.
Area under
Irrigation
Surface Water 9.47 Sq. Km.
Ground Water 14.76 Sq. Km.
Principal Crops Crop Type Area (Sq. Km.)
Pulses 63.85
Cotton 35.46
Cereals 51.55
Oil Seeds 113.66
Horticultural Crops Sugarcane 53.12
Others 42.88
1.6.WATER LEVEL BEHAVIOUR
1.6.1. Aquifer-I/Shallow Aquifer (Phreatic Aquifer)
Pre-Monsoon (May-2019) Post-Monsoon (November-2019)
❖ Depth to water level less than 5 mbgl is
observed only as very small isolated
patch of 0.5 sq km area.
❖ Depth to water level between 5 mbgl
❖ The depth to water level between 2 mbgl and
5 mbgl is observed in 29.8 Sq Km area in the
western part of the block as an isolated
patch.

172
and 10 mbgl observed in 131 Sq Km
area in the eastern parts of the block.
❖ Depth to water level between 10 mbgl
and 20mbgl is observed in 157.6 sq km
area in the western parts of the block.
❖ The deeper depths to water level more
than 20 mbgl is observed in 34.5 sq km
area in the west-central parts of the
block.
❖ Depth to water level between 5 mbgl and 10
mbgl is observed in 310 Sq Km area in the
remaining parts of the block.
Water Level Map- Aquifer-I/Shallow Aquifer (Phreatic Aquifer)
Pre-Monsoon Water Level (May 2019)
Post-Monsoon Water Level (Nov.2019)
1.6.2. Aquifer-II/Deeper Aquifer (Semiconfined/Confined Aquifer)
Pre-Monsoon (May-2019) Post-Monsoon (November-2019)
Pre-Monsoon Water Level(May 2019) Post-Monsoon Water Level(November 2019)
❖ Depth to water level between 5mbgl
and 10 mbgl is observed in the whole of
the block.
❖ The depth to water level between 5 mbgl and
10 mbgl is observed in 238.6 Sq Km area in
the major parts of the block.
❖ Depth to water level between 10 mbgl and 20
mbgl is observed in 101.9 Sq Km area in the
eastern parts of the block.
1.7. Hydrograph

173
The hydrograph of CGWB Monitoring site at Barad for the period 2010 to 2019 shows:
❖ A rising trend during premonsoon @ 0.047 m/year and a falling trend postmonsoon @ 0.117 m/year
respectively.
❖ The depth to water level during premonsoon ranges from 11.17 mbgl to 13.03 mbgl.
❖ The depth to water level during postmonsoon ranges from 3.63 mbgl to 9.93 mbgl.
❖ A rising rainfall trend @ 11.43mm/year for the period 2010 to 2019.
1.8. Water Level Trend (2010-19)
Pre-Monsoon Trend (May 2010-2019) Post-Monsoon Trend (November 2010-2019)
Rising Trend @ Falling Trend @ Rising Trend @ Falling Trend @
0.0 to 0.2 m/year
in 12.8 Sq Km area
0.0 to 0.2 m/year in 86.47
Sq Km area, 0.2 to 0.4
m/year in 115.4 Sq Km
area, 0.4 to 0.6 m/year in
123.1 sq km area and >0.6
m/year in 2.72 sq km area.
0 to 0.2 m/year in
52.58 Sq Km area
0 to 0.2 m/year in 277.1 Sq
Km area
Pre-Monsoon WL Trend (May 2010-2019) Post-Monsoon WL Trend (Nov.2010-2019)
2. GROUND WATER ISSUES
1) Variation in stage of ground water development
Rainfall:y = 11.434x + 821.29Pre WL:y = 0.0474x + 12.161
Post WL:y = -0.1172x + 6.5387
0
2
4
6
8
10
12
140
200
400
600
800
1000
1200
1400
1600
2010 2011 2012 2013 2014 2015 2016 2017 2018 2019
De
pth
to
wa
ter
le
ve
l (m
bg
l)
Ra
infa
ll (
mm
)
Year
ANNUAL RF Premonsson Wl Post monsoon Wl

174
The stage of ground water development has varied from 61.82 % (2004) to 57.47% (2017) with the
decrease in Net Ground Water Availability from 45 MCM (2004) to 36 MCM (2017).
1) Declining Water Level Trend: - The decline in water level trend (2010-19) more than 0.6 m/year
is observed in 327 sq km area of the block during premonsoon
3) Low ground water yield Potential of the aquifers:
The ground water yield potentiality of the aquifers ranges from 0 to 1 lps in major parts of the block.
However, high yielding aquifers are obtained only along the drainages, faults/ fractures or joints. The low
potential zone in major parts of the block is due to limited extent of porosity and permeability evolved
from secondary porosity and hence poor sustainability of aquifers.
QUIFER DISPOSITION
3.1. Number of Aquifers (Major) Two: Basalt –Aquifer-I, Aquifer-II
3.2. LITHOLOGICAL DISPOSITION
3.3. CROSS SECTIONS
61.8256.13 54.10
57.47
0
10
20
30
40
50
60
70
2008 2011 2013 2017
Net Annual Ground Water Availability

175
3.4 AQUIFER CHARACTERISTICS
Major Aquifer Basalt (Deccan Traps)
Type of Aquifer
(Phreatic/Semiconfined/Confined)
Aquifer-I (Phreatic) Aquifer-II
(Semiconfined/confined)
Depth to bottom of aquifer (mbgl) 10 to 16 60 to 150
Weathered/ Fractured rocks thickness (m) 8 to 12 2 to 8
Yield Potential 15 to 100 m3/day 0 to 0.4 lps
Specific Yield (Sy)/ Storativity (S) 0.02 0.0006
Transmissivity (T) - 5.83 to 6.78 m2/day
4.CHEMICAL QUALITY OF GROUND WATER &CONTAMINATION
4.1 Aquifer I/Shallow Aquifer
Suitability for Drinking Purposes Suitability for Irrigation Purposes
➢ The overall quality of Aquifer is potable
and useful for drinking and domestic
puposes
➢ The entire block has EC between 750 and
2250 microsiemens/cm
➢ In the entire block, where EC > 750
microsiemens/cm, special management for
salinity control may be required and plants
with good salt tolerance should be selected.
4.1 Aquifer II/Deeper Aquifer
Suitability for Drinking Purposes Suitability for Irrigation Purposes
➢ The overall quality of Aquifer is potable
and useful for drinking and domestic
puposes except in Nitrate affected
Mudkhed village.
➢ The entire block has EC well has EC
between 750 and 2250 microsiemens/cm
➢ The entire block has EC > 750
icrosiemens/cm, where special management
for salinity control may be required and
plants with good salt tolerance should be
selected.
➢ All the analysed samples in the block have
SAR value well within 0 to 10 types and are
therefore good for irrigation.
➢ The RSC values of all the analysed samples
have values < 1.25 meq/l indicating that the
ground water is good for irrigation.
About 50 % of the analysed samples have %Na

176
between 20 and 40; 50% have %Na between 40 and
60
3.2.CHEMICAL QUALITY MAP
Phreatic Aquifer (Aquifer-I)
Semiconfined/Confined Aquifer (Aquifer II)
5. GROUND WATER RESOURCE & EXTRACTION
Aquifer-I/ Phreatic Aquifer (Basalt)
Ground Water Recharge Worthy Area (Sq. Km.) 323.94
Total Annual Ground Water Recharge (MCM) 38.85
Natural Discharge (MCM) 1.94
Net Annual Ground Water Availability (MCM) 36.90
Existing Gross Ground Water Draft for irrigation
(MCM)
20.62
Existing Gross Ground Water Draft for domestic
and industrial water supply(MCM)
0.58
Existing Gross Ground Water Draft for All
uses(MCM)
21.21
Net Ground Water Availability for future
irrigation development(MCM)
14.47
Provision for domestic and industrial
requirement supply to 2025(MCM)
1.76
Stage of Ground Water Development % 57.47
Category SAFE
Aquifer-II
Semiconfined/Confined Aquifer (Basalt)
Resources above the confining layer Resources within the confining layer
Total
Area
(Sq.
Km.)
Mean
aquifer
thickness
(m)
S Resources
above
confining
layer (MCM)
Total
Area (Sq.
Km.)
Mean
aquifer
thickness
(m)
S Resources
within the
confining
layer
(MCM)
Total
Resou
rces
(MC
M)
338
3.63
0.0006 0.736
338
5
0.000
6 1.014 1.75
5.0. GROUND WATER RESOURCE ENHANCEMENT
Available Resource (MCM) 36.90

177
Gross Annual Draft (MCM) 21.21
5.1.SUPPLY SIDE MANAGEMENT
SUPPLY (MCM)
Agricultural Supply -GW 20.62
Agricultural Supply -SW 9.47
Domestic Supply - GW 0.58
Domestic Supply - SW 0.12
Total Supply 30.79
Area of Block (Sq. Km.) 338
Area suitable for Artificial recharge
(Sq. Km)
323.94
Type of Aquifer Hard Rock Soft Rock
Area feasible for Artificial
Recharge(WL >5mbgl) (Sq. Km.)
326.73 -
Volume of Unsaturated Zone (MCM) 653.46 -
Average Specific Yield 0.020 -
Volume of Sub surface Storage Space
available for Artificial Recharge
(MCM)
13.07
-
Surplus water Available (MCM) 7.32 -
Proposed Structures Percolation Tank
(Av. Gross
Capacity-100
TCM*2 fillings =
200 TCM)
Check Dam ( Av.
Gross Capacity-10
TCM * 3 fillings = 30
TCM)
Recharge shaft (Av.
Gross Capacity-60
TCM )
Number of Structures 19 55 0
Volume of Water expected to be
conserved / recharged @ 75%
efficiency (MCM)
2.85 1.2375
0
Area of Saline Patch Nil
Proposed Structures Nil
No of farm pond proposed (size:
30m*30m*3) with 3 filling= 0.0081
mcm capacity, 50% available water
may be utilized for harvesting
through farm ponds.
Nil
Volume of water available for
harvesting
Nil
Additional volume created by
desilting Nil
RTRWH Structures – Urban Areas
Households to be covered (25% with
50 m2area)
4277
Total RWH potential (MCM) 0.189
Rainwater harvested / recharged @
80% runoff co-efficient
0.151 (Economically not viable & Not Recommended)

178
5.2.DEMAND SIDE MANAGEMENT
Micro irrigation techniques
Ground water irrigated Sugarcane
cropped area proposed through drip
irrigation
5.3
Volume of Water expected to be
saved (MCM).
(Surface Flooding req- 2.45 m. Drip
Req. - 1.88, WUE- 0.57 m)
5.03
Proposed Cropping Pattern change
Irrigated area under Water Intensive
Crop(ha)
Not proposed
Water Saving by Change in Cropping
Pattern
Nil
5.3.EXPECTED BENEFITS
Net Ground Water Availability
(MCM) 36.90
Additional GW resources available
after Supply side interventions
(MCM)
4.0875
Ground Water Availability after
Supply side intervention 40.9875
Existing Ground Water Draft for All
Purposes (MCM) 21.21
Saving of Ground Water through
demand side intervention (MCM) 5.03
GW draft after Demand Side
Interventions (MCM) 16.18
Present stage of Ground Water
Development (%) 57.5
Expected Stage of Ground Water
Development after interventions (%) 39.48
Other Interventions Proposed, if any
Alternate Water Sources Available Nil
5.4.RECOMMENDATION
Ground water development is recommended to bring the stage of development from 57.5 % to 70%
5.5.DEVELOPMENT PLAN
Volume of water available to bring
the stage of GWD is to 70% (MCM) 7.48125
Proposed Number of DW( @ 1.5 ham
for 90% of GWR Available) 449
Proposed Number of BW( @ 1.5 ham
for 10% of GWR Available) 75
Additional Area (sq.km.) proposed to
be brought under assured GW
irrigation with av. CWR of 0.65 m
12

179
Proposed Artificial Recharge Structure
Addditional Area proposed to be brought under
assured ground water irrigation

180
9.13 MUKHED BLOCK, NANDED DISTRICT
1. SALIENT INFORMATION 1.1.Introduction Block Name Mukhed
Geographical Area (Sq. Km.) 941.47Sq. Km.
Hilly Area (Sq. Km) 65.53 Sq. Km.
Poor Quality Area (Sq. Km.) Nil
Population (2011) 266235
Climate Tropical climate
1.2. Rainfall Analysis
Normal Rainfall 765.27 mm
Annual Rainfall (2019) 1033.9 mm
Decadal Average Annual Rainfall
(2010-19)
780.9 mm
Long Term Rainfall Analysis
(1999-2019)
Falling Trend: 1.18 m/year.
Probability of Normal/Excess Rainfall: - 62% & 19%.
Probability of Drought (Moderate/ Severe/ Acute):- 19%
Moderate
Frequency of occurrence of Drought:- 1 in 5 Years
RAINFALL TREND ANALYSIS (1999 to 2019)
1.3. Geomorphology, Soil & Geology
Geomorphic Unit ➢ Butte (B)
➢ Escarpment Slope (ES)
➢ Plateau Moderately Dissected (PLM)
➢ Plateau Slightly Dissected (PLS), 0-1m weathering
➢ Plateau Undissected (PLU), 0-1m weathering
➢ Plateau Weathered (PLW), 2-5m weathering
➢ Plateau Weathered (PLW), 2-5m weathering
y = -1.1866x + 778.32
0
200
400
600
800
1000
1200
199
9
20
00
20
01
20
02
20
03
20
04
20
05
20
06
20
07
20
08
20
09
20
10
20
11
20
12
20
13
20
14
20
15
20
16
20
17
20
18
20
19
Longterm Rainfall Analysi (2000 to 2019) of Mukhed Block

181
➢ Plateau Weathered (PLWS), 1-2m weathering
➢ Plateau Weathered-Canal Command (PLC)
Soil ➢ Shallow, well drained, clayey soils on gently sloping
lands with moderate erosion
➢ Very shallow, somewhat excessively drained, loamy
soils on gently sloping undulating lands with mesas
and buttes with moderate erosion
➢ Deep, moderately well drained, fine soils on gently
sloping plains and valleys with moderate erosion
Geology Deccan Trap-Sahyadri Group (Late Cretaceous to Early Eocene
Age)
1.4.Hydrology & Drainage
Drainage Landi river & its tributaries
Hydrology(as on March 2017)
Major & Medium
Irrigation Projects
(>250 Ha)
1 Major Project & 1 Medium Project
Minor Irrigation
Projects (0 to 250
Ha)
No. of projects
completed till
March 2017
118
No. of projects
operating till end
118
Command area
of the operating
project (Sq. Km.)
78.57
Net irrigated area
under Operating
project (Sq. Km.)
38.77
1.5.LAND USE, AGRICULTURE, IRRIGATION & CROPPING PATTERN
Geographical Area 941.47Sq. Km.
Forest Area 21.81 Sq. Km.
Cultivable Area 785.72 Sq. Km.
Net Sown Area 751.10 Sq. Km.
Double Cropped Area 168.32 Sq. Km.
Area under
Irrigation
Surface Water 85.00 Sq. Km.
Ground Water 2.3 Sq. Km.
Principal Crops Crop Type Area (Sq. Km.)
Pulses 251.65
Cotton 63.13
Cereals 192.34
Oil Seeds 351.92
Horticultural Crops Sugarcane 15.00
Others 3.63
1.6.WATER LEVEL BEHAVIOUR
1.6.1. Aquifer-I/Shallow Aquifer (Phreatic Aquifer)
Pre-Monsoon (May-2019) Post-Monsoon (November-2019)

182
❖ Depth to water level between 5 mbgl
and 10 mbgl observed in 9.8 Sq Km
areas in a small isolated patch in the
southern part of the block.
❖ Depth to water level between 10 mbgl
and 20 mbgl observed in 612 Sq Km
area in the major parts of the block.
❖ Depth to water level between 20 mbgl
and 30 mbgl is observed in 36 sq km
area in the eastern part of the block.
❖ The shallow depth to water level less than
2 mbgl is observed in 73 sq km area in
isolated patches in the block.
❖ Depth to water level between 2 mbgl and
5 mbgl is observed in 188 Sq Km area in
north-eastern, north-western and
southern parts of the block.
❖ Depth to water level between 5 mbgl and
10 mbgl is observed in 580.67 Sq Km area
in the major parts of the block.
❖ Depth to water level between 10 mbgl and
20 mbgl is observed in 82.61 Sq Km area in
isolated patches in the northern part of
the block.
Water Level Map- Aquifer-I/Shallow Aquifer (Phreatic Aquifer)
Pre-Monsoon Water Level (May 2019)
Post-Monsoon Water Level (Nov.2019)
1.6.2. Aquifer-II/Deeper Aquifer (Semiconfined/Confined Aquifer)
Pre-Monsoon (May-2019) Post-Monsoon (November-2019)
Pre-Monsoon Water Level(May 2019) Post-Monsoon Water Level(November 2019)
❖ Depth to water level between 5 mbgl
and 10 mbgl is observed in 237.8 Sq Km
area northeastern part of the block.
❖ Depth to water level between 10 mbgl and
20 mbgl is observed in 438.7 Sq Km area in
the eastern part of the block

183
❖ Depth to water level between 10 mbgl
and 20 mbgl is observed in about 438.7
Sq Km area in the eastern, central and
western parts of the block.
❖ Depth to water level more than 20 mbgl
is observed in 253.7 Sq Km area in the
southern parts the block.
❖ Depth to water level between 20 mbgl and
30 mbgl is observed in 347.1 Sq Km area
along the central part of the block
❖ The deeper depth to water level of more
than 30 mbgl is observed in 137.6 Sq Km
area in the north-western boundary of the
block.
1.7. Hydrograph
The hydrograph of CGWB Monitoring site at Mukhed for the period 2010 to 2019 shows:
❖ A falling trend during premonsoon @ 0.377 m/year and a rising trend during postmonsoon @
0.331 m/year.
❖ The depth to water level during premonsoon ranges from 4.05 mbgl to 9.68 mbgl.
❖ The depth to water level during postmonsoon ranges from 0.15 mbgl to 5.25 mbgl.
❖ A rising rainfall trend @0.207 mm/year for the period 2010-19
1.8. Water Level Trend (2010-19)
Pre-Monsoon Trend (May 2010-2019) Post-Monsoon Trend (November 2010-2019)
Rising Trend @ Falling Trend @ Rising Trend @ Falling Trend @
0.0 to 0.2 m/year
in 93.73 Sq Km
area and 0.2 to 0.4
m/year in 208.9 sq
km area and 0.4 to
0.6 m/year in 74.45
sq km area.
0.0 to 0.2 m/year in 213.7
Sq Km area, 0.2 to 0.4
m/year in 114.2 Sq Km
area, 0.4 to 0.6 m/year in
81.06 sq km area.
0 to 0.2 m/year in 124.4
Sq Km area; 0.2 to 0.4
m/year in 271.6 sq km
area and0.4 to 0.6
m/year in 54.99 sq km
area. And > 0.6 m/year
in 25.86 sq km area.
0 to 0.2 m/year in
398.6 Sq Km area and
0.2 to 0.4 m/year in
23.26 Sq Km area
Pre-Monsoon WL Trend (May 2010-2019) Post-Monsoon WL Trend (Nov.2010-2019)
Rainfall:y = 0.2073x + 779.76
Pre WL:y = -0.3774x + 8.8187 Post WL:y = 0.3309x + 0.34
0
2
4
6
8
10
120
200
400
600
800
1000
1200
2010 2011 2012 2013 2014 2015 2016 2017 2018 2019
De
pth
to
wa
ter
le
ve
l (m
bg
l)
Ra
infa
ll (
mm
)
Year
ANNUAL RF Premonsson Wl Post monsoon Wl

184
2. GROUND WATER ISSUES
1) Low Development:-Low Development of 25.43% of Stage of Ground Water Development is
observed in the block
2) Declining Water Level Trend: -
The decline in water level trend (2010-19) upto 0.6 m/year is observed in 408 sq km area of
the block during premonsoon and upto 0.4 m/year in 421 sq km area during postmonsoon.
3) Low ground water yield Potential of the aquifers: The ground water yield potentiality of the
aquifers ranges from 0 to 1 lps in major parts of the block. However, high yielding aquifers re
obtained only along the drainages, faults/ fractures or joints. The low potential zone in major
parts of the block is due to limited extent of porosity and permeability evolved from
secondary porosity and hence poor sustainability of aquifers.
3. AQUIFER DISPOSITION
3.1. Number of Aquifers (Major) 1)Basalt –Aquifer-I, Aquifer-II
2)Granite-Aquifer-I, Aquifer-II
3.2. LITHOLOGICAL DISPOSITION
3.3. CROSS SECTIONS

185
3.4 AQUIFER CHARACTERISTICS
Major Aquifer Basalt (Deccan Traps)
Type of Aquifer
(Phreatic/Semiconfined/Confined)
Aquifer-I (Phreatic) Aquifer-II
(Semiconfined/confined)
Depth to bottom of aquifer (mbgl) 9 to 16 30 to 90
Weathered/ Fractured rocks thickness (m) 5.4 to 12.8 2 to 8
Yield Potential 0 to 100 m3/day 0.23 to 0.4 lps
Specific Yield (Sy)/ Storativity (S) 0.02 0.0008
Transmissivity (T) - 2.62 to 5.35 m2/day
4.CHEMICAL QUALITY OF GROUND WATER &CONTAMINATION
4.1 Aquifer I/Shallow Aquifer
Suitability for Drinking Purposes Suitability for Irrigation Purposes
➢ The overall quality of Aquifer is potable
and useful for drinking and domestic
puposes except in Nitrate affected areas.
➢ About 402.1 Sq Km area of the block has
EC well within the potable range of 250
to 750 microsiemens/cm; 505 sq Km area
has EC between 750 and 2250
microsiemens/cm
➢ In 402 Sq Km area of the block, plants
with moderate salt tolerance can be
grown. However, in 505 sq Km area
where EC > 750 microsiemens/cm,
special management for salinity control
may be required and plants with good
salt tolerance should be selected.
➢ All the analysed samples in the block
have SAR value well within 0 to 10 types
and are therefore good for irrigation.
➢ The RSC values of all the analysed
samples have values < 1.25 meq/l except
at Balegaon Village indicating that the
ground water is good for irrigation.
➢ The analysed samples have %Na between
20 and 40
Hence, the overall quality of ground water is
suitable for irrigation purposes.

186
4.1 Aquifer II/Deeper Aquifer
Suitability for Drinking Purposes Suitability for Irrigation Purposes
➢ The overall quality of Aquifer is potable
and useful for drinking and domestic
purposes
➢ About 213.6 Sq Km area of the block has
EC well within the potable range of 250
to 750microsiemens/cm; 712.9 sq Km
area has EC between 750 and 2250
microsiemens/cm
➢ In 213 Sq Km area, plants with moderate
salt tolerance can be grown. However, in
712.9 sq Km area where EC > 750
microsiemens/cm, special management
for salinity control may be required and
plants with good salt tolerance should be
selected.
➢ All the analysed samples in the block
have SAR value well within 0 to 10 types
and are therefore good for irrigation.
➢ The RSC values of all the analysed
samples have values < 1.25 meq/l except
in Berli village indicating that the ground
water is good for irrigation.
➢ About 33 % of the analysed samples have
% Na between 20 and 40 and 64% of
analysed samples has %Na more than
60%
Hence, the quality of ground water is not suitable
for irrigation purposes with high RSC values and
with %Na values more than 60%.
3.2.CHEMICAL QUALITY MAP
Phreatic Aquifer (Aquifer-I)
Semiconfined/Confined Aquifer (Aquifer II)
5. GROUND WATER RESOURCE & EXTRACTION
Aquifer-I/ Phreatic Aquifer (Basalt)
Ground Water Recharge Worthy Area (Sq. Km.) 875.94
Total Annual Ground Water Recharge (MCM) 97.10
Natural Discharge (MCM) 4.89

187
Net Annual Ground Water Availability (MCM) 92.20
Existing Gross Ground Water Draft for irrigation
(MCM)
20.45
Existing Gross Ground Water Draft for domestic
and industrial water supply(MCM)
3.55
Existing Gross Ground Water Draft for All
uses(MCM)
23.45
Net Ground Water Availability for future
irrigation development(MCM)
61.97
Provision for domestic and industrial
requirement supply to 2025(MCM)
9.69
Stage of Ground Water Development % 25.43
Category SAFE
Aquifer-II
Semiconfined/Confined Aquifer (Basalt)
Total Area
(Sq. Km.)
Mean
aquifer
thickness
(m)
S Resources
above
confining
layer
(MCM)
Total
Area
(Sq.
Km.)
Mean
aquifer
thickness
(m)
S Resources
within the
confining
layer
(MCM)
Total
Resourc
es
(MCM)
941.47 4.21 0.0008 3.409 941.4
7 5
0.00
08 4.048 7.45
5.0. GROUND WATER RESOURCE ENHANCEMENT
Available Resource (MCM) 92.20
Gross Annual Draft (MCM) 23.45
5.1.SUPPLY SIDE MANAGEMENT
SUPPLY (MCM)
Agricultural Supply -GW 20.45
Agricultural Supply -SW 85.00
Domestic Supply - GW 2.98
Domestic Supply - SW 0.60
Total Supply 109.03
Area of Block (Sq. Km.) 941.47
Area suitable for Artificial recharge
(Sq. Km)
875.94
Type of Aquifer Hard Rock Soft Rock
Area feasible for Artificial
Recharge(WL >5mbgl) (Sq. Km.) 504.70 -
Volume of Unsaturated Zone (MCM) 1009.39 -
Average Specific Yield 0.020 -
Volume of Sub surface Storage Space
available for Artificial Recharge
(MCM)
20.2
-
Surplus water Available (MCM) 11.31
-

188
Proposed Structures Percolation Tank
(Av. Gross
Capacity-100
TCM*2 fillings =
200 TCM)
Check Dam ( Av.
Gross Capacity-10
TCM * 3 fillings = 30
TCM)
Recharge shaft
(Av. Gross
Capacity-60 TCM
)
Number of Structures 30 85 0
Volume of Water expected to be
conserved / recharged @ 75%
efficiency (MCM)
4.5 1.9125
0
Area of Saline Patch Nil
Proposed Structures Nil
No of farm pond proposed (size:
30m*30m*3) with 3 filling= 0.0081
mcm capacity, 50% available water
may be utilized for harvesting
through farm ponds.
Nil
Volume of water available for
harvesting
Nil
Additional volume created by
desilting Nil
RTRWH Structures – Urban Areas
Households to be covered (25% with
50 m2area)
13462
Total RWH potential (MCM) 0.525
Rainwater harvested / recharged @
80% runoff co-efficient
0.420 (Economically not viable & Not Recommended)
5.2.DEMAND SIDE MANAGEMENT
Micro irrigation techniques
Remaining ground water irrigated
Sugarcane cropped area proposed
through drip irrigation
Nil
Volume of Water expected to be
saved (MCM).
(Surface Flooding req- 2.45 m. Drip
Req. - 1.88, WUE- 0.57 m)
Nil
Proposed Cropping Pattern change
Irrigated area under Water Intensive
Crop(ha)
Not proposed
Water Saving by Change in Cropping
Pattern
Nil
5.3.EXPECTED BENEFITS
Net Ground Water Availability
(MCM) 92.20
Additional GW resources available
after Supply side interventions
(MCM)
6.4125
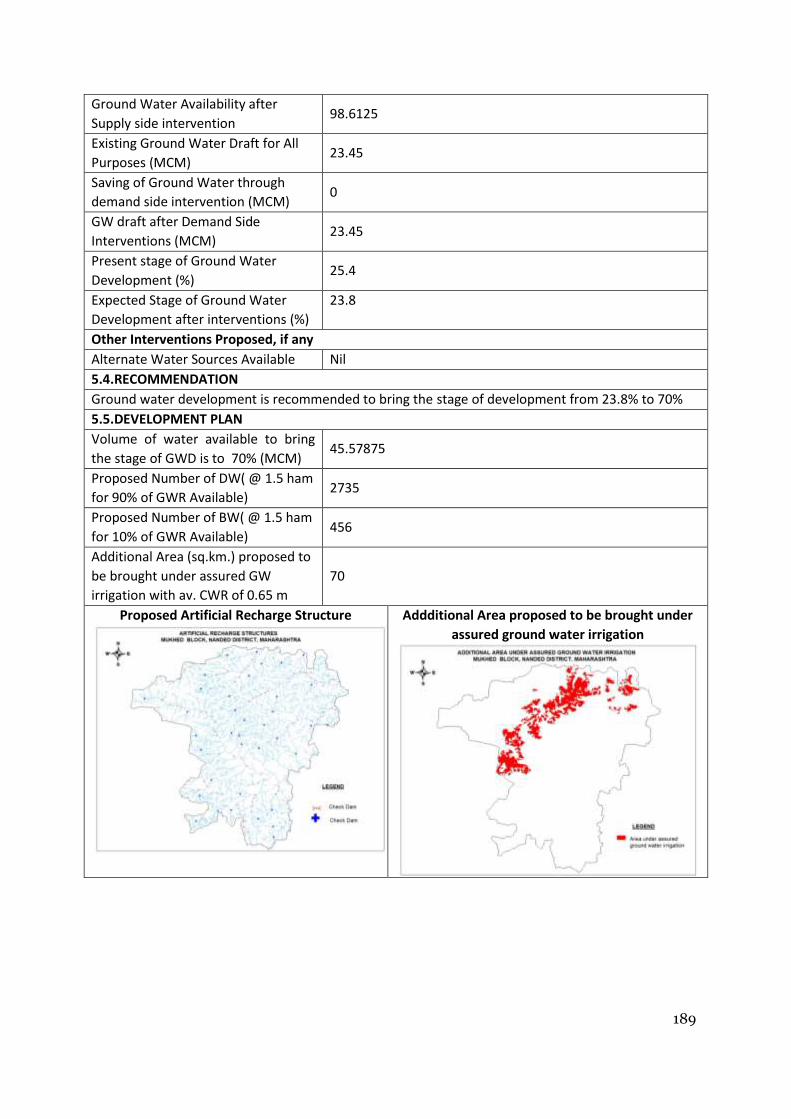
189
Ground Water Availability after
Supply side intervention 98.6125
Existing Ground Water Draft for All
Purposes (MCM) 23.45
Saving of Ground Water through
demand side intervention (MCM) 0
GW draft after Demand Side
Interventions (MCM) 23.45
Present stage of Ground Water
Development (%) 25.4
Expected Stage of Ground Water
Development after interventions (%)
23.8
Other Interventions Proposed, if any
Alternate Water Sources Available Nil
5.4.RECOMMENDATION
Ground water development is recommended to bring the stage of development from 23.8% to 70%
5.5.DEVELOPMENT PLAN
Volume of water available to bring
the stage of GWD is to 70% (MCM) 45.57875
Proposed Number of DW( @ 1.5 ham
for 90% of GWR Available) 2735
Proposed Number of BW( @ 1.5 ham
for 10% of GWR Available) 456
Additional Area (sq.km.) proposed to
be brought under assured GW
irrigation with av. CWR of 0.65 m
70
Proposed Artificial Recharge Structure
Addditional Area proposed to be brought under
assured ground water irrigation

190
9.14 NAIGAON BLOCK, NANDED DISTRICT
1. SALIENT INFORMATION 1.1.Introduction
Block Name Naigaon
Geographical Area (Sq. Km.) 580.08 Sq. Km.
Hilly Area (Sq. Km) 14.48 Sq. Km.
Poor Quality Area (Sq. Km.) Nil
Population (2011) 182868
Climate Tropical climate
1.2. Rainfall Analysis
Normal Rainfall 760.99 mm
Annual Rainfall (2019) 955.7 mm
Decadal Average Annual Rainfall
(2010-19)
700.21 mm
Long Term Rainfall Analysis
(2001-2019)
Falling Trend: -10.34 m/year.
Probability of Normal/Excess Rainfall: - 53% & 31%.
Probability of Drought (Moderate/ Severe/ Acute):- 16%
Moderate & 10% Severe
Frequency of occurance of Drought:- 1 in 6 Years
RAINFALL TREND ANALYSIS (2001 to 2019)
1.3. Geomorphology,Soil&Geology
Geomorphic Unit ➢ Butte (B)
➢ Escarment Slope (ES)
➢ Plateau Moderately Dissected (PLM)
➢ Plateau Slightly Dissected (PLS), 0-1m weathering
➢ Plateau Undissected (PLU), 0-1m weathering
➢ Plateau Weathered (PLW), 2-5m weathering
➢ Plateau Weathered (PLWS), 1-2m weathering
➢ Plateau Weathered-Canal Command (PLC)
y = -10.347x + 895.51
0
200
400
600
800
1000
1200
1400
1600
1800
199
8
199
9
20
00
20
01
20
02
20
03
20
04
20
05
20
06
20
07
20
08
20
09
20
10
20
11
20
12
20
13
20
14
20
15
20
16
20
17
20
18
20
19
Longterm Rainfall Analysis (2001 to 2019) of Naigaon Khurd block

191
Soil ➢ Very shallow, somewhat excessively drained, loamy
soils on moderately sloping summits/spurs with
severe erosion
➢ Shallow, well drained, clayey soils on gently sloping
lands with moderate erosion
➢ Deep, imperfectly drained, fine, calcareous soils on
very gently sloping plains and valleys with moderate
erosion; moderate salinity and slight sodicity
➢ Deep, moderately well drained, fine soils on gently
sloping plains and valleys with moderate erosion
➢ Very shallow, well drained, loamy soils on gently
sloping rolling lands with mesas and buttes with
moderate erosion and moderate stoniness
Geology Deccan Trap-Sahyadri Group (Late Cretaceous to Early Eocene
Age) & Gneiss-Granitoid / Migmatite Complex (Archean)
1.4.Hydrology & Drainage
Drainage Godavari river & its tributaries
Hydrology(as on March 2017)
Major & Medium
Irrigation Projects
(>250 Ha)
Nil
Minor Irrigation
Projects (0 to 250
Ha)
No. of projects
completed till
March 2017
51
No. of projects
operating till end
49
Command area
of the operating
project (Sq. Km.)
19.43
Net irrigated area
under Operating
project (Sq. Km.)
12.53
1.5.LAND USE, AGRICULTURE, IRRIGATION & CROPPING PATTERN
Geographical Area 580.08 Sq. Km.
Forest Area 8.36 Sq. Km.
Cultivable Area 423.94 Sq. Km.
Net Sown Area 423.94 Sq. Km.
Double Cropped Area 132.92 Sq. Km.
Area under
Irrigation
Surface Water 26.95 Sq Km.
Ground Water 2.50 Sq. Km.
Principal Crops Crop Type Area (Sq. Km.)
Pulses 99.60
Cotton 193.36
Cereals 42.03
Oil Seeds 215.52
Horticultural Crops Sugarcane 1.04
Others 2.72

192
1.6.WATER LEVEL BEHAVIOUR
1.6.1. Aquifer-I/Shallow Aquifer (Phreatic Aquifer)
Pre-Monsoon (May-2019) Post-Monsoon (November-2019)
❖ Depth to water level between 5 mbgl and
10 mbgl observed in 358.75 Sq Km areas
in the major parts of the block.
❖ Depth to water level between 10 mbgl
and 20 mbgl observed in 197.9 Sq Km
area in patches in eastern, western and
northern parts of the block.
❖ The shallow depth to water level less
than 2 mbgl is obseerved only as isolated
patch in the south-eastern part of the
block covering only 4.6 Sq Km area.
❖ The depth to water level between 2 mbgl
and 5 mbgl is observed in 219.9 Sq Km
area in the western and eastern major
parts of the block.
❖ Depth to water level between 5 mbgl and
10 mbgl is observed in 344.58 Sq Km area
in the remaining parts of the block.
Water Level Map- Aquifer-I/Shallow Aquifer (Phreatic Aquifer)
Pre-Monsoon Water Level (May 2019)
Post-Monsoon Water Level (Nov.2019)
1.6.2. Aquifer-II/Deeper Aquifer (Semiconfined/Confined Aquifer)
Pre-Monsoon (May-2019) Post-Monsoon (November-2019)
Pre-Monsoon Water Level(May 2019) Post-Monsoon Water Level(November 2019)
❖ Depth to water level between 5 mbgl and
10 mbgl is observed in the whole of the
❖ The depth to water level between 5 mbgl
and 10 mbgl is observed in 222.2 Sq Km

193
block area in the noth-eastern and north-
western parts of the block
❖ Depth to water level between 10 mbgl
and 20 mbgl is observed in 288.6 Sq Km
along the central part of the block
❖ Deeper depth to water level between 20
mbgl and 30 mbgl is observed in 67.62 Sq
Km area south-western part of the block.
1.7. Hydrograph
The hydrograph of CGWB Monitoring site at Naigaon for the period 2010 to 2019 shows:
❖ A rising trend during both premonsoon and postmonsoon @ 0.296 m/year and 0.1107 m/year
respectively.
❖ The depth to water level during premonsoon ranges from 6.13 mbgl to 10.45 mbgl.
❖ The depth to water level during postmonsoon ranges from 3.8 mbgl to 8.3 mbgl.
❖ A rising rainfall trend @ 8.43mm/year is observed for the period 2010 to 2019
1.8. Water Level Trend (2010-19)
Pre-Monsoon Trend (May 2010-2019) Post-Monsoon Trend (November 2010-2019)
Rising Trend @ Falling Trend @ Rising Trend @ Falling Trend @
0.0 to 0.2 m/year
in 177.8 Sq Km
area and 0.2 to 0.4
m/year in 48.38 sq
km area
0.0 to 0.2 m/year in 183 Sq
Km area, 0.2 to 0.4 m/year
in 137 Sq Km area, 0.4 to
0.6 m/year in 7.6 sq km
area.
0 to 0.2 m/year in 48.55
Sq Km area; 0.2 to 0.4
m/year in 89.58 sq km
area; 0.4 to 0.6 m/year
in 112.7 sq km area; 0.6
to 0.8 m/year in79.42
sq km area and >0.8
m/year in 140.6 sq km
area.
0 to 0.2 m/year in 17.7
Sq Km area
Pre-Monsoon WL Trend (May 2010-2019) Post-Monsoon WL Trend (Nov.2010-2019)
Rainfall:y = 8.4382x + 653.8Pre WL:y = 0.296x + 6.92 Post WL:y = 0.1107x + 5.2935
0
2
4
6
8
10
120
200
400
600
800
1000
1200
2010 2011 2012 2013 2014 2015 2016 2017 2018 2019
De
pth
to
wa
ter
le
ve
l (m
bg
l)
Ra
infa
ll (
mm
)
Year
ANNUAL RF Premonsson Wl Post monsoon Wl

194
2. GROUND WATER ISSUES
1. Low Development:-Low Development of 32.42 % of Stage of Ground Water Development is
observed in the block
2. Declining Water Level Trend: -
The decline in water level trend (2010-19) upto 0.6 m/year is observed in 327 sq km area of
the block during premonsoon.
3. Low ground water yield Potential of the aquifers: The ground water yield potentiality of the
aquifers ranges from 0 to 1 lps in major parts of the block. However, high yielding aquifers re
obtained only along the drainages, faults/ fractures or joints. The low potential zone in major
parts of the block is due to limited extent of porosity and permeability evolved from
secondary porosity and hence poor sustainability of aquifers.
3. AQUIFER DISPOSITION
3.1. Number of Aquifers (Major) 1)Basalt –Aquifer-I, Aquifer-II
2)Granite-Aquifer-I, Aquifer-II
3.2. LITHOLOGICAL DISPOSITION
3.3. CROSS SECTIONS

195
3.4 AQUIFER CHARACTERISTICS
Major Aquifer Basalt (Deccan Traps) Granite
Type of Aquifer
(Phreatic/Semiconfined/
Confined) Aquifer-I (Phreatic)
Aquifer-II
(Semiconfine
d/confined)
Aquifer-I
(Phreatic)
Aquifer-II
(Semiconfined
/confined)
Depth to bottom of
aquifer (mbgl) 10 to 16 30 to 90
Weathered/ Fractured
rocks thickness (m) 8 to 12.8 5 to 14
Yield Potential 0 to 100 m3/day 0 to 0.4 lps
Specific Yield (Sy)/
Storativity (S) 0.02 0.00249
Transmissivity (T) -
64.7 to
326.26
m2/day
4.CHEMICAL QUALITY OF GROUND WATER &CONTAMINATION
4.1 Aquifer I/Shallow Aquifer
Suitability for Drinking Purposes Suitability for Irrigation Purposes

196
➢ The overall quality of Aquifer is potable
and useful for drinking and domestic
puposes
➢ About 463.9 Sq Km area of the block has
EC between 750 and 2250
microsiemens/cm and 114.5 Sq Km area
has EC more than 2250 microsiemens/cm
➢ In major parts of the block covering 463.9
Sq Km area, where EC > 750
microsiemens/cm, special management
for salinity control may be required and
plants with good salt tolerance should be
selected.
➢ All the analysed samples in the block
have SAR value well within 0 to 10 types
and are therefore good for irrigation.
➢ The RSC values of all the analysed
samples have values < 1.25 meq/l except
in Somthana village indicating that the
ground water is good for irrigation in
major parts of the block.
➢ About 50 % of the analysed samples have
% Na less than 20 and 50% have %Na
between 20 and 40
Hence, the overall quality of ground water is
suitable for irrigation purposes.
4.1 Aquifer II/Deeper Aquifer
Suitability for Drinking Purposes Suitability for Irrigation Purposes
➢ The overall quality of Aquifer is potable
and useful for drinking and domestic
puposes except in Nitrate affected Narsi
village.
➢ About 12.58 Sq Km area of the block has
EC well within the potable range of 250
to 750microsiemens/cm; 565.9 sq Km
area has EC between 750 and 2250
microsiemens/cm
➢ In 12.85 Sq Km area, plants with
moderate salt tolerance can be grown.
However, in 565.9 sq Km area where EC >
750 microsiemens/cm, special
management for salinity control may be
required and plants with good salt
tolerance should be selected.
➢ All the analysed samples in the block
have SAR value well within 0 to 10 types
and are therefore good for irrigation.
➢ The RSC values of all the analysed
samples have values < 1.25 meq/l
indicating that the ground water is good
for irrigation.
➢ About 33 % of the analysed samples have
% Na less than 20; 33 % have %Na
between 40 and 60; 34% have %Na more
than 60
Hence, the overall quality of ground water is
suitable for irrigation purposes except in areas
where %Na is more than 60.
3.2.CHEMICAL QUALITY MAP

197
Phreatic Aquifer (Aquifer-I)
Semiconfined/Confined Aquifer (Aquifer II)
5. GROUND WATER RESOURCE & EXTRACTION
Aquifer-I/ Phreatic Aquifer (Basalt)
Ground Water Recharge Worthy Area (Sq. Km.) 565.60
Total Annual Ground Water Recharge (MCM) 65.84
Natural Discharge (MCM) 3.29
Net Annual Ground Water Availability (MCM) 62.55
Existing Gross Ground Water Draft for irrigation
(MCM)
18.71
Existing Gross Ground Water Draft for domestic
and industrial water supply(MCM)
1.56
Existing Gross Ground Water Draft for All
uses(MCM)
20.27
Net Ground Water Availability for future irrigation
development(MCM)
38.45
Provision for domestic and industrial requirement
supply to 2025(MCM)
3.65
Stage of Ground Water Development % 32.42
Category SAFE
Aquifer-II
Semiconfined/Confined Aquifer (Basalt)
Resources above the confining layer Resources within the confining layer
Total
Area
(Sq.
Km.)
Mean
aquifer
thicknes
s (m)
S Resources
above
confining
layer
9MCM)
Total
Area (Sq.
Km.)
Mean
aquifer
thicknes
s (m)
S Resources
within the
confining
layer
(MCM)
Total
Resources
(MCM)
580.08
4.48
0.002
49 6.47 580.08 9.5
0.00
249 13.72 20.193
5.0. GROUND WATER RESOURCE ENHANCEMENT
Available Resource (MCM) 62.55
Gross Annual Draft (MCM) 20.27
5.1.SUPPLY SIDE MANAGEMENt

198
SUPPLY (MCM)
Agricultural Supply -GW 18.71
Agricultural Supply -SW 26.95
Domestic Supply - GW 1.56
Domestic Supply - SW 0.31
Total Supply 47.53
Area of Block (Sq. Km.) 580.08
Area suitable for Artificial recharge
(Sq. Km)
565.6
Type of Aquifer Hard Rock Soft Rock
Area feasible for Artificial
Recharge(WL >5mbgl) (Sq. Km.) 323.27 -
Volume of Unsaturated Zone (MCM) 646.546 -
Average Specific Yield 0.020 -
Volume of Sub surface Storage Space
available for Artificial Recharge
(MCM)
12.93
-
Surplus water Available (MCM) 7.241 -
Proposed Structures Percolation Tank
(Av. Gross
Capacity-100
TCM*2 fillings =
200 TCM)
Check Dam ( Av.
Gross Capacity-10
TCM * 3 fillings = 30
TCM)
Recharge shaft
(Av. Gross
Capacity-60 TCM
)
Number of Structures 19 54 0
Volume of Water expected to be
conserved / recharged @ 75%
efficiency (MCM)
2.85 1.215
0
Area of Saline Patch Nil
Proposed Structures Nil
No of farm pond proposed (size:
30m*30m*3) with 3 filling= 0.0081
mcm capacity, 50% available water
may be utilized for harvesting
through farm ponds.
Nil
Volume of water available for
harvesting
Nil
Additional volume created by
desilting Nil
RTRWH Structures – Urban Areas
Households to be covered (25% with
50 m2area)
9742
Total RWH potential (MCM) 0.341
Rainwater harvested / recharged @
80% runoff co-efficient
0.273 (Economically not viable & Not Recommended)
5.2.DEMAND SIDE MANAGEMENT
Micro irrigation techniques

199
Remaining ground water irrigated
Sugarcane cropped area proposed
through drip irrigation
Nil
Volume of Water expected to be
saved (MCM).
(Surface Flooding req- 2.45 m. Drip
Req. - 1.88, WUE- 0.57 m)
Nil
Proposed Cropping Pattern change
Irrigated area under Water Intensive
Crop(ha)
Not proposed
Water Saving by Change in Cropping
Pattern
Nil
5.3.EXPECTED BENEFITS
Net Ground Water Availability
(MCM) 62.55
Additional GW resources available
after Supply side interventions
(MCM)
4.065
Ground Water Availability after
Supply side intervention 66.615
Existing Ground Water Draft for All
Purposes (MCM) 20.27
Saving of Ground Water through
demand side intervention (MCM) 0
GW draft after Demand Side
Interventions (MCM) 20.27
Present stage of Ground Water
Development (%) 32.4
Expected Stage of Ground Water
Development after interventions (%) 30.4
Other Interventions Proposed, if any
Alternate Water Sources Available Nil
5.4.RECOMMENDATION
Ground water development is recommended to bring the stage of development from 59.76% to 70%
5.5.DEVELOPMENT PLAN
Volume of water available to bring
the stage of GWD is to 70% (MCM) 26.3605
Proposed Number of DW( @ 1.5 ham
for 90% of GWR Available) 1582
Proposed Number of BW( @ 1.5 ham
for 10% of GWR Available) 264
Additional Area (sq.km.) proposed to
be brought under assured GW
irrigation with av. CWR of 0.65 m
41
Proposed Artificial Recharge Structure
Addditional Area proposed to be brought under
assured ground water irrigation

200

201
9.15 NANDED BLOCK, NANDED DISTRICT
1. SALIENT INFORMATION 1.1.Introduction Block Name Nanded
Geographical Area (Sq. Km.) 406.80 Sq. Km.
Hilly Area (Sq. Km) 0.4 Sq. Km.
Poor Quality Area (Sq. Km.) Nil
Population (2011) 168749
Climate Tropical climate
1.2. Rainfall Analysis
Normal Rainfall 906.3 mm
Annual Rainfall (2019) 992.1 mm
Decadal Average Annual Rainfall
(2010-19)
874.85 mm
Long Term Rainfall Analysis
(1901-2019)
Falling Trend: -0.883 m/year.
Probability of Normal/Excess Rainfall: - 59% & 22%.
Probability of Drought (Moderate/ Severe/ Acute):- 14%
Moderate & 4% Severe & 1% Acute
Frequency of occurance of Drought:- 1 in 5 Years
RAINFALL TREND ANALYSIS (1901 to 2019)
1.3. Geomorphology,Soil&Geology
Geomorphic Unit ➢ Alluvial Plain - Deep (APD)
➢ Alluvial Plain - Older - Moderate (AYM)
➢ Butte (B)
➢ Plateau Slightly Dissected (PLS), 0-1m weathering
➢ Plateau Undissected (PLU), 0-1m weathering
➢ Plateau Weathered-Canal Command (PLC)
Soil ➢ Very shallow, well drained, loamy, moderately
calcareous soils on gently sloping undulating lands
y = -0.8837x + 959.42
0
200
400
600
800
1000
1200
1400
1600
1800
2000
190
1
190
6
1911
1916
192
1
192
6
193
1
193
6
194
1
194
6
195
1
195
6
196
1
196
6
197
1
197
6
198
1
198
6
199
1
199
6
20
01
20
06
20
11
20
16
Lonterm Rainfall Analysis (1901 to 2019) of Nanded Block

202
with moderate erosion
➢ Very shallow, somewhat excessively drained, loamy
soils on moderately sloping summits/spurs with
severe erosion
➢ Deep, imperfectly drained, fine, calcareous soils on
very gently sloping plains and valleys with moderate
erosion; moderate salinity and slight sodicity
Geology Recent River Alluvium-sand/Clay dominant & Deccan Trap-
Sahyadri Group (Late Cretaceous to Early Eocene Age)
1.4.Hydrology & Drainage
Drainage Godavari river & its tributary
Hydrology(as on March 2017)
Major & Medium
Irrigation Projects
(>250 Ha)
1 Major Project
Minor Irrigation
Projects (0 to 250
Ha)
No. of projects
completed till
March 2017
25
No. of projects
operating till end
26
Command area
of the operating
project (Sq. Km.)
12.10
Net irrigated area
under Operating
project (Sq. Km.)
8.38
1.5.LAND USE, AGRICULTURE, IRRIGATION & CROPPING PATTERN
Geographical Area 406.80 Sq. Km.
Forest Area Nil
Cultivable Area 354.39 Sq. Km.
Net Sown Area 314.11 Sq. Km.
Double Cropped Area 187.61 Sq. Km.
Area under
Irrigation
Surface Water 304.39Sq. Km.
Ground Water 3.042 SQ Km.
Principal Crops Crop Type Area (Sq. Km.)
Pulses 163.56
Cotton 64.48
Cereals 96.30
Oil Seeds 174.80
Horticultural Crops Sugarcane 30.17
Others 14.22
1.6.WATER LEVEL BEHAVIOUR
1.6.1. Aquifer-I/Shallow Aquifer (Phreatic Aquifer)
Pre-Monsoon (May-2019) Post-Monsoon (November-2019)

203
❖ Depth to water level between 5 mbgl
and 10 mbgl observed in 25.33 Sq Km
areas as isolated patches in parts of the
block.
❖ Depth to water level between 10 mbgl
and 20 mbgl observed in 350.95 Sq Km
area in the major parts of the block.
❖ Depth to water level more than 20 mbgl
is observed in 13.48 sq km area in
patches in western and eastern parts of
the block.
❖ The shallow depth to water level less than
2 mbgl is observed in 63.86 sq km area in
the south-central part of the block.
❖ The depth to water level between 2 mbgl
and 5 mbgl is observed in 200 Sq Km area
in the central parts of the block.
❖ Depth to water level between 5 mbgl and
10 mbgl is observed in 129 Sq Km area in
the northwestern and south-western parts
of the block.
Water Level Map- Aquifer-I/Shallow Aquifer (Phreatic Aquifer)
Pre-Monsoon Water Level (May 2019)
Post-Monsoon Water Level (Nov.2019)
1.6.2. Aquifer-II/Deeper Aquifer (Semiconfined/Confined Aquifer)
Pre-Monsoon (May-2019) Post-Monsoon (November-2019)
Pre-Monsoon Water Level(May 2019) Post-Monsoon Water Level(November 2019)
❖ Depth to water level between 5 mbgl
and 10 mbgl is observed in 331 Sq Km
area in the central part of the whole of
the block
❖ The depth to water level between 5 mbgl
and 10 mbgl is observed in 83.5 Sq Km
area in the eastern part of the block.
❖ Depth to water level between 10 mbgl and
20 mbgl is observed in the remaining parts

204
of the block.
1.7. Hydrograph
The hydrograph of CGWB Monitoring site at Sikarghat for the period 2010 to 2019 shows:
❖ A falling trend during premonsoon @ 0.608 m/year and a rising trend @ 0.0003 m/year during
postmonsoon.
❖ The depth to water level during premonsoon ranges from 9.3 mbgl to 31.7 mbgl.
❖ The depth to water level during postmonsoon ranges from 2.6 mbgl to 3.7 mbgl.
❖ A rising rainfall trend @ 8.4 mm/year is observed during the period 2010-19
1.8. Water Level Trend (2010-19)
Pre-Monsoon Trend (May 2010-2019) Post-Monsoon Trend (November 2010-2019)
Rising Trend @ Falling Trend @ Rising Trend @ Falling Trend @
0 to 0.2 m/year in
79.60 Sq Km area
0 to 0.2 m/year in 83.79 Sq
Km area; 0. to 0.4 m/year
in 120.2 sq km area and
0.4 to 0.6 m/year in 38.29
sq km area and >0.6
m/year in 52.50 sq km
area
0 to 0.2 m/year in 36.86
Sq Km area and 0.2 to
0.4 m/year in 13.74 sq
km area.
0 to 0.2 m/year in
143.2 Sq Km area; 0.2
to 0.4 m/year in 145 sq
km area and 0.4 to 0.6
m/year in 54.77 sq km
area
Pre-Monsoon WL Trend (May 2010-2019) Post-Monsoon WL Trend (Nov.2010-2019)
Rainfall:y = 8.4382x + 653.8Pre WL:y = 0.6087x + 21.37 y = Post WL: -0.0003x + 3.1867
0
5
10
15
20
25
30
350
200
400
600
800
1000
1200
1400
2010 2011 2012 2013 2014 2015 2016 2017 2018 2019
De
pth
to
wa
ter
le
ve
l (m
bg
l)
Ra
infa
ll (
mm
)
Year
ANNUAL RF Premonsson Wl Post monsoon Wl

205
2. GROUND WATER ISSUES
1) Low Development:-Low Development of 43.39 % of Stage of Ground Water Development is
observed in the block
2) Declining Water Level Trend: -
The decline in water level trend (2010-19) more than 0.6 m/year is observed in 294 sq km
area of the block during premonsoon and upto 0.6m/year in 293 sq km area during
postmonsoon.
3) Low ground water yield Potential of the aquifers: The ground water yield potentiality of the
aquifers ranges from 0 to 1 lps in major parts of the block. However, high yielding aquifers re
obtained only along the drainages, faults/ fractures or joints. The low potential zone in major
parts of the block is due to limited extent of porosity and permeability evolved from
secondary porosity and hence poor sustainability of aquifers.
3. AQUIFER DISPOSITION
3.1. Number of Aquifers (Major) One:Basalt –Aquifer-I, Aquifer-II
3.2. LITHOLOGICAL DISPOSITION
3.3. CROSS SECTIONS
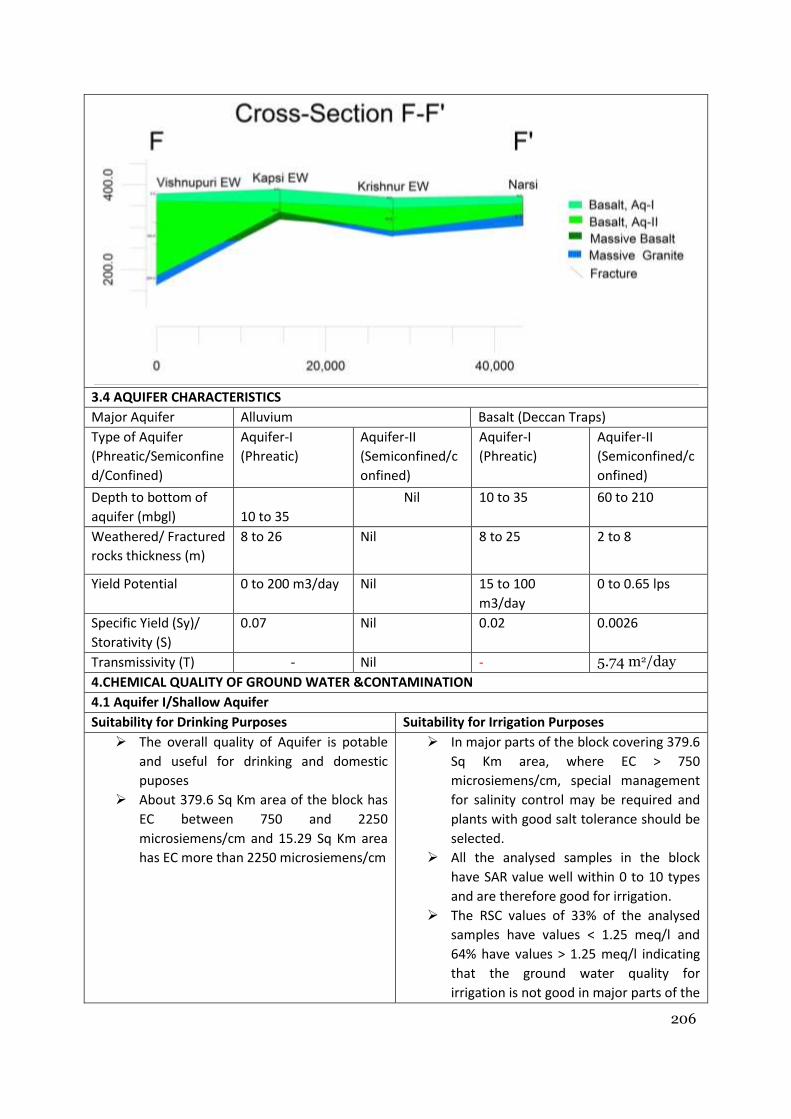
206
3.4 AQUIFER CHARACTERISTICS
Major Aquifer Alluvium Basalt (Deccan Traps)
Type of Aquifer
(Phreatic/Semiconfine
d/Confined)
Aquifer-I
(Phreatic)
Aquifer-II
(Semiconfined/c
onfined)
Aquifer-I
(Phreatic)
Aquifer-II
(Semiconfined/c
onfined)
Depth to bottom of
aquifer (mbgl)
10 to 35
Nil 10 to 35 60 to 210
Weathered/ Fractured
rocks thickness (m)
8 to 26 Nil 8 to 25 2 to 8
Yield Potential 0 to 200 m3/day Nil 15 to 100
m3/day
0 to 0.65 lps
Specific Yield (Sy)/
Storativity (S)
0.07 Nil 0.02 0.0026
Transmissivity (T) - Nil - 5.74 m2/day
4.CHEMICAL QUALITY OF GROUND WATER &CONTAMINATION
4.1 Aquifer I/Shallow Aquifer
Suitability for Drinking Purposes Suitability for Irrigation Purposes
➢ The overall quality of Aquifer is potable
and useful for drinking and domestic
puposes
➢ About 379.6 Sq Km area of the block has
EC between 750 and 2250
microsiemens/cm and 15.29 Sq Km area
has EC more than 2250 microsiemens/cm
➢ In major parts of the block covering 379.6
Sq Km area, where EC > 750
microsiemens/cm, special management
for salinity control may be required and
plants with good salt tolerance should be
selected.
➢ All the analysed samples in the block
have SAR value well within 0 to 10 types
and are therefore good for irrigation.
➢ The RSC values of 33% of the analysed
samples have values < 1.25 meq/l and
64% have values > 1.25 meq/l indicating
that the ground water quality for
irrigation is not good in major parts of the

207
block.
➢ All the analysed samples have % Na
between 20 and 40
Hence, the overall quality of ground water is
suitable for irrigation purposes.
4.1 Aquifer II/Deeper Aquifer
Suitability for Drinking Purposes Suitability for Irrigation Purposes
➢ The overall quality of Aquifer is potable
and useful for drinking and domestic
puposes except in Nitrate affected Talni
and Borgaon Telang.
➢ About 82.77 Sq Km area of the block has
EC well within the potable range of 250
to 750microsiemens/cm; 307.8 sq Km
area has EC between 750 and 2250
microsiemens/cm and 2.19 Sq Km area
has EC more than 2250 microsiemens/cm
➢ In 82.7 Sq Km area, plants with moderate
salt tolerance can be grown. However, in
307.8 sq Km area where EC > 750
microsiemens/cm, special management
for salinity control may be required and
plants with good salt tolerance should be
selected.
➢ The analysed sample in the block have
SAR value well within 0 to 10 types and
are therefore good for irrigation.
➢ The RSC values of the analysed sample
haS value > 1.25 meq/l indicating that the
ground water is not good for irrigation.
➢ The %Na value of the analysed sample is
between 40 and 60.
3.2.CHEMICAL QUALITY MAP
Phreatic Aquifer (Aquifer-I)
Semiconfined/Confined Aquifer (Aquifer II)
5. GROUND WATER RESOURCE & EXTRACTION
Aquifer-I/ Phreatic Aquifer (Basalt)
Ground Water Recharge Worthy Area (Sq. Km.) 406.33
Total Annual Ground Water Recharge (MCM) 61.40
Natural Discharge (MCM) 3.07
Net Annual Ground Water Availability (MCM) 58.33
Existing Gross Ground Water Draft for irrigation
(MCM)
20.62
Existing Gross Ground Water Draft for domestic
and industrial water supply(MCM)
4.68

208
Existing Gross Ground Water Draft for All
uses(MCM)
25.31
Net Ground Water Availability for future
irrigation development(MCM)
23.06
Provision for domestic and industrial
requirement supply to 2025(MCM)
13.36
Stage of Ground Water Development % 43.39
Category SAFE
Aquifer-II
Semiconfined/Confined Aquifer (Basalt)
Resources above the confining layer Resources within the confining layer
Total Area
(Sq. Km.)
Mean
aquifer
thicknes
s (m)
S Resources
above
confining
layer
9MCM)
Total
Area (Sq.
Km.)
Mean
aquifer
thicknes
s (m)
S Resource
s within
the
confining
layer
(MCM)
Total
Resource
s (MCM)
406.8 1.13 0.0026 1.195 406.8 5 0.002
6 5.28 6.48
0. GROUND WATER RESOURCE ENHANCEMENT
Available Resource (MCM) 58.33
Gross Annual Draft (MCM) 25.31
5.1.SUPPLY SIDE MANAGEMENt
SUPPLY (MCM)
Agricultural Supply -GW 20.62
Agricultural Supply -SW 304.39
Domestic Supply - GW 4.68
Domestic Supply - SW 0.94
Total Supply 330.63
Area of Block (Sq. Km.) 406.8
Area suitable for Artificial recharge
(Sq. Km)
406.3
Type of Aquifer Hard Rock Soft Rock
Area feasible for Artificial
Recharge(WL >5mbgl) (Sq. Km.) 232.49 -
Volume of Unsaturated Zone (MCM) 464.98 -
Average Specific Yield 0.020 -
Volume of Sub surface Storage Space
available for Artificial Recharge
(MCM)
9.2996
-
Surplus water Available (MCM) 5.21
-
Proposed Structures Percolation Tank
(Av. Gross
Capacity-100
TCM*2 fillings =
Check Dam ( Av.
Gross Capacity-10
TCM * 3 fillings = 30
TCM)
Recharge shaft
(Av. Gross
Capacity-60 TCM
)

209
200 TCM)
Number of Structures 14 39 0
Volume of Water expected to be
conserved / recharged @ 75%
efficiency (MCM)
2.1 0.8775
0
Area of Saline Patch Nil
Proposed Structures Nil
No of farm pond proposed (size:
30m*30m*3) with 3 filling= 0.0081
mcm capacity, 50% available water
may be utilized for harvesting
through farm ponds.
Nil
Volume of water available for
harvesting
Nil
Additional volume created by
desilting Nil
RTRWH Structures – Urban Areas
Households to be covered (25% with
50 m2area)
7810
Total RWH potential (MCM) 0.341
Rainwater harvested / recharged @
80% runoff co-efficient
0.273(Economically not viable & Not Recommended)
5.2.DEMAND SIDE MANAGEMENT
Micro irrigation techniques
Remaining ground water irrigated
Sugarcane cropped area proposed
through drip irrigation
Nil
Volume of Water expected to be
saved (MCM).
(Surface Flooding req- 2.45 m. Drip
Req. - 1.88, WUE- 0.57 m)
Nil
Proposed Cropping Pattern change
Irrigated area under Water Intensive
Crop(ha)
Not proposed
Water Saving by Change in Cropping
Pattern
Nil
5.3.EXPECTED BENEFITS
Net Ground Water Availability
(MCM) 58.33
Additional GW resources available
after Supply side interventions
(MCM)
2.9775
Ground Water Availability after
Supply side intervention 61.3075
Existing Ground Water Draft for All
Purposes (MCM) 25.31

210
Saving of Ground Water through
demand side intervention (MCM) 0
GW draft after Demand Side
Interventions (MCM) 25.31
Present stage of Ground Water
Development (%) 43.4
Expected Stage of Ground Water
Development after interventions (%) 41.3
Other Interventions Proposed, if any
Alternate Water Sources Available Nil
5.4.RECOMMENDATION
Ground water development is recommended to bring the stage of development from 43.4% to 70%
5.5.DEVELOPMENT PLAN
Volume of water available to bring
the stage of GWD is to 70% (MCM) 17.60525
Proposed Number of DW( @ 1.5 ham
for 90% of GWR Available) 1056
Proposed Number of BW( @ 1.5 ham
for 10% of GWR Available) 176
Additional Area (sq.km.) proposed to
be brought under assured GW
irrigation with av. CWR of 0.65 m
27
Proposed Artificial Recharge Structure
Addditional Area proposed to be brought under
assured ground water irrigation

211
9.16 UMARI BLOCK, NANDED DISTRICT
1. SALIENT INFORMATION 1.1.Introduction Block Name Umari
Geographical Area (Sq. Km.) 408.01 Sq. Km.
Hilly Area (Sq. Km) 1.81 Sq. Km.
Poor Quality Area (Sq. Km.) Nil
Population (2011) 85518
Climate Tropical climate
1.2. Rainfall Analysis
Normal Rainfall 844.3 mm
Annual Rainfall (2019) 1085.6 mm
Decadal Average Annual Rainfall (2010-19) 826.4 mm
Long Term Rainfall Analys
(1998-2019)
Falling Trend: -8.25 m/year.
Probability of Normal/Excess Rainfall: - 52% & 29%.
Probability of Drought (Moderate/ Severe/ Acute):-
19% Moderate
Frequency of occurance of Drought:- 1 in 5 Years
RAINFALL TREND ANALYSIS (1998 to 2019)
1.3. Geomorphology,Soil&Geology
Geomorphic Unit ➢ Butte (B)
➢ Plateau Slightly Dissected (PLS), 0-1m
weathering
➢ Plateau Undissected (PLU), 0-1m weathering
➢ Plateau Weathered (PLW), 2-5m weathering
➢ Plateau Weathered (PLWS), 1-2m weathering
➢ Plateau Weathered-Canal Command (PLC)
Soil ➢ Very shallow, well drained, loamy, moderately
y = -8.2563x + 943.04
0
200
400
600
800
1000
1200
1400
199
8
199
9
20
00
20
01
20
02
20
03
20
04
20
05
20
06
20
07
20
08
20
09
20
10
20
11
20
12
20
13
20
14
20
15
20
16
20
17
20
18
20
19
Longterm Rainfall Analysis (1998 to 2019) of Umari Block

212
calcareous soils on gently sloping undulating
lands with moderate erosion
➢ Very shallow, somewhat excessively drained,
loamy soils on gently sloping rolling lands with
mesas and buttes with severe erosion
➢ Shallow, well drained, clayey soils on gently
sloping lands with moderate erosion
➢ Deep, imperfectly drained, fine, calcareous soils
on very gently sloping plains and valleys with
moderate erosion; moderate salinity and slight
sodicity
Geology Deccan Trap-Sahyadri Group ( Late Cretaceous to Early
Eocene Age)
1.4.Hydrology & Drainage
Drainage Godavari river & its tributary
Hydrology(as on March 2017)
Major & Medium
Irrigation Projects
(>250 Ha)
1Medium Project
Minor Irrigation
Projects (0 to 250
Ha)
No. of projects
completed till
March 2017
20
No. of projects
operating till
end
20
Command area
of the operating
project (Sq.
Km.)
22.12
Net irrigated
area under
Operating
project (Sq.
Km.)
11.27
1.5.LAND USE, AGRICULTURE, IRRIGATION & CROPPING PATTERN
Geographical Area 408.01 Sq. Km.
Forest Area 23.37 Sq. Km.
Cultivable Area 317.94 Sq. Km.
Net Sown Area 307.54 Sq. Km.
Double Cropped Area 44.72 Sq. Km.
Area under
Irrigation
Surface Water 18.89 Sq. Km.
Ground Water 7.00 Sq. Km.
Principal Crops Crop Type Area (Sq. Km.)
Pulses 96.52
Cotton 113.37
Cereals 23.70
Oil Seeds 135.62

213
Horticultural Crops Sugarcane 23.08
Others 5.27
1.6.WATER LEVEL BEHAVIOUR
1.6.1. Aquifer-I/Shallow Aquifer (Phreatic Aquifer)
Pre-Monsoon (May-2019) Post-Monsoon (November-2019)
❖ Depth to water level between 2 mbgl
and 5 mbgl observed in 2.96 Sq Km
areas in an isolated patch in western
part of the block.
❖ Depth to water level between 5 mbgl
and 10 mbgl observed in 331 Sq Km
area in the major parts of the block.
❖ Depth to water level between 10 mbgl
and 20 mbgl is observed in 62.6 sq km
area in the eastern and western parts
of the block.
❖ The shallow depth to water level less than 2
mbgl is obseerved only as isolated patch in
the central part of the block covering only 14
Sq Km area.
❖ The depth to water level between 2 mbgl
and 5 mbgl is observed in 228 Sq Km area in
the major parts of the block.
❖ Depth to water level between 5 mbgl and 10
mbgl is observed in 171 Sq Km area in the
western and northern parts of the block.
Water Level Map- Aquifer-I/Shallow Aquifer (Phreatic Aquifer)
Pre-Monsoon Water Level (May 2019)
Post-Monsoon Water Level (Nov.2019)
1.6.2. Aquifer-II/Deeper Aquifer (Semiconfined/Confined Aquifer)
Pre-Monsoon (May-2019) Post-Monsoon (November-2019)

214
Pre-Monsoon Water Level(May 2019) Post-Monsoon Water Level(November 2019)
❖ Depth to water level between 20 mbgl
and 30 mbgl is observed in 409.8 Sq
Km area covering almost the entire
block.
❖ Depth to water level between 10 mbgl
and 20 mbgl is observed only in a
small patch of 4.5 sq km.
❖ The depth to water level between 5 mbgl
and 10 mbgl is observed in 231 Sq Km area
in the western, south-western parts of the
block.
❖ Depth to water level between 10 mbgl and
20 mbgl is observed in 183.9 sq km area in
the remaining parts of the block.
1.7. Hydrograph
The hydrograph of CGWB Monitoring site at Umri-Gortha for the period 2010 to 2019 shows:
❖ A falling trend during both premonsoon and postmonsoon @ 0.0339 m/year and 0.121 m/year
respectively.
❖ The depth to water level during premonsoon ranges from 1.5 mbgl to 6.2 mbgl.
❖ The depth to water level during postmonsoon ranges from 1.8 mbgl to 4.9 mbgl.
❖ A rising rainfall trend @9.27 mm/year is observed during the period 2010-19
1.8. Water Level Trend (2010-19)
Rainfall:y = 9.2782x + 823.82
PreWL:y = -0.0399x + 3.2247 Post WL:y = -0.1216x + 3.496
0
1
2
3
4
5
6
70
200
400
600
800
1000
1200
1400
2010 2011 2012 2013 2014 2015 2016 2017 2018 2019
De
pth
to
wa
ter
le
ve
l (m
bg
l)
Ra
infa
ll (
mm
)
Year
ANNUAL RF Premonsson Wl Post monsoon Wl

215
Pre-Monsoon Trend (May 2010-2019) Post-Monsoon Trend (November 2010-2019)
Rising Trend @ Falling Trend @ Rising Trend @ Falling Trend @
0 to 0.2 m/year in
243.4 Sq Km area
0 to 0.2 m/year in 49.7 Sq
Km area; 0.2 to 0.4 m/year
in 47.95 sq km area and
0.4 to 0.6 m/year in 71.33
sq km area
0 to 0.2 m/year in 95.63
Sq Km area ;0.2 to 0.4
m/year in 53.05 sq km
area; 0.4 to 0.6 m/year
in 36.39 sq km area and
>0.6 m/year in 7.306 sq
km area
0 to 0.2 m/year in
221.5 Sq Km area
Pre-Monsoon WL Trend (May 2010-2019) Post-Monsoon WL Trend (Nov.2010-2019)
2. GROUND WATER ISSUES
1) Low Development:-Low Development of 32.11 % of Stage of Ground Water Development is
observed in the block
2) Declining Water Level Trend: -
The decline in water level trend (2010-19) upto 0.6 m/year is observed in 168 sq km area of
the block during premonsoon.
3) Low ground water yield Potential of the aquifers: The ground water yield potentiality of the
aquifers ranges from 0 to 1 lps in major parts of the block. However, high yielding aquifers re
obtained only along the drainages, faults/ fractures or joints. The low potential zone in major
parts of the block is due to limited extent of porosity and permeability evolved from
secondary porosity and hence poor sustainability of aquifers.
3. AQUIFER DISPOSITION
3.1. Number of Aquifers (Major) One:Basalt –Aquifer-I, Aquifer-II
3.2. LITHOLOGICAL DISPOSITION

216
3.3. CROSS SECTIONS
3.4 AQUIFER CHARACTERISTICS
Major Aquifer Basalt (Deccan Traps)
Type of Aquifer
(Phreatic/Semiconfined/Confined)
Aquifer-I (Phreatic) Aquifer-II
(Semiconfined/confined)
Depth to bottom of aquifer (mbgl) 10 to 35 60 to 210
Weathered/ Fractured rocks thickness (m) 8 to 25 2 to 8
Yield Potential 15 to 200 m3/day 0 to 0.65 lps
Specific Yield (Sy)/ Storativity (S) 0.02 0.0024
Transmissivity (T) - 75.87 to 281 m2/day
4.CHEMICAL QUALITY OF GROUND WATER &CONTAMINATION
4.1 Aquifer I/Shallow Aquifer
Suitability for Drinking Purposes Suitability for Irrigation Purposes

217
➢ The overall quality of Aquifer is
potable and useful for drinking and
domestic puposes
➢ About 408.7 Sq Km area of the block
has EC between 750 and 2250
microsiemens/cm and 5.85 Sq Km
area has EC more than 2250
microsiemens/cm
➢ In major parts of the block covering 408.7 Sq
Km area, where EC > 750 microsiemens/cm,
special management for salinity control may
be required and plants with good salt
tolerance should be selected.
➢ All the analysed samples in the block have SAR
value well within 0 to 10 types and are
therefore good for irrigation.
➢ The analysed samples have values > 1.25
meq/l indicating that the ground water is not
good for irrigation in Umri-Gortha village.
➢ The analysed samples has %Na between 20
and 40
Hence, the overall quality of ground water is suitable
for irrigation except in RSC affected and mpre % Na
areas.
4.1 Aquifer II/Deeper Aquifer
Suitability for Drinking Purposes Suitability for Irrigation Purposes
➢ The overall quality of Aquifer is
potable and useful for drinking and
domestic puposes
➢ About 146.2 Sq Km area of the block
has EC well within the potable range
of 250 to 750microsiemens/cm;
268.1 sq Km area has EC between
750 and 2250 microsiemens/cm
➢ In 146.2 Sq Km area, plants with moderate salt
tolerance can be grown. However, in 268.1 sq
Km area where EC > 750 microsiemens/cm,
special management for salinity control may
be required and plants with good salt
tolerance should be selected.
➢ The analysed sample in the block have SAR
value well within 0 to 10 types and are
therefore good for irrigation.
➢ The RSC value of the analysed sample is > 1.25
meq/l indicating that the ground water is
notgood for irrigation.
➢ The analysed samples has %Na between 40
and 60 and hence good for irrigation.
3.2.CHEMICAL QUALITY MAP

218
Phreatic Aquifer (Aquifer-I)
Semiconfined/Confined Aquifer (Aquifer II)
5. GROUND WATER RESOURCE & EXTRACTION
Aquifer-I/ Phreatic Aquifer (Basalt)
Ground Water Recharge Worthy Area (Sq.
Km.)
406.20
Total Annual Ground Water Recharge (MCM) 43.61
Natural Discharge (MCM) 2.18
Net Annual Ground Water Availability (MCM) 41.42
Existing Gross Ground Water Draft for
irrigation (MCM)
11.91
Existing Gross Ground Water Draft for
domestic and industrial water supply(MCM)
1.38
Existing Gross Ground Water Draft for All
uses(MCM)
13.30
Net Ground Water Availability for future
irrigation development(MCM)
25.99
Provision for domestic and industrial
requirement supply to 2025(MCM)
3.42
Stage of Ground Water Development % 32.11
Category SAFE
Aquifer-II
Semiconfined/Confined Aquifer (Basalt)
Resources above the confining layer Resources within the confining layer
Total
Area
(Sq.
Km.)
Mean
aquifer
thickness
(m)
S Resources
above
confining
layer
(MCM)
Total Area
(Sq. Km.)
Mean
aquifer
thickne
ss (m)
S Resources
within the
confining
layer
(MCM)
Total
Resourc
es
(MCM)
408.01 6.5 0.0024 5 408.01 5 0.0024 4.89 11.26
5.0. GROUND WATER RESOURCE ENHANCEMENT
Available Resource (MCM) 41.43
Gross Annual Draft (MCM) 13.30

219
5.1.SUPPLY SIDE MANAGEMENt
SUPPLY (MCM)
Agricultural Supply -GW 11.91
Agricultural Supply -SW 18.89
Domestic Supply - GW 1.38
Domestic Supply - SW 0.28
Total Supply 32.46
Area of Block (Sq. Km.) 408.01
Area suitable for Artificial recharge
(Sq. Km)
406.2
Type of Aquifer Hard
Rock Soft Rock
Area feasible for Artificial Recharge(WL
>5mbgl) (Sq. Km.) 418.39 -
Volume of Unsaturated Zone (MCM) 836.786 -
Average Specific Yield 0.020 -
Volume of Sub surface Storage Space available
for Artificial Recharge (MCM)
16.74
-
Surplus water Available (MCM) 9.372 -
Proposed Structures Percolat
ion Tank
(Av.
Gross
Capacity
-100
TCM*2
fillings =
200
TCM)
Check Dam ( Av.
Gross Capacity-
10 TCM * 3
fillings = 30 TCM)
Recharge shaft (Av.
Gross Capacity-60
TCM )
Number of Structures 25 70 0
Volume of Water expected to be conserved /
recharged @ 75% efficiency (MCM)
3.75 1.575 0
Area of Saline Patch Nil
Proposed Structures Nil
No of farm pond proposed (size: 30m*30m*3)
with 3 filling= 0.0081 mcm capacity, 50%
available water may be utilized for harvesting
through farm ponds.
Nil
Volume of water available for harvesting Nil
Additional volume created by desilting Nil
RTRWH Structures – Urban Areas
Households to be covered (25% with 50
m2area)
4250
Total RWH potential (MCM) 0.176
Rainwater harvested / recharged @ 80%
runoff co-efficient
0.140 (Economically not viable & Not
Recommended)

220
5.2.DEMAND SIDE MANAGEMENT
Micro irrigation techniques
Remaining ground water irrigated Sugarcane
cropped area proposed through drip irrigation Nil
Volume of Water expected to be saved
(MCM).
(Surface Flooding req- 2.45 m. Drip Req. -
1.88, WUE- 0.57 m)
Nil
Proposed Cropping Pattern change
Irrigated area under Water Intensive Crop(ha) Not proposed
Water Saving by Change in Cropping Pattern Nil
5.3.EXPECTED BENEFITS
Net Ground Water Availability (MCM) 41.43
Additional GW resources available after
Supply side interventions (MCM) 5.325
Ground Water Availability after Supply side
intervention 46.755
Existing Ground Water Draft for All Purposes
(MCM) 13.30
Saving of Ground Water through demand side
intervention (MCM) 0
GW draft after Demand Side Interventions
(MCM) 13.3
Present stage of Ground Water Development
(%) 32.1
Expected Stage of Ground Water
Development after interventions (%)
28.4
Other Interventions Proposed, if any
Alternate Water Sources Available Nil
5.4.RECOMMENDATION
Ground water development is recommended to bring the stage of development from 32.1% to 70%
5.5.DEVELOPMENT PLAN
Volume of water available to bring the stage
of GWD is to 70% (MCM) 19.42
Proposed Number of DW( @ 1.5 ham for 90%
of GWR Available) 1166
Proposed Number of BW( @ 1.5 ham for 10%
of GWR Available) 194
Additional Area (sq.km.) proposed to be
brought under assured GW irrigation with av.
CWR of 0.65 m
30
Proposed Artificial Recharge Structure Addditional Area proposed to be brought under
assured ground water irrigation

221

222
10. ANNEXURES
ANNEXURE 1: SALIENT FEATURES OF GROUND WATER EXPLORATION
ANNEXURE II: DETAILS OF GW EXPLORATION WELLS IN NANDED DISTRICT
ANNEXURE III: DETAILS OF GW MONITORING WELLS IN NANDED DISTRICT
ANNEXURE IV: CHEMICAL ANALYSIS OF GROUND WATER SAMPLES, AQUIFER-
1/SHALLOW AQUIFERS
ANNEXURE V: CHEMICAL ANALYSIS OF GROUND WATER SAMPLES, AQUIFER-
II/DEEPER AQUIFERS
ANNEXURE VI: WATER LEVEL OF GROUND WATER MONITORING WELLS (2019)
WITH LONG TERM TREND (2010-19)
ANNEXURE VII: LOCATION OF PERCOLATION TANK
ANNEXURE VIII: LOCATION OF CHECK DAMS

223
ANNEXURE I: SALIENT FEATURES OF GROUND WATER EXPLORATION
Sl No
District Taluka Wells Drilled Drilled depth Zones (mbgl)
Discharge (lps)
SWL (mbgl)
1 Nanded Ardhapur EW-1, OW-1 77.4-199.4 34.7-37.8 - 3.4-3.6
2 Nanded Bhokar EW-4, OW-3 70-178.15 12.7-66 0.14-19.66 8.5-39.2
3 Nanded Biloli EW-3,OW-2, PZ-2 31.65-141.55 9-80 0.14-7.76 4.8-16.9
4 Nanded Deglur EW-2,OW-1,PZ-1 30-122 12.5-50 0.07-3.35 3.01-11.05
5 Nanded Hadgaon EW-3 202 13-87 0.38-0.78 1.48-10.8
6 Nanded Himayatnagar
EW-2, OW-1 134-159 6.75-128.75 - 4.4-15.6
7 Nanded Kandhar EW-3, OW-5 30-186 8-173.5 0.78-8 6.2-54.75
8 Nanded Kinwat EW-6, OW-2 94.75-183.65 8-178 0.38-5.39 2.07-30.35
9 Nanded Loha EW-2, OW-3 12.85-201.95 12.15-60.65 0.14-17.99 3.01-14.34
10 Nanded Mahur EW-2, OW-3 90-165.45 21.3-150 9.07-10.34 5.6-15.75
11 Nanded Mudkhed EW-2, OW-2 52-165.35 6.75-132.35 3.17 9.2-12.2
12 Nanded Mukhed EW-3, OW-1 78-107.5 9.25-70.75 3.3 5.1-23
13 Nanded Naigaon EW-2, OW-1 71.35-90.5 13-64 1.05 9.4-13.09
14 Nanded Nanded EW-2, OW-1 132.4-208 7-123 1.05-3.77 5.85-13.05
Total EW-37, OW-26, PZ-3 12.85-208 6.75-132.35 traces-19.66
1.48-54.75

224
ANNEXURE II: DETAILS OF GW EXPLORATION WELLS IN NANDED DISTRICT
Sl No
District Taluka Village Longitude Latitude Altitude (m)
Year of drilling
Type
Aquifer Drilling_ depth
Casing (mbgl)
Aquifer Zones
Drilling_SWL
Disharge (lps)
1 Nanded Biloli Biloli 77.77416667
18.72333333
347 1995-96
PZ GRANITE 34 26 26.4 -29 4.8 0.14
2 Nanded Naigaon Narsi 77.53527778
18.81333333
374.3 1995-96
EW FMB/W. GRANITE
71.35 7 13 -16.45 ,44 -58
13.09 1.05
3 Nanded Naigaon Krishnur 77.48166667
18.94222222
369.7 1995-96
EW Basalt/ Granite
90.5 2 40 -43 ,60 -64.75
10.63
4 Nanded Naigaon Krisnur 77.48166667
18.94222222
369.7 1995-96
OW Basalt 80.25 2.75 22 -26 ,40.5 -44 ,60 -64.25
9.4
5 Nanded Biloli Atkali 77.58944444
18.66 358.7 1995-96
PZ F.W.GRANITE
31.65 3.25 22.55 -28.65
6.94 7.76
6 Nanded Deglur Hanegaon
77.34 18.44833333
449 1995-96
PZ Basalt 30 5.9 12.50-17.00
3.01 0.07
7 Nanded Biloli Manjaran 77.43916667
18.845 396 1996-97
OW Basalt 56.15 2.5 17 -20 ,47 -53
5.35 5.29
8 Nanded Biloli Manjaran 77.43916667
18.845 396 1996-97
EW Basalt 141.55
1.6 9-10.35, 23-25.65,77-80
5.65
10 Nanded Biloli Karkheli 77.725 18.95416667
367 1996-97
EW W Granite 55 12.6 15-19.5, 57-59
7.05 1.37

225
Sl No
District Taluka Village Longitude Latitude Altitude (m)
Year of drilling
Type
Aquifer Drilling_ depth
Casing (mbgl)
Aquifer Zones
Drilling_SWL
Disharge (lps)
11 Nanded Biloli Arjapur 77.74166667
18.79166667
373 1996-97
EW W F Granite
109.3 29.6 29.6 -37, 52 -55
15.6 4.09
12 Nanded Biloli Arjapur 77.74166667
18.79166667
373 1996-97
OW W F Granite
104.35
23.5 23.5 -38 16.9
13 Nanded Bhokar Mokhandi
77.73083333
19.08083333
400 1996-97
EW F W MB 97.25 2 31 -35.5 16.9 19.66
14 Nanded Bhokar Mokhandi
77.73083333
19.08083333
400 1996-97
OW F W MB 121 3.25 23 -23.5, 26 -28
17.8 4.43
15 Nanded Bhokar Bhokar 77.67166667
19.2225 459 1996-97
EW F W Basalt 174 12.6 12.7 -13.2 , 24.5 -25.5 , 40 -44
8.8 4.31
16 Nanded Bhokar Bhokar 77.67166667
19.2225 459 1996-97
OW F W Basalt 178.15
12.5 12.7 -15.5, 25 -28
8.5
17 Nanded Hadgaon
Tamsa 77.615 19.37416667
412 1996-97
EW W VB 202 4.2 13 -15.45, 83-87
9.25 0.78
18 Nanded Himayatnagar
Himayat Nagar
77.87833333
19.42833333
409 1996-97
EW F VB & W Granite
138 6.2 6.75 -12.85, 126 -128.75
4.4
19 Nanded Himayatnagar
Himayat Nagar
77.87833333
19.42833333
409 1996-97
OW F VB & W Granite
134 6 125.75 -128.75
15.6

226
Sl No
District Taluka Village Longitude Latitude Altitude (m)
Year of drilling
Type
Aquifer Drilling_ depth
Casing (mbgl)
Aquifer Zones
Drilling_SWL
Disharge (lps)
20 Nanded Himayatnagar
Javalgaon 77.78333333
19.37 411 1996-97
EW F VB & W Granite
159.25
7.3
21 Nanded Hadgaon
Koli 77.51 19.58333333
432 1996-97
EW F MB 201.95
4.25 21 -25, 1.48 0.78
22 Nanded Hadgaon
Ambala 77.61666667
19.51833333
411 1996-97
EW F MB 201.95
6.5 33 -35, 48 -51
10.8 0.38
23 Nanded Mudkhed
Barad 77.45833333
19.23055556
371.3 1996-97
EW F W MB 165.35
4 6.75 -9.75, 43.35 -46.35
9.22
24 Nanded Mudkhed
Barad 77.45833333
19.23055556
371.3 1996-97
OW F W MB 55.55 4.2 7 -9.75, 40.25 -43.35
9.55
25 Nanded Nanded Vishnupuri
77.26388889
19.08611111
379.2 1996-97
OW F VB & F MB
208 13 7 -9.75, 40.25 -43.35
13.05 3.77
26 Nanded Nanded Vishnupuri
77.26388889
19.08611111
379.2 1996-97
EW F VB & F MB
201.55
11.5 51.5 -53.5 ,56.6 -60
14.7 3.515
27 Nanded Loha Kapsi 77.38333333
19.01833333
390 1996-97
EW W F VB & MB
60 16.5 21 -23 ,48-55, 57 -60.65
6.74 17.99
28 Nanded Loha Kapsi 77.38333333
19.01833333
390 1996-97
OW W VB 12.85 12.15
12.15 -12.85
3.01
29 Nanded Loha Kapsi 77.383333 19.018333 390 1996 OW F W MB 58.55 18.7 15.5 -18 6.17

227
Sl No
District Taluka Village Longitude Latitude Altitude (m)
Year of drilling
Type
Aquifer Drilling_ depth
Casing (mbgl)
Aquifer Zones
Drilling_SWL
Disharge (lps)
33 33 -97 5
30 Nanded Loha Kapsi 77.38333333
19.01833333
390 1996-97
OW F W MB 60.65 10 12.5 -16.5 ,48 -51
6.58
31 Nanded Kinwat Islapur 78.01083333
19.40916667
395 1996-97
EW F VB & MB & Granite
94.75 1.55 37.25 -38 ,46 -49,91.25-94
30.35 0.6
32 Nanded Kinwat Bodhari 78.19722222
19.49861111
352.6 1996-97
EW F VB & MB & Granite
141.55
4.75 6.75 -9 ,129 -135
4.78
33 Nanded Kinwat Bodhari 78.19722222
19.49861111
352.6 1996-97
OW F M Granite
139 7.3 42 -45 ,76 -85 ,123 -126
8 4.17
34 Nanded Nanded Mugat 77.43333333
19.15 361 1996-97
EW W VB 132.4 4.6 7.4 -9 ,26 -31,117-123
5.85 1.05
35 Nanded Bhokar Matul 77.77361111
19.13888889
388.1 1996-97
EW F MB & W Granite
70 4 25.5 -40 ,54 -60
12.03
36 Nanded Bhokar Matul 77.77361111
19.13888889
388.1 1996-97
OW F MB & W Granite
85.8 4.2 37 -40 ,44 -47
17.11
37 Nanded Ardhapur
Kamtha 77.31416667
19.28083333
373 1996-97
EW W F VB 199.4 4 34.7 -37.8
3.4

228
Sl No
District Taluka Village Longitude Latitude Altitude (m)
Year of drilling
Type
Aquifer Drilling_ depth
Casing (mbgl)
Aquifer Zones
Drilling_SWL
Disharge (lps)
38 Nanded Ardhapur
Kamtha 77.31416667
19.28083333
373 1996-97
OW W F VB 77.4 4.2 34.7 -37.8
3.68
39 Nanded Kinwat Kinwat 78.2 19.625 316 1997-98
EW F W Granite
110.45
13.7 13.7 -13.7 ,15.4 -15.4
6.69 0.38
40 Nanded Kinwat Shivani 78.11083333
19.3275 405 1997-98
EW Basalt & Granite
140.25
2.5 13 -16 ,20.25 -30
5.25 5.395
41 Nanded Kinwat Shivani 78.11083333
19.3275 405 1997-98
OW Basalt & Granite
100 4.75 21 -31 ,46 -53
2.07
42 Nanded Kinwat Mandwi 78.27416667
19.79583333
296 1997-98
EW Basalt 123 9.7 9.7 -15 ,30.3 -33.65
6.73 1.37
43 Nanded Mahur Sindkhed 78.125 19.87166667
263 1997-98
EW F Basalt & Granite
122.65
0.6 46.35 -49 ,58 -64.65
6.15 9.07
44 Nanded Mahur Sindkhed 78.125 19.87166667
263 1997-98
OW F Basalt & Granite
90 0.65 43.35 -49.45
5.6
45 Nanded Kinwat Rajgar 78.1425 19.72833333
402 1997-98
EW F Basalt & Granite
183.65
0.7 8 -12.5 ,176 -178
30
46 Nanded Mahur Lakhmapur
77.9425 19.86583333
281 1997-98
EW Basalt & Granite
161.25
21.3 21.3 -25 ,35 -37 ,146.5 -
15.75 10.34

229
Sl No
District Taluka Village Longitude Latitude Altitude (m)
Year of drilling
Type
Aquifer Drilling_ depth
Casing (mbgl)
Aquifer Zones
Drilling_SWL
Disharge (lps)
150 ,95 -97
47 Nanded Mahur Lakhmapur
77.9425 19.86583333
281 1997-98
OW F VB & MB & Fr Granite
86.05 24.3 24.3 -26 ,36.5 -40
7.9
48 Nanded Mahur Lakhmapur
77.9425 19.86583333
281 1997-98
OW F VB & Massive Basalt & Fr Granite
165.45
21.3 21.5 -25 ,42 -45
6.89
49 Nanded Loha Loha 77.115 18.94416667
406 1997-98
EW F W MB 201.95
14 16 -22 14.34 0.14
50 Nanded Kandhar Osman Nagar
77.29583333
18.96666667
407 1997-98
EW F W MB 73.85 4 8 -10 ,49 -50
6.26
51 Nanded Kandhar Osman Nagar
77.29583333
18.96666667
407 1997-98
OW F W MB 120.15
7 8 -10 ,49.25 -50
6.39 8.017
52 Nanded Kandhar Osman Nagar
77.29583333
18.96666667
407 1997-98
OW F MB & F Granite
186 61.65
119 -120 ,172 -173.5
6.61
53 Nanded Mukhed Berli (BK) 77.38833333
18.7375 380 1997-98
EW F MB 107.5 2.55 10 -15 ,44.7 -46.7
5.65 3.348
54 Nanded Mukhed Berli (BK) 77.38833333
18.7375 380 1997-98
OW F MB 93.5 3.3 9.25 -15 ,44.5 -46.5
5.1

230
Sl No
District Taluka Village Longitude Latitude Altitude (m)
Year of drilling
Type
Aquifer Drilling_ depth
Casing (mbgl)
Aquifer Zones
Drilling_SWL
Disharge (lps)
55 Nanded Mukhed Barahalli 77.33333333
18.56583333
425 1997-98
EW F MB & W Granite
107.35
10 10 -11 ,48.5 -50
4.7
56 Nanded Deglur Sugaon 77.64166667
18.6475 356 1997-98
EW F W Granite
54 11.9 18.5 -21 11.05
57 Nanded Deglur Sugaon 77.64166667
18.6475 356 1997-98
OW F W Granite
96.5 14 17 -25 10.5 3.35
58 Nanded Mukhed Mukramabad
77.36666667
18.46666667
423 1998-99
EW F Basalt 78 6 28.05 -31.15 ,24.15 -37.25 ,67.75 -70.75 ,43.35 -46.35
23 traces
59 Nanded Kandhar Kautha 77.37472222
18.8075 379 1998-99
EW F Basalt 116.55
11.65
7 -12 ,20 -30
7.76
60 Nanded Kandhar Kautha 77.37472222
18.8075 379 1998-99
OW F Basalt 105.41
11.55
62 -64 9.12 4.43
61 Nanded Kandhar Kautha 77.37472222
18.8075 379 1998-99
OW F Basalt 30 11.5 10 -12 ,20 -30
7.1 0.78
62 Nanded Kandhar Manuspuri
77.21333333
18.87 404 1998-99
EW F VB 139 5.75 8 -10 ,33 -37, 134-139
54.75 7.76
63 Nanded Kandhar Manuspuri
77.21333333
18.87 404 1998-99
OW F VB 139 5.65 6 -7.5 ,67 -
36 7.76

231
Sl No
District Taluka Village Longitude Latitude Altitude (m)
Year of drilling
Type
Aquifer Drilling_ depth
Casing (mbgl)
Aquifer Zones
Drilling_SWL
Disharge (lps)
69,137-139.20
64 Nanded Bhokar Talegaon 77.625 19.50138889
437.3 1998-99
EW F Basalt & Granite
86.05 7 42 -43 ,63 -66
39.2 0.14
65 Nanded Mudkhed
Mudkhed 77.50166667
19.15888889
367.7 1998-99
EW F VB & W Granite
150.75
5.6 21 -22.55 ,83 -86 ,129.35 -132.35 ,110 -114.05
12.21 3.17
66 Nanded Mudkhed
Mudkhed 77.50166667
19.15888889
367.7 1998-99
OW F VB 52 5.6 21 -22.4 ,34 -37.7
10.05
67 Nanded Deglur Degloor 77.58333333
18.53611111
375 1998-99
EW F W Granite
122 5.6 48 -50 9.72 traces

232
ANNEXURE III: DETAILS OF GW MONITORING WELLS IN NANDED DISTRICT
Sl No
Project type
District Block Village Latitude(DD) Longitude(DD) Height of Measuring Point (magl)
Type of Well Water level (mbgl)
Pre-monsoon
Post-monsoon
1 NHS Nanded KANDHAR Ambe Sangwi 19.0042 77.1875 1.15 Dug Well 13.35 3.6
2 NHS Nanded KINWAT Anjankhed 19.8389 78.0778 0.3 Dug Well 7.2 5.2
3 NHS Nanded NANDED Ardhapur-1 19.2947 77.3783 0 Dug Well 18.2 7.2
4 NHS Nanded DEGLUR Atkali_Pz 18.5917 77.5083 0.5 Bore Well 29.4
5 NHS Nanded DEGLUR Atkali-1 18.6478 77.6031 1.2 Dug Well 15.3 6.7
6 NHS Nanded MUKHED Balegaon 18.9606 77.5761 0.3 Dug Well 5.5 1.7
7 NHS Nanded NANDED Barad 19.2333 77.4333 0.47 Dug Well 12.3 4.3
8 NHS Nanded KANDHAR Barul 18.8494 77.3253 0.55 Dug Well 2.05
9 NHS Nanded BHOKAR Bhokar 19.2167 77.6833 0.75 Dug Well 9.65 4.25
10 NHS Nanded BILOLI Biloli-1 18.8992 77.7233 0.6 Dug Well 3 7.3
11 NHS Nanded KINWAT Chikhli Chota 19.5333 78.2333 0.8 Dug Well 8
12 NHS Nanded NANDED Dhanegaon 19.1300 77.3297 0.4 Dug Well 9.9 1.7
13 NHS Nanded NANDED Dharmabad 18.8917 77.8394 0.7 Dug Well 9.59
14 NHS Nanded HADGAON Dhawari Buzurg 19.2889 77.6639 0 Dug Well 8.6 2.8
15 NHS Nanded HADGAON Dorli 19.4239 77.6344 0.72 Dug Well 5.4 3.1
16 NHS Nanded HADGAON Gadga 18.8069 77.4606 0.8 Dug Well 17.3 1.2
17 NHS Nanded KINWAT Gokunda (Kinwat)-1 19.5833 78.2333 0.55 Dug Well 8.15 2.6
18 NHS Nanded HADGAON Hadgaon-1 19.5000 77.6667 0.4 Dug Well 22.6 6.1
19 NHS Nanded HADGAON Himayat Nagar 19.4167 77.8667 1.5 Dug Well 11.09 1.2
20 NHS Nanded HADGAON Himayat Nagar-1 19.4208 77.8672 0.2 Dug Well 5.6
21 NHS Nanded KINWAT Islapur 19.4167 78.0167 0.75 Dug Well 1.75 2.7
22 NHS Nanded MUKHED Jamb Buzurg 18.6561 77.1833 0.4 Dug Well 13.1 4.4
23 NHS Nanded KANDHAR Janapuri-1 19.0667 77.2333 0.55 Dug Well 8.75 3.5

233
Sl No
Project type
District Block Village Latitude(DD) Longitude(DD) Height of Measuring Point (magl)
Type of Well Water level (mbgl)
Pre-monsoon
Post-monsoon
24 NHS Nanded KINWAT Jhalakwadi 19.3417 78.0833 0.5 Dug Well 6.8 4.2
25 NHS Nanded KINWAT Kamtala 19.6750 78.1833 0.7 Dug Well 9.1 6.1
26 NHS Nanded KANDHAR Kandar-1 18.8728 77.1961 0.3 Dug Well 8
27 NHS Nanded NANDED Kapsi Gumta 19.0125 77.4144 1.1 Dug Well 1.7 2.6
28 NHS Nanded DEGLUR Karadkher-1 18.4850 77.4908 0.3 Dug Well 5.5 1.45
29 NHS Nanded NANDED Khambegaon 18.9906 77.0731 1.2 Dug Well 11.4 3.3
30 NHS Nanded MUKHED Kolambi 18.8900 77.4178 0 Dug Well 9 1.8
31 NHS Nanded BILOLI Kuncheli 18.7694 77.5631 0 Dug Well 10.1 0.01
32 NHS Nanded NANDED Lahan 19.2819 77.4625 0.8 Dug Well 8.2 4.7
33 NHS Nanded KINWAT Lakmapur 19.8750 77.9500 0.65 Dug Well 7.5 1.95
34 NHS Nanded KANDHAR Malegaon (I) 18.8167 77.0167 1.1 Dug Well 2.9
35 NHS Nanded NANDED Malegaon (II) 19.3111 77.3167 0.9 Dug Well 10.6 4.5
36 NHS Nanded HADGAON Manwadi phata 19.5047 77.5997 0.75 Dug Well 12.55 2
37 NHS Nanded HADGAON Mathala 19.5881 77.5469 0 Dug Well 7.6
38 NHS Nanded NANDED Mudkhed2 19.1500 77.5167 1 Dug Well 11.5 3.5
39 NHS Nanded MUKHED Mukher-1 18.7167 77.3833 0 Dug Well 10.4 1.3
40 NHS Nanded MUKHED Mukrambad (Kharka)
18.4833 77.3667 0.75 Dug Well 6.25 1.2
41 NHS Nanded BHOKAR Nagapur 19.2125 77.6992 1.15 Dug Well 8.65 3.65
42 NHS Nanded BILOLI Naigaon 18.8500 77.5333 0.75 Dug Well 10.45 4
43 NHS Nanded NANDED Nanded 19.1906 77.3394 0.65 Dug Well 10.05 4.6
44 NHS Nanded BILOLI Narsi 18.8097 77.5333 0.6 Dug Well 9.2 5.6
45 NHS Nanded BHOKAR Narwat 19.2333 77.6333 0.48 Dug Well 8.15 1.75
46 NHS Nanded MUKHED Pala 18.6417 77.4458 0.7 Dug Well 8 8
47 NHS Nanded BILOLI Panchpipli 18.7919 77.6267 1 Dug Well 9.5 10.5

234
Sl No
Project type
District Block Village Latitude(DD) Longitude(DD) Height of Measuring Point (magl)
Type of Well Water level (mbgl)
Pre-monsoon
Post-monsoon
48 NHS Nanded NANDED Police Wadi 18.9219 77.0967 0.45 Dug Well 10 1.7
49 NHS Nanded MUKHED Ramwadi Shivar 18.4853 77.3178 0 Dug Well 3 2.15
50 NHS Nanded BHOKAR Shelgaon 19.0669 77.5814 0.3 Dug Well 9.5 6.7
51 NHS Nanded NANDED Sikarghat (Amdura) 19.1333 77.4167 0.3 Dug Well 31.7 3.15
52 NHS Nanded MUKHED Somthana 18.9428 77.4403 0.4 Dug Well 11.2 1.5
53 NHS Nanded BILOLI Talani 18.7925 77.6117 0.3 Dug Well 9 3.8
54 NHS Nanded NANDED Taroda (Bk) 19.2094 77.2906 0.4 Dug Well 18 13.8
55 NHS Nanded DEGLUR Umri-Gortha 19.0497 77.6264 1.25 Dug Well 1.55 2.6
56 NHS Nanded KINWAT Unkeshwar 19.8500 78.2000 1 Dug Well 9.1
57 NHS Nanded BHOKAR Wadgaon (kh) 19.3208 77.7383 0.9 Dug Well 15 3.4
58 NHS Nanded HADGAON Wanwadi 19.3097 77.5478 0 Dug Well 7.1
59 NHS Nanded HADGAON Waranga 19.4333 77.4833 0.5 Dug Well 4.8 1.3
60 GSDA Nanded ARDHAPUR Lahan 19.28194444 77.46250000 Dug Well 8.20 3.20
61 GSDA Nanded ARDHAPUR Malegaon 19.29583333 77.26944444 Dug Well 13.00 7.40
62 GSDA Nanded ARDHAPUR Pardi I 19.32500000 77.38472222 Dug Well 4.80 3.50
63 GSDA Nanded ARDHAPUR Pimpalgaon M 19.20833333 77.33888889 Dug Well 14.00 10.20
64 GSDA Nanded BHOKAR Divshi Kh 19.19583333 77.83666667 Dug Well 8.70 2.90
65 GSDA Nanded BHOKAR Halda 19.14583333 77.68750000 Dug Well 6.80 1.80
66 GSDA Nanded BHOKAR Kini 19.24166667 77.80972222 Dug Well 6.20 2.10
67 GSDA Nanded BHOKAR Loglood 19.17916667 77.80277778 Dug Well 7.30 2.60
68 GSDA Nanded BHOKAR Nanda Bk 19.10555556 77.73194444 Dug Well 6.80 2.30
69 GSDA Nanded BHOKAR Somthana (patti Bhokar)
19.27500000 77.71250000 Dug Well 9.30 2.70
70 GSDA Nanded BHOKAR Wakad 19.23888889 77.57222222 Dug Well 8.80 3.60
71 GSDA Nanded BILOLI Adampur 18.64972222 77.61666667 Dug Well 10.50 8.70

235
Sl No
Project type
District Block Village Latitude(DD) Longitude(DD) Height of Measuring Point (magl)
Type of Well Water level (mbgl)
Pre-monsoon
Post-monsoon
72 GSDA Nanded BILOLI Biloli New 18.77083333 77.72777778 Dug Well 9.90 4.70
73 GSDA Nanded BILOLI Hippargathadi New 18.67083333 77.70416667 Dug Well 16.80 9.40
74 GSDA Nanded BILOLI Kinala 18.77361111 77.56250000 Dug Well 10.80 7.60
75 GSDA Nanded BILOLI Kondalwadi 18.80555556 77.77083333 Dug Well 10.50 8.80
76 GSDA Nanded BILOLI Talni 18.78888889 77.61111111 Dug Well 9.20 5.10
77 GSDA Nanded BILOLI Yesgi New 18.70277778 77.78888889 Dug Well 8.60 9.80
78 GSDA Nanded DEGLUR Amdapur 18.48750000 77.46666667 Dug Well 17.50 7.40
79 GSDA Nanded DEGLUR Chakur Ballur 18.52500000 77.52638889 Dug Well 10.20
80 GSDA Nanded DEGLUR Dawangir 18.38888889 77.47916667 Dug Well 8.40 8.20
81 GSDA Nanded DEGLUR Deglur 18.54583333 77.57916667 Dug Well 14.60 11.50
82 GSDA Nanded DEGLUR Hali 18.38750000 77.51944444 Dug Well 4.70 0.70
83 GSDA Nanded DEGLUR Hanegaon 18.34166667 77.44861111 Dug Well 7.20 8.90
84 GSDA Nanded DEGLUR Narangal b.k 18.56250000 77.66666667 Dug Well 17.20 8.80
85 GSDA Nanded DEGLUR Tadkhel 18.58750000 77.51666667 Dug Well 11.00 5.80
86 GSDA Nanded DEGLUR Wazarga 18.64166667 77.60472222 Dug Well 20.40 7.80
87 GSDA Nanded DEGLUR Zari 18.44166667 77.52000000 Dug Well 7.55 6.80
88 GSDA Nanded DHARMABAD Dharmabad 18.88194444 77.85666667 Dug Well 13.00 9.80
89 GSDA Nanded DHARMABAD Karkheli 18.96250000 77.74194444 Dug Well 11.70 7.60
90 GSDA Nanded DHARMABAD Loha Berli Kh 18.93333333 77.83333333 Dug Well 12.00 4.20
91 GSDA Nanded DHARMABAD Patoda Kh 18.86805556 77.77777778 Dug Well 12.45 7.00

236
Sl No
Project type
District Block Village Latitude(DD) Longitude(DD) Height of Measuring Point (magl)
Type of Well Water level (mbgl)
Pre-monsoon
Post-monsoon
92 GSDA Nanded DHARMABAD Yeoti 18.96611111 77.80333333 Dug Well 7.60 7.60
93 GSDA Nanded HADGAON Dhanora(hastara) 19.51527778 77.58527778 Dug Well 8.20 7.40
94 GSDA Nanded HADGAON Dongargaon 19.48055556 77.63333333 Dug Well 4.50 1.10
95 GSDA Nanded HADGAON Gargavhan 19.46944444 77.59027778 Dug Well 13.30 1.80
96 GSDA Nanded HADGAON Ghogari 19.30416667 77.64722222 Dug Well 10.00 2.70
97 GSDA Nanded HADGAON Gojegaon 19.53333333 77.65833333 Dug Well 7.30 3.10
98 GSDA Nanded HADGAON Hadgaon 19.50138889 77.66111111 Dug Well 9.80 8.70
99 GSDA Nanded HADGAON Koli 19.58194444 77.50833333 Dug Well 8.70 3.00
100 GSDA Nanded HADGAON Niwgha 19.58333333 77.56666667 Dug Well 3.80 1.20
101 GSDA Nanded HADGAON Pimparkhed New 19.51277778 77.51194444 Dug Well 9.40 5.25
102 GSDA Nanded HADGAON Sapti 19.64305556 77.58055556 Dug Well 6.70 1.90
103 GSDA Nanded HADGAON Shivpuri 19.33416667 77.63250000 Dug Well 7.60 4.25
104 GSDA Nanded HADGAON Sibdara (j) 19.51666667 77.52361111 Dug Well 13.60 4.40
105 GSDA Nanded HADGAON Talni 19.63888889 77.53333333 Dug Well 10.50 1.45
106 GSDA Nanded HADGAON Tamsa New 19.38638889 77.60138889 Dug Well 10.10 4.70
107 GSDA Nanded HADGAON Umri J 19.36666667 77.60000000 Dug Well 11.00 3.80
108 GSDA Nanded HADGAON Umri p.k 19.61388889 77.47222222 Dug Well 9.60 3.40
109 GSDA Nanded HADGAON Walki Kh. 19.39583333 77.69027778 Dug Well 10.60 7.20
110 GSDA Nanded HIMAYATNAGAR Dabdari T 19.31250000 77.76388889 Dug Well 4.20 2.20
111 GSDA Nanded HIMAYATNAGAR Himayatnager 19.42500000 77.87500000 Dug Well 12.50 4.40
112 GSDA Nanded HIMAYATNAGAR Kamarwadi 19.38500000 77.76388889 Dug Well 10.50 4.90

237
Sl No
Project type
District Block Village Latitude(DD) Longitude(DD) Height of Measuring Point (magl)
Type of Well Water level (mbgl)
Pre-monsoon
Post-monsoon
113 GSDA Nanded HIMAYATNAGAR Kandi Bk 19.41666667 77.83333333 Dug Well 10.35 5.60
114 GSDA Nanded HIMAYATNAGAR Khairgaon 19.37722222 77.76444444 Dug Well 11.40 2.40
115 GSDA Nanded HIMAYATNAGAR Palaspur 19.46888889 77.84527778 Dug Well 7.50 2.30
116 GSDA Nanded KANDHAR Babulgaon 18.86666667 77.12500000 Dug Well 8.30 2.40
117 GSDA Nanded KANDHAR Bachoti 18.86388889 77.25416667 Dug Well 7.50 2.70
118 GSDA Nanded KANDHAR Bahadarpura 18.86666667 77.20416667 Dug Well 8.80 3.40
119 GSDA Nanded KANDHAR Bamni p.k 18.90138889 77.27777778 Dug Well 8.70 1.00
120 GSDA Nanded KANDHAR Barul 18.85000000 77.32777778 Dug Well 2.60 2.70
121 GSDA Nanded KANDHAR Digras Kh 18.73055556 77.22500000 Dug Well 13.20 5.30
122 GSDA Nanded KANDHAR Nagalgaon 18.77361111 77.14166667 Dug Well 10.00 2.40
123 GSDA Nanded KANDHAR Osmanagar 18.96250000 77.29166667 Dug Well 13.00 2.70
124 GSDA Nanded KANDHAR Pethwadaj 18.78055556 77.32083333 Dug Well 8.20 4.10
125 GSDA Nanded KANDHAR Rauthkheda 18.83750000 77.34583333 Dug Well 11.00 3.80
126 GSDA Nanded KANDHAR Shekapur 18.85222222 77.17500000 Dug Well 10.50 5.80
127 GSDA Nanded KANDHAR Umraj Patalganga 18.83666667 77.12500000 Dug Well 4.30
128 GSDA Nanded KANDHAR Warwant 18.81250000 77.32222222 Dug Well 4.30 1.20
129 GSDA Nanded KINWAT Apprao peth 19.26250000 78.16388889 Dug Well 11.30 1.20
130 GSDA Nanded KINWAT Bodhadi Bk. 19.52000000 78.20111111 Dug Well 8.20 3.30
131 GSDA Nanded KINWAT Chikhali 19.28333333 78.06666667 Dug Well 7.40 4.30
132 GSDA Nanded KINWAT Gokunda 19.50555556 78.20277778 Dug Well 10.50 5.30
133 GSDA Nanded KINWAT Islapur 19.46750000 78.30611111 Dug Well 7.40 3.30
134 GSDA Nanded KINWAT Kamthala 19.66944444 78.18333333 Dug Well 9.90 5.30

238
Sl No
Project type
District Block Village Latitude(DD) Longitude(DD) Height of Measuring Point (magl)
Type of Well Water level (mbgl)
Pre-monsoon
Post-monsoon
135 GSDA Nanded KINWAT Kinwat New 19.53944444 78.20000000 Dug Well 11.20 6.30
136 GSDA Nanded KINWAT Kosmet 19.37361111 78.00972222 Dug Well 6.00 3.10
137 GSDA Nanded KINWAT Kuncholi 19.28055556 78.09305556 Dug Well 7.70 5.30
138 GSDA Nanded KINWAT Malborgaon 19.67777778 78.09583333 Dug Well 6.00 2.30
139 GSDA Nanded KINWAT Mandvi 19.79305556 78.27916667 Dug Well 8.30 1.90
140 GSDA Nanded KINWAT Nandgaon tanda 19.38472222 78.06250000 Dug Well 7.50 1.70
141 GSDA Nanded KINWAT Pradhnsangvi 19.56944444 78.21805556 Dug Well 7.70 4.50
142 GSDA Nanded KINWAT Rajgad tanda 19.72916667 78.14027778 Dug Well 6.70 2.40
143 GSDA Nanded KINWAT Sarkhani 19.80000000 78.11805556 Dug Well 12.40 7.30
144 GSDA Nanded KINWAT Sawari 19.46805556 78.16250000 Dug Well 10.10 3.60
145 GSDA Nanded KINWAT Shivani 19.32500000 78.10972222 Dug Well 6.10 1.10
146 GSDA Nanded KINWAT Singarwadi 19.45833333 78.23611111 Dug Well 8.60 3.70
147 GSDA Nanded KINWAT Talaiguda 19.72500000 78.31388889 Dug Well 6.60 2.90
148 GSDA Nanded KINWAT Umri Bazar 19.79166667 78.16666667 Dug Well 10.20 3.80
149 GSDA Nanded LOHA Janapuri 19.06250000 77.24305556 Dug Well 8.60 2.80
150 GSDA Nanded LOHA Kapsi Bk 19.00000000 77.38333333 Dug Well 8.30 2.30
151 GSDA Nanded LOHA Khadak Manjari 19.01666667 77.14722222 Dug Well 12.70 3.60
152 GSDA Nanded LOHA Malkoli Khedkarwadi
18.87222222 77.05555556 Dug Well 6.30 1.80
153 GSDA Nanded LOHA Sawargaon N 18.91805556 77.04166667 Dug Well 6.30 5.90
154 GSDA Nanded LOHA Shambergaon 19.03472222 77.35555556 Dug Well 13.60 4.20
155 GSDA Nanded MAHUR Datta Manjri 19.80000000 77.94333333 Dug Well 5.90 2.10
156 GSDA Nanded MAHUR Lakhmapur I 19.86333333 77.94444444 Dug Well 11.30 3.40
157 GSDA Nanded MAHUR Sindkhed I I 19.87083333 78.12500000 Dug Well 6.90 3.60
158 GSDA Nanded MAHUR Wanola 19.75222222 78.01666667 Dug Well 9.70 5.00

239
Sl No
Project type
District Block Village Latitude(DD) Longitude(DD) Height of Measuring Point (magl)
Type of Well Water level (mbgl)
Pre-monsoon
Post-monsoon
159 GSDA Nanded MUDKHED Barad 19.23055556 77.45833333 Dug Well 12.50 4.70
160 GSDA Nanded MUDKHED Mudkhed 19.15555556 77.50833333 Dug Well 8.90 2.50
161 GSDA Nanded MUDKHED Mugat 19.14861111 77.43333333 Dug Well 11.30 2.70
162 GSDA Nanded MUKHED Barhali 18.56250000 77.33055556 Dug Well 11.80 7.70
163 GSDA Nanded MUKHED Dapka Gundopant 18.29166667 77.50000000 Dug Well 8.10 6.00
164 GSDA Nanded MUKHED Halni 18.45833333 77.30694444 Dug Well 10.90 7.90
165 GSDA Nanded MUKHED Khatgaon 18.40694444 77.39166667 Dug Well 10.00 4.80
166 GSDA Nanded MUKHED Kotgyal 18.71250000 77.32500000 Dug Well 12.00 7.20
167 GSDA Nanded MUKHED Mandlapur 18.65694444 77.45833333 Dug Well 5.50 3.20
168 GSDA Nanded MUKHED Mukarmabad 18.47500000 77.37222222 Dug Well 7.10 3.00
169 GSDA Nanded MUKHED Sawargaon Pir 18.66944444 77.26527778 Dug Well 14.60 8.30
170 GSDA Nanded MUKHED Yeoti 18.61666667 77.40972222 Dug Well 11.90 6.80
171 GSDA Nanded NAIGAON Aluwadgaon 18.78750000 77.44861111 Dug Well 7.30 2.70
172 GSDA Nanded NAIGAON Antargaon 18.99305556 77.52638889 Dug Well 14.80 9.40
173 GSDA Nanded NAIGAON Badbada 18.99166667 77.50000000 Dug Well 10.30 4.80
174 GSDA Nanded NAIGAON Krushnoor 18.94111111 77.48277778 Dug Well 7.10 2.70
175 GSDA Nanded NAIGAON Naigaon Bazar 18.84583333 77.52777778 Dug Well 9.30 5.10
176 GSDA Nanded NANDED Limbgaon 19.18055556 77.19583333 Dug Well 10.30 3.30
177 GSDA Nanded NANDED Markand 19.11250000 77.23888889 Dug Well 14.50 1.20
178 GSDA Nanded NANDED Marlak kd 19.21666667 77.23888889 Dug Well 8.60 1.40
179 GSDA Nanded NANDED Taroda New 19.18138889 77.29305556 Dug Well 16.80 12.30
180 GSDA Nanded NANDED Tuppa 19.10194444 77.35833333 Dug Well 13.20 9.30
181 GSDA Nanded NANDED Wadi Bk New 19.18333333 77.27083333 Dug Well 13.90 9.80
182 GSDA Nanded NANDED Wajegaon 19.14305556 77.34861111 Dug Well 10.40 4.70

240
Sl No
Project type
District Block Village Latitude(DD) Longitude(DD) Height of Measuring Point (magl)
Type of Well Water level (mbgl)
Pre-monsoon
Post-monsoon
183 GSDA Nanded UMRI Gortha 19.05416667 77.62222222 Dug Well 10.00 4.70
184 GSDA Nanded UMRI Karla Ii 19.10555556 77.60000000 Dug Well 5.90 2.40
185 GSDA Nanded UMRI Kawalguda Kh 18.90416667 77.66583333 Dug Well 11.10
186 GSDA Nanded UMRI Nimtok 18.97777778 77.66666667 Dug Well 6.10 2.70
187 GSDA Nanded UMRI Sindhi 19.09166667 77.55000000 Dug Well 4.30 1.30
188 GSDA Nanded UMRI Somthana J 19.06750000 77.66805556 Dug Well 7.60 2.10
189 GSDA Nanded UMRI Talegaon 19.00833333 77.62500000 Dug Well 10.30 4.80

241
ANNEXURE IV: CHEMICAL ANALYSIS OF GROUND WATER SAMPLES, AQUIFER-1/SHALLOW AQUIFERS
Sl No DISTRICT_NAME
TAHSIL_NAME SITE_NAME
Data Source
LATITUDE
LONGITUDE pH EC TDS TH Ca Mg Na K CO3 HCO3 Cl SO4
NO3 F
1 Nanded NANDED Sikarghat (Amdura) CGWA 19.13333 77.41667 7.6 1052 557 372 102 28 79 2.18 0 488 96 40 33
0.29
2 Nanded BHOKAR Bhokar CGWA 19.21667 77.68333 7.5 1879 997 541 129 52 97 22.7 0 494 249 57 42 0.13
3 Nanded BHOKAR Narwat CGWA 19.23333 77.63333 7.6 1378 929 444 123 33 49 7.01 0 482 98 35 42 0.12
4 Nanded Kinwat Islapur CGWA 19.41667 78.01667 7.7 480 254 163 47 11 32 5.26 0 226 26 21 3 0.3
5 Nanded NANDED Malegaon (II) CGWA 19.31111 77.31667 7.7 1394 738 490 108 52 50 3.55 0 434 150 47 41
0.39
6 Nanded HADGAON Dhawari Buzurg CGWA 19.28889 77.66389 7.6 1294 686 469 114 44 51 4.66 0 464 110 50 42
0.31
7 Nanded NANDED Barad CGWA 19.23333 77.43333 7.6 1279 677 515 112 56 30 0.51 0 446 128 29 41 0.39
8 Nanded HADGAON Dorli CGWA 19.42389 77.63444 7.7 3065 1625 571 82 87 199 50.17 0 613 334 53 42
0.33
9 Nanded NANDED Lahan CGWA 19.28194 77.4625 7.6 1690 894 515 102 62 62 10.14 0 446 120 45 41 0.13
10 Nanded BILOLI Narsi CGWA 18.80972 77.53333 7.6 2096 1112 627 119 79 92 22.12 0 541 257 36 35
0.21
11 Nanded KANDHAR Janapuri-1 CGWA 19.06667 77.23333 7.6 908 480 372 82 40 38 0.71 0 416 63 29 39 0.49
12 Nanded KINWAT Gokunda (Kinwat)-1 CGWA 19.58333 78.23333 7.7 1528 810 505 119 50 95 1.14 0 523 130 45 33
1.56
13 Nanded Himayatnagar
Wadgaon (kh) CGWA 19.32083 77.73833 7.4 787 417 214 31 33 79 1.39 0 285 101 36 8
4.91
14 Nanded Hadgaon Mathala CGWA 19.58806 77.54694 7.6 741 393 393 72 51 19 2.1 0 345 46 32 38 0.46
15 Nanded NANDED Ardhapur-1 CGWA 19.29472 77.37833 7.2 679 360 296 67 30 34 2.43 0 333 41 28 1 0.42
16 Nanded Umri Umri-Gortha CGWA 19.04972 77.62639 7.6 1203 638 316 74 32 80 2.92 0 285 101 60 31 0.54

242
Sl No DISTRICT_NAME
TAHSIL_NAME SITE_NAME
Data Source
LATITUDE
LONGITUDE pH EC TDS TH Ca Mg Na K CO3 HCO3 Cl SO4
NO3 F
17 Nanded BILOLI Biloli-1 CGWA 18.89917 77.72333 7.8 1171 621 403 51 66 103 1.09 0 565 21 66 11 2.18
18 Nanded NANDED Kapsi Gumta CGWA 19.0125 77.41444 7.4 591 313 230 61 18 45 2.41 0 291 46 41 1 0.92
19 Nanded NANDED Nanded CGWA 19.19056 77.33944 7.4 1455 771 520 86 73 64 1.3 0 375 177 35 42 0.62
20 Nanded Nanded Dhanegaon CGWA 19.13 77.32972 7.4 2458 1307 780 178 80 129 1.98 0 607 309 71 41
0.58
21 Nanded NANDED Police Wadi CGWA 18.92194 77.09667 7.5 1818 962 724 43 147 105 1.71 0 732 153 67 41 0.45
22 Nanded MUKHED Balegaon CGWA 18.96056 77.57611 7.4 2392 1268 979 180 126 112 1.65 0 791 341 50 42
0.98
23 Nanded Naigaon Kolambi CGWA 18.89 77.41778 7.7 973 496 439 53 73 39 0.92 0 547 34 24 42 0.55
24 Nanded KANDHAR Kandar-1 CGWA 18.87278 77.19611 7.5 1681 891 627 102 89 92 5.69 0 726 91 18 36 0.39
25 Nanded HADGAON Manwari phata CGWA 19.50472 77.59972 7.7 744 394 250 51 29 33 0.83 0 232 31 75 40
0.74
26 Nanded Naigaon Somthana CGWA 18.94278 77.44028 7.5 2274 1206 525 108 61 119 40.36 0 369 252 71 42
0.39
27 Nanded Deglur Karadkher-1 CGWA 18.485 77.49083 7.6 848 449 321 55 44 40 0.72 0 410 38 27 32 1.23
28 Nanded BILOLI Kuncheli CGWA 18.76944 77.56306 7.5 962 510 372 47 61 38 1.33 0 369 66 37 42 0.5
29 Nanded Loha Ambe Sangwi CGWA 19.00417 77.1875 7.4 899 476 321 49 47 81 3.87 0 404 101 28 10
1.05
30 Nanded Barul CGWA 18.84944 77.32528 7.6 1217 645 449 78 61 73 3.73 0 470 96 43 28 0.4
31 Nanded Wanwadi CGWA 19.30972 77.54778 7.6 708 375 352 55 51 21 0.55 0 393 24 26 37 0.23
32 Nanded MUKHED PAISMAL GSDA 18.5915 77.3399 8.1 600 390 156 16 NA 22 22 12 0.7
33 Nanded MUKHED
SUGAON (BK) GSDA 18.5988 77.3053
6.9 737 480 206 24 NA
26 24 11 0.8
34 Nanded MUKHED UNDRI (PM) GSDA 18.5988 77.3053 8.1 753 490 202 24 NA 24 41 15 0.5

243
Sl No DISTRICT_NAME
TAHSIL_NAME SITE_NAME
Data Source
LATITUDE
LONGITUDE pH EC TDS TH Ca Mg Na K CO3 HCO3 Cl SO4
NO3 F
35 Nanded DEGLOOR DAREGAON
GSDA 18.4966 77.4715 7.4 662 430 180 24 NA
48 28 26 0.3
36 Nanded HIMAYATNAGAR
WAGHI GSDA 19.4144 77.7943
7.8 2227 1448
480 22 NA
168 48 166 0.7
37 Nanded
HIMAYATNAGAR
TAKRALA(BK) GSDA 19.3003 77.7052
8.0 1310 852 240 33 NA
100 63 148 1.0
38 Nanded
HIMAYATNAGAR
WALKEWADI GSDA 19.3498 77.8343
7.6 1367 859 266 33 NA
102 70 88 0.9
39 Nanded HIMAYATNAGAR
DARESARSAM GSDA 19.3414 77.9036
7.8 1446 940 340 34 NA
132 78 29 0.6
40 Nanded MAHOOR
EWALESHWAR GSDA 19.7607 77.9181
7.3 794 516 188 59 NA
100 18 45 0.5
41 Nanded MAHOOR PAWANALA GSDA 19.7591 77.9719 8.3 772 502 226 56 NA 106 35 15 0.4
42 Nanded MAHOOR TANDALA GSDA 19.7779 77.9223 7.5 785 510 234 59 NA 94 26 33 0.3
43 Nanded MAHOOR
DATTAMANJARI GSDA 19.7994 77.9318
7.3 818 532 216 76 NA
74 43 32 0.4
44 Nanded MAHOOR HADSANI GSDA 19.8045 77.8674 8.0 852 554 230 83 NA 114 53 45 0.3
45 Nanded MAHOOR RUI GSDA 19.8339 77.884 8.0 883 574 242 102 NA 94 54 45 0.4
46 Nanded MAHOOR SHEKAPUR GSDA 19.862 77.8979 7.9 877 570 220 88 NA 62 38 45 0.2
47 Nanded MAHOOR KEROLI GSDA 19.8541 77.8895 8.0 735 478 246 98 NA 70 26 39 0.4
48 Nanded DHARMABAD
HASNALI GSDA 18.9712 77.7808

244
ANNEXURE V: CHEMICAL ANALYSIS OF GROUND WATER SAMPLES, AQUIFER-II/DEEPER AQUIFERS
Sl. No.
Data Source
District
Taluka
Village
Longitude
Latitude
Drilling depth
pH EC TDS
TH Ca
Mg Na K CO3
HCO3
Cl SO4
NO3
Fe F
1 CGWA Nanded
Biloli Biloli 77.774167 18.723333
34 8.2 610 315 180 36 22 58 3 0 323 25 0 7 0 0
2 CGWA Nanded
Naigaon
Narsi 77.535278 18.813333
71.35 8.35
1700 1040
425 136
21 147 10.1
3 281 330 70 95 0 0
3 CGWA Nanded
Naigaon
Krisnur 77.481667 18.942222
80.25 8.4 1170 680 235 38 34 145 27 9 268 145 125 24 0 0
4 CGWA Nanded
Biloli Atkali 77.589444 18.660000
31.65 8.6 1030 628 155 20 26 166 2 27 189 35 25 7 0 0
5 CGWA Nanded
Mukhed
Hanegaon
77.340000 18.448333
30 8.2 1070 605 425 60 67 51 4 0 275 71 175 38 0 0
6 CGWA Nanded
Naigaon
Manjaran
77.439167 18.845000
- 7.8 910 500 375 82 41 37 2 0 201 131 75 33 0 0
7 CGWA Nanded
Biloli Karkheli
77.825000 18.954167
130 7 1850 875 355 76 40 276 16 0 140 266 60 8.5
8 CGWA Nanded
Biloli Arjapur 77.741667 18.791667
109.3 8.5 460 250 115 38 5 54 13 15 207 18 5 7
9 CGWA Nanded
Umri Mokhandi
77.730833 19.080833
97.25 8.5 540 280 120 18 18 69 2 15 256 21 5
10 CGWA Nanded
Bhokar
Bhokar 77.671667 19.222500
174 8.6 520 270 180 56 10 33 5 18 220 25 5 10 0.06
11 CGWA Nanded
Hadgaon
Tamsa 77.615000 19.374167
202 8.5 810 440 335 70 44 23 6 153 135 50 31
12 CGWA Nanded
Himayatnagar
Himayat Nagar
77.878333 19.428333
138
13 CGWA Nanded
Hadgaon
Koli 77.510000 19.583333
201.95 8.6 680 375 120 28 101 10 12 244 50 30 21
14 CGWA Nand Hadga Ambala 77.616667 19.51 201.95 8 488 265 95 24 9 67 0 0 183 56 20 3.

245
Sl. No.
Data Source
District
Taluka
Village
Longitude
Latitude
Drilling depth
pH EC TDS
TH Ca
Mg Na K CO3
HCO3
Cl SO4
NO3
Fe F
ed on 8333 8
15 CGWA Nanded
Nanded
Vishnupuri
77.263889 19.086111
208 8.6 1000 600 235 70 15 122 2 12 96 177 120 32
16 CGWA Nanded
Kinwat
Islapur 78.010833 19.409167
94.75 8 1070 456 125 26 15 189 3 0 49 308 60 1
17 CGWA Nanded
Kinwat
Bodhari
78.197222 19.498611
141.55 8.03
590 330 85 26 5 92 3 183 64 50 _
18 CGWA Nanded
Mudkhed
Mugat 77.433333 19.150000
135.5 8.2 950 521 345 90 59 60 2 305 131 32 24
19 CGWA Nanded
Kinwat
Kinwat 78.200000 19.625000
110.45 7.55
1680 900 560 92 80 107 14 348 259 103 42
20 CGWA Nanded
Kinwat
Mandwi
78.274167 19.795833
123 7.85
680 352 285 68 25 2 250
71 15 18.2
21 CGWA Nanded
Mahur
Sindkhed
78.125000 19.871667
90 9.8 1300 905 140 34 13 229 6 30 259 250 1.63
22 CGWA Nanded
Kinwat
Rajgar 78.142500 19.728333
183.65 7.35
590 325 190 50 16 46 4 189 57 20 38
23 CGWA Nanded
Mahur
Lakhmapur
77.942500 19.865833
165.45 7.9 720 385 180 48 15 80 3 366 18 12 22
24 CGWA Nanded
Kandhar
Osman Nagar
77.295833 18.966667
73.85 7.35
1640 834 485 96 64 140 2 380 148 170 44.3
0.37
25 CGWA Nanded
Mukhed
Berli (BK)
77.388333 18.737500
107.5 8.17
530 291 40 10 3.6 85 2 189 71 23 0.14
1.63
26 CGWA Nanded
Deglur
Sugaon 77.641667 18.647500
54 8.4 800 440 235 42 32 75 6 15 281 50 60 18
27 CGWA Nanded
Mukhed
Mukramabad
77.366667 18.466667
78 7 1870 1218
285 110
2.4 294 9 55 234 536 3 2.05
28 CGWA Nanded
Kandh Kautha 77.374722 18.807500
116.55 7.22
1460 810 210 36 29 239 2 640 57 118 5.37
23.37
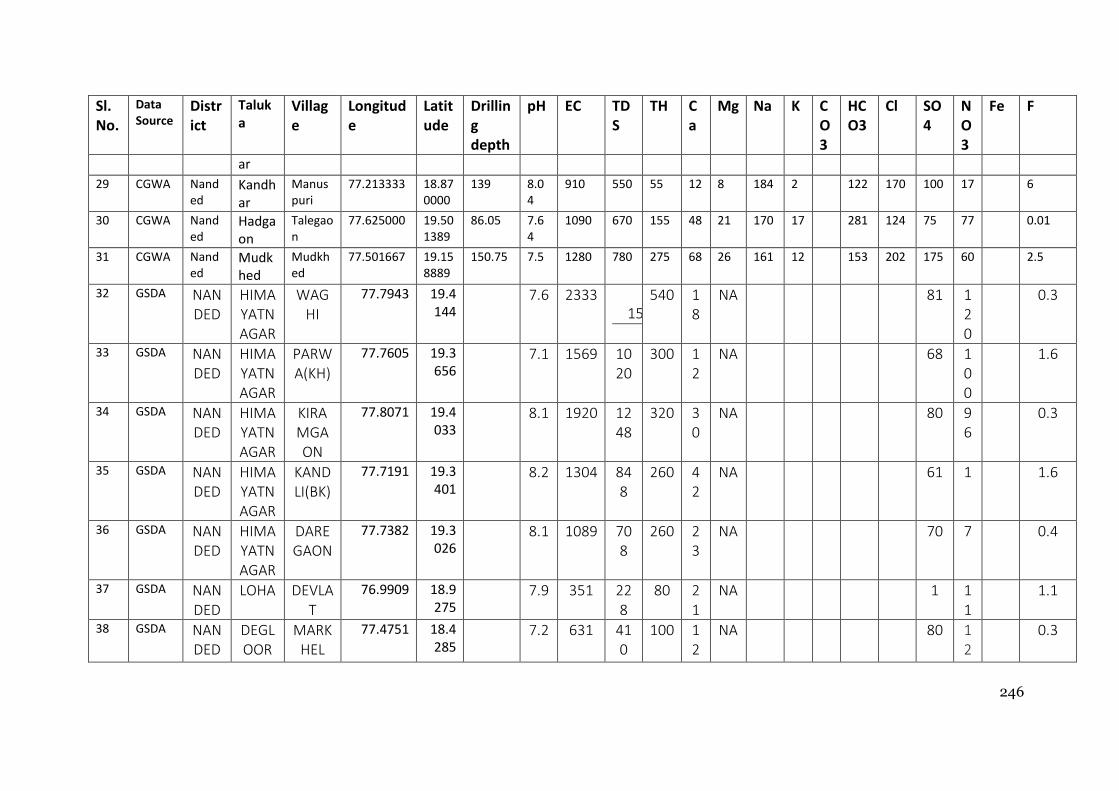
246
Sl. No.
Data Source
District
Taluka
Village
Longitude
Latitude
Drilling depth
pH EC TDS
TH Ca
Mg Na K CO3
HCO3
Cl SO4
NO3
Fe F
ar
29 CGWA Nanded
Kandhar
Manuspuri
77.213333 18.870000
139 8.04
910 550 55 12 8 184 2 122 170 100 17 6
30 CGWA Nanded
Hadgaon
Talegaon
77.625000 19.501389
86.05 7.64
1090 670 155 48 21 170 17 281 124 75 77 0.01
31 CGWA Nanded
Mudkhed
Mudkhed
77.501667 19.158889
150.75 7.5 1280 780 275 68 26 161 12 153 202 175 60 2.5
32 GSDA NANDED
HIMAYATNAGAR
WAGHI
77.7943 19.4144
7.6 2333
1517
540 18
NA
81 120
0.3
33 GSDA NANDED
HIMAYATNAGAR
PARWA(KH)
77.7605 19.3656
7.1 1569 10
20 300 1
2 NA
68 1
00
1.6
34 GSDA NANDED
HIMAYATNAGAR
KIRAMGAON
77.8071 19.4033
8.1 1920 12
48 320 3
0 NA
80 9
6
0.3
35 GSDA NANDED
HIMAYATNAGAR
KANDLI(BK)
77.7191 19.3401
8.2 1304 84
8 260 4
2 NA
61 1
1.6
36 GSDA NANDED
HIMAYATNAGAR
DAREGAON
77.7382 19.3026
8.1 1089 70
8 260 2
3 NA
70 7
0.4
37 GSDA NANDED
LOHA DEVLA T
76.9909 18.9275
7.9 351 22
8 80 2
1 NA
1 1
1
1.1
38 GSDA NANDED
DEGLOOR
MARKHEL
77.4751 18.4285
7.2 631 41
0 100 1
2 NA
80 1
2
0.3

247
Sl. No.
Data Source
District
Taluka
Village
Longitude
Latitude
Drilling depth
pH EC TDS
TH Ca
Mg Na K CO3
HCO3
Cl SO4
NO3
Fe F
39 GSDA NANDED
DEGLOOR
SANGVI (K)
77.5007 18.5038
6.9 1354 88
0 420 5
1 NA
49 6
8
0.2
40 GSDA NANDED
DEGLOOR
DAREGAON
77.4715 18.4966
7.2 646 42
0 148 2
1 NA
14 2
4
0.3
41 GSDA NANDED
BILOLI
DONGAON (BK)
77.6216 18.7166
7.3 707 46
0 152 8 NA
68 2
6
1.0
42 GSDA NANDED
BILOLI
PACHPIMPALI
77.6302 18.761
7.4 1323 86
0 264 2
2 NA
186
73
0.9
43 GSDA NANDED
BILOLI
TORNA
77.6654 18.8489
7.3 738 48
0 156 1
1 NA
31 7
6
0.1
44 GSDA NANDED
BILOLI
DUGAON(BK
)
77.6449 18.8505
7.8 1369 89
0 340 4
2 NA
101
56
0.7
45 GSDA NANDED
BILOLI
HARNALA
77.8032 18.7908
7.9 754 49
0 184 2
1 NA
40 1
7
0.1
46 GSDA NANDED
BILOLI
KOLGAON
77.6952 18.8603
8.5 769 90
0 380 2
6 NA
18 3
5
0.6
47 GSDA NANDED
ARDHAPUR
DEGAON
KHU.
0 0
8.4 2362 1535
624 226
NA
138
114
0.5

248
ANNEXURE VI: WATER LEVEL OF GROUND WATER MONITORING WELLS (2019)
WITH LONG TERM TREND (2010-19)
Sl No Village SITE ID Latitude
Longitude
DTWL_May 2019 (mbgl)
Pre_trend(2010-19)
DTWL_Nov 2019 (mbgl)
post_trend(2010-19)
1 Anjankhed W195020078044002 19.8389
78.0778
7.2 0.088 5.2 0.29
2 Ardhapur-1 W191741077224201 19.2947
77.3783
18.2 1.164 7.2 0.40
3 Atkali_Pz W183530077303001 18.5917
77.5083
29.4 1.177 0 -0.97
4 Atkali-1 W183852077361101 18.6478
77.6031
15.3 2.386 6.7 -0.22
5 Balegaon W185738077343401 18.9606
77.5761
5.5 -0.053 1.7 -0.68
6 Barad W191400077260001 19.2333
77.4333
12.3 0.047 4.3 -0.11
7 Bhokar W191300077410001 19.2167
77.6833
9.65 -0.189 4.25 -0.35
8 Biloli-1 W185357077432401 18.8992
77.7233
3 -0.189 7.3 0.53
9 Bodhadi Bk-1 W192947078115201 19.4964
78.1978
NA NA 0 -0.50
10 Chikhli Chota W193200078140001 19.5333
78.2333
8 0.002 0 0.16
11 Dhanegaon W190748077194701 19.1300
77.3297
9.9 -0.152 1.7 0.65
12 Dharmabad W185330077502201 18.8917
77.8394
9.59 0.496 0 0.35
13 Dhawari Buzurg
W191720077395001 19.2889
77.6639
8.6 0.145 2.8 0.27
14 Divshi Kh GSDA 19.19583333
77.83666667
8.7 -0.003 0 0.03
15 Dorli W192526077380401 19.4239
77.6344
5.4 0.012 3.1 0.11
16 Gokunda (Kinwat)-1
W193500078140002 19.5833
78.2333
8.15 0.563 2.6 0.13
17 Hadgaon-1 W193000077400002 19.5000
77.6667
22.6 1.176 6.1 0.29
18 Halda GSDA 19.14583333
77.6875
6.8 0.269 0 0.25
19 Himayat Nagar
W192500077520001 19.4167
77.8667
11.09 0.516 1.2 -0.59
20 Himayat Nagar-1
W192515077520201 19.4208
77.8672
5.6 0.284 0 0.29
21 Islapur W192500078010001 19.4167
78.0167
1.75 -0.575 2.7 0.07

249
Sl No Village SITE ID Latitude
Longitude
DTWL_May 2019 (mbgl)
Pre_trend(2010-19)
DTWL_Nov 2019 (mbgl)
post_trend(2010-19)
22 Jamb Buzurg W183922077110001 18.6561
77.1833
13.1 0.050 4.4 -0.37
23 Janapuri-1 W190400077140002 19.0667
77.2333
8.75 0.066 3.5 -0.31
24 Jhalakwadi W192030078050001 19.3417
78.0833
6.8 0.065 4.2 0.02
25 Kamtala W194030078110001 19.6750
78.1833
9.1 0.523 6.1 0.68
26 Kandar-1 W185222077114601 18.8728
77.1961
8 -0.386 0 -0.89
27 Kapsi Gumta W190045077245201 19.0125
77.4144
1.7 -0.243 2.6 0.17
28 Karadkher-1 W182906077292701 18.4850
77.4908
5.5 -0.519 1.45 -0.86
29 Khambegaon W185926077042301 18.9906
77.0731
11.4 0.225 3.3 -0.47
30 Kini GSDA 19.24166667
77.80972222
6.2 0.328 0 -0.52
31 Kolambi W185324077250401 18.8900
77.4178
9 0.045 1.8 -1.03
32 Kuncheli W184610077334701 18.7694
77.5631
10.1 -0.267 0.01 -1.92
33 Lahan W191655077274501 19.2819
77.4625
8.2 0.094 4.7 0.06
34 Lahan W191655077274501 19.28194444
77.4625
8.2 0.133 4.7 0.07
35 Lakmapur W195230077570001 19.8750
77.9500
7.5 0.158 1.95 -0.21
36 Loglood GSDA 19.17916667
77.80277778
7.3 0.119 0 0.08
37 Mahur W194820077552001 19.8056
77.9222
0 0.778 0 0.24
38 Malegaon GSDA 19.29583333
77.26944444
13 0.090 0 0.66
39 Malegaon (I) W184900077010001 18.8167
77.0167
2.9 -0.091 0 0.05
40 Malegaon (II) W191840077190001 19.3111
77.3167
10.6 0.052 4.5 0.53
41 Manwadi phata
W193017077355901 19.5047
77.5997
12.55 -0.360 NA NA
42 Mathala W193517077324901 19.5881
77.5469
7.6 0.477 NA NA
43 Mudkhed2 W190900077310002 19.1 77.516 11.5 0.401 3.5 0.13

250
Sl No Village SITE ID Latitude
Longitude
DTWL_May 2019 (mbgl)
Pre_trend(2010-19)
DTWL_Nov 2019 (mbgl)
post_trend(2010-19)
500 7
44 Mukher-1 W184300077230002 18.7167
77.3833
10.4 0.510 1.3 -0.28
45 Mukrambad (Kharka)
W182900077220001 18.4833
77.3667
6.25 -0.377 1.2 0.33
46 Nagapur W191245077415701 19.2125
77.6992
8.65 0.065 3.65 0.13
47 Naigaon W185100077320001 18.8500
77.5333
10.45 0.296 4 0.11
48 Nanda Bk GSDA 19.10555556
77.73194444
6.8 -0.035 0 0.07
49 Nanded W191126077202201 19.1906
77.3394
10.05 0.397 4.6 0.79
50 Narsi W184835077320001 18.8097
77.5333
9.2 0.223 5.6 -0.10
51 Narwat W191400077380001 19.2333
77.6333
8.15 -0.201 1.75 -0.05
52 Pala W183830077264501 18.6417
77.4458
8 0.139 8 0.50
53 Panchpipli W184731077373601 18.7919
77.6267
9.5 -0.380 10.5 -1.30
54 Pardi I GSDA 19.325
77.38472222
4.8 0.209 0 0.11
55 Pimpalgaon M
GSDA 19.20833333
77.33888889
14 0.092 0 -0.06
56 Police Wadi W185519077054801 18.9219
77.0967
10 0.298 1.7 -0.11
57 Shelgaon W190401077345301 19.0669
77.5814
9.5 0.592 6.7 0.07
58 Sikarghat (Amdura)
W190800077250001 19.1333
77.4167
31.7 0.609 3.15 0.02
59 Somthana W185634077262501 18.9428
77.4403
11.2 -0.310 1.5 -1.76
60 Somthana (patti Bhokar)
GSDA 19.275
77.7125
9.3 -0.310 0 -1.76
61 Talani W184733077364201 18.7925
77.6117
9 -0.056 3.8 -0.93
62 Tamsa_Pz W192215077370001 19.3708
77.6167
0 -0.272 0 0.84
63 Taroda (Bk) W191234077172601 19.2094
77.2906
18 1.074 13.8 0.51
64 Umri-Gortha W190259077373501 19.0497
77.6264
1.55 -0.023 2.6 -0.17
65 Unkeshwar W195100078120001 19.8 78.200 9.1 0.495 0 0.13

251
Sl No Village SITE ID Latitude
Longitude
DTWL_May 2019 (mbgl)
Pre_trend(2010-19)
DTWL_Nov 2019 (mbgl)
post_trend(2010-19)
500 0
66 Wadgaon (kh)
W191915077441801 19.3208
77.7383
15 0.532 3.4 -0.18
67 Wakad GSDA 19.23888889
77.57222222
8.8 0.126 0 0.05
68 Waranga W192600077290001 19.4333
77.4833
4.8 -0.112 1.3 0.11

252
ANNEXURE VII: LOCATION OF PERCOLATION TANK
Sl No VILLAGE TALUKA
1 Umri Kinwat
2 Bhiku Na Kinwat
3 Kothari Kinwat
4 Nichpur Kinwat
5 Ambadi Kinwat
6 KINWAT Kinwat
7 Wadoli Kinwat
8 Jawarla Kinwat
9 Mulzara Kinwat
10 Karanji Kinwat
11 Jaldhara Kinwat
12 Yavli Hadgaon
13 Loha Hadgaon
14 Ghogri Hadgaon
15 Pimprala Hadgaon
16 Jambhala Hadgaon
17 Chabhara Hadgaon
18 Nimgaon Hadgaon
19 Manatha Hadgaon
20 Manatha Hadgaon
21 Khamgavh Hadgaon
22 Kedargud Hadgaon
23 Pimparkh Hadgaon
24 Laihari Hadgaon
25 Dongarga Hadgaon
26 Niwdha Hadgaon
27 Matala Hadgaon
28 Peva Hadgaon
29 Delup Kh Ardhapur
30 Sangvi K Ardhapur
31 Barasgao Ardhapur
32 Pangri T Nanded
33 Talni Nanded
34 Sayal Nanded
35 Chanapur Ardhapur
36 Patnur Ardhapur
37 Chanapur Ardhapur
38 Babulgao Nanded
39 Tuppa Nanded
40 WAGHALA Nanded
41 Malegaon Ardhapur
42 Chikhali Nanded
Sl No VILLAGE TALUKA
43 NANDED Nanded
44 Taroda K Nanded
45 Sangvi B Nanded
46 Wadi Jan Nanded
47 Punegaon Nanded
48 Nandusa Nanded
49 Degaon B Nanded
50 Pathrad Mudkhed
51 Saregaon Mudkhed
52 Pimpal K Mudkhed
53 Pimpal K Mudkhed
54 Pandharw Mudkhed
55 Dongarga Mudkhed
56 Daregaon Mudkhed
57 Pimpalka Mudkhed
58 Pimpalga Mudkhed
59 Devapur Mudkhed
60 Shemboli Mudkhed
61 Wai Mudkhed
62 Wadi Niy Mudkhed
63 Barad Mudkhed
64 Takli Mudkhed
65 Malkauth Mudkhed
66 Mendka Mudkhed
67 Gargotwa Bhokar
68 Ijali Mudkhed
69 Eardada Mudkhed
70 Dholumri Umri
71 Palasgao Umri
72 Karla Umri
73 Kalgaon Bhokar
74 Kalgaon Umri
75 Ishwarna Umri
76 Hunda (p Umri
77 Rahati B Umri
78 Sailgaon Umri
79 Sailgaon Umri
80 Jamgaon Umri
81 Ijjatgao Umri
82 Ijjatgao Umri
83 Gortha Umri
84 PETHUMRI Umri

253
Sl No VILLAGE TALUKA
85 Talegaon Umri
86 Bolsa Bk Umri
87 Somthana Umri
88 Shirur Umri
89 Bitnal Umri
90 Mandala Umri
91 Miyadadp Umri
92 Kaudgaon Umri
93 Waghala Umri
94 Bolsa Umri
95 Hassa Umri
96 Bhoshi Bhokar
97 Bhoshi Bhokar
98 Chitgiri Bhokar
99 Amdariwa Bhokar
100 Therban Bhokar
101 Somthana Bhokar
102 Kini Bhokar
103 Paki Tan Bhokar
104 Raikhod Bhokar
105 Raikhod Bhokar
106 Amdari Bhokar
107 Bhokar Bhokar
108 Narwat Bhokar
109 Wakad Bhokar
110 Tatkalwa Bhokar
111 Pandurna Bhokar
112 Ritha Bhokar
113 Pomnala Bhokar
114 Sonari Bhokar
115 Maslaga Bhokar
116 Nekli Bhokar
117 Nekli Bhokar
118 Pimpaldh Bhokar
119 Kandli Bhokar
120 Baliram Himayatn
121 Turati Bhokar
122 Dharjani Bhokar
123 Nanda Bk Bhokar
124 Kamangao Bhokar
125 Rajapur Dharmaba
126 Rajapur Dharmaba
127 Junni Dharmaba
Sl No VILLAGE TALUKA
128 Babulgao Dharmaba
129 Yeoti Dharmaba
130 Mutnyal( Dharmaba
131 Patoda B Dharmaba
132 DHARMABA Dharmaba
133 DHARMABA Dharmaba
134 Jaflapur Dharmaba
135 Sirajkhe Dharmaba
136 Atkur Dharmaba
137 Bannali Dharmaba
138 Belur Bk Dharmaba
139 Salegaon Dharmaba
140 Babhali Dharmaba
141 Aloor Dharmaba
142 Sirajkhe Dharmaba
143 Vilegaon Dharmaba
144 Dugaon Biloli
145 Iklimore Biloli
146 Betak Bi Biloli
147 Atala Biloli
148 Torna Biloli
149 Belkoni Biloli
150 Lohgaon Biloli
151 Kinala Biloli
152 Ramtirth Biloli
153 Nagani Biloli
154 Daulapur Biloli
155 BILOLI Biloli
156 Kerur Biloli
157 Alandi Biloli
158 Kamras P Biloli
159 Kerur Biloli
160 Hipparga Biloli
161 Sangroli Biloli
162 Bamni Bk Biloli
163 Badur Biloli
164 Bhosi Biloli
165 Sawali Biloli
166 Chirli Biloli
167 BILOLI Biloli
168 BILOLI Biloli
169 Belkoni Biloli
170 Gaglegao Biloli

254
Sl No VILLAGE TALUKA
171 KUNDALWA Biloli
172 Padada T Biloli
173 KUNDALWA Biloli
174 Minki Biloli
175 Hangraga Naigaon
176 Koklegao Naigaon
177 Kaudgaon Naigaon
178 Sategaon Naigaon
179 Vanjarwa Naigaon
180 Ghungral Naigaon
181 Bhukmari Naigaon
182 Manjram Naigaon
183 Manjram Naigaon
184 Kedar Wa Naigaon
185 Marwali Naigaon
186 Kandala Naigaon
187 Naigaon Naigaon
188 Bendri Naigaon
189 Manjram Naigaon
190 Manjram Naigaon
191 Hiparga Naigaon
192 Kuncholi Naigaon
193 Kandala Naigaon
194 Hippar G Naigaon
195 Halda Kandhar
196 Umra Kandhar
197 Chikhali Kandhar
198 Katkalmb Kandhar
199 Barul Kandhar
200 Bachoti Kandhar
201 Bachoti Kandhar
202 Bachoti Kandhar
203 Navrangp Kandhar
204 KANDHAR Kandhar
205 Tolyachi Kandhar
206 Patalgan Kandhar
207 Umbaj Kandhar
208 Kandhare Kandhar
209 Nagalgao Kandhar
210 Kurla Kandhar
211 Wahad Kandhar
212 Daithana Kandhar
213 Guttewad Kandhar
Sl No VILLAGE TALUKA
214 Kurla Kandhar
215 Bolka Kandhar
216 Nandansh Kandhar
217 Hadoli B Kandhar
218 Somthana Kandhar
219 Digras B Kandhar
220 Gandhina Kandhar
221 Harbal P Kandhar
222 Dewaichi Kandhar
223 Gaul Kandhar
224 Bramhwad Kandhar
225 Kalka Kandhar
226 Shirsi B Kandhar
227 Rahati Kandhar
228 Kallali Kandhar
229 Kallali Kandhar
230 Rahati Kandhar
231 Penur Loha
232 Sayal. Loha
233 Bhedegao Loha
234 Sonkhed Loha
235 Kiwala Loha
236 Kalambar Loha
237 Golegaon Loha
238 Hadoli J Loha
239 Haranwad Loha
240 Sawargao Loha
241 Maski Loha
242 Shirsi K Kandhar
243 Madali Mukhed
244 Tembhurn Naigaon
245 Ghubadwa Kandhar
246 Ravankol Mukhed
247 Halni Mukhed
248 Ravi Mukhed
249 Bennal Mukhed
250 Savarmal Mukhed
251 Wandgir Mukhed
252 Itgyal P Mukhed
253 Jamb Bk. Mukhed
254 Kamjalga Mukhed
255 Sangvi B Mukhed
256 Admalwad Mukhed

255
Sl No VILLAGE TALUKA
257 Berli Bk Mukhed
258 Kharab K Mukhed
259 Takli(t. Mukhed
260 Bapshetw Mukhed
261 Undri P. Mukhed
262 Paismal Mukhed
263 Jirga Mukhed
264 Rathodwa Mukhed
265 Kamlewad Mukhed
266 Shikara Mukhed
267 Pimpalku Mukhed
268 Saknur Mukhed
269 Bhatapur Mukhed
270 Chondi Mukhed
271 Khapral Mukhed
272 Ratna Ta Mukhed
273 Bhagnurw Mukhed
274 Karna Mukhed
275 Mukhed K Mukhed
276 Shelkewa Mukhed
277 Jambhali Mukhed
278 Walanki Mukhed
279 Hatral Mukhed
280 Dapka Gu Mukhed
281 Khanapur Deglur
282 Adlur Deglur
283 Dhanaj Mukhed
284 Tadkhel Deglur
285 Tadkhel Deglur
286 DEGLUR Deglur
287 Gavandga Deglur
288 Manur Bk Deglur
Sl No VILLAGE TALUKA
289 Bembra Deglur
290 Wazar Deglur
291 Tumbarpa Deglur
292 Bhutan H Deglur
293 Kini Deglur
294 Kanmarpa Deglur
295 Bijalwad Deglur
296 Markhel Deglur
297 Pujarwad Deglur
298 Walag Deglur
299 Devapur Deglur
300 Achegaon Deglur
301 Tamlur Deglur
302 Chainpur Deglur
303 Khanapur Deglur
304 Alur Deglur
305 Malegaon Deglur
306 Takali J Deglur
307 Kutub Sh Deglur
308 Loni Deglur
309 Loni Deglur
310 Yedur. Deglur
311 Thana Mukhed
312 Hanuman Deglur
313 Met Mahur
314 Gundwal Mahur
315 Murli Mahur
316 Chorad Mahur
317 Hadsani Mahur
318 Dattaman Mahur
319 Asoli Mahur

256
ANNEXURE VIII: LOCATION OF CHECK DAMS
Sl No Village Taluka
1 Rui Mahur
2 Dattamanjari Mahur
3 Gundwal Mahur
4 Dattamanjari Mahur
5 Dattamanjari Mahur
6 Mahor Mahur
7 Mahor Mahur
8 Lakhamapur Tanda Mahur
9 Ner Mahur
10 Ner Mahur
11 Ner Mahur
12 Pavnala Mahur
13 Machehhandra Pardi
Mahur
14 Kasarpeth Mahur
15 Kasarpeth Mahur
16 Wanola Mahur
17 Wanola Mahur
18 Borwadi Mahur
19 Wai Mahur
20 Vazra Bk Kinwat
21 Gauri Kinwat
22 Gauri Kinwat
23 Chinchkhed Kinwat
24 Unakdeo Kinwat
25 Nichpur Kinwat
26 Nichpur Kinwat
27 Nichpur Kinwat
28 Sindgi (kinwat) Kinwat
29 Sindgi (kinwat) Kinwat
30 Warche Maregaon Kinwat
31 Warche Maregaon Kinwat
32 Loni Kinwat
33 Loni Kinwat
34 Wadoli Kinwat
35 Wadoli Kinwat
36 Wadoli Kinwat
37 Damandhari Kinwat
38 Hudi (islapur) Kinwat
39 Kothari Kinwat
40 Mulzara Kinwat
41 Bhosi Kinwat
42 Andhbori (islapur) Kinwat
43 Shivni (islapur) Kinwat
44 Shivni (islapur) Kinwat
45 Dayal Dhanora Kinwat
46 Shivni (islapur) Kinwat
47 Nagzari Kinwat
48 Nagzari Kinwat
49 Nagzari Kinwat
50 Pawana Himayatnagar
51 Umri Kh Hadgaon
52 Talni Hadgaon
53 Koli Hadgaon
54 Marlegaon Hadgaon
55 Bhanegaon Tanda Hadgaon
56 Kawana Hadgaon
57 Baradshewala Hadgaon
58 Jagapur Hadgaon
59 Jagapur Hadgaon
60 Jagapur Hadgaon
61 Jagapur Hadgaon
62 Pingli Hadgaon
63 Umri (daryabai) Hadgaon
64 Dorli Hadgaon
65 Shivani Hadgaon
66 Jambhala Hadgaon
67 Krushnapur Hadgaon
68 Ekrala Hadgaon
69 Digras Hadgaon
70 Digras Hadgaon
71 Choramba (nanded) Hadgaon
72 Nimgaon Hadgaon
73 Lahan Ardhapur
74 Lahan Ardhapur
75 Chabhara Hadgaon
76 Hardaf Hadgaon
77 Hardaf Hadgaon
78 HADGAON Hadgaon

257
79 Kothala Hadgaon
80 Pangri(tamsa) Hadgaon
81 Tamsa Hadgaon
82 Tamsa Hadgaon
83 Wadgaon Bk Hadgaon
84 Kanjara (kh) Hadgaon
85 Kanjara (kh) Hadgaon
86 Choramba Kh. Hadgaon
87 Deshmukhwadi Hadgaon
88 Marlegaon Hadgaon
89 Pimparkheda Hadgaon
90 Hastara Hadgaon
91 Shirad Hadgaon
92 Warwat Hadgaon
93 Chabhara Hadgaon
94 Nimgaon Hadgaon
95 Patnur Ardhapur
96 Chanapur Ardhapur
97 Chanapur Ardhapur
98 Lahan Ardhapur
99 Loni Kh. Ardhapur
100 Ardhapur Ardhapur
101 Ardhapur Ardhapur
102 Chabhara Hadgaon
103 Chabhara Hadgaon
104 Wadi Emshet Ardhapur
105 Degaon Bk. Ardhapur
106 Daur Ardhapur
107 Daur Ardhapur
108 Ardhapur Ardhapur
109 Belsar Ardhapur
110 Barad Mudkhed
111 Barad Mudkhed
112 Chinchban Ardhapur
113 Ganpur Ardhapur
114 Ganpur Ardhapur
115 Wadi Bk. Nanded
116 Sayal Nanded
117 Waghi Nanded
118 Waghi Nanded
119 Sugaon Bk. Nanded
120 Hassapur Nanded
121 Pimpalgaon Mishri Nanded
122 Talni Nanded
123 Wadwana Nanded
124 Nila Nanded
125 Ekdara Nanded
126 Ekdara Nanded
127 Alegaon Nanded
128 Hadidadpur Nanded
129 Hadidadpur Nanded
130 Nerli Nanded
131 Khurgaon Nanded
132 Kalhal Nanded
133 NANDED Nanded
134 NANDED Nanded
135 NANDED Nanded
136 WAGHALA Nanded
137 WAGHALA Nanded
138 Pimpalgaon Korka Nanded
139 Tuppa Nanded
140 Wasri Nanded
141 WAGHALA Nanded
142 WAGHALA Nanded
143 NANDED Nanded
144 Kakandi Tarf Pasadga
Nanded
145 Pathrad Nanded
146 Waghi Nanded
147 Pimpalgaon Korka Nanded
148 WAGHALA Nanded
149 WAGHALA Nanded
150 Kottirth Nanded
151 Pimpalgaon Korka Nanded
152 Naleshwar Nanded
153 Barad Mudkhed
154 Khairgaon Kh. Mudkhed
155 Amrapur (dudhawadi)
Mudkhed
156 Dhanaj Mudkhed
157 Saregaon Mudkhed
158 Mugat Mudkhed

258
159 Mugat Mudkhed
160 Trikut Nanded
161 Rajwadi Mudkhed
162 MUDKHED Mudkhed
163 Dongaon Mudkhed
164 Dongaon Mudkhed
165 Dongaon Mudkhed
166 Gopalwadi (n.v.) Mudkhed
167 Pimpalkautha Mudkhed
168 Bolsa Umri
169 Manur Umri
170 Manur Umri
171 Manur Umri
172 Malkautha Mudkhed
173 Chilpimpri Mudkhed
174 Rajwadi Mudkhed
175 Pimpalgoan (rohi) Mudkhed
176 Malkautha Mudkhed
177 Pimpalgoan (rohi) Mudkhed
178 Umra Loha
179 Dhanaj Bk. Loha
180 Kapshi Bk. Loha
181 MUDKHED Mudkhed
182 Chikala Mudkhed
183 Hajapur Mudkhed
184 MUDKHED Mudkhed
185 MUDKHED Mudkhed
186 Daregaon Mudkhed
187 Daregaon Mudkhed
188 Pangargaon Mudkhed
189 Pimpalgoan (rohi) Mudkhed
190 Pimpalgoan (rohi) Mudkhed
191 Kamlaj Mudkhed
192 Shankhtirth Mudkhed
193 Devapur Mudkhed
194 Amrapur (dudhawadi)
Mudkhed
195 Jawala Murhar Mudkhed
196 Saregaon Mudkhed
197 MUDKHED Mudkhed
198 MUDKHED Mudkhed
199 Pardi (vaijapur) Mudkhed
200 Pardi (vaijapur) Mudkhed
201 Pardi (vaijapur) Mudkhed
202 MUDKHED Mudkhed
203 Barad Mudkhed
204 Chanapur Mudkhed
205 Nageli Mudkhed
206 Daregaon Mudkhed
207 Pimpalgoan (rohi) Mudkhed
208 Ralaj Bhokar
209 Palaj Bhokar
210 Palaj Bhokar
211 Mahalsapur Bhokar
212 Mahagaon Bhokar
213 Mahagaon Bhokar
214 Kini Bhokar
215 Kini Bhokar
216 Kini Bhokar
217 Divshi Bk. Bhokar
218 Divshi Bk. Bhokar
219 Divshi Bk. Bhokar
220 Mahagaon Bhokar
221 Divshi Kh. Bhokar
222 Divshi Kh. Bhokar
223 Divshi Kh. Bhokar
224 Divshi Kh. Bhokar
225 Paki Bhokar
226 Nanda Kh. Bhokar
227 Nanda Kh. Bhokar
228 Kolgaon Bk. Bhokar
229 Divshi Kh. Bhokar
230 Divshi Kh. Bhokar
231 Ranapur Bhokar
232 Ranapur Bhokar
233 Kolgaon Kh. Bhokar
234 Kolgaon Bk. Bhokar
235 Borgaon Bhokar
236 Borgaon Bhokar
237 Dhanora Bhokar
238 Borgaon Bhokar
239 Borgaon Bhokar

259
240 Narwat Bhokar
241 Pandurna Bhokar
242 Gargotwadi Bhokar
243 Dorli Bhokar
244 Hassapur Bhokar
245 Hassapur Bhokar
246 Raikhod Bhokar
247 Raikhod Bhokar
248 Sayal Bhokar
249 Daur Bhokar
250 Daur Bhokar
251 Daur Bhokar
252 Pimpaldhav Bhokar
253 Moghali Bhokar
254 Moghali Bhokar
255 Dharjani Bhokar
256 Dharjani Bhokar
257 Dharjani Bhokar
258 Dharjani Bhokar
259 Daur Bhokar
260 Bendri Bhokar
261 Bendri Bhokar
262 Matul Bhokar
263 Pimpaldhav Bhokar
264 Ballal Bhokar
265 Ballal Bhokar
266 Laglud Bhokar
267 Laglud Bhokar
268 Matul Bhokar
269 Matul Bhokar
270 Rawangaon Bhokar
271 Rawangaon Bhokar
272 Laglud Bhokar
273 Ranapur Bhokar
274 Bhoshi Bhokar
275 Bhoshi Bhokar
276 Bhoshi Bhokar
277 Bhoshi Bhokar
278 Bhoshi Bhokar
279 Bhoshi Bhokar
280 Bachoti Kamp.(n.v.) Bhokar
281 Tatkalwadi Bhokar
282 Tatkalwadi Bhokar
283 Tatkalwadi Bhokar
284 Bembar Bhokar
285 Hassapur Bhokar
286 Matul Bhokar
287 Nanda Patti Mhaisa. Bhokar
288 Rawangaon Bhokar
289 Rahati Bk.. Umri
290 Yelegaon Naigaon
291 Bolsa Umri
292 Ijjatgaon Umri
293 Balegaon Umri
294 Balegaon Umri
295 Balegaon Umri
296 Balegaon Umri
297 Baghalwada Umri
298 Salegaon (d) Umri
299 Golegaon Umri
300 Golegaon Umri
301 Sindhi Umri
302 Sindhi Umri
303 Sindhi Umri
304 Sailgaon Umri
305 Sailgaon Umri
306 Sailgaon Umri
307 Sailgaon Umri
308 Sailgaon Umri
309 Sailgaon Umri
310 Palasgaon Umri
311 Sailgaon Umri
312 Kudla Umri
313 Kudla Umri
314 Sailgaon Umri
315 Kudla Umri
316 Sailgaon Umri
317 Talegaon Umri
318 Talegaon Umri
319 Talegaon Umri
320 Ijjatgaon Umri
321 Dhanora Bk Umri

260
322 Dhanora Bk Umri
323 Bolsa Bk Umri
324 Bolsa Bk Umri
325 Bolsa Kh Umri
326 Bolsa Kh Umri
327 Bolsa Bk Umri
328 Dhanora Bk Umri
329 Dhanora Bk Umri
330 Dhanora Bk Umri
331 Sawargaon (kala) Umri
332 Ramkhadak Umri
333 Ramkhadak Umri
334 Mandala Umri
335 Sindhi Umri
336 Palasgaon Umri
337 Hunda (patti Ganga)
Umri
338 Bolsa Umri
339 Gortha Umri
340 Gortha Umri
341 Gortha Umri
342 Gortha Umri
343 Gortha Umri
344 Dhanora Bk Umri
345 Waghala Umri
346 Mandala Umri
347 Mandala Umri
348 Bitnal Umri
349 Hangirga Umri
350 Hangirga Umri
351 Hangirga Umri
352 Miyadadpur Umri
353 Balegaon Umri
354 Balegaon Umri
355 Atkur Dharmabad
356 DHARMABAD Dharmabad
357 DHARMABAD Dharmabad
358 DHARMABAD Dharmabad
359 Patoda Bk. Dharmabad
360 Patoda Bk. Dharmabad
361 Patoda Bk. Dharmabad
362 Patoda Bk. Dharmabad
363 Patoda Kh. Dharmabad
364 Dhanora Kh. Dharmabad
365 Cholakha Dharmabad
366 Belgujari Dharmabad
367 Belgujari Dharmabad
368 Atala Dharmabad
369 Sangam Biloli
370 Nagani Biloli
371 Machnur Biloli
372 Nagani Biloli
373 Samrala Dharmabad
374 Samrala Dharmabad
375 Samrala Dharmabad
376 Pangri Dharmabad
377 Pangri Dharmabad
378 Haregaon Dharmabad
379 Baghalwada Dharmabad
380 Dhanora Kh. Dharmabad
381 Chincholi Dharmabad
382 Chincholi Dharmabad
383 Naigaon (d) Dharmabad
384 Aloor Dharmabad
385 Sirajkhed Dharmabad
386 Sirajkhed Dharmabad
387 Yeoti Dharmabad
388 Karkheli Dharmabad
389 Karkheli Dharmabad
390 Junni Dharmabad
391 Salegaon (d) Dharmabad
392 Salegaon (d) Dharmabad
393 Bolsa Bk Dharmabad
394 Dhanora Kh. Dharmabad
395 Dhanora Kh. Dharmabad
396 Samrala Dharmabad
397 DHARMABAD Dharmabad
398 Shelgaon Thadi Dharmabad
399 Shelgaon Thadi Biloli
400 Sangam Dharmabad
401 Chincholi Dharmabad
402 Sirajkhed Dharmabad

261
403 Mutnyal(d) Dharmabad
404 Mutnyal(d) Dharmabad
405 Adampur Biloli
406 Adampur Biloli
407 Adampur Biloli
408 Atkali Biloli
409 Atkali Biloli
410 Sangroli Biloli
411 Sangroli Biloli
412 Daulatpur Biloli
413 Laghul Biloli
414 Laghul Biloli
415 Pokharni Bk. Biloli
416 Rampur (m) Biloli
417 Mukhed Biloli
418 Dongaon Bk. Biloli
419 Pach Pimpli Biloli
420 Talni Biloli
421 Dongaon Bk. Biloli
422 Lohgaon Biloli
423 Lohgaon Biloli
424 Lohgaon Biloli
425 Lohgaon Biloli
426 Lohgaon Biloli
427 Takli Bk. Biloli
428 Takli Bk. Biloli
429 Takli Bk. Biloli
430 Ganjgaon Biloli
431 Ganjgaon Biloli
432 Waliyabad Biloli
433 Waliyabad Biloli
434 Bavalgaon Biloli
435 Bavalgaon Biloli
436 Babhali (a) Biloli
437 Machnur Biloli
438 Arli Biloli
439 Arli Biloli
440 Arli Biloli
441 Arli Biloli
442 Arli Biloli
443 Sawali Biloli
444 Hungunda Biloli
445 Atala Biloli
446 Atala Dharmabad
447 Atala Dharmabad
448 Chondi Dharmabad
449 Chondi Biloli
450 Jarikot Dharmabad
451 Hussa Biloli
452 Hussa Biloli
453 Shelgaon Thadi Biloli
454 Karhal Biloli
455 KUNDALWADI Biloli
456 Mamdapur Biloli
457 KUNDALWADI Biloli
458 KUNDALWADI Biloli
459 BILOLI Biloli
460 BILOLI Biloli
461 BILOLI Biloli
462 Kerur Biloli
463 Atkali Biloli
464 Alandi Biloli
465 Alandi Biloli
466 Dongaon Bk. Biloli
467 Dongaon Bk. Biloli
468 Bhopala Biloli
469 Bhopala Biloli
470 Bhopala Biloli
471 Belkoni Kh. Biloli
472 Belkoni Kh. Biloli
473 Kumbhargaon Biloli
474 Kumbhargaon Biloli
475 Gujri Biloli
476 Chondi Biloli
477 Jarikot Biloli
478 Belkoni Kh. Biloli
479 Gaglegaon Biloli
480 Gaglegaon Biloli
481 Machnur Biloli
482 Rudrapur Biloli
483 Dongaon Bk. Biloli
484 Anjani Biloli

262
485 Pach Pimpli Biloli
486 Sawali Biloli
487 Belkoni Kh. Biloli
488 Kangathi Biloli
489 Hussa Biloli
490 Dornali Mukhed
491 Mukramabad Mukhed
492 Mukramabad Mukhed
493 Mukramabad Mukhed
494 Paratpur Mukhed
495 Bamni Mukhed
496 Ravi Mukhed
497 Ravi Mukhed
498 Degaon Mukhed
499 Degaon Mukhed
500 Degaon Mukhed
501 Gonegaon Mukhed
502 Gonegaon Mukhed
503 Gojegaon Mukhed
504 Walag Deglur
505 Andegaon Mukhed
506 Sawali Mukhed
507 Bhatapur P.mu. Mukhed
508 Bhatapur P.mu. Mukhed
509 Dornali Mukhed
510 Hatral Mukhed
511 Dapka Gundopant Mukhed
512 Dapka Gundopant Mukhed
513 Krushnawadi (n.v.) Mukhed
514 Bapshetwadi Mukhed
515 Motarga Mukhed
516 Motarga Mukhed
517 Motarga Mukhed
518 Dhanaj Mukhed
519 Dhanaj Mukhed
520 Jamkhed Mukhed
521 Pala Mukhed
522 Pala Mukhed
523 Pala Mukhed
524 Bhagnurwadi Mukhed
525 Tandli Mukhed
526 Tandli Mukhed
527 Umardari Mukhed
528 Umardari Mukhed
529 Honwadaj Mukhed
530 Sugaon Mukhed
531 Sugaon Mukhed
532 Sugaon Mukhed
533 Kundral Mukhed
534 Mangyal Mukhed
535 Mangyal Mukhed
536 Mangyal Mukhed
537 Takli Bk. Mukhed
538 Shelgaon Gauri Mukhed
539 Bawalgaon Mukhed
540 Bawalgaon Mukhed
541 Bawalgaon Mukhed
542 Nandgaon P.k. Mukhed
543 Nandgaon P.k. Mukhed
544 Nandgaon P.k. Mukhed
545 Nandgaon P.k. Mukhed
546 Salagara Kh. Mukhed
547 Salagara Kh. Mukhed
548 Berli Bk. Mukhed
549 Khairka Mukhed
550 Khairka Mukhed
551 Bavanwadi (n.v.) Mukhed
552 Mukhed Khede Mukhed
553 MUKHED Mukhed
554 Kotgyal Mukhed
555 Kotgyal Mukhed
556 Kotgyal Mukhed
557 Rui Mukhed
558 Wartala Mukhed
559 Wartala Mukhed
560 Kamjalga Mukhed
561 Dapka Raja Mukhed
562 Dapka Raja Mukhed
563 Hipparga Mukhed
564 Chandola Mukhed
565 Bhendegaon Kh. Mukhed
566 Kabnur Mukhed

263
567 Hippalnari Mukhed
568 Barhali Mukhed
569 Kalambar Mukhed
570 Kalambar Mukhed
571 Dapka Gundopant Mukhed
572 Hatral Mukhed
573 Nagral Mukhed
574 Chinchgaon Mukhed
575 Hipparga Thadi Deglur
576 Shevala Deglur
577 Shevala Deglur
578 Nandur Deglur
579 Khatgaon Deglur
580 Kotekallur Deglur
581 Limba Deglur
582 Tupshelgaon Deglur
583 Wazarga Deglur
584 Atkali Deglur
585 Lakhkha Deglur
586 Manshakarga Deglur
587 Sugaon Deglur
588 Eklara Deglur
589 Eklara Deglur
590 Hanuman Hipparga Deglur
591 Sundgi Kh. Deglur
592 Degaon Kh Deglur
593 Munjalga Deglur
594 Takli Bagam Deglur
595 Degaon Bk. Deglur
596 Kavalgaon Deglur
597 Sangvi Karadkhed Deglur
598 Karadkhed Deglur
599 Karadkhed Deglur
600 Somar Deglur
601 Khutmapur Deglur
602 Kamajiwadi Deglur
603 Hanegaon Deglur
604 Hanegaon Deglur
605 Kudali Deglur
606 Hanegaon Deglur
607 Kshirsamudra Deglur
608 Kshirsamudra Deglur
609 Kshirsamudra Deglur
610 Kshirsamudra Deglur
611 Kini Deglur
612 Yergi Deglur
613 Devapur Deglur
614 Devapur Deglur
615 Devapur Deglur
616 Bembra Deglur
617 Bembra Deglur
618 Ramtapur Deglur
619 Yedur. Deglur
620 Yedur. Deglur
621 Yedur. Deglur
622 Yedur. Deglur
623 Yedur. Deglur
624 Yedur. Deglur
625 Yedur. Deglur
626 Bembra Deglur
627 Bembra Deglur
628 Somar Deglur
629 Somar Deglur
630 Wazar Deglur
631 Shilwani Deglur
632 Shilwani Deglur
633 Shilwani Deglur
634 Shilwani Deglur
635 Shilwani Deglur
636 Hanegaon Deglur
637 Kini Deglur
638 Kshirsamudra Deglur
639 Kshirsamudra Deglur
640 Dhosni Deglur
641 Bhayegaon Deglur
642 Kavalgadda Deglur
643 Kavalgadda Deglur
644 Lingapur Deglur
645 Rampur Thadi Deglur
646 Shevala Deglur
647 Shevala Deglur
648 Shevala Deglur

264
649 Kotekallur Deglur
650 Kotekallur Deglur
651 Kesrali Deglur
652 Kesrali Deglur
653 Atkali Deglur
654 Sugaon Deglur
655 Mavali Deglur
656 Alandi Deglur
657 Sugaon Deglur
658 Borgaon Thadi Deglur
659 Mavali Deglur
660 Malegoan Deglur
661 Khanapur Deglur
662 Tadkhel Deglur
663 Tadkhel Deglur
664 Alur Deglur
665 Nandur Deglur
666 Devapur Deglur
667 Pendpalli Deglur
668 Takali Jahagir Deglur
669 Takali Jahagir Deglur
670 Takali Jahagir Deglur
671 Zari Deglur
672 Zari Deglur
673 Markhel Deglur
674 Walag Deglur
675 Markhel Deglur
676 Markhel Deglur
677 Markhel Deglur
678 Bennal Deglur
679 Markhel Deglur
680 Badbade Naigaon
681 Badbade Naigaon
682 Vazirgaon Naigaon
683 Vazirgaon Naigaon
684 Vazirgaon Naigaon
685 Vazirgaon Naigaon
686 Kahala Bk. Naigaon
687 Badbade Naigaon
688 Badbade Naigaon
689 Patoda (t.b.) Naigaon
690 Kuntoor Naigaon
691 Ghungrala Naigaon
692 Degaon Naigaon
693 Talbid Naigaon
694 Kuntoor Naigaon
695 Koklegaon Naigaon
696 Degaon Naigaon
697 Naigaon (b) Naigaon
698 Naigaonwadi Naigaon
699 Lalondi Naigaon
700 Kuntoor Naigaon
701 Atala Dharmabad
702 Singnapur Naigaon
703 Hassa Umri
704 Kaudgaon Naigaon
705 Bijegaon Naigaon
706 Tembhurni Naigaon
707 Tembhurni Naigaon
708 Tembhurni Naigaon
709 Kedar Wadgaon Naigaon
710 Manjram Naigaon
711 Godamgaon Naigaon
712 Kolambi Naigaon
713 Manjram Naigaon
714 Talbid Naigaon
715 Ransugaon Naigaon
716 Sategaon Naigaon
717 Sategaon Naigaon
718 Balegaon Naigaon
719 Rui Bk Naigaon
720 Manur Tarf Ba Naigaon
721 Kahala Bk. Naigaon
722 Takli Bk. Naigaon
723 Naigaon (b) Naigaon
724 Naigaon (b) Naigaon
725 Bendri Naigaon
726 Kandala Naigaon
727 Marwali Naigaon
728 Marwali Mukhed
729 Mugaon Naigaon
730 Mugaon Naigaon

265
731 Mugaon Naigaon
732 Tembhurni Naigaon
733 Nawandi Naigaon
734 Kedar Wadgaon Naigaon
735 Kautha Kandhar
736 Shirur Kandhar
737 Kautha Kandhar
738 Jakapur Kandhar
739 Rahati Kandhar
740 Rahati Kandhar
741 Kautha Kandhar
742 Telur Kandhar
743 Telur Kandhar
744 Pethwadaj Kandhar
745 Pethwadaj Kandhar
746 Pethwadaj Kandhar
747 Pethwadaj Kandhar
748 Pethwadaj Kandhar
749 Pethwadaj Kandhar
750 Abulaga Kandhar
751 Abulaga Kandhar
752 Abulaga Kandhar
753 Gaul Kandhar
754 Gaul Kandhar
755 Gaul Kandhar
756 Gaul Kandhar
757 Gaul Kandhar
758 Harbal P.k. Kandhar
759 Ghagardarwadi Kandhar
760 Phulwal Kandhar
761 Phulwal Kandhar
762 Phulwal Kandhar
763 Panshewadi Kandhar
764 Panshewadi Kandhar
765 Panshewadi Kandhar
766 Panshewadi Kandhar
767 Nagalgaon Kandhar
768 Nagalgaon Kandhar
769 Mohija Kandhar
770 Mathandoh Kandhar
771 Mathandoh Kandhar
772 Wahad Kandhar
773 Wahad Kandhar
774 Hatkayal Kandhar
775 Hatkayal Kandhar
776 Hatkayal Kandhar
777 Ramanaik Tanda Kandhar
778 Ramanaik Tanda Kandhar
779 Ghodaj Kandhar
780 Ghodaj Kandhar
781 Umbaj Kandhar
782 Umbaj Kandhar
783 Shekapur Kandhar
784 Bijewadi (n.v.) Kandhar
785 Mangal Sangvi Kandhar
786 Sawleshwar Kandhar
787 Chikhali Kandhar
788 Dahikalamba Kandhar
789 Datala Kandhar
790 Dahikalamba Kandhar
791 Shiradhon Kandhar
792 Shiradhon Kandhar
793 Shiradhon Kandhar
794 Shiradhon Kandhar
795 Osmannagar Kandhar
796 Osmannagar Kandhar
797 Osmannagar Kandhar
798 Osmannagar Kandhar
799 Pangra Kandhar
800 Sanguchiwadi Kandhar
801 Sanguchiwadi Kandhar
802 Sanguchiwadi Loha
803 Panbhoshi Kandhar
804 Panbhoshi Kandhar
805 Naugharwadi Kandhar
806 Panbhoshi Kandhar
807 Wanjarwadi Kandhar
808 Bahadarpura Kandhar
809 KANDHAR Kandhar
810 Bijewadi (n.v.) Kandhar
811 Bijewadi (n.v.) Kandhar
812 Gulabwadi Kandhar

266
813 Gulabwadi Kandhar
814 Mangal Sangvi Kandhar
815 Telur Kandhar
816 Kautha Kandhar
817 Kautha Kandhar
818 Katkalmba Kandhar
819 Rautkheda Kandhar
820 Kautha Kandhar
821 Kautha Kandhar
822 Rautkheda Kandhar
823 Ladka Kandhar
824 Ladka Kandhar
825 Dinda Kandhar
826 Binda Kandhar
827 Kallali Kandhar
828 Kallali Kandhar
829 Rui Kandhar
830 Rui Kandhar
831 Rui Kandhar
832 Rui Kandhar
833 Rui Kandhar
834 Jawala Loha
835 Jawala Loha
836 Bet Sangvi Loha
837 Penur Loha
838 Penur Loha
839 Penur Loha
840 Dongargaon Loha
841 Hanmantwadi (n.v.) Loha
842 Dagad Sangvi Loha
843 Dagad Sangvi Loha
844 Dagad Sangvi Loha
845 Shivani Jamga Loha
846 Shivani Jamga Loha
847 Waka Loha
848 Kumbhargaon Loha
849 Kiwala Loha
850 Takalgaon Loha
851 Walki Bk. Loha
852 Malkautha Mudkhed
853 Telki Loha
854 Londhe Sangvi Loha
855 Wagdarwadi Loha
856 Chondi Loha
857 Raywadi Loha
858 Pimpalgaon Dhage Loha
859 Kabegaon Loha
860 Dhanora (makta) Loha
861 Deulgaon Loha
862 Murambi Loha
863 Malkajam Tanda (n.v.
Kinwat
864 Kolgaon Hadgaon
865 Hardaf Hadgaon
866 HADGAON Hadgaon
867 Chendkapur Hadgaon
868 Hajapur Mudkhed
869 Hajapur Mudkhed
870 Kolha Mudkhed
871 Kolha Mudkhed
872 Chikala Mudkhed
873 Kuntoor Naigaon
874 Shekapur Kandhar

267

268

269

270

271