Geographic Information System (GIS) What is GIS? - Connect ...
IDENTIFICATION OF GROUNDWATER POTENTIAL ZONES USING RSAND GIS
A.S. Chandra Bose1, M.V.S.S.Giridhar2 and G.K.Viswanadh3
1Lecturer, Dept. of Civil Engineering, Govt. Polytechnic, Warangal – 506 001, India, Tel: + 91-9849318002; Fax: +91-040-23158668
E.mail:[email protected] Prof in Center for Water Resources and Addl. Controller of Exams, J N T U Hyderabad,
India, Tel: + 91-9440590695; Fax: +91-040-23158668
E.mail: [email protected] 3 Professor of Civil Engg and Director of Evaluation, J.N.T.U.H, Hyderabad - 500 085, India,
Tel: + 91-9849163875; Fax: +91-040-23158668E.mail:[email protected]
KEYWORDS: 3D analyst, weighted overlay analysis, TIN, DEM, Slope map, spatial analyst.
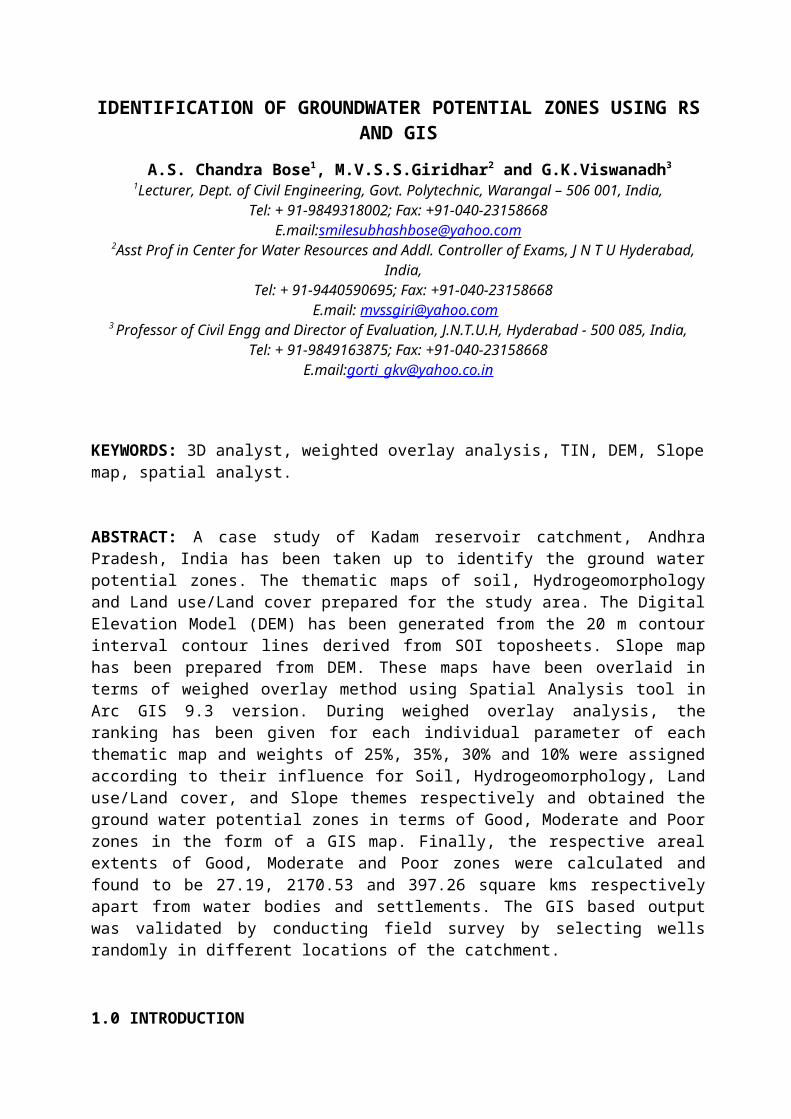
ABSTRACT: A case study of Kadam reservoir catchment, AndhraPradesh, India has been taken up to identify the ground waterpotential zones. The thematic maps of soil, Hydrogeomorphologyand Land use/Land cover prepared for the study area. The DigitalElevation Model (DEM) has been generated from the 20 m contourinterval contour lines derived from SOI toposheets. Slope maphas been prepared from DEM. These maps have been overlaid interms of weighed overlay method using Spatial Analysis tool inArc GIS 9.3 version. During weighed overlay analysis, theranking has been given for each individual parameter of eachthematic map and weights of 25%, 35%, 30% and 10% were assignedaccording to their influence for Soil, Hydrogeomorphology, Landuse/Land cover, and Slope themes respectively and obtained theground water potential zones in terms of Good, Moderate and Poorzones in the form of a GIS map. Finally, the respective arealextents of Good, Moderate and Poor zones were calculated andfound to be 27.19, 2170.53 and 397.26 square kms respectivelyapart from water bodies and settlements. The GIS based outputwas validated by conducting field survey by selecting wellsrandomly in different locations of the catchment.
1.0 INTRODUCTION
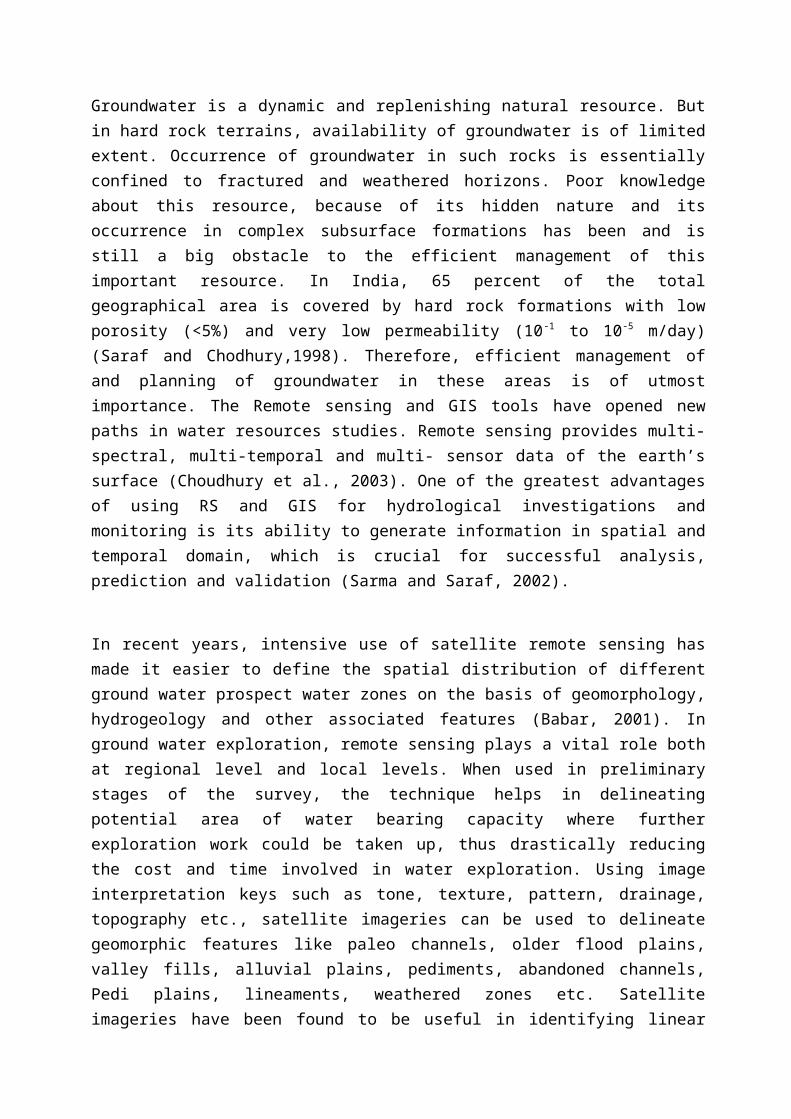
Groundwater is a dynamic and replenishing natural resource. Butin hard rock terrains, availability of groundwater is of limitedextent. Occurrence of groundwater in such rocks is essentiallyconfined to fractured and weathered horizons. Poor knowledgeabout this resource, because of its hidden nature and itsoccurrence in complex subsurface formations has been and isstill a big obstacle to the efficient management of thisimportant resource. In India, 65 percent of the totalgeographical area is covered by hard rock formations with lowporosity (<5%) and very low permeability (10-1 to 10-5 m/day)(Saraf and Chodhury,1998). Therefore, efficient management ofand planning of groundwater in these areas is of utmostimportance. The Remote sensing and GIS tools have opened newpaths in water resources studies. Remote sensing provides multi-spectral, multi-temporal and multi- sensor data of the earth’ssurface (Choudhury et al., 2003). One of the greatest advantagesof using RS and GIS for hydrological investigations andmonitoring is its ability to generate information in spatial andtemporal domain, which is crucial for successful analysis,prediction and validation (Sarma and Saraf, 2002).
In recent years, intensive use of satellite remote sensing hasmade it easier to define the spatial distribution of differentground water prospect water zones on the basis of geomorphology,hydrogeology and other associated features (Babar, 2001). Inground water exploration, remote sensing plays a vital role bothat regional level and local levels. When used in preliminarystages of the survey, the technique helps in delineatingpotential area of water bearing capacity where furtherexploration work could be taken up, thus drastically reducingthe cost and time involved in water exploration. Using imageinterpretation keys such as tone, texture, pattern, drainage,topography etc., satellite imageries can be used to delineategeomorphic features like paleo channels, older flood plains,valley fills, alluvial plains, pediments, abandoned channels,Pedi plains, lineaments, weathered zones etc. Satelliteimageries have been found to be useful in identifying linear
features such as fractures, faults, etc which are localidealizers of ground water sinks especially in hard rockterrains. Lithologic contacts are also brought out fairly wellon the images. Remotely sensed data provides valuableinformation on the drainage pattern and drainage density, whichhave a bearing on the recharge conditions and permeability ofthe rocks. Dykes which act as ground water barrier can be easilyidentified on the imagery. Satellite data thus offers uniquetool in for extracting information on geology, drainage, Landuse and soils which are essential in identifying the possibleoccurrence of ground water.
2.0 STUDY AREAThe Godavari basin is situated between East longitudes 73021' to81009' and North latitudes 16007' to 22050' in the Deccanplateau. The Godavari basin extends over an area of 3,13,812square km which is nearly 10% of the total geographical area ofthe country. Godavari catchment was divided in to eight subbasins. In the present study, G-5 sub basin i.e. ‘MiddleGodavari’ sub basin of River Godavari has been considered toassess the ground water prospects in the study area. The MiddleGodavari sub basin lies between latitudes 17004’ and 18030’N andlongitudes 77043’ and 79053’E. The ‘Middle Godavari’ sub basinhas a catchment area of 35723 km2, which constitutes 11.38% ofthe total basin. The catchment area of the ‘Middle Godavari’ subbasin entirely lies in the State of Andhra Pradesh. In thepresent study, Middle Godavari sub basin has been considered upto Kadam reservoir only which lies between latitudes 19005’ and19035’ North and longitudes 78010’ and 78055’ East. The arealextent of the study area is 2617.56 km2, which constitutes 7.4%of the sub basin area.
3.0 DATA USED
3.1 Software used Arc GIS 9.3 and ERDAS 8.7
3.2 Data used Toposheets used(1:50,000scale) : 56-I 3, I 6, I 7, I
8, I 10, I 11, I 12, I 14, I 15 &I 16 Satellite imagery of IRS-P6, LISS –III with a
resolution of 23.5m dated 28th March, 2005

4.0 METHODOLOGY
In this section, preparation of various thematic maps such asContour map, DEM map, Slope map, Soil map, Land use / land covermap and Hydro geomorphology map for the study area have beendiscussed. Contour map: Contours are polylines that connect points ofequal value of elevation. The elevation points were preparedfrom toposheets 56-I 3, I 6, I 7, I 8, I 10, I 11, I 12, I 14,I 15 & I 16 on a scale of 1:50,000 collected from Survey ofIndia (SOI), Hyderabad. The collected toposheets were scannedand registered with tic points and rectified. Further, therectified maps were projected. All individual projected mapswere finally merged as a single layer. The contours weredigitized with an interval of 20 m. The contour attribute tablecontains an elevation attribute for each contour polylines. Thecontour map was prepared using Arc Map of Arc GIS 9.3. Contourmap is a useful surface representation because they enable tosimultaneously visualize flat and steep areas, ridges, valleysin the study area.
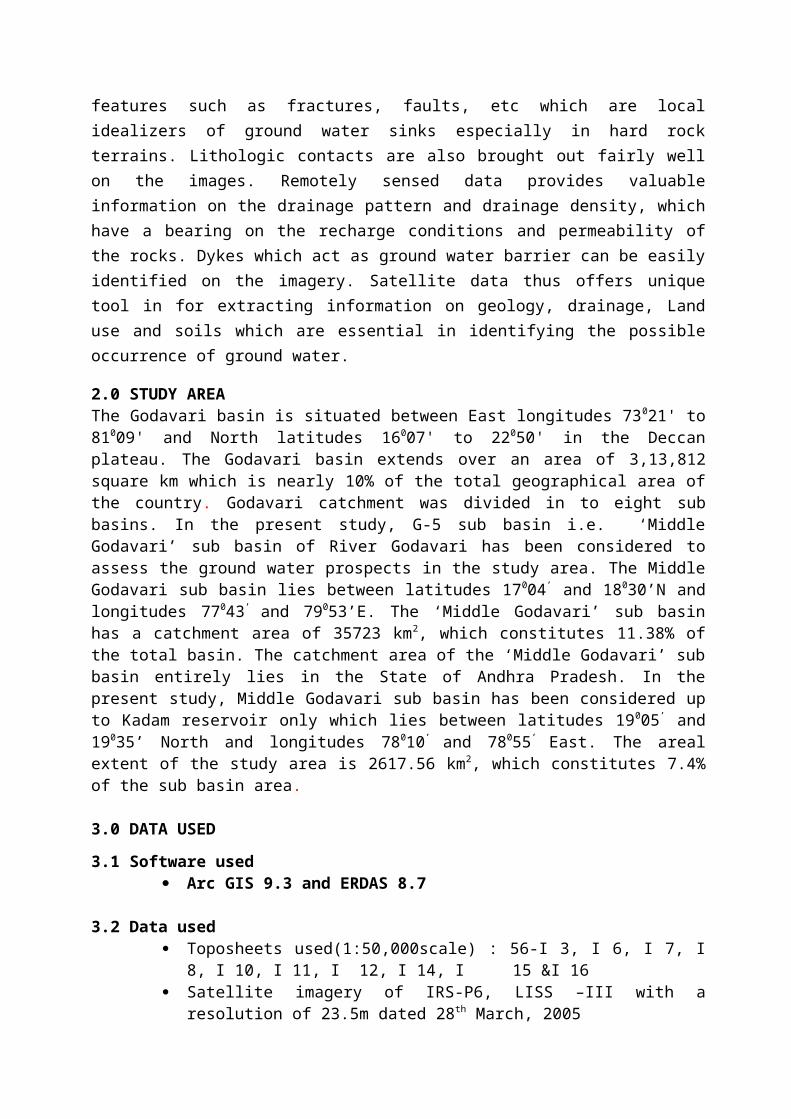
Digital Elevation Models (DEM): A DEM is a rasterrepresentation of a continuous surface, usually referring tothe surface of the earth. The DEM is used to refer specificallyto a regular grid of spot heights. It is the simplest and mostcommon form of digital representation of topography. TheDigital Elevation model for the study area was generated fromthe contour map using Surface Analysis tool of Spatial Analystin Arc Map as shown in Figure 4.1
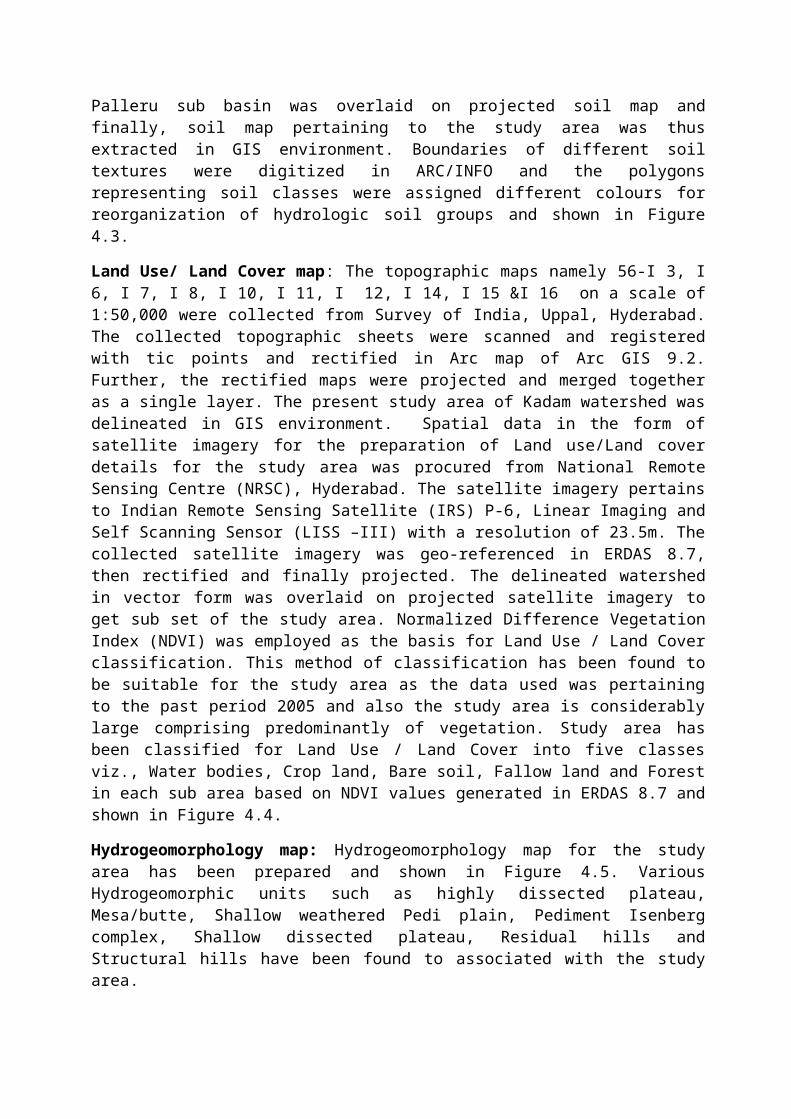
Slope map: The Slope function in Arc GIS 9.2 calculates themaximum rate of change between each cell and its neighbors.Every cell in the output raster has a slope value. The lower theslope value indicates the terrain is flatter and the higher theslope value, the steeper the terrain. The output slope rastercan be calculated either in percent of slope or degree of slope.Slope map was prepared from the DEM. The Figure 4.2 shows theslope of the terrain.
Soil map: The soil maps collected from National Bureau of SoilSurvey and Land Use, Nagpur were scanned and registered with ticpoints and rectified. Further, the rectified maps wereprojected. All individual projected maps were finally merged asa single layer. And later, the delineated study area map of
Palleru sub basin was overlaid on projected soil map andfinally, soil map pertaining to the study area was thusextracted in GIS environment. Boundaries of different soiltextures were digitized in ARC/INFO and the polygonsrepresenting soil classes were assigned different colours forreorganization of hydrologic soil groups and shown in Figure4.3.
Land Use/ Land Cover map: The topographic maps namely 56-I 3, I6, I 7, I 8, I 10, I 11, I 12, I 14, I 15 &I 16 on a scale of1:50,000 were collected from Survey of India, Uppal, Hyderabad.The collected topographic sheets were scanned and registeredwith tic points and rectified in Arc map of Arc GIS 9.2.Further, the rectified maps were projected and merged togetheras a single layer. The present study area of Kadam watershed wasdelineated in GIS environment. Spatial data in the form ofsatellite imagery for the preparation of Land use/Land coverdetails for the study area was procured from National RemoteSensing Centre (NRSC), Hyderabad. The satellite imagery pertainsto Indian Remote Sensing Satellite (IRS) P-6, Linear Imaging andSelf Scanning Sensor (LISS –III) with a resolution of 23.5m. Thecollected satellite imagery was geo-referenced in ERDAS 8.7,then rectified and finally projected. The delineated watershedin vector form was overlaid on projected satellite imagery toget sub set of the study area. Normalized Difference VegetationIndex (NDVI) was employed as the basis for Land Use / Land Coverclassification. This method of classification has been found tobe suitable for the study area as the data used was pertainingto the past period 2005 and also the study area is considerablylarge comprising predominantly of vegetation. Study area hasbeen classified for Land Use / Land Cover into five classesviz., Water bodies, Crop land, Bare soil, Fallow land and Forestin each sub area based on NDVI values generated in ERDAS 8.7 andshown in Figure 4.4.
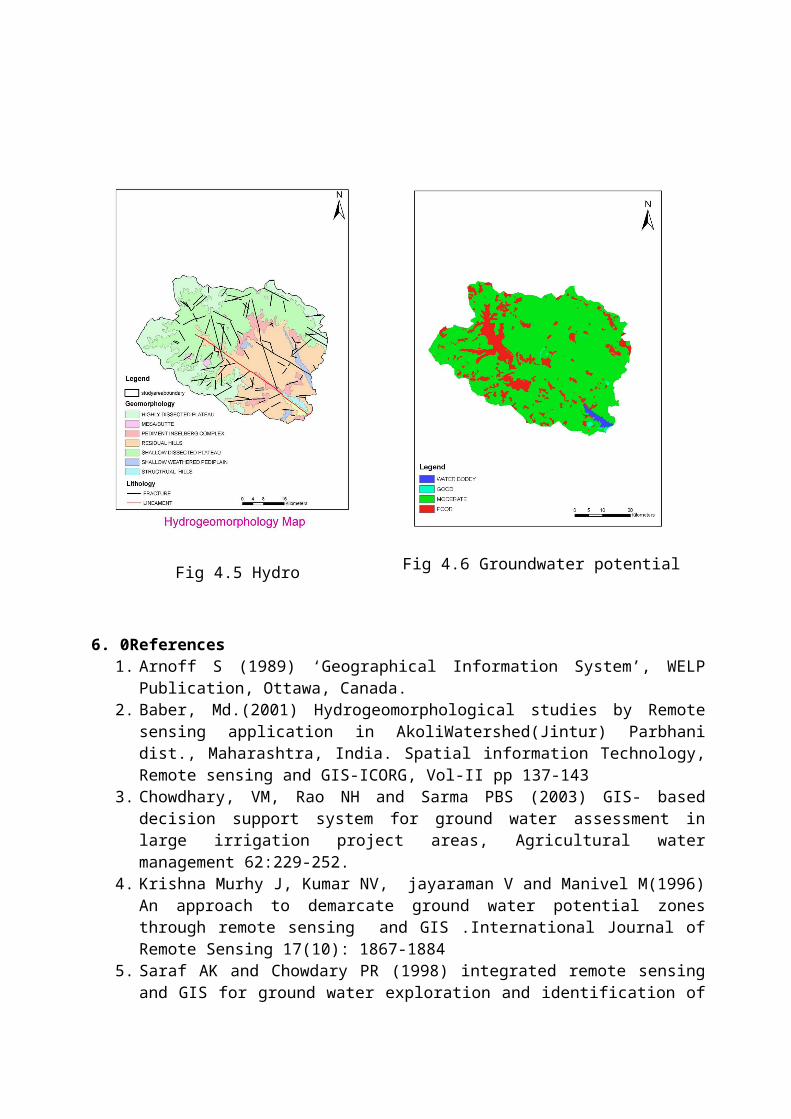
Hydrogeomorphology map: Hydrogeomorphology map for the studyarea has been prepared and shown in Figure 4.5. VariousHydrogeomorphic units such as highly dissected plateau,Mesa/butte, Shallow weathered Pedi plain, Pediment Isenbergcomplex, Shallow dissected plateau, Residual hills andStructural hills have been found to associated with the studyarea.
Ground Potential zones map: The thematic maps of soil,Hydrogeomorphology and Land use/Land cover prepared for thestudy area. The Digital Elevation Model (DEM) has been generatedfrom the 20 m contour interval contour lines derived from SOItoposheets. Slope map has been prepared from DEM. These vectormaps have been converted into raster format using conversiontool in GIS environment. Further, these raster maps have beenreclassified. These reclassified maps have been overlaid interms of weighed overlay method using Spatial Analyst tool inArc GIS 9.3 version. During weighed overlay analysis, theranking has been given for each individual parameter of eachthematic map and weights of 25%, 35%, 30% and 10% were assignedaccording to their influence for Soil, Hydrogeomorphology, Landuse/Land cover, and Slope themes respectively and obtained theground water potential zones in terms of Good, Moderate and Poorzones in the form of a GIS map as shown in Figure 4.6.
5.0 RESULTS & DISCUSSION:
Contour and DEM maps have been developed in GIS environment. Thehighest and lowest elevations were found to be 350 and 160mtsrespectively. Slope map was prepared from the DEM map. Slopes ofthe study area were found to vary between 0 to 28%. The varioussoil units obtained from soil map are 19, 59, 60, 61,62,63,66and 68 with coverage percentages of 0.58, 10.59, 0.67, 18.91,14.85, 48.83 and 0.97 respectively. The soil unit 63 is found tobe predominant, covering 48.83 % in the study area. Study areahas been classified for Land Use / Land Cover into five classes’viz., Water bodies, Crop land, Bare soil, Fallow land and Forestbased on Normalized Difference Vegetation Index (NDVI) valueswith areal extents of 20.244, 457.625, 49.931, 143.337 and1946.43 sq km respectively. Forest class in the study has beenfound to be predominant with 73% of the total area. VariousHydrogeomorphic units such as highly dissected plateau,Mesa/butte, Shallow weathered Pedi plain, Pediment Isenbergcomplex, shallow dissected plateau, Residual hills andStructural hills have been found to be associated with the studyarea covering 554.46, 17.05, 146.69, 831.54, 983.21, 45.15 and16.82 square kms respectively. These maps have been overlaid interms of weighed overlay method using Spatial Analysis tool in
Arc GIS 9.3 version. During weighed overlay analysis, theranking has been given for each individual parameter of eachthematic map and weights of 25%, 35%, 30% and 10% were assignedaccording to their influence for Soil, Hydrogeomorphology, Landuse/Land cover, and Slope themes respectively and obtained theground water potential zones in terms of Good, Moderate and Poorzones in the form of a GIS map. Finally, the respective arealextents of Good, Moderate and Poor zones were calculated andfound to be 27.19, 2170.53 and 397.26 square kms respectivelyapart from water bodies and settlements. The GIS based outputwas validated by conducting field survey by selecting wellsrandomly in different locations of the catchment.
Fig 4.1 DEM map Fig 4.2 Slope Map
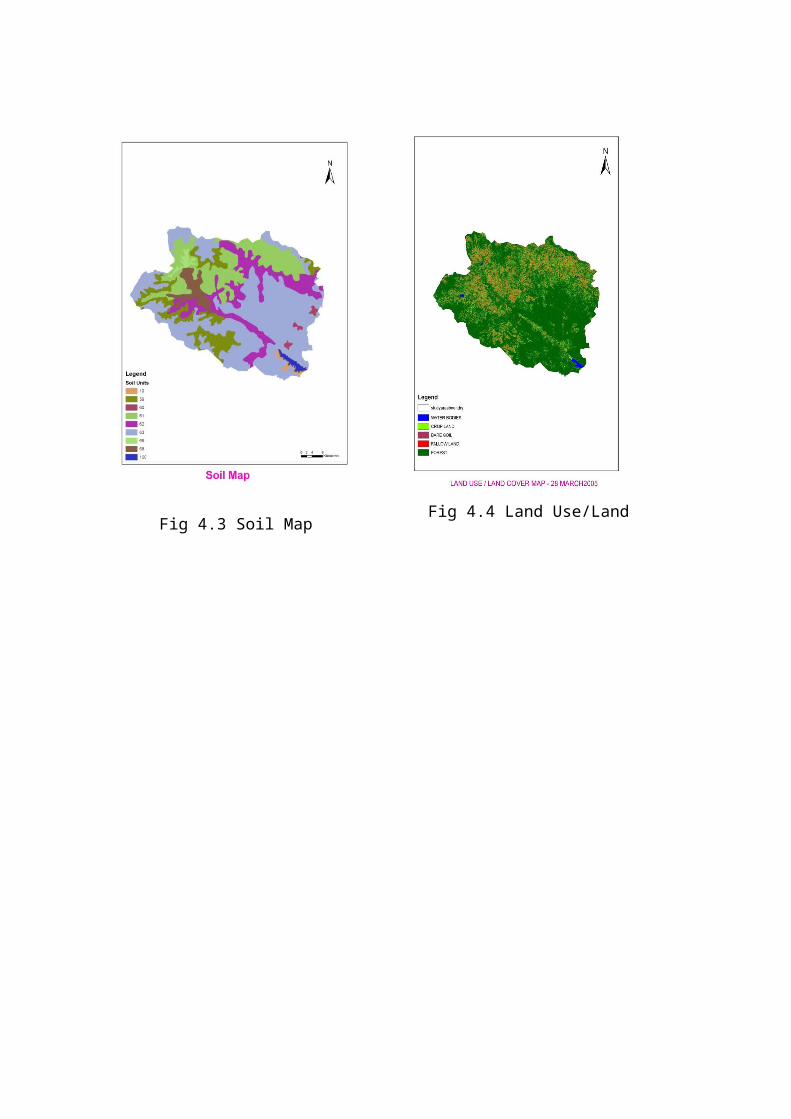
Fig 4.3 Soil Map Fig 4.4 Land Use/LandCover map
6. 0References1. Arnoff S (1989) ‘Geographical Information System’, WELP
Publication, Ottawa, Canada.2. Baber, Md.(2001) Hydrogeomorphological studies by Remote
sensing application in AkoliWatershed(Jintur) Parbhanidist., Maharashtra, India. Spatial information Technology,Remote sensing and GIS-ICORG, Vol-II pp 137-143
3. Chowdhary, VM, Rao NH and Sarma PBS (2003) GIS- baseddecision support system for ground water assessment inlarge irrigation project areas, Agricultural watermanagement 62:229-252.
4. Krishna Murhy J, Kumar NV, jayaraman V and Manivel M(1996)An approach to demarcate ground water potential zonesthrough remote sensing and GIS .International Journal ofRemote Sensing 17(10): 1867-1884
5. Saraf AK and Chowdary PR (1998) integrated remote sensingand GIS for ground water exploration and identification of
Fig 4.5 HydroGeomorphology Map
Fig 4.6 Groundwater potentialzone map

artificial recharge sites. International Journal of Remotesensing 19(10): 1825-1841
6. Sarma B and Saraf AK (2002) Study of land use – groundwater relationship using an integrated remote sensing andGIS approach, http://www.gisdevelopmentnet
Form for Full Paper
Paper Title: IDENTIFICATION OF GROUNDWATER POTENTIAL ZONES USINGRS AND GIS
Author(s): Chandra Bose A.S.1, Giridhar M.V.S.S.2 and ViswanadhG.K.3
Postal Address of Presenting Author: Prof. G.K. Viswanadh Professor of Civil Engineering and Director of Evaluation,Jawaharlal Nehru Technological University Hyderabad, Kukatpally, Hyderabad – 500 085, Andhra Pradesh, IndiaMobile no:091-9849163875Fax:-091-40-23158668
A USB flash memory or CD-ROM with PowerPoint format of MicrosoftOffice.
To,31st ACRS Secretariat,Department of Environmental Information Study and Analysis EISAInstitute of Geography18 Hoang Quoc Viet Rd., Cau Giay, Hanoi, VietnamPhone : 84-04-37562417Fax : 84-04-8361192E-mail for general correspondence: [email protected]
Copyright © 2022 FDOKUMEN