Studies on Hanoi Urban Transition in the Late 20 th Century Based on GIS/RS
16
Title Studies on Hanoi Urban Transition in the Late 20th Century Based on GIS/RS Author(s) Ho Dinh Duan; Shibayama, Mamoru Citation 東南アジア研究 (2009), 46(4): 532-546 Issue Date 2009-03-31 URL http://hdl.handle.net/2433/88034 Right Type Journal Article Textversion publisher KURENAI : Kyoto University Research Information Repository Kyoto University
Transcript of Studies on Hanoi Urban Transition in the Late 20 th Century Based on GIS/RS

Title Studies on Hanoi Urban Transition in the Late 20th CenturyBased on GIS/RS
Author(s) Ho Dinh Duan; Shibayama, Mamoru
Citation 東南アジア研究 (2009), 46(4): 532-546
Issue Date 2009-03-31
URL http://hdl.handle.net/2433/88034
Right
Type Journal Article
Textversion publisher
KURENAI : Kyoto University Research Information Repository
Kyoto University

Studies on Hanoi Urban Transition in
the Late 20th
Century Based on GIS/RS
O HIBAYAMAHO Dinh Duan* and SHIBAYAMA Mamoru**
Abstract
This paper describes the urbanization process of Hanoi during the late 20th century using the
methods of GIS (Geographical Information Systems) and remote sensing technologies. The data
sources for the study compose of historical maps, recent maps, and various satellite images
acquired from 1975 to 2005 (Landsat MSS, TM, ETM, JERS, ASTER, IKONOS and QuickBird).
The main techniques used in our image processing are NDVI and Water Index, combined with a
decision-tree classification for medium resolution images (Landsat and ASTER). High resolution
images (IKONOS and QuickBird) were used to validate the signature of land use classes and to
verify certain urban construction features. The analysis showed that the spatial growth of Hanoi
is limited by natural barriers, such as streams to the northeast and east, water bodies to the north,
and a swamp area to the south. The expansion of Hanoi stretches in four directions South,
Southwest, West and East following main transportation axes connecting the inner city to
neighboring areas. Both spatial expansion and in-fill expansion took place in the urbanization of
Hanoi. It is important to relate the urban transition with social-economic mile stones of the city
and to find correlations between remote sensing derived maps and indices with other statistics
such as population, population density, road and housing densities, but these have not been
included in our present work.
Keywords : urbanization, remote sensing, land use change, spatial expansion, vegetation index,
physical features, housing density
I Introduction
Hanoi city, the capital of Vietnam, was founded in 1010 under the name Thang Long and has
been always the political and cultural center of the nation. The name Hanoi was first given to
the city in 1831 by King Minh Mang. Almost a thousand years have passed since its
establishment, and Hanoi has changed drastically through different periods in the country’s
history. One aspect of the history of Hanoi that can give significant insights into the political
and socio-economic development of the city is its spatial expansion through the urbanization
* Institute of Resources Geography, HCMC, Vietnam.
e-mail: [email protected]** 柴山 守,Center for Southeast Asian Studies, Kyoto University
e-mail: [email protected]
Southeast Asian Studies, Vol. 46, No. 4, March 2009
532

process. This, in connection with other historical data, can efficiently enhance the analysis of
the city’s urban transition through different periods of time.
In this work we focus on the urbanization process of Hanoi during the late 20th century
utilizing the methods of GIS and remote sensing. The data sources for the study include Hanoi
maps, satellite images as well as other ancillary data that allowed us to focus on the urban
transition of Hanoi during the period from 1975 to 2003. In these three decades following the
reunion of the country after a long period of war and the Doi Moi (Innovation) of the late 1980s,
many changes have occurred in Hanoi. Furthermore, the availability of satellite images from
various sensors and other map data of Hanoi in this period has enabled us to study the urban
transition of the city using advanced techniques of remote sensing and GIS.
Hanoi has a long history of development spanning almost a thousand years. Nowadays the
once core city of Hanoi (Citadel) covers only about 1.2 square kilometers. In fact, from the very
beginning of Thang Long, the citadel and the adjacent commercial area (the Old Quarter) were
merged together to form the capital city. This conjunction justified the Eastern expression
thanh thị which means a combination of a citadel (administration and defense settlement) and a
business place [Phan Huy Le 2005]. During this time, the city has been bordered to the east by
東南ア4604-4,1a
Fig. 1a Spatial Expansion of Hanoi
Note: Red River (east), To Lich River (west) and a marsh
area (south) have been natural barriers against the
expansion of old Hanoi city. Color composite of
Water Indices in 1993 (blue), 2000 (green), and 2003
(red).
東南ア4604-4,1b
Fig. 1b Hanoi Administrative Bo-
undary (2002) with Inner
City Road Network Overlaid
on Landsat Satellite Image
(2000)
Note: Two new districts, Long Bien and
Hoang Mai, were established in
2003.
O HIBAYAMAHO Dinh Duan and SHIBAYAMA M. : Studies on Hanoi Urban Transition in the Late 20th Century
533

the Red River and to the west by the To Lich River, as shown in Fig. 1a. Hanoi has grown in
stages, gradually expanding into the surrounding area to reach its current size and spatial
distribution. The boundaries of the city have extended in all directions, but mainly to the
South, Southwest, West, and later to the East (crossing the Red River), as shown in Fig. 1b.
The city’s expansion in the past has been influenced very much by the natural barriers such as
rivers, lakes and swamp areas. The total area has now increased to 921 km2 , and the
population has been estimated to be 3.15 million (2005 statistics). Hanoi now comprises of nine
inner districts (Quận) and five peripheral districts (Huyện) located on both sides of the Red
River.1) The most significant enlargement of the city in the past few decades occurred in 1961
after the nation’s three-year plan to make Hanoi into an industrialized city. Four of these
districts, Ba Dinh, Dong Da, Hai Ba Trung, and Hoan Kiem, are considered the core urban area
of Hanoi. Other suburbs were once agricultural areas that provided foods for the city.
Urbanization, generally, can be defined as changes in the territorial and socio-economic
progress of an area that includes a general transformation of land cover/use categories [Weber
and Paissant 2002]. Apart from the socio-economic aspect, factors that are relevant to the
development of a city in terms of spatial expansion include physical features, vegetation
coverage, water surface, infrastructure conditions (roads and streets), and housing construction.
These factors change with increased urbanization, and are usually considered key parameters
for studying urban development.
This paper studies the spatial urban growth of Hanoi and analyzes its pattern and trends;
related parameters such as road density, housing density and remote sensing-derived indices,
namely, the Normalized Difference Vegetation Index (NDVI) and Water Index (WI), have also
been considered. The availability of satellite data (Landsat, JERS, ASTER, IKONOS and
QuickBird) for different dates from 1975 to 2005 allows us to address the spatial expansion of
Hanoi over this period, in an integrated approach combining remote sensing, GIS and analysis of
ancillary data. In our satellite image analysis, the Landsat MSS, TM, ETM and ASTER
imageries were used principally for mapping land use changes, whereas the radar JERS and
high resolution IKONOS and QuickBird images were used as supporting data.
II Study on Hanoi Urbanization and the Use of Remote Sensing
Located along the right bank of a bend in the Red River, in the center of the river delta, Hanoi
represents the center of development for North Vietnam in terms of its economy, society, and
urbanization. In 2005, Hanoi comprised of nine inner districts and five suburban districts
located on both sides of the Red River. The five suburban districts (Soc Son, Dong Anh, Gia
Lam, Thanh Tri and Tu Liem) encompass the city area of Hanoi, the nine inner districts that
occupy about 28% of the total Hanoi administrative area. Four of these districts, Ba Dinh,
1) This is statistics of 2005. Recently Hanoi has merged with Ha Tay province to get an enormous size and
population.
東南アジア研究 46巻 4 号
534
Dong Da, Hai Ba Trung, and Hoan Kiem, are considered the core urban area of Hanoi. The
peri-urban areas have been gradually converted and absorbed by the city, but a large portion
still remains as agricultural land and plays an important role in supplying food and other
agricultural products to Hanoi [Thapa et al. 2004].
The population of Hanoi is not evenly distributed between the inner city and its
surrounding areas. In 1960, the urban population of Hanoi accounted for 71% of the total area,
which could have been a consequence of the first important urbanization of Hanoi after the
Indochina war. This followed a 3-year plan for 1958-60 by D.R. Vietnam to boost an industrial-
based economy. In 1961 large urban population and achievements in economic growth led the
government to decide to greatly expand the administrative boundary of Hanoi to a total size of
461 square kilometers (previously it was 152 square kilometers). This can be considered the
first significant expansion of Hanoi in terms of administrative boundary. During this 3-year
period, industrial sites were created throughout the city (in-fill urbanization) but especially in
the outskirts (expansion). Outlying quarters like Bay Mau and Van Ho were converted to
urban areas and new residential areas sprawled around industrial sites. A great deal of water
surface was converted to built-up areas in these years.
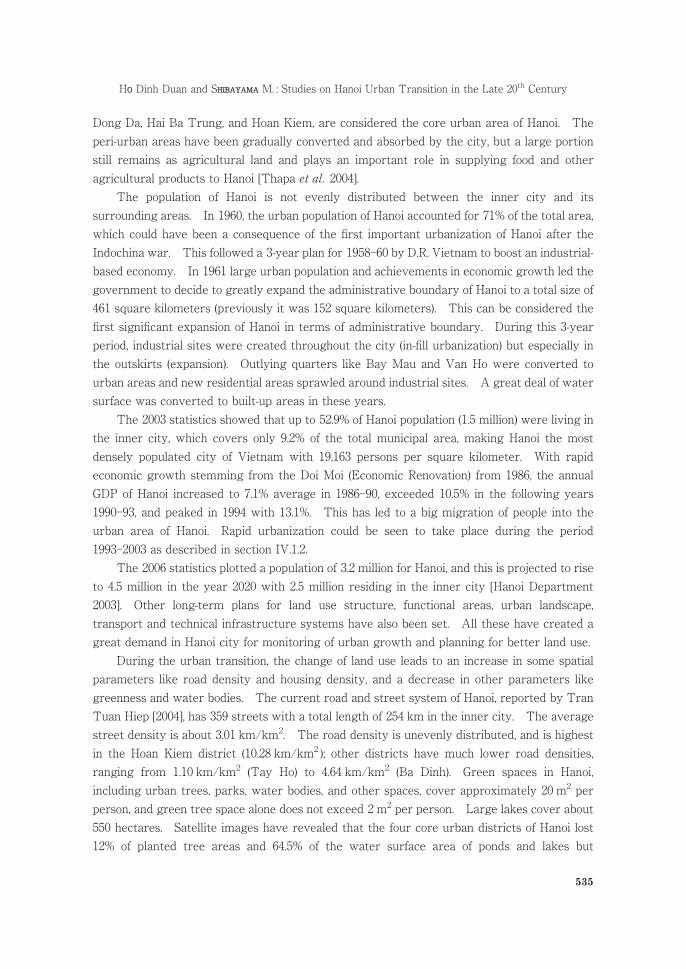
The 2003 statistics showed that up to 52.9% of Hanoi population (1.5 million) were living in
the inner city, which covers only 9.2% of the total municipal area, making Hanoi the most
densely populated city of Vietnam with 19,163 persons per square kilometer. With rapid
economic growth stemming from the Doi Moi (Economic Renovation) from 1986, the annual
GDP of Hanoi increased to 7.1% average in 1986-90, exceeded 10.5% in the following years
1990-93, and peaked in 1994 with 13.1%. This has led to a big migration of people into the
urban area of Hanoi. Rapid urbanization could be seen to take place during the period
1993-2003 as described in section IV.1.2.
The 2006 statistics plotted a population of 3.2 million for Hanoi, and this is projected to rise
to 4.5 million in the year 2020 with 2.5 million residing in the inner city [Hanoi Department
2003]. Other long-term plans for land use structure, functional areas, urban landscape,
transport and technical infrastructure systems have also been set. All these have created a
great demand in Hanoi city for monitoring of urban growth and planning for better land use.
During the urban transition, the change of land use leads to an increase in some spatial
parameters like road density and housing density, and a decrease in other parameters like
greenness and water bodies. The current road and street system of Hanoi, reported by Tran
Tuan Hiep [2004], has 359 streets with a total length of 254 km in the inner city. The average
street density is about 3.01 km/km2. The road density is unevenly distributed, and is highest
in the Hoan Kiem district (10.28 km/km2 ); other districts have much lower road densities,
ranging from 1.10 km/km2 (Tay Ho) to 4.64 km/km2 (Ba Dinh). Green spaces in Hanoi,
including urban trees, parks, water bodies, and other spaces, cover approximately 20 m2 per
person, and green tree space alone does not exceed 2 m2 per person. Large lakes cover about
550 hectares. Satellite images have revealed that the four core urban districts of Hanoi lost
12% of planted tree areas and 64.5% of the water surface area of ponds and lakes but
O HIBAYAMAHO Dinh Duan and SHIBAYAMA M. : Studies on Hanoi Urban Transition in the Late 20th Century
535

experienced a 22.4% increase in residential area in 10 years of development, from 1986 to 1996
[VACNE 2006]. Urbanization results in the expansion of administrative boundaries, stretching
in various directions and leading to changes in land use, mainly at the periphery. Agricultural
lands, natural vegetation, and other sites are converted to residential areas with enhanced
transportation systems, increased housing density, and lost green space [Tran Mai Anh et al.
2005].
Various works have been carried out concerning the urbanization of Hanoi from different
approaches. Douglas et al. [2002] considered urbanization a process of transition from an
ancient city to a modern one, particularly a conversion of cultivated land into settlement sprawl.
Two indicators were used in the study: population density according to levels of urbanization,
and vegetation cover based on the NDVI from Landsat data. Small et al. [2005] used Landsat
and nighttime data sets to identify the possible relationships between light intensity and urban
areas. They found different linear relationships for periods from 1992 to 2000. Pham Van Cu
et al. [2004] used ASTER data to detect urban changes based on an analysis of thermal bands.
Waibel [2004] focused on the urbanization process of Hanoi through various periods
corresponding to urban management practices, from ancient quarters in previous centuries to
modern planned-development periods. Yamagata et al. [1997] introduced the vegetation-soil-
water (VSW) index to better analyze the category-mixing ratio for the three elements of
vegetation, soil and water in one pixel (“mixel”), and this method was used by Pham Minh Hai et
al. [2006] to investigate the urban expansion of Hanoi over time based on multi-temporal
Landsat and ASTER data.
Other research has employed more advanced and sophisticated tools on multisensor
remote sensing data. Tomowski et al. [2006] presented a decision-based data fusion technique
for detecting settlement areas using a texture-oriented hierarchical segmentation procedure on
high resolution images combined with medium ones. Sheeren et al. [2006] proposed an object-
oriented knowledge-based approach to create a decision tree classification that produced higher
classification accuracy for urban mapping. This method was used with a machine learning
algorithm on multispectral QuickBird, Landsat images to obtain not only classes such as
vegetation, water bodies, soil and build-up, but also further details of classified sub-categories
like low density or high density build-up areas.
An important aspect in studying urban growth is to combine multi-temporal remote
sensing data and socio-economic data. Statistical analysis of the detected changes including
socio-economic information can give a better understanding of the urbanization process as well
as its driving forces, which can provide a good calibration for land use change models [Goetzke
et al. 2006]. A purely socio-economic review of Hanoi urbanization during the period 1946-73
can be found in Turley [1974] where a brief history of the city’s urbanization in this period is
presented together with important demographic and other statistical data.
Previous studies on the urbanization of Hanoi often focused only on land use changes
related to economical activities, city management policies, and spatial urban planning [Douglas
et al. 2002]. Other aspects, such as spatial patterns of urban growth relating to construction
東南アジア研究 46巻 4 号
536

density, particularly of housing and roads, have not yet been considered. To better understand
the city’s urban transition through a century, we addressed the spatial expansion of Hanoi over
time, considering the pattern of spatial urbanization related to physical features and
construction density, by analyzing satellite images and ancillary data including historical maps,
land use maps and statistical data.
The objective of this study is to employ an integrated method of GIS and remote sensing to
understand the urban transition of Hanoi in terms of the spatial expansion and the pattern of
urbanization in the period from 1975 to recent years. The analysis is supported by other
statistical data such as the population structure of Hanoi over the years. Through this study,
an implicit correlation between the urban growth, the trend of spatial expansion of the city and
other relevant geographic and socio-economic features can be proposed. Although a land use
change model derived from the study is beyond the scope of this paper, we believe that a better
understanding of the urbanization process over time would allow a more reasonable and optimal
land use planning for the city.
III Data Used and Processing Method
III. 1 Data Used
For most parts of the world, satellite data are generally available from the 1970s to the present.
In this study we have used Landsat MSS (1975), Landsat TM (1993), JERS (1995), Landsat ETM
(2000), IKONOS (2002), ASTER (2003) and QuickBird (2005), all of which are either free to
download from NASA or are provided by the Project on Development of Area Informatics,
Center for Southeast Asian Studies, Kyoto University.
Digitized maps of 1 : 10,000 of Hanoi and 1 : 20,000 of the inner city were used as base maps
for rectifying the satellite images, as shown in Figs. 2a and 2b respectively. The 1 : 10,000 map
東南ア4604-4,2a
Fig. 2a Base Map of Hanoi
(Scale 1 : 10,000)
東南ア4604-4,2b
Fig. 2b Base Map of Hanoi
(Scale 1 : 20,000)
O HIBAYAMAHO Dinh Duan and SHIBAYAMA M. : Studies on Hanoi Urban Transition in the Late 20th Century
537

was updated based on the QuickBird image 2005 (0.6 meter resolution). They have been
projected into WGS-84 datum, UTM zone 48 North projection, as are all satellite images.
As urban growth ultimately leads to land use changes, image classification is the essential
technique to be used. Three Landsat scenes of 1975, 1993 and 2000 and one ASTER scene of
2003 were rectified to the same spatial resolution of 14.25 meters (panchromatic band of the
ETM) for best use. Supplementary information was obtained from the radar JERS (1995) and
the high resolution IKONOS and QuickBird images, for example to validate the signature for
image classification and to verify the derived density maps. In addition, the NDVI and water
indices were calculated and used in our decision-tree classification. Integration of these index
maps with classification provides an effective way of detecting urban growth of the city in this
period. Water masks can also be used to mark the reduction in numbers and size of water
bodies (ponds, lakes, and rivers), a common phenomenon of the urbanization process.
Urbanized areas and the directions in which they are expanding as well as the narrowing or
disappearance of greenness and water bodies can be visualized and depicted. Significant land
use changes that occurred during the periods 1975-92 and 1993-2003 can be revealed and
quantified.
III. 2 Method
To facilitate the comparison of land use changes, the pixel sizes of the images were spatially re-
sampled following the Landsat ETM+ resolution of 14.25 m (panchromatic band). This spatial
size was selected based on the minimum mapping unit that yields the highest spatial resolution
from a satellite data set [Jensen 1996], excluding the IKONOS and QuickBird data.
To identify patterns of urban expansion, particularly the actual boundaries of the city, we
used the NDVI and WI derived from band ratio calculations.
�NDVI was calculated from red and near infrared bands.
NDVI=(near infrared−red)/(near infrared+red)
�WI was used to separate land from water. This index was calculated as the band ratio
between wavelengths of 1,600 nm (middle infrared) and 520-600 nm (green) to identify water
bodies. Bands 5 and 2 of Landsat TM and ETM, and bands 4 and 1 of ASTER were used.
WI=middle infrared band/green band
The NDVI and Water Index images were layer-stacked to create images of vegetated and
water bodies from 1975 to 2003.
Landsat images in 1975, 1993, 2000 and ASTER image 2003 were classified using the
supervised Maximum Likelihood method. The selection of training samples was guided by
ancillary GIS data and the high resolution imageries IKONOS and QuickBird. Five land use
東南アジア研究 46巻 4 号
538

classes were considered: water, vegetation, build-up, fallow and sand. (The water in the Red
River and water in Hanoi lakes and ponds have different signatures.) The sandy areas in and
along the Red River and the wetland areas in the south happened to be of seasonal change and
can easily be mixed with other classes, so we created masks for these areas prior to image
classification. Also, urban spatial signatures of Hanoi land use are difficult to differentiate, even
having different classes mixed in one pixel (“mixel” problem), and therefore we employed a
decision-tree algorithm using the above NDVI and WI to support the classification. First the
Landsat and ASTER images were classified using the Maximum Likelihood method and rule
images were created. The decision-tree method was then based on these rule images and the
NDVI or WI. The JERS image 1995 was fused with the TM image 1993 to give a better
visualization of water bodies for this image date, as shown in Figs. 3a and 3b.
Several methods can be used to depict the land use changes (hence the spatial urban
growth can be visualized). One method is to present time-series classified images. The
changes can be quantified by associated change matrices which tell how much (or percentage)
of a class has been converted into others.
To compute the road density and housing density using GIS tools, the base map was
spatially divided into cells of size 100 m×100 m. For each cell
Road density cell value=100×Total road length in that cell (km/km2)
Housing density cell value=100×Total house block area in that cell
東南ア4604-4,3a
Fig. 3a Fusion Image from Landsat TM
1993 and JERS 1995
Note: Water bodies are enhanced.
東南ア4604-4,3b
Fig. 3b Water Mask Image Created from
Fusion Image on the Left
O HIBAYAMAHO Dinh Duan and SHIBAYAMA M. : Studies on Hanoi Urban Transition in the Late 20th Century
539

To create a finer density map we can use smaller cell size instead of 100 meters. These
two raster maps can be overlaid with the satellite images or the classification maps to enhance
the analysis.
IV Results and Discussion
IV. 1 The Development of Hanoi City in the Past Three Decades
IV. 1. 1 The Period from 1975-93
A remarkable expansion of the urban area occurred during this period, extending far to the To
Lich River in the west and the swamp area in the south. To the north, the urban area reached
West Lake, and growth occurred along main transportation axes. The urban area expanded
about 6 km from the Red River to the west and 8 km from West Lake to the south. The solid
lines in Figs. 4a and 4b show the boundary of area in 1975 and 1993 respectively. Before 1980,
東南ア4604-4,4a
Fig. 4a Urban Area in 1975
東南ア4604-4,4b
Fig. 4b Urban Area in 1993
東南ア4604-4,5a
(a) 1993
東南ア4604-4,5b
(b) 2000
東南ア4604-4,5c
(c) 2003
Fig. 5 Urban Expansion of Hanoi during 1993, 2000, and 2003
Note: In-fill and expansion patterns can be seen (processed from Landsat imageries).
東南アジア研究 46巻 4 号
540

there was only one bridge across the Red River in the Hanoi area (Long Bien bridge, built in
1902). Later, two other bridges, Chuong Duong and Thang Long were built. This explains
why the city’s expansion across the Red River in the east occurred rather late. The year 1986
also witnessed the launch of a new economic policy as a consequence of Doi Moi, and the
economy began to grow gradually. The spatial urban growth could be seen to be of a strongly
linear branch pattern.
IV. 1. 2 The Period from 1993 to 2003
Fig. 5, processed from Landsat images acquired in 1993, 2000 and 2003, gives a visualization of
the spatial extent and pattern of the city’ s expansion. This period also witnessed the
establishment of two new urban districts, Hoang Mai and Long Bien. As a result, the total
number of inner districts of Hanoi rose to nine and the area was almost doubled. Also, a
composite image of NDVIs from three dates is shown in Fig. 6a. The scattering of white color
in Fig. 5 shows the spread of the road and housing densities. Based on patterns of its scat-
tering, the increase of newly constructed roads and houses can be recognized on Figs. 5(a), (b),
and (c). From 2000 to 2003, the western border crossed over the To Lich River. Urbanization
occurred around West Lake and along the north side of the Red River in the Gia Lam area.
Based on Fig. 6a, the road density from the inner city to the periphery for south, and southwest
directions has also been increasing as seen with the dark gray and black colors. Also, newly
constructed buildings and houses can be seen along with the road and inner city in red except
areas in the Red River. And, the surrounding area in the blue color shows that no change can
be seen in the farmland during this period. Fig. 6b shows the road density of Hanoi with the
pink color overlaid on IKONOS image. Analysis of IKONOS (2002) and QuickBird (2005)
images also indicated that new buildings were constructed in areas that were formerly
agricultural land or lakes. In particular, parts of West Lake to the north were filled in.
東南ア4604-4,6a
Fig. 6a Color Composite of NDVIs of 1993
(blue), 2000 (green) and 2003 (red)
東南ア4604-4,6b
Fig. 6b Road Density of Hanoi Overlaid
on IKONOS Image
O HIBAYAMAHO Dinh Duan and SHIBAYAMA M. : Studies on Hanoi Urban Transition in the Late 20th Century
541

IV. 2 Spatial Features of Hanoi Urban
Geographically, the Hanoi area is situated on the right bank of the Red River and is subject to
the flow regime and landforms made by this stream. The Red River is characterized by many
bends, low levees, a shallow channel, irregular flow and a stream channel that has changed
many times. Flooding often happens in the rainy season during the high water period from
June to October. Within the floodplain of the river there are many oxbow lakes and marshes
located at different river sections. Topographically, the average elevation of the Hanoi area is
about 7.5 m (above sea level) based on 1 : 20,000 Hanoi map [Yonezawa 2009], which in the dry
seasons equals the water level of the river that rises higher in the rainy season. In this
situation, Hanoi is often lower than the river and would suffer floods without some means of
prevention. In order to protect Hanoi from flooding, a system of dikes was constructed along
both river banks, and these have almost become new shorelines, from which the distance to the
river bank can reach 1-2 km depending on the local topography of river segments.
Hanoi, located in the river floodplain by the West Lake and the Red River, has extended in
opposite directions. These two water bodies constitute natural barriers at the north and east
parts of Hanoi. A large marsh, swamp area at Van Dien in Thanh Tri district is the southern
most part of Hanoi. The To Lich River, running from the lake to south, is considered as the
first border of urban Hanoi, and the Nhue River as the farther second one for the city westward.
These are illustrated in Fig. 1a, which is a color composite for Water Indices of 1993 in blue,
2000 in green and 2003 in red. In general, more space to expand is available to the west and
southwest of Hanoi than in the north, south and east, which are restricted by large water bodies
and a marsh area. This is observable by analyzing old maps and satellite images, which
indicate that the border of urban Hanoi has gradually stretched to the west and southwest.
IV. 3 Construction Features of Hanoi
Road and housing density were considered as construction features of urban Hanoi, and these
were combined with house size and green space with regard to land use. Integration of these
makes observable signatures on satellite images of medium spatial resolution such as Landsat
and ASTER. When QuickBird and IKONOS images were used, these features were
particularly clearly differentiated, as shown in Figs. 7a, 7b, and 7c. Based on analyzed results
東南ア4604-4,7a
Fig. 7a High Construction
Density
東南ア4604-4,7b
Fig. 7b Medium Construc-
tion Density
東南ア4604-4,7c
Fig. 7c Mixed Construc-
tion Density
東南アジア研究 46巻 4 号
542

of satellite images, these features can be basically classified into the following types as a pre-
survey on the visual observation, reviewed in Table 1.
Three types of construction density were identified:
�High density: coverage of green space and urban trees (along streets) is very low. Other
features are small houses, very short, narrow streets, and distances between intersections of
less than 200 m. The spatial structure is stable and compact. All these make a relatively
unique spectral reflection on satellite images.
�Medium density: All features are similar to the above type, but spatial patterns are more
regular with square blocks, larger houses, higher density of urban trees. In places, small
houses are replaced by tall buildings.
�Mixed density: small houses and tall, large buildings are mixed together at the urban
fringe. Green space remains from cultivated land. Large new blocks of buildings and small
houses alternate, creating an irregular mosaic of high and low density.
It is noted that while the space between the main dyke and the river bank can be
considered unsuitable for urban development, but the housing density in this corridor is as high
as areas of type 1. The Citadel area is not classified in any category as it retains most urban
trees including parks. Two areas of type 1 are connected together via the train station and they
form one of the main axes of urban growth to the environs. To the north of the West Lake, a
new direction of growth has emerged and it surpassed the administrative border of the urban
core.
As a result obtained in this study, it was found that the type of density based on the
constructed building and houses, and roads can be categorized into three types, as shown in
Table 1, and the spatial growth of Hanoi is limited by natural barriers, such as streams to the
northeast and east, water bodies to the north, and a swamp area to the south. The expansion of
Hanoi stretches mainly in four directions South, Southwest, West and East following main
Table 1 Construction Features of Urban Hanoi
No Type
Features
Distribution (typical)Houses Roads Green
Space Pattern
1 High Density Small,dense
Narrow,short Low Unique,
compact
Ancient quarter (excluding theCitadel), north Hoan Kiem lake,west Hang Co train station, VanChuong lake area
2 MediumDensity
Large, tallbuildings
Largerthan “1”
High, talltrees
Regular,square South Hoan Kiem lake
3MixedDensity (lowand high)
Small andlargeblock
Small,main road,long
MediumIrregularpattern,mosaic type
Urban fringe, cultivated areasin suburban zones constructedbefore 1995
O HIBAYAMAHO Dinh Duan and SHIBAYAMA M. : Studies on Hanoi Urban Transition in the Late 20th Century
543

transportation axes connecting the inner city to neighboring areas. Both spatial expansion and
in-fill expansion took place in the urbanization of Hanoi. This result has been obtained from an
analysis on several kinds of satellite images and overlaying with both base maps scale 1 : 10,000
and 1 : 20,000 using GIS technologies. It is important to relate the urban transition with social-
economic mile stones of the city and to find correlations between remote sensing derived maps
and indices with other statistics such as population, population density, road and housing
density, but these have not been included in our present work. This subject is beyond the scope
of the present paper.
V Conclusions
Over time, urban Hanoi has greatly expanded to the west and southwest. Although urban
Hanoi was initially located by the West Lake, its space has passed over the north side of the lake
in recent years. Until 1993, land use types around the lake were mainly cultivated land. Until
2000 and then 2003, 2005 on this fringe area agricultural land type still remained, but newly
constructed buildings have encroached, indicating that urbanization is in progress.
Urbanization of Hanoi largely occurred in 1993-2000, and continues today at a low rate,
primarily on the south side of the Red River. Namely, increasing of the area in 2003, as shown
in the red color except the river bank in the Red River, can be recognized in the inner city
compared with the black-colored area which was urbanized in 1993-2000, as shown in Fig. 6a.
And, the surrounding area as shown in the blue color for the inner city in 1993 is still being used
as farmlands. The urban growth is realized in expansion, in-fill and linear branch patterns.
To the north, growth is limited by West Lake. Two main growth axes run in the northeast-
southwest and north-east directions, as shown in Fig. 5. The west axis appeared late, perhaps
after 2003, following the construction of the national stadium My Dinh, as shown in Fig. 5 (c).
The current development of the city does not seem to match the city’s Master Plan.
Our results indicate that the spatial growth of Hanoi is limited by natural barriers, such as
streams to the northeast and east, water bodies to the north, and wetland to the south.
Spatially, the expansion of Hanoi stretches in the obvious directions, and the urbanization
process follows the main transportation axes connecting the inner city to neighboring areas,
while the administrative boundaries have expanded in other directions.
A combination of index images is very useful for detecting changes, urban margins, and
physical limits, particularly to identify urban borders. The combination of indices used in this
study illustrated a large difference between the urban center and the surrounding areas. The
water index combination can help detect changes in streams, such as the Red River, which
represents a significant northern limit to urbanization. However, this index was unable to
identify small water bodies within the urban area, due to shadows cast by tall buildings, which
were confirmed by a comparison of QuickBird and IKONOS images.
To validate and confirm these results, it is necessary to analyze more high-resolution
satellite images, such as IKONOS and QuickBird, from which information on housing density
東南アジア研究 46巻 4 号
544

can be extracted. Such an analysis would support the identification of growth patterns of
Hanoi over time.
Acknowledgment
This study has been made supported by a visiting research grant from Center for Southeast Asian Studies,
Kyoto University; satellite images and historical maps were provided by project Grant-in-Aid, Scientific
Research (S) Development of Area Informatics: With Emphasis on Southeast Asia, Subject ID 17101008,
CSEAS, Kyoto University. We wish to thank Professor Venkatesh Raghavan of Osaka City University for
his generous help and valuable suggestions, which have contributed to this paper. We have also used a
great deal of material from the paper by Pham Bach Viet et al. [2006], to whom we wish to express our
sincere thanks.
References
Do Hau. 2004. Urban Planning in Hanoi City towards Sustainable Development. International Work-
shop on Asian Approach toward Sustainable Urban Regeneration, September 2004, The University of
Tokyo, Japan.
Douglas M.; Michael D.; Valuncha P.; Pornpan B.; Made B.; Wiwik B.; Dan F.; Scott H.; Rizky K.; and Kana T.
2002. The Urban Transition in Vietnam : United Nations Development Programme, Vietnam.
University of Hawaii at Manoa, United Nations Human Settlement Programme, UN-Habitat, Fukuoka,
Japan.
Goetzke R.; Braun M.; and Menz G. 2006. Patterns and Driving Forces of Urban Growth in North Rhine-
Westphalia (Germany) by Intersecting Multi-temporal Remote Sensing and Socioeconomic Data. In
Proceedings of the 1st EARSeL Workshop of the SIG Urban Remote Sensing, March 2006, Berlin.
Hanoi Department of Planning and Investment. 2003. Hanoi Master Plan to the Year 2020.
http://www.hapi.gov.vn/portals/
Jensen, J.R. 1996. Introductory Digital Image Processing: A Remote Sensing Perspective. 2nd ed.
Prentice Hall.
Pham B. Viet; Ho D. Duan; Raghavan V.; and ShibayamaM. 2006. Using Satellite Imagery to Study Urban
Expansion of Hanoi, Vietnam. In Proceedings of the International Symposium GIS-IDEAS 2006,
HCMC, Vietnam.
Pham Minh Hai; and Yamaguchi, Y. 2006. Monitoring Land Cover Change of Hanoi City Center Under
Impacts of Urbanization by Using Remote Sensing. In Proceedings of the International Symposium
GIS-IDEAS 2006, HCMC, Vietnam.
Pham Van Cu; Huy C.X.; Huong H.K.; Thu H.X.; and Watanabe, H. 2004. Comparison of Row Channel and
Physical Index Channel Classification of ASTER in Urban Change Detection, the Case of Thanh Tri
District in Suburban of Hanoi, Vietnam. In Proceedings of the International Symposium GIS-IDEAS
2004, Hanoi, Vietnam.
Phan Huy Le. 2005. Preserving and Promoting Hanoi: Thang Long History. In Proceedings of the
International Symposium on Geo-Informatics for Historical Studies in Asia, Nov. 2005, Hanoi, Vietnam.
Sheeren D.; Puissant A.; Weber C.; Gancarski; and Wemmert C. 2006. Deriving Classification Rules from
Multiple Remotely Sensed Urban Data with Data Mining. In Proceedings of the 1st EARSeL
Workshop of the SIG Urban Remote Sensing, March 2006, Berlin.
Small, C. et al. 2005. Spatial Analysis of Global Urban Extent from DMSP-OLS Night Lights. Remote
Sensing of Environment 96: 277-291.
Thapa R.B.; Borne F.; Kusanagi M.; and Pham V.C. 2004. Integration of RS, GIS and AHP for Hanoi Peri-
O HIBAYAMAHO Dinh Duan and SHIBAYAMA M. : Studies on Hanoi Urban Transition in the Late 20th Century
545

Urban Agriculture Planning. In Proceedings of the Map Asia 2004, Beijing, China.
Tomowski D.; Ehlers M.; Michel U.; and Bohmann G. 2006. Decision Based Data Fusion Techniques for
Settlement Area Detection from Multisensor Remote Sensing Data. In Proceedings of the 1st
EARSeL Workshop of the SIG Urban Remote Sensing, March 2006, Berlin.
Tran Mai Anh; Kidokoro T.; and Do Hau. 2005. Study on the Role of Urban Planning Practices in Hanoi
Urban Fringe, Focusing on Management of Spontaneous Development: A Case Study in Phu Thuong
Ward, Hanoi City. In Proceedings of the 8th International Conference of the Asian Planning Schools
Association.
Tran Tuan Hiep. 2004. Hanoi Transportation Current Problems and Strategies for Future. Paper from
Center for Sustainable Urban Regeneration. At http://www.csur.t.u-tokyo.ac.jp/ws2004/papers/B2-
Hiep.pdf , accessed at August 10, 2006.
Turley W. S. 1974. Urbanization in War: Hanoi, 1946-1973. Association for Asian Studies, Boston, April
1974.
Vietnam Association for Conservation of Nature and Environment (VACNE). At http://www.vacne.
org.vn/CD_ROM/root/data/tomtatEN_URBAN.html, accessed at August 25, 2006.
Waibel, M. 2004. The Ancient Quarter of Hanoi: A Reflection of Urban Transition Process. ASIEN 92:
30-45.
Weber, C.; and Puissant, A. 2002. Urbanization Pressure and Modeling of Urban Growth: Example of the
Tunis Metropolitan Area. Remote Sensing of Environment 86: 341-352.
Yamagata, Y.; Sugita, S.; and Yasuoka, Y. 1997. Development of Vegetation-Soil-Water Index Algorithms
and Applications. Remote Sensing Society of Japan 17: 54-64.
Yonezawa, G. 2009. Generation of DEM for Urban Transformation of Hanoi, Vietnam. Kyoto Working
Papers on Area Studies 62 (G-COE Series 60).
東南アジア研究 46巻 4 号
546