Application of GIS and RS for Flood Evacuation Planning: A Lonavala Case Study
11
Application of GIS and RS for Flood Evacuation Planning: A Lonavala Case Study Pawar Amol D 1 Dr Jyoti Sarup 2 Dr Sushil Kumar Mittal 3 1. Assistant Professor Grade I NICMAR Pune Campus 2. Associate Professor in Civil Engineering Department MANIT Bhopal 3. Professor in Civil Engineering Department MANIT Bhopal ABSTRACT India is one of the world’s most flood affected country, being second in the world after Bangladesh and accounts for the one fifth of death count due to floods. About 40 Million hectares or nearly 1/8th of India’s geographical area is flood prone. This paper highlights the use of Quantum GIS (QGIS) software for flood risk management. The study area selected is Lonavla, a famous tourist destination, located between Pune & Mumbai in Maharashtra India. A residential colony situated on the banks of river Indrayani, which originates from village Kurwande, near Lonavala. The colony lies on the downstream of Lonavala Lake, a reservoir constructed by Tata Power Company. A Google image of the study area was taken, using QGIS software, area were identified for the different buffer zones In this paper, Google image was used & QGIS platform was used to create a buffer analysis for different submergence levels. Keywords- Floods, GIS, Lonavla, RS. 1 INTRODUCTION FLOOD recurring in one part of the country or other, flood losses in terms of life and damage to property is substantial. The costs incurred by any country government in flood disaster preparedness, rescue and relief operations and the post flood rehabilitation of the victims and public utility account for bulk of annual budget for the disaster management. Flood damages are crudely estimated to crops and livestock, public infrastructure and properties, and interrupted activities and rescue and relief. [1] 1.1 FLOOD PLAIN MAPPING Flood plains provide very good locations for urban expansion and development. Unfortunately, the same rivers and streams that attract development periodically overflow their banks causing losses of life and property. Although a variety of flood
Transcript of Application of GIS and RS for Flood Evacuation Planning: A Lonavala Case Study
Application of GIS and RS for Flood EvacuationPlanning: A Lonavala Case Study
Pawar Amol D1 Dr Jyoti Sarup2 Dr Sushil Kumar Mittal3
1. Assistant Professor Grade I NICMAR Pune Campus
2. Associate Professor in Civil Engineering Department MANIT Bhopal
3. Professor in Civil Engineering Department MANIT Bhopal
ABSTRACT India is one of the world’s most flood affected country, being second in theworld after Bangladesh and accounts for the one fifth of death count due tofloods. About 40 Million hectares or nearly 1/8th of India’s geographical areais flood prone. This paper highlights the use of Quantum GIS (QGIS) softwarefor flood risk management. The study area selected is Lonavla, a famoustourist destination, located between Pune & Mumbai in Maharashtra India. Aresidential colony situated on the banks of river Indrayani, which originatesfrom village Kurwande, near Lonavala. The colony lies on the downstream ofLonavala Lake, a reservoir constructed by Tata Power Company. A Googleimage of the study area was taken, using QGIS software, area were identifiedfor the different buffer zones In this paper, Google image was used & QGISplatform was used to create a buffer analysis for different submergencelevels.
Keywords- Floods, GIS, Lonavla, RS.
1 INTRODUCTIONFLOOD recurring in one part of the country or other, flood losses in terms of life anddamage to property is substantial. The costs incurred by any country government inflood disaster preparedness, rescue and relief operations and the post floodrehabilitation of the victims and public utility account for bulk of annual budget forthe disaster management. Flood damages are crudely estimated to crops and livestock,public infrastructure and properties, and interrupted activities and rescue and relief.[1]
1.1 FLOOD PLAIN MAPPING
Flood plains provide very good locations for urban expansion and development.Unfortunately, the same rivers and streams that attract development periodicallyoverflow their banks causing losses of life and property. Although a variety of flood
mitigation measures has different levels of success, flooding continue to plague manyareas, locations in different countries. It is however, becoming clear to planners thatit is neither possible nor desirable to control floods, completely through structuralmeasures due to technical and economic reasons. A vital element of any flood plain management program is the identification and delineation of the flood prone areas.Management of flood prone areas is the result of complex decision making process todefine all those measures that can compensate the effects of progressive urbanizationover hydrological processes. Estimation of predication of flood inundation is notstraight forward since the extended flood inundation depth depends highly ontopography, which plays an important role in water flux, distribution and energy withinthe landscapes. For years, flood plain management studies have been expensive and tedious work.Technological advancements , and development of improved computational capabilities ,the availability of high sophisticated 3 D GIS software’s continues to expand newpossibilities for engineers to perform flood inundation analysis in conjunction withhydraulic models to represent water surface elevations , generated from hydrologic andhydraulic models, in a three dimensional terrain model. Visualization helps to bridgethe gap between the engineers and decision makers by providing a method for exploring,analyzing and verifying hypothesis from large quantities of spatially referenced data.GIS is being used in a variety of ways to plan, prepare, respond and evaluate floodevents. On the other hand, water resource management applications are inherentlyspatial and generate large amounts of data relating to physical phenomenon in space andtime. So the multidimensional nature of this data makes it quite natural to couplehydraulic modeling and GIS environment through an appropriate interface. Through thehydraulic analysis modeling simulations and the visualations of flood inundationdecision makers can obtain improves understanding and make more informed managementdecisions.[2]
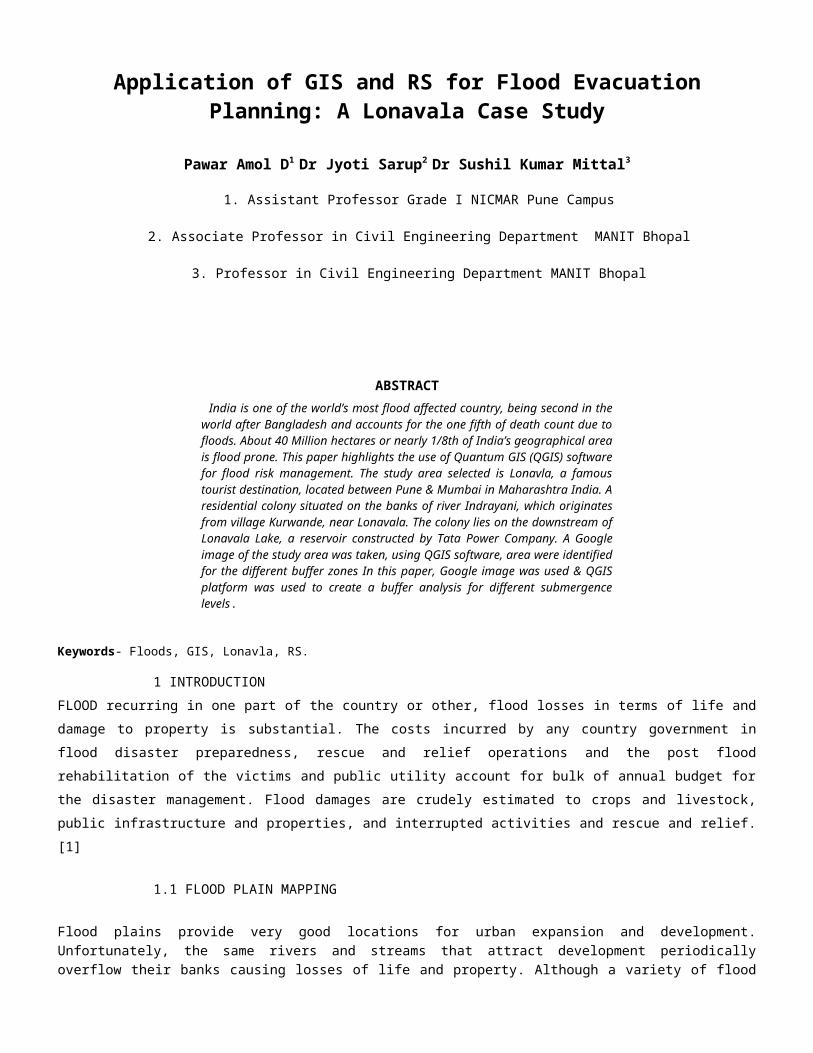
2. Study Area
India
STUDYAREA
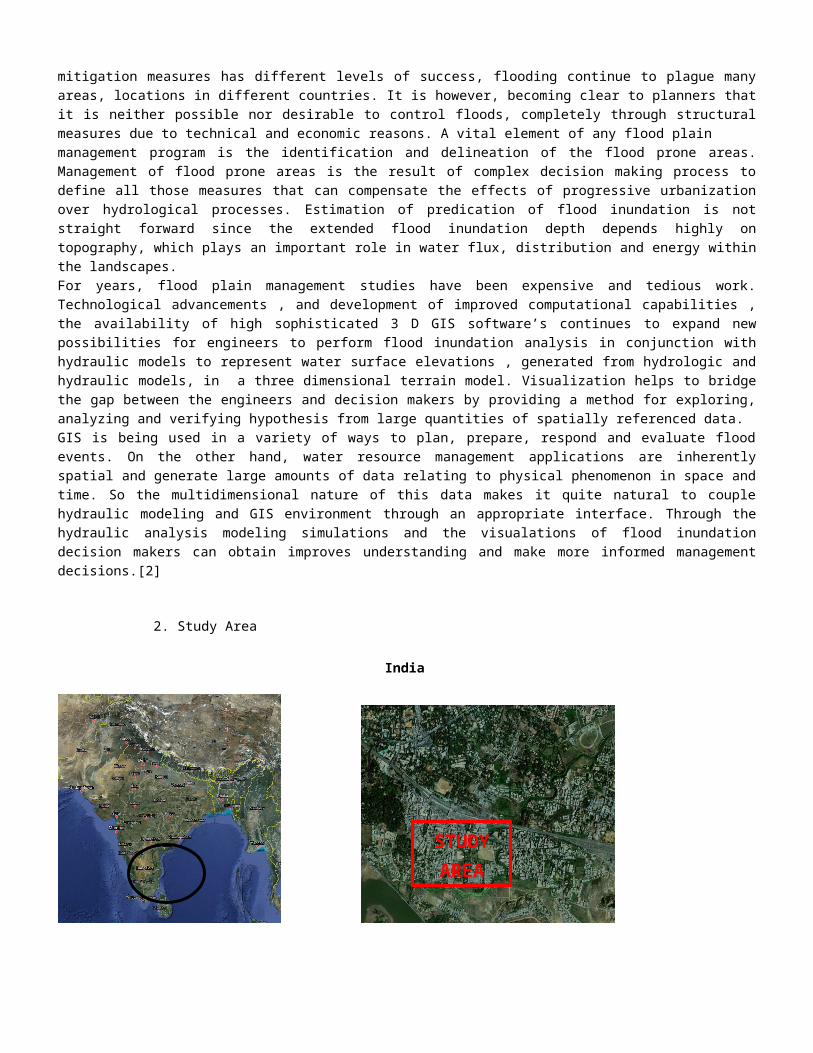
Source: Google Maps
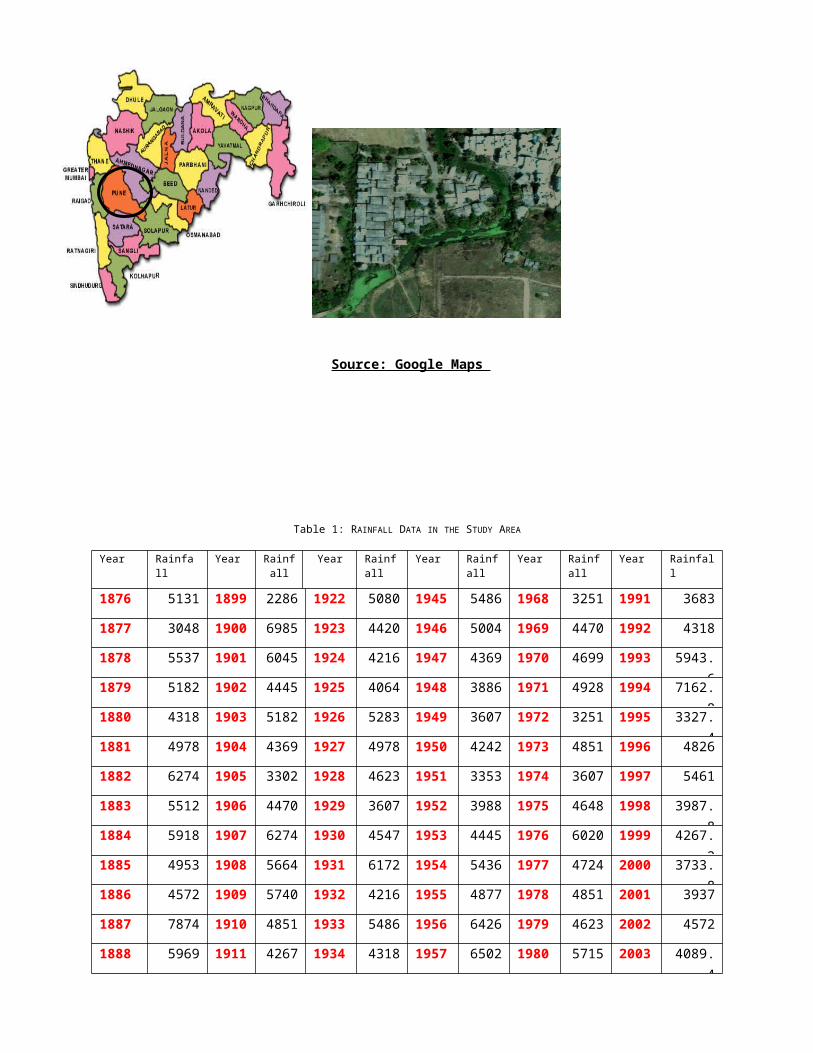
Table 1: RAINFALL DATA IN THE STUDY AREA
Year Rainfall
Year Rainfall
Year Rainfall
Year Rainfall
Year Rainfall
Year Rainfall
1876 5131 1899 2286 1922 5080 1945 5486 1968 3251 1991 3683
1877 3048 1900 6985 1923 4420 1946 5004 1969 4470 1992 4318
1878 5537 1901 6045 1924 4216 1947 4369 1970 4699 1993 5943.61879 5182 1902 4445 1925 4064 1948 3886 1971 4928 1994 7162.81880 4318 1903 5182 1926 5283 1949 3607 1972 3251 1995 3327.41881 4978 1904 4369 1927 4978 1950 4242 1973 4851 1996 4826
1882 6274 1905 3302 1928 4623 1951 3353 1974 3607 1997 5461
1883 5512 1906 4470 1929 3607 1952 3988 1975 4648 1998 3987.81884 5918 1907 6274 1930 4547 1953 4445 1976 6020 1999 4267.21885 4953 1908 5664 1931 6172 1954 5436 1977 4724 2000 3733.81886 4572 1909 5740 1932 4216 1955 4877 1978 4851 2001 3937
1887 7874 1910 4851 1933 5486 1956 6426 1979 4623 2002 4572
1888 5969 1911 4267 1934 4318 1957 6502 1980 5715 2003 4089.4
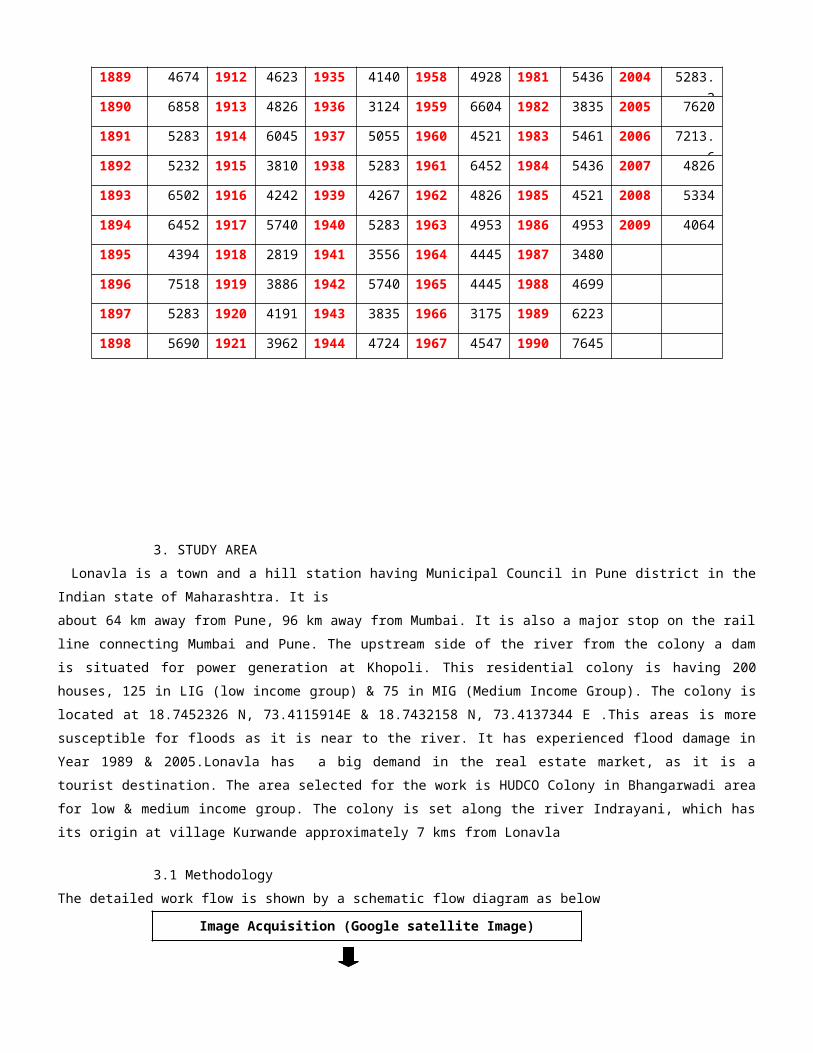
1889 4674 1912 4623 1935 4140 1958 4928 1981 5436 2004 5283.21890 6858 1913 4826 1936 3124 1959 6604 1982 3835 2005 7620
1891 5283 1914 6045 1937 5055 1960 4521 1983 5461 2006 7213.61892 5232 1915 3810 1938 5283 1961 6452 1984 5436 2007 4826
1893 6502 1916 4242 1939 4267 1962 4826 1985 4521 2008 5334
1894 6452 1917 5740 1940 5283 1963 4953 1986 4953 2009 4064
1895 4394 1918 2819 1941 3556 1964 4445 1987 3480
1896 7518 1919 3886 1942 5740 1965 4445 1988 4699
1897 5283 1920 4191 1943 3835 1966 3175 1989 6223
1898 5690 1921 3962 1944 4724 1967 4547 1990 7645
3. STUDY AREALonavla is a town and a hill station having Municipal Council in Pune district in the
Indian state of Maharashtra. It is about 64 km away from Pune, 96 km away from Mumbai. It is also a major stop on the railline connecting Mumbai and Pune. The upstream side of the river from the colony a damis situated for power generation at Khopoli. This residential colony is having 200houses, 125 in LIG (low income group) & 75 in MIG (Medium Income Group). The colony islocated at 18.7452326 N, 73.4115914E & 18.7432158 N, 73.4137344 E .This areas is moresusceptible for floods as it is near to the river. It has experienced flood damage inYear 1989 & 2005.Lonavla has a big demand in the real estate market, as it is atourist destination. The area selected for the work is HUDCO Colony in Bhangarwadi areafor low & medium income group. The colony is set along the river Indrayani, which hasits origin at village Kurwande approximately 7 kms from Lonavla
3.1 Methodology The detailed work flow is shown by a schematic flow diagram as below
Image Acquisition (Google satellite Image)
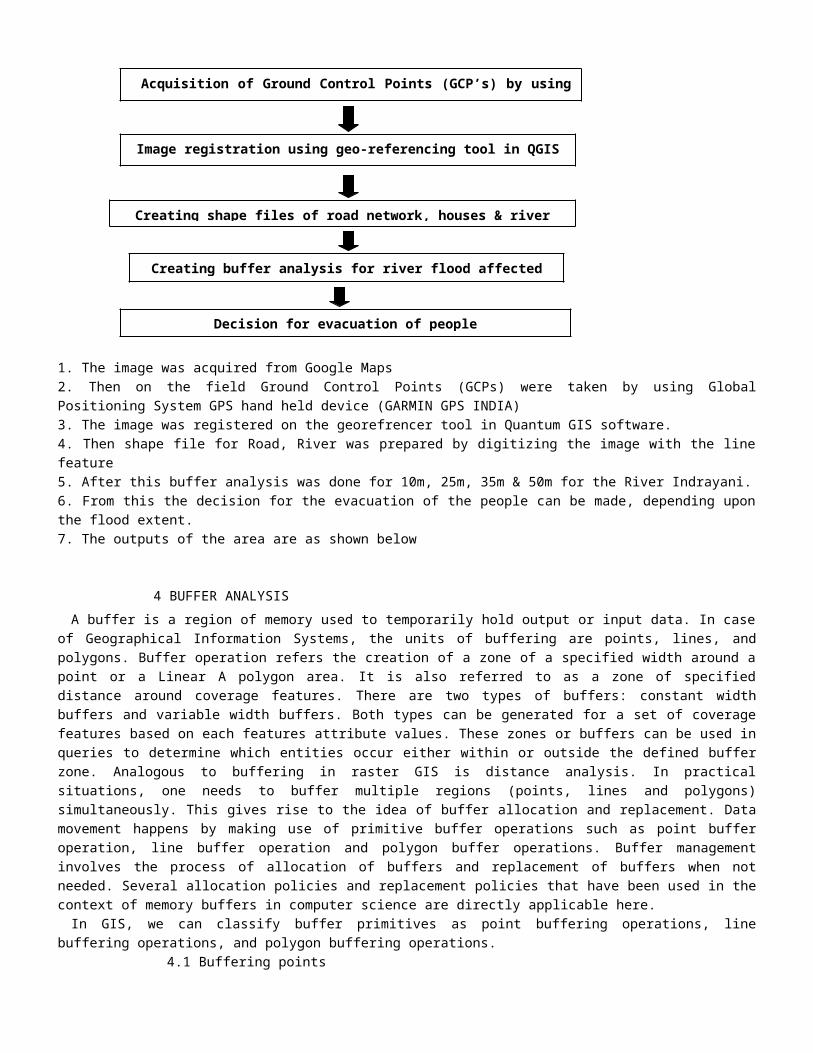
1. The image was acquired from Google Maps2. Then on the field Ground Control Points (GCPs) were taken by using GlobalPositioning System GPS hand held device (GARMIN GPS INDIA) 3. The image was registered on the georefrencer tool in Quantum GIS software.4. Then shape file for Road, River was prepared by digitizing the image with the linefeature5. After this buffer analysis was done for 10m, 25m, 35m & 50m for the River Indrayani.6. From this the decision for the evacuation of the people can be made, depending uponthe flood extent.7. The outputs of the area are as shown below
4 BUFFER ANALYSISA buffer is a region of memory used to temporarily hold output or input data. In case
of Geographical Information Systems, the units of buffering are points, lines, andpolygons. Buffer operation refers the creation of a zone of a specified width around apoint or a Linear A polygon area. It is also referred to as a zone of specifieddistance around coverage features. There are two types of buffers: constant widthbuffers and variable width buffers. Both types can be generated for a set of coveragefeatures based on each features attribute values. These zones or buffers can be used inqueries to determine which entities occur either within or outside the defined bufferzone. Analogous to buffering in raster GIS is distance analysis. In practicalsituations, one needs to buffer multiple regions (points, lines and polygons)simultaneously. This gives rise to the idea of buffer allocation and replacement. Datamovement happens by making use of primitive buffer operations such as point bufferoperation, line buffer operation and polygon buffer operations. Buffer managementinvolves the process of allocation of buffers and replacement of buffers when notneeded. Several allocation policies and replacement policies that have been used in thecontext of memory buffers in computer science are directly applicable here.In GIS, we can classify buffer primitives as point buffering operations, line
buffering operations, and polygon buffering operations.4.1 Buffering points
Acquisition of Ground Control Points (GCP’s) by usingGPS system
Creating shape files of road network, houses & river
Creating buffer analysis for river flood affected
Image registration using geo-referencing tool in QGIS
Decision for evacuation of people
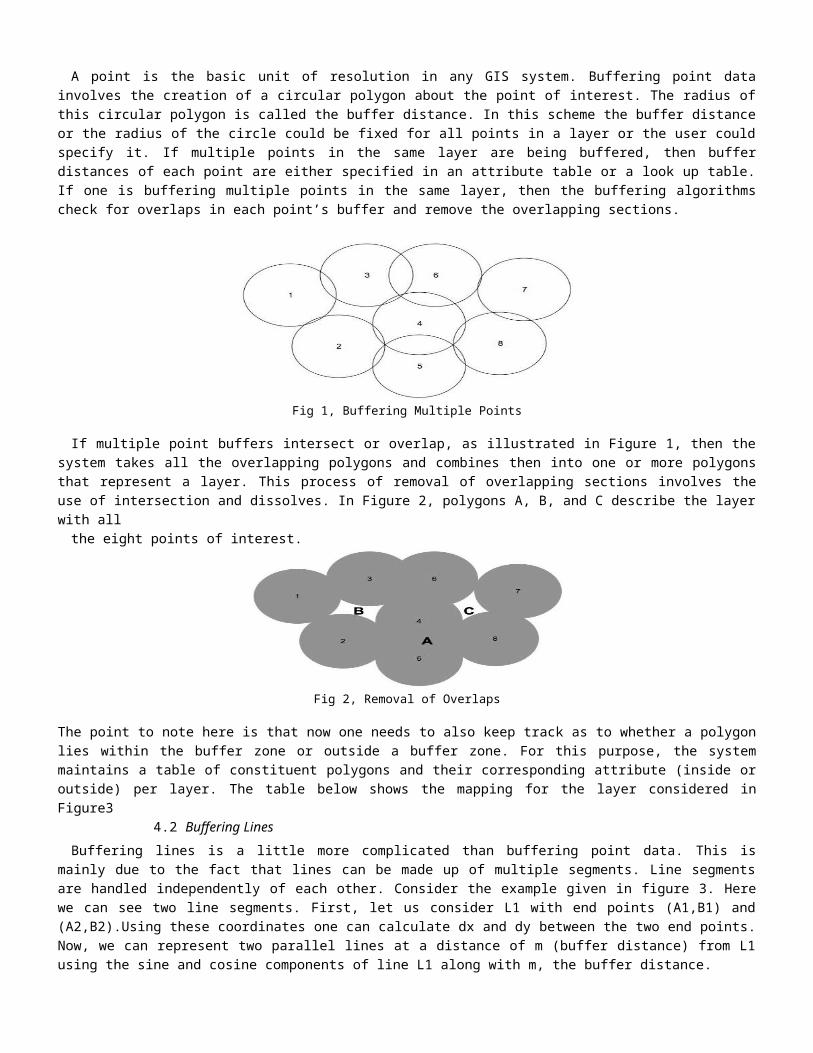
A point is the basic unit of resolution in any GIS system. Buffering point datainvolves the creation of a circular polygon about the point of interest. The radius ofthis circular polygon is called the buffer distance. In this scheme the buffer distanceor the radius of the circle could be fixed for all points in a layer or the user couldspecify it. If multiple points in the same layer are being buffered, then bufferdistances of each point are either specified in an attribute table or a look up table.If one is buffering multiple points in the same layer, then the buffering algorithmscheck for overlaps in each point’s buffer and remove the overlapping sections.
Fig 1, Buffering Multiple Points
If multiple point buffers intersect or overlap, as illustrated in Figure 1, then thesystem takes all the overlapping polygons and combines then into one or more polygonsthat represent a layer. This process of removal of overlapping sections involves theuse of intersection and dissolves. In Figure 2, polygons A, B, and C describe the layerwith allthe eight points of interest.
Fig 2, Removal of Overlaps
The point to note here is that now one needs to also keep track as to whether a polygonlies within the buffer zone or outside a buffer zone. For this purpose, the systemmaintains a table of constituent polygons and their corresponding attribute (inside oroutside) per layer. The table below shows the mapping for the layer considered inFigure3
4.2 Buffering LinesBuffering lines is a little more complicated than buffering point data. This is
mainly due to the fact that lines can be made up of multiple segments. Line segmentsare handled independently of each other. Consider the example given in figure 3. Herewe can see two line segments. First, let us consider L1 with end points (A1,B1) and(A2,B2).Using these coordinates one can calculate dx and dy between the two end points.Now, we can represent two parallel lines at a distance of m (buffer distance) from L1using the sine and cosine components of line L1 along with m, the buffer distance.
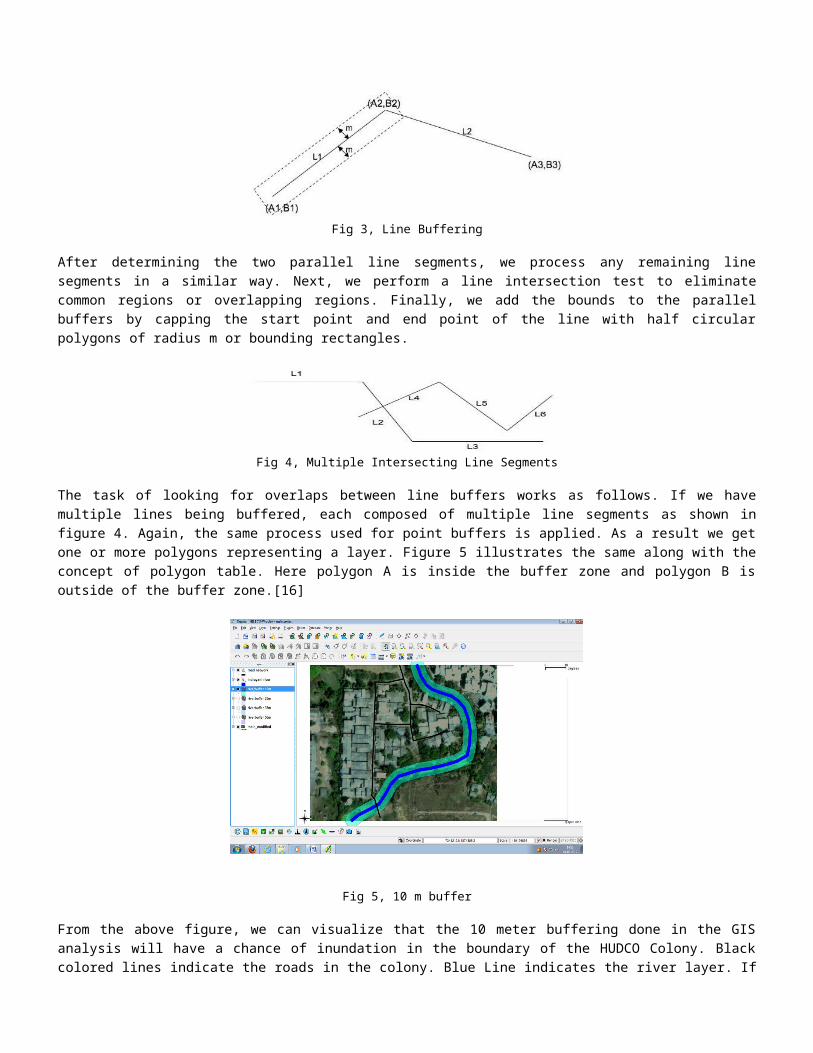
Fig 3, Line Buffering
After determining the two parallel line segments, we process any remaining linesegments in a similar way. Next, we perform a line intersection test to eliminatecommon regions or overlapping regions. Finally, we add the bounds to the parallelbuffers by capping the start point and end point of the line with half circularpolygons of radius m or bounding rectangles.
Fig 4, Multiple Intersecting Line Segments
The task of looking for overlaps between line buffers works as follows. If we havemultiple lines being buffered, each composed of multiple line segments as shown infigure 4. Again, the same process used for point buffers is applied. As a result we getone or more polygons representing a layer. Figure 5 illustrates the same along with theconcept of polygon table. Here polygon A is inside the buffer zone and polygon B isoutside of the buffer zone.[16]
Fig 5, 10 m buffer
From the above figure, we can visualize that the 10 meter buffering done in the GISanalysis will have a chance of inundation in the boundary of the HUDCO Colony. Blackcolored lines indicate the roads in the colony. Blue Line indicates the river layer. If

we go for further increasing the distance to buffering to 25 meters, it could be seenthat the water will cross the boundaries of the colony & one of the roads in the colonywill be under submergence causing blocking of one end of evacuation of the people.
Fig 7 35 meter buffer
In this figure we could see that, the distance of the buffer is increased to 35 meters, will lead to submergence of the roads in the colony to a higher extent, leading to problems in evacuation. Also as seen from the figure, there will be subsidence in the houses adjoining to the river. This part will be more vulnerable to the flooding.
Fig 8 50 meter Buffer
5 CONCLUSION/RECOMMENDATIONS
1. The study area falls in the flood plain of River Indrayani. It is susceptible toflooding as there is no space available for the water to flow naturally. 2. The area is in part of the city which has two small bridges narrowing the channel
of the river, causing the increase in the level near the study area, leading tosubmergence. 3. It could be seen from the buffer analysis that the 35 m & 50 m will lead to heavy
submergence in the area. 4. Proper planning for the evacuation for the people should be done for these levels.
ACKNOWLDGEMENTSWe express sincere thanks to the Department of Civil engineering MANIT Bhopal &
management of NICMAR Pune Campus for the support for this work. Also sincere thanks toLonavla Municipal Council, Shri Angal Sir Chief Engineer (Civil) for providing the data& permission to use it.
REFERENCES
Arya D S, Mizanur Rehman Md, , 2011, Design flow and stagecomputations in the Teesta River, Bangladesh, using frequencyanalysis and MIKE 11 Modeling, Journal of HydrologicEngineering,Volume16 No 2 PP176 – 186,
Arabinda Sharma, 2010, Remote Sensing based Approach forVulnerability Assessment of an Agricultural WatershedInternational Journal of Ecology & Development Volume 17 NumberF10.
Bates P D, Wilson M D, etal, 2006, Reach scale flood plaininundation dynamics observed using air borne SAR imagery: Data& analysis, Journal of Hydrology, pp 306-318.
Billa L & Mansoor Shattri etal, 2006 Comprehensive planning &the role of SDSS in flood disaster management in Malaysia,Disaster Prevention & managementVol15No 2 pp 233-240.
Fugura A Al, T Ahmed, Ghazali A,2008, The application ofHydraulic model with GIS for Visual Flood plain mapping: A casestudy of Kualalumpur Malaysia, Intl Conference on Construction& Building Technologies.
G V Bapalu, Rajiv Sinha, 2005, GIS in Flood Hazard Mapping: Acase study of Kosi river basin, India,” GIS Development onlineedition
Haile A T , Reintes T H M, 2005 ,Effects of LIDAR Resolution inFlood Modeling : A model sensitivity study for the city ofTegucigalpa, Honduras, ISPRS workshop The Netherlands WGIII/3,
Kafle T P , Hazarkika M K & Samarakoon L , Flood Riskassessment in the flood plain of Bagamati River in NepalConference paper.
Khanna R K, Agarwal C K, CWC New Delhi Report, “Remote Sensing& GIS Applications in Flood Management.
Mingyuan Zhang, 2013, Dam Emergency Shelters Selection Based onGIS International Journal of Applied Mathematics andStatistics, Volume 51, Issue Number :22 [ Issue in Progress]
Mohammed Monirul Islam, Mohammed Kawser Ahmed, Abdus Shahid,Sirajul Haque, Dilshad Islam, 2009, Determination of Land CoverChanges and Suitable Shrimp Farming area Using Remote Sensingand GIS in Southwestern Bangladesh, International Journal ofEcology and Development Winter 2009. Volume 12, Number W09
Nelson J, Jones N, 1999, Adaptive Tessellations method forcreating TINS from GIS data, Journal of Hydrologic Engineering,Volume 4 No 1.
Nansham Zheng, Y Tachikawa, K Takara, 2008 , A distributedFlood Inundation model with rainfall Runoff processing usingGIS & RS data, The international Archives of Photogrammetric,Remote sensing & Spatial information sciences Volume 37 partB4.
N Pramod, “Buffer Operations in GIS’ http://www-users.cs.umn.edu/~npramod/enc_pdf.pdf
Pradhan B, 2009 ‘Flood susceptible mapping & risk areasdelineation using logistic regression, GIS & RS , Journal ofSpatial Hydrology Vol 09 No 2 .
Prasad A ,Vinay kumar Ketal 2006 ‘Potentiality of Multisensorysatellite data in mapping Flood Hazard, Journal of IndianSociety of Remote sensing Volume 34 No 3,.
Paul Sutton, Christopher D Elvidge, Tillottama Ghosh, 2007,Estimation of Gross Domestic Product at Sub-National Scales
using Nighttime Satellite Imagery, International Journal ofEcological Economics and Statistics, Volume 8, Number S07.
Singh A K & Sharma A K,2009 GIS & RS based approach for urbanflood plain mapping for the Tapi catchment , India , Joint IAHS& IAH convention Hyderabad Sept 2009 India IAHS Publ,.331.
Shantawi F M , Goodwill J, 2010 ‘ Comparison of Flood top widthpredictions using surveyed & Lidar derived Channel Geometries”Journal of Hydrologic Engineering , Volume 15 No 2 PP 97-106.
Zheng F, Bedient P B, 2011‘long term performance of a floodalert system and upgrade to FAS3: A Houston Texas Case study,Journal of Hydrologic Engineering.

![INSTALL GUIDE OL-NI(RS)-NI5-[OL-RS-NI5]-EN - iDatalink](https://static.fdokumen.com/doc/165x107/633aa8bc006fce433007d856/install-guide-ol-nirs-ni5-ol-rs-ni5-en-idatalink.jpg)