assessment of ground water quality of perambalur and ...
66
ASSESSMENT OF GROUND WATER QUALITY OF PERAMBALUR AND ARIYALUR DISTRICTS, TAMIL NADU M.BASKAR, A.SARAVANAN, L.CHITHRA, P.DHEVAGI, D.LENIN RAJA, P.PANDIYARAJAN, S.K.AMBAST Dept. of Soil Science &Agricultural Chemistry AD Agricultural College &Research Institute Tamil Nadu Agricultural University Tiruchirappalli-620 009, Tamil Nadu, India 2013
-
Upload
khangminh22 -
Category
Documents
-
view
1 -
download
0
Transcript of assessment of ground water quality of perambalur and ...
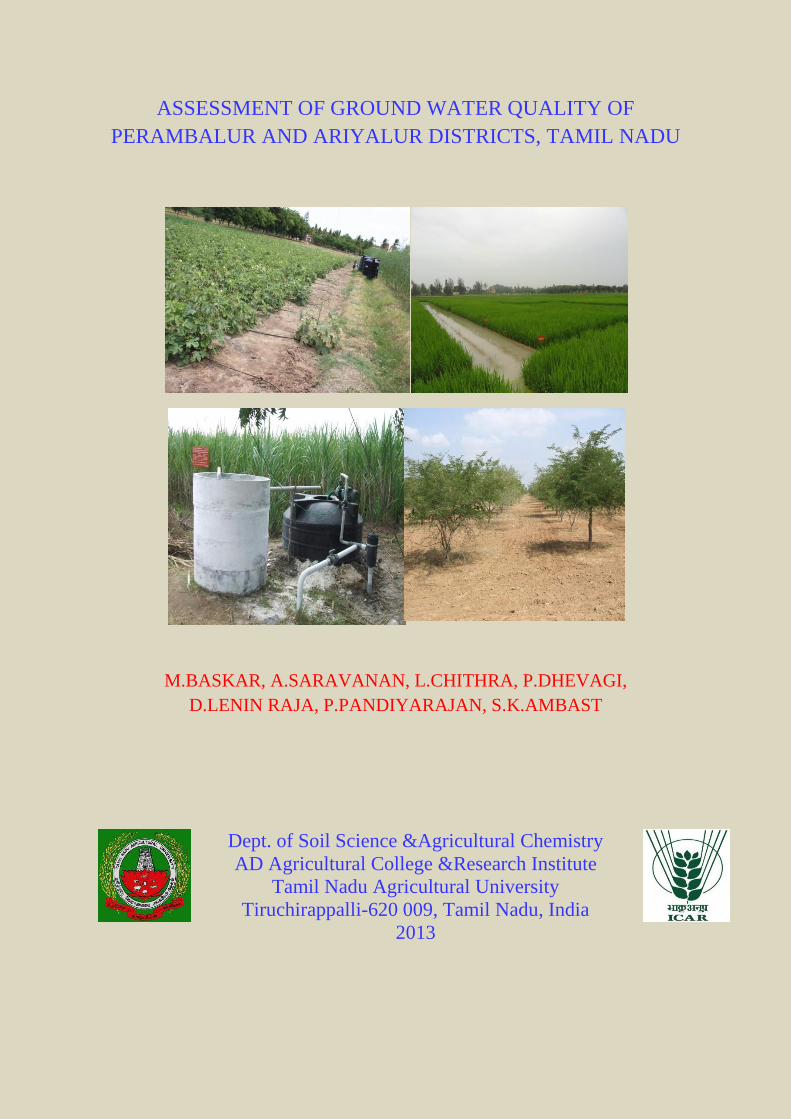
ASSESSMENT OF GROUND WATER QUALITY OF
PERAMBALUR AND ARIYALUR DISTRICTS, TAMIL NADU
M.BASKAR, A.SARAVANAN, L.CHITHRA, P.DHEVAGI,
D.LENIN RAJA, P.PANDIYARAJAN, S.K.AMBAST
Dept. of Soil Science &Agricultural Chemistry
AD Agricultural College &Research Institute
Tamil Nadu Agricultural University
Tiruchirappalli-620 009, Tamil Nadu, India
2013
TNAU
ICAR -AICRP
On
MANAGEMENT OF SALT AFFECTED SOILS AND USE OF
SALINE WATER IN AGRICULTURE
Bulletin on
Assessment of Ground Water Quality of Perambalur and
Ariyalur Districts, Tamil Nadu
M.BASKAR, A.SARAVANAN, L.CHITHRA, P.DHEVAGI,
D.LENIN RAJA, P.PANDIYARAJAN, S.K.AMBAST
Dept. of Soil Science &Agricultural Chemistry
Anbil Dharmalingam Agricultural College and Research Institute
Tamil Nadu Agricultural University
Tiruchirapalli - 620 009
2013

PREFACE
Water is essential for all forms of life, food production and economic development on this planet.
Among the total water availability, only 0.5 % of water is available on earth surface making it more precious
commodity on earth.
With the advancement in modern technologies and irrigation system, there is a tremendous
pressure on groundwater quantity and quality. Monsoon failure, decline in storage capacities of tank due to
encroachment leads to lowering of water table which in turn cause, sea water intrusion, the share of fresh
water to Agriculture is decreasing, and hence farmers are forced to use available water irrespective of its
quality. As a consequence, groundwater depth and quality are deteriorating at a alarming rate in many
parts of the state. Quality of irrigation water is one of the main factors to be understood in irrigated
Agriculture. Water used for irrigation varies greatly in quality depending upon type and quantity of dissolved
salts. Injudicious irrigations even with good quality waters may also turn good soil into saline or alkaline
condition. The use of saline water is unavoidable in areas where no alternate facility for irrigation is
available. Such waters are being used knowing well that the quality of soil and yield of the crop would
continuously decrease.
In the arid and semiarid regions, irrigation is essential for successful agriculture and in some areas
particularly in arid zone, the main source of irrigation is groundwater that is usually saline with varying
degree of salt concentration. Such waters have been in use for decades with adverse effects on soil
productivity and crop growth.
Keeping all these in view and to combat these problems, this bulletin is prepared in comprehensive
form which contains considerable information regarding the fluctuation and quality of groundwater being
used by the farmers for irrigation purpose. In the present publication, Ground water quality of Perambalur
and Ariyalur district of Tamil Nadu, attempts have been made to assess the quality of saline water, to
categorize with respect to their suitability for crops and Soils. Also this bulletin is to update the relevant
information and Technologies developed by the AICRP on management of Salt affected soils and use of
saline water in agriculture, at Anbil Dharmalingam Agricultural College and Research Institute, Trichy have
also been included for adoption by the farmers.
Inspiration and constant encouragement received from the Dean ADAC and RI, Trichy is greatly
acknowledged. We express our deep sense of gratitude to Director, Central Soil Salinity Research Institute,
Karnal 132 001, Haryana, India, Dr. S.K.Ambast, Project Coordinator, AICRP scheme on “Management of
Salt Affected Soils and Use of saline water in Agriculture“ for their valuable guidance and financial
assistance. Acknowledgment is also due to our colleagues working in the project for the help rendered by
them. It is our sincere belief that this publication will be useful for the scientist, extension workers and
farmers for managing saline water for sustainable crop production. We wish to record the gratitude to our
field staff, office staff and all who rendered their support and services in various capacities throughout the
preparation of this document.
AUTHORS

Water is essential for all forms of life, food production and economic development. Only
0.5 % of water is available on earth surface making it more precious commodity on earth. The
present trends of population dynamics, shrinking land holding and reduced water availability
forces us to harness the available poor quality groundwater by evolving suitable technology and
proper management practices. Due to overexploitation of groundwater, even the available
water for irrigation is getting deteriorating in quality besides depletion in quantity.Utilization of
such poor quality water buildup salinity, sodicity and toxicity in soils leading to low productivity.
Hence it is inevitable to device proper irrigation management techniques. With the available
information, groundwater quality of Tamil Nadu was already prepared by All India Coordinated
research Project on management of salt affected soils, ADAC & RI, Trichy which is useful for
macrolevel planning. Microlevel planning is also needed since each subgroup needs specific
management practices at block level or village level. Hence an attempt has been made by the
AICRP scientists at ADAC & RI, Trichy to evaluate specific management practices along with
groundwater quality at block level. Adoption of these management practices by the farmers in
the affected region will not only make it possible to obtain reasonable yields but save further
degradation of land irrigated with such waters.The present bulletin on assessment of
groundwater quality of Ariyalur and Perambalur district is very appropriate and would provide a
stepping stone for enhancing the crop production and also for managing the poor quality water
in the district.
I complement the authors for bringing out such a compilation of survey and management practices for poor quality water of Perambalur and Ariyalur districts of Tamil Nadu. I hope this publication will be useful not only to the farmers but also to the scientific community, developmental agencies and planners for enhancing the crop production with the available poor quality waters.
(K. RAMASAMY)
*Tel: Off: +91 422 2431788 *Res: +91 422 2430887 *Fax: +91 422 2431672 *Email: [email protected]
Dr. K. RAMASAMY
Vice-Chancellor
Tamil Nadu Agricultural University
Coimbatore-641 003
Tamil Nadu, India
FOREWORD
Date:27-05-2013
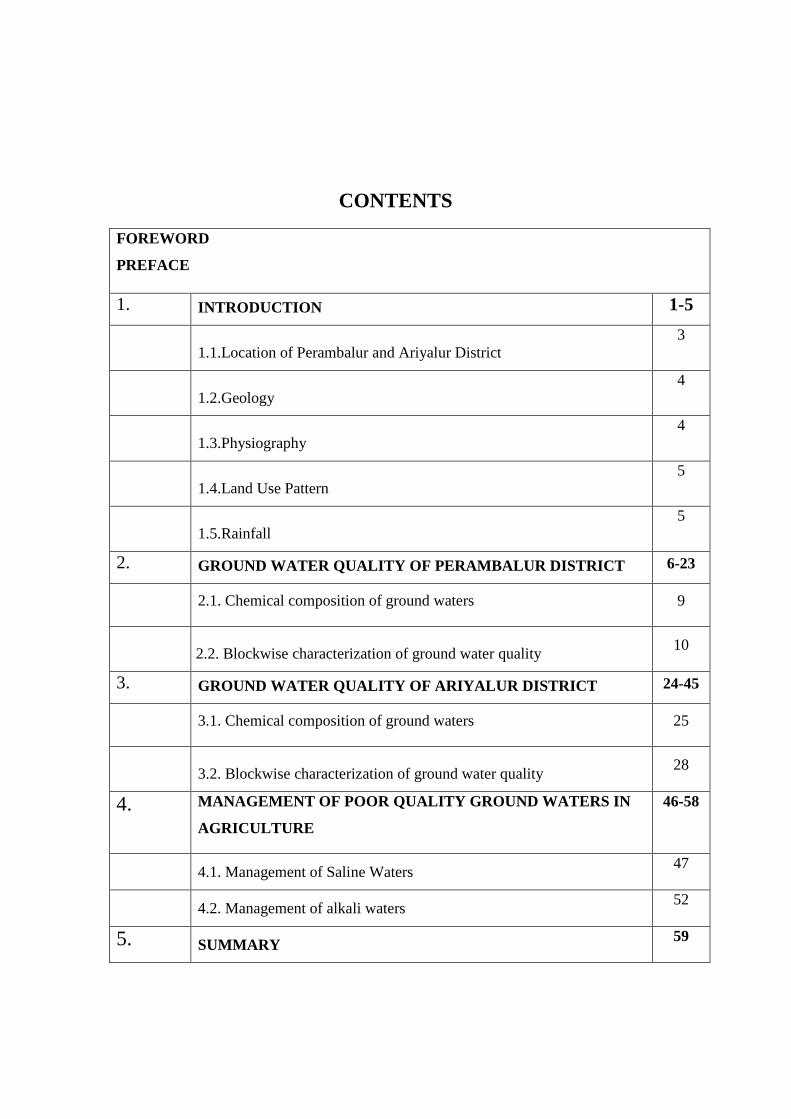
CONTENTS
FOREWORD
PREFACE
1. INTRODUCTION 1-5
1.1.Location of Perambalur and Ariyalur District
3
1.2.Geology
4
1.3.Physiography
4
1.4.Land Use Pattern
5
1.5.Rainfall
5
2. GROUND WATER QUALITY OF PERAMBALUR DISTRICT 6-23
2.1. Chemical composition of ground waters 9
2. 2.2. Blockwise characterization of ground water quality
10
3. GROUND WATER QUALITY OF ARIYALUR DISTRICT 24-45
3.1. Chemical composition of ground waters 25
3.2. Blockwise characterization of ground water quality
28
4. MANAGEMENT OF POOR QUALITY GROUND WATERS IN
AGRICULTURE
46-58
4.1. Management of Saline Waters 47
4.2. Management of alkali waters 52
5. SUMMARY 59
1
1 INTRODUCTION
The importance of irrigation and its interlinking with agricultural prosperity was well
understood. But presently Tamil Nadu is a water deficit state. The annual available water
resource per capita in Tamil Nadu is estimated at 600 m3, which is far below the national average
of 2200 m3. Due to overexploitation of ground water, even the available water for irrigation is
getting deteriorated in quality besides depletion in quantity.
Indiscriminant use of poor quality water poses great risk to human and animal health,
while deteriorating soil and environment. Utilization of such waters causes build up of salinity,
sodicity and toxicity in soils impairing crop productivity and many a times turning land unfit for
cultivation. In order to plan management strategies, there has been requirement of detailed
survey of groundwater quality.
Information on chemical composition is necessary but this alone is not sufficient to
decide its potential use for crop production at a specific location. Several other factors such as
nature of crop to be grown, soil characteristics (texture and mineralogy), climate and other water
management and cultural practices are equally important and should be taken into consideration.
Based on the characteristic features of majority of ground waters in use by the farmers in
different agro-ecological regions of the country and the above indices those describe the nature
of hazards on soils and crops, irrigation water have been broadly grouped into four classes
namely good, saline , alkali and toxic waters (AICRP – saline water,1991). By using the data
base available with different agencies viz., State Ground and Surface Water Resources Date
Centre (SG & SWRDC) and Soil Testing Laboratories, Department of Agriculture and AICRP
on management of salt affected soil, ground water quality of Tamil Nadu was already prepared
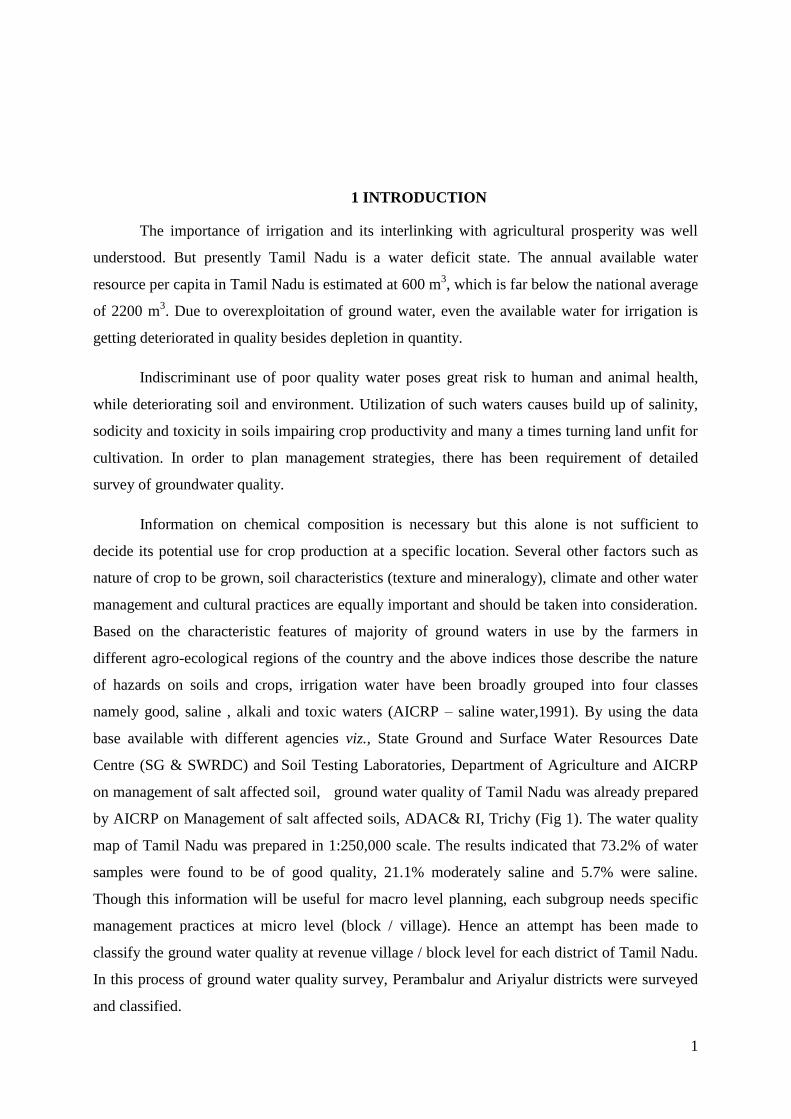
by AICRP on Management of salt affected soils, ADAC& RI, Trichy (Fig 1). The water quality
map of Tamil Nadu was prepared in 1:250,000 scale. The results indicated that 73.2% of water
samples were found to be of good quality, 21.1% moderately saline and 5.7% were saline.
Though this information will be useful for macro level planning, each subgroup needs specific
management practices at micro level (block / village). Hence an attempt has been made to
classify the ground water quality at revenue village / block level for each district of Tamil Nadu.
In this process of ground water quality survey, Perambalur and Ariyalur districts were surveyed
and classified.
2
Fig.1 Ground water quality Map of Tamil Nadu
3
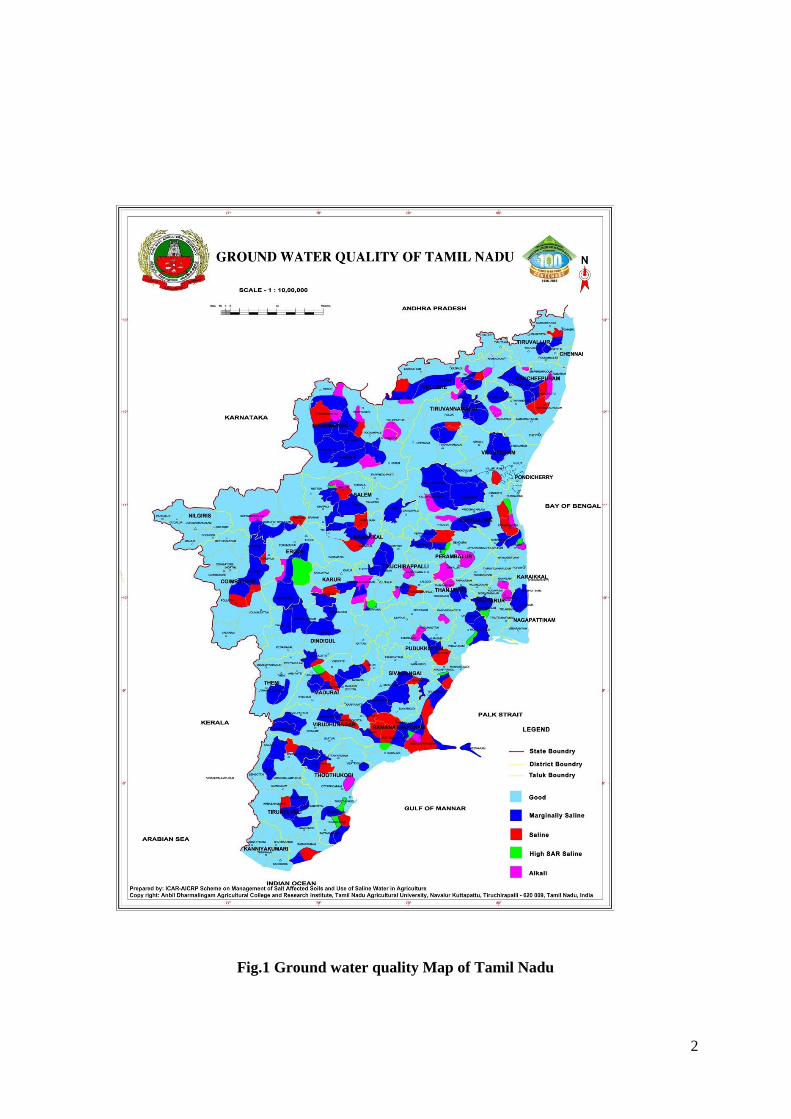
1.1. Location of Perambalur and Ariyalur District
Perambalur and Ariyalur districts are centrally located in Tamil Nadu (Fig 2) and are
267 KM away in southern direction from Chennai. Perambalur district is carved out from the
erstwhile composite district of Tiruchirapalli with the headquarters at Perambalur. Later
Perambalur district was bifurcated into two districts namely Perambalur distict with head
quarters at Perambalur and Ariyalur distict with headquarters at Ariyalur. However the
administrative set up towards agricultural activities is being operated combinedly with
headquarters at Perambalur.
The landscape of composite Perambalur district is versatile with hill range, series of
planins and valley bottoms. This composite district is bounded on the North by Cuddalore
district, North-West by Namakkal district and South-West by Tiruchirapalli and South by
Thanjavur districts. The district has an area of 3691.07 sq.km spread between 10.54’ and 11
0 30
degree Northen latitude and 780
38’ to 79
0 31
’ degree of the
Eastern longitude. It is an inland
district without coastal line. The Pachamallai hill situated on the North boundary of Perambalur
is the most important hill in the district.
Fig. 2 Location map of Perambalur and Ariyalur districts
4
1.2. Geology
The composite Perambalur district is made up of Archean, cretaceous, tertiary and
quartenary formation. Formations of upper Gondwana age are also found in a limited extent. The
Archaeans consist of biotite, hornblende, gneisses and charnockites. To the south and north they
are covered by alluvial deposits and to the east by the Cuddalore sand stone. The district is quite
rich in minerals like limestone, clays, clayey sand stones etc., The details are given below
1.Clays: These clays are used locally for superior type of pottery and also for
the manufacture of salt glazed pipes, fine bricks and electrical
insulators. Alluvial clays of Kollidam river and sandy clays occurring
over Cuddalore sand stone, are used locally for bricks making.
2.Lime stone: Sedimentary lime stone occurring as cretaceous formations and is
estimated 2,26,000 tonnes of 50 % CaO found in this district
3. Garnet: Garnet sand concretions occur on the Eastern and Northern sides.
Massive garnet, is reported to occur in crystalline lime stone in
Perambalur block.
4. Mineral pigments: Pale yellow ocherous clays associated with cretaceous clays occur in
Kunnam block.
1.3. Physiography
The general physiography of this district is versatile with hill ranges, series of plains,
valley bottoms undulating upland area and broken chains of Eastern Ghats viz., Pachamalai hills.
A part of Pachamalai hill is the important hill in Perambalur taluk of this district. The average
height of Pachamalai hill is 600 meters though a few of the peaks raise to about 1020 meters
above Mean Sea Level. But for this hill, Perambalur forms a gentle undulating upland and
having hilly areas. In this district, vellar is the important river flowing and substantially
benefiting agricultural activities. The vellar river rises from Salem district and forms boundary
between Perambalur and Cuddalore district. Kallar and Chinnar, which are tributaries of Vellar
and Marudaiyar rivers, traversing through Perambalur district.
5
1.4. Land Use Pattern
In this district, out of the total geographical extent of 3.69107 ha, only 2,38,814 ha (64.70
%) are used for agricultural purposes. A total of 32,933 ha (8.92 %) are kept as fallow lands. The
lands put to non-agricultural purposes occupy 43,953(11.91 %) ha. The cultivable waste lands of
7,742 (2.10 %) ha can be brought in to agricultural uses by suitable measures. The major crops
cultivated in the district are rice, millets, pulses, sugarcane, cotton and oil seeds. Rice is grown
as rainfed crop. Oil seeds such as groundnut and gingelly are grown both under irrigated and
rainfed conditions. Pulses like blackgram, greengram and redgram are grown in rice fallows.
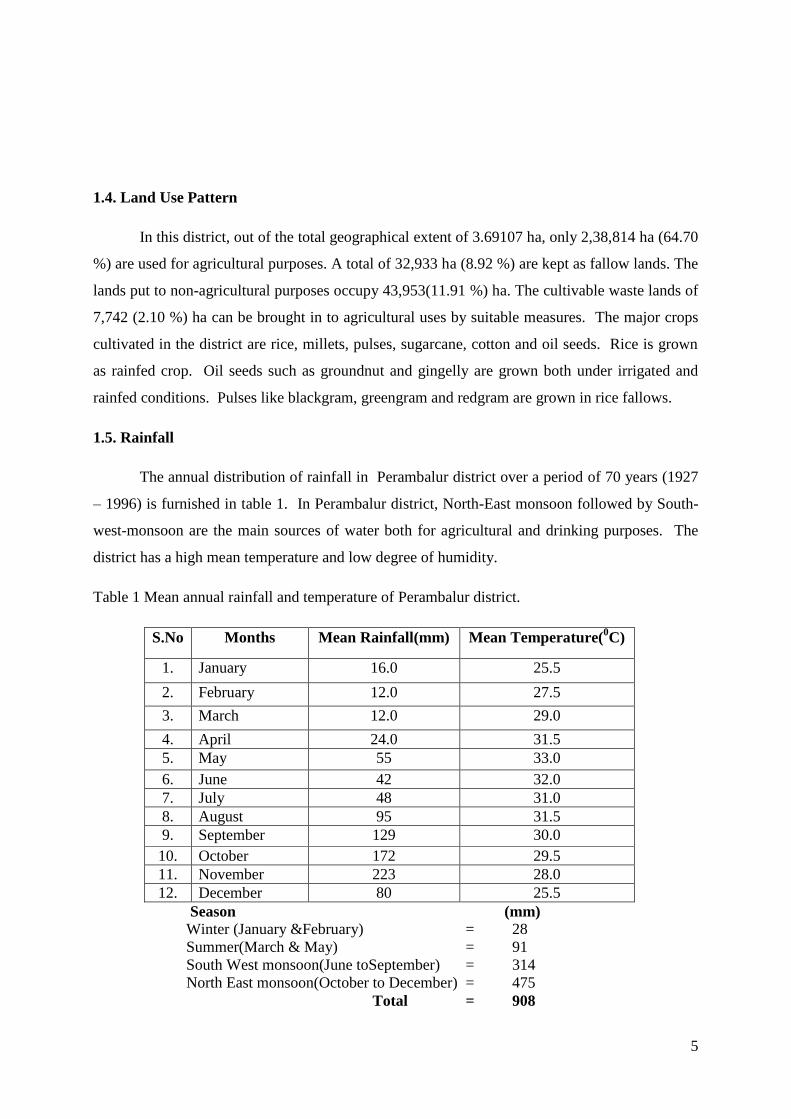
1.5. Rainfall
The annual distribution of rainfall in Perambalur district over a period of 70 years (1927
– 1996) is furnished in table 1. In Perambalur district, North-East monsoon followed by South-
west-monsoon are the main sources of water both for agricultural and drinking purposes. The
district has a high mean temperature and low degree of humidity.
Table 1 Mean annual rainfall and temperature of Perambalur district.
S.No Months Mean Rainfall(mm) Mean Temperature(0C)
1. January 16.0 25.5
2. February 12.0 27.5
3. March 12.0 29.0
4. April 24.0 31.5
5. May 55 33.0
6. June 42 32.0
7. July 48 31.0
8. August 95 31.5
9. September 129 30.0
10. October 172 29.5
11. November 223 28.0
12. December 80 25.5
Season (mm)
Winter (January &February) = 28
Summer(March & May) = 91
South West monsoon(June toSeptember) = 314
North East monsoon(October to December) = 475
Total = 908
6
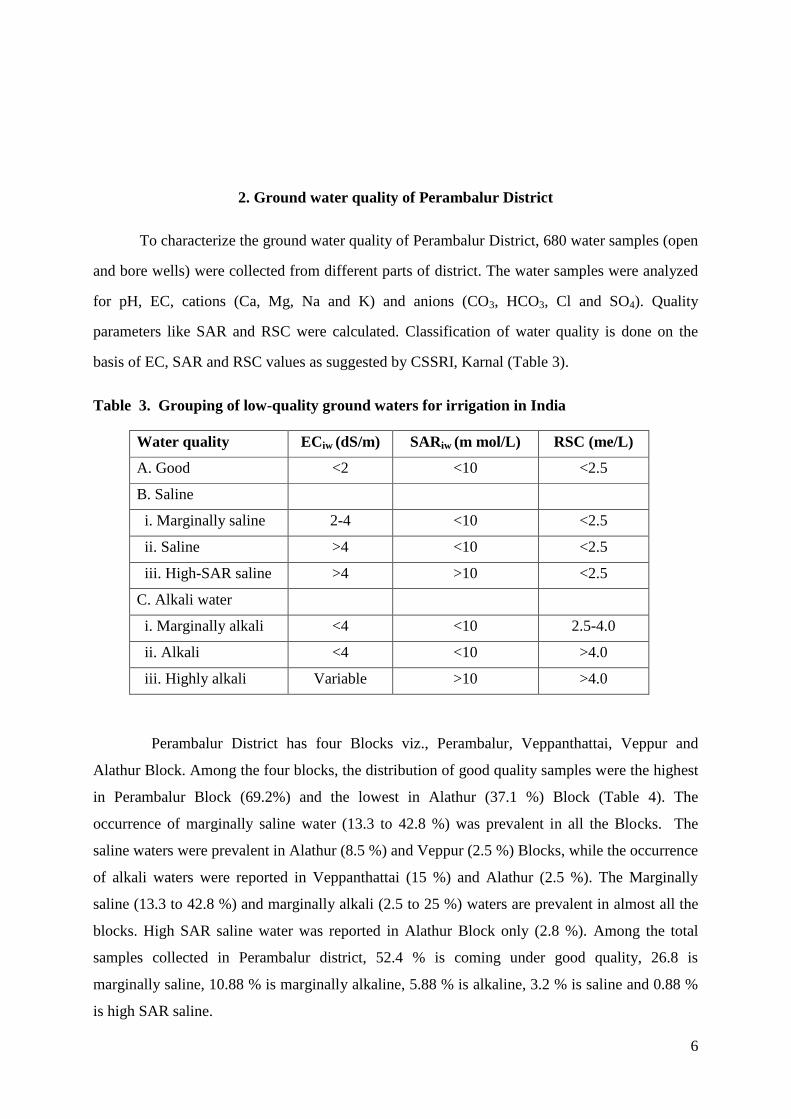
2. Ground water quality of Perambalur District
To characterize the ground water quality of Perambalur District, 680 water samples (open
and bore wells) were collected from different parts of district. The water samples were analyzed
for pH, EC, cations (Ca, Mg, Na and K) and anions (CO3, HCO3, Cl and SO4). Quality
parameters like SAR and RSC were calculated. Classification of water quality is done on the
basis of EC, SAR and RSC values as suggested by CSSRI, Karnal (Table 3).
Table 3. Grouping of low-quality ground waters for irrigation in India
Water quality ECiw (dS/m) SARiw (m mol/L) RSC (me/L)
A. Good <2 <10 <2.5
B. Saline
i. Marginally saline 2-4 <10 <2.5
ii. Saline >4 <10 <2.5
iii. High-SAR saline >4 >10 <2.5
C. Alkali water
i. Marginally alkali <4 <10 2.5-4.0
ii. Alkali <4 <10 >4.0
iii. Highly alkali Variable >10 >4.0
Perambalur District has four Blocks viz., Perambalur, Veppanthattai, Veppur and
Alathur Block. Among the four blocks, the distribution of good quality samples were the highest
in Perambalur Block (69.2%) and the lowest in Alathur (37.1 %) Block (Table 4). The
occurrence of marginally saline water (13.3 to 42.8 %) was prevalent in all the Blocks. The
saline waters were prevalent in Alathur (8.5 %) and Veppur (2.5 %) Blocks, while the occurrence
of alkali waters were reported in Veppanthattai (15 %) and Alathur (2.5 %). The Marginally
saline (13.3 to 42.8 %) and marginally alkali (2.5 to 25 %) waters are prevalent in almost all the
blocks. High SAR saline water was reported in Alathur Block only (2.8 %). Among the total
samples collected in Perambalur district, 52.4 % is coming under good quality, 26.8 is
marginally saline, 10.88 % is marginally alkaline, 5.88 % is alkaline, 3.2 % is saline and 0.88 %
is high SAR saline.
7
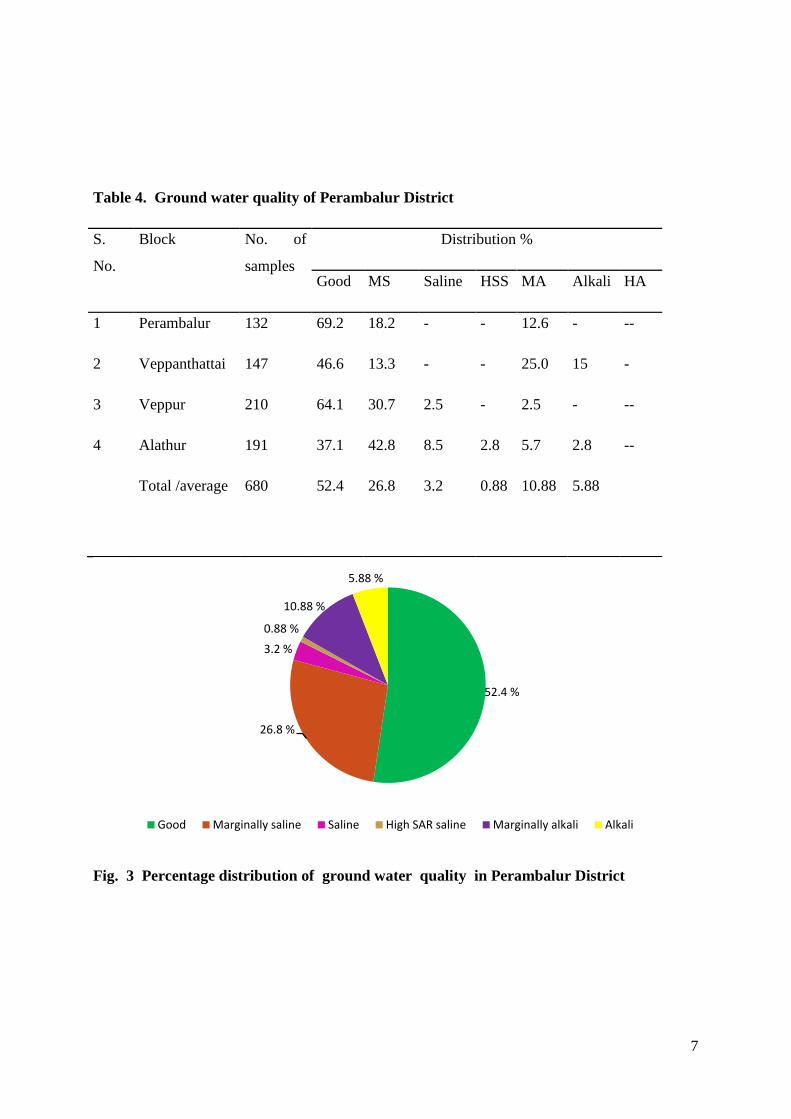
Table 4. Ground water quality of Perambalur District
S.
No.
Block No. of
samples
Distribution %
Good MS Saline HSS MA Alkali HA
1 Perambalur 132 69.2 18.2 - - 12.6 - --
2 Veppanthattai 147 46.6 13.3 - - 25.0 15 -
3 Veppur 210 64.1 30.7 2.5 - 2.5 - --
4 Alathur 191 37.1 42.8 8.5 2.8 5.7 2.8 --
Total /average 680 52.4 26.8 3.2 0.88 10.88 5.88
Fig. 3 Percentage distribution of ground water quality in Perambalur District
52.4 %
26.8 %
3.2 %
0.88 %
10.88 %
5.88 %
Good Marginally saline Saline High SAR saline Marginally alkali Alkali
8
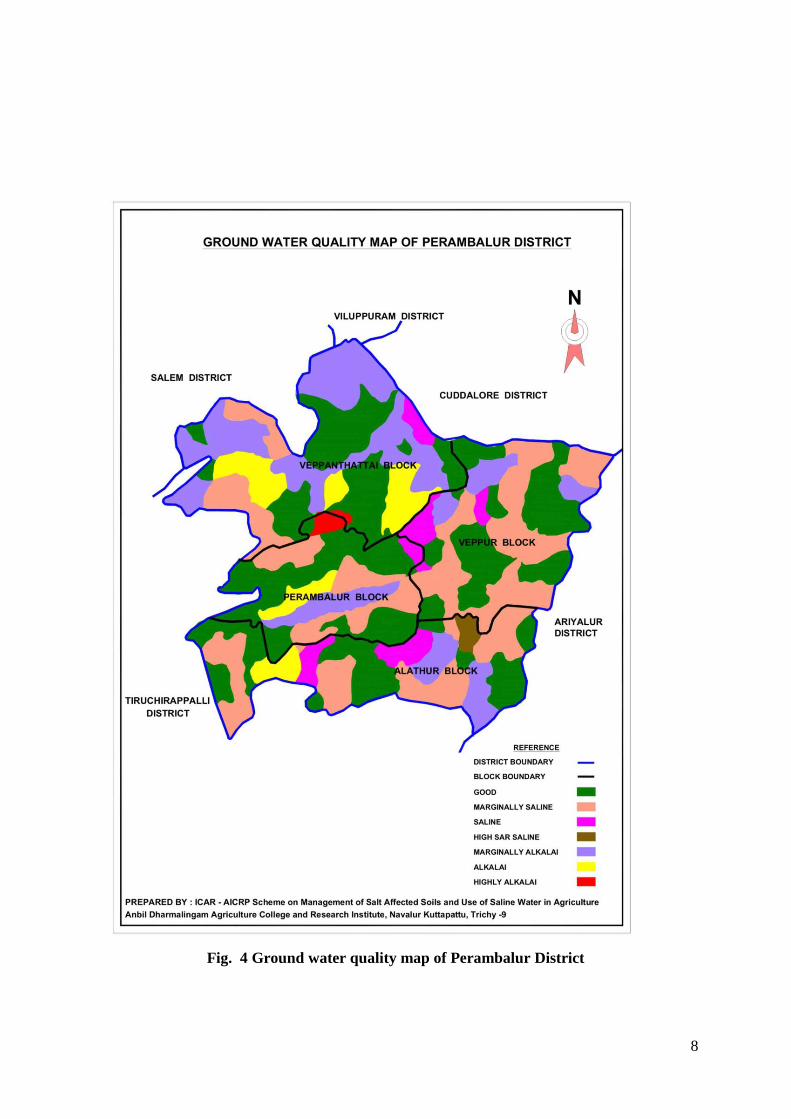
Fig. 4 Ground water quality map of Perambalur District
9
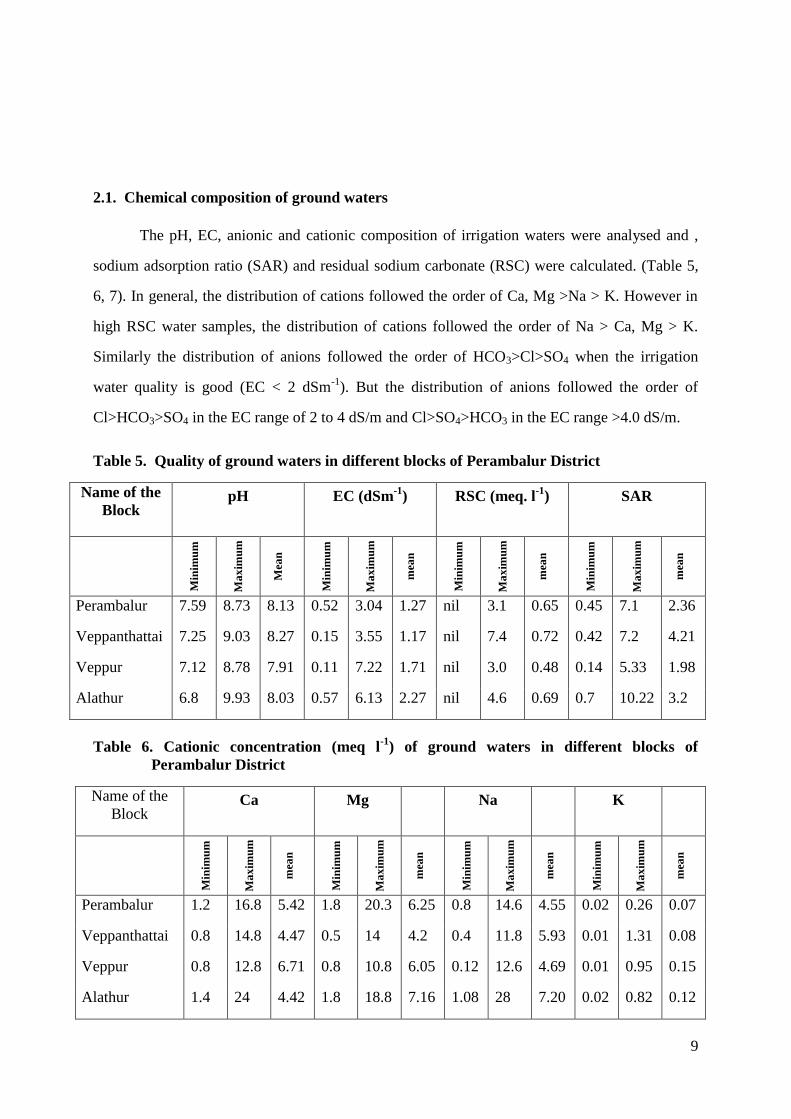
2.1. Chemical composition of ground waters
The pH, EC, anionic and cationic composition of irrigation waters were analysed and ,
sodium adsorption ratio (SAR) and residual sodium carbonate (RSC) were calculated. (Table 5,
6, 7). In general, the distribution of cations followed the order of Ca, Mg >Na > K. However in
high RSC water samples, the distribution of cations followed the order of Na > Ca, Mg > K.
Similarly the distribution of anions followed the order of HCO3>Cl>SO4 when the irrigation
water quality is good (EC < 2 dSm-1
). But the distribution of anions followed the order of
Cl>HCO3>SO4 in the EC range of 2 to 4 dS/m and Cl>SO4>HCO3 in the EC range >4.0 dS/m.
Table 5. Quality of ground waters in different blocks of Perambalur District
Name of the
Block pH EC (dSm
-1) RSC (meq. l
-1) SAR
Min
imu
m
Ma
xim
um
Mea
n
Min
imu
m
Ma
xim
um
mea
n
Min
imu
m
Ma
xim
um
mea
n
Min
imu
m
Ma
xim
um
mea
n
Perambalur 7.59 8.73 8.13 0.52 3.04 1.27 nil 3.1 0.65 0.45 7.1 2.36
Veppanthattai 7.25 9.03 8.27 0.15 3.55 1.17 nil 7.4 0.72 0.42 7.2 4.21
Veppur 7.12 8.78 7.91 0.11 7.22 1.71 nil 3.0 0.48 0.14 5.33 1.98
Alathur 6.8 9.93 8.03 0.57 6.13 2.27 nil 4.6 0.69 0.7 10.22 3.2
Table 6. Cationic concentration (meq l-1
) of ground waters in different blocks of
Perambalur District
Name of the
Block Ca Mg Na K
Min
imu
m
Ma
xim
um
mea
n
Min
imu
m
Ma
xim
um
mea
n
Min
imu
m
Ma
xim
um
mea
n
Min
imu
m
Ma
xim
um
mea
n
Perambalur 1.2 16.8 5.42 1.8 20.3 6.25 0.8 14.6 4.55 0.02 0.26 0.07
Veppanthattai 0.8 14.8 4.47 0.5 14 4.2 0.4 11.8 5.93 0.01 1.31 0.08
Veppur 0.8 12.8 6.71 0.8 10.8 6.05 0.12 12.6 4.69 0.01 0.95 0.15
Alathur 1.4 24 4.42 1.8 18.8 7.16 1.08 28 7.20 0.02 0.82 0.12
10
Table 7. Anionic concentration (meq l-1
) of ground waters in different blocks of
Perambalur District
Name of the
Block HCO3 CO3 SO4 Cl
Min
imu
m
Ma
xim
um
Mea
n
Min
imu
m
Ma
xim
um
mea
n
Min
imu
m
Ma
xim
um
mea
n
Min
imu
m
Ma
xim
um
mea
n
Perambalur 1.2 16.8 5.32 0.06 6.2 2.41 0.4 7.36 1.65 1 19 5.69
Veppanthattai 1.0 9.8 5.20 0.2 4.4 2.34 0.13 8.22 1.50 0.6 21 3.36
Veppur 0.6 8.4 4.05 0.4 5.6 2.05 0.01 9.5 2.8 1 22 6.34
Alathur 1.8 12.8 7.5 0.6 6.4 2.6 0.22 18.6 4.2 2 25 8.6
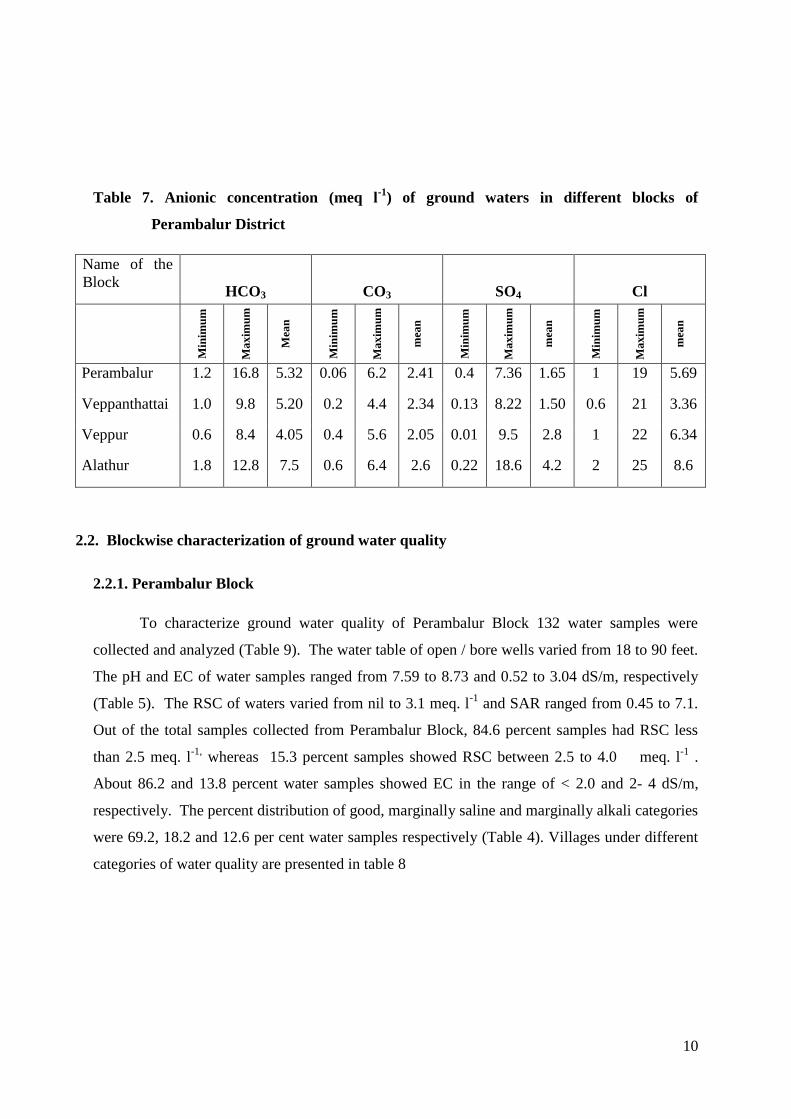
2.2. Blockwise characterization of ground water quality
2.2.1. Perambalur Block
To characterize ground water quality of Perambalur Block 132 water samples were
collected and analyzed (Table 9). The water table of open / bore wells varied from 18 to 90 feet.
The pH and EC of water samples ranged from 7.59 to 8.73 and 0.52 to 3.04 dS/m, respectively
(Table 5). The RSC of waters varied from nil to 3.1 meq. l-1
and SAR ranged from 0.45 to 7.1.
Out of the total samples collected from Perambalur Block, 84.6 percent samples had RSC less
than 2.5 meq. l-1,
whereas 15.3 percent samples showed RSC between 2.5 to 4.0 meq. l-1
.
About 86.2 and 13.8 percent water samples showed EC in the range of < 2.0 and 2- 4 dS/m,
respectively. The percent distribution of good, marginally saline and marginally alkali categories
were 69.2, 18.2 and 12.6 per cent water samples respectively (Table 4). Villages under different
categories of water quality are presented in table 8
11
Table 8 Villages under different categories of water quality in Perambalur Block of
Perambalur District
Water
quality
Name of the villages
GOOD Aranarai, Sokkanadhapuram, Alampadi, Cencheri, Aranari Chanankottakai,
Ayalur, Kudikadu, Chathramanai, Esanai, Pappankarai, Alangeli, Elambalur,
Indhranagar, Kothadimaikalani, Gurumbalur, Kalpadi, K.Eraiur, Erayachathram,
Neduvasal, Kelakkarai, Perampalur, Pommanappadi, Vellur, Pudhu Vellur,
Kelakkanavai, Thambiranpatti, Renganathapuram, Serukunam, Arumadal,
Palappadi, Vadakkumadhavi, Somanadhapudhur, Govindhapuram
MA Duraimangalam, Kalarampatti, Pudhu Naduvalur, Vilamuthur, Renganathapuram,
Metlur, Pudhur, Sathanur, Gandhi Nagar, Notchiam, Cellipalaiyam.
MS Melapuliyur, Navalur, Thirupaiyur, Siruvatchur.
2.2.2. Veppanthattai Block
In Veppanthattai Block, for studying the water quality 147 water samples were collected
and analyzed (Table 11). The water table of open / bore wells varied from 12 to 80 feet. The
variation in pH and EC ranged from 7.25 to 9.03 and 0.15 to 3.55 dSm-1
, respectively (Table 5).
The RSC of waters varied from nil to 7.4 meq. l-1
and SAR ranged from 0.42 to 7.2. Out of the
total samples collected from Perambalur Block, 60 percent samples had RSC less than 2.5 meq. l-
1, whereas, 25 per cent samples showed RSC between 2.5 to 4.0 meq. l
-1 and 15 percent samples
showed RSC > 4.0 meq. l-1
. About 86.6 and 13.3 percent water samples showed EC in the
range of < 2.0 and 2- 4 dS/m, respectively. The percent distribution of good, marginally saline,
marginally alkali and alkali water categories were 46.6, 13.3, 25.0 and 15.0 per cent respectively
(Table 4). Villages under different categories of water quality are presented in table 10.

12
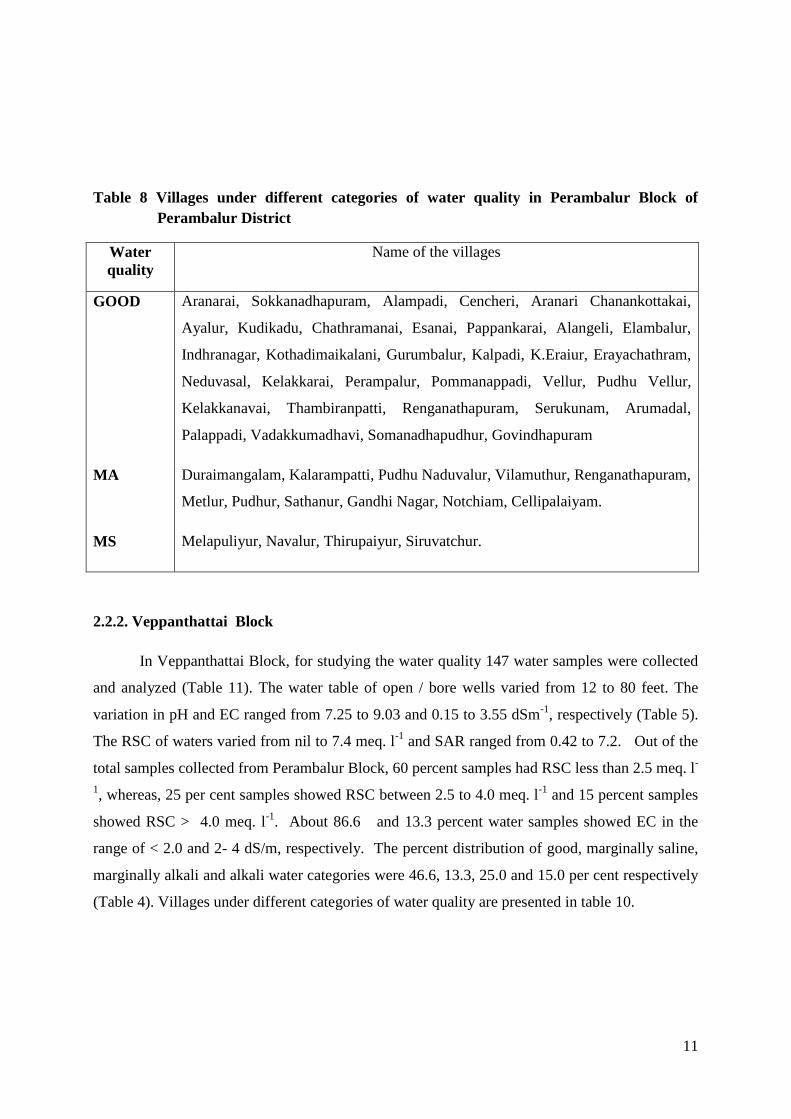
Tab
le 9 C
hem
ical characteristics o
f un
derg
rou
nd irrig
ation
waters o
f Peram
balu
r blo
ck o
f Peram
balu
r distirct
S.N
o
Rev
inu
e villa
ge
No.
of
sam
ple
s
PH
E
C
dS
m-1
Ca
meq
l -1
Mg
meq
l -1
Na
meq
l -1
K
meq
l -1
CO
3
meq
l -1
HC
O3
meq
l -1
Cl
meq
l -1
SO
4
meq
l -1
RS
C
meq
l -1
SA
R
1
Ara
narai
6
7.9
-8.3
0
.7-0
.91
3.2
-4.8
3
.2-5
.8
1.8
-3.1
0
.04
-0.6
1
.0-1
.8
1.4
-3.1
3
-7
0.6
-1.8
4
Nil
1.3
5-2
.1
2
Aran
arai(W)
4
7.9
-8.3
0
.69
-
0.7
7
2.0
-3.8
2
.2-5
.0
0.9
5-1
.8
0.0
3-
0.0
5
0.8
-1.4
1
.2-2
.8
2.0
-6.0
0
.4-1
.18
Nil
0.4
5-1
.2
3
Aran
arai(S)
5
7.6
-
8.1
3
0.9
-1.9
7
3.8
-4.4
3
.2-8
.2
3.6
-6.0
5
0.0
2-
0.0
7
1.8
-2.1
2
.8-7
.1
2.6
-8.0
0
.8-1
.22
Nil
1.6
5-2
.8
4
Alan
kizh
i 5
8
.0-
8.2
4
1.2
-1.9
2
4.8
-6.8
3
.6-6
.2
1.2
-4.2
0
.06
-
0.1
2
1.2
-2.2
2
.8-4
.4
4-9
1
.2-1
.72
Nil
0.7
1-1
.8
5
Am
map
alayam
6
7
.72
-
8.1
-
0.6
9-1
.1
2.8
-4.2
4
.0-6
.8
0.8
-1.6
7
0.0
2-
0.0
8
0.8
-1.2
3
.2-4
.2
2.0
-6.0
1
.7-2
.69
Nil
2.2
6-0
.8
6
Ayelu
r 5
7
.59
-
7.9
-
1.-1
.5
4.8
-7.0
4
.2-1
0.2
1
.2-6
.2
0.0
5-
0.1
0
0.0
9-2
.6
3.6
-9.8
3
-7
2.2
6-
1.8
5
Nil
0.5
5-1
.0
7
Ch
athram
anai
6
7.5
2-
8.0
0.6
-1.1
2
.6-4
.4
3.2
-4.8
0
.8-1
.18
0.0
3-
0.0
8
0.2
-0.6
4
.2-2
.9
2-4
1
.2-3
.31
Nil
0.5
5-2
.8
8
Dh
uraim
angalam
5
8
.51
-
8.7
7
0.9
6-
1.9
7
1.8
-4.8
1
.9-3
.6
9.8
- 14
.6
0.0
2-
0.0
6
2.8
-4
5.6
-7.2
2
-10
0.0
8-
1.8
6
Nil-3
.1
1.2
4-7
.1
9
Esan
ani
5
7.8
5-
8.0
1.0
-1.3
6
2.6
-3.9
2
.8-9
.8
1.2
-3.1
0
.03
-
0.0
6
1.2
-4.8
1
.8-3
2
-9
1.0
-2.3
3
Nil
0.8
1-1
.9
10
Elam
balu
r 5
7
.9-
8.3
6
0.9
9-1
.2
3.2
-4.1
2
.8-5
.2
1.8
-4.2
0
.02
-
0.0
7
1.6
-2.2
2
.6-4
.8
2-5
0
.8-1
.57
Nil
0.9
8-1
.4
11
Ku
rum
balu
r(N)
5
7.8
3-
8.2
0.9
9-1
.2
1.9
-4.2
2
.6-6
.4
0.0
8-
2.2
6
0.0
2-
0.0
6
1-1
.4
2.1
-4.2
2
.1-6
1
.0-1
.68
Nil
0.8
-1.3
6
12
Ku
rum
balu
r(S)
4
7.8
-
8.2
5
0.9
4-1
.2
3.2
-4.6
3
.8-6
.4
1.2
-3.2
0
.04
-
0.0
7
0.8
-2.2
1
.4-4
.2
2.2
-5
1.2
-2.8
4
Nil
0.8
-1.9
13
Kalp
adi (N
) 4
8
.12
-
8.2
8
0.7
8-
3.0
4
4.6
-16.8
5
.2-2
0.3
4
.2-1
2.6
0
.11
-
0.2
6
3.8
-6.2
4
--16
.8
5-1
9
1.3
1-
7.9
6
Nil
1.7
4-
2.9
3
14
Kalp
adi (S
) 4
8
.07
-
8.2
3
1.3
8-
1.8
7
5.2
-6.8
7
.2-9
.8
3.5
2-4
.6
0.0
5-
0.0
8
2.8
-4.2
6
.2-6
.8
6-9
1
.68
-
2.1
7
Nil-5
1
.22
-
1.7
4
13
15
Kalaram
patti
5
8.5
4-
8.7
2
0.6
9-
0.7
6
1.2
-2.6
1
.8-2
.2
8.2
-9.4
0
.06
-
0.0
8
2.2
-2.6
4
.8-5
.2
4--6
0
.38
-
0.8
6
Nil-2
.6
1.8
3-3
.0
16
Keelak
arai 6
7
.9-8
.2
1.2
2-
1.3
2
4.8
-5.4
3
.2-4
.2
2.6
-4
0.0
4-
0.0
8
1.2
-2.2
4
.2-4
.8
4-6
0
.64
-
1.2
4
Nil
1.3
-1.8
8
17
Melap
uliu
r(E)
6
7.6
8-
7.9
2
1.9
2-
2.2
5
7.0
-8.6
8
.0-1
0.4
4
.6-5
.8
0.0
5-
0.1
0
2.8
-3.4
3
.6-4
.8
8-1
4
1.8
-2.6
5
Nil
2.6
-3.8
1
18
Melap
uliu
r(W)
6
7.9
4-
8.1
4
2.1
0-
2.2
4
5.2
-6.4
6
.4-8
.8
3.2
-3.8
0
.04
-
0.0
6
1.8
-2.2
4
.6-6
.4
10
-16
1.1
5-2
.9
Nil
2.8
-3.4
2
19
No
tchiam
6
8
.47
-
8.6
3
0.7
7-
0.9
4
2.8
-3.2
4
-4.8
4
.2-8
.4
0.0
3-
0.0
6
2.6
-3.4
6
.8-7
.2
2-5
0
.43
-
0.4
6
1.8
-3.0
2
.1-4
.43
20
Peram
balu
r(s) 5
8
.13
-
8.2
8
0.6
8-
1.0
4
4.2
-6.6
4
.8-5
.2
2.8
-4.4
0
.03
-
0.0
8
1.6
-1.8
3
.2-4
.4
6-1
0
0.2
3-1
.2
Nil
1.4
-1.6
21
Pu
thu
Nad
uvalu
r 6
8
.63
-
8.7
3
0.7
9-
0.9
4
4.4
-4.8
4
.2-4
.6
4.9
8-
9.1
3
0.0
4-
0.0
3
2.4
-2.8
8
.2-9
.2
2-4
0
.62
-
2.5
6
2.6
-2.9
1
.58
-3.4
22
Po
mm
anap
pad
i 5
7
.95
-
8.4
9
1.3
2-
1.8
4
4.2
-8.6
5
.6-9
.8
4.2
-6.8
0
.08
-
0.1
7
2.6
-4.2
4
.8-8
.9
4-8
1
.27
-
2.4
9
Nil- 1
.7
1.5
9-
3.0
7
23
Ch
iruvatch
ur
6
7.8
9-
8.2
8
0.7
6-
3.0
4
4.8
-14.8
4
.2-1
0.6
2
.4-6
.14
0.0
3-
0.0
5
1.2
-4.2
2
.6-8
.4
6-1
3
1.6
3-
5.9
9
Nil
0.7
5-
1.1
3
24
Vellu
r 7
7
.69
-
7.9
2
0.7
7-
0.8
2
2-4
.8
3.2
-6.4
0
.98
-
1.5
4
0.0
2-
0.1
6
1.2
-2.2
1
.4-4
.2
2-4
0
.8-3
.5
Nil
0.5
-0.7
2
25
Seru
ku
nam
4
8
.28
-
8.4
8
0.9
-1.1
9
4-6
.8
4.2
-4.8
2
.8-4
.25
0.0
4-
0.1
2
2.8
-4.2
2
-6.8
2
-7
0.2
9-
0.7
2
Nil
1.8
-2.0
26
Peram
balu
r (N)
6
8.2
3-
8.2
5
0.5
2-
0.9
8
1.6
-5.8
2
.6-4
.2
2.7
-3.6
9
0.5
2-
0.0
7
1.2
-2.2
2
.3-4
.8
3-5
0
.77
-
1.9
1
Nil
Nil
1.2
1
14
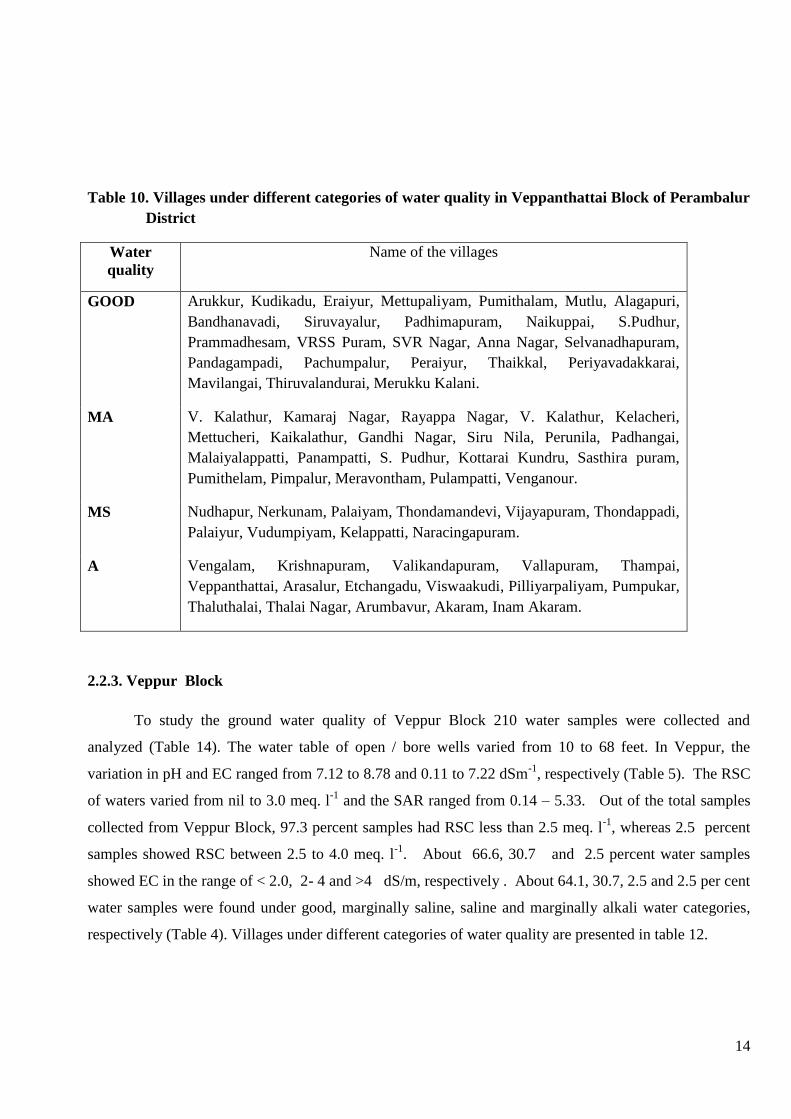
Table 10. Villages under different categories of water quality in Veppanthattai Block of Perambalur
District
Water
quality
Name of the villages
GOOD Arukkur, Kudikadu, Eraiyur, Mettupaliyam, Pumithalam, Mutlu, Alagapuri,
Bandhanavadi, Siruvayalur, Padhimapuram, Naikuppai, S.Pudhur,
Prammadhesam, VRSS Puram, SVR Nagar, Anna Nagar, Selvanadhapuram,
Pandagampadi, Pachumpalur, Peraiyur, Thaikkal, Periyavadakkarai,
Mavilangai, Thiruvalandurai, Merukku Kalani.
MA V. Kalathur, Kamaraj Nagar, Rayappa Nagar, V. Kalathur, Kelacheri,
Mettucheri, Kaikalathur, Gandhi Nagar, Siru Nila, Perunila, Padhangai,
Malaiyalappatti, Panampatti, S. Pudhur, Kottarai Kundru, Sasthira puram,
Pumithelam, Pimpalur, Meravontham, Pulampatti, Venganour.
MS Nudhapur, Nerkunam, Palaiyam, Thondamandevi, Vijayapuram, Thondappadi,
Palaiyur, Vudumpiyam, Kelappatti, Naracingapuram.
A Vengalam, Krishnapuram, Valikandapuram, Vallapuram, Thampai,
Veppanthattai, Arasalur, Etchangadu, Viswaakudi, Pilliyarpaliyam, Pumpukar,
Thaluthalai, Thalai Nagar, Arumbavur, Akaram, Inam Akaram.
2.2.3. Veppur Block
To study the ground water quality of Veppur Block 210 water samples were collected and
analyzed (Table 14). The water table of open / bore wells varied from 10 to 68 feet. In Veppur, the
variation in pH and EC ranged from 7.12 to 8.78 and 0.11 to 7.22 dSm-1
, respectively (Table 5). The RSC
of waters varied from nil to 3.0 meq. l-1
and the SAR ranged from 0.14 – 5.33. Out of the total samples
collected from Veppur Block, 97.3 percent samples had RSC less than 2.5 meq. l-1
, whereas 2.5 percent
samples showed RSC between 2.5 to 4.0 meq. l-1
. About 66.6, 30.7 and 2.5 percent water samples
showed EC in the range of < 2.0, 2- 4 and >4 dS/m, respectively . About 64.1, 30.7, 2.5 and 2.5 per cent
water samples were found under good, marginally saline, saline and marginally alkali water categories,
respectively (Table 4). Villages under different categories of water quality are presented in table 12.
15
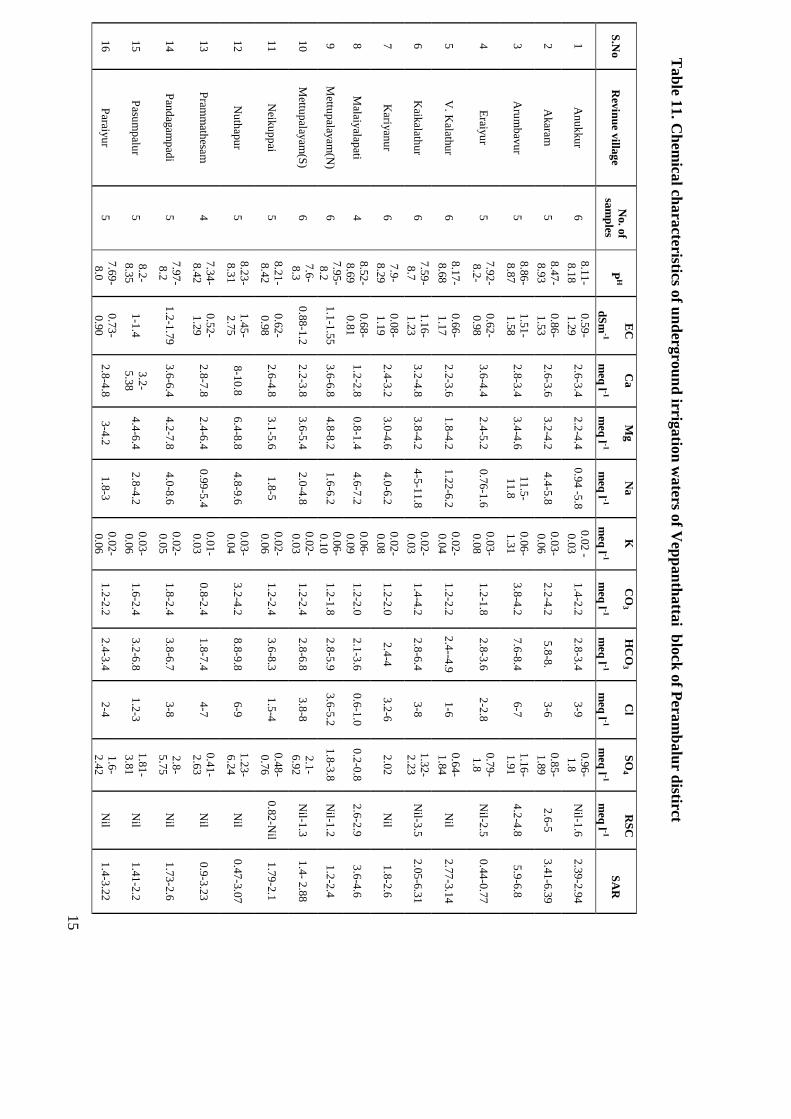
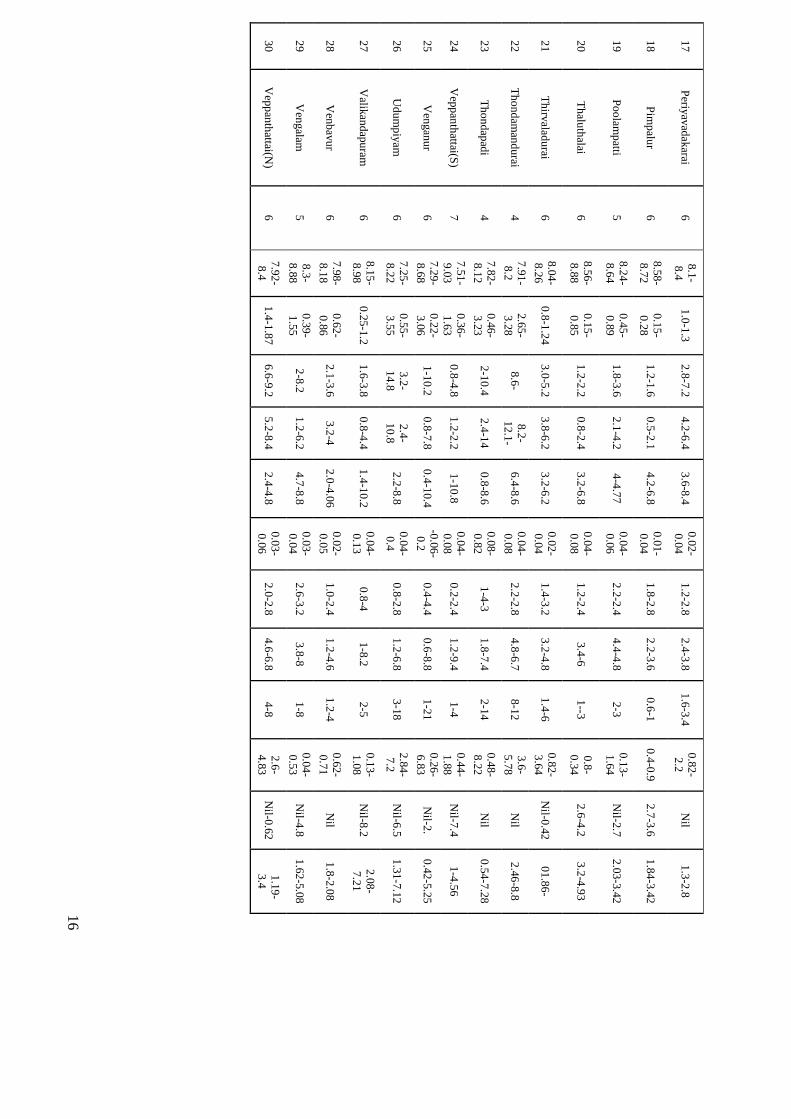
Ta
ble 1
1. C
hem
ical ch
ara
cteristics of u
nd
ergro
un
d irrig
atio
n w
aters o
f Vep
pa
nth
atta
i blo
ck o
f Pera
mb
alu
r distirct
S.N
o
Rev
inu
e villa
ge
No. o
f
sam
ples
PH
EC
dS
m-1
Ca
meq
l -1
Mg
meq
l -1
Na
meq
l -1
K
meq
l -1
CO
3
meq
l -1
HC
O3
meq
l -1
Cl
meq
l -1
SO
4
meq
l -1
RS
C
meq
l -1
SA
R
1
An
ukku
r 6
8
.11
-
8.1
8
0.5
9-
1.2
9
2.6
-3.4
2
.2-4
.4
0.9
4 -5
.8
0.0
2 -
0.0
3
1.4
-2.2
2
.8-3
.4
3-9
0
.96
-
1.8
N
il-1.6
2
.39
-2.9
4
2
Akaram
5
8
.47
-
8.9
3
0.8
6-
1.5
3
2.6
-3.6
3
.2-4
.2
4.4
-5.8
0
.03
-
0.0
6
2.2
-4.2
5
.8-8
. 3
-6
0.8
5-
1.8
9
2.6
-5
3.4
1-6
.39
3
Aru
mb
avu
r 5
8
.86
-
8.8
7
1.5
1-
1.5
8
2.8
-3.4
3
.4-4
.6
11
.5-
11
.8
0.0
6-
1.3
1
3.8
-4.2
7
.6-8
.4
6-7
1
.16
-
1.9
1
4.2
-4.8
5
.9-6
.8
4
Eraiy
ur
5
7.9
2-
8.2
-
0.6
2-
0.9
8
3.6
-4.4
2
.4-5
.2
0.7
6-1
.6
0.0
3-
0.0
8
1.2
-1.8
2
.8-3
.6
2-2
.8
0.7
9-
1.8
N
il-2.5
0
.44
-0.7
7
5
V. K
alathu
r 6
8
.17
-
8.6
8
0.6
6-
1.1
7
2.2
-3.6
1
.8-4
.2
1.2
2-6
.2
0.0
2-
0.0
4
1.2
-2.2
2
.4--4
.9
1-6
0
.64
-
1.8
4
Nil
2.7
7-3
.14
6
Kaik
alathu
r 6
7
.59
-
8.7
1.1
6-
1.2
3
3.2
-4.8
3
.8-4
.2
4-5
-11
.8
0.0
2-
0.0
3
1.4
-4.2
2
.8-6
.4
3-8
1
.32
-
2.2
3
Nil-3
.5
2.0
5-6
.31
7
Kariy
anu
r 6
7
.9-
8.2
9
0.0
8-
1.1
9
2.4
-3.2
3
.0-4
.6
4.0
-6.2
0
.02
-
0.0
8
1.2
-2.0
2
.4-4
3
.2-6
2
.02
Nil
1.8
-2.6
8
Malaiy
alapati
4
8.5
2-
8.6
9
0.6
8-
0.8
1
1.2
-2.8
0
.8-1
.4
4.6
-7.2
0
.06
-
0.0
9
1.2
-2.0
2
.1-3
.6
0.6
-1.0
0
.2-0
.8
2.6
-2.9
3
.6-4
.6
9
Mettu
palay
am(N
) 6
7
.95
-
8.2
1
.1-1
.55
3.6
-6.8
4
.8-8
.2
1.6
-6.2
0
.06
-
0.1
0
1.2
-1.8
2
.8-5
.9
3.6
-5.2
1
.8-3
.8
Nil-1
.2
1.2
-2.4
10
Mettu
palay
am(S
) 6
7
.6-
8.3
0
.88
-1.2
2
.2-3
.8
3.6
-5.4
2
.0-4
.8
0.0
2-
0.0
3
1.2
-2.4
2
.8-6
.8
3.8
-8
2.1
-
6.9
2
Nil-1
.3
1.4
- 2.8
8
11
Neik
up
pai
5
8.2
1-
8.4
2
0.6
2-
0.9
8
2.6
-4.8
3
.1-5
.6
1.8
-5
0.0
2-
0.0
6
1.2
-2.4
3
.6-8
.3
1.5
-4
0.4
8-
0.7
6
0.8
2-N
il 1
.79
-2.1
12
Nu
thap
ur
5
8.2
3-
8.3
1
1.4
5-
2.7
5
8-1
0.8
6
.4-8
.8
4.8
-9.6
0
.03
-
0.0
4
3.2
-4.2
8
.8-9
.8
6-9
1
.23
-
6.2
4
Nil
0.4
7-3
.07
13
Pram
math
esam
4
7.3
4-
8.4
2
0.5
2-
1.2
9
2.8
-7.8
2
.4-6
.4
0.9
9-5
.4
0.0
1-
0.0
3
0.8
-2.4
1
.8-7
.4
4-7
0
.41
-
2.6
3
Nil
0.9
-3.2
3
14
Pan
dag
amp
adi
5
7.9
7-
8.2
1
.2-1
.79
3.6
-6.4
4
.2-7
.8
4.0
-8.6
0
.02
-
0.0
5
1.8
-2.4
3
.8-6
.7
3-8
2
.8-
5.7
5
Nil
1.7
3-2
.6
15
Pasu
mp
alur
5
8.2
-
8.3
5
1-1
.4
3.2
-
5.3
8
4.4
-6.4
2
.8-4
.2
0.0
3-
0.0
6
1.6
-2.4
3
.2-6
.8
1.2
-3
1.8
1-
3.8
1
Nil
1.4
1-2
.2
16
Paraiy
ur
5
7.6
9-
8.0
0.7
3-
0.9
0
2.8
-4.8
3
-4.2
1
.8-3
0
.02
-
0.0
6
1.2
-2.2
2
.4-3
.4
2-4
1
.6-
2.4
2
Nil
1.4
-3.2
2
16
17
Periy
avad
akarai
6
8.1
-
8.4
1
.0-1
.3
2.8
-7.2
4
.2-6
.4
3.6
-8.4
0
.02
-
0.0
4
1.2
-2.8
2
.4-3
.8
1.6
-3.4
0
.82
-
2.2
N
il 1
.3-2
.8
18
Pim
palu
r 6
8
.58
-
8.7
2
0.1
5-
0.2
8
1.2
-1.6
0
.5-2
.1
4.2
-6.8
0
.01
-
0.0
4
1.8
-2.8
2
.2-3
.6
0.6
-1
0.4
-0.9
2
.7-3
.6
1.8
4-3
.42
19
Po
olam
patti
5
8.2
4-
8.6
4
0.4
5-
0.8
9
1.8
-3.6
2
.1-4
.2
4-4
.77
0.0
4-
0.0
6
2.2
-2.4
4
.4-4
.8
2-3
0
.13
-
1.6
4
Nil-2
.7
2.0
3-3
.42
20
Th
aluth
alai 6
8
.56
-
8.8
8
0.1
5-
0.8
5
1.2
-2.2
0
.8-2
.4
3.2
-6.8
0
.04
-
0.0
8
1.2
-2.4
3
.4-6
1
--3
0.8
-
0.3
4
2.6
-4.2
3
.2-4
.93
21
Th
irvalad
urai
6
8.0
4-
8.2
6
0.8
-1.2
4
3.0
-5.2
3
.8-6
.2
3.2
-6.2
0
.02
-
0.0
4
1.4
-3.2
3
.2-4
.8
1.4
-6
0.8
2-
3.6
4
Nil-0
.42
01
.86
-
22
Th
on
dam
and
urai
4
7.9
1-
8.2
2.6
5-
3.2
8
8.6
- 8
.2-
12
.1-
6.4
-8.6
0
.04
-
0.0
8
2.2
-2.8
4
.8-6
.7
8-1
2
3.6
-
5.7
8
Nil
2.4
6-8
.8
23
Th
on
dap
adi
4
7.8
2-
8.1
2
0.4
6-
3.2
3
2-1
0.4
2
.4-1
4
0.8
-8.6
0
.08
-
0.8
2
1-4
-3
1.8
-7.4
2
-14
0.4
8-
8.2
2
Nil
0.5
4-7
.28
24
Vep
pan
thattai(S
) 7
7
.51
-
9.0
3
0.3
6-
1.6
3
0.8
-4.8
1
.2-2
.2
1-1
0.8
0
.04
-
0.0
8
0.2
-2.4
1
.2-9
.4
1-4
0
.44
-
1.8
8
Nil-7
.4
1-4
.56
25
Ven
gan
ur
6
7.2
9-
8.6
8
0.2
2-
3.0
6
1-1
0.2
0
.8-7
.8
0.4
-10.4
-0
.06
-
0.2
0
.4-4
.4
0.6
-8.8
1
-21
0.2
6-
6.8
3
Nil-2
. 0
.42
-5.2
5
26
Ud
um
piy
am
6
7.2
5-
8.2
2
0.5
5-
3.5
5
3.2
-
14
.8
2.4
-
10
.8
2.2
-8.8
0
.04
-
0.4
0
.8-2
.8
1.2
-6.8
3
-18
2.8
4-
7.2
N
il-6.5
1
.31
-7.1
2
27
Valik
and
apu
ram
6
8.1
5-
8.9
8
0.2
5-1
.2
1.6
-3.8
0
.8-4
.4
1.4
-10.2
0
.04
-
0.1
3
0.8
-4
1-8
.2
2-5
0
.13
-
1.0
8
Nil-8
.2
2.0
8-
7.2
1
28
Ven
bav
ur
6
7.9
8-
8.1
8
0.6
2-
0.8
6
2.1
-3.6
3
.2-4
2
.0-4
.06
0.0
2-
0.0
5
1.0
-2.4
1
.2-4
.6
1.2
-4
0.6
2-
0.7
1
Nil
1.8
-2.0
8
29
Ven
galam
5
8
.3-
8.8
8
0.3
9-
1.5
5
2-8
.2
1.2
-6.2
4
.7-8
.8
0.0
3-
0.0
4
2.6
-3.2
3
.8-8
1
-8
0.0
4-
0.5
3
Nil-4
.8
1.6
2-5
.08
30
Vep
pan
thattai(N
) 6
7
.92
-
8.4
1
.4-1
.87
6.6
-9.2
5
.2-8
.4
2.4
-4.8
0
.03
-
0.0
6
2.0
-2.8
4
.6-6
.8
4-8
2
.6-
4.8
3
Nil-0
.62
1.1
9-
3.4
17
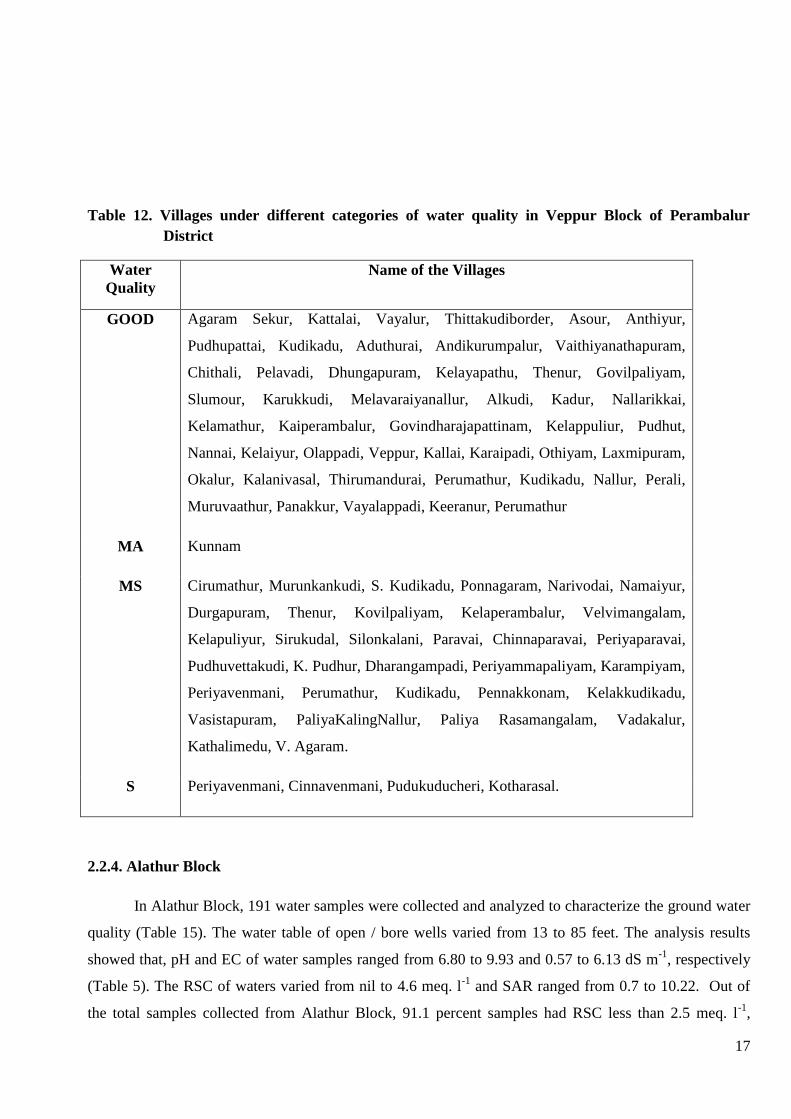
Table 12. Villages under different categories of water quality in Veppur Block of Perambalur
District
Water
Quality
Name of the Villages
GOOD Agaram Sekur, Kattalai, Vayalur, Thittakudiborder, Asour, Anthiyur,
Pudhupattai, Kudikadu, Aduthurai, Andikurumpalur, Vaithiyanathapuram,
Chithali, Pelavadi, Dhungapuram, Kelayapathu, Thenur, Govilpaliyam,
Slumour, Karukkudi, Melavaraiyanallur, Alkudi, Kadur, Nallarikkai,
Kelamathur, Kaiperambalur, Govindharajapattinam, Kelappuliur, Pudhut,
Nannai, Kelaiyur, Olappadi, Veppur, Kallai, Karaipadi, Othiyam, Laxmipuram,
Okalur, Kalanivasal, Thirumandurai, Perumathur, Kudikadu, Nallur, Perali,
Muruvaathur, Panakkur, Vayalappadi, Keeranur, Perumathur
MA Kunnam
MS Cirumathur, Murunkankudi, S. Kudikadu, Ponnagaram, Narivodai, Namaiyur,
Durgapuram, Thenur, Kovilpaliyam, Kelaperambalur, Velvimangalam,
Kelapuliyur, Sirukudal, Silonkalani, Paravai, Chinnaparavai, Periyaparavai,
Pudhuvettakudi, K. Pudhur, Dharangampadi, Periyammapaliyam, Karampiyam,
Periyavenmani, Perumathur, Kudikadu, Pennakkonam, Kelakkudikadu,
Vasistapuram, PaliyaKalingNallur, Paliya Rasamangalam, Vadakalur,
Kathalimedu, V. Agaram.
S Periyavenmani, Cinnavenmani, Pudukuducheri, Kotharasal.
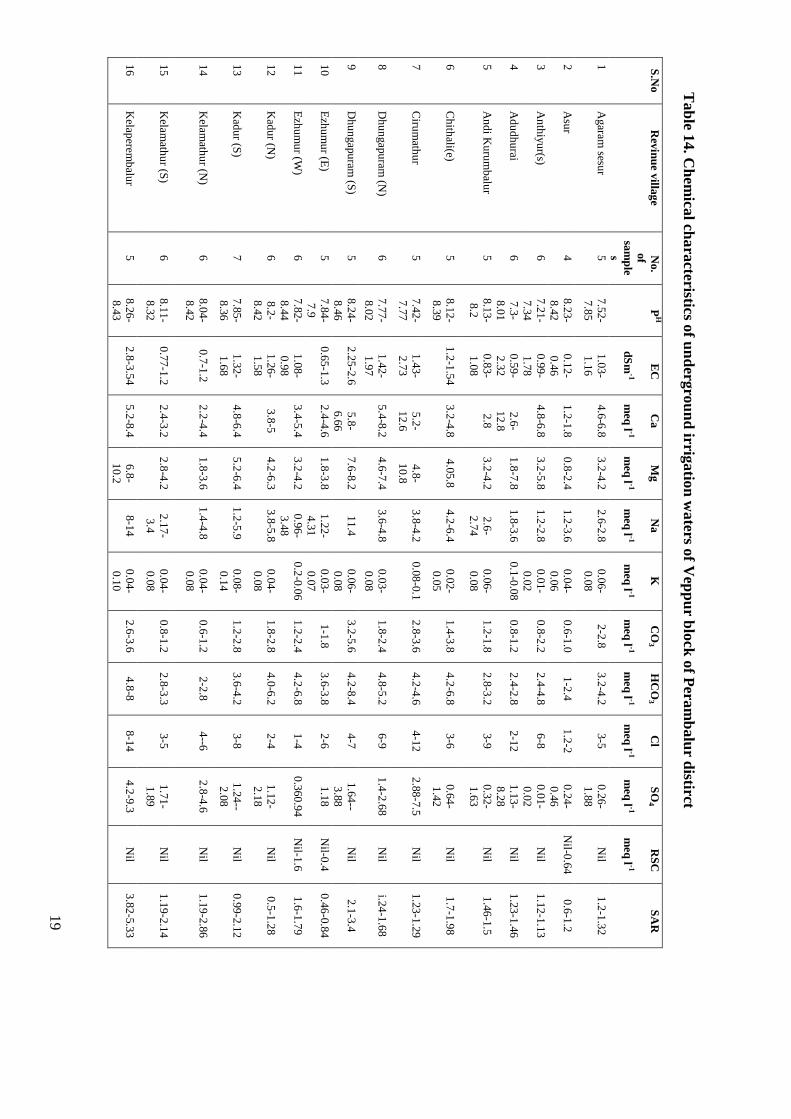
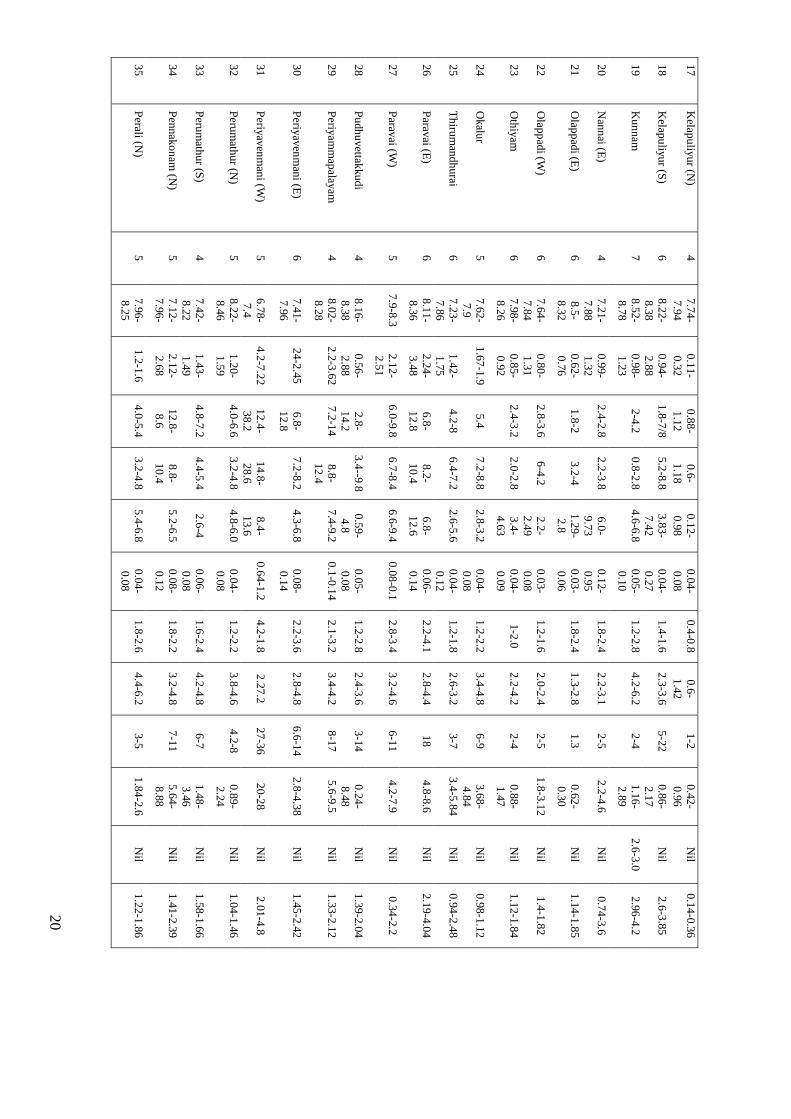
2.2.4. Alathur Block
In Alathur Block, 191 water samples were collected and analyzed to characterize the ground water
quality (Table 15). The water table of open / bore wells varied from 13 to 85 feet. The analysis results
showed that, pH and EC of water samples ranged from 6.80 to 9.93 and 0.57 to 6.13 dS m-1
, respectively
(Table 5). The RSC of waters varied from nil to 4.6 meq. l-1
and SAR ranged from 0.7 to 10.22. Out of
the total samples collected from Alathur Block, 91.1 percent samples had RSC less than 2.5 meq. l-1
,
18
whereas 5.7 percent samples showed RSC between 2.5 to 4.0 meq. l-1
and 5.6 per cent samples showed
RSC > 4 meq. l-1
. About 45.6, 42.8 and 8.5 percent water samples showed EC in the range of < 2.0 2- 4
and > 4 dS/m, respectively. About 37.1, 42.8, 8.5 ,2.8, 5.7 and 2.8 per cent water samples were found
under good, marginally saline, high SAR saline, marginally alkali and Alkali range categories,
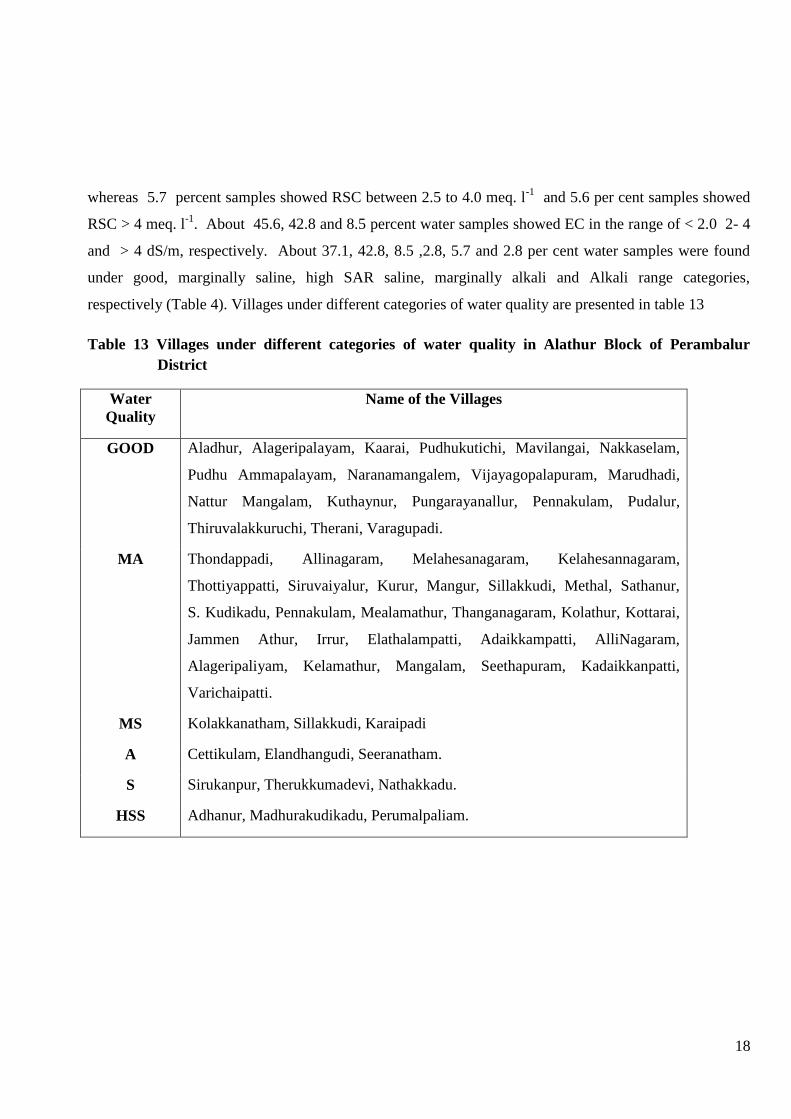
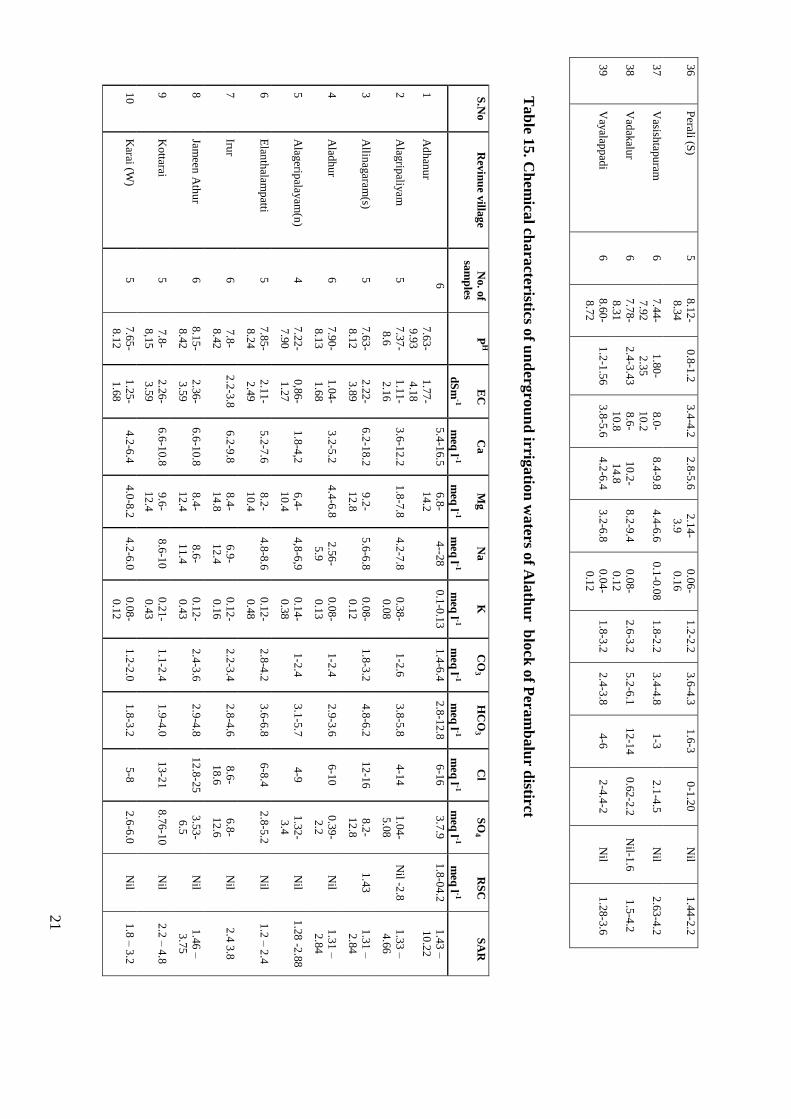
respectively (Table 4). Villages under different categories of water quality are presented in table 13
Table 13 Villages under different categories of water quality in Alathur Block of Perambalur
District
Water
Quality
Name of the Villages
GOOD Aladhur, Alageripalayam, Kaarai, Pudhukutichi, Mavilangai, Nakkaselam,
Pudhu Ammapalayam, Naranamangalem, Vijayagopalapuram, Marudhadi,
Nattur Mangalam, Kuthaynur, Pungarayanallur, Pennakulam, Pudalur,
Thiruvalakkuruchi, Therani, Varagupadi.
MA Thondappadi, Allinagaram, Melahesanagaram, Kelahesannagaram,
Thottiyappatti, Siruvaiyalur, Kurur, Mangur, Sillakkudi, Methal, Sathanur,
S. Kudikadu, Pennakulam, Mealamathur, Thanganagaram, Kolathur, Kottarai,
Jammen Athur, Irrur, Elathalampatti, Adaikkampatti, AlliNagaram,
Alageripaliyam, Kelamathur, Mangalam, Seethapuram, Kadaikkanpatti,
Varichaipatti.
MS Kolakkanatham, Sillakkudi, Karaipadi
A Cettikulam, Elandhangudi, Seeranatham.
S Sirukanpur, Therukkumadevi, Nathakkadu.
HSS Adhanur, Madhurakudikadu, Perumalpaliam.
1
9
Ta
ble 1
4. C
hem
ical ch
ara
cteristics of u
nd
ergro
un
d irrig
atio
n w
aters o
f Vep
pu
r blo
ck o
f Pera
mb
alu
r distirct
S
.No
Rev
inu
e villa
ge
No.
of
sam
ple
s
PH
E
C
dS
m-1
Ca
meq
l -1
Mg
meq
l -1
Na
meq
l -1
K
meq
l -1
CO
3
meq
l -1
HC
O3
meq
l -1
Cl
meq
l -1
SO
4
meq
l -1
RS
C
meq
l -1
SA
R
1
Agaram
sesur
5
7.5
2-
7.8
5
1.0
3-
1.1
6
4.6
-6.8
3
.2-4
.2
2.6
-2.8
0
.06
-
0.0
8
2-2
.8
3.2
-4.2
3
-5
0.2
6-
1.8
8
Nil
1.2
-1.3
2
2
Asu
r 4
8
.23
-
8.4
2
0.1
2-
0.4
6
1.2
-1.8
0
.8-2
.4
1.2
-3.6
0
.04
-
0.0
6
0.6
-1.0
1
-2.4
1
.2-2
0
.24
-
0.4
6
Nil-0
.64
0.6
-1.2
3
An
thiy
ur(s)
6
7.2
1-
7.3
4
0.9
9-
1.7
8
4.8
-6.8
3
.2-5
.8
1.2
-2.8
0
.01
-
0.0
2
0.8
-2.2
2
.4-4
.8
6-8
0
.01
-
0.0
2
Nil
1.1
2-1
.13
4
Ad
ud
hu
rai 6
7
.3-
8.0
1
0.5
9-
2.3
2
2.6
-
12
.8
1.8
-7.8
1
.8-3
.6
0.1
-0.0
8
0.8
-1.2
2
.4-2
.8
2-1
2
1.1
3-
8.2
8
Nil
1.2
3-1
.46
5
An
di K
uru
mb
alur
5
8.1
3-
8.2
0.8
3-
1.0
8
2.8
3
.2-4
.2
2.6
-
2.7
4
0.0
6-
0.0
8
1.2
-1.8
2
.8-3
.2
3-9
0
.32
-
1.6
3
Nil
1.4
6-1
.5
6
Ch
ithali(e)
5
8.1
2-
8.3
9
1.2
-1.5
4
3.2
-4.8
4
.05
.8
4.2
-6.4
0
.02
-
0.0
5
1.4
-3.8
4
.2-6
.8
3-6
0
.64
-
1.4
2
Nil
1.7
-1.9
8
7
Ciru
math
ur
5
7.4
2-
7.7
7
1.4
3-
2.7
3
5.2
-
12
.6
4.8
-
10
.8
3.8
-4.2
0
.08
-0.1
2
.8-3
.6
4.2
-4.6
4
-12
2.8
8-7
.5
Nil
1.2
3-1
.29
8
Dh
un
gap
uram
(N)
6
7.7
7-
8.0
2
1.4
2-
1.9
7
5.4
-8.2
4
.6-7
.4
3.6
-4.8
0
.03
-
0.0
8
1.8
-2.4
4
.8-5
.2
6-9
1
.4-2
.68
Nil
i.24
-1.6
8
9
Dh
un
gap
uram
(S)
5
8.2
4-
8.4
6
2.2
5-2
.6
5.8
-
6.6
6
7.6
-8.2
1
1.4
0
.06
-
0.0
8
3.2
-5.6
4
.2-8
.4
4-7
1
.64
--
3.8
8
Nil
2.1
-3.4
10
Ezh
um
ur (E
) 5
7
.84
-
7.9
0.6
5-1
.3
2.4
-4.6
1
.8-3
.8
1.2
2-
4.3
1
0.0
3-
0.0
7
1-1
.8
3.6
-3.8
2
-6
1.1
8
Nil-0
.4
0.4
6-0
.84
11
Ezh
um
ur (W
) 6
7
.82
-
8.4
4
1.0
8-
0.9
8
3.4
-5.4
3
.2-4
.2
0.9
6-
3.4
8
0.2
-0.0
6
1.2
-2.4
4
.2-6
.8
1-4
0
.36
0.9
4
Nil-1
.6
1.6
-1.7
9
12
Kad
ur (N
) 6
8
.2-
8.4
2
1.2
6-
1.5
8
3.8
-5
4.2
-6.3
3
.8-5
.8
0.0
4-
0.0
8
1.8
-2.8
4
.0-6
.2
2-4
1
.12
-
2.1
8
Nil
0.5
-1.2
8
13
Kad
ur (S
) 7
7
.85
-
8.3
6
1.3
2-
1.6
8
4.8
-6.4
5
.2-6
.4
1.2
-5.9
0
.08
-
0.1
4
1.2
-2.8
3
.6-4
.2
3-8
1
.24
--
2.0
8
Nil
0.9
9-2
.12
14
Kelam
athu
r (N)
6
8.0
4-
8.4
2
0.7
-1.2
2
.2-4
.4
1.8
-3.6
1
.4-4
.8
0.0
4-
0.0
8
0.6
-1.2
2
-2.8
4
--6
2.8
-4.6
N
il 1
.19
-2.8
6
15
Kelam
athu
r (S)
6
8.1
1-
8.3
2
0.7
7-1
.2
2.4
-3.2
2
.8-4
.2
2.1
7-
3.4
0.0
4-
0.0
8
0.8
-1.2
2
.8-3
.3
3-5
1
.71
-
1.8
9
Nil
1.1
9-2
.14
16
Kelap
eremb
alur
5
8.2
6-
8.4
3
2.8
-3.5
4
5.2
-8.4
6
.8-
10
.2
8-1
4
0.0
4-
0.1
0
2.6
-3.6
4
.8-8
8
-14
4.2
-9.3
N
il 3
.82
-5.3
3
2
0
17
Kelap
uliy
ur (N
) 4
7
.74
-
7.9
4
0.1
1-
0.3
2
0.8
8-
1.1
2
0.6
-
1.1
8
0.1
2-
0.9
8
0.0
4-
0.0
8
0.4
-0.8
0
.6-
1.4
2
1-2
0
.42
-
0.9
6
Nil
0.1
4-0
.36
18
Kelap
uliy
ur (S
) 6
8
.22
-
8.3
8
0.9
4-
2.8
8
1.8
-7/8
5
.2-8
.8
3.8
3-
7.4
2
0.0
4-
0.2
7
1.4
-1.6
2
.3-3
.6
5-2
2
0.8
6-
2.1
7
Nil
2.6
-3.8
5
19
Ku
nn
am
7
8.5
2-
8.7
8
0.9
8-
1.2
3
2-4
.2
0.8
-2.8
4
.6-6
.8
0.0
5-
0.1
0
1.2
-2.8
4
.2-6
.2
2-4
1
.16
-
2.8
9
2.6
-3.0
2
.96
-4.2
20
Nan
nai (E
) 4
7
.21
-
7.8
8
0.9
9-
1.3
2
2.4
-2.8
2
.2-3
.8
6.0
-
9.7
3
0.1
2-
0.9
5
1.8
-2.4
2
.2-3
.1
2-5
2
.2-4
.6
Nil
0.7
4-3
.6
21
Olap
pad
i (E)
6
8.5
-
8.3
2
0.6
2-
0.7
6
1.8
-2
3.2
-4
1.2
9-
2.8
0.0
3-
0.0
6
1.8
-2.4
1
.3-2
.8
1.3
0
.62
-
0.3
0
Nil
1.1
4-1
.85
22
Olap
pad
i (W)
6
7.6
4-
7.8
4
0.8
0-
1.3
1
2.8
-3.6
6
-4.2
2
.2-
2.4
9
0.0
3-
0.0
8
1.2
-1.6
2
.0-2
.4
2-5
1
.8-3
.12
Nil
1.4
-1.8
2
23
Oth
iyam
6
7
.98
-
8.2
6
0.8
5-
0.9
2
2.4
-3.2
2
.0-2
.8
3.4
-
4.6
3
0.0
4-
0.0
9
1-2
.0
2.2
-4.2
2
-4
0.8
8-
1.4
7
Nil
1.1
2-1
.84
24
Okalu
r 5
7
.62
-
7.9
1.6
7-1
.9
5.4
7
.2-8
.8
2.8
-3.2
0
.04
-
0.0
8
1.2
-2.2
3
.4-4
.8
6-9
3
.68
-
4.8
4
Nil
0.9
8-1
.12
25
Th
irum
and
hu
rai 6
7
.23
-
7.8
6
1.4
2-
1.7
5
4.2
-8
6.4
-7.2
2
.6-5
.6
0.0
4-
0.1
2
1.2
-1.8
2
.6-3
.2
3-7
3
.4-5
.84
Nil
0.9
4-2
.48
26
Parav
ai (E)
6
8.1
1-
8.3
6
2.2
4-
3.4
8
6.8
-
12
.8
8.2
-
10
.4
6.8
-
12
.6
0.0
6-
0.1
4
2.2
-4.1
2
.8-4
.4
18
4.8
-8.6
N
il 2
.19
-4.0
4
27
Parav
ai (W)
5
7.9
-8.3
2
.12
-
2.5
1
6.0
-9.8
6
.7-8
.4
6.6
-9.4
0
.08
-0.1
2
.8-3
.4
3.2
-4.6
6
-11
4.2
-7.9
N
il 0
.34
-2.2
28
Pu
dh
uvettak
ku
di
4
8.1
6-
8.3
8
0.5
6-
2.8
8
2.8
-
14
.2
3.4
--9.8
0
.59
-
4.8
0.0
5-
0.0
8
1.2
-2.8
2
.4-3
.6
3-1
4
0.2
4-
8.4
8
Nil
1.3
9-2
.04
29
Periy
amm
apalay
am
4
8.0
2-
8.2
8
2.2
-3.6
2
7.2
-14
8.8
-
12
.4
7.4
-9.2
0
.1-0
.14
2.1
-3.2
3
.4-4
.2
8-1
7
5.6
-9.5
N
il 1
.33
-2.1
2
30
Periy
aven
man
i (E)
6
7.4
1-
7.9
6
24
-2.4
5
6.8
-
12
.8
7.2
-8.2
4
.3-6
.8
0.0
8-
0.1
4
2.2
-3.6
2
.8-4
.8
6.6
-14
2.8
-4.3
8
Nil
1.4
5-2
.42
31
Periy
aven
man
i (W)
5
6.7
8-
7.4
4.2
-7.2
2
12
.4-
38
.2
14
.8-
28
.6
8.4
-
13
.6
0.6
4-1
.2
4.2
-1.8
2
.27
.2
27
-36
20
-28
Nil
2.0
1-4
.8
32
Peru
math
ur (N
) 5
8
.22
-
8.4
6
1.2
0-
1.5
9
4.0
-6.6
3
.2-4
.8
4.8
-6.0
0
.04
-
0.0
8
1.2
-2.2
3
.8-4
.6
4.2
-8
0.8
9-
2.2
4
Nil
1.0
4-1
.46
33
Peru
math
ur (S
) 4
7
.42
-
8.2
2
1.4
3-
1.4
9
4.8
-7.2
4
.4-5
.4
2.6
-4
0.0
6-
0.0
8
1.6
-2.4
4
.2-4
.8
6-7
1
.48
-
3.4
6
Nil
1.5
8-1
.66
34
Pen
nak
on
am (N
) 5
7
.12
-
7.9
6-
2.1
2-
2.6
8
12
.8-
8.6
8.8
-
10
.4
5.2
-6.5
0
.08
-
0.1
2
1.8
-2.2
3
.2-4
.8
7-1
1
5.6
4-
8.8
8
Nil
1.4
1-2
.39
35
Perali (N
) 5
7
.96
-
8.2
5
1.2
-1.6
4
.0-5
.4
3.2
-4.8
5
.4-6
.8
0.0
4-
0.0
8
1.8
-2.6
4
.4-6
.2
3-5
1
.84
-2.6
N
il 1
.22
-1.8
6
2
1
36
Perali (S
) 5
8
.12
-
8.3
4
0.8
-1.2
3
.4-4
.2
2.8
-5.6
2
.14
-
3.9
0.0
6-
0.1
6
1.2
-2.2
3
.6-4
.3
1.6
-3
0-1
.20
Nil
1.4
4-2
.2
37
Vasish
tapu
ram
6
7.4
4-
7.9
2
1.8
0-
2.3
5
8.0
-
10
.2
8.4
-9.8
4
.4-6
.6
0.1
-0.0
8
1.8
-2.2
3
.4-4
.8
1-3
2
.1-4
.5
Nil
2.6
3-4
.2
38
Vad
akalu
r 6
7
.78
-
8.3
1
2.4
-3.4
3
8.6
-
10
.8
10
.2-
14
.8
8.2
-9.4
0
.08
-
0.1
2
2.6
-3.2
5
.2-6
.1
12
-14
0.6
2-2
.2
Nil-1
.6
1.5
-4.2
39
Vay
alapp
adi
6
8.6
0-
8.7
2
1.2
-1.5
6
3.8
-5.6
4
.2-6
.4
3.2
-6.8
0
.04
-
0.1
2
1.8
-3.2
2
.4-3
.8
4-6
2
-4.4
-2
Nil
1.2
8-3
.6
Ta
ble 1
5. C
hem
ical ch
ara
cteristics of u
nd
ergro
un
d irrig
atio
n w
aters o
f Ala
thu
r blo
ck o
f Per
am
ba
lur d
istirct
S.N
o
Rev
inu
e villa
ge
No. o
f
sam
ples
PH
E
C
dS
m-1
Ca
meq
l -1
Mg
meq
l -1
Na
meq
l -1
K
meq
l -1
CO
3
meq
l -1
HC
O3
meq
l -1
Cl
meq
l -1
SO
4
meq
l -1
RS
C
meq
l -1
SA
R
1
Ad
han
ur
6
7.6
3-
9.9
3
1.7
7-
4.1
8
5.4
-16.5
6
.8-
14
.2
4--2
8
0.1
-0.1
3
1.4
-6.4
2
.8-1
2.8
6
-16
3.7
.9
1.8
-04.2
1
.43
–
10
.22
2
Alag
ripaliy
am
5
7.3
7-
8.6
1.1
1-
2.1
6
3.6
-12.2
1
.8-7
.8
4.2
-7.8
0
.38
-
0.0
8
1-2
.6
3.8
-5.8
4
-14
1.0
4-
5.0
8
Nil -2
.8
1.3
3 –
4.6
6
3
Allin
agaram
(s) 5
7
.63
-
8.1
2
2.2
2-
3.8
9
6.2
-18.2
9
.2-
12
.8
5.6
-6.8
0
.08
-
0.1
2
1.8
-3.2
4
.8-6
.2
12
-16
8.2
-
12
.8
1.4
3
1.3
1 –
2.8
4
4
Alad
hu
r 6
7
.90
-
8.1
3
1.0
4-
1.6
8
3.2
-5.2
4
.4-6
.8
2.5
6-
5.9
0.0
8-
0.1
3
1-2
.4
2.9
-3.6
6
-10
0.3
9-
2.2
Nil
1.3
1 –
2.8
4
5
Alag
eripalay
am(n
) 4
7
.22
-
7.9
0
0,8
6-
1.2
7
1.8
-4,2
6
,4-
10
.4
4,8
-6,9
0
.14
-
0.3
8
1-2
.4
3.1
-5.7
4
-9
1.3
2-
3.4
Nil
1.2
8 -2
.88
6
Elan
thalam
patti
5
7.8
5-
8.2
4
2.1
1-
2.4
9
5.2
-7.6
8
.2-
10
.4
4.8
-8.6
0
.12
-
0.4
8
2.8
-4.2
3
.6-6
.8
6-8
.4
2.8
-5.2
N
il 1
.2 –
2.4
7
Irur
6
7.8
-
8.4
2
2.2
-3.8
6
.2-9
.8
8.4
-
14
.8
6.9
-
12
.4
0.1
2-
0.1
6
2.2
-3.4
2
.8-4
.6
8.6
-
18
.6
6.8
-
12
.6
Nil
2.4
3.8
8
Jameen
Ath
ur
6
8.1
5-
8.4
2
2.3
6-
3.5
9
6.6
-10.8
8
.4-
12
.4
8.6
-
11
.4
0.1
2-
0.4
3
2.4
-3.6
2
.9-4
.8
12
.8-2
5
3.5
3-
6.5
Nil
1.4
6 –
3.7
5
9
Ko
ttarai 5
7
.8-
8,1
5
2.2
6-
3.5
9
6.6
-10.8
9
.6-
12
.4
8.6
-10
0.2
1-
0.4
3
1.1
-2.4
1
.9-4
.0
13
-21
8.7
6-1
0
Nil
2.2
– 4
.8
10
Karai (W
) 5
7
.65
-
8.1
2
1.2
5-
1.6
8
4.2
-6.4
4
.0-8
.2
4.2
-6.0
0
.08
-
0.1
2
1.2
-2.0
1
.8-3
.2
5-8
2
.6-6
.0
Nil
1.8
– 3
.2
2
2
11
Ko
lakkan
atham
7
8
.56
-
8.7
2
0.8
9-
1.3
9
1.4
-2.4
2
.2-3
.4
8.2
-
9.3
9
0.1
6-
0.2
8
2.4
-3.2
6
.0-7
.1
2-5
0
.68
-
0.9
6
Nil
2.8
– 4
.6
12
Ko
lathu
r 6
7
.32
-
7.8
6
2.8
-3.1
7
.2-1
0.6
8
.8-
12
.6
7.2
-9.2
0
.10
-
0.1
6
2.0
-3.2
1
.8-3
.8
13
-22
6.5
-9.8
N
il 2
.6 –
4.2
13
Ku
thur
6
6.8
-8.0
4
.8-6
.03
18
.2-
24
.2
20
.0-
28
.6
10
.2-
14
.4
0.2
8-
0.3
8
2.8
-4.6
3
.0-5
.4
3.2
-19
18
-24
Nil
2.2
-3.6
14
Melam
athu
r 6
7
.16
-
7.7
8
2.4
-3.2
7
8.6
-14.4
9
.8-
16
.9
8.8
-
10
.4
0.1
8-
0.2
6
2.0
-3.8
2
.6-4
.4
10
-18
8.6
-
12
.4
Nil
3.2
-4.8
15
Mav
ilangai
5
8.0
3-
8.3
6
0.9
8-
1.3
4
3.2
-4.8
2
.4-6
.5
3.6
-6.4
0
.12
-
0.1
8
1.2
-3
1.8
-3.4
6
.0-
10
.4
2.8
–
4.6
Nil
1.4
3-2
.4
16
Nak
ka S
elam
6
7.8
4-
8.2
0.8
6-
1.1
3
2.6
-3.2
3
-4.4
1
.3-4
.8
0.0
2-
0.1
0
1-3
.4
1.2
-3.8
2
-3
1.4
-
2.1
2
Nil
1.2
5-2
.9
17
Naran
aman
galam
6
8
.03
-
8.4
9
0.5
7-
1.3
4
2.2
4-2
.8
2.2
-6.0
1
.27
-
4.8
0
0.0
3-
0.1
8
0.6
-1.2
3
.2-3
.3
3-7
1
.80
–
4.4
8
Nil
0.7
5-1
.35
18
Nattarm
angalam
4
7
.96
-
8.2
2
0.7
5-
1.1
2
2.8
-3.6
3
.4-4
.8
2.3
8-
4.0
0.0
4-
0.1
0
1.8
-2.8
2
.0-3
.6
4.0
-5.8
0
.22
–
2.8
Nil
1.3
5-2
.4
19
Pu
ngaray
anallu
r 6
8
.03
-
8.3
6
0.9
1-
1.2
8
1.4
-3.9
2
.6-5
.0
1.0
8-
4.8
0.0
5-
0.0
9
0.6
-2.4
3
.7-4
.8
3-6
.0
1.4
–
2.4
Nil –
0.3
0
.76
-1.8
6
20
Pen
nak
ku
lam (N
) 5
7
.34
-
8.2
0.8
-1.2
2
.2-4
.8
3.6
-5.2
2
.1-3
.4
0.0
8-
0.1
2
0.8
-1.2
1
.8-3
.2
4-7
4
.0 -
7.0
Nil
1.2
-1.8
6
21
Pen
nak
ku
lem (S
) 6
7
.12
-
8.0
2.1
2-2
.
68
6.4
-8.6
7
.2-9
.2
2.8
-6.5
0
.12
-
0.1
8
2.2
-3.6
3
.2-4
.8
6-9
4
.8 –
7.2
Nil
2.0
-3.4
22
Pu
dh
u A
mm
apaliy
am
6
6.9
-7.7
-
8
1.9
7-
6.1
3
8.0
- 24
.0
12
.2-
18
.8
6.8
-
18
.0
0.2
6-
0.8
2
2.2
-4.8
3
.6-8
.4
16
.8-3
2
4.8
–
18
.6
Nil
2.5
2-4
.8
23
Pad
alur (E
) 5
7
.7-8
.2
0.7
2-
I.97
1.8
-4.2
4
.8-
12
.4
2.8
-6.0
0
.08
-0.1
0
.4-0
.8
2.6
-3.2
3
.8-1
3
2.4
–
4.3
9
Nil
1.3
5 -2
.6
24
Pad
alur (W
) 6
8
.22
-
8.4
8
0.7
5-
1.1
2
2.8
-4.2
3
.4-4
.8
2.3
8-
4.6
0.0
4-
0.1
0
1.2
-2.8
2
.6-4
.2
3-5
0
.22
–
2.6
0
Nil
3.0
7-1
.4
25
Sath
anu
r 6
8
.56
-
8.8
5
1.2
1-
1.4
9
2.2
-2.8
1
.8-3
.4
6.8
-
14
.6
0.0
4
2.4
-3.2
6
.09
3-4
.8
1.1
0 –
1.7
2
2.6
-3.4
2
.8-5
.07
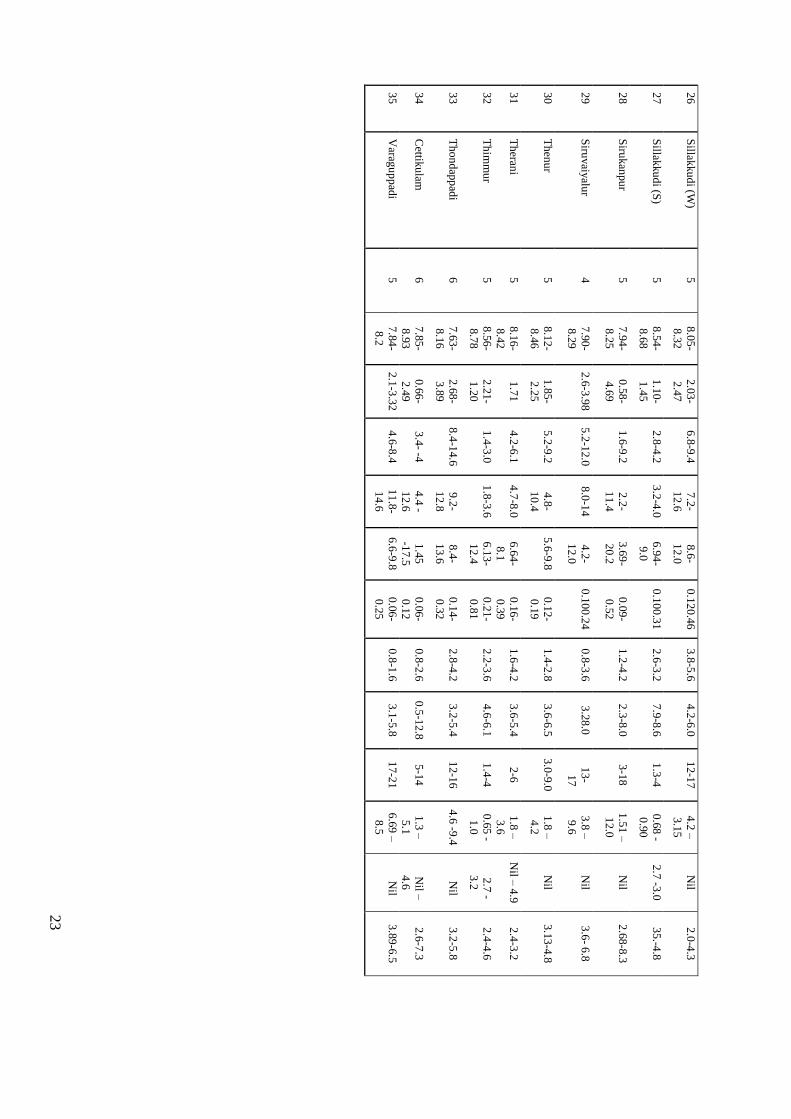
2
3
26
Sillak
ku
di (W
) 5
8
.05
-
8.3
2
2.0
3-
2.4
7
6.8
-9.4
7
.2-
12
.6
8.6
-
12
.0
0.1
20
.46
3.8
-5.6
4
.2-6
.0
12
-17
4.2
–
3.1
5
Nil
2.0
-4.3
27
Sillak
ku
di (S
) 5
8
.54
-
8.6
8
1.1
0-
1.4
5
2.8
-4.2
3
.2-4
.0
6.9
4-
9.0
0.1
00
.31
2.6
-3.2
7
.9-8
.6
1.3
-4
0.6
8 -
0.9
0
2.7
-3.0
3
5.-4
.8
28
Siru
kan
pu
r 5
7
.94
-
8.2
5
0.5
8-
4.6
9
1.6
-9.2
2
.2-
11
.4
3.6
9-
20
.2
0.0
9-
0.5
2
1.2
-4.2
2
.3-8
.0
3-1
8
1.5
1 –
12
.0
Nil
2.6
8-8
.3
29
Siru
vaiy
alur
4
7.9
0-
8.2
9
2.6
-3.9
8
5.2
-12.0
8
.0-1
4
4.2
-
12
.0
0.1
00
.24
0.8
-3.6
3
.28
.0
13
-
17
3.8
–
9.6
Nil
3.6
- 6.8
30
Th
enu
r 5
8
.12
-
8.4
6
1.8
5-
2.2
5
5.2
-9.2
4
.8-
10
.4
5.6
-9.8
0
.12
-
0.1
9
1.4
-2.8
3
.6-6
.5
3.0
-9.0
1
.8 –
4.2
Nil
3.1
3-4
.8
31
Th
erani
5
8.1
6-
8.4
2
1.7
1
4.2
-6.1
4
.7-8
.0
6.6
4-
8.1
0.1
6-
0.3
9
1.6
-4.2
3
.6-5
.4
2-6
1
.8 –
3.6
Nil –
4.9
2
.4-3
.2
32
Th
imm
ur
5
8.5
6-
8.7
8
2.2
1-
1.2
0
1.4
-3.0
1
.8-3
.6
6.1
3-
12
.4
0.2
1-
0.8
1
2.2
-3.6
4
.6-6
.1
1.4
-4
0.6
5 -
1.0
2.7
-
3.2
2.4
-4.6
33
Th
on
dap
pad
i 6
7
.63
-
8.1
6
2.6
8-
3.8
9
8.4
-14.6
9
.2-
12
.8
8.4
-
13
.6
0.1
4-
0.3
2
2.8
-4.2
3
.2-5
.4
12
-16
4.6
-9.4
N
il 3
.2-5
.8
34
Cettik
ulam
6
7
.85
-
8.9
3
0.6
6-
2.4
9
3.4
- -4
4.4
-
12
.6
1.4
5
-17
.5
0.0
6-
0.1
2
0.8
-2.6
0
.5-1
2.8
5
-14
1.3
–
5.1
Nil –
4.6
2.6
-7.3
35
Varag
up
pad
i 5
7
.84
-
8.2
2.1
-3.3
2
4.6
-8.4
1
1.8
-
14
.6
6.6
-9.8
0
.06
-
0.2
5
0.8
-1.6
3
.1-5
.8
17
-21
6.6
9 –
8.5
Nil
3.8
9-6
.5

24
3. Ground water quality of Ariyalur District
To characterize the ground water quality of Ariyalur District 835 water samples
(open and bore wells) were collected from different parts of Ariyalur district. The water samples
were analyzed for pH, EC, cations (Ca, Mg, Na and K) and anions (CO3, HCO3, Cl and SO4).
Quality parameters like SAR and RSC were calculated. Classification of water quality is done on
the basis of EC, SAR and RSC values as suggested by CSSRI, Karnal (Table 3). Among the total
samples collected, 67.8 % is coming under good quality, 6.35 % is marginally saline, 19.9% is
marginally alkaline, 3.59 % is alkaline, 2.04 % is saline and 0.48 % is highly alkaline. (Table 16
and Fig 5).
Ariyalur District has six Blocks viz., Ariyalur, Thirumanur, Andimadam, Jayankondam,
T.Palur and Senthurai. Among the six blocks, the distribution of good quality samples were the
highest in Andimadam Block (73.4 %) and the lowest in Jayankondam (56.5 %) Block (Table
16). The occurrence of marginally Alkali water (8.72 to 30.4 %) was prevalent in all the Blocks.
Marginally saline water is prevalent in Ariyalur (8.72 %), Thirumanur (15.4 %), Jayankondam
(8.7 %) and Senthurai (4.17 %) Blocks. The saline waters were prevalent in Ariyalur (3.49 %),
Thirumanur (3.36 %) and Senthurai (5 %) blocks, while the occurrence of alkali waters were
reported in Ariyalur (2.91 %), Thirumanur (3.36 %), Jayankondam (4.35), T.Palur (3.65 %) and
Senthurai (8.33 %) Blocks. Highly alkali water was reported only in Ariyalur Block (2.33 %).
Table 16. Water quality distribution (%) in Ariyalur district.
S.No Block No.of
samples
Good MS Saline HSS MA Alkali HA
1 Ariyalur 172 68.0 8.72 3.49 - 14.53 2.91 2.33
2 Thirumanur 149 69.13 15.4 3.36 - 8.72 3.36 -
3 Andimadam 142 73.4 - - - 24.6 - -
4 Jayankondam 115 56.5 8.70 - - 30.4 4.35 -
5 T.Palur 137 68.6 - - - 27.7 3.65 -
6 Senthurai 120 65.8 4.17 5.00 - 16.7 8.33 -
Total /average 835 67.8 6.35 2.04 - 19.9 3.54 0.48
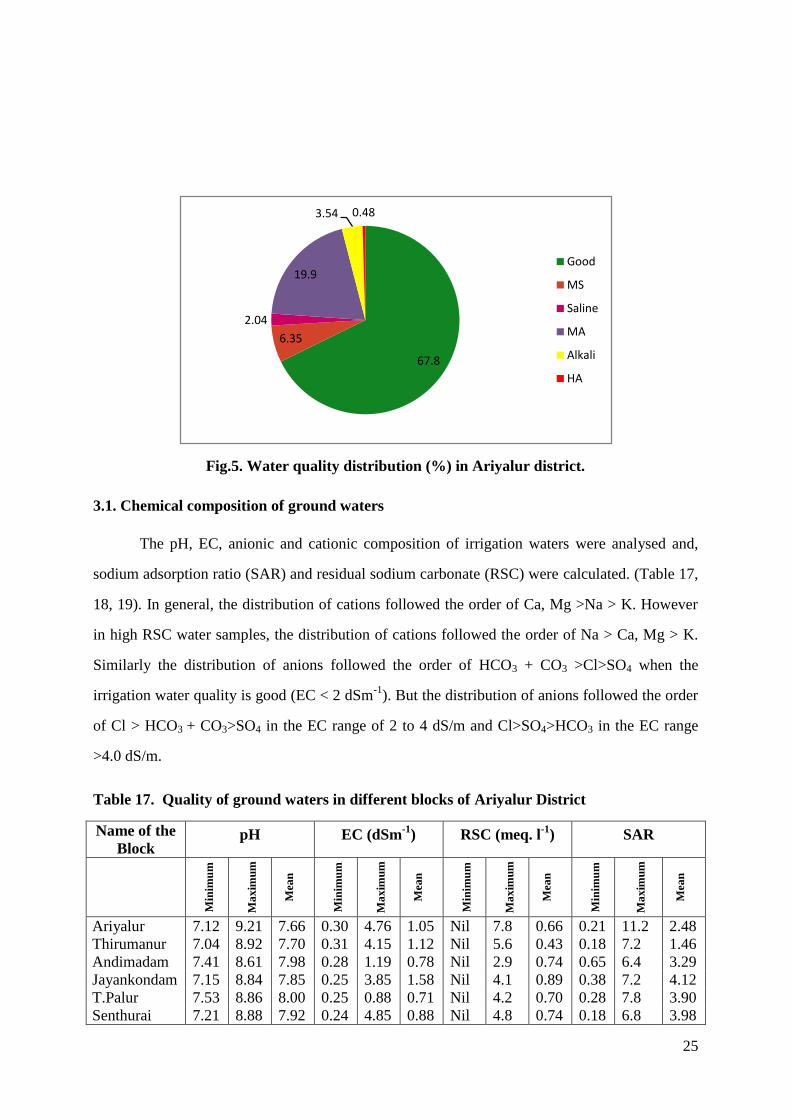
25
Fig.5. Water quality distribution (%) in Ariyalur district.
3.1. Chemical composition of ground waters
The pH, EC, anionic and cationic composition of irrigation waters were analysed and,
sodium adsorption ratio (SAR) and residual sodium carbonate (RSC) were calculated. (Table 17,
18, 19). In general, the distribution of cations followed the order of Ca, Mg >Na > K. However
in high RSC water samples, the distribution of cations followed the order of Na > Ca, Mg > K.
Similarly the distribution of anions followed the order of HCO3 + CO3 >Cl>SO4 when the
irrigation water quality is good (EC < 2 dSm-1
). But the distribution of anions followed the order
of Cl > HCO3 + CO3>SO4 in the EC range of 2 to 4 dS/m and Cl>SO4>HCO3 in the EC range
>4.0 dS/m.
Table 17. Quality of ground waters in different blocks of Ariyalur District
Name of the
Block pH EC (dSm
-1) RSC (meq. l
-1) SAR
Min
imu
m
Ma
xim
um
Mea
n
Min
imu
m
Ma
xim
um
Mea
n
Min
imu
m
Ma
xim
um
Mea
n
Min
imu
m
Ma
xim
um
Mea
n
Ariyalur 7.12 9.21 7.66 0.30 4.76 1.05 Nil 7.8 0.66 0.21 11.2 2.48
Thirumanur 7.04 8.92 7.70 0.31 4.15 1.12 Nil 5.6 0.43 0.18 7.2 1.46
Andimadam 7.41 8.61 7.98 0.28 1.19 0.78 Nil 2.9 0.74 0.65 6.4 3.29
Jayankondam 7.15 8.84 7.85 0.25 3.85 1.58 Nil 4.1 0.89 0.38 7.2 4.12
T.Palur 7.53 8.86 8.00 0.25 0.88 0.71 Nil 4.2 0.70 0.28 7.8 3.90
Senthurai 7.21 8.88 7.92 0.24 4.85 0.88 Nil 4.8 0.74 0.18 6.8 3.98
67.8
6.35
2.04
19.9
3.54 0.48
Good
MS
Saline
MA
Alkali
HA

26
Table 18. Cationic composition of ground water in different blocks of Ariyalur district.
Name of the
Block
Ca2+
Mg2+
Na+ K
+
Min
imu
m
Ma
xim
um
Mea
n
Min
imu
m
Ma
xim
um
mea
n
Min
imu
m
Ma
xim
um
Mea
n
Min
imu
m
Ma
xim
um
Mea
n
Ariyalur 0.20 20.6 4.09 0.7 16.7 2.64 0.6 10.8 2.64 0.01 1.09 0.17
Thirumanur 0.60 13.8 4.32 0.4 10.6 3.30 0.60 8.60 3.14 0.01 1.10 1.15
Andimadam 0.4 8.2 3.96 0.3 6.8 2.61 0.8 4.8 2.88 0.01 0.13 0.06
Jayankondam 0.6 7.8 3.87 0.2 4.8 2.58 0.6 8.8 2.54 0.02 0.42 0.12
T.Palur 0.6 9.6 2.83 0.3 5.4 1.88 0.5 4.2 2.02 0.01 0.21 0.15
Senthurai 0.6 19.4 3.8 0.3 15.2 2.47 0.4 8.6 2.22 0.01 0.30 0.13
Table 19. Anionic composition of ground waters in different blocks of Ariyalur district.
Name of the
Block CO3
2+ HCO3
- Cl
- SO4
2-
Min
imu
m
Ma
xim
um
Mea
n
Min
imu
m
Ma
xim
um
Mea
n
Min
imu
m
Ma
xim
um
Mea
n
Min
imu
m
Ma
xim
um
Mea
n
Ariyalur 0.06 3.8 1.51 1.0 18.4 3.91 0.40 23.8 4.77 0.22 5.5 2.86
Thirumanur 0.8 3.2 1.69 1.0 14.4 4.69 0.6 17.2 4.05 0.12 6.8 1.18
Andimadam 0.4 3.2 1.62 0.8 5.8 3.45 0.40 8.1 4.08 0.18 2.2 2.88
Jayankondam 0.62 4.2 1.59 1.1 13.1 3.73 0.2 20.3 3.56 0.12 2.52 0.93
T.Palur 0.60 3.0 1.54 0.80 5.3 2.48 0.10 7.90 2.77 0.13 1.86 0.90
Senthurai 0.40 3.2 1.43 0.70 16.4 2.93 0.40 24.4 3.70 0.22 6.90 1.04
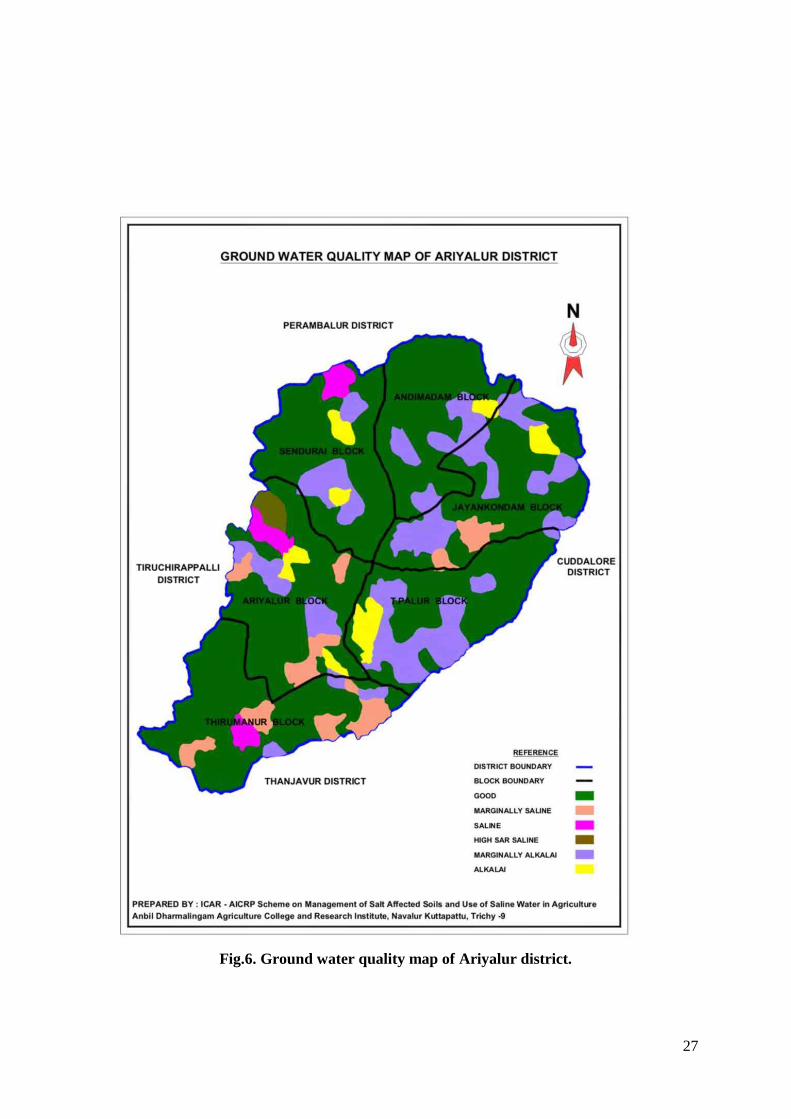
27
Fig.6. Ground water quality map of Ariyalur district.
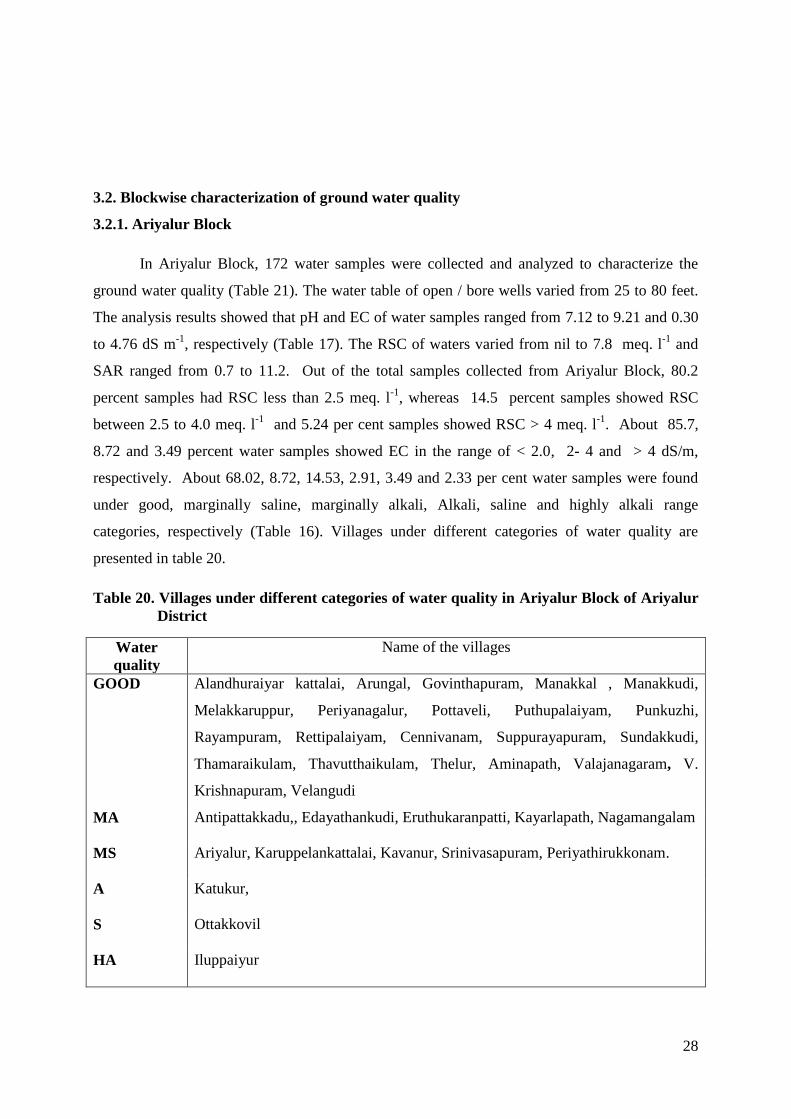
28
3.2. Blockwise characterization of ground water quality
3.2.1. Ariyalur Block
In Ariyalur Block, 172 water samples were collected and analyzed to characterize the
ground water quality (Table 21). The water table of open / bore wells varied from 25 to 80 feet.
The analysis results showed that pH and EC of water samples ranged from 7.12 to 9.21 and 0.30
to 4.76 dS m-1
, respectively (Table 17). The RSC of waters varied from nil to 7.8 meq. l-1
and
SAR ranged from 0.7 to 11.2. Out of the total samples collected from Ariyalur Block, 80.2
percent samples had RSC less than 2.5 meq. l-1
, whereas 14.5 percent samples showed RSC
between 2.5 to 4.0 meq. l-1
and 5.24 per cent samples showed RSC > 4 meq. l-1
. About 85.7,
8.72 and 3.49 percent water samples showed EC in the range of < 2.0, 2- 4 and > 4 dS/m,
respectively. About 68.02, 8.72, 14.53, 2.91, 3.49 and 2.33 per cent water samples were found
under good, marginally saline, marginally alkali, Alkali, saline and highly alkali range
categories, respectively (Table 16). Villages under different categories of water quality are
presented in table 20.
Table 20. Villages under different categories of water quality in Ariyalur Block of Ariyalur
District
Water
quality
Name of the villages
GOOD Alandhuraiyar kattalai, Arungal, Govinthapuram, Manakkal , Manakkudi,
Melakkaruppur, Periyanagalur, Pottaveli, Puthupalaiyam, Punkuzhi,
Rayampuram, Rettipalaiyam, Cennivanam, Suppurayapuram, Sundakkudi,
Thamaraikulam, Thavutthaikulam, Thelur, Aminapath, Valajanagaram, V.
Krishnapuram, Velangudi
MA Antipattakkadu,, Edayathankudi, Eruthukaranpatti, Kayarlapath, Nagamangalam
MS Ariyalur, Karuppelankattalai, Kavanur, Srinivasapuram, Periyathirukkonam.
A Katukur,
S Ottakkovil
HA Iluppaiyur

29
Ta
ble 2
1. C
hem
ical ch
ara
cteristics of u
nd
ergro
un
d irrig
atio
n w
aters o
f Ariy
alu
r blo
ck o
f Ariy
alu
r distirct
S.N
o
Rev
enu
e villa
ge
No
. of
sam
pl
es
pH
E
C
dS
m-1
Ca
meq
l -1
Mg
meq
l -1
Na
meq
l -1
K
meq
l -1
CO
3
meq
l -1
HC
O3
meq
l -1
Cl
meq
l -1
SO
4
meq
l -1
RS
C
meq
l -1 S
AR
1
Ala
nd
huraiy
ar
kattalai
5
7.4
2-8
.07
0.6
2-0
.85
3.0
-3.2
2
.4-2
.6
1.4
-1.8
0
.04
-0.1
0
1.0
-0.8
2
1.6
-2.6
4
.2- 4
.8
0.6
0-0
.98
Nil
0.8
4-1
.08
2
Antip
attikkad
u
4
7.7
9-.5
2.
0.5
0-1
.02
1.0
-5.2
0
.8-4
.0
2.8
-3.2
0
.06
-0.1
2
0.8
0-1
.6
2.8
-3.3
1
.2- 6
.2
0.1
2-0
.82
Nil-2
.6
1.3
1-3
.37
3
Ariy
alur
5
7.8
1-8
.02
1.2
7-3
.31
6.2
-5.0
4
.0-9
.6
2.6
-6.4
0
.03
-1.9
1
.02
-4.8
5
.2-9
.2
6.8
-16
.1
0.9
2-2
.8
Nil
1.1
5-1
.82
4
Aru
ngal
6
7.2
3-8
.11
0.4
8-0
.82
1.9
-2.0
1
.0-1
.2
1.6
-3.6
0
.1-0
.02
2.0
-0.6
2
1.8
-2.4
1
.2-2
.0
0.2
5-0
.28
Nil-1
.1
2.8
5-1
.33
5
Ed
ayath
ank
uti
5
7.1
2-7
.96
0.3
6-1
.40
1.6
-5.8
1
.2-4
.4
1.0
-2.2
0
.02
-.09
0.8
2-1
.6
1.0
-3.4
2
.0-8
.1
0.2
2-0
.45
Nil
0.9
7-0
.85
6
Eru
thukara
np
atti 5
7
.89
-8.4
3
0.4
5-1
.04
1.6
-5.2
0
.7-4
.0
2.9
-2.8
0
.10
-0.0
6
0.4
-0.7
2
3.2
-3.3
0
.9-6
.2
0.0
9-1
.42
Nil-1
.3
2.7
0-1
.31
7
Go
vin
thap
ura
m
4
7.1
5-7
.22
0.4
4-1
.02
1.6
-5.2
1
.4-4
.0
1.0
-2.8
0
.03
-0.4
0
0.8
2-1
.1
1.3
-3.4
1
.8-6
.3
0.2
0-1
.22
Nil
0.8
2-1
.31
8
Ilup
paiy
ur
4
8.2
6-9
.21
0.7
8-1
.35
1.6
-3.8
1
.0-3
.0
2-1
0.8
0
.18
-0.3
2
1.0
-2.4
2
.3-8
.8
4.2
-0.6
0
.62
-1.4
2
Nil-8
.6
1.0
8-9
.47
9
Katu
kur
5
7.5
0-8
.96
0.5
2-0
.83
2.2
-3.8
1
.0-2
.7
1.0
-1.9
0
.5-0
.6
1.2
-1.3
1
.6-2
.9
2.4
-4.0
0
.22
-0.7
0
Nil
0.7
8-1
.05
10
Karu
pp
elangkattalai
5
7.4
6-8
.02
1.3
6-3
.06
6.2
-3.2
4
.0-1
.1
2.6
-6.4
0
.04
-0.2
5
1.0
2-3
.1
5.2
-6.4
6
.8-1
8.8
1
.12
-2.4
N
il 1
.15
-1.8
4
11
Kav
anur
4
7.3
5-8
.15
1.2
-3.4
9
5.8
-5.6
4
.0-2
.4
2.2
-8.0
0
.07
-0.1
0
1.1
2-3
.4
5.0
-3.1
6
.4-1
8.2
1
.18
-3.8
2
Nil
0.9
9-2
.14
12
Kayarlap
ath
5
7.8
9-8
.58
0.8
3-1
.48
2.2
-6.6
1
.8-3
.8
3.0
-4.7
0
.02
-0.4
1
.5-1
.6
5.2
-5.6
1
.1-7
.5
0.3
5-1
.35
Nil-3
.1
1.3
2-3
.32
13
Man
akkal
5
7.2
2-7
.67
0.4
4-0
.58
1.8
-2.0
1
.4-1
.8
1.0
-1.6
0
.16
-0.2
5
0.8
0-1
.1
1.4
-2.0
2
.0-2
.2
0.4
5-0
.61
Nil
0.7
9-1
.16
14
Man
akk
uti
5
7.4
6-7
.91
0.4
5-0
.62
1.9
-2.4
1
.0-2
.0
1.4
-1.6
0
.12
-0.2
2
0.6
2-1
.2
1.0
-2.2
2
.6-3
.0
0.3
1-0
80
Nil
0.9
4-1
.33
15
Melak
katu
pp
ur
4
7.4
8-7
.61
0.8
7-1
.86
8.2
-3.2
0
.8-2
.8
2.0
-3.1
0
.03
-0.0
7
1.4
-1.6
2
.8-7
.5
3.6
-8.9
0
.24
-0.4
2
Nil-0
.1
1.1
5-1
.46
16
Ottak
ko
vil
6
8.1
6-7
.14
1.2
2-4
.76
5.8
-0.6
4
.01
-.7
2.6
-6.3
0
.4-0
.03
0.8
2-2
.0
5.2
-8.4
6
.8-2
3.8
1
.2-5
.4
Nil
1.1
7-1
.46
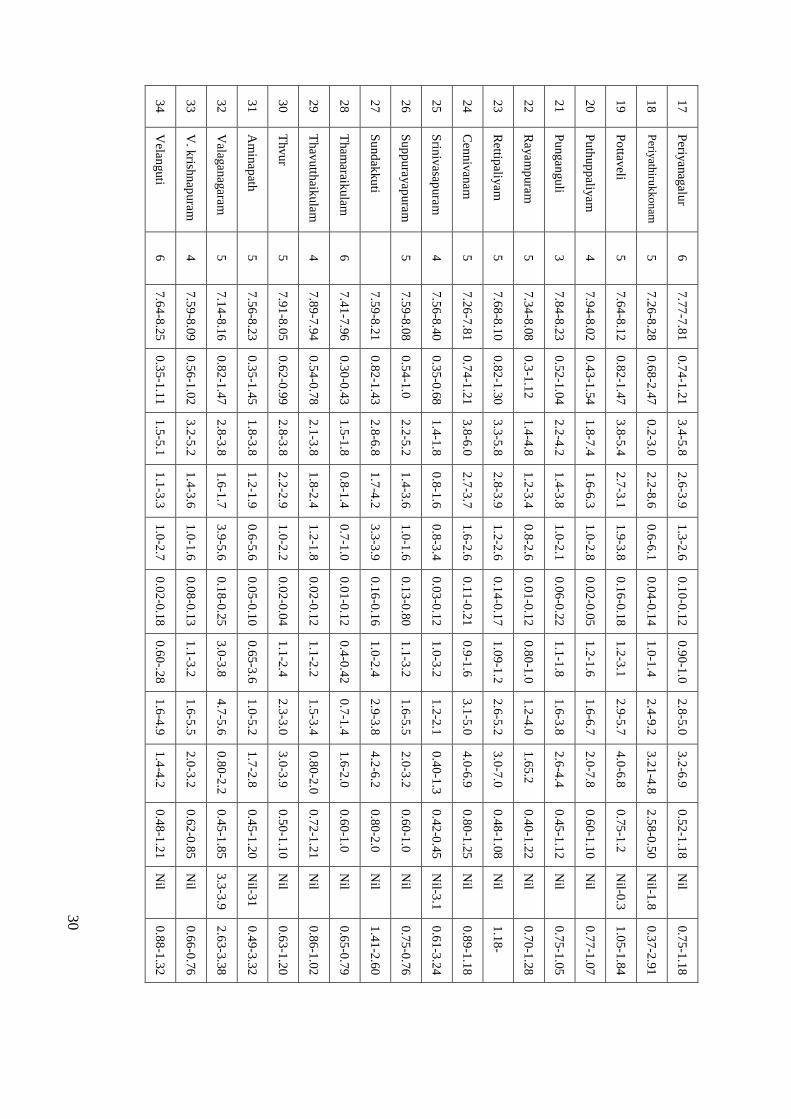
30
17
Periy
anag
alur
6
7.7
7-7
.81
0.7
4-1
.21
3.4
-5.8
2
.6-3
.9
1.3
-2.6
0
.10
-0.1
2
0.9
0-1
.0
2.8
-5.0
3
.2-6
.9
0.5
2-1
.18
Nil
0.7
5-1
.18
18
Periy
athiru
kko
nam
5
7
.26
-8.2
8
0.6
8-2
.47
0.2
-3.0
2
.2-8
.6
0.6
-6.1
0
.04
-0.1
4
1.0
-1.4
2
.4-9
.2
3.2
1-4
.8
2.5
8-0
.50
Nil-1
.8
0.3
7-2
.91
19
Po
ttaveli
5
7.6
4-8
.12
0.8
2-1
.47
3.8
-5.4
2
.7-3
.1
1.9
-3.8
0
.16
-0.1
8
1.2
-3.1
2
.9-5
.7
4.0
-6.8
0
.75
-1.2
N
il-0.3
1
.05
-1.8
4
20
Puth
up
paliy
am
4
7
.94
-8.0
2
0.4
3-1
.54
1.8
-7.4
1
.6-6
.3
1.0
-2.8
0
.02
-0.0
5
1.2
-1.6
1
.6-6
.7
2.0
-7.8
0
.60
-1.1
0
Nil
0.7
7-1
.07
21
Pungan
gu
li 3
7
.84
-8.2
3
0.5
2-1
.04
2.2
-4.2
1
.4-3
.8
1.0
-2.1
0
.06
-0.2
2
1.1
-1.8
1
.6-3
.8
2.6
-4.4
0
.45
-1.1
2
Nil
0.7
5-1
.05
22
Rayam
pura
m
5
7.3
4-8
.08
0.3
-1.1
2
1.4
-4.8
1
.2-3
.4
0.8
-2.6
0
.01
-0.1
2
0.8
0-1
.0
1.2
-4.0
1
.65
.2
0.4
0-1
.22
Nil
0.7
0-1
.28
23
Rettip
aliyam
5
7
.68
-8.1
0
0.8
2-1
.30
3.3
-5.8
2
.8-3
.9
1.2
-2.6
0
.14
-0.1
7
1.0
9-1
.2
2.6
-5.2
3
.0-7
.0
0.4
8-1
.08
Nil
1.1
8-
24
Cen
niv
anam
5
7
.26
-7.8
1
0.7
4-1
.21
3.8
-6.0
2
.7-3
.7
1.6
-2.6
0
.11
-0.2
1
0.9
-1.6
3
.1-5
.0
4.0
-6.9
0
.80
-1.2
5
Nil
0.8
9-1
.18
25
Srin
ivasap
ura
m
4
7.5
6-8
.40
0.3
5-0
.68
1.4
-1.8
0
.8-1
.6
0.8
-3.4
0
.03
-0.1
2
1.0
-3.2
1
.2-2
.1
0.4
0-1
.3
0.4
2-0
.45
Nil-3
.1
0.6
1-3
.24
26
Sup
pura
yap
ura
m
5
7.5
9-8
.08
0.5
4-1
.0
2.2
-5.2
1
.4-3
.6
1.0
-1.6
0
.13
-0.8
0
1.1
-3.2
1
.6-5
.5
2.0
-3.2
0
.60
-1.0
N
il 0
.75
-0.7
6
27
Su
nd
akku
ti
7.5
9-8
.21
0.8
2-1
.43
2.8
-6.8
1
.7-4
.2
3.3
-3.9
0
.16
-0.1
6
1.0
-2.4
2
.9-3
.8
4.2
-6.2
0
.80
-2.0
N
il 1
.41
-2.6
0
28
Tham
araikula
m
6
7.4
1-7
.96
0.3
0-0
.43
1.5
-1.8
0
.8-1
.4
0.7
-1.0
0
.01
-0.1
2
0.4
-0.4
2
0.7
-1.4
1
.6-2
.0
0.6
0-1
.0
Nil
0.6
5-0
.79
29
Thav
utth
aiku
lam
4
7
.89
-7.9
4
0.5
4-0
.78
2.1
-3.8
1
.8-2
.4
1.2
-1.8
0
.02
-0.1
2
1.1
-2.2
1
.5-3
.4
0.8
0-2
.0
0.7
2-1
.21
Nil
0.8
6-1
.02
30
Thvur
5
7.9
1-8
.05
0.6
2-0
.99
2.8
-3.8
2
.2-2
.9
1.0
-2.2
0
.02
-0.0
4
1.1
-2.4
2
.3-3
.0
3.0
-3.9
0
.50
-1.1
0
Nil
0.6
3-1
.20
31
Am
inap
ath
5
7.5
6-8
.23
0.3
5-1
.45
1.8
-3.8
1
.2-1
.9
0.6
-5.6
0
.05
-0.1
0
0.6
5-3
.6
1.0
-5.2
1
.7-2
.8
0.4
5-1
.20
Nil-3
1
0.4
9-3
.32
32
Valag
anag
aram
5
7
.14
-8.1
6
0.8
2-1
.47
2.8
-3.8
1
.6-1
.7
3.9
-5.6
0
.18
-0.2
5
3.0
-3.8
4
.7-5
.6
0.8
0-2
.2
0.4
5-1
.85
3.3
-3.9
2
.63
-3.3
8
33
V. k
rishnap
ura
m
4
7.5
9-8
.09
0.5
6-1
.02
3.2
-5.2
1
.4-3
.6
1.0
-1.6
0
.08
-0.1
3
1.1
-3.2
1
.6-5
.5
2.0
-3.2
0
.62
-0.8
5
Nil
0.6
6-0
.76
34
Velan
guti
6
7.6
4-8
.25
0.3
5-1
.11
1.5
-5.1
1
.1-3
.3
1.0
-2.7
0
.02
-0.1
8
0.6
0-.2
8
1.6
-4.9
1
.4-4
.2
0.4
8-1
.21
Nil
0.8
8-1
.32
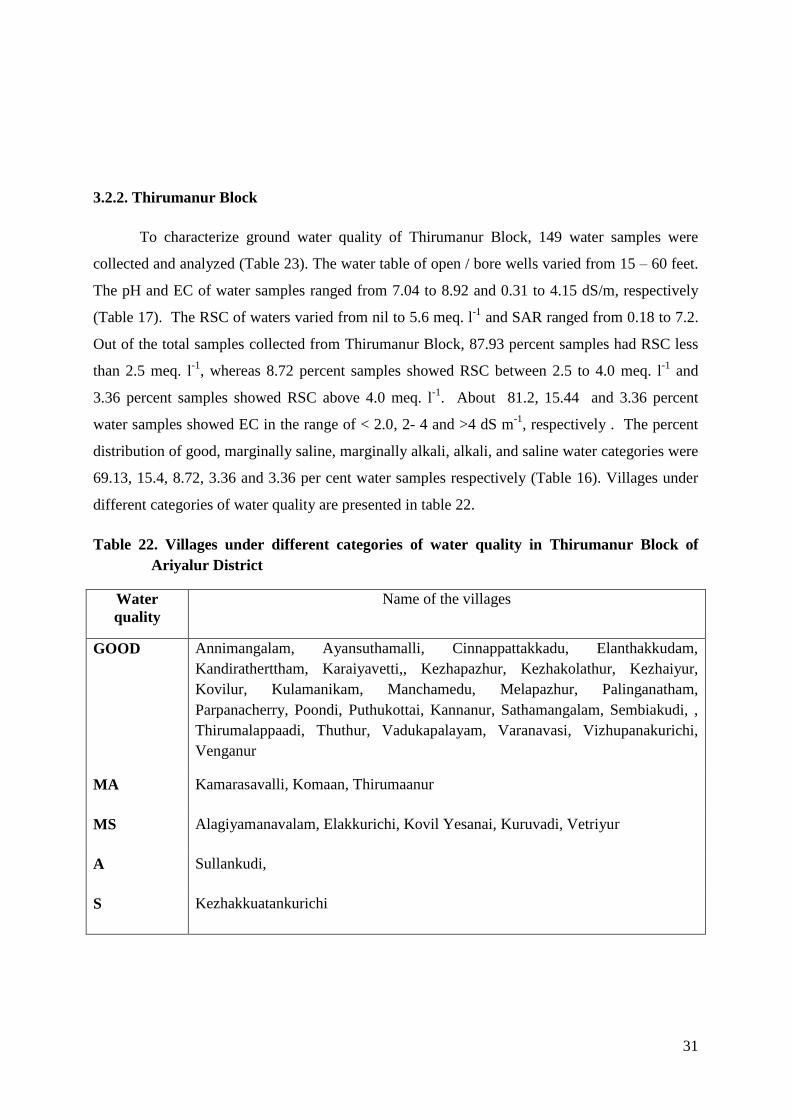
31
3.2.2. Thirumanur Block
To characterize ground water quality of Thirumanur Block, 149 water samples were
collected and analyzed (Table 23). The water table of open / bore wells varied from 15 – 60 feet.
The pH and EC of water samples ranged from 7.04 to 8.92 and 0.31 to 4.15 dS/m, respectively
(Table 17). The RSC of waters varied from nil to 5.6 meq. l-1
and SAR ranged from 0.18 to 7.2.
Out of the total samples collected from Thirumanur Block, 87.93 percent samples had RSC less
than 2.5 meq. l-1
, whereas 8.72 percent samples showed RSC between 2.5 to 4.0 meq. l-1
and
3.36 percent samples showed RSC above 4.0 meq. l-1
. About 81.2, 15.44 and 3.36 percent
water samples showed EC in the range of < 2.0, 2- 4 and >4 dS m-1
, respectively . The percent
distribution of good, marginally saline, marginally alkali, alkali, and saline water categories were
69.13, 15.4, 8.72, 3.36 and 3.36 per cent water samples respectively (Table 16). Villages under
different categories of water quality are presented in table 22.
Table 22. Villages under different categories of water quality in Thirumanur Block of
Ariyalur District
Water
quality
Name of the villages
GOOD Annimangalam, Ayansuthamalli, Cinnappattakkadu, Elanthakkudam,
Kandiratherttham, Karaiyavetti,, Kezhapazhur, Kezhakolathur, Kezhaiyur,
Kovilur, Kulamanikam, Manchamedu, Melapazhur, Palinganatham,
Parpanacherry, Poondi, Puthukottai, Kannanur, Sathamangalam, Sembiakudi, ,
Thirumalappaadi, Thuthur, Vadukapalayam, Varanavasi, Vizhupanakurichi,
Venganur
MA Kamarasavalli, Komaan, Thirumaanur
MS Alagiyamanavalam, Elakkurichi, Kovil Yesanai, Kuruvadi, Vetriyur
A Sullankudi,
S Kezhakkuatankurichi
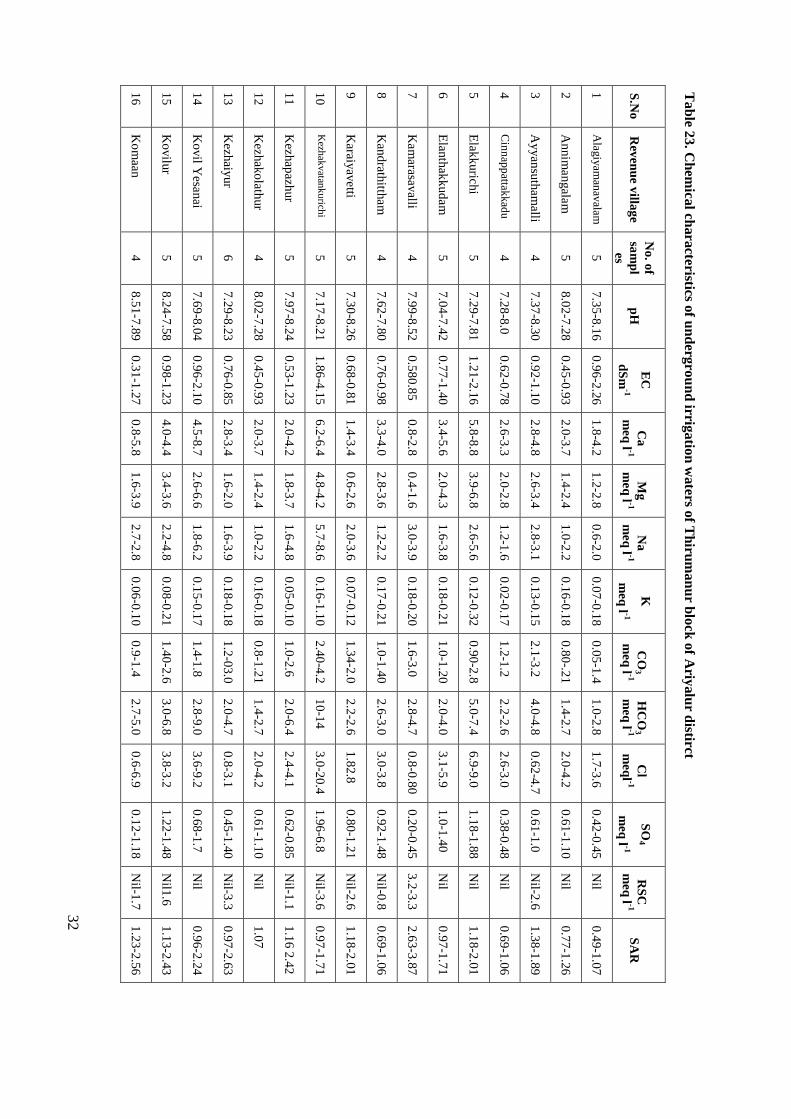
32
Tab
le 2
3. C
hem
ical ch
ara
cteristics of u
nd
ergro
un
d irrig
atio
n w
aters o
f Th
irum
an
ur b
lock
of A
riyalu
r distirct
S.N
o
Rev
enu
e villa
ge
No
. of
sam
pl
es
pH
E
C
dS
m-1
Ca
meq
l -1
Mg
meq
l -1
Na
meq
l -1
K
meq
l -1
CO
3
meq
l -1
HC
O3
meq
l -1
Cl
meq
l -1
SO
4
meq
l -1
RS
C
meq
l -1 S
AR
1
Alag
iyam
anav
alam
5
7.3
5-8
.16
0.9
6-2
.26
1.8
-4.2
1
.2-2
.8
0.6
-2.0
0
.07
-0.1
8
0.0
5-1
.4
1.0
-2.8
1
.7-3
.6
0.4
2-0
.45
Nil
0.4
9-1
.07
2
An
nim
an
gala
m
5
8.0
2-7
.28
0.4
5-0
.93
2.0
-3.7
1
.4-2
.4
1.0
-2.2
0
.16
-0.1
8
0.8
0-.2
1
1.4
-2.7
2
.0-4
.2
0.6
1-1
.10
Nil
0.7
7-1
.26
3
Ay
yan
suth
am
alli 4
7
.37
-8.3
0
0.9
2-1
.10
2.8
-4.8
2
.6-3
.4
2.8
-3.1
0
.13
-0.1
5
2.1
-3.2
4
.0-4
.8
0.6
2-4
.7
0.6
1-1
.0
Nil-2
.6
1.3
8-1
.89
4
Cin
nap
pattak
kad
u
4
7.2
8-8
.0
0.6
2-0
.78
2.6
-3.3
2
.0-2
.8
1.2
-1.6
0
.02
-0.1
7
1.2
-1.2
2
.2-2
.6
2.6
-3.0
0
.38
-0.4
8
Nil
0.6
9-1
.06
5
Elak
kuric
hi
5
7.2
9-7
.81
1.2
1-2
.16
5.8
-8.8
3
.9-6
.8
2.6
-5.6
0
.12
-0.3
2
0.9
0-2
.8
5.0
-7.4
6
.9-9
.0
1.1
8-1
.88
Nil
1.1
8-2
.01
6
Elan
thak
kud
am
5
7
.04
-7.4
2
0.7
7-1
.40
3.4
-5.6
2
.0-4
.3
1.6
-3.8
0
.18
-0.2
1
1.0
-1.2
0
2.0
-4.0
3
.1-5
.9
1.0
-1.4
0
Nil
0.9
7-1
.71
7
Kam
arasavalli
4
7.9
9-8
.52
0.5
80.8
5
0.8
-2.8
0
.4-1
.6
3.0
-3.9
0
.18
-0.2
0
1.6
-3.0
2
.8-4
.7
0.8
-0.8
0
0.2
0-0
.45
3.2
-3.3
2
.63
-3.8
7
8
Kan
drath
ittham
4
7
.62
-7.8
0
0.7
6-0
.98
3.3
-4.0
2
.8-3
.6
1.2
-2.2
0
.17
-0.2
1
1.0
-1.4
0
2.6
-3.0
3
.0-3
.8
0.9
2-1
.48
Nil-0
.8
0.6
9-1
.06
9
Karaiy
avetti
5
7.3
0-8
.26
0.6
8-0
.81
1.4
-3.4
0
.6-2
.6
2.0
-3.6
0
.07
-0.1
2
1.3
4-2
.0
2.2
-2.6
1
.82
.8
0.8
0-1
.21
Nil-2
.6
1.1
8-2
.01
10
Kezh
akvatan
ku
richi
5
7.1
7-8
.21
1.8
6-4
.15
6.2
-6.4
4
.8-4
.2
5.7
-8.6
0
.16
-1.1
0
2.4
0-4
.2
10
-14
3.0
-20
.4
1.9
6-6
.8
Nil-3
.6
0.9
7-1
.71
11
Kezh
apazh
ur
5
7.9
7-8
.24
0.5
3-1
.23
2.0
-4.2
1
.8-3
.7
1.6
-4.8
0
.05
-0.1
0
1.0
-2.6
2
.0-6
.4
2.4
-4.1
0
.62
-0.8
5
Nil-1
.1
1.1
6 2
.42
12
Kezh
ako
lathur
4
8.0
2-7
.28
0.4
5-0
.93
2.0
-3.7
1
.4-2
.4
1.0
-2.2
0
.16
-0.1
8
0.8
-1.2
1
1.4
-2.7
2
.0-4
.2
0.6
1-1
.10
Nil
1.0
7
13
Kezh
aiyur
6
7.2
9-8
.23
0.7
6-0
.85
2.8
-3.4
1
.6-2
.0
1.6
-3.9
0
.18
-0.1
8
1.2
-03
.0
2.0
-4.7
0
.8-3
.1
0.4
5-1
.40
Nil-3
.3
0.9
7-2
.63
14
Ko
vil Y
esanai
5
7.6
9-8
.04
0.9
6-2
.10
4.5
-8.7
2
.6-6
.6
1.8
-6.2
0
.15
-0.1
7
1.4
-1.8
2
.8-9
.0
3.6
-9.2
0
.68
-1.7
N
il 0
.96
-2.2
4
15
Ko
vilu
r 5
8
.24
-7.5
8
0.9
8-1
.23
4.0
-4.4
3
.4-3
.6
2.2
-4.8
0
.08
-0.2
1
1.4
0-2
.6
3.0
-6.8
3
.8-3
.2
1.2
2-1
.48
Nil1
.6
1.1
3-2
.43
16
Ko
maan
4
8
.51
-7.8
9
0.3
1-1
.27
0.8
-5.8
1
.6-3
.9
2.7
-2.8
0
.06
-0.1
0
0.9
-1.4
2
.7-5
.0
0.6
-6.9
0
.12
-1.1
8
Nil-1
.7
1.2
3-2
.56

33
17
Guru
vad
i 5
7
.89
-8.0
4
0.4
8-2
.09
2.6
-8.1
1
.1-7
.2
1.0
-6.2
0
.07
-0.1
2
1.3
-2.0
1
.6-8
.2
2.4
-8.8
0
.32
-1.3
2
Nil
0.7
4-2
.24
18
Kula
man
ikam
5
7
.38
-7.8
1
0.9
3-1
.21
3.8
-5.8
2
.6-3
.9
2.2
-2.6
0
.12
-0.1
6
0.9
-1.4
2
2.8
-5.0
3
.2-6
.9
1.1
8-1
.82
Nil
1.1
8-1
.23
19
Man
cham
edu
6
7
.29
-7.4
2
0.7
0-0
.90
2.7
-3.2
2
.0-2
.8
1.9
-2.4
0
.02
-0.2
1
1.2
-1.3
1
1.8
-2.6
2
.2-3
.6
0.6
8-1
.20
Nil
1.2
4-1
.39
20
Melap
azhur
4
7.1
6-8
.38
0.6
6-1
.28
2.8
-4.4
2
.2-3
.4
1.1
-4.6
0
.18
-0.0
8
1.4
-2.6
1
.8-6
.4
2.4
-2.6
1
.62
-0.4
6
Nil-1
.2
0.7
0-2
.33
21
Palin
ganath
am
5
7
.90
-8.2
1
0.7
1-1
.12
3.0
-3.8
2
.4-3
.0
1.6
-4.8
0
.10
-0.2
2
1.4
0-2
.6
1.9
-6.4
2
.5-2
.4
0.6
2-0
.62
Nil-2
.2
0.9
7-2
.60
22
Parp
anach
erry
4
7.5
2-8
.40
1.0
8-1
.16
2.8
-4.0
2
.0-3
.2
4.7
-4.8
0
.10
-0.1
2
2.4
-2.8
3
.1-6
.6
1.6
-4.4
1
.01
-1.8
2
1.8
-1.1
2
.48
-3.1
0
23
Po
ond
i 5
7
.54
-7.7
7
0.9
0-1
.20
3.2
-4.8
2
.8-4
.0
2.4
-3.2
0
.31
-0.4
0
1.3
1-1
.8
2.6
-3.8
3
.6-4
.2
0.6
8-1
.32
Nil
1.3
9-1
.53
24
Pud
hu
ko
ttai 5
7
.61
-8.2
8
0.5
2-1
.00
2.6
-3.8
1
.1-3
.5
1.0
-2.6
0
.07
-0.2
1
1.3
-1.5
1
.6-3
.3
2.4
-4.2
0
.32
-1.1
N
il 0
.74
-1.3
6
25
Kan
nan
ur
6
7.5
1-8
.18
0.8
2-1
.42
3.6
-6.8
2
.8-3
.8
1.8
-2.6
0
.08
-0.0
9
0.8
-1.0
2
.4-5
.2
3.6
-8.0
0
.61
-1.0
5
Nil
1.0
1-1
.13
26
Sath
am
angala
m
4
7.7
6-8
.08
0.6
8-1
.38
2.8
-5.4
2
.0-4
.6
1.6
-3.8
0
.02
-0.2
7
1.2
-1.2
2
.2-3
.8
2.6
-4.1
0
.38
-2.1
0
Nil
1.0
3-1
.70
27
Sem
bia
kud
i 5
7
.45
-8.2
1
0.8
0-1
.23
3.4
-4.4
2
.6-3
.4
2.2
-4.6
0
.1-2
.106
1.2
-2.6
2
.6-6
.4
2.0
-3.8
0
.92
-1.9
4
Nil-1
.2
1.2
7-2
.33
28
Sulla
nkud
i 5
8
.01
-8.9
8
0.8
0-1
.23
0.6
-4.0
0
.3-3
.0
5.1
-6.4
0
.08
-0.1
2
1.2
-2.8
3
.8-5
.9
1.9
-3.2
0
.82
-1.8
5
4.1
-1.7
2
.73
-9.5
4
29
Thiru
maa
nur
5
7.5
3-8
.14
0.9
2-3
.16
4.2
-3.8
2
.8-1
0
2.0
-6.8
0
.04
-0.0
7
1.4
-2.2
2
.8-7
.5
3.0
-17
.2
0.4
2-4
.4
Nil
1.0
7-1
.95
30
Thiru
malap
paad
i 4
7
.31
-8.1
7
0.4
0-0
.96
1.9
-3.8
1
.0-2
.7
1.6
-2.4
0
.19
-0.2
1
0.6
2-1
.3
1.1
-2.4
3
.0-3
.6
0.5
2-0
.85
Nil
1.3
3
31
Thuttu
r 4
7
.30
-7.4
4
1.0
4-1
.16
4.2
-4.6
3
.9-4
.0
3.2
-3.4
0
.08
-0.1
2
1.8
-2.1
3
.3-3
.4
4.0
-4.1
1
.10
-1.6
0
Nil
1.5
4-1
.69
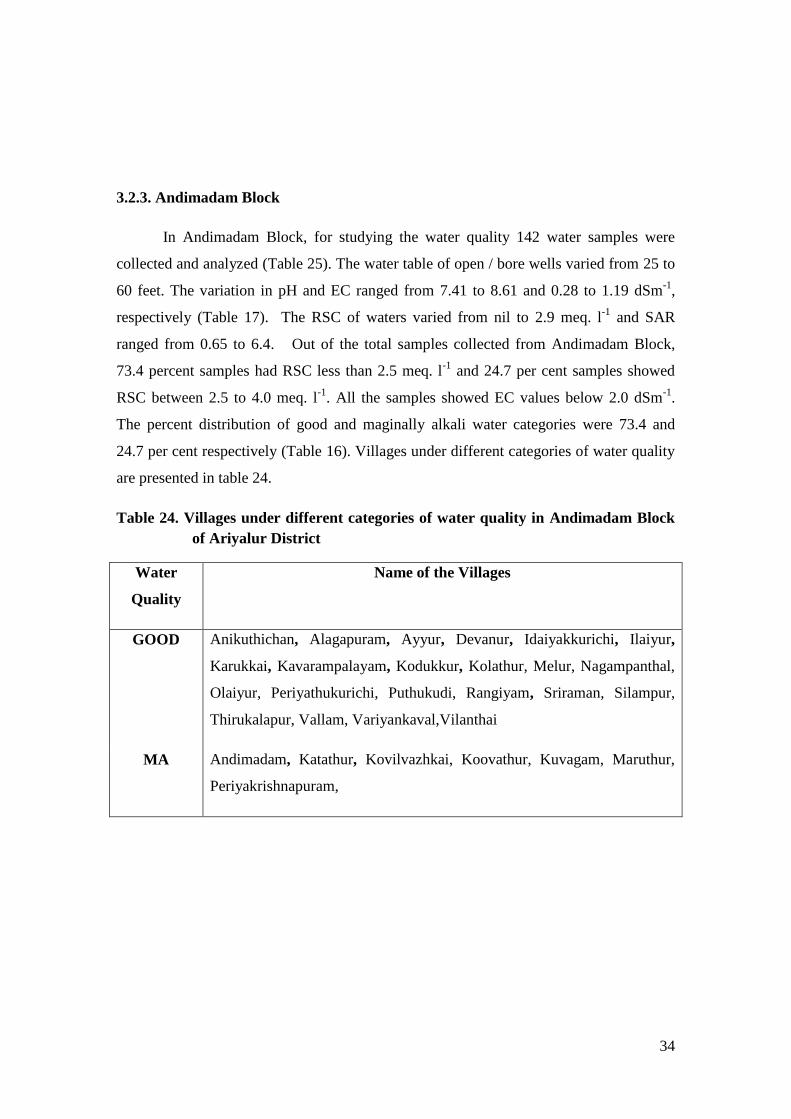
34
3.2.3. Andimadam Block
In Andimadam Block, for studying the water quality 142 water samples were
collected and analyzed (Table 25). The water table of open / bore wells varied from 25 to
60 feet. The variation in pH and EC ranged from 7.41 to 8.61 and 0.28 to 1.19 dSm-1
,
respectively (Table 17). The RSC of waters varied from nil to 2.9 meq. l-1
and SAR
ranged from 0.65 to 6.4. Out of the total samples collected from Andimadam Block,
73.4 percent samples had RSC less than 2.5 meq. l-1
and 24.7 per cent samples showed
RSC between 2.5 to 4.0 meq. l-1
. All the samples showed EC values below 2.0 dSm-1
.
The percent distribution of good and maginally alkali water categories were 73.4 and
24.7 per cent respectively (Table 16). Villages under different categories of water quality
are presented in table 24.
Table 24. Villages under different categories of water quality in Andimadam Block
of Ariyalur District
Water
Quality
Name of the Villages
GOOD Anikuthichan, Alagapuram, Ayyur, Devanur, Idaiyakkurichi, Ilaiyur,
Karukkai, Kavarampalayam, Kodukkur, Kolathur, Melur, Nagampanthal,
Olaiyur, Periyathukurichi, Puthukudi, Rangiyam, Sriraman, Silampur,
Thirukalapur, Vallam, Variyankaval,Vilanthai
MA Andimadam, Katathur, Kovilvazhkai, Koovathur, Kuvagam, Maruthur,
Periyakrishnapuram,
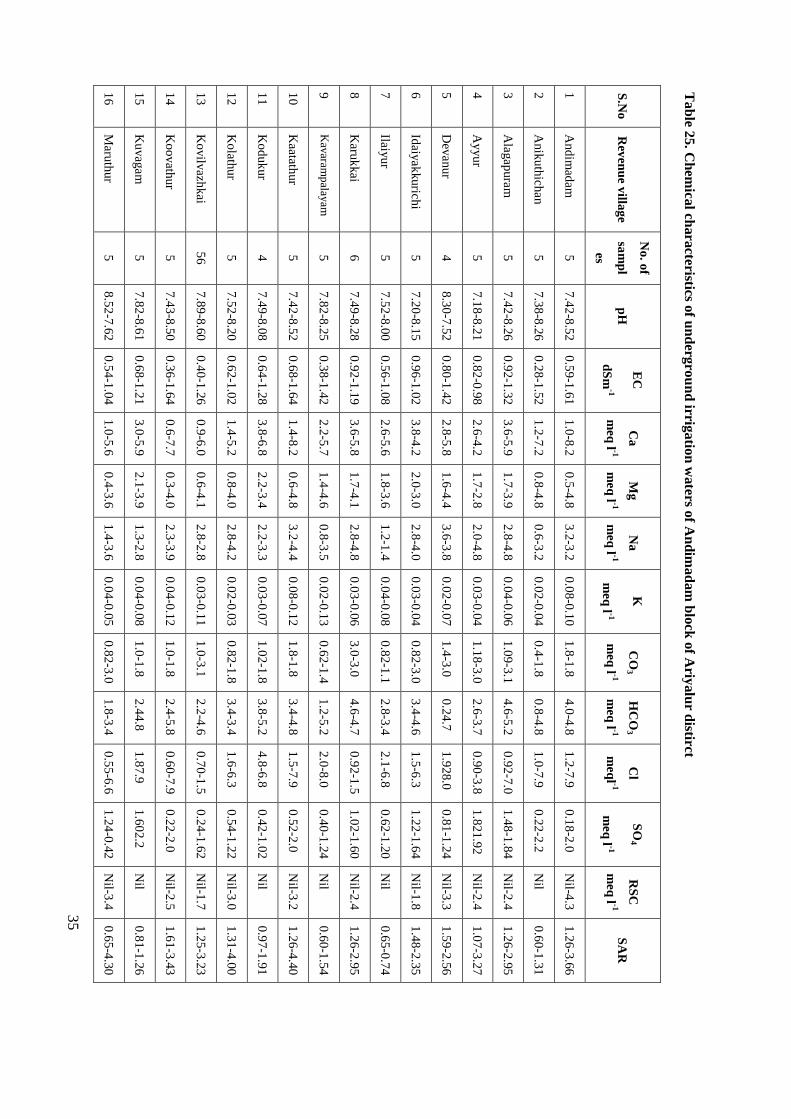
35
Tab
le 2
5. C
hem
ical ch
ara
cteristics of u
nd
ergro
un
d irrig
atio
n w
aters o
f An
dim
ad
am
blo
ck o
f Ariy
alu
r distirct
S.N
o
Rev
enu
e villa
ge
No
. of
sam
pl
es
pH
EC
dS
m-1
Ca
meq
l -1
Mg
meq
l -1
Na
meq
l -1
K
meq
l -1
CO
3
meq
l -1
HC
O3
meq
l -1
Cl
meq
l -1
SO
4
meq
l -1
RS
C
meq
l -1 S
AR
1
And
imad
am
5
7
.42
-8.5
2
0.5
9-1
.61
1.0
-8.2
0
.5-4
.8
3.2
-3.2
0
.08
-0.1
0
1.8
-1.8
4
.0-4
.8
1.2
-7.9
0
.18
-2.0
N
il-4.3
1
.26
-3.6
6
2
Anik
uth
ichan
5
7
.38
-8.2
6
0.2
8-1
.52
1.2
-7.2
0
.8-4
.8
0.6
-3.2
0
.02
-0.0
4
0.4
-1.8
0
.8-4
.8
1.0
-7.9
0
.22
-2.2
N
il 0
.60
-1.3
1
3
Ala
gap
ura
m
5
7.4
2-8
.26
0.9
2-1
.32
3.6
-5.9
1
.7-3
.9
2.8
-4.8
0
.04
-0.0
6
1.0
9-3
.1
4.6
-5.2
0
.92
-7.0
1
.48
-1.8
4
Nil-2
.4
1.2
6-2
.95
4
Ay
yur
5
7.1
8-8
.21
0.8
2-0
.98
2.6
-4.2
1
.7-2
.8
2.0
-4.8
0
.03
-0.0
4
1.1
8-3
.0
2.6
-3.7
0
.90
-3.8
1
.82
1.9
2
Nil-2
.4
1.0
7-3
.27
5
Dev
anur
4
8.3
0-7
.52
0.8
0-1
.42
2.8
-5.8
1
.6-4
.4
3.6
-3.8
0
.02
-0.0
7
1.4
-3.0
0
.24
.7
1.9
28.0
0
.81
-1.2
4
Nil-3
.3
1.5
9-2
.56
6
Idaiy
ak
kuric
hi
5
7.2
0-8
.15
0.9
6-1
.02
3.8
-4.2
2
.0-3
.0
2.8
-4.0
0
.03
-0.0
4
0.8
2-3
.0
3.4
-4.6
1
.5-6
.3
1.2
2-1
.64
Nil-1
.8
1.4
8-2
.35
7
Ilaiyur
5
7.5
2-8
.00
0.5
6-1
.08
2.6
-5.6
1
.8-3
.6
1.2
-1.4
0
.04
-0.0
8
0.8
2-1
.1
2.8
-3.4
2
.1-6
.8
0.6
2-1
.20
Nil
0.6
5-0
.74
8
Karu
kkai
6
7.4
9-8
.28
0.9
2-1
.19
3.6
-5.8
1
.7-4
.1
2.8
-4.8
0
.03
-0.0
6
3.0
-3.0
4
.6-4
.7
0.9
2-1
.5
1.0
2-1
.60
Nil-2
.4
1.2
6-2
.95
9
Kav
aramp
alayam
5
7
.82
-8.2
5
0.3
8-1
.42
2.2
-5.7
1
.4-4
.6
0.8
-3.5
0
.02
-0.1
3
0.6
2-1
.4
1.2
-5.2
2
.0-8
.0
0.4
0-1
.24
Nil
0.6
0-1
.54
10
Kaatath
ur
5
7.4
2-8
.52
0.6
8-1
.64
1.4
-8.2
0
.6-4
.8
3.2
-4.4
0
.08
-0.1
2
1.8
-1.8
3
.4-4
.8
1.5
-7.9
0
.52
-2.0
N
il-3.2
1
.26
-4.4
0
11
Ko
duk
ur
4
7.4
9-8
.08
0.6
4-1
.28
3.8
-6.8
2
.2-3
.4
2.2
-3.3
0
.03
-0.0
7
1.0
2-1
.8
3.8
-5.2
4
.8-6
.8
0.4
2-1
.02
Nil
0.9
7-1
.91
12
Ko
lathur
5
7.5
2-8
.20
0.6
2-1
.02
1.4
-5.2
0
.8-4
.0
2.8
-4.2
0
.02
-0.0
3
0.8
2-1
.8
3.4
-3.4
1
.6-6
.3
0.5
4-1
.22
Nil-3
.0
1.3
1-4
.00
13
Ko
vilv
azhkai
56
7.8
9-8
.60
0.4
0-1
.26
0.9
-6.0
0
.6-4
.1
2.8
-2.8
0
.03
-0.1
1
1.0
-3.1
2
.2-4
.6
0.7
0-1
.5
0.2
4-1
.62
Nil-1
.7
1.2
5-3
.23
14
Ko
ovath
ur
5
7.4
3-8
.50
0.3
6-1
.64
0.6
-7.7
0
.3-4
.0
2.3
-3.9
0
.04
-0.1
2
1.0
-1.8
2
.4-5
.8
0.6
0-7
.9
0.2
2-2
.0
Nil-2
.5
1.6
1-3
.43
15
Ku
vag
am
5
7
.82
-8.6
1
0.6
8-1
.21
3.0
-5.9
2
.1-3
.9
1.3
-2.8
0
.04
-0.0
8
1.0
-1.8
2
.44
.8
1.8
7.9
1
.60
2.2
N
il 0
.81
-1.2
6
16
Maru
thur
5
8.5
2-7
.62
0.5
4-1
.04
1.0
-5.6
0
.4-3
.6
1.4
-3.6
0
.04
-0.0
5
0.8
2-3
.0
1.8
-3.4
0
.55
-6.6
1
.24
-0.4
2
Nil-3
.4
0.6
5-4
.30
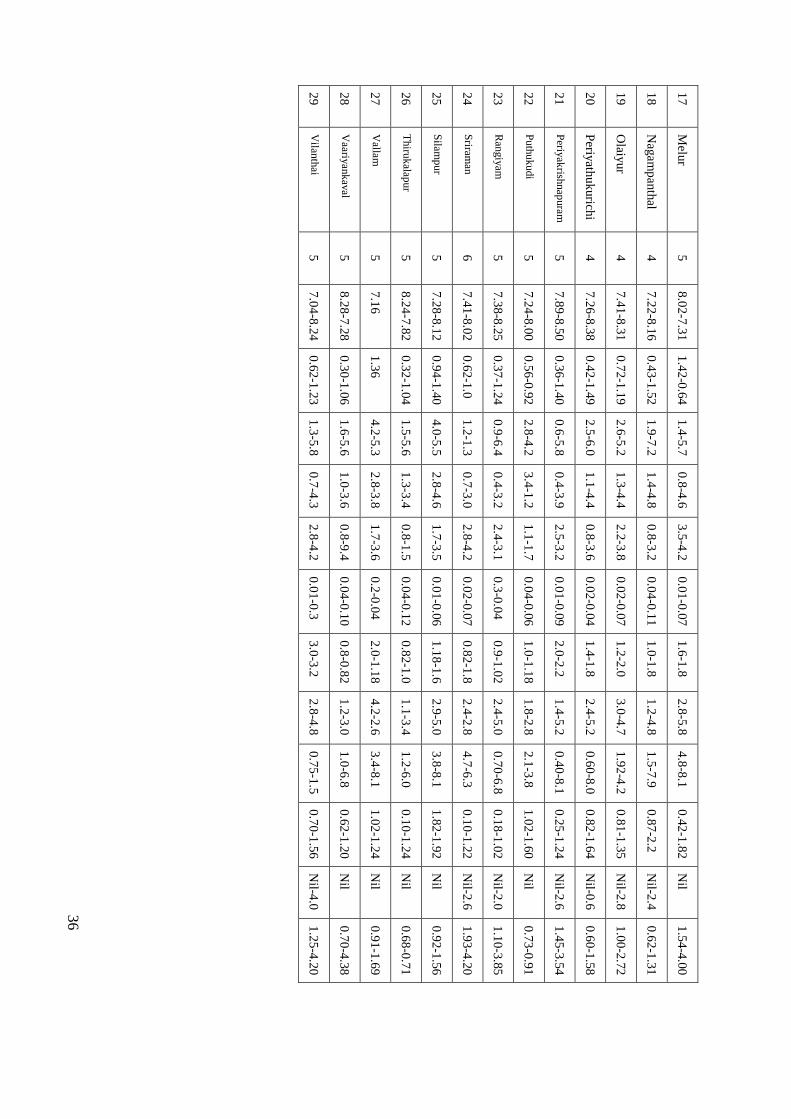
36
17
Melu
r 5
8
.02
-7.3
1
1.4
2-0
.64
1.4
-5.7
0
.8-4
.6
3.5
-4.2
0
.01
-0.0
7
1.6
-1.8
2
.8-5
.8
4.8
-8.1
0
.42
-1.8
2
Nil
1.5
4-4
.00
18
Nag
am
panth
al 4
7
.22
-8.1
6
0.4
3-1
.52
1.9
-7.2
1
.4-4
.8
0.8
-3.2
0
.04
-0.1
1
1.0
-1.8
1
.2-4
.8
1.5
-7.9
0
.87
-2.2
N
il-2.4
0
.62
-1.3
1
19
Olaiy
ur
4
7.4
1-8
.31
0.7
2-1
.19
2.6
-5.2
1
.3-4
.4
2.2
-3.8
0
.02
-0.0
7
1.2
-2.0
3
.0-4
.7
1.9
2-4
.2
0.8
1-1
.35
Nil-2
.8
1.0
0-2
.72
20
Periy
athu
kurich
i 4
7
.26
-8.3
8
0.4
2-1
.49
2.5
-6.0
1
.1-4
.4
0.8
-3.6
0
.02
-0.0
4
1.4
-1.8
2
.4-5
.2
0.6
0-8
.0
0.8
2-1
.64
Nil-0
.6
0.6
0-1
.58
21
Periy
akrish
nap
uram
5
7
.89
-8.5
0
0.3
6-1
.40
0.6
-5.8
0
.4-3
.9
2.5
-3.2
0
.01
-0.0
9
2.0
-2.2
1
.4-5
.2
0.4
0-8
.1
0.2
5-1
.24
Nil-2
.6
1.4
5-3
.54
22
Puth
uk
udi
5
7.2
4-8
.00
0.5
6-0
.92
2.8
-4.2
3
.4-1
.2
1.1
-1.7
0
.04
-0.0
6
1.0
-1.1
8
1.8
-2.8
2
.1-3
.8
1.0
2-1
.60
Nil
0.7
3-0
.91
23
Ran
giy
am
5
7.3
8-8
.25
0.3
7-1
.24
0.9
-6.4
0
.4-3
.2
2.4
-3.1
0
.3-0
.04
0.9
-1.0
2
2.4
-5.0
0
.70
-6.8
0
.18
-1.0
2
Nil-2
.0
1.1
0-3
.85
24
Sriram
an
6
7.4
1-8
.02
0.6
2-1
.0
1.2
-1.3
0
.7-3
.0
2.8
-4.2
0
.02
-0.0
7
0.8
2-1
.8
2.4
-2.8
4
.7-6
.3
0.1
0-1
.22
Nil-2
.6
1.9
3-4
.20
25
Silam
pur
5
7.2
8-8
.12
0.9
4-1
.40
4.0
-5.5
2
.8-4
.6
1.7
-3.5
0
.01
-0.0
6
1.1
8-1
.6
2.9
-5.0
3
.8-8
.1
1.8
2-1
.92
Nil
0.9
2-1
.56
26
Thiru
kalap
ur
5
8.2
4-7
.82
0.3
2-1
.04
1.5
-5.6
1
.3-3
.4
0.8
-1.5
0
.04
-0.1
2
0.8
2-1
.0
1.1
-3.4
1
.2-6
.0
0.1
0-1
.24
Nil
0.6
8-0
.71
27
Vallam
5
7
.16
1
.36
4.2
-5.3
2
.8-3
.8
1.7
-3.6
0
.2-0
.04
2.0
-1.1
8
4.2
-2.6
3
.4-8
.1
1.0
2-1
.24
Nil
0.9
1-1
.69
28
Vaariy
ank
aval
5
8.2
8-7
.28
0.3
0-1
.06
1.6
-5.6
1
.0-3
.6
0.8
-9.4
0
.04
-0.1
0
0.8
-0.8
2
1.2
-3.0
1
.0-6
.8
0.6
2-1
.20
Nil
0.7
0-4
.38
29
Vilan
thai
5
7.0
4-8
.24
0.6
2-1
.23
1.3
-5.8
0
.7-4
.3
2.8
-4.2
0
.01
-0.3
3
.0-3
.2
2.8
-4.8
0
.75
-1.5
0
.70
-1.5
6
Nil-4
.0
1.2
5-4
.20

37
3.2.4. Jayankondam Block
To study the ground water quality of Jayankondam Block 115 water samples were
collected and analyzed (Table 27). The water table of open / bore wells varied from 40 to 70 feet.
In Jayankondam block, the variation in pH and EC ranged from 7.15 to 8.84 and 0.25 to 3.85
dSm-1
, respectively (Table 17). The RSC of waters varied from nil to 4.1 meq. l-1
and the SAR
ranged from 0.38 – 7.2. Out of the total samples collected from Jayankondam Block, 65.2
percent samples had RSC less than 2.5 meq. l-1
, 30.4 percent samples showed RSC between 2.5
to 4.0 meq. l-1
and 4.35 percent samples showed RSC between 2.5 to 4.0 meq. l-1
. About 91.3 and
8.7 percent water samples showed EC in the range of < 2.0 and 2- 4 dS/m, respectively . About
56.5, 8.70, 30.43 and 4.35 per cent water samples were found under good, marginally saline,
marginally alkali and alkali water categories, respectively (Table 16). Villages under different
categories of water quality are presented in table 26.
Table 26. Villages under different categories of water quality in Jayankondam Block of
Ariyalur District
Water
Quality
Name of the Villages
GOOD Aalathipallam, Aamanakkanthondi, Angarayanallur, Thevamangalam,
Ilayaperumanallur, Eravankudi, G.K. Solapuram, Guruvayapparkovil,
Kazhumangalam, Kazhuvanthondi, Kattagaram, Melanikuzhi, Padanilai,
Pappakudi, Pilichikuzhi, Pillapalayam, Prancheri, Pichanur, Saluppai,
Thazhuthalai medu, Thathanur, T. Solankurichi, Utkottai, Vunkudi
MA Jeyamkondam, Udaiyarpalayam, Kundaveli, Periyavalayam,, Kachi perumal,
Thandalai,Idaiyar
MS Kallathur Vanathirayanpattinam
A A.Nayakanpettai
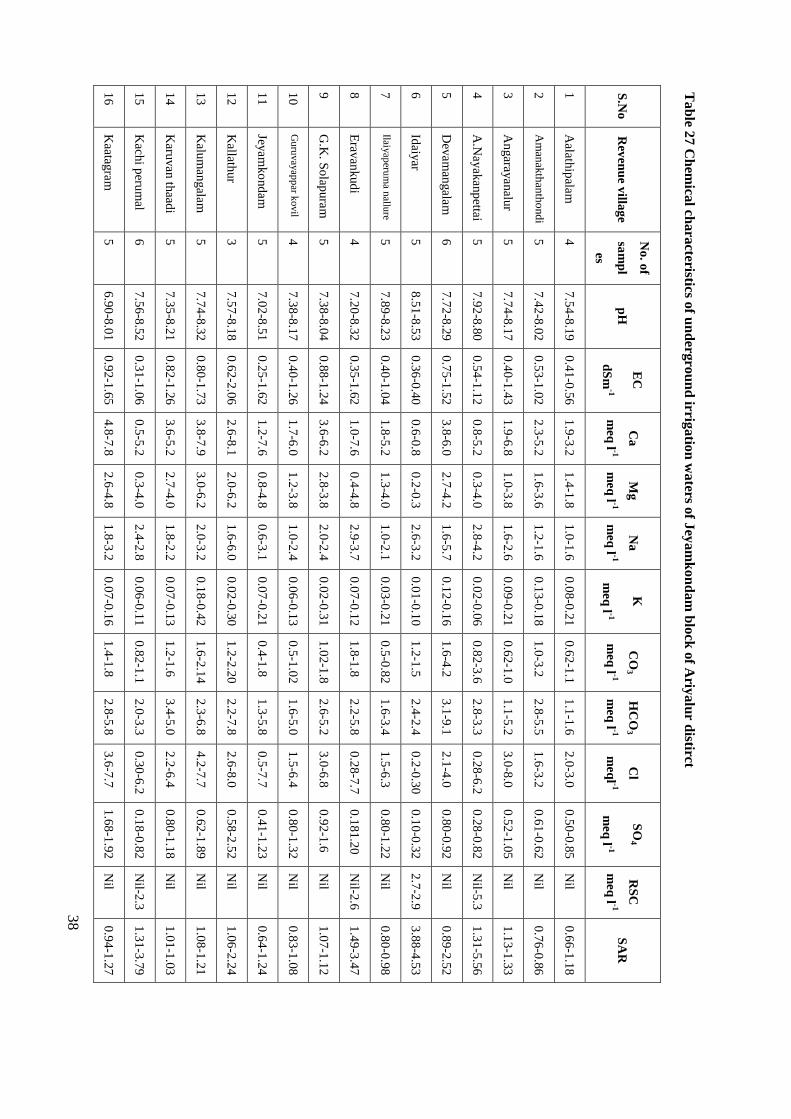
38
Tab
le 2
7 C
hem
ical ch
ara
cteristics of u
nd
ergro
un
d irrig
atio
n w
aters o
f Jey
am
kon
dam
blo
ck o
f Ariy
alu
r distirct
S.N
o
Rev
enu
e villa
ge
No
. of
sam
pl
es
pH
EC
dS
m-1
Ca
meq
l -1
Mg
meq
l -1
Na
meq
l -1
K
meq
l -1
CO
3
meq
l -1
HC
O3
meq
l -1
Cl
meq
l -1
SO
4
meq
l -1
RS
C
meq
l -1 S
AR
1
Aalath
ipala
m
4
7.5
4-8
.19
0.4
1-0
.56
1.9
-3.2
1
.4-1
.8
1.0
-1.6
0
.08
-0.2
1
0.6
2-1
.1
1.1
-1.6
2
.0-3
.0
0.5
0-0
.85
Nil
0.6
6-1
.18
2
Am
anak
than
tho
nd
i 5
7
.42
-8.0
2
0.5
3-1
.02
2.3
-5.2
1
.6-3
.6
1.2
-1.6
0
.13
-0.1
8
1.0
-3.2
2
.8-5
.5
1.6
-3.2
0
.61
-0.6
2
Nil
0.7
6-0
.86
3
An
gara
yanalu
r 5
7
.74
-8.1
7
0.4
0-1
.43
1.9
-6.8
1
.0-3
.8
1.6
-2.6
0
.09
-0.2
1
0.6
2-1
.0
1.1
-5.2
3
.0-8
.0
0.5
2-1
.05
Nil
1.1
3-1
.33
4
A.N
ayakan
pettai
5
7.9
2-8
.80
0.5
4-1
.12
0.8
-5.2
0
.3-4
.0
2.8
-4.2
0
.02
-0.0
6
0.8
2-3
.6
2.8
-3.3
0
.28
-6.2
0
.28
-0.8
2
Nil-5
.3
1.3
1-5
.56
5
Dev
am
angala
m
6
7.7
2-8
.29
0.7
5-1
.52
3.8
-6.0
2
.7-4
.2
1.6
-5.7
0
.12
-0.1
6
1.6
-4.2
3
.1-9
.1
2.1
-4.0
0
.80
-0.9
2
Nil
0.8
9-2
.52
6
Idaiy
ar 5
8
.51
-8.5
3
0.3
6-0
.40
0.6
-0.8
0
.2-0
.3
2.6
-3.2
0
.01
-0.1
0
1.2
-1.5
2
.4-2
.4
0.2
-0.3
0
0.1
0-0
.32
2.7
-2.9
3
.88
-4.5
3
7
Ilaiyap
erum
a nallu
re 5
7
.89
-8.2
3
0.4
0-1
.04
1.8
-5.2
1
.3-4
.0
1.0
-2.1
0
.03
-0.2
1
0.5
-0.8
2
1.6
-3.4
1
.5-6
.3
0.8
0-1
.22
Nil
0.8
0-0
.98
8
Erav
ankud
i 4
7
.20
-8.3
2
0.3
5-1
.62
1.0
-7.6
0
.4-4
.8
2.9
-3.7
0
.07
-0.1
2
1.8
-1.8
2
.2-5
.8
0.2
8-7
.7
0.1
81.2
0
Nil-2
.6
1.4
9-3
.47
9
G.K
. So
lapura
m
5
7.3
8-8
.04
0.8
8-1
.24
3.6
-6.2
2
.8-3
.8
2.0
-2.4
0
.02
-0.3
1
1.0
2-1
.8
2.6
-5.2
3
.0-6
.8
0.9
2-1
.6
Nil
1.0
7-1
.12
10
Gu
ruvay
app
ar kovil
4
7.3
8-8
.17
0.4
0-1
.26
1.7
-6.0
1
.2-3
.8
1.0
-2.4
0
.06
-0.1
3
0.5
-1.0
2
1.6
-5.0
1
.5-6
.4
0.8
0-1
.32
Nil
0.8
3-1
.08
11
Jeyam
ko
nd
am
5
7
.02
-8.5
1
0.2
5-1
.62
1.2
-7.6
0
.8-4
.8
0.6
-3.1
0
.07
-0.2
1
0.4
-1.8
1
.3-5
.8
0.5
-7.7
0
.41
-1.2
3
Nil
0.6
4-1
.24
12
Kallath
ur
3
7.5
7-8
.18
0.6
2-2
.06
2.6
-8.1
2
.0-6
.2
1.6
-6.0
0
.02
-0.3
0
1.2
-2.2
0
2.2
-7.8
2
.6-8
.0
0.5
8-2
.52
Nil
1.0
6-2
.24
13
Kalu
man
gala
m
5
7.7
4-8
.32
0.8
0-1
.73
3.8
-7.9
3
.0-6
.2
2.0
-3.2
0
.18
-0.4
2
1.6
-2.1
4
2.3
-6.8
4
.2-7
.7
0.6
2-1
.89
Nil
1.0
8-1
.21
14
Karu
van th
aadi
5
7.3
5-8
.21
0.8
2-1
.26
3.6
-5.2
2
.7-4
.0
1.8
-2.2
0
.07
-0.1
3
1.2
-1.6
3
.4-5
.0
2.2
-6.4
0
.80
-1.1
8
Nil
1.0
1-1
.03
15
Kach
i peru
mal
6
7.5
6-8
.52
0.3
1-1
.06
0.5
-5.2
0
.3-4
.0
2.4
-2.8
0
.06
-0.1
1
0.8
2-1
.1
2.0
-3.3
0
.30
-6.2
0
.18
-0.8
2
Nil-2
.3
1.3
1-3
.79
16
Kaatag
ram
5
6
.90
-8.0
1
0.9
2-1
.65
4.8
-7.8
2
.6-4
.8
1.8
-3.2
0
.07
-0.1
6
1.4
-1.8
2
.8-5
.8
3.6
-7.7
1
.68
-1.9
2
Nil
0.9
4-1
.27
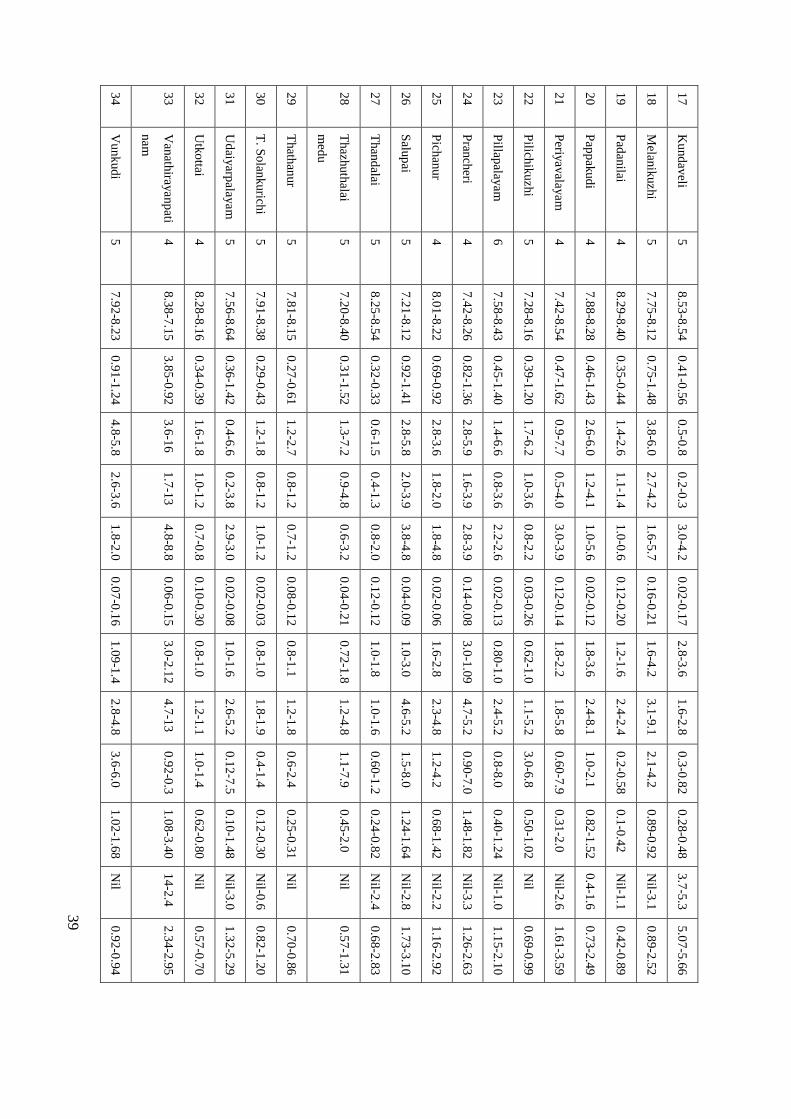
39
17
Ku
nd
aveli
5
8.5
3-8
.54
0.4
1-0
.56
0.5
-0.8
0
.2-0
.3
3.0
-4.2
0
.02
-0.1
7
2.8
-3.6
1
.6-2
.8
0.3
-0.8
2
0.2
8-0
.48
3.7
-5.3
5
.07
-5.6
6
18
Melan
ikuzhi
5
7.7
5-8
.12
0.7
5-1
.48
3.8
-6.0
2
.7-4
.2
1.6
-5.7
0
.16
-0.2
1
1.6
-4.2
3
.1-9
.1
2.1
-4.2
0
.89
-0.9
2
Nil-3
.1
0.8
9-2
.52
19
Pad
anilai
4
8.2
9-8
.40
0.3
5-0
.44
1.4
-2.6
1
.1-1
.4
1.0
-0.6
0
.12
-0.2
0
1.2
-1.6
2
.4-2
.4
0.2
-0.5
8
0.1
-0.4
2
Nil-1
.1
0.4
2-0
.89
20
Pap
pak
ud
i 4
7
.88
-8.2
8
0.4
6-1
.43
2.6
-6.0
1
.2-4
.1
1.0
-5.6
0
.02
-0.1
2
1.8
-3.6
2
.4-8
.1
1.0
-2.1
0
.82
-1.5
2
0.4
-1.6
0
.73
-2.4
9
21
Periy
avala
yam
4
7
.42
-8.5
4
0.4
7-1
.62
0.9
-7.7
0
.5-4
.0
3.0
-3.9
0
.12
-0.1
4
1.8
-2.2
1
.8-5
.8
0.6
0-7
.9
0.3
1-2
.0
Nil-2
.6
1.6
1-3
.59
22
Pilich
ikuzhi
5
7.2
8-8
.16
0.3
9-1
.20
1.7
-6.2
1
.0-3
.6
0.8
-2.2
0
.03
-0.2
6
0.6
2-1
.0
1.1
-5.2
3
.0-6
.8
0.5
0-1
.02
Nil
0.6
9-0
.99
23
Pillap
alayam
6
7
.58
-8.4
3
0.4
5-1
.40
1.4
-6.6
0
.8-3
.6
2.2
-2.6
0
.02
-0.1
3
0.8
0-1
.0
2.4
-5.2
0
.8-8
.0
0.4
0-1
.24
Nil-1
.0
1.1
5-2
.10
24
Pran
cheri
4
7.4
2-8
.26
0.8
2-1
.36
2.8
-5.9
1
.6-3
.9
2.8
-3.9
0
.14
-0.0
8
3.0
-1.0
9
4.7
-5.2
0
.90
-7.0
1
.48
-1.8
2
Nil-3
.3
1.2
6-2
.63
25
Pich
anur
4
8.0
1-8
.22
0.6
9-0
.92
2.8
-3.6
1
.8-2
.0
1.8
-4.8
0
.02
-0.0
6
1.6
-2.8
2
.3-4
.8
1.2
-4.2
0
.68
-1.4
2
Nil-2
.2
1.1
6-2
.92
26
Salu
pai
5
7.2
1-8
.12
0.9
2-1
.41
2.8
-5.8
2
.0-3
.9
3.8
-4.8
0
.04
-0.0
9
1.0
-3.0
4
.6-5
.2
1.5
-8.0
1
.24
-1.6
4
Nil-2
.8
1.7
3-3
.10
27
Than
dalai
5
8.2
5-8
.54
0.3
2-0
.33
0.6
-1.5
0
.4-1
.3
0.8
-2.0
0
.12
-0.1
2
1.0
-1.8
1
.0-1
.6
0.6
0-1
.2
0.2
4-0
.82
Nil-2
.4
0.6
8-2
.83
28
Thazh
uth
alai
med
u
5
7.2
0-8
.40
0.3
1-1
.52
1.3
-7.2
0
.9-4
.8
0.6
-3.2
0
.04
-0.2
1
0.7
2-1
.8
1.2
-4.8
1
.1-7
.9
0.4
5-2
.0
Nil
0.5
7-1
.31
29
Thath
anur
5
7.8
1-8
.15
0.2
7-0
.61
1.2
-2.7
0
.8-1
.2
0.7
-1.2
0
.08
-0.1
2
0.8
-1.1
1
.2-1
.8
0.6
-2.4
0
.25
-0.3
1
Nil
0.7
0-0
.86
30
T. S
olan
kurich
i 5
7
.91
-8.3
8
0.2
9-0
.43
1.2
-1.8
0
.8-1
.2
1.0
-1.2
0
.02
-0.0
3
0.8
-1.0
1
.8-1
.9
0.4
-1.4
0
.12
-0.3
0
Nil-0
.6
0.8
2-1
.20
31
Ud
aiyarp
alayam
5
7
.56
-8.6
4
0.3
6-1
.42
0.4
-6.6
0
.2-3
.8
2.9
-3.0
0
.02
-0.0
8
1.0
-1.6
2
.6-5
.2
0.1
2-7
.5
0.1
0-1
.48
Nil-3
.0
1.3
2-5
.29
32
Utk
ottai
4
8.2
8-8
.16
0.3
4-0
.39
1.6
-1.8
1
.0-1
.2
0.7
-0.8
0
.10
-0.3
0
0.8
-1.0
1
.2-1
.1
1.0
-1.4
0
.62
-0.8
0
Nil
0.5
7-0
.70
33
Van
athira
yanp
ati
nam
4
8.3
8-7
.15
3.8
5-0
.92
3.6
-16
1.7
-13
4.8
-8.8
0
.06
-0.1
5
3.0
-2.1
2
4.7
-13
0.9
2-0
.3
1.0
8-3
.40
14
-2.4
2
.34
-2.9
5
34
Vu
nk
ud
i 5
7
.92
-8.2
3
0.9
1-1
.24
4.8
-5.8
2
.6-3
.6
1.8
-2.0
0
.07
-0.1
6
1.0
9-1
.4
2.8
-4.8
3
.6-6
.0
1.0
2-1
.68
Nil
0.9
2-0
.94
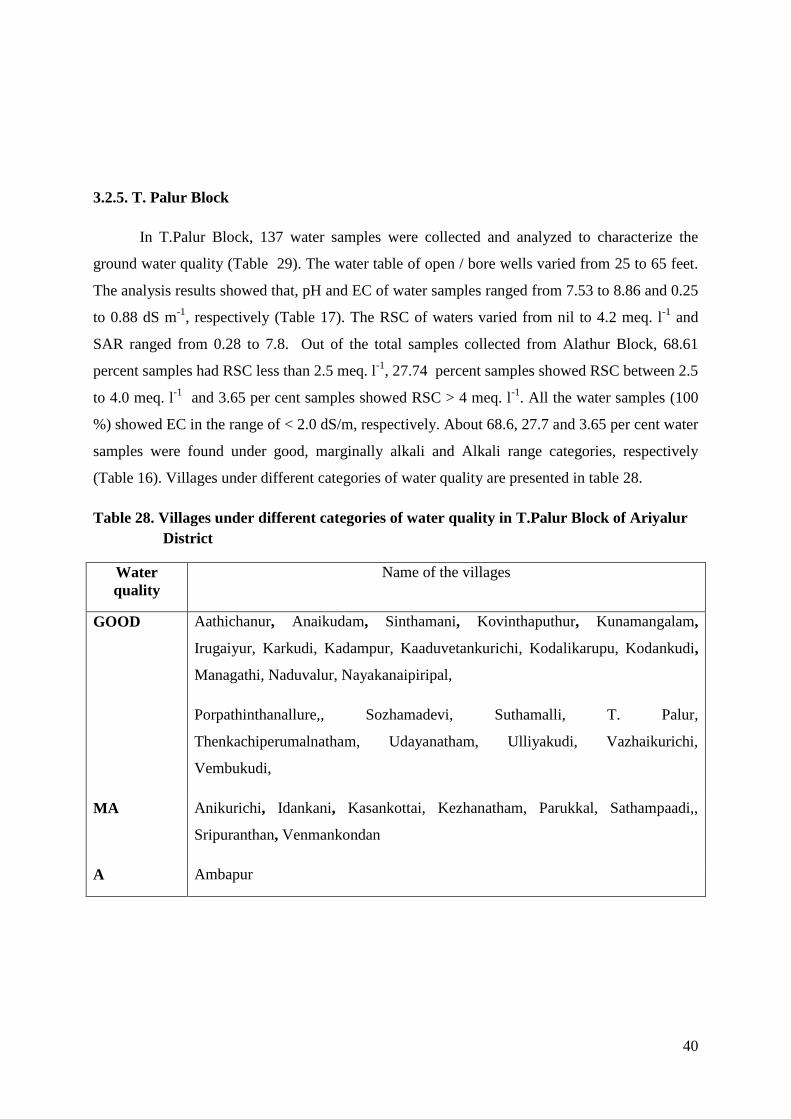
40
3.2.5. T. Palur Block
In T.Palur Block, 137 water samples were collected and analyzed to characterize the
ground water quality (Table 29). The water table of open / bore wells varied from 25 to 65 feet.
The analysis results showed that, pH and EC of water samples ranged from 7.53 to 8.86 and 0.25
to 0.88 dS m-1
, respectively (Table 17). The RSC of waters varied from nil to 4.2 meq. l-1
and
SAR ranged from 0.28 to 7.8. Out of the total samples collected from Alathur Block, 68.61
percent samples had RSC less than 2.5 meq. l-1
, 27.74 percent samples showed RSC between 2.5
to 4.0 meq. l-1
and 3.65 per cent samples showed RSC > 4 meq. l-1
. All the water samples (100
%) showed EC in the range of < 2.0 dS/m, respectively. About 68.6, 27.7 and 3.65 per cent water
samples were found under good, marginally alkali and Alkali range categories, respectively
(Table 16). Villages under different categories of water quality are presented in table 28.
Table 28. Villages under different categories of water quality in T.Palur Block of Ariyalur
District
Water
quality
Name of the villages
GOOD Aathichanur, Anaikudam, Sinthamani, Kovinthaputhur, Kunamangalam,
Irugaiyur, Karkudi, Kadampur, Kaaduvetankurichi, Kodalikarupu, Kodankudi,
Managathi, Naduvalur, Nayakanaipiripal,
Porpathinthanallure,, Sozhamadevi, Suthamalli, T. Palur,
Thenkachiperumalnatham, Udayanatham, Ulliyakudi, Vazhaikurichi,
Vembukudi,
MA Anikurichi, Idankani, Kasankottai, Kezhanatham, Parukkal, Sathampaadi,,
Sripuranthan, Venmankondan
A Ambapur

41
Ta
ble 2
9. C
hem
ical ch
ara
cteristics of u
nd
ergro
un
d irrig
atio
n w
aters o
f T.P
alu
r blo
ck o
f Ariy
alu
r distirct
S.N
o
Rev
enu
e villa
ge
No
. of
sam
pl
es
pH
E
C
dS
m-1
Ca
meq
l -1
Mg
meq
l -1
Na
meq
l -1
K
meq
l -1
CO
3
meq
l -1
HC
O3
meq
l -1
Cl
meq
l -1
SO
4
meq
l -1
RS
C
meq
l -1 S
AR
1
Aath
isalur
4
7.8
9-7
.78
0.6
1-0
.69
2.7
-2.8
1
.1-5
.9
1.0
-1.2
0
.8-0
.9
1.0
-1.1
1
.8-2
.0
2.2
-2.4
1
.25
-1.3
2
Nil
0.6
8-0
.79
2
Am
bap
ur
5
8.8
6-7
.82
0.4
9-1
.42
0.7
-5.7
0
.4-4
.6
3.5
-3.6
0
.01
-0.1
3
1.6
-2.6
2
.2-5
.0
0.8
0-7
.2
0.7
5-1
.86
Nil-3
.7
1.5
4-4
.85
3
Anaik
ud
am
5
7
.52
-8.1
6
0.5
0-1
.18
1.1
-5.4
0
.6-3
.2
2.0
-3.2
0
.03
-0.0
6
2.8
-3.0
2
.0-4
.6
0.5
2-1
.5
0.4
2-1
.60
Nil-3
.1
0.9
6-3
.47
4
Anik
uric
hi
6
8.5
2-8
.50
0.3
3-0
.48
0.8
-0.8
0
.4-0
.7
1.9
-2.2
0
.14
-0.2
2
1.8
-2.4
1
.3-1
.9
0.2
-0.4
0
0.1
2-0
.31
1.9
-2.8
2
.45
-2.5
4
5
Sin
tham
ani
4
7.7
6-8
.24
0.4
8-1
.31
2.8
-3.3
1
.5-3
.6
0.5
0-.6
0
.02
-0.0
7
0.6
0-.0
9
1.8
-4.8
2
.1-6
.0
0.6
2-1
.02
Nil
0.3
4-3
.55
6
Idan
kan
i 4
7
.88
-8.5
7
0.8
8-1
.43
6.2
-3.6
2
.8-3
.9
2.0
-3.4
0
.04
-0.0
9
1.8
-2.0
3
.02
-.2
2.2
-8.0
1
.24
-1.7
0
Nil
1.1
2-1
.51
7
Ko
vin
dap
uth
ur
5
7.2
1-8
.13
0.3
5-1
.82
0.7
-9.6
0
.2-5
.2
2.3
-3.1
0
.08
-0.2
1
1.8
-4.9
1
.4-5
.0
0.6
-10
.5
0.1
7-1
.80
Nil-2
.3
1.1
4-3
.43
8
Ku
nam
an
gala
m
5
8.0
3-8
.22
0.6
4-0
.65
2.8
-3.0
2
.0-2
.1
1.3
-1.3
0
.02
-0.0
4
1.0
-1.0
1
.6-1
.8
2.2
-2.4
1
.42
-1.6
0
Nil
0.8
1-0
.84
9
Irugaiy
ur
5
8.0
9-8
.29
0.2
5-0
.50
1.2
-2.1
0
.8-1
.7
0.5
-1.1
0
.05
-0.0
7
0.6
8-1
.0
0.9
-1.3
1
.1-1
.5
0.2
2-0
.50
Nil
0.5
0-0
.80
10
Kark
ud
i 6
7
.73
-7.8
8
0.6
8-0
.52
2.3
-2.8
1
.5-1
.6
1.2
-1.2
0
.9-0
.18
1.0
-1.0
1
.4-2
.0
2.0
-2.3
0
.21
-0.3
2
Nil
0.8
2-0
.86
11
Kasan
ko
ttai 5
7
.62
-8.5
4
0.5
7-1
.28
1.2
-6.6
0
.9-4
.3
3.8
-2.8
0
.07
-0.0
3
2.8
-3.0
2
.0-4
.8
0.9
-2.5
0
.36
-1.5
6
Nil
0.7
1-1
.20
12
Kad
am
pur
6
7.2
8-8
.12
0.3
4-0
.62
1.6
-2.8
1
.0-2
.0
0.8
-1.3
0
.01
-0.0
2
0.8
-1.0
1
.2-1
.6
0.6
-2.2
0
.31
1.4
2
Nil
0.7
0-0
.84
13
Kad
uvetan
ku
richi
5
7.5
2-8
.10
0.6
2-1
.62
2.8
-7.8
2
.0-5
.4
1.3
-3.4
0
.02
-0.0
4
1.0
-1.8
1
.6-4
.8
2.2
-7.9
1
.43
-2.2
N
il 0
.84
-1.3
2
14
Kezh
anath
am
5
8
.52
-8.5
1
0.4
2-0
.84
1.2
-3.3
0
.8-2
.1
0.5
-2.0
0
.02
-0.0
4
0.8
0-1
.6
1.0
-3.2
0
.30
-2.2
0
.50
-1.7
0
Nil
0.5
0-1
.22

42
15
Ko
dalik
arup
u
5
7.9
4-8
.23
0.5
8-0
.48
1.1
-1.9
0
.03
-1.4
1
.0-1
.8
1.9
-0.1
1
2.1
-1.0
0
.8-1
.2
1.5
-2.0
0
.82
-0.8
9
Nil-.7
7
1.3
3-1
.40
16
Ko
dan
kud
i 5
7
.84
-8.2
4
0.5
8-0
.92
2.9
-4.2
1
.1-2
.8
1.7
-3.0
0
.06
-0.2
1
1.1
8-2
.0
2.8
-3.4
0
.62
-3.8
0
.80
-1.0
2
Nil-1
.4
0.9
1-2
.12
17
Man
agath
i 5
7
.53
-8.2
2
0.5
2-0
.62
1.4
-2.8
0
.8-2
.2
1.0
-3.2
0
.02
-0.2
0
1.1
-1.8
2
.1-3
.4
1.6
-3.2
0
.54
-0.7
2
Nil-3
.0
0.6
3-3
.05
18
Nad
uvalu
r 5
8
.07
-7.8
2
0.4
8-0
.42
1.8
-1.9
1
.4-1
.4
0.8
-1.0
0
.02
-0.0
7
1.0
-1.0
1
.2-1
.2
1.5
-2.0
0
.70
-0.8
0
Nil
0.9
7-0
.62
19
Nay
ank
anaip
iripal
4
8.0
2-7
.42
0.8
1-1
.0
3.8
-4.2
2
.4-3
.0
1.8
-2.6
0
.04
-0.1
8
0.8
2-1
.4
2.4
-2.8
3
.6-6
.3
1.2
2-1
.68
Nil
1.0
2-1
.37
20
Paru
kkal
3
7.9
2-8
.60
0.3
8-1
.12
0.9
-6.0
0
.4-3
.8
2.2
-2.5
0
.03
-0.0
6
1.0
2-2
.8
1.1
-5.2
0
.10
-6.8
0
.13
-1.0
2
Nil-2
.6
0.9
9-3
.10
21
Porp
athin
than
allure
5
8.2
1-8
.16
0.1
4-0
.57
2.0
-2.8
1
.3-1
.8
0.7
-1.1
0
.08
-0.0
8
1.0
-1.1
1
.6-1
.8
1.1
-2.1
0
.72
-1.6
N
il 0
.54
-0.7
3
22
Sath
am
paad
i 5
8
.75
-8.5
7
0.7
2-0
.66
1.4
-1.8
1
.0-1
.2
2.3
-3.8
0
.02
-0.2
0
3.1
-3.4
2
.9-3
.2
0.6
0-0
.9
0.2
7-0
.32
3.5
-3.6
2
.10
-3.1
0
23
So
zham
adevi
5
7.0
1-8
.02
0.4
4-1
.26
2.1
-4.6
1
.4-3
.2
0.8
-2.6
0
.02
-0.1
1
0.8
2-1
.0
1.2
-2.4
1
.5-6
.3
0.8
9-1
.22
2.4
-2.5
0
.60
-1.3
2
24
Srip
uran
than
4
8
.53
-8.5
1
0.3
9-0
.40
0.6
-0.6
0
.3-0
.4
2.7
-2.8
0
.02
-0.0
8
2.3
-2.4
1
.0-1
.1
0.3
8-0
.4
0.4
2-0
.62
Nil
3.8
2-4
.17
25
Suth
am
alli 4
8
.17
-7.3
7
0.3
5-1
.47
1.4
-6.2
1
.0-3
.9
0.9
-3.4
0
.04
-0.0
9
0.8
0-2
.0
1.0
-5.2
1
.4-8
.0
0.7
4-1
.24
Nil
0.8
2-1
.51
26
T.P
alur
6
7.9
6-7
.93
0.4
4-0
.35
1.3
-1.8
1
.1-1
.4
0.8
-1.0
0
.05
-0.1
6
0.7
5-0
.8
1.0
-1.4
1
.5-2
.0
0.3
2-0
.61
Nil
0.7
3-0
.97
27
Then
kac
hip
erum
alnath
am
5
7.3
4-8
.21
0.6
2-0
.89
1.5
-4.2
0
.6-2
.4
1.8
-4.1
0
.03
-0.0
7
1.1
8-1
.8
2.4
-2.6
2
.0-3
.8
0.6
2-1
.02
Nil-2
.1
0.9
9-4
.00
28
Ud
ayan
atham
4
7
.91
-8.3
2
0.3
6-0
.48
1.0
-1.4
0
.8-1
.1
0.7
-2.8
0
.02
-0.4
4
0.7
2-2
.0
1.2
-1.8
0
.9-1
.3
0.2
6-0
.65
Nil-2
.0
0.6
3-2
.95
29
Ulliy
ak
ud
i 5
7
.71
-8.1
2
0.3
9-0
.64
1.8
-3.0
1
.2-2
.1
0.7
-1.3
0
.04
-0.3
0
1.0
-1.0
1
.1-2
.8
1.4
-2.4
0
.81
-0.8
2
Nil
0.5
7-0
.57
30
Vem
bu
kud
i 5
7
.18
-8.2
0
0.6
2-1
.48
1.4
-6.2
0
.8-3
.9
3.4
-4.1
0
.02
-0.0
8
1.8
-1.8
2
.8-5
.3
2.7
-8.0
0
.70
-1.2
8
Nil-2
.4
1.5
1-3
.91
31
Ven
man
ko
nd
an
3
7
.48
-7.9
9
0.8
8-1
.08
5.9
-4.8
3
.6-2
.8
1.5
-1.7
0
.02
-0.0
4
0.8
-1.0
8
2.6
-3.4
3
.4-6
.8
1.0
2-1
.20
Nil
0.6
9-0
.87
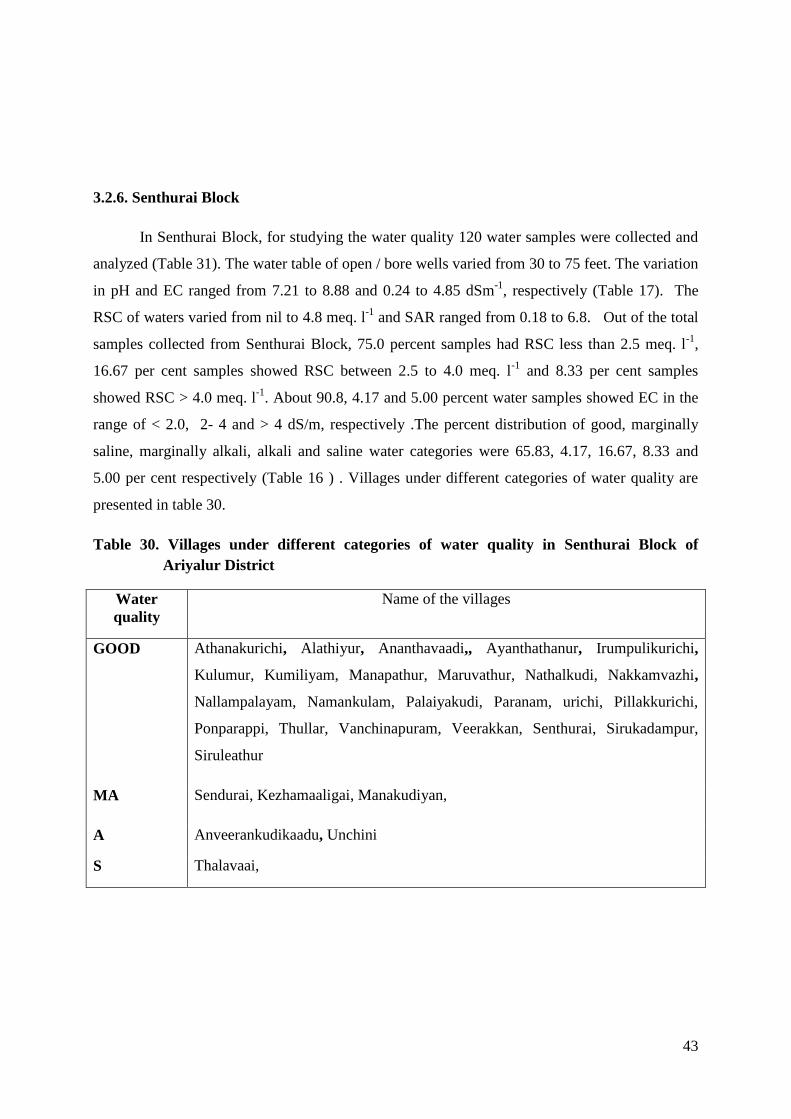
43
3.2.6. Senthurai Block
In Senthurai Block, for studying the water quality 120 water samples were collected and
analyzed (Table 31). The water table of open / bore wells varied from 30 to 75 feet. The variation
in pH and EC ranged from 7.21 to 8.88 and 0.24 to 4.85 dSm-1
, respectively (Table 17). The
RSC of waters varied from nil to 4.8 meq. l-1
and SAR ranged from 0.18 to 6.8. Out of the total
samples collected from Senthurai Block, 75.0 percent samples had RSC less than 2.5 meq. l-1
,
16.67 per cent samples showed RSC between 2.5 to 4.0 meq. l-1
and 8.33 per cent samples
showed RSC > 4.0 meq. l-1
. About 90.8, 4.17 and 5.00 percent water samples showed EC in the
range of < 2.0, 2- 4 and > 4 dS/m, respectively .The percent distribution of good, marginally
saline, marginally alkali, alkali and saline water categories were 65.83, 4.17, 16.67, 8.33 and
5.00 per cent respectively (Table 16 ) . Villages under different categories of water quality are
presented in table 30.
Table 30. Villages under different categories of water quality in Senthurai Block of
Ariyalur District
Water
quality
Name of the villages
GOOD Athanakurichi, Alathiyur, Ananthavaadi,, Ayanthathanur, Irumpulikurichi,
Kulumur, Kumiliyam, Manapathur, Maruvathur, Nathalkudi, Nakkamvazhi,
Nallampalayam, Namankulam, Palaiyakudi, Paranam, urichi, Pillakkurichi,
Ponparappi, Thullar, Vanchinapuram, Veerakkan, Senthurai, Sirukadampur,
Siruleathur
MA Sendurai, Kezhamaaligai, Manakudiyan,
A Anveerankudikaadu, Unchini
S Thalavaai,
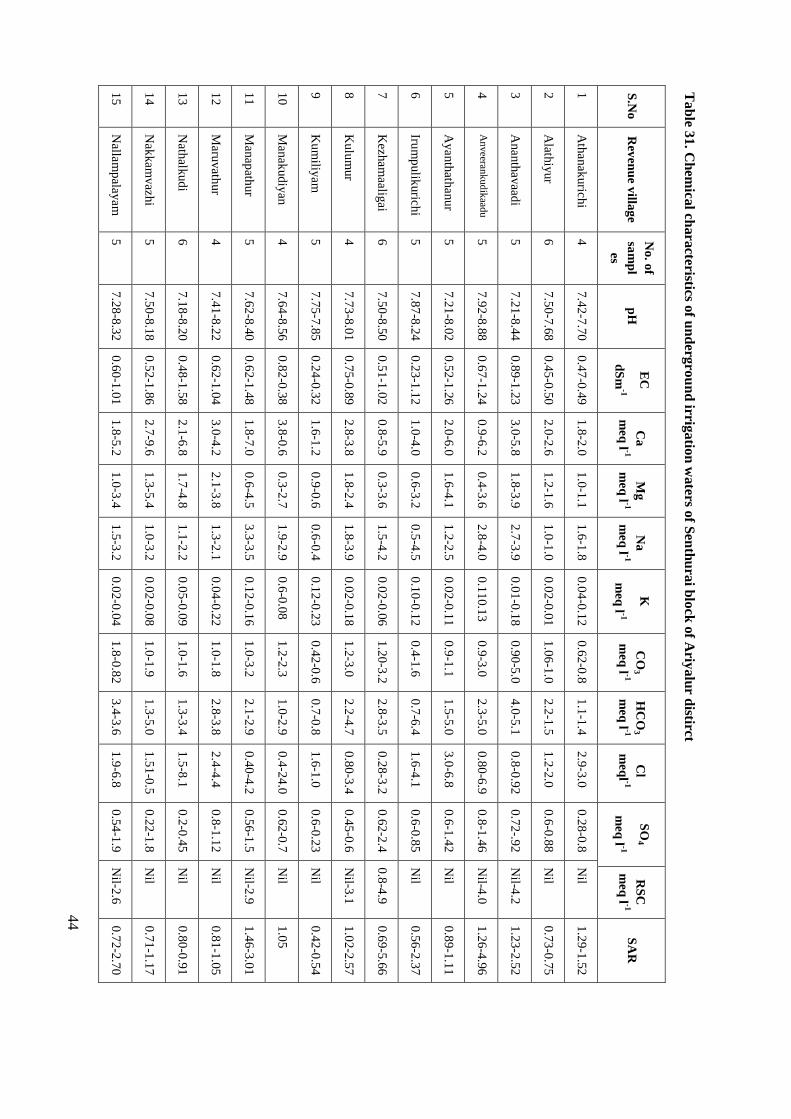
44
Tab
le 3
1. C
hem
ical ch
ara
cteristics of u
nd
ergro
un
d irrig
atio
n w
aters o
f Sen
thu
rai b
lock
of A
riyalu
r distirct
S.N
o
Rev
enu
e villa
ge
No
. of
sam
pl
es
pH
E
C
dS
m-1
Ca
meq
l -1
Mg
meq
l -1
Na
meq
l -1
K
meq
l -1
CO
3
meq
l -1
HC
O3
meq
l -1
Cl
meq
l -1
SO
4
meq
l -1
RS
C
meq
l -1 S
AR
1
Ath
anak
uric
hi
4
7.4
2-7
.70
0.4
7-0
.49
1.8
-2.0
1
.0-1
.1
1.6
-1.8
0
.04
-0.1
2
0.6
2-0
.8
1.1
-1.4
2
.9-3
.0
0.2
8-0
.8
Nil
1.2
9-1
.52
2
Alath
iyur
6
7.5
0-7
.68
0.4
5-0
.50
2.0
-2.6
1
.2-1
.6
1.0
-1.0
0
.02
-0.0
1
1.0
6-1
.0
2.2
-1.5
1
.2-2
.0
0.6
-0.8
8
Nil
0.7
3-0
.75
3
Ananth
avaad
i 5
7
.21
-8.4
4
0.8
9-1
.23
3.0
-5.8
1
.8-3
.9
2.7
-3.9
0
.01
-0.1
8
0.9
0-5
.0
4.0
-5.1
0
.8-0
.92
0.7
2-.9
2
Nil-4
.2
1.2
3-2
.52
4
An
veeran
kud
ikaad
u
5
7.9
2-8
.88
0.6
7-1
.24
0.9
-6.2
0
.4-3
.6
2.8
-4.0
0
.11
0.1
3
0.9
-3.0
2
.3-5
.0
0.8
0-6
.9
0.8
-1.4
6
Nil-4
.0
1.2
6-4
.96
5
Ayanth
athanur
5
7.2
1-8
.02
0.5
2-1
.26
2.0
-6.0
1
.6-4
.1
1.2
-2.5
0
.02
-0.1
1
0.9
-1.1
1
.5-5
.0
3.0
-6.8
0
.6-1
.42
Nil
0.8
9-1
.11
6
Irum
pulik
uric
hi
5
7.8
7-8
.24
0.2
3-1
.12
1.0
-4.0
0
.6-3
.2
0.5
-4.5
0
.10
-0.1
2
0.4
-1.6
0
.7-6
.4
1.6
-4.1
0
.6-0
.85
Nil
0.5
6-2
.37
7
Kezh
am
aaligai
6
7.5
0-8
.50
0.5
1-1
.02
0.8
-5.9
0
.3-3
.6
1.5
-4.2
0
.02
-0.0
6
1.2
0-3
.2
2.8
-3.5
0
.28
-3.2
0
.62
-2.4
0
.8-4
.9
0.6
9-5
.66
8
Kulu
mur
4
7.7
3-8
.01
0.7
5-0
.89
2.8
-3.8
1
.8-2
.4
1.8
-3.9
0
.02
-0.1
8
1.2
-3.0
2
.2-4
.7
0.8
0-3
.4
0.4
5-0
.6
Nil-3
.1
1.0
2-2
.57
9
Ku
miliy
am
5
7
.75
-7.8
5
0.2
4-0
.32
1.6
-1.2
0
.9-0
.6
0.6
-0.4
0
.12
-0.2
3
0.4
2-0
.6
0.7
-0.8
1
.6-1
.0
0.6
-0.2
3
Nil
0.4
2-0
.54
10
Man
akud
iyan
4
7
.64
-8.5
6
0.8
2-0
.38
3.8
-0.6
0
.3-2
.7
1.9
-2.9
0
.6-0
.08
1.2
-2.3
1
.0-2
.9
0.4
-24
.0
0.6
2-0
.7
Nil
1.0
5
11
Man
apath
ur
5
7.6
2-8
.40
0.6
2-1
.48
1.8
-7.0
0
.6-4
.5
3.3
-3.5
0
.12
-0.1
6
1.0
-3.2
2
.1-2
.9
0.4
0-4
.2
0.5
6-1
.5
Nil-2
.9
1.4
6-3
.01
12
Maru
vath
ur
4
7.4
1-8
.22
0.6
2-1
.04
3.0
-4.2
2
.1-3
.8
1.3
-2.1
0
.04
-0.2
2
1.0
-1.8
2
.8-3
.8
2.4
-4.4
0
.8-1
.12
Nil
0.8
1-1
.05
13
Nath
alkud
i 6
7
.18
-8.2
0
0.4
8-1
.58
2.1
-6.8
1
.7-4
.8
1.1
-2.2
0
.05
-0.0
9
1.0
-1.6
1
.3-3
.4
1.5
-8.1
0
.2-0
.45
Nil
0.8
0-0
.91
14
Nak
kam
vaz
hi
5
7.5
0-8
.18
0.5
2-1
.86
2.7
-9.6
1
.3-5
.4
1.0
-3.2
0
.02
-0.0
8
1.0
-1.9
1
.3-5
.0
1.5
1-0
.5
0.2
2-1
.8
Nil
0.7
1-1
.17
15
Nalla
mp
alayam
5
7
.28
-8.3
2
0.6
0-1
.01
1.8
-5.2
1
.0-3
.4
1.5
-3.2
0
.02
-0.0
4
1.8
-0.8
2
3.4
-3.6
1
.9-6
.8
0.5
4-1
.9
Nil-2
.6
0.7
2-2
.70
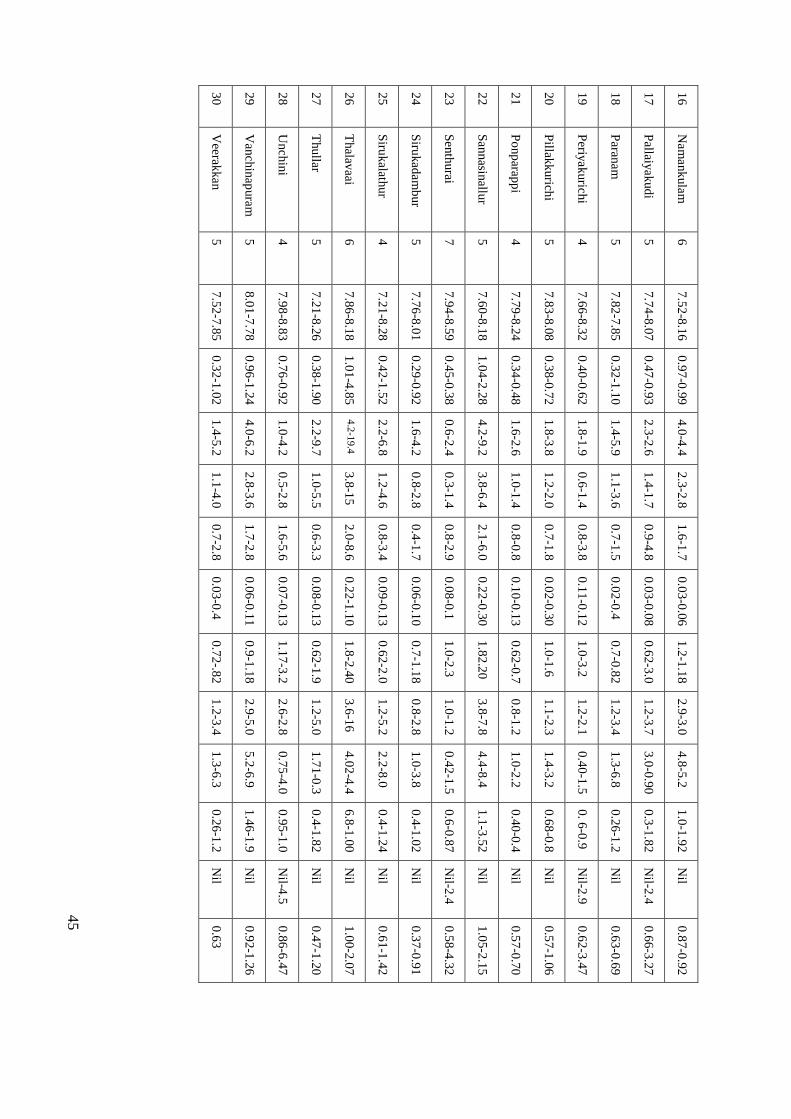
45
16
Nam
ank
ula
m
6
7.5
2-8
.16
0.9
7-0
.99
4.0
-4.4
2
.3-2
.8
1.6
-1.7
0
.03
-0.0
6
1.2
-1.1
8
2.9
-3.0
4
.8-5
.2
1.0
-1.9
2
Nil
0.8
7-0
.92
17
Pallaiy
ak
ud
i 5
7
.74
-8.0
7
0.4
7-0
.93
2.3
-2.6
1
.4-1
.7
0.9
-4.8
0
.03
-0.0
8
0.6
2-3
.0
1.2
-3.7
3
.0-0
.90
0.3
-1.8
2
Nil-2
.4
0.6
6-3
.27
18
Paran
am
5
7
.82
-7.8
5
0.3
2-1
.10
1.4
-5.9
1
.1-3
.6
0.7
-1.5
0
.02
-0.4
0
.7-0
.82
1.2
-3.4
1
.3-6
.8
0.2
6-1
.2
Nil
0.6
3-0
.69
19
Periy
akuric
hi
4
7.6
6-8
.32
0.4
0-0
.62
1.8
-1.9
0
.6-1
.4
0.8
-3.8
0
.11
-0.1
2
1.0
-3.2
1
.2-2
.1
0.4
0-1
.5
0. 6
-0.9
N
il-2.9
0
.62
-3.4
7
20
Pillak
kurich
i 5
7
.83
-8.0
8
0.3
8-0
.72
1.8
-3.8
1
.2-2
.0
0.7
-1.8
0
.02
-0.3
0
1.0
-1.6
1
.1-2
.3
1.4
-3.2
0
.68
-0.8
N
il 0
.57
-1.0
6
21
Po
np
arapp
i 4
7
.79
-8.2
4
0.3
4-0
.48
1.6
-2.6
1
.0-1
.4
0.8
-0.8
0
.10
-0.1
3
0.6
2-0
.7
0.8
-1.2
1
.0-2
.2
0.4
0-0
.4
Nil
0.5
7-0
.70
22
San
nasin
allur
5
7.6
0-8
.18
1.0
4-2
.28
4.2
-9.2
3
.8-6
.4
2.1
-6.0
0
.22
-0.3
0
1.8
2.2
0
3.8
-7.8
4
.4-8
.4
1.1
-3.5
2
Nil
1.0
5-2
.15
23
Sen
thurai
7
7.9
4-8
.59
0.4
5-0
.38
0.6
-2.4
0
.3-1
.4
0.8
-2.9
0
.08
-0.1
1
.0-2
.3
1.0
-1.2
0
.42
-1.5
0
.6-0
.87
Nil-2
.4
0.5
8-4
.32
24
Siru
kad
am
bur
5
7.7
6-8
.01
0.2
9-0
.92
1.6
-4.2
0
.8-2
.8
0.4
-1.7
0
.06
-0.1
0
0.7
-1.1
8
0.8
-2.8
1
.0-3
.8
0.4
-1.0
2
Nil
0.3
7-0
.91
25
Siru
kalath
ur
4
7.2
1-8
.28
0.4
2-1
.52
2.2
-6.8
1
.2-4
.6
0.8
-3.4
0
.09
-0.1
3
0.6
2-2
.0
1.2
-5.2
2
.2-8
.0
0.4
-1.2
4
Nil
0.6
1-1
.42
26
Thalav
aai 6
7
.86
-8.1
8
1.0
1-4
.85
4.2
-19
.4
3.8
-15
2.0
-8.6
0
.22
-1.1
0
1.8
-2.4
0
3.6
-16
4.0
2-4
.4
6.8
-1.0
0
Nil
1.0
0-2
.07
27
Thullar
5
7.2
1-8
.26
0.3
8-1
.90
2.2
-9.7
1
.0-5
.5
0.6
-3.3
0
.08
-0.1
3
0.6
2-1
.9
1.2
-5.0
1
.71
-0.3
0
.4-1
.82
Nil
0.4
7-1
.20
28
Unchin
i 4
7
.98
-8.8
3
0.7
6-0
.92
1.0
-4.2
0
.5-2
.8
1.6
-5.6
0
.07
-0.1
3
1.1
7-3
.2
2.6
-2.8
0
.75
-4.0
0
.95
-1.0
N
il-4.5
0
.86
-6.4
7
29
Van
chin
apura
m
5
8.0
1-7
.78
0.9
6-1
.24
4.0
-6.2
2
.8-3
.6
1.7
-2.8
0
.06
-0.1
1
0.9
-1.1
8
2.9
-5.0
5
.2-6
.9
1.4
6-1
.9
Nil
0.9
2-1
.26
30
Veerak
kan
5
7
.52
-7.8
5
0.3
2-1
.02
1.4
-5.2
1
.1-4
.0
0.7
-2.8
0
.03
-0.4
0
.72
-.82
1.2
-3.4
1
.3-6
.3
0.2
6-1
.2
Nil
0.6
3
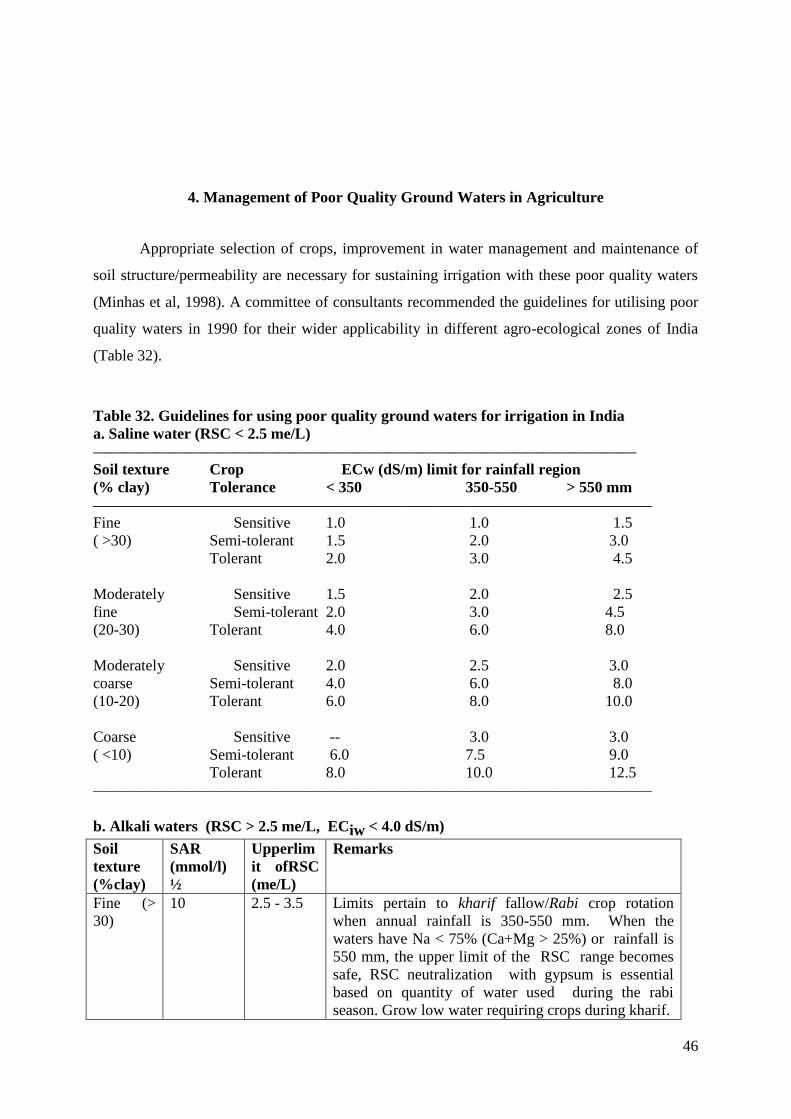
46
4. Management of Poor Quality Ground Waters in Agriculture
Appropriate selection of crops, improvement in water management and maintenance of
soil structure/permeability are necessary for sustaining irrigation with these poor quality waters
(Minhas et al, 1998). A committee of consultants recommended the guidelines for utilising poor
quality waters in 1990 for their wider applicability in different agro-ecological zones of India
(Table 32).
Table 32. Guidelines for using poor quality ground waters for irrigation in India
a. Saline water (RSC < 2.5 me/L)
———————————————————————————————————
Soil texture Crop ECw (dS/m) limit for rainfall region
(% clay) Tolerance < 350 350-550 > 550 mm
————————————————————————————————————
Fine Sensitive 1.0 1.0 1.5
( >30) Semi-tolerant 1.5 2.0 3.0
Tolerant 2.0 3.0 4.5
Moderately Sensitive 1.5 2.0 2.5
fine Semi-tolerant 2.0 3.0 4.5
(20-30) Tolerant 4.0 6.0 8.0
Moderately Sensitive 2.0 2.5 3.0
coarse Semi-tolerant 4.0 6.0 8.0
(10-20) Tolerant 6.0 8.0 10.0
Coarse Sensitive -- 3.0 3.0
( <10) Semi-tolerant 6.0 7.5 9.0
Tolerant 8.0 10.0 12.5
————————————————————————————————————
b. Alkali waters (RSC > 2.5 me/L, ECiw < 4.0 dS/m)
Soil
texture
(%clay)
SAR
(mmol/l)
½
Upperlim
it ofRSC
(me/L)
Remarks
Fine (>
30)
10 2.5 - 3.5 Limits pertain to kharif fallow/Rabi crop rotation
when annual rainfall is 350-550 mm. When the
waters have Na < 75% (Ca+Mg > 25%) or rainfall is
550 mm, the upper limit of the RSC range becomes
safe, RSC neutralization with gypsum is essential
based on quantity of water used during the rabi
season. Grow low water requiring crops during kharif.
47
Moderate
ly fine
10 3.5 - 5.0
Moderate
ly coarse
15 5.0 - 7.5
Coarse (>
10)
20 7.5 - 10
4.1. Management of Saline Waters
Plant growth is affected adversely with saline irrigation primarily through the impacts of
excessive salts on osmotic pressures of the soil solution. Under the field situations, the first
reaction of plants to the use of saline waters is reduction in the germination but the most
conspicuous effect is the growth retardation of crops. A general conclusion can be that the
detrimental effects of salinity include reduced initial growth resulting in smaller plants. These
smaller plants with lesser leaf area in turn are able to produce lesser assimilates for their
conversion to seeds.
4.1.1. The management options for successful use of saline water are as follows:
For successful utilisation of saline waters, crops those are semi-tolerant to tolerant
(mustards, wheat, cotton), as well as those with low water requirement are recommended
while crops like rice, sugarcane and berseem, those require liberal water use, should be
avoided. In low rainfall areas (< 40cm), mono-cropping is recommended for maintaining
salt balances.
The accumulation of salts vis-à-vis tolerance limits to the use of saline waters gets
modified with soil texture, annual rainfall and ionic constituents of salinity. As a ‘thumb
rule’ accumulation of salts is nearly one half that of irrigation water in coarse textured
soils (loamy sand and sand). It is equal to that of irrigation water in medium textured
sandy loam to loam soils and more than two times in fine textured soils (clay and clay
loam). In other terms, irrigation with water of salinity 8 dSm-1
would result in soil salinity
of about 4, 8 and 16 dSm-1
in loamy sand, sandy loam and clay loam soils, respectively.
Thus, waters of as high salt concentration as having an EC of 12 dSm-1
can be used for
growing tolerant and semi-tolerant crops in coarse textured soils, provided the annual
rainfall is not less than 400 mm. But in fine textured soils, waters with EC more than 2
dSm-1
would often create salinity problems.
48
One of the fortunate situations with continental monsoon climate of India is the
concentration of rains in a short span of 2-3 months. In Tamil Nadu during North East
monsoon (October- December) majority of rainfall is received. Thus, if the water
penetrating into soils during this period exceeds the evapo-transpiration demands of
crops, it induces leaching of salts added through saline irrigation to summer or Kharif
winter crops or in low rainfall regions. The amount and frequency of rains basically
govern the salt leaching occurring during monsoon season but soil texture has also been
shown to influence leaching.
Predictions show that removal of 80% of the salts accumulated during the period
preceding monsoons would require 1.85, 0.95 and 0.76 cm of rainwater per cm soil depth
in fine, medium and coarse textured soils. Thus, in areas with annual rainfall less than
250 mm, saline waters of EC about 4 dSm-1
will cause salt toxicity in most of the crops.
But in areas where annual rainfall exceeds 500 mm, waters up to an EC of 16 dSm-1
could be gainfully utilised for saline tolerant crops in coarse textured soils. Such waters,
however, should not be used for raising kharif or summer season crops.
Chlorides, being more toxic tend to reduce the tolerance limits of crops to the use of
saline water by 1.2-1.5 times as compared with sulphate rich waters). Similarly, more
salts tend to accumulate in soils when irrigated with waters of high SAR and thus these
also tend to reduce the limits of saline water use.
All crops do not tolerate salinity equally well at different stages of their growth e.g.
germination and early seedling establishment being the most critical stage followed by
the phase changes from vegetative to reproductive i.e. heading and flowering to fruit
setting. Therefore, the use of saline waters should be avoided during initial stages of crop
growth.
In addition to intergenic variations, crop cultivars also vary in their tolerance to salinity.
Such cultivars have been identified on their rating for high yield potential, salt tolerance
and stability under saline environments
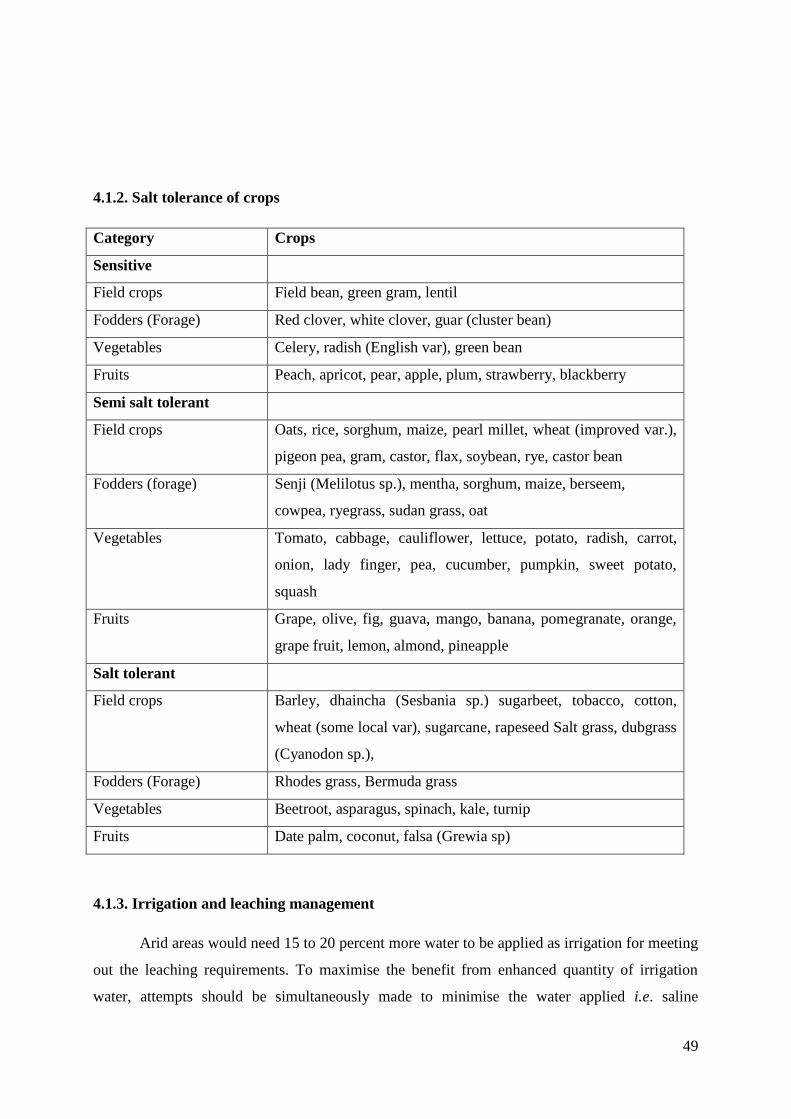
49
4.1.2. Salt tolerance of crops
Category Crops
Sensitive
Field crops Field bean, green gram, lentil
Fodders (Forage) Red clover, white clover, guar (cluster bean)
Vegetables Celery, radish (English var), green bean
Fruits Peach, apricot, pear, apple, plum, strawberry, blackberry
Semi salt tolerant
Field crops Oats, rice, sorghum, maize, pearl millet, wheat (improved var.),
pigeon pea, gram, castor, flax, soybean, rye, castor bean
Fodders (forage) Senji (Melilotus sp.), mentha, sorghum, maize, berseem,
cowpea, ryegrass, sudan grass, oat
Vegetables Tomato, cabbage, cauliflower, lettuce, potato, radish, carrot,
onion, lady finger, pea, cucumber, pumpkin, sweet potato,
squash
Fruits Grape, olive, fig, guava, mango, banana, pomegranate, orange,
grape fruit, lemon, almond, pineapple
Salt tolerant
Field crops Barley, dhaincha (Sesbania sp.) sugarbeet, tobacco, cotton,
wheat (some local var), sugarcane, rapeseed Salt grass, dubgrass
(Cyanodon sp.),
Fodders (Forage) Rhodes grass, Bermuda grass
Vegetables Beetroot, asparagus, spinach, kale, turnip
Fruits Date palm, coconut, falsa (Grewia sp)
4.1.3. Irrigation and leaching management
Arid areas would need 15 to 20 percent more water to be applied as irrigation for meeting
out the leaching requirements. To maximise the benefit from enhanced quantity of irrigation
water, attempts should be simultaneously made to minimise the water applied i.e. saline
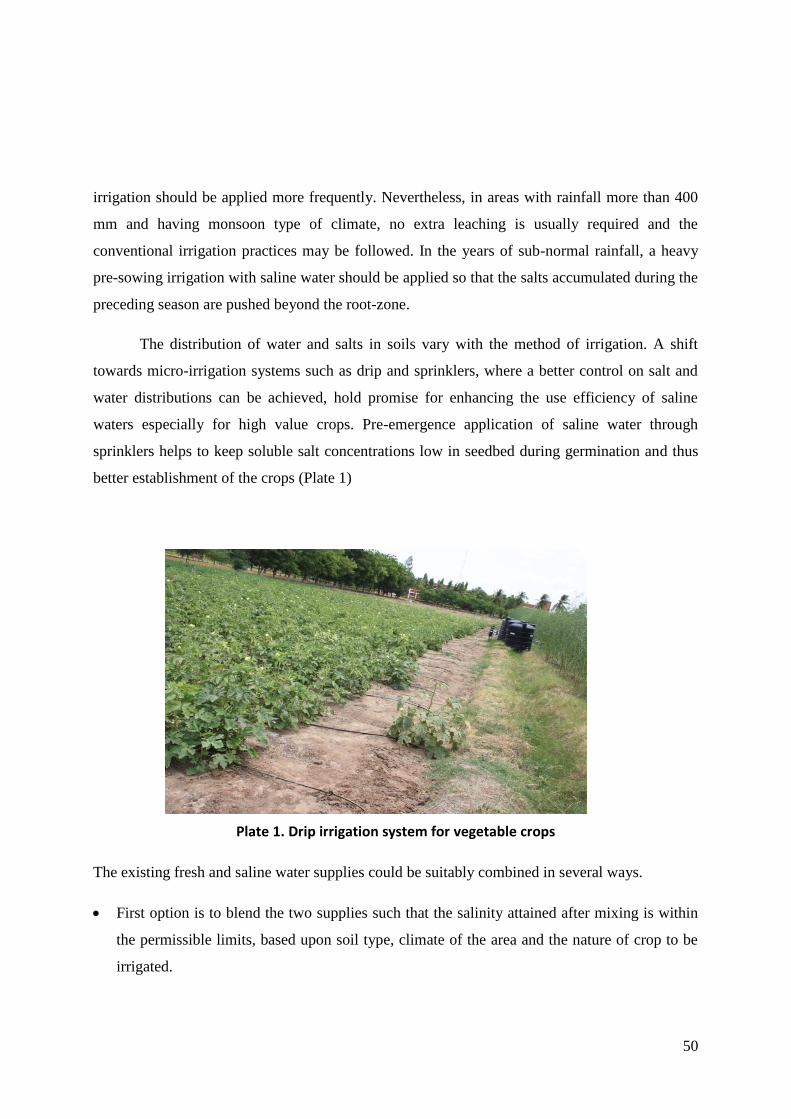
50
irrigation should be applied more frequently. Nevertheless, in areas with rainfall more than 400
mm and having monsoon type of climate, no extra leaching is usually required and the
conventional irrigation practices may be followed. In the years of sub-normal rainfall, a heavy
pre-sowing irrigation with saline water should be applied so that the salts accumulated during the
preceding season are pushed beyond the root-zone.
The distribution of water and salts in soils vary with the method of irrigation. A shift
towards micro-irrigation systems such as drip and sprinklers, where a better control on salt and
water distributions can be achieved, hold promise for enhancing the use efficiency of saline
waters especially for high value crops. Pre-emergence application of saline water through
sprinklers helps to keep soluble salt concentrations low in seedbed during germination and thus
better establishment of the crops (Plate 1)
Plate 1. Drip irrigation system for vegetable crops
The existing fresh and saline water supplies could be suitably combined in several ways.
First option is to blend the two supplies such that the salinity attained after mixing is within
the permissible limits, based upon soil type, climate of the area and the nature of crop to be
irrigated.
51
Application of the two waters separately, so that higher salinity water is avoided at sensitive
growth stages/crops viz., the germination and seedling establishment stage. Therefore, the
better quality water should be utilised for pre-sowing irrigation and early stages of crop
growth.
4.1.4. Role of amendments and fertilizers
Farmyard manure (FYM): FYM and other organic materials play an important role in
structural improvements, which further influences leaching of salts and reduce their
accumulation in the root zone. .
Fertilizers: Application of nutrients is important for obtaining good yields with saline irrigation.
Response to applied nitrogen is rather reduced under saline irrigation. Thus, additional
doses of nitrogenous fertilisers are recommended to compensate for volatilisation losses.
Soils irrigated with chloride rich waters respond to higher phosphate application, because
the chloride ions reduce availability of soil phosphorus to plants.
For sulphate rich waters, no additional application of phosphate fertilisers is required and
the dose recommended under normal conditions may be applied.
For micro-nutrients such as zinc, the recommended doses based on soil test values should
be applied.
4.1.5. Other cultural practices
To ensure better populations following measures are suggested
Reduce inter/intra row spaces and use 20-30% extra seed than required under normal
conditions.
Dry seeding and keeping the surface soil moist through sprinkler/ post-sowing saline
irrigation helps in better establishment of crops.
Modifications in seedbed e.g. sowing near the bottom of the furrows on both sides of the
ridges and applying irrigation in alternate row recommended. For the larger seeded crops,
the seeds can be planted in the furrows.
Adoption of measures for better intake of rainwater and its conservation in soil via
checking unproductive evaporation losses is recommended during monsoon season.
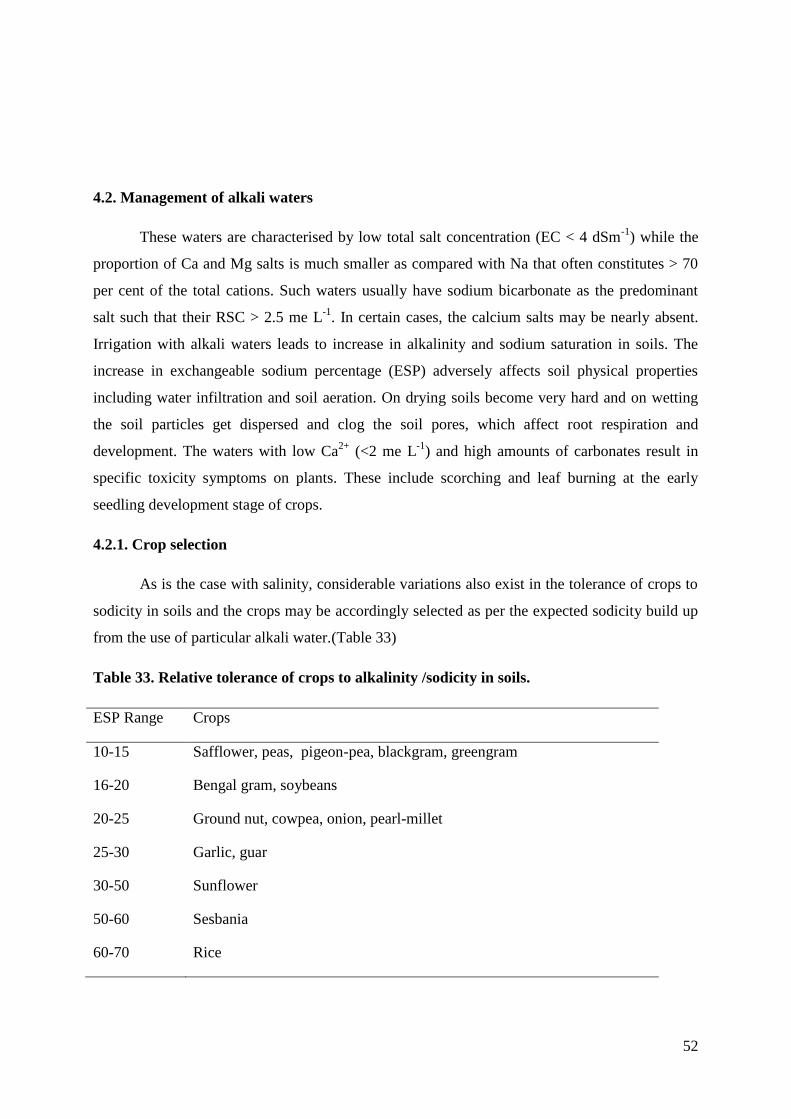
52
4.2. Management of alkali waters
These waters are characterised by low total salt concentration (EC < 4 dSm-1
) while the
proportion of Ca and Mg salts is much smaller as compared with Na that often constitutes > 70
per cent of the total cations. Such waters usually have sodium bicarbonate as the predominant
salt such that their RSC > 2.5 me L-1
. In certain cases, the calcium salts may be nearly absent.
Irrigation with alkali waters leads to increase in alkalinity and sodium saturation in soils. The
increase in exchangeable sodium percentage (ESP) adversely affects soil physical properties
including water infiltration and soil aeration. On drying soils become very hard and on wetting
the soil particles get dispersed and clog the soil pores, which affect root respiration and
development. The waters with low Ca2+
(<2 me L-1
) and high amounts of carbonates result in
specific toxicity symptoms on plants. These include scorching and leaf burning at the early
seedling development stage of crops.
4.2.1. Crop selection
As is the case with salinity, considerable variations also exist in the tolerance of crops to
sodicity in soils and the crops may be accordingly selected as per the expected sodicity build up
from the use of particular alkali water.(Table 33)
Table 33. Relative tolerance of crops to alkalinity /sodicity in soils.
ESP Range Crops
10-15 Safflower, peas, pigeon-pea, blackgram, greengram
16-20 Bengal gram, soybeans
20-25 Ground nut, cowpea, onion, pearl-millet
25-30 Garlic, guar
30-50 Sunflower
50-60 Sesbania
60-70 Rice

53
Cultivation of high water requiring crops like sugarcane and rice should be avoided with
alkali waters as these aggravate the sodicity problems.
In low rainfall areas (average annual rainfall < 400 mm) if the good quality canal water is
not available, it is advisable to keep the fields fallow during kharif season. During rabi,
only tolerant and semi-tolerant crops should be grown.
For areas having rainfall > 400 mm/annum, it is ensured that sowing, particularly of
kharif crops is done with rain water or good quality canal water. Besides, not more than 2
to 3 irrigations should be applied with alkali waters in the kharif.
Alkali waters should not be used for growing summer crops in the month of April to
June.
4.2.2. Amendment needs
Adverse effect of alkali waters on physical properties of the soil can be mitigated,
provided calcium-bearing amendments like gypsum is used. It is considered as the cheapest
source of calcium and is available in large quantity in the country. Acids or the acid forming
substances such as sulphuric acid or pyrites can also be used which on reaction with soil CaCO3
release Ca2+
. However, by virtue of low cost and ease in handling, gypsum is by far the most
suitable amendment for creating favourable sodium to calcium ratio and the crop growth is
highly improved.
Quantity of gypsum: Application of gypsum has earlier been recommended when RSC of
irrigation water exceeds 2.5 me/L (Plate 2). However later on it has been shown that factors such
as the level of the existing deterioration of the soil, cropping intensity and the water requirements
of the crops to be raised will ultimately decide the amount of gypsum required. Field
observations are that gypsum helps in maintaining the yields of the crops irrigated with alkali
waters (RSC > 5 me/L) especially when paddy is grown in rotation and rainfall of the area being
is < 50 cm. In wheat-fallow rotation, no response to gypsum has been reported on light textured
(sandy loam) soils when irrigated with waters having RSC upto 10 me/L. Once the role of
amendments is established for raising crops with alkali waters, questions regarding its mode,
amount and time of application have to be answered.
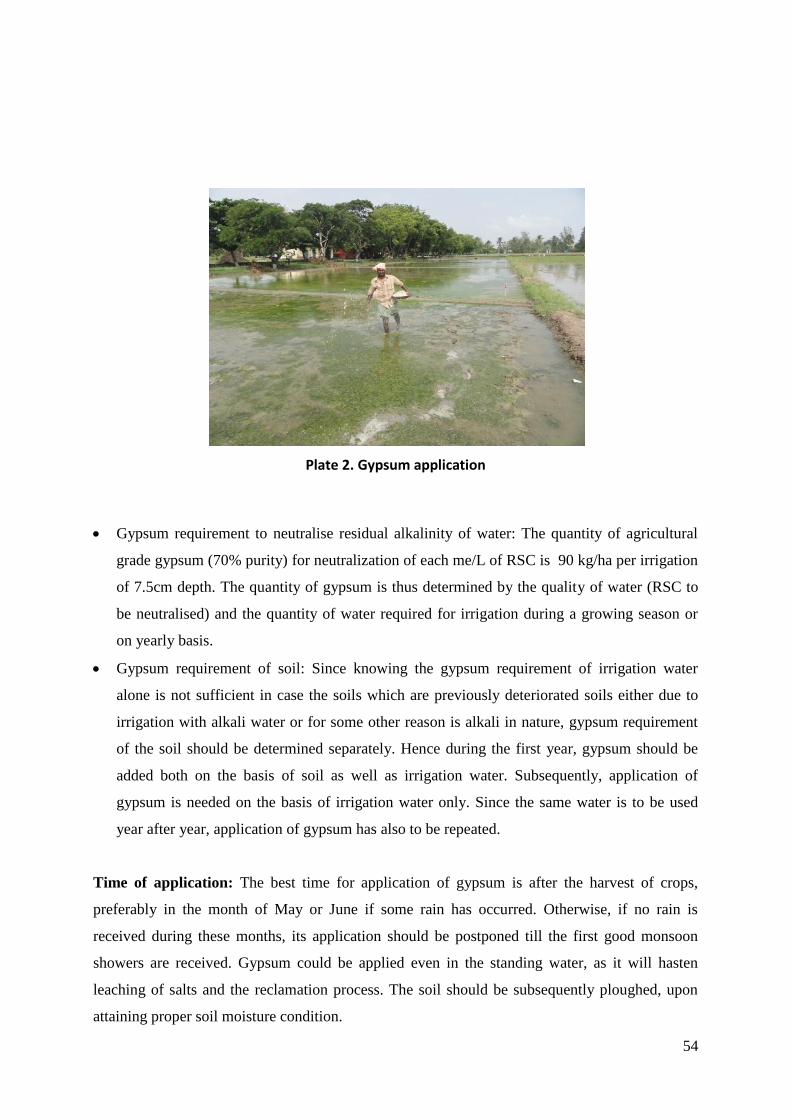
54
Plate 2. Gypsum application
Gypsum requirement to neutralise residual alkalinity of water: The quantity of agricultural
grade gypsum (70% purity) for neutralization of each me/L of RSC is 90 kg/ha per irrigation
of 7.5cm depth. The quantity of gypsum is thus determined by the quality of water (RSC to
be neutralised) and the quantity of water required for irrigation during a growing season or
on yearly basis.
Gypsum requirement of soil: Since knowing the gypsum requirement of irrigation water
alone is not sufficient in case the soils which are previously deteriorated soils either due to
irrigation with alkali water or for some other reason is alkali in nature, gypsum requirement
of the soil should be determined separately. Hence during the first year, gypsum should be
added both on the basis of soil as well as irrigation water. Subsequently, application of
gypsum is needed on the basis of irrigation water only. Since the same water is to be used
year after year, application of gypsum has also to be repeated.
Time of application: The best time for application of gypsum is after the harvest of crops,
preferably in the month of May or June if some rain has occurred. Otherwise, if no rain is
received during these months, its application should be postponed till the first good monsoon
showers are received. Gypsum could be applied even in the standing water, as it will hasten
leaching of salts and the reclamation process. The soil should be subsequently ploughed, upon
attaining proper soil moisture condition.

55
Method of application: Gypsum is preferably added to the soil, being easier to accomplish, than
treating the water itself. The ISI grade gypsum may be applied through broadcast in requisite
quantity on a previously graded field and mixed in a shallow depth of soil with a cultivator or
disc. Proper levelling of the fields is another important pre-requisite. Fields should be provided
with 35 to 40 cm high strong bunds for retaining the entire rainwater. Bunds also prevent the
entry of water from outside.
Use of gypsum beds: It requires some mechanism for dissolution of gypsum in the irrigation
water itself. Such a practice will also eliminate the costs involved in powdering, bagging and
proper storage before its actual use. In view of the costs involved, the dissolution of gypsum
directly in water through the use of gypsum beds or its application to the irrigation channels,
appears an economical preposition. Dissolution of gypsum is affected by factors such as size
distribution of gypsum fragments, flow velocity, salt content and chemical composition of water.
For flowing water to pick up Ca through dissolution of gypsum, special gypsum bed has been
designed. Nevertheless it is pointed here that gypsum bed water quality improvement technique
may not dissolve > 8 me/l of Ca2+
. (Plate 3)
Plate 3. Gypsum bed treatment of alkali water
56
At Tiruchirapalli, a new model of gypsum bed was designed using RCC rings of 0.9 m
diameter and 0.3 m height to treat alkali water using phosphor-gypsum. Totally four RCC rings
were used to achieve the structural dimension of 1.2 m height and 0.9 m diameter (Fig.8) which
is closed at the bottom with inlet (50mm size) in the bottom ring and other in the upper most
ring, so as to enable the water coming from the PVC conveyance pipes in the farmers holdings to
pass through the gypsum beds. The phospho –gypsum was placed in cloth bags over the iron
mesh provided in between the third and fourth ring. The cost of one such structure is estimated at
Rs.4,000/- and therefore it should it should be possible for the farmer to construct the same at
their fields.
4.2.3. Fertilizer application
Since alkali waters cause a rise in soil pH that leads to greater nitrogen losses through
volatilisation and denitrification, extra nitrogen may have to be added to meet the requirement of
the crops. Similarly, the availability of zinc and iron is also low due to their precipitation as
hydroxides and carbonates.
Application of 25% extra nitrogen is needed as compared to the normal conditions.
Zinc sulphate @ 25 kg/ha should be added, particularly to the rabi crops.
Phosphorus, potassium and other limiting nutrients may also be applied on the basis of
soil test values.
Some alkali waters may be rich in nutrients like nitrogen, potassium and sulphur. Such
waters should be analysed and the fertiliser dose of concerned nutrient reduced
accordingly.
4.2.4. Irrigation practices
Emphasis should be to minimise the irrigation with alkali water as deterioration of soil
directly depends on the quantities of irrigation water. The 'sodic hazard' is reduced considerably
if the water are used alternatively or mixed with canal water. Besides reducing the gypsum
requirement of the soil, conjunctive use of alkali and canal water will help in bringing more area
under protective irrigation and also in controlling rise in groundwater table and the associated
problem.

57
4.2.5. Alternate Land Uses
In some cases, it is neither feasible nor economical to use saline waters for crop
production especially on lands those are already degraded. Best land use under such situations is
to retire such areas to permanent vegetation. To establish plantations and to improve biomass
production from such lands, pit auger hole technology was developed (Plate 4, 5).
Plate 4. Planting technique using Auger hole
Plate 5. Alternate land use of growing tree crops
58
This technology consists of making a pit of size with auger of 30 cm diameter 120 cm
deep. If the excavated soil is alkali, soil should be amended with Gypsum @ 50 % GR or
Gypsum @ 25 % GR + 75 ml DSW / kg of soil or DSW @ 150 ml / kg of soil. Preferred choice
for tree species should be; Tamarindus indica, Bambusa bamboo. Lueceana leucocephala,
Prosopis juliflora, Acacia leucophloea, , Azardirachta indica and Dalbergia sisoo (Plate 6).

59
5. SUMMARY
Perambalur and Ariyalur districts are centrally located in Tamil Nadu wherein the ground
water is the major source of irrigation. The major crops cultivated in the district are rice, millets,
pulses, sugarcane, cotton and oil seeds. Rice is grown as rainfed crop. Oil seeds such as
groundnut and gingelly are grown both under irrigated and rainfed conditions. Pulses like
blackgram, green gram and redgram are grown in rice fallows. The mean annual rainfall of the
district is 908 mm. Due to over-exploitation of ground water for irrigation water and also due to
pressure from others like industry and domestic use, the quality of irrigation water is becoming
poorer. In order to plan management strategies, detailed survey of groundwater quality is
required. Hence an attempt has been made to classify the ground water quality at revenue village
/ block level for each district of Tamil Nadu. In this process of ground water quality survey,
Perambalur and Ariyalur districts were surveyed and classified.
The ground water quality of Permabalur District (680 samples) and Ariyalur District (835
samples) of Tamil Nadu were characterized by collecting water samples from both open and
borewells.
Perambalur District has four Blocks viz., Perambalur, Veppanthattai, Veppur and
Alathur Block. Among the four blocks, the distribution of good quality samples were the highest
in Perambalur Block (69.2%) and the lowest in Alathur (37.1 %) Block. The occurrence of
marginally saline water (13.3 to 42.8 %) was prevalent in all the Blocks. The saline waters were
prevalent in Alathur (8.5 %) and Veppur (2.5 %) Blocks, while the occurrence of alkali waters
were reported in Veppanthattai (15 %) and Alathur (2.5 %). The marginally saline (13.3 to 42.8
%) and marginally alkali (2.5 to 25 %) waters are prevalent in almost all the blocks. High SAR
saline water was reported in Alathur Block only (2.8 %). Among the total samples collected in
Perambalur district, 52.4 % is coming under good quality, 26.8 is marginally saline, 10.88 % is
marginally alkaline, 5.88 % is alkaline, 3.2 % is saline and 0.88 % is high SAR saline.
Ariyalur District has six Blocks viz., Ariyalur, Thirumanur, Andimadam, Jayankondam,
T.Palur and Senthurai. Among the six blocks, the distribution of good quality samples were the
highest in Andimadam Block (73.4 %) and the lowest in Jayankondam (56.5 %) Block. The
occurrence of marginally Alkali water (8.72 to 30.4 %) was prevalent in all the Blocks.
60
Marginally saline water is prevalent in Ariyalur (8.72 %), Thirumanur (15.4 %), Jayankondam
(8.7 %) and Senthurai (4.17 %) Blocks. The saline waters were prevalent in Ariyalur (3.49 %),
Thirumanur (3.36 %) and Senthurai (5 %) blocks, while the occurrence of alkali waters were
reported in Ariyalur (2.91 %), Thirumanur (3.36 %), Jayankondam (4.35), T.Palur (3.65 %) and
Senthurai (8.33 %) blocks. Highly alkali water was reported only in Ariyalur Block (2.33 %).
Among the total samples collected, 67.8 % is coming under good quality, 6.35 % is marginally
saline, 19.9% is marginally alkaline, 3.59 % is alkaline, 2.04 % is saline and 0.48 % is highly
alkaline.
The strategies to be followed based up to the efforts made in different centers of AICRP
on management of salt affected soils and use of saline water in agriculture and Tamil Nadu
Agricultural University such as growing tolerant crops and variety, conjunctive use of saline
water with canal water in dilution/ cyclic mode, passing saline water through gypsum bed before
irrigation, irrigation through pressurized systems (Drip/ sprinkler) and alternative land use
(growing tree crops) are discussed.
The adverse effects of alkali waters on soil physical properties can be mitigated by
applying amendments like gypsum. The quantity of gypsum for neutralization of each me L-1
of
RSC is 90 kg ha-1
per irrigation @ 7.5 cm depth. The gypsum application is recommended when
the RSC of irrigation water exceeds 5.0. Also by passing the alkali water through gypsum bed,
RSC of irrigation water can be reduced.