Water quality technical report for Namoi surface water area ...
Upload
khangminh22Category
view
0download
0
Experiment
13
Earth Science with Calculators 13 - 1
Water Quality – TDS(Total Dissolved Solids)
Solids are found in streams in two forms, suspended and dissolved. Suspended solids includesilt, stirred-up bottom sediment, decaying plant matter, or sewage-treatment effluent. Suspendedsolids will not pass through a filter, whereas dissolved solids will. Total dissolved solids, or TDS,can be determined by using a Vernier Conductivity Probe to determine the ability of thedissolved salts and their resulting ions to conduct an electrical current. The conductivity is thenconverted to TDS.
The TDS concentration in a body of water is affectedby many different factors. A high concentration ofdissolved ions is not, by itself, an indication that astream is polluted or unhealthy. It is normal forstreams to dissolve and accumulate fairly highconcentrations of ions from the minerals in the rocksand soils over which they flow. If these depositscontain salts (sodium chloride or potassium chloride)or limestone (calcium carbonate), then significantconcentrations of ions will result.
TDS is sometimes used as a “watchdog”environmental test. Any change in the ioniccomposition between testing sites in a stream canquickly be detected using a Conductivity Probe. TDSvalues will change when ions are introduced to waterfrom salts, acids, bases, hard-water minerals, orsoluble gases that ionize in solution. However, thetest described here will not tell you the specific ionresponsible for the increase or decrease in TDS. Itsimply give a general indication of the level ofdissolved solids in the stream or lake.
There are many possible human induced sources ofions that may contribute to elevated TDS readings. Fertilizers from fields and lawns can add avariety of ions to a stream. Increases in TDS can also result from runoff from roads that havebeen salted in the winter. Organic matter from wastewater treatment plants may contributehigher levels of nitrate or phosphate ions. Treated wastewater may also have higher TDSreadings than surrounding streams if urban drinking water has been highly chlorinated.Irrigation water that is returned to a stream will often have higher concentrations of sodium orchloride ions. Acidic rainwater, with dissolved gases like CO2, NO2, or SO2, often yieldselevated H+ ion concentrations.
If TDS levels are high, especially due to dissolved salts, many forms of aquatic life are affected.The salts act to dehydrate the skin of animals. High concentrations of dissolved solids can add alaxative effect to water or cause the water to have an unpleasant mineral taste. It is also possiblefor dissolved ions to affect the pH of a body of water, which in turn may influence the health ofaquatic life. If high TDS readings are due to hard-water ions, then soaps may be less effective, orsignificant boiler plating may occur in heating pipes.
Sources of Total Dissolved Solids• Hard-Water Ions
- Ca2+
- Mg2+
- HCO3–
• Fertilizer in agricultural runoff- NH4
+
- NO3–
- PO43–
- SO42–
• Urban runoff- Na+
- Cl–
• Salinity from tidal mixing, minerals, or returned irrigation water
- Na+
- K+
- Cl–
• Acidic rainfall- H+
- NO3–
- SO32–, SO4
2–

Experiment 13
13 - 2 Earth Science with Calculators
Expected LevelsTDS values in lakes and streams are typically found to be in the range of 50 to 250 mg/L. Inareas of especially hard water or high salinity, TDS values may be as high as 500 mg/L.Drinking water will tend to be 25 to 500 mg/L TDS. United States Drinking Water Standards1include a recommendation that TDS in drinking water should not exceed 500 mg/L TDS. Freshdistilled water, by comparison, will usually have a conductivity of 0.5 to 1.5 mg/L TDS.
Table 1: TDS in Selected Rivers
Site Season TDS(mg/L)
Season TDS(mg/L)
Rio Grande River, El Paso, TX Spring 510 Fall 610
Mississippi River, Memphis, TN Spring 133 Fall 220
Sacramento River, Keswick, CA Spring 71 Fall 60
Ohio River, Benwood, WV Spring 300 Fall 143
Hudson River, Poughkeepsie, NY Spring 90 Fall 119
MATERIALSLabPro or CBL 2 Interface tissues or paper towelsTI Graphing Calculator wash bottle with distilled waterDataMate program 500 mg/L TDS standard solutionVernier Conductivity Probe 50 mg/L TDS standard solution (optional)small paper or plastic cup (optional)
Collection and Storage of Samples1. This test can be conducted on site or in the lab. A 100-mL water sample is required.
2. It is important to obtain the water sample from below the surface of the water as far awayfrom shore as is safe. If suitable areas of the stream appear to be unreachable, samplersconsisting of a rod and container can be constructed for collection.
3. If the testing cannot be conducted within a few hours, place the samples in an ice chest or arefrigerator.
PROCEDURE1. Set the switch on the Conductivity Probe box to 0-2000 µS (2000 µS = 1000 mg/L TDS).
2. Plug the Conductivity Probe into Channel 1 of the LabPro or CBL 2 interface. Use the linkcable to connect the TI Graphing Calculator to the interface. Firmly press in the cable ends.
1Established by 1986 Amendments to the Safe Drinking Water Act

Water Quality – TDS
Earth Science with Calculators 13 - 3
3. Turn on the calculator and start the DATAMATE program. PressCLEAR to reset the program.
4. Set up the calculator and interface for the Conductivity Probe.a. Select SETUP from the main screen.b. Press ENTER to select CH 1.c. Select CONDUCTIVITY from the SELECT SENSOR menu (not
required if your Conductivity Probe is auto-ID).d. Select CONDUCT 1000 (MG/L) or CONDUCTIVITY (MG/L)
from the CONDUCTIVITY menu.
5. You are now ready to prepare the Conductivity Probe for calibration.• If your instructor directs you to use the stored calibration, proceed directly to Step 6.• If your instructor directs you to manually enter the calibration values, select CALIBRATE
then MANUAL ENTRY. Enter the intercept and slope values for the 0-1000 mg/Lconductivity calibration, select OK, then proceed to Step 6.
• If your instructor directs you to perform a new calibration for the Conductivity Probe,follow this procedure.
First Calibration Pointa. Select CALIBRATE, then CALIBRATE NOW.b. Perform the first calibration point with the probe in the air (e.g., out of any solution).c. Wait for the readings stabilize and press ENTER .d. Type “0” as the mg/L TDS and press ENTER .
Second Calibration Pointe. Place the Conductivity Probe into the 500 mg/L TDS standard solution. The hole near the
tip of the probe should be covered completely.f. Wait for the readings to stabilize and press ENTER .g. Type “500” as the mg/L TDS and press ENTER .h. Select OK to return to the setup screen.
6. Set up the data-collection mode.a. To select MODE, press once
and press ENTER .b. Select SINGLE POINT from the
SELECT MODE menu.c. Select OK to return to the main
screen.
7. Collect TDS concentration data.a. Place the tip of the electrode into a
cup with sample water from thebody of water you are testing. Thehole near the tip of the probe shouldbe covered completely.
b. When the reading has stabilized, select START to begin sampling. Important: Leave theprobe tip submerged while data is being collected for the next 10 seconds.

Experiment 13
13 - 4 Earth Science with Calculators
c. After 10 seconds, the TDS value will appear on the calculator screen. Record this valueon the Data & Calculations sheet (round to the nearest 1 mg/L TDS).2
d. Press ENTER to return to the main screen.e. Select START to repeat the measurement. Record this value on the Data & Calculations
sheet (round to the nearest 1 mg/L TDS).f. Press ENTER to return to the main screen.
2If your readings are less than 100 mg/L, you may choose to recalibrate the probe for a lower range setting of 0-100 mg/L for more accurate results. To do this, change the setting on the probe box to 0-200 µS and repeat Steps2-5. Use the stored 100-mg/L TDS calibration, or calibrate with a 50 mg/L TDS standard provided by yourinstructor.

Water Quality – TDS
Earth Science with Calculators 13 - 5
DATA & CALCULATIONS
TDS: Total Dissolved SolidsStream or lake: _____________________________ Date: ________________________________
Site name: ________________________________ Time of day: ___________________________
Student name: _____________________________ Student name: _________________________
Student name: _____________________________ Student name: _________________________
Reading TDS(mg/L)
1
2
Average
Field Observations (e.g., weather, geography, vegetation along stream) _________________________
__________________________________________________________________________________
__________________________________________________________________________________
__________________________________________________________________________________
Test Completed: ________________ Date: ______

Experiment
TEACHER INFORMATION 13
Earth Science with Calculators 13 - 1 T
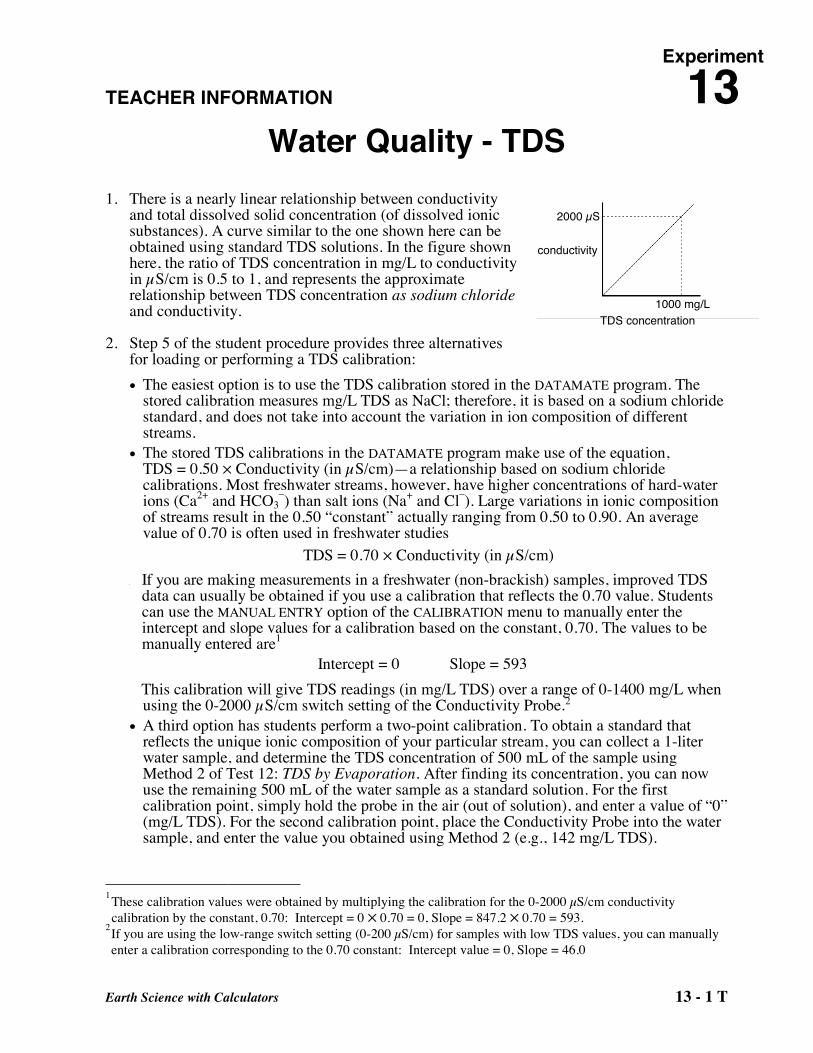
Water Quality - TDS1. There is a nearly linear relationship between conductivity
and total dissolved solid concentration (of dissolved ionicsubstances). A curve similar to the one shown here can beobtained using standard TDS solutions. In the figure shownhere, the ratio of TDS concentration in mg/L to conductivityin µS/cm is 0.5 to 1, and represents the approximaterelationship between TDS concentration as sodium chlorideand conductivity.
2. Step 5 of the student procedure provides three alternativesfor loading or performing a TDS calibration:• The easiest option is to use the TDS calibration stored in the DATAMATE program. The
stored calibration measures mg/L TDS as NaCl; therefore, it is based on a sodium chloridestandard, and does not take into account the variation in ion composition of differentstreams.
• The stored TDS calibrations in the DATAMATE program make use of the equation,TDS = 0.50 ! Conductivity (in µS/cm)—a relationship based on sodium chloridecalibrations. Most freshwater streams, however, have higher concentrations of hard-waterions (Ca2+ and HCO3
–) than salt ions (Na+ and Cl–). Large variations in ionic compositionof streams result in the 0.50 “constant” actually ranging from 0.50 to 0.90. An averagevalue of 0.70 is often used in freshwater studies
TDS = 0.70 ! Conductivity (in µS/cm)• If you are making measurements in a freshwater (non-brackish) samples, improved TDS
data can usually be obtained if you use a calibration that reflects the 0.70 value. Studentscan use the MANUAL ENTRY option of the CALIBRATION menu to manually enter theintercept and slope values for a calibration based on the constant, 0.70. The values to bemanually entered are1
Intercept = 0 Slope = 593 This calibration will give TDS readings (in mg/L TDS) over a range of 0-1400 mg/L when
using the 0-2000 µS/cm switch setting of the Conductivity Probe.2• A third option has students perform a two-point calibration. To obtain a standard that
reflects the unique ionic composition of your particular stream, you can collect a 1-literwater sample, and determine the TDS concentration of 500 mL of the sample usingMethod 2 of Test 12: TDS by Evaporation. After finding its concentration, you can nowuse the remaining 500 mL of the water sample as a standard solution. For the firstcalibration point, simply hold the probe in the air (out of solution), and enter a value of “0”(mg/L TDS). For the second calibration point, place the Conductivity Probe into the watersample, and enter the value you obtained using Method 2 (e.g., 142 mg/L TDS).
1These calibration values were obtained by multiplying the calibration for the 0-2000 µS/cm conductivitycalibration by the constant, 0.70: Intercept = 0 ! 0.70 = 0, Slope = 847.2 ! 0.70 = 593.
2If you are using the low-range switch setting (0-200 µS/cm) for samples with low TDS values, you can manuallyenter a calibration corresponding to the 0.70 constant: Intercept value = 0, Slope = 46.0
conductivity
1000 mg/L
2000 µS
TDS concentration

Experiment 13
13 - 2 T Earth Science with Calculators
3. If you choose to calibrate the Conductivity Probe, you will want accurate standard solutions.The 1000 µS/cm Standard that shipped with the Conductivity Probe will last a long time ifyou take care not to contaminate it with a wet or dirty probe. This is a good concentration tocalibrate your Conductivity Probe in the middle range (0 to 2000 µS). Vernier sells threeConductivity Standards, one appropriate for each range of the Conductivity Probe. Theycome in 500 mL bottles for $12 each. Order codes are:
• Low Conductivity Standard 150 µS/cm............................CON-LST• Medium Conductivity Standard 1413 µS/cm ................. CON-MST• High Conductivity Standard 12,880 µS/cm..................... CON-HST
To prepare your own standard solutions using solid NaCl, use a container with accuratevolume markings (e.g., volumetric flask) and add the amount of solid shown in the firstcolumn of Table 2. This standard can be used to calibrate Conductivity Probe for Test 12,using the amount shown in mg/L as TDS (second column).
Table 2Add this amount of NaCl to
make 1 liter of solution TDS and Conductivity values equivalent to
the NaCl concentration in the first columnTotal dissolved solids (TDS) Conductivity
0.0474 g (47.4 mg/L) 50 mg/L as TDS 100 µS/cm0.491 g (491 mg/L) 500 mg/L as TDS 1000 µS/cm1.005 g (1005 mg/L) 1000 mg/L as TDS 2000 µS/cm5.566 g (5566 mg/L) 5000 mg/L as TDS 10,000 µS/cm
4. Flinn Scientific (P.O. Box 21, Batavia, IL 60510, Tel: 800-452-1261, www.flinnsci.com)sells a set of four standard solutions in 500-mL bottles. The concentrations correspond to thefour solutions shown in Table 2. Here is the ordering information:− Conductivity Calibration Kit with four 500-mL bottles (50 mg/L, 500 mg/L, 1000 mg/L,
and 5000 mg/L TDS, order code AP 9111)
5. Your Vernier Conductivity Probe is automatically temperature compensated betweentemperatures of 5 and 35°C. Readings are automatically referenced to a conductivity value at25°C. The Conductivity Probe will, therefore, give the same conductivity reading in asolution that is at 15°C as it would if the same solution were warmed to 25°C. This meansyou can calibrate your probe in the lab, and then use these stored calibrations to takereadings in colder (or warmer) water in a lake or stream. If the probe was not temperaturecompensated, you would notice a change in the conductivity reading as temperaturechanged, even though the actual ion concentration did not change.
6. The SINGLE POINT data-collection mode was designed to make measurements easier andmore accurate. When SINGLE POINT mode is used, the interface takes readings for 10seconds. These readings are averaged and this average value is displayed on the calculator.This method has several advantages over other data-collection modes: (1) It eliminates theneed for students to choose one value over another if that value is fluctuating; (2) If thereadings are fluctuating a little, an average of the values is desirable; (3) It requires thestudents to hold the sensor in the water longer that they might tend to otherwise.

Water Quality - TDS
Earth Science with Calculators 13 - 3 T
Sampling in Ocean Salt Water or Tidal EstuariesSalt-water samples may exceed the high range of the Conductivity Probe, 0 to 20,000 µS/cm(0 to 10,000 mg/L TDS). Seawater from the mid-Atlantic ocean has a conductivity value of53,000 µS/cm (or a TDS concentration of about 26,500 mg/L). Samples in this range will needto be diluted in order for them to be measured using the high range. For example, you can take asample of ocean water, and dilute it to ¼ of its original concentration by adding 100 mL of thesalt-water sample to 300 mL of distilled water. This diluted sample can then be measured usingthe Conductivity Probe at the high-range setting. If the TDS value for the diluted sample ismeasured to be 6,600 mg/L, then this answer is multiplied by a factor of 4 to obtain the TDSvalue of the original sample: 4 !6,600 = 26,400 mg/L TDS.
How the Conductivity Probe WorksThe Vernier Conductivity Probe measures the ability of a solution to conduct an electric currentbetween two electrodes. In solution, the current flows by ion transport; therefore, an increasingconcentration of ions in the solution will result in higher conductivity values.
The Conductivity Probe is actually measuring conductance, defined as the reciprocal ofresistance. When resistance is measured in ohms, conductance is measured using the SI unit,siemens (formerly known as a mho). Aqueous samples are commonly measured inmicrosiemens, or µS.
Even though the Conductivity Probe is measuring conductance, we are often interested infinding the conductivity of a solution. Conductivity, C, is found using the following formula
C = G • kcwhere G is the conductance, and kc is the cell constant. The cell constant is determined for aprobe using the following formula
kc = d / Awhere d is the distance between the two electrodes, and A is thearea of the electrode surface. For example, the cell in the figureshown here has a cell constant of
kc = d / A = 1.0 cm / 1.0 cm2 = 1.0 cm-1
The conductivity value is found by multiplying conductance and the cell constant. Since theVernier Conductivity Probe also has a cell constant of 1.0 cm-1, its conductivity andconductance have the same numerical value. For a solution with a conductance value of 1000µS, the conductivity, C, would be
C = G • kc = (1000 µS) ! (1.0 cm-1) = 1000 µS/cmA potential difference is applied to the two probe electrodes in the Conductivity Probe. Theresulting current is proportional to the conductivity or TDS value of the solution. This current isconverted into a voltage to be read by Logger Pro.
1 cm
1 cm
d = 1 cm

Experiment 13
13 - 4 T Earth Science with Calculators
Alternating current is supplied to prevent thecomplete ion migration to the two electrodes.As shown in the figure below, with each cycleof the alternating current, the polarity of theelectrodes is reversed, which in turn reversesthe direction of ion flow. This very importantfeature of the Conductivity Probe preventsmost electrolysis and polarization fromoccurring at the electrodes. Thus, thesolutions that are being measured forconductivity are not fouled. It also greatlyreduces redox products from forming on therelatively inert graphite electrodes.
The Vernier Conductivity Probe has threesensitivity range settings.
• 0 to 200 µS/cm (0 to 100 mg/L TDS)• 0 to 2000 µS/cm (0 to 1000 mg/L TDS)• 0 to 20,000 µS/cm (0 to 10,000 mg/L TDS)
These ranges are selected using a toggle switch on the end of the amplifier box attached to theprobe. It is very important to consider this setting when loading or performing a calibration; nosingle calibration can be used for all three settings.
graphite electrodes
Epoxy body
Copyright © 2022 FDOKUMEN