WATER QUALITY MANAGEMENT OF GODAVARI RIVER IN ...
150
WATER QUALITY MANAGEMENT OF GODAVARI RIVER IN NASIK CITY A DISSERTATION Submitted in partial fulfillment of the requirements for the award of the degree of MASTER OF TECHNOLOGY in CONSERVATION OF RIVERS AND LAKES By CHAVAN AJAY DAULAT • Ms4?J /\\\. I X ALTERNATE HYDRO. ENERGY CENTRE INDIAN INSTITUTE OF TECHNOLOGY ROORKEE ROORKEE-247 667 (INDIA) JUNE, 2008
-
Upload
khangminh22 -
Category
Documents
-
view
0 -
download
0
Transcript of WATER QUALITY MANAGEMENT OF GODAVARI RIVER IN ...

WATER QUALITY MANAGEMENT OF GODAVARI RIVER IN NASIK CITY
A DISSERTATION Submitted in partial fulfillment of the
requirements for the award of the degree of
MASTER OF TECHNOLOGY in
CONSERVATION OF RIVERS AND LAKES
By
CHAVAN AJAY DAULAT
• Ms4?J /\\\. I
X
ALTERNATE HYDRO. ENERGY CENTRE INDIAN INSTITUTE OF TECHNOLOGY ROORKEE
ROORKEE-247 667 (INDIA)
JUNE, 2008

CANDIDATE'S DECLARATION
I hereby declare that the work presented in this Dissertation report entitled
"WATER QUALITY MANAGEMENT OF GODAVARI RIVER IN NASIK CITY" in
partial fulfillment of the requirements for the award of the degree of Master of Technology
in "Conservation of Rivers and Lakes" submitted in Alternate Hydro Energy Centre,
Indian Institute of Technology, Roorkee is an authentic record of my own work carried out
during the period between July 2007 to June 2008 under the guidance of Dr. Renu
Bhargava, Professor, Civil Engineering Department, Indian Institute of Technology,
Roorkee and Dr. M. P. Sharma, Associate Professor, Alternate Hydro Energy Centre,
Indian Institute of Technology, Roorkee.
The matter contained herein has not been submitted by me for the award of any other
degree or diploma elsewhere.
Date: 30 ''June, 2008
CHAVAN AJAY DAULAT
Place: Roorkee M. Tech (CRL)
AHEC, IIT Roorkee
This is to certify that the above statement made by the candidate is correct to the best of our
knowledge.
J
(Dr. Renu Bhargava)
Professor,
Civil Engineering Department,
Indian Institute of Technology,
Roorkee — 247 667 (Uttarakhand)
INDIA
(Dr. M.P. Sharma)
Associate Professor,
Alternate Hydro Energy Centre,
Indian Institute of Technology,
Roorkee — 247 667 (Uttarakhand)
INDIA
1

ACKNOWLEDGEMENT
First and foremost, I would like to thank GOD for giving me this opportunity to
be here and to complete my post graduation degree from this reputed institute.
I heartily like to acknowledge my sincere gratitude and indebtedness to my guides, Dr. Renu Bhargava, Professor, Civil Engineering Department, Indian Institute of Technology, Roorkee and Dr. M.P. Sharma, Associate Professor, Alternate Hydro Energy Centre, Indian Institute of Technology, Roorkee for their precious guidance and
kind information, continuous help and the affectionate treatment and constant help
throughout the course of this dissertation work. Their useful suggestions and meticulous
scrutiny of this work are gratefully acknowledged.
I wish to express my profound gratitude to Shri Arun Kumar, Head, Alternate Hydro Energy Centre, Dr. R.P. Saini, Associate Professor and Course Coordinator
(Conservation of Rivers and Lakes), Alternate Hydro Energy Centre, Indian Institute of
Technology, Roorkee for providing all the facilities at the Centre, which have made it
possible for me to complete this dissertation report. The cooperation they gave is greatly appreciated.
I would also like to thank Shri P.P. Nandusekar, Principle Scientific Officer and Shri P. K. Mirashe, Regional Officer, Maharashtra Pollution Control Board for his help,
affectionate treatment and contributing technical ideas during the time of data collection.
I am eternally indebted to my parents and family members for their love, constant
support and encouragement.
Finally, I would like to thank all my friends at home and in Roorkee and the staffs
of Alternate Hydro Energy Centre and Civil Engineering Department who have directly
and indirectly helped me in successfully completing this dissertation work.
th Date: 30 June 2008 (AJAY D. CHAVAN)
ii
ABSTRACT
The Godavari River is a second largest river in India and originates from Trimbakeswar,
Nasik Maharashtra and passes through the Nasik city. It adds an aesthetic value for the
beautification of Nasik city. The study covers about 65 km stretch of river starting from
Kushawart Trimbakeswar to Saikheda Village, from where the river enters the city. For
convenience of study, a reference point is assumed as Origin of the river. The river water
is used for washing clothes, bathing and other uses. Ten sampling stations were selected
for collection of water sample from river Godavari. The collected water samples were
analyzed in Environmental Laboratory of Maharashtra Pollution Control Board and Om
Laboratories for various water quality parameters. The observed values of various water
quality parameters were discussed and compared with the prevailing standards,
corresponding to use of the water body. The analytical results have shown
that the river is grossly polluted with high BOD. The DO decreases gradually as soon as
the river enters the city. Moreover, the water body is highly polluted with faecal coliform,
which indicates the discharge of untreated domestic sewage into it.
The water of the Godavari River collected at the various sampling stations from
the different point sources has been analyzed for the physico-chemical parameters and
bacteriological parameters such as total coliform and faecal coliform. The water quality
has been evaluated as per standard methods. The comparison of the water quality of the
river reflects the extent of pollution at respective sampling stations and different point
sources which help to plan necessary measures to combat pollution of the river.
The NSFWQI online software has been used to evaluate the water quality of the Godavari
River. The NSFWQI is mostly used in the USA and also applicable to the Indian water
environment. The trends have indicated that in the study stretch of river, the vast
variations in all the parameters were found perhaps due to the addition of various
pollutants at various locations. Gangapur Dam is found as the second sampling station
where river is almost pollution free and Tapowan or downstream of the Nasik is the
eighth sampling station up to where it receives maximum pollution from the city.
iii

Based on the results of water quality assessment of the River Godavari, it is
observed that the overall water quality of the River Godavari is "bad" or "medium" as
fact reflected at all the sampling locations. The NSFWQI observed between 26 to 50 and
51 to 70 indicates that the water quality of the Godavari River is between bad — medium
range, further the results of the year 2003 and 2007 indicate the improvement in water
quality at all locations because of the existing conservation measures being taken by the
Nasik Municipal Corporation. Major stressor of pollution has been found as pollution due
to sewage i.e. organic pollution with main contribution from faecal coliforms, BOD and
reduced DO. The water quality maps prepared on the basis of NSFWQI have also
indicated the same trend. These maps can be used to plan conservation measures for
achieving the objectives. Existing conservations are three sewage treatment plants having
capacity 78 MLD, 7.5 MLD and 22 MLD at Tapowan, Dasak and Takali respectively,
solid waste treatment plant and bio- Medical waste treatment plant appear to be
inadequate to improve the water quality due to substantial improved population.
A few conservation measures have also been suggested in order to restore the River
Godavari back to its pristine state. There is no doubt that the River Godavari is a polluted
river. However, if all the stakeholders join hands together and seriously act to conserve it,
there is still a chance to restore it back to acceptable levels.
iv

CONTENTS
Chapter No. Title Page No.
Candidates declaration i Acknowledgement ii
Abet iii Contents v Notation/abbreviations viii List of tables, figures, photos, graphs and maps x
CHAPTER 1N1UCTION 1-24 1.1 General 1 1.2 Global water scenario 2 1.2.1 Water scenario of India 3 1.2.2 Water and Ecology 10
1.2.3 Factors affecting fresh water resources 10 1.2.4 National water policy 2002 11 1.3 Literature Review 11
1.3.1 Study of pollution status of river 14
1.3.2 Water Quality Indices 17
1.3.2.1 History of Development 18
1.3.2.2 Uses of Water Quality Indices 19
1.3.2.3 Types of Water Quality Indices 19
1.3.3 Trend of pollution 19
1.3.4 Study of water Quality Management of rivers 20
1.3.5 Effects of river water 20
1.3.6 Development of BUD and DOModel. 21
Objective of the Study 22
1.5 National river conservation-plan (NRCP) 23

CHAPTER 2 ,~ UDY AREA OF RIVER GODAVARI 25-42 2.1 Introduction 25
2.2 Origin and Importance of River Godavari 25
2.3 Study Area 26
2.3.1 Status of pollution in river Godavari 28
2.3.2 Data collection for selected study stretch 29
2.3.3 Climate 31
2.3.4 Industries located at Nasik 31
2.3.5 Sources of pollution 32
2.4 Pollution of study stretch 33
2.5 Pollution by Industries 35
2.6 Past and Present Scenario of the river Godavari 38
2.6.1 Past status of the river Godavari 40
2.6.2 Present status of the river Godavari 41
2.6.3 Impact on Godavari River water 41
CHAPTER 3 IHODOLOGY FOR DISSERTATION WORK 43-66
3.1 General 43
3.1.1 Water quality assessment and management 46
3.2 Reconnaissance Survey 49
3.2.1 Measurement of Godavari River water Quality 49
3.2.2 Present approach to water quality management 49
3.2.3 CPCB annual report of environment monitoring 50
3.2.4 National water quality management strategy 51
3.3 Water Quality Indices 52 3.3.1 Historical development 52 3.3.2 Significance of Water Quality Indices 52 3.3.3 Development of Indices 54 3.3.4 Classification of Water Quality Indices 55 3.3.4.1 General water quality indices 56 3.3.4.2 Specific-use indices 59 3.3.4.3 Planning indices 60
vi

3.3.4.4 Indices based on statistical approach 3.3.5 Indices Selected for determining Water Quality
for study stretch of the River Godavari 3.3.6 NSFWQI for River Godavari.
CHAPTER 4 Ø VTER QUALITY ASSESSMENT FOR STUDY STRETCH OF RIVER GODAVARI
4.1 General 4.2 Selection & Description of Sampling Stations 4.3 Water Quality Sampling 4.4 Sampling Programme 4.5 Experimental Methods 4.6 Data collection and water sampling 4.7 Co utation of NSFWQI
CHAPTER 5 RHS'IILTS AND DISCUSSION 5.1 General
61
61 62
67-109 67 69
73 74 74 75
93
110-126
110 5.2 Water Quality Parameters
5.3 NSFWQI for study stretch 5.4 Water quality management of Godavari River 5.4.1 Conservation Measures suggested to control
the water quality 5.4.1.1 Sewage treatments 5.4.1.2 Municipal solid waste management
5.4.1.3 Public participation
5.4.2 Conservation Measures already taken by the Nasik
Corporation
5.4.2.1 Municipal solid waste management
5.4. .2 Conservation Measures for Bio-Medical Waste
5. .2.2 Conservation Measures for Sewage treatment.
CHAPTER 6 C0ICLUSIONS AND RECOMMENDATIONS
132-133
erences 134-137
110 112
120
121
121 123 124
125 125 125 131
vii

NOTATIONS AND ABBREVIATIONS
Symbol / Abbreviation Meaning / Explanation
Amm. N. Ammonical Nitrogen
APHA American Public Health Association
AWWA American Water Works Assocation
BOD Biological Oxygen Demand
CEQ Council of Environmental Quality
COD Chemical Oxygen Demand
CPCB Central Pollution Control Board
DBU Designated Best Use
DO Dissolved Oxygen
DW Discriptor Words
FC Faecal Coliform
HOP High Organic pollution
IV Index Value
ISI Indian Standard Institute
MICO Motor Industries Company Limited
MPCB Maharashtra Pollution Control Board
MSEB Maharashtra State Electricity Board MPN Most Probable Number
NSFWQI National Sanitation Foundation Water
Quality Index
NMC Nasik Municipal Corporation
NTU Nephelometric Turbidity Unit
O&G Oil and Grease OP
ODR Organic Pollution
Odour
viii

pH Negative Log of Hydrogen Ion
Concentration
RPI River Pollution Index
SPC Specific Conductance
SS Sampling Station
TC Total Coliform
TDS Total Dissolved Solids
TEMP. Temperature
TKN Total Kjeldahal Nitrogen
TN Total Nitrates
TP Total Phosphates
TS Total Solids
TSS Total Suspended Solids
TUR Turbidity
WPCF Water Pollution Control Federation
WQI Water Quality Index
ix

LIST OF TABLES I
Table Title Page No. No.
Table 1.1 Water availability in India 3
Table 1.2 Details of major river basins in India 4
Table 1.3 Trend of water, supply, waste water generation and 7
treatment in class I cities/ Class II Cities
Table 1.4 Primary Water Quality Criteria for 9
Designated-Best-Use Classes
Table 1.5 Sources of river pollution in India 15
Table 2.1 Classification of water body based on "designated best use" 29
Table 3.1 Classification of major water pollutants: 48
Table 3.2 Parameters and their weights for NSFWQI 64
Table 3.3 Descriptor Words and Colours Suggested For 66
Reporting the NSFWQI
Table 4.1 Location of sampling stations 69
Table 4.2 Sampling Location Details with Present Activities: 72
Table 4.3 Primary Water Quality Data collection schedule 76 for study stretch
Table 4.4 Analysis Results with NSFWQI for Primary Data 77-78
Table 4.5 Analysis Results with NSFWQI for Secondary Data (02-05)79-90
Table 4.6 Secondary Data: Analysis Results of Godavari River for the Year 2003 91-93
Table 4.7 Secondary Data for the year 2006-2007 94-101
x

LIST OF TABLES
Table Title Page No. No.
Table 5.1 Sample Calculations of NSFWQI
for Study stretch of River Godavari at Nasik 114-116
Table 5.2 NSF Water Quality Index for primary data 117
Table 5.3 NSF Water Quality Index for Secondary data 118
Table: 5.4 Water quality index in the selected study stretch 119
LIST OF FIGURES
Figure Title Page No. No.
Fig. 1.1 Total water on earth 02
Fig. 1.2 Distribution of fresh water on earth 02
Fig. 1.3 River basin map of India 05
Fig. 1.4 Trend of water supply, Waste water generation and 08
treatment in Class I Cities
Fig. 1.5 Trend of water supply, Waste water generation and treatment 08
in Class II Cities
Fig. 2.1 Water quality based classification of river Godavari 39
xi

LIST OF GRAPHS Graph Title No.
Page No.
Graph No 1 Bar chart showing NSFWQI for primary & secondary data 127
Graph No 2 Line Diagram showing NSFWQI for primary & secondary data 127
Graph No 3 Line Diagram showing NSFWQI for the year 2002-2007 128
Graph No 4 Line Diagram showing NSFWQI for the year 2003 & 2007 128
Graph No 5 Line Diagram showing NSFWQI for the year for primary data 128
LIST OF MAPS Map Title. Page No. No.
Map No.1 Study stretch water quality trend map showing for the year 2003 129
Map No 2 Study stretch water quality trend map showing for the year 2007 130
Map No 3 Study stretch water quality trend map showing for February 2008 131
LIST OF PHOTOS Photo Title Page No. No.
Photo nos. 1 Photos of solid waste treatment plant at Nasik 102-103
Photo nos.2 Bio-Medical waste treatment plant at Nasik 104
Photo nos.3 Different sewage treatment plants at Nasik 105-107
Photo nos.4 Conservation Measures and Sampling Locations of
Study stretch of Godavari River 108-109
xii

CHAPTER 1
INTRODUCTION 1.1 GENERAL
Water is colorless, tasteless, and odourless and is made up of only two elements, but it is
a substance that no one can live without it and is, therefore, the basis for survival and
growth not only of human beings but also all plants, animals and micro-organisms on the
earth. All the known ancient civilizations existed along the banks of great rivers. Water
also holds an important position in our religious beliefs. Several festivals such as the
Kumbh Mela are observed while standing in water. Now-a-days, water has come to be
seen as the driving force of the economy through its use in agriculture, industry and hydro-electricity generation.
Man has always treated air and water as free gifts of nature which are meant to be
exploited to their full extent. The dearth of fresh drinking water is already being felt
world on Sohra (Cherrapunjee), which receives some of the heaviest rainfall in the
world, lies barren and people have to walk for miles together for a bucket of clean water.
For this reason, it is fondly called the "wettest desert in the world".
Fresh water is a very scarce natural resource. However, it has been exploited due to
domestic, agriculture and industrial uses and is returned to nature only as waste water
laden with all kinds of pollutants. The famous French explorer Jacques Cousteau once
said, "Water and air, the two essential fluids on which all life depends, have become
global garbage cans". Our waste has choked our rivers and lakes. The fish have either
moved away or simply died. The fact that 2003 was declared as the "United Nations
International Year of Freshwater" shows as to how this problem has become a global
concern even though it is an important input for economic development and
environmental sustainability.
I

1.2 GLOBAL WATER SCENARIO
Water is available in abundance on the earth. Three fourths of its surface is covered with
water, more than 97% of this is in the form of the saline water of the oceans, 2% is
locked up in ice-caps and glaciers and a large proportion of the remaining 1 % lies in deep
inaccessible aquifers that are too expensive to be exploited. Thus, effectively 0.2 million
cubic kilometers of fresh water is available in rivers, lakes, wetlands, soil moisture,
shallow ground water and reservoirs to meet the, demands of all the plants, animals and
humans inhabiting this planet. This constitutes only about 0.01% of all the water on earth.
The World Health Organization (WHO) estimates that only 0.007% of all water on earth
is readily available for human consumption globally. Figures 1.1 and 1.2 shows the total
water availability and distribution of fresh water on earth respectively. The small amount
of available fresh water is constantly being renewed by the hydrological cycle in the form
of rain. However, a large portion of rain water either flows back into the sea as run-off or
gets evaporated back to the atmosphere.
3%
El Glaciers and ice-caps
■ Ground water upto 800 m
❑ Ground water below 800 m
o Lakes, rivers, streams etc.
El Fresh Water
■ Saline water
97%
Fig. 1.1 Total water on earth Fig. 1.2 Distribution of fresh water on earth
Source [3]
With the increase in world population, the demand for clean and fresh water also
increases. Yet at the same time, human activities leading to degradation of nature and
climate changes have put pressure on the hydrological cycle of nature also the World
2

Bank Vice President for Environmental Affairs when he said, "The wars of the twenty first century will be fought over water".
1.2.1 WATER SCENARIO OF INDIA
India supports 16% of the world's population in about 2% of the world's land area and
contains about 4% of the world's fresh water resources. India is basically an agrarian
society with its economy highly dependant on irrigated agriculture. The largest use of
fresh water in India is, thus, for irrigation. There are a total of 113 major and minor river
basins which form the lifeline of thousands of cities, towns and villages in India. Of
these, there are 13 major rivers which share 83% of the total drainage, contribute 85% of
the total surface flow and also accommodate 80% of the total population. The details of
the major river basins in India are given in Table 1.1 and Figure 1.5 shows the drainage
map of India.
Table 1.1 Water Availability In India
Sr. No. Source of water availability Quantity .
(billion M3)
1 Average annual precipitation 4000
2 Average annual water run-off potential 1869
3 Utilizable surface water 690
4 Replenishable ground water 432
Source [3]
t
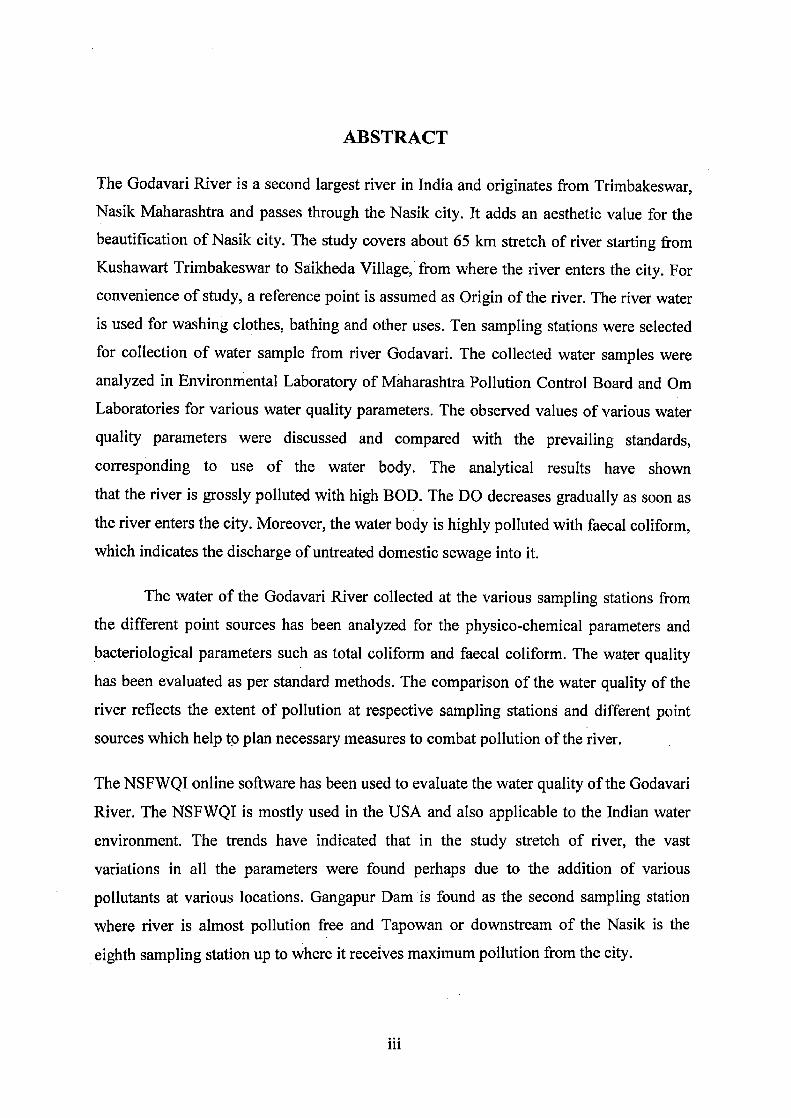
Table 1.2 Details of Major River Basins In India
• Basin
r. ` Length g
Area .Average
No. Name of the River in India in
India annual •Discharge Place of origin Destination
(Km.) (Sq. (MCM) Km.)
1 Ganga . 2525 861404 493400 Gangotri Glacier Bay of Bengal Uttar Kashi, U.P.
2 Indus 1270 321290 91455 Near Mansarovar Arabian Sea Lake, Tibet
3 Godavari 1465 312812 105000 Nasik, Maharastra Bay of Bengal
4 Krishna 1400 258948 67675 Mahabaleshwar Bay of Bengal Maharashtra
5 Brahmaputra 720 187110 510450 Kailash Range, Bay of Bengal China
6 Mahanadi 857 141600 66640 Raipur, M.P Bay of Bengal
7 Narmada 1312 98796 40705 Amarkantak, Arabian Sea M.P.
8 Cauvery 800 87900 20950 Coorg, Karnataka Bay of Bengal
9 Tapi 724 65145 17982 Batul, M.P. Gulf of Khambhat
10 Pennar 597 55213 3238 Chennakesva Bay of Bengal Hills, Karnataka
11 Brahmani 800 39033 18310 Ranchi, Bihar Bay of Bengal
12 Mahi 533 34842 8500 Ratlam, M.P. Gulf of Khambhat
13 Sabarmati 300 21674 3200 Aravali Hills Gulf of Gujarat Khambhat
Source [6]

Major River Basins of
India tnaus Amin -
NEPAL Yomuna ' J
13DM86 ~vri Ch*176a
BEtirv,
&harn - H
i ~j R ! 1Ichano~i`6ocin'3aFl~tu4 f 44
•Tapti~ '. othvài
i (3odaveri
— _ 9sr3in
eti+mo ' - •Gati~Yarl
Mama Kr hris Bsain Krishna ' .
Ttatgarmdra . Panne
IANO LAO ESH
Map not to So Pumas Basin
Po+v Yar Ricci
G®uytryr
Copyright (c) Compare tnfobaso Pvt. Ltd. 2001-02• T • -
Fig. 1.3 River basin map of India
Source [3]
3 India receives an average annual rainfall of about 4000 billion m from the monsoons.
The rainfall is highly erratic and unevenly distributed throughout the country. This has
led to increased irrigation and ground water extraction. Of the total rainfall received, 3 3
1869 billion m is lost as natural run-off in the streams and rivers, 432 billion m goes for 3
recharging the ground water and only about 690 billion m of the surface water can be
utilized. Table 1.2 shows the water availability in the country.
5

These statistics show that India has a good supply of fresh water but this is far from the
truth. Almost 200 million Indians do not have access to safe and clean drinking water and
an estimated 90% of the country's water sources are polluted to a great extent. Ground
water has been grossly exploited and at a number of places in the country, the amount of
water withdrawn exceeds the amount that is recharged.
In India, water quality has deteriorated steadily with time. With increase in. population,
the demand of fresh water also increased which in turn, led to the increased generation of
wastewater. Rapid urbanization in the last century has led to the metropolitan and other
bigger cities getting choked with myriad environmental problems such as water supply,
wastewater and solid waste generation and their collection, treatment and disposal. A
study conducted by the Central Pollution Control Board in 2003-04 indicates that about
26,254 million litres per day of waste water are generated in the 921 Class I cities and
Class II towns in India (having more than 70% of urban population) with treatment
facilities available for about 7044 million litres per day only. Table 1.3 below shows the
trend of water supply, waste water generation and treatment available in Class I cities and
Class II towns in India.
0

Table 1.3: Trend of Water Supply, Waste Water Generation And Treatment In
Class I Cities/ Class H Towns
Class I Cities Class II towns Parameters
1978-79 1989-90 1994-95 2003-04 1978-79 1989-90 1994-95 2003-04
Number 142 212 299 423 190 241 345 498
Population (millions) 60 102 128 187 12.8 20.7 23.6 37.5
Water supply 8,638 15,191 20,607 29,782 1,533 1,622 1,936 3,035 (mid)
Wastewater 7,007 12,145 16,662 23,826 1,226 1,280 1,650 2,428 generation (mid) (81%) (80%) (81%) (80%) (80%) (79%) (85%) (80%)
Wastewater 2,756 2,485 4,037 6,955 67 27 62 89 treated (mid) (39%) (20.5%) (24%) (29%) (5.44%) (2.12%) (3.73%) (3..67%).
Wastewater 4,251 9,660 12,625 16,871 1,160 1,252 1,588 2,339 untreated (mid) (61%) (79.5%) (76%) (71%) (94.56%) (97.88%) (96.27%) (96.33%)
Source [4]
In view of the prevailing population growth rate, it has been predicted that by 2025, India
will become a water stressed nation. The demand for fresh water will far exceed the
availability. Today, India is ranked 122 out of 130 countries for its water quality and 132
out of 180 countries for its water availability.
The Central Pollution Control Board (CPCB) has prescribed different water quality
standards for different water uses by introducing the concept of "Designated-Best-Use".
This concept states that out of several uses, a particular water body is put to the use
demanding the highest quality of water is called its "designated-best-use" and
accordingly, the water body has been designated. The Board has identified five such
7

"designated-best-use" classes as shown in Table 1.4 along with their prescribed water
quality criteria.
Trend of water supply,Waste water generation and treatment in Class I cities
35000 30000 25000 20000 15000
10000 5000
0 1978-79 1989-90 1994-95 2003-04
Year
p Number
■ Water Supply (MLD)
❑ Waste water genatration (MLD)
❑ Waste Water treated (MLD)
■ Waste Water untreated (MLD)
Fig 1.4 Trend of water supply, Waste water generation and treatment in Class I
Cities, Source [41
TREND OF WATER SUPPLY, WASTE WATER GENERATION AND TREATMENT IN CLASS II
TOWNS
3500 3000 2500 2000 1500 1000 500
0 1978-79 1989-90 1994-95 2003-04
YEAR
p Number
■ Water Supply (MLD)
o Waste water genatration (MLD)
o Waste Water treated (MLD)
■ Waste Water untreated (MLD)
II ~
Fig 1.5 Trend of water supply, Waste water generation and treatment in Class H Cities, Source [41

Table 1.4: Primary Water Quality Criteria for Designated-Best-Use Classes
Sr. Designated-Best- Class. of Criteria
No. ' Use water
Drinking Water 1. Total Coliforms Organism MPN/100ml shall be Source without 50 or less
1 conventional A 2. pH between 6.5 and 8.5
treatment but after 3. Dissolved Oxygen 6mg/1 or more
disinfection. 4. BOD 5 days 20°C 2mg/l or less
1. Total Coliforms Organism MPN/100m1 shall be
500 or less Outdoor bathing
2 B 2. pH between 6.5 and 8.5 (Organized)
3. Dissolved Oxygen 5mg/l or more
4. BOD 5 days 20°C 3mg/l or less
1. Total Coliforms Organism MPN/100ml shall be Drinking water
5000 or less source after
2. pH between 6 to 9 3 conventional C
3. Dissolved Oxygen 4mg/1-or more treatment and
4. BOD 5 days 20°C 3mg/1 or less disinfection.
Propagation of 1. pH between 6.5 to 8.5
4 Wildlife and D 2. Dissolved Oxygen 4mg/l or more
Fisheries 3. Free Ammonia (as N) 1.2 mg/l or less
1. pH between 6.0 to 8.5 Irrigation,
2. Electrical Conductivity at 25°C imhos/cm Industrial Cooling,
5 E Max. 2250 Controlled Waste
3. Sodium absorption Ratio Max. 26 disposal
4. Boron Max. 2mg/l
6 Not for any use Below E Not meeting A B C D,E Criteria
Source [ 14]

1.2.2 WATER AND ECOLOGY
The water of most of the rivers is considered holy. River waters are treated holy by the
people in India. Water is the most important input for survival / growth of not only plant,
human beings, animals and other living beings on the earth but also economic
development and environmental sustainability. Water had, both to be managed and
exploited for the survival of the human race, on the one hand people had to protect
themselves against floods, on the other they had to ensure safe water supply for domestic
use and irrigation. Rivers flourised only on the basis of their superior water management
systems. Water is considered to be renewable natural resource since it is continually
being renewed through nature's hydrological cycle. Also it may be regarded as a unique
resource, as the total amount of water available on the "Global basis" remains constant.
Degrading the quality or supply of that water can have disastrous effect on the
environment and on biodiversity. Irrigation, which consumes for more water than any
other use, has generated enormous benefits. Introducing improved varieties, improved
cropping patterns and using minimum tillage methods which conserve water, proper
water management is essential for adequate availability of quality water, for agriculture,
industrial and domestic uses; but also for protecting the ecosystem. Water availability is
critical to the maintenance of local flora fauna in a watershed particularly fish and other
aquatic species. Water is also needed to maintain existing wetlands, flood plains which
can have additional positive impact on the watershed because they can recharge aquifers,
digest organic waste and store runoff.
1.2.3 HOW FRESHWATER RESOURCES ARE AFFECTED?
The fresh water resources are affected of the selected stretch due to various contaminants
added in the water by the human activities like washing of cloths, animals, vehicles,
bathing activities mainly at sampling point one and at sampling point six that is at
Kushawart and Ramkund respectively, also at some points solid waste disposal and waste
water mixed through various nallas. Due to these human actions changes the hydrological
cycle and seriously pollute available freshwater. Climate change, global warming also
affects the hydrological cycle significantly thereby affecting freshwater production and
its distribution. India has declared 2003 as year of the freshwater in keeping with the
United Nations Resolution declaring 2003 as international freshwater year. The objective
of adopting 2003 as the year of freshwater are increasing awareness among stack-holders
regarding scarcity value of fresh water conservation and efficient use of freshwater
preservation quality and its ecosystem. Augmentation of freshwater resources,
community partnership for informed decision making.
1.2.4 NATIONAL WATER POLICY 2002
The National water policy 2002 recognizes water as a precious national asset. It
embodies- the Nation's resolve that planning development and management of water
resources would be governed by National perspectives. The National water policy, 2002
emphasized integrated water resource development and management for optimal and
sustainable utilization of the available surface and groundwater creation of well
developed information system, use of traditional methods of water conservation, non
conventional methods for water utilization and demand management.
The revised policy integrated quantity and quality aspects as well as en
environmental considerations for water through adequate institutional arrangements.
Besides `ecological needs' have been assigned due to priority in water allocation. Greater
emphasis has been laid on water quality aspects. The policy also stresses involvement of
people in project planning and participatory approach in water resources management.
1.3 LITERATURE REVIEW
The growth of civilization and subsequent needs for better living standard of human
being has caused great impact on the environment. The various issues and challenges
before the mankind for utilization of natural resources for a sustainable development have
compelled to look back at various environmental problems at different levels. One of the
major environmental problems is the pollution of surface water body due to discharge of
domestic and industrial effluent. According to Odum (1971), "Pollution is an undesirable
change in the physical, chemical or biological characteristics of our air, water and land
that may or will harmfully affect human life or that of desirable species or industrial
11

processes, living conditions and cultural assets, or that may or will waste or deteriorate
our material resources". Human waste was historically the first pollution problem. In
ancient times, people naturally settled near source of water and thus, communities grew
besides lakes, along rivers, and in areas where spring or well water was available.
The environmental issues had dominated after Stockholm conference in 1972 and this has
led to growing realization of the problem of water pollution, resulting in a rapid
proliferation of hydrobiological studies. As a result, rivers are being studied for the past
several years by various departments and researchers of different discipline. Besides this,
various conference were held to focus the attention of the Central and State Government
and particularly of the public toward the deteriorating condition of our rivers. The growth
of literature and data based on water pollution with special reference to urbanization and
industrialization has been influenced after the implementation of the Ganga Action Plan,
1985. The growing population and subsequently urbanization and industrialization are
unabatedly polluting the rivers. The quality of the river water starting from the sources to
the sea is a mirror of the human activities. The water is drawn for use such as drinking,
washing, agriculture, industries and other purposes and return to the river as an effluent
along the flow path. As a result, due to increasing industrialization and urbanization and
other anthropogenic activities, fresh water is becoming an increasingly scarce resource.
As population and development pressure continue to grow, most of our water bodies have
become polluted (Saluja and Jain, 1998). Murugesan and Sukumaran (1999) noted that
rapid population growth, increasing living standard, wide sphere of human activities,
growing urbanization and industrialization have resulted in greater demand of good
quality water, while on the other hand pollution of water resources is also increasingly
steadily in the future days.The riverine resources of India containing 113 river basins out
of which 14 are major, 44 medium and remaining 55 are minor rivers. The fourteen major
river basin account for 83 % of the total area of the basin and contributes 85 % of the
total surface flow and covers 80% of the total length (Nilay Chaudhuri, 1983) [7]. A river
basin of 720000 km2 catchments area characterizes the major rivers (Rao, 1979;
Jhingran, 1991 and Gopakumar et al., 2000). [8].
12

The main cause of river pollution is due to discharge of industrial effluent, domestic
sewage, agrochemical and other human activities. Regarding to the human health,
number of diseases affecting heart, kidney and bones are caused due to pollution of the
aquatic system. Nearly 20 lakh people are dying annually due to polluted water in India.
The polluted water takes the life of one child in every minute in India.
•The Central Pollution Control Board (CPCB) has brought out the amount of deterioration
of water quality over the years as per analysis of river water from 1986 to 1977. The
Board also indicated that mean BOD values have gone up in the entire major river during
the last two decades. Water quality assessment in respect of BOD values indicates that
Kerala is at the bottom and Maharashtra at the top in 1997. Regarding to coliform bacteria, the most affected states are Assam, Uttar Pradesh, Gujarat and Tamil Nadu. In
respect of chemical pollution, Gujarat ranks first and next- followed by Maharashtra,
Andhra Pradesh, Tamil Nadu, Uttar Pradesh and Punjab. Recent survey has revealed that
almost all major river in India have become highly polluted (Mahajan, 1988).[9]
The World Health Organization (WHO, 1985) found that more than 1000 organic
compounds are present in river water and effluents. The confluence of such effluents has
great impact on the physico chemical and biological character of the river system. The
nature and health of the aquatic communities indicate an expression of the quality of
water. The gradual increasing high values of physico chemical parameters might have
eliminated all the indigenous life leading to the formation of biological desert. (Rana and
Palria, 1982). The growth of civilization and subsequent needs for better living standard
of human being has caused great impact on the environment. The various issues and
challenges before the mankind for utilization of natural resources for a sustainable
development have compelled to look back at various environmental problems at different
levels. One of the major environmental problems is the pollution of surface water body
due to discharge of domestic and industrial effluent. During the Industrial Revolution of
the 19 h̀ century, cities in the United States and Western Europe grew at a tremendous
rate. Refuse of all kinds including great quantities of horse manure ended up in the
streets, open sewers and nearby rivers. Devastating epidemics of water borne diseases
such as cholera, typhoid and dysentery were common in large cities.
13

By the early part of the 20th century, the connection between diseases and sewage-borne
microorganisms had been recognized. Luis Pasteur (1822-1895) and Robert Koch (1843-
1910) postulated the Germ theory of disease. This focused attention of the scientific
community to the safe disposal of domestic sewage and need to practice sanitation.
Accordingly, safe water supplies were established in most industrialized nations. As a
result, water borne diseases have been virtually eliminated in those countries; however,
those are still very common in less developed countries, where waste disposal systems
are often inadequate or non-existent. In industrialize nations; contamination with
hazardous chemicals has become the main threat to the surface water body. Therefore, it
becomes necessary to assess and monitor the water quality of the surface water body to
determine its acceptability for the different uses as well as pollution status of the water
body. If the level of pollution increases above the acceptance level, then necessary
control measures have to be established. However, before setting any control measure,
we should know the effectiveness of such measures and for this, water quality model has
to be developed for the surface water body. Water quality model will help in predicting
water quality responses of the water body in different load condition and allow us . to
choose alternative option.
The literature has been reviewed under two headings namely (1) Study of pollution status
of river and (2) Water Quality Index.
1.3.1 STUDY OF POLLUTION STATUS OF RIVER
A number of studies have been carried out in connection with water quality of river.
Grande (1964) studied the water quality of river Otra, Norway. He studied the
conductivity, colour, COD, organic suspended solids and pH of different water samples
of pulp and paper mill wastes on fish population of the river. Similar works were carried
out in the river Yodo, Japan (Shoji, 1966); in the river Holme, (Brown et al., 1979); in the
river Isumi, Japan (Mori et al., 1979) and in Glatt River, Switzerland (Gunten et al.,
1986). Schroesfer (1963) carried out some research works in the Mississipi River,
Rajagopalan et al. (1973) studied pollution of Subarnrekha River at Rachi.
Chattopadhyay et al. (1984) studied the pH, alkalinity, chloride, sulphate, phosphate,
14

nitrogen in different forms, DO, BOD, and COD of the Ganga river water in the Kanpur
region and found that the river water in Kanpur region has become highly polluted.
Similar works on the Ganga River was carried out in Varanashi region (Sing,
1985).Agarwal et al. (1986) studied the DDT residues in the river Jamuna, Delhi and
found that the river contains moderate to high levels of DDT residues. The concentration
of total DDT residues ranges from 0.04 to 3.42 milligram per litre in water, 0.007 mg per
kg in bottom sediments, 0.05 to 15.24 mg per kg in various invertebrates and 0.54 to
56.31 mg per kg of fishes. Anderson and Peterson (1969) showed by experiments that
DDT has sub lethal effects on the nervous system of Brook Trout. Tirath et al. (1982)
studied the water quality of Gomti River, Lucknow (U.P.). They studied DO, BOD,
nitrogen in different forms, TDS, TSS and turbidity and found that the river water is
polluted. Raina et al. (1984) studied the pollution status of the river Jhelum-1. Das et al
Table 1.5 Sources of river pollution in India
Si. No. Name of the river Sources of pollution 1 Ganga Industrial, urban and agricultural activities.
2 Yamuna, Delhi Sewage, DDT factory and other industries and power plant
3 Kali, Meerut (UP) Sugar mills, distilleries, paint, soap, silk, yarn, tin and glycerin industries
4 Bajora, Bareilly (UP) Synthetic rubber factories
5 Ganga, Kanpur Jute, chemical, metal, surgical, tanneries, and sewage
6 Gomti, Lucknow (UP) Paper and pulp mills and sewage
7 Suvaon, U.P Sugar mills
8 Siwan, Bihar Paper, sulphur, cement & sugar mills
9 Damodar, Bokaro Fertilizers, steel mills, coal and paper plant
10 Sone, Bihar Cement, pulp and paper mills
11 Hooghly, Kolkata Paper & pulp, power plant, jute, textile, chemical,
paint, varnishes, metal, steel, oil, rayon, soap and sewage
.12 Bhadra, Karnataka Pulp, paper and steel industries
13 Cooum, Adyar and Buckingham canal, Madras
Automobiles and sewage
15

14 Cauvery (Tamil Nadu) Sewage, tanneries, distilleries, paper and rayon mills
15 Godavari Paper mills
16 Kulu, Mumbai Chemical, rayon and tanneries
17 Brahmaputra Oil drilling, refineries, paper mills and sewage
18 Barak Paper mills
19 Digboi river Refineries
20 Dilli Fertilizers
21 Kolong Paper mills
22 Bharalu Sewage and small industries
23 Tunia Refineries and petrochemicals, railways, small industries and sewages.
Source: [14]
(1987) studied pollution status in river Ib (physico-chemical characteristics). Ajmal et al.
(1988) studied pollution of Hindon and Kali nadi. Sankaran (1988) studied pollution on
Cauvery and Adyar rivers in Tamil Nadu. Shah (1988) studied physico-chemical aspects
of pollution in river Jhelum (kasmir). Sinha (1988) studied effect of waste disposal on
water quality of river Damodar in Bihar with special reference to physico-chemical
characteristics. Khan et al. (1994) studied water quality parameter (physico-chemical
characteristics) in river Ganga between Narora and Kannauj, U.P.
Ghose et al. (1990) studied the water pollution due to the surface and underground
mining activity in Satgram Underground Coal Project. Kakoti (1990) studied physico-
chemical characteristics of municipal wastewater of Guwahati city flowing through 9
major drains in different areas of the city. Pophali et al. (1990) studied the pollution load
in pre monsoon and post monsoon seasons in Patra River, Bhopal, and Madhya Pradesh.
Katariya (1994), studied water quality of Kalisot River, Mandideep, Bhopal. Angelidis et
al. (1995) studied the impact of point (domestic and industrial effluent) and non-point
(agricultural land run off) pollution sources on the quality of the receiving waters of the
Evrotas River (Laconia; Greece). Vutukuru et al. (2002) studied the impact of domestic
and industrial wastes on the water quality structure of Gostani and Velpur canal, Tanku,
West Godavari district, Andhra Pradesh. The canal was subjected to organic pollution,
16

indicated by high BOD and COD values besides poor microbial water quality. Nagaraj et
al. (2005) studied the impact of industrial effluents and domestic sewage on ground water
pollution in Vrishabavathi river basin, Karnataka.
The State Pollution Control Board, Maharashtra has made some water quality
measurements in the Godavari River and its other tributaries, under Environmental
monitoring, GEMS and MINNARS Project. The analysis results of all the sampling
points of the various rivers including Godavari River under these projects are available
on MPCB and CPCB websites. Das (1977) studied the pH, DO, BOD, oil and phenol in
the water of the Godavari River. He found that amounts of these parameters were
considerably high in comparison to the CPCB standards. Sharma et al. (1994) studied the
physico-chemical parameters of Godavari River water. The results showed high pollution
status with values of some parameter beyond the permissible limits DO (1.0 mg/1),
Alkalinity (430 mg/1), BOD (12.2 mg/1) and COD (62.0 mg/1) etc.[5]
1.3.2 WATER QUALITY INDICES
An index is a means devised to reduce a large quantity of data down to a simplest form.
The environmental indicator or sub-index function is calculated which refer to a single
quantity devised from one or two polluted variables or characteristic parameters (Ott,
1978) .Basically, it is used to reflect some environmental attribute. Water Quality Index
(WQI) is then calculated which is a mathematical aggregation of two or more indicators
in some function. Water quality index is simply a numerical value having no units and
compare water quality or status to a prescribed base or to scientific arbitrary standards.
Water quality indices can be formulated in two ways, one is water pollution indices in
which index number increases with the degree of pollution and another water quality
indices in which index number decreases with the degree of pollution.
Indices that use a numerical scale to represent the gradation in water quality levels were
first introduced by Horton (1965) [1]: Brown et al. (1970) has developed a water quality
index similar in structure to the Horton's index This effort was supported by the National
Sanitation Foundation (NSF). As a result, the brown index is also referred as NSF WQI.
This is most favorable in assessing the water quality in a polluted water bodies.
17

In this study, NSFWQI is used for assessment and evaluation of pollution status at the
sampling station of the Godavari River.
Public awareness and consciousness about pollution in general and pollution of water in
particular has increased over the recent years. Emergences of International Organization
like Green Peace are testimony to this fact. However, in spite of awareness of water
quality and water pollution, the general public is at loss to understand the actual level of
water quality as it is explained in technical parameters. In such circumstances, if the
water quality is expressed in terms of numbers, the public as well as technologists and
administrators can better understand it.
An index is a mean device to reduce a large quantity of data down to a simplest form.
First the term environmental indicator or sub-index function is calculated which refers to
a single quantity derived from one or two polluted variables/characteristic parameters
(Ott-1978). It is used to reflect some environmental attribute. Water Quality Index (WQI)
is then calculated by a mathematical aggregation of two or more indicators in some
fashion. It is simply a numerical value having no units. WQI is a comparison of water
quality or status to a prescribed base or to a scientific arbitrary standard. Various ranges
of WQI may be used to classify the quality of water for a given use into various classes
such as excellent, good, satisfactory, poor and unacceptable etc.
1.3.2.1 HISTORY OF DEVELOPMENT
It is reported that attempts were made in Germany as early as 1848 to relate the level of•
water pollution to the occurrence of certain biological organism (Landwehr-1974). Since
then, various European countries have developed and applied different system to clarify
the quality of surface water. Indices, which use a numerical scale to represent the
gradation in water quality levels, were first introduced by Horton (1965). In India,
Bhargava (1985) has suggested a water quality index for river Ganga for zoning and
classification with respect to specific use.
18
1.3.2.2 USES OF WQI
The planning Committee of National Academy of Sciences (NAS) 1975 has indicated
that the Environmental indices perform an important role in formulating policy, judgment
of effectiveness of environmental. protection programmes, designing such programmes,
and communicating with the public concerning conditions of the environment and
progress towards its enhancement.
1.3.2.3 Types of WQI
The different water quality indices developed into four general categories:
1) General water quality indices,
2) Specific-use indices,
3) Planning indices, and
4) Indices based on statistical approach
All the details of various water quality indices including NSF WQI are given in chapter 3.
1.3.3 TREND OF POLLUTION
The water of the Godavari River in Nasik city has gradually deteriorated due to
industrialization and urbanization of the Nasik city. The study revealed that the streams
of Nasik city are polluted with municipal wastes. The water of Kapila River and other
resources have also deteriorated due to increasing urban and industrial activities Nasik
city. The river Godavari in Nasik city is also polluted due to the similar reason.
The river Godavari at Maharashtra, Jamuna at Delhi, Hooghly at kolkata, Ganga at
Kanpur, Allahabad and Varanasi have polluted due to receiving of municipal sewage and
industrial effluent. Therefore, all water resources of neighbouring urban area have
gradually polluted due to growing human activities.
The growing population and subsequent urbanization and industrialization are unabatedly
19

polluting-of all rivers in the world. Increasing pollution of rivers has become a matter of
great concern regarding study of the river eco system. Most of the studies have been
carried out on the basis of physico chemical characteristics of the river and effects of the
river pollution on the morphology and physiology of the flora and fauna.
All the studies indicate that it is essential for the proper management of rivers to preserve
the river eco-system on the most priority basis in favour of the whole natural
environment.
1.3.4 STUDY OF WATER QUALITY MANAGEMENT OF RIVER
Pollution of river water associated with industrial and sewage discharge is a global
problem. It is reported that about 70% of the available water in India (Citizens report,
1982) is polluted [1]. The chief sources of pollution is identified to be industrial pollution
constituting 8-16% of the waste water and sewage comprises 84-92% (Chaudhuri, 1982)
[7]. The sources of river pollution in India are tabulated in Table 1.1.
1.3.5 EFFECTS ON RIVER WATER
With the rapid industrialization and urbanization during- the last 50 years, most of the
Indian rivers are subjected to indiscriminate discharge of effluents affecting water quality
and aquatic life (Verma and Shukla, 1969) [18].The effect on river water due to
discharges of industrial effluents and domestic waste water are considered on the
following parameters:
1. Effect on physico chemical parameters of the river water,
2. Effect on flora and fauna of the river aquatic system,
3. Eutrophication of the river.
4. Effect on bacteriological parameters,
5. Effect on self purification capacity of the river.
20

1.3.6 DEVELOPMENT OF BOD AND DO MODEL
The mathematical modeling of water quality in a river has progressed from the
pioneering work of Harold Streeter and Earle Phelps (1925) who developed the
relationship between the decay of an organic waste measured by the biochemical oxygen
demand (BOD) and dissolved oxygen (DO) resources of the river, producing the classic
dissolved sag model. These two counteracting processes, (BOD and DO), are considered
in the traditional BOD-DO model of Streeter and Phelps (1925) in the mathematical
form. Subsequent to Streeter and Phelps (1925), several BOD-DO models and several
concepts were introduced in the past (Theriault, 1927; Camp, 1963; Li, 1972; Gundelach
and Castillo, 1976; Van Genuchten and Alves, 1982; Bhargava, 1983; Thomman and
Muller, 1987; Jolankai, 1997, Yu et al., 1991; Adrain et al., 1994). Most of these models
have gradually increased in terms of the number of variables representing the variation of
BOD as well as DO concentrations. However, some of the models are different in
functional forms and do not transform to the widely used Streeter and Phelps model.
To assess the changes in water quality of rivers in spatial and temporal scales, very
limited modeling efforts have been made in India in recent years (Bhargava 1983;
Choudhary et al., 1990; Ghosh, 1993; Jain, 1998; Sharma et al., 2000). Abbasi et al.,
(2002) studied the modeling of Bukingham canal water quality, Chennai, India by using
the QUAL2E-UNCAS software. Numbers of software are available for water quality
modeling of river and stream. They are QUAL2K, QUAL2E, WASP, CE-QUALM-ICM,
HEC5Q, MIKE1 I, ATV MODEL, SALMON-Q, DUFLOW, AQUSIM and DESERT etc.
These software's have been developed for the Environmental Protection Agency (EPA)
of United States of America. QUAL2K is a modeling Framework for simulating river and
stream water quality developed by Steve Chapra, Greg Pelleties and Hua Tao.
21

OF THE STUDY
of the River Godavari has been used for domestic, industrial and irrigation
However, with the increase in the population of Nasik and its haphazard
growth, in some of the areas of the Nasik City mostly slum areas and undeveloped areas
this river has been converted into a drain used for dumping almost everything in some
areas mostly at downstream of the Nasik city. The objective of present study
To study the effects of all these anthropogenic sources of pollution at several points
from Kushawart Trimbakeswar to Saikheda Village total 65 Kms stretch at ten locations
of the River.
To find out point sources and non point sources for selected study stretch.
To.assess the water quality of selected locations as a primary data for 2-3 times between
eight months period.
.T6 collect secondary data for last 5-6 years from MPCB office and CPCB websites.
,-T6 use online software of NSFWQI to find out water quality indices and water quality
on the basis of indices.
To represent NSFWQI on water quality graphs and maps to find out the trend of water
quality of selected stretch.
jo compare primary and secondary data for the year 2003 and year 2007 for to assess
water quality management measures taken by NMC Nasik.
To suggest conservation measures and recommendations by considering the performance
of present measures taken by Nasik Municipal Corporation mainly three sewage
treatment plants of capacities 78 MLD, 7.5 MLD and 22 MLD at Tapowan, Panchak and
Chehadi respectively in addition to that one solid waste treatment plant and one bio-
medical waste treatment plant, which will help in preparing and implementing the mitigation measures for improving the water quality of the river based on the study.
JJtk1 22 T Y
V3CA3

NATIONAL RIVER CONSERVATION PLAN (MRCP)
The Ministry of Environment and Forests, Government of India, started a programme for
cleaning up of rivers in the country with the implementation of the Ganga Action Plan
(GAP) in 1985. A Central Ganga Authority (CGA) was set up under the Prime Minister
with the members being the Chief Ministers of the concerned states, Union Ministers and
Secretaries of the concerned Central Ministries along with experts in the field of water
quality. GAP was extended to GAP Phase — II in 1993 and then to NRCP in 1995. GAP
Phase — II was merged into NRCP in 1996. The objective of the NRCP was to improve
the water quality of major rivers as the major fresh water source in the country, through
the implementation of pollution abatement schemes. Since thenf a single scheme of NRCP is under implementation as a Centrally Sponsored Scheme. The CGA was
renamed as National River Conservation Authority (NRCA) with a larger mandate to
cover all the programmes supported by the National River Conservation Directorate.
he functions of the NRCA are as follows:
(1) To lay down, promote and approve appropriate policies and programmes (long and
short-term) to achieve the objectives.
(2) To examine and approve the priorities of the NRCP.
(3) To mobilize necessary financial resources.
(4) To review the progress of implementation of approved programmes and give
necessary directions to the Steering Committee, and
(5) To make all such measures as may be necessary to achieve the objectives.
G P Phase I: - Was started in 1985 as a 100% centrally funded scheme. The main
objective was to improve the water quality of the River Ganga to acceptable standards by
preventing the pollution load from reaching the river. Under GAP Phase— I pollution
abatement works were taken up in 21 Class — I towns in Uttar Pradesh, Bihar and West
Bengal. GAP Phase — I was extended to GAP Phase — II, approved in stages between
1993 and 1996. It covered the River Ganga and its major tributaries, viz. Yamuna,
Gomati and Damodar. This plan covered pollution abatement works in 95 towns along
23

the polluted stretches of these 4 rivers spread over 7 states. Accordingly, GAP was
merged into a National River Conservation Plan (NRCP) in 1995 on 50:50 cost sharing
basis between Centre and State Governments. The Ganga Project Directorate was
converted into the National River Conservation Directorate (NRCD) for servicing the
National River Conservation Authority and the Steering Committee. It covered pollution
abatement works in 46 towns along the polluted stretches of 18 rivers spread over 10
states. The GAP Phase —II was merged with NRCP in 1996. NRCP was converted into a
100% centrally funded scheme in November 1998 with only the land cost to be borne by
the States. However, in March 2001, it was decided to adopt an integrated approach for
the river cleaning programme and that all future programmes will be shared on a 70:30
cost sharing basis between the Centre and State Governments respectively. [ 14]
24

CHAPTER 2
STUDY AREA OF RIVER GODAVARI
2.1 INTRODUCTION
River Godavari at Nasik is contained to be one of the major rivers in India, which
attaches considerable significance to the Hindu mythology, and the religious sentiments
of bathers.Nashik has a glorious history of 4500 years. Nashik is an important pilgrimage
center where large number of devotees who come across from all over world. The
number of pilgrims rises to lacks at the time of Kumbhmela. Kumbhmela occurs after
every twelve year. According to one interpretation the place was named Nashik because
it is situated on the nine peaks known as Narshikhara. The other interpretation is that the
place got its name as Laxman cut off the nose of Shrupankha during the Ramayan period.
Nasik has developed on both sides of river Godavari which is considered to be scared as
Lord Ram along with Laxman and Sita are believed to have stayed at Panchavati situated
on left bank during their exile. Sita was abducted by Ravan from this place. In around
1637 AD the mughals overthrew the regime of then rulers of NIZAMSHAHI dynasty and
merged Nashik with Aurangabad. In 1818 AD Holkar's Nasik possession passed into
hands of the British Empire. According to legend Lord Indra was running with Amrit
Kumbha and was being chased by Danavas. A few drops fall in Godavari (Ramkund) and
people rushed to get these drops of Amrit. The kumbhmela is held since then. It is
believed that the water of Godavari has a purifying value during this period that the
sacred rivers like the Ganga, Yamuna, Narmada & Saraswati come to wash in Godavari.
Most of the temples of Nasik were built around 1216 AD by Yadav's of.Devgiri and
some of the important temples are Trimbakeshwar, Kapaleshwar, and Someshwar.
2.2 ORIGIN AND IMPORTANCE OF RIVER GODAVARI
The second largest river in India, Godavari is often referred to as the Vriddh (Old) Ganga
or the Dakshin (South) Ganga. The name may be apt in more ways than one, as the river
follows the course of Ganga's tragedy: Pollution in this peninsular river is fast reaching
unsafe levels. The Godavari originates near Triambak in the Nasik district of
25

Maharashtra, and flows through the states of Madhya Pradesh, Karnataka, Orissa and
Andhra Pradesh. Although its point of origin is just.80 kms away from the Arabian Sea,.it
journeys 1,465 kms to fall into the Bay of Bengal. Some of its tributaries include
Indravati, Manjira, Bindusara and Sarbari. Some important urban centers on its banks
include Nasik, Aurangabad, Nagpur, Nizamabad, Rajahmundry, and Balaghat.
Like most other rivers, domestic pollution is the biggest polluter of the river Godavari,
accounting for 82 per cent of total pollution, whereas industrial pollution accounts for
about 18 percent. Over half of the river basin (18.6 million ha), is categorized as
cultivable land. Most of the river's water is drawn for irrigation purposes. The river water
is heavily used for agriculture, as it is the only available water source.for setting water
quality objectives of a water body, it is essential to identify the uses of water in that water
body. Normally each stretch is used for various purposes. Out of these, the use which
demands highest water quality is termed as Designated Best Use and accordingly the
water body is classifies. The CPCB has identified five such "designated best use" as
given in Table 3.1. Water, being a best solvent available on earth, is seldom found in pure
state, it exists as a mixture. In nature, the most nearly pure state of water is in its
evaporation state. For water to condense, it requires a surface or a nuclei, thus water may
acquire impurities at the very moment of condensation. In the hydrological cycle, water
comes in contact with various gases and particulate matter in the atmosphere, soils, rocks
and other materials on land and various minerals underground. During this contact, water
acquires impurities. The characteristics of water of a particular place depend on the types
and quality of the materials it has come into contact with. Human activities contribute
further impurities to the water. Industrial and mining wastes, domestic wastes,
agricultural chemicals and other contaminants added by humans have greatly affected the
quality of water bodies.
2.3 STUDY AREA
Study area for the present work covers stretch of 65 Km falling within the Nasik District
is considered to be sacred and pilgrims in large numbers. It results it has become dustbin
for eventual disposal of all sorts of pollutants (waste water, debris etc.) due to the rapid

and unplanned growth of human settlements along both sides of the river banks,
insufficient sewage disposal and treatment facilitates lack of bathing ghats, Dhobi Ghats
(place for washing cloths), Place for washing of animals, vehicles etc. Last Kumbhmela
was in the year 2003-2004, during that period lot of work completed for conservation of
Godavari River like 78 MLD Sewage Treatment Plant at Tapowan, Nasik,7.5 MLD STP
at Dasak Village and 12 MLD STP at Takali. Village, apart from this Solid Waste
Treatment Plant and Bio- medical waste treatment and disposal plant were installed. I
have to concentrate on the study of water quality assessment of the Godavari River so
that reduce the pollution in the river Godavari for a particular case only. That is from
Kushawart to the Saikheda village total 65 kms stretch. Within which the major nallas
causing the pollution meets the river in the city area only.
To identify the sources of pollution and management of water quality, this dissertation
will be carried out. In this dissertation the survey of area around river Godavari that
contributes the discharge of sewage in it is required. Their pollution strength will be
determined by performing tests from the samples from these polluted sources. The tests
will be performed on the samples for about 8 months to study the variation in the
pollution strength due to variation in flow condition and seasonal change. The following
tests will be carried out:
1) pH
2) Dissolved Oxygen (DO)
3) Biological Oxygen Demand (BOD)
4) Chemical Oxygen Demand (COD)
5) Total Hardness
6) Calcium Hardness
7) Magnesium Hardness
8) Electrical Conductivity
9) Alkalinity
27
10) Chlorides
11) Sodium
12) Potassium
13) Sulphates
14) Phosphates
15) Nitrate
16) Total Suspended Solids
17) Total Dissolved Solids
2.3.1 Status of Pollution in Godavari River
Godavari River has been considered as holy and is supposed that a dip in river Godavari
make people free from sins. But today a dip in this river will make people free from their
skins. The stretch of 65 km falling within the Nasik Collectorate limits was taken for
study in this dissertation work. Pollution of the river starts from Kushawart where people
take holy bath and wash cloths, which is a religious cum tourist spot. Domestic waste of
Someshwar released in the river without any treatment. Chikalli nalla, which joins the
river Next to Someshwar and before Anandwali station, sometime release wastewater
from Satpur and Ambad MIDC industrial areas. At Anandwali station everything, which
is waste or unwanted, is dumped at the bank of the river and also the pollution in the river
is due to the domestic sewage discharged in it. At Ramkund station large no of Pilgrims
converge to take holy dip in its water and performs various religious rites besides
worshiping and burning of dead bodies etc. While on the other hand it has become a
dustbin for eventual disposal of all sort of pollutants (debries, wastewater, Nirmalya,
Asthi and Raksha — Visarjan etc.) necessitated due to the rapid and unplanned growth of
human settlements along both sides of the riverbank, inadequate sewage disposal and
treatment facility, lack of bathing ghats and direct discharge of Waghadi nalla water.

Table 2.1 Classification of water body based on "designated best use"
Sr. Designated Best Use Quality Primary quality criteria
No. Class
1 Drinking water source without conventional PH 6.5-8.5; DO>:6.0; A
treatment but with disinfections BOD< 2; MPN< 50
2 Organized outdoor bathing PH 6.5-8.5; DO>_ B
5.0:BOD<-3.0;MPN<500
3 Drinking water source with conventional PH 6.5-8.5; DO>-6.0; treatment followed by disinfections C
BOD55.0; MPN<5000
4 Propagation of wildlife and fisheries PH 6.5-8.5; DO>-6.0; D
NFL + 1.2
5 Irrigation, .Industrial cooling and controlled PH6.5-8.5;Na absorption E -
water disposal ratio max 20
2.3.2 Data Collection
On the industrial area Nashik has acquired a great importance on the industrial map of
India. Two industrial areas in Nashik namely Ambad and Satpur Industrial Areas has
been developed in Nashik Municipal Corporation. Due to which the population of Nashik
city has increased considerably in the short period. The population according to 2001
census has crossed the mark of 14, 00,000. Leading to the development of large numbers
of residential areas without considering drainage system.
Nasik an industrial and developed city in the state of Maharashtra and the Godavari River
29

is flowing through the city. The development is growing after establishment of. the
industrial area like Satpur and Ambad MIDC. Industrial development in that area mainly
large and medium scale industries like Motor Industries Company Limited (MICO),
Mahindra and Mahindra, VIP Industries, Ceat Limited, Carbon Corporation Limited,
ABB Limited, BCL Forging Limited, Gloxo Limited, Siemens, Garware Polyester Ltd,
Gabriel and so on, nearly 125 large scale and 350 medium scale units along with 2500
small scale units are presently running in these industrial estates. All these units are at the
upper part of the City and Bank of Godavari River. All this large scale, medium scale
units and other small scale industrial units were set up under the private and public
sectors. This has initiated the massive industrial growth in the area. Some tertiary
industries such as laundry, hotel, restaurant, pathological laboratories and nursing home
etc are growing in and around the Godavari River. The water of Godavari River was
being used by people for domestic purposes such as drinking, bathing, cleaning and other
aesthetics purposes.
The present dissertation is concerned waste water quality management of river Godavari
in Nasik City. That is from Kushawart Trimbakeswar (source of water) to the Saikheda
village within which the several activities like washing of cloths, washing of vehicles,
washing of animals, Bathing activities, sewage disposal of nallas causing the pollution
meets the river in the area only. The work included identification of pollution sources
based on the survey of area around river Godavari contributing the discharge of sewage.
The sampling points were located on the stretch. The CPCB as well as MPCB data
considered as secondary data where as data collected for assuming the pollution load of
these locations was processed to computing the NSF water quality indices. The samples
were taken these locations in the month of December 2007 and February 2008 only. The
main parameters were carried out like pH, Total Suspended Solids, Total Dissolved
Solids (TDS), Dissolved Oxygen (DO), Biological Oxygen Demand (BOD), Chemical
Oxygen Demand (COD), Total Hardness, Nitrate, Phosphates, Electrical Conductivity,
Faecal Coliform, Chlorides, and Sulphates etc.
These data was converted with National Sanitation Foundation Water Quality Index to
achieve at a single value defining the water quality at selected locations.
30

2.3.3 CLIMATE
Nashik has a mild climate with plenty of sunshine all through the year. In summers May
is the hottest month with maximum temperature. The months of September to March are
the best to visit Nashik and nearby areas. The monthly maximum temperature reported to
have been recorded was in the month of May 2008 was 41.5 deg.0 and monthly average
minimum temperature recorded in jan.2008 was 6.5 deg.C. The weather is observed cold
from Dec. — Feb. and is hot / dry from March to May. Rainy / monsoon season from June
to September is due to South — West monsoon. The weather is fair after the rainy season
i.e. October and November. Relative humidity is maximum 62% and minimum 23.65%
2.3.4 INDUSTRIES LOCATED AT NASIK
Two industrial estates of Satpur and Ambad developed by MIDC come within the limits
of Nasik Municipal Corporation limits, these industrial area establishments in the year
1962 and 1978 respectively. The total employees employed in this industrial area are
more than one lacs. The city industrial and development corporation (CIDCO) has also
developed residential area to meet the influx of population due to establishment of the
two industrial areas of MIDC at Satpur and Ambad. This residential area developed by
CIDCO is included in the trend of development. The industrial development is
responsible for the rapid growth of the population in the NMC area. Simultaneously there
is increase in the slum area.
All the drinking water supplied to Nasik city is from Gangapur Dam. Which is an earthen
dam was built across river Godavari which was completed in year 1965. The dam was
built with purpose to supply water for irrigation, domestic and industrial use of Nashik
City. The Catchment area: 357.40 sq. KM, Submergence area: 2231 Ha,Left Bank Canal:
a) Length 64 Km, b) Discharge 8.92 M3/sec,Right Bank Canal: a) Length 30 Km, b)
Discharge 3.68 M3/sec, Radial gates: 9 No.'s, Storage capacity: 215.88 million M3, Live
storage: 203.88 million M3, Dead storage: 12 million M3, Year of completion of dam: 1st
stage: 1954 and 2°d stage: 1965, Cost of the project: 5 Crores.
31

2.3.5 SOURCES OF POLLUTION
The rapid industrialization and urbanization and extensive use of fertilizer and agro-
chemicals along with other chemicals have put in severe strain on the river eco-system.
Gradually, increasing pollution of river water has become a matter of great concern in
recent years. Basically, the growing population and subsequent urbanization and
industrialization are main unabated polluting causes of the rivers in the world.
Industrialization and urbanization are growing hand in hand to form modern
technological society. Subsequently, it affected adversely the neighboring water
resources along with the natural . environment. The growth of modern technology and
industry has initiated to increase the population in urban settlements.
The urban area occupies roughly 0.3 % of world's geographical area and about 40% of
the World's population resides in this urban area. The dynamics of industrialization and
increase of population has led to the growth of the large modern urban complexes.
Consequently, high density of population, high consumption of energy, large amount of
solid wastes generation, discharge of domestic sewage and industrial effluents are the
distinctive character of both industrialization and urbanization. The river, therefore, has
been affected by the above causes in respect of the morphological and ecological aspects.
Some of the important Domestic sewage discharge, washing activities of vehicles, cloths
and animals, bathing activities Pollution causing factors were observed, in some places
solid waste disposal and bio- medical waste disposal were also observed. presently no
open nalla discharge observed in the area except some washing activities, because lot of
work done during the period of Kumbhmela like 3 STP's, Solid waste and Bio-Medical
waste treatment and disposal plant.
Major Sources of Pollution in River Godavari Location of Point Sources
The fieldwork was done along the banks of the river to identify the source of pollution in
the river. The stretch of 65 KM is considered in this dissertation work. As already said
the present pollution occurring in Godavari River is mainly due to the domestic sewage
and washing activities only like washing of cloths, animals, vehicles etc.
32

The major nallla's were discharging domestic sewage in Godavari before the years 2003
are namely Nalla at Kannamwar Bridge, Shreerangnagar Nala, Chikhali nalla,
Malharkhan Nala, Anandwalli nalla, Saraswati Nala, Waghadi nalla, Bhoi Nallas at Downstream of Nashik, Nalla at Amardham.
All these above nallas were diverted to newly installed 78 MLD STP at Tapowan for
treatment of waste water, after proper treatment waste water disposed off in to Godavari
River. Present locations of the point sources are Kushawart, Someswar, Anandwali,
Victoria Bridge, Ramkund, and Tapowan, Dasak Village, Saikheda Village of Nasik also
at some times discharges effluent at Anandwali point in the Godavari
2.4 POLLUTION OF STUDY STRETCH
The water of the Godavari River is gradually deteriorated due to industrialization and
urbanization of Nasik City. Water is polluted by industrial and domestic activities. The
industrial pollution is more complex than the pollution due to urban activities. The
pollution loads are concentrated in between city area out let to Nasik city area along the
flow path of Godavari River.
SOURCES OF POLLUTION
The sources of pollution of the Godavari River can be classified as;
1. Point sources
2. Non point sources.
Point Sources
Point sources involve discharge or wastes from identifiable points. The sources are:
1. Industrial plants : Industries such as Motor Industries Limited (MICO),
Mahindra and Mahindra, Ceat Limited, Graphite India Limited, Siemens, Garware
Polyester Limited, Kirloskar Oil Engines, Gabriel, Taj Residency, Atlas Capco, Asian
Electronocs, Pferd Tools, Caprihans Limited, Jyoti Structures Limited, Jyoti Ceramics
33

Limited and other medium and small industrial units which treated their industrial and
domestic waste water as per Maharashtra Pollution Control Board norms and used for
gardening in their own premises no waste water directly discharges in to the Godavari
River. However some times some small scale units illegally discharges their untreated or
treated waste water during night time in to the Godavari River.
2. Drainage system: The sewage from Nasik city municipal area is going to the
Godavari River with treatment after 78 MLD Sewage treatment plant. The domestic
sewage of some parts of the municipal area not treated and same is discharges directly in
to the river. The Nasik Municipal Corporation is trying to collect all sewage from the
municipal area for treatment and proper disposal in to the river, consequently, because of
this; river area is highly polluted by the sewage water.
3. Storm water run off: The storm water confluence directly with the Godavari
river water through the drain. It increases the siltation and BUD load in the Godavari.
River.
Non Point Sources
Non point sources involves the diffuse discharge wastes from land run off, atmospheric
washout and other sources that are difficult to identify and control. Considering to the
Godavari River, the sources are:
1. Urban storm water run off: This source leads to siltation and organic pollution
load in the river water.
2. Run off of chemical fertilizers, pesticides and saline irrigation water from
crop land: These sources are limited with respect to other sources because of very less
amount are used such types of chemicals. Besides, about 20 square km area are used as
cultivated land. Therefore, their adverse affect can be ignored in comparison to the other
sources.
Basically, non point sources of pollution are widely spread out, difficult to identify and
hard to control.
0

2.5 POLLUTION BY INDUSTRIES
As already explained above the Godavari River is less polluted by the above major
industrial units and these sources not dominated major portion of pollution load in respect
of the Godavari River. But mainly the sewage of the Municipal area is the problem in
regards of the Godavari River Pollution.
BIO-MEDICAL WASTE
There are thirty large hospitals and more than 500 nursing homes and fifty pathological
labs are performing their functions in the entire Nasik City area. The total bed of said
nursing home and hospitals are about 2000, for this one common Bio- Medical Waste
treatment and disposal Facility is working under Nasik Municipal Corporation , but
presently 60 — 70 % Hospitals are giving their BMW regularly to this facility. There is a
more scope for conservation measures in this area, details are given in the chapter 7.
Automobile Waste Water
There are 50 numbers of motor garages and 30 numbers of servicing centre which are
operating in the Nasik Municipal area. Consequently, the waste water is discharged to
their respective drain which is ultimately going to the Godavari River. Some large service
stations are having their own treatment plants, some small units are in process to do the
treatment plants as per pollution control board norms.
Industrial Estate, Satpur and Ambad
There are 50 plastic industries and few small chemical industrial units in the estate but
their discharge amount is very negligible and other industries also show similar nature in
respect of such effluent discharge.
POLLUTION BY DOMESTIC SOURCES
Both urban and rural area discharges waste water into the neighbouring area ultimately
which goes to the Godavari River.
35

Rural Area
There area about 50 thousand people live in and around the Godavari River along its 65
km distance of flow path in the rural area. Depending upon the habits and standards of
living of the people, about 75 liter of water is used by a person in a day. Due to large
disposal area and diverse nature, nearly 20 % of its use of water is going to the Godavari
River as sewage water. The adverse affect of this sewage water is negligible due to its
diverse nature and favorable natural factors of self purification process of the Godavari
River (as referred from the project report, studies on the water quality analysis of
Godavari river, August, 2004) [46].
Urban Area
The total population of Nasik municipal area and new developing area is 15 Lacs. The
water is used per day for domestic purposes as based on of a gross of per capita average
demand of 150 1pcd. About 60-70 % waste water generated from the municipal area is
treated through various sewage treatment plants, for remaining water corporation work is
in progress. The details are given in the conservation measures chapter 7. Therefore, the
water quality of the Godavari River has been gradually increasing regularly.
Pollution by Agricultural Chemicals
The fertilizers and agricultural chemicals such as pesticide, weedicide and insecticides
may be ignored along the flow path of the Godavari River in rural area under the
catchments area of the Godavari River. There are no pesticides; weedicide and insecticide
are found in the water analysis of the Godavari River. Besides, use of fertilizers is also
very less with respect to the other parts of the country. Average 8.6 kg of fertilizers are
used in a bigha (0.13387 hectares) in the state which is very small quantity with compare
to the required amount of the soil. The use of fertilizers in the agricultural land of the
catchments area of Godavari River is less than the state average because of this area is
less agricultural developed with respect to the other parts of the state. Therefore, the
adverse affect of fertilizers and agricultural chemicals can be ignored with compare to the
water pollution load in the Godavari River.
36

Organic Pollution
All the sources carry pollutants as organic nature into the Godavari River. Both industries
and domestic activities are responsible for polluting the Godavari River. Basically,
industrial pollution is more Complex than the domestic pollution. The sources of organic
pollution are as:
Domestic
The organic load is directly proportional to the population. Urban communities contribute
the largest share of organic pollution load than the rural communities. The sources of
rural and urban area for the Godavari River are considered as:
Rural area
The BOD contribution of rural area has been considered as 15 grams per person in a day
into the Godavari River due to the divergence nature of disposal system. This assumption
has been generally used to estimate pollution load in Brahmaputra river as referred from
"The Brahmaputra Basin" which is published by the CPCB, October, 2000 [Assessment
and development study of river basin series : ADSORBS/33/2000-2001] [9].
There are 50 thousands people live in rural area of the Godavari River and the BOD load
is contributed by the rural people to the Godavari River.. Again this organic load is
distributed as a divergent nature and easily removed their adverse affect by the self
purification process of the river.
Urban area
The total population of Nasik Corporation area is 15 Lacs and contributes more BOD
load in a day into the Godavari River. This amount concentrates as a point source in a
close area of Godavari River. Consequently, it affects the entire ecosystem of the
Godavari River
37

Oil pollution
The Godavari River receives very less amount of oil and grease mainly from various
servicing stations. Both pollutant are important and affect adversely on the Godavari
River ecosystem. Analysis results show both parameters under permissible limits but
water quality of the river is gradually deteriorated due to this pollutants
2.6 PAST AND PRESENT SCENARIO OF THE RIVER GODAVARI
The whole stretch of the study area of river Godavari is divided into three parts according
to the water use by the people residing nearby area of the river as shown in Fig. 4.1.
Stretch No.1: The river water is used for drinking, bathing, washing clothes and other
useful purposes in upper stretch of the river and till now the water quality in this stretch is
not deteriorated due to less anthropogenic activities that is up to the Someswar sampling
location. This upper basin is characterized in Class I area; only few human settlements
are taking place in this area due to inaccessibility and poor infrastructure (road, electricity
and communication). The water body of this stretch of the river can be classified as class
`A' on the basis of DBU. This stretch has a length of about 34 km from the origin. The
clear water of this stretch is shown in the photograph.
Stretch No.2: The river water in this stretch is also used for drinking, bathing, washing
clothes and other purposes. However due to the growth of the city in the downward
direction and settlement of people in that locality, the river water gets polluted, due to the
discharge of domestic sewage. It leads the water body unsuitable for drinking purposes
and is used for washing clothes, washing animals, washing vehicles, bathing and other
purposes. This stretch has a length of about 5 km and can be classified as class `B' on the
basis of DBU. The water quality in this stretch is slightly turbid and shown in the
photograph.
Stretch No.3: In this stretch, the river water is used for bathing, washing clothes,
washing animals, washing vehicles, irrigation & other useful purposes.
38
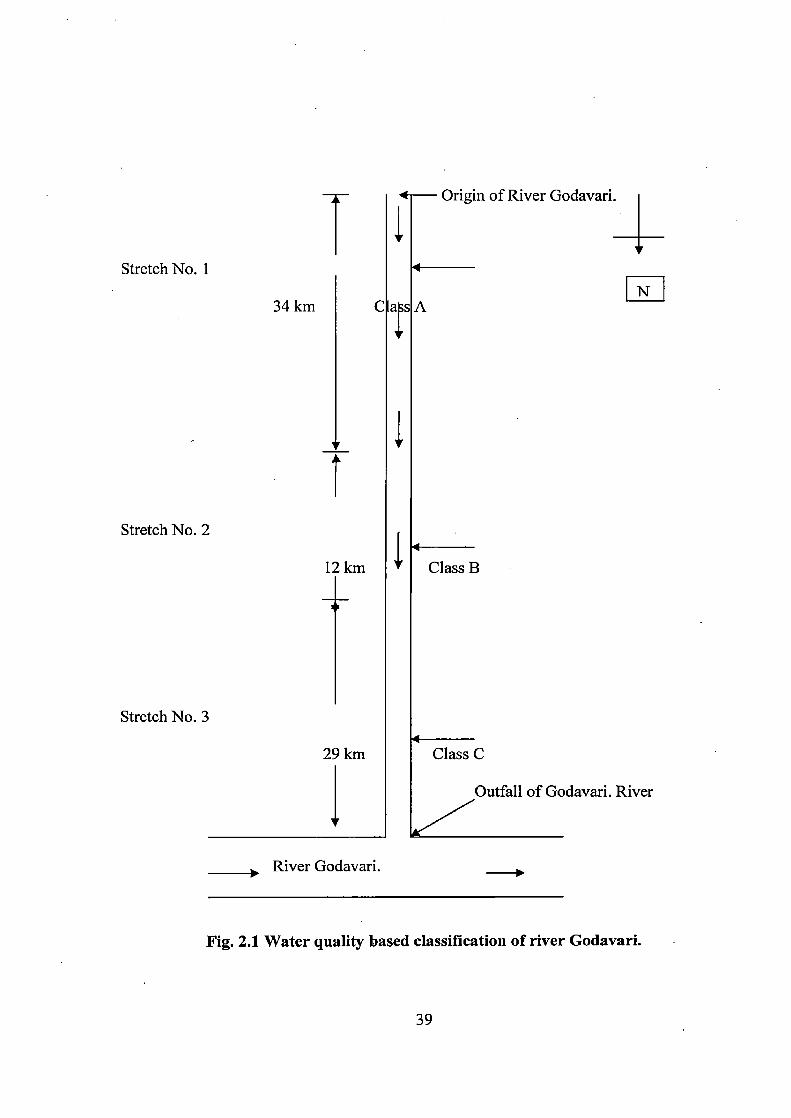
Origin of River Godavari.
Stretch No. 1
34 km 0
Stretch No. 2
12 km Class B
Stretch No. 3
29 km Class C
I Outfall of Godavari. River
River Godavari.
Fig. 2.1 Water quality based classification of river Godavari.
39

2.6.1 PAST STATUS OF THE RIVER GODAVARI
Major Sources of Pollution in River Godavari
An extensive fieldwork was done along the banks of the river to identify the source of
pollution in the river. The stretch of 65 KM is considered for this dissertation work. As
already said the pollution occurring in Godavari was due to the domestic sewage, solid
waste, and-plastic waste and Bio Medical wastes also.
The major nalllas were discharging domestic sewage in Godavari before the years 2003
are as follows:
1) Chikhali nalla
2) Anandwalli nalla
3) Shreerangnagar Nala
4) Malharkhan Nala
5) Saraswati Nala
6) Waghadi nalla
7) Bhoi/Nallas at Downstream of Nashik
8) Nalla at Amardham
9) Nalla at Kannamwar bridge
All the above nallas discharge their sewage in to the most holy stretch of the Godavari
river for example gangapur naka, discharge was measured, near slum area at rathi farm,
and shrirangnagar nalla was measured near old gangapur Naka etc.
.Water supply and sanitation
As in the case with other hilly regions, the main sources of water supply are rivers,
streams and natural springs. Ground water contribution towards domestic water supply is
very less. The supply is augmented by the various water supply schemes installed by the
Public Health Engineering Department, Government of Maharashtra around the city. As

these sources are mainly rain-fed, there is acute water shortage in many parts of the city
during the dry winter and spring months. While the responsibility of supplying drinking
water in the municipal limits lies with the Nasik Municipal Corporation.
2.6.2 PRESENT STATUS OF THE RIVER GODAVARI
The water of the River Godavari has been used for domestic, industrial and irrigation
purposes since time immemorial. However, with the increase in the population of Nasik
and its haphazard growth, in some of the areas of the Nasik City mostly slum areas and
undeveloped areas this river has been converted into a drain used for dumping almost
everything. From domestic waste water to direct discharge from latrines, from municipal
solid waste to construction debris, this river accepts all types of wastes. The present study
aims at studying the effects of all these anthropogenic sources of pollution at several
points along the river and some of its tributaries. The study includes the use of water
quality indices to study the quality of the river water and to represent these indices on
water quality maps for better understanding and interpretation. Based on the findings,
conservation measures and recommendations, which will help in preparing and
implementing the mitigation measures for improving the water quality of the river, have
been suggested.
2.6.3 IMPACT ON GODAVARI RIVER WATER
The water retained increases the settlement of suspended material, thus decreasing
turbidity and improving its quality. The impact of reservoir regulations reduces the
habitat for water birds. It is the sign of degradation in the ecosystem. The concept of
reserving water for environmental flow can be realized quickly enough to sustain the
river ecosystem before irreversible damage is done to the river system. Environmental
flow released from the reservoir during closure period of the reservoir to the downstream
of the river will maintain the river ecosystem. It reduces the flooding in the reservoir
water spread area during monsoon period.
The water replacement renewal period of the reservoir also reduced. It improves the
quality of the water. It improves the dissolved oxygen content of the reservoir water
41
quality and it also reduces the turbidity. It reduces algal blooms in the reservoir. The
upstream reservoirs also made to release environmental minimum dependable flow in the
river system to maintain ecological sustainability of riverine ecosystem. This
environmental flow improves the downstream fish production and quality of the reservoir
water. Continuous inflow and releasement will improve the water quality of the reservoir
instead of heavy impounding storage. 'Heavy impounding without releasement and
without inflow, the renewal of water gets extended. It leads detonation of quality.
Minimum quantity of fresh water has to be enforced in to reservoir from upstream
reservoir at least with reference to releasement for environmental flow' release for
downstream river ecological requirement. The environmental flow will take care of
dilution of contamination and self purification of the river as well as life in the river
system. Complete closure of the reservoir releasement will affect the quality of the
reservoir water. The reservoir should have necessary minimum environmental flow entry
in the upstream side and also necessary environmental flow to be released from the
reservoir in the downstream side ecosystem sustainability.
In Stanley reservoir due to lack of entry of minimum environmental flow from the
upstream reservoirs and poor releasement for only water supply to the downstream some
stretch of the river Godavari, the total riverine ecological system of Godavari from
Gangapur Dam to pitchavaram mangrove wet land in the Bay of Bengal got highly
affected. Necessary changes in the releasement for environmental flow can be effected
quickly enough to sustain the river ecosystem before irreversible' damage is done to the
catchment and water resources.
42.

CHAPTER 3
METHODOLOGY FOR DISSERTATION WORK
3.1 GENERAL
It is an accepted fact that water is the most important natural resource without which life
on earth will not exist. Some anaerobic bacteria can live without oxygen but not without
water. The role of water as a life sustainer has been taken for granted by human beings. It
was not until the 1960s that consciousness concerning the water quality and not only
water quantity has started in the mind of the public [1].
One way to express the quality of water is by listing out the concentrations of everything
that the water contains. This list will be as long as the number of constituents analyzed
and can be anything from twenty common constituents to hundreds. Comparing the
quality of different samples of water is thus, almost an impossible task. For example, a
sample of water having six parameters — pH, hardness, chloride, sulphate, iron and
sodium — 5% above the permissible limits may not be as bad for drinking as another
sample with just one constituent — e.g. mercury— at 5% higher than permissible [1].
The quest for determining the quality of water has led to the collection of a large volume
of data in the past four to five decades. With the development of technology, this volume
of data has been increasing at a very fast pace and it is challenging man's ability to
understand and assimilate it [24]. This vast volume of data has to be analyzed and
presented in such a way that everyone from the policy and decision makers and layman
can understand it. Water quality data is very difficult to present in a simple way but the
concept of "water quality index" has been found as the easiest way of expressing it.
An index is a means devised to reduce a large quantity of data down to its simplest form,
retaining essential meaning for the questions being asked of the data. In short, an index is
designed `to simplify' [24]. It is a number that is created by mathematically combining a
set of numbers. It does not represent a particular measurement, but it can be used to make
comparisons simpler. A. water quality index (WQI) combines several different water
43

quality parameters. The parameters used to develop a WQI are picked up based on the
historical information, ecological importance, human use, seasonal fluctuations, and other
considerations [10]. In the process of simplification, some information is lost. However,
if designed properly, the lost information will not seriously distort the true picture [24].
Water quality indices are generally of two forms:
i) Those in which the index numbers increase with increasing pollution, and
ii) Those in which the index numbers decrease with increasing pollution.
Some specialists in the field refer to the former as "environmental pollution" indices and
the latter as "environmental quality" indices. However, these terms are not universally
accepted. The general terms for these indices are either "increasing scale" form, in which
the index values increase with increasing pollution, or "decreasing scale" form, in which
the index values decrease with increasing pollution [24].
A versatile WQI generally should satisfy the following conditions:
i. The value of the index changes with changes in the values of each of the water
quality variables,
ii. The changes in the value of an index should be more significant due to a variable
which produces more significant impact to the water quality,
iii. The value of an index should approach the poorest designated value when a
critical variable, whose concentration beyond the permissible levels cannot be
compromised, exceeds the permissible limits, and
iv. The value of an index should remain unchanged when a variable's concentration
changes within its permissible limits [1].
Public awareness and consciousness about pollution in general and pollution of water in
particular has increased over the recent years. Emergences of International Organization
like Green Peace are testimony to this fact. However, in spite of awareness of water
quality and water pollution, the general public is at loss to understand the actual level of
water quality as it is explained in technical parameters. In such circumstances, if the
water quality -is expressed in terms of numbers, the public as well as technologists and
administrators can better understand it.

An index is a mean device to reduce a large quantity of data down to a simplest form.
First the term environmental indicator or sub-index function is calculated which refers to
a single quantity derived from one or two polluted variables/characteristic parameters
(Ott-1978). It is used to reflect some environmental attribute. Water"Quality Index (WQI)
is then calculated by a mathematical aggregation of two or more indicators in some
fashion. It is simply a numerical value having no units. WQI is a comparison of water
quality or status to a prescribed base or to a scientific arbitrary standard. Various .ranges
of WQI may be used to classify the quality of water for a given use into various classes
such as excellent, good, satisfactory, poor and unacceptable etc.
Indiscriminate disposal of industrial effluent and domestic sewage in rivers has led to
serious river pollution in India. Effective monitoring of parameters is an important initial
step in abatement of river pollution. The monitoring techniques can be classified as
conventional, automatic recording and remote sensing techniques. - The Godavari River
has been monitored conventionally for all seasons. Ten sampling stations are selected
after conducting the reconnaissance survey of the river. Samples were collected in
December and February and analysed for the required parameters for primary data also
secondary data collected for the period January 2002 to December 2007 from CPCB and
MPCB Websites.
The Central Pollution Control Board (CPCB) has established a network of monitoring
stations on rivers across the country. The present network comprises of 870 stations in 26
states and 5 union Territories spread over the country. The monitoring is done on
monthly or quarterly basis in surface waters and on half yearly basis in case of ground
waters. The water quality data are reported in water quality status year book. The water
quality data on all the monitoring locations is computed for the year 2004 and is
summarized as minimum, maximum and mean value for all the rivers in a basin. The
monitoring locations are arranged according to the longitudinal profile of the river from
its origin to its confluence with the deeper valley of the larger river or before meeting to
the sea.
45

The Central and State Pollution Control Boards/ Pollution Control Committees in Union-
Territories in India are responsible for restoration and maintenance of the wholesomeness
of aquatic resources. To ensure that the water quality is being maintained or restored at
desired level it is important that the pollution control boards regularly monitor the water
quality. The water quality monitoring is performed with following main objectives.
i. For rational planning of pollution control strategies and their prioritization;
ii. To assess nature and extent of pollution control needed in different water bodies
or their part;
iii. To evaluate effectiveness of pollution control measures already is existence;
iv. To evaluate water quality trend over a period of time;
v. To assess assimilative capacity of a water body thereby reducing cost on
pollution control;
vi. To understand the environmental fate of different pollutants.
vii. To assess the fitness of water for different uses.
3.1.1 Water Quality Assessment and Management:
The objective of water quality management is to control the discharge of pollutants so
that water quality is not degraded to an unacceptable extent below the natural background
level. However controlling waste discharges must be quantitative endeavors. We must be
able to measure the pollutants, predict the impact of the pollutant on water quality,
determine the background water quality which would be present without human
invention and decide the levels acceptable for intended uses of the water.
Pollution is the introduction of any substances or energy (chemicals, noise, heat, light,
energy and others) into the environment which results in deleterious effects of such a
nature as to endanger human health, harm living resources and ecosystems, and impair or
interfere with amenities and other legitimate uses of the environment. The simplest
definition of water pollution is "the loss of any of the actual or potential beneficial uses of
water caused by any change in its composition due to human activity".

Rivers are the surface water bodies characterized by the unidirectional current with a high
average flow velocity (ranging from 0.1 to 1 m/s). The flow is highly variable in time
depending on the climatic situation and drainage pattern. Through and continuous vertical
mixing is achieved due to prevailing current and turbulence. They transport sediment
from continental highlands to lakes, alluvial fans, and ultimately the ocean.Towns and
factories are built near rivers so that they can use water from the river. But often the
water is not cleaned before it is put back into the river. This dirtying of river water (also
air and soil) is called river pollution.
India's fourteen major, 55 minor and several hundred small rivers receive millions of
liters of sewage, industrial and agricultural wastes. Most of these rivers have been
degraded to sewage flowing drains. There are serious water quality problems in the towns
and villages using these rivers as a source of their water.
It means the assessment of water quality & thereby to define the pollution status of a
particular river for a particular stretch or for the whole stream along with its all
tributaries, if necessary in the basin'area of the identified or suspected location.
Generally both quantitative and qualitative assessment of the pollutants at the outfalls,
river water at upstream and downstream monitoring stations as well as sediment is
carried out to depict the pollution profile of that river. Several factors are to be considered
such as pollution load, river discharge, mixing nature, carrying capacity, sampling
techniques and the method of quantification. Results are generally expressed in the form
of table, graph or indices.
Information required studying the pollution profile of a river:
Physical characteristics: Topography, Catchment Area, Annual flow rate, Type of flow,
Seasonal variation:
Pollutant's characteristics: Type of pollutants:
47

Table 3.1: Classification of major water pollutants:
Si No Types Examples
1 Oxygen demanding wastes Human & animal waste, decaying vegetation.
2 Plants nutrients Nitrates & phosphates.
3 Infectious agents Bacteria, virus, protozoa, fungi.
4 Organic matters Oil, detergents, pesticides etc.
5 Inorganic metals & Acids, Heavy & toxic metals
chemicals
6 Priority pollutants DDT(organo chlorine),PCBs(polychlorinated
biphenyl), POPs (dioxin & furan).
7 Heat Used water for cooling in industries.
8 Radioactive substances Fallout products, radioactive wastes.
Parameters to be analyzed:
Analyses of the following water quality parameters, not all of them at a time, are
to be carried out in order to detect pollution of a river. Samples are to be collected from
the drainage outfall point, river water as well as from the sediments of the river.
1. Physical parameters like PH, Temperature (°C),Turbidity (NTU), TSS (mg/1),
TDS(mg/1),Color, taste & odour, Electrical conductivity (µ-mho/cm), Radioactivity etc.
2. Chemical parameters like BOD, COD, DO (mg/1), Ca, Mg as CaCO3, Oil & grease
(mg/1), Sulphates, Chlorides etc.
48

3. Biological parameters like Total coliform (MPN/100ml), Faecal coliform
(MPN/100ml)
3.2 RECONNAISSANCE SURVEY
The reconnaissance survey has been performed before selecting the sampling
station, sampling schedule and frequency of sampling. The following information's are
collected through the reconnaissance survey:
a. The industrial effluents are confluences with the Godavari River water.
b. The domestic waste water is directly discharging into the river.
c. Two crematoria's are used on the bank. of Godavari River
d. The waste water including urine, sewage, bio-medical waste and solid wastes of
the Nasik city are directly discharging into the river..
e. River water is being utilized for agricultural purposes at Nasik corporation area.
3.2.1 Measurement of Godavari River Water Quality:
In practice, sampling programmes designed to monitor physico-chemical characteristics
are carried out at frequencies between weekly and monthly. It is advisable, however, that
such regular sampling be augmented by more detailed surveys, e.g. of 24-hour duration,
carried out in the more important reaches at critical periods. The most important period is
likely to be in the summer or autumn months when river flows are at their maximum,
water temperatures are at their maximum and dissolved oxygen levels are at their lowest.
3.2.2 Present Approach to Water Quality Management:-
The water quality management in India is performed under the provision of Water
(Prevention and Control of Pollution) Act, 1974. The basic objective of this Act is to
maintain and restore the wholesomeness of national aquatic resources by prevention and
control of pollution. The Act does not define the level of wholesomeness to be
maintained or restored in different water bodies of the country. The Central Pollution
Control Board (CPCB) has tired to define the wholesomeness in terms of protection of
human uses, and thus, taken human uses of water as base for identification of water
quality objectives for different water bodies in the country. It was considered ambitious

to maintain or restore all natural water bodies at pristine level. Planning pollution control
activities to attain such a goal is bound to be deterrent to development activities and cost
prohibitive. Since the natural water bodies have got to be used for various competing as
well as conflicting demands, the objective is aimed at restoring and/or maintaining
natural water bodies or their parts to such a quality as needed for their best uses. Thus, a
concept of "designated best use" (DBU) was developed. According to this concept, out of
several uses a water body is put to, the use which demands highest quality of water is
termed as "designated best use", and accordingly the water body is designated. Primary
water quality criteria for different uses have been identified. A summary of the use based
classification system is presented in table 1.4
1 CPCB Annual Report of Environmental Monitoring:-
monitoring is an important exercise, which helps in evaluating the nature
-J.iJ4Qdnt J pollution control required, and effectiveness of pollution control measures
aJr existence. It also helps in drawing the water quality trends and prioritizing
- pollution control efforts. CPCB identifies areas of high priority based on the severity of
the problem. These water bodies are not meeting the desired level of water quality for
defined use with respect to Bio-chemical oxygen demand. In the present analysis, those
water bodies having BOD more than 6mg/l are identified as polluted water bodies. In
some of the states few surface water bodies are identified as that they are having polluted
stretches. The SPCB were requested to take remedial measures and formulate action
plans to restore the water quality of the water bodies by CPCB.The government of India
has taken so many steps to control pollution through various legislations, Water Act,
Environmental protection Act and Action plans such as Ganga action Plan, Yamuna
action Plan and other river action plans. Even then the pollution of rivers and the water
quality in the rivers has not yet improved to the expected level. The reasons are the lack
of public participation in planning, execution and post implementation stages. The
various stakeholders were not involved in planning, selection of technology and decision
making processes.
50

3.2.4 National Water Quality Management Strategy:-
The National Water Quality Management Strategy (NWQMS) has been jointly developed
since 1992 by the Australian Government in cooperation with state and territory
governments, currently under the Natural Resource Management Ministerial Council.
Other ministerial councils have also been involved for some issues. The NWQMS is part
of the Council of Australian Governments' (COAG) Water Reform Framework and is
acknowledged in the National Water Initiative.
Policies
The main policy objective of the NWQMS is to achieve sustainable use of the nation's
water resources by protecting and enhancing their quality while maintaining economic
and social development.
Process
The NWQMS process involves community and government development and
implementation of a management plan for each catchment, aquifer, estuary, coastal water
or other water body. This includes use of high-status national guidelines with local
implementation.
National guidelines
Following are the major NWQMS guidelines for managing key elements of the water
cycle.
The NWQMS guidelines cover:
a. policies and processes to achieve water quality
b. effluent and sewerage system management
c. urban storm water and recycled water
d. fresh and marine water quality
e. monitoring and reporting
f. groundwater protection
g. drinking water
h. guidelines for diffuse and point sources.
51

3.3 WATER QUALITY INDICES
The indices will help us to reduce the large amount of water quality data into simple
numbers which can easily be interpreted and understood. Index values, thus, calculated
can be mapped to show the water quality in the river. The index values can also form the
basis for making decisions on the type and extent of conservation measures, to be taken to
restore the river back to its original condition.
3.3.1 Historical Development
The concept of using indices to represent in a single value the status of several variables
is not a novel idea. It has been a common method in economics and commerce for a very
long time now, e.g. the 'consumer price index' is a single value obtained on the basis of
an integration of the prices of certain commodities in order to determine whether the
market is, overall, cheaper or costlier at any given instant compared to any other past
instant. Similarly, a WQI gives a single value to the water quality of a source by
integrating the concentrations of its constituents. In this way, one can easily compare the
quality of different sources of water [1].
Water quality indices have gained popularity during the last three decades. This concept,
in its very rudimentary form, was first introduced in Germany way back in 1848 when the
presence or absence of certain biological organisms in water was used as an indicator of
its level ofpurity or pollution. Since then, several European countries have developed
and applied different systems to classify the quality of the water within their boundaries.
These water classification systems usually were of two types:
i) Those concerned with the amount of pollution present, and
ii) Those concerned with living communities of macro- and microscopic organisms.
Rather than assigning a numerical value to represent water quality, these classification
systems categorized water bodies into one of several pollution classes or levels. By
contrast, indices using a numerical scale to represent gradations in water quality levels is
a recent phenomenon, beginning with Horton's index in 1965 [24].
52

3.3.2 Significance! Uses of Water Quality Indices
It has been emphasized by agencies responsible for water supply and control of water
pollution that it is desirable to develop and utilize water quality indices, as the role played
by these indices is usually linked to the basic reason for which environmental monitoring
data are collected. Indices play a role in evaluating the effectiveness of regulatory
activities and in translating the complex data into a form that is easily understood. The
indices serve as convenient tools to examine trends, to highlight specific environmental
conditions, and to help governmental decision-makers in evaluating the effectiveness of
.regulatory programme [1].
A report by the Planning Committee on Environmental Indices of the National Academy
of Sciences (NAS), United States of America (1975) indicated that the indices play an
important role in four ways:
i) . To assist in formulating policy;
ii) To provide a means for judging the effectiveness of environmental protection
programmes;
iii) To assist in designing these programmes; and
iv) To facilitate communications with the public concerning conditions of the
environment and progress towards its enhancement [24].
Wayne Ott [24] identifies six basic uses of indices:
a. Resource allocation Indices may be applied to water related decisions to
assist managers in allocating funds and determining priorities.
b. Ranking of Locations Indices may be applied to assist in comparing water quality
at different locations or geographical areas.
c. Enforcement of standards Indices may be applied to specific locations to
determine the extent to which legislative standards and existing criteria are being
met or exceeded.
d. Trend Analysis Indices may be applied to water quality data at different points in
time to determine the changes in the quality (degradation or improvement) which
have occurred over the period.

e. Public Information Indices may be used to keep the public informed about the
overall water quality of any source, or of different alternative sources, on a day-
to-day basis.
f. Scientific Research Indices may be used to reduce a large quantity of complex
water quality data to a simple form which makes their application very valuable in
scientific research.
The development of water quality indices remains quite a controversial issue with the
primary debate centering on the amount of information which is lost in the process of
simplification from a huge quantity of data to a simple number. One view holds that the
raw, undoctored data give the best means of evaluating water quality and the distortions
caused by index development are unacceptable. This view is usually held by those
involved with water quality measurements. On the contrary, persons not involved in
water quality measurement are more willing to accept the distortion for the reason that
indices give a simplified picture of the water quality of a source. This argument illustrates
the "classic dichotomy" of views towards all types of environmental indices.
3.3.3 Development of Indices
The calculation of an index consists of the following fundamental steps:
i) Selection of pollutant variables or parameters,
ii) Transformation of the pollutant variables with different units and dimensions to a
common scale by calculating the sub-indices for each variable,
iii) Assignment of weightages to the different pollutant variables, and
iv) Aggregation of the sub-indices into the overall index.
Selecting pollutant variables for an index . is a very difficult job. From among the
hundreds of variables a water sample can have, one has to choose only a set of a few
variables which together will reflect the overall water quality for the given end use. It is
here that subjectivity creeps in as different experts and end users may have different
perceptions of the importance of a variable vis-a-vis a given end use. This step in index
development is as fraught with uncertainty and subjectivity as it is crucial to the
usefulness of the index. Hence, enormous care, attention, experience and consensus-
54

gathering skills are required to ensure that only the most representative variables are
included in a particular index. It may consist of a simple multiplier, or the pollutant
variable raised to a power, or some other functional relationship.
Selecting weightages for the different pollutant variables is another step which is a matter
of personal opinion; hence, subjectivity again creeps in. In some indices, equal weightage
is given to all the variables. But in a majority of indices, different weightages are
assigned to different variables. For this step, well formulated techniques of opinion
gathering such as the Delphi Method are utilized to minimize subjectivity and enhance
credibility. Once the sub indices are calculated, these are usually aggregated together in a
second mathematical step to form the final index, The aggregation function usually
consist either of a summation operation, in which individual sub indices are added
together, or a multiplication operation, in which a product is formed of some or all of the
sub indices, or a maximum operation, in which just the maximum sub index is reported.
3.3.4 Classification of Water Quality Indices
There are two general types of water quality index forms.
a. Increasing scale form — those in which the index numbers increase with increasing
pollution level.
b. Decreasing scale form — those in which the index numbers decrease with
increasing pollution level.
Some specialists in the field refer to the former as "Water Pollution Indices" and later as
"Water Quality Indices". In an increasing scale form, an index of zero indicates no
pollution, while, in a decreasing scale form, index of zero indicates maximum polluted or
100% polluted water. Both the terms are inter-related and, therefore, in practice both type
of indices are called "Water Quality Indices".
To present many indices found in the literature in an orderly fashion, Wayne Ott (1978)
[24] has classified the different water quality indices developed into four general
categories:
i. General water quality indices,
55

ii. Specific-use indices,
iii. Planning indices, and
iv. Indices based on statistical approach.
General conditions to be satisfied by WQI
a. It should change with the changes in the values of each of the water quality
variables.
b. The change should be greater due to a variable, which produces the more
important quality impact.
c. It should approach the poorest designated value when a critical variable, whose
concentration beyond the permissible levels cannot be compromised, exceeds the
permissible limits.
d. It should remain unchanged when a variable's concentration changes within its
permissible limits.
Criteria for formulation of WQI as given by Council of Environmental Quality (CEQ)
are:
It should facilitate communication of environmental quality information to the public.
It should be readily derived from, available monitored data. It should strike a balance
between over simplification and complex technical conceptualization. It should impart an
understanding of significance of data represented. It should be objectively designed but
amenable to comparison with expert judgment so that their validity can be assed
3.3.4.1 General water quality indices
Water has a variety of different uses, viz, public drinking water supply, irrigation,
recreational etc. Water quality requirements vary depending upon the intended use. Some
indices, however, are based on the assumption that "water quality" is a general attribute
of surface water irrespective of the use to which the water is put. Such indices are termed
as general water quality indices which include different WQIs. Some selected WQls are
discussed below.
a. Horton's Quality Index: Horton's index was the first formal water quality index
which was introduced in 1965 [24]. Horton selected eight of the most commonly
56

measured water quality variables for his index and fixed weights ranging from 1 to 4 for
each variable (Table 3.1). Among the variables, specific conductance served as an
approximate measure of total dissolved solids (TDS) and carbon chloroform extract
(CCE) reflected the influence of organic matter. A major drawback of Horton's index
was that it did not include the effects of toxic substances.
Horton (.1965) proposed first water quality index formulated on the following criterion
• Number of variables should be limited
• Variables should be of significance
• Variables should reflect the availability of data.
b. National Sanitation Foundation water quality index (NSFWQI):This water
quality index is selected for present study because of its versatility and also on line
software available on internet for calculating indices, hence studied and explained in
detail in 3.2.5
c. Prati's Implicit Index of Pollution: Prati et al. (1971) proposed an index for
surface water based on .the water quality classification system given as under. They
considered 13 .pollutant variables. NIP = 1 q; n i=i
This index was developed by Prati, Pavanello and Pesarin [24] in 1971 on the basis of
water quality standards used in a number of countries. The concentration values of all the
pollutants were transformed into levels of pollution expressed in new units through
mathematical expressions. These mathematical expressions were constructed in such a
way that the new units were proportional to the polluting effect relative to other factors. It
should be noted that toxic substances were not included in the index as it was felt that in
case a toxic substance is present in concentrations above a given limit, the index is
automatically classified in the highest category, i.e. heavily polluted.
d. McDuffie's River Pollution Index: McDuffie et al. (1973) presented a WQI,
which they called the River Pollution Index (RPI). Although 8 pollutant variables are
discussed in their paper, either fewer or more than 8 variables can be included depending
on the available data.
57

e. Dinius' Social Accounting System: Dinius (1972) proposed a water quality index
as a first step towards designing a `rudimentary social accounting system', which would
measure the costs and impact of pollution control efforts. This WQI includes 11
parameters. Like Horton's index and NSF WQI, it has a decreasing scale with values
ranging from 0-100.
f. Oregon Water Quality Index: The Oregon Water Quality Index (OWQI) was
introduced in the 1970s and was improved in 1995 to reflect the advances in the
knowledge of water quality and in the design of water quality indices. It is a single
number that expresses the quality of river water by integrating the measurements of eight
water quality variables, viz, temperature, dissolved oxygen, biochemical oxygen demand,
pH, ammonia+nitrate nitrogen, total phosphorus, total solids and faecal coliform [10]. It
aids in the assessment of water quality for general recreational uses (i.e. fishing and
swimming). The original OWQI was modeled after the National Sanitation Foundation's
Water Quality Index (NSFWQI).
g. Said, Stevens and Sehike Water Quality Index: The Said, et al Water Quality
Index (WQI) [26] was developed with a view to have an index which uses fewer water
quality variables and which can be used to compare sites having different water quality.
This WQI was constructed using only the basic water quality variables, which include
dissolved oxygen (DO), faecal coliform, turbidity, total phosphorus and specific
conductance. The other variables that affect the water quality, such as pH, temperature,
and nitrogen are reflected to a certain degree by these basic variables. This index is
further simplified by the fact that the step for calculating subindices has been eliminated.
The index was designed to range from 0 to 3. The maximum or ideal value of this index
is 3 and is possible in very good waters that have 100% dissolved oxygen, no ,TP, no
faecal coliform, turbidity less than 1 NTU, and specific conductance less than 5 µS/cm.
From 3 to 2, the water is acceptable and values less than 2 mean that the water is
marginal and some remediation processes are needed. If one or two variables have
deteriorated, the value of this index will be less than 2. If most of the variables have
deteriorated, the index is less than 1, which means that water quality is poor.
58

3.3.4.2 Specific Use Indices
Indices developed in consideration of the specific use of water are classified as per
specific use indices. These are indices designed for specific water use and include indices
such as O'Connor's Indices designed for public water supply, Deininger and Landwehr's
Public Water Supply Index, Walski and Parker's Index designed for recreation, Stoner's
Index designed for public water supply and irrigation, etc.
a. O'Connor's Indices: O'Connor developed two water quality indices for specific,
but very different, water uses. His first index was the Fish and Wildlife (FAWL) index
and it was intended to describe the quality of a surface body of raw water used to sustain
a population of fish and wildlife. His second index was the Public Water Supply (PWS)
index which was intended to describe the quality of a surface body of raw water which
will be treated as necessary and used for public water supplies. Both indices were
developed using Delphi technique to reduce the subjectivity in selection of the pollutant
variables and their weights.
b. Walski and Parker's Index: Walski and Parker introduced this index in 1974. It
was based on empirical information on the suitability of water for a particular use, and
was developed specifically for the recreational water, such as swimming and fishing. The
authors introduced four general categories of variables:
(1) Those which affect aquatic life (e.g. DO, pH, and temperature),
(2) Those which affect health (e.g. coliforms),
(3) Those which affect taste and odour (e.g. threshold odour number); and
(4) Those which affect the appearance of the water (e.g. turbidity, grease and colour).
c. Stoner's Index: Stoner proposed an index designed for use in public water supply
and irrigation. This index employed a single aggregation function which selected from
two sets of recommended limits and subindex equations. This approach was viewed as a
general structure designed to accommodate any water use. Although Stoner applied the
index to just two water uses, it could be adapted to additional water uses as well.
59

3.3.4.3 Planning indices
These indices are designed specifically for management decision-making and they do not
usually depict ambient water quality or related conditions. Instead, they are "custom-
designed" to assist the user in making specific decisions or in solving particular
problems. Planning indices often incorporate variables other than those routinely
measured by water pollution monitoring programmes. For example, a planning index
designed for allocating water pollution abatement funds might ' include the "cost of
wastewater treatment facilities". Some of such indices are MITRE's National Planning
Priorities Index (NPPI), Dee's Environmental Evaluation System, Inhaber's Canadian
National Index, Johanson and Johnson's Pollution Index, etc.
a. MITRE's National Planning Priorities Index (NPPI): It was designed as a tool
for assigning priorities to different demand sectors in order to ensure that funds are
granted and used in a cost-effective manner for the planned water treatment projects.
Each sub index was calculated using a segmented linear function and the final index was
computed as the weighted sum of 10 sub indices:
b. Dee's Environmental Evaluation System: Dee et al proposed a system for
evaluating the environmental impact of large scale water resources projects. The system
included a water quality index, which was represented by 12 common water quality
variables (such as DO pH, turbidity and faecal coliforms), besides pesticides and toxic
substances. The sub indices of various water quality variables were similar to those in the
NSFWQI. The index was calculated with and without considering the proposed water
resources project. The _ difference between the two scores provided a measure of the
environmental impact (EI) of the project:
c. Inhaber's Canadian National Index: The Environmental Quality Index was
suggested by Inhaber in 1974 as a national index for Canada. It included an air quality
index, a water quality index, and a land quality index. The water quality index combined
two sub indices in a root mean square operation — an ambient water quality sub index and
a pollutant source sub index based on effluents from point sources. The pollutant source
sub index was based on pollutant variables measured in effluents from five sources, viz.

municipal wastes, the petroleum-refining, chlor-alkali, fish-processing and paper
industries. The sub indices were combined in successive root mean square operations.
d. Johanson and Johnson's Pollution Index: Johanson and Johnson (1976)
developed a planning index as a tool to assist in the process of identifying locations of in-
place pollutants, particularly toxic pollutants, in harbours and navigable waterways and to
take steps to remove and dispose of them. They used the index to screen 652 data sets
from waterways across the United States of America. For each pollutant i, the weight was
based on the reciprocal of the median of observed national concentrations. Using the
index, it was possible to scan the data by computer and identify the locations receiving
the highest priority for removal of pollutants.
3.3.4.4 Indices based on statistical approach
These indices usually employ some standard statistical procedure, already available in
literature, adapted for use with water quality data. The statistical approaches have the
advantage that they incorporate fewer subjective assumptions than the traditional indices.
However, they are more complex and often more difficult to apply. Harkin's Index is an
example of this type of indices. One more type of water quality index does exist in
literature, i.e. "Biological Water Quality Indices". These are generally developed after
evaluating water quality in terms of its impact on aquatic life in some form. The
biological indices are entirely dissimilar in approach to other categories.
a. Harkin's Index: Harkin presented a statistical approach for analyzing water
quality data based on the rank order of observations. It begins with ranking the
observations for each pollutant variable, including a control value, which is usually a
water quality standard or recommended limit.
3.3.5 INDICES SELECTED FOR DETERMINING THE WATER QUALITY OF
THE STUDY STRETCH OF GODAVATI RIVER:
National Sanitation Foundation's Water Quality Index selected for studying the water
quality of the River Godavari. With the river being visibly much polluted, no specific
uses were possible with its water. Hence, an only general water quality index is selected.
61

Sufficient literature was available explaining how to calculate indices. The NSFWQI was
selected because it was the most widely used water quality index in the world. It had been
field tested in different river basins all over the world and it had proven its applicability.
The colour scheme suggested by Brown et al for representing the index, made
interpretation and understanding of the water quality at different points along the river
very easy. Also online software available on internet for to calculate water quality index
easily. Various ranges of the WQI may be used to classify the quality of water for a given
use into various classes such as excellent, good, satisfactory, poor and unacceptable.
Considering the evaluation of water quality index of the GodvariRiver, the National
Sanitation Foundation Water Quality Index (NSF WQI) applied to evaluate the water
quality.
This WQI is selected because other indices are having various limitations like,
i. They can only be used to assess water quality for general uses.
ii. They cannot be used in making regulatory decisions or to indicate water
quality for specific uses.
iii. They cannot always show the impact of random short-term changes, such as
a spill, except if it occurs repeatedly or for a long time. The best results with
this index can be obtained only in natural conditions and natural
measurement sites (not downstream of river outfall).
iv. Localized changes in water quality are not immediately reflected.
v. Changes in the stream habitat are not reflected by this index.
vi. The index cannot be used to indicate contamination from trace metals,
organic contaminants or other toxic substances.
vii. Some index has also not considered the effects of biochemical oxygen
demand which is a very important pollutant variable.
3.3.6 NATIONAL SANITATION FOUNDATION WATER QUALITY INDEX
Brown et al. (1970) had presented a water quality index similar in structure to Horton's
index. It is also called National Sanitation Foundation Water Quality Index (NSFWQI)
[13].It is calculated after aggregating the sub indices for 9 parameters as weighted sum, using the following equation.
62

NSFWQI = W;Q;
The weights for 9 parameters are given in the Table 3.2
The NSFWQI is most commonly employed easy to use index. Most of the state in the
USA has modified it to suit their requirement and standards. Higher value of the index
indicates better water quality of the river.
The Council of Environmental Quality had proposed the following five criteria for the
WQI formulation.
a. It should facilitate communication of environmental quality information to the
public.
b. It would be readily derived from available monitoring data.
c. It should strike a balance between over simplification and complex technical
conceptualization.
d. It should impart an understanding of significance of data represented.
e. It would be objectively designed but amenable to comparison with expert
judgment so that their validity can be assessed.
The NSFWQI has confirmed all the above five criteria. This index is most widely
accepted to evaluate the water quality index instead of many water quality indices
developed so far. The NSFWQI has got the effectiveness and flexibility, while it is
simple to formulate. It indicates higher value of the index is to be better water quality.
The water quality index of the Godavari River at the various sampling stations has been
calculated by the NSFWQI through Online software available on internet at www.water-
research.net/watrqualindex by Wilkes University, Center for Environmental Quality,
environmental Engineering and Earth Sciences, Wilkes-Barre, PA as follows.
Brown et al. (1970) presented a water quality index similar in structure to Horton's index.
A decreasing scale, 0 — 100 is used for expressing the water quality index. It is also called
National Sanitation water Quality Index. A system of reporting NSFWQI which relates
63

the index values to 5 descriptors words and colours was also suggested by Mechelland et
al. (1976) as shown in the following Table 3.2
Table 3.2: Parameters and their weights for NSFWQI
Parameters Weights
Dissolved oxygen 0.17
Faecal coliform 0.15
pH 0.12
BOD 0.10
Nitrates 0.10
Phosphates 0.10
Temperature 0.10
Turbidity 0.08
Total solids 0.08
Total 1.00
Source: [24]
In this form if any one sub-index approaches zero, the over all index approaches zero. A
system of reporting NSF WQI which relates the index values to 5 words and colours was
also suggested by MeClelland et al. (1976) as shown in Table 3.3
In 1970, Brown, McClelland, Deininger and Tozer [24] presented a water quality index
supported by the National Sanitation Foundation, United States of America. This index
came to be popularly known as the National Sanitation Foundation's Water Quality Index
(NSFWQI). It was developed using a formal procedure based on the Rand Corporation's
Delphi Technique combining the opinions of a large number of water quality experts of
the U.S.A. In this approach, the experts were given a questionnaire and their opinions
were tabulated and reported to each member. This enabled the members to see and
compare his response vis-a-vis that of the others. The experts were given two more sets

of questionnaires and were asked to prepare rating curves to finally arrive at a consensus
on the index. After analysis of all the questionnaires, the investigators identified 9
individual variables and 2 grouped variables of greatest importance. The individual
variables were DO, faecal coliforms, pH, BOD, nitrates, phosphates, temperature,
turbidity and total solids. The grouped variables were toxic substances and pesticides.As
for the two grouped variables, it was unanimously agreed by all panelists that for
pesticides, the NSFWQI would automatically be set to zero if the concentration of
detectable pesticides (of all types) exceeds 0.1 mg/L and for toxic substances and it
would be set to zero if any toxic substance exceeded its assigned upper limit, as
prescribed in published drinking water standards.
The next step was to derive a set of weights which would sum to 1.0 but which would
reflect the significance ratings assigned to the variables by the panelists. The arithmetic
means of the significance ratings were calculated for all variables rated (Table 3.2).
"Temporary weights" were then derived by dividing the variable with the highest
significance rating, i.e. DO which is 1.4, by the significance rating of each variable.
Finally, each temporary weight was divided by the sum of the temporary weights to give
the sub index weights (last column of Table 3.2). The temperature pollutant variable is
defined as the deviation from equilibrium temperature (degrees Celsius). Equilibrium
temperature is that which occurs without the influence of a heated or cooled discharge. In
field applications, two temperatures are taken: one at the sampling site and one at some
point upstream where a heated or cooled discharge is known to be absent. To calculate
the index, one has to read the sub index value I. from the appropriate curve for the
pollutant variable i . The sub indices are then multiplied by the weighting factor to arrive n
at a subtotal for each variable. The nine resulting subtotals are then added using a
weighted linear summation:
Finally, the developers of the NSFWQI also suggested a way of reporting the index. This
reporting procedure relates the index values to five descriptor words and to colours of the
spectrum as shown in Table 3.3 below.
65

Table 3.3: Descriptor Words and Colours Suggested For Reporting the NSFWQI
S.No. Descriptor Words . Numerical Range Colour
1 Very Bad 0- 25 Red
2 Bad 26-50 Orange
3 Medium 51-70 Yellow
4 Good 71- 90 Green
5 Excellent 91-100 Blue
Source [24]
The NSFWQI is the most widely used of all existing water quality indices. It has been
field-tested and applied to data from a number of different geographical areas and has
withstood the tests. It is an effective technique for reporting water quality data,
examining trends and evaluating the effectiveness of water pollution control programmes.
Another advantage of the NSFWQI is that if data of all the 9 variables are not available,
the overall WQI can still be estimated by adding the results and then adjusting for the
number of pollutant variables with available data. For example, if there are 2 variables
with no available data, the 7 remaining subtotals are added and the 7 weighting factors
are added. The former is then divided by the latter to obtain the final WQI [49].
The main limitation of the additive form of the NSFWQI is eclipsing of the result when a
single pollutant variable shows extremely poor water quality. This has been overcome by
using the multiplicative form, which is equivalent to the weighted product aggregate with
the same weights becoming powers of the sub indices.

CHAPTER 4
WATER QUALITY ASSESSMENT OF STUDY STRETCH OF
GODAVARI RIVER
4.1. General
Indiscriminate disposal of sewage and industrial waste in rivers has led to serious river
pollution in India. Effective monitoring of quality parameters is an important initial step
in abatement of river pollution. Monitoring of water quality through physical senses,
general appearance, taste and odour, is a very old practice. Modern monitoring
techniques could be classified as conventional, automatic recording and remote sensing
techniques. In present study, river Godavari was monitored conventionally (i.e. samples
were collected manually) for three months. After conducting reconnaissance survey, eight
sampling stations (river point) were chosen. Water samples were collected from these
sampling stations in the month of December 2007 and February 2008, transported to
laboratory and tested for various water quality parameters at Environmental Laboratory
of Maharashtra Pollution Control Board and Om Laboratory Nasik.
For the convenient of discussion, the methodology has been divided into two parts:
(I) Methodology for water sample collection and analysis
(II) Methodology for Calculation of NSF Water Quality Index
Reconnaissance Survey
The sampling schedule, locations and frequency of sampling was decided after the
reconnaissance survey was made. Data pertaining to the catchment activities, significant
from the view of having an impact on river system, was collected from Nasik City and
nearby areas. During reconnaissance survey, a preliminary strategy was made about the
sampling programme to carryout the study in a convenient manner according to available
resources.
Criteria for Selection of Sampling Station
The sampling station should be located to provide a realistic description of existing water
quality. Besides this, the sampling stations should be selected to maximize the ease of
67

sampling. The actual location of sampling station is primarily depending on the physical
situation. The selection of sampling station or sampling points depends on various
objectives of water quality monitoring program such as;
1. Too near or too far distant of sampling points should be avoided for
chemical analysis in respect of the site of water sampling.
2. The sampling points should be moved upstream of the discharge point or
sufficiently down stream to ensure that mixing has taken place.
3. Impact of human activities upon the quality of water and suitability for
use.
4. The sources and pathways of pollutants.
5. Influence of polluted and unpolluted water on distribution, density and
community structure of the biota.
6. It should be accessible in all seasons of the year.
7. It should have proper mixing of pollutants thus representing water quality
of river at that particular stretch.
8. Facilities to take water samples are provided for better collection of
samples from the water bodies.
9. Stagnant zone of"the surface water should be avoided for bacteriological
samples.
10. Self purification capacity of the water body.
11. The quality of water in its natural state which might be available to meet
the future need.
12. It should effect the quality of water.
1. Before drains from the city discharge.
2. Inside city where maximum pollution occurs and
3. After the river leaves the city area.
13 To see that the secondary data is available, that's why the sampling
locations are selected on the basis that those points are having the
available secondary data.
Based on the above criteria, ten numbers of sampling stations were identified
along the stretch of the Godavari River and the outfall of small industrial nalla near
68

someswar and other industrial units along with sewage water of Satpur and Ambad
MIDC, Residential areas and Ramkund area including before and after confluencing with
the Kapila River to Godavari River.
4.2 SELECTION AND DESCRIPTION OF SAMPLING STATIONS
Ten sampling locations were selected along the River Godavari at Nasik city as per para
4.1.2. The objective of sampling is to collect the water samples form the river at the
various point sources. The following sampling stations of the Godavari River are selected
on the basis of required criteria. For the present study, only two months
primary/fresh water quality data was generated. The other secondary data used has
been taken from a report on a joint study, conducted by the Nasik Municipal
Corporation and the Maharashtra State Pollution Control Board (MPCB),. The data
taken from this report has been used in the calculation of all the NSF water quality
indices chosen. Also secondary- data taken from CPCB and MPCB websites. The
methodologies adopted for sampling and description of the sampling locations are as
follows.For assessment of water quality of River Godavari ten locations were selected.
The general layouts of the sampling stations are shown in enclosed maps and locations of
sampling stations are given in Table 5.2. The study covers about '65 km stretch of river
starting from Kushawart Trimbakeswar to Saikheda Village.
The details of these sampling stations are given as below.
Table 4.1 Location of sampling stations
Sr. No Category Sampling station Location
1 River Point So Kushawart
2 River Point S1 Gangapur Dam
3 River Point S2 Someswar
4 River Point S3 Anandwali
5 River Point S4 Victoria Bridge
6 River Point S5 Ramkund

7 River Point S6 Goda Kapila Sangam
8 River Point S7 Tapowan, D/s Nasik
9 River Point S8 Dasak Village
10 River Point S9 Saikheda Village
The detailed descriptions of above sampling stations are given as follows.
1 Sampling station (SSo): Kushawart: This sampling station is selected at the
source of the Godavari River; water comes from origin of the river before confluencing
with the Kushawart pond. The Godavari River is not received any effluent or sewage
before this station. This sampling location is ten -kilometers from origin of the river
Godavari.This sampling station is selected because it represents the clear water zone
before water enters in to the kushawart bathing pond, and mass bathing activities are
observed at this point. In this area, no pollution activities are their like remarkable
industries or motor workshops are situated. Origin of river is assumed as reference point,
from where the river starts and designated as Class A of water quality.
2 Sampling station (SS1): Gangapur Dam: This sampling station is located at the
Gangapur Village and about 28 km away from the source of the Godavari River. This
sampling station is selected and recognized by the pollution control board, only water
storage activity is their at this point. This is the main drinking water source for Nasik
City, water used for drinking purpose after disinfection.
3 Sampling station (SS2): Someshwar: The sampling station is located at
someswar at a distance of 6 km from the previous sampling station SS1 and total distance
of about 34 km from the source of the Godavari River. Bathing and Cloth washing
activities are observed at this point. Also pooja materials are disposed in the river.
4 Sampling station (SS3): Anandwali: The sampling station is located at•
Anandwali village at a distance of 5 km away from the SS2 and about total distance of 39
km from the source of the Godavari River. The sewage water from the Anandwali village
area confluenced with the water of the Godavari River before this station. After
'LI'

confluence of proper mixing, the station is selected for ascertaining the quality of river
water. Besides, the sewage water is also released from the washing activities of animals,
cloth, vehicles, hotel, restaurant, pathological laboratories, nursing homes etc in this area
and ultimately reached to the Godavari River.
5 Sampling station (SS4): Victoria Bridge: This sampling station is located in the
heart of the city which is near ramkund, at a distance of 3 km from the previous sampling
station SS3 and at about total distance of 42 km from the source. The sewage water from
the some residential areas is confluenced with the Godavari River water.
6. Sampling station (SS5): Ramkund: This sampling station is located in city area
which is at a distance of 1- km from the SS4 and at about total distance of 43 km from the
source of the Godavari River. Mass Bathing activities are observed at this point.
7 Sampling station (SS6): Goda Kapila Sangam: This sampling station is located
at the down stream of the Nasik city area which is about 2 km away from the SS5 and at a
total distance of about 45 km from the source of the Godavari River. Kapila river water is
mixed at this point; besides this the sewage water is also released from the washing
activities of animals, cloth, vehicles, hotel, restaurant, pathological laboratories, nursing
homes etc in this area and ultimately reached to the Godavari River.
8 Sampling Station (SS7): Tapowan or Down stream of Nashik :This station is
located at Tapowan area which is at a distance of about 1 km from the SS6 and at a total
distance of about 46 km from the source of the Godavari River. Waste water from 78
MLD Sewage treatment plant enters in to the Godavari River after treatment at this point.
9 Sampling Station (SS8): Dasak Village: This sampling station is located at
Dasak Village with a distance of 6 km from the SS7 and at a total distance of about 52 km
from the source of the Godavari River. Ashes of human bodies from the crematoria's are
mixed with the water of the Godavari River before the station. Besides this the sewage
water is also released from the washing activities of animals, cloth, vehicles, hotel,
restaurant, pathological laboratories, nursing homes etc in this area and ultimately
reached to the Godavari River. Oil and grease from washing of vehicles, Solid waste from
the houses and surrounding shops, Domestic waste water, Construction debris, Waste
water overflowing from septic tanks, Hospital waste etc. are mixed some times of very
71

little quantity with the Godavari River water.
10 Sampling station (SS9): Saikheda . Village This sampling station is located at
Saikheda village which is at the distance of 23 km from the SS8 with total distance of
about 75 km from the source of the Godavari River. Ashes of human bodies from the
crematoria's are mixed with the water of the Godavari River before the station. Besides
this the sewage water is also released from the washing activities of animals, cloth,
vehicles, hotel, restaurant, pathological laboratories, nursing homes etc in this area and
ultimately reached to the Godavari River. Oil and grease from washing of vehicles,
Construction debris, Waste water overflowing from septic tanks, Hospital waste etc. are
mixed some times of very little quantity with the Godavari River water.
The brief summaries of sampling station and effluents or domestic sewage are
confluenced with the Godavari River water before the respective sampling stations are
tabulated in Table 4.2
Table 4.2 Sampling Location Details With Present Activities:
Distance Distance from Sampling
Sl. from sources of Confluence of effluent/ station Location
No. previous Godavari sewage before SS from (SS)
SS (km) River (km)
1. SSo Kushawart 0 10 Bathing,
2. SS1 Gangapur Dam 18 28 Storage only
Bathing,Cloth,Vehicle 3. SS2 Someshwar 06 34
Washing
Cloths, animals 4. SS3 Anandwali 05 39
Washing
Bathing,Cloth,Vehicle 5. SS4 Victoria Bridge 03 42
Washing
6. SS5 Ramkund 01 43 Bathing,cloth,Vehicle
72

Washing
Goda Kapila Kapila River mixing, 7. SS6 02 45
sangam Cloth Washing
Treated waste water 8. SS7 D/S of Nashik 01 46
mixing
Bathing,Cloth,Vehicle 9. SS8 Dasak Village 06 52
Washing
Cloths, animal, Vehicle 10. SS9 Saikheda Village 23 75
Washing
The locations of sampling stations are shown at the Godavari River Maps and also shown
the photographs of the said sampling stations.
4.3 WATER QUALITY SAMPLING
The first step of the sampling programme was to conduct a preliminary survey
along the River Godavari and its tributaries and incoming drains so as to be able to
select sampling locations which will be representative of the entire river and also to
identify the river water uses and polluting activities. The next step was the selection
of the physico- chemical and bacteriological parameters for monitoring of the river
water.
Types of Samples
The samples must be representative in nature. The samples are generally of three types:
1. Grab sample: It is a sample taken at a sampling point and time. The sample is
collected from the main current and 20 to 30 cm below the surface to avoid collection of
scum. This sample may be taken to represent the water quality of the source.
2. Composite sample: It is a 'combination of equal volumes of a number of grab
samples collected at the same location at different times. Composite samples may be
required only in special cases for calculation of mass flux in rivers when the quality of
water is suspected to change over short periods of time.
73
3. Integrated sample: It is a mixture of grab samples collected simultaneously at
different locations across the width of the river or at different depth. The need for an
integrated sample may occur for very wide and deep rivers where the quality of water
may vary across its width and depth.
Water Sampling Methods
The grab samples were collected for all sampling locations.
Water samples for chemical analysis: The water samples were collected from a depth
of 20-30 cm from the river by the plastic containers of 2 liter of capacity, provided with
double cap device. The samples were collected up to the top, without leaving any space
so as to prevent the premature release of dissolved gases during the transit period.
Water samples of bacteriological analysis: The water samples were collected from 30
cm depth of the river in properly sterilized neutral glass bottles of 120 ml capacity. Some
space was left for air for survival of bacteria. The water sample were analysed within 24
hours from collection.
4.4 ' SAMPLING PROGRAMME
Water samples were collected and analysed in the two months for this study. Grab
samples were collected from the respective sampling stations since time constraints and
shortage of manpower did not permitted to collection of integrated or composite samples
from the river. The following sampling schedule is mentioned in Table 5.2.Sampling was
done in the month of December 2007 and February 2008. Considering the amount of
efforts required, time and resources available, sampling was done for two months as the
secondary data were available for more than 5 years.
4.5. EXPERIMENTAL METHODS
The water quality for a given use depends on the following:
a. Parameters which significantly -affect the utility for the use
b. Individual values of each significant parameter
c. The relative importance of various relevant parameters for that particular
use
74

Considering above points, following water quality parameters were determined;
temperature, pH, DO, BOD, COD, total solids, total suspended solids, total dissolved
solids, turbidity, specific- conductivity, nitrate, phosphate, total coliform (MPN), faecal
coliform and heavy metals. Physico-chemical and bacteriological parameters were
evaluated according to methods specified in "Standard Methods for the Examination of
water and Wastewater" (APHA-AWWA-WPCF 1995).
4.6 DATA COLLECTION AND WATER SAMPLING
The data collected for the study of river water pollution is basically the physiochemical
analysis of river water samples. Depending on the major sources of waste water /
•pollutants 10 sampling stations were selected along the flow f from Kushawart
Trimbakeswar to Saikheda Village. The samples were analysed in the pollution control
laboratory and Om laboratory for different parameters of physical chemical and
biological aspects. Samples were collected at all ten locations in the month December
2007 and February 2008. Results of the analysis are tabulated in tables. The Samples
were collected in two litre plastic cans, labeled with name of sampling spot & date of
collection. Samples were immediately sent for analysis except dissolved oxygen. Samples
for DO were taken in DO bottle of 300 ml capacity. DO was fixed on the site
immediately after filling the DO bottles by adding 2 ml of MnSo4 solution followed by
2m1 alkali iodide azide solution to each bottle was stopper properly maintaining water
seal upto laboratory.
Samples were analysed for parameters like SS, TDS, BOD, COD, pH, Total Hardness,
Calcium Hardness, Total alkalinity, chlorides, sodium, potassium, Sulphate, phosphate,
nitrate, Faecal coliform, electrical conductivity, each parameter is having its unique
importance & is linked to specific source of pollution so all of them are considered of
equal importance.
75

Table 4.3 Primary Water Quality Data collection schedule for study stretch
Sr.
No.
Sampling Points/
Locations
Distance
from
origin in
kms
Data collected on
20.12.2007 22.02.2008
Remarks/ Activities
1 Kushawart 10 Bathing,
2 Gangapur Dam 28 22.12.2007 24.02.2008 Storage only
3 Someshwar 34 22.12.2007 24.02.2008 Bathing,Cloth,Vehicle Washing
4 Anandwali 39 22.12.2007 24.02.2008 Cloths, animals Washing
5 Victoria Bridge 42 23.12.2007 25.02.2008 Bathing,Cloth,Vehicle Washing
6 Ramkund 43 23.12.2007 25.02.2008 Bathing,cloth,Vehicle Washing
7 Goda Kapila sangam 45 24.12.2007 26.02.2008 Kapila River mixing, Cloth Washing
8 D/S of Nashik 46 24.12.2007 26.02.2008 Treated waste water mixing
9 Dasak Village 52 25.12.2007 27.02.2008 Bathing,Cloth,Vehicle Washing
10 Saikheda Village 75 25.12.2007 27.02.2008 Cloths, animal, Vehicle Washing
76

Table 4.4 Analysis Results with NSFWQI for Primary Data
December 2007
Parameters SO Si S2 S3 S4 S5 S6 S7 S8 S9
PH 7.11 8.10 7.78 7.86 8.27 7.50 7.60 7.75 7.6 7.86
DO 1.95 6.8 7.0 5.7 4.7 5.0 4.0 4.6 4.8 3.60
BOD 85 5.1 5.7 8.0 8.1 10.3 11.8 15 21 9
COD 152 21 24 29 30 40 37 40 36 44
Total 100 78 118 114 135 190 196 198 230 236 Hardness Calcium
120 46 78 70.6 81 122 1 40 46 49 Hardness Magnesium Hardness 11.67 32 40 43.4 54 68 89 17.02 27 25.3
Electrical Conductivity 379 200 279 154 170 160 160 594 523 270
Chlorides 37 11 18 69 89 100 1 50 41 35
Sodium 18 6.0 11 10 17 21 27 28 25 29
Sulphates 29 5.16 17 29 24 14.6 14.5 38.2 59 0.48
Phosphates .450 0.011 0.06 0.05 0.07 0.04 0.07 2.94 0.54 0.50
Nitrate 0.478 0.23 0.27 1.39 1.81 0.8 1.12 0.021 2.89 0.03
TSS 16 22 25 35 34 49 46 49 30 52
TDS 210 180 490 335 535 299 155 487 212 215
77

February 2008
Parameters SO Si S2 S3 S4 S5 S6 S7 S8 S9
PH 7.01 7.30 7.99 7.91 8.30 7.20 7.10 7.69 7.68 7.78
DO 1.9 7.5 7.4 5.8 4.7 4.8 3.1 1.6 4.17 3.40
BOD 24 4.8 5.9 7.3 7.60 9.8 10.3 36 24 12
COD 40 28 19 21 33 24 33 84 40 32
Total 140 126 126 127 191 96 214 - 260 256 Hardness Calcium
Hardness 64 92 80 81.2 122 66 148 - 56 99
Magnesium Hardness 2.44 34 46 45.8 69 30 66 - 3.76 29.3
Electrical Conductivity 426.5 189 248 296 378 370 620 599.5 - 240
Chlorides 53 17 19 37 62 93 129 85 37.5 45
Sodium 19 25 5.0 8.5 9.5 16.5 35 - - 39
Sulphates 18 3.28 27 23 25 15.4 16.6 - 75 68
Phosphates 0.358 0015 0.5 0.14 0.21 0. 0.04 - 0.52 0.90
Nitrate 0.833 0.15 0.90 1.93 2.23 0.97 0.99. - 3.76 0.13
Total Suspended 27 45 51- 36 26 41 51 40 35 52
Solids
Total Dissolved 340 165 149 139 221 156 597 212 166 215
Solids
78

Table 4.5 Analysis Results with NSFWQI for Secondary.Data
Year-2002 Gangapur Dam Nasik
MONTHS PH BOD COD DO TOTAL
COLIFORM Temp. Index
Jan 8.5 4.8 202 6.8 170 28
Feb 8 6 20.6 5.4 175 29
Mar 8.3 4.4 20.4 6.2 200 28
Apr 7 6 20 6.4 225 29
36 May 7.5 5 20 7 175 30
Jun 7.7 5.5 16 6.2 350 24
July 7.6 9 32 6.2 225 23
Aug 7.6 5 16 6 175 22
• Sept 8.1 5.5 16 6.5 175 20
Oct 8.5 9 24 5.9 225 23
Nov 7.4 4 16 6.7 275 24
Dec 8.2 7 24 6.8 250 22
Average 7.86 5.9 35.583 6.34 218.3 24.4
79

Year-2002 Godavari River Ramkund Nasik
MONTHS PH BOD COD DO TOTAL
COLIFORM Temp.. Index
Jan 7.4 10.8 . 24 3.2 250 20
Feb 7.3 7 26 4 350 29
Mar 8 4 16 6.8 250 30
Apr 7.4 7 24 6.7 150 25
May 7.3 5 20 6 175 21 35
Jun 7.2 35 56 3.5 225 24
July 7.7 5.5 24 5.5 175 29
Aug 7.6 4 16 6.9 175 26
Sept 8 5 16 7.5 120 27
Oct 7.4 10 32 3.8 200 24
Nov 7.5 3 20 - 6.3 140 29
Dec 7.8 8 28 6.5 200 28
Average 7.55 8.69 25.167 5.558 200.83 27

Year-2002 Godavari River D/S of Nasik
•
MONTHS PH BOD COD DO TOTAL
COLIFORM Temp. Index
Jan 7.2 7.4 28 3.6 350 23
Feb 7.5 10 29 4.4 170 21
Mar 7.9 3 30 7 250 25
Apr 7.0 5 20 5.7 350 30
May 7.3 8 44 5.9 115 27 34
Jun 7.2 36 52 3.5 175 29
July 7.8 10 40 5.3 170 25
Aug 7.7 4 20 6.5 150 24
Sept 8.0 2 24 7 275 24
Oct 7.6 8.5 24 4.8 175 29
Nov 7.5 4 24 7 110 28
Dec 7.8 5 20 7 350 25
Average 7.54 8.57 29.583 5.64 220 25.83
81

Year-2003 Gangapur Dam Nasik
MONTHS PH BOD COD DO TOTAL
COLIFORM Temp. Index
Jan 8.3 4.4 20.4 6.2 200 22
Feb 8 6 20.6 5.4 175 27
March 8.5 4.8 24 6.8 170 25
Apr 7.8 3.2 18.6 7.78 525 32
May 7.6 4.6 20.4 6.9 204 27 38
Jun 8.6 5.7 25.8 6.2 202 29
July 8.1 7.1 21.2 6.6 14.7 25
Aug 7.9 5.6 29.2 7.1 192 23
Sept 7.8 21 60.2 5.8 139 32
Oct 8.1 5.6 26.1 7.2 21.6 32
Nov 8.4 9.4 36.4. 6.8 850 24
Dec 7.4 6.2 28.3 7.6 4.8 30
Average 8.041 6.97 27.6 6.69 224.84 27.33
82

Year-2003 Godavari River Ramkund Nasik
MONTHS PH BOD COD DO TOTAL
COLIFORM Temp. Index
Jan 8 4 16 .6.8 250 28
Feb 7.4 10.8 24 3.2 250 29
Mar 7.3 7 26 4 350 28
Apr 8.2 3.9 52.6 6.7 421 29
May 6.6 6.2 32.5 4.6 225 30 34
Jun 8.1 7.6 27.8 5.9 205 24
July 7.4 2.9 32.6 7.8 213 23
Aug 7.4 4.2 31.6 7.2 421 22
Sept 7.6 6.4 52.8 7.6 221 20
Oct 7.9 2.8 35 7.2 232 23
Nov 7.1 41.6 49.2 5.6 750 24
Dec 7.6 2.9 40 7.6 232 22
Average 7.55 8.35 35 6.18 314.77 24.4
83

Year-2003 Godavari River D/S of Nasik
MONTHS PH BOO COD DO TOTAL
COLIFORM Temp. Index
Jan 7.9 3 30 7 250 20
Feb 7.5 10 29 4.4 170 24
Mar 7.2 7.4 28 3.6 350 28
Apr 7.6 7.2 26 5.2 525 34
May 7.0 14.6 39.8 7.2 308 22
Jun 7.6 12.5 36. 7.6 314 24
July 7.6 18.5 39.6 5.2 306 27
Aug 7.6 26.5 52.5 4.7 292 29
Sept 7.4 18.9 39.2 5.6 242 26 35
Oct 7.6 12.5 24.6 6.8 325 34
Nov 7.4 16.2 36.5 5.2 292 27
Dec 7.6 12.8 29.6 8.5 242. 36
Average 7.5 13.34 34.22 5.91 301.33 27.83
84

Year-2004 Gangapur Dam Nasik
MONTHS PH BOD COD DO TOTAL
COLIFORM Temp. Index
Jan 8.3 4.4 20.4 6.2 200 28
Feb 8 6 20.6 5.4 175 29
Mar 8.5 4.8 20.2 6.8 170 28
Apr 7.8 3 18.4 7.4 550 29
40 May 7.2 4 20.2 6.3 200 30
Jun 8.2 5 25.8 6.6 225 24
July 8.2 7 22.2 6.5 14 23
Aug 8.1 5.5 30.2 7.2 196 22
Sept 7.9 22 60.2 5.9 140 20
Oct 8.2 5 27.5 7.6 22 23
Nov 8.9 9 36.8 6.8 900 24
Dec 7.8 6 28.1 7.2 4 22
Average 8.09 6.8 27.85 6.66 233 24.4
85

Year-2004 Godavari River Ramkund Nasik
MONTHS PH BOD COD DO TOTAL
COLIFORM Temp. Index
Jan 7.2 3 16 7 280 32
Feb 7.7 4 24 7.1 250 31
Mar 7.8 7 26 5.8 350 32
Apr 8 3 54 6.6 425 29
May 6.7 6 38 4.9 250 32
Jun 8.2 7.5 28 5.8 250 - 26
July 7.8 2 39 7.9 14 25
Aug 7.5 3 32 7.1 425 22
40 Sept 7.9 6 54 7.4 220 30
Oct 7.6 2 35 7.3 220 24
Nov 7.2 48 43 5.7 900 30
Dec 7.5 2 41 7.2 220 28
Average 7.59 7.79 35.83 6.65 317 28.41667

Year-2004 Godavari River D/S of Nasik
MONTHS PH BOD COD DO TOTAL
COLIFORM Temp. Index
Jan 6.9 14 42 6.9 300 23
Feb 7.2 10 29 6.9 350 21
Mar 7.7 20 58 4.1 400 25
Apr 7.8 4 13 5.1 550 30
May 6.9 14 39 6.9 306 27 40
Jun 7.2 10 32 6.9 312 29
July 7.7 15 41 5.1 309 25
Aug 7.1 20 54 4.1 290 24
Sept 7.3 13 38 5.9 245 24
Oct 7.4 10 28 6.2 350 29
Nov 7.3 14 39 5.8 298 28
Dec 7.2 12 32. 7 240 25
Average 7.30 13 37 5.9 329 25.88
87

Year-2005 Gangapur Dam Nasik
MONTHS PH BOD COD DO TOTAL
COLIFORM Temp. Index
Jan 8.3 4.4 20.4 6.2 200 28
Feb 8 6 20.6 5.4 175 29
Mar 8.5 4.8 202 6.8 170 28
42
Apr 8.5 5.5 51- 7.1 23 29
May 7.6 6.9 58 7.2 9.4 30
Jun 7.3 9.4 21.5 5.6 197 24
July 7.6 5.6 19.4 7.1 1806 23
Aug 7.6 15.4 42 5.8 45 22
Sept 7.6 5.6 19 6.5 276 20
Oct 8.6 8.9 28.9 7.2 17.5 .23
•Nov 7.5 5.6 22.5. 7.6 6.9 24
Dec 8.2 5.8 22.5 7.1 18.5. 22
Average 7.94 6.99 43.98 6.63 245.66 24.4
88

Year-2005 Godavari River Ramkund Nasik
MONTHS PH BOD COD DO TOTAL
COLIFORM Temp. Index
Jan 8 4 16 6.8.. 250 23
Feb 7.4 10.8 24 3.2 250 21
Mar 7.3 7 26 4 350 25
Apr 7.4 6 22 7.2 - 1100 30
May 7.9 5 70 6.5 130 27 40
Jun 7.3 9 26 5.2 225 29
July 7.9 10 3.2 6.2 900 25
Aug 7.6 13 39 5.7 355 24
Sept 7.8 5.9 23 6.7 13 24
Oct 8.2 8.6 26 6.8 142 29
Nov 8.2 4.6 18 7.4 26.5 28
Dec 7.8 9.2 23.5 1.8 115 25
Average 7.73 7.758 26.39 5.62 321.35 25.67
~. 5

Year-2005 Godavari River D/S of Nasik
TOTAL MONTHS PH BOD COD - DO Temp. Index
COLIFORM
32 Jan 6.9 3 30 7 250
24 Feb 7.2 10 29 4.4 170
29 Mar 7.7 7.4 ' 28 3.6 350
30 Apr 7.5 8.0 32 6.5 900
May 7.8 10 29 5.9 175 32 41
28 Jun 7.6 14 38 5.2 225
23 July 7.7 30 36 4.5 1600
26 Aug 7.4 14 32 4.9 425
20 Sept 7.9 11 32 .7 20
23 Oct 7.8 13 36 .5.5 1580
24 Nov 8.21 9 29 6.4 1579
22 Dec 7.8 7 22 6.2 5500
Average 7.62 11.36 31.08 5.59 1064.5 26.83

Table 4.6- Secondary Data: Analysis Results of Godavari River for the Year 2003
pH
Month Gangapur Dam Someshwar Anandwali Victoria
Bridge Ramk
and Down stream
Jan.03 7.70 8.10 8.21 8.15 7.60 7.50
Feb.03 7.80 8.30 8.16 8.00 7.70 7.60
Mar.03 8.40 8.40 8.08 8.35 7.50 7.60
Apr.03 7.30 7.99 7.91 8.30 7.20 7.10
Sept.03 8.10 7.78 7.86 8.27 7.50 7.60
Oct.03 8.30 7.78 7.90 8.29 7.20 7.10
Nov.03 8.20 7.78 7.73 7.90 7.60 7.50
Dec.03 7.90 7.85 7.70 7.46 7.10 7.20
Dissolved Oxygen
Month Gangapur Dam Someshwar Anandwali Victoria
Bridge Ramk
and Down stream
Jan.03 5.8 5.9 4.8 4.6 4.8 3.5
Feb.03 6.50 6.6 4.9 4.9 5.1 3.9
Mar.03 7.4 7.6 5.7 5.0 5.1 4.9
Apr.03 7.5 7.4 5.8 4.7 4.8 3.1
Sept.03 6.8 7.0 5.7 4.7 5.0 4.0
Oct.03 6.8 6.9 4.9 4.4 4.7 4.6
Nov.03 6.1 7.0 5.1 4.6 . 4.9 4.5
Dec.03 5.9 6.5 5.0 4.0 4.4 4.2
91

Biological Oxygen Demand
Month Gangapur Dam Someshwar Anandwali
Victoria Bridge
Ramk and
Down
stream
Jan.03 4.0 7.5 8.5 8.5 8.10 18.9
Feb.03 6.0 6.9 8.3 8.0 9.0 13.0
Mar.03 4.5 5.5 6.0 7.0 11.0 11.90
Apr.03 4.8 5.9 7.3 7.60 9.8 10.3
Sept.03 5.1 5.7 8.0 8.1 10.3 11.8
Oct.03 4.4 6.8 9.0 15 23.6 26.0
Nov.03 4.8 8.5 9.0 12.5 16.9 18.0
Dec.03 5.0 9.9 21.0 23.8 26.0 30.0
Total Suspended Solids
Month Gangapur Dam
Someshwar Anandwali Victoria Bridge
Ramk and
Down
stream
Jan.03 32 35 30 . 36 51 46
Feb.03 53 61 3.1 34 57 49
Mar.03 21 27 26 32 52 59
Apr.03 45 51 36 26 41 51
Sept.03 22 25 35 34 49 46
Oct.03 28 31 34 31 50 62
Nov.03 24 26 26 69 47 57
Dec.03 41 49 35 26 46 65
92

Total Dissolved Solids
Month Gangapur Dam
Someshwar Anandwali Victoria Bridge
Ramk and
Down
stream
Jan.03 123 781 530 639 342 341 Feb.03 121 530 654 211 338 401
Mar.03 159 221 390 '217 361 378 Apr.03 165 149 139 221 156 597
Sept.03 180 490 335 535 299 155
Oct.03 128 471 520 331 230 466
Nov.03 116 781 421 731 142 156
Dec.03 166 790 630 846 224 599
4.7 COMPUTATION OF NSF WATER QUALITY INDICES
The NSFWQI was calculated using a software which was available on the
internet from the site of the Wilkes University, Centre for Environmental
Quality,PennsylvaniaU.S.A.,viz.www.waterresearch.net/watrqualindex/waterqualityind
ex htm ,to calculate the index, firstly, dissolved oxygen concentration had to be
converted into percent saturation. Secondly, entered the concentration values of the
pollutant variables one by one in the spaces provided in the software and note the sub
index value that was returned. These sub index values were then inputted in a
different table, which aggregated them and returned the NSFWQI value of the
particular location and then by repeating the same procedure the NSFWQI is obtained
for all the sampling locations shown in table 5.2 and table 5.3 for primary and secondary
data.
Some sample calculations of NSFWQI for primary data, secondary data , and
NSFWQI results for all the primary and secondary data are shown in results
sheets at table 5.1 -5.4 in the next chapter on page nos.114-119 respectively.
93

L N 'ct CO 'C O C
d
L. N _ ' 00 lD
_ 00 R '- p1
z O C O ~ O L.
O O O O O O
~n
y y h
R a0 00 N .RC 0 00 00 Q N LR' 'ct Os M 00
o O G O o C O C) O 0 h' G - - O O O
a a a N N ~A '.D '. S N N Ir \O '.O R '.O CO
B B E O O O C
00 M
00 M "t' O N N C
00 M
CO M '~ O [N N C N N A R kn y-~ M • M 'fit
lO
E N B = E
0 • V O 00 O O
_ •~ Val OHO O Vim' '~ M 00 O M N O
U " B
N N m
E 'O N N M
E ;, N M o CO N CO cV N t'
O O
Q̀ O N N ~ M [~ [~ •O N N M N N •O N N N N L
U U .4
b 00 all
00 '.o 0 0 li
7 rn h
CO —
'.o N
rn In to CO V~
o'. ~D
o' 00
v M
t 00 N
C N M W) ~ '.O O 'fl Ccn kn n
G M N N N N 4 00 U U 0 U o
d f/~ N M o0 y Cam!] O N v? OHO in eC C/~ N O ~D O~ ONO
N '.D N Q ~ v'i N ~D N aRi !F'. t~ 00 [~ ' n O\ • [~ ~--. N M N M M N M N M M ,'+ N r N ern - -
4 O O
z oz _ N .o C~ [~ z N N N N M N Vl 0'. v1 . -
N N N '.O N N M N O'. v1 , N M 'n '.D N v'. —
F
O
0
U d' N oo0 O l~ 00 N N -- N U \o M v
~ O V
. N N N - N ~ N N - N U n c 0 7 -
O
Q N 00. 0 r '.05 N 'O ON. N h '.000 'cY N N v 'F'. kn M Q In vi eF CO N Q '.G \C kn 'd. ~o '.G
In ]~y N C\\0 Cl? eh N ]'y N M N '0'0 N 00 G; 00 N a, 00 S N CO N S w 00 N S N
N M _
d O M a
M N CNn
o. N
F N N N N N N F tin N N F N M M M N
R L .. . 1i vJ R L
R

c
L 1 l~ CO
01 00 O O O O O . O O O O O O z d'
00 O p
WI ~
y ~
y d
. d O V~
O O Ste' O.
!~ O
'.0 ~' t L7~
CF Cl) O\ '-'
`C~' ~_ 00
0 O O O
C O O y
O O O
C O p O v~ O O O O O
a a
a N m N N C3. N N [~
m d 'a' of M N pp
•d d' M
'.D CF
N l0
'1 en
'.O V1
' en
'.O d
'ct M
'.O V1 \O
d 0 M N \D M M CL O CL R
•V N ON
O 00
00 N
N 01
O 00
00 IN
O .v N
C' O 00
N O\
O 00
O' 00 0'.
3 M 00 e}
01 N O'.
O 00
N 00 V V
U
_ E c 'O N N vii
? ~0 N 'n N v'~ M In o ;0 N en v1 N en
O ci)
p ~ O
CI y O 'fl
y CI
O N '~
01 N N 'O N 01 00 N Q'. ~--~ m 01 m 'L O O en
of N C'. M N — 01 — 01 N V V s
N '.O
00 N
N N
'.O 00
N O'.
O'. 00 O '.O
O'. '.O N
N O'.
'ct N
M 00
'.O ~
N 00 In O'. N
00 M O 'O p ~O o ' M . r .r N
1_C
U R
C
U
C 00 c
Q - N00 in It 0000 ~ R f/) en in l0 N In en V]
i) N en O M M N \C O'. 00 v1
'.O Q R CI
IO !F 00 In d' tO A In '.o
as V1 '.o
O\ '.O in
00 In A
h O N p 00
In In 1 O, er
N 00 °4 '--~ ~+ y .r .-r — •-• ate+ F N M .-r —
z z z In M d' In M :fl 'V' In In M .fl M M et In 'ct
.L
E+ H ~i
I
0 O U
E L W
U O+ N N C'.O
0 O F
N vo 00 N N en
O N C N N
Q N in In N
G In N .. In M m N N M N M E
I CI WI R L .p ; I o I L
co C6 R i1_
a' v) Id 2 a A 0
a L
12
C'. U In '.o O
0 O F
O d' Q\ 00 O\ 00 \O V N In In
O N O\ 00 Q' N N N In 7 vj
Q t- N O, — in N In \O h '.D M M
•-- N a 0 N 0000
G In — In '.O N CI M N M N M M
F
WI aLi d I 2 I. a
R A
L R l.Iy v~
.. o
' d
lo
.~ .~ '
i iz
a A c7
E
W
D ~NOON 0 '.0 vp i C)
N 0 N N N N
N M M M
Q N N — In in 11 '.0\ In N cn N
CO N N N N
C.
F N en M _ M N M
1 6 1 I WI R L o .0 A 3 'O lo
10 10 l I
P 1 I
'o
6I F
c

R en - Vl _ o C> 0 O O O O
Fr
M M =
•C N f+7 M M
E •O V M
00 — N T
O 00
N C% 00
E ;6 N M tr
N N tn O ~
00
N
•O en N - - - s
- v — 0'. N - N en
O C O
d V1 M M 0 O O 00
00 In N v1 O, v1 O'.
N in v'. — in .-. i0 M It'. 'ch V'1
E L
N
O.
00 o o o o
V
C C C Q~ p O O O O
_a ° 00 N N it'. !
E
'.O 'cY V' K1 It'. In ed
E_ O\ N
O'. O 00 N
O, O 00
N '.O
E
V tn N N O
O
en - N N s U
00 0'. N 00 O ~O N N o
In I!1 'O 00
00 It'. Q'. V1 01 It'.
E
U N00 N
O
z o 0 0 0 o
V
y --~ M . \O © d l0 O O C 0 O C
s a
Cd s N to N _a — a • - M en 00
E 0
M N 'O en ' In. GD ce
E
•~ M 00
Q'. N 01
O 00
N 00
U E 'C N
~ M ~
N M O 00
O M N M . s U
O o
0 U _
OM C/] M d' 'ct in. '.0
o o — — v o C Fr N en — — N
N V1 [N V1 .-w M M M Vl
.O L 7
E L
Q N N M
0 O
en K! T 001 oo N r t~
4 y N
N CNV
_ M N
_ M N
1 61 I II ri ICO L 1:9 I.
A c i. i
E ai CI. I s' CRD EC O I 100 QI00 d ~" A
Q - N as N 'n en U
0 "n 'c rn oo o V'1 V1 1n et
N '.o 'n oo N
'►Zi N N o cn ' .. G
F M M N M N N
E V R L _~ .0
R A 3 '° i .
L s I I E Ic.. Ia"i
•~? o
tw C p Iz 100 d A 9k I 00
fh
N 00 N N 0 N N M
en 00 .Mi OA M ~; O
Q - N M N M N .a vi .o '.o '.o
Ar N p0 S S N S
N _ F N N M M N N
I,'. 6Li
1 61 R A
~
k
L
I • O
100
i
•R
0
d L I 'y„
. L' R i . Z E' O
[7

z O O O O O O '~ O O O O O O O O O O
to R :2 CQ Vl :A
S O O O 0 O O L O O Q O O O p O O O 0 a C1r
G N M v~'~ N d .N-~ N M M •_ (V N 00
~ C ~
N M \O fry N r~'1 Vim' \O n C -j N bD
? c"~ - 'in~h ONi 00 Q i M 00 ~ 00 M .fir Cl C N
U
_ O N M N N N %p N M N V1 vi. 01 E N M Nin N N N
Cl) 00 ~
d ~
• O M N in dam' In ~ L O O M ' N N .-• 01 .-r 01 M 00 O M N — — -
~ U S U t U
N '.O
'.O 5
O', '.D '.O d' 00 M
00 N
as S
N '.D
In '.O
O' N
O IO
N '.O
e' O
N M
~t O \p •p M N — '.p .O M N ., . M N N N
o Q
z~ C O ~ C
Vl M M 'It in \O V] M O M o0 et ID l— M 't N In V1 N O O~ v~ M cLC V VA M M M ei' I!1 N o
N '.O O to ~ C'. 00 i q In O N O' in C% ~r 00 in N Cl) A 'n O N O in 01 in %0
"O '.~I "fI s in in E.I N in M y N M
N M
In 00 M
V1 in M :fl M er in M N in :D `cr d' Vl
L I. A F F F
E w w
E L
II U N - - N It',000 V - N N u N N N N COO
F F ~
N N in N N N 0'. N 0 N N N N N in
m ~p 'cF oC M Wj l- N vi o0
Q '.O N N '~Y 00 Q N N in'd' S N Q O'. N It', et 00 '.o '.c vi ~t p '.c 'I'. r; q '.o N N '.c
o a r a. `' 00 '.0 55 N M N in x Q'. in M N y~!
E ` t 0'. N - in E o, in in E o, 't in •- F . N M M Cl M N Cl M N M M Ey M Cl M N M
L cl RC
y cl _
d A a ems as A ~a
L` R R 6, E O CC R CC I. P' O t0 c0 CC L 2
bD • GE V] L bD E . L' OD E am
a I t. I Irn d l.
a, A z I
. a1 Z ° I. 21 I
icI I II C7 Ic I7
N

0 d O
Z N O O O Z O O f V O C O O O — N
y d
y d
y d
V1 S. 00 00 01
M 01
00 O~
en 01
00 O~
W O M
O~ 00 O~
00 .~
00 O\
y~ O kn
- N v — O 'n O O C a '_ a
N d N 00 o0 00 en pip 00 M
d 0 .0 0. N
00 M N M 00 M M N
d 0 G.
00 M N en N N N
O = _ ~p •y 00 0 •w y 00
l-1 00 CA ~
O 00 N en N O N en N O N M N O N en N N M N N ON O 00 = 2 N ON O 00 Cl — N N
V L) e° 00
2 _ _ 2 E v' ?
o en ~h ~t
_ d b
_ ct M et N 'n N o0 Oi
En
U, ~
O • O\ N en N 01 N M N a\ N
N d
L O M N T N • • ' O7, N N OI
H ~
L. O N 01 N N .0 Z
M p U U U
N O~ M 00 M '.o O\
Q M
v =
'O O'.
N M
00 O'
O% N
— N
— '.O N eh
O\ O\
'.O N N C N N ~--~ N O C N N ~--~ N ,fl N N M
V ~ V o ----------- -
eC V] N O' %C a, ID O~ VJ %D O\ --
N as (] -- -----
~} pNp M
'L O
01 N '.0 N 00 N
N 00 N 00 N N N V7 '.O O', - V'1 ~o 01 eY O\ M .-r ~.,, en
_ 0_____ ____ en. N M ~, [Ay N M N M [Ay N
p
z z z '~~+' M N
1.'. '.O 'd' N
If'. '.O 7 N
It'. '' :fl '.O ei' N
I1'. M N I". ~n n . 'n d .--~ If'. "p M '.p N
: F _
E I. E ̀ E
o o N "O
O U
N 00 N 00 0 C) o,
O U
If'. N 00 N co O '.000 O 0 U V1 M N N ON
F F F L
y 6 N N - N N N 0 M N M N - N 0 d' - N N M M .-..
a A ~ ii veri
p ,~ M° '.o o, `~ If'. A ~t '.c vi q N vi ~t
N ~" O N N 01 If ]~ v1 N N It'. If'. ►~ M
N
a 00
M
a 2 O ~
a. 2' ~ O ~ L.
.2 . y K1 M en M M M M M N M N M M
Z 01 = ° y r~ .S Fr
eCa
C7 > C7 > C9
00 ON

4 M 00
= M a ~ O O
4. R
N
7 In
E 0
C c N M O1
0 U E
%p CM— .Mr O
"O
O en N .0 U
u en 0 a M C O U
cl rA N O a? GO
en en
N N
~ F
--
N In
.O L7
E
E L
W_
U M M
H
ca
N N N N tni
N N Q
Q l- N--~ N N In \c In '" 'c In
x N n c N a 0 0000
N F N M M en N
0 L A •OL G •cC
E e o a v~
E
S m rn LO
w 0
0 ~}' 00 N M
00 N " N
C oo In
Q In
N "o
C' v
-' N 5 '.o
M N
C' N
c+'• '.D N
a
[y
N N N M M M M
Ill CC L o .fl A3 L 7 s I. PqI. Iz
E
S
0 4. 0
0 CM00
V N
In
Q V'1 N• M '.o
N ~
n' N
N
~ °~`O M \D
00
I"- en I' "D
I;;
C7 _ 00 00 en
O C O C C C
yam, et Q N S M o a M ~0 O 0 O~ O
O O N
cl ~D N
a N N kn M N
• N 'n O M M
R..I
E_ M GO O\ \O N O N O
R
E N en - N O O o N M 'cf M
"C
~ N M M N vii Z U
ON1 S o o (7,, 00 O M M N M L O U Q
Cd VJ N Cl %0 "0 'O ci) en M M V1 d' Vl
0 0 M 0
Q0 00
en
en en N c+Ni C
N vl '0 In 'O N :fl M of V'1 In of
L
4)
O C ° O O °
a M - M 00 0 ON O ° O
.1. c+. 4. s a
N d en
O' N N
00 M
E 0
N eh C' 00 ~''? N
bA R1
M
E 3 U M 00 5 '.o N O N M N ce U E E O N M ~ O\ N M O —
'D U.
M N en M N N X U
r O In
-
N
M
en C' A00 N M
en
C
~ O U
y V1 C/~
N M
O M
'O M
--. V1
'0 "4
F.1 N en en M N M
z
M In In
.O L 7

w z
C7
In
o ° r
Co
N 7
00
E In
0 N
Co
E
m Co U E 7
O 00
In
'O
O N
U
u N
O ~ C
U 00
N
s A C (y M
I-- IN I-- I~ N
N N N
vi v vi N
N 00
M IM IM IN
0 N N 00
- fV .-+
Q en N OO N '.D O'. v, '.d vS '.c v N
x o0 M 00 0600
N O~ N N N
FE N N N N N M N
lC L = .1 A I lo I .L c
y E O I
~ CO lo °
CO
© N O ~t N
t
00 N 00 N '!1 V1 pp '.p
O I '.O N 'O N N N
N N N O~ C
E cc In , ~n — M M M M M
° CO I R I
R A
191 v L
3 s 1 2 O lo
o 3 .fl L w L 0
c co
° z
E O
C7
o O o
I- I- to I°en
00 ~D 00 00 N
N M
I~ IN I~ IM
IN IN I:° I2'
I.I.I.j.I'r€
IN IN N IM
. a, O Vl
N en
I - I' I M
00 -- °I~ IN
° ° N N '"
• - M Vl \O \O O O O G O
cc R N V1 et' O\ 00
00
E
N M . N
ea en N
E M c°
N " h CO U
E N M N "
N O O
N
00
d 'O
O N N N CD en .0
M N N N c n N O C
a V]
w (A.~ N N N ° c +) If) N 0
z M 'V' N M in M
.O L
E L w°
CO
O
N o 0 © 0 0 ra O
cc'. cs T a
s°
d M M N M N M
E
w 00 00
bD CO
E D _
N en N N N N
CO U E _O '0 M
_ _
O 00
0
0 • N N N N N
N O 00
If) N N N
N N N
N N O
en
N M N to N M o U
z If) M • to 7 If)
.a I-
2 Lw°
CO
O

N L. 1 00 O Cs v - N 0, C '(`1 •--~ N N M C C C .--~ .--~ O z O O fV O C
d R R _
O O C O O O O C O 0 0 O O C O
Qti ~
d
c
r? t N QN •'"' N N CJ C 00 M 00 M V7 N M N a~i = M 110 oq O7 M
..r
..fir
►~ d0' dam' vl M lN0 C
h pNp N CD
O t~ l~ d •~ 000 N N
N Z o0
U r,
v'! N Cf O\ M 2 h N O O, ~O C ' O
tn ~n In V l v
~
N M 'O 00 (y N N M N pp C\ M
o
d i
CC N N N N N N N L O l- N N .-• M N l N N 0 s O, N en N 110 M O~
P' = _ .~ 'D 'tP en
N O O - [~ V1 I .j p N N O- C\ N N I~ \O V1 O Vl Cf v C ~O - N N [~ N N N lA O C~
PC ~--~ N M v1 vl .fl N N N N
N o
ou zc n E
~ it
01 N N en _
V 01 V] VI
Vl .--.
C M
N V] V1 'ci' O ONO O M .-i
• I- .r
M .-i 'G
v~
.C..
,,y
`SI C~ ~ d:' N O n A kn N rn - ~D N Q ~D M N vfi rn "V
04
ID C\ N v1 '-O p y1 .-• N o N N Q, vl - %0 ND - N M N en U .y N N N M 'r : 'V' V1 M N
a WQ'
E 2 a~
N
0 "o r E C •~ N
U F L ~
~t o M
a, M N
'^ A N
o M
v N
rn N
Cl) N
Cn 0 0 N
o, - N
M M N N
(
E
M N N oo
x ~ a - Q oo '0 N. t0 N Q N et o0 5. N O\
'~ ~O M O) a ~O 'cF 00 W) Os c- a Vl 1
M V'1 N N 00 ° N '0 , O 00 o.
- 00 'o E O r N V'n C' en E - v1 0 - d N M M N N y F
M N M en N N y F
M N en M N N
CL .0 . L L CO CL '0 Cl) .~
3 7 z y qL s 7 •0 Fo d A 3 L G' Fo
E o a~ 2 E C o R 00. ca CL a o o 00 Cl) e o o v]

I
SOLID WASTE MANAGEMENT AT NASIK
102

"4'
MUNICIPAL SOLID WASTE TREATMENT PLANT AT NASIK CITY
WASTE STORAGE YARD
WASTE FEEDING TO 1ST STAGE SEGREGATION
~s t
2ND STAGE SEGREGATION (35MM & 16MM SIEVE) COMPOST AS MANURE FOR REUSE
103

It h. BIO-MEDICAL WASTE
AUTOCLAVE
BIO-MEDICAL TREATMENT PLANT AT NASIK, MAHARASHTRA
MANUAL SEGREGATION OF BMW
INCINERATOR
CHIMNEY
104

(5)
(3)
uL
w 1 t?
(6)
PHOTOGRAPHS OF 78 MLD WASTEWATER TREATMENT PLANT (UASB) AT NASIK
II (2)
105

PHOTOGRAPHS OF 7.5 MLD ACTIVATED SLUDGE PROCESS (ASP) AT NASIK
Wn ►ti II! t\ H :
(3)
~1 ■ i _
l
~~` ~ w.. ., ~ _,~ •qtr
0)
(6)
106

78 MLD UASB SEWAGE TREATMENT PLANT AT TAPOWAN NASIK
DISTRIBUTION BOX
UASB REACTOR
~~ d FINAL POLISHING POND
107

CONSERVATION MEASURES AT VARIOUS STRETCHES OF GODAVARI RIVER
ACTIVITIES AT VARIOUS SAMPLING LOCATIONS OF GODAVARI RIVER
r • -
••I•••
di1 -c • •:' b 7:4J'
•
aim
W.

(4)
PHOTOGRAPHS OF SAMPLING LOCATIONS AT GODAVARI RIVER
(2)
hLI
(N
109
CHAPTER-5
RESULTS AND DISCUSSIONS
5.1 GENERAL
The River Godavari has been monitored for certain physico-chemical and bacteriological
parameters namely temperature, pH, turbidity, specific conductivity, total solids,
suspended solids, dissolved oxygen, biochemical oxygen demand, chemical oxygen
demand, nitrate, phosphate, total coliform and faecal coliform from October 2007 to
April 2008, also the available data from MPCB office and CPCB websites are referred
as a secondary data. The river received domestic sewage when it enters the Nasik city.
The river water quality changes while passing through the city towards downstream.
5.2 WATER QUALITY PARAMETERS
5.2.1 Temperature
The temperature values were recorded at site during the time of sample collection. The
recorded water temperature of the Godavari River varies from station to station ranges
from 18°C to 37°C as observed in primary data as well as secondary data shown in table.
Moreover, the seasonal variation of temperature is also observed from secondary data.
The temperature is one of the important factors for the survival of the aquatic life. Even
1°C temperature rise in water may affect the aquatic organisms.
5.2.2 pH
The present analysis shows that the water of Godavari River is slightly alkaline. The pH
value ranges from 6.5 to 8.49 throughout the stretch. All the values observed within the
CPCB limits of the selected stretch which is 6.5 to 8.5.
5.2.3 Dissolved Oxygen (DO)
The concentration of DO is one of the most important indices of purity of river water.
The concentration of DO in water represents the nature of organic matter present, the
present analysis shows that the DO concentrations are within the range of 1.to7.90 mg/l.
Generally, the DO value increases with the decrease in temperature.
110

5.2.4 Biochemical Oxygen Demand (BOD)
BOD approximates the amount of oxidisable organic matter in water. In the present
study, the BOD values are found to be increasing gradually towards downstream part of
the river. The BOD values were found within the range of 3.0 mg/l to 59.0 mg/. The
increases of BOD toward the d/s stretch because of the city wastewater having high BOD
(range 30mg/l to 75mg/1) are discharged into the river. Average BOD values at all the
sampling stations are higher than 3mg/l.
5.2.5 Chemical Oxygen Demand (COD)
It is observed that the COD values are higher than the BOD values at all sampling
stations. The COD values are within the range 12 mg/l to 76 mg/l. It is observed that
COD values increases gradually from upstream to the downstream of the river from
secondary data as well as primary data.
5.2.6 Turbidity
The guide value set for drinking water by WHO is 5 NTU. Low turbidity means greater
penetration of light resulting in better photosynthetic activity in river and leading to better
water quality. It is observed from data turbidity value varies from 3 to 59 NTU. CPCB
has not specified any limit for turbidity thus, river water is suitable for recreational
purpose, bathing and washing clothes etc. as far as turbidity is concerned.
5.2.7 Total Suspended Solids (TSS).
Total Suspended Solids (TSS). Values observed. from 149 mg/l to 597 mg/l. More
suspended solids possess more turbidity. Due to less photosynthesis and low DO, water
in downstream stretches may have high TSS values.
5.2.8 Total Coliform
The presence of coliform is an important indication of the degree of health risk associated
with use of river water for different purposes. CPCB has prescribed maximum value for
MPN of 500/100ml while IS 2296 — 1974 has specified a much higher value of
5000/100ml. The observed values of total coliform ranges from 4 to 288
111

5.2.9 Heavy Metal
The water samples from various sampling stations were tested for heavy metals. The
observed values are shown in the various tables of primary and secondary data. From the
results it is observed that, all the heavy metals are within the permissible limit.
5.3 NSF WQI FOR STUDY STRETCH
There are various water quality indices available in the literature as already discussed in
Chapter-2 and Chapter-3. NSFWQI is the most commonly employed and easy to use
index software. In this present study, NSFWQI has been selected for assessment of the
river water quality because of its versatility and on line software availability on internet.
5.3.1 NSF WQI
NSF WQI have been calculated for Dec'07 and Feb'08 for primary data and from the
year 2002 to the year 2007 for secondary data are shown in Table 5.1 and Table 5.2 and
also it shows on enclosed graphs namely NSFWQI Graph No.1,2,3 and Godavari River
NSFWQI maps for River water quality. Higher value of the index indicates better water
quality. In the present study, all the nine variables have been used to calculate the final
index, for this report, when data for less than the nine variables is available, the
index is calculated by summing up the sub index values of the variables present and
dividing it by the sum of their weights. When all the available variables are
considered, the index values have stayed more or less in the "bad" and "medium"
categories. Upon removal of faecal coliform only, the index values increase
considerably. Though, the values remain in the "medium" category for all sampling
locations at all times, a marked increase can be observed. Similarly, when dissolved
oxygen is removed, there is an obvious improvement in the index values. Dissolved
oxygen has been given the highest weightage (0.17), but the variation after its removal
is found to be less than that of faecal coliform in many of the locations. BOD has been
given a weightage of only 0.10, but its removal also shows an appreciable variation,
which proves that it is a critical pollutant variable. When the pollutant variables are
removed in combination, the index values further increase to indicate improved
water quality. When the combination of faecal coliform and dissolved oxygen is
removed, there is a big increase from the original index value. The other combinations,
112

i.e. faecal coliform — BOD and dissolved oxygen — BOD, also show appreciable increase from the original value, but less than that. of the faecal coliform — dissolved oxygen
combination. When all three pollutant variables are removed, the index value shoots up to
the "good" category, even touching the "excellent" that is NSFWQI observed
between 85 to 92 at some points. This is a clear indication that these three variables
are very important for a river monitoring programme. They are the main pollutants in
the Godavari River. Faecal coliform comes from the direct discharge of sewage from
the latrines on the river banks and also from open defecation mainly at downstream of
the river. Low dissolved oxygen levels and high BOD are due to the solid and other waste dumped into the river
113

Calculations of NSFWQI of various water quality parameters are given in below.
Table 5.1: Sample Calculations of NSFWQI for River Godavari at Nasik
Year 2002 NSFWQI Sample Calculation for secondary Data
Sampling
Location Parameter Results Unit
Individual
Quality
Rating (qi)
Weight
Factor
(wi)
Water
Quality
Index
Dissolved Oxygen 6.34 % sat 5 0.17
Faecal Coliform 218.3 MPN/100ml 37 0.15
pH 7.86 88 0.12
BOD 5.9 mg/L 51 0.10
Gangapur
Dam Nitrates mg/L 0.10 36
Phosphates mg/L 0.10
Temperature 24 ° C 17 0.10
Turbidity NTU 0.08
Total Solids Mg/L 0.08
114

December 2007 NSFWQI Sample Calculation for Primary Data
Sampling
Location Parameter Results Unit
Individual
Quality
Rating (qi)
Weight
Factor
(wi)
Water
Quality
Index
Dissolved Oxygen 5.558 % sat 5 0.17
Faecal Coliform 223.83 MPN/100ml 34 0.15
pH 7.11 90 0.12
Kushawart
BOD 8.69 mg/L 71 0.10
69 Nitrates mg/L 0.10
Phosphates mg/L 0.10
Temperature 27 °C 13 0.10
Turbidity 1.0 NTU 96 0.08
Total Solids Mg/L 0.08
115

February 2008 NSFWQI Sample Calculation for Primary Data
Sampling
Location Parameter Results Unit
Individual
Quality
Rating (qi)
Weight
Factor
(wi)
Water
Quality
Index
Dissolved Oxygen 6.8 % sat 5 0.17
Faecal Coliform 78 MPN/100ml 47 0.15
pH 8.1 84 0.12
BOD 5.1 mg/L 55 0.10
Gangapur
Dam Nitrates 0.23 mg/L 97 0.10 57
Phosphates 0.011 mg/L 100 0.10
Temperature 29 ° C 11 0.10
Turbidity 22 NTU 59 0.08
Total Solids 181 Mg/L 75 0.08
116

Table 5.2 NSF Water Quality Index for primary data
Sr No Sampling Locations DEC - 2007 FEB - 2008
1 Kushawart 69 64 2 Gangapur Dam 56 57
3 Someshwar 54 55
4 Anandwali 52 51
5 Victoria Bridge 52 51
6 Ramkund 55 52
7 Goda Kapila Sangam 42 41
8 Tapowan or D/S of Nasik 48 47
9 Dasak Village 52 54
10 Saikheda Village 54 61
117
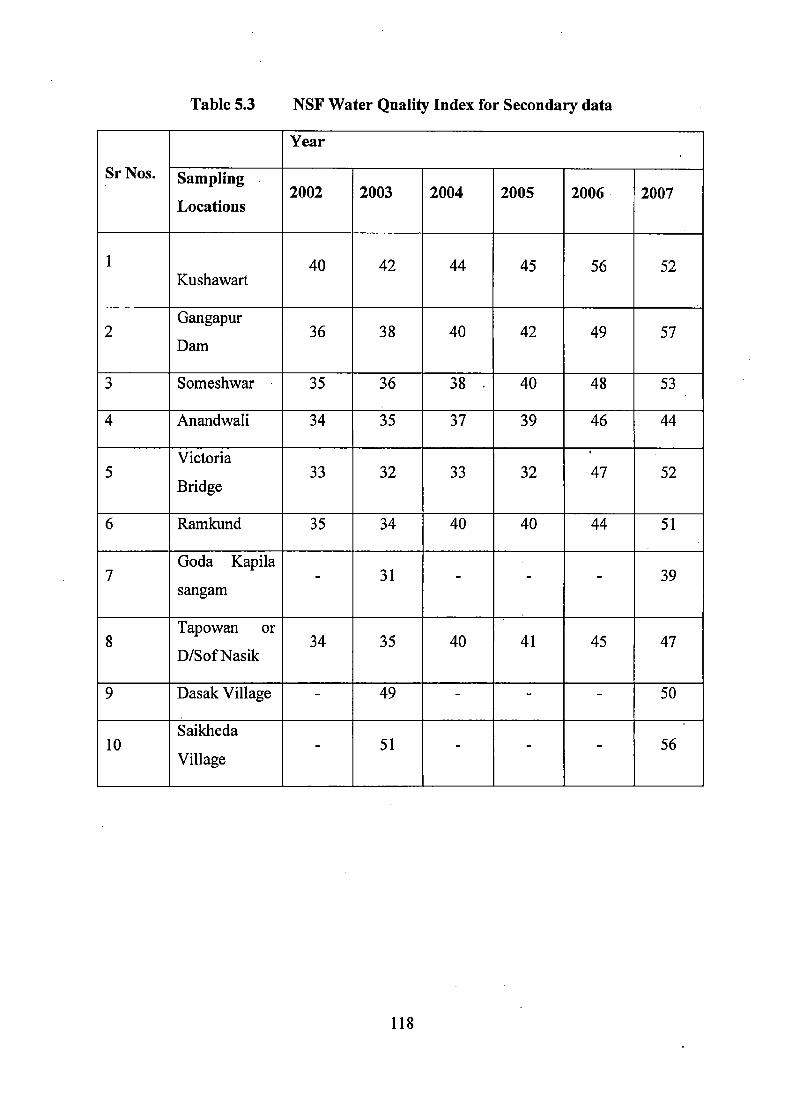
Table 5.3 NSF Water Quality Index for Secondary data
Year
Sr Nos. Sampling 2002 2003 2004 2005 2006 2007
Locations
1 40 42 44 45 56 52 Kushawart
Gangapur 2 36 38 40 42 49 57
Dam
3 Someshwar 35 36 38 40 48 53
4 Anandwali 34 35 37 39 46 44
Victoria 5 33 32 33 32 47 52
Bridge
6 Ramkund 35 34 40 40 44 51
Goda Kapila 7 - 31 - - - 39
sangam
Tapowan or 8 34 35 40 41 45 47
D/Sof Nasik
9 Dasak Village - 49 - - - 50
Saikheda 10 - 51 - - - 56
Village
118

NSF Water Quality Indices
The water quality indexes of the Godavari River for the various sampling stations are
tabulated in table 5.3 to ascertain the water quality at the respective stations.
Table: 5.4 Water quality index in the selected study stretch
Sr.
No.
Sampling
stations
Year 2003 Year 2007 Dec. 2007 Feb. 2008
DW IV C DW IV C DW IV C DW IV C
1 SS0 B 42 0 M 52 Y M 69 Y M 64 Y
2 SSI B 38 0 M 57 Y M 56 Y M 57 Y
3 SS2 B 36 0 M 53 Y M 54 Y M 55 Y
4 SS3 B 35 0 B 44 0 M 52 Y M 51 Y
5 SS4 B 32 0 M 52 Y M 52 Y M 51 Y
6 SS5 B 34 0 M 51 Y M 55 Y M 52 Y
7 SS6 B 31 O B 39 0 B 42 0 B 41 0
8 SSA B 35 O B 47 O B 48 O B 47 0
9 SS8 B 49 0 B 50 0 M 52 Y M 54 Y
10 SS9 M 51 Y M 56 Y M 54 Y M 61 Y
DW = Descriptor words, IV = Index value, C = Colour,
VB = Very bad, 0-25 R = Red,
B = Bad, 26-50 0= Orange,
M = Medium, 51-70 Y = Yellow,
G = Good, 71-90 G = Green,
E = Excellent, 91-100 B = Blue
119

From the above tables it is observed that, it can seen that the NSFWQI is between 31 to
51 for the year 2003 and index values between 39 to 57 for the year 2007 for secondary
data where as index values varies from 42 to 69 for primary data at selected study stretch
at sampling location no 8 index values for all the months is observed less as compared to
next two sampling locations reason is that the discharge/effluent of 78 MLD sewage
treatment plant confluence to this point and hence because of this the index has increased
to indicating the impact of STP on the river water quality. The quality of water before
STP also shows improvement because, after the year 2003 waste water from the city
which was discharging in the river has been diverted to the STP.
Primary as well as secondary data clearly indicates that river water quality degrades
while its passage through the city. The index value decreases from station 3 towards
downstream and attains lowest value at station 7 and index increases from sampling
station 7 to sampling station 10 in the year 2003. The index values increases in the year
2007 at all sampling locations as compared to the year 2003 the values of NSFWQI
between 26 to 50 indicates, the river water quality as "Bad" in the descriptive words and
denotes, colour orange and the values of NSFWQI between 51 to 70 indicates, the river
water quality as "Medium" in the descriptive words and denotes colour Yellow as shown
in the enclosed river water quality maps and graphs. Only these two colors and index
ranges are observed in the selected study stretch that means water quality was bad during
the year 2003 and it gradually increasing towards medium till today because of the
several conservation measures are taken by the Nasik Municipal Corporation which are
discussed in para 5.4.1.
5.4 WATER QUALITY MANAGEMENT OF GODAVARI RIVER
As discussed earlier, the main pollutants in River Godavari are faecal coliform and
organic wastes. The water quality management measures to be adopted should
target the removal of these two main pollutants first. The main source of faecal
coliform is waste water coming into the river from the numerous drains and the
direct sewage generated near the river banks. The lack of proper management of
municipal solid waste .in some areas of the city has led to its being dumped
indiscriminately into drains and the river itself. Same of water quality techniques are
120

suggested to tackle the main sources of pollution of the River Godavari e.g. Sewage
treatment, effluent treatment plants for industrial waste water, solid waste treatment
and disposal plants, Low Cost Sanitation, Electric and Improved Crematoria, Bathing
Ghats / River Front Developments, Plantation and Land Scaping, Biomedical waste
treatment plant, Decentralized sewage treatment plants etc.
The key to the water problems is control by water quality management planning and
proper implementation of various pollution control acts, environmental laws enforcement
of national standards, the licensing and policing of discharges, by following approved
procedures in agriculture, and by creating environmental awareness on the part of the
public with proper control measures.
5.4.1 Management Measure Suggested To Control Water Quality of Godavari
River
5.4.1.1 Sewage Treatment
Need for wastewater treatment
The purpose of wastewater treatment is to remove the organic and inorganic solids. The
organic solids are decomposed by microorganisms and inorganic solids that are inert are
removed by sedimentation. The treatment of sewage consists of primary, secondary and
tertiary treatment. The primary treatment units are screen chamber, grit chamber, and
primary settling tank. The secondary treatment units are aeration tank and secondary
settling tank. The tertiary treatment units are rapid sand filtration or slow sand filtration
and nutrient removal by various methods. The domestic sewage is the major source of
pollution for surface as well as ground water. The water becomes unfit for various uses
and causing waterborne diseases. The discharge of untreated wastewater into, the aquatic
environment is the main cause of diarrhea diseases. As the quantity of wastewater
discharged into the rivers/water bodies exceeds the self cleansing capacity of rivers the
dissolved oxygen in the water reduces and the aquatic life will starts disappearing. As the
rivers are the major sources of drinking water needs, the treatment of wastewater
becomes necessary.
The waste water treatment systems are very essential for the following reasons
121

To reduce human disease and to promote public health,
To eliminate gross water pollution effects and
To achieve levels of water quality that allows native marine organisms / aquatic life to
return to normal growth patterns and allows full human recreational use.
Removal of Suspended Solids by Clarification (In Sedimentation Tank) &
Decomposition (By providing Suitable conditions for bacteria)
Removal of Organics by Decomposition (By providing Suitable conditions for bacteria)
& Provide conditions for separation of the wastewater from the Bacteria.
Removal of Residual bacteria present in separated wastewater by adding powerful
oxidants such as Chlorine.
DESIGN PERIOD:
The sewage treatment system is normally designed to meet the requirements for a period
of 30 years or more after the completion of construction activities. The system should not
be under-loaded in the initial years nor be over-loaded in the dying stages. A provision
has also to be made for installation of civil structures at any later date depending upon the
requirement.
POPULATION AND WATER DEMAND OF NASIK CITY:
Present population of Nasik City is 15 Lacks and the present treatment system is for 60%
of the total waste water generated, for remaining 40% sewage one more sewage treatment
plant of 52 MLD capacities UASB technology work is in progress and other two more
STPS are proposed. Existing treatment systems are UASB and ASP technology based out
of three two are 78 MLD and 22 MLD of UASB technology based an done is 7.5 MLD
Activated Sludge Process technology based. One more STP of 52 MLD UASB based
work is in progress. All these existing and proposed sewage treatment plants are as per
national River Conservation Plan (NRCP) and hence the activities of NRCP are taken in
to consideration.
The manual of water supply and treatment shows a water requirement of 135 lit/cap/day
is sufficient for domestic use. Since in this project, the domestic water supply is only
122

considered. The study done in the report of domestic water conservation has also
mentioned that 135 lit/cap/day supply of water fulfills the public demand. According to
IS 1171-1971 also, in India on an average the domestic consumption of water under
normal conditions is 135 lit/cap/day. Hence the figure is chosen.
Hence by considering losses in treatment plant and distribution system = 15 % and 5 %
for non domestic supply, water treatment plants are to be designed for the capacity of
= (1500000 X 135 X1.20)/ 106
= 202.5 MLD
Presently three treatment plants are working properly with a capacity of (78+22+7.5)
MLD, that means only 107.5 MLD wastewater is treated by Nasik Municipal Corporation
and remaining 95 MLD (202.5 — 107.5 = 95 MLD) waste water is directly discharged in
to Godawari River through various domestic wastewater Nallas which causes river pollution.
Nasik city has grown in a haphazard manner with absolutely no planning at all. To
plan and lay a sewer system in the city is an impossible task as of now. The only way to
stop the waste water from entering the river, is to intercept all the drains and tributaries at
their point of confluence with the river and treat and dispose it properly through various
treatment plants installed by Nasik Municipal Corporation. Present population of
Nasik city is more than 15 Lacs and the 60% waste water is treated through various
treatment plants like 78 MLD UASB based plant at Tapowan Nasik and 7.5 MLD ASP
based treatment plant at panchak village, Nasik and 22 MLD plant of UASB based at
chehadi village additional 52 MLD UASB sewage treatment plant work is in progress at
Tapowan and the same will be completed in the next year. After completing this plant
additional 10 % waste water will be treated, even though there is scope for remaining
30% waste water treatment for which I will suggest two more decentralized sewage
treatment plants.
5.4.1.2 Municipal Solid Waste Management
Presently solid waste collected by the Nasik Corporation from major part of the city, the
focus should be require on management of solid waste in the adjoining areas of the
123

city. The most effective method to manage waste in these semi-urban areas is by
localizing the collection and treatment of the waste, i.e. waste generated - within one
locality is collected and treated within that locality itself. In the commercial areas, it
shall be the responsibility of the traders to collect their own waste and store it at sites
designated by the Nasik Municipal Corporation for collection or transport it
themselves to the treatment sites. The cheapest methods of waste treatment are
heap composting and vermin composting. The organic fertilizer produced from
composting can be sold off to generate money.
Finally, solid waste management depends on the people's attitude and co-
operation. If the entire community shows willingness to mange their waste, there is
nothing that can stop them from doing it. To create this willingness, it takes a lot of hard
work on the part of the experts to educate and spread awareness about solid waste and its
management required by the Nasik Municipal Corporation and various government
authorities.
5.4.1.3 Public Participation
In any conservation project, the role to be played by the public is of utmost
importance. There are many stakeholders involved with the River Godavari.
Various Government Departments, like the Department of Urban Affairs, the Nasik
Municipal Corporation, the Maharashtra State Electricity Board, the Maharashtra
State Pollution Control Board, the Agriculture Department, the Tourism Department,
etc, have a direct role to play with regards to the.river. The main stakeholders are, of
course, the public. A clean River Godavari means better living environment, clean
water to use and even recreation.
The only source of pollution in the river is from anthropogenic activities.
Stopping these activities will be the only solution to restore the river to its pristine
state. The attitude of the people should change completely. They should manage their
wastes in a proper manner instead of directly discharging or dumping them into the
river. The Government departments can only create awareness among the public about
the river and its conservation. It is finally only up to the people to see that the river is
clean. Several NGOs and Self Help Groups are doing a lot of work in spreading
124

awareness and in trying to clean up the River Godavari. These groups should be
encouraged to carry on with their work by the government authorities.
Finally, the Government with its experts and man-power should start an extensive
awareness campaign about cleaning the River Godavari. The high-level meetings and
committees should now start their work in the field and ensure that the people are
made are about the danger of our losing a natural resource and how we can join
hands together to restore it back to an acceptable level, if not to its original pristine
condition.
5.4.2 CONSERVATION MEASURES ALREADY TAKEN BY THE NASIK
CORPORATION
5.4.2.1 Municipal Solid Waste Management
In the year 2001- municipal solid waste plant at pathardi, Nasik was installed by Nasik
Municipal Corporation on BOOT basis. The capacity of the plant for treatment of solid
waste is 300 MT/Day, but presently waste collected by the corporation is 250 MT/day
from the city area only as the total population of Nasik Corporation is 15 Lacs but total
solid waste generated is not collected and treated. The collection system is door to door
on contract basis by tractor trolleys called as Ghanta Gadis. Segregation process on the
site is done be 40-50 rag pickers manually. Three stage segregation with composting
process is working effectively on 23 acres land area, out of that 7 acre area is for land
filling. Sufficient tree plantation is done by the corporation in the premises. From this
process final product compost is manufactured 20 MT/day which is sold to farmers for
use as a manure. Some photographs of the plant are enclosed.
5.4.2.2 Conservation Measures taken for Bio-Medical Waste
The daily quantity of bio- medical waste collected and treated presently is 1500 to 2000
kgs/day, almost all the major hospitals are attached to this common bio- medical facility
run by water grace products on BOOT basis. Collection of BMW waste in Biodegradable
& incinerable bags. Waste collected in specially designed vehicles. The major units of the
treatment process in this plant are
i) Incineration
125

ii) Autoclaving
iii) Shredding.
Some photographs of the BMW plant are enclosed.
5.4.2.3 Sewage Treatment
At Tapowan 78 MLD sewage treatment plant is installed in the year 2003 by the Nasik
Corporation during the Kumbhmela. Presently the plant is working at full capacity; all the
results are within limits as per CPCB norms. The plant is based on UASB technology.
Foaming problems are observed in final polishing pond at site because of the more
washing activities and detergent use. New CCT (Chlorine Contact Tank) Unit installed in
last month to reduce faecal count, Aeration outlet channel construction work was in
progress to reduce foaming, with the help of these channels water will discharge
smoothly in the final polishing ponds instead of pressurized disposal. Incoming flow
observed is as per plant capacity. In addition of that 7.5 MLD ASP based treatment plant
at panchak village, Nasik and 22 MLD plant of UASB based at chehadi village were also
working satisfactorily. New proposed 52 MLD UASB technology based sewage
treatment plant construction work is in progress.
As already discussed in para 5.3 Bar chart and Line, diagram Graghs for the primary and
secondary data enclosed on page nos 127 and 128 also different maps of study stretch of
Godavari River for the year 2003, 2007 and for the month February are enclosed at page
nos. 129— 131. on the basis of these graphs some conclusions are drawn in chapter 6.
126

Bar Chart Showing Godavari River NSFWQI for Primary and Secondary Data
NS 0 2003 ■ 2007 ❑ Dec.2007 ❑ Feb.2008
Sampling Locations
Graph no. 1- NSFWQI 1
100 90 80
FW¢~ 60 50 40 30 20 10
I GaDgap Vi rnia Gods Yapila I Dasak SaOCheda K shawart pam Sameshwar Aaaodwati Bridge saagam SN of Village Village
D 2003 42 38 36 35 32 34 31 I 49 51
■ 2007 52 57 53 44 52 51 39 I 47 I so I 56
O Dec.2007 69 56 I I 52 52 55 42 I 48 I 52 54
k Feb1000 64 57 55 51 51 52 41 47 54 61
Graph no. 2 — NSFWQI 2
12.7

NSFWQI of Godavari River for Primary Data
N S FWQI-3
100 90 80 --.-- 2002 70 -.- 2003 50
2004 50 -~c- 2005 40 -
30 20 -.-2007 2007 10 0
1 2 3 4 5 6 SAMPLING POINTS
Graph no. 3 — NSFWQI 3
NSFWQI Comparision graph of Godavari River for the Year 2003 and 2007
100
80
60 • 2003
40 • 2007
20
0
1 2 3 4 5 6 7 8 9 10 SAMPLING LOCATIONS
Graph no. 4 — NSFWQI 4
NSFWQI of Godavari River for Primary data.
100 - 90 80 70
60 - Dec_2007 50
40 Feb_2008 30 20 10
O
Sampling Locaions
Graph no. 5 — NSFWQI 5
128

U, 0 4..
U 0 —J
= ---2
CL
$ ... 17
— ! ! LE
ts c, •(
Z 2 to
Oj N 2 -It1 U
r_Zv w 10
1071
M 43 ji
• ':: 1; FLJj 5 .
o p/I! cW
'U 5 . . —1 ---- Q 4 II. •
( \ —
\*\ J \
129

L!i I tj 14
i [1
• -P!
) = CL
— & vf: iJi4 •L
CD — •••-
'-I '•> i.
, r E• f
• •.- .
o 0 I I - D
4-. co In - v
0 CD oE E Cl h. 2 2 I-
— x • uu LU •g _'; 2
•• i • i -w
j —''x is
I
cac Of
_ J— > • • ! O.I OW
.2 • E .' — :•: -. cl
LU LU _I
130

c
a-W
IU5
U) C
.0
J
131
0 ti
cTr
0 J
I I - ?• is e c
Eu
may - a «
\)i:' " t .ky' •,~' ~ ~ 41 ~ CI
t7 o o
am ie y f ,i
r• 7~Ir t-~ `7t;~I {~' I T~ ` ';z ~ ~~ tia°~ ~ `psi-1'r ~i-
V:z" 4 ai'~ ; • I ~
1 I.&. [,fig raR 1 G_ Y ® ~' ,% a I FJ _ r:
~..J•~ , i !~'ti!~_= ~ ~ is .~`!`- 1C k` p- •
mac ti's
i yl _
. ,..\ L)
uI:ii;. \\
L1tL a z
N

CHAPTER 6
, C ONC USION AND RECOMMENDATIONS C
The NSFWQI is a versatile and flexible index software using this the calculatuu-vanes
are used to draw graphs like line diagram and bar chart and also a water quality profile of
the Godavari River has been plotted for the year 2002 to the year 2007 and for primary
data also through GIS. From the water quality profile of Godavari River, it is observed
that there is very little variation in the water quality throughout the study stretch of
the river. The NSFWQI values remain in the "bad" and "medium" categories throughout
the selected study stretch. This evidently shows that the river is in a very bad state of
pollution and its entire stretch has been affected and the same is increasing towards
medium and good quality from the year 2003 to the year 2007. Therefore, the following
important conclusions are drawn from the study.
1. Is observed from primary data table 5.2 that the water quality before rGV r
Dam is in the medium ran a but aft r water enterin in to citY it convert bad
range at sampling location 7 and 8 indicates that the river is polluted due to
effluents and sewage it receives from the various sources from Nasik city.
2. The BOD values reveal that the water quality of the Godavari River is o bad
category range due to high content of organic matters in the water mainly at
sampling locations 4, 7 and 8.
3. The water quality index such as NSFWQI is used to ascertain the water quality of
the Godavari River. The NSFWQI indicates the water quality is in between bad
and medium ranges at different locations for primary and secondary data at all
sampling locations.
4. The NSFWQI reveal that the Godavari River is suffering from the high organic ~}c
pollution problem due to sewage water it receives from the various sources 7
mainly at downstream of the Nasik city.
5. The water contains high total coliform and faecal coliform which indicate the
presence of pathogens in the river water.
132
6. Gangapur Dam is the second sampling station where river is almost pollution free
and downstream is the eighth sampling station up to where it receives maximum
pollution from the city.
7 Out of the various indices, NSFWQI is determined in this study. This shows that,
water quality is bad and medium throughout the stretch as its value is between 26
to 50 and 51 to 70 for all locations.
Index values obtained by the NSFWQI have been put into, water quality maps and
graphs to show the changes in the water quality of the River Godavari. From these
maps, it is observed that the water quality of the river has very less variation
throughout the year. It remains polluted throughout the year and no more dilution
has been observed during the monsoon months. This ' mainly due to high faecal
coliform counts and high loads of BOD and COD that the river carries.
Based on the results of water quality assessment of the River Godavari, it is
observed that the overall water quality of the River Godavari is "bad" or
"medium" as fact reflected at all the sampling locations. The NSFWQI
observed between 26 to 50 and 51 to 70 indicates that the water quality of the Godavari
River is between bad — medium range, further the results of the year 2003 and 2007
indicate the improvement in water quality at all locations because of the existing
conservation measures being taken by the Nasik Municipal Corporation. Major stressor
of pollution has been found as pollution due to sewage i.e. organic pollution with main
contribution from faecal coliforms, BOD' and reduced DO. The water quality maps
prepared on the basis of NSFWQI have also indicated the same trend. These maps can
be used to plan conservation measures for achieving the objectives. . Existing
conservations are three sewage treatment plants having capacity 78 MLD, 7.5 MLD
f ' and 22 MLD at Tapowan, Dasak and Takali respectively, solid waste treatment plant
and bio- Medical waste t -a men nt appear to be inadequate to improve the water
quality due to substantial improved p pulation.
In view of above two mo age treatment plants recommended in addition to
improvements in the areas namely municipal solid waste management, bio-medical
waste management, plastic waste, slaughter house waste, e waste etc.
133

REFERENCES
1. Arceivala, S.J., "Waste Water Treatment for Pollution Control", 211d Edition,
Tata McGraw-Hill Publishing Company Limited, New Delhi, 214-17, 2003.
2. APHA — AWWA — WPCF, "Standard methods for the examination of water
and waste water", 19 h̀ Edition, Washington, D.C. 1995.
3. . Bansil, P.C., "Water Management in India", Concept Publishing Company,
New Delhi, 550-558, 2004.
4. Bhardwaj, R.M., "Status of Wastewater generation and Treatment in India",
IWG-Env, International Work Session on Water Statistics, Vienna, 2005.
5. www.mpcb,mah.nic.in.
6. www.cpcb.nic.in/mar95ii.htm
7. Chaudhari N. Water Quality Control., The Indian context central board for
prevention and control of water pollution , New Delhi, 1982
8. Das, D.N., "Studies on the sources of pollution in Tunia river", M.Tech,
Project report, AHEC IITR. Roorkee, 2005.
9. Mahajan, K.K., "Deteriorating Nation's rivers. In: ecology and pollution of
Indian rivers" (Ed. RK Trivedy), Ashish Publishing house, New Delhi. 1-38,
1988.
10. www.sandee.ch/publications.
11. Cude, C.G., "Oregon Water Quality Index: A Tool for Evaluating Water
Quality Management Effectiveness", Journal of the American
Water Resources Association, 37 (1), 125-137, 2001
12. Central Public Health and Environmental Engineering Organisation,
"Manual on Sewerage and Sewage Treatment (Second Edition)", 1993.
13. www.cpcb.nic.in/pcpdiv plan4.htm
134
14 www.cpcb.nic.in
15 Joseph F. Malina, Design of Anaerobic Processes for the treatment of Industrial Microbiology and Municipal waste 7, 13-15 & 59-61.
16. Journal of Environmental Management. 73(3), 229-242, 2004.
17. www.iitr.ernet.in
18. Kumar N., "Pollution Studies on River Ramganga at Moradabad", M.E. Thesis, Environmental Engineering Section, Department of Civil Engineering, University of Roorkee, Roorkee, 1997.
19. The Times of India, New Delhi, "Survey Finds India Overusing its
Groundwater Resources", 22nd March 2006.
20. Odum E.P, `Fundamentals of Ecology', Natraj publisher, Dehradun, 1996.
21. www.environment .gov.au/waier/Quality
22 www.hydrologydatainfo.org
23. www.sciencedirect.com
24. NAS, Planning for Environmental Indices', A Report of Planning Committee
on Environmental Indices, national Academy of . Sciences, Washington D.C.1975.
25. www.bcn.boulder.co.us/basin/watershedJwgi_nsf.html
26. Ott, W.R., `Environmental Indices — Theory and Practice", Ann Arbor
Science Publishers Inc., Michigan, 369-371, 1978.
27. Chapman, D., "Water Quality Assessments", 2nd Edition, E&FN SPON, London, 243-74, 1996.
28. Guidelines for Drinking Water Quality, `Health Criteria and Other Supporting information', WHO, Geneva, 1, 1984, .
135

29. Trivedi, R.R, "Research Methodology and System Analysis", Paper — IX, Indian Institute of Ecology and Environment, New Delhi -30, 28-40, 2000.
30 www.waterontheweb.org/under/waterguality/oxygen.html
31 Citizen report" The state of Indian's environmental centre for science and
environment", New Delhi, India, 1982
32 www.glcf.umiaes.umd.edu/index.shtml
33 Central Pollution Control Board, "The Brahmaputra Basin", sub basin inventory of water pollution, Ministry of Environment & Forests, 31-39,
2000.
34 Mathur, R.P., "Water and waste water testing" (Laboratory Manual), 1St
Edition, Nem Chand & Bros (Publishers), Roorkee, 1982.
35 Mc Carty, P.L.; Parkin, G.F. and Sawyer, C.N, "Chemistry for Environmental
Engineering and Science" 5th Edition, Tata Mc Graw-Hill Publishing
Company Limited, New Delhi, 2003.
36 Peavy, H.S; Row, D.R. and Tchobanoglous, G., `Environmental Engineering",
International Edition, Mc Graw-Hill Book company, New Delhi, 14-
110,1984.
37 Tchobanoglous, G. and Burton, F.L., "Waste Water Engineering", 3 d Edition,
Tata McGraw-Hill Publishing Company Limited, New Delhi, 12-14, 2003.
38 Thomann, R.V. and Mueller, J.A, "Principles of Surface Water Quality
Modeling and Control" 1St Edition, Harper & Row Publishers, New York.
1987. G
39. www.nashikcorporation.com
40. http://www.cpcb.nic.in/dstscontent.htm
136

41. Said, A., Stevens, D.K. and S e h l k e , G., "Environmental Assessment — An Innovative Index for Evaluating Water Quality in Streams", Environmental Management, 34(3), 406-414, 2004.
42. www.water-research.net/watrqualindex/water ualityindex htm
43. Rajesh Baruah, M.Tech (CRL), AHEC, IIT Roorkee, Dissertation Report `Study Of Impact of Domestic Sewage and Industrial Effluent on Water Quality of River Bharalu'2006.
44. Bantehsonglang Blahwar, M.Tech (CRL), AHEC, IIT Roorkee, Dissertation
Report "Water quality assessment and conservation of Umkhrah River" 2006.
45 Dhwajendra Nath Das M.Tech (CRL), AHEC, IIT Roorkee, Dissertation
Report "The Effect on Water of Tunia River Due To Pollution of the Industrialization and Urbanization" 2006.
46 Project Report on Godavari River Water Quality Analysis submitted by Kishor Dabhade for Manipal Sikkim University.2004
47 W.H.O., "Guideline for Drinking Water Quality, World Health Organization", Geneva 3: 121. , 1985.
48 Central Public Health and Environmental Engineering Organisation,
"Manual on Municipal Solid Waste Management. (First Edition)", 2000
49 www.noah.dk/miliosk/vidya.pdf
50 www.nollutedplaces.oig/region/south asialindia/shillon .sg html
51 www.corvallis.kl2.or.us/cvhs/bregard/fb/Wgindex.htm
137