Integrated Water Quality Modelling of the River Zenne (Belgium) Using OpenMI
20
Metadata of the chapter that will be visualized in SpringerLink Book Title Advances in Hydroinformatics Series Title 10174 Chapter Title Integrated Water Quality Modelling of the River Zenne (Belgium) Using Openmi Copyright Year 2014 Copyright HolderName Springer Science+Business Media Singapore Corresponding Author Family Name Leta Particle Given Name Olkeba Tolessa Suffix Division Department of Hydrology and Hydraulic Engineering Organization Vrije Universiteit Brussel Address Pleinlaan 2, 1050, Brussels, Belgium Email [email protected] Author Family Name Shrestha Particle Given Name Narayan Kumar Suffix Division Department of Hydrology and Hydraulic Engineering Organization Vrije Universiteit Brussel Address Pleinlaan 2, 1050, Brussels, Belgium Email Author Family Name Fraine Particle de Given Name Bruno Suffix Division Department of Computer Science Organization Vrije Universiteit Brussel Address Pleinlaan 2, 1050, Brussels, Belgium Email Author Family Name Griensven Particle van Given Name Ann Suffix Division Department of Hydrology and Hydraulic Engineering Organization Vrije Universiteit Brussel Address Pleinlaan 2, 1050, Brussels, Belgium Division UNESCO-IHE Institute for Water Education Organization Core of Hydrology and Water Resources Address Delft, The Netherlands Email
-
Upload
manoa-hawaii -
Category
Documents
-
view
0 -
download
0
Transcript of Integrated Water Quality Modelling of the River Zenne (Belgium) Using OpenMI
Metadata of the chapter that will be visualized inSpringerLink
Book Title Advances in HydroinformaticsSeries Title 10174
Chapter Title Integrated Water Quality Modelling of the River Zenne (Belgium) Using Openmi
Copyright Year 2014
Copyright HolderName Springer Science+Business Media Singapore
Corresponding Author Family Name LetaParticle
Given Name Olkeba TolessaSuffix
Division Department of Hydrology and Hydraulic Engineering
Organization Vrije Universiteit Brussel
Address Pleinlaan 2, 1050, Brussels, Belgium
Email [email protected]
Author Family Name ShresthaParticle
Given Name Narayan KumarSuffix
Division Department of Hydrology and Hydraulic Engineering
Organization Vrije Universiteit Brussel
Address Pleinlaan 2, 1050, Brussels, Belgium
Author Family Name FraineParticle deGiven Name BrunoSuffix
Division Department of Computer Science
Organization Vrije Universiteit Brussel
Address Pleinlaan 2, 1050, Brussels, Belgium
Author Family Name GriensvenParticle vanGiven Name AnnSuffix
Division Department of Hydrology and Hydraulic Engineering
Organization Vrije Universiteit Brussel
Address Pleinlaan 2, 1050, Brussels, Belgium
Division UNESCO-IHE Institute for Water Education
Organization Core of Hydrology and Water Resources
Address Delft, The Netherlands
Author Family Name BauwensParticle
Given Name WillySuffix
Division Department of Hydrology and Hydraulic Engineering
Organization Vrije Universiteit Brussel
Address Pleinlaan 2, 1050, Brussels, Belgium
Abstract The modelling of the different catchment processes is key for integrated water resources management.Constructing a single model for all the catchment processes may not always be a feasible option, and itdoes not make appropriate use of existing models. The Open Modelling Interface (OpenMI), which allowstime-dependent models to exchange data at run-time, might just be useful for such proposes. We used theSoil and Water Assessment Tool (SWAT) and the Storm Water Management Model (SWMM) forsimulating rural and urban catchment processes, respectively. We also used SWMM to model the riverprocesses. To link these models in OpenMI, both models were migrated to the OpenMI platform. As thewater quality processes in SWAT are based on the QUAL2E process description, a new OpenMI compliantwater quality module that is based on the same principles was developed to simulate the water qualityprocesses in the river. The latter model, which uses a river network that is similar to that of the SWMMriver model, is then also linked to the SWMM model using OpenMI. We tested this integrated model forthe river Zenne in Belgium. The integrated model results show that such integration can be very useful as adecision support tools for integrated river basin management approach.
Keywords (separated by '-') OpenMI - SWAT - SWMM - Water quantity model - Water quality model - Integrated modelling
UN
CO
RR
ECTE
DPR
OO
F
1 Integrated Water Quality Modelling2 of the River Zenne (Belgium) Using3 Openmi
4 Olkeba Tolessa Leta, Narayan Kumar Shrestha, Bruno de Fraine,5 Ann van Griensven and Willy Bauwens
6 Abstract The modelling of the different catchment processes is key for integrated7 water resources management. Constructing a single model for all the catchment8 processes may not always be a feasible option, and it does not make appropriate9 use of existing models. The Open Modelling Interface (OpenMI), which allows
10 time-dependent models to exchange data at run-time, might just be useful for such11 proposes. We used the Soil and Water Assessment Tool (SWAT) and the Storm12 Water Management Model (SWMM) for simulating rural and urban catchment13 processes, respectively. We also used SWMM to model the river processes. To14 link these models in OpenMI, both models were migrated to the OpenMI platform.15 As the water quality processes in SWAT are based on the QUAL2E process16 description, a new OpenMI compliant water quality module that is based on the17 same principles was developed to simulate the water quality processes in the river.18 The latter model, which uses a river network that is similar to that of the SWMM19 river model, is then also linked to the SWMM model using OpenMI. We tested this20 integrated model for the river Zenne in Belgium. The integrated model results21 show that such integration can be very useful as a decision support tools for22 integrated river basin management approach.
23 Keywords OpenMI � SWAT � SWMM � Water quantity model � Water quality24 model � Integrated modelling25
O. T. Leta (&) � N. K. Shrestha � A. van Griensven � W. BauwensDepartment of Hydrology and Hydraulic Engineering, Vrije Universiteit Brussel,Pleinlaan 2, 1050 Brussels, Belgiume-mail: [email protected]
B. de FraineDepartment of Computer Science, Vrije Universiteit Brussel, Pleinlaan 2,1050 Brussels, Belgium
A. van GriensvenUNESCO-IHE Institute for Water Education, Core of Hydrology and Water Resources,Delft, The Netherlands
AQ1
Layout: T1 Standard SC Book ID: 308561_1_En Book ISBN: 978-981-4451-41-3Chapter No.: 22 Date: 30-5-2013 Page: 1/16
P. Gourbesville et al. (eds.), Advances in Hydroinformatics,Springer Hydrogeology, DOI: 10.1007/978-981-4451-42-0_22,� Springer Science+Business Media Singapore 2014
1
Au
tho
r P
roo
f
UN
CO
RR
ECTE
DPR
OO
F
26 1 Introduction
27 The awareness of water quality issues and the environmental policy has gained28 increased importance in recent years. For example, in 2000, the European Union29 has launched the Water Framework Directive (EU-WFD) which calls to achieve a30 good water quality and a good ecological status by 2015 through integrated river31 basin management [1]. In this framework, integrated modelling of the water32 quantity and quality processes is essential to assess the present and future quality33 of the water bodies. Apart from water quantity and quality assessment, integrated34 modelling can help decision makers to better understand environmental problems35 and to design appropriate mitigation measures [2, 3]. In the realm of integrated36 modelling, different water quantity and quality processes need to be considered37 without neglecting the most important physical phenomena: the upland rural38 catchment processes, the hydraulics of the river and the in-stream transport and39 conversion processes of water quality constituents.40 There exist numerous environmental simulators for the modelling of the upland41 catchment processes. These models differ in terms of complexity for the repre-42 sentation of the physical processes, in temporal and spatial scales and regarding43 the input data requirements. For example, hydrological models such as the Soil and44 Water Assessment Tool (SWAT) [4] and SHE [5] are widely used for upland45 catchment modelling and also contain water quality modules. In general, the46 hydrological models provide a detailed representation of the upland processes but47 use simplified routing techniques for the receiving water bodies [3].48 As a typical example of a hydrological simulator, SWAT considers the inter-49 actions between water, soil and plants—the latter being quite important in view of50 the modelling of the nutrient processes—in the upland catchments in a quite51 detailed way [6–11], but its river routing modules—the variable storage method52 [12] or the Muskingum method [13]—are just simplified approximations of the53 kinematic wave equation and cannot take backwater effects into consideration [2].54 In addition, hydraulic structures such as weirs, locks, orifices, pumps and gates55 cannot be implemented in SWAT. Hence, to be generally applicable for integrated56 catchment modelling, SWAT needs an improvement of its routing modules by57 replacing these modules by a dynamic wave routing approach or it should be58 coupled with a hydraulic model that uses such an approach.59 As opposed to most hydrological simulators, the hydraulic simulators generally60 consider the full dynamic wave equation for river routing and are thus able to61 account for backwater effect and to represent various hydraulic structures. Some of62 these simulators also consider the in-stream transport and conversion of water63 quality constituents in a more or less detailed way. Examples of such simulators64 are the Storm Water Management Model (SWMM) [14], HEC-RAS [15] and65 MIKE11 [16]. The weak point of these simulators is that they generally represent66 the upland catchment processes in a simplified way [2]. Therefore, the hydraulic67 models also need to be complemented by more detailed hydrological models.
2 O. T. Leta et al.
Layout: T1 Standard SC Book ID: 308561_1_En Book ISBN: 978-981-4451-41-3Chapter No.: 22 Date: 30-5-2013 Page: 2/16
Au
tho
r P
roo
f
UN
CO
RR
ECTE
DPR
OO
F
68 An optimal solution to the problem consists of integrating various types of69 models, thereby making use of one’s strength over the other’s weakness. Brandmeyer70 and Karimi [17] provide an overview of various coupling techniques for environ-71 mental modelling. Recently, the Open Modelling Interface (OpenMI) [18]—based72 coupling is getting more and more attention for integrated modelling because (1) it73 makes use of existing models [18], (2) it ensures dynamic linking of data between74 time-dependent models at run-time and thereby eliminates the time-consuming and75 error-prone task of data extraction and conversion [17, 19], (3) it offers flexibility and76 a generic model integration [2], and (4) it allows for the reuse of models [19]. Hence,77 we also used the OpenMI coupling method.78 In this paper, we present an OpenMI-based fully integrated modelling approach79 to simulate the in-stream water quality process applied to the river Zenne, Bel-80 gium. For the rural catchments of our study case, we used SWAT to simulate both81 flow and water quality variables. To represent the river processes, as well as the82 processes in the major sewer systems, we selected SWMM. In addition, as SWMM83 lacks a detailed representation of the water quality processes, we developed a new84 water quality simulation tool. The latter is based on the QUAL2E [20] principles.85 Although the QUAL2E approach has some clear shortcomings [21], the approach86 was chosen because of its wide applicability and simplicity. More important, as the87 representation of the water quality processes in SWAT is based on the same88 principles, the same state variables could be used for both models. Finally, to89 address the temperature effects on the kinetic parameters of water quality simu-90 lator, we developed a new model code to calculate the stream water temperature.91 The temperature simulator assumes a nonlinear relationship between air and92 stream water temperature, as suggested by Mohseni et al. [22].93 To be able to link these different components in the OpenMI platform, we94 migrated the existing modelling tools (SWAT and SWMM) to the OpenMI standard95 by rearranging the engine core, while the new model codes were directly conceived96 in an OpenMI compliant way. The main objective of this paper is to test the97 applicability and usefulness of OpenMI-based integrated water quality modelling.98 A brief description of the study basin and the used different models for inte-99 grated water quality modelling are given in Sect. 2. Section 2 also provides details
100 on the data used including the calibration strategy, and the structure for integrated101 water quality modelling. Results of the application for the integrated models are102 shown and discussed in Sect. 3. Final conclusions are formulated in Sect. 4.
103 2 Materials and Methods
104 2.1 Description of the Models
105 SWAT is a physically based, semi-distributed, hydrological and water quality106 simulator that operates on different time steps at a basin scale. SWAT was orig-107 inally developed to predict the impact of watershed management on water,
Integrated Water Quality Modelling of the River Zenne 3
Layout: T1 Standard SC Book ID: 308561_1_En Book ISBN: 978-981-4451-41-3Chapter No.: 22 Date: 30-5-2013 Page: 3/16
Au
tho
r P
roo
f
UN
CO
RR
ECTE
DPR
OO
F
108 sediment, nutrients and agricultural and chemical yields at basin scale [4]. Addi-109 tionally, SWAT can integrate complex watersheds with varying land use, weather,110 soils, topography and management conditions over a long period of time. The111 model is interfaced with a geographic information system (GIS) to integrate112 various spatial and hydro-meteorological data [23]. A watershed is divided into a113 number of subbasins that have homogeneous climatic conditions [24]. Subbasins114 are further subdivided into hydrological response units (HRUs) based on a115 homogenous combination of land use, soil type and slope [25]. The water balance116 equation includes precipitation, surface runoff, actual evapotranspiration, interflow117 and return flow components profile [26]. The simulator uses a modification of the118 Soil Conservation Service Curve Number (SCS-CN) method [27], which deter-119 mines the surface run-off based on the antecedent moisture content for each HRU,120 or alternatively, it uses the Green and Ampt method as modified by Mein and121 Larson [28] if subdaily precipitation data are provided. The percolation through122 each soil layer is estimated using a storage routing techniques [29]. SWAT offers123 three options to estimate the potential evapotranspiration (PET) from climatic124 data: the Penman-Monteith method [30], the Hargreaves method [31] and the125 Priestley-Taylor method [32]. River routing can be performed by the variable126 storage method [12] or by the Muskingum method [13].127 SWAT simulates the nutrient cycles for nitrogen and phosphorous in the soil128 profile and in the shallow aquifer by considering mineralization, decomposition129 and immobilization processes from different pools. For the nitrogen cycle, the130 model considers five pools: two inorganic forms (ammonium and nitrate) and three131 organic forms (fresh, stable and active). Similarly, the phosphorous cycle is132 monitored at six different pools: three inorganic and three organic forms. The river133 water quality module, which is incorporated into the SWAT, is based on the134 concepts of QUAL2E [20]. Variables that can be simulated include nutrients,135 biochemical oxygen demand, dissolved oxygen and microorganisms [6, 26].136 SWMM is a dynamic rainfall runoff and conduit or channel flow simulation137 model, aiming at computing the run-off quantity and quality primarily from urban138 areas. SWMM can be used for both continuous and single event modelling. A139 drainage system in the SWMM is modelled as a series of water and material flows140 between four major subunits: the atmosphere compartment, the land surface com-141 partment, the groundwater compartment and the transport compartment [14]. The142 latter takes care of the flow routing, based on the dynamic wave routing approach143 (or approximations of the latter). It allows also for the representation of many types144 of hydraulic structures in the system and the definition of their operation rules.145 The developed in-stream water quality model incorporates the water constitu-146 ents interactions based on the principles and concepts of QUAL2E [20]. The147 stoichiometric matrix with the process rates for the water quality model is shown148 in Table 1. The model contains 9 state variables and 15 processes.149 The temperature model uses a regression model between air and stream tem-150 perature. Such model has lesser calculation overhead and proved to be quite151 accurate too. A nonlinear fit of the type as suggested by Mohseni et al. [22] is used.152 Besides, thermal discharges—for example, from WWTPs—can be considered.
4 O. T. Leta et al.
Layout: T1 Standard SC Book ID: 308561_1_En Book ISBN: 978-981-4451-41-3Chapter No.: 22 Date: 30-5-2013 Page: 4/16
Au
tho
r P
roo
f
UN
CO
RR
ECTE
DPR
OO
F
Tab
le1
Sto
ichi
omet
ric
mat
rix
ofth
ew
ater
qual
ity
mod
elw
ith
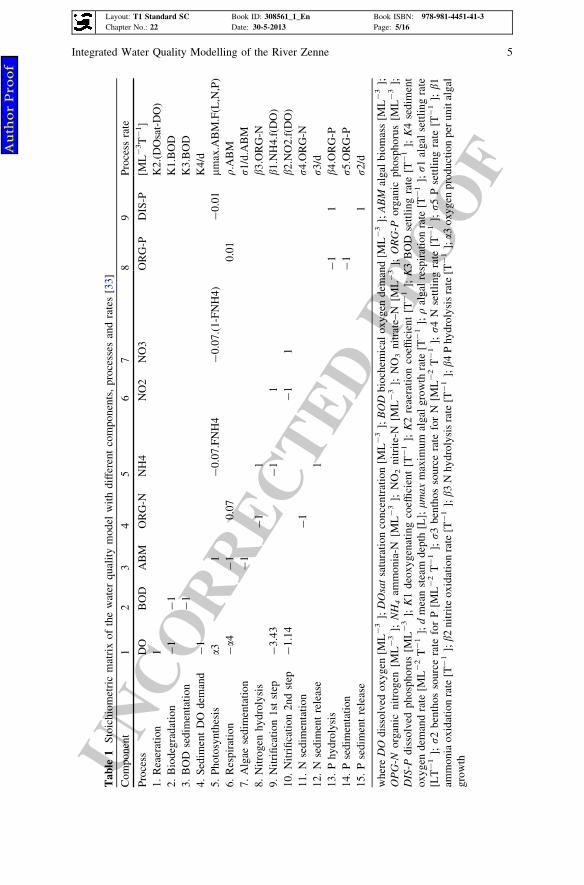
diff
eren
tco
mpo
nent
s,pr
oces
ses
and
rate
s[3
3]
Com
pone
nt1
23
45
67
89
Pro
cess
rate
Pro
cess
DO
BO
DA
BM
OR
G-N
NH
4N
O2
NO
3O
RG
-PD
IS-P
[ML
-3T
-1]
1.R
eaer
atio
n1
K2.
(DO
sat-
DO
)2.
Bio
degr
adat
ion
-1
-1
K1.
BO
D3.
BO
Dse
dim
enta
tion
-1
K3.
BO
D4.
Sed
imen
tD
Ode
man
d-
1K
4/d
5.P
hoto
synt
hesi
sa3
1-
0.07
.FN
H4
-0.
07.(
1-F
NH
4)-
0.01
lmax
.AB
M.F
(L,N
,P)
6.R
espi
rati
on-
a4-
10.
070.
01q.
AB
M7.
Alg
aese
dim
enta
tion
-1
r1/d
.AB
M8.
Nit
roge
nhy
drol
ysis
-1
1b3
.OR
G-N
9.N
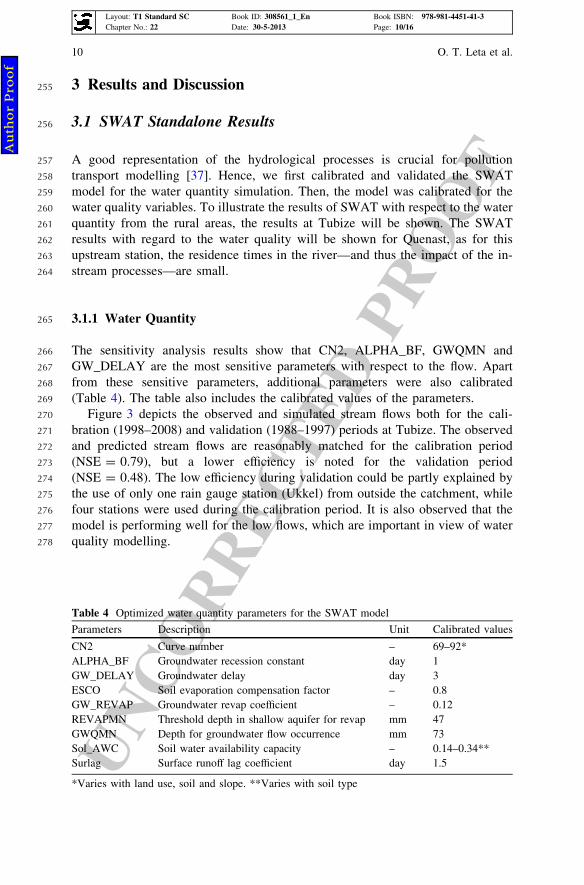
itri
fica
tion
1st
step
-3.
43-
11
b1.N
H4.
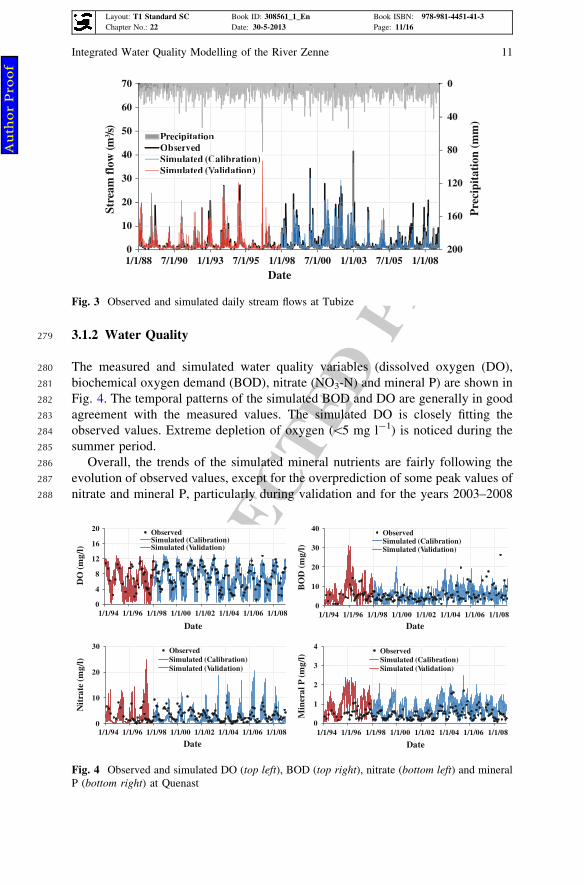
f(D
O)
10.
Nit
rifi
cati
on2n
dst
ep-
1.14
-1
1b2
.NO
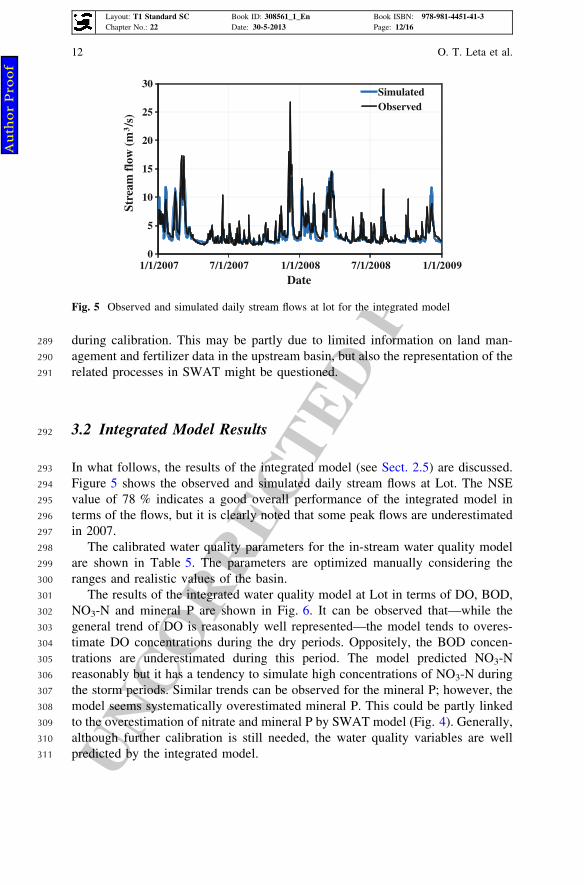
2.f(
DO
)11
.N
sedi
men
tati
on-
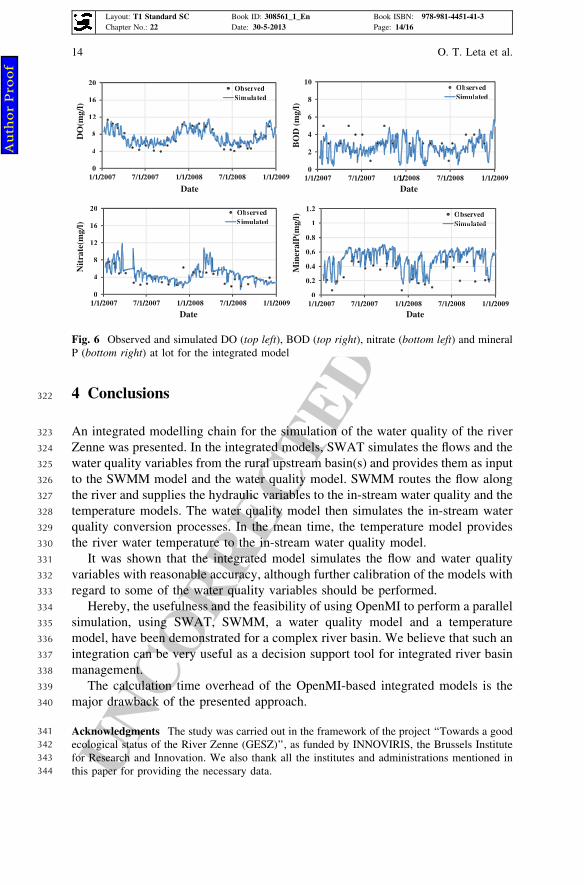
1r4
.OR
G-N
12.
Nse
dim
ent
rele
ase
1r3
/d13
.P
hydr
olys
is-
11
b4.O
RG
-P14
.P
sedi
men
tati
on-
1r5
.OR
G-P
15.
Pse
dim
ent
rele
ase
1r2
/d
whe
reD
Odi
ssol
ved
oxyg
en[M
L-
3];
DO
sat
satu
rati
onco
ncen
trat
ion
[ML
-3
];B
OD
bioc
hem
ical
oxyg
ende
man
d[M
L-
3];
AB
Mal
gal
biom
ass
[ML
-3
];O
PG
-Nor
gani
cni
trog
en[M
L-
3];
NH
4am
mon
ia-N
[ML
-3
];N
O2
nitr
ite-
N[M
L-
3];
NO
3ni
trat
e–N
[ML
-3
];O
RG
-Por
gani
cph
osph
orus
[ML
-3
];D
IS-P
diss
olve
dph
osph
orus
[ML
-3
];K
1de
oxyg
enat
ing
coef
fici
ent
[T-
1];
K2
reae
rati
onco
effi
cien
t[T
-1
];K
3B
OD
sett
ling
rate
[T-
1];
K4
sedi
men
tox
ygen
dem
and
rate
[ML
-2
T-
1];
dm
ean
stea
mde
pth
[L];
lm
axm
axim
umal
gal
grow
thra
te[T
-1
];q
alga
lre
spir
atio
nra
te[T
-1
];r1
alga
lse
ttli
ngra
te[L
T-
1];
r2
bent
hos
sour
cera
tefo
rP
[ML
-2
T-
1];
r3
bent
hos
sour
cera
tefo
rN
[ML
-2
T-
1];
r4
Nse
ttli
ngra
te[T
-1
];r5
Pse
ttli
ngra
te[T
-1
];b1
amm
onia
oxid
atio
nra
te[T
-1
];b2
nitr
ite
oxid
atio
nra
te[T
-1
];b3
Nhy
drol
ysis
rate
[T-
1];
b4P
hydr
olys
isra
te[T
-1
];a3
oxyg
enpr
oduc
tion
per
unit
alga
lgr
owth
Integrated Water Quality Modelling of the River Zenne 5
Layout: T1 Standard SC Book ID: 308561_1_En Book ISBN: 978-981-4451-41-3Chapter No.: 22 Date: 30-5-2013 Page: 5/16
Au
tho
r P
roo
f
UN
CO
RR
ECTE
DPR
OO
F
153 2.2 The Study Area
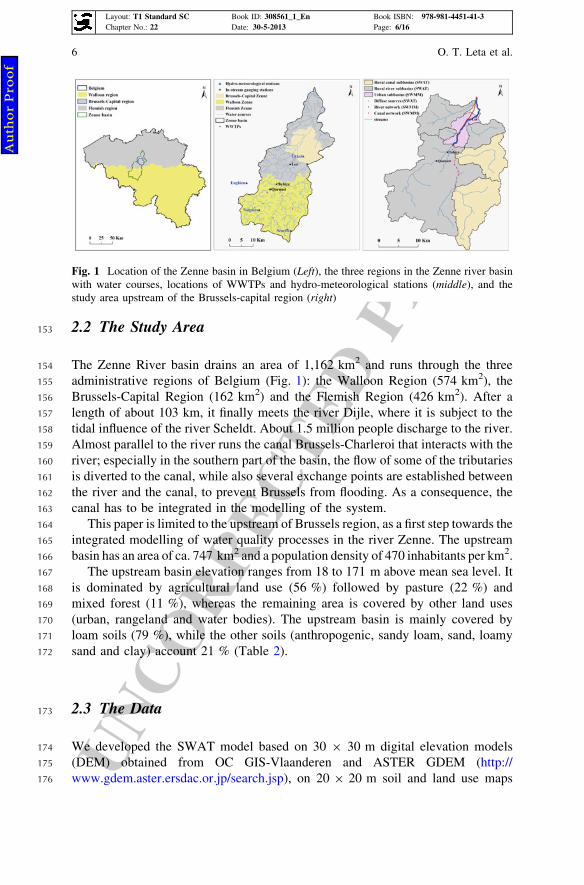
154 The Zenne River basin drains an area of 1,162 km2 and runs through the three155 administrative regions of Belgium (Fig. 1): the Walloon Region (574 km2), the156 Brussels-Capital Region (162 km2) and the Flemish Region (426 km2). After a157 length of about 103 km, it finally meets the river Dijle, where it is subject to the158 tidal influence of the river Scheldt. About 1.5 million people discharge to the river.159 Almost parallel to the river runs the canal Brussels-Charleroi that interacts with the160 river; especially in the southern part of the basin, the flow of some of the tributaries161 is diverted to the canal, while also several exchange points are established between162 the river and the canal, to prevent Brussels from flooding. As a consequence, the163 canal has to be integrated in the modelling of the system.164 This paper is limited to the upstream of Brussels region, as a first step towards the165 integrated modelling of water quality processes in the river Zenne. The upstream166 basin has an area of ca. 747 km2 and a population density of 470 inhabitants per km2.167 The upstream basin elevation ranges from 18 to 171 m above mean sea level. It168 is dominated by agricultural land use (56 %) followed by pasture (22 %) and169 mixed forest (11 %), whereas the remaining area is covered by other land uses170 (urban, rangeland and water bodies). The upstream basin is mainly covered by171 loam soils (79 %), while the other soils (anthropogenic, sandy loam, sand, loamy172 sand and clay) account 21 % (Table 2).
173 2.3 The Data
174 We developed the SWAT model based on 30 9 30 m digital elevation models175 (DEM) obtained from OC GIS-Vlaanderen and ASTER GDEM (http://176 www.gdem.aster.ersdac.or.jp/search.jsp), on 20 9 20 m soil and land use maps
Fig. 1 Location of the Zenne basin in Belgium (Left), the three regions in the Zenne river basinwith water courses, locations of WWTPs and hydro-meteorological stations (middle), and thestudy area upstream of the Brussels-capital region (right)
6 O. T. Leta et al.
Layout: T1 Standard SC Book ID: 308561_1_En Book ISBN: 978-981-4451-41-3Chapter No.: 22 Date: 30-5-2013 Page: 6/16
Au
tho
r P
roo
f
UN
CO
RR
ECTE
DPR
OO
F
177 from OC GIS-Vlaanderen and the Carte Numérique des Sols de Wallonie (http://178 cartographie.wallonie.be/NewPortailCarto/) and on Corrine data from Ministère de179 la Région Wallonne- Générale de I’Aménagement du Territoire, du Logement et180 du Patrimoine (MRW- DGATLP).181 For the SWMM river and canal model, we used the geometric data of the river182 sections with an approximate spatial resolution of 100 m, in combination with data183 of the hydraulic structures, as provided by Flanders Hydraulic Research-Water-184 bouwkundig Laboratorium (http://www.watlab.be/en).185 We obtained daily precipitation data for 3 stations (Enghien, Soignies, Seneffe)186 of the Direction Générale Opérationnelle de la Mobilité et des Voies Hydrauliques187 of the Walloon Region (DGVH) (http://voies-hydrauliques.wallonie.be/opencms/188 opencms/fr/hydro/Archive/annuaires/index.html) and for one station (Ukkel) of189 the Royal Meteorological Institute of Belgium. Daily maximum and minimum190 temperatures, wind speed, solar radiation and relative humidity were also available191 for the Ukkel station.192 We estimated the point sources from households and industry based on the193 assessment of the inhabitant equivalents (IE) and considering a water consumption194 of 150 l/day.IE, 60 g BOD/day.IE, 10 g Kjeldahl nitrogen/day.IE and 2.2 g total195 phosphorous/day.IE. We considered the wastewater treatment efficiencies based on196 data for the different wastewater treatment plants (WWTPs) design capacity197 (Table 3). For the assessment of the diffuse pollution by SWAT, we used the198 following annual average application of fertilizers: 125 kg ha-1 mineral N,199 12 kg ha-1 mineral P and 79 kg ha-1 organic N (OrgN), as obtained from200 Direction Générale Opérationnelle Agriculture, Ressources Naturelles et Envi-201 ronnement (DGARNE) (http://aqualim.environnement.wallonie.be). As data for202 organic P (OrgP) were not available, we used a ratio of OrgN to OrgP of 2.2, based203 on data for the Flemish Region.204 For the calibration of the flow models, we used daily flow data at Tubize (DGVH)205 and at Lot (Vlaamse Milieu Maatschappij, VMM) (http://www.hydronet.be).206 Pollutant concentrations were available at Quenast (DGARNE) and at Lot (VMM)207 for the calibration of the water quality models (Fig. 1).
Table 2 Land use and soil characteristics of the upstream Zenne basin
Land use Soil
Type Area (km2) % Type Area (km2) %
Agriculture 416 56 Loam 590 79Pasture 167 22 Anthropogenic 87 12Forest 82 11 Sandy loam 46 6Urban 72 10 Sandy 13 2Rangeland 5 1 Loamy sand 6 1Water 5 1 Clay 4 1
Integrated Water Quality Modelling of the River Zenne 7
Layout: T1 Standard SC Book ID: 308561_1_En Book ISBN: 978-981-4451-41-3Chapter No.: 22 Date: 30-5-2013 Page: 7/16
Au
tho
r P
roo
f
UN
CO
RR
ECTE
DPR
OO
F
208 2.4 Model Set-Up
209 We built the SWAT model for the upstream basin based on the DEM, the land use210 map, the soil map and the hydro-meteorological data sets of the basin. The model211 consists of 33 subbasins and 214 HRUs. We set up the SWAT model for the period212 1985–2008. The WWTPs in the Walloon Region were considered as explicit in213 Sect. 2.3.214 A SWMM network has been developed for the reach between the border of215 Walloon–Flemish Region and the Brussels-Capital Region. Hereby, the river and216 the canal are segmented in intervals of ca. 100 m or less. In addition, the infor-217 mation on special structures on the river such as weirs, orifice and locks and their218 control rules has been implemented. A diversion structure between the river and219 the canal is implemented a few km downstream of the Walloon–Flemish border.220 The WWTPs of Beersel and St. Pt. Leeuw were considered as explicit in Sect. 2.3,221 and a simplified representation of its sewer system was implemented in SWMM.222 The SWMM gets its in-flow boundaries from the SWAT model during run-time.223 The SWMM network is further also used to represent the system for the water224 quality and the temperature models.
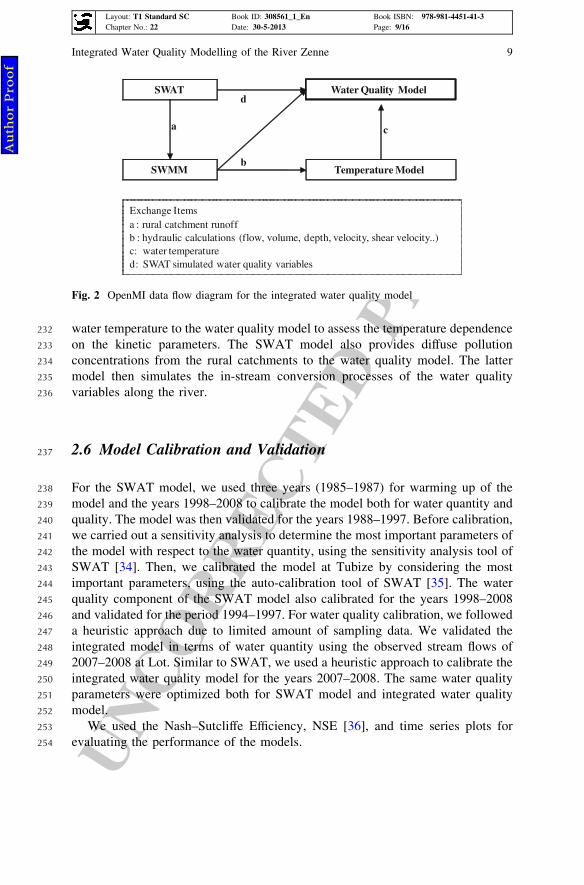
225 2.5 Model Integration
226 The integrated model consists of 4 OpenMI compliant models (SWAT, SWMM,227 the water quality model and the temperature model) as summarized in Fig. 2. The228 SWAT model provides the run-off from the rural catchments to the SWMM model229 that calculates the hydraulic variables in the river reaches and provides them to the230 temperature and the water quality models. SWMM is also used to simulate the231 flows in the (simplified) sewer networks. The temperature model provides stream
Table 3 WWTPs design capacity of the upstream Zenne Basin
WWTP
Name Design capacity(IE)
Region Name Design capacity(IE)
Region
Av.Behault 5,400 Walloon R. PontDemeur
25,000 Walloon
Itrre/Catala 5,600 Walloon St. Pt. Leeuw 30,000 FlemishRuc de L’ave
del7,300 Walloon Monstreux 44,450 Walloon
Braine-le-Comte
11,500 Walloon Beersel 50,000 Flemish
Biamont 14,000 Walloon Soudromont 65,000 Walloon
Sources Société Publique de la Gestion de l’Eau, SPGE (http://www.spge.be) of Walloon regionand Aquafin (http://www.aquafin.be) of Flemish region
8 O. T. Leta et al.
Layout: T1 Standard SC Book ID: 308561_1_En Book ISBN: 978-981-4451-41-3Chapter No.: 22 Date: 30-5-2013 Page: 8/16
Au
tho
r P
roo
f
UN
CO
RR
ECTE
DPR
OO
F
232 water temperature to the water quality model to assess the temperature dependence233 on the kinetic parameters. The SWAT model also provides diffuse pollution234 concentrations from the rural catchments to the water quality model. The latter235 model then simulates the in-stream conversion processes of the water quality236 variables along the river.
237 2.6 Model Calibration and Validation
238 For the SWAT model, we used three years (1985–1987) for warming up of the239 model and the years 1998–2008 to calibrate the model both for water quantity and240 quality. The model was then validated for the years 1988–1997. Before calibration,241 we carried out a sensitivity analysis to determine the most important parameters of242 the model with respect to the water quantity, using the sensitivity analysis tool of243 SWAT [34]. Then, we calibrated the model at Tubize by considering the most244 important parameters, using the auto-calibration tool of SWAT [35]. The water245 quality component of the SWAT model also calibrated for the years 1998–2008246 and validated for the period 1994–1997. For water quality calibration, we followed247 a heuristic approach due to limited amount of sampling data. We validated the248 integrated model in terms of water quantity using the observed stream flows of249 2007–2008 at Lot. Similar to SWAT, we used a heuristic approach to calibrate the250 integrated water quality model for the years 2007–2008. The same water quality251 parameters were optimized both for SWAT model and integrated water quality252 model.253 We used the Nash–Sutcliffe Efficiency, NSE [36], and time series plots for254 evaluating the performance of the models.
SWAT
SWMM
Water Quality Model
Temperature Model
a
b
c
Exchange Itemsa : rural catchment runoffb : hydraulic calculations (flow, volume, depth, velocity, shear velocity..) c: water temperatured: SWAT simulated water quality variables
d
Fig. 2 OpenMI data flow diagram for the integrated water quality model
Integrated Water Quality Modelling of the River Zenne 9
Layout: T1 Standard SC Book ID: 308561_1_En Book ISBN: 978-981-4451-41-3Chapter No.: 22 Date: 30-5-2013 Page: 9/16
Au
tho
r P
roo
f
UN
CO
RR
ECTE
DPR
OO
F
255 3 Results and Discussion
256 3.1 SWAT Standalone Results
257 A good representation of the hydrological processes is crucial for pollution258 transport modelling [37]. Hence, we first calibrated and validated the SWAT259 model for the water quantity simulation. Then, the model was calibrated for the260 water quality variables. To illustrate the results of SWAT with respect to the water261 quantity from the rural areas, the results at Tubize will be shown. The SWAT262 results with regard to the water quality will be shown for Quenast, as for this263 upstream station, the residence times in the river—and thus the impact of the in-264 stream processes—are small.
265 3.1.1 Water Quantity
266 The sensitivity analysis results show that CN2, ALPHA_BF, GWQMN and267 GW_DELAY are the most sensitive parameters with respect to the flow. Apart268 from these sensitive parameters, additional parameters were also calibrated269 (Table 4). The table also includes the calibrated values of the parameters.270 Figure 3 depicts the observed and simulated stream flows both for the cali-271 bration (1998–2008) and validation (1988–1997) periods at Tubize. The observed272 and predicted stream flows are reasonably matched for the calibration period273 (NSE = 0.79), but a lower efficiency is noted for the validation period274 (NSE = 0.48). The low efficiency during validation could be partly explained by275 the use of only one rain gauge station (Ukkel) from outside the catchment, while276 four stations were used during the calibration period. It is also observed that the277 model is performing well for the low flows, which are important in view of water278 quality modelling.
Table 4 Optimized water quantity parameters for the SWAT model
Parameters Description Unit Calibrated values
CN2 Curve number – 69–92*ALPHA_BF Groundwater recession constant day 1GW_DELAY Groundwater delay day 3ESCO Soil evaporation compensation factor – 0.8GW_REVAP Groundwater revap coefficient – 0.12REVAPMN Threshold depth in shallow aquifer for revap mm 47GWQMN Depth for groundwater flow occurrence mm 73Sol_AWC Soil water availability capacity – 0.14–0.34**Surlag Surface runoff lag coefficient day 1.5
*Varies with land use, soil and slope. **Varies with soil type
10 O. T. Leta et al.
Layout: T1 Standard SC Book ID: 308561_1_En Book ISBN: 978-981-4451-41-3Chapter No.: 22 Date: 30-5-2013 Page: 10/16
Au
tho
r P
roo
f
UN
CO
RR
ECTE
DPR
OO
F
279 3.1.2 Water Quality
280 The measured and simulated water quality variables (dissolved oxygen (DO),281 biochemical oxygen demand (BOD), nitrate (NO3-N) and mineral P) are shown in282 Fig. 4. The temporal patterns of the simulated BOD and DO are generally in good283 agreement with the measured values. The simulated DO is closely fitting the284 observed values. Extreme depletion of oxygen (\5 mg l-1) is noticed during the285 summer period.286 Overall, the trends of the simulated mineral nutrients are fairly following the287 evolution of observed values, except for the overprediction of some peak values of288 nitrate and mineral P, particularly during validation and for the years 2003–2008
0
40
80
120
160
2000
10
20
30
40
50
60
70
1/1/88 7/1/90 1/1/93 7/1/95 1/1/98 7/1/00 1/1/03 7/1/05 1/1/08
Pre
cipi
tati
on (
mm
)
Stre
am f
low
(m3 /s
)
Date
Prece ipitationnObsservedSimmulated (CCalibratiion)Simmulated (VVaVV lidatioon)
Fig. 3 Observed and simulated daily stream flows at Tubize
0
4
8
12
16
20
1/1/94 1/1/96 1/1/98 1/1/00 1/1/02 1/1/04 1/1/06 1/1/08
DO
(mg/
l)
Date
ObservedSimulated (Calibration)Simulated (Validation)
0
10
20
30
40
1/1/94 1/1/96 1/1/98 1/1/00 1/1/02 1/1/04 1/1/06 1/1/08
BO
D (
mg/
l)
Date
ObservedSimulated (Calibration)Simulated (Validation)
0
10
20
30
1/1/94 1/1/96 1/1/98 1/1/00 1/1/02 1/1/04 1/1/06 1/1/08
Nit
rate
(mg/
l)
Date
ObservedSimulated (Calibration)Simulated (Validation)
0
1
2
3
4
1/1/94 1/1/96 1/1/98 1/1/00 1/1/02 1/1/04 1/1/06 1/1/08
Min
eral
P (m
g/l)
Date
ObservedSimulated (Calibration)Simulated (Validation)
Fig. 4 Observed and simulated DO (top left), BOD (top right), nitrate (bottom left) and mineralP (bottom right) at Quenast
Integrated Water Quality Modelling of the River Zenne 11
Layout: T1 Standard SC Book ID: 308561_1_En Book ISBN: 978-981-4451-41-3Chapter No.: 22 Date: 30-5-2013 Page: 11/16
Au
tho
r P
roo
f
UN
CO
RR
ECTE
DPR
OO
F
289 during calibration. This may be partly due to limited information on land man-290 agement and fertilizer data in the upstream basin, but also the representation of the291 related processes in SWAT might be questioned.
292 3.2 Integrated Model Results
293 In what follows, the results of the integrated model (see Sect. 2.5) are discussed.294 Figure 5 shows the observed and simulated daily stream flows at Lot. The NSE295 value of 78 % indicates a good overall performance of the integrated model in296 terms of the flows, but it is clearly noted that some peak flows are underestimated297 in 2007.298 The calibrated water quality parameters for the in-stream water quality model299 are shown in Table 5. The parameters are optimized manually considering the300 ranges and realistic values of the basin.301 The results of the integrated water quality model at Lot in terms of DO, BOD,302 NO3-N and mineral P are shown in Fig. 6. It can be observed that—while the303 general trend of DO is reasonably well represented—the model tends to overes-304 timate DO concentrations during the dry periods. Oppositely, the BOD concen-305 trations are underestimated during this period. The model predicted NO3-N306 reasonably but it has a tendency to simulate high concentrations of NO3-N during307 the storm periods. Similar trends can be observed for the mineral P; however, the308 model seems systematically overestimated mineral P. This could be partly linked309 to the overestimation of nitrate and mineral P by SWAT model (Fig. 4). Generally,310 although further calibration is still needed, the water quality variables are well311 predicted by the integrated model.
0
5
10
15
20
25
30
1/1/2007 7/1/2007 1/1/2008 7/1/2008 1/1/2009
Stre
am f
low
(m
3/s
)
Date
SimulatedObserved
Fig. 5 Observed and simulated daily stream flows at lot for the integrated model
12 O. T. Leta et al.
Layout: T1 Standard SC Book ID: 308561_1_En Book ISBN: 978-981-4451-41-3Chapter No.: 22 Date: 30-5-2013 Page: 12/16
Au
tho
r P
roo
f

UN
CO
RR
ECTE
DPR
OO
F312 While the results of this study seem promising with respect to the potential of313 OpenMI, it should be mentioned that the approach involves a significant calcu-314 lation time overhead. When compared to a standalone SWMM simulation of the315 considered system, the calculation time for the integrated model is increased by a316 factor of 3–4. The latter is due to the chain of request–reply calls between the317 models. Hereby, it should be kept in mind that the parallel application of the318 different models, whereby information has to be exchanged between several319 models for each of the model reaches/junctions, is an extreme case with regard to320 the application of OpenMI. The latter is indeed most often used to link models at a321 limited number of junctions only.
Table 5 Calibrated parameter values for the water quality model
Parameters Description Unit Ranges Calibrated values
K1 BOD deoxygenation ratecoefficient
day-1 0.02–3.4 0.21
K2 Oxygen recreation rate day-1 0–100 1K3 Rate loss of BOD due to
settlingday-1 -0.36–0.36 0.36
K4 Sediment oxygen demandrate
mgO2m-2
day-1Variable 2
b1 Rate constant for biologicaloxidation of NH4 toNO2
day-1 0.1–1 0.25
b2 Rate constant for biologicaloxidation of NO2 toNO3
day-1 0.2–2 0.2
b3 Rate constant for hydrolysisof OrgN to NH4
day-1 0.02–0.4 0.05
b4 Rate constant formineralization oforganic P to mineral P
day-1 0.01–0.7 0.1
r1 Rate coefficient for organicN settling
day-1 0.5–6 0.08
r2 Benthic source rate formineral P
mgPm-2
day-1Variable 1.5
r3 Benthic source rate for NH4 mgNH4m-2
day-1Variable 0.01
r4 OrgN settling rate day-1 0.001–0.1 0.08r5 Rate coefficient for organic
P settlingday-1 0.001–0.1 0.1
lmax Maximum algal growth rate day-1 1.0–3.0 2.2q Algal respiration rate day-1 0.05–0.5 0.2
Integrated Water Quality Modelling of the River Zenne 13
Layout: T1 Standard SC Book ID: 308561_1_En Book ISBN: 978-981-4451-41-3Chapter No.: 22 Date: 30-5-2013 Page: 13/16
Au
tho
r P
roo
f
UN
CO
RR
ECTE
DPR
OO
F
322 4 Conclusions
323 An integrated modelling chain for the simulation of the water quality of the river324 Zenne was presented. In the integrated models, SWAT simulates the flows and the325 water quality variables from the rural upstream basin(s) and provides them as input326 to the SWMM model and the water quality model. SWMM routes the flow along327 the river and supplies the hydraulic variables to the in-stream water quality and the328 temperature models. The water quality model then simulates the in-stream water329 quality conversion processes. In the mean time, the temperature model provides330 the river water temperature to the in-stream water quality model.331 It was shown that the integrated model simulates the flow and water quality332 variables with reasonable accuracy, although further calibration of the models with333 regard to some of the water quality variables should be performed.334 Hereby, the usefulness and the feasibility of using OpenMI to perform a parallel335 simulation, using SWAT, SWMM, a water quality model and a temperature336 model, have been demonstrated for a complex river basin. We believe that such an337 integration can be very useful as a decision support tool for integrated river basin338 management.339 The calculation time overhead of the OpenMI-based integrated models is the340 major drawback of the presented approach.
341 Acknowledgments The study was carried out in the framework of the project ‘‘Towards a good342 ecological status of the River Zenne (GESZ)’’, as funded by INNOVIRIS, the Brussels Institute343 for Research and Innovation. We also thank all the institutes and administrations mentioned in344 this paper for providing the necessary data.
0
4
8
12
16
20
1/1/2/ 007 7/1/2/ 007 1/1/2/ 008 7/1/2/ 008 1/1/2/ 009
DO
(mg/
l)ObservedSSiimmuullaatteedd
0
4
8
12
16
20
1/1/2/ 007 7/1/2/ 007 1/1/2/ 008 7/1/2/ 008 1/1/2/ 009
Nit
rate
(mg/
l)
Date Date
Date Date
ObservedSimulated
0
2
4
6
8
10
1/1/2/ 007 7/1/2/ 007 1/1/2/ 008 7/1/2/ 008 1/1/2/ 009
BO
D (
mg/
l)
11//
ObservedSSiimmuullaatteedd
0
0.2
0.4
0.6
0.8
1
1.2
1/1/2/ 007 7/1/2/ 007 1/1/2/ 008 7/1/2/ 008 1/1/2/ 009M
iner
alP
(mg/
l) ObservedSSiimmuullaatteedd
Fig. 6 Observed and simulated DO (top left), BOD (top right), nitrate (bottom left) and mineralP (bottom right) at lot for the integrated model
14 O. T. Leta et al.
Layout: T1 Standard SC Book ID: 308561_1_En Book ISBN: 978-981-4451-41-3Chapter No.: 22 Date: 30-5-2013 Page: 14/16
Au
tho
r P
roo
f
UN
CO
RR
ECTE
DPR
OO
F
345 References
346 1. EU (2000). Directive 2000/60/EC of the European parliament and of the council of 23 Oct347 2000 establishing a framework for community action in the field of water policy. EU-WFD.348 2. Betrie, G. D., van Griensven, A., Mohamed, Y. A., Popescu, I., Mynett, A. E., & Hummel, S.349 (2011). Linking SWAT and SOBEK using open modeling interface (OpenMI) for sediment350 transport simulation in the Blue Nile river basin. Trans. Am. Soc. Agric. Biol Eng, 54,351 1749–1757.352 3. Debele, B., Srinivasan, R., & Parlange, J. Y. (2008). Coupling upland watershed and353 downstream waterbody hydrodynamic and water quality models (SWAT and CE-QUAL-W2)354 for better water resources management in complex river basins. Env. Model. Assess., 13,355 135–153.356 4. Arnold, J. G., Srinivasan, R., Mukundan, R. S., & Williams, J. R. (1998). Large area357 hydrologic modeling and assessment part I: model development. J. Am. Water Res. Ass., 34,358 73–78.359 5. Refsgaard, J. C. (1997). Parameterisation, calibration and validation of distributed360 hydrological models. J. Hydrol., 198, 69–97.361 6. Jha, M. K., Gassman, P. W., & Arnold, J. G. (2007). Water quality modeling for the Raccoon362 river watershed using SWAT. Trans. Am. Soc. Agric. Biol. Eng., 50, 479–493.363 7. Lam, Q. D., Schmalz, B., & Fohrer, N. (2010). Modelling point and diffuse source pollution364 of nitrate in a rural lowland catchment using the SWAT model. Agr. Water Manag., 97,365 317–325.366 8. Santhi, C., Arnold, J. G., Williams, J. R., Dugas, W. A., Srinivasan, R., & Hauck, L. M.367 (2001). Validation of the SWAT model on a large river basin with point and nonpoint368 sources. J. Am. Water Res. Ass., 37, 1169–1188.369 9. Srinivasan, R., Ramanarayanan, T. S., Arnold, J. G., & Bednarz, S. T. (1998). Large area370 hydrologic modeling and assessment part II: Model application. J. Am. Water Res. Ass., 34,371 91–101.372 10. White, K. L., & Chaubey, I. (2005). Sensitivity analysis, calibration, and validations for a373 multisite and multivariable SWAT model. J. Am. Water Res. Ass., 41, 1077–1089.374 11. Gassman, P. W., Reyes, M. R., Green, C. H., & Arnold, J. G. (2007). The soil and water375 assessment tool: Historical development, applications, and future research directions. Trans.376 Am. Soc. Agric. Biol. Eng., 50, 1211–1250.377 12. Williams, J. R. (1969). Flood routing with variable travel time or variable storage378 coefficients. Trans. Am. Soc. Agric. Biol. Eng., 12, 0100–0103.379 13. Chow, V. T. (1959). Open channel hydraulics. New York: McGraw-Hill Book Company.380 14. Rossman, L. A. (2010). Storm water management model user’s manual. Cincinnati: National381 risk management research laboratory. 45268.382 15. Brunner, G. W. (2008). HEC-RAS River analysis system user manual, version 4.0. Davis:383 Institute for Water Resources.384 16. Havno, K., Madsen, M. N., & Dorge, J. (Eds.). (1995). MIKE-11: A generalized river385 modeling package, Highlands Ranch. Colo: Water Resources Publications.386 17. Brandmeyer, J. E., & Karimi, H. A. (2000). Coupling methodologies for environmental387 models. Environ. Model. Softw., 15, 479–488.388 18. Gregersen, J. B., Gijsbers, J. A., & Westen, S. J. P. (2007). OpenMI: Open modelling389 interface. J. Hydroinformatics, 9, 175–191.390 19. Reubner, F., Alex, J., Bach, M., Schutze, M., & Muschalla, D. (2009). Basin-wide integrated391 modelling via OpenMI considering multiple urban catchments. Water Sci. Technol., 60,392 1241–1248.393 20. Brown, L. C., & Barnwell, T. O. (1987). The enhanced stream water quality models QUAL2E394 and QUAL-UNCAS: Documentation and user manual. EPA.
Integrated Water Quality Modelling of the River Zenne 15
Layout: T1 Standard SC Book ID: 308561_1_En Book ISBN: 978-981-4451-41-3Chapter No.: 22 Date: 30-5-2013 Page: 15/16
Au
tho
r P
roo
f
UN
CO
RR
ECTE
DPR
OO
F
395 21. Masliev, I., Somlyody, L. & Koncsos, L. (1995). On reconciliation of traditional water396 quality models and activated sludge models. Working paper WP-95-18, IIASA, Laxenburg,397 Austria.398 22. Mohseni, O., Stefan, H. G., & Erickson, T. R. (1998). A nonlinear regression model for399 weekly stream temperatures. Water Resour. Res., 34, 2685–2692.400 23. Winchell, M., Srinivasan, R., & Luzio, M. D. (2010). ArcSWAT interface for SWAT2009401 user’s guide. Blackland: Soil and Water Research Laboratory Agricultural Research Service.402 24. van Liew, M. W., Arnold, J. G., & Bosch, D. D. (2005). Problems and potential of403 autocalibrating a hydrologic model. Trans. Am. Soc. Agric. Biol. Eng., 48, 1025–1040.404 25. Arnold, J. G., Kiniry, J. R., Srinivasan, R., Williams, J. R., Haney, E. B., & Neitsch, S. L.405 (2011). Soil and water assessment tool. Input/output file documentation, Version 2009.406 Temple: Agrilife Blackland Research Center. 76502.407 26. Neitsch, S. L, Arnold, J. G, Kiniry, J. R, Williams, J. R. (2011). Soil and water assessment408 tool. Theoretical documentation, Version 2009. Grassland, Soil and Water Research409 Laboratory, Agricultural Research Service Blackland Research Center-Texas AgriLife410 Research.411 27. USDA-SCS. (1986). US Department of Agriculture-Soil Conservation Service (USDA-SCS):412 Urban hydrology for small watersheds. Washington, DC: USDA.413 28. Mein, R. G., & Larson, C. L. (1973). Modeling infiltration during a steady rain. Water414 Resour. Res., 9, 384–394.415 29. Arnold, J. G., Williams, J. R., & Maidment, D. R. (1995). Continuous-time water and416 sediment-routing model for large basins. J. Hydraul. Eng., 121, 171–183.417 30. Monteith, J. L. (1995). Evaporation and environment. Symp. Soc. Exp. Biol., 19, 205–234.418 31. Hargreaves, G. L., Hargreaves, G. H., & Riley, J. P. (1985). Agricultural benefits for Senegal419 River basin. J. Irrig. Drainage Eng., 111, 113–124.420 32. Priestley, C. H. B., & Taylor, R. J. (1972). On the assessment of surface heat flux and421 evaporation using large-scale parameters. Mon. Weather Rev., 100, 81–92.422 33. Reichert, P., Borchardt, D., Henze, M., Rauch, W., Shanahan, P., Somlyody, L., et al. (2001).423 River water quality model no. 1. London: IWA Publishing.424 34. van Griensven, A., Meixner, T., Grunwald, S., Bishop, T., Di Lluzio, M., & Srinivasan, R.425 (2006). A global sensitivity analysis tool for the parameters of multi-variable catchment426 models. J. Hydrol., 324, 10–23.427 35. Green, C. H., & Van Griensven, A. (2008). Autocalibration in hydrologic modeling: Using428 SWAT2005 in small-scale watersheds. Environ. Model. Softw., 23, 422–434.429 36. Nash, J. E., & Sutcliffe, J. V. (1970). River flow forecasting through conceptual models part I:430 A discussion of principles. J. Hydrol., 10, 282–290.431 37. Kannan, N., White, S. M., Worrall, F., & Whelan, M. J. (2007). Hydrological modelling of a432 small catchment using SWAT-2000: Ensuring correct flow partitioning for contaminant433 modelling. J. Hydrol., 334, 64–72.
16 O. T. Leta et al.
Layout: T1 Standard SC Book ID: 308561_1_En Book ISBN: 978-981-4451-41-3Chapter No.: 22 Date: 30-5-2013 Page: 16/16
Au
tho
r P
roo
f
UN
CO
RR
ECTE
DPR
OO
F
Author Query Form
Book ID : 308561_1_EnChapter No.: 22
123the language of science
Please ensure you fill out your response to the queries raisedbelow and return this form along with your corrections
Dear AuthorDuring the process of typesetting your chapter, the following queries havearisen. Please check your typeset proof carefully against the queries listedbelow and mark the necessary changes either directly on the proof/onlinegrid or in the ‘Author’s response’ area provided below
Query Refs. Details Required Author’s Response
AQ1 Please confirm the inserted city name is correct and amend ifnecessary.
Au
tho
r P
roo
f
MARKED PROOF
Please correct and return this set
Instruction to printer
Leave unchanged under matter to remain
through single character, rule or underline
New matter followed by
or
or
or
or
or
or
or
or
or
and/or
and/or
e.g.
e.g.
under character
over character
new character
new characters
through all characters to be deleted
through letter or
through characters
under matter to be changed
under matter to be changed
under matter to be changed
under matter to be changed
under matter to be changed
Encircle matter to be changed
(As above)
(As above)
(As above)
(As above)
(As above)
(As above)
(As above)
(As above)
linking characters
through character or
where required
between characters or
words affected
through character or
where required
or
indicated in the margin
Delete
Substitute character or
substitute part of one or
more word(s)Change to italics
Change to capitals
Change to small capitals
Change to bold type
Change to bold italic
Change to lower case
Change italic to upright type
Change bold to non-bold type
Insert ‘superior’ character
Insert ‘inferior’ character
Insert full stop
Insert comma
Insert single quotation marks
Insert double quotation marks
Insert hyphen
Start new paragraph
No new paragraph
Transpose
Close up
Insert or substitute space
between characters or words
Reduce space betweencharacters or words
Insert in text the matter
Textual mark Marginal mark
Please use the proof correction marks shown below for all alterations and corrections. If you
in dark ink and are made well within the page margins.
wish to return your proof by fax you should ensure that all amendments are written clearly