Mercury baseline levels in Flemish soils (Belgium)
21
This manuscript was published in Tack F.M.G., Vanhaesebroeck T., Verloo M.G., Van Rompaey K., Van Ranst E., 2005. Mercury baseline levels in Flemish soils (Belgium). Environmental Pollution 134 (1), 173-179. The original publication is available at http://www.elsevier.com/ Mercury baseline levels in Flemish soils (Belgium) Tack Filip M.G. a , Vanhaesebroeck Thomas a , Verloo Marc G. a , Van Rompaey Kurt b , Van Ranst Eric b a Ghent University, Laboratory of Analytical Chemistry and Applied Ecochemistry, Coupure Links 653, B-9000 Gent, Belgium b Ghent University, Laboratory of Soil Science, Geologisch Instituut, Krijgslaan 281 (S8), B-9000 Gent, Belgium Corresponding author: Tack Filip M.G. Ghent University Laboratory of Analytical Chemistry and Applied Ecochemistry Coupure Links 653 B-9000 Gent Belgium [email protected] Tel. 32 (0)9 264 59 93 Fax. 32(0)9 264 62 32 Capsule: Increased mercury levels may reflect human activity 1
Transcript of Mercury baseline levels in Flemish soils (Belgium)

This manuscript was published in
Tack F.M.G., Vanhaesebroeck T., Verloo M.G., Van Rompaey K., Van Ranst E., 2005. Mercury
baseline levels in Flemish soils (Belgium). Environmental Pollution 134 (1), 173-179.
The original publication is available at http://www.elsevier.com/
Mercury baseline levels in Flemish soils (Belgium)
Tack Filip M.G.a, Vanhaesebroeck Thomasa, Verloo Marc G.a, Van Rompaey Kurtb, Van Ranst Ericb
aGhent University, Laboratory of Analytical Chemistry and Applied Ecochemistry, Coupure Links
653, B-9000 Gent, BelgiumbGhent University, Laboratory of Soil Science, Geologisch Instituut, Krijgslaan 281 (S8), B-9000
Gent, Belgium
Corresponding author:
Tack Filip M.G.
Ghent University
Laboratory of Analytical Chemistry and Applied Ecochemistry
Coupure Links 653
B-9000 Gent
Belgium
Tel. 32 (0)9 264 59 93
Fax. 32(0)9 264 62 32
Capsule: Increased mercury levels may reflect human activity
1

Mercury baseline levels in Flemish soils (Belgium)
Tack Filip M.G.a*, Vanhaesebroeck Thomasa, Verloo Marc G.a, Van Rompaey Kurtb, Van Ranst
Ericb
aGhent University, Laboratory of Analytical Chemistry and Applied Ecochemistry, Coupure Links
653, B-9000 Gent, BelgiumbGhent University, Laboratory of Soil Science, Geologisch Instituut, Krijgslaan 281 (S8), B-9000
Gent, Belgium
Abstract
It is important to establish contaminant levels that are normally present in soils to provide baseline
data for pollution studies. Mercury is a toxic element of concern. This study was aimed at assessing
baseline mercury levels in soils in Flanders. In a previous study, mercury contents in soils in Oost-
Vlaanderen were found to be significantly above levels reported elsewhere. For the current study,
observations were extended over two more provinces, West-Vlaanderen and Antwerpen. Ranges of
soil Hg contents were distinctly higher in the province Oost-Vlaanderen (interquartile range from
0.09 to 0.43 mg/kg) than in the other provinces (interquartile ranges from 0.7 - 0.13 and 0.7 - 0.15
mg/kg for West-Vlaanderen and Antwerpen, respectively). The standard threshold method was
applied to separate soils containing baseline levels of Hg from the data. Baseline concentrations for
Hg were characterized by a median of 0.10 mg Hg/kg dry soil, an interquartile range from 0.07 to
0.14 mg/kg and a 90% percentile value of 0.30 mg/kg. The influence of soil properties such as clay
and organic carbon contents, and pH on baseline Hg concentrations was not important. Maps of the
spatial distribution of Hg levels showed that the Province Oost-Vlaanderen exhibited zones with
systematically higher Hg soil contents. This may be related to the former presence of many small-
scale industries employing mercury in that region.
Keywords: soils, mercury, baseline concentrations, background concentrations, spatial distribution
Introduction
The metal mercury is known since antiquity. It was known to ancient Chinese and Hindus and was
found in Egyptian tombs from around 1500 BC (Hammond, 1975). The huge incident of mass
poisoning with Hg in Minamata Bay in Japan during the fifties has in a dramatic way drawn the
attention on the significant hazards associated with its use (ATSDR, 1999).
As a result of natural processes such as volcanic activities and weathering of rock and ores, an
estimated amount between 2 700 to 6 000 metric tons of Hg is released yearly in the environment.
This is about 1.3 to 3 times the rate of release by anthropogenic sources (ATSDR, 1999). An
estimated 10 000 metric tons of mercury are mined each year, although there is a considerable year-
to-year variation (ATSDR, 1999). One third of that amount is used in the chlorine-alkaline-
industry. Other uses include application in electronic industry, production of paints, paper industry,
pharmaceutical industry, dentistry and agriculture (Sznopek & Goonan, 2003).
* Corresponding author
2

Mercury is naturally present in soils, although in very low concentrations. Worldwide mercury
concentrations in soils range between 0.01 to 0.2 mg/kg soil (Adriano, 1986). Some concentrations
reported for various countries are listed in Table 1.
Due to the long-distance aerial transport of trace elements, true geochemical background
concentrations can be difficult to estimate. Geochemical background concentrations should
represent natural concentrations, which exclude human influence. Geochemical baselines, in
contrast, represent concentrations that are time and area specific. These are not always true
background levels (Kabata-Pendias & Pendias, 1984; Kabata-Pendias et al., 1992).
In a previous contribution (Tack et al., 1997) we estimated baseline concentrations of trace elements
for Flanders, Belgium, based on up to 461 observations (156 for Hg) in the province Oost-
Vlaanderen between the cities of Gent and Antwerpen. The 90% percentile values for baseline Hg
contents were estimated between 1.1 and 1.9 mg/kg with a median of 0.17 mg/kg. These levels were
significantly higher than those reported elsewhere (Table 1). For this study, additional sampling was
performed in other regions in Flanders to investigate whether these relatively high levels are
common to different areas in the Flemish region and to improve estimates of baseline Hg-levels for
the Flemish region.
Materials and methods
Compilation of the data
Mercury baseline concentrations were derived from data obtained from 316 sampling locations in
three provinces, West-Vlaanderen (n = 100), Oost-Vlaanderen (n = 116) and Antwerpen (n = 100)
in Flanders, Belgium (Figure 1). Soils in Flanders are mostly derived from recent sedimentary
parent materials deposited during the Pleistocene or Holocene periods. The geographical regions in
the studied area have been described previously (Tack et al., 1997).
Samples were available from several sampling campaigns aimed at assessing baseline trace element
concentrations in Flanders. Samples from the province Oost-Vlaanderen were taken during a survey
study on soil and plant element contents, conducted by the Laboratory of Applied Analytical
Chemistry and Ecochemistry in 1979 and 1980 (Cottenie and Verloo, 1985). Up to 494 points were
sampled in an area covering approximately 630 km2 between the cities of Gent and Antwerpen, of
which 116 samples were analysed for Hg. Samples from the provinces West-Vlaanderen and
Antwerpen were taken during a study in 1998 (Gellinck, 1998; Van Rompaey, 1998) using the same
sampling approach as the Oost-Vlaanderen study.
Sampling locations were selected in agricultural fields (61% of all samples), forest (12%), pasture
(20%) or fallow land (7%). In all studies, samples were taken from the topsoil (0-20 cm). Each
sample is a composite of between four to eight samples randomly taken within 30 m around the
selected grid point. Samples were stored in polyethylene bags, air-dried upon arrival in the
laboratory. They were subsequently sieved through a 2-mm screen and stored in dark and dry
conditions at room temperature.
3

Analytical procedures
Soil pH is based on measuring the pH of a 1:5 soil: water suspension (Van Ranst et al., 1999). Soil
clay and sand contents are based on classical wet and dry seeving techniques and the pipette method
(Gee & Bauder, 1986). For the Oost-Vlaanderen samples, clay contents were in most instances
estimated from clay contents determined in neighbouring similar soils (Tack et al., 1997). Organic
carbon was estimated using the Walkley & Black method (Nelson & Sommers, 1982).
From the more than 300 soil samples available from West-Vlaanderen and Antwerpen, 100 for each
province were randomly selected to analyse the Hg content. Mercury data for the Oost-Vlaanderen
soils were taken from the previous studies (Tack et al., 1997; Tack & Verloo, 1996). To check the
quality of these data, 17 samples were re-analysed. A paired t-test revealed no significant difference
between the previous and current analyses.
Total soil mercury was analysed with flameless atomic absorption after a specific destruction
procedure. In a destruction flask 60 mgV2O5 and 10 ml 65% ultrapure HNO3 (Merck, Darmstadt)
was added to 0.5 g of soil. The suspension was then heated at 165 ºC for 30 minutes on a digestor.
Then, 15 ml of concentrated H2SO4 (18 mol/L) was added and destruction was continued for one
hour. This procedure releases different forms of Hg in the form of the mercuric cation. For
measurement, the suspension was transferred to a glass stoppered glass tube. After addition of 10 ml
10% SnCl2 solution in 2% concentrated H2SO4, the tube was connected to the mercury analyser
(Coleman Mercury Analyzer MAS-50B). The solution added reduces all mercury to the metallic
form. Air is blown through the suspension that conducts the volatile elemental Hg through the
apparatus such that a transient absorption signal is obtained. The apparatus was calibrated with
standards of 0, 0.125, 0.25, 0.5, and 1 µg Hg. A typical calibration curve yielded absorbance values
of 0.004, 0.053, 0.102, 0.197 and 0.377, respectively. The detection limit (2σ ) was approximately
0.03 µg Hg/kg.
The accuracy of the method was verified through analysis of a calcareous loam soil CRM 141 R
standard reference sample (Quevauviller et al., 1996). The certified total Hg content of CRM 141 R
is 0.25 ± 0.02 mg/kg Hg. Triplicate analysis yielded a value of 0.24 ± 0.05 mg/kg, with both
uncertainty intervals reported as the half width of the 95% confidence interval of the mean.
Data processing
Statistical analysis was performed using R, an Open Source language and environment for statistical
computing and graphics (http://lib.stat.cmu.edu/R/CRAN/) (Ihaka & Gentleman, 1996). To
segregate the population of soil containing baseline Hg levels from the collected data, probability
plots were used to evaluate the presence of multiple populations within the data sets. Multiple
populations will form distinct straight-line segments on a probability plot provided each population
is normally distributed. Where two populations overlap, an inflection point will form. This point,
referred to as the "threshold point" by Fleischhauer & Korte (1990), represents the separation point
between two populations. The threshold was taken objectively as the value that gave the skewness
of the resultant background population nearest to 0 as described in Fleischhauer and Korte (1990)
and Tobias et al. (1997). The highest values were consecutively removed from the data and the
skewness of each resulting population was calculated. The threshold point was identified as the data
point for which the resulting population showed the skewness nearest to 0. Through this method,
populations can be identified and segregated from one another for further analysis. Segregation of
4

the data will be partial where overlap exists; however, the statistical bias probably will remain small
(Fleischhauer and Korte, 1990). Baseline mercury concentration ranges were estimated from the
segregated dataset using non-parametric statistics such as the median and percentile values.
Contour maps displaying the spatial distribution of Hg in each province were produced based on
geostatistical analysis using the package GeoR (http://www.est.ufpr.br/geoR/) (Ribeiro & Diggle,
2001). Spatial interpolation was performed using ordinary kriging. Covariance parameters were
estimated by fitting a parametric model to an empirical variogram using ordinary least squares. For
other settings, program defaults were used (Ribeiro & Diggle, 2001).
Results and discussion
Soil properties and mercury contents
A statistical summary of the observations grouped by province and for the combined data is
provided in Table 2. Soils of West-Vlaanderen are characterised by higher clay and pH values
compared to soils in the other provinces. The soils in Antwerpen tend to be sandy and acidic. The
soils of Oost-Vlaanderen have intermediate characteristics. For all data, organic carbon contents
ranged from below 1% to 24%, but typical soils in the Flemish region have organic carbon contents
between 1.5 - 2.5% , corresponding to about 3 - 5% organic matter.
Mercury contents ranged from lower than the detection limit (0.03 mg/kg) to 4.2 mg/kg dry soil.
This is a wide range, well above soil mercury ranges reported for non polluted soils (Table 1).
Percentile values show that the area sampled in Oost-Vlaanderen clearly has higher soil Hg-contents
than the other provinces. The median for Oost-Vlaanderen, at 1.8 mg/kg, is almost twice that of the
other provinces and that for all data. One quarter of the Oost-Vlaanderen soil samples had mercury
levels above 0.37 mg/kg.
Figure 2 shows a boxplot of the data, where the difference between Oost-Vlaanderen and the other
provinces is very apparent. Values larger than 1 mg Hg/kg were not plotted. Many of the data of
Oost-Vlaanderen are considered 'outliers' in the boxplot of the whole data, i.e., they extend further
than 1.5 times the interquartile range and are plotted as dots in the boxplot of the entire data.
Derivation of baseline values
Concentrations ranges commonly found in the majority of soils of the region are considered baseline
concentrations ranges. To estimate baseline concentration ranges from the data, the “standard
threshold method”, described by Fleischhauwer & Korte (1990) and Tobias et al. (1997) was
applied. In this approach it is assumed that elemental contents will be distributed according to a log-
normal distribution. When a different population is represented in the data, it will show up as a
deviation from the log-normal distribution.
The normal probability plot of the mercury contents is shown in Figure 3. Low values deviate from
linearity because these were under the detection limit and had all been assigned a value of 0.03
mg/kg. Two different linear segments revealed the presence of two different populations. High data
points were removed until the skew of the distribution became minimal. That point was considered
the threshold, delineating the baseline-population from soils from a different population. The
5

threshold was located at log Hg = –0.39, which corresponds to a Hg-level of 0.41 mg/kg. Values
higher than 0.41 are therefore assumed not to belong to the population of soils with baseline Hg
levels. Data below the threshold were retained to estimate background Hg contents in Flemish soils
from their statistics.
Percentile values for baseline mercury contents are listed in Table 3. These values can be used as
reference values to determine whether a soil might be contaminated or not. Such an indication of
contamination only implies that the total contents are higher than one would normally expect in
unpolluted areas. No indications may be inferred about potential hazards that could be associated
with the observed element contents.
Correlations with soil properties
Soil properties are expected to be correlated with baseline contents of metals (Tack et al., 1997).
Soil constituents such as clay and organic carbon increase the binding capacity of the soil for metals
(Bolt & Bruggenwert, 1976). They decrease the probability that elements released from weathering
of the soil minerals or entering the soil through aerial transport and deposition or other sources will
be removed by leaching. Baseline contents of metals will therefore tend to be higher in soils with
high contents of clay and/or organic matter. Mobility and retention is also strongly affected by soil
pH. Cationic elements tend to be more mobile with decreasing pH, while anionic elements will
become mobilised at higher pH values (Förstner, 1990).
Scatterplots of baseline Hg contents as a function of soil clay and organic carbon contents and pH
(Figure 4) do not reveal distinct trends, although some observations can be made. Mercury contents
in soils with high clay contents and high organic C contents (plots A and B in Figure 4) vary over a
wider range than those in soils with lower clay or organic carbon contents. This reflects the metal
binding capacity of these soil constituents. Mercury, entering the soil system through aerial
transport and deposition or released through weathering of soil minerals, will more likely be
retained in soils high in clay or organic matter. Also differences in mineralogy and hence lithogenic
Hg levels between sandy and clayey soils may constitute a factor. With respect to pH, wider ranges
in Hg levels occurred in soils with higher pH-values, reflecting a higher tendency for binding in
these soils.
In line with the wide scatter in the data, linear trends between soil properties and mercury contents
were mostly not significant (Table 4). Only for organic carbon was there a significant positive
correlation with baseline Hg concentrations. However, only 2.5 % of the total variability in baseline
Hg contents is explained by a linear regression model with organic carbon as predictor variable (Hg
(mg/kg) = 0.098 + 0.0110 OC(%); R2 = 0.0252, p = 0.009). Thus, the influence of soil properties on
Hg baseline contents overall is, although statistically significant, not very important, in contrast to
trends found for trace elements such as Cd, Cu, Pb or Zn (Tack et al., 1997). While clay and organic
carbon contents may be major factors in determining the retention of trace elements that mainly
occur in cationic forms (e.g. Zn, Cu, Pb), the more complex environmental chemistry of Hg implies
that several mechanisms may control Hg retention. For example, the retention of Hg in soils is not
only caused by valence-type ionic adsorption on organic and inorganic materials. It may also be
controlled by formation of covalent bonds with organic compounds or by precipitation as highly
insoluble carbonates, phosphates or sulphides (Adriano, 1986; Yaron et al., 1996).
6
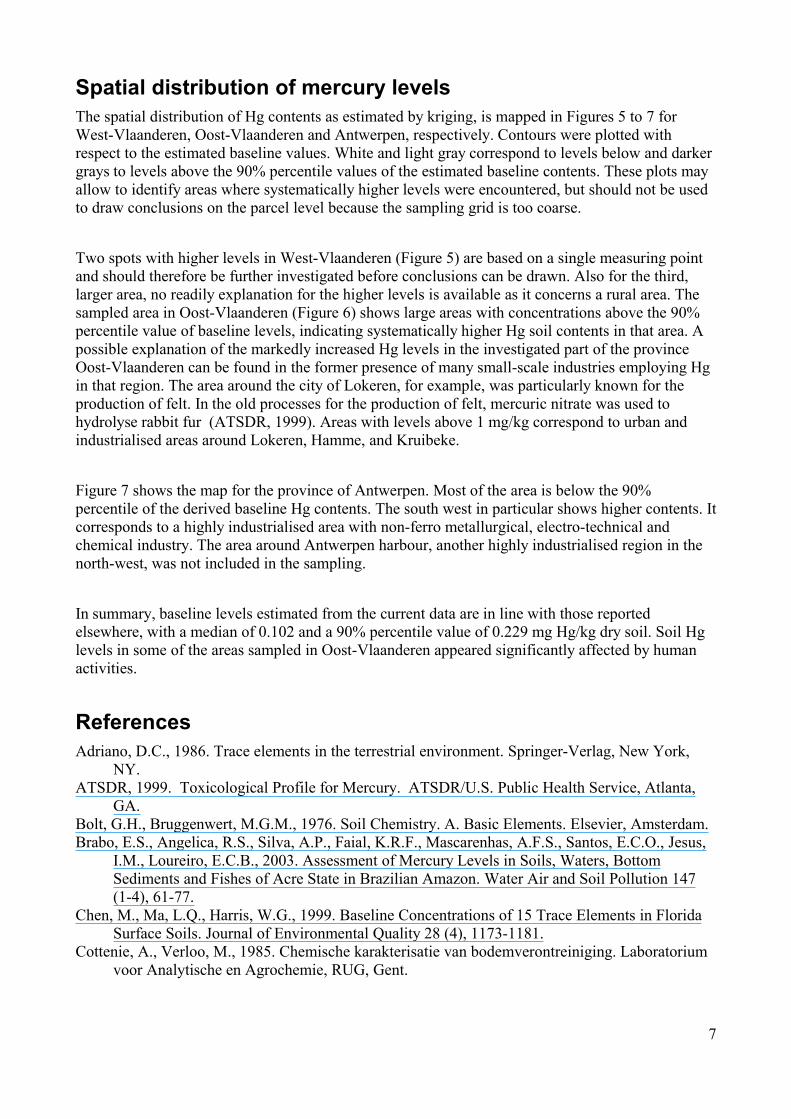
Spatial distribution of mercury levels
The spatial distribution of Hg contents as estimated by kriging, is mapped in Figures 5 to 7 for
West-Vlaanderen, Oost-Vlaanderen and Antwerpen, respectively. Contours were plotted with
respect to the estimated baseline values. White and light gray correspond to levels below and darker
grays to levels above the 90% percentile values of the estimated baseline contents. These plots may
allow to identify areas where systematically higher levels were encountered, but should not be used
to draw conclusions on the parcel level because the sampling grid is too coarse.
Two spots with higher levels in West-Vlaanderen (Figure 5) are based on a single measuring point
and should therefore be further investigated before conclusions can be drawn. Also for the third,
larger area, no readily explanation for the higher levels is available as it concerns a rural area. The
sampled area in Oost-Vlaanderen (Figure 6) shows large areas with concentrations above the 90%
percentile value of baseline levels, indicating systematically higher Hg soil contents in that area. A
possible explanation of the markedly increased Hg levels in the investigated part of the province
Oost-Vlaanderen can be found in the former presence of many small-scale industries employing Hg
in that region. The area around the city of Lokeren, for example, was particularly known for the
production of felt. In the old processes for the production of felt, mercuric nitrate was used to
hydrolyse rabbit fur (ATSDR, 1999). Areas with levels above 1 mg/kg correspond to urban and
industrialised areas around Lokeren, Hamme, and Kruibeke.
Figure 7 shows the map for the province of Antwerpen. Most of the area is below the 90%
percentile of the derived baseline Hg contents. The south west in particular shows higher contents. It
corresponds to a highly industrialised area with non-ferro metallurgical, electro-technical and
chemical industry. The area around Antwerpen harbour, another highly industrialised region in the
north-west, was not included in the sampling.
In summary, baseline levels estimated from the current data are in line with those reported
elsewhere, with a median of 0.102 and a 90% percentile value of 0.229 mg Hg/kg dry soil. Soil Hg
levels in some of the areas sampled in Oost-Vlaanderen appeared significantly affected by human
activities.
References
Adriano, D.C., 1986. Trace elements in the terrestrial environment. Springer-Verlag, New York,
NY.
ATSDR, 1999. Toxicological Profile for Mercury. ATSDR/U.S. Public Health Service, Atlanta,
GA.
Bolt, G.H., Bruggenwert, M.G.M., 1976. Soil Chemistry. A. Basic Elements. Elsevier, Amsterdam.
Brabo, E.S., Angelica, R.S., Silva, A.P., Faial, K.R.F., Mascarenhas, A.F.S., Santos, E.C.O., Jesus,
I.M., Loureiro, E.C.B., 2003. Assessment of Mercury Levels in Soils, Waters, Bottom
Sediments and Fishes of Acre State in Brazilian Amazon. Water Air and Soil Pollution 147
(1-4), 61-77.
Chen, M., Ma, L.Q., Harris, W.G., 1999. Baseline Concentrations of 15 Trace Elements in Florida
Surface Soils. Journal of Environmental Quality 28 (4), 1173-1181.
Cottenie, A., Verloo, M., 1985. Chemische karakterisatie van bodemverontreiniging. Laboratorium
voor Analytische en Agrochemie, RUG, Gent.
7

Cox, G.A. and Colvin, G.G. (1996) Evaluation of background metal contents in Ohio soils. Cox-
Colvin & Associates, Inc., Columbus, Ohio
Curlic, J., Sefcik, P., Vojtas, J., 1995. Preliminary results on background values for some elements
in Slovakian soils. In: Proc. Conf. "From soil survey to sustainable farming" Stara lesna.
Fleischhauer, H.L., Korte, N. Formulation of Cleanup Standards for Trace Elements with
Probability Plots. Environmental Management 14 (1), 95-105.
Förstner, U., 1993. Metal speciation - general concepts and applications. International Journal of
Environmental Analytical Chemistry 51, 5-23.
Gee, G.W., Bauder, J.W., 1986. Particle-size analysis. In: Klute, A. (Eds.), Methods of soil analysis,
Part 1. Physical and mineralogical methods. ASA, Madison, Wisconsin, pp. 377-382.
Gellinck, B. (1998) Het verband tussen achtergrondwaarden van zware metalen en
bodemkenmerken in de bodems van de provincie West-Vlaanderen. Universiteit Gent, Gent
Hammond, C.R., The elements. In: CRC handbook of Chemistry and Physics. CRC Press,
Cleveland, OH, pp. 5-38.
Ihaka, R., Gentleman, R., 1996. R: a language for data analysis and graphics. Journal of
Computational and Graphical Statistics 5, 299-314.
Kabata-Pendias, A., Dudka, S., Chlopecka, A., Gawinowska, T., 1992. Background levels and
environmental influences on trace metals in soils of the temperate humid zone of Europe. In:
Adriano, D.C. (Eds.), Biogeochemistry of trace metals. Lewis Publishers, Boca Raton, pp. 61-
84.
Kabata-Pendias, A., Pendias, H., 1984. Trace elements in soils and plants. CRC Press, Boca Raton,
FL.
Kim, K.H., Kim, S.H., 1999. Heavy Metal Pollution of Agricultural Soils in Central Regions of
Korea. Water Air and Soil Pollution 111 (1-4), 109-122.
Li, J., Wu, Y., 1991. Historical changes of soil metal background values in select areas of China.
Water Air and Soil Pollution 57-58, 755-761.
Nelson, D.W., Sommers, L.E., 1982. Total carbon, organic carbon, and organic matter. In: Page,
A.L., Miller, R.H., Keeney, D.R. (Eds.), Methods of soil analysis, Part 2. Chemical and
microbiological properties. ASA, Madison, Wisconsin, pp. 539-579.
Podlesakova, A., Nemecek, J., 1995. Contamination and pollution of soils in the Czech republic. In:
Proc. Conf. "From soil survey to sustainable farming". Stara lesna.
Quevauviller, Ph., Muntau, H., Fortunati, U., Vercoutere, K., 1996. The certification of the total
contents (mass fractions) of Cd, Co, Cr, Cu, Hg, Mn, Ni, Pb and Zn and the aqua regia soluble
contents (mass fractions) of Cd, Co, Cr, Cu, Hg, Mn, Ni, Pn and Zn in a calcareous loam soil -
CRM 141 R. Office for Official Publications of the European Communities., Luxembourg.
Ribeiro, J.R., Diggle, P.J., 2001. geoR: A package for geostatistical analysis. R-NEWS 1 (2), 15-18.
Sznopek, J.L. and Goonan, T.G., 2000. The materials flow of mercury in the economies of the
United States and the world. U.S. Geological Survey Circular 1197, Reston, VA. Available on
line at http://greenwood. cr.usgs.gov/pub/circulars/c1197/
Tack, F.M., Verloo, M.G., 1996. Metal contents in stinging nettle (Urtica dioica L.) as affected by
soil characteristics. The Science of the Total Environment 192, 31-39.
Tack, F.M.G., Verloo, M.G., Vanmechelen, L., Van Ranst, E., 1997. Baseline concentration levels
of trace elements as a function of clay and organic carbon contents in soils in Flanders
(Belgium). The Science of the Total Environment 201, 113-123.
Tobías, F.J., Bech, J., Sánchez Algarra, P., 1997. Statistical approach to discriminate background
and anthropogenic input of trace elements in soils of Catalonia, Spain. Water, Air, and Soil
Pollution 100, 63-78.
Van Ranst, E., Verloo, M., Demeyer, A., Pauwels, J.M., 1999. Manual for the soil chemistry and
fertility laboratory. International Training Centre for Post-Graduate Soil Scientists, Gent,
Belgium.
8

Van Rompaey, K. (1998) Het verband tussen achtergrondwaarden van zware metalen en
bodemkenmerken in de bodems van de provincie Antwerpen. Universiteit Gent, Gent
Yaron, B., Calvet, R., Prost, R., 1996. Soil pollution: processes and dynamics. Springer-Verlag,
Berlin.
9
Figure captions
Figure 1. Map indicating sampling locations in the three provinces, West-Vlaanderen, Oost-
Vlaanderen and Antwerpen from left to right, respectively.
Figure 2. Box -and-whisker plot of the data for each of the Provinces and for all data. Whiskers
extend to to the most extreme data point which is no more than 1.5 times the interquartile range
from the box. Values higher than 1 mg/kg were not plotted.
Figure 3. Normal probability plot of the data with indication of the 'threshold' (see text for
explanation).
Figure 4. Baseline Hg contents as a function of soil clay content, organic carbon content and pH.
Figure 5. Spatial distribution of Hg contents in the province West-Vlaanderen with indication of the
sampling points. White indicates Hg levels below the median of baseline Hg levels, light gray below
the 90% percentile values of baseline levels. Darker colours represent levels above baseline ranges
as indicated by the figure legend. Coordinates, which are expressed in meters (m), are according the
Belgian Lambert system.
Figure 6. Spatial distribution of Hg contents in the province Oost-Vlaanderen with indication of the
sampling points. White indicates Hg levels below the median of baseline Hg levels, light gray below
the 90% percentile values of baseline levels. Darker colours represent levels above baseline ranges
as indicated by the figure legend. Coordinates, which are expressed in meters (m), are according the
Belgian Lambert system.
Figure 7. Spatial distribution of Hg contents in the province Antwerpen with indication of the
sampling points. White indicates Hg levels below the median of baseline Hg levels, light gray below
the 90% percentile values of baseline levels. Darker colours represent levels above baseline ranges
as indicated by the figure legend. Coordinates, which are expressed in meters (m), are according the
Belgian Lambert system.

Table 1. Some soil Hg contents reported in literature
Hg (mg/kg) Reference
Brazil Average 0.077 Brabo et al. (2003)
China Background 0.02-0.03 Li & Wu (1991)
Florida Baseline 0.0008-0.04 Chen et al. (1999)
Korea Unpolluted soils (n = 109) 0.045 Kim & Kim (1999)
Ohio, USA Median 0.06 Cox & Colvin (1996)
Slovakia Median 0.06-0.13 Curlik et al. (1995)
Czech republic Background 0.12-0.19 Podlesakova &
Nemecec (1995)
Worldwide Background < 0.4 Kabata-Pendias &
Pendias (1984)

Table 2. Summary statistics of the data
n Min. 1st Qu. Median Mean 3rd Qu. Max.
West -Vlaanderen
Hg (mg/kg) 100 0.03 0.07 0.11 0.13 0.13 1.47
Clay (%) 100 0.6 8.5 12.3 16.7 19.6 58.1
Sand (%) 100 8.3 32.8 54.8 53.6 71.1 99.5
OC (%) 100 0.06 1.29 1.57 2.02 2.55 6.88
pH-H2O 100 3.71 5.92 6.5 6.58 7.49 8.73
Oost-Vlaanderen
Hg (mg/kg) 116 0.03 0.09 0.18 0.37 0.43 3.07
Clay (%) 108 0.4 5.4 8.3 13.6 16.5 53.8
Sand (%) 108 5.7 40.5 56.9 56.8 77.3 94.7
OC (%) 116 0.36 1.26 1.61 2.05 2.04 10.4
pH-H2O 116 4.3 5.54 6 6.13 6.71 8.1
Antwerpen
Hg (mg/kg) 100 0.03 0.07 0.10 0.21 0.19 4.19
Clay (%) 100 0 2 3.6 4.6 5.3 30.8
Sand (%) 100 42.4 78.7 87.5 83.9 92.6 98.6
OC (%) 100 0.52 1.52 2.11 2.61 2.71 23.81
pH-H2O 100 3.31 4.2 5.21 5.12 5.8 7.4
All data
Hg (mg/kg) 316 0.03 0.07 0.12 0.24 0.22 4.19
Clay (%) 308 0 3.7 7.5 11.7 14.0 58.1
Sand (%) 308 5.7 45.4 70.9 64.5 86.1 99.5
OC (%) 316 0.06 1.32 1.74 2.22 2.51 23.81
pH-H2O 316 3.31 5.28 5.95 5.95 6.63 8.73
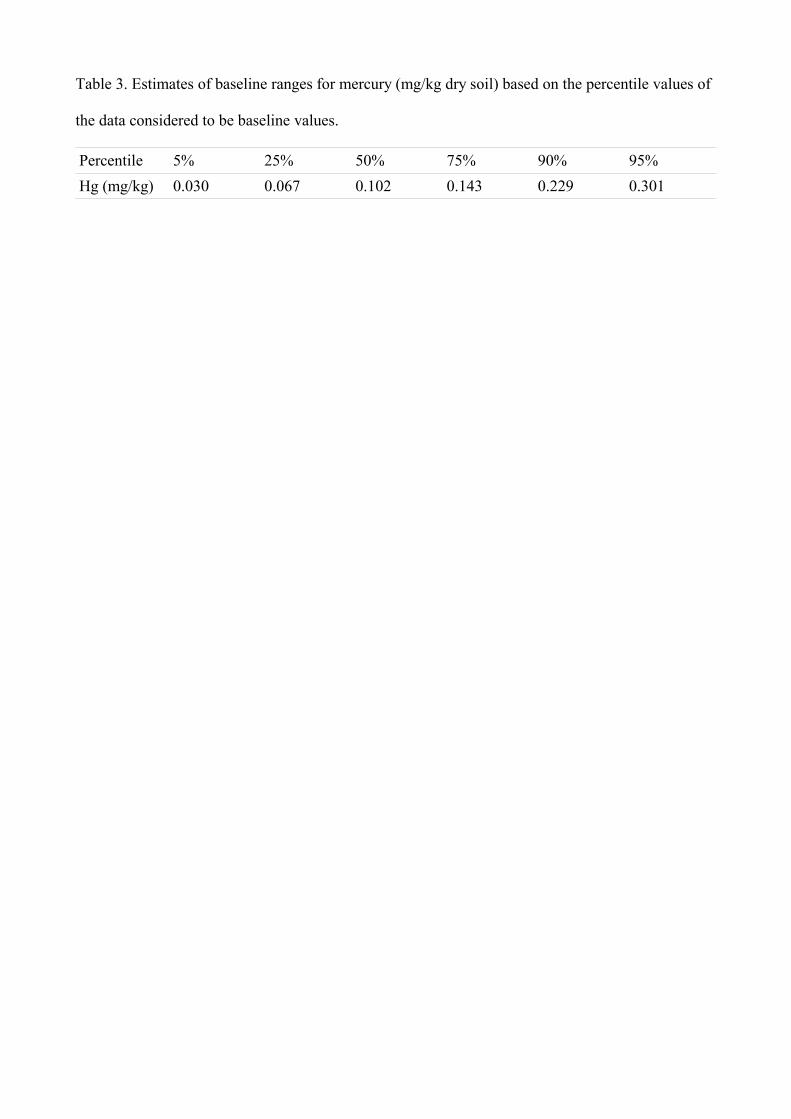
Table 3. Estimates of baseline ranges for mercury (mg/kg dry soil) based on the percentile values of
the data considered to be baseline values.
Percentile 5% 25% 50% 75% 90% 95%
Hg (mg/kg) 0.030 0.067 0.102 0.143 0.229 0.301

Table 4. Pearson correlations between Hg contents and some soil properties. Significance at the 5%
level is indicated with "*", at the 1% level with "**"
Hg (mg/kg) Clay (%) Sand (%) OC (%) pH
Hg (mg/kg) 1.000 0.033 -0.058 0.159** 0.043
Clay (%) 1.000 -0.844** 0.184** 0.640**
Sand (%) 1.000 -0.087 -0.569**
OC (%) 1.000 -0.037
pH 1.000


West−Vl Oost−Vl Antwerpen All data
0.0
0.2
0.4
0.6
0.8
1.0
Data group
Tot
al H
g (m
g/kg
)

−3 −2 −1 0 1 2 3
−1.
5−
1.0
−0.
50.
00.
5Normal Q−Q Plot
Theoretical Quantiles
log
Hg
Threshold

0.2 1.0 5.0 50.0
0.1
0.2
0.3
0.4
Clay content (%)
Hg
(mg/
kg)
A
0.2 0.5 2.0 5.0
0.1
0.2
0.3
0.4
Organic carbon content (%)
Hg
(mg/
kg)
B
4 5 6 7 8
0.1
0.2
0.3
0.4
Soil pH
Hg
(mg/
kg)
C

0
1
2
3
4
30000 50000 70000
160000
170000
180000
190000
200000
210000
220000
West−Vlaanderen

0
1
2
3
4
110000 130000
180000
190000
200000
210000
220000
230000
Oost−Vlaanderen

0
1
2
3
4
140000 160000 180000 200000
180000
200000
220000
240000
260000
Antwerpen