Hydrodynamic and Water Quality Modeling of the Tigris River ...
324
Portland State University Portland State University PDXScholar PDXScholar Dissertations and Theses Dissertations and Theses Winter 3-21-2018 Hydrodynamic and Water Quality Modeling of the Hydrodynamic and Water Quality Modeling of the Tigris River System in Iraq Using CE-QUAL-W2 Tigris River System in Iraq Using CE-QUAL-W2 Muhanned Al Murib Portland State University Follow this and additional works at: https://pdxscholar.library.pdx.edu/open_access_etds Part of the Civil and Environmental Engineering Commons, and the Water Resource Management Commons Let us know how access to this document benefits you. Recommended Citation Recommended Citation Al Murib, Muhanned, "Hydrodynamic and Water Quality Modeling of the Tigris River System in Iraq Using CE-QUAL-W2" (2018). Dissertations and Theses. Paper 4230. https://doi.org/10.15760/etd.6114 This Dissertation is brought to you for free and open access. It has been accepted for inclusion in Dissertations and Theses by an authorized administrator of PDXScholar. Please contact us if we can make this document more accessible: [email protected].
-
Upload
khangminh22 -
Category
Documents
-
view
3 -
download
0
Transcript of Hydrodynamic and Water Quality Modeling of the Tigris River ...
Portland State University Portland State University
PDXScholar PDXScholar
Dissertations and Theses Dissertations and Theses
Winter 3-21-2018
Hydrodynamic and Water Quality Modeling of the Hydrodynamic and Water Quality Modeling of the
Tigris River System in Iraq Using CE-QUAL-W2 Tigris River System in Iraq Using CE-QUAL-W2
Muhanned Al Murib Portland State University
Follow this and additional works at: https://pdxscholar.library.pdx.edu/open_access_etds
Part of the Civil and Environmental Engineering Commons, and the Water Resource Management
Commons
Let us know how access to this document benefits you.
Recommended Citation Recommended Citation Al Murib, Muhanned, "Hydrodynamic and Water Quality Modeling of the Tigris River System in Iraq Using CE-QUAL-W2" (2018). Dissertations and Theses. Paper 4230. https://doi.org/10.15760/etd.6114
This Dissertation is brought to you for free and open access. It has been accepted for inclusion in Dissertations and Theses by an authorized administrator of PDXScholar. Please contact us if we can make this document more accessible: [email protected].
Hydrodynamic and Water Quality Modeling of the Tigris River System in Iraq Using
CE-QUAL-W2
by
Muhanned Al Murib
A dissertation submitted in partial fulfillment of the
requirements for the degree of
Doctor of Philosophy
in
Civil and Environmental Engineering
Dissertation Committee:
Scott Wells, Chair
Chris Berger
Mark Sytsma
Stefan Talke
Portland State University
2018

© 2018 Muhanned Al Murib
i
Abstract
The Tigris River is one of two primary rivers in Iraq and is, along with the Euphrates, the
main source for drinking and irrigation water in the country. The Tigris River originates in
the Taurus Mountains in Turkey, and is 1850 km long. The majority of the river, 1418 km
lie within Iraq. The river passes through, and is the primary drinking water source for,
major cities such as Mosul, Baeji, Samarra, Baghdad (the capital), and Kut. The Tigris
River joints the Euphrates River in Qurna city within Basra province to form the Shatt Al-
Arab River which eventually discharges into the Persian Gulf.
As a result of fluctuations in flow rate along the Tigris River that cause both potential
flooding and drought, Mosul Dam was built on the mainstem of the Tigris River upstream
of the city of Mosul and was operated starting in July1986 to control the river flow and to
generate hydroelectricity. Some canals were also constructed to divert excess fresh water
from the mainstem of the river at Samarra Barrage located 125 km north (upstream) of
Baghdad to Tharthar Lake, an artificial lake located 100 km northwest Baghdad city. The
Tigris-Tharthar canal, 75 km long, was constructed in 1956 to divert excess water from
Samarra Barrage to Tharthar Lake and to prevent potential flooding in Baghdad. During
dry seasons, high total dissolved solids (TDS) water is diverted from Tharthar Lake into
the mainstem of the Tigris River through the 65 km long Tharthar-Tigris canal, which is
located 25 km upstream Baghdad.
ii
Due to rapid population growth and increasing industrial activates, the Tigris River is also
facing many water quality challenges from inflows of contaminated wastewater from
treatment plant stations. A water quality model that simulates the Tigris River system is
therefore needed to study the effects of these discharges and how water quality of the Tigris
River could be managed. To address this issue, I used CE-QUAL-W2 to develop a 2-D
(longitudinal and vertical) hydrodynamic and water quality model of the mainstem Tigris
River from Mosul Dam (Rkm 0) to Kut Barrage (Rkm 880). In addition, Tharthar Lake and
its canals were modeled.
A full suite of hydrodynamic and water quality variables were simulated for the year 2009,
including flowrates, water level, and water temperature. Additionally, water quality
constituents such as total dissolved solids (TDS), phosphate (PO4), ammonium (NH4),
nitrate (NO3), biochemical oxygen demand (BOD), chlorophyll-a (Chl-a), and dissolved
oxygen (DO) were also simulated. Bathymetry of the Tigris River and field data such as
flowrate, water level, TDS, NO3 were obtained from the Ministry of Water Resources in
Iraq, while surface water temperatures of the Tigris River were estimated remotely using
Landsat satellites. These satellites provided a continuous observation record of remote
sites. Other water quality field data, such as PO4, NH4, BOD, and DO, were estimated
from literature values.
iii
Meteorological data, including, wind speed, wind direction, air and dew point
temperatures, cloud cover, and solar radiation were obtained from the Iraqi Ministry of
Transportation, the General Organization for Meteorology and Seismic Monitoring.
Model predictions of flow and water level were compared to field data at three stations
along the mainstem of the Tigris River, including Baeji, downstream of Samarra Barrage,
and Baghdad. The absolute mean error in the flow varied from 12.6 to 3.4 m3/s and the
water level absolute mean error varied from 0.036 to 0.018 m. The percentage error of the
overall flowrate at Baeji, downstream Samarra Barrage and Baghdad was 1.9%, 0.8%, and
0.8% respectively. Injecting a conservative tracer at Mosul Dam showed that a parcel of
water reaches to Baeji, Samarra Barrage, Baghdad, and Kut Barrage after approximately 3
days, 5 days, 10 days, and 19 days, respectively.
Water temperature field data in Iraq are limited and there was no archive of existing field
data. Therefore, I obtained estimates of surface water temperature on the Tigris River using
the thermal band of the Landsat satellite, one of a series of satellites launched by the
National Aeronautics and Space Administration (NASA). The calibration between satellite
data and water temperature was validated using sparse field data from 2004, and the
calibration then applied to 82 Landsat images from the year 2009. Landsat estimates
showed a bias of -2 ⁰ C compared to model results in winter months, possibly due to
uncertainty in Landsat estimations. The absolute mean errors of the CE-QUAL-W2 model
predictions of water temperature compared to Landsat estimated temperatures were 0.9 and
1.0 ⁰ C at Baeji and Baghdad respectively. Temperature calibration in the Tigris River
system was highly sensitive to meteorological input data. Landsat Images were also used
to estimate longitudinal variation in surface water temperature of Tharthar Lake. It was
iv
found that surface water temperature in Tharthar Lake varied longitudinally along the
North-South axis with warmer temperatures in the lower part compared with the upper part
of the lake.
Total dissolved solids concentrations in the Tigris River significantly increased from Mosul
Dam to Kut Barrage with peak concentrations of 900 mg/l and 1050 mg/l at Baghdad and
Kut, respectively, due to high TDS water diverted from Tharthar Lake, irrigation return
flow, urban runoff, and uncontrolled discharge of wastewater effluents. NO3
concentrations did not significantly increase between Samarra Barrage and Baghdad city.
BOD concentrations within Baghdad were extremely high due to direct discharge of
industrial wastewater into the mainstem of the Tigris River from outlets located within the
city.
Management scenarios were simulated with the model of the Tigris River system and were
compared with the base model. The main scenarios implemented on the Tigris River
system were altering upstream hydrology, increasing air temperature due to the effect of
climate change, disconnecting Tharthar Lake from the Tigris River system, and simulating
long-term effects on Tharthar Lake. Increasing upstream inflows caused a decrease in TDS
concentrations from 495 mg/l to 470 mg/l over all the mainstem of the river. In addition,
CBOD concentrations decreased somewhat from 5.9 mg/l to 5.74 mg/l. On the other hand,
decreasing upstream flows caused a significant increase in average TDS concentrations
over the entire Tigris mainstem from 495 mg/l to 527 mg/l. Also, an increase in CBOD
concentrations from 5.9 mg/l to 6.2 mg/l was predicted over all the mainstem of the river.
Implementing the climate change scenario on the base model of the Tigris River system
showed a 5% increase in annually averaged water temperature from 20.7 ⁰C to 21.68 ⁰C
v
over the mainstem river. Climate change scenarios produced no significant impacts on TDS
and CBOD concentrations in the mainstem, while DO concentrations decreased from 8.15
mg/l to 7.98 mg/l with a slight increase in Chl-a concentration from 1.97 µg/l to 2 µg/l in
the mainstem. Disconnecting Tharthar Lake from the system showed a remarkable 25%
decrease in TDS concentrations, with an average concentration changed from 495 mg/l to
397 mg/l in the mainstem due to an extra 36% increase in flow discharged downstream of
Samarra Barrage. Also, Chl-a concentration significantly decreased by 40% with an
average concentration changed from 2 µg/l to 1.2 µg/l.
Additionally, a 6-year model simulation of the Tigris River system was performed to
evaluate the long-term effects on Tharthar Lake. No significant impact was observed in the
average temperature of the lake. TDS concentrations in the lake decreased from 1239 mg/l
to 1041 mg/l. PO4, NH4 and NO3 concentrations decreased by 2%, 66% and 26%,
respectively. Chl-a concentration in Tharthar Lake decreased from 2.0 µg/l to 1.61 µg/l.
After decreasing BOD concentrations of the Tigris River by 50%, BOD concentrations in
the mainstem decreased by 24%, while DO concentrations increased by 2.8%. There were
no significant impacts on Chl-a concentrations in the mainstem of the river. Finally, for a
scenario where extremely low dissolved oxygen release from Mosul Dam in the summer,
it was found that approximately 50 km below Mosul Dam was affected before DO
concentrations reached an equilibrium concentration.

vi
For further work on the Tigris River system, it is recommended to model the Tigris River
from Kut Barrage to the confluence with the Euphrates River, about 400 km long, and
connect it with the current model to have a complete model of the Tigris River system from
Mosul Dam to the confluence with the Euphrates River. This is necessary to manage water
the entire system of the Tigris River and also to provide enough water with good quality in
Basra.

vii
Acknowledgments
A huge thank you to Dr. Scott Wells for his continued teaching, assistance, kindness, and
availability throughout my PhD program. Without him, this work wouldn’t be possible.
Thanks and appreciation to Dr. Stefan Talke for his assistance with remote sensing
techniques.
Thanks to Dr. Chris Berger and Dr. Mark Sytsma for serving in my PhD committee.
Thanks and appreciations to the Civil and Environmental Department of Portland State
University for having me succeed through this journey.
Thanks and appreciations to my parents, my wife (Mawj) and kids (Abdullah and Taim),
and my friends for their continuous support and encouragement.
Thanks to the Iraqi Ministry of Water Resources and the Iraqi Ministry of Communication
for providing field data of the Tigris River system.
viii
Table of Contents
Abstract ................................................................................................................................ i
Acknowledgments.............................................................................................................. vii
List of Tables ..................................................................................................................... xii
List of Figures ................................................................................................................... xiv
Chapter One: Introduction .................................................................................................. 1
Study Objectives and Hypotheses ................................................................................... 6
Chapter Two: The Tigris River and Tharthar Lake Study Area ......................................... 8
Point Sources in the Study area within Baghdad City .................................................. 13
Water Treatment Plants (WTPs) ................................................................................ 13
Wastewater Treatment Plants (WWTPs) ................................................................... 14
Non-Point Sources of the Tigris River .......................................................................... 15
The Tigris River Flow Regime...................................................................................... 16
Hydraulic Structures on The Tigris River in Iraq ......................................................... 20
Irrigation in Iraq ............................................................................................................ 21
Water Quality in The Tigris River System.................................................................... 22
Chapter Three: Surface Water Temperature Estimation from Remote Sensing ............... 34
Introduction ................................................................................................................... 34
Remote Sensing ............................................................................................................. 36
Landsat 7 ETM+ ........................................................................................................... 36
Previous Research Studies Using Remote Sensing Data .............................................. 37
Satellite Data Acquisition.............................................................................................. 41
Image Processing ....................................................................................................... 44
Converting Landsat Thermal Bands to Surface Temperature ................................... 46
Estimation of Surface Water Temperature of the Tigris River ..................................... 48
Validation of Surface Water Temperature ................................................................. 50
Surface Water Temperature Statistical Model ........................................................... 51
Estimation of Surface water Temperature in Tharthar Lake ......................................... 57
Chapter Four: CE-QUAL-W2 Model Overview .............................................................. 61
Hydraulic Model Selection for the Tigris River System ............................................... 61
ix
Model Introduction .................................................................................................... 63
CE-QUAL-W2 State Variables ................................................................................. 64
Input Data Preparation ............................................................................................... 66
Hydrodynamics Governing Equations .......................................................................... 66
x-Momentum ............................................................................................................. 67
z-Momentum ............................................................................................................. 68
Continuity .................................................................................................................. 68
Free-Surface ............................................................................................................... 68
Constituent Transport ................................................................................................ 69
Equation of State ....................................................................................................... 69
Chapter Five: The Tigris River Model Set Up.................................................................. 70
Bathymetry and Grid Development of the Tigris River System ................................... 71
The Tigris River Grid ................................................................................................ 72
Tharthar Lake Grid .................................................................................................... 78
Meteorological Inputs ................................................................................................... 84
Flow Inputs .................................................................................................................... 87
Spillways ................................................................................................................... 90
Temperature Inputs ....................................................................................................... 93
Constituents Inputs ........................................................................................................ 95
Chapter Six: The Tigris River Model Calibration .......................................................... 101
Model Calibration: Flow-Tharthar Lake ..................................................................... 101
Evaporation in Tharthar Lake .................................................................................. 103
Model Calibration: Flow in the Tigris River ............................................................... 104
Flow Error Statistics ................................................................................................ 108
Distributed Flows .................................................................................................... 110
Model Adjustments.................................................................................................. 115
Water Age and Travel Time .................................................................................... 118
Model Calibration: Temperature ................................................................................. 122
Water Temperature of Tharthar Lake ...................................................................... 122
Water Temperature of the Tigris River ................................................................... 125
x
Model Calibration: Water Quality Constituents.......................................................... 132
Total Dissolved Solids ............................................................................................. 132
Other Water Quality State Variables ....................................................................... 139
Chapter Seven: The Tigris River Management Scenarios .............................................. 151
Historical Hydrology of the Tigris River System ....................................................... 153
Management Scenario 1: Increasing Upstream Flow ................................................. 154
Management Scenario 2: Decreasing Upstream Flow ................................................ 157
Management Scenario 3: Decreasing Upstream Flow and Increasing Nutrients ........ 163
Management Scenario 4: Increasing Tharthar Lake’s Flow ....................................... 169
Management Scenario 5: The Effect of Climate Change ............................................ 171
Management Scenario 6: The Effect of Climate Change with Decreasing Upstream
Flow ............................................................................................................................. 176
Management Scenario 7: Disconnecting Tharthar Lake ............................................. 182
Management Scenario 8: Long Term Model .............................................................. 188
Management Scenario 9: Decreasing BOD in the Tigris River within Baghdad City 193
Management Scenario 10: Dissolved Oxygen Release from Mosul Dam .................. 197
Summary of Management Scenarios........................................................................... 198
Chapter Eight: Conclusions and Recommendations ....................................................... 200
The Tigris River Model Improvements and Recommendations ................................. 208
Flow Data ................................................................................................................ 208
Temperature Data .................................................................................................... 208
Water Quality Data .................................................................................................. 209
Model Grid and Bathymetry Data ........................................................................... 210
Meteorological Data ................................................................................................ 210
References ....................................................................................................................... 211
Appendix A: Management Scenarios of the Tigris River Model ................................... 219
Management Scenario 1: Increasing Upstream Flow ................................................. 219
Management Scenario 2: Decreasing Upstream Flow ................................................ 225
Management Scenario 3: Decreasing Upstream Flow and Increasing Nutrients ........ 228
Management Scenario 4: Increasing Tharthar Lake’s Flow ....................................... 231
Management Scenario 5: The Effect of Climate Change ............................................ 238

xi
Management Scenario 6: The Effect of Climate Change with Decreasing Upstream
Flow ............................................................................................................................. 243
Management Scenario 7: Disconnecting Tharthar Lake ............................................. 246
Appendix B: Histograms of Water Quality Constituents in the Tigris River System .... 250
Appendix C: The Tigris River Model Control File ........................................................ 258
xii
List of Tables
Table 1: Lower tributaries of the Tigris River (ESCWA-BGR, 2013) ............................. 11
Table 2: Designed and Produced capacity of WTPs in Baghdad city in 2009 (CSO, 2010).
........................................................................................................................................... 13
Table 3: Designed and Produced capacity of WWTPs in Mosul, Tikrit, and Baghdad
cities in 2009 (CSO, 2010)................................................................................................ 15
Table 4: Drainage area of the Tigris River basin (Al-Ansari and Knutsson, 2011). ........ 18
Table 5: Dams in the Tigris River Basin, Iraq; BCM: billion cubic meters; I: Irrigation; F:
Flood control. .................................................................................................................... 20
Table 6: Water characteristics of the Tigris River within Baghdad City (Mutlak et al.,
1980) ................................................................................................................................. 26
Table 7: USDA Salinity Laboratory’s classification of saline irrigation water based on
salinity level, potential injury to plants, and management necessary for satisfactory
utilization (Camberato, 2001). .......................................................................................... 29
Table 8: Water quality correlations of some research studies. B1, B2, B3, B4, B5, B6,
B61, and B62 are blue, green, red, near infrared, shortwave infrared, thermal, thermal
Low Gain, and thermal High Gain bands respectively. .................................................... 40
Table 9: Landsat 5 (LT5) and Landsat 7 (LE7) images used in this study. ...................... 43
Table 10: Statistical values of the surface water models. ................................................. 54
Table 11: Landsat images cover Tharthar Lake ................................................................ 57
Table 12: Comparison of 1-D, 2-D, and 3-D hydraulic models ....................................... 62
Table 13: Dimensions of all waterbodies and branches of the Tigris River System, DS:
Downstream, B: Barrage ................................................................................................... 83
Table 14: Spillway specifications in the Tigris River System. ......................................... 92
Table 15: Water Quality field data extracted from literatures and used for boundary
conditions at Mosul Dam and downstream model calibration at Baghdad City; WWTPs:
Wastewater treatment plants. ............................................................................................ 96
Table 16: Error statistics for model comparisons to field data for flow and water level
(W.L.). ............................................................................................................................. 109
Table 17: Model and theoretical estimation of irrigation water in Baghdad, Diyala, and
Kut................................................................................................................................... 114
Table 18: Manning’s coefficients and slopes used in the Tigris River model ................ 117
Table 19: Travel time of upstream pulse inputs every 2 months .................................... 121
Table 20: Error statistics for model comparisons to satellite data for longitudinal water
temperature in Tharthar Lake.......................................................................................... 124
Table 21: Error statistics for model comparisons to satellite data for water temperature
from January to December 2009. .................................................................................... 130
Table 22: Error statistics for model comparisons to satellite data for water temperature
from April to October 2009. ........................................................................................... 131

xiii
Table 23: Error statistics for model predictions of TDS in the middle of the month
compared with field data. ................................................................................................ 136
Table 24: The Tigris River management scenarios ........................................................ 152
Table 25: Average of water quality constituents in the mainstem of the Tigris River for
the base model and management scenarios. ................................................................... 199
Table 26: Average of water quality constituents in Tharthar Lake for the base model and
management scenarios. ................................................................................................... 199
xiv
List of Figures
Figure 1: The official map of Iraq showing the Tigris and the Euphrates Rivers (Arc GIS)
............................................................................................................................................. 2
Figure 2: Sources of water for the Tigris and the Euphrates Rivers in Iraq (MWR 2005). 3
Figure 3: Water uses in Iraq in 2009 (CSO, 2010). ............................................................ 4
Figure 4: Land characteristics in Iraq in 2009 (CSO, 2010). .............................................. 4
Figure 5: The Tigris River and Tharthar Lake study area from Mosul Dam to Kut
Barrage. ............................................................................................................................... 9
Figure 6: Samarra Barrage (Google Earth). ...................................................................... 10
Figure 7: Kut Barrage (Google Earth). ............................................................................. 10
Figure 8: Tharthar Lake and its canals (Google Earth). .................................................... 12
Figure 9: Point and non-point sources in Baghdad city. ................................................... 14
Figure 10: A famous Iraqi street in Bagdad City under flooding in 1950 (Mix Max,
2009). ................................................................................................................................ 17
Figure 11: Schematic of Landsat 7 ETM+ satellite (NASA, 2014). ................................. 37
Figure 12: Landsat TM5 covers the Tigris River at Mosul Dam. ..................................... 42
Figure 13: Landsat TM5 covers the Tigris River at Samarra Barrage and Tharthar Lake.
........................................................................................................................................... 42
Figure 14: Landsat TM5 covers the Tigris River at Baghdad and Kut. ............................ 42
Figure 15: Land-water mask of the Tigris River at Mosul Dam and Mosul City. ............ 46
Figure 16: Surface water temperature of the Tigris River at Mosul Dam Lake. .............. 49
Figure 17: Surface water temperature of the Tigris River at Samarra Barrage. ............... 49
Figure 18: Surface water temperature of the Tigris River within Baghdad City. ............. 50
Figure 19: Validation of satellite water temperature. ....................................................... 51
Figure 20: Daily air temperature at Mosul, Baeji, and Baghdad cities (2009). ................ 52
Figure 21: Satellite data (Landsat 5 and Landsat 7) and daily surface water temperature of
the Tigris River estimated by regression models at Mosul Dam, Baeji city, and Baghdad
city for the simulated year 2009. ....................................................................................... 56
Figure 22: Surface water temperature in the upper and the lower parts of Tharthar Lake
(part 1); the top row represents the upper part of the lake, while the bottom row
represents the lower part of the lake. ................................................................................ 58
Figure 23: Surface water temperature in the upper and the lower parts of Tharthar Lake
(part 2); the top row represents the upper part of the lake, while the bottom row
represents the lower part of the lake. ................................................................................ 58
Figure 24: Seasonal variation in longitudinal surface water temperature in Tharthar Lake
in 2009. ............................................................................................................................. 59
Figure 25: Longitudinal surface water temperature in Tharthar Lake in winter and
summer of 2009. ............................................................................................................... 60
Figure 26: Schematic diagram of the Tigris River system. .............................................. 71
xv
Figure 27: Cross sections of the Tigris River from Mosul Dam to Kut Barrage with the
river cross-sections as provided from the Iraqi Water Resources Ministry (WRM), colors
represent river cross-section files as received from WRM. .............................................. 73
Figure 28: The Tigris River cross-section at river km 490 km. ........................................ 74
Figure 29: Bottom elevation of the mainstem of the Tigris River study area from Mosul
Dam to Kut Barrage. ......................................................................................................... 75
Figure 30: Segment section # 123 (Baghdad city) with 82 active layers (1 m each)
constructed by the W2 model. .......................................................................................... 75
Figure 31: Longitudinal profile for waterbody 1, branch 1 of the Tigris River model
constructed by the W2 model, Upper Zab and lower Zab at model segment 27 and 50
respectively with purple colors. ........................................................................................ 76
Figure 32: Longitudinal profile for waterbody 2, branch 2 of the Tigris River model
constructed by the W2 model, Samarra Barrage at model segment 80 with a brown color.
........................................................................................................................................... 76
Figure 33: Longitudinal profile for waterbody 3, branch 3 of the Tigris River model
constructed by the W2 model. Extra tributary at model segment 84. Audaim and Diyala
Rivers at model segments 97 and 130 respectively with purple colors. Withdrawals
represented in red colors. .................................................................................................. 77
Figure 34: Longitudinal profile for waterbody 4, branch 4 of the Tigris River model
constructed by the W2 model, an extra tributary at model segment 140 with a purple
color. ................................................................................................................................. 77
Figure 35: Topographic map of Tharthar Lake (Sissakian 2011). .................................... 79
Figure 36: Tharthar Lake digitized contour lines. ........................................................... 79
Figure 37: Constructing of contour lines in meters of Tharthar Lake constructed by
Surfer................................................................................................................................. 80
Figure 38: Model segments of Tharthar Lake created by Surfer. ..................................... 80
Figure 39: Longitudinal profile for waterbody 5, branch 5 (Tigris-Tharthar Canal) of the
Tigris River model constructed by the W2 model (Cole and Wells, 2017). ..................... 81
Figure 40: Model longitudinal profile of water body 6, branch 6 Tharthar Lake, including
all segments and layers constructed by W2 model (Cole and Wells, 2017), the outlet of
the lake at segment 297 with a brown color. .................................................................... 81
Figure 41: Model segment #270 section (Tharthar Lake) with 82 active layers (1 m each)
constructed by the W2 model (Cole and Wells, 2017). .................................................... 82
Figure 42: Longitudinal profile for waterbody 7, branch 7 (Tharthar Canal) of the Tigris
River model constructed by the W2 model (Cole and Wells, 2017). ............................... 82
Figure 43: Longitudinal profile for waterbody 8, branch 8 (Tharthar-Tigris Canal) of the
Tigris River model constructed by the W2 model (Cole and Wells, 2017). ..................... 83
Figure 44: Daily dew-point temperature at Mosul, Baeji, and Baghdad cities (2009). .... 85
Figure 45: Daily wind speed at Mosul, Baeji, and Baghdad cities (2009). ...................... 85
Figure 46: Wind direction at Baghdad City (2009). ......................................................... 86
Figure 47: Daily cloud cover at Mosul, Baeji, and Baghdad cities (2009). ...................... 87
xvi
Figure 48: Daily flowrates of the Tigris River in 2009 at Mosul Dam, Baeji city, Samarra
Barrage, Baghdad city, and Kut Barrage. ......................................................................... 88
Figure 49: Daily flowrates of the Upper and Lower Zab Rivers in 2009. ........................ 89
Figure 50: Water sources of the Tigris River in Iraq for the year 2009 (CSO, 2010). ..... 90
Figure 51: Schematic diagram of water and spillway elevations for free flowing and
submerged weir used in spillway analysis (Cole and Wells, 2017). ................................. 92
Figure 52: Daily surface water temperature of the Tigris River at Baeji City with 95% CI.
........................................................................................................................................... 94
Figure 53: Daily surface water temperature of the Tigris River at Baghdad City with 95%
CI....................................................................................................................................... 94
Figure 54: Input field data of TDS concentration for boundary conditions at Mosul Dam.
........................................................................................................................................... 99
Figure 55: Estimated concentrations of PO4, NH4, and NO3 for boundary conditions at
Mosul Dam...................................................................................................................... 100
Figure 56: Estimated BODu and DO concentrations for boundary conditions at Mosul
Dam ................................................................................................................................. 100
Figure 57: Model and data of the water level of Tharthar Lake in 2009. ....................... 102
Figure 58: Model flowrate in Tharthar Lake canals in 2009. ......................................... 102
Figure 59: Flow balance in Tharthar Lake. ..................................................................... 103
Figure 60: Model flowrate predictions compared to the Tigris River field data at Baeji
city (segment 54)............................................................................................................. 105
Figure 61: Model water level predictions compared to the Tigris River field data at Baeji
city (segment 54)............................................................................................................. 105
Figure 62: Model flowrate predictions compared to the Tigris River field data at Samarra
Barrage (segment 83). ..................................................................................................... 106
Figure 63: Model water level predictions compared to the Tigris River field data at
Samarra Barrage (segment 83). ....................................................................................... 106
Figure 64: Model flowrate predictions compared to the Tigris River field data at Baghdad
City (segment 123). ......................................................................................................... 107
Figure 65: Model water level predictions compared to the Tigris River field data at
Baghdad City (segment 123). ......................................................................................... 107
Figure 66: Inflow and distributed flow and the ratio of the flow in branch 2 of the Tigris
River model. .................................................................................................................... 111
Figure 67: Inflow and distributed flow and the ratio of the flow in branch 2 of the Tigris
River model. .................................................................................................................... 112
Figure 68: Inflow and distributed flow and the ratio of the flow in branch 2 of the Tigris
River model. .................................................................................................................... 113
Figure 69: Bridges and meandering on the Tigris River within Mosul city. .................. 116
Figure 70: Bridges and meandering on the Tigris River within Baghdad city. .............. 116
Figure 71: Model predictions of water age throughout the mainstem of the Tigris River
system for the base model. .............................................................................................. 118
xvii
Figure 72: Model predictions of water age in Tharthar Lake. ........................................ 119
Figure 73: A tracer pulse input at upstream boundary condition and travel time of that
pulse along the main stream of the Tigris River at Baeji city, Samarra Barrage, Baghdad
city, and Kut Barrage. ..................................................................................................... 120
Figure 74: A tracer pulse input at JDAY 1.5 condition and travel time of that pulse along
the main stream of the Tigris River at Baeji city, Samarra Barrage, Baghdad city, and Kut
Barrage. ........................................................................................................................... 120
Figure 75: A tracer pulse input at JDAY 1.0 condition and travel time of that pulse in
Tharthar Lake. ................................................................................................................. 121
Figure 76: Model predictions of longitudinal surface water temperature in Tharthar Lake
on February 4th, March8th, and May 27th. ...................................................................... 123
Figure 77: Model predictions of longitudinal surface water temperature in Tharthar Lake
on July 30thand August 15th. ........................................................................................... 124
Figure 78: Model surface water temperature predictions compared to the Tigris River
remote sensing data at Baeji City (segment 54).............................................................. 126
Figure 79: Model surface water temperature predictions compared to the Tigris River
remote sensing data at Baghdad City (segment 123). ..................................................... 126
Figure 80: Model temperature contour lines of Tharthar Lake at JDAY 5.5, 55.5, and
105.5 of 2009 (Part 1). .................................................................................................... 127
Figure 81: Model temperature contour lines of Tharthar Lake at JDAY 170.5, 260.5, and
350.5 of 2009 (Part 2). .................................................................................................... 128
Figure 82: Model temperature contour lines of Samarra Barrage (model segment 80) . 129
Figure 83: Model temperature contour lines of Kut Barrage (model segment 189) ....... 129
Figure 84: Model TDS predictions compared to the Tigris River field data at Mosul Dam
(segment 2) the upstream boundary condition. ............................................................... 134
Figure 85: Model TDS predictions compared to the Tigris River field data at Samarra
Barrage (segment 83). ..................................................................................................... 134
Figure 86: Model TDS predictions compared to the Tigris River field data at Baghdad
City (segment 123). ......................................................................................................... 135
Figure 87: Model TDS predictions compared to the Tigris River field data at Kut Barrage
(segment 189).................................................................................................................. 135
Figure 88: Model TDS predictions at the outlet of Tharthar Lake in 2009 (segment 297).
......................................................................................................................................... 136
Figure 89: Model contours of TDS in Tharthar Lake at JDAY 55.5, and 105.5 of 2009
(Part 1). ........................................................................................................................... 137
Figure 90: Model contours of TDS in Tharthar Lake at JDAY 170.5, 260.5, and 360.5 of
2009 (Part 2). .................................................................................................................. 138
Figure 91: Model PO4 predictions at Mosul Dam, at Samarra Barrage, at Tharthar Lake,
at Baghdad City, and at Kut City. ................................................................................... 141
Figure 92: Model Ammonium predictions at Mosul Dam, at Samarra Barrage, at Tharthar
Lake, at Baghdad City, and at Kut Barrage. ................................................................... 142
xviii
Figure 93: Model Nitrate predictions at Mosul Dam, at Samarra Barrage (model Vs. field
data), at Tharthar Lake, at Baghdad City (model Vs. field data), and at Kut City. ........ 143
Figure 94: Model Dissolved Oxygen predictions at Mosul Dam, at Samarra Barrage, at
Tharthar Lake, at Baghdad City, and at Kut Barrage. .................................................... 144
Figure 95: Model CBOD predictions at Mosul Dam, at Samarra Barrage, at Baghdad City
(model Vs. field data), and at Kut Barrage. .................................................................... 145
Figure 96: Model Chlorophyll-a predictions at Mosul Dam, at Samarra Barrage, at
Tharthar Lake, at Baghdad City, and at Kut Barrage using algae growth rate of 1.5 d-1.
......................................................................................................................................... 146
Figure 97: Model predictions of Chl-a in Tharthar Lake using [AG] 1.5 d-1 compared
with Satellite data. ........................................................................................................... 148
Figure 98: Model predictions of Chl-a in Tharthar Lake using [AG] 0.98 d-1 compared
with Satellite data. ........................................................................................................... 148
Figure 99: Model predictions of Chl-a in the Tigris River system using [AG] 0.98 d-1 . 149
Figure 100: Model predictions of NH4 in Kut Barrage and Tharthar Lake. .................. 150
Figure 101: Model predictions of NO3 in Kut Barrage and Tharthar Lake. .................. 150
Figure 102: Historical flow regime in Mosul city before and after Mosul Dam Operation.
......................................................................................................................................... 153
Figure 103: Model total dissolved solids (TDS) predictions for base model and
management scenario 1 (increasing upstream flow) at Samarra Barrage, Baghdad City,
Kut Barrage, and Tharthar Lake. .................................................................................... 155
Figure 104: Model carbonaceous biological oxygen demand (CBOD) predictions for base
model and management scenario 1 (increasing upstream flow) at Samarra Barrage,
Baghdad City, Kut Barrage, and Tharthar Lake. ............................................................ 156
Figure 105: Model total dissolved solids (TDS) predictions for base model and
management scenario 2 (decreasing upstream flow) at Samarra Barrage, Baghdad City,
Kut Barrage, and Tharthar Lake. .................................................................................... 158
Figure 106: Model phosphate (PO4) predictions for base model and management scenario
2 (decreasing upstream flow) at Samarra Barrage, Baghdad City, Kut Barrage, and
Tharthar Lake. ................................................................................................................. 159
Figure 107: Model ammonia (NH4) predictions for base model and management scenario
2 (decreasing upstream flow) at Samarra Barrage, Baghdad City, Kut Barrage, and
Tharthar Lake. ................................................................................................................. 160
Figure 108: Model nitrate (NO3) predictions for base model and management scenario 2
(decreasing upstream flow) at Samarra Barrage, Baghdad City, Kut Barrage, and Tharthar
Lake................................................................................................................................. 161
Figure 109: Model carbonaceous biological oxygen demand (CBOD) predictions for base
model and management scenario 2 (decreasing upstream flow) at Samarra Barrage,
Baghdad City, Kut Barrage, and Tharthar Lake. ............................................................ 162
xix
Figure 110: Model total dissolved solids (TDS) predictions for base model and
management scenario 3 (decreasing upstream flow with increasing nutrients) at Samarra
Barrage, Baghdad City, Kut Barrage, and Tharthar Lake. .............................................. 164
Figure 111: Model phosphate (PO4) predictions for base model and management
scenario 3 (decreasing upstream flow with increasing nutrients) at Samarra Barrage,
Baghdad City, Kut Barrage, and Tharthar Lake. ............................................................ 165
Figure 112: Model ammonia (NH4) predictions for base model and management scenario
3 (decreasing upstream flow with increasing nutrients) at Samarra Barrage, Baghdad
City, Kut Barrage, and Tharthar Lake. ........................................................................... 166
Figure 113: Model nitrate (NO3) predictions for base model and management 3
(decreasing upstream flow with increasing nutrients) at Samarra Barrage, Baghdad City,
Kut Barrage, and Tharthar Lake. .................................................................................... 167
Figure 114: Model carbonaceous biological oxygen demand (CBOD) predictions for base
model and management scenario 3 (decreasing upstream flow with increasing nutrients)
at Samarra Barrage, Baghdad City, Kut Barrage, and Tharthar Lake. ........................... 168
Figure 115: Model total dissolved solids (TDS) predictions for base model and
management scenario 4 (increasing Tharthar Lake’s inflow) at Samarra Barrage,
Baghdad City, Kut Barrage, and Tharthar Lake. ............................................................ 170
Figure 116: Dew point temperature of the base model and management scenario 5
(Climate Change) at Mosul, Baeji, and Baghdad cities in 2009. .................................... 172
Figure 117: Model water temperature (T) predictions for base model and management
scenario 5 (climate change) at Samarra Barrage, Baghdad City, Kut Barrage, and
Tharthar Lake. ................................................................................................................. 173
Figure 118: Model dissolved oxygen (DO) predictions for base model and management
scenario 5 (climate change) at Samarra Barrage, Baghdad City, Kut Barrage, and
Tharthar Lake. ................................................................................................................. 174
Figure 119: Model chlorophyll-a (Chl-a) predictions for base model and management
scenario 5 (climate change) at Samarra Barrage, Baghdad City, Kut Barrage, and
Tharthar Lake. ................................................................................................................. 175
Figure 120: Model water temperature (Tw) predictions for base model and management
scenario 6 (climate change with decreasing hydrology) at Samarra Barrage, Baghdad
City, Kut Barrage and Tharthar Lake. ............................................................................ 177
Figure 121 Model total dissolved solids (TDS) predictions for base model and
management scenario 6 (climate change with decreasing hydrology) at Samarra Barrage,
Baghdad City, Kut Barrage and Tharthar Lake. ............................................................. 178
Figure 122: Model carbonaceous biological oxygen demand (CBOD) predictions for base
model and management scenario 6 (climate change with decreasing hydrology) at
Samarra Barrage, Baghdad City, Kut Barrage and Tharthar Lake. ................................ 179
Figure 123: Model dissolved oxygen (DO) predictions for base model and management
scenario 6 (climate change with decreasing hydrology) at Samarra Barrage, Baghdad
City, Kut Barrage and Tharthar Lake. ............................................................................ 180
xx
Figure 124 Model chlorophyll-a (Chl-a) predictions for base model and management
scenario 6 (climate change with decreasing hydrology) at Samarra Barrage, Baghdad
City, Kut Barrage and Tharthar Lake. ............................................................................ 181
Figure 125 Model total dissolved solids (TDS) predictions for base model and
management scenario 7 (disconnecting Tharthar Lake) at Samarra Barrage, Baghdad
City, Kut Barrage. ........................................................................................................... 183
Figure 126: Model carbonaceous biological oxygen demand (CBOD) predictions for base
model and management scenario 7 (disconnecting Tharthar Lake) at Samarra Barrage,
Baghdad City, Kut Barrage. ............................................................................................ 184
Figure 127: Model dissolved oxygen (DO) predictions for base model and management
scenario 7 (disconnecting Tharthar Lake) at Samarra Barrage, Baghdad City, Kut
Barrage. ........................................................................................................................... 185
Figure 128: Model chlorophyll-a (Chl-a) predictions for base model and management
scenario 7 (disconnecting Tharthar Lake) at Samarra Barrage, Baghdad City, Kut
Barrage. ........................................................................................................................... 186
Figure 129: Model flowrate (Q) predictions for base model and management scenario 7
(disconnecting Tharthar Lake) at Samarra Barrage and Baghdad City. ......................... 187
Figure 130: Model water temperature (Tw) predictions for management scenario 8 (Long
Term simulation) in Tharthar Lake. ................................................................................ 189
Figure 131: Model total dissolved solids (TDS) predictions for management scenario 8
(Long Term simulation) in Tharthar Lake. ..................................................................... 189
Figure 132: Model phosphate (PO4) predictions for management scenario 8 (Long Term
simulation) in Tharthar Lake. ......................................................................................... 190
Figure 133: Model ammonia (NH4) predictions for management scenario 8 (Long Term
simulation) in Tharthar Lake. ......................................................................................... 190
Figure 134: Model nitrate (NO3) predictions for management scenario 8 (Long Term
simulation) in Tharthar Lake. ......................................................................................... 191
Figure 135: Model carbonaceous biological oxygen demand (CBOD) predictions for
management scenario 8 (Long Term simulation) in Tharthar Lake. .............................. 191
Figure 136: Model dissolved oxygen (DO) predictions for management scenario 8 (Long
Term simulation) in Tharthar Lake. ................................................................................ 192
Figure 137: Model chlorophyll-a (Chl-a) predictions for management scenario 8 (Long
Term simulation) in Tharthar Lake. ................................................................................ 192
Figure 138: Model carbonaceous biological oxygen demand (CBOD) predictions for base
model and management scenario 9 (50% BOD Reduction) at Baghdad City and Kut
Barragel. .......................................................................................................................... 194
Figure 139: Model dissolved oxygen (DO) predictions for base model and management
scenario 9 (50% BOD Reduction) at Baghdad City and Kut Barrage. ........................... 195
Figure 140: Model chlorophyll-a (Chl-a) predictions for base model and management
scenario 9 (50% BOD Reduction) at Baghdad City and Kut Barrage. ........................... 196

xxi
Figure 141: Model predictions of DO in the Mainstem of the Tigris River at model
segments 2, 4, 6, 7, 8, 9, and 11. ..................................................................................... 197
1
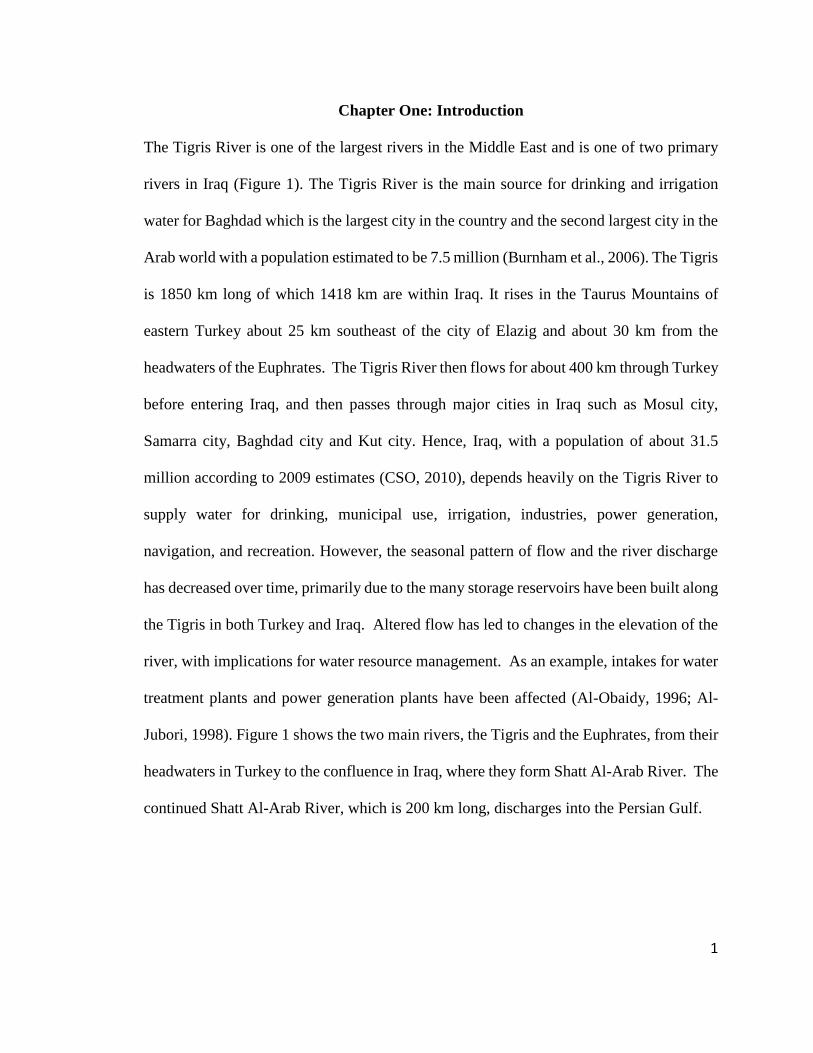
Chapter One: Introduction
The Tigris River is one of the largest rivers in the Middle East and is one of two primary
rivers in Iraq (Figure 1). The Tigris River is the main source for drinking and irrigation
water for Baghdad which is the largest city in the country and the second largest city in the
Arab world with a population estimated to be 7.5 million (Burnham et al., 2006). The Tigris
is 1850 km long of which 1418 km are within Iraq. It rises in the Taurus Mountains of
eastern Turkey about 25 km southeast of the city of Elazig and about 30 km from the
headwaters of the Euphrates. The Tigris River then flows for about 400 km through Turkey
before entering Iraq, and then passes through major cities in Iraq such as Mosul city,
Samarra city, Baghdad city and Kut city. Hence, Iraq, with a population of about 31.5
million according to 2009 estimates (CSO, 2010), depends heavily on the Tigris River to
supply water for drinking, municipal use, irrigation, industries, power generation,
navigation, and recreation. However, the seasonal pattern of flow and the river discharge
has decreased over time, primarily due to the many storage reservoirs have been built along
the Tigris in both Turkey and Iraq. Altered flow has led to changes in the elevation of the
river, with implications for water resource management. As an example, intakes for water
treatment plants and power generation plants have been affected (Al-Obaidy, 1996; Al-
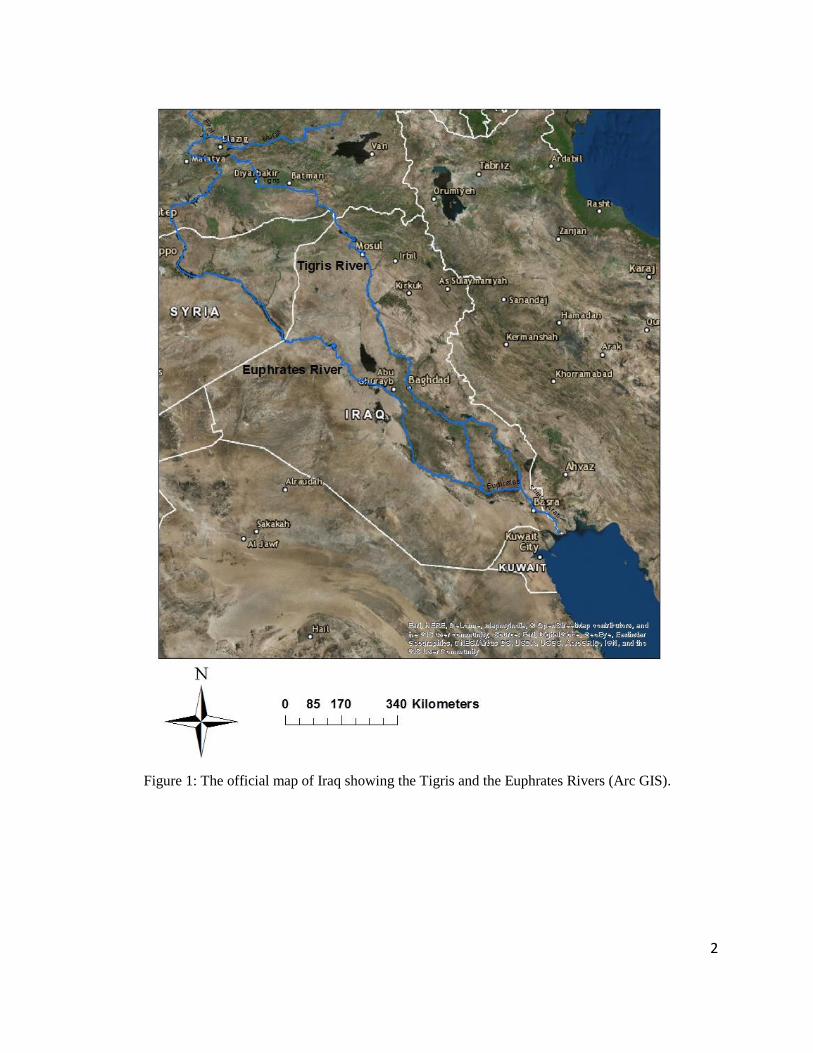
Jubori, 1998). Figure 1 shows the two main rivers, the Tigris and the Euphrates, from their
headwaters in Turkey to the confluence in Iraq, where they form Shatt Al-Arab River. The
continued Shatt Al-Arab River, which is 200 km long, discharges into the Persian Gulf.
2
Figure 1: The official map of Iraq showing the Tigris and the Euphrates Rivers (Arc GIS).
3
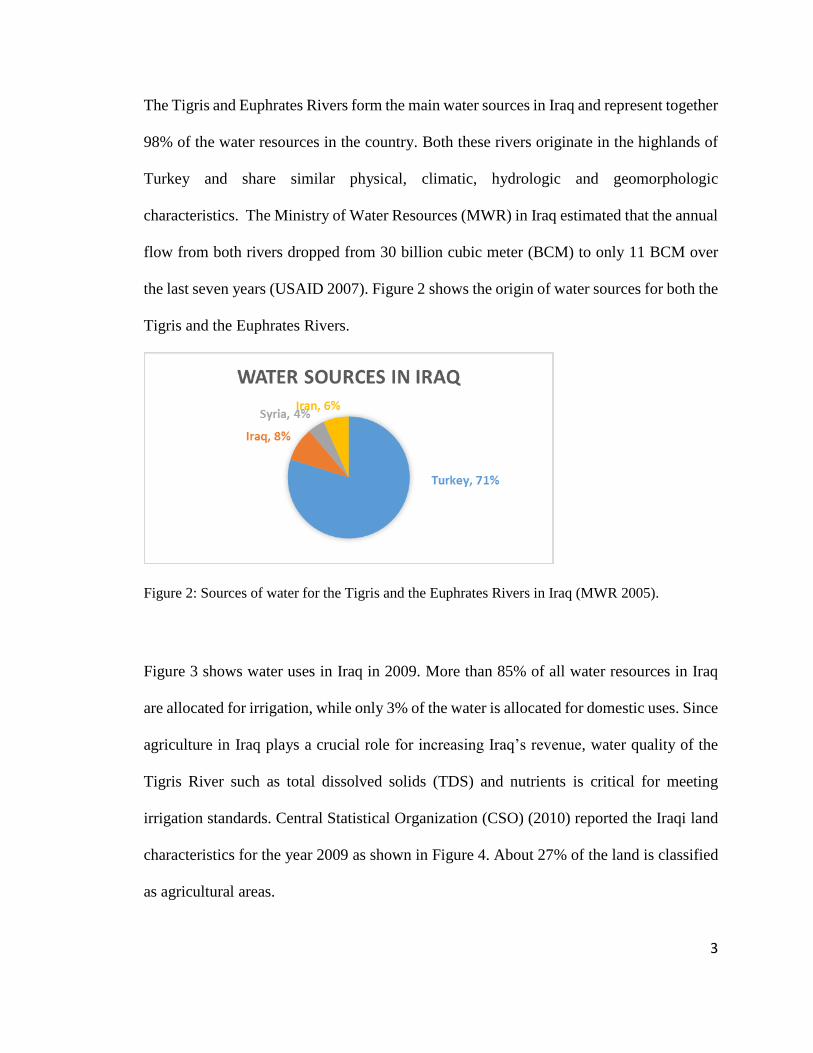
The Tigris and Euphrates Rivers form the main water sources in Iraq and represent together
98% of the water resources in the country. Both these rivers originate in the highlands of
Turkey and share similar physical, climatic, hydrologic and geomorphologic
characteristics. The Ministry of Water Resources (MWR) in Iraq estimated that the annual
flow from both rivers dropped from 30 billion cubic meter (BCM) to only 11 BCM over
the last seven years (USAID 2007). Figure 2 shows the origin of water sources for both the
Tigris and the Euphrates Rivers.
Figure 2: Sources of water for the Tigris and the Euphrates Rivers in Iraq (MWR 2005).
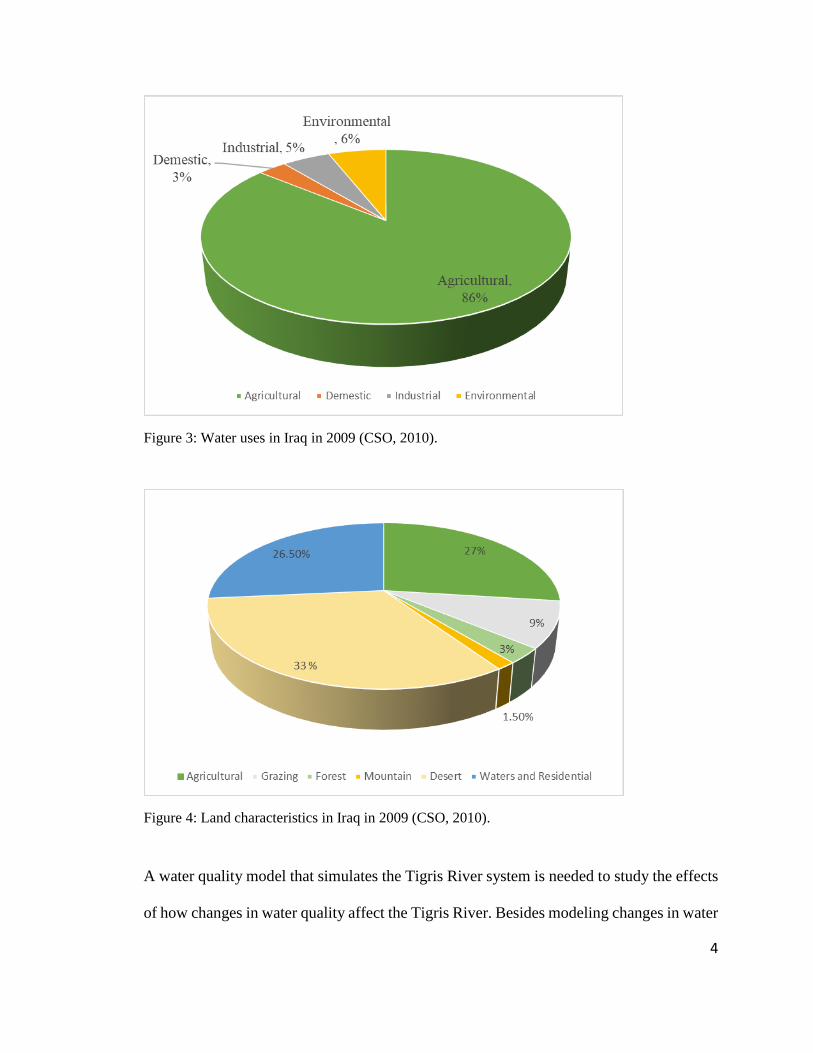
Figure 3 shows water uses in Iraq in 2009. More than 85% of all water resources in Iraq
are allocated for irrigation, while only 3% of the water is allocated for domestic uses. Since
agriculture in Iraq plays a crucial role for increasing Iraq’s revenue, water quality of the
Tigris River such as total dissolved solids (TDS) and nutrients is critical for meeting
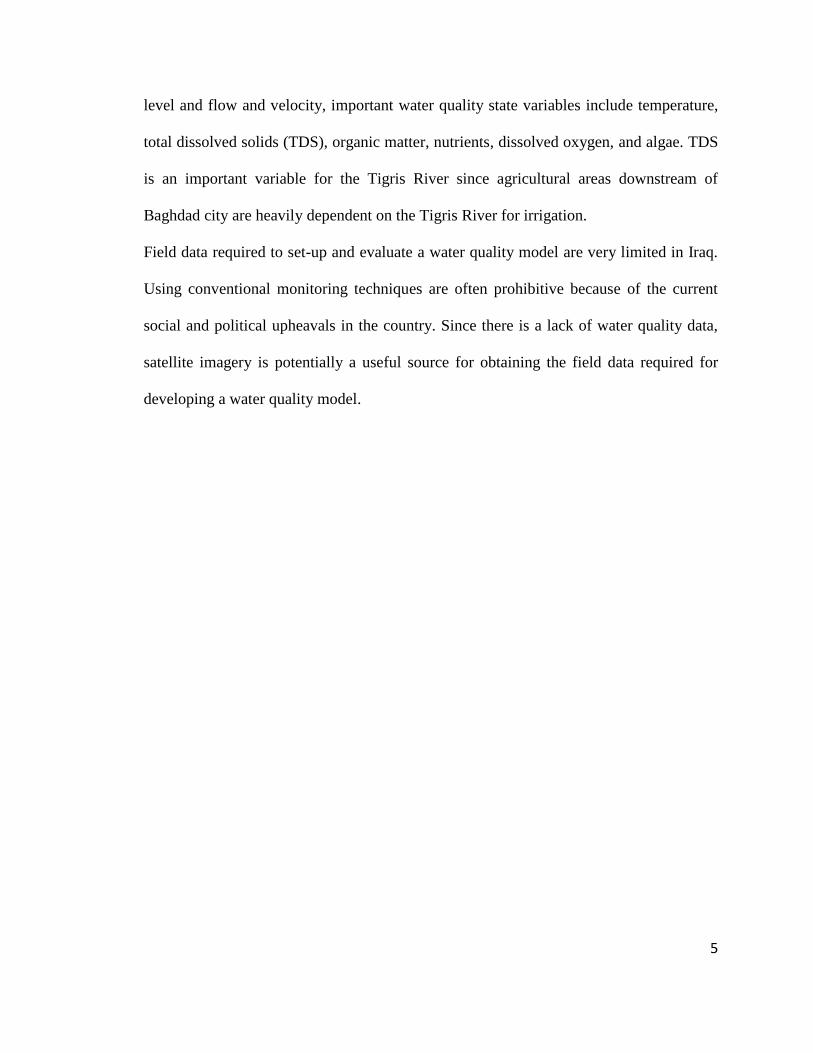
irrigation standards. Central Statistical Organization (CSO) (2010) reported the Iraqi land
characteristics for the year 2009 as shown in Figure 4. About 27% of the land is classified
as agricultural areas.
4
Figure 3: Water uses in Iraq in 2009 (CSO, 2010).
Figure 4: Land characteristics in Iraq in 2009 (CSO, 2010).
A water quality model that simulates the Tigris River system is needed to study the effects
of how changes in water quality affect the Tigris River. Besides modeling changes in water
5
level and flow and velocity, important water quality state variables include temperature,
total dissolved solids (TDS), organic matter, nutrients, dissolved oxygen, and algae. TDS
is an important variable for the Tigris River since agricultural areas downstream of
Baghdad city are heavily dependent on the Tigris River for irrigation.
Field data required to set-up and evaluate a water quality model are very limited in Iraq.
Using conventional monitoring techniques are often prohibitive because of the current
social and political upheavals in the country. Since there is a lack of water quality data,
satellite imagery is potentially a useful source for obtaining the field data required for
developing a water quality model.
6
Study Objectives and Hypotheses
The primary objective of this research is to develop a systematic hydrodynamic and water
quality model of the Tigris River and use it to evaluate changes in water quality as a result
of changes in flow management in the Tigris basin. Specifically, this objective will be met
by
• Developing a 2-D water quality model of the Tigris River system and Tharthar Lake using
the water quality and hydrodynamics model CE-QUAL-W2 (Cole and Wells, 2017). This
includes compiling historical water quality, meteorological, and stream channel
morphology data for the Tigris River System.
• Estimating surface water temperature of the Tigris River from remotely sensed data using
thermal bands of both Landsat 5 TM and Landsat 7 ETM+ to obtain upstream boundary
conditions and downstream water temperatures for the model calibration.
• Estimating water quality constituents such as total dissolved solids (TDS), biological
oxygen demand (BOD), nutrients (NO3) and (PO4), and algae of the Tigris River using
limited field data obtained from Water Resources Ministry in Iraq (WRM) and other field
data extracted from previous studies of the Tigris River.
• Using the Tigris model system to evaluate some management scenarios for improving
water quality in the Tigris River such as altering river flow due to upstream flow control
by Turkey and disconnecting Tharthar Lake from the Tigris River system to enhance the
river quality in Baghdad and downstream cities.
• Estimating the potential impact of climate change on the river system.

7
The hypotheses to be investigated by this dissertation are:
• Increasing upstream river flow at Mosul Dam will decrease total dissolved solids (TDS)
concentrations in both Tharthar Lake and the Tigris River through dilution and reduction
in both residence time and evaporation rates.
• Estimating surface water temperature from remote sensing is a feasible method for defining
the model’s upstream boundary conditions and calibrating downstream areas.
• Disconnecting Tharthar Lake from the Tigris River system will enhance water quality in
Baghdad and downstream cities by passing more waters from Samarra Barrage.
• Increasing air temperature due to the impact of climate change will increase water
temperature in the Tigris River system and negatively impact DO concentrations.
8
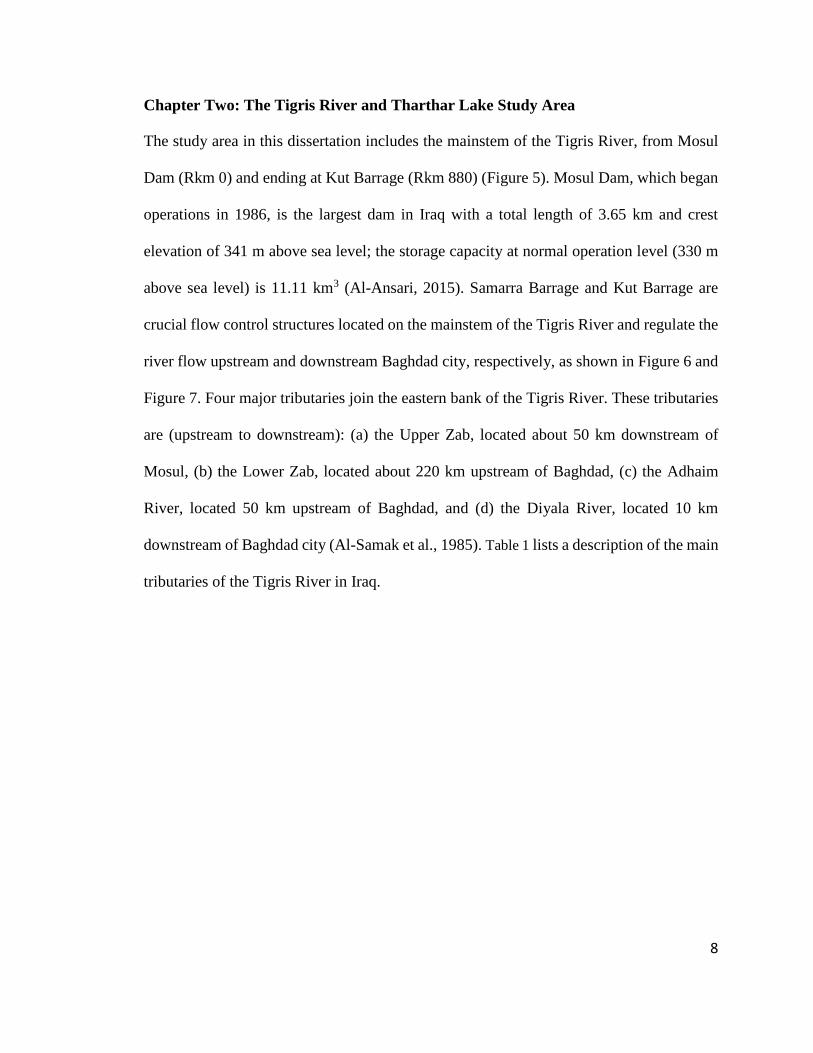
Chapter Two: The Tigris River and Tharthar Lake Study Area
The study area in this dissertation includes the mainstem of the Tigris River, from Mosul
Dam (Rkm 0) and ending at Kut Barrage (Rkm 880) (Figure 5). Mosul Dam, which began
operations in 1986, is the largest dam in Iraq with a total length of 3.65 km and crest
elevation of 341 m above sea level; the storage capacity at normal operation level (330 m
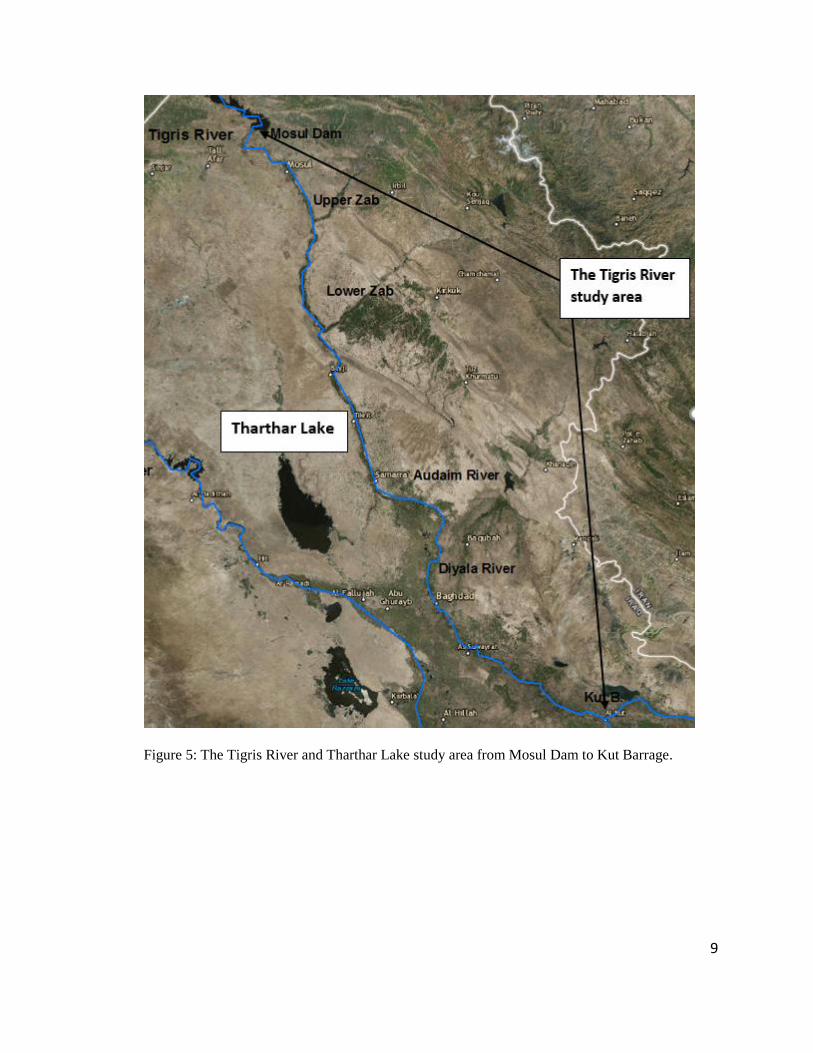
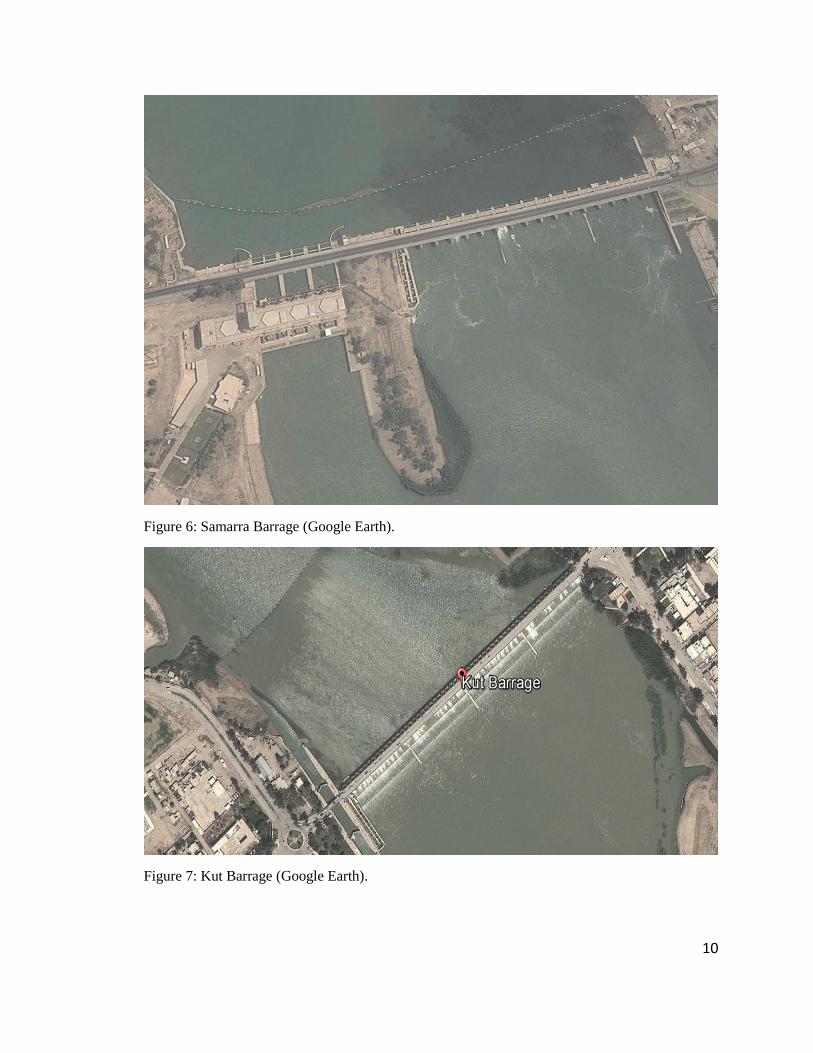
above sea level) is 11.11 km3 (Al-Ansari, 2015). Samarra Barrage and Kut Barrage are
crucial flow control structures located on the mainstem of the Tigris River and regulate the
river flow upstream and downstream Baghdad city, respectively, as shown in Figure 6 and
Figure 7. Four major tributaries join the eastern bank of the Tigris River. These tributaries
are (upstream to downstream): (a) the Upper Zab, located about 50 km downstream of
Mosul, (b) the Lower Zab, located about 220 km upstream of Baghdad, (c) the Adhaim
River, located 50 km upstream of Baghdad, and (d) the Diyala River, located 10 km
downstream of Baghdad city (Al-Samak et al., 1985). Table 1 lists a description of the main
tributaries of the Tigris River in Iraq.
9
Figure 5: The Tigris River and Tharthar Lake study area from Mosul Dam to Kut Barrage.
10
Figure 6: Samarra Barrage (Google Earth).
Figure 7: Kut Barrage (Google Earth).
11
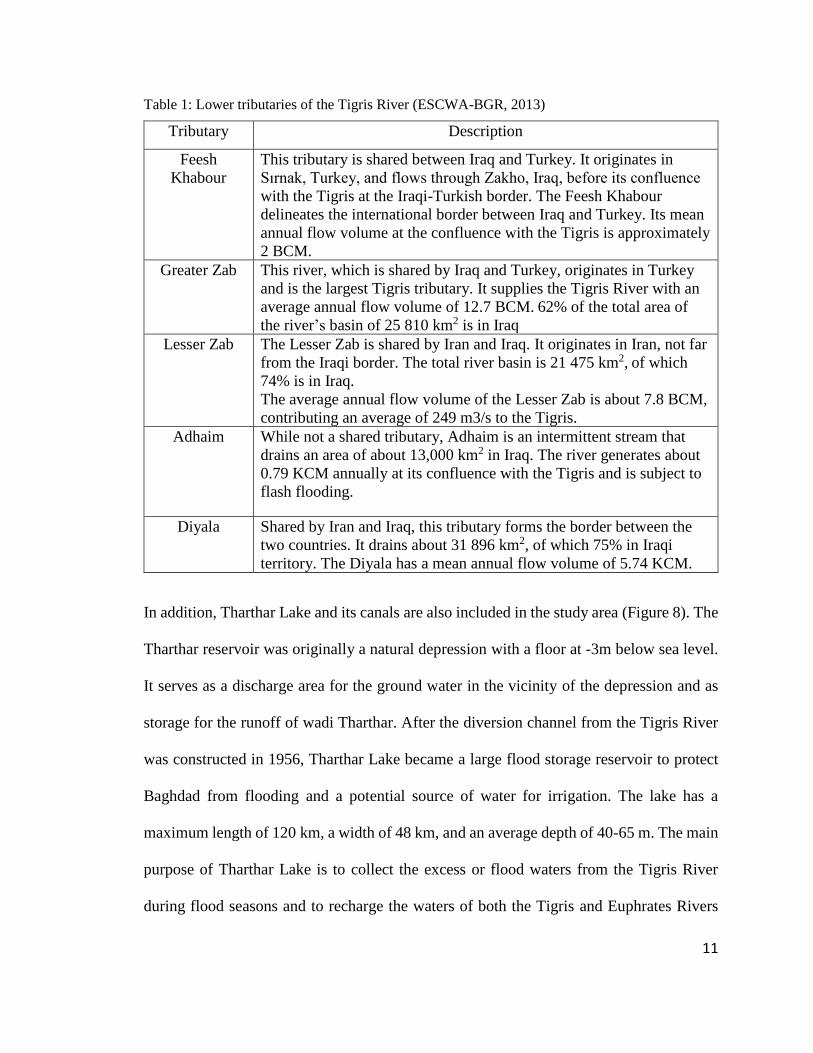
Table 1: Lower tributaries of the Tigris River (ESCWA-BGR, 2013)
Tributary Description
Feesh
Khabour
This tributary is shared between Iraq and Turkey. It originates in
Sırnak, Turkey, and flows through Zakho, Iraq, before its confluence
with the Tigris at the Iraqi-Turkish border. The Feesh Khabour
delineates the international border between Iraq and Turkey. Its mean
annual flow volume at the confluence with the Tigris is approximately
2 BCM.
Greater Zab This river, which is shared by Iraq and Turkey, originates in Turkey
and is the largest Tigris tributary. It supplies the Tigris River with an
average annual flow volume of 12.7 BCM. 62% of the total area of
the river’s basin of 25 810 km2 is in Iraq
Lesser Zab The Lesser Zab is shared by Iran and Iraq. It originates in Iran, not far
from the Iraqi border. The total river basin is 21 475 km2, of which
74% is in Iraq.
The average annual flow volume of the Lesser Zab is about 7.8 BCM,
contributing an average of 249 m3/s to the Tigris.
Adhaim While not a shared tributary, Adhaim is an intermittent stream that
drains an area of about 13,000 km2 in Iraq. The river generates about
0.79 KCM annually at its confluence with the Tigris and is subject to
flash flooding.
Diyala Shared by Iran and Iraq, this tributary forms the border between the
two countries. It drains about 31 896 km2, of which 75% in Iraqi
territory. The Diyala has a mean annual flow volume of 5.74 KCM.
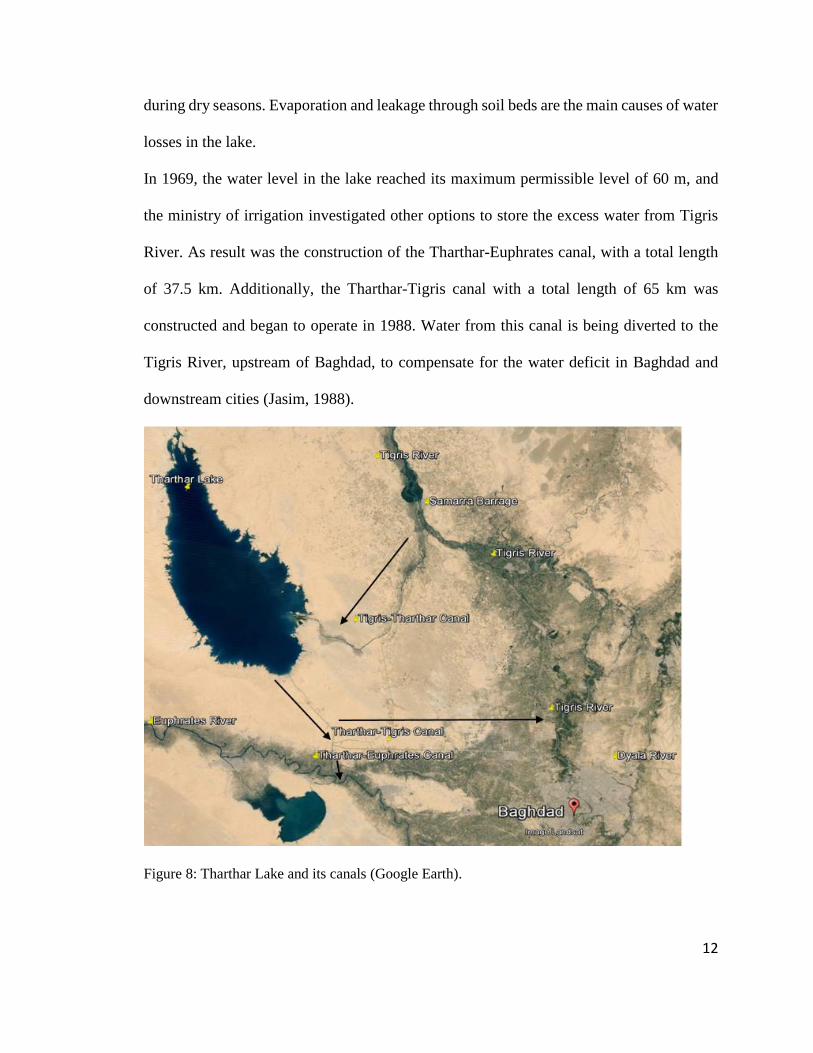
In addition, Tharthar Lake and its canals are also included in the study area (Figure 8). The
Tharthar reservoir was originally a natural depression with a floor at -3m below sea level.
It serves as a discharge area for the ground water in the vicinity of the depression and as
storage for the runoff of wadi Tharthar. After the diversion channel from the Tigris River
was constructed in 1956, Tharthar Lake became a large flood storage reservoir to protect
Baghdad from flooding and a potential source of water for irrigation. The lake has a
maximum length of 120 km, a width of 48 km, and an average depth of 40-65 m. The main
purpose of Tharthar Lake is to collect the excess or flood waters from the Tigris River
during flood seasons and to recharge the waters of both the Tigris and Euphrates Rivers
12
during dry seasons. Evaporation and leakage through soil beds are the main causes of water
losses in the lake.
In 1969, the water level in the lake reached its maximum permissible level of 60 m, and
the ministry of irrigation investigated other options to store the excess water from Tigris
River. As result was the construction of the Tharthar-Euphrates canal, with a total length
of 37.5 km. Additionally, the Tharthar-Tigris canal with a total length of 65 km was
constructed and began to operate in 1988. Water from this canal is being diverted to the
Tigris River, upstream of Baghdad, to compensate for the water deficit in Baghdad and
downstream cities (Jasim, 1988).
Figure 8: Tharthar Lake and its canals (Google Earth).

13
Point Sources in the Study area within Baghdad City
Water Treatment Plants (WTPs)
Eight water treatment plants (WTPs) are located along the main stream of the Tigris River
within Baghdad city that draw water from the river. These water treatment plants (see
Figure 9) from upstream to downstream area: Karkh, Sharq Dijlah (or East Tigris), Karama,
Wathba, Qadisiya, Dora, and Rasheed water treatment plants. The annual amount of treated
water produced by these plants in the year 2009 was about 797.5E6 m3. Relative to the
average flow of the Tigris River within Baghdad city, the water treatment plants mentioned
above withdrew about 6% of the average water flow in the Tigris River.
Table 2: Designed and Produced capacity of WTPs in Baghdad city in 2009 (CSO, 2010).
Water
TreatmentPlant
Designed Capacity
(1000 m3/year)
Produced Capacity
(1000 m3/year)
Kharkh 491400 415160
East Dijla 269700 225387
Karama 79200 54837
Wathba 48900 28250
Qadisiya 74640 31721
Dora 41400 26328
Wihda 5920 19480
Rasheed 24480 15780
Total 1055640 816943
14
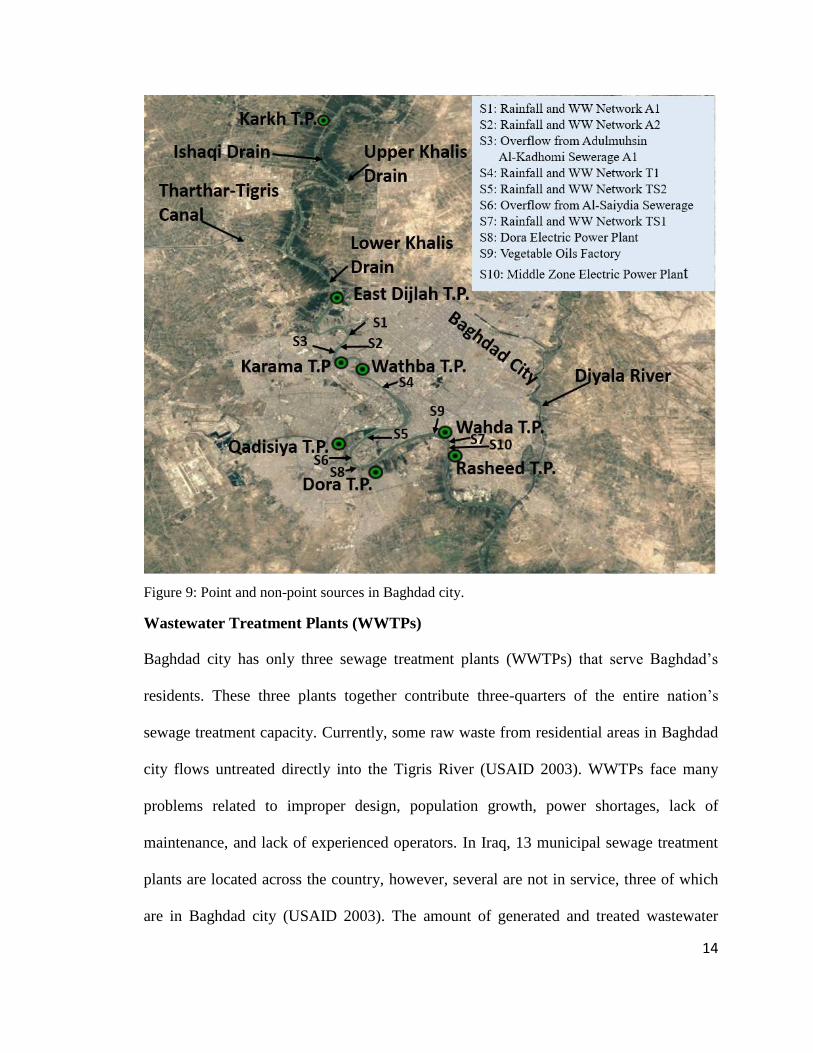
Figure 9: Point and non-point sources in Baghdad city.
Wastewater Treatment Plants (WWTPs)
Baghdad city has only three sewage treatment plants (WWTPs) that serve Baghdad’s
residents. These three plants together contribute three-quarters of the entire nation’s
sewage treatment capacity. Currently, some raw waste from residential areas in Baghdad
city flows untreated directly into the Tigris River (USAID 2003). WWTPs face many
problems related to improper design, population growth, power shortages, lack of
maintenance, and lack of experienced operators. In Iraq, 13 municipal sewage treatment
plants are located across the country, however, several are not in service, three of which
are in Baghdad city (USAID 2003). The amount of generated and treated wastewater
15
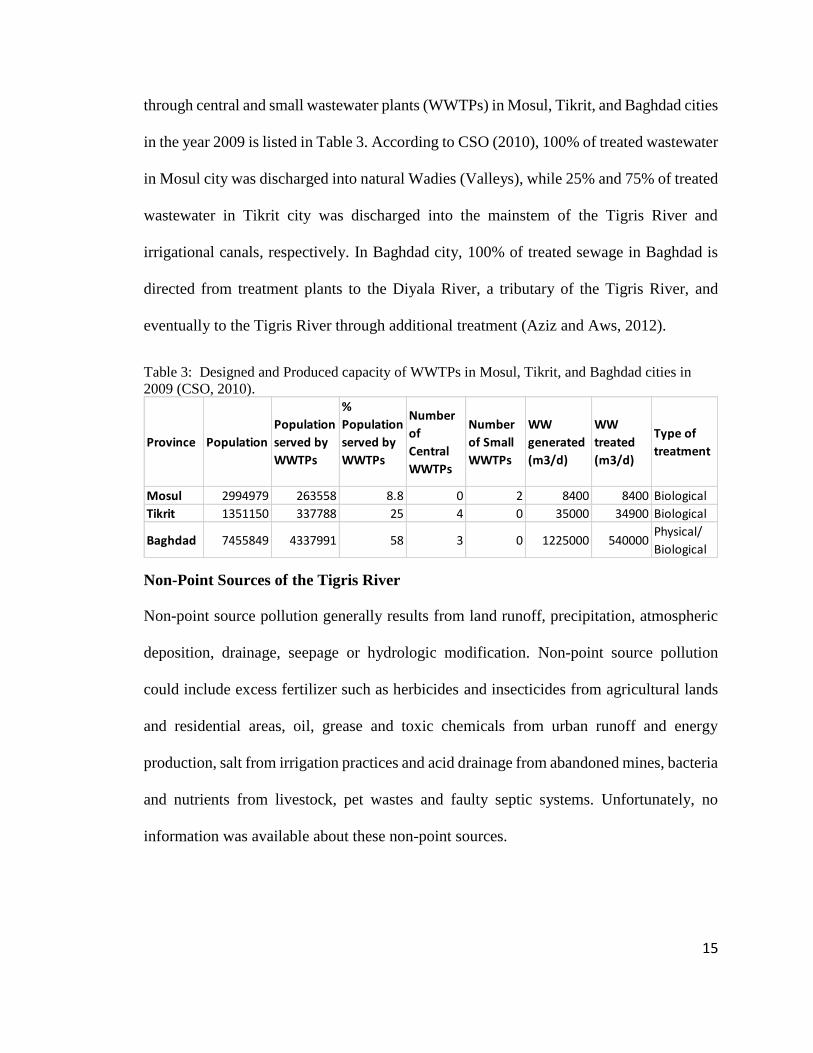
through central and small wastewater plants (WWTPs) in Mosul, Tikrit, and Baghdad cities
in the year 2009 is listed in Table 3. According to CSO (2010), 100% of treated wastewater
in Mosul city was discharged into natural Wadies (Valleys), while 25% and 75% of treated
wastewater in Tikrit city was discharged into the mainstem of the Tigris River and
irrigational canals, respectively. In Baghdad city, 100% of treated sewage in Baghdad is
directed from treatment plants to the Diyala River, a tributary of the Tigris River, and
eventually to the Tigris River through additional treatment (Aziz and Aws, 2012).
Table 3: Designed and Produced capacity of WWTPs in Mosul, Tikrit, and Baghdad cities in
2009 (CSO, 2010).
Non-Point Sources of the Tigris River
Non-point source pollution generally results from land runoff, precipitation, atmospheric
deposition, drainage, seepage or hydrologic modification. Non-point source pollution
could include excess fertilizer such as herbicides and insecticides from agricultural lands
and residential areas, oil, grease and toxic chemicals from urban runoff and energy
production, salt from irrigation practices and acid drainage from abandoned mines, bacteria
and nutrients from livestock, pet wastes and faulty septic systems. Unfortunately, no
information was available about these non-point sources.
Province Population
Population
served by
WWTPs
%
Population
served by
WWTPs
Number
of
Central
WWTPs
Number
of Small
WWTPs
WW
generated
(m3/d)
WW
treated
(m3/d)
Type of
treatment
Mosul 2994979 263558 8.8 0 2 8400 8400 Biological
Tikrit 1351150 337788 25 4 0 35000 34900 Biological
Baghdad 7455849 4337991 58 3 0 1225000 540000Physical/
Biological
16
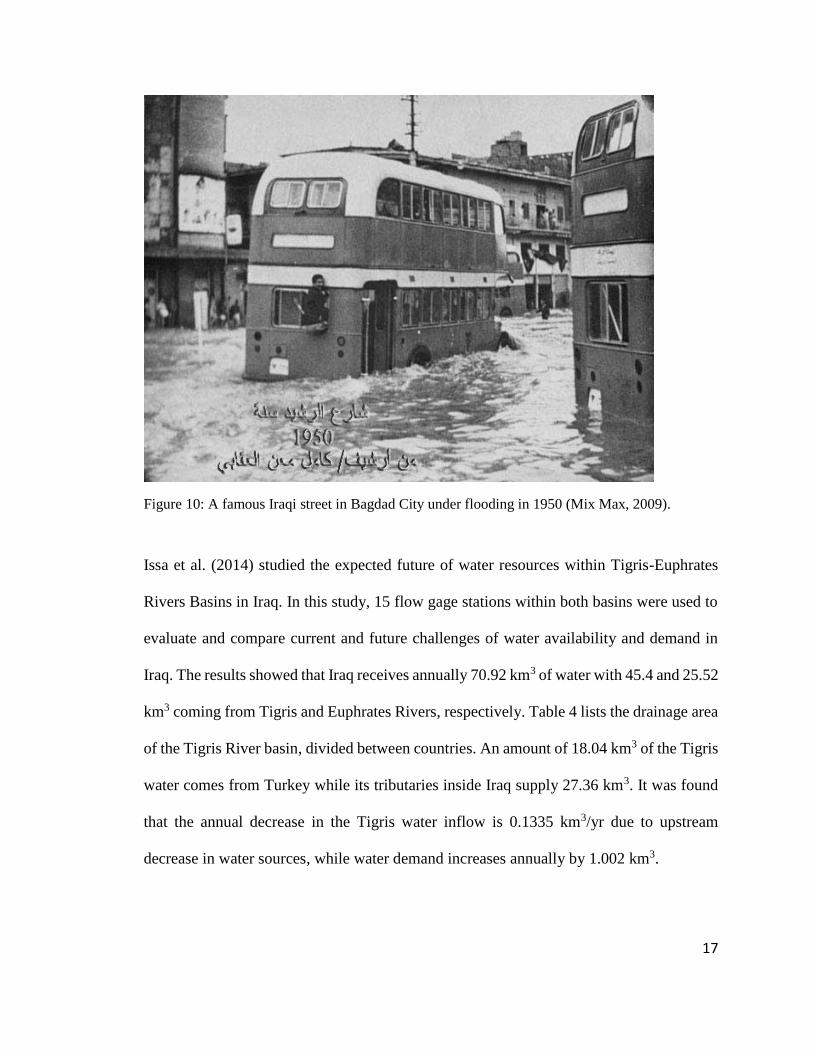
The Tigris River Flow Regime
Due to large annual and interannual fluctuations in both the Tigris and the Euphrates
Rivers, the average annual flow in both rivers is difficult to estimate (FAO, 2008). Baghdad
city is occasionally exposed to flooding due to high flows in the Tigris River. The last big
flood happened in 1950 as shown in Figure 10 with minor ones occurred later. Therefore,
the Iraqi Government started to construct a series of dams and projects to control the flow
and to prevent major cities from flooding. According to Al-Shahrabaly (2008), monthly
average discharge of the Tigris River within Baghdad city at Sarai Baghdad station has
fallen sharply from 927 m3/s during the 1960-1999 period to 531 m3/s during the 2000-
2010 period. Since water is highly regulated by Turkey and there has been a huge increase
of water demand, the Iraqi Government realized that a plan of building dams along both
rivers and all tributaries should be investigated and considered seriously.
17
Figure 10: A famous Iraqi street in Bagdad City under flooding in 1950 (Mix Max, 2009).
Issa et al. (2014) studied the expected future of water resources within Tigris-Euphrates
Rivers Basins in Iraq. In this study, 15 flow gage stations within both basins were used to
evaluate and compare current and future challenges of water availability and demand in
Iraq. The results showed that Iraq receives annually 70.92 km3 of water with 45.4 and 25.52
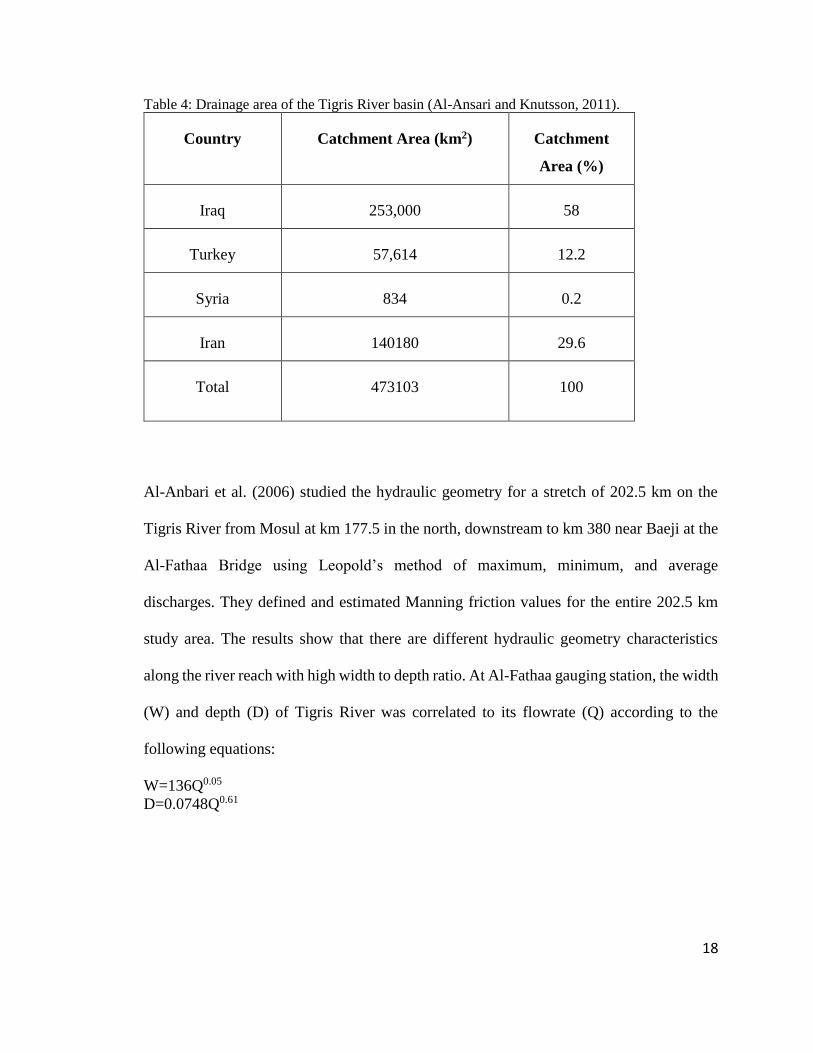
km3 coming from Tigris and Euphrates Rivers, respectively. Table 4 lists the drainage area
of the Tigris River basin, divided between countries. An amount of 18.04 km3 of the Tigris
water comes from Turkey while its tributaries inside Iraq supply 27.36 km3. It was found
that the annual decrease in the Tigris water inflow is 0.1335 km3/yr due to upstream
decrease in water sources, while water demand increases annually by 1.002 km3.
18
Table 4: Drainage area of the Tigris River basin (Al-Ansari and Knutsson, 2011).
Country Catchment Area (km2) Catchment
Area (%)
Iraq 253,000 58
Turkey 57,614 12.2
Syria 834 0.2
Iran 140180 29.6
Total 473103 100
Al-Anbari et al. (2006) studied the hydraulic geometry for a stretch of 202.5 km on the
Tigris River from Mosul at km 177.5 in the north, downstream to km 380 near Baeji at the
Al-Fathaa Bridge using Leopold’s method of maximum, minimum, and average
discharges. They defined and estimated Manning friction values for the entire 202.5 km
study area. The results show that there are different hydraulic geometry characteristics
along the river reach with high width to depth ratio. At Al-Fathaa gauging station, the width
(W) and depth (D) of Tigris River was correlated to its flowrate (Q) according to the
following equations:
W=136Q0.05
D=0.0748Q0.61
19
Ali et al. (2012) used surveyed data of the bed of Tigris River to predict the maximum
flood capacity for the river using the HEC-RAS (U.S. army Corps of Engineers, 2010) one-
dimensional hydraulic model for steady flow. This study used bathymetry data from MWR
(2008) and extended from north of Baghdad to the confluence with the Diyala River south
of Baghdad. Calibration of the model was carried out using field measurements for water
level. The model showed a significant predicted reduction in the current river capacity
below that which the river had carried during the floods of 1971 and 1988.
20
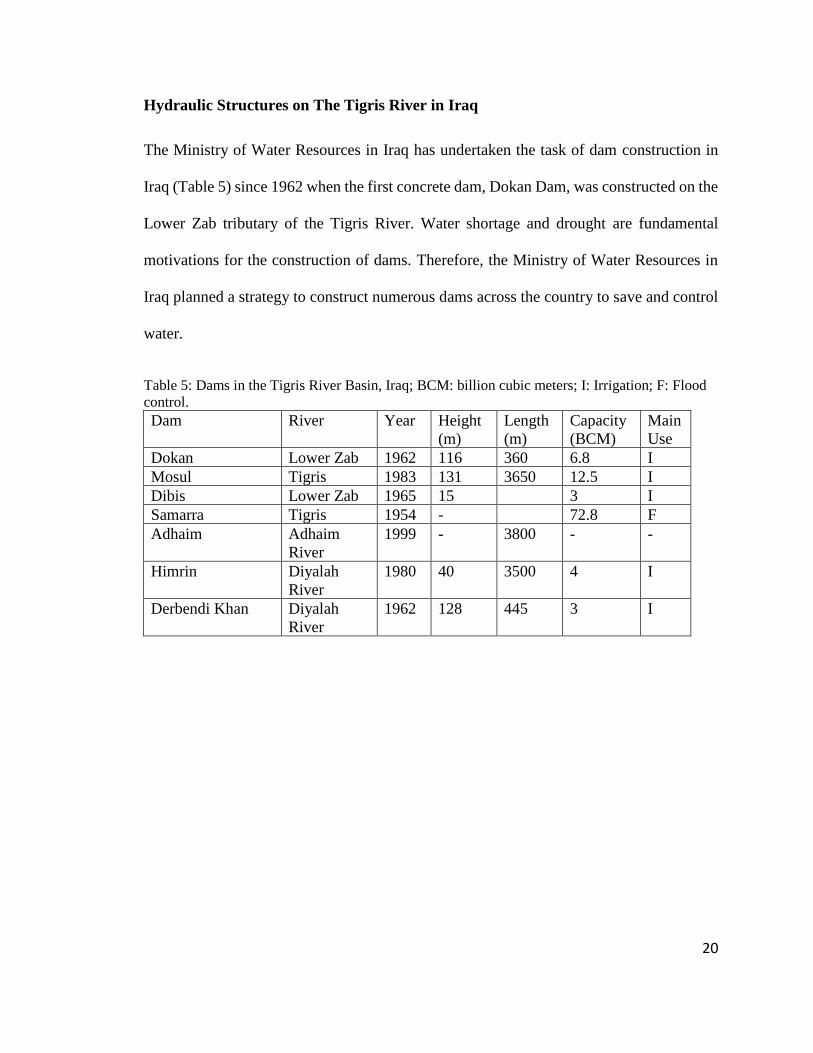
Hydraulic Structures on The Tigris River in Iraq
The Ministry of Water Resources in Iraq has undertaken the task of dam construction in
Iraq (Table 5) since 1962 when the first concrete dam, Dokan Dam, was constructed on the
Lower Zab tributary of the Tigris River. Water shortage and drought are fundamental
motivations for the construction of dams. Therefore, the Ministry of Water Resources in
Iraq planned a strategy to construct numerous dams across the country to save and control
water.
Table 5: Dams in the Tigris River Basin, Iraq; BCM: billion cubic meters; I: Irrigation; F: Flood
control.
Dam River Year Height
(m)
Length
(m)
Capacity
(BCM)
Main
Use
Dokan Lower Zab 1962 116 360 6.8 I
Mosul Tigris 1983 131 3650 12.5 I
Dibis Lower Zab 1965 15 3 I
Samarra Tigris 1954 - 72.8 F
Adhaim Adhaim
River
1999 - 3800 - -
Himrin Diyalah
River
1980 40 3500 4 I
Derbendi Khan Diyalah
River
1962 128 445 3 I
21
Irrigation in Iraq
Although treated wastewater, rich in nutrients, has been used for irrigation of grasslands
and pastures and some vegetables, some raw wastewater has also been used by some
farmers. This has caused serious problems such as crop contamination with pathogens and
heavy metals, and salinity accumulation in soils (Aziz and Aws, 2012). The reuse of
drainage irrigation flow can lead to salt accumulation in soils. Irrigation return flows are
large and are approximately 20-25% of the original supplied water, or about 7 billion cubic
meters (BCM) (Aziz and Aws, 2012). This implies that about 14% of the water contribution
to the Tigris and the Euphrates Rivers is from irrigation return flows.
Due to numerous wars during the 1980s, 1991, and 2003, lack of maintenance and
irrigation development plans have adversely affected agriculture and consequently reduced
the percentage of irrigable lands. To a substantial extent, the irrigation infrastructure has
broken down in Iraq (The World Bank, 2006). On the other hand, the combination of over-
irrigation, poor drainage, and high evaporation rates are the main factors that significantly
affect the quality of irrigation water. Currently, unregulated water has been withdrawn
from the main stream of the Tigris River through pumps, while saline return flow is being
directly discharged into the river causing a significant degradation in its quality.

22
Water Quality in The Tigris River System
Due to the rapid population growth from about 11.5 million in 1975 to 31 million in 2010
(Worldometers, 2017) and increasing industrial development, the Tigris River is facing
many water quality challenges such as inflows of contaminated water from wastewater
treatment plants and saline irrigation return flows (Baban, 1977). Several provinces
including Baghdad have suffered from fatal outbreaks of cholera due to poor drinking water
quality (Aenab and Singh 2012). Also, sewage is often discharged directly into the river
because some areas do not have sewage treatment plants. In central Baghdad, the water
supply and sewerage network system are broken in many places and therefore there is
cross-contamination of the drinking water supply (Aenab and Singh 2012). According to
the UN factsheet (2013), water quality of the water used for drinking and irrigation is poor
and violates both Iraqi National Standards and World Health Organization guidelines. As
reported by IOM (2012), high pollution and salinity had devastating effects on livestock,
agriculture, and fishing in the southern part of Iraq.
Many researchers have studied water quality of the Tigris River. A summary of several of
these studies is listed below.
Ismail and Abed (2013) conducted a BOD and DO modeling study of the Tigris River
within Baghdad city using the QUAL2K model. The study area was 50 km long and
extended from Fahama region at which the river enters Baghdad city into the south of
Baghdad at Zuforaniyah where the river exits Baghdad city. Field DO concentrations at
multiple locations within the study area were 5, 7.2, 1, 5.5, 7.6, and 0 mg/l at river km 0,
17.7, 20, 38, 43.4, and 48.5 respectively, while field BOD concentrations at these river kms
were 2, 2, 120, 5.2, 220, and 160 mg/l respectively. The high concentrations of BOD were
23
found at locations where industrial and oil effluents were discharged directly to the Tigris
River. Remote sensing and GIS applications were used in this study to provide input data
for the QUAL2K model. It was found that the simulation results agreed with the measured
concentrations. DO concentrations in the entire study area were found above 4 mg/l. CBOD
in the Tigris River within Baghdad city from Fahama region to Al-Dora district was
between 2-4 mg/l. Due to the industrial discharge of pollutants to the river, the most
polluted zone in the Tigris River study area was located downstream of Al-Dora refinery
and extended to the end of the study area. To control the level of CBOD in the river, it was
suggested that CBOD of the discharged effluents from industries should not exceed 50
mg/l to keep the CBOD in the study area no more than 4 mg/l.
Al-Jebouri and Edham (2012) conducted a study in 2004 utilizing selected sectors of the
Tigris River and the Lower Zab tributary in Kirkuk and Salahaldeen cities. The study area
was divided into eight stations starting at the confluence of the Lower Zab and the Tigris
River passing through downstream of the river at Samarra. Water quality analyzed in this
study were BOD, turbidity, electrical conductivity (EC), and water temperature. It was
found that BOD concentrations at the end of the Lower Zab before the confluence with the
Tigris River were in the range of 1.4-3.8 mg/l in August and January, the mean water
turbidity was 35 NTU, while EC was about 354 µS/cm. A wide variation in the water
quality was found in this study. BOD data provided in this study were used in our study
for boundary conditions of the Upper Zab and the Lower Zab Rivers in the Tigris River
model.
24
Alobaidy et al. (2010) evaluated both raw and treated water quality of the Tigris River
within Baghdad city by means of a water quality index (WQI). WQI was a single value
indicator of the water quality determined through summarizing multiple parameters of
water test results into simple terms for management and decision makers. In this study, 7
sampling stations and 13 water quality parameters were considered. These parameters were
pH (7.63), alkalinity (139.88 mg/l), turbidity (5.5 NTU), total dissolved solids, hardness,
calcium, magnesium, chloride, sulphate, ammonia, fluoride, iron, and aluminum. The data
used in this study were provided from Baghdad Mayoralty and covered the period from
February 2002 to December 2008. According to the WQI, it was concluded that the Tigris
water never reached an excellent nor an unsuitable condition.
Abdul Razzak et al. (2009) developed a model to simulate the distribution of total dissolved
solids (TDS) and biochemical oxygen demand (BOD5) in a stretch of 9 km of the Tigris
River extended from Al-A'imma Bridge to Al-Jumhuria Bridge within Baghdad city. Field
data were collected from twelve stations along the river twice a month from November
2005 to April 2006. It was found that the concentration of BOD5 varied in the range of 140-
170 mg/l, while TDS concentrations were at the acceptable range 500 mg/l with exception
of a high value of 1100 mg/l was measured 1 km downstream Al-Sarafiya Bridge. During
the days of field sampling, the water level (Z) m and flowrate (Q) m3/s of the Tigris River
were measured at Sarai gauging station (6.8 km from Al'Aimma Bridge). The rating curve
was estimated using the following correlation
Q=32.014 (Z-24.01)1.89

25
Odemis et al. (2010) studied the quantifying long-term changes in water quality and
quantity of the Euphrates and the Tigris Rivers in Turkey. Both watersheds originate in
Turkey and are “one of the most import transboundary watersheds in the Middle East.” In
this study, data from 1971 to 2002 from 14 stations on the Euphrates River and seven
stations on the Tigris River were analyzed. It was found that the upper west part of the
Tigris River had higher electrical conductivity (EC), Ca, Mg, and SO4 and lower flow rate,
Na, and sodium adsorption ratio (SAR) than the lower parts of the Tigris River. The upper
east parts of the river had higher HCO3 and Boron (B) and lower flowrate and water
temperature than the lower Tigris River.
Mutlak et al. (1980), studied the effect of Baghdad on the water quality of the Tigris River
from April 1977 to March 1978. Typical chemical and physical characteristics of the water
that were necessary in judging the quality of water for irrigation were studied. The study
area was divided into four sampling sites with a total length of 50 km and extended from
Fahama region at which the river enters Baghdad City into the south of Baghdad at
Zuforaniyah region at which Baghdad City ends. Water temperature, pH, turbidity, flow
rate and the stream level were recorded once a month at each sampling site. Other water
quality parameters measured in this study were dissolved oxygen (DO), biochemical
oxygen demand (BOD), nitrate (NO3-), nitrite (NO2
-), and ammonium (NH4+) ions. It was
found that Baghdad City was responsible for increasing the water salinity from 390 to 443
mg/l. On the other hand, total hardness and turbidity were increased in the Tigris River
when it passed through Baghdad City. It was concluded that the increase in the total
hardness was mostly due to the increase in Mg concentration. Heavy metals have no direct
impact on the water used for irrigation. Table 6 shows changes in temperature, water level,
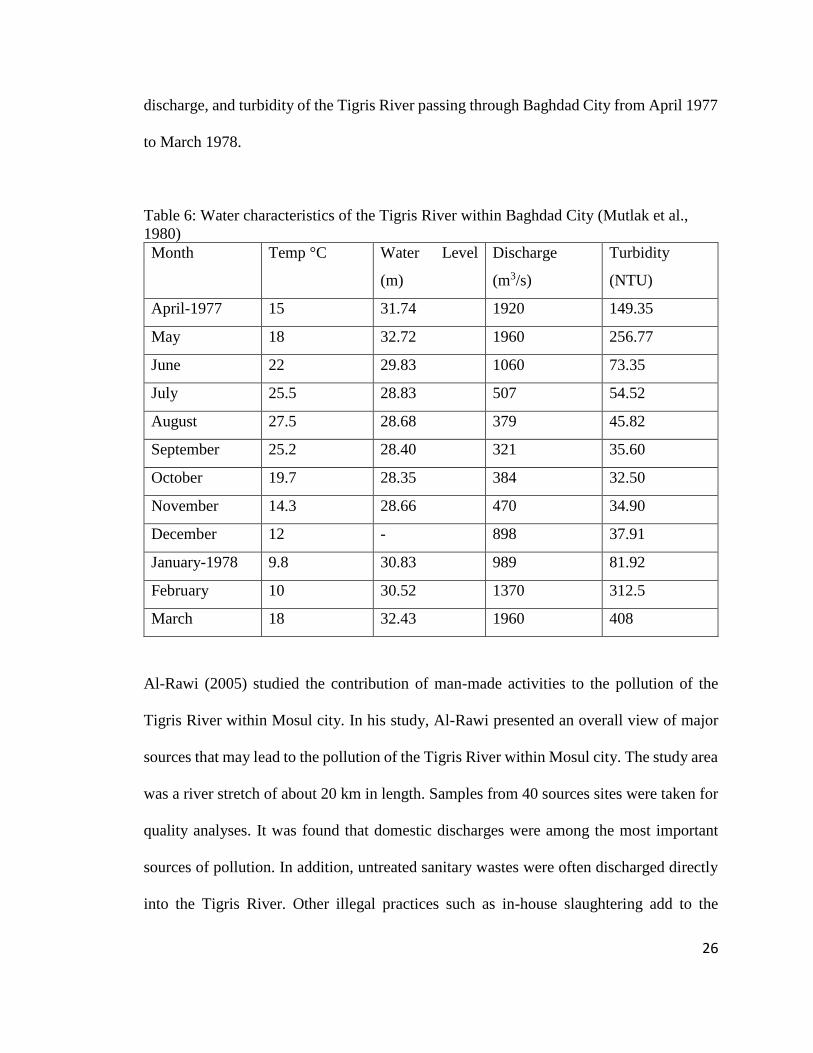
26
discharge, and turbidity of the Tigris River passing through Baghdad City from April 1977
to March 1978.
Table 6: Water characteristics of the Tigris River within Baghdad City (Mutlak et al.,
1980)
Month Temp °C Water Level
(m)
Discharge
(m3/s)
Turbidity
(NTU)
April-1977 15 31.74 1920 149.35
May 18 32.72 1960 256.77
June 22 29.83 1060 73.35
July 25.5 28.83 507 54.52
August 27.5 28.68 379 45.82
September 25.2 28.40 321 35.60
October 19.7 28.35 384 32.50
November 14.3 28.66 470 34.90
December 12 898 37.91
January-1978 9.8 30.83 989 81.92
February 10 30.52 1370 312.5
March 18 32.43 1960 408
Al-Rawi (2005) studied the contribution of man-made activities to the pollution of the
Tigris River within Mosul city. In his study, Al-Rawi presented an overall view of major
sources that may lead to the pollution of the Tigris River within Mosul city. The study area
was a river stretch of about 20 km in length. Samples from 40 sources sites were taken for
quality analyses. It was found that domestic discharges were among the most important
sources of pollution. In addition, untreated sanitary wastes were often discharged directly
into the Tigris River. Other illegal practices such as in-house slaughtering add to the
27
pollution as well. Industrial wastewater was discharged to the Tigris River with low
treatment efficiency. These wastes contain lead, chrome, and other heavy metals that may
pose health risks. On the other hand, eutrophication which is a characteristic problem of
lakes was found to occur in the Tigris River because of the intensive use of detergents rich
in nutrients (P&N compounds). Textile industries discharged effluents with pH (7.7), PO4
(1.01 mg/l), NO3 (1.22 mg/l), and BOD (135 mg/l).
The Tigris River system has suffered from high water salinity for decades. Total dissolved
solids (TDS) refer to any minerals, salts, metals, cations (positive ions) or anions (negative
ions) dissolved in water. TDS represent the total amount of mobile charged ions and
expressed in units of mg/unit volume of water mg/l or sometimes referred to as parts per
million (ppm). In general, TDS concentration is the sum of both cations and anions. Some
principal constituents of TDS in water are calcium, carbonate, nitrate, phosphate, sodium,
potassium, chloride, iron, manganese, magnesium, and aluminum. Potential sources of
TDS are leaves, industrial waste, wastewater or sewage, silt, fertilizers, pesticides, mining,
and runoff from urban areas. The current EPA secondary maximum contaminant level
(MCL) for TDS in drinking water is 500 mg/l (Water research foundation, 2015).
The Iraqi standards of TDS concentrations in drinking water is 500 mg/l (Ministry of
Environment, 1998). Many researchers have studied the effect of salinity on the water
quality of both the Tigris River and Tharthar Lake. It was found that the salinity in the
Tigris river increased from 390 to 443 mg/l in Baghdad city as the river passes through the
city from April 1977 to March 1978 (Mutlak et al., 1980). The main cations causing
hardness in the water of the Tigris River are calcium and magnesium, while the
predominant anions are bicarbonates, sulphate, chlorides, and carbonate of calcium and
28
magnesium. It was also found that hardness in the Tigris River increases in the middle and
southern regions of Iraq due to existing irrigation return flow drainage canals (Baban,
1977). In general, the concentration of total dissolved solids in the Tigris River is governed
by urban runoff, irrigation return flow through multiple canals along both banks of the
Tigris River, wastewater flow into the river through Diyala River, and high salinity
intrusion through both Tharthar-Tigris canal and Audaim River tributary. On the other
hand, salinity in Tharthar Lake is of high concern in Iraq since the lake is the largest
reservoir in the country and the main water supply to Baghdad city and downstream areas
during dry seasons. The water in Tharthar Lake is unsuitable for both drinking and
irrigation purposes due to high concentrations of sulphate and salinity (Albadry, 1972).
Tharthar Lake’s water is classified as C4S1 (C4: waters with electrical conductivity > 2.25
dS/m; S1: very high sodium adsorption ratio) class according to the U.S. salinity laboratory
classificatory (Jehad, 1983). According to Swiss consultants (1979), salinity in Wadi Al-
Tharthar was estimated as 5000 mg/l. It was found that there was only a 1-3% change in
the vertical gradient in salinity from the surface of the lake to the bottom (Al-Badry and
Artin, 1972), while the horizontal gradient in salinity along the North-South axis of the
lake was in the range of 4500-2500 mg/l (Swiss consultants, 1979). This indicates that
water salinity highly corresponds to the inflow from local catchment areas in the northern
parts of the lake. According to the salinity classifications listed in Table 7, irrigation water
in the Tigris River at Baghdad and downstream areas is classified as high salinity water.
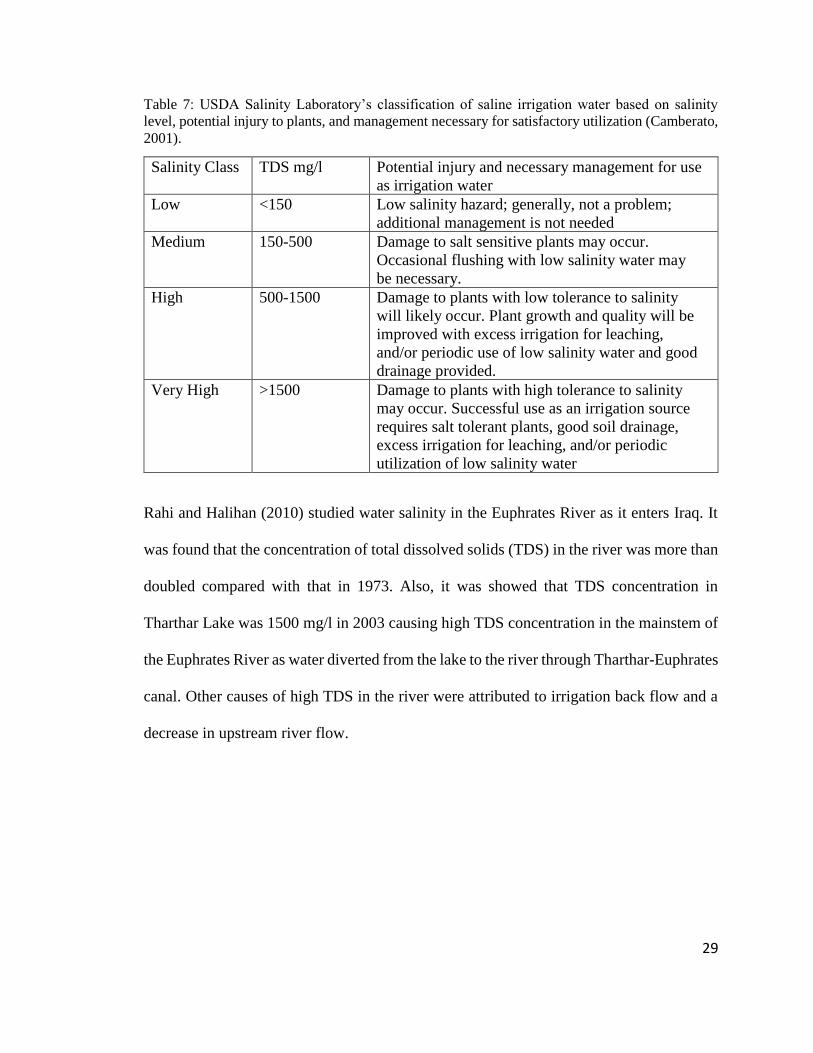
29
Table 7: USDA Salinity Laboratory’s classification of saline irrigation water based on salinity
level, potential injury to plants, and management necessary for satisfactory utilization (Camberato,
2001).
Salinity Class TDS mg/l Potential injury and necessary management for use
as irrigation water
Low <150 Low salinity hazard; generally, not a problem;
additional management is not needed
Medium 150-500 Damage to salt sensitive plants may occur.
Occasional flushing with low salinity water may
be necessary.
High 500-1500 Damage to plants with low tolerance to salinity
will likely occur. Plant growth and quality will be
improved with excess irrigation for leaching,
and/or periodic use of low salinity water and good
drainage provided.
Very High >1500 Damage to plants with high tolerance to salinity
may occur. Successful use as an irrigation source
requires salt tolerant plants, good soil drainage,
excess irrigation for leaching, and/or periodic
utilization of low salinity water
Rahi and Halihan (2010) studied water salinity in the Euphrates River as it enters Iraq. It
was found that the concentration of total dissolved solids (TDS) in the river was more than
doubled compared with that in 1973. Also, it was showed that TDS concentration in
Tharthar Lake was 1500 mg/l in 2003 causing high TDS concentration in the mainstem of
the Euphrates River as water diverted from the lake to the river through Tharthar-Euphrates
canal. Other causes of high TDS in the river were attributed to irrigation back flow and a
decrease in upstream river flow.
30
Kadhem (2013) compared water quality data of the Tigris River using a geographic
information system (GIS). In his study, 96 water samples were collected from eight
locations along the Tigris River. The locations were chosen to cover all the distance of the
Tigris River within Baghdad city during Jun-Dec 2008. The chemical analysis shows the
mean concentration of 700 mg/l for total dissolved solid (TDS), 28 NTU for turbidity, and
0.77 mg/l for Iron (Fe). Field data compiled by Kadhem (2013) were compared to the
World Health Organization (WHO) and Iraqi drinking water quality standards. These
standards were 500 mg/l for TDS, 5 NTU for turbidity, and 0.3 mg/l for Fe. Other water
quality variables included in this study that were compared with the Iraqi drinking water
quality standards were pH, total hardness (TH), Magnesium (Mg), Chlorine (Cl), Nitrate
(NO2), Nitrate (NO3), and Phosphate (PO4). The average values for pH, NO3, PO4 were
8.02, 0.53, and 0.07 mg/l, respectively.
Al-Marsoumi et al. (2006) investigated the ionic concentrations of the Tigris and Euphrates
Rivers. A significant increase in the total dissolved solids (TDS) concentrations was found
downstream of Baghdad city (557 mg/l) at Amara city compared to 260 mg/l at Mosul city
which is located about 560 km north of Baghdad. As total hardness was measured in the
study, the Euphrates could be divided into two groups from upstream to downstream as
hard to very hard, respectively, while Tigris water is considered hard.
Al-Layla and Al-Rizzo (1989) developed and calibrated a mathematical model that
numerically solved a 1-D advection-dispersion equation for water quality parameters of
interest in the Tigris River downstream of Sadam Dam. The studied study area was 75 km
long extending from Sadam Dam to Mosul city. Fieldwork was conducted in the period
31
from July to September 1986. Water samples were collected twice a month. Water quality
parameters of interest were DO with a range of 7.0-9.0 mg/l, BOD with a range of 0.7-1.0
mg/l, ammonia-N with a range of 0.02-0.24, nitrate-N with a range of 1.0-0.7, nitrite-N
with a range of 0.01-0.06, phosphate with a range of 0.4-0.55, chloride with a range of 35-
48, sulphate with a range of 0.02-0.24, hardness with a range of 210-260, and TDS with a
range of 234-260. Good agreement was found between modeled and in-situ measurements.
It was found that DO concentrations increased downstream of the dam due to re-aeration
by turbulence.
Jehad (1983) conducted a study to develop a mathematical model to decrease sulphate
(SO4) concentrations in Tharthar Lake. He tested the scenario of diverting different
quantities of fresh water through Tigris- Tharthar canal and releasing the same quantities
through Tharthar canal to the Euphrates River. SO4 concentration could be reduced to the
maximum allowable concentration of 400 mg/l after 11 years if 10 cubic km water diverted
through the Tigris River and released through the lake.
Al-Dabbas and Al-Juburi (1985) evaluated the hydrochemical and sediment transport in
Tharthar Lake and its canals. They confirmed that salinity in the lake was mostly increasing
in the northern parts of the lake and the lake’s water contains Ca, Mg, Na, K, and a
combination of sulphate and chloride, while very low concentrations of Br, Cr, Cd, Fe, Cu,
Zn, and Mn were determined.
32
The following conclusions can be reached:
• Most studies on the Tigris River were conducted for the river reaches within
Baghdad, and focused on water quality and river discharge.
• Iraq heavily depends on the Tigris River for its water resources, including irrigation
and drinking water.
• High concentrations of BOD were found in Baghdad at locations where industrial
and oil effluents were discharged directly to the Tigris River.
• The Tigris River water never reached a quality of excellent nor of unsuitable.
• The increase in the total hardness in the Tigris River within Baghdad was mostly
due to the increase in Mg concentration
• There is an increase in the annual water demand by 1 km3, while there is an annual
decrease in the Tigris water by 0.133 km3 due to upstream decrease in water
quantity.
• Field data in the Tigris River within Baghdad were compared with the Iraqi and the
World Health Organization (WHO) water quality standards and showed that TDS
concentrations exceeded both water quality standards.
• TDS in the Tigris River does not meet the Iraqi drinking water standards and does
not reach the excellent level according to a water quality index. The Tigris River is
considered medium to highly saline.
• Untreated domestic and industrial effluents were directly discharged to the Tigris
River and are a main major source of pollution in the river.
33
• Eutrophication, which is a characteristic problem of lakes, was found to occur in
the Tigris River because of the intensive use of detergents rich in nutrients (P and
N compounds).
• The average Total dissolved solids (TDS) concentration in Tharthar Lake was 1500
mg/l in 2003, and salinity in the lake was mostly increasing in the northern parts of
the lake.
• TDS concentrations were significantly increased in the Tigris River between Mosul
Dam and Baghdad city as a result of irrigation return flow, saline water diverted
through Tharthar-Tigris canal, and urban runoff.
• Typical BOD concentrations in the Lower Zab tributary were in the range of 1.4-
3.8 mg/l in 2004, while seasonal BOD concentrations in the mainstem of the Tigris
River within Baghdad city were in the range of 2-4 mg/l in 2009.
34
Chapter Three: Surface Water Temperature Estimation from Remote Sensing
In this chapter, the process of utilizing remote sensing to estimate the surface water
temperature of the Tigris River is described. A statistical model of water temperature based
on air temperature and flow rate is developed from these surface water temperature
estimates, and is used to infill temporal gaps in the satellite record. The resulting daily
water temperature data is used to define the upstream boundary conditions for water
temperature and to calibrate/validate the model within the domain.
Introduction
Monitoring the temperature distribution in water is fundamental for modeling and
interpreting the water quality of waterbodies. Water temperature is a key factor of chemical
and biochemical processes in aquatic ecosystems and controls the thermodynamics of
waterbodies. Conventional monitoring of water surface temperature requires in-situ
measurements, which can be expensive, time consuming and limited in spatial extent. In
Iraq, the evaporation rate during the summer is large and both water temperature and
evaporation in off-river storage lakes such as Tharthar Lake (see Figure 8) is significant.
Other factors influence water temperature, including effluents from water and wastewater
treatment plants, agricultural return flow, and industrial wastewater discharged to the Tigris
River. In addition, short wave solar radiation, long wave atmospheric radiation, back
radiation, and conduction are significantly influence water temperature.
Unfortunately, surface water temperature field data in Iraq is limited, and there is no
publically available archive of in-situ data. Therefore, remote sensing from satellites is
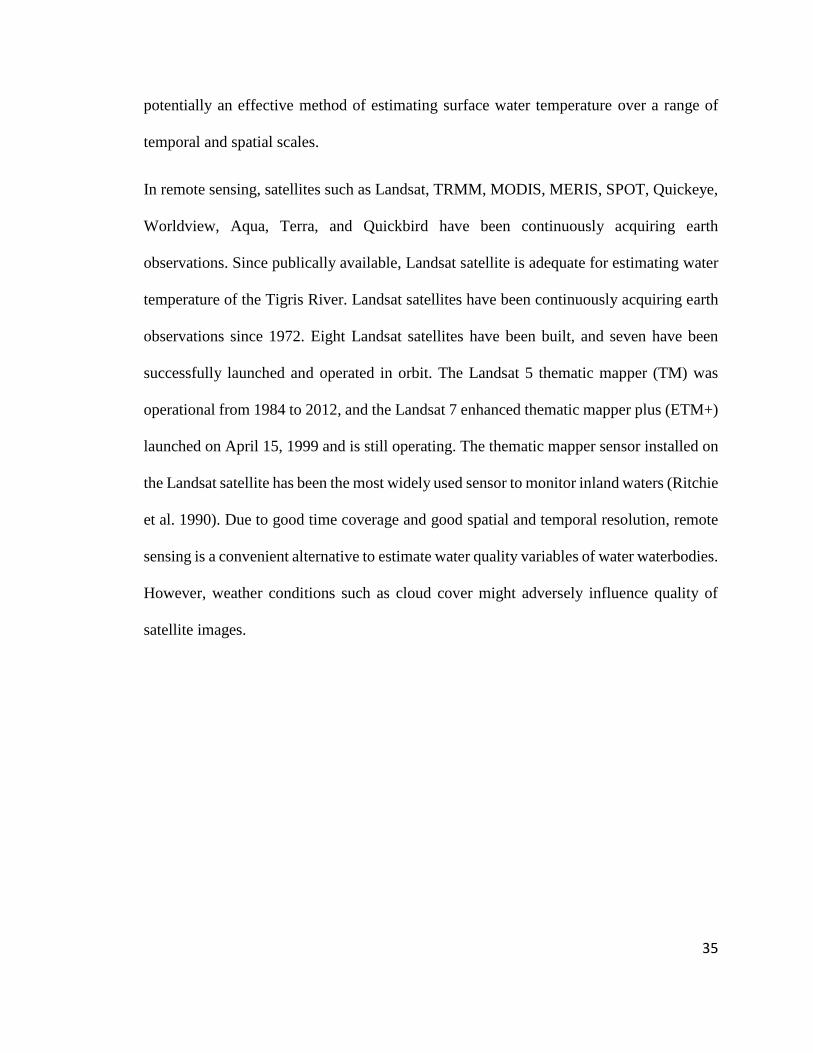
35
potentially an effective method of estimating surface water temperature over a range of
temporal and spatial scales.
In remote sensing, satellites such as Landsat, TRMM, MODIS, MERIS, SPOT, Quickeye,
Worldview, Aqua, Terra, and Quickbird have been continuously acquiring earth
observations. Since publically available, Landsat satellite is adequate for estimating water
temperature of the Tigris River. Landsat satellites have been continuously acquiring earth
observations since 1972. Eight Landsat satellites have been built, and seven have been
successfully launched and operated in orbit. The Landsat 5 thematic mapper (TM) was
operational from 1984 to 2012, and the Landsat 7 enhanced thematic mapper plus (ETM+)
launched on April 15, 1999 and is still operating. The thematic mapper sensor installed on
the Landsat satellite has been the most widely used sensor to monitor inland waters (Ritchie
et al. 1990). Due to good time coverage and good spatial and temporal resolution, remote
sensing is a convenient alternative to estimate water quality variables of water waterbodies.
However, weather conditions such as cloud cover might adversely influence quality of
satellite images.

36
Remote Sensing
Remote sensing is the science of gathering object information on earth’s surface, land and
ocean, by sensors installed on aircrafts or on satellites. Satellites observe earth’s surface
and acquire images at different temporal (< 24 hours - > 16 days) and spatial (0.41m -
>1000 m) resolutions. Reflective radiance from an object or a phenomenon is detected
within a wide range of wavelengths. Reflective radiance can be converted to Top Of
Atmosphere (TOA) reflectance where subsequent atmospheric correction is needed.
Compared with conventional and traditional methods, data acquired from satellites could
be a reliable alternative to provide information on earth’s and water’s surface such as
surface water temperature, land use and cover.
Landsat 7 ETM+
Landsat is one of a series of satellites launched by the National Aeronautics and Space
Administration (NASA) to acquire satellite imageries of earth. Landsat program began in
1972 with Landsat 1. Landsat 5 Thematic Mapper (TM) was launched on March 1, 1984
and decommissioned on January 2013. Landsat 7 enhanced thematic mapper plus (ETM+)
was launched on April 15, 1999 and is still operating. Landsat satellites provide continuous
earth observation information that are important for monitoring global changes (Fuller at
al., 1994; Wulder at al., 2008). Figure 11 shows a schematic of Landsat 7 ETM+. Landsat
imageries have been archived and available from the United States and Geological Surveys
(USGS).
37
Figure 11: Schematic of Landsat 7 ETM+ satellite (NASA, 2014).
Previous Research Studies Using Remote Sensing Data
Nas et al. (2010) have investigated spatial patterns in water quality in Lake Beysehir, the
largest fresh water reservoir in Turkey, using Landsat 5 Thematic Mapper (TM) data and
ground data. Water quality variables of interest were suspended sediments (SS), turbidity,
secchi disk depth (SDD), and chlorophyll-a (chl-a). Multiple regression (MR) and bivariate
(2 band independents) were used to estimate spatial patterns based on both remote sensed
and ground data. It was found that band 3 (TM3) provided a significant relationship with
SS concentration, while band 1 (TM1), band 2 (TM2), and band 4 (TM4) were strongly
correlated with Ch-a concentrations. Turbidity was shown to be significantly correlated
with TM1, TM2, and TM3, while SDD was correlated with the ratio TM1/TM3 and TM1.
In Kabbara et al. (2008), Landsat 7 ETM+ was used to assess water quality in the coastal
area of Tripoli (Lebanon). Empirical algorithms for chlorophyll-a concentration, secchi
disk depth, and turbidity were derived. Maps of the distribution of selected water quality
38
parameters were generated for the entire area of interest. Moderate eutrophication
conditions were indicated by the water quality in the coastal area.
Wang et al. (2006) investigated water quality in the Reelfoot Lake, Tennessee using
Landsat5 TM imagery. Empirical algorithms were developed for water quality parameters
such as turbidity, chlorophyll-a (Chl-a), and Secchi disk depth as listed in Table 8. They
concluded that remote sensing was a useful tool to map Chl-a distribution in Reelfoot Lake.
Khattab and Merkel (2014) derived simple and accurate algorithms for the retrieval of
water quality variables for Mosul Dam Lake, Iraq. Landsat 5 TM and Landsat 7 ETM+
were used in this study. Water quality variables of interest included temperature, turbidity,
Secchi disk, chlorophyll-a, nitrate, nitrite, phosphate, total inorganic carbon, dissolved
organic carbon, total dissolved solids, and pH. Image enhancement was used to evaluate
the values of reflectance bands properly. A significant correlation between developed
models and water quality variables was concluded in this study. Normalized difference
water index (NDWI) was used to delineate the surface water of the lake. It was concluded
that “ETM+ algorithms were more precise” and that algorithms based on surface
reflectance for Landsat7 ETM+ were more quantitative and accurate than those based on
Landsat 5TM.
Using Landsat Thematic Mapper (TM), Giardino et al. (2001) modeled and mapped water
quality parameters including temperature in the sub-alpine Lake Iseo, Italy. A Landsat
imagery-independent procedure was used to derive the surface temperature of the lake from
the TM data. A window of 3×3-pixel array was used in the study. The temperature model
was not based on a correlation between satellite and in-situ data such as other water quality

39
variables used in the study. It was based on an image independent procedure using the
inverted Plank’s law of temperature.
Lamaro et al. (2013) utilized the thermal bands of Landsat7 ETM+ to estimate surface
water temperature in Embalse del Rio Tercero reservoir, Argentina. “The single-channel
generalized method (SCGM) developed by Jimenez-Munoz and Sobrino (2003)” was used
in this study. A constant water emissivity value of 0.9885 was used. Significant correlation
coefficients R2 of 0.9498 for SCGM method and R2 of 0.9584 for RTM method were
achieved.
Fan et al. (2014) predicted the chlorophyll a concentration in Xiangxi Bay in the Three
Gorges Reservoir using Hj-1 satellite imagery. Several models were established based on
a correlation analysis between in situ measurements of the chlorophyll a concentration and
the values obtained from satellite images of the study area from January 2010 to December
2011. The results show that the maximum correlation is between the reflectance of the band
combination of B4/(B2+B3) and in situ measurements of chlorophyll a concentration (see
Table 8). The results provided a reference for water bloom prediction in typical tributaries
of the Three Gorges Reservoir and was deemed useful for water quality management.
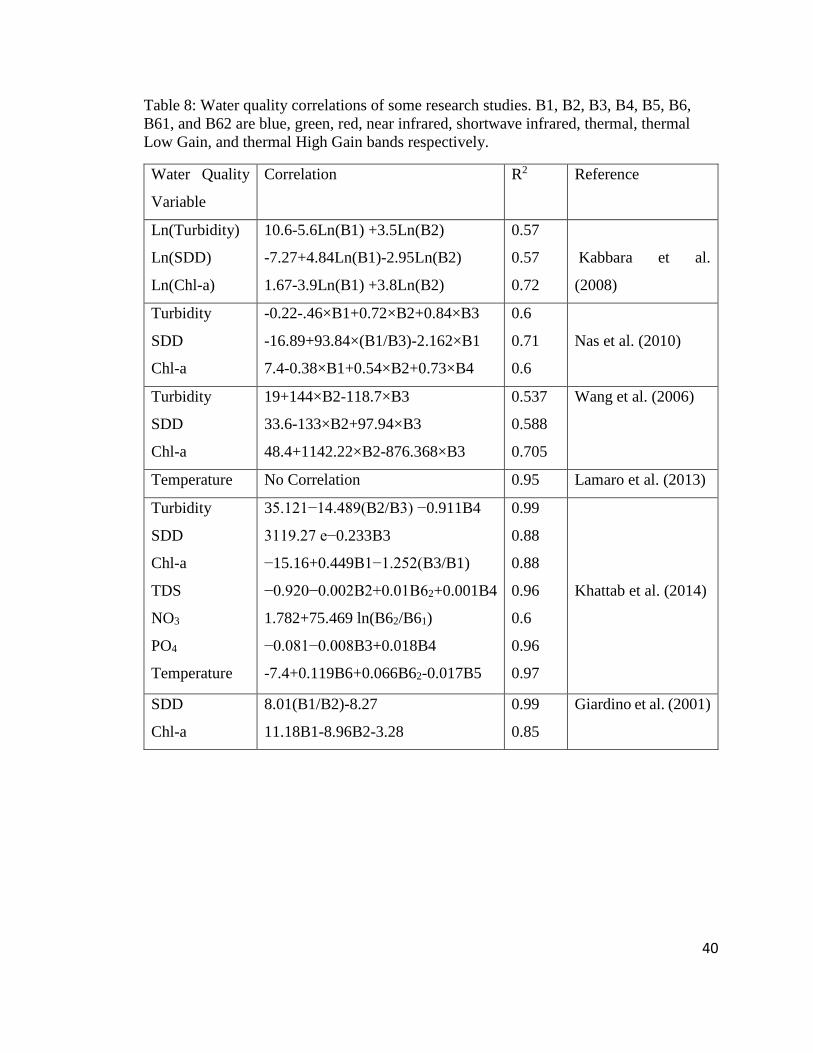
40
Table 8: Water quality correlations of some research studies. B1, B2, B3, B4, B5, B6,
B61, and B62 are blue, green, red, near infrared, shortwave infrared, thermal, thermal
Low Gain, and thermal High Gain bands respectively.
Water Quality
Variable
Correlation R2 Reference
Ln(Turbidity)
Ln(SDD)
Ln(Chl-a)
10.6-5.6Ln(B1) +3.5Ln(B2)
-7.27+4.84Ln(B1)-2.95Ln(B2)
1.67-3.9Ln(B1) +3.8Ln(B2)
0.57
0.57
0.72
Kabbara et al.
(2008)
Turbidity
SDD
Chl-a
-0.22-.46×B1+0.72×B2+0.84×B3
-16.89+93.84×(B1/B3)-2.162×B1
7.4-0.38×B1+0.54×B2+0.73×B4
0.6
0.71
0.6
Nas et al. (2010)
Turbidity
SDD
Chl-a
19+144×B2-118.7×B3
33.6-133×B2+97.94×B3
48.4+1142.22×B2-876.368×B3
0.537
0.588
0.705
Wang et al. (2006)
Temperature No Correlation 0.95 Lamaro et al. (2013)
Turbidity
SDD
Chl-a
TDS
NO3
PO4
Temperature
35.121−14.489(B2/B3) −0.911B4
3119.27 e−0.233B3
−15.16+0.449B1−1.252(B3/B1)
−0.920−0.002B2+0.01B62+0.001B4
1.782+75.469 ln(B62/B61)
−0.081−0.008B3+0.018B4
-7.4+0.119B6+0.066B62-0.017B5
0.99
0.88
0.88
0.96
0.6
0.96
0.97
Khattab et al. (2014)
SDD
Chl-a
8.01(B1/B2)-8.27
11.18B1-8.96B2-3.28
0.99
0.85
Giardino et al. (2001)
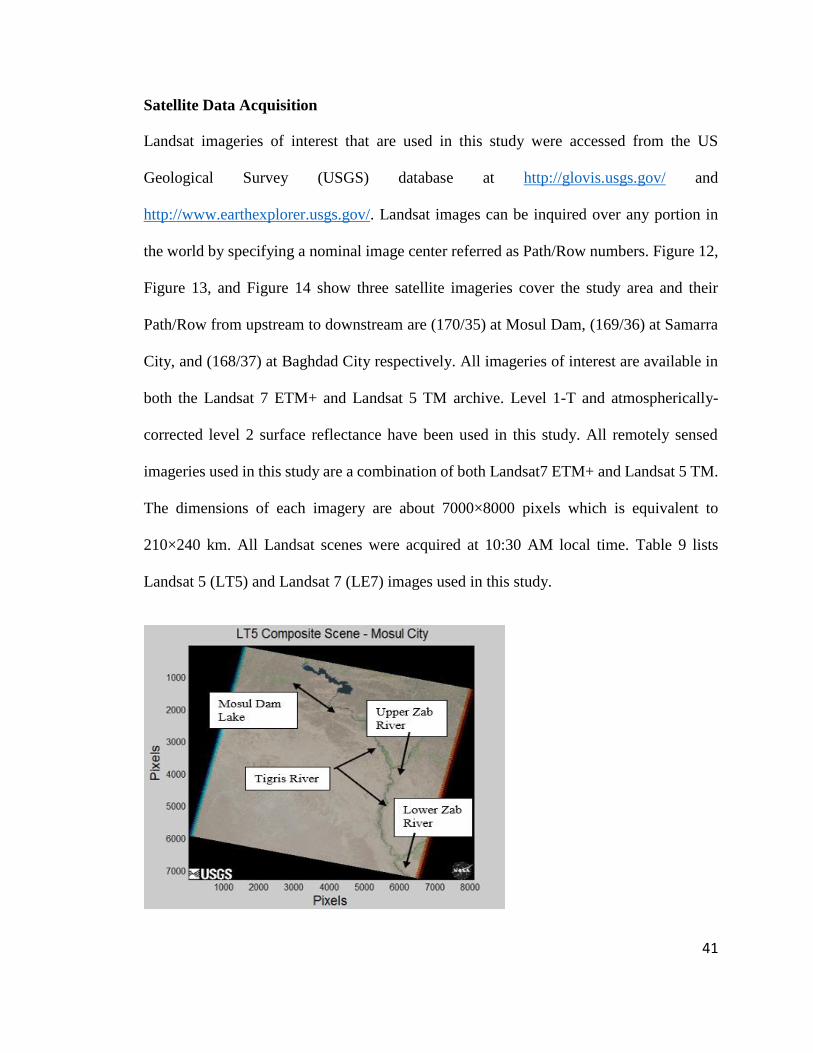
41
Satellite Data Acquisition
Landsat imageries of interest that are used in this study were accessed from the US
Geological Survey (USGS) database at http://glovis.usgs.gov/ and
http://www.earthexplorer.usgs.gov/. Landsat images can be inquired over any portion in
the world by specifying a nominal image center referred as Path/Row numbers. Figure 12,
Figure 13, and Figure 14 show three satellite imageries cover the study area and their
Path/Row from upstream to downstream are (170/35) at Mosul Dam, (169/36) at Samarra
City, and (168/37) at Baghdad City respectively. All imageries of interest are available in
both the Landsat 7 ETM+ and Landsat 5 TM archive. Level 1-T and atmospherically-
corrected level 2 surface reflectance have been used in this study. All remotely sensed
imageries used in this study are a combination of both Landsat7 ETM+ and Landsat 5 TM.
The dimensions of each imagery are about 7000×8000 pixels which is equivalent to
210×240 km. All Landsat scenes were acquired at 10:30 AM local time. Table 9 lists
Landsat 5 (LT5) and Landsat 7 (LE7) images used in this study.
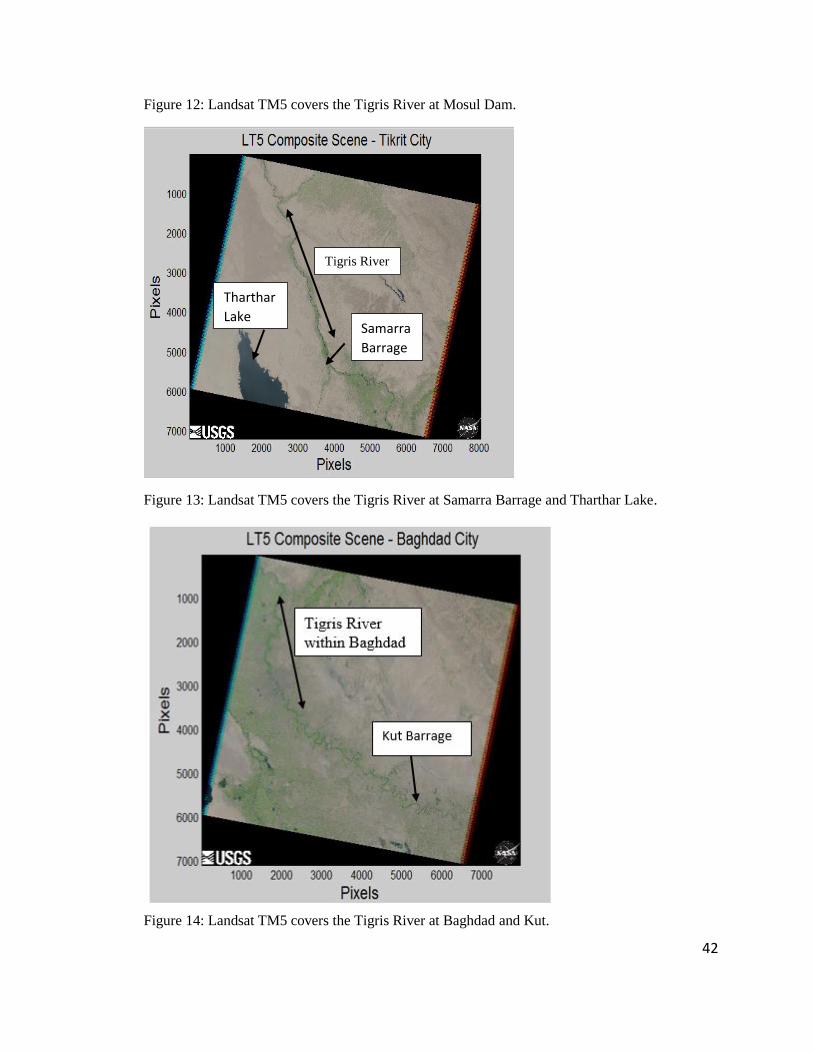
42
Figure 12: Landsat TM5 covers the Tigris River at Mosul Dam.
Figure 13: Landsat TM5 covers the Tigris River at Samarra Barrage and Tharthar Lake.
Figure 14: Landsat TM5 covers the Tigris River at Baghdad and Kut.
Tigris River
Samarra
Barrage
Tharthar
Lake
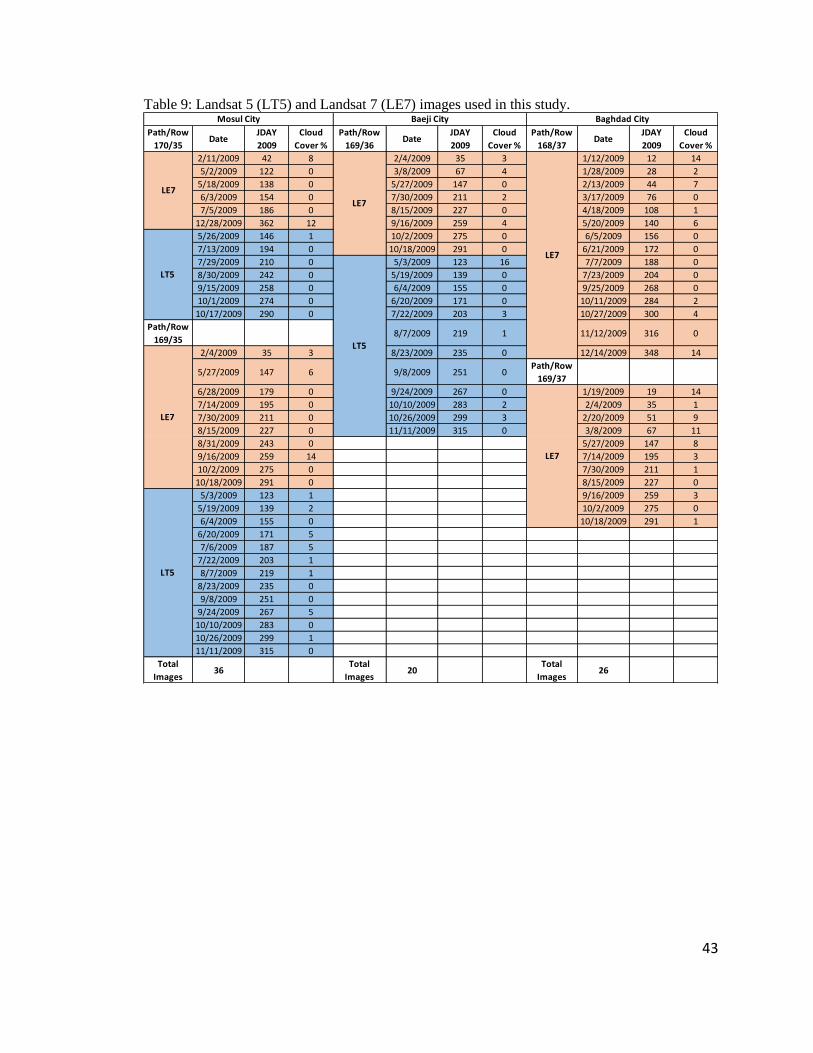
43
Table 9: Landsat 5 (LT5) and Landsat 7 (LE7) images used in this study.
Path/Row
170/35Date
JDAY
2009
Cloud
Cover %
Path/Row
169/36Date
JDAY
2009
Cloud
Cover %
Path/Row
168/37Date
JDAY
2009
Cloud
Cover %
2/11/2009 42 8 2/4/2009 35 3 1/12/2009 12 14
5/2/2009 122 0 3/8/2009 67 4 1/28/2009 28 2
5/18/2009 138 0 5/27/2009 147 0 2/13/2009 44 7
6/3/2009 154 0 7/30/2009 211 2 3/17/2009 76 0
7/5/2009 186 0 8/15/2009 227 0 4/18/2009 108 1
12/28/2009 362 12 9/16/2009 259 4 5/20/2009 140 6
5/26/2009 146 1 10/2/2009 275 0 6/5/2009 156 0
7/13/2009 194 0 10/18/2009 291 0 6/21/2009 172 0
7/29/2009 210 0 5/3/2009 123 16 7/7/2009 188 0
8/30/2009 242 0 5/19/2009 139 0 7/23/2009 204 0
9/15/2009 258 0 6/4/2009 155 0 9/25/2009 268 0
10/1/2009 274 0 6/20/2009 171 0 10/11/2009 284 2
10/17/2009 290 0 7/22/2009 203 3 10/27/2009 300 4
Path/Row
169/358/7/2009 219 1 11/12/2009 316 0
2/4/2009 35 3 8/23/2009 235 0 12/14/2009 348 14
5/27/2009 147 6 9/8/2009 251 0Path/Row
169/37
6/28/2009 179 0 9/24/2009 267 0 1/19/2009 19 14
7/14/2009 195 0 10/10/2009 283 2 2/4/2009 35 1
7/30/2009 211 0 10/26/2009 299 3 2/20/2009 51 9
8/15/2009 227 0 11/11/2009 315 0 3/8/2009 67 11
8/31/2009 243 0 5/27/2009 147 8
9/16/2009 259 14 7/14/2009 195 3
10/2/2009 275 0 7/30/2009 211 1
10/18/2009 291 0 8/15/2009 227 0
5/3/2009 123 1 9/16/2009 259 3
5/19/2009 139 2 10/2/2009 275 0
6/4/2009 155 0 10/18/2009 291 1
6/20/2009 171 5
7/6/2009 187 5
7/22/2009 203 1
8/7/2009 219 1
8/23/2009 235 0
9/8/2009 251 0
9/24/2009 267 5
10/10/2009 283 0
10/26/2009 299 1
11/11/2009 315 0
Total
Images36
Total
Images20
Total
Images26
LE7
LT5
LE7
LE7
LT5
LE7
Mosul City Baeji City Baghdad City
LE7
LT5
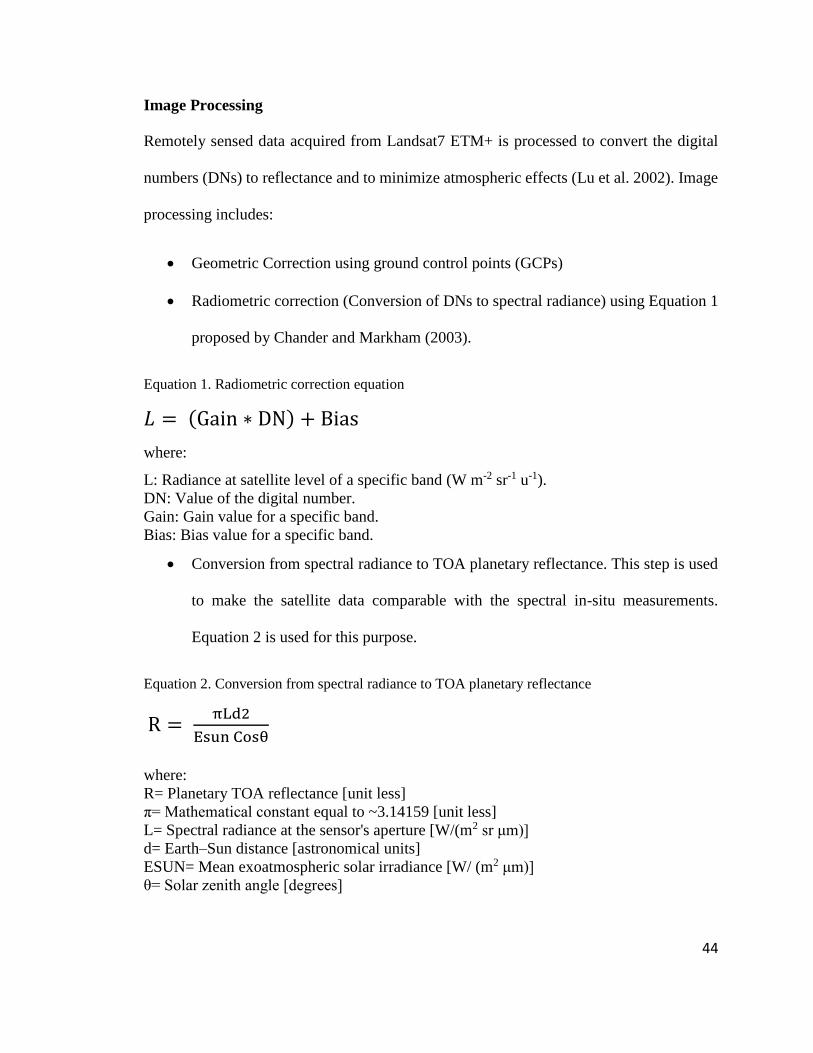
44
Image Processing
Remotely sensed data acquired from Landsat7 ETM+ is processed to convert the digital
numbers (DNs) to reflectance and to minimize atmospheric effects (Lu et al. 2002). Image
processing includes:
• Geometric Correction using ground control points (GCPs)
• Radiometric correction (Conversion of DNs to spectral radiance) using Equation 1
proposed by Chander and Markham (2003).
Equation 1. Radiometric correction equation
𝐿 = (Gain ∗ DN) + Bias
where:
L: Radiance at satellite level of a specific band (W m-2 sr-1 u-1).
DN: Value of the digital number.
Gain: Gain value for a specific band.
Bias: Bias value for a specific band.
• Conversion from spectral radiance to TOA planetary reflectance. This step is used
to make the satellite data comparable with the spectral in-situ measurements.
Equation 2 is used for this purpose.
Equation 2. Conversion from spectral radiance to TOA planetary reflectance
R = πLd2
Esun Cosθ
where:
R= Planetary TOA reflectance [unit less]
π= Mathematical constant equal to ~3.14159 [unit less]
L= Spectral radiance at the sensor's aperture [W/(m2 sr μm)]
d= Earth–Sun distance [astronomical units]
ESUN= Mean exoatmospheric solar irradiance [W/ (m2 μm)]
θ= Solar zenith angle [degrees]
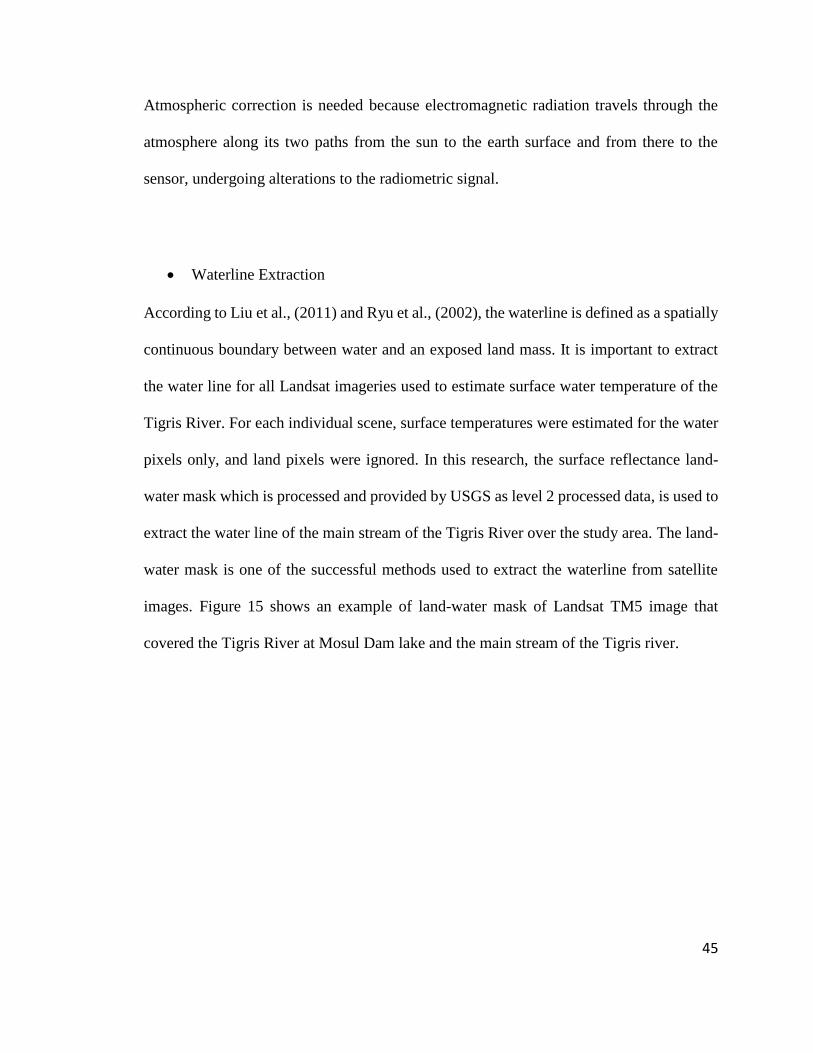
45
Atmospheric correction is needed because electromagnetic radiation travels through the
atmosphere along its two paths from the sun to the earth surface and from there to the
sensor, undergoing alterations to the radiometric signal.
• Waterline Extraction
According to Liu et al., (2011) and Ryu et al., (2002), the waterline is defined as a spatially
continuous boundary between water and an exposed land mass. It is important to extract
the water line for all Landsat imageries used to estimate surface water temperature of the
Tigris River. For each individual scene, surface temperatures were estimated for the water
pixels only, and land pixels were ignored. In this research, the surface reflectance land-
water mask which is processed and provided by USGS as level 2 processed data, is used to
extract the water line of the main stream of the Tigris River over the study area. The land-
water mask is one of the successful methods used to extract the waterline from satellite
images. Figure 15 shows an example of land-water mask of Landsat TM5 image that
covered the Tigris River at Mosul Dam lake and the main stream of the Tigris river.
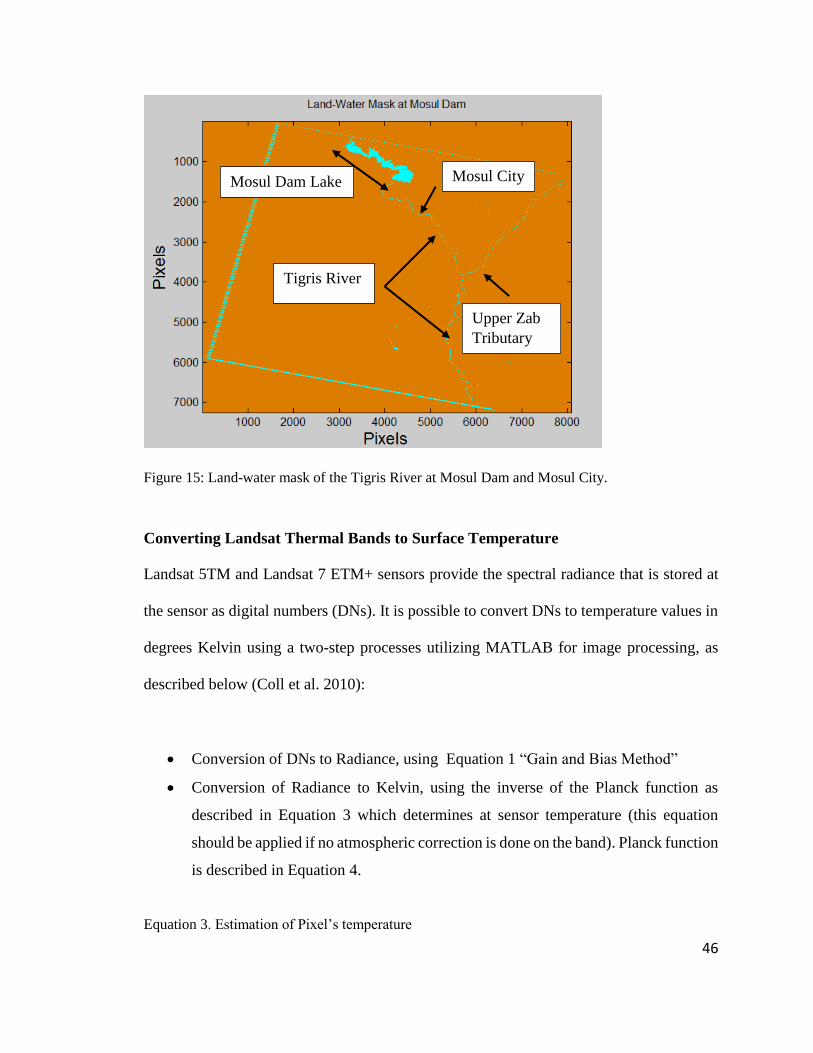
46
Figure 15: Land-water mask of the Tigris River at Mosul Dam and Mosul City.
Converting Landsat Thermal Bands to Surface Temperature
Landsat 5TM and Landsat 7 ETM+ sensors provide the spectral radiance that is stored at
the sensor as digital numbers (DNs). It is possible to convert DNs to temperature values in
degrees Kelvin using a two-step processes utilizing MATLAB for image processing, as
described below (Coll et al. 2010):
• Conversion of DNs to Radiance, using Equation 1 “Gain and Bias Method”
• Conversion of Radiance to Kelvin, using the inverse of the Planck function as
described in Equation 3 which determines at sensor temperature (this equation
should be applied if no atmospheric correction is done on the band). Planck function
is described in Equation 4.
Equation 3. Estimation of Pixel’s temperature
Mosul Dam Lake Mosul City
Upper Zab
Tributary
Tigris River
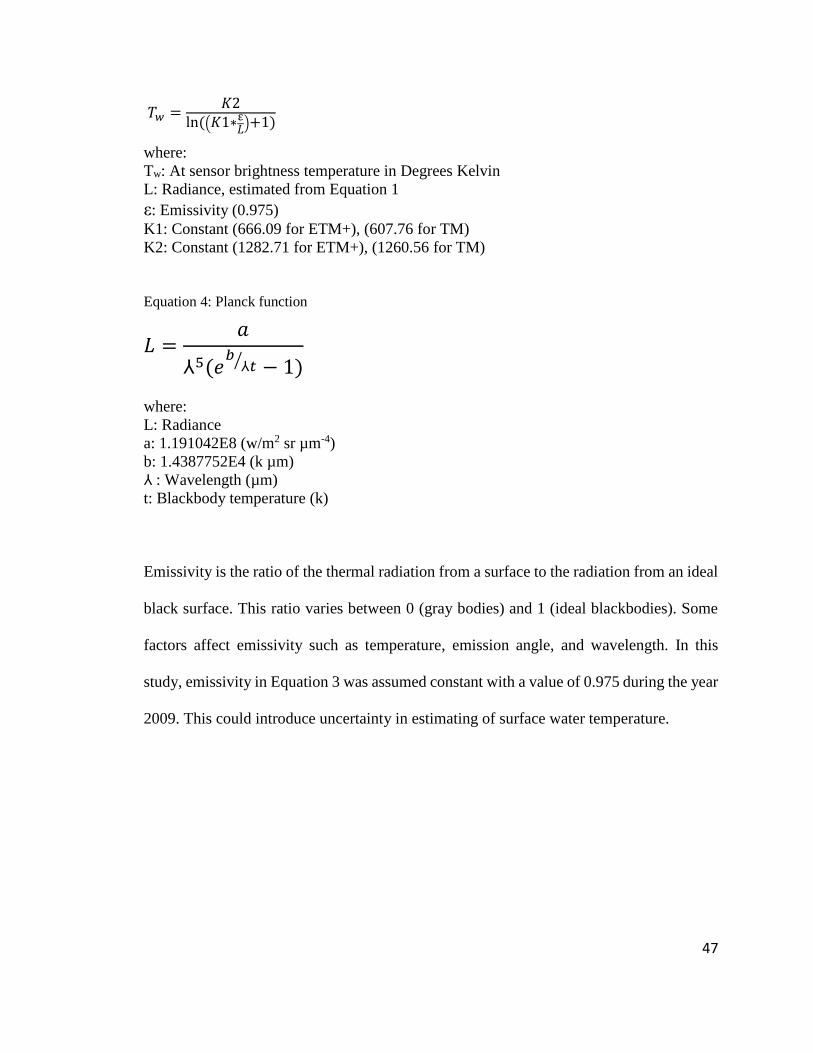
47
𝑇𝑤 =𝐾2
ln ((𝐾1∗ε𝐿
)+1)
where:
Tw: At sensor brightness temperature in Degrees Kelvin
L: Radiance, estimated from Equation 1
ε: Emissivity (0.975)
K1: Constant (666.09 for ETM+), (607.76 for TM)
K2: Constant (1282.71 for ETM+), (1260.56 for TM)
Equation 4: Planck function
𝐿 =𝑎
⅄5(𝑒𝑏
⅄𝑡⁄ − 1)
where:
L: Radiance
a: 1.191042E8 (w/m2 sr µm-4)
b: 1.4387752E4 (k µm)
⅄ : Wavelength (µm)
t: Blackbody temperature (k)
Emissivity is the ratio of the thermal radiation from a surface to the radiation from an ideal
black surface. This ratio varies between 0 (gray bodies) and 1 (ideal blackbodies). Some
factors affect emissivity such as temperature, emission angle, and wavelength. In this
study, emissivity in Equation 3 was assumed constant with a value of 0.975 during the year
2009. This could introduce uncertainty in estimating of surface water temperature.
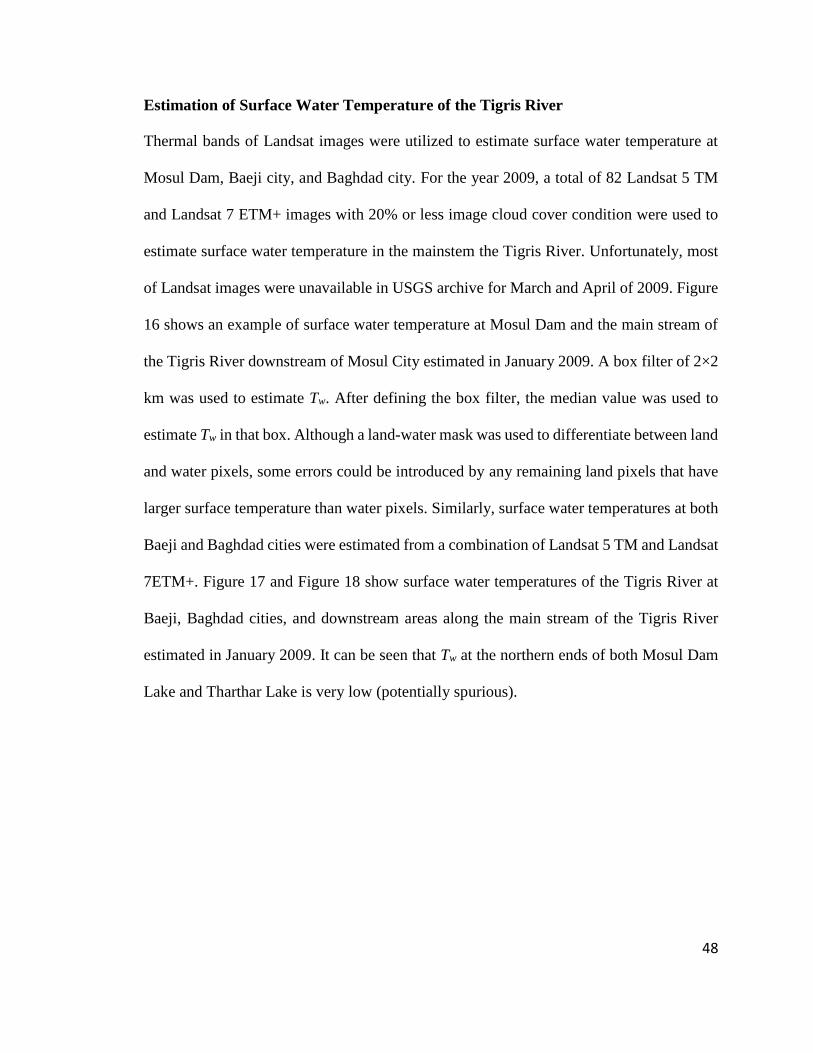
48
Estimation of Surface Water Temperature of the Tigris River
Thermal bands of Landsat images were utilized to estimate surface water temperature at
Mosul Dam, Baeji city, and Baghdad city. For the year 2009, a total of 82 Landsat 5 TM
and Landsat 7 ETM+ images with 20% or less image cloud cover condition were used to
estimate surface water temperature in the mainstem the Tigris River. Unfortunately, most
of Landsat images were unavailable in USGS archive for March and April of 2009. Figure
16 shows an example of surface water temperature at Mosul Dam and the main stream of
the Tigris River downstream of Mosul City estimated in January 2009. A box filter of 2×2
km was used to estimate Tw. After defining the box filter, the median value was used to
estimate Tw in that box. Although a land-water mask was used to differentiate between land
and water pixels, some errors could be introduced by any remaining land pixels that have
larger surface temperature than water pixels. Similarly, surface water temperatures at both
Baeji and Baghdad cities were estimated from a combination of Landsat 5 TM and Landsat
7ETM+. Figure 17 and Figure 18 show surface water temperatures of the Tigris River at
Baeji, Baghdad cities, and downstream areas along the main stream of the Tigris River
estimated in January 2009. It can be seen that Tw at the northern ends of both Mosul Dam
Lake and Tharthar Lake is very low (potentially spurious).
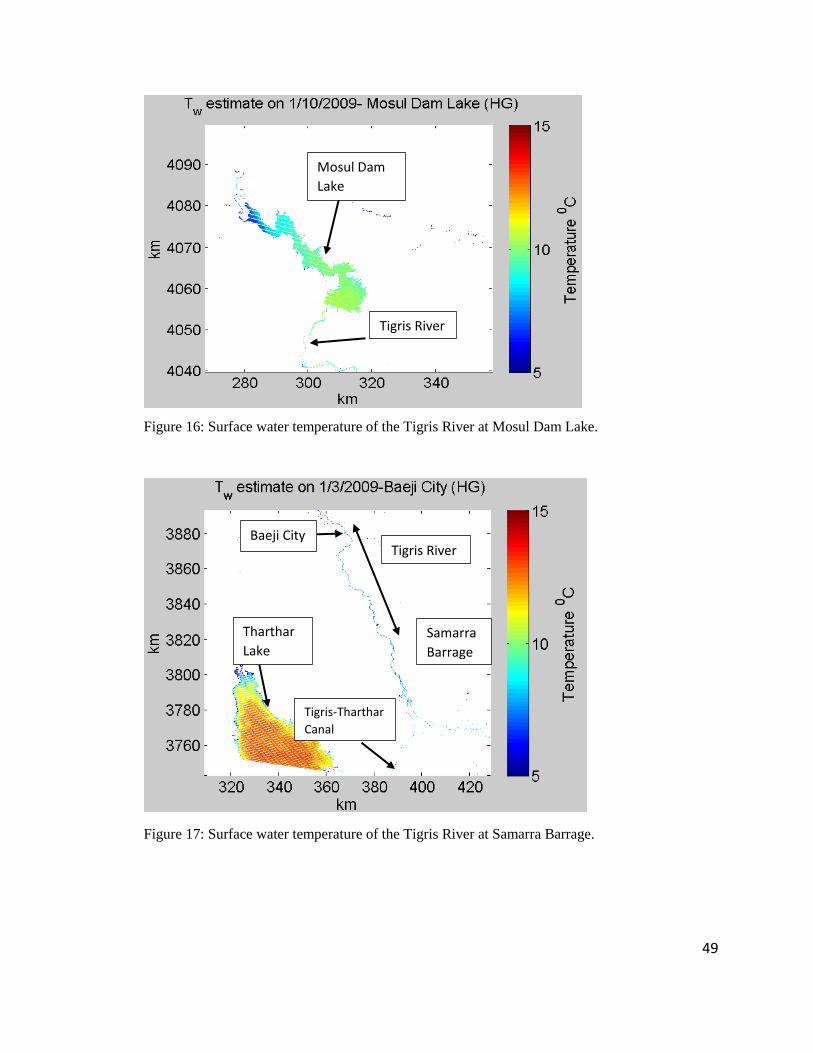
49
Figure 16: Surface water temperature of the Tigris River at Mosul Dam Lake.
Figure 17: Surface water temperature of the Tigris River at Samarra Barrage.
Mosul Dam
Lake
Tigris River
Samarra
Barrage
Tharthar
Lake
Baeji City Tigris River
Tigris-Tharthar
Canal
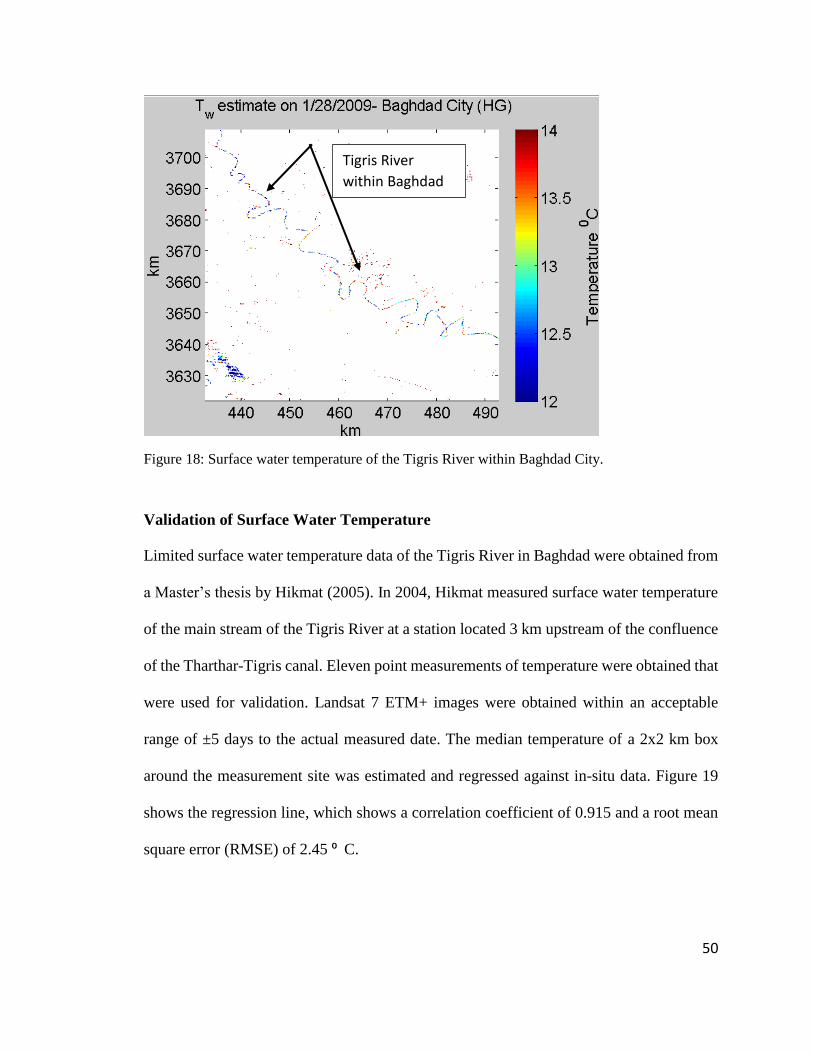
50
Figure 18: Surface water temperature of the Tigris River within Baghdad City.
Validation of Surface Water Temperature
Limited surface water temperature data of the Tigris River in Baghdad were obtained from
a Master’s thesis by Hikmat (2005). In 2004, Hikmat measured surface water temperature
of the main stream of the Tigris River at a station located 3 km upstream of the confluence
of the Tharthar-Tigris canal. Eleven point measurements of temperature were obtained that
were used for validation. Landsat 7 ETM+ images were obtained within an acceptable
range of ±5 days to the actual measured date. The median temperature of a 2x2 km box
around the measurement site was estimated and regressed against in-situ data. Figure 19
shows the regression line, which shows a correlation coefficient of 0.915 and a root mean
square error (RMSE) of 2.45 ⁰ C.
Tigris River
within Baghdad
city
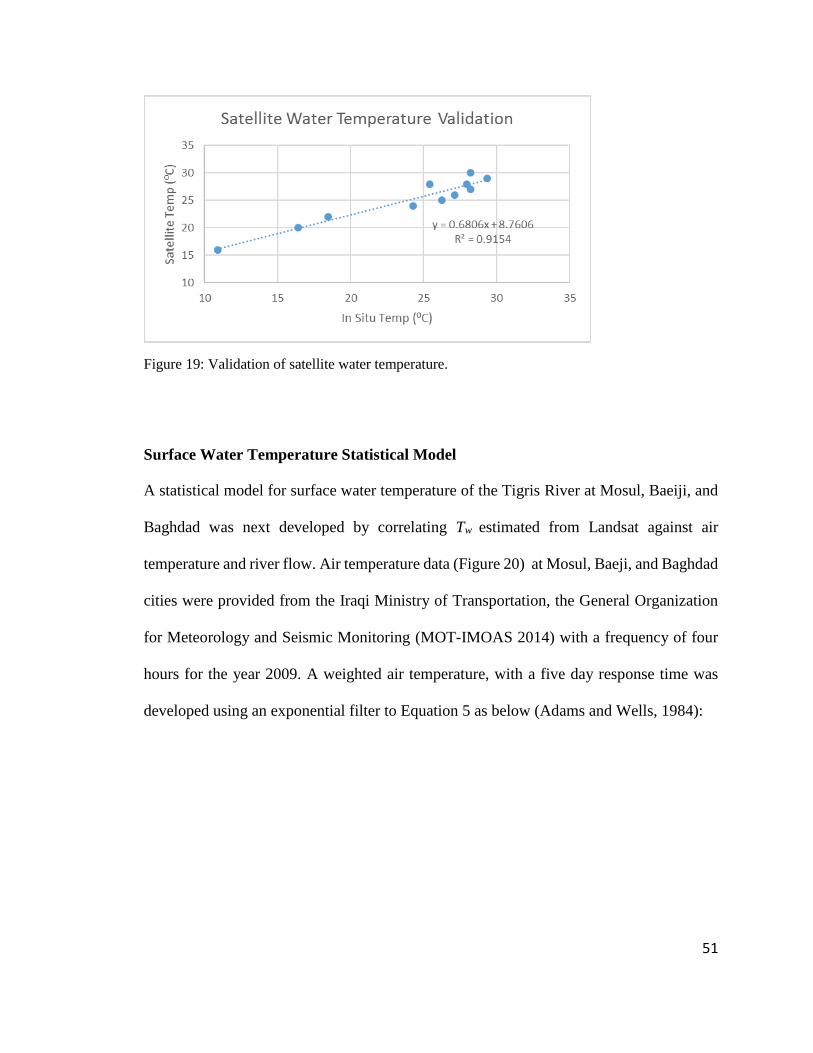
51
Figure 19: Validation of satellite water temperature.
Surface Water Temperature Statistical Model
A statistical model for surface water temperature of the Tigris River at Mosul, Baeiji, and
Baghdad was next developed by correlating Tw estimated from Landsat against air
temperature and river flow. Air temperature data (Figure 20) at Mosul, Baeji, and Baghdad
cities were provided from the Iraqi Ministry of Transportation, the General Organization
for Meteorology and Seismic Monitoring (MOT-IMOAS 2014) with a frequency of four
hours for the year 2009. A weighted air temperature, with a five day response time was
developed using an exponential filter to Equation 5 as below (Adams and Wells, 1984):
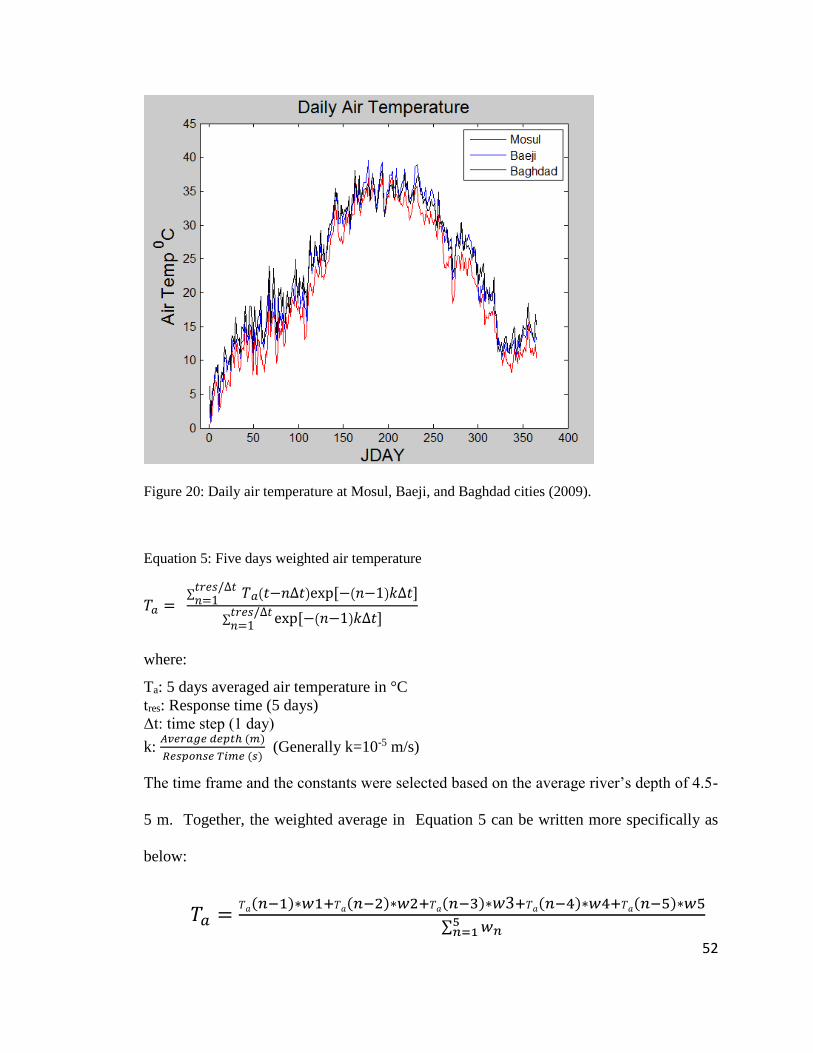
52
Figure 20: Daily air temperature at Mosul, Baeji, and Baghdad cities (2009).
Equation 5: Five days weighted air temperature
𝑇𝑎 = ∑ 𝑇𝑎(𝑡−𝑛∆𝑡)exp [−(𝑛−1)𝑘∆𝑡]𝑡𝑟𝑒𝑠/∆𝑡
𝑛=1
∑ exp [−(𝑛−1)𝑘∆𝑡]𝑡𝑟𝑒𝑠/∆𝑡𝑛=1
where:
Ta: 5 days averaged air temperature in °C
tres: Response time (5 days)
Δt: time step (1 day)
k: 𝐴𝑣𝑒𝑟𝑎𝑔𝑒 𝑑𝑒𝑝𝑡ℎ (𝑚)
𝑅𝑒𝑠𝑝𝑜𝑛𝑠𝑒 𝑇𝑖𝑚𝑒 (𝑠) (Generally k=10-5 m/s)
The time frame and the constants were selected based on the average river’s depth of 4.5-
5 m. Together, the weighted average in Equation 5 can be written more specifically as
below:
𝑇𝑎 =𝑇𝑎(𝑛−1)∗𝑤1+𝑇𝑎(𝑛−2)∗𝑤2+𝑇𝑎(𝑛−3)∗𝑤3+𝑇𝑎(𝑛−4)∗𝑤4+𝑇𝑎(𝑛−5)∗𝑤5
∑ 𝑤𝑛5𝑛=1
53
where:
W: Weight assigned to each day (the closer day to Tn the higher weight value assigned)
The last step after developing a weighted air temperature was to regress it, along with daily
average flowrate, to the entire year of surface water temperatures estimated from Landsat
images. The following statistical correlation (Equation 6) was solved using least-squares
regression.
Equation 6: The statistical equation
𝑇𝑤 = 𝑎 + 𝑏𝑇𝑎 + 𝑐𝑄
Flowrate was found to be a statistically insignificant predictor of surface water temperature,
and was subsequently eliminated from all regression models (Equation 7, Equation 8, and
Equation 9). Table 10 shows regression statistics. It can be seen that all coefficients (a1
and a2) are significant with a P-value much less than 0.05 for a confidence interval of 95%.
Equation 7: Statistical Model of water temperature at Mosul Dam
𝑇𝑤(𝑀𝑜𝑠𝑢𝑙) = 4.3022 + 0.7294 ∗ 𝑇𝑎
Equation 8: Statistical Model of water temperature at Baeji city
𝑇𝑤(𝐵𝑎𝑒𝑗𝑖) = 4.7764 + 0.7010 ∗ 𝑇𝑎
Equation 9: Statistical Model of water temperature at Baghdad city
𝑇𝑤(𝐵𝑎𝑔ℎ𝑑𝑎𝑑) = 3.4249 + 0.7594 ∗ 𝑇𝑎
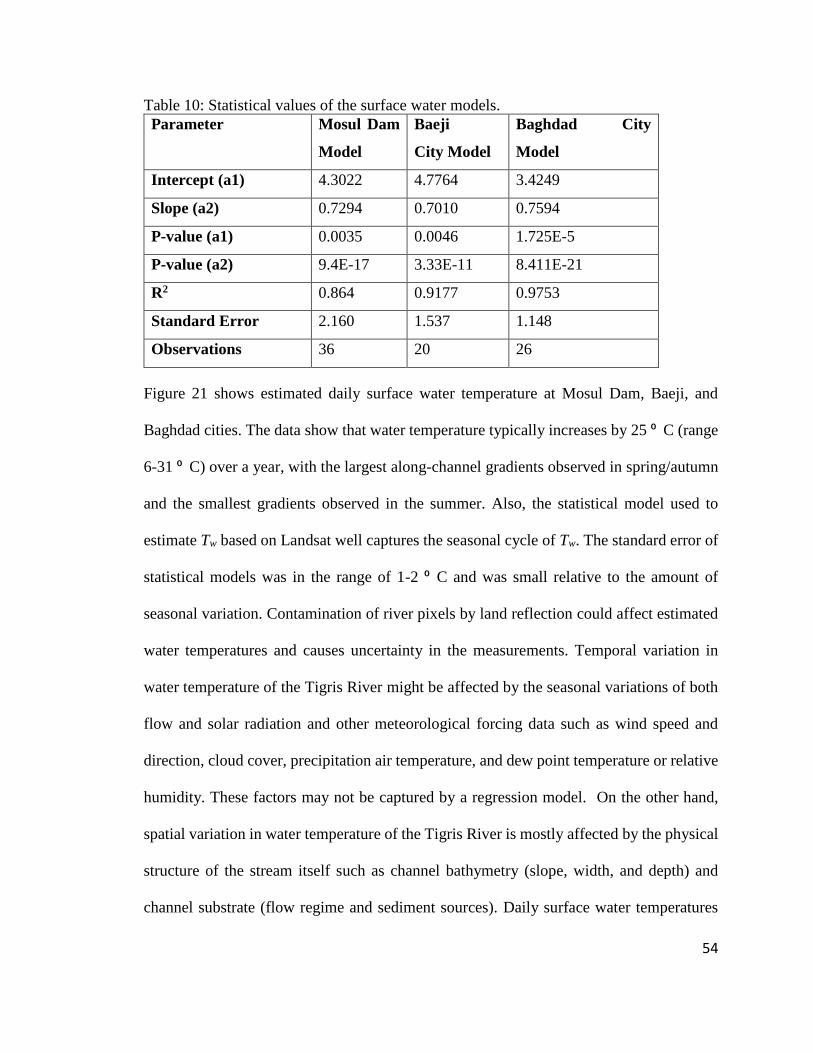
54
Table 10: Statistical values of the surface water models.
Parameter Mosul Dam
Model
Baeji
City Model
Baghdad City
Model
Intercept (a1) 4.3022 4.7764 3.4249
Slope (a2) 0.7294 0.7010 0.7594
P-value (a1) 0.0035 0.0046 1.725E-5
P-value (a2) 9.4E-17 3.33E-11 8.411E-21
R2 0.864 0.9177 0.9753
Standard Error 2.160 1.537 1.148
Observations 36 20 26
Figure 21 shows estimated daily surface water temperature at Mosul Dam, Baeji, and
Baghdad cities. The data show that water temperature typically increases by 25 ⁰ C (range
6-31 ⁰ C) over a year, with the largest along-channel gradients observed in spring/autumn
and the smallest gradients observed in the summer. Also, the statistical model used to
estimate Tw based on Landsat well captures the seasonal cycle of Tw. The standard error of
statistical models was in the range of 1-2 ⁰ C and was small relative to the amount of
seasonal variation. Contamination of river pixels by land reflection could affect estimated
water temperatures and causes uncertainty in the measurements. Temporal variation in
water temperature of the Tigris River might be affected by the seasonal variations of both
flow and solar radiation and other meteorological forcing data such as wind speed and
direction, cloud cover, precipitation air temperature, and dew point temperature or relative
humidity. These factors may not be captured by a regression model. On the other hand,
spatial variation in water temperature of the Tigris River is mostly affected by the physical
structure of the stream itself such as channel bathymetry (slope, width, and depth) and
channel substrate (flow regime and sediment sources). Daily surface water temperatures

55
obtaining using Equation 7 were used to develop flow temperature input files as boundary
conditions of the Tigris River model at Mosul Dam, while daily surface water temperatures
at both Baeji and Baghdad (Equation 8 and Equation 9) were used for the model calibration.
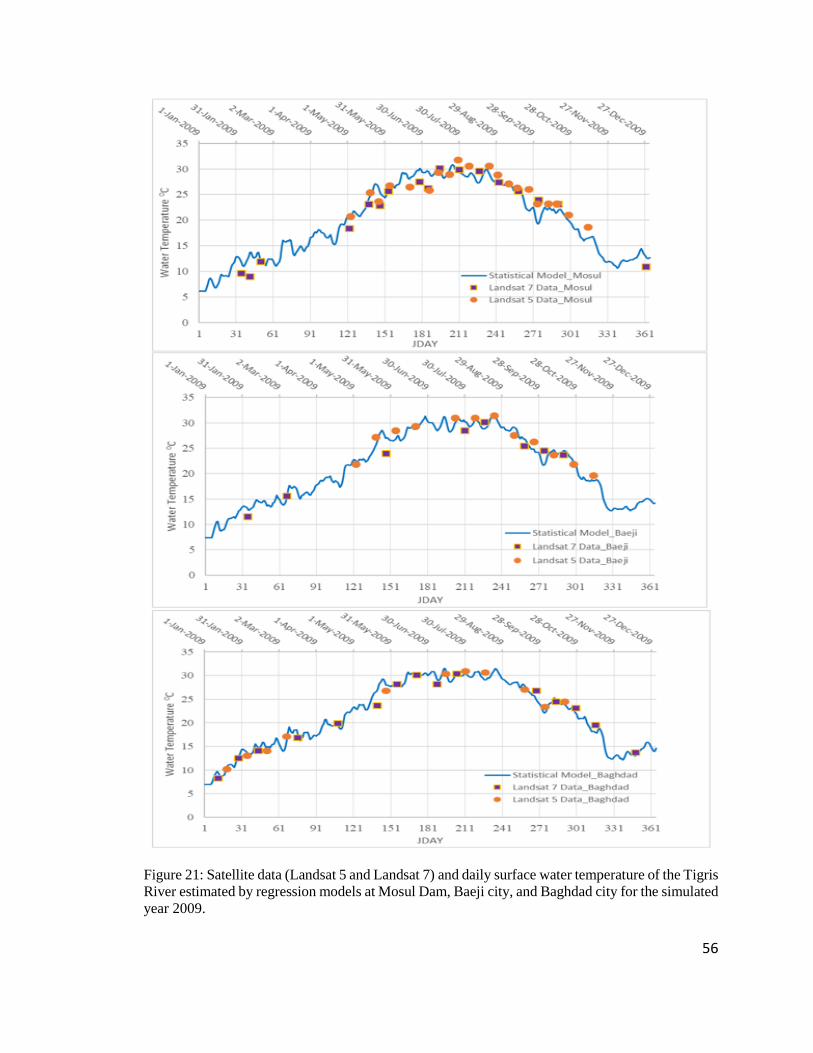
56
Figure 21: Satellite data (Landsat 5 and Landsat 7) and daily surface water temperature of the Tigris
River estimated by regression models at Mosul Dam, Baeji city, and Baghdad city for the simulated
year 2009.
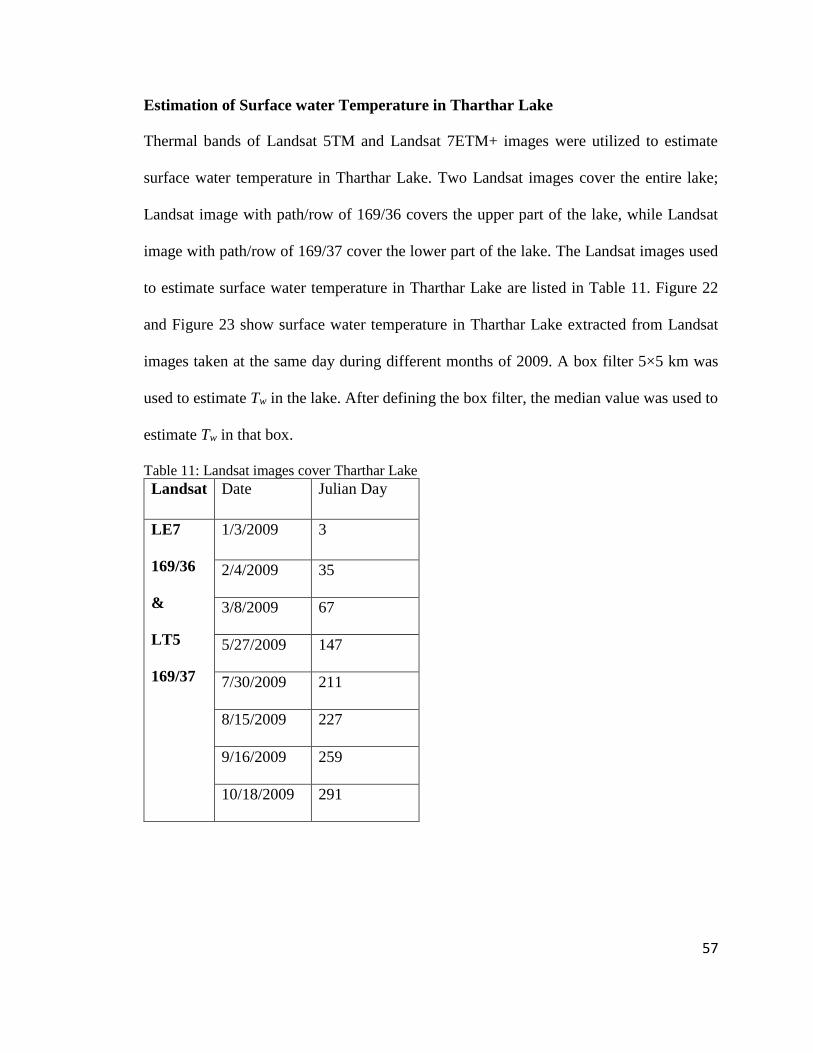
57
Estimation of Surface water Temperature in Tharthar Lake
Thermal bands of Landsat 5TM and Landsat 7ETM+ images were utilized to estimate
surface water temperature in Tharthar Lake. Two Landsat images cover the entire lake;
Landsat image with path/row of 169/36 covers the upper part of the lake, while Landsat
image with path/row of 169/37 cover the lower part of the lake. The Landsat images used
to estimate surface water temperature in Tharthar Lake are listed in Table 11. Figure 22
and Figure 23 show surface water temperature in Tharthar Lake extracted from Landsat
images taken at the same day during different months of 2009. A box filter 5×5 km was
used to estimate Tw in the lake. After defining the box filter, the median value was used to
estimate Tw in that box.
Table 11: Landsat images cover Tharthar Lake
Landsat Date Julian Day
LE7
169/36
&
LT5
169/37
1/3/2009 3
2/4/2009 35
3/8/2009 67
5/27/2009 147
7/30/2009 211
8/15/2009 227
9/16/2009 259
10/18/2009 291
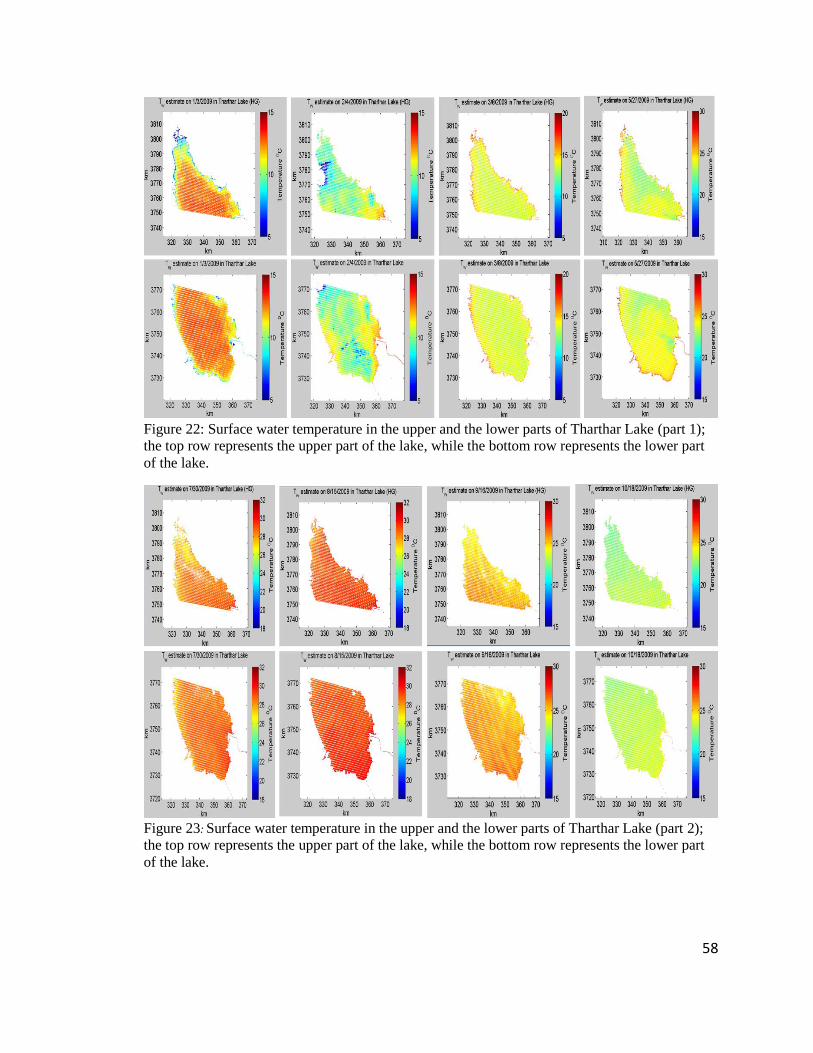
58
Figure 22: Surface water temperature in the upper and the lower parts of Tharthar Lake (part 1);
the top row represents the upper part of the lake, while the bottom row represents the lower part
of the lake.
Figure 23: Surface water temperature in the upper and the lower parts of Tharthar Lake (part 2);
the top row represents the upper part of the lake, while the bottom row represents the lower part
of the lake.
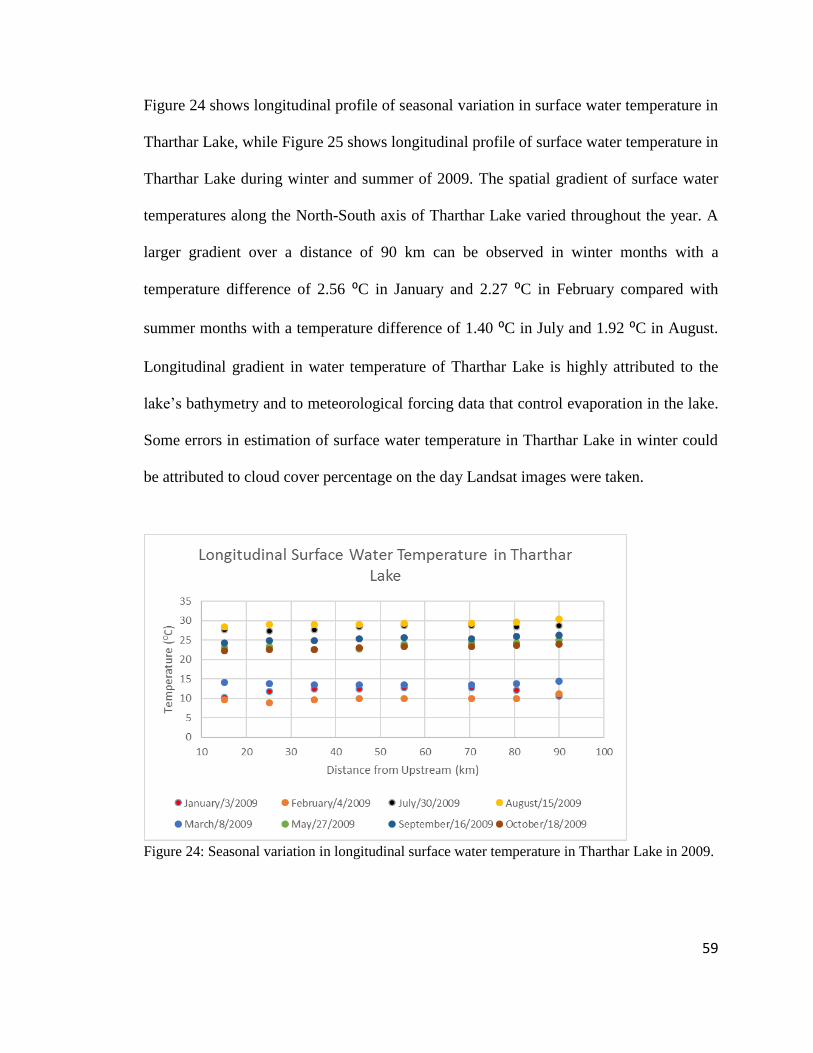
59
Figure 24 shows longitudinal profile of seasonal variation in surface water temperature in
Tharthar Lake, while Figure 25 shows longitudinal profile of surface water temperature in
Tharthar Lake during winter and summer of 2009. The spatial gradient of surface water
temperatures along the North-South axis of Tharthar Lake varied throughout the year. A
larger gradient over a distance of 90 km can be observed in winter months with a
temperature difference of 2.56 ⁰C in January and 2.27 ⁰C in February compared with
summer months with a temperature difference of 1.40 ⁰C in July and 1.92 ⁰C in August.
Longitudinal gradient in water temperature of Tharthar Lake is highly attributed to the
lake’s bathymetry and to meteorological forcing data that control evaporation in the lake.
Some errors in estimation of surface water temperature in Tharthar Lake in winter could
be attributed to cloud cover percentage on the day Landsat images were taken.
Figure 24: Seasonal variation in longitudinal surface water temperature in Tharthar Lake in 2009.

60
Figure 25: Longitudinal surface water temperature in Tharthar Lake in winter and summer of
2009.
61
Chapter Four: CE-QUAL-W2 Model Overview
This chapter reviews the governing equations of the hydrodynamic and water quality
model, CE-QUAL-W2, Version 4. For more detailed discussion, refer to the user manual
by Cole and Wells (2017).
Hydraulic Model Selection for the Tigris River System
1-D, 2-D, and 3-D models are general applications to simulate hydrodynamics and water
quality of surface waterbodies. The choice of the proper model is based on the application
of the model to evaluate management strategies, model calibration, model sensitivity
analysis, computational representation, and the physical characteristics of each system
component such as river, reservoir. Table 12 lists the main advantages and disadvantages
of 1-D, 2-D, and 3-D hydraulic models.
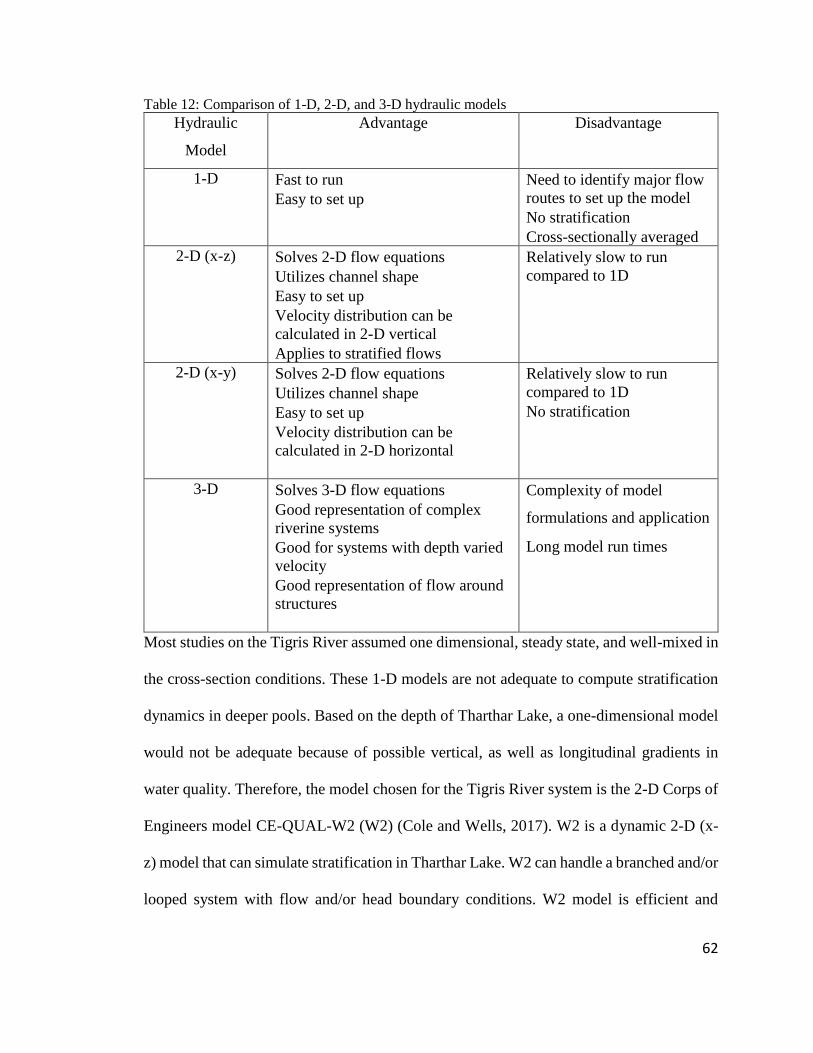
62
Table 12: Comparison of 1-D, 2-D, and 3-D hydraulic models
Hydraulic
Model
Advantage Disadvantage
1-D • Fast to run
• Easy to set up
•
• Need to identify major flow
routes to set up the model
• No stratification
• Cross-sectionally averaged
2-D (x-z) • Solves 2-D flow equations
• Utilizes channel shape
• Easy to set up
• Velocity distribution can be
calculated in 2-D vertical
• Applies to stratified flows
• Relatively slow to run
compared to 1D
•
2-D (x-y) • Solves 2-D flow equations
• Utilizes channel shape
• Easy to set up
• Velocity distribution can be
calculated in 2-D horizontal
•
• Relatively slow to run
compared to 1D
• No stratification
•
3-D • Solves 3-D flow equations
• Good representation of complex
riverine systems
• Good for systems with depth varied
velocity
• Good representation of flow around
structures
•
• Complexity of model
formulations and application
• Long model run times
Most studies on the Tigris River assumed one dimensional, steady state, and well-mixed in
the cross-section conditions. These 1-D models are not adequate to compute stratification
dynamics in deeper pools. Based on the depth of Tharthar Lake, a one-dimensional model
would not be adequate because of possible vertical, as well as longitudinal gradients in
water quality. Therefore, the model chosen for the Tigris River system is the 2-D Corps of
Engineers model CE-QUAL-W2 (W2) (Cole and Wells, 2017). W2 is a dynamic 2-D (x-
z) model that can simulate stratification in Tharthar Lake. W2 can handle a branched and/or
looped system with flow and/or head boundary conditions. W2 model is efficient and

63
allows the user to use the ultimate quickest numerical scheme for improved numerical
accuracy.
Model Introduction
CE-QUAL-W2 is a physically based, two-dimensional (longitudinal and vertical), laterally
averaged, finite difference hydrodynamic and water quality model. The Version 3 model
to Version 3.5 model was developed by a collaboration between the U.S. Army Corps of
Engineers and the Water Quality Research Group at Portland State University. After
Version 3.5, the model has been maintained by the water quality research group at Portland
State University. The model applies spatial and temporal averaging to the Navier-Stokes
and continuity equations to model surface water hydrodynamics. In addition, the advection
diffusion equation is used for the transport of heat and water quality constituents. Because
the model assumes lateral homogeneity, it is best suited for relatively long and narrow
waterbodies exhibiting longitudinal and vertical water quality gradients. W2 simulates
river/reservoir, lake stage, vertical and horizontal velocities, water temperature, and a user-
defined number of water quality constituents including nutrients, algae, dissolved oxygen,
and suspended sediment. W2 has been applied to hundreds of reservoirs, lakes, estuaries,
and river systems all over the world (Cole and Wells 2017). W2 model has been used in
many countries outside the United States such as Columbia, Brazil, Venezuela, Panama,
United Kingdom, Spain, Thailand, Italy, New Zealand, China, South Korea, Taiwan, South
Africa, Iran, Peru, Costa Rica, Israel, Canada, and Norway.

64
CE-QUAL-W2 State Variables
The hydrodynamic capabilities of the model include predictions of flow, water surface
elevation, velocities, and temperature. The water quality state variables include (Cole and
Wells, 2017):
1. any number of generic constituents defined by a 0 and/or a 1st order decay rate and/or
a settling velocity and/or an Arrhenius temperature rate multiplier that can be used to
define any number of the following:
a. conservative tracer(s)
b. water age or hydraulic residence time
c. N2 gas and %Total Dissolved Gas
d. coliform bacteria(s)
e. contaminant(s)
2. any number of inorganic suspended solids groups
3. any number of phytoplankton groups
4. any number of periphyton/epiphyton groups
5. any number of CBOD groups
6. any number of submerged macrophyte groups
7. ammonium
8. nitrate and nitrite
9. bioavailable phosphorus (commonly represented by orthophosphate or soluble reactive
phosphorus)
10. silica (dissolved and particulate)
11. labile dissolved organic matter
12. refractory dissolved organic matter
13. labile particulate organic matter
14. refractory particulate organic matter
15. total inorganic carbon
16. alkalinity
65
17. iron and manganese
18. dissolved oxygen
19. organic sediments
20. gas entrainment
21. any number of macrophyte groups
22. any number of zooplankton groups
23. labile dissolved organic matter-P
24. refractory dissolved organic matter-P
25. labile particulate organic matter-P
26. refractory particulate organic matter-P
27. labile dissolved organic matter-N
28. refractory dissolved organic matter-N
29. labile particulate organic matter-N
30. refractory particulate organic matter-N
31. Sediment and water column CH4
32. Sediment and water column H2S
33. Sediment and water column SO4
34. Sediment and water column Sulfide
35. Sediment and water column FeOOH(s)
36. Sediment and water column Fe+2
37. Sediment and water column MnO2(s)
38. Sediment and water column Mn+2
39. Sediment organic P, sediment PO4
40. Sediment organic N, sediment NO3, sediment NH4
41. Sediment Temperature
42. Sediment pH
43. Sediment alkalinity
44. Sediment Total Inorganic C
45. Sediment organic C
66
46. Turbidity correlation to Suspended solids
Input Data Preparation
The follow input files were developed to run W2 model. Detailes about input data
preparations are discussed in chapter five “The Tigris River Model Set Up”
• Bathymetry
• Meteorological data
• Shade file
• Wind Sheltering
• Initial conditions
• Boundary conditions, such as inputs from point or non-point sources, outflows or
withdrawals from the system
• In-river water quality, water level, flow for calibration
Hydrodynamics Governing Equations
Governing equations for hydrodynamics are listed below. The assumptions made are (Cole
and Wells, 2017):
• Incompressible fluid.
• Centripetal acceleration correction to the gravity term is negligible
• Boussinesq approximation
• Coriolis forces are not important in an x-z model
• Within a grid cell, density variation can be taken to be negligible for purposes
of temporal averaging
• Each cell or control volume is vertically and laterally averaged
• The coordinate system is transformed so that the +z direction is vertical downward
and perpendicular to the channel slope (thus, for a slope channel, there is a small
difference in the +z direction and vertically downward).
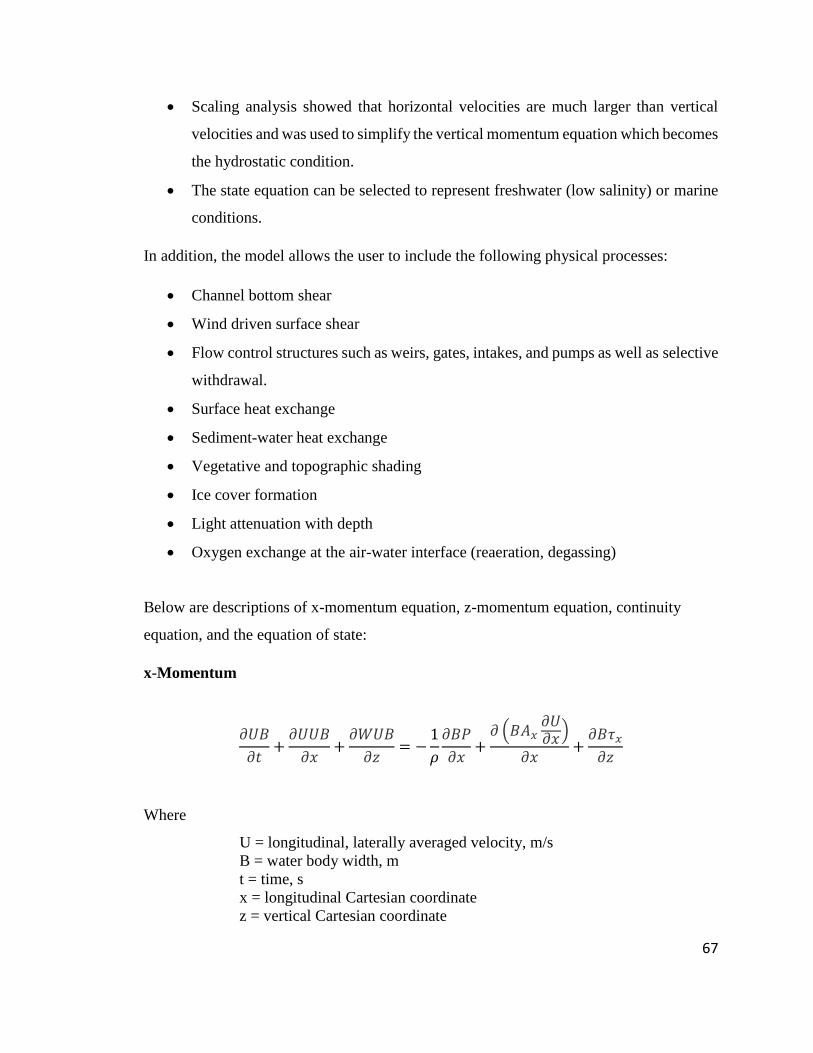
67
• Scaling analysis showed that horizontal velocities are much larger than vertical
velocities and was used to simplify the vertical momentum equation which becomes
the hydrostatic condition.
• The state equation can be selected to represent freshwater (low salinity) or marine
conditions.
In addition, the model allows the user to include the following physical processes:
• Channel bottom shear
• Wind driven surface shear
• Flow control structures such as weirs, gates, intakes, and pumps as well as selective
withdrawal.
• Surface heat exchange
• Sediment-water heat exchange
• Vegetative and topographic shading
• Ice cover formation
• Light attenuation with depth
• Oxygen exchange at the air-water interface (reaeration, degassing)
Below are descriptions of x-momentum equation, z-momentum equation, continuity
equation, and the equation of state:
x-Momentum
𝜕𝑈𝐵
𝜕𝑡+
𝜕𝑈𝑈𝐵
𝜕𝑥+
𝜕𝑊𝑈𝐵
𝜕𝑧= −
1
𝜌
𝜕𝐵𝑃
𝜕𝑥+
𝜕 (𝐵𝐴𝑥𝜕𝑈𝜕𝑥
)
𝜕𝑥+
𝜕𝐵𝜏𝑥
𝜕𝑧
Where
U = longitudinal, laterally averaged velocity, m/s
B = water body width, m
t = time, s
x = longitudinal Cartesian coordinate
z = vertical Cartesian coordinate
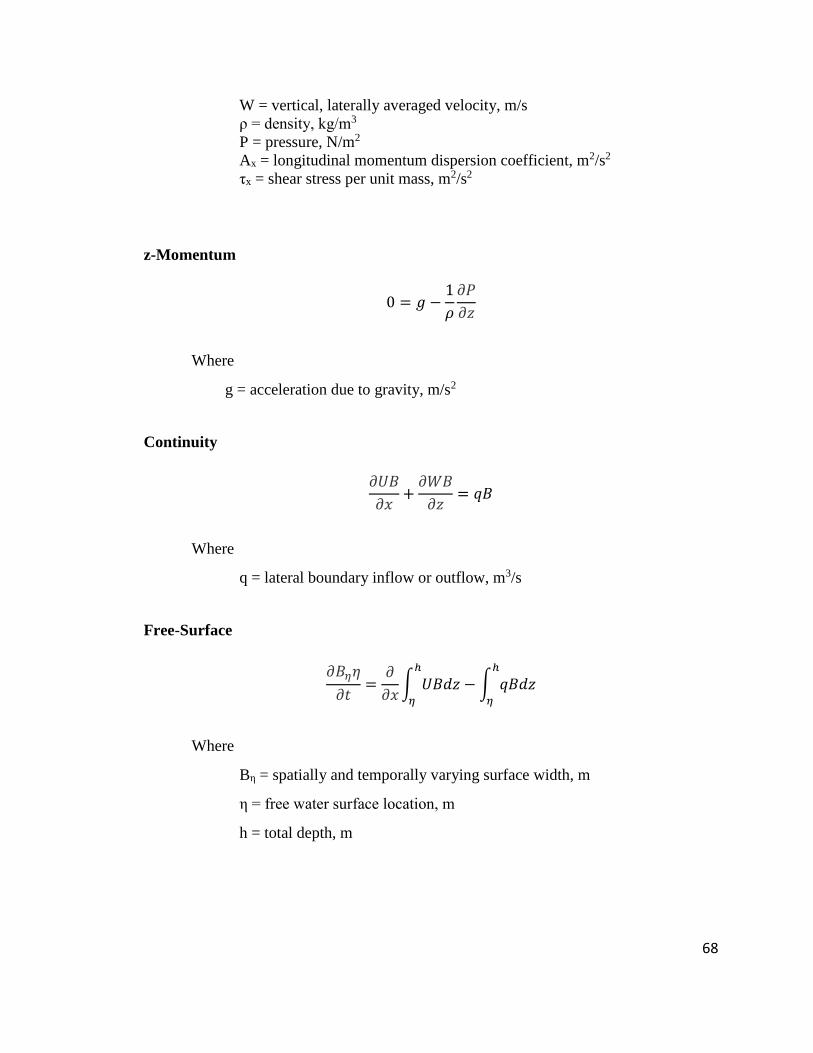
68
W = vertical, laterally averaged velocity, m/s
ρ = density, kg/m3
P = pressure, N/m2
Ax = longitudinal momentum dispersion coefficient, m2/s2
τx = shear stress per unit mass, m2/s2
z-Momentum
0 = 𝑔 −1
𝜌
𝜕𝑃
𝜕𝑧
Where
g = acceleration due to gravity, m/s2
Continuity
𝜕𝑈𝐵
𝜕𝑥+
𝜕𝑊𝐵
𝜕𝑧= 𝑞𝐵
Where
q = lateral boundary inflow or outflow, m3/s
Free-Surface
𝜕𝐵𝜂𝜂
𝜕𝑡=
𝜕
𝜕𝑥∫ 𝑈𝐵𝑑𝑧
ℎ
𝜂
− ∫ 𝑞𝐵𝑑𝑧ℎ
𝜂
Where
Bη = spatially and temporally varying surface width, m
η = free water surface location, m
h = total depth, m
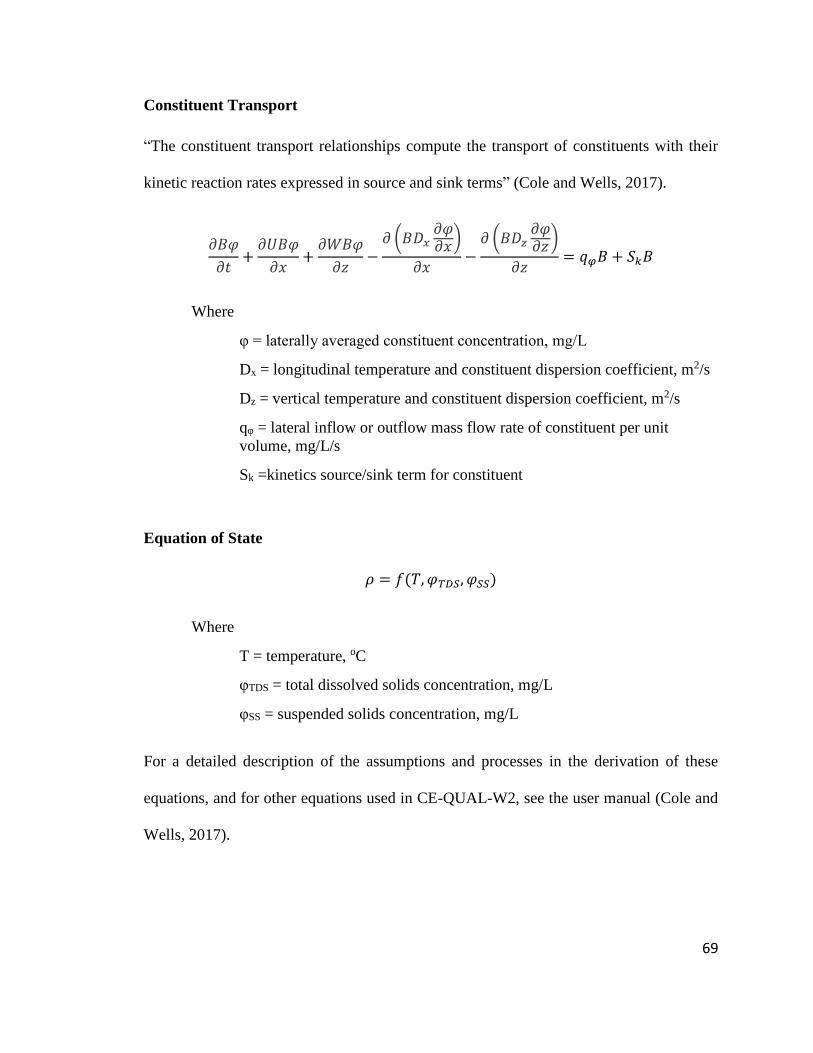
69
Constituent Transport
“The constituent transport relationships compute the transport of constituents with their
kinetic reaction rates expressed in source and sink terms” (Cole and Wells, 2017).
𝜕𝐵𝜑
𝜕𝑡+
𝜕𝑈𝐵𝜑
𝜕𝑥+
𝜕𝑊𝐵𝜑
𝜕𝑧−
𝜕 (𝐵𝐷𝑥𝜕𝜑𝜕𝑥
)
𝜕𝑥−
𝜕 (𝐵𝐷𝑧𝜕𝜑𝜕𝑧
)
𝜕𝑧= 𝑞𝜑𝐵 + 𝑆𝑘𝐵
Where
φ = laterally averaged constituent concentration, mg/L
Dx = longitudinal temperature and constituent dispersion coefficient, m2/s
Dz = vertical temperature and constituent dispersion coefficient, m2/s
qφ = lateral inflow or outflow mass flow rate of constituent per unit
volume, mg/L/s
Sk =kinetics source/sink term for constituent
Equation of State
𝜌 = 𝑓(𝑇, 𝜑𝑇𝐷𝑆, 𝜑𝑆𝑆)
Where
T = temperature, oC
φTDS = total dissolved solids concentration, mg/L
φSS = suspended solids concentration, mg/L
For a detailed description of the assumptions and processes in the derivation of these
equations, and for other equations used in CE-QUAL-W2, see the user manual (Cole and
Wells, 2017).
70
Chapter Five: The Tigris River Model Set Up
The mainstem of the Tigris River was modeled from Mosul Dam (river km 0) to Kut
Barrage (river km 880). The mainstem of the Tigris River was discretized into four
waterbodies. A waterbody is defined in the model by specifying the waterbody latitude and
longitude, bottom elevation of the grid, starting and ending branches of the waterbody. Due
to varying channel slope, the mainstem of the river was divided into four branches, a branch
is a collection of model segments with variable model slope. The physical characteristics
of the river varied widely, and multiple branches allowed for separate characteristics such
as branch slope to be implemented in the model. In addition, Tigris-Tharthar Canal,
Tharthar Arm, Tharthar-Tigris Canal, Tharthar Lake, and Erwaeiya canal were discretized
into five waterbodies and were also modeled in this study. All model branches were
connected based on specified upstream and downstream external/internal flow, internal
head, or dam flow boundary condition. a schematic diagram of the Tigris River system is
shown in Figure 26. Gates, spillways, and hydraulic structures were defined to convey
water through the system.
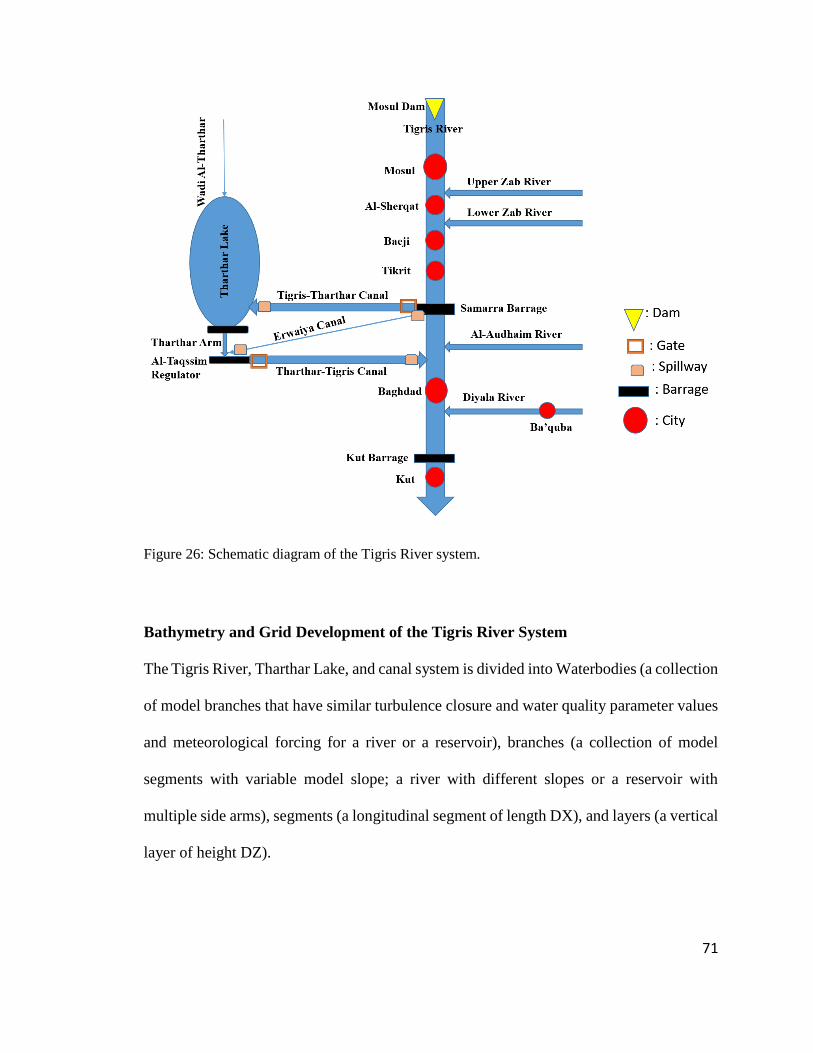
71
Figure 26: Schematic diagram of the Tigris River system.
Bathymetry and Grid Development of the Tigris River System
The Tigris River, Tharthar Lake, and canal system is divided into Waterbodies (a collection
of model branches that have similar turbulence closure and water quality parameter values
and meteorological forcing for a river or a reservoir), branches (a collection of model
segments with variable model slope; a river with different slopes or a reservoir with
multiple side arms), segments (a longitudinal segment of length DX), and layers (a vertical
layer of height DZ).
72
The Tigris River Grid
The model grid of the mainstem of the Tigris River was developed based on the river cross
section data provided by the Iraqi Ministry of Water Resources for 880 km along the main
stream of the Tigris River from Mosul Dam to Kut Barrage. Data were provided in the
form of x,y,z cross-sections with 5 km increments as shown in Figure 27 and were used to
develop the river grid for the CE-QUAL-W2 model (Al-Murib, 2014). Geographical
Information system (GIS) was implemented to visualize river morphology and project all
cross sections with a projection UTM 1984 Zone 38N (North) and a datum GCS WGS
1984. Linear regression was used to fill gaps of some missing cross sections.
The first waterbody in the mainstem of the Tigris River (350 km in length) starts at Mosul
Dam (River km 0) and ends 15 km downstream of Tikrit city (River km 350). The second
waterbody starts from there to Samarra Barrage (a length of 40 km). The third waterbody
(a length of 256.5 km) starts at Samarra Barrage and ends at 70 km downstream of Baghdad
city, while the fourth waterbody (a length of 233.5 km) starts from there to Kut Barrage (at
River km 880). Four main tributaries flow from the right bank of the main stream of the
Tigris River between Mosul Dam to Kut Barrage.
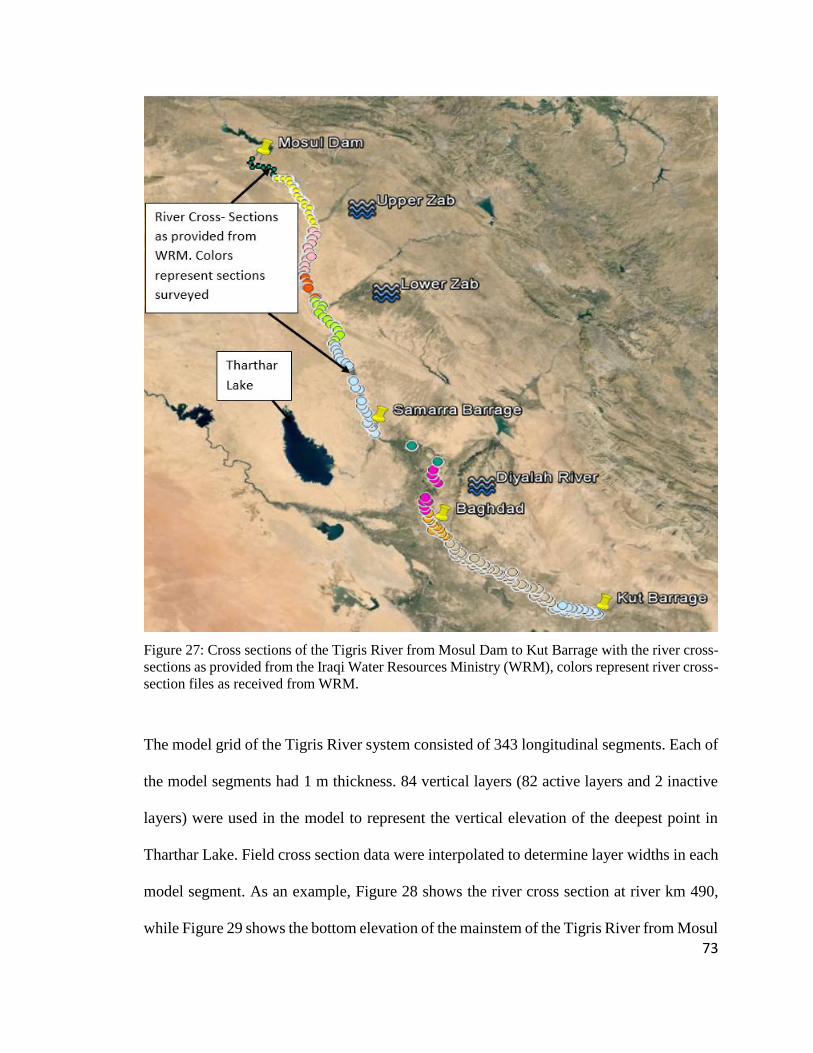
73
Figure 27: Cross sections of the Tigris River from Mosul Dam to Kut Barrage with the river cross-
sections as provided from the Iraqi Water Resources Ministry (WRM), colors represent river cross-
section files as received from WRM.
The model grid of the Tigris River system consisted of 343 longitudinal segments. Each of
the model segments had 1 m thickness. 84 vertical layers (82 active layers and 2 inactive
layers) were used in the model to represent the vertical elevation of the deepest point in
Tharthar Lake. Field cross section data were interpolated to determine layer widths in each
model segment. As an example, Figure 28 shows the river cross section at river km 490,
while Figure 29 shows the bottom elevation of the mainstem of the Tigris River from Mosul
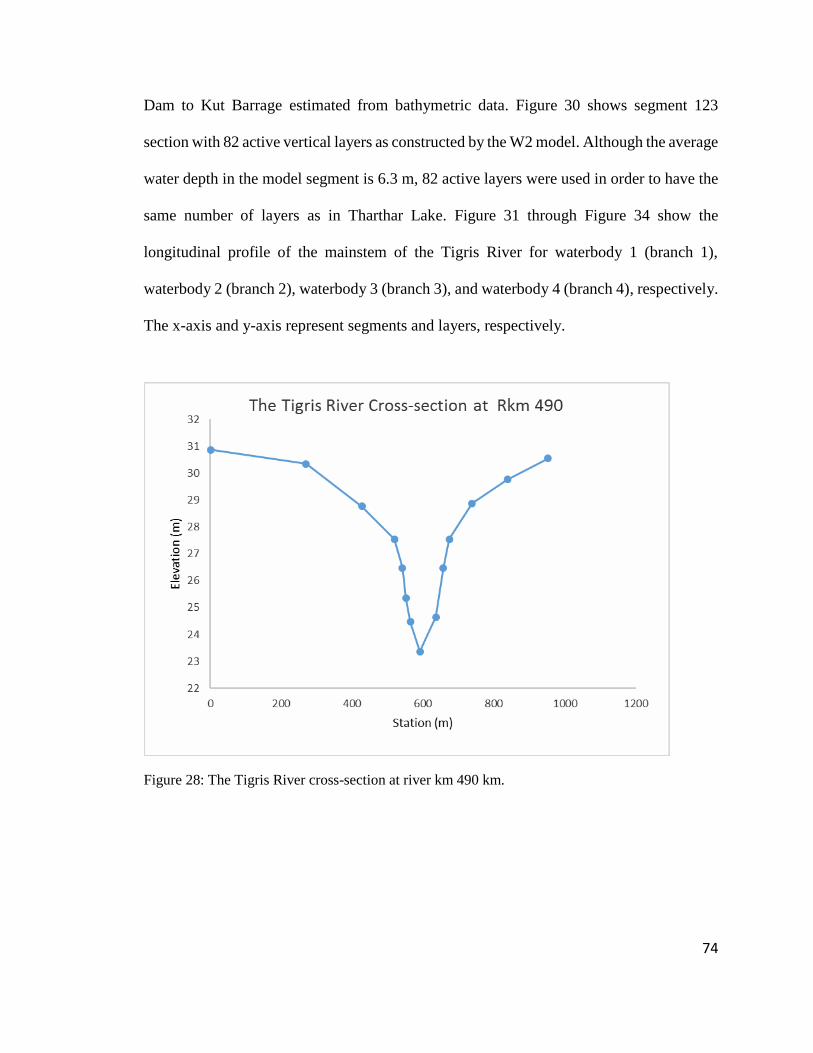
74
Dam to Kut Barrage estimated from bathymetric data. Figure 30 shows segment 123
section with 82 active vertical layers as constructed by the W2 model. Although the average
water depth in the model segment is 6.3 m, 82 active layers were used in order to have the
same number of layers as in Tharthar Lake. Figure 31 through Figure 34 show the
longitudinal profile of the mainstem of the Tigris River for waterbody 1 (branch 1),
waterbody 2 (branch 2), waterbody 3 (branch 3), and waterbody 4 (branch 4), respectively.
The x-axis and y-axis represent segments and layers, respectively.
Figure 28: The Tigris River cross-section at river km 490 km.

75
Figure 29: Bottom elevation of the mainstem of the Tigris River study area from Mosul Dam to
Kut Barrage.
Figure 30: Segment section # 123 (Baghdad city) with 82 active layers (1 m each) constructed by
the W2 model.
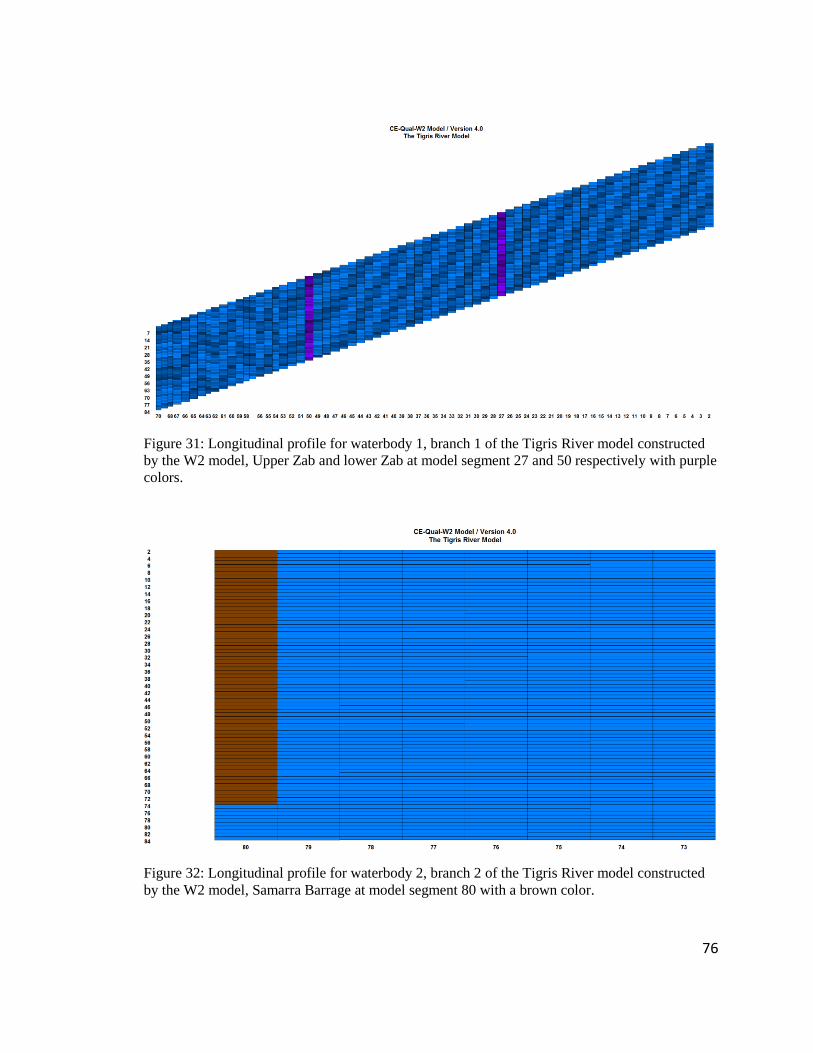
76
Figure 31: Longitudinal profile for waterbody 1, branch 1 of the Tigris River model constructed
by the W2 model, Upper Zab and lower Zab at model segment 27 and 50 respectively with purple
colors.
Figure 32: Longitudinal profile for waterbody 2, branch 2 of the Tigris River model constructed
by the W2 model, Samarra Barrage at model segment 80 with a brown color.
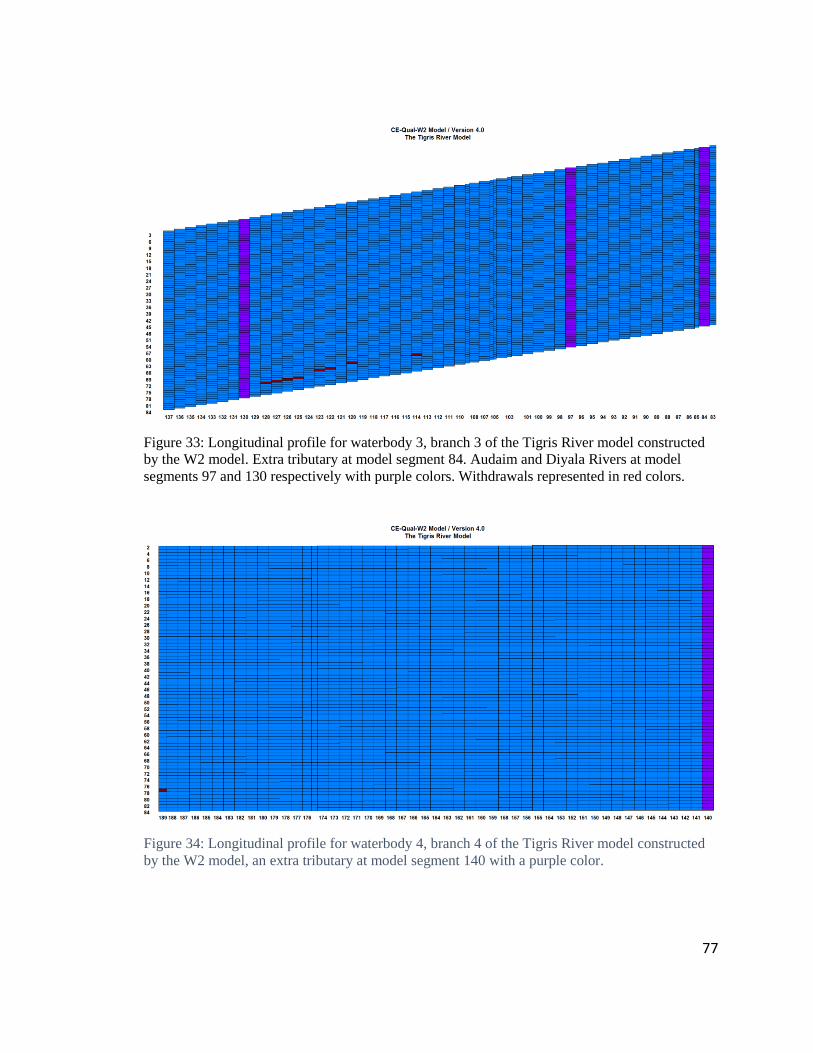
77
Figure 33: Longitudinal profile for waterbody 3, branch 3 of the Tigris River model constructed
by the W2 model. Extra tributary at model segment 84. Audaim and Diyala Rivers at model
segments 97 and 130 respectively with purple colors. Withdrawals represented in red colors.
Figure 34: Longitudinal profile for waterbody 4, branch 4 of the Tigris River model constructed
by the W2 model, an extra tributary at model segment 140 with a purple color.
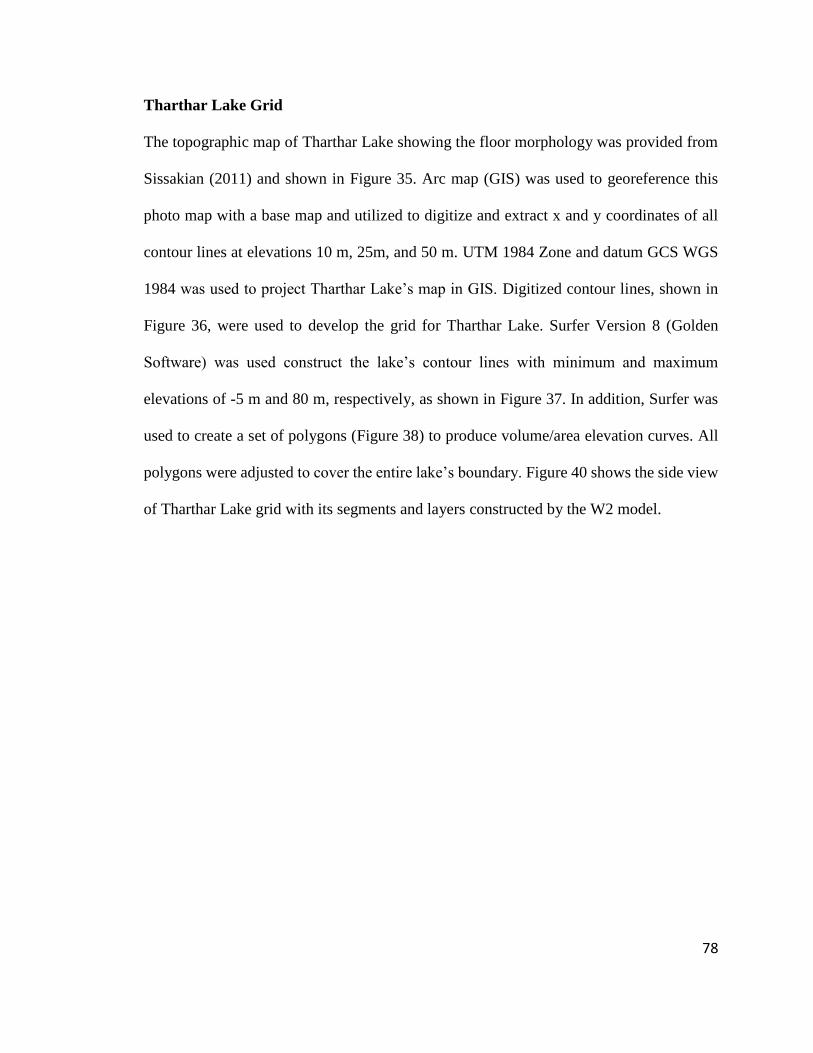
78
Tharthar Lake Grid
The topographic map of Tharthar Lake showing the floor morphology was provided from
Sissakian (2011) and shown in Figure 35. Arc map (GIS) was used to georeference this
photo map with a base map and utilized to digitize and extract x and y coordinates of all
contour lines at elevations 10 m, 25m, and 50 m. UTM 1984 Zone and datum GCS WGS
1984 was used to project Tharthar Lake’s map in GIS. Digitized contour lines, shown in
Figure 36, were used to develop the grid for Tharthar Lake. Surfer Version 8 (Golden
Software) was used construct the lake’s contour lines with minimum and maximum
elevations of -5 m and 80 m, respectively, as shown in Figure 37. In addition, Surfer was
used to create a set of polygons (Figure 38) to produce volume/area elevation curves. All
polygons were adjusted to cover the entire lake’s boundary. Figure 40 shows the side view
of Tharthar Lake grid with its segments and layers constructed by the W2 model.
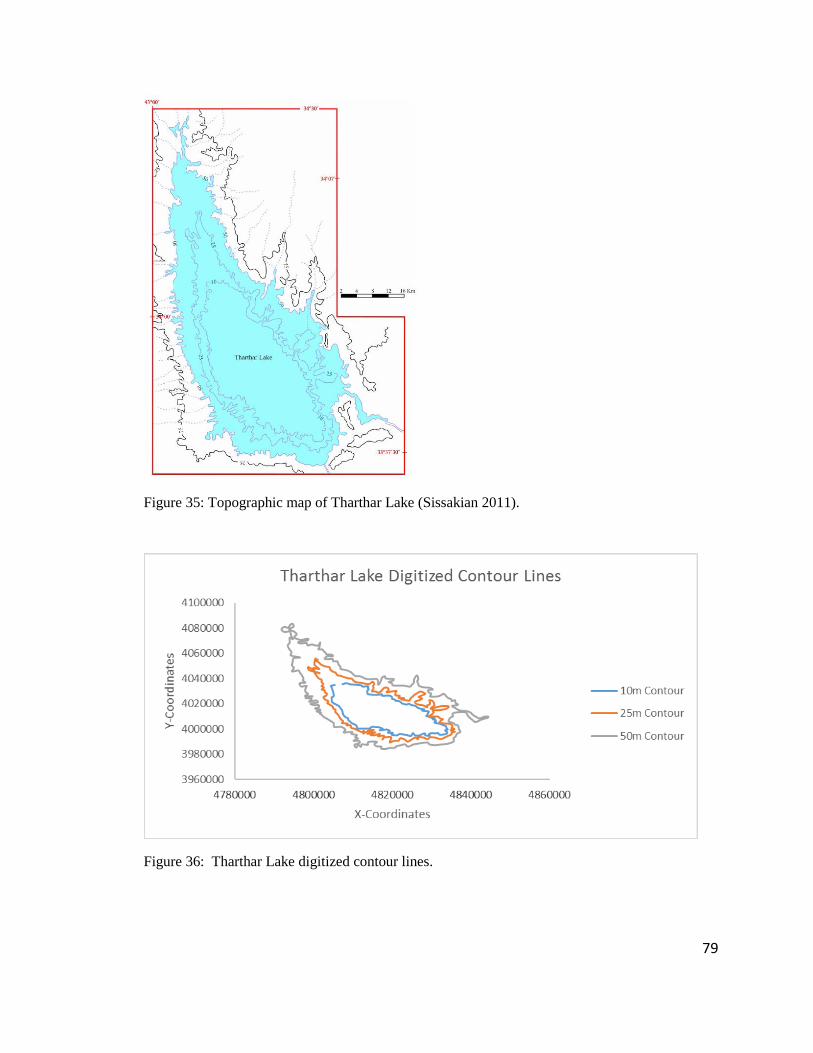
79
Figure 35: Topographic map of Tharthar Lake (Sissakian 2011).
Figure 36: Tharthar Lake digitized contour lines.
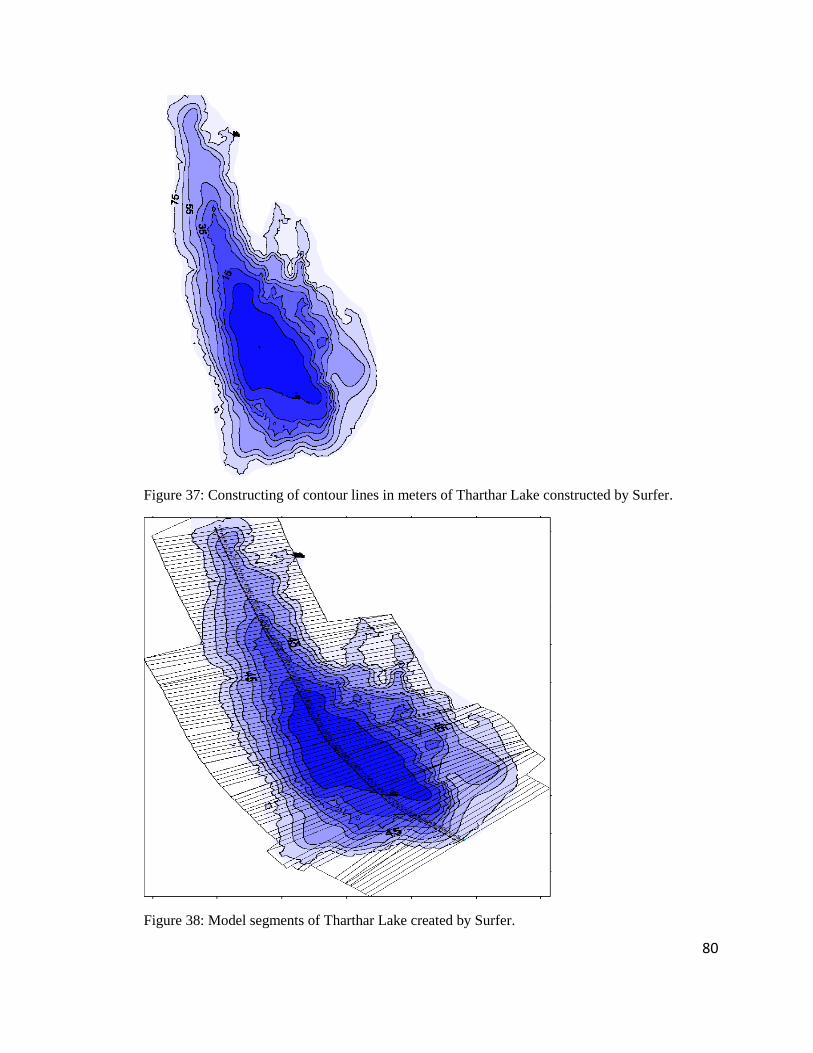
80
Figure 37: Constructing of contour lines in meters of Tharthar Lake constructed by Surfer.
Figure 38: Model segments of Tharthar Lake created by Surfer.

81
Figure 39: Longitudinal profile for waterbody 5, branch 5 (Tigris-Tharthar Canal) of the Tigris
River model constructed by the W2 model (Cole and Wells, 2017).
Figure 40: Model longitudinal profile of water body 6, branch 6 Tharthar Lake, including all
segments and layers constructed by W2 model (Cole and Wells, 2017), the outlet of the lake at
segment 297 with a brown color.
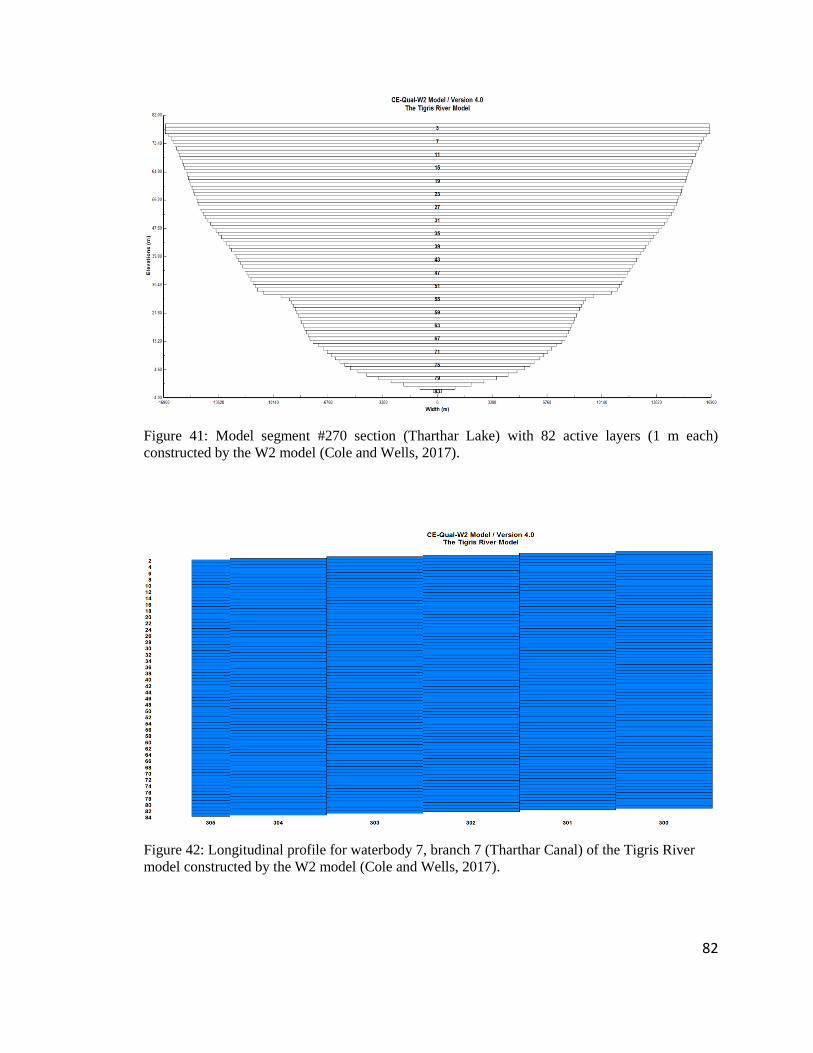
82
Figure 41: Model segment #270 section (Tharthar Lake) with 82 active layers (1 m each)
constructed by the W2 model (Cole and Wells, 2017).
Figure 42: Longitudinal profile for waterbody 7, branch 7 (Tharthar Canal) of the Tigris River
model constructed by the W2 model (Cole and Wells, 2017).
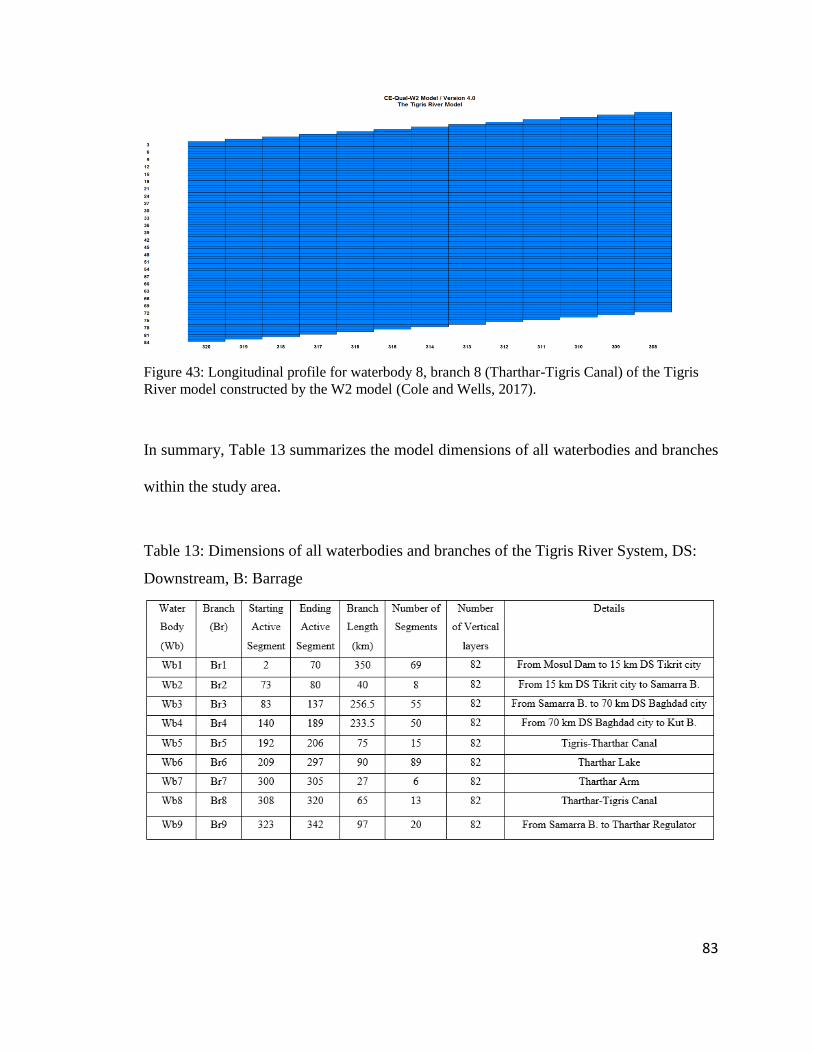
83
Figure 43: Longitudinal profile for waterbody 8, branch 8 (Tharthar-Tigris Canal) of the Tigris
River model constructed by the W2 model (Cole and Wells, 2017).
In summary, Table 13 summarizes the model dimensions of all waterbodies and branches
within the study area.
Table 13: Dimensions of all waterbodies and branches of the Tigris River System, DS:
Downstream, B: Barrage
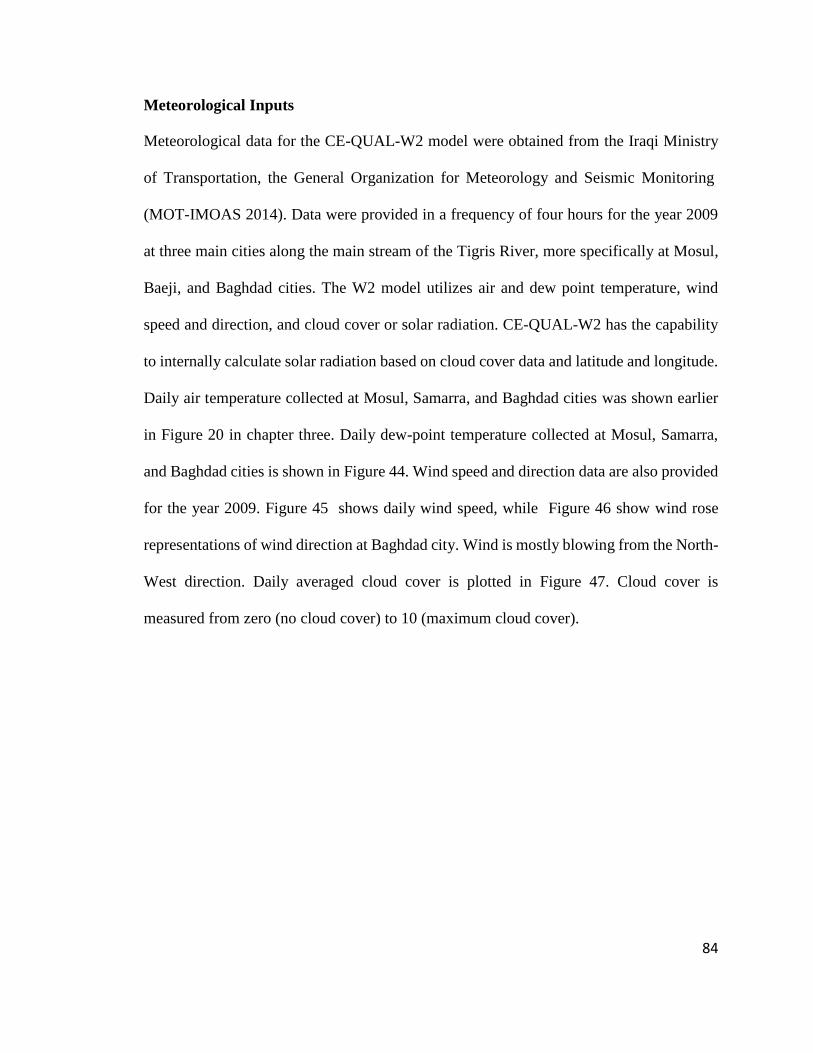
84
Meteorological Inputs
Meteorological data for the CE-QUAL-W2 model were obtained from the Iraqi Ministry
of Transportation, the General Organization for Meteorology and Seismic Monitoring
(MOT-IMOAS 2014). Data were provided in a frequency of four hours for the year 2009
at three main cities along the main stream of the Tigris River, more specifically at Mosul,
Baeji, and Baghdad cities. The W2 model utilizes air and dew point temperature, wind
speed and direction, and cloud cover or solar radiation. CE-QUAL-W2 has the capability
to internally calculate solar radiation based on cloud cover data and latitude and longitude.
Daily air temperature collected at Mosul, Samarra, and Baghdad cities was shown earlier
in Figure 20 in chapter three. Daily dew-point temperature collected at Mosul, Samarra,
and Baghdad cities is shown in Figure 44. Wind speed and direction data are also provided
for the year 2009. Figure 45 shows daily wind speed, while Figure 46 show wind rose
representations of wind direction at Baghdad city. Wind is mostly blowing from the North-
West direction. Daily averaged cloud cover is plotted in Figure 47. Cloud cover is
measured from zero (no cloud cover) to 10 (maximum cloud cover).

85
Figure 44: Daily dew-point temperature at Mosul, Baeji, and Baghdad cities (2009).
Figure 45: Daily wind speed at Mosul, Baeji, and Baghdad cities (2009).
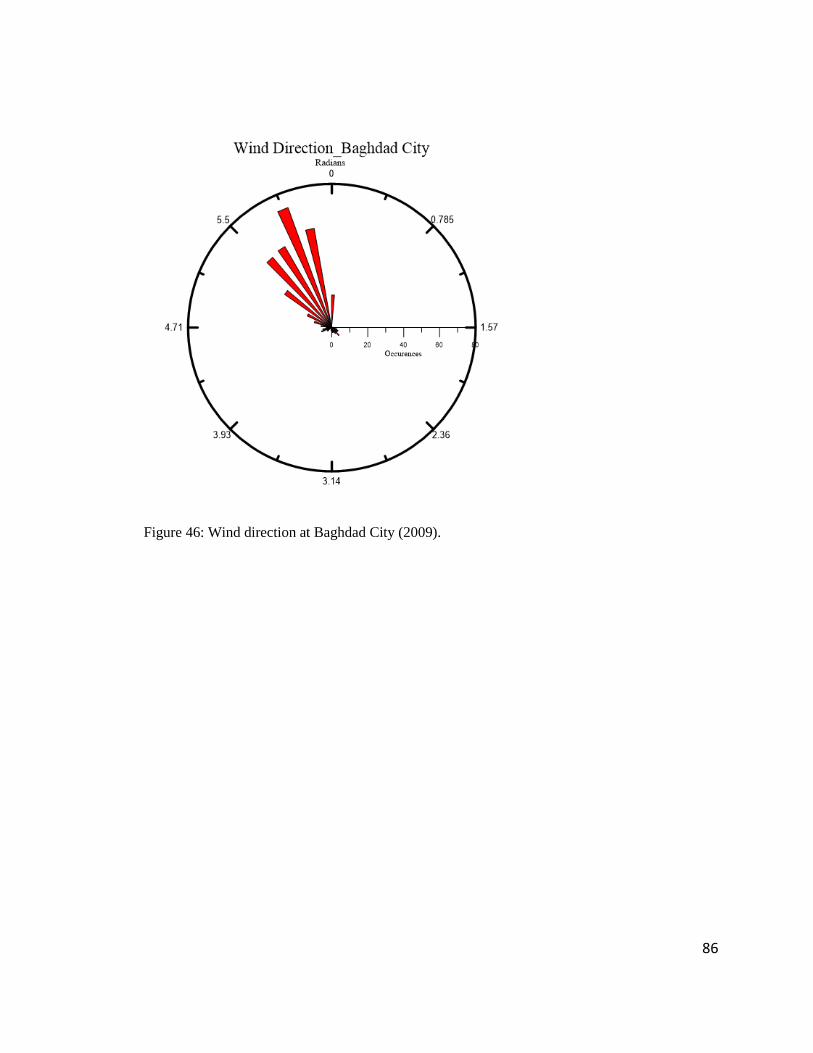
86
Figure 46: Wind direction at Baghdad City (2009).
87
Figure 47: Daily cloud cover at Mosul, Baeji, and Baghdad cities (2009).
Flow Inputs
Daily flowrate and water level data were required for the entire model time period from
January 1, 2009 to December 31, 2009 for upstream boundary conditions and calibration
of the mainstem of the Tigris River model. These data were obtained at multiple monitoring
stations from the Ministry of Water Resources (MWR) in Iraq for the year of 2009.
Flowrate data were provided at Mosul Dam (Rkm 0), Beije city (Rkm 290), outflow from
Samarra Barrage (Rkm 390), Baghdad City (Rkm 576.5), outflow from Kut Barrage (Rkm
880), and Tharthar-Euphrates canal. Water level data were provided at Baeji city, Samarra
Barrage, and Baghdad city. Figure 48 shows daily flowrates of the mainstem of the Tigris
River in 2009 at Mosul Dam, Baeji city, Samarra Barrage, Baghdad city, and Kut Barrage.
Unfortunately, flowrate data for the Tigris River main tributaries, Upper Zab and Lower
Zab Rivers, were unavailable at the Ministry of Water Resources (MWR) in Iraq for the
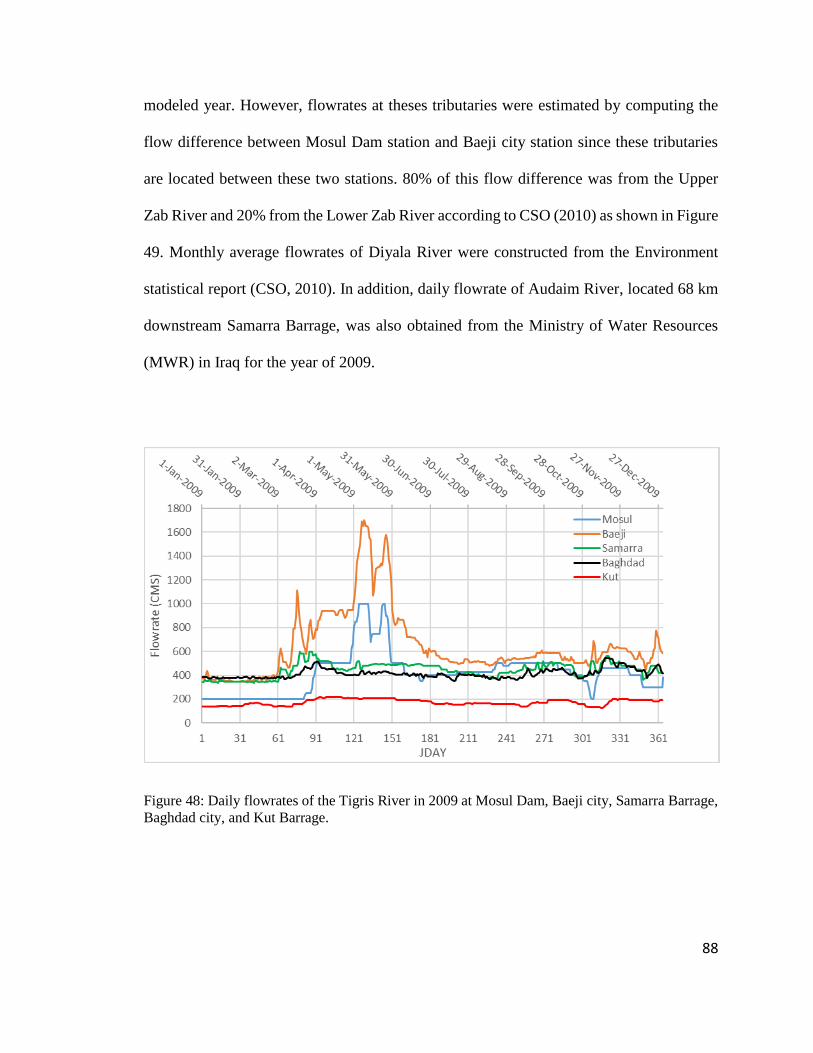
88
modeled year. However, flowrates at theses tributaries were estimated by computing the
flow difference between Mosul Dam station and Baeji city station since these tributaries
are located between these two stations. 80% of this flow difference was from the Upper
Zab River and 20% from the Lower Zab River according to CSO (2010) as shown in Figure
49. Monthly average flowrates of Diyala River were constructed from the Environment
statistical report (CSO, 2010). In addition, daily flowrate of Audaim River, located 68 km
downstream Samarra Barrage, was also obtained from the Ministry of Water Resources
(MWR) in Iraq for the year of 2009.
Figure 48: Daily flowrates of the Tigris River in 2009 at Mosul Dam, Baeji city, Samarra Barrage,
Baghdad city, and Kut Barrage.
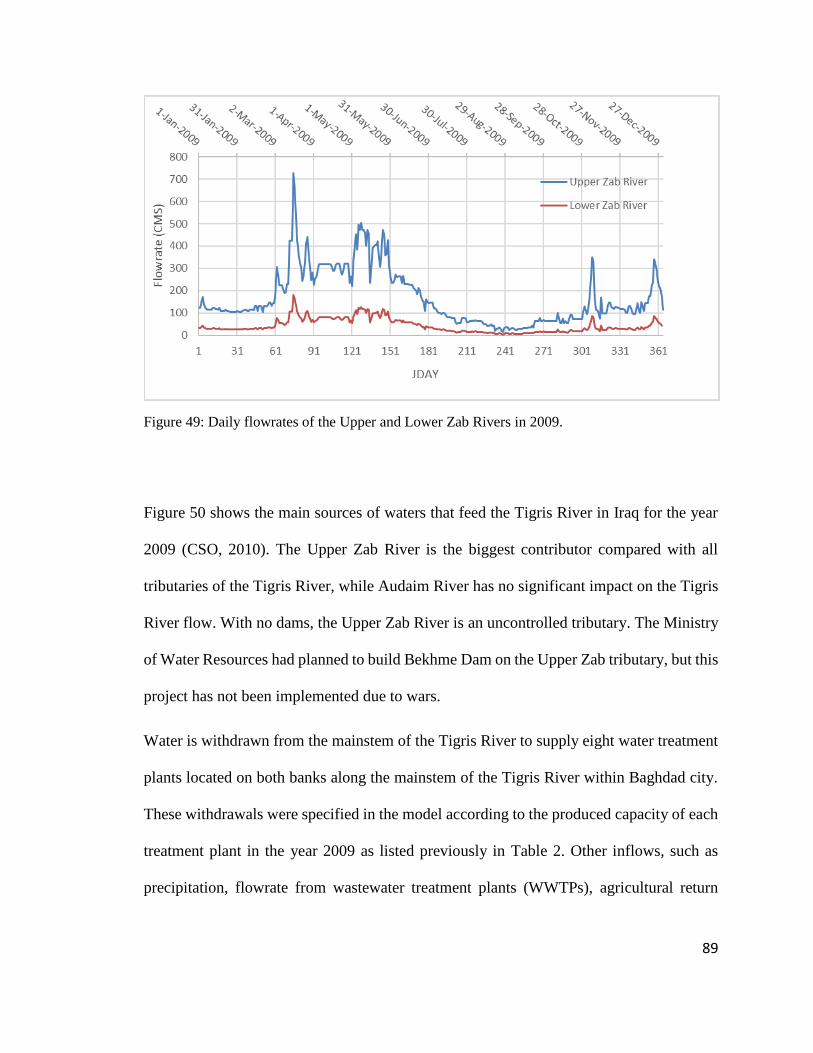
89
Figure 49: Daily flowrates of the Upper and Lower Zab Rivers in 2009.
Figure 50 shows the main sources of waters that feed the Tigris River in Iraq for the year
2009 (CSO, 2010). The Upper Zab River is the biggest contributor compared with all
tributaries of the Tigris River, while Audaim River has no significant impact on the Tigris
River flow. With no dams, the Upper Zab River is an uncontrolled tributary. The Ministry
of Water Resources had planned to build Bekhme Dam on the Upper Zab tributary, but this
project has not been implemented due to wars.
Water is withdrawn from the mainstem of the Tigris River to supply eight water treatment
plants located on both banks along the mainstem of the Tigris River within Baghdad city.
These withdrawals were specified in the model according to the produced capacity of each
treatment plant in the year 2009 as listed previously in Table 2. Other inflows, such as
precipitation, flowrate from wastewater treatment plants (WWTPs), agricultural return

90
flows, and flowrate of groundwater, were unavailable but were accounted for within the
distributed tributary for each waterbody in the Tigris River model.
Figure 50: Water sources of the Tigris River in Iraq for the year 2009 (CSO, 2010).
Spillways
Spillways were added at the end of some branches in the Tigris River model to ensure
smooth transition of water between branches. Crest elevations and other used-defined
parameters affected the way water moved over the spillway. Generally, most spillways
were set so that a spillway’s crest was located on the bottom elevation of the channel.
Spillways follow power functions for both free flowing and submerged conditions as
described in Equation 10 and Equation 11, respectively (Cole and Wells, 2017):
Equation 10: Free flow conditions
𝑄 = 𝛼1𝛥ℎ𝛽1
Equation 11: submerged conditions
𝑄 = 𝛼2𝛥ℎ𝛽2
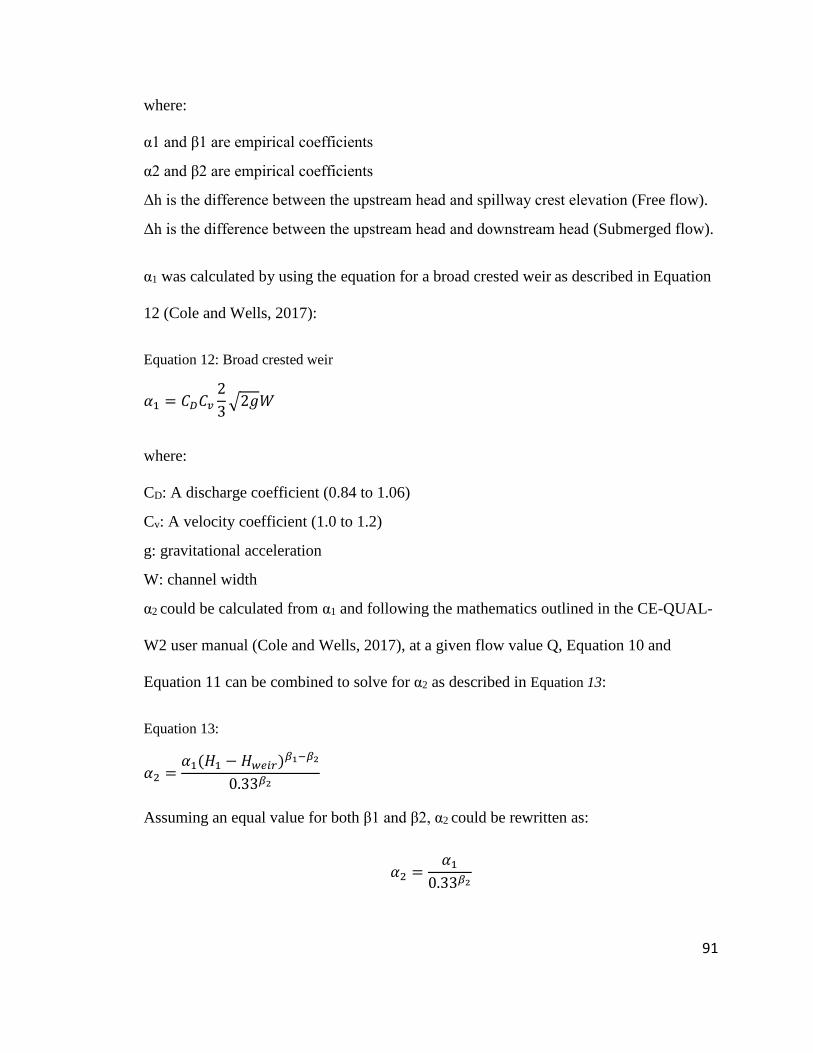
91
where:
α1 and β1 are empirical coefficients
α2 and β2 are empirical coefficients
Δh is the difference between the upstream head and spillway crest elevation (Free flow).
Δh is the difference between the upstream head and downstream head (Submerged flow).
α1 was calculated by using the equation for a broad crested weir as described in Equation
12 (Cole and Wells, 2017):
Equation 12: Broad crested weir
𝛼1 = 𝐶𝐷𝐶𝑣
2
3√2𝑔𝑊
where:
CD: A discharge coefficient (0.84 to 1.06)
Cv: A velocity coefficient (1.0 to 1.2)
g: gravitational acceleration
W: channel width
α2 could be calculated from α1 and following the mathematics outlined in the CE-QUAL-
W2 user manual (Cole and Wells, 2017), at a given flow value Q, Equation 10 and
Equation 11 can be combined to solve for α2 as described in Equation 13:
Equation 13:
𝛼2 =𝛼1(𝐻1 − 𝐻𝑤𝑒𝑖𝑟)𝛽1−𝛽2
0.33𝛽2
Assuming an equal value for both β1 and β2, α2 could be rewritten as:
𝛼2 =𝛼1
0.33𝛽2
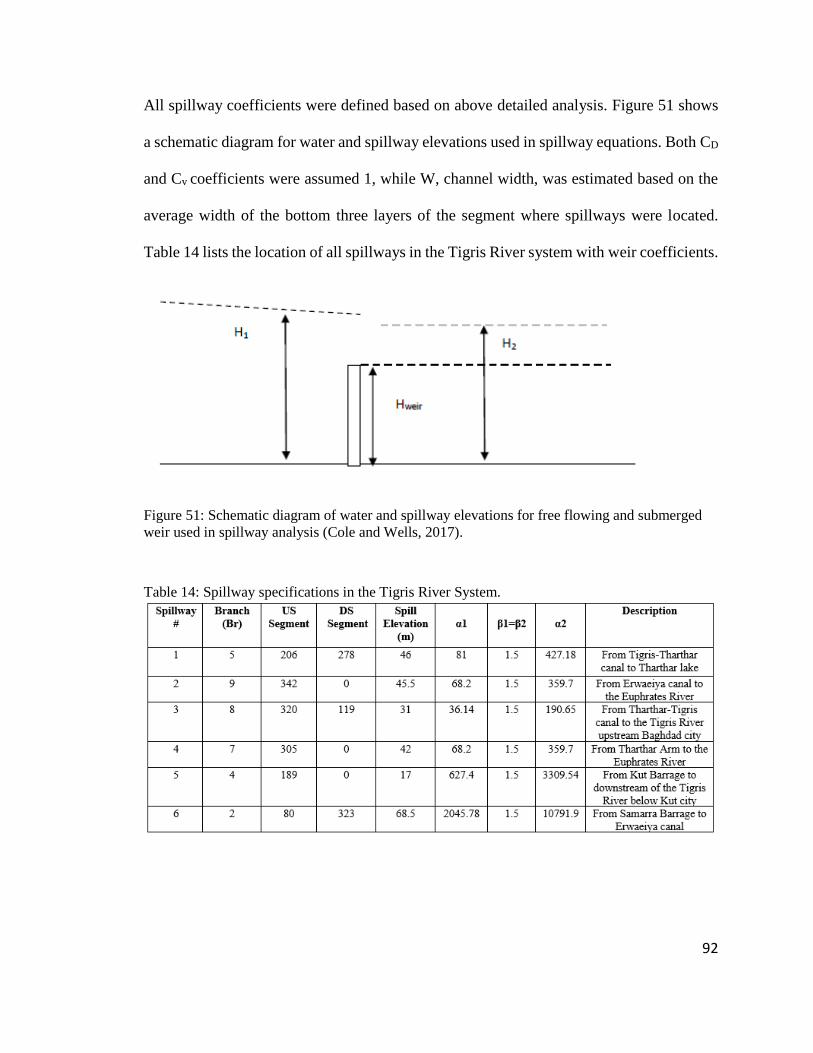
92
All spillway coefficients were defined based on above detailed analysis. Figure 51 shows
a schematic diagram for water and spillway elevations used in spillway equations. Both CD
and Cv coefficients were assumed 1, while W, channel width, was estimated based on the
average width of the bottom three layers of the segment where spillways were located.
Table 14 lists the location of all spillways in the Tigris River system with weir coefficients.
Figure 51: Schematic diagram of water and spillway elevations for free flowing and submerged
weir used in spillway analysis (Cole and Wells, 2017).
Table 14: Spillway specifications in the Tigris River System.
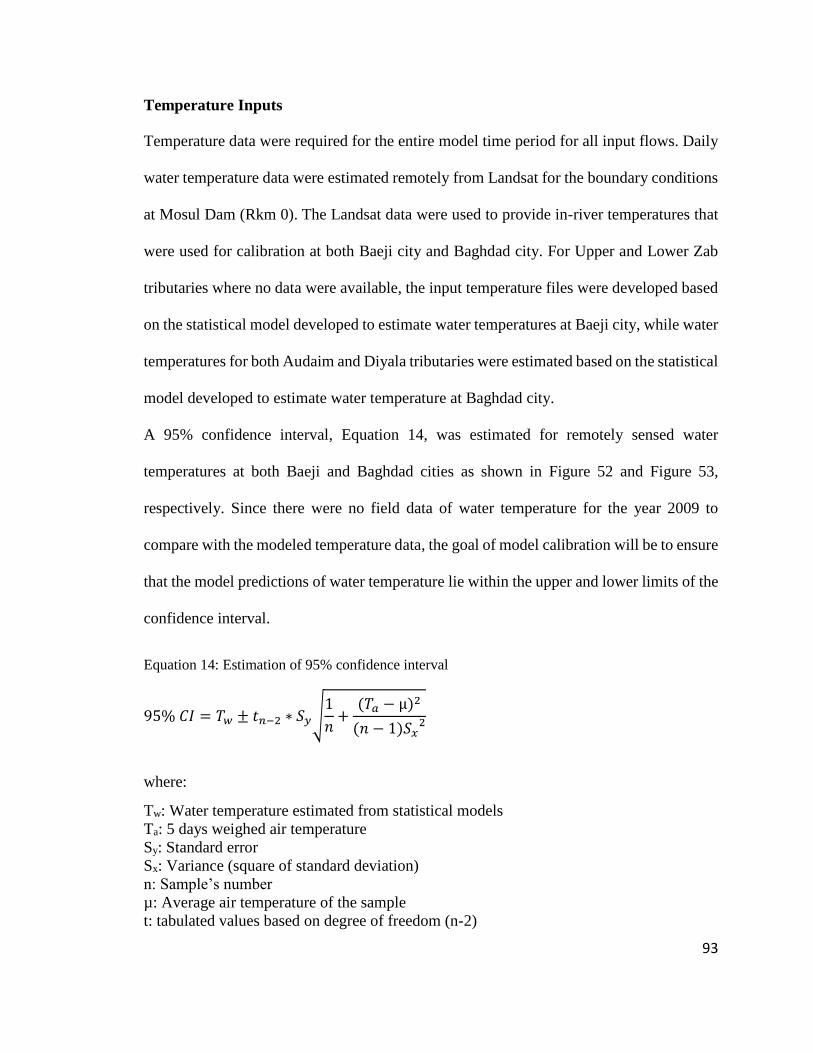
93
Temperature Inputs
Temperature data were required for the entire model time period for all input flows. Daily
water temperature data were estimated remotely from Landsat for the boundary conditions
at Mosul Dam (Rkm 0). The Landsat data were used to provide in-river temperatures that
were used for calibration at both Baeji city and Baghdad city. For Upper and Lower Zab
tributaries where no data were available, the input temperature files were developed based
on the statistical model developed to estimate water temperatures at Baeji city, while water
temperatures for both Audaim and Diyala tributaries were estimated based on the statistical
model developed to estimate water temperature at Baghdad city.
A 95% confidence interval, Equation 14, was estimated for remotely sensed water
temperatures at both Baeji and Baghdad cities as shown in Figure 52 and Figure 53,
respectively. Since there were no field data of water temperature for the year 2009 to
compare with the modeled temperature data, the goal of model calibration will be to ensure
that the model predictions of water temperature lie within the upper and lower limits of the
confidence interval.
Equation 14: Estimation of 95% confidence interval
95% 𝐶𝐼 = 𝑇𝑤 ± 𝑡𝑛−2 ∗ 𝑆𝑦√1
𝑛+
(𝑇𝑎 − µ)2
(𝑛 − 1)𝑆𝑥2
where:
Tw: Water temperature estimated from statistical models
Ta: 5 days weighed air temperature
Sy: Standard error
Sx: Variance (square of standard deviation)
n: Sample’s number
µ: Average air temperature of the sample
t: tabulated values based on degree of freedom (n-2)
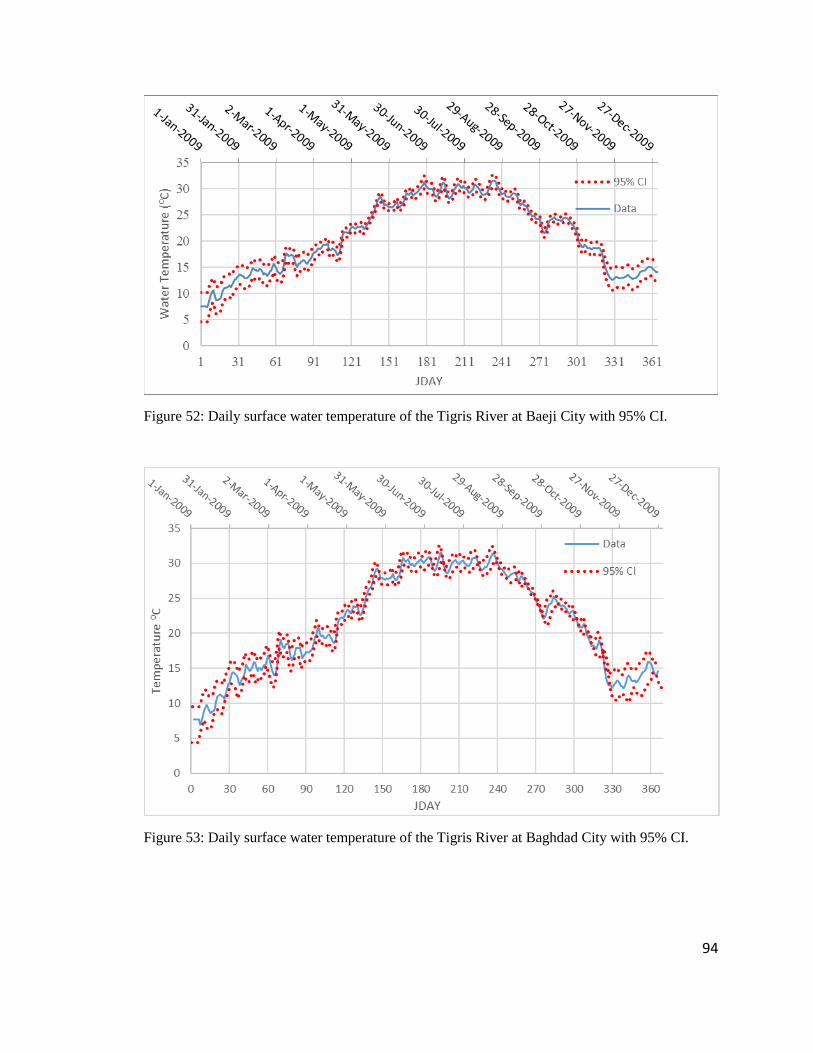
94
Figure 52: Daily surface water temperature of the Tigris River at Baeji City with 95% CI.
Figure 53: Daily surface water temperature of the Tigris River at Baghdad City with 95% CI.
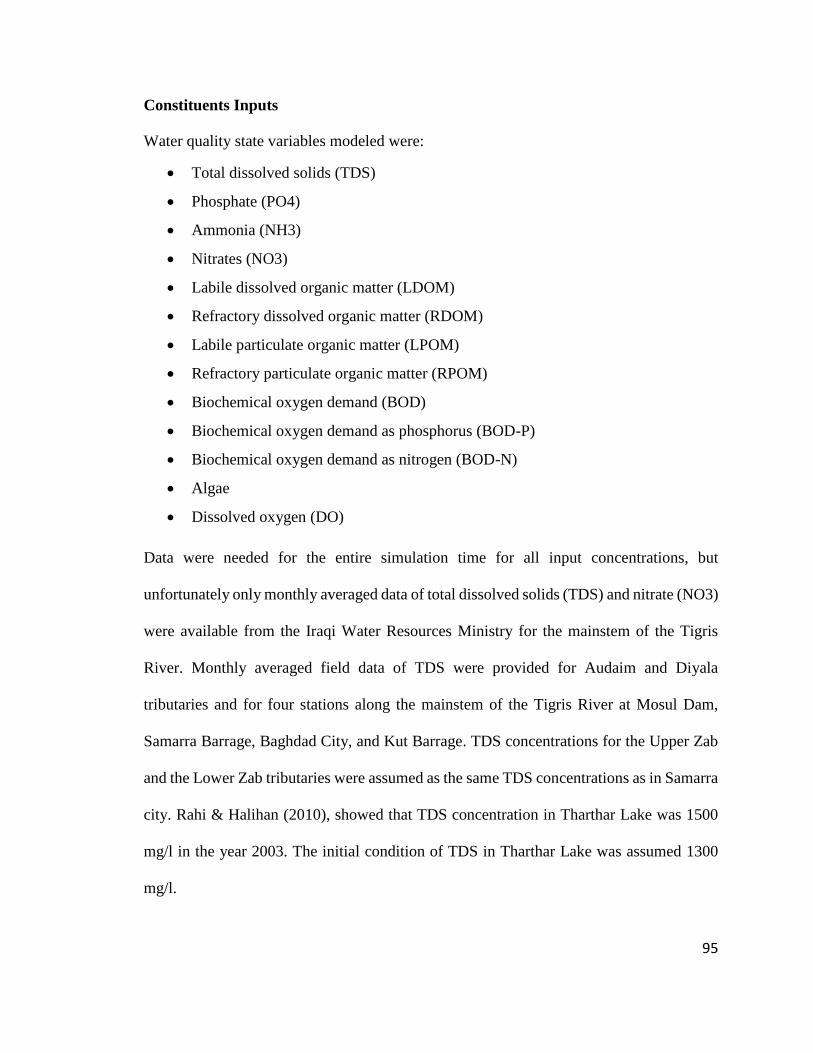
95
Constituents Inputs
Water quality state variables modeled were:
• Total dissolved solids (TDS)
• Phosphate (PO4)
• Ammonia (NH3)
• Nitrates (NO3)
• Labile dissolved organic matter (LDOM)
• Refractory dissolved organic matter (RDOM)
• Labile particulate organic matter (LPOM)
• Refractory particulate organic matter (RPOM)
• Biochemical oxygen demand (BOD)
• Biochemical oxygen demand as phosphorus (BOD-P)
• Biochemical oxygen demand as nitrogen (BOD-N)
• Algae
• Dissolved oxygen (DO)
Data were needed for the entire simulation time for all input concentrations, but
unfortunately only monthly averaged data of total dissolved solids (TDS) and nitrate (NO3)
were available from the Iraqi Water Resources Ministry for the mainstem of the Tigris
River. Monthly averaged field data of TDS were provided for Audaim and Diyala
tributaries and for four stations along the mainstem of the Tigris River at Mosul Dam,
Samarra Barrage, Baghdad City, and Kut Barrage. TDS concentrations for the Upper Zab
and the Lower Zab tributaries were assumed as the same TDS concentrations as in Samarra
city. Rahi & Halihan (2010), showed that TDS concentration in Tharthar Lake was 1500
mg/l in the year 2003. The initial condition of TDS in Tharthar Lake was assumed 1300
mg/l.
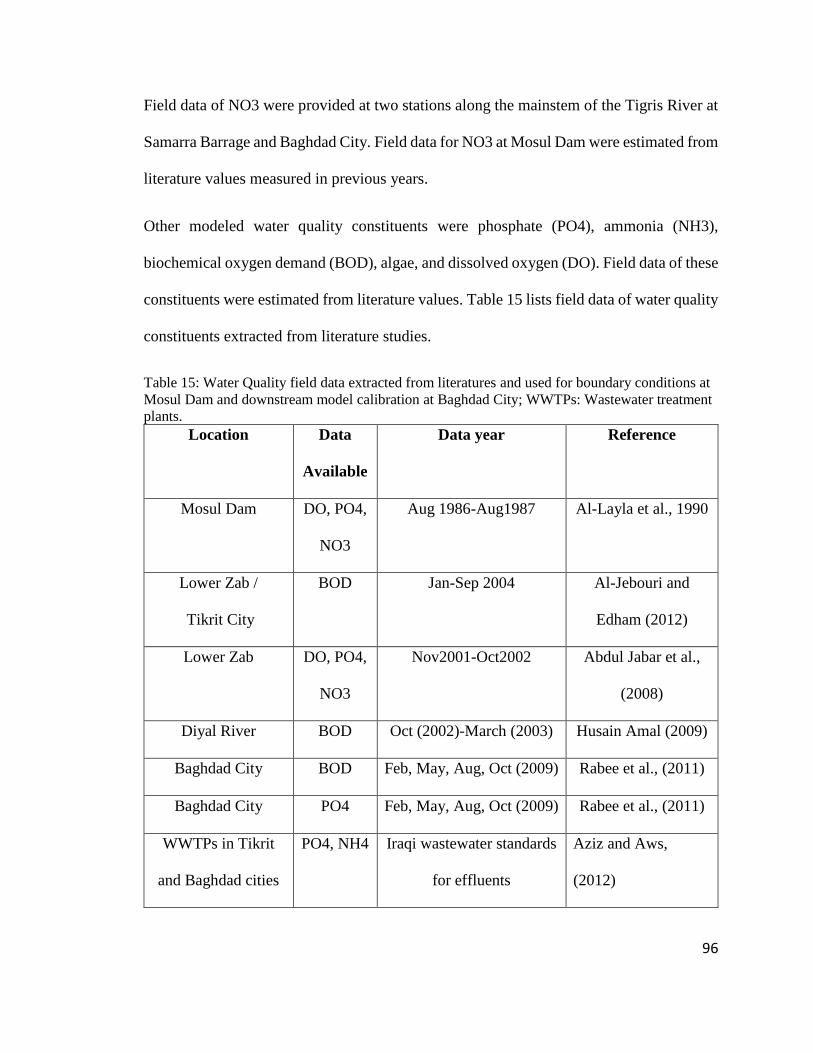
96
Field data of NO3 were provided at two stations along the mainstem of the Tigris River at
Samarra Barrage and Baghdad City. Field data for NO3 at Mosul Dam were estimated from
literature values measured in previous years.
Other modeled water quality constituents were phosphate (PO4), ammonia (NH3),
biochemical oxygen demand (BOD), algae, and dissolved oxygen (DO). Field data of these
constituents were estimated from literature values. Table 15 lists field data of water quality
constituents extracted from literature studies.
Table 15: Water Quality field data extracted from literatures and used for boundary conditions at
Mosul Dam and downstream model calibration at Baghdad City; WWTPs: Wastewater treatment
plants.
Location Data
Available
Data year Reference
Mosul Dam DO, PO4,
NO3
Aug 1986-Aug1987 Al-Layla et al., 1990
Lower Zab /
Tikrit City
BOD Jan-Sep 2004 Al-Jebouri and
Edham (2012)
Lower Zab DO, PO4,
NO3
Nov2001-Oct2002 Abdul Jabar et al.,
(2008)
Diyal River BOD Oct (2002)-March (2003) Husain Amal (2009)
Baghdad City BOD Feb, May, Aug, Oct (2009) Rabee et al., (2011)
Baghdad City PO4 Feb, May, Aug, Oct (2009) Rabee et al., (2011)
WWTPs in Tikrit
and Baghdad cities
PO4, NH4 Iraqi wastewater standards
for effluents
Aziz and Aws,
(2012)
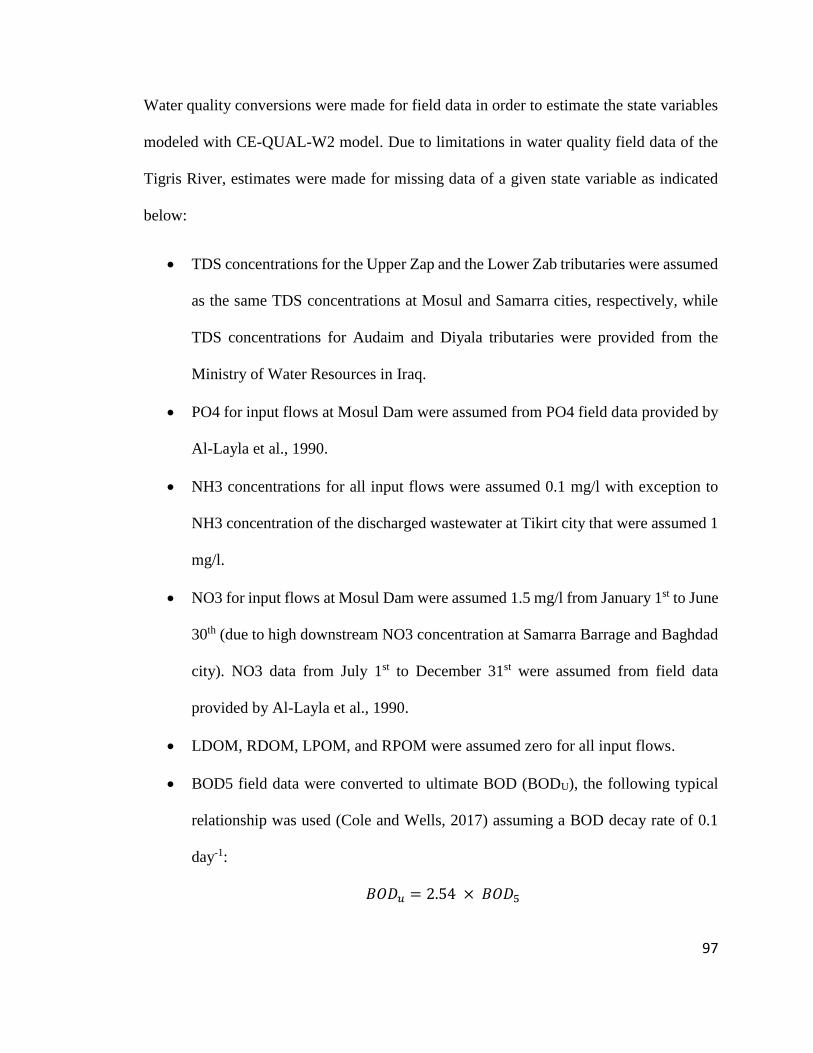
97
Water quality conversions were made for field data in order to estimate the state variables
modeled with CE-QUAL-W2 model. Due to limitations in water quality field data of the
Tigris River, estimates were made for missing data of a given state variable as indicated
below:
• TDS concentrations for the Upper Zap and the Lower Zab tributaries were assumed
as the same TDS concentrations at Mosul and Samarra cities, respectively, while
TDS concentrations for Audaim and Diyala tributaries were provided from the
Ministry of Water Resources in Iraq.
• PO4 for input flows at Mosul Dam were assumed from PO4 field data provided by
Al-Layla et al., 1990.
• NH3 concentrations for all input flows were assumed 0.1 mg/l with exception to
NH3 concentration of the discharged wastewater at Tikirt city that were assumed 1
mg/l.
• NO3 for input flows at Mosul Dam were assumed 1.5 mg/l from January 1st to June
30th (due to high downstream NO3 concentration at Samarra Barrage and Baghdad
city). NO3 data from July 1st to December 31st were assumed from field data
provided by Al-Layla et al., 1990.
• LDOM, RDOM, LPOM, and RPOM were assumed zero for all input flows.
• BOD5 field data were converted to ultimate BOD (BODU), the following typical
relationship was used (Cole and Wells, 2017) assuming a BOD decay rate of 0.1
day-1:
𝐵𝑂𝐷𝑢 = 2.54 × 𝐵𝑂𝐷5
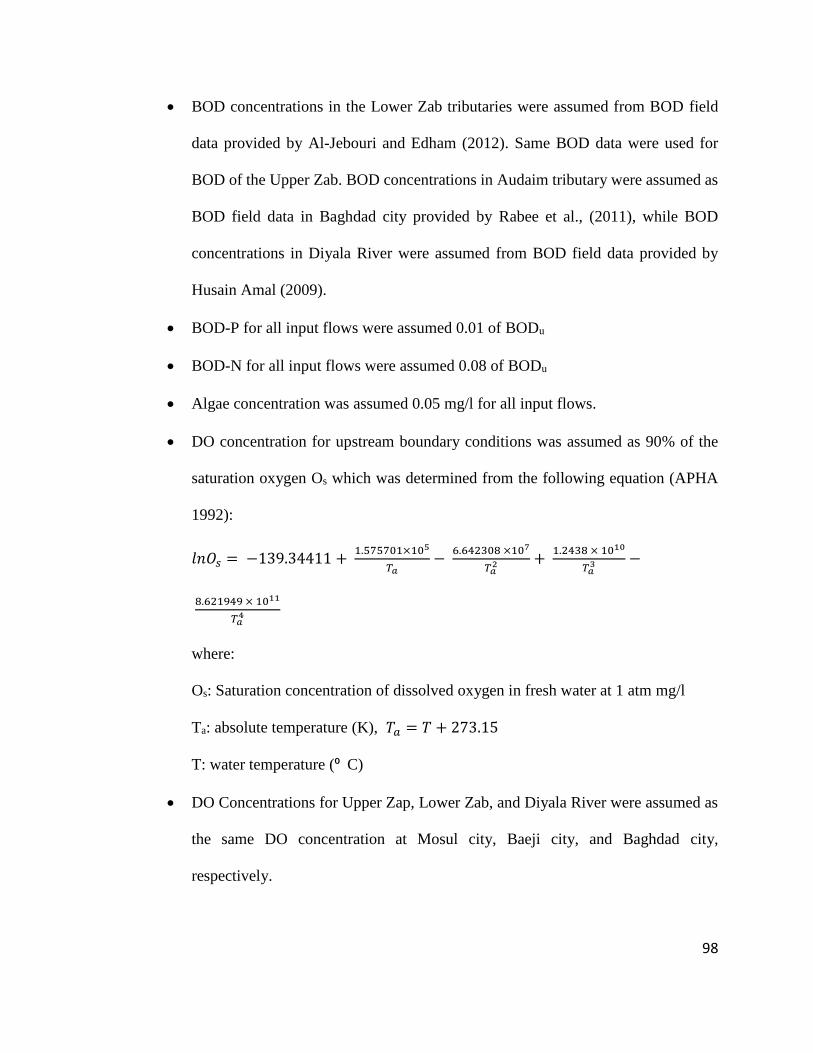
98
• BOD concentrations in the Lower Zab tributaries were assumed from BOD field
data provided by Al-Jebouri and Edham (2012). Same BOD data were used for
BOD of the Upper Zab. BOD concentrations in Audaim tributary were assumed as
BOD field data in Baghdad city provided by Rabee et al., (2011), while BOD
concentrations in Diyala River were assumed from BOD field data provided by
Husain Amal (2009).
• BOD-P for all input flows were assumed 0.01 of BODu
• BOD-N for all input flows were assumed 0.08 of BODu
• Algae concentration was assumed 0.05 mg/l for all input flows.
• DO concentration for upstream boundary conditions was assumed as 90% of the
saturation oxygen Os which was determined from the following equation (APHA
1992):
𝑙𝑛𝑂𝑠 = −139.34411 + 1.575701×10⁵
𝑇𝑎−
6.642308 ×10⁷
𝑇𝑎2 +
1.2438 × 10¹⁰
𝑇𝑎3 −
8.621949 × 10¹¹
𝑇𝑎4
where:
Os: Saturation concentration of dissolved oxygen in fresh water at 1 atm mg/l
Ta: absolute temperature (K), 𝑇𝑎 = 𝑇 + 273.15
T: water temperature (⁰ C)
• DO Concentrations for Upper Zap, Lower Zab, and Diyala River were assumed as
the same DO concentration at Mosul city, Baeji city, and Baghdad city,
respectively.
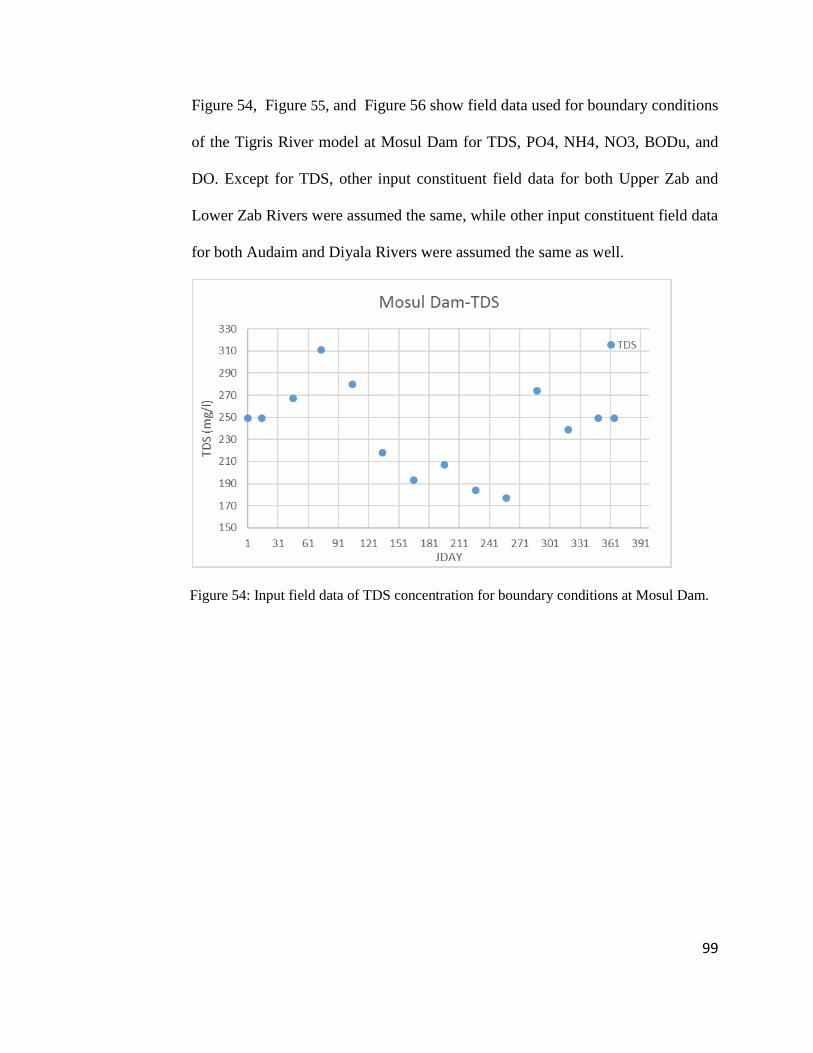
99
Figure 54, Figure 55, and Figure 56 show field data used for boundary conditions
of the Tigris River model at Mosul Dam for TDS, PO4, NH4, NO3, BODu, and
DO. Except for TDS, other input constituent field data for both Upper Zab and
Lower Zab Rivers were assumed the same, while other input constituent field data
for both Audaim and Diyala Rivers were assumed the same as well.
Figure 54: Input field data of TDS concentration for boundary conditions at Mosul Dam.
100
Figure 55: Estimated concentrations of PO4, NH4, and NO3 for boundary conditions at Mosul
Dam.
Figure 56: Estimated BODu and DO concentrations for boundary conditions at Mosul Dam
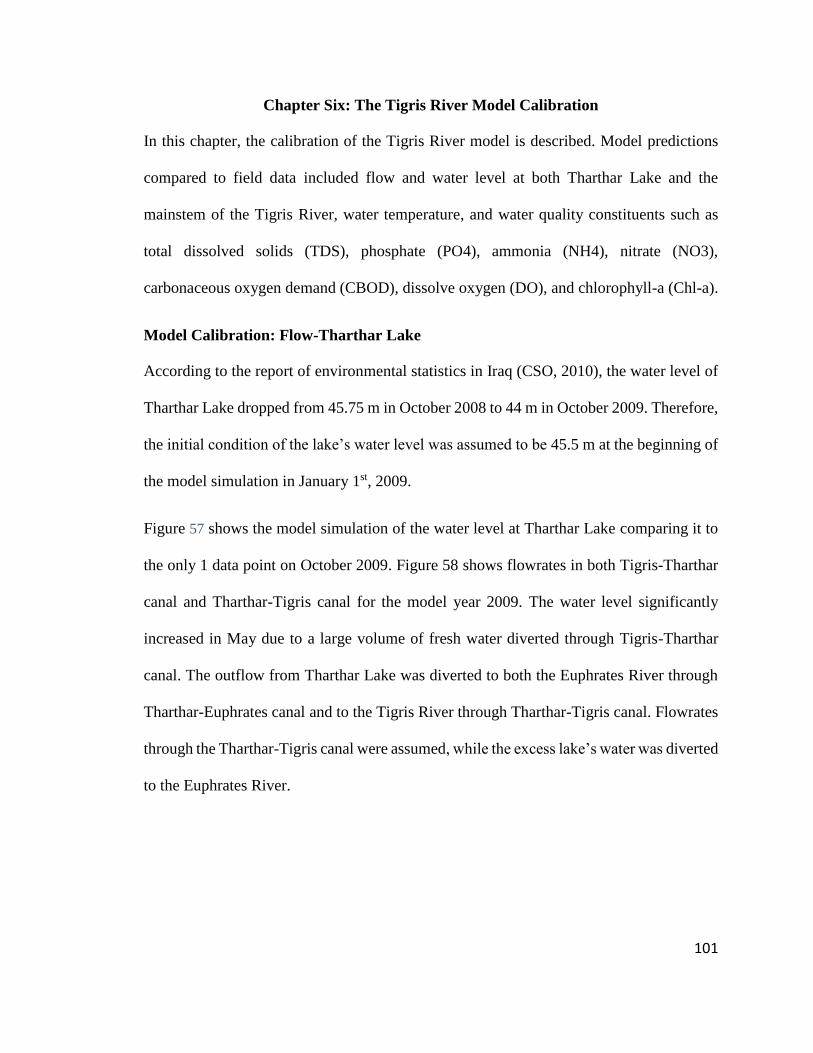
101
Chapter Six: The Tigris River Model Calibration
In this chapter, the calibration of the Tigris River model is described. Model predictions
compared to field data included flow and water level at both Tharthar Lake and the
mainstem of the Tigris River, water temperature, and water quality constituents such as
total dissolved solids (TDS), phosphate (PO4), ammonia (NH4), nitrate (NO3),
carbonaceous oxygen demand (CBOD), dissolve oxygen (DO), and chlorophyll-a (Chl-a).
Model Calibration: Flow-Tharthar Lake
According to the report of environmental statistics in Iraq (CSO, 2010), the water level of
Tharthar Lake dropped from 45.75 m in October 2008 to 44 m in October 2009. Therefore,
the initial condition of the lake’s water level was assumed to be 45.5 m at the beginning of
the model simulation in January 1st, 2009.
Figure 57 shows the model simulation of the water level at Tharthar Lake comparing it to
the only 1 data point on October 2009. Figure 58 shows flowrates in both Tigris-Tharthar
canal and Tharthar-Tigris canal for the model year 2009. The water level significantly
increased in May due to a large volume of fresh water diverted through Tigris-Tharthar
canal. The outflow from Tharthar Lake was diverted to both the Euphrates River through
Tharthar-Euphrates canal and to the Tigris River through Tharthar-Tigris canal. Flowrates
through the Tharthar-Tigris canal were assumed, while the excess lake’s water was diverted
to the Euphrates River.
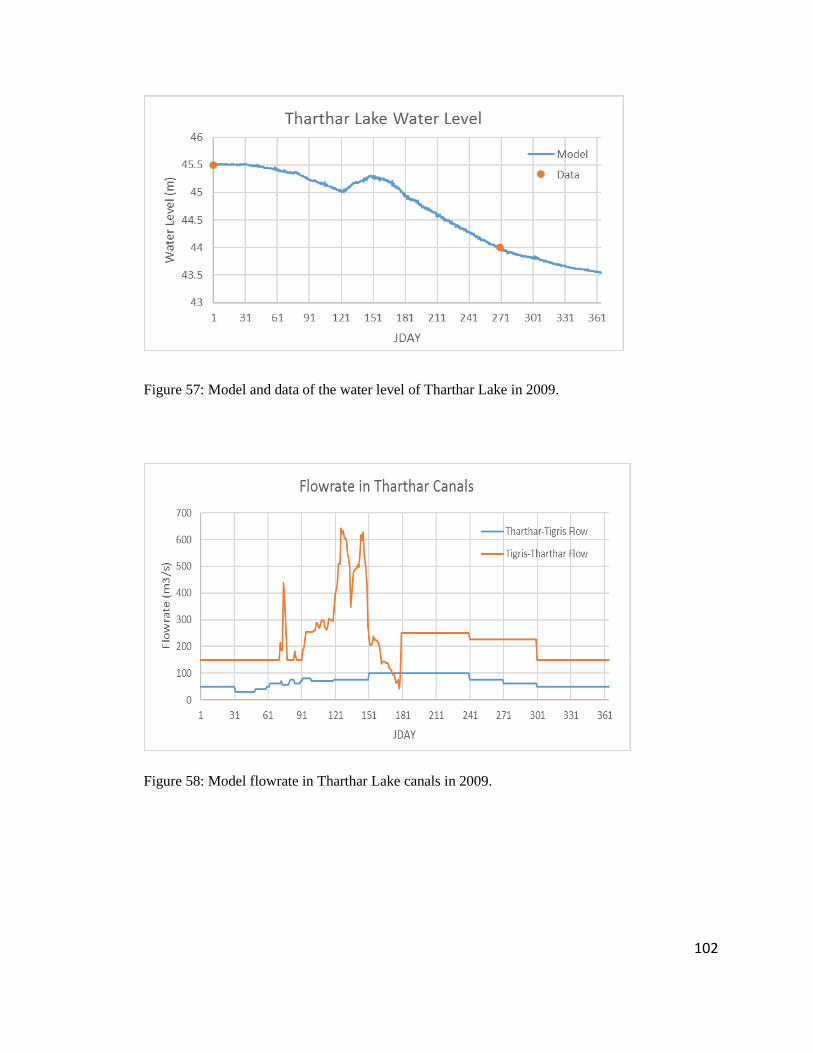
102
Figure 57: Model and data of the water level of Tharthar Lake in 2009.
Figure 58: Model flowrate in Tharthar Lake canals in 2009.
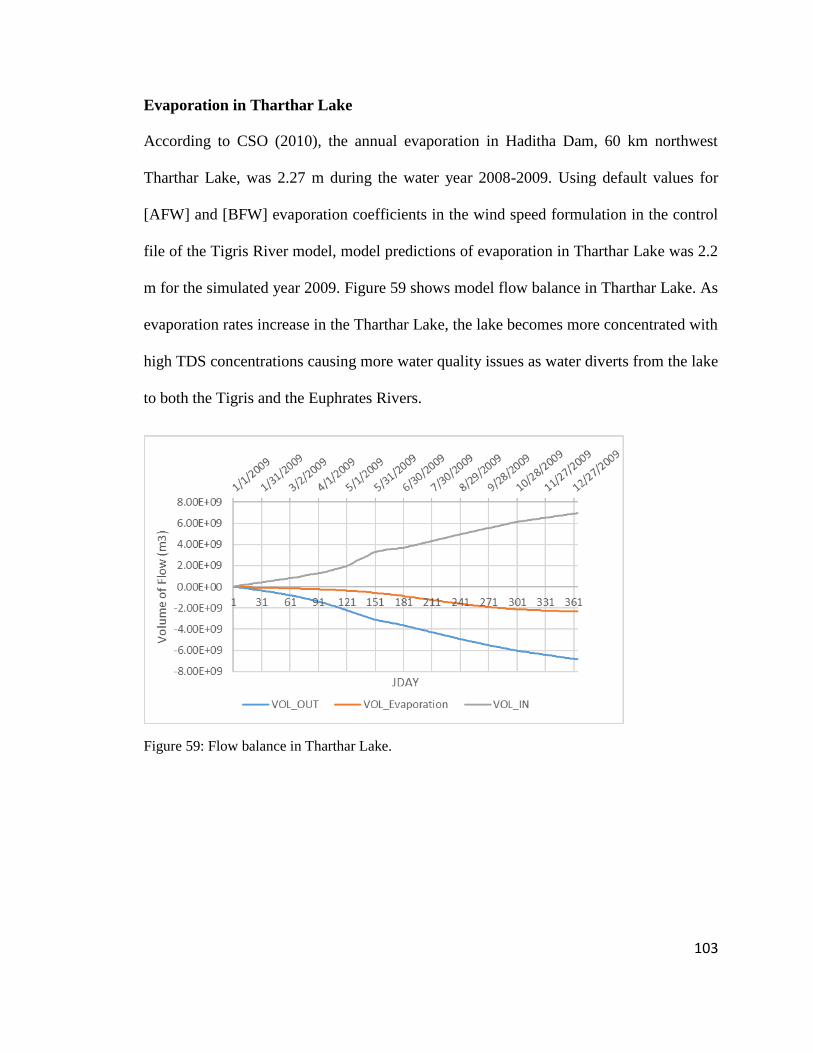
103
Evaporation in Tharthar Lake
According to CSO (2010), the annual evaporation in Haditha Dam, 60 km northwest
Tharthar Lake, was 2.27 m during the water year 2008-2009. Using default values for
[AFW] and [BFW] evaporation coefficients in the wind speed formulation in the control
file of the Tigris River model, model predictions of evaporation in Tharthar Lake was 2.2
m for the simulated year 2009. Figure 59 shows model flow balance in Tharthar Lake. As
evaporation rates increase in the Tharthar Lake, the lake becomes more concentrated with
high TDS concentrations causing more water quality issues as water diverts from the lake
to both the Tigris and the Euphrates Rivers.
Figure 59: Flow balance in Tharthar Lake.
104
Model Calibration: Flow in the Tigris River
The model calibration of flowrate started at the upstream portions of the model and moved
downstream comparing model predictions of flow and water level to field data of flow and
water level along the mainstem of the Tigris River. Field data were provided by the Iraqi
Ministry of Water Resources and were used for model-data comparisons during the model
simulation year 2009. Calibration of flow and water level were done at Baeji city, Samarra
Barrage, and Baghdad city. Flow calibration process is based on adding or subtracting flow
through a distributed tributary. A distributed tributary accounts for ungaged inflows during
storm events or outflow from the system such as numerous ungaged irrigation withdrawals
along the river banks. This is done through multiple iterations until model predicted flows
agree with field data. Figure 60 through Figure 65 show comparisons of model predictions
and field data for flowrate and water level at Baeji city, Samarra Barrage, and Baghdad
city, respectively.
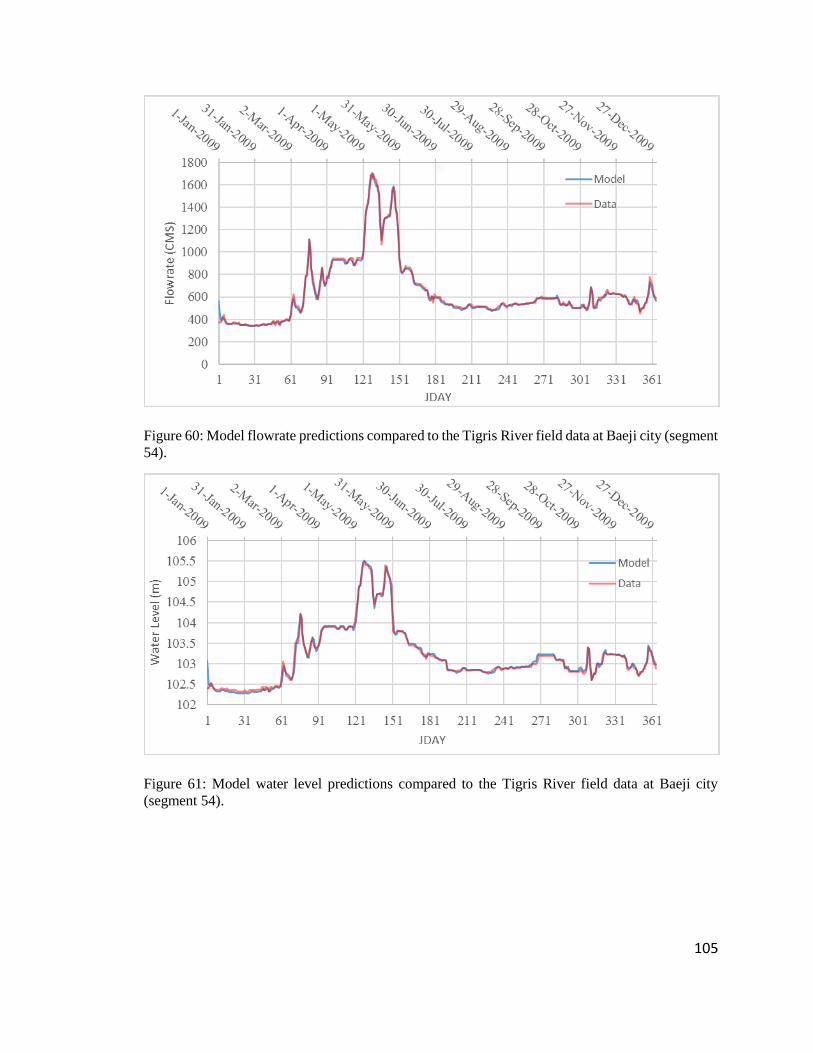
105
Figure 60: Model flowrate predictions compared to the Tigris River field data at Baeji city (segment
54).
Figure 61: Model water level predictions compared to the Tigris River field data at Baeji city
(segment 54).
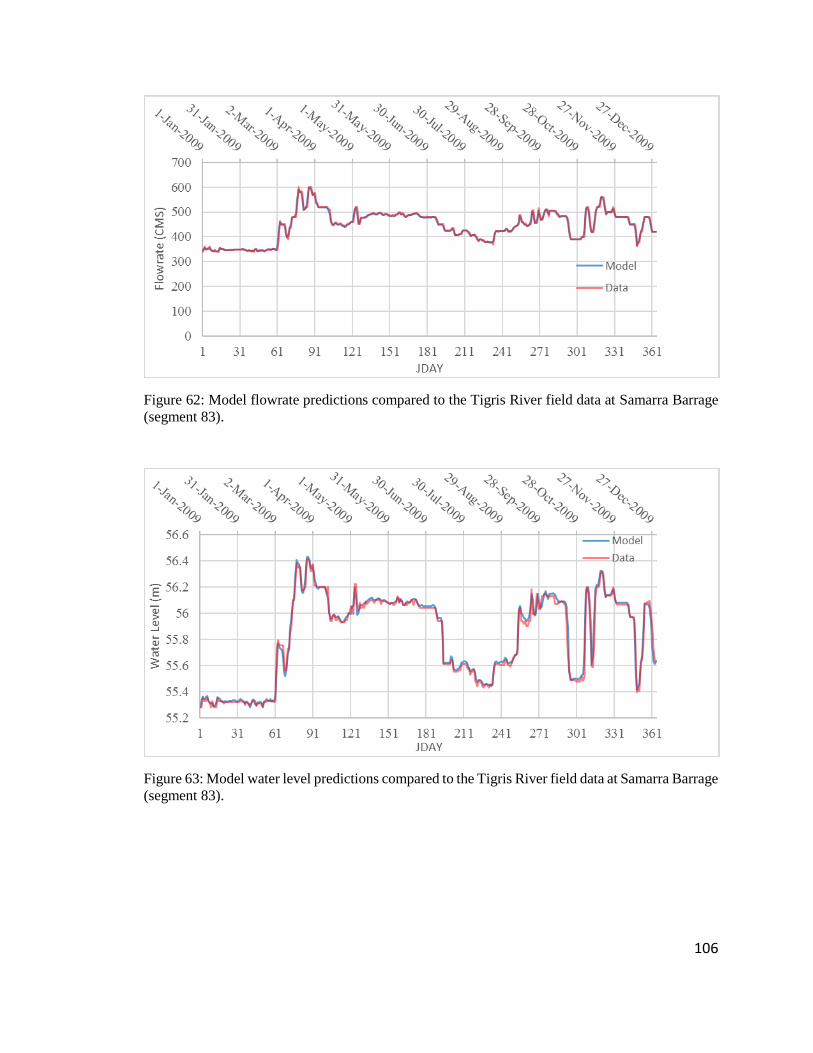
106
Figure 62: Model flowrate predictions compared to the Tigris River field data at Samarra Barrage
(segment 83).
Figure 63: Model water level predictions compared to the Tigris River field data at Samarra Barrage
(segment 83).
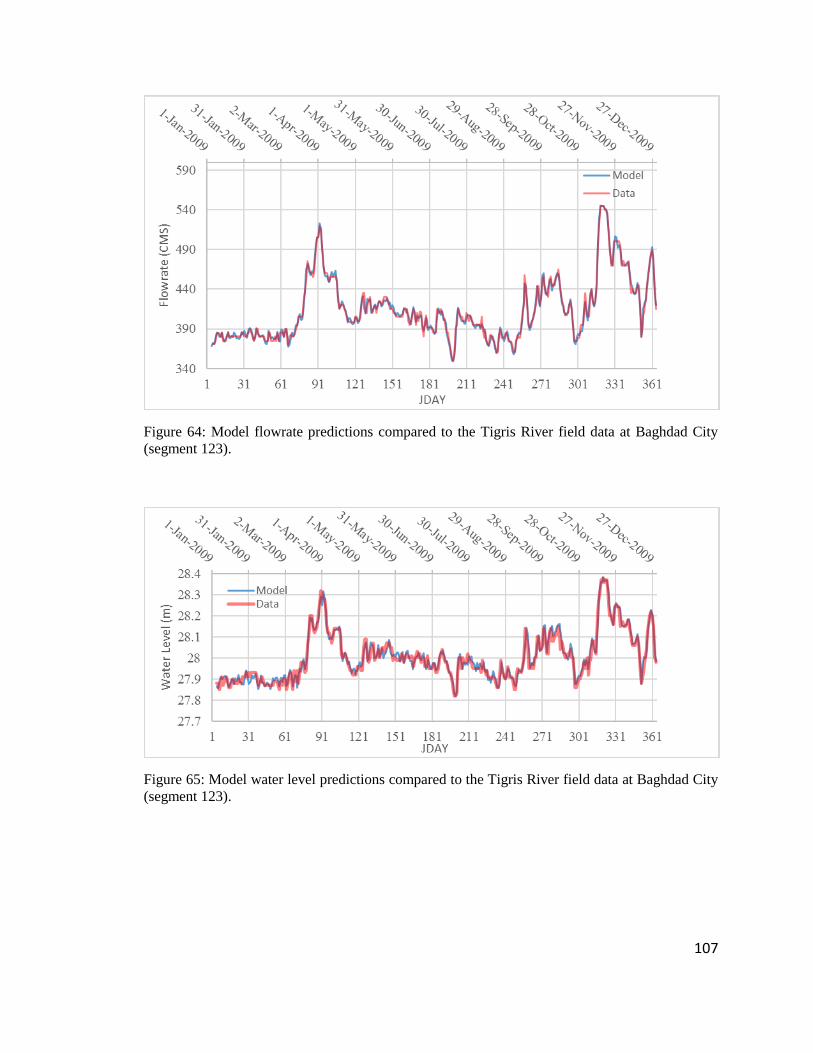
107
Figure 64: Model flowrate predictions compared to the Tigris River field data at Baghdad City
(segment 123).
Figure 65: Model water level predictions compared to the Tigris River field data at Baghdad City
(segment 123).
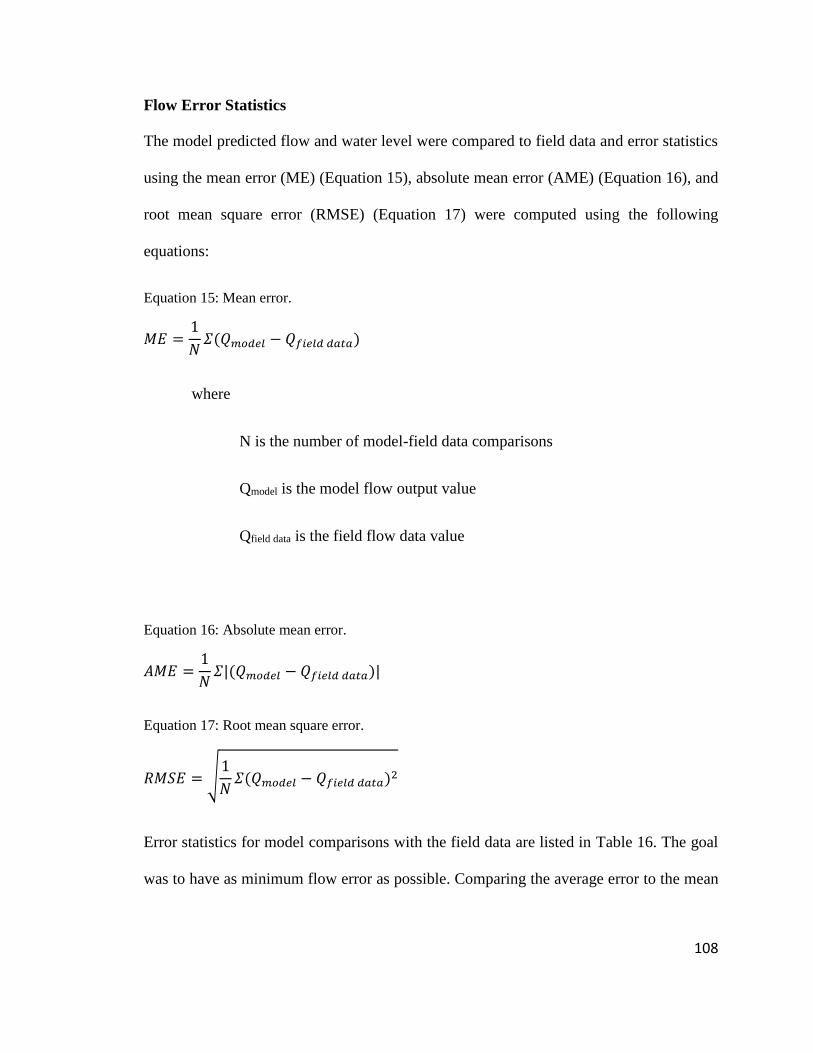
108
Flow Error Statistics
The model predicted flow and water level were compared to field data and error statistics
using the mean error (ME) (Equation 15), absolute mean error (AME) (Equation 16), and
root mean square error (RMSE) (Equation 17) were computed using the following
equations:
Equation 15: Mean error.
𝑀𝐸 =1
𝑁𝛴(𝑄𝑚𝑜𝑑𝑒𝑙 − 𝑄𝑓𝑖𝑒𝑙𝑑 𝑑𝑎𝑡𝑎)
where
N is the number of model-field data comparisons
Qmodel is the model flow output value
Qfield data is the field flow data value
Equation 16: Absolute mean error.
𝐴𝑀𝐸 =1
𝑁𝛴|(𝑄𝑚𝑜𝑑𝑒𝑙 − 𝑄𝑓𝑖𝑒𝑙𝑑 𝑑𝑎𝑡𝑎)|
Equation 17: Root mean square error.
𝑅𝑀𝑆𝐸 = √1
𝑁𝛴(𝑄𝑚𝑜𝑑𝑒𝑙 − 𝑄𝑓𝑖𝑒𝑙𝑑 𝑑𝑎𝑡𝑎)2
Error statistics for model comparisons with the field data are listed in Table 16. The goal
was to have as minimum flow error as possible. Comparing the average error to the mean
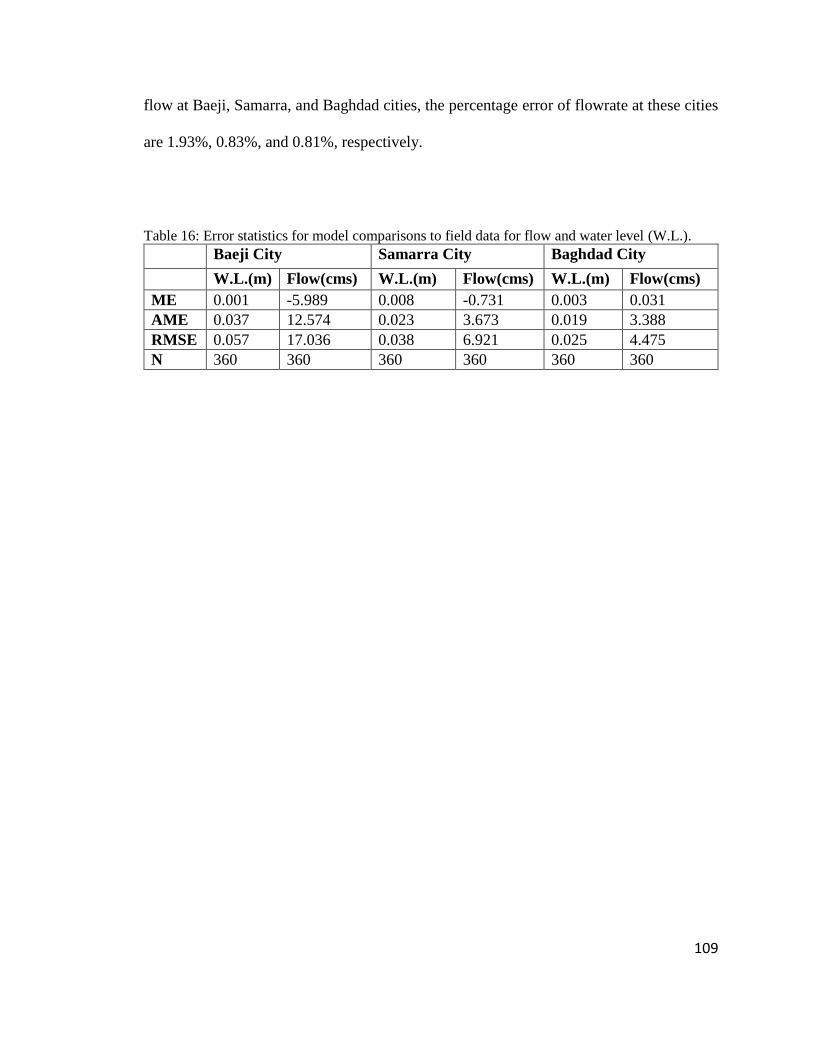
109
flow at Baeji, Samarra, and Baghdad cities, the percentage error of flowrate at these cities
are 1.93%, 0.83%, and 0.81%, respectively.
Table 16: Error statistics for model comparisons to field data for flow and water level (W.L.). Baeji City Samarra City Baghdad City
W.L.(m) Flow(cms) W.L.(m) Flow(cms) W.L.(m) Flow(cms)
ME 0.001 -5.989 0.008 -0.731 0.003 0.031
AME 0.037 12.574 0.023 3.673 0.019 3.388
RMSE 0.057 17.036 0.038 6.921 0.025 4.475
N 360 360 360 360 360 360
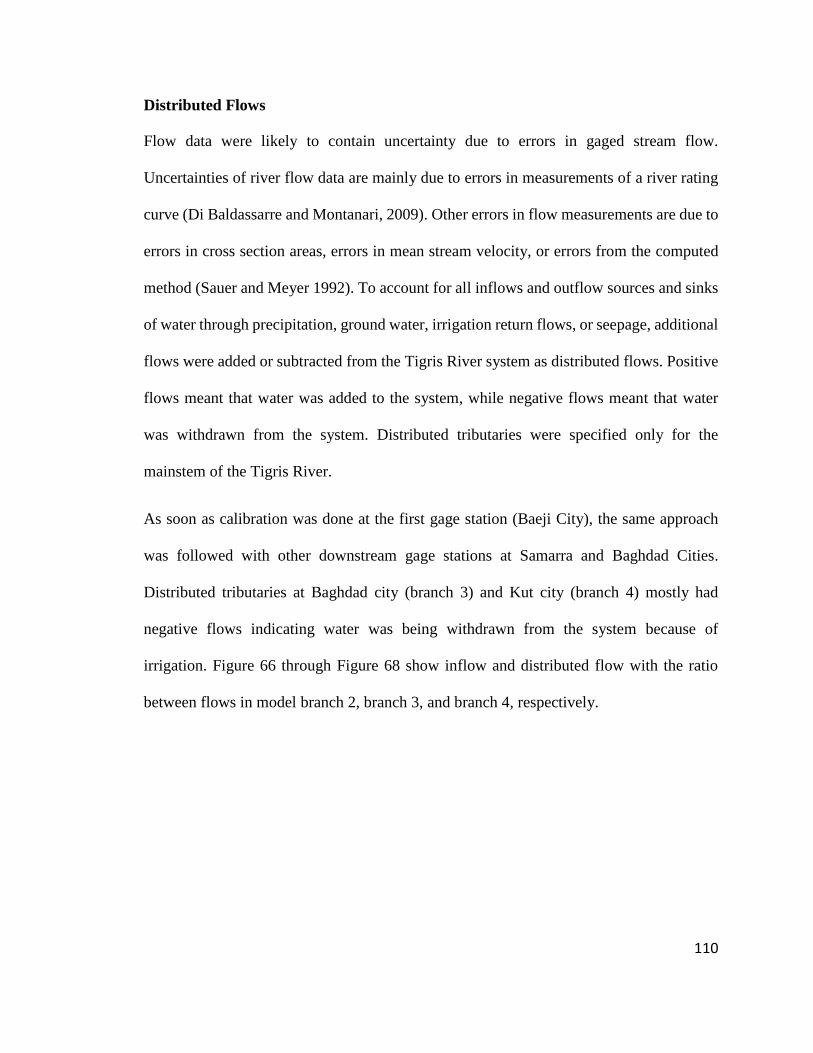
110
Distributed Flows
Flow data were likely to contain uncertainty due to errors in gaged stream flow.
Uncertainties of river flow data are mainly due to errors in measurements of a river rating
curve (Di Baldassarre and Montanari, 2009). Other errors in flow measurements are due to
errors in cross section areas, errors in mean stream velocity, or errors from the computed
method (Sauer and Meyer 1992). To account for all inflows and outflow sources and sinks
of water through precipitation, ground water, irrigation return flows, or seepage, additional
flows were added or subtracted from the Tigris River system as distributed flows. Positive
flows meant that water was added to the system, while negative flows meant that water
was withdrawn from the system. Distributed tributaries were specified only for the
mainstem of the Tigris River.
As soon as calibration was done at the first gage station (Baeji City), the same approach
was followed with other downstream gage stations at Samarra and Baghdad Cities.
Distributed tributaries at Baghdad city (branch 3) and Kut city (branch 4) mostly had
negative flows indicating water was being withdrawn from the system because of
irrigation. Figure 66 through Figure 68 show inflow and distributed flow with the ratio
between flows in model branch 2, branch 3, and branch 4, respectively.
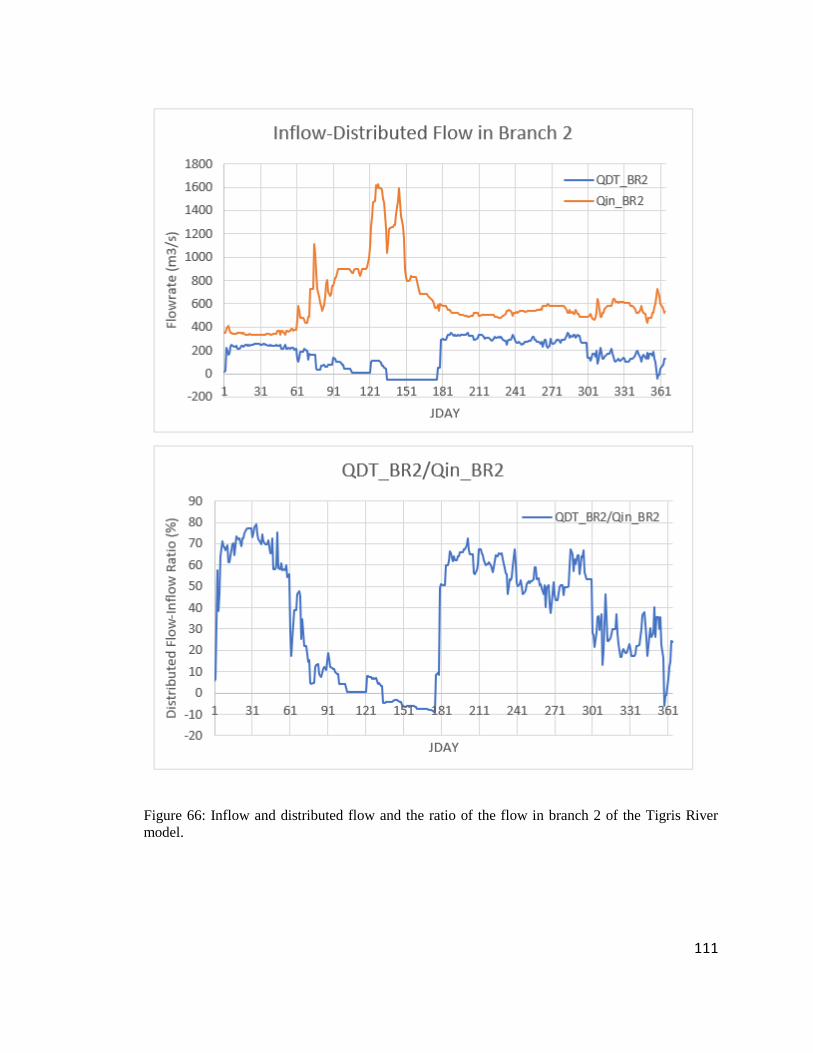
111
Figure 66: Inflow and distributed flow and the ratio of the flow in branch 2 of the Tigris River
model.
112
Figure 67: Inflow and distributed flow and the ratio of the flow in branch 2 of the Tigris River
model.
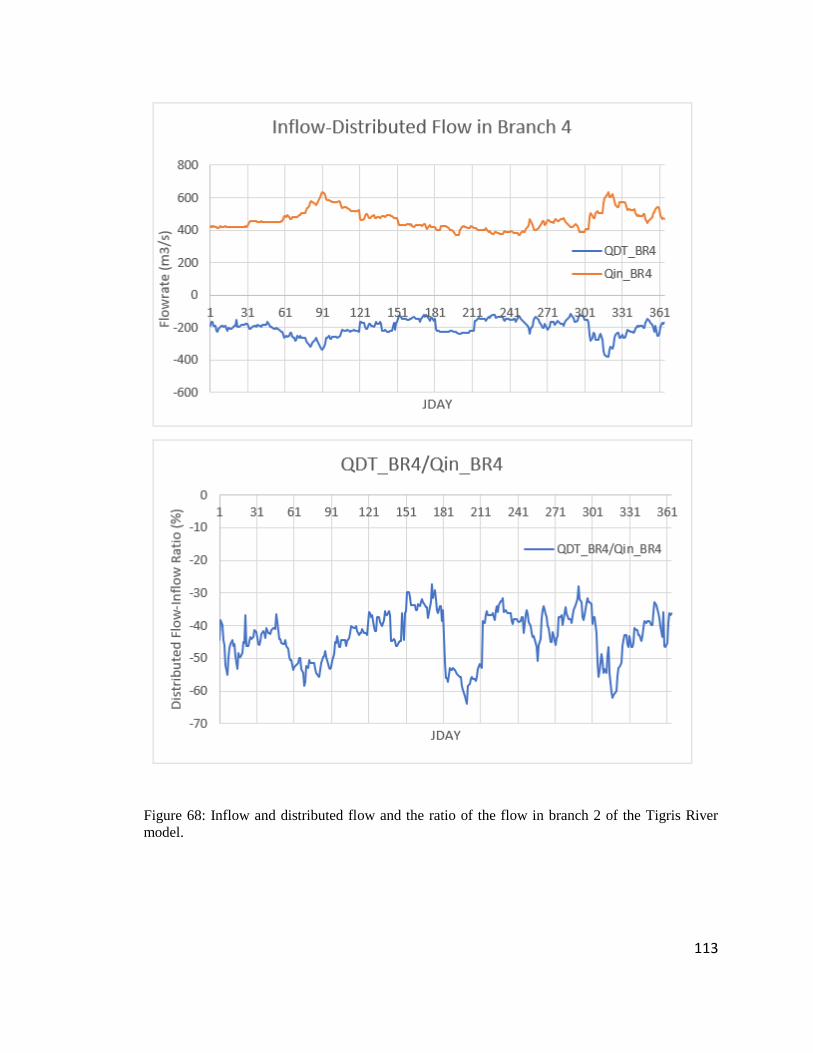
113
Figure 68: Inflow and distributed flow and the ratio of the flow in branch 2 of the Tigris River
model.
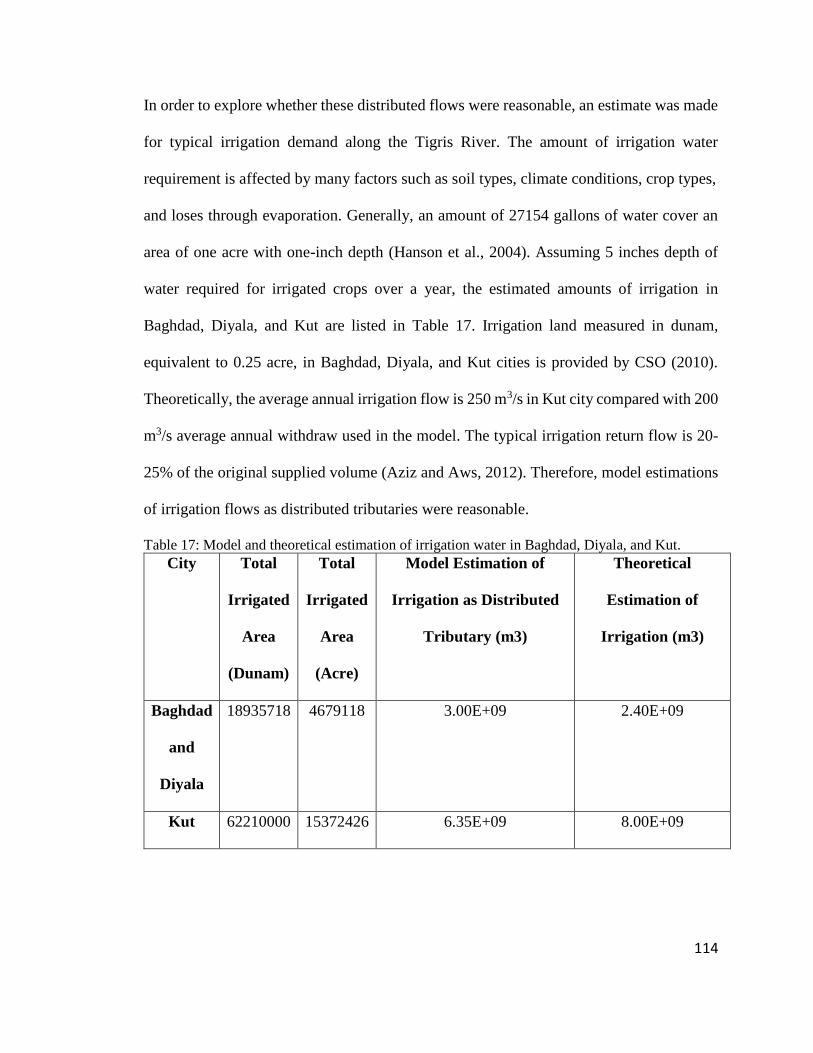
114
In order to explore whether these distributed flows were reasonable, an estimate was made
for typical irrigation demand along the Tigris River. The amount of irrigation water
requirement is affected by many factors such as soil types, climate conditions, crop types,
and loses through evaporation. Generally, an amount of 27154 gallons of water cover an
area of one acre with one-inch depth (Hanson et al., 2004). Assuming 5 inches depth of
water required for irrigated crops over a year, the estimated amounts of irrigation in
Baghdad, Diyala, and Kut are listed in Table 17. Irrigation land measured in dunam,
equivalent to 0.25 acre, in Baghdad, Diyala, and Kut cities is provided by CSO (2010).
Theoretically, the average annual irrigation flow is 250 m3/s in Kut city compared with 200
m3/s average annual withdraw used in the model. The typical irrigation return flow is 20-
25% of the original supplied volume (Aziz and Aws, 2012). Therefore, model estimations
of irrigation flows as distributed tributaries were reasonable.
Table 17: Model and theoretical estimation of irrigation water in Baghdad, Diyala, and Kut.
City Total
Irrigated
Area
(Dunam)
Total
Irrigated
Area
(Acre)
Model Estimation of
Irrigation as Distributed
Tributary (m3)
Theoretical
Estimation of
Irrigation (m3)
Baghdad
and
Diyala
18935718 4679118 3.00E+09 2.40E+09
Kut 62210000 15372426 6.35E+09 8.00E+09
115
Model Adjustments
Bathymetry was a crucial factor in flow calibration. Specifying the model grid properly
includes describing the channel friction and slope, segment widths and depths.
Channel Friction and Slope
Water depths could be adjusted by altering Manning’s coefficient. Decreasing Manning’s
coefficients cause the water to move more quickly in the system, while increasing
Manning’s coefficients slow the water in the system. Altering Manning’s friction helped
in matching water level to field data. According to Othman and Deguan (2004), 74% of
the Tigris River bed within Mosul city was very coarse gravel. The bed of the Tigris River
within Baghdad city is mainly covered by sand (Al-Ansari et al., 2015; Ali et al., 2012).
Chow (1959) reported a minimum Manning’s coefficient of 0.025 for natural streams that
are clean with no deep pools and maximum Manning’s coefficient of 0.05 for natural
streams with sluggish reaches, while a maximum Manning’s coefficient of 0.011 for
constructed channels with concrete. Small concrete fragments remained in the Tigris River
bed within Baghdad city after falling fom three major bridges, Al-Mu’alaq Bridge, Sarafia
Bridge, and Jumhuriya Bridge, due to a considerable damage during the wars of 1991 and
2003. Bridge piers are obstacles to stream flows and cause backwater and consequently
cause an effective increase in Manning’s coefficient (Charbeneau and Holley 2001). Five
bridges were constructed on the Tigris River within Mosul city, Figure 69, while 13 bridges
were constructed on the Tigris River within Baghdad city, Figure 70. These can cause an
increase in the channel friction. In this study, Manning’s coefficient of the river within
Mosul city to Samarra Barrage was 0.025, while Manning’s coefficient of the river within
Bagdad city was increased to 0.05. High Manning’s friction in the Tigris River within
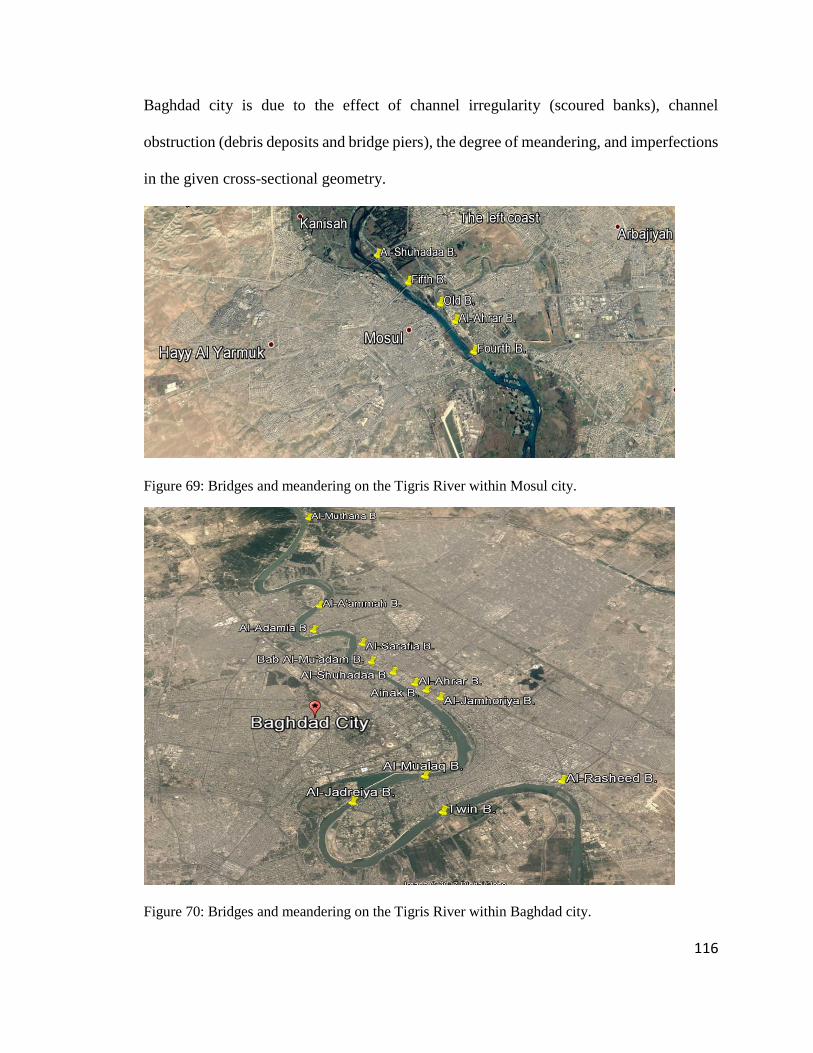
116
Baghdad city is due to the effect of channel irregularity (scoured banks), channel
obstruction (debris deposits and bridge piers), the degree of meandering, and imperfections
in the given cross-sectional geometry.
Figure 69: Bridges and meandering on the Tigris River within Mosul city.
Figure 70: Bridges and meandering on the Tigris River within Baghdad city.

117
In the W2 model, each branch had a channel slope. This was the general slope of each
branch and the included segments. However, the channel slope may not accurately capture
the hydraulic gradient slope due to real channel characteristics, such as falls, riffles, or
other features (Cole and Wells, 2017). Due to this reason, a separate variable, SLOPEC in
the model control file, was specified for each branch and represented the hydraulic
equivalent slope. This variable was used to calculate fluid acceleration in the momentum
equations (Cole and Wells, 2017). In the Tigris River model, SLOPEC was assumed as the
same as the actual channel slope. According to Al-Obaidy (1996), the slope of the Tigris
River below Mosul city in the region between the Upper and the Lower Zabs is 0.000544.
Table 18 lists Manning’s coefficients and slopes used in the model.
Table 18: Manning’s coefficients and slopes used in the Tigris River model
Model Branch
Manning's Coefficients
Slope Details
1 0.025 0.00054 From Mosul Dam to 15 km DS Tikrit city
2 0.025 0 Samarra Barrage
3 0.05 0.000154 From Samarra B. to 70 km DS Baghdad city
4 0.05 0 Kut Barrage
5 0.011 0.00012 Tigris-Tharthar Canal
6 0.011 0 Tharthar Lake
7 0.011 0.00011 Tharthar Arm
8 0.011 0.0002 Tharthar-Tigris Canal
9 0.011 0.0001 Erwaeiya Canal
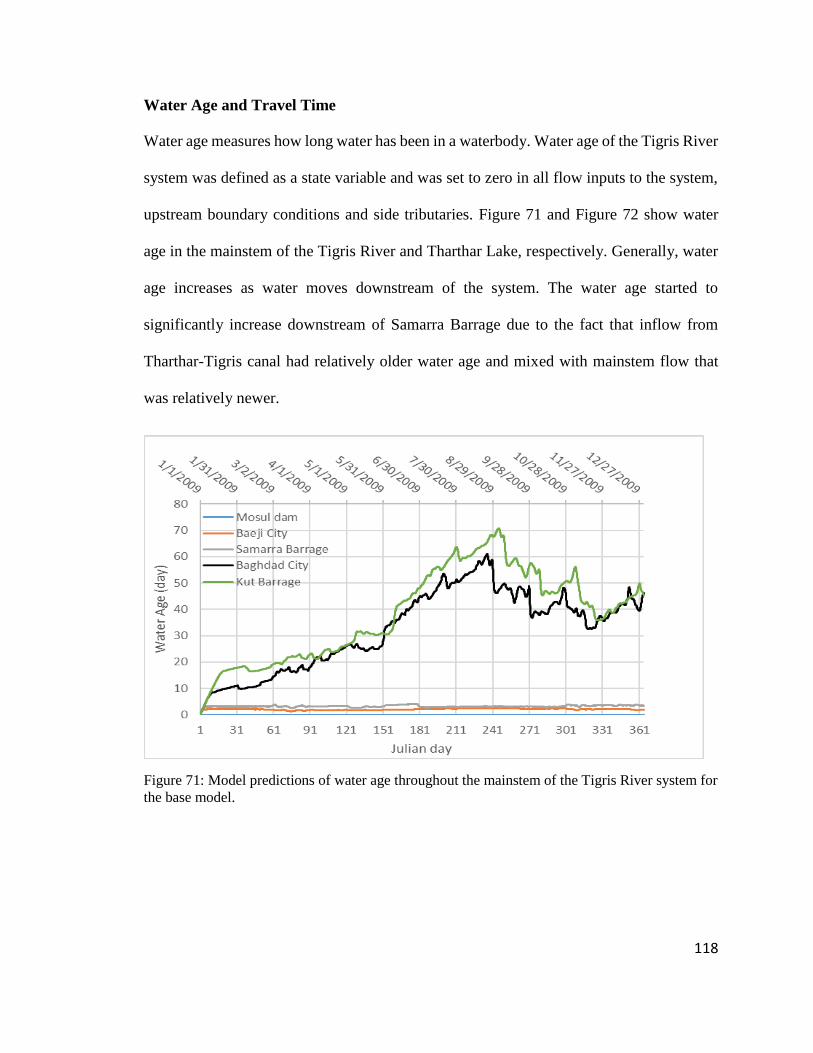
118
Water Age and Travel Time
Water age measures how long water has been in a waterbody. Water age of the Tigris River
system was defined as a state variable and was set to zero in all flow inputs to the system,
upstream boundary conditions and side tributaries. Figure 71 and Figure 72 show water
age in the mainstem of the Tigris River and Tharthar Lake, respectively. Generally, water
age increases as water moves downstream of the system. The water age started to
significantly increase downstream of Samarra Barrage due to the fact that inflow from
Tharthar-Tigris canal had relatively older water age and mixed with mainstem flow that
was relatively newer.
Figure 71: Model predictions of water age throughout the mainstem of the Tigris River system for
the base model.
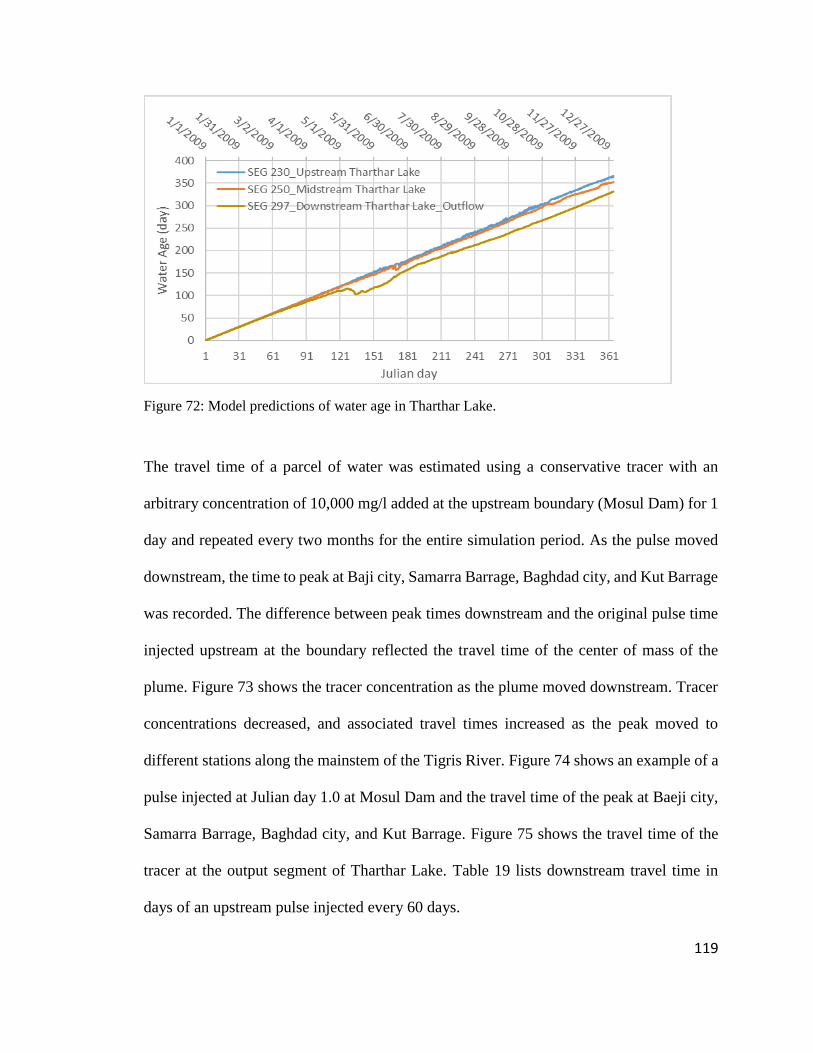
119
Figure 72: Model predictions of water age in Tharthar Lake.
The travel time of a parcel of water was estimated using a conservative tracer with an
arbitrary concentration of 10,000 mg/l added at the upstream boundary (Mosul Dam) for 1
day and repeated every two months for the entire simulation period. As the pulse moved
downstream, the time to peak at Baji city, Samarra Barrage, Baghdad city, and Kut Barrage
was recorded. The difference between peak times downstream and the original pulse time
injected upstream at the boundary reflected the travel time of the center of mass of the
plume. Figure 73 shows the tracer concentration as the plume moved downstream. Tracer
concentrations decreased, and associated travel times increased as the peak moved to
different stations along the mainstem of the Tigris River. Figure 74 shows an example of a
pulse injected at Julian day 1.0 at Mosul Dam and the travel time of the peak at Baeji city,
Samarra Barrage, Baghdad city, and Kut Barrage. Figure 75 shows the travel time of the
tracer at the output segment of Tharthar Lake. Table 19 lists downstream travel time in
days of an upstream pulse injected every 60 days.
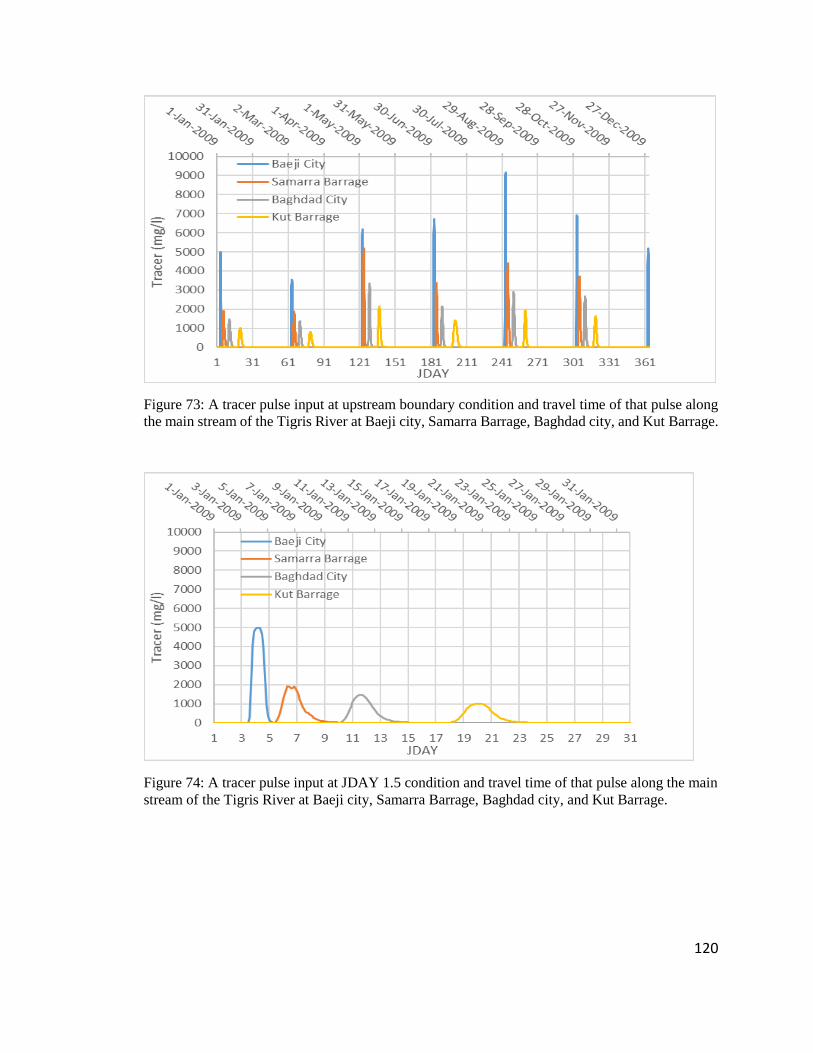
120
Figure 73: A tracer pulse input at upstream boundary condition and travel time of that pulse along
the main stream of the Tigris River at Baeji city, Samarra Barrage, Baghdad city, and Kut Barrage.
Figure 74: A tracer pulse input at JDAY 1.5 condition and travel time of that pulse along the main
stream of the Tigris River at Baeji city, Samarra Barrage, Baghdad city, and Kut Barrage.
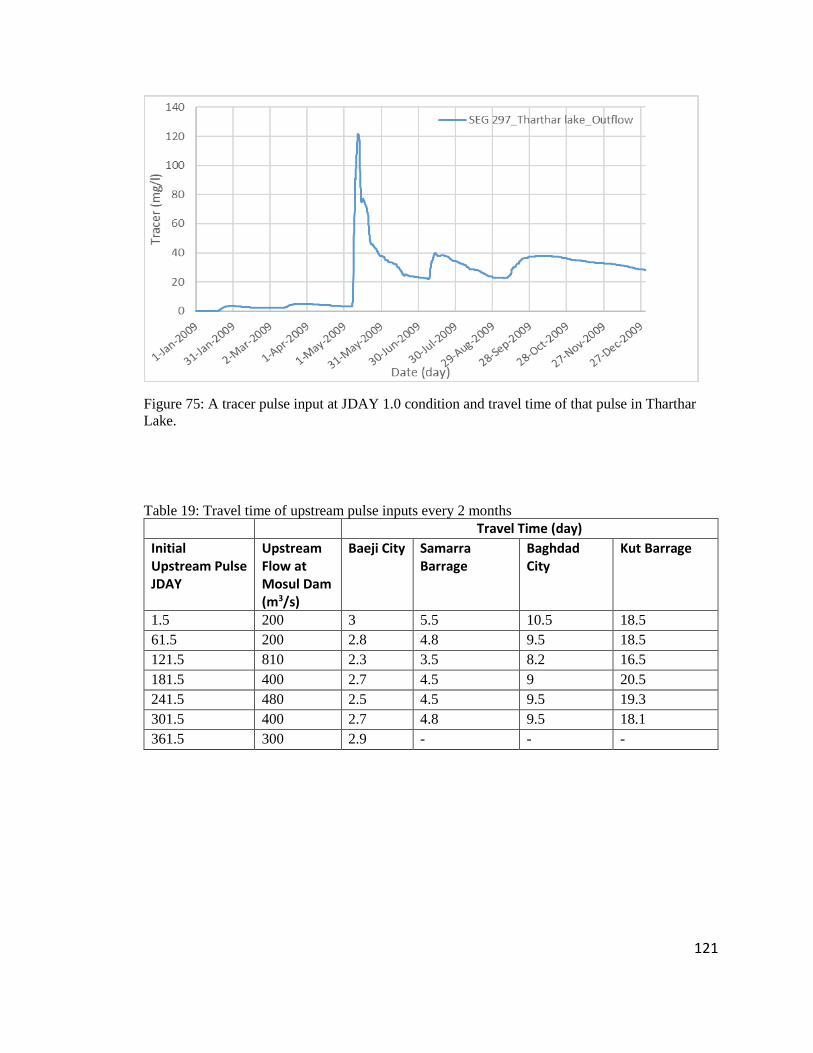
121
Figure 75: A tracer pulse input at JDAY 1.0 condition and travel time of that pulse in Tharthar
Lake.
Table 19: Travel time of upstream pulse inputs every 2 months Travel Time (day)
Initial Upstream Pulse JDAY
Upstream Flow at Mosul Dam (m3/s)
Baeji City Samarra Barrage
Baghdad City
Kut Barrage
1.5 200 3 5.5 10.5 18.5
61.5 200 2.8 4.8 9.5 18.5
121.5 810 2.3 3.5 8.2 16.5
181.5 400 2.7 4.5 9 20.5
241.5 480 2.5 4.5 9.5 19.3
301.5 400 2.7 4.8 9.5 18.1
361.5 300 2.9 - - -
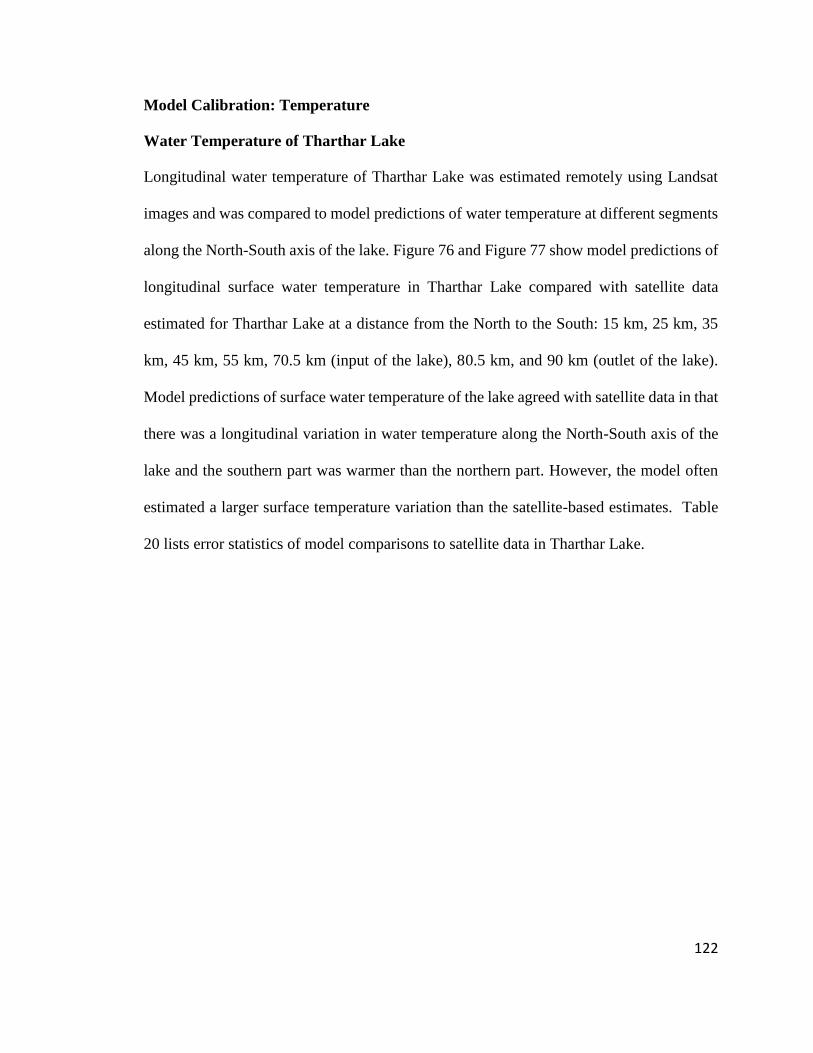
122
Model Calibration: Temperature
Water Temperature of Tharthar Lake
Longitudinal water temperature of Tharthar Lake was estimated remotely using Landsat
images and was compared to model predictions of water temperature at different segments
along the North-South axis of the lake. Figure 76 and Figure 77 show model predictions of
longitudinal surface water temperature in Tharthar Lake compared with satellite data
estimated for Tharthar Lake at a distance from the North to the South: 15 km, 25 km, 35
km, 45 km, 55 km, 70.5 km (input of the lake), 80.5 km, and 90 km (outlet of the lake).
Model predictions of surface water temperature of the lake agreed with satellite data in that
there was a longitudinal variation in water temperature along the North-South axis of the
lake and the southern part was warmer than the northern part. However, the model often
estimated a larger surface temperature variation than the satellite-based estimates. Table
20 lists error statistics of model comparisons to satellite data in Tharthar Lake.

123
Figure 76: Model predictions of longitudinal surface water temperature in Tharthar Lake on
February 4th, March8th, and May 27th.
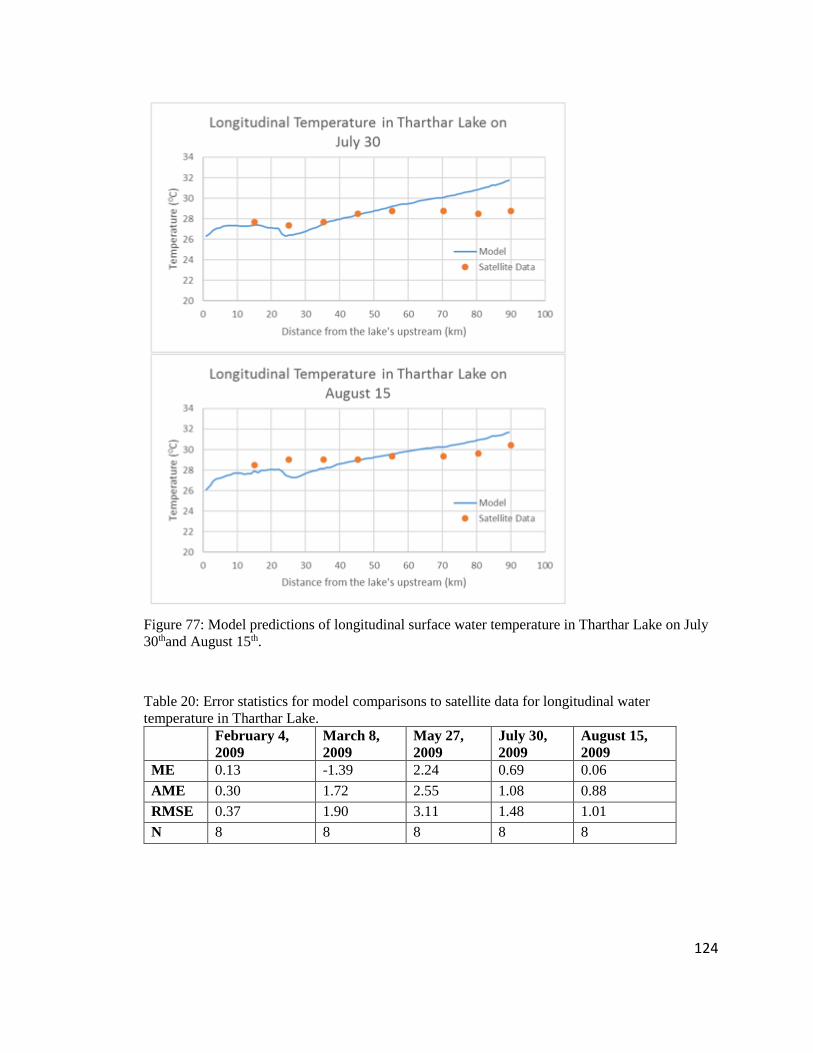
124
Figure 77: Model predictions of longitudinal surface water temperature in Tharthar Lake on July
30thand August 15th.
Table 20: Error statistics for model comparisons to satellite data for longitudinal water
temperature in Tharthar Lake. February 4,
2009
March 8,
2009
May 27,
2009
July 30,
2009
August 15,
2009
ME 0.13 -1.39 2.24 0.69 0.06
AME 0.30 1.72 2.55 1.08 0.88
RMSE 0.37 1.90 3.11 1.48 1.01
N 8 8 8 8 8
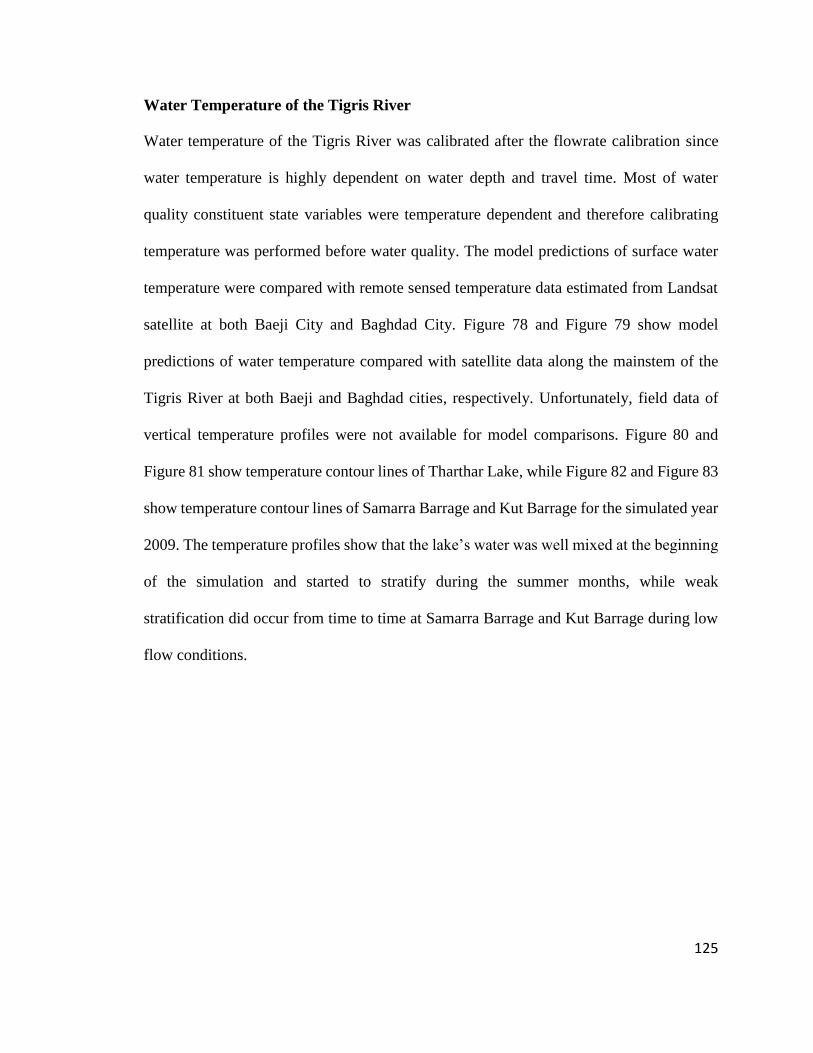
125
Water Temperature of the Tigris River
Water temperature of the Tigris River was calibrated after the flowrate calibration since
water temperature is highly dependent on water depth and travel time. Most of water
quality constituent state variables were temperature dependent and therefore calibrating
temperature was performed before water quality. The model predictions of surface water
temperature were compared with remote sensed temperature data estimated from Landsat
satellite at both Baeji City and Baghdad City. Figure 78 and Figure 79 show model
predictions of water temperature compared with satellite data along the mainstem of the
Tigris River at both Baeji and Baghdad cities, respectively. Unfortunately, field data of
vertical temperature profiles were not available for model comparisons. Figure 80 and
Figure 81 show temperature contour lines of Tharthar Lake, while Figure 82 and Figure 83
show temperature contour lines of Samarra Barrage and Kut Barrage for the simulated year
2009. The temperature profiles show that the lake’s water was well mixed at the beginning
of the simulation and started to stratify during the summer months, while weak
stratification did occur from time to time at Samarra Barrage and Kut Barrage during low
flow conditions.
126
Figure 78: Model surface water temperature predictions compared to the Tigris River remote
sensing data at Baeji City (segment 54).
Figure 79: Model surface water temperature predictions compared to the Tigris River remote
sensing data at Baghdad City (segment 123).
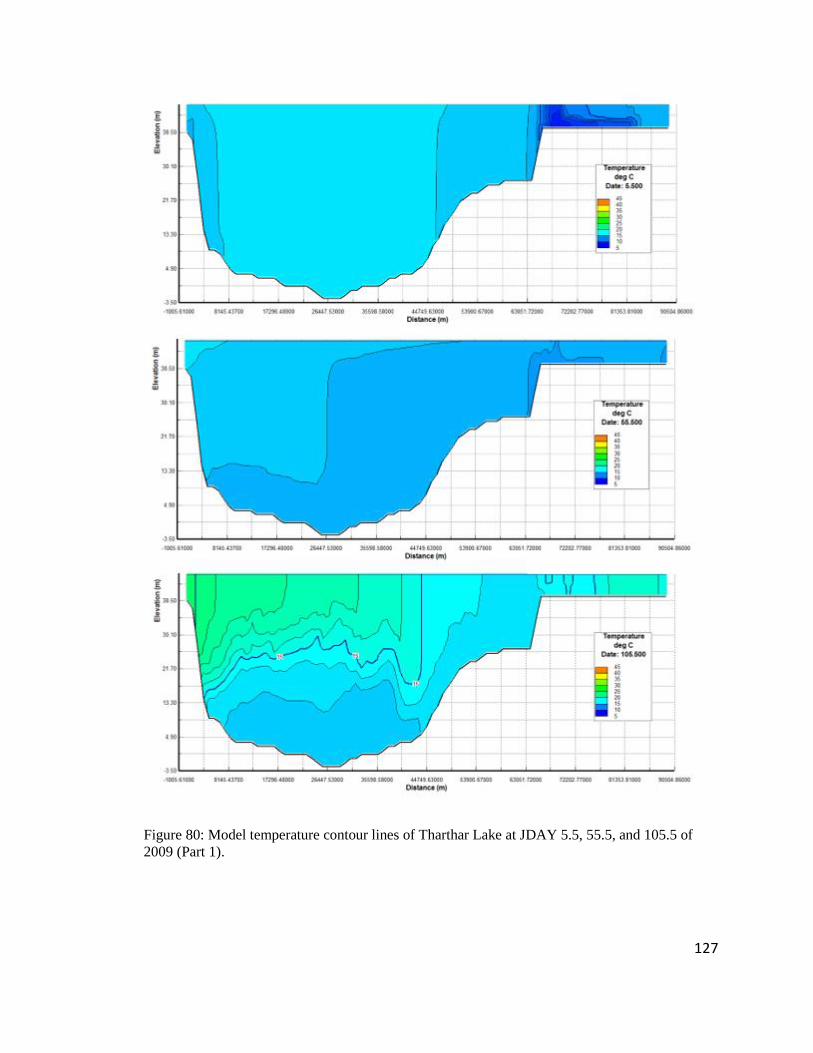
127
Figure 80: Model temperature contour lines of Tharthar Lake at JDAY 5.5, 55.5, and 105.5 of
2009 (Part 1).
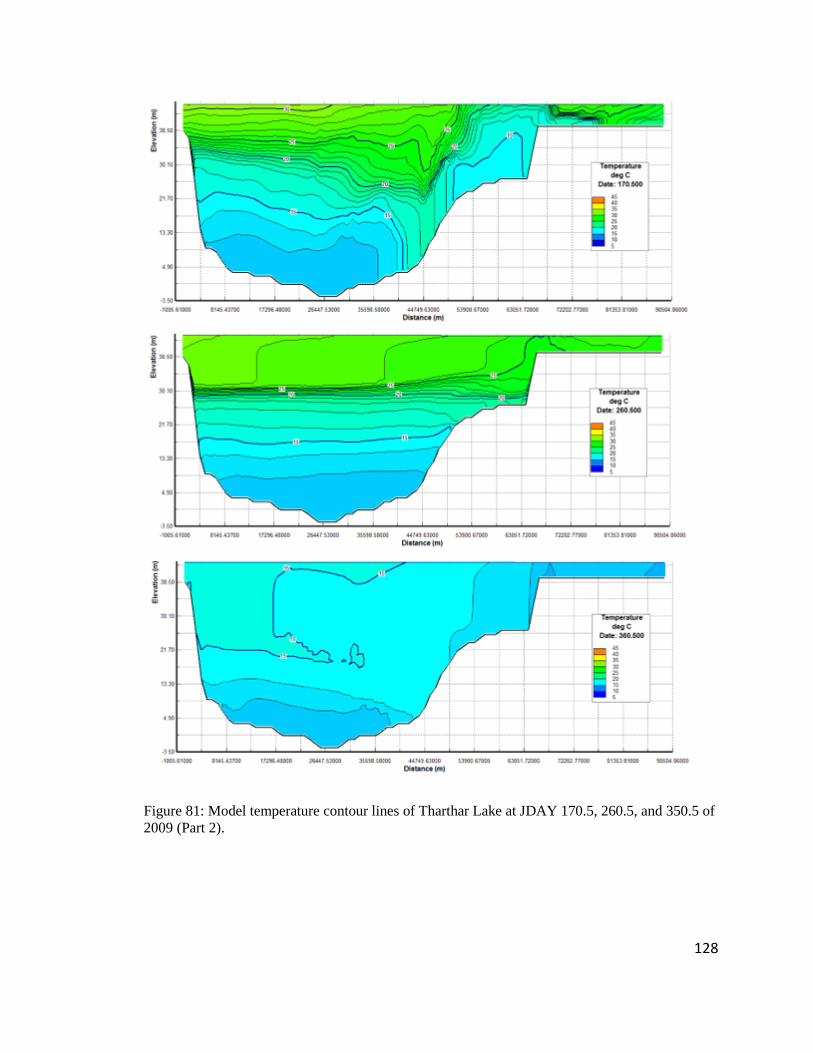
128
Figure 81: Model temperature contour lines of Tharthar Lake at JDAY 170.5, 260.5, and 350.5 of
2009 (Part 2).
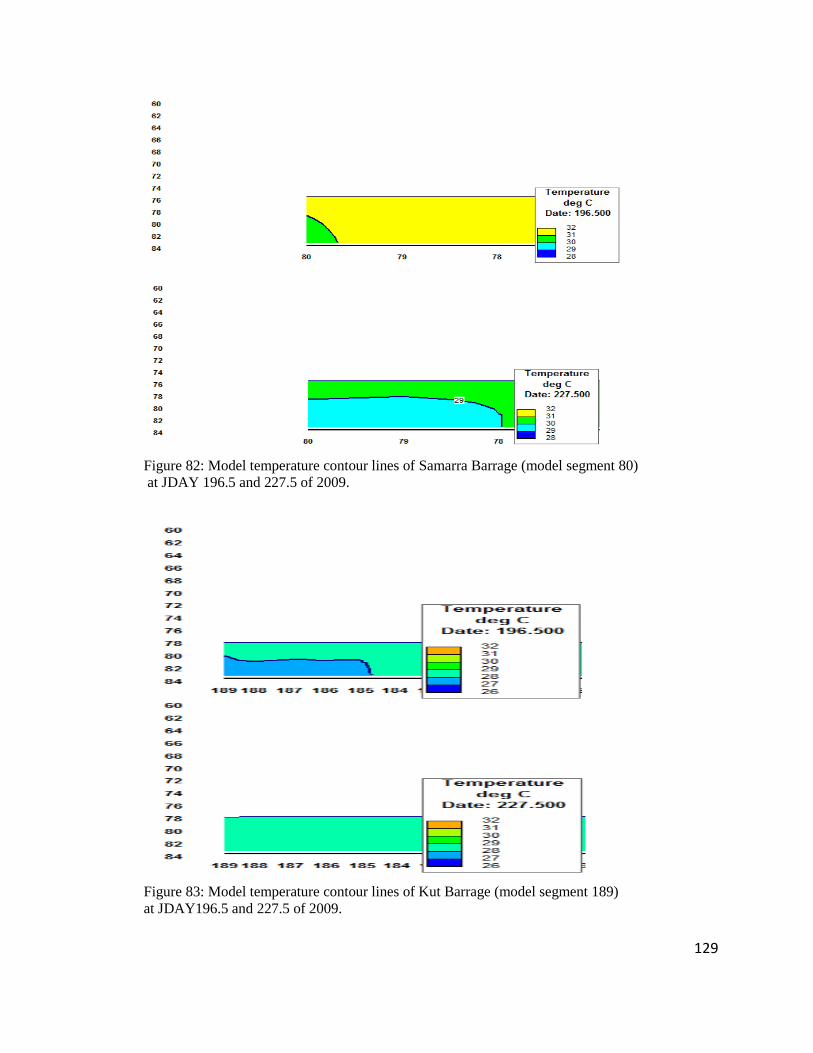
129
Figure 82: Model temperature contour lines of Samarra Barrage (model segment 80)
at JDAY 196.5 and 227.5 of 2009.
Figure 83: Model temperature contour lines of Kut Barrage (model segment 189)
at JDAY196.5 and 227.5 of 2009.
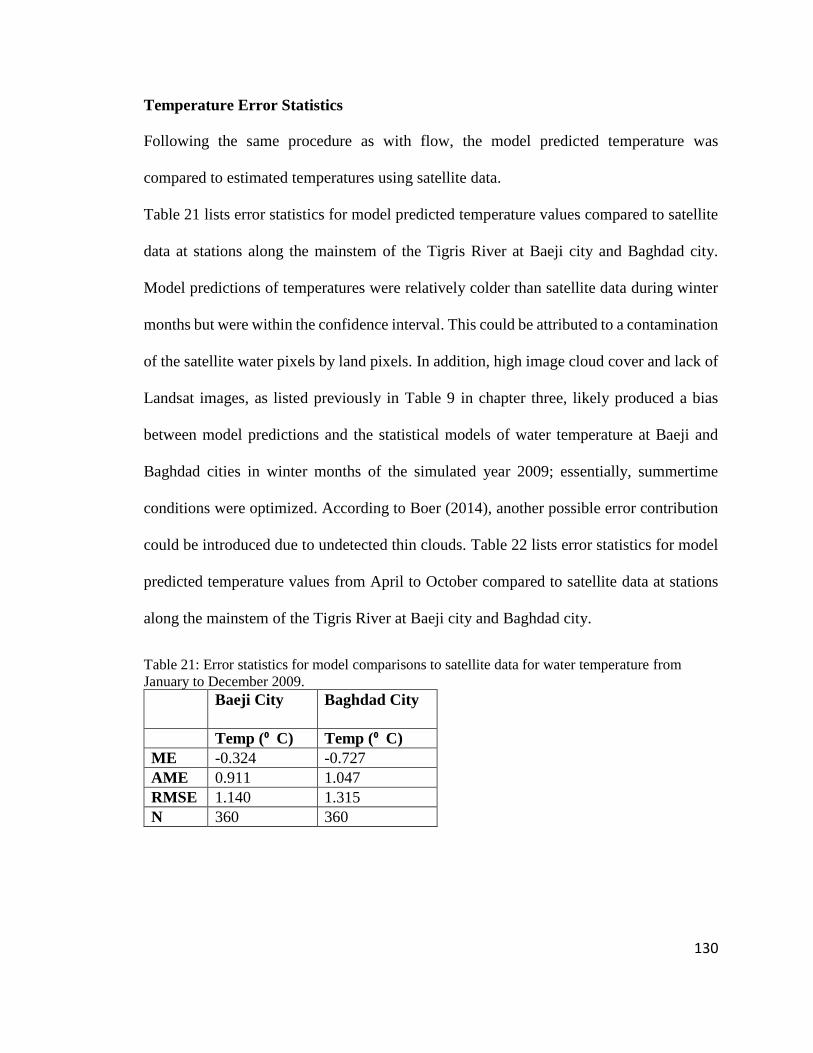
130
Temperature Error Statistics
Following the same procedure as with flow, the model predicted temperature was
compared to estimated temperatures using satellite data.
Table 21 lists error statistics for model predicted temperature values compared to satellite
data at stations along the mainstem of the Tigris River at Baeji city and Baghdad city.
Model predictions of temperatures were relatively colder than satellite data during winter
months but were within the confidence interval. This could be attributed to a contamination
of the satellite water pixels by land pixels. In addition, high image cloud cover and lack of
Landsat images, as listed previously in Table 9 in chapter three, likely produced a bias
between model predictions and the statistical models of water temperature at Baeji and
Baghdad cities in winter months of the simulated year 2009; essentially, summertime
conditions were optimized. According to Boer (2014), another possible error contribution
could be introduced due to undetected thin clouds. Table 22 lists error statistics for model
predicted temperature values from April to October compared to satellite data at stations
along the mainstem of the Tigris River at Baeji city and Baghdad city.
Table 21: Error statistics for model comparisons to satellite data for water temperature from
January to December 2009. Baeji City Baghdad City
Temp (⁰ C) Temp (⁰ C)
ME -0.324 -0.727
AME 0.911 1.047
RMSE 1.140 1.315
N 360 360
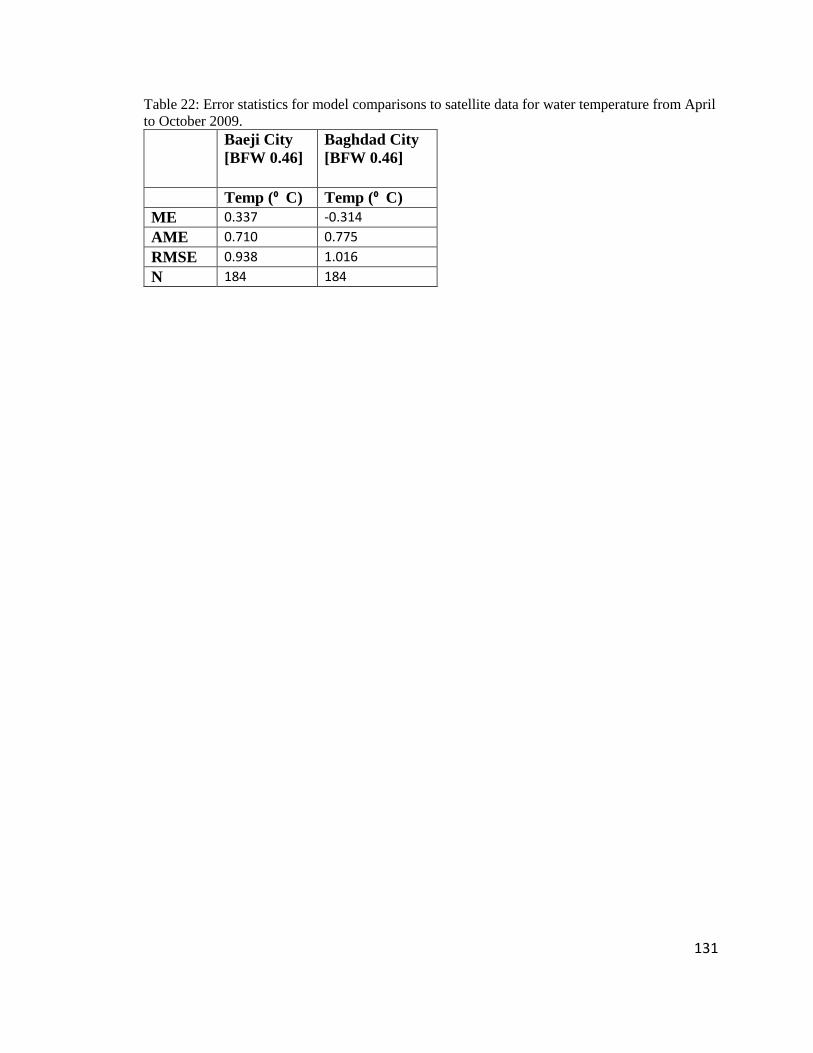
131
Table 22: Error statistics for model comparisons to satellite data for water temperature from April
to October 2009.
Baeji City
[BFW 0.46]
Baghdad City
[BFW 0.46]
Temp (⁰ C) Temp (⁰ C)
ME 0.337 -0.314
AME 0.710 0.775
RMSE 0.938 1.016
N 184 184
132
Model Calibration: Water Quality Constituents
Like flow and temperature calibration, model predictions of water quality constituents were
compared to the measurements in the Tigris River when field data were available.
Unfortunately, not all water quality field data were available for either the model boundary
conditions or for comparisons to model predictions during model calibration. Monthly
average field data of both total dissolved solids (TDS) and nitrates (NO3) were the only
two water quality constituents provided by the Iraqi Ministry of Water Resources for the
modeled year 2009. Other water quality constituents modeled in this study such as PO4,
NO3, BODu, algae, and DO were estimated from literature values.
Total Dissolved Solids
In-situ monthly average data of total dissolved solids were provided by the Iraqi ministry
of Water Resources (MOWR 2014). Data were provided at Mosul Dam, Samarra Barrage,
Audaim tributary, Baghdad City (Al-Shahada Bridge), Diyala River tributary, and Kut
Barrage. No TDS data are available for both Upper Zab and Lower Zab Rivers, and
therefore TDS concentrations at these two tributaries were assumed based on the available
data. Unfortunately, daily average data of TDS were unavailable and therefore the model
calibration for TDS was based on the monthly average data.
Due to relatively low flowrates and high TDS concentrations introduced to the mainstem
of the Tigris River upstream Baghdad city through the Tharthar-Tigris canal, TDS in the
mainstem of the river at Baghdad city was relatively high during the first two months of
the year (winter time). This peak in TDS concentration at Baghdad city and downstream
areas (Kut Barrage) could mostly be due to ungaged irrigation return flows that were
133
directly discharged into the mainstem of the Tigris River through numerous man-made
irrigation channels along both river banks. The effects of these return flows were added to
the model as tributaries.
To account for high TDS concentration in Baghdad City during the first two months of the
year, an extra tributary was introduced into the mainstem of the Tigris River system and
was placed downstream of Samarra Barrage. This extra tributary had low flowrates (1 m3/s)
with high mass of TDS to adjust for the deficit in TDS concentrations during the winter
months. This was like adding a mass source of TDS to the river. Another tributary was
introduced downstream of Baghdad City to account for high TDS at Kut Barrage in winter
months. Figure 84 through Figure 88show the model predictions of TDS compared with
field data at Mosul Dam (boundary condition), Samarra Barrage, Baghdad City, Kut
Barrage, and Tharthar Lake respectively. Unfortunately, field data of TDS in Tharthar Lake
were not available for model comparison. TDS contour lines for the longitudinal and
vertical at Tharthar Lake are shown in Figure 90. As water was continuously diverted to
Tharthar Lake from Samarra Barrage through Tigris-Tharthar Canal, TDS concentrations
in Tharthar Lake decreased during the simulated year due to continuous dilution.
According to Ansari et al., (2012), TDS and other water quality constituents decrease with
increasing dilution. The initial condition of TDS at Tharthar Lake was 1300 mg/l and
dropped down to about 1150 mg/l at the end of the simulation. Table 23 lists error statistics
of model predictions for TDS compared with the monthly averaged field data at Samarra
Barrage, Baghdad city, and Kut Barrage.
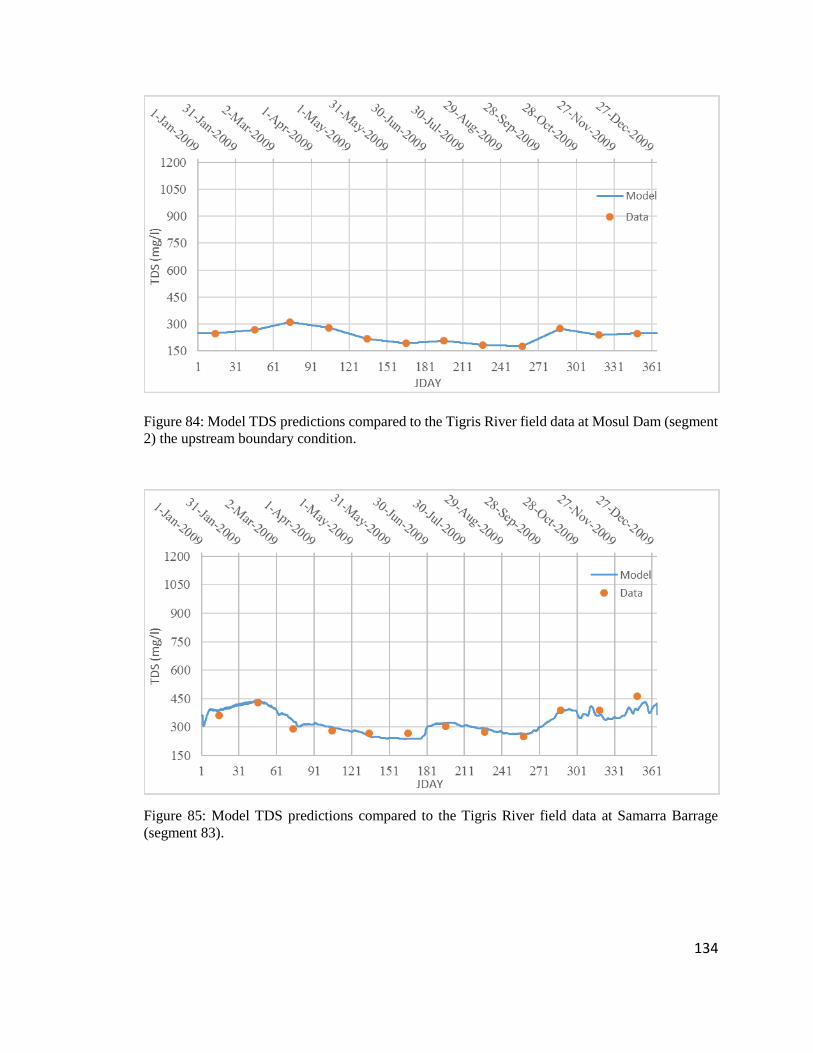
134
Figure 84: Model TDS predictions compared to the Tigris River field data at Mosul Dam (segment
2) the upstream boundary condition.
Figure 85: Model TDS predictions compared to the Tigris River field data at Samarra Barrage
(segment 83).
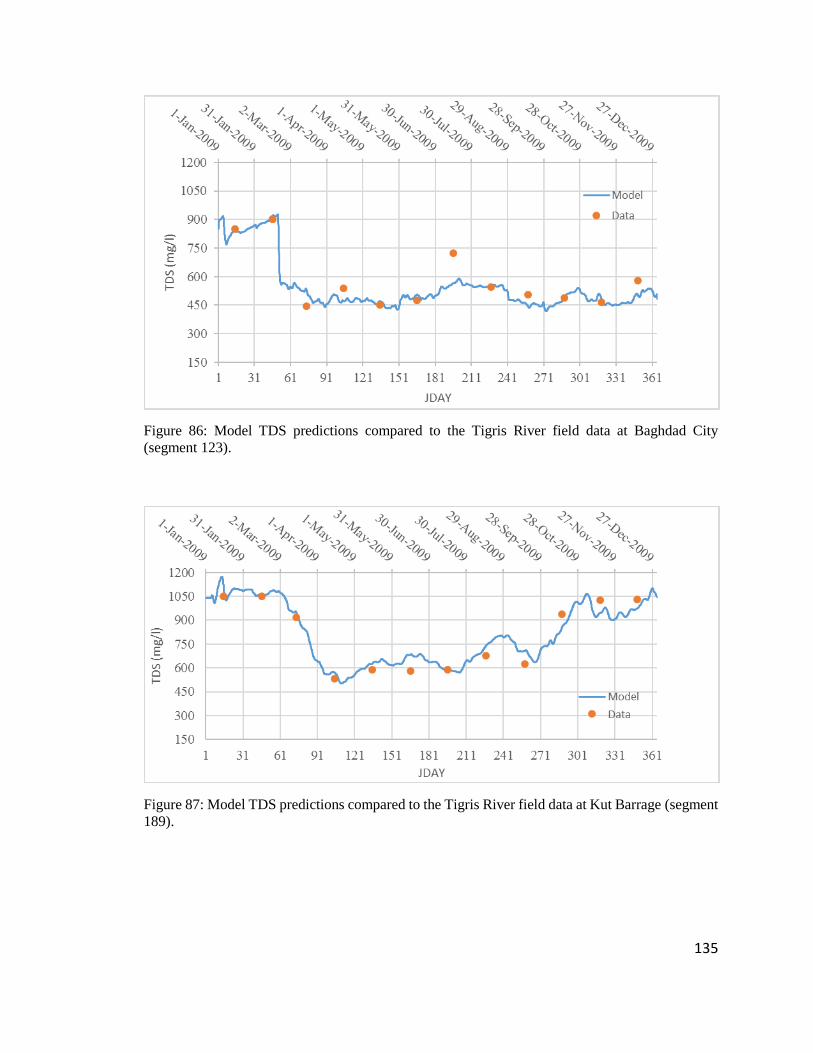
135
Figure 86: Model TDS predictions compared to the Tigris River field data at Baghdad City
(segment 123).
Figure 87: Model TDS predictions compared to the Tigris River field data at Kut Barrage (segment
189).
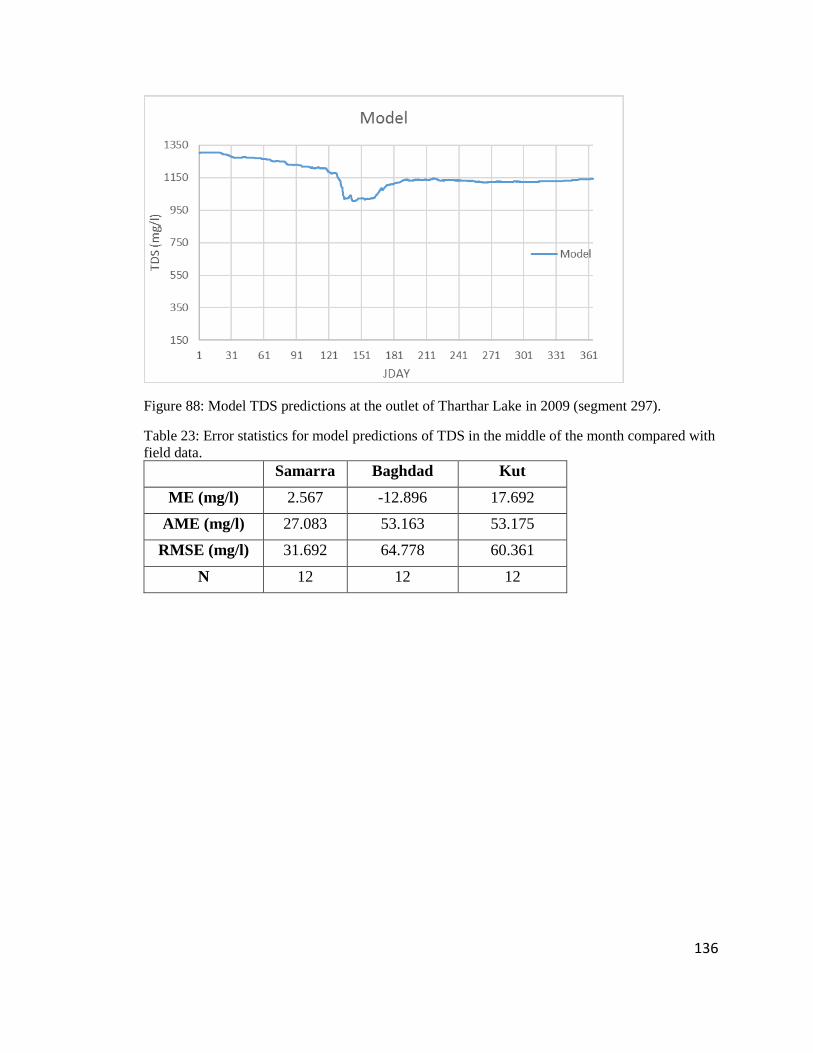
136
Figure 88: Model TDS predictions at the outlet of Tharthar Lake in 2009 (segment 297).
Table 23: Error statistics for model predictions of TDS in the middle of the month compared with
field data. Samarra Baghdad Kut
ME (mg/l) 2.567 -12.896 17.692
AME (mg/l) 27.083 53.163 53.175
RMSE (mg/l) 31.692 64.778 60.361
N 12 12 12
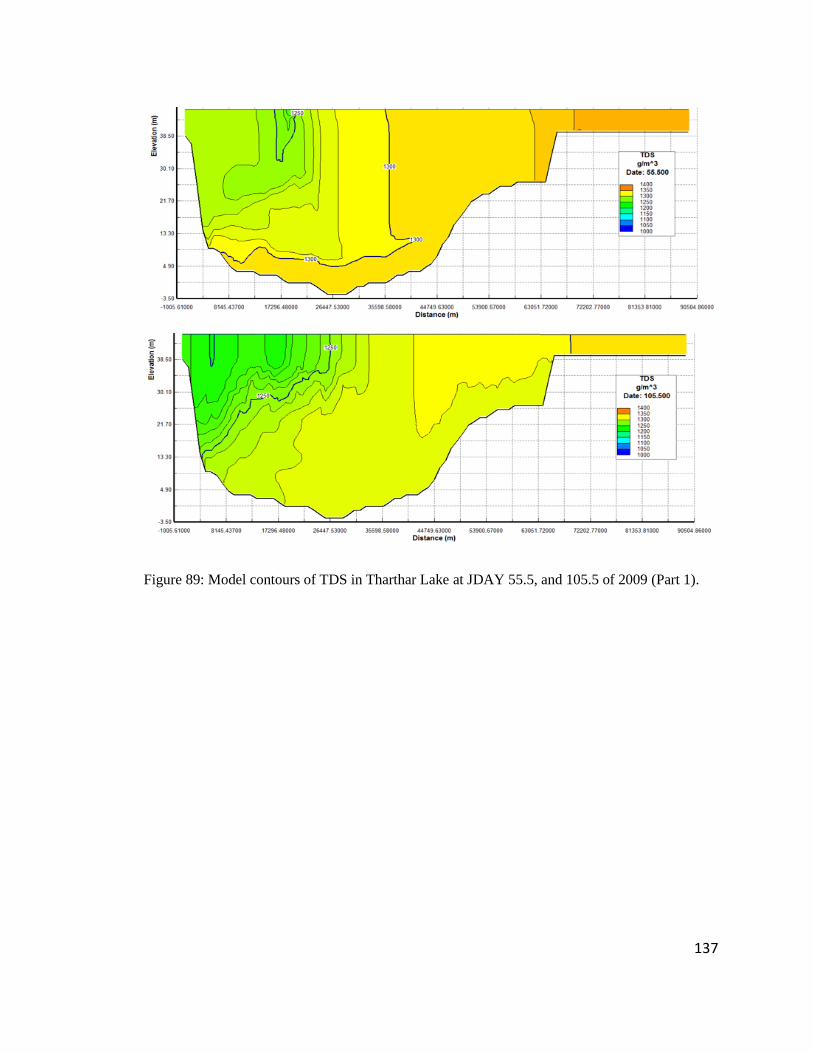
137
Figure 89: Model contours of TDS in Tharthar Lake at JDAY 55.5, and 105.5 of 2009 (Part 1).
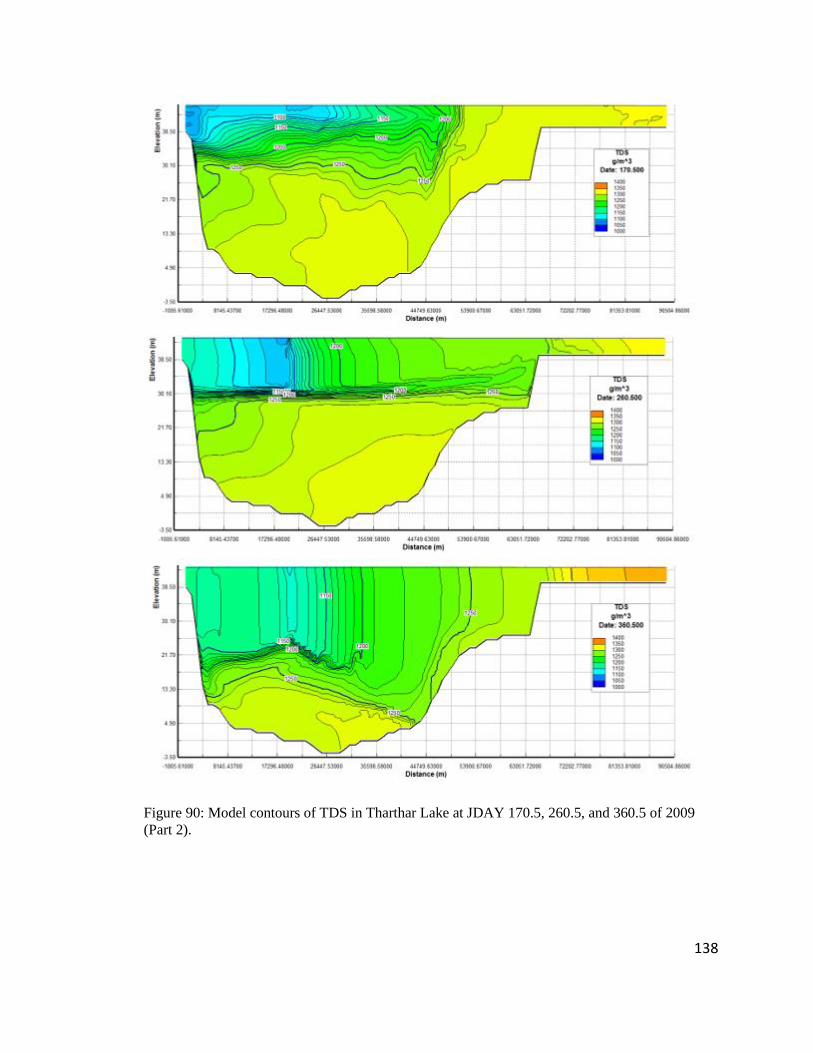
138
Figure 90: Model contours of TDS in Tharthar Lake at JDAY 170.5, 260.5, and 360.5 of 2009
(Part 2).
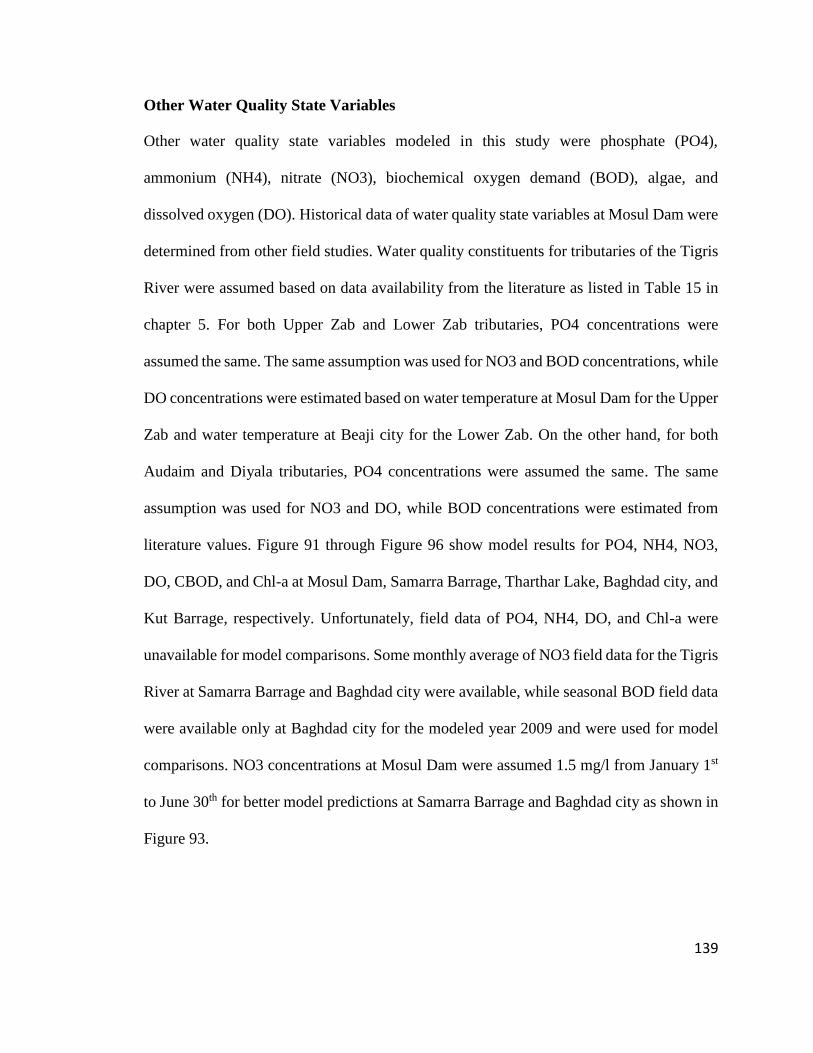
139
Other Water Quality State Variables
Other water quality state variables modeled in this study were phosphate (PO4),
ammonium (NH4), nitrate (NO3), biochemical oxygen demand (BOD), algae, and
dissolved oxygen (DO). Historical data of water quality state variables at Mosul Dam were
determined from other field studies. Water quality constituents for tributaries of the Tigris
River were assumed based on data availability from the literature as listed in Table 15 in
chapter 5. For both Upper Zab and Lower Zab tributaries, PO4 concentrations were
assumed the same. The same assumption was used for NO3 and BOD concentrations, while
DO concentrations were estimated based on water temperature at Mosul Dam for the Upper
Zab and water temperature at Beaji city for the Lower Zab. On the other hand, for both
Audaim and Diyala tributaries, PO4 concentrations were assumed the same. The same
assumption was used for NO3 and DO, while BOD concentrations were estimated from
literature values. Figure 91 through Figure 96 show model results for PO4, NH4, NO3,
DO, CBOD, and Chl-a at Mosul Dam, Samarra Barrage, Tharthar Lake, Baghdad city, and
Kut Barrage, respectively. Unfortunately, field data of PO4, NH4, DO, and Chl-a were
unavailable for model comparisons. Some monthly average of NO3 field data for the Tigris
River at Samarra Barrage and Baghdad city were available, while seasonal BOD field data
were available only at Baghdad city for the modeled year 2009 and were used for model
comparisons. NO3 concentrations at Mosul Dam were assumed 1.5 mg/l from January 1st
to June 30th for better model predictions at Samarra Barrage and Baghdad city as shown in
Figure 93.
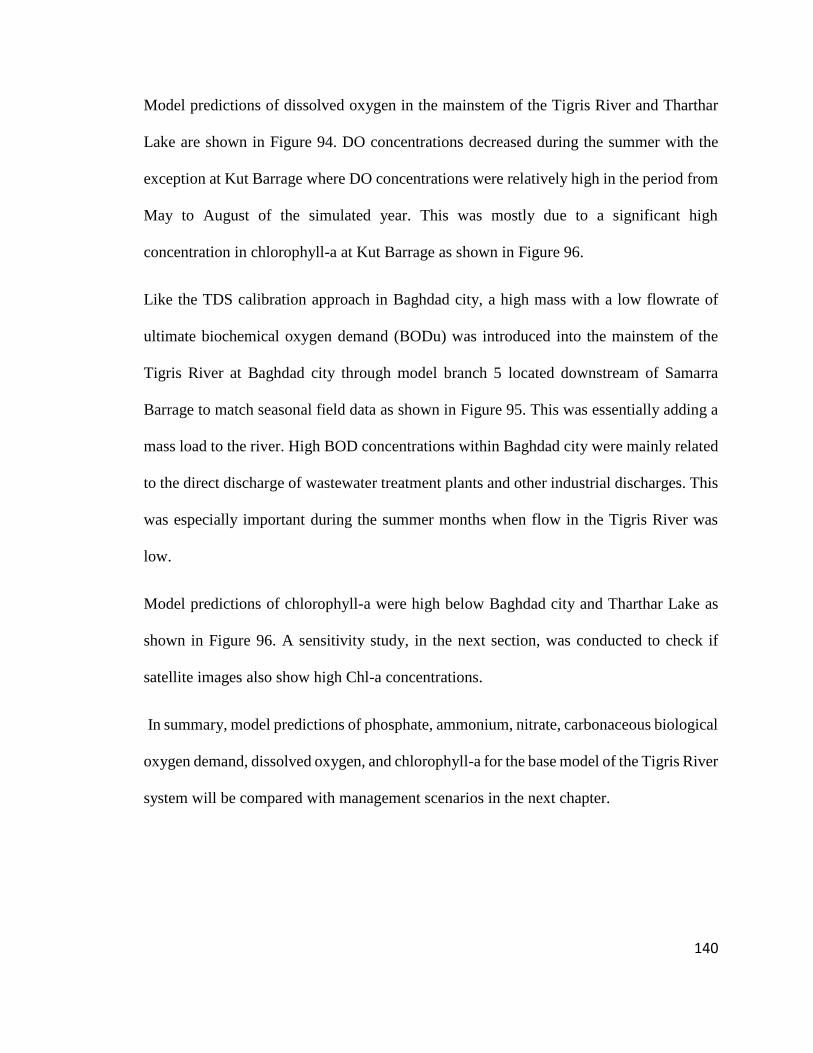
140
Model predictions of dissolved oxygen in the mainstem of the Tigris River and Tharthar
Lake are shown in Figure 94. DO concentrations decreased during the summer with the
exception at Kut Barrage where DO concentrations were relatively high in the period from
May to August of the simulated year. This was mostly due to a significant high
concentration in chlorophyll-a at Kut Barrage as shown in Figure 96.
Like the TDS calibration approach in Baghdad city, a high mass with a low flowrate of
ultimate biochemical oxygen demand (BODu) was introduced into the mainstem of the
Tigris River at Baghdad city through model branch 5 located downstream of Samarra
Barrage to match seasonal field data as shown in Figure 95. This was essentially adding a
mass load to the river. High BOD concentrations within Baghdad city were mainly related
to the direct discharge of wastewater treatment plants and other industrial discharges. This
was especially important during the summer months when flow in the Tigris River was
low.
Model predictions of chlorophyll-a were high below Baghdad city and Tharthar Lake as
shown in Figure 96. A sensitivity study, in the next section, was conducted to check if
satellite images also show high Chl-a concentrations.
In summary, model predictions of phosphate, ammonium, nitrate, carbonaceous biological
oxygen demand, dissolved oxygen, and chlorophyll-a for the base model of the Tigris River
system will be compared with management scenarios in the next chapter.
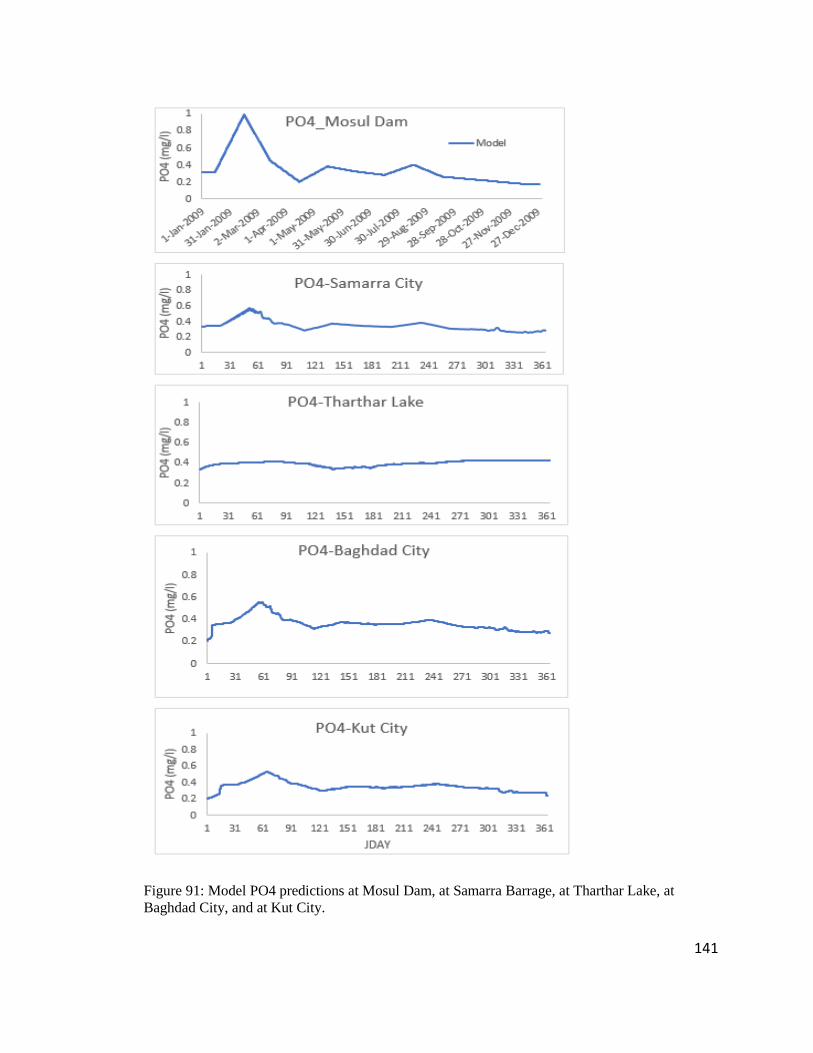
141
Figure 91: Model PO4 predictions at Mosul Dam, at Samarra Barrage, at Tharthar Lake, at
Baghdad City, and at Kut City.
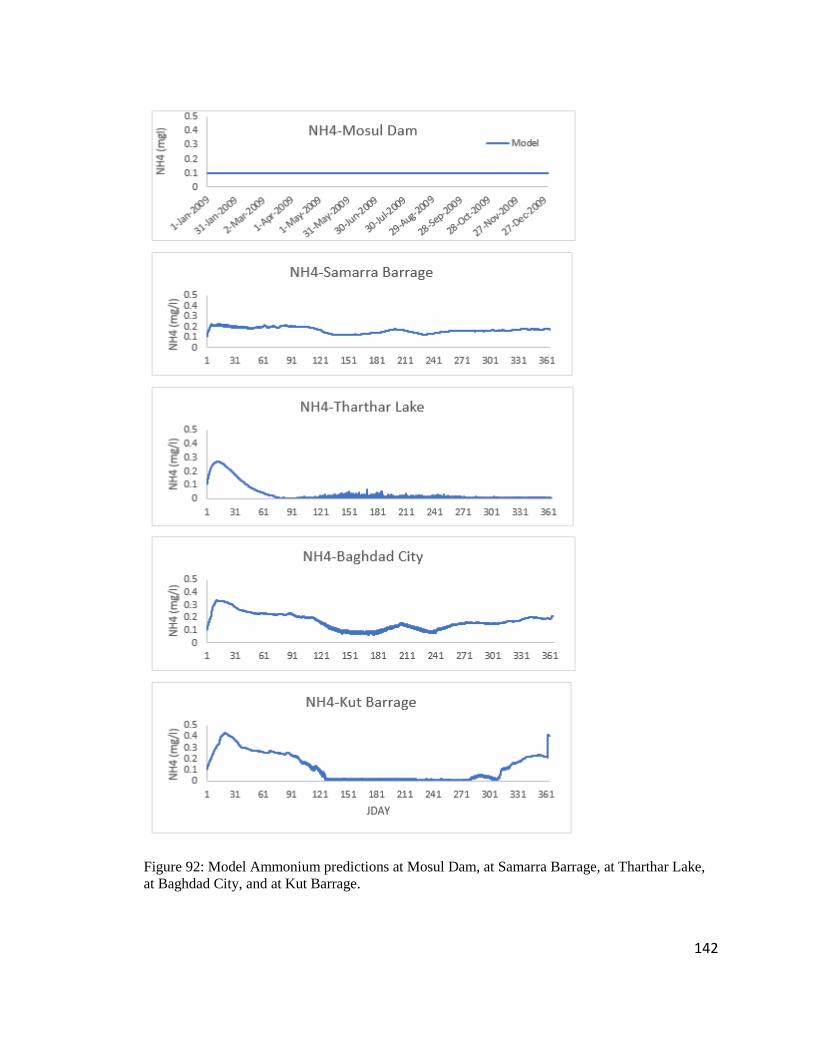
142
Figure 92: Model Ammonium predictions at Mosul Dam, at Samarra Barrage, at Tharthar Lake,
at Baghdad City, and at Kut Barrage.
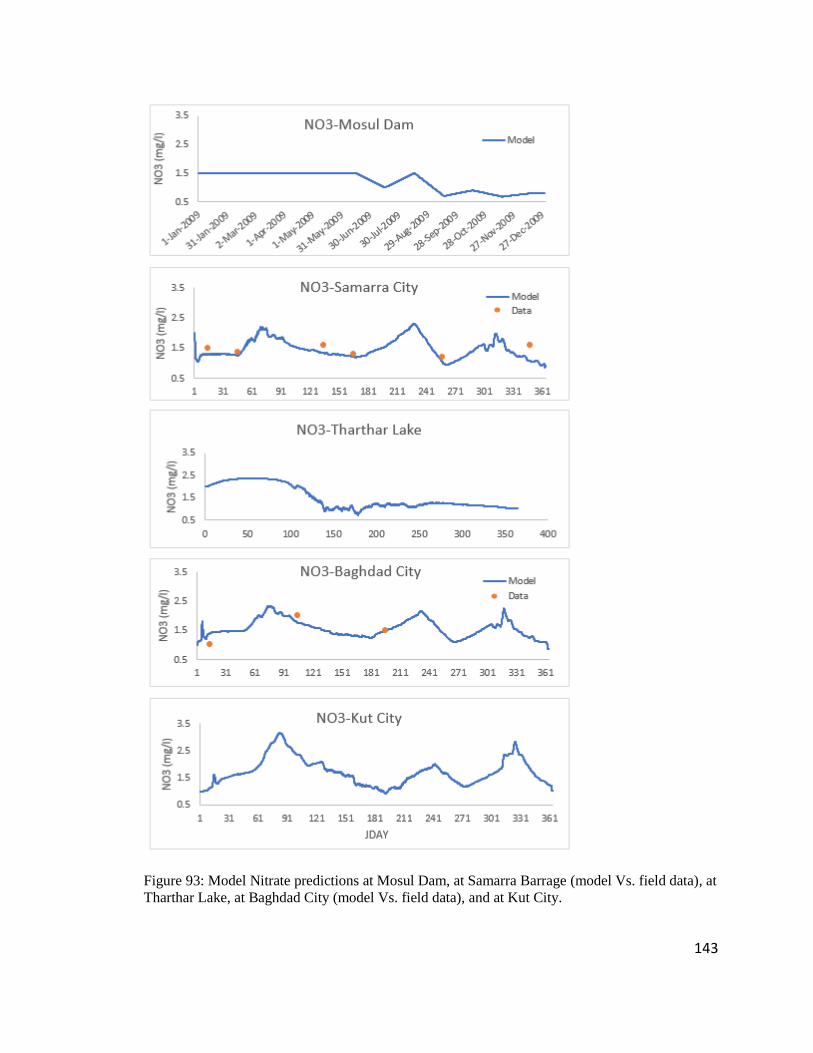
143
Figure 93: Model Nitrate predictions at Mosul Dam, at Samarra Barrage (model Vs. field data), at
Tharthar Lake, at Baghdad City (model Vs. field data), and at Kut City.
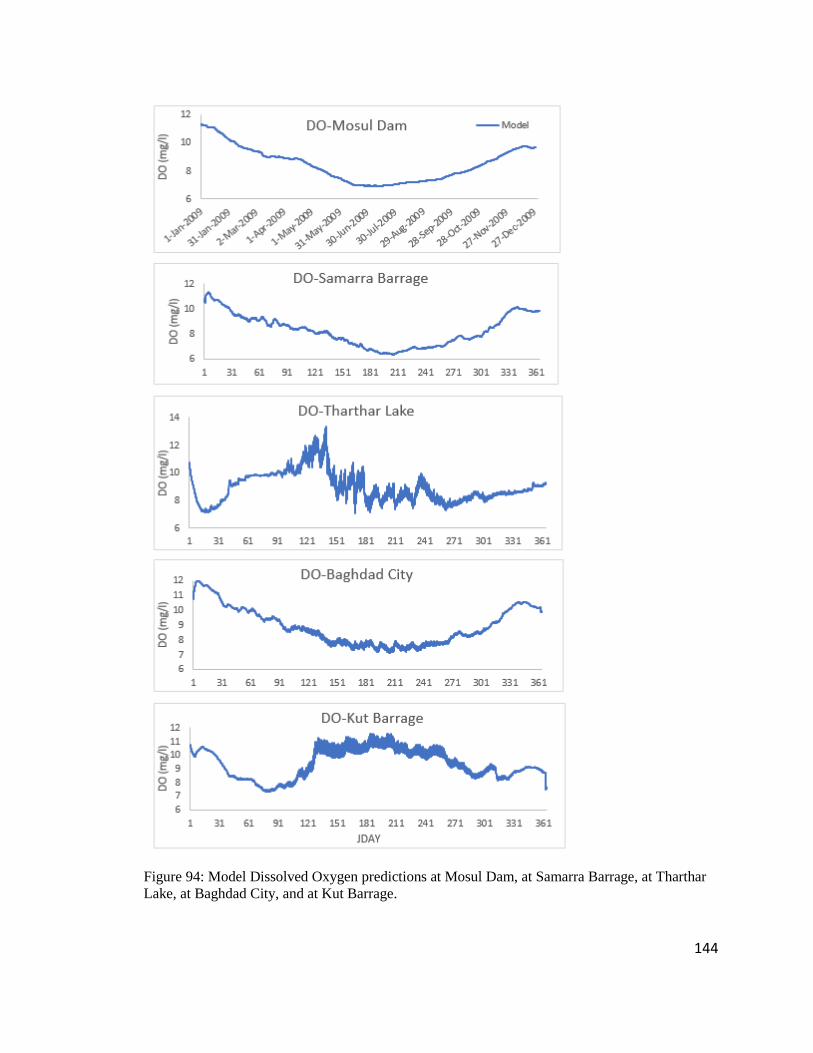
144
Figure 94: Model Dissolved Oxygen predictions at Mosul Dam, at Samarra Barrage, at Tharthar
Lake, at Baghdad City, and at Kut Barrage.
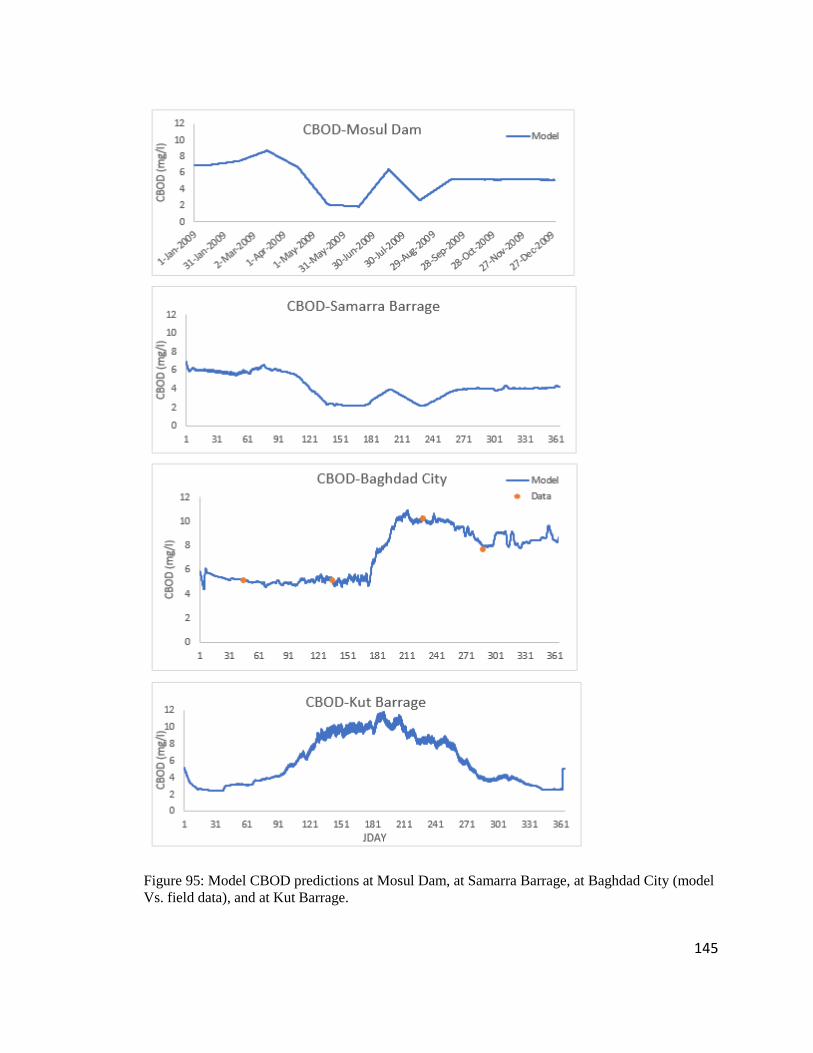
145
Figure 95: Model CBOD predictions at Mosul Dam, at Samarra Barrage, at Baghdad City (model
Vs. field data), and at Kut Barrage.

146
Figure 96: Model Chlorophyll-a predictions at Mosul Dam, at Samarra Barrage, at Tharthar Lake,
at Baghdad City, and at Kut Barrage using algae growth rate of 1.5 d-1.
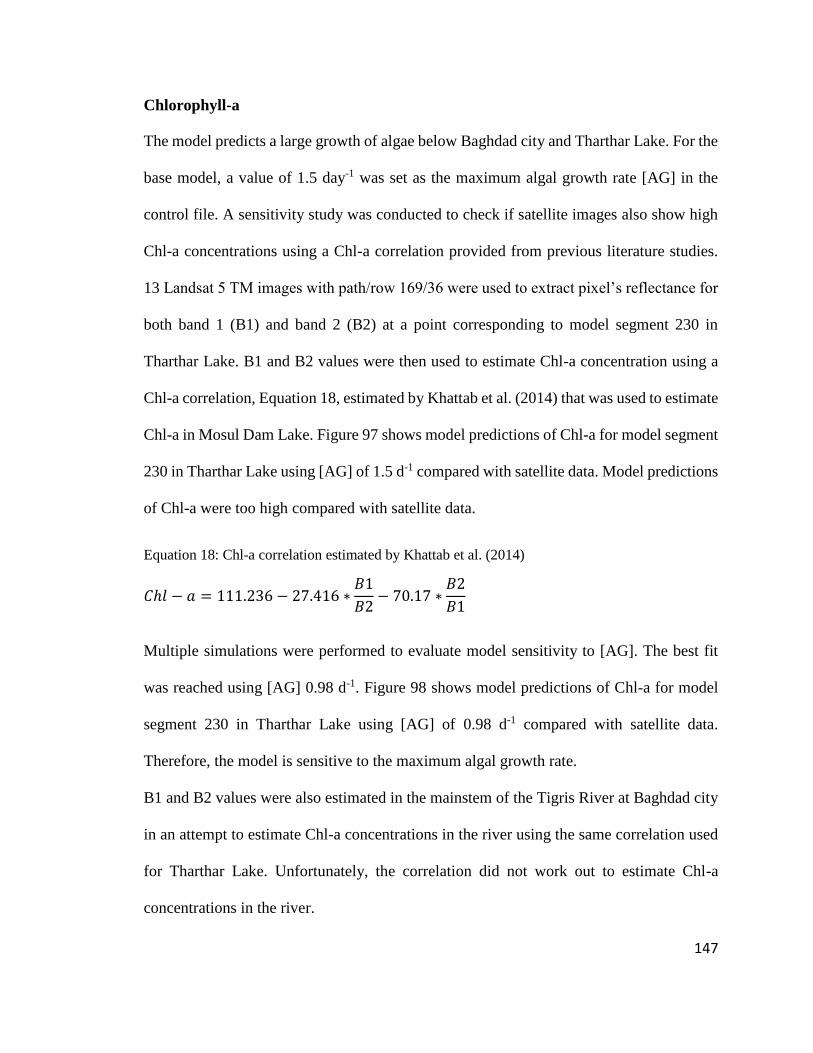
147
Chlorophyll-a
The model predicts a large growth of algae below Baghdad city and Tharthar Lake. For the
base model, a value of 1.5 day-1 was set as the maximum algal growth rate [AG] in the
control file. A sensitivity study was conducted to check if satellite images also show high
Chl-a concentrations using a Chl-a correlation provided from previous literature studies.
13 Landsat 5 TM images with path/row 169/36 were used to extract pixel’s reflectance for
both band 1 (B1) and band 2 (B2) at a point corresponding to model segment 230 in
Tharthar Lake. B1 and B2 values were then used to estimate Chl-a concentration using a
Chl-a correlation, Equation 18, estimated by Khattab et al. (2014) that was used to estimate
Chl-a in Mosul Dam Lake. Figure 97 shows model predictions of Chl-a for model segment
230 in Tharthar Lake using [AG] of 1.5 d-1 compared with satellite data. Model predictions
of Chl-a were too high compared with satellite data.
Equation 18: Chl-a correlation estimated by Khattab et al. (2014)
𝐶ℎ𝑙 − 𝑎 = 111.236 − 27.416 ∗𝐵1
𝐵2− 70.17 ∗
𝐵2
𝐵1
Multiple simulations were performed to evaluate model sensitivity to [AG]. The best fit
was reached using [AG] 0.98 d-1. Figure 98 shows model predictions of Chl-a for model
segment 230 in Tharthar Lake using [AG] of 0.98 d-1 compared with satellite data.
Therefore, the model is sensitive to the maximum algal growth rate.
B1 and B2 values were also estimated in the mainstem of the Tigris River at Baghdad city
in an attempt to estimate Chl-a concentrations in the river using the same correlation used
for Tharthar Lake. Unfortunately, the correlation did not work out to estimate Chl-a
concentrations in the river.
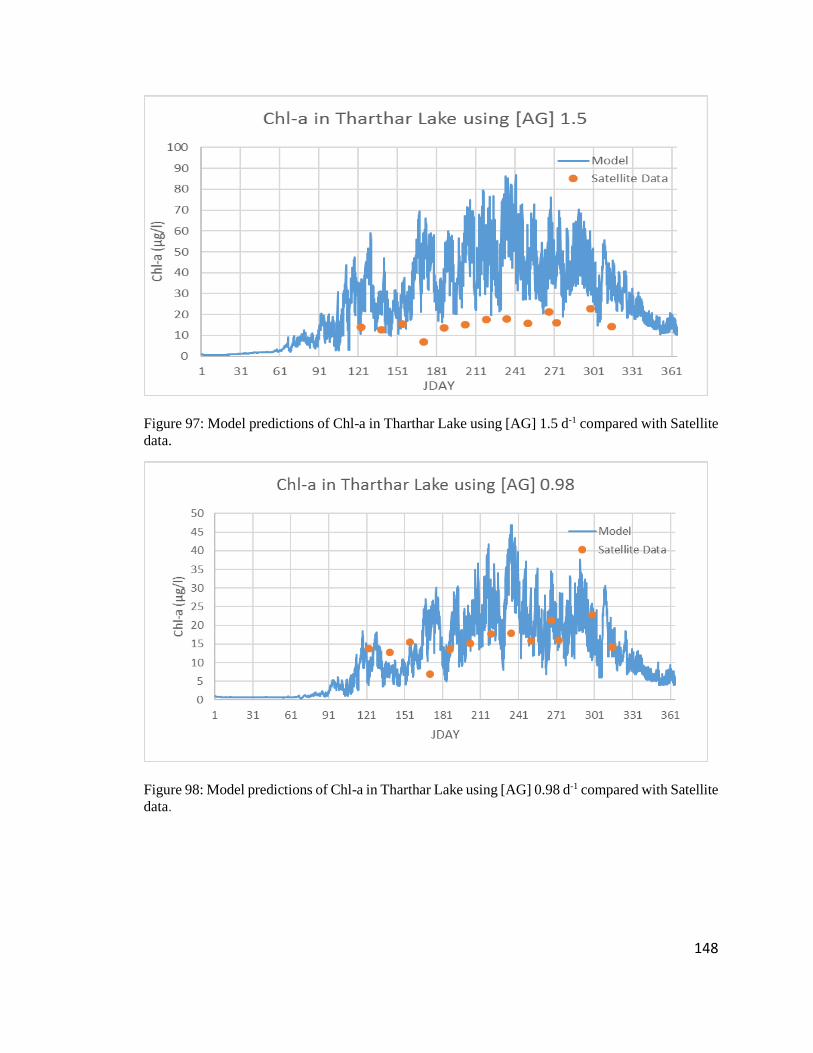
148
Figure 97: Model predictions of Chl-a in Tharthar Lake using [AG] 1.5 d-1 compared with Satellite
data.
Figure 98: Model predictions of Chl-a in Tharthar Lake using [AG] 0.98 d-1 compared with Satellite
data.
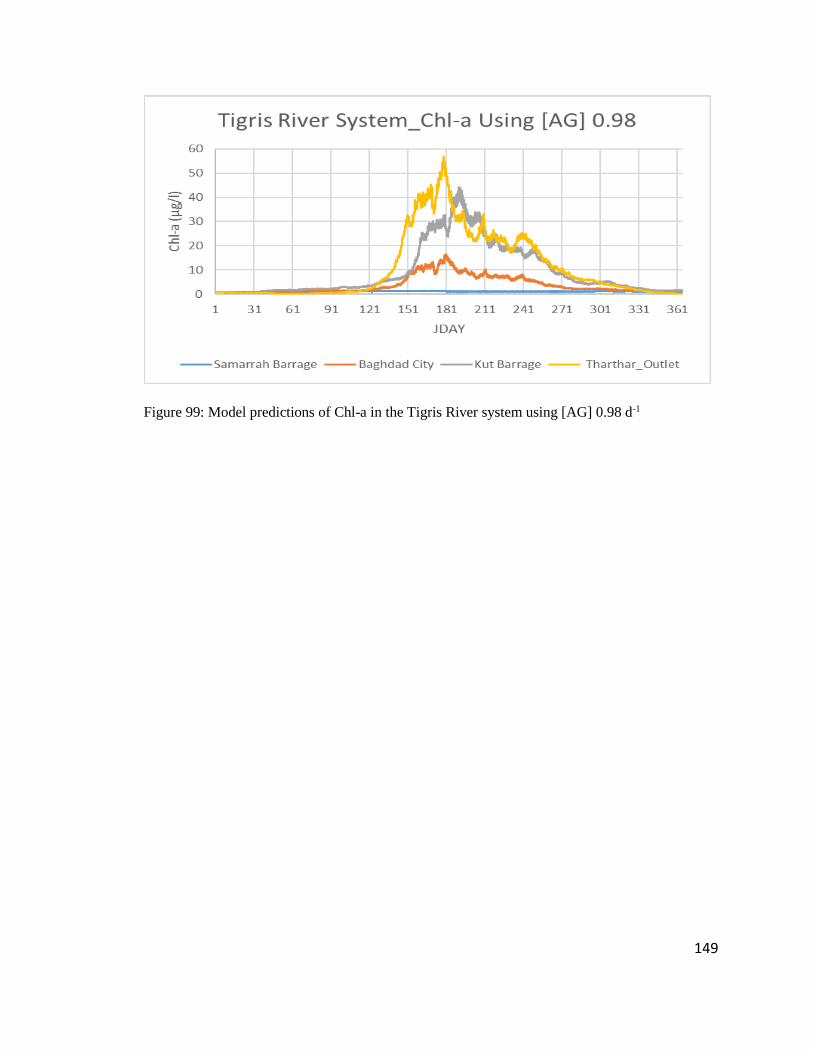
149
Figure 99: Model predictions of Chl-a in the Tigris River system using [AG] 0.98 d-1
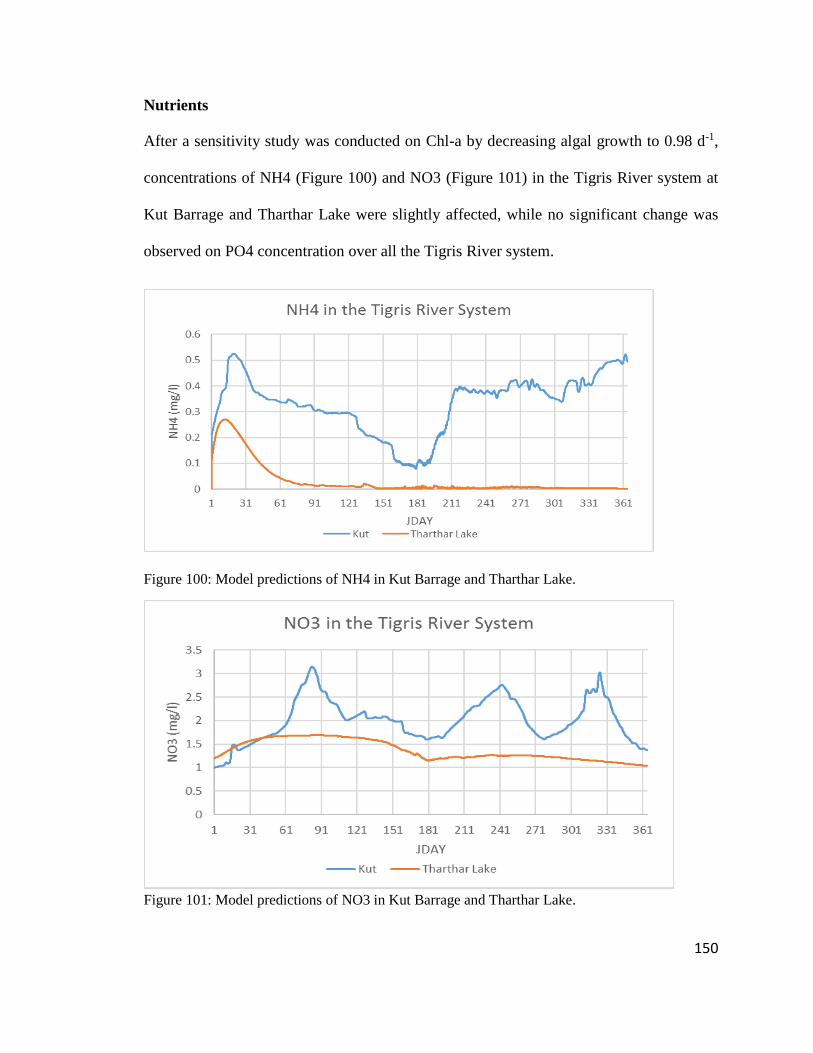
150
Nutrients
After a sensitivity study was conducted on Chl-a by decreasing algal growth to 0.98 d-1,
concentrations of NH4 (Figure 100) and NO3 (Figure 101) in the Tigris River system at
Kut Barrage and Tharthar Lake were slightly affected, while no significant change was
observed on PO4 concentration over all the Tigris River system.
Figure 100: Model predictions of NH4 in Kut Barrage and Tharthar Lake.
Figure 101: Model predictions of NO3 in Kut Barrage and Tharthar Lake.
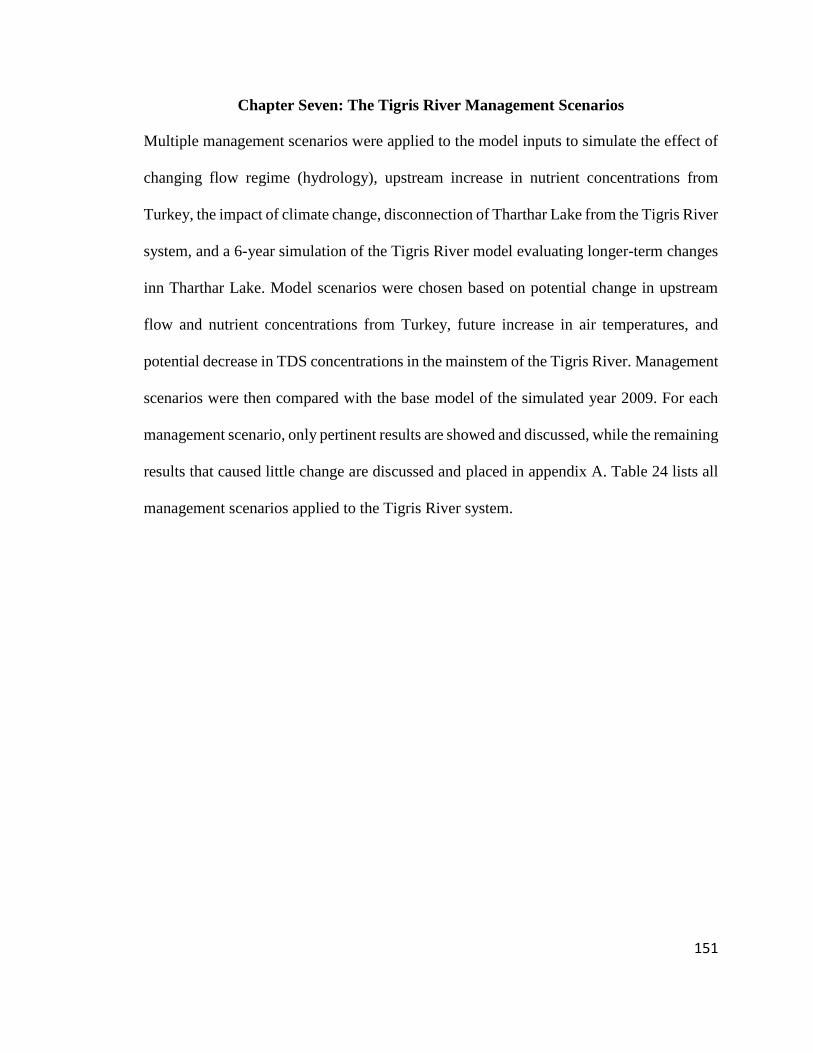
151
Chapter Seven: The Tigris River Management Scenarios
Multiple management scenarios were applied to the model inputs to simulate the effect of
changing flow regime (hydrology), upstream increase in nutrient concentrations from
Turkey, the impact of climate change, disconnection of Tharthar Lake from the Tigris River
system, and a 6-year simulation of the Tigris River model evaluating longer-term changes
inn Tharthar Lake. Model scenarios were chosen based on potential change in upstream
flow and nutrient concentrations from Turkey, future increase in air temperatures, and
potential decrease in TDS concentrations in the mainstem of the Tigris River. Management
scenarios were then compared with the base model of the simulated year 2009. For each
management scenario, only pertinent results are showed and discussed, while the remaining
results that caused little change are discussed and placed in appendix A. Table 24 lists all
management scenarios applied to the Tigris River system.
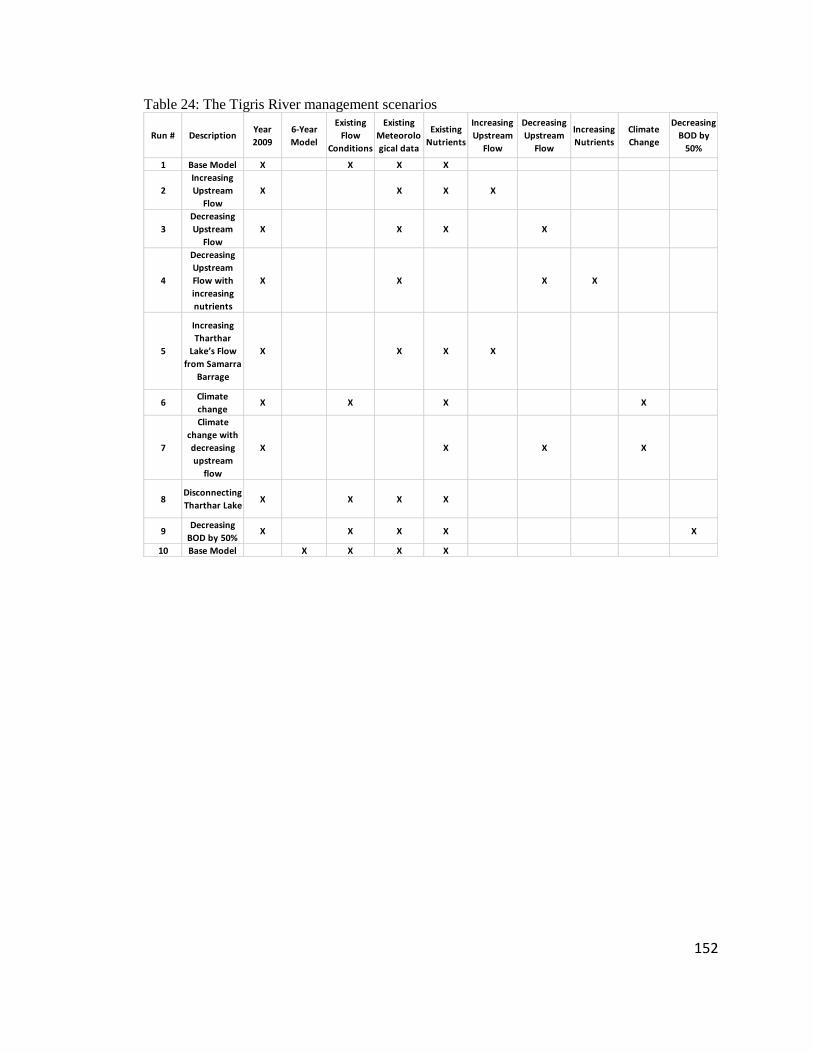
152
Table 24: The Tigris River management scenarios
Run # DescriptionYear
2009
6-Year
Model
Existing
Flow
Conditions
Existing
Meteorolo
gical data
Existing
Nutrients
Increasing
Upstream
Flow
Decreasing
Upstream
Flow
Increasing
Nutrients
Climate
Change
Decreasing
BOD by
50%
1 Base Model X X X X
2
Increasing
Upstream
Flow
X X X X
3
Decreasing
Upstream
Flow
X X X X
4
Decreasing
Upstream
Flow with
increasing
nutrients
X X X X
5
Increasing
Tharthar
Lake’s Flow
from Samarra
Barrage
X X X X
6Climate
changeX X X X
7
Climate
change with
decreasing
upstream
flow
X X X X
8Disconnecting
Tharthar LakeX X X X
9Decreasing
BOD by 50%X X X X X
10 Base Model X X X X
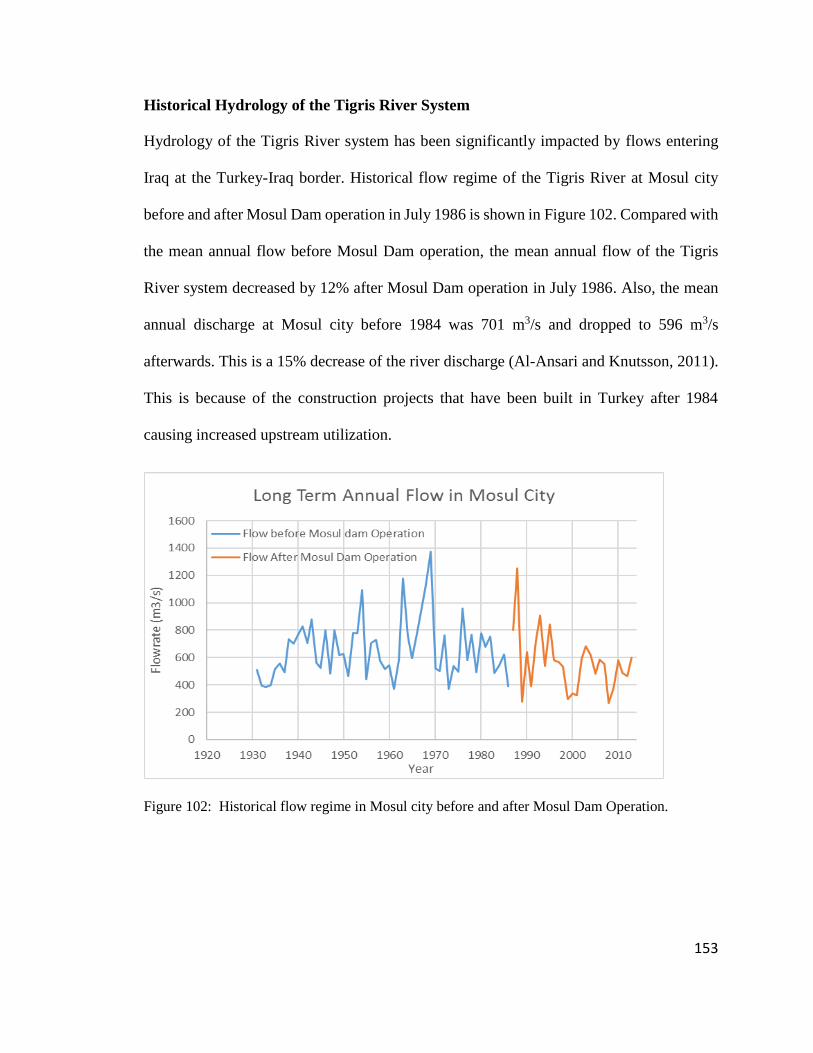
153
Historical Hydrology of the Tigris River System
Hydrology of the Tigris River system has been significantly impacted by flows entering
Iraq at the Turkey-Iraq border. Historical flow regime of the Tigris River at Mosul city
before and after Mosul Dam operation in July 1986 is shown in Figure 102. Compared with
the mean annual flow before Mosul Dam operation, the mean annual flow of the Tigris
River system decreased by 12% after Mosul Dam operation in July 1986. Also, the mean
annual discharge at Mosul city before 1984 was 701 m3/s and dropped to 596 m3/s
afterwards. This is a 15% decrease of the river discharge (Al-Ansari and Knutsson, 2011).
This is because of the construction projects that have been built in Turkey after 1984
causing increased upstream utilization.
Figure 102: Historical flow regime in Mosul city before and after Mosul Dam Operation.
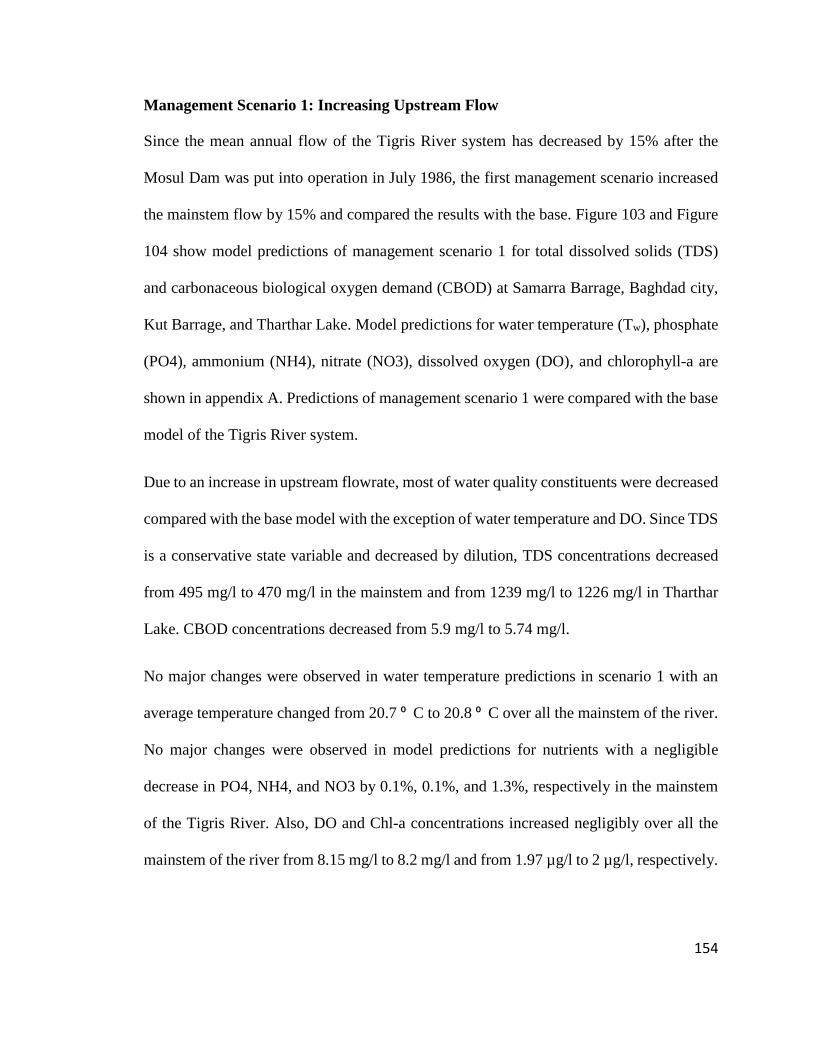
154
Management Scenario 1: Increasing Upstream Flow
Since the mean annual flow of the Tigris River system has decreased by 15% after the
Mosul Dam was put into operation in July 1986, the first management scenario increased
the mainstem flow by 15% and compared the results with the base. Figure 103 and Figure
104 show model predictions of management scenario 1 for total dissolved solids (TDS)
and carbonaceous biological oxygen demand (CBOD) at Samarra Barrage, Baghdad city,
Kut Barrage, and Tharthar Lake. Model predictions for water temperature (Tw), phosphate
(PO4), ammonium (NH4), nitrate (NO3), dissolved oxygen (DO), and chlorophyll-a are
shown in appendix A. Predictions of management scenario 1 were compared with the base
model of the Tigris River system.
Due to an increase in upstream flowrate, most of water quality constituents were decreased
compared with the base model with the exception of water temperature and DO. Since TDS
is a conservative state variable and decreased by dilution, TDS concentrations decreased
from 495 mg/l to 470 mg/l in the mainstem and from 1239 mg/l to 1226 mg/l in Tharthar
Lake. CBOD concentrations decreased from 5.9 mg/l to 5.74 mg/l.
No major changes were observed in water temperature predictions in scenario 1 with an
average temperature changed from 20.7 ⁰ C to 20.8 ⁰ C over all the mainstem of the river.
No major changes were observed in model predictions for nutrients with a negligible
decrease in PO4, NH4, and NO3 by 0.1%, 0.1%, and 1.3%, respectively in the mainstem
of the Tigris River. Also, DO and Chl-a concentrations increased negligibly over all the
mainstem of the river from 8.15 mg/l to 8.2 mg/l and from 1.97 µg/l to 2 µg/l, respectively.
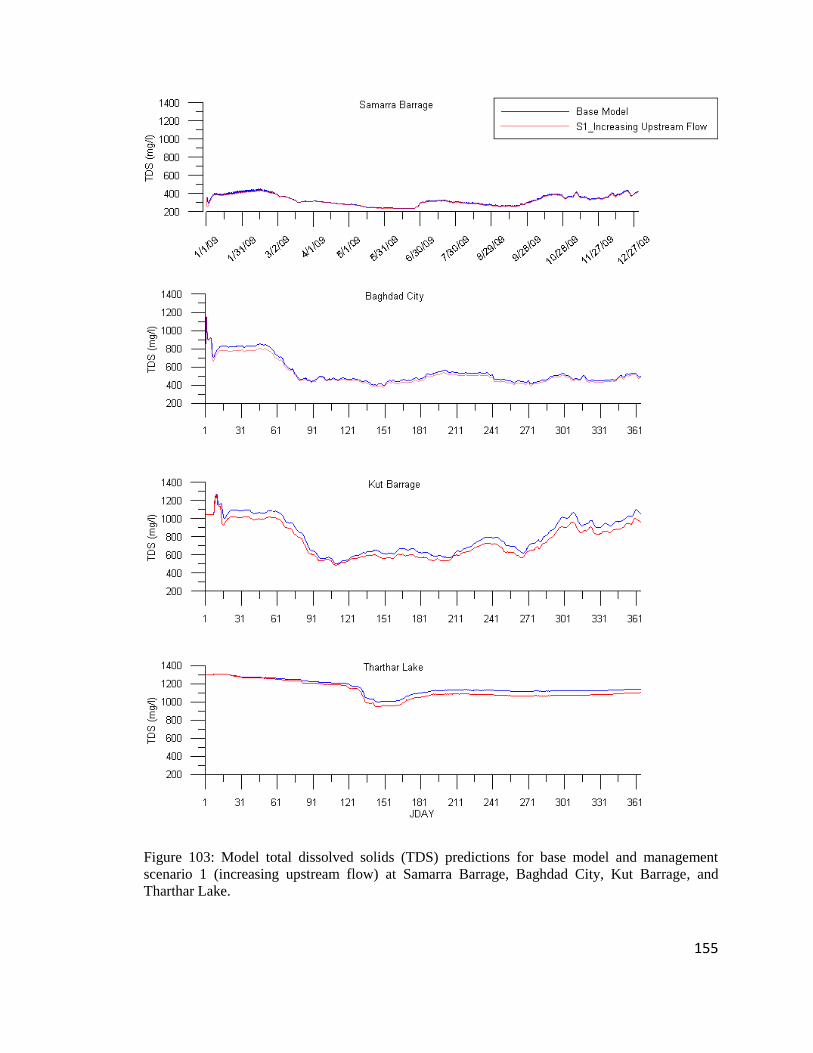
155
Figure 103: Model total dissolved solids (TDS) predictions for base model and management
scenario 1 (increasing upstream flow) at Samarra Barrage, Baghdad City, Kut Barrage, and
Tharthar Lake.
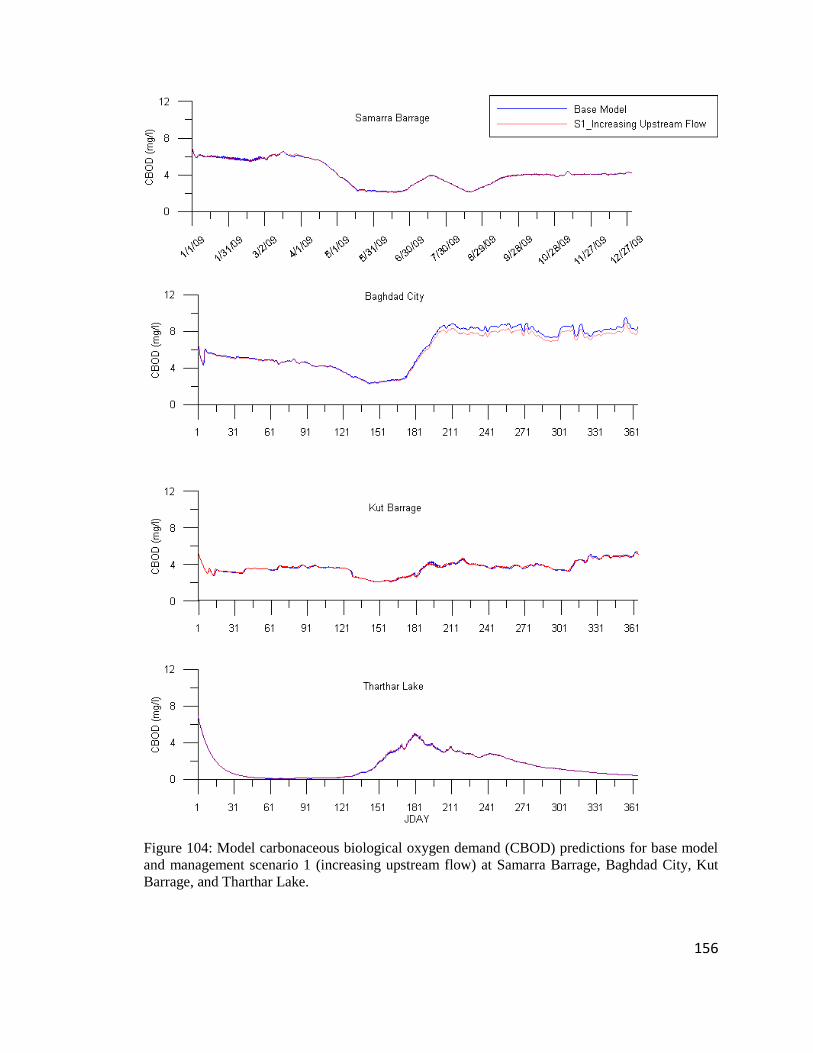
156
Figure 104: Model carbonaceous biological oxygen demand (CBOD) predictions for base model
and management scenario 1 (increasing upstream flow) at Samarra Barrage, Baghdad City, Kut
Barrage, and Tharthar Lake.
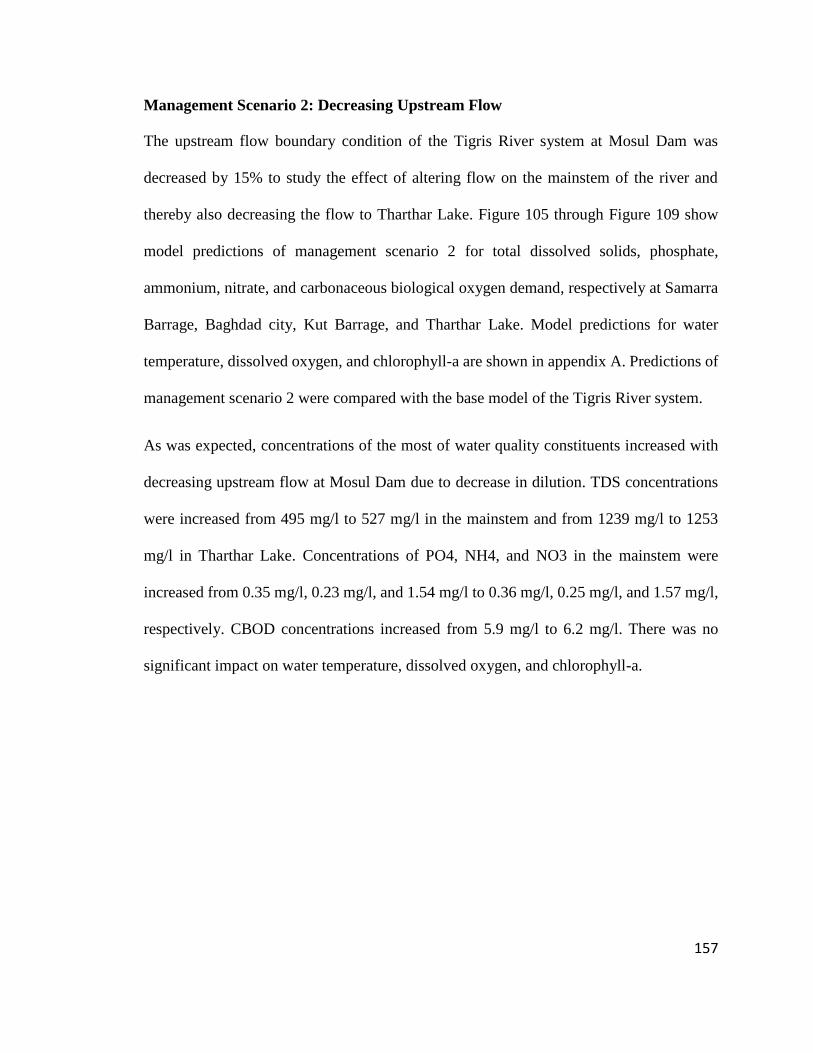
157
Management Scenario 2: Decreasing Upstream Flow
The upstream flow boundary condition of the Tigris River system at Mosul Dam was
decreased by 15% to study the effect of altering flow on the mainstem of the river and
thereby also decreasing the flow to Tharthar Lake. Figure 105 through Figure 109 show
model predictions of management scenario 2 for total dissolved solids, phosphate,
ammonium, nitrate, and carbonaceous biological oxygen demand, respectively at Samarra
Barrage, Baghdad city, Kut Barrage, and Tharthar Lake. Model predictions for water
temperature, dissolved oxygen, and chlorophyll-a are shown in appendix A. Predictions of
management scenario 2 were compared with the base model of the Tigris River system.
As was expected, concentrations of the most of water quality constituents increased with
decreasing upstream flow at Mosul Dam due to decrease in dilution. TDS concentrations
were increased from 495 mg/l to 527 mg/l in the mainstem and from 1239 mg/l to 1253
mg/l in Tharthar Lake. Concentrations of PO4, NH4, and NO3 in the mainstem were
increased from 0.35 mg/l, 0.23 mg/l, and 1.54 mg/l to 0.36 mg/l, 0.25 mg/l, and 1.57 mg/l,
respectively. CBOD concentrations increased from 5.9 mg/l to 6.2 mg/l. There was no
significant impact on water temperature, dissolved oxygen, and chlorophyll-a.
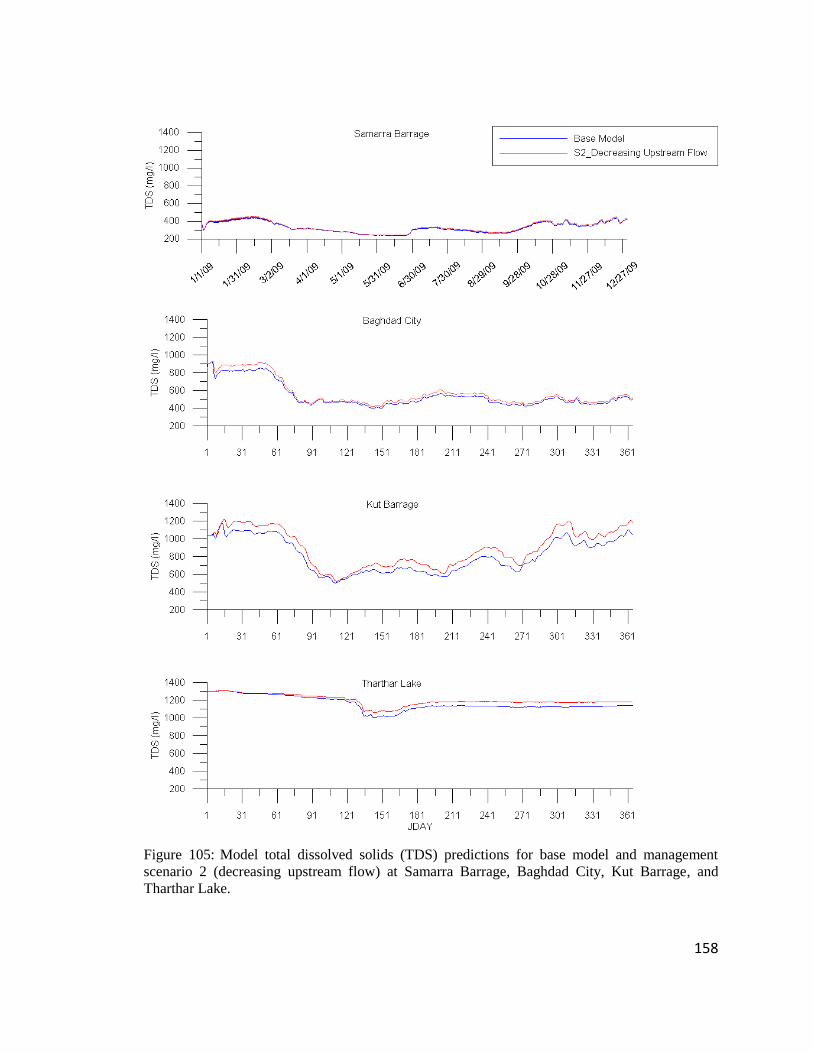
158
Figure 105: Model total dissolved solids (TDS) predictions for base model and management
scenario 2 (decreasing upstream flow) at Samarra Barrage, Baghdad City, Kut Barrage, and
Tharthar Lake.
159
Figure 106: Model phosphate (PO4) predictions for base model and management scenario 2
(decreasing upstream flow) at Samarra Barrage, Baghdad City, Kut Barrage, and Tharthar Lake.
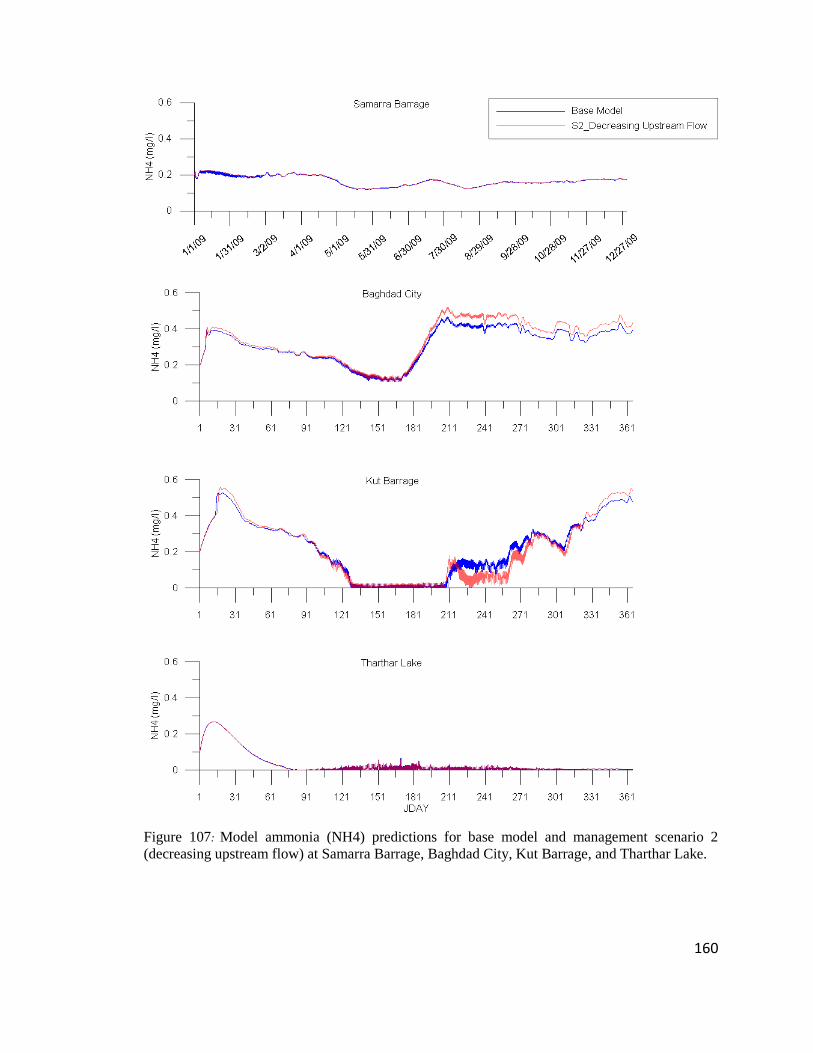
160
Figure 107: Model ammonia (NH4) predictions for base model and management scenario 2
(decreasing upstream flow) at Samarra Barrage, Baghdad City, Kut Barrage, and Tharthar Lake.
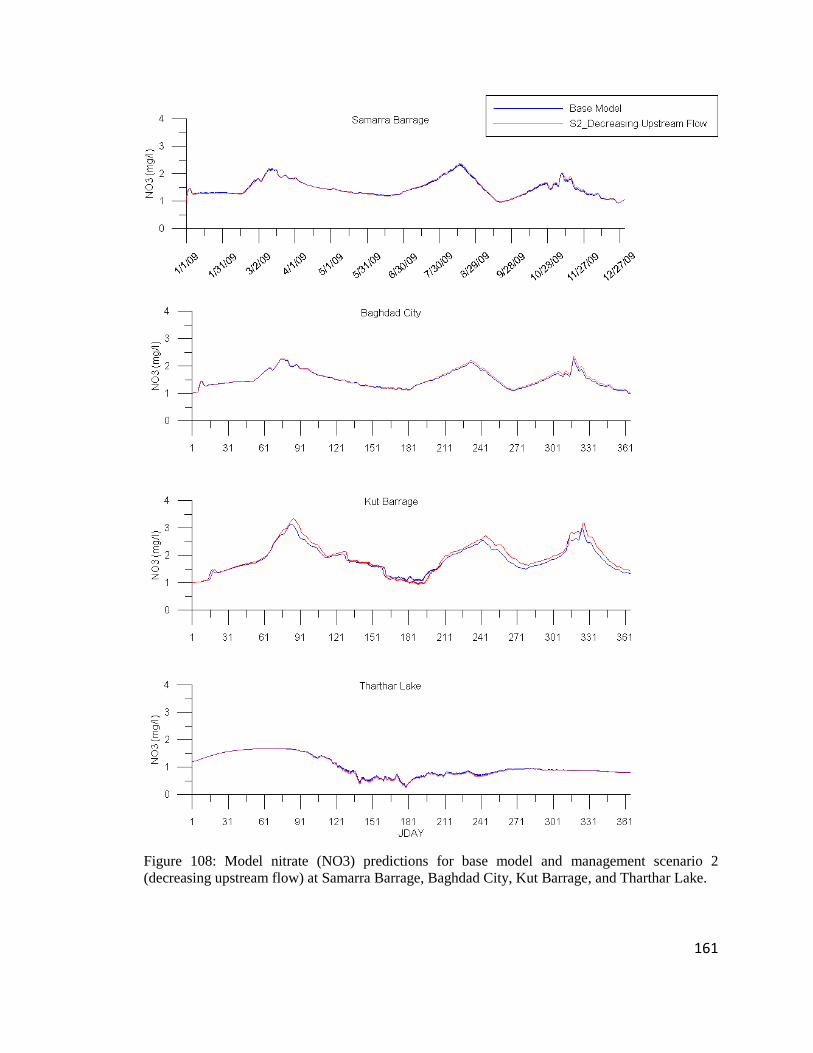
161
Figure 108: Model nitrate (NO3) predictions for base model and management scenario 2
(decreasing upstream flow) at Samarra Barrage, Baghdad City, Kut Barrage, and Tharthar Lake.
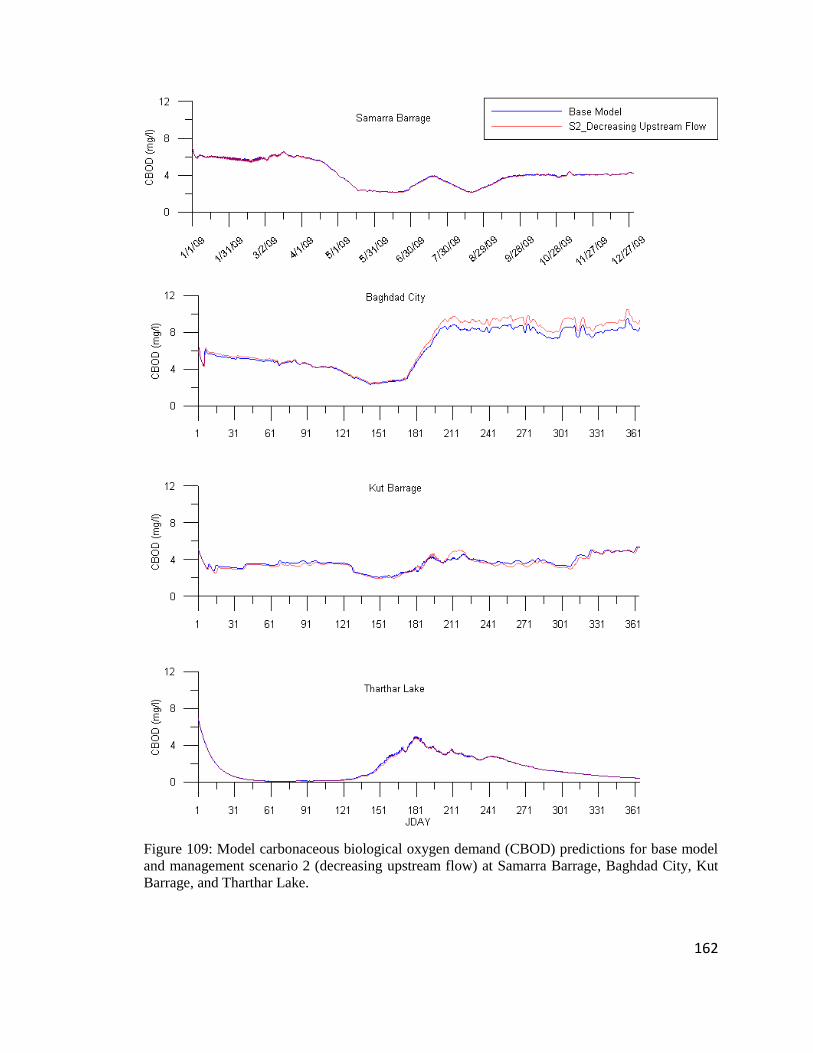
162
Figure 109: Model carbonaceous biological oxygen demand (CBOD) predictions for base model
and management scenario 2 (decreasing upstream flow) at Samarra Barrage, Baghdad City, Kut
Barrage, and Tharthar Lake.

163
Management Scenario 3: Decreasing Upstream Flow and Increasing Nutrients
Assuming a future increase in nutrient concentrations at Mosul Dam, a 10% increase in
phosphate, ammonium, and nitrate concentrations was implemented along with a 15%
decrease in upstream flow boundary conditions at Mosul Dam. Figure 110 through Figure
114 show model predictions of management scenario 3 for total dissolved solids,
phosphate, ammonium, nitrate, and carbonaceous biological oxygen demand, respectively,
at Samarra Barrage, Baghdad city, Kut Barrage, and Tharthar Lake. Model predictions for
water temperature, dissolved oxygen, and chlorophyll-a are shown in appendix A.
Predictions of management scenario 3 were compared with the base model of the Tigris
River system.
In this scenario, a similar trend in water quality concentrations was noticed as in scenario
2 with a slight increase in nutrient concentrations. Compared with the base model, TDS
concentrations increased by 9% in the mainstem and by 1.2% in Tharthar Lake.
Concentrations of PO4, NH4, and NO3 increased in the mainstem from 0.35 mg/l, 0.23
mg/l, and 1.54 mg/l to 0.37 mg/l, 0.25 mg/l, and 1.63 mg/l respectively. CBOD
concentrations increased from 5.9 mg/l to 6.2 mg/l. There were no significant impacts on
water temperature and dissolved oxygen.
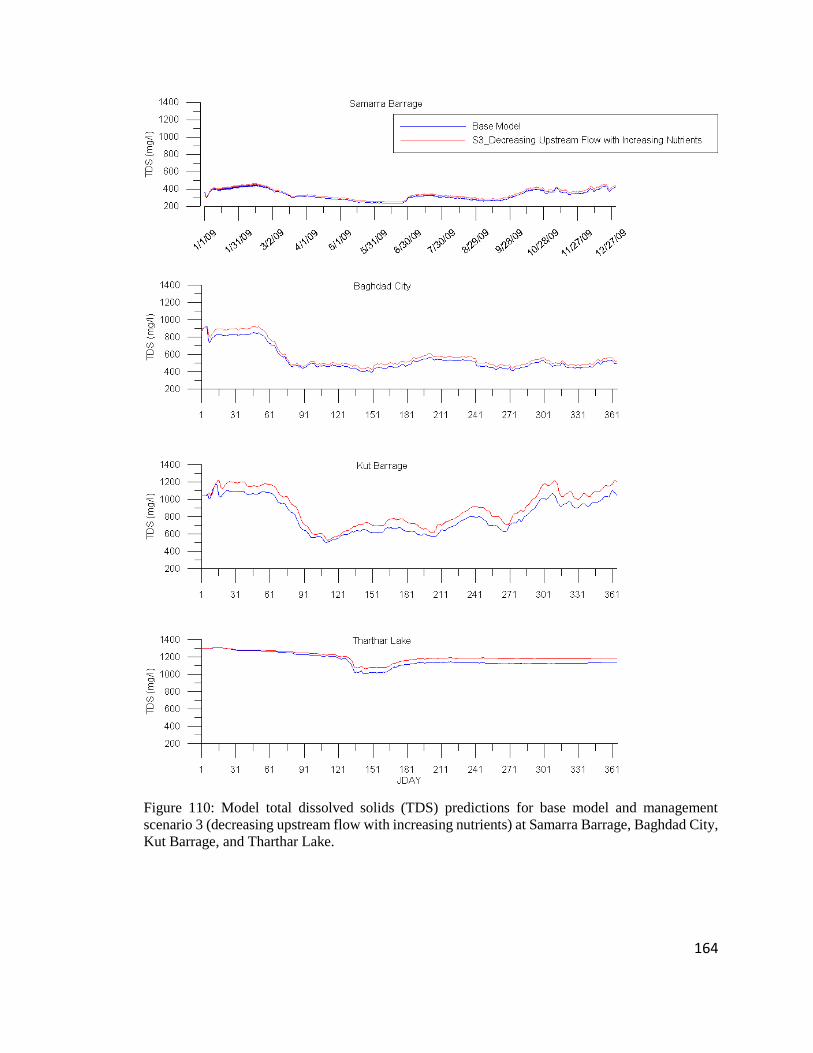
164
Figure 110: Model total dissolved solids (TDS) predictions for base model and management
scenario 3 (decreasing upstream flow with increasing nutrients) at Samarra Barrage, Baghdad City,
Kut Barrage, and Tharthar Lake.
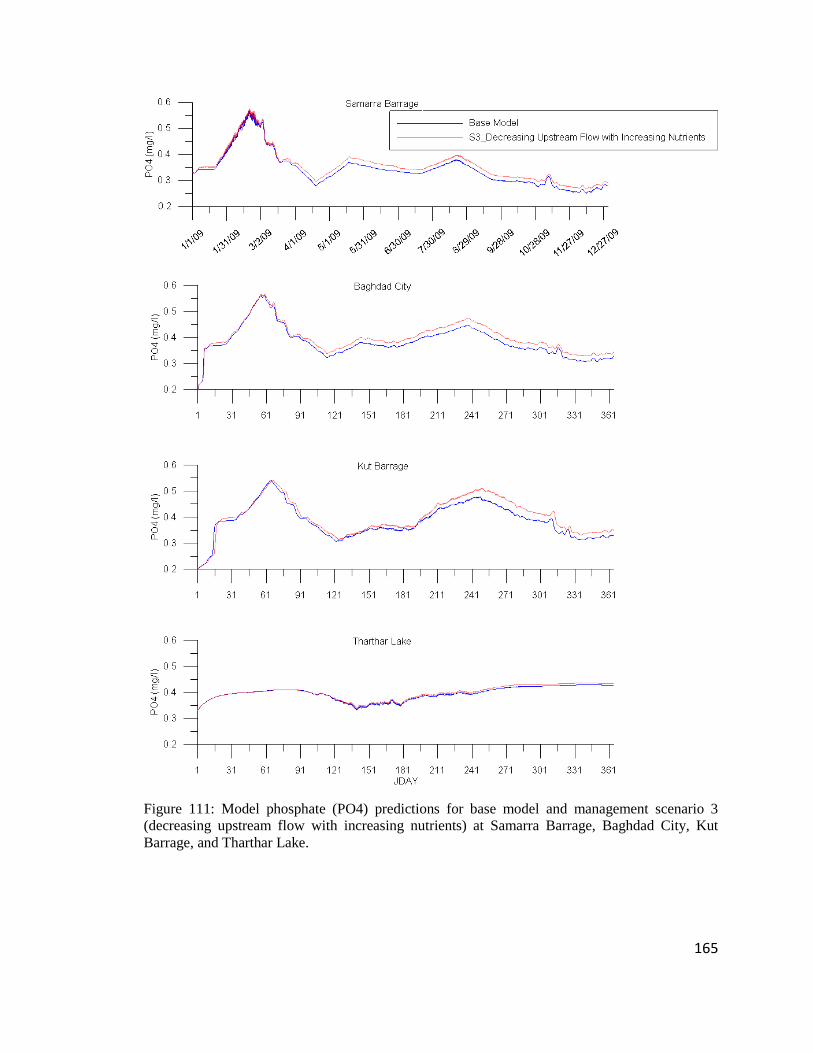
165
Figure 111: Model phosphate (PO4) predictions for base model and management scenario 3
(decreasing upstream flow with increasing nutrients) at Samarra Barrage, Baghdad City, Kut
Barrage, and Tharthar Lake.

166
Figure 112: Model ammonia (NH4) predictions for base model and management scenario 3
(decreasing upstream flow with increasing nutrients) at Samarra Barrage, Baghdad City, Kut
Barrage, and Tharthar Lake.
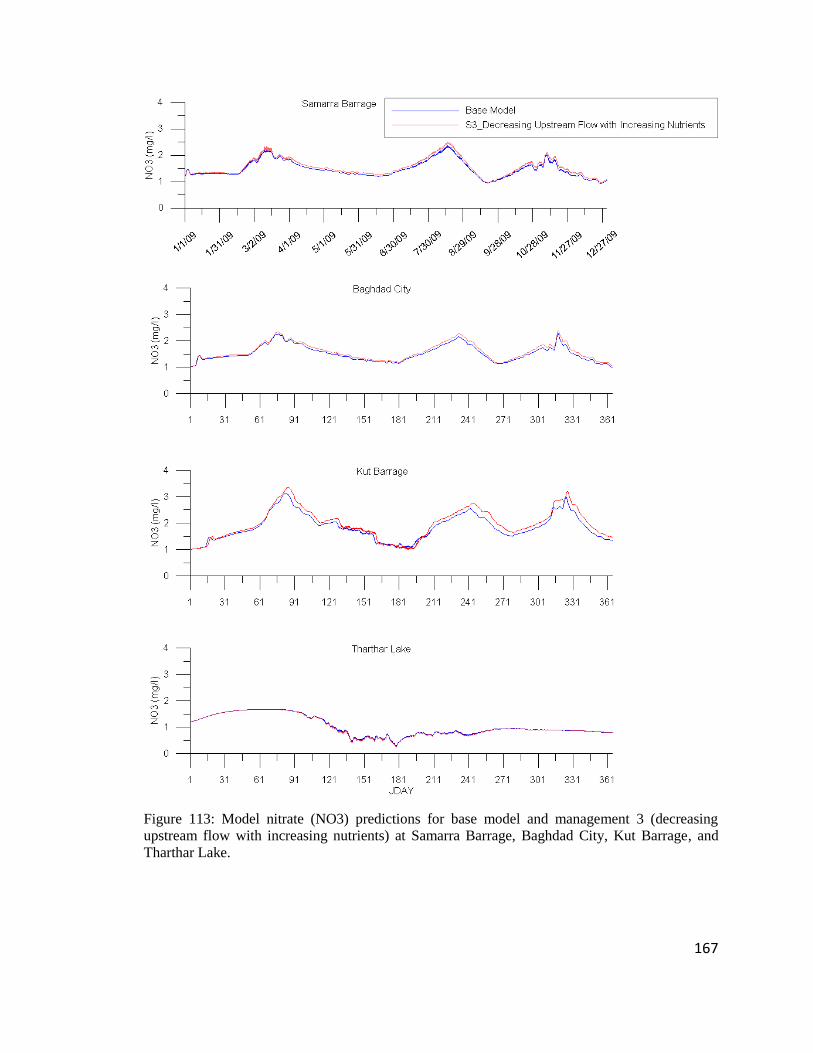
167
Figure 113: Model nitrate (NO3) predictions for base model and management 3 (decreasing
upstream flow with increasing nutrients) at Samarra Barrage, Baghdad City, Kut Barrage, and
Tharthar Lake.
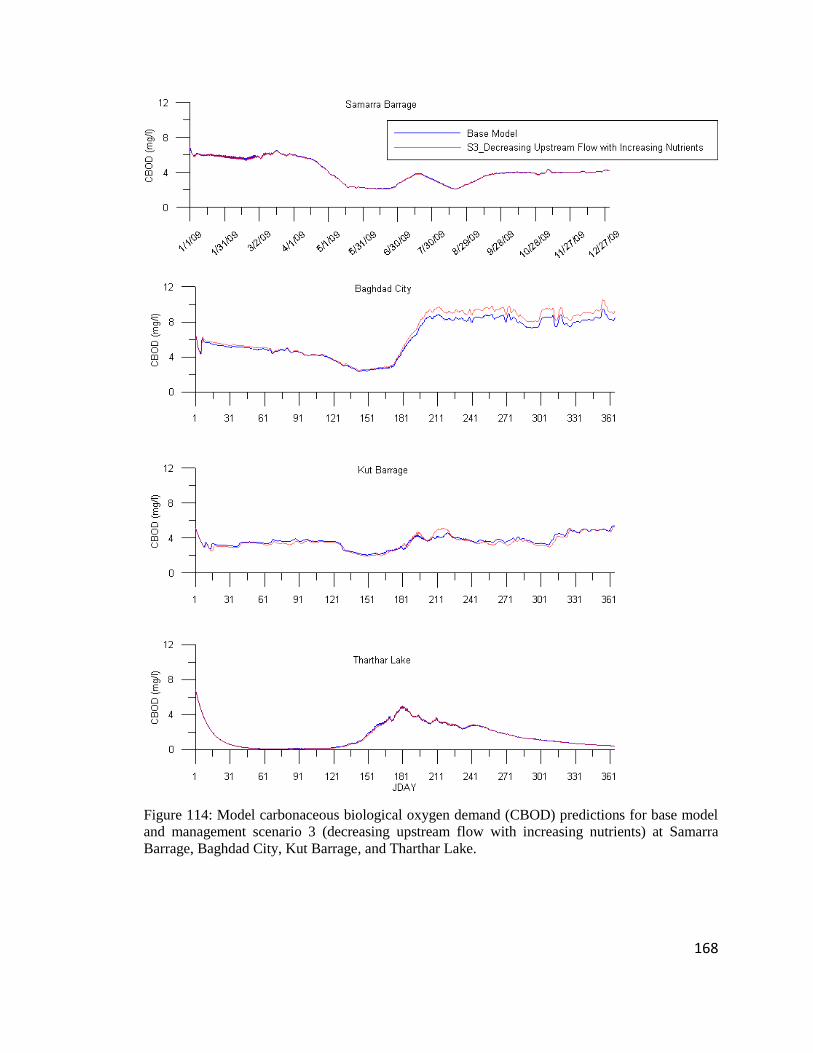
168
Figure 114: Model carbonaceous biological oxygen demand (CBOD) predictions for base model
and management scenario 3 (decreasing upstream flow with increasing nutrients) at Samarra
Barrage, Baghdad City, Kut Barrage, and Tharthar Lake.
169
Management Scenario 4: Increasing Tharthar Lake’s Flow
In this management scenario, a 10% increase in flow was diverted from Samarra barrage
to Tharthar Lake through Tigris-Tharthar canal to study the effect of increasing the lake’s
flow on Tharthar Lake and the mainstem of the Tigris River downstream Samarra Barrage.
Figure 115 shows model predictions of management scenario 4 for total dissolved solids
at Samarra Barrage, Baghdad city, Kut Barrage, and Tharthar Lake. Model predictions of
phosphate, ammonium, nitrate, carbonaceous biological oxygen demand, and chlorophyll-
a are shown in appendix A. Predictions of management scenario 4 were compared with the
base model of the Tigris River system.
There was no substantial impact on TDS concentrations in the mainstem with an average
concentration decreased from 495 mg/l to 493 mg/l, while a decrease from 1239 mg/l to
1231 mg/l was recorded in Tharthar Lake. There were no major changes in water
temperature, nutrients, CBOD, DO, and Chl-a.
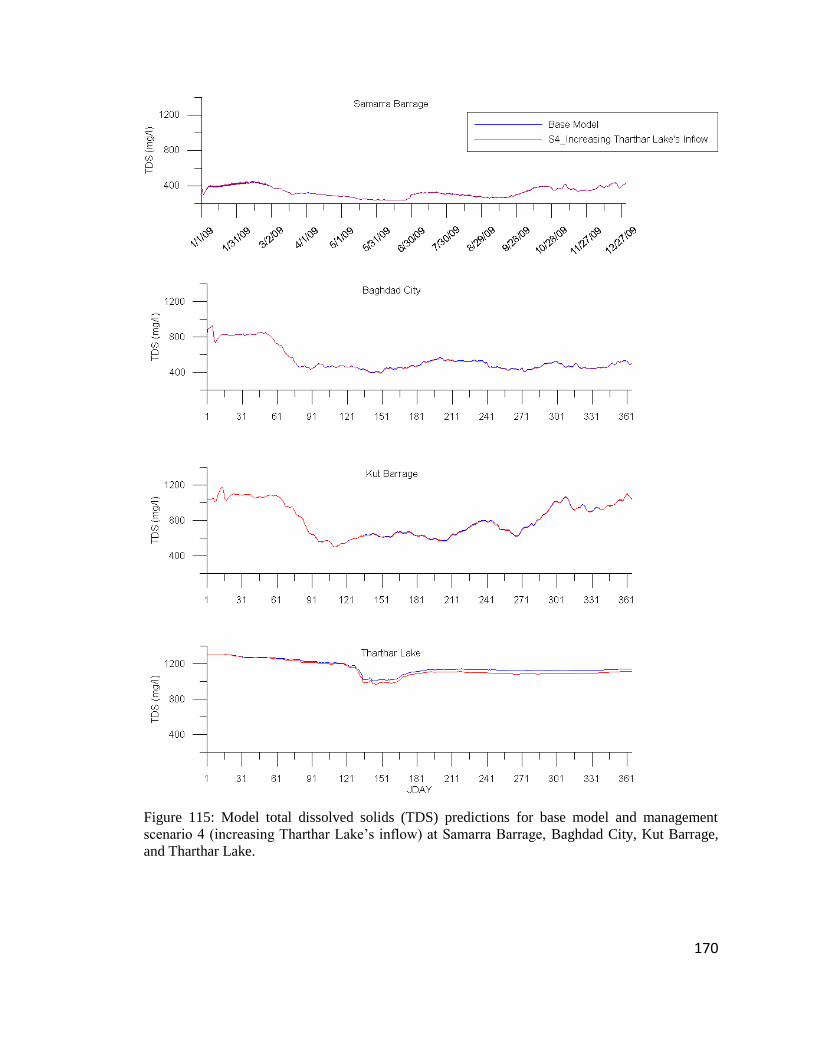
170
Figure 115: Model total dissolved solids (TDS) predictions for base model and management
scenario 4 (increasing Tharthar Lake’s inflow) at Samarra Barrage, Baghdad City, Kut Barrage,
and Tharthar Lake.
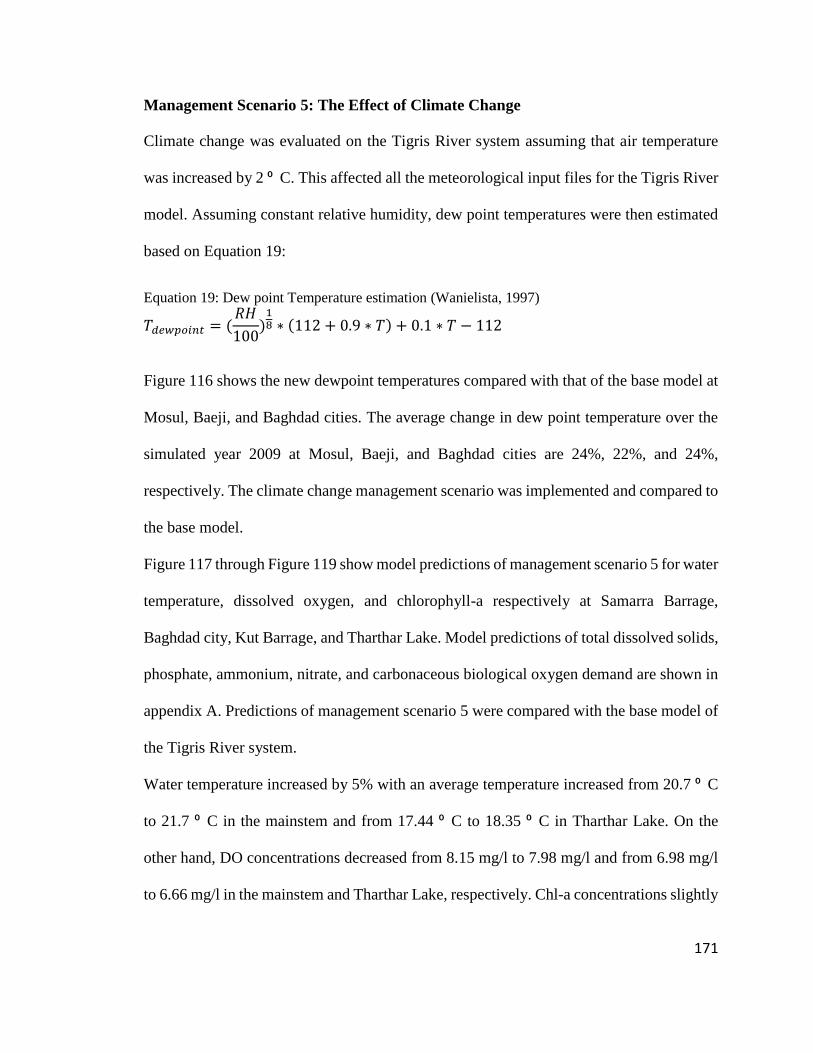
171
Management Scenario 5: The Effect of Climate Change
Climate change was evaluated on the Tigris River system assuming that air temperature
was increased by 2 ⁰ C. This affected all the meteorological input files for the Tigris River
model. Assuming constant relative humidity, dew point temperatures were then estimated
based on Equation 19:
Equation 19: Dew point Temperature estimation (Wanielista, 1997)
𝑇𝑑𝑒𝑤𝑝𝑜𝑖𝑛𝑡 = (𝑅𝐻
100)
18 ∗ (112 + 0.9 ∗ 𝑇) + 0.1 ∗ 𝑇 − 112
Figure 116 shows the new dewpoint temperatures compared with that of the base model at
Mosul, Baeji, and Baghdad cities. The average change in dew point temperature over the
simulated year 2009 at Mosul, Baeji, and Baghdad cities are 24%, 22%, and 24%,
respectively. The climate change management scenario was implemented and compared to
the base model.
Figure 117 through Figure 119 show model predictions of management scenario 5 for water
temperature, dissolved oxygen, and chlorophyll-a respectively at Samarra Barrage,
Baghdad city, Kut Barrage, and Tharthar Lake. Model predictions of total dissolved solids,
phosphate, ammonium, nitrate, and carbonaceous biological oxygen demand are shown in
appendix A. Predictions of management scenario 5 were compared with the base model of
the Tigris River system.
Water temperature increased by 5% with an average temperature increased from 20.7 ⁰ C
to 21.7 ⁰ C in the mainstem and from 17.44 ⁰ C to 18.35 ⁰ C in Tharthar Lake. On the
other hand, DO concentrations decreased from 8.15 mg/l to 7.98 mg/l and from 6.98 mg/l
to 6.66 mg/l in the mainstem and Tharthar Lake, respectively. Chl-a concentrations slightly
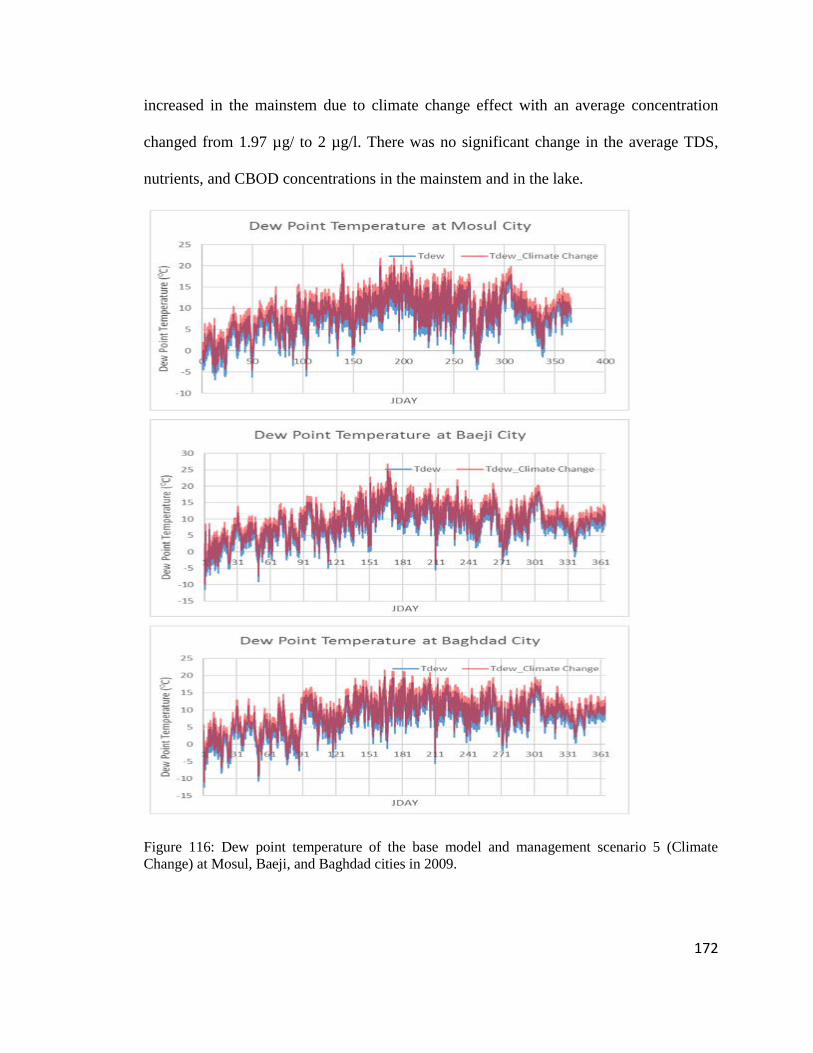
172
increased in the mainstem due to climate change effect with an average concentration
changed from 1.97 µg/ to 2 µg/l. There was no significant change in the average TDS,
nutrients, and CBOD concentrations in the mainstem and in the lake.
Figure 116: Dew point temperature of the base model and management scenario 5 (Climate
Change) at Mosul, Baeji, and Baghdad cities in 2009.
173
Figure 117: Model water temperature (T) predictions for base model and management scenario 5
(climate change) at Samarra Barrage, Baghdad City, Kut Barrage, and Tharthar Lake.
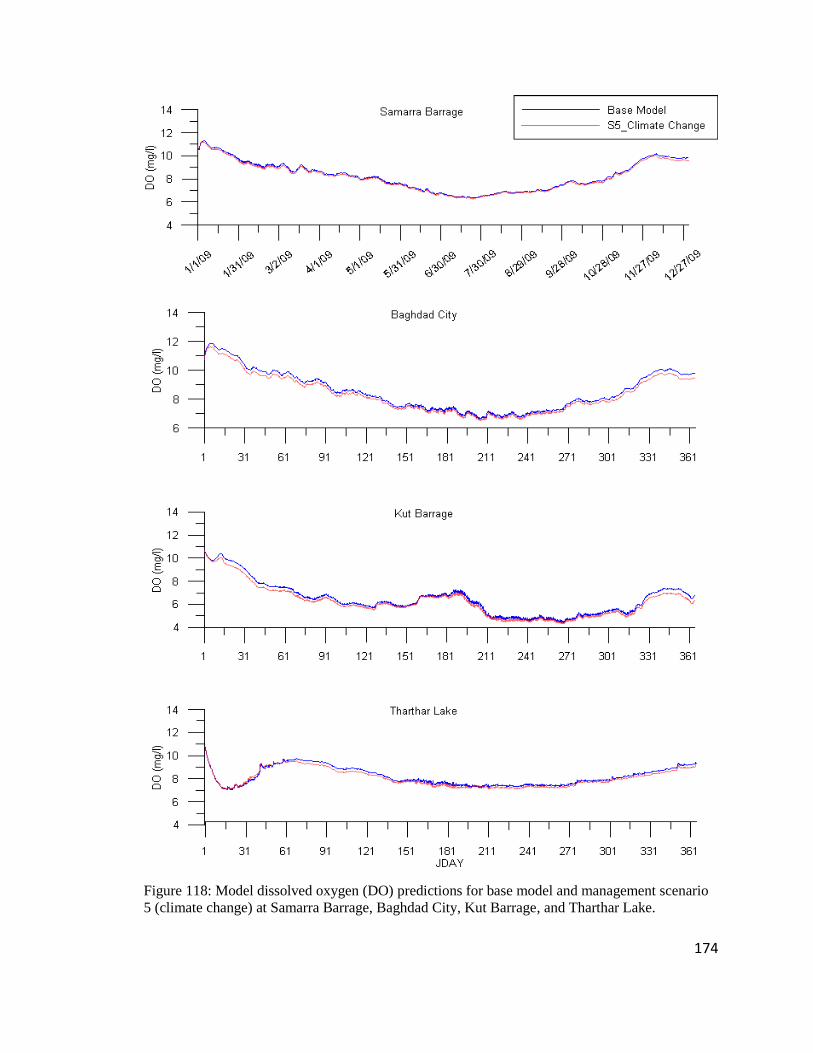
174
Figure 118: Model dissolved oxygen (DO) predictions for base model and management scenario
5 (climate change) at Samarra Barrage, Baghdad City, Kut Barrage, and Tharthar Lake.

175
Figure 119: Model chlorophyll-a (Chl-a) predictions for base model and management scenario 5
(climate change) at Samarra Barrage, Baghdad City, Kut Barrage, and Tharthar Lake.
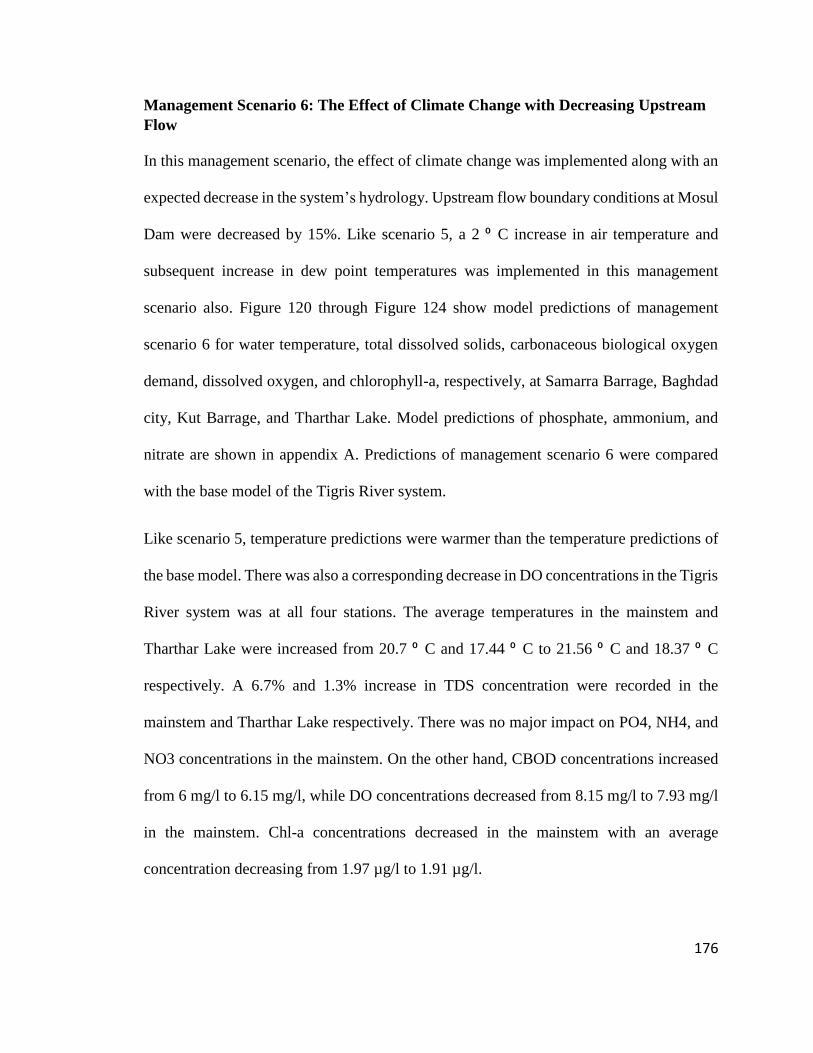
176
Management Scenario 6: The Effect of Climate Change with Decreasing Upstream
Flow
In this management scenario, the effect of climate change was implemented along with an
expected decrease in the system’s hydrology. Upstream flow boundary conditions at Mosul
Dam were decreased by 15%. Like scenario 5, a 2 ⁰ C increase in air temperature and
subsequent increase in dew point temperatures was implemented in this management
scenario also. Figure 120 through Figure 124 show model predictions of management
scenario 6 for water temperature, total dissolved solids, carbonaceous biological oxygen
demand, dissolved oxygen, and chlorophyll-a, respectively, at Samarra Barrage, Baghdad
city, Kut Barrage, and Tharthar Lake. Model predictions of phosphate, ammonium, and
nitrate are shown in appendix A. Predictions of management scenario 6 were compared
with the base model of the Tigris River system.
Like scenario 5, temperature predictions were warmer than the temperature predictions of
the base model. There was also a corresponding decrease in DO concentrations in the Tigris
River system was at all four stations. The average temperatures in the mainstem and
Tharthar Lake were increased from 20.7 ⁰ C and 17.44 ⁰ C to 21.56 ⁰ C and 18.37 ⁰ C
respectively. A 6.7% and 1.3% increase in TDS concentration were recorded in the
mainstem and Tharthar Lake respectively. There was no major impact on PO4, NH4, and
NO3 concentrations in the mainstem. On the other hand, CBOD concentrations increased
from 6 mg/l to 6.15 mg/l, while DO concentrations decreased from 8.15 mg/l to 7.93 mg/l
in the mainstem. Chl-a concentrations decreased in the mainstem with an average
concentration decreasing from 1.97 µg/l to 1.91 µg/l.
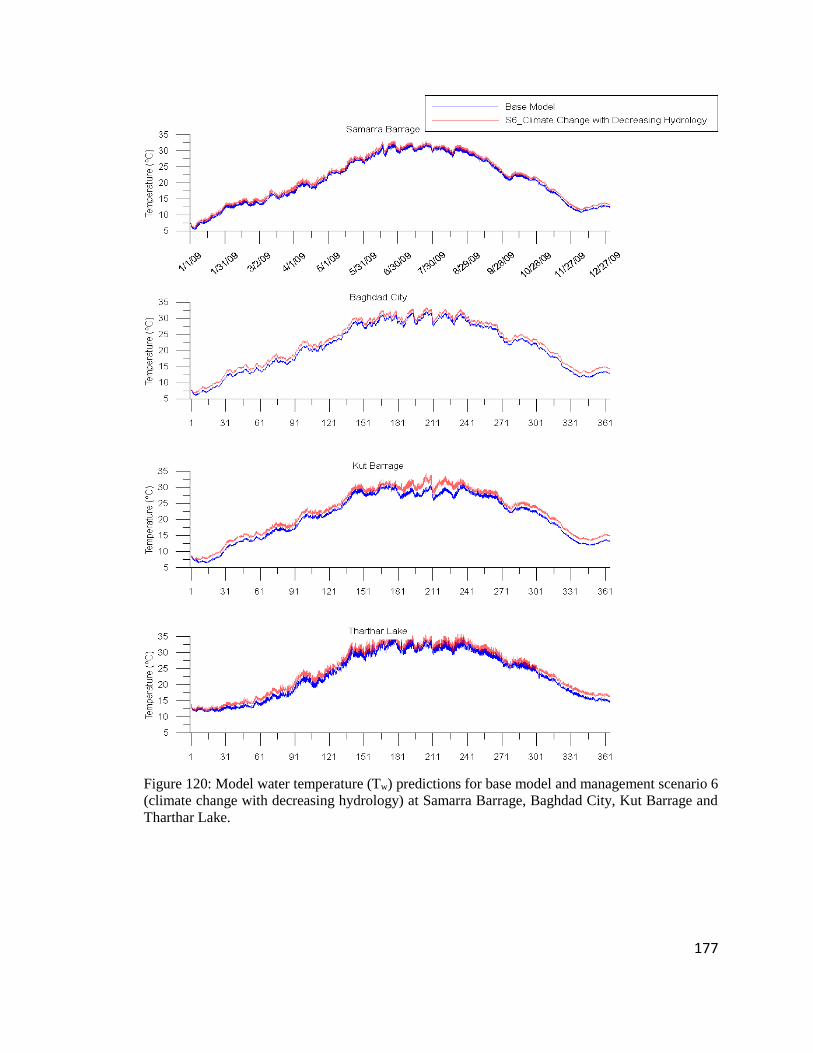
177
Figure 120: Model water temperature (Tw) predictions for base model and management scenario 6
(climate change with decreasing hydrology) at Samarra Barrage, Baghdad City, Kut Barrage and
Tharthar Lake.
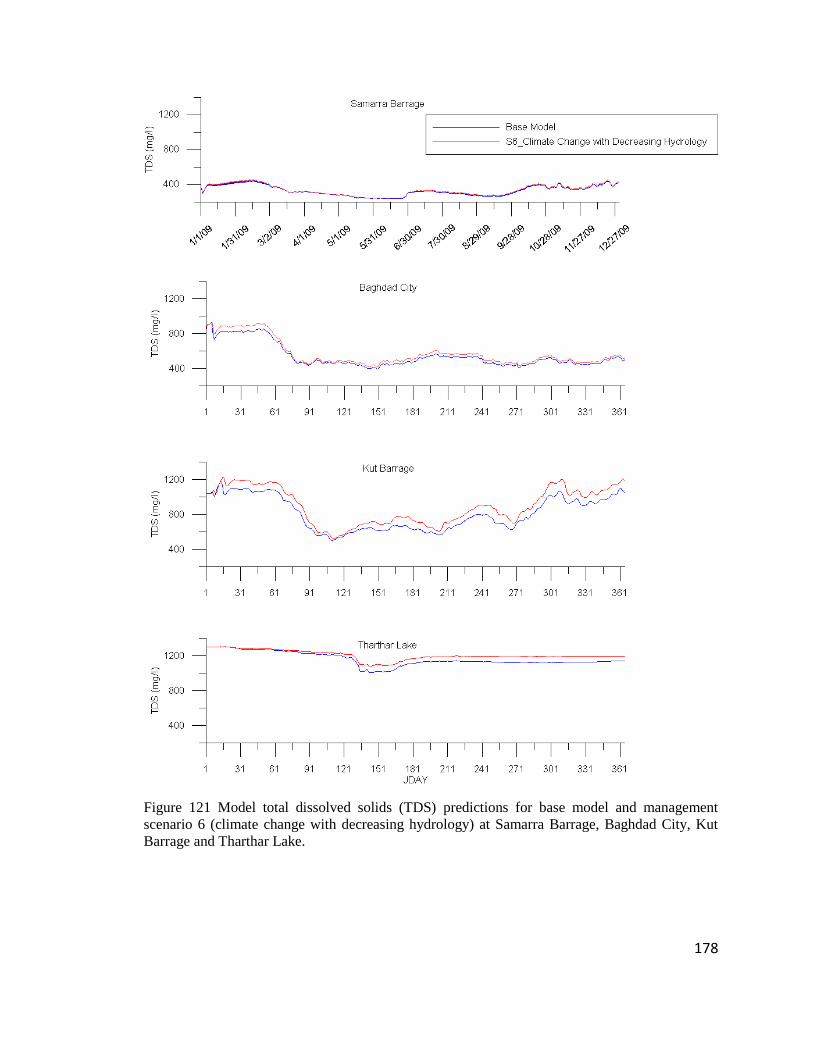
178
Figure 121 Model total dissolved solids (TDS) predictions for base model and management
scenario 6 (climate change with decreasing hydrology) at Samarra Barrage, Baghdad City, Kut
Barrage and Tharthar Lake.
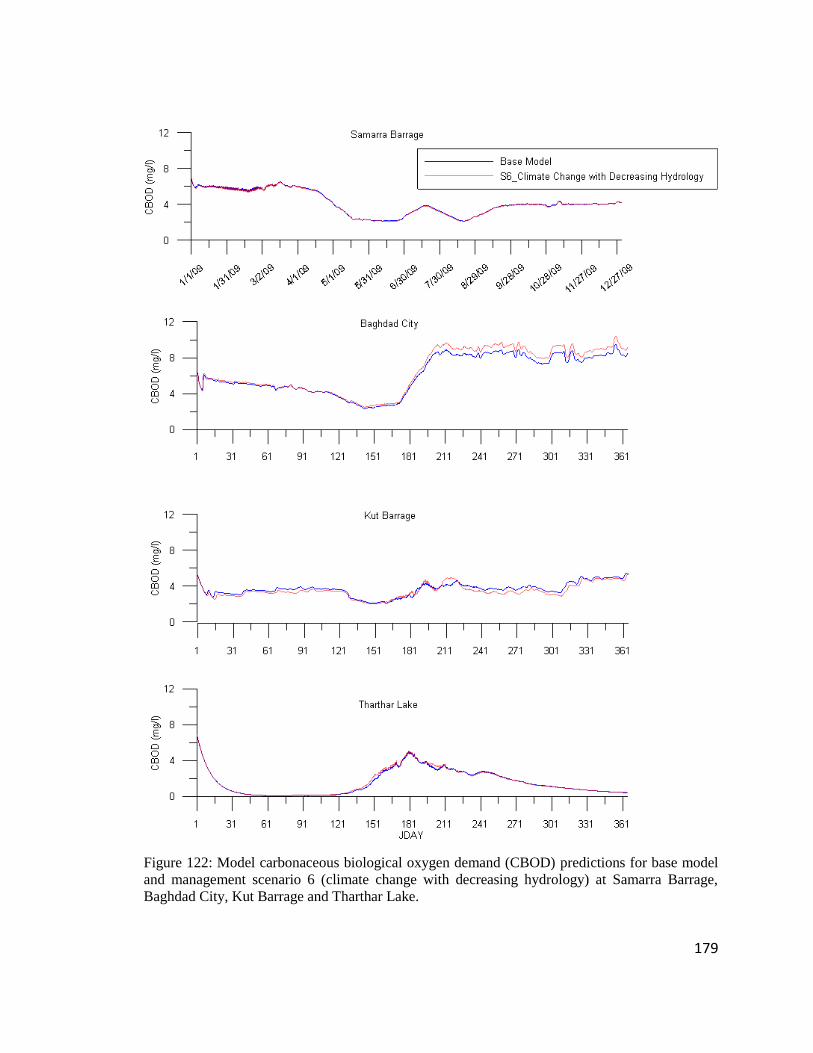
179
Figure 122: Model carbonaceous biological oxygen demand (CBOD) predictions for base model
and management scenario 6 (climate change with decreasing hydrology) at Samarra Barrage,
Baghdad City, Kut Barrage and Tharthar Lake.
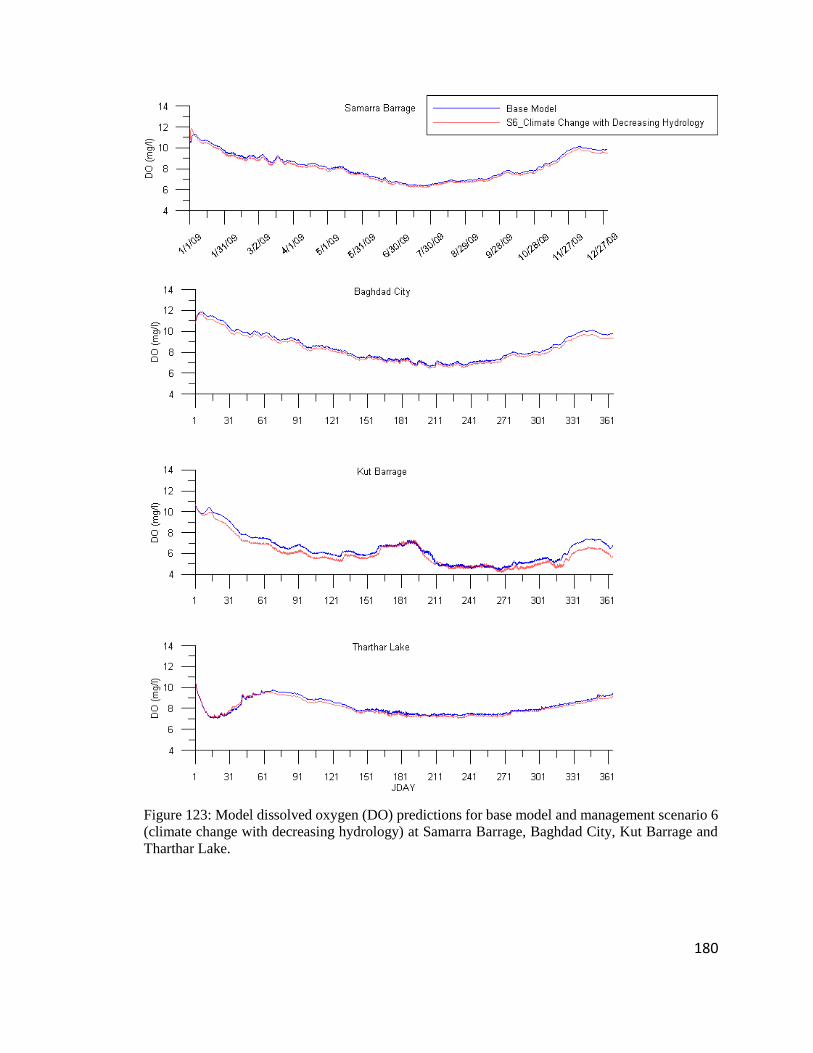
180
Figure 123: Model dissolved oxygen (DO) predictions for base model and management scenario 6
(climate change with decreasing hydrology) at Samarra Barrage, Baghdad City, Kut Barrage and
Tharthar Lake.
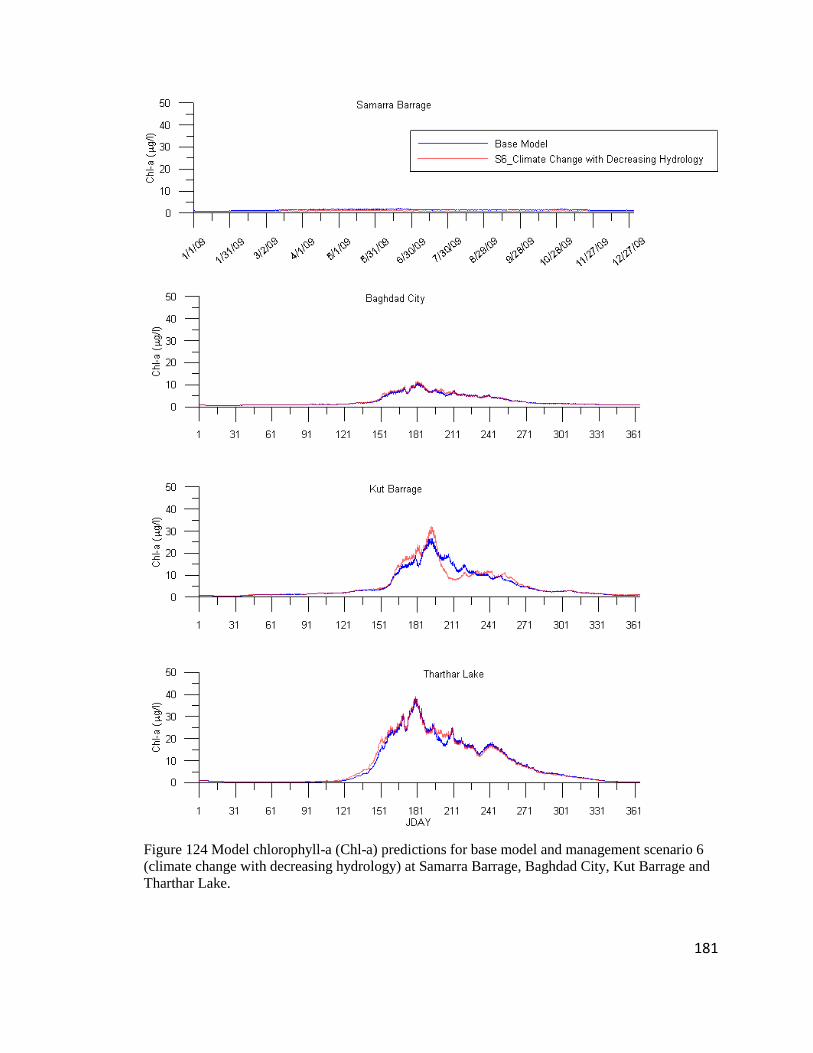
181
Figure 124 Model chlorophyll-a (Chl-a) predictions for base model and management scenario 6
(climate change with decreasing hydrology) at Samarra Barrage, Baghdad City, Kut Barrage and
Tharthar Lake.
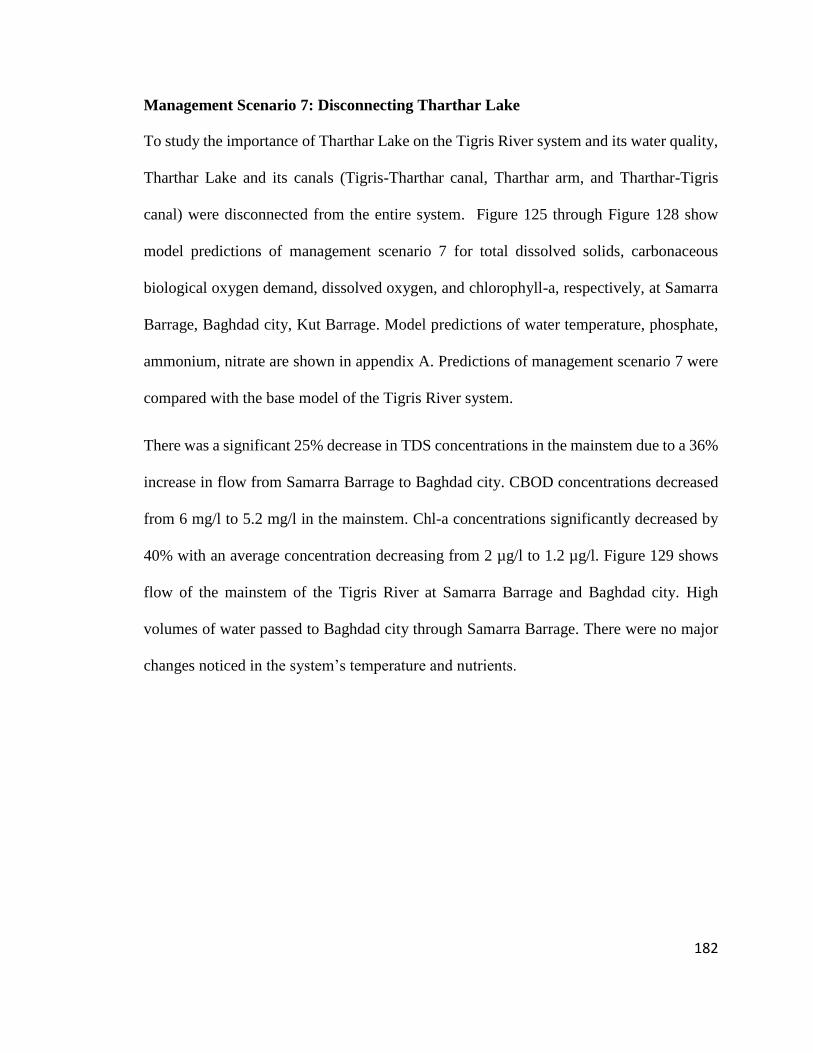
182
Management Scenario 7: Disconnecting Tharthar Lake
To study the importance of Tharthar Lake on the Tigris River system and its water quality,
Tharthar Lake and its canals (Tigris-Tharthar canal, Tharthar arm, and Tharthar-Tigris
canal) were disconnected from the entire system. Figure 125 through Figure 128 show
model predictions of management scenario 7 for total dissolved solids, carbonaceous
biological oxygen demand, dissolved oxygen, and chlorophyll-a, respectively, at Samarra
Barrage, Baghdad city, Kut Barrage. Model predictions of water temperature, phosphate,
ammonium, nitrate are shown in appendix A. Predictions of management scenario 7 were
compared with the base model of the Tigris River system.
There was a significant 25% decrease in TDS concentrations in the mainstem due to a 36%
increase in flow from Samarra Barrage to Baghdad city. CBOD concentrations decreased
from 6 mg/l to 5.2 mg/l in the mainstem. Chl-a concentrations significantly decreased by
40% with an average concentration decreasing from 2 µg/l to 1.2 µg/l. Figure 129 shows
flow of the mainstem of the Tigris River at Samarra Barrage and Baghdad city. High
volumes of water passed to Baghdad city through Samarra Barrage. There were no major
changes noticed in the system’s temperature and nutrients.
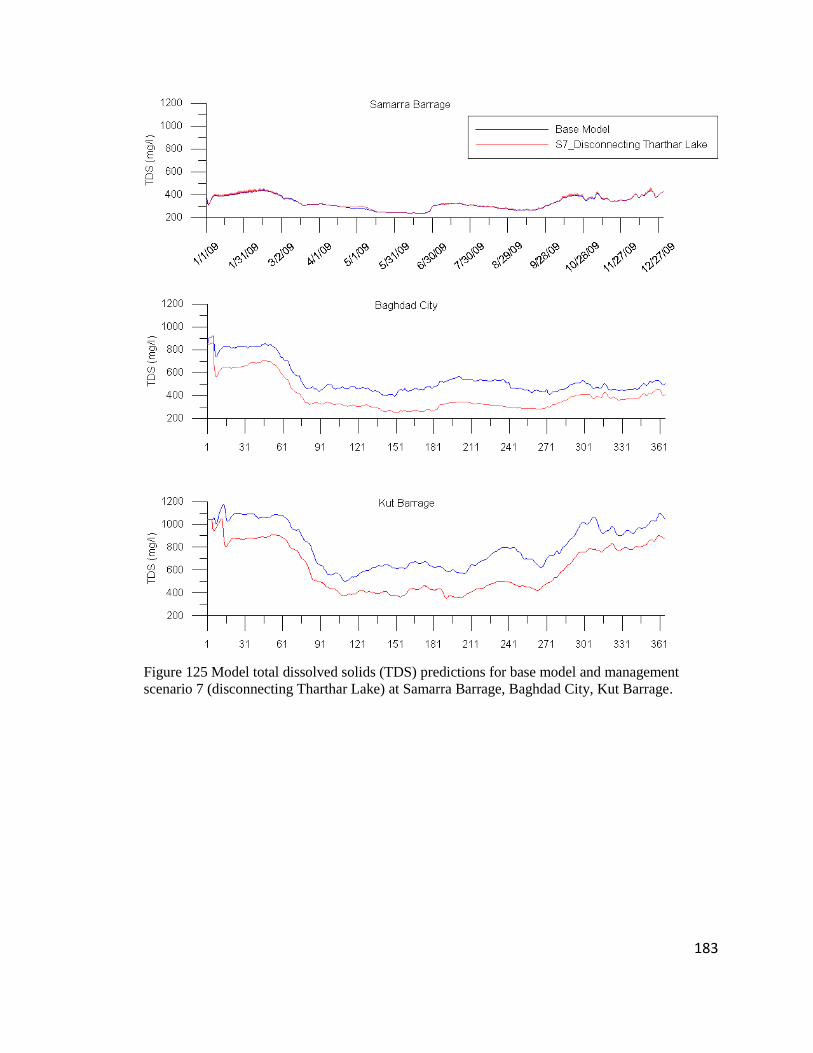
183
Figure 125 Model total dissolved solids (TDS) predictions for base model and management
scenario 7 (disconnecting Tharthar Lake) at Samarra Barrage, Baghdad City, Kut Barrage.
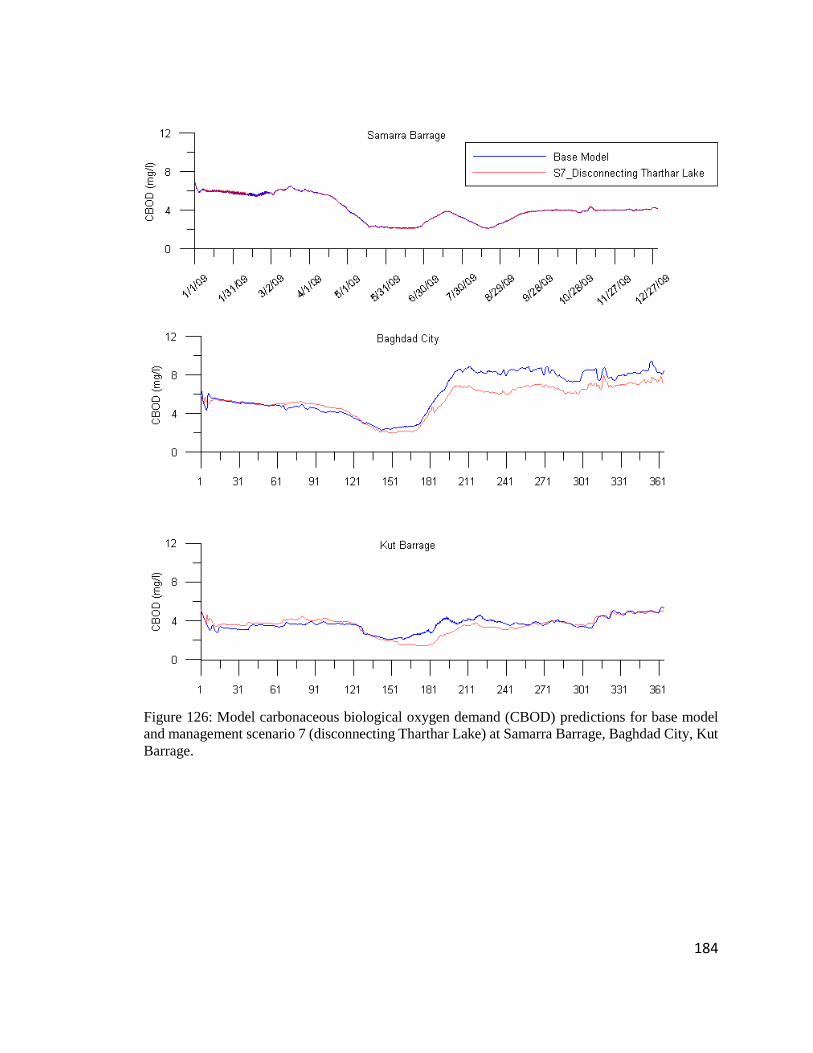
184
Figure 126: Model carbonaceous biological oxygen demand (CBOD) predictions for base model
and management scenario 7 (disconnecting Tharthar Lake) at Samarra Barrage, Baghdad City, Kut
Barrage.
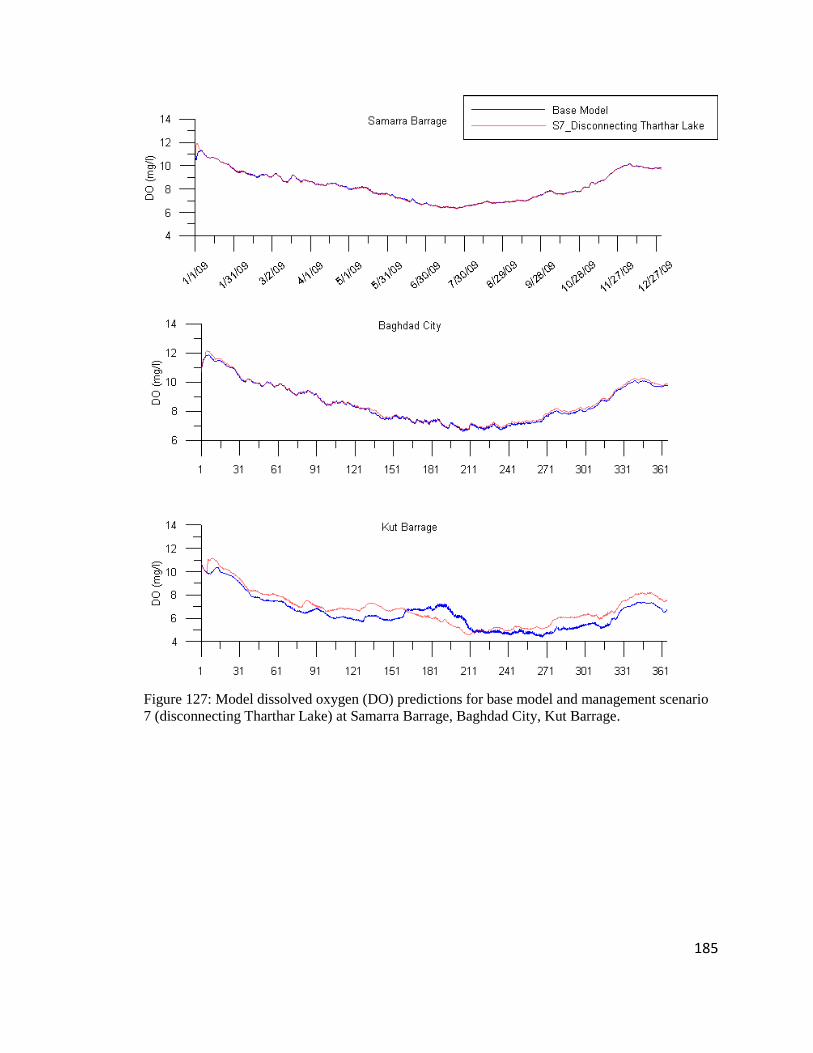
185
Figure 127: Model dissolved oxygen (DO) predictions for base model and management scenario
7 (disconnecting Tharthar Lake) at Samarra Barrage, Baghdad City, Kut Barrage.
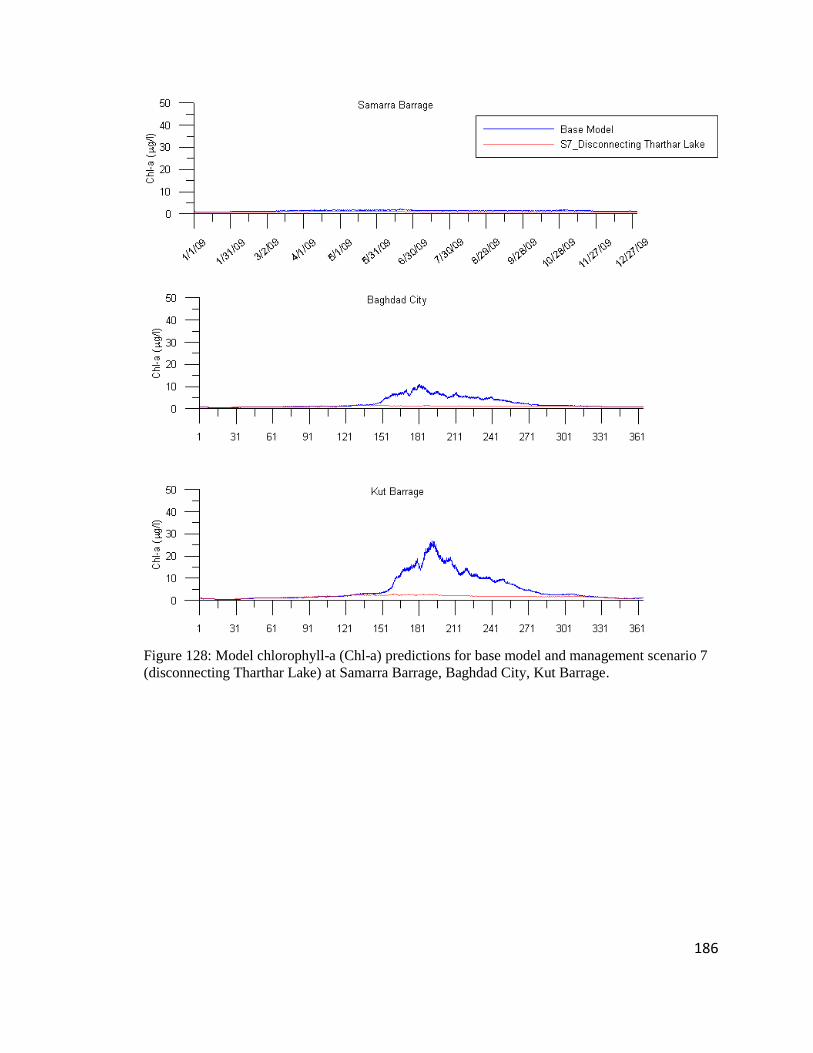
186
Figure 128: Model chlorophyll-a (Chl-a) predictions for base model and management scenario 7
(disconnecting Tharthar Lake) at Samarra Barrage, Baghdad City, Kut Barrage.

187
Figure 129: Model flowrate (Q) predictions for base model and management scenario 7
(disconnecting Tharthar Lake) at Samarra Barrage and Baghdad City.
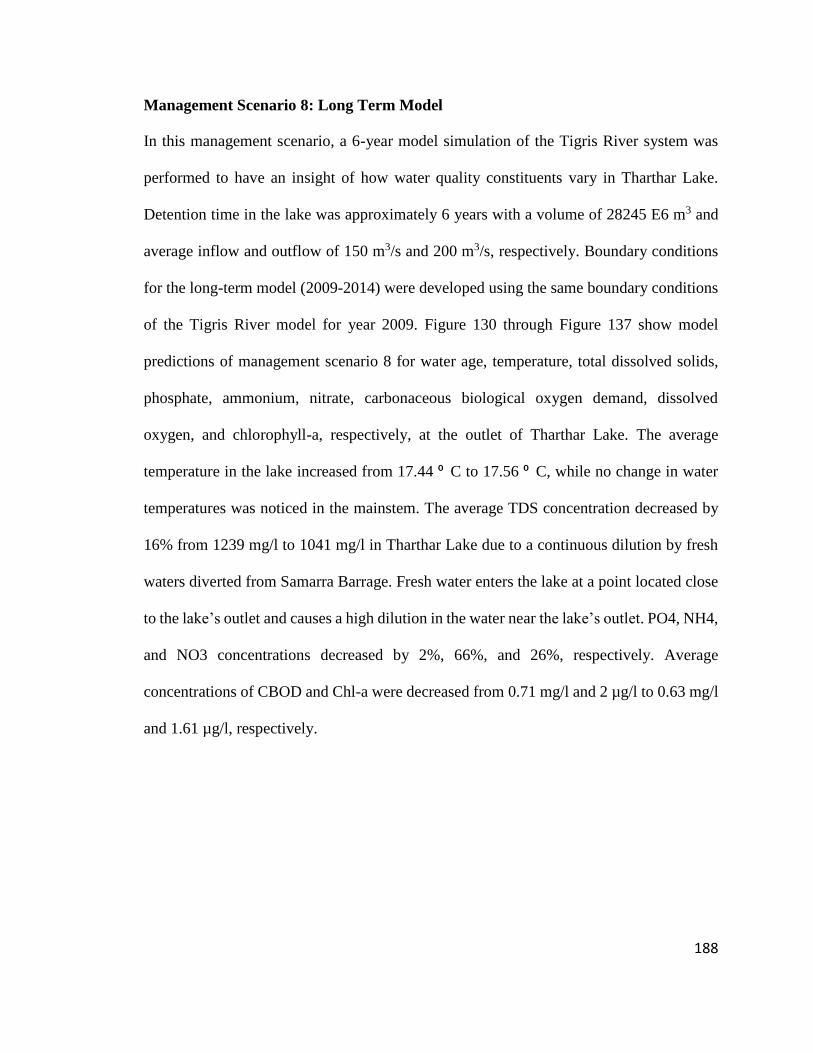
188
Management Scenario 8: Long Term Model
In this management scenario, a 6-year model simulation of the Tigris River system was
performed to have an insight of how water quality constituents vary in Tharthar Lake.
Detention time in the lake was approximately 6 years with a volume of 28245 E6 m3 and
average inflow and outflow of 150 m3/s and 200 m3/s, respectively. Boundary conditions
for the long-term model (2009-2014) were developed using the same boundary conditions
of the Tigris River model for year 2009. Figure 130 through Figure 137 show model
predictions of management scenario 8 for water age, temperature, total dissolved solids,
phosphate, ammonium, nitrate, carbonaceous biological oxygen demand, dissolved
oxygen, and chlorophyll-a, respectively, at the outlet of Tharthar Lake. The average
temperature in the lake increased from 17.44 ⁰ C to 17.56 ⁰ C, while no change in water
temperatures was noticed in the mainstem. The average TDS concentration decreased by
16% from 1239 mg/l to 1041 mg/l in Tharthar Lake due to a continuous dilution by fresh
waters diverted from Samarra Barrage. Fresh water enters the lake at a point located close
to the lake’s outlet and causes a high dilution in the water near the lake’s outlet. PO4, NH4,
and NO3 concentrations decreased by 2%, 66%, and 26%, respectively. Average
concentrations of CBOD and Chl-a were decreased from 0.71 mg/l and 2 µg/l to 0.63 mg/l
and 1.61 µg/l, respectively.
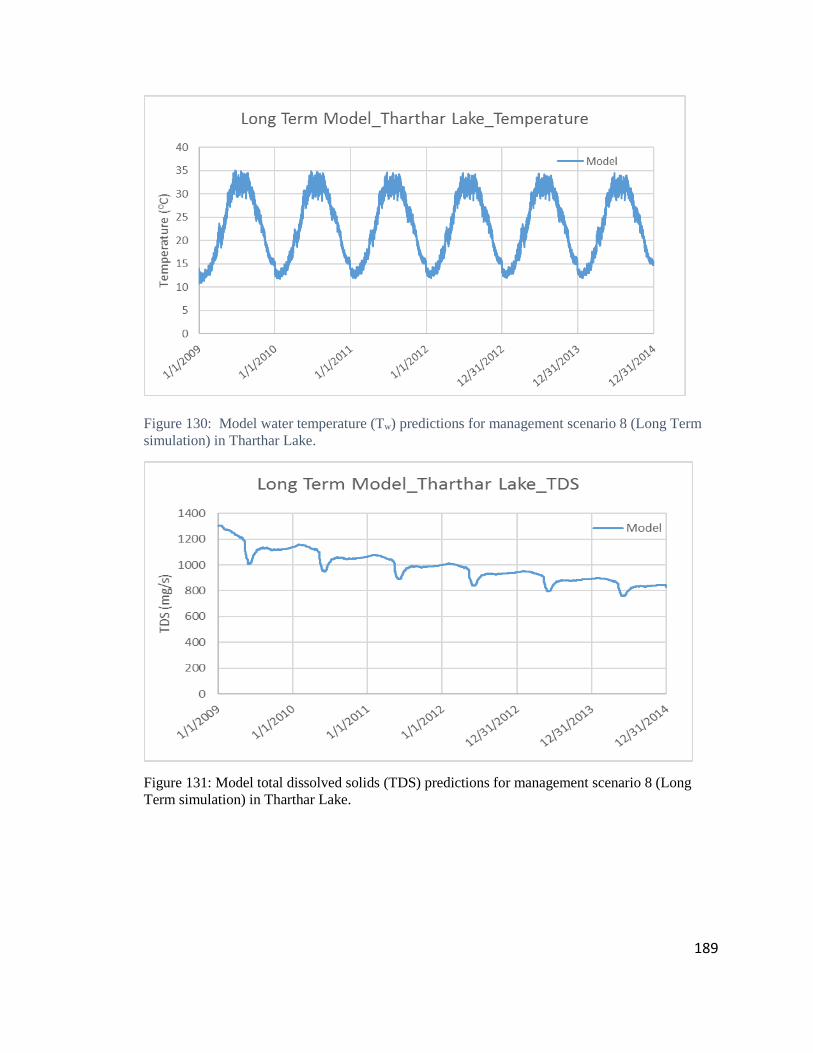
189
Figure 130: Model water temperature (Tw) predictions for management scenario 8 (Long Term
simulation) in Tharthar Lake.
Figure 131: Model total dissolved solids (TDS) predictions for management scenario 8 (Long
Term simulation) in Tharthar Lake.
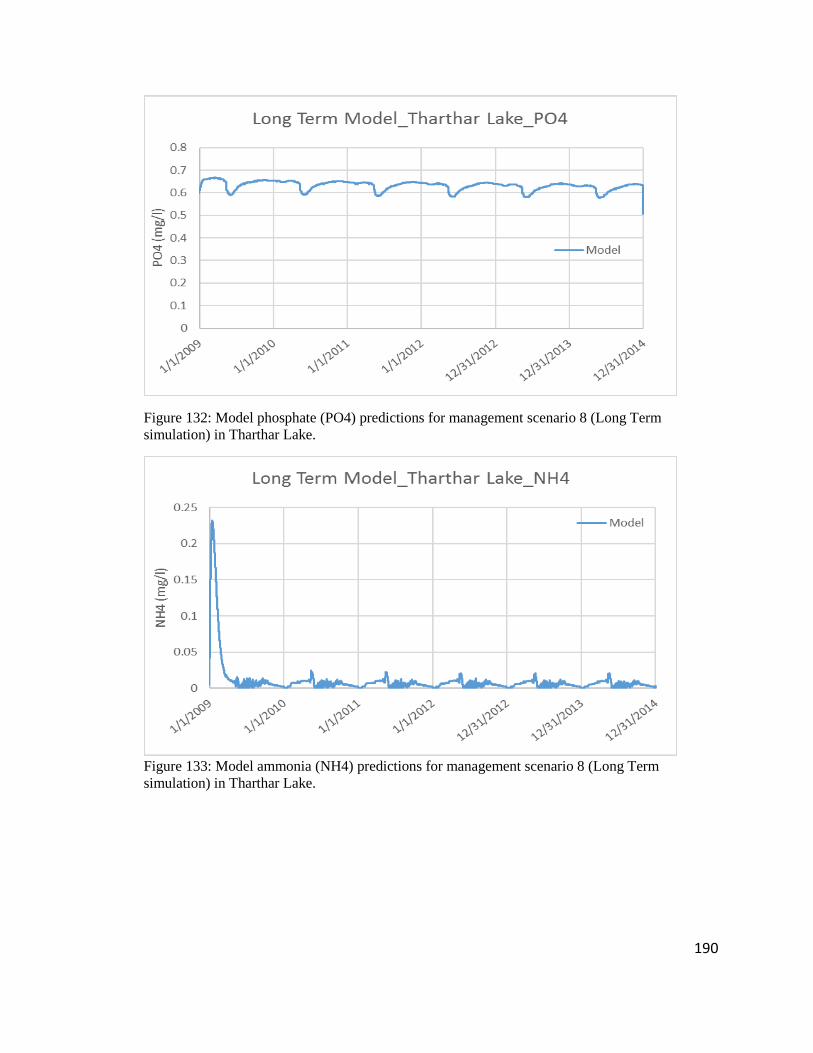
190
Figure 132: Model phosphate (PO4) predictions for management scenario 8 (Long Term
simulation) in Tharthar Lake.
Figure 133: Model ammonia (NH4) predictions for management scenario 8 (Long Term
simulation) in Tharthar Lake.
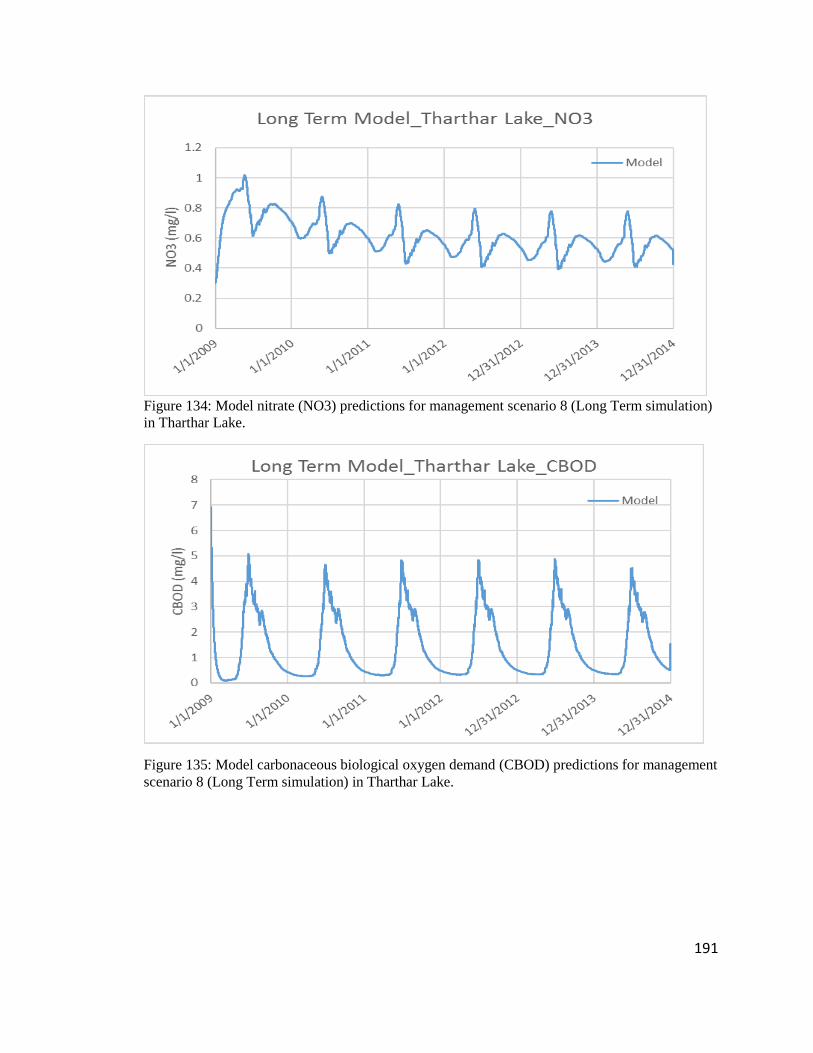
191
Figure 134: Model nitrate (NO3) predictions for management scenario 8 (Long Term simulation)
in Tharthar Lake.
Figure 135: Model carbonaceous biological oxygen demand (CBOD) predictions for management
scenario 8 (Long Term simulation) in Tharthar Lake.
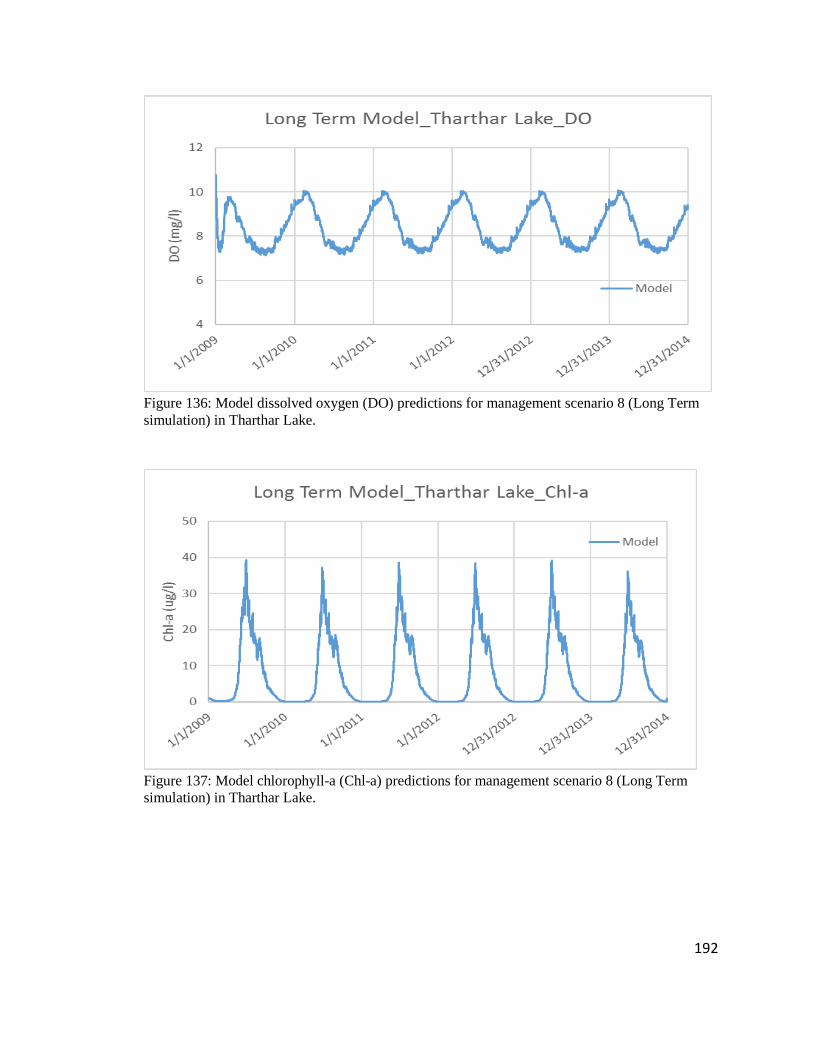
192
Figure 136: Model dissolved oxygen (DO) predictions for management scenario 8 (Long Term
simulation) in Tharthar Lake.
Figure 137: Model chlorophyll-a (Chl-a) predictions for management scenario 8 (Long Term
simulation) in Tharthar Lake.
193
Management Scenario 9: Decreasing BOD in the Tigris River within Baghdad City
In this management scenario, BOD concentrations in the Tigris River within Baghdad city
were decreased by 50% to study its impact on DO and Chl-a concentrations in Baghdad
city and downstream cites. Effluents with high BOD concentrations were directly
discharged into the mainstem of the river causing significant increase in BOD
concentrations in Baghdad city and downstream cities. Figure 138 through Figure 140
show model predictions of management scenario 9 for carbonaceous biological oxygen
demand, dissolved oxygen, and chlorophyll-a, respectively, at Baghdad city and Kut
Barrage. Predictions of management scenario 9 were compared with the base model of the
Tigris River system. BOD concentrations in the mainstem decreased by 24%, while DO
concentrations increased by 2.8%. There were no significant impacts on Chl-a
concentrations in the mainstem of the river.
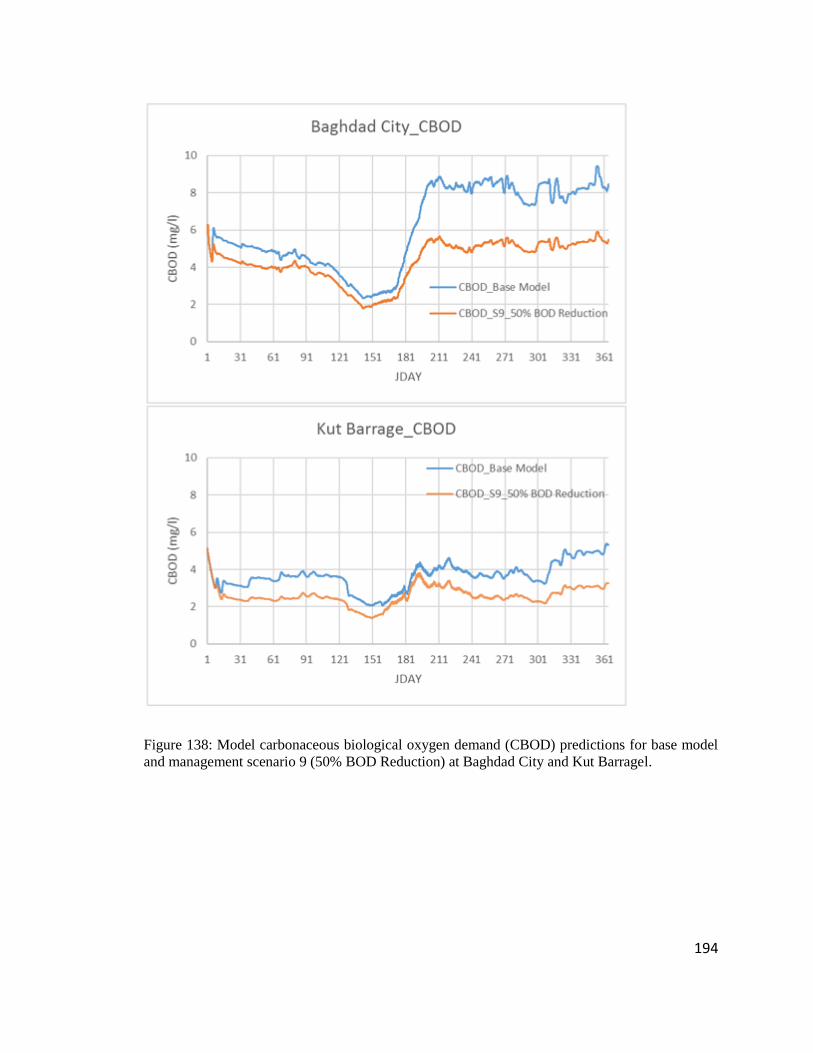
194
Figure 138: Model carbonaceous biological oxygen demand (CBOD) predictions for base model
and management scenario 9 (50% BOD Reduction) at Baghdad City and Kut Barragel.
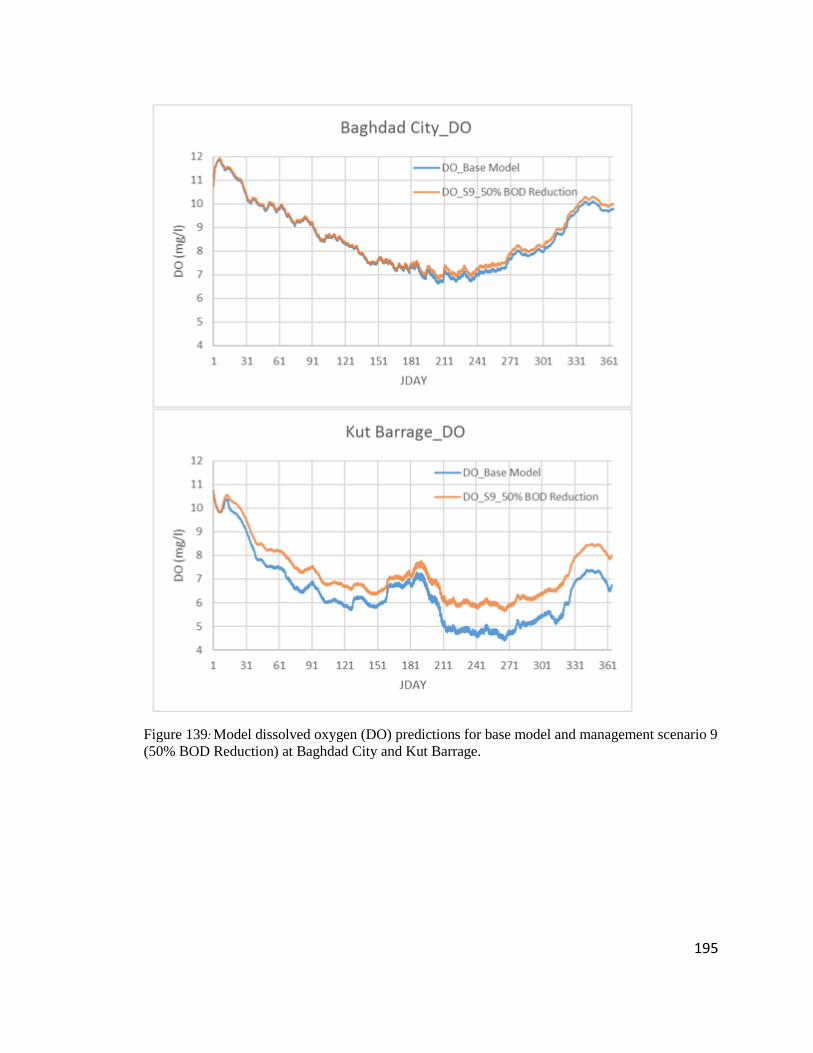
195
Figure 139: Model dissolved oxygen (DO) predictions for base model and management scenario 9
(50% BOD Reduction) at Baghdad City and Kut Barrage.
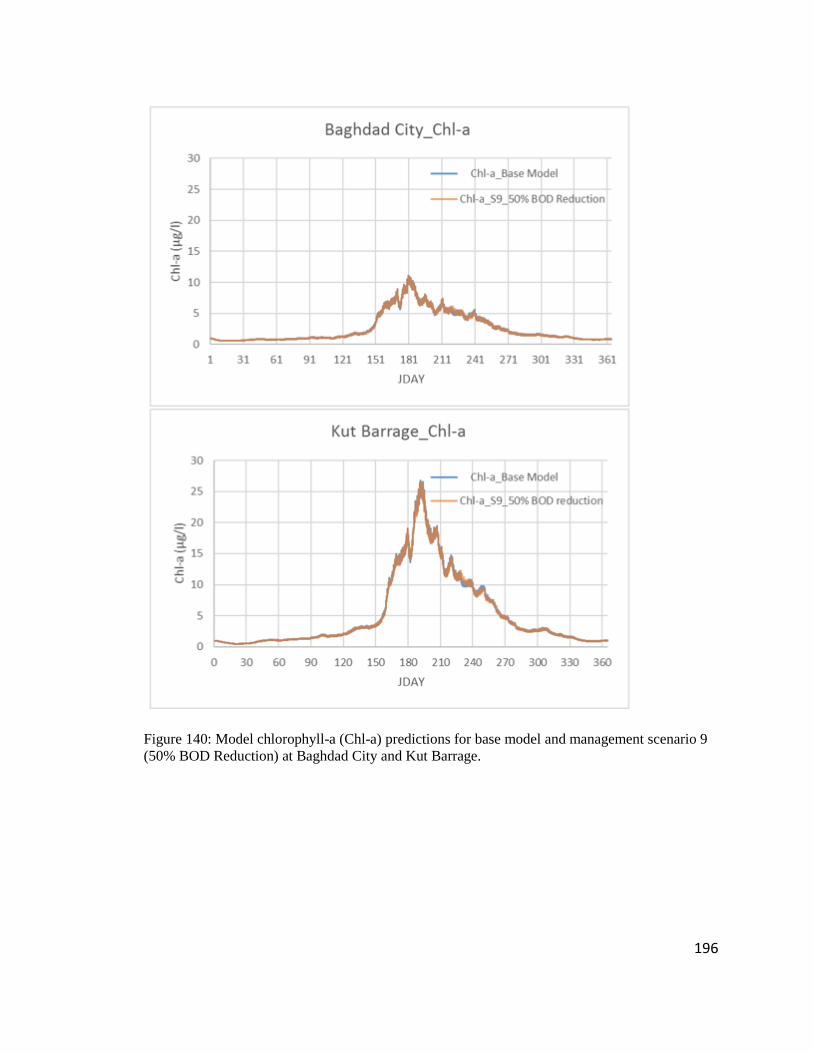
196
Figure 140: Model chlorophyll-a (Chl-a) predictions for base model and management scenario 9
(50% BOD Reduction) at Baghdad City and Kut Barrage.
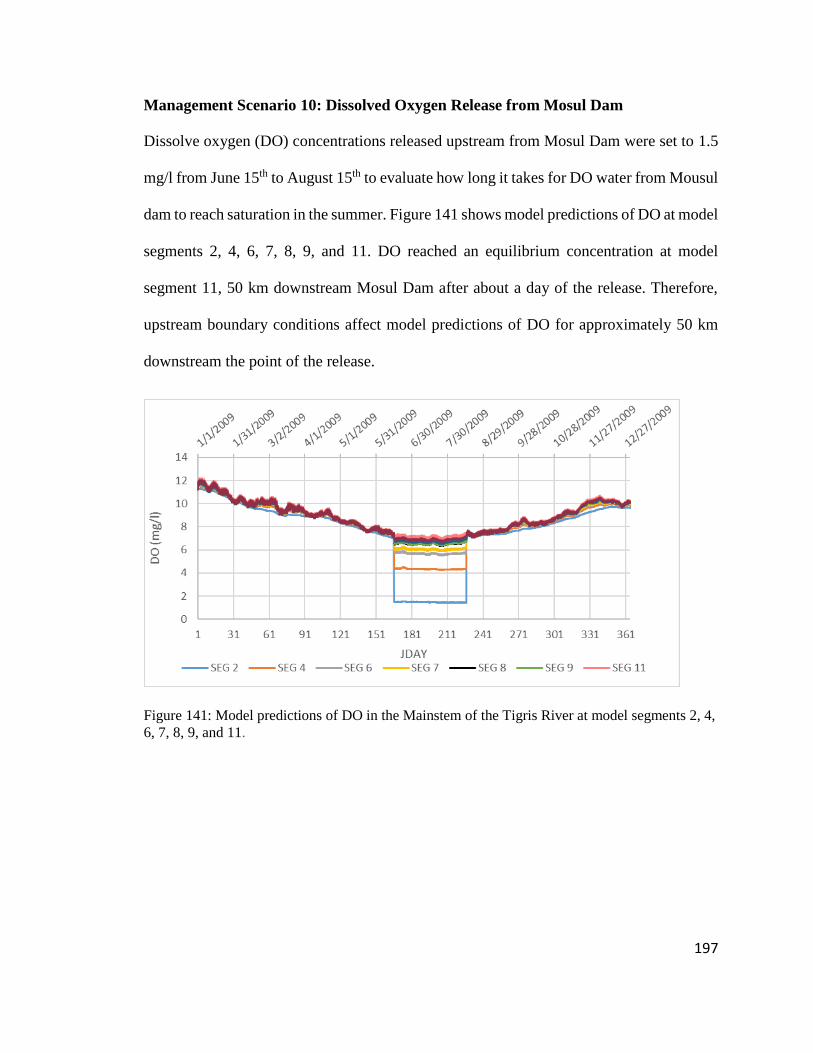
197
Management Scenario 10: Dissolved Oxygen Release from Mosul Dam
Dissolve oxygen (DO) concentrations released upstream from Mosul Dam were set to 1.5
mg/l from June 15th to August 15th to evaluate how long it takes for DO water from Mousul
dam to reach saturation in the summer. Figure 141 shows model predictions of DO at model
segments 2, 4, 6, 7, 8, 9, and 11. DO reached an equilibrium concentration at model
segment 11, 50 km downstream Mosul Dam after about a day of the release. Therefore,
upstream boundary conditions affect model predictions of DO for approximately 50 km
downstream the point of the release.
Figure 141: Model predictions of DO in the Mainstem of the Tigris River at model segments 2, 4,
6, 7, 8, 9, and 11.
198
Summary of Management Scenarios
Different management scenarios were implemented on the Tigris River system and
compared with the base model to study the effect of each individual scenario on the
mainstem of the Tigris River and Tharthar Lake. Increasing the upstream flow rates at
Mosul Dam decreased TDS and nutrient concentrations, while increasing nutrient
concentrations at Mosul Dam directly affected the entire system’s water quality by
increasing in the system’s nutrient concentrations. Temperatures in the Middle East region
are expected to increase due to the impact of climate change (AFED, 2009; IPCC, 2007;
and WRI, 2002). A study conducted by Zakaria et al. (2013) showed an increase in
temperatures due to the impact of climate change. In this study, climate change directly
impacted the system’s temperatures and decreased DO concentrations at Samarra Barrage,
Baghdad city, Kut Barrage, and Tharthar Lake.
Most water quality constituents such as TDS, NH4, CBOD, and Chl-a concentrations
tended to increase downstream of Samarra Barrage at both Baghdad city and Kut Barrage.
The DO concentrations at Kut Barrage and Tharthar Lake were highly affected by algae
production at these stations. On the other hand, disconnecting Tharthar Lake changed the
entire hydrologic regime in the mainstem of the Tigris River downstream of Samarra
Barrage by passing high volumes of water to Baghdad city and downstream areas. In
addition, Chl-a concentrations in the mainstem were reduced after disconnecting Tharthar
Lake from the Tigris River system, and DO concentrations decreased at Kut Barrage as a
result. Appendix B shows histograms for different scenario runs comparing water
temperatures, total dissolved solids, phosphate, ammonium, nitrate, carbonaceous
biological oxygen demand, dissolved oxygen, and chlorophyll-a in the mainstem of the
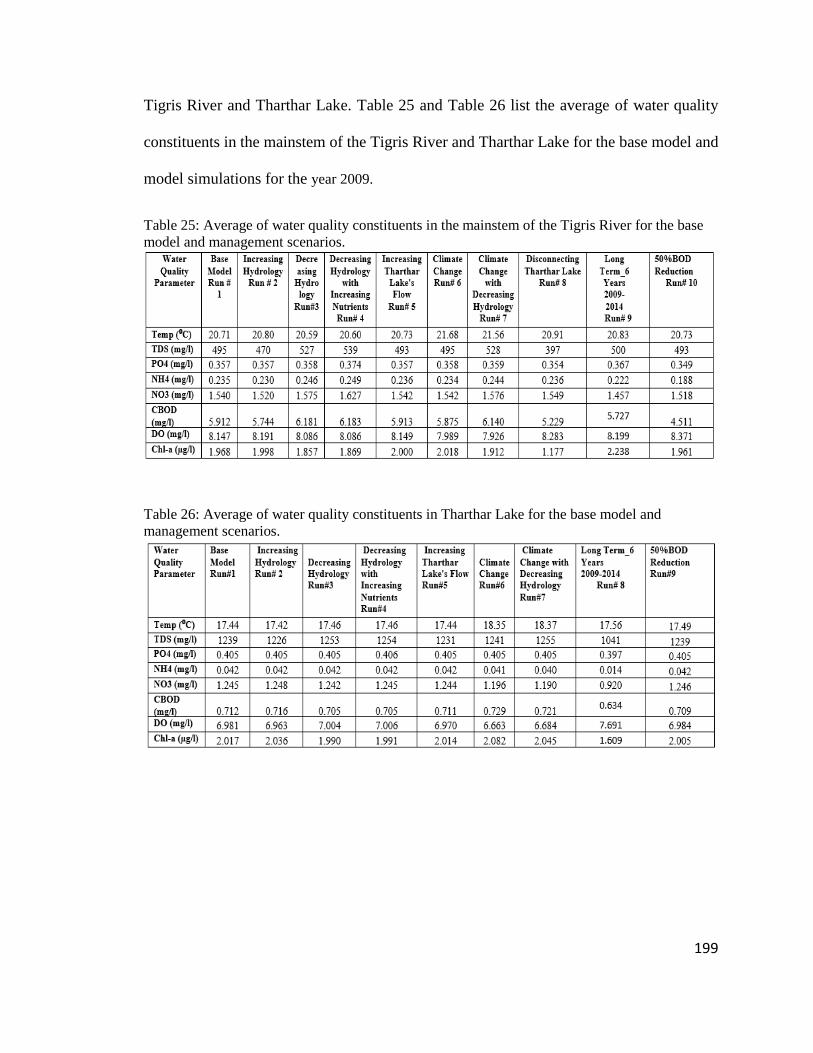
199
Tigris River and Tharthar Lake. Table 25 and Table 26 list the average of water quality
constituents in the mainstem of the Tigris River and Tharthar Lake for the base model and
model simulations for the year 2009.
Table 25: Average of water quality constituents in the mainstem of the Tigris River for the base
model and management scenarios.
Table 26: Average of water quality constituents in Tharthar Lake for the base model and
management scenarios.
200
Chapter Eight: Conclusions and Recommendations
The Tigris River system (the mainstem of the Tigris River and Tharthar Lake with its
canals) in Iraq was modeled using the 2-D hydrodynamics and water quality model CE-
QUAL-W2 Version 4.0 from Mosul Dam (river km 0) upstream Mosul City to Kut Barrage
(river km 880) in Kut City. The model was run from January 1st, 2009 to December 31st,
2009. The model state variables included longitudinal and vertical velocity, water level,
water temperature, total dissolved solids, phosphate, ammonia, nitrate, carbonaceous
oxygen demand, dissolve oxygen, and algae. Chlorophyll-a was also included in the Tigris
River model as a derived water quality constituent. Scenarios were performed with the base
model of the Tigris River to give more insight into how the river responds to changes in
hydrology, an upstream increase in nutrients at Mosul Dam, and possible climate change
of increasing air temperatures. The Tigris River system was classified into 9 waterbodies
with 9 branches, 343 longitudinal segments, and 84 vertical layers for each segment with
1 m height for each layer.
Field data such as flow, water level, bathymetry and some water quality constituents (total
dissolved solids and nitrate) were provided from the Water Resources Ministry in Iraq
(MOWR, 2014) and were used to develop the model’s input files and to calibrate the model
by comparing model predictions to field data. Meteorological data for the Tigris River
model were obtained from the Iraqi Ministry of Transportation, the General Organization
for Meteorology and Seismic Monitoring (MOT-IMOAS 2014).
201
Field data for water temperature were extremely scarce in Iraq and therefore water
temperatures for upstream boundary conditions at Mosul Dam and model calibration at
Baeji and Baghdad cities were estimated from Landsat using remote sensing and image
processing technique.
Model predictions of flow and water level were compared to field data at three stations
along the mainstem of the Tigris River located at Baeji city, downstream Samarra Barrage
and Baghdad city with flow absolute mean error varying from 12.57 to 3.38 m3/s and water
level absolute mean error varying from 0.036 to 0.018 m. The average percentage errors of
flowrate at Baeji city, downstream Samarra Barrage and Baghdad city were 1.93%, 0.83%,
and 0.81% respectively. Adding a distributed tributary to the Tigris River model allowed
for flow calibration by accounting for ungaged flow such as ground water, runoff, and
irrigation return flow. Model predictions of flow could be improved by having more field
data at different gaging stations along the mainstem of the Tigris River and Tharthar Lake.
Model predictions of temperatures were compared to remotely sensed temperature data at
both Baeji and Baghdad cities. Model predictions of temperatures significantly agreed with
the estimated data since model predictions were within 95% confidence interval with a
noticeable bias in winter months due to uncertainty in Landsat estimations at both Baeji
and Baghdad cities. The absolute mean error of temperature predictions varied from 0.91
to 1.04 ⁰ C. Model predictions of temperatures could significantly be improved by
providing temperature field data at multiple gaging stations both longitudinally and
vertically to compare with the model vertical profile.
202
Model predictions of total dissolved solids and nitrate were compared to monthly averaged
field data. Model predictions of TDS were compared to field data at Samarra Barrage,
Baghdad city, and Kut Barrage. TDS concentrations in the Tigris River started to
significantly increase from Mosul dam to Kut Barrage with a peak in winter months due to
storm water runoff. Unregulated effluents from three waste water treatment plants
(WWTPs) within Baghdad city cause a significant increase in TDS concentrations in
addition to irrigation back flow in Baghdad city and downstream areas since this region
contains agricultural lands. Model predictions of NO3 were compared to field data at both
Samarra Barrage and Baghdad city. There was no significant increase in NO3
concentrations between Samarra Barrage and Baghdad city.
Model predictions of other water quality state variables such as phosphate, ammonium,
biochemical oxygen demand, algae and chlorophyll-a and dissolved oxygen were
estimated based on field data collected from the literature. BOD concentrations within
Baghdad city were extremely high due to direct discharge of industrial wastewater into the
mainstem of the Tigris River from numerous factories located along the river banks. There
were no considerable changes in both PO4 and NH4 concentrations in Baghdad and
downstream cites. A sensitivity study was conducted to check if satellite images show high
Chl-a concentrations using a Chl-a correlation provided from previous literature studies.
The study showed that the best algal growth rate was 0.98 d-1 that subsequently used for
all management scenarios of the Tigris River system. Evaporation rate in Tharthar Lake
was 2.2 m for the simulated year 2009 which compared well with measured evaporation of
2.27 m for a nearby lake (CSO, 2010).

203
Multiple scenarios were implemented using the base 2009 model of the Tigris River by
altering hydrology, increasing upstream nutrients, increasing air temperature,
disconnecting Tharthar Lake from the Tigris River system, and simulating a long-term
model of the Tigris River system. Increasing upstream flowrates at Mosul Dam by 15%
decreased TDS concentrations from 495 mg/l to 470 mg/l in the mainstem. CBOD
concentrations in the mainstem were also decreased by 3%.
On the other hand, decreasing upstream flow showed a significant impact on water quality
in the Tigris River causing a significant increase in concentrations of TDS by 6.55%, PO4
by 3%, NH4 by 4.5%, NO3 by 2.3%, and CBOD by 5%, while DO concentration decreased
by 0.33%. Increasing nutrient concentrations by 10% at Mosul Dam increased PO4, NH4,
and NO3concentrations in the mainstem by 4.6%, 5.65%, and 5.65%, respectively.
Assuming an increase in air temperatures of 2 ⁰C and a corresponding increase in dew point
temperatures increased water temperatures in the mainstem of the Tigris River from 20.7
⁰ C to 21.7 ⁰ C causing a subsequent decrease in DO levels from 8.15 mg/l to 7.98 mg/l.
Average TDS concentrations in the mainstem and Tharthar Lake increased from 494.5 mg/l
and 1239 mg/l to 495 mg/l and 1241 mg/l, respectively. NO3 concentration in the lake
decreased from 1.24 mg/l to 1.196 mg/l, while there were no changes in PO4 and NH4
concentrations compared with the base model. There were no significant impacts on CBOD
concentration in the mainstem. Chl-a concentrations were slightly increased in the
mainstem due to climate change effect with an average concentration changed from 1.97
µg/ to 2 µg/l.
204
Disconnecting Tharthar Lake from the Tigris River system significantly affected the
hydrologic regime downstream of Samarra Barrage by passing 36% more water from
Samarra Barrage to Baghdad city causing a substantial decrease in TDS concentration by
25%. In addition, Chl-a concentrations were decreased dramatically from 1.97 µg/l to 1.18
µg/l in the mainstem of the Tigris River.
A long-term 6-year simulation was performed on the Tigris River system. The average
temperature in Tharthar Lake increased from 17.44 ⁰ C to 17.5 ⁰ C, while no change in
water temperatures was noticed in the mainstem. The average TDS concentration
decreased from 1239 mg/l to 1041 mg/l in Tharthar Lake, while the average TDS
concentration was increased from 495 mg/l to 500 mg/l in the mainstem. There were no
major changes in the average concentrations of PO4, NH4, and NO3 in the mainstem. PO4,
NH4, and NO3 concentrations decreased by 2%, 62%, and 95.4%, respectively. Average
concentrations of CBOD and Chl-a decreased from 0.71 mg/l and 2 µg/l to 0.63 mg/l and
1.6 µg/l, respectively.
After decreasing BOD concentrations of the Tigris River by 50%, BOD concentrations in
the mainstem decreased by 24%, while DO concentrations increased by 2.8%. There were
no significant impacts on Chl-a concentrations in the mainstem of the river.
Finally, it was found that approximately 50 km below Mosul Dam was affected by
extremely low dissolved oxygen release from Mosul Dam before DO concentrations
reached an equilibrium concentration.
205
The following conclusions can be made:
• Due to extremely low flow rates, there was no significant effect of highly saline
water discharged through Audiam tributary to the mainstem of the Tigris River.
• Ungaged flow in the Tigris River system was significantly important in the model
flow calibration and can be accounted for using distributed tributaries.
• Water Treatment plants in Baghdad city withdrew about 6% of the average flow
in the Tigris River.
• Saline water diverted from Tharthar Lake, irrigation return flow, wastewater
effluents, and urban runoff caused high TDS concentration in the Tigris River from
Baghdad city to Kut Barrage.
• The mainstem of the Tigris River within Mosul city was not affected by treated
wastewater as it discharged to natural Wadies. Also, the Tigris River from Tikrit
city to Samarra Barrage was not affected by discharging 25% of the treated
wastewater due to extremely low flow rates.
• Landsat images proved a good resource to estimate water temperatures in the Tigris
River for upstream boundary conditions at Mosul Dam and for in-river calibration.
• Chlorophyll-a concentrations in Tharthar Lake could be retrieved from Landsat
images.
• Air temperature is a significant predictor of surface water temperature of the Tigris
River.
• Temperature calibration in the Tigris River system was highly sensitive to
meteorological input data.
206
• There was no noticeable stratification found in both Samarra Barrage and Kut
Barrage.
• Surface water temperature in Tharthar Lake varied longitudinally along the North-
South axis with warmer temperatures in the lower part compared with the upper
part of the lake.
• High Manning’s friction in the Tigris River within Baghdad city was observed due
to the effect of channel irregularity and obstruction (such as debris deposits and
bridge piers), the degree of meandering, and imperfections in the given cross-
sectional geometry.
• Diverted water from Tharthar Lake to the Tigris River caused a significant increase
in the water age of the river within Baghdad and downstream cites.
• A parcel of water released from Mosul Dam reaches to Baeji, Samarra Barrage,
Baghdad, and Kut Barrage after approximately 3 days, 5 days, 10 days, and 19
days, respectively.
• Increasing upstream flow by 15% at Mosul Dam significantly improved TDS
concentrations in the mainstem and in Tharthar Lake, while decreasing upstream
flow negatively impacted TDS concentrations in the Tigris River system.
• A 10% increase in the annual average flow diverted from Samarra Barrage to
Tharthar Lake should be allocated to constantly reduce salinity in the lake.
• 50 km long in the mainstem of the Tigris River below Mosul Dam was affected by
extremely low DO release from Mosul Dam before DO concentrations reached
steady state.
207
The following recommendations can be made:
• The head water quantity and quality of the Tigris River as it inters Iraq through the
Turkey-Iraqi border should be monitored based on previously signed agreements
between the two countries because this is an important boundary condition for
predicting downstream water quality
• Since the model started at the base on Mosul dam, the reservoir itself should be
monitored and modeled to assess water quality transformations within the reservoir
• The average annual flow of the Tigris River in Baghdad city should not be less
than the existing annual average flow of 420 m3/s to keep the average TDS
concentration in the mainstem less than 500 mg/l. A decrease in the river flow will
negatively impact its quality by increasing TDS, nutrients, BOD, and Chl-a
concentrations.
• Since the Upper Zab tributary is the biggest contributor, after the upper Tigris
basin, to the Tigris River with 33% of its annual volume, its flow should be
managed through constructing a new dam that controls its discharge to the
mainstem of the river.
• Wastewater in Baghdad city should efficiently be treated.
• Man-made canals used for irrigation should strictly be monitored to understand the
impact of irrigation return flow on the mainstem of the Tigris River.
• Unregulated water withdrawn from the main stream of the Tigris River for
irrigation should be controlled and new polices should be strictly implemented.
208
• More strategies on restoring the Tigris River should be planned a head as the future
climate change will significantly impact the river’s thermal regime.
The Tigris River Model Improvements and Recommendations
The mainstem of the Tigris River and Tharthar Lake was modeled for the year of 2009.
The current model can be improved by the following suggestions organized by data type.
Flow Data
Having flow rate data, the Tigris River system model uncertainty can be reduced. Flowrate
data in Tharthar Lake and its canals are extremely important for model comparisons and
currently no such data were available for this study. Flowrate data are also needed for the
mainstem of the Tigris River in the area between Baghdad city and Kut Barrage where
numerous unmonitored withdrawals, runoff, and irrigation return flow occurred. These
data give more understanding and more insight of how water is entering and leaving the
system. It is also very important to have flow data for both the Upper Zab and Lower Zab
tributaries since they are significant contributors to the Tigris water. Currently, the Upper
Zab tributary was completely unmonitored for flow. Finally, flow data from Samarra
Barrage to Erwaeiya canal are needed as well.
Temperature Data
In-situ water temperature data of the Tigris River system would be important for improving
model calibration. The current model was evaluated utilizing surface water temperatures
estimated from Landsat which add a level of uncertainty in model predictions and
ultimately affect the temperature calibration. The mainstem of the Tigris River and
Tharthar Lake lack temperature monitoring stations. Moreover, vertical temperature
209
profiles in Tharthar Lake would be very important to verify the model’s predicted thermal
dynamics in the water column. In addition, all tributaries of the Tigris River had no
available temperature data, and therefore it is crucial to monitor flow temperature of at
least both the Upper Zab and Lower Zab which are the main tributaries of the Tigris River.
Availability of field temperature data gives the opportunity to validate satellite temperate
and to reduce the level of uncertainty in the satellite estimates.
Water Quality Data
The mainstem of the Tigris River and Tharthar Lake lack most of water quality constituents
used in the model study. Most of the available data of the Tigris River were monthly
average TDS and nitrates during the simulated year 2009, while there were no data
available for phosphate, dissolved oxygen, ammonia, organic matter, alkalinity, inorganic
carbon, and algae. Although some monthly average data were available, it was difficult to
distinguish specific seasonal and diurnal trends. Upstream of the Tigris River model at
Mosul Dam, there were no water quality data available except for monthly average data of
TDS. Knowing that the Mosul Dam can affect water quality significantly, knowing the
discharge water quality coming from Mosul Dam is an important aspect of understanding
how this inflow affects the Tigris River. Tharthar Lake also had no water quality data
available during the simulated year. In addition, more water quality monitoring stations
should be available along the main tributaries of the Tigris River such as Upper Zab and
Lower Zab. Also, no water quality data were available from the WWTPs that discharge
effluents into Diyala River, a tributary of the Tigris River, and eventually discharge into
the mainstem of the Tigris River. Therefore, water quality data from WWTPs would be
important for assessing water quality impacts on the Tigris River.
210
Model Grid and Bathymetry Data
Having 500 m or 1 km cross sections of the Tigris River would allow for more accurate
calibration of flow and depths, temperature, and water quality constituents. The current
cross section data of the mainstem of the Tigris River were provided with 5 km increments
with some areas with missing data filled by interpolation. Moreover, more accurate
bathymetric data of Tharthar Lake could significantly improve model calibration of the
lake. A new cross section survey of the mainstem of the Tigris River would be important
to provide bathymetric data of the system as a result of sediments were introduced into the
water system after numerous wars in Iraq.
Meteorological Data
Improved meteorological data would be useful for temperature and water quality
calibration. Solar radiation data would be a valuable and would significantly affect the
water temperature calibration. Moreover, metrological data were only available from a
meteorological station near Baghdad airport in Baghdad city and therefore more
metrological data in the western parts of Iraq where Tharthar Lake is located would be
important to understand thermal dynamics and summer stratification in Tharthar Lake.
211
References
Abdul Jabar, R. A., Al-Lami, A. A-Z., Abdul Khader, R. S., Radhi, A. G., (2008). “Effects
of some physical and chemical factors of Lower Zab water on Tigris River.” Tikrit J. of
Pure Sci. 13, 132-142.
Abdul Razzak, I. A., Sulaymon, A. H., and Al-Zoubaidy, A. R. (2009). “Modeling the
distribution of BOD and TDS in part of Tigris River within Baghdad.” J. Engineering, 15,
3673-3691.
Abdul Razzak, I., (2006) “Studying and modeling the effects of pollution sources in Tigris
river between Al-A’imma Bridge and al-Jumhuriya Bridge in Baghdad.” Master’s thesis,
University of Baghdad, Iraq.
Adams, E. E. and Wells, S. A. (1984) "Field Measurements on Side Arms of Lake Anna,
Virginia," Journal of Hydraulic Engineering, ASCE, Vol. 110, No. 6, 773-793.
Aenab, A. M., and Singh, S. K., (2012). “Evaluation of drinking water pollution and health
effects in Baghdad, Iraq.” J. Environ. Protection, 3, 533-537.
AFED (Arab Forum for Environment and Development) (2009). “Impact of Climate
Change on Arab Countries.”
http://www.afedonline.org/en/ (October/19/2017)
Alena, A. M., and Singh, S. K., (2012). “Evaluation of drinking water pollution and health
effects in Baghdad, Iraq.” J. Environ. Protection, 3, 533-537.
Ali, A. A., Al-Ansari, N. A., and Knutsson, S., (2012). “Morphology of Tigris River within
Baghdad city.” J. Hydrol. Earth Syst. Sci., 16, 3783-3790.
Alobaidy, A. H., Maulood, B. K., and Kadhem, A. J. (2010). “Evaluating raw and treated
water quality of Tigris River within Baghdad by index analysis.” J. Water Res. and prot.,
2, 629-635.
Ansari, F., Awasthi, A. K., and Srivastava, B. P. (2012). “Physico-chemical
Characterization of Distillery Effluent and its Dilution Effect at Different Levels.” Scholars
Research Library Archives of Applied Science Research, 4(4), 1705–1715.
Al-Anbari, R. A., Mahmood, T. A., and Yousif, W. F., (2006). “Hydraulic geometry of the
Tigris River from Mosul to Bejee related to water temperature modeling.” J. Env. Hydrol.,
14, 1-11.
Al-Ansari, N., Ali, A. A., Al-Suhail, Q., & Knutsson, S. (2015). Flow of River Tigris and
its Effect on the Bed Sediment within Baghdad, Iraq. Open Engineering, 5(1), 465–477.
https://doi.org/10.1515/eng-2015-0054
212
Al-Ansari, N. and Knutsson, S., (2011). “Toward prudent management of water resources
in Iraq.” J. Advanced Science and Eng. Res., 1, 53-67.
Al-Badry, M., and Artin, Y., (1972). “Study of salinity of Tigris and Euphrates Rivers and
Tharthar Lake with reference to sweetening period of Tharthar lake “unpublished report”,
Ministry of Irrigation, D.G of Dams and Reservoirs.
Al-Dabbas, M., and Hassan, H. A., (1987). “On condition Tharthar salinity problem
model.” J. Agriculture and Water Resources Research, AWRRC, Council for Scientific
research, Iraq.
Al-Dabbas, M. and Al-Juburi, H., (1985). “Hydrochemical analysis and sediment
distribution of Tharthar reservoir.” Unpublished report, Water Resources Dept., AWRRC.,
Council for Scientific Research, Iraq.
Al-Jebouri, M. M., and Edham, M. H., (2012). “An Assessment of biological pollution in
certain sector of lower Al-Zab and river Tigris waters using bacterial indicators and related
factors in Iraq.” J. Water Resources and Pollution, 4, 32-38
Al-Jubori, M.A.M. (1998). “Watercourse flow pattern of the River Tigris between the two
Zabs.” Ph.D. thesis, Mosul Univ., Iraq.
Al-Layla, M. A, and Al-Rizzo, H. M., (1989). “A water quality model for the Tigris River
downstream of Sadam Dam, Iraq.” J. Hydro. Sci., 34:6, 687-704.
Al-Layla, M. A, Kharrufa, S. N., Akrawi, S. M., (1990). “Effect of Saddam Dam on Tigris
River water quality.” J. Environ. Sci. Health, A25(1), 47-66.
Al-Marsoumi, A. H., Al-Bayati, K. M., and Al-Mallah, E. A., (2006). “Hydrogeochemical
aspects of Tigris and Euphrates Rivers within Iraq: A comparative study.” J. RAF. Sci., 17,
2, 34-49.
Al-Murib, M. (2014) "Application of CE-QUAL-W2 on Tigris River in Iraq." Civil and
environmental Engineering Master’s Project Report.
http://pdxscholar.library.pdx.edu/cengin_gradprojects/9
Al-Obaidy, F. M. Sh. (1996). “Hydrological study of the stage and other characteristics of
Tigris River.” M.S. thesis, Mosul Univ., Iraq.
Al-Rawi, S. M., (2005). “Contribution of Man – Made Activities to the Pollution of the
Tigris within Mosul Area/IRAQ.” International J. Environ. Research & Public Health, 2,
245-250.
Al-Samak, M.A.S., Al-Saati, B.A, Al-Janabi, F.H., Al-Timimi, A.A. and Ghalib, S.A.
(1985). “Iraq-Regional Study.” Vol.1, Dar Al-Kutib, Mosul Univ., P304 (in Arabic).
213
Al-Shahrabaly, Q. M. (2008). “River discharges for Tigris and Euphrates gauging
stations.” Ministry of water Resources, Baghdad.
APHA (American Public Health Association) (1992). Standard methods for the
examination of water and wastewater, 18ed., Washington, DC.
Aziz, A. M., Aws, A. (2012). “Wastewater production treatment and use in Iraq country
report.” Ministry of water Resources, Iraq.
Baban, I. J., (1977). “General survey of hardness in natural waters of Iraq and effects of
drainage schemes on it.” M.S. thesis, Baghdad Univ., Iraq.
Boer, T. (2014). “Assessing the Accuracy of Water Temperature Determination and
Monitoring of Inland Surface Waters Using Landsat 7 ETM + Thermal Infrared Images A
Case Study on the Rhine River, North Sea Canal, and Hollands Diep.” M.S. thesis, Delft
University of Technology, Delft, The Netherlands.
Burnham, G., Lafta, R., Doocy, S., and Roberts, L., (2006). “Mortality after the 2003
Invasion of Iraq: A cross-sectional cluster sample survey.” Lancet, 368, 9545, 1421-1428.
Camberato, J., (2001). “Irrigation water quality.” Clemson University,
http://www.scnla.com/Irrigation_Water_Quality.pdf (Apr.19, 2017)
Charbeneau, R. J., and Holley, E. R., (2001). “Backwater effects of bridge piers in
subcritical flow.” Research report conducted for the Texas Dept. of Transportation.
http://ctr.utexas.edu/wp-content/uploads/pubs/1805_1.pdf
CSO (2010). “Central Statistical Organization in Iraq_Environmental Statistics Report in
Iraq for the year 2009.” In Arabic. Accessed on April-21-2017.
http://www.cosit.gov.iq/ar/env-stat/envi-stat
Chander, G., & Markham, B. (2003). Revised Landsat-5 TM radiometric calibration
procedures and post calibration dynamic ranges. IEEE Transactions on Geoscience and
Remote Sensing, 41, 2674–2677.
Chow, V.T., (1959). “Open-channel hydraulics”: New York, McGraw-Hill, 680 p.
Chipman, J. W., Lillesand, T. M., Schmaltz, J. E., Leale, J. E., & Nordheim, M. J. (2004).
Mapping lake water clarity with Landsat images in Wisconsin, USA. Canada Journal of
Remote Sensing, 30, 1–7.
Cole, T. M., Wells, S. A. (2017). “CE-QUAl-W2: a two-dimensional, laterally averaged,
hydrodynamic and water quality model.” version 3.71. Instruction Report EL-2000. US
Army Engineering and Research Development Center, Vicksburg.
214
Coll, C., Galve, J. M., Sánchez, J.M., and Caselles, V. (2010), “Validation of Landsat-
7/ETM+ Thermal-Band Calibration and Atmospheric Correction with Ground-Based
Measurements”, IEEE Trans. Geosci. Remote Sens., vol. 48, no. 1, pp. 547–555.
Di Baldassarre, G., & Montanari, A. (2009). Uncertainty in river discharge observations: a
quantitative analysis. Hydrology and Earth System Sciences, 13(6), 913–921.
https://doi.org/10.5194/hess-13-913-2009
Edinger, J.E., and Buchak, E.M. 1975. "A Hydrodynamic, Two-Dimensional Reservoir
Model: The Computational Basis", prepared for US Army Engineer Division, Ohio River,
Cincinnati, Ohio.
Fan, D., Huang, Y., Song, L., Liu, D., & Zhang, G. (2014). “Prediction of chlorophyll a
concentration using HJ-1 satellite imagery for Xiangxi Bay in Three Gorges Reservoir.”
Water Science and Engineering, 7(1), 70–80.
FAO (2008) “Irrigation in the Middle East region in figures – AQUASTAT Survey”
http://www.fao.org/nr/water/aquastat/basins/euphrates-tigris/Euphrates.tigris-
CP_eng.pdf. (Sep. 12, 2017).
Fuller, R. M., Groom, G. B., & Jones, A. R. (1994). “The land cover map of Great Britain:
An automated classification of Landsat Thematic Mapper data”, Photogrammetric
Engineering and Remote Sensing, 60, 553−562.
Giardino, C., Pepe, M., Brivio, P. A., Ghezzi, P., and Zilioli, E., (2001). “Detecting
chlorophyll. Secchi disk depth and surface temperature in a sub-alpine lake using Landsat
Imagery.” J. Sci. Total Environ. 268, 19-29.
Hanson, B., Schwankl, L., and Fulton, A., (2004). “Introduction to irrigation scheduling.”
Scheduling irrigations: When and how much water to apply, Water Management
Handbook Series, UC ANR publication 3396.
Hikmat, M. (2005). “Two-dimensional numerical model for the distribution of pollutants
in Tigris River downstream of Tharthar-Tigris channe1.” M.S. thesis, University of
Baghdad, Baghdad, Iraq.
Husain, A. (2009). “Monthly changes of some physiochemical parameters for Tigris River-
Baghdad between 2002-2003. J. Engineering and Technology, 27, 64-70.
IPCC (Intergovernmental Panel on Climate Change) (2007) Climate Change 2007: Climate
Change Impacts, Adaptation and Vulnerability. Cambridge University Press, Geneva.
Ismail, A. H., and Abed, G. A., (2013). “BOD and DO modeling for Tigris River at
Baghdad city portion using QUAL2K model.” J. Kerbala University. 11, 257-273.
Issa, I. E., Al-Ansari, N. A., Sherwany, G, and Knutsson, S., (2014). “Expected future of
water resources within Tigris-Euphrates Rivers, Iraq.” J. water Resources and Protection,
6, 421-432.
215
Jasim, H. A. J. (1988). “Some effects of Tharthar-Tigris canal on water quality of the Tigris
River.” M.S. thesis, Baghdad Univ., Iraq.
Jehad, A. A., (1983). “Effect of Tharthar canal salty water on the quality of Euphrates
water.” M.S. thesis, Technology Univ., Iraq.
Jimeneze-Munoz, J. C., Sobrino, J. A. (2003) “A generalized single-channel method for
retrieving land surface temperature from remote sensing data.” J. Geophysical Research,
108, (D22).
Kabbara, N., Benkhelil, J. Awad, M., and Barale, V., (2008) “Monitoring water quality in
the coastal area of Tripoli (Lebanon) using high-resolution satellite data.” J.
Photogrammetry &Remote sensing, 63, 488-495.
Kadhem, A. J., (2013). “Assessment of water quality in Tigris River-Iraq by using GIS
mapping.” J. Natural Resources, 4, 441-448.
Khattab, M. F. O., and Merkel, B. J., (2014) “Application of Landsat 5 and Landsat 7
images data for water quality mapping in Mosul Dam Lake, northern Iraq.” Arab J. Geosci.
7, 3557-3573.
Lamaro, A. A., Marinelarena, A., Torrusio, S. E., and Sala, S. E., (2013) “Water surface
temperature estimation from Landsat 7 ETM+ thermal infrared data using the generalized
single-channel method: Case study of Embalse del Rio tercero (Corodoba, Argentina).” J.
Advances in Space Research, 51, 492-500.
Leopold, L. B., and Maddock, T.J., (1953) “hydraulic geometry of stream channels and
some physiographic implication.” USGS professional paper 252, 55p.
Liu X, Wang L, Sherman DJ, Wu Q, Su H (2011) Algorithmic foundation and software
tools for extracting shoreline features from remote sensing imagery and LiDAR data. J
Geogr Inf Syst 3(2):99–119.
Lu, D., Mausel, P., Brondizio, E. and Moran, E., (2002), Assessment of atmospheric
correction methods for Landsat TM data applicable to Amazon basin LBA research.
International Journal of Remote Sensing, 23, pp. 1671–2651.
Ministry of Environment, “System Maintenance of River and Public Water Pollution in
Iraq,” 1998. http://www.moen.gov.iq
Ministry of Water Resources-Iraq (MWR) (2005), Schematic diagram of main control
structures in Iraq, General directorate of water resources management, hydrological studies
center.
Mix Max (2009). “Iraq the Lasting Love”
http://iraqthelastinglove.blogspot.com/2009/09/more-from-iraqs-old-days.html.
(September 21, 2017)
216
MOT-IMOAS (2014) “Ministry of Transportation-Iraqi Meterological Organization and
Seismology” http://www.meteoseism.gov.iq/index.php (Oct. 18, 2017).
MOWR (2014) “Ministry of Water Resources in Iraq”
https://www.mowr.gov.iq/en (Oct. 16, 2017).
Mutlak, S. M., Salih, B. M., and Tawfiq, S. J., (1980). “Quality of Tigris River passing
through Baghdad for irrigation.” J. Water, Air, and Soil Pollut. 13, 9-16.
Nas, B., Ekercin, S., and Karabork, H., (2010). “An application of Landsat-5TM image
data for water quality mapping in Lake Beysehir, Turkey.” J. Water Air Soil Pollut. 212,
183-197.
NASA (2014). “Land Remote-Sensing Satellite System 7”
https://www.nasa.gov/directorates/heo/scan/services/missions/earth/Landsat7.html
(Nov. 25, 2017).
Odemis, B., Sangun, M. K., and Evrendilek, F. (2010). “Quantifying long-term changes in
water quality and quantity of Euphrates and Tigris rivers, Turkey.” J. Environ. Monit.
Assess, 170, 475-490.
Olmanson, L. G., Bauer, M. E.,&Brezonik, P. L. (2008). “A 20-year Landsat water clarity
census of Minnesota’s 10, 000 Lakes”. Remote Sensing of Environment, 122(11), 4086–
4097.
Othman, K. I., and Deguan, W. (2004). “Characteristics of Tigris River bed at Mosul City,
Iraq.” Journal of Lake Sciences, 16, 61–71.
Rabee A-M., Abdul-Kareem., B. M., Al-Dhamin, A. S., (2011). “Seasonal variations of
some ecological parameters in Tigris River water at Baghdad region, Iraq.” J. Water
Resources and Protection, 3, 262-267.
Rahi, K. A., and Halihan, T. (2010). “Changes in the salinity of the Euphrates River system
in Iraq.” Regional Environmental Change, 10(1), 27–35.
Reddy, M. A. (1997). A detailed statistical study on selection of optimum IRS LISS pixel
configuration for development of water quality models. International Journal of Remote
Sensing, 18, 2559–2570.
Ritchie, R., Cooper CM., Schiebe, FB., (1990) “The relationship of MMS and TM digital
data with suspended sediments, chlorophyll and temperature in Moon Lake, Mississippi.”
J. Remote Sensing of Environment, 33, 137-148.
Ryu, JH, Won JS, Min, KD (2002). “Waterline exreaction from Landsat TM data in a
tidal flat: a case study in Gomso Bay, Korea.” J. Remote Sens Environ, 83(3), 442-456
Sauer, V. B., & Meyer, R. W. (1992). “Determination of error in individual discharge
measurements.” United States Geological Survey Open - File Report.
Simon, R. N., Tormos, T., and Danis, P. A., (2014) “Retrieving water surface temperature
from archive Landsat thermal infrared data: Application of the mono-channel atmospheric
217
correction algorithm over two freshwater reservoirs.” International J. Applied Earth
Observation and Geoinformation, 30, 247-250.
Sissakian, V. K., (2011). “Genesis and age estimation of the Tharthar depression, central
west Iraq.” J. Iraqi Bulletin of Geology and Mining, 7, 47-62.
Swiss Consultants. (1979). “Tigris River water resources study.” “unpublished report”,
Ministry of Irrigation.
The World Bank. (2006). “Iraq - Country water resource assistance strategy: addressing
major threats to people’s livelihoods.” 1–97. https://doi.org/36297-IQ
UN-ESCWA and BGR, (2013), Inventory of Shared Water Resources in Western Asia,
United Nations Economic and Social Commission for Western Asia and Bundesanstalt für
Geowissenschaften und Rohstoffe, Beirut.
United Nation (UN) factsheet (2013) “Water in Iraq Factsheet”
http://www.iraqicivilsociety.org/wp-content/uploads/2014/02/Water-Factsheet.pdf (Aug.
28, 2017).
U.S. Army Corps of Engineers, (2010). “HEC-RAS” manual.
http://www.hec.usace.army.mil/ (Aug. 31, 2017).
United States Geological Survey (USGS) http://glovis.usgs.gov/ (Aug. 31, 2017).
United States Geological Survey (USGS)
http://www.earthexplorer.usgs.gov/ (Aug. 31, 2017).
USAID (2003) “Providing Sanitation to Iraq”
http://pdf.usaid.gov/pdf_docs/Pdack151.pdf (Aug. 31, 2017).
USAID (2007) “Iraq Private Sector Growth and Employment Generation.”
http://www.iajd.org/files/3_1.pdf. (Aug. 31, 2017).
Wanielista M, Kersten R, Eaglin R. (1997) “Hydrology: Water Quantity and Quality
Control,” 2nd edition. John Wiley & Sons, Inc. pp. 68–72.
Wang, F., Han, L., Kung, H., and Ardale, R. (2006) “Application of Landsat5 TM imagery
in assessing and mapping water quality in Reelfoot Lake, Tennessee” International J.
Remote sensing, 27, 5269-5283.
Water Research Foundation (2015). “EPA Secondary Maximum Contaminant Levels: A
Strategy for Drinking Water Quality and Consumer Acceptability.” Web report#4537.
http://www.waterrf.org/Pages/Projects.aspx?PID=4537 (April/19/2017).
Worldometers. “World Population.”
http://www.worldometers.info/world-population/iraq-population/ (December/23/2017).
218
Wulder, M. A.,White, J. C., Goward, S. N., Masek, J. G., Irons, J. R., Herold, M., Cohen,W.
B., Loveland, T. R., &Woodcock, C. E. (2008). “Landsat continuity: Issues and
opportunities for land cover monitoring”, Remote Sensing of Environment, 112, 955−969.
WRI (World Resources Institute) (2002) Drylands, People, and Ecosystem Goods and
Services: A Web-Based Geo-Spatial Analysis. http://www.wri.org
Zakaria, S., Al-ansari, N., & Knutsson, S. (2013). “Historical and Future Climatic
Change Scenarios for Temperature and Rainfall for Iraq,” 7(12), 1574–1594.
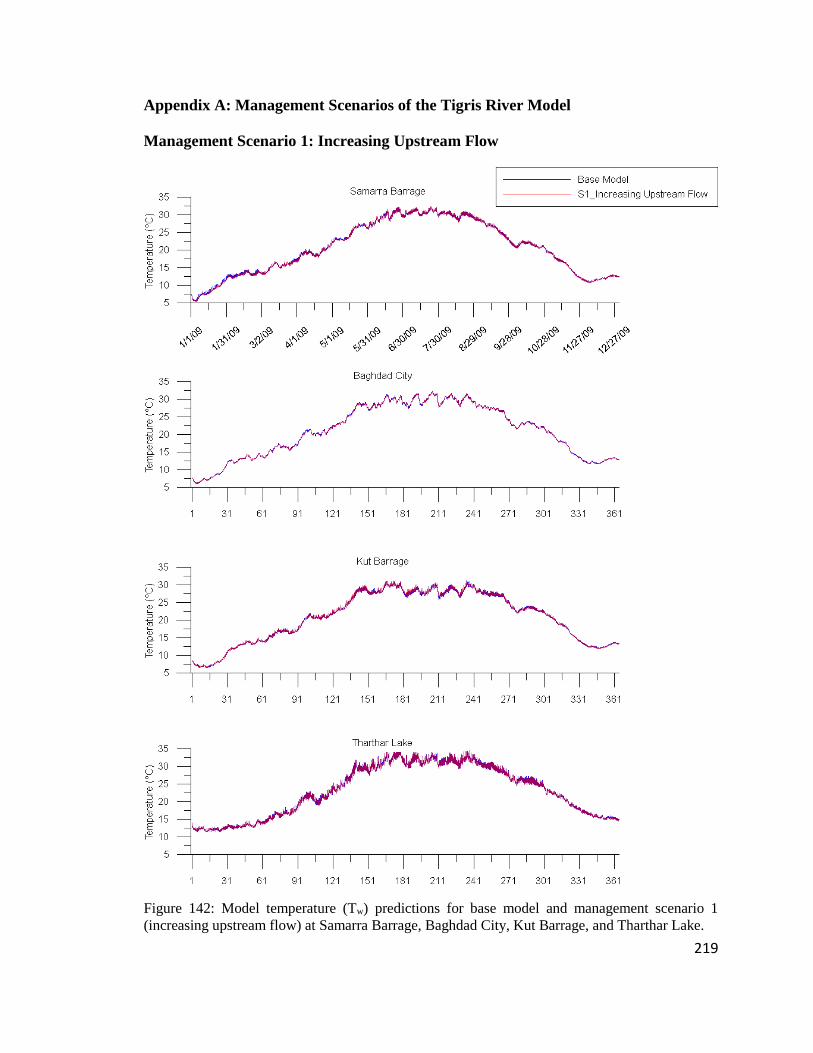
219
Appendix A: Management Scenarios of the Tigris River Model
Management Scenario 1: Increasing Upstream Flow
Figure 142: Model temperature (Tw) predictions for base model and management scenario 1
(increasing upstream flow) at Samarra Barrage, Baghdad City, Kut Barrage, and Tharthar Lake.
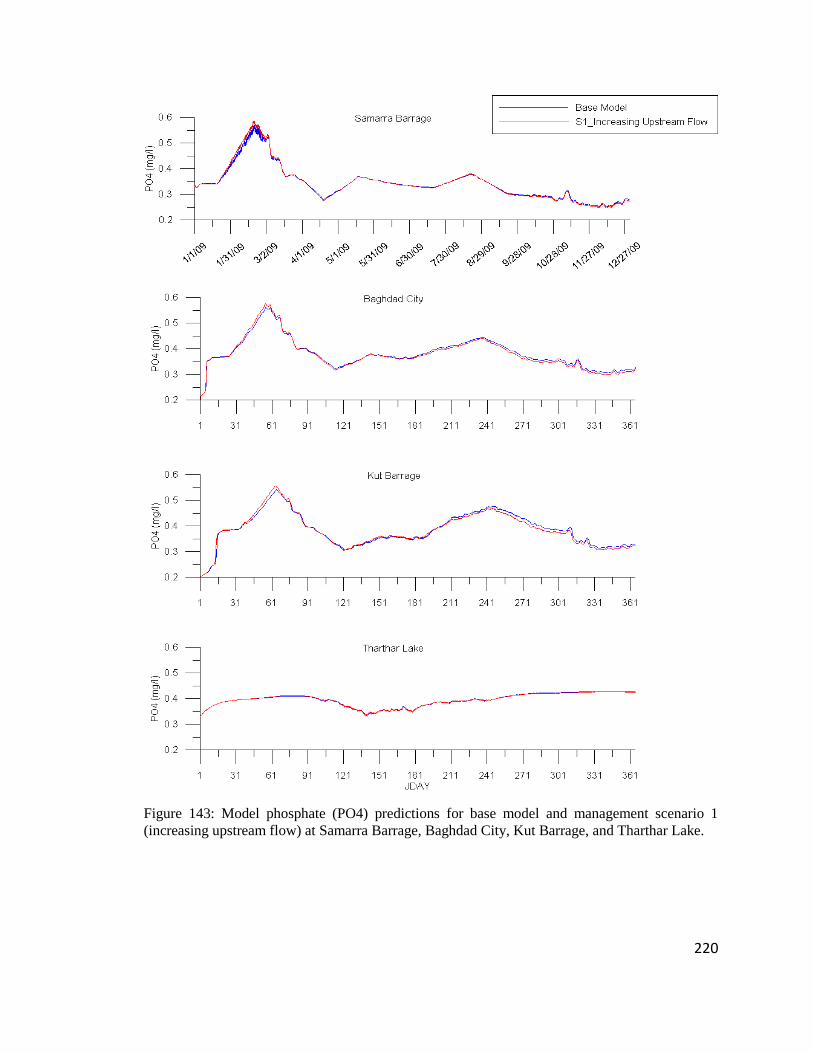
220
Figure 143: Model phosphate (PO4) predictions for base model and management scenario 1
(increasing upstream flow) at Samarra Barrage, Baghdad City, Kut Barrage, and Tharthar Lake.

221
Figure 144: Model ammonia (NH4) predictions for base model and management scenario 1
(increasing upstream flow) at Samarra Barrage, Baghdad City, Kut Barrage, and Tharthar Lake.
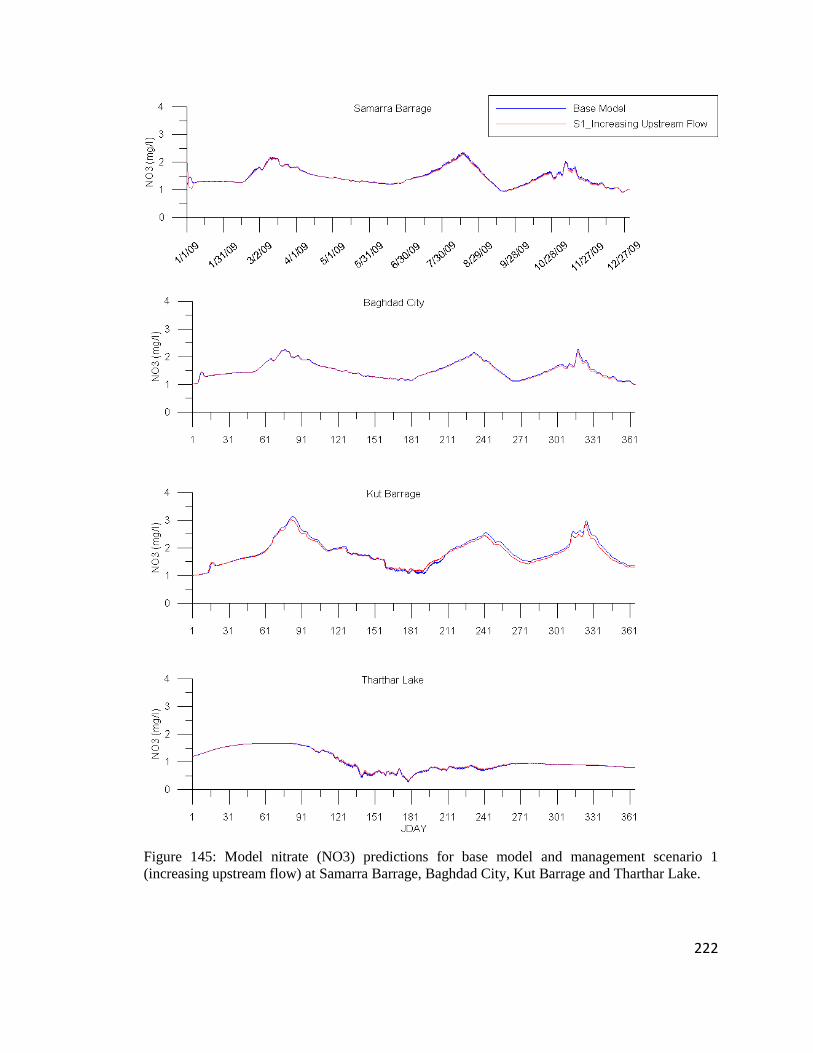
222
Figure 145: Model nitrate (NO3) predictions for base model and management scenario 1
(increasing upstream flow) at Samarra Barrage, Baghdad City, Kut Barrage and Tharthar Lake.
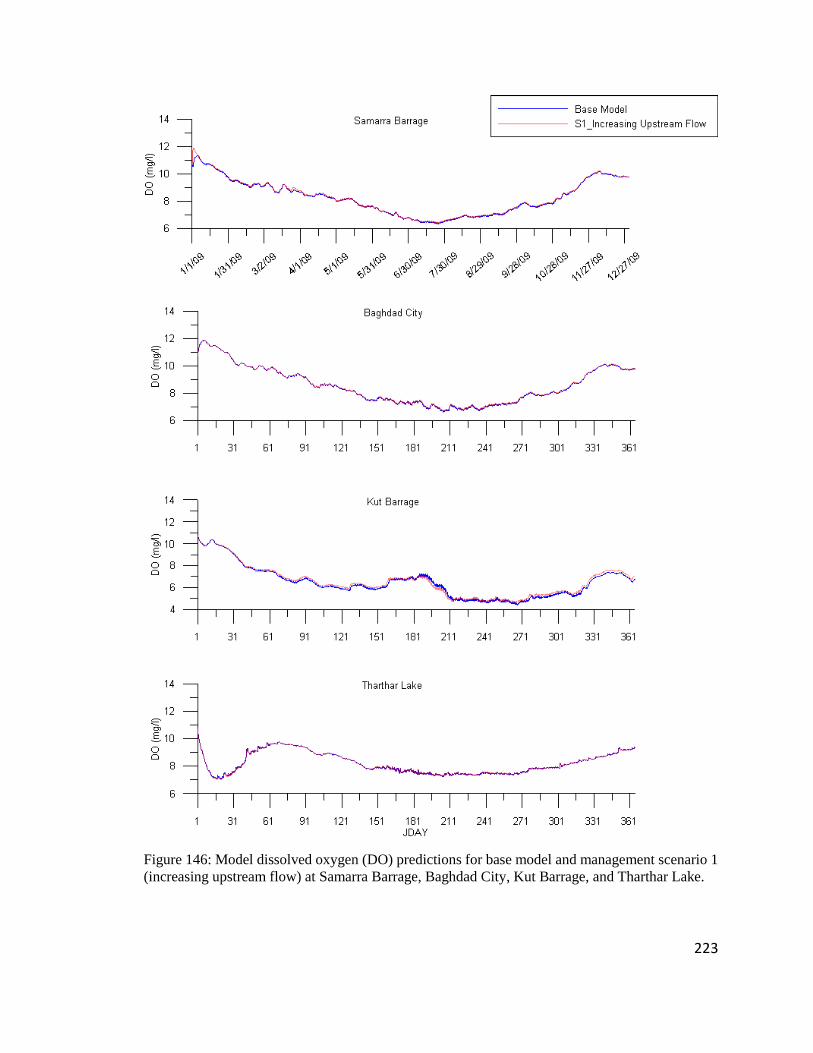
223
Figure 146: Model dissolved oxygen (DO) predictions for base model and management scenario 1
(increasing upstream flow) at Samarra Barrage, Baghdad City, Kut Barrage, and Tharthar Lake.
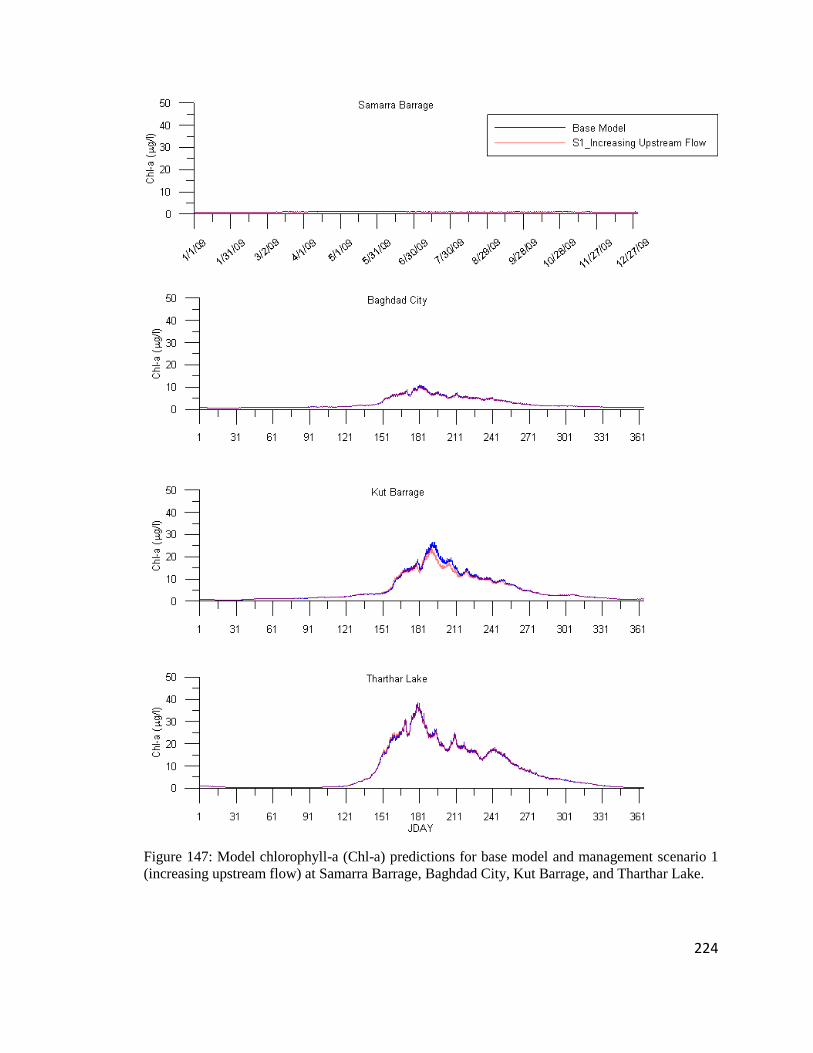
224
Figure 147: Model chlorophyll-a (Chl-a) predictions for base model and management scenario 1
(increasing upstream flow) at Samarra Barrage, Baghdad City, Kut Barrage, and Tharthar Lake.
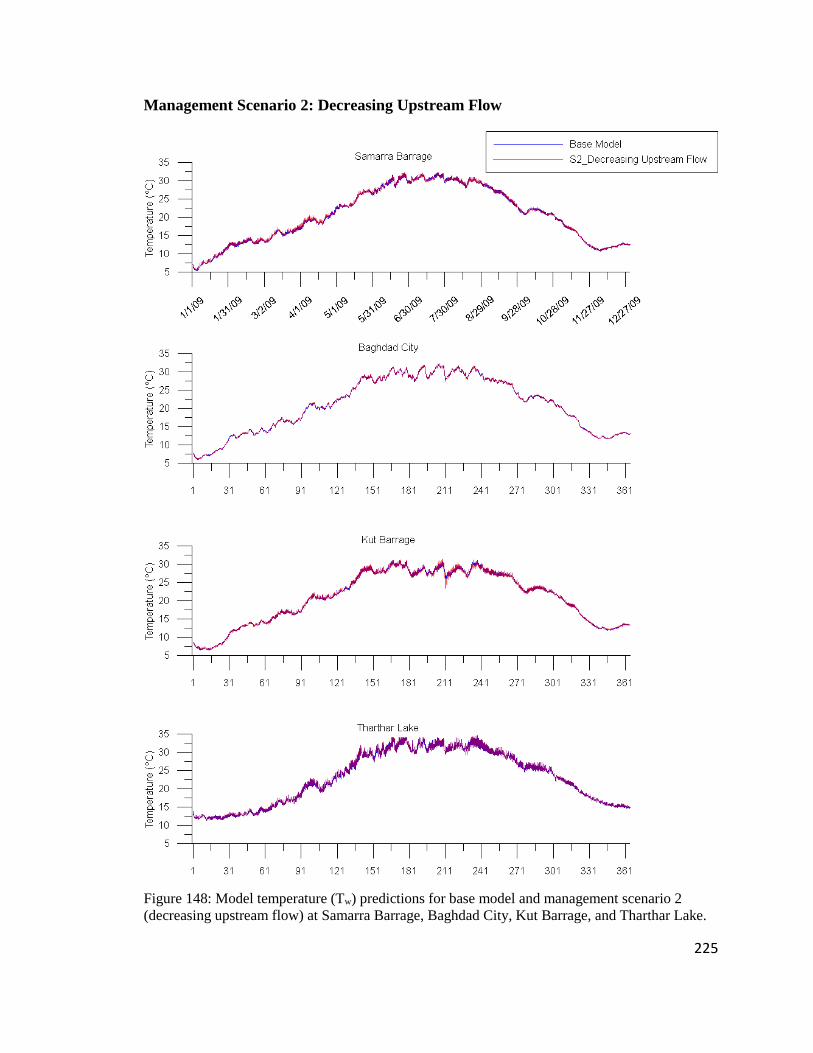
225
Management Scenario 2: Decreasing Upstream Flow
Figure 148: Model temperature (Tw) predictions for base model and management scenario 2
(decreasing upstream flow) at Samarra Barrage, Baghdad City, Kut Barrage, and Tharthar Lake.
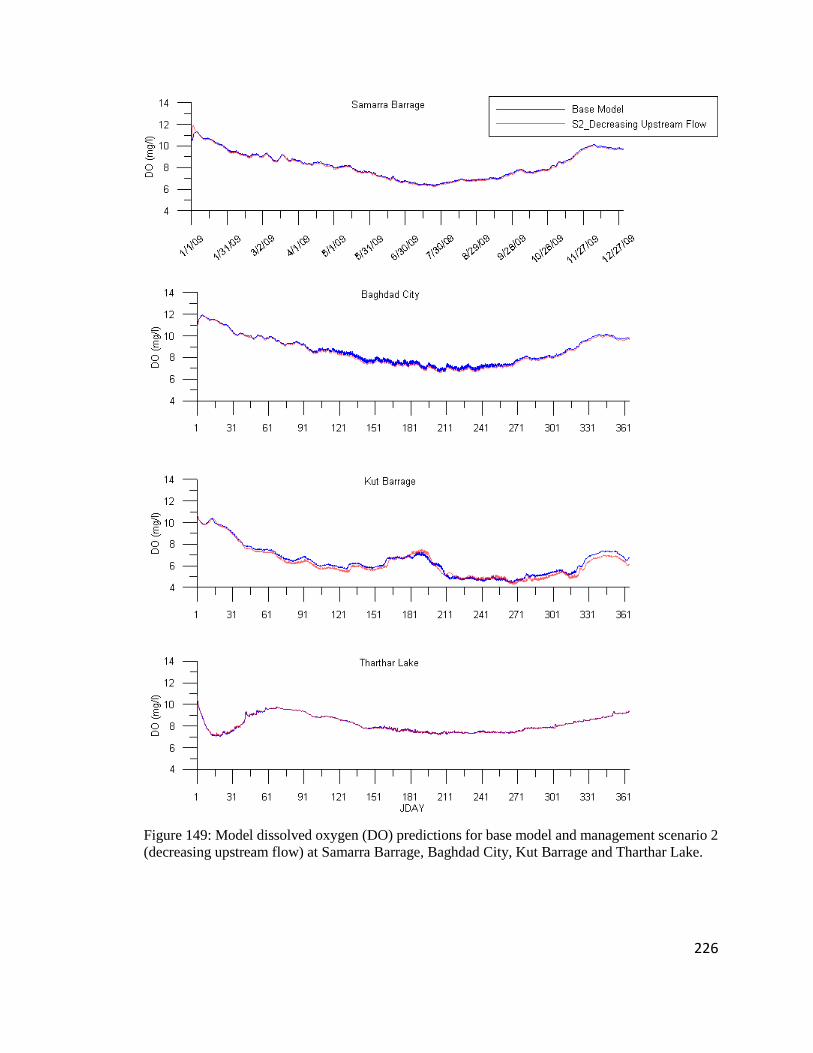
226
Figure 149: Model dissolved oxygen (DO) predictions for base model and management scenario 2
(decreasing upstream flow) at Samarra Barrage, Baghdad City, Kut Barrage and Tharthar Lake.
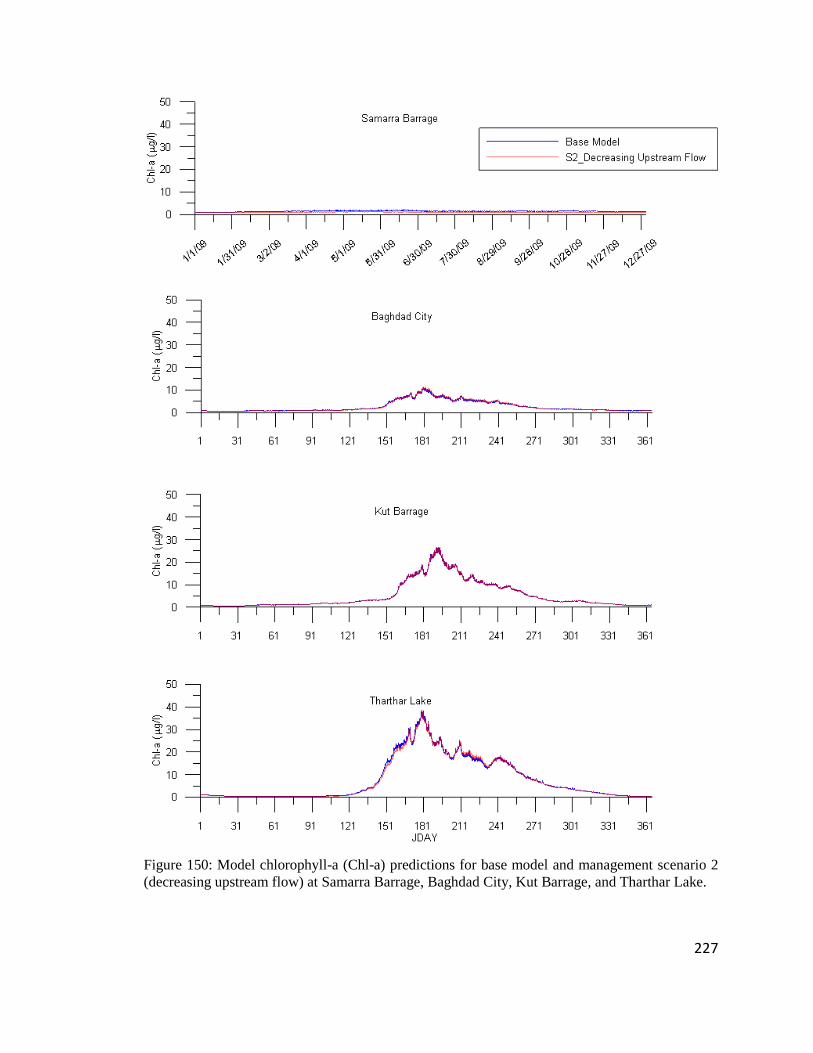
227
Figure 150: Model chlorophyll-a (Chl-a) predictions for base model and management scenario 2
(decreasing upstream flow) at Samarra Barrage, Baghdad City, Kut Barrage, and Tharthar Lake.
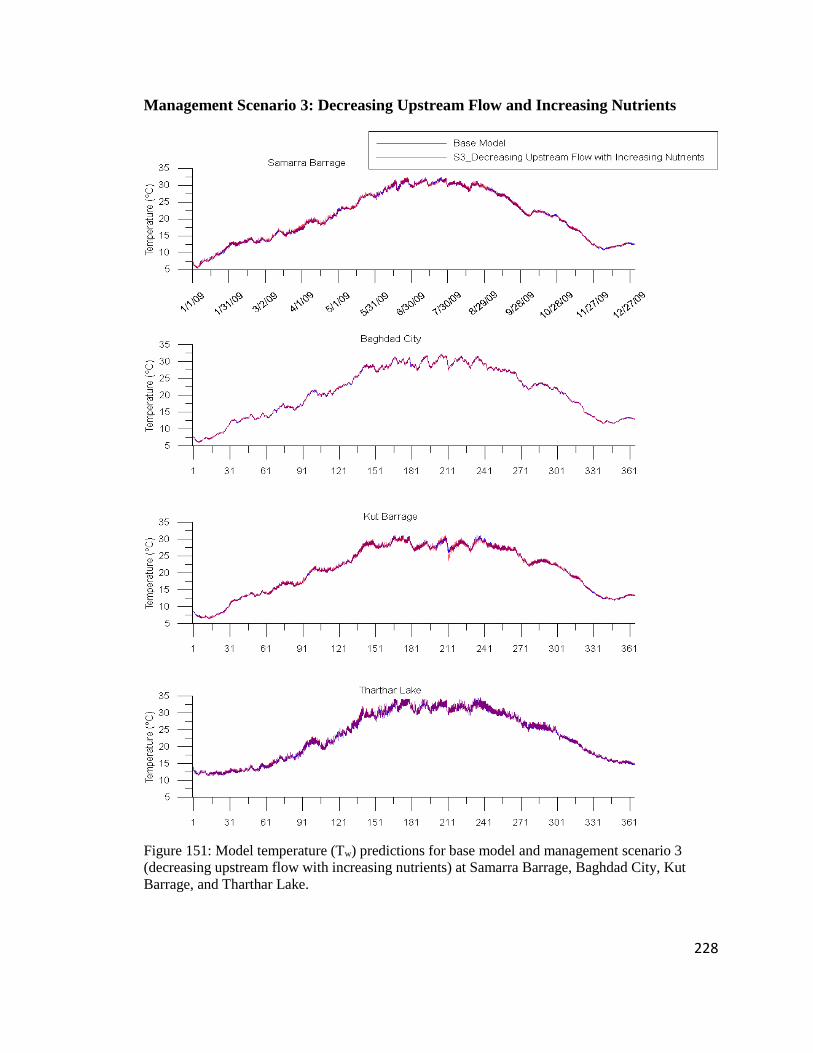
228
Management Scenario 3: Decreasing Upstream Flow and Increasing Nutrients
Figure 151: Model temperature (Tw) predictions for base model and management scenario 3
(decreasing upstream flow with increasing nutrients) at Samarra Barrage, Baghdad City, Kut
Barrage, and Tharthar Lake.
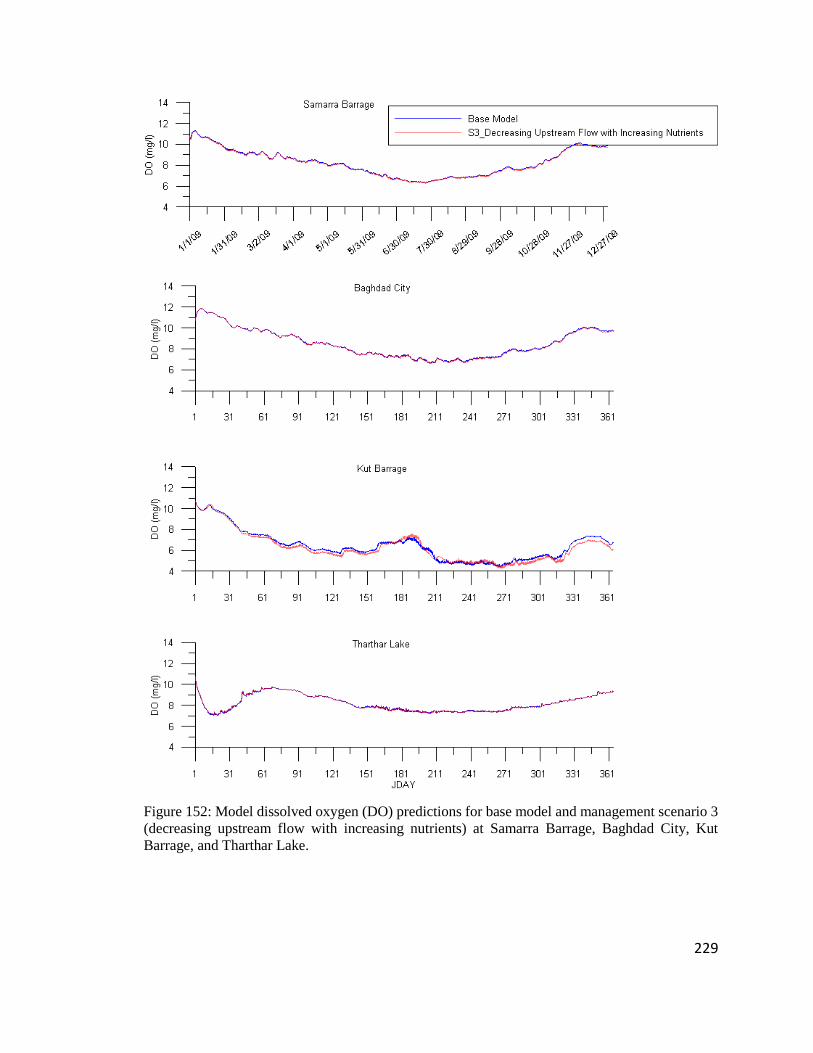
229
Figure 152: Model dissolved oxygen (DO) predictions for base model and management scenario 3
(decreasing upstream flow with increasing nutrients) at Samarra Barrage, Baghdad City, Kut
Barrage, and Tharthar Lake.
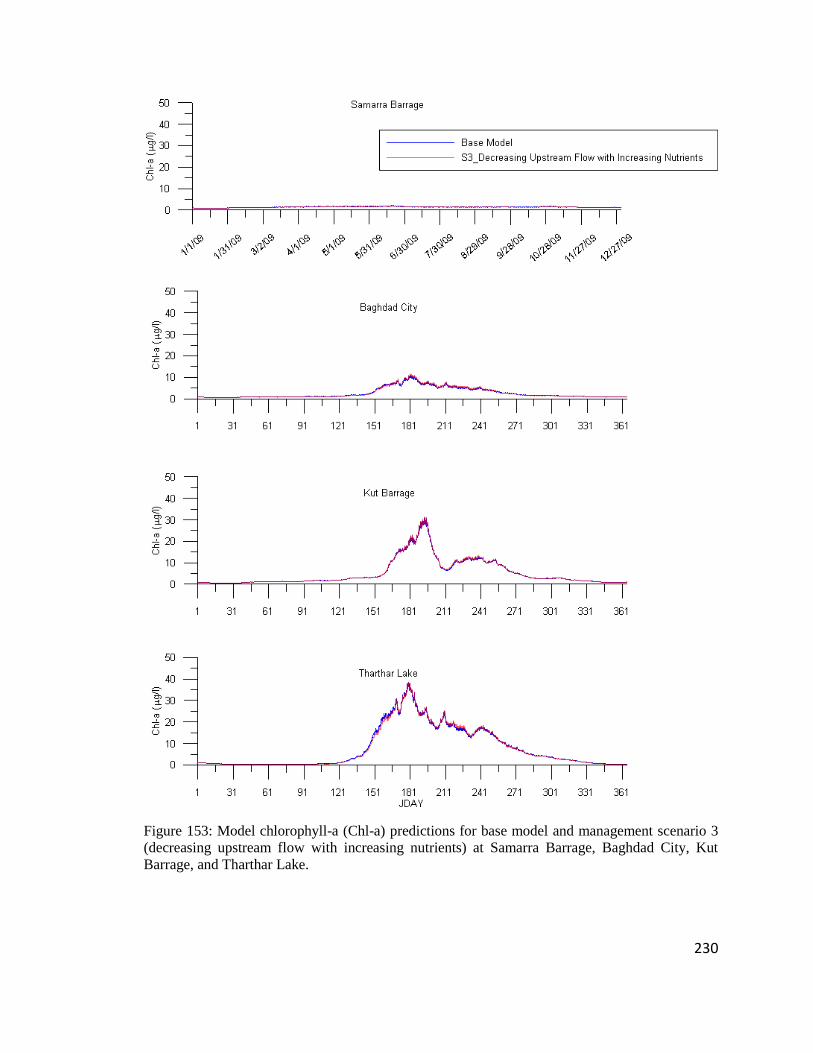
230
Figure 153: Model chlorophyll-a (Chl-a) predictions for base model and management scenario 3
(decreasing upstream flow with increasing nutrients) at Samarra Barrage, Baghdad City, Kut
Barrage, and Tharthar Lake.
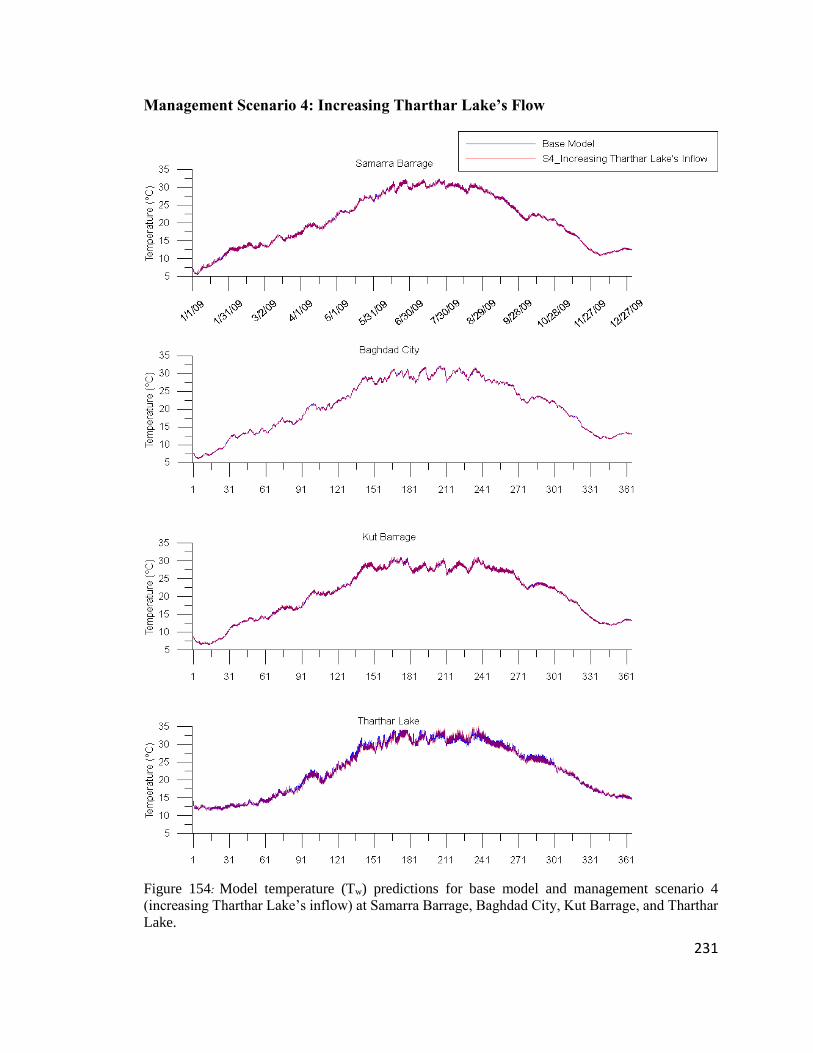
231
Management Scenario 4: Increasing Tharthar Lake’s Flow
Figure 154: Model temperature (Tw) predictions for base model and management scenario 4
(increasing Tharthar Lake’s inflow) at Samarra Barrage, Baghdad City, Kut Barrage, and Tharthar
Lake.
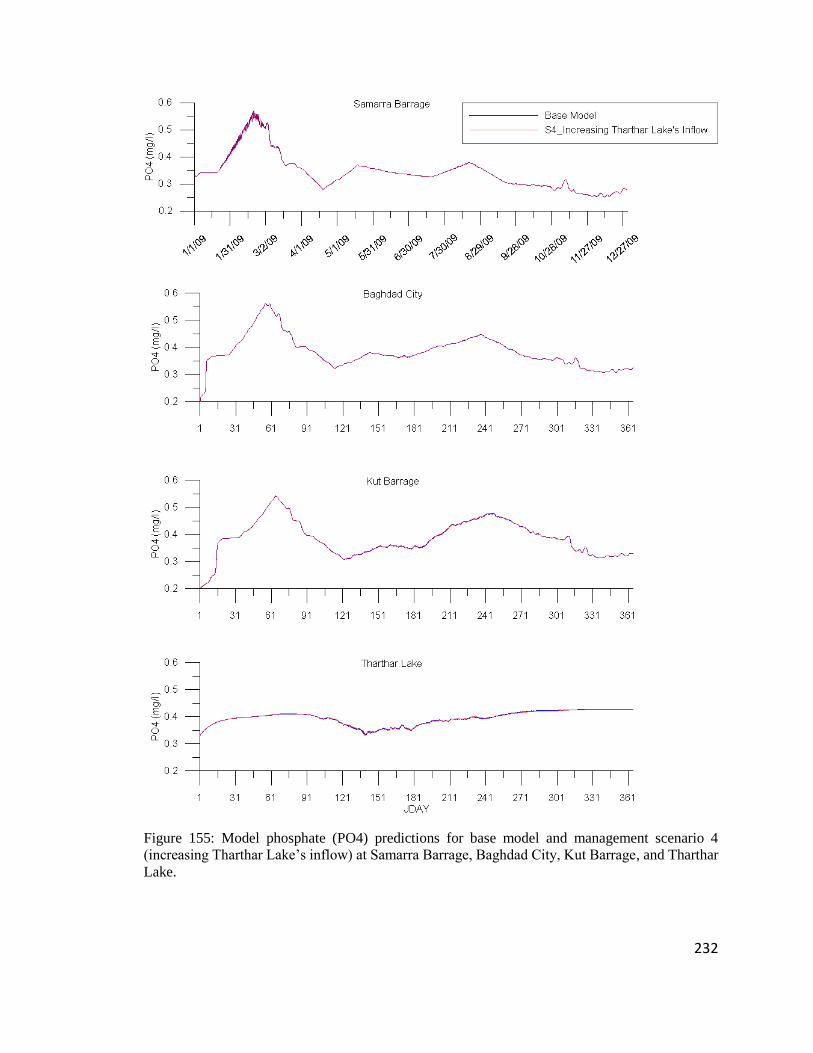
232
Figure 155: Model phosphate (PO4) predictions for base model and management scenario 4
(increasing Tharthar Lake’s inflow) at Samarra Barrage, Baghdad City, Kut Barrage, and Tharthar
Lake.
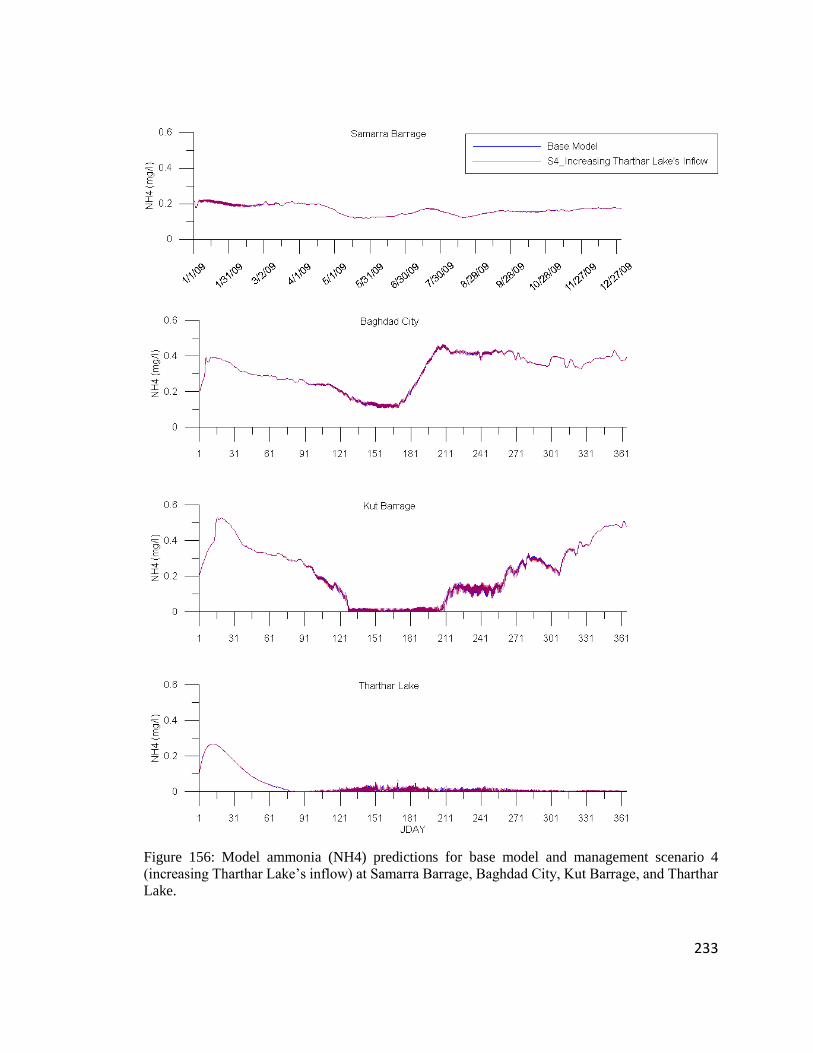
233
Figure 156: Model ammonia (NH4) predictions for base model and management scenario 4
(increasing Tharthar Lake’s inflow) at Samarra Barrage, Baghdad City, Kut Barrage, and Tharthar
Lake.
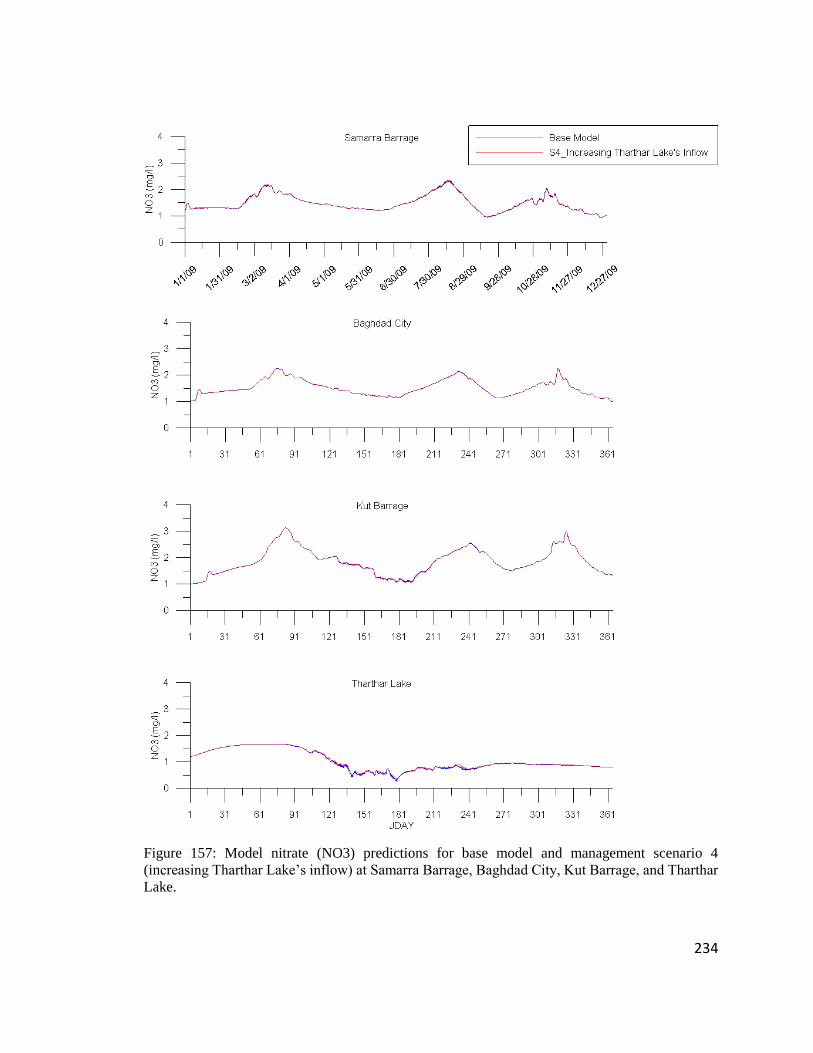
234
Figure 157: Model nitrate (NO3) predictions for base model and management scenario 4
(increasing Tharthar Lake’s inflow) at Samarra Barrage, Baghdad City, Kut Barrage, and Tharthar
Lake.
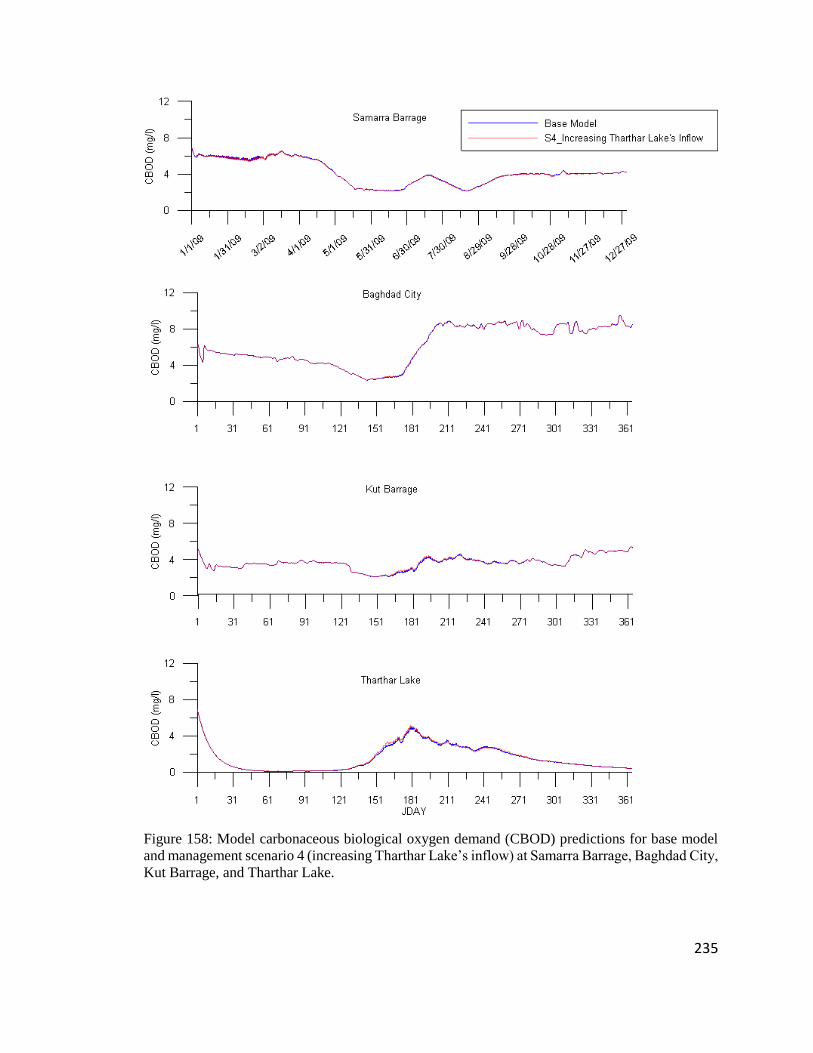
235
Figure 158: Model carbonaceous biological oxygen demand (CBOD) predictions for base model
and management scenario 4 (increasing Tharthar Lake’s inflow) at Samarra Barrage, Baghdad City,
Kut Barrage, and Tharthar Lake.
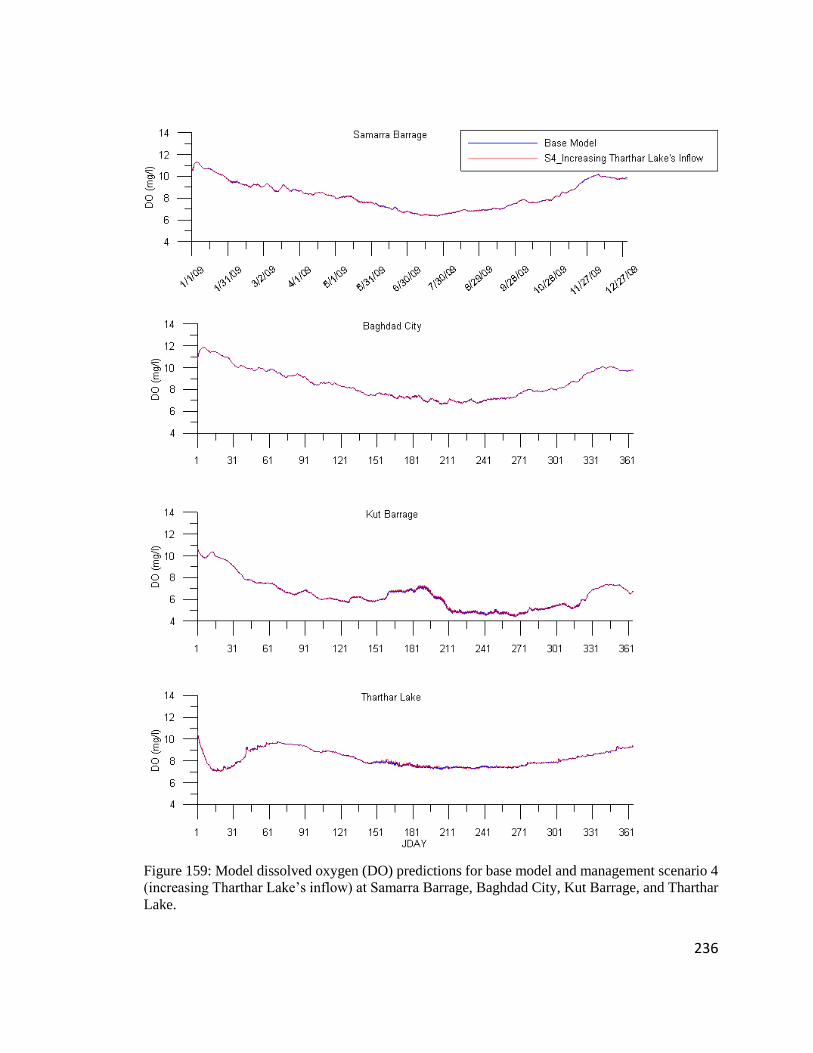
236
Figure 159: Model dissolved oxygen (DO) predictions for base model and management scenario 4
(increasing Tharthar Lake’s inflow) at Samarra Barrage, Baghdad City, Kut Barrage, and Tharthar
Lake.
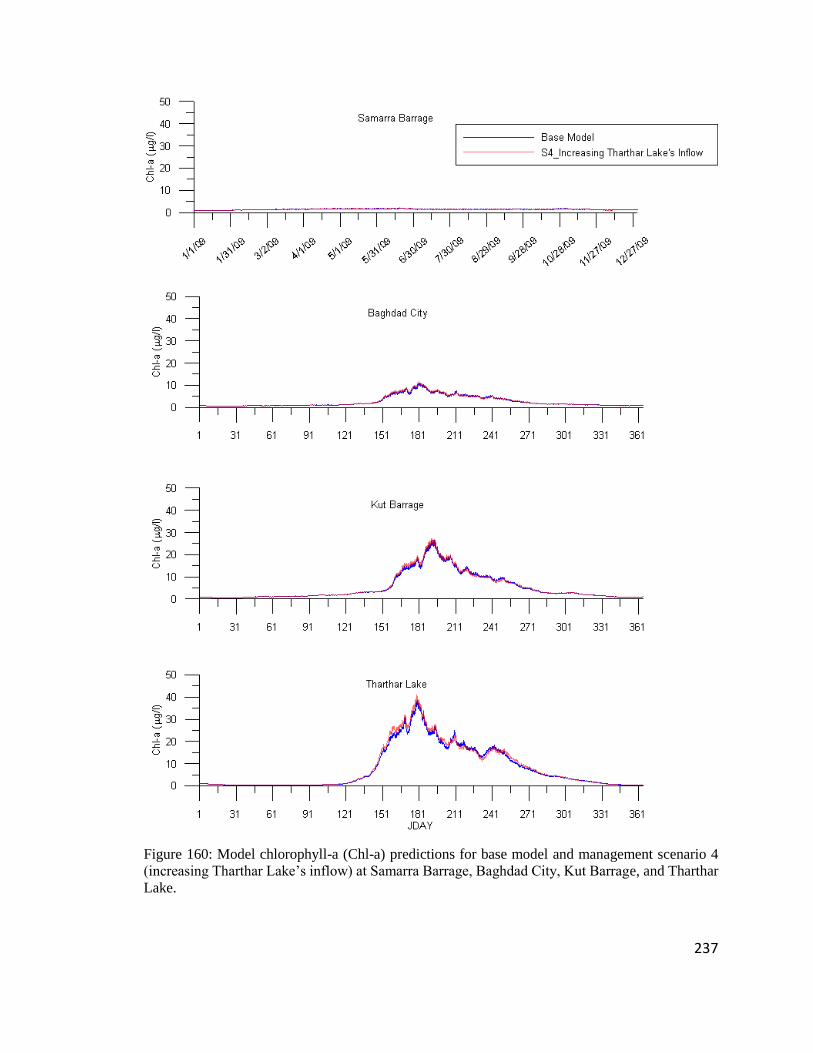
237
Figure 160: Model chlorophyll-a (Chl-a) predictions for base model and management scenario 4
(increasing Tharthar Lake’s inflow) at Samarra Barrage, Baghdad City, Kut Barrage, and Tharthar
Lake.
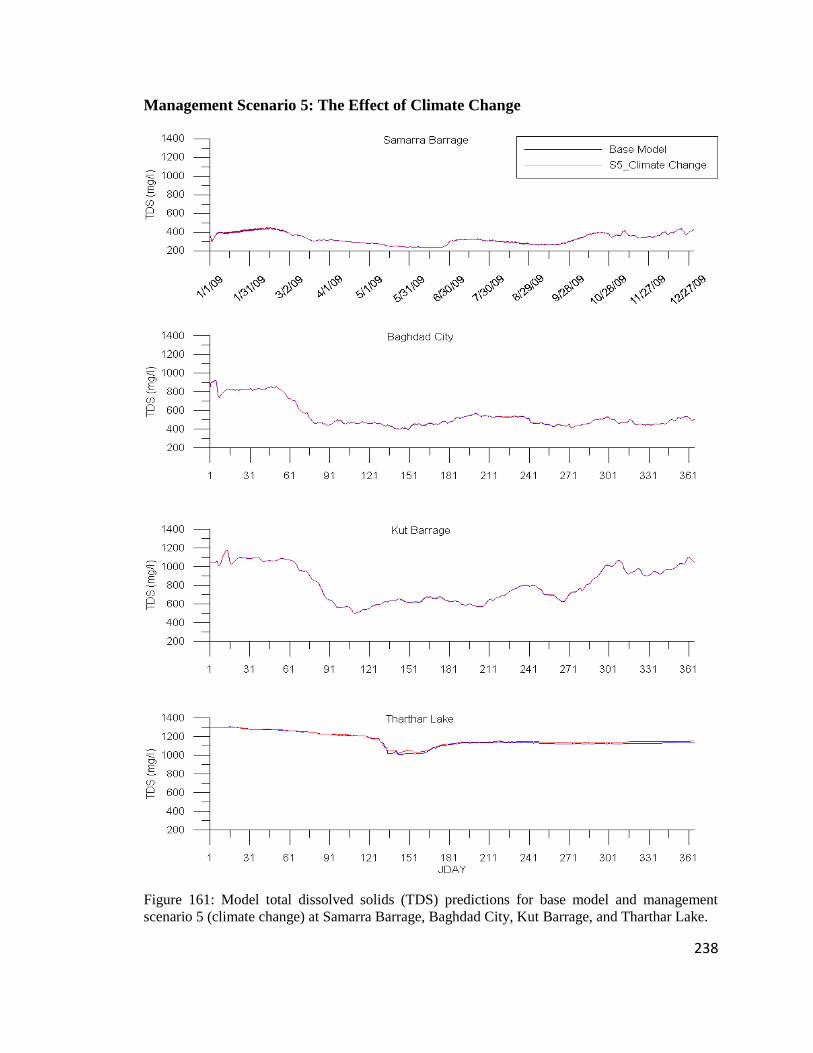
238
Management Scenario 5: The Effect of Climate Change
Figure 161: Model total dissolved solids (TDS) predictions for base model and management
scenario 5 (climate change) at Samarra Barrage, Baghdad City, Kut Barrage, and Tharthar Lake.
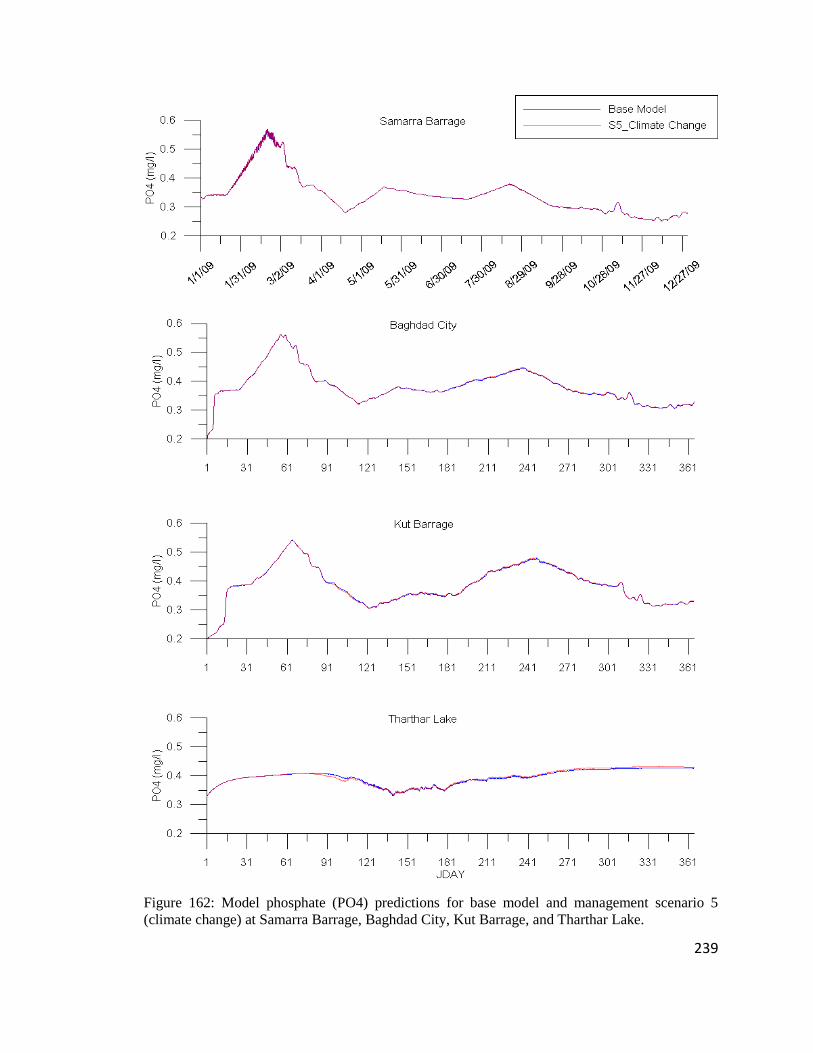
239
Figure 162: Model phosphate (PO4) predictions for base model and management scenario 5
(climate change) at Samarra Barrage, Baghdad City, Kut Barrage, and Tharthar Lake.
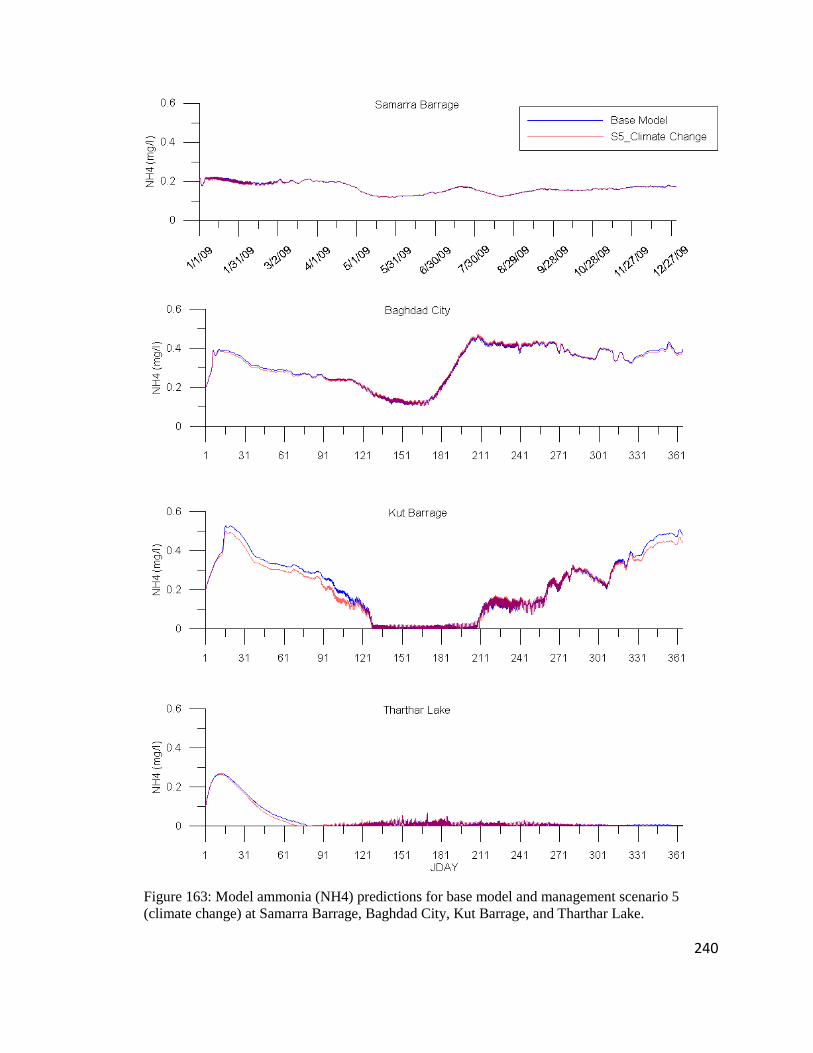
240
Figure 163: Model ammonia (NH4) predictions for base model and management scenario 5
(climate change) at Samarra Barrage, Baghdad City, Kut Barrage, and Tharthar Lake.
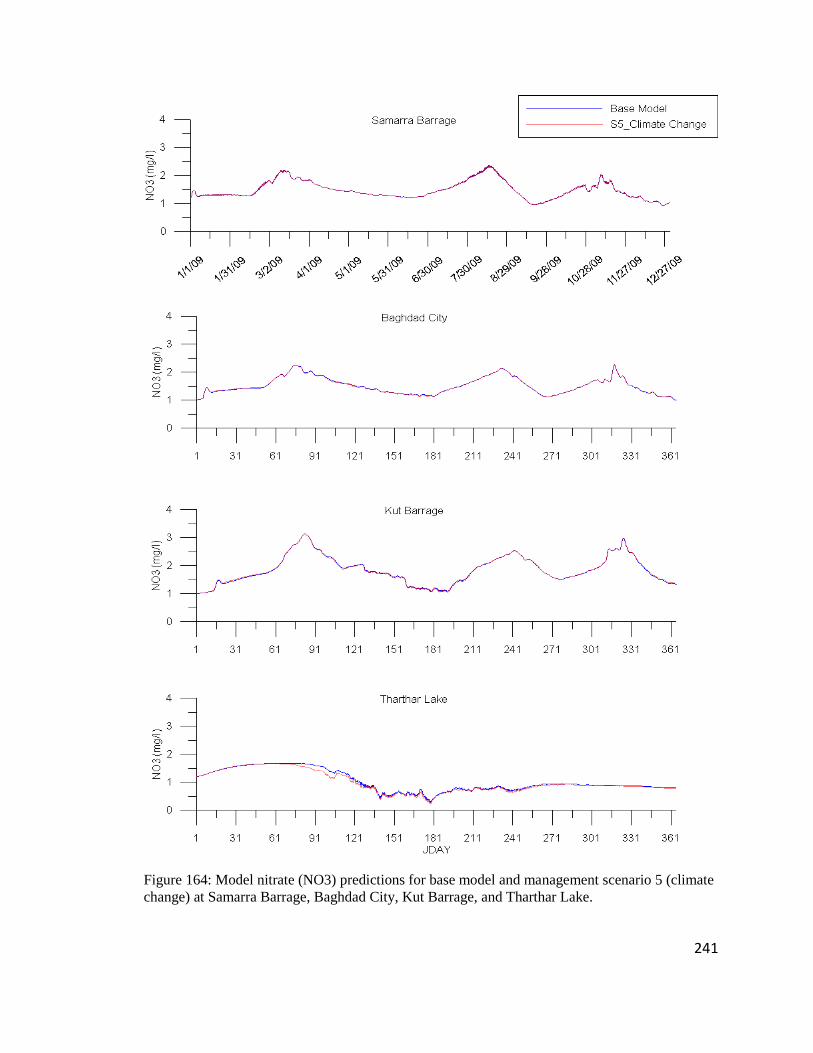
241
Figure 164: Model nitrate (NO3) predictions for base model and management scenario 5 (climate
change) at Samarra Barrage, Baghdad City, Kut Barrage, and Tharthar Lake.

242
Figure 165: Model carbonaceous biological oxygen demand (CBOD) predictions for base model
and management scenario 5 (climate change) at Samarra Barrage, Baghdad City, Kut Barrage, and
Tharthar Lake.
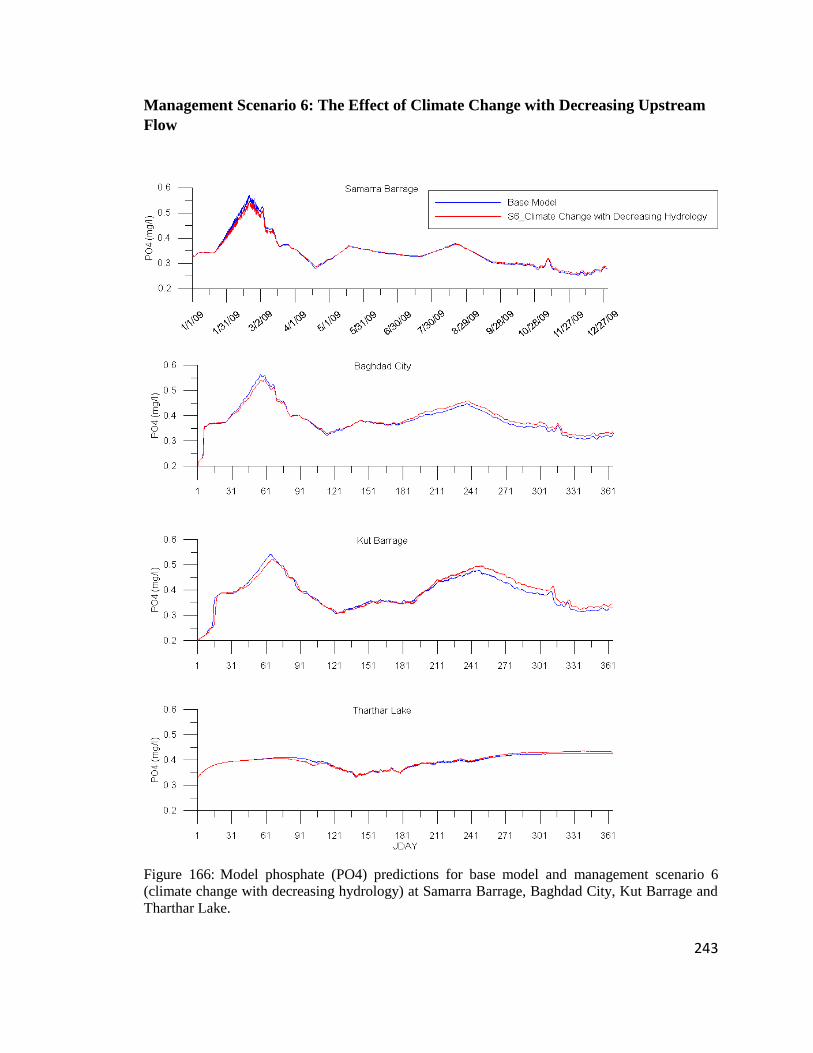
243
Management Scenario 6: The Effect of Climate Change with Decreasing Upstream
Flow
Figure 166: Model phosphate (PO4) predictions for base model and management scenario 6
(climate change with decreasing hydrology) at Samarra Barrage, Baghdad City, Kut Barrage and
Tharthar Lake.
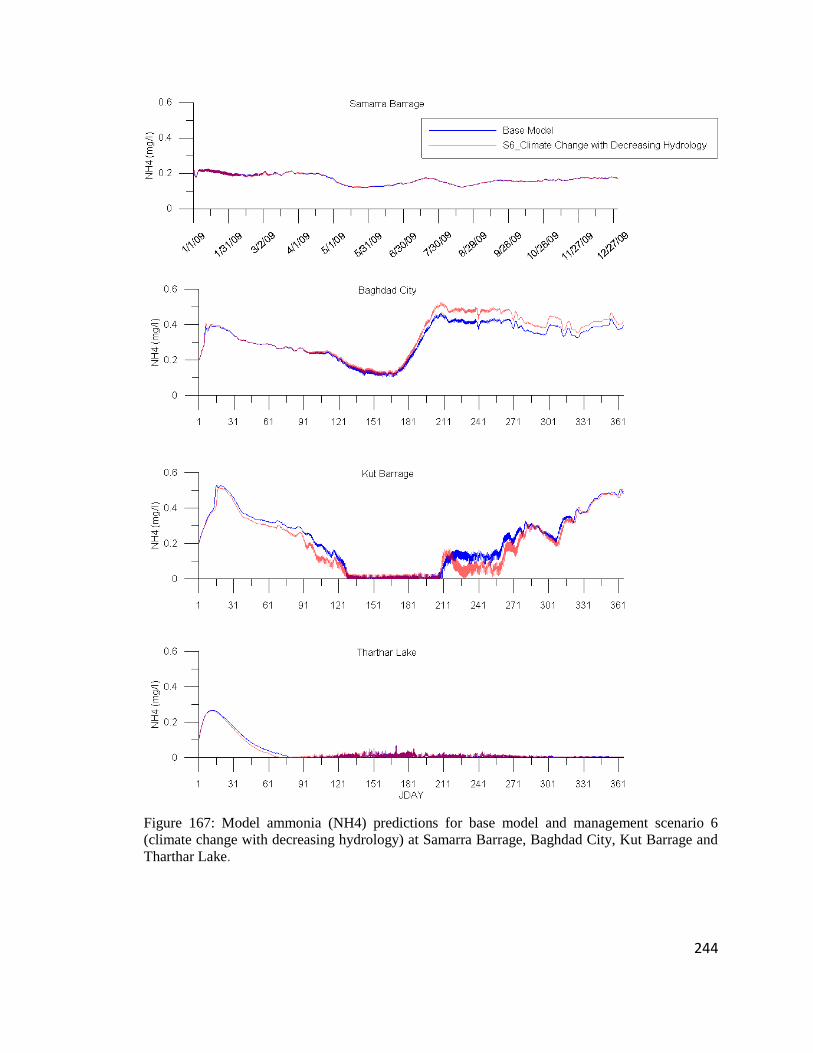
244
Figure 167: Model ammonia (NH4) predictions for base model and management scenario 6
(climate change with decreasing hydrology) at Samarra Barrage, Baghdad City, Kut Barrage and
Tharthar Lake.
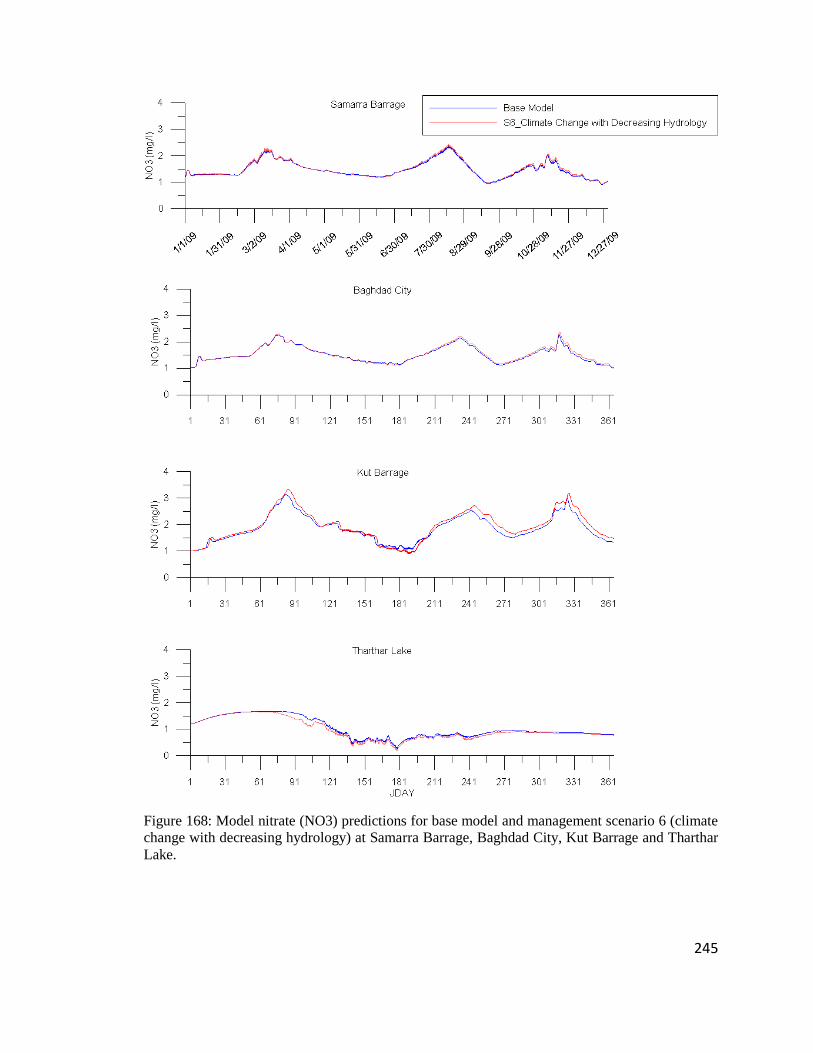
245
Figure 168: Model nitrate (NO3) predictions for base model and management scenario 6 (climate
change with decreasing hydrology) at Samarra Barrage, Baghdad City, Kut Barrage and Tharthar
Lake.
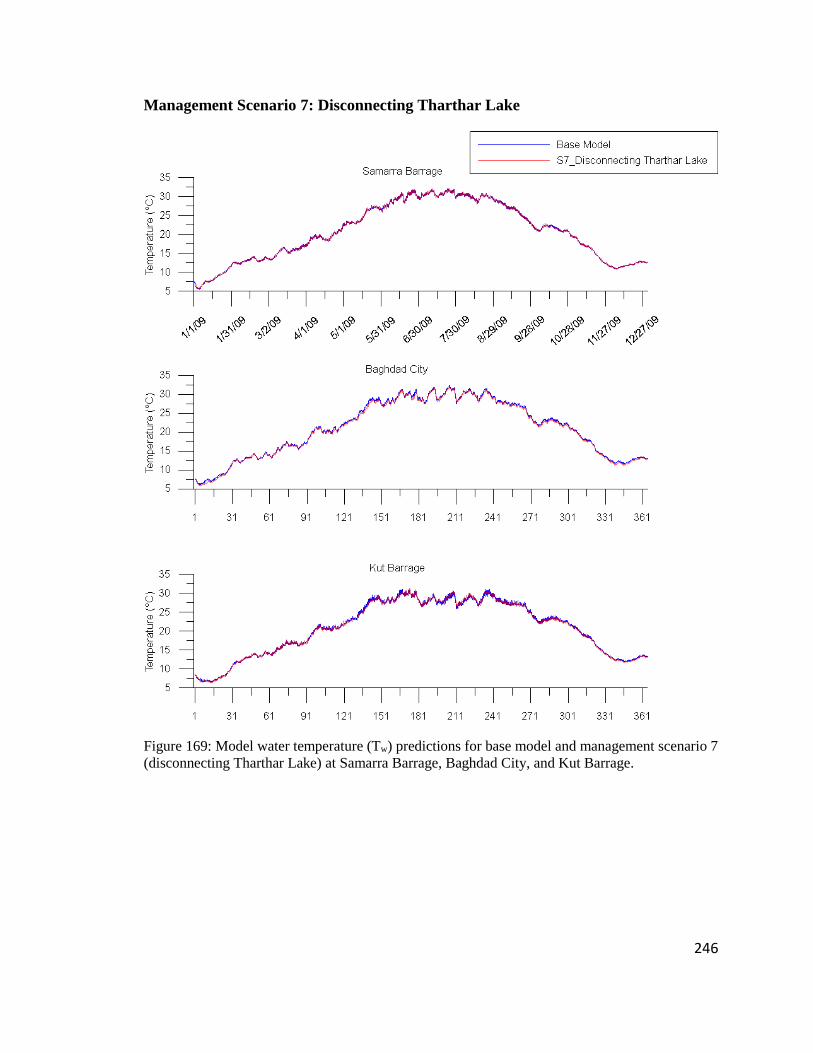
246
Management Scenario 7: Disconnecting Tharthar Lake
Figure 169: Model water temperature (Tw) predictions for base model and management scenario 7
(disconnecting Tharthar Lake) at Samarra Barrage, Baghdad City, and Kut Barrage.
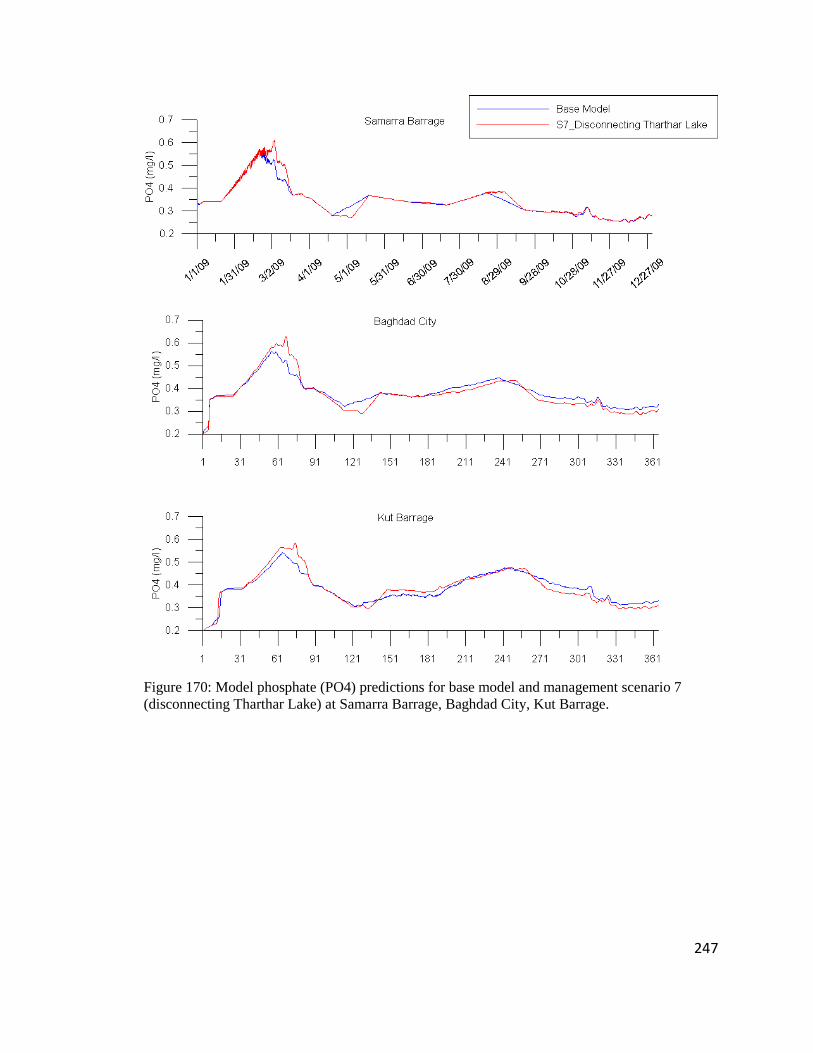
247
Figure 170: Model phosphate (PO4) predictions for base model and management scenario 7
(disconnecting Tharthar Lake) at Samarra Barrage, Baghdad City, Kut Barrage.
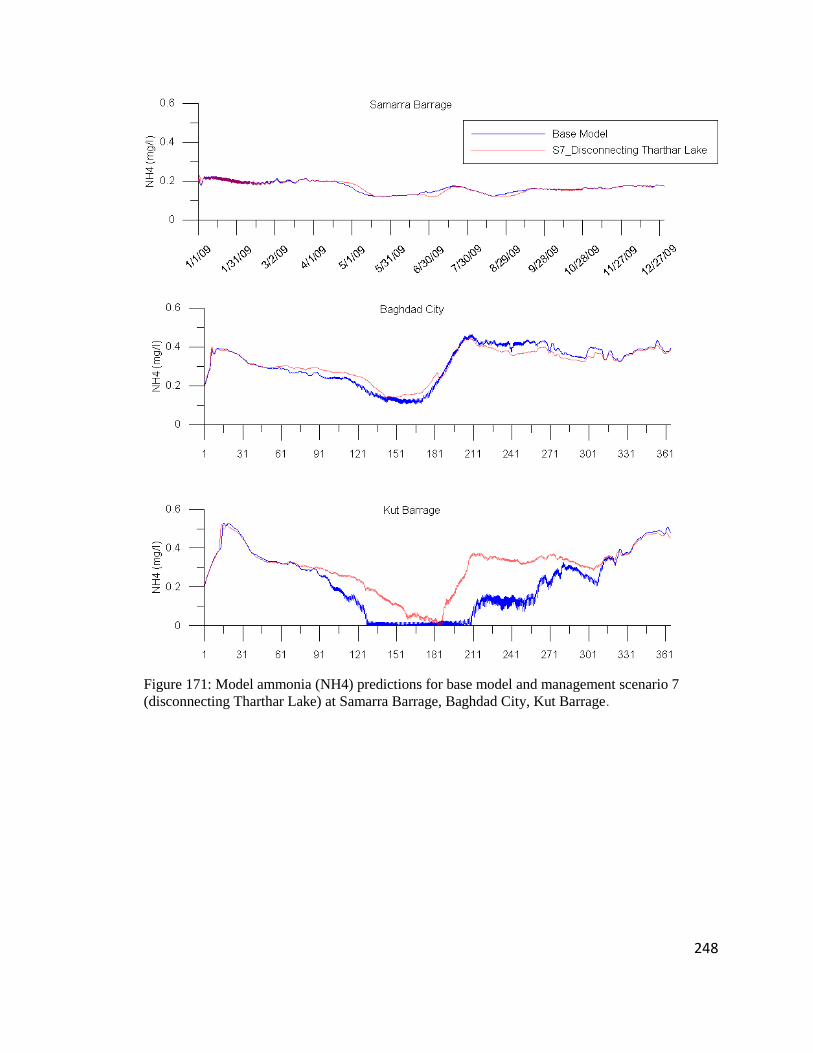
248
Figure 171: Model ammonia (NH4) predictions for base model and management scenario 7
(disconnecting Tharthar Lake) at Samarra Barrage, Baghdad City, Kut Barrage.
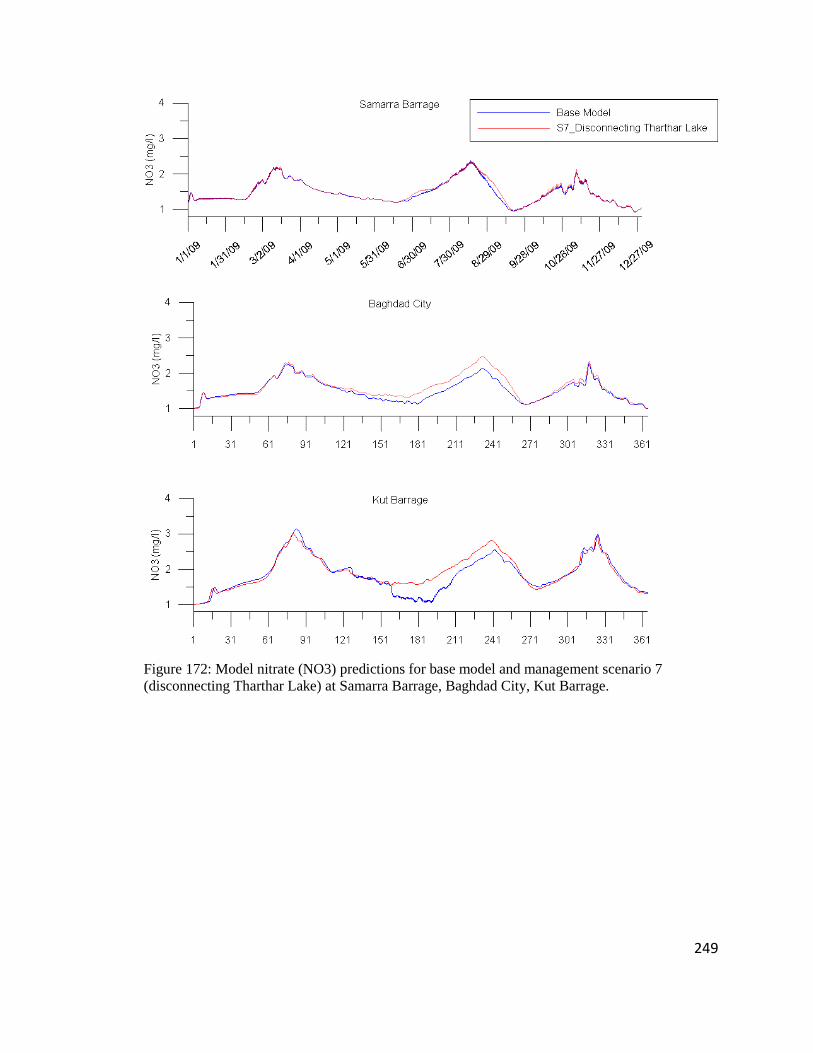
249
Figure 172: Model nitrate (NO3) predictions for base model and management scenario 7
(disconnecting Tharthar Lake) at Samarra Barrage, Baghdad City, Kut Barrage.
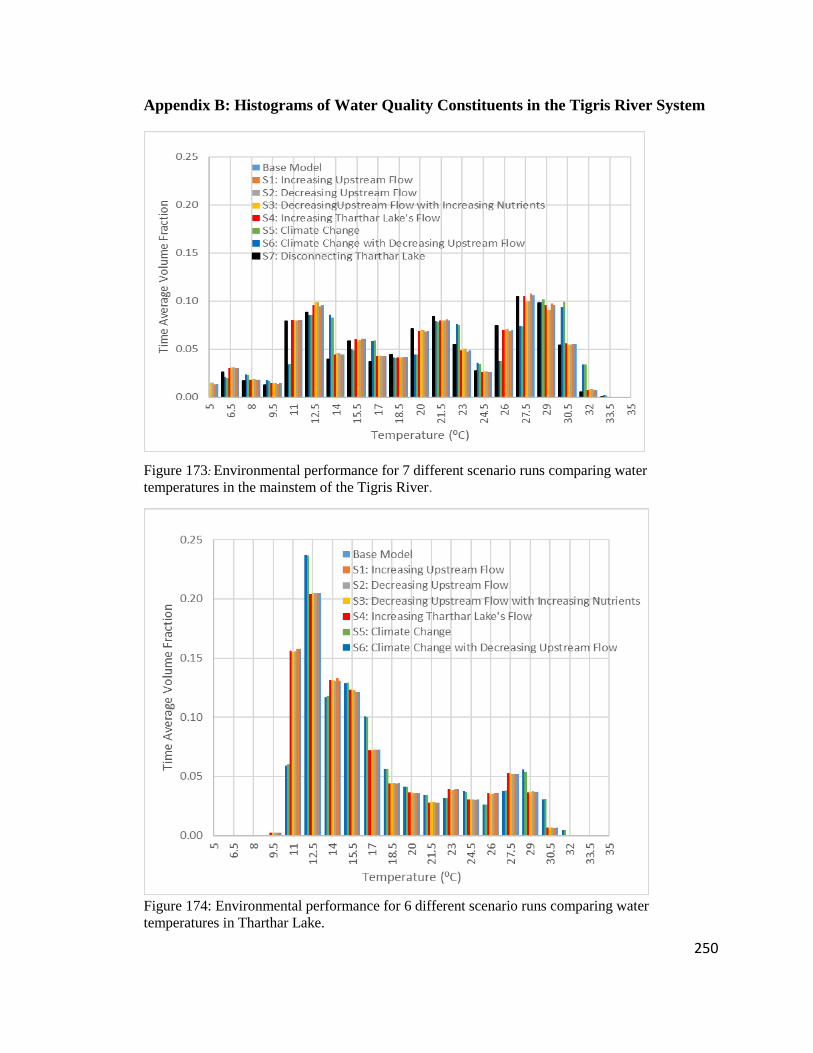
250
Appendix B: Histograms of Water Quality Constituents in the Tigris River System
Figure 173: Environmental performance for 7 different scenario runs comparing water
temperatures in the mainstem of the Tigris River.
Figure 174: Environmental performance for 6 different scenario runs comparing water
temperatures in Tharthar Lake.
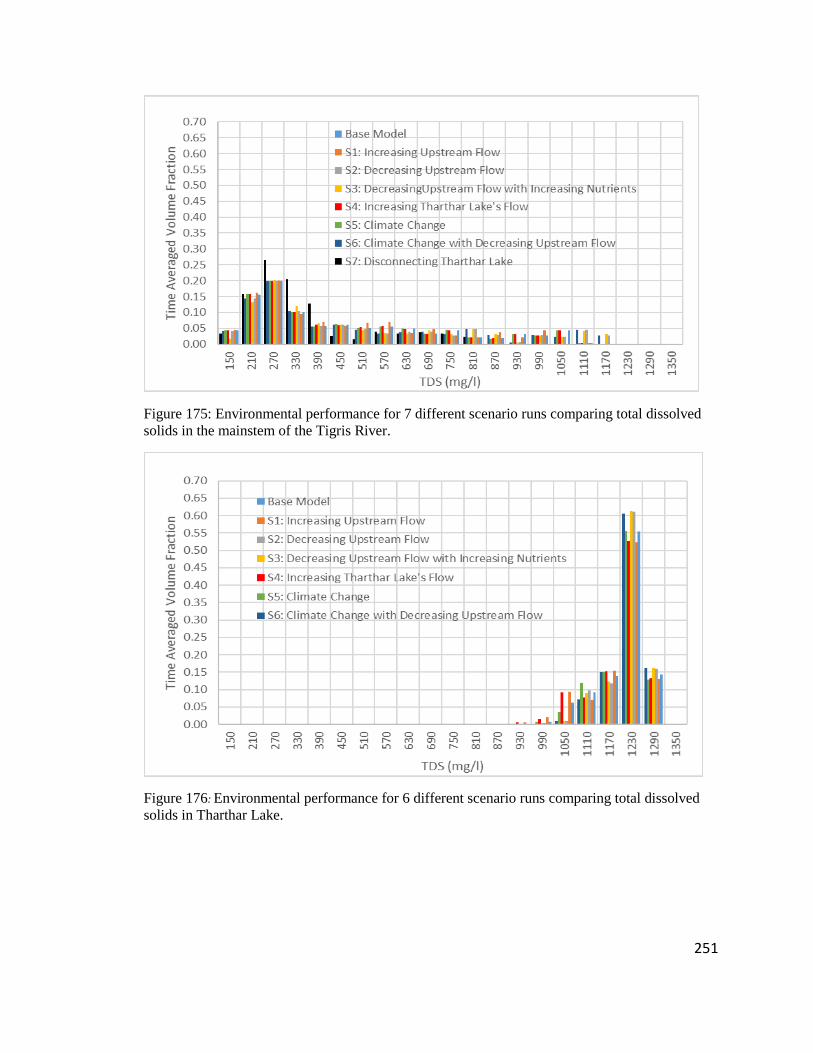
251
Figure 175: Environmental performance for 7 different scenario runs comparing total dissolved
solids in the mainstem of the Tigris River.
Figure 176: Environmental performance for 6 different scenario runs comparing total dissolved
solids in Tharthar Lake.
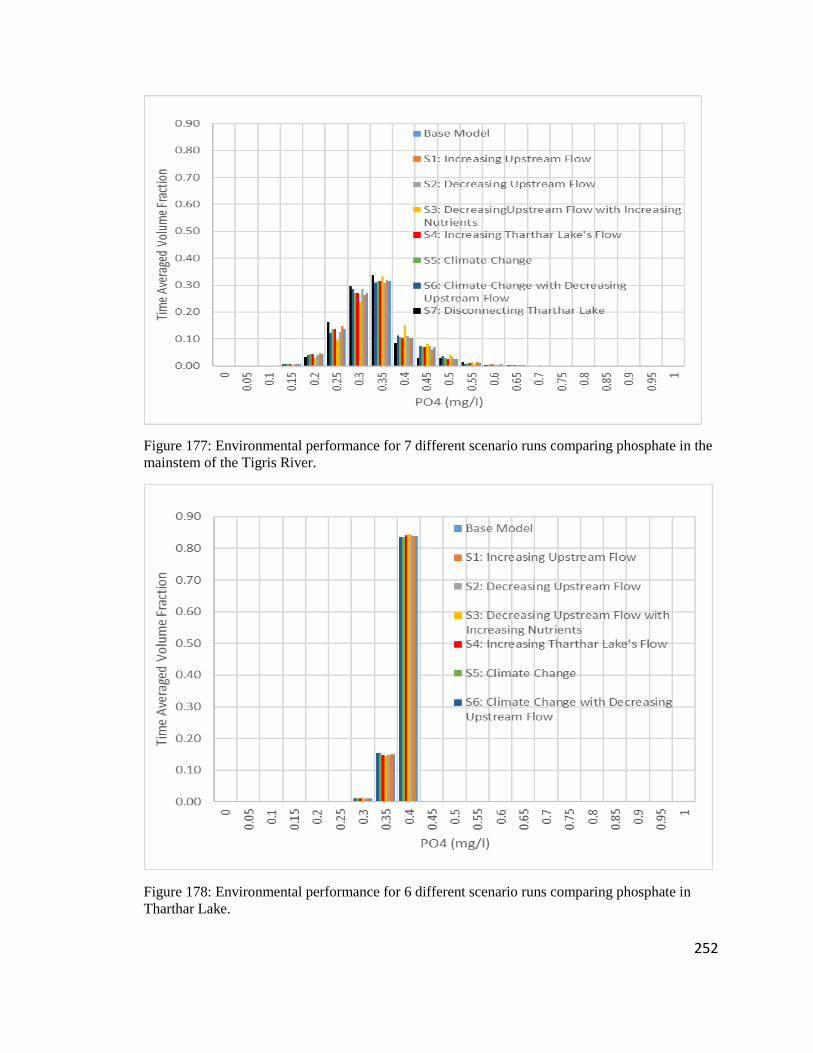
252
Figure 177: Environmental performance for 7 different scenario runs comparing phosphate in the
mainstem of the Tigris River.
Figure 178: Environmental performance for 6 different scenario runs comparing phosphate in
Tharthar Lake.
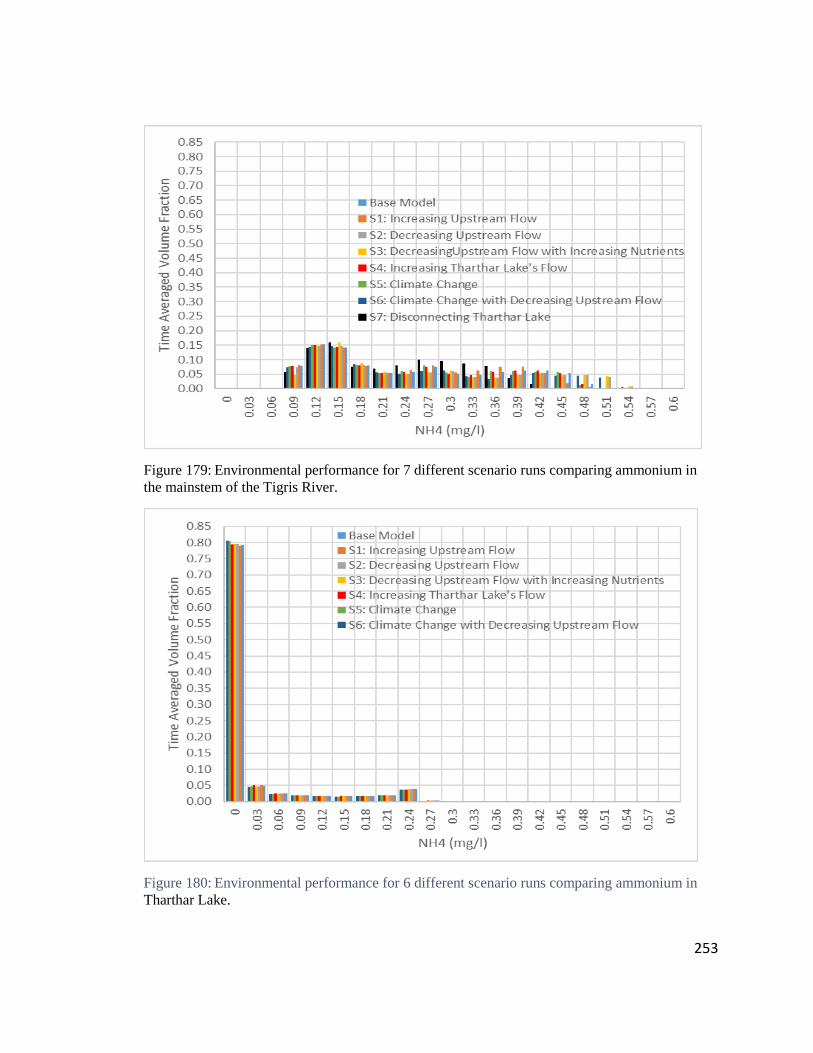
253
Figure 179: Environmental performance for 7 different scenario runs comparing ammonium in
the mainstem of the Tigris River.
Figure 180: Environmental performance for 6 different scenario runs comparing ammonium in
Tharthar Lake.
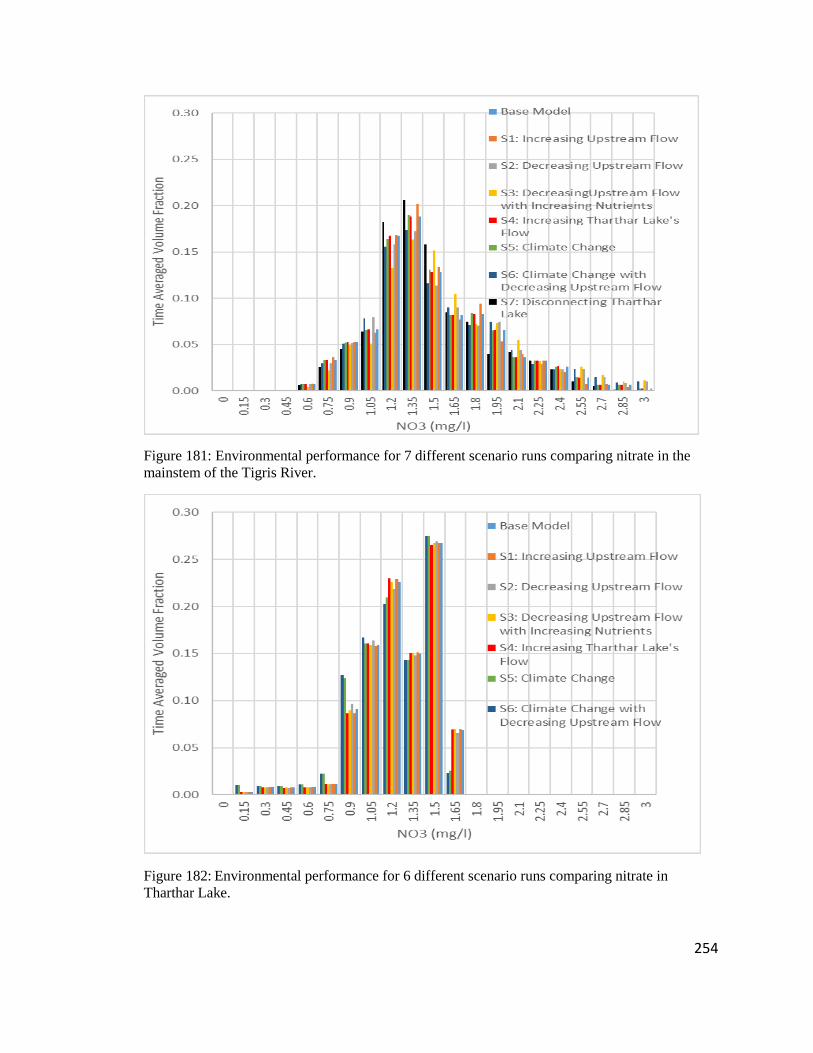
254
Figure 181: Environmental performance for 7 different scenario runs comparing nitrate in the
mainstem of the Tigris River.
Figure 182: Environmental performance for 6 different scenario runs comparing nitrate in
Tharthar Lake.
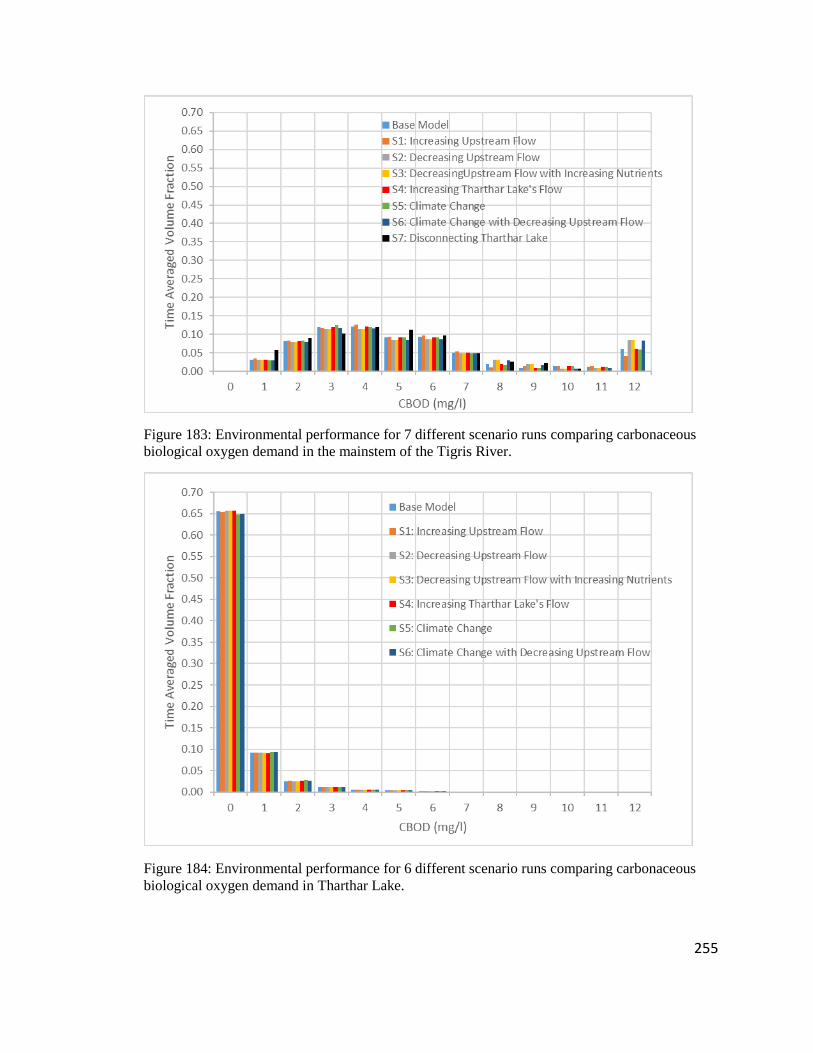
255
Figure 183: Environmental performance for 7 different scenario runs comparing carbonaceous
biological oxygen demand in the mainstem of the Tigris River.
Figure 184: Environmental performance for 6 different scenario runs comparing carbonaceous
biological oxygen demand in Tharthar Lake.
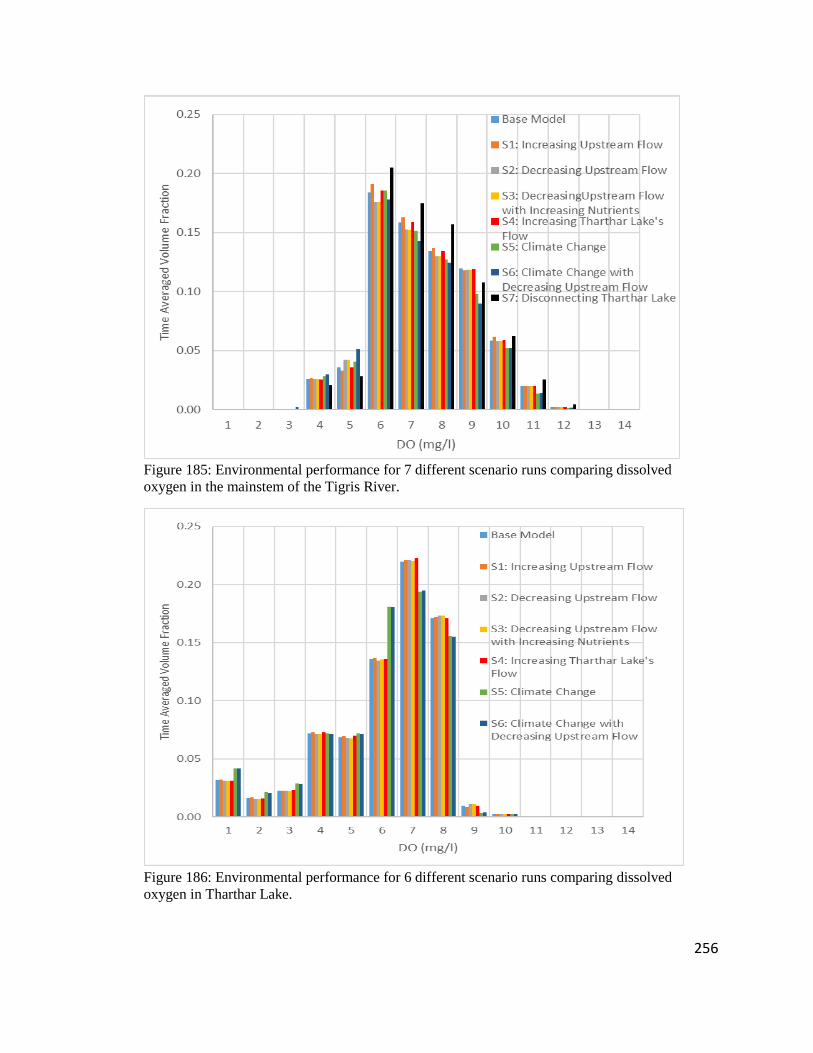
256
Figure 185: Environmental performance for 7 different scenario runs comparing dissolved
oxygen in the mainstem of the Tigris River.
Figure 186: Environmental performance for 6 different scenario runs comparing dissolved
oxygen in Tharthar Lake.
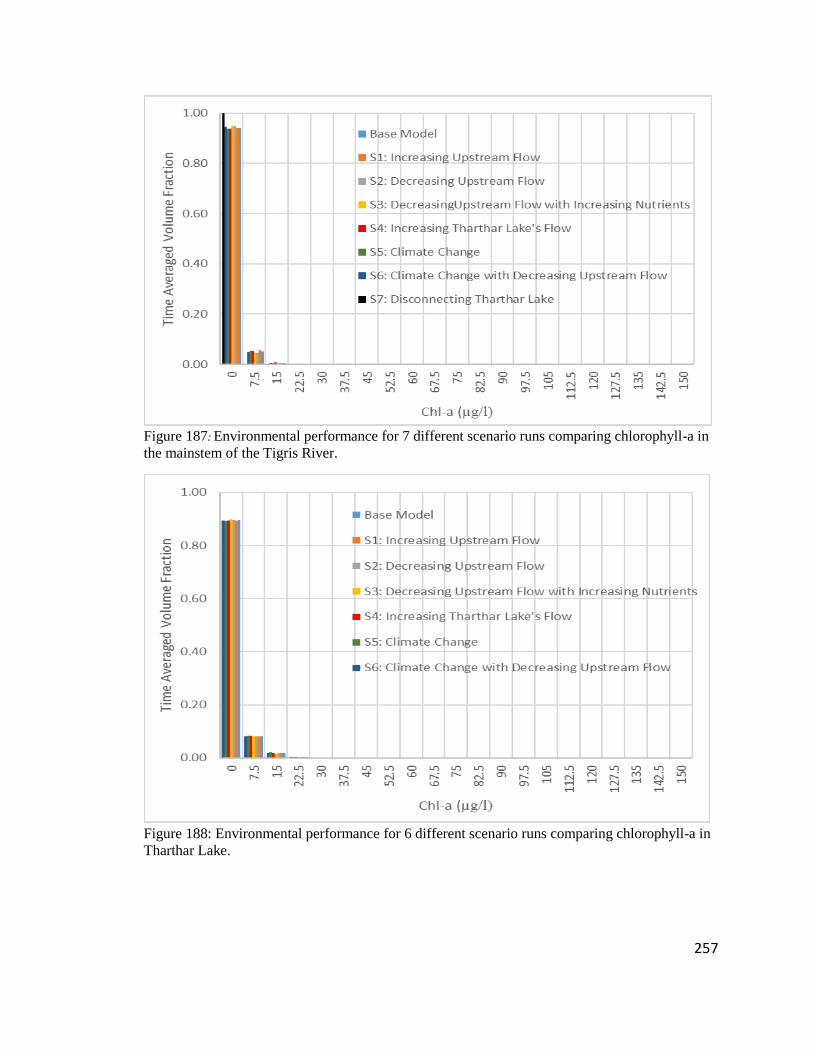
257
Figure 187: Environmental performance for 7 different scenario runs comparing chlorophyll-a in
the mainstem of the Tigris River.
Figure 188: Environmental performance for 6 different scenario runs comparing chlorophyll-a in
Tharthar Lake.
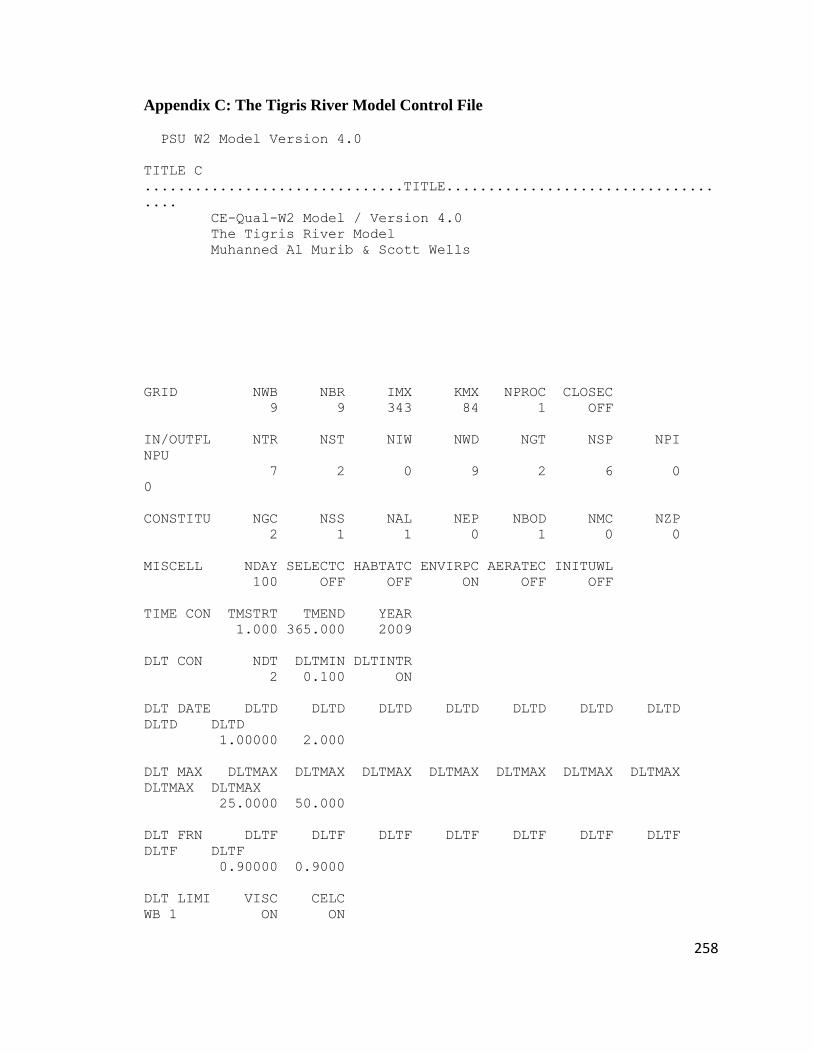
258
Appendix C: The Tigris River Model Control File
PSU W2 Model Version 4.0
TITLE C
...............................TITLE................................
....
CE-Qual-W2 Model / Version 4.0
The Tigris River Model
Muhanned Al Murib & Scott Wells
GRID NWB NBR IMX KMX NPROC CLOSEC
9 9 343 84 1 OFF
IN/OUTFL NTR NST NIW NWD NGT NSP NPI
NPU
7 2 0 9 2 6 0
0
CONSTITU NGC NSS NAL NEP NBOD NMC NZP
2 1 1 0 1 0 0
MISCELL NDAY SELECTC HABTATC ENVIRPC AERATEC INITUWL
100 OFF OFF ON OFF OFF
TIME CON TMSTRT TMEND YEAR
1.000 365.000 2009
DLT CON NDT DLTMIN DLTINTR
2 0.100 ON
DLT DATE DLTD DLTD DLTD DLTD DLTD DLTD DLTD
DLTD DLTD
1.00000 2.000
DLT MAX DLTMAX DLTMAX DLTMAX DLTMAX DLTMAX DLTMAX DLTMAX
DLTMAX DLTMAX
25.0000 50.000
DLT FRN DLTF DLTF DLTF DLTF DLTF DLTF DLTF
DLTF DLTF
0.90000 0.9000
DLT LIMI VISC CELC
WB 1 ON ON
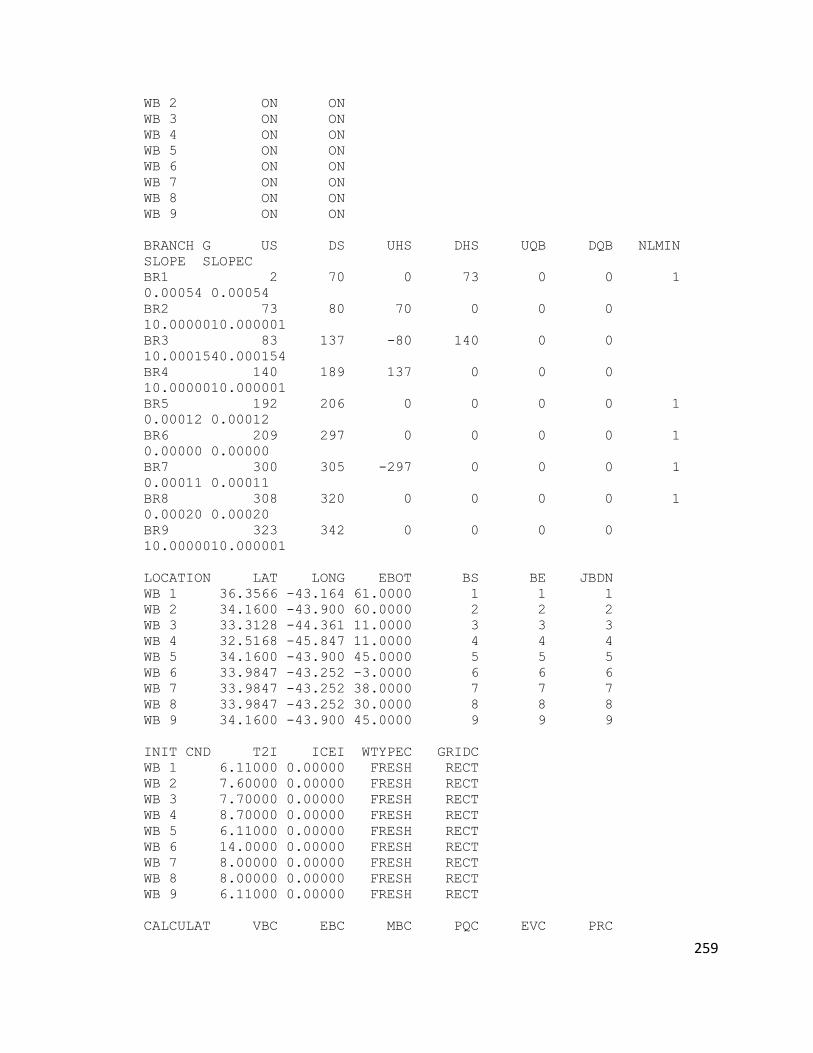
259
WB 2 ON ON
WB 3 ON ON
WB 4 ON ON
WB 5 ON ON
WB 6 ON ON
WB 7 ON ON
WB 8 ON ON
WB 9 ON ON
BRANCH G US DS UHS DHS UQB DQB NLMIN
SLOPE SLOPEC
BR1 2 70 0 73 0 0 1
0.00054 0.00054
BR2 73 80 70 0 0 0
10.0000010.000001
BR3 83 137 -80 140 0 0
10.0001540.000154
BR4 140 189 137 0 0 0
10.0000010.000001
BR5 192 206 0 0 0 0 1
0.00012 0.00012
BR6 209 297 0 0 0 0 1
0.00000 0.00000
BR7 300 305 -297 0 0 0 1
0.00011 0.00011
BR8 308 320 0 0 0 0 1
0.00020 0.00020
BR9 323 342 0 0 0 0
10.0000010.000001
LOCATION LAT LONG EBOT BS BE JBDN
WB 1 36.3566 -43.164 61.0000 1 1 1
WB 2 34.1600 -43.900 60.0000 2 2 2
WB 3 33.3128 -44.361 11.0000 3 3 3
WB 4 32.5168 -45.847 11.0000 4 4 4
WB 5 34.1600 -43.900 45.0000 5 5 5
WB 6 33.9847 -43.252 -3.0000 6 6 6
WB 7 33.9847 -43.252 38.0000 7 7 7
WB 8 33.9847 -43.252 30.0000 8 8 8
WB 9 34.1600 -43.900 45.0000 9 9 9
INIT CND T2I ICEI WTYPEC GRIDC
WB 1 6.11000 0.00000 FRESH RECT
WB 2 7.60000 0.00000 FRESH RECT
WB 3 7.70000 0.00000 FRESH RECT
WB 4 8.70000 0.00000 FRESH RECT
WB 5 6.11000 0.00000 FRESH RECT
WB 6 14.0000 0.00000 FRESH RECT
WB 7 8.00000 0.00000 FRESH RECT
WB 8 8.00000 0.00000 FRESH RECT
WB 9 6.11000 0.00000 FRESH RECT
CALCULAT VBC EBC MBC PQC EVC PRC
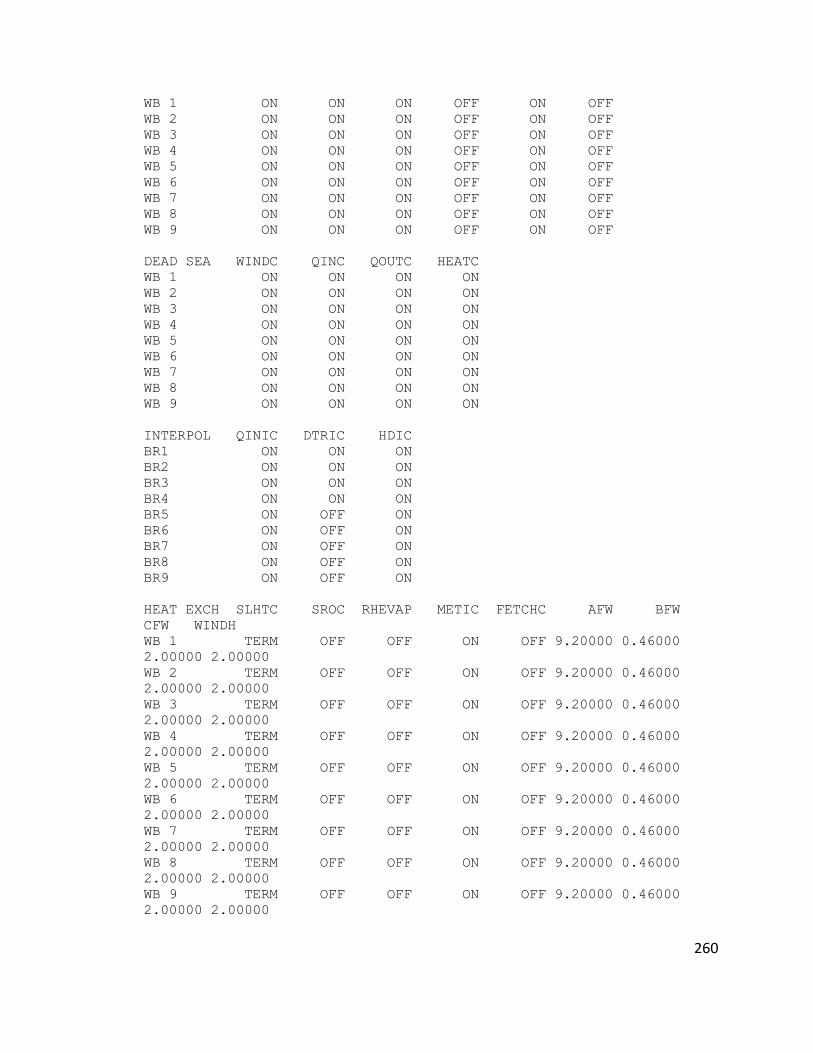
260
WB 1 ON ON ON OFF ON OFF
WB 2 ON ON ON OFF ON OFF
WB 3 ON ON ON OFF ON OFF
WB 4 ON ON ON OFF ON OFF
WB 5 ON ON ON OFF ON OFF
WB 6 ON ON ON OFF ON OFF
WB 7 ON ON ON OFF ON OFF
WB 8 ON ON ON OFF ON OFF
WB 9 ON ON ON OFF ON OFF
DEAD SEA WINDC QINC QOUTC HEATC
WB 1 ON ON ON ON
WB 2 ON ON ON ON
WB 3 ON ON ON ON
WB 4 ON ON ON ON
WB 5 ON ON ON ON
WB 6 ON ON ON ON
WB 7 ON ON ON ON
WB 8 ON ON ON ON
WB 9 ON ON ON ON
INTERPOL QINIC DTRIC HDIC
BR1 ON ON ON
BR2 ON ON ON
BR3 ON ON ON
BR4 ON ON ON
BR5 ON OFF ON
BR6 ON OFF ON
BR7 ON OFF ON
BR8 ON OFF ON
BR9 ON OFF ON
HEAT EXCH SLHTC SROC RHEVAP METIC FETCHC AFW BFW
CFW WINDH
WB 1 TERM OFF OFF ON OFF 9.20000 0.46000
2.00000 2.00000
WB 2 TERM OFF OFF ON OFF 9.20000 0.46000
2.00000 2.00000
WB 3 TERM OFF OFF ON OFF 9.20000 0.46000
2.00000 2.00000
WB 4 TERM OFF OFF ON OFF 9.20000 0.46000
2.00000 2.00000
WB 5 TERM OFF OFF ON OFF 9.20000 0.46000
2.00000 2.00000
WB 6 TERM OFF OFF ON OFF 9.20000 0.46000
2.00000 2.00000
WB 7 TERM OFF OFF ON OFF 9.20000 0.46000
2.00000 2.00000
WB 8 TERM OFF OFF ON OFF 9.20000 0.46000
2.00000 2.00000
WB 9 TERM OFF OFF ON OFF 9.20000 0.46000
2.00000 2.00000
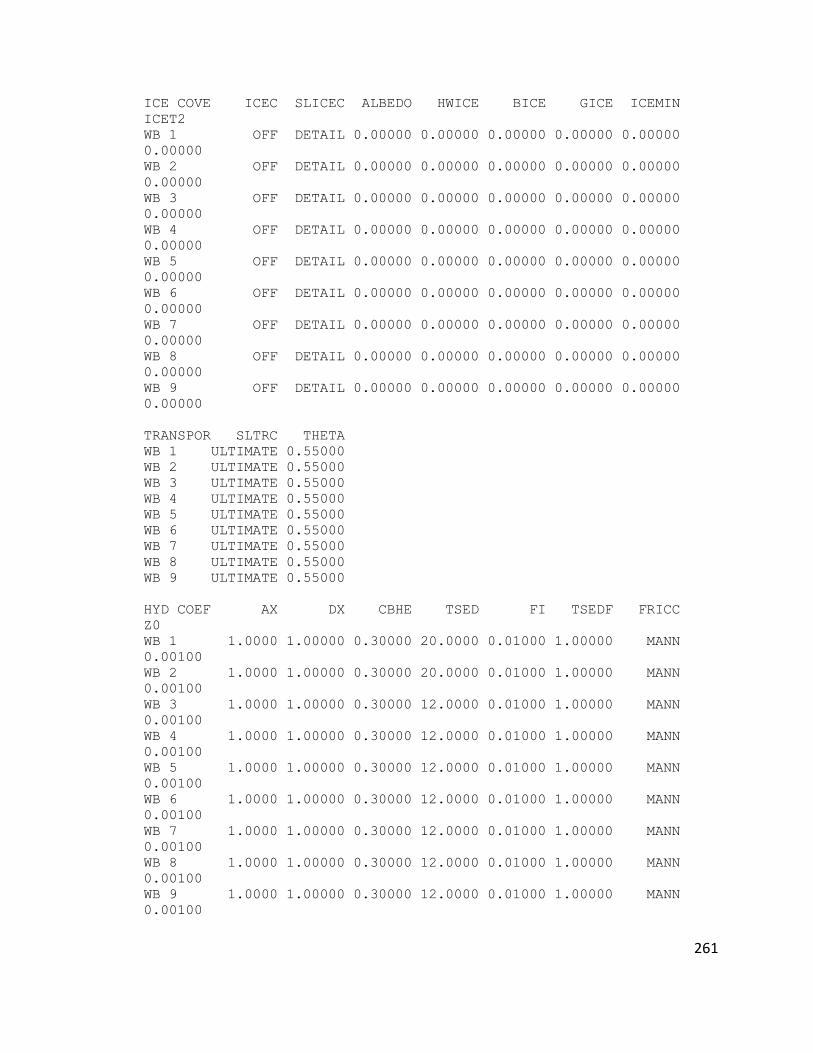
261
ICE COVE ICEC SLICEC ALBEDO HWICE BICE GICE ICEMIN
ICET2
WB 1 OFF DETAIL 0.00000 0.00000 0.00000 0.00000 0.00000
0.00000
WB 2 OFF DETAIL 0.00000 0.00000 0.00000 0.00000 0.00000
0.00000
WB 3 OFF DETAIL 0.00000 0.00000 0.00000 0.00000 0.00000
0.00000
WB 4 OFF DETAIL 0.00000 0.00000 0.00000 0.00000 0.00000
0.00000
WB 5 OFF DETAIL 0.00000 0.00000 0.00000 0.00000 0.00000
0.00000
WB 6 OFF DETAIL 0.00000 0.00000 0.00000 0.00000 0.00000
0.00000
WB 7 OFF DETAIL 0.00000 0.00000 0.00000 0.00000 0.00000
0.00000
WB 8 OFF DETAIL 0.00000 0.00000 0.00000 0.00000 0.00000
0.00000
WB 9 OFF DETAIL 0.00000 0.00000 0.00000 0.00000 0.00000
0.00000
TRANSPOR SLTRC THETA
WB 1 ULTIMATE 0.55000
WB 2 ULTIMATE 0.55000
WB 3 ULTIMATE 0.55000
WB 4 ULTIMATE 0.55000
WB 5 ULTIMATE 0.55000
WB 6 ULTIMATE 0.55000
WB 7 ULTIMATE 0.55000
WB 8 ULTIMATE 0.55000
WB 9 ULTIMATE 0.55000
HYD COEF AX DX CBHE TSED FI TSEDF FRICC
Z0
WB 1 1.0000 1.00000 0.30000 20.0000 0.01000 1.00000 MANN
0.00100
WB 2 1.0000 1.00000 0.30000 20.0000 0.01000 1.00000 MANN
0.00100
WB 3 1.0000 1.00000 0.30000 12.0000 0.01000 1.00000 MANN
0.00100
WB 4 1.0000 1.00000 0.30000 12.0000 0.01000 1.00000 MANN
0.00100
WB 5 1.0000 1.00000 0.30000 12.0000 0.01000 1.00000 MANN
0.00100
WB 6 1.0000 1.00000 0.30000 12.0000 0.01000 1.00000 MANN
0.00100
WB 7 1.0000 1.00000 0.30000 12.0000 0.01000 1.00000 MANN
0.00100
WB 8 1.0000 1.00000 0.30000 12.0000 0.01000 1.00000 MANN
0.00100
WB 9 1.0000 1.00000 0.30000 12.0000 0.01000 1.00000 MANN
0.00100
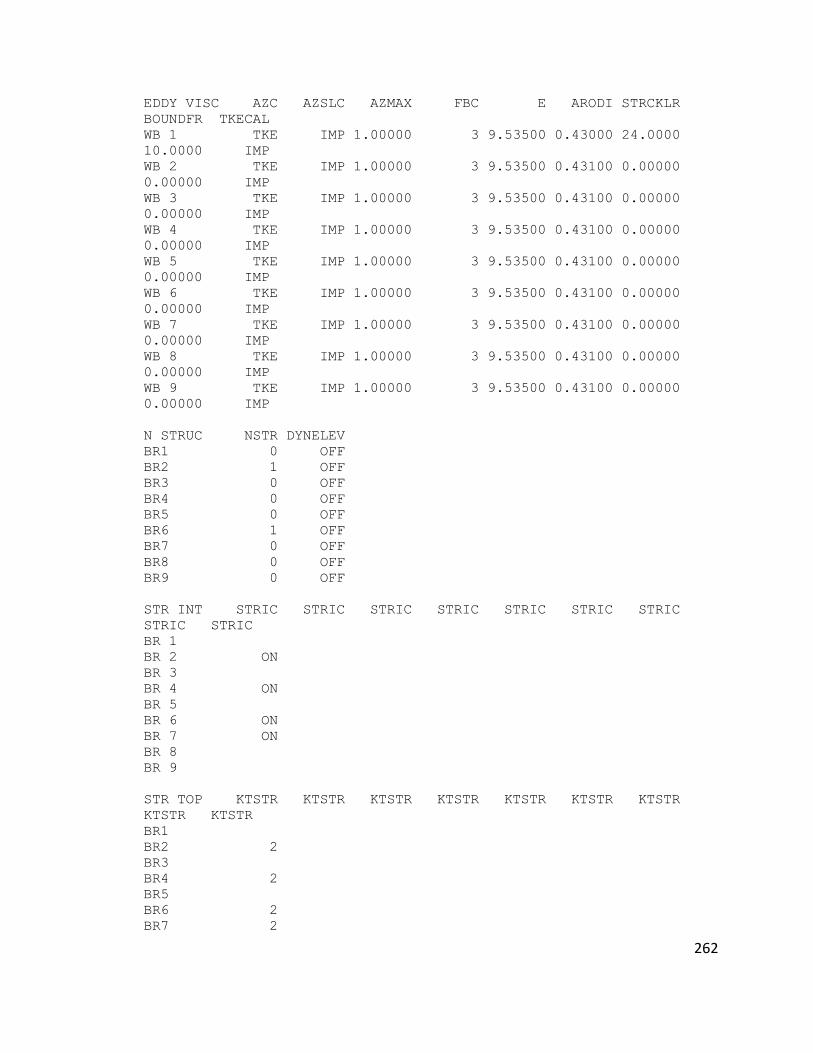
262
EDDY VISC AZC AZSLC AZMAX FBC E ARODI STRCKLR
BOUNDFR TKECAL
WB 1 TKE IMP 1.00000 3 9.53500 0.43000 24.0000
10.0000 IMP
WB 2 TKE IMP 1.00000 3 9.53500 0.43100 0.00000
0.00000 IMP
WB 3 TKE IMP 1.00000 3 9.53500 0.43100 0.00000
0.00000 IMP
WB 4 TKE IMP 1.00000 3 9.53500 0.43100 0.00000
0.00000 IMP
WB 5 TKE IMP 1.00000 3 9.53500 0.43100 0.00000
0.00000 IMP
WB 6 TKE IMP 1.00000 3 9.53500 0.43100 0.00000
0.00000 IMP
WB 7 TKE IMP 1.00000 3 9.53500 0.43100 0.00000
0.00000 IMP
WB 8 TKE IMP 1.00000 3 9.53500 0.43100 0.00000
0.00000 IMP
WB 9 TKE IMP 1.00000 3 9.53500 0.43100 0.00000
0.00000 IMP
N STRUC NSTR DYNELEV
BR1 0 OFF
BR2 1 OFF
BR3 0 OFF
BR4 0 OFF
BR5 0 OFF
BR6 1 OFF
BR7 0 OFF
BR8 0 OFF
BR9 0 OFF
STR INT STRIC STRIC STRIC STRIC STRIC STRIC STRIC
STRIC STRIC
BR 1
BR 2 ON
BR 3
BR 4 ON
BR 5
BR 6 ON
BR 7 ON
BR 8
BR 9
STR TOP KTSTR KTSTR KTSTR KTSTR KTSTR KTSTR KTSTR
KTSTR KTSTR
BR1
BR2 2
BR3
BR4 2
BR5
BR6 2
BR7 2
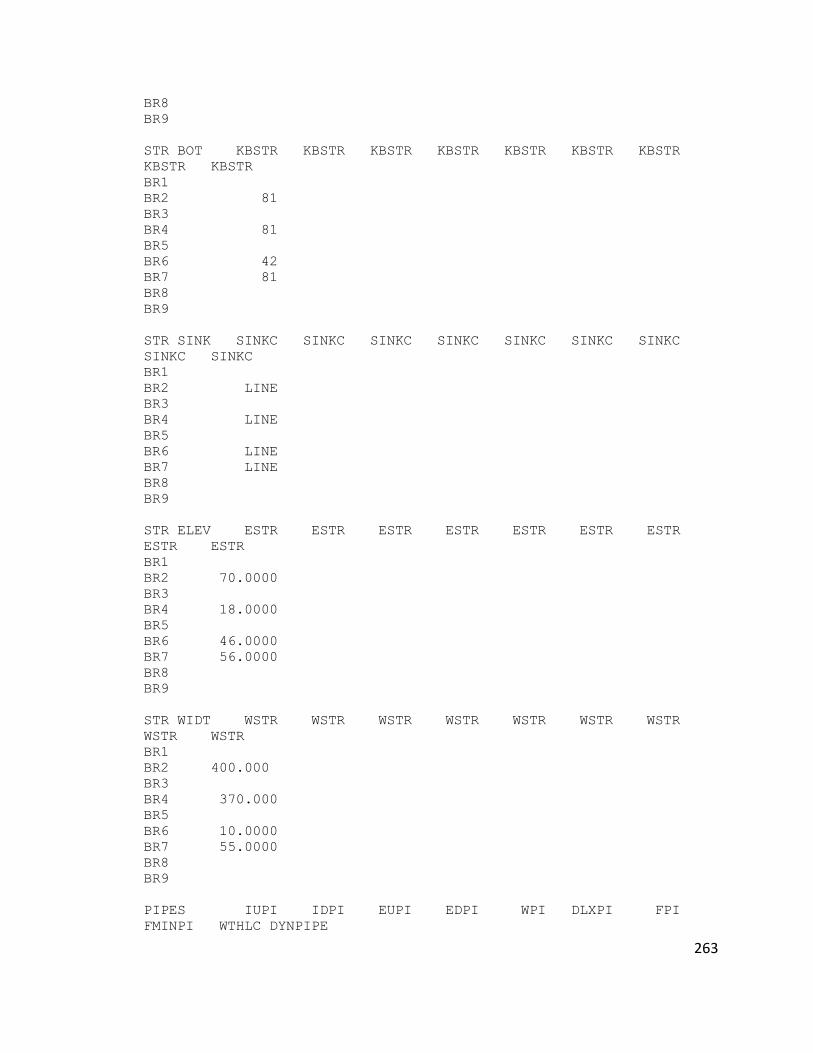
263
BR8
BR9
STR BOT KBSTR KBSTR KBSTR KBSTR KBSTR KBSTR KBSTR
KBSTR KBSTR
BR1
BR2 81
BR3
BR4 81
BR5
BR6 42
BR7 81
BR8
BR9
STR SINK SINKC SINKC SINKC SINKC SINKC SINKC SINKC
SINKC SINKC
BR1
BR2 LINE
BR3
BR4 LINE
BR5
BR6 LINE
BR7 LINE
BR8
BR9
STR ELEV ESTR ESTR ESTR ESTR ESTR ESTR ESTR
ESTR ESTR
BR1
BR2 70.0000
BR3
BR4 18.0000
BR5
BR6 46.0000
BR7 56.0000
BR8
BR9
STR WIDT WSTR WSTR WSTR WSTR WSTR WSTR WSTR
WSTR WSTR
BR1
BR2 400.000
BR3
BR4 370.000
BR5
BR6 10.0000
BR7 55.0000
BR8
BR9
PIPES IUPI IDPI EUPI EDPI WPI DLXPI FPI
FMINPI WTHLC DYNPIPE
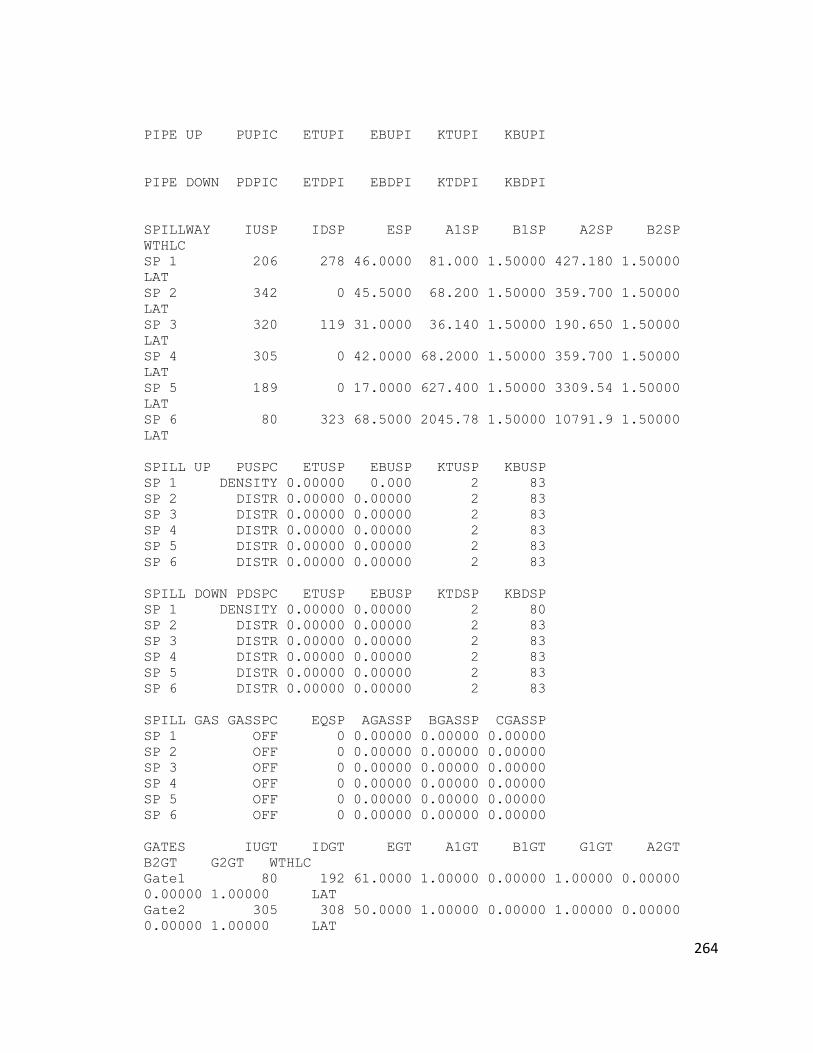
264
PIPE UP PUPIC ETUPI EBUPI KTUPI KBUPI
PIPE DOWN PDPIC ETDPI EBDPI KTDPI KBDPI
SPILLWAY IUSP IDSP ESP A1SP B1SP A2SP B2SP
WTHLC
SP 1 206 278 46.0000 81.000 1.50000 427.180 1.50000
LAT
SP 2 342 0 45.5000 68.200 1.50000 359.700 1.50000
LAT
SP 3 320 119 31.0000 36.140 1.50000 190.650 1.50000
LAT
SP 4 305 0 42.0000 68.2000 1.50000 359.700 1.50000
LAT
SP 5 189 0 17.0000 627.400 1.50000 3309.54 1.50000
LAT
SP 6 80 323 68.5000 2045.78 1.50000 10791.9 1.50000
LAT
SPILL UP PUSPC ETUSP EBUSP KTUSP KBUSP
SP 1 DENSITY 0.00000 0.000 2 83
SP 2 DISTR 0.00000 0.00000 2 83
SP 3 DISTR 0.00000 0.00000 2 83
SP 4 DISTR 0.00000 0.00000 2 83
SP 5 DISTR 0.00000 0.00000 2 83
SP 6 DISTR 0.00000 0.00000 2 83
SPILL DOWN PDSPC ETUSP EBUSP KTDSP KBDSP
SP 1 DENSITY 0.00000 0.00000 2 80
SP 2 DISTR 0.00000 0.00000 2 83
SP 3 DISTR 0.00000 0.00000 2 83
SP 4 DISTR 0.00000 0.00000 2 83
SP 5 DISTR 0.00000 0.00000 2 83
SP 6 DISTR 0.00000 0.00000 2 83
SPILL GAS GASSPC EQSP AGASSP BGASSP CGASSP
SP 1 OFF 0 0.00000 0.00000 0.00000
SP 2 OFF 0 0.00000 0.00000 0.00000
SP 3 OFF 0 0.00000 0.00000 0.00000
SP 4 OFF 0 0.00000 0.00000 0.00000
SP 5 OFF 0 0.00000 0.00000 0.00000
SP 6 OFF 0 0.00000 0.00000 0.00000
GATES IUGT IDGT EGT A1GT B1GT G1GT A2GT
B2GT G2GT WTHLC
Gate1 80 192 61.0000 1.00000 0.00000 1.00000 0.00000
0.00000 1.00000 LAT
Gate2 305 308 50.0000 1.00000 0.00000 1.00000 0.00000
0.00000 1.00000 LAT
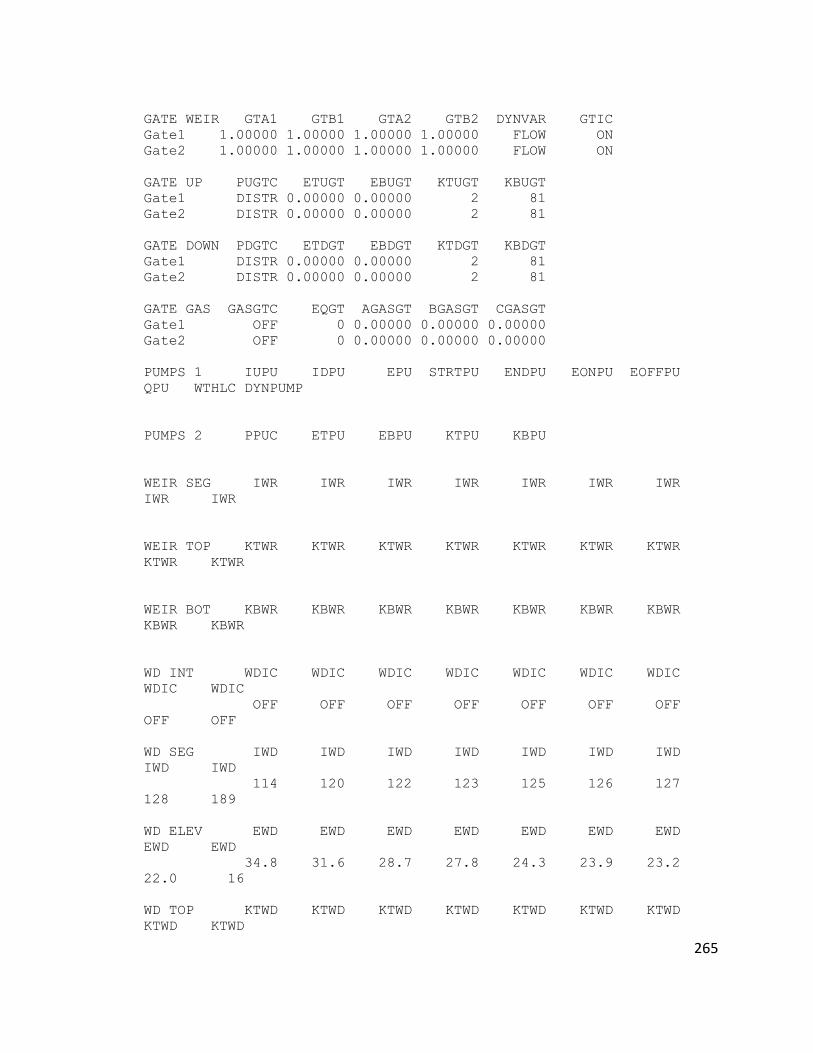
265
GATE WEIR GTA1 GTB1 GTA2 GTB2 DYNVAR GTIC
Gate1 1.00000 1.00000 1.00000 1.00000 FLOW ON
Gate2 1.00000 1.00000 1.00000 1.00000 FLOW ON
GATE UP PUGTC ETUGT EBUGT KTUGT KBUGT
Gate1 DISTR 0.00000 0.00000 2 81
Gate2 DISTR 0.00000 0.00000 2 81
GATE DOWN PDGTC ETDGT EBDGT KTDGT KBDGT
Gate1 DISTR 0.00000 0.00000 2 81
Gate2 DISTR 0.00000 0.00000 2 81
GATE GAS GASGTC EQGT AGASGT BGASGT CGASGT
Gate1 OFF 0 0.00000 0.00000 0.00000
Gate2 OFF 0 0.00000 0.00000 0.00000
PUMPS 1 IUPU IDPU EPU STRTPU ENDPU EONPU EOFFPU
QPU WTHLC DYNPUMP
PUMPS 2 PPUC ETPU EBPU KTPU KBPU
WEIR SEG IWR IWR IWR IWR IWR IWR IWR
IWR IWR
WEIR TOP KTWR KTWR KTWR KTWR KTWR KTWR KTWR
KTWR KTWR
WEIR BOT KBWR KBWR KBWR KBWR KBWR KBWR KBWR
KBWR KBWR
WD INT WDIC WDIC WDIC WDIC WDIC WDIC WDIC
WDIC WDIC
OFF OFF OFF OFF OFF OFF OFF
OFF OFF
WD SEG IWD IWD IWD IWD IWD IWD IWD
IWD IWD
114 120 122 123 125 126 127
128 189
WD ELEV EWD EWD EWD EWD EWD EWD EWD
EWD EWD
34.8 31.6 28.7 27.8 24.3 23.9 23.2
22.0 16
WD TOP KTWD KTWD KTWD KTWD KTWD KTWD KTWD
KTWD KTWD
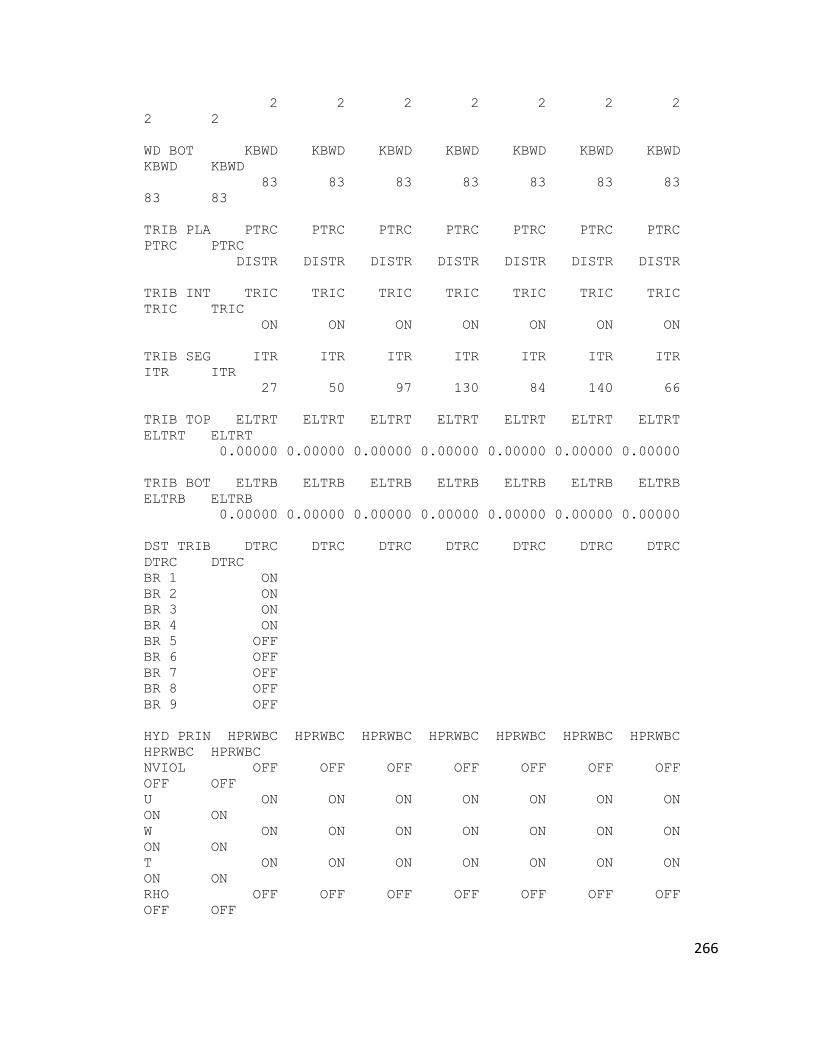
266
2 2 2 2 2 2 2
2 2
WD BOT KBWD KBWD KBWD KBWD KBWD KBWD KBWD
KBWD KBWD
83 83 83 83 83 83 83
83 83
TRIB PLA PTRC PTRC PTRC PTRC PTRC PTRC PTRC
PTRC PTRC
DISTR DISTR DISTR DISTR DISTR DISTR DISTR
TRIB INT TRIC TRIC TRIC TRIC TRIC TRIC TRIC
TRIC TRIC
ON ON ON ON ON ON ON
TRIB SEG ITR ITR ITR ITR ITR ITR ITR
ITR ITR
27 50 97 130 84 140 66
TRIB TOP ELTRT ELTRT ELTRT ELTRT ELTRT ELTRT ELTRT
ELTRT ELTRT
0.00000 0.00000 0.00000 0.00000 0.00000 0.00000 0.00000
TRIB BOT ELTRB ELTRB ELTRB ELTRB ELTRB ELTRB ELTRB
ELTRB ELTRB
0.00000 0.00000 0.00000 0.00000 0.00000 0.00000 0.00000
DST TRIB DTRC DTRC DTRC DTRC DTRC DTRC DTRC
DTRC DTRC
BR 1 ON
BR 2 ON
BR 3 ON
BR 4 ON
BR 5 OFF
BR 6 OFF
BR 7 OFF
BR 8 OFF
BR 9 OFF
HYD PRIN HPRWBC HPRWBC HPRWBC HPRWBC HPRWBC HPRWBC HPRWBC
HPRWBC HPRWBC
NVIOL OFF OFF OFF OFF OFF OFF OFF
OFF OFF
U ON ON ON ON ON ON ON
ON ON
W ON ON ON ON ON ON ON
ON ON
T ON ON ON ON ON ON ON
ON ON
RHO OFF OFF OFF OFF OFF OFF OFF
OFF OFF
267
AZ OFF OFF OFF OFF OFF OFF OFF
OFF OFF
SHEAR OFF OFF OFF OFF OFF OFF OFF
OFF OFF
ST OFF OFF OFF OFF OFF OFF OFF
OFF OFF
SB OFF OFF OFF OFF OFF OFF OFF
OFF OFF
ADMX OFF OFF OFF OFF OFF OFF OFF
OFF OFF
DM OFF OFF OFF OFF OFF OFF OFF
OFF OFF
HDG OFF OFF OFF OFF OFF OFF OFF
OFF OFF
ADMZ OFF OFF OFF OFF OFF OFF OFF
OFF OFF
HPG OFF OFF OFF OFF OFF OFF OFF
OFF OFF
GRAV OFF OFF OFF OFF OFF OFF OFF
OFF OFF
SNP PRINT SNPC NSNP NISNP
WB 1 ON 2 5
WB 2 ON 2 2
WB 3 ON 2 2
WB 4 ON 2 2
WB 5 OFF 2 2
WB 6 OFF 2 2
WB 7 OFF 2 2
WB 8 OFF 2 2
WB 9 OFF 2 2
SNP DATE SNPD SNPD SNPD SNPD SNPD SNPD SNPD
SNPD SNPD
WB 1 1.00000 1.60000
WB 2 1.00000 1.60000
WB 3 1.00000 1.60000
WB 4 1.00000 1.60000
WB 5 1.00000 1.60000
WB 6 1.00000 1.60000
WB 7 1.00000 1.60000
WB 8 1.00000 1.60000
WB 9 1.00000 1.60000
SNP FREQ SNPF SNPF SNPF SNPF SNPF SNPF SNPF
SNPF SNPF
WB 1 0.10000 7.00000
WB 2 0.10000 7.00000
WB 3 0.10000 7.00000
WB 4 0.10000 7.00000
WB 5 0.10000 7.00000
WB 6 0.10000 7.00000
WB 7 0.10000 7.00000
268
WB 8 0.10000 7.00000
WB 9 0.10000 7.00000
SNP SEG ISNP ISNP ISNP ISNP ISNP ISNP ISNP
ISNP ISNP
WB 1 2 20 40 60 70
WB 2 73 80
WB 3 83 123
WB 4 140 189
WB 5 192 206
WB 6 209 297
WB 7 300 305
WB 8 308 320
WB 9 323 342
SCR PRINT SCRC NSCR
WB 1 ON 1
WB 2 OFF 0
WB 3 OFF 0
WB 4 OFF 0
WB 5 OFF 0
WB 6 OFF 0
WB 7 OFF 0
WB 8 OFF 0
WB 9 OFF 0
SCR DATE SCRD SCRD SCRD SCRD SCRD SCRD SCRD
SCRD SCRD
WB 1 1.00000
WB 2
WB 3
WB 4
WB 5
WB 6
WB 7
WB 8
WB 9
SCR FREQ SCRF SCRF SCRF SCRF SCRF SCRF SCRF
SCRF SCRF
WB 1 0.25000
WB 2
WB 3
WB 4
WB 5
WB 6
WB 7
WB 8
WB 9
PRF PLOT PRFC NPRF NIPRF
WB 1 OFF 0 0
WB 2 OFF 0 0
269
WB 3 OFF 0 0
WB 4 OFF 0 0
WB 5 OFF 0 0
WB 6 OFF 0 0
WB 7 OFF 0 0
WB 8 OFF 0 0
WB 9 OFF 0 0
PRF DATE PRFD PRFD PRFD PRFD PRFD PRFD PRFD
PRFD PRFD
WB 1
WB 2
WB 3
WB 4
WB 5
WB 6
WB 7
WB 8
WB 9
PRF FREQ PRFF PRFF PRFF PRFF PRFF PRFF PRFF
PRFF PRFF
WB 1
WB 2
WB 3
WB 4
WB 5
WB 6
WB 7
WB 8
WB 9
PRF SEG IPRF IPRF IPRF IPRF IPRF IPRF IPRF
IPRF IPRF
WB 1
WB 2
WB 3
WB 4
WB 5
WB 6
WB 7
WB 8
WB 9
SPR PLOT SPRC NSPR NISPR
WB 1 OFF 12 1
WB 2 OFF 0 0
WB 3 OFF 0 0
WB 4 OFF 0 0
WB 5 OFF 0 0
WB 6 OFF 0 0
WB 7 OFF 0 0
WB 8 OFF 0 0
270
WB 9 OFF 0 0
SPR DATE SPRD SPRD SPRD SPRD SPRD SPRD SPRD
SPRD SPRD
WB 1 158.670 179.670 200.670 228.670 229.670 242.670 244.670
245.670 249.670
257.670 270.670 271.670
WB 2
WB 3
WB 4
WB 5
WB 6
WB 7
WB 8
WB 9
SPR FREQ SPRF SPRF SPRF SPRF SPRF SPRF SPRF
SPRF SPRF
WB 1 500.000 500.000 500.000 500.000 500.000 500.000 500.000
500.000 500.000
500.000 500.000 500.000
WB 2
WB 3
WB 4
WB 5
WB 6
WB 7
WB 8
WB 9
SPR SEG ISPR ISPR ISPR ISPR ISPR ISPR ISPR
ISPR ISPR
WB 1 36
WB 2
WB 3
WB 4
WB 5
WB 6
WB 7
WB 8
WB 9
VPL PLOT VPLC NVPL
WB 1 ON 1
WB 2 OFF 0
WB 3 OFF 0
WB 4 OFF 0
WB 5 OFF 0
WB 6 OFF 0
WB 7 OFF 0
WB 8 OFF 0
WB 9 OFF 0
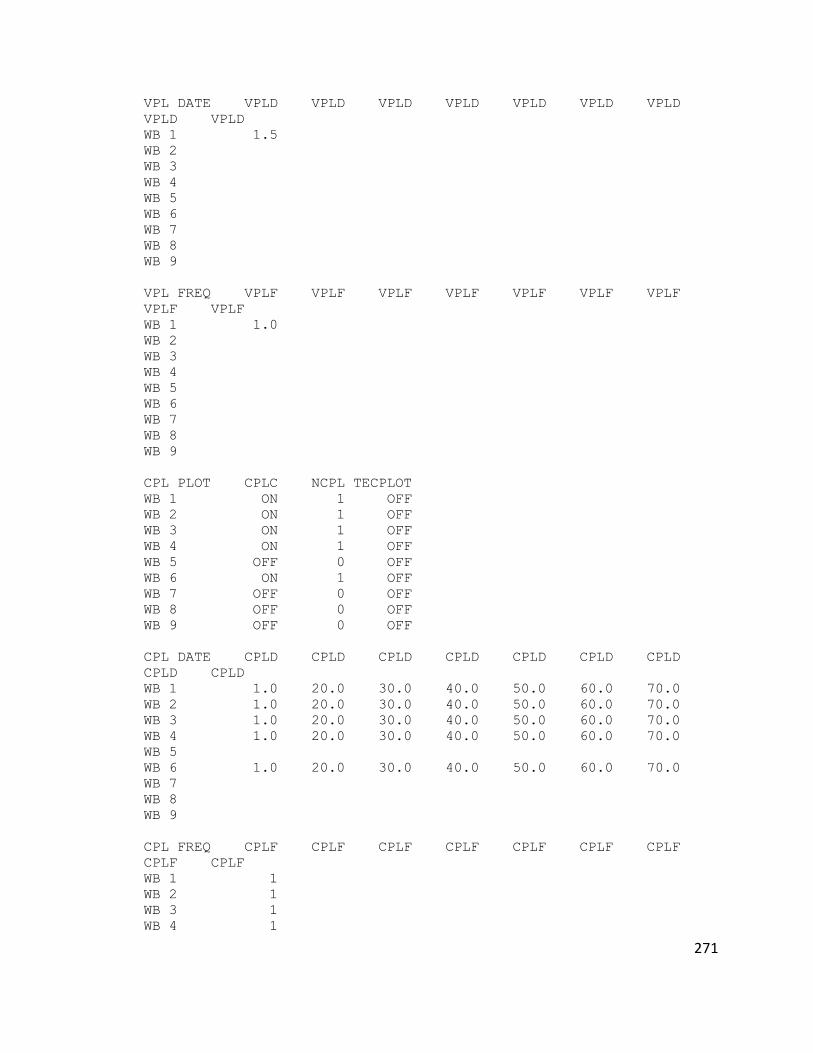
271
VPL DATE VPLD VPLD VPLD VPLD VPLD VPLD VPLD
VPLD VPLD
WB 1 1.5
WB 2
WB 3
WB 4
WB 5
WB 6
WB 7
WB 8
WB 9
VPL FREQ VPLF VPLF VPLF VPLF VPLF VPLF VPLF
VPLF VPLF
WB 1 1.0
WB 2
WB 3
WB 4
WB 5
WB 6
WB 7
WB 8
WB 9
CPL PLOT CPLC NCPL TECPLOT
WB 1 ON 1 OFF
WB 2 ON 1 OFF
WB 3 ON 1 OFF
WB 4 ON 1 OFF
WB 5 OFF 0 OFF
WB 6 ON 1 OFF
WB 7 OFF 0 OFF
WB 8 OFF 0 OFF
WB 9 OFF 0 OFF
CPL DATE CPLD CPLD CPLD CPLD CPLD CPLD CPLD
CPLD CPLD
WB 1 1.0 20.0 30.0 40.0 50.0 60.0 70.0
WB 2 1.0 20.0 30.0 40.0 50.0 60.0 70.0
WB 3 1.0 20.0 30.0 40.0 50.0 60.0 70.0
WB 4 1.0 20.0 30.0 40.0 50.0 60.0 70.0
WB 5
WB 6 1.0 20.0 30.0 40.0 50.0 60.0 70.0
WB 7
WB 8
WB 9
CPL FREQ CPLF CPLF CPLF CPLF CPLF CPLF CPLF
CPLF CPLF
WB 1 1
WB 2 1
WB 3 1
WB 4 1
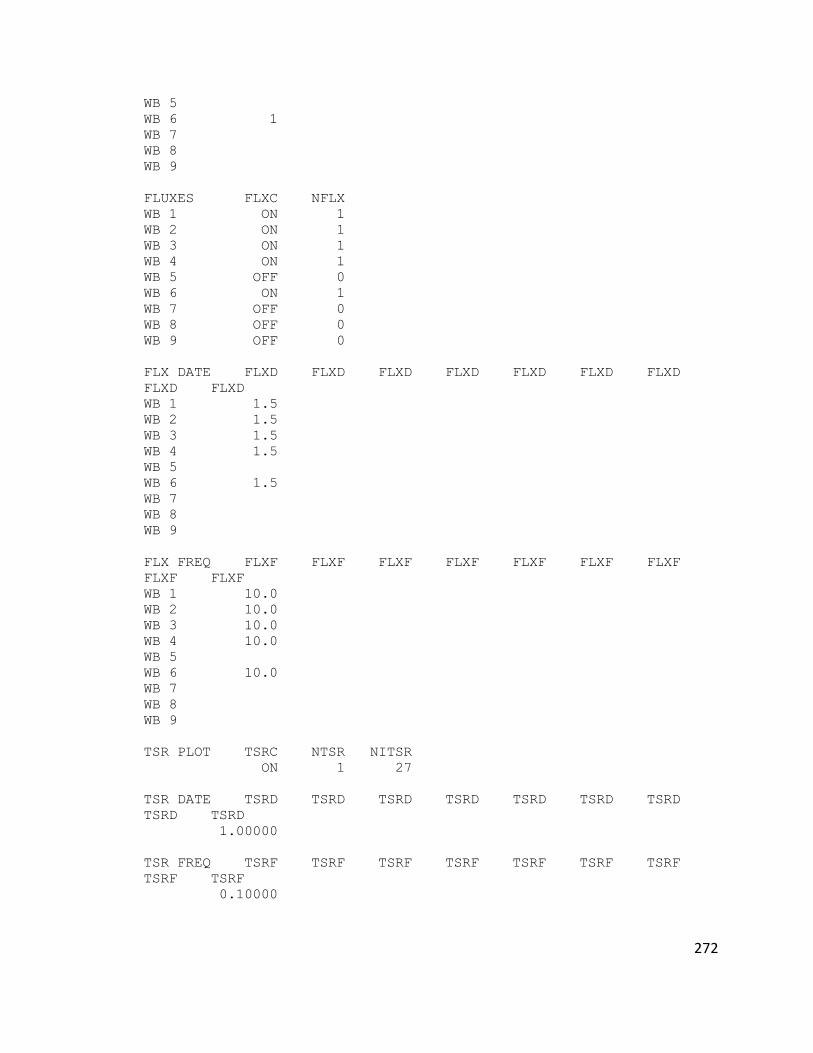
272
WB 5
WB 6 1
WB 7
WB 8
WB 9
FLUXES FLXC NFLX
WB 1 ON 1
WB 2 ON 1
WB 3 ON 1
WB 4 ON 1
WB 5 OFF 0
WB 6 ON 1
WB 7 OFF 0
WB 8 OFF 0
WB 9 OFF 0
FLX DATE FLXD FLXD FLXD FLXD FLXD FLXD FLXD
FLXD FLXD
WB 1 1.5
WB 2 1.5
WB 3 1.5
WB 4 1.5
WB 5
WB 6 1.5
WB 7
WB 8
WB 9
FLX FREQ FLXF FLXF FLXF FLXF FLXF FLXF FLXF
FLXF FLXF
WB 1 10.0
WB 2 10.0
WB 3 10.0
WB 4 10.0
WB 5
WB 6 10.0
WB 7
WB 8
WB 9
TSR PLOT TSRC NTSR NITSR
ON 1 27
TSR DATE TSRD TSRD TSRD TSRD TSRD TSRD TSRD
TSRD TSRD
1.00000
TSR FREQ TSRF TSRF TSRF TSRF TSRF TSRF TSRF
TSRF TSRF
0.10000
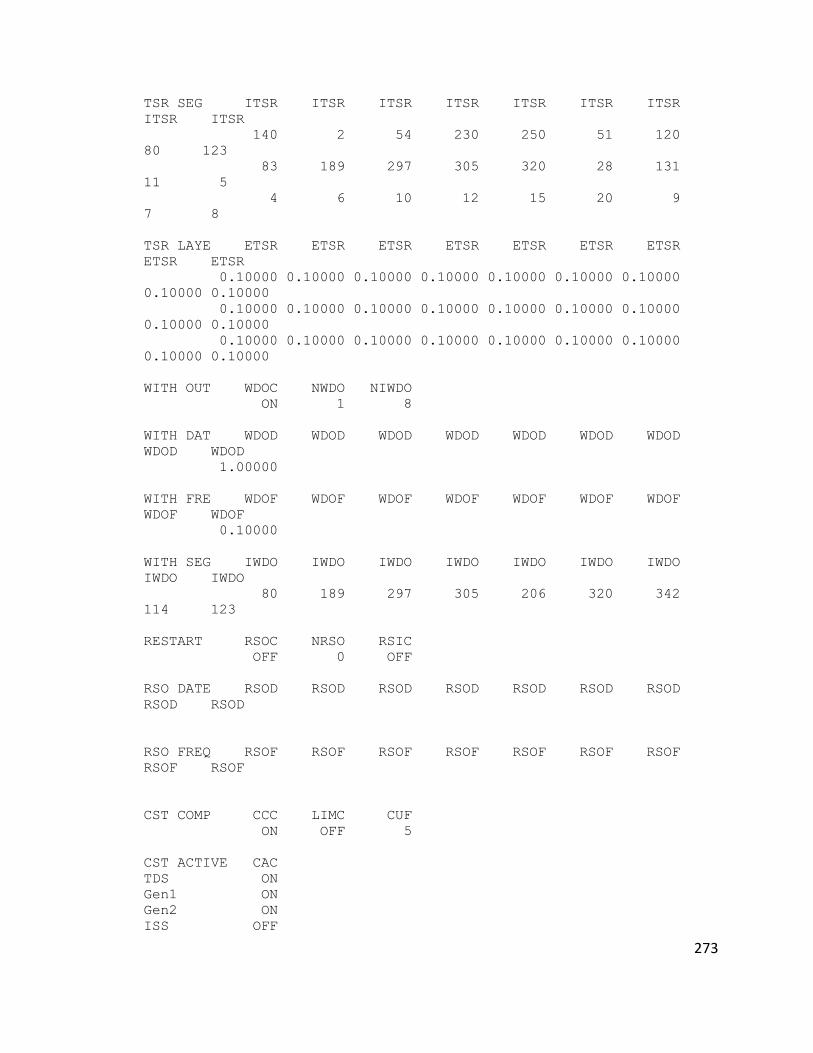
273
TSR SEG ITSR ITSR ITSR ITSR ITSR ITSR ITSR
ITSR ITSR
140 2 54 230 250 51 120
80 123
83 189 297 305 320 28 131
11 5
4 6 10 12 15 20 9
7 8
TSR LAYE ETSR ETSR ETSR ETSR ETSR ETSR ETSR
ETSR ETSR
0.10000 0.10000 0.10000 0.10000 0.10000 0.10000 0.10000
0.10000 0.10000
0.10000 0.10000 0.10000 0.10000 0.10000 0.10000 0.10000
0.10000 0.10000
0.10000 0.10000 0.10000 0.10000 0.10000 0.10000 0.10000
0.10000 0.10000
WITH OUT WDOC NWDO NIWDO
ON 1 8
WITH DAT WDOD WDOD WDOD WDOD WDOD WDOD WDOD
WDOD WDOD
1.00000
WITH FRE WDOF WDOF WDOF WDOF WDOF WDOF WDOF
WDOF WDOF
0.10000
WITH SEG IWDO IWDO IWDO IWDO IWDO IWDO IWDO
IWDO IWDO
80 189 297 305 206 320 342
114 123
RESTART RSOC NRSO RSIC
OFF 0 OFF
RSO DATE RSOD RSOD RSOD RSOD RSOD RSOD RSOD
RSOD RSOD
RSO FREQ RSOF RSOF RSOF RSOF RSOF RSOF RSOF
RSOF RSOF
CST COMP CCC LIMC CUF
ON OFF 5
CST ACTIVE CAC
TDS ON
Gen1 ON
Gen2 ON
ISS OFF
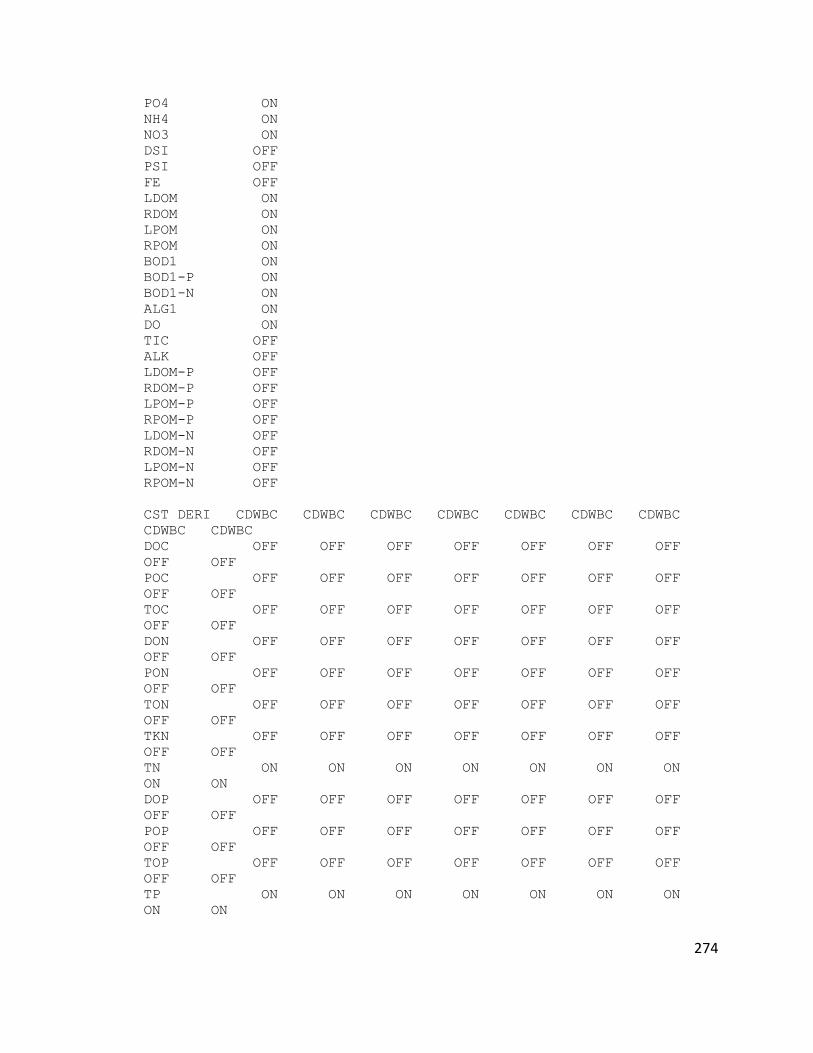
274
PO4 ON
NH4 ON
NO3 ON
DSI OFF
PSI OFF
FE OFF
LDOM ON
RDOM ON
LPOM ON
RPOM ON
BOD1 ON
BOD1-P ON
BOD1-N ON
ALG1 ON
DO ON
TIC OFF
ALK OFF
LDOM-P OFF
RDOM-P OFF
LPOM-P OFF
RPOM-P OFF
LDOM-N OFF
RDOM-N OFF
LPOM-N OFF
RPOM-N OFF
CST DERI CDWBC CDWBC CDWBC CDWBC CDWBC CDWBC CDWBC
CDWBC CDWBC
DOC OFF OFF OFF OFF OFF OFF OFF
OFF OFF
POC OFF OFF OFF OFF OFF OFF OFF
OFF OFF
TOC OFF OFF OFF OFF OFF OFF OFF
OFF OFF
DON OFF OFF OFF OFF OFF OFF OFF
OFF OFF
PON OFF OFF OFF OFF OFF OFF OFF
OFF OFF
TON OFF OFF OFF OFF OFF OFF OFF
OFF OFF
TKN OFF OFF OFF OFF OFF OFF OFF
OFF OFF
TN ON ON ON ON ON ON ON
ON ON
DOP OFF OFF OFF OFF OFF OFF OFF
OFF OFF
POP OFF OFF OFF OFF OFF OFF OFF
OFF OFF
TOP OFF OFF OFF OFF OFF OFF OFF
OFF OFF
TP ON ON ON ON ON ON ON
ON ON
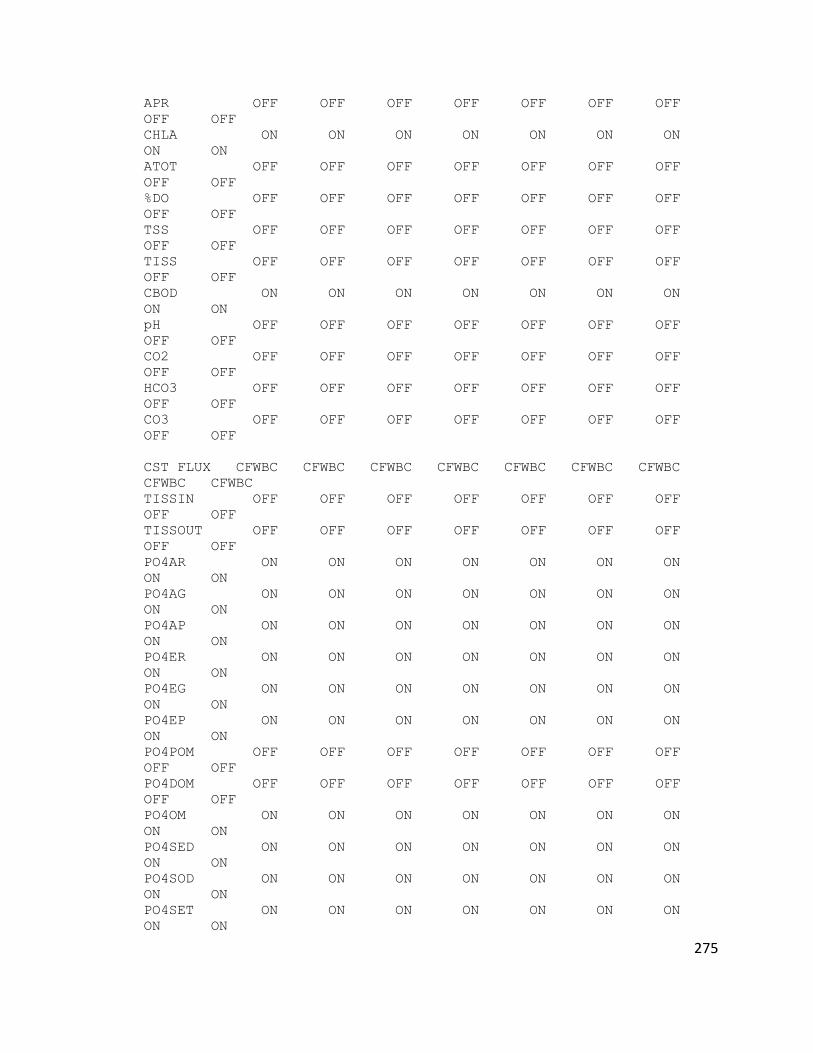
275
APR OFF OFF OFF OFF OFF OFF OFF
OFF OFF
CHLA ON ON ON ON ON ON ON
ON ON
ATOT OFF OFF OFF OFF OFF OFF OFF
OFF OFF
%DO OFF OFF OFF OFF OFF OFF OFF
OFF OFF
TSS OFF OFF OFF OFF OFF OFF OFF
OFF OFF
TISS OFF OFF OFF OFF OFF OFF OFF
OFF OFF
CBOD ON ON ON ON ON ON ON
ON ON
pH OFF OFF OFF OFF OFF OFF OFF
OFF OFF
CO2 OFF OFF OFF OFF OFF OFF OFF
OFF OFF
HCO3 OFF OFF OFF OFF OFF OFF OFF
OFF OFF
CO3 OFF OFF OFF OFF OFF OFF OFF
OFF OFF
CST FLUX CFWBC CFWBC CFWBC CFWBC CFWBC CFWBC CFWBC
CFWBC CFWBC
TISSIN OFF OFF OFF OFF OFF OFF OFF
OFF OFF
TISSOUT OFF OFF OFF OFF OFF OFF OFF
OFF OFF
PO4AR ON ON ON ON ON ON ON
ON ON
PO4AG ON ON ON ON ON ON ON
ON ON
PO4AP ON ON ON ON ON ON ON
ON ON
PO4ER ON ON ON ON ON ON ON
ON ON
PO4EG ON ON ON ON ON ON ON
ON ON
PO4EP ON ON ON ON ON ON ON
ON ON
PO4POM OFF OFF OFF OFF OFF OFF OFF
OFF OFF
PO4DOM OFF OFF OFF OFF OFF OFF OFF
OFF OFF
PO4OM ON ON ON ON ON ON ON
ON ON
PO4SED ON ON ON ON ON ON ON
ON ON
PO4SOD ON ON ON ON ON ON ON
ON ON
PO4SET ON ON ON ON ON ON ON
ON ON
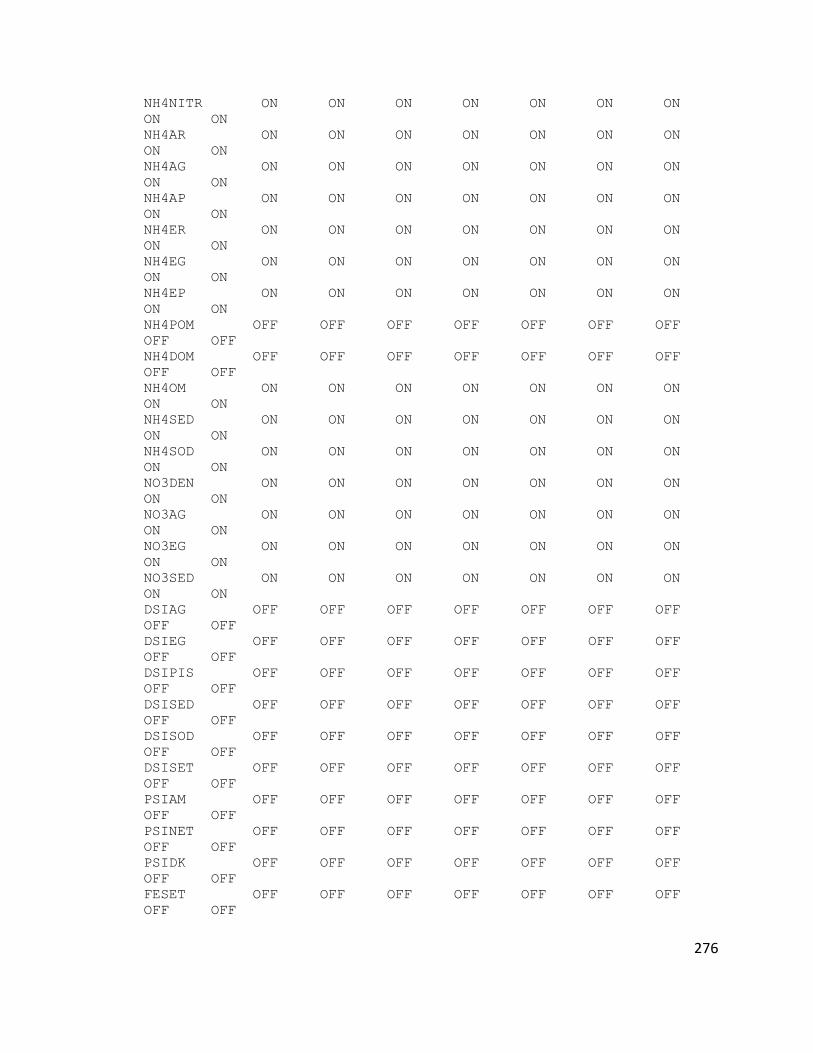
276
NH4NITR ON ON ON ON ON ON ON
ON ON
NH4AR ON ON ON ON ON ON ON
ON ON
NH4AG ON ON ON ON ON ON ON
ON ON
NH4AP ON ON ON ON ON ON ON
ON ON
NH4ER ON ON ON ON ON ON ON
ON ON
NH4EG ON ON ON ON ON ON ON
ON ON
NH4EP ON ON ON ON ON ON ON
ON ON
NH4POM OFF OFF OFF OFF OFF OFF OFF
OFF OFF
NH4DOM OFF OFF OFF OFF OFF OFF OFF
OFF OFF
NH4OM ON ON ON ON ON ON ON
ON ON
NH4SED ON ON ON ON ON ON ON
ON ON
NH4SOD ON ON ON ON ON ON ON
ON ON
NO3DEN ON ON ON ON ON ON ON
ON ON
NO3AG ON ON ON ON ON ON ON
ON ON
NO3EG ON ON ON ON ON ON ON
ON ON
NO3SED ON ON ON ON ON ON ON
ON ON
DSIAG OFF OFF OFF OFF OFF OFF OFF
OFF OFF
DSIEG OFF OFF OFF OFF OFF OFF OFF
OFF OFF
DSIPIS OFF OFF OFF OFF OFF OFF OFF
OFF OFF
DSISED OFF OFF OFF OFF OFF OFF OFF
OFF OFF
DSISOD OFF OFF OFF OFF OFF OFF OFF
OFF OFF
DSISET OFF OFF OFF OFF OFF OFF OFF
OFF OFF
PSIAM OFF OFF OFF OFF OFF OFF OFF
OFF OFF
PSINET OFF OFF OFF OFF OFF OFF OFF
OFF OFF
PSIDK OFF OFF OFF OFF OFF OFF OFF
OFF OFF
FESET OFF OFF OFF OFF OFF OFF OFF
OFF OFF
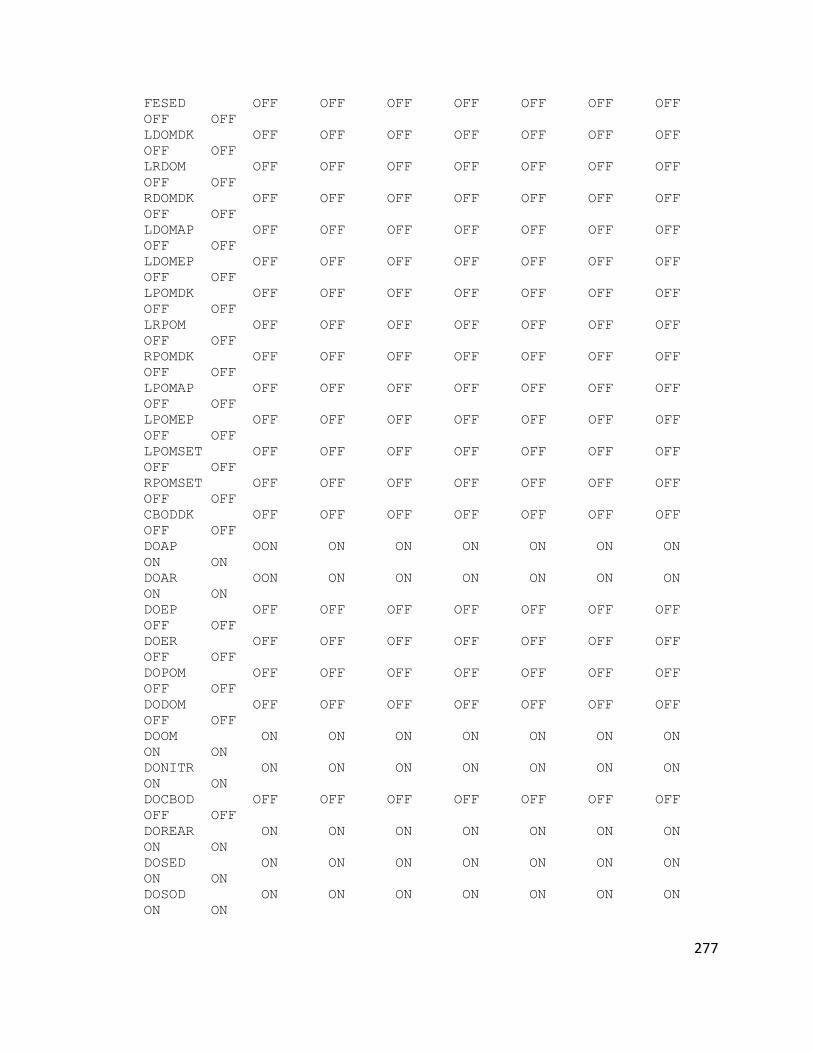
277
FESED OFF OFF OFF OFF OFF OFF OFF
OFF OFF
LDOMDK OFF OFF OFF OFF OFF OFF OFF
OFF OFF
LRDOM OFF OFF OFF OFF OFF OFF OFF
OFF OFF
RDOMDK OFF OFF OFF OFF OFF OFF OFF
OFF OFF
LDOMAP OFF OFF OFF OFF OFF OFF OFF
OFF OFF
LDOMEP OFF OFF OFF OFF OFF OFF OFF
OFF OFF
LPOMDK OFF OFF OFF OFF OFF OFF OFF
OFF OFF
LRPOM OFF OFF OFF OFF OFF OFF OFF
OFF OFF
RPOMDK OFF OFF OFF OFF OFF OFF OFF
OFF OFF
LPOMAP OFF OFF OFF OFF OFF OFF OFF
OFF OFF
LPOMEP OFF OFF OFF OFF OFF OFF OFF
OFF OFF
LPOMSET OFF OFF OFF OFF OFF OFF OFF
OFF OFF
RPOMSET OFF OFF OFF OFF OFF OFF OFF
OFF OFF
CBODDK OFF OFF OFF OFF OFF OFF OFF
OFF OFF
DOAP OON ON ON ON ON ON ON
ON ON
DOAR OON ON ON ON ON ON ON
ON ON
DOEP OFF OFF OFF OFF OFF OFF OFF
OFF OFF
DOER OFF OFF OFF OFF OFF OFF OFF
OFF OFF
DOPOM OFF OFF OFF OFF OFF OFF OFF
OFF OFF
DODOM OFF OFF OFF OFF OFF OFF OFF
OFF OFF
DOOM ON ON ON ON ON ON ON
ON ON
DONITR ON ON ON ON ON ON ON
ON ON
DOCBOD OFF OFF OFF OFF OFF OFF OFF
OFF OFF
DOREAR ON ON ON ON ON ON ON
ON ON
DOSED ON ON ON ON ON ON ON
ON ON
DOSOD ON ON ON ON ON ON ON
ON ON
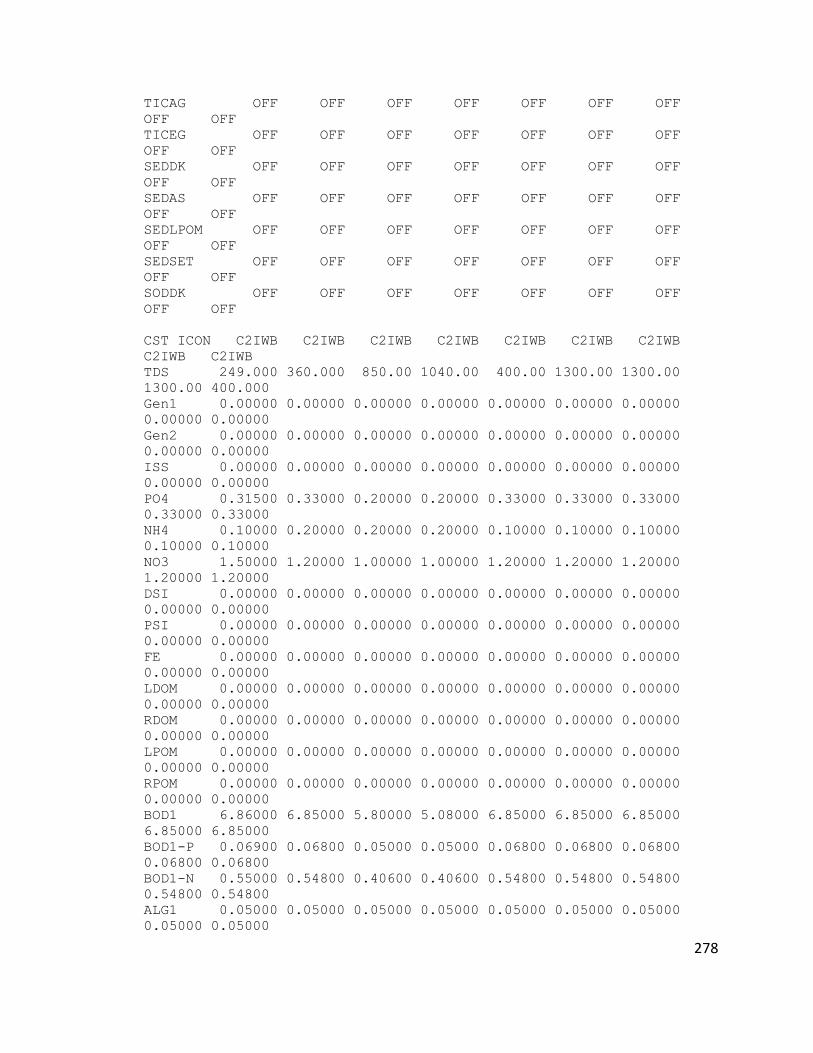
278
TICAG OFF OFF OFF OFF OFF OFF OFF
OFF OFF
TICEG OFF OFF OFF OFF OFF OFF OFF
OFF OFF
SEDDK OFF OFF OFF OFF OFF OFF OFF
OFF OFF
SEDAS OFF OFF OFF OFF OFF OFF OFF
OFF OFF
SEDLPOM OFF OFF OFF OFF OFF OFF OFF
OFF OFF
SEDSET OFF OFF OFF OFF OFF OFF OFF
OFF OFF
SODDK OFF OFF OFF OFF OFF OFF OFF
OFF OFF
CST ICON C2IWB C2IWB C2IWB C2IWB C2IWB C2IWB C2IWB
C2IWB C2IWB
TDS 249.000 360.000 850.00 1040.00 400.00 1300.00 1300.00
1300.00 400.000
Gen1 0.00000 0.00000 0.00000 0.00000 0.00000 0.00000 0.00000
0.00000 0.00000
Gen2 0.00000 0.00000 0.00000 0.00000 0.00000 0.00000 0.00000
0.00000 0.00000
ISS 0.00000 0.00000 0.00000 0.00000 0.00000 0.00000 0.00000
0.00000 0.00000
PO4 0.31500 0.33000 0.20000 0.20000 0.33000 0.33000 0.33000
0.33000 0.33000
NH4 0.10000 0.20000 0.20000 0.20000 0.10000 0.10000 0.10000
0.10000 0.10000
NO3 1.50000 1.20000 1.00000 1.00000 1.20000 1.20000 1.20000
1.20000 1.20000
DSI 0.00000 0.00000 0.00000 0.00000 0.00000 0.00000 0.00000
0.00000 0.00000
PSI 0.00000 0.00000 0.00000 0.00000 0.00000 0.00000 0.00000
0.00000 0.00000
FE 0.00000 0.00000 0.00000 0.00000 0.00000 0.00000 0.00000
0.00000 0.00000
LDOM 0.00000 0.00000 0.00000 0.00000 0.00000 0.00000 0.00000
0.00000 0.00000
RDOM 0.00000 0.00000 0.00000 0.00000 0.00000 0.00000 0.00000
0.00000 0.00000
LPOM 0.00000 0.00000 0.00000 0.00000 0.00000 0.00000 0.00000
0.00000 0.00000
RPOM 0.00000 0.00000 0.00000 0.00000 0.00000 0.00000 0.00000
0.00000 0.00000
BOD1 6.86000 6.85000 5.80000 5.08000 6.85000 6.85000 6.85000
6.85000 6.85000
BOD1-P 0.06900 0.06800 0.05000 0.05000 0.06800 0.06800 0.06800
0.06800 0.06800
BOD1-N 0.55000 0.54800 0.40600 0.40600 0.54800 0.54800 0.54800
0.54800 0.54800
ALG1 0.05000 0.05000 0.05000 0.05000 0.05000 0.05000 0.05000
0.05000 0.05000
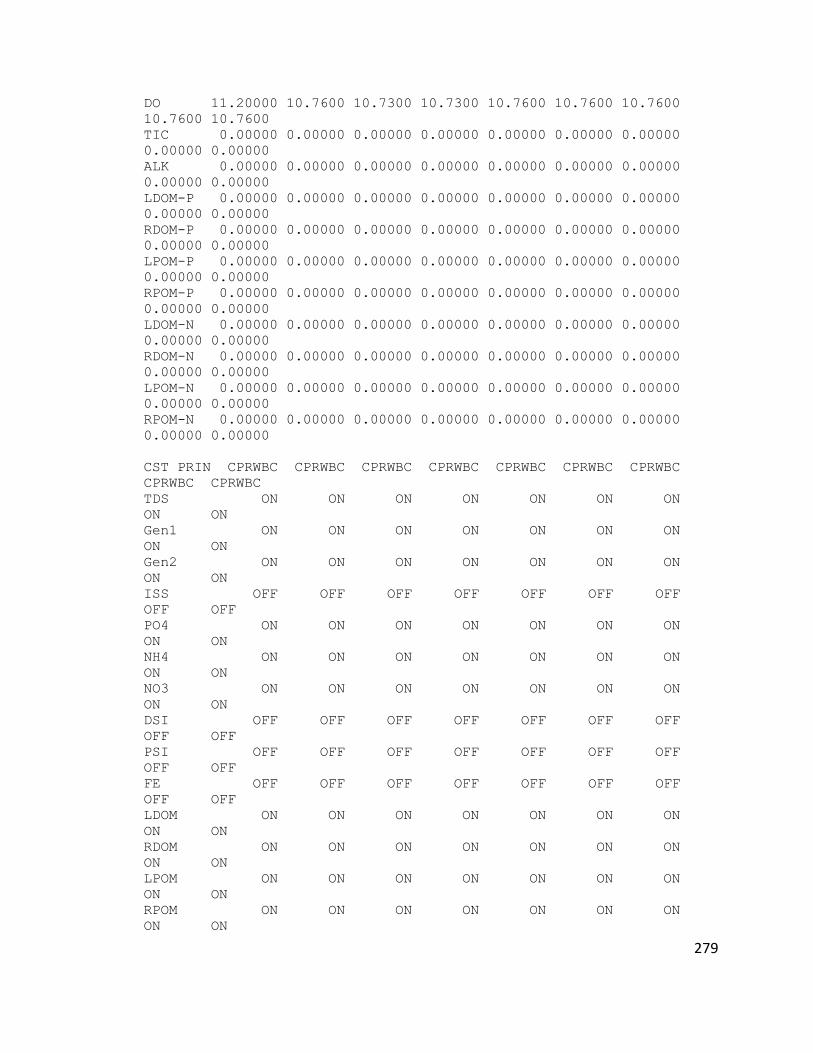
279
DO 11.20000 10.7600 10.7300 10.7300 10.7600 10.7600 10.7600
10.7600 10.7600
TIC 0.00000 0.00000 0.00000 0.00000 0.00000 0.00000 0.00000
0.00000 0.00000
ALK 0.00000 0.00000 0.00000 0.00000 0.00000 0.00000 0.00000
0.00000 0.00000
LDOM-P 0.00000 0.00000 0.00000 0.00000 0.00000 0.00000 0.00000
0.00000 0.00000
RDOM-P 0.00000 0.00000 0.00000 0.00000 0.00000 0.00000 0.00000
0.00000 0.00000
LPOM-P 0.00000 0.00000 0.00000 0.00000 0.00000 0.00000 0.00000
0.00000 0.00000
RPOM-P 0.00000 0.00000 0.00000 0.00000 0.00000 0.00000 0.00000
0.00000 0.00000
LDOM-N 0.00000 0.00000 0.00000 0.00000 0.00000 0.00000 0.00000
0.00000 0.00000
RDOM-N 0.00000 0.00000 0.00000 0.00000 0.00000 0.00000 0.00000
0.00000 0.00000
LPOM-N 0.00000 0.00000 0.00000 0.00000 0.00000 0.00000 0.00000
0.00000 0.00000
RPOM-N 0.00000 0.00000 0.00000 0.00000 0.00000 0.00000 0.00000
0.00000 0.00000
CST PRIN CPRWBC CPRWBC CPRWBC CPRWBC CPRWBC CPRWBC CPRWBC
CPRWBC CPRWBC
TDS ON ON ON ON ON ON ON
ON ON
Gen1 ON ON ON ON ON ON ON
ON ON
Gen2 ON ON ON ON ON ON ON
ON ON
ISS OFF OFF OFF OFF OFF OFF OFF
OFF OFF
PO4 ON ON ON ON ON ON ON
ON ON
NH4 ON ON ON ON ON ON ON
ON ON
NO3 ON ON ON ON ON ON ON
ON ON
DSI OFF OFF OFF OFF OFF OFF OFF
OFF OFF
PSI OFF OFF OFF OFF OFF OFF OFF
OFF OFF
FE OFF OFF OFF OFF OFF OFF OFF
OFF OFF
LDOM ON ON ON ON ON ON ON
ON ON
RDOM ON ON ON ON ON ON ON
ON ON
LPOM ON ON ON ON ON ON ON
ON ON
RPOM ON ON ON ON ON ON ON
ON ON
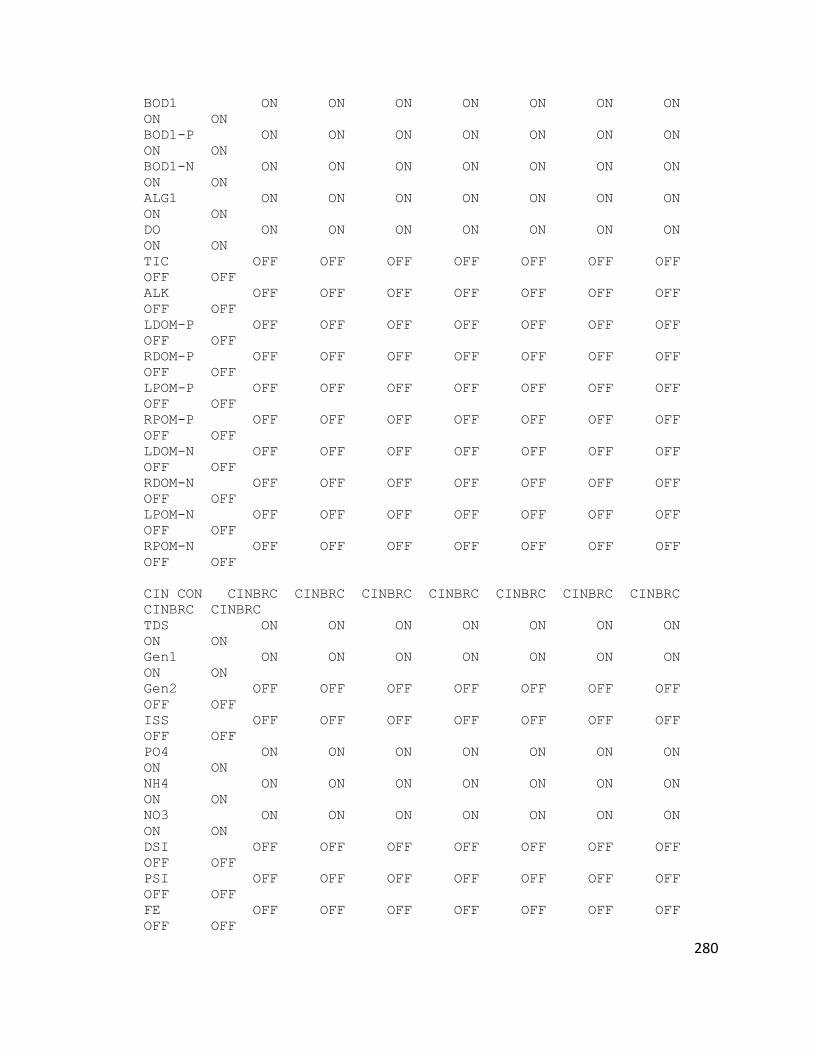
280
BOD1 ON ON ON ON ON ON ON
ON ON
BOD1-P ON ON ON ON ON ON ON
ON ON
BOD1-N ON ON ON ON ON ON ON
ON ON
ALG1 ON ON ON ON ON ON ON
ON ON
DO ON ON ON ON ON ON ON
ON ON
TIC OFF OFF OFF OFF OFF OFF OFF
OFF OFF
ALK OFF OFF OFF OFF OFF OFF OFF
OFF OFF
LDOM-P OFF OFF OFF OFF OFF OFF OFF
OFF OFF
RDOM-P OFF OFF OFF OFF OFF OFF OFF
OFF OFF
LPOM-P OFF OFF OFF OFF OFF OFF OFF
OFF OFF
RPOM-P OFF OFF OFF OFF OFF OFF OFF
OFF OFF
LDOM-N OFF OFF OFF OFF OFF OFF OFF
OFF OFF
RDOM-N OFF OFF OFF OFF OFF OFF OFF
OFF OFF
LPOM-N OFF OFF OFF OFF OFF OFF OFF
OFF OFF
RPOM-N OFF OFF OFF OFF OFF OFF OFF
OFF OFF
CIN CON CINBRC CINBRC CINBRC CINBRC CINBRC CINBRC CINBRC
CINBRC CINBRC
TDS ON ON ON ON ON ON ON
ON ON
Gen1 ON ON ON ON ON ON ON
ON ON
Gen2 OFF OFF OFF OFF OFF OFF OFF
OFF OFF
ISS OFF OFF OFF OFF OFF OFF OFF
OFF OFF
PO4 ON ON ON ON ON ON ON
ON ON
NH4 ON ON ON ON ON ON ON
ON ON
NO3 ON ON ON ON ON ON ON
ON ON
DSI OFF OFF OFF OFF OFF OFF OFF
OFF OFF
PSI OFF OFF OFF OFF OFF OFF OFF
OFF OFF
FE OFF OFF OFF OFF OFF OFF OFF
OFF OFF
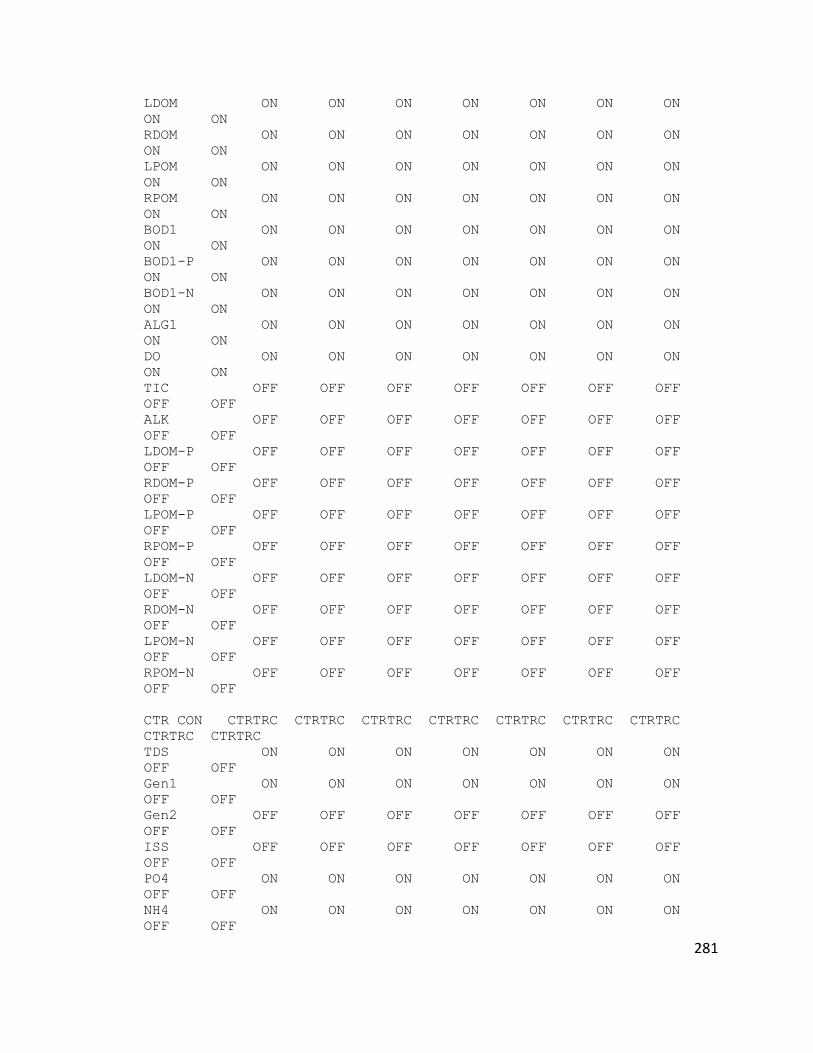
281
LDOM ON ON ON ON ON ON ON
ON ON
RDOM ON ON ON ON ON ON ON
ON ON
LPOM ON ON ON ON ON ON ON
ON ON
RPOM ON ON ON ON ON ON ON
ON ON
BOD1 ON ON ON ON ON ON ON
ON ON
BOD1-P ON ON ON ON ON ON ON
ON ON
BOD1-N ON ON ON ON ON ON ON
ON ON
ALG1 ON ON ON ON ON ON ON
ON ON
DO ON ON ON ON ON ON ON
ON ON
TIC OFF OFF OFF OFF OFF OFF OFF
OFF OFF
ALK OFF OFF OFF OFF OFF OFF OFF
OFF OFF
LDOM-P OFF OFF OFF OFF OFF OFF OFF
OFF OFF
RDOM-P OFF OFF OFF OFF OFF OFF OFF
OFF OFF
LPOM-P OFF OFF OFF OFF OFF OFF OFF
OFF OFF
RPOM-P OFF OFF OFF OFF OFF OFF OFF
OFF OFF
LDOM-N OFF OFF OFF OFF OFF OFF OFF
OFF OFF
RDOM-N OFF OFF OFF OFF OFF OFF OFF
OFF OFF
LPOM-N OFF OFF OFF OFF OFF OFF OFF
OFF OFF
RPOM-N OFF OFF OFF OFF OFF OFF OFF
OFF OFF
CTR CON CTRTRC CTRTRC CTRTRC CTRTRC CTRTRC CTRTRC CTRTRC
CTRTRC CTRTRC
TDS ON ON ON ON ON ON ON
OFF OFF
Gen1 ON ON ON ON ON ON ON
OFF OFF
Gen2 OFF OFF OFF OFF OFF OFF OFF
OFF OFF
ISS OFF OFF OFF OFF OFF OFF OFF
OFF OFF
PO4 ON ON ON ON ON ON ON
OFF OFF
NH4 ON ON ON ON ON ON ON
OFF OFF
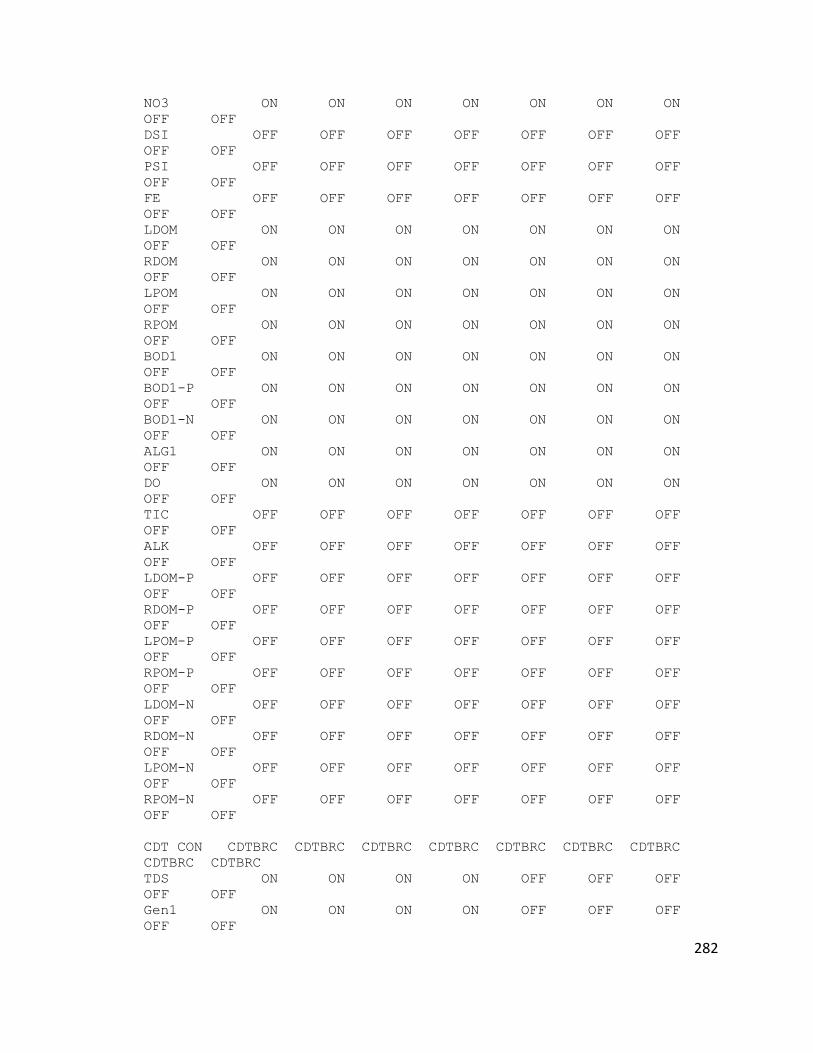
282
NO3 ON ON ON ON ON ON ON
OFF OFF
DSI OFF OFF OFF OFF OFF OFF OFF
OFF OFF
PSI OFF OFF OFF OFF OFF OFF OFF
OFF OFF
FE OFF OFF OFF OFF OFF OFF OFF
OFF OFF
LDOM ON ON ON ON ON ON ON
OFF OFF
RDOM ON ON ON ON ON ON ON
OFF OFF
LPOM ON ON ON ON ON ON ON
OFF OFF
RPOM ON ON ON ON ON ON ON
OFF OFF
BOD1 ON ON ON ON ON ON ON
OFF OFF
BOD1-P ON ON ON ON ON ON ON
OFF OFF
BOD1-N ON ON ON ON ON ON ON
OFF OFF
ALG1 ON ON ON ON ON ON ON
OFF OFF
DO ON ON ON ON ON ON ON
OFF OFF
TIC OFF OFF OFF OFF OFF OFF OFF
OFF OFF
ALK OFF OFF OFF OFF OFF OFF OFF
OFF OFF
LDOM-P OFF OFF OFF OFF OFF OFF OFF
OFF OFF
RDOM-P OFF OFF OFF OFF OFF OFF OFF
OFF OFF
LPOM-P OFF OFF OFF OFF OFF OFF OFF
OFF OFF
RPOM-P OFF OFF OFF OFF OFF OFF OFF
OFF OFF
LDOM-N OFF OFF OFF OFF OFF OFF OFF
OFF OFF
RDOM-N OFF OFF OFF OFF OFF OFF OFF
OFF OFF
LPOM-N OFF OFF OFF OFF OFF OFF OFF
OFF OFF
RPOM-N OFF OFF OFF OFF OFF OFF OFF
OFF OFF
CDT CON CDTBRC CDTBRC CDTBRC CDTBRC CDTBRC CDTBRC CDTBRC
CDTBRC CDTBRC
TDS ON ON ON ON OFF OFF OFF
OFF OFF
Gen1 ON ON ON ON OFF OFF OFF
OFF OFF
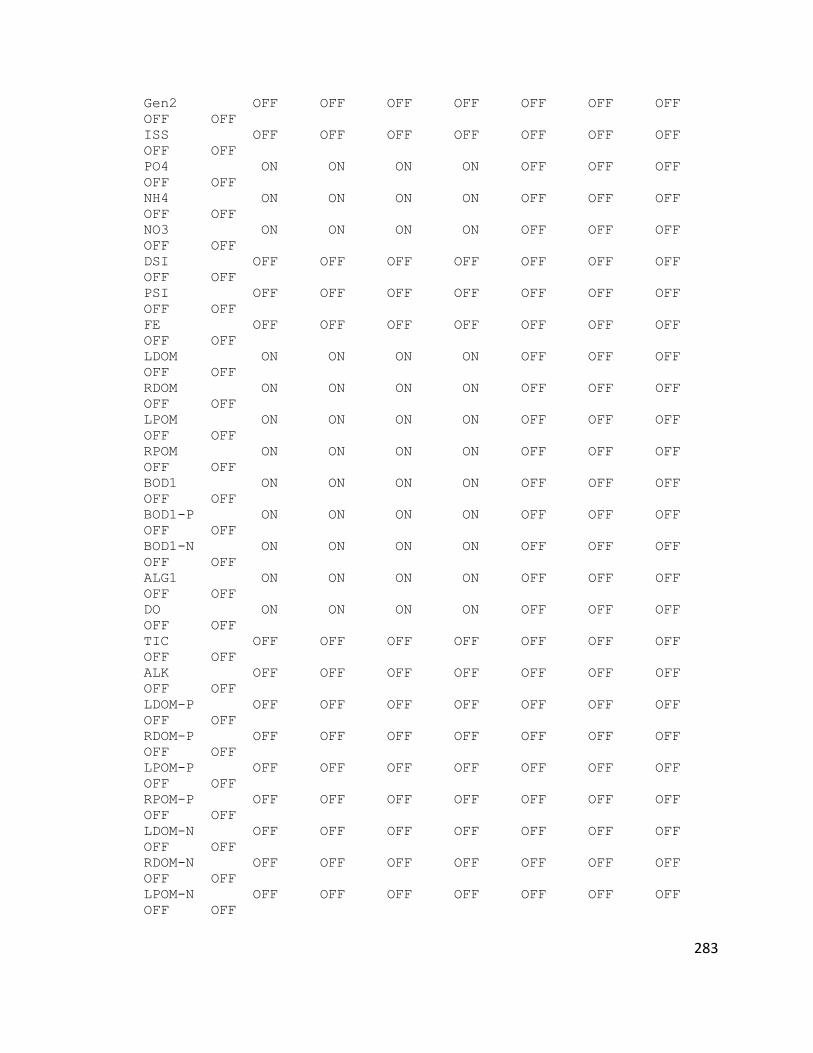
283
Gen2 OFF OFF OFF OFF OFF OFF OFF
OFF OFF
ISS OFF OFF OFF OFF OFF OFF OFF
OFF OFF
PO4 ON ON ON ON OFF OFF OFF
OFF OFF
NH4 ON ON ON ON OFF OFF OFF
OFF OFF
NO3 ON ON ON ON OFF OFF OFF
OFF OFF
DSI OFF OFF OFF OFF OFF OFF OFF
OFF OFF
PSI OFF OFF OFF OFF OFF OFF OFF
OFF OFF
FE OFF OFF OFF OFF OFF OFF OFF
OFF OFF
LDOM ON ON ON ON OFF OFF OFF
OFF OFF
RDOM ON ON ON ON OFF OFF OFF
OFF OFF
LPOM ON ON ON ON OFF OFF OFF
OFF OFF
RPOM ON ON ON ON OFF OFF OFF
OFF OFF
BOD1 ON ON ON ON OFF OFF OFF
OFF OFF
BOD1-P ON ON ON ON OFF OFF OFF
OFF OFF
BOD1-N ON ON ON ON OFF OFF OFF
OFF OFF
ALG1 ON ON ON ON OFF OFF OFF
OFF OFF
DO ON ON ON ON OFF OFF OFF
OFF OFF
TIC OFF OFF OFF OFF OFF OFF OFF
OFF OFF
ALK OFF OFF OFF OFF OFF OFF OFF
OFF OFF
LDOM-P OFF OFF OFF OFF OFF OFF OFF
OFF OFF
RDOM-P OFF OFF OFF OFF OFF OFF OFF
OFF OFF
LPOM-P OFF OFF OFF OFF OFF OFF OFF
OFF OFF
RPOM-P OFF OFF OFF OFF OFF OFF OFF
OFF OFF
LDOM-N OFF OFF OFF OFF OFF OFF OFF
OFF OFF
RDOM-N OFF OFF OFF OFF OFF OFF OFF
OFF OFF
LPOM-N OFF OFF OFF OFF OFF OFF OFF
OFF OFF

284
RPOM-N OFF OFF OFF OFF OFF OFF OFF
OFF OFF
CPR CON CPRBRC CPRBRC CPRBRC CPRBRC CPRBRC CPRBRC CPRBRC
CPRBRC CPRBRC
TDS OFF OFF OFF OFF OFF OFF OFF
OFF OFF
Gen1 OFF OFF OFF OFF OFF OFF OFF
OFF OFF
Gen2 OFF OFF OFF OFF OFF OFF OFF
OFF OFF
ISS OFF OFF OFF OFF OFF OFF OFF
OFF OFF
PO4 OFF OFF OFF OFF OFF OFF OFF
OFF OFF
NH4 OFF OFF OFF OFF OFF OFF OFF
OFF OFF
NO3 OFF OFF OFF OFF OFF OFF OFF
OFF OFF
DSI OFF OFF OFF OFF OFF OFF OFF
OFF OFF
PSI OFF OFF OFF OFF OFF OFF OFF
OFF OFF
FE OFF OFF OFF OFF OFF OFF OFF
OFF OFF
LDOM OFF OFF OFF OFF OFF OFF OFF
OFF OFF
RDOM OFF OFF OFF OFF OFF OFF OFF
OFF OFF
LPOM OFF OFF OFF OFF OFF OFF OFF
OFF OFF
RPOM OFF OFF OFF OFF OFF OFF OFF
OFF OFF
BOD1 OFF OFF OFF OFF OFF OFF OFF
OFF OFF
BOD1-P OFF OFF OFF OFF OFF OFF OFF
OFF OFF
BOD1-N OFF OFF OFF OFF OFF OFF OFF
OFF OFF
ALG1 OFF OFF OFF OFF OFF OFF OFF
OFF OFF
DO OFF OFF OFF OFF OFF OFF OFF
OFF OFF
TIC OFF OFF OFF OFF OFF OFF OFF
OFF OFF
ALK OFF OFF OFF OFF OFF OFF OFF
OFF OFF
LDOM-P OFF OFF OFF OFF OFF OFF OFF
OFF OFF
RDOM-P OFF OFF OFF OFF OFF OFF OFF
OFF OFF
LPOM-P OFF OFF OFF OFF OFF OFF OFF
OFF OFF
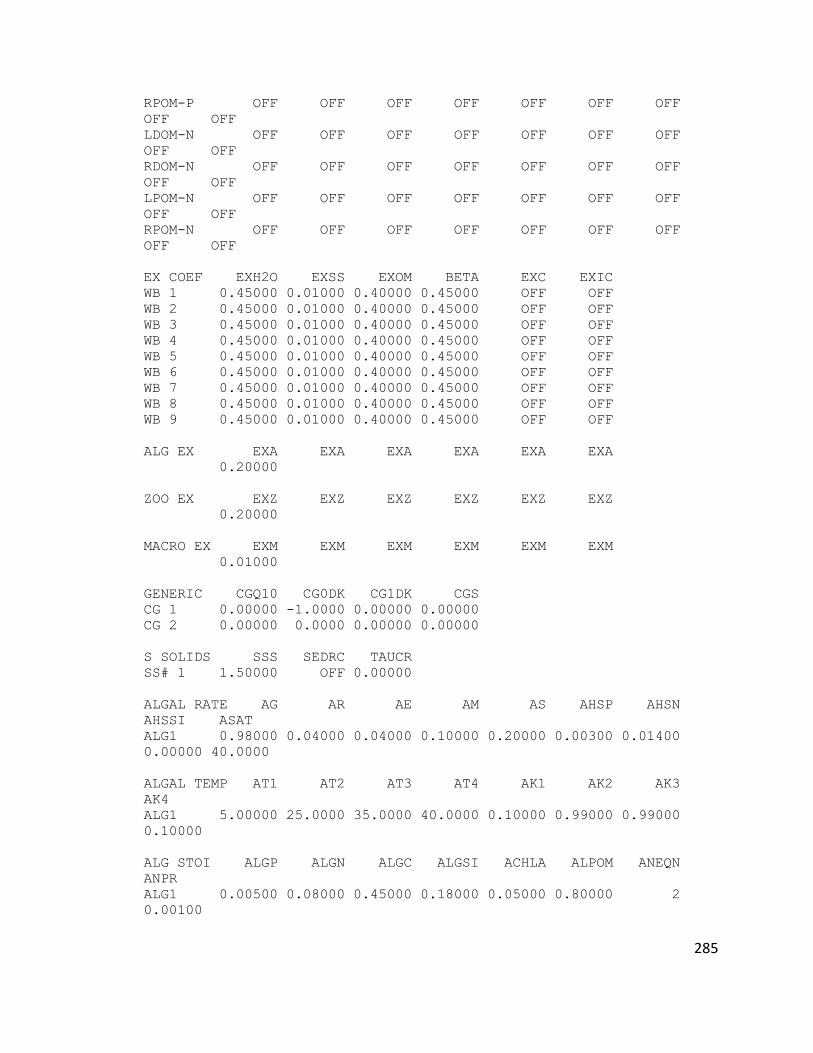
285
RPOM-P OFF OFF OFF OFF OFF OFF OFF
OFF OFF
LDOM-N OFF OFF OFF OFF OFF OFF OFF
OFF OFF
RDOM-N OFF OFF OFF OFF OFF OFF OFF
OFF OFF
LPOM-N OFF OFF OFF OFF OFF OFF OFF
OFF OFF
RPOM-N OFF OFF OFF OFF OFF OFF OFF
OFF OFF
EX COEF EXH2O EXSS EXOM BETA EXC EXIC
WB 1 0.45000 0.01000 0.40000 0.45000 OFF OFF
WB 2 0.45000 0.01000 0.40000 0.45000 OFF OFF
WB 3 0.45000 0.01000 0.40000 0.45000 OFF OFF
WB 4 0.45000 0.01000 0.40000 0.45000 OFF OFF
WB 5 0.45000 0.01000 0.40000 0.45000 OFF OFF
WB 6 0.45000 0.01000 0.40000 0.45000 OFF OFF
WB 7 0.45000 0.01000 0.40000 0.45000 OFF OFF
WB 8 0.45000 0.01000 0.40000 0.45000 OFF OFF
WB 9 0.45000 0.01000 0.40000 0.45000 OFF OFF
ALG EX EXA EXA EXA EXA EXA EXA
0.20000
ZOO EX EXZ EXZ EXZ EXZ EXZ EXZ
0.20000
MACRO EX EXM EXM EXM EXM EXM EXM
0.01000
GENERIC CGQ10 CG0DK CG1DK CGS
CG 1 0.00000 -1.0000 0.00000 0.00000
CG 2 0.00000 0.0000 0.00000 0.00000
S SOLIDS SSS SEDRC TAUCR
SS# 1 1.50000 OFF 0.00000
ALGAL RATE AG AR AE AM AS AHSP AHSN
AHSSI ASAT
ALG1 0.98000 0.04000 0.04000 0.10000 0.20000 0.00300 0.01400
0.00000 40.0000
ALGAL TEMP AT1 AT2 AT3 AT4 AK1 AK2 AK3
AK4
ALG1 5.00000 25.0000 35.0000 40.0000 0.10000 0.99000 0.99000
0.10000
ALG STOI ALGP ALGN ALGC ALGSI ACHLA ALPOM ANEQN
ANPR
ALG1 0.00500 0.08000 0.45000 0.18000 0.05000 0.80000 2
0.00100
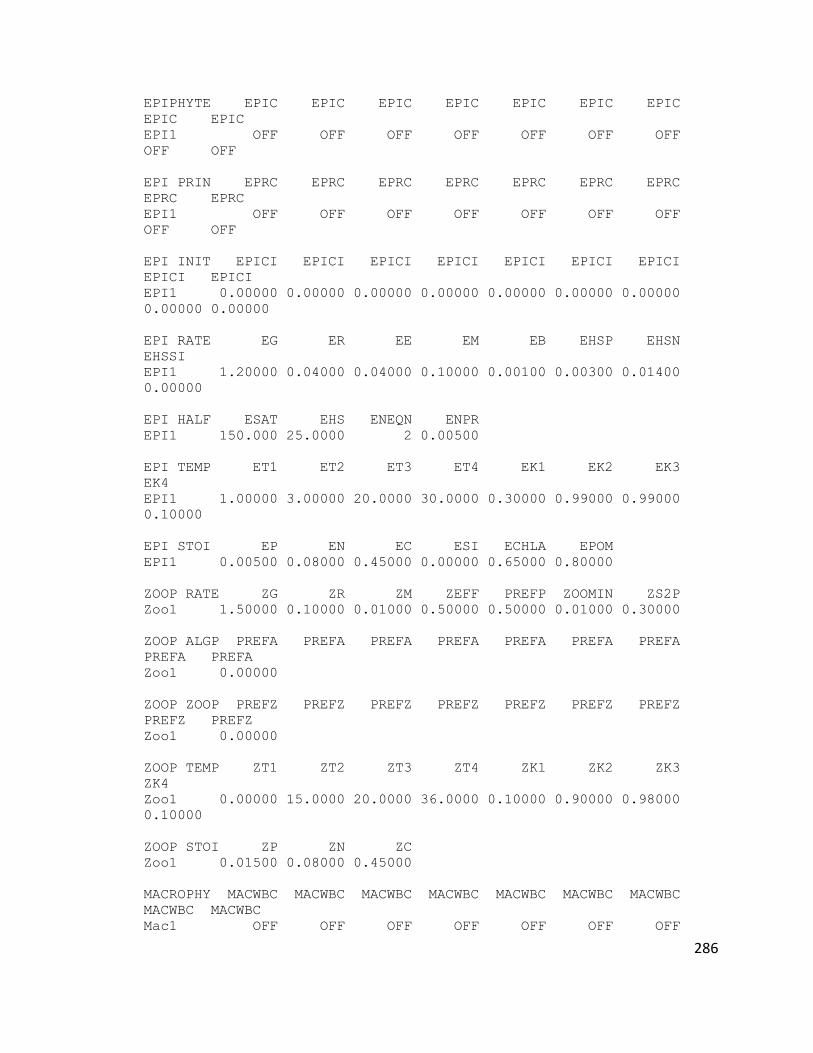
286
EPIPHYTE EPIC EPIC EPIC EPIC EPIC EPIC EPIC
EPIC EPIC
EPI1 OFF OFF OFF OFF OFF OFF OFF
OFF OFF
EPI PRIN EPRC EPRC EPRC EPRC EPRC EPRC EPRC
EPRC EPRC
EPI1 OFF OFF OFF OFF OFF OFF OFF
OFF OFF
EPI INIT EPICI EPICI EPICI EPICI EPICI EPICI EPICI
EPICI EPICI
EPI1 0.00000 0.00000 0.00000 0.00000 0.00000 0.00000 0.00000
0.00000 0.00000
EPI RATE EG ER EE EM EB EHSP EHSN
EHSSI
EPI1 1.20000 0.04000 0.04000 0.10000 0.00100 0.00300 0.01400
0.00000
EPI HALF ESAT EHS ENEQN ENPR
EPI1 150.000 25.0000 2 0.00500
EPI TEMP ET1 ET2 ET3 ET4 EK1 EK2 EK3
EK4
EPI1 1.00000 3.00000 20.0000 30.0000 0.30000 0.99000 0.99000
0.10000
EPI STOI EP EN EC ESI ECHLA EPOM
EPI1 0.00500 0.08000 0.45000 0.00000 0.65000 0.80000
ZOOP RATE ZG ZR ZM ZEFF PREFP ZOOMIN ZS2P
Zoo1 1.50000 0.10000 0.01000 0.50000 0.50000 0.01000 0.30000
ZOOP ALGP PREFA PREFA PREFA PREFA PREFA PREFA PREFA
PREFA PREFA
Zoo1 0.00000
ZOOP ZOOP PREFZ PREFZ PREFZ PREFZ PREFZ PREFZ PREFZ
PREFZ PREFZ
Zoo1 0.00000
ZOOP TEMP ZT1 ZT2 ZT3 ZT4 ZK1 ZK2 ZK3
ZK4
Zoo1 0.00000 15.0000 20.0000 36.0000 0.10000 0.90000 0.98000
0.10000
ZOOP STOI ZP ZN ZC
Zoo1 0.01500 0.08000 0.45000
MACROPHY MACWBC MACWBC MACWBC MACWBC MACWBC MACWBC MACWBC
MACWBC MACWBC
Mac1 OFF OFF OFF OFF OFF OFF OFF
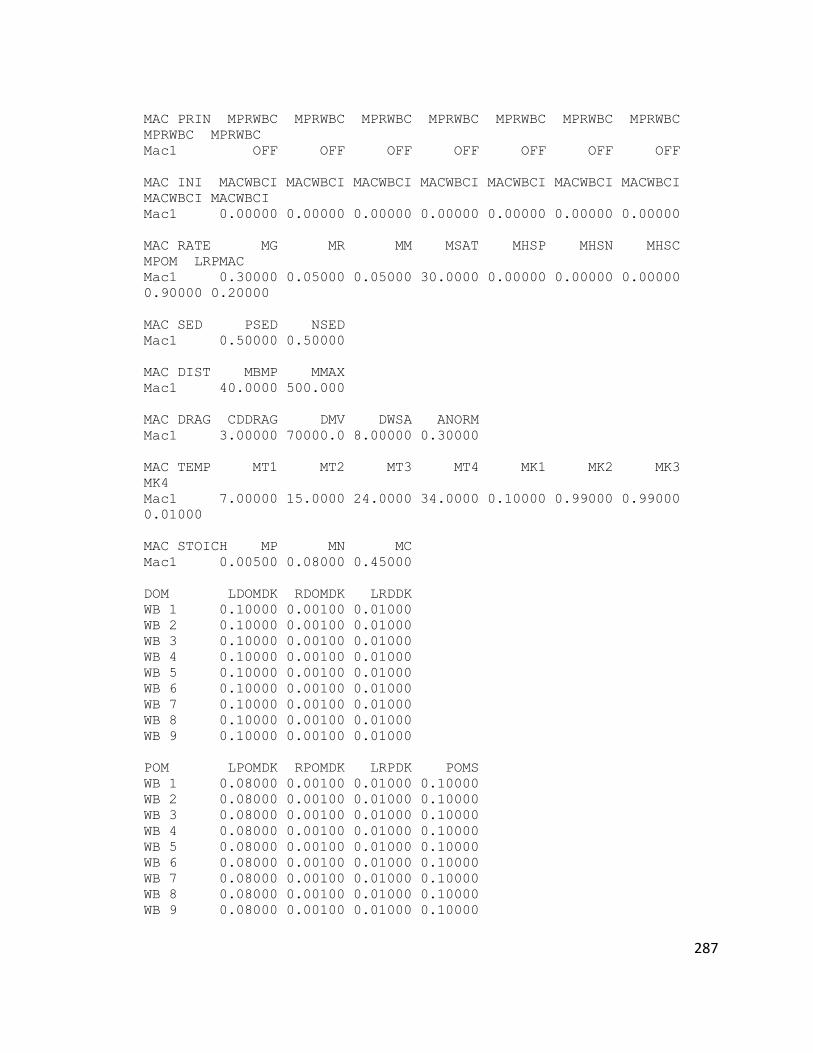
287
MAC PRIN MPRWBC MPRWBC MPRWBC MPRWBC MPRWBC MPRWBC MPRWBC
MPRWBC MPRWBC
Mac1 OFF OFF OFF OFF OFF OFF OFF
MAC INI MACWBCI MACWBCI MACWBCI MACWBCI MACWBCI MACWBCI MACWBCI
MACWBCI MACWBCI
Mac1 0.00000 0.00000 0.00000 0.00000 0.00000 0.00000 0.00000
MAC RATE MG MR MM MSAT MHSP MHSN MHSC
MPOM LRPMAC
Mac1 0.30000 0.05000 0.05000 30.0000 0.00000 0.00000 0.00000
0.90000 0.20000
MAC SED PSED NSED
Mac1 0.50000 0.50000
MAC DIST MBMP MMAX
Mac1 40.0000 500.000
MAC DRAG CDDRAG DMV DWSA ANORM
Mac1 3.00000 70000.0 8.00000 0.30000
MAC TEMP MT1 MT2 MT3 MT4 MK1 MK2 MK3
MK4
Mac1 7.00000 15.0000 24.0000 34.0000 0.10000 0.99000 0.99000
0.01000
MAC STOICH MP MN MC
Mac1 0.00500 0.08000 0.45000
DOM LDOMDK RDOMDK LRDDK
WB 1 0.10000 0.00100 0.01000
WB 2 0.10000 0.00100 0.01000
WB 3 0.10000 0.00100 0.01000
WB 4 0.10000 0.00100 0.01000
WB 5 0.10000 0.00100 0.01000
WB 6 0.10000 0.00100 0.01000
WB 7 0.10000 0.00100 0.01000
WB 8 0.10000 0.00100 0.01000
WB 9 0.10000 0.00100 0.01000
POM LPOMDK RPOMDK LRPDK POMS
WB 1 0.08000 0.00100 0.01000 0.10000
WB 2 0.08000 0.00100 0.01000 0.10000
WB 3 0.08000 0.00100 0.01000 0.10000
WB 4 0.08000 0.00100 0.01000 0.10000
WB 5 0.08000 0.00100 0.01000 0.10000
WB 6 0.08000 0.00100 0.01000 0.10000
WB 7 0.08000 0.00100 0.01000 0.10000
WB 8 0.08000 0.00100 0.01000 0.10000
WB 9 0.08000 0.00100 0.01000 0.10000
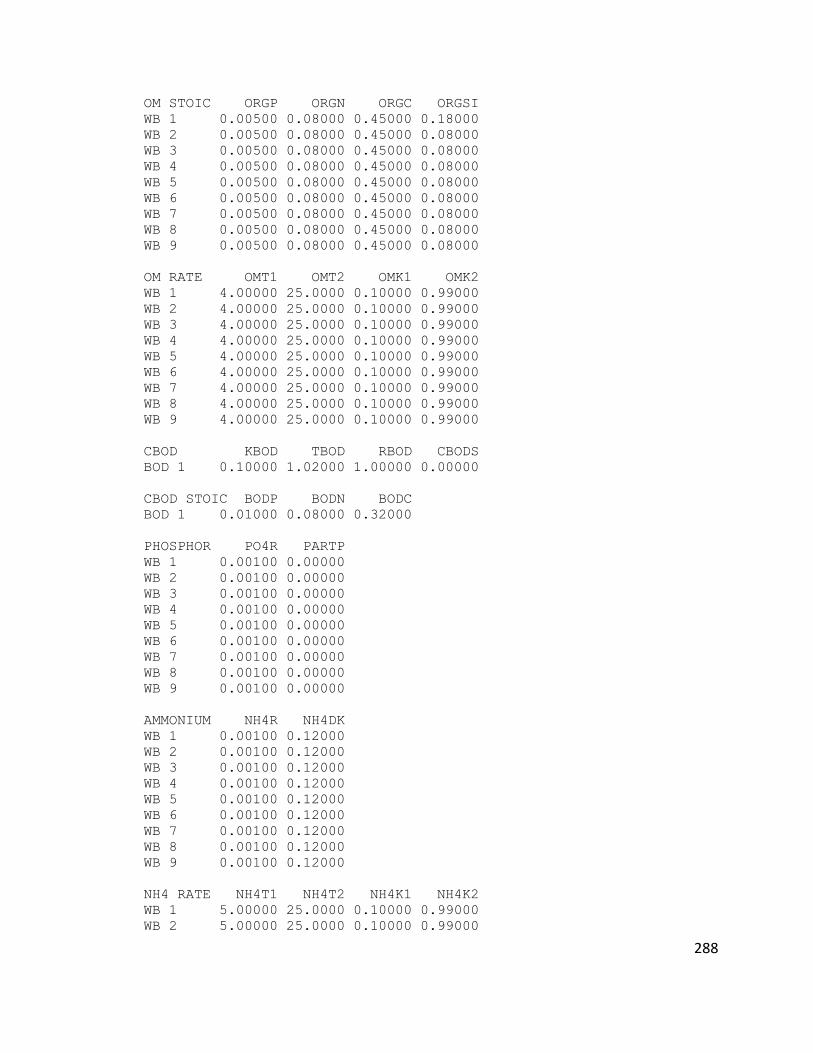
288
OM STOIC ORGP ORGN ORGC ORGSI
WB 1 0.00500 0.08000 0.45000 0.18000
WB 2 0.00500 0.08000 0.45000 0.08000
WB 3 0.00500 0.08000 0.45000 0.08000
WB 4 0.00500 0.08000 0.45000 0.08000
WB 5 0.00500 0.08000 0.45000 0.08000
WB 6 0.00500 0.08000 0.45000 0.08000
WB 7 0.00500 0.08000 0.45000 0.08000
WB 8 0.00500 0.08000 0.45000 0.08000
WB 9 0.00500 0.08000 0.45000 0.08000
OM RATE OMT1 OMT2 OMK1 OMK2
WB 1 4.00000 25.0000 0.10000 0.99000
WB 2 4.00000 25.0000 0.10000 0.99000
WB 3 4.00000 25.0000 0.10000 0.99000
WB 4 4.00000 25.0000 0.10000 0.99000
WB 5 4.00000 25.0000 0.10000 0.99000
WB 6 4.00000 25.0000 0.10000 0.99000
WB 7 4.00000 25.0000 0.10000 0.99000
WB 8 4.00000 25.0000 0.10000 0.99000
WB 9 4.00000 25.0000 0.10000 0.99000
CBOD KBOD TBOD RBOD CBODS
BOD 1 0.10000 1.02000 1.00000 0.00000
CBOD STOIC BODP BODN BODC
BOD 1 0.01000 0.08000 0.32000
PHOSPHOR PO4R PARTP
WB 1 0.00100 0.00000
WB 2 0.00100 0.00000
WB 3 0.00100 0.00000
WB 4 0.00100 0.00000
WB 5 0.00100 0.00000
WB 6 0.00100 0.00000
WB 7 0.00100 0.00000
WB 8 0.00100 0.00000
WB 9 0.00100 0.00000
AMMONIUM NH4R NH4DK
WB 1 0.00100 0.12000
WB 2 0.00100 0.12000
WB 3 0.00100 0.12000
WB 4 0.00100 0.12000
WB 5 0.00100 0.12000
WB 6 0.00100 0.12000
WB 7 0.00100 0.12000
WB 8 0.00100 0.12000
WB 9 0.00100 0.12000
NH4 RATE NH4T1 NH4T2 NH4K1 NH4K2
WB 1 5.00000 25.0000 0.10000 0.99000
WB 2 5.00000 25.0000 0.10000 0.99000
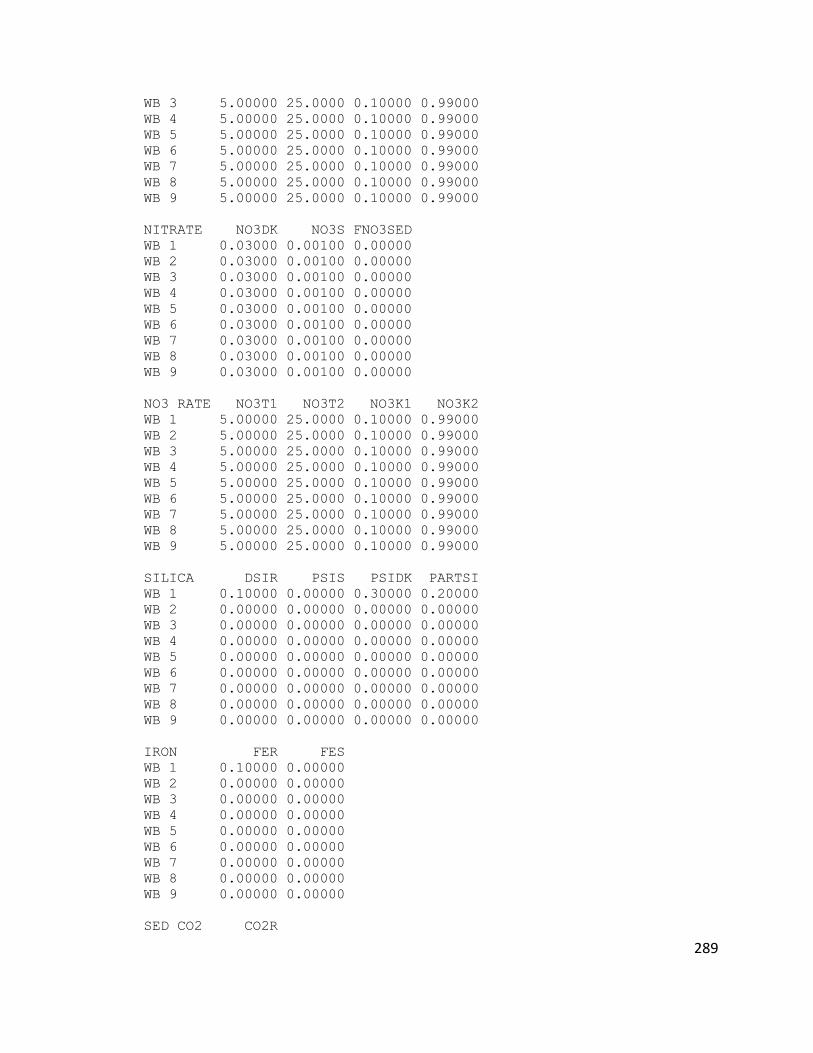
289
WB 3 5.00000 25.0000 0.10000 0.99000
WB 4 5.00000 25.0000 0.10000 0.99000
WB 5 5.00000 25.0000 0.10000 0.99000
WB 6 5.00000 25.0000 0.10000 0.99000
WB 7 5.00000 25.0000 0.10000 0.99000
WB 8 5.00000 25.0000 0.10000 0.99000
WB 9 5.00000 25.0000 0.10000 0.99000
NITRATE NO3DK NO3S FNO3SED
WB 1 0.03000 0.00100 0.00000
WB 2 0.03000 0.00100 0.00000
WB 3 0.03000 0.00100 0.00000
WB 4 0.03000 0.00100 0.00000
WB 5 0.03000 0.00100 0.00000
WB 6 0.03000 0.00100 0.00000
WB 7 0.03000 0.00100 0.00000
WB 8 0.03000 0.00100 0.00000
WB 9 0.03000 0.00100 0.00000
NO3 RATE NO3T1 NO3T2 NO3K1 NO3K2
WB 1 5.00000 25.0000 0.10000 0.99000
WB 2 5.00000 25.0000 0.10000 0.99000
WB 3 5.00000 25.0000 0.10000 0.99000
WB 4 5.00000 25.0000 0.10000 0.99000
WB 5 5.00000 25.0000 0.10000 0.99000
WB 6 5.00000 25.0000 0.10000 0.99000
WB 7 5.00000 25.0000 0.10000 0.99000
WB 8 5.00000 25.0000 0.10000 0.99000
WB 9 5.00000 25.0000 0.10000 0.99000
SILICA DSIR PSIS PSIDK PARTSI
WB 1 0.10000 0.00000 0.30000 0.20000
WB 2 0.00000 0.00000 0.00000 0.00000
WB 3 0.00000 0.00000 0.00000 0.00000
WB 4 0.00000 0.00000 0.00000 0.00000
WB 5 0.00000 0.00000 0.00000 0.00000
WB 6 0.00000 0.00000 0.00000 0.00000
WB 7 0.00000 0.00000 0.00000 0.00000
WB 8 0.00000 0.00000 0.00000 0.00000
WB 9 0.00000 0.00000 0.00000 0.00000
IRON FER FES
WB 1 0.10000 0.00000
WB 2 0.00000 0.00000
WB 3 0.00000 0.00000
WB 4 0.00000 0.00000
WB 5 0.00000 0.00000
WB 6 0.00000 0.00000
WB 7 0.00000 0.00000
WB 8 0.00000 0.00000
WB 9 0.00000 0.00000
SED CO2 CO2R
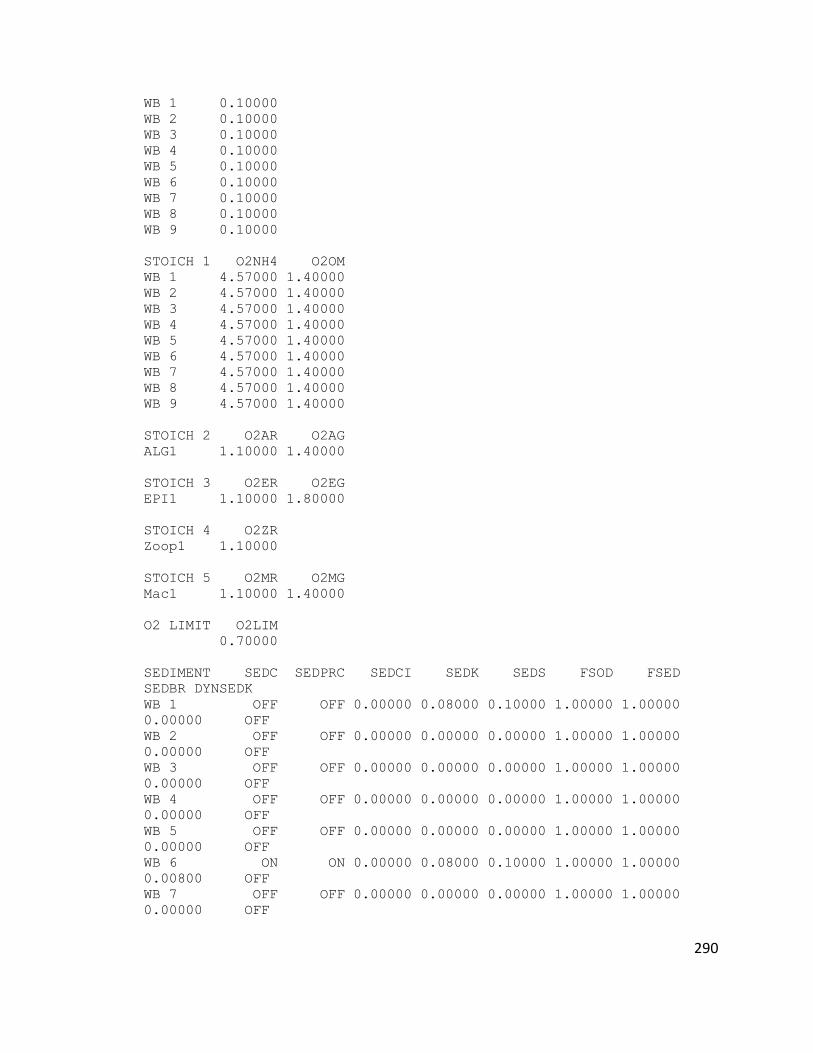
290
WB 1 0.10000
WB 2 0.10000
WB 3 0.10000
WB 4 0.10000
WB 5 0.10000
WB 6 0.10000
WB 7 0.10000
WB 8 0.10000
WB 9 0.10000
STOICH 1 O2NH4 O2OM
WB 1 4.57000 1.40000
WB 2 4.57000 1.40000
WB 3 4.57000 1.40000
WB 4 4.57000 1.40000
WB 5 4.57000 1.40000
WB 6 4.57000 1.40000
WB 7 4.57000 1.40000
WB 8 4.57000 1.40000
WB 9 4.57000 1.40000
STOICH 2 O2AR O2AG
ALG1 1.10000 1.40000
STOICH 3 O2ER O2EG
EPI1 1.10000 1.80000
STOICH 4 O2ZR
Zoop1 1.10000
STOICH 5 O2MR O2MG
Mac1 1.10000 1.40000
O2 LIMIT O2LIM
0.70000
SEDIMENT SEDC SEDPRC SEDCI SEDK SEDS FSOD FSED
SEDBR DYNSEDK
WB 1 OFF OFF 0.00000 0.08000 0.10000 1.00000 1.00000
0.00000 OFF
WB 2 OFF OFF 0.00000 0.00000 0.00000 1.00000 1.00000
0.00000 OFF
WB 3 OFF OFF 0.00000 0.00000 0.00000 1.00000 1.00000
0.00000 OFF
WB 4 OFF OFF 0.00000 0.00000 0.00000 1.00000 1.00000
0.00000 OFF
WB 5 OFF OFF 0.00000 0.00000 0.00000 1.00000 1.00000
0.00000 OFF
WB 6 ON ON 0.00000 0.08000 0.10000 1.00000 1.00000
0.00800 OFF
WB 7 OFF OFF 0.00000 0.00000 0.00000 1.00000 1.00000
0.00000 OFF
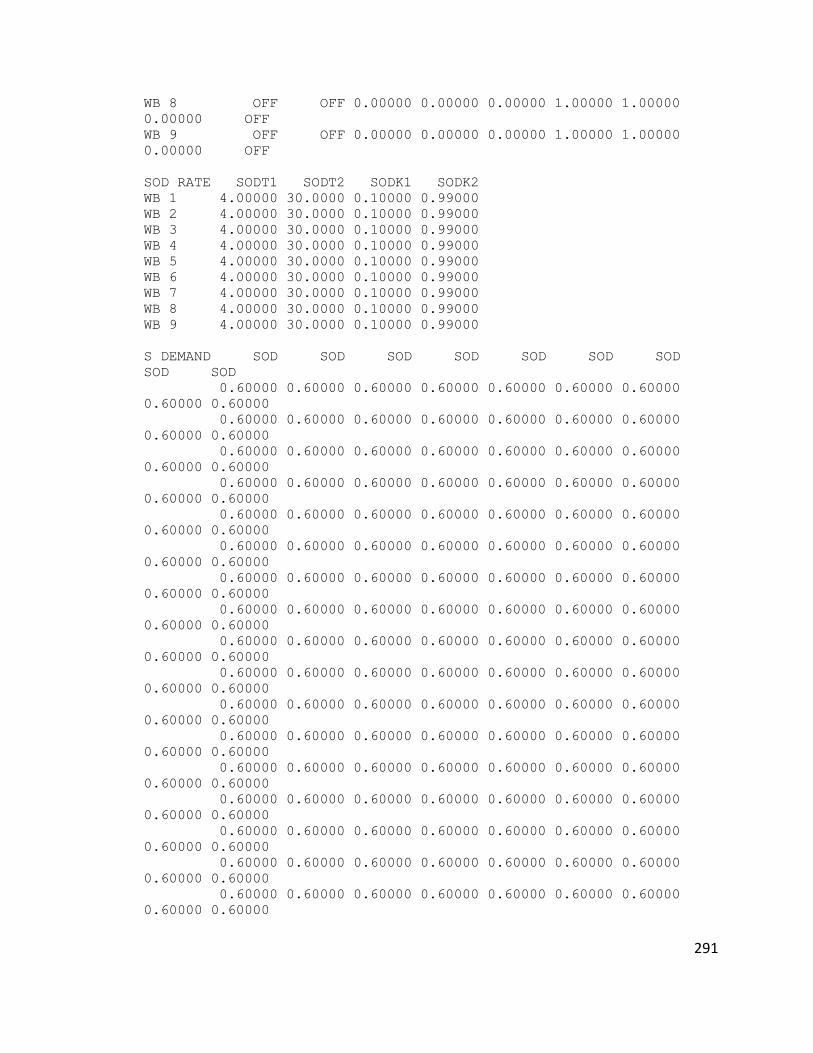
291
WB 8 OFF OFF 0.00000 0.00000 0.00000 1.00000 1.00000
0.00000 OFF
WB 9 OFF OFF 0.00000 0.00000 0.00000 1.00000 1.00000
0.00000 OFF
SOD RATE SODT1 SODT2 SODK1 SODK2
WB 1 4.00000 30.0000 0.10000 0.99000
WB 2 4.00000 30.0000 0.10000 0.99000
WB 3 4.00000 30.0000 0.10000 0.99000
WB 4 4.00000 30.0000 0.10000 0.99000
WB 5 4.00000 30.0000 0.10000 0.99000
WB 6 4.00000 30.0000 0.10000 0.99000
WB 7 4.00000 30.0000 0.10000 0.99000
WB 8 4.00000 30.0000 0.10000 0.99000
WB 9 4.00000 30.0000 0.10000 0.99000
S DEMAND SOD SOD SOD SOD SOD SOD SOD
SOD SOD
0.60000 0.60000 0.60000 0.60000 0.60000 0.60000 0.60000
0.60000 0.60000
0.60000 0.60000 0.60000 0.60000 0.60000 0.60000 0.60000
0.60000 0.60000
0.60000 0.60000 0.60000 0.60000 0.60000 0.60000 0.60000
0.60000 0.60000
0.60000 0.60000 0.60000 0.60000 0.60000 0.60000 0.60000
0.60000 0.60000
0.60000 0.60000 0.60000 0.60000 0.60000 0.60000 0.60000
0.60000 0.60000
0.60000 0.60000 0.60000 0.60000 0.60000 0.60000 0.60000
0.60000 0.60000
0.60000 0.60000 0.60000 0.60000 0.60000 0.60000 0.60000
0.60000 0.60000
0.60000 0.60000 0.60000 0.60000 0.60000 0.60000 0.60000
0.60000 0.60000
0.60000 0.60000 0.60000 0.60000 0.60000 0.60000 0.60000
0.60000 0.60000
0.60000 0.60000 0.60000 0.60000 0.60000 0.60000 0.60000
0.60000 0.60000
0.60000 0.60000 0.60000 0.60000 0.60000 0.60000 0.60000
0.60000 0.60000
0.60000 0.60000 0.60000 0.60000 0.60000 0.60000 0.60000
0.60000 0.60000
0.60000 0.60000 0.60000 0.60000 0.60000 0.60000 0.60000
0.60000 0.60000
0.60000 0.60000 0.60000 0.60000 0.60000 0.60000 0.60000
0.60000 0.60000
0.60000 0.60000 0.60000 0.60000 0.60000 0.60000 0.60000
0.60000 0.60000
0.60000 0.60000 0.60000 0.60000 0.60000 0.60000 0.60000
0.60000 0.60000
0.60000 0.60000 0.60000 0.60000 0.60000 0.60000 0.60000
0.60000 0.60000
292
0.60000 0.60000 0.60000 0.60000 0.60000 0.60000 0.60000
0.60000 0.60000
0.60000 0.60000 0.60000 0.60000 0.60000 0.60000 0.60000
0.60000 0.60000
0.60000 0.60000 0.60000 0.60000 0.60000 0.60000 0.60000
0.60000 0.60000
0.60000 0.60000 0.60000 0.60000 0.60000 0.60000 0.60000
0.60000 0.60000
0.60000 0.60000 0.60000 0.60000 0.60000 0.60000 0.60000
0.60000 0.60000
0.60000 0.60000 0.60000 0.60000 0.60000 0.60000 0.60000
0.60000 0.60000
0.60000 0.60000 0.60000 0.60000 0.60000 0.60000 0.60000
0.60000 0.60000
0.60000 0.60000 0.60000 0.60000 0.60000 0.60000 0.60000
0.60000 0.60000
0.60000 0.60000 0.60000 0.60000 0.60000 0.60000 0.60000
0.60000 0.60000
0.60000 0.60000 0.60000 0.60000 0.60000 0.60000 0.60000
0.60000 0.60000
0.60000 0.60000 0.60000 0.60000 0.60000 0.60000 0.60000
0.60000 0.60000
0.60000 0.60000 0.60000 0.60000 0.60000 0.60000 0.60000
0.60000 0.60000
0.60000 0.60000 0.60000 0.60000 0.60000 0.60000 0.60000
0.60000 0.60000
0.60000 0.60000 0.60000 0.60000 0.60000 0.60000 0.60000
0.60000 0.60000
0.60000 0.60000 0.60000 0.60000 0.60000 0.60000 0.60000
0.60000 0.60000
0.60000 0.60000 0.60000 0.60000 0.60000 0.60000 0.60000
0.60000 0.60000
0.60000 0.60000 0.60000 0.60000 0.60000 0.60000 0.60000
0.60000 0.60000
0.60000 0.60000 0.60000 0.60000 0.60000 0.60000 0.60000
0.60000 0.60000
0.60000 0.60000 0.60000 0.60000 0.60000 0.60000 0.60000
0.60000 0.60000
0.60000 0.60000 0.60000 0.60000 0.60000 0.60000 0.60000
0.60000 0.60000
0.60000 0.60000 0.60000 0.60000 0.60000 0.60000 0.60000
0.60000 0.60000
0.60000 0.60000 0.60000 0.60000 0.60000 0.60000 0.60000
0.60000 0.60000
REAERATION TYPE EQN# COEF1 COEF2 COEF3 COEF4
WB 1 RIVER 7 0.00000 0.00000 0.00000 0.00000
WB 2 RIVER 7 0.00000 0.00000 0.00000 0.00000
WB 3 RIVER 7 0.00000 0.00000 0.00000 0.00000
WB 4 RIVER 7 0.00000 0.00000 0.00000 0.00000
WB 5 RIVER 7 0.00000 0.00000 0.00000 0.00000
WB 6 LAKE 6 0.00000 0.00000 0.00000 0.00000
WB 7 RIVER 7 0.00000 0.00000 0.00000 0.00000
293
WB 8 RIVER 7 0.00000 0.00000 0.00000 0.00000
WB 9 RIVER 7 0.00000 0.00000 0.00000 0.00000
RSI
FILE..................................RSIFN.........................
........
rsi.npt
QWD
FILE..................................QWDFN.........................
........
qWD.npt
QGT
FILE..................................QGTFN.........................
........
qgt.npt
WSC
FILE..................................WSCFN.........................
........
wsc.npt
SHD
FILE..................................SHDFN.........................
........
shade.npt
BTH
FILE..................................BTHFN.........................
........
WB 1 bth_wb1.csv
WB 2 bth_wb2.csv
WB 3 bth_wb3.csv
WB 4 bth_wb4.csv
WB 5 bth_wb5.csv
WB 6 bth_wb6.csv
WB 7 bth_wb7.csv
WB 8 bth_wb8.csv
WB 9 bth_wb9.csv
MET
FILE..................................METFN.........................
........
WB 1 met_wb1.npt
WB 2 met_wb2.npt
WB 3 met_wb3.npt
WB 4 met_wb4.npt
WB 5 met_wb5.npt
WB 6 met_wb6.npt
WB 7 met_wb7.npt
WB 8 met_wb8.npt
WB 9 met_wb9.npt
294
EXT
FILE..................................EXTFN.........................
........
WB 1 ext_1.npt - not used
WB 2 ext_2.npt
WB 3 ext_3.npt
WB 4 ext_4.npt
WB 5 ext_5.npt
WB 6 ext_6.npt
WB 7 ext_7.npt
WB 8 ext_8.npt
WB 9 ext_9.npt
VPR
FILE..................................VPRFN.........................
........
WB 1 vpr_1.npt
WB 2 vpr_2.npt
WB 3 vpr_3.npt
WB 4 vpr_4.npt
WB 5 vpr_5.npt
WB 6 vpr_6.npt
WB 7 vpr_7.npt
WB 8 vpr_8.npt
WB 9 vpr_9.npt
LPR
FILE..................................LPRFN.........................
........
WB 1 lpr_1.npt - not used
WB 2 lpr_2.npt
WB 3 lpr_3.npt
WB 4 lpr_4.npt
WB 5 lpr_5.npt
WB 6 lpr_6.npt
WB 7 lpr_7.npt
WB 8 lpr_8.npt
WB 9 lpr_9.npt
QIN
FILE..................................QINFN.........................
........
BR1 qin_br1.npt
BR2 qin_br2.npt
BR3 qin_br3.npt
BR4 qin_br4.npt
BR5 qin_br5.npt
BR6 qin_br6.npt
BR7 qin_br7.npt
BR8 qin_br8.npt
BR9 qin_br9.npt
295
TIN
FILE..................................TINFN.........................
........
BR1 tin_br1.npt
BR2 tin_br2.npt
BR3 tin_br3.npt
BR4 tin_br4.npt
BR5 tin_br5.npt
BR6 tin_br6.npt
BR7 tin_br7.npt
BR8 tin_br8.npt
BR9 tin_br9.npt
CIN
FILE..................................CINFN.........................
........
BR1 cin_br1.csv
BR2 cin_br2.npt
BR3 cin_br3.npt
BR4 cin_br4.npt
BR5 cin_br5.npt
BR6 cin_br6.npt
BR7 cin_br7.npt
BR8 cin_br8.npt
BR9 cin_br9.npt
QOT
FILE..................................QOTFN.........................
........
BR1 qot_br1.npt
BR2 qot_br2.npt
BR3 qot_br3.npt
BR4 qot_br4.npt
BR5 qot_br5.npt
BR6 qot_br6.npt
BR7 qot_br7.npt
BR8 qot_br8.npt
BR9 qot_br9.npt
QTR
FILE..................................QTRFN.........................
........
TR1 qtr_tr1.npt
TR2 qtr_tr2.npt
TR3 qtr_tr3.npt
TR4 qtr_tr4.npt
TR5 qtr_tr5.npt
TR6 qtr_tr6.npt
TR7 qtr_tr7.npt
TTR
FILE..................................TTRFN.........................
........
296
TR1 ttr_tr1.npt
TR2 ttr_tr2.npt
TR3 ttr_tr3.npt
TR4 ttr_tr4.npt
TR5 ttr_tr5.npt
TR6 ttr_tr6.npt
TR7 ttr_tr7.npt
CTR
FILE..................................CTRFN.........................
........
TR1 ctr_tr1.csv
TR2 ctr_tr2.csv
TR3 ctr_tr3.csv
TR4 ctr_tr4.csv
TR5 ctr_tr5.csv
TR6 ctr_tr6.csv
TR7 ctr_tr7.csv
QDT
FILE..................................QDTFN.........................
........
BR1 qdt_br1.npt
BR2 qdt_br2.npt
BR3 qdt_br3.npt
BR4 qdt_br4.npt
BR5 qdt_br5.npt
BR6 qdt_br6.npt
BR7 qdt_br7.npt
BR8 qdt_br8.npt
BR9 qdt_br9.npt
TDT
FILE..................................TDTFN.........................
........
BR1 tdt_br1.npt
BR2 tdt_br2.npt
BR3 tdt_br3.npt
BR4 tdt_br4.npt
BR5 tdt_br5.npt
BR6 tdt_br6.npt
BR7 tdt_br7.npt
BR8 tdt_br8.npt
BR9 tdt_br9.npt
CDT
FILE..................................CDTFN.........................
........
BR1 cdt_br1.csv
BR2 cdt_br2.csv
BR3 cdt_br3.csv
BR4 cdt_br4.csv
BR5 cdt_br5.csv
297
BR6 cdt_br6.csv
BR7 cdt_br7.csv
BR8 cdt_br8.csv
BR9 cdt_br9.csv
PRE
FILE..................................PREFN.........................
........
BR1 pre_br1.npt - not used
BR2 pre_br2.npt
BR3 pre_br3.npt
BR4 pre_br4.npt
BR5 pre_br5.npt
BR6 pre_br6.npt
BR7 pre_br7.npt
BR8 pre_br8.npt
BR9 pre_br9.npt
TPR
FILE..................................TPRFN.........................
........
BR1 tpr_br1.npt - not used
BR2 tpr_br2.npt
BR3 tpr_br3.npt
BR4 tpr_br4.npt
BR5 tpr_br5.npt
BR6 tpr_br6.npt
BR7 tpr_br7.npt
BR8 tpr_br8.npt
BR9 tpr_br9.npt
CPR
FILE..................................CPRFN.........................
........
BR1 cpr_br1.npt - not used
BR2 cpr_br2.npt
BR3 cpr_br3.npt
BR4 cpr_br4.npt
BR5 cpr_br5.npt
BR6 cpr_br6.npt
BR7 cpr_br7.npt
BR8 cpr_br8.npt
BR9 cpr_br9.npt
EUH
FILE..................................EUHFN.........................
........
BR1 euh_br1.npt
BR2 euh_br2.npt
BR3 euh_br3.npt
BR4 euh_br4.npt
BR5 euh_br5.npt
BR6 euh_br6.npt
298
BR7 euh_br7.npt
BR8 euh_br8.npt
BR9 euh_br9.npt
TUH
FILE..................................TUHFN.........................
........
BR1 tuh_br1.npt
BR2 tuh_br2.npt
BR3 tuh_br3.npt
BR4 tuh_br4.npt
BR5 tuh_br5.npt
BR6 tuh_br6.npt
BR7 tuh_br7.npt
BR8 tuh_br8.npt
BR9 tuh_br9.npt
CUH
FILE..................................CUHFN.........................
........
BR1 cuh_br1.npt
BR2 cuh_br2.npt
BR3 cuh_br3.npt
BR4 cuh_br4.npt
BR5 cuh_br5.npt
BR6 cuh_br6.npt
BR7 cuh_br7.npt
BR8 cuh_br8.npt
BR9 cuh_br9.npt
EDH
FILE..................................EDHFN.........................
........
BR1 edh_br1.npt
BR2 edh_br2.npt
BR3 edh_br3.npt
BR4 edh_br4.npt
BR5 edh_br5.npt
BR6 edh_br6.npt
BR7 edh_br7.npt
BR8 edh_br8.npt
BR9 edh_br9.npt
TDH
FILE..................................TDHFN.........................
........
BR1 tdh_br1.npt
BR2 tdh_br2.npt
BR3 tdh_br3.npt
BR4 tdh_br4.npt
BR5 tdh_br5.npt
BR6 tdh_br6.npt
BR7 tdh_br7.npt
299
BR8 tdh_br8.npt
BR9 tdh_br9.npt
CDH
FILE..................................CDHFN.........................
........
BR1 cdh_br1.npt
BR2 cdh_br2.npt
BR3 cdh_br3.npt
BR4 cdh_br4.npt
BR5 cdh_br5.npt
BR6 cdh_br6.npt
BR7 cdh_br7.npt
BR8 cdh_br8.npt
BR9 cdh_br9.npt
SNP
FILE..................................SNPFN.........................
........
WB 1 snp1.opt
WB 2 snp_WB2.opt
WB 3 snp_WB3.opt
WB 4 snp_WB4.opt
WB 5 snp_WB5.opt
WB 6 snp_WB6.opt
WB 7 snp_WB7.opt
WB 8 snp_WB8.opt
WB 9 snp_WB9.opt
PRF
FILE..................................PRFFN.........................
........
WB 1 prf1.opt
WB 2 prf_2.opt
WB 3 prf_3.opt
WB 4 prf_4.opt
WB 5 prf_5.opt
WB 6 prf_6.opt
WB 7 prf_7.opt
WB 8 prf_8.opt
WB 9 prf_9.opt
VPL
FILE..................................VPLFN.........................
........
WB 1 Tigris.w2l
WB 2 vpl_2.opt
WB 3 vpl_3.opt
WB 4 vpl_4.opt
WB 5 vpl_5.opt
WB 6 vpl_6.opt
WB 7 vpl_7.opt
WB 8 vpl_8.opt
300
WB 9 vpl_9.opt
CPL
FILE..................................CPLFN.........................
........
WB 1 cpl1.opt
WB 2 cpl_2.opt
WB 3 cpl_3.opt
WB 4 cpl_4.opt
WB 5 cpl_5.opt
WB 6 cpl_6.opt
WB 7 cpl_7.opt
WB 8 cpl_8.opt
WB 9 cpl_9.opt
SPR
FILE..................................SPRFN.........................
........
WB 1 spr1.opt
WB 2 spr_2.opt
WB 3 spr_3.opt
WB 4 spr_4.opt
WB 5 spr_5.opt
WB 6 spr_6.opt
WB 7 spr_7.opt
WB 8 spr_8.opt
WB 9 spr_9.opt
FLX
FILE..................................FLXFN.........................
........
WB 1 kfl1.opt
WB 2 flx_2.opt
WB 3 flx_3.opt
WB 4 flx_4.opt
WB 5 flx_5.opt
WB 6 flx_6.opt
WB 7 flx_7.opt
WB 8 flx_8.opt
WB 9 flx_9.opt
TSR
FILE..................................TSRFN.........................
........
tsr.csv
WDO
FILE..................................WDOFN.........................
........
wdo.csv