BOD and DO modeling for Tigris River at Baghdad city
17
Journal of Kerbala University , Vol. 11 No.3 Scientific . 2013 BOD and DO modeling for Tigris River at Baghdad city portion using QUAL2K model ﻧﻤﺬﺟﺔ اﻟﻤﻄﻠﺐ اﻟﺤﯿﻮي ﻟﻸوﻛﺴﺠﯿﻦ واﻷوﻛﺴﺠﯿﻦ اﻟﻤﺬاب ﻟﻤﯿﺎه ﻧﮭﺮ دﺟﻠﺔ ﻓﻲ ﻣﺪﯾﻨﺔ ﺑﻐﺪاد ﺑﺎﺳﺘﺨﺪامQUAL2K ﻣﻮدﯾﻞAlhassan H. Ismail * , Dr. Ghassan A. Abed ** Alhassan H. Ismail: (Asst. Lecturer), Foundation of technical education, Institute of technology, Department of water resource techniques - Baghdad, Iraq. Dr. Ghassan A. Abed: (Lecturer), Foundation of technical education, Institute of technology, Head of water resource techniques Department - Baghdad, Iraq. ∗ Author for correspondence, e-mail: [email protected] ∗∗ Author for correspondence, e-mail: [email protected] Abstract: This study was conducted within Baghdad portion of Tigris River, which is significant due to the presence of various drains joining the river. Water samples have been collected from Tigris River along different points between Alfahama to Al-Zafarania and were analyzed for various water quality parameters during low flow season (November). The study involves application of QUAL2K model to simulate and predict the dissolved oxygen (DO) and biochemical oxygen demand (BOD 5 ) profiles of Tigris River in a stretch of 49.97 kilometer. Remote sensing &GIS technique (ERDAS 9.2 & Global Mapper 11) used in this study as supported software to provide some QUAL2K input data related to the river geometric parameter. The simulation results were verified and showed that the predicted values were in agreement with the measured values. Model output showed that DO in the entire river was within limit of not less than 4 mg/L. For CBOD, the entire river may be divided into three reaches; first one is extended from AlFahama (0 km) to Alkadhmiah (9 km) and have CBOD concentration of 2 mg/L and the second reach has CBOD range (2–4) mg/L in which begins from Alkadhmiah and extend to near Aldora refinery. The third reach extends from Aldora refinery to Al-Zafaraniah (49.97) in the south before river confluence with Diyala River which has CBOD concentrations of more than 4 mg/L. The most polluted zone in the river located downstream of Aldora refinery and extend to the last segment due to the industrial discharge of pollutants to the river. Two strategies were suggested to control the level of CBOD in the river. First strategy suggest that the CBOD of the discharged effluent from industries should not exceed at least 50 mg/L to keep the CBOD of the entire river within limits of not more than 4 mg/L. While the second strategy does not give significant results in which the level of CBOD increase even with reduction in the pollution load (point source). Key words: QUAL2K; Water quality modeling; Tigris River; BOD; DO; GIS. اﻟﻤﺴﺘﺨﻠﺺ: أﺧﺘﺺ ھﺬا اﻟﺒﺤﺚ ﺑﺪراﺳﺔ ﺟﺰء ﻣﻦ ﻧﮭﺮ دﺟﻠﺔ واﻟﻮاﻗﻊ ﻓﻲ ﺑﻐﺪاد واﻟﺬي ﺗﺒﺮز اھﻤﯿﺘﮫ ﻧﺘﯿﺠﺔ وﺟﻮد ﻋﺪة ﻣﺼﺒﺎت ﺗﺼﺐ ﻓﻲ اﻟﻨﮭﺮ. ﻟﻌﺪة ﻣﻮاﻗﻊ ﺑﯿﻦ ﻣﻨﻄﻘﺔ اﻟﻔﺤﺎﻣﺔ واﻟﺰﻋﻔﺮاﻧﯿﺔ وﺗﻢ أﺟﺮاء ﺑﻌﺾ اﻟﻔﺤﻮﺻﺎت ﻋﻠﯿﮭﺎ ﺧﻼل ﻣﻮﺳﻢ ﺗﻢ ﺟﻤﻊ اﻟﻌﯿﻨﺎت ﻣﻦ ﻧﮭﺮ دﺟﻠﺔ ﺟﺮﯾﺎن ﻣﻨﺨﻔﺾ. وﺗﻀﻤﻨﺖ ھﺬه اﻟﺪراﺳﺔ ﺗﻄﺒﯿﻖ ﻟﻠﻤﻮدﯾﻞQUAL2K ﻟﻤﺤﺎﻛﺎة وﺗﻮﻗﻊ اﻻوﻛﺴﺠﯿﻦ اﻟﻤﺬاب واﻟﻤﻄﻠﺐ اﻟﺤﯿﻮي ﻟﻸوﻛﺴﺠﯿﻦ ﻓﻲ ﻣﯿﺎه اﻟﻨﮭﺮ ﺑﻤﺴﺎﻓﺔ ﺗﻘﺪر ﺑﺤﻮاﻟﻲ49.97 ﻛﯿﻠﻮﻣﺘﺮ. أﺳﺘﺨﺪﻣﺖ ﺗﻘﻨﯿﺔ اﻟﺘﺤﺴﺲ اﻟﻨﺎﺋﻲ و ﻧﻈﻢ اﻟﻤﻌﻠﻮﻣﺎت اﻟﺠﻐﺮاﻓﯿﺔ ﻓﻲ ھﺬه اﻟﺪراﺳﺔ ﻛﺒﺮﻧﺎﻣﺞ داﻋﻢ ﻟﺘﺠﮭﯿﺰ ﺑﻌﺾ اﻟﺒﯿﺎﻧﺎت ﻟﻠﻤﻮدﯾﻞQUAL2K واﻟﻤﺘﻌﻠﻘﺔ ﺑﺎﻟﻤﺤﺪدات اﻟﮭﻨﺪﺳﯿﺔ ﻟﻠﻨﮭﺮ. ﺗﻢ اﻟﺘﺤﻘﻖ ﻣﻦ ﻧﺘﺎﺋﺞ اﻟﻤﻮدﯾﻞ واﻟﺘﻲ أظﮭﺮت ان اﻟﻘﯿﻢ اﻟﻤﺘﻮﻗﻌﺔ ﻛﺎﻧﺖ ﻣﻨﺴﺠﻤﺔ ﻣﻊ اﻟﻘﯿﻢ اﻟﻤﻘﺎﺳﺔ. أظﮭﺮت ﻧﺘﺎﺋﺞ اﻟﻤﻮدﯾﻞ ﺑﺄن ﺗﺮﻛﯿﺰ اﻷوﻛﺴﺠﯿﻦ اﻟﻤﺬاب ﻓﻲ اﻟﻨﮭﺮ ﯾﻘﻊ ﺿﻤﻦ اﻟﻤﻮاﺻﻔﺎت ﻻﯾﻘﻞ ﻋﻦ4 ﻣﻠﻐﻢ/ﻟﺘﺮ أﻣﺎ ﻓﻲ ﺣﺎﻟﺔ اﻟـBOD ﻓﯿﻤﻜﻦ ﺗﻘﺴﯿﻢ اﻟﻤﻨﻄﻘﺔ اﻟﻤﺪروﺳﺔ اﻟﻰ ﺛﻼث اﺟﺰاء، اﻟ) ﺠﺰء اﻻول ﯾﻤﺘﺪ ﻣﻦ اﻟﻔﺤﺎﻣﺔ0 ) اﻟﻰ اﻟﻜﺎظﻤﯿﺔ( ﻛﻢ9 واﻟﺬي ﻟﮫ ﺗﺮﻛﯿﺰ اﻟﻤﻄﻠﺐ اﻟﺤﯿﻮي ﻟﻼوﻛﺴﺠﯿﻦ( ﻛﻢ2 ﻣﻠﻐﻢ/ﻟﺘﺮ،257
Transcript of BOD and DO modeling for Tigris River at Baghdad city

Journal of Kerbala University , Vol. 11 No.3 Scientific . 2013
BOD and DO modeling for Tigris River at Baghdad city portion using QUAL2K model
مدینة نمذجة المطلب الحیوي لألوكسجین واألوكسجین المذاب لمیاه نھر دجلة في مودیل QUAL2K باستخدام بغداد
Alhassan H. Ismail*, Dr. Ghassan A. Abed** Alhassan H. Ismail: (Asst. Lecturer), Foundation of technical education, Institute of
technology, Department of water resource techniques - Baghdad, Iraq.
Dr. Ghassan A. Abed: (Lecturer), Foundation of technical education, Institute of technology, Head of water resource techniques Department - Baghdad, Iraq.
∗ Author for correspondence, e-mail: [email protected] ∗∗ Author for correspondence, e-mail: [email protected]
Abstract: This study was conducted within Baghdad portion of Tigris River, which is significant due to the presence of various drains joining the river. Water samples have been collected from Tigris River along different points between Alfahama to Al-Zafarania and were analyzed for various water quality parameters during low flow season (November). The study involves application of QUAL2K model to simulate and predict the dissolved oxygen (DO) and biochemical oxygen demand (BOD5) profiles of Tigris River in a stretch of 49.97 kilometer. Remote sensing &GIS technique (ERDAS 9.2 & Global Mapper 11) used in this study as supported software to provide some QUAL2K input data related to the river geometric parameter. The simulation results were verified and showed that the predicted values were in agreement with the measured values. Model output showed that DO in the entire river was within limit of not less than 4 mg/L. For CBOD, the entire river may be divided into three reaches; first one is extended from AlFahama (0 km) to Alkadhmiah (9 km) and have CBOD concentration of 2 mg/L and the second reach has CBOD range (2–4) mg/L in which begins from Alkadhmiah and extend to near Aldora refinery. The third reach extends from Aldora refinery to Al-Zafaraniah (49.97) in the south before river confluence with Diyala River which has CBOD concentrations of more than 4 mg/L. The most polluted zone in the river located downstream of Aldora refinery and extend to the last segment due to the industrial discharge of pollutants to the river. Two strategies were suggested to control the level of CBOD in the river. First strategy suggest that the CBOD of the discharged effluent from industries should not exceed at least 50 mg/L to keep the CBOD of the entire river within limits of not more than 4 mg/L. While the second strategy does not give significant results in which the level of CBOD increase even with reduction in the pollution load (point source). Key words: QUAL2K; Water quality modeling; Tigris River; BOD; DO; GIS.
المستخلص:البحث بدراسة جزء من نھر دجلة والواقع في بغداد والذي تبرز اھمیتھ نتیجة وجود عدة مصبات تصب في النھر. أختص ھذا
تم جمع العینات من نھر دجلة لعدة مواقع بین منطقة الفحامة والزعفرانیة وتم أجراء بعض الفحوصات علیھا خالل موسم لمحاكاة وتوقع االوكسجین المذاب والمطلب الحیوي QUAL2Kجریان منخفض. وتضمنت ھذه الدراسة تطبیق للمودیل
نظم المعلومات الجغرافیة في تقنیة التحسس النائي و كیلومتر. أستخدمت 49.97لألوكسجین في میاه النھر بمسافة تقدر بحوالي للنھر. تم التحقق من الھندسیة والمتعلقة بالمحددات QUAL2Kھذه الدراسة كبرنامج داعم لتجھیز بعض البیانات للمودیل
نتائج المودیل والتي أظھرت ان القیم المتوقعة كانت منسجمة مع القیم المقاسة. أظھرت نتائج المودیل بأن تركیز األوكسجین فیمكن تقسیم المنطقة المدروسة الى ثالث BODملغم/لتر أما في حالة الـ 4المذاب في النھر یقع ضمن المواصفات الیقل عن
ملغم/لتر، 2كم) والذي لھ تركیز المطلب الحیوي لالوكسجین 9كم) الى الكاظمیة ( 0جزء االول یمتد من الفحامة (اجزاء، ال
257

Journal of Kerbala University , Vol. 11 No.3 Scientific . 2013
ویبدأ ھذا الجزء من الكاظمیة ویمتد الى مصفى الدورة 4-2والجزء الثاني یتراوح تركیز المطلب الحیوي لالوكسجین لھ بین ملغم/لتر. ان اكثر 4أعلى من BODصفى الدورة الى الزعفرانیة والذي لھ تراكیز تقریبا، أما الجزء الثالث فیمتد من أسفل م
مناطق النھر تلوثا ھي تلك التي تقع اسفل التیار من مصفى الدورة لتمتد الى الزعفرانیة بسبب طرح الملوثات الى النھر. تم ھر. الستراتیجیة االولى تقترح بأن تلتزم المصانع اقتراح ستراتیجیتان للسیطرة على مستوى المطلب الحیوي لالوكسجین في الن
ملغم/لتر لتبقى قیم المطلب الحیوي 50بطرح مخلفاتھا مع ضمان عدم ارتفاع تركیز المطلب الحیوي لالوكسجین عن ئج مھمة، ملغم/لتر. بینما الستراتیجیة الثانیة لم تعطي نتا 4لالوكسجین في النھر ضمن الحدود المسموح بھا وھي ان الیتجاوز
حیث یزداد تركیز المطلب الحیوي لألوكسجین حتى مع انخفاض التلوث من المصادر النقطیة. Abbreviations: CBOD: carbonaceous biochemical oxygen demand DO: dissolved oxygen USEPA: united states environmental protection agency GIS: geographic information systems ETM: enhanced thematic mapper DEM: digital elevation model
1. Introduction The wastewater disposal generated from municipal and industrial sources without adequate treatment prior to discharge is current practice in most developing countries [1]. The population of Baghdad has been increased rapidly from 4.5 million in 1990 to 6.5 million in 2004 and wastewater generation in the city is about 1.2 m3/day [2]. In Baghdad (capital of Iraq), wastewater disposal has been continuing over the history of civilization but as a result of population growth, serious problems of water quality are commonplace in water bodies of Baghdad [2]. The Tigris River is the main river in Baghdad in which entering the city divided into two parts Karkh and Rasafa. The river water in Baghdad is used for both abstractive and in-stream purposes. The water is used as raw water source for seven drinking water treatment plants, irrigation purposes and for cooling by industries. Effective management of this segment of the river is, therefore, of prime importance. In this context, computer-aided models have gained wide acceptance as a tools to predict the quality of water. Strategy of the water quality management may involve a series of complex inter-disciplinary decisions based on expect responses of water quality to changing controls [3]. Mathematical models are described the complex relationships between waste loads from different sources and the resulting water qualities of the receiving waters [4]. A suitable water quality model which can simulate the river system is essential to the water quality management of Tigris River. The most widely used mathematical model for conventional pollutant impact evaluation is QUAL2E [5] developed by United States Environmental Protection Agency (US EPA). However, several limitations of the QUAL2E have been reported [6, 7]. One of the major inadequacies is the lack of provision for conversion of algal death to carbonaceous biochemical oxygen demand [6]. Now, USEPA has released a new version model, QUAL2K [8] to represent a modernized version of the QUAL2E model. QUAL2K model included the addition of new water quality interactions, such as conversion of algal death to BOD, denitrification, and DO change caused by fixed plants and, these new elements can overcome limitations of QUAL2E. Although, USEPA has released a new version model (QUAL2Kw) but this version is related to the QUAL2K model that was developed by [8] with including of some processes such as genetic algorithm and Monte Carlo simulation. Paliwal [9] have simulated the BOD and DO concentration in Yamuna River at Delhi using QUAL2E model. They had showed four different pollution scenarios to manage the water quality in the river. Their results were wide acceptance with literature studies conducted on the river. Kannel [10] has used QUAL2Kw model to simulate various water quality management strategies during the critical period for Bagmati River in Kathmandu Valley (Nepal). They stated that the local oxygenation is effective to maintain minimum DO concentrations in the river.
258
Journal of Kerbala University , Vol. 11 No.3 Scientific . 2013 QUAL2K is one-dimensional, steady flow stream water quality model and thus its application is limited to steady state flow condition. It has many new elements. It includes DO interaction with fixed plants, conversion of algal death to CBOD and reduction of amount of CBOD due to denitrification. It is useful in data limited conditions and is freely available (http://www.ecy.wa.gov/). A real situation of a river can be represented more closely using complex models. However, the complex models, such as 2D or 3D, are highly sophisticated and are usually reserved for large (i.e. deep and wide) rivers/estuaries where the mixing patterns are complex and require large amount of data [11]. The Tigris River-reach being simulated is long with respect to the mixing length over the cross-section and the transport is dominated by longitudinal changes [12, 13]. Thus, the assumption of 1D process is valid. Hence QUAL2K was chosen as a framework of water quality modeling. In this paper, the utilization of QUAL2K as a complete decision-making package has been studied to predict the DO and BOD5 concentration in the Tigris river at Baghdad stretch.
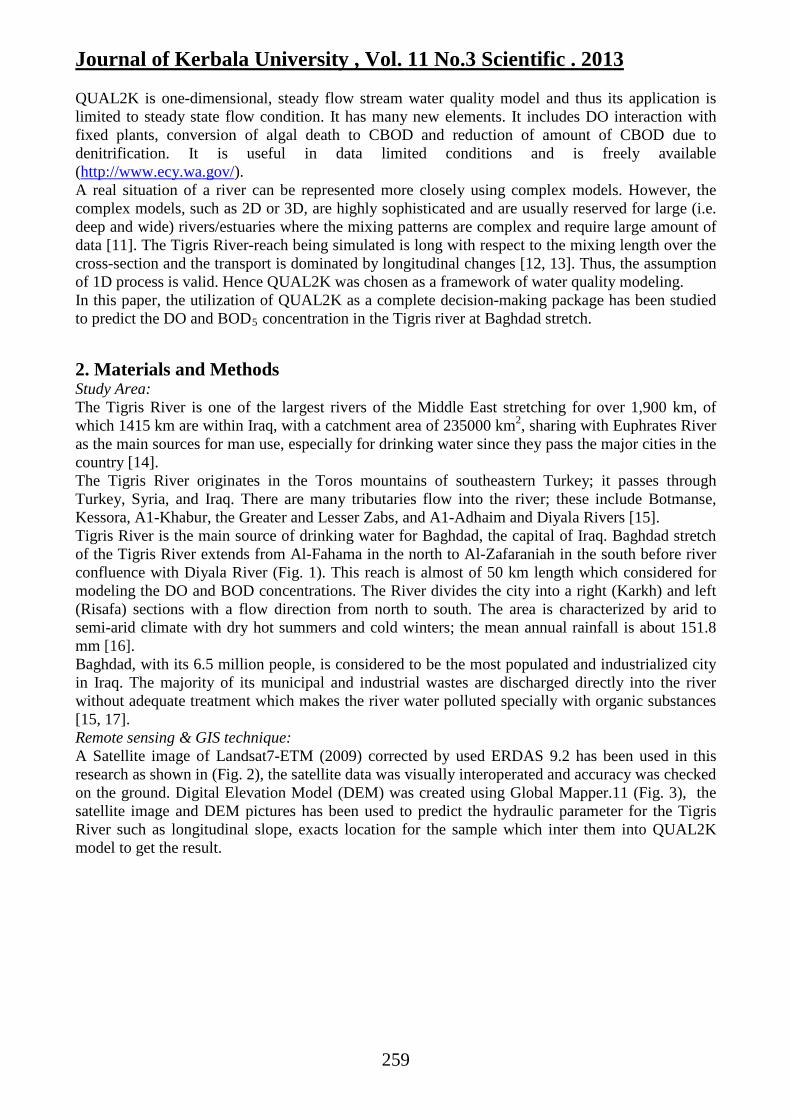
2. Materials and Methods Study Area: The Tigris River is one of the largest rivers of the Middle East stretching for over 1,900 km, of which 1415 km are within Iraq, with a catchment area of 235000 km2, sharing with Euphrates River as the main sources for man use, especially for drinking water since they pass the major cities in the country [14]. The Tigris River originates in the Toros mountains of southeastern Turkey; it passes through Turkey, Syria, and Iraq. There are many tributaries flow into the river; these include Botmanse, Kessora, A1-Khabur, the Greater and Lesser Zabs, and A1-Adhaim and Diyala Rivers [15]. Tigris River is the main source of drinking water for Baghdad, the capital of Iraq. Baghdad stretch of the Tigris River extends from Al-Fahama in the north to Al-Zafaraniah in the south before river confluence with Diyala River (Fig. 1). This reach is almost of 50 km length which considered for modeling the DO and BOD concentrations. The River divides the city into a right (Karkh) and left (Risafa) sections with a flow direction from north to south. The area is characterized by arid to semi-arid climate with dry hot summers and cold winters; the mean annual rainfall is about 151.8 mm [16]. Baghdad, with its 6.5 million people, is considered to be the most populated and industrialized city in Iraq. The majority of its municipal and industrial wastes are discharged directly into the river without adequate treatment which makes the river water polluted specially with organic substances [15, 17]. Remote sensing & GIS technique: A Satellite image of Landsat7-ETM (2009) corrected by used ERDAS 9.2 has been used in this research as shown in (Fig. 2), the satellite data was visually interoperated and accuracy was checked on the ground. Digital Elevation Model (DEM) was created using Global Mapper.11 (Fig. 3), the satellite image and DEM pictures has been used to predict the hydraulic parameter for the Tigris River such as longitudinal slope, exacts location for the sample which inter them into QUAL2K model to get the result.
259

Journal of Kerbala University , Vol. 11 No.3 Scientific . 2013
Figure 2: Satellite images of Baghdad city from Landsat7-ETM (2009) corrected by used ERDAS 9.2
Figure 1: description of study area with sampling locations
260
Journal of Kerbala University , Vol. 11 No.3 Scientific . 2013
Figure 3: Digital elevation model (DEM) for Tigris River by Using Global Mapper.11
Model Description: QUAL2K is a river and stream water quality model and is modernized version of the QUAL2E. The following features characterize QUAL2K: [8] (i) one dimensional (the channel is well-mixed vertically and laterally); (ii) steady-state hydraulics (non-uniform, steady flow is simulated); (iii) diurnal heat budget (the heat budget and temperature are simulated as a function of meteorology on a diurnal time scale); (iv) diurnal water-quality kinetics (all water-quality variables are simulated on a diurnal time scale); (v) Heat and mass inputs (point and non-point loads and abstractions are simulated). In the QUAL2K model the River is divided into several reaches and each reach divided into segments. These segments are model’s shortest parts of simulation. A steady-state flow balance is implemented for each model reach:
iabiinii QQQQ ,,1 −+= − (1) where Qi is outflow from reach i into reach i +1, m3/d; Qi-1 is inflow from the upstream reach i-1, m3/d; Qin,i is the total inflow into the reach from point and non-point sources, m3/d; and Qab,i is the total outflow from the reach due to point and non-point abstractions, m3/d. Once the outflow for each reach is computed, the depth and velocity are calculated in one of three ways: weirs, rating curves, and Manning equations. In this study, each river reach is idealized as a trapezoidal channel [17]. Under conditions of steady flow, the Manning equation can be used to express the relationship between flow and depth as:
3/2
3/52/1
PA
nSQ c
×= (2)
Where Q = flow [m3/sec]; So = bottom longitudinal slope [m/m]; n = Manning roughness coefficient; Ac = cross sectional area [m2]; and P = wetted perimeter [m]. This model can simulate fate and transport of so many parameters and contaminants including temperature, pH, carbonaceous biochemical demand, sediment oxygen demand, dissolved oxygen, various kinds of nutrients, phytoplankton and bottom algae. In this study, DO and BOD are considered for modeling their concentration in the river.
261

Journal of Kerbala University , Vol. 11 No.3 Scientific . 2013 The modeling tool QUAL2K has a general mass balance equation for a constituent concentration (Fig. 4) in the water column of a reach i (the transport and loading terms are omitted from the mass balance equation for bottom algae modeling) as: [18]
ii
iii
i
iii
i
ii
i
iabi
i
ii
i
ii SVW
CCVE
CCV
EC
V
QC
V
QC
V
Q
dt
dc++−+−+−−= −−
−−
− )111,
11 ()( (3)
where Ci is variable concentration for reach i, g/m3; t is time, d; Qi is outflow from reach i into reach i +1, m3/s or m3/d; Vi is volume of ith reach (m3); Ei is bulk dispersion coefficient between reaches i and i +1, m3/d; Wi is external loading of the constituent to reach i, g/d or mg/d; and Si is sources and sinks of the constituent due to reactions and mass transfer mechanisms, g/m3/d or mg/m3/d. For bottom algae the transport and loading terms are omitted. The QUAL2K employed hydraulics based formula to determine the longitudinal dispersion for a boundary between two reaches (internally compute dispersion based on the channel’s hydraulics): [8]
∗=
ii
iiip
UHBUE
22
011.0, (4)
iii SgHU =∗ (5)
where Ep,i is the longitudinal dispersion between reaches i and i + 1 [m2/s], Ui is velocity [m/s], Bi is width [m], Hi is mean depth [m], and Ui
* is shear velocity [m/s], g is acceleration due to gravity [= 9.81 m/s2] and S is channel longitudinal slope. Model requires input of these characteristics: geographic characteristics (geographical longitude and latitude, elevation), meteorological characteristics (air temperature, dew point, wind speed, cloud cover, shade), physical-chemical and biological parameters of waste water, hydraulic (morphological elements, Manning roughness coefficient, flow curve).
Figure 4: Mass balance in a reach segment i. Sampling: For model calibration and verification, four sampling stations were selected on Tigris River namely Al-Muthana bridge (S1), Medical City bridge (S2), Al-Jadriyah Bridge (S3), and Al-Zafarania (S4) (Fig. 1). To provide data for head water, sampling from Alfahama station also done and were analyzed. The technical methods used for the analysis of the sampling are summarized in Table 1. The monitoring works were performed at low flow conditions for applicability of the steady flow
262
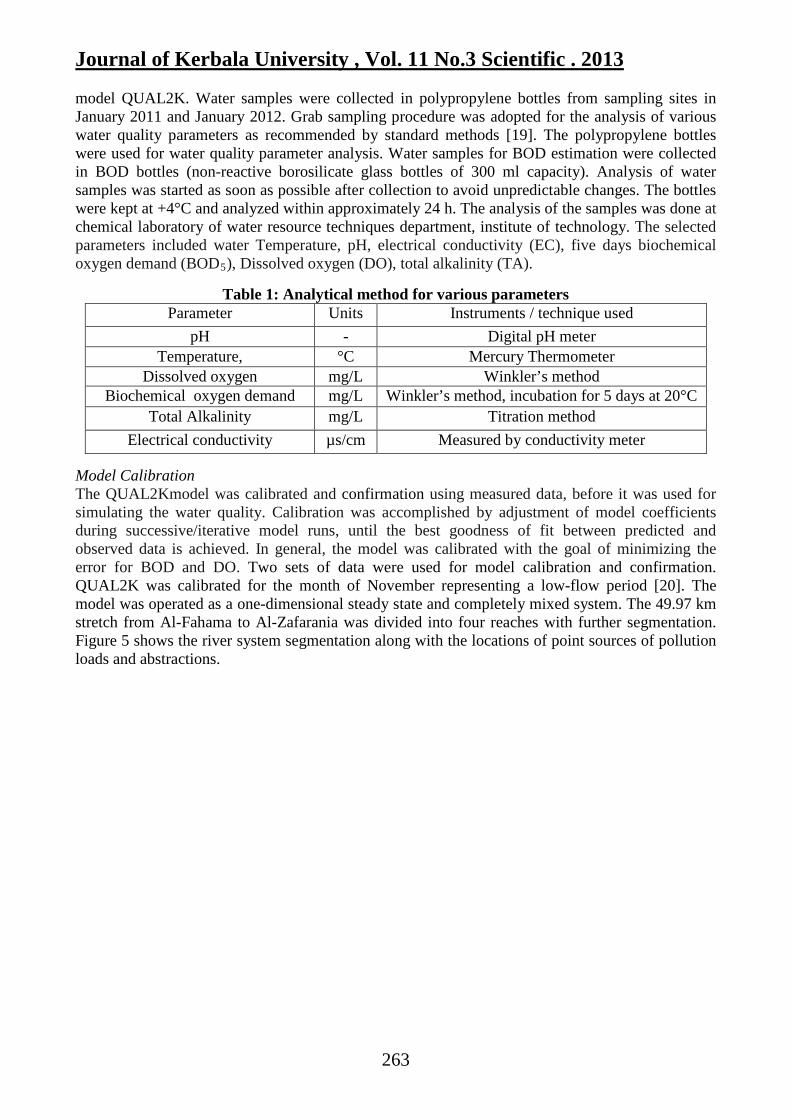
Journal of Kerbala University , Vol. 11 No.3 Scientific . 2013 model QUAL2K. Water samples were collected in polypropylene bottles from sampling sites in January 2011 and January 2012. Grab sampling procedure was adopted for the analysis of various water quality parameters as recommended by standard methods [19]. The polypropylene bottles were used for water quality parameter analysis. Water samples for BOD estimation were collected in BOD bottles (non-reactive borosilicate glass bottles of 300 ml capacity). Analysis of water samples was started as soon as possible after collection to avoid unpredictable changes. The bottles were kept at +4°C and analyzed within approximately 24 h. The analysis of the samples was done at chemical laboratory of water resource techniques department, institute of technology. The selected parameters included water Temperature, pH, electrical conductivity (EC), five days biochemical oxygen demand (BOD5), Dissolved oxygen (DO), total alkalinity (TA).
Table 1: Analytical method for various parameters Parameter Units Instruments / technique used
pH - Digital pH meter Temperature, °C Mercury Thermometer
Dissolved oxygen mg/L Winkler’s method Biochemical oxygen demand mg/L Winkler’s method, incubation for 5 days at 20°C
Total Alkalinity mg/L Titration method Electrical conductivity µs/cm Measured by conductivity meter
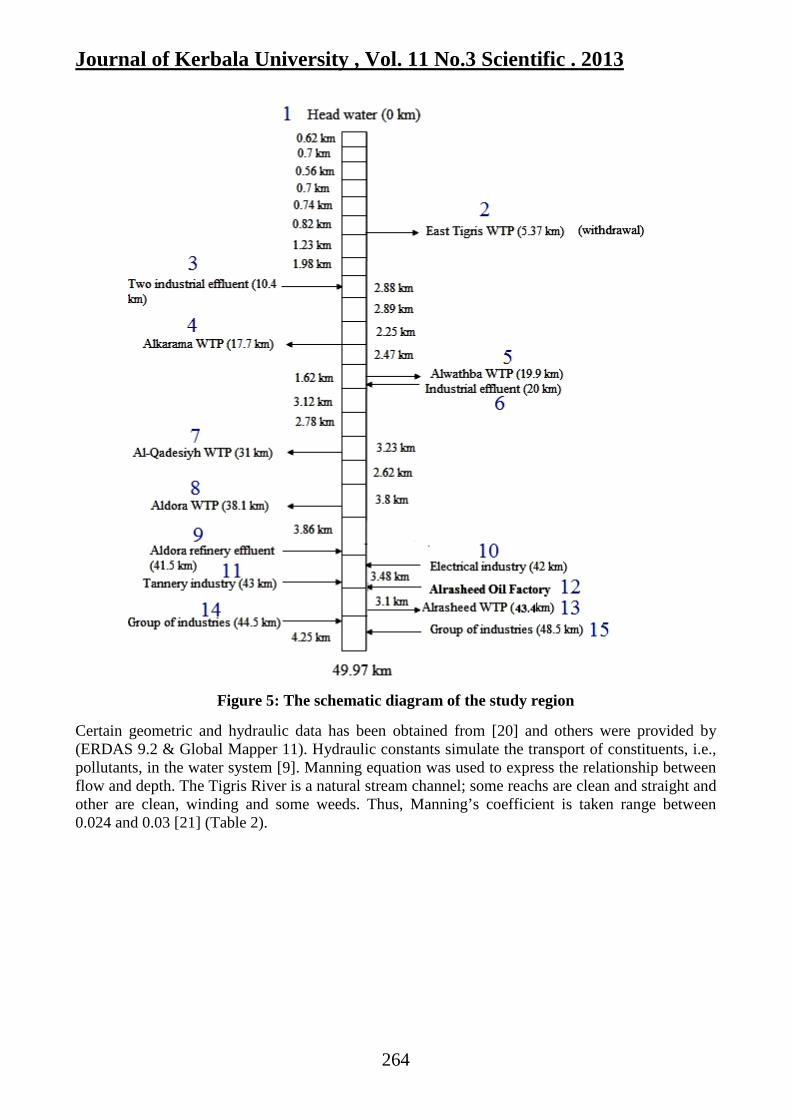
Model Calibration The QUAL2Kmodel was calibrated and confirmation using measured data, before it was used for simulating the water quality. Calibration was accomplished by adjustment of model coefficients during successive/iterative model runs, until the best goodness of fit between predicted and observed data is achieved. In general, the model was calibrated with the goal of minimizing the error for BOD and DO. Two sets of data were used for model calibration and confirmation. QUAL2K was calibrated for the month of November representing a low-flow period [20]. The model was operated as a one-dimensional steady state and completely mixed system. The 49.97 km stretch from Al-Fahama to Al-Zafarania was divided into four reaches with further segmentation. Figure 5 shows the river system segmentation along with the locations of point sources of pollution loads and abstractions.
263
Journal of Kerbala University , Vol. 11 No.3 Scientific . 2013
Figure 5: The schematic diagram of the study region
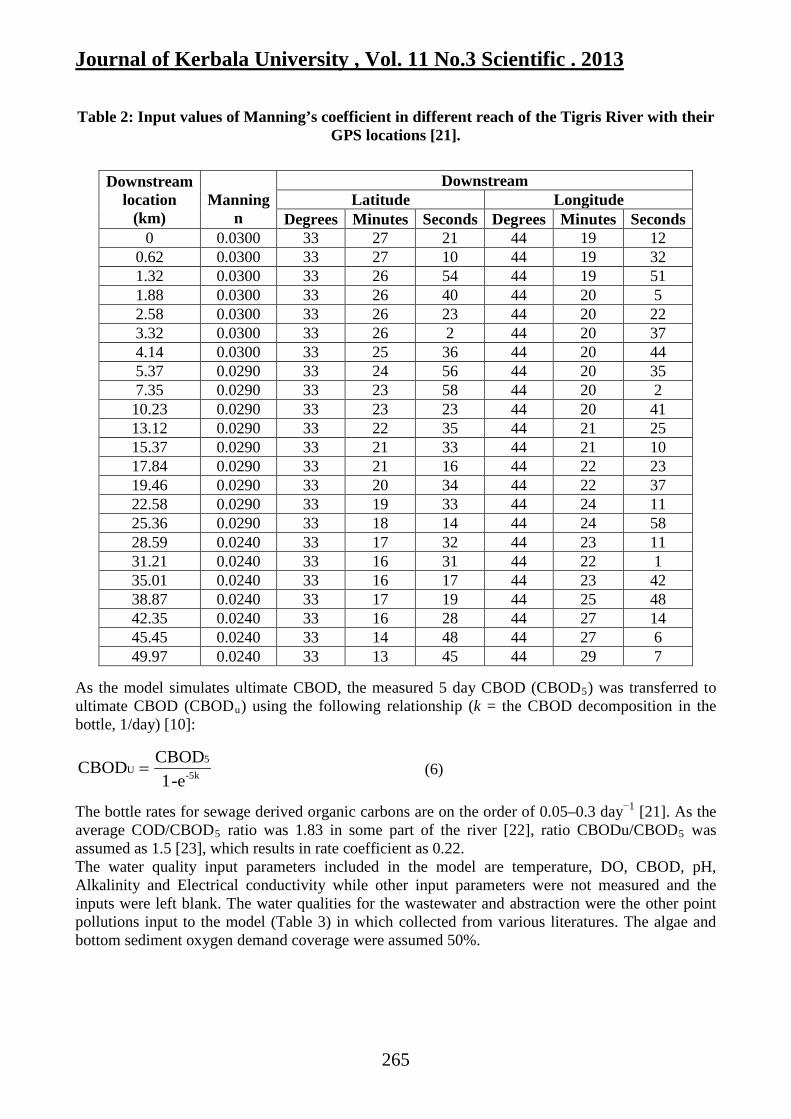
Certain geometric and hydraulic data has been obtained from [20] and others were provided by (ERDAS 9.2 & Global Mapper 11). Hydraulic constants simulate the transport of constituents, i.e., pollutants, in the water system [9]. Manning equation was used to express the relationship between flow and depth. The Tigris River is a natural stream channel; some reachs are clean and straight and other are clean, winding and some weeds. Thus, Manning’s coefficient is taken range between 0.024 and 0.03 [21] (Table 2).
264
Journal of Kerbala University , Vol. 11 No.3 Scientific . 2013
Table 2: Input values of Manning’s coefficient in different reach of the Tigris River with their
GPS locations [21].
Downstream location
(km)
Manning
n
Downstream Latitude Longitude
Degrees Minutes Seconds Degrees Minutes Seconds 0 0.0300 33 27 21 44 19 12
0.62 0.0300 33 27 10 44 19 32 1.32 0.0300 33 26 54 44 19 51 1.88 0.0300 33 26 40 44 20 5 2.58 0.0300 33 26 23 44 20 22 3.32 0.0300 33 26 2 44 20 37 4.14 0.0300 33 25 36 44 20 44 5.37 0.0290 33 24 56 44 20 35 7.35 0.0290 33 23 58 44 20 2 10.23 0.0290 33 23 23 44 20 41 13.12 0.0290 33 22 35 44 21 25 15.37 0.0290 33 21 33 44 21 10 17.84 0.0290 33 21 16 44 22 23 19.46 0.0290 33 20 34 44 22 37 22.58 0.0290 33 19 33 44 24 11 25.36 0.0290 33 18 14 44 24 58 28.59 0.0240 33 17 32 44 23 11 31.21 0.0240 33 16 31 44 22 1 35.01 0.0240 33 16 17 44 23 42 38.87 0.0240 33 17 19 44 25 48 42.35 0.0240 33 16 28 44 27 14 45.45 0.0240 33 14 48 44 27 6 49.97 0.0240 33 13 45 44 29 7
As the model simulates ultimate CBOD, the measured 5 day CBOD (CBOD5) was transferred to ultimate CBOD (CBODu) using the following relationship (k = the CBOD decomposition in the bottle, 1/day) [10]:
-5k5
U-e1
CBODCBOD = (6) The bottle rates for sewage derived organic carbons are on the order of 0.05–0.3 day−1 [21]. As the average COD/CBOD5 ratio was 1.83 in some part of the river [22], ratio CBODu/CBOD5 was assumed as 1.5 [23], which results in rate coefficient as 0.22. The water quality input parameters included in the model are temperature, DO, CBOD, pH, Alkalinity and Electrical conductivity while other input parameters were not measured and the inputs were left blank. The water qualities for the wastewater and abstraction were the other point pollutions input to the model (Table 3) in which collected from various literatures. The algae and bottom sediment oxygen demand coverage were assumed 50%.
265

Journal of Kerbala University , Vol. 11 No.3 Scientific . 2013
Table 3: The input water qualities data for head water, point source and abstraction.
No Drain/Discharge Location (km) Flow m3/s DO mg/L BOD mg/L
1 Headwater (Al-Fahama) 0.0 298b 5 2 2 East Tigris WTP 5.37 -2.47c 6.5 2.3 3 Two industrial effluent 10.4 0.01d 1.5 110 4 Alkarama WTP 17.7 -8.2a 7.2 2 5 Alwathba WTP 19.9 -13.889a 7.2 2 6 Industrial effluent 20 0.01d 1 120 7 AlQadesiya WTP 31 -4.37c 5 4 8 Aldora WTP 38.1 -4.37c 5.5 5.2 9 Aldora refinery effluent 41.5 0.01d 0 150 10 Thermal power plant 42 0.013d 0 144 11 Tannery industry 43 0.120d 0 168 12 Alrashed oil factory 43.2 0.013d 0 220 13 Alrashed WTP 43.4 -2.47C 7.6 4 14 Group of industries 44.5 0.2d 0 160 15 Group of industries 48.5 0.2d 0 160
Negative sign signifies withdrawal. Source: data in the table was extracted from various sources a- (Abdul Razzak et al, 2009) [24] b- (Ali et al, 2012) [20] c- (AL-Rawi and Razuki, 2010) [25] d- (Tawfik, 2007) [26] Model parameters All the parameters were set as default in QUAL2K with some exception. Some of model rate parameters required by QUAL2K were obtained from QUAL2K user manual [8]. To calculate re-aeration rate, Owens–Gibbs formula [27] was applied. Exponential model was chosen for oxygen inhibition for CBOD oxidation, nitrification and de-nitrification. Table 4 shows the model parameters used in this study. Model validation Two sets of data were used for model calibration and validation. After giving all inputs, a number of trials were made to ensure matching of observed and simulated values of BOD and DO. Errors in simulations are estimated as the difference between model forecasted values and observed data. The relative error for BOD was 23%, 14%, 4%, 13 % at Al-Muthana bridge (S1), Medical City bridge (S2), Al-Jadriyah Bridge (S3), and Al-Zafarania (S4) respectively while for DO was 10%, 15%, 11%, 8 % at Al-Muthana bridge (S1), Medical City bridge (S2), Al-Jadriyah Bridge (S3), and Al-Zafarania (S4) respectively.
266
Journal of Kerbala University , Vol. 11 No.3 Scientific . 2013
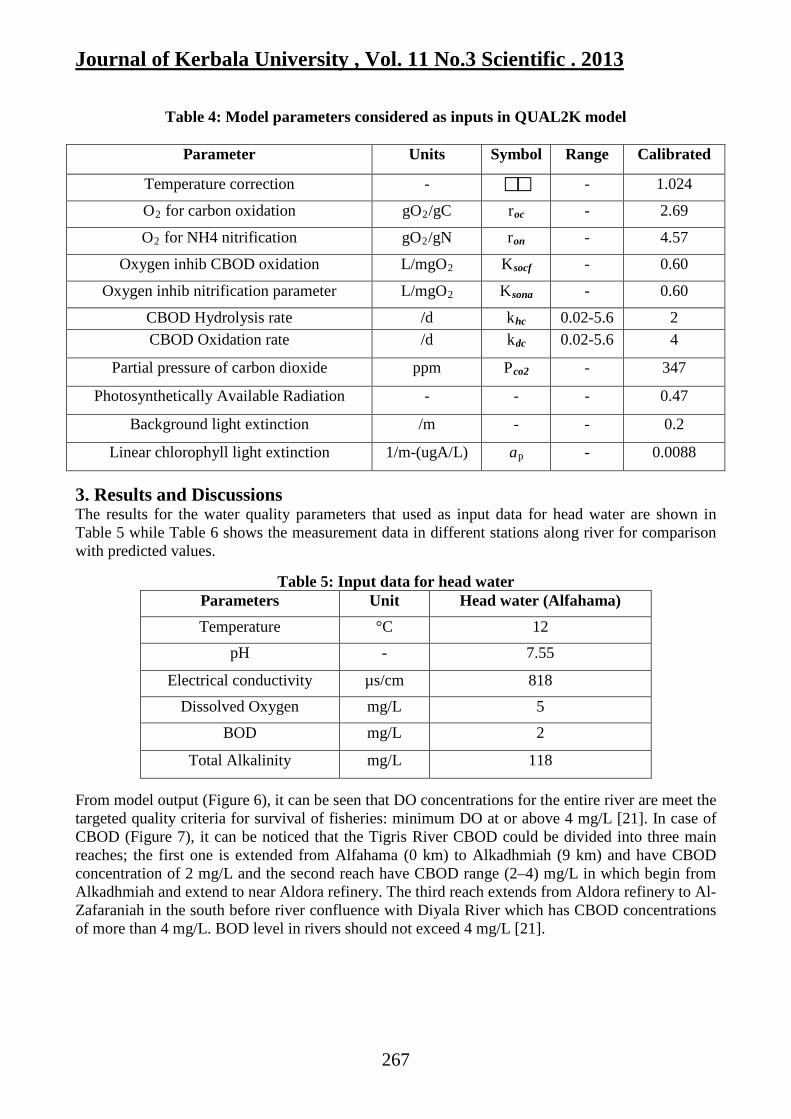
Table 4: Model parameters considered as inputs in QUAL2K model
Parameter Units Symbol Range Calibrated
Temperature correction - - 1.024
O2 for carbon oxidation gO2/gC roc - 2.69
O2 for NH4 nitrification gO2/gN ron - 4.57
Oxygen inhib CBOD oxidation L/mgO2 Ksocf - 0.60
Oxygen inhib nitrification parameter L/mgO2 Ksona - 0.60
CBOD Hydrolysis rate /d khc 0.02-5.6 2 CBOD Oxidation rate /d kdc 0.02-5.6 4
Partial pressure of carbon dioxide ppm Pco2 - 347
Photosynthetically Available Radiation - - - 0.47
Background light extinction /m - - 0.2
Linear chlorophyll light extinction 1/m-(ugA/L) ap - 0.0088
3. Results and Discussions The results for the water quality parameters that used as input data for head water are shown in Table 5 while Table 6 shows the measurement data in different stations along river for comparison with predicted values.
Table 5: Input data for head water Parameters Unit Head water (Alfahama) Temperature °C 12
pH - 7.55
Electrical conductivity µs/cm 818 Dissolved Oxygen mg/L 5
BOD mg/L 2
Total Alkalinity mg/L 118 From model output (Figure 6), it can be seen that DO concentrations for the entire river are meet the targeted quality criteria for survival of fisheries: minimum DO at or above 4 mg/L [21]. In case of CBOD (Figure 7), it can be noticed that the Tigris River CBOD could be divided into three main reaches; the first one is extended from Alfahama (0 km) to Alkadhmiah (9 km) and have CBOD concentration of 2 mg/L and the second reach have CBOD range (2–4) mg/L in which begin from Alkadhmiah and extend to near Aldora refinery. The third reach extends from Aldora refinery to Al-Zafaraniah in the south before river confluence with Diyala River which has CBOD concentrations of more than 4 mg/L. BOD level in rivers should not exceed 4 mg/L [21].
267

Journal of Kerbala University , Vol. 11 No.3 Scientific . 2013
Table 6: water quality data along river Sampling Station Dissolved Oxygen
(mg/L) BOD (mg/L)
Al-Muthana bridge (S1) 7 1.5 Medical City bridge (S2) 8 4.5
Al-Jadriyah Bridge (S3) 8.5 3.9 Al-Zafarania (S4) 8.7 6.6
Figure 6: The confirmation results in November (comparison of observed and predicted DO values).
Figure 7: The confirmation results in November (comparison of observed and predicted CBOD values).
The high level of CBOD in the third reach of the river may due to discharges of untreated wastewater from different industries [28]. At 25 km distance near Alsink bridge, it can be readily seen that CBOD level slightly decreases due to self-purification of the river. In general, The Tigris River upstream of Al-Jadriyah Bridge is not heavily polluted organically. The most polluted zone in the river located downstream of Aldora refinery because of the discharge of pollutants. In case of dissolved oxygen, the DO in surface water should not be less 4 mg/L; the entire Tigris River is within standard of 4 mg/L. the low DO concentration in headwater may due to agricultures activities upstream of Alfahama (Figure 6).
268
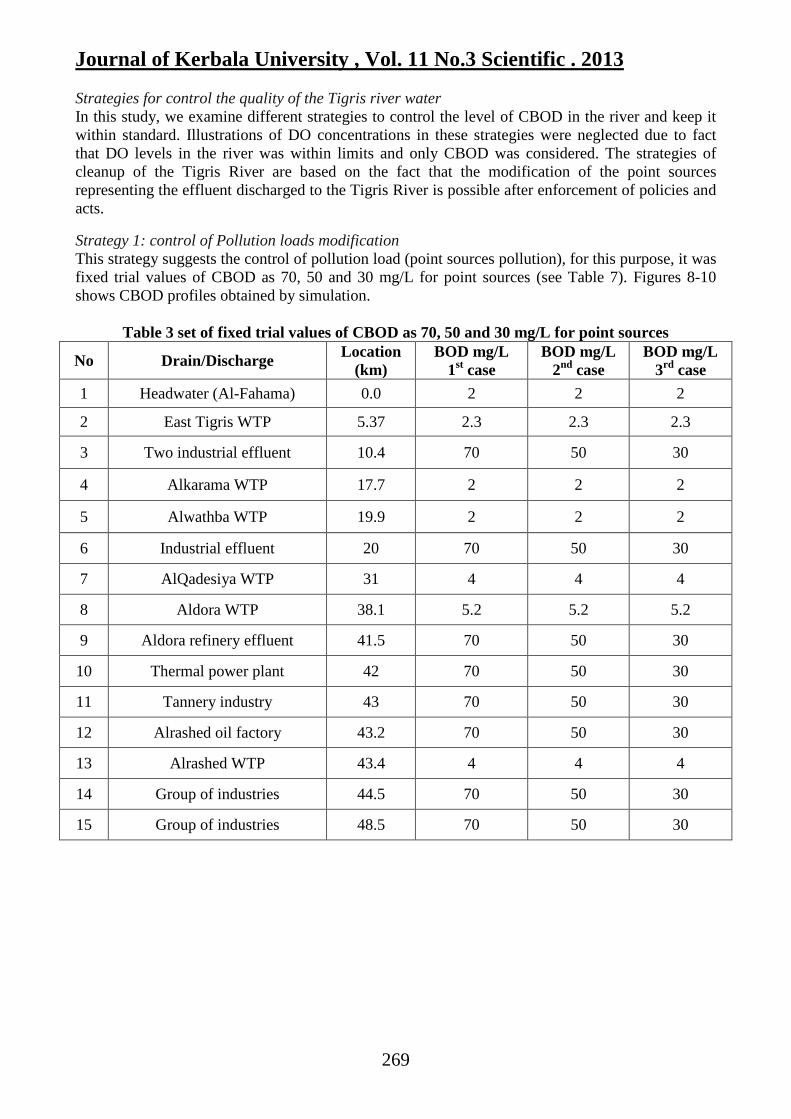
Journal of Kerbala University , Vol. 11 No.3 Scientific . 2013 Strategies for control the quality of the Tigris river water In this study, we examine different strategies to control the level of CBOD in the river and keep it within standard. Illustrations of DO concentrations in these strategies were neglected due to fact that DO levels in the river was within limits and only CBOD was considered. The strategies of cleanup of the Tigris River are based on the fact that the modification of the point sources representing the effluent discharged to the Tigris River is possible after enforcement of policies and acts. Strategy 1: control of Pollution loads modification This strategy suggests the control of pollution load (point sources pollution), for this purpose, it was fixed trial values of CBOD as 70, 50 and 30 mg/L for point sources (see Table 7). Figures 8-10 shows CBOD profiles obtained by simulation.
Table 3 set of fixed trial values of CBOD as 70, 50 and 30 mg/L for point sources
No Drain/Discharge Location (km)
BOD mg/L 1st case
BOD mg/L 2nd case
BOD mg/L 3rd case
1 Headwater (Al-Fahama) 0.0 2 2 2
2 East Tigris WTP 5.37 2.3 2.3 2.3
3 Two industrial effluent 10.4 70 50 30
4 Alkarama WTP 17.7 2 2 2
5 Alwathba WTP 19.9 2 2 2
6 Industrial effluent 20 70 50 30
7 AlQadesiya WTP 31 4 4 4
8 Aldora WTP 38.1 5.2 5.2 5.2
9 Aldora refinery effluent 41.5 70 50 30
10 Thermal power plant 42 70 50 30
11 Tannery industry 43 70 50 30
12 Alrashed oil factory 43.2 70 50 30
13 Alrashed WTP 43.4 4 4 4
14 Group of industries 44.5 70 50 30
15 Group of industries 48.5 70 50 30
269

Journal of Kerbala University , Vol. 11 No.3 Scientific . 2013
Figure 8: CBOD concentrations along Tigris River in case of control the discharges of point sources as 70 mg/L BOD.
Figure 9: CBOD concentrations along Tigris River in case of control the discharges of point sources as 50 mg/L BOD.
Figure 10: CBOD concentrations along Tigris River in case of control the discharges of point
sources as 30 mg/L BOD. Figure 8 shows CBOD concentrations along Tigris River in case of control the discharges of point sources as 70 mg/L of BOD. It can be noticed that the third polluted reach still exceeds 4 mg/L at 42 km distance of the river near Alrasheed water treatment plant. While Figure 9 shows CBOD concentrations along Tigris River in case of control the discharges of point sources as 50 mg/L BOD, in this case (2nd case) it can be seen that CBOD concentrations in the river are almost within limits. As shown in Figure 10, best results of CBOD were noticed, this case (3rd case) suggest that the point source pollution (effluent discharge to the river) should not exceed 30 mg/L of BOD. The concentrations of CBOD in the range of (2 - 3) along the Tigris River (see Figure 10).
270
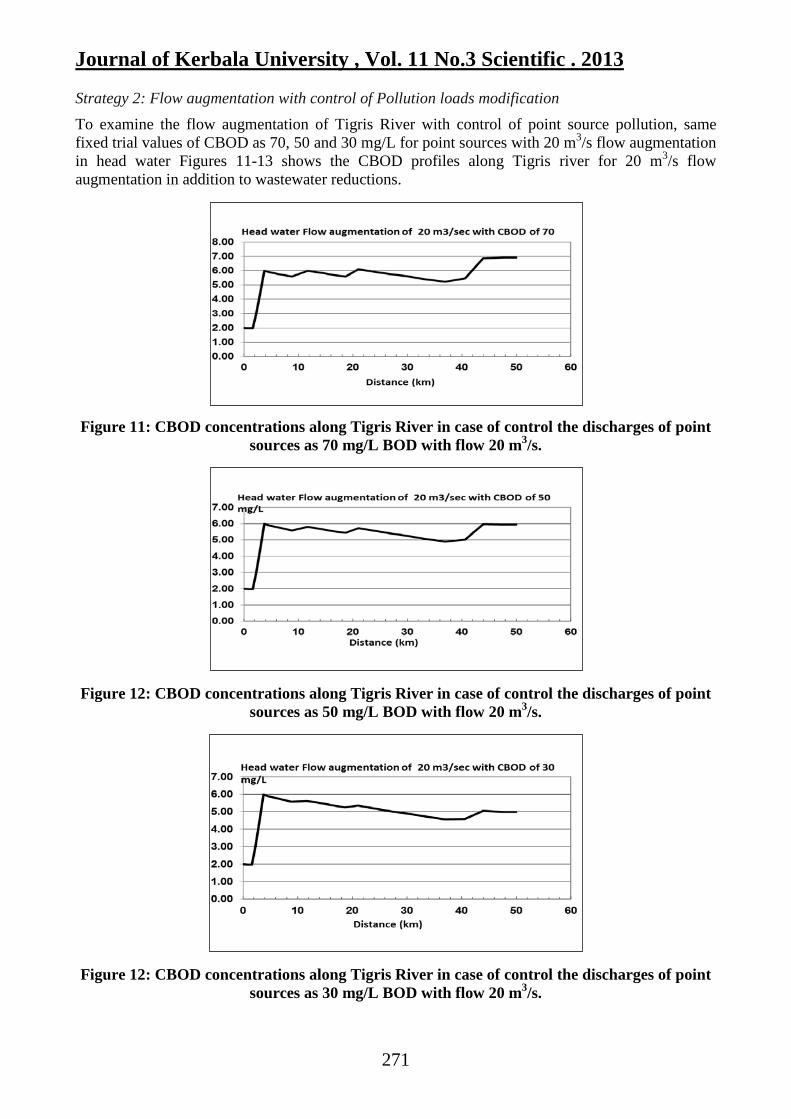
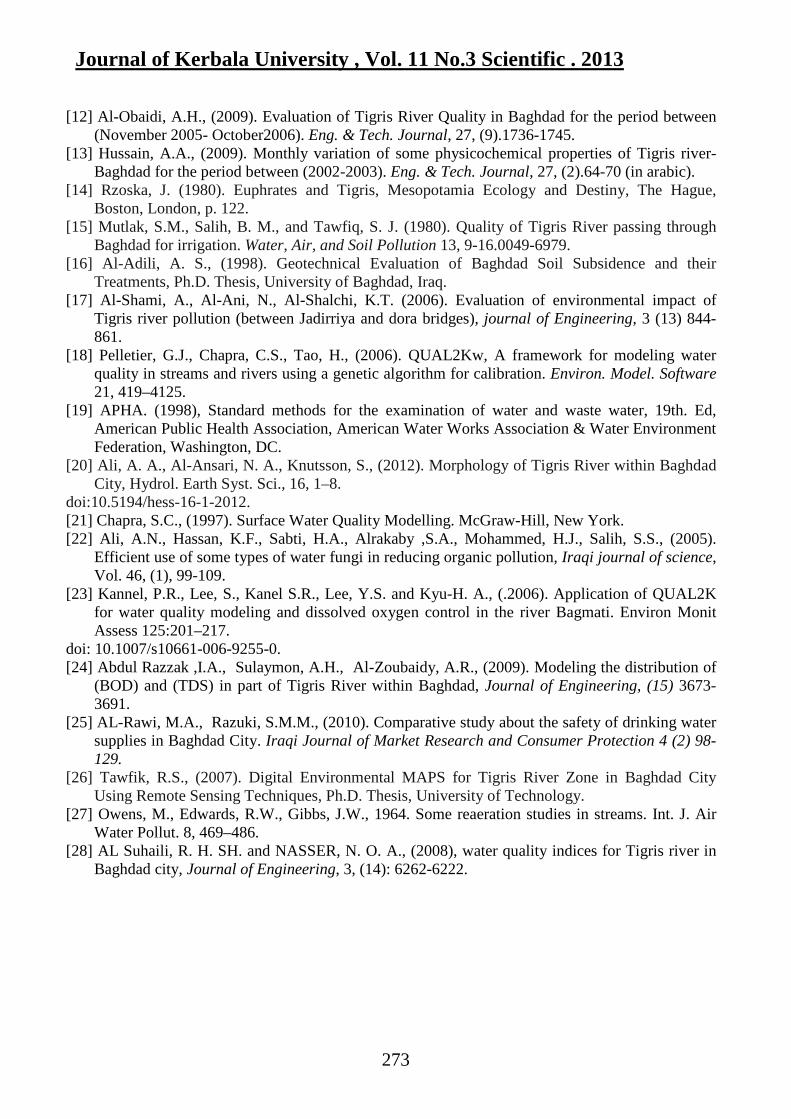
Journal of Kerbala University , Vol. 11 No.3 Scientific . 2013 Strategy 2: Flow augmentation with control of Pollution loads modification
To examine the flow augmentation of Tigris River with control of point source pollution, same fixed trial values of CBOD as 70, 50 and 30 mg/L for point sources with 20 m3/s flow augmentation in head water Figures 11-13 shows the CBOD profiles along Tigris river for 20 m3/s flow augmentation in addition to wastewater reductions.
Figure 11: CBOD concentrations along Tigris River in case of control the discharges of point sources as 70 mg/L BOD with flow 20 m3/s.
Figure 12: CBOD concentrations along Tigris River in case of control the discharges of point
sources as 50 mg/L BOD with flow 20 m3/s.
Figure 12: CBOD concentrations along Tigris River in case of control the discharges of point sources as 30 mg/L BOD with flow 20 m3/s.
271
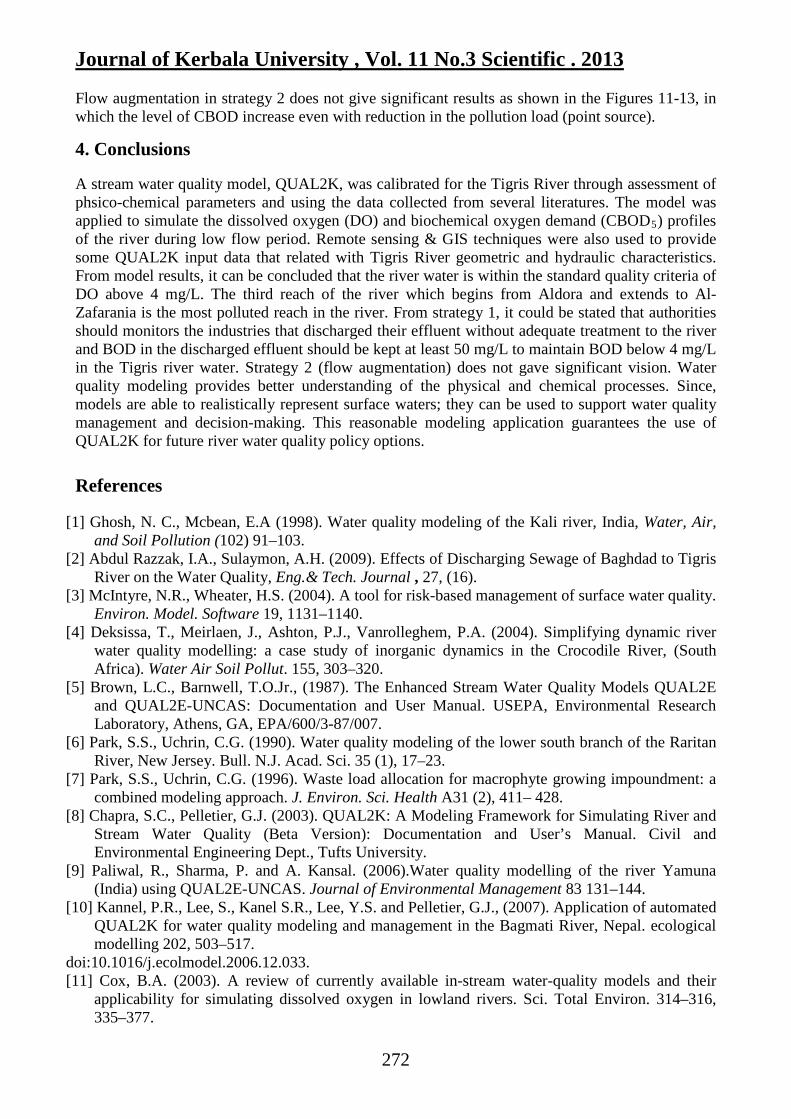
Journal of Kerbala University , Vol. 11 No.3 Scientific . 2013 Flow augmentation in strategy 2 does not give significant results as shown in the Figures 11-13, in which the level of CBOD increase even with reduction in the pollution load (point source).
4. Conclusions A stream water quality model, QUAL2K, was calibrated for the Tigris River through assessment of phsico-chemical parameters and using the data collected from several literatures. The model was applied to simulate the dissolved oxygen (DO) and biochemical oxygen demand (CBOD5) profiles of the river during low flow period. Remote sensing & GIS techniques were also used to provide some QUAL2K input data that related with Tigris River geometric and hydraulic characteristics. From model results, it can be concluded that the river water is within the standard quality criteria of DO above 4 mg/L. The third reach of the river which begins from Aldora and extends to Al-Zafarania is the most polluted reach in the river. From strategy 1, it could be stated that authorities should monitors the industries that discharged their effluent without adequate treatment to the river and BOD in the discharged effluent should be kept at least 50 mg/L to maintain BOD below 4 mg/L in the Tigris river water. Strategy 2 (flow augmentation) does not gave significant vision. Water quality modeling provides better understanding of the physical and chemical processes. Since, models are able to realistically represent surface waters; they can be used to support water quality management and decision-making. This reasonable modeling application guarantees the use of QUAL2K for future river water quality policy options.
References
[1] Ghosh, N. C., Mcbean, E.A (1998). Water quality modeling of the Kali river, India, Water, Air, and Soil Pollution (102) 91–103.
[2] Abdul Razzak, I.A., Sulaymon, A.H. (2009). Effects of Discharging Sewage of Baghdad to Tigris River on the Water Quality, Eng.& Tech. Journal , 27, (16).
[3] McIntyre, N.R., Wheater, H.S. (2004). A tool for risk-based management of surface water quality. Environ. Model. Software 19, 1131–1140.
[4] Deksissa, T., Meirlaen, J., Ashton, P.J., Vanrolleghem, P.A. (2004). Simplifying dynamic river water quality modelling: a case study of inorganic dynamics in the Crocodile River, (South Africa). Water Air Soil Pollut. 155, 303–320.
[5] Brown, L.C., Barnwell, T.O.Jr., (1987). The Enhanced Stream Water Quality Models QUAL2E and QUAL2E-UNCAS: Documentation and User Manual. USEPA, Environmental Research Laboratory, Athens, GA, EPA/600/3-87/007.
[6] Park, S.S., Uchrin, C.G. (1990). Water quality modeling of the lower south branch of the Raritan River, New Jersey. Bull. N.J. Acad. Sci. 35 (1), 17–23.
[7] Park, S.S., Uchrin, C.G. (1996). Waste load allocation for macrophyte growing impoundment: a combined modeling approach. J. Environ. Sci. Health A31 (2), 411– 428.
[8] Chapra, S.C., Pelletier, G.J. (2003). QUAL2K: A Modeling Framework for Simulating River and Stream Water Quality (Beta Version): Documentation and User’s Manual. Civil and Environmental Engineering Dept., Tufts University.
[9] Paliwal, R., Sharma, P. and A. Kansal. (2006).Water quality modelling of the river Yamuna (India) using QUAL2E-UNCAS. Journal of Environmental Management 83 131–144.
[10] Kannel, P.R., Lee, S., Kanel S.R., Lee, Y.S. and Pelletier, G.J., (2007). Application of automated QUAL2K for water quality modeling and management in the Bagmati River, Nepal. ecological modelling 202, 503–517.
doi:10.1016/j.ecolmodel.2006.12.033. [11] Cox, B.A. (2003). A review of currently available in-stream water-quality models and their
applicability for simulating dissolved oxygen in lowland rivers. Sci. Total Environ. 314–316, 335–377.
272
Journal of Kerbala University , Vol. 11 No.3 Scientific . 2013
[12] Al-Obaidi, A.H., (2009). Evaluation of Tigris River Quality in Baghdad for the period between
(November 2005- October2006). Eng. & Tech. Journal, 27, (9).1736-1745. [13] Hussain, A.A., (2009). Monthly variation of some physicochemical properties of Tigris river-
Baghdad for the period between (2002-2003). Eng. & Tech. Journal, 27, (2).64-70 (in arabic). [14] Rzoska, J. (1980). Euphrates and Tigris, Mesopotamia Ecology and Destiny, The Hague,
Boston, London, p. 122. [15] Mutlak, S.M., Salih, B. M., and Tawfiq, S. J. (1980). Quality of Tigris River passing through
Baghdad for irrigation. Water, Air, and Soil Pollution 13, 9-16.0049-6979. [16] Al-Adili, A. S., (1998). Geotechnical Evaluation of Baghdad Soil Subsidence and their
Treatments, Ph.D. Thesis, University of Baghdad, Iraq. [17] Al-Shami, A., Al-Ani, N., Al-Shalchi, K.T. (2006). Evaluation of environmental impact of
Tigris river pollution (between Jadirriya and dora bridges), journal of Engineering, 3 (13) 844-861.
[18] Pelletier, G.J., Chapra, C.S., Tao, H., (2006). QUAL2Kw, A framework for modeling water quality in streams and rivers using a genetic algorithm for calibration. Environ. Model. Software 21, 419–4125.
[19] APHA. (1998), Standard methods for the examination of water and waste water, 19th. Ed, American Public Health Association, American Water Works Association & Water Environment Federation, Washington, DC.
[20] Ali, A. A., Al-Ansari, N. A., Knutsson, S., (2012). Morphology of Tigris River within Baghdad City, Hydrol. Earth Syst. Sci., 16, 1–8.
doi:10.5194/hess-16-1-2012. [21] Chapra, S.C., (1997). Surface Water Quality Modelling. McGraw-Hill, New York. [22] Ali, A.N., Hassan, K.F., Sabti, H.A., Alrakaby ,S.A., Mohammed, H.J., Salih, S.S., (2005).
Efficient use of some types of water fungi in reducing organic pollution, Iraqi journal of science, Vol. 46, (1), 99-109.
[23] Kannel, P.R., Lee, S., Kanel S.R., Lee, Y.S. and Kyu-H. A., (.2006). Application of QUAL2K for water quality modeling and dissolved oxygen control in the river Bagmati. Environ Monit Assess 125:201–217.
doi: 10.1007/s10661-006-9255-0. [24] Abdul Razzak ,I.A., Sulaymon, A.H., Al-Zoubaidy, A.R., (2009). Modeling the distribution of
(BOD) and (TDS) in part of Tigris River within Baghdad, Journal of Engineering, (15) 3673-3691.
[25] AL-Rawi, M.A., Razuki, S.M.M., (2010). Comparative study about the safety of drinking water supplies in Baghdad City. Iraqi Journal of Market Research and Consumer Protection 4 (2) 98-129.
[26] Tawfik, R.S., (2007). Digital Environmental MAPS for Tigris River Zone in Baghdad City Using Remote Sensing Techniques, Ph.D. Thesis, University of Technology.
[27] Owens, M., Edwards, R.W., Gibbs, J.W., 1964. Some reaeration studies in streams. Int. J. Air Water Pollut. 8, 469–486.
[28] AL Suhaili, R. H. SH. and NASSER, N. O. A., (2008), water quality indices for Tigris river in Baghdad city, Journal of Engineering, 3, (14): 6262-6222.
273