The Influence of Agroforestry and Other Land-Use Types on the Persistence of a Sumatran Tiger (...
13
The Influence of Agroforestry and Other Land-Use Types on the Persistence of a Sumatran Tiger (Panthera tigris sumatrae) Population: An Individual-Based Model Approach Muhammad Ali Imron • Sven Herzog • Uta Berger Received: 16 November 2009 / Accepted: 23 September 2010 / Published online: 22 October 2010 Ó Springer Science+Business Media, LLC 2010 Abstract The importance of preserving both protected areas and their surrounding landscapes as one of the major conservation strategies for tigers has received attention over recent decades. However, the mechanism of how land-use surrounding protected areas affects the dynamics of tiger populations is poorly understood. We developed Panthera Population Persistence (PPP)—an individual-based model—to investigate the potential mechanism of the Su- matran tiger population dynamics in a protected area and under different land-use scenarios surrounding the reserve. We tested three main landscape compositions (single, com- bined and real land-uses of Tesso-Nilo National Park and its surrounding area) on the probability of and time to extinction of the Sumatran tiger over 20 years in Central Sumatra. The model successfully explains the mechanisms behind the population response of tigers under different habitat land- scape compositions. Feeding and mating behaviours of tigers are key factors, which determined population persistence in a heterogeneous landscape. All single land-use scenarios resulted in tiger extinction but had a different probability of extinction within 20 years. If tropical forest was combined with other land-use types, the probability of extinction was smaller. The presence of agroforesty and logging conces- sions adjacent to protected areas encouraged the survival of tiger populations. However, with the real land-use scenario of Tesso-Nilo National Park, tigers could not survive for more than 10 years. Promoting the practice of agroforestry systems surrounding the park is probably the most reason- able way to steer land-use surrounding the Tesso-Nilo National Park to support tiger conservation. Keywords Predator–prey relationship Landscape ecology Ecological modelling Central Sumatra Human-wildlife conflict Viability analysis Introduction The importance of managing protected areas together with the surrounding landscape is a central issue for the conser- vation of large endangered mammals such as the Sumatran tiger (Johnson and others 2006; Nyhus and Tilson 2004; Kusters and others 2008; Maddox and others 2007). As a large carnivore, the Sumatran tiger requires large protected areas for habitat, food availability and reproduction. The social, political and economic realities of many landscapes in Asia have turned large suitable habitats into small, frag- mented ones (Nyhus and Tilson 2004) and the difficulty of halting forest loss has made the situation even worse (Kin- naird and others 2003). Therefore, the need for integrated and comprehensive management strategies that take into account the complexity of landscapes surrounding protected areas has become more urgent over recent decades. In order to integrate the surrounding landscape with protected areas, particular attention should be paid to the M. A. Imron S. Herzog Faculty of Forest, Geo and Hydro-Sciences, Institute of Silviculture and Forest Protection, Lectureship of Wildlife Ecology and Game Management, Dresden University of Technology, Piennerstr. 8, 01737 Tharandt, Sachen, Germany M. A. Imron (&) Wildlife Ecology and Management, Faculty of Forestry, Gadjah Mada University, Jl. Agro Bulaksumur Yogyakarta D.I, Yogyakarta 55281, Indonesia e-mail: [email protected]; [email protected] U. Berger Faculty of Forest, Geo and Hydro-Sciences, Institute of Forest Growth and Computer Science, Dresden University of Technology, Piennerstr. 8, 01737 Tharandt, Sachen, Germany 123 Environmental Management (2011) 48:276–288 DOI 10.1007/s00267-010-9577-0
-
Upload
independent -
Category
Documents
-
view
2 -
download
0
Transcript of The Influence of Agroforestry and Other Land-Use Types on the Persistence of a Sumatran Tiger (...

The Influence of Agroforestry and Other Land-Use Typeson the Persistence of a Sumatran Tiger (Panthera tigris sumatrae)Population: An Individual-Based Model Approach
Muhammad Ali Imron • Sven Herzog •
Uta Berger
Received: 16 November 2009 / Accepted: 23 September 2010 / Published online: 22 October 2010
� Springer Science+Business Media, LLC 2010
Abstract The importance of preserving both protected
areas and their surrounding landscapes as one of the major
conservation strategies for tigers has received attention over
recent decades. However, the mechanism of how land-use
surrounding protected areas affects the dynamics of tiger
populations is poorly understood. We developed Panthera
Population Persistence (PPP)—an individual-based
model—to investigate the potential mechanism of the Su-
matran tiger population dynamics in a protected area and
under different land-use scenarios surrounding the reserve.
We tested three main landscape compositions (single, com-
bined and real land-uses of Tesso-Nilo National Park and its
surrounding area) on the probability of and time to extinction
of the Sumatran tiger over 20 years in Central Sumatra. The
model successfully explains the mechanisms behind the
population response of tigers under different habitat land-
scape compositions. Feeding and mating behaviours of tigers
are key factors, which determined population persistence in a
heterogeneous landscape. All single land-use scenarios
resulted in tiger extinction but had a different probability of
extinction within 20 years. If tropical forest was combined
with other land-use types, the probability of extinction was
smaller. The presence of agroforesty and logging conces-
sions adjacent to protected areas encouraged the survival of
tiger populations. However, with the real land-use scenario
of Tesso-Nilo National Park, tigers could not survive for
more than 10 years. Promoting the practice of agroforestry
systems surrounding the park is probably the most reason-
able way to steer land-use surrounding the Tesso-Nilo
National Park to support tiger conservation.
Keywords Predator–prey relationship � Landscape
ecology � Ecological modelling � Central Sumatra �Human-wildlife conflict � Viability analysis
Introduction
The importance of managing protected areas together with
the surrounding landscape is a central issue for the conser-
vation of large endangered mammals such as the Sumatran
tiger (Johnson and others 2006; Nyhus and Tilson 2004;
Kusters and others 2008; Maddox and others 2007). As a
large carnivore, the Sumatran tiger requires large protected
areas for habitat, food availability and reproduction. The
social, political and economic realities of many landscapes
in Asia have turned large suitable habitats into small, frag-
mented ones (Nyhus and Tilson 2004) and the difficulty of
halting forest loss has made the situation even worse (Kin-
naird and others 2003). Therefore, the need for integrated
and comprehensive management strategies that take into
account the complexity of landscapes surrounding protected
areas has become more urgent over recent decades.
In order to integrate the surrounding landscape with
protected areas, particular attention should be paid to the
M. A. Imron � S. Herzog
Faculty of Forest, Geo and Hydro-Sciences, Institute of
Silviculture and Forest Protection, Lectureship of Wildlife
Ecology and Game Management, Dresden University of
Technology, Piennerstr. 8, 01737 Tharandt, Sachen, Germany
M. A. Imron (&)
Wildlife Ecology and Management, Faculty of Forestry,
Gadjah Mada University, Jl. Agro Bulaksumur Yogyakarta D.I,
Yogyakarta 55281, Indonesia
e-mail: [email protected]; [email protected]
U. Berger
Faculty of Forest, Geo and Hydro-Sciences, Institute of Forest
Growth and Computer Science, Dresden University of
Technology, Piennerstr. 8, 01737 Tharandt, Sachen, Germany
123
Environmental Management (2011) 48:276–288
DOI 10.1007/s00267-010-9577-0
landscape structure. Landscape structures play an impor-
tant role in population dynamics (Fahrig 2007) with land-
scape composition providing different risks and benefits to
maintain wildlife populations. Sumatran tiger populations
have been facing habitat fragmentation and possible pop-
ulation isolation due to forest conversion over the last three
decades (Franklin and others 1999). As a result, the land-
scape of Sumatra is comprised of many land-use types such
as logging concessions, agriculture, settlements, oil-palm
plantations as well as mining operations. A challenge for
conserving the Sumatran tiger is to understand how tigers
respond to those land-uses Seindensticker and others
(1999) and which landscape configurations are able to
support tiger populations.
The response of tigers to different land-use types should
consider their relation to prey species. As a carnivore,
tigers depend on prey populations (Miquelle and others
1999; Ramakrishnan and others 1999; Karanth and Stith
1999; Karanth and others 2004). However, the response of
predators to the loss and fragmentation of habitat depends
on the complex interaction between predator, prey and
their habitat (Ryall and Fahrig 2006). Therefore, in order to
be able to understand the response of the Sumatran tiger to
a heterogeneous landscape, we have to understand the
mechanism of individual behaviour and the relation with
prey distributions and landscape configurations.
To the best of our knowledge, it is hard to find any
information on the mechanisms behind the response of the
Sumatran tiger to a heterogeneous landscape. Several
studies have shown the distribution pattern of the Sumatran
tiger and its prey in different habitat types, such as tropical
forest within protected areas (Franklin and others 1999;
Kinnaird and others 2003; Linkie and others 2003; O’Brien
and others 2003), areas with agroforestry (Nyhus and Til-
son 2004), palm oil plantations (Maddox and others 2007)
and logging concessions (Linkie and others 2008). How-
ever, those studies did not explain the mechanistic process
involved in responding to different habitat types. In addi-
tion, the cryptic characteristics of the tiger and the com-
plexity of the existing landscape configuration have
resulted in very few behavioural studies of this species,
presenting us with further limitations to understanding their
response to habitat change.
Considering the rapid loss of tropical forests on the
Island of Sumatra, the emergence of various habitat types
surrounding protected areas and the lack of knowledge on
the response of tigers and prey to various habitat types, we
require an alternative approach to deal with this situation.
The approach should be able to be used to understand
individual behaviour as influenced by different landscapes.
Modelling is one possible approach for predicting popu-
lation consequences from landscape structure. Individual-
based modelling (IBM) has been used to deal with
individual behaviour patterns and their emergence at higher
levels such as the population or landscape level. IBMs have
the ability to simulate the behaviour of individuals and
predict interactions depending on complex environmental
conditions (Ahearn and others 2001; Grimm and Railsback
2005). It is almost impossible to set up experiments with
different land-use types surrounding a protected area to
monitor the response of tiger populations. The use of IBM
would therefore appear to be a promising option that would
complement existing monitoring programs. For these rea-
sons, IBM was chosen for this study as a tool for under-
standing the response of tiger populations to very dynamic
changes in land-use.
Methods
Study Area and the Development of Land-Use Maps
We selected the Tesso-Nilo National Park and its sur-
rounding landscape with a total size of 3,841 km2. The
national park is situated in the lowland area of Riau
province in Central Sumatra, Indonesia. The park was
established in 2004 and was formerly an area designated
for logging concessions. The park is surrounded by dif-
ferent land-use types as shown in Fig. 1. We developed a
land-use map from a satellite image of LANDSAT (Path
126 row 60 date 07 August 2005). To adjust it to the
current situation of the study area, we compared it with a
land-cover map from WWF-Riau and a ground check was
conducted in November and December 2009. We classified
the study area into six major land-use types: tropical forest,
logging concessions, agroforestry, acacia (Acacia man-
gium) plantations, palm-oil plantations, and settlements.
Model Description
We developed the Panthera Population Persistence (PPP)
model, which was derived from the TIGMOD model
(Ahearn and others 2001). The TIGMOD model has been
successfully used to simulate basic behaviour of the tiger
and its potential conflict with humans in Nepal. The model
description follows the ODD (overview, design concepts
and details) protocol for describing individual- and agent-
based models (Grimm and Railsback 2005; Grimm and
others 2006).
Purpose
The purpose of the model is to investigate the potential
mechanisms of tiger population dynamics in the reserve
under different land-uses.
Environmental Management (2011) 48:276–288 277
123
State Variables and Scales
The PPP model comprises three animal species: the Su-
matran tiger (Panthera tigris sumatrae) and two of its prey
species, the Sambar deer (Rusa unicolor) and the red
muntjac (Muntiacus muntjac). The individuals of tigers
have different sex and age classes, hunger and starvation
levels and reproductive-based state variables. Sambar deer
and red muntjac have age and hunger levels. Table 1 shows
the description of state variables for each species in the
PPP model. The simulated area is Tesso Nilo National Park
and its surrounding landscape (Fig. 1).
Process Overview and Scheduling
Ageing. As in TIGMOD (Ahearn and others 2001), tigers
and prey increase in age with a time-step of 0.5 days with
the age-classes changing accordingly. The age classes and
internal state conditions lead to different behaviour patterns
such as cubs that only follow the mother or hunger-levels
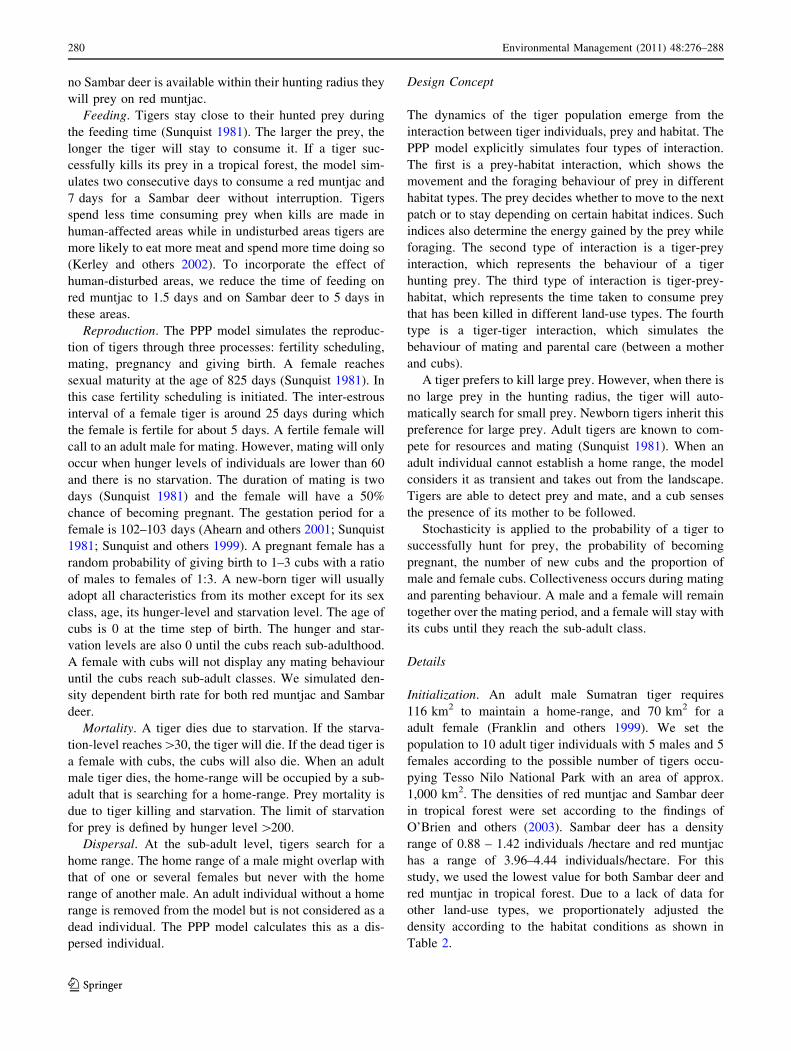
Fig. 1 Initial conditions of
three different landscape
compositions: a single land use
b combined land-use c real land
use in Tesso Nilo National Park
and the surrounding landscape
of Central Sumatra. The whiteline indicates the border of the
park. Different grid cell colours
represent different land-use
types (very light greysettlements, light grey palm oil
plantations, medium grey acacia
plantations and agroforestry,
dark grey logging concessions
and very dark grey tropical
forest)
Table 1 The description and unit of state variables of individuals in the PPP model
Individuals State variables Description Values and units Note
Sumatran
tiger
Age Age of individual 0–5,400 days Sunquist and others
(1999); Smith (1993)
Age-classes Classes of age Cub (0–660 days) Sunquist and others (1999)
Sub-adult (660.5–825 days) Sunquist and others (1999)
Adult (825.5–5,400 days) Sunquist and others (1999)
old ([5,400 days) Sunquist and others (1999)
Sex Sex of individual Male, female
Hunger-level Energy level of an individual 0–100 Ahearn and others 2001
Starvation-level Starvation level of individual 0–30 Ahearn and others (2001)
Reproduction-related
status
Female state variable related
to reproduction condition
Fertile, infertile, pregnant,
parent
Ahearn and others (2001)
Prey Age Age of individual Sambar deer (0–6,120 days) Nugen and others (2001)
Red muntjac (0–3,600 days) Chapman and others (2005)
Hunger-level Energy level of individual 0–200 Adjusted parameter
278 Environmental Management (2011) 48:276–288
123
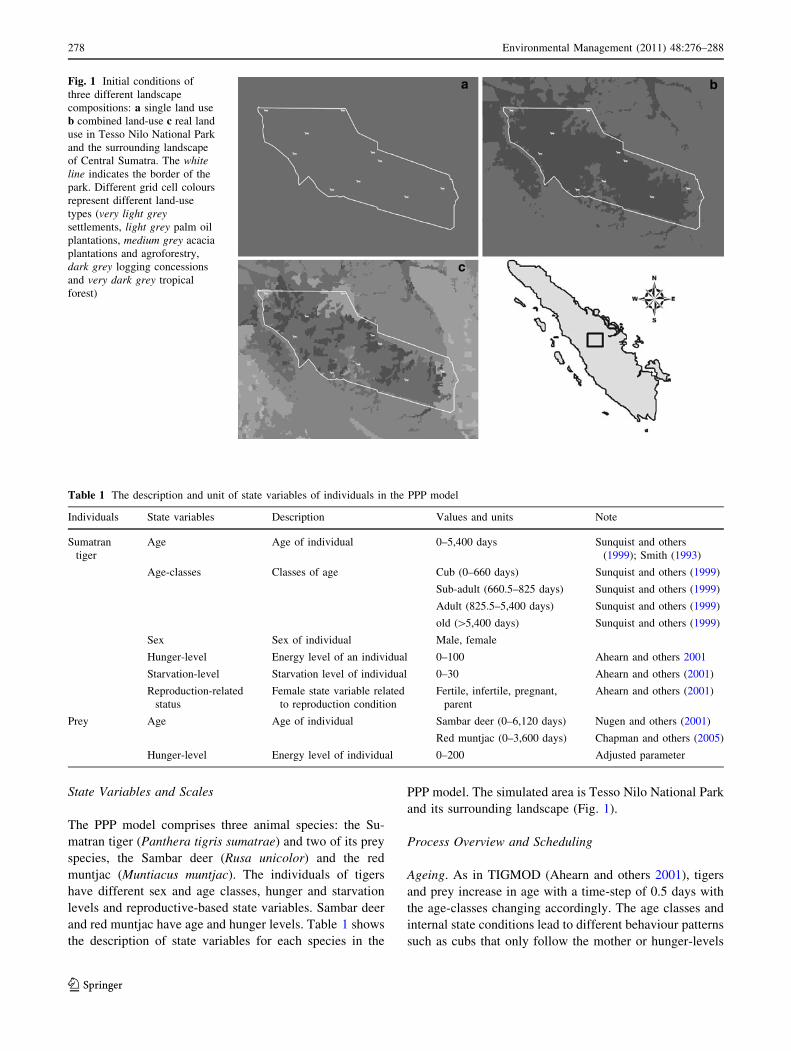
which determine whether an individual will hunt or not.
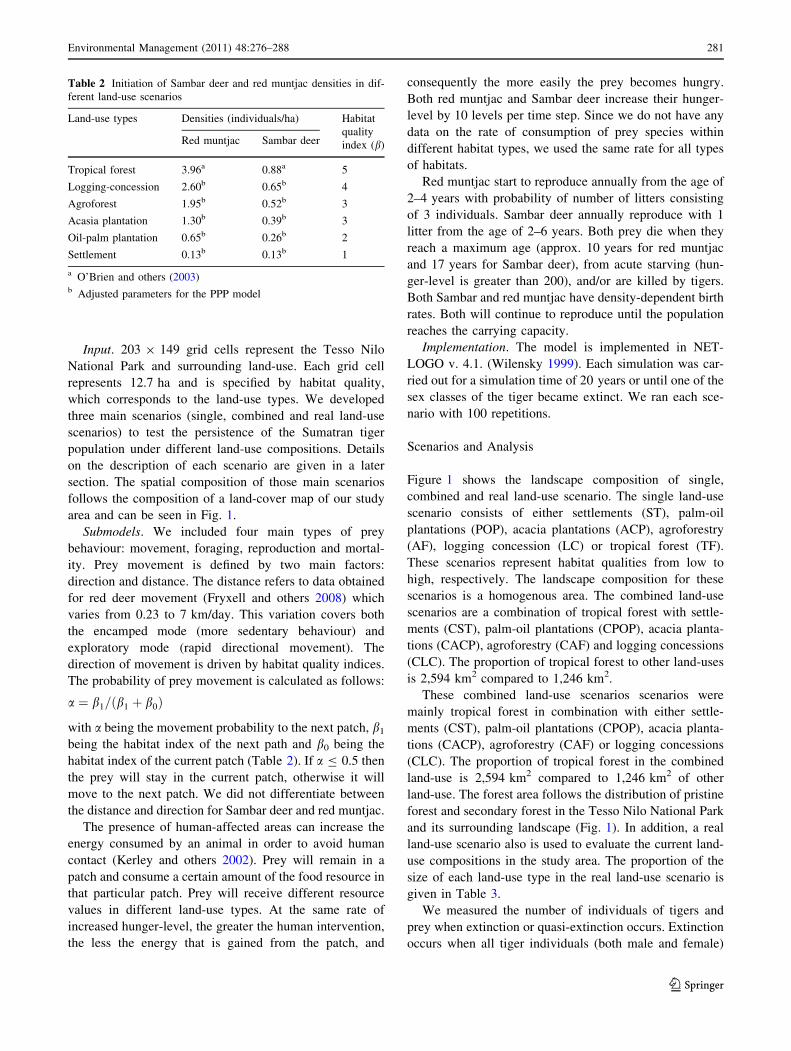
Figure 2 shows the behaviour of tigers in different age
classes within the PPP model.
Movement. The PPP simulates two types of movement
for tigers; random and directed movement. Random
movement is not related to any object. It is part of the
behaviour involved in maintaining a home-range, repro-
duction and parenting. Directed movement includes ‘‘fol-
lowing the mother’’, hunting, mating, and parenting
(described below). Appendix 1 shows further details and
parameters. A prey decides to move or to stay based on the
habitat quality of the patch.
Hunger and Starvation. The hunger level of a tiger starts
at 0 and increases by 10 per time-step and by 12.5 for a
female with cubs. If an individual has a hunger-level above
90, starvation will start. In that case, the hunger level is
fixed to 90, and the starvation-level increases by 0.5 per
time step. If a tiger reaches a starvation level of 30, it will
die. When hunger levels are[60, hunting is stimulated. The
hunger levels of a tiger will decrease when it has success-
fully caught and consumed its prey, the starvation level is
then set to zero again and the hunger level is reduced by
12.5 per time-step over the entire feeding period. Foraging
behaviour of a prey is controlled by its hunger level.
Hunting. A tiger searches for prey within a specific
hunting radius. When a tiger has sensed its prey, it will
change direction accordingly. The hunting success rate of a
tiger varies from 5% to 50% (Sunquist 2010). Hunting
success is assumed to be 50% on any hunting occasion.
Tigers prefer Sambar deer (Reddy and others 2004), and if
Cubs Adult Old
Sex?
malefemale
pregnancy
Sub-adult
Home-range exist?
N
Maintain Homerange
Y
Ageing
Dispersing Die
Hunger, starving, hunting, feeding
Fertility Scheduling
Fertile? Y
N
mating
Parenting Giving-Birth
Following-mom
female
Fig. 2 Conceptual diagram of main tiger behaviour in different age-classes within the PPP model. The age class determines behaviour of an
individual in relation with its internal conditions and environmental conditions
Environmental Management (2011) 48:276–288 279
123
no Sambar deer is available within their hunting radius they
will prey on red muntjac.
Feeding. Tigers stay close to their hunted prey during
the feeding time (Sunquist 1981). The larger the prey, the
longer the tiger will stay to consume it. If a tiger suc-
cessfully kills its prey in a tropical forest, the model sim-
ulates two consecutive days to consume a red muntjac and
7 days for a Sambar deer without interruption. Tigers
spend less time consuming prey when kills are made in
human-affected areas while in undisturbed areas tigers are
more likely to eat more meat and spend more time doing so
(Kerley and others 2002). To incorporate the effect of
human-disturbed areas, we reduce the time of feeding on
red muntjac to 1.5 days and on Sambar deer to 5 days in
these areas.
Reproduction. The PPP model simulates the reproduc-
tion of tigers through three processes: fertility scheduling,
mating, pregnancy and giving birth. A female reaches
sexual maturity at the age of 825 days (Sunquist 1981). In
this case fertility scheduling is initiated. The inter-estrous
interval of a female tiger is around 25 days during which
the female is fertile for about 5 days. A fertile female will
call to an adult male for mating. However, mating will only
occur when hunger levels of individuals are lower than 60
and there is no starvation. The duration of mating is two
days (Sunquist 1981) and the female will have a 50%
chance of becoming pregnant. The gestation period for a
female is 102–103 days (Ahearn and others 2001; Sunquist
1981; Sunquist and others 1999). A pregnant female has a
random probability of giving birth to 1–3 cubs with a ratio
of males to females of 1:3. A new-born tiger will usually
adopt all characteristics from its mother except for its sex
class, age, its hunger-level and starvation level. The age of
cubs is 0 at the time step of birth. The hunger and star-
vation levels are also 0 until the cubs reach sub-adulthood.
A female with cubs will not display any mating behaviour
until the cubs reach sub-adult classes. We simulated den-
sity dependent birth rate for both red muntjac and Sambar
deer.
Mortality. A tiger dies due to starvation. If the starva-
tion-level reaches[30, the tiger will die. If the dead tiger is
a female with cubs, the cubs will also die. When an adult
male tiger dies, the home-range will be occupied by a sub-
adult that is searching for a home-range. Prey mortality is
due to tiger killing and starvation. The limit of starvation
for prey is defined by hunger level [200.
Dispersal. At the sub-adult level, tigers search for a
home range. The home range of a male might overlap with
that of one or several females but never with the home
range of another male. An adult individual without a home
range is removed from the model but is not considered as a
dead individual. The PPP model calculates this as a dis-
persed individual.
Design Concept
The dynamics of the tiger population emerge from the
interaction between tiger individuals, prey and habitat. The
PPP model explicitly simulates four types of interaction.
The first is a prey-habitat interaction, which shows the
movement and the foraging behaviour of prey in different
habitat types. The prey decides whether to move to the next
patch or to stay depending on certain habitat indices. Such
indices also determine the energy gained by the prey while
foraging. The second type of interaction is a tiger-prey
interaction, which represents the behaviour of a tiger
hunting prey. The third type of interaction is tiger-prey-
habitat, which represents the time taken to consume prey
that has been killed in different land-use types. The fourth
type is a tiger-tiger interaction, which simulates the
behaviour of mating and parental care (between a mother
and cubs).
A tiger prefers to kill large prey. However, when there is
no large prey in the hunting radius, the tiger will auto-
matically search for small prey. Newborn tigers inherit this
preference for large prey. Adult tigers are known to com-
pete for resources and mating (Sunquist 1981). When an
adult individual cannot establish a home range, the model
considers it as transient and takes out from the landscape.
Tigers are able to detect prey and mate, and a cub senses
the presence of its mother to be followed.
Stochasticity is applied to the probability of a tiger to
successfully hunt for prey, the probability of becoming
pregnant, the number of new cubs and the proportion of
male and female cubs. Collectiveness occurs during mating
and parenting behaviour. A male and a female will remain
together over the mating period, and a female will stay with
its cubs until they reach the sub-adult class.
Details
Initialization. An adult male Sumatran tiger requires
116 km2 to maintain a home-range, and 70 km2 for a
adult female (Franklin and others 1999). We set the
population to 10 adult tiger individuals with 5 males and 5
females according to the possible number of tigers occu-
pying Tesso Nilo National Park with an area of approx.
1,000 km2. The densities of red muntjac and Sambar deer
in tropical forest were set according to the findings of
O’Brien and others (2003). Sambar deer has a density
range of 0.88 – 1.42 individuals /hectare and red muntjac
has a range of 3.96–4.44 individuals/hectare. For this
study, we used the lowest value for both Sambar deer and
red muntjac in tropical forest. Due to a lack of data for
other land-use types, we proportionately adjusted the
density according to the habitat conditions as shown in
Table 2.
280 Environmental Management (2011) 48:276–288
123
Input. 203 9 149 grid cells represent the Tesso Nilo
National Park and surrounding land-use. Each grid cell
represents 12.7 ha and is specified by habitat quality,
which corresponds to the land-use types. We developed
three main scenarios (single, combined and real land-use
scenarios) to test the persistence of the Sumatran tiger
population under different land-use compositions. Details
on the description of each scenario are given in a later
section. The spatial composition of those main scenarios
follows the composition of a land-cover map of our study
area and can be seen in Fig. 1.
Submodels. We included four main types of prey
behaviour: movement, foraging, reproduction and mortal-
ity. Prey movement is defined by two main factors:
direction and distance. The distance refers to data obtained
for red deer movement (Fryxell and others 2008) which
varies from 0.23 to 7 km/day. This variation covers both
the encamped mode (more sedentary behaviour) and
exploratory mode (rapid directional movement). The
direction of movement is driven by habitat quality indices.
The probability of prey movement is calculated as follows:
a ¼ b1=ðb1 þ b0Þ
with a being the movement probability to the next patch, b1
being the habitat index of the next path and b0 being the
habitat index of the current patch (Table 2). If a B 0.5 then
the prey will stay in the current patch, otherwise it will
move to the next patch. We did not differentiate between
the distance and direction for Sambar deer and red muntjac.
The presence of human-affected areas can increase the
energy consumed by an animal in order to avoid human
contact (Kerley and others 2002). Prey will remain in a
patch and consume a certain amount of the food resource in
that particular patch. Prey will receive different resource
values in different land-use types. At the same rate of
increased hunger-level, the greater the human intervention,
the less the energy that is gained from the patch, and
consequently the more easily the prey becomes hungry.
Both red muntjac and Sambar deer increase their hunger-
level by 10 levels per time step. Since we do not have any
data on the rate of consumption of prey species within
different habitat types, we used the same rate for all types
of habitats.
Red muntjac start to reproduce annually from the age of
2–4 years with probability of number of litters consisting
of 3 individuals. Sambar deer annually reproduce with 1
litter from the age of 2–6 years. Both prey die when they
reach a maximum age (approx. 10 years for red muntjac
and 17 years for Sambar deer), from acute starving (hun-
ger-level is greater than 200), and/or are killed by tigers.
Both Sambar and red muntjac have density-dependent birth
rates. Both will continue to reproduce until the population
reaches the carrying capacity.
Implementation. The model is implemented in NET-
LOGO v. 4.1. (Wilensky 1999). Each simulation was car-
ried out for a simulation time of 20 years or until one of the
sex classes of the tiger became extinct. We ran each sce-
nario with 100 repetitions.
Scenarios and Analysis
Figure 1 shows the landscape composition of single,
combined and real land-use scenario. The single land-use
scenario consists of either settlements (ST), palm-oil
plantations (POP), acacia plantations (ACP), agroforestry
(AF), logging concession (LC) or tropical forest (TF).
These scenarios represent habitat qualities from low to
high, respectively. The landscape composition for these
scenarios is a homogenous area. The combined land-use
scenarios are a combination of tropical forest with settle-
ments (CST), palm-oil plantations (CPOP), acacia planta-
tions (CACP), agroforestry (CAF) and logging concessions
(CLC). The proportion of tropical forest to other land-uses
is 2,594 km2 compared to 1,246 km2.
These combined land-use scenarios scenarios were
mainly tropical forest in combination with either settle-
ments (CST), palm-oil plantations (CPOP), acacia planta-
tions (CACP), agroforestry (CAF) or logging concessions
(CLC). The proportion of tropical forest in the combined
land-use is 2,594 km2 compared to 1,246 km2 of other
land-use. The forest area follows the distribution of pristine
forest and secondary forest in the Tesso Nilo National Park
and its surrounding landscape (Fig. 1). In addition, a real
land-use scenario also is used to evaluate the current land-
use compositions in the study area. The proportion of the
size of each land-use type in the real land-use scenario is
given in Table 3.
We measured the number of individuals of tigers and
prey when extinction or quasi-extinction occurs. Extinction
occurs when all tiger individuals (both male and female)
Table 2 Initiation of Sambar deer and red muntjac densities in dif-
ferent land-use scenarios
Land-use types Densities (individuals/ha) Habitat
quality
index (b)Red muntjac Sambar deer
Tropical forest 3.96a 0.88a 5
Logging-concession 2.60b 0.65b 4
Agroforest 1.95b 0.52b 3
Acasia plantation 1.30b 0.39b 3
Oil-palm plantation 0.65b 0.26b 2
Settlement 0.13b 0.13b 1
a O’Brien and others (2003)b Adjusted parameters for the PPP model
Environmental Management (2011) 48:276–288 281
123
become absent in the model. Quasi-extinction is the loss of
one of the sex classes from the model due to mortality or
dispersal. We refer both extinction and quasi extinction as
extinction for further use. We recorded the time-step when
extinction occurred. We also calculated the probability of
extinction P0(t20) which represents a ratio between the
numbers of simulations resulting in extinction and the total
number of simulations in each scenario during 20 years of
simulation. If extinction did not occur during a simulation,
we calculated number of tigers, prey and dispersed tigers at
the end of the simulation.
We calculated the time to extinction, the arithmetic
mean time to extinction (Tavg) and the intrinsic mean time
to extinction (Tm). The Tavg is the average time-step from
all simulations. Compared to Tavg, Tm is a more robust
measure that does not depend on the shape of the distri-
bution of extinction time or the initial conditions (Grimm
and Wissel 2004). Tm is the slope of the linear regression
line based on the ln (1 - P0(t)) plot. P0(t) is the cumu-
lative probability of extinction calculated on the basis of
the histogram of extinction times. We also calculated the
relaxation time (Trel), which specifies the period until the
dynamics of the tiger population are no longer affected by
the initial conditions of the model. The Trel is derived
from the intercept of the regression line of -ln (1 - P0(t))
with the x-axis. The probability distributions of the state
variables are then quasi-stationary (Grimm and Wissel
2004). We did not calculated both of Tm and Trel if the
P0(t B 20) is very low.
For conservation purposes, the intrinsic mean time to
extinction is very important to provide a careful prediction.
Unlike the arithmetic time to extinction where the initial
conditions have an effect on the established phase, the
initial conditions of the model do not have any conse-
quences for the relaxation time (Grimm and Wissel 2004).
In addition, to understand how landscape structures affect
the tiger population, we also recorded the number of dis-
persed tigers. This value corresponds to the number of tiger
individuals leaving the study area because they are unable
to establish a home-range.
Results
Tiger and Prey Densities Under Different Land-Use
Scenarios
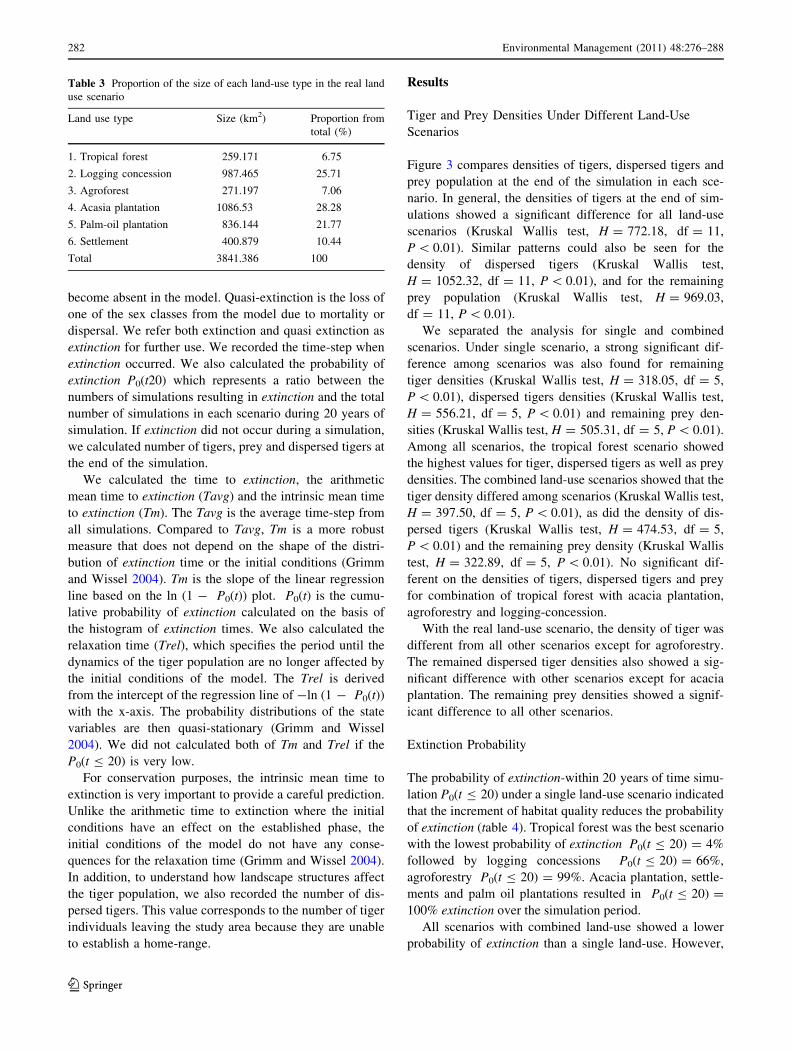
Figure 3 compares densities of tigers, dispersed tigers and
prey population at the end of the simulation in each sce-
nario. In general, the densities of tigers at the end of sim-
ulations showed a significant difference for all land-use
scenarios (Kruskal Wallis test, H = 772.18, df = 11,
P \ 0.01). Similar patterns could also be seen for the
density of dispersed tigers (Kruskal Wallis test,
H = 1052.32, df = 11, P \ 0.01), and for the remaining
prey population (Kruskal Wallis test, H = 969.03,
df = 11, P \ 0.01).
We separated the analysis for single and combined
scenarios. Under single scenario, a strong significant dif-
ference among scenarios was also found for remaining
tiger densities (Kruskal Wallis test, H = 318.05, df = 5,
P \ 0.01), dispersed tigers densities (Kruskal Wallis test,
H = 556.21, df = 5, P \ 0.01) and remaining prey den-
sities (Kruskal Wallis test, H = 505.31, df = 5, P \ 0.01).
Among all scenarios, the tropical forest scenario showed
the highest values for tiger, dispersed tigers as well as prey
densities. The combined land-use scenarios showed that the
tiger density differed among scenarios (Kruskal Wallis test,
H = 397.50, df = 5, P \ 0.01), as did the density of dis-
persed tigers (Kruskal Wallis test, H = 474.53, df = 5,
P \ 0.01) and the remaining prey density (Kruskal Wallis
test, H = 322.89, df = 5, P \ 0.01). No significant dif-
ferent on the densities of tigers, dispersed tigers and prey
for combination of tropical forest with acacia plantation,
agroforestry and logging-concession.
With the real land-use scenario, the density of tiger was
different from all other scenarios except for agroforestry.
The remained dispersed tiger densities also showed a sig-
nificant difference with other scenarios except for acacia
plantation. The remaining prey densities showed a signif-
icant difference to all other scenarios.
Extinction Probability
The probability of extinction-within 20 years of time simu-
lation P0(t B 20) under a single land-use scenario indicated
that the increment of habitat quality reduces the probability
of extinction (table 4). Tropical forest was the best scenario
with the lowest probability of extinction P0(t B 20) = 4%
followed by logging concessions P0(t B 20) = 66%,
agroforestry P0(t B 20) = 99%. Acacia plantation, settle-
ments and palm oil plantations resulted in P0(t B 20) =
100% extinction over the simulation period.
All scenarios with combined land-use showed a lower
probability of extinction than a single land-use. However,
Table 3 Proportion of the size of each land-use type in the real land
use scenario
Land use type Size (km2) Proportion from
total (%)
1. Tropical forest 259.171 6.75
2. Logging concession 987.465 25.71
3. Agroforest 271.197 7.06
4. Acasia plantation 1086.53 28.28
5. Palm-oil plantation 836.144 21.77
6. Settlement 400.879 10.44
Total 3841.386 100
282 Environmental Management (2011) 48:276–288
123
combined palm oil plantations and settlement only showed a
slight difference from a single scenario. The combined
scenario of tropical forest with acacia plantations and agro-
forestry showed a remarkable improvement in the proba-
bility of extinction from that of the single acacia plantation
and single agroforestry scenarios. In addition, combined
logging concession and combined agroforestry was similar
as single tropical forest P0(t B 20) = 4%, while the real
land-use scenario showed P0(t B 20) = 100% of all simu-
lations resulting in an extinction within 20 years of the
simulation.
Time to Extinction
Arithmetic Time to Extinction
Among all single land-use scenarios, tropical forest dis-
played the highest Tavg values whereas settlements showed
the lowest. From the combined scenarios, the combination
of tropical forest with acacia plantation, agroforestry and
logging concessions improved the time to extinction from
their single scenarios. The real land-use scenarios were
able to support a tiger population with a Tavg of 7.31 years
(Table 4).
Relaxation Time
The relaxation time was measured only on the scenarios
with C30 simulations which resulted tiger extinction/quasi
0
0.5
1
a ab
c
d
e
b,f
b,c,g
e e
e
c,h
den
sity
(in
d/10
0 km
2)
ST
PO
P
AC
P
AF
LC TF
CS
T
CP
OP
CA
CP
CA
F
CL
C
LU
0
1
2
3
4
5
den
sity
(in
d/ k
m 2
)
0
1
2
3
a a
b
c
d
e
fg
ee
e
b
ST
PO
P
AC
P
AF
LC TF
CS
T
CP
OP
CA
CP
CA
F
CL
C
LU
Tigers
Prey
Dispersed tigers
a b
c d
e
f
g
h
i
i
j
i
ST
PO
P
AC
P
AF
LC TF
CS
T
CP
OP
CA
CP
CA
F
CL
C
LU
ST = SettlementsPOP = Palm-oil PlantationACP = Acacia Plantation AF = AgroforestryLC = Logging-concessionTF = Tropical ForestCST = Combined SettlementCPOP = Combined Palm-oil PlantationCACP = Combined Acacia PlantationCAF = Combined AgroforestryCLC = Combined Logging-concessionLU = Real Land-use
Fig. 3 Box plot comparison of
tiger density, dispersed tiger
density and prey density on
different scenarios. Letters
indicate significant different at
0.01
Table 4 The number of simulations resulting in extinction and the
arithmetic time to extinction (Tavg) under different scenarios
Scenarios N Tavg (years)
Settlement (ST) 100 0.134
Palm-oil Plantation (POP) 100 0.224
Acasia Plantation (ACP) 96 10.830
Agroforest (AF) 72 14.789
Logging concession(LC) 37 16.314
Tropical Forest (TF) 10 18.967
Tropical forest ? settlement (CST) 100 8.899
Tropical forest ? Palm oil Plantation (CPOP) 99 10.508
Tropical forest ? Acasia plantation (CACP) 19 16.547
Tropical forest ? Agro forest (CAF) 19 17.217
Tropical forest ? logging concession(CLC) 8 19.737
Real landuse (LU) 99 7.792
Environmental Management (2011) 48:276–288 283
123
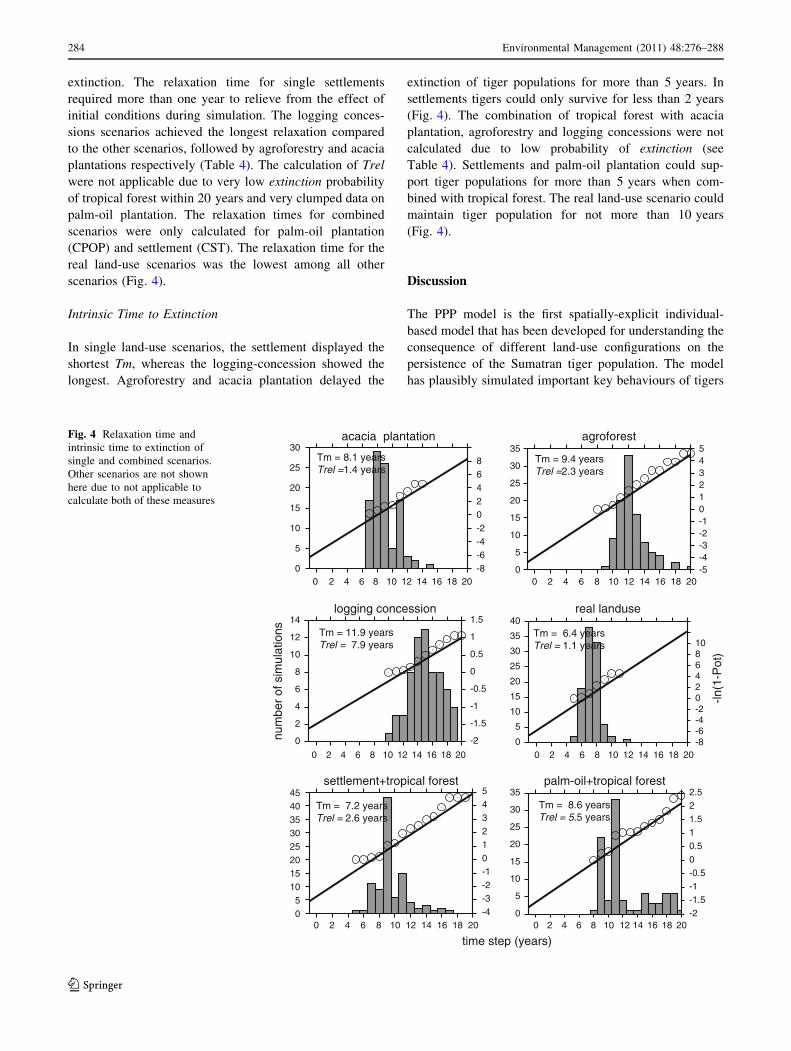
extinction. The relaxation time for single settlements
required more than one year to relieve from the effect of
initial conditions during simulation. The logging conces-
sions scenarios achieved the longest relaxation compared
to the other scenarios, followed by agroforestry and acacia
plantations respectively (Table 4). The calculation of Trel
were not applicable due to very low extinction probability
of tropical forest within 20 years and very clumped data on
palm-oil plantation. The relaxation times for combined
scenarios were only calculated for palm-oil plantation
(CPOP) and settlement (CST). The relaxation time for the
real land-use scenarios was the lowest among all other
scenarios (Fig. 4).
Intrinsic Time to Extinction
In single land-use scenarios, the settlement displayed the
shortest Tm, whereas the logging-concession showed the
longest. Agroforestry and acacia plantation delayed the
extinction of tiger populations for more than 5 years. In
settlements tigers could only survive for less than 2 years
(Fig. 4). The combination of tropical forest with acacia
plantation, agroforestry and logging concessions were not
calculated due to low probability of extinction (see
Table 4). Settlements and palm-oil plantation could sup-
port tiger populations for more than 5 years when com-
bined with tropical forest. The real land-use scenario could
maintain tiger population for not more than 10 years
(Fig. 4).
Discussion
The PPP model is the first spatially-explicit individual-
based model that has been developed for understanding the
consequence of different land-use configurations on the
persistence of the Sumatran tiger population. The model
has plausibly simulated important key behaviours of tigers
0
5
10
15
20
25
30
35
0 2 4 6 8 10 12 14 16 18 20-2-1.5-1-0.500.511.522.5
palm-oil+tropical forest
05
10 15 20 25 30 35 40 45
0 2 4 6 8 10 12 14 16 18 20-4-3-2-1012345
settlement+tropical forest
0
2
4
6
8
10
12
14
0 2 4 6 8 10 12 14 16 18 20
-2
-1.5
-1
-0.5
0
0.5
1
1.5
-ln(1
-Pot
)
logging concession
0
5
10
15
20
25
30
35
40
0 2 4 6 8 10 12 14 16 18 20-8-6-4-20246810
12 14
real landuse
0
5
10
15
20
25
30
35
0 2 4 6 8 10 12 14 16 18 20-5-4-3-2-1012345
agroforest
0
5
10
15
20
25
30
0 2 4 6 8 10 12 14 16 18 20-8-6-4-202468
10
num
ber
of s
imul
atio
ns
time step (years)
acacia plantation
Tm = 8.1 yearsTrel =1.4 years
Tm = 9.4 yearsTrel =2.3 years
Tm = 11.9 yearsTrel = 7.9 years
Tm = 6.4 yearsTrel = 1.1 years
Tm = 7.2 yearsTrel = 2.6 years
Tm = 8.6 yearsTrel = 5.5 years
Fig. 4 Relaxation time and
intrinsic time to extinction of
single and combined scenarios.
Other scenarios are not shown
here due to not applicable to
calculate both of these measures
284 Environmental Management (2011) 48:276–288
123

to respond to different land-use types in Central Sumatra.
The landscape compositions affected the persistence of
Sumatran tiger populations due to three types of mecha-
nisms. The first of these mechanisms are habitat conditions,
which affect the numbers of prey available for tigers. The
second-prey mortality is affected by a variation in the food
consumption of prey under different land-use types. The
third mechanism of human-affected areas reduces the time
to consume prey that has been killed by the tiger.
Tigers respond to the presence of humans by reducing
the time they have to consume prey and by exhibiting a less
efficient consumption than in undisturbed areas (Kenney
and others 1995). The PPP model simulated different times
for feeding (t-feeding) for tigers in various land-use types.
In their natural habitat, tigers use a maximum time for
feeding, but in human-affected land-use areas, tigers con-
sume prey with less time for feeding. Consequently, tigers
gain less energy in habitats with anthropogenic land-use
than in habitats with tropical forest land-use. The direct
consequences of an individual gaining less energy results
in a higher probability of starvation, eventually leading to
mortality. Since the PPP model only simulates mating
behaviour when individuals are not hungry and starving,
the probability of mating is reduced when less energy is
gained by an individual. In turn, this will reduce the
probability of reproduction. These two factors determined
the probability of extinction as well as the time to extinc-
tion in each scenario.
The results from the single scenarios clearly indicate
that different habitat qualities are important for population
persistence analysis. The PPP model plausibly showed the
effect of habitat conditions on the foraging and movement
behaviour of prey and the movement and feeding
behaviour of tigers. Even though we used an optimistic
value for the hunting radius, the results of our simulation
still showed that the survival chance was relatively low
except under the tropical forest scenario. The tropical
forest scenario is the best scenario among all of the
scenarios. The model showed that large protected natural
landscapes are preferable for tigers to survive and
reproduce, in line with the empirical study by Linkie and
others (2003) that tigers are best conserved in large pro-
tected areas.
The combined scenarios highlighted the importance of
the land-uses surrounding protected areas for tiger con-
servation (Baeza and Estades 2010). Although logging-
concessions, agroforestry and acacia plantation as single
land-use scenarios were not the best habitat for Sumatran
tigers, the combination of tropical forest with them
resulted in an improved situation. However, since we did
not test the simulation for more than 20 years, further
analysis beyond this time horizon will be more
meaningful.
Among all anthropogenic land-use types, selective log-
ging concessions provided the best alternative to maintain
forest cover and ensure the availability of alternative food
for prey (Meijaard and Sheil 2008). In addition, the gaps
created from logging provide tigers with the opportunity to
have a better access for dispersal and hunting (Linkie and
others 2008). Selective logging concessions close to a
protected area provide a good habitat for tigers (Linkie and
others 2008). The fact that Tesso-Nilo National Park used
to be logging concessions but is still able to support a tiger
population suggests that it is reasonable to combine this
type of land-use when it is close to a protected area as part
of an overall tiger conservation strategy.
Agroforestry and forest plantations have become
increasingly more apparent in the Sumatran landscape. The
probability of these two scenarios for the persistence of
tiger populations was more than 90% over 20 years if
combined with tropical forest. Our findings can be used to
explain why agroforestry has the potential to conserve tiger
populations in Nepal (Gurung and others 2008; Dinerstein
and others 1999) and Sumatra (Nyhus and Tilson 2004).
Agroforestry surrounding strict protected areas can support
the conservation of the Sumatran tiger through a greater
availability of prey (Nyhus and Tilson 2004). The Agro-
forestry system on the island of Sumatra varies in its
vegetation compositions such as rubber (Beukema and
others 2007), multi-storied tree gardens (Michon and others
1986), Damar/resin production agroforestry (Kusters and
others 2008) as well as coffee agroecosystems (Philpott and
others 2008). These different vegetation compositions
might bring about different consequences for both the
Sumatran tiger and its prey. A large-scale forest plantation
might provide protection from human pressure. However,
most forest plantations are managed in a monoculture
system, which might not support many species of prey, but
could lead to a population explosion for some species, such
as wild boar.
The settlement and oil-palm plantation scenarios clearly
showed the detrimental effect of these land-use types on
tiger persistence. Both single and combined scenarios
resulted in extinction within a relatively short period of
time. This finding is consistent with the absence or non-
detection of tigers in settlements and palm-oil plantations
(Maddox and others 2007). Settlements and oil-palm
plantations do not provide good habitat for prey, provide
poor habitat and experience high human pressure, leading
to the absence of tigers.
The real land-use scenario resulted in a relatively short
time to tiger extinction. A small proportion of tropical
forest (6.75%) and a large proportion of settlements and
palm-oil plantations (32.2%) might explain the disappear-
ance of tigers due to a low density of prey (see Table 3).
However, since the PPP model integrated a land-cover map
Environmental Management (2011) 48:276–288 285
123
which is not directly represented by a habitat-matrix map
for prey species, the incorporation of a habitat suitability
index map might improve the prediction. In addition, the
pressure from poaching under anthropogenic land-use
scenarios is crucial for the persistence of both tiger and
prey (Nyhus and Tilson 2004). Therefore, to improve our
understanding of the effect of these land-uses, poaching
should also be included.
The PPP model simulated the response of both tiger and
prey on the presence of anthropogenic land-use. However,
we assume that the movement decision of Sambar deer and
red muntjac are similar. The Sumatran tiger is known to
predate wild-boar which behaves differently toward the
presence of human. Studies have shown that the movement
decisions of individuals are important factors for popula-
tions of the lynx (Kramer-Schadt and others 2004) and the
Florida panther (Cramer and Portier 2001). Therefore
considering species-dependent different movement deci-
sion of prey would be worth in the next model
development.
Conservation Implications
The PPP model successfully simulated the response of
tigers and their prey to various land-use types. The model
demonstrates the mechanisms of how tigers and their prey
are affected by different land-use scenarios. The PPP
model proves that tropical forest is the best scenario.
However, with the current rates of tropical deforestation on
the island of Sumatra, a large tropical forest area is rarely
found in a real situation. The PPP model also showed the
importance of including logging concessions and agrofor-
estry in the overall conservation strategy for the tiger.
However, the potential detrimental effect such as that from
poaching pressure should be considered.
Despite the ability of acacia plantations surrounding a
protected area to extend the time to extinction, due to its
potential bad effect from monoculture practices, this land-
use type is not recommended to be established sur-
rounding a reserve. Both palm-oil and settlement scenar-
ios, either on their own or combined with tropical forest
do not support tiger conservation. Therefore, avoiding
these land-use types from surrounding a protected area
can help to reduce the probability of local extinction
(Table 5).
Our findings highlight the importance of logging con-
cessions and agroforestry surrounding a protected area for
the conservation of the Sumatran tiger. Agroforestry pro-
vides ecological services through corridors and food
sources for the tiger and its prey. This study shows the
critical condition of the land-use composition surrounding
the Tesso-Nilo National Park. A low proportion of natural
areas together with a large proportion of human-affected
areas are critical factors affecting the tiger in the Central
Sumatran landscape. Under the assumption that the re-
establishment of natural, undisturbed forests in the region
is unrealistic, the most feasible way to improve this con-
dition is to promote the practise of agroforestry systems
surrounding the park, while at the same time reducing
poaching.
Acknowledgments We are very grateful for the support provided
by the Gadjah Mada University, Gesellschaft fur TU Dresden and
Deutscher Akademischer Austauschdienst (DAAD / the German
Academic Exchange Service) that provided funds for field work and
Balai Taman Nasional Tesso Nilo for issuing us with a research
permit. Furthermore, we thank Conservation International for pro-
viding travel support to present this article on the World Agroforestry
Congress in Kenya. We also thank Karmila Parakkasi and Sunarto
from WWF-Riau for providing land covers maps and satellite images
and for their support during field work, Arief Wijaya for providing
assistantship of GIS work, Yustina and Eggy for assisting the field
work. We thank also for comments given by editors, three anonymous
reviewers, and Nabiul Khan. Finally, we thank Janine Murphy and
Sarah Gwillym-Margianto for proof-reading an earlier version of this
manuscript.
Appendix 1
See Table 6.
Table 5 The effect of all land-use scenarios on population persis-
tence are symbolized by the arrow direction
Scenario Single Combined
Tropical forest
Logging-concession
Agroforest
Acasia plantation
Palm-oil plantation
Settlement
Real land use
The arrows pointing upwards with a white background represent good
scenarios for the Sumatran tiger, horizontal arrows with a light greyare relatively neutral and arrows pointing downwards with dark greyare bad scenarios for the tigers
286 Environmental Management (2011) 48:276–288
123
References
Ahearn SC, Smith JLD, Joshi AR, Ding J (2001) TIGMOD: an
individual-based spatially explicit model for simulating tiger/
human interaction in multiple use forests. Ecological Modelling
140:81–97
Baeza A, Estades CF (2010) Effect of the landscape context on the
density and persistence of a predator population in a protected
area subject to environmental variability. Biological Conserva-
tion 143:94–101
Beukema H, Danielsen F, Vincent G, Hardiwinoto S, and van Andel
J. (2007) Plant and bird diversity in rubber agroforests in the
lowlands of Sumatra, indonesia. Agro forest System 70. doi:
10.1007/s10457-007-9037-x
Chapman NG, Furlong M, Harris S (1997) Reproductive strategies
and the influence of date of birth on growth and sexual
development of an aseasonally-breeding ungulate: Reeves’
muntjac (Muntiacus reevesi). Journal of Zoology, London
241:551–570
Chapman NG, Brown WAB, Rothery P (2005) Assessing the age of
Reeves’ muntjac (Muntiacus reevesi) by scoring wear of the
mandibular molars. Journal of Zoology, London 267:233–247.
doi:10.1017/S0952836905007405
Cramer PC, Portier KM (2001) Modeling Florida panther movements
in response to human attributes of the landscape and ecological
settings. Ecological Modelling 140:51–80
Dinerstein E, Rijal A, Bookbinder M, Kattel B, Rajuria A (1999)
Tigers as neighbours: efforts to promote local guardianship of
endangered species in lowland Nepal. In: Seindensticker J,
Christie S, Jackson P (eds) Riding the tiger tiger conservation in
human dominated landscapes. Cambridge University Press, UK,
Australia, New York
Fahrig L (2007) Non-optimal animal movement in human-altered
landscapes. Functional Ecology 21:1003–1015
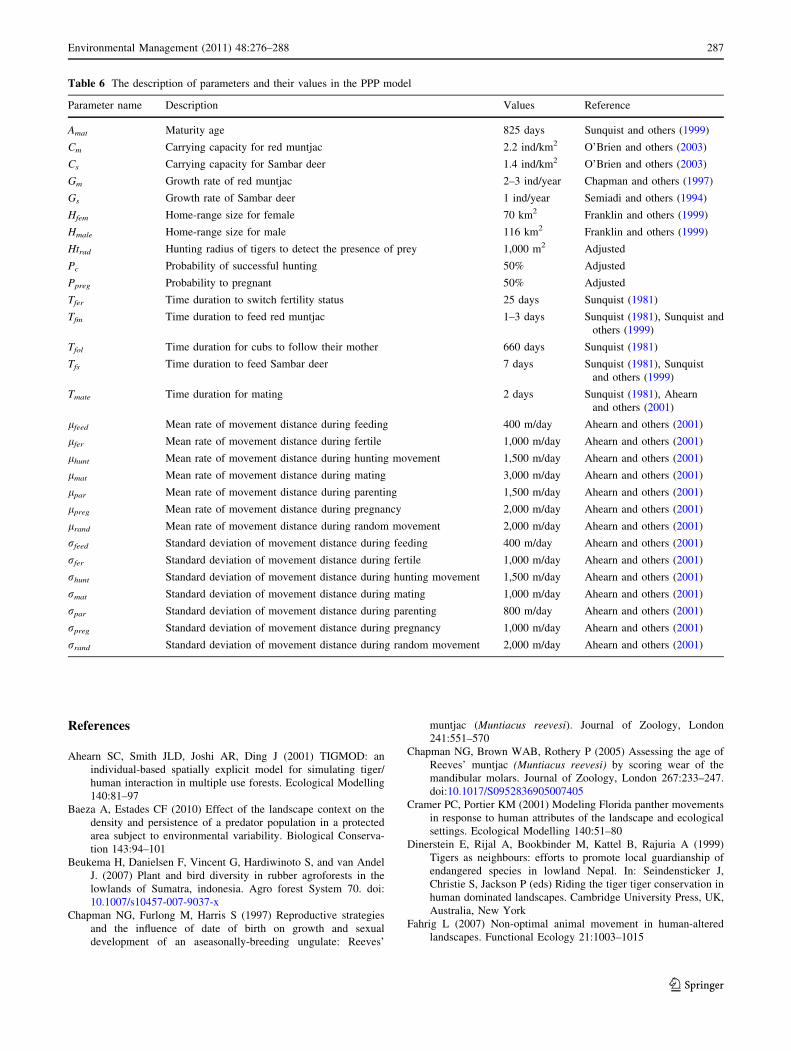
Table 6 The description of parameters and their values in the PPP model
Parameter name Description Values Reference
Amat Maturity age 825 days Sunquist and others (1999)
Cm Carrying capacity for red muntjac 2.2 ind/km2 O’Brien and others (2003)
Cs Carrying capacity for Sambar deer 1.4 ind/km2 O’Brien and others (2003)
Gm Growth rate of red muntjac 2–3 ind/year Chapman and others (1997)
Gs Growth rate of Sambar deer 1 ind/year Semiadi and others (1994)
Hfem Home-range size for female 70 km2 Franklin and others (1999)
Hmale Home-range size for male 116 km2 Franklin and others (1999)
Htrad Hunting radius of tigers to detect the presence of prey 1,000 m2 Adjusted
Pc Probability of successful hunting 50% Adjusted
Ppreg Probability to pregnant 50% Adjusted
Tfer Time duration to switch fertility status 25 days Sunquist (1981)
Tfm Time duration to feed red muntjac 1–3 days Sunquist (1981), Sunquist and
others (1999)
Tfol Time duration for cubs to follow their mother 660 days Sunquist (1981)
Tfs Time duration to feed Sambar deer 7 days Sunquist (1981), Sunquist
and others (1999)
Tmate Time duration for mating 2 days Sunquist (1981), Ahearn
and others (2001)
lfeed Mean rate of movement distance during feeding 400 m/day Ahearn and others (2001)
lfer Mean rate of movement distance during fertile 1,000 m/day Ahearn and others (2001)
lhunt Mean rate of movement distance during hunting movement 1,500 m/day Ahearn and others (2001)
lmat Mean rate of movement distance during mating 3,000 m/day Ahearn and others (2001)
lpar Mean rate of movement distance during parenting 1,500 m/day Ahearn and others (2001)
lpreg Mean rate of movement distance during pregnancy 2,000 m/day Ahearn and others (2001)
lrand Mean rate of movement distance during random movement 2,000 m/day Ahearn and others (2001)
rfeed Standard deviation of movement distance during feeding 400 m/day Ahearn and others (2001)
rfer Standard deviation of movement distance during fertile 1,000 m/day Ahearn and others (2001)
rhunt Standard deviation of movement distance during hunting movement 1,500 m/day Ahearn and others (2001)
rmat Standard deviation of movement distance during mating 1,000 m/day Ahearn and others (2001)
rpar Standard deviation of movement distance during parenting 800 m/day Ahearn and others (2001)
rpreg Standard deviation of movement distance during pregnancy 1,000 m/day Ahearn and others (2001)
rrand Standard deviation of movement distance during random movement 2,000 m/day Ahearn and others (2001)
Environmental Management (2011) 48:276–288 287
123

Franklin N, Bastoni S, Siswomartono D, Manangsang J, Tilson R
(1999) Last of the indonesian tigers: a cause for optimism. In:
Seindensticker J, Christie S, Jackson P (eds) Riding the tiger:
tiger conservation in human dominated landscapes. Cambridge
University Press, UK, Australia, New York
Fryxell JM, Hazell M, Berger L, Dalziel BD, Haydon DT, Morales
JM, McIntosch T, Rosatte RC (2008) Multiple movement modes
by large herbivores at multiple spatiotemporal scales. PNAS
105:19114–19119
Grimm V, Railsback SF (2005) Individual-based Modelling and
Ecology, Princeton Series in theorical and computational
biology, vol 1. Princeton University Press, Princeton and Oxford
Grimm V, Wissel C (2004) The intrinsic mean team to extinction: a
unifying approach to analysing persistence and viability of
populations. OIKOS 105:501–511
Grimm V, Berger U, Bastiansen F, Eliassen S, Ginot V, Giske J,
Goss-Custard J, Grand T, Heinz SK, Huse G, Huth A, Jepsen JU,
Jorgensen C, Mooij WM, Mueller B, Pe’er G, Piou C, Railsback
SF, Robbins AM, Robbins MM, Rossmanith E, Ruger N, Strand
E, Souissi S, Stillman RA, Vabø R, Visser U, DeAngelis DL
(2006) A standard protocol for describing individual based and
agent-based models. Ecological Modelling 198:115–126
Gurung B, Smith JLD, McDougal C, Karkic JB, Barl A (2008)
Factors associated with human-killing tigers in Chitwan national
park, Nepal. Biological Conservation 141:3069–3078
Johnson A, Vongkhamheng C, Hedemark M, Saithongdam T (2006)
Effect of human-carnivore conflict on tiger (Panthera tigris) and
prey population in Lao PDR. Animal Conservation 9:421–430
Karanth UK, Stith BM (1999) Prey depletion as critical determinant
of tiger population viability. In: Seindensticker J, Christie S,
Jackson P (eds) Riding the tiger: tiger conservation in human
dominated landscapes. Cambridge University Press, UK, Aus-
tralia, New York
Karanth UK, Nichols JD, Kumar NS, Link WA, Hines JE (2004)
Tiger and their prey: predicting carnivore densities from prey
abundance. PNAS: 4854–4858
Kenney JS, Smith JLD, Starfeld AM, McDougal CW (1995) The
long-term effects of tiger poaching on population viability.
Conservation Biology 9:1127–1133
Kerley LL, Goodrich JM, Miquelle DG, Smirnov EN, Quigley HB,
Hornocker MG (2002) Effects of roads and human disturbance
on Amur tigers. Conservation Biology 16:97–108
Kinnaird MF, Sanderson EW, O’Brien TG, Wibisono HT, Woolmer
G (2003) Deforestation trends in a tropical landscape and
implications for endangered large mammals. Conservation
Biology 17:245–257
Kramer-Schadt S, Revilla E, Wiegand T, Breitenmoser U (2004)
Fragmented landscapes, road mortality and patch connectivity:
modeling influences on the dispersal of Eurasian lynx. Journal of
Applied Ecology 41:711–723
Kusters K, P’erez MR, de Foresta H, Dietz T, Ros-Tonen M, Belcher
B, Manalu P, Nawir A, Wollenberg E (2008) Will agroforests
vanish? The case of damar agroforests in Indonesia. Human
Ecology 36:357–370
Linkie M, Martyr DJ, Holden J, Yanuar A, Hartana AT, Sugardjito J,
Williams NL (2003) Habitat destruction and poaching threaten
the Sumatran tiger in Kerinci Seblat national park, Sumatra.
Oryx 37:41–48
Linkie M,I, Haidir A, Nugroho A, Dinata Y (2008) Conserving tigers
panthera tigris in selectively logged sumatran forests. Biological
Conservation 141:2410–2415 (Research Note)
Maddox T, Priatna D, Gemita E, Salampessy A (2007) The
conservation of tigers and other wildlife in oil palm plantations
Jambi Province, Sumatra, Indonesia. ZSL Conservation Report
No. 7 The Zoological Society of London, London
Meijaard E, Sheil D (2008) The persistence of conservation of
borneo’s mammals in lowland rain forests managed for timber:
observation, overview and opportunities. Ecological Research
23:21–34
Michon G, Mary F, Bompard J (1986) Multistoried agroforest system
garden system in west Sumatra, Indonesia. Agrorofestry sytem
4:315–338
Miquelle DG, Smirnov EN, Merril TW, Myslenkov AE, Quigley HB,
Hornocker MG, Schleyer B (1999) Hierrachical spatial analysis
of Amur tiger relationships to habitat and prey. In: Seindens-
ticker J, Christie S, Jackson P (eds) Riding the tiger: tiger
conservation in human dominated landscapes. Cambridge Uni-
versity Press, UK, Australia, New York
Nugen G, Fraser KW, Asher GW, Tustin KG (2001) Advances in
New Zealand mammalogy 1990–2000: Deer. Journal of The
Royal Society of New Zealand 31:263–298
Nyhus P, Tilson R (2004) Agroforesry, elephants, and tigers:
balancing conservation theory and practice in human dominated
landscape of southeast Asia. Agriculture, Ecosystem and Envi-
ronment 104:87–97
O’Brien TG, Kinnaird MF, Wibisono HT (2003) Crouching tigers,
hidden prey: Sumatran tiger and prey populations in a tropical
forest landscape. Animal Conservation 6:131–139
Philpott SM, Bichier P, Rice RA, Greenberg R (2008) Biodiversity
conservation, yield, and alternative products in caffe agroeco-
systems in Sumatra, Indonesia. Biodiversity Conservation
17:1805–1820. doi:10.1007/s10531-007-9267-2
Ramakrishnan U, Coss RG, Pelkey NW (1999) Tiger decline caused by
reduction of large ungulate prey: evidence from a study of leopard
diets in southern India. Biological Conservation 89:113–120
Reddy HS, Srinivasulu C, Rao KT (2004) Prey selection by Indian
tiger (Phantera tigris tigris) in Nagarjunasagar Srisailam tiger
reserve, India. Mammalian Biology 69:384–391
Ryall KL, Fahrig L (2006) Response of predators to loss and fragmen-
tation of prey habitat: a review of theory. Ecology 87:1086–1093
Seindensticker J, Christie S, Jackson P (1999) Tiger ecology: under-
standing and encouraging landscape patterns and condition where
tigers can persist. In: Seindensticker J, Christie S, Jackson P (eds)
Riding the tiger: tiger conservation in human dominated land-
scapes. Cambridge University Press, UK, Australia, New York
Semiadi G, Muir PD, Barry TN (1994) General biology of sambar
deer (Cervus unicolor) in captivity. New Zealand Journal of
Agricultural Research 37:79–85
Smith JLD (1993) The role of dispersal in structuring the Chitwan
tiger population. Behaviour 124:169–195
Sunquist ME (1981) The Social Organization of Tigers (Phanteratigris) in Royal Chitawan National Park, Nepal. Smitsonian
contribution to zoology, 336th edn. Smitsonian Institution Press,
Washington
Sunquist M (2010) What is a tiger? Ecology and behavior. In: Tilson
R, Nyhus R (eds) Tigers of the world the science, politics and
conservation of Panthera tigris, 2nd ed. Academic Press,
London, Chap. 1, pp 16–34
Sunquist M, Karanth KU, Sunquist F (1999) Ecology, behaviour and
resilience of the tiger and its conservation needs. In: Seindens-
ticker J, Christie S, Jackson P (eds) Riding the tiger: tiger
conservation in human dominated landscapes. Cambridge Uni-
versity Press, UK, Australia, New York
Wilensky U (1999) NetLogo. Center for Connected Learning and
Computer-Based Modeling Northwestern University, Evanston,
IL. NetLogo 4.1RC3 eds. http://ccl.northwestern.edu/netlogo/
288 Environmental Management (2011) 48:276–288
123