An ecological assessment for Tigris River within Baghdad, Iraq
14
5 International Conference for Environmental Researcuys-Environmental Researc 5 th International Conference for Environmental Researc uys - Environmental Researc Jornal of Babylon Univ. Special Issue - Proceding of 5th International Conference of Environmental Scince University of Babylon / Environmental Research Center 3-5 December 2013 26 An ecological assessment for Tigris River within Baghdad, Iraq Fikrat M. Hassan 1* Najm A. J. AL-Zubaidi Weeam A. A. Al- Dulaimi 1 College of Science for Woman, University of Baghdad, Baghdad, IRAQ. 2 College of Pure- Education, University of Diyala , IRAQ. * Email [email protected] Abstract: The present study has been conducted to assess the Tigris River within Baghdad City during one year from October 2011 to December 2012. Four sites along the studied river were selected; the study included measuring physiochemical factors of the Tigris River, such as: temperature (air and water), electrical conductivity (EC), salinity (S‰), current flow, total dissolved material (TDS), total solid suspended (TSS), total alkalinity (TA), dissolved oxygen (DO), biochemical oxygen demand (BOD5) , total nitrogen (TN) and total phosphorus (TP). The water quality of Tigris River was assessed using the Canadian Council of Ministry of the Environment Water Quality Index (CCME WQI). Seven environmental factors were used to assess the WQI, they are temperature, pH, TDS, DO, BOD5, TN and TP. The mean ranges of the studied factors were recorded: air temperature ( 13.00-43.20 C°), water temperature (10.80-32.43 C°), current flow (0.07-0.303) m/Sec, pH (7.94-8.62), EC ( 214.33-319.67 μS/cm), S‰ (0.130-0.191), TDS (154.50-211.83 mg/l), TSS (1.52-1.72 mg/l), TA (44.33-80.17 mg/l), DO (6.70-13.50 mg/l), BOD5 (0.04-4.26 mg/l), TN (14.01-19.65μg/l) and TP (0.005-0.023 μg/l ). The WQI values ranged 20.32 - 60.48. Hence, the water quality of the Tigris River is rated as poor- marginal. A statistical analysis was done using the canonical correspondence analysis (CCA). Keywords: Water quality index, physicochemical parameters, Tigris River, Iraq. 1. Introduction: Tigris River is suffering from different agricultural drainages, industrial discharge and domestic's disposal during its passing in different cities in Iraq terrain in addition to the impact of Tharthar Lake and Diyala River (1, 2, 3, 4). Many previous researches on the Tigris River showed a significant decline in its water quality (5, 6). Recently, few studies focused on water quality index to fill the gap of information in this issue (7, 8 ). Less attention from government authorities to prevent the decline in water quality of the main Iraqi water
Transcript of An ecological assessment for Tigris River within Baghdad, Iraq

5th International Conference for Environmental Researcuys-Environmental Researc
5th International Conference for Environmental Researcuys-Environmental ResearcJornal of Babylon Univ. Special Issue - Proceding of 5th International Conference of Environmental Scince University of Babylon / Environmental Research Center 3-5 December 2013
26
An ecological assessment for Tigris River within Baghdad, Iraq
Fikrat M. Hassan1* Najm A. J. AL-Zubaidi Weeam A. A. Al- Dulaimi
1 College of Science for Woman, University of Baghdad, Baghdad, IRAQ. 2 College of Pure-Education, University of Diyala , IRAQ.
* Email [email protected]
Abstract:
The present study has been conducted to assess the Tigris River within Baghdad City during one year from October 2011 to December 2012. Four sites along the studied river were selected; the study included measuring physiochemical factors of the Tigris River, such as: temperature (air and water), electrical conductivity (EC), salinity (S‰), current flow, total dissolved material (TDS), total solid suspended (TSS), total alkalinity (TA), dissolved oxygen (DO), biochemical oxygen demand (BOD5) , total nitrogen (TN) and total phosphorus (TP). The water quality of Tigris River was assessed using the Canadian Council of Ministry of the Environment Water Quality Index (CCME WQI). Seven environmental factors were used to assess the WQI, they are temperature, pH, TDS, DO, BOD5, TN and TP. The mean ranges of the studied factors were recorded: air temperature ( 13.00-43.20 C°), water temperature (10.80-32.43 C°), current flow (0.07-0.303) m/Sec, pH (7.94-8.62), EC ( 214.33-319.67 μS/cm), S‰ (0.130-0.191), TDS (154.50-211.83 mg/l), TSS (1.52-1.72 mg/l), TA (44.33-80.17 mg/l), DO (6.70-13.50 mg/l), BOD5 (0.04-4.26 mg/l), TN (14.01-19.65µg/l) and TP (0.005-0.023 µg/l ). The WQI values ranged 20.32 - 60.48. Hence, the water quality of the Tigris River is rated as poor- marginal. A statistical analysis was done using the canonical correspondence analysis (CCA).
Keywords: Water quality index, physicochemical parameters, Tigris River, Iraq.
1. Introduction:
Tigris River is suffering from different agricultural drainages, industrial discharge and domestic's disposal during its passing in different cities in Iraq terrain in addition to the impact of Tharthar Lake and Diyala River (1, 2, 3, 4). Many previous researches on the Tigris River showed a significant decline in its water quality (5, 6). Recently, few studies focused on water quality index to fill the gap of information in this issue (7, 8 ). Less attention from government authorities to prevent the decline in water quality of the main Iraqi water
5th International Conference for Environmental Researcuys-Environmental Researc
5th International Conference for Environmental Researcuys-Environmental ResearcJornal of Babylon Univ. Special Issue - Proceding of 5th International Conference of Environmental Scince University of Babylon / Environmental Research Center 3-5 December 2013
27
resources is one of importance to use the water quality index in Iraq in order to simplify the results of many data of water quality data. The industrialized countries developed many criteria of water quality since 1965 when Horton (9) suggested water quality index. The water quality index illustrates all physical and chemical features of river or an aquatic system by simple decision whether an aquatic system is valid for different human uses or for aquatic organism lives (10).
The present study aimed to fill the gap of information on water quality of the studied area.
2. Materials and Methods:
Four sites were chosen along the Tigris River within Baghdad City (Figure 1). Table 1 shows
the GPS values of the selected sites for the present study.
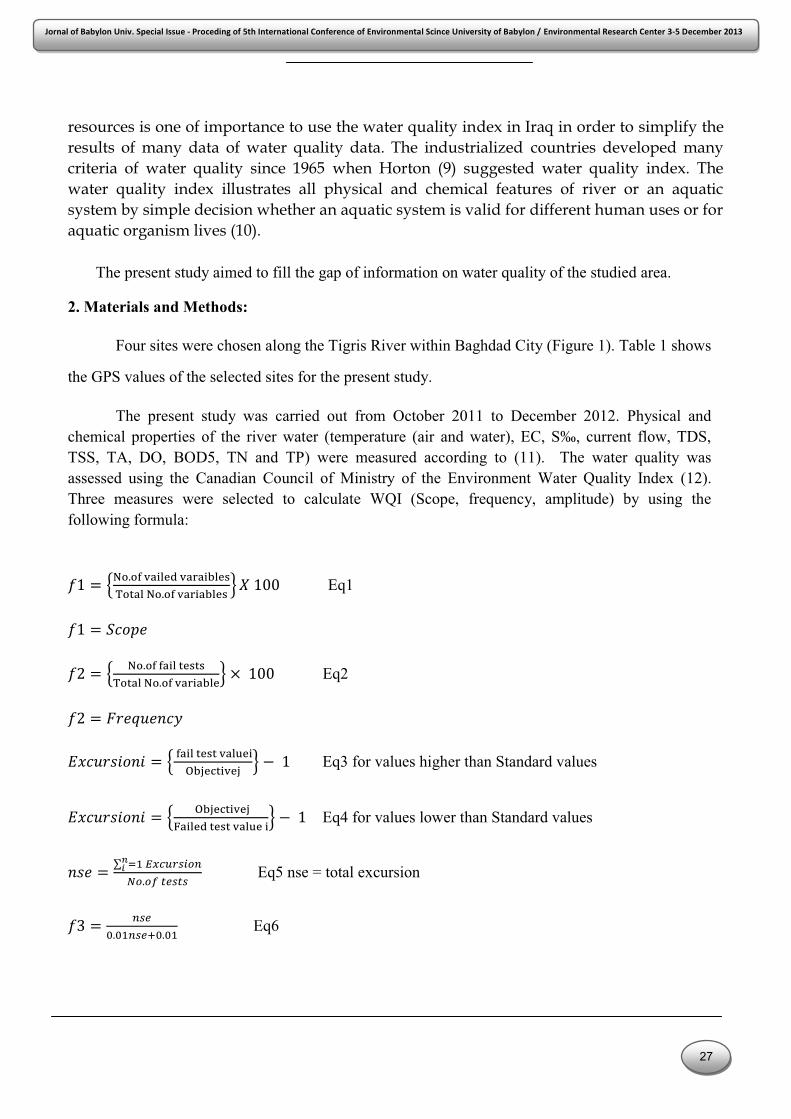
The present study was carried out from October 2011 to December 2012. Physical and chemical properties of the river water (temperature (air and water), EC, S‰, current flow, TDS, TSS, TA, DO, BOD5, TN and TP) were measured according to (11). The water quality was assessed using the Canadian Council of Ministry of the Environment Water Quality Index (12). Three measures were selected to calculate WQI (Scope, frequency, amplitude) by using the following formula:
�1 = ���.�� ���� �� �������� ��.�� �� ���� � � 100 Eq1
�1 = �����
�2 = � ��.�� �� ��������� ��.�� �� ���� × 100 Eq2
�2 = ���������
�!���"#��# = � �� ���� ��$�%�&�'���& � − 1 Eq3 for values higher than Standard values
�!���"#��# = � %�&�'���&(��� ���� ��$� � − 1 Eq4 for values lower than Standard values
�"� = ∑ *+ ,-/3456789:
;7.7< >?5>5 Eq5 nse = total excursion
�3 = 85?A.A+85?BA.A+ Eq6

5th International Conference for Environmental Researcuys-Environmental Researc
5th International Conference for Environmental Researcuys-Environmental ResearcJornal of Babylon Univ. Special Issue - Proceding of 5th International Conference of Environmental Scince University of Babylon / Environmental Research Center 3-5 December 2013
28
The equations 1 and 2 for calculated Scope and frequency, respectively. While values of Amplitude (�3) was calculated by using the other equations (3, 4 and 5). The values of these three measures were used in the following formula to calculate WQI:
�CDE = √�+GB�HGB�IG
+.JIH
The classification of water quality as poor, marginal, fair, good or excellent followed Al-Janabi et al. (7). The statistic analyses were done by using correlation coefficient (r), and canonical correspondence analysis (CCA). CCA method was conducted by using the computer program CANOCO, version 4.5 in order to clarify the relationships between physiochemical parameters.
3. Results and Discussion:
The environmental characteristic of the water in the study area is shown in Table (2). The air temperature reached its high value ( 43.20 c0 ) in Site 4 and its lowest value ( 13.00 c0 ) in Site 1 , while the water temperature ranged between 9.06 to 31 .43 in sites 1 and 4 respectively (Figure 2). Narrow fluctuation of pH was observed during the study period, with the highest average value of 8.46 and a low of 7.8; this observation was mentioned earlier in Iraqi aquatic systems by Talling (13). PH variation might be caused by many factors such as biotic activities, discharge of waste water, photosynthesis and nature of river basin (14, 15). Similar results match with other studies (15, 16, 17, 18, 19, 20, 21).
High conductivity values were (319.67 µs. cm-1) at site3 in summer 2012, lower value was (241.33 µs. cm-1) at site2 in spring 2012, while water salinity in the study area ranged (0.130 – 0.191 ‰) at sites 4 and 1 in winter 2011 and summer 2012, respectively. The increasing values of conductivity and salinity in the Tigris River during hot seasons indicated the increase of the evaporation rate due to the discharge of agricultural and industrial wastewater (22, 23)
The total dissolved solid (TDS) represented all inorganic salts, organic material and other soluble material in water. These constituted may be found naturally or due to discharge of municipal, industrial and agricultural, so its values followed the trend as conductivity and salinity. It ranged from 154.50 mg\l at site 1 spring 2012 to 211.83 mg\l at site 4 in summer 2012. Significant differences between seasons were noticed at P<0.05. TSS values ranged (1.52 to 1.72 mg\l) at sites 2 and 4 during autumn 2011 and winter 2012, respectively (Fig.3). Many factors affecting TSS values in water such as silting, microscopic organisms and suspended organic matter lead to catch the dust and other materials not drawn into the water column and subsequently deposited on the bottom of the river (21, 24). No significant differences between seasons and sites except between sites 2and 4 were noticed at P<0.05.
Total alkalinity is a function of water contents from hydroxide, bicarbonate and carbonate, its values used to find out the validity of the water to be used in different purposes (11). Many authors mentioned that the Iraqi water systems characterized as alkaline water due to the presence of

5th International Conference for Environmental Researcuys-Environmental Researc
5th International Conference for Environmental Researcuys-Environmental ResearcJornal of Babylon Univ. Special Issue - Proceding of 5th International Conference of Environmental Scince University of Babylon / Environmental Research Center 3-5 December 2013
29
bicarbonate ions (25, 26). Its values in this study ranged (44.33- 80.17 mg/l) during autumn 2011 and summer 2012 at sites 4 and 3, respectively.
Concentration of dissolved oxygen is not recorded less than 6 mg/l in the present study. This concentration ranged from 6.70 mg\l to 13.50 mg\l at sites 2 and 3 in autumn 2011 and spring 2012 respectively. The concentration of dissolved oxygen was affected by many factors especially biological activities such as photosynthesis, respiration and decomposition process at the river bottom in addition to the rainfall effects ( 27, 28, 29 ). The dissolved oxygen concentration was found to be within the standard limited (30) in the present study. Only a significant difference between sites 2 and 3 was observed at P<0.05.
The concentrations of BOD5 ranged from 0.04 mg\l at site 4 in autumn 2011 to 4.26 mg\l at site1 in summer 2012. These results revealed that the study river may be suffering from pollution (11, 26, 31). These BOD5 values may be attributed to increase in temperature during the hot months in addition to different human activities (32).
Significant differences between sites 2 and 4 were observed at P<0.05. The water flow results of the present study showed high flow after flooding months (early summer in Iraq), and ranged (0.07- 0.303 m/sec at sites 3 and 1 in autumn 2011 and winter 2012 respectively. The fluctuations in water flow are related to river channel morphology (33). Only in site 3, significant differences were noticed among the study seasons and also significant differences recorded among sites during the study per season except in summer 2012 at P<0.05.
Total nitrogen concentration ranged (14.01-19.65 µg/l) at sites 1 and 4 during winter and summer 2012, respectively. The results showed no clear seasonal variation during the study period, the source of nitrogen in aquatic systems included different chemical reactions in water, rainfall, inputs from human activities such as; municipal, agricultural and industrial (33, 34). Significant differences, noticed in two sites during the study seasons at level P<0.05 and no significant differences among studied sites except in site 4, may be due to dense growth of macrophytes. Moreover, this site is exposed to the effect of residential communities and industrial plants.
Most of phosphorus forms in environment are low solubility in water (35). Different forms of phosphorus (inorganic and organic) found as soluble or particulate (36). The present results show no clear variation among months that may indicate the effect of different types of discharge sources into the river and due to rainfall that washed away soil compounds and Phosphorus agricultural fertilized land (36, 37). TP concentrations ranged (0.005-0.023 µg/l) in sites 1 and 4 during summer 2012 and autumn 2011, respectively.
CCM WQI results revealed that the water quality of the Tigris River ranged between poor- marginal. The higher value (60.48) was recorded at site 2 in summer 2012, while the lower value was 20.32 at sit 3 in winter 2012. The WQI in all study sites ranked as marginal except in site 1 as poor. Two studied parameters (BOD5 and TN) exceeded the standard limits.

5th International Conference for Environmental Researcuys-Environmental Researc
5th International Conference for Environmental Researcuys-Environmental ResearcJornal of Babylon Univ. Special Issue - Proceding of 5th International Conference of Environmental Scince University of Babylon / Environmental Research Center 3-5 December 2013
30
CCA for water quality in the present study (Figure 4) indicated that weak positive relationships are found between water temperature and BOD5 (r=0.101, P<0.01), while negative relationships are found between DO and temperature ( r= -0.539, P<0.05) .Similar results appeared between EC, TDS and temperature (r=-0.743) that may be due to evaporate effect. Positive relationships were recorded between EC and TDS (r= 0.823), due to the relation between the quantity and quality of dissolved salts and EC (38). Also positive relationships were found between pH and salinity (r=0.673) because of salinity effects on solubility of CO2HCO3
− and CO3= (39 ).
Positive relationships were found between total alkalinity and water flow. These results may not agree with another study which showed negative relationships between them (40).
4. Conclusion
The present study results revealed that temperature and total nitrogen play important roles in the water quality of Tigris River in this study. The rank of WQI for Tigris River was poor-marginal.
5. Acknowledgements
We are grateful to Department of Biology, College of Science for Women, University of Baghdad and Department of Biology, College of Pure-Education, University of Diyala for their support to this research.
References
1. Al-Marsoumi, A.M.H., Al-Bayati, K. M. and Al-Mallah, E.A. (2006). Hydrogeochemical Aspects Of Tigris And Euphrates Rivers Within Iraq: A Comparative Study. Raf. Jour. Sci.,17(2): 34-49.
2. Al-Obaidi ,A. H. (2009 ) . Evaluation of Tigris River Quality in Baghdad for the period between (November 2005- October2006). Eng. & Tech. Journal, 27(9) : 1736- 1746.
3. Hussain, A. A. 2009. Monthly Changes of Some Physiochemical Parameters for Tigris River- Baghdad between 2002-2003. Eng. & Tech. Journal, 27(2) : 64- 70.
4. Meshhadani ,Y. D. and Jassim A. A. 2012. Study of some Characteristics of Tigris River Between Mosul City and Hamam Al – Aleel Provice. Rafidain Journal of Science, 23(4): 56-67.
5. Al-Masri N.A. and Ali A.A. ,1985, "Effect of Domestic and Industrial Wastewater Discharge
on Pollutant Variation in River Tigris", Proceeding of Iraq Conference on
Engineering,IDE,pp.467-474.
6. Al-Khafaji, J.L.A.,1985, "Study of Dissolved Load in Tigris River within Baghdad", M.Sc.

5th International Conference for Environmental Researcuys-Environmental Researc
5th International Conference for Environmental Researcuys-Environmental ResearcJornal of Babylon Univ. Special Issue - Proceding of 5th International Conference of Environmental Scince University of Babylon / Environmental Research Center 3-5 December 2013
31
Thesis, University of Baghdad.
7. Al- Janabi, Z. Z.., Al-Kubaisi, A. R. and Al-Obaidy, A. H. M. J. 2012. Assessment of Water Quality of Tigris River by using Water Quality Index (CCME WQI). Journal of Al-Nahrain University, 15 (1:119-126
8. Aenab, A. M., Singh, S. K. and Al-Rubaye, A. A. M. 2012. Evaluation of Tigris River by Water Quality Index Analysis Using C++ Program. Journal of Water Resource and Protection, 4: 523-527.
9. Horton, R.K.(1965). An Index Number System for Rating Water Quality. J. of Water Poll. Control Federation, 37(3): 300-306.
10. Akoteyon, et al., “Determination of Water Quality Index and Suitability of Urban River for Municipal Water Sup-ply in Lagos-Nigeria,” European Journal of Scientific Research, Vol. 54, No. 2, 2011, pp. 263-271.
11. APHA ( American public health association ) , "Standard methods for the examination of water and waste water" , 20 Ed., DC. Washington, 2003.
12. CCME, Canadian Council of Ministers of the Environment (2001). Canadian Water Quality Guidelines for the Protection of Aquatic Life: Canadian Water Quality Index 1.0 Technical Report. In Canadian Environmental Quality Guidelines, Winnipeg, Manitoba.
13. Talling, J.F. (1980). Water characteristics in Euphrates and Tigris. "Mesopotamian ecology and desting" by Jullian Rzoska, Dr.W.Jund.br. Publishers. The Hyge London .
14. Tanimu, Y., Bako,S.P. Adakole, J.A. and Tanimu, J. 2011. Phytoplankton as bioindicators of water quality in saminaka Reservoir northern Nigeria , Proceeding of International Symposium on Environmental Science and Technology , Dongguan , Guandong province , China.
15. Zakariya, A.M., Adelanwa, M.A. and Tanimu, Y. 2013. Physico – chemical characteristics and phytoplankton Abundance of the lower niger river , Kogi state , Nigeria" , IOSR Journal of Environmental Science , Toxicology and food Technology, 2 (4) : 31 – 37.
16. . Hassan F.M.1997. A limnological study on Hilla river , Al-Mustansiriya J. Sci., 8: 22 – 30 .
17. Hassan F.M., Talyor, W.D., Al- Taee, M.S. and Al - Fatlawi , H.J.J . 2010.. phytoplankton composition of Euphrates river in Al – Hindiya barrage and Kifil city region of Iraq, J. Environ . Biol ., 31: 343 – 350.
18. Al- Saadi , H.A., Hassan, F.M. and Alkam,F.M. 2008. Phytoplankton and related nutrients in Sawa lake , Iraq , J. Dohuk Univ., 11(1): 67 - 76 .

5th International Conference for Environmental Researcuys-Environmental Researc
5th International Conference for Environmental Researcuys-Environmental ResearcJornal of Babylon Univ. Special Issue - Proceding of 5th International Conference of Environmental Scince University of Babylon / Environmental Research Center 3-5 December 2013
32
19. Salman, J.M., AlKam,F.M and Al- Fatlawi, H.J. 2012. A Biodiversity of phytoplankton in Euphrates river , middle of Iraq" , Iraqi Journal of Science, special issue 1st conference of Biology, University of Baghdad ,6-7 March 2012 , p.277-293.
20. Salman, J.M. and Hussain, H.A. 2012. Water quality and some heavy metals in water and sediment of Euphrates river, Iraq , J. Environ. Sci and Engi., A 1, 1(.9): 1088-1095.
21. Ayoade, A.A., Agarwal, N.K. and Chandola – Saklani, A.2009. Changes in physicochemical Features and plankton of Two regulated high Altitude rivers Garhwal Himalaya , India" , European Journal of scientific research , 27 ( 1):77- 92 .
22. Hassan, F.M., Saleh, M. M. and Salman, J.M. 2010. A study of physic chemical parameters and nine heavy metals in Euphrates river , Iraq, E – Journal of Chemistry, 7 (3): 685 – 692.
23. CPCB, Central Pollution Control Board .2006. Water quality status of Yamuna river (1999-2005). Ministry of Environment and Forests, Govr. Of India. Assessment and Development of river Basin Series: ADSORBS/41/2006-07.
24. Mitsch, W.J. and Gosselink, J.G. 2000. Wetlands 3rd. ed. John Wiley and Sons, Inc.
25. Sabri, A.W,; Moulood, B.K. and Sulaiman, N.I. 1989. Limnological Studies on River Tigris: Some Physical and Chemical Characters. J. Biol. Scie. Res, 20(3): 565-579.
26. Salman, J. M., , Al-Azawey, A. S.N. and Hassan F.M. 2013. Study of Bacterial Indicators in Water and Sediments from Al- Hilla River, Iraq. Hydrol Current Res S13: 001. doi:10.4172/2157-7587.S13-001.
27. Olele , N. F. and Ekelemu,J. K. 2008. Physicochemical and Periphyton/Phytoplankton
Study of Onah Lake, Asaba, Nigeria, African Journal of General Agriculture, 4( 3): 183-193.
28. Campanelli,A, Bulatoric, A. and Cabrini, M. 2009. Spatial Dis- tribution of Physical, Chemical and Biological Oceano- graphic Properties, Phytoplankton, Nutrients and Colour- ed Dissolved Organic Matter (CDOM) in the Boka Ko- torska Bay (Adriatic Sea. GEDFIZIKA, 26( 2): 215-228.
29. Amer, A. S. and Abd El-Gawad, H. A. 2012. Rapid Bio-Indi- cators Assessment of
Macrobiotic Pollution on Aquatic Environment. International Water Technology Journal, 2 (3): 196-206.

5th International Conference for Environmental Researcuys-Environmental Researc
5th International Conference for Environmental Researcuys-Environmental ResearcJornal of Babylon Univ. Special Issue - Proceding of 5th International Conference of Environmental Scince University of Babylon / Environmental Research Center 3-5 December 2013
33
30. UNESCO-WHO-UNEP. 1996. Water Quality Assessment—A Guide to the Use of Biota, Sediments and Water in Envi- ronmental Monitoring,” E and FN Spon, Cambridge.
31. Adakole J.A., J.K. Balogun and A.K. Haroon. 1984. Water quality Impacts Assessment Associated with an Urban Stream in Zaria, Nigeria . NISEB Journal , 2 (3): 195 – 203 .
32. Essien – Ibok , M.A. and Umoh, I.A. 2013. Seasonal association of physic – chemical parameters and phytoplankton density in Mboriver , Akwa Ibom state , Nigeria " , IACS TT International Journal of Engineering and Technology,.5( 1): 146 – 148 .
33. Wetzel, R.G.(2001)limnology,Lake and river ecosystem. 3rd. Acadimic pres, AQn Elsevier imprint , Sanfrancisco,New York, Londona
34. Lampert, W. and Sommer, U. 1997. Limnoecology: The ecology of lakes and streams. Oxford University Press.
35. Goldman, C.R. & Horne, A.J. (1983). Limnology. McGraw-Hill Int. B. Co. 464 pp.
36. Sims, J.T & Sharpley, A. (2005). Phosphorus: Agriculture and the Environment. Publisher by American Society of Agronomy-Crop Science Society of America-Soil Science Society of America; illustrated Edition, 1121pp.
37. Yeoman, S.; Stephenoson, T.; Lester, J.N. & Perry, R. (1988). The Removal of Phytoplankton during Waste Water Treatment. A review. Environ. Pollution, 49: 183- 233.
38. Weiner , E . R. (2000). Application of environmental chemistry . Lewis Puplshers , London , New York
39. Golterman, H. L. (1975). Chemistry Chapter 2. In. Witton, B.A. (Editor) River Ecology, Studies In Ecology. Vol. 2 Blackwell Scientific Publication, pp. 39-80.
40. Trivedi, R.K. and Goel, P.K. 1992. Chemical and Biological Methods for Water Pollution Studies. Environ. Publ., Karad.

5th International Conference for Environmental Researcuys-Environmental Researc
5th International Conference for Environmental Researcuys-Environmental ResearcJornal of Babylon Univ. Special Issue - Proceding of 5th International Conference of Environmental Scince University of Babylon / Environmental Research Center 3-5 December 2013
34
Figure (1): Map of the study area

5th International Conference for Environmental Researcuys-Environmental Researc
5th International Conference for Environmental Researcuys-Environmental ResearcJornal of Babylon Univ. Special Issue - Proceding of 5th International Conference of Environmental Scince University of Babylon / Environmental Research Center 3-5 December 2013
35
Table1: GPS values of the study sites
Table2: Range (mean ±SE) of Physical and chemical properties of water in Tigris river from Autumn 2011 to Summer 2012.
Sites 1 2 3 4
Longitude (East) 44°20'14.57" 44°21'24.60" 44°23'0.19" 44°31'2.31"
Latitude (North) 33°23'03.37" 33°21'33.75" 33°15'54.23" 33°13'57.14"
Parameters
1 2 3 4
Water temp ( Cᴏ ) 28.30-11.46 (1.72±0.77)
30.06-10.80 (0.61±0.55)
31.50-12.40 (0.58±0.30)
32.43-12.76 (2.83±0.26)
pH 8.62-8.08 (0.17±0.02)
8.22-7.94 (0.03±0.10)
8.57-8.06 (0.13±0.07)
8.59-8.32 (0.10±0.09)
TDS (Mg/L) 189.96-154.50 (11.58±2.63)
203.33-161.56 (26.82±7.65)
207.63-173.60 (17.06±12.88)
211.83-173.53 (23.34±9.24)
DO (Mg/L) 11.46-8.36 (1.24±1.80)
11.63-6.70 (1.12±0.40)
13.50-8.86 (0.50±0.93)
10.06-7.53 (0.29±0.58)
BOD5(mg/L) 4.26-2.73 (2.21±1.27)
3.37-0.65 (0.50±0.40)
3.50-2.53 (0.37±1.33)
2.93-0.55 (0.53±0.03)
T.N(mg/L) 18.80-14.01 (1.68± 0.47)
19.20-16.24 (1.86±0.72)
18.40-14.73 (0.67±0.80)
19.65-15.85 (1.59±1.65)
T.P( mg/L) 0.010-0.005 (0.00±0.002)
0.016-0.008 (0.01±0.002)
0.018-0.008 (0.015±0.002)
0.023-0.008 (0.02±0.002)

5th International Conference for Environmental Researcuys-Environmental Researc
5th International Conference for Environmental Researcuys-Environmental ResearcJornal of Babylon Univ. Special Issue - Proceding of 5th International Conference of Environmental Scince University of Babylon / Environmental Research Center 3-5 December 2013
36
Figure 2: Season variation of the studied parameters ( Air temperature (AT), Water Temperature(WT), pH,
EC, S‰, TDS, Total alkalinity (T.ALK) and Water flow(W.F)) during the study period in Tigris River.
0
20
40
60
A.T
0
20
40
W.T
7.5
8
8.5
9
PH
200
250
300
350
E.C
200
250
300
350
S‰
0
100
200
300
T.D.
S
40
50
60
70
80
90
Autumn2011Winter2012Spring2012Summer2012
T. A
lk
0.050.1
0.150.2
0.250.3
0.350.4
0.450.5
Autumn2011Winter2012Spring2012Summer2012
W.F

5th International Conference for Environmental Researcuys-Environmental Researc
5th International Conference for Environmental Researcuys-Environmental ResearcJornal of Babylon Univ. Special Issue - Proceding of 5th International Conference of Environmental Scince University of Babylon / Environmental Research Center 3-5 December 2013
37
56789
101112131415
D.O
1.41.451.5
1.551.6
1.65
1.7
1.75
T.S.
S
1414.5
1515.5
1616.5
1717.5
1818.5
1919.5
20
Autumn2011Winter2012Spring2012
Summer2012
T.N
56789
101112131415
BOD 5
0
0.004
0.008
0.012
0.016
0.02
0.024
Autumn2011Winter2012Spring2012
Summer2012
T.P
Figure3: Season variation of the studied parameters (TSS, DO, BOD5, TN, TP) during the study period in Tigris
River.

5th International Conference for Environmental Researcuys-Environmental Researc
5th International Conference for Environmental Researcuys-Environmental ResearcJornal of Babylon Univ. Special Issue - Proceding of 5th International Conference of Environmental Scince University of Babylon / Environmental Research Center 3-5 December 2013
38
Figure (4): Correlations between physical and chemical parameters according to Canoco(CCA).
-0.4 0.6
0.60.6
PH
EC TDS
WT
AT
D O
BOD5
Sal
T k
WFTSS
cha C
cha P
pha C
pha P
TN
TP

5th International Conference for Environmental Researcuys-Environmental Researc
5th International Conference for Environmental Researcuys-Environmental ResearcJornal of Babylon Univ. Special Issue - Proceding of 5th International Conference of Environmental Scince University of Babylon / Environmental Research Center 3-5 December 2013
39
التقييم البيئي لنهر دجلة ضمن مدينة بغداد, العراق
نجم عبد هللا جمعة وئام احمد علوان الدليمي 1*فكرت مجيد حسن
جامعة ديالى -جامعة بغداد كلية التربية للعلوم الصرفة –العلوم للبنات كلية 1
المستخلص:
ر تم اختيا 2012إلى ديسمبر 2011ت الدراسة الحالية لتقييم نهر دجلة داخل مدينة بغداد خالل فترة سنة واحدة من أكتوبر يأجرأربعة مواقع على طول نهر دجلة ؛ وشملت الدراسة قياس العوامل الفيزيائية لنهر دجلة ، مثل : درجة الحرارة (الهواء و الماء) ،
) TSS) ، المواد الصلبة العالقة ( TDS) ، سرعة الجريان ، والمواد الذائبة الكلية ( S(‰) ، والملوحة ECالتوصيل الكهربائي () و TN) ، النتروجين الكلي ( BOD5) ، المتطلب الحيوي لألوكسجين ( DO) ، األوكسجين المذاب ( TAة ( ، القاعدية الكلي
بــــاستعمال دليــــل نوعيـــة الميــــاه المعتمـــد لمعيشة اإلحياء المائية) . وتم تقييم نوعية مياه نهر دجلة TPالفسفور الكلي () , واستخدمت سبع عوامل بيئية لتقييم نوعية المياه وهي درجة الحرارة ، األس الهيدروجيني ، CCM(علـــى الموديل الكنــدي
المواد الصلبة الذائبة ,األوكسجين المذاب, المتطلب الحيوي لألوكسجين, النتروجين الكلي, الفسفور الكلي . تراوحت درجة حرارة ) م / ثا ، واألس 0.07-0.303، سرعة الجريان(° ) C 32.43-8.10، درجة حرارة الماء (° ) 43.20C-13( الهواء
) ‰S 0.130-0.191, والملوحة() مايكروسمنس/سم241.33-319.67التوصيل الكهربائي ( ) ،8.62-7.94الهيدروجيني( ألوكسجين المذاب (لتر ، وا\) ملغم 1.52-1.72لتر ، والمواد الصلبة العالقة بين (\)ملغم154.50-211.83،والمواد الذائبة الكلية(
/ لتر مايكروغرام (19.65 - 14.01 )لتر ،والنتروجين الكلي \)ملغم 0.04-4.26لتر وقيم المتطلب الحيوي (\ملغم 13.50-6.70)تصنف نوعية , وعليه )60.48- 20.32( لتر, تراوحت قيم دليل نوعية المياه\ ) مايكروغرام0.0050.023- ) والفسفور الكلي(
. لنتائج الدراسة )CCAالتحليل اإلحصائي الكونكي ( وتم اجراء فقير. -نهر دجلة بتقدير حافي فيالمياه