Estimation of Baghdad Municipal Solid Waste Generation Rate
15
,2009 1 . No , 27 . Vol , Journal . Tech & . Eng *Building and Construction Engineering Department./University of Technology / Baghdad Estimation of Baghdad Municipal Solid Waste Generation Rate Dr. Adnan A. Alsamawi*, Dr. Abdul Razzak T. Zboon* &Dr. Aumar Alnakeeb* Received on: 12/3/2008 Accepted on:7/8/2008 Abstract Generally In this paper, Baghdad Municipal Solid Waste (MSW) Generate for five years period (from year 2006 to year 2010). This Period are estimated as a minimum duration of landfill site operation time. Geographic Information System (GIS) technique are used to prepare digital map of Baghdad city to determine all of Baghdad ten districts areas and its geographic distribution. Population size forecasting are interpolated to find urban population size of each district and its population density. Depending on economic studies of population wealth variation of Gross Domestic Product (GDP) and the adopted percentage of the chronically poor population in Baghdad which could reach 40% in some districts, the individual waste generation rates of each districts are assumed to ranged between 0.3 and 0.8 kg/capita/day. A value of 0.63 kg/capita/day is concluded for the year 2006 and increase it at a net rate (growth rate less waste reduction rate) of the expected GDP increase of 4% per year to reach 0.74 kg/capita/day in year 2010. Comparison between the obtained estimation with other studies for other countries, puts Iraq in class of middle income countries. Keywords: Municipal Solid Waste; Landfill; Generation Rate; Population; GIS. ﺒﻐﺩﺍﺩ ﻟﻤﺩﻴﻨﺔ ﺍﻟﻤﺘﻭﻟﺩﺓ ﺍﻟﺼﻠﺒﺔ ﺍﻟﺒﻠﺩﻴﺔ ﻨﻔﺎﻴﺎﺕ ﻤﻌﺩل ﺘﺨﻤﻴﻥ ﺍﻟﺨﻼﺼﺔ ﺴﻨﻭﺍﺕ ﺨﻤﺱ ﻟﻔﺘﺭﺓ ﺒﻐﺩﺍﺩ ﻟﻤﺩﻴﻨﺔ ﺍﻟﻤﺘﻭﻟﺩﺓ ﺍﻟﺼﻠﺒﺔ ﺍﻟﺒﻠﺩﻴﺔ ﻨﻔﺎﻴﺎﺕ ﻤﻌﺩل ﺘﺨﻤﻴﻥ ﺘﻡ ﺍﻟﺩﺭﺍﺴﺔ، ﻫﺫﻩ ﻓﻲ) ﻋﺎﻡ ﻤﻥ2006 ﻋﺎﻡ ﺇﻟﻰ2010 ( ﺍﻟـﺼﺤﻲ ﺍﻟﻁﻤـﺭ ﻤﻭﻗﻊ ﻻﺸﺘﻐﺎل ﻤﺩﺓ ﺍﻗل ﻴﻌﺘﺒﺭ ﻭﺍﻟﺫﻱ. ﺍﺴـﺘﺨﺩﻤﺕ ﺍﻟﻤ ﻨﻅﻡ ﺘﻘﻨﻴﺎﺕ ﺍﻟﻌـﺸﺭ ﺒﻠـﺩﻴﺎﺘﻬﺎ ﻤﻥ ﻜل ﻤﺴﺎﺤﺔ ﻹﻴﺠﺎﺩ ﺒﻐﺩﺍﺩ ﻟﻤﺩﻴﻨﺔ ﺨﺎﺭﻁﺔ ﻹﻋﺩﺍﺩ ﺍﻟﺠﻐﺭﺍﻓﻴﺔ ﻌﻠﻭﻤﺎﺕ ﺍﻟﺠﻐﺭﺍﻓﻲ ﻭﺘﻭﺯﻴﻌﻬﺎ. ﺩﺭﺍﺴﺎﺕ ﻤﻥ ﺒﻠﺩﻴﺔ ﻟﻜل ﺒﻐﺩﺍﺩ ﻤﺩﻴﻨﺔ ﻓﻲ ﻭﻜﺜﺎﻓﺘﻬﻡ ﺴﻜﺎﻥ ﻤﻥ ﺍﻟﻤﺘﻤﺩﻨﻴﻥ ﻋﺩﺩ ﺇﻴﺠﺎﺩ ﺘﻡ ﺍﻟﺴﻜﺎﻥ ﺘﻭﻗﻌﺎﺕ. ﺍﻟﻤﻨﺯﻟـﻲ ﺍﻟﻨﺎﺘﺞ ﻭﺘﻐﻴﺭ ﺍﻟﺴﻜﺎﻨﻴﺔ ﻟﻠﺜﺭﻭﺓ ﺍﻻﻗﺘﺼﺎﺩﻴﺔ ﺍﻟﺩﺭﺍﺴﺎﺕ ﻋﻠﻰ ﻭﺍﻋﺘﻤﺎﺩﺍ ﺍﻹﺠﻤـﺎﻟﻲ ﺇﻟﻰ ﺘﺼل ﻗﺩ ﻭﺍﻟﺘﻲ ﺍﻟﻔﻘﺭ ﻨﺴﺏ ﻭﺍﻋﺘﻤﺎﺩ40 % ﻤﺨﺘﻠﻔـﺔ ﻤﺘﻭﻟـﺩﺓ ﻨﻔﺎﻴﺎﺕ ﻤﻌﺩ ﺍﺨﺫ ﺘﻡ ﺍﻟﺒﻠﺩﻴﺎﺕ، ﺒﻌﺽ ﻓﻲ ﺒـﻴﻥ ﻟﺘﺘﺭﺍﻭﺡ ﻓﺭﻀﺕ ﻭﺍﻟﺘﻲ ﺒﻠﺩﻴﺔ ﻟﻜل0,3 ﻭ0,8 ﻜﻐـﻡ/ ﺸـﺨﺹ/ ﻴـﻭﻡ. ﻗﻴﻤـﺔ ﻭﺍﺴـﺘﻨﺘﺠﺕ0,63 ﻜﻐﻡ/ ﺸﺨﺹ/ ﻟﻠﻌﺎﻡ ﻴﻭﻡ2006 ﺼﺎﻓﻲ ﻜﻤﻌﺩل ﺘﺯﺩﺍﺩ ﻭﺍﻟﺘﻲ) ﺍﻨﺨﻔـﺎﺽ ﻤﻌـﺩل ﻤﻨﻪ ﻤﻁﺭﻭﺡ ﺍﻟﻨﻤﻭ ﻤﻌﺩل ﺍﻟ ﻨﻔﺎﻴﺎﺕ( ﺒﺤﻭﺍﻟﻲ ﻤﺭﺘﻘﺏ ﺇﺠﻤﺎﻟﻲ ﻤﻨﺯﻟﻲ ﻟﻨﺎﺘﺞ4 % ﺇﻟﻰ ﻟﻴﺼل ﻋﺎﻡ ﻟﻜل0,74 ﻜﻐﻡ/ ﺸﺨﺹ/ ﺍﻟﻌﺎﻡ ﻓﻲ ﻴﻭﻡ2010 . ﺍﻟﺩﺨل ﻤﺘﻭﺴﻁﺔ ﺍﻟﺩﻭل ﺨﺎﻨﺔ ﻓﻲ ﺍﻟﻌﺭﺍﻕ ﻭﻀﻌﺕ ﺃﺨﺭﻯ، ﺩﻭل ﺩﺭﺍﺴﺎﺕ ﻤﻊ ﺍﻟﺘﺨﻤﻴﻥ ﻫﺫﺍ ﻤﻘﺎﺭﻨﺔ. 1-Introduction Municipal Solid Waste (MSW) is usually expressed in terms of kilograms per capita per day. The unit of measure is easily applicable for household waste where the per capita value can be directly multiplied by the population to obtain the total amount. In the case of MSW of urban areas, household wastes constitute the largest percentage of waste types. It is for this reason that the unit of kilograms per capita per day is adopted. In the case of the other waste types such as industrial, hospital, commercial municipal services or institution waste, the relation is not direct. Industrial PDF created with pdfFactory Pro trial version www.pdffactory.com
-
Upload
khangminh22 -
Category
Documents
-
view
1 -
download
0
Transcript of Estimation of Baghdad Municipal Solid Waste Generation Rate

,20091.No, 27.Vol,Journal . Tech& . Eng
*Building and Construction Engineering Department./University of Technology / Baghdad
Estimation of Baghdad Municipal Solid Waste Generation Rate
Dr. Adnan A. Alsamawi*, Dr. Abdul Razzak T. Zboon* &Dr. Aumar Alnakeeb*
Received on: 12/3/2008 Accepted on:7/8/2008
Abstract Generally In this paper, Baghdad Municipal Solid Waste (MSW) Generate for
five years period (from year 2006 to year 2010). This Period are estimated as a minimum duration of landfill site operation time. Geographic Information System (GIS) technique are used to prepare digital map of Baghdad city to determine all of Baghdad ten districts areas and its geographic distribution. Population size forecasting are interpolated to find urban population size of each district and its population density. Depending on economic studies of population wealth variation of Gross Domestic Product (GDP) and the adopted percentage of the chronically poor population in Baghdad which could reach 40% in some districts, the individual waste generation rates of each districts are assumed to ranged between 0.3 and 0.8 kg/capita/day. A value of 0.63 kg/capita/day is concluded for the year 2006 and increase it at a net rate (growth rate less waste reduction rate) of the expected GDP increase of 4% per year to reach 0.74 kg/capita/day in year 2010. Comparison between the obtained estimation with other studies for other countries, puts Iraq in class of middle income countries. Keywords: Municipal Solid Waste; Landfill; Generation Rate; Population; GIS.
تخمين معدل نفايات البلدية الصلبة المتولدة لمدينة بغداد
الخالصةفي هذه الدراسة، تم تخمين معدل نفايات البلدية الصلبة المتولدة لمدينة بغداد لفترة خمس سنوات
اسـتخدمت . والذي يعتبر اقل مدة الشتغال موقع الطمـر الـصحي ) 2010 إلى عام 2006من عام (علومات الجغرافية إلعداد خارطة لمدينة بغداد إليجاد مساحة كل من بلـدياتها العـشر تقنيات نظم الم
تم إيجاد عدد المتمدنين من سكان وكثافتهم في مدينة بغداد لكل بلدية من دراسات . وتوزيعها الجغرافي اإلجمـالي واعتمادا على الدراسات االقتصادية للثروة السكانية وتغير الناتج المنزلـي . توقعات السكان
في بعض البلديات، تم اخذ معد نفايات متولـدة مختلفـة % 40واعتماد نسب الفقر والتي قد تصل إلى 0,63واسـتنتجت قيمـة . يـوم /شـخص / كغـم 0,8 و 0,3لكل بلدية والتي فرضت لتتراوح بـين
معدل النمو مطروح منه معـدل انخفـاض ( والتي تزداد كمعدل صافي 2006يوم للعام /شخص/كغميوم في العام /شخص/ كغم 0,74لكل عام ليصل إلى % 4لناتج منزلي إجمالي مرتقب بحوالي ) نفاياتال
.مقارنة هذا التخمين مع دراسات دول أخرى، وضعت العراق في خانة الدول متوسطة الدخل . 2010
1-Introduction
Municipal Solid Waste (MSW) is usually expressed in terms of kilograms per capita per day. The unit of measure is easily applicable for household waste where the per capita value can be directly multiplied by the population to obtain the total amount. In the case of MSW
of urban areas, household wastes constitute the largest percentage of waste types. It is for this reason that the unit of kilograms per capita per day is adopted. In the case of the other waste types such as industrial, hospital, commercial municipal services or institution waste, the relation is not direct. Industrial
PDF created with pdfFactory Pro trial version www.pdffactory.com
Eng.& Tech. Journal ,Vol.27, No.1,2009 Estimation of Baghdad Municipal Solid Waste Generation Rate
waste is usually expressed as a percentage of the production [1].
Hospital waste is usually expressed as a weight per hospital bed. Commercial waste is often expressed per employee and municipal services wastes are usually expressed in terms of kilometers of roadways. When the objective is to develop an assessment for estimating the total amount of MSW reach the landfill sites, the waste quantities generated from non-household sources are back calculated in order to be expressed as a function of the population serviced. Another method is to increase the amount of household waste by the pro-rata of the waste from other sources in order to obtain an easily comparable unit of measure [2]. 2. City Survey
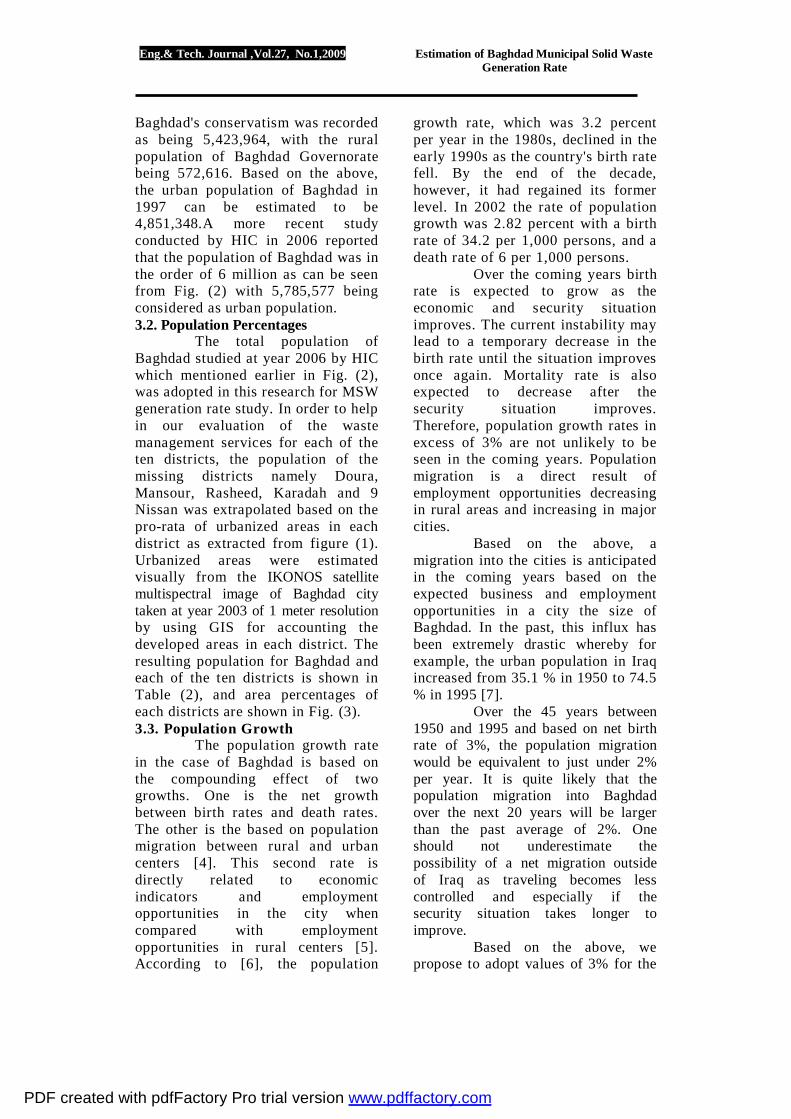
The city of Baghdad was divided into ten districts, five districts on the east bank of the Tigris River {Al-Rusafa} which are: Adhamiyah, Rusafa, Sader, 9 Nissan and Karadah; and others five on the west bank {Al-Karakh} which are: Kadhimiyah, Mansour, Karakh, Doura and Rasheed. These ten districts are further subdivided into many neighborhoods. As a part of this study, digital map of Baghdad city is prepared by the implementation of Geographic Information System (GIS) to show layers of: urbanized area, industrial areas, trade centers, hospitals, main and sub roads, wet lands, streams and channels, railway, airports, palaces, camps, high voltage power lines, gardens, agricultural lands, transfer stations, municipality garages, name of neighborhoods, and sector numbers. Resources of collected data obtained from visual survey, IKONOS multispectral image of 1 m resolution taken at 2003, Baghdad mayoralty information, and maps of Degenerative Iraqi Armed Agencies /
Military Survey Directorate (DIAA / MSD). Geometry corrections images and maps are done with an average error less than 0.2 m. The digital map produced of Baghdad City is shown in Fig. (1) in scale of 1:120,000 proportion to layout paper size.
According to this digital map produced, Baghdad city covers the area of about 670 km2. Its ten districts areas obtained from the prepared digital map, and some of district neighborhood named are presented in Table (1). 3. Population Estimation
The population of Baghdad is a key element in the assessment of the quantities of solid waste generated. One method for estimating the total amount of solid waste generated is to rely on published data for countries with similar socio-economic indicators and obtain the amount of waste per capita per day. This number multiplied by the population being studied can provide the total amount of the generated waste. As can be expected, data on the population of Baghdad is not readily available and the data obtained is often either contradictory or at least not converging to the same value. The variation in the number could be caused by the change in the demographic map of Iraq (birth rate, death rate, population migration) over the last two to three decades with the Iran-Iraq war, the Gulf War, the UN Embargo period and the more recent events of 2003 and after [3]. Addition to the communalism combat done latter to closely control on Baghdad which made political mean deform all population statistics. 3.1. Population Size
According to the Humanitarian Information Center for Iraq (HIC) [3], a census conducted on October 16, 1997 indicated that the total population of Iraq was around 22 millions. The total population of
PDF created with pdfFactory Pro trial version www.pdffactory.com
Eng.& Tech. Journal ,Vol.27, No.1,2009 Estimation of Baghdad Municipal Solid Waste Generation Rate
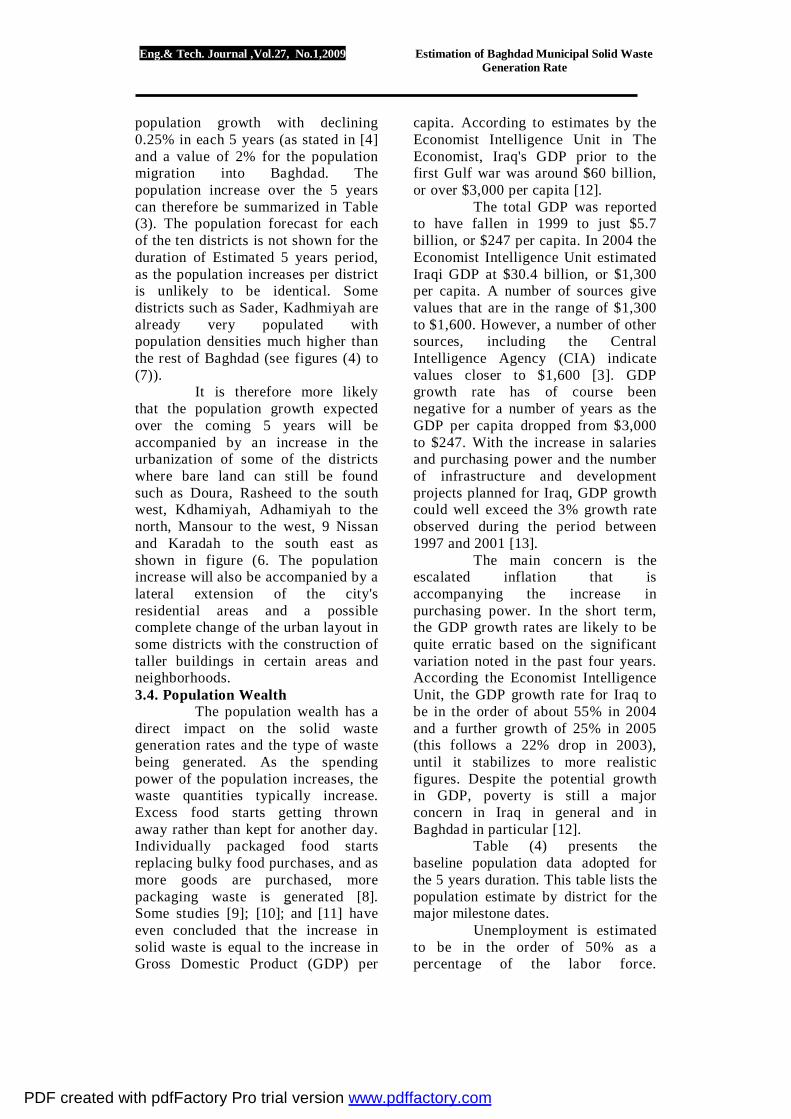
Baghdad's conservatism was recorded as being 5,423,964, with the rural population of Baghdad Governorate being 572,616. Based on the above, the urban population of Baghdad in 1997 can be estimated to be 4,851,348.A more recent study conducted by HIC in 2006 reported that the population of Baghdad was in the order of 6 million as can be seen from Fig. (2) with 5,785,577 being considered as urban population. 3.2. Population Percentages
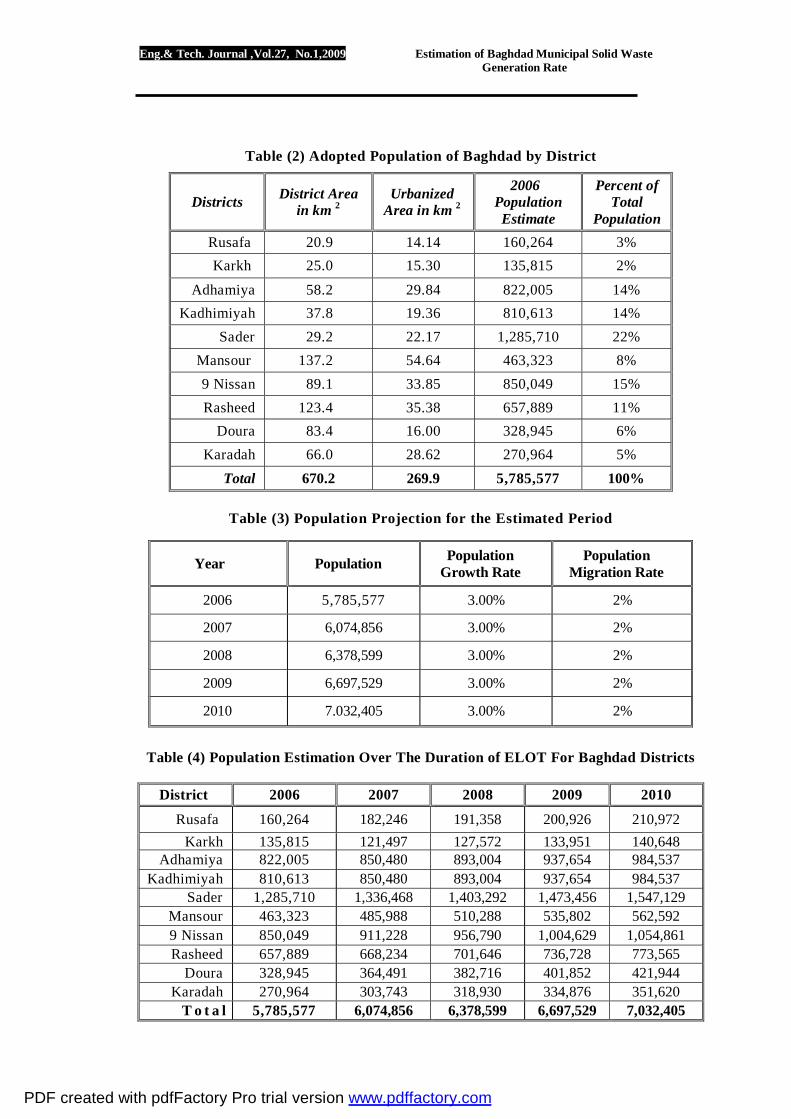
The total population of Baghdad studied at year 2006 by HIC which mentioned earlier in Fig. (2), was adopted in this research for MSW generation rate study. In order to help in our evaluation of the waste management services for each of the ten districts, the population of the missing districts namely Doura, Mansour, Rasheed, Karadah and 9 Nissan was extrapolated based on the pro-rata of urbanized areas in each district as extracted from figure (1). Urbanized areas were estimated visually from the IKONOS satellite multispectral image of Baghdad city taken at year 2003 of 1 meter resolution by using GIS for accounting the developed areas in each district. The resulting population for Baghdad and each of the ten districts is shown in Table (2), and area percentages of each districts are shown in Fig. (3). 3.3. Population Growth
The population growth rate in the case of Baghdad is based on the compounding effect of two growths. One is the net growth between birth rates and death rates. The other is the based on population migration between rural and urban centers [4]. This second rate is directly related to economic indicators and employment opportunities in the city when compared with employment opportunities in rural centers [5]. According to [6], the population
growth rate, which was 3.2 percent per year in the 1980s, declined in the early 1990s as the country's birth rate fell. By the end of the decade, however, it had regained its former level. In 2002 the rate of population growth was 2.82 percent with a birth rate of 34.2 per 1,000 persons, and a death rate of 6 per 1,000 persons.
Over the coming years birth rate is expected to grow as the economic and security situation improves. The current instability may lead to a temporary decrease in the birth rate until the situation improves once again. Mortality rate is also expected to decrease after the security situation improves. Therefore, population growth rates in excess of 3% are not unlikely to be seen in the coming years. Population migration is a direct result of employment opportunities decreasing in rural areas and increasing in major cities.
Based on the above, a migration into the cities is anticipated in the coming years based on the expected business and employment opportunities in a city the size of Baghdad. In the past, this influx has been extremely drastic whereby for example, the urban population in Iraq increased from 35.1 % in 1950 to 74.5 % in 1995 [7].
Over the 45 years between 1950 and 1995 and based on net birth rate of 3%, the population migration would be equivalent to just under 2% per year. It is quite likely that the population migration into Baghdad over the next 20 years will be larger than the past average of 2%. One should not underestimate the possibility of a net migration outside of Iraq as traveling becomes less controlled and especially if the security situation takes longer to improve.
Based on the above, we propose to adopt values of 3% for the
PDF created with pdfFactory Pro trial version www.pdffactory.com
Eng.& Tech. Journal ,Vol.27, No.1,2009 Estimation of Baghdad Municipal Solid Waste Generation Rate
population growth with declining 0.25% in each 5 years (as stated in [4] and a value of 2% for the population migration into Baghdad. The population increase over the 5 years can therefore be summarized in Table (3). The population forecast for each of the ten districts is not shown for the duration of Estimated 5 years period, as the population increases per district is unlikely to be identical. Some districts such as Sader, Kadhmiyah are already very populated with population densities much higher than the rest of Baghdad (see figures (4) to (7)).
It is therefore more likely that the population growth expected over the coming 5 years will be accompanied by an increase in the urbanization of some of the districts where bare land can still be found such as Doura, Rasheed to the south west, Kdhamiyah, Adhamiyah to the north, Mansour to the west, 9 Nissan and Karadah to the south east as shown in figure (6. The population increase will also be accompanied by a lateral extension of the city's residential areas and a possible complete change of the urban layout in some districts with the construction of taller buildings in certain areas and neighborhoods. 3.4. Population Wealth
The population wealth has a direct impact on the solid waste generation rates and the type of waste being generated. As the spending power of the population increases, the waste quantities typically increase. Excess food starts getting thrown away rather than kept for another day. Individually packaged food starts replacing bulky food purchases, and as more goods are purchased, more packaging waste is generated [8]. Some studies [9]; [10]; and [11] have even concluded that the increase in solid waste is equal to the increase in Gross Domestic Product (GDP) per
capita. According to estimates by the Economist Intelligence Unit in The Economist, Iraq's GDP prior to the first Gulf war was around $60 billion, or over $3,000 per capita [12].
The total GDP was reported to have fallen in 1999 to just $5.7 billion, or $247 per capita. In 2004 the Economist Intelligence Unit estimated Iraqi GDP at $30.4 billion, or $1,300 per capita. A number of sources give values that are in the range of $1,300 to $1,600. However, a number of other sources, including the Central Intelligence Agency (CIA) indicate values closer to $1,600 [3]. GDP growth rate has of course been negative for a number of years as the GDP per capita dropped from $3,000 to $247. With the increase in salaries and purchasing power and the number of infrastructure and development projects planned for Iraq, GDP growth could well exceed the 3% growth rate observed during the period between 1997 and 2001 [13].
The main concern is the escalated inflation that is accompanying the increase in purchasing power. In the short term, the GDP growth rates are likely to be quite erratic based on the significant variation noted in the past four years. According the Economist Intelligence Unit, the GDP growth rate for Iraq to be in the order of about 55% in 2004 and a further growth of 25% in 2005 (this follows a 22% drop in 2003), until it stabilizes to more realistic figures. Despite the potential growth in GDP, poverty is still a major concern in Iraq in general and in Baghdad in particular [12].
Table (4) presents the baseline population data adopted for the 5 years duration. This table lists the population estimate by district for the major milestone dates.
Unemployment is estimated to be in the order of 50% as a percentage of the labor force.
PDF created with pdfFactory Pro trial version www.pdffactory.com

Eng.& Tech. Journal ,Vol.27, No.1,2009 Estimation of Baghdad Municipal Solid Waste Generation Rate
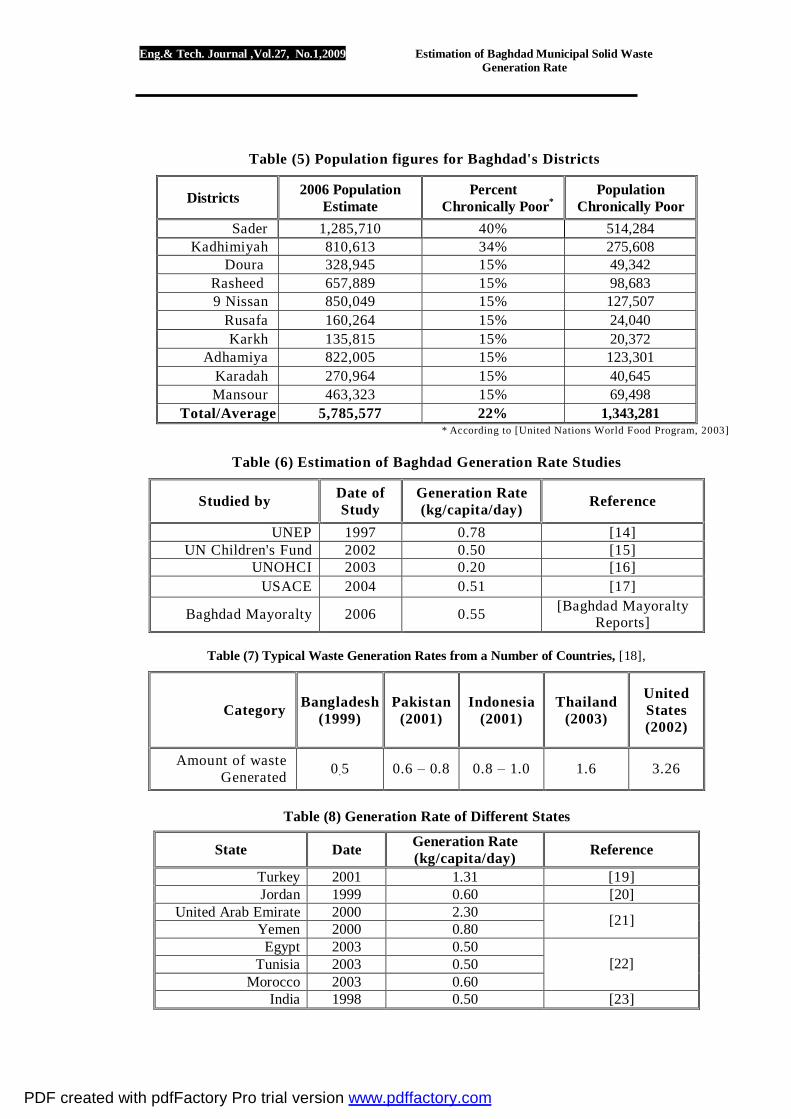
According to the [14], the percentage of the chronically poor population in Baghdad could reach 40% in some districts, with the wealthier districts having about 15% of the population chronically poor. The results of this study for Baghdad's ten districts are presented in the table (5). 4. Waste Generation Rate
4.1. Published Data Estimates A review of published data
on solid waste generation rate applicable to Iraq has revealed the table (6). 4.2. Comparison with International
Waste Generation Rater In the present state, daily
per capita generation of MSW is much lower in developing countries than in developed countries. Differences also arise between high and low income countries in terms of waste composition and physical characteristics of wastes.
Table (7) shows the difference in these items between the developed and developing countries [18]. Data from nearby and other countries are presented in the subsequent sections.
Another examples of generation rate in many neighbors states and countries with similar socio-economic indicators are illustrate in table (8).
According to [24]. The amount of solid waste generated per person and per day in least developed Asian countries in the order of kg/capita/day are shown in Fig. (8). 4.3. Variation With Income Level Typically low-income countries have the lowest percentage of urban populations and the lowest waste generation rates, ranging between 0.1 to 0.5 kg per capita per day [25]. Countries that have a Gross National Product (GNP) per capita less than US $400 produce under 0.5 kg per capita per day[26]. As GNP increases toward the middle-income
range, the per capita urban waste generation rates also increase, ranging from 0.5 to 1.1 kg per day. As predicted, the high-income countries show the greatest urban waste generation rates, typically
above 1.1 kg per capita per day. A study presented by [29]
evaluated the solid waste composition and rates in accordance with the income level of selected countries. Three categories were presented, namely low income, medium-income, and industrialized countries. Countries were categorized according to their mean annual income per capita: • Low income countries were
selected as those countries with less than US$400 mean annual income per capita.
• Middle-income countries were selected as those countries whose mean annual income per capita was between US$400 and US$3,500.
• Industrialized countries were selected as those countries whose mean annual income per capita exceeded US$3,500. The following classification was obtained.
4.4. Waste Generation Rate
This waste generation rate is then multiplied by the population serviced to obtain a total tonnage of waste generated by a neighborhood, a district or the entire City of Baghdad for a given period of time. Although the aim is to arrive at a single value for the waste generation rate per capita per day, it should be stressed that there are inherent day-to-day variations in such values even at the level of each individual, who does not discard the same amount of refuse every day [Baghdad Mayoralty Records]. Nevertheless, the generation rate is a useful planning guide and tool [28].
PDF created with pdfFactory Pro trial version www.pdffactory.com
Eng.& Tech. Journal ,Vol.27, No.1,2009 Estimation of Baghdad Municipal Solid Waste Generation Rate
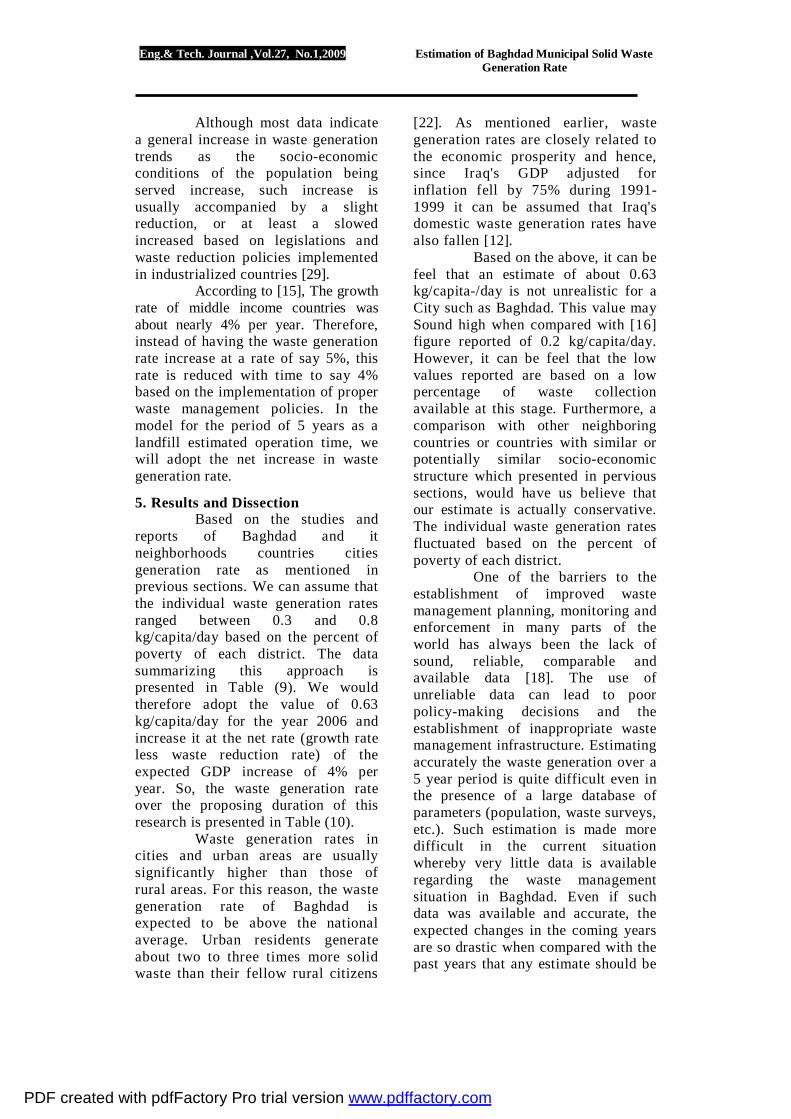
Although most data indicate a general increase in waste generation trends as the socio-economic conditions of the population being served increase, such increase is usually accompanied by a slight reduction, or at least a slowed increased based on legislations and waste reduction policies implemented in industrialized countries [29].
According to [15], The growth rate of middle income countries was about nearly 4% per year. Therefore, instead of having the waste generation rate increase at a rate of say 5%, this rate is reduced with time to say 4% based on the implementation of proper waste management policies. In the model for the period of 5 years as a landfill estimated operation time, we will adopt the net increase in waste generation rate.
5. Results and Dissection Based on the studies and
reports of Baghdad and it neighborhoods countries cities generation rate as mentioned in previous sections. We can assume that the individual waste generation rates ranged between 0.3 and 0.8 kg/capita/day based on the percent of poverty of each district. The data summarizing this approach is presented in Table (9). We would therefore adopt the value of 0.63 kg/capita/day for the year 2006 and increase it at the net rate (growth rate less waste reduction rate) of the expected GDP increase of 4% per year. So, the waste generation rate over the proposing duration of this research is presented in Table (10).
Waste generation rates in cities and urban areas are usually significantly higher than those of rural areas. For this reason, the waste generation rate of Baghdad is expected to be above the national average. Urban residents generate about two to three times more solid waste than their fellow rural citizens
[22]. As mentioned earlier, waste generation rates are closely related to the economic prosperity and hence, since Iraq's GDP adjusted for inflation fell by 75% during 1991-1999 it can be assumed that Iraq's domestic waste generation rates have also fallen [12].
Based on the above, it can be feel that an estimate of about 0.63 kg/capita-/day is not unrealistic for a City such as Baghdad. This value may Sound high when compared with [16] figure reported of 0.2 kg/capita/day. However, it can be feel that the low values reported are based on a low percentage of waste collection available at this stage. Furthermore, a comparison with other neighboring countries or countries with similar or potentially similar socio-economic structure which presented in pervious sections, would have us believe that our estimate is actually conservative. The individual waste generation rates fluctuated based on the percent of poverty of each district.
One of the barriers to the establishment of improved waste management planning, monitoring and enforcement in many parts of the world has always been the lack of sound, reliable, comparable and available data [18]. The use of unreliable data can lead to poor policy-making decisions and the establishment of inappropriate waste management infrastructure. Estimating accurately the waste generation over a 5 year period is quite difficult even in the presence of a large database of parameters (population, waste surveys, etc.). Such estimation is made more difficult in the current situation whereby very little data is available regarding the waste management situation in Baghdad. Even if such data was available and accurate, the expected changes in the coming years are so drastic when compared with the past years that any estimate should be
PDF created with pdfFactory Pro trial version www.pdffactory.com

Eng.& Tech. Journal ,Vol.27, No.1,2009 Estimation of Baghdad Municipal Solid Waste Generation Rate
adopted with caution and regularly updated.
The values indicated are overall average values. Variation in the waste generation rates is expected by district, by income level, by season (especially fruit and vegetable waste) and over time. Values for the populations and therefore overall values for total daily waste generation are dependent on the accuracy of the population estimates.
Solid waste generation and composition in Baghdad (like other countries) is typically affected by population growth, urbanization, improved economic conditions, improved collection service, changes in lifestyles, social and cultural habits, social development, income class composition, and diffusion of technical competence [30]. Improvements in incomes of the urban employed would lead to a change in consumption patterns whereas the emphasis would shift to packaged products, which tend to produce large amounts of litter such as plastics, tins, and bottles. External factors such as economic growth, recession, legislations, and wars are among the factor that could very easily change the predictions. The data has to be continuously re-evaluated and corrected in order to ensure as accurate an estimate as possible. 6. Conclusions 1. The value of 0.63 kg/capita/day is
adopted for the year 2006 and it increases at the net rate (growth rate less waste reduction rate) of the expected GDP increase of 4% per year. And, 0.66, 0.68, 0.71 and 0.74 kg/capita/day for years 2007, 2008, 2009, and 2010 respectively.
2. Adopted generation rate value of 0.63 kg/capita/day predicted based on full collection of Baghdad MSW.
3. With 5,785,577 population size in year 2006, daily waste generated about 3,645 tons/day and about 1,330,393 ton generated per year. With population growth reaching about 7,032,405 at 2010, expected waste generation of 5,204 ton per day and about 1,899,453 ton is generated in this year.
4. The predicted values of generation rate indicated are overall average values. Variation in the waste generation rates is expected by district, by income level, by season (especially fruit and vegetable waste) and over time. Values for the populations and therefore overall values for total daily waste generation are dependent on the accuracy of the population estimates.
5. Comparison of Baghdad MSW composition and generation rate with other studies of other countries, puts Iraq in class of middle income countries.
7. References [1] International Bank of Reconstruction and Development (IBRD), May 1999. “What a Waste: Solid Waste Management In Asia”. Washington; USA. [2] Nickolas J. Themelis And Scott M. Kaufman, October 2004. “Solid Waste Generation And Management In The US”. ISWA, USA. [3] CIA, 2003. “The World Fact Book”. http://www.umsl.edu/services/govdocs/wofact2003/index.html [4] Humanitarian Information Center for Iraq (HIC), 2006. “Iraq Population Forecasting for Year 2005”. Ministry of Planning and Development Cooperation, Iraq. [5] Indian Statistical Institute (ISI), 2003. “Variance In Municipal Solid Waste Generation Rate”. India. [6] CIA, 2002. “Iraq CIA World Fact book 2002 Import”. http://wikitravel.org/en/Talk:Iraq/CIA_World_Factbook_2002_import
PDF created with pdfFactory Pro trial version www.pdffactory.com

Eng.& Tech. Journal ,Vol.27, No.1,2009 Estimation of Baghdad Municipal Solid Waste Generation Rate
[7] United Nation Office Of Humanitarian Coordination Of Iraq (UNOHCI), June 2003. “Iraq Situation Report”. [8] Nickolas J. Themelis And Scott M. Kaufman, October 2004. “Solid Waste Generation And Management In The US”. ISWA, USA. [9] Environmental Protection Agency (EPA), 2001. “Characterization of Municipal Solid Waste in The United States:1995Upsate”. Washington, USA. [10] Oladele Osibanjo, December 2006. “Waste Challenge In Urban Development”. University Of Ibadan; Nigeria. [11] Inter-American Development Bank, August 2004. “Georgetown Solid Waste Management Pregame Sponsored”. Environmental and Social impact report. [12] Jonathan E. Sanford, June 2003. “Iraq’s Economy: Past, Present, Future”. Report for Congress, Received through the CRS Web. Foreign Affairs, Defense, And Trade Division. [13] Worldpress.org, July 2007. “Iraq: Facts”. http://www.worldpress.org/profiles/Iraq.cfm [14] United Nations Environmental Programme (UNEP), October 2003. “Environment In Iraq: UNEP Progress Report”. United Nations Environmental Programme. [15] United Nation Population Division, 2002. “World Urbanization Prospects; The 2000 Revision Data Table And Highlights”. New York; United Nation. [16] United Nation Office Of Humanitarian Coordination Of Iraq (UNOHCI), July 2003. “Iraq Weekly Update”. [17] United States Corp of Engineers (USACE), 2004."Baghdad Solid Waste Situation Report". [18] Christian Zurbrugg, November 2002. “Urban Solid Waste Management in Low-Income Countries Of Asia: How To Cope With The Garbage Crisis”. Scientific Committee On Problems Of
Environment (SCOPE), Durban; South Africa. [19] Turkey State Institute of Statistics, December 2001. “Estimation Of Solid Waste Generation Rate In Urbanize Area”. Ankara; Turkey. [20] Atiyat N., and M. Mosa, 1999. “Environmental Impact Assessment For Domestic Solid Waste Landfill Project”. Environmental Research center, Royal Scientific Society, Amman; Jordan. [21] United Nation Environmental Program (UNEP), March 2000. “State of The Environment of Western Asia - Urban Areas”. [22] African Studies Association Of Austrasia and the Pacific, 2003. “Globalization, Urbanization And Municipal Solid Waste Management In Africa”. Eric Achankeng, University Of Adelaide. [23] Ministry of Environment And Forests, 1998. “Sustainable Development Study Of Urbanized Area”. New Delhi, India. [24] Ulrich Glawe, C. Visvanathan, and M. Alamgir, 2005. “Solid Waste Management In Least Developed Asian Countries: A Comparative Analysis”. Asian Institute Of Technology, Pathumathni; Thailand. [25] Olar Zerbock, April 2003. “Urban Solid Waste Management: Waste Reduction In Developing Nation”. Michigan Technology University; USA. [26] Christian Zurbrugg, November 2002. “Urban Solid Waste Management in Low-Income Countries Of Asia: How To Cope With The Garbage Crisis”. Scientific Committee On Problems Of Environment (SCOPE), Durban; South Africa. [29] World Bank, 1999. “Entitled Solid Waste Management In Asia”. (PDF part3). [28] Salequzzman MD., Umme Tania Sultana, MD. Ahasanul Hoque; 2006. “Ecological Footprint Of Waste Generation: A Sustainable Tool For Solid Waste Management Of Khulna
PDF created with pdfFactory Pro trial version www.pdffactory.com

Eng.& Tech. Journal ,Vol.27, No.1,2009 Estimation of Baghdad Municipal Solid Waste Generation Rate
City Corporation Of Bangladesh”. Murdoch University; Australia. [29] Solid Waste Association Of North America (SWANA), January 2003. “Pushing The Envelope On Waste Reduction And Recovery”. USA. [30] Eurostat database, 2002. “Regarding Manufacturing Waste Generated Per Capita in The Eastern Europe”. The Caucasus and Central Asia (EECCA) region (an oil producing region).
Table (1), Baghdad’s Ten Districts and Its Neighborhoods
District Neighborhood
Adhamiyah (58 km 2)
Adhamiyah, Krai'at, Maghreb, Qahira, Sumer, Shaab, Tunis. Ur, Waziriya, Shamasiya, Seida, Bnowk, Camp.
Rusafa (21 km2)
Abu Nuwas, Al Saadoon, Hay 14 July, Idrissi, Khulani, Shorgea, Altib, Mustansiriya, Nile, Orphalia, Bataween, Sheikh Omar, Sinak. Al-Rasheed,
Al-Ulum, Jumhiya, Nidal. Sader
(29 km2) Jamila, Ishbilya, Sader City(1), Sader City(2), Sader City(3), Sader City(4)
9 Nissan (89 km2)
Fedhailia, Kamaliya, Ghadeer, Baladiat, Mashta, Amin, Rustomiya, Muthanna, Zayonna, Baghdad Al-Jadidah, Obaydi, Sumer, Nasb Al-Shahid
Karadah (66 km2)
6 Kanun, Camp Sarah, Rasheed Airport, Zafraniya, Karadah In. Karada outh, Arasat, Masbah, Alwiya Hay A1-Wehda, Sindabad Zuwiya, Jadiriya, Riyadh,
Babil, Jami’a Kadhimiyah
(38 km 2) Ali AI-Saleh, Salaam, Hibna, Hurriyah, Kadimiyah, Sho’la, Nur, Mohit,
Fajer, Utifiya Karkh
(25 km2) Karkh, A1-Kindi, Harithiya, Karadat Maryam, Muthanna Airport, Salhia,
Hayfa, Sheik Maaruf, President Complex, Zawra Park, Sheikh Junaid
Mansour (137km2)
14 Ramadhan, Al Ghazaliya, A1 Khadhra'a, AI Jamia'a, Al- Yarmuk, A1-Adil, Baghdad International Airport, Abu Ghrib Road, Iskan, Mansour,
Dragh, Baghdad International Fair, Qadissiya, Safarat, Kafa'at, Washash, Andlus, Hateen, Ameriya, Abu Ghuraib Palace
Rasheed (123 km2)
Baiyaa, A’alam, Shurta, Saydiyah, Shohada’a, Radwaniyah, Shabab, Ma’alef, Furat, Amel, Jihad, Resala, Radwaniyah, Radwaniyah Palace
Doura (83 km2)
Doura, Masafa Al-Doura, Zubaida, Abu Dsheir, Hadar, Jaza’ir, Jazeera, Masafee, Arab Jbour, Albu Aitha, Gareb Degela.
PDF created with pdfFactory Pro trial version www.pdffactory.com
Eng.& Tech. Journal ,Vol.27, No.1,2009 Estimation of Baghdad Municipal Solid Waste Generation Rate
Table (2) Adopted Population of Baghdad by District
Districts District Area in km 2
Urbanized Area in km 2
2006 Population Estimate
Percent of Total
Population Rusafa 20.9 14.14 160,264 3% Karkh 25.0 15.30 135,815 2%
Adhamiya 58.2 29.84 822,005 14% Kadhimiyah 37.8 19.36 810,613 14%
Sader 29.2 22.17 1,285,710 22% Mansour 137.2 54.64 463,323 8% 9 Nissan 89.1 33.85 850,049 15% Rasheed 123.4 35.38 657,889 11%
Doura 83.4 16.00 328,945 6% Karadah 66.0 28.62 270,964 5%
Total 670.2 269.9 5,785,577 100%
Table (3) Population Projection for the Estimated Period
Year Population Population Growth Rate
Population Migration Rate
2006 5,785,577 3.00% 2%
2007 6,074,856 3.00% 2%
2008 6,378,599 3.00% 2%
2009 6,697,529 3.00% 2%
2010 7.032,405 3.00% 2%
Table (4) Population Estimation Over The Duration of ELOT For Baghdad Districts
District 2006 2007 2008 2009 2010
Rusafa 160,264 182,246 191,358 200,926 210,972 Karkh 135,815 121,497 127,572 133,951 140,648
Adhamiya 822,005 850,480 893,004 937,654 984,537 Kadhimiyah 810,613 850,480 893,004 937,654 984,537
Sader 1,285,710 1,336,468 1,403,292 1,473,456 1,547,129 Mansour 463,323 485,988 510,288 535,802 562,592 9 Nissan 850,049 911,228 956,790 1,004,629 1,054,861 Rasheed 657,889 668,234 701,646 736,728 773,565
Doura 328,945 364,491 382,716 401,852 421,944 Karadah 270,964 303,743 318,930 334,876 351,620
T o t a l 5,785,577 6,074,856 6,378,599 6,697,529 7,032,405
PDF created with pdfFactory Pro trial version www.pdffactory.com
Eng.& Tech. Journal ,Vol.27, No.1,2009 Estimation of Baghdad Municipal Solid Waste Generation Rate
Table (5) Population figures for Baghdad's Districts
Districts 2006 Population Estimate
Percent Chronically Poor*
Population Chronically Poor
Sader 1,285,710 40% 514,284 Kadhimiyah 810,613 34% 275,608
Doura 328,945 15% 49,342 Rasheed 657,889 15% 98,683 9 Nissan 850,049 15% 127,507
Rusafa 160,264 15% 24,040 Karkh 135,815 15% 20,372
Adhamiya 822,005 15% 123,301 Karadah 270,964 15% 40,645 Mansour 463,323 15% 69,498
Total/Average 5,785,577 22% 1,343,281 * According to [United Nations World Food Program, 2003]
Table (6) Estimation of Baghdad Generation Rate Studies
Studied by Date of Study
Generation Rate (kg/capita/day) Reference
UNEP 1997 0.78 [14] UN Children's Fund 2002 0.50 [15]
UNOHCI 2003 0.20 [16] USACE 2004 0.51 [17]
Baghdad Mayoralty 2006 0.55 [Baghdad Mayoralty Reports]
Table (7) Typical Waste Generation Rates from a Number of Countries, [18],
Category Bangladesh (1999)
Pakistan (2001)
Indonesia (2001)
Thailand (2003)
United States (2002)
Amount of waste Generated 0.5 0.6 – 0.8 0.8 – 1.0 1.6 3.26
Table (8) Generation Rate of Different States
State Date Generation Rate (kg/capita/day) Reference
Turkey 2001 1.31 [19] Jordan 1999 0.60 [20]
United Arab Emirate 2000 2.30 Yemen 2000 0.80 [21]
Egypt 2003 0.50 Tunisia 2003 0.50
Morocco 2003 0.60 [22]
India 1998 0.50 [23]
PDF created with pdfFactory Pro trial version www.pdffactory.com

Eng.& Tech. Journal ,Vol.27, No.1,2009 Estimation of Baghdad Municipal Solid Waste Generation Rate
Table (9) Waste Generation Rate Calculation for Baghdad
District Population Percent
Chronically Poor
Waste Generation
Rate (kg/cap./day)
Daily Waste Generation (kg/day)
Sader 1,285,710 40% 0.30 385,713 Kadhimiyah 810,613 34% 0.35 283,715
Doura 328,945 15% 0.80 263,156 Rasheed 657,889 15% 0.80 526,311 9 Nissan 850,049 15% 0.80 680,039
Rusafa 160,264 15% 0.80 128,211 Karkh 135,815 15% 0.80 108,652
Adhamiya 822,005 15% 0.80 657,604 Karadah 270,964 15% 0.80 216,771
Mansour 463,323 15% 0.80 370,658 TOTAL 5,785,577 22% 0.63 3,620,831
. Table (10) Total Waste Generation Calculation for Baghdad
Year Waste Generation Rate (kg/capita/day)
Adopted Growth Rate
2006 0.63 4 % 2007 0.66 4 % 2008 0.68 4 % 2009 0.71 4 % 2010 0.74 4 %
Figure (1) Digital Map of Baghdad City
PDF created with pdfFactory Pro trial version www.pdffactory.com

Eng.& Tech. Journal ,Vol.27, No.1,2009 Estimation of Baghdad Municipal Solid Waste Generation Rate
Figure (2) Baghdad Population Estimation [4]
Figure (3) Area Percentages of Baghdad Districts
Figure (4) Urbanized Area Percentages of Baghdad Districts
PDF created with pdfFactory Pro trial version www.pdffactory.com

Eng.& Tech. Journal ,Vol.27, No.1,2009 Estimation of Baghdad Municipal Solid Waste Generation Rate
Figure (5) Population Percentages of Baghdad Districts
Figure (6) Percentage Of Urbanized Area Per Districts Area Of Baghdad City
Figure (7) Population Density of Baghdad Districts In 1000 Persons Per km2 of Urbanized
Area
PDF created with pdfFactory Pro trial version www.pdffactory.com

Eng.& Tech. Journal ,Vol.27, No.1,2009 Estimation of Baghdad Municipal Solid Waste Generation Rate
Figure (8) Solid waste generation rate in kg per capita per day in least developed
Asian countries, [24]
PDF created with pdfFactory Pro trial version www.pdffactory.com