Geoenvironmental site investigation using different techniques in a municipal solid waste disposal...
17
ORIGINAL ARTICLE Geoenvironmental site investigation using different techniques in a municipal solid waste disposal site in Brazil Giulliana Mondelli Heraldo Luiz Giacheti Maria Euge ˆ nia Gimenez Boscov Vagner Roberto Elis Jorge Hamada Received: 23 June 2006 / Accepted: 19 September 2006 / Published online: 8 November 2006 Ó Springer-Verlag 2006 Abstract Different geoenvironmental site investiga- tion techniques to assess contamination from a muni- cipal solid waste disposal site in Brazil are presented here. Superficial geophysical investigation (geoelectri- cal survey), resistivity piezocone penetration tests (RCPTU), soil samples collected with direct-push samplers and water samples collected from monitoring wells were applied in this study. The application of the geoelectrical method was indispensable to identify the presence and flow direction of contamination plumes (leachate) as well as to indicate the most suitable locations for RCPTU tests and soil and water sampling. Chemical analyses of groundwater samples contributed to a better understanding of the flow of the contami- nated plume. The piezocone presented some limita- tions for tropical soils, since the groundwater level is sometimes deeper than the layer which is impenetrable to the cone, and the soil genesis and unsaturated con- ditions affect soil behavior. The combined interpreta- tion of geoelectrical measurements and soil and water samplings underpinned the interpretation of RCPTU tests. The interpretation of all the test results indicates that the contamination plume has already overreached the landfill’s west-northwest borders. Geoenviron- mental laboratory test results suggest that contamina- tion from the solid waste disposal site has been developing gradually, indicating the need for continu- ous monitoring of the groundwater. Keywords Site investigation Tropical soils Electrical resistivity Piezocone test Contamination Introduction Municipal and industrial solid waste disposal sites have been the focus of special attention in recent years since they are a significant source of soil, water and air contamination. Unfortunately, waste is disposed, uncontrolled at many sites, where the restrictions im- posed by environmental agencies are disregarded and the rules and techniques for proper landfill manage- ment are ignored. According to the Brazilian Institute for Geography and Statistics (IBGE 2002), Brazil produces about 125,281 tons of municipal solid waste (MSW) per day, 30.5% of which are disposed off in garbage dumps, 22.3% in controlled dumps and 47.1% in sanitary landfills. Although, the selectiveness of garbage disposal has improved in recent years (in 1989, only G. Mondelli (&) Department of Geotechnical Engineering, University of Sa ˜o Paulo, Sa ˜o Carlos, SP, Brazil e-mail: [email protected] H. L. Giacheti J. Hamada Department of Civil Engineering, Sa ˜ o Paulo State University, Bauru, SP, Brazil e-mail: [email protected] J. Hamada e-mail: [email protected] M. E. G. Boscov Department of Structures and Geotechnical Engineering, University of Sa ˜o Paulo, Sa ˜o Paulo, SP, Brazil e-mail: [email protected] V. R. Elis Institute of Astronomy, Geophysics and Atmospheric Sciences, University of Sa ˜o Paulo, Sa ˜o Paulo, SP, Brazil e-mail: [email protected] 123 Environ Geol (2007) 52:871–887 DOI 10.1007/s00254-006-0529-1
Transcript of Geoenvironmental site investigation using different techniques in a municipal solid waste disposal...

ORIGINAL ARTICLE
Geoenvironmental site investigation using different techniquesin a municipal solid waste disposal site in Brazil
Giulliana Mondelli Æ Heraldo Luiz Giacheti ÆMaria Eugenia Gimenez Boscov Æ Vagner Roberto Elis ÆJorge Hamada
Received: 23 June 2006 / Accepted: 19 September 2006 / Published online: 8 November 2006� Springer-Verlag 2006
Abstract Different geoenvironmental site investiga-
tion techniques to assess contamination from a muni-
cipal solid waste disposal site in Brazil are presented
here. Superficial geophysical investigation (geoelectri-
cal survey), resistivity piezocone penetration tests
(RCPTU), soil samples collected with direct-push
samplers and water samples collected from monitoring
wells were applied in this study. The application of the
geoelectrical method was indispensable to identify the
presence and flow direction of contamination plumes
(leachate) as well as to indicate the most suitable
locations for RCPTU tests and soil and water sampling.
Chemical analyses of groundwater samples contributed
to a better understanding of the flow of the contami-
nated plume. The piezocone presented some limita-
tions for tropical soils, since the groundwater level is
sometimes deeper than the layer which is impenetrable
to the cone, and the soil genesis and unsaturated con-
ditions affect soil behavior. The combined interpreta-
tion of geoelectrical measurements and soil and water
samplings underpinned the interpretation of RCPTU
tests. The interpretation of all the test results indicates
that the contamination plume has already overreached
the landfill’s west-northwest borders. Geoenviron-
mental laboratory test results suggest that contamina-
tion from the solid waste disposal site has been
developing gradually, indicating the need for continu-
ous monitoring of the groundwater.
Keywords Site investigation � Tropical soils �Electrical resistivity � Piezocone test � Contamination
Introduction
Municipal and industrial solid waste disposal sites have
been the focus of special attention in recent years since
they are a significant source of soil, water and air
contamination. Unfortunately, waste is disposed,
uncontrolled at many sites, where the restrictions im-
posed by environmental agencies are disregarded and
the rules and techniques for proper landfill manage-
ment are ignored.
According to the Brazilian Institute for Geography
and Statistics (IBGE 2002), Brazil produces about
125,281 tons of municipal solid waste (MSW) per day,
30.5% of which are disposed off in garbage dumps,
22.3% in controlled dumps and 47.1% in sanitary
landfills. Although, the selectiveness of garbage
disposal has improved in recent years (in 1989, only
G. Mondelli (&)Department of Geotechnical Engineering,University of Sao Paulo, Sao Carlos, SP, Brazile-mail: [email protected]
H. L. Giacheti � J. HamadaDepartment of Civil Engineering, Sao Paulo StateUniversity, Bauru, SP, Brazile-mail: [email protected]
J. Hamadae-mail: [email protected]
M. E. G. BoscovDepartment of Structures and Geotechnical Engineering,University of Sao Paulo, Sao Paulo, SP, Brazile-mail: [email protected]
V. R. ElisInstitute of Astronomy, Geophysics and AtmosphericSciences, University of Sao Paulo, Sao Paulo, SP, Brazile-mail: [email protected]
123
Environ Geol (2007) 52:871–887
DOI 10.1007/s00254-006-0529-1
10.7% of garbage was discarded in sanitary and/or
controlled dumps), 63.6% of Brazilian towns still dis-
pose off their solid waste in dumps.
This scenario indicates the necessity for the devel-
opment of faster, more practical, direct and inexpen-
sive modern geoenvironmental technologies, designed
for the analysis of tropical soils, which can be easily
applied in the assessment of contaminated sites. Geo-
environmental site investigations, including laboratory
tests, are therefore essential for characterizing and
quantifying possible contaminations. All these are
fundamental for the selection of the appropriate
remediation program which is also crucial for the fu-
ture reemployment of the land where the landfill is
situated.
According to Davies and Campanella (1995), envi-
ronmental site characterization refers to the superficial
and underground representation of a site which
approximates actual in situ conditions. This represen-
tation is typically developed by both surface and sub-
surface characterization.
Nowadays, this type of investigation begins with
geophysical tests, which are noninvasive tests that al-
low the identification of the presence and direction of
subsurface contaminative flows. Geophysical tests are
used in the preliminary mapping phase (McFarlane
et al. 1983; Davis and Annan 1989; Beres and Haeni
1991; Lanz et al. 1994; Heitfeld and Heitfeld 1997;
Sauck et al. 1998; Green et al. 1999; Atekwana et al.
2000; Bernstone et al. 2000; Aristodemou and Thomas-
Betts 2000; Sauck 2000; Stanton and Schrader 2001;
Karlik and Kaya 2001; Orlando and Marchesi 2001;
Dawson et al. 2002; Soupios et al. 2005a, b, c, 2006),
providing the necessary information upon which to
base invasive investigation methods such as standard
penetration tests (SPT), monitoring wells and cone
penetration tests (CPT) (Rhoades and van Schilfg-
aarde 1976; Cherry et al. 1983; Campanella and
Weemees 1990; Strutynsky et al. 1992; Burns and
Mayne 1998; Fukue et al. 1998, 2001; Daniel et al. 2003;
Opydke et al. 2006).
The piezocone technology, especially the resistivity
piezocone test (RCPTU) together with direct-push
soil, water and gas samplers is an interesting approach
for invasive tests. Because resistivity piezocone test
research in Brazil is still incipient, this tool requires
many investigations to evaluate its performance in
tropical and unsaturated soils, rendering this a highly
challenging enterprise due to the country’s enormous
size and the existence of different soil types.
Estimates of pollutant transport parameters based
on laboratory tests such as column, diffusion and
batch equilibrium tests, are also important in the
more detailed phases of geoenvironmental investiga-
tions (Freeze and Cherry 1979; Rowe et al. 1988;
Barone et al. 1989; Shackelford et al. 1989; Shackel-
ford and Daniel 1991; Yong et al. 1992; Shackelford
1993; Yong 2001; Du and Hayashi 2004). These tests,
which enable to assess the soil’s capacity to retain
different chemical compounds, only began to be
conducted in Brazil a few years ago (Boscov 1997;
Boscov et al. 1999; Ritter et al. 1999; Leite and Par-
aguassu 2002).
The proposal to use different techniques to evaluate
contamination from a municipal solid waste disposal
site was applied in Bauru, state of Sao Paulo in Brazil.
Geoelectrical and piezocone tests (CPTU and
RCPTU) were carried out. Soil and water samples
were collected using direct-push samplers and moni-
toring wells, supported the interpretation of data ob-
tained by indirect tests. Geoenvironmental laboratory
tests were also carried out to evaluate the detaining of
various heavy metals in the local soil.
Geoenvironmental site characterization
Definition
Environmental, or geoenvironmental site character-
ization is a relatively new term for geotechnical engi-
neers. So, there are several interpretations of what an
geoenvironmental site characterization program is.
Davies and Campanella (1995) define it as the field of
study that links geological, geotechnical and environ-
mental engineering, and the corresponding sciences, to
form an area of interest that includes all environmental
concerns within natural or processed geological media.
The detection and assessment of groundwater con-
tamination caused by waste disposal is an excellent
example where geoenvironmental site characterization
is necessary.
A geoenvironmental site characterization requires
stratigraphy, geotechnical, hydrogeological and some
specific environmental parameters. Combining geo-
physical and geotechnical in situ techniques is the best
way to achieve all the required information (Campanella
et al. 1994).
To obtain information about the soil conditions
below the surface, some form of subsurface exploration
is required. Methods of observing the soils below the
surface, obtaining samples, and determining physical
properties of the soils and rock include test pits,
trenching (particularly for locating faults and slide
planes), boring, and cone penetration tests.
872 Environ Geol (2007) 52:871–887
123

Geophysical methods
Geophysical methods are indirect site investigation
techniques and predominantly non-intrusive. The main
advantage of superficial geophysical methods is the
possibility to investigate large areas at a low cost.
The direct result of a geophysical survey is a map of
the distribution in space or time of some physical
property such as electrical conductivity. The map is
only one piece in a puzzle, but it serves as a guide in
the first phase of a subsurface investigation (Green-
house et al. 1995).
Geophysical tests, particularly electrical methods,
can be used to study different geoenvironmental
characteristics. The following geological, geotechnical,
hydrogeological and environmental characteristics can
be assessed using different geophysical methods: (a)
rock depth, (b) discontinuities, (c) changes on the soil
texture, (d) groundwater level, (e) groundwater flow,
(f) presence and three-dimensional distribution of the
waste, (g) contaminated soil, (h) contaminated
groundwater and plume shape. All characteristics are
indispensable in a good geoenvironmental site char-
acterization.
Electrical resistivity tomography (ERT) is poten-
tially an appropriate subsurface imaging tool for
landfill site characterization, due to its ability to dis-
tinguish permeable sand and gravel from clays. How-
ever, engineers want more accurate identification of
interface depth than what standard ERT inversions
supply. So, the use of reference geoelectrical models
based on RCPT can be investigated. The use of RCPT
data can potentially guide the inversion algorithm to-
wards improved solutions (Catt et al. 2005).
Penetrometer methods
Stratigraphics specializes in penetrometer exploration
services for geoenvironmental and geotechnical stud-
ies. The penetrometer method is minimally intrusive,
using a high capacity hydraulic ram mounted on a
heavy truck to push small, 4.3 cm diameter probes di-
rectly into the ground, without drilling a borehole.
The modern site characterization approach is based
on the piezocone penetration test (CPTU). The stan-
dard piezocone measurements can be used as a tool for
logging soils. Empirical and semi-theoretical correla-
tions are available to estimate mechanical properties of
the soils. The measurements of excess pore water
pressure, which are generated during penetration and
their subsequent dissipation provided insight into the
soil type and its hydraulic parameters (Campanella
et al. 1994).
Site characterization including contaminant plume
delineation can be accurately performed using rapid
penetrometer methods. Temporary groundwater
monitoring wells can then be economically installed at
optimal locations using a minimum of expensive
borehole drilling. The combination of minimally
intrusive penetrometer methods and large diameter
borehole drilling is less expensive and less disruptive to
site activities than use of drilling methods alone.
Sometimes, instruments other than the basic
standard CPT probe are used, including: piezometric
cone penetration tests with soil electrical conductivity
measurements (CPTU-EC or RCPTU) which provide
simultaneous measurements allowing geotechnical,
hydrogeological and qualitative geochemical evalua-
tion of site characteristics. Soil electrical conductivity
and temperature are continuously measured using a
high resolution (2.5 cm) electrode array and thermal
sensor mounted on the penetrometer. Soil electrical
conductivity depends primarily on the soil pore fluids
and soil clay content. Unsaturated soils and soils
saturated with many LNAPL (light non-aqueous
phase liquids) and DNAPL (dense non-aqueous
phase liquid) compounds exhibit very low electrical
conductivity (EC). Dissolved inorganic compounds,
such as those contained in brines and landfill
leachates, significantly increase soil electrical con-
ductivity.
The CPT, CPTU and RCPTU graphical data pre-
sentations (sounding logs) are produced immediately
as the penetrometer test progresses. Layering and
saturation are visibly obvious, as are relative strength
and consistency. Soil EC anomalies, possibly associ-
ated with contamination, are also obvious. A series of
penetrometer sounding logs can be used to character-
ize subsurface site conditions with ease and accuracy.
In addition to penetrometers with sensors, pene-
trometer samplers are used to sample groundwater,
soil and soil gas. Direct samples confirming indirect
measurements are quickly, reliably and economically
obtained. The modern piezocone technology for geo-
environmental site characterization incorporated spe-
cial samplers for this purpose (Lunne et al. 1997).
Samples are used to confirm indirect testing data or to
measure a specific contamination. Liquid and gas
samplers are pushed to a selected depth based on
interpretation of an adjacent CPTU test. A variety of
soil samplers from the direct-push technology are also
available. CPTU test can also govern the depths from
where to recover soil samples and the equipment that
pushes the cone can be used to push in the sampler.
Monitoring wells are still a very interesting option for a
long-term liquid sampling and geophysical and CPTU
Environ Geol (2007) 52:871–887 873
123

tests can be used to select the best location to install
them.
Site description
The city of Bauru, located in the center of the state of
Sao Paulo in southeastern Brazil (Fig. 1), has a pop-
ulation of about 320,000. The study area is a MSW
disposal site located northwest of the city, which re-
ceives 207.2 tons/day of urban wastes. This site can be
considered as a controlled dump because it is a planned
landfill that incorporates some of the features of a
sanitary landfill such as: siting with respect to hydro-
geological suitability, grading, compaction of the
wastes, leachate control, partial gas management, reg-
ular (not usually daily) cover, access control, basic re-
cord-keeping, and controlled waste picking.
The site’s geology is characterized by sandstone
from the Marılia Formation, covered by alluvial sandy
soils or colluvial clayey sands. Underneath these lay-
ers are residual soils from sandstone. The hydraulic
conductivity of these soils was found to vary from 10–7
to 10–6 m/s. The depth of the groundwater level is
about 5 m below the base of the landfill. In order to
protect the subsurface and the shallow groundwater
table from leakages from the landfill, four 20-cm-thick
layers were compacted using local soil with water
content 3% above the optimum water content, and
compacted to around 95% of the Standard Proctor
maximum dry density. The upper surface of these
layers was coated twice with diluted asphalt emulsion
to seal and protect the bottom of the landfill. This
procedure was used because it was inexpensive and
acceptable for controlled dumps in Brazil when the
landfill was established.
Site investigation program
Figure 2 shows the location of all the in situ tests car-
ried out at Bauru’s MSW disposal site. Disturbed and
undisturbed soil samples, (where structural properties
of the soil do not represent and represent the in-situ
conditions, respectively), were collected from a slope
located along 70 m south-west of the landfill. Table 1
presents the average geotechnical parameters deter-
mined by the laboratory tests carried out on these
samples, those were also used for column and batch
equilibrium tests.
Geophysical tests
Geophysical methods are indirect site investigation
techniques and are predominantly noninvasive. The
main advantage of superficial geophysical methods is
that they allow large areas to be investigated at a low
cost. For the detection and mapping of contaminant
plumes and leakages, electrical methods are the most
useful for detecting inorganic plumes. Among the
various existing methods, electrical resistivity method
is the most widely applied and well known (Green-
house and Harris 1983; Kean et al. 1987; Bernstone and
Dahlin 1998; Green et al. 1999; Svenson et al. 1999;
Bernstone et al. 2000; Aristodemou and Thomas-Betts
2000; Meju 2000; Orlando and Marchesi 2001; Dahlin
et al. 2002; Porsani et al. 2004; Mota et al. 2004).
The electrical resistivity method encompasses vari-
ous techniques for the application of field tests, which
basically consist of electrical sounding and electrical
profiling techniques and include a wide variety of
possible electrode configurations, rendering the meth-
od highly versatile.
In a vertical electrical sounding (VES), the distance
between the current electrodes and the potential
electrodes is systematically increased, thereby yielding
information on subsurface resistivity from successively
greater depths. The variation of resistivity with depth is
modeled using forward and inverse modeling computer
software.
In a dipole–dipole electrical profiling, two electrodes
are separated by a constant spacing called the ‘‘a’’
spacing and are used to inject current into the ground.
Two additional electrodes also separated by the ‘‘a’’
spacing are moved along the survey line at distances
from the current electrodes that are multiples of the
‘‘a’’ spacing (Johnson 2005).
Figure 2 shows the location of dipole–dipole elec-
trical profiling (C1–C5) and vertical electrical sound-
ing (VES 1–VES 9) lines on which the various
geophysical tests were carried out. The electrical
Fig. 1 A general map of South America with a detailed mapshowing the location of the city of Bauru, state of Sao Paulo inBrazil
874 Environ Geol (2007) 52:871–887
123

profiling lines were laid out with 10 m spacing be-
tween the electrodes, while the vertical electrical
sounding lines were laid out in a Schlumberger array
with a maximum spacing of 150 m. Figure 3 illustrates
the field equipment used for the electrical resistivity
measurements.
Piezocone technology
The piezocone (CPTU) is a standard instrumented
probe (ASTM 1986) with a 60� apex and typical
diameter of 35.7 mm (10 cm2 area) on the end of a
series of rods (Fig. 4). It is pushed into the ground at a
constant rate of 20 mm/s by a hydraulic pushing source.
Standard CPTU measurements of tip resistance (qc),
sleeve friction (fs) and pore pressure (u2) are typically
recorded at intervals of 25 or 50 mm depth. These
three parameters, in various combinations such as
friction ratio (Rf = (fs/qc)*100%), are used to delineate
site stratigraphy using specific charts like the one pro-
posed by Robertson et al. (1986). Empirical and semi-
theoretical correlations are available in the literature
to estimate the mechanical properties of the soils.
The resistivity module, which can be attached to the
piezocone, consists of Wenner, Schlumberger or di-
pole–dipole electrode arrays. Figure 4 depicts a resis-
tivity Wenner type piezocone with a four-electrode
array, with which resistivity measurements are taken
with the inner electrodes and the current is applied
through outer electrodes. These measurements are
digitally recorded at 25 mm intervals, providing
essentially continuous in situ data sampling, in addition
Fig. 2 Location of the testscarried out at Bauru’s MSWdisposal site
Table 1 Average geotechnical soil properties of the samples collected around Bauru’s MSW disposal site
w(%)
cn (kN/m3)
Gs cd (kN/m3)
e Sr
(%)n(%)
Sand(%)
Silt(%)
Clay(%)
wL
(%)wP
(%)qd max (g/cm3)
wop
(%)kv (m/s)
6 16 2.7 15 0.8 19 45 73 6 21 20 15 1.9 12 6x10⁻⁷
w water content, cn natural unit weight, Gs specific gravity, cd dry unit weight, e void ratio, Sr degree of saturation, n porosity, wL liquidlimit, wP plastic limit, qd max maximum dry density, wop optimum water content, kv vertical hydraulic conductivity
Fig. 3 Iris Syscal R2 equipment used and installed at Bauru’sMSW disposal site for electrical resistivity tests
Environ Geol (2007) 52:871–887 875
123

to all other standard CPTU measurements. Linear
calibration factors are developed by immersing the
module in water baths of known resistivities and
measuring the module output.
Several piezocone trial tests were carried out at
Bauru’s MSW disposal site on different occasions. On
the first occasion (CPTU-1 to CPTU-4), a standard
100 kN CPTU probe with 10 cm2 cross sectional area
was used to measure the tip resistance (qc), sleeve
friction (fs) and pore pressure (u2). In the other tests
(RCPTU-1 to RCPTU-16) an electrical resistivity
module was attached to the CPTU probe to measure
the bulk resistivity of the soil (R). The piezocone
transmitted the signals captured by the sensors through
sound waves. A self-anchoring (Fig. 5), multi-purpose
push platform with a hydraulic system of 200 kN
capacity was used for pushing CPT probes and
groundwater or soil samplers. The pore pressure was
measured at the standard position behind the shoulder
of the tip (u2) using a slot filter filled with automotive
grease in all the tests, as suggested by Larsson (1995),
except for RCPTU-5, in which the traditional porous
filter element saturated with glycerine was used.
Soil and water samples were collected using the
direct-push system at depths that exhibited alterations
in the qc and Rf values found in some of the sounding
profiles. These samples were used in grain size dis-
tribution tests, determination of electrical conductivity
and pH values.
Note that electrical conductivity (EC) is the inverse
of resistivity (R), and that the following expression can
be applied:
EC (lS=cmÞ ¼ 10; 000
R ðohm mÞ : ð1Þ
Monitoring wells
Based on the results of the geophysical tests, nine
monitoring wells for water sampling were located and
drilled around the study area, in addition to five tem-
porary monitoring wells that had been previously
constructed, as shown in Fig. 2. Figures 6, 7, respec-
tively, give a schematic representation of the perma-
nent and temporary monitoring wells built in the area.
The permanent monitoring wells were built according
to the Brazilian standard (ABNT 1997, with the char-
acteristics shown in Fig. 6. The temporary wells were
built using the same self-anchoring, multi-purpose push
platform used for the piezocone tests, which also al-
Fig. 4 Schematicrepresentation of a resistivitypiezocone probe with4-electrode array
Fig. 5 Self-anchoring, multi-purpose push platform carrying outpiezocone tests at Bauru’s MSW disposal site
Fig. 6 Schematic drawing of the permanent monitoring wellsbuilt at Bauru’s MSW disposal site
876 Environ Geol (2007) 52:871–887
123

lowed for the drilling of 75 mm diameter holes down to
the groundwater level and the installation of 50.8 mm
PVC (polyvinyl chloride) pipes with a 1.0 m filter tube
wrapped in geotextiles.
Laboratory tests
Due to the several variables that affect the results of
field tests to assess contamination, column and batch
equilibrium tests were carried out to evaluate the
retention of several heavy metals in the soil in the
surrounding area of the Bauru’s MSW disposal site.
Leachate collected from the landfill’s recirculation cell
and a synthetic solution composed of about 10 mg/L of
Ni, Zn, Cd and Pb were used as percolation fluids. The
concentrations of these four metals were enhanced in
the leachate by adding nitrates of these metals to im-
prove the quality of the chemical analyses, since the
concentrations measured in the leachate were close to
the detection limit of the atomic emission spectrometer
(ICP-OES—inductively coupled plasma optical emis-
sion spectrometer) used in this research.
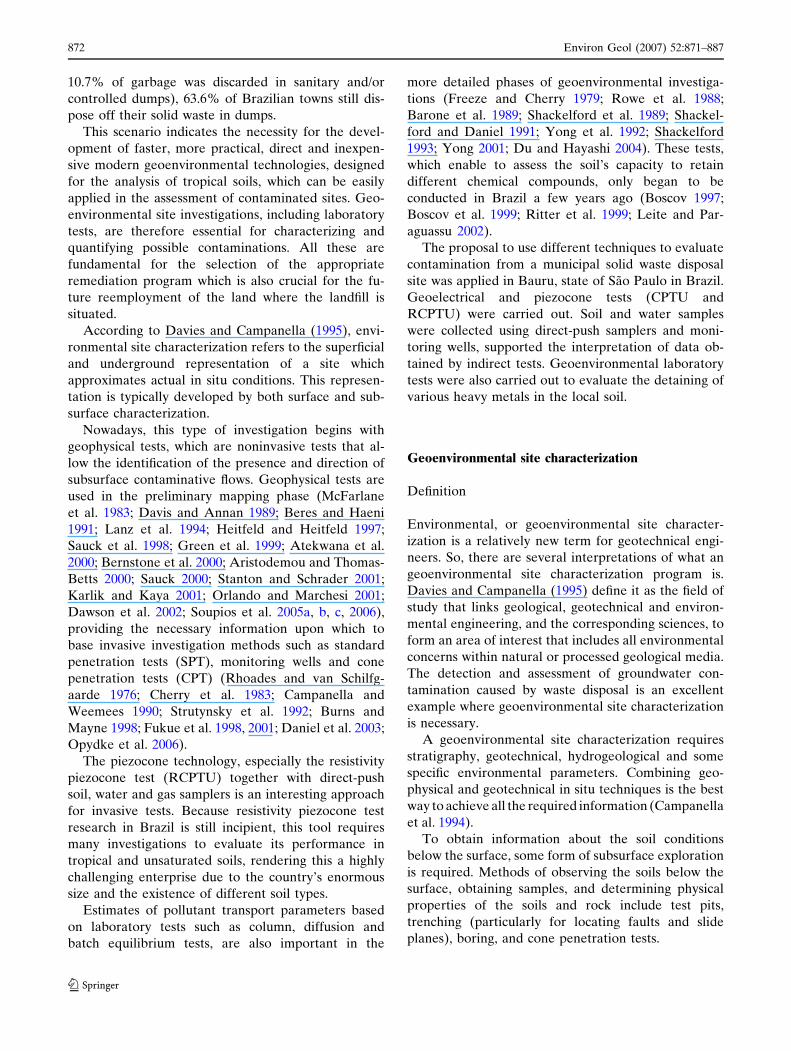
The column tests were carried out with a Tri-Flex 2
permeameter (Fig. 8). Prior to the actual column tests,
permeability and column tests were conducted with a
100 mg/L saline solution to check the soil’s reaction to
low and high electrical conductivity fluids and to dif-
ferent confining pressures. Permeability tests were
carried out till a fluid volume equal to two pore vol-
umes of the soil sample had percolated through the soil
to guarantee the stabilization of the degree of satura-
tion and therefore of the hydraulic conductivity. The
column tests with percolation of the metal solutions
and the leachate with added metal nitrates were car-
ried out at a confining pressure of 30 kPa and with
hydraulic gradients of 11.6 and 13.0, respectively.
Batch equilibrium tests were carried out following
appropriate guidelines (ASTM 2001), with soil-solu-
tion ratio 1:4 (25 g of dry soil sieved through a 40 mesh
to 100 mL of solution). The equilibrium time was
determined by preliminary tests for 168 h (1 week) for
all studied metals, both for the synthetic solution and
the leachate. Figure 9 shows the orbital shaker, i.e. the
device used for shaking the flasks containing the sus-
pensions at a rotation rate of 60 rpm. After equilib-
rium, the suspensions were filtered and nitric acid was
added. The flasks containing leachate were also cen-
trifuged and filtered again. The filtrates were stored in
a refrigerator at 5�C till the chemical analysis.
Results were expressed as the adsorption degree as a
function of the equilibrium concentration. The
adsorption degree (S) is defined by the following
equation:
S ¼ C0 � Ceð Þ � VM
: ð2Þ
C0 = initial concentration of the solution, Ce = equi-
librium concentration, V = volume of the solution in
the flask, M = dry soil mass.
Test results and discussion
Geophysical tests
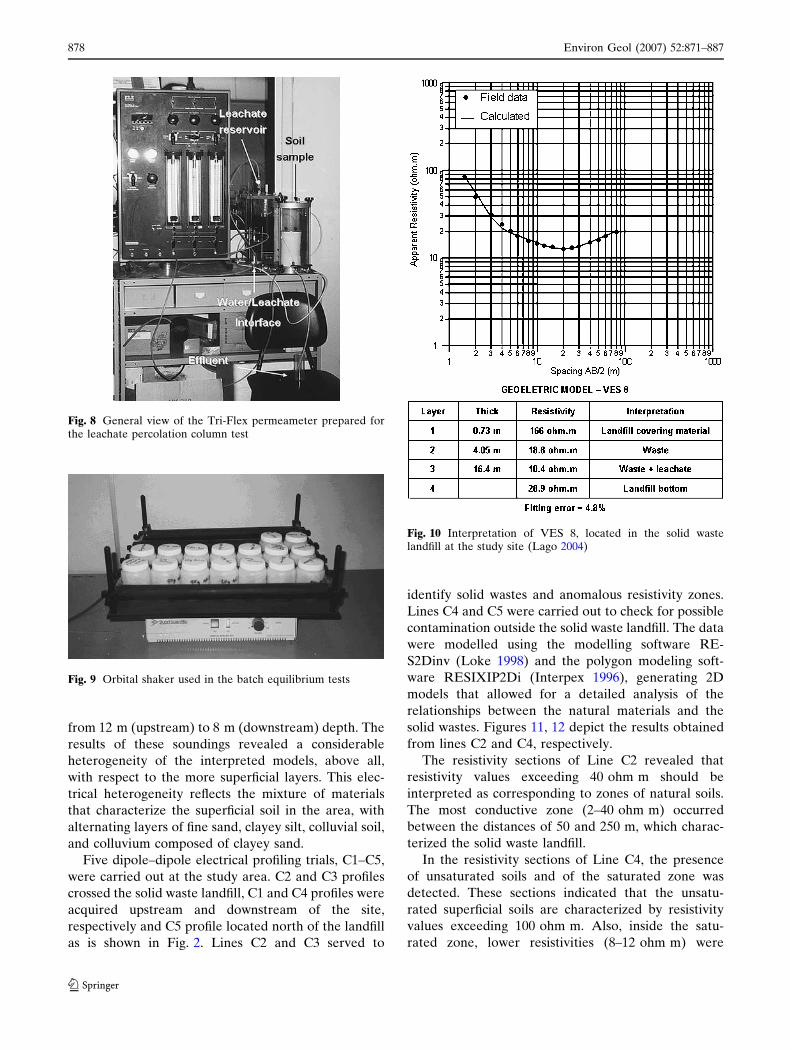
The vertical electrical soundings VES 8 and VES 9
were performed within solid waste landfill to study the
relation between wastes and natural soil. Based on
these soundings, the geoelectrical layers characterized
by low resistivity (10.2 to 18.8 ohm m) were inter-
preted as waste and as leachate-saturated waste. The
bottom of the landfill was found to vary in depth from
16 to 20 m and was characterized by resistivity values
of 28.9–29.9 ohm m (Fig. 10).
Vertical electrical soundings were performed out-
side the solid waste landfill provided information about
the position of the groundwater level, which varied
Fig. 7 Schematic drawing of the temporary monitoring wellsbuilt at Bauru’s MSW disposal site
Environ Geol (2007) 52:871–887 877
123
from 12 m (upstream) to 8 m (downstream) depth. The
results of these soundings revealed a considerable
heterogeneity of the interpreted models, above all,
with respect to the more superficial layers. This elec-
trical heterogeneity reflects the mixture of materials
that characterize the superficial soil in the area, with
alternating layers of fine sand, clayey silt, colluvial soil,
and colluvium composed of clayey sand.
Five dipole–dipole electrical profiling trials, C1–C5,
were carried out at the study area. C2 and C3 profiles
crossed the solid waste landfill, C1 and C4 profiles were
acquired upstream and downstream of the site,
respectively and C5 profile located north of the landfill
as is shown in Fig. 2. Lines C2 and C3 served to
identify solid wastes and anomalous resistivity zones.
Lines C4 and C5 were carried out to check for possible
contamination outside the solid waste landfill. The data
were modelled using the modelling software RE-
S2Dinv (Loke 1998) and the polygon modeling soft-
ware RESIXIP2Di (Interpex 1996), generating 2D
models that allowed for a detailed analysis of the
relationships between the natural materials and the
solid wastes. Figures 11, 12 depict the results obtained
from lines C2 and C4, respectively.
The resistivity sections of Line C2 revealed that
resistivity values exceeding 40 ohm m should be
interpreted as corresponding to zones of natural soils.
The most conductive zone (2–40 ohm m) occurred
between the distances of 50 and 250 m, which charac-
terized the solid waste landfill.
In the resistivity sections of Line C4, the presence
of unsaturated soils and of the saturated zone was
detected. These sections indicated that the unsatu-
rated superficial soils are characterized by resistivity
values exceeding 100 ohm m. Also, inside the satu-
rated zone, lower resistivities (8–12 ohm m) were
Fig. 8 General view of the Tri-Flex permeameter prepared forthe leachate percolation column test
Fig. 9 Orbital shaker used in the batch equilibrium tests
Fig. 10 Interpretation of VES 8, located in the solid wastelandfill at the study site (Lago 2004)
878 Environ Geol (2007) 52:871–887
123

found in the positions between 120 and 150 m and
200 and 250 m, suggesting probable groundwater
contamination.
Detection of the plume and delineation of its
shape is very important information for geoenviron-
mental site characterization. All the data obtained by
Fig. 11 Results of Line C2.a RES2Dinv resistivitymodel; b RESIXIP2Di model
Fig. 12 Results of Line C4.a RES2Dinv resistivitymodel; b RES IXIP2Di model
Environ Geol (2007) 52:871–887 879
123

geoelectrical profiling can be used to generate
apparent resistivity maps at different depths and
these data can be used to assess the horizontal
direction of the contamination plume. Figure 13
shows a map of the 15 m theoretical depth, where an
anomaly with low resistivity is visible in the landfill
area.
Based on the results obtained from the geophysical
tests, it was recommended that the RCPTU soundings,
the monitoring wells and the soil and water samplings
be carried out mainly in several specific positions along
Line C4 as well as northeast of the landfill, since low
values of resistivity within the saturated zone were
identified at these locations, suggesting the presence of
contaminants.
Piezocone technology
The profiles obtained with the piezocone test were
interpreted using Robertson et al. (1986) classification
chart to identify the soil behavior type (SBT) at the study
site. As has been found in other researches with tropical
soils (Giacheti et al. 2003), the results shown in Figs. 14,
15 indicate that the identification of the stratigraphical
profile from piezocone soundings, based on this classi-
fication chart, also presents limitations for this area,
since it identifies soils with distinct behaviors, but does
not permit their textural classification. However, a
combined analysis of the qc and Rf records led to the
identification of the layers with distinct behaviors where
soil samples were retrivied using direct-push samplers.
The CPTU-1 sounding was carried out east of the
landfill to try to obtain a reference resistivity profile of
the uncontaminated ground. However, the resistance
to cone penetration was greater than the capacity of
the self-anchoring, multi-purpose push platform to
reach the groundwater level.
The RCPTU-14 and RCPTU-15 soundings, whose
results are shown in Fig. 14, were carried out close to
the solid waste landfill, followed by water and soil
samplings to check contamination of the area. Two sets
of RCPTU soundings were carried out close to the
temporary monitoring wells in the west, where Line C4
indicated greater contrasts in the resistivity values.
Figure 15 shows the results of the CPTU-4 and
RCPTU-1, RCPTU-2, RCPTU-3 and RCPTU-9 tests.
All the RCPTU tests that reached groundwater re-
vealed an abrupt drop in resistivity and this informa-
tion was useful to help identify the groundwater level.
The resistivity profiles shown in Fig. 15 for the satu-
rated zone indicate that they are affected by soil tex-
ture and mineralogy. Resistivity was higher in sandy
layers than in clayey layers. The influence of soil type
on the resistivity values of the RCPTU-14 and
RCPTU-15 tests were not so clear, since the resistivity
value found in the RCPTU-14 test was around
50 ohm m while that of the RCPTU-15 test was mea-
sured around 20 ohm m (Fig. 14). It indicates migra-
tion of the contamination plume through the sandy
layer, based on water sampling using a direct-push
sampler at depths of 8.0 to 9.0 m, since it presented low
electrical resistivity, which is indicative of the presence
Fig. 13 Map of the apparentresistivity at 15 m theoreticaldepth at the Bauru’s MSWdisposal site. Low values(<75 ohm m) indicate thatthe contamination is reachingthe saturated zone
880 Environ Geol (2007) 52:871–887
123

of contaminants dissolved in the water. In this partic-
ular case, soil and water sampling is required to
underpin the interpretation of the resistivity piezocone
test.
Table 2 compares the bulk resistivity values mea-
sured in the RCPTU tests against those obtained from
the water samples collected from the temporary mon-
itoring wells in the same period as the tests. These data
Fig. 14 Resistivity piezocone test results, grain size distribution and groundwater analyses for the study site, adjacent to the edge of thesolid waste landfill
Fig. 15 Resistivity piezoconetest results and grain sizedistribution from samplescollected downstream fromthe solid waste landfill at thestudy site
Environ Geol (2007) 52:871–887 881
123

allowed for estimates to be made of the soil’s forma-
tion factor (FF), given by the following expression
(Archie 1942)
FF ¼ qb
qf
¼ a � n�m � S�sr : ð3Þ
where FF = formation factor, qb = bulk resistivity of
the soil; qf =fluid resistivity; a, m, s = factors that de-
pend on the soil’s mineralogy; n = porosity; Sr = de-
gree of saturation.
The interpretation of the resistivity values in the
unsaturated zone (Figs. 14, 15) indicates that this
parameter is strongly affected by the degree of satu-
ration of the soil mass, which is in accordance with
Archie’s law. Figure 15 shows the differences between
the resistivity values at 1.5–2.0 m depth for the
RCPTU-9 test and all the other tests (RCPTU-1, 2 and
3), which were carried out in the rainy season. On the
other hand, RCPTU-15 was carried out in a drier
season than RCPTU-14 and the resistivity values up to
2.0 m depth were higher. Resistivity values at depths of
more than 2.0 m were highly variable in the unsatu-
rated zone and could not be interpreted.
The apparent resistivity values shown in Fig. 13, as
well as those determined in the RCPTU tests (Figs. 14,
15), indicate congruence for the saturated zone, since
tests RCPTU-4, 5, 6 and 11 showed lower resistivity
values than tests RCPTU-1, 2, 3 and 9 (Fig. 15). Note
that the former are closer to a patch of apparent
resistivity lower than 75 ohm m than are the latter
(Mondelli 2004). Note, also, that the resistivity values
determined from the piezocone were congruent with
the resistivity contrasts presented in the map in Fig. 13,
which indicates that the RCPTU-15 test was the one
closest to the plume and showed the lowest resistivity
values. On the other hand, the RCPTU-14 test, which
was carried out slightly farther from the plume, albeit
also in a region with traces of contamination, showed
higher resistivity values than the RCPTU-15 test.
Monitoring wells
Three campaigns to collect water samples from the
permanent monitoring wells were carried out during
this study. The first and third campaigns were con-
ducted during the rainy season and the second during
the dry season.
Several campaigns to collect water samples from the
temporary monitoring wells were carried out during a
year, which yielded concentrations of the metals Fe
and Pb only in the last campaign. These results were
compared with those obtained from the permanent
monitoring wells, as shown in Table 3.
Overall, it can be stated that the wells most strongly
affected by the contamination plume are PW-1 and
TW-3, followed by PW-7, which presented the lowest
values of electrical resistivity and the highest values of
chlorides, BOD, COD and several heavy metals, con-
firming the signs of contamination revealed by tests
RCPTU-14 and RCPTU-15 conducted west-northwest
of the landfill. These signs of contamination close to
the landfill were confirmed by the chemical analyses of
the water samples shown in Fig. 14.
The results of the analyses of water samples from
wells PW-5 and TW-1 confirmed the low resistivity
blotch that appeared on the map of apparent resistivity
at the 15 m theoretical depth, west of the landfill. The
contamination found in these two wells may indicate
interference from a cesspit located in their proximity
(Fig. 2).
This finding indicates that care must be taken in the
interpretation of data from monitoring wells, and that
the physical and geological factors of the site must be
taken into account, as well as other possible sources of
contamination in the area.
Laboratory tests
Figure 16 shows the values of hydraulic conductivity of
the soil surrounding Bauru’s MSW landfill as a func-
tion of the confining pressure for water and for a saline
solution. As expected, the hydraulic conductivity
decreased as the confining pressure increased. The
hydraulic conductivity for the saline solution was
approximately threefold higher than for distilled water,
which varied from 1 · 10–7 m/s to 6 · 10–7 m/s under
the applied confining pressures.
The hydraulic conductivity of the soil around
Bauru’s MSW disposal site determined in column and
falling head tests (10–7 m/s) can be considered low
for sandy soils, but are above the maximum limit of
10–9 m/s for bottom liners, according to most environ-
mental regulations.
Table 2 Estimate of the soil formation factor (FF) for watersamples collected in the same period the RCPTU tests werecarried out
Depth(m)
Well/test R(ohm m)
FF Interpretatedlayer
7.0 PT-1 (Feb/2002)
26.3 1.83 Silty sand
RCPTU 4, 6 48.26.0 PT-2 (Feb/
2002)69.4 2.24 Silty sand
RCPTU 1, 2, 3 155.47.0 PT-3 (Jul/2002) 18.8 1.55 Silty sand
RCPTU-15 29.1
882 Environ Geol (2007) 52:871–887
123

Figures 17 and 18 present, respectively, the electri-
cal conductivity of the effluents from the columns
percolated with metal solution and with leachate plus
metals as a function of the percolated volume. In
Fig. 17, note that the conductivity increased rapidly up
to 0.25 percolated pore volumes and slowly after that
point, tending to reach the solution’s initial conduc-
tivity (72.9 lS/cm). In theory, this would indicate that
the pollutant front reached the other extremity of the
test specimen, but the effluent metal concentrations
were still practically 0 at almost 3.5 percolated pore
volumes. The same behavior was observed in the col-
umn test with leachate (Fig. 18), since the break-
through curves of the metals were just beginning to
form when the effluent conductivity reached the value
of the influent leachate (15,140 lS/cm), at about 3.5
percolated pore volumes.
In the column tests, the pH of the metal solution,
which was 8, dropped to about 5.5 during percolation
through the soil. On the other hand, the pH of the
effluent from the column tests with leachate dropped
from 8 to 4.5 up to a percolated pore volume of 0.7,
after which the pH rose to its original level. The same
behavior was observed in the batch tests, i.e., the pH of
the filtrates of the metal solution was 4.5 while the
filtrates from the leachate remained at about 8.5. This
indicates that the leachate’s pH was less affected by
percolation through the soil.
As for the batch equilibrium tests, the sorption iso-
therms obtained for the metal solution were convex in
relation to the axis of the abscissas, indicating that
adsorption degree(S) increases along with the increase
in equilibrium concentration (Ce) (Fig. 19). The sorp-
tion isotherms for the leachate were slightly concave in
Table 3 Average values of the parameters obtained from the chemical analyses carried out for the various campaigns to collect waterfrom the monitoring wells
Well GWL(m)
R(ohm.m)
BOD (mg/L)
COD (mg/L)
Cd (mg/L)
Cr (mg/L)
Fe (mg/L)
Ni (mg/L)
Pb (mg/L)
Zn (mg/L)
Chloride(mg/L)
PW-1 8.7 17.9 14.3 56.3 – 0.17 24.2 0.09 0.03 0.12 114.0PW-2 7.3 161.8 7.3 25.7 – 0.14 28.4 0.01 0.02 0.19 3.8PW-3 10.4 45.6 4.7 15.0 – 0.11 2.30 – – 0.07 3.7PW-4 30.7 33.9 1.8 10.0 0.02 0.08 1.25 0.02 0.04 0.15 2.8PW-5 6.3 17.1 6.7 22.7 0.08 0.11 9.44 0.05 0.06 0.13 15.9PW-6 2.9 220.8 8.3 34.7 – 0.07 2.05 0.08 0.04 0.13 3.1PW-7 6.5 27.1 7.7 32.7 – 0.25 50.8 0.05 0.01 0.16 55.2PW-8 6.9 48.6 5.7 15.7 – 0.08 0.50 – 0.01 0.11 29.9PW-9 6.6 23.6 3.3 15.0 – 0.09 2.14 0.01 0.03 0.04 59.5TW-1 7.0 37.9 10.0 22.1 – – 11.1 – 0.16 – 11.5TW-2 6.0 73.4 20.7 12.7 – – 0.03 – 0.08 – 13.0TW-3 7.0 15.7 40.6 47.5 – – 62.2 – 0.53 – 93.0TW-4 7.0 42.4 30.8 20.1 – – 0.07 – 0.11 – 18.7TW-5 2.0 142.3 5.3 11.2 – – 5.55 – 0.15 – 8.4
PW permanent wells, TW temporary wells, GWL groundwater level, R electrical resistivity; BOD biological oxygen demand, CODchemical oxygen demand
Detection limits: R = 100,000 ohm m or C = 0.1 lS/cm, BOD = 1 mg/L, COD = 1 mg/L, Cd = 0.0006 mg/L, Cr = 0.005 mg/L,Fe = 0.005 mg/L, Ni = 0.008 mg/L, Pb = 0.01 mg/L, Zn = 0.002 mg/L, Chloride = 0.1 mg/L
Fig. 16 Hydraulicconductivity as a function ofconfining pressure for waterand saline solution usingundisturbed soil samples fromthe surroundings of Bauru’sMSW disposal site
Environ Geol (2007) 52:871–887 883
123

relation to the axis of the abscissas, but presented no
visible stabilization of adsorbed solute mass (Fig. 20).
In both cases, the linear isotherm was the one that best
described the results, presenting a better fit to the
testing data.
Table 4 shows values of Kd and Rd obtained in the
batch tests, where Kd represents the partition coeffi-
cient (the angular coefficient of the linear sorption
isotherm) and Rd is the retardation factor given by
Eq. 4:
Fig. 17 Electricalconductivity as a functionof percolated porevolume—metal solution—foran undisturbed soil samplefrom the surroundings ofBauru’s MSW disposal site
Fig. 18 Electricalconductivity as a functionof percolated porevolume—leachate plusmetals—for an undisturbedsoil sample from thesurroundings of Bauru’sMSW disposal site
Fig. 19 Linear sorption isotherm of Zn obtained for the metalsolution for an undisturbed soil sample from the surroundings ofBauru’s MSW disposal site
Fig. 20 Linear sorption isotherm of Zn obtained for the leachateplus metals for an undisturbed soil sample from the surroundingsof Bauru’s MSW disposal site
884 Environ Geol (2007) 52:871–887
123
Rd ¼ 1þ qd
n�Kd: ð4Þ
where qd = dry density, n= porosity.
A comparison of the Kd and Rd values in Table 4
with the values reported for other soils indicates that
this soil has a high retention capacity relative to the
studied metals. Ritter (1998) classified the solute as
essentially immobile when Kd is higher than 10. On the
other hand, Rd values display the same order of mag-
nitude as those obtained by Nascentes (2003) with
similar soil and range of tested concentrations. Azev-
edo et al. (2003) point out that the high Rd values
obtained by Nascentes (2003) may have been the result
of the low concentrations of metals used in the pollu-
tant solutions. However, the metal concentrations used
in this investigation are consistent and even higher
than those measured in the leachate from Bauru’s
MSW landfill (Mondelli 2004), indicating the possibil-
ity of a high level of metal retention actually occurring
in situ.
Conclusions
The surficial geoelectrical tests allowed for the detec-
tion of the shape and direction of the contamination
plume and were essential in indicating the locations for
the piezocone tests and soil and water samplings in the
study area.
The piezocone proved to be a very repeatable test
and allowed for the identification of better spots for
water sampling. Unfortunately, this technique pre-
sented some limitations for tropical soils, since the
groundwater level is sometimes deeper than the layer
which is impenetrable to the cone. Another important
aspect in tropical soils is that soil genesis and unsatu-
rated conditions affect soil behavior; therefore, soil and
water sampling are required to support the interpre-
tation of RCPTU tests.
The results of the resistivity piezocone tests
(RCPTU) carried out in the area of the Baurus MSW
disposal site allowed for the identification of contami-
nant-saturated zones, which were confirmed through
the combined analysis of the results of the geoelectrical
tests and the soil and water samples. The combined
analysis of all the test campaigns indicates that the
contamination plume has already overreached the
landfill’s west-northwest borders.
The column and batch equilibrium tests indicated
that this soil has a good capacity to retain Ni, Zn, Cd
and Pb. On the other hand, values of pH solution and
electrical conductivity were not much influenced by
the percolation through the soil, possibly because of
the complex interaction with other constituents of the
leachate, such as organic matter and high content of
Na, K, Ca and Mg. The association of these observa-
tions indicates that the pollution around Bauru’s mu-
nicipal solid waste disposal site may be occurring very
slowly, but already shows signs that site remediation
need to be adopted.
The consideration of the site’s physical and geolog-
ical features is also fundamental to monitor the evo-
lution of the contamination plume. Periodic campaigns
to collect and analyze the water from the monitoring
wells are ongoing in order to control the environment’s
natural characteristics of the site.
Acknowledgments The authors gratefully acknowledge theBrazilian agencies FAPESP (State of Sao Paulo ResearchFoundation), FUNDUNESP (State of Sao Paulo UniversityResearch Foundation) and CNPq (National Council for Scien-tific and Technological Development) for funding their re-searches. They are also indebted to EMDURB (BauruMunicipal Urban and Rural Development Company) and to theLaboratory of Atomic Emission and Absorption Spectrometry atthe University of Sao Paulo’s, Institute of Chemistry.
References
ABNT (1997) Construcao de pocos de monitoramento e amos-tragem—procedimento. NBR-13895/97. Associacao Brasile-ira de Normas Tecnicas, Sao Paulo
Archie GE (1942) The electrical resistivity log as an aid indetermining some reservoir characteristics. Trans Am InstMin Met Eng 146:54–62
Aristodemou E, Thomas-Betts A (2000) DC resistivity andinduced polarisation investigations at a waste disposal siteand its environments. J Appl Geophys 44:275–302
ASTM (1986) Standard test method for deep quasi-static, coneand friction-cone penetration tests of soils. D 3441. Am Socfor Test Mater, Philadelphia
ASTM (2001) Standard test method for distribution ratios by theshort-term batch method. D 4319–93. Am Soc for TestMater, Philadelphia
Table 4 Results of the batch equilibrium tests on soil from thesurroundings of Bauru’s MSW disposal site (C0 initial concen-tration of the solution; R2 correlation factor)
Parameter C0 (mg/L) Kd (mL/g) R2 Rd
Metal solutionNi 8.6 31.0 0.7802 104Zn 6.0 14.6 0.8779 50Cd 8.4 21.6 0.8964 73Pb 0.1 –76.4 0.6219 –
Leachate plus metalsNi 8.8 7.2 0.7110 25Zn 5.1 74.5 0.9756 249Cd 2.6 55.6 0.9489 186Pb 14.2 298.4 0.9934 996
Environ Geol (2007) 52:871–887 885
123

Atekwana EA, Sauck WA, Werkema DD Jr (2000) Investiga-tions of geoelectrical signatures at a hydrocarbon contam-inated site. J Appl Geophys 44:167–180
Azevedo ICD, Nascentes CR, Azevedo RF, Matos AT, Gui-maraes LM (2003) Coeficiente de dispersao hidrodinamica efator de retardamento de metais pesados em solo residualcompactado. Solos e Rochas 26:229–249
Barone FS, Yanful EK, Quigley RM, Rowe RK (1989) Effect ofmultiple contaminant migration on diffusion and adsorptionof some domestic waste contaminants in a natural clayeysoil. Can Geotech J 26:189–198
Beres M, Haeni FP (1991) Application of ground penetratingradar methods in hydrogeologic studies. Ground Water29(3):375–386
Bernstone C, Dahlin T (1998) DC resistivity mapping of oldlandfills: two case studies. Eur J Environ Eng Geophys2(2):127–136
Bernstone C, Dahlin T, Ohlsson T, Hogland W (2000) DC-resistivity mapping of internal landfill structures: two pre-excavation surveys. Environ Geol 39:360–370
Boscov MEG (1997) Contribuicao ao projeto de sistemas decontencao de resıduos perigosos utilizando solos laterıticos.PhD, Department of Structures and Geotechnical Engi-neering, University of Sao Paulo
Boscov MEG, Oliveira E, Ghilardi MP, Silva MM (1999)Difusao de metais atraves de uma argila laterıtica compact-ada. In: 4� congresso brasileiro de geotecnia ambiental(REGEO’99), Sao Jose dos Campos-SP, December 1999, pp323–330
Burns SE, Mayne PW (1998) Penetrometers for soil permeabilityand chemical detection, geosystems engineering group.School of Civil and Environmental Engineering, GeorgiaInstitute of Technology Atlanta, Georgia 30332–0355,National Science Foundation Arlington, Virginia ArmyResearch Office, North Carolina, July 1998
Campanella RG, Weemees IA (1990) Development and use ofan electrical resistivity cone for groundwater contaminationstudies. Can Geotech J 27:557–567
Campanella RG, Davies MP, Boyd TJ, Everard JL (1994) In-situtesting methods for groundwater contamination studies. In:Symposium on Developments in Geotechnical Engineering,From Harvard to New Delhi, 1936–1994, Bangkok, Thai-land, 694 pp
Catt LM, West LJ, Clark RA, Murray T (2005) Electricalresistivity inversion constrained by resistivity cone penet-rometry (RCPT): application to landfill site characterisation.EOS: Transactions of the American Geophysical Union,Joint Assembly Meeting Supplement 86
Cherry JA, Gillham RW, Anderson EG, Johnson PE (1983)Migration of contaminants in groundwater at a landfill: acase study, 2. Groundwater monitoring devices. J Hydrol63:31–49
Dahlin T, Bernstone C, Loke MH (2002) Case history: A 3-Dresistivity investigation of a contaminated site at Lernacken,Sweden. Geophysics 67(6):1692–1700
Daniel CR, Campanella RG, Howie JA, Giacheti HL (2003)Specific depth cone resistivity measurements to determinesoil engineering properties. J Environ Eng Geophys 8(1):15–22
Davies MP, Campanella RG (1995) Environmental site char-acterization using in-situ testing methods. In: 48th Cana-dian geotechnical conference, Vancouver-BC, September1995
Davis JL, Annan AP (1989) Ground penetrating radar for highresolution mapping of soil and rock stratigraphy. GeophysProspect 37:531–551
Dawson CB, Lane JW Jr, White EA, Belaval M (2002)Integrated geophysical characterization of the winthroplandfill southern flow path, Winthrop, Maine. In: Sympo-sium on the application of geophysics to engineering andenvironmental problems, Las Vegas, Nevada, February2002, CD-ROM
Du YJ, Hayashi S (2004) Effect of leachate composition on theadsorption properties of two soils. Geotech Test J27(4):404–410
Freeze RA, Cherry JA (1979) Groundwater. Prentice Hall,Englewood Cliffs
Fukue M, Minato T, Matsumoto M, Taya N (1998) Developmentof resistivity cone for monitoring contaminated and non-contaminated soil layers. In: Proceedings of the 3rd inter-national congress on environmental geothecnics, Lisboa,Portugal, September 1998, pp 575–580
Fukue M, Minato T, Matsumoto M, Horibe H, Taya N (2001)Use of a resistivity cone for detecting contaminated soillayers. Eng Geol 60:361–369
Giacheti HL, Marques MEM, Peixoto ASP (2003) Cone pene-tration testing on Brazilian tropical soils. In: XII panamer-ican conference of soil mechanics and geotechnicalengineering (Soil Rock America), Massachusetts Instituteof Technology, Cambridge, 1:397–402
Green A, Lanz E, Maurer H (1999) A template for geophysicalinvestigations of small landfills. Leading Edge 18(2):248–254
Greenhouse JP, Harris RD (1983) Migration of contaminants ingroundwater at a landfill: a case study, 7.DC, VLF, andinductive resistivity surveys. J Hydrol 63:177–197
Greenhouse JP, Gudjurgis P and Slaine D (1995) Applications ofsurface geophysics to environmental investigations. In:Symposium on the Application of Geophysics to Engineer-ing and Environmental Problems, Orlando, April 1995(Reference Notes)
Heitfeld KH, Heitfeld M (1997) Sitting and planning of wastedisposal facilities in difficult hydrogeological conditions.In: Marinos, Koukis, Tsiambaos, Stoumaras (eds) Engineer-ing geology and the environment. Balkema, Rotterdam,pp 1623–1628
IBGE (2002) Pesquisa nacional de saneamento basico 2000.Instituto Brasileiro de Geografia e Estatıstica, Rio deJaneiro-RJ, Brazil. Available at http://www.ibge.gov.br
Interpex Limited (1996) RESIX IP2DI v3—Resistivity andinduced polarization data interpretation software. InterpexGolden, Colorado, pp 280
Johnson WJ (2005) Applications of the electrical resistivitymethod for detection of underground mine workings. In:Geophysical technologies for detecting underground coalmine voids: an interactive forum. Available at http://www.fhwa.dot.gov/engineering/geotech/hazards/mine/work-shops/ktwkshp/ky0311.cfm, 23 July 2006
Karlik G, Kaya MA (2001) Investigation of groundwatercontamination using electric and electromagnetic methodsat an open waste-disposal site: a case study from Isparta,Turkey. Environ Geol 40:725–731
Kean WF, Waller MJ, Layson HR (1987) Monitoring moisturemigration in the vadose zone with resitivity. Ground Water25(5):562–571
Lago AL (2004) Aplicacao integrada de metodos geofısicos emarea de disposicao de resıduos solidos urbanos em Bauru-SP. MSc, Institute of Astronomy, Geophysics and Atmo-spheric Sciences, University of Sao Paulo, Sao Paulo-SP,Brazil
Lanz E, Jemmi L, Muller R, Green A, Pugin A, Huggenberger P(1994) Integrated studies of swiss waste disposal sites: resultsfrom georadar and other geophysical surveys. In: Proceed-
886 Environ Geol (2007) 52:871–887
123

ings of the 5th international conference on groundpenetrating radar (GPR ‘94), Kitchener, Ontario, Canada,1994, pp 1261–1274
Larsson R (1995) Use of a thin slot as filter in piezocone tests. In:International symposium on cone penetration test (CPT’95),Linkoping, Sweden 2:35–40
Leite AL, Paraguassu AB (2002) Diffusion of inorganic chem-icals in some compacted tropical soils. In: Proceedings of the4th international congress in environmental geotechnics (4thICEG), Rio de Janeiro-RJ, Brazil, August 1:39–45
Loke MH (1998) RES2Dinv ver. 3.3. for Windows 3.1 and95—Rapid 2D resistivity and IP inversion using the least-squares method. Geotomo Software User’s Manual, Penang,Malaysia, pp 35
Lunne T, Robertson PK, Powell J (1997) Cone penetration testin geotechnical practice. Blackie Academic & Professional,London, pp 311
MacFarlane DS, Cherry JA, Ghillham RW, Sudicky EA (1983)Migration of contaminants in groundwater at a landfill: acase study, 1. Groundwater flow and plume delineation. JHydrol 63:1–29
Meju M A (2000) Geoelectrical investigation of old abandoned,covered landfill sites in urban areas: model developmentwith a genetic diagnosis approach. J Appl Geophys 44:115–150
Mondelli G (2004) Investigacao geoambiental em areas dedisposicao de resıduos solidos urbanos utilizando a tecno-logia do piezocone. MSc, Department of Structures andGeotechnical Engineering, University of Sao Paulo, SaoPaulo-SP, Brazil
Mota R, Monteiro Santos FA, Mateus A, Marques FO,Goncalves MA, Figueiras J, Amaral H (2004). Granitefracturing and incipient pollution beneath a recent landfillfacility as detected by geoelectrical surveys. J ApplGeophys 57:11–22
Nascentes CR (2003) Coeficiente de dispersao hidrodinamica efator de retardamento de metais pesados em solo residualcompactado. MSc, Department of Civil Engineering, Fed-eral University of Vicosa, Vicosa-MG, Brazil
Opdyke SM, Lazarte CA, Espinoza RD, Germain AM (2006)Use of CPT resistivity and dissipation tests for delineatingliquid levels in a landfill. In: Proceedings of geotechnicalengineering in the information technology age (GEOCON-GRESS 2006), The Geo-Institute of the American Societyof Civil Engineers, Atlanta, Georgia, March 2006, CD-ROM
Orlando L, Marchesi E (2001) Georadar as a tool to identify andcharacterise solid waste dump deposits. J Appl Geophys48:163–174
Porsani JL, Malagutti Filho W, Elis VR, Fisseha S, Dourado JC,Moura HP (2004) The use of GPR and VES in delineating acontamination plume in a landfill site: a case study in SEBrazil. J Appl Geophys 55:199–209
Rhoades JD, van Schilfgaarde J (1976) An electrical conductivityprobe for determining soil salinity. Soil Sci Soc Am 40:647–651
Ritter E (1998) Efeito da salinidade na difusao e sorcao dealguns ıons inorganicos em um solo argiloso saturado. PhD,Department of Civil Engineering, Federal University of Riode Janeiro, Rio de Janeiro-RJ, Brazil
Ritter E, Ehrlich M, Barbosa MC (1999) Difusao e sorcao desolucoes multiplas e monossolucoes em solos argilosossalinos e nao salinos. In: 4� congresso brasileiro de geotecnia
ambiental (REGEO’99). Sao Jose dos Campos-SP, Decem-ber 1999, pp 331–338
Robertson PK, Campanella RG, Gillespie DJ, Grieg J (1986)Use of piezometer cone data. In: Proceedings of In-Situ’ 86,ASCE, Geotechnical Special Publication 6:1263–1280
Rowe RK, Caers CJ, Barone FS (1988) Laboratory determina-tion of diffusion and distribution coefficients of contami-nants using undisturbed clayey soil. Can Geotech J25(1):108–118
Sauck WA, Atekwana EA, Nash MS (1998) High conductivitiesassociated with an LNAPL plume imaged by integratedgeophysical techniques. J Environ Eng Geophys 2(3):203–212
Sauck WA (2000) A model for the resistivity structure ofLNAPL plumes and their environs in sandy sediments. JAppl Geophys 44:151–165
Shackelford CD (1993) Contaminant transport. In: GeotechnicalPractice for Waste Disposal, Chapman & Hall, London, pp33–65
Shackelford CD, Daniel DE, Liljestrand HM (1989) Diffusion ofinorganic chemical species in compacted clay soil. J ContamHydrol 4(3):441–473
Shackelford CD, Daniel DE (1991) Diffusion in saturated soil. I:background. J Geotech Eng 117(3):467–484
Soupios P, Manios T, Sarris A, Vallianatos F, Maniadakis K,Papadopoulos N, Makris JP, Kouli M, Gidarakos E, SaltasV, Kourgialas N (2005a) Integrated environmental investi-gation of a municipal landfill using modern techniques.Paper presented at International workshop in geoenviron-ment and geotechnics, Milos Island, pp 75–82
Soupios P, Vallianatos F, Papadopoulos I, Makris JP, MarinakisM (2005b) Surface-geophysical investigation of a landfill inchania, Crete. Paper presented at International workshop ingeoenvironment and geotechnics, Milos Island,pp 149–156
Soupios P, Vallianatos F, Makris JP, Papadopoulos I (2005c)Determination of a landfill structure using HVSR, geoelec-trical and seismic tomographies. Paper presented at theinternational workshop in geoenvironment and geotechnics,Milos Island pp 83–90
Soupios P, Papadopoulos I, Kouli M, Georgaki I, Vallianatos F,Kokkinou E (2006) Investigation of waste disposal areasusing electrical methods: a case study from Chania, Crete,Environ Geol. DOI 10.1007/s00254-006-0418-7
Stanton GP, Schrader TP (2001) Surface geophysical investiga-tion of a chemical waste landfill in northwestern Arkansas.Presented in Eve L. Kuniansky (ed) 2001, U.S. GeologicalSurvey Karst Interest Group Proceedings, Water-ResourcesInvestigations Report 01-4011, pp 107–115
Strutynsky AI, Sandiford RE, Cavaliere D (1992) Use ofpiezometric cone penetration testing with electrical conduc-tivity measurements (CPTU-EC) for detection of hydrocar-bon contamination in saturated granular soils. In: Currentpractices in ground water and vadose zone investigations,ASTM STP 1118, Philadelphia, pp 169–182
Svenson M, Benrstone C, Dahlin T (1999) The combination ofthe SASW method and DC-resistivity in characterization ofold landfills. In: Proceedings of the 5th meeting of environ-mental & engineering geophysical society (EEGS ESMeeting 1999). Budapest, pp 123–131
Yong RN (2001) Geoenvironmental engineering: contaminatedsoils, pollutant fate and mitigation. CRC Press, USA, pp 307
Yong RN, Mohamed AMO, Warkentin BP (1992) Principles ofcontaminant transport in soils. Elsevier B.V., pp 327
Environ Geol (2007) 52:871–887 887
123