LCA of the Collection, Transportation, Treatment and Disposal ...
13
sustainability Article LCA of the Collection, Transportation, Treatment and Disposal of Source Separated Municipal Waste: A Southern Italy Case Study Giovanni De Feo 1, *, Carmen Ferrara 1 , Cristina Iuliano 2 and Alberto Grosso 3 1 Department of Industrial Engineering (DIIN), University of Salerno, via Giovanni Paolo II 132, 84084 Fisciano (Sa), Italy; [email protected] 2 M.Sc. in Env. Science, Via R. Nicodemi 34, 84084 Fisciano (Sa), Italy; [email protected] 3 Agenzia Regionale per la Protezione dell’Ambiente della Campania, Via Vicinale Santa Maria del Pianto, Centro Polifunzionale, Torre n. 1, 80143 Naples, Italy; [email protected] * Correspondence: [email protected]; Tel.: +39-089-964-113; Fax: +39-089-968-738 Academic Editor: Marc A. Rosen Received: 23 July 2016; Accepted: 19 October 2016; Published: 25 October 2016 Abstract: This study performed a Life Cycle Assessment of the collection, transport, treatment and disposal of source-separated municipal waste (MW) in Baronissi, a town of 17,000 inhabitants in the Campania region of Italy. Baronissi is a high-performing town in a region with scarcity of MW facilities. The environmental impacts were assessed with three different methods—IPCC 2007, Ecological Footprint and ReCiPe 2008—in order to evaluate how they influence the results as well as how the global warming affects the results, since it is one of the major environmental concerns of people. The obtained results showed how the presence of facilities in the area is fundamental. Their lack means high environmental loads due to the transportation of materials for long distances, particularly for the organic fraction. The presence of a composting plant at 10 km from the municipality would result in a decrease of 65% of the impacts due to the external transport, regardless of the evaluation method. The results obtained with ReCiPe 2008 and Ecological Footprint agreed, while those obtained with IPCC 2007 were very different since global warming is strongly affected by the transport phase. IPCC 2007 does not allow to take into account the advantages obtainable with a good level of separate collection. Considering a single impact evaluation method, there is a high risk of coming to misleading conclusions. Keywords: collection; disposal; Ecological Footprint; IPCC; LCA; municipal waste; ReCiPe; source separation; transport; treatment 1. Introduction Four hierarchical subsequent levels are at the base of a proper waste management system, according to the European Union strategy: (1) reduction of waste production; (2) recovery of material; (3) recovery of energy; and finally, (4) landfill disposal (EU, 2006). Between (1) and (2) there are the source-separated collection systems that allow for the recovery of secondary raw materials from municipal waste (MW). There are different types of separate collection: the bring system and the house-to-house kerbside collection system [1]. The main difference between the two collection methods is that with the house-to-house kerbside collection system, there are no stable street containers and the citizens have to put out the different waste fractions daily based on a detailed collection schedule [2]. The use of infrastructure, equipment and vehicles needed for the delivery of waste by the citizens and their subsequent collection and transportation to the MW facilities produces several Sustainability 2016, 8, 1084; doi:10.3390/su8111084 www.mdpi.com/journal/sustainability
-
Upload
khangminh22 -
Category
Documents
-
view
0 -
download
0
Transcript of LCA of the Collection, Transportation, Treatment and Disposal ...
sustainability
Article
LCA of the Collection, Transportation, Treatment andDisposal of Source Separated Municipal Waste:A Southern Italy Case Study
Giovanni De Feo 1,*, Carmen Ferrara 1, Cristina Iuliano 2 and Alberto Grosso 3
1 Department of Industrial Engineering (DIIN), University of Salerno, via Giovanni Paolo II 132,84084 Fisciano (Sa), Italy; [email protected]
2 M.Sc. in Env. Science, Via R. Nicodemi 34, 84084 Fisciano (Sa), Italy; [email protected] Agenzia Regionale per la Protezione dell’Ambiente della Campania, Via Vicinale Santa Maria del Pianto,
Centro Polifunzionale, Torre n. 1, 80143 Naples, Italy; [email protected]* Correspondence: [email protected]; Tel.: +39-089-964-113; Fax: +39-089-968-738
Academic Editor: Marc A. RosenReceived: 23 July 2016; Accepted: 19 October 2016; Published: 25 October 2016
Abstract: This study performed a Life Cycle Assessment of the collection, transport, treatmentand disposal of source-separated municipal waste (MW) in Baronissi, a town of 17,000 inhabitantsin the Campania region of Italy. Baronissi is a high-performing town in a region with scarcityof MW facilities. The environmental impacts were assessed with three different methods—IPCC2007, Ecological Footprint and ReCiPe 2008—in order to evaluate how they influence the results aswell as how the global warming affects the results, since it is one of the major environmentalconcerns of people. The obtained results showed how the presence of facilities in the area isfundamental. Their lack means high environmental loads due to the transportation of materials forlong distances, particularly for the organic fraction. The presence of a composting plant at 10 kmfrom the municipality would result in a decrease of 65% of the impacts due to the external transport,regardless of the evaluation method. The results obtained with ReCiPe 2008 and Ecological Footprintagreed, while those obtained with IPCC 2007 were very different since global warming is stronglyaffected by the transport phase. IPCC 2007 does not allow to take into account the advantagesobtainable with a good level of separate collection. Considering a single impact evaluation method,there is a high risk of coming to misleading conclusions.
Keywords: collection; disposal; Ecological Footprint; IPCC; LCA; municipal waste; ReCiPe; sourceseparation; transport; treatment
1. Introduction
Four hierarchical subsequent levels are at the base of a proper waste management system,according to the European Union strategy: (1) reduction of waste production; (2) recovery of material;(3) recovery of energy; and finally, (4) landfill disposal (EU, 2006).
Between (1) and (2) there are the source-separated collection systems that allow for the recovery ofsecondary raw materials from municipal waste (MW). There are different types of separate collection:the bring system and the house-to-house kerbside collection system [1]. The main difference betweenthe two collection methods is that with the house-to-house kerbside collection system, there are nostable street containers and the citizens have to put out the different waste fractions daily based ona detailed collection schedule [2].
The use of infrastructure, equipment and vehicles needed for the delivery of waste by thecitizens and their subsequent collection and transportation to the MW facilities produces several
Sustainability 2016, 8, 1084; doi:10.3390/su8111084 www.mdpi.com/journal/sustainability
Sustainability 2016, 8, 1084 2 of 13
environmental impacts (due to the consumption of raw materials and energy as well as pollutantemissions). The procedure of Life Cycle Assessment (LCA) is able to effectively evaluate theseenvironmental impacts [3].
LCA is one of the more useful instruments since it allows to evaluate the environmentalperformance of alternative systems considering both the whole life cycle (i.e., from cradle-to-grave) andonly some parts (e.g., from cradle to gate or from gate to grave, as in the case of MW management) [4].
LCA allows to carry out comparisons between systems considering resource consumption andpollutant emissions in the environment by including the extraction of raw materials, processing,manufacture, use and end of life of these systems [5].
LCA is a powerful decision making tool when it is applied to the waste management sector,because it is able to consider both site-specific conditions and improvement opportunities [6].A sustainable waste management system requires a multidisciplinary approach; consequently, it isnecessary to adopt a holistic view of the system [7].
The early studies of LCA applied to waste management systems date back to the early nineties [8].During the subsequent years, the application of the methodology to the waste sector was increasinglyrefined in order to follow the growing modelling complexity. In most of the studies, LCA was appliedto MW trying to take into account different aspects of the problem [6].
Some authors focused on aspects related to the management of waste disposal processes,comparing the environmental impacts of alternative treatment systems. Some examples concernthe assessment of the most environmentally sound plastic waste management scenario [9], or thecomparison between possible scenarios for the residual waste treatment [10,11], or the evaluation ofalternative strategies for organic waste disposal [12,13].
Other authors expanded the system boundaries, also taking into account logistical ortransportation aspects (e.g., different waste collection alternatives). In fact, there are studies dealingwith the application of LCA to alternative scenarios of MW management in relation to differentseparate collection systems or different collection percentages [2,14–16].
These studies provided important results such as:
• for higher separate collection percentages, it is preferable to adopt a management system finalizedto materials recovery and recycling rather than to incineration [14];
• it is important to correctly define the recycling rate for each recovered material, together with thepercentage of separate collection [2];
• it is necessary to support waste management systems based on the separate collection withsuitable facilities for the treatment of all the separately collected fractions [15].
Other authors also evaluated the influence of governmental and social aspects on MWmanagement systems; they showed that these aspects could play an important role in decreasing theefficiency that waste treatment plants could provide [17].
An important aspect highlighted from many of these studies is that the obtained results aresite-specific [6,8]. The availability of MW treatment facilities in the territory under study is an exampleof the importance of local specific conditions. In fact, the lack of near facilities generates environmentalimpacts due to waste transportation over long distances with a worsening of the global environmentalperformance of the waste management system.
The present study arises in this context. It proposes an LCA study of the collection, transportation,treatment and disposal of the source-separated MW in Baronissi, a town of around 17,000 inhabitantsin the Province of Salerno, in the Campania region of Italy [1]. The impacts of the waste managementsystem under study were calculated with three different evaluation methods—IPCC 2007, EcologicalFootprint and ReCiPe 2008—in order to assess how the choice of the method could affect the results.In fact, the three adopted methods differ for the increasing level of complexity as well as for numberand type of environmental impact categories considered.

Sustainability 2016, 8, 1084 3 of 13
The municipality of Baronissi is a high-performing town in terms of waste management ifcompared with the regional context. In fact, in the whole region there is a scarcity of suitable MWfacilities, especially for the treatment of recyclable and compostable materials. In order to evaluatethe positive effects due to the presence of near treatment facilities, a part of the study deals with thecomparison of the environmental performance of today’s waste management system, and that of analternative future scenario where a composting plant has been planned for the aerobic treatment ofwaste organic fraction at 10 km from the town.
2. Material and Methods
2.1. The Area and the Separated Collection System under Study
The study was performed in 2014 for the town of Baronissi in the province of Salerno, inthe Campania region of Southern Italy. The population of Baronissi was 16,820 inhabitants witha population density of 942.3 inhabitants/km2 (corresponding to an area of 17.85 km2). The town hasone principal centre and twelve geographical districts.
The following MW components were separately collected by means of a kerbside collectionsystem: organic for composting (three times a week); paper and cardboard (once a week); glass(twice a month); aluminium and other metals together with plastic for recycling (twice a week);non-recycling residues for RDF production (twice a month); sanitary towels, nappies and incontinencepads (six days a week); bulk refuses and Waste Electrical and Electronic (WEEE); used clothing and,finally, hazardous MW.
One of the principal features of the Baronissi system is the frequency of collection for non-recyclingresidues that is typical of some areas of Northern Italy, like Consorzio Priula, in the Province ofTreviso [18]. In the Central-Southern Italy, this is a novelty. The adoption of this solution, together withthe opening of a Separate Collection Centre (SCC), allowed the municipality of Baronissi to improvethe percentage of separate collection. Moreover, it allowed to reduce the waste fee in the period2010–2012: 5% during 2010, 5% during 2011, and 7% during 2012, when the Municipality of Baronissireceived a Green Public Procurement Award from the Italian Ministry of Economy and Finance [1].
SCCs are centralised collection sites where the citizens can deliver the recyclable fractions of MW,integrating the two collection modalities as well as exploiting the advantages of the two systems andminimizing their defects [19].
Organic and recyclable materials were sent out of the Campania region due to the absence oftreatment facilities [20], while non-recycling residues were treated in a RDF production plant in thetown of Battipaglia, in the Province of Salerno. Each MW component was directly collected near thehome of every resident except for bulk refuse and WEEE, which were collected on demand or directlydelivered to the SCC of the city. The waste cooking oil could only be delivered to the SCC [1].
The construction of the SCC was completed in 2009, but it was only opened to the public in2010 due to red tape issues. In Italy, the construction and management of separate collection centres(named “municipal collection centres”) are specifically regulated by the Ministry Decree of 8 April 2008,as amended and supplemented by the Decree of the Ministry of the Environment dated 13 May 2009.Citizens can directly deliver to the SCC all the MSW separate collection fractions, except putresciblematerials and non-recycling residues [1].
2.2. The LCA Approach
The performed LCA study took into account the level of separated collection, the location oftreatment and disposal facilities, the management of the collection program and the transportation ofthe collected materials inside (performed with a separate kerbside collection system) and outside thetown (transportation toward the facilities).
The assessment was developed regarding two scenarios: (1) the treatment and disposal, collectionand external transportation scenario for the year 2013 (Scenario 1); (2) an alternative scenario, differing
Sustainability 2016, 8, 1084 4 of 13
from Scenario 1 by the presence of a composting plant at 10 km from the town of Baronissi, withouta transfer station (Scenario 2).
The LCA was performed using the software tool SimaPro v.7.3 (PRé Consultants, Amersfoort,The Netherlands), using the Ecoinvent 2.2 database and a modelling approach developed subsequently [3].
The goal and scope of the study was the use of LCA to calculate the resources used and theenvironmental impacts produced to carry out the MW kerbside separate collection service of the townunder study in a year. The function of the LCA study was the activities of the MW components deliveryby citizens and the subsequent collection and transport to the MW facilities, while the functionalunit (i.e., unit of output for which results will be presented [21]) was one ton of waste with a definedcomposition and, finally, the reference flow (i.e., the flow to which all other modelled flows of thesystem are related [22]) was quantified as the amount of waste treated in a year.
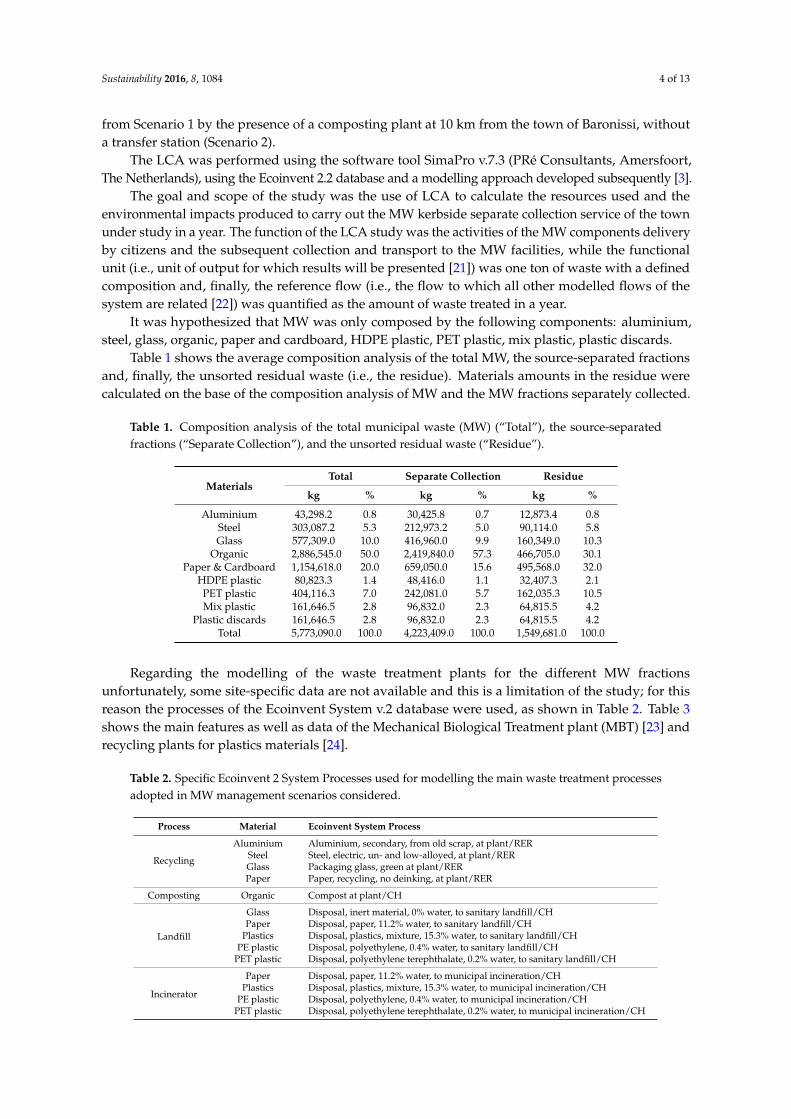
It was hypothesized that MW was only composed by the following components: aluminium,steel, glass, organic, paper and cardboard, HDPE plastic, PET plastic, mix plastic, plastic discards.
Table 1 shows the average composition analysis of the total MW, the source-separated fractionsand, finally, the unsorted residual waste (i.e., the residue). Materials amounts in the residue werecalculated on the base of the composition analysis of MW and the MW fractions separately collected.
Table 1. Composition analysis of the total municipal waste (MW) (“Total”), the source-separatedfractions (“Separate Collection”), and the unsorted residual waste (“Residue”).
MaterialsTotal Separate Collection Residue
kg % kg % kg %
Aluminium 43,298.2 0.8 30,425.8 0.7 12,873.4 0.8Steel 303,087.2 5.3 212,973.2 5.0 90,114.0 5.8Glass 577,309.0 10.0 416,960.0 9.9 160,349.0 10.3
Organic 2,886,545.0 50.0 2,419,840.0 57.3 466,705.0 30.1Paper & Cardboard 1,154,618.0 20.0 659,050.0 15.6 495,568.0 32.0
HDPE plastic 80,823.3 1.4 48,416.0 1.1 32,407.3 2.1PET plastic 404,116.3 7.0 242,081.0 5.7 162,035.3 10.5Mix plastic 161,646.5 2.8 96,832.0 2.3 64,815.5 4.2
Plastic discards 161,646.5 2.8 96,832.0 2.3 64,815.5 4.2Total 5,773,090.0 100.0 4,223,409.0 100.0 1,549,681.0 100.0
Regarding the modelling of the waste treatment plants for the different MW fractionsunfortunately, some site-specific data are not available and this is a limitation of the study; for thisreason the processes of the Ecoinvent System v.2 database were used, as shown in Table 2. Table 3shows the main features as well as data of the Mechanical Biological Treatment plant (MBT) [23] andrecycling plants for plastics materials [24].
Table 2. Specific Ecoinvent 2 System Processes used for modelling the main waste treatment processesadopted in MW management scenarios considered.
Process Material Ecoinvent System Process
Recycling
Aluminium Aluminium, secondary, from old scrap, at plant/RERSteel Steel, electric, un- and low-alloyed, at plant/RERGlass Packaging glass, green at plant/RERPaper Paper, recycling, no deinking, at plant/RER
Composting Organic Compost at plant/CH
Landfill
Glass Disposal, inert material, 0% water, to sanitary landfill/CHPaper Disposal, paper, 11.2% water, to sanitary landfill/CH
Plastics Disposal, plastics, mixture, 15.3% water, to sanitary landfill/CHPE plastic Disposal, polyethylene, 0.4% water, to sanitary landfill/CH
PET plastic Disposal, polyethylene terephthalate, 0.2% water, to sanitary landfill/CH
Incinerator
Paper Disposal, paper, 11.2% water, to municipal incineration/CHPlastics Disposal, plastics, mixture, 15.3% water, to municipal incineration/CH
PE plastic Disposal, polyethylene, 0.4% water, to municipal incineration/CHPET plastic Disposal, polyethylene terephthalate, 0.2% water, to municipal incineration/CH
Sustainability 2016, 8, 1084 5 of 13
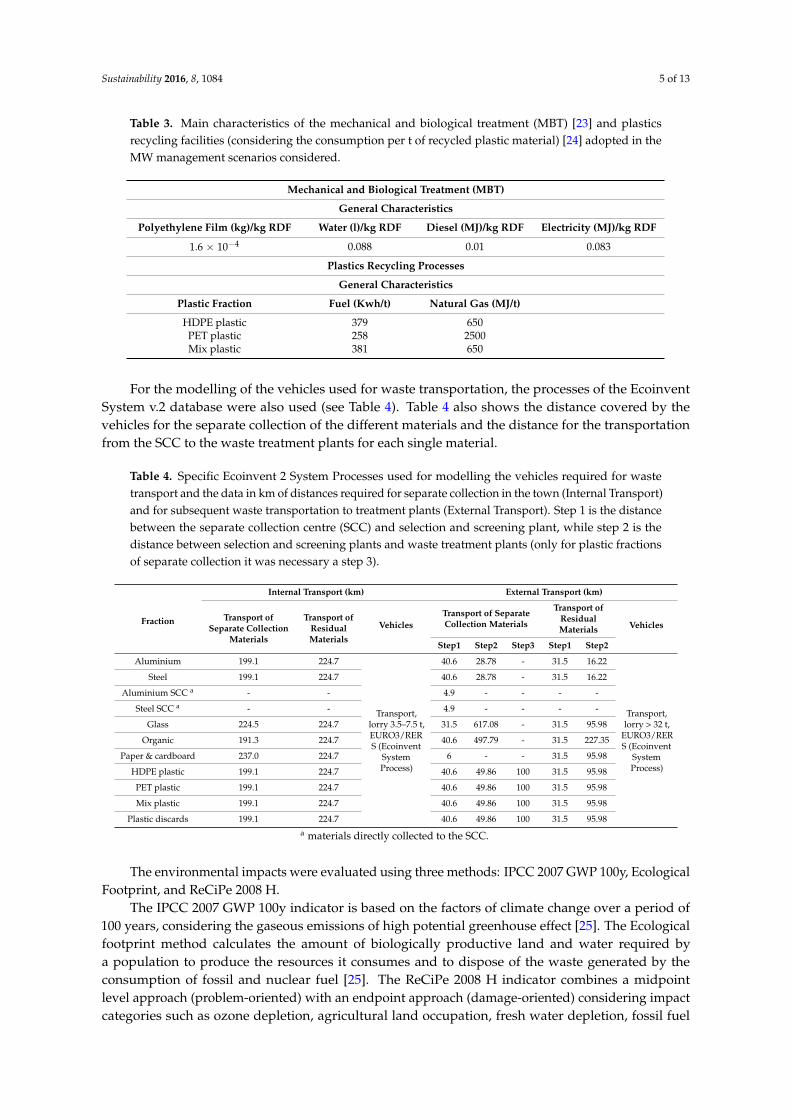
Table 3. Main characteristics of the mechanical and biological treatment (MBT) [23] and plasticsrecycling facilities (considering the consumption per t of recycled plastic material) [24] adopted in theMW management scenarios considered.
Mechanical and Biological Treatment (MBT)
General Characteristics
Polyethylene Film (kg)/kg RDF Water (l)/kg RDF Diesel (MJ)/kg RDF Electricity (MJ)/kg RDF
1.6 × 10⁻⁴ 0.088 0.01 0.083
Plastics Recycling Processes
General Characteristics
Plastic Fraction Fuel (Kwh/t) Natural Gas (MJ/t)
HDPE plastic 379 650PET plastic 258 2500Mix plastic 381 650
For the modelling of the vehicles used for waste transportation, the processes of the EcoinventSystem v.2 database were also used (see Table 4). Table 4 also shows the distance covered by thevehicles for the separate collection of the different materials and the distance for the transportationfrom the SCC to the waste treatment plants for each single material.
Table 4. Specific Ecoinvent 2 System Processes used for modelling the vehicles required for wastetransport and the data in km of distances required for separate collection in the town (Internal Transport)and for subsequent waste transportation to treatment plants (External Transport). Step 1 is the distancebetween the separate collection centre (SCC) and selection and screening plant, while step 2 is thedistance between selection and screening plants and waste treatment plants (only for plastic fractionsof separate collection it was necessary a step 3).
Fraction
Internal Transport (km) External Transport (km)
Transport ofSeparate Collection
Materials
Transport ofResidualMaterials
VehiclesTransport of SeparateCollection Materials
Transport ofResidualMaterials Vehicles
Step1 Step2 Step3 Step1 Step2
Aluminium 199.1 224.7
Transport,lorry 3.5–7.5 t,EURO3/RERS (Ecoinvent
SystemProcess)
40.6 28.78 - 31.5 16.22
Transport,lorry > 32 t,
EURO3/RERS (Ecoinvent
SystemProcess)
Steel 199.1 224.7 40.6 28.78 - 31.5 16.22
Aluminium SCC a - - 4.9 - - - -
Steel SCC a - - 4.9 - - - -
Glass 224.5 224.7 31.5 617.08 - 31.5 95.98
Organic 191.3 224.7 40.6 497.79 - 31.5 227.35
Paper & cardboard 237.0 224.7 6 - - 31.5 95.98
HDPE plastic 199.1 224.7 40.6 49.86 100 31.5 95.98
PET plastic 199.1 224.7 40.6 49.86 100 31.5 95.98
Mix plastic 199.1 224.7 40.6 49.86 100 31.5 95.98
Plastic discards 199.1 224.7 40.6 49.86 100 31.5 95.98a materials directly collected to the SCC.
The environmental impacts were evaluated using three methods: IPCC 2007 GWP 100y, EcologicalFootprint, and ReCiPe 2008 H.
The IPCC 2007 GWP 100y indicator is based on the factors of climate change over a period of100 years, considering the gaseous emissions of high potential greenhouse effect [25]. The Ecologicalfootprint method calculates the amount of biologically productive land and water required bya population to produce the resources it consumes and to dispose of the waste generated by theconsumption of fossil and nuclear fuel [25]. The ReCiPe 2008 H indicator combines a midpointlevel approach (problem-oriented) with an endpoint approach (damage-oriented) considering impactcategories such as ozone depletion, agricultural land occupation, fresh water depletion, fossil fuel
Sustainability 2016, 8, 1084 6 of 13
depletion, etc. The hierarchist perspective (H) is based on the most common policy principlesconcerning the time frame and other issues [26].
The three adopted methods have an increasing level of complexity. Global warming is the uniqueimpact category taken into account with the IPCC method, and thus it represents 100% of the method.Instead, in the Ecological Footprint, global warming is one category out of three, thus numerically itrepresents 33% of all the categories. Finally, in the case of ReCiPe 2008, the global warming appearsone time out of eighteen (corresponding to 5.9%) at the midpoint level, and two times out of seventeenat the endpoint level (11.8%). With ReCiPe, going from the midpoint to the endpoint categories,each single impact is weighted according to the adopted perspective (H in this study).
3. Results and Discussion
3.1. Analysis of Scenario 1 with IPCC 2007 100y
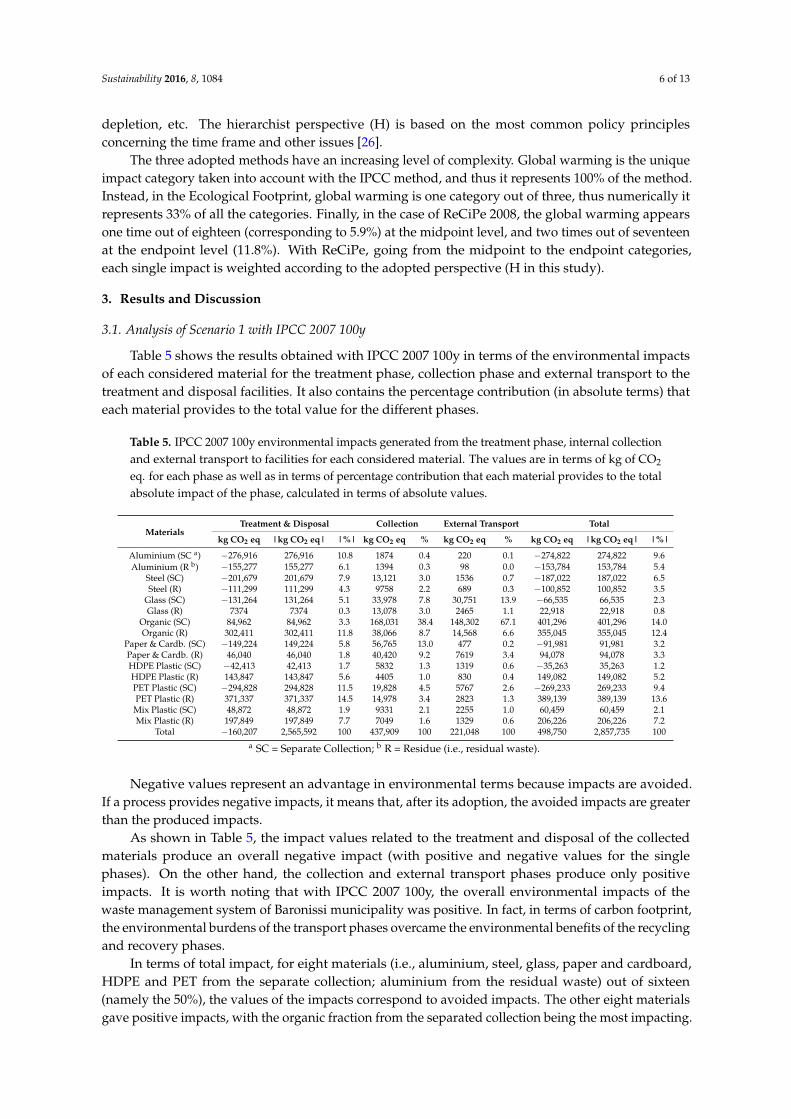
Table 5 shows the results obtained with IPCC 2007 100y in terms of the environmental impactsof each considered material for the treatment phase, collection phase and external transport to thetreatment and disposal facilities. It also contains the percentage contribution (in absolute terms) thateach material provides to the total value for the different phases.
Table 5. IPCC 2007 100y environmental impacts generated from the treatment phase, internal collectionand external transport to facilities for each considered material. The values are in terms of kg of CO2
eq. for each phase as well as in terms of percentage contribution that each material provides to the totalabsolute impact of the phase, calculated in terms of absolute values.
MaterialsTreatment & Disposal Collection External Transport Total
kg CO2 eq |kg CO2 eq| |%| kg CO2 eq % kg CO2 eq % kg CO2 eq |kg CO2 eq| |%|
Aluminium (SC a) −276,916 276,916 10.8 1874 0.4 220 0.1 −274,822 274,822 9.6Aluminium (R b) −155,277 155,277 6.1 1394 0.3 98 0.0 −153,784 153,784 5.4
Steel (SC) −201,679 201,679 7.9 13,121 3.0 1536 0.7 −187,022 187,022 6.5Steel (R) −111,299 111,299 4.3 9758 2.2 689 0.3 −100,852 100,852 3.5
Glass (SC) −131,264 131,264 5.1 33,978 7.8 30,751 13.9 −66,535 66,535 2.3Glass (R) 7374 7374 0.3 13,078 3.0 2465 1.1 22,918 22,918 0.8
Organic (SC) 84,962 84,962 3.3 168,031 38.4 148,302 67.1 401,296 401,296 14.0Organic (R) 302,411 302,411 11.8 38,066 8.7 14,568 6.6 355,045 355,045 12.4
Paper & Cardb. (SC) −149,224 149,224 5.8 56,765 13.0 477 0.2 −91,981 91,981 3.2Paper & Cardb. (R) 46,040 46,040 1.8 40,420 9.2 7619 3.4 94,078 94,078 3.3HDPE Plastic (SC) −42,413 42,413 1.7 5832 1.3 1319 0.6 −35,263 35,263 1.2HDPE Plastic (R) 143,847 143,847 5.6 4405 1.0 830 0.4 149,082 149,082 5.2PET Plastic (SC) −294,828 294,828 11.5 19,828 4.5 5767 2.6 −269,233 269,233 9.4PET Plastic (R) 371,337 371,337 14.5 14,978 3.4 2823 1.3 389,139 389,139 13.6Mix Plastic (SC) 48,872 48,872 1.9 9331 2.1 2255 1.0 60,459 60,459 2.1Mix Plastic (R) 197,849 197,849 7.7 7049 1.6 1329 0.6 206,226 206,226 7.2
Total −160,207 2,565,592 100 437,909 100 221,048 100 498,750 2,857,735 100a SC = Separate Collection; b R = Residue (i.e., residual waste).
Negative values represent an advantage in environmental terms because impacts are avoided.If a process provides negative impacts, it means that, after its adoption, the avoided impacts are greaterthan the produced impacts.
As shown in Table 5, the impact values related to the treatment and disposal of the collectedmaterials produce an overall negative impact (with positive and negative values for the singlephases). On the other hand, the collection and external transport phases produce only positiveimpacts. It is worth noting that with IPCC 2007 100y, the overall environmental impacts of thewaste management system of Baronissi municipality was positive. In fact, in terms of carbon footprint,the environmental burdens of the transport phases overcame the environmental benefits of the recyclingand recovery phases.
In terms of total impact, for eight materials (i.e., aluminium, steel, glass, paper and cardboard,HDPE and PET from the separate collection; aluminium from the residual waste) out of sixteen(namely the 50%), the values of the impacts correspond to avoided impacts. The other eight materialsgave positive impacts, with the organic fraction from the separated collection being the most impacting.
Sustainability 2016, 8, 1084 7 of 13
Regarding the source-separated organic fraction, the major contributors to the total impact werethe collection and external transport. This depended on two factors: the large amounts collected andlong distances to reach the composting plants outside the region.
Only four materials provided a percentage contribution greater than 10%: the source-separatedaluminium (10.8%), the residual organic fraction (11.8%), the source-separated PET (11.5%), and thePET in the residue (14.5%).
The results obtained for the source-separated aluminium confirm the importance of the aluminiumrecycling in terms of global warming saving as already reported in other studies [2,27].
It is worth noting that the source-separated PET contributed to the total global warming burdenas avoided impact, whilst the residual PET generated positive impacts. In fact, on the one hand,recycling is the treatment for the source-separated plastic materials, while, on the other, incineration isthe disposal method for the residual plastic materials. The obtained results emphasize the importanceof the separate collection. In particular, the source separation of the plastic materials avoids theconsumption of fossil fuels, on the one hand, and avoids the generation of hazardous pollutants due tothe incineration processes, on the other [28].
As shown in Table 5, the organic fraction provided the greatest percentage contribution to thetotal impact for both the internal collection and external transportation. The high quantity of materialproduced as well as the long distances to reach the treatment plants were the main reasons for suchan occurrence.
The phase of internal collection of source-separated paper and cardboard gave another importantcontribution for the total impact due to the large quantities produced. Finally, the externaltransportation of glass phase gave a significant contribution due to the long distances to reach thetreatment plants.
3.2. Analysis of Scenario 1 with Ecological Footprint and ReCiPe 2008 H
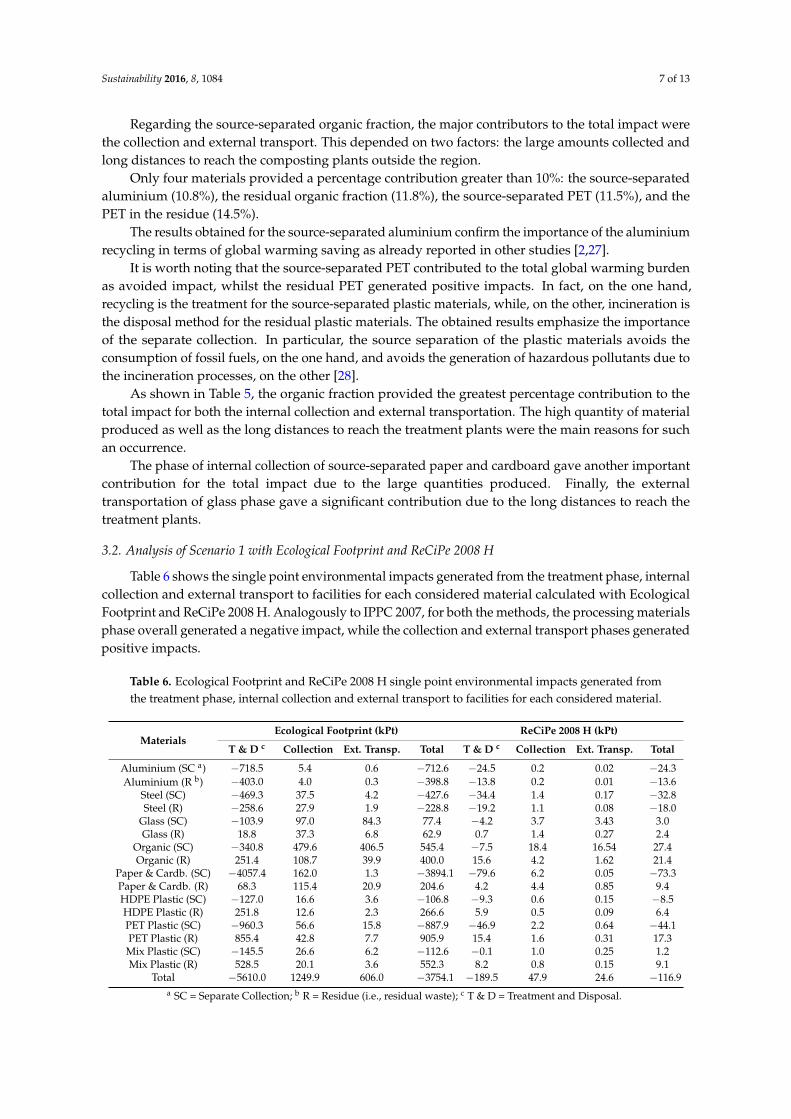
Table 6 shows the single point environmental impacts generated from the treatment phase, internalcollection and external transport to facilities for each considered material calculated with EcologicalFootprint and ReCiPe 2008 H. Analogously to IPPC 2007, for both the methods, the processing materialsphase overall generated a negative impact, while the collection and external transport phases generatedpositive impacts.
Table 6. Ecological Footprint and ReCiPe 2008 H single point environmental impacts generated fromthe treatment phase, internal collection and external transport to facilities for each considered material.
MaterialsEcological Footprint (kPt) ReCiPe 2008 H (kPt)
T & D c Collection Ext. Transp. Total T & D c Collection Ext. Transp. Total
Aluminium (SC a) −718.5 5.4 0.6 −712.6 −24.5 0.2 0.02 −24.3Aluminium (R b) −403.0 4.0 0.3 −398.8 −13.8 0.2 0.01 −13.6
Steel (SC) −469.3 37.5 4.2 −427.6 −34.4 1.4 0.17 −32.8Steel (R) −258.6 27.9 1.9 −228.8 −19.2 1.1 0.08 −18.0
Glass (SC) −103.9 97.0 84.3 77.4 −4.2 3.7 3.43 3.0Glass (R) 18.8 37.3 6.8 62.9 0.7 1.4 0.27 2.4
Organic (SC) −340.8 479.6 406.5 545.4 −7.5 18.4 16.54 27.4Organic (R) 251.4 108.7 39.9 400.0 15.6 4.2 1.62 21.4
Paper & Cardb. (SC) −4057.4 162.0 1.3 −3894.1 −79.6 6.2 0.05 −73.3Paper & Cardb. (R) 68.3 115.4 20.9 204.6 4.2 4.4 0.85 9.4HDPE Plastic (SC) −127.0 16.6 3.6 −106.8 −9.3 0.6 0.15 −8.5HDPE Plastic (R) 251.8 12.6 2.3 266.6 5.9 0.5 0.09 6.4PET Plastic (SC) −960.3 56.6 15.8 −887.9 −46.9 2.2 0.64 −44.1PET Plastic (R) 855.4 42.8 7.7 905.9 15.4 1.6 0.31 17.3Mix Plastic (SC) −145.5 26.6 6.2 −112.6 −0.1 1.0 0.25 1.2Mix Plastic (R) 528.5 20.1 3.6 552.3 8.2 0.8 0.15 9.1
Total −5610.0 1249.9 606.0 −3754.1 −189.5 47.9 24.6 −116.9a SC = Separate Collection; b R = Residue (i.e., residual waste); c T & D = Treatment and Disposal.
Sustainability 2016, 8, 1084 8 of 13
However, for both the methods, contrary to what happened with IPCC 2007, the overallenvironmental impacts of the waste management system were negative, because the total avoidedimpacts of the treatment and disposal phases overcame the environmental loads produced by thecollection and external transport phases.
The IPCC method, that only considers the impact category of the global warming, tends tooverestimate the environmental burden of the transport phase compared with the avoided impactsof the treatment and disposal phases. Thus, the carbon footprint is not able to take into account thedifferent advantages obtainable with a good level of separate collection and consequent recovery ofmaterials. In fact, only considering the obtained results from a global warming perspective, it had tobe concluded that it would not be convenient to push for an increase of the separate collection level.
Analysing the results for each single MW fraction, with Ecological Footprint and ReCiPe 2008 H,ten materials out of sixteen gave total avoided impacts. They were the same eight of the IPPC plus thesource-separated organic fraction and the source-separated plastic mix.
The source-separated organic fraction goes to the composting process for the production of anagriculture soil conditioner (i.e., the compost) with a proper fertilising capacity [29,30]. The use ofcompost avoids the production of mineral fertilizers. Due to their multiple-issues approach, EcologicalFootprint and ReCiPe 2008 are able to take into consideration the avoided impacts due to the avoidedproduction of mineral fertilizers. On the other hand, due to its single-issue approach, IPCC 2007 is notable to consider all the advantages and drawbacks of the recovery of materials and energy obtainablewith the source-separated collection.
The recycling process of the source-separated plastics mix provides recycled plastic as a finalproduct to use as street furniture components (benches, fences, planters); this would avoid usingwood for the construction of such components [24]. Analysing the contributions of each damagecategory of Ecological Footprint (see Table 7), it is evident that Land occupation predominates largelyover the others and provides a contribution in terms of avoided impact, while the category that takesinto account the CO2 production contributes with a positive impact. This is in line with the resultsobtained with the IPCC method that, in fact, assigns a positive impact to the treatment source-separatedplastic mix.
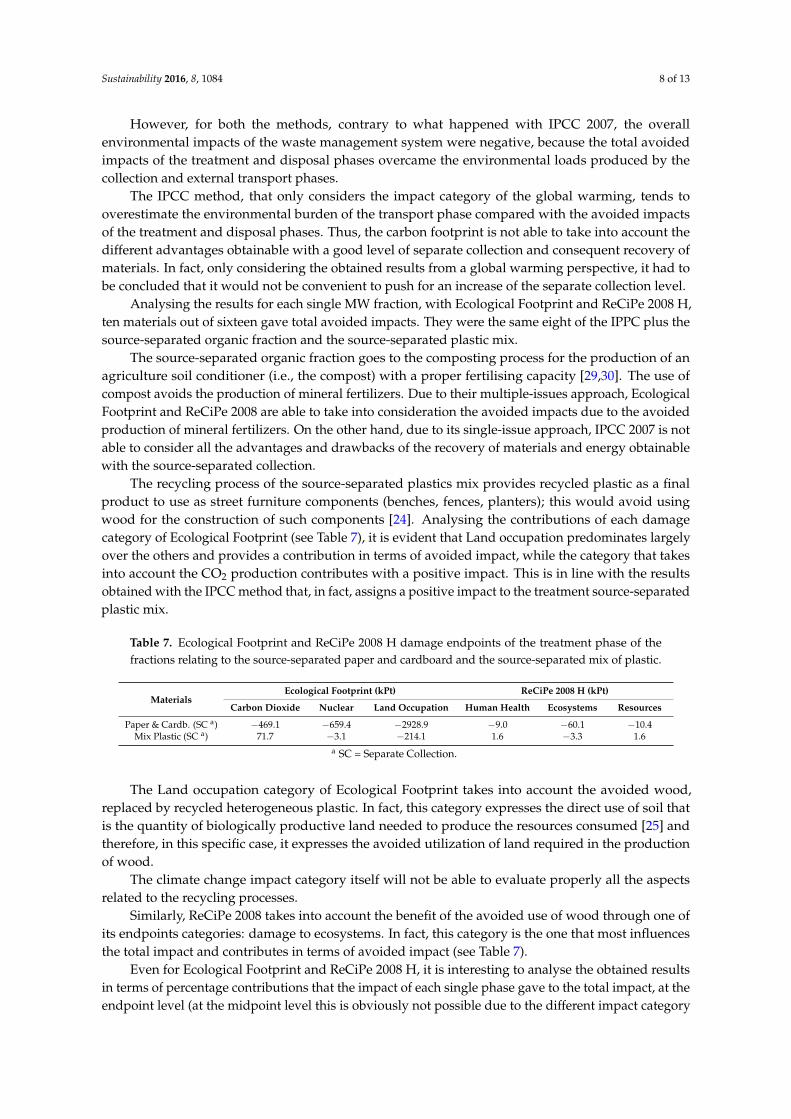
Table 7. Ecological Footprint and ReCiPe 2008 H damage endpoints of the treatment phase of thefractions relating to the source-separated paper and cardboard and the source-separated mix of plastic.
MaterialsEcological Footprint (kPt) ReCiPe 2008 H (kPt)
Carbon Dioxide Nuclear Land Occupation Human Health Ecosystems Resources
Paper & Cardb. (SC a) −469.1 −659.4 −2928.9 −9.0 −60.1 −10.4Mix Plastic (SC a) 71.7 −3.1 −214.1 1.6 −3.3 1.6
a SC = Separate Collection.
The Land occupation category of Ecological Footprint takes into account the avoided wood,replaced by recycled heterogeneous plastic. In fact, this category expresses the direct use of soil thatis the quantity of biologically productive land needed to produce the resources consumed [25] andtherefore, in this specific case, it expresses the avoided utilization of land required in the productionof wood.
The climate change impact category itself will not be able to evaluate properly all the aspectsrelated to the recycling processes.
Similarly, ReCiPe 2008 takes into account the benefit of the avoided use of wood through one ofits endpoints categories: damage to ecosystems. In fact, this category is the one that most influencesthe total impact and contributes in terms of avoided impact (see Table 7).
Even for Ecological Footprint and ReCiPe 2008 H, it is interesting to analyse the obtained resultsin terms of percentage contributions that the impact of each single phase gave to the total impact, at theendpoint level (at the midpoint level this is obviously not possible due to the different impact category
Sustainability 2016, 8, 1084 9 of 13
indicators). Table 8 shows only the percentage contributions relating to the treatment phase of materialsbecause for the phases of internal collection and external transport, the percentage contributions arevery similar to those obtained with IPCC (see Table 5).
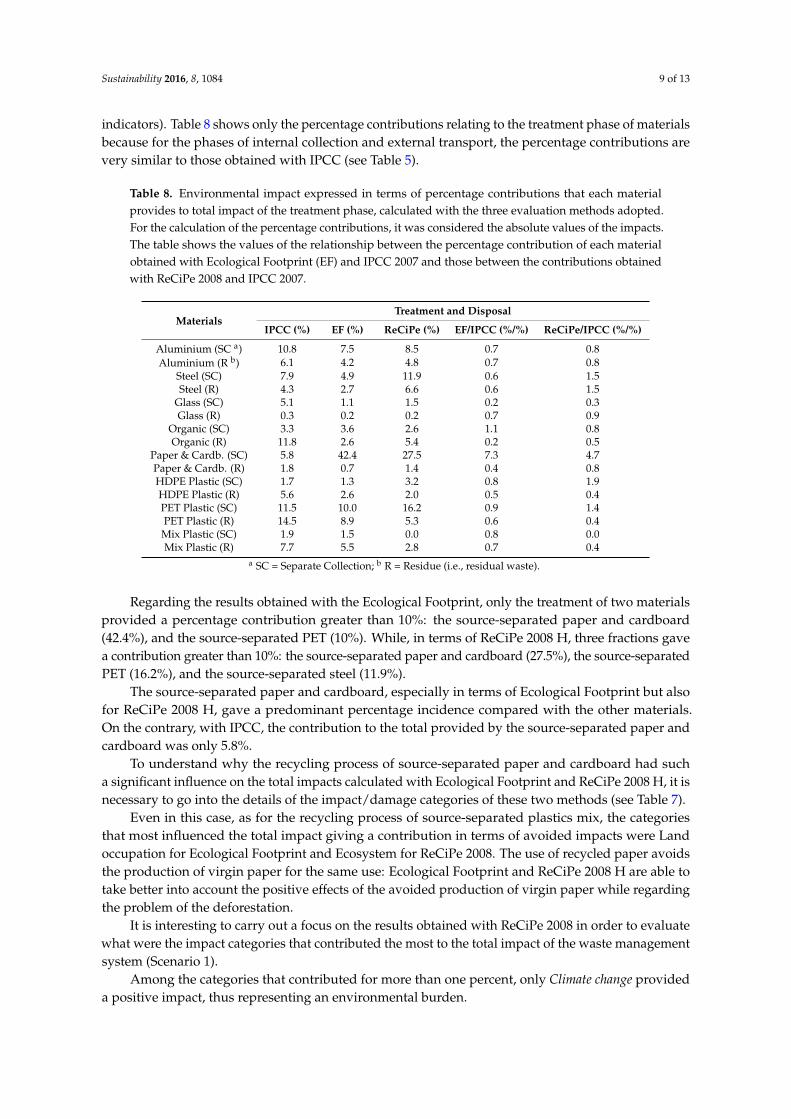
Table 8. Environmental impact expressed in terms of percentage contributions that each materialprovides to total impact of the treatment phase, calculated with the three evaluation methods adopted.For the calculation of the percentage contributions, it was considered the absolute values of the impacts.The table shows the values of the relationship between the percentage contribution of each materialobtained with Ecological Footprint (EF) and IPCC 2007 and those between the contributions obtainedwith ReCiPe 2008 and IPCC 2007.
MaterialsTreatment and Disposal
IPCC (%) EF (%) ReCiPe (%) EF/IPCC (%/%) ReCiPe/IPCC (%/%)
Aluminium (SC a) 10.8 7.5 8.5 0.7 0.8Aluminium (R b) 6.1 4.2 4.8 0.7 0.8
Steel (SC) 7.9 4.9 11.9 0.6 1.5Steel (R) 4.3 2.7 6.6 0.6 1.5
Glass (SC) 5.1 1.1 1.5 0.2 0.3Glass (R) 0.3 0.2 0.2 0.7 0.9
Organic (SC) 3.3 3.6 2.6 1.1 0.8Organic (R) 11.8 2.6 5.4 0.2 0.5
Paper & Cardb. (SC) 5.8 42.4 27.5 7.3 4.7Paper & Cardb. (R) 1.8 0.7 1.4 0.4 0.8HDPE Plastic (SC) 1.7 1.3 3.2 0.8 1.9HDPE Plastic (R) 5.6 2.6 2.0 0.5 0.4PET Plastic (SC) 11.5 10.0 16.2 0.9 1.4PET Plastic (R) 14.5 8.9 5.3 0.6 0.4Mix Plastic (SC) 1.9 1.5 0.0 0.8 0.0Mix Plastic (R) 7.7 5.5 2.8 0.7 0.4
a SC = Separate Collection; b R = Residue (i.e., residual waste).
Regarding the results obtained with the Ecological Footprint, only the treatment of two materialsprovided a percentage contribution greater than 10%: the source-separated paper and cardboard(42.4%), and the source-separated PET (10%). While, in terms of ReCiPe 2008 H, three fractions gavea contribution greater than 10%: the source-separated paper and cardboard (27.5%), the source-separatedPET (16.2%), and the source-separated steel (11.9%).
The source-separated paper and cardboard, especially in terms of Ecological Footprint but alsofor ReCiPe 2008 H, gave a predominant percentage incidence compared with the other materials.On the contrary, with IPCC, the contribution to the total provided by the source-separated paper andcardboard was only 5.8%.
To understand why the recycling process of source-separated paper and cardboard had sucha significant influence on the total impacts calculated with Ecological Footprint and ReCiPe 2008 H, it isnecessary to go into the details of the impact/damage categories of these two methods (see Table 7).
Even in this case, as for the recycling process of source-separated plastics mix, the categoriesthat most influenced the total impact giving a contribution in terms of avoided impacts were Landoccupation for Ecological Footprint and Ecosystem for ReCiPe 2008. The use of recycled paper avoidsthe production of virgin paper for the same use: Ecological Footprint and ReCiPe 2008 H are able totake better into account the positive effects of the avoided production of virgin paper while regardingthe problem of the deforestation.
It is interesting to carry out a focus on the results obtained with ReCiPe 2008 in order to evaluatewhat were the impact categories that contributed the most to the total impact of the waste managementsystem (Scenario 1).
Among the categories that contributed for more than one percent, only Climate change provideda positive impact, thus representing an environmental burden.
Sustainability 2016, 8, 1084 10 of 13
Agricultural land occupation is the impact category that contributed the most (as an environmentalsaving) to the total impact with 36.3%; at the midpoint level, this impact was equal to −2,133,180 m2/year(corresponding to −126.8 m2/year/inhabitant). Fossil depletion and Metal depletion provideda percentage contribution of 28.4% and 16.2%, respectively; the impacts at midpoint level wereequal to −274,099 kg oil eq. (corresponding to −16.3 kg oil eq./inhabitant) and −362,475 kg Fe eq.(corresponding −21.6 kg Fe eq./inhabitant), respectively. The results obtained for such categorieshighlight the environmental advantages achievable with a good level of source-separate collection thatallows to recycle materials and, thus, to avoid the use of virgin raw materials.
The other two categories that contributed for more than one percent even providing a negativeimpacts were Particulate matter formation (3.0%; −1211.5 kg PM10 eq.) and Human toxicity (2.2%;−329,017 kg DB eq.). As already mentioned, Climate change was the only category, among thosewith a contribution more than one percent, that provided a positive value of impact (500,940 kg CO2
eq., corresponding to 29.8 kg CO2 eq./inhabitant). Such category at endpoint level is considered fordamage caused to human health (Climate change Human Health) as well as for ecosystems damage(Climate change Ecosystems), and together they provided a contribution to the total impact of about 12%.The positive value of the impact is not a surprise and the reasons are the same previously discussedfor the results obtained with the IPCC 2007 method.
The results highlight the importance of considering more than one single impact assessmentmethod or, alternatively, more environmental impact categories in order to be able to assess all thedifferent aspects related to the analysed processes. Considering more impact categories, it is importantto try to put together the results obtained for the single categories. In fact, it is necessary to rememberthat LCA is a procedure to support decision makers. From this point of view, it is difficult to takedecisions if the midpoint impact categories give conflicting results. In current literature, there aremany studies discussing the results of LCA studies for each single impact category (usually globalwarming, acidification, eutrophication, etc.) without trying to give some suggestions to the decisionmakers. The damage categories at the endpoint level offer a valuable help in this sense.
3.3. Scenario 1 vs. Scenario 2
The obtained results highlighted the importance of the source-separate organic fraction collectionand transportation to the treatment plants. This material contributed for 40% of the total impact ofthe internal collection and for 67% to the total impact of the external transport, with all the evaluationmethods considered. As discussed above, there were two main reasons for this result: the highquantities collected as well as the huge distances to transport these quantities to the treatment plantslocated out of the region.
In order to highlight, in environmental terms, the importance of the presence on the territory ofadequate treatment facilities, a second scenario was modelled in which the presence of a compostingplant 10 km from the municipality of Baronissi was hypothesized. Comparing the environmentalperformances of the two scenarios, it was possible to show how the environmental performance of thecommon waste management system could improve.
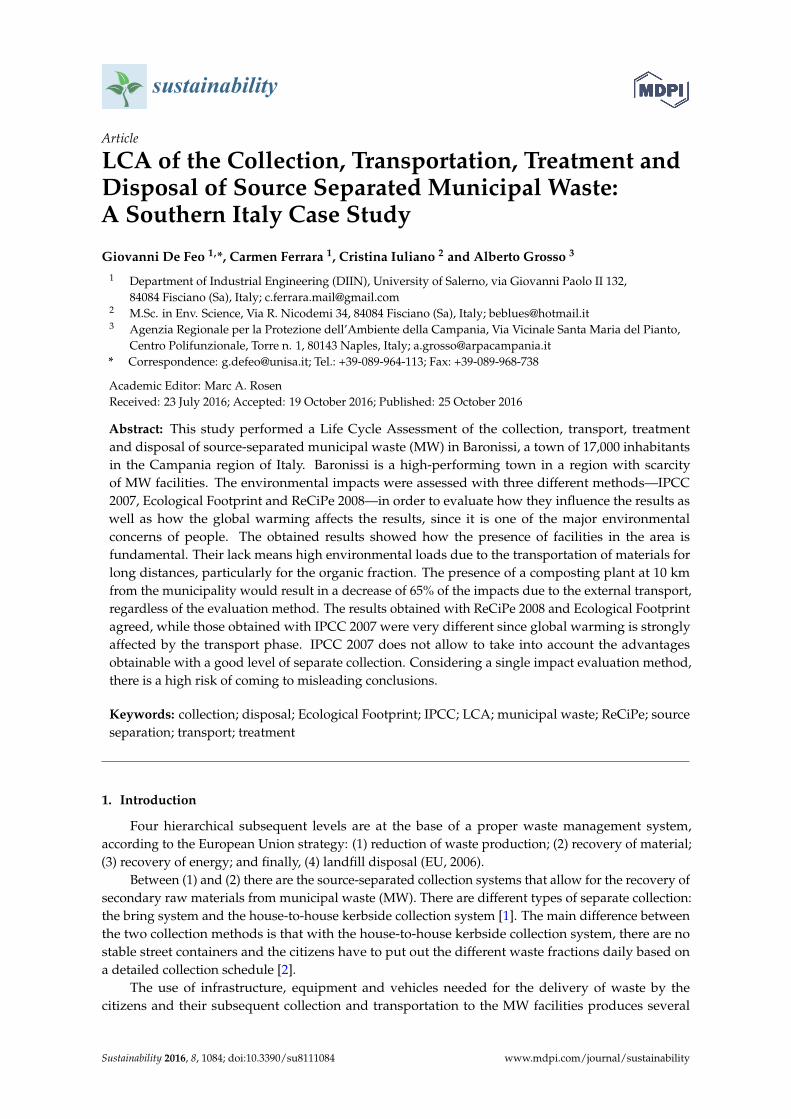
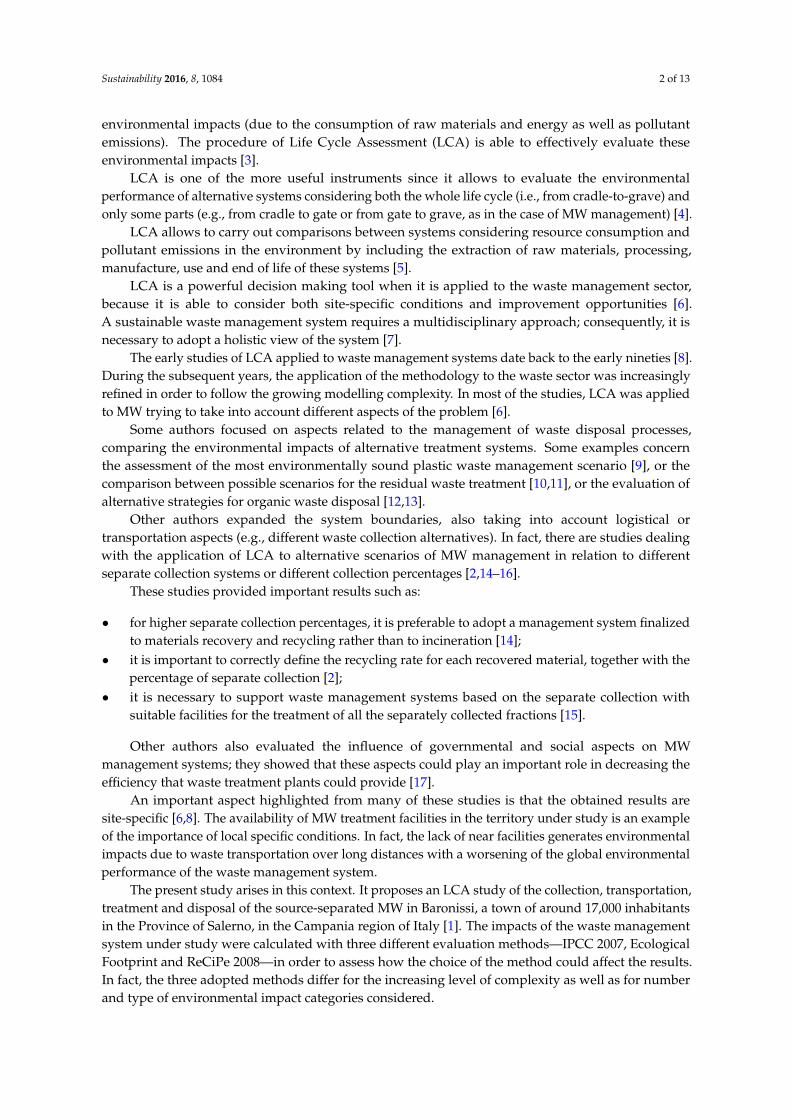
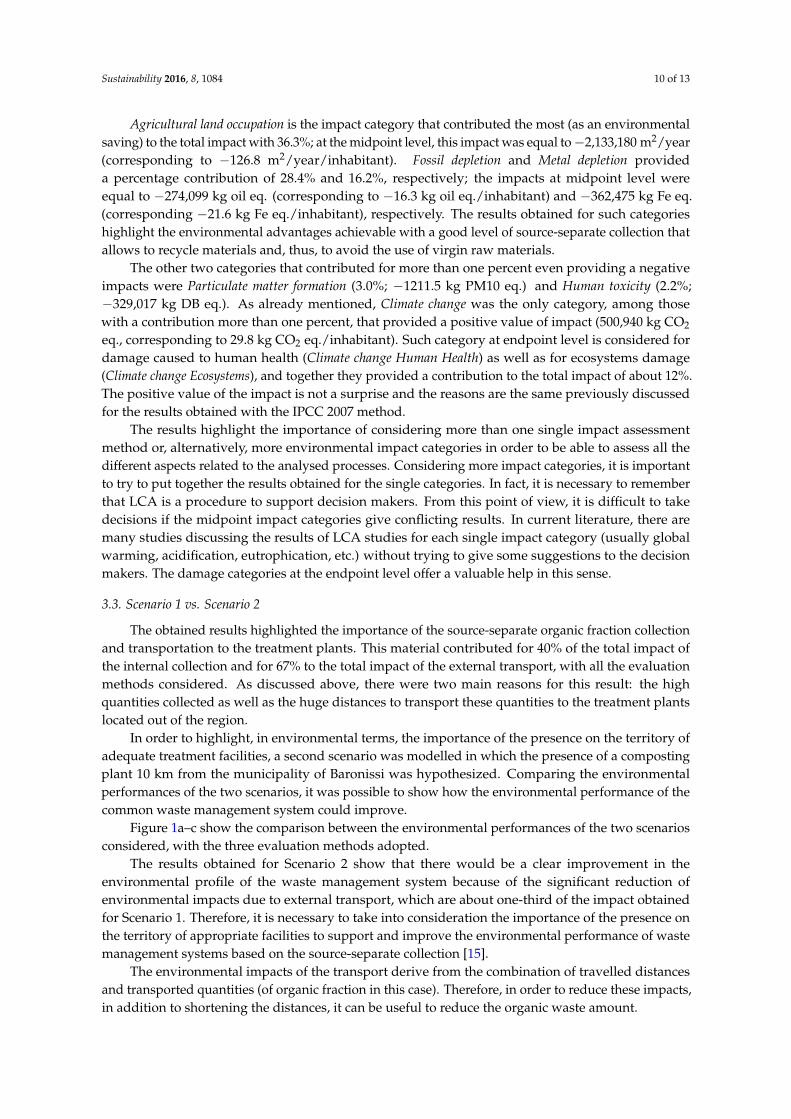
Figure 1a–c show the comparison between the environmental performances of the two scenariosconsidered, with the three evaluation methods adopted.
The results obtained for Scenario 2 show that there would be a clear improvement in theenvironmental profile of the waste management system because of the significant reduction ofenvironmental impacts due to external transport, which are about one-third of the impact obtainedfor Scenario 1. Therefore, it is necessary to take into consideration the importance of the presence onthe territory of appropriate facilities to support and improve the environmental performance of wastemanagement systems based on the source-separate collection [15].
The environmental impacts of the transport derive from the combination of travelled distancesand transported quantities (of organic fraction in this case). Therefore, in order to reduce these impacts,in addition to shortening the distances, it can be useful to reduce the organic waste amount.
Sustainability 2016, 8, 1084 11 of 13
Using an openwork basket for the household collection of the organic waste allows to easily andconveniently reduce the quantity of putrescibles. In fact, the uniform openings around the entirebasket (also below), together with a compostable plastic bag or compostable paper bag, facilitate waterevaporation. The results are a weight reduction of 20%–30% as well as a complete disappearanceof odours due to the reduction of putrescibility. The weight loss produces a consequent reductionof the environmental impacts of the municipal collection as well as the external transport to thecomposting plants.
Sustainability 2016, 8, 1084 11 of 13
environmental impacts of the municipal collection as well as the external transport to the composting plants.
(a) (b)
(c) (d)
Figure 1. Environmental impacts of Scenario 1 and Scenario 2 calculated with IPCC 2007 (a); Ecological Footprint (b); ReCiPe 2008 (c); Percentage contributions of each phase (Treatment and Disposal—T & D, Collection, and External Transport) to total impact, for Scenario 1 (S1) and Scenario 2 (S2), obtained with the three evaluation methods adopted (d).
Figure 1d shows that the transport phases (internal collection and external transport) gave the most significant percentage contribution with IPCC 2007 for both the compared scenarios. On the contrary, the treatment and disposal phases (T & D) had a percentage incidence on the total impacts calculated with Ecological Footprint and ReCiPe 2008 H greater than 72%.
Once again, the obtained results show that, considering an assessment method that consider a unique impact category, there is a certain risk of misleading conclusions.
4. Conclusions
This study assessed the environmental impacts of the MW management system of Baronissi, a town in Southern Italy, for the year 2013. The environmental performance of the system was compared with that of a hypothetical alternative scenario in which the presence of a composting facility 10 km from the municipality was assumed.
The environmental impacts were assessed with three evaluation methods: IPCC 2007 100y, Ecological Footprint and ReCiPe 2008 H.
Different aspects arose from the results. First, the presence in the area of adequate waste treatment and disposal facilities, which support the separate collection system, is fundamental. In fact, the lack of facilities means high environmental loads due to the transportation of materials for long distances, particularly for those abundant materials such as the organic fraction. The results obtained for Scenario 2 showed that the presence of a composting plant at 10 km from the municipality would result in a decrease of about 65% of the impacts of the waste management system due to the external transport, regardless of the evaluation method used.
-200000
-100000
0
100000
200000
300000
400000
500000
600000
700000
Scenario 1 Sceario 2
IPC
C 2
00
7(k
g C
O2
eq.
)
T&D Collection Ext Transp-6000
-5000
-4000
-3000
-2000
-1000
0
1000
2000
Scenario 1 Sceario 2
Eco
logi
cal
Foo
tpri
nt
(kP
t)
T&D Collection Ext Transp
-200
-150
-100
-50
0
50
100
Scenario 1 Sceario 2
ReC
iPe
20
08
(kP
t)
T&D Collection Ext Transp
19.6 23.7
75.1 79.372.3 77.0
53.5
64.7
16.717.7
18.319.527.0
11.6 8.1 3.0 9.4 3.6
0
10
20
30
40
50
60
70
80
90
100
IPCC_S1 IPCC_S2 EF_S1 EF_S2 ReCiPe_S1ReCiPe_S2
%
T&D Collection Ext Transp
Figure 1. Environmental impacts of Scenario 1 and Scenario 2 calculated with IPCC 2007 (a); EcologicalFootprint (b); ReCiPe 2008 (c); Percentage contributions of each phase (Treatment and Disposal—T & D,Collection, and External Transport) to total impact, for Scenario 1 (S1) and Scenario 2 (S2), obtainedwith the three evaluation methods adopted (d).
Figure 1d shows that the transport phases (internal collection and external transport) gave themost significant percentage contribution with IPCC 2007 for both the compared scenarios. On thecontrary, the treatment and disposal phases (T & D) had a percentage incidence on the total impactscalculated with Ecological Footprint and ReCiPe 2008 H greater than 72%.
Once again, the obtained results show that, considering an assessment method that considera unique impact category, there is a certain risk of misleading conclusions.
4. Conclusions
This study assessed the environmental impacts of the MW management system of Baronissi,a town in Southern Italy, for the year 2013. The environmental performance of the system wascompared with that of a hypothetical alternative scenario in which the presence of a compostingfacility 10 km from the municipality was assumed.
The environmental impacts were assessed with three evaluation methods: IPCC 2007 100y,Ecological Footprint and ReCiPe 2008 H.

Sustainability 2016, 8, 1084 12 of 13
Different aspects arose from the results. First, the presence in the area of adequate waste treatmentand disposal facilities, which support the separate collection system, is fundamental. In fact, thelack of facilities means high environmental loads due to the transportation of materials for longdistances, particularly for those abundant materials such as the organic fraction. The results obtainedfor Scenario 2 showed that the presence of a composting plant at 10 km from the municipality wouldresult in a decrease of about 65% of the impacts of the waste management system due to the externaltransport, regardless of the evaluation method used.
Another important aspect is the choice of the impacts evaluation method. In fact, the resultsobtained showed that the choice of the method significantly influence the results. The main reasonfor this was because the global warming category is significantly affected by the transport phase.The categories related to climate change, thus, do not allow to take into account the advantagesobtainable with a good level of separate collection as well as the consequent increase in the recoveryof materials. Therefore, the obtained results pointed out that by only considering a single impactsevaluation method, there is a high risk of misleading conclusions.
Acknowledgments: This article is part of the research project called SNECS—Social Network delle Entità deiCentri Storici (“Social Network Entities of Historic Places”)—Notice 713/Ric 29 October 2010. The authors wish tothank Sacha A. Berardo for the English revision.
Author Contributions: Giovanni De Feo conceived and designed the study; Carmen Ferrara and Cristina Iulianoperformed the calculations; Alberto Grosso provided some data; Giovanni De Feo, Carmen Ferrara, Cristina Iulianoand Alberto Grosso analysed the data; Giovanni De Feo and Carmen Ferrara wrote the paper.
Conflicts of Interest: The authors declare no conflict of interest.
References
1. De Feo, G.; Polito, A. Using economic benefits for recycling in a separate collection centre managed asa “reverse supermarket”: A sociological survey. Waste Manag. 2015, 38, 12–21. [CrossRef] [PubMed]
2. Giugliano, M.; Cernuschi, S.; Grosso, M.; Rigamonti, L. Material and energy recovery in integrated wastemanagement systems—An evaluation based on life cycle assessment. Waste Manag. 2011, 31, 2092–2101.[CrossRef] [PubMed]
3. De Feo, G.; Malvano, C. Technical, economic and environmental analysis of a MSW kerbside collectionsystem applied to small communities. Waste Manag. 2012, 32, 1760–1774. [CrossRef] [PubMed]
4. Curran, M.A. Life cycle assessment. Encycl. Ecol. 2008, 3, 2168–2174.5. International Organization for Standardization (ISO). Environmental Management—Life Cycle Assessment—Principles
and Framework; ISO 14040:2006; ISO: Geneva, Switzerland, 2002.6. Laurent, A.; Bakas, I.; Clavreul, J.; Bernstad, A.; Niero, M.; Gentil, E.; Hauschild, M.Z.; Christensen, T.H.
Review of LCA studies of solid waste management systems—Part I: Lessons learned and perspectives.Waste Manag. 2014, 34, 573–588. [CrossRef] [PubMed]
7. Bing, X.; Bloemhof, J.M.; Ramos, T.R.P.; Barbosa-Pavoa, A.P.; Wong, C.Y.; Van der Vorst, J.G.A.J.Research challenges in municipal solid waste logistics management. Waste Manag. 2016, 48, 584–592.[CrossRef] [PubMed]
8. Gentil, E.C.; Damgaard, A.; Hauschild, M.; Finnveden, G.; Eriksson, O.; Thorneloe, S.; Kaplan, P.O.; Barlaz, M.;Muller, O.; Matsui, Y.; et al. Models for waste life cycle assessment: Review of technical assumptions.Waste Manag. 2010, 30, 2636–2648. [CrossRef] [PubMed]
9. Rigamonti, L.; Grosso, M.; Møller, J.; Martinez Sanchez, V.; Magnani, S.; Christensen, T.H. Environmentalevaluation of plastic waste management scenarios. Resour. Conserv. Recycl. 2014, 85, 42–53. [CrossRef]
10. Cimpan, C.; Wenzel, H. Energy implications of mechanical and mechanical-biological treatmentcompared todirect waste-to-energy. Waste Manag. 2013, 33, 1648–1658. [CrossRef] [PubMed]
11. Panepinto, D.; Blengini, G.A.; Genon, G. Economic and environmental comparison between two scenarios ofwaste management: MBT vs. thermal treatment. Resour. Conserv. Recycl. 2015, 97, 16–23. [CrossRef]
12. Takata, M.; Fukushima, K.; Kawai, M.; Nagao, N.; Niwa, C.; Yoshida, T.; Toda, T. The choice of biologicalwaste treatment method for urban areas in Japan—An environmental perspective. Renew. Sustain. Energy Rev.2013, 23, 557–567. [CrossRef]
Sustainability 2016, 8, 1084 13 of 13
13. Pubule, J.; Blumberga, A.; Romagnoli, F.; Blumberga, D. Finding an optimal solution for biowastemanagement in the Baltic States. J. Clean. Prod. 2015, 88, 214–223. [CrossRef]
14. De Feo, G.; Malvano, C. The use of LCA in selecting the best MSW management system. Waste Manag. 2009,29, 1901–1915. [CrossRef] [PubMed]
15. Chi, Y.; Dong, J.; Tang, Y.; Huang, Q.; Ni, M. Life cycle assessment of municipal solid waste source-separetedcollection and integrated waste management systems in Hangzhou, China. J. Mater. Cycles Waste Manag.2015, 17, 695–706. [CrossRef]
16. Yildiz-Geyhan, E.; Yilan-Çiftçi, G.; Altun-Çiftçioglu, A.; Kadirgan, M.A.N. Environmental analysis of differentpackaging waste collection systems for Istanbul–Turkey case study. Resour. Conserv. Recycl. 2016, 107, 27–37.[CrossRef]
17. Zabaleta, I.; Rodic, L. Recovery of essential nutrients from municipal solid waste—Impact of wastemanagement infrastructure and governance aspects. Waste Manag. 2015, 44, 178–187. [CrossRef] [PubMed]
18. Contò, P. Il Caso studio del Consorzio Priula (TV) (“The case study of Consorzio Priula (TV)”). In Rifiutisolidi (“Solid Waste”); De Feo, G., De Gisi, S., GAlasso, M., Eds.; DArio Flaccovio Editore: Palermo, Italy, 2009;pp. 253–259. (In Italian)
19. De Feo, G.; De Gisi, S. Domestic separation and collection of municipal solid waste: Option and awarenessof citizens and workers. Sustainability 2010, 2, 1297–1326. [CrossRef]
20. De Feo, G.; De Gisi, S.; Williams, I.D. Public perception of odour and environmental pollution attributed toMSW treatment and disposal facilities: A case study. Waste Manag. 2013, 33, 974–987. [CrossRef] [PubMed]
21. Curran, M.A. Environmental Life Cycle Assessment; McGraw-Hill: New York, NY, USA, 1996.22. Baumann, H.; Tillman, A.M. The Hitch Hiker’s Guide to LCA; Studentlitteratur: Lund, Sweeden, 2004.23. Arena, U.; Mastellone, M.L.; Perugini, F. The environmental performance of alternative solid waste
management options: A life cycle assessment study. Chem. Eng. J. 2003, 96, 207–222. [CrossRef]24. Rigamonti, L.; Grosso, M. Riciclo dei Rifiuti: Analisi del Ciclo di Vita dei Materiali da Imballaggio (2009);
ISBN: 978-88-7758-897-5. Dario Flaccovio Editore s.r.l: Palermo, Italy, 2009; p. 286. (In Italian)25. PRé. SimaPro Database Manual Methods Library, Report Version: 2.8. 2015. Available online:
http://www.pre-sustainability.com/download/DatabaseManualMethods.pdf (accessed on 14 August 2015).26. Goedkoop, M.; Heijungs, R.; Huijbregts, M.; De Schryver, A.; Struijs, J.; van Zelm, R. ReCiPe 2008—A Life
Cycle Impact Assessment Method Which Comprises Harmonised Category Indicators at the Midpointand the Endpoint Level First Edition (Version 1.08), Report I: Characterisation. 2013. Available online:http://www.lcia-recipe.net/file-cabinet/ReCiPe_main_report_MAY_2013.pdf?attredirects=0 (accessed on14 August 2015).
27. Brogaard, L.K.; Damgaard, A.; Jensen, M.B.; Barlaz, M.; Christensen, T.H. Evaluation of life cycle inventorydata for recycling systems. Resour. Conserv. Recycl. 2014, 87, 30–45. [CrossRef]
28. Simon, B.; Amor, M.B.; Földényi, R. Life cycle impact assessment of beverage packaging systems: Focus onthe collection of post-consumer bottles. J. Clean. Prod. 2016, 112, 238–248. [CrossRef]
29. Makan, A.; Ossobhei, O.; Mountader, M. Initial air pressure influence on in-vessel composting for thebiodegradable fraction of municipal solid waste in Morocco. Int. J. Environ. Sci. Technol. 2014, 11, 53–58.[CrossRef]
30. Quirós, R.; Villalba, G.; Gabarrell, X.; Muñoz, P. Life cycle assessment of organic and mineral fertilizers ina crop sequence of cauliflower and tomato. Int. J. Environ. Sci. Technol. 2015, 12, 3299–3316. [CrossRef]
© 2016 by the authors; licensee MDPI, Basel, Switzerland. This article is an open accessarticle distributed under the terms and conditions of the Creative Commons Attribution(CC-BY) license (http://creativecommons.org/licenses/by/4.0/).