
Harwich Haven Disposal Site TH027 - GOV.UK
200
January 2017 DLM7823-RT001-R02-00 Harwich Haven Disposal Site TH027 Monitoring Report
-
Upload
khangminh22 -
Category
Documents
-
view
1 -
download
0
Transcript of Harwich Haven Disposal Site TH027 - GOV.UK
January 2017DLM7823-RT001-R02-00
Harwich Haven Disposal Site TH027Monitoring Report

Harwich Haven Disposal Site TH027
Monitoring Report
DLM7823-RT001-R02-00
Document information
Document permissions Confidential - client
Project number DLM7823
Project name Harwich Haven Disposal Site TH027
Report title Monitoring Report
Report number RT001
Release number R02-00
Report date January 2017
Client Harwich Haven Authority
Client representative John Brien
Project manager Nigel Feates
Project director Mike Dearnaley
Document history
Date Release Prepared Approved Authorised Notes
16 Jan 2017 02-00 NGF MPD MPD Final report
02 Dec 2016 01-00 NGF MPD MPD Draft report for comment
Document authorisation
Prepared Approved Authorised
© HR Wallingford Ltd
This report has been prepared for HR Wallingford’s client and not for any other person. Only our client should rely upon the contents of this report and any
methods or results which are contained within it and then only for the purposes for which the report was originally prepared. We accept no liability for any
loss or damage suffered by any person who has relied on the contents of this report, other than our client.
This report may contain material or information obtained from other people. We accept no liability for any loss or damage suffered by any person, including
our client, as a result of any error or inaccuracy in third party material or information which is included within this report.
To the extent that this report contains information or material which is the output of general research it should not be relied upon by any person, including
our client, for a specific purpose. If you are not HR Wallingford’s client and you wish to use the information or material in this report for a specific purpose,
you should contact us for advice.

Harwich Haven Disposal Site TH027
Monitoring Report
DLM7823-RT001-R02-00
Executive summary
The Marine Management Organisation (MMO) has granted Harwich Haven Authority
(HHA) a Marine Licence (L/2013/00392/3) that permits two trial disposals of 500,000 m3 of
dredged material arising from maintenance dredging at Harwich and Felixstowe Harbour.
The trial disposal site is referred to as the Harwich Haven Disposal Site (Cefas Site Code
TH027).
A condition of the licence is that monitoring data is collected during the course of the two trial disposal
campaigns (Trial 1 and Trial 2) and a Monitoring Report is submitted to the MMO within four months of
completion of the two trial campaigns. The Trial 1 disposal campaign was carried out from 9 to 17 June 2016
and the Trial 2 campaign from 21 to 30 August 2016.
This report presents the results of the analysis of the monitoring data collected and where appropriate
compares the results with those previously predicted by HR Wallingford in their Characterisation Report and
Addendums (HR Wallingford, 2014).
Activities assessed within this report include:
long-term measurements of suspended solids concentrations at 0.5 m above the seabed at three
monitoring locations before, during and after the two disposal trials and the comparison of that data with
the results of previous plume dispersion modelling studies;
the analysis of multibeam bathymetric surveys undertaken pre-Trial 1, pre-Trial 2 and post-Trial 2; and
a high level assessment of particle size and benthic fauna surveys undertaken pre-Trial 1, pre-Trial 2 and
post-Trial 2.
Suspended solids concentrations
There was no evidence of any large-scale increases in measured concentrations levels at the three
monitoring locations as a result of the disposal activity, nor was there evidence of an increase in the
background concentration during the course of the disposals.
The magnitude of the increases in concentration above background levels predicted by the numerical model
(approximately 100 mg/l) were not seen in the measured data.
Seabed levels
Multi beam echo sounder (MBES) surveys of disposal site TH027 were carried out pre-Trial 1, pre-Trial 2
and post-Trial 2 to determine if the placement of individual loads or wider long term effects could be detected
on the seabed. Analysis of the bathymetry data has shown very little evidence of seabed level changes in
excess of 0.2 m (i.e. beyond the quoted vertical repeatability / accuracy of the MBES instrument) that can be
attributed directly to the disposal activities indicating that much of the placed material had likely dispersed
outside of the boundary of the disposal site by the time of the surveys.
Particle size and benthic fauna
There does not appear to be any clear correlation between the composition of the bed material and the
disposal of dredged material having taken place at disposal site TH027 and that there is no evidence of an
increase in fine material resulting from the disposal activities. Each of the three sampling campaigns showed
a wide variability in the composition of the bed material both temporally and spatially. Notably, at the time of

Harwich Haven Disposal Site TH027
Monitoring Report
DLM7823-RT001-R02-00
the sampling campaigns, there was no general increase or reduction in the proportion of any particular size
fraction (fines, sands and gravels) that could be directly attributed to the disposal activities indicating that
much of the placed material had likely dispersed outside of the boundary of the disposal site by this time.
There was a general decrease in biodiversity between the new 2016 surveys and the 2012 characterisation
survey, however the biodiversity levels once the disposal operations start remain relatively constant. The
overall number of individuals in the benthic community are observed to increase over the disposal period.
There also appears to be a temporary increase in of species which would be typically prevalent in estuarine
communities and increase in the abundance of opportunistic scavengers, however there is no evidence of
these organisms establishing permanent communities.
Whilst harbour species are temporarily being found within the survey area there are no clear trends in the
faunal assemblage in terms of species and abundance that can be directly related to the disposal activities
that have taken place at disposal site TH027. The changes seen considered to be the result of natural
variation in the marine environment.
Summary
The suspended solids concentrations measured at the three monitoring locations were lower than those
predicted by numerical modelling.
Analysis of the bathymetry data has shown very little evidence of seabed level changes in excess of 0.2 m
(i.e. beyond the quoted vertical repeatability / accuracy of the MBES instrument) that can be attributed
directly to the disposal of individual loads or wider long term effects indicating that much of the placed
material had likely dispersed outside of the boundary of the disposal site by this time.
There was no clear correlation between the composition of the bed material and the disposal of dredged
material having taken place at disposal site TH027.
There has been an observed change in the species assemblage at the site, with an increase in opportunistic
species. However, there has not been a change from the previously observed marine assemblage found on
muddy sands and gravels. There are no clear trends that can be directly related to the disposal activities that
have taken place at disposal site TH027 and any changes that are seen are typical of natural variation that
can occur.
Harwich Haven Disposal Site TH027
Monitoring Report
DLM7823-RT001-R02-00
Contents
Executive summary
1. Background _________________________________________________________ 1
2. Disposal records _____________________________________________________ 4
3. Dredged material physical characteristics __________________________________ 5
4. Suspended solids data ________________________________________________ 6
4.1. Seabed frames .................................................................................................................................. 6
4.2. Turbidity calibration ........................................................................................................................... 8
4.3. Measured suspended sediment concentrations ............................................................................. 11
5. Wave and wind data _________________________________________________ 14
5.1. Wave data ....................................................................................................................................... 15
5.2. Wind data ........................................................................................................................................ 15
6. Assessment of disposal activities _______________________________________ 17
6.1. Disposal Trial 1 ................................................................................................................................ 17
6.2. Disposal Trial 2 ................................................................................................................................ 19
7. Comparison with numerical modelling ____________________________________ 21
7.1. Predicted concentration changes .................................................................................................... 21
7.1.1. Summary ............................................................................................................................ 26
7.2. Predicted deposition ........................................................................................................................ 27
8. Assessment of bathymetric survey data __________________________________ 28
8.1. Bathymetric surveys ........................................................................................................................ 28
8.2. Changes in bathymetry ................................................................................................................... 33
8.2.1. May 2016 to July 2016 ....................................................................................................... 33
8.2.2. July 2016 to October 2016 ................................................................................................. 33
8.2.3. May 2016 to October 2016 ................................................................................................ 34
8.3. Discussion ....................................................................................................................................... 34
9. Assessment of particle size and benthic community data _____________________ 40
9.1. Particle size analysis ....................................................................................................................... 41
9.1.1. August 2012 background and May 2016 pre-Trial 1 particle size data ............................. 41
9.1.2. 2016 pre-Trial 1, post-Trial 1 and post-Trial 2 particle size data ....................................... 44
9.1.3. Discussion .......................................................................................................................... 44
9.2. Benthic community data .................................................................................................................. 45
9.2.1. August 2012 characterisation survey ................................................................................. 45
9.2.2. May 2016 pre-Trial 1 monitoring survey ............................................................................ 46
9.2.3. July 2016 post-Trial 1 monitoring survey ........................................................................... 46
9.2.4. September 2016 post-Trial 2 monitoring survey ................................................................ 47
9.2.5. Discussion .......................................................................................................................... 48
10. Conclusions ________________________________________________________ 52
Harwich Haven Disposal Site TH027
Monitoring Report
DLM7823-RT001-R02-00
11. References ________________________________________________________ 53
Appendices ____________________________________________________________ 54
A. Titan Environmental Surveys seabed frame deployment report
B. Thomson Unicomarine particle size analysis reports
C. Thomson Unicomarine benthic community data reports
Figures Figure 1.1: Monitoring locations .................................................................................................................. 3
Figure 2.1: Trial 1 disposal records ............................................................................................................ 4
Figure 2.2: Trial 2 disposal records ............................................................................................................ 4
Figure 2.3: TSHD Barent Zanen ................................................................................................................. 5
Figure 2.4: TSHD HAM 316 ........................................................................................................................ 5
Figure 3.1: Particle size analysis of a sediment sample taken from the dredger hopper during maintenance dredging in 2012.................................................................................................................... 6
Figure 4.1: Equipped seabed frame ........................................................................................................... 7
Figure 4.2: Booner tube sediment............................................................................................................... 7
Figure 4.3: Site 1: Trial 1 booner PSD ........................................................................................................ 9
Figure 4.4: Site 1: Trial 2 booner PSD ........................................................................................................ 9
Figure 4.5: Site 2: Trial 1 booner PSD ........................................................................................................ 9
Figure 4.6: Site 2: Trial 2: booner PSD ....................................................................................................... 9
Figure 4.7: Site 3: Trial 1 booner PSD ........................................................................................................ 9
Figure 4.8: Site 3: Trial 2 booner PSD ........................................................................................................ 9
Figure 4.9: Full range turbidity (NTU) to sediment concentration (mg/l dry weight) sensor calibrations ................................................................................................................................................ 10
Figure 4.10: Measured range turbidity (NTU) to sediment concentration (mg/l dry weight) sensor calibrations ................................................................................................................................................ 11
Figure 4.11: Suspended solids concentrations and water depths at Sites 1, 2 and 3 .............................. 12
Figure 4.12: Pre-Trial 1 sediment concentrations at Sites 1, 2 and 3 during the period 7-9 June 2016 .......................................................................................................................................................... 13
Figure 4.13: Pre-Trial 2 sediment concentrations at Sites 1, 2 and 3 during the period 19-21 August 2016 ......................................................................................................................................... 13
Figure 5.1: Location of the Felixstowe Waverider, the HHA meteorological station and disposal site TH027 ....................................................................................................................................................... 14
Figure 5.2: Recorded wave and wind data and measured suspended solids concentrations at Site 1 ... 16
Figure 6.1: Trial 1: Site 2 measured sediment concentrations before, during and after disposals .......... 17
Figure 6.2: Disposal Trial 1 measured suspended sediment concentration data ..................................... 18
Figure 6.3: Trial 2: Site 2 measured sediment concentrations before, during and after disposals .......... 19
Figure 6.4: Disposal Trial 2 measured suspended sediment concentration data ..................................... 20
Figure 7.1: Predicted concentration increases above background levels at Site 1 .................................. 22
Figure 7.2: Predicted concentration increases above background levels at Site 2 .................................. 22
Figure 7.3: Predicted concentration increases above background levels at Site 3 .................................. 23
Figure 7.4: Predicted concentration increases above background levels at Site 2 for disposals commencing mid-neap tide ....................................................................................................................... 23
Harwich Haven Disposal Site TH027
Monitoring Report
DLM7823-RT001-R02-00
Figure 7.5: Measured concentrations at Site 2 during disposal Trial 1 ..................................................... 24
Figure 7.6: Predicted concentration increases above background levels at Site 2 for disposals commencing mid-spring tide ..................................................................................................................... 25
Figure 7.7: Measured concentrations at Site 2 during disposal Trial 2 ..................................................... 25
Figure 7.8: Predicted concentration increases above background levels at Site 2 for disposals commencing mid-spring tide with and without waves ............................................................................... 26
Figure 7.9: Predicted sedimentation thickness above background levels at Site 1 .................................. 27
Figure 7.10: Predicted sedimentation thickness above background levels at Site 2 ................................ 27
Figure 7.11: Predicted sedimentation thickness above background levels at Site 3 ................................ 28
Figure 8.1: May 2016 bathymetry survey of disposal site TH027 ............................................................. 30
Figure 8.2: July 2016 bathymetry survey of disposal site TH027 ............................................................. 31
Figure 8.3: October 2016 bathymetry survey of disposal site TH027 ....................................................... 32
Figure 8.4: Bathymetry difference July 2016 minus May 2016 ................................................................. 36
Figure 8.5: Bathymetry difference October 2016 minus July 2016 ........................................................... 37
Figure 8.6: Bathymetry difference October 2016 minus May 2016 .......................................................... 38
Figure 8.7: Bathymetry difference within the boundary of the disposal site October 2016 minus May 2016 at a minimum resolution of ±0.1 m ................................................................................................... 39
Figure 9.1: Particle size distribution in August 2012 and pre-Trial 1 disposal in May 2016 ..................... 42
Figure 9.2: Particle size distribution May 2016 pre-Trial 1 disposal, July 2016 post-Trial 1 disposal and September 2016 post-Trial 2 disposal ............................................................................................... 43
Figure 9.3: Comparison of the number of species (biodiversity) between the characterisation survey and the pre-Trial 1, post-Trial 1 and post-Trial 2 monitoring surveys ....................................................... 49
Figure 9.4: Comparison of the number of individuals (abundance) between the characterisation survey and the pre-Trial 1, post-Trial 1 and post-Trial 2 monitoring surveys ........................................... 50
Figure 9.5: Abundance of Sabellaria spinulosa at the disposal site ......................................................... 51
Tables Table 1.1: Proposed monitoring measures ................................................................................................. 2
Table 2.1: Summary of disposal records .................................................................................................... 4
Table 4.1: Seabed frame locations ............................................................................................................. 6
Table 4.2: Summary of seabed frame deployments ................................................................................... 8
Table 4.3: Trial 1 booner tube particle size distribution summary .............................................................. 8
Table 4.4: Trial 2 booner tube particle size distribution summary .............................................................. 8
Table 7.1: Summary of disposal records .................................................................................................. 21
Table 8.1: Bathymetry difference models ................................................................................................. 33
Table 9.1: Monitoring survey sampling regime ......................................................................................... 40
Table 9.2: August 2012 characterisation survey – numbers of species and individuals .......................... 45
Table 9.3: May 2016 pre-Trial 1 monitoring survey – numbers of species and individuals ...................... 46
Table 9.4: July 2016 post-Trial 1 monitoring survey – numbers of species and individuals..................... 47
Table 9.5: September 2016 post-Trial 2 monitoring survey – numbers of species and individuals ......... 47

Harwich Haven Disposal Site TH027
Monitoring Report
DLM7823-RT001-R02-00 1
1. Background
The Marine Management Organisation (MMO) has granted Harwich Haven Authority
(HHA) a Marine Licence (L/2013/00392/3) that permits two trial disposals of 500,000 m3 of
dredged material arising from maintenance dredging at Harwich and Felixstowe Harbour.
The trial disposal site is referred to as the Harwich Haven Disposal Site (Cefas Site Code
TH027).
A condition of the licence is that monitoring data is collected during the course of the two trial disposal
campaigns and a Monitoring Report is submitted to the MMO within four months of completion of the two trial
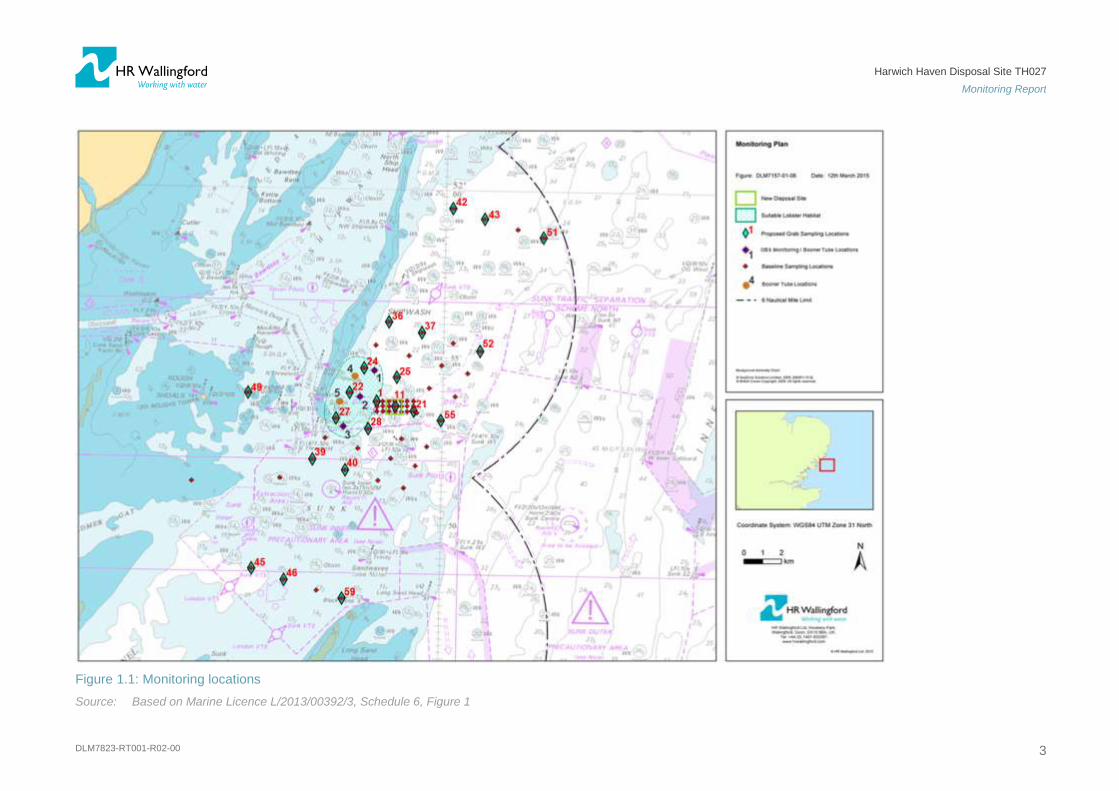
campaigns. The monitoring requirements are described in Licence Schedule 6 and summarised in Table 1.1
and the monitoring locations are shown in Figure 1.1.
HR Wallingford has previously produced a Characterisation Report and Addendums (HR Wallingford, 2014)
which included plume dispersion studies to look at the physical effects of using the proposed new disposal
site. They concluded that the disposal was not likely to produce a significant influence on the fisheries in the
area and that they would be broadly similar to the influences arising from disposal at the current Inner
Gabbard site. The documents recognised that if the disposal resulted in a significantly higher level of
suspended sediment concentration or seabed deposition than that predicted in the modelling study, there
was a risk that the magnitude of the effects on shellfish in particular could be higher than predicted.
To check the findings of the plume dispersion modelling studies reported in HR Wallingford (2014), and
identify any unexpected effects such as significant increases in suspended sediment concentration or
seabed deposition HHA proposed a programme of monitoring with the focus being on physical changes, as
these provide rapid feedback on the effects of disposal activities. Benthic analysis was also proposed to
monitor any longer term effects on the benthic community.
HR Wallingford was asked by HHA to undertake the analysis of bathymetric surveys and monitoring data
(collected by Titan Environmental Surveys) and the benthic community (collected by Thomson Unicomarine)
and to compare the results of these analyses with predictions made in the HR Wallingford Characterisation
Report and Addendums.
Monitoring activities assessed within this report included:
long-term measurements of suspended solids concentrations at 0.5 m above the seabed at three
monitoring locations before, during and after the two disposal trials;
the analysis of multibeam bathymetric surveys undertaken pre-Trial 1, pre-Trial 2 and post-Trial 2; and
a high level assessment of benthic fauna surveys undertaken pre-Trial 1, pre-Trial 2 and post-Trial 2.
The results of the analysis of the monitoring data and the comparison of that data with the results of the
plume dispersion modelling studies are presented in this Monitoring Report to be submitted to the MMO.

Harwich Haven Disposal Site TH027
Monitoring Report
DLM7823-RT001-R02-00 2
Table 1.1: Proposed monitoring measures
Monitoring
measure Methodology Frequency and duration
Turbidity/ suspended
sediment
concentration
3 no. calibrated optical backscatter (OBS)
sensors deployed on the seabed to the west
of the disposal site.
Locations shown on Figure 1.1.
In place for the first two disposal
campaigns. Deployment approximately 2
weeks prior to the disposal campaign;
retrieval after 4-6 weeks (to capture, pre,
during and post disposal).
Seabed deposition 21 no. surface grab samples analysed for
particle size.
Sample locations shown on Figure 1.1.
Survey carried out in conjunction with
benthic sampling (see below).
Before and after the first two disposal
campaigns.
Seabed deposition Multibeam bathymetric survey of the
disposal site and immediate vicinity.
Before and after the first two disposal
campaigns.
Seabed deposition 5 no. passive sediment ‘traps’ attached to
crab/lobster pots**.
Before, during and after the first two
disposal campaigns. Locations and
deployment methodology to be agreed with
potting fishermen*.
Benthic community 21 no. surface grab samples analysed for
benthic fauna.
Sample locations shown on Figure 1.1.
Survey carried out in conjunction with
particle size sampling (see above).
Before and after the first two disposal
campaigns. Surveys to be carried out during
spring/summer months (May – September).
Source: Marine Licence L/2013/00392/3, Schedule 6.
* Prior to the first disposal campaign, HHA liaised with Cefas and the fishermen who lay pots in the area to the west of
the disposal site (as shown on Figure 1.1) to plan a practical programme for deploying sediment traps.
** As it was impractical to attach the sediment traps to crab/lobster pots it was agreed with Cefas that the traps could be
attached to purpose built seabed frames.
Harwich Haven Disposal Site TH027
Monitoring Report
DLM7823-RT001-R02-00 3
Figure 1.1: Monitoring locations
Source: Based on Marine Licence L/2013/00392/3, Schedule 6, Figure 1

Harwich Haven Disposal Site TH027
Monitoring Report
DLM7823-RT001-R02-00 4
2. Disposal records
As permitted in the Marine Licence (L/2013/00392/3), the material arising from two maintenance dredging
campaigns at Harwich and Felixstowe Harbour was placed at the Harwich Haven Disposal Site (Cefas Site
Code TH027). The disposal records arising from the Trial 1 and Trial 2 dredging campaigns in terms of
Tonnes Dry Solids (TDS) are shown in Figure 2.1 and Figure 2.2 and summarised in Table 2.1.
Figure 2.1: Trial 1 disposal records Figure 2.2: Trial 2 disposal records
Source: Harwich haven Authority Source: Harwich haven Authority
Table 2.1: Summary of disposal records
Trial # Start date End date No. days No. loads Avg. TDS Total m3 Total TDS
1 09/06/2016 17/06/2016 9 58 4,252 470,786 246,609
2 21/08/2016 30/08/2016 10 51 3,176 455,761 161,977
Source: Harwich haven Authority
The dredging associated with the two disposal trails was routine maintenance dredging of Harwich Harbour
using dredging plant available on the market at those times. For this reason it was not possible to design the
dredging campaigns to exactly match that previously adopted in the plume dispersion modelling studies
reported in HR Wallingford (2014). For the case of the plume dispersion modelling a total of 197,760 TDS
was simulated as being disposed of in 32 loads over 5 days using a Trailing Suction Hopper Dredger (TSHD)
having a hopper capacity of 16,000 m3 (see Section 7).
The Trial 1 dredging campaign was carried out by the TSHD Barent Zanen, operated by Boskalis
Westminster (Figure 2.3). The Barent Zanen has a hopper capacity of about 8,000 m3. The Trial 2 dredging
campaign was carried out by the TSHD HAM 316, operated by Van Oord (Figure 2.4). The HAM 316 has a
hopper capacity of about 9,500 m3.
The time taken to dispose of each dredged load at disposal site TH027 was, on average, 8.4 minutes for the
Barent Zanen and 11.9 minutes for the HAM 316. The length of time between disposals was, on average
about 3.4 hours for the Barent Zanen and 4.2 hours for the HAM 316.

Harwich Haven Disposal Site TH027
Monitoring Report
DLM7823-RT001-R02-00 5
Figure 2.3: TSHD Barent Zanen Figure 2.4: TSHD HAM 316
3. Dredged material physical characteristics
As reported in HR Wallingford (2014) a sample of material was taken from the hopper of the dredger during
the December 2012 maintenance campaign and tested by the National Laboratory Service for particle size
analysis; the sample was found to be fine muddy material with some fine sand. 100% of the grain size
fraction is less than 1000 µm. A graph showing the results of the analysis is shown in Figure 3.1. Samples
taken in 2016 for particle size and contamination analysis for the MMO showed the material to be very
similar.
The Maintenance Dredging Protocol Baseline Document for the Stour and Orwell Estuaries,
Harwich/Felixstowe Harbour and Deep Water Channel (HHA, 2012) provides information to enable the
assessment of maintenance dredging activities within Harwich and Felixstowe and the surrounding area and
their effects on the Stour and Orwell Estuaries Special Protection Area (SPA). The Baseline Document
states that with the exception of the predominantly 100 µm fine sand which is occasionally dredged from the
Deep Water Channel at the South Shipwash Buoy, all the maintenance dredging undertaken in the harbour
and rivers is largely silt sized with a variable clay fraction (HHA, 2012). The clay content (< 2 µm) varies from
up to 30% in the lower harbour to about 10% or less further up the estuaries. The typical material generally
has less than 5% fine sand or any coarser material. Recently deposited material is dredged at a bulk density
of about 1.25 T/m3 whilst older, more consolidated, material can attain a bulk density of 1.35 T/m
3.
A detailed study by HR Wallingford (1998) measured sediment properties of maintenance dredged material
from Harwich Harbour, including samples collected in-situ from the areas to be dredged, and samples
collected from the dredger hopper. This study recorded a low sand content: in the in-situ samples, 95% of
material was mud and 5% sand; in the dredger hopper samples, 98% of the material was mud and 2% was
sand.

Harwich Haven Disposal Site TH027
Monitoring Report
DLM7823-RT001-R02-00 6
Figure 3.1: Particle size analysis of a sediment sample taken from the dredger hopper during maintenance dredging in 2012
Source: HR Wallingford, 2014
4. Suspended solids data
4.1. Seabed frames
Seabed frames were deployed by Titan Environmental Surveys at five locations to the west of the disposal
site as shown in Figure 1.1 and Table 4.1 (Titan Environmental Surveys, 2016).
Table 4.1: Seabed frame locations
Site # WGS84 Latitude WGS84 Longitude Easting (m) Northing (m)
1 51°54.529'N 01°36.803'E 404617 5751805
2 51°53.804'N 01°36.111'E 403798 5750477
3 51°53.041'N 01°35.570'E 403150 5749075
4 51°54.377'N 01°35.901'E 403577 5751543
5 51°53.611'N 01°35.232'E 402783 5750138
Source: Titan Environmental Surveys

Harwich Haven Disposal Site TH027
Monitoring Report
DLM7823-RT001-R02-00 7
At monitoring Sites 1, 2 and 3, each frame was equipped with a JFE Infinity Turbidity Logger measuring at
0.5 m above the seabed and configured to record the measured data at 10 minute intervals. In addition to
measuring turbidity the JFE instrument also recorded water depth and temperature at the same time
intervals.
Also attached to each seabed frame were two booner tubes which trap the suspended sediment from the
same height above the seabed as the turbidity measurements were made. The material collected in the
booner tubes was subsequently used to calibrate the measured turbidity data in terms of suspended solids
concentration in mg/l (see Section 4.2).
At Site 4 and Site 5, each seabed frame was equipped with two booner tubes to trap the suspended
sediment at 0.5 m above the seabed. Turbidity was not to be measured at Site 4 and Site 5.
It should be noted that whilst the booner tubes collected material for use in the calibration of the turbidity
sensors (at Sites 1, 2 and 3) it was not possible to determine sedimentation rates from the booner tube
deployments as in most cases the tubes had either become blocked during the course of the deployment or
had overfilled with trapped sediment (see Appendix A for further details).
Figure 4.1 shows one of the seabed frames deployed equipped with two booner tubes and a JFE turbidity
logger and Figure 4.2 shows an example the sediment trapped within one of the booner tubes. Note that
there was no indication that the material size or colour had varied during the course of individual tides or
during the spring-neap cycle (this would normally be indicated by layering of the trapped booner tube
sediment); this was the case for all booner tube samples (see Appendix A).
Figure 4.1: Equipped seabed frame Figure 4.2: Booner tube sediment
Source: Titan Environmental Surveys Source: Titan Environmental Surveys
The seabed frames were deployed at the five sites prior to the commencement of the Trial 1 disposal on
26 May 2016 and recovered after completion of the Trial 2 disposal as shown in Table 4.2.
Harwich Haven Disposal Site TH027
Monitoring Report
DLM7823-RT001-R02-00 8
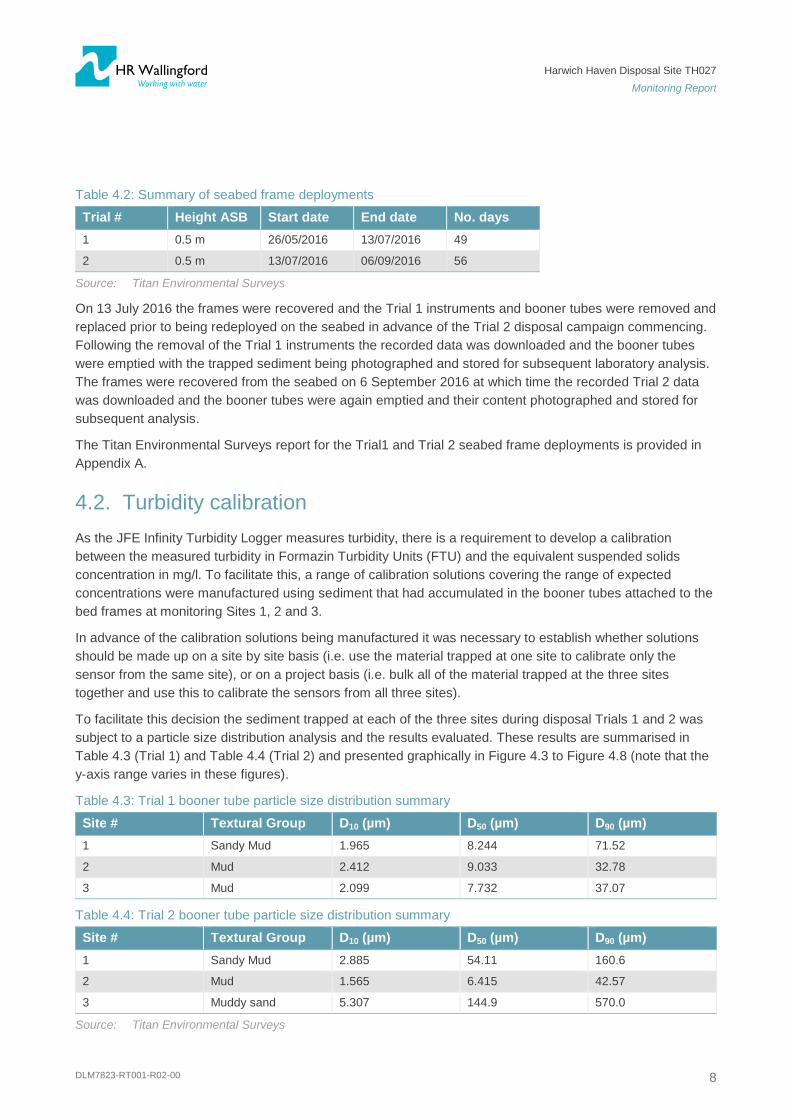
Table 4.2: Summary of seabed frame deployments
Trial # Height ASB Start date End date No. days
1 0.5 m 26/05/2016 13/07/2016 49
2 0.5 m 13/07/2016 06/09/2016 56
Source: Titan Environmental Surveys
On 13 July 2016 the frames were recovered and the Trial 1 instruments and booner tubes were removed and
replaced prior to being redeployed on the seabed in advance of the Trial 2 disposal campaign commencing.
Following the removal of the Trial 1 instruments the recorded data was downloaded and the booner tubes
were emptied with the trapped sediment being photographed and stored for subsequent laboratory analysis.
The frames were recovered from the seabed on 6 September 2016 at which time the recorded Trial 2 data
was downloaded and the booner tubes were again emptied and their content photographed and stored for
subsequent analysis.
The Titan Environmental Surveys report for the Trial1 and Trial 2 seabed frame deployments is provided in
Appendix A.
4.2. Turbidity calibration
As the JFE Infinity Turbidity Logger measures turbidity, there is a requirement to develop a calibration
between the measured turbidity in Formazin Turbidity Units (FTU) and the equivalent suspended solids
concentration in mg/l. To facilitate this, a range of calibration solutions covering the range of expected
concentrations were manufactured using sediment that had accumulated in the booner tubes attached to the
bed frames at monitoring Sites 1, 2 and 3.
In advance of the calibration solutions being manufactured it was necessary to establish whether solutions
should be made up on a site by site basis (i.e. use the material trapped at one site to calibrate only the
sensor from the same site), or on a project basis (i.e. bulk all of the material trapped at the three sites
together and use this to calibrate the sensors from all three sites).
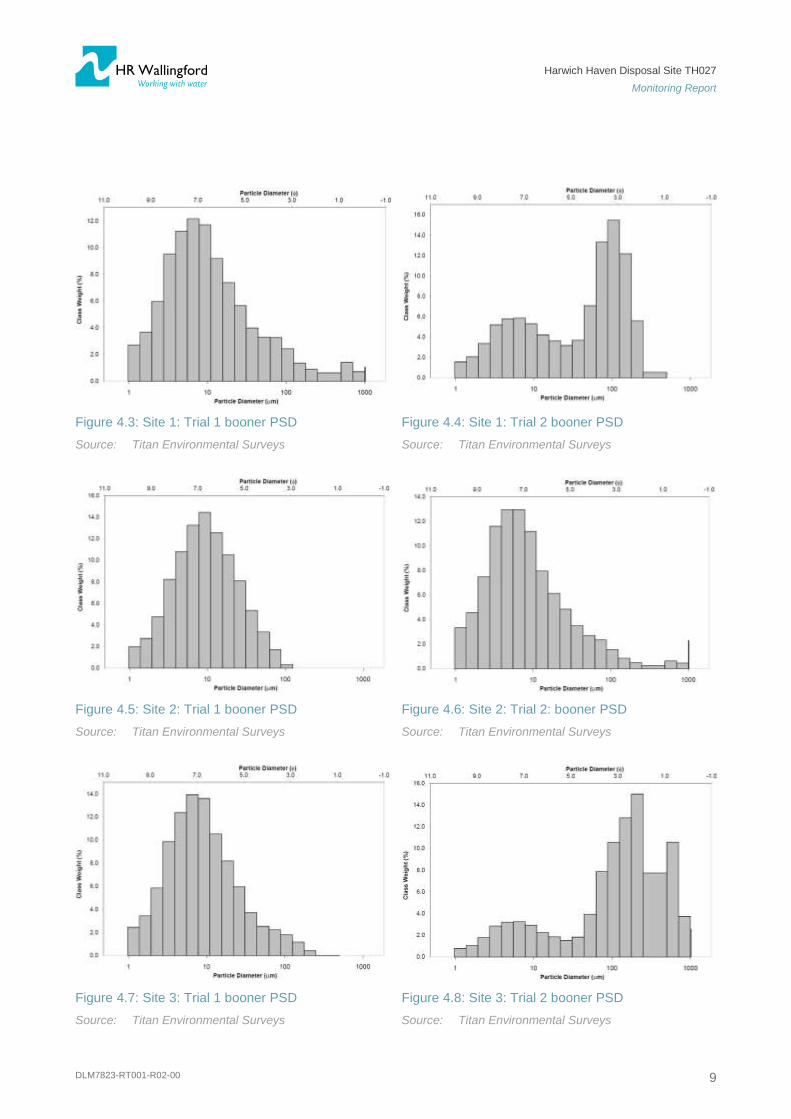
To facilitate this decision the sediment trapped at each of the three sites during disposal Trials 1 and 2 was
subject to a particle size distribution analysis and the results evaluated. These results are summarised in
Table 4.3 (Trial 1) and Table 4.4 (Trial 2) and presented graphically in Figure 4.3 to Figure 4.8 (note that the
y-axis range varies in these figures).
Table 4.3: Trial 1 booner tube particle size distribution summary
Site # Textural Group D10 (µm) D50 (µm) D90 (µm)
1 Sandy Mud 1.965 8.244 71.52
2 Mud 2.412 9.033 32.78
3 Mud 2.099 7.732 37.07
Table 4.4: Trial 2 booner tube particle size distribution summary
Site # Textural Group D10 (µm) D50 (µm) D90 (µm)
1 Sandy Mud 2.885 54.11 160.6
2 Mud 1.565 6.415 42.57
3 Muddy sand 5.307 144.9 570.0
Source: Titan Environmental Surveys
Harwich Haven Disposal Site TH027
Monitoring Report
DLM7823-RT001-R02-00 9
Figure 4.3: Site 1: Trial 1 booner PSD Figure 4.4: Site 1: Trial 2 booner PSD
Source: Titan Environmental Surveys Source: Titan Environmental Surveys
Figure 4.5: Site 2: Trial 1 booner PSD Figure 4.6: Site 2: Trial 2: booner PSD
Source: Titan Environmental Surveys Source: Titan Environmental Surveys
Figure 4.7: Site 3: Trial 1 booner PSD Figure 4.8: Site 3: Trial 2 booner PSD
Source: Titan Environmental Surveys Source: Titan Environmental Surveys

Harwich Haven Disposal Site TH027
Monitoring Report
DLM7823-RT001-R02-00 10
From Table 4.3 and Table 4.4 and Figure 4.3 to Figure 4.8 it can be seen that the particle size distributions of
the sediment trapped at the three sites during disposal Trials 1 and 2 can broadly be divided into two particle
size populations, one being more silty (<63µm) and one being more sandy (>63µm). It should be noted here
that whilst material in the sand size fraction was found in the booner tube material, the trial disposal activities
would have released only a small proportion of material in the sand size fraction (5-10%).
When manufacturing calibration solutions for turbidity sensors, where fine material is present in the
measured environment, it is important that the material used to generate the solutions also contains a
representation of that fine material1.
For Trial 1, based on the results of this assessment it was decided that the material collected within the
booner tubes during Trial 1 at Sites 1, 2 and 3 should be bulked together and the resulting sample used to
manufacture a suite of calibration solutions to be used to calibrate each of the Trial 1 turbidity sensors.
For Trial 2, the material collected within the booner tubes during Trial 2 at Sites 1 and 3 was bulked together
and used to calibrate the sensors at those sites for the derivation of suspended solids concentrations in mg/l.
As the particle size distribution of material within the Trial 2 booner tube at Site 2 was quite different (similar
to the Trial 1 material), the Site 2 material from Trial 2 was used to calibrate the sensor at this site only.
The turbidity to sediment concentration calibrations derived for each of the six JFE sensors are shown in
Figure 4.9. for the full range of calibration solutions utilised and in Figure 4.10 for the typical range of
concentrations measured during the disposal trials.
Figure 4.9: Full range turbidity (NTU) to sediment concentration (mg/l dry weight) sensor calibrations
Source: Titan Environmental Surveys
1 Turbidity sensors are more sensitive to the concentration of fine sediment particles such as silt (<63 µm) than to the
concentration of sand particles (>63 µm).

Harwich Haven Disposal Site TH027
Monitoring Report
DLM7823-RT001-R02-00 11
Figure 4.10: Measured range turbidity (NTU) to sediment concentration (mg/l dry weight) sensor calibrations
Source: Titan Environmental Surveys
4.3. Measured suspended sediment concentrations
The suspended sediment concentrations measured at monitoring Sites 1, 2 and 3 are shown as time series
sub-plots in Figure 4.11. Also shown in the sub-plots is the water depth measured at each site and the times
at which disposals of dredged material took place at the nearby disposal site TH027.
The sub-plots demonstrate that whilst the measured data is generally of good quality there are occasions
when unusually noisy data has been measured. This noisy data is indicative of the measuring sensor having
been partially obscured by detritus or marine growth. An example of this noisy data can be seen in the Site 3
data between about 24 July and 4 August.

Harwich Haven Disposal Site TH027
Monitoring Report
DLM7823-RT001-R02-00 12
Figure 4.11: Suspended solids concentrations and water depths at Sites 1, 2 and 3
Note: Also shown are the times of Trial 1 and Trial 2 disposals at disposal site TH027
Source: Titan Environmental Surveys / Harwich Haven Authority
14
16
18
20
22
24
0
100
200
300
400
500
26/05/2016 09/06/2016 23/06/2016 07/07/2016 21/07/2016 04/08/2016 18/08/2016 01/09/2016
Wat
er d
epth
(m
)
Susp
end
ed s
olid
s co
nce
ntr
atio
n (
mg/
l)
Date
Site 1
Suspended Solids Concentration Disposal Water depth
14
16
18
20
22
24
0
100
200
300
400
500
26/05/2016 09/06/2016 23/06/2016 07/07/2016 21/07/2016 04/08/2016 18/08/2016 01/09/2016
Wat
er
de
pth
(m
)
Susp
en
de
d s
olid
s co
nce
ntr
atio
n (
mg/
l)
Date
Site 2
Suspended Solids Concentration Disposal Water depth
14
16
18
20
22
24
0
100
200
300
400
500
26/05/2016 09/06/2016 23/06/2016 07/07/2016 21/07/2016 04/08/2016 18/08/2016 01/09/2016
Wat
er d
ep
th (
m)
Susp
end
ed s
olid
s co
nce
ntr
atio
n (
mg/
l)
Date
Site 3
Suspended Solids Concentration Disposal Water depth
Harwich Haven Disposal Site TH027
Monitoring Report
DLM7823-RT001-R02-00 13
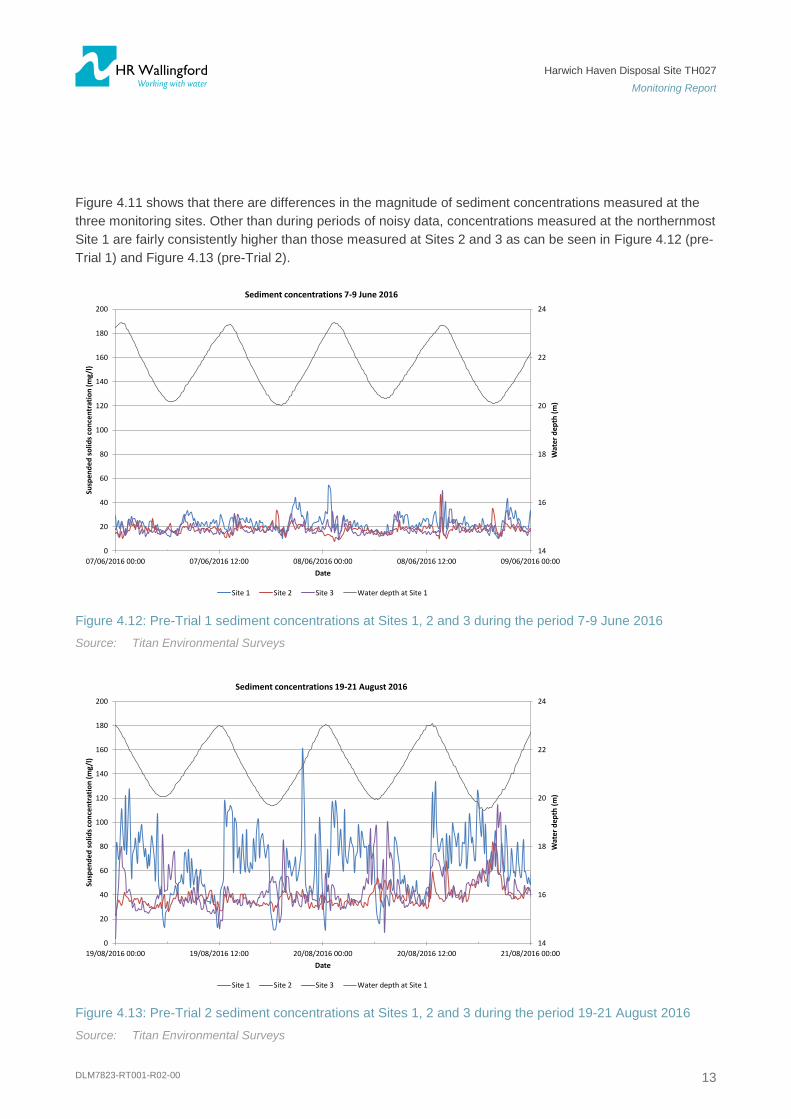
Figure 4.11 shows that there are differences in the magnitude of sediment concentrations measured at the
three monitoring sites. Other than during periods of noisy data, concentrations measured at the northernmost
Site 1 are fairly consistently higher than those measured at Sites 2 and 3 as can be seen in Figure 4.12 (pre-
Trial 1) and Figure 4.13 (pre-Trial 2).
Figure 4.12: Pre-Trial 1 sediment concentrations at Sites 1, 2 and 3 during the period 7-9 June 2016
Source: Titan Environmental Surveys
Figure 4.13: Pre-Trial 2 sediment concentrations at Sites 1, 2 and 3 during the period 19-21 August 2016
Source: Titan Environmental Surveys
14
16
18
20
22
24
0
20
40
60
80
100
120
140
160
180
200
07/06/2016 00:00 07/06/2016 12:00 08/06/2016 00:00 08/06/2016 12:00 09/06/2016 00:00W
ater
dep
th (
m)
Susp
end
ed s
olid
s co
nce
ntr
atio
n (
mg/
l)
Date
Sediment concentrations 7-9 June 2016
Site 1 Site 2 Site 3 Water depth at Site 1
14
16
18
20
22
24
0
20
40
60
80
100
120
140
160
180
200
19/08/2016 00:00 19/08/2016 12:00 20/08/2016 00:00 20/08/2016 12:00 21/08/2016 00:00
Wat
er d
epth
(m
)
Susp
end
ed s
olid
s co
nce
ntr
atio
n (
mg/
l)
Date
Sediment concentrations 19-21 August 2016
Site 1 Site 2 Site 3 Water depth at Site 1

Harwich Haven Disposal Site TH027
Monitoring Report
DLM7823-RT001-R02-00 14
The periods of sediment concentration data shown in Figure 4.12 (a period of reducing tidal range) and
Figure 4.13 (a period of increasing tidal range) are just before the Trial 1 and Trial 2 disposals at disposal
site TH027 commence and are thus representative of the range of background concentrations that existed in
the monitoring area at that time.
Within the measured data at all three monitoring sites are clear correlations between sediment concentration
and tidal range, with larger concentrations being measured during spring tides than neap tides as would be
expected (see Figure 4.9). Other factors which may be expected to influence sediment concentrations are
wave and wind conditions; these are discussed in Section 5.
5. Wave and wind data Wave data recorded at 30 minute intervals for the period of the seabed frame deployments was obtained for
the Cefas WaveNet ‘Felixstowe Waverider’ (WMO ID: 6201052) buoy operated by Gardline Environmental
on behalf of the Environment Agency. This directional Waverider is located at 51°56.29’N 001°23.63’E, in
8 m water depth.
Wind data recorded at 10 minute intervals for the period of the seabed frame deployments was provided by
HHA. This data is measured at the HHA radar tower on Landguard Point located at 51°56.148'N
001°19.096'E.
The location of the Felixstowe Waverider buoy and the HHA radar tower in relation to Harwich and disposal
site TH027 is shown in Figure 5.1.
Figure 5.1: Location of the Felixstowe Waverider, the HHA meteorological station and disposal site TH027
Source: Google Earth ©

Harwich Haven Disposal Site TH027
Monitoring Report
DLM7823-RT001-R02-00 15
5.1. Wave data
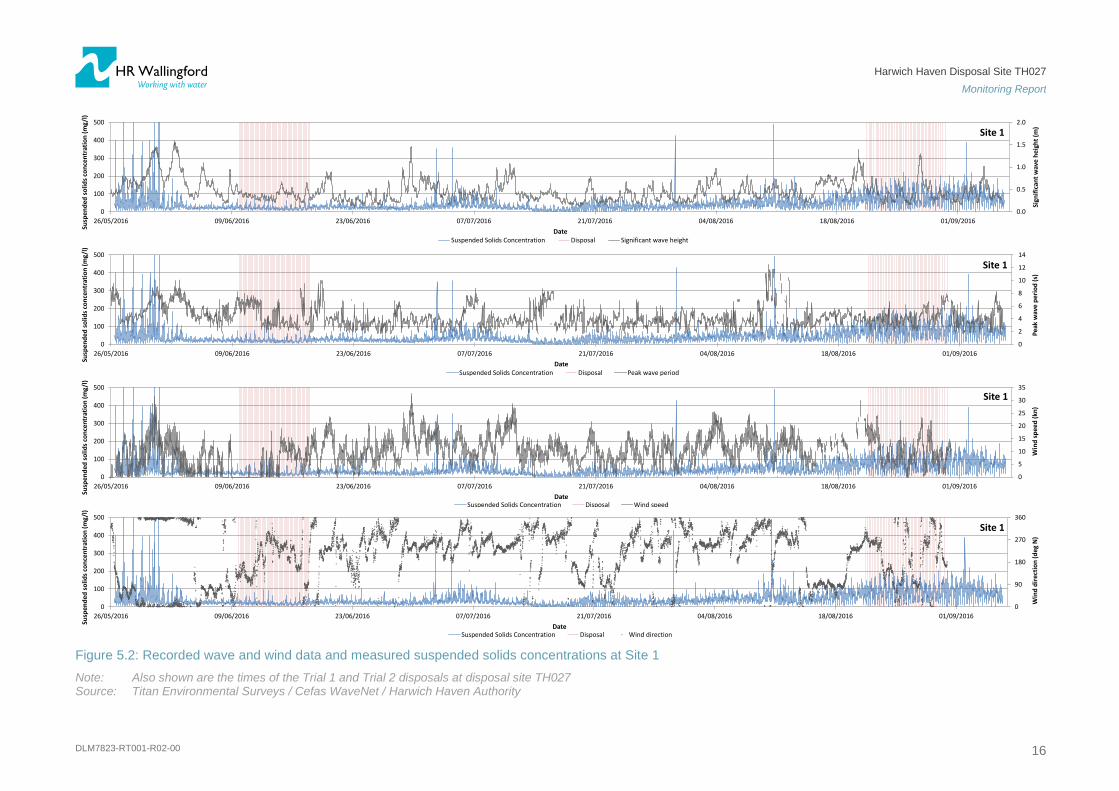
A time series of the recorded significant wave height and peak wave period wave data is shown overlaid on
the suspended solids concentrations measured at Site 1 in the upper two panels of Figure 5.2. Also shown in
Figure 5.2 are the times of the Trial 1 and Trial 2 disposals at disposal site TH027.
The figures show that the longest period of persistently large waves occurred at the start of the record during
the two weeks prior to the Trial 1 disposals commencing. During this time the maximum significant wave
height measured was about 1.6 m. After this time significant wave heights were generally less than about
0.8 m. The average significant wave height during the deployment period was calculated to be about 0.46 m.
The peak wave periods measured during the period of the seabed frame deployments were generally about
3 to 5 seconds. Longer period waves of up to about 12 seconds were recorded to occur over relatively short
periods of time during the course of the frame deployments. The average peak wave period during the
deployment period was calculated to be about 4.26 m.
As shown in the upper two panels of Figure 5.2 there is no clear correlation between the wave conditions
measured by the Felixstowe Waverider buoy and sediment concentrations at monitoring Site 1. A period of
possible correlation exists during the first week of measurements at Site 1 when high sediment
concentrations were measured coincident with a period of neap tides and relatively strong winds and large
waves.
5.2. Wind data
A time series of the recorded wind speed and wind direction data is shown overlaid on the suspended solids
concentrations measured at Site 1 in the lower two panels of Figure 5.2.
There are numerous occasions during the seabed frame deployment period when high wind speeds are
coincident with large waves being measured. An examples of this can be seen during the first 10 days of the
time series data during which time the wind is consistently blowing from the north.
The maximum wind speed measured during the period of the seabed frame deployments was about
33 knots, recorded on 29 June 2016. This maximum wind speed can be seen to be associated with a
corresponding peak in significant wave height of about 1.5 m. The average wind speed during the
deployment period was calculated to be about 9.3 knots.
Wind directions were variable during the period of the seabed frame deployments but most commonly blew
from the west (250º to 290º sector) and to a lesser extent from the east (70º to 110º sector).
As shown in the lower two panels of Figure 5.2 there is no clear correlation between the wind conditions
measured at the HHA radar tower on Landguard Point and sediment concentrations at monitoring Site 1. As
noted in Section 5.1, a period of possible correlation exists during the first week of measurements at Site 1
when high sediment concentrations were measured coincident with a period of neap tides and relatively
strong winds and large waves.
Harwich Haven Disposal Site TH027
Monitoring Report
DLM7823-RT001-R02-00 16
Figure 5.2: Recorded wave and wind data and measured suspended solids concentrations at Site 1
Note: Also shown are the times of the Trial 1 and Trial 2 disposals at disposal site TH027 Source: Titan Environmental Surveys / Cefas WaveNet / Harwich Haven Authority
0
2
4
6
8
10
12
14
0
100
200
300
400
500
26/05/2016 09/06/2016 23/06/2016 07/07/2016 21/07/2016 04/08/2016 18/08/2016 01/09/2016
Pea
k w
ave
pe
rio
d (
s)
Susp
end
ed s
olid
s co
nce
ntr
atio
n (
mg/
l)
Date
Site 1
Suspended Solids Concentration Disposal Peak wave period
0
5
10
15
20
25
30
35
0
100
200
300
400
500
26/05/2016 09/06/2016 23/06/2016 07/07/2016 21/07/2016 04/08/2016 18/08/2016 01/09/2016
Win
d s
pe
ed (
kn)
Susp
end
ed s
olid
s co
nce
ntr
atio
n (
mg/
l)
Date
Site 1
Suspended Solids Concentration Disposal Wind speed
0.0
0.5
1.0
1.5
2.0
0
100
200
300
400
500
26/05/2016 09/06/2016 23/06/2016 07/07/2016 21/07/2016 04/08/2016 18/08/2016 01/09/2016
Sign
ific
ant
wav
e h
eigh
t (m
)
Susp
end
ed s
olid
s co
nce
ntr
atio
n (
mg/
l)
Date
Site 1
Suspended Solids Concentration Disposal Significant wave height
0
90
180
270
360
0
100
200
300
400
500
26/05/2016 09/06/2016 23/06/2016 07/07/2016 21/07/2016 04/08/2016 18/08/2016 01/09/2016
Win
d d
irec
tio
n (
deg
N)
Susp
end
ed s
olid
s co
nce
ntr
atio
n (
mg/
l)
Date
Site 1
Suspended Solids Concentration Disposal Wind direction

Harwich Haven Disposal Site TH027
Monitoring Report
DLM7823-RT001-R02-00 17
6. Assessment of disposal activities
To establish whether the suspended solids concentrations at Sites 1, 2 and 3 are influenced by the Trial 1
and Trial 2 disposal activities time series plots of the concentration data were first produced. These data are
discussed below.
6.1. Disposal Trial 1
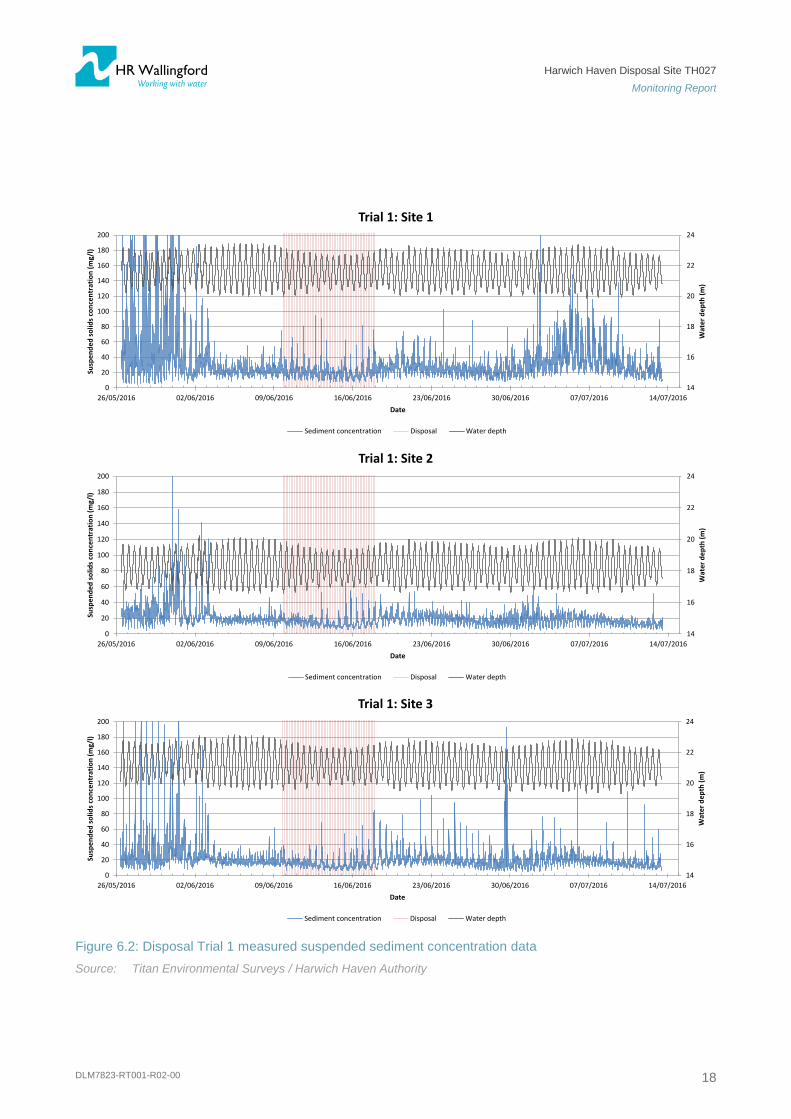
Figure 6.2 shows that the highest concentrations measured at 0.5 m above the seabed during the Trial 1
measurement period (26/05/2016 to 13/07/2016) occurred at all 3 monitoring sites during the first week of the
deployment during a period of neap tides when relatively strong winds and large waves persisted (Section 5,
Figure 5.2). After this time, neap tide concentrations were generally lower that those measured during spring
tides. During the spring tide periods a small elevation in the background (baseline) concentration was
observed.
During the period of the Trial 1 disposals (indicated by the red vertical lines in Figure 6.2) there is no
evidence of any large-scale increases in concentration, nor is there evidence of the background (baseline)
concentration increasing as a result of the disposal activity. Background (baseline) concentrations during the
period of the Trial 1 disposals are seen to decrease initially before gradually increasing after about
16/06/2016 in response to the increasing tidal range at that time.
Coincident with the increasing tidal range seen after about 15/06/2016, is an increase in the peak through-
tide concentrations at Site 2 and Site 3. This feature, which can be seen more clearly in Figure 6.1, may be
present as a result of fine material which had previously settled onto the seabed during the benign neap
tides being resuspended into the water column by the increased shear stresses associated with the larger
range tides. This feature is not so clearly evident in the Site 1 concentration data.
Figure 6.1: Trial 1: Site 2 measured sediment concentrations before, during and after disposals
Source: Titan Environmental Surveys / Harwich Haven Authority
14
15
16
17
18
19
20
21
22
23
24
0
20
40
60
80
100
120
140
160
180
200
09/06/2016 11/06/2016 13/06/2016 15/06/2016 17/06/2016 19/06/2016 21/06/2016 23/06/2016
Wat
er
de
pth
(m
)
Susp
en
de
d s
olid
s co
nce
ntr
atio
n (
mg/
l)
Date
Trial 1: Site 2
Suspended solids concentration Disposal Water depth
Harwich Haven Disposal Site TH027
Monitoring Report
DLM7823-RT001-R02-00 18
Figure 6.2: Disposal Trial 1 measured suspended sediment concentration data
Source: Titan Environmental Surveys / Harwich Haven Authority
14
16
18
20
22
24
0
20
40
60
80
100
120
140
160
180
200
26/05/2016 02/06/2016 09/06/2016 16/06/2016 23/06/2016 30/06/2016 07/07/2016 14/07/2016
Wat
er
de
pth
(m
)
Susp
en
de
d s
olid
s co
nce
ntr
atio
n (
mg/
l)
Date
Trial 1: Site 1
Sediment concentration Disposal Water depth
14
16
18
20
22
24
0
20
40
60
80
100
120
140
160
180
200
26/05/2016 02/06/2016 09/06/2016 16/06/2016 23/06/2016 30/06/2016 07/07/2016 14/07/2016
Wat
er
de
pth
(m
)
Susp
en
de
d s
olid
s co
nce
ntr
atio
n (
mg/
l)
Date
Trial 1: Site 2
Sediment concentration Disposal Water depth
14
16
18
20
22
24
0
20
40
60
80
100
120
140
160
180
200
26/05/2016 02/06/2016 09/06/2016 16/06/2016 23/06/2016 30/06/2016 07/07/2016 14/07/2016
Wat
er
de
pth
(m
)
Susp
en
de
d s
olid
s co
nce
ntr
atio
n (
mg/
l)
Date
Trial 1: Site 3
Sediment concentration Disposal Water depth
Harwich Haven Disposal Site TH027
Monitoring Report
DLM7823-RT001-R02-00 19
6.2. Disposal Trial 2
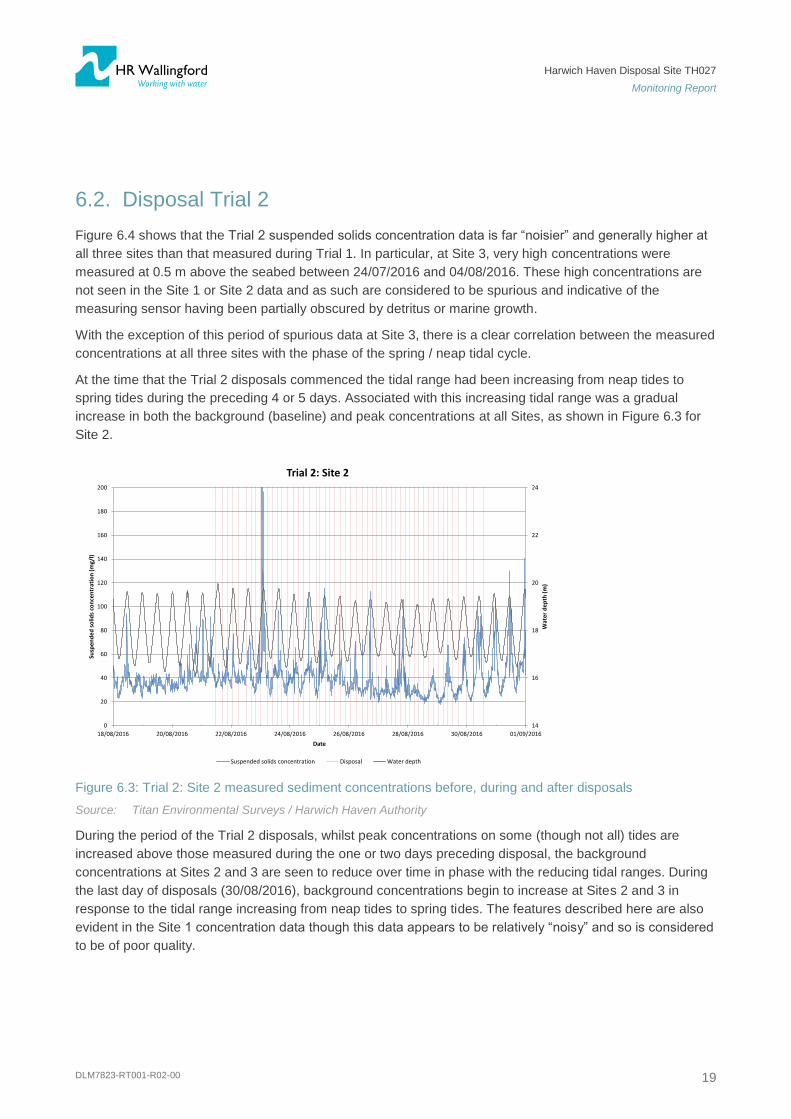
Figure 6.4 shows that the Trial 2 suspended solids concentration data is far “noisier” and generally higher at
all three sites than that measured during Trial 1. In particular, at Site 3, very high concentrations were
measured at 0.5 m above the seabed between 24/07/2016 and 04/08/2016. These high concentrations are
not seen in the Site 1 or Site 2 data and as such are considered to be spurious and indicative of the
measuring sensor having been partially obscured by detritus or marine growth.
With the exception of this period of spurious data at Site 3, there is a clear correlation between the measured
concentrations at all three sites with the phase of the spring / neap tidal cycle.
At the time that the Trial 2 disposals commenced the tidal range had been increasing from neap tides to
spring tides during the preceding 4 or 5 days. Associated with this increasing tidal range was a gradual
increase in both the background (baseline) and peak concentrations at all Sites, as shown in Figure 6.3 for
Site 2.
Figure 6.3: Trial 2: Site 2 measured sediment concentrations before, during and after disposals
Source: Titan Environmental Surveys / Harwich Haven Authority
During the period of the Trial 2 disposals, whilst peak concentrations on some (though not all) tides are
increased above those measured during the one or two days preceding disposal, the background
concentrations at Sites 2 and 3 are seen to reduce over time in phase with the reducing tidal ranges. During
the last day of disposals (30/08/2016), background concentrations begin to increase at Sites 2 and 3 in
response to the tidal range increasing from neap tides to spring tides. The features described here are also
evident in the Site 1 concentration data though this data appears to be relatively “noisy” and so is considered
to be of poor quality.
14
16
18
20
22
24
0
20
40
60
80
100
120
140
160
180
200
18/08/2016 20/08/2016 22/08/2016 24/08/2016 26/08/2016 28/08/2016 30/08/2016 01/09/2016
Wat
er
de
pth
(m
)
Susp
en
de
d s
olid
s co
nce
ntr
atio
n (
mg/
l)
Date
Trial 2: Site 2
Suspended solids concentration Disposal Water depth

Harwich Haven Disposal Site TH027
Monitoring Report
DLM7823-RT001-R02-00 20
Figure 6.4: Disposal Trial 2 measured suspended sediment concentration data
Source: Titan Environmental Surveys / Harwich Haven Authority
14
16
18
20
22
24
0
20
40
60
80
100
120
140
160
180
200
13/07/2016 20/07/2016 27/07/2016 03/08/2016 10/08/2016 17/08/2016 24/08/2016 31/08/2016 07/09/2016
Wat
er
de
pth
(m
)
Susp
en
de
d s
olid
s co
nce
ntr
atio
n (
mg/
l)
Date
Trial 2: Site 1
Sediment concentration Disposal Water depth
14
16
18
20
22
24
0
20
40
60
80
100
120
140
160
180
200
13/07/2016 20/07/2016 27/07/2016 03/08/2016 10/08/2016 17/08/2016 24/08/2016 31/08/2016 07/09/2016
Wat
er
de
pth
(m
)
Susp
en
de
d s
olid
s co
nce
ntr
atio
n (
mg/
l)
Date
Trial 2: Site 2
Sediment concentration Disposal Water depth
14
16
18
20
22
24
0
20
40
60
80
100
120
140
160
180
200
13/07/2016 20/07/2016 27/07/2016 03/08/2016 10/08/2016 17/08/2016 24/08/2016 31/08/2016 07/09/2016
Wat
er
de
pth
(m
)
Susp
en
de
d s
olid
s co
nce
ntr
atio
n (
mg/
l)
Date
Trial 2: Site 3
Sediment concentration Disposal Water depth
Harwich Haven Disposal Site TH027
Monitoring Report
DLM7823-RT001-R02-00 21
7. Comparison with numerical modelling
As part of the studies previously undertaken by HR Wallingford the influence of the disposal activities at
disposal site TH027 were predicted through plume dispersion modelling (HR Wallingford, 2014).
Three disposal scenarios were modelled; the first representing disposals commencing mid way through the
neap tides, the second representing disposals commencing mid way through the spring tides and a third
scenario being the same as the second, but with the effects of 0.5 m high waves included.
As the model simulations were configured to represent a worst case scenario the use of the largest TSHD
expected to undertake maintenance dredging of Harwich Harbour was assumed. Therefore, a TSHD having
a hopper capacity of 16,000 m3 was represented disposing of 32 loads, with each disposal taking 10
minutes. The disposals occurred approximately once every 3.75 hours, this being representative of the
anticipated cycle time of the dredger. The TDS released into the water column during each disposal was
6,180 Tonnes giving a total TDS disposed in each simulation of 197,760 Tonnes. These rates and total
disposal masses can be compared to that actually placed during the two trials as shown in Table 7.1 (see
also Section 2).
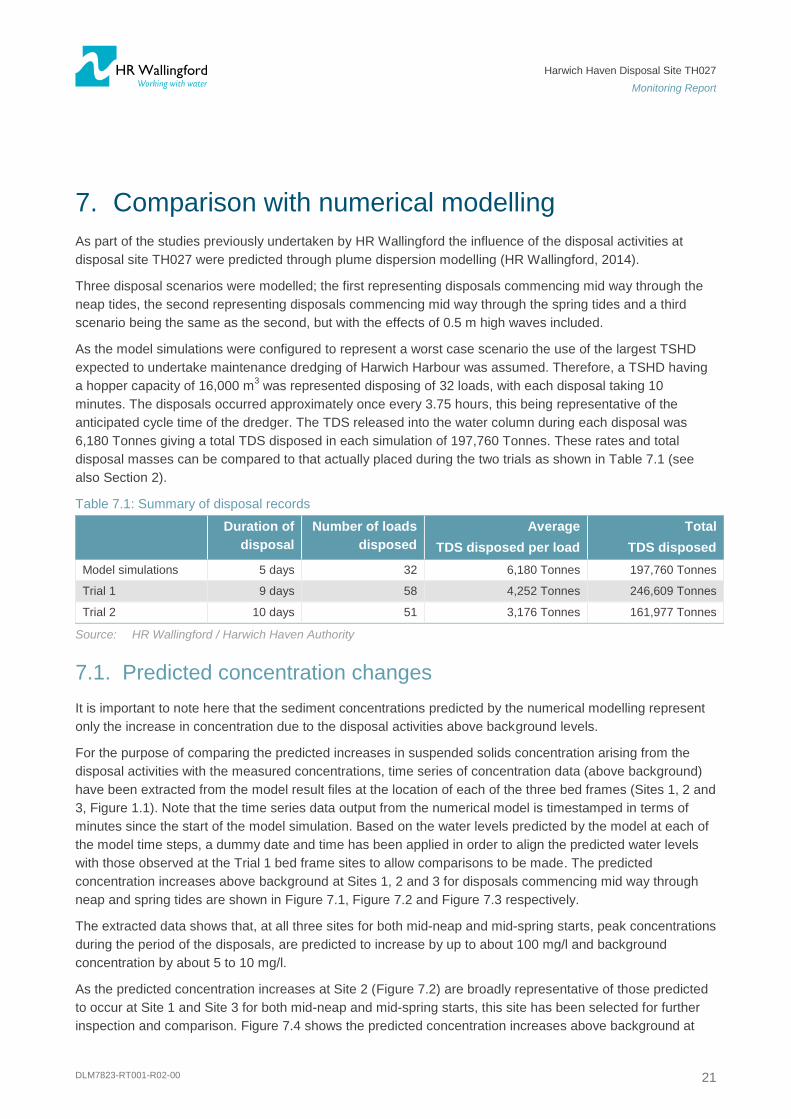
Table 7.1: Summary of disposal records
Duration of
disposal
Number of loads
disposed
Average
TDS disposed per load
Total
TDS disposed
Model simulations 5 days 32 6,180 Tonnes 197,760 Tonnes
Trial 1 9 days 58 4,252 Tonnes 246,609 Tonnes
Trial 2 10 days 51 3,176 Tonnes 161,977 Tonnes
Source: HR Wallingford / Harwich Haven Authority
7.1. Predicted concentration changes
It is important to note here that the sediment concentrations predicted by the numerical modelling represent
only the increase in concentration due to the disposal activities above background levels.
For the purpose of comparing the predicted increases in suspended solids concentration arising from the
disposal activities with the measured concentrations, time series of concentration data (above background)
have been extracted from the model result files at the location of each of the three bed frames (Sites 1, 2 and
3, Figure 1.1). Note that the time series data output from the numerical model is timestamped in terms of
minutes since the start of the model simulation. Based on the water levels predicted by the model at each of
the model time steps, a dummy date and time has been applied in order to align the predicted water levels
with those observed at the Trial 1 bed frame sites to allow comparisons to be made. The predicted
concentration increases above background at Sites 1, 2 and 3 for disposals commencing mid way through
neap and spring tides are shown in Figure 7.1, Figure 7.2 and Figure 7.3 respectively.
The extracted data shows that, at all three sites for both mid-neap and mid-spring starts, peak concentrations
during the period of the disposals, are predicted to increase by up to about 100 mg/l and background
concentration by about 5 to 10 mg/l.
As the predicted concentration increases at Site 2 (Figure 7.2) are broadly representative of those predicted
to occur at Site 1 and Site 3 for both mid-neap and mid-spring starts, this site has been selected for further
inspection and comparison. Figure 7.4 shows the predicted concentration increases above background at

Harwich Haven Disposal Site TH027
Monitoring Report
DLM7823-RT001-R02-00 22
Site 2 for disposals commencing mid way through neap tides and Figure 7.5 shows the measured
concentrations over the same duration of time with the water levels aligned to a common base (i.e. neap and
spring tides occur at broadly the same time).
Figure 7.1: Predicted concentration increases above background levels at Site 1
Source: HR Wallingford
Figure 7.2: Predicted concentration increases above background levels at Site 2
Source: HR Wallingford

Harwich Haven Disposal Site TH027
Monitoring Report
DLM7823-RT001-R02-00 23
Figure 7.3: Predicted concentration increases above background levels at Site 3
Source: HR Wallingford
Figure 7.4: Predicted concentration increases above background levels at Site 2 for disposals commencing mid-neap tide
Source: HR Wallingford

Harwich Haven Disposal Site TH027
Monitoring Report
DLM7823-RT001-R02-00 24
Figure 7.5: Measured concentrations at Site 2 during disposal Trial 1
Source: Titan Environmental Surveys / Harwich Haven Authority
The data shown in Figure 7.4 and Figure 7.5 demonstrates that during the period of disposal and during the
following spring tide period the model is conservative in its prediction of concentration increases above
background levels at Site 2 as the magnitude of the predicted concentration peaks are not achieved in the
measured data. It should be noted here however that as shown in Table 7.1, whilst the total mass placed at
the disposal site in the model simulation was smaller than during Trial 1 (197,760 TDS c.f. 246,609 TDS), the
rate at which the material was placed was faster in the model simulation than during Trial 1 (32 loads
@6,180 TDS over 5 days c.f. 58 loads @4,252 TDS over 9 days). During the second neap and spring tide
periods at Site 2 (after about 27/06/16) the predicted concentration increases are much smaller (<20 mg/l)
and within the natural variability observed in the measured data at this site.
Figure 7.6 shows the predicted concentration increases above background levels at Site 2 for disposals
commencing mid way through spring tides and Figure 7.7 shows the measured concentrations over the
same duration of time with the water levels aligned to a common base (i.e. neap and spring tides occur at
broadly the same time).
6
8
10
12
14
16
18
20
22
0
20
40
60
80
100
120
140
160
09/06/16 16/06/16 23/06/16 30/06/16 07/07/16
Wat
er
de
pth
(m
)
Susp
en
de
d s
olid
s co
nce
ntr
atio
n (
mg/
l)
Date
Trial 1: Site 2
Suspended solids concentration Disposal Water depth

Harwich Haven Disposal Site TH027
Monitoring Report
DLM7823-RT001-R02-00 25
Figure 7.6: Predicted concentration increases above background levels at Site 2 for disposals commencing mid-spring tide
Source: HR Wallingford
Figure 7.7: Measured concentrations at Site 2 during disposal Trial 2
Source: Titan Environmental Surveys / Harwich Haven Authority
In the case of Trial 2, the disposals occurred at a different time within the spring-neap cycle than those
modelled for the mid-spring start scenario and so are not directly comparable. However, Figure 7.6 indicates
that during the period of disposals, peak concentration increases above background levels of up about
100 mg/l and an underlying increase of about 10 mg/l can be expected at Site 2. The Site 2 measured data
6
8
10
12
14
16
18
20
22
0
20
40
60
80
100
120
140
160
16/08/16 23/08/16 30/08/16 06/09/16 13/09/16
Wat
er
de
pth
(m
)
Susp
en
de
d s
olid
s co
nce
ntr
atio
n (
mg/
l)
Date
Trial 2: Site 2
Suspended solids concentration Disposal Water depth

Harwich Haven Disposal Site TH027
Monitoring Report
DLM7823-RT001-R02-00 26
(Figure 7.7) demonstrates that during the 4 or 5 days preceding the commencement of disposal
concentrations are increasing as a result of the increasing spring tidal range. From the time that disposals
commence on 21/08/16 there is no evidence of any large-scale increases in concentration of the magnitude
predicted by the model (up to 100 mg/l), nor is there evidence of the underlying concentration increasing as a
result of the disposal activity. Note here again that the total mass of material placed and the rate at which it
was placed was different for the model simulation and Trial 2 (see Table 7.1).
The comparisons described above for Site 2 are also broadly valid for the measured and predicted
concentrations at Sites 1 and 3.
For the modelled scenario whereby disposals commenced mid way through the spring tides including the
effects of 0.5 m high waves the results were not dissimilar to the case without waves though elevated by
about 10 mg/l as shown at Site 2 in Figure 7.8.
Figure 7.8: Predicted concentration increases above background levels at Site 2 for disposals commencing mid-spring tide with and without waves
Source: HR Wallingford
7.1.1. Summary
The magnitude of the increases in concentration above background levels predicted by the numerical model
are not seen in the measured data. Where the timing of the modelled disposals corresponds more closely to
the actual disposals, such as the mid-neap model scenario and Trial 1, the predicted concentrations (above
background levels) and measured concentrations are not dissimilar (Figure 7.4 and Figure 7.5).
As shown in Table 7.1, whilst the total mass of material placed at the disposal site in the modelling and
during the trials is broadly similar, the rate at which the material was placed was significantly different. In the
modelled scenarios 32 loads of about 6,200 Tonnes were placed over a 5 day period. During the trials
between 51 and 58 loads of between about 3,200 and 4,200 Tonnes were place over 8 to 10 days.
As the rate of placement was significantly faster in the modelled scenarios this would be expected to result in
larger predicted increases in concentration above background than those observed; and this was seen to be
the case.
Harwich Haven Disposal Site TH027
Monitoring Report
DLM7823-RT001-R02-00 27
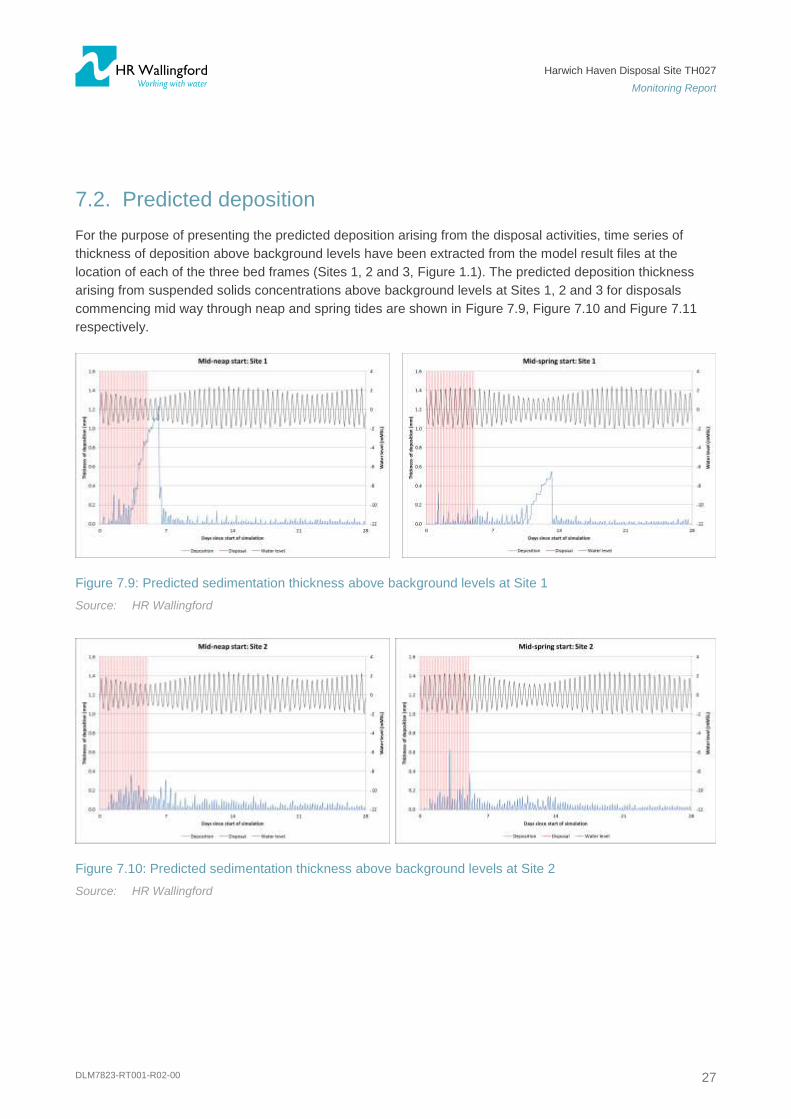
7.2. Predicted deposition
For the purpose of presenting the predicted deposition arising from the disposal activities, time series of
thickness of deposition above background levels have been extracted from the model result files at the
location of each of the three bed frames (Sites 1, 2 and 3, Figure 1.1). The predicted deposition thickness
arising from suspended solids concentrations above background levels at Sites 1, 2 and 3 for disposals
commencing mid way through neap and spring tides are shown in Figure 7.9, Figure 7.10 and Figure 7.11
respectively.
Figure 7.9: Predicted sedimentation thickness above background levels at Site 1
Source: HR Wallingford
Figure 7.10: Predicted sedimentation thickness above background levels at Site 2
Source: HR Wallingford
Harwich Haven Disposal Site TH027
Monitoring Report
DLM7823-RT001-R02-00 28
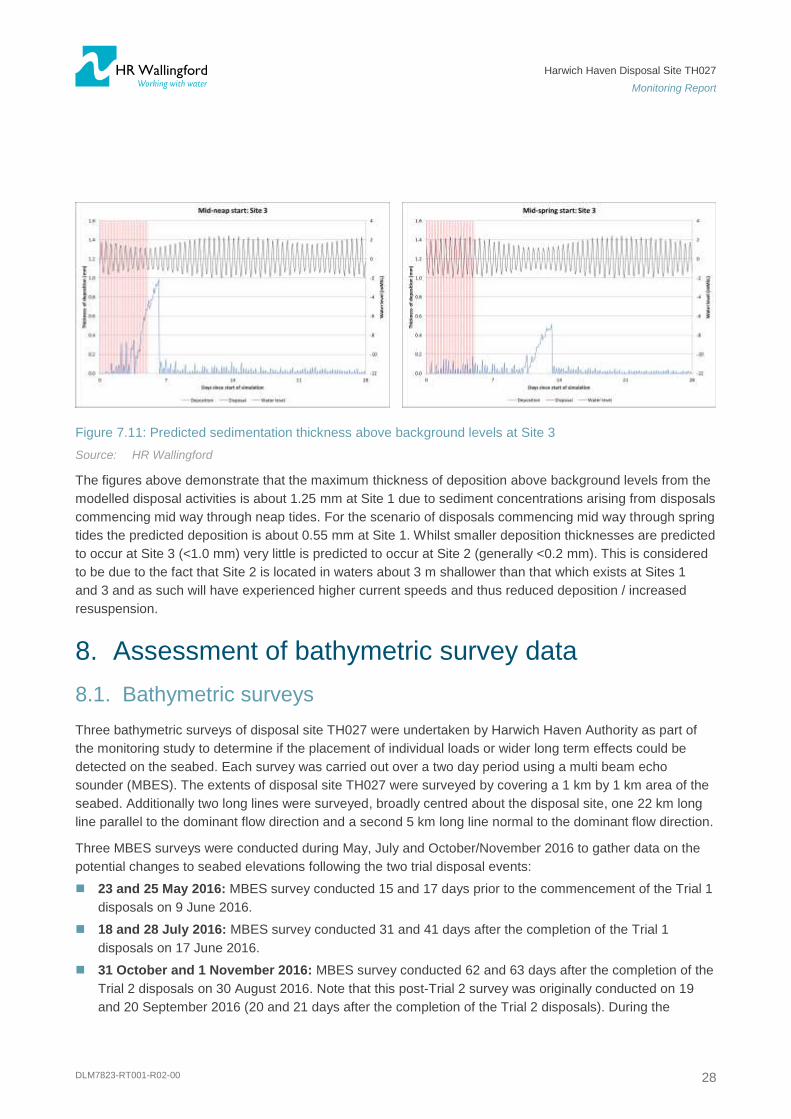
Figure 7.11: Predicted sedimentation thickness above background levels at Site 3
Source: HR Wallingford
The figures above demonstrate that the maximum thickness of deposition above background levels from the
modelled disposal activities is about 1.25 mm at Site 1 due to sediment concentrations arising from disposals
commencing mid way through neap tides. For the scenario of disposals commencing mid way through spring
tides the predicted deposition is about 0.55 mm at Site 1. Whilst smaller deposition thicknesses are predicted
to occur at Site 3 (<1.0 mm) very little is predicted to occur at Site 2 (generally <0.2 mm). This is considered
to be due to the fact that Site 2 is located in waters about 3 m shallower than that which exists at Sites 1
and 3 and as such will have experienced higher current speeds and thus reduced deposition / increased
resuspension.
8. Assessment of bathymetric survey data
8.1. Bathymetric surveys
Three bathymetric surveys of disposal site TH027 were undertaken by Harwich Haven Authority as part of
the monitoring study to determine if the placement of individual loads or wider long term effects could be
detected on the seabed. Each survey was carried out over a two day period using a multi beam echo
sounder (MBES). The extents of disposal site TH027 were surveyed by covering a 1 km by 1 km area of the
seabed. Additionally two long lines were surveyed, broadly centred about the disposal site, one 22 km long
line parallel to the dominant flow direction and a second 5 km long line normal to the dominant flow direction.
Three MBES surveys were conducted during May, July and October/November 2016 to gather data on the
potential changes to seabed elevations following the two trial disposal events:
23 and 25 May 2016: MBES survey conducted 15 and 17 days prior to the commencement of the Trial 1
disposals on 9 June 2016.
18 and 28 July 2016: MBES survey conducted 31 and 41 days after the completion of the Trial 1
disposals on 17 June 2016.
31 October and 1 November 2016: MBES survey conducted 62 and 63 days after the completion of the
Trial 2 disposals on 30 August 2016. Note that this post-Trial 2 survey was originally conducted on 19
and 20 September 2016 (20 and 21 days after the completion of the Trial 2 disposals). During the

Harwich Haven Disposal Site TH027
Monitoring Report
DLM7823-RT001-R02-00 29
subsequent post-processing of this survey data it was recognised that the data was of sufficiently poor
quality that the survey should be repeated.
The MBES survey data was provided to HR Wallingford in x, y, z format at a 2 m horizontal resolution. The
data provided was a “median selection” rather than being either “raw” data or “shoal biased” data. Each of
the three survey data sets were processed and 3D surface models of the surveyed areas created at 1 m
horizontal resolution.
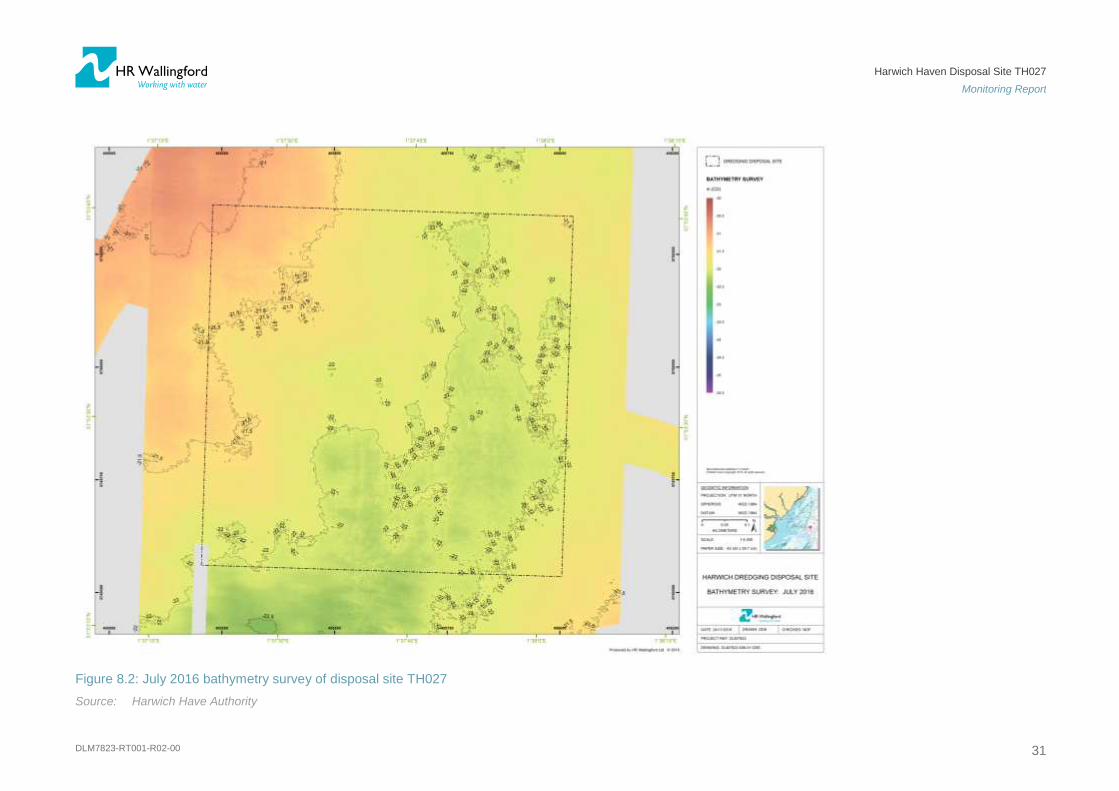
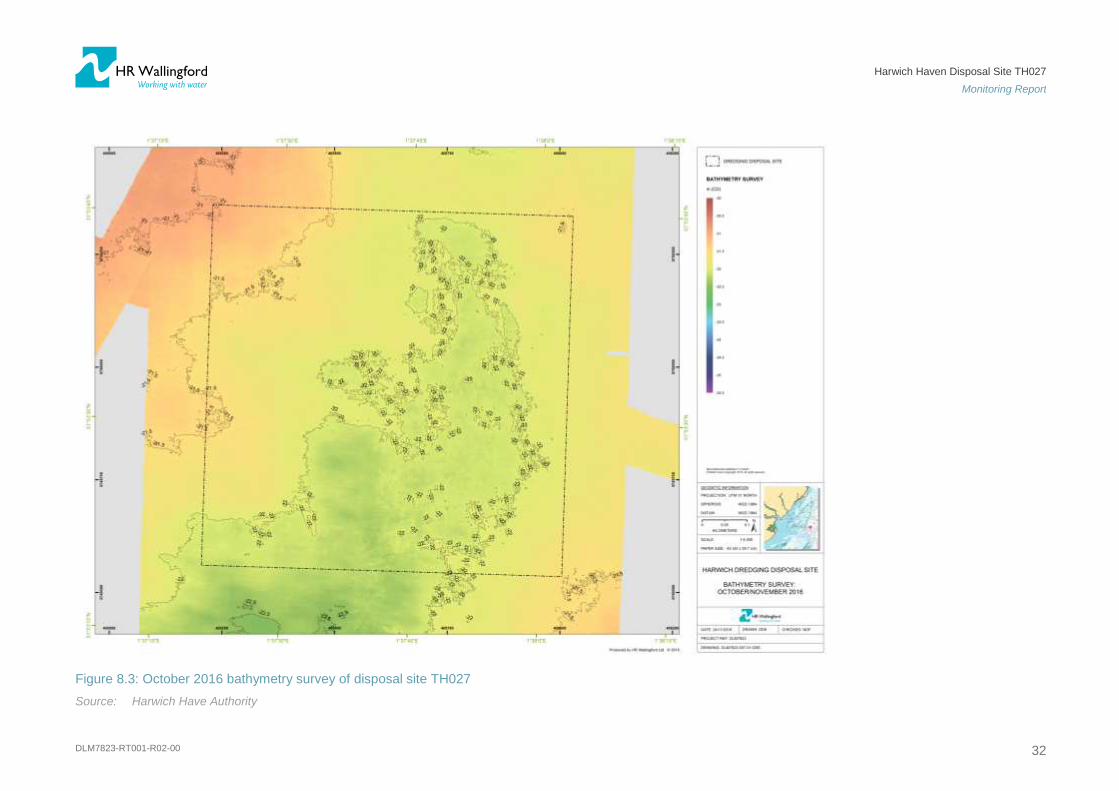
The 3D surfaces generated from the May, July and October 2016 surveys of disposal site TH027 are shown
in Figure 8.1, Figure 8.2 and Figure 8.3 respectively.
The figures show that the seafloor within the footprint of disposal site TH027 is very flat with seabed
elevations varying from between -21mCD in the north-east corner to about -22.5mCD in the central north-
south ‘ridge’ area.
The seabed elevations within disposal site TH027 measured prior to the Trial 1 disposal (Figure 8.1) and
after the Trial 2 disposal (Figure 8.3) can be seen to be very similar. Seabed elevations measured between
the two disposal trials (Figure 8.2) can be seen to be generally slightly elevated in the northern central area
of the disposal site. It should be noted here that the vertical repeatability / accuracy of the MBES system is
quoted as being ±0.2 m.

Harwich Haven Disposal Site TH027
Monitoring Report
DLM7823-RT001-R02-00 30
Figure 8.1: May 2016 bathymetry survey of disposal site TH027
Source: Harwich Have Authority
Harwich Haven Disposal Site TH027
Monitoring Report
DLM7823-RT001-R02-00 31
Figure 8.2: July 2016 bathymetry survey of disposal site TH027
Source: Harwich Have Authority
Harwich Haven Disposal Site TH027
Monitoring Report
DLM7823-RT001-R02-00 32
Figure 8.3: October 2016 bathymetry survey of disposal site TH027
Source: Harwich Have Authority

Harwich Haven Disposal Site TH027
Monitoring Report
DLM7823-RT001-R02-00 33
8.2. Changes in bathymetry
To identify areas of the seabed where changes in seabed elevation had occurred during the course of the
trial disposal difference models were generated by subtracting one surface from another.
For the purpose of this study two difference models were created as shown in Table 8.1.
Table 8.1: Bathymetry difference models
Difference model See Figure
July 2016 minus May 2016 Figure 8.4
October 2016 minus July 2016 Figure 8.5
October 2016 minus May 2016 Figure 8.6
Source: HR Wallingford
As the quoted vertical repeatability / accuracy of MBES surveys being ±0.2 m only changes in seabed levels
of greater than 0.2 m (accretion or erosion) are shown in the difference models. Any changes smaller that
this are coloured in white in Figure 8.4, Figure 8.5 and Figure 8.6.
8.2.1. May 2016 to July 2016
The changes in bathymetry that occurred between May and July 2016 are shown in Figure 8.4. During this
period the Trial 1 disposal operations took place at Site TH027 between 9 and 17 June 2016.
Within the boundary of disposal site TH027 there is generally no change in seabed elevation (shown as
white). Whilst there are patches of apparent accretion of up to about 0.3 m (shown as yellow) this is not
considered to be entirely due to real changes in seabed elevation but due to a combination of bed level
changes and tidal reduction inaccuracies encountered due to the relatively large distance between the
survey area and the Harwich tide gauge (~24 km).
Along the length of the 22 km long flow parallel survey line apparent erosion of up to 0.4 m (shown in green)
was measured to the north of disposal site TH027. This is again considered to be largely due to tidal
reduction inaccuracies compounded by the presence of Shipwash Bank between the survey area and the
Harwich tide gauge. It can be seen in Figure 8.4 that the apparent erosion along this survey line is only
present offshore of Shipwash Bank and the inaccuracy increases further north along the line (as the distance
to the tide gauge increases). In the area to the south of Shipwash Bank the MBES data is of much higher
quality, showing detail of bedforms having moved in a southerly direction between the two surveys as shown
in the inset to Figure 8.4.
Along the length of the 5 km long flow normal survey line, which includes the area of seabed to the west of
the disposal site where the seabed frames were deployed (see Section 3), no changes in seabed elevation
in excess of 0.2 m are observed (shown as white).
8.2.2. July 2016 to October 2016
The changes in bathymetry that occurred between July and October 2016 are shown in Figure 8.5. During
this period the Trial 2 disposal operations took place at disposal site TH027 between 21 and 30 August
2016.

Harwich Haven Disposal Site TH027
Monitoring Report
DLM7823-RT001-R02-00 34
Within the boundary of disposal site TH027 there is no change in seabed elevation in excess of 0.2 m
(shown as white).
Towards the northern end of the 22 km long flow parallel survey line apparent accretion of up to 0.3 m
(shown in yellow) was measured. As discussed in Section 8.2.1, this is considered to be largely due to tidal
reduction inaccuracies which have been shown to be more prevalent at greater distances from the Harwich
tide gauge and compounded by the presence of Shipwash Bank. In the area to the south of Shipwash Bank
the MBES data is again of much higher quality, showing detail of bedforms having moved in a southerly
direction between the two surveys as shown in the inset to Figure 8.5.
No changes in seabed elevation in excess of 0.2 m are seen along the length of the 5 km long flow normal
survey line (shown as white).
8.2.3. May 2016 to October 2016
The changes in bathymetry that occurred between May and October 2016 are shown in Figure 8.6. During
this period encompassed by these two surveys both the Trial 1 and Trial 2 disposal operations had taken
place at disposal site TH027 between 9 June and 30 August 2016.
Within the boundary of disposal site TH027 there is generally no change in seabed elevation (shown as
white in Figure 8.6). For this case the changes in bathymetry that occurred within the boundaries of the
disposal site between May and October 2016 have also been plotted in Figure 8.7 to show changes of
greater than 0.1 m. Figure 8.7 demonstrates that the largest changes in bed level occurred in the north-east
quadrant of the disposal site where accretion of up 0.2 m is widely observed and accretion of between 0.3 m
and 0.4 m is seen over small areas. There is no definitive evidence of the placement of individual loads on
the seabed or wider long term effects. As previously noted in Section 8.2.1 (May to July 2016), the apparent
accretion is not considered to be entirely due to real changes in seabed elevation but due to a combination
of bed level changes and tidal reduction inaccuracies encountered during the surveys.
Along the length of the 22 km long flow parallel survey line apparent erosion of up to 0.4 m (shown in green)
was measured to the north of disposal site TH027. As discussed in Section 8.2.1, this is considered to be
largely due to tidal reduction inaccuracies which have been shown to be more prevalent at greater distances
from the Harwich tide gauge and compounded by the presence of Shipwash Bank. In the area to the south of
Shipwash Bank the MBES data is again of much higher quality, showing detail of bedforms having moved in
a southerly direction between the two surveys.
No changes in seabed elevation in excess of 0.2 m are seen along the length of the 5 km long flow normal
survey line (shown as white).
8.3. Discussion
MBES surveys were carried out prior to the two trial disposals commencing in May 2016, between the two
disposal trials in July 2016 and after the trials had finished in October 2016.
Analysis of the bathymetry data has been undertaken and this has shown very little evidence of seabed level
changes in excess of 0.2 m (i.e. beyond the quoted vertical repeatability / accuracy of the MBES instrument
±0.2 m) that can be attributed directly to the disposal activities. There is no definitive evidence of the
placement of individual loads on the seabed or wider long term effects.

Harwich Haven Disposal Site TH027
Monitoring Report
DLM7823-RT001-R02-00 35
Between May and July 2016 (and to a lesser extent between May and October 2016) some apparent seabed
level changes were observed but this is largely attributable to tidal reduction inaccuracies encountered due
to the relatively large distance between the survey area and the Harwich tide gauge (~24 km). The
inaccuracies are thought to be compounded by the presence of Shipwash Bank.
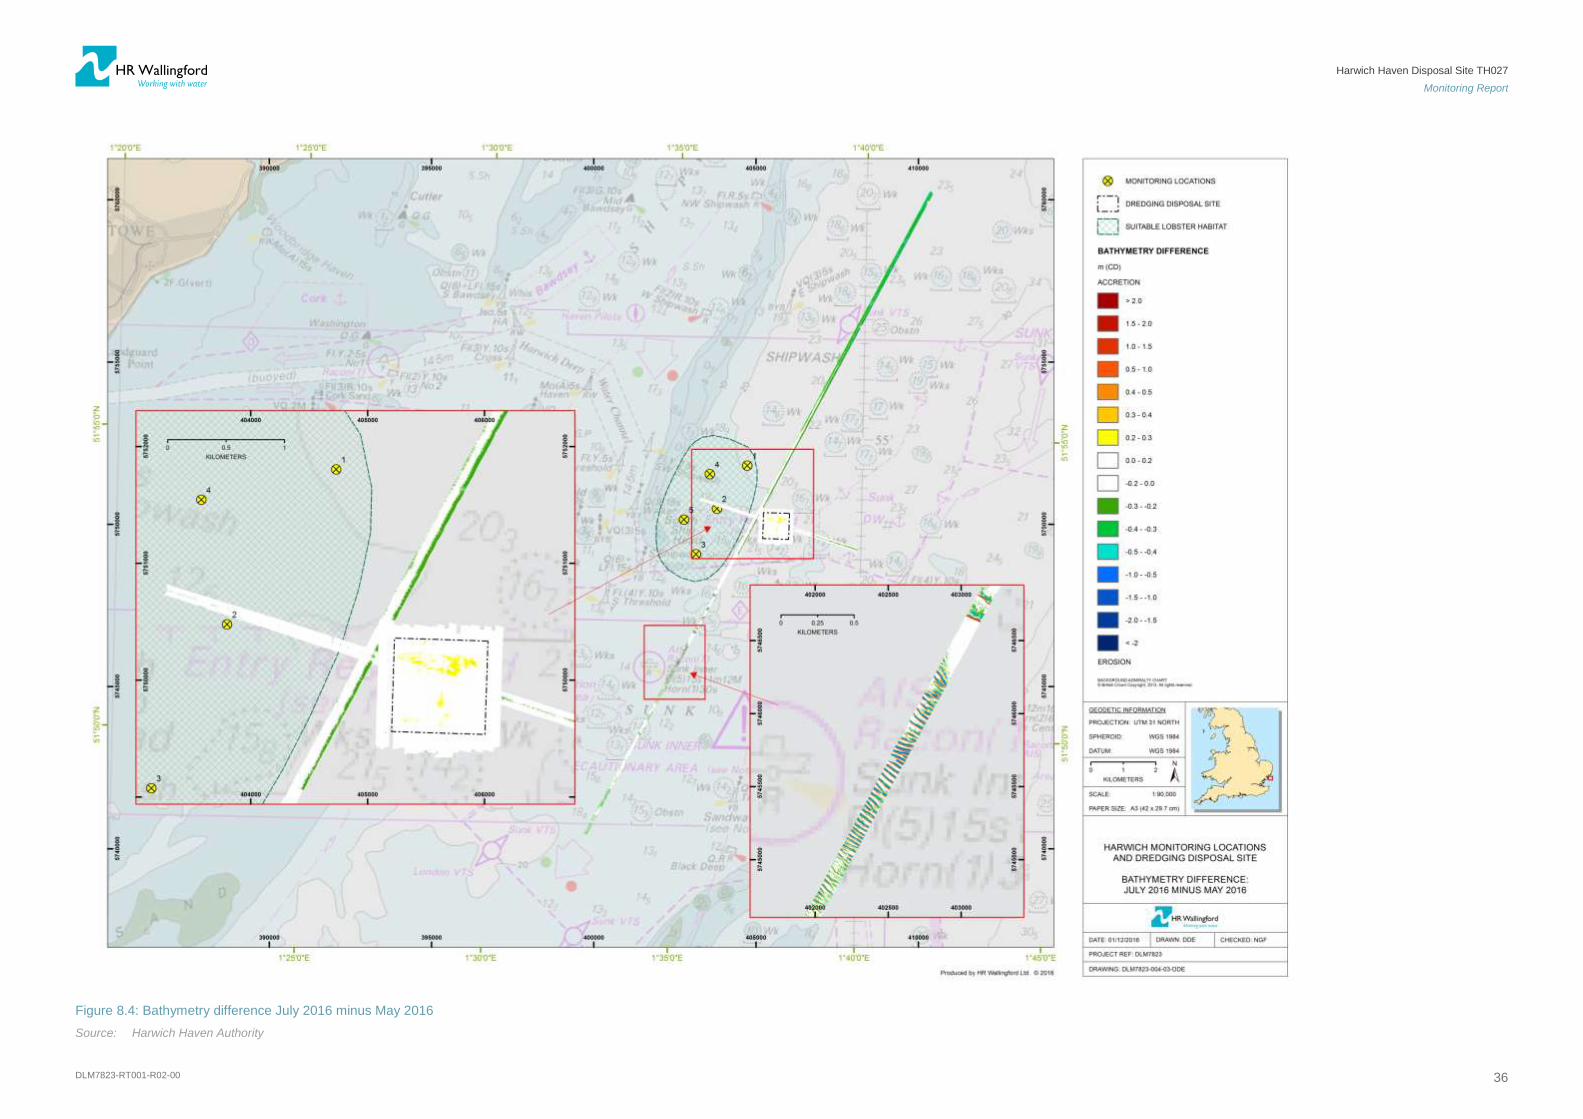
Harwich Haven Disposal Site TH027
Monitoring Report
DLM7823-RT001-R02-00 36
Figure 8.4: Bathymetry difference July 2016 minus May 2016
Source: Harwich Haven Authority

Harwich Haven Disposal Site TH027
Monitoring Report
DLM7823-RT001-R02-00 37
Figure 8.5: Bathymetry difference October 2016 minus July 2016
Source: Harwich Haven Authority
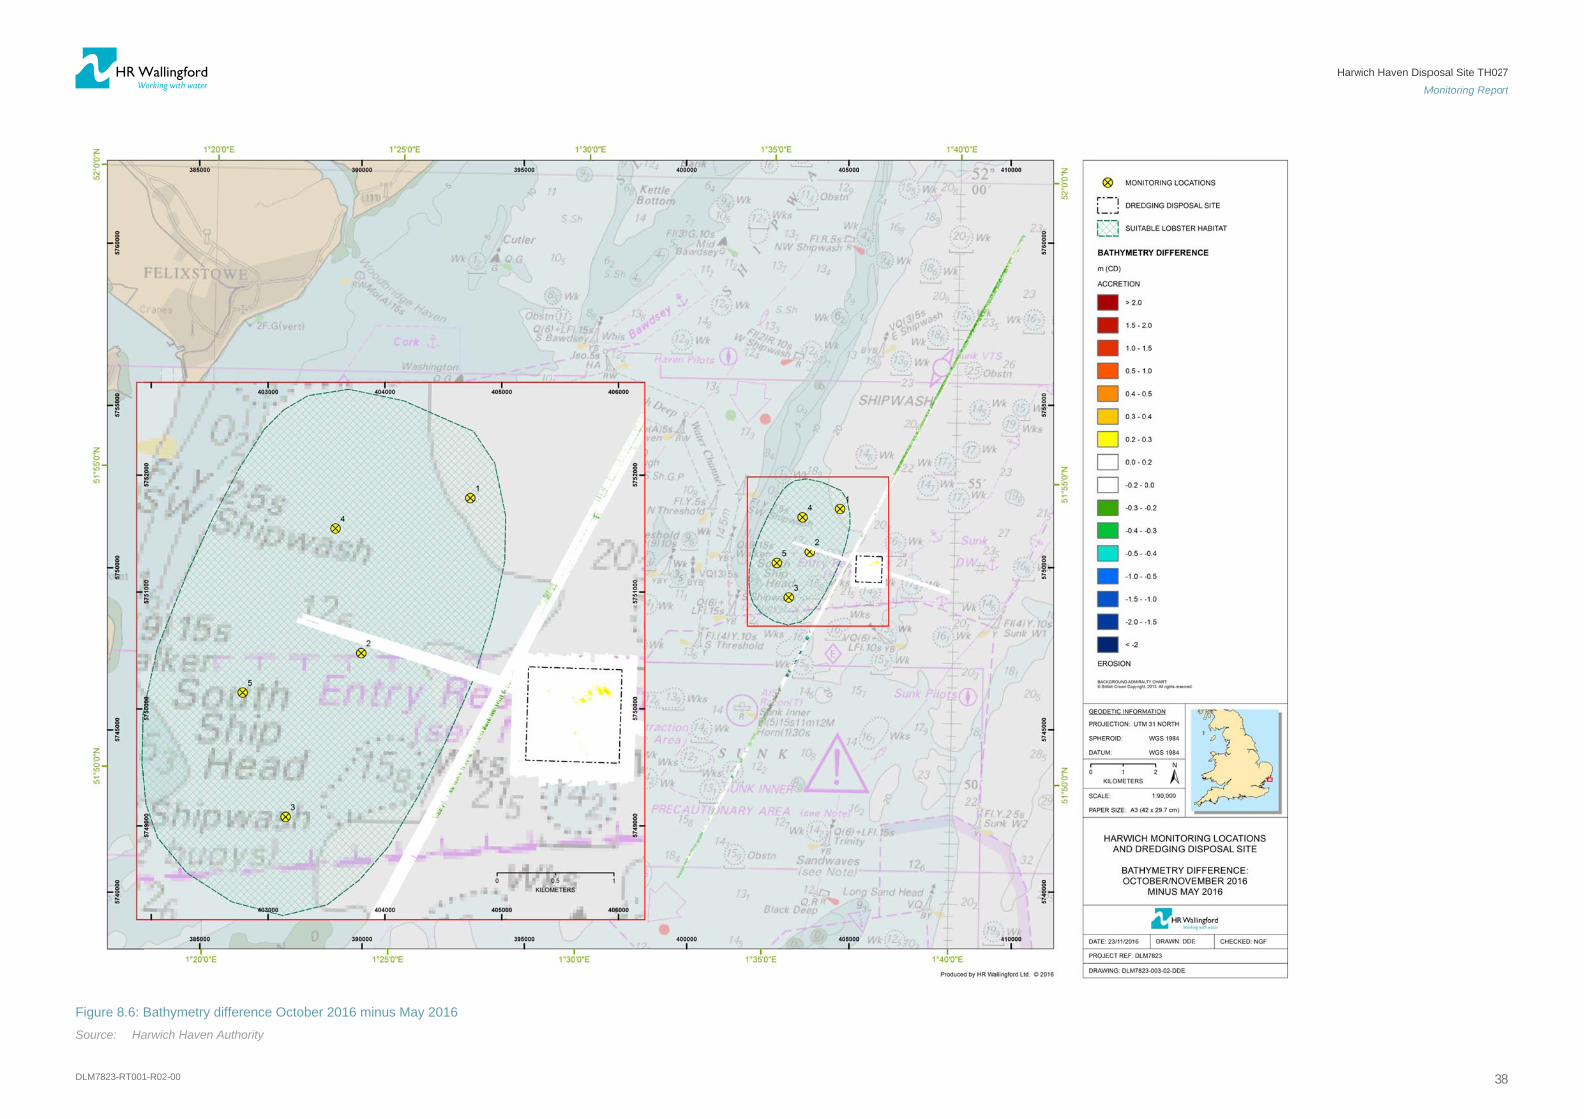
DLM7823-RT001
Figure 8.6:
Source: Ha
1-R02-00
Bathymetry d
arwich Haven
difference O
Authority
ctober 2016 minus May 22016
Harw
wich Haven Disp
M
posal Site TH02
Monitoring Repo
3
7
rt
8
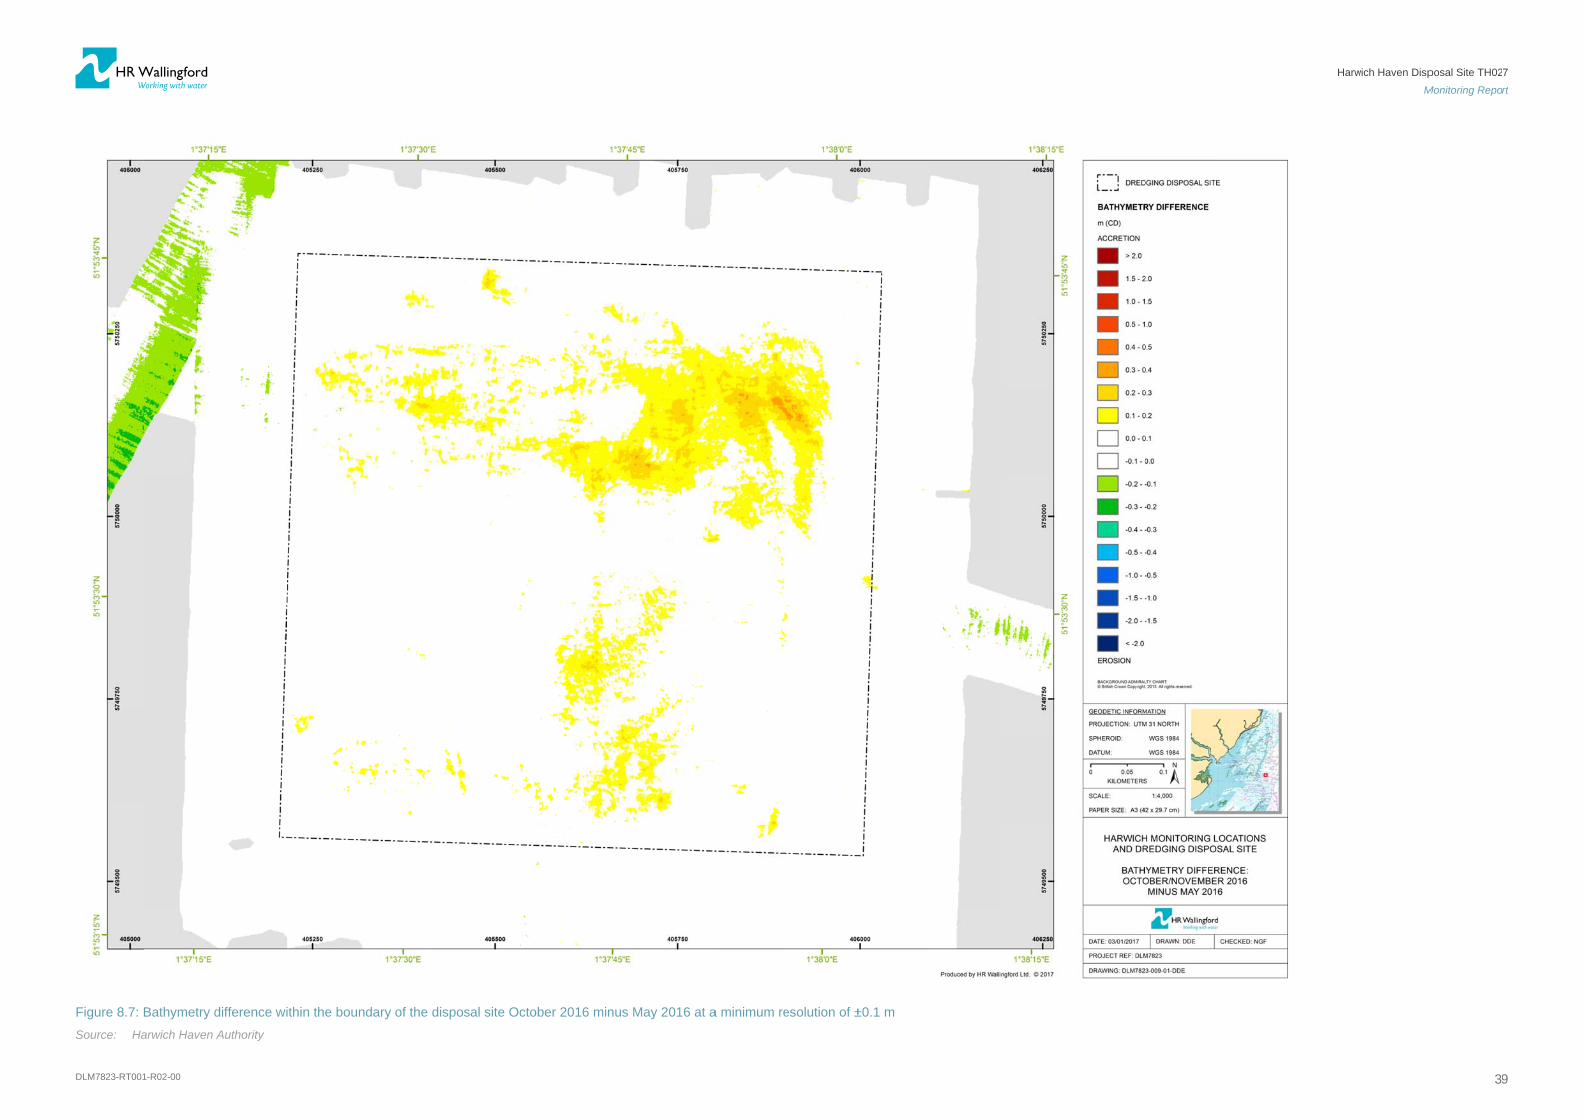
DLM7823-RT001
Figure 8.7:
Source: Ha
1-R02-00
Bathymetry d
arwich Haven
difference wi
Authority
ithin the boundary of the disposal sitee October 20016 minus Maay 2016 at aa minimum reesolution of ±±0.1 m
Harw
wich Haven Disp
M
posal Site TH02
Monitoring Repo
3
7
rt
9
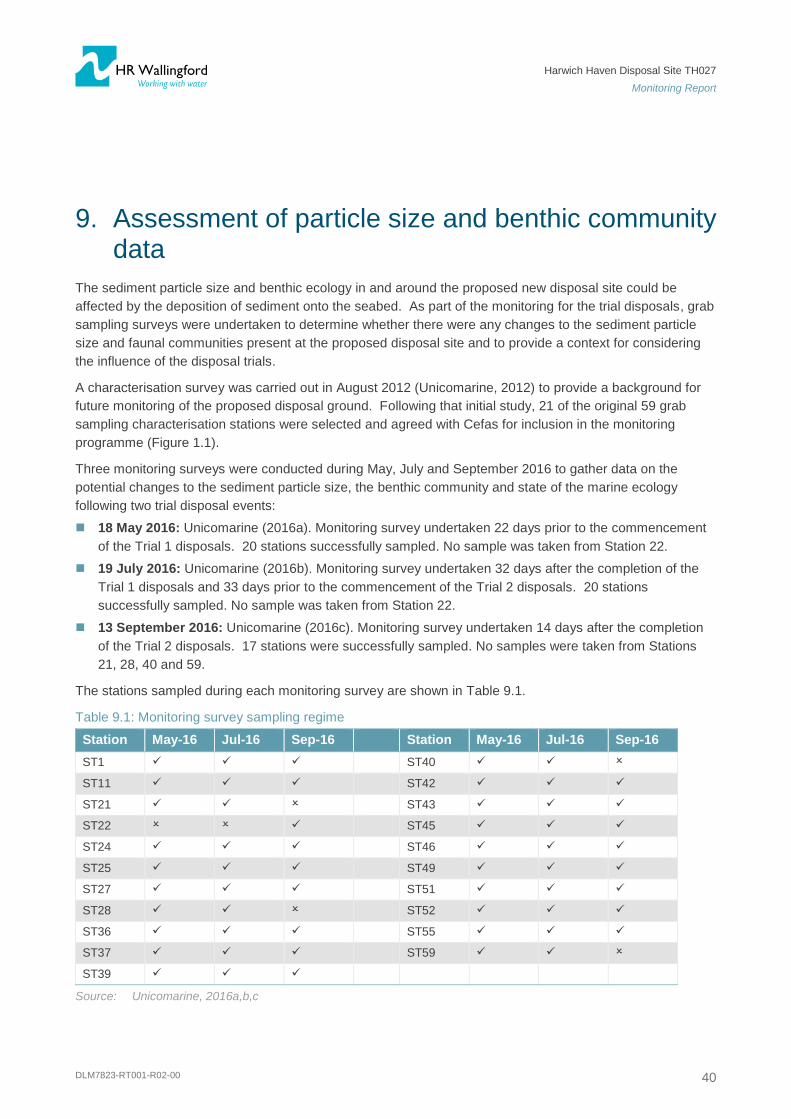
Harwich Haven Disposal Site TH027
Monitoring Report
DLM7823-RT001-R02-00 40
9. Assessment of particle size and benthic community data
The sediment particle size and benthic ecology in and around the proposed new disposal site could be
affected by the deposition of sediment onto the seabed. As part of the monitoring for the trial disposals, grab
sampling surveys were undertaken to determine whether there were any changes to the sediment particle
size and faunal communities present at the proposed disposal site and to provide a context for considering
the influence of the disposal trials.
A characterisation survey was carried out in August 2012 (Unicomarine, 2012) to provide a background for
future monitoring of the proposed disposal ground. Following that initial study, 21 of the original 59 grab
sampling characterisation stations were selected and agreed with Cefas for inclusion in the monitoring
programme (Figure 1.1).
Three monitoring surveys were conducted during May, July and September 2016 to gather data on the
potential changes to the sediment particle size, the benthic community and state of the marine ecology
following two trial disposal events:
18 May 2016: Unicomarine (2016a). Monitoring survey undertaken 22 days prior to the commencement
of the Trial 1 disposals. 20 stations successfully sampled. No sample was taken from Station 22.
19 July 2016: Unicomarine (2016b). Monitoring survey undertaken 32 days after the completion of the
Trial 1 disposals and 33 days prior to the commencement of the Trial 2 disposals. 20 stations
successfully sampled. No sample was taken from Station 22.
13 September 2016: Unicomarine (2016c). Monitoring survey undertaken 14 days after the completion
of the Trial 2 disposals. 17 stations were successfully sampled. No samples were taken from Stations
21, 28, 40 and 59.
The stations sampled during each monitoring survey are shown in Table 9.1.
Table 9.1: Monitoring survey sampling regime
Station May-16 Jul-16 Sep-16 Station May-16 Jul-16 Sep-16
ST1 ST40
ST11 ST42
ST21 ST43
ST22 ST45
ST24 ST46
ST25 ST49
ST27 ST51
ST28 ST52
ST36 ST55
ST37 ST59
ST39
Source: Unicomarine, 2016a,b,c
Harwich Haven Disposal Site TH027
Monitoring Report
DLM7823-RT001-R02-00 41
The results of the sediment particle size analysis are presented in Section 9.1 and the results of the benthic
analysis in Section 9.2.
9.1. Particle size analysis
The Thomson Unicomarine particle size analysis reports for each of the surveys are provided in Appendix B.
Whilst these data reports do not describe the survey methodology Thomson Unicomarine has confirmed that
this followed that adopted during the August 2012 characterisation survey and that the subsequent
laboratory processing of samples followed standard Thomson Unicomarine procedures. For each of the
stations sampled (Table 9.1) the sediment was subject to particle size analysis.
For the purpose of providing a high level overview of this data the percentage fines (<62.5µm), sands
(>62.5µm<2.0mm) and gravels (>2.0mm) within each sample was extracted from the 2012 characterisation
survey report (Unicomarine, 2012) and the 2016 monitoring survey reports (Unicomarine, 2016a,b,c) and
plotted as pie charts on a base map of the results of the plume dispersion modelling reported in
HR Wallingford (2014)2.
9.1.1. August 2012 background and May 2016 pre-Trial 1 particle size data
Figure 9.1 shows a the percentage of fines, sands and gravels present at each of the monitoring stations at
the time of the characterisation survey in August 2012 (black border pies) and at the time of the pre-Trial 1
survey in May 2016 (red border pies).
Figure 9.1 demonstrates the following:
There is a large variability in the composition of the bed materials over the surveyed area before the
disposal trials took place.
At some stations the composition of the bed material in August 2012 and May 2016 was very similar (e.g.
Stations 27, 30, 42 and 51).
At other locations the composition in August 2012 and May 2016 was very different (e.g. Stations 21, 24,
25, 39 and 43).
In August 2012 the bed materials north of the disposal site often comprised a greater proportion of gravel
(e.g. Stations 24, 25, 37, 52 and 43).
South of the disposal site there is very little fine material present in the bed materials.
Fine material is principally present in the area of the seabed immediately to the east of Shipwash Bank
(e.g. Stations 30 and 36).
In August 2012 fine material was present within the boundary of, and to the east of, the disposal site
(Stations 11, 21 and 55). This fine material was not present when sampled in May 2016 prior to the
disposal trials.
2 HR Wallingford (2014), Figure 6.8. Maximum deposition over 28 Day Cycle. Model Run 1: Spring Tide with 0.5m
waves.
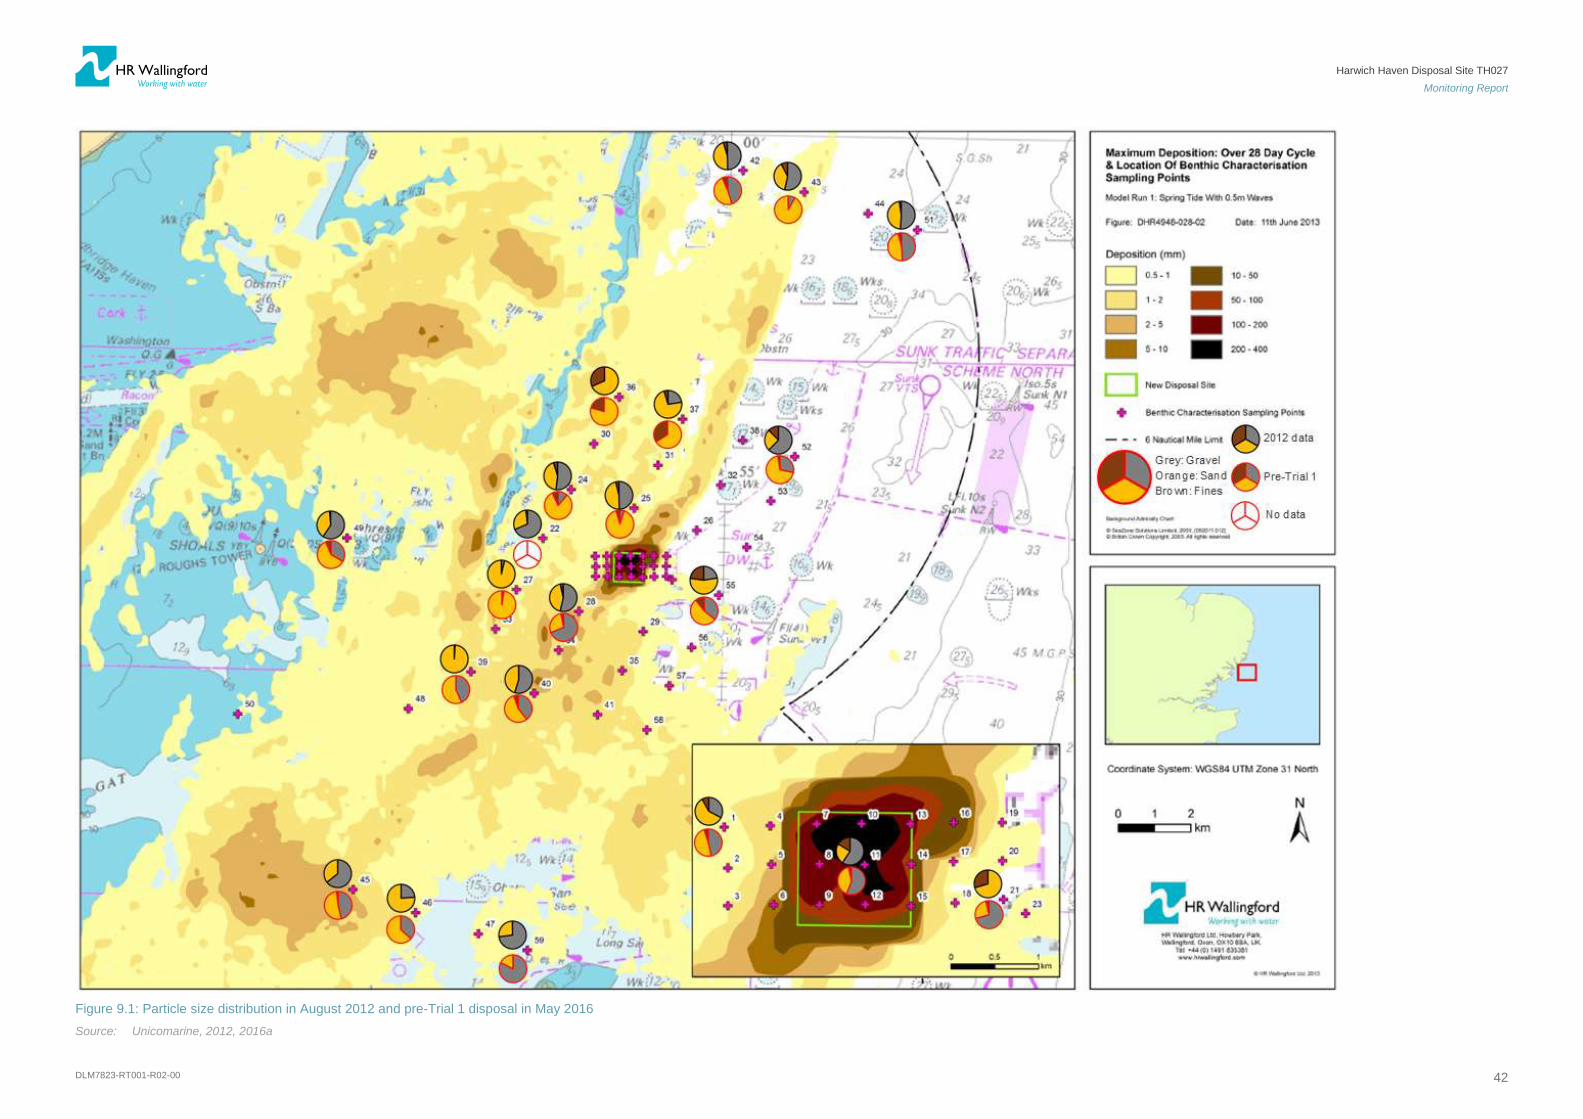
Harwich Haven Disposal Site TH027
Monitoring Report
DLM7823-RT001-R02-00 42
Figure 9.1: Particle size distribution in August 2012 and pre-Trial 1 disposal in May 2016
Source: Unicomarine, 2012, 2016a

Harwich Haven Disposal Site TH027
Monitoring Report
DLM7823-RT001-R02-00 43
Figure 9.2: Particle size distribution May 2016 pre-Trial 1 disposal, July 2016 post-Trial 1 disposal and September 2016 post-Trial 2 disposal
Source: Unicomarine, 2016a,b,c
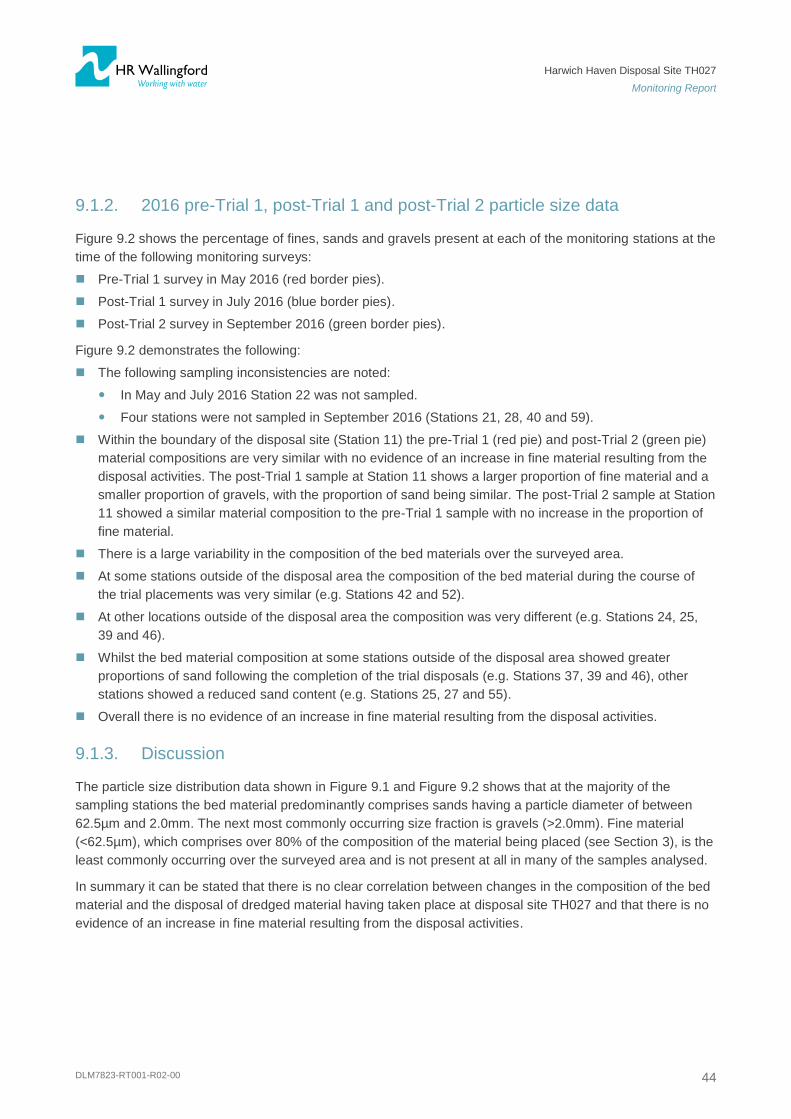
Harwich Haven Disposal Site TH027
Monitoring Report
DLM7823-RT001-R02-00 44
9.1.2. 2016 pre-Trial 1, post-Trial 1 and post-Trial 2 particle size data
Figure 9.2 shows the percentage of fines, sands and gravels present at each of the monitoring stations at the
time of the following monitoring surveys:
Pre-Trial 1 survey in May 2016 (red border pies).
Post-Trial 1 survey in July 2016 (blue border pies).
Post-Trial 2 survey in September 2016 (green border pies).
Figure 9.2 demonstrates the following:
The following sampling inconsistencies are noted:
In May and July 2016 Station 22 was not sampled.
Four stations were not sampled in September 2016 (Stations 21, 28, 40 and 59).
Within the boundary of the disposal site (Station 11) the pre-Trial 1 (red pie) and post-Trial 2 (green pie)
material compositions are very similar with no evidence of an increase in fine material resulting from the
disposal activities. The post-Trial 1 sample at Station 11 shows a larger proportion of fine material and a
smaller proportion of gravels, with the proportion of sand being similar. The post-Trial 2 sample at Station
11 showed a similar material composition to the pre-Trial 1 sample with no increase in the proportion of
fine material.
There is a large variability in the composition of the bed materials over the surveyed area.
At some stations outside of the disposal area the composition of the bed material during the course of
the trial placements was very similar (e.g. Stations 42 and 52).
At other locations outside of the disposal area the composition was very different (e.g. Stations 24, 25,
39 and 46).
Whilst the bed material composition at some stations outside of the disposal area showed greater
proportions of sand following the completion of the trial disposals (e.g. Stations 37, 39 and 46), other
stations showed a reduced sand content (e.g. Stations 25, 27 and 55).
Overall there is no evidence of an increase in fine material resulting from the disposal activities.
9.1.3. Discussion
The particle size distribution data shown in Figure 9.1 and Figure 9.2 shows that at the majority of the
sampling stations the bed material predominantly comprises sands having a particle diameter of between
62.5µm and 2.0mm. The next most commonly occurring size fraction is gravels (>2.0mm). Fine material
(<62.5µm), which comprises over 80% of the composition of the material being placed (see Section 3), is the
least commonly occurring over the surveyed area and is not present at all in many of the samples analysed.
In summary it can be stated that there is no clear correlation between changes in the composition of the bed
material and the disposal of dredged material having taken place at disposal site TH027 and that there is no
evidence of an increase in fine material resulting from the disposal activities.

Harwich Haven Disposal Site TH027
Monitoring Report
DLM7823-RT001-R02-00 45
9.2. Benthic community data
The Thomson Unicomarine benthic community data reports for each of the 2016 monitoring surveys are
provided in Appendix C. Whilst these data reports do not describe the survey methodology Thomson
Unicomarine has confirmed that this followed that adopted during the 2012 characterisation survey
(Unicomarine, 2012) and that the subsequent laboratory processing of samples followed standard Thomson
Unicomarine procedures.
9.2.1. August 2012 characterisation survey
During the August 2012 characterisation survey (Unicomarine, 2012) 59 stations were successfully sampled
using a 0.1 m2 mini-Hamon grab as shown in Figure 9.1. The stations were arranged in a rectangular pattern
running NNE – SSW in line with the prevailing currents in the area. The highest concentrations of stations
were positioned within close proximity to the proposed disposal site, with the remainder arranged as
reference stations.
The 59 survey stations recorded a total of 4489 individuals from 196 species, see Table 9.2. The total
number of individuals does not include those identified as “present”, i.e. species not enumerated due to their
colonial nature, e.g. bryozoans. The variation in diversity did not appear to be highly dependent on sediment
composition. Fauna found at the survey area were similar to those found during monitoring surveys at nearby
disposal grounds (Unicomarine, 2012).
Table 9.2: August 2012 characterisation survey – numbers of species and individuals
Phylum
(sub-phylum or class)
Number of
species
% Composition Number of individuals % Composition
Cnidaria (hydrozoan) 13 6.6
129 (excludes “present”
species)
3
Annelida (polychaeta) 75 38.3 1629 36
Arthropoda (crustacea) 40 20.4 214 5
Mollusca (bivalvia) 30 15.3 2224 50
Bryozoans 16 8.2 Present (not enumerated) -
Echinodermata 10 5.1 179 4
Other 12 6.1
114 (excludes “present”
species)
3
Total 196 100 4489 100
Source: Unicomarine, 2012
Notes: Other includes species not included in the above categories including nemertea, nematoda, turbellaria,
Sipuncula, ciliophora and chelicerata.
The benthic community were typical of mixed coarse sandy sediments, predominantly comprised annelids
(38% of species), crustaceans (20% of species) and bivalve molluscs (15%). Various species of polychaete
worms were identified ranging from deposit and filter feeders to highly mobile predators, over 30 species of
crustaceans (amphipods, shrimp and crabs), a similar number of molluscs and several sea spider
(pycnogonid) species. Bivalve species abundance was dominated by the common mussel, Mytilus edulis,
and species common in muddy sands and gravels – Abra alba, Kurtiella bidentata and Nucula spp
(HR Wallingford, 2014).
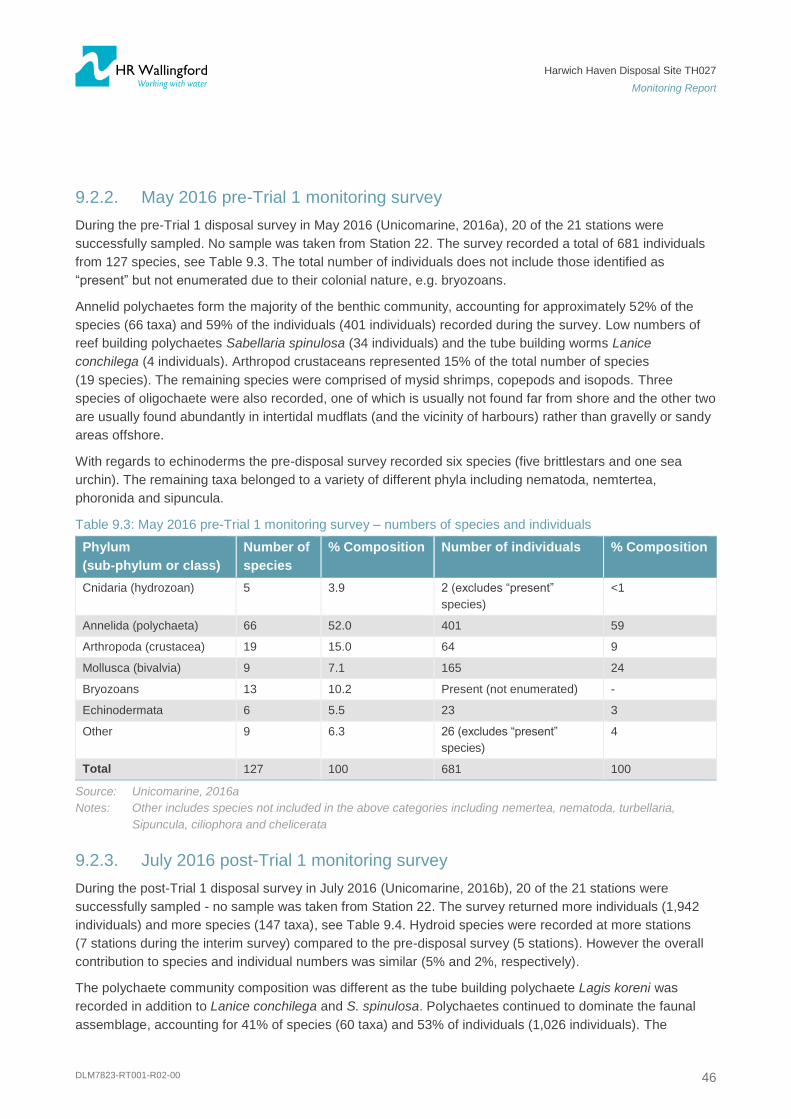
Harwich Haven Disposal Site TH027
Monitoring Report
DLM7823-RT001-R02-00 46
9.2.2. May 2016 pre-Trial 1 monitoring survey
During the pre-Trial 1 disposal survey in May 2016 (Unicomarine, 2016a), 20 of the 21 stations were
successfully sampled. No sample was taken from Station 22. The survey recorded a total of 681 individuals
from 127 species, see Table 9.3. The total number of individuals does not include those identified as
“present” but not enumerated due to their colonial nature, e.g. bryozoans.
Annelid polychaetes form the majority of the benthic community, accounting for approximately 52% of the
species (66 taxa) and 59% of the individuals (401 individuals) recorded during the survey. Low numbers of
reef building polychaetes Sabellaria spinulosa (34 individuals) and the tube building worms Lanice
conchilega (4 individuals). Arthropod crustaceans represented 15% of the total number of species
(19 species). The remaining species were comprised of mysid shrimps, copepods and isopods. Three
species of oligochaete were also recorded, one of which is usually not found far from shore and the other two
are usually found abundantly in intertidal mudflats (and the vicinity of harbours) rather than gravelly or sandy
areas offshore.
With regards to echinoderms the pre-disposal survey recorded six species (five brittlestars and one sea
urchin). The remaining taxa belonged to a variety of different phyla including nematoda, nemtertea,
phoronida and sipuncula.
Table 9.3: May 2016 pre-Trial 1 monitoring survey – numbers of species and individuals
Phylum
(sub-phylum or class)
Number of
species
% Composition Number of individuals % Composition
Cnidaria (hydrozoan) 5 3.9 2 (excludes “present”
species)
<1
Annelida (polychaeta) 66 52.0 401 59
Arthropoda (crustacea) 19 15.0 64 9
Mollusca (bivalvia) 9 7.1 165 24
Bryozoans 13 10.2 Present (not enumerated) -
Echinodermata 6 5.5 23 3
Other 9 6.3 26 (excludes “present”
species)
4
Total 127 100 681 100
Source: Unicomarine, 2016a
Notes: Other includes species not included in the above categories including nemertea, nematoda, turbellaria,
Sipuncula, ciliophora and chelicerata
9.2.3. July 2016 post-Trial 1 monitoring survey
During the post-Trial 1 disposal survey in July 2016 (Unicomarine, 2016b), 20 of the 21 stations were
successfully sampled - no sample was taken from Station 22. The survey returned more individuals (1,942
individuals) and more species (147 taxa), see Table 9.4. Hydroid species were recorded at more stations
(7 stations during the interim survey) compared to the pre-disposal survey (5 stations). However the overall
contribution to species and individual numbers was similar (5% and 2%, respectively).
The polychaete community composition was different as the tube building polychaete Lagis koreni was
recorded in addition to Lanice conchilega and S. spinulosa. Polychaetes continued to dominate the faunal
assemblage, accounting for 41% of species (60 taxa) and 53% of individuals (1,026 individuals). The
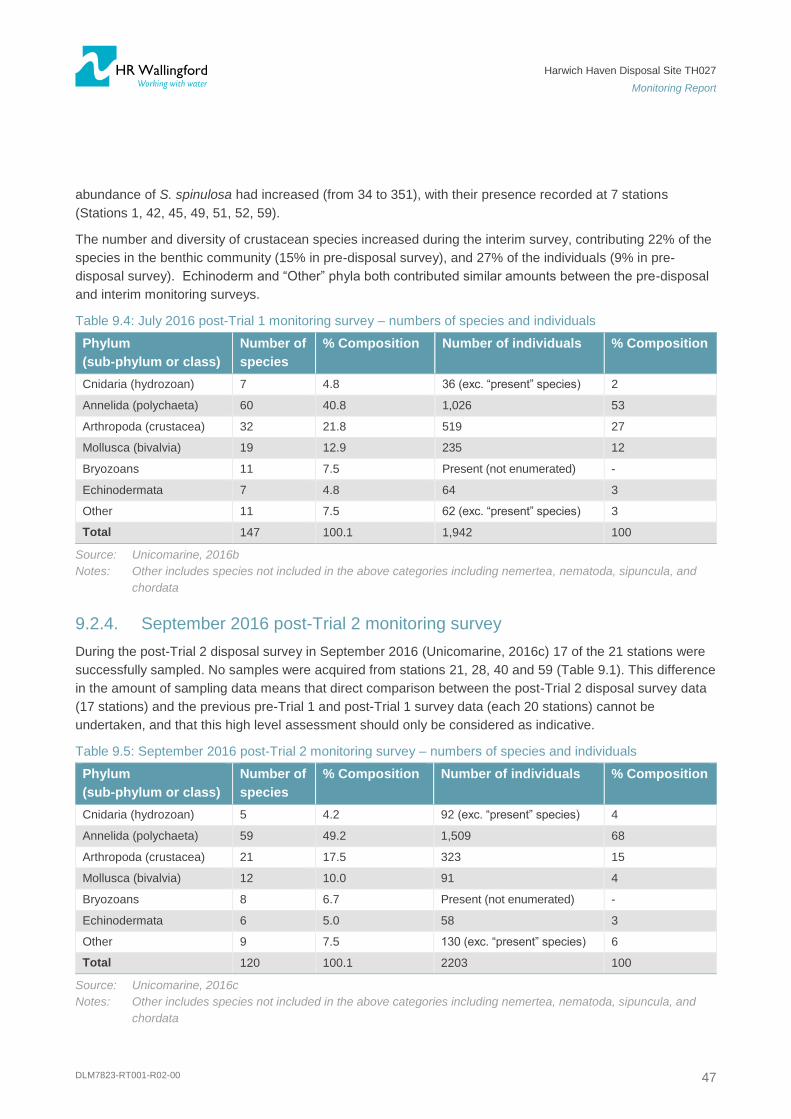
Harwich Haven Disposal Site TH027
Monitoring Report
DLM7823-RT001-R02-00 47
abundance of S. spinulosa had increased (from 34 to 351), with their presence recorded at 7 stations
(Stations 1, 42, 45, 49, 51, 52, 59).
The number and diversity of crustacean species increased during the interim survey, contributing 22% of the
species in the benthic community (15% in pre-disposal survey), and 27% of the individuals (9% in pre-
disposal survey). Echinoderm and “Other” phyla both contributed similar amounts between the pre-disposal
and interim monitoring surveys.
Table 9.4: July 2016 post-Trial 1 monitoring survey – numbers of species and individuals
Phylum
(sub-phylum or class)
Number of
species
% Composition Number of individuals % Composition
Cnidaria (hydrozoan) 7 4.8 36 (exc. “present” species) 2
Annelida (polychaeta) 60 40.8 1,026 53
Arthropoda (crustacea) 32 21.8 519 27
Mollusca (bivalvia) 19 12.9 235 12
Bryozoans 11 7.5 Present (not enumerated) -
Echinodermata 7 4.8 64 3
Other 11 7.5 62 (exc. “present” species) 3
Total 147 100.1 1,942 100
Source: Unicomarine, 2016b
Notes: Other includes species not included in the above categories including nemertea, nematoda, sipuncula, and
chordata
9.2.4. September 2016 post-Trial 2 monitoring survey
During the post-Trial 2 disposal survey in September 2016 (Unicomarine, 2016c) 17 of the 21 stations were
successfully sampled. No samples were acquired from stations 21, 28, 40 and 59 (Table 9.1). This difference
in the amount of sampling data means that direct comparison between the post-Trial 2 disposal survey data
(17 stations) and the previous pre-Trial 1 and post-Trial 1 survey data (each 20 stations) cannot be
undertaken, and that this high level assessment should only be considered as indicative.
Table 9.5: September 2016 post-Trial 2 monitoring survey – numbers of species and individuals
Phylum
(sub-phylum or class)
Number of
species
% Composition Number of individuals % Composition
Cnidaria (hydrozoan) 5 4.2 92 (exc. “present” species) 4
Annelida (polychaeta) 59 49.2 1,509 68
Arthropoda (crustacea) 21 17.5 323 15
Mollusca (bivalvia) 12 10.0 91 4
Bryozoans 8 6.7 Present (not enumerated) -
Echinodermata 6 5.0 58 3
Other 9 7.5 130 (exc. “present” species) 6
Total 120 100.1 2203 100
Source: Unicomarine, 2016c
Notes: Other includes species not included in the above categories including nemertea, nematoda, sipuncula, and
chordata

Harwich Haven Disposal Site TH027
Monitoring Report
DLM7823-RT001-R02-00 48
The total number of species observed at the disposal site during the post-Trial 2 disposal survey (120 taxa)
are similar to the pre-Trial 1 survey (127 taxa), see Table 9.5. The total number of individuals has increased
to 2,203 compared to the post-Trial 1 survey result of 1,942 organisms. It is expected that if the full
complement of stations was sampled, that the number of species and individuals would be higher.
The benthic community continues to be dominated by the annelid polychaetes, both in terms of species
number (49% of total); and number of individuals accounting for 68% of all organisms recorded during the
survey. The abundance of S spinulosa increased to 1,124 individuals, although this species was only
observed at five stations (Stations 1, 37, 39, 42 and 45). The number of L. conchilega and L. koreni
individuals were observed to decrease.
The benthic community has a moderate crustacean fraction (17% of community species,) which account for
approximately 15% of the individuals observed during the survey. This included seven different species of
crab (and hermit crab), indicating that the number of scavenging species has increased from the pre-Trial 1
and post-Trial 1 monitoring survey levels. The identification of Hyas areneus individuals is unusual for this
area, as they are more typically found in the North Atlantic and on the western coast of Scotland (NBN
Gateway, 2013), although they have been recorded in the North Sea, further assessment is advisable.
The bryozoan community is becoming less diverse, with only eight species recorded during the post-Trial 2
disposal monitoring survey and the brackish water species identified from the pre-Trial survey not being
present.
9.2.5. Discussion
During the August 2012 characterisation study, a total of 4,489 individuals (excluding non-enumerated
species) belonging to196 different species were recorded. The average number of taxa per station was
17 species, and approximately 76 individuals. Fauna found in the survey area had a high degree of variability
between stations. The variation in diversity did not appear to be highly dependent on sediment composition.
Figure 9.3 shows a general decrease in biodiversity following the characterisation survey, however this is over
a two year period and cannot be attributed to the disposal operations. Following the commencement of
disposal operations the number of species remains approximately the same, with a marginal increase observed
during the inter-trial survey. In terms of individual taxa, polychaete and bryozoan species numbers decrease
following the disposal operations. However hydrozoans, crustaceans, bivalves and other phyla show an
increase in species numbers following the Trial 1 disposal event. This suggests that there is shift in ecosystem
composition occurring at the site. The same trend was also present between the August 2012 characterisation
survey and the May 2016 pre-Trial 1 survey which suggests that it is not related to disposal operations.

Harwich Haven Disposal Site TH027
Monitoring Report
DLM7823-RT001-R02-00 49
Figure 9.3: Comparison of the number of species (biodiversity) between the characterisation survey and the pre-Trial 1, post-Trial 1 and post-Trial 2 monitoring surveys
Source: Unicomarine, 2012, Unicomarine, 2016a,b,c
The May 2016 pre-Trial 1 monitoring survey tended to record lower numbers of individuals than the August
2012 characterisation survey (Figure 9.4). However, if the August 2012 survey is excluded from the analysis,
the abundance of individuals increases steadily throughout the disposal trials (from May to September,
2016). At a taxa level; hydrozoans, polychaetes and other taxa abundance increased following the pre-Trial
1 survey, whereas crustaceans, bivalves and Echinodermata showed a decrease in population numbers.
The increase in crab species (particularly juveniles) observed in the September 2016 post-Trial 2 monitoring
survey indicates that there is an increased opportunity for scavenger species.
This suggests that certain species of these phyla are adapting to the influences of the disposal events, and
taking advantage of change in nutrient levels, prey and environmental conditions. This trend, which occurred
since the start of the disposal operations, supports the premise that the changes in community structure and
abundance are the result of natural variation.
0
50
100
150
200
250
August, 2012, survey May, 2016 survey July, 2016 survey Sept., 2016 survey
No
. S
pe
cie
s
Total no. of species

Harwich Haven Disposal Site TH027
Monitoring Report
DLM7823-RT001-R02-00 50
Figure 9.4: Comparison of the number of individuals (abundance) between the characterisation survey and the pre-Trial 1, post-Trial 1 and post-Trial 2 monitoring surveys
Source: Unicomarine, 2012, Unicomarine, 2016a,b,c
Although there is no evidence of an increase in fine material from the disposal activities (Section 9.1.2) there
was a temporary increase in the number of species tolerant of variable/brackish salinities, characteristic of
the estuarine sediments dredged from Harwich Harbour, that have been transported in the dredged sediment
to the disposal site. However there is no evidence of these species establishing a permanent presence at the
site as no individuals were found during the September 2016 post-Trial 2 survey.
S. spinulosa was found at multiple stations in August 2012 (27 stations) and 2016 (3, 7 and 5 stations in the
pre-Trial 1, post-Trial 1 and post-Trial 2 surveys respectively), and can form established reef structures
(biogenic reefs) which provide species, which would not otherwise be found in the area, with a suitable
habitat (JNCC, 2008). Biogenic reefs are listed as an Annex I habitat under the EC Habitats directive, and
are considered an environmentally protected area.
S.spinulosa abundance increased steadily following the Trial 1 disposal event to levels that exceeded the
2012 characterisation survey. S.spinulosa was routinely observed at a number of stations during the
monitoring surveys, although it was not as widespread across the monitoring stations as it was in the 2012
characterisation survey. The species was initially recorded in lower numbers during the pre-Trial 1 survey
compared to the characterisation survey of 2012. However subsequent monitoring surveys, post-Trial 1 and
2, recorded increasing numbers of individuals (Figure 9.5), at approximately the same number of stations.
The disposal operations did not appear to have a significantly negative effect on the communities observed
during the monitoring surveys.
0
500
1000
1500
2000
2500
3000
3500
4000
4500
5000
August, 2012, survey May, 2016 survey July, 2016 survey Sept., 2016 survey
No
. S
pe
cie
s
Total no. individuals

Harwich Haven Disposal Site TH027
Monitoring Report
DLM7823-RT001-R02-00 51
Figure 9.5: Abundance of Sabellaria spinulosa at the disposal site
Source: Unicomarine, 2012, Unicomarine, 2016a,b,c
It is unclear whether the changes to the faunal assemblage in terms of species and abundance are
temporary due to natural variations in the local environment or whether they are related to the trial disposal
activities. Whilst harbour species are temporarily being found within the survey area there are no clear trends
in the faunal assemblage in terms of species and abundance that can be directly related to the disposal
activities that have taken place at disposal site TH027. The changes seen are typical of natural variation that
can occur.
Harwich Haven Disposal Site TH027
Monitoring Report
DLM7823-RT001-R02-00 52
10. Conclusions
Activities assessed within this report included:
Long-term measurements of suspended solids concentrations at 0.5 m above the seabed at three
locations before, during and after the two disposal trials and the comparison of that data with the results
of previous plume dispersion modelling studies;
The analysis of multibeam bathymetric surveys undertaken before and after the two disposal trials; and
A high level assessment of particle size and benthic fauna surveys undertaken before and after the two
disposal trials.
Suspended solids concentrations
There was no evidence of any large-scale increase in measured concentrations as a result of the disposal
activity, nor was there evidence of an increase in the background (baseline) concentration during the course
of the disposals.
The magnitude of the increases in concentration above background predicted by the numerical model were
not seen in the measured data.
Seabed levels
Multi beam echo sounder (MBES) surveys of disposal site TH027 were carried out before, between and after
the two trial disposals. Analysis of the bathymetry data has shown very little evidence of seabed level
changes in excess of 0.2 m (i.e. beyond the quoted vertical accuracy of the MBES instrument) that can be
attributed directly to the disposal activities indicating that much of the placed material had likely dispersed
outside of the boundary of the disposal site by this time.
Particle size and benthic fauna
There does not appear to be any clear correlation between the composition of the bed material and the
disposal of dredged material having taken place at disposal site TH027 and that there is no evidence of an
increase in fine material resulting from the disposal activities. Each of the three sampling campaigns showed
a wide variability in the composition of the bed material both temporally and spatially. Notably, at the time of
the sampling campaigns, there was no general increase or reduction in the proportion of any particular size
fraction (fines, sands and gravels) that could be directly attributed to the disposal activities indicating that
much of the placed material had likely dispersed outside of the boundary of the disposal site by this time.
A high level assessment of the benthic monitoring surveys shows that there has been an observed change in
the species assemblage at the site, with an increase in opportunistic species. However, there has not been a
change from the previously observed marine assemblage found on muddy sands and gravels. Whilst
harbour species are temporarily being found within the survey area, the available evidence suggests that this
is the result of natural variation in community structure and is not the direct result of disposal activities that
have taken place at disposal site TH027.

Harwich Haven Disposal Site TH027
Monitoring Report
DLM7823-RT001-R02-00 53
11. References
HHA (2012) Maintenance Dredging Protocol Baseline Document: Stour and Orwell Estuaries,
Harwich/Felixstowe Harbour and Deep Water Channel. Version 6.0.
HR Wallingford, 1998. Properties of Dredged material. Measurement of sediment properties of dredged
material from Harwich Harbour. HR Wallingford Report TR 46, June 1998.
HR Wallingford, 2014. Characterisation of a new offshore disposal site. Characterisation report.
HR Wallingford Report DLM7157-RT001-R06-00, January 2014.
National Biological Network (NBN) Gateway. 2013. Distribution of Hyas areneus. Available online at
https://data.nbn.org.uk/Taxa/NBNSYS0000175822 [accessed 28/11/2016].
Titan Environmental Surveys, 2016. Harwich Turbidity Investigation, Survey Data Report, May 2016 –
September 2016. Titan Environmental Surveys Report CS0491_HTI_DR_V1, November 2016.
Unicomarine, 2012. Phillips, R. J., Finbow, L. A. & Worsfold, T.M., 2012. Characterisation of the proposed
alternative to the Gabbard disposal site at the Sunk, off Harwich, 2012. Thomson Unicomarine Report
HRWGABD12 to HR Wallingford Ltd, October 2012.
Unicomarine, 2016a. HHAESC16 - Harwich East Ship Channel May 2016, Benthic invertebrate analysis.
Unicomarine, 2016b. Harwich East Ship Channel - Survey July 2016, Benthic invertebrate analysis.
Unicomarine, 2016c. Harwich East Ship Channel - Survey September 2016, Benthic invertebrate analysis.

Harwich Haven Disposal Site TH027
Monitoring Report
DLM7823-RT001-R02-00
Appendices
A. Titan Environmental Surveys seabed frame deployment report

Client:
Harwich Haven Authority
Project:
Harwich Turbidity Investigation
Description:
Survey Data Report
Survey Date:
May 2016 – September 2016
Project Number:
CS0491
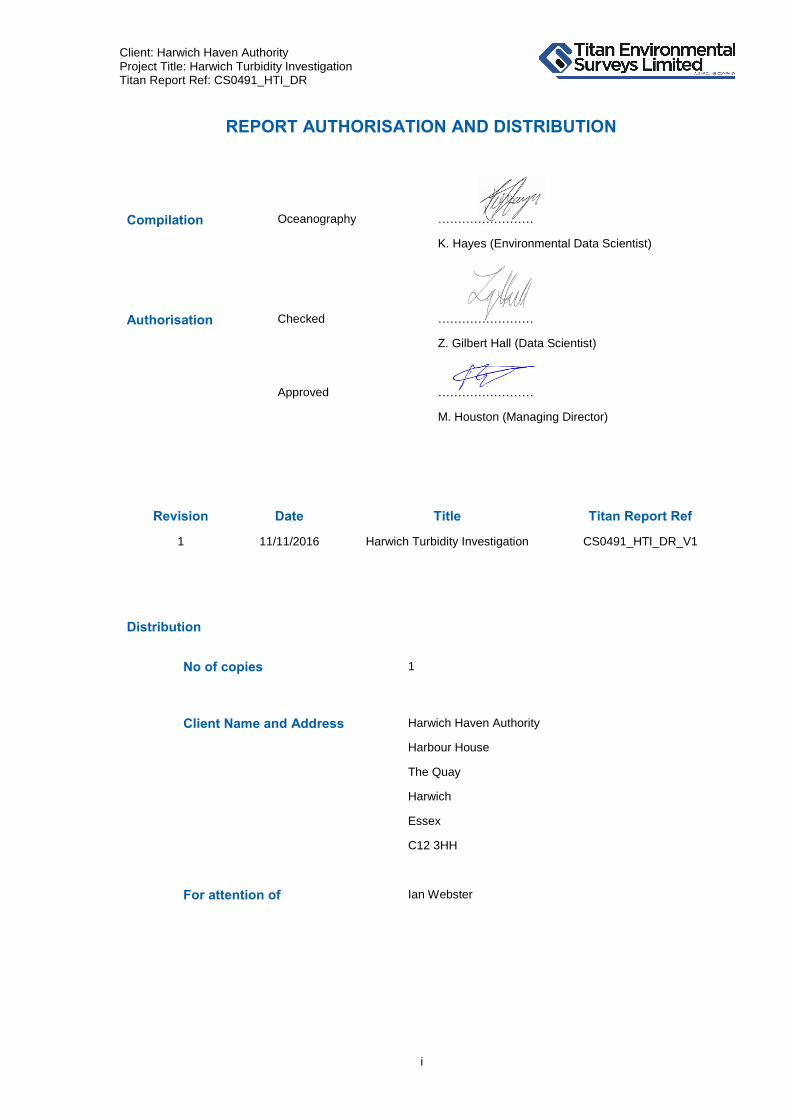
Client: Harwich Haven Authority Project Title: Harwich Turbidity Investigation Titan Report Ref: CS0491_HTI_DR
i
REPORT AUTHORISATION AND DISTRIBUTION
Compilation Oceanography
……………………
K. Hayes (Environmental Data Scientist)
Authorisation Checked
……………………
Z. Gilbert Hall (Data Scientist)
Approved
……………………
M. Houston (Managing Director)
Revision Date Title Titan Report Ref
1 11/11/2016 Harwich Turbidity Investigation CS0491_HTI_DR_V1
Distribution
No of copies 1
Client Name and Address Harwich Haven Authority
Harbour House
The Quay
Harwich
Essex
C12 3HH
For attention of Ian Webster

Client: Harwich Haven Authority Project Title: Harwich Turbidity Investigation Titan Report Ref: CS0491_HTI_DR
ii
SERVICE WARRANTY
USE OF THIS REPORT
This report has been prepared with due care and diligence and with the skill reasonably
expected of a reputable contractor experienced in the types of work, carried out under the
contract. As such the findings in this report are based on an interpretation of data that is a
matter of opinion on which professionals may differ and unless clearly stated is not a
recommendation for any course of action.
Titan Environmental Surveys Ltd has prepared this report for the clients identified on the
front cover in fulfilment of its contractual obligations under the contract and the only
liabilities Titan Environmental Surveys Ltd accepts are those contained therein.
Please be aware that further distribution of this report, in whole or part, or the use of the
data for a purpose not expressly stated within the contractual work scope is at the client’s
sole risk. Titan Environmental Surveys Ltd recommends that this disclaimer be included
in any such distribution.
TITAN ENVIRONMENTAL SURVEYS LIMITED
Orion House, Parc Crescent, Waterton Ind. Est. Bridgend, CF31 3BQ, Wales, UK
Telephone +44 (0) 1656 673673 Fax +44 (0) 1656 673674
www.titansurveys.com

Client: Harwich Haven Authority Project Title: Harwich Turbidity Investigation Titan Report Ref: CS0491_HTI_DR
iii
TABLE OF CONTENTS
REPORT AUTHORISATION AND DISTRIBUTION ................................................................................. I
SERVICE WARRANTY ........................................................................................................................... II
USE OF THIS REPORT .......................................................................................................................... II
TABLE OF CONTENTS.......................................................................................................................... III
APPENDICES ......................................................................................................................................... IV
LIST OF FIGURES .................................................................................................................................. V
LIST OF TABLES .................................................................................................................................... V
LIST OF PHOTOGRAPHS ..................................................................................................................... VI
1. INTRODUCTION ...................................................................................................................... 1
1.1 General ........................................................................................................................ 1 1.2 Reporting ..................................................................................................................... 2
2. SURVEY OPERATIONS .......................................................................................................... 3
2.1 Personnel .................................................................................................................... 3 2.2 Vessel .......................................................................................................................... 3 2.3 Health, Safety and Environment .................................................................................. 3 2.4 Summary of Operations .............................................................................................. 4
3. MOORING DESIGN AND INSTRUMENTATION .................................................................... 5
3.1 Mooring Design ........................................................................................................... 5
3.2 Mooring Instrumentation .............................................................................................. 7
4. REFERENCE CONTROL ...................................................................................................... 11
4.1 Co-ordinate System ................................................................................................... 11
4.2 Vertical Control .......................................................................................................... 11
4.3 Reference Tidal Port ................................................................................................. 11 4.4 Calibration and Measurement Precision ................................................................... 12
5. DATA PROCESSING ............................................................................................................. 15
5.1 Turbidity/Suspended Sediment Concentration .......................................................... 15 5.2 Particle Size Distribution ........................................................................................... 16
6. RESULTS ............................................................................................................................... 17
6.1 Summary ................................................................................................................... 17 6.2 Site BO1 .................................................................................................................... 21
6.3 Site BO2 .................................................................................................................... 25 6.4 Site BO3 .................................................................................................................... 29
6.5 Site B4 ....................................................................................................................... 33 6.6 Site B5 ....................................................................................................................... 36

Client: Harwich Haven Authority Project Title: Harwich Turbidity Investigation Titan Report Ref: CS0491_HTI_DR
iv
APPENDICES
APPENDIX A GLOSSARY FOR EXPORTED DATASETS
APPENDIX B INSTRUMENT SPECIFICATIONS
B1 - JFE INIFNITY TURBI LOGGER
B2 – SONARDYNE TZ/OBC TRANSPONDER
APPENDIX C CALIBRATION REPORTS
C1 – TURBIDITY
C2 – SUSPENDED SEDIMENT CONCENTRATION
APPENDIX D DATA RESULTS
D1 – SUSPENDED SEDIMENT CONCENTRATION
D2 – PARTICLE SIZE DISTRIBUTION ANALYSIS
Client: Harwich Haven Authority Project Title: Harwich Turbidity Investigation Titan Report Ref: CS0491_HTI_DR
v
LIST OF FIGURES
Figure 1.1 Locations of the proposed mooring sites ............................................................................ 1
Figure 1.2 Summary of scope of work.................................................................................................. 2
Figure 3.1 “L-shaped” mooring configuration with a small instrument frame and surface marker
(Dahn flag)........................................................................................................................... 6
Figure 6.1 Comparison of SSC (mg/l) concentrations and water depth (m) observed at Sites BO1,
BO2 and BO3 between 23/07/2016-05/08/2016 ............................................................... 19
Figure 6.2 SSC (mg/l) recorded at Sites BO1, BO2 and BO3 during the first spoil disposal period .. 20
Figure 6.3 SSC (mg/l) recorded at Sites BO1, BO2 and BO3 during the second spoil disposal period
.......................................................................................................................................... 20
Figure 6.4 Deployed positions of Site BO1 relative to its proposed position ..................................... 21
Figure 6.5 Deployed positions of Site BO2 relative to its proposed position ..................................... 25
Figure 6.6 Deployed positions of Site BO3 relative to its proposed position ..................................... 29
Figure 6.7 Deployed positions of Site B4 relative to its proposed position ........................................ 33
Figure 6.8 Deployed positions of Site B5 relative to its proposed position ........................................ 36
LIST OF TABLES
Table 1.1 Proposed locations and monitoring instrumentation to be deployed at the four
oceanographic mooring sites .............................................................................................. 2
Table 2.1 Key Titan Personnel ............................................................................................................ 3
Table 2.2 Summary of the Principal Mooring Activities ....................................................................... 4
Table 3.1 Summary of the monitoring instrumentation utilised at each monitoring site ..................... 7
Table 4.1 Co-ordinate System .......................................................................................................... 11
Table 4.2 Port of Harwich calculated mean tide ranges ................................................................... 11
Table 4.3 JFE units used for the different sediment slurry blends .................................................... 13
Table 6.1 Spoil Ground Disposal Schedule ...................................................................................... 18
Table 6.2 Deployed positions of Site BO1 relative to proposed position .......................................... 21
Table 6.3 Data return from instrumentation deployed at Site BO1 ................................................... 24
Table 6.4 Deployed positions of Site BO2 relative to proposed position .......................................... 25
Table 6.5 Data return from instrumentation deployed at Site BO2 ................................................... 28
Table 6.6 Deployed positions of Site BO3 relative to proposed position .......................................... 29
Table 6.7 Data return from instrumentation deployed at Site BO3 ................................................... 32
Table 6.8 Deployed positions of Site B4 relative to proposed position ............................................. 33
Table 6.9 Deployed positions of Site B5 relative to proposed position ............................................. 36

Client: Harwich Haven Authority Project Title: Harwich Turbidity Investigation Titan Report Ref: CS0491_HTI_DR
vi
LIST OF PHOTOGRAPHS
Photo 2.1 Haven Hornbill (©MarineTraffic) ......................................................................................... 3
Photo 3.1 Instrument seabed frame containing the JFE Turbi, Booner tubes and Sonardyne
transponder ......................................................................................................................... 5
Photo 3.2 View of the sensor windows and wiper on the JFE Infinity-Turbi logger ............................ 8
Photo 3.3 Suspended Sediment Traps/Booner Tubes (©Sussex.ac.uk) ............................................ 9
Photo 3.4 Sonardyne Transponder positioned on bed frame (circled) .............................................. 10
Photo 4.1 In-house JFE turbidity calibration using Formazin ............................................................ 12
Photo 4.2 1l bottle samples taken from the bath at the end of each calibration test: (1) Fully mixed
(2) after 24 hours’ settlement period ................................................................................. 14
Photo 6.1 The sensors located on the JFE logger at Site BO1 after the first service interval and final
recovery............................................................................................................................. 22
Photo 6.2 The Booner Tube samples retrieved from Site BO1 after the first deployment phase ..... 22
Photo 6.3 The Booner Tube samples retrieved from Site BO1 after the second deployment phase 23
Photo 6.4 The sensors located on the JFE logger at Site BO2 after the first service interval and final
recovery............................................................................................................................. 26
Photo 6.5 The Booner Tube samples retrieved from Site BO2 after the first deployment phase ..... 26
Photo 6.6 The Booner Tube samples retrieved from Site BO2 after the second deployment phase 27
Photo 6.7 The sensors located on the JFE logger at Site BO3 after the first service interval and on
final recovery ..................................................................................................................... 30
Photo 6.8 The Booner Tube samples retrieved from Site BO3 after the first deployment phase ..... 30
Photo 6.9 The Booner Tube samples retrieved from Site BO3 after the second deployment phase 31
Photo 6.10 The Booner Tube samples retrieved from Site B4 after the first deployment phase ........ 34
Photo 6.11 The Booner Tube samples retrieved from Site B4 after the second deployment phase .. 35
Photo 6.12 The Booner Tube samples retrieved from Site B5 after the first deployment phase ........ 37
Photo 6.13 The Booner Tube samples retrieved from Site B5 after the second deployment phase .. 37
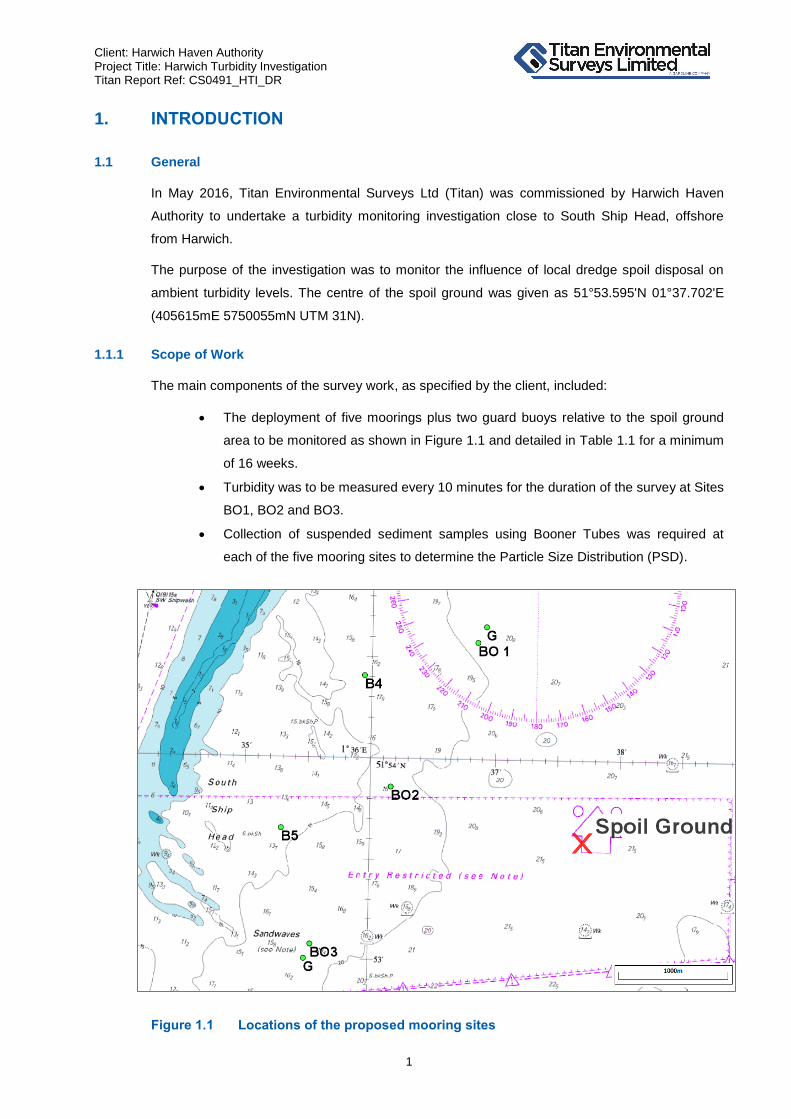
Client: Harwich Haven Authority Project Title: Harwich Turbidity Investigation Titan Report Ref: CS0491_HTI_DR
1
1. INTRODUCTION
1.1 General
In May 2016, Titan Environmental Surveys Ltd (Titan) was commissioned by Harwich Haven
Authority to undertake a turbidity monitoring investigation close to South Ship Head, offshore
from Harwich.
The purpose of the investigation was to monitor the influence of local dredge spoil disposal on
ambient turbidity levels. The centre of the spoil ground was given as 51°53.595'N 01°37.702'E
(405615mE 5750055mN UTM 31N).
1.1.1 Scope of Work
The main components of the survey work, as specified by the client, included:
The deployment of five moorings plus two guard buoys relative to the spoil ground
area to be monitored as shown in Figure 1.1 and detailed in Table 1.1 for a minimum
of 16 weeks.
Turbidity was to be measured every 10 minutes for the duration of the survey at Sites
BO1, BO2 and BO3.
Collection of suspended sediment samples using Booner Tubes was required at
each of the five mooring sites to determine the Particle Size Distribution (PSD).
Figure 1.1 Locations of the proposed mooring sites

Client: Harwich Haven Authority Project Title: Harwich Turbidity Investigation Titan Report Ref: CS0491_HTI_DR
2
Table 1.1 Proposed locations and monitoring instrumentation to be deployed at the
four oceanographic mooring sites
Site Description Latitude Longitude Easting Northing
(WGS84) (UTM31N)
BO1 OBS1+Booner 51°54.578’N 001°36.841’E 404662 5751896
BO2 OBS2+Booner 51°53.859’N 001°36.160’E 403856 5750578
BO3 OBS3+Booner 51°53.074’N 001°35.533’E 403109 5749137
B4 Booner4 51°54.409’N 001°35.937’E 403620 5751601
B5 Booner5 51°53.648’N 001°35.286’E 402847 5750205
G Northern Guard Buoy 51°54.657’N 001°36.907’E 404741 5752040
G Southern Guard Buoy 51°53.003’N 001°35.484’E 403050 5749005
Figure 1.2 Summary of scope of work
1.2 Reporting
This report summarises the events that took place during the initial deployment, servicing and
final recovery of the five monitoring sites. It also includes the results of the processed datasets
(graphical and statistical) for each of the deployed sites for the deployment phases between May
2016 and September 2016. The following parameters have been reported:
Turbidity and calculated Suspended Sediment Concentration (SSC) for Sites BO1,
BO2 and BO3.
Particle Size Distribution analysis for the collected Booner tube sediment samples
from Sites BO1, BO2, BO3, B4 and B5.
Information regarding the instrumentation specifications and methods adopted for the survey
operations, calibration/verification of the equipment, processing techniques and an assessment
of the data quality are also included in this report.

Client: Harwich Haven Authority Project Title: Harwich Turbidity Investigation Titan Report Ref: CS0491_HTI_DR
3
2. SURVEY OPERATIONS
2.1 Personnel
Table 2.1 lists the key Titan personnel who were involved with the project.
Table 2.1 Key Titan Personnel
Key Personnel
Technical Director Dan Owens
Project Manager Gwyn Nelson
Party Chief Dan Pitt, Dave Richards
Surveyors Robert Millar, Yolanda Barnes
2.2 Vessel
The Haven Hornbill was used for the deployment, servicing and final recovery of the mooring
equipment used for this project. Owned and managed by Harwich Port Authority, the 20m vessel
is equipped with a hydraulic crane, drum winch and large deck area suitable for performing
mooring activities safely and efficiently.
Photo 2.1 Haven Hornbill (©MarineTraffic)
2.3 Health, Safety and Environment
Prior to commencing work onboard the Haven Hornbill, a third-party vessel audit was completed
to ensure all necessary certification was in place including lifting gear requirements.
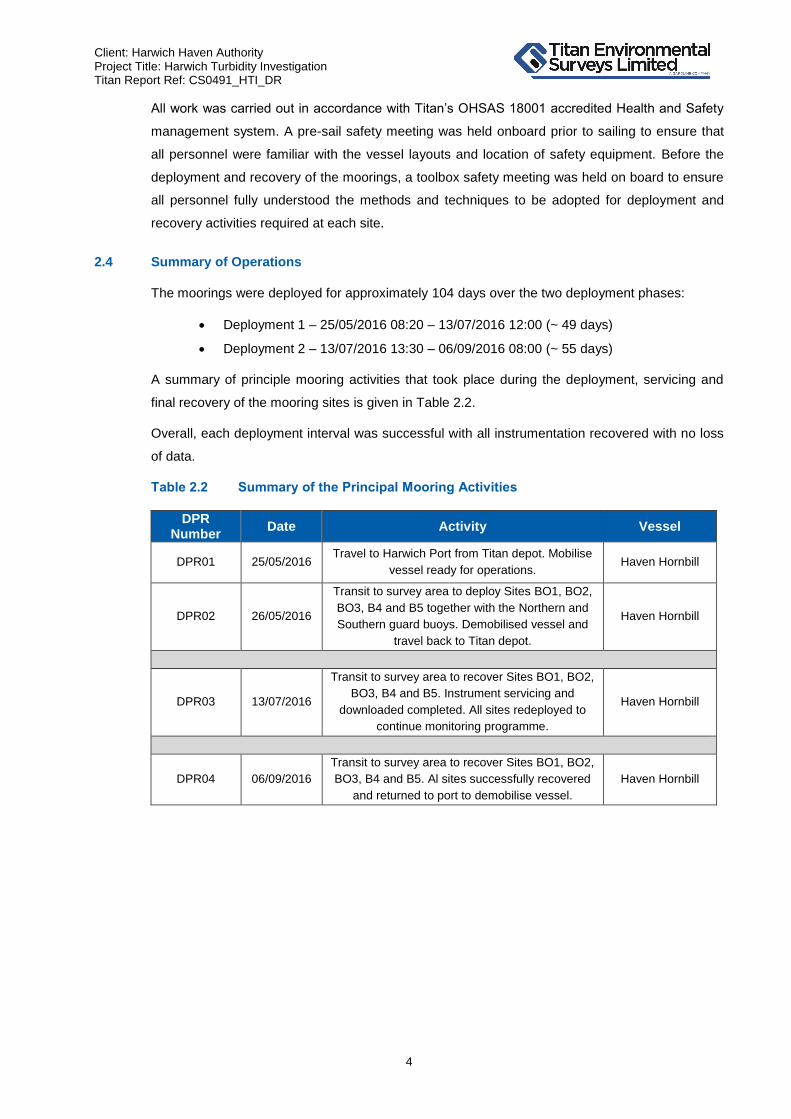
Client: Harwich Haven Authority Project Title: Harwich Turbidity Investigation Titan Report Ref: CS0491_HTI_DR
4
All work was carried out in accordance with Titan’s OHSAS 18001 accredited Health and Safety
management system. A pre-sail safety meeting was held onboard prior to sailing to ensure that
all personnel were familiar with the vessel layouts and location of safety equipment. Before the
deployment and recovery of the moorings, a toolbox safety meeting was held on board to ensure
all personnel fully understood the methods and techniques to be adopted for deployment and
recovery activities required at each site.
2.4 Summary of Operations
The moorings were deployed for approximately 104 days over the two deployment phases:
Deployment 1 – 25/05/2016 08:20 – 13/07/2016 12:00 (~ 49 days)
Deployment 2 – 13/07/2016 13:30 – 06/09/2016 08:00 (~ 55 days)
A summary of principle mooring activities that took place during the deployment, servicing and
final recovery of the mooring sites is given in Table 2.2.
Overall, each deployment interval was successful with all instrumentation recovered with no loss
of data.
Table 2.2 Summary of the Principal Mooring Activities
DPR Number
Date Activity Vessel
DPR01 25/05/2016 Travel to Harwich Port from Titan depot. Mobilise
vessel ready for operations. Haven Hornbill
DPR02 26/05/2016
Transit to survey area to deploy Sites BO1, BO2,
BO3, B4 and B5 together with the Northern and
Southern guard buoys. Demobilised vessel and
travel back to Titan depot.
Haven Hornbill
DPR03 13/07/2016
Transit to survey area to recover Sites BO1, BO2,
BO3, B4 and B5. Instrument servicing and
downloaded completed. All sites redeployed to
continue monitoring programme.
Haven Hornbill
DPR04 06/09/2016
Transit to survey area to recover Sites BO1, BO2,
BO3, B4 and B5. Al sites successfully recovered
and returned to port to demobilise vessel.
Haven Hornbill

Client: Harwich Haven Authority Project Title: Harwich Turbidity Investigation Titan Report Ref: CS0491_HTI_DR
5
3. MOORING DESIGN AND INSTRUMENTATION
3.1 Mooring Design
The design of the mooring configuration for the Harwich Turbidity Investigation Project took into
account a number of influencing elements:
Water depth
Current velocities
Seabed consistency
Monitoring requirements
Local activity/other sea users
The final design for each of the monitoring sites was based on a “L” shaped design, consisting of
these main components: an instrument seabed frame, a large chain clump weight and one
surface marker (Figure 3.1).
Each bed frame was connected to a clump weight via a rope groundline. This clump weight was
then connected to a Dahn flag using a rope riser to enable safe and swift recovery of the mooring
during service intervals from the surface.
A Sonardyne Acoustic Transponder was attached to each frame to aid recovery in the event of
the surface marker being lost or the mooring being moved by third party interference during the
deployment period from its original documented position.
Photo 3.1 Instrument seabed frame containing the JFE Turbi, Booner tubes and
Sonardyne transponder
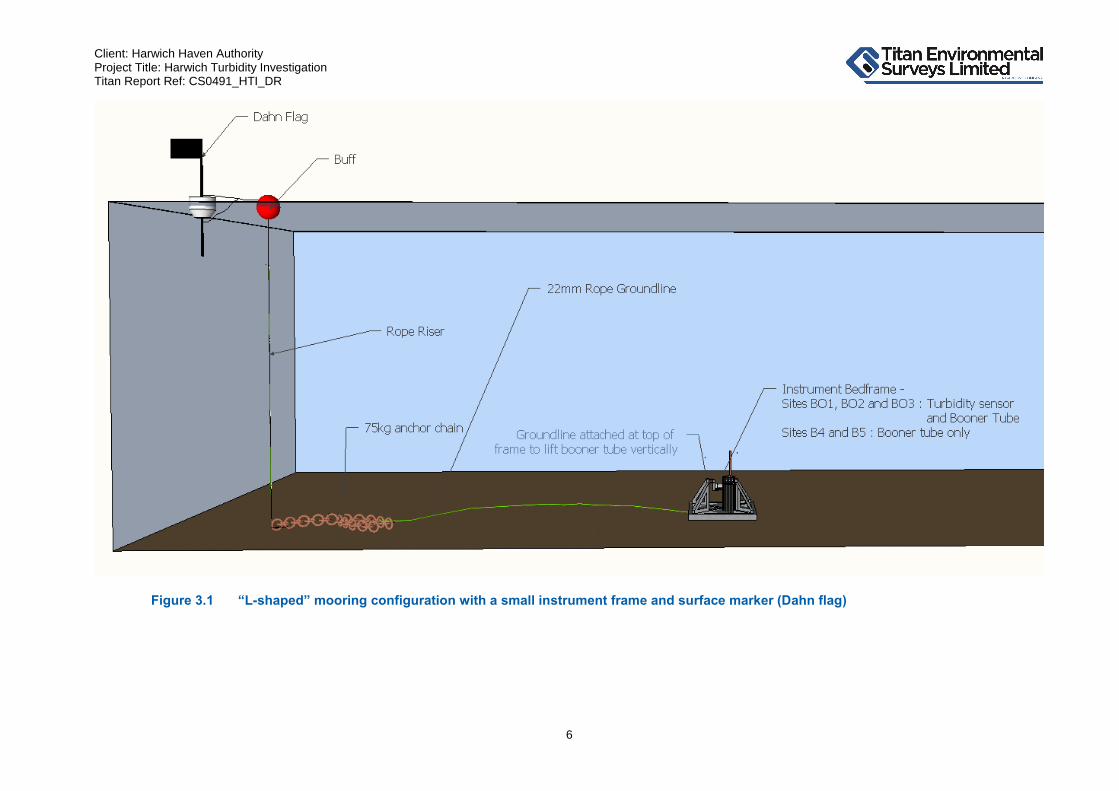
Client: Harwich Haven Authority Project Title: Harwich Turbidity Investigation Titan Report Ref: CS0491_HTI_DR
6
Figure 3.1 “L-shaped” mooring configuration with a small instrument frame and surface marker (Dahn flag)
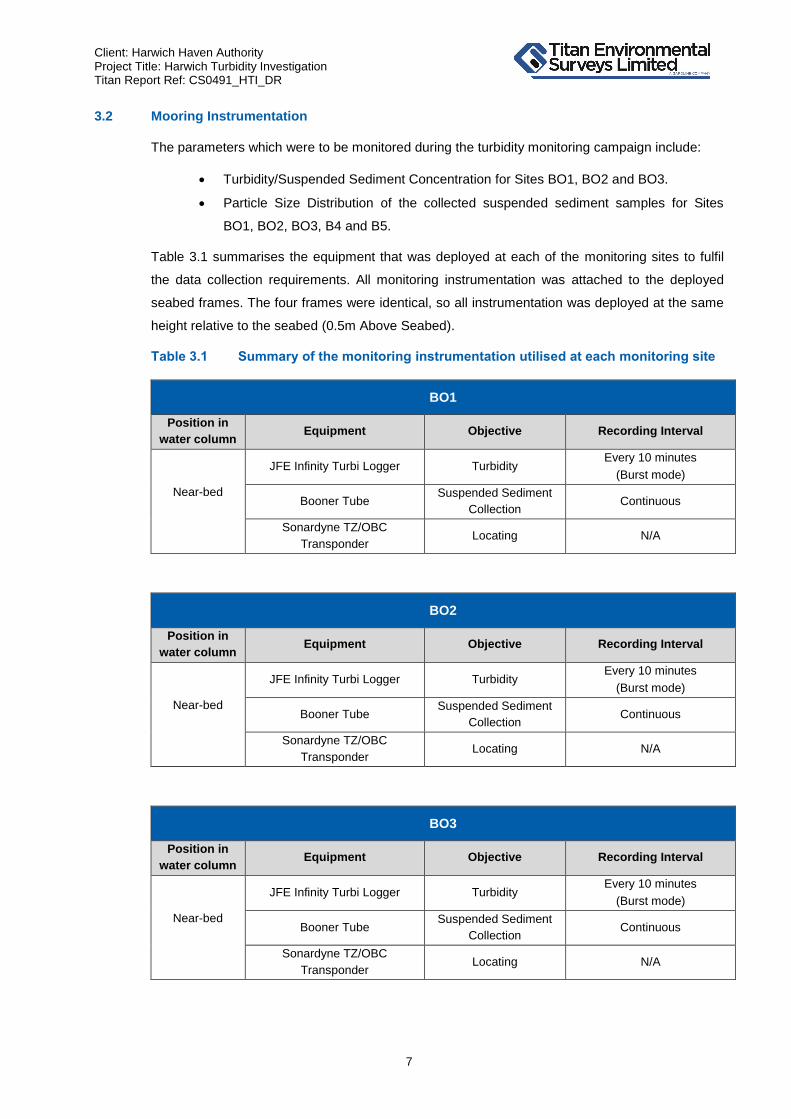
Client: Harwich Haven Authority Project Title: Harwich Turbidity Investigation Titan Report Ref: CS0491_HTI_DR
7
3.2 Mooring Instrumentation
The parameters which were to be monitored during the turbidity monitoring campaign include:
Turbidity/Suspended Sediment Concentration for Sites BO1, BO2 and BO3.
Particle Size Distribution of the collected suspended sediment samples for Sites
BO1, BO2, BO3, B4 and B5.
Table 3.1 summarises the equipment that was deployed at each of the monitoring sites to fulfil
the data collection requirements. All monitoring instrumentation was attached to the deployed
seabed frames. The four frames were identical, so all instrumentation was deployed at the same
height relative to the seabed (0.5m Above Seabed).
Table 3.1 Summary of the monitoring instrumentation utilised at each monitoring site
BO1
Position in
water column Equipment Objective Recording Interval
Near-bed
JFE Infinity Turbi Logger Turbidity Every 10 minutes
(Burst mode)
Booner Tube Suspended Sediment
Collection Continuous
Sonardyne TZ/OBC
Transponder Locating N/A
BO2
Position in
water column Equipment Objective Recording Interval
Near-bed
JFE Infinity Turbi Logger Turbidity Every 10 minutes
(Burst mode)
Booner Tube Suspended Sediment
Collection Continuous
Sonardyne TZ/OBC
Transponder Locating N/A
BO3
Position in
water column Equipment Objective Recording Interval
Near-bed
JFE Infinity Turbi Logger Turbidity Every 10 minutes
(Burst mode)
Booner Tube Suspended Sediment
Collection Continuous
Sonardyne TZ/OBC
Transponder Locating N/A

Client: Harwich Haven Authority Project Title: Harwich Turbidity Investigation Titan Report Ref: CS0491_HTI_DR
8
B4
Position in
water column Equipment Objective Recording Interval
Near-bed
Booner Tube Suspended Sediment
Collection Continuous
Sonardyne TZ/OBC
Transponder Locating N/A
B5
Position in
water column Equipment Objective Recording Interval
Near-bed
Booner Tube Suspended Sediment
Collection Continuous
Sonardyne TZ/OBC
Transponder Locating N/A
3.2.1 Turbidity
The JFE Infinity-Turbi loggers are autonomous data loggers designed for long-term turbidity
measurements by using their dual sensors capable of monitoring turbidity levels at low (0 to
1000FTU) and high (0 to 100,000 mg/l as Kaolin) concentrations. It is equipped with a
mechanical wiper to keep the optical window clean and free of biofouling and has secondary
sensors to provide records of ambient temperature and pressure.
Please refer to Appendix B for further information on this instrument.
Photo 3.2 View of the sensor windows and wiper on the JFE Infinity-Turbi logger
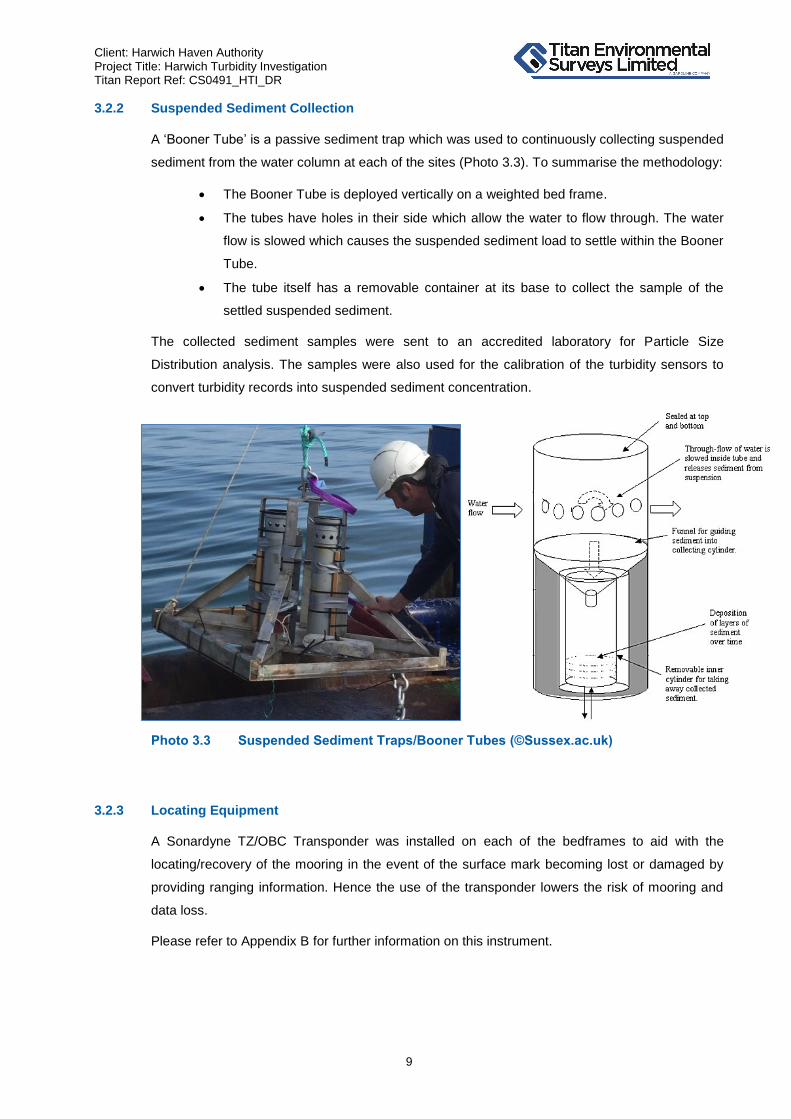
Client: Harwich Haven Authority Project Title: Harwich Turbidity Investigation Titan Report Ref: CS0491_HTI_DR
9
3.2.2 Suspended Sediment Collection
A ‘Booner Tube’ is a passive sediment trap which was used to continuously collecting suspended
sediment from the water column at each of the sites (Photo 3.3). To summarise the methodology:
The Booner Tube is deployed vertically on a weighted bed frame.
The tubes have holes in their side which allow the water to flow through. The water
flow is slowed which causes the suspended sediment load to settle within the Booner
Tube.
The tube itself has a removable container at its base to collect the sample of the
settled suspended sediment.
The collected sediment samples were sent to an accredited laboratory for Particle Size
Distribution analysis. The samples were also used for the calibration of the turbidity sensors to
convert turbidity records into suspended sediment concentration.
Photo 3.3 Suspended Sediment Traps/Booner Tubes (©Sussex.ac.uk)
3.2.3 Locating Equipment
A Sonardyne TZ/OBC Transponder was installed on each of the bedframes to aid with the
locating/recovery of the mooring in the event of the surface mark becoming lost or damaged by
providing ranging information. Hence the use of the transponder lowers the risk of mooring and
data loss.
Please refer to Appendix B for further information on this instrument.

Client: Harwich Haven Authority Project Title: Harwich Turbidity Investigation Titan Report Ref: CS0491_HTI_DR
10
Photo 3.4 Sonardyne Transponder positioned on bed frame (circled)

Client: Harwich Haven Authority Project Title: Harwich Turbidity Investigation Titan Report Ref: CS0491_HTI_DR
11
4. REFERENCE CONTROL
4.1 Co-ordinate System
The co-ordinate reference system for this project was agreed with the client prior to the initial
deployment of instrumentation. All co-ordinates are referred to the WGS84 datum. WGS84 datum
transformations were to UTM31 North using the EGM96 (global) model (Table 4.1).
Table 4.1 Co-ordinate System
Co-ordinate System Group UTM
Zone 31 North
Datum Transformation WGS1984 (no datum transformation)
Geoid Model EGM96 (Global)
4.2 Vertical Control
All water depth (pressure) data presented by Titan for this project was reported as a depth below
sea level relative to the position of the deployed JFE turbidity instruments. This data has been
provided, along with temperature, as a secondary parameter and therefore has not been quality
assured.
Please note that the water depth data provided in the turbidity datasets was calculated by the
JFE data processing software and assumed a fixed atmospheric pressure of 1020.4mbar and a
density constant of 1025kg/m3.
4.3 Reference Tidal Port
The reference tidal port for this project was Harwich. Predicted tidal data for this port, based on
Admiralty tidal predictions, was provided by GTE SeaZone Tidal Viewer. For the purpose of this
report, the statistical analysis has taken into account the spring and neap tidal periods which
occurred during the deployment phase:
Spring tide : 03/06/2016 00:00 – 09/06/2016 23:59
Neap tide : 12/06/2016 00:00 – 16/06/2016 23:59
These tidal periods were determined using a ±25 percentage classification based on the
difference between the mean spring and neap ranges for the Port of Harwich (Table 4.2).
Table 4.2 Port of Harwich calculated mean tide ranges
Port MHWS (m CD)
MLWS (m CD)
Mean Spring Range (m)
Harwich
4.0 0.4 3.6
MHWN (m CD)
MLWN (m CD)
Mean Neap Range (m)
3.4 1.1 2.3

Client: Harwich Haven Authority Project Title: Harwich Turbidity Investigation Titan Report Ref: CS0491_HTI_DR
12
4.4 Calibration and Measurement Precision
4.4.1 General
All times quoted in this report and associated datasets are in Coordinated Universal Time (UTC)
and units of measurement refer to the metric system.
4.4.2 Turbidity
Each of the deployed JFE turbidity sensors was subject to in-house laboratory turbidity
calibrations to check their integrity and to provide sufficient calibration coefficients to apply to the
n-values recorded by each instrument. An n-value is a raw figure that is recorded by the
instrument prior to the application of the factory-set internal coefficients to convert these values
into engineering units, normally FTU.
Although the JFE units are equipped with both mid-range and high-range sensors to monitor
varying levels of turbidity, the n-values collected by the mid-range sensors were utilised. This was
due to field turbidity levels observed at Sites BO1, BO2 and BO3 remaining below the mid-range
sensor’s 1000FTU maximum range and the mid-range sensor’s ability for improved definition at
the lower turbidities.
The JFE units were calibrated for Turbidity (FTU) using a Formazin standard. This procedure is
based on a standard addition technique using a 4000FTU standard for the range 0-250FTU in a
black calibration bath containing 5l of water and four instruments (Photo 4.1). This was followed
by immersion into tubs containing prepared standards in increments of 500, 750 and 1000 FTU.
Using the resulting n-values recorded in response to these known Formazin increments, new
calibration coefficients could be formulated through the use of regression analysis. The turbidity
calibration reports for each of the deployed JFE units are located in Appendix C.1.
Photo 4.1 In-house JFE turbidity calibration using Formazin

Client: Harwich Haven Authority Project Title: Harwich Turbidity Investigation Titan Report Ref: CS0491_HTI_DR
13
4.4.3 Suspended Sediment Concentration
In total, six turbidity datasets, collected by the six deployed JFE units, required a conversion from
turbidity (FTU) into Suspended Sediment Concentration (SSC, mg/l). This conversion process
utilised the mid-range sensor n-values recorded by each individual unit together with the
suspended sediment samples collected by the deployed Booner tubes at Sites BO1, BO2 and
BO3.
Based on the results of the Particle Size Distribution analysis performed by the National
Laboratory Service (NLS) on the collected suspended sediment samples (See Appendix D), it
was decided that three calibration tests were required using different sediment slurry blends. This
was to ensure that the distribution of particle size observed during each deployment phase at
Sites BO1, BO2 and BO3 was fully represented:
SSC_D1 – using a sediment slurry blend that contained equal quantities (by wet weight)
of suspended sediment collected at Sites BO1, BO2 and BO3 during Deployment 1.
SSC_D2_1 - using a sediment slurry blend that contained equal quantities (by wet
weight) of suspended sediment collected at Sites BO1 and BO3 during Deployment 2.
SSC_D2_2 – using the suspended sediment collected at Site BO2 during Deployment 2.
Using a similar methodology employed for the turbidity calibration process, three JFE units were
placed into a black calibration bath containing 5l of water together with an Aquatec AQUAlogger
210 to provide a real-time turbidity output for each calibration test, as a real-time output is not
available for a JFE unit. One JFE unit (s/n 0236) was used in every calibration test to act as a
reference unit (Table 4.3).
Table 4.3 JFE units used for the different sediment slurry blends
JFE S/N Deployed at SSC_D1 SSC_D2_1 SSC_D2_2
0234 BO1 Dep2
0235 BO2 Dep2
0236 BO1 Dep1
0237 BO2 Dep1
0238 BO3 Dep1
0239 BO3 Dep2
Due to each of the sediment slurry blends containing sand particles, the increments added to the
calibration bath were based on wet weight using a balance with a resolution of 10mg. Using the
Aquatec AQUAlogger 210 real-time turbidity output, the size of the increments could be
approximated so to represent the distribution of turbidities achieved during the deployment
phases. The sediment slurry blend additions were kept in suspension with the aid of a magnetic
stirrer.

Client: Harwich Haven Authority Project Title: Harwich Turbidity Investigation Titan Report Ref: CS0491_HTI_DR
14
On completion of each calibration test, two 1l samples were taken from the calibration bath while
the suspension remained stirred (Photo 4.2). One sample (1) from each test was sent to ALS
Environmental, a UKAS accredited laboratory, to determine the Total Suspended Solids (TSS)
concentration in mg/l at 105°C. ALS performed the analysis in triplicate. Three bottles (2)
remained at Titan as replicate samples.
(1)
(2)
Photo 4.2 1l bottle samples taken from the bath at the end of each calibration test:
(1) Fully mixed (2) after 24 hours’ settlement period
Photo 4.2 (1) and (2) shows the appearance of the samples when fully mixed (1) and also after
settlement (2) for 24 hours. Thus the settled sample photo gives an indication of the very fine
fraction of the sediment within each sample blend.
On receipt of the determined TSS concentrations from the laboratory, the increments of each of
the sediment slurry blends were corrected to the mean dry weight ratios. Using the resulting n-
values recorded in response to these known dry weight increments, the SSC conversion
coefficients were formulated through the use of regression analysis. The SSC calibration reports
for each of the deployed JFE units are located in Appendix C.2.
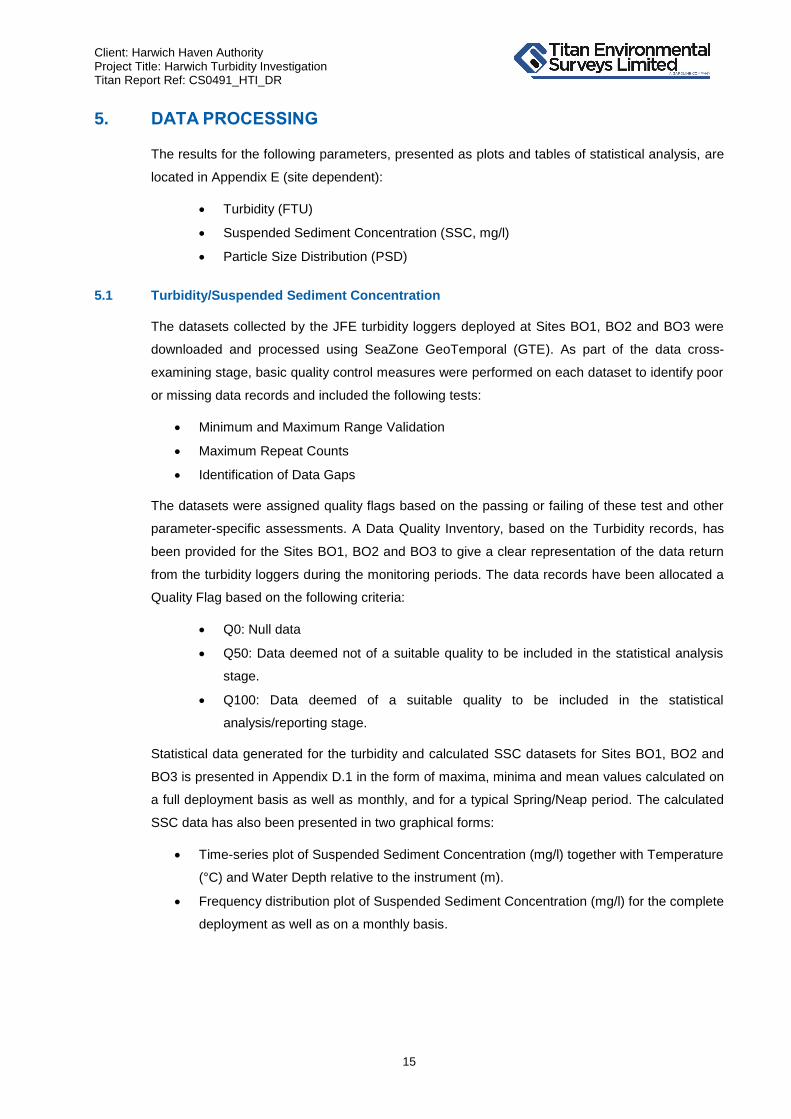
Client: Harwich Haven Authority Project Title: Harwich Turbidity Investigation Titan Report Ref: CS0491_HTI_DR
15
5. DATA PROCESSING
The results for the following parameters, presented as plots and tables of statistical analysis, are
located in Appendix E (site dependent):
Turbidity (FTU)
Suspended Sediment Concentration (SSC, mg/l)
Particle Size Distribution (PSD)
5.1 Turbidity/Suspended Sediment Concentration
The datasets collected by the JFE turbidity loggers deployed at Sites BO1, BO2 and BO3 were
downloaded and processed using SeaZone GeoTemporal (GTE). As part of the data cross-
examining stage, basic quality control measures were performed on each dataset to identify poor
or missing data records and included the following tests:
Minimum and Maximum Range Validation
Maximum Repeat Counts
Identification of Data Gaps
The datasets were assigned quality flags based on the passing or failing of these test and other
parameter-specific assessments. A Data Quality Inventory, based on the Turbidity records, has
been provided for the Sites BO1, BO2 and BO3 to give a clear representation of the data return
from the turbidity loggers during the monitoring periods. The data records have been allocated a
Quality Flag based on the following criteria:
Q0: Null data
Q50: Data deemed not of a suitable quality to be included in the statistical analysis
stage.
Q100: Data deemed of a suitable quality to be included in the statistical
analysis/reporting stage.
Statistical data generated for the turbidity and calculated SSC datasets for Sites BO1, BO2 and
BO3 is presented in Appendix D.1 in the form of maxima, minima and mean values calculated on
a full deployment basis as well as monthly, and for a typical Spring/Neap period. The calculated
SSC data has also been presented in two graphical forms:
Time-series plot of Suspended Sediment Concentration (mg/l) together with Temperature
(°C) and Water Depth relative to the instrument (m).
Frequency distribution plot of Suspended Sediment Concentration (mg/l) for the complete
deployment as well as on a monthly basis.

Client: Harwich Haven Authority Project Title: Harwich Turbidity Investigation Titan Report Ref: CS0491_HTI_DR
16
5.2 Particle Size Distribution
Following the retrieval of the suspended sediment samples from the Booner tubes deployed at
each of the five sites, sub-samples were sent to the National Laboratory Service (NLS), a UKAS
accredited laboratory, to be analysed for PSD.
The results of the PSD analysis have been presented using Gradistat V8.0, a grain size
distribution and statistics package developed by Dr. S J Blott. The program provided graphs of
the grain size distribution and cumulative distribution of the data in both metric and phi units.
The Gradistat reports for the suspended sediment samples collected at each site for each
deployment phase are located in Appendix D.2.

Client: Harwich Haven Authority Project Title: Harwich Turbidity Investigation Titan Report Ref: CS0491_HTI_DR
17
6. RESULTS
All monitoring sites were deployed between the dates of 26th May 2016 and 6
th September 2016
which was split into two deployment phases by a service interval that took place on 13th July
2016.
The following section provides a summary of:
Each site deployment position and deployment phase length.
Notes on equipment condition on recovery.
A review of the data percentage returns from the deployed turbidity loggers for Sites
BO1, BO2 and BO3.
The processed field data collected at each of the deployed sites is presented in Appendix D in
the form of:
SSC timeseries plots and associated statistical information for Sites BO1, BO2 and BO3
for the full duration of the deployment phase.
Reports for the PSD analysis results for Sites BO1, BO2, BO3, B4 and B5 performed on
the suspended sediment samples collected during deployment phases 1 and 2.
6.1 Summary
6.1.1 Turbidity/Suspended Sediment Concentration
The turbidity levels recorded at Sites BO1, BO2 and BO3 for the duration of the monitoring period
generally remained low. On average, the SSC at Site BO2 was 25mg/l SSC whereas at Sites
BO1 and BO3, SSC was approximately 40mg/l. The trends in ambient turbidity levels observed at
each of the three sites were generally similar to each other albeit on different scales.
It was difficult to identify what factors contributed to the fluctuations in turbidity in the area due to
having limited data available for comparison. The movement of the tidal currents in the area are
known to be rectilinear, moving NNE to SSW on a flood tide and SSW to NNE on an ebb tide.
The influence of the tide can sometimes be identified within the turbidity datasets as regular
fluctuations in response to the daily tidal patterns. The shift in tidal phases between spring and
neap tides can also be loosely associated with the variability in turbidity levels on an extended
timescale. It was also noted on the Admiralty Chart that the south end of the deployment area
was subject to the movement of sandwaves.
A noticeable event that occurred during the monitoring phase was observed at Site BO3 between
24/07/2016 and 04/08/2016 (Figure 6.1). The SSC levels fluctuated between 30-600mg/l in
response to the local tidal patterns; reductions in SSC levels were seen to occur on the flood tide
prior to HW slack after which they increased up to an average of 150mg/l before falling again
after slack LW. At Sites BO1 and BO2, the SSC levels generally stayed below 60mg/l with
reductions in SSC aligning with HW and LW slack periods.

Client: Harwich Haven Authority Project Title: Harwich Turbidity Investigation Titan Report Ref: CS0491_HTI_DR
18
While the turbidity monitoring moorings were deployed at Sites BO1, BO2 and BO3, spoil
disposal was scheduled in close proximity to the location indicated on Figure 1.1. The dates of
the disposal that occurred at the spoil ground during the deployment phases, as provided by
Harwich Harbour Authority, are shown in Table 6.1. The cycle time for the dredger was
approximately 3.5 hours.
Table 6.1 Spoil Ground Disposal Schedule
When comparing the recorded SSC levels for Sites BO1, BO2 and BO3 during these two spoil
disposal periods, it was difficult to determine if it had influenced the levels of SSC recorded at
each of the sites. Figure 6.2 represents the SSC timeseries data collected at the three monitoring
sites during the first spoil disposal period. It can be seen that the flood and ebb periods either
side of high water had a tendency to temporarily increase the ambient SSC levels. The levels
recorded at all three sites were of a similar range.
During the spoil disposal activities in the second deployment phase (Figure 6.3), the
characteristics of the ambient SSC levels were different to those observed during the previous
spoil disposal phase although it is not clearly evident that it was the result of these activities.
There was a marked difference in the SSC levels recorded at Site BO1 when compared with
Sites BO2 and BO3. At Site BO1, the SCC levels fluctuated in accordance to the flood and ebb
tides where drops in SSC coincided with either HW or LW slack. The levels achieved on ebb tide
were visibly higher than those obtained during the flood tide. At Sites BO2 and BO3, there was a
gradual rise and fall in SSC between each LW slack. At Site BO3, there were SSC spikes in the
BO3 dataset that coincided with the flood tide immediately after HW slack during the spring tide;
these were minimal during the neap phase of the tide during the spoil disposal period.
6.1.2 Particle Size Distribution
In terms of the Particle Size Distribution for the suspended sediment collected in the deployed
Booner tubes, there seemed to be a marked difference in the grain size distribution observed at
three of the five sites between the two different deployment phases. At Sites BO2 and B4, the
sand to mud ratio remained relatively consistent between the deployments, giving a medium to
fine silt at Site BO2 and a very coarse silt at Site B4. At Sites BO1, BO3 and B5, a shift in the
percentages of sand to mud ratio from a mainly mud-based presence to a dominant sand
influence can be seen between deployment phases. During the first deployment, a medium silt
was collected at all three sites; whereas during the second deployment phase, a very coarse
silt/very fine sand was collected.
Deployment Phase Dates of Spoil Disposal
1 17-19/06/2016
2 21-30/08/2016
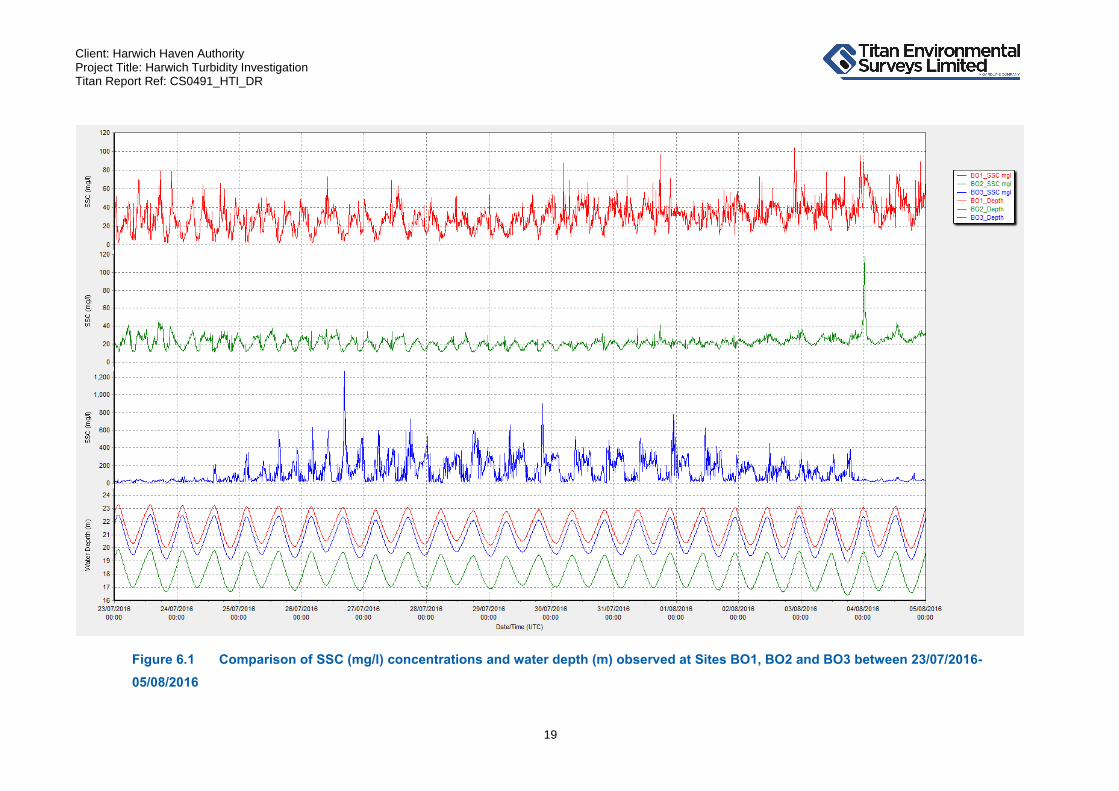
Client: Harwich Haven Authority Project Title: Harwich Turbidity Investigation Titan Report Ref: CS0491_HTI_DR
19
Figure 6.1 Comparison of SSC (mg/l) concentrations and water depth (m) observed at Sites BO1, BO2 and BO3 between 23/07/2016-
05/08/2016
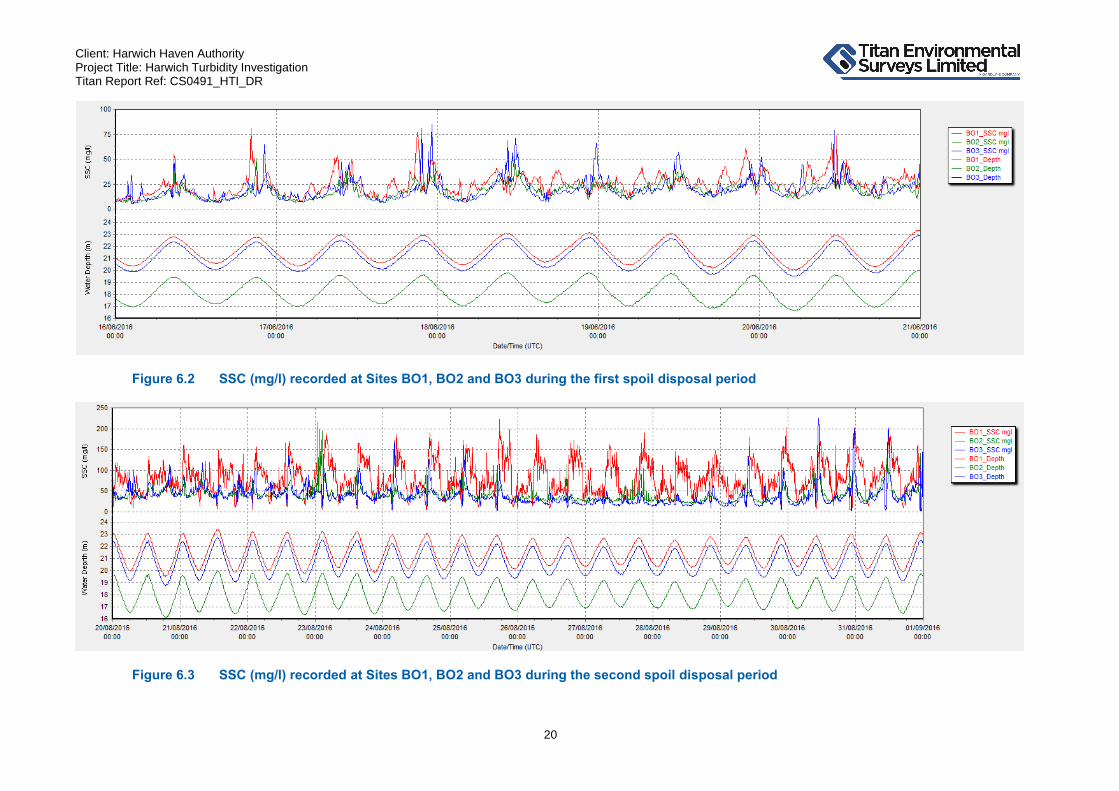
Client: Harwich Haven Authority Project Title: Harwich Turbidity Investigation Titan Report Ref: CS0491_HTI_DR
20
Figure 6.2 SSC (mg/l) recorded at Sites BO1, BO2 and BO3 during the first spoil disposal period
Figure 6.3 SSC (mg/l) recorded at Sites BO1, BO2 and BO3 during the second spoil disposal period

Client: Harwich Haven Authority Project Title: Harwich Turbidity Investigation Titan Report Ref: CS0491_HTI_DR
21
6.2 Site BO1
BO1 was deployed for a total of approximately 103 days between 26th May 2016 and 6
th
September 2016. The mooring locations of each deployment phase were in close proximity to the
originally proposed position (Figure 6.4, Table 6.2).
Figure 6.4 Deployed positions of Site BO1 relative to its proposed position
Table 6.2 Deployed positions of Site BO1 relative to proposed position
Site Proposed Position
BO1 51°54.578’N
01°36.841’E
404662 E
5751896 N
Deployment Dates of Deployment Deployed Position
(Frame)
1
26/05/2016 10:50
–
13/07/2016 11:20
51°54.529'N 01°36.803'E
404617 E 5751805 N
2
13/07/2016 13:50
-
06/09/2016 08:00
51°54.531'N 01°36.799'E
404612 E 5751809 N
Co-ordinate Zone/Geoid : UTM 31N/EGM96
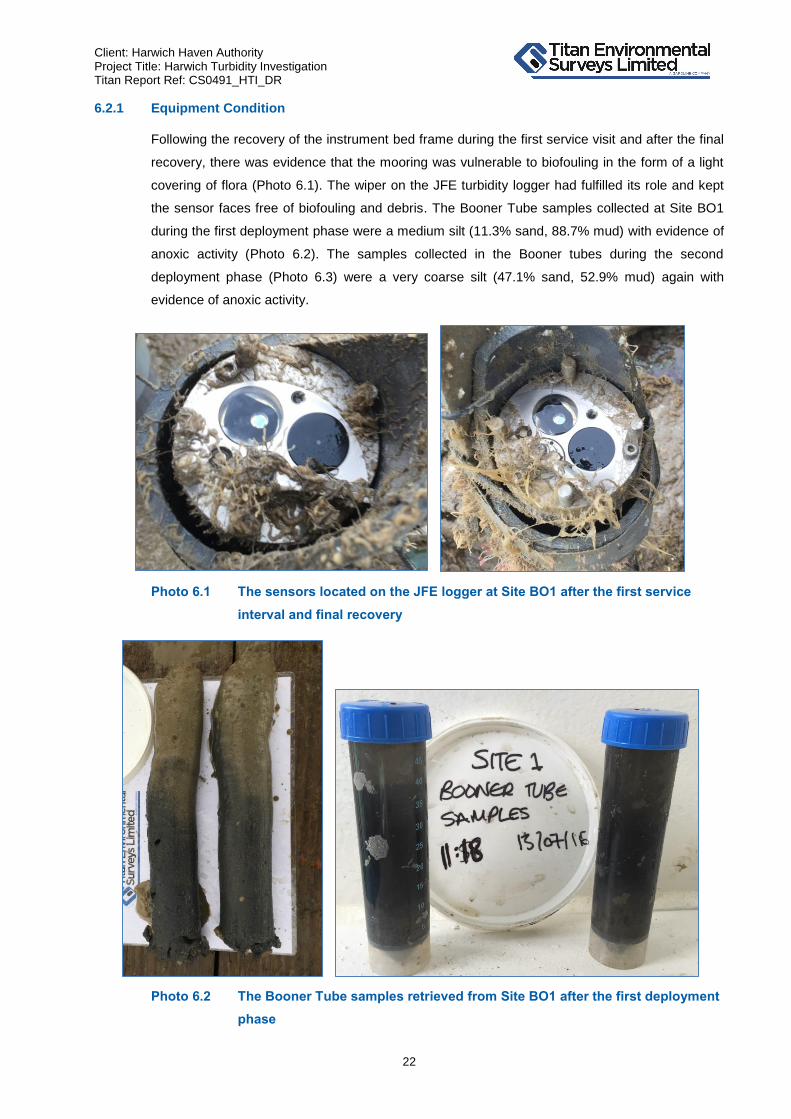
Client: Harwich Haven Authority Project Title: Harwich Turbidity Investigation Titan Report Ref: CS0491_HTI_DR
22
6.2.1 Equipment Condition
Following the recovery of the instrument bed frame during the first service visit and after the final
recovery, there was evidence that the mooring was vulnerable to biofouling in the form of a light
covering of flora (Photo 6.1). The wiper on the JFE turbidity logger had fulfilled its role and kept
the sensor faces free of biofouling and debris. The Booner Tube samples collected at Site BO1
during the first deployment phase were a medium silt (11.3% sand, 88.7% mud) with evidence of
anoxic activity (Photo 6.2). The samples collected in the Booner tubes during the second
deployment phase (Photo 6.3) were a very coarse silt (47.1% sand, 52.9% mud) again with
evidence of anoxic activity.
Photo 6.1 The sensors located on the JFE logger at Site BO1 after the first service
interval and final recovery
Photo 6.2 The Booner Tube samples retrieved from Site BO1 after the first deployment
phase
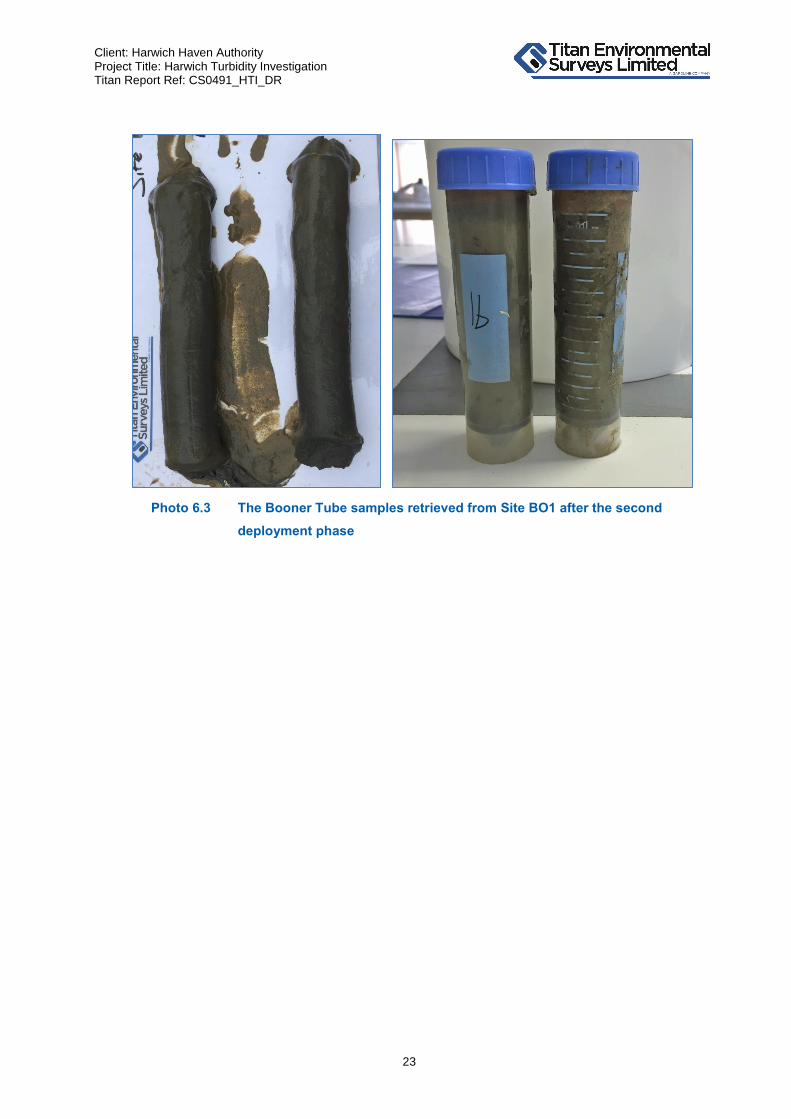
Client: Harwich Haven Authority Project Title: Harwich Turbidity Investigation Titan Report Ref: CS0491_HTI_DR
23
Photo 6.3 The Booner Tube samples retrieved from Site BO1 after the second
deployment phase

Client: Harwich Haven Authority Project Title: Harwich Turbidity Investigation Titan Report Ref: CS0491_HTI_DR
24
6.2.2 Data Percentage Return
The overall data return for both deployments was excellent, with close to 100% of the data collected being a suitable standard to be included in the
statistical analysis/reporting stage (Table 6.3).
Table 6.3 Data return from instrumentation deployed at Site BO1
ASB = Above Seabed, BSL = Below Sea Level
The JFE Infinity Turbi logger was set to collect data on a 10-minute sampling regime. Therefore the total number of records expected for each deployment would be:
Deployment 1 (48.02 Days) = 6916 records
Deployment 2 (54.76 Days) = 7886 records
Deployment Instrument Height ASB
or Depth BSL
Parameter Total
expected records
Total achieved records
% return Total
records at Q100
% return
1 JFE Infinity Turbi 0.50m ASB Turbidity 6916 6916 100 6915 99.99
2 JFE Infinity Turbi 0.50m ASB Turbidity 7886 7886 100 7883 99.96

Client: Harwich Haven Authority Project Title: Harwich Turbidity Investigation Titan Report Ref: CS0491_HTI_DR
25
6.3 Site BO2
BO2 was deployed for a total of approximately 103 days between 26th May 2016 and 6
th
September 2016. The mooring locations of each deployment phase were in close proximity to the
originally proposed position (Figure 6.5, Table 6.4).
Figure 6.5 Deployed positions of Site BO2 relative to its proposed position
Table 6.4 Deployed positions of Site BO2 relative to proposed position
Site Proposed Position
BO2 51°53.859’N
01°36.160’E
403856 E
5750578 N
Deployment Dates of Deployment Deployed Position
(Frame)
1
26/05/2016 10:20
-
13/07/2016 11:40
51°53.804'N 01°36.111'E
403798 E 5750477 N
2
13/07/2016 13:30
-
06/09/2016 07:30
51°53.821'N 01°36.121'E
403810 E 5750508 N
Co-ordinate Zone/Geoid : UTM 31N/EGM96

Client: Harwich Haven Authority Project Title: Harwich Turbidity Investigation Titan Report Ref: CS0491_HTI_DR
26
6.3.1 Equipment Condition
Following the recovery of the instrument bed frame during the first service visit and after the final
recovery, there was evidence that the mooring was vulnerable to biofouling in the form of a light
covering of flora (Photo 6.4). The wiper on the JFE turbidity loggers had fulfilled its role and kept
the sensor faces free of biofouling and debris. The Booner Tube samples collected at Site BO2
for each deployment were of a similar consistency; a medium silt in the first deployment phase
(2.1% sand, 97.9% mud) followed by a fine silt in the second deployment phase (7.0% sand,
93.0% mud). Only one Booner tube vial was collected for each deployment as a result of
blockages in the upper part of the Booner tube where there was also evidence of anoxic activity
(Photo 6.5, Photo 6.6).
Photo 6.4 The sensors located on the JFE logger at Site BO2 after the first service
interval and final recovery
Photo 6.5 The Booner Tube samples retrieved from Site BO2 after the first deployment
phase

Client: Harwich Haven Authority Project Title: Harwich Turbidity Investigation Titan Report Ref: CS0491_HTI_DR
27
Photo 6.6 The Booner Tube samples retrieved from Site BO2 after the second
deployment phase

Client: Harwich Haven Authority Project Title: Harwich Turbidity Investigation Titan Report Ref: CS0491_HTI_DR
28
6.3.2 Data Percentage Return
The overall data return for both deployments was excellent, with close to 100% of the data collected being a suitable standard to be included in the
statistical analysis/reporting stage (Table 6.5).
Table 6.5 Data return from instrumentation deployed at Site BO2
ASB = Above Seabed, BSL = Below Sea Level
The JFE Infinity Turbi logger was set to collect data on a 10-minute sampling regime. Therefore the total number of records expected for each deployment would be:
Deployment 1 (48.06 Days) = 6921 records
Deployment 2 (54.75 Days) = 7885 records
Deployment Instrument Height ASB
or Depth BSL
Parameter Total
expected records
Total achieved records
% return Total
records at Q100
% return
1 JFE Infinity Turbi 0.50m ASB Turbidity 6921 6921 100 6917 99.94
2 JFE Infinity Turbi 0.50m ASB Turbidity 7885 7885 100 7871 99.82
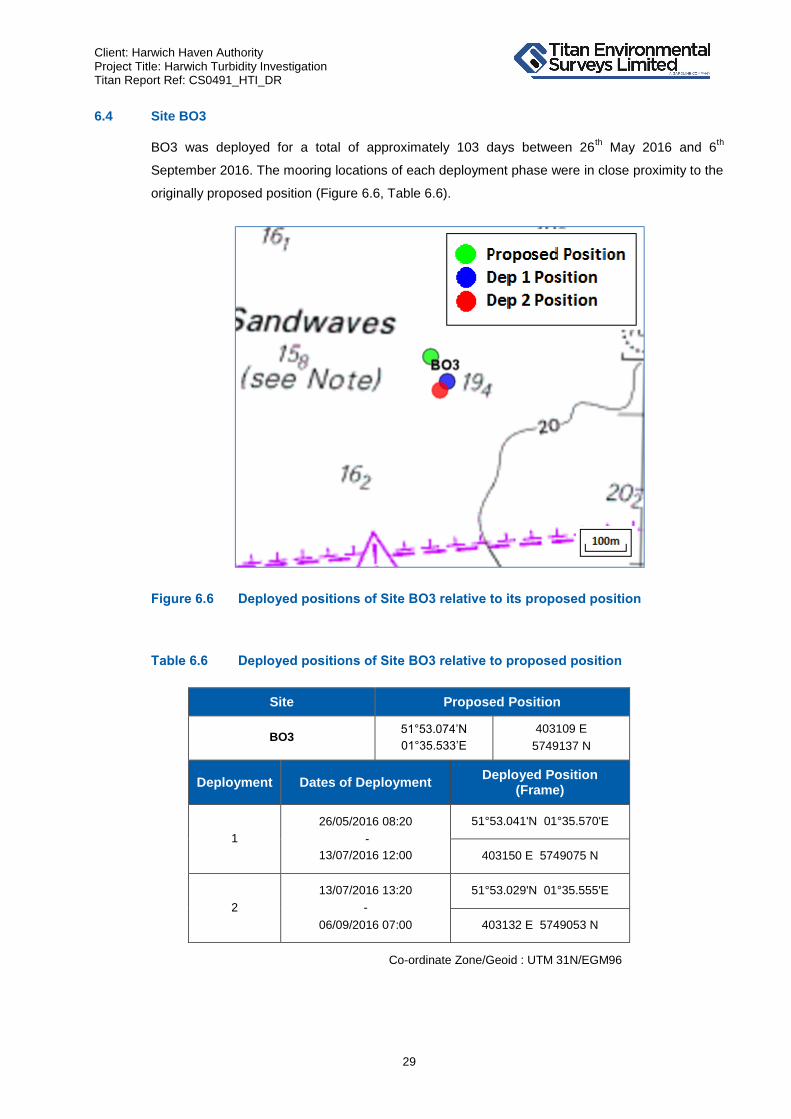
Client: Harwich Haven Authority Project Title: Harwich Turbidity Investigation Titan Report Ref: CS0491_HTI_DR
29
6.4 Site BO3
BO3 was deployed for a total of approximately 103 days between 26th May 2016 and 6
th
September 2016. The mooring locations of each deployment phase were in close proximity to the
originally proposed position (Figure 6.6, Table 6.6).
Figure 6.6 Deployed positions of Site BO3 relative to its proposed position
Table 6.6 Deployed positions of Site BO3 relative to proposed position
Site Proposed Position
BO3 51°53.074’N
01°35.533’E
403109 E
5749137 N
Deployment Dates of Deployment Deployed Position
(Frame)
1
26/05/2016 08:20
-
13/07/2016 12:00
51°53.041'N 01°35.570'E
403150 E 5749075 N
2
13/07/2016 13:20
-
06/09/2016 07:00
51°53.029'N 01°35.555'E
403132 E 5749053 N
Co-ordinate Zone/Geoid : UTM 31N/EGM96

Client: Harwich Haven Authority Project Title: Harwich Turbidity Investigation Titan Report Ref: CS0491_HTI_DR
30
6.4.1 Equipment Condition
Following the recovery of the instrument bed frame during the first service visit and after the final
recovery, there was evidence that the mooring was vulnerable to biofouling in the form of a light
covering of flora (Photo 6.7). The wiper on the JFE turbidity loggers had fulfilled its role and kept
the sensor faces free of biofouling and debris. Minimal suspended sediment was collected in the
Booner vials due to blockages in the upper part of the Booner tubes. The Booner Tube samples
collected at Site BO3 during the first deployment phase were a medium silt (5.6% sand, 94.4%
mud) with evidence of anoxic activity (Photo 6.8). The samples collected in the Booner tubes
during the second deployment phase (Photo 6.9) were a very fine sand (72.8% sand, 27.2%
mud) again with evidence of anoxic activity.
Photo 6.7 The sensors located on the JFE logger at Site BO3 after the first service
interval and on final recovery
Photo 6.8 The Booner Tube samples retrieved from Site BO3 after the first deployment
phase

Client: Harwich Haven Authority Project Title: Harwich Turbidity Investigation Titan Report Ref: CS0491_HTI_DR
31
Photo 6.9 The Booner Tube samples retrieved from Site BO3 after the second
deployment phase
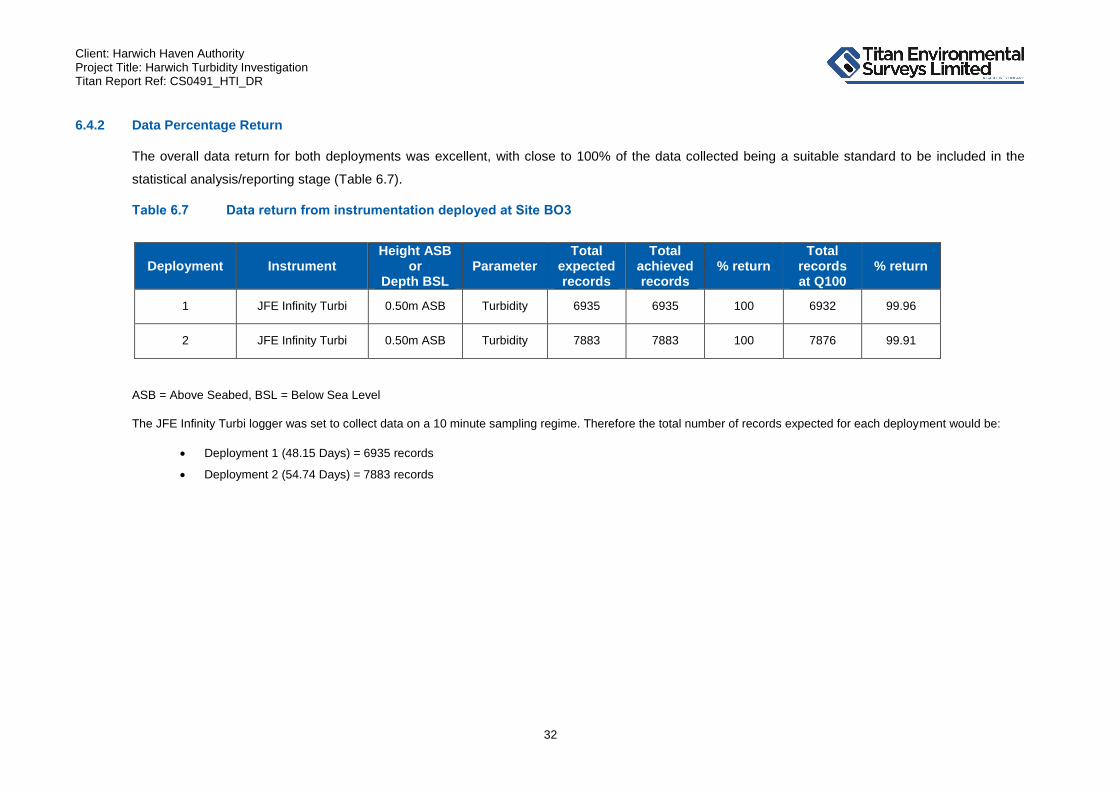
Client: Harwich Haven Authority Project Title: Harwich Turbidity Investigation Titan Report Ref: CS0491_HTI_DR
32
6.4.2 Data Percentage Return
The overall data return for both deployments was excellent, with close to 100% of the data collected being a suitable standard to be included in the
statistical analysis/reporting stage (Table 6.7).
Table 6.7 Data return from instrumentation deployed at Site BO3
ASB = Above Seabed, BSL = Below Sea Level
The JFE Infinity Turbi logger was set to collect data on a 10 minute sampling regime. Therefore the total number of records expected for each deployment would be:
Deployment 1 (48.15 Days) = 6935 records
Deployment 2 (54.74 Days) = 7883 records
Deployment Instrument Height ASB
or Depth BSL
Parameter Total
expected records
Total achieved records
% return Total
records at Q100
% return
1 JFE Infinity Turbi 0.50m ASB Turbidity 6935 6935 100 6932 99.96
2 JFE Infinity Turbi 0.50m ASB Turbidity 7883 7883 100 7876 99.91
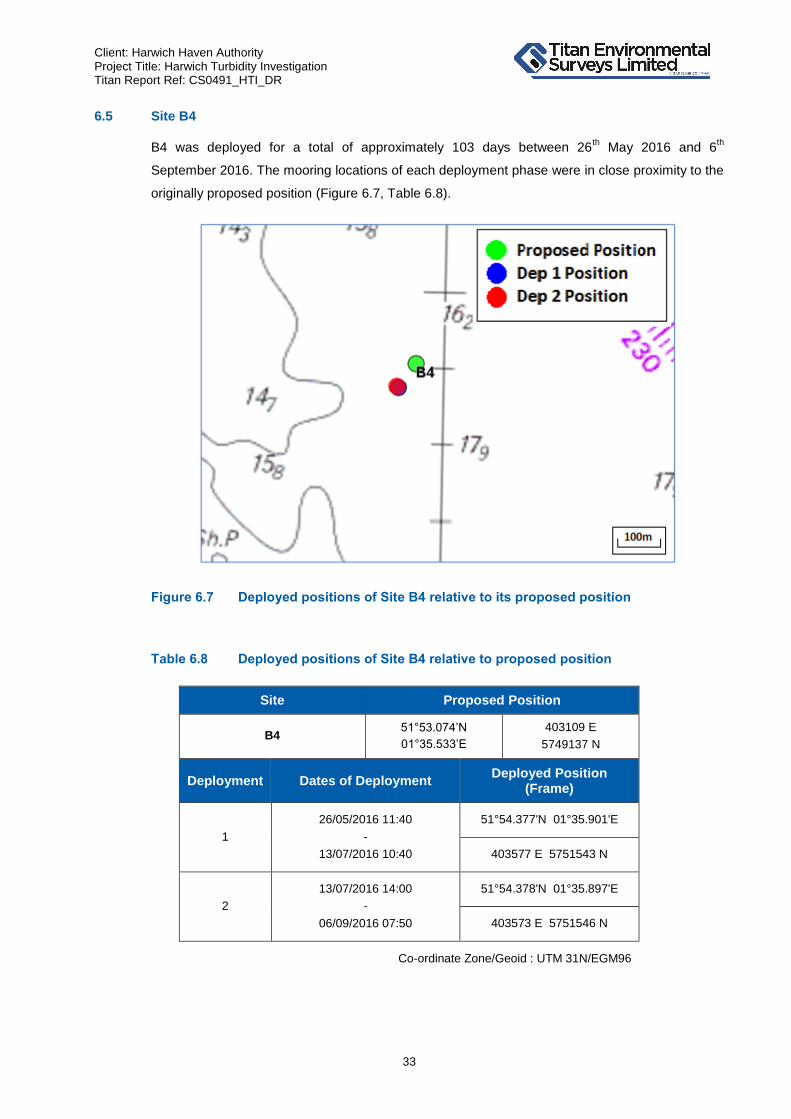
Client: Harwich Haven Authority Project Title: Harwich Turbidity Investigation Titan Report Ref: CS0491_HTI_DR
33
6.5 Site B4
B4 was deployed for a total of approximately 103 days between 26th May 2016 and 6
th
September 2016. The mooring locations of each deployment phase were in close proximity to the
originally proposed position (Figure 6.7, Table 6.8).
Figure 6.7 Deployed positions of Site B4 relative to its proposed position
Table 6.8 Deployed positions of Site B4 relative to proposed position
Site Proposed Position
B4 51°53.074’N
01°35.533’E
403109 E
5749137 N
Deployment Dates of Deployment Deployed Position
(Frame)
1
26/05/2016 11:40
-
13/07/2016 10:40
51°54.377'N 01°35.901'E
403577 E 5751543 N
2
13/07/2016 14:00
-
06/09/2016 07:50
51°54.378'N 01°35.897'E
403573 E 5751546 N
Co-ordinate Zone/Geoid : UTM 31N/EGM96

Client: Harwich Haven Authority Project Title: Harwich Turbidity Investigation Titan Report Ref: CS0491_HTI_DR
34
6.5.1 Equipment Condition
The Booner Tube samples collected at Site B4 for each deployment were deemed a very coarse
silt where there was only slight differences in the sand to mud ratios; the first deployment phase
(66.4% sand, 33.6% mud), the second deployment phase (58.8% sand, 41.2% mud). Only one
Booner tube vial was collected during the first deployment and none in the second deployment as
a result of blockages in the upper part of the Booner tube where there was also evidence of
anoxic activity (Photo 6.10, Photo 6.11).
Photo 6.10 The Booner Tube samples retrieved from Site B4 after the first deployment
phase
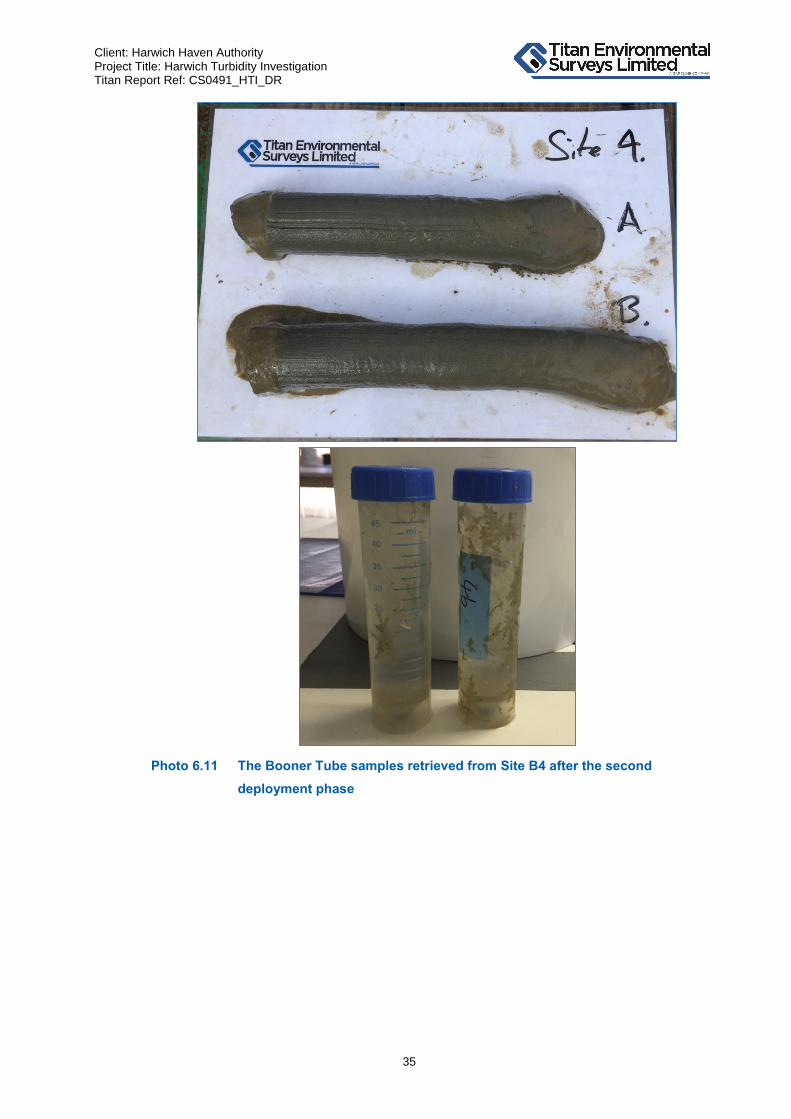
Client: Harwich Haven Authority Project Title: Harwich Turbidity Investigation Titan Report Ref: CS0491_HTI_DR
35
Photo 6.11 The Booner Tube samples retrieved from Site B4 after the second
deployment phase

Client: Harwich Haven Authority Project Title: Harwich Turbidity Investigation Titan Report Ref: CS0491_HTI_DR
36
6.6 Site B5
B5 was deployed for a total of approximately 103 days between 26th May 2016 and 6
th
September 2016. The mooring locations of each deployment phase were in close proximity to the
originally proposed position (Figure 6.8, Table 6.9).
Figure 6.8 Deployed positions of Site B5 relative to its proposed position
Table 6.9 Deployed positions of Site B5 relative to proposed position
Site Proposed Position
B5 51°53.648’N
01°35.286’E
402847 E
5750205 N
Deployment Dates of Deployment Deployed Position
(Frame)
1
26/05/2016 12:15
-
13/07/2016 10:00
51°53.611'N 01°35.232'E
402783 E 5750138 N
2
13/07/2016 10:300
-
06/09/2016 08:40
51°53.637'N 01°35.270'E
402827 E 5750186 N
Co-ordinate Zone/Geoid : UTM 31N/EGM96
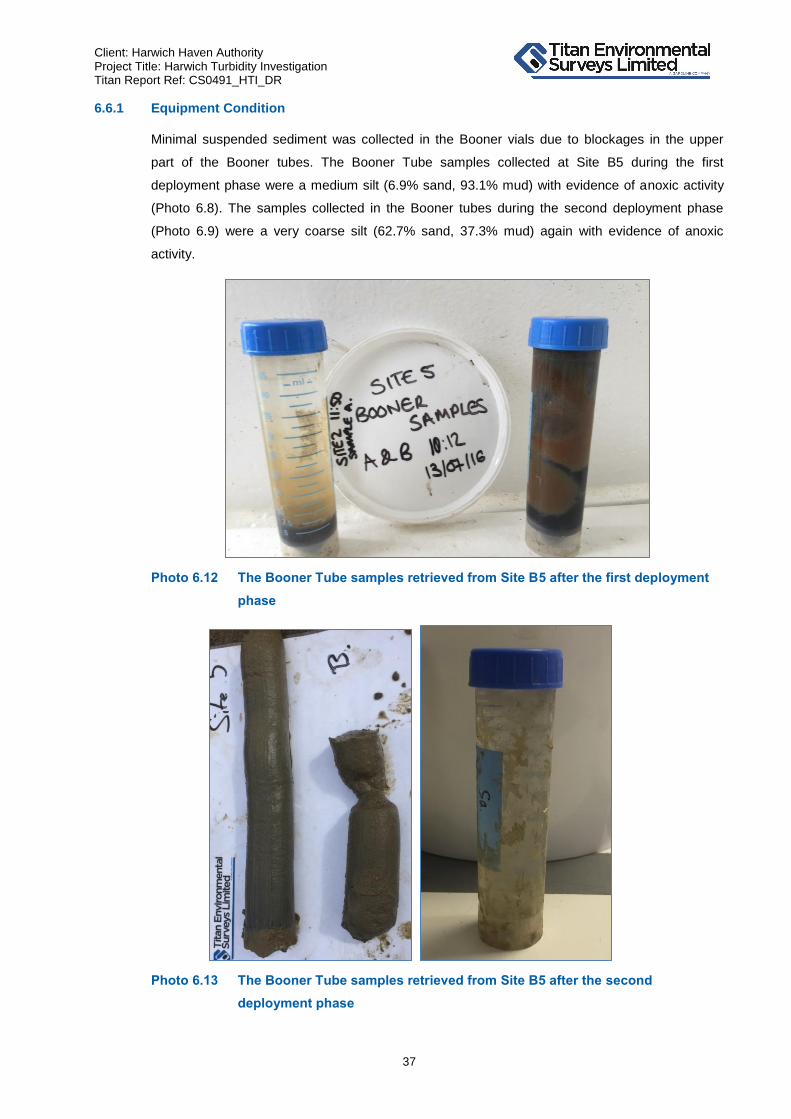
Client: Harwich Haven Authority Project Title: Harwich Turbidity Investigation Titan Report Ref: CS0491_HTI_DR
37
6.6.1 Equipment Condition
Minimal suspended sediment was collected in the Booner vials due to blockages in the upper
part of the Booner tubes. The Booner Tube samples collected at Site B5 during the first
deployment phase were a medium silt (6.9% sand, 93.1% mud) with evidence of anoxic activity
(Photo 6.8). The samples collected in the Booner tubes during the second deployment phase
(Photo 6.9) were a very coarse silt (62.7% sand, 37.3% mud) again with evidence of anoxic
activity.
Photo 6.12 The Booner Tube samples retrieved from Site B5 after the first deployment
phase
Photo 6.13 The Booner Tube samples retrieved from Site B5 after the second
deployment phase

Client: Harwich Haven Authority Project Title: Harwich Turbidity Investigation Titan Report Ref: CS0491_HTI_DR
APPENDIX A
Glossary of Terms for Exported Datasets

Oceanography Glossary
1
This document has been created to clarify the meaning of terms used in the column headers of datasets used within and exported from SeaZone GTE.
Column headers found within the GTE datasets for the Turbidity Time-Series data
Glossary of Terms
Term Definition Unit/Format
Group Designated group in which file was assigned in GTE
File Name of file imported into GTE
idData Unique number for each row of data
DateTime Date and time of measurement dd/mm/yy hh:mm:ss
Height_ASB Height of instrument above sea bed m
Pressure_MPa Pressure as measured by the JFE unit
(secondary parameter) MPa
Depth_m Depth of JFE unit below sea level; calculated by JFE
unit m
Temp_C Temperature as measured by the JFE unit
(secondary parameter) °C
Turb_M_NValue Value output provided by JFE mid-range turbidity
sensor No unit
Turb_M_FTU_Raw Turbidity values provided by the JFE unit; calculated
by application of internal coefficients on N-Values collected by mid-range sensor.
FTU
Turb_M_FTU Turbidity values calculated via the application of Titan-derived calibration coefficients to the JFE mid-range
N-Values FTU
SSC_mgl Suspended Sediment Concentration (calculated) mg/l
idCalibration Number allocated to individual calibration certificates
applied to JFE mid-range N-Values
Quality Number allocated to individual measurements to
indicate quality 0-100
Also present in the Datasets but not utilised for this project :
Turb_H_NValue Raw values provided by JFE high-range turbidity
sensor No unit
Turb_H_ppm Turbidity values provided by the JFE unit; calculated
by application of internal coefficients on N-Values collected by high-range sensor.
Kaolin ppm
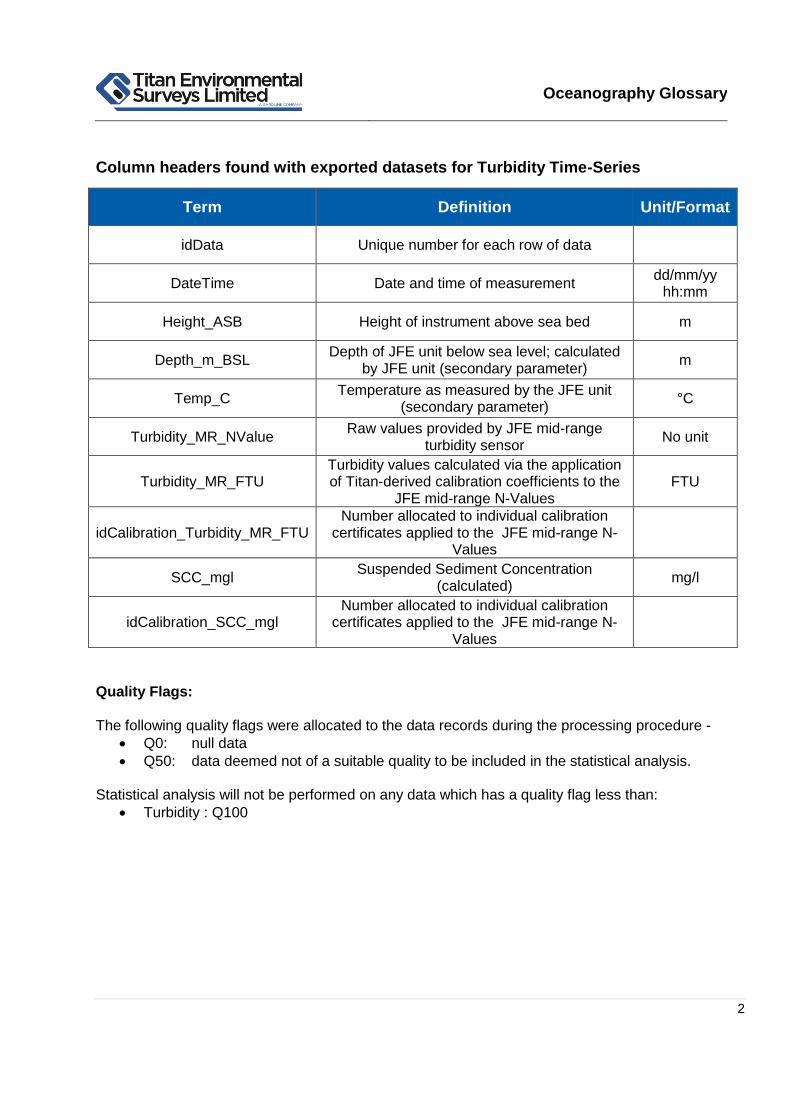
Oceanography Glossary
2
Column headers found with exported datasets for Turbidity Time-Series
Quality Flags: The following quality flags were allocated to the data records during the processing procedure -
Q0: null data
Q50: data deemed not of a suitable quality to be included in the statistical analysis. Statistical analysis will not be performed on any data which has a quality flag less than:
Turbidity : Q100
Term Definition Unit/Format
idData Unique number for each row of data
DateTime Date and time of measurement dd/mm/yy
hh:mm
Height_ASB Height of instrument above sea bed m
Depth_m_BSL Depth of JFE unit below sea level; calculated
by JFE unit (secondary parameter) m
Temp_C Temperature as measured by the JFE unit
(secondary parameter) °C
Turbidity_MR_NValue Raw values provided by JFE mid-range
turbidity sensor No unit
Turbidity_MR_FTU Turbidity values calculated via the application of Titan-derived calibration coefficients to the
JFE mid-range N-Values FTU
idCalibration_Turbidity_MR_FTU Number allocated to individual calibration
certificates applied to the JFE mid-range N-Values
SCC_mgl Suspended Sediment Concentration
(calculated) mg/l
idCalibration_SCC_mgl Number allocated to individual calibration
certificates applied to the JFE mid-range N-Values

Client: Harwich Haven Authority Project Title: Harwich Turbidity Investigation Titan Report Ref: CS0491_HTI_DR
APPENDIX B
Instrument Specifications
B.1 JFE Infinity-Turbi Logger
B.2 Sonardyne TZ/OBC Transponder

Client: Harwich Haven Authority Project Title: Harwich Turbidity Investigation Titan Report Ref: CS0491_HTI_DR
B1. JFE INIFNITY-TURBI LOGGER
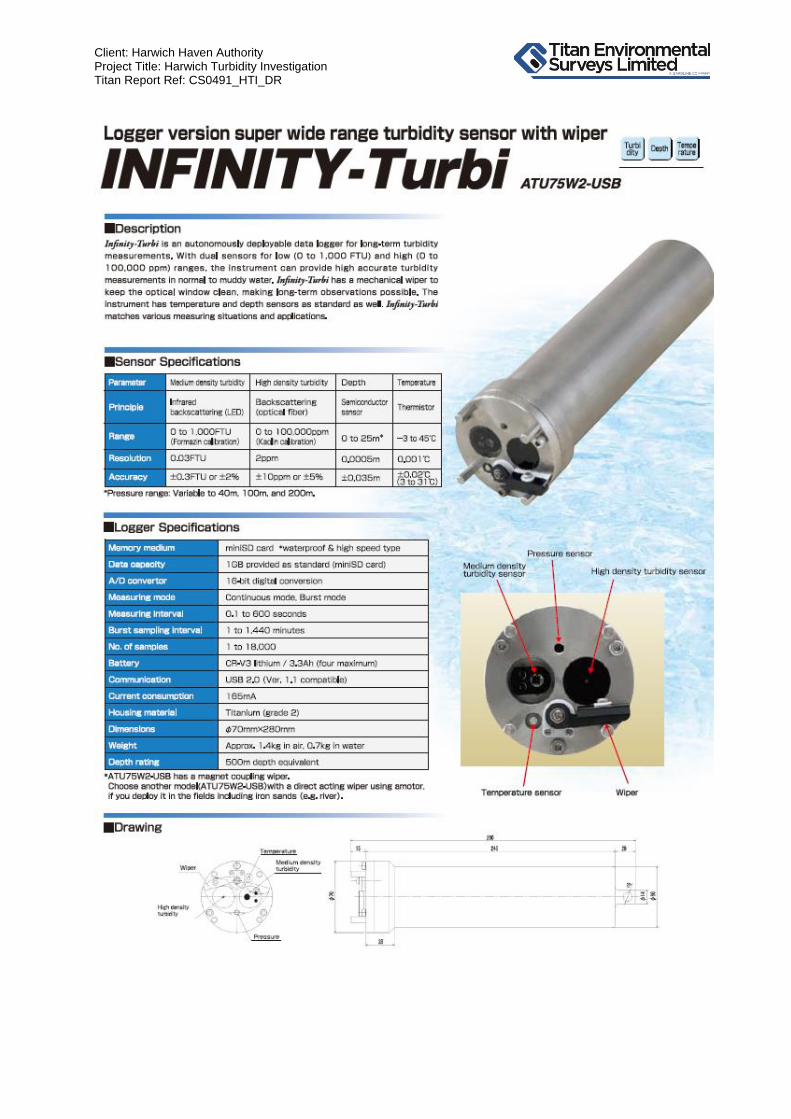
Client: Harwich Haven Authority Project Title: Harwich Turbidity Investigation Titan Report Ref: CS0491_HTI_DR

Client: Harwich Haven Authority Project Title: Harwich Turbidity Investigation Titan Report Ref: CS0491_HTI_DR
B2. SONARDYNE TZ/OBC TRANSPONDER

Client: Harwich Haven Authority Project Title: Harwich Turbidity Investigation Titan Report Ref: CS0491_HTI_DR

Client: Harwich Haven Authority Project Title: Harwich Turbidity Investigation Titan Report Ref: CS0491_HTI_DR
APPENDIX C
Calibration Reports
C.1 Turbidity
C.2 Suspended Sediment Concentration

Client: Harwich Haven Authority Project Title: Harwich Turbidity Investigation Titan Report Ref: CS0491_HTI_DR
C.1 TURBIDITY

Client: Harwich Haven Authority Project Title: Harwich Turbidity Investigation Titan Report Ref: CS0491_HTI_DR
SITE BO1 C.1.1
C.1.1.1 DEPLOYMENT 1: JFE 0236

Client: Harwich Haven Authority Project Title: Harwich Turbidity Investigation Titan Report Ref: CS0491_HTI_DR
C.1.1.2 DEPLOYMENT 2: JFE 0234

Client: Harwich Haven Authority Project Title: Harwich Turbidity Investigation Titan Report Ref: CS0491_HTI_DR
SITE BO2 C.1.2
C.1.2.1 DEPLOYMENT 1: JFE 0237

Client: Harwich Haven Authority Project Title: Harwich Turbidity Investigation Titan Report Ref: CS0491_HTI_DR
C.1.2.1 DEPLOYMENT 2: JFE 0235
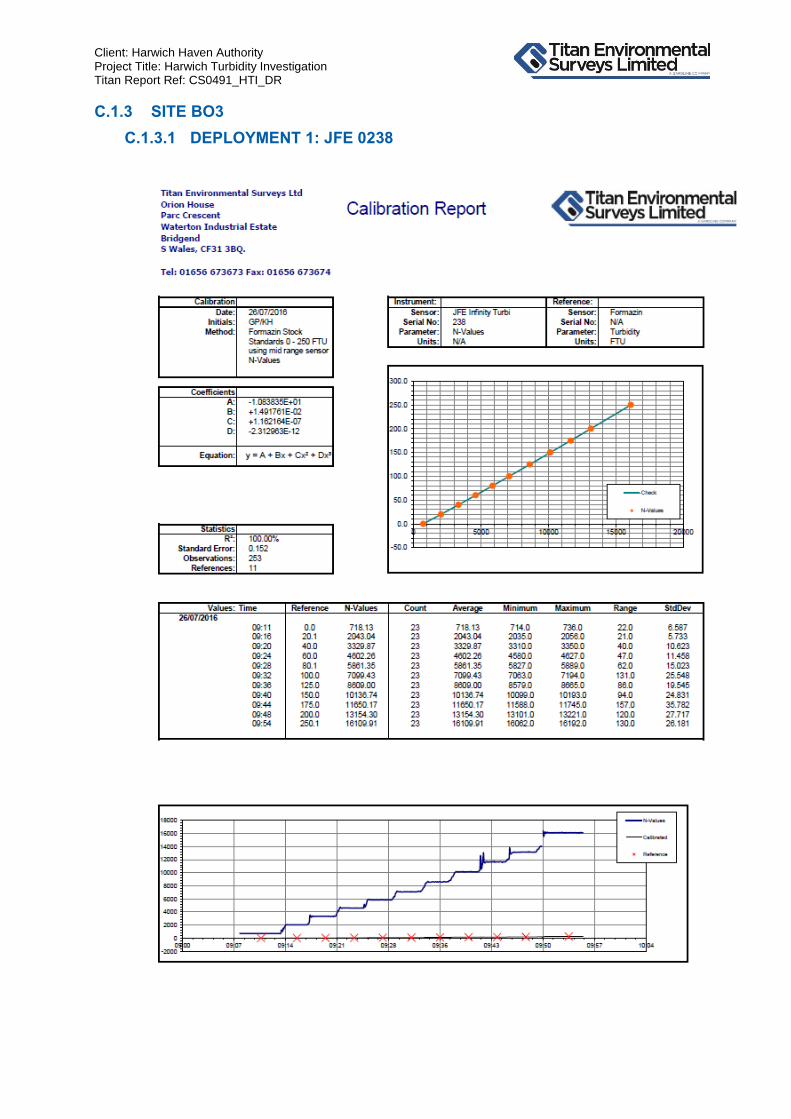
Client: Harwich Haven Authority Project Title: Harwich Turbidity Investigation Titan Report Ref: CS0491_HTI_DR
SITE BO3 C.1.3
C.1.3.1 DEPLOYMENT 1: JFE 0238
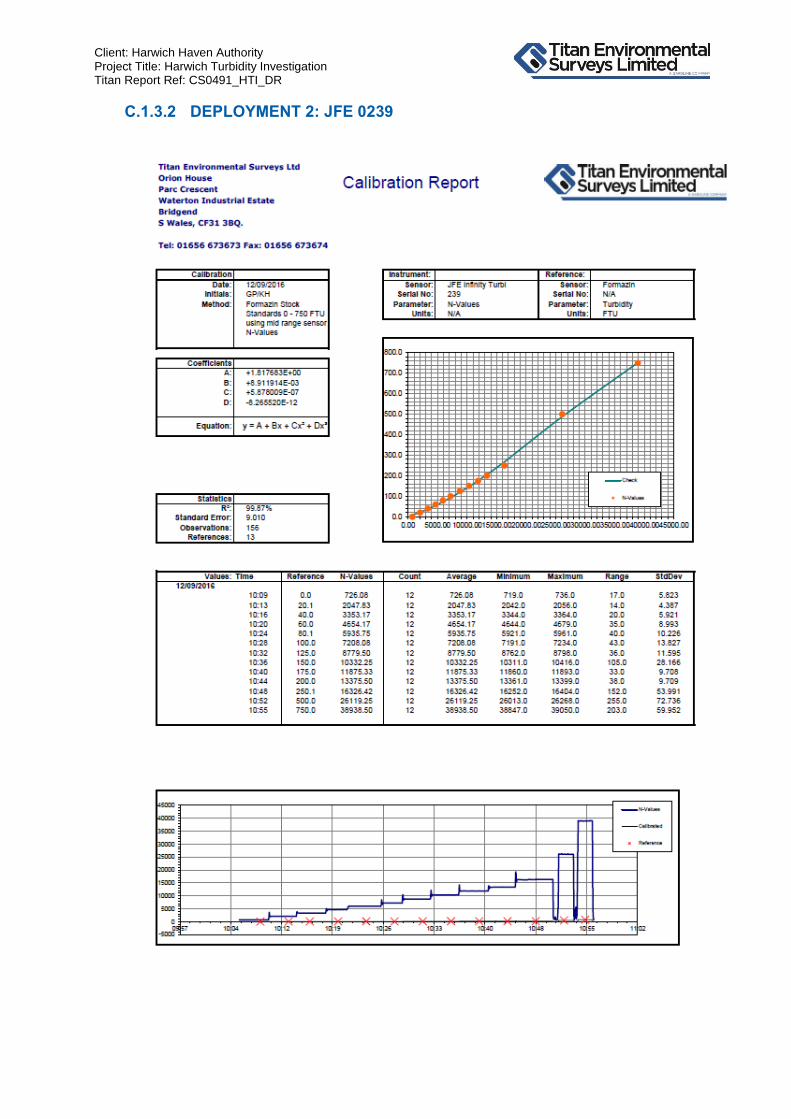
Client: Harwich Haven Authority Project Title: Harwich Turbidity Investigation Titan Report Ref: CS0491_HTI_DR
C.1.3.2 DEPLOYMENT 2: JFE 0239

Client: Harwich Haven Authority Project Title: Harwich Turbidity Investigation Titan Report Ref: CS0491_HTI_DR
C.2 SUSPENDED SEDIMENT CONCENTRATION

Client: Harwich Haven Authority Project Title: Harwich Turbidity Investigation Titan Report Ref: CS0491_HTI_DR
SSC1 C.2.1
C.2.1.1 JFE 0236

Client: Harwich Haven Authority Project Title: Harwich Turbidity Investigation Titan Report Ref: CS0491_HTI_DR
C.2.1.2 JFE 0237

Client: Harwich Haven Authority Project Title: Harwich Turbidity Investigation Titan Report Ref: CS0491_HTI_DR
C.2.1.3 JFE 0238

Client: Harwich Haven Authority Project Title: Harwich Turbidity Investigation Titan Report Ref: CS0491_HTI_DR
SSC2 C.2.2
C.2.2.1 JFE 0234

Client: Harwich Haven Authority Project Title: Harwich Turbidity Investigation Titan Report Ref: CS0491_HTI_DR
C.2.2.2 JFE 0236 (REFERENCE)

Client: Harwich Haven Authority Project Title: Harwich Turbidity Investigation Titan Report Ref: CS0491_HTI_DR
C.2.2.3 JFE 0239
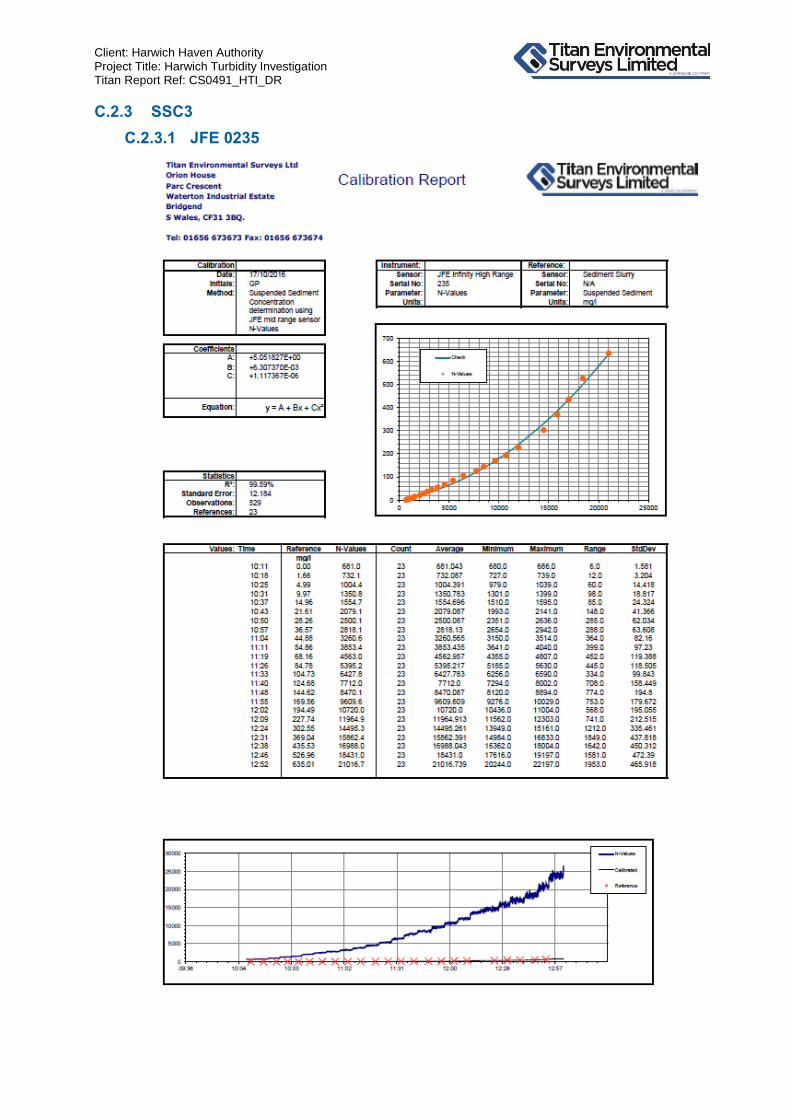
Client: Harwich Haven Authority Project Title: Harwich Turbidity Investigation Titan Report Ref: CS0491_HTI_DR
SSC3 C.2.3
C.2.3.1 JFE 0235

Client: Harwich Haven Authority Project Title: Harwich Turbidity Investigation Titan Report Ref: CS0491_HTI_DR
C.2.3.2 JFE 0236 (REFERENCE)

Client: Harwich Haven Authority Project Title: Harwich Turbidity Investigation Titan Report Ref: CS0491_HTI_DR
C.2.3.3 JFE 0239 (ADDITIONAL SENSOR)

Client: Harwich Haven Authority Project Title: Harwich Turbidity Investigation Titan Report Ref: CS0491_HTI_DR
APPENDIX D
DATA RESULTS
D.1 Turbidity/Suspended Sediment Concentration
D.2 Particle Size Distribution Analysis

Client: Harwich Haven Authority Project Title: Harwich Turbidity Investigation Titan Report Ref: CS0491_HTI_DR
D.1 TURBIDITY/SUSPENDED SEDIMENT CONCENTRATION

Client: Harwich Haven Authority Project Title: Harwich Turbidity Investigation Titan Report Ref: CS0491_HTI_DR
D.1.1 BO1
Table 1.1 Mean, maximum and minimum Turbidity (FTU) recorded at the near bed at BO1 (Q100)
Data Period
Mean
Turbidity
(FTU)
Maximum
Turbidity
(FTU)
Date and Time
(UTC)
Minimum
Turbidity
(FTU))
Date and Time
(UTC)
All 39.4 541.5 31/05/2016 13:20 6.7 15/07/2016 14:00
May-16 67.1 541.5 31/05/2016 13:20 8.3 27/05/2016 21:20
Jun-16 26.9 167.1 02/06/2016 03:00 9.7 01/06/2016 08:10
Jul-15 28.6 289.3 02/07/2016 15:40 6.7 15/07/2016 14:00
Aug-15 52.1 341.3 10/08/2016 15:00 7.8 31/08/2016 23:00
Sep-15 68.6 280.0 02/09/2016 00:20 8.9 05/09/2016 13:50
Spring 27.6 100.1 03/06/2016 02:40 12.3 05/06/2016 05:20
Neap 22.2 92.0 12/06/2016 17:10 10.7 15/06/2016 01:50
Table 1.2 Mean, maximum and minimum Suspended Sediment Concentrations (mg/l) recorded at the near bed at BO1 (Q100)
Data Period Mean SSC
(mg/l)
Maximum
SSC (mg/l)
Date and Time
(UTC)
Minimum
SSC (mg/l)
Date and Time
(UTC)
All 41.0 764.0* 31/05/2016 13:20 0.8 15/07/2016 14:00
May-16 70.6 764.0* 31/05/2016 13:20 4.7 27/05/2016 21:10
Jun-16 24.0 184.4 02/06/2016 03:00 6.1 01/06/2016 01:50
Jul-15 26.8 346.3 02/07/2016 15:40 0.8 15/07/2016 14:00
Aug-15 59.4 484.1 10/08/2016 15:00 2.2 31/08/2016 23:00
Sep-15 81.3 389.3 02/09/2016 00:20 3.5 05/09/2016 13:50
Spring 24.8 104.4 03/06/2016 02:40 8.8 05/06/2016 05:20
Neap 19.2 95.2 12/06/2016 17:10 7.1 15/06/2016 01:50
* = this value was obtained through extrapolation of the SSC conversion coefficients
All data - Dep. 1: 26/05/2016 10:50 – 13/07/2016 11:20 Dep. 2: 13/07/2016 13:50 – 06/09/2016 08:00 Tidal Period - Spring: 03/06/2016 00:00 – 09/06/2016 23:59 Neap: 12/06/2016 00:00 – 16/06/2016 23:59
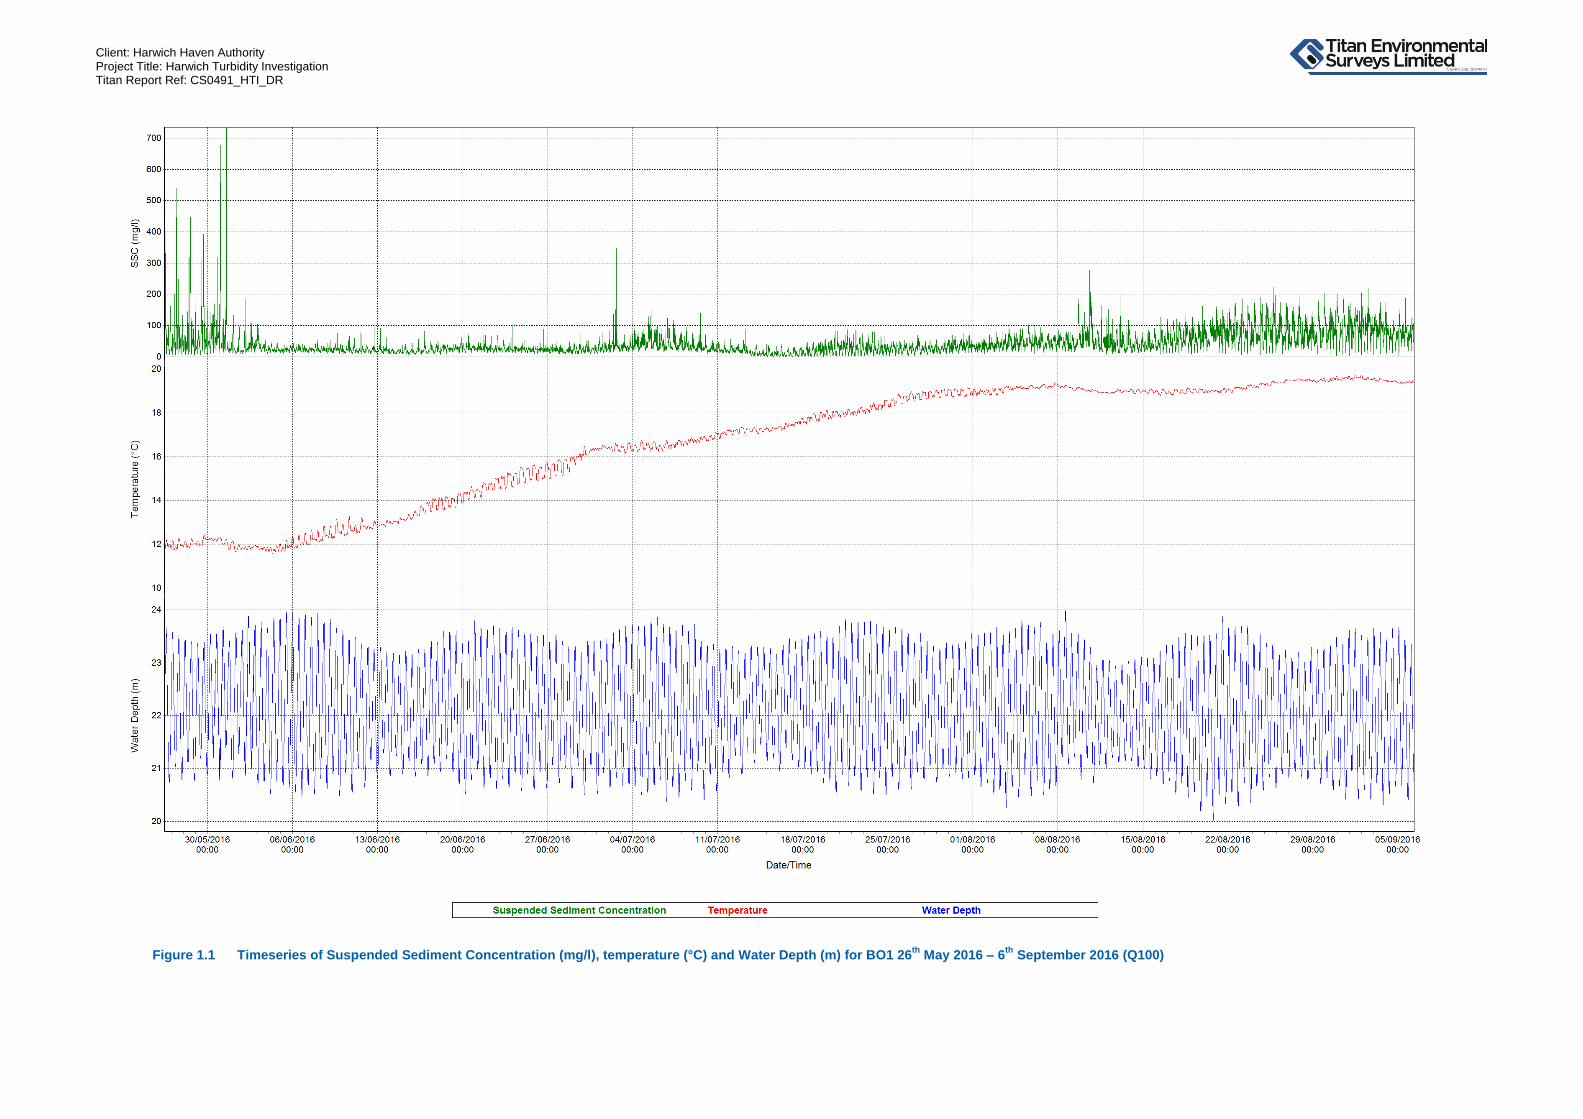
Client: Harwich Haven Authority Project Title: Harwich Turbidity Investigation Titan Report Ref: CS0491_HTI_DR
Figure 1.1 Timeseries of Suspended Sediment Concentration (mg/l), temperature (°C) and Water Depth (m) for BO1 26
th May 2016 – 6
th September 2016 (Q100)
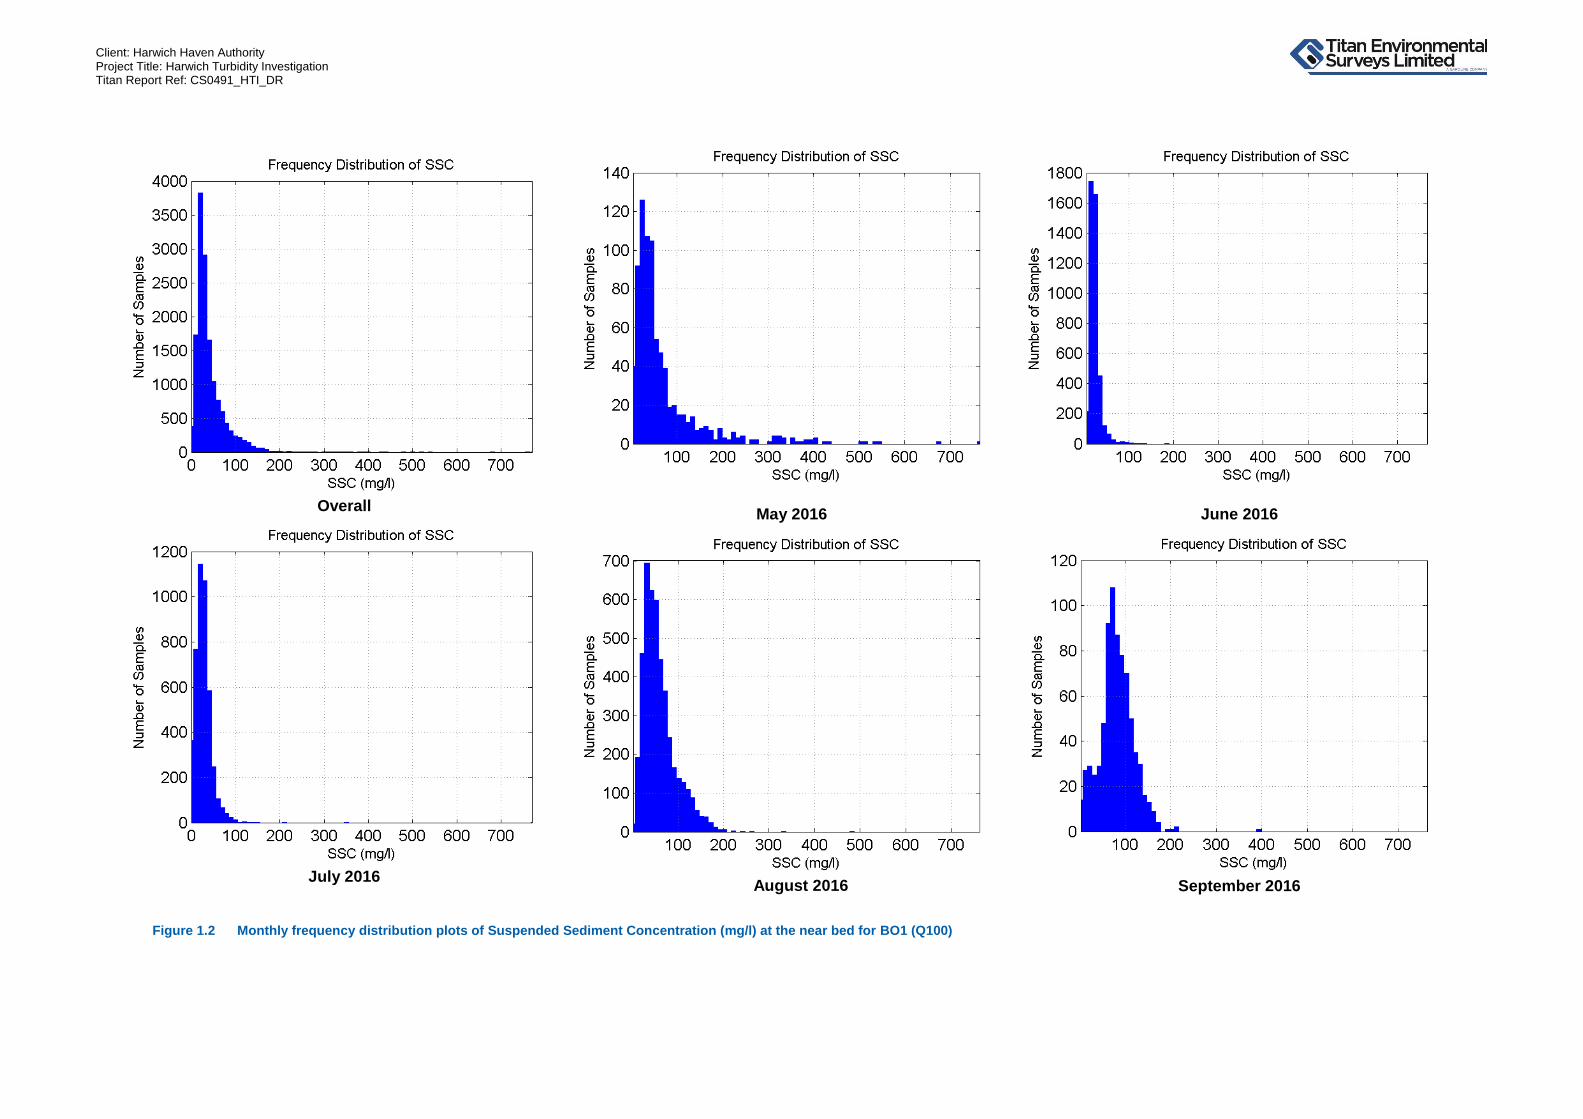
Client: Harwich Haven Authority Project Title: Harwich Turbidity Investigation Titan Report Ref: CS0491_HTI_DR
Overall
May 2016
June 2016
July 2016
August 2016
September 2016
Figure 1.2 Monthly frequency distribution plots of Suspended Sediment Concentration (mg/l) at the near bed for BO1 (Q100)

Client: Harwich Haven Authority Project Title: Harwich Turbidity Investigation Titan Report Ref: CS0491_HTI_DR
D.1.2 BO2
Table 1.3 Mean, maximum and minimum Turbidity (FTU) recorded at the near bed at BO2 (Q100)
Data Period
Mean
Turbidity
(FTU)
Maximum
Turbidity
(FTU)
Date and Time
(UTC)
Minimum
Turbidity
(FTU))
Date and Time
(UTC)
All 24.2 189.4 10/08/2016 16:30 1.3 18/07/2016 16:50
May-16 32.9 186.5 31/05/2016 00:00 1.7 28/05/2016 16:10
Jun-16 18.8 139.1 02/06/2016 14:30 2.5 30/06/2016 13:50
Jul-15 16.2 78.8 01/07/2016 00:00 1.3 18/07/2016 16:50
Aug-15 31.9 189.4 10/08/2016 16:30 7.2 01/08/2016 16:40
Sep-15 48.2 103.7 01/09/2016 23:30 19.6 01/09/2016 11:50
Spring 20.2 120.9 03/06/2016 03:50 4.8 09/06/2016 02:30
Neap 13.1 72.2 15/06/2106 08:00 3.0 14/06/2016 12:40
Table 1.4 Mean, maximum and minimum Suspended Sediment Concentrations (mg/l) recorded at the near bed at BO2 (Q100)
Data Period Mean SSC
(mg/l)
Maximum
SSC (mg/l)
Date and Time
(UTC)
Minimum
SSC (mg/l)
Date and Time
(UTC)
All 24.8 269.3 10/08/2016 16:30 4.7 01/07/2016 14:30
May-16 30.2 205.0 31/05/2016 00:00 4.9 28/05/2016 16:10
Jun-16 18.0 141.4 02/06/2016 14:30 5.4 30/06/2016 13:50
Jul-15 18.5 80.6 20/07/2016 15:40 4.7 01/07/2016 14:30
Aug-15 32.9 269.3 10/08/2016 16:30 14.1 01/08/2016 16:40
Sep-15 47.2 114.3 01/09/2016 23:30 22.2 01/09/2016 11:50
Spring 19.1 119.2 03/06/2016 03:50 7.1 09/06/2016 02:30
Neap 13.5 65.9 15/06/2016 08:00 5.8 14/06/2016 12:40
All data - Dep. 1: 26/05/2016 10:20 – 13/07/2016 11:40 Dep. 2: 13/07/2016 13:30 – 06/09/2016 07:30 Tidal Period - Spring: 03/06/2016 00:00 – 09/06/2016 23:59 Neap: 12/06/2016 00:00 – 16/06/2016 23:59

Client: Harwich Haven Authority Project Title: Harwich Turbidity Investigation Titan Report Ref: CS0491_HTI_DR
Figure 1.3 Timeseries of Suspended Sediment Concentration (mg/l), temperature (°C) and Water Depth (m) for BO2 26
th May 2016 – 6
th September 2016 (Q100)

Client: Harwich Haven Authority Project Title: Harwich Turbidity Investigation Titan Report Ref: CS0491_HTI_DR
Overall
May 2016
June 2016
July 2016
August 2016
September 2016
Figure 1.4 Monthly frequency distribution plots of Suspended Sediment Concentration (mg/l) at the near bed for BO2 (Q100)

Client: Harwich Haven Authority Project Title: Harwich Turbidity Investigation Titan Report Ref: CS0491_HTI_DR
D.1.3 BO3
Table 1.5 Mean, maximum and minimum Turbidity (FTU) recorded at the near bed at BO3 (Q100)
Data Period
Mean
Turbidity
(FTU)
Maximum
Turbidity
(FTU)
Date and Time
(UTC)
Minimum
Turbidity
(FTU))
Date and Time
(UTC)
All 35.9 734.1 26/07/2016 16:30 2.4 30/06/2016 13:40
May-16 36.8 243.6 28/05/2016 17:10 4.4 28/05/2016 09:40
Jun-16 19.8 175.9 29/06/2016 16:00 2.4 30/06/2016 13:40
Jul-15 45.5 734.1 26/07/2016 16:30 2.5 01/07/2016 14:40
Aug-15 38.8 443.8 01/08/2016 11:20 9.9 31/08/2016 23:20
Sep-15 44.7 165.7 01/09/2016 00:10 9.4 02/09/2016 12:10
Spring 20.8 84.0 03/06/2016 04:10 7.4 04/06/2016 10:40
Neap 13.7 73.5 13/06/2016 05:40 3.2 15/06/2016 14:20
Table 1.6 Mean, maximum and minimum Suspended Sediment Concentrations (mg/l) recorded at the near bed at BO3 (Q100)
Data Period Mean SSC
(mg/l)
Maximum
SSC (mg/l)
Date and Time
(UTC)
Minimum
SSC (mg/l)
Date and Time
(UTC)
All 40.0 1267.0* 26/07/2016 16:30 0.5 18/07/2016 16:20
May-16 35.4 262.7 27/05/2016 16:30 6.6 28/05/2016 22:20
Jun-16 19.0 193.1 29/06/2016 16:00 5.2 30/06/2016 13:40
Jul-15 53.0 1267.0* 26/07/2016 16:30 0.5 18/07/2016 16:20
Aug-15 42.9 630.6* 01/08/2016 11:20 2.0 31/08/2016 23:20
Sep-15 51.2 213.6 02/09/2016 12:10 1.2 02/09/2016 12:10
Spring 19.6 79.1 03/06/2016 04:10 8.9 04/06/2016 10:40
Neap 6.9 68.1 13/06/2016 05:40 5.7 15/06/2016 14:20
* = this value was obtained through extrapolation of the SSC conversion coefficients
All data - Dep. 1: 26/05/2016 08:20 – 13/07/2016 12:00 Dep. 2: 13/07/2016 13:20 – 06/09/2016 06:50 Tidal Period - Spring: 03/06/2016 00:00 – 09/06/2016 23:59 Neap: 12/06/2016 00:00 – 16/06/2016 23:59

Client: Harwich Haven Authority Project Title: Harwich Turbidity Investigation Titan Report Ref: CS0491_HTI_DR
Figure 1.5 Timeseries of Suspended Sediment Concentration (mg/l), temperature (°C) and Water Depth (m) for BO3 26
th May 2016 – 6
th September 2016 (Q100)
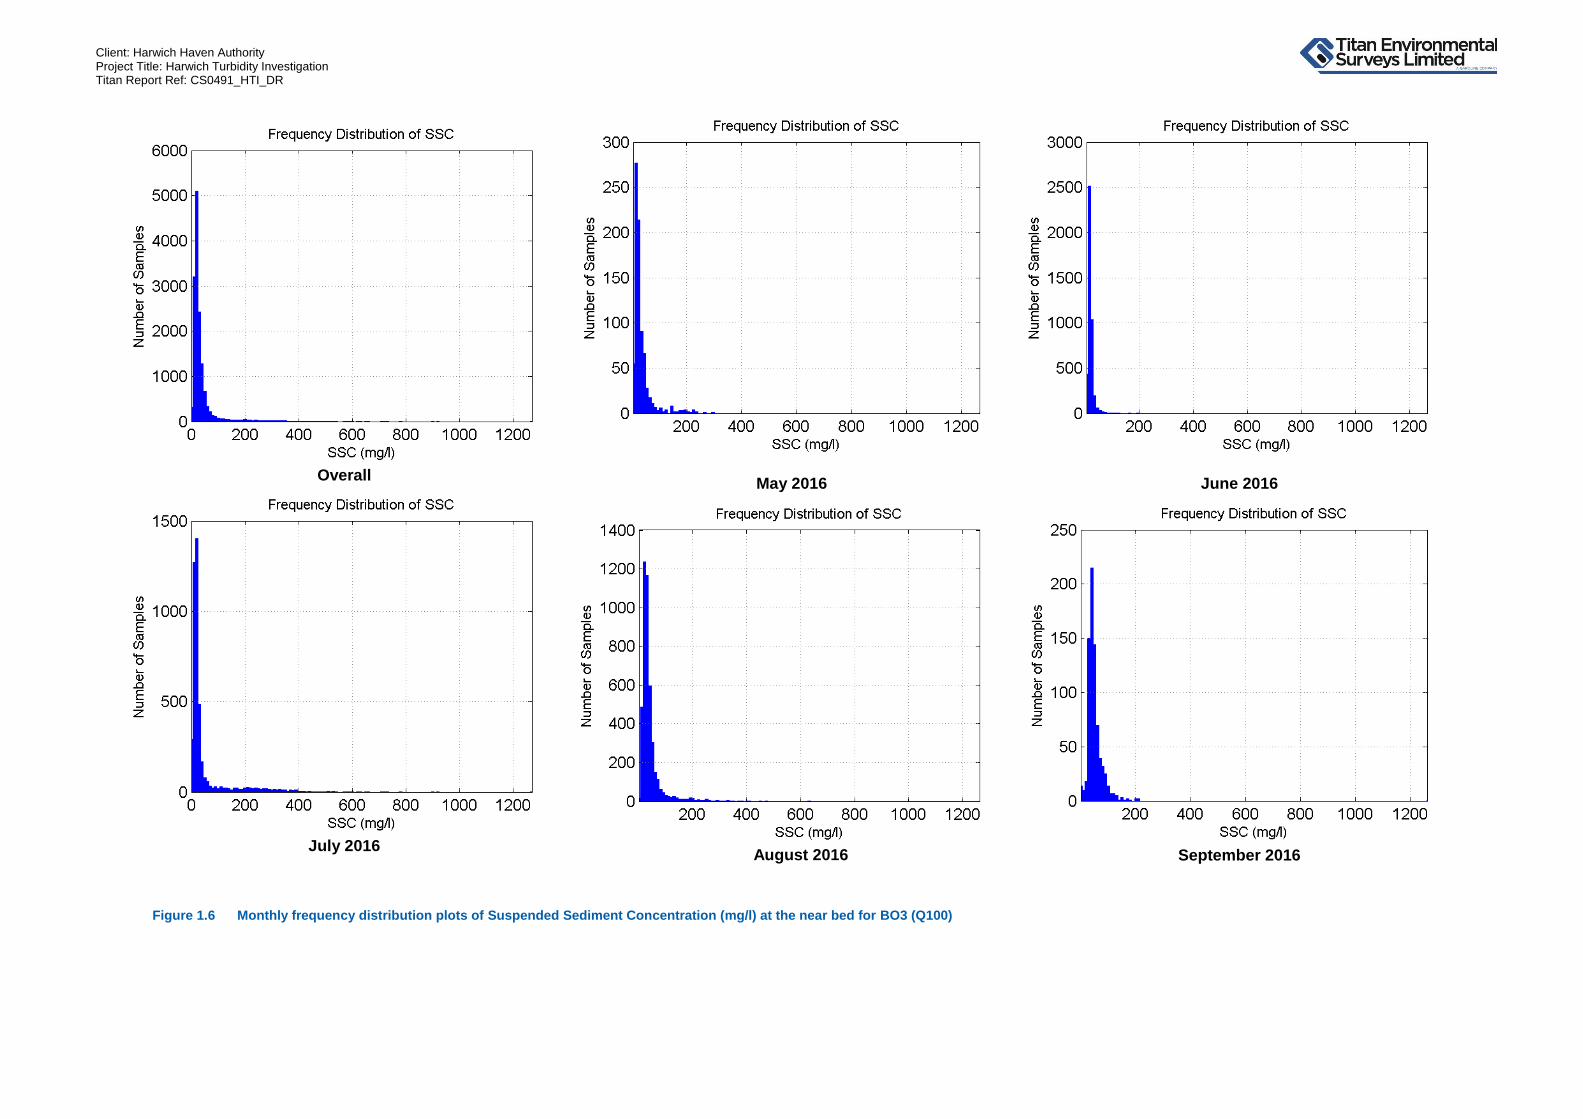
Client: Harwich Haven Authority Project Title: Harwich Turbidity Investigation Titan Report Ref: CS0491_HTI_DR
Overall
May 2016
June 2016
July 2016
August 2016
September 2016
Figure 1.6 Monthly frequency distribution plots of Suspended Sediment Concentration (mg/l) at the near bed for BO3 (Q100)

Client: Harwich Haven Authority Project Title: Harwich Turbidity Investigation Titan Report Ref: CS0491_HTI_DR
D.2 PARTICLE SIZE DISTRIBUTION
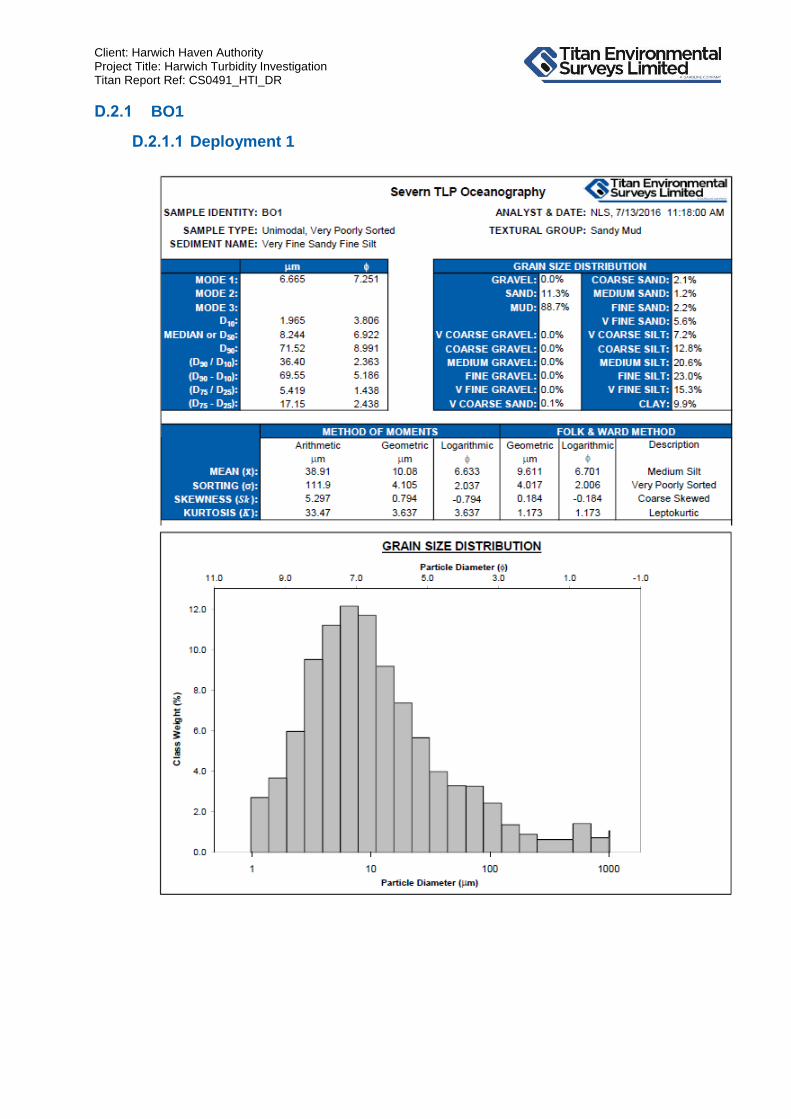
Client: Harwich Haven Authority Project Title: Harwich Turbidity Investigation Titan Report Ref: CS0491_HTI_DR
D.2.1 BO1
D.2.1.1 Deployment 1

Client: Harwich Haven Authority Project Title: Harwich Turbidity Investigation Titan Report Ref: CS0491_HTI_DR
D.2.1.2 Deployment 2

Client: Harwich Haven Authority Project Title: Harwich Turbidity Investigation Titan Report Ref: CS0491_HTI_DR
D.2.2 BO2
D.2.2.1 Deployment 1

Client: Harwich Haven Authority Project Title: Harwich Turbidity Investigation Titan Report Ref: CS0491_HTI_DR
D.2.2.2 Deployment 2

Client: Harwich Haven Authority Project Title: Harwich Turbidity Investigation Titan Report Ref: CS0491_HTI_DR
D.2.3 BO3
D.2.3.1 Deployment 1

Client: Harwich Haven Authority Project Title: Harwich Turbidity Investigation Titan Report Ref: CS0491_HTI_DR
D.2.3.2 Deployment 2

Client: Harwich Haven Authority Project Title: Harwich Turbidity Investigation Titan Report Ref: CS0491_HTI_DR
D.2.4 B4
D.2.4.1 Deployment 1

Client: Harwich Haven Authority Project Title: Harwich Turbidity Investigation Titan Report Ref: CS0491_HTI_DR
D.2.4.2 Deployment 2

Client: Harwich Haven Authority Project Title: Harwich Turbidity Investigation Titan Report Ref: CS0491_HTI_DR
D.2.5 B5
D.2.5.1 Deployment 1

Client: Harwich Haven Authority Project Title: Harwich Turbidity Investigation Titan Report Ref: CS0491_HTI_DR
D.2.5.2 Deployment 2

Harwich Haven Disposal Site TH027
Monitoring Report
DLM7823-RT001-R02-00
B. Thomson Unicomarine particle size analysis reports
B.1. May 2016
Client Name
Client Address
Report Title
Method
Subcontracted Tests
Authorisation Daisy Chamberlain 13.06.16
Laboratory Manager
N/A
Thomson Ecology, Compass House, 60 Priestley Road, Surrey Research Park, Guildford,
GU2 7AG
Harwich Haven Authority
TEM10 Particle Size Analysis
Harbour House, The Quay, Harwich, Essex, CO12
3HH
HHAESC16 ‐ Harwich East Ship Channel May 2016
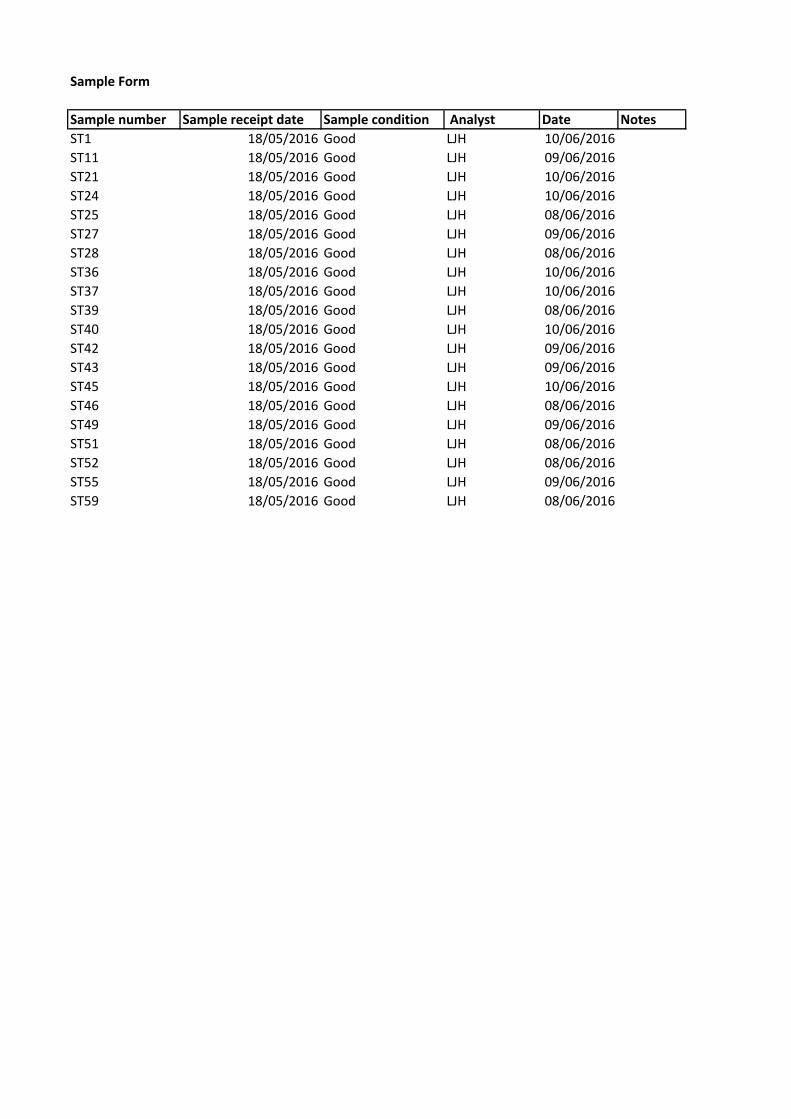
Sample Form
Sample number Sample receipt date Sample condition Analyst Date Notes
ST1 18/05/2016 Good LJH 10/06/2016
ST11 18/05/2016 Good LJH 09/06/2016
ST21 18/05/2016 Good LJH 10/06/2016
ST24 18/05/2016 Good LJH 10/06/2016
ST25 18/05/2016 Good LJH 08/06/2016
ST27 18/05/2016 Good LJH 09/06/2016
ST28 18/05/2016 Good LJH 08/06/2016
ST36 18/05/2016 Good LJH 10/06/2016
ST37 18/05/2016 Good LJH 10/06/2016
ST39 18/05/2016 Good LJH 08/06/2016
ST40 18/05/2016 Good LJH 10/06/2016
ST42 18/05/2016 Good LJH 09/06/2016
ST43 18/05/2016 Good LJH 09/06/2016
ST45 18/05/2016 Good LJH 10/06/2016
ST46 18/05/2016 Good LJH 08/06/2016
ST49 18/05/2016 Good LJH 09/06/2016
ST51 18/05/2016 Good LJH 08/06/2016
ST52 18/05/2016 Good LJH 08/06/2016
ST55 18/05/2016 Good LJH 09/06/2016
ST59 18/05/2016 Good LJH 08/06/2016
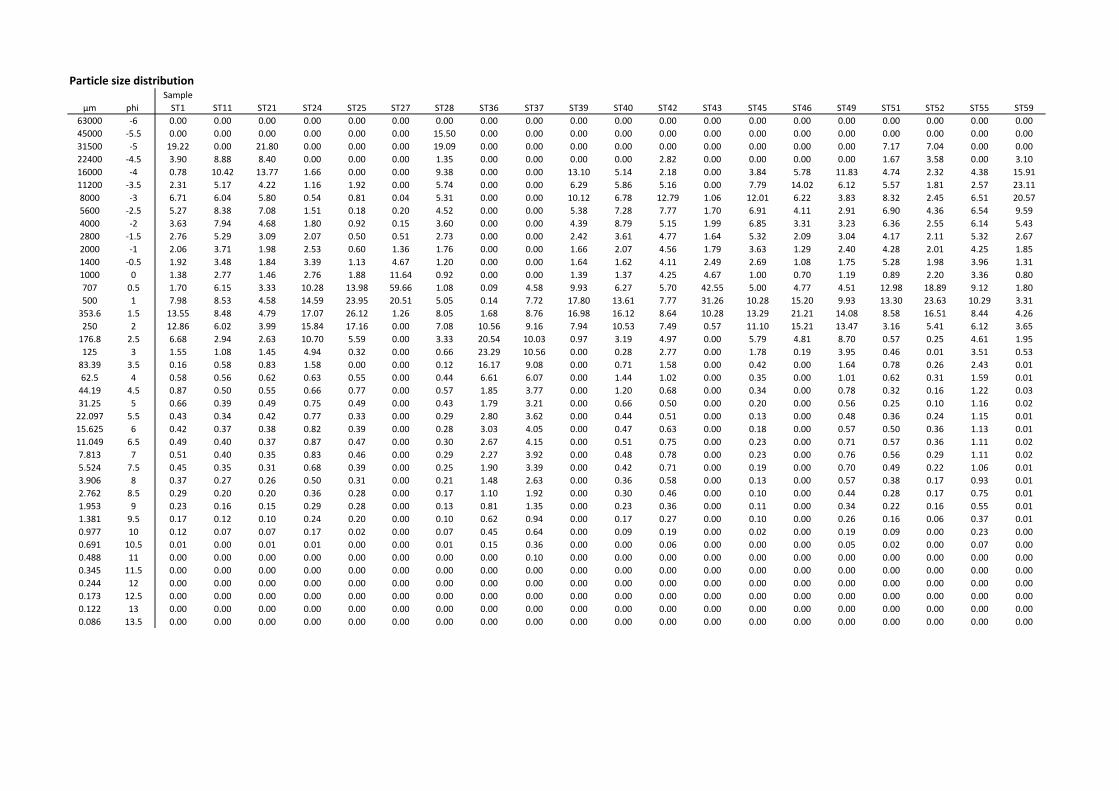
Particle size distributionSample
µm phi ST1 ST11 ST21 ST24 ST25 ST27 ST28 ST36 ST37 ST39 ST40 ST42 ST43 ST45 ST46 ST49 ST51 ST52 ST55 ST59
63000 ‐6 0.00 0.00 0.00 0.00 0.00 0.00 0.00 0.00 0.00 0.00 0.00 0.00 0.00 0.00 0.00 0.00 0.00 0.00 0.00 0.00
45000 ‐5.5 0.00 0.00 0.00 0.00 0.00 0.00 15.50 0.00 0.00 0.00 0.00 0.00 0.00 0.00 0.00 0.00 0.00 0.00 0.00 0.00
31500 ‐5 19.22 0.00 21.80 0.00 0.00 0.00 19.09 0.00 0.00 0.00 0.00 0.00 0.00 0.00 0.00 0.00 7.17 7.04 0.00 0.00
22400 ‐4.5 3.90 8.88 8.40 0.00 0.00 0.00 1.35 0.00 0.00 0.00 0.00 2.82 0.00 0.00 0.00 0.00 1.67 3.58 0.00 3.10
16000 ‐4 0.78 10.42 13.77 1.66 0.00 0.00 9.38 0.00 0.00 13.10 5.14 2.18 0.00 3.84 5.78 11.83 4.74 2.32 4.38 15.91
11200 ‐3.5 2.31 5.17 4.22 1.16 1.92 0.00 5.74 0.00 0.00 6.29 5.86 5.16 0.00 7.79 14.02 6.12 5.57 1.81 2.57 23.11
8000 ‐3 6.71 6.04 5.80 0.54 0.81 0.04 5.31 0.00 0.00 10.12 6.78 12.79 1.06 12.01 6.22 3.83 8.32 2.45 6.51 20.57
5600 ‐2.5 5.27 8.38 7.08 1.51 0.18 0.20 4.52 0.00 0.00 5.38 7.28 7.77 1.70 6.91 4.11 2.91 6.90 4.36 6.54 9.59
4000 ‐2 3.63 7.94 4.68 1.80 0.92 0.15 3.60 0.00 0.00 4.39 8.79 5.15 1.99 6.85 3.31 3.23 6.36 2.55 6.14 5.43
2800 ‐1.5 2.76 5.29 3.09 2.07 0.50 0.51 2.73 0.00 0.00 2.42 3.61 4.77 1.64 5.32 2.09 3.04 4.17 2.11 5.32 2.67
2000 ‐1 2.06 3.71 1.98 2.53 0.60 1.36 1.76 0.00 0.00 1.66 2.07 4.56 1.79 3.63 1.29 2.40 4.28 2.01 4.25 1.85
1400 ‐0.5 1.92 3.48 1.84 3.39 1.13 4.67 1.20 0.00 0.00 1.64 1.62 4.11 2.49 2.69 1.08 1.75 5.28 1.98 3.96 1.31
1000 0 1.38 2.77 1.46 2.76 1.88 11.64 0.92 0.00 0.00 1.39 1.37 4.25 4.67 1.00 0.70 1.19 0.89 2.20 3.36 0.80
707 0.5 1.70 6.15 3.33 10.28 13.98 59.66 1.08 0.09 4.58 9.93 6.27 5.70 42.55 5.00 4.77 4.51 12.98 18.89 9.12 1.80
500 1 7.98 8.53 4.58 14.59 23.95 20.51 5.05 0.14 7.72 17.80 13.61 7.77 31.26 10.28 15.20 9.93 13.30 23.63 10.29 3.31
353.6 1.5 13.55 8.48 4.79 17.07 26.12 1.26 8.05 1.68 8.76 16.98 16.12 8.64 10.28 13.29 21.21 14.08 8.58 16.51 8.44 4.26
250 2 12.86 6.02 3.99 15.84 17.16 0.00 7.08 10.56 9.16 7.94 10.53 7.49 0.57 11.10 15.21 13.47 3.16 5.41 6.12 3.65
176.8 2.5 6.68 2.94 2.63 10.70 5.59 0.00 3.33 20.54 10.03 0.97 3.19 4.97 0.00 5.79 4.81 8.70 0.57 0.25 4.61 1.95
125 3 1.55 1.08 1.45 4.94 0.32 0.00 0.66 23.29 10.56 0.00 0.28 2.77 0.00 1.78 0.19 3.95 0.46 0.01 3.51 0.53
83.39 3.5 0.16 0.58 0.83 1.58 0.00 0.00 0.12 16.17 9.08 0.00 0.71 1.58 0.00 0.42 0.00 1.64 0.78 0.26 2.43 0.01
62.5 4 0.58 0.56 0.62 0.63 0.55 0.00 0.44 6.61 6.07 0.00 1.44 1.02 0.00 0.35 0.00 1.01 0.62 0.31 1.59 0.01
44.19 4.5 0.87 0.50 0.55 0.66 0.77 0.00 0.57 1.85 3.77 0.00 1.20 0.68 0.00 0.34 0.00 0.78 0.32 0.16 1.22 0.03
31.25 5 0.66 0.39 0.49 0.75 0.49 0.00 0.43 1.79 3.21 0.00 0.66 0.50 0.00 0.20 0.00 0.56 0.25 0.10 1.16 0.02
22.097 5.5 0.43 0.34 0.42 0.77 0.33 0.00 0.29 2.80 3.62 0.00 0.44 0.51 0.00 0.13 0.00 0.48 0.36 0.24 1.15 0.01
15.625 6 0.42 0.37 0.38 0.82 0.39 0.00 0.28 3.03 4.05 0.00 0.47 0.63 0.00 0.18 0.00 0.57 0.50 0.36 1.13 0.01
11.049 6.5 0.49 0.40 0.37 0.87 0.47 0.00 0.30 2.67 4.15 0.00 0.51 0.75 0.00 0.23 0.00 0.71 0.57 0.36 1.11 0.02
7.813 7 0.51 0.40 0.35 0.83 0.46 0.00 0.29 2.27 3.92 0.00 0.48 0.78 0.00 0.23 0.00 0.76 0.56 0.29 1.11 0.02
5.524 7.5 0.45 0.35 0.31 0.68 0.39 0.00 0.25 1.90 3.39 0.00 0.42 0.71 0.00 0.19 0.00 0.70 0.49 0.22 1.06 0.01
3.906 8 0.37 0.27 0.26 0.50 0.31 0.00 0.21 1.48 2.63 0.00 0.36 0.58 0.00 0.13 0.00 0.57 0.38 0.17 0.93 0.01
2.762 8.5 0.29 0.20 0.20 0.36 0.28 0.00 0.17 1.10 1.92 0.00 0.30 0.46 0.00 0.10 0.00 0.44 0.28 0.17 0.75 0.01
1.953 9 0.23 0.16 0.15 0.29 0.28 0.00 0.13 0.81 1.35 0.00 0.23 0.36 0.00 0.11 0.00 0.34 0.22 0.16 0.55 0.01
1.381 9.5 0.17 0.12 0.10 0.24 0.20 0.00 0.10 0.62 0.94 0.00 0.17 0.27 0.00 0.10 0.00 0.26 0.16 0.06 0.37 0.01
0.977 10 0.12 0.07 0.07 0.17 0.02 0.00 0.07 0.45 0.64 0.00 0.09 0.19 0.00 0.02 0.00 0.19 0.09 0.00 0.23 0.00
0.691 10.5 0.01 0.00 0.01 0.01 0.00 0.00 0.01 0.15 0.36 0.00 0.00 0.06 0.00 0.00 0.00 0.05 0.02 0.00 0.07 0.00
0.488 11 0.00 0.00 0.00 0.00 0.00 0.00 0.00 0.00 0.10 0.00 0.00 0.00 0.00 0.00 0.00 0.00 0.00 0.00 0.00 0.00
0.345 11.5 0.00 0.00 0.00 0.00 0.00 0.00 0.00 0.00 0.00 0.00 0.00 0.00 0.00 0.00 0.00 0.00 0.00 0.00 0.00 0.00
0.244 12 0.00 0.00 0.00 0.00 0.00 0.00 0.00 0.00 0.00 0.00 0.00 0.00 0.00 0.00 0.00 0.00 0.00 0.00 0.00 0.00
0.173 12.5 0.00 0.00 0.00 0.00 0.00 0.00 0.00 0.00 0.00 0.00 0.00 0.00 0.00 0.00 0.00 0.00 0.00 0.00 0.00 0.00
0.122 13 0.00 0.00 0.00 0.00 0.00 0.00 0.00 0.00 0.00 0.00 0.00 0.00 0.00 0.00 0.00 0.00 0.00 0.00 0.00 0.00
0.086 13.5 0.00 0.00 0.00 0.00 0.00 0.00 0.00 0.00 0.00 0.00 0.00 0.00 0.00 0.00 0.00 0.00 0.00 0.00 0.00 0.00

SAMPLE STATISTICS
ST59 ST28 ST39 ST46 ST25 ST52 ST51 ST11
ANALYST AND DATE: LJH, 6/13/2016 LJH, 6/13/2016 LJH, 6/13/2016 LJH, 6/13/2016 LJH, 6/13/2016 LJH, 6/13/2016 LJH, 6/13/2016 LJH, 6/13/2016SIEVING ERROR:SAMPLE TYPE: Bimodal, Poorly Sorted Trimodal, Very Poorly Sorted Trimodal, Very Poorly Sorted Bimodal, Very Poorly Sorted Unimodal, Moderately Sorted Trimodal, Very Poorly Sorted Polymodal, Very Poorly Sorted Trimodal, Very Poorly SortedTEXTURAL GROUP: Gravel Sandy Gravel Sandy Gravel Sandy Gravel Slightly Gravelly Sand Gravelly Sand Sandy Gravel Sandy GravelSEDIMENT NAME: Medium Gravel Sandy Very Coarse Gravel Sandy Medium Gravel Sandy Medium Gravel lightly Medium Gravelly Medium San Fine Gravelly Coarse Sand Sandy Medium Gravel Sandy Coarse Gravel
METHOD OF MEAN 10156.1 19876.3 5375.5 4461.2 909.9 5578.5 7020.2 7157.2MOMENTS SORTING 6773.2 19986.6 6667.3 6019.7 2042.5 10742.8 10436.6 8577.8
Arithmetic (m) SKEWNESS 0.282 0.570 1.098 1.196 5.334 2.248 2.006 1.189KURTOSIS 2.497 1.779 2.736 2.979 31.55 6.684 6.143 3.101
METHOD OF MEAN 6083.7 5476.0 1884.1 1368.6 460.9 1268.5 1981.2 2264.9MOMENTS SORTING 3.783 9.167 4.611 4.825 2.990 5.289 6.608 6.542
Geometric (m) SKEWNESS -1.446 -0.873 0.326 0.537 -1.088 0.336 -0.705 -0.737KURTOSIS 4.226 2.981 1.439 1.581 10.68 3.945 4.078 3.531
METHOD OF MEAN -2.605 -2.453 -0.914 -0.453 1.117 -0.343 -0.986 -1.179MOMENTS SORTING 1.920 3.196 2.205 2.271 1.580 2.403 2.724 2.710Logarithmic () SKEWNESS 1.446 0.873 -0.326 -0.537 1.088 -0.336 0.705 0.737
KURTOSIS 4.226 2.981 1.439 1.581 10.68 3.945 4.078 3.531
FOLK AND MEAN 5780.5 5845.0 1699.3 1343.0 476.1 1417.2 2276.8 2778.7WARD METHOD SORTING 3.724 7.813 4.526 4.704 1.970 4.534 5.716 5.814
(m) SKEWNESS -0.611 -0.451 0.522 0.613 0.034 0.624 0.077 -0.160KURTOSIS 1.539 0.559 0.584 0.557 1.552 1.022 0.895 0.714
FOLK AND MEAN -2.531 -2.547 -0.765 -0.425 1.071 -0.503 -1.187 -1.474WARD METHOD SORTING 1.897 2.966 2.178 2.234 0.978 2.181 2.515 2.540() SKEWNESS 0.611 0.451 -0.522 -0.613 -0.034 -0.624 -0.077 0.160
KURTOSIS 1.539 0.559 0.584 0.557 1.552 1.022 0.895 0.714
FOLK AND MEAN: Fine Gravel Fine Gravel Very Coarse Sand Very Coarse Sand Medium Sand Very Coarse Sand Very Fine Gravel Very Fine GravelWARD METHOD SORTING: Poorly Sorted Very Poorly Sorted Very Poorly Sorted Very Poorly Sorted Moderately Sorted Very Poorly Sorted Very Poorly Sorted Very Poorly Sorted(Description) SKEWNESS: Very Fine Skewed Very Fine Skewed Very Coarse Skewed Very Coarse Skewed Symmetrical Very Coarse Skewed Symmetrical Fine Skewed
KURTOSIS: Very Leptokurtic Very Platykurtic Very Platykurtic Very Platykurtic Very Leptokurtic Mesokurtic Platykurtic Platykurtic
MODE 1 (m): 13600.0 38250.0 605.0 427.5 427.5 605.0 605.0 19200.0
MODE 2 (m): 427.5 19200.0 19200.0 13600.0 38250.0 9600.0 427.5
MODE 3 (m): 427.5 9600.0 6800.0 38250.0 4800.0MODE 1 (): -3.743 -5.235 0.747 1.247 1.247 0.747 0.747 -4.243MODE 2 (): 1.247 -4.243 -4.243 -3.743 -5.235 -3.243 1.247MODE 3 (): 1.247 -3.243 -2.743 -5.235 -2.243
D10 (m): 477.9 280.8 362.9 280.5 237.7 365.9 358.1 269.0D50 (m): 9844.8 11957.0 882.8 609.5 473.6 727.2 1892.7 3229.2D90 (m): 19356.7 50706.3 17324.7 14371.3 950.6 23771.3 20629.4 21604.7(D90 / D10) (m): 40.50 180.6 47.74 51.23 4.000 64.96 57.60 80.31(D90 - D10) (m): 18878.8 50425.5 16961.8 14090.7 713.0 23405.3 20271.2 21335.6(D75 / D25) (m): 3.083 64.63 18.92 22.04 2.033 6.900 14.84 20.23(D75 - D25) (m): 9855.6 37096.8 8800.4 8070.8 344.9 2947.2 8244.6 10334.6D10 (): -4.275 -5.664 -4.115 -3.845 0.073 -4.571 -4.367 -4.433D50 (): -3.299 -3.580 0.180 0.714 1.078 0.460 -0.920 -1.691D90 (): 1.065 1.833 1.462 1.834 2.073 1.450 1.481 1.894(D90 / D10) (): -0.249 -0.324 -0.355 -0.477 28.38 -0.317 -0.339 -0.427(D90 - D10) (): 5.340 7.497 5.577 5.679 2.000 6.021 5.848 6.327(D75 / D25) (): 0.580 -0.149 -0.319 -0.449 2.830 -0.561 -0.238 -0.260(D75 - D25) (): 1.625 6.014 4.242 4.462 1.024 2.787 3.892 4.338
% GRAVEL: 82.2% 69.0% 43.4% 36.8% 4.9% 28.2% 49.2% 55.8%% SAND: 17.6% 27.9% 56.6% 63.2% 90.7% 69.5% 46.6% 40.6%% MUD: 0.2% 3.1% 0.0% 0.0% 4.4% 2.3% 4.2% 3.6%% V COARSE GRAVEL: 0.0% 33.7% 0.0% 0.0% 0.0% 6.7% 6.9% 0.0%% COARSE GRAVEL: 19.0% 11.6% 13.1% 5.8% 0.0% 6.2% 6.7% 19.3%% MEDIUM GRAVEL: 43.7% 11.1% 16.4% 20.2% 2.7% 4.3% 13.9% 11.2%% FINE GRAVEL: 15.0% 8.1% 9.8% 7.4% 1.1% 6.9% 13.3% 16.3%% V FINE GRAVEL: 4.5% 4.5% 4.1% 3.4% 1.1% 4.1% 8.5% 9.0%% V COARSE SAND: 2.1% 2.1% 3.0% 1.8% 3.0% 4.2% 6.2% 6.3%% COARSE SAND: 5.1% 6.1% 27.7% 20.0% 37.9% 42.5% 26.3% 14.7%% MEDIUM SAND: 7.9% 15.1% 24.9% 36.4% 43.3% 21.9% 11.7% 14.5%% FINE SAND: 2.5% 4.0% 1.0% 5.0% 5.9% 0.3% 1.0% 4.0%% V FINE SAND: 0.0% 0.6% 0.0% 0.0% 0.6% 0.6% 1.4% 1.2%% V COARSE SILT: 0.0% 1.0% 0.0% 0.0% 1.2% 0.3% 0.6% 0.9%% COARSE SILT: 0.0% 0.6% 0.0% 0.0% 0.7% 0.6% 0.9% 0.7%% MEDIUM SILT: 0.0% 0.6% 0.0% 0.0% 0.9% 0.7% 1.1% 0.8%% FINE SILT: 0.0% 0.5% 0.0% 0.0% 0.7% 0.4% 0.9% 0.6%% V FINE SILT: 0.0% 0.3% 0.0% 0.0% 0.6% 0.3% 0.5% 0.4%% CLAY: 0.0% 0.2% 0.0% 0.0% 0.2% 0.1% 0.3% 0.2%
:)( a:)( ax
:)( aSk:)( aK
:)( gx:)( g
:)( gSk:)( gK
:)( x:)(
:)Sk(
:)( K
:)( ZM:)( I
:)( ISk:)( GK
:)( GK
:)( GM:)( G
:)( GSk

SAMPLE STATISTICS
ANALYST AND DATE:SIEVING ERROR:SAMPLE TYPE: TEXTURAL GROUP: SEDIMENT NAME:
METHOD OF MEANMOMENTS SORTINGArithmetic (m) SKEWNESS
KURTOSISMETHOD OF MEANMOMENTS SORTINGGeometric (m) SKEWNESS
KURTOSISMETHOD OF MEANMOMENTS SORTINGLogarithmic () SKEWNESS
KURTOSISFOLK AND MEANWARD METHOD SORTING(m) SKEWNESS
KURTOSISFOLK AND MEANWARD METHOD SORTING() SKEWNESS
KURTOSISFOLK AND MEAN:WARD METHOD SORTING:(Description) SKEWNESS:
KURTOSIS:MODE 1 (m):MODE 2 (m):MODE 3 (m):MODE 1 ():MODE 2 ():MODE 3 ():D10 (m):D50 (m):D90 (m):(D90 / D10) (m):(D90 - D10) (m):(D75 / D25) (m):(D75 - D25) (m):D10 ():D50 ():D90 ():(D90 / D10) ():(D90 - D10) ():(D75 / D25) ():(D75 - D25) ():% GRAVEL:% SAND:% MUD:% V COARSE GRAVEL:% COARSE GRAVEL:% MEDIUM GRAVEL:% FINE GRAVEL:% V FINE GRAVEL:% V COARSE SAND:% COARSE SAND:% MEDIUM SAND:% FINE SAND:% V FINE SAND:% V COARSE SILT:% COARSE SILT:% MEDIUM SILT:% FINE SILT:% V FINE SILT:% CLAY:
:)( a:)( ax
:)( aSk:)( aK
:)( gx:)( g
:)( gSk:)( gK
:)( x:)(
:)Sk(
:)( K
:)( ZM:)( I
:)( ISk:)( GK
:)( GK
:)( GM:)( G
:)( GSk
ST42 ST27 ST55 ST49 ST43 ST40 ST45 ST21
LJH, 6/13/2016 LJH, 6/13/2016 LJH, 6/13/2016 LJH, 6/13/2016 LJH, 6/13/2016 LJH, 6/13/2016 LJH, 6/13/2016 LJH, 6/13/2016
Polymodal, Very Poorly Sorted Unimodal, Well Sorted Trimodal, Very Poorly Sorted Trimodal, Very Poorly Sorted Unimodal, Moderately Sorted Bimodal, Very Poorly Sorted Trimodal, Very Poorly Sorted Polymodal, Very Poorly SortedMuddy Sandy Gravel Slightly Gravelly Sand Muddy Sandy Gravel Sandy Gravel Gravelly Sand Sandy Gravel Sandy Gravel Muddy Sandy Gravel
Medium Silty Sandy Medium Gravelightly Very Fine Gravelly Coarse SanVery Coarse Silty Sandy Fine Grave Sandy Coarse Gravel Fine Gravelly Coarse Sand Sandy Fine Gravel Sandy Medium Gravel ery Coarse Silty Sandy Coarse Grav
4452.4 933.6 3162.5 4257.3 1109.0 3815.0 4284.9 15384.45995.2 498.9 4743.4 6564.8 1368.3 5253.7 5202.3 14566.41.926 7.279 2.040 1.456 4.218 1.614 1.274 0.5096.859 86.94 6.646 3.526 22.07 4.693 3.687 1.727
1253.8 860.2 782.1 866.8 829.1 1129.7 1484.3 4987.37.329 1.384 7.890 7.584 1.814 6.084 5.283 8.163-0.790 1.764 -0.711 -0.217 2.084 -0.479 -0.321 -1.1133.629 10.02 3.363 3.083 7.969 3.463 2.829 3.693
-0.326 0.217 0.355 0.206 0.270 -0.176 -0.570 -2.3182.874 0.469 2.980 2.923 0.859 2.605 2.401 3.0290.790 -1.764 0.711 0.217 -2.084 0.479 0.321 1.1133.629 10.02 3.363 3.083 7.969 3.463 2.829 3.693
1445.4 833.3 910.6 1090.7 736.0 1211.8 1442.1 5335.46.697 1.347 7.914 7.510 1.639 5.482 4.676 7.240-0.079 0.091 -0.027 0.334 0.160 0.310 0.267 -0.4760.882 1.590 1.087 0.889 1.993 0.861 0.612 0.702
-0.532 0.263 0.135 -0.125 0.442 -0.277 -0.528 -2.4162.744 0.429 2.984 2.909 0.713 2.455 2.225 2.8560.079 -0.091 0.027 -0.334 -0.160 -0.310 -0.267 0.4760.882 1.590 1.087 0.889 1.993 0.861 0.612 0.702
Very Coarse Sand Coarse Sand Coarse Sand Very Coarse Sand Coarse Sand Very Coarse Sand Very Coarse Sand Fine GravelVery Poorly Sorted Well Sorted Very Poorly Sorted Very Poorly Sorted Moderately Sorted Very Poorly Sorted Very Poorly Sorted Very Poorly Sorted
Symmetrical Symmetrical Symmetrical Very Coarse Skewed Coarse Skewed Very Coarse Skewed Coarse Skewed Very Fine SkewedPlatykurtic Very Leptokurtic Mesokurtic Platykurtic Very Leptokurtic Platykurtic Very Platykurtic Platykurtic
9600.0 855.0 605.0 427.5 855.0 427.5 427.5 38250.0427.5 9600.0 19200.0 4800.0 9600.0 19200.0
2400.0 19200.0 4800.0 4800.0 6800.0-3.243 0.247 0.747 1.247 0.247 1.247 1.247 -5.2351.247 -3.243 -4.243 -2.243 -3.243 -4.243-1.243 -4.243 -2.243 -2.243 -2.743
141.1 580.6 49.33 136.3 486.1 226.8 245.8 268.91327.6 834.9 770.2 513.1 756.5 688.3 1011.2 10085.811332.7 1281.4 9567.7 16854.6 1542.0 11901.3 12066.1 38208.780.34 2.207 194.0 123.7 3.173 52.47 49.10 142.1
11191.6 700.8 9518.3 16718.3 1056.0 11674.5 11820.4 37939.819.97 1.332 15.18 19.91 1.579 14.68 19.14 30.26
6920.1 240.5 3979.3 5150.1 339.2 5232.6 7065.7 26751.0-3.502 -0.358 -3.258 -4.075 -0.625 -3.573 -3.593 -5.256-0.409 0.260 0.377 0.963 0.402 0.539 -0.016 -3.3342.826 0.784 4.341 2.875 1.041 2.140 2.025 1.895-0.807 -2.193 -1.332 -0.706 -1.666 -0.599 -0.564 -0.3616.328 1.142 7.600 6.950 1.666 5.714 5.618 7.151-0.508 8.786 -0.877 -0.769 6.873 -0.557 -0.469 -0.0274.320 0.414 3.924 4.315 0.659 3.875 4.258 4.919
45.2% 2.3% 35.7% 33.4% 8.2% 39.5% 46.3% 70.8%48.3% 97.7% 53.5% 60.2% 91.8% 55.2% 51.7% 25.5%6.5% 0.0% 10.8% 6.4% 0.0% 5.3% 1.9% 3.6%0.0% 0.0% 0.0% 0.0% 0.0% 0.0% 0.0% 20.8%5.0% 0.0% 4.4% 11.8% 0.0% 5.1% 3.8% 23.1%
18.0% 0.0% 9.1% 9.9% 1.1% 12.6% 19.8% 10.0%12.9% 0.4% 12.7% 6.1% 3.7% 16.1% 13.8% 11.8%9.3% 1.9% 9.6% 5.4% 3.4% 5.7% 9.0% 5.1%8.4% 16.3% 7.3% 2.9% 7.2% 3.0% 3.7% 3.3%
13.5% 80.2% 19.4% 14.4% 73.8% 19.9% 15.3% 7.9%16.1% 1.3% 14.6% 27.6% 10.8% 26.7% 24.4% 8.8%7.7% 0.0% 8.1% 12.7% 0.0% 3.5% 7.6% 4.1%2.6% 0.0% 4.0% 2.7% 0.0% 2.2% 0.8% 1.5%1.2% 0.0% 2.4% 1.3% 0.0% 1.8% 0.5% 1.0%1.1% 0.0% 2.3% 1.1% 0.0% 0.9% 0.3% 0.8%1.5% 0.0% 2.2% 1.5% 0.0% 1.0% 0.5% 0.7%1.3% 0.0% 2.0% 1.3% 0.0% 0.8% 0.3% 0.6%0.8% 0.0% 1.3% 0.8% 0.0% 0.5% 0.2% 0.3%0.5% 0.0% 0.7% 0.5% 0.0% 0.3% 0.1% 0.2%

SAMPLE STATISTICS
ANALYST AND DATE:SIEVING ERROR:SAMPLE TYPE: TEXTURAL GROUP: SEDIMENT NAME:
METHOD OF MEANMOMENTS SORTINGArithmetic (m) SKEWNESS
KURTOSISMETHOD OF MEANMOMENTS SORTINGGeometric (m) SKEWNESS
KURTOSISMETHOD OF MEANMOMENTS SORTINGLogarithmic () SKEWNESS
KURTOSISFOLK AND MEANWARD METHOD SORTING(m) SKEWNESS
KURTOSISFOLK AND MEANWARD METHOD SORTING() SKEWNESS
KURTOSISFOLK AND MEAN:WARD METHOD SORTING:(Description) SKEWNESS:
KURTOSIS:MODE 1 (m):MODE 2 (m):MODE 3 (m):MODE 1 ():MODE 2 ():MODE 3 ():D10 (m):D50 (m):D90 (m):(D90 / D10) (m):(D90 - D10) (m):(D75 / D25) (m):(D75 - D25) (m):D10 ():D50 ():D90 ():(D90 / D10) ():(D90 - D10) ():(D75 / D25) ():(D75 - D25) ():% GRAVEL:% SAND:% MUD:% V COARSE GRAVEL:% COARSE GRAVEL:% MEDIUM GRAVEL:% FINE GRAVEL:% V FINE GRAVEL:% V COARSE SAND:% COARSE SAND:% MEDIUM SAND:% FINE SAND:% V FINE SAND:% V COARSE SILT:% COARSE SILT:% MEDIUM SILT:% FINE SILT:% V FINE SILT:% CLAY:
:)( a:)( ax
:)( aSk:)( aK
:)( gx:)( g
:)( gSk:)( gK
:)( x:)(
:)Sk(
:)( K
:)( ZM:)( I
:)( ISk:)( GK
:)( GK
:)( GM:)( G
:)( GSk
ST24 ST1 ST36 ST37
LJH, 6/13/2016 LJH, 6/13/2016 LJH, 6/13/2016 LJH, 6/13/2016
Bimodal, Poorly Sorted Trimodal, Very Poorly Sorted Unimodal, Poorly Sorted Bimodal, Very Poorly SortedGravelly Sand Sandy Gravel Muddy Sand Muddy Sand
Very Fine Gravelly Medium Sand Sandy Very Coarse Gravel Coarse Silty Fine Sand Medium Silty Fine Sand
1270.2 10414.2 146.7 209.52993.6 14774.7 98.34 225.74.600 1.168 0.839 1.33925.23 2.600 5.579 4.060
433.8 1808.9 94.17 85.174.263 9.522 3.370 5.211-0.556 -0.215 -1.595 -0.7225.791 2.466 5.021 2.628
1.205 -0.855 3.409 3.5542.092 3.251 1.753 2.3820.556 0.215 1.595 0.7225.791 2.466 5.021 2.628
459.9 2057.8 95.49 86.843.583 8.964 3.156 5.4470.029 0.302 -0.542 -0.3411.961 0.721 1.707 0.867
1.121 -1.041 3.389 3.5251.841 3.164 1.658 2.445-0.029 -0.302 0.542 0.3411.961 0.721 1.707 0.867
Medium Sand Very Fine Gravel Very Fine Sand Very Fine SandPoorly Sorted Very Poorly Sorted Poorly Sorted Very Poorly SortedSymmetrical Very Coarse Skewed Very Fine Skewed Very Fine Skewed
Very Leptokurtic Platykurtic Very Leptokurtic Platykurtic
427.5 38250.0 152.5 215.01700.0 427.5 13.34
9600.01.247 -5.235 2.737 2.237-0.743 1.247 6.250
-3.243
133.0 205.5 12.96 6.821428.4 986.6 138.0 128.6
2367.2 37379.2 271.4 555.117.79 181.9 20.95 81.37
2234.1 37173.7 258.5 548.33.094 40.01 2.605 11.90525.8 13167.9 126.1 279.7-1.243 -5.224 1.881 0.8491.223 0.019 2.858 2.9592.910 2.283 6.270 7.196-2.341 -0.437 3.333 8.4744.153 7.507 4.389 6.3475.475 -0.417 1.604 3.0881.629 5.322 1.382 3.573
11.3% 46.6% 0.0% 0.0%81.8% 48.4% 79.1% 66.1%6.9% 5.0% 20.9% 33.9%0.0% 18.4% 0.0% 0.0%1.7% 5.5% 0.0% 0.0%1.7% 9.0% 0.0% 0.0%3.3% 8.9% 0.0% 0.0%4.6% 4.8% 0.0% 0.0%6.2% 3.3% 0.0% 0.0%
24.9% 9.7% 0.2% 12.3%32.9% 26.4% 12.2% 17.9%15.6% 8.2% 43.8% 20.6%2.2% 0.8% 22.8% 15.2%1.4% 1.5% 3.6% 6.9%1.6% 0.9% 5.8% 7.7%1.7% 1.0% 4.9% 8.1%1.2% 0.8% 3.4% 6.0%0.7% 0.5% 1.9% 3.3%0.4% 0.3% 1.2% 2.0%

Size Class & Stats TableSample
Sediment* mm phi f ST1 ST11 ST21 ST24 ST25 ST27 ST28 ST36 ST37 ST39V. coarse gravel >32<64 <-5>-6 18.37 0.00 20.84 0.00 0.00 0.00 33.74 0.00 0.00 0.00Coarse gravel >16<32 <-4>-5 5.53 19.30 23.14 1.66 0.00 0.00 11.57 0.00 0.00 13.10Medium gravel >8<16 <-3>-4 9.02 11.21 10.01 1.70 2.73 0.04 11.05 0.00 0.00 16.40Fine gravel >4<8 <-2>-3 8.90 16.32 11.76 3.31 1.10 0.35 8.11 0.00 0.00 9.78V. fine gravel >2<4 <-1>-2 4.82 9.00 5.07 4.60 1.09 1.87 4.49 0.00 0.00 4.08V. coarse sand >1<2 <0>-1 3.30 6.26 3.30 6.16 3.01 16.32 2.12 0.00 0.00 3.03Coarse sand >0.5<1 <1>0 9.68 14.68 7.91 24.87 37.93 80.16 6.12 0.23 12.30 27.73Medium sand >0.25<0.5 <2>1 26.40 14.50 8.79 32.91 43.28 1.26 15.13 12.25 17.92 24.92Fine sand >0.125<0.25 <3>2 8.23 4.03 4.08 15.64 5.91 0.00 3.99 43.83 20.60 0.97V. fine sand >0.0625<0.125 <4>3 0.75 1.16 1.46 2.22 0.57 0.00 0.58 22.82 15.23 0.00V. coarse silt >0.03125<0.0625 <5>4 1.51 0.88 1.03 1.40 1.24 0.00 0.99 3.60 6.89 0.00Coarse silt >0.015625<0.03125 <6>5 0.86 0.71 0.81 1.60 0.73 0.00 0.57 5.83 7.67 0.00Medium silt >0.007813<0.015625 <7>6 1.00 0.80 0.71 1.69 0.94 0.00 0.59 4.94 8.07 0.00Fine silt >0.003906<0.007813 <8>7 0.82 0.62 0.56 1.18 0.69 0.00 0.46 3.37 6.02 0.00V. fine silt >0.001953<0.003906 <5>5 0.53 0.36 0.35 0.65 0.55 0.00 0.30 1.91 3.27 0.00Clay <0.001953 >9 0.30 0.19 0.17 0.42 0.22 0.00 0.18 1.21 2.04 0.00
Statistics** Mean (phi) -1.04 -1.47 -2.42 1.12 1.07 0.26 -2.55 3.39 3.53 -0.76Sorting 3.16 2.54 2.86 1.84 0.98 0.43 2.97 1.66 2.45 2.18Skewness -0.30 0.16 0.48 -0.03 -0.03 -0.09 0.45 0.54 0.34 -0.52Kurtosis 0.72 0.71 0.70 1.96 1.55 1.59 0.56 1.71 0.87 0.58% Silt/Clay 5.00 3.56 3.63 6.93 4.38 0.00 3.09 20.87 33.95 0.00
Textural Group* Sandy Gravel Sandy Gravel Muddy Sandy Gravel Gravelly Sand Slightly Gravelly
SandSlightly Gravelly
Sand Sandy Gravel Muddy Sand Muddy Sand Sandy Gravel

Size Class & Stats Table
Sediment* mm phi fV. coarse gravel >32<64 <-5>-6Coarse gravel >16<32 <-4>-5Medium gravel >8<16 <-3>-4Fine gravel >4<8 <-2>-3V. fine gravel >2<4 <-1>-2V. coarse sand >1<2 <0>-1Coarse sand >0.5<1 <1>0Medium sand >0.25<0.5 <2>1Fine sand >0.125<0.25 <3>2V. fine sand >0.0625<0.125 <4>3V. coarse silt >0.03125<0.0625 <5>4Coarse silt >0.015625<0.03125 <6>5Medium silt >0.007813<0.015625 <7>6Fine silt >0.003906<0.007813 <8>7V. fine silt >0.001953<0.003906 <5>5Clay <0.001953 >9
Statistics** Mean (phi)SortingSkewnessKurtosis% Silt/Clay
Textural Group*
ST40 ST42 ST43 ST45 ST46 ST49 ST51 ST52 ST55 ST590.00 0.00 0.00 0.00 0.00 0.00 6.86 6.73 0.00 0.005.14 5.01 0.00 3.84 5.78 11.83 6.72 6.22 4.38 19.0012.64 17.95 1.06 19.79 20.24 9.95 13.89 4.26 9.08 43.6816.07 12.92 3.69 13.76 7.42 6.14 13.26 6.91 12.69 15.025.69 9.34 3.43 8.96 3.38 5.44 8.46 4.13 9.57 4.512.99 8.36 7.16 3.69 1.78 2.94 6.17 4.18 7.33 2.1119.88 13.47 73.81 15.28 19.97 14.43 26.28 42.52 19.41 5.1026.65 16.13 10.85 24.39 36.42 27.55 11.74 21.92 14.57 7.913.47 7.74 0.00 7.57 5.00 12.65 1.03 0.27 8.11 2.472.18 2.62 0.00 0.79 0.00 2.66 1.40 0.57 4.05 0.021.84 1.16 0.00 0.52 0.00 1.32 0.56 0.26 2.35 0.050.91 1.14 0.00 0.31 0.00 1.06 0.86 0.60 2.28 0.020.98 1.53 0.00 0.47 0.00 1.47 1.13 0.66 2.22 0.030.78 1.30 0.00 0.32 0.00 1.27 0.87 0.39 1.98 0.020.53 0.81 0.00 0.21 0.00 0.79 0.50 0.33 1.31 0.020.27 0.51 0.00 0.12 0.00 0.51 0.27 0.06 0.67 0.01
-0.28 -0.53 0.44 -0.53 -0.43 -0.13 -1.19 -0.50 0.14 -2.532.45 2.74 0.71 2.23 2.23 2.91 2.52 2.18 2.98 1.90-0.31 0.08 -0.16 -0.27 -0.61 -0.33 -0.08 -0.62 0.03 0.610.86 0.88 1.99 0.61 0.56 0.89 0.89 1.02 1.09 1.545.30 6.46 0.00 1.94 0.00 6.40 4.19 2.29 10.81 0.15
Sandy Gravel Muddy Sandy Gravel Gravelly Sand Sandy Gravel Sandy Gravel Sandy Gravel Sandy Gravel Gravelly Sand Muddy Sandy
Gravel Gravel
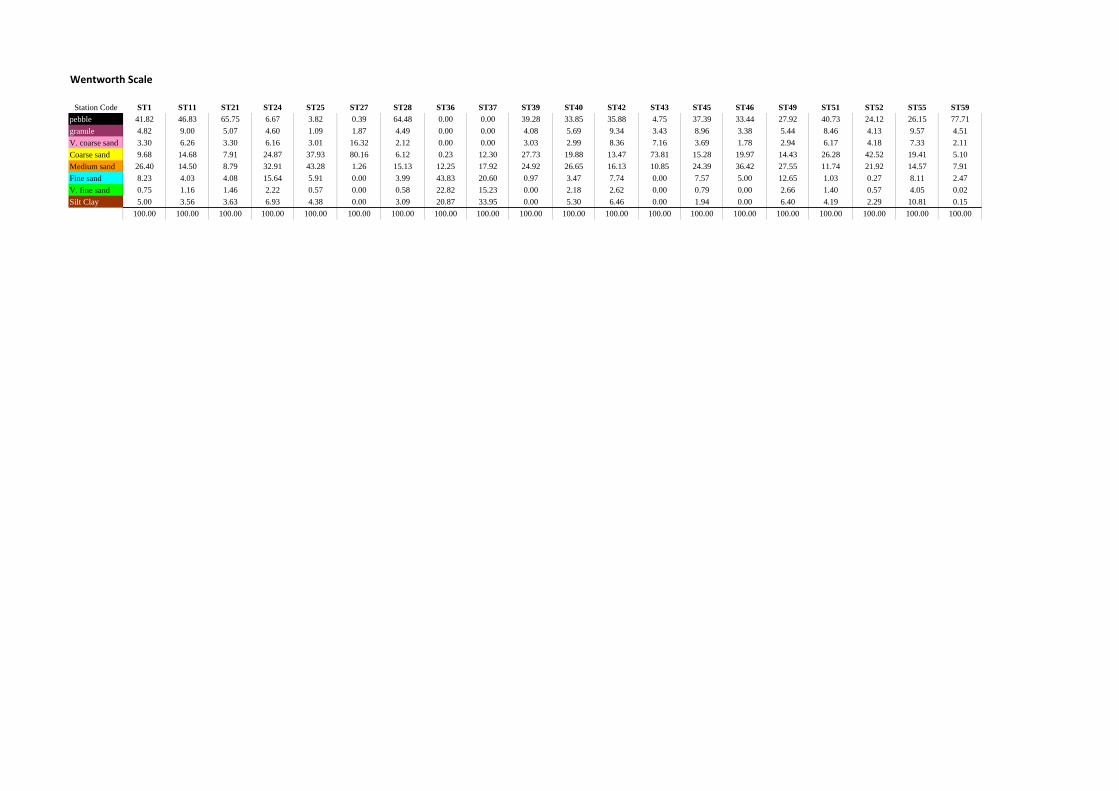
Wentworth Scale
Station Code ST1 ST11 ST21 ST24 ST25 ST27 ST28 ST36 ST37 ST39 ST40 ST42 ST43 ST45 ST46 ST49 ST51 ST52 ST55 ST59pebble 41.82 46.83 65.75 6.67 3.82 0.39 64.48 0.00 0.00 39.28 33.85 35.88 4.75 37.39 33.44 27.92 40.73 24.12 26.15 77.71granule 4.82 9.00 5.07 4.60 1.09 1.87 4.49 0.00 0.00 4.08 5.69 9.34 3.43 8.96 3.38 5.44 8.46 4.13 9.57 4.51V. coarse sand 3.30 6.26 3.30 6.16 3.01 16.32 2.12 0.00 0.00 3.03 2.99 8.36 7.16 3.69 1.78 2.94 6.17 4.18 7.33 2.11Coarse sand 9.68 14.68 7.91 24.87 37.93 80.16 6.12 0.23 12.30 27.73 19.88 13.47 73.81 15.28 19.97 14.43 26.28 42.52 19.41 5.10Medium sand 26.40 14.50 8.79 32.91 43.28 1.26 15.13 12.25 17.92 24.92 26.65 16.13 10.85 24.39 36.42 27.55 11.74 21.92 14.57 7.91Fine sand 8.23 4.03 4.08 15.64 5.91 0.00 3.99 43.83 20.60 0.97 3.47 7.74 0.00 7.57 5.00 12.65 1.03 0.27 8.11 2.47V. fine sand 0.75 1.16 1.46 2.22 0.57 0.00 0.58 22.82 15.23 0.00 2.18 2.62 0.00 0.79 0.00 2.66 1.40 0.57 4.05 0.02Silt Clay 5.00 3.56 3.63 6.93 4.38 0.00 3.09 20.87 33.95 0.00 5.30 6.46 0.00 1.94 0.00 6.40 4.19 2.29 10.81 0.15
100.00 100.00 100.00 100.00 100.00 100.00 100.00 100.00 100.00 100.00 100.00 100.00 100.00 100.00 100.00 100.00 100.00 100.00 100.00 100.00

Harwich Haven Disposal Site TH027
Monitoring Report
DLM7823-RT001-R02-00
B.2. July 2016

Client Name
Client Address
Report Title
Method
Subcontracted Tests
Authorisation Daisy Chamberlain 30/08/2016
Labortory Manager
N/A
Thomson Ecology, Compass House, 60 Priestley Road, Surrey Research Park, Guildford,
GU2 7AG
Harwich Haven Authority
TEM10 Particle Size Analysis
Navigation House, Harwich, CO12 3EJ
Harwich East Ship Channel ‐ Survey July 2016
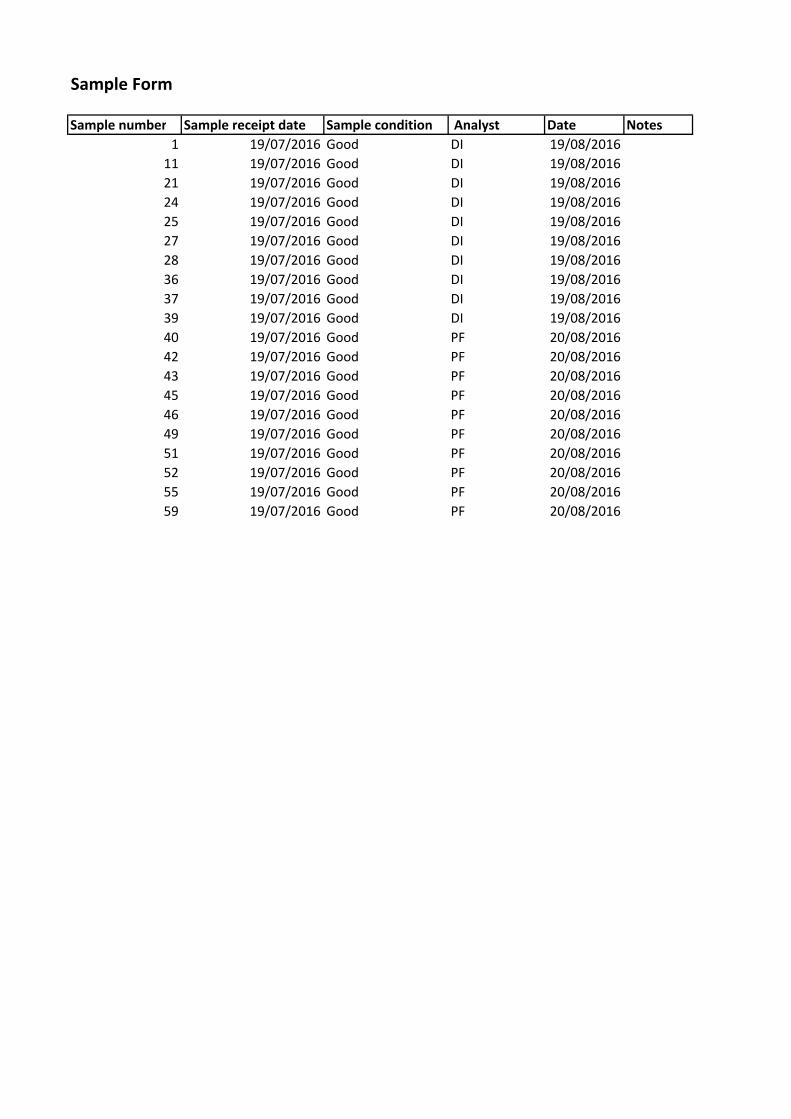
Sample Form
Sample number Sample receipt date Sample condition Analyst Date Notes
1 19/07/2016 Good DI 19/08/2016
11 19/07/2016 Good DI 19/08/2016
21 19/07/2016 Good DI 19/08/2016
24 19/07/2016 Good DI 19/08/2016
25 19/07/2016 Good DI 19/08/2016
27 19/07/2016 Good DI 19/08/2016
28 19/07/2016 Good DI 19/08/2016
36 19/07/2016 Good DI 19/08/2016
37 19/07/2016 Good DI 19/08/2016
39 19/07/2016 Good DI 19/08/2016
40 19/07/2016 Good PF 20/08/2016
42 19/07/2016 Good PF 20/08/2016
43 19/07/2016 Good PF 20/08/2016
45 19/07/2016 Good PF 20/08/2016
46 19/07/2016 Good PF 20/08/2016
49 19/07/2016 Good PF 20/08/2016
51 19/07/2016 Good PF 20/08/2016
52 19/07/2016 Good PF 20/08/2016
55 19/07/2016 Good PF 20/08/2016
59 19/07/2016 Good PF 20/08/2016
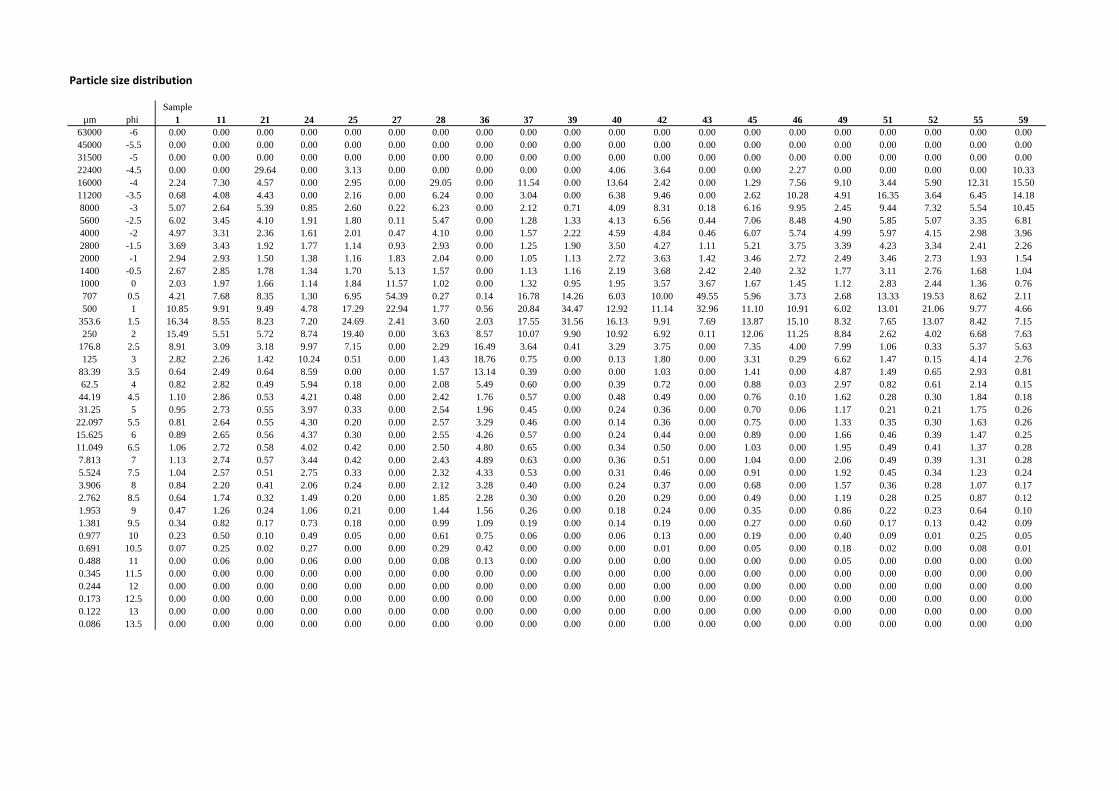
Particle size distribution
Sampleµm phi 1 11 21 24 25 27 28 36 37 39 40 42 43 45 46 49 51 52 55 59
63000 -6 0.00 0.00 0.00 0.00 0.00 0.00 0.00 0.00 0.00 0.00 0.00 0.00 0.00 0.00 0.00 0.00 0.00 0.00 0.00 0.0045000 -5.5 0.00 0.00 0.00 0.00 0.00 0.00 0.00 0.00 0.00 0.00 0.00 0.00 0.00 0.00 0.00 0.00 0.00 0.00 0.00 0.0031500 -5 0.00 0.00 0.00 0.00 0.00 0.00 0.00 0.00 0.00 0.00 0.00 0.00 0.00 0.00 0.00 0.00 0.00 0.00 0.00 0.0022400 -4.5 0.00 0.00 29.64 0.00 3.13 0.00 0.00 0.00 0.00 0.00 4.06 3.64 0.00 0.00 2.27 0.00 0.00 0.00 0.00 10.3316000 -4 2.24 7.30 4.57 0.00 2.95 0.00 29.05 0.00 11.54 0.00 13.64 2.42 0.00 1.29 7.56 9.10 3.44 5.90 12.31 15.5011200 -3.5 0.68 4.08 4.43 0.00 2.16 0.00 6.24 0.00 3.04 0.00 6.38 9.46 0.00 2.62 10.28 4.91 16.35 3.64 6.45 14.188000 -3 5.07 2.64 5.39 0.85 2.60 0.22 6.23 0.00 2.12 0.71 4.09 8.31 0.18 6.16 9.95 2.45 9.44 7.32 5.54 10.455600 -2.5 6.02 3.45 4.10 1.91 1.80 0.11 5.47 0.00 1.28 1.33 4.13 6.56 0.44 7.06 8.48 4.90 5.85 5.07 3.35 6.814000 -2 4.97 3.31 2.36 1.61 2.01 0.47 4.10 0.00 1.57 2.22 4.59 4.84 0.46 6.07 5.74 4.99 5.97 4.15 2.98 3.962800 -1.5 3.69 3.43 1.92 1.77 1.14 0.93 2.93 0.00 1.25 1.90 3.50 4.27 1.11 5.21 3.75 3.39 4.23 3.34 2.41 2.262000 -1 2.94 2.93 1.50 1.38 1.16 1.83 2.04 0.00 1.05 1.13 2.72 3.63 1.42 3.46 2.72 2.49 3.46 2.73 1.93 1.541400 -0.5 2.67 2.85 1.78 1.34 1.70 5.13 1.57 0.00 1.13 1.16 2.19 3.68 2.42 2.40 2.32 1.77 3.11 2.76 1.68 1.041000 0 2.03 1.97 1.66 1.14 1.84 11.57 1.02 0.00 1.32 0.95 1.95 3.57 3.67 1.67 1.45 1.12 2.83 2.44 1.36 0.76707 0.5 4.21 7.68 8.35 1.30 6.95 54.39 0.27 0.14 16.78 14.26 6.03 10.00 49.55 5.96 3.73 2.68 13.33 19.53 8.62 2.11500 1 10.85 9.91 9.49 4.78 17.29 22.94 1.77 0.56 20.84 34.47 12.92 11.14 32.96 11.10 10.91 6.02 13.01 21.06 9.77 4.66
353.6 1.5 16.34 8.55 8.23 7.20 24.69 2.41 3.60 2.03 17.55 31.56 16.13 9.91 7.69 13.87 15.10 8.32 7.65 13.07 8.42 7.15250 2 15.49 5.51 5.72 8.74 19.40 0.00 3.63 8.57 10.07 9.90 10.92 6.92 0.11 12.06 11.25 8.84 2.62 4.02 6.68 7.63
176.8 2.5 8.91 3.09 3.18 9.97 7.15 0.00 2.29 16.49 3.64 0.41 3.29 3.75 0.00 7.35 4.00 7.99 1.06 0.33 5.37 5.63125 3 2.82 2.26 1.42 10.24 0.51 0.00 1.43 18.76 0.75 0.00 0.13 1.80 0.00 3.31 0.29 6.62 1.47 0.15 4.14 2.76
83.39 3.5 0.64 2.49 0.64 8.59 0.00 0.00 1.57 13.14 0.39 0.00 0.00 1.03 0.00 1.41 0.00 4.87 1.49 0.65 2.93 0.8162.5 4 0.82 2.82 0.49 5.94 0.18 0.00 2.08 5.49 0.60 0.00 0.39 0.72 0.00 0.88 0.03 2.97 0.82 0.61 2.14 0.1544.19 4.5 1.10 2.86 0.53 4.21 0.48 0.00 2.42 1.76 0.57 0.00 0.48 0.49 0.00 0.76 0.10 1.62 0.28 0.30 1.84 0.1831.25 5 0.95 2.73 0.55 3.97 0.33 0.00 2.54 1.96 0.45 0.00 0.24 0.36 0.00 0.70 0.06 1.17 0.21 0.21 1.75 0.26
22.097 5.5 0.81 2.64 0.55 4.30 0.20 0.00 2.57 3.29 0.46 0.00 0.14 0.36 0.00 0.75 0.00 1.33 0.35 0.30 1.63 0.2615.625 6 0.89 2.65 0.56 4.37 0.30 0.00 2.55 4.26 0.57 0.00 0.24 0.44 0.00 0.89 0.00 1.66 0.46 0.39 1.47 0.2511.049 6.5 1.06 2.72 0.58 4.02 0.42 0.00 2.50 4.80 0.65 0.00 0.34 0.50 0.00 1.03 0.00 1.95 0.49 0.41 1.37 0.287.813 7 1.13 2.74 0.57 3.44 0.42 0.00 2.43 4.89 0.63 0.00 0.36 0.51 0.00 1.04 0.00 2.06 0.49 0.39 1.31 0.285.524 7.5 1.04 2.57 0.51 2.75 0.33 0.00 2.32 4.33 0.53 0.00 0.31 0.46 0.00 0.91 0.00 1.92 0.45 0.34 1.23 0.243.906 8 0.84 2.20 0.41 2.06 0.24 0.00 2.12 3.28 0.40 0.00 0.24 0.37 0.00 0.68 0.00 1.57 0.36 0.28 1.07 0.172.762 8.5 0.64 1.74 0.32 1.49 0.20 0.00 1.85 2.28 0.30 0.00 0.20 0.29 0.00 0.49 0.00 1.19 0.28 0.25 0.87 0.121.953 9 0.47 1.26 0.24 1.06 0.21 0.00 1.44 1.56 0.26 0.00 0.18 0.24 0.00 0.35 0.00 0.86 0.22 0.23 0.64 0.101.381 9.5 0.34 0.82 0.17 0.73 0.18 0.00 0.99 1.09 0.19 0.00 0.14 0.19 0.00 0.27 0.00 0.60 0.17 0.13 0.42 0.090.977 10 0.23 0.50 0.10 0.49 0.05 0.00 0.61 0.75 0.06 0.00 0.06 0.13 0.00 0.19 0.00 0.40 0.09 0.01 0.25 0.050.691 10.5 0.07 0.25 0.02 0.27 0.00 0.00 0.29 0.42 0.00 0.00 0.00 0.01 0.00 0.05 0.00 0.18 0.02 0.00 0.08 0.010.488 11 0.00 0.06 0.00 0.06 0.00 0.00 0.08 0.13 0.00 0.00 0.00 0.00 0.00 0.00 0.00 0.05 0.00 0.00 0.00 0.000.345 11.5 0.00 0.00 0.00 0.00 0.00 0.00 0.00 0.00 0.00 0.00 0.00 0.00 0.00 0.00 0.00 0.00 0.00 0.00 0.00 0.000.244 12 0.00 0.00 0.00 0.00 0.00 0.00 0.00 0.00 0.00 0.00 0.00 0.00 0.00 0.00 0.00 0.00 0.00 0.00 0.00 0.000.173 12.5 0.00 0.00 0.00 0.00 0.00 0.00 0.00 0.00 0.00 0.00 0.00 0.00 0.00 0.00 0.00 0.00 0.00 0.00 0.00 0.000.122 13 0.00 0.00 0.00 0.00 0.00 0.00 0.00 0.00 0.00 0.00 0.00 0.00 0.00 0.00 0.00 0.00 0.00 0.00 0.00 0.000.086 13.5 0.00 0.00 0.00 0.00 0.00 0.00 0.00 0.00 0.00 0.00 0.00 0.00 0.00 0.00 0.00 0.00 0.00 0.00 0.00 0.00

SAMPLE STATISTICS
1 11 21 24 25 27 28 36
ANALYST AND DATE: LJH, 8/30/2016 LJH, 8/30/2016 LJH, 8/30/2016 LJH, 8/30/2016 LJH, 8/30/2016 LJH, 8/30/2016 LJH, 8/30/2016 LJH, 8/30/2016SIEVING ERROR:SAMPLE TYPE: Bimodal, Very Poorly Sorted Polymodal, Very Poorly Sorted Trimodal, Very Poorly Sorted Polymodal, Very Poorly Sorted Unimodal, Poorly Sorted Unimodal, Well Sorted Unimodal, Extremely Poorly Sorted Bimodal, Very Poorly SortedTEXTURAL GROUP: Gravelly Muddy Sand Gravelly Muddy Sand Muddy Sandy Gravel Gravelly Muddy Sand Gravelly Sand Gravelly Sand Muddy Gravel Muddy SandSEDIMENT NAME: dium Gravelly Medium Silty Coarse Sarse Gravelly Coarse Silty Coarse Soarse Silty Sandy Very Coarse GravFine Gravelly Coarse Silty Fine Sand Coarse Gravelly Coarse Sand Very Fine Gravelly Very Coarse Sand Very Coarse Silty Coarse Gravel Medium Silty Fine Sand
METHOD OF MEAN 3063.7 4313.6 15194.0 811.1 3722.8 1362.4 11020.6 178.7MOMENTS SORTING 5321.0 7788.8 16377.0 2051.8 8343.1 940.5 11493.1 158.1
Arithmetic (m) SKEWNESS 2.664 2.045 0.511 4.095 3.000 7.164 0.425 1.265KURTOSIS 10.67 5.863 1.468 20.71 11.28 77.13 1.433 6.367
METHOD OF MEAN 793.9 521.7 3732.0 158.1 927.6 1217.9 1444.5 86.31MOMENTS SORTING 6.380 12.63 9.142 6.411 4.509 1.463 21.60 4.578
Geometric (m) SKEWNESS -0.534 -0.301 -0.694 -0.056 0.374 1.878 -0.667 -0.895KURTOSIS 3.864 2.281 2.933 2.964 5.282 9.714 1.991 2.670
METHOD OF MEAN 0.333 0.939 -1.900 2.661 0.108 -0.284 -0.531 3.534MOMENTS SORTING 2.674 3.659 3.192 2.681 2.173 0.549 4.433 2.195Logarithmic () SKEWNESS 0.534 0.301 0.694 0.056 -0.374 -1.878 0.667 0.895
KURTOSIS 3.864 2.281 2.933 2.964 5.282 9.714 1.991 2.670
FOLK AND MEAN 1066.5 548.6 4767.8 143.5 983.8 1173.8 1624.1 87.78WARD METHOD SORTING 6.216 15.45 7.611 6.588 3.527 1.404 20.72 4.490
(m) SKEWNESS 0.191 -0.133 -0.269 -0.140 0.564 0.151 -0.608 -0.567KURTOSIS 1.315 0.903 0.665 1.154 2.061 1.626 0.641 0.797
FOLK AND MEAN -0.093 0.866 -2.253 2.800 0.024 -0.231 -0.700 3.510WARD METHOD SORTING 2.636 3.950 2.928 2.720 1.818 0.490 4.373 2.167() SKEWNESS -0.191 0.133 0.269 0.140 -0.564 -0.151 0.608 0.567
KURTOSIS 1.315 0.903 0.665 1.154 2.061 1.626 0.641 0.797
FOLK AND MEAN: Very Coarse Sand Coarse Sand Fine Gravel Fine Sand Coarse Sand Very Coarse Sand Very Coarse Sand Very Fine SandWARD METHOD SORTING: Very Poorly Sorted Very Poorly Sorted Very Poorly Sorted Very Poorly Sorted Poorly Sorted Well Sorted Extremely Poorly Sorted Very Poorly Sorted(Description) SKEWNESS: Coarse Skewed Fine Skewed Fine Skewed Fine Skewed Very Coarse Skewed Coarse Skewed Very Fine Skewed Very Fine Skewed
KURTOSIS: Leptokurtic Mesokurtic Very Platykurtic Leptokurtic Very Leptokurtic Very Leptokurtic Very Platykurtic Platykurtic
MODE 1 (m): 605.0 855.0 38250.0 215.0 605.0 1200.0 26950.0 215.0
MODE 2 (m): 9600.0 4800.0 855.0 26.67 13.34
MODE 3 (m): 107.5 13600.0 9600.0MODE 1 (): 0.747 0.247 -5.235 2.237 0.747 -0.243 -4.731 2.237MODE 2 (): -3.243 -2.243 0.247 5.250 6.250MODE 3 (): 3.237 -3.743 -3.243
D10 (m): 105.9 11.92 323.4 12.32 334.8 795.2 11.53 8.121D50 (m): 642.9 697.1 6042.0 193.5 658.6 1164.7 6160.8 163.6D90 (m): 10017.6 17938.0 39898.3 1403.0 12571.4 1920.7 28012.0 374.0(D90 / D10) (m): 94.58 1504.7 123.4 113.9 37.55 2.415 2429.4 46.05(D90 - D10) (m): 9911.6 17926.1 39574.9 1390.7 12236.6 1125.5 28000.5 365.9(D75 / D25) (m): 8.101 44.29 46.57 10.62 2.483 1.367 249.5 10.66(D75 - D25) (m): 2647.0 3553.9 32594.1 423.7 671.7 364.7 23396.5 240.4D10 (): -3.324 -4.165 -5.318 -0.489 -3.652 -0.942 -4.808 1.419D50 (): 0.637 0.521 -2.595 2.370 0.602 -0.220 -2.623 2.612D90 (): 3.239 6.390 1.629 6.343 1.579 0.331 6.438 6.944(D90 / D10) (): -0.974 -1.534 -0.306 -12.984 -0.432 -0.351 -1.339 4.894(D90 - D10) (): 6.563 10.56 6.947 6.832 5.231 1.272 11.25 5.525(D75 / D25) (): -0.893 -1.937 -0.096 4.110 -6.740 -0.017 -0.749 2.784(D75 - D25) (): 3.018 5.469 5.541 3.409 1.312 0.451 7.963 3.415
% GRAVEL: 28.3% 30.0% 55.7% 8.9% 18.6% 8.7% 57.6% 0.0%% SAND: 63.2% 47.2% 39.7% 62.2% 78.5% 91.3% 20.1% 67.0%% MUD: 8.5% 22.8% 4.6% 28.9% 2.9% 0.0% 22.2% 33.0%% V COARSE GRAVEL: 0.0% 0.0% 28.3% 0.0% 3.0% 0.0% 0.0% 0.0%% COARSE GRAVEL: 2.9% 11.4% 10.3% 0.0% 5.3% 0.0% 35.3% 0.0%% MEDIUM GRAVEL: 11.1% 6.1% 9.5% 2.8% 4.4% 0.3% 11.7% 0.0%% FINE GRAVEL: 8.7% 6.7% 4.3% 3.4% 3.1% 1.4% 7.0% 0.0%% V FINE GRAVEL: 5.6% 5.8% 3.3% 2.7% 2.9% 7.0% 3.6% 0.0%% V COARSE SAND: 6.2% 9.7% 10.0% 2.4% 8.8% 66.0% 1.3% 0.1%% COARSE SAND: 27.2% 18.5% 17.7% 12.0% 42.0% 25.3% 5.4% 2.6%% MEDIUM SAND: 24.4% 8.6% 8.9% 18.7% 26.5% 0.0% 5.9% 25.1%% FINE SAND: 3.5% 4.7% 2.1% 18.8% 0.5% 0.0% 3.0% 31.9%% V FINE SAND: 1.9% 5.7% 1.0% 10.2% 0.7% 0.0% 4.6% 7.3%% V COARSE SILT: 1.7% 5.3% 1.1% 8.2% 0.5% 0.0% 5.1% 5.2%% COARSE SILT: 2.0% 5.4% 1.1% 8.4% 0.7% 0.0% 5.1% 9.1%% MEDIUM SILT: 2.2% 5.3% 1.1% 6.2% 0.8% 0.0% 4.7% 9.2%% FINE SILT: 1.5% 3.9% 0.7% 3.6% 0.4% 0.0% 4.0% 5.6%% V FINE SILT: 0.8% 2.1% 0.4% 1.8% 0.4% 0.0% 2.4% 2.6%% CLAY: 0.3% 0.8% 0.1% 0.8% 0.0% 0.0% 1.0% 1.3%
:)( a:)( ax
:)( aSk:)( aK
:)( gx:)( g
:)( gSk:)( gK
:)( x:)(
:)Sk(
:)( K
:)( ZM:)( I
:)( ISk:)( GK
:)( GK
:)( GM:)( G
:)( GSk

SAMPLE STATISTICS
ANALYST AND DATE:SIEVING ERROR:SAMPLE TYPE: TEXTURAL GROUP: SEDIMENT NAME:
METHOD OF MEANMOMENTS SORTINGArithmetic (m) SKEWNESS
KURTOSISMETHOD OF MEANMOMENTS SORTINGGeometric (m) SKEWNESS
KURTOSISMETHOD OF MEANMOMENTS SORTINGLogarithmic () SKEWNESS
KURTOSISFOLK AND MEANWARD METHOD SORTING(m) SKEWNESS
KURTOSISFOLK AND MEANWARD METHOD SORTING() SKEWNESS
KURTOSISFOLK AND MEAN:WARD METHOD SORTING:(Description) SKEWNESS:
KURTOSIS:MODE 1 (m):MODE 2 (m):MODE 3 (m):MODE 1 ():MODE 2 ():MODE 3 ():D10 (m):D50 (m):D90 (m):(D90 / D10) (m):(D90 - D10) (m):(D75 / D25) (m):(D75 - D25) (m):D10 ():D50 ():D90 ():(D90 / D10) ():(D90 - D10) ():(D75 / D25) ():(D75 - D25) ():% GRAVEL:% SAND:% MUD:% V COARSE GRAVEL:% COARSE GRAVEL:% MEDIUM GRAVEL:% FINE GRAVEL:% V FINE GRAVEL:% V COARSE SAND:% COARSE SAND:% MEDIUM SAND:% FINE SAND:% V FINE SAND:% V COARSE SILT:% COARSE SILT:% MEDIUM SILT:% FINE SILT:% V FINE SILT:% CLAY:
:)( a:)( ax
:)( aSk:)( aK
:)( gx:)( g
:)( gSk:)( gK
:)( x:)(
:)Sk(
:)( K
:)( ZM:)( I
:)( ISk:)( GK
:)( GK
:)( GM:)( G
:)( GSk
37 39 40 42 43 45 46 49
LJH, 8/30/2016 LJH, 8/30/2016 LJH, 8/30/2016 LJH, 8/30/2016 LJH, 8/30/2016 LJH, 8/30/2016 LJH, 8/30/2016 LJH, 8/30/2016
Bimodal, Very Poorly Sorted Unimodal, Moderately Sorted Trimodal, Very Poorly Sorted Polymodal, Very Poorly Sorted Unimodal, Well Sorted Bimodal, Very Poorly Sorted Bimodal, Very Poorly Sorted Polymodal, Very Poorly SortedGravelly Sand Gravelly Sand Sandy Gravel Sandy Gravel Gravelly Sand Muddy Sandy Gravel Sandy Gravel Muddy Sandy Gravel
Coarse Gravelly Coarse Sand Fine Gravelly Coarse Sand Sandy Coarse Gravel Sandy Medium Gravel Very Fine Gravelly Very Coarse SandMedium Silty Sandy Medium Gravel Sandy Medium Gravel Medium Silty Sandy Coarse Gravel
4899.8 1249.4 8403.4 6750.7 1243.1 3568.5 8080.3 5071.98820.6 1806.3 11242.6 9262.8 1025.7 5386.7 9549.1 8435.71.871 4.374 1.246 1.793 6.839 2.084 1.252 1.7344.777 23.94 3.207 5.853 63.01 7.361 3.794 4.598
1172.8 869.1 2275.4 2013.5 1087.1 994.8 2894.6 687.05.582 1.923 6.352 6.321 1.500 6.436 4.917 11.31-0.063 2.126 -0.266 -0.624 2.217 -0.586 0.040 -0.2644.272 8.000 3.038 3.724 11.68 3.664 1.430 2.461
-0.230 0.202 -1.186 -1.010 -0.120 0.007 -1.533 0.5422.481 0.944 2.667 2.660 0.585 2.686 2.298 3.5000.063 -2.126 0.266 0.624 -2.217 0.586 -0.040 0.2644.272 8.000 3.038 3.724 11.68 3.664 1.430 2.461
1670.1 789.1 2370.7 2156.9 1033.6 1224.0 3052.1 804.85.570 1.780 5.357 5.505 1.399 6.305 4.746 11.930.392 0.297 0.459 0.203 0.011 0.152 0.001 0.0932.548 1.959 0.590 0.779 1.350 1.057 0.579 0.946
-0.740 0.342 -1.245 -1.109 -0.048 -0.292 -1.610 0.3132.478 0.832 2.422 2.461 0.484 2.657 2.247 3.577-0.392 -0.297 -0.459 -0.203 -0.011 -0.152 -0.001 -0.0932.548 1.959 0.590 0.779 1.350 1.057 0.579 0.946
Very Coarse Sand Coarse Sand Very Fine Gravel Very Fine Gravel Very Coarse Sand Very Coarse Sand Very Fine Gravel Coarse SandVery Poorly Sorted Moderately Sorted Very Poorly Sorted Very Poorly Sorted Well Sorted Very Poorly Sorted Very Poorly Sorted Very Poorly Sorted
Very Coarse Skewed Coarse Skewed Very Coarse Skewed Coarse Skewed Symmetrical Coarse Skewed Symmetrical SymmetricalVery Leptokurtic Very Leptokurtic Very Platykurtic Platykurtic Leptokurtic Mesokurtic Very Platykurtic Mesokurtic
855.0 855.0 605.0 855.0 1200.0 605.0 605.0 26950.026950.0 26950.0 19200.0 9600.0 19200.0 427.5
6800.0 2400.0 9600.00.247 0.247 0.747 0.247 -0.243 0.747 0.747 -4.731-4.731 -4.731 -4.243 -3.243 -4.243 1.247
-2.743 -1.243 -3.243
339.6 494.8 393.1 304.3 726.4 162.3 419.8 19.23863.6 769.8 1201.3 1453.9 1064.8 779.1 3088.6 547.5
23440.9 1380.3 27151.3 19471.1 1397.1 11242.4 22276.1 21055.669.02 2.790 69.06 63.98 1.923 69.27 53.07 1094.7
23101.3 885.5 26758.1 19166.8 670.7 11080.1 21856.3 21036.42.525 1.676 25.18 16.80 1.486 12.56 21.66 33.26833.7 398.1 14183.1 9917.5 412.8 4588.4 12806.9 5983.1-4.551 -0.465 -4.763 -4.283 -0.482 -3.491 -4.477 -4.3960.212 0.377 -0.265 -0.540 -0.091 0.360 -1.627 0.8691.558 1.015 1.347 1.716 0.461 2.623 1.252 5.700-0.342 -2.183 -0.283 -0.401 -0.956 -0.751 -0.280 -1.2976.109 1.480 6.110 6.000 0.944 6.114 5.730 10.10-1.873 39.88 -0.198 -0.198 -0.704 -0.575 -0.184 -0.9261.336 0.745 4.654 4.070 0.572 3.650 4.437 5.056
23.0% 8.4% 45.3% 46.8% 6.0% 34.3% 53.1% 34.0%72.5% 91.6% 52.2% 49.3% 94.0% 58.4% 46.9% 51.1%4.5% 0.0% 2.4% 3.8% 0.0% 7.3% 0.1% 14.9%0.0% 0.0% 3.9% 3.5% 0.0% 0.0% 2.2% 0.0%
14.6% 0.0% 20.2% 12.0% 0.0% 3.9% 17.9% 14.0%3.4% 2.0% 8.2% 14.9% 0.6% 13.2% 18.4% 7.4%2.8% 4.1% 8.1% 9.1% 1.6% 11.3% 9.5% 8.4%2.2% 2.3% 4.9% 7.3% 3.8% 5.9% 5.0% 4.3%
18.1% 15.2% 8.0% 13.6% 53.2% 7.6% 5.2% 3.8%38.4% 66.0% 29.0% 21.0% 40.6% 25.0% 26.0% 14.3%13.7% 10.3% 14.2% 10.7% 0.1% 19.4% 15.3% 16.8%1.1% 0.0% 0.1% 2.8% 0.0% 4.7% 0.3% 11.5%1.2% 0.0% 0.9% 1.2% 0.0% 1.7% 0.1% 4.6%0.9% 0.0% 0.4% 0.7% 0.0% 1.4% 0.1% 2.5%1.2% 0.0% 0.6% 0.9% 0.0% 1.9% 0.0% 3.6%1.2% 0.0% 0.7% 1.0% 0.0% 2.0% 0.0% 4.0%0.7% 0.0% 0.4% 0.7% 0.0% 1.2% 0.0% 2.8%0.4% 0.0% 0.3% 0.4% 0.0% 0.6% 0.0% 1.5%0.1% 0.0% 0.1% 0.1% 0.0% 0.2% 0.0% 0.6%

SAMPLE STATISTICS
ANALYST AND DATE:SIEVING ERROR:SAMPLE TYPE: TEXTURAL GROUP: SEDIMENT NAME:
METHOD OF MEANMOMENTS SORTINGArithmetic (m) SKEWNESS
KURTOSISMETHOD OF MEANMOMENTS SORTINGGeometric (m) SKEWNESS
KURTOSISMETHOD OF MEANMOMENTS SORTINGLogarithmic () SKEWNESS
KURTOSISFOLK AND MEANWARD METHOD SORTING(m) SKEWNESS
KURTOSISFOLK AND MEANWARD METHOD SORTING() SKEWNESS
KURTOSISFOLK AND MEAN:WARD METHOD SORTING:(Description) SKEWNESS:
KURTOSIS:MODE 1 (m):MODE 2 (m):MODE 3 (m):MODE 1 ():MODE 2 ():MODE 3 ():D10 (m):D50 (m):D90 (m):(D90 / D10) (m):(D90 - D10) (m):(D75 / D25) (m):(D75 - D25) (m):D10 ():D50 ():D90 ():(D90 / D10) ():(D90 - D10) ():(D75 / D25) ():(D75 - D25) ():% GRAVEL:% SAND:% MUD:% V COARSE GRAVEL:% COARSE GRAVEL:% MEDIUM GRAVEL:% FINE GRAVEL:% V FINE GRAVEL:% V COARSE SAND:% COARSE SAND:% MEDIUM SAND:% FINE SAND:% V FINE SAND:% V COARSE SILT:% COARSE SILT:% MEDIUM SILT:% FINE SILT:% V FINE SILT:% CLAY:
:)( a:)( ax
:)( aSk:)( aK
:)( gx:)( g
:)( gSk:)( gK
:)( x:)(
:)Sk(
:)( K
:)( ZM:)( I
:)( ISk:)( GK
:)( GK
:)( GM:)( G
:)( GSk
51 52 55 59
LJH, 8/30/2016 LJH, 8/30/2016 LJH, 8/30/2016 LJH, 8/30/2016
Bimodal, Very Poorly Sorted Trimodal, Poorly Sorted Bimodal, Very Poorly Sorted Bimodal, Very Poorly SortedSandy Gravel Sandy Gravel Muddy Sandy Gravel Sandy Gravel
Sandy Coarse Gravel Sandy Medium Gravel ery Coarse Silty Sandy Coarse Grav Sandy Coarse Gravel
7099.3 4930.8 6382.3 13556.37899.8 7344.4 9400.2 12666.30.929 1.877 1.321 0.5602.520 5.505 3.165 2.094
2512.3 1700.2 1057.9 4638.56.007 4.798 10.44 7.116-0.906 -0.443 -0.386 -0.8714.217 4.674 2.588 2.950
-1.329 -0.766 -0.081 -2.2142.587 2.263 3.384 2.8310.906 0.443 0.386 0.8714.217 4.674 2.588 2.950
2968.1 1995.1 1266.7 5149.14.964 3.960 11.23 6.1720.018 0.515 0.052 -0.5510.754 0.814 0.874 0.595
-1.570 -0.996 -0.341 -2.3642.311 1.986 3.489 2.626-0.018 -0.515 -0.052 0.5510.754 0.814 0.874 0.595
Very Fine Gravel Very Coarse Sand Very Coarse Sand Fine GravelVery Poorly Sorted Poorly Sorted Very Poorly Sorted Very Poorly Sorted
Symmetrical Very Coarse Skewed Symmetrical Very Fine SkewedPlatykurtic Platykurtic Platykurtic Very Platykurtic
19200.0 855.0 26950.0 26950.01200.0 13600.0 855.0 427.5
26950.0-4.243 0.247 -4.731 -4.731-0.243 -3.743 0.247 1.247
-4.731
420.2 513.8 41.15 320.62441.5 1126.0 888.6 11370.819570.0 15650.7 23881.9 31857.346.58 30.46 580.4 99.37
19149.8 15136.9 23840.7 31536.715.80 8.259 36.98 34.43
12309.6 5407.0 10163.8 22146.8-4.291 -3.968 -4.578 -4.994-1.288 -0.171 0.170 -3.5071.251 0.961 4.603 1.641-0.292 -0.242 -1.006 -0.3295.542 4.929 9.181 6.635-0.072 -0.162 -0.539 -0.1323.982 3.046 5.209 5.106
51.8% 34.9% 36.7% 66.1%44.6% 62.1% 51.3% 31.8%3.6% 2.9% 12.0% 2.1%0.0% 0.0% 0.0% 9.9%
19.8% 9.5% 18.8% 30.1%15.3% 12.4% 8.9% 17.3%10.2% 7.5% 5.4% 6.2%6.6% 5.5% 3.6% 2.6%
16.2% 22.0% 10.0% 2.9%20.7% 34.1% 18.2% 11.8%3.7% 4.3% 12.0% 13.3%3.0% 0.8% 7.1% 3.6%1.1% 0.9% 4.0% 0.3%0.6% 0.5% 3.3% 0.5%0.9% 0.8% 2.8% 0.5%0.9% 0.7% 2.5% 0.5%0.6% 0.5% 1.9% 0.3%0.4% 0.4% 1.1% 0.2%0.1% 0.0% 0.3% 0.1%
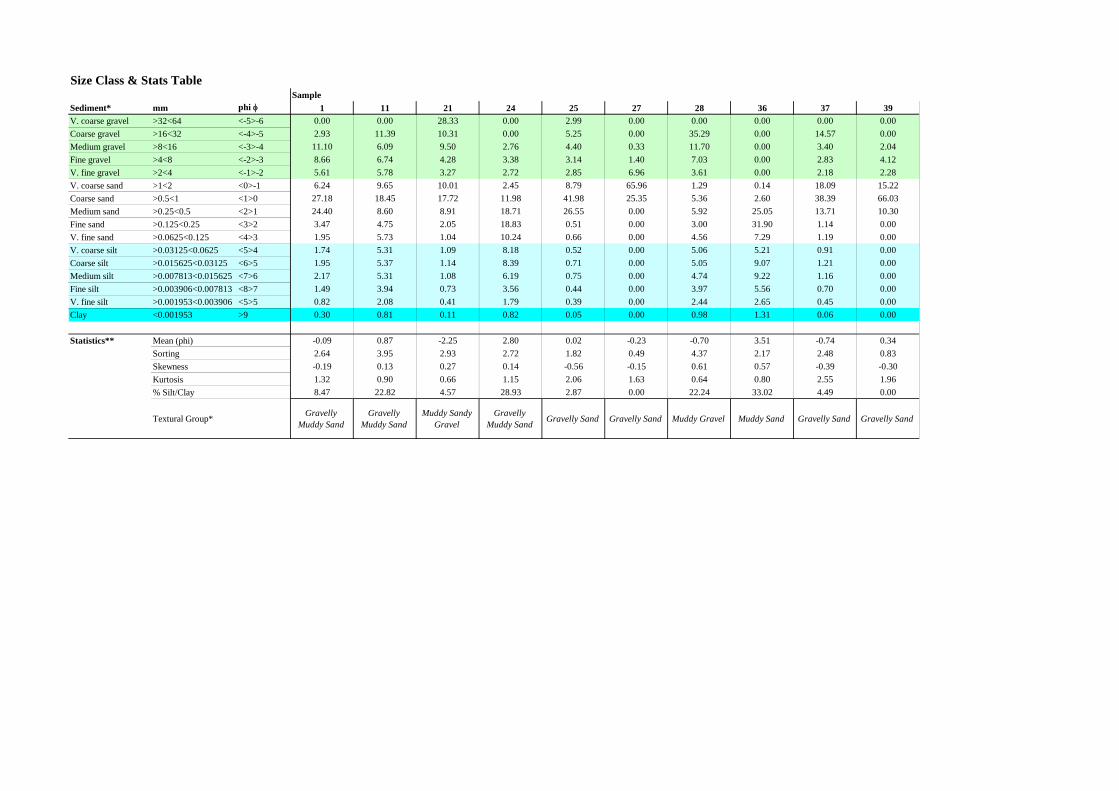
Size Class & Stats TableSample
Sediment* mm phi 1 11 21 24 25 27 28 36 37 39V. coarse gravel >32<64 <-5>-6 0.00 0.00 28.33 0.00 2.99 0.00 0.00 0.00 0.00 0.00Coarse gravel >16<32 <-4>-5 2.93 11.39 10.31 0.00 5.25 0.00 35.29 0.00 14.57 0.00Medium gravel >8<16 <-3>-4 11.10 6.09 9.50 2.76 4.40 0.33 11.70 0.00 3.40 2.04Fine gravel >4<8 <-2>-3 8.66 6.74 4.28 3.38 3.14 1.40 7.03 0.00 2.83 4.12V. fine gravel >2<4 <-1>-2 5.61 5.78 3.27 2.72 2.85 6.96 3.61 0.00 2.18 2.28V. coarse sand >1<2 <0>-1 6.24 9.65 10.01 2.45 8.79 65.96 1.29 0.14 18.09 15.22Coarse sand >0.5<1 <1>0 27.18 18.45 17.72 11.98 41.98 25.35 5.36 2.60 38.39 66.03Medium sand >0.25<0.5 <2>1 24.40 8.60 8.91 18.71 26.55 0.00 5.92 25.05 13.71 10.30Fine sand >0.125<0.25 <3>2 3.47 4.75 2.05 18.83 0.51 0.00 3.00 31.90 1.14 0.00V. fine sand >0.0625<0.125 <4>3 1.95 5.73 1.04 10.24 0.66 0.00 4.56 7.29 1.19 0.00V. coarse silt >0.03125<0.0625 <5>4 1.74 5.31 1.09 8.18 0.52 0.00 5.06 5.21 0.91 0.00Coarse silt >0.015625<0.03125 <6>5 1.95 5.37 1.14 8.39 0.71 0.00 5.05 9.07 1.21 0.00Medium silt >0.007813<0.015625 <7>6 2.17 5.31 1.08 6.19 0.75 0.00 4.74 9.22 1.16 0.00Fine silt >0.003906<0.007813 <8>7 1.49 3.94 0.73 3.56 0.44 0.00 3.97 5.56 0.70 0.00V. fine silt >0.001953<0.003906 <5>5 0.82 2.08 0.41 1.79 0.39 0.00 2.44 2.65 0.45 0.00Clay <0.001953 >9 0.30 0.81 0.11 0.82 0.05 0.00 0.98 1.31 0.06 0.00
Statistics** Mean (phi) -0.09 0.87 -2.25 2.80 0.02 -0.23 -0.70 3.51 -0.74 0.34Sorting 2.64 3.95 2.93 2.72 1.82 0.49 4.37 2.17 2.48 0.83Skewness -0.19 0.13 0.27 0.14 -0.56 -0.15 0.61 0.57 -0.39 -0.30Kurtosis 1.32 0.90 0.66 1.15 2.06 1.63 0.64 0.80 2.55 1.96% Silt/Clay 8.47 22.82 4.57 28.93 2.87 0.00 22.24 33.02 4.49 0.00
Textural Group* Gravelly Muddy Sand
Gravelly Muddy Sand
Muddy Sandy Gravel
Gravelly Muddy Sand Gravelly Sand Gravelly Sand Muddy Gravel Muddy Sand Gravelly Sand Gravelly Sand
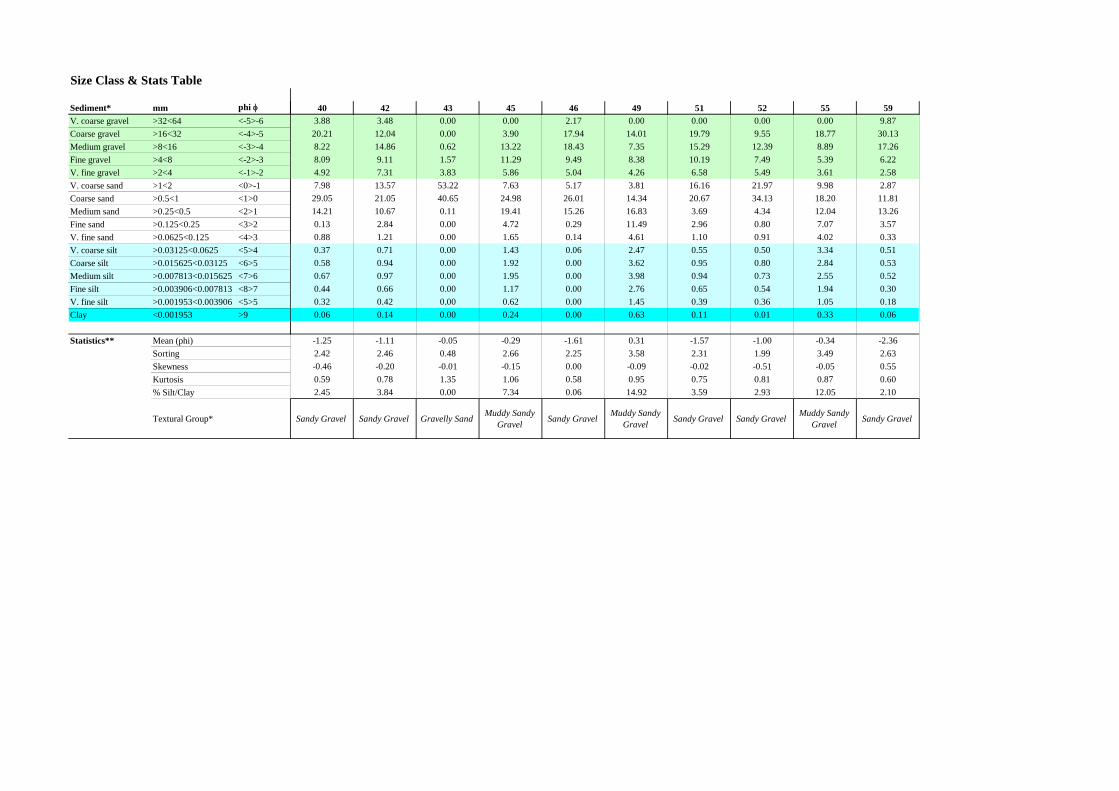
Size Class & Stats Table
Sediment* mm phiV. coarse gravel >32<64 <-5>-6Coarse gravel >16<32 <-4>-5Medium gravel >8<16 <-3>-4Fine gravel >4<8 <-2>-3V. fine gravel >2<4 <-1>-2V. coarse sand >1<2 <0>-1Coarse sand >0.5<1 <1>0Medium sand >0.25<0.5 <2>1Fine sand >0.125<0.25 <3>2V. fine sand >0.0625<0.125 <4>3V. coarse silt >0.03125<0.0625 <5>4Coarse silt >0.015625<0.03125 <6>5Medium silt >0.007813<0.015625 <7>6Fine silt >0.003906<0.007813 <8>7V. fine silt >0.001953<0.003906 <5>5Clay <0.001953 >9
Statistics** Mean (phi)SortingSkewnessKurtosis% Silt/Clay
Textural Group*
40 42 43 45 46 49 51 52 55 593.88 3.48 0.00 0.00 2.17 0.00 0.00 0.00 0.00 9.8720.21 12.04 0.00 3.90 17.94 14.01 19.79 9.55 18.77 30.138.22 14.86 0.62 13.22 18.43 7.35 15.29 12.39 8.89 17.268.09 9.11 1.57 11.29 9.49 8.38 10.19 7.49 5.39 6.224.92 7.31 3.83 5.86 5.04 4.26 6.58 5.49 3.61 2.587.98 13.57 53.22 7.63 5.17 3.81 16.16 21.97 9.98 2.8729.05 21.05 40.65 24.98 26.01 14.34 20.67 34.13 18.20 11.8114.21 10.67 0.11 19.41 15.26 16.83 3.69 4.34 12.04 13.260.13 2.84 0.00 4.72 0.29 11.49 2.96 0.80 7.07 3.570.88 1.21 0.00 1.65 0.14 4.61 1.10 0.91 4.02 0.330.37 0.71 0.00 1.43 0.06 2.47 0.55 0.50 3.34 0.510.58 0.94 0.00 1.92 0.00 3.62 0.95 0.80 2.84 0.530.67 0.97 0.00 1.95 0.00 3.98 0.94 0.73 2.55 0.520.44 0.66 0.00 1.17 0.00 2.76 0.65 0.54 1.94 0.300.32 0.42 0.00 0.62 0.00 1.45 0.39 0.36 1.05 0.180.06 0.14 0.00 0.24 0.00 0.63 0.11 0.01 0.33 0.06
-1.25 -1.11 -0.05 -0.29 -1.61 0.31 -1.57 -1.00 -0.34 -2.362.42 2.46 0.48 2.66 2.25 3.58 2.31 1.99 3.49 2.63-0.46 -0.20 -0.01 -0.15 0.00 -0.09 -0.02 -0.51 -0.05 0.550.59 0.78 1.35 1.06 0.58 0.95 0.75 0.81 0.87 0.602.45 3.84 0.00 7.34 0.06 14.92 3.59 2.93 12.05 2.10
Sandy Gravel Sandy Gravel Gravelly Sand Muddy Sandy Gravel Sandy Gravel Muddy Sandy
Gravel Sandy Gravel Sandy Gravel Muddy Sandy Gravel Sandy Gravel

Wentworth Scale
Station Code 1 11 21 24 25 27 28 36 37 39 40 42 43 45 46 49 51 52 55 59pebble 22.69 24.22 52.42 6.14 15.78 1.73 54.02 0.00 20.80 6.16 40.39 39.50 2.19 28.41 48.03 29.74 45.27 29.43 33.05 63.48granule 5.61 5.78 3.27 2.72 2.85 6.96 3.61 0.00 2.18 2.28 4.92 7.31 3.83 5.86 5.04 4.26 6.58 5.49 3.61 2.58V. coarse sand 6.24 9.65 10.01 2.45 8.79 65.96 1.29 0.14 18.09 15.22 7.98 13.57 53.22 7.63 5.17 3.81 16.16 21.97 9.98 2.87Coarse sand 27.18 18.45 17.72 11.98 41.98 25.35 5.36 2.60 38.39 66.03 29.05 21.05 40.65 24.98 26.01 14.34 20.67 34.13 18.20 11.81Medium sand 24.40 8.60 8.91 18.71 26.55 0.00 5.92 25.05 13.71 10.30 14.21 10.67 0.11 19.41 15.26 16.83 3.69 4.34 12.04 13.26Fine sand 3.47 4.75 2.05 18.83 0.51 0.00 3.00 31.90 1.14 0.00 0.13 2.84 0.00 4.72 0.29 11.49 2.96 0.80 7.07 3.57V. fine sand 1.95 5.73 1.04 10.24 0.66 0.00 4.56 7.29 1.19 0.00 0.88 1.21 0.00 1.65 0.14 4.61 1.10 0.91 4.02 0.33Silt Clay 8.47 22.82 4.57 28.93 2.87 0.00 22.24 33.02 4.49 0.00 2.45 3.84 0.00 7.34 0.06 14.92 3.59 2.93 12.05 2.10
100.00 100.00 100.00 100.00 100.00 100.00 100.00 100.00 100.00 100.00 100.00 100.00 100.00 100.00 100.00 100.00 100.00 100.00 100.00 100.00

Harwich Haven Disposal Site TH027
Monitoring Report
DLM7823-RT001-R02-00
B.3. September 2016

Client Name
Client Address
Report Title
Method
Subcontracted Tests
Authorisation Daisy Chamberlain 25/10/2016
Laboratory Manager
N/A
Thomson Ecology, Compass House, 60 Priestley Road, Surrey Research Park, Guildford, GU2 7AG
Harwich Haven Authority
TEM10 Particle Size Analysis
Navigation House, Harwich, CO12 3EJ
Harwich East Ship Channel ‐ Survey September 2016
Sample Form
Sample number Sample receipt date Sample condition Analyst Date Notes
ST01 13/09/3016 Good PF 24/10/2016
ST11 13/09/3016 Good PF 24/10/2016
ST22 13/09/3016 Good PF 24/10/2016
ST24 13/09/3016 Good PF 24/10/2016
ST25 13/09/3016 Good PF 24/10/2016
ST27 13/09/3016 Good PF 24/10/2016
ST36 13/09/3016 Good PF 24/10/2016
ST37 13/09/3016 Good PF 24/10/2016
ST39 13/09/3016 Good PF 24/10/2016
ST42 13/09/3016 Good PF 24/10/2016
ST43 13/09/3016 Good PF 24/10/2016
ST45 13/09/3016 Good PF 24/10/2016
ST46 13/09/3016 Good PF 24/10/2016
ST49 13/09/3016 Good PF 24/10/2016
ST51 13/09/3016 Good PF 24/10/2016
ST52 13/09/3016 Good PF 24/10/2016
ST55 13/09/3016 Good PF 24/10/2016
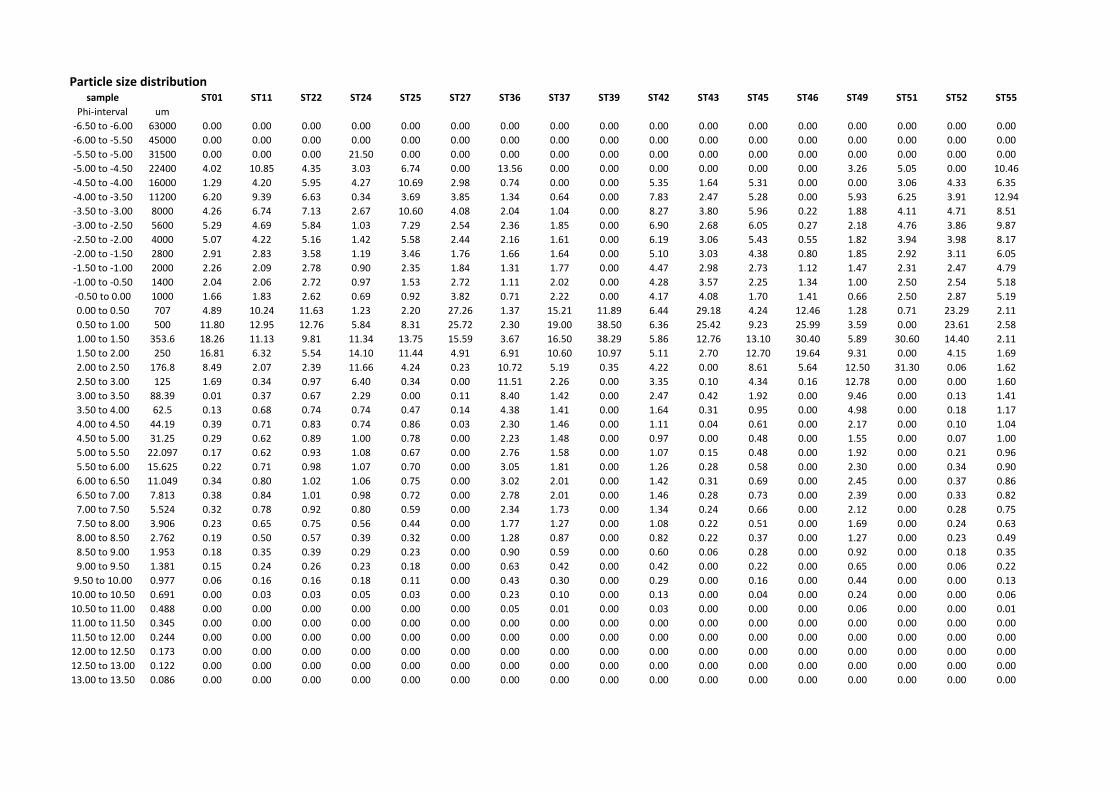
Particle size distributionsample ST01 ST11 ST22 ST24 ST25 ST27 ST36 ST37 ST39 ST42 ST43 ST45 ST46 ST49 ST51 ST52 ST55
Phi‐interval um
‐6.50 to ‐6.00 63000 0.00 0.00 0.00 0.00 0.00 0.00 0.00 0.00 0.00 0.00 0.00 0.00 0.00 0.00 0.00 0.00 0.00
‐6.00 to ‐5.50 45000 0.00 0.00 0.00 0.00 0.00 0.00 0.00 0.00 0.00 0.00 0.00 0.00 0.00 0.00 0.00 0.00 0.00
‐5.50 to ‐5.00 31500 0.00 0.00 0.00 21.50 0.00 0.00 0.00 0.00 0.00 0.00 0.00 0.00 0.00 0.00 0.00 0.00 0.00
‐5.00 to ‐4.50 22400 4.02 10.85 4.35 3.03 6.74 0.00 13.56 0.00 0.00 0.00 0.00 0.00 0.00 3.26 5.05 0.00 10.46
‐4.50 to ‐4.00 16000 1.29 4.20 5.95 4.27 10.69 2.98 0.74 0.00 0.00 5.35 1.64 5.31 0.00 0.00 3.06 4.33 6.35
‐4.00 to ‐3.50 11200 6.20 9.39 6.63 0.34 3.69 3.85 1.34 0.64 0.00 7.83 2.47 5.28 0.00 5.93 6.25 3.91 12.94
‐3.50 to ‐3.00 8000 4.26 6.74 7.13 2.67 10.60 4.08 2.04 1.04 0.00 8.27 3.80 5.96 0.22 1.88 4.11 4.71 8.51
‐3.00 to ‐2.50 5600 5.29 4.69 5.84 1.03 7.29 2.54 2.36 1.85 0.00 6.90 2.68 6.05 0.27 2.18 4.76 3.86 9.87
‐2.50 to ‐2.00 4000 5.07 4.22 5.16 1.42 5.58 2.44 2.16 1.61 0.00 6.19 3.06 5.43 0.55 1.82 3.94 3.98 8.17
‐2.00 to ‐1.50 2800 2.91 2.83 3.58 1.19 3.46 1.76 1.66 1.64 0.00 5.10 3.03 4.38 0.80 1.85 2.92 3.11 6.05
‐1.50 to ‐1.00 2000 2.26 2.09 2.78 0.90 2.35 1.84 1.31 1.77 0.00 4.47 2.98 2.73 1.12 1.47 2.31 2.47 4.79
‐1.00 to ‐0.50 1400 2.04 2.06 2.72 0.97 1.53 2.72 1.11 2.02 0.00 4.28 3.57 2.25 1.34 1.00 2.50 2.54 5.18
‐0.50 to 0.00 1000 1.66 1.83 2.62 0.69 0.92 3.82 0.71 2.22 0.00 4.17 4.08 1.70 1.41 0.66 2.50 2.87 5.19
0.00 to 0.50 707 4.89 10.24 11.63 1.23 2.20 27.26 1.37 15.21 11.89 6.44 29.18 4.24 12.46 1.28 0.71 23.29 2.11
0.50 to 1.00 500 11.80 12.95 12.76 5.84 8.31 25.72 2.30 19.00 38.50 6.36 25.42 9.23 25.99 3.59 0.00 23.61 2.58
1.00 to 1.50 353.6 18.26 11.13 9.81 11.34 13.75 15.59 3.67 16.50 38.29 5.86 12.76 13.10 30.40 5.89 30.60 14.40 2.11
1.50 to 2.00 250 16.81 6.32 5.54 14.10 11.44 4.91 6.91 10.60 10.97 5.11 2.70 12.70 19.64 9.31 0.00 4.15 1.69
2.00 to 2.50 176.8 8.49 2.07 2.39 11.66 4.24 0.23 10.72 5.19 0.35 4.22 0.00 8.61 5.64 12.50 31.30 0.06 1.62
2.50 to 3.00 125 1.69 0.34 0.97 6.40 0.34 0.00 11.51 2.26 0.00 3.35 0.10 4.34 0.16 12.78 0.00 0.00 1.60
3.00 to 3.50 88.39 0.01 0.37 0.67 2.29 0.00 0.11 8.40 1.42 0.00 2.47 0.42 1.92 0.00 9.46 0.00 0.13 1.41
3.50 to 4.00 62.5 0.13 0.68 0.74 0.74 0.47 0.14 4.38 1.41 0.00 1.64 0.31 0.95 0.00 4.98 0.00 0.18 1.17
4.00 to 4.50 44.19 0.39 0.71 0.83 0.74 0.86 0.03 2.30 1.46 0.00 1.11 0.04 0.61 0.00 2.17 0.00 0.10 1.04
4.50 to 5.00 31.25 0.29 0.62 0.89 1.00 0.78 0.00 2.23 1.48 0.00 0.97 0.00 0.48 0.00 1.55 0.00 0.07 1.00
5.00 to 5.50 22.097 0.17 0.62 0.93 1.08 0.67 0.00 2.76 1.58 0.00 1.07 0.15 0.48 0.00 1.92 0.00 0.21 0.96
5.50 to 6.00 15.625 0.22 0.71 0.98 1.07 0.70 0.00 3.05 1.81 0.00 1.26 0.28 0.58 0.00 2.30 0.00 0.34 0.90
6.00 to 6.50 11.049 0.34 0.80 1.02 1.06 0.75 0.00 3.02 2.01 0.00 1.42 0.31 0.69 0.00 2.45 0.00 0.37 0.86
6.50 to 7.00 7.813 0.38 0.84 1.01 0.98 0.72 0.00 2.78 2.01 0.00 1.46 0.28 0.73 0.00 2.39 0.00 0.33 0.82
7.00 to 7.50 5.524 0.32 0.78 0.92 0.80 0.59 0.00 2.34 1.73 0.00 1.34 0.24 0.66 0.00 2.12 0.00 0.28 0.75
7.50 to 8.00 3.906 0.23 0.65 0.75 0.56 0.44 0.00 1.77 1.27 0.00 1.08 0.22 0.51 0.00 1.69 0.00 0.24 0.63
8.00 to 8.50 2.762 0.19 0.50 0.57 0.39 0.32 0.00 1.28 0.87 0.00 0.82 0.22 0.37 0.00 1.27 0.00 0.23 0.49
8.50 to 9.00 1.953 0.18 0.35 0.39 0.29 0.23 0.00 0.90 0.59 0.00 0.60 0.06 0.28 0.00 0.92 0.00 0.18 0.35
9.00 to 9.50 1.381 0.15 0.24 0.26 0.23 0.18 0.00 0.63 0.42 0.00 0.42 0.00 0.22 0.00 0.65 0.00 0.06 0.22
9.50 to 10.00 0.977 0.06 0.16 0.16 0.18 0.11 0.00 0.43 0.30 0.00 0.29 0.00 0.16 0.00 0.44 0.00 0.00 0.13
10.00 to 10.50 0.691 0.00 0.03 0.03 0.05 0.03 0.00 0.23 0.10 0.00 0.13 0.00 0.04 0.00 0.24 0.00 0.00 0.06
10.50 to 11.00 0.488 0.00 0.00 0.00 0.00 0.00 0.00 0.05 0.01 0.00 0.03 0.00 0.00 0.00 0.06 0.00 0.00 0.01
11.00 to 11.50 0.345 0.00 0.00 0.00 0.00 0.00 0.00 0.00 0.00 0.00 0.00 0.00 0.00 0.00 0.00 0.00 0.00 0.00
11.50 to 12.00 0.244 0.00 0.00 0.00 0.00 0.00 0.00 0.00 0.00 0.00 0.00 0.00 0.00 0.00 0.00 0.00 0.00 0.00
12.00 to 12.50 0.173 0.00 0.00 0.00 0.00 0.00 0.00 0.00 0.00 0.00 0.00 0.00 0.00 0.00 0.00 0.00 0.00 0.00
12.50 to 13.00 0.122 0.00 0.00 0.00 0.00 0.00 0.00 0.00 0.00 0.00 0.00 0.00 0.00 0.00 0.00 0.00 0.00 0.00
13.00 to 13.50 0.086 0.00 0.00 0.00 0.00 0.00 0.00 0.00 0.00 0.00 0.00 0.00 0.00 0.00 0.00 0.00 0.00 0.00

SAMPLE STATISTICS
ST01 ST11 ST22 ST24 ST25 ST27 ST36 ST37
ANALYST AND DATE: LJH, 10/27/2016 LJH, 10/27/2016 LJH, 10/27/2016 LJH, 10/27/2016 LJH, 10/27/2016 LJH, 10/27/2016 LJH, 10/27/2016 LJH, 10/27/2016SIEVING ERROR:SAMPLE TYPE: Polymodal, Very Poorly Sorted Trimodal, Very Poorly Sorted Bimodal, Very Poorly Sorted Trimodal, Very Poorly Sorted Trimodal, Very Poorly Sorted Bimodal, Poorly Sorted Polymodal, Extremely Poorly Sorted Unimodal, Very Poorly SortedTEXTURAL GROUP: Sandy Gravel Muddy Sandy Gravel Muddy Sandy Gravel Muddy Sandy Gravel Muddy Sandy Gravel Gravelly Sand Gravelly Muddy Sand Gravelly Muddy SandSEDIMENT NAME: Sandy Medium Gravel Medium Silty Sandy Medium Gravel Medium Silty Sandy Medium Graveloarse Silty Sandy Very Coarse Gravery Coarse Silty Sandy Coarse Grav Medium Gravelly Coarse Sand oarse Gravelly Coarse Silty Fine Sanne Gravelly Medium Silty Coarse Sa
METHOD OF MEAN 3656.5 6619.1 5055.6 10560.5 6537.3 2443.2 4673.0 916.3MOMENTS SORTING 6343.7 8825.7 7178.2 15648.0 8219.9 4288.4 9255.2 1769.0
Arithmetic (m) SKEWNESS 2.369 1.312 1.670 1.051 1.241 2.616 1.849 4.449KURTOSIS 8.224 3.396 4.902 2.267 3.344 9.076 4.650 25.59
METHOD OF MEAN 944.5 1576.8 1232.2 1107.1 1650.4 1039.0 299.5 321.1MOMENTS SORTING 5.452 8.317 8.070 12.66 8.063 3.001 13.76 5.542
Geometric (m) SKEWNESS 0.071 -0.676 -0.723 0.074 -0.616 1.348 0.290 -1.037KURTOSIS 3.451 3.423 3.516 2.124 3.040 3.831 2.342 4.293
METHOD OF MEAN 0.082 -0.657 -0.301 -0.147 -0.723 -0.055 1.739 1.639MOMENTS SORTING 2.447 3.056 3.013 3.663 3.011 1.585 3.782 2.470Logarithmic () SKEWNESS -0.071 0.676 0.723 -0.074 0.616 -1.348 -0.290 1.037
KURTOSIS 3.451 3.423 3.516 2.124 3.040 3.831 2.342 4.293
FOLK AND MEAN 1031.1 1716.4 1463.3 1340.8 2168.3 1089.8 348.3 311.2WARD METHOD SORTING 4.658 7.649 7.573 12.32 7.454 2.988 17.38 4.996
(m) SKEWNESS 0.565 0.194 0.129 0.409 -0.118 0.559 0.225 -0.394KURTOSIS 0.718 0.922 1.045 0.691 0.820 2.054 1.034 2.218
FOLK AND MEAN -0.044 -0.779 -0.549 -0.423 -1.117 -0.124 1.522 1.684WARD METHOD SORTING 2.220 2.935 2.921 3.623 2.898 1.579 4.119 2.321() SKEWNESS -0.565 -0.194 -0.129 -0.409 0.118 -0.559 -0.225 0.394
KURTOSIS 0.718 0.922 1.045 0.691 0.820 2.054 1.034 2.218
FOLK AND MEAN: Very Coarse Sand Very Coarse Sand Very Coarse Sand Very Coarse Sand Very Fine Gravel Very Coarse Sand Medium Sand Medium SandWARD METHOD SORTING: Very Poorly Sorted Very Poorly Sorted Very Poorly Sorted Very Poorly Sorted Very Poorly Sorted Poorly Sorted Extremely Poorly Sorted Very Poorly Sorted(Description) SKEWNESS: Very Coarse Skewed Coarse Skewed Coarse Skewed Very Coarse Skewed Fine Skewed Very Coarse Skewed Coarse Skewed Very Fine Skewed
KURTOSIS: Platykurtic Mesokurtic Mesokurtic Platykurtic Platykurtic Very Leptokurtic Mesokurtic Very Leptokurtic
MODE 1 (m): 427.5 605.0 605.0 38250.0 427.5 855.0 26950.0 605.0
MODE 2 (m): 13600.0 26950.0 9600.0 302.5 19200.0 9600.0 215.0
MODE 3 (m): 4800.0 13600.0 19200.0 9600.0 18.86MODE 1 (): 1.247 0.747 0.747 -5.235 1.247 0.247 -4.731 0.747MODE 2 (): -3.743 -4.731 -3.243 1.747 -4.243 -3.243 2.237MODE 3 (): -2.243 -3.743 -4.243 -3.243 5.750
D10 (m): 220.6 232.5 116.4 101.7 223.6 392.6 10.51 17.83D50 (m): 525.7 963.9 908.8 430.8 2118.6 739.8 191.1 469.7D90 (m): 12213.3 23009.1 16274.5 38119.7 20216.8 8619.6 24496.4 1546.7(D90 / D10) (m): 55.37 98.98 139.8 374.8 90.40 21.95 2330.3 86.76(D90 - D10) (m): 11992.8 22776.6 16158.0 38018.0 19993.2 8227.0 24485.9 1528.8(D75 / D25) (m): 13.49 23.82 17.28 97.92 26.46 2.072 29.94 3.218(D75 - D25) (m): 3989.5 10433.4 7113.4 21349.6 9529.0 566.0 2017.8 523.4D10 (): -3.610 -4.524 -4.025 -5.252 -4.337 -3.108 -4.615 -0.629D50 (): 0.928 0.053 0.138 1.215 -1.083 0.435 2.387 1.090D90 (): 2.181 2.105 3.103 3.297 2.161 1.349 6.572 5.810(D90 / D10) (): -0.604 -0.465 -0.771 -0.628 -0.498 -0.434 -1.424 -9.234(D90 - D10) (): 5.791 6.629 7.127 8.550 6.498 4.456 11.19 6.439(D75 / D25) (): -0.781 -0.328 -0.409 -0.493 -0.429 -7.111 -3.619 5.247(D75 - D25) (): 3.753 4.574 4.111 6.614 4.726 1.051 4.904 1.686
% GRAVEL: 31.3% 45.0% 41.4% 36.3% 50.4% 19.5% 25.2% 8.5%% SAND: 65.8% 48.0% 49.9% 55.3% 43.2% 80.5% 51.1% 75.8%% MUD: 2.9% 7.0% 8.7% 8.4% 6.4% 0.0% 23.7% 15.6%% V COARSE GRAVEL: 0.0% 0.0% 0.0% 20.5% 0.0% 0.0% 0.0% 0.0%% COARSE GRAVEL: 5.3% 15.1% 10.3% 8.2% 17.4% 3.0% 14.3% 0.0%% MEDIUM GRAVEL: 10.5% 16.1% 13.8% 3.0% 14.3% 7.9% 3.4% 1.7%% FINE GRAVEL: 10.4% 8.9% 11.0% 2.5% 12.9% 5.0% 4.5% 3.5%% V FINE GRAVEL: 5.2% 4.9% 6.4% 2.1% 5.8% 3.6% 3.0% 3.4%% V COARSE SAND: 3.7% 3.9% 5.3% 1.7% 2.4% 6.5% 1.8% 4.2%% COARSE SAND: 16.7% 23.2% 24.4% 7.1% 10.5% 53.0% 3.7% 34.2%% MEDIUM SAND: 35.1% 17.5% 15.4% 25.4% 25.2% 20.5% 10.6% 27.1%% FINE SAND: 10.2% 2.4% 3.4% 18.1% 4.6% 0.2% 22.2% 7.4%% V FINE SAND: 0.1% 1.1% 1.4% 3.0% 0.5% 0.3% 12.8% 2.9%% V COARSE SILT: 0.7% 1.3% 1.7% 1.7% 1.6% 0.0% 4.5% 2.9%% COARSE SILT: 0.4% 1.3% 1.9% 2.1% 1.4% 0.0% 5.8% 3.4%% MEDIUM SILT: 0.7% 1.6% 2.0% 2.0% 1.5% 0.0% 5.8% 4.0%% FINE SILT: 0.6% 1.4% 1.7% 1.4% 1.0% 0.0% 4.1% 3.0%% V FINE SILT: 0.4% 0.8% 1.0% 0.7% 0.5% 0.0% 2.2% 1.5%% CLAY: 0.2% 0.4% 0.4% 0.5% 0.3% 0.0% 1.3% 0.8%
:)( a:)( ax
:)( aSk:)( aK
:)( gx:)( g
:)( gSk:)( gK
:)( x:)(
:)Sk(
:)( K
:)( ZM:)( I
:)( ISk:)( GK
:)( GK
:)( GM:)( G
:)( GSk

SAMPLE STATISTICS
ANALYST AND DATE:SIEVING ERROR:SAMPLE TYPE: TEXTURAL GROUP: SEDIMENT NAME:
METHOD OF MEANMOMENTS SORTINGArithmetic (m) SKEWNESS
KURTOSISMETHOD OF MEANMOMENTS SORTINGGeometric (m) SKEWNESS
KURTOSISMETHOD OF MEANMOMENTS SORTINGLogarithmic () SKEWNESS
KURTOSISFOLK AND MEANWARD METHOD SORTING(m) SKEWNESS
KURTOSISFOLK AND MEANWARD METHOD SORTING() SKEWNESS
KURTOSISFOLK AND MEAN:WARD METHOD SORTING:(Description) SKEWNESS:
KURTOSIS:MODE 1 (m):MODE 2 (m):MODE 3 (m):MODE 1 ():MODE 2 ():MODE 3 ():D10 (m):D50 (m):D90 (m):(D90 / D10) (m):(D90 - D10) (m):(D75 / D25) (m):(D75 - D25) (m):D10 ():D50 ():D90 ():(D90 / D10) ():(D90 - D10) ():(D75 / D25) ():(D75 - D25) ():% GRAVEL:% SAND:% MUD:% V COARSE GRAVEL:% COARSE GRAVEL:% MEDIUM GRAVEL:% FINE GRAVEL:% V FINE GRAVEL:% V COARSE SAND:% COARSE SAND:% MEDIUM SAND:% FINE SAND:% V FINE SAND:% V COARSE SILT:% COARSE SILT:% MEDIUM SILT:% FINE SILT:% V FINE SILT:% CLAY:
:)( a:)( ax
:)( aSk:)( aK
:)( gx:)( g
:)( gSk:)( gK
:)( x:)(
:)Sk(
:)( K
:)( ZM:)( I
:)( ISk:)( GK
:)( GK
:)( GM:)( G
:)( GSk
ST39 ST42 ST43 ST45 ST46 ST49 ST51 ST52
LJH, 10/27/2016 LJH, 10/27/2016 LJH, 10/27/2016 LJH, 10/27/2016 LJH, 10/27/2016 LJH, 10/27/2016 LJH, 10/27/2016 LJH, 10/27/2016
Unimodal, Well Sorted Trimodal, Very Poorly Sorted Unimodal, Poorly Sorted Trimodal, Very Poorly Sorted Unimodal, Moderately Well Sorted Polymodal, Very Poorly Sorted Polymodal, Very Poorly Sorted Polymodal, Poorly SortedSand Muddy Sandy Gravel Gravelly Sand Sandy Gravel Slightly Gravelly Sand Gravelly Muddy Sand Sandy Gravel Gravelly Sand
Well Sorted Coarse Sand Medium Silty Sandy Medium Gravel Medium Gravelly Coarse Sand Sandy Fine Gravel ightly Very Fine Gravelly Medium Saedium Gravelly Medium Silty Fine Sa Sandy Medium Gravel Medium Gravelly Coarse Sand
532.2 4209.0 2097.7 3469.7 625.8 2373.9 4135.7 2928.1157.4 5462.4 3564.5 5262.0 739.0 5705.1 7066.4 4750.30.582 1.404 3.026 1.774 7.183 3.061 2.065 2.2552.753 3.932 12.26 5.162 69.54 12.19 6.386 7.201
502.1 969.8 956.9 857.7 496.8 232.3 982.9 1093.21.344 9.723 3.276 6.739 1.728 9.335 5.252 4.076-0.057 -0.811 -0.247 -0.344 1.558 0.209 0.753 -0.2392.525 3.098 7.148 3.254 7.858 2.978 2.001 5.454
0.994 0.044 0.064 0.222 1.009 2.106 0.025 -0.1290.426 3.281 1.712 2.753 0.789 3.223 2.393 2.0270.057 0.811 0.247 0.344 -1.558 -0.209 -0.753 0.2392.525 3.098 7.148 3.254 7.858 2.978 2.001 5.454
502.7 1147.9 1032.5 971.4 473.1 265.2 969.7 1266.81.376 9.454 2.671 6.334 1.606 10.89 5.368 3.4780.003 -0.181 0.503 0.288 0.097 0.145 0.637 0.5510.993 0.973 1.775 0.866 1.081 1.887 0.647 1.055
0.992 -0.199 -0.046 0.042 1.080 1.915 0.044 -0.3410.460 3.241 1.418 2.663 0.683 3.445 2.424 1.798-0.003 0.181 -0.503 -0.288 -0.097 -0.145 -0.637 -0.5510.993 0.973 1.775 0.866 1.081 1.887 0.647 1.055
Coarse Sand Very Coarse Sand Very Coarse Sand Coarse Sand Medium Sand Medium Sand Coarse Sand Very Coarse SandWell Sorted Very Poorly Sorted Poorly Sorted Very Poorly Sorted Moderately Well Sorted Very Poorly Sorted Very Poorly Sorted Poorly SortedSymmetrical Fine Skewed Very Coarse Skewed Coarse Skewed Symmetrical Coarse Skewed Very Coarse Skewed Very Coarse SkewedMesokurtic Mesokurtic Very Leptokurtic Platykurtic Mesokurtic Very Leptokurtic Very Platykurtic Mesokurtic
427.5 9600.0 855.0 427.5 427.5 215.0 215.0 855.0855.0 9600.0 13600.0 427.5 9600.09.431 19200.0 26950.0 13600.0 19200.0
1.247 -3.243 0.247 1.247 1.247 2.237 2.237 0.2470.247 -3.243 -3.743 1.247 -3.2436.750 -4.243 -4.731 -3.743 -4.243
340.4 32.28 402.5 139.6 269.5 11.42 199.9 382.0501.8 1228.4 766.3 551.1 468.2 192.9 437.6 764.9749.7 12945.0 6067.9 11652.2 889.0 9681.3 14361.7 9876.82.203 401.0 15.08 83.47 3.299 848.0 71.84 25.86409.3 12912.7 5665.4 11512.6 619.6 9669.9 14161.8 9494.81.570 24.32 2.201 17.59 1.838 5.587 20.56 4.564228.9 6382.6 660.6 4550.1 295.3 408.9 4577.2 1881.90.416 -3.694 -2.601 -3.543 0.170 -3.275 -3.844 -3.3040.995 -0.297 0.384 0.860 1.095 2.374 1.192 0.3871.555 4.953 1.313 2.841 1.892 6.453 2.323 1.3883.741 -1.341 -0.505 -0.802 11.15 -1.970 -0.604 -0.4201.139 8.647 3.914 6.383 1.722 9.728 6.167 4.6931.977 -0.683 -3.127 -0.822 2.401 3.468 -0.925 -0.7260.651 4.604 1.138 4.136 0.878 2.482 4.362 2.190
0.0% 44.1% 19.7% 35.1% 3.0% 18.4% 32.4% 26.4%100.0% 43.9% 78.5% 59.1% 97.0% 61.5% 67.6% 71.2%0.0% 12.0% 1.8% 5.8% 0.0% 20.1% 0.0% 2.4%0.0% 0.0% 0.0% 0.0% 0.0% 0.0% 0.0% 0.0%0.0% 5.4% 1.6% 5.3% 0.0% 3.3% 8.1% 4.3%0.0% 16.1% 6.3% 11.2% 0.2% 7.8% 10.4% 8.6%0.0% 13.1% 5.7% 11.5% 0.8% 4.0% 8.7% 7.8%0.0% 9.6% 6.0% 7.1% 1.9% 3.3% 5.2% 5.6%0.0% 8.5% 7.7% 4.0% 2.8% 1.7% 5.0% 5.4%
50.4% 12.8% 54.6% 13.5% 38.4% 4.9% 0.7% 46.9%49.3% 11.0% 15.5% 25.8% 50.0% 15.2% 30.6% 18.6%0.3% 7.6% 0.1% 12.9% 5.8% 25.3% 31.3% 0.1%0.0% 4.1% 0.7% 2.9% 0.0% 14.5% 0.0% 0.3%0.0% 2.1% 0.0% 1.1% 0.0% 3.7% 0.0% 0.2%0.0% 2.3% 0.4% 1.1% 0.0% 4.2% 0.0% 0.6%0.0% 2.9% 0.6% 1.4% 0.0% 4.8% 0.0% 0.7%0.0% 2.4% 0.5% 1.2% 0.0% 3.8% 0.0% 0.5%0.0% 1.4% 0.3% 0.7% 0.0% 2.2% 0.0% 0.4%0.0% 0.9% 0.0% 0.4% 0.0% 1.4% 0.0% 0.1%

SAMPLE STATISTICS
ANALYST AND DATE:SIEVING ERROR:SAMPLE TYPE: TEXTURAL GROUP: SEDIMENT NAME:
METHOD OF MEANMOMENTS SORTINGArithmetic (m) SKEWNESS
KURTOSISMETHOD OF MEANMOMENTS SORTINGGeometric (m) SKEWNESS
KURTOSISMETHOD OF MEANMOMENTS SORTINGLogarithmic () SKEWNESS
KURTOSISFOLK AND MEANWARD METHOD SORTING(m) SKEWNESS
KURTOSISFOLK AND MEANWARD METHOD SORTING() SKEWNESS
KURTOSISFOLK AND MEAN:WARD METHOD SORTING:(Description) SKEWNESS:
KURTOSIS:MODE 1 (m):MODE 2 (m):MODE 3 (m):MODE 1 ():MODE 2 ():MODE 3 ():D10 (m):D50 (m):D90 (m):(D90 / D10) (m):(D90 - D10) (m):(D75 / D25) (m):(D75 - D25) (m):D10 ():D50 ():D90 ():(D90 / D10) ():(D90 - D10) ():(D75 / D25) ():(D75 - D25) ():% GRAVEL:% SAND:% MUD:% V COARSE GRAVEL:% COARSE GRAVEL:% MEDIUM GRAVEL:% FINE GRAVEL:% V FINE GRAVEL:% V COARSE SAND:% COARSE SAND:% MEDIUM SAND:% FINE SAND:% V FINE SAND:% V COARSE SILT:% COARSE SILT:% MEDIUM SILT:% FINE SILT:% V FINE SILT:% CLAY:
:)( a:)( ax
:)( aSk:)( aK
:)( gx:)( g
:)( gSk:)( gK
:)( x:)(
:)Sk(
:)( K
:)( ZM:)( I
:)( ISk:)( GK
:)( GK
:)( GM:)( G
:)( GSk
ST55
LJH, 10/27/2016
Polymodal, Very Poorly SortedMuddy Sandy Gravel
ery Coarse Silty Sandy Medium Grav
8206.68454.11.0402.969
2691.68.606-1.3734.430
-1.4283.1051.3734.430
3185.67.675-0.4641.234
-1.6722.9400.4641.234
Very Fine GravelVery Poorly SortedVery Fine Skewed
Leptokurtic
13600.026950.06800.0-3.743-4.731-2.743
104.15185.022737.0218.4
22632.910.86
11590.2-4.507-2.3743.264-0.7247.7710.0643.440
67.1%24.7%8.2%0.0%
16.8%21.5%18.0%10.8%10.4%4.7%3.8%3.2%2.6%2.0%1.9%1.7%1.4%0.8%0.4%

Size Class & Stats TableSample
Sediment* mm phi ST01 ST11 ST22 ST24 ST25 ST27 ST36 ST37V. coarse gravel >32<64 <-5>-6 0.00 0.00 0.00 20.55 0.00 0.00 0.00 0.00Coarse gravel >16<32 <-4>-5 5.30 15.05 10.30 8.24 17.43 2.98 14.30 0.00Medium gravel >8<16 <-3>-4 10.46 16.12 13.75 3.01 14.29 7.93 3.38 1.68Fine gravel >4<8 <-2>-3 10.36 8.91 11.00 2.45 12.87 4.98 4.52 3.46V. fine gravel >2<4 <-1>-2 5.18 4.92 6.35 2.09 5.81 3.60 2.97 3.41V. coarse sand >1<2 <0>-1 3.70 3.90 5.35 1.65 2.45 6.54 1.82 4.23Coarse sand >0.5<1 <1>0 16.69 23.19 24.39 7.07 10.52 52.97 3.67 34.21Medium sand >0.25<0.5 <2>1 35.07 17.45 15.36 25.44 25.20 20.50 10.58 27.10Fine sand >0.125<0.25 <3>2 10.18 2.41 3.36 18.06 4.58 0.23 22.23 7.44V. fine sand >0.0625<0.125 <4>3 0.15 1.06 1.43 3.05 0.48 0.25 12.83 2.86V. coarse silt >0.03125<0.0625 <5>4 0.67 1.31 1.70 1.72 1.62 0.03 4.47 2.91Coarse silt >0.015625<0.03125 <6>5 0.39 1.33 1.91 2.14 1.37 0.00 5.81 3.39Medium silt >0.007813<0.015625 <7>6 0.72 1.64 2.03 2.03 1.47 0.00 5.80 4.02Fine silt >0.003906<0.007813 <8>7 0.56 1.44 1.68 1.36 1.04 0.00 4.11 3.00V. fine silt >0.001953<0.003906 <5>5 0.36 0.85 0.96 0.67 0.55 0.00 2.18 1.46Clay <0.001953 >9 0.21 0.42 0.44 0.46 0.32 0.00 1.34 0.83
Statistics** Mean (phi) -0.04 -0.78 -0.55 -0.42 -1.12 -0.12 1.52 1.68Sorting 2.22 2.94 2.92 3.62 2.90 1.58 4.12 2.32Skewness -0.56 -0.19 -0.13 -0.41 0.12 -0.56 -0.23 0.39Kurtosis 0.72 0.92 1.05 0.69 0.82 2.05 1.03 2.22% Silt/Clay 2.91 6.98 8.72 8.39 6.37 0.03 23.70 15.61
Textural Group* Sandy Gravel Muddy Sandy Gravel
Muddy Sandy Gravel
Muddy Sandy Gravel
Muddy Sandy Gravel Gravelly Sand Gravelly
Muddy SandGravelly
Muddy Sand

Size Class & Stats Table
Sediment* mm phiV. coarse gravel >32<64 <-5>-6Coarse gravel >16<32 <-4>-5Medium gravel >8<16 <-3>-4Fine gravel >4<8 <-2>-3V. fine gravel >2<4 <-1>-2V. coarse sand >1<2 <0>-1Coarse sand >0.5<1 <1>0Medium sand >0.25<0.5 <2>1Fine sand >0.125<0.25 <3>2V. fine sand >0.0625<0.125 <4>3V. coarse silt >0.03125<0.0625 <5>4Coarse silt >0.015625<0.03125 <6>5Medium silt >0.007813<0.015625 <7>6Fine silt >0.003906<0.007813 <8>7V. fine silt >0.001953<0.003906 <5>5Clay <0.001953 >9
Statistics** Mean (phi)SortingSkewnessKurtosis% Silt/Clay
Textural Group*
ST39 ST42 ST43 ST45 ST46 ST49 ST51 ST52 ST550.00 0.00 0.00 0.00 0.00 0.00 0.00 0.00 0.000.00 5.35 1.64 5.31 0.00 3.26 8.11 4.33 16.810.00 16.09 6.28 11.23 0.22 7.81 10.35 8.62 21.450.00 13.09 5.74 11.49 0.83 4.00 8.70 7.84 18.040.00 9.57 6.01 7.12 1.92 3.32 5.23 5.58 10.840.00 8.46 7.65 3.95 2.75 1.66 5.00 5.41 10.3650.40 12.80 54.60 13.47 38.45 4.88 0.71 46.90 4.7049.26 10.97 15.46 25.80 50.03 15.20 30.60 18.55 3.800.35 7.58 0.10 12.95 5.80 25.27 31.30 0.06 3.220.00 4.14 0.72 2.88 0.00 14.49 0.00 0.31 2.600.00 2.05 0.04 1.07 0.00 3.67 0.00 0.17 2.020.00 2.32 0.44 1.06 0.00 4.21 0.00 0.55 1.860.00 2.88 0.60 1.42 0.00 4.84 0.00 0.70 1.680.00 2.41 0.45 1.17 0.00 3.81 0.00 0.52 1.370.00 1.41 0.28 0.66 0.00 2.18 0.00 0.40 0.830.00 0.88 0.00 0.42 0.00 1.38 0.00 0.06 0.42
0.99 -0.20 -0.05 0.04 1.08 1.91 0.04 -0.34 -1.670.46 3.24 1.42 2.66 0.68 3.44 2.42 1.80 2.940.00 0.18 -0.50 -0.29 -0.10 -0.15 -0.64 -0.55 0.460.99 0.97 1.77 0.87 1.08 1.89 0.65 1.06 1.230.00 11.96 1.80 5.80 0.00 20.10 0.00 2.40 8.18
Sand Muddy Sandy Gravel Gravelly Sand Sandy Gravel Slightly
Gravelly SandGravelly
Muddy Sand Sandy Gravel Gravelly Sand Muddy Sandy Gravel
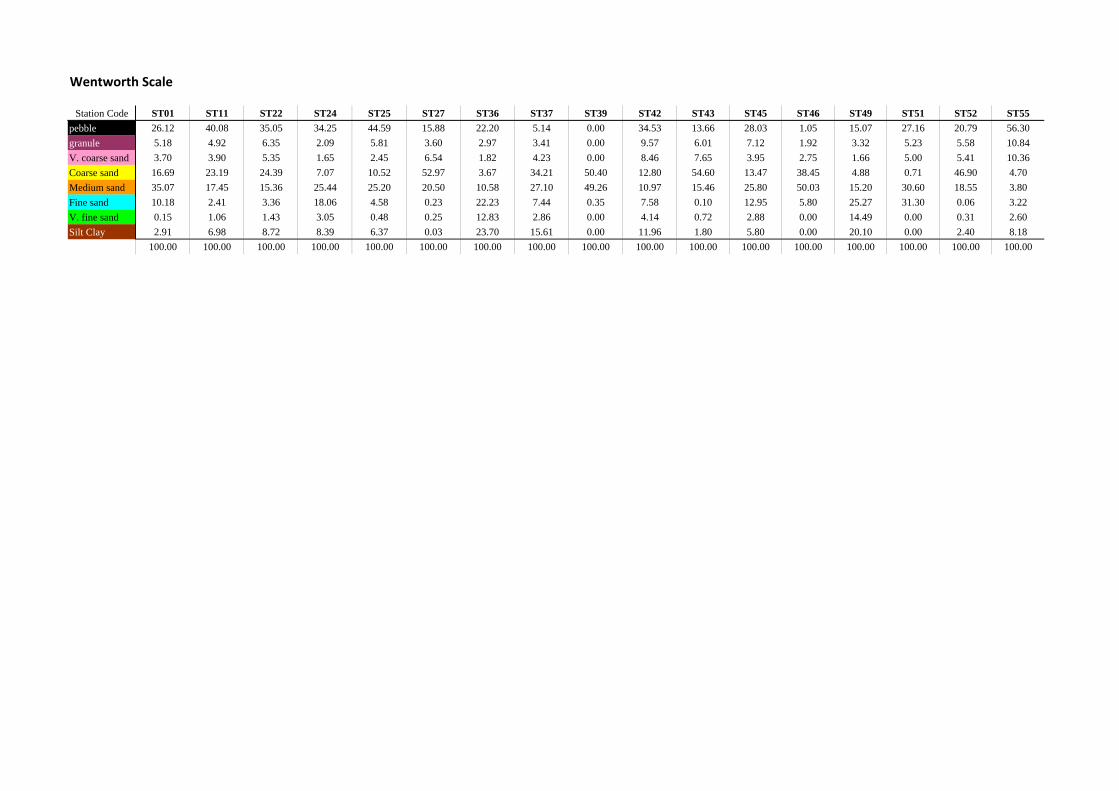
Wentworth Scale
Station Code ST01 ST11 ST22 ST24 ST25 ST27 ST36 ST37 ST39 ST42 ST43 ST45 ST46 ST49 ST51 ST52 ST55pebble 26.12 40.08 35.05 34.25 44.59 15.88 22.20 5.14 0.00 34.53 13.66 28.03 1.05 15.07 27.16 20.79 56.30granule 5.18 4.92 6.35 2.09 5.81 3.60 2.97 3.41 0.00 9.57 6.01 7.12 1.92 3.32 5.23 5.58 10.84V. coarse sand 3.70 3.90 5.35 1.65 2.45 6.54 1.82 4.23 0.00 8.46 7.65 3.95 2.75 1.66 5.00 5.41 10.36Coarse sand 16.69 23.19 24.39 7.07 10.52 52.97 3.67 34.21 50.40 12.80 54.60 13.47 38.45 4.88 0.71 46.90 4.70Medium sand 35.07 17.45 15.36 25.44 25.20 20.50 10.58 27.10 49.26 10.97 15.46 25.80 50.03 15.20 30.60 18.55 3.80Fine sand 10.18 2.41 3.36 18.06 4.58 0.23 22.23 7.44 0.35 7.58 0.10 12.95 5.80 25.27 31.30 0.06 3.22V. fine sand 0.15 1.06 1.43 3.05 0.48 0.25 12.83 2.86 0.00 4.14 0.72 2.88 0.00 14.49 0.00 0.31 2.60Silt Clay 2.91 6.98 8.72 8.39 6.37 0.03 23.70 15.61 0.00 11.96 1.80 5.80 0.00 20.10 0.00 2.40 8.18
100.00 100.00 100.00 100.00 100.00 100.00 100.00 100.00 100.00 100.00 100.00 100.00 100.00 100.00 100.00 100.00 100.00

Harwich Haven Disposal Site TH027
Monitoring Report
DLM7823-RT001-R02-00
C. Thomson Unicomarine benthic community data reports
C.1. May 2016
Thomson Ecology, Compass House, 60 Priestley Road, Surrey Research Park, Guildford, GU2 7AG
Client Name Harwich Haven Authority
Client Address
Harbour House, The Quay, Harwich Essex, CO12 3HH
Report title HHAESC16 ‐ Harwich East Ship Channel May 2016
Method TEM09 Benthic Invertbrate Analysis
Subcontracted Tests N/A
Author Laura Hearnden 03/06/2016
Biologist
Authorisation Ruth Barnich 03/06/2016
Principal Biologist

HHAESC16 - Harwich East Ship Channel May 2016
Sample number Sample receipt date Sample condition Mesh Size Sieve Analyst Date Sorting Analyst Date Identifcation Analyst Date QC Analyst Date Notes
64510 18 May 16 Good 1000 µm SH 26 May 16 SH 31 May 16 RBA 02 Jun 16
64511 18 May 16 Good 1000 µm LTW 27 May 16 LTW 27 May 16 LJH 31 May 16 RBA 01 Jun 16
64512 18 May 16 Good 1000 µm LJH 25 May 16 LJH 25 May 16 DC 26 May 16 RBA 01 Jun 16
64513 18 May 16 Good 1000 µm LTW 26 May 16 LTW 26 May 16 DC 31 May 16 RBA 01 Jun 16
64514 18 May 16 Good 1000 µm LTW 27 May 16 LTW 27 May 16 LJH 31 May 16 RBA 01 Jun 16
64515 18 May 16 Good 1000 µm LTW 25 May 16 LTW 26 May 16 DC 27 May 16 RBA 01 Jun 16
64516 18 May 16 Good 1000 µm LJH 25 May 16 LJH 25 May 16 LJH 31 May 16 RBA 01 Jun 16
64517 18 May 16 Good 1000 µm LJH 27 May 16 SH 31 May 16 DC 01 Jun 16
64518 18 May 16 Good 1000 µm LTW 27 May 16 LTW 27 May 16 LJH 31 May 16 RBA 01 Jun 16
64519 18 May 16 Good 1000 µm SH 24 May 16 LJH 25 May 16 LJH 31 May 16 RBA 01 Jun 16
64520 18 May 16 Good 1000 µm DC 27 May 16 DC 27 May 16 DC 31 May 16 RBA 01 Jun 16
64521 18 May 16 Good 1000 µm SH 24 May 16 SH 24 May 16 DC 31 May 16 RBA 01 Jun 16
64522 18 May 16 Good 1000 µm SH 23 May 16 SH 23 May 16 LJH 24 May 16 RBA 01 Jun 16
64523 18 May 16 Good 1000 µm LTW 31 May 16 SH 31 May 16 DC 02 Jun 16 RBA 02 Jun 16
64524 18 May 16 Good 1000 µm LTW 27 May 16 LTW 27 May 16 LJH 31 May 16 RBA 01 Jun 16
64525 18 May 16 Good 1000 µm LJH 27 May 16 LTW 01 Jun 16 DC 02 Jun 16 RBA 02 Jun 16
64526 18 May 16 Good 1000 µm LTW 31 May 16 LTW 31 May 16 LJH 01 Jun 16
64527 18 May 16 Good 1000 µm LTW 27 May 16 LTW 27 May 16 LJH 31 May 16 RBA 01 Jun 16
64528 18 May 16 Good 1000 µm LTW 31 May 16 LTW 31 May 16 LJH 01 Jun 16 RBA 01 Jun 16
64529 18 May 16 Good 1000 µm LTW 26 May 16 LTW 26 May 16 DC 31 May 16 RBA 01 Jun 16
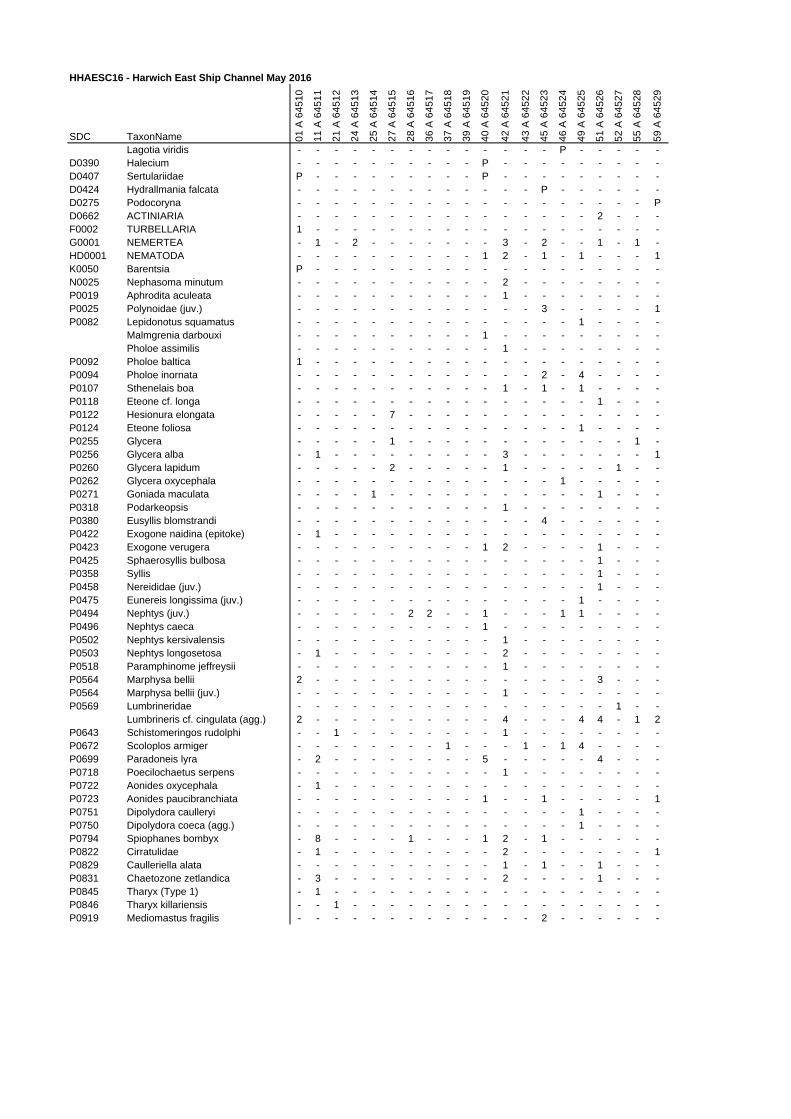
HHAESC16 - Harwich East Ship Channel May 2016
SDC TaxonName 01
A 6
45
10
11
A 6
45
11
21
A 6
45
12
24
A 6
45
13
25
A 6
45
14
27
A 6
45
15
28
A 6
45
16
36
A 6
45
17
37
A 6
45
18
39
A 6
45
19
40
A 6
45
20
42
A 6
45
21
43
A 6
45
22
45
A 6
45
23
46
A 6
45
24
49
A 6
45
25
51
A 6
45
26
52
A 6
45
27
55
A 6
45
28
59
A 6
45
29
Lagotia viridis - - - - - - - - - - - - - - P - - - - -D0390 Halecium - - - - - - - - - - P - - - - - - - - -D0407 Sertulariidae P - - - - - - - - - P - - - - - - - - -D0424 Hydrallmania falcata - - - - - - - - - - - - - P - - - - - -D0275 Podocoryna - - - - - - - - - - - - - - - - - - - PD0662 ACTINIARIA - - - - - - - - - - - - - - - - 2 - - -F0002 TURBELLARIA 1 - - - - - - - - - - - - - - - - - - -G0001 NEMERTEA - 1 - 2 - - - - - - - 3 - 2 - - 1 - 1 -HD0001 NEMATODA - - - - - - - - - - 1 2 - 1 - 1 - - - 1K0050 Barentsia P - - - - - - - - - - - - - - - - - - -N0025 Nephasoma minutum - - - - - - - - - - - 2 - - - - - - - -P0019 Aphrodita aculeata - - - - - - - - - - - 1 - - - - - - - -P0025 Polynoidae (juv.) - - - - - - - - - - - - - 3 - - - - - 1P0082 Lepidonotus squamatus - - - - - - - - - - - - - - - 1 - - - -
Malmgrenia darbouxi - - - - - - - - - - 1 - - - - - - - - -Pholoe assimilis - - - - - - - - - - - 1 - - - - - - - -
P0092 Pholoe baltica 1 - - - - - - - - - - - - - - - - - - -P0094 Pholoe inornata - - - - - - - - - - - - - 2 - 4 - - - -P0107 Sthenelais boa - - - - - - - - - - - 1 - 1 - 1 - - - -P0118 Eteone cf. longa - - - - - - - - - - - - - - - - 1 - - -P0122 Hesionura elongata - - - - - 7 - - - - - - - - - - - - - -P0124 Eteone foliosa - - - - - - - - - - - - - - - 1 - - - -P0255 Glycera - - - - - 1 - - - - - - - - - - - - 1 -P0256 Glycera alba - 1 - - - - - - - - - 3 - - - - - - - 1P0260 Glycera lapidum - - - - - 2 - - - - - 1 - - - - - 1 - -P0262 Glycera oxycephala - - - - - - - - - - - - - - 1 - - - - -P0271 Goniada maculata - - - - 1 - - - - - - - - - - - 1 - - -P0318 Podarkeopsis - - - - - - - - - - - 1 - - - - - - - -P0380 Eusyllis blomstrandi - - - - - - - - - - - - - 4 - - - - - -P0422 Exogone naidina (epitoke) - 1 - - - - - - - - - - - - - - - - - -P0423 Exogone verugera - - - - - - - - - - 1 2 - - - - 1 - - -P0425 Sphaerosyllis bulbosa - - - - - - - - - - - - - - - - 1 - - -P0358 Syllis - - - - - - - - - - - - - - - - 1 - - -P0458 Nereididae (juv.) - - - - - - - - - - - - - - - - 1 - - -P0475 Eunereis longissima (juv.) - - - - - - - - - - - - - - - 1 - - - -P0494 Nephtys (juv.) - - - - - - 2 2 - - 1 - - - 1 1 - - - -P0496 Nephtys caeca - - - - - - - - - - 1 - - - - - - - - -P0502 Nephtys kersivalensis - - - - - - - - - - - 1 - - - - - - - -P0503 Nephtys longosetosa - 1 - - - - - - - - - 2 - - - - - - - -P0518 Paramphinome jeffreysii - - - - - - - - - - - 1 - - - - - - - -P0564 Marphysa bellii 2 - - - - - - - - - - - - - - - 3 - - -P0564 Marphysa bellii (juv.) - - - - - - - - - - - 1 - - - - - - - -P0569 Lumbrineridae - - - - - - - - - - - - - - - - - 1 - -
Lumbrineris cf. cingulata (agg.) 2 - - - - - - - - - - 4 - - - 4 4 - 1 2P0643 Schistomeringos rudolphi - - 1 - - - - - - - - 1 - - - - - - - -P0672 Scoloplos armiger - - - - - - - - 1 - - - 1 - 1 4 - - - -P0699 Paradoneis lyra - 2 - - - - - - - - 5 - - - - - 4 - - -P0718 Poecilochaetus serpens - - - - - - - - - - - 1 - - - - - - - -P0722 Aonides oxycephala - 1 - - - - - - - - - - - - - - - - - -P0723 Aonides paucibranchiata - - - - - - - - - - 1 - - 1 - - - - - 1P0751 Dipolydora caulleryi - - - - - - - - - - - - - - - 1 - - - -P0750 Dipolydora coeca (agg.) - - - - - - - - - - - - - - - 1 - - - -P0794 Spiophanes bombyx - 8 - - - - 1 - - - 1 2 - 1 - - - - - -P0822 Cirratulidae - 1 - - - - - - - - - 2 - - - - - - - 1P0829 Caulleriella alata - - - - - - - - - - - 1 - 1 - - 1 - - -P0831 Chaetozone zetlandica - 3 - - - - - - - - - 2 - - - - 1 - - -P0845 Tharyx (Type 1) - 1 - - - - - - - - - - - - - - - - - -P0846 Tharyx killariensis - - 1 - - - - - - - - - - - - - - - - -P0919 Mediomastus fragilis - - - - - - - - - - - - - 2 - - - - - -
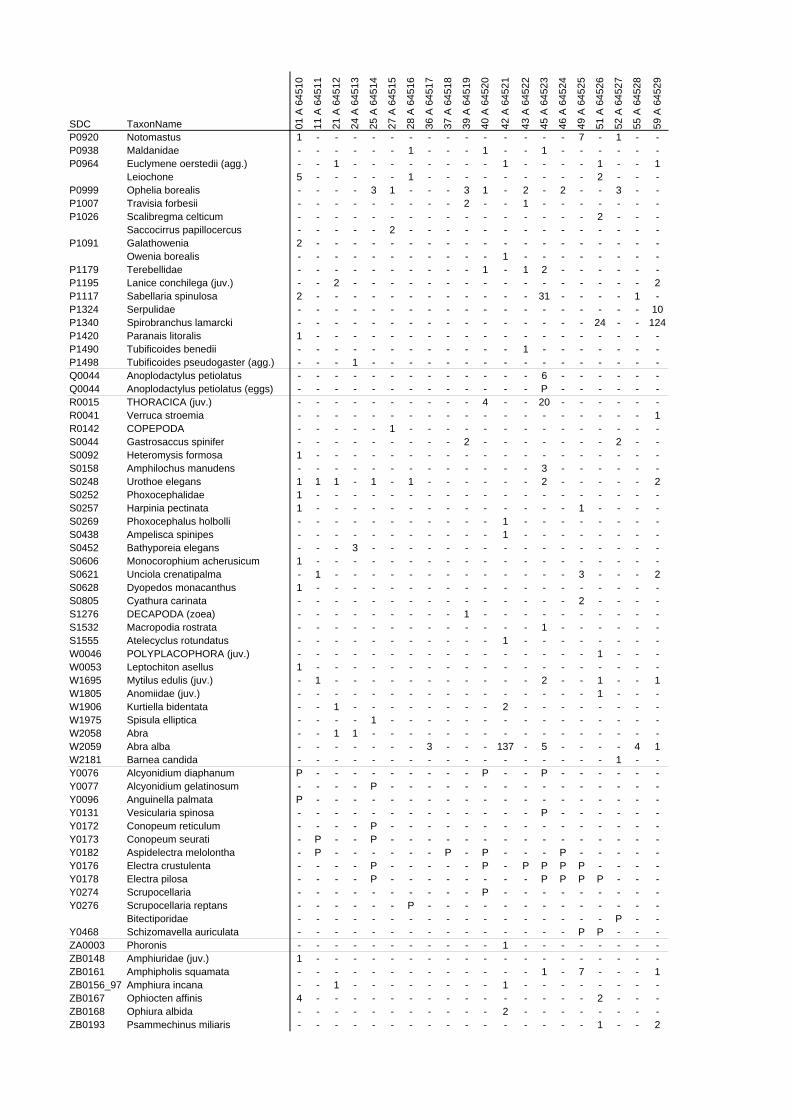
SDC TaxonName 01
A 6
45
10
11
A 6
45
11
21
A 6
45
12
24
A 6
45
13
25
A 6
45
14
27
A 6
45
15
28
A 6
45
16
36
A 6
45
17
37
A 6
45
18
39
A 6
45
19
40
A 6
45
20
42
A 6
45
21
43
A 6
45
22
45
A 6
45
23
46
A 6
45
24
49
A 6
45
25
51
A 6
45
26
52
A 6
45
27
55
A 6
45
28
59
A 6
45
29
P0920 Notomastus 1 - - - - - - - - - - - - - - 7 - 1 - -P0938 Maldanidae - - - - - - 1 - - - 1 - - 1 - - - - - -P0964 Euclymene oerstedii (agg.) - - 1 - - - - - - - - 1 - - - - 1 - - 1
Leiochone 5 - - - - - 1 - - - - - - - - - 2 - - -P0999 Ophelia borealis - - - - 3 1 - - - 3 1 - 2 - 2 - - 3 - -P1007 Travisia forbesii - - - - - - - - - 2 - - 1 - - - - - - -P1026 Scalibregma celticum - - - - - - - - - - - - - - - - 2 - - -
Saccocirrus papillocercus - - - - - 2 - - - - - - - - - - - - - -P1091 Galathowenia 2 - - - - - - - - - - - - - - - - - - -
Owenia borealis - - - - - - - - - - - 1 - - - - - - - -P1179 Terebellidae - - - - - - - - - - 1 - 1 2 - - - - - -P1195 Lanice conchilega (juv.) - - 2 - - - - - - - - - - - - - - - - 2P1117 Sabellaria spinulosa 2 - - - - - - - - - - - - 31 - - - - 1 -P1324 Serpulidae - - - - - - - - - - - - - - - - - - - 10P1340 Spirobranchus lamarcki - - - - - - - - - - - - - - - - 24 - - 124P1420 Paranais litoralis 1 - - - - - - - - - - - - - - - - - - -P1490 Tubificoides benedii - - - - - - - - - - - - 1 - - - - - - -P1498 Tubificoides pseudogaster (agg.) - - - 1 - - - - - - - - - - - - - - - -Q0044 Anoplodactylus petiolatus - - - - - - - - - - - - - 6 - - - - - -Q0044 Anoplodactylus petiolatus (eggs) - - - - - - - - - - - - - P - - - - - -R0015 THORACICA (juv.) - - - - - - - - - - 4 - - 20 - - - - - -R0041 Verruca stroemia - - - - - - - - - - - - - - - - - - - 1R0142 COPEPODA - - - - - 1 - - - - - - - - - - - - - -S0044 Gastrosaccus spinifer - - - - - - - - - 2 - - - - - - - 2 - -S0092 Heteromysis formosa 1 - - - - - - - - - - - - - - - - - - -S0158 Amphilochus manudens - - - - - - - - - - - - - 3 - - - - - -S0248 Urothoe elegans 1 1 1 - 1 - 1 - - - - - - 2 - - - - - 2S0252 Phoxocephalidae 1 - - - - - - - - - - - - - - - - - - -S0257 Harpinia pectinata 1 - - - - - - - - - - - - - - 1 - - - -S0269 Phoxocephalus holbolli - - - - - - - - - - - 1 - - - - - - - -S0438 Ampelisca spinipes - - - - - - - - - - - 1 - - - - - - - -S0452 Bathyporeia elegans - - - 3 - - - - - - - - - - - - - - - -S0606 Monocorophium acherusicum 1 - - - - - - - - - - - - - - - - - - -S0621 Unciola crenatipalma - 1 - - - - - - - - - - - - - 3 - - - 2S0628 Dyopedos monacanthus 1 - - - - - - - - - - - - - - - - - - -S0805 Cyathura carinata - - - - - - - - - - - - - - - 2 - - - -S1276 DECAPODA (zoea) - - - - - - - - - 1 - - - - - - - - - -S1532 Macropodia rostrata - - - - - - - - - - - - - 1 - - - - - -S1555 Atelecyclus rotundatus - - - - - - - - - - - 1 - - - - - - - -W0046 POLYPLACOPHORA (juv.) - - - - - - - - - - - - - - - - 1 - - -W0053 Leptochiton asellus 1 - - - - - - - - - - - - - - - - - - -W1695 Mytilus edulis (juv.) - 1 - - - - - - - - - - - 2 - - 1 - - 1W1805 Anomiidae (juv.) - - - - - - - - - - - - - - - - 1 - - -W1906 Kurtiella bidentata - - 1 - - - - - - - - 2 - - - - - - - -W1975 Spisula elliptica - - - - 1 - - - - - - - - - - - - - - -W2058 Abra - - 1 1 - - - - - - - - - - - - - - - -W2059 Abra alba - - - - - - - 3 - - - 137 - 5 - - - - 4 1W2181 Barnea candida - - - - - - - - - - - - - - - - - 1 - -Y0076 Alcyonidium diaphanum P - - - - - - - - - P - - P - - - - - -Y0077 Alcyonidium gelatinosum - - - - P - - - - - - - - - - - - - - -Y0096 Anguinella palmata P - - - - - - - - - - - - - - - - - - -Y0131 Vesicularia spinosa - - - - - - - - - - - - - P - - - - - -Y0172 Conopeum reticulum - - - - P - - - - - - - - - - - - - - -Y0173 Conopeum seurati - P - - P - - - - - - - - - - - - - - -Y0182 Aspidelectra melolontha - P - - - - - - P - P - - - P - - - - -Y0176 Electra crustulenta - - - - P - - - - - P - P P P P - - - -Y0178 Electra pilosa - - - - P - - - - - - - - P P P P - - -Y0274 Scrupocellaria - - - - - - - - - - P - - - - - - - - -Y0276 Scrupocellaria reptans - - - - - - P - - - - - - - - - - - - -
Bitectiporidae - - - - - - - - - - - - - - - - - P - -Y0468 Schizomavella auriculata - - - - - - - - - - - - - - - P P - - -ZA0003 Phoronis - - - - - - - - - - - 1 - - - - - - - -ZB0148 Amphiuridae (juv.) 1 - - - - - - - - - - - - - - - - - - -ZB0161 Amphipholis squamata - - - - - - - - - - - - - 1 - 7 - - - 1ZB0156_97 Amphiura incana - - 1 - - - - - - - - 1 - - - - - - - -ZB0167 Ophiocten affinis 4 - - - - - - - - - - - - - - - 2 - - -ZB0168 Ophiura albida - - - - - - - - - - - 2 - - - - - - - -ZB0193 Psammechinus miliaris - - - - - - - - - - - - - - - - 1 - - 2

Harwich Haven Disposal Site TH027
Monitoring Report
DLM7823-RT001-R02-00
C.2. July 2016
Client Name
Client Address
Report title
Method
Subcontracted Tests
Author 25/08/2016
Authorisation 26/08/2016Ruth Barnich
Principal Taxonomist
Laura Hearnden
Project Manager
N/A
Thomson Ecology, Compass House, 60 Priestley Road, Surrey Research Park,
Guildford, GU2 7AG
TEM09 Benthic Invertbrate Analysis
Harwich Haven Authority
Navigation House, Harwich CO12 3EJ
Harwich East Ship Channel ‐ Survey July 2016

Harwich East Ship Channel ‐ Survey July 2016
Sample number Sample receipt date Sample condition Mesh Size Sieve Analyst Date Sorting Analyst Date Identifcation Analyst Date QC Analyst Date Notes
01 B 64662 19 Jul 16 Good 1 mm LJH 09 Aug 16 LJH 09 Aug 16 LJH 10 Aug 16 DC 10 Aug 16
11 B 64663 19 Jul 16 Good 1 mm LJH 08 Aug 16 LJH 08 Aug 16 LJH 08 Aug 16 DC 08 Aug 16
21 B 64664 19 Jul 16 Good 1 mm LTW 16 Aug 16 LTW 17 Aug 16 LJH 18 Aug 16 DC 18 Aug 16
24 B 64665 19 Jul 16 Good 1 mm LJH 09 Aug 16 LJH 09 Aug 16 LJH 09 Aug 16 DC 09 Aug 16
25 B 64666 19 Jul 16 Good 1 mm LJH 08 Aug 16 LJH 08 Aug 16 LJH 09 Aug 16 DC 09 Aug 16
27 B 64667 19 Jul 16 Good 1 mm LTW 17 Aug 16 LTW 17 Aug 16 LJH 18 Aug 16 DC 18 Aug 16
28 B 64668 19 Jul 16 Good 1 mm LJH 11 Aug 16 LJH 12 Aug 16 LJH 12 Aug 16 DC 12 Aug 16
36 B 64669 19 Jul 16 Good 1 mm LJH 09 Aug 16 LJH 09 Aug 16 LJH 09 Aug 16 DC 09 Aug 16
37 B 64670 19 Jul 16 Good 1 mm LJH 15 Aug 16 LJH 16 Aug 16 LJH 16 Aug 16 DC 16 Aug 16
39 B 64671 19 Jul 16 Good 1 mm LJH 08 Aug 16 LJH 08 Aug 16 LJH 08 Aug 16 DC 08 Aug 16
40 B 64672 19 Jul 16 Good 1 mm LJH 05 Aug 16 LJH 16 Aug 05 LJH 08 Aug 16 DC 08 Aug 16
42 B 64673 19 Jul 16 Good 1 mm LTW 17 Aug 16 LTW 19 Aug 16 LJH 22 Aug 16 DC 22 Aug 16
43 B 64674 42570 Good 1 mm LTW 42598 LTW 42599 LJH 42599 DC 42599
45 B 64675 42570 Good 1 mm LTW 42597 LJH 42599 LJH 42599 DC 42599
46 B 64676 42570 Good 1 mm LJH 42597 LJH 42598 LJH 42598 DC 42598
49 B 64677 42570 Good 1 mm LTW 42594 LTW 42597 LJH 42597 DC 42597
51 B 64678 42570 Good 1 mm LTW 42593 LJH 42597 LJH 42597 DC 42597
52 B 64681 42570 Good 1 mm LJH 42593 LJH 42593 LJH 42594 DC 42594
55 B 64679 42570 Good 1 mm LJH 42591 LJH 42592 LJH 42593 DC 42593
59 B 64680 42570 Good 1 mm LJH 42600 LJH 42599 LJH 42599 DC 42599

HHAESC16 ‐ Harwich East Ship Channel ‐ Survey July 2016
SDC Taxon Name 01 B 64662
11 B 64663
21 B 64664
24 B 64665
25 B 64666
27 B 64667
28 B 64668
36 B 64669
37 B 64670
39 B 64671
40 B 64672
42 B 64673
43 B 64674
45 B 64675
46 B 64676
49 B 64677
51 B 64678
52 B 64681
55 B 64679
59 B 64680
Lagotia viridis ‐ ‐ ‐ ‐ ‐ P ‐ ‐ ‐ ‐ ‐ ‐ ‐ ‐ ‐ ‐ ‐ ‐ ‐ ‐
D0462 Nemertesia ‐ ‐ ‐ ‐ ‐ ‐ ‐ ‐ ‐ ‐ P ‐ ‐ ‐ ‐ ‐ ‐ ‐ ‐ ‐
D0407 Sertulariidae ‐ ‐ P ‐ ‐ ‐ ‐ P ‐ P P ‐ ‐ ‐ ‐ ‐ ‐ ‐ ‐ ‐
D0424 Hydrallmania falcata ‐ ‐ ‐ ‐ ‐ ‐ ‐ ‐ ‐ ‐ P ‐ ‐ ‐ ‐ ‐ ‐ ‐ ‐ ‐
D0141 ANTHOATHECATA P ‐ ‐ ‐ ‐ ‐ ‐ ‐ ‐ ‐ P ‐ ‐ ‐ ‐ P ‐ ‐ ‐ ‐
D0491 Campanulariidae P ‐ ‐ ‐ ‐ ‐ ‐ ‐ ‐ ‐ P P ‐ P ‐ ‐ ‐ ‐ ‐ ‐
D0632 Cerianthus lloydii ‐ ‐ ‐ ‐ ‐ ‐ ‐ ‐ ‐ ‐ ‐ ‐ ‐ 2 ‐ ‐ ‐ ‐ ‐ ‐
D0662 ACTINIARIA 4 ‐ ‐ ‐ ‐ ‐ ‐ ‐ ‐ ‐ ‐ 1 ‐ 1 ‐ ‐ ‐ ‐ ‐ 28
G0001 NEMERTEA 1 ‐ ‐ 1 ‐ ‐ ‐ ‐ ‐ ‐ ‐ 3 ‐ 4 ‐ 2 1 1 ‐ ‐
HD0001 NEMATODA ‐ ‐ ‐ ‐ ‐ ‐ ‐ ‐ ‐ ‐ ‐ ‐ ‐ ‐ ‐ ‐ 1 ‐ ‐ ‐
N0017 Golfingia vulgaris ‐ ‐ ‐ ‐ ‐ ‐ ‐ ‐ ‐ ‐ 1 ‐ ‐ ‐ ‐ ‐ ‐ ‐ ‐ ‐
P0025 Polynoidae (juv.) ‐ ‐ ‐ ‐ ‐ ‐ ‐ ‐ ‐ ‐ ‐ ‐ ‐ ‐ ‐ ‐ ‐ ‐ ‐ 2
P0050 Harmothoe 1 ‐ 1 ‐ ‐ ‐ ‐ ‐ ‐ ‐ ‐ 13 ‐ 12 ‐ ‐ 2 ‐ 1 7
P0092 Pholoe baltica 1 ‐ ‐ ‐ ‐ ‐ ‐ ‐ ‐ ‐ ‐ 1 ‐ ‐ ‐ ‐ 2 ‐ 1 ‐
P0094 Pholoe inornata 1 ‐ ‐ ‐ ‐ ‐ ‐ ‐ ‐ ‐ 1 ‐ ‐ ‐ ‐ ‐ ‐ ‐ ‐ 2
P0107 Sthenelais boa ‐ ‐ ‐ ‐ ‐ ‐ ‐ ‐ ‐ ‐ ‐ ‐ ‐ 2 ‐ ‐ ‐ ‐ ‐ ‐
P0167 Eumida sanguinea (agg.) 2 ‐ ‐ ‐ ‐ ‐ ‐ ‐ ‐ ‐ 2 2 ‐ 8 ‐ ‐ 1 ‐ 1 6
P0256 Glycera alba ‐ ‐ 1 1 ‐ ‐ ‐ ‐ ‐ ‐ ‐ ‐ ‐ ‐ ‐ ‐ ‐ ‐ ‐ ‐
P0260 Glycera lapidum ‐ ‐ ‐ ‐ ‐ ‐ 1 ‐ ‐ ‐ 1 ‐ 1 ‐ ‐ ‐ 2 1 1 ‐
P0262 Glycera oxycephala ‐ ‐ ‐ ‐ ‐ ‐ ‐ ‐ ‐ ‐ ‐ ‐ ‐ ‐ 1 ‐ ‐ ‐ ‐ ‐
P0266 Goniadidae (juv.) ‐ ‐ ‐ ‐ ‐ ‐ ‐ ‐ ‐ ‐ ‐ ‐ ‐ 1 ‐ ‐ ‐ ‐ ‐ ‐
P0268 Glycinde nordmanni ‐ ‐ ‐ ‐ ‐ ‐ ‐ ‐ ‐ ‐ ‐ 1 ‐ ‐ ‐ ‐ ‐ ‐ ‐ ‐
P0271 Goniada maculata ‐ ‐ 1 ‐ ‐ ‐ ‐ ‐ ‐ ‐ ‐ 1 ‐ 1 ‐ 3 ‐ ‐ ‐ ‐
Autolytinae ‐ ‐ ‐ ‐ ‐ ‐ ‐ ‐ ‐ ‐ ‐ ‐ ‐ 1 ‐ ‐ ‐ ‐ ‐ ‐
P0380 Eusyllis blomstrandi 1 ‐ ‐ ‐ 1 ‐ ‐ ‐ ‐ ‐ ‐ ‐ ‐ ‐ ‐ ‐ ‐ ‐ ‐ ‐
P0449 Myrianida 1 ‐ ‐ ‐ ‐ ‐ ‐ ‐ ‐ ‐ ‐ ‐ ‐ ‐ ‐ ‐ ‐ ‐ ‐ ‐
Sphaerosyllis sp. A ‐ ‐ ‐ ‐ ‐ ‐ ‐ ‐ ‐ ‐ 1 ‐ ‐ ‐ ‐ ‐ ‐ ‐ ‐ ‐
P0371 Syllis variegata 1 ‐ ‐ ‐ ‐ ‐ ‐ ‐ ‐ ‐ ‐ ‐ ‐ ‐ ‐ ‐ ‐ ‐ ‐ ‐
P0475 Eunereis longissima ‐ ‐ ‐ ‐ ‐ ‐ ‐ ‐ ‐ ‐ ‐ 4 ‐ 2 ‐ 1 ‐ ‐ ‐ ‐
P0494 Nephtys (juv.) 4 ‐ ‐ ‐ 1 ‐ 1 ‐ ‐ ‐ ‐ ‐ ‐ 1 ‐ 1 ‐ ‐ ‐ ‐
P0496 Nephtys caeca ‐ ‐ ‐ ‐ ‐ ‐ ‐ ‐ ‐ ‐ ‐ ‐ ‐ 4 ‐ ‐ 1 ‐ ‐ 1
P0564 Marphysa bellii ‐ ‐ 1 ‐ ‐ ‐ 2 ‐ ‐ ‐ ‐ ‐ ‐ 4 ‐ ‐ ‐ ‐ ‐ ‐
P0564 Marphysa bellii (juv.) 2 ‐ ‐ ‐ ‐ ‐ 2 ‐ ‐ ‐ 1 1 ‐ ‐ ‐ ‐ ‐ ‐ ‐ ‐
Lumbrineris cf. cingulata (agg.) ‐ ‐ ‐ ‐ ‐ ‐ ‐ ‐ ‐ ‐ 1 3 ‐ 2 ‐ ‐ 1 1 1 2
P0643 Schistomeringos rudolphi ‐ ‐ ‐ ‐ ‐ ‐ ‐ ‐ ‐ ‐ 1 1 ‐ ‐ ‐ ‐ 1 ‐ ‐ ‐
P0672 Scoloplos armiger 1 ‐ ‐ ‐ ‐ ‐ ‐ ‐ ‐ ‐ 1 ‐ ‐ 1 ‐ ‐ ‐ ‐ ‐ 2
P0699 Paradoneis lyra ‐ 3 ‐ ‐ ‐ ‐ 1 ‐ ‐ ‐ 1 ‐ ‐ 1 ‐ ‐ ‐ ‐ ‐ ‐
P0718 Poecilochaetus serpens ‐ ‐ 1 ‐ ‐ ‐ ‐ ‐ ‐ ‐ ‐ ‐ ‐ ‐ ‐ ‐ ‐ ‐ ‐ ‐
P0733 Laonice bahusiensis ‐ ‐ ‐ ‐ ‐ ‐ ‐ ‐ ‐ ‐ ‐ 1 ‐ ‐ ‐ ‐ ‐ ‐ ‐ ‐
P0774 Pseudopolydora pulchra ‐ ‐ ‐ ‐ ‐ ‐ ‐ ‐ ‐ ‐ ‐ ‐ ‐ ‐ ‐ ‐ ‐ ‐ 1 ‐
P0776 Pygospio elegans ‐ ‐ ‐ ‐ ‐ ‐ ‐ ‐ ‐ ‐ 1 ‐ ‐ ‐ ‐ ‐ ‐ ‐ ‐ ‐
Spio goniocephala ‐ ‐ ‐ ‐ ‐ ‐ ‐ ‐ ‐ ‐ ‐ ‐ ‐ ‐ 3 ‐ ‐ ‐ ‐ ‐
P0794 Spiophanes bombyx 80 15 9 4 1 ‐ 20 ‐ ‐ ‐ 5 4 ‐ 4 1 ‐ ‐ ‐ 4 2
P0797 Streblospio ‐ 1 ‐ ‐ ‐ ‐ ‐ ‐ ‐ ‐ ‐ ‐ ‐ ‐ ‐ ‐ ‐ ‐ ‐ ‐
P0831 Chaetozone zetlandica ‐ ‐ ‐ ‐ ‐ ‐ ‐ ‐ ‐ ‐ 1 ‐ ‐ 1 ‐ ‐ ‐ ‐ 1 2
P0845 Tharyx ‐ ‐ 1 ‐ ‐ ‐ ‐ ‐ ‐ ‐ ‐ ‐ ‐ 1 ‐ ‐ ‐ ‐ ‐ ‐
Tharyx maryae ‐ ‐ ‐ ‐ ‐ ‐ 1 ‐ ‐ ‐ ‐ 3 ‐ ‐ ‐ 2 ‐ ‐ ‐ 1
P0846 Tharyx killariensis ‐ ‐ ‐ ‐ ‐ ‐ 3 ‐ ‐ ‐ ‐ ‐ ‐ ‐ ‐ ‐ ‐ ‐ ‐ ‐
P0906 Capitella ‐ ‐ ‐ ‐ ‐ ‐ ‐ ‐ ‐ ‐ 1 ‐ ‐ ‐ ‐ ‐ ‐ ‐ ‐ ‐
P0919 Mediomastus fragilis ‐ 1 ‐ ‐ ‐ ‐ ‐ ‐ ‐ ‐ ‐ ‐ ‐ ‐ ‐ ‐ ‐ ‐ ‐ ‐
P0920 Notomastus ‐ ‐ ‐ ‐ ‐ ‐ ‐ ‐ ‐ ‐ ‐ ‐ ‐ 2 ‐ ‐ ‐ ‐ ‐ ‐
P0927 Pseudonotomastus southerni ‐ ‐ ‐ ‐ ‐ ‐ ‐ ‐ ‐ ‐ ‐ ‐ ‐ 1 ‐ ‐ ‐ ‐ ‐ ‐
P0938 Maldanidae ‐ ‐ ‐ ‐ ‐ ‐ 2 ‐ ‐ ‐ ‐ 1 ‐ ‐ ‐ ‐ ‐ ‐ ‐ ‐
P0964 Euclymene oerstedii (agg.) 2 ‐ 6 ‐ ‐ ‐ ‐ ‐ ‐ ‐ ‐ ‐ ‐ ‐ ‐ ‐ ‐ ‐ ‐ 2
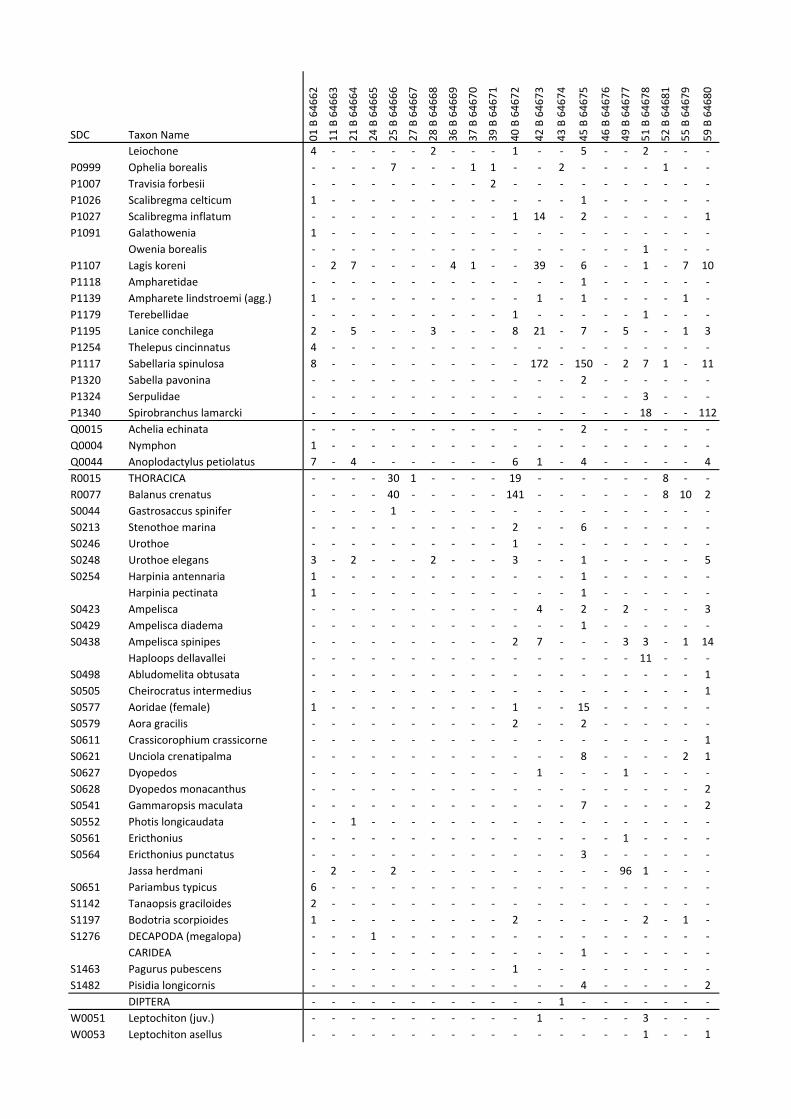
SDC Taxon Name 01 B 64662
11 B 64663
21 B 64664
24 B 64665
25 B 64666
27 B 64667
28 B 64668
36 B 64669
37 B 64670
39 B 64671
40 B 64672
42 B 64673
43 B 64674
45 B 64675
46 B 64676
49 B 64677
51 B 64678
52 B 64681
55 B 64679
59 B 64680
Leiochone 4 ‐ ‐ ‐ ‐ ‐ 2 ‐ ‐ ‐ 1 ‐ ‐ 5 ‐ ‐ 2 ‐ ‐ ‐
P0999 Ophelia borealis ‐ ‐ ‐ ‐ 7 ‐ ‐ ‐ 1 1 ‐ ‐ 2 ‐ ‐ ‐ ‐ 1 ‐ ‐
P1007 Travisia forbesii ‐ ‐ ‐ ‐ ‐ ‐ ‐ ‐ ‐ 2 ‐ ‐ ‐ ‐ ‐ ‐ ‐ ‐ ‐ ‐
P1026 Scalibregma celticum 1 ‐ ‐ ‐ ‐ ‐ ‐ ‐ ‐ ‐ ‐ ‐ ‐ 1 ‐ ‐ ‐ ‐ ‐ ‐
P1027 Scalibregma inflatum ‐ ‐ ‐ ‐ ‐ ‐ ‐ ‐ ‐ ‐ 1 14 ‐ 2 ‐ ‐ ‐ ‐ ‐ 1
P1091 Galathowenia 1 ‐ ‐ ‐ ‐ ‐ ‐ ‐ ‐ ‐ ‐ ‐ ‐ ‐ ‐ ‐ ‐ ‐ ‐ ‐
Owenia borealis ‐ ‐ ‐ ‐ ‐ ‐ ‐ ‐ ‐ ‐ ‐ ‐ ‐ ‐ ‐ ‐ 1 ‐ ‐ ‐
P1107 Lagis koreni ‐ 2 7 ‐ ‐ ‐ ‐ 4 1 ‐ ‐ 39 ‐ 6 ‐ ‐ 1 ‐ 7 10
P1118 Ampharetidae ‐ ‐ ‐ ‐ ‐ ‐ ‐ ‐ ‐ ‐ ‐ ‐ ‐ 1 ‐ ‐ ‐ ‐ ‐ ‐
P1139 Ampharete lindstroemi (agg.) 1 ‐ ‐ ‐ ‐ ‐ ‐ ‐ ‐ ‐ ‐ 1 ‐ 1 ‐ ‐ ‐ ‐ 1 ‐
P1179 Terebellidae ‐ ‐ ‐ ‐ ‐ ‐ ‐ ‐ ‐ ‐ 1 ‐ ‐ ‐ ‐ ‐ 1 ‐ ‐ ‐
P1195 Lanice conchilega 2 ‐ 5 ‐ ‐ ‐ 3 ‐ ‐ ‐ 8 21 ‐ 7 ‐ 5 ‐ ‐ 1 3
P1254 Thelepus cincinnatus 4 ‐ ‐ ‐ ‐ ‐ ‐ ‐ ‐ ‐ ‐ ‐ ‐ ‐ ‐ ‐ ‐ ‐ ‐ ‐
P1117 Sabellaria spinulosa 8 ‐ ‐ ‐ ‐ ‐ ‐ ‐ ‐ ‐ ‐ 172 ‐ 150 ‐ 2 7 1 ‐ 11
P1320 Sabella pavonina ‐ ‐ ‐ ‐ ‐ ‐ ‐ ‐ ‐ ‐ ‐ ‐ ‐ 2 ‐ ‐ ‐ ‐ ‐ ‐
P1324 Serpulidae ‐ ‐ ‐ ‐ ‐ ‐ ‐ ‐ ‐ ‐ ‐ ‐ ‐ ‐ ‐ ‐ 3 ‐ ‐ ‐
P1340 Spirobranchus lamarcki ‐ ‐ ‐ ‐ ‐ ‐ ‐ ‐ ‐ ‐ ‐ ‐ ‐ ‐ ‐ ‐ 18 ‐ ‐ 112
Q0015 Achelia echinata ‐ ‐ ‐ ‐ ‐ ‐ ‐ ‐ ‐ ‐ ‐ ‐ ‐ 2 ‐ ‐ ‐ ‐ ‐ ‐
Q0004 Nymphon 1 ‐ ‐ ‐ ‐ ‐ ‐ ‐ ‐ ‐ ‐ ‐ ‐ ‐ ‐ ‐ ‐ ‐ ‐ ‐
Q0044 Anoplodactylus petiolatus 7 ‐ 4 ‐ ‐ ‐ ‐ ‐ ‐ ‐ 6 1 ‐ 4 ‐ ‐ ‐ ‐ ‐ 4
R0015 THORACICA ‐ ‐ ‐ ‐ 30 1 ‐ ‐ ‐ ‐ 19 ‐ ‐ ‐ ‐ ‐ ‐ 8 ‐ ‐
R0077 Balanus crenatus ‐ ‐ ‐ ‐ 40 ‐ ‐ ‐ ‐ ‐ 141 ‐ ‐ ‐ ‐ ‐ ‐ 8 10 2
S0044 Gastrosaccus spinifer ‐ ‐ ‐ ‐ 1 ‐ ‐ ‐ ‐ ‐ ‐ ‐ ‐ ‐ ‐ ‐ ‐ ‐ ‐ ‐
S0213 Stenothoe marina ‐ ‐ ‐ ‐ ‐ ‐ ‐ ‐ ‐ ‐ 2 ‐ ‐ 6 ‐ ‐ ‐ ‐ ‐ ‐
S0246 Urothoe ‐ ‐ ‐ ‐ ‐ ‐ ‐ ‐ ‐ ‐ 1 ‐ ‐ ‐ ‐ ‐ ‐ ‐ ‐ ‐
S0248 Urothoe elegans 3 ‐ 2 ‐ ‐ ‐ 2 ‐ ‐ ‐ 3 ‐ ‐ 1 ‐ ‐ ‐ ‐ ‐ 5
S0254 Harpinia antennaria 1 ‐ ‐ ‐ ‐ ‐ ‐ ‐ ‐ ‐ ‐ ‐ ‐ 1 ‐ ‐ ‐ ‐ ‐ ‐
Harpinia pectinata 1 ‐ ‐ ‐ ‐ ‐ ‐ ‐ ‐ ‐ ‐ ‐ ‐ 1 ‐ ‐ ‐ ‐ ‐ ‐
S0423 Ampelisca ‐ ‐ ‐ ‐ ‐ ‐ ‐ ‐ ‐ ‐ ‐ 4 ‐ 2 ‐ 2 ‐ ‐ ‐ 3
S0429 Ampelisca diadema ‐ ‐ ‐ ‐ ‐ ‐ ‐ ‐ ‐ ‐ ‐ ‐ ‐ 1 ‐ ‐ ‐ ‐ ‐ ‐
S0438 Ampelisca spinipes ‐ ‐ ‐ ‐ ‐ ‐ ‐ ‐ ‐ ‐ 2 7 ‐ ‐ ‐ 3 3 ‐ 1 14
Haploops dellavallei ‐ ‐ ‐ ‐ ‐ ‐ ‐ ‐ ‐ ‐ ‐ ‐ ‐ ‐ ‐ ‐ 11 ‐ ‐ ‐
S0498 Abludomelita obtusata ‐ ‐ ‐ ‐ ‐ ‐ ‐ ‐ ‐ ‐ ‐ ‐ ‐ ‐ ‐ ‐ ‐ ‐ ‐ 1
S0505 Cheirocratus intermedius ‐ ‐ ‐ ‐ ‐ ‐ ‐ ‐ ‐ ‐ ‐ ‐ ‐ ‐ ‐ ‐ ‐ ‐ ‐ 1
S0577 Aoridae (female) 1 ‐ ‐ ‐ ‐ ‐ ‐ ‐ ‐ ‐ 1 ‐ ‐ 15 ‐ ‐ ‐ ‐ ‐ ‐
S0579 Aora gracilis ‐ ‐ ‐ ‐ ‐ ‐ ‐ ‐ ‐ ‐ 2 ‐ ‐ 2 ‐ ‐ ‐ ‐ ‐ ‐
S0611 Crassicorophium crassicorne ‐ ‐ ‐ ‐ ‐ ‐ ‐ ‐ ‐ ‐ ‐ ‐ ‐ ‐ ‐ ‐ ‐ ‐ ‐ 1
S0621 Unciola crenatipalma ‐ ‐ ‐ ‐ ‐ ‐ ‐ ‐ ‐ ‐ ‐ ‐ ‐ 8 ‐ ‐ ‐ ‐ 2 1
S0627 Dyopedos ‐ ‐ ‐ ‐ ‐ ‐ ‐ ‐ ‐ ‐ ‐ 1 ‐ ‐ ‐ 1 ‐ ‐ ‐ ‐
S0628 Dyopedos monacanthus ‐ ‐ ‐ ‐ ‐ ‐ ‐ ‐ ‐ ‐ ‐ ‐ ‐ ‐ ‐ ‐ ‐ ‐ ‐ 2
S0541 Gammaropsis maculata ‐ ‐ ‐ ‐ ‐ ‐ ‐ ‐ ‐ ‐ ‐ ‐ ‐ 7 ‐ ‐ ‐ ‐ ‐ 2
S0552 Photis longicaudata ‐ ‐ 1 ‐ ‐ ‐ ‐ ‐ ‐ ‐ ‐ ‐ ‐ ‐ ‐ ‐ ‐ ‐ ‐ ‐
S0561 Ericthonius ‐ ‐ ‐ ‐ ‐ ‐ ‐ ‐ ‐ ‐ ‐ ‐ ‐ ‐ ‐ 1 ‐ ‐ ‐ ‐
S0564 Ericthonius punctatus ‐ ‐ ‐ ‐ ‐ ‐ ‐ ‐ ‐ ‐ ‐ ‐ ‐ 3 ‐ ‐ ‐ ‐ ‐ ‐
Jassa herdmani ‐ 2 ‐ ‐ 2 ‐ ‐ ‐ ‐ ‐ ‐ ‐ ‐ ‐ ‐ 96 1 ‐ ‐ ‐
S0651 Pariambus typicus 6 ‐ ‐ ‐ ‐ ‐ ‐ ‐ ‐ ‐ ‐ ‐ ‐ ‐ ‐ ‐ ‐ ‐ ‐ ‐
S1142 Tanaopsis graciloides 2 ‐ ‐ ‐ ‐ ‐ ‐ ‐ ‐ ‐ ‐ ‐ ‐ ‐ ‐ ‐ ‐ ‐ ‐ ‐
S1197 Bodotria scorpioides 1 ‐ ‐ ‐ ‐ ‐ ‐ ‐ ‐ ‐ 2 ‐ ‐ ‐ ‐ ‐ 2 ‐ 1 ‐
S1276 DECAPODA (megalopa) ‐ ‐ ‐ 1 ‐ ‐ ‐ ‐ ‐ ‐ ‐ ‐ ‐ ‐ ‐ ‐ ‐ ‐ ‐ ‐
CARIDEA ‐ ‐ ‐ ‐ ‐ ‐ ‐ ‐ ‐ ‐ ‐ ‐ ‐ 1 ‐ ‐ ‐ ‐ ‐ ‐
S1463 Pagurus pubescens ‐ ‐ ‐ ‐ ‐ ‐ ‐ ‐ ‐ ‐ 1 ‐ ‐ ‐ ‐ ‐ ‐ ‐ ‐ ‐
S1482 Pisidia longicornis ‐ ‐ ‐ ‐ ‐ ‐ ‐ ‐ ‐ ‐ ‐ ‐ ‐ 4 ‐ ‐ ‐ ‐ ‐ 2
DIPTERA ‐ ‐ ‐ ‐ ‐ ‐ ‐ ‐ ‐ ‐ ‐ ‐ 1 ‐ ‐ ‐ ‐ ‐ ‐ ‐
W0051 Leptochiton (juv.) ‐ ‐ ‐ ‐ ‐ ‐ ‐ ‐ ‐ ‐ ‐ 1 ‐ ‐ ‐ ‐ 3 ‐ ‐ ‐
W0053 Leptochiton asellus ‐ ‐ ‐ ‐ ‐ ‐ ‐ ‐ ‐ ‐ ‐ ‐ ‐ ‐ ‐ ‐ 1 ‐ ‐ 1
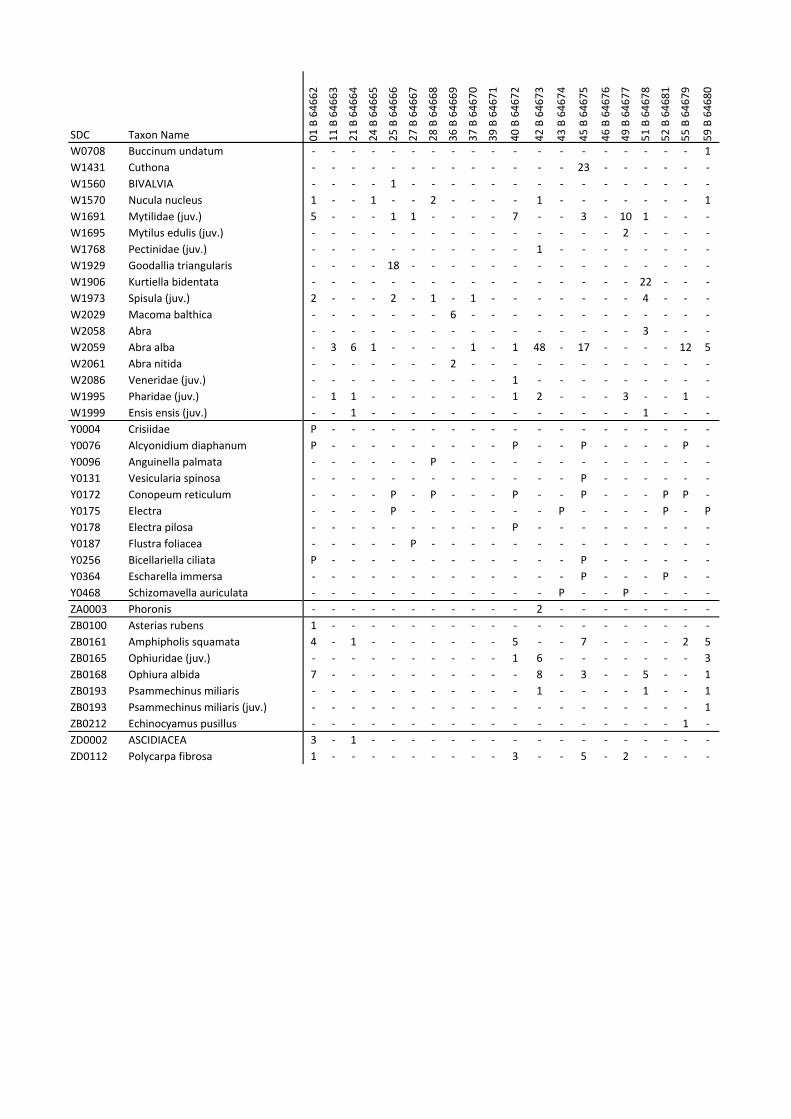
SDC Taxon Name 01 B 64662
11 B 64663
21 B 64664
24 B 64665
25 B 64666
27 B 64667
28 B 64668
36 B 64669
37 B 64670
39 B 64671
40 B 64672
42 B 64673
43 B 64674
45 B 64675
46 B 64676
49 B 64677
51 B 64678
52 B 64681
55 B 64679
59 B 64680
W0708 Buccinum undatum ‐ ‐ ‐ ‐ ‐ ‐ ‐ ‐ ‐ ‐ ‐ ‐ ‐ ‐ ‐ ‐ ‐ ‐ ‐ 1
W1431 Cuthona ‐ ‐ ‐ ‐ ‐ ‐ ‐ ‐ ‐ ‐ ‐ ‐ ‐ 23 ‐ ‐ ‐ ‐ ‐ ‐
W1560 BIVALVIA ‐ ‐ ‐ ‐ 1 ‐ ‐ ‐ ‐ ‐ ‐ ‐ ‐ ‐ ‐ ‐ ‐ ‐ ‐ ‐
W1570 Nucula nucleus 1 ‐ ‐ 1 ‐ ‐ 2 ‐ ‐ ‐ ‐ 1 ‐ ‐ ‐ ‐ ‐ ‐ ‐ 1
W1691 Mytilidae (juv.) 5 ‐ ‐ ‐ 1 1 ‐ ‐ ‐ ‐ 7 ‐ ‐ 3 ‐ 10 1 ‐ ‐ ‐
W1695 Mytilus edulis (juv.) ‐ ‐ ‐ ‐ ‐ ‐ ‐ ‐ ‐ ‐ ‐ ‐ ‐ ‐ ‐ 2 ‐ ‐ ‐ ‐
W1768 Pectinidae (juv.) ‐ ‐ ‐ ‐ ‐ ‐ ‐ ‐ ‐ ‐ ‐ 1 ‐ ‐ ‐ ‐ ‐ ‐ ‐ ‐
W1929 Goodallia triangularis ‐ ‐ ‐ ‐ 18 ‐ ‐ ‐ ‐ ‐ ‐ ‐ ‐ ‐ ‐ ‐ ‐ ‐ ‐ ‐
W1906 Kurtiella bidentata ‐ ‐ ‐ ‐ ‐ ‐ ‐ ‐ ‐ ‐ ‐ ‐ ‐ ‐ ‐ ‐ 22 ‐ ‐ ‐
W1973 Spisula (juv.) 2 ‐ ‐ ‐ 2 ‐ 1 ‐ 1 ‐ ‐ ‐ ‐ ‐ ‐ ‐ 4 ‐ ‐ ‐
W2029 Macoma balthica ‐ ‐ ‐ ‐ ‐ ‐ ‐ 6 ‐ ‐ ‐ ‐ ‐ ‐ ‐ ‐ ‐ ‐ ‐ ‐
W2058 Abra ‐ ‐ ‐ ‐ ‐ ‐ ‐ ‐ ‐ ‐ ‐ ‐ ‐ ‐ ‐ ‐ 3 ‐ ‐ ‐
W2059 Abra alba ‐ 3 6 1 ‐ ‐ ‐ ‐ 1 ‐ 1 48 ‐ 17 ‐ ‐ ‐ ‐ 12 5
W2061 Abra nitida ‐ ‐ ‐ ‐ ‐ ‐ ‐ 2 ‐ ‐ ‐ ‐ ‐ ‐ ‐ ‐ ‐ ‐ ‐ ‐
W2086 Veneridae (juv.) ‐ ‐ ‐ ‐ ‐ ‐ ‐ ‐ ‐ ‐ 1 ‐ ‐ ‐ ‐ ‐ ‐ ‐ ‐ ‐
W1995 Pharidae (juv.) ‐ 1 1 ‐ ‐ ‐ ‐ ‐ ‐ ‐ 1 2 ‐ ‐ ‐ 3 ‐ ‐ 1 ‐
W1999 Ensis ensis (juv.) ‐ ‐ 1 ‐ ‐ ‐ ‐ ‐ ‐ ‐ ‐ ‐ ‐ ‐ ‐ ‐ 1 ‐ ‐ ‐
Y0004 Crisiidae P ‐ ‐ ‐ ‐ ‐ ‐ ‐ ‐ ‐ ‐ ‐ ‐ ‐ ‐ ‐ ‐ ‐ ‐ ‐
Y0076 Alcyonidium diaphanum P ‐ ‐ ‐ ‐ ‐ ‐ ‐ ‐ ‐ P ‐ ‐ P ‐ ‐ ‐ ‐ P ‐
Y0096 Anguinella palmata ‐ ‐ ‐ ‐ ‐ ‐ P ‐ ‐ ‐ ‐ ‐ ‐ ‐ ‐ ‐ ‐ ‐ ‐ ‐
Y0131 Vesicularia spinosa ‐ ‐ ‐ ‐ ‐ ‐ ‐ ‐ ‐ ‐ ‐ ‐ ‐ P ‐ ‐ ‐ ‐ ‐ ‐
Y0172 Conopeum reticulum ‐ ‐ ‐ ‐ P ‐ P ‐ ‐ ‐ P ‐ ‐ P ‐ ‐ ‐ P P ‐
Y0175 Electra ‐ ‐ ‐ ‐ P ‐ ‐ ‐ ‐ ‐ ‐ ‐ P ‐ ‐ ‐ ‐ P ‐ P
Y0178 Electra pilosa ‐ ‐ ‐ ‐ ‐ ‐ ‐ ‐ ‐ ‐ P ‐ ‐ ‐ ‐ ‐ ‐ ‐ ‐ ‐
Y0187 Flustra foliacea ‐ ‐ ‐ ‐ ‐ P ‐ ‐ ‐ ‐ ‐ ‐ ‐ ‐ ‐ ‐ ‐ ‐ ‐ ‐
Y0256 Bicellariella ciliata P ‐ ‐ ‐ ‐ ‐ ‐ ‐ ‐ ‐ ‐ ‐ ‐ P ‐ ‐ ‐ ‐ ‐ ‐
Y0364 Escharella immersa ‐ ‐ ‐ ‐ ‐ ‐ ‐ ‐ ‐ ‐ ‐ ‐ ‐ P ‐ ‐ ‐ P ‐ ‐
Y0468 Schizomavella auriculata ‐ ‐ ‐ ‐ ‐ ‐ ‐ ‐ ‐ ‐ ‐ ‐ P ‐ ‐ P ‐ ‐ ‐ ‐
ZA0003 Phoronis ‐ ‐ ‐ ‐ ‐ ‐ ‐ ‐ ‐ ‐ ‐ 2 ‐ ‐ ‐ ‐ ‐ ‐ ‐ ‐
ZB0100 Asterias rubens 1 ‐ ‐ ‐ ‐ ‐ ‐ ‐ ‐ ‐ ‐ ‐ ‐ ‐ ‐ ‐ ‐ ‐ ‐ ‐
ZB0161 Amphipholis squamata 4 ‐ 1 ‐ ‐ ‐ ‐ ‐ ‐ ‐ 5 ‐ ‐ 7 ‐ ‐ ‐ ‐ 2 5
ZB0165 Ophiuridae (juv.) ‐ ‐ ‐ ‐ ‐ ‐ ‐ ‐ ‐ ‐ 1 6 ‐ ‐ ‐ ‐ ‐ ‐ ‐ 3
ZB0168 Ophiura albida 7 ‐ ‐ ‐ ‐ ‐ ‐ ‐ ‐ ‐ ‐ 8 ‐ 3 ‐ ‐ 5 ‐ ‐ 1
ZB0193 Psammechinus miliaris ‐ ‐ ‐ ‐ ‐ ‐ ‐ ‐ ‐ ‐ ‐ 1 ‐ ‐ ‐ ‐ 1 ‐ ‐ 1
ZB0193 Psammechinus miliaris (juv.) ‐ ‐ ‐ ‐ ‐ ‐ ‐ ‐ ‐ ‐ ‐ ‐ ‐ ‐ ‐ ‐ ‐ ‐ ‐ 1
ZB0212 Echinocyamus pusillus ‐ ‐ ‐ ‐ ‐ ‐ ‐ ‐ ‐ ‐ ‐ ‐ ‐ ‐ ‐ ‐ ‐ ‐ 1 ‐
ZD0002 ASCIDIACEA 3 ‐ 1 ‐ ‐ ‐ ‐ ‐ ‐ ‐ ‐ ‐ ‐ ‐ ‐ ‐ ‐ ‐ ‐ ‐
ZD0112 Polycarpa fibrosa 1 ‐ ‐ ‐ ‐ ‐ ‐ ‐ ‐ ‐ 3 ‐ ‐ 5 ‐ 2 ‐ ‐ ‐ ‐

Harwich Haven Disposal Site TH027
Monitoring Report
DLM7823-RT001-R02-00
C.3. September 2016

Client Name
Client Address
Report title
Method
Subcontracted Tests
Author 25/10/2016
Authorisation 25/10/2016
Thomson Ecology, Compass House, 60 Priestley Road, Surrey Research Park,
Guildford, GU2 7AG
TEM09 Benthic Invertbrate Analysis
Harwich Haven Authority
Navigation House, Harwich CO12 3EJ
Harwich East Ship Channel ‐ Survey September 2016
Daisy Chamberlain
Laboratory Manager
Laura Hearnden
Project Manager
N/A

HHAESC16 ‐ Harwich East Ship Channel ‐ Survey September 2016
Sample number Sample receipt date Sample condition Mesh Size Sieve Analyst Date Sorting Analyst Date Identifcation Analyst Date QC Analyst Date Notes
01 C 64871 13 Sep 16 Good 1 mm LTW 18 Oct 16 LTW 18 Oct 16 LJH 20 Oct 16 DC 25 Oct 16
11 C 64872 13 Sep 16 Good 1 mm LTW 13 Oct 16 LTW 13 Oct 16 LJH 20 Oct 16 DC 24 Oct 16
22 C 64873 13 Sep 16 Good 1 mm LTW 18 Oct 16 LTW 19 Oct 16 LJH 19 Oct 16 DC 24 Oct 16
24 C 64874 13 Sep 16 Good 1 mm LTW 18 Oct 16 LTW 19 Oct 16 LJH 20 Oct 16 DC 24 Oct 16
25 C 64875 13 Sep 16 Good 1 mm LTW 18 Oct 16 LTW 18 Oct 16 LJH 20 Oct 16 DC 24 Oct 16
27 C 64876 13 Sep 16 Good 1 mm LTW 17 Oct 16 LTW 19 Oct 16 LJH 19 Oct 16 DC 24 Oct 16
36 C 64877 13 Sep 16 Good 1 mm LTW 13 Oct 16 LTW 17 Oct 16 LJH 20 Oct 16 DC 24 Oct 16
37 C 64878 13 Sep 16 Good 1 mm LTW 18 Oct 16 LTW 18 Oct 16 LJH 20 Oct 16 DC 24 Oct 16
39 C 64879 13 Sep 16 Good 1 mm LTW 18 Oct 16 LTW 18 Oct 16 LJH 20 Oct 16 DC 24 Oct 16
42 C 64880 13 Sep 16 Good 1 mm LTW 18 Oct 16 LTW 19 Oct 16 LJH 21 Oct 16 DC 25 Oct 16
43 C 64881 13 Sep 16 Good 1 mm LTW 13 Oct 16 LTW 13 Oct 16 LJH 20 Oct 16 DC 24 Oct 16
45 C 64882 13 Sep 16 Good 1 mm LTW 17 Oct 16 LTW 17 Oct 16 LJH 21 Oct 16 DC 25 Oct 16
46 C 64883 13 Sep 16 Good 1 mm LTW 17 Oct 16 LTW 19 Oct 16 LJH 20 Oct 16 DC 24 Oct 16
49 C 64884 13 Sep 16 Good 1 mm LTW 18 Oct 16 LTW 18 Oct 16 LJH 20 Oct 16 DC 24 Oct 16
51 C 64885 13 Sep 16 Good 1 mm LTW 18 Oct 16 LTW 19 Oct 16 LJH 20 Oct 16 DC 24 Oct 16
52 C 64886 13 Sep 16 Good 1 mm LTW 18 Oct 16 LTW 19 Oct 16 LJH 19 Oct 16 DC 24 Oct 16
55 C 64887 13 Sep 16 Good 1 mm LTW 17 Oct 16 LTW 19 Oct 16 LJH 20 Oct 16 DC 24 Oct 16
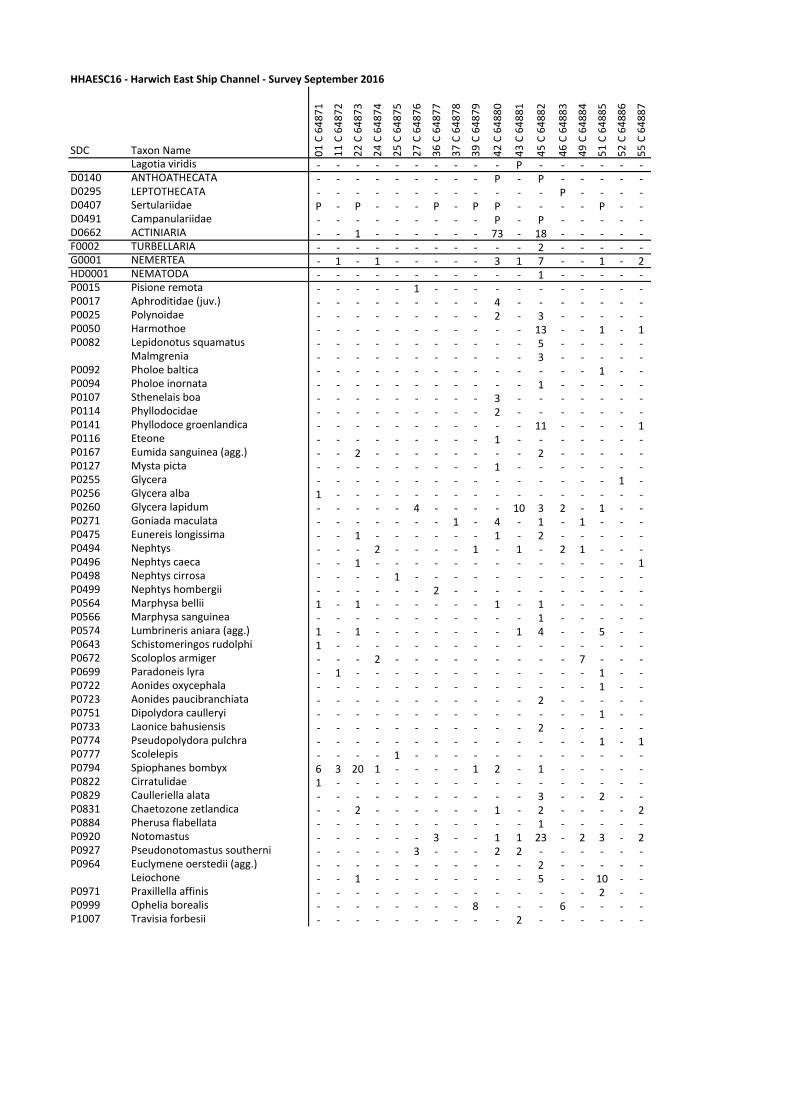
HHAESC16 ‐ Harwich East Ship Channel ‐ Survey September 2016
SDC Taxon Name 01 C 64871
11 C 64872
22 C 64873
24 C 64874
25 C 64875
27 C 64876
36 C 64877
37 C 64878
39 C 64879
42 C 64880
43 C 64881
45 C 64882
46 C 64883
49 C 64884
51 C 64885
52 C 64886
55 C 64887
Lagotia viridis ‐ ‐ ‐ ‐ ‐ ‐ ‐ ‐ ‐ ‐ P ‐ ‐ ‐ ‐ ‐ ‐D0140 ANTHOATHECATA ‐ ‐ ‐ ‐ ‐ ‐ ‐ ‐ ‐ P ‐ P ‐ ‐ ‐ ‐ ‐D0295 LEPTOTHECATA ‐ ‐ ‐ ‐ ‐ ‐ ‐ ‐ ‐ ‐ ‐ ‐ P ‐ ‐ ‐ ‐D0407 Sertulariidae P ‐ P ‐ ‐ ‐ P ‐ P P ‐ ‐ ‐ ‐ P ‐ ‐D0491 Campanulariidae ‐ ‐ ‐ ‐ ‐ ‐ ‐ ‐ ‐ P ‐ P ‐ ‐ ‐ ‐ ‐D0662 ACTINIARIA ‐ ‐ 1 ‐ ‐ ‐ ‐ ‐ ‐ 73 ‐ 18 ‐ ‐ ‐ ‐ ‐F0002 TURBELLARIA ‐ ‐ ‐ ‐ ‐ ‐ ‐ ‐ ‐ ‐ ‐ 2 ‐ ‐ ‐ ‐ ‐G0001 NEMERTEA ‐ 1 ‐ 1 ‐ ‐ ‐ ‐ ‐ 3 1 7 ‐ ‐ 1 ‐ 2HD0001 NEMATODA ‐ ‐ ‐ ‐ ‐ ‐ ‐ ‐ ‐ ‐ ‐ 1 ‐ ‐ ‐ ‐ ‐P0015 Pisione remota ‐ ‐ ‐ ‐ ‐ 1 ‐ ‐ ‐ ‐ ‐ ‐ ‐ ‐ ‐ ‐ ‐P0017 Aphroditidae (juv.) ‐ ‐ ‐ ‐ ‐ ‐ ‐ ‐ ‐ 4 ‐ ‐ ‐ ‐ ‐ ‐ ‐P0025 Polynoidae ‐ ‐ ‐ ‐ ‐ ‐ ‐ ‐ ‐ 2 ‐ 3 ‐ ‐ ‐ ‐ ‐P0050 Harmothoe ‐ ‐ ‐ ‐ ‐ ‐ ‐ ‐ ‐ ‐ ‐ 13 ‐ ‐ 1 ‐ 1P0082 Lepidonotus squamatus ‐ ‐ ‐ ‐ ‐ ‐ ‐ ‐ ‐ ‐ ‐ 5 ‐ ‐ ‐ ‐ ‐
Malmgrenia ‐ ‐ ‐ ‐ ‐ ‐ ‐ ‐ ‐ ‐ ‐ 3 ‐ ‐ ‐ ‐ ‐P0092 Pholoe baltica ‐ ‐ ‐ ‐ ‐ ‐ ‐ ‐ ‐ ‐ ‐ ‐ ‐ ‐ 1 ‐ ‐P0094 Pholoe inornata ‐ ‐ ‐ ‐ ‐ ‐ ‐ ‐ ‐ ‐ ‐ 1 ‐ ‐ ‐ ‐ ‐P0107 Sthenelais boa ‐ ‐ ‐ ‐ ‐ ‐ ‐ ‐ ‐ 3 ‐ ‐ ‐ ‐ ‐ ‐ ‐P0114 Phyllodocidae ‐ ‐ ‐ ‐ ‐ ‐ ‐ ‐ ‐ 2 ‐ ‐ ‐ ‐ ‐ ‐ ‐P0141 Phyllodoce groenlandica ‐ ‐ ‐ ‐ ‐ ‐ ‐ ‐ ‐ ‐ ‐ 11 ‐ ‐ ‐ ‐ 1P0116 Eteone ‐ ‐ ‐ ‐ ‐ ‐ ‐ ‐ ‐ 1 ‐ ‐ ‐ ‐ ‐ ‐ ‐P0167 Eumida sanguinea (agg.) ‐ ‐ 2 ‐ ‐ ‐ ‐ ‐ ‐ ‐ ‐ 2 ‐ ‐ ‐ ‐ ‐P0127 Mysta picta ‐ ‐ ‐ ‐ ‐ ‐ ‐ ‐ ‐ 1 ‐ ‐ ‐ ‐ ‐ ‐ ‐P0255 Glycera ‐ ‐ ‐ ‐ ‐ ‐ ‐ ‐ ‐ ‐ ‐ ‐ ‐ ‐ ‐ 1 ‐P0256 Glycera alba 1 ‐ ‐ ‐ ‐ ‐ ‐ ‐ ‐ ‐ ‐ ‐ ‐ ‐ ‐ ‐ ‐P0260 Glycera lapidum ‐ ‐ ‐ ‐ ‐ 4 ‐ ‐ ‐ ‐ 10 3 2 ‐ 1 ‐ ‐P0271 Goniada maculata ‐ ‐ ‐ ‐ ‐ ‐ ‐ 1 ‐ 4 ‐ 1 ‐ 1 ‐ ‐ ‐P0475 Eunereis longissima ‐ ‐ 1 ‐ ‐ ‐ ‐ ‐ ‐ 1 ‐ 2 ‐ ‐ ‐ ‐ ‐P0494 Nephtys ‐ ‐ ‐ 2 ‐ ‐ ‐ ‐ 1 ‐ 1 ‐ 2 1 ‐ ‐ ‐P0496 Nephtys caeca ‐ ‐ 1 ‐ ‐ ‐ ‐ ‐ ‐ ‐ ‐ ‐ ‐ ‐ ‐ ‐ 1P0498 Nephtys cirrosa ‐ ‐ ‐ ‐ 1 ‐ ‐ ‐ ‐ ‐ ‐ ‐ ‐ ‐ ‐ ‐ ‐P0499 Nephtys hombergii ‐ ‐ ‐ ‐ ‐ ‐ 2 ‐ ‐ ‐ ‐ ‐ ‐ ‐ ‐ ‐ ‐P0564 Marphysa bellii 1 ‐ 1 ‐ ‐ ‐ ‐ ‐ ‐ 1 ‐ 1 ‐ ‐ ‐ ‐ ‐P0566 Marphysa sanguinea ‐ ‐ ‐ ‐ ‐ ‐ ‐ ‐ ‐ ‐ ‐ 1 ‐ ‐ ‐ ‐ ‐P0574 Lumbrineris aniara (agg.) 1 ‐ 1 ‐ ‐ ‐ ‐ ‐ ‐ ‐ 1 4 ‐ ‐ 5 ‐ ‐P0643 Schistomeringos rudolphi 1 ‐ ‐ ‐ ‐ ‐ ‐ ‐ ‐ ‐ ‐ ‐ ‐ ‐ ‐ ‐ ‐P0672 Scoloplos armiger ‐ ‐ ‐ 2 ‐ ‐ ‐ ‐ ‐ ‐ ‐ ‐ ‐ 7 ‐ ‐ ‐P0699 Paradoneis lyra ‐ 1 ‐ ‐ ‐ ‐ ‐ ‐ ‐ ‐ ‐ ‐ ‐ ‐ 1 ‐ ‐P0722 Aonides oxycephala ‐ ‐ ‐ ‐ ‐ ‐ ‐ ‐ ‐ ‐ ‐ ‐ ‐ ‐ 1 ‐ ‐P0723 Aonides paucibranchiata ‐ ‐ ‐ ‐ ‐ ‐ ‐ ‐ ‐ ‐ ‐ 2 ‐ ‐ ‐ ‐ ‐P0751 Dipolydora caulleryi ‐ ‐ ‐ ‐ ‐ ‐ ‐ ‐ ‐ ‐ ‐ ‐ ‐ ‐ 1 ‐ ‐P0733 Laonice bahusiensis ‐ ‐ ‐ ‐ ‐ ‐ ‐ ‐ ‐ ‐ ‐ 2 ‐ ‐ ‐ ‐ ‐P0774 Pseudopolydora pulchra ‐ ‐ ‐ ‐ ‐ ‐ ‐ ‐ ‐ ‐ ‐ ‐ ‐ ‐ 1 ‐ 1P0777 Scolelepis ‐ ‐ ‐ ‐ 1 ‐ ‐ ‐ ‐ ‐ ‐ ‐ ‐ ‐ ‐ ‐ ‐P0794 Spiophanes bombyx 6 3 20 1 ‐ ‐ ‐ ‐ 1 2 ‐ 1 ‐ ‐ ‐ ‐ ‐P0822 Cirratulidae 1 ‐ ‐ ‐ ‐ ‐ ‐ ‐ ‐ ‐ ‐ ‐ ‐ ‐ ‐ ‐ ‐P0829 Caulleriella alata ‐ ‐ ‐ ‐ ‐ ‐ ‐ ‐ ‐ ‐ ‐ 3 ‐ ‐ 2 ‐ ‐P0831 Chaetozone zetlandica ‐ ‐ 2 ‐ ‐ ‐ ‐ ‐ ‐ 1 ‐ 2 ‐ ‐ ‐ ‐ 2P0884 Pherusa flabellata ‐ ‐ ‐ ‐ ‐ ‐ ‐ ‐ ‐ ‐ ‐ 1 ‐ ‐ ‐ ‐ ‐P0920 Notomastus ‐ ‐ ‐ ‐ ‐ ‐ 3 ‐ ‐ 1 1 23 ‐ 2 3 ‐ 2P0927 Pseudonotomastus southerni ‐ ‐ ‐ ‐ ‐ 3 ‐ ‐ ‐ 2 2 ‐ ‐ ‐ ‐ ‐ ‐P0964 Euclymene oerstedii (agg.) ‐ ‐ ‐ ‐ ‐ ‐ ‐ ‐ ‐ ‐ ‐ 2 ‐ ‐ ‐ ‐ ‐
Leiochone ‐ ‐ 1 ‐ ‐ ‐ ‐ ‐ ‐ ‐ ‐ 5 ‐ ‐ 10 ‐ ‐P0971 Praxillella affinis ‐ ‐ ‐ ‐ ‐ ‐ ‐ ‐ ‐ ‐ ‐ ‐ ‐ ‐ 2 ‐ ‐P0999 Ophelia borealis ‐ ‐ ‐ ‐ ‐ ‐ ‐ ‐ 8 ‐ ‐ ‐ 6 ‐ ‐ ‐ ‐P1007 Travisia forbesii ‐ ‐ ‐ ‐ ‐ ‐ ‐ ‐ ‐ ‐ 2 ‐ ‐ ‐ ‐ ‐ ‐
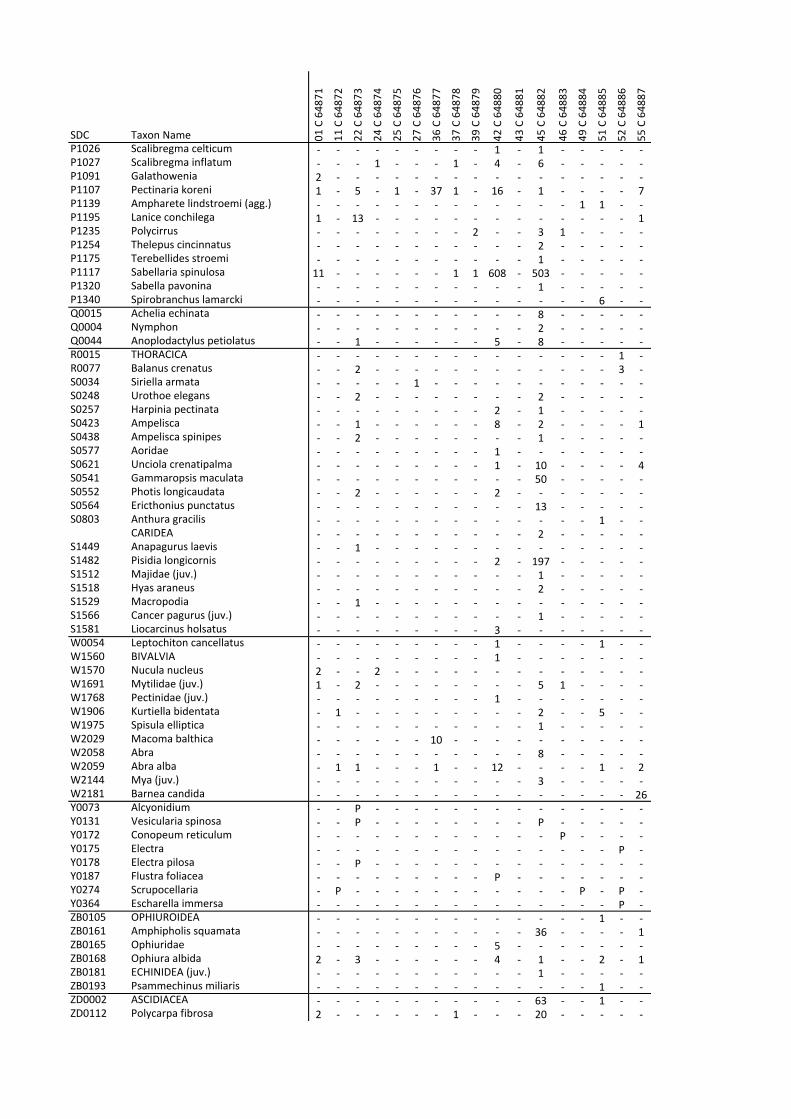
SDC Taxon Name 01 C 64871
11 C 64872
22 C 64873
24 C 64874
25 C 64875
27 C 64876
36 C 64877
37 C 64878
39 C 64879
42 C 64880
43 C 64881
45 C 64882
46 C 64883
49 C 64884
51 C 64885
52 C 64886
55 C 64887
P1026 Scalibregma celticum ‐ ‐ ‐ ‐ ‐ ‐ ‐ ‐ ‐ 1 ‐ 1 ‐ ‐ ‐ ‐ ‐P1027 Scalibregma inflatum ‐ ‐ ‐ 1 ‐ ‐ ‐ 1 ‐ 4 ‐ 6 ‐ ‐ ‐ ‐ ‐P1091 Galathowenia 2 ‐ ‐ ‐ ‐ ‐ ‐ ‐ ‐ ‐ ‐ ‐ ‐ ‐ ‐ ‐ ‐P1107 Pectinaria koreni 1 ‐ 5 ‐ 1 ‐ 37 1 ‐ 16 ‐ 1 ‐ ‐ ‐ ‐ 7P1139 Ampharete lindstroemi (agg.) ‐ ‐ ‐ ‐ ‐ ‐ ‐ ‐ ‐ ‐ ‐ ‐ ‐ 1 1 ‐ ‐P1195 Lanice conchilega 1 ‐ 13 ‐ ‐ ‐ ‐ ‐ ‐ ‐ ‐ ‐ ‐ ‐ ‐ ‐ 1P1235 Polycirrus ‐ ‐ ‐ ‐ ‐ ‐ ‐ ‐ 2 ‐ ‐ 3 1 ‐ ‐ ‐ ‐P1254 Thelepus cincinnatus ‐ ‐ ‐ ‐ ‐ ‐ ‐ ‐ ‐ ‐ ‐ 2 ‐ ‐ ‐ ‐ ‐P1175 Terebellides stroemi ‐ ‐ ‐ ‐ ‐ ‐ ‐ ‐ ‐ ‐ ‐ 1 ‐ ‐ ‐ ‐ ‐P1117 Sabellaria spinulosa 11 ‐ ‐ ‐ ‐ ‐ ‐ 1 1 608 ‐ 503 ‐ ‐ ‐ ‐ ‐P1320 Sabella pavonina ‐ ‐ ‐ ‐ ‐ ‐ ‐ ‐ ‐ ‐ ‐ 1 ‐ ‐ ‐ ‐ ‐P1340 Spirobranchus lamarcki ‐ ‐ ‐ ‐ ‐ ‐ ‐ ‐ ‐ ‐ ‐ ‐ ‐ ‐ 6 ‐ ‐Q0015 Achelia echinata ‐ ‐ ‐ ‐ ‐ ‐ ‐ ‐ ‐ ‐ ‐ 8 ‐ ‐ ‐ ‐ ‐Q0004 Nymphon ‐ ‐ ‐ ‐ ‐ ‐ ‐ ‐ ‐ ‐ ‐ 2 ‐ ‐ ‐ ‐ ‐Q0044 Anoplodactylus petiolatus ‐ ‐ 1 ‐ ‐ ‐ ‐ ‐ ‐ 5 ‐ 8 ‐ ‐ ‐ ‐ ‐R0015 THORACICA ‐ ‐ ‐ ‐ ‐ ‐ ‐ ‐ ‐ ‐ ‐ ‐ ‐ ‐ ‐ 1 ‐R0077 Balanus crenatus ‐ ‐ 2 ‐ ‐ ‐ ‐ ‐ ‐ ‐ ‐ ‐ ‐ ‐ ‐ 3 ‐S0034 Siriella armata ‐ ‐ ‐ ‐ ‐ 1 ‐ ‐ ‐ ‐ ‐ ‐ ‐ ‐ ‐ ‐ ‐S0248 Urothoe elegans ‐ ‐ 2 ‐ ‐ ‐ ‐ ‐ ‐ ‐ ‐ 2 ‐ ‐ ‐ ‐ ‐S0257 Harpinia pectinata ‐ ‐ ‐ ‐ ‐ ‐ ‐ ‐ ‐ 2 ‐ 1 ‐ ‐ ‐ ‐ ‐S0423 Ampelisca ‐ ‐ 1 ‐ ‐ ‐ ‐ ‐ ‐ 8 ‐ 2 ‐ ‐ ‐ ‐ 1S0438 Ampelisca spinipes ‐ ‐ 2 ‐ ‐ ‐ ‐ ‐ ‐ ‐ ‐ 1 ‐ ‐ ‐ ‐ ‐S0577 Aoridae ‐ ‐ ‐ ‐ ‐ ‐ ‐ ‐ ‐ 1 ‐ ‐ ‐ ‐ ‐ ‐ ‐S0621 Unciola crenatipalma ‐ ‐ ‐ ‐ ‐ ‐ ‐ ‐ ‐ 1 ‐ 10 ‐ ‐ ‐ ‐ 4S0541 Gammaropsis maculata ‐ ‐ ‐ ‐ ‐ ‐ ‐ ‐ ‐ ‐ ‐ 50 ‐ ‐ ‐ ‐ ‐S0552 Photis longicaudata ‐ ‐ 2 ‐ ‐ ‐ ‐ ‐ ‐ 2 ‐ ‐ ‐ ‐ ‐ ‐ ‐S0564 Ericthonius punctatus ‐ ‐ ‐ ‐ ‐ ‐ ‐ ‐ ‐ ‐ ‐ 13 ‐ ‐ ‐ ‐ ‐S0803 Anthura gracilis ‐ ‐ ‐ ‐ ‐ ‐ ‐ ‐ ‐ ‐ ‐ ‐ ‐ ‐ 1 ‐ ‐
CARIDEA ‐ ‐ ‐ ‐ ‐ ‐ ‐ ‐ ‐ ‐ ‐ 2 ‐ ‐ ‐ ‐ ‐S1449 Anapagurus laevis ‐ ‐ 1 ‐ ‐ ‐ ‐ ‐ ‐ ‐ ‐ ‐ ‐ ‐ ‐ ‐ ‐S1482 Pisidia longicornis ‐ ‐ ‐ ‐ ‐ ‐ ‐ ‐ ‐ 2 ‐ 197 ‐ ‐ ‐ ‐ ‐S1512 Majidae (juv.) ‐ ‐ ‐ ‐ ‐ ‐ ‐ ‐ ‐ ‐ ‐ 1 ‐ ‐ ‐ ‐ ‐S1518 Hyas araneus ‐ ‐ ‐ ‐ ‐ ‐ ‐ ‐ ‐ ‐ ‐ 2 ‐ ‐ ‐ ‐ ‐S1529 Macropodia ‐ ‐ 1 ‐ ‐ ‐ ‐ ‐ ‐ ‐ ‐ ‐ ‐ ‐ ‐ ‐ ‐S1566 Cancer pagurus (juv.) ‐ ‐ ‐ ‐ ‐ ‐ ‐ ‐ ‐ ‐ ‐ 1 ‐ ‐ ‐ ‐ ‐S1581 Liocarcinus holsatus ‐ ‐ ‐ ‐ ‐ ‐ ‐ ‐ ‐ 3 ‐ ‐ ‐ ‐ ‐ ‐ ‐W0054 Leptochiton cancellatus ‐ ‐ ‐ ‐ ‐ ‐ ‐ ‐ ‐ 1 ‐ ‐ ‐ ‐ 1 ‐ ‐W1560 BIVALVIA ‐ ‐ ‐ ‐ ‐ ‐ ‐ ‐ ‐ 1 ‐ ‐ ‐ ‐ ‐ ‐ ‐W1570 Nucula nucleus 2 ‐ ‐ 2 ‐ ‐ ‐ ‐ ‐ ‐ ‐ ‐ ‐ ‐ ‐ ‐ ‐W1691 Mytilidae (juv.) 1 ‐ 2 ‐ ‐ ‐ ‐ ‐ ‐ ‐ ‐ 5 1 ‐ ‐ ‐ ‐W1768 Pectinidae (juv.) ‐ ‐ ‐ ‐ ‐ ‐ ‐ ‐ ‐ 1 ‐ ‐ ‐ ‐ ‐ ‐ ‐W1906 Kurtiella bidentata ‐ 1 ‐ ‐ ‐ ‐ ‐ ‐ ‐ ‐ ‐ 2 ‐ ‐ 5 ‐ ‐W1975 Spisula elliptica ‐ ‐ ‐ ‐ ‐ ‐ ‐ ‐ ‐ ‐ ‐ 1 ‐ ‐ ‐ ‐ ‐W2029 Macoma balthica ‐ ‐ ‐ ‐ ‐ ‐ 10 ‐ ‐ ‐ ‐ ‐ ‐ ‐ ‐ ‐ ‐W2058 Abra ‐ ‐ ‐ ‐ ‐ ‐ ‐ ‐ ‐ ‐ ‐ 8 ‐ ‐ ‐ ‐ ‐W2059 Abra alba ‐ 1 1 ‐ ‐ ‐ 1 ‐ ‐ 12 ‐ ‐ ‐ ‐ 1 ‐ 2W2144 Mya (juv.) ‐ ‐ ‐ ‐ ‐ ‐ ‐ ‐ ‐ ‐ ‐ 3 ‐ ‐ ‐ ‐ ‐W2181 Barnea candida ‐ ‐ ‐ ‐ ‐ ‐ ‐ ‐ ‐ ‐ ‐ ‐ ‐ ‐ ‐ ‐ 26Y0073 Alcyonidium ‐ ‐ P ‐ ‐ ‐ ‐ ‐ ‐ ‐ ‐ ‐ ‐ ‐ ‐ ‐ ‐Y0131 Vesicularia spinosa ‐ ‐ P ‐ ‐ ‐ ‐ ‐ ‐ ‐ ‐ P ‐ ‐ ‐ ‐ ‐Y0172 Conopeum reticulum ‐ ‐ ‐ ‐ ‐ ‐ ‐ ‐ ‐ ‐ ‐ ‐ P ‐ ‐ ‐ ‐Y0175 Electra ‐ ‐ ‐ ‐ ‐ ‐ ‐ ‐ ‐ ‐ ‐ ‐ ‐ ‐ ‐ P ‐Y0178 Electra pilosa ‐ ‐ P ‐ ‐ ‐ ‐ ‐ ‐ ‐ ‐ ‐ ‐ ‐ ‐ ‐ ‐Y0187 Flustra foliacea ‐ ‐ ‐ ‐ ‐ ‐ ‐ ‐ ‐ P ‐ ‐ ‐ ‐ ‐ ‐ ‐Y0274 Scrupocellaria ‐ P ‐ ‐ ‐ ‐ ‐ ‐ ‐ ‐ ‐ ‐ ‐ P ‐ P ‐Y0364 Escharella immersa ‐ ‐ ‐ ‐ ‐ ‐ ‐ ‐ ‐ ‐ ‐ ‐ ‐ ‐ ‐ P ‐ZB0105 OPHIUROIDEA ‐ ‐ ‐ ‐ ‐ ‐ ‐ ‐ ‐ ‐ ‐ ‐ ‐ ‐ 1 ‐ ‐ZB0161 Amphipholis squamata ‐ ‐ ‐ ‐ ‐ ‐ ‐ ‐ ‐ ‐ ‐ 36 ‐ ‐ ‐ ‐ 1ZB0165 Ophiuridae ‐ ‐ ‐ ‐ ‐ ‐ ‐ ‐ ‐ 5 ‐ ‐ ‐ ‐ ‐ ‐ ‐ZB0168 Ophiura albida 2 ‐ 3 ‐ ‐ ‐ ‐ ‐ ‐ 4 ‐ 1 ‐ ‐ 2 ‐ 1ZB0181 ECHINIDEA (juv.) ‐ ‐ ‐ ‐ ‐ ‐ ‐ ‐ ‐ ‐ ‐ 1 ‐ ‐ ‐ ‐ ‐ZB0193 Psammechinus miliaris ‐ ‐ ‐ ‐ ‐ ‐ ‐ ‐ ‐ ‐ ‐ ‐ ‐ ‐ 1 ‐ ‐ZD0002 ASCIDIACEA ‐ ‐ ‐ ‐ ‐ ‐ ‐ ‐ ‐ ‐ ‐ 63 ‐ ‐ 1 ‐ ‐ZD0112 Polycarpa fibrosa 2 ‐ ‐ ‐ ‐ ‐ ‐ 1 ‐ ‐ ‐ 20 ‐ ‐ ‐ ‐ ‐

© HR Wallingford
FS 516431EMS 558310OHS 595357
HR Wallingford is an independent engineering and environmental hydraulics organisation. We deliver practical solutions to the complex water-related challenges faced by our international clients. A dynamic research programme underpins all that we do and keeps us at the leading edge. Our unique mix of know-how, assets and facilities includes state of the art physical modelling laboratories, a full range of numerical modelling tools and, above all, enthusiastic people with world-renowned skills and expertise.
HR Wallingford, Howbery Park, Wallingford, Oxfordshire OX10 8BA, United Kingdomtel +44 (0)1491 835381 fax +44 (0)1491 832233 email [email protected]