
WEST HAVEN CITY STANDARD FOR LOW IMPACT ...
194
WEST HAVEN CITY STANDARD FOR LOW IMPACT DEVELOPMENT (LID) February 2020
-
Upload
khangminh22 -
Category
Documents
-
view
1 -
download
0
Transcript of WEST HAVEN CITY STANDARD FOR LOW IMPACT ...

WEST HAVEN CITY
STANDARD FOR LOW IMPACT DEVELOPMENT
(LID)
February 2020
i
WEST HAVEN CITY
STANDARD FOR LOW IMPACT DEVELOPMENT (LID)
TABLE OF CONTENTS
Section Title Page
A Executive Summary ....................................................................... i
1 Summary & Permit Requirements ...............................................1
1.1 Background ......................................................................................1
1.2 Summary of LID Report ..................................................................1
1.3 Requirements ...................................................................................2
1.4 Checklist ..........................................................................................3
2 Water Quality Volume ..................................................................3
2.1 Summary of Calculations .................................................................3
2.2 Method for Calculating Rainfall Depth ...........................................3
2.3 Method for Calculating Water Quality Volume ..............................4
3 LID Practices ..................................................................................5
3.1 Summary of Practices ......................................................................5
3.2 List of Practices................................................................................5
3.3 Soils Report ......................................................................................6
4 Infeasibility .....................................................................................6
4.1 Infeasibility Guidelines ....................................................................6
5 Appendix A 80th Percentile Calculations
B West Haven Hydrologic Soils Group Map
C Storm Water Quality Report Form
D Long Term Maintenance Agreement
E General Permit Section 4.2.5 - Long-Term Storm Water Management in New
Development and Redevelopment (Post-Construction Strom water Management)
F Guide to Low Impact Development within Utah
ii
SECTION A - Executive Summary
The purpose of this Low Impact Development (LID) Standard is to fulfill the requirements of
the “Section 4.2.5 Long-Term Storm Water Management in New Development and
Redevelopment (Post-Construction Strom water Management) of the General Permit”
(Section 4.2.5 of the General Permit) under the Utah Pollutant Discharge Elimination
System.
This standard covers the Small MS4 General Permit and West Haven City requirements for
new developments and redevelopment projects in preventing the off-site discharge of the
precipitation from all rainfall events less than or equal to the 80th percentile rain event.
Meeting the 80th percentile requirements will be accomplished by implementing approved
LID practices that are discussed later in this report.
West Haven City’s 80th percentile storm depth is 0.49 inches. Developments are required to
obtain and submit a soils report. This soils report will help to determine effective methods to
retain the 80th percentile storm event. The storm water depths and soil characteristics will be
used to calculate the water quality volume (WQV).
Each LID practice discussed in this report must be approved by West Haven City prior to
use. The selected LID practices must be shown to be feasible, effective, and maintainable.
This standard will go into further detail on best management practices (BMPs), technical
information, background, and how to decide which LID practice is best suited for each
Permittees development. If an LID approach cannot be utilized, the Permittee must provide
documentation and explanation of why the development will not meet LID standards.
Documentation and explanation must be submitted for an alternative to retention of the 80th
percentile storm.
All LID practices will be submitted by the Permittee as part of the plan review process and
be reviewed by West Haven City Storm Water Manager or Engineering staff. Long term
maintenance agreements between the Permittee and West Haven City will be required after
plan approval and prior to construction. The City will review and revise this plan in the
future as needed.
West Haven City is committed to a clean environment and caring for the quality of water that
is discharged from the City. By implementing the new requirements set forth in this plan
measures will be taken to reduce off-site discharge and minimize negative impacts on water
quality.
1
SECTION 1 – Summary & Permit Requirements
1.1 Background
The purpose of traditional storm water management in the past was to convey runoff flow offsite
as directly as possible. Strom drains have been used as flood control infrastructure to convey
runoff and discharge it to some receiving water. This runoff discharged to receiving waters often
carries pollutants and degrades the quality of the receiving water. These negative impacts can be
reduced with the incorporation of Low Impact Development practices.
Low Impact Development (LID) is referred to as engineered systems that use or mimic natural
processes to promote infiltration, evapotranspiration, and/or reuse of storm water as close to its
source as possible to protect water quality. These engineered systems can be made by structural
or natural means.
West Haven City has developed this standard to incorporate LID practices into new and
redevelopment projects. As of July 1, 2020, all new development and redevelopment projects
will be required to prevent off site discharge of all rainfall events less than or equal to the 80th
percentile rainfall event, and incorporate LID practices into development.
1.2 Summary of LID Report
This Standard for Low Impact Development Report will be the guideline for all new
developments and redevelopment project in West Haven. All developments will be required to
submit LID practices to West Haven City for plan review prior to construction. The requirements
and expectations from both the Small MS4 General Permit and West Haven City will be
addressed in this document.
The new requirements state that all new developments and redevelopments must implement
section 4.2.5.1.2 of the General Permit, located in Appendix E, requiring Permittee to manage
rainfall, on site, less than or equal to the 80th percentile rainfall event. West Haven City’s 80th
percentile storm depth is 0.49 inch for a rainfall event. Calculations for water quality volume
(WQV), using 80th percentile storm depth, will need to be submitted. A Soils Report will be
required to determine effective methods to retain the 80th percentile rainfall event.
A list of the LID practices can be found in “A Guide to Low Impact Development within Utah”
located in this documents Appendix F. Prior to use, LID practices discussed in this standard must
be approved by West Haven City. The selected LID practices must be shown to be feasible,
effective, and maintainable. If an LID approach cannot be utilized, documentation and
explanation must be submitted for an alternative to retention of the 80th percentile storm by the
Permittee.
1.3 Requirements
The requirements covered in this standard have been specified in “Section 4.2.5 of the General
Permit,” shown in Appendix E. Additional requirements are also included in the section.
2
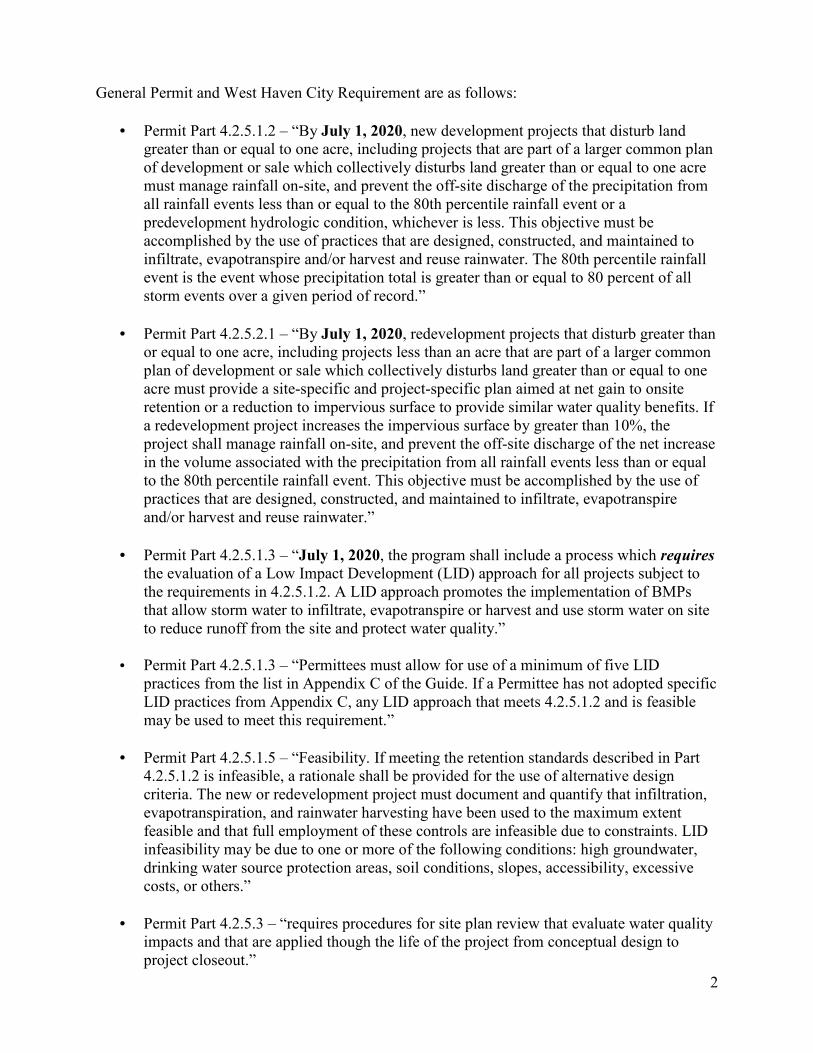
General Permit and West Haven City Requirement are as follows:
• Permit Part 4.2.5.1.2 – “By July 1, 2020, new development projects that disturb land
greater than or equal to one acre, including projects that are part of a larger common plan
of development or sale which collectively disturbs land greater than or equal to one acre
must manage rainfall on-site, and prevent the off-site discharge of the precipitation from
all rainfall events less than or equal to the 80th percentile rainfall event or a
predevelopment hydrologic condition, whichever is less. This objective must be
accomplished by the use of practices that are designed, constructed, and maintained to
infiltrate, evapotranspire and/or harvest and reuse rainwater. The 80th percentile rainfall
event is the event whose precipitation total is greater than or equal to 80 percent of all
storm events over a given period of record.”
• Permit Part 4.2.5.2.1 – “By July 1, 2020, redevelopment projects that disturb greater than
or equal to one acre, including projects less than an acre that are part of a larger common
plan of development or sale which collectively disturbs land greater than or equal to one
acre must provide a site-specific and project-specific plan aimed at net gain to onsite
retention or a reduction to impervious surface to provide similar water quality benefits. If
a redevelopment project increases the impervious surface by greater than 10%, the
project shall manage rainfall on-site, and prevent the off-site discharge of the net increase
in the volume associated with the precipitation from all rainfall events less than or equal
to the 80th percentile rainfall event. This objective must be accomplished by the use of
practices that are designed, constructed, and maintained to infiltrate, evapotranspire
and/or harvest and reuse rainwater.”
• Permit Part 4.2.5.1.3 – “July 1, 2020, the program shall include a process which requires
the evaluation of a Low Impact Development (LID) approach for all projects subject to
the requirements in 4.2.5.1.2. A LID approach promotes the implementation of BMPs
that allow storm water to infiltrate, evapotranspire or harvest and use storm water on site
to reduce runoff from the site and protect water quality.”
• Permit Part 4.2.5.1.3 – “Permittees must allow for use of a minimum of five LID
practices from the list in Appendix C of the Guide. If a Permittee has not adopted specific
LID practices from Appendix C, any LID approach that meets 4.2.5.1.2 and is feasible
may be used to meet this requirement.”
• Permit Part 4.2.5.1.5 – “Feasibility. If meeting the retention standards described in Part
4.2.5.1.2 is infeasible, a rationale shall be provided for the use of alternative design
criteria. The new or redevelopment project must document and quantify that infiltration,
evapotranspiration, and rainwater harvesting have been used to the maximum extent
feasible and that full employment of these controls are infeasible due to constraints. LID
infeasibility may be due to one or more of the following conditions: high groundwater,
drinking water source protection areas, soil conditions, slopes, accessibility, excessive
costs, or others.”
• Permit Part 4.2.5.3 – “requires procedures for site plan review that evaluate water quality
impacts and that are applied though the life of the project from conceptual design to
project closeout.”
3
• Permit Part 4.2.5.2.3 – “The ordinance or other regulatory mechanism shall include
provisions for post-construction access for Permittees to inspect storm water control
measures on private properties that discharge to the MS4 to ensure that adequate
maintenance is being performed.”
• Permit Part 4.2.5.2.4 – “Permanent structural BMPs shall be inspected at least once
during installation by qualified personnel. Upon completion, the Permittee must verify
that long-term BMPs were constructed as designed.”
• Permit Part 4.2.5.2.5 – “Inspections and any necessary maintenance must be conducted at
least every other year or as necessary to maintain functionality of the control by either the
Permittee, or, if applicable, the property owner/operator…… Following an inspection, if
there is an observed failure of a facility to perform as designed, the Permittee must
document its findings in an inspection report.” (See General Permit for inspection report
guidelines)
• All LID practices must be submitted to West Haven City to show that each LID practice
is feasible, maintainable, and effect. City must approve LID practices prior to instillation.
• Submit Soils Report identifying soil properties to be used in design and selection of LID
practices and calculations. See section 3 for more details.
• Provide a “Storm Water Quality Report” shown in Appendix C as part of the submittal to
West Haven City.
• A long term maintenance agreement between West Haven City and Permittee will be
required prior to construction.
1.4 Checklist
� Soils Report
� Calculations (Depth & WQV)
� LID practices to meet 80th percentile requirement
� Storm water quality report
� Infeasibility documentation and explanation (if applicable)
� Plan Approval prior to construction
� Long term maintenance agreement identifying management plan and inspection schedule
SECTION 2 - Water Quality Volume
2.1 Summary of Calculations

4
The 80th percentile rainfall depth represents the depth of rainfall which is not exceeded in 80
percent of all runoff producing rainfall events within the time period analyzed. Meaning that 80
percent of all storm events that happen in West Haven that produce runoff will be less than or
equal to the depth calculated. Calculating the rainfall depth and WQV with be required prior to
selecting LID techniques to infiltrate, harvest or evapotranspire the runoff generated by the
rainfall.
2.2 Method for Calculating 80th Percentile Depth
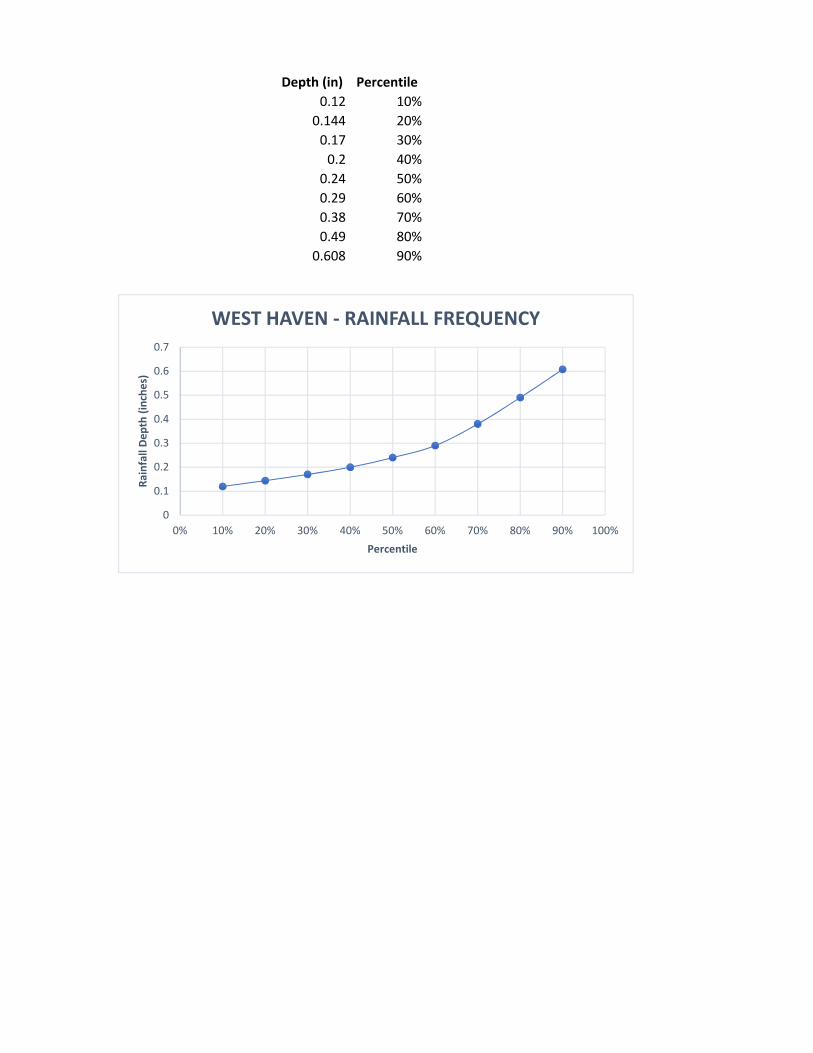
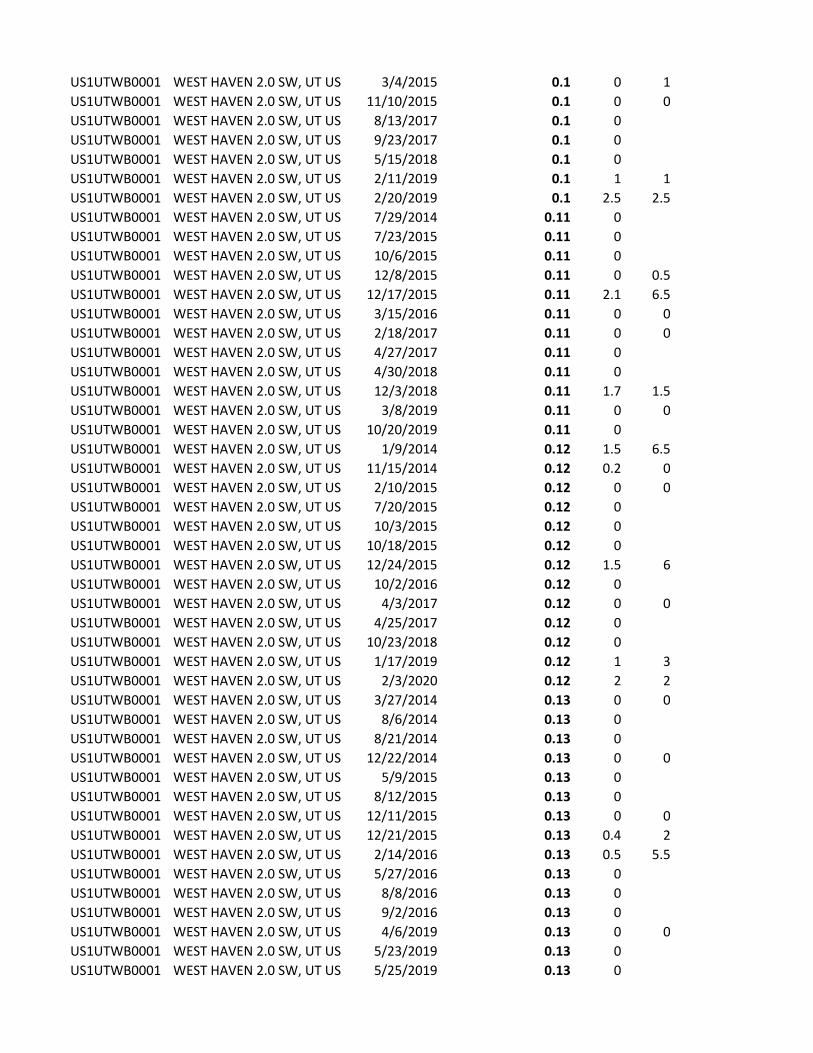
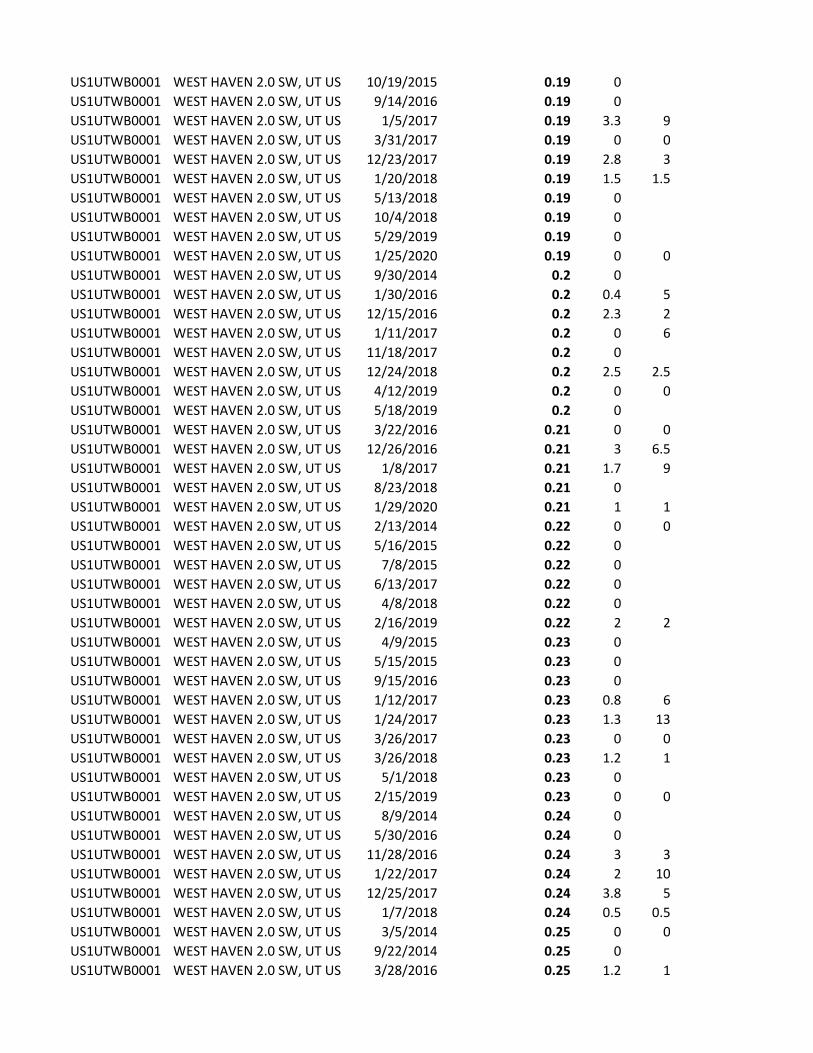
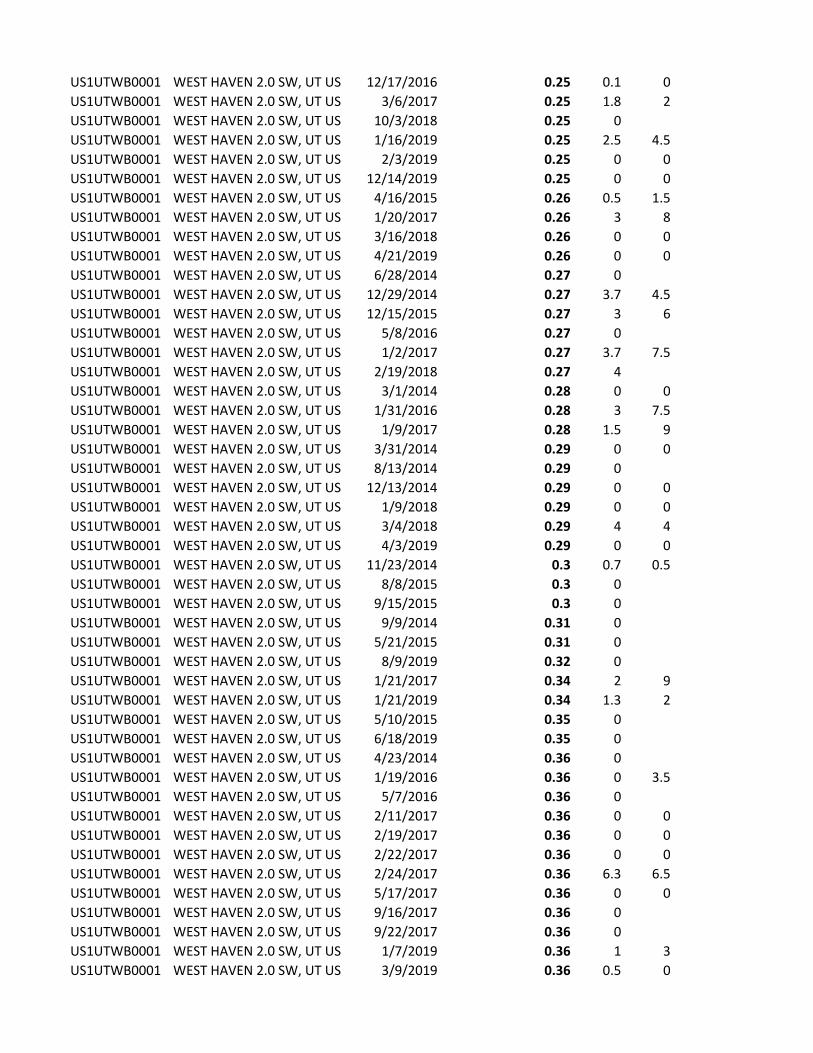
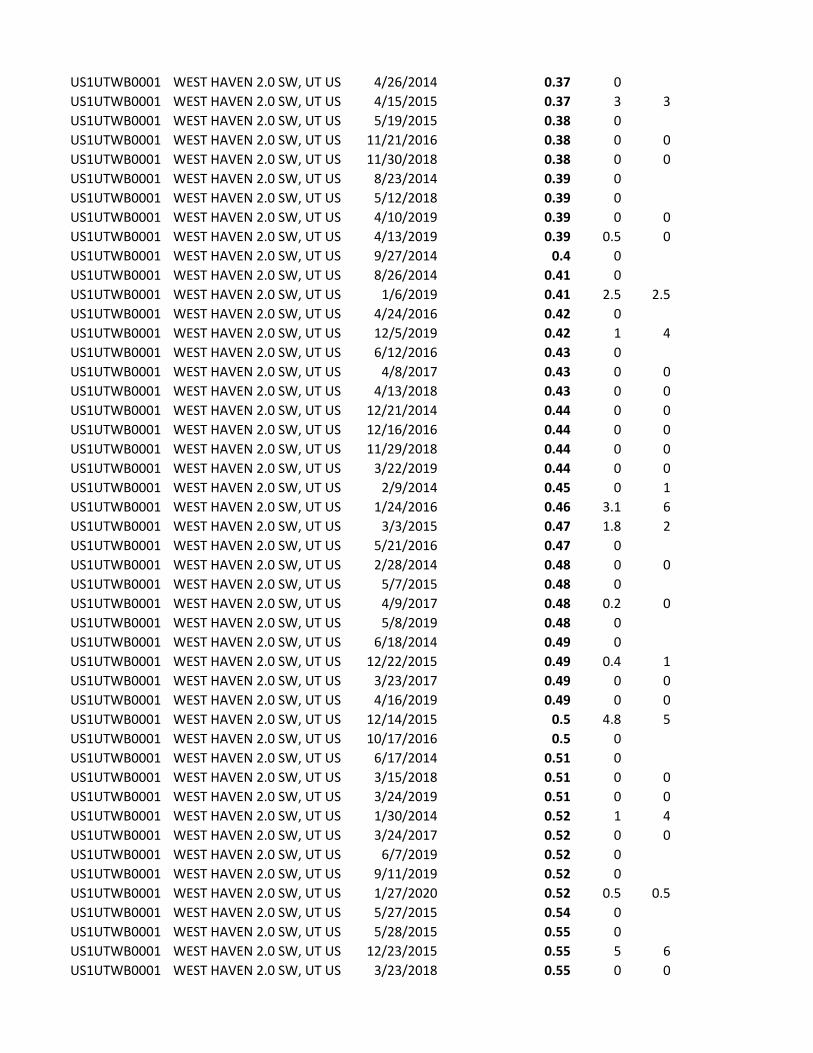
The depth is calculated by obtaining the long term daily rainfall data reported in inches.
Precipitation data is sorted from low to high and events less than or equal to 0.1 inch are
eliminated. Events less than 0.1 inch do not result in a measurable runoff due to evaporation,
infiltration, etc.
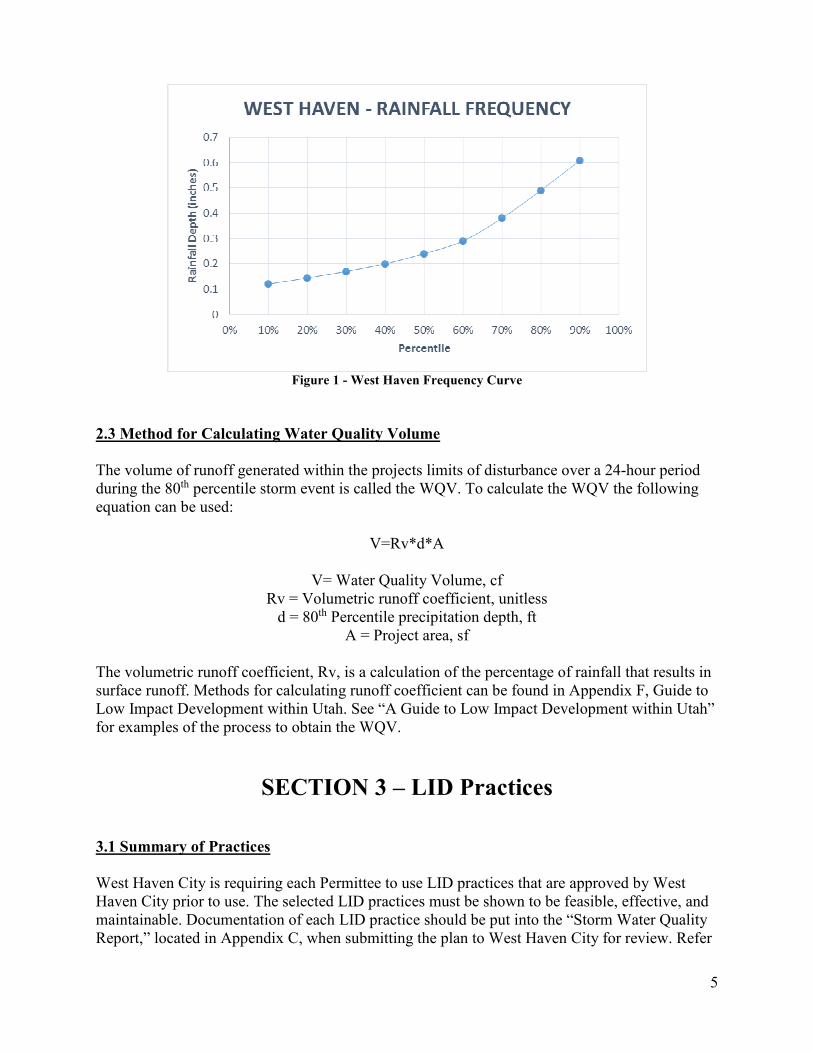
The percentile function in excel (k=0.2….0.8, 0.85, 0.9, 0.95) is used to calculate the 80th
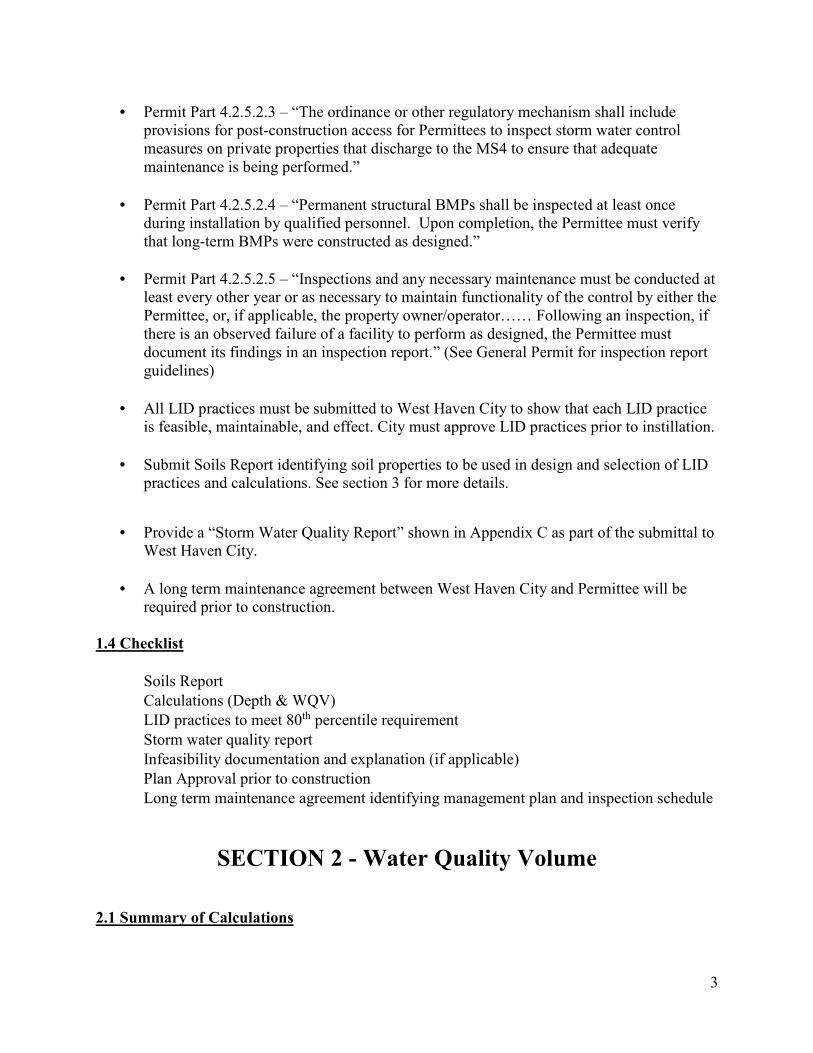
percentile value of data, see Table 1 below. A frequency curve, is shown in Figure 1 below,
which depicts the percentile of rainfall events greater than or equal to a given rainfall depth.
West Haven City has calculated a 0.49 inch rainfall depth for the 80th percentile event. This
depth will be used to calculate the volume of water required to be retained onsite or the WQV
more detail can be found in Appendix F – “A Guide to Low Impact Development within Utah.”
Table 1 – West Haven 80th Percentile Value of Data
Depth (in) Percentile
0.12 10%
0.144 20%
0.17 30%
0.2 40%
0.24 50%
0.29 60%
0.38 70%
0.49 80%
0.608 90%
5
Figure 1 - West Haven Frequency Curve
2.3 Method for Calculating Water Quality Volume
The volume of runoff generated within the projects limits of disturbance over a 24-hour period
during the 80th percentile storm event is called the WQV. To calculate the WQV the following
equation can be used:
V=Rv*d*A
V= Water Quality Volume, cf
Rv = Volumetric runoff coefficient, unitless
d = 80th Percentile precipitation depth, ft
A = Project area, sf
The volumetric runoff coefficient, Rv, is a calculation of the percentage of rainfall that results in
surface runoff. Methods for calculating runoff coefficient can be found in Appendix F, Guide to
Low Impact Development within Utah. See “A Guide to Low Impact Development within Utah”
for examples of the process to obtain the WQV.
SECTION 3 – LID Practices 3.1 Summary of Practices
West Haven City is requiring each Permittee to use LID practices that are approved by West
Haven City prior to use. The selected LID practices must be shown to be feasible, effective, and
maintainable. Documentation of each LID practice should be put into the “Storm Water Quality
Report,” located in Appendix C, when submitting the plan to West Haven City for review. Refer

6
to the “A Guide to Low Impact Development within Utah” for in depth detail about each LID
practices.
3.2 List of LID Practices
There are many different LID practices available to use. Each will depend on the development
characteristics to best decide which LID practices to use. “A Guide to Low Impact Development
within Utah” in appendix F provides detail for possible LID practices that should be considered.
The permittee must decide which LID practice best fits within their project. The following is a
list of LID practices from the “A Guide to Low Impact Development within Utah”:
• Rain Garden
• Bioretention Cell
• Bioswale
• Vegetated Strip
• Tree Box Filter
• Green Roofs
• Pervious Surfaces
• Infiltration Basin
• Infiltration Trench
• Dry Well
• Underground Infiltration Galleries
• Harvest and Reuse
Design criteria, calculation methods, example calculations, effectiveness, designer checklist,
vegetation, installation, installation costs, maintenance, and a figures for LID practices can be
found in “A Guide to Low Impact Development within Utah”.
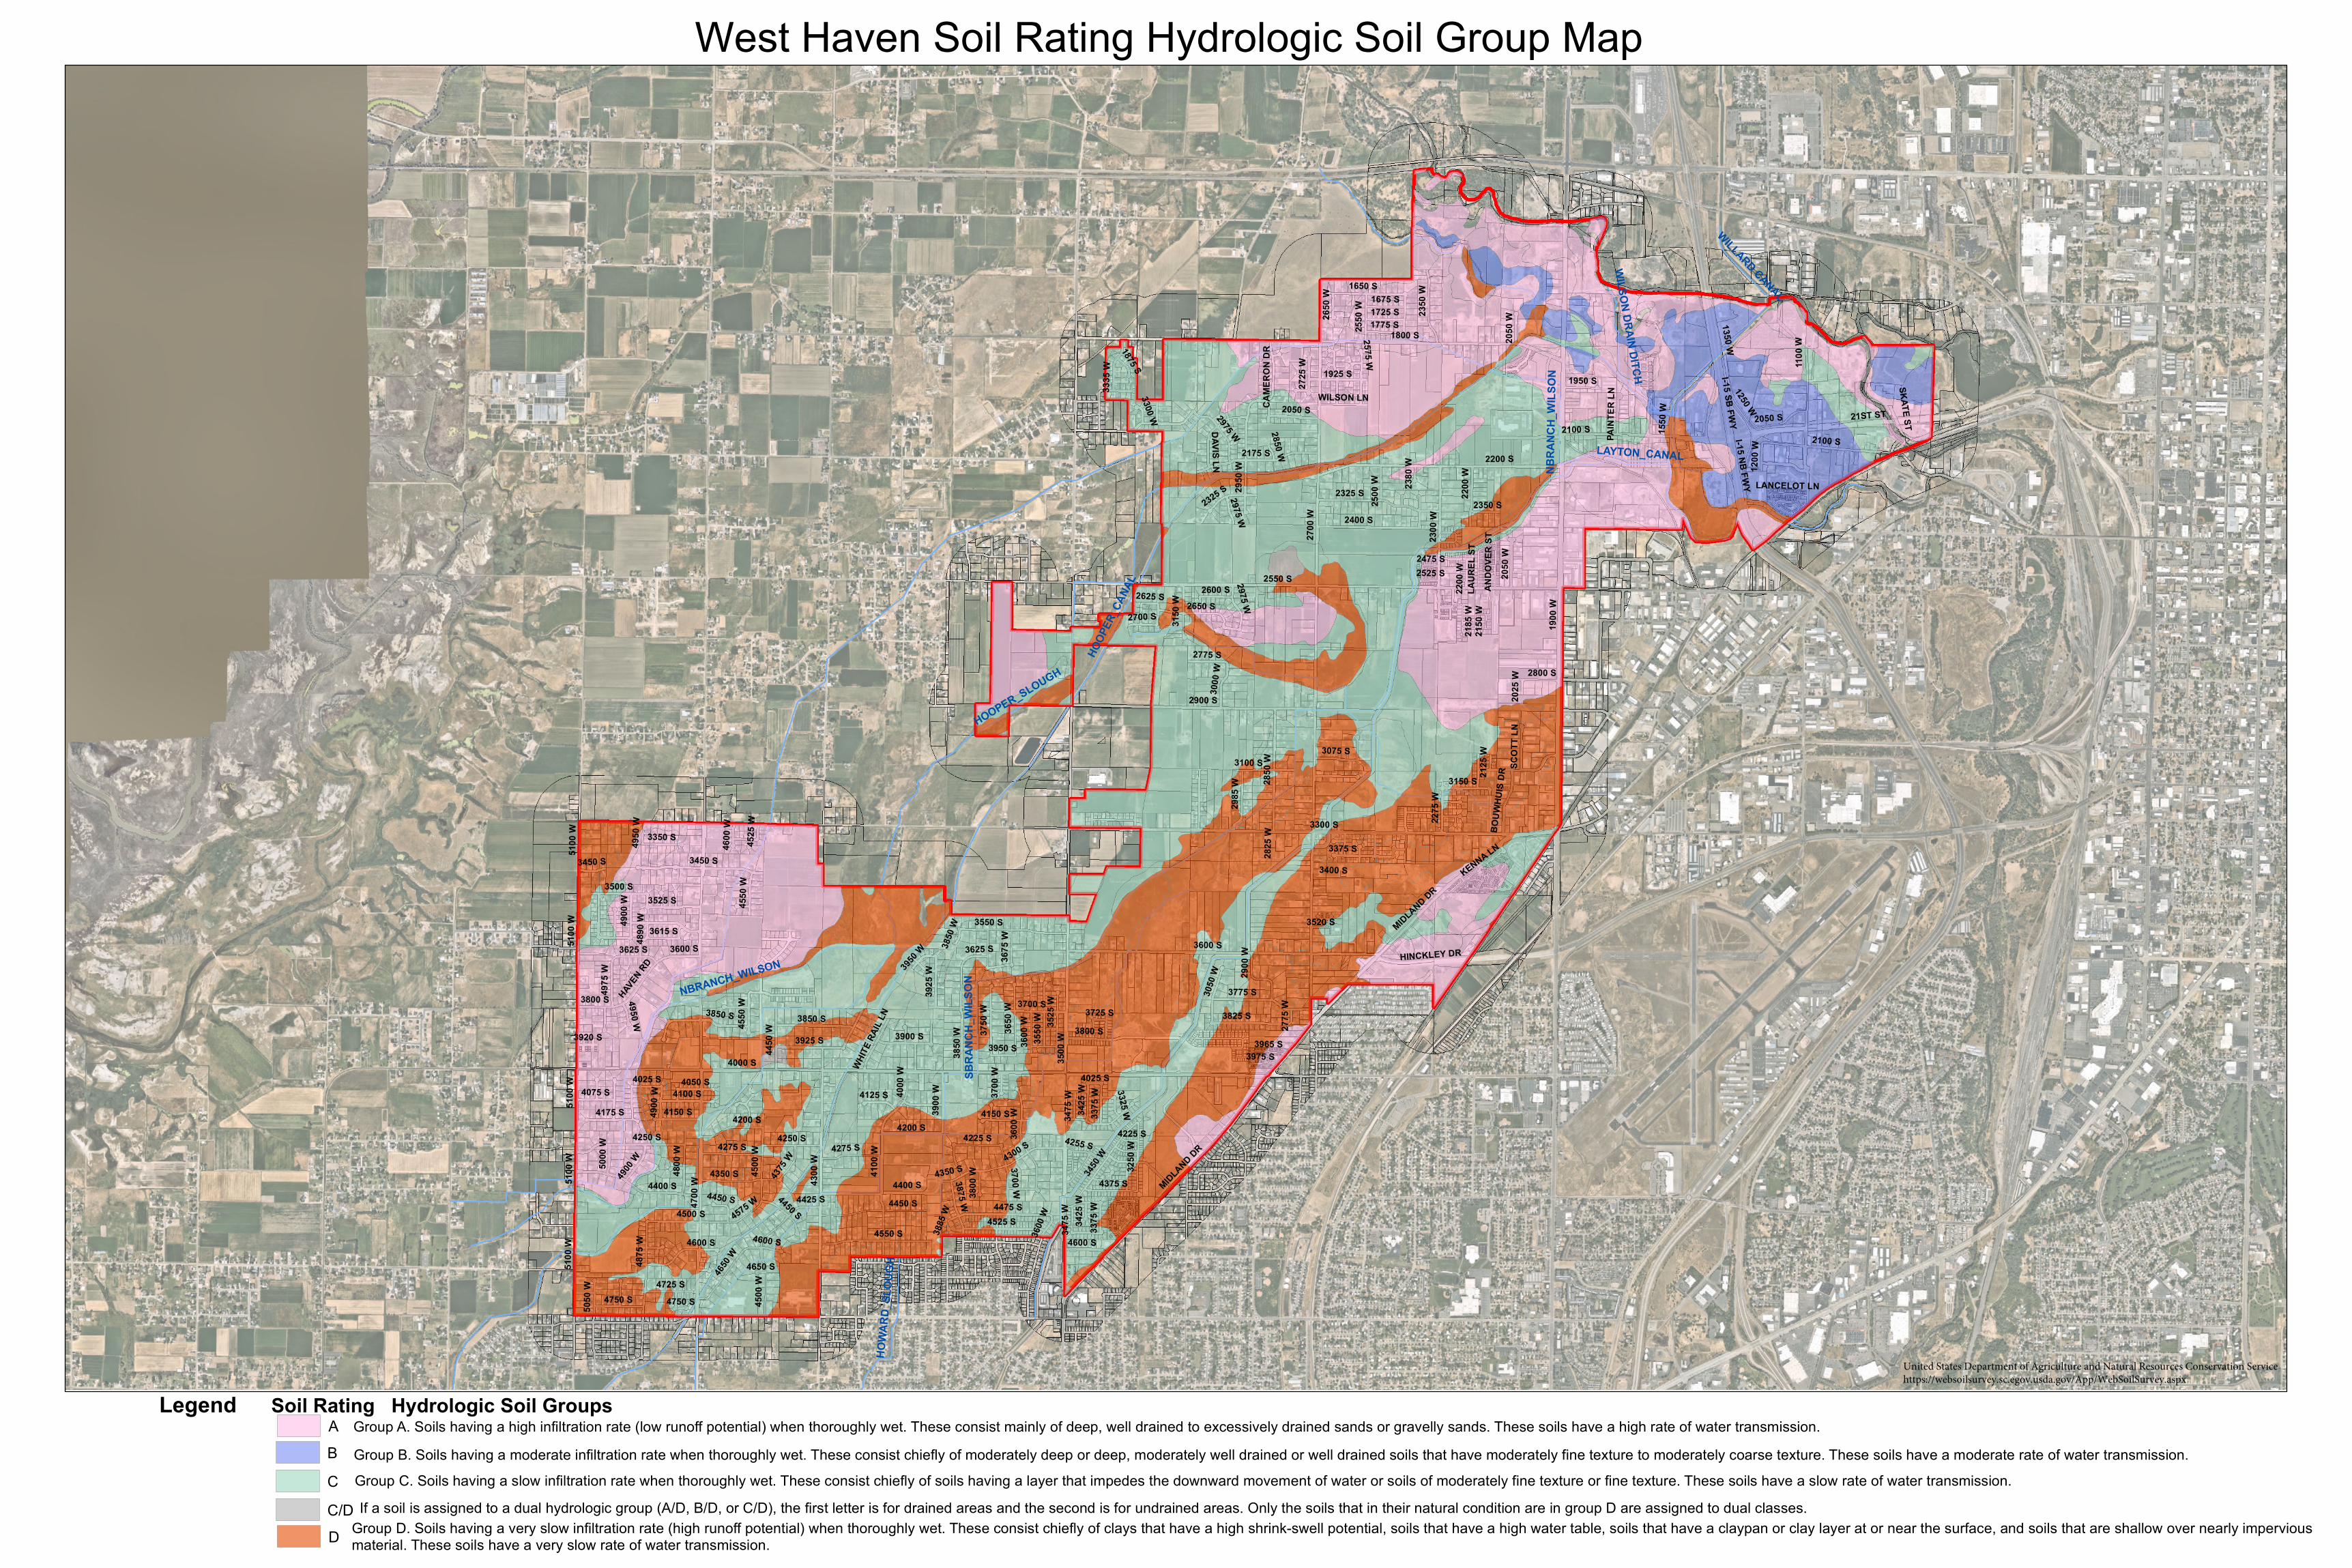
3.3 Soils Report
When designing and planning LID practices, soil characteristics and depth of ground water must
be considered. Soil properties should also be considered in plant selection. A Hydrologic Soil
Group Map for West Haven that shows an estimate of what soils are in each area of the city is
included for reference in Appendix B.
A Soils report is required to for each new development and redevelopment and must be
submitted during the plan review with all other documentation for Permittees LID practices. A
Soils Report will provide soil properties, ground water depth, infiltration rates, and other
information needed in selecting LID’s.
SECTION 4 – Infeasibility
4.1 Infeasibility Guidelines

7
Permittee is required to implement LID practices. “A Guide to Low Impact Development within
Utah, Appendix C”, shown in Appendix F, should be used for reference in LID selection to
retain the 80th percentile storm.
There may be cases where it is infeasible to meet the requirements of retaining the 80th percentile
storm onsite. If an LID approach cannot be utilized and is infeasible, the Permittee must submit
to West Haven City documentation and explanation of why an LID approach is infeasible. This
documentation must also include an alternative to retention of the 80th percentile storm and LID
implementation, explaining what degree of compliance the project will reach.
This alternative criteria must be approved by West Haven City.

APPENDIX A
80TH PERCENTILE
CALCULATIONS
Depth (in) Percentile
0.12 10%
0.144 20%
0.17 30%
0.2 40%
0.24 50%
0.29 60%
0.38 70%
0.49 80%
0.608 90%
0
0.1
0.2
0.3
0.4
0.5
0.6
0.7
0% 10% 20% 30% 40% 50% 60% 70% 80% 90% 100%
Ra
infa
ll D
ep
th (
inch
es)
Percentile
WEST HAVEN - RAINFALL FREQUENCY
US1UTWB0001 WEST HAVEN 2.0 SW, UT US 3/4/2015 0.1 0 1
US1UTWB0001 WEST HAVEN 2.0 SW, UT US 11/10/2015 0.1 0 0
US1UTWB0001 WEST HAVEN 2.0 SW, UT US 8/13/2017 0.1 0
US1UTWB0001 WEST HAVEN 2.0 SW, UT US 9/23/2017 0.1 0
US1UTWB0001 WEST HAVEN 2.0 SW, UT US 5/15/2018 0.1 0
US1UTWB0001 WEST HAVEN 2.0 SW, UT US 2/11/2019 0.1 1 1
US1UTWB0001 WEST HAVEN 2.0 SW, UT US 2/20/2019 0.1 2.5 2.5
US1UTWB0001 WEST HAVEN 2.0 SW, UT US 7/29/2014 0.11 0
US1UTWB0001 WEST HAVEN 2.0 SW, UT US 7/23/2015 0.11 0
US1UTWB0001 WEST HAVEN 2.0 SW, UT US 10/6/2015 0.11 0
US1UTWB0001 WEST HAVEN 2.0 SW, UT US 12/8/2015 0.11 0 0.5
US1UTWB0001 WEST HAVEN 2.0 SW, UT US 12/17/2015 0.11 2.1 6.5
US1UTWB0001 WEST HAVEN 2.0 SW, UT US 3/15/2016 0.11 0 0
US1UTWB0001 WEST HAVEN 2.0 SW, UT US 2/18/2017 0.11 0 0
US1UTWB0001 WEST HAVEN 2.0 SW, UT US 4/27/2017 0.11 0
US1UTWB0001 WEST HAVEN 2.0 SW, UT US 4/30/2018 0.11 0
US1UTWB0001 WEST HAVEN 2.0 SW, UT US 12/3/2018 0.11 1.7 1.5
US1UTWB0001 WEST HAVEN 2.0 SW, UT US 3/8/2019 0.11 0 0
US1UTWB0001 WEST HAVEN 2.0 SW, UT US 10/20/2019 0.11 0
US1UTWB0001 WEST HAVEN 2.0 SW, UT US 1/9/2014 0.12 1.5 6.5
US1UTWB0001 WEST HAVEN 2.0 SW, UT US 11/15/2014 0.12 0.2 0
US1UTWB0001 WEST HAVEN 2.0 SW, UT US 2/10/2015 0.12 0 0
US1UTWB0001 WEST HAVEN 2.0 SW, UT US 7/20/2015 0.12 0
US1UTWB0001 WEST HAVEN 2.0 SW, UT US 10/3/2015 0.12 0
US1UTWB0001 WEST HAVEN 2.0 SW, UT US 10/18/2015 0.12 0
US1UTWB0001 WEST HAVEN 2.0 SW, UT US 12/24/2015 0.12 1.5 6
US1UTWB0001 WEST HAVEN 2.0 SW, UT US 10/2/2016 0.12 0
US1UTWB0001 WEST HAVEN 2.0 SW, UT US 4/3/2017 0.12 0 0
US1UTWB0001 WEST HAVEN 2.0 SW, UT US 4/25/2017 0.12 0
US1UTWB0001 WEST HAVEN 2.0 SW, UT US 10/23/2018 0.12 0
US1UTWB0001 WEST HAVEN 2.0 SW, UT US 1/17/2019 0.12 1 3
US1UTWB0001 WEST HAVEN 2.0 SW, UT US 2/3/2020 0.12 2 2
US1UTWB0001 WEST HAVEN 2.0 SW, UT US 3/27/2014 0.13 0 0
US1UTWB0001 WEST HAVEN 2.0 SW, UT US 8/6/2014 0.13 0
US1UTWB0001 WEST HAVEN 2.0 SW, UT US 8/21/2014 0.13 0
US1UTWB0001 WEST HAVEN 2.0 SW, UT US 12/22/2014 0.13 0 0
US1UTWB0001 WEST HAVEN 2.0 SW, UT US 5/9/2015 0.13 0
US1UTWB0001 WEST HAVEN 2.0 SW, UT US 8/12/2015 0.13 0
US1UTWB0001 WEST HAVEN 2.0 SW, UT US 12/11/2015 0.13 0 0
US1UTWB0001 WEST HAVEN 2.0 SW, UT US 12/21/2015 0.13 0.4 2
US1UTWB0001 WEST HAVEN 2.0 SW, UT US 2/14/2016 0.13 0.5 5.5
US1UTWB0001 WEST HAVEN 2.0 SW, UT US 5/27/2016 0.13 0
US1UTWB0001 WEST HAVEN 2.0 SW, UT US 8/8/2016 0.13 0
US1UTWB0001 WEST HAVEN 2.0 SW, UT US 9/2/2016 0.13 0
US1UTWB0001 WEST HAVEN 2.0 SW, UT US 4/6/2019 0.13 0 0
US1UTWB0001 WEST HAVEN 2.0 SW, UT US 5/23/2019 0.13 0
US1UTWB0001 WEST HAVEN 2.0 SW, UT US 5/25/2019 0.13 0

US1UTWB0001 WEST HAVEN 2.0 SW, UT US 7/27/2019 0.13 0
US1UTWB0001 WEST HAVEN 2.0 SW, UT US 11/30/2019 0.13 1.7 7
US1UTWB0001 WEST HAVEN 2.0 SW, UT US 11/20/2015 0.14 0 0
US1UTWB0001 WEST HAVEN 2.0 SW, UT US 3/14/2016 0.14 0 0
US1UTWB0001 WEST HAVEN 2.0 SW, UT US 2/8/2017 0.14 0 4.5
US1UTWB0001 WEST HAVEN 2.0 SW, UT US 2/9/2017 0.14 0 1
US1UTWB0001 WEST HAVEN 2.0 SW, UT US 5/9/2019 0.14 0
US1UTWB0001 WEST HAVEN 2.0 SW, UT US 9/30/2019 0.14 0
US1UTWB0001 WEST HAVEN 2.0 SW, UT US 1/10/2014 0.15 1 7
US1UTWB0001 WEST HAVEN 2.0 SW, UT US 5/25/2015 0.15 0
US1UTWB0001 WEST HAVEN 2.0 SW, UT US 10/23/2015 0.15 0
US1UTWB0001 WEST HAVEN 2.0 SW, UT US 11/2/2015 0.15 0 0
US1UTWB0001 WEST HAVEN 2.0 SW, UT US 9/22/2016 0.15 0
US1UTWB0001 WEST HAVEN 2.0 SW, UT US 10/31/2016 0.15 0
US1UTWB0001 WEST HAVEN 2.0 SW, UT US 2/27/2017 0.15 2.8 3
US1UTWB0001 WEST HAVEN 2.0 SW, UT US 3/23/2019 0.15 0 0
US1UTWB0001 WEST HAVEN 2.0 SW, UT US 4/15/2019 0.15 0 0
US1UTWB0001 WEST HAVEN 2.0 SW, UT US 10/18/2019 0.15 0
US1UTWB0001 WEST HAVEN 2.0 SW, UT US 2/6/2020 0.15 1 2.5
US1UTWB0001 WEST HAVEN 2.0 SW, UT US 5/9/2014 0.16 0
US1UTWB0001 WEST HAVEN 2.0 SW, UT US 5/22/2015 0.16 0
US1UTWB0001 WEST HAVEN 2.0 SW, UT US 11/24/2016 0.16 0 0
US1UTWB0001 WEST HAVEN 2.0 SW, UT US 1/10/2017 0.16 0 7.5
US1UTWB0001 WEST HAVEN 2.0 SW, UT US 4/21/2017 0.16 0 0
US1UTWB0001 WEST HAVEN 2.0 SW, UT US 2/6/2019 0.16 1 1
US1UTWB0001 WEST HAVEN 2.0 SW, UT US 12/8/2019 0.16 0.3 2
US1UTWB0001 WEST HAVEN 2.0 SW, UT US 1/1/2020 0.16 2.5 3.5
US1UTWB0001 WEST HAVEN 2.0 SW, UT US 4/6/2014 0.17 0 0
US1UTWB0001 WEST HAVEN 2.0 SW, UT US 6/27/2014 0.17 0
US1UTWB0001 WEST HAVEN 2.0 SW, UT US 1/28/2015 0.17 0 0
US1UTWB0001 WEST HAVEN 2.0 SW, UT US 5/23/2015 0.17 0
US1UTWB0001 WEST HAVEN 2.0 SW, UT US 2/18/2016 0.17 0 0
US1UTWB0001 WEST HAVEN 2.0 SW, UT US 3/23/2016 0.17 0 0
US1UTWB0001 WEST HAVEN 2.0 SW, UT US 10/29/2016 0.17 0
US1UTWB0001 WEST HAVEN 2.0 SW, UT US 11/29/2016 0.17 2 4
US1UTWB0001 WEST HAVEN 2.0 SW, UT US 12/22/2018 0.17 0.5 0.5
US1UTWB0001 WEST HAVEN 2.0 SW, UT US 5/31/2019 0.17 0
US1UTWB0001 WEST HAVEN 2.0 SW, UT US 2/10/2014 0.18 0 1
US1UTWB0001 WEST HAVEN 2.0 SW, UT US 10/20/2015 0.18 0
US1UTWB0001 WEST HAVEN 2.0 SW, UT US 1/15/2016 0.18 2 5
US1UTWB0001 WEST HAVEN 2.0 SW, UT US 2/19/2016 0.18 0.3 0
US1UTWB0001 WEST HAVEN 2.0 SW, UT US 3/30/2016 0.18 0 0
US1UTWB0001 WEST HAVEN 2.0 SW, UT US 2/7/2017 0.18 0 5
US1UTWB0001 WEST HAVEN 2.0 SW, UT US 6/14/2017 0.18 0
US1UTWB0001 WEST HAVEN 2.0 SW, UT US 9/19/2017 0.18 0
US1UTWB0001 WEST HAVEN 2.0 SW, UT US 3/25/2019 0.18 0 0
US1UTWB0001 WEST HAVEN 2.0 SW, UT US 11/26/2019 0.18 2 2
US1UTWB0001 WEST HAVEN 2.0 SW, UT US 10/19/2015 0.19 0
US1UTWB0001 WEST HAVEN 2.0 SW, UT US 9/14/2016 0.19 0
US1UTWB0001 WEST HAVEN 2.0 SW, UT US 1/5/2017 0.19 3.3 9
US1UTWB0001 WEST HAVEN 2.0 SW, UT US 3/31/2017 0.19 0 0
US1UTWB0001 WEST HAVEN 2.0 SW, UT US 12/23/2017 0.19 2.8 3
US1UTWB0001 WEST HAVEN 2.0 SW, UT US 1/20/2018 0.19 1.5 1.5
US1UTWB0001 WEST HAVEN 2.0 SW, UT US 5/13/2018 0.19 0
US1UTWB0001 WEST HAVEN 2.0 SW, UT US 10/4/2018 0.19 0
US1UTWB0001 WEST HAVEN 2.0 SW, UT US 5/29/2019 0.19 0
US1UTWB0001 WEST HAVEN 2.0 SW, UT US 1/25/2020 0.19 0 0
US1UTWB0001 WEST HAVEN 2.0 SW, UT US 9/30/2014 0.2 0
US1UTWB0001 WEST HAVEN 2.0 SW, UT US 1/30/2016 0.2 0.4 5
US1UTWB0001 WEST HAVEN 2.0 SW, UT US 12/15/2016 0.2 2.3 2
US1UTWB0001 WEST HAVEN 2.0 SW, UT US 1/11/2017 0.2 0 6
US1UTWB0001 WEST HAVEN 2.0 SW, UT US 11/18/2017 0.2 0
US1UTWB0001 WEST HAVEN 2.0 SW, UT US 12/24/2018 0.2 2.5 2.5
US1UTWB0001 WEST HAVEN 2.0 SW, UT US 4/12/2019 0.2 0 0
US1UTWB0001 WEST HAVEN 2.0 SW, UT US 5/18/2019 0.2 0
US1UTWB0001 WEST HAVEN 2.0 SW, UT US 3/22/2016 0.21 0 0
US1UTWB0001 WEST HAVEN 2.0 SW, UT US 12/26/2016 0.21 3 6.5
US1UTWB0001 WEST HAVEN 2.0 SW, UT US 1/8/2017 0.21 1.7 9
US1UTWB0001 WEST HAVEN 2.0 SW, UT US 8/23/2018 0.21 0
US1UTWB0001 WEST HAVEN 2.0 SW, UT US 1/29/2020 0.21 1 1
US1UTWB0001 WEST HAVEN 2.0 SW, UT US 2/13/2014 0.22 0 0
US1UTWB0001 WEST HAVEN 2.0 SW, UT US 5/16/2015 0.22 0
US1UTWB0001 WEST HAVEN 2.0 SW, UT US 7/8/2015 0.22 0
US1UTWB0001 WEST HAVEN 2.0 SW, UT US 6/13/2017 0.22 0
US1UTWB0001 WEST HAVEN 2.0 SW, UT US 4/8/2018 0.22 0
US1UTWB0001 WEST HAVEN 2.0 SW, UT US 2/16/2019 0.22 2 2
US1UTWB0001 WEST HAVEN 2.0 SW, UT US 4/9/2015 0.23 0
US1UTWB0001 WEST HAVEN 2.0 SW, UT US 5/15/2015 0.23 0
US1UTWB0001 WEST HAVEN 2.0 SW, UT US 9/15/2016 0.23 0
US1UTWB0001 WEST HAVEN 2.0 SW, UT US 1/12/2017 0.23 0.8 6
US1UTWB0001 WEST HAVEN 2.0 SW, UT US 1/24/2017 0.23 1.3 13
US1UTWB0001 WEST HAVEN 2.0 SW, UT US 3/26/2017 0.23 0 0
US1UTWB0001 WEST HAVEN 2.0 SW, UT US 3/26/2018 0.23 1.2 1
US1UTWB0001 WEST HAVEN 2.0 SW, UT US 5/1/2018 0.23 0
US1UTWB0001 WEST HAVEN 2.0 SW, UT US 2/15/2019 0.23 0 0
US1UTWB0001 WEST HAVEN 2.0 SW, UT US 8/9/2014 0.24 0
US1UTWB0001 WEST HAVEN 2.0 SW, UT US 5/30/2016 0.24 0
US1UTWB0001 WEST HAVEN 2.0 SW, UT US 11/28/2016 0.24 3 3
US1UTWB0001 WEST HAVEN 2.0 SW, UT US 1/22/2017 0.24 2 10
US1UTWB0001 WEST HAVEN 2.0 SW, UT US 12/25/2017 0.24 3.8 5
US1UTWB0001 WEST HAVEN 2.0 SW, UT US 1/7/2018 0.24 0.5 0.5
US1UTWB0001 WEST HAVEN 2.0 SW, UT US 3/5/2014 0.25 0 0
US1UTWB0001 WEST HAVEN 2.0 SW, UT US 9/22/2014 0.25 0
US1UTWB0001 WEST HAVEN 2.0 SW, UT US 3/28/2016 0.25 1.2 1
US1UTWB0001 WEST HAVEN 2.0 SW, UT US 12/17/2016 0.25 0.1 0
US1UTWB0001 WEST HAVEN 2.0 SW, UT US 3/6/2017 0.25 1.8 2
US1UTWB0001 WEST HAVEN 2.0 SW, UT US 10/3/2018 0.25 0
US1UTWB0001 WEST HAVEN 2.0 SW, UT US 1/16/2019 0.25 2.5 4.5
US1UTWB0001 WEST HAVEN 2.0 SW, UT US 2/3/2019 0.25 0 0
US1UTWB0001 WEST HAVEN 2.0 SW, UT US 12/14/2019 0.25 0 0
US1UTWB0001 WEST HAVEN 2.0 SW, UT US 4/16/2015 0.26 0.5 1.5
US1UTWB0001 WEST HAVEN 2.0 SW, UT US 1/20/2017 0.26 3 8
US1UTWB0001 WEST HAVEN 2.0 SW, UT US 3/16/2018 0.26 0 0
US1UTWB0001 WEST HAVEN 2.0 SW, UT US 4/21/2019 0.26 0 0
US1UTWB0001 WEST HAVEN 2.0 SW, UT US 6/28/2014 0.27 0
US1UTWB0001 WEST HAVEN 2.0 SW, UT US 12/29/2014 0.27 3.7 4.5
US1UTWB0001 WEST HAVEN 2.0 SW, UT US 12/15/2015 0.27 3 6
US1UTWB0001 WEST HAVEN 2.0 SW, UT US 5/8/2016 0.27 0
US1UTWB0001 WEST HAVEN 2.0 SW, UT US 1/2/2017 0.27 3.7 7.5
US1UTWB0001 WEST HAVEN 2.0 SW, UT US 2/19/2018 0.27 4
US1UTWB0001 WEST HAVEN 2.0 SW, UT US 3/1/2014 0.28 0 0
US1UTWB0001 WEST HAVEN 2.0 SW, UT US 1/31/2016 0.28 3 7.5
US1UTWB0001 WEST HAVEN 2.0 SW, UT US 1/9/2017 0.28 1.5 9
US1UTWB0001 WEST HAVEN 2.0 SW, UT US 3/31/2014 0.29 0 0
US1UTWB0001 WEST HAVEN 2.0 SW, UT US 8/13/2014 0.29 0
US1UTWB0001 WEST HAVEN 2.0 SW, UT US 12/13/2014 0.29 0 0
US1UTWB0001 WEST HAVEN 2.0 SW, UT US 1/9/2018 0.29 0 0
US1UTWB0001 WEST HAVEN 2.0 SW, UT US 3/4/2018 0.29 4 4
US1UTWB0001 WEST HAVEN 2.0 SW, UT US 4/3/2019 0.29 0 0
US1UTWB0001 WEST HAVEN 2.0 SW, UT US 11/23/2014 0.3 0.7 0.5
US1UTWB0001 WEST HAVEN 2.0 SW, UT US 8/8/2015 0.3 0
US1UTWB0001 WEST HAVEN 2.0 SW, UT US 9/15/2015 0.3 0
US1UTWB0001 WEST HAVEN 2.0 SW, UT US 9/9/2014 0.31 0
US1UTWB0001 WEST HAVEN 2.0 SW, UT US 5/21/2015 0.31 0
US1UTWB0001 WEST HAVEN 2.0 SW, UT US 8/9/2019 0.32 0
US1UTWB0001 WEST HAVEN 2.0 SW, UT US 1/21/2017 0.34 2 9
US1UTWB0001 WEST HAVEN 2.0 SW, UT US 1/21/2019 0.34 1.3 2
US1UTWB0001 WEST HAVEN 2.0 SW, UT US 5/10/2015 0.35 0
US1UTWB0001 WEST HAVEN 2.0 SW, UT US 6/18/2019 0.35 0
US1UTWB0001 WEST HAVEN 2.0 SW, UT US 4/23/2014 0.36 0
US1UTWB0001 WEST HAVEN 2.0 SW, UT US 1/19/2016 0.36 0 3.5
US1UTWB0001 WEST HAVEN 2.0 SW, UT US 5/7/2016 0.36 0
US1UTWB0001 WEST HAVEN 2.0 SW, UT US 2/11/2017 0.36 0 0
US1UTWB0001 WEST HAVEN 2.0 SW, UT US 2/19/2017 0.36 0 0
US1UTWB0001 WEST HAVEN 2.0 SW, UT US 2/22/2017 0.36 0 0
US1UTWB0001 WEST HAVEN 2.0 SW, UT US 2/24/2017 0.36 6.3 6.5
US1UTWB0001 WEST HAVEN 2.0 SW, UT US 5/17/2017 0.36 0 0
US1UTWB0001 WEST HAVEN 2.0 SW, UT US 9/16/2017 0.36 0
US1UTWB0001 WEST HAVEN 2.0 SW, UT US 9/22/2017 0.36 0
US1UTWB0001 WEST HAVEN 2.0 SW, UT US 1/7/2019 0.36 1 3
US1UTWB0001 WEST HAVEN 2.0 SW, UT US 3/9/2019 0.36 0.5 0
US1UTWB0001 WEST HAVEN 2.0 SW, UT US 4/26/2014 0.37 0
US1UTWB0001 WEST HAVEN 2.0 SW, UT US 4/15/2015 0.37 3 3
US1UTWB0001 WEST HAVEN 2.0 SW, UT US 5/19/2015 0.38 0
US1UTWB0001 WEST HAVEN 2.0 SW, UT US 11/21/2016 0.38 0 0
US1UTWB0001 WEST HAVEN 2.0 SW, UT US 11/30/2018 0.38 0 0
US1UTWB0001 WEST HAVEN 2.0 SW, UT US 8/23/2014 0.39 0
US1UTWB0001 WEST HAVEN 2.0 SW, UT US 5/12/2018 0.39 0
US1UTWB0001 WEST HAVEN 2.0 SW, UT US 4/10/2019 0.39 0 0
US1UTWB0001 WEST HAVEN 2.0 SW, UT US 4/13/2019 0.39 0.5 0
US1UTWB0001 WEST HAVEN 2.0 SW, UT US 9/27/2014 0.4 0
US1UTWB0001 WEST HAVEN 2.0 SW, UT US 8/26/2014 0.41 0
US1UTWB0001 WEST HAVEN 2.0 SW, UT US 1/6/2019 0.41 2.5 2.5
US1UTWB0001 WEST HAVEN 2.0 SW, UT US 4/24/2016 0.42 0
US1UTWB0001 WEST HAVEN 2.0 SW, UT US 12/5/2019 0.42 1 4
US1UTWB0001 WEST HAVEN 2.0 SW, UT US 6/12/2016 0.43 0
US1UTWB0001 WEST HAVEN 2.0 SW, UT US 4/8/2017 0.43 0 0
US1UTWB0001 WEST HAVEN 2.0 SW, UT US 4/13/2018 0.43 0 0
US1UTWB0001 WEST HAVEN 2.0 SW, UT US 12/21/2014 0.44 0 0
US1UTWB0001 WEST HAVEN 2.0 SW, UT US 12/16/2016 0.44 0 0
US1UTWB0001 WEST HAVEN 2.0 SW, UT US 11/29/2018 0.44 0 0
US1UTWB0001 WEST HAVEN 2.0 SW, UT US 3/22/2019 0.44 0 0
US1UTWB0001 WEST HAVEN 2.0 SW, UT US 2/9/2014 0.45 0 1
US1UTWB0001 WEST HAVEN 2.0 SW, UT US 1/24/2016 0.46 3.1 6
US1UTWB0001 WEST HAVEN 2.0 SW, UT US 3/3/2015 0.47 1.8 2
US1UTWB0001 WEST HAVEN 2.0 SW, UT US 5/21/2016 0.47 0
US1UTWB0001 WEST HAVEN 2.0 SW, UT US 2/28/2014 0.48 0 0
US1UTWB0001 WEST HAVEN 2.0 SW, UT US 5/7/2015 0.48 0
US1UTWB0001 WEST HAVEN 2.0 SW, UT US 4/9/2017 0.48 0.2 0
US1UTWB0001 WEST HAVEN 2.0 SW, UT US 5/8/2019 0.48 0
US1UTWB0001 WEST HAVEN 2.0 SW, UT US 6/18/2014 0.49 0
US1UTWB0001 WEST HAVEN 2.0 SW, UT US 12/22/2015 0.49 0.4 1
US1UTWB0001 WEST HAVEN 2.0 SW, UT US 3/23/2017 0.49 0 0
US1UTWB0001 WEST HAVEN 2.0 SW, UT US 4/16/2019 0.49 0 0
US1UTWB0001 WEST HAVEN 2.0 SW, UT US 12/14/2015 0.5 4.8 5
US1UTWB0001 WEST HAVEN 2.0 SW, UT US 10/17/2016 0.5 0
US1UTWB0001 WEST HAVEN 2.0 SW, UT US 6/17/2014 0.51 0
US1UTWB0001 WEST HAVEN 2.0 SW, UT US 3/15/2018 0.51 0 0
US1UTWB0001 WEST HAVEN 2.0 SW, UT US 3/24/2019 0.51 0 0
US1UTWB0001 WEST HAVEN 2.0 SW, UT US 1/30/2014 0.52 1 4
US1UTWB0001 WEST HAVEN 2.0 SW, UT US 3/24/2017 0.52 0 0
US1UTWB0001 WEST HAVEN 2.0 SW, UT US 6/7/2019 0.52 0
US1UTWB0001 WEST HAVEN 2.0 SW, UT US 9/11/2019 0.52 0
US1UTWB0001 WEST HAVEN 2.0 SW, UT US 1/27/2020 0.52 0.5 0.5
US1UTWB0001 WEST HAVEN 2.0 SW, UT US 5/27/2015 0.54 0
US1UTWB0001 WEST HAVEN 2.0 SW, UT US 5/28/2015 0.55 0
US1UTWB0001 WEST HAVEN 2.0 SW, UT US 12/23/2015 0.55 5 6
US1UTWB0001 WEST HAVEN 2.0 SW, UT US 3/23/2018 0.55 0 0

US1UTWB0001 WEST HAVEN 2.0 SW, UT US 11/24/2018 0.55 0.5 0.5
US1UTWB0001 WEST HAVEN 2.0 SW, UT US 4/25/2015 0.56 0
US1UTWB0001 WEST HAVEN 2.0 SW, UT US 11/26/2015 0.57 3.8 4
US1UTWB0001 WEST HAVEN 2.0 SW, UT US 4/19/2017 0.57 0 0
US1UTWB0001 WEST HAVEN 2.0 SW, UT US 9/29/2019 0.57 0
US1UTWB0001 WEST HAVEN 2.0 SW, UT US 5/17/2019 0.58 0
US1UTWB0001 WEST HAVEN 2.0 SW, UT US 4/17/2019 0.59 0 0
US1UTWB0001 WEST HAVEN 2.0 SW, UT US 3/7/2016 0.6 0 0
US1UTWB0001 WEST HAVEN 2.0 SW, UT US 3/7/2019 0.6 0 0
US1UTWB0001 WEST HAVEN 2.0 SW, UT US 5/27/2019 0.6 0
US1UTWB0001 WEST HAVEN 2.0 SW, UT US 12/25/2016 0.61 5 5
US1UTWB0001 WEST HAVEN 2.0 SW, UT US 5/20/2016 0.62 0
US1UTWB0001 WEST HAVEN 2.0 SW, UT US 9/21/2019 0.62 0
US1UTWB0001 WEST HAVEN 2.0 SW, UT US 3/29/2016 0.65 0.5 0
US1UTWB0001 WEST HAVEN 2.0 SW, UT US 4/27/2014 0.66 0
US1UTWB0001 WEST HAVEN 2.0 SW, UT US 4/26/2015 0.66 0
US1UTWB0001 WEST HAVEN 2.0 SW, UT US 1/23/2017 0.66 4 13.5
US1UTWB0001 WEST HAVEN 2.0 SW, UT US 1/7/2016 0.67 0.3 4
US1UTWB0001 WEST HAVEN 2.0 SW, UT US 12/13/2019 0.67 0 0
US1UTWB0001 WEST HAVEN 2.0 SW, UT US 1/13/2015 0.68 1.3 1.5
US1UTWB0001 WEST HAVEN 2.0 SW, UT US 7/9/2015 0.69 0
US1UTWB0001 WEST HAVEN 2.0 SW, UT US 1/18/2019 0.69 0.5 2
US1UTWB0001 WEST HAVEN 2.0 SW, UT US 10/5/2018 0.7 0
US1UTWB0001 WEST HAVEN 2.0 SW, UT US 11/28/2019 0.7 9 11
US1UTWB0001 WEST HAVEN 2.0 SW, UT US 5/21/2019 0.71 0 0
US1UTWB0001 WEST HAVEN 2.0 SW, UT US 9/28/2014 0.76 0
US1UTWB0001 WEST HAVEN 2.0 SW, UT US 2/14/2019 0.77 1 0
US1UTWB0001 WEST HAVEN 2.0 SW, UT US 9/17/2015 0.82 0
US1UTWB0001 WEST HAVEN 2.0 SW, UT US 5/22/2019 0.82 0
US1UTWB0001 WEST HAVEN 2.0 SW, UT US 9/15/2017 0.89 0
US1UTWB0001 WEST HAVEN 2.0 SW, UT US 11/17/2017 0.89 0
US1UTWB0001 WEST HAVEN 2.0 SW, UT US 7/30/2014 0.92 0
US1UTWB0001 WEST HAVEN 2.0 SW, UT US 10/10/2018 1 0
US1UTWB0001 WEST HAVEN 2.0 SW, UT US 9/24/2016 1.04 0
US1UTWB0001 WEST HAVEN 2.0 SW, UT US 3/29/2019 1.08 0.5 0
US1UTWB0001 WEST HAVEN 2.0 SW, UT US 12/11/2016 1.19 0.5 0.5
US1UTWB0001 WEST HAVEN 2.0 SW, UT US 9/23/2016 1.2 0 0
US1UTWB0001 WEST HAVEN 2.0 SW, UT US 5/17/2015 1.96 0
US1UTWB0001 WEST HAVEN 2.0 SW, UT US 5/8/2014 2 0.73 0
US1UTWB0001 WEST HAVEN 2.0 SW, UT US 8/5/2015 3 0.58
US1UTWB0001 WEST HAVEN 2.0 SW, UT US 4/15/2016 2 0.92 0
US1UTWB0001 WEST HAVEN 2.0 SW, UT US 5/10/2016 2 0.41 0
US1UTWB0001 WEST HAVEN 2.0 SW, UT US 2/24/2018 2 0.32 6.5
APPENDIX B
WEST HAVEN HYDROLOGIC
SOILS GROUP MAP
4000 S
2700
W
1900
W
4700
W
2550 S
3300 S
3600 S
3500
W
1800 S
2200 S
4300
W
2900 S
1100
W
21ST ST
5100
W
I-15 SB FWY
3700 S
I-15 NB FWY
4100
W
MIDLAND DR
2100 S
3450 S
4400 S
2850
W
2300
W
3900
W
4450 S
4550 S
3550 S
4250 S4300 S
3850
W
4475 S
3775 S36
00 W
4500
W
3450 W
4500 S
4875
W 4600 S
1650 S
2650 S
2400 S
2175 S
1350 W
4525 S
3825 S
4350 S
3850 S
2950
W
2350
W
3925 S
2325 S
3750
W
3700 W
3650
W
3250
W4275 S
3100 S
4200 S
3550
W
1925 S
4800
W
2500
W
2985
W
2200
W
3500 S
4450
W
4650 W
3525 S
3150 S
3900 S
2050 S
4375 S
4725 S
4175 S
3525
W
2575 W
3050
W
4750 S
3150
W
4225 S
4150 S33
35 W
3925
W
2275
W
3675
W3800 S4975
W
2050
W
HINCKLEY DR
3075 S
3625 S
3400 S
3000
W
KENNA LN
2800 S
1675 S
3350 S
1725 S
SKATE ST
4100 S
1950 S
1775 S
1250 W
4000
W
2775 S
4900 W
4075 S4050 S
2975 W
3425
W
4375 W
4425 S
4125 S
3875 W
HAVEN RD
2600 S
3965 S
5050
W
3615 S
1550
W
2725
W
4890
W
2150
W
4575 W
4550
W
4950 W
CAME
RON
DR
4025 S
2350 S
BOUW
HUIS
DR
DAVIS LN
2700 S
SCOT
T LN
3375
W
5000
W
WILSON LN
1200
W
3475
W
4255 S
ANDO
VER
ST
3950 S
2125
W
WHITE R
AIL LN
2825
W
2900
W
PAIN
TER
LN
3975 S
2650
W
3950 W
3800
W
4600
W
LAUR
EL S
T
1875 S
3920 S
2550
W
3300 W
3520 S
LANCELOT LN
3375 S
3325 W
2475 S2525 S
2625 S
4650 S
4525
W
2380
W
2185
W
3725 S
2025
W
2775
W
3885
W
4400 S
2325 S
4750 S
2100 S
MIDLAND DR4275 S
2850 W
4950
W
4600 S
4450 S
4350 S
3600
W
3450 S
3375
W
4200 S
5100
W
3600
W
4250 S
2200
W
3800 S
3475
W
4550
W
3425
W
4500
W
2050
W
5100
W
4150 S
3625 S
4225 S
3600 S
4600 S
4900
W
4025 S
5100
W51
00 W
3850
W
2975 W
3850 S
2050 S
3700
W
4900
W
4450 S
2975 WHO
OPER
_CAN
AL
LAYTON_CANAL
SBRA
NCH_
WILS
ON
HOOPER_SLOUGH
NBRA
NCH_
WILS
ON
HOWA
RD_S
LOUG
H
WILSON DRAIN DITCH
WILLARD CANAL
NBRANCH_WILSON
West Haven Soil Rating Hydrologic Soil Group Map
Legend Soil Rating Hydrologic Soil GroupsABCC/DD
Group A. Soils having a high infiltration rate (low runoff potential) when thoroughly wet. These consist mainly of deep, well drained to excessively drained sands or gravelly sands. These soils have a high rate of water transmission.Group B. Soils having a moderate infiltration rate when thoroughly wet. These consist chiefly of moderately deep or deep, moderately well drained or well drained soils that have moderately fine texture to moderately coarse texture. These soils have a moderate rate of water transmission.Group C. Soils having a slow infiltration rate when thoroughly wet. These consist chiefly of soils having a layer that impedes the downward movement of water or soils of moderately fine texture or fine texture. These soils have a slow rate of water transmission.
Group D. Soils having a very slow infiltration rate (high runoff potential) when thoroughly wet. These consist chiefly of clays that have a high shrink-swell potential, soils that have a high water table, soils that have a claypan or clay layer at or near the surface, and soils that are shallow over nearly imperviousmaterial. These soils have a very slow rate of water transmission.
If a soil is assigned to a dual hydrologic group (A/D, B/D, or C/D), the first letter is for drained areas and the second is for undrained areas. Only the soils that in their natural condition are in group D are assigned to dual classes.
United States Department of Agriculture and Natural Resources Conservation Servicehttps://websoilsurvey.sc.egov.usda.gov/App/WebSoilSurvey.aspx
APPENDIX C
STORM WATER QUALITY
REPORT FORM

Storm Water Quality Report – Template
Date:
Project Name:
Project ID: ______
Design Engineer: ______
Is the project within a watershed that is 303(d) listed?
If yes:
Name of receiving water(s):
Listed Impairment(s):
Does the watershed have an approved TMDL?
If yes:
Approved TMDL(s):
I have reviewed the storm water quality design and find this report to be complete, accurate, and current.
[stamp required at final design phase]
[name], Project Manager
[name], Designate Storm Water Coordinator
[name], Head of Maintenance
[name], Landscape Architect or Equivalent

Project Information
Type of Project (New Development, Redevelopment):
Area of Land Disturbance (ac):
Project Impervious Area (ac):
Project Imperviousness (%):
Project Volumetric Runoff Coefficient, RV:
80th Storm Depth (in): ________
Project 80th Percentile Volume, Vgoal (cf): ______
Subsurface Information
Groundwater
Depth to Groundwater (ft): ______
Historical High Depth to Groundwater if known (ft): ___ ___
Source: ___ ___ ___ ___ ___ ___ ___ ___
Groundwater Contamination at Site: ___ ___ ______
Soil Information
Infiltration Rate (in/hr): ___ ___ ___
Hydrologic Soil Group: _____________
Source: ___ _____ _____ _____ ____
Soil Contamination at Site: ___ __ ____
Drinking Water
Within Drinking Water Source Area Protection: ___ _____
Additional Relevant Site Information

LID Drainage Areas
Add additional rows as needed.
Contributing Drainage
Area Area (ac)
Impervious Area (ac)
Imperviousness (%)
Volumetric Runoff
Coefficient, RV
Water Quality Volume, WQV (cf)
CDA 1
CDA 2
CDA 3
CDA 4
Total WQV (cf)
LID BMP Design
Add additional rows as needed.
Contributing Drainage Area
LID BMP Type Water Quality
Volume, WQV (cf) Runoff Retained
(cf) Percent of Runoff
Captured (%)
CDA1
CDA 2
CDA 3
CDA 4
Total Volume Retained (cf)
Percent of Vgoal captured by LID BMPs: ____%
If 100% of Vgoal is not captured, document and provide narrative of technical infeasibilities and/or alternate
compliance measures below:
Describe additional storm water quality measures incorporated into the site:

APPENDIX D
LONG TERM MAINTENANCE
AGREEMENT
Page 1 of 7
When recorded, mail to:
West Haven City 4150 S 3900 W West Haven, UT 84401 Affects Parcel No(s): __________________________________
LONG-TERM STORMWATER MANAGEMENT AGREEMENT
This Long-Term Stormwater Management Agreement (“Agreement”) is made and entered into this _______ day of ______________________, 20_______, by and between WEST HAVEN CITY, a Utah municipal corporation (“City”), and ___________________________________________________________________, a ______________________________________________________ (“Owner”).
RECITALS
WHEREAS, the City is authorized and required to regulate and control the storm and surface waters within the MS4, as set forth in the City Stormwater Ordinance, (“Ordinance”), adopted pursuant to the Utah Water Quality Act, as set forth in Utah Code Ann. §§ 19-5-101, et seq., as amended (“Act”); and WHEREAS, the Owner hereby represents and acknowledges that it is the owner in fee simple of certain real property more particularly described in Exhibit “A”, attached hereto and incorporated herein by this reference (“Property”); and WHEREAS, the Owner desires to build or develop the Property and/or to conduct certain regulated construction activities on the Property which will alter existing storm and surface water conditions on the Property and/or adjacent lands; and WHEREAS, in order to accommodate and regulate these anticipated changes in existing storm and surface water flow conditions, the Owner is required to build and maintain at Owner’s expense a storm and surface water management facility or improvements (“Stormwater Facilities”); and
Page 2 of 7
WHEREAS, the Stormwater Facilities are more particularly described and shown in the final site plan or subdivision approved for the Property and related engineering drawings, and any amendments thereto, which plans and drawings are on file with the City and are hereby incorporated herein by this reference (“Development Plan”); and WHEREAS, summary description of all Stormwater Facilities, details and all appurtenance draining to and affecting the Stormwater Facilities and establishing the standard operation and routine maintenance procedures for the Stormwater Facilities, and control measures installed on the Property, (“Long Term Stormwater Management Plan”) more particularly shown in Exhibit “B” on file with the City Recorder and, WHEREAS, a condition of Development Plan approval, and as required as part of the City’s Small MS4 UPDES General Permit from the State of Utah, Owner is required to enter into this Agreement establishing a means of documenting the execution of the Long Term Stormwater Management Plan and, NOW, THEREFORE, in consideration of the benefits received and to be received by the Owner, its successors and assigns, as a result of the City’s approval of the Long Term Stormwater Management Plan, and the mutual covenants contained herein, the parties agree as follows:
Section 1
Construction of Stormwater Facilities. The Owner shall, at its sole cost and expense, construct the Stormwater Facilities in accordance with the Development Plans and specifications, and any amendments thereto which have been approved by the City.
Section 2
Maintenance of Stormwater Facilities. The Owner shall, at its sole cost and expense, adequately maintain the Stormwater Facilities. Owner’s maintenance obligations shall include all system and appurtenance built to convey stormwater, as well as all structures, improvements, and vegetation provided to control the quantity and quality of the stormwater. Adequate maintenance, for purposes of this Agreement, is defined as good working condition so that the Stormwater Facilities are performing their design functions. The Owner shall, at its sole cost and expense, perform all work necessary to keep the Stormwater Facilities in good working condition.
Section 3
Annual Maintenance Report of Stormwater Facilities. The Owner shall, at its sole cost and expense, inspect the Stormwater Facilities and submit an inspection report and certification to the MS4 annually. The purpose of the inspection and certification is to assure safe and proper functioning of the Stormwater Facilities. The annual inspection shall cover all aspects of the Stormwater Facilities, including, but not limited to, the parking lots, structural improvements, berms, channels, outlet structure, pond areas, access roads, vegetation, landscaping, etc. Deficiencies shall be noted in the inspection report. The report shall also contain a certification as to whether adequate maintenance has been performed and whether the structural controls are operating as
Page 3 of 7
designed to protect water quality. The annual inspection report and certification shall be due by June 30th of each year and shall be on forms acceptable to the City.
Section 4
City Oversight Inspection Authority. The Owner hereby grants permission to the City, its authorized agents and employees, to enter upon the Property and to inspect the Stormwater Facilities upon reasonable notice not less than three business days to the Owner. Such inspections shall be conducted in a reasonable manner and at reasonable times, as determined appropriate by the City. The purpose of the inspection shall be to determine and ensure that the Stormwater Facilities are being adequately maintained, are continuing to perform in an adequate manner, and are in compliance with the Act, the Ordinance, and the Stormwater Facilities Maintenance Plan.
Section 5
Notice of Deficiencies. If the City finds that the Stormwater Facilities contain any defects or are not being maintained adequately, the City shall send Owner written notice of the defects or deficiencies and provide Owner with a reasonable time, but not less than sixty (60) days, to cure such defects or deficiencies. Such notice shall be confirmed delivery to the Owner or sent certified mail to the Owner at the address listed on the County Tax Assessor.
Section 6
Owner to Make Repairs. The Owner shall, at its sole cost and expense, make such repairs, changes or modifications to the Stormwater Facilities as may be determined as reasonably necessary by the City within the required cure period to ensure that the Stormwater Facilities are adequately maintained and continue to operate as designed and approved.
Section 7
City’s Corrective Action Authority. In the event the Owner fails to adequately maintain the Stormwater Facilities in good working condition acceptable to the City, after due notice of deficiencies as provided in Section 5 and failure to cure, then, upon Owner’s failure to cure or correct within thirty days following a second notice delivered to Owner, the City may issue a Citation punishable as a Misdemeanor in addition to any State or EPA fine. The City may also give written notice that the facility storm drain connection will be disconnected. Any damage resulting from the disconnection is subject to the foregoing cure periods. It is expressly understood and agreed that the City is under no obligation to maintain or repair the Stormwater Facilities, and in no event shall this Agreement be construed to impose any such obligation on the City. The actions described in this Section are in addition to and not in lieu of any and all equitable remedies available to the City as provided by law for Owner’s failure to remedy deficiencies or any other failure to perform under the terms and conditions of this Agreement.
Section 8

Page 4 of 7
Reimbursement of Costs. In the event the City, pursuant to this Agreement, incurs any costs, or expends any funds resulting from enforcement or cost for labor, use of equipment, supplies, materials, and the like related to storm drain disconnection from the City system, the Owner shall reimburse the City upon demand, within thirty (30) days of receipt thereof for all actual costs incurred by the City. After said thirty (30) days, such amount shall be deemed delinquent and shall be subject to interest at the rate of ten percent (10%) per annum. Owner shall also be liable for any collection costs, including attorneys’ fees and court costs, incurred by the City in collection of delinquent payments.
Section 9
Successor and Assigns. This Agreement shall be recorded in the County Recorder’s Office and the covenants and agreements contained herein shall run with the land and whenever the Property shall be held, sold, conveyed or otherwise transferred, it shall be subject to the covenants, stipulations, agreements and provisions of this Agreement which shall apply to, bind and be obligatory upon the Owner hereto, its successors and assigns, and shall bind all present and subsequent owners of the Property described herein.
Section 10
Severability Clause. The provisions of this Agreement shall be severable and if any phrase, clause, sentence or provision is declared unconstitutional, or the applicability thereof to the Owner, its successors and assigns, is held invalid, the remainder of this Covenant shall not be affected thereby.
Section 11
Utah Law and Venue. This Agreement shall be interpreted under the laws of the State of Utah. Any and all suits for any claims or for any and every breach or dispute arising out of this Agreement shall be maintained in the appropriate court of competent jurisdiction in Weber County, Utah.
Section 12
Indemnification. This Agreement imposes no liability of any kind whatsoever on the City, and the Owner agrees to hold the City harmless from any liability in the event the Stormwater Facilities fail to operate properly. The Owner shall indemnify and hold the City harmless for any and all damages, accidents, casualties, occurrences, or claims which might arise or be asserted against the City from failure of Owner to comply with its obligations under this agreement relating to the Stormwater Facilities.
Section 13
Amendments. This Agreement shall not be modified except by written instrument executed by the City and the Owner of the Property at the time of modification, and no modification shall be effective until recorded in the Weber County Recorder’s Office.
Section 14

Page 5 of 7
Subordination Requirement. If there is a lien, trust deed or other property interest recorded against the Property, the trustee, lien holder, etc., shall be required to execute a subordination agreement or other acceptable recorded document agreeing to subordinate their interest to the Agreement.
Section 15
Exhibit B. The Long-Term Stormwater Management Plan (LTSWMP) must adapt to change in good judgment when site conditions and operations change and when existing programs are ineffective. Exhibit B will not be filed with the agreement at County Recorder but is included by reference and kept on file with the City Recorder. Revision applications must be filed with the City _________________ and amended into the LTSWMP on file with the ______________ City recorder.

Page 6 of 7
LONG-TERM STORMWATER MANAGEMENT PLAN AGREEMENT
SO AGREED this ____________day of ___________________20_______.
PROPERTY OWNER
By:_________________________________ Title: _______________________
By:_________________________________ Title: _______________________
STATE OF UTAH )
:ss.
COUNTY OF )
The above instrument was acknowledged before me by __________________, this _______ day
of _____________________, 20______.
___________________________________
Notary Public
Residing in: _________________________
My commission expires: _______________
_______________________ CITY
By: __________________________________ Date: _____________________
Mayor _______________
Attest: ________________________________
City Recorder
STATE OF UTAH )
:ss.
COUNTY OF )
The above instrument was acknowledged before me by __________________, this _______ day
of _____________________, 20______.
___________________________________
Notary Public
Residing in: _________________________
My commission expires: _______________ LTSWMP_____

Page 7 of 7
Attachments:
Exhibit A: Legal Description
Exhibit B: Long-Term Stormwater Management Plan; Filed with WEST HAVEN City Recorder
APPENDIX E
GENERAL PERMIT SECTION
4.2.5 – LONG-TERM STORM
WATER MANAGEMENT IN NEW
DEVELOPMENT AND
REDEVELOPMENT (POST-CONSTRUCTION STORM
WATER MANAGEMENT)

Small MS4 General UPDES Permit Permit No. UTR090000
22
4.2.4.5 The Permittee must ensure that all staff whose primary job duties are related to
implementing the construction storm water program, including permitting, plan review, construction site inspections, and enforcement, are annually trained to conduct these activities. The training can be conducted by the MS4 or outside training can be attended. Such training must extend to third-party inspectors and plan reviewers as well. The Permittee shall ensure that all new hires are trained within 60 days of hire date and annually thereafter, at a minimum. Follow-up training shall be provided as needed to address changes in procedures, methods or staffing. The training records to be kept include dates, activities or course descriptions, and names and positions of staff in attendance.
4.2.4.6. All Permittees shall implement a procedure to maintain records of all projects
disturbing greater than or equal to one acre, including projects less than one acre that are part of a larger common plan of development or sale which collectively disturbs land greater than or equal to one acre. Permittees shall keep records which include but are not limited to, site plan reviews, SWPPPs, inspections and enforcement actions including verbal warnings, stop work orders, warning letters, notices of violation, and other enforcement records. Permittees shall keep records of these projects for five years or until construction is completed, whichever is longer.
4.2.5. Long-Term Storm Water Management in New Development and Redevelopment (Post-Construction Storm Water Management)
The Permittee shall revise as necessary, implement and enforce a program to address post-construction storm water runoff to the MS4 from private and public new development and redevelopment construction sites meeting the thresholds below. The water quality considerations of this minimum control measure do not replace or substitute for water quantity or flood management requirements implemented on the local level for new development or redevelopment sites. The water quality controls may be incorporated into the design of structures intended for flow control; or water quality control may be achieved with separate control measures. The program must apply to private and public development sites. The minimum performance measures are:
4.2.5.1. Post-construction Controls. The Permittee’s new development/redevelopment
program must have requirements or standards to ensure that any storm water controls or management practices for new development and redevelopment will prevent or minimize impacts to water quality. BMPs must be selected that address pollutants known to be discharged or anticipated to be discharged from the site.
4.2.5.1.1. The Permittee’s new development/redevelopment program should include non-structural BMPs such as requirements and standards to minimize development in areas susceptible to erosion and sediment loss; to minimize the disturbance of native soils and vegetation; to preserve areas that provide important water quality benefits; to implement measures for flood control; and to protect the integrity of natural resources and sensitive areas.
Small MS4 General UPDES Permit Permit No. UTR090000
23
4.2.5.1.2. Retention Requirement. The Permittee must develop and define a specific hydrologic method or methods for calculating runoff volumes and flow rates to ensure consistent sizing of structural BMPs in their jurisdiction and to facilitate plan review.
By July 1, 2020, new development projects that disturb land greater than or equal to one acre, including projects that are part of a larger common plan of development or sale which collectively disturbs land greater than or equal to one acre must manage rainfall on-site, and prevent the off-site discharge of the precipitation from all rainfall events less than or equal to the 80th percentile rainfall event or a predevelopment hydrologic condition, whichever is less. This objective must be accomplished by the use of practices that are designed, constructed, and maintained to infiltrate, evapotranspire and/or harvest and reuse rainwater. The 80th percentile rainfall event is the event whose precipitation total is greater than or equal to 80 percent of all storm events over a given period of record.
By July 1, 2020, redevelopment projects that disturb greater than or equal to one acre, including projects less than an acre that are part of a larger common plan of development or sale which collectively disturbs land greater than or equal to one acre must provide a site-specific and project-specific plan aimed at net gain to onsite retention or a reduction to impervious surface to provide similar water quality benefits. If a redevelopment project increases the impervious surface by greater than 10%, the project shall manage rainfall on-site, and prevent the off-site discharge of the net increase in the volume associated with the precipitation from all rainfall events less than or equal to the 80th percentile rainfall event. This objective must be accomplished by the use of practices that are designed, constructed, and maintained to infiltrate, evapotranspire and/or harvest and reuse rainwater.
4.2.5.1.3. Low Impact Development Approach. By July 1, 2020, the program shall include a process which requires the evaluation of a Low Impact Development (LID) approach for all projects subject to the requirements in 4.2.5.1.2. A LID approach promotes the implementation of BMPs that allow storm water to infiltrate, evapotranspire or harvest and use storm water on site to reduce runoff from the site and protect water quality.
Guidance for implementing LID can be found in DWQ’s LID controls which are appropriate for use in the State of Utah can be found in A Guide to Low Impact Development within Utah (the Guide), available on DWQ’s website.
Permittees must allow for use of a minimum of five LID practices from the list in Appendix C of the Guide. If a Permittee has not adopted specific LID practices from Appendix C, any LID approach that meets 4.2.5.1.2 and is feasible may be used to meet this requirement.
4.2.5.1.4. Since 2010, rainwater harvesting is legal in the State of Utah. Depending on the volume of rainwater collected and stored for beneficial use, the Permittee must meet the requirements of the Utah Division of Water Rights to harvest rainwater found on their website: http://waterrights.utah.gov/forms/rainwater.asp.
4.2.5.1.5. Feasibility. If meeting the retention standards described in Part 4.2.5.1.2 is infeasible, a rationale shall be provided for the use of alternative design criteria. The new or redevelopment project must document and quantify that infiltration, evapotranspiration, and rainwater harvesting have been used to the maximum extent

Small MS4 General UPDES Permit Permit No. UTR090000
24
feasible and that full employment of these controls are infeasible due to constraints. LID infeasibility may be due to one or more of the following conditions: high groundwater, drinking water source protection areas, soil conditions, slopes, accessibility, excessive costs, or others.
Guidance for assessing and documenting site conditions can be found in DWQ’s “A Guide to Low Impact Development within Utah” Appendix B “Storm Water Quality Report Template” located on the DWQ website at: https://documents.deq.utah.gov/water-quality/stormwater/updes/DWQ-2019-000161.pdf.
A MS Word version can be found on DWQ’s website at: https://documents.deq.utah.gov/water-quality/stormwater/DWQ-2018-013750.docx.
4.2.5.2. Regulatory Mechanism. Develop and adopt an ordinance or other regulatory mechanism that requires long-term post-construction storm water controls at new development and redevelopment sites. The ordinance or other regulatory mechanism shall apply, at a minimum, to new development and redevelopment sites that discharge to the MS4 and that disturb greater than or equal to one acre, including projects less than one acre that are part of a larger common plan of development or sale which collectively disturbs land greater than or equal to one acre. The ordinance or other regulatory mechanism shall require BMP selection, design, installation, operation and maintenance standards necessary to protect water quality and reduce the discharge of pollutants to the MS4. The Permitee shall implement an enforcement strategy and implement the enforcement provisions of the ordinance or other regulatory mechanism. The Permittee’s ordinance or other regulatory mechanism must include an appeals process
4.2.5.2.1 The Permittee must include enforcement provisions in the ordinance or other regulatory mechanism, including procedures that include specific processes and sanctions to minimize the occurrence of, and obtain compliance from, chronic and recalcitrant violators which shall include appropriate, escalating enforcement procedures and actions.
4.2.5.2.2 The Permittee must maintain documentation on how the requirements of the
ordinance or other regulatory mechanism will protect water quality and reduce the discharge of pollutants to the MS4. Documentation shall include:
• How long-term storm water BMPs were selected; • The pollutant removal expected from the selected BMPs; and • The technical basis which supports the performance claims for the
selected BMPs.
All Permittees shall adopt and implement SOPs or similar type of documents for site inspection and enforcement of post-construction storm water control measures. These procedures must ensure adequate ongoing long-term operation and maintenance of approved storm water control measures.
4.2.5.2.3 The ordinance or other regulatory mechanism shall include provisions for post-
construction access for Permittees to inspect storm water control measures on private properties that discharge to the MS4 to ensure that adequate maintenance is being
Small MS4 General UPDES Permit Permit No. UTR090000
25
performed. The ordinance or other regulatory mechanism may, in lieu of requiring that the Permittee’s staff inspect and maintain storm water controls on private property, instead require private property owner/operators or qualified third parties to conduct maintenance and provide annual certification that adequate maintenance has been performed and the structural controls are operating as designed to protect water quality. If the Permittee requires a maintenance agreement addressing maintenance requirements for any control measures installed on site the agreement must allow the Permittee to conduct oversight inspections of the storm water control measures and also account for transfer of responsibility in leases and/or deeds. The agreement must also allow the Permittee to perform necessary maintenance or corrective actions neglected by the property owner/operator, and bill or recoup costs from the property owner/operator as needed.
4.2.5.2.4 Permanent structural BMPs shall be inspected at least once during installation by
qualified personnel. Upon completion, the Permittee must verify that long-term BMPs were constructed as designed.
4.2.5.2.5 Inspections and any necessary maintenance must be conducted at least every other
year or as necessary to maintain functionality of the control by either the Permittee, or, if applicable, the property owner/operator. On sites where the property owner/operator is conducting maintenance, the Permittee shall inspect those storm water control measures at least once every five years, or more frequently as determined by the Permittee to verify and ensure that adequate maintenance is being performed. Following an inspection, if there is an observed failure of a facility to perform as designed, the Permittee must document its findings in an inspection report which includes the following:
• Inspection date; • Name and signature of inspector; • Project location; • Current ownership information; • A description of the condition of the storm water control measure including
the quality of: vegetation and soils; inlet and outlet channels and structures; catch basins; spillways; weirs, and other control structures; and sediment and debris accumulation in storage as well as in and around inlet and outlet structures; and,
• Specific maintenance issues or violations found that need to be corrected by the property owner or operator along with deadlines and re-inspection dates.
4.2.5.3. Plan Review. The Permittee shall:
4.2.5.3.1 Adopt and implement procedures for site plan review which evaluate water quality impacts. The procedures shall apply through the life of the project from conceptual design to project closeout.
4.2.5.3.2 Review post-construction plans for, at a minimum, all new development and
redevelopment sites that disturb greater than or equal to one acre, including projects less than one acre that are part of a larger common plan of development or sale which collectively disturbs land greater than or equal to one acre, to ensure that the plans include long-term storm water management measures that meet the requirements of this minimum control measure.
Small MS4 General UPDES Permit Permit No. UTR090000
26
4.2.5.4. Inventory. The Permittee must maintain an inventory of all post-construction
structural storm water control measures installed and implemented at new development and redeveloped sites that disturb greater than or equal to one acre, including projects less than one acre that are part of a larger common plan of development or sale which collectively disturbs land greater than or equal to one acre. This inventory must include both public and private sector sites that were developed since the Permittee obtained coverage by this permit or the date that post-construction requirements came into effect, whichever is later; and area located within the Permittee’s service area.
4.2.5.4.1 Each entry to the inventory must include basic information on each project, such as
project’s name, owner’s name and contact information, location, start/end date, etc. In addition, inventory entries must include the following for each project:
• Short description of each storm water control measure (type, number, design
or performance specifications); • Short description of maintenance requirements (frequency of required
maintenance and inspections); and • Inspection information (date, findings, follow up activities, prioritization of
follow-up activities, compliance status). 4.2.5.4.2 Based on inspections conducted pursuant to Part 4.2.5.2.5, the Permittee must update
the inventory as appropriate where changes occur in property ownership or the specific control measures implemented at the site.
4.2.5.5. Training. Permittees shall ensure that all staff involved in post-construction storm
water management, including those that conduct plan review, annual maintenance inspections, and enforcement, receive appropriate training.. Training shall be provided or made available for staff in the fundamentals of long-term storm water management through the use of structural and non-structural control methods. The training records to be kept include dates, activities or course descriptions, and names and positions of staff in attendance. The Permittee shall ensure that all new hires are trained within 60 days of hire and annually thereafter, at a minimum. Follow-up training shall be provided as needed to address changes in procedures, methods or staffing.
4.2.6. Pollution Prevention and Good Housekeeping for Municipal Operations All Permittees must implement a program for Permittee-owned or operated facilities,
operations and structural storm water controls that includes SOPs, pollution prevention BMPs, storm water pollution prevention plans or similar type of documents, and a training component that have the ultimate goal of preventing or reducing the runoff of pollutants to the MS4 and waters of the state. All components of the program shall be included in the SWMP document and must identify the department responsible for performing each activity described in this section. The Permittee shall develop an inventory of all such Permittee-owned or operated facilities. The Permittee must review this inventory annually and update as necessary.

APPENDIX F
GUIDE TO LOW IMPACT
DEVELOPMENT WITHIN UTAH
A Guide to
Low Impact Development
within Utah
Prepared for:
Utah Department of Environmental Quality
Division of Water Quality
195 North 1950 West
Salt Lake City, UT 84116
December 2018
Prepared by:
Michael Baker International
7090 South Union Park Ave, Suite 500
Salt Lake City, UT 84047
Environmental Planning Group, LLC
208 E 800 S
Salt Lake City, UT 84111
A Guide to Low Impact Development within Utah i
Table of Contents
Introduction ....................................................................................................................................................................... 1
Purpose ........................................................................................................................................................................... 1
Low Impact Development ............................................................................................................................................. 1
Projects Covered by the Manual ................................................................................................................................... 2
Storm Water Integration ................................................................................................................................................... 3
Long-Term Storm Water Management at the Jurisdictional Level ............................................................................ 3
Impaired Waters ........................................................................................................................................................ 3
Ordinances ................................................................................................................................................................. 3
Ordinances within Utah ............................................................................................................................................ 4
Retrofitting Programs ................................................................................................................................................ 7
Curb Cuts ............................................................................................................................................................... 8
Dual-Purpose Basins .............................................................................................................................................. 9
Trash Capture Devices ........................................................................................................................................... 9
Alternative Compliance and Credit Systems ............................................................................................................ 9
Alternative Compliance Options ........................................................................................................................... 9
Credit Systems and Alternative Compliance Programs ..................................................................................... 10
Minnesota Pollution Control Agency .............................................................................................................. 10
San Diego County ............................................................................................................................................. 10
Los Angeles County .......................................................................................................................................... 11
Storm Water at the Project Level ................................................................................................................................ 12
Site Considerations .................................................................................................................................................. 12
Soils ....................................................................................................................................................................... 12
Groundwater ........................................................................................................................................................ 13
Existing drainage patterns ................................................................................................................................... 13
Existing pervious areas and vegetation .............................................................................................................. 13
Site Design Practices ................................................................................................................................................ 13
Reduction of Impervious Surfaces ...................................................................................................................... 13
Disconnected Impervious Areas.......................................................................................................................... 14
Curb Cuts .............................................................................................................................................................. 14
Documentation ........................................................................................................................................................ 15
The 90th Percentile Volume ............................................................................................................................................ 16
LID Impact on Hydrology ........................................................................................................................................... 16
Developing the 90th Percentile Volume ...................................................................................................................... 16
Step 1: 90th Percentile Depth ................................................................................................................................... 17
Step 2: Imperviousness ........................................................................................................................................... 17
Step 3: Volumetric Runoff Coefficient .................................................................................................................... 17
Step 4: 90th Percentile Volume ............................................................................................................................... 19
LID BMPs ......................................................................................................................................................................... 21

A Guide to Low Impact Development within Utah ii
Introduction ................................................................................................................................................................. 21
LID BMP Fact Sheets................................................................................................................................................... 21
Preface to Fact Sheets ................................................................................................................................................. 22
Pollutant Removal Effectiveness ........................................................................................................................... 22
Primary Functions .................................................................................................................................................. 22
Design Criteria ........................................................................................................................................................ 22
Calculation Methods ............................................................................................................................................... 22
Sample Calculations ................................................................................................................................................ 25
Evaluating BMP Effectiveness ................................................................................................................................ 25
Technical Infeasibilities ........................................................................................................................................... 27
Water Quality Concerns .......................................................................................................................................... 27
Designer Checklist .................................................................................................................................................. 28
Vegetation ............................................................................................................................................................... 28
Installation .............................................................................................................................................................. 28
Installation Costs .................................................................................................................................................... 28
Maintenance ............................................................................................................................................................ 28
Maintenance Activities ........................................................................................................................................... 29
Maintenance Costs .................................................................................................................................................. 29
Figures ..................................................................................................................................................................... 30
Treatment Trains ........................................................................................................................................................ 30
Proprietary Devices .................................................................................................................................................... 30
LID BMP Selection ...................................................................................................................................................... 31
BMPs Categorized by 303(d)/TMDL ...................................................................................................................... 31
BMPs Categorized by Land Use ............................................................................................................................. 32
BMP Selection Flow Charts .....................................................................................................................................33
Vegetation Selection .................................................................................................................................................... 37
Benefits of Using Vegetation in BMPs .................................................................................................................... 37
Vegetation Considerations ..................................................................................................................................... 38
Vegetation Guidance by BMP Type ....................................................................................................................... 40
Steps to Selecting Vegetation for BMPs................................................................................................................. 42
Land Use Examples .................................................................................................................................................... 43
Local Case Studies ...................................................................................................................................................... 49
Preface to Case Studies ........................................................................................................................................... 49
Additional Local LID Implementation ....................................................................................................................... 54
Daybreak, South Jordan .......................................................................................................................................... 54
Utah State University Research Sites ..................................................................................................................... 54
Green Meadows, Logan ........................................................................................................................................... 55
Northern Utah Runoff Coefficients......................................................................................................................... 56
Appendix A 90th Percentile Storm Depths ............................................................................................................. A-1
Appendix B Storm Water Quality Report Template .............................................................................................. B-1
Appendix C LID BMP Fact Sheets .......................................................................................................................... C-1

A Guide to Low Impact Development within Utah iii
Rain Garden ............................................................................................................................................................... C-2
Bioretention Cell ........................................................................................................................................................ C-9
Bioswale ................................................................................................................................................................... C-16
Vegetated Strip ........................................................................................................................................................ C-23
Tree Box Filter ........................................................................................................................................................ C-28
Green Roof ............................................................................................................................................................... C-31
Pervious Surfaces ..................................................................................................................................................... C-36
Infiltration Basin ..................................................................................................................................................... C-41
Infiltration Trench ................................................................................................................................................... C-47
Dry Well ................................................................................................................................................................... C-53
Underground Infiltration Galleries ........................................................................................................................ C-58
Harvest and Reuse ................................................................................................................................................... C-62
Appendix D Utah Plant Hardiness Zones .............................................................................................................. D-1
Appendix E Utah Plant Selection Matrix by Climate Zone and BMP................................................................... E-1
Appendix F References ........................................................................................................................................... F-1

A Guide to Low Impact Development within Utah iv
List of Tables
Table 1: Example parking lot runoff gap analysis results. .............................................................................................. 4
Table 2: LID ordinances within Utah ............................................................................................................................... 5
Table 3: Nationwide storm water programs using credit systems. .............................................................................. 11
Table 4: LID project team. .............................................................................................................................................. 12
Table 5: Runoff coefficient equations based on the NRCS Soil Group. ........................................................................ 19
Table 6: BMP types rated for the removal of pollutants that are either 303(d) listed or have approved TMDLs within Utah. .................................................................................................................................................................... 32
Table 7: Expected pollutants by common land uses. ....................................................................................................33
Table 8: LID BMP characteristics designed for the Sandy City Public Works facility. ............................................... 52
Table 9: Summary of monitored constituents at five sites. ........................................................................................... 55

A Guide to Low Impact Development within Utah v
List of Figures
Figure 1: Impervious parking lot with no pervious areas or storm water quality features ........................................... 2
Figure 2: Potential curb cut location that could be retrofitted into a swale ................................................................... 7
Figure 3: Retrofitted island curb within parking lot ....................................................................................................... 7
Figure 4: Multi-stage overflow outlet with trash screen ................................................................................................. 9
Figure 5: End-of-pipe trash netting.................................................................................................................................. 9
Figure 6: LID BMPs shown in site plans ........................................................................................................................ 12
Figure 7: Downspout disconnected from parking lot .................................................................................................... 14
Figure 8: Curb cuts to a rock lined swale. ...................................................................................................................... 14
Figure 9: Typical hydrologic impact of development on-site hydrology. ..................................................................... 16
Figure 10: General post development hydrograph with LID. ....................................................................................... 16
Figure 11: Standing water after a rain event at a bioretention BMP. .......................................................................... 29
Figure 12: A vegetated swale that will provide pretreatment for a dry well. ............................................................... 30
Figure 13: Proprietary tree box filter ............................................................................................................................. 30
Figure 14: Proposed residential development. ............................................................................................................. 43
Figure 15: LID approach to residential development. .................................................................................................. 44
Figure 16: Proposed commercial development. ............................................................................................................ 45
Figure 17: LID approach to commercial development. ................................................................................................ 46
Figure 18: Proposed industrial development. ................................................................................................................ 47
Figure 19: LID approach to industrial development. ................................................................................................... 48
Figure 20: Bioretention area at Mountview Park. ........................................................................................................ 50
Figure 21: Proposed rain garden location. ..................................................................................................................... 51
Figure 22: Construction progress of permaculture garden. .......................................................................................... 53

A Guide to Low Impact Development within Utah 1
Introduction
Purpose
This manual is to be used as a reference and guide for incorporating low impact development (LID) storm water
approaches into new development and redevelopment projects. It helps planners and designers in selecting
appropriate practices to incorporate in their site design as well as municipal separate storm sewer system (MS4)
program managers in evaluating LID practices and determining what is most appropriate for their storm water
programs. The information contained in this guidance complies with the goals of the federal Clean Water Act
(CWA) “to reduce the discharge of pollutants to the maximum extent practicable.”
This manual provides background and technical information on LID best management practices (BMPs),
maintenance practices, selection of appropriate plant materials, methods to retain the volume generated from the
90th percentile storm event, and other relevant information needed to assist decision makers, planners, designers,
and reviewers in making the best possible decisions for their storm water programs and developments while
complying with Utah’s Division of Water Quality (DWQ) storm water permit requirements.
Users of this manual are encouraged to seek out innovative and effective methods in addition to those discussed
here to accommodate site-specific conditions and to achieve the key principles of LID and meet permit
requirements. A wide array of LID approaches is presented; however, as with any environmental discipline for any
development, site-specific decisions from qualified personnel will always be required. While the LID BMPs
presented are widely used, local climate, soil conditions, vegetation, and other factors must be considered to
determine what will work best within the project location.
Low Impact Development
LID refers to engineered systems, either structural or natural, that use or
mimic natural processes to promote infiltration, evapotranspiration,
and/or reuse of storm water as close to its source as possible to protect
water quality and aquatic habitat. LID practices at the regional and site-
specific level preserve, restore, and create green space using soils,
vegetation, and rainwater harvesting techniques. These systems and
practices are referred to as BMPs.
Green infrastructure (GI) includes LID practices but is a broader practice
that also includes ecological services and approaches such as “filtering air
pollutants, reducing energy demands, mitigating urban heat islands,
sequestering and storing carbon, enhancing aesthetics and property
values, and preserving and creating natural habitat functions.” (United
States Environmental Protection Agency, 2012)
Urban development has historically resulted in increased impervious surfaces, vehicle use, and other human
activities that introduce pollutants and create adverse hydrologic conditions detrimental to water quality. In the
past, the goal of traditional storm water management was to convey these flows offsite as directly as possible
(Figure 1), giving little to no consideration to preserving open spaces or creating pervious areas where rainfall
could be managed onsite. Flood control infrastructure such as storm drains have been used to convey runoff and
discharge it to a receiving surface water. Polluted runoff degrades the quality of the receiving water, impacting
aquatic life and dependent ecosystems. Incorporating LID practices reduces the impact of development on natural
waterways and watersheds and provides practical as well as aesthetic benefits. Other benefits include reduced
construction costs by conveying runoff through vegetated swales instead of through pipes. Pavers or other
pervious surfaces can reduce the size of an onsite basin by retaining runoff within a subsurface storage layer and
Key LID Principles
➢ Mimic natural processes
➢ Promote infiltration, evapotranspiration, harvest/reuse
➢ Manage storm water close to source
➢ Site design planning at project conception
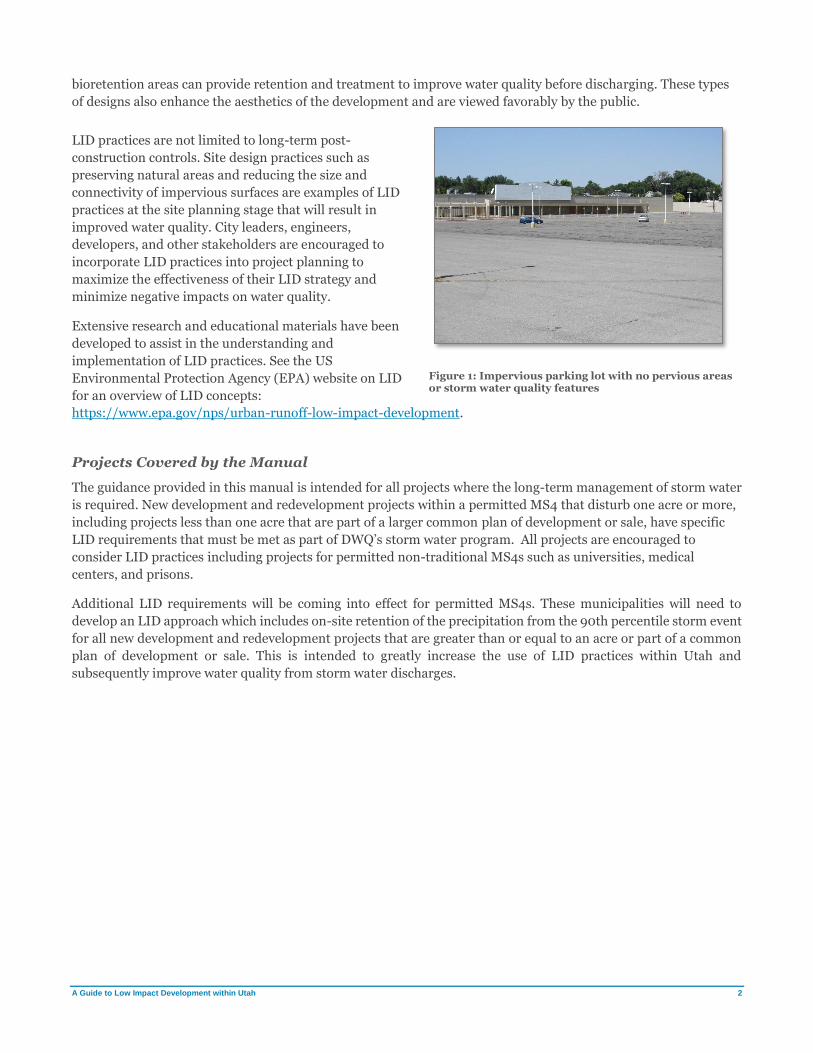
A Guide to Low Impact Development within Utah 2
bioretention areas can provide retention and treatment to improve water quality before discharging. These types
of designs also enhance the aesthetics of the development and are viewed favorably by the public.
LID practices are not limited to long-term post-
construction controls. Site design practices such as
preserving natural areas and reducing the size and
connectivity of impervious surfaces are examples of LID
practices at the site planning stage that will result in
improved water quality. City leaders, engineers,
developers, and other stakeholders are encouraged to
incorporate LID practices into project planning to
maximize the effectiveness of their LID strategy and
minimize negative impacts on water quality.
Extensive research and educational materials have been
developed to assist in the understanding and
implementation of LID practices. See the US
Environmental Protection Agency (EPA) website on LID
for an overview of LID concepts:
https://www.epa.gov/nps/urban-runoff-low-impact-development.
Projects Covered by the Manual
The guidance provided in this manual is intended for all projects where the long-term management of storm water
is required. New development and redevelopment projects within a permitted MS4 that disturb one acre or more,
including projects less than one acre that are part of a larger common plan of development or sale, have specific
LID requirements that must be met as part of DWQ’s storm water program. All projects are encouraged to
consider LID practices including projects for permitted non-traditional MS4s such as universities, medical
centers, and prisons.
Additional LID requirements will be coming into effect for permitted MS4s. These municipalities will need to
develop an LID approach which includes on-site retention of the precipitation from the 90th percentile storm event
for all new development and redevelopment projects that are greater than or equal to an acre or part of a common
plan of development or sale. This is intended to greatly increase the use of LID practices within Utah and
subsequently improve water quality from storm water discharges.
Figure 1: Impervious parking lot with no pervious areas or storm water quality features

A Guide to Low Impact Development within Utah 3
Storm Water Integration
Long-Term Storm Water Management at the Jurisdictional Level
Successful integration of LID features and green infrastructure requires that jurisdictions be able to provide
technical and planning guidance to stakeholders. Storm water master plans and technical guidance documents
will assist stakeholders in developing their planning approach and design process
Organizational structures vary widely but implementation of long-term storm water quality requirements typically
fall within the duties of the public works, utilities, engineering, maintenance, and/or land development groups. It
may become necessary to have staff dedicated to storm water management as the jurisdiction develops
ordinances, land development standards, storm water master plans, and review processes.
Familiarity with permit requirements is imperative to succeed at implementation. Dedication to achieve and
maintain compliance with permit requirements is necessary for a successful and functioning storm water
management program. Restraints to success; such as competing interests, budgetary constraints, lack of inter-
departmental communication, and lack of support within the jurisdiction, must be addressed or they will
jeopardize implementation at the program level, the planning level, and ultimately at the project level.
Impaired Waters
Permittees should be aware of receiving waters within their jurisdiction that have been listed as having
impairments on the State’s 303(d) list and those that have been identified as requiring or have an approved Total
Maximum Daily Load (TMDL). Project sites near these waters may have additional restrictions and require more
attention. An interactive map identifying such waters can be found at the DWQ website:
https://enviro.deq.utah.gov/
Ordinances
Ordinances should be adopted or modified that promote or mandate LID principles and green infrastructure for
development within the jurisdiction. Ordinances should be developed that:
➢ Promote and preserve open spaces
➢ Help meet density goals by specifying building footprint, height limits, and setbacks that allow for the
proper placement of LID BMPs
➢ Include an LID analysis as part of the site plan review
➢ Allow for the use of pervious surfaces within parking lots within parking code
➢ Encourage clustering development to increase green space within developments
➢ Address any public safety concerns relating to LID practices
➢ Allow vegetation appropriate to the BMP being used (See Vegetation Selection for specific information
relating to the goals and benefits of selecting appropriate vegetation)
➢ Address maintenance agreements that:
o Determine final ownership of the BMP (if not the MS4)
o Require a maintenance schedule, list of activities, and identify the responsible party
o Allow the municipality to access BMPs for inspections and/or maintenance
o Provide a method of resolution should violation of the maintenance agreement occur

A Guide to Low Impact Development within Utah 4
Examples of ordinances related to storm water maintenance and maintenance agreements templates may be
found at the following links:
o EPA – Urban Runoff: Model Ordinances for Stormwater Control:
https://www.epa.gov/nps/urban-runoff-model-ordinances-stormwater-control
o Utah Storm Water Advisory Committee – Long-Term Stormwater Management Agreement:
https://uswac.files.wordpress.com/2018/09/uswac-long-term-stormwater-management-
agreement-template.docx
Creating zoning ordinances and providing incentives that promote LID will lay the groundwork for LID
implementation. A gap analysis of existing codes will determine if existing codes are preventing LID principles
from being implemented.
A gap analysis is a systematic approach to reviewing ordinances to determine how LID practices can be written
into city codes. The results of the gap analysis will identify the objective, a reference to specific codes or standards,
and give recommendations for how the code can be modified (Table 1).
Table 1: Example parking lot runoff gap analysis results.
Objective Code Summary of Impediment
Determine if rain gardens,
bioretention cells, and
other bioretention devices
are permitted within
parking areas.
ORD 04-13.b
Vegetation within parking lots
shall be within raised areas
and protected by curbs.
The existing code does not
permit storm water flows within
parking lots to sheet flow into
bioretention or vegetated areas.
An example of a gap analysis template for Small MS4s within California was based on a requirement for
permittees to review local planning and permitting processes and identify gaps or impediments to effective
implementation of post-construction requirements. Landscaping is directly identified as a priority in the permit.
The gap analysis identifies five areas related to the conservation and creation of landscapes (AHBL, 2017):
1. Vegetation conservation
2. Open space management
3. Rooftop runoff
4. Open space/cluster development
5. Street and parking lot standards
The full gap analysis template can be found here:
https://www.casqa.org/sites/default/files/downloads/20171109_gap_analysis_user_guide.pdf.
Ordinances within Utah
A review of current ordinances within Utah reveals that some cities have created or modified codes to address LID
(Table 2). Ordinances range from general descriptions of implementation to entire sections dedicated to storm
water ordinances and design criteria. Examples of some of these are provided in the following table.
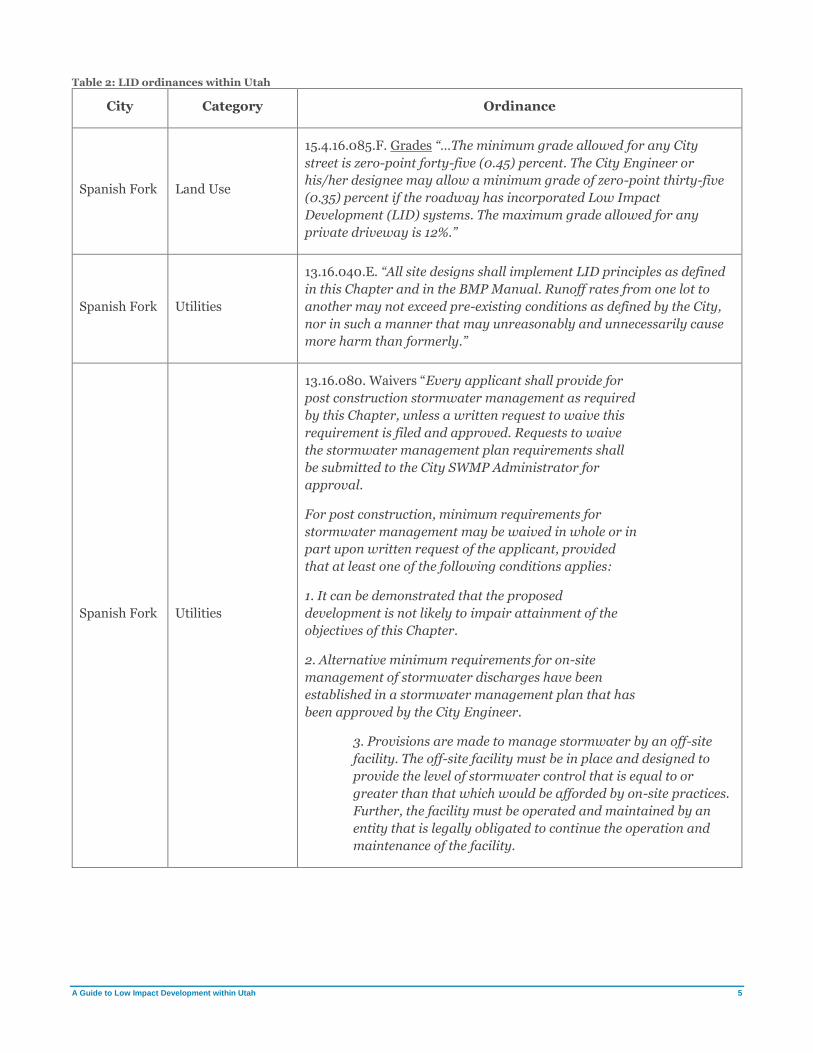
A Guide to Low Impact Development within Utah 5
Table 2: LID ordinances within Utah
City Category Ordinance
Spanish Fork Land Use
15.4.16.085.F. Grades “…The minimum grade allowed for any City
street is zero-point forty-five (0.45) percent. The City Engineer or
his/her designee may allow a minimum grade of zero-point thirty-five
(0.35) percent if the roadway has incorporated Low Impact
Development (LID) systems. The maximum grade allowed for any
private driveway is 12%.”
Spanish Fork Utilities
13.16.040.E. “All site designs shall implement LID principles as defined
in this Chapter and in the BMP Manual. Runoff rates from one lot to
another may not exceed pre-existing conditions as defined by the City,
nor in such a manner that may unreasonably and unnecessarily cause
more harm than formerly.”
Spanish Fork Utilities
13.16.080. Waivers “Every applicant shall provide for
post construction stormwater management as required
by this Chapter, unless a written request to waive this
requirement is filed and approved. Requests to waive
the stormwater management plan requirements shall
be submitted to the City SWMP Administrator for
approval.
For post construction, minimum requirements for
stormwater management may be waived in whole or in
part upon written request of the applicant, provided
that at least one of the following conditions applies:
1. It can be demonstrated that the proposed
development is not likely to impair attainment of the
objectives of this Chapter.
2. Alternative minimum requirements for on-site
management of stormwater discharges have been
established in a stormwater management plan that has
been approved by the City Engineer.
3. Provisions are made to manage stormwater by an off-site
facility. The off-site facility must be in place and designed to
provide the level of stormwater control that is equal to or
greater than that which would be afforded by on-site practices.
Further, the facility must be operated and maintained by an
entity that is legally obligated to continue the operation and
maintenance of the facility.
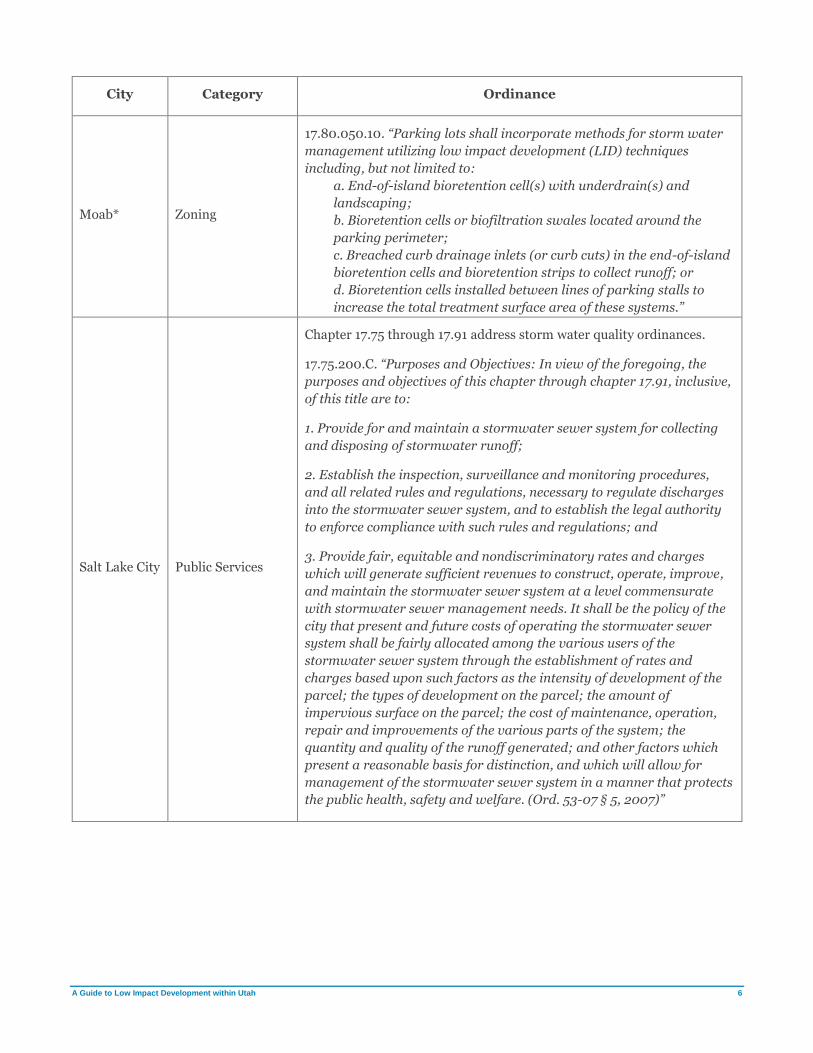
A Guide to Low Impact Development within Utah 6
City Category Ordinance
Moab* Zoning
17.80.050.10. “Parking lots shall incorporate methods for storm water
management utilizing low impact development (LID) techniques
including, but not limited to:
a. End-of-island bioretention cell(s) with underdrain(s) and
landscaping;
b. Bioretention cells or biofiltration swales located around the
parking perimeter;
c. Breached curb drainage inlets (or curb cuts) in the end-of-island
bioretention cells and bioretention strips to collect runoff; or
d. Bioretention cells installed between lines of parking stalls to
increase the total treatment surface area of these systems.”
Salt Lake City Public Services
Chapter 17.75 through 17.91 address storm water quality ordinances.
17.75.200.C. “Purposes and Objectives: In view of the foregoing, the
purposes and objectives of this chapter through chapter 17.91, inclusive,
of this title are to:
1. Provide for and maintain a stormwater sewer system for collecting
and disposing of stormwater runoff;
2. Establish the inspection, surveillance and monitoring procedures,
and all related rules and regulations, necessary to regulate discharges
into the stormwater sewer system, and to establish the legal authority
to enforce compliance with such rules and regulations; and
3. Provide fair, equitable and nondiscriminatory rates and charges
which will generate sufficient revenues to construct, operate, improve,
and maintain the stormwater sewer system at a level commensurate
with stormwater sewer management needs. It shall be the policy of the
city that present and future costs of operating the stormwater sewer
system shall be fairly allocated among the various users of the
stormwater sewer system through the establishment of rates and
charges based upon such factors as the intensity of development of the
parcel; the types of development on the parcel; the amount of
impervious surface on the parcel; the cost of maintenance, operation,
repair and improvements of the various parts of the system; the
quantity and quality of the runoff generated; and other factors which
present a reasonable basis for distinction, and which will allow for
management of the stormwater sewer system in a manner that protects
the public health, safety and welfare. (Ord. 53-07 § 5, 2007)”

A Guide to Low Impact Development within Utah 7
City Category Ordinance
Logan Public Services
13.14.200.A. “All site designs shall control the peak flow rates of storm
water discharge associated with design storms specified in this chapter
or in the BMP manual and reduce the generation of postconstruction
storm water runoff volumes and water quality to preconstruction
levels. These practices should seek to utilize pervious areas for storm
water treatment and to infiltrate storm water runoff from driveways,
sidewalks, rooftops, parking lots, and landscaped areas to the
maximum extent practical to provide treatment for both water quality
and quantity. Other low impact development (LID) methods are also
encouraged.”
*Not a permitted MS4
Retrofitting Programs
A retrofit program is the structured evaluation of existing
development to identify possible improvements to
infrastructure with the goal of creating and improving
the design of storm water practices and improving water
quality. A retrofit program may require dedicated
funding for development and implementation. Note that
permitted MS4s are required to develop a ranking of
control measures to determine those best suited for
retrofits. Retrofits can be completed on both public and
private properties. Retrofits on private property require
coordination and approval from the property owner and
may require encouragement through financial incentives
to be accepted.
Retrofit programs include activities such as adding curb
cuts that allow runoff of impervious surfaces to enter
vegetated areas. Figure 2 shows an existing development
that has a slightly depressed, curbed, vegetated area that is surrounded by impervious surfaces. If allowable after
considering grading of the site, potential conflicts with the existing utilities, and the environmental sensitivity of
receiving waters, a curb cut or multiple curb cuts at the upstream end of the swale to allow parking lot storm water
runoff to be conveyed through it would be considered a retrofit. Project site parameters such as the contributing
drainage area, imperviousness, 90th percentile volume,
water quality flow, and the swale’s geometry should be
analyzed to determine the impact of the retrofit. Additional
analysis would be needed to determine the potential
contributing drainage area if a curb cut were to be made at
the upstream end. Figure 3 shows the curb of a parking lot
island that has been retrofitted to allow storm water runoff
to be retained within the island.
A common need among all programs is prioritizing where
retrofit efforts should be focused based on geography and
environmental needs. The following factors identified in
the Utah 2016 General Permit for Discharges from Small
MS4s (UTR090000) must be considered in prioritizing:
Figure 2: Potential curb cut location that could be retrofitted into a swale
Figure 3: Retrofitted island curb within parking lot

A Guide to Low Impact Development within Utah 8
• Proximity to waterbody
• Status of waterbody to improve impaired waterbodies and protect unimpaired
waterbodies
• Hydrologic condition of the receiving waterbody
• Proximity to sensitive ecosystem or protected area
• Any upcoming sites that could be further enhanced by retrofitting storm water controls
The general steps below can be used in the development of a retrofit program:
1. Identify local need and capacity for storm water retrofitting. Include an evaluation of watersheds in the
MS4 that are 303(d) listed or have TMDLs associated with them.
2. Identify potential locations within the MS4 including publicly owned properties, right-of-way, easements,
culverts, and existing detention practices that lack adequate storm water practices or are undergoing
modifications in the near future.
3. Visit potential project locations to verify current conditions and identify potential retrofit BMP options.
4. Create an inventory of potential locations with site sketches, photos, and basic hydraulic calculations.
5. Based on the permittee’s developed ranking of control measures, evaluate retrofit options for factors like
performance, cost, community support, property ownership, and feasibility.
6. Model water quality benefits for chosen retrofitting option to determine most cost-effective approach.
Online models are available that give users multiple options and associated costs.
a. Green Values Storm Water Management Calculator:
http://greenvalues.cnt.org/calculator/calculator.php
b. EPA’s National Stormwater Calculator: https://www.epa.gov/water-research/national-
stormwater-calculator
7. Once the most cost-effective and environmentally beneficial option is determined and funds are obtained,
move the project to the design and construction phase. Allow time for sites surveys, permitting, bidding,
and specifications.
The LID BMPs described in this manual can be used to retrofit existing sites in addition to the control measures
described below.
Curb Cuts Identify areas where introducing a curb cut will result in flows being diverted from gutters into vegetated areas. A
curb cut detailing a depression within the curb may be needed to ensure that flows do not bypass the curb cut.
Regrading of the vegetated receiving area and inlet protection may be necessary on the downstream side of the
cut.
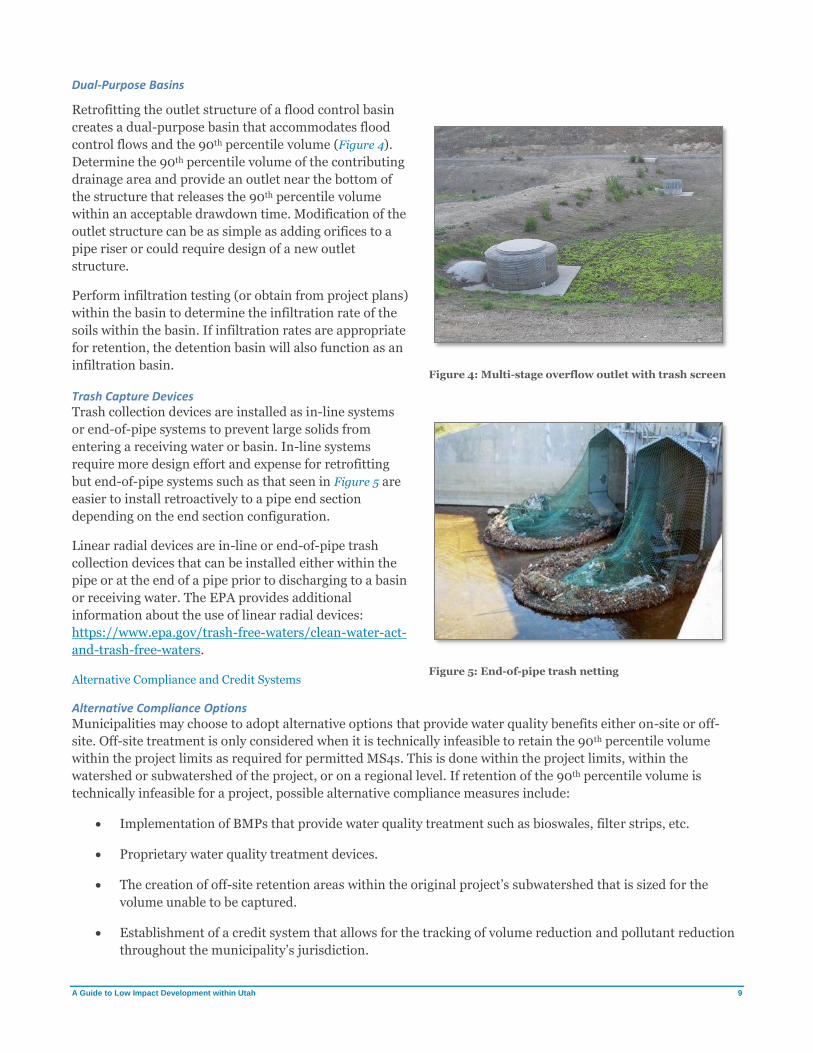
A Guide to Low Impact Development within Utah 9
Dual-Purpose Basins
Retrofitting the outlet structure of a flood control basin
creates a dual-purpose basin that accommodates flood
control flows and the 90th percentile volume (Figure 4).
Determine the 90th percentile volume of the contributing
drainage area and provide an outlet near the bottom of
the structure that releases the 90th percentile volume
within an acceptable drawdown time. Modification of the
outlet structure can be as simple as adding orifices to a
pipe riser or could require design of a new outlet
structure.
Perform infiltration testing (or obtain from project plans)
within the basin to determine the infiltration rate of the
soils within the basin. If infiltration rates are appropriate
for retention, the detention basin will also function as an
infiltration basin.
Trash Capture Devices Trash collection devices are installed as in-line systems
or end-of-pipe systems to prevent large solids from
entering a receiving water or basin. In-line systems
require more design effort and expense for retrofitting
but end-of-pipe systems such as that seen in Figure 5 are
easier to install retroactively to a pipe end section
depending on the end section configuration.
Linear radial devices are in-line or end-of-pipe trash
collection devices that can be installed either within the
pipe or at the end of a pipe prior to discharging to a basin
or receiving water. The EPA provides additional
information about the use of linear radial devices:
https://www.epa.gov/trash-free-waters/clean-water-act-
and-trash-free-waters.
Alternative Compliance and Credit Systems
Alternative Compliance Options Municipalities may choose to adopt alternative options that provide water quality benefits either on-site or off-
site. Off-site treatment is only considered when it is technically infeasible to retain the 90th percentile volume
within the project limits as required for permitted MS4s. This is done within the project limits, within the
watershed or subwatershed of the project, or on a regional level. If retention of the 90th percentile volume is
technically infeasible for a project, possible alternative compliance measures include:
• Implementation of BMPs that provide water quality treatment such as bioswales, filter strips, etc.
• Proprietary water quality treatment devices.
• The creation of off-site retention areas within the original project’s subwatershed that is sized for the
volume unable to be captured.
• Establishment of a credit system that allows for the tracking of volume reduction and pollutant reduction
throughout the municipality’s jurisdiction.
Figure 4: Multi-stage overflow outlet with trash screen
Figure 5: End-of-pipe trash netting

A Guide to Low Impact Development within Utah 10
Spanish Fork’s Municipal Code (13.16.080) which is cited within the example ordinances (Table 2), allows requests
to be submitted to waive post construction storm water requirements.
Credit Systems and Alternative Compliance Programs In its simplest form, a credit system is a database of projects that documents project volume retention goals and
the actual volume retained. This applies to pollutant reduction goals as well. Regional BMPs can be used within
the credit system. Additional runoff at one project location can be retained to account for runoff that may have
been technically infeasible to retain at other project locations.
A few examples of credit systems and other alternative compliance programs are briefly explained below. Links to
additional credit systems in use throughout the country are found below the examples in Table 3.
Minnesota Pollution Control Agency The state of Minnesota credit system quantifies storm water runoff volume and pollutant reduction. Every cubic
foot of the design storm that is captured is counted as a credit. Pollutant removal is counted as 1 credit based on
the unit of measurement for the pollutant. For example, if a BMP removes 10 pounds of phosphorus per year, it is
counted as 10 credits. Multiple credits can be claimed for each BMP depending on its function. A bioretention area
that removes multiple pollutants can claim credit for the volume reduction and the reduction of any pollutants
(Kieser & Associates, LLC, 2009).
Credits can be used towards the following:
• To meet a TMDL waste load allocation
• To meet the Minimal Impact Design Standards performance goal
• To provide incentive to site developers to encourage the preservation of natural areas
• To reduce costs associated with BMPs
• To supplement the Minnesota Pollution Control Agency Construction General Permit or be used for
projects not covered under the CGP
• As part of the financial evaluation under a local storm water utility program
San Diego County San Diego County implements an Alternative Compliance program that is implemented in areas that are unable to
retain 100% of the required retention volume on-site. There may be several reasons why the volume cannot be
handled on-site including poorly infiltrating soils, high groundwater, and concerns with pollutant mobilization.
San Diego County has identified the following measures for alternative compliance (California Regional Water
Quality Control Board San Diego Region, 2015):
• Stream or riparian area rehabilitation
• Retrofitting existing infrastructure for storm water retention or treatment
• Groundwater recharge projects
• Regional BMPs
• Water supply augmentation projects
• Floodplain preservation through land purchase
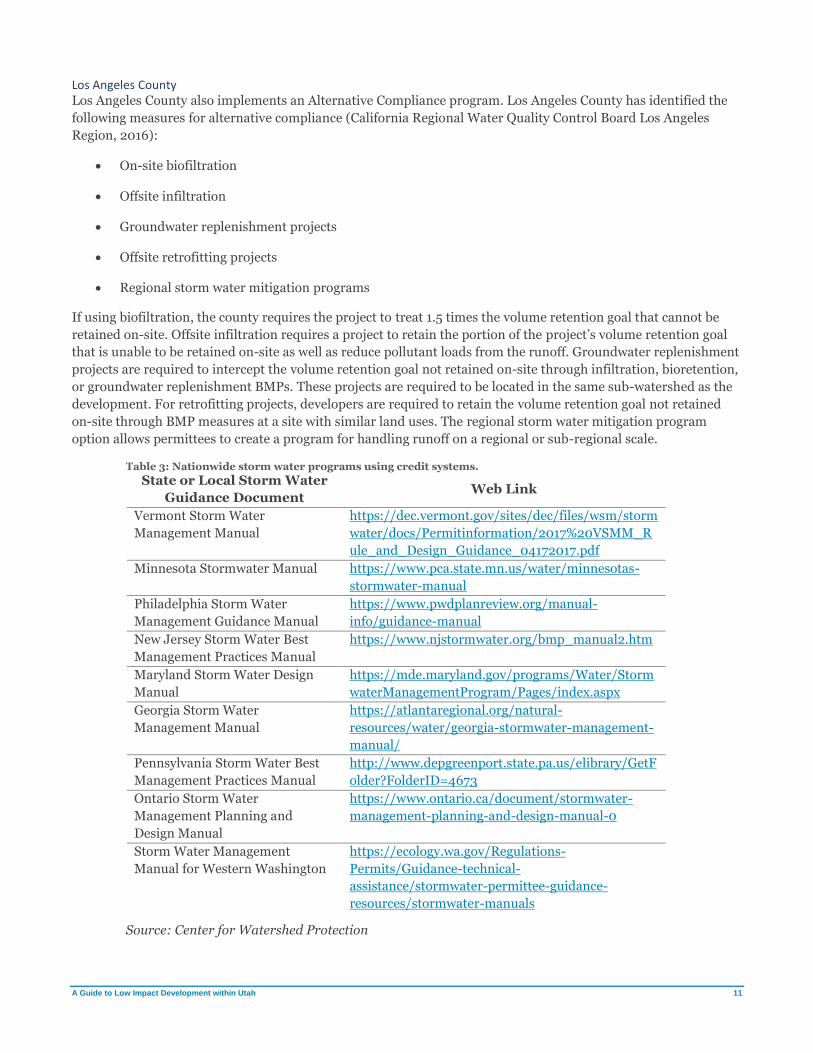
A Guide to Low Impact Development within Utah 11
Los Angeles County Los Angeles County also implements an Alternative Compliance program. Los Angeles County has identified the
following measures for alternative compliance (California Regional Water Quality Control Board Los Angeles
Region, 2016):
• On-site biofiltration
• Offsite infiltration
• Groundwater replenishment projects
• Offsite retrofitting projects
• Regional storm water mitigation programs
If using biofiltration, the county requires the project to treat 1.5 times the volume retention goal that cannot be
retained on-site. Offsite infiltration requires a project to retain the portion of the project’s volume retention goal
that is unable to be retained on-site as well as reduce pollutant loads from the runoff. Groundwater replenishment
projects are required to intercept the volume retention goal not retained on-site through infiltration, bioretention,
or groundwater replenishment BMPs. These projects are required to be located in the same sub-watershed as the
development. For retrofitting projects, developers are required to retain the volume retention goal not retained
on-site through BMP measures at a site with similar land uses. The regional storm water mitigation program
option allows permittees to create a program for handling runoff on a regional or sub-regional scale.
Table 3: Nationwide storm water programs using credit systems.
State or Local Storm Water
Guidance Document Web Link
Vermont Storm Water
Management Manual
https://dec.vermont.gov/sites/dec/files/wsm/storm
water/docs/Permitinformation/2017%20VSMM_R
ule_and_Design_Guidance_04172017.pdf
Minnesota Stormwater Manual https://www.pca.state.mn.us/water/minnesotas-
stormwater-manual
Philadelphia Storm Water
Management Guidance Manual
https://www.pwdplanreview.org/manual-
info/guidance-manual
New Jersey Storm Water Best
Management Practices Manual
https://www.njstormwater.org/bmp_manual2.htm
Maryland Storm Water Design
Manual
https://mde.maryland.gov/programs/Water/Storm
waterManagementProgram/Pages/index.aspx
Georgia Storm Water
Management Manual
https://atlantaregional.org/natural-
resources/water/georgia-stormwater-management-
manual/
Pennsylvania Storm Water Best
Management Practices Manual
http://www.depgreenport.state.pa.us/elibrary/GetF
older?FolderID=4673
Ontario Storm Water
Management Planning and
Design Manual
https://www.ontario.ca/document/stormwater-
management-planning-and-design-manual-0
Storm Water Management
Manual for Western Washington
https://ecology.wa.gov/Regulations-
Permits/Guidance-technical-
assistance/stormwater-permittee-guidance-
resources/stormwater-manuals
Source: Center for Watershed Protection

A Guide to Low Impact Development within Utah 12
Storm Water at the Project Level
Incorporating LID principles at the planning stages of a
development will increase the likelihood that they will be
able to be integrated into the site (Figure 6). If LID is
considered late in the design, it becomes more expensive
to implement due to costs associated with redesign of the
site layout, additional geotechnical studies, or
coordination with community councils, watershed
management groups, or other state or federal agencies.
Integration of LID principles should be done by qualified
engineers who understand the goals of the project, the
requirements within the municipality’s jurisdiction, and
the design criteria for the BMPs.
Collaboration among a project’s stakeholders for
including LID principles should occur as part of the
regular project development, as would be the case for
other design elements like grading, utilities, and flood control. As the design progresses, project meetings should
include discussion on the storm water elements of the project to ensure that water quality requirements are being
met and that the LID approach is functional and compatible with the site’s hydrologic and hydraulic design.
Additional meetings and coordination to address design details and/or conflicts should be expected. A list of
potential project team members who will be involved in the coordination and/or design of LID features is
presented in Table 4.
Table 4: LID project team.
Jurisdiction/Permittee Site Designer/Developer/Architect
MUNICIPALITY NON-TRADITIONAL MS4s Project Manager
Storm Water Coordinator Storm Water Coordinator Civil Engineers
Environmental Compliance Environmental Compliance Geotechnical Engineers
City Engineer Facilities Director Lead Architect
Public Works Project Coordinator Landscape Architects
Utilities Utilities Landscape Engineers
Planner Planner Environmental Engineers
Maintenance Maintenance
Landscaping Landscaping
Site Considerations
Gather subsurface, geotechnical, topographical, and any other technical information about the site to incorporate
into the site design. Site conditions will dictate an appropriate LID approach by revealing opportunities and
limitations.
Soils Soil characteristics will determine if certain LID approaches are feasible. Soils that are classified as Hydrologic
Soil Group ‘A’ are generally acceptable for bioretention and infiltration BMPs. ‘B’ soils may be marginal for
Figure 6: LID BMPs shown in site plans

A Guide to Low Impact Development within Utah 13
infiltration and bioretention. ‘C’ and ‘D’ soils generally have limited capacity for bioretention and infiltration. For
a planning level analysis of the Hydrologic Soil Groups, the Web Soil Survey developed by the National
Cooperative Soil Survey can be used: https://websoilsurvey.sc.egov.usda.gov/App/WebSoilSurvey.aspx. For
design, geotechnical reports should determine if the existing soils are acceptable.
Groundwater Infiltration BMPs should not be utilized within areas of shallow groundwater as it may lead to flooding of the
BMP or introduction of pollutants into the groundwater. Measurements should be taken at each BMP location to
determine the depth to the historical high groundwater level. The following groundwater resources are available
for planning level decision making:
Hydrogeology of Recharge Areas and Water Quality of the Principal Aquifers along the Wasatch Front and
Adjacent Areas, Utah – A snapshot of the overall hydrogeology within the Wasatch Front area of Utah.
https://pubs.usgs.gov/wri/1993/4221/report.pdf
Groundwater Conditions in Utah, Spring of 2017 – An annual report on groundwater conditions within Utah.
https://ut.water.usgs.gov/publications/GW2017.pdf
Utah Active Water Level Network, USGS – Active monitoring of groundwater wells throughout the state.
https://groundwaterwatch.usgs.gov/StateMap.asp?sa=UT&sc=49
Project sites with contaminated groundwater may not be appropriate for infiltration due to the potential for
mobilizing the contamination into new areas. Coordinate with jurisdictions or watershed management groups to
identify areas with contaminated groundwater to determine the level of concern it presents.
Existing drainage patterns Drainage patterns will be readily evident for any redevelopment project either from visual observation or from
plan sets. Determine the constraints introduced by the existing storm drain network such as pipe capacity and
inlet and outlet elevations. For new development projects, determine the existing drainage patterns as determined
by the site’s topography. It is more likely that the site’s pre-development hydrology can be mirrored if the design
maintains the original drainage patterns and paths.
Existing pervious areas and vegetation If existing pervious areas can support bioretention or already provide bioretention, maintain them or otherwise
make them a part of the site design. Taking advantage of natural depressions or areas of vegetation is an ideal and
cost-effective alternative to grading and design. Preserve existing trees and other vegetation on-site when possible.
Site Design Practices
Storm water treatment and retention is most effective when done close to its source. Site design practices
accomplish this by taking advantage of approaches that are not necessarily quantifiable but are aimed at reducing
the overall impact of the development.
Reduction of Impervious Surfaces
Reducing impervious surfaces, preserving pervious surfaces, or creating pervious surfaces provides multiple
benefits to storm water quality. From a storm water quality standpoint, the potential for treatment is higher for
runoff that lands on the pervious surface instead of on an impervious surface. Pervious surfaces with healthy soils
will infiltrate more runoff from frequent storms. From a design standpoint, increasing the pervious area decreases
the total runoff from the site. Pervious surfaces also provide the opportunity to add shade trees or other types of
vegetation that will increase the aesthetic appeal of the site.
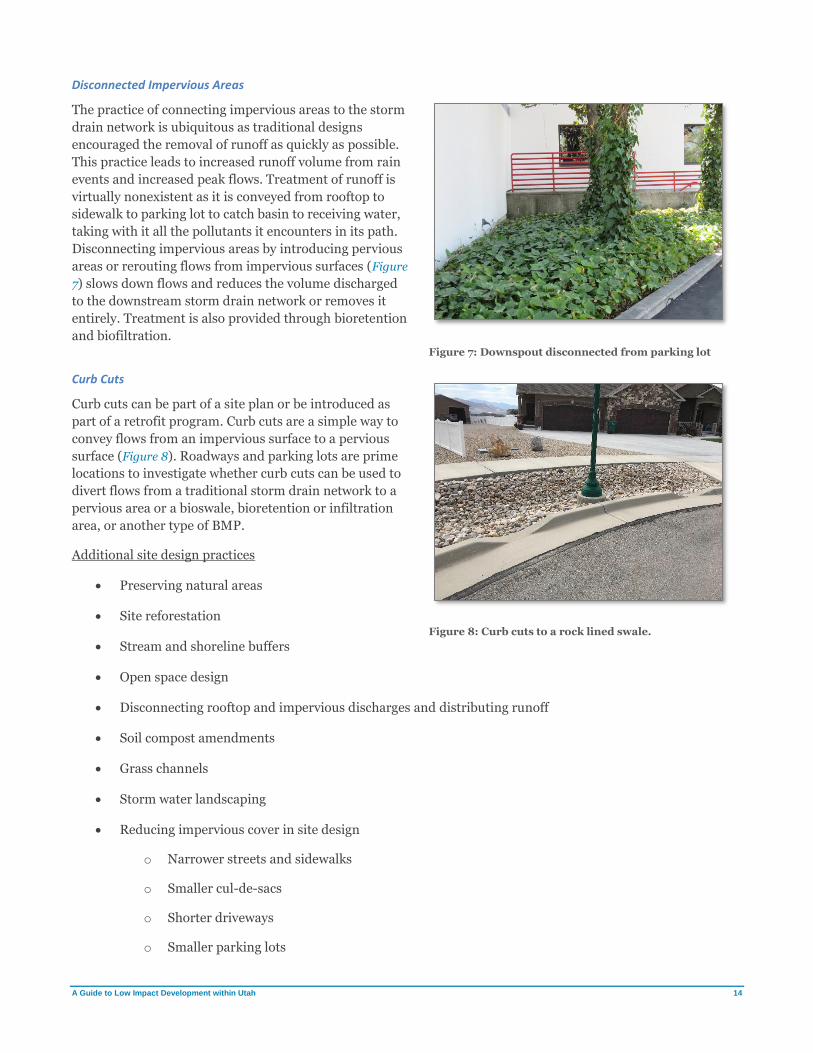
A Guide to Low Impact Development within Utah 14
Disconnected Impervious Areas
The practice of connecting impervious areas to the storm
drain network is ubiquitous as traditional designs
encouraged the removal of runoff as quickly as possible.
This practice leads to increased runoff volume from rain
events and increased peak flows. Treatment of runoff is
virtually nonexistent as it is conveyed from rooftop to
sidewalk to parking lot to catch basin to receiving water,
taking with it all the pollutants it encounters in its path.
Disconnecting impervious areas by introducing pervious
areas or rerouting flows from impervious surfaces (Figure
7) slows down flows and reduces the volume discharged
to the downstream storm drain network or removes it
entirely. Treatment is also provided through bioretention
and biofiltration.
Curb Cuts
Curb cuts can be part of a site plan or be introduced as
part of a retrofit program. Curb cuts are a simple way to
convey flows from an impervious surface to a pervious
surface (Figure 8). Roadways and parking lots are prime
locations to investigate whether curb cuts can be used to
divert flows from a traditional storm drain network to a
pervious area or a bioswale, bioretention or infiltration
area, or another type of BMP.
Additional site design practices
• Preserving natural areas
• Site reforestation
• Stream and shoreline buffers
• Open space design
• Disconnecting rooftop and impervious discharges and distributing runoff
• Soil compost amendments
• Grass channels
• Storm water landscaping
• Reducing impervious cover in site design
o Narrower streets and sidewalks
o Smaller cul-de-sacs
o Shorter driveways
o Smaller parking lots
Figure 7: Downspout disconnected from parking lot
Figure 8: Curb cuts to a rock lined swale.

A Guide to Low Impact Development within Utah 15
Documentation
MS4s are required to review and document that a project’s LID approach and design are consistent with the
permittee’s requirements and other project developers may wish to document design parameters. A template for
documentation is provided in Appendix B. The storm water quality report template provides jurisdictions a sample
of project documentation that ensures consistent design and verifies compliance with LID considerations and
retention requirements. The report template may be used during a project’s design and review process and be
required as part of a project’s submittal documents to ensure that water quality requirements have been met. The
review process may differ between municipalities, and the template can be altered as needed by the user. Sample
text is highlighted.

A Guide to Low Impact Development within Utah 16
The 90th Percentile Volume
LID Impact on Hydrology
Storm water programs have focused on
the goal of mimicking predevelopment
hydrologic conditions over the last
several decades as municipal and
department of transportation (DOT)
storm water programs have increased
their efforts to comply with the Federal
Clean Water Act of 1972 and their
associated MS4 permits. LID BMPs,
green infrastructure practices, and
retention of the 90th percentile volume
are tools and requirements that are used
to accomplish this goal.
More frequent peak flows, higher peak
flows, and higher runoff volumes are
well-documented hydrologic impacts of
urbanization and development due to an
increase in impervious surfaces (D.B.
Booth, 1997; Konrad & Booth, 2002)
(Figure 9).
Traditional approaches to storm water
management that remove runoff from a
site by quickly conveying flows to a
storm drain network are also effective in
protecting life and property and should
be implemented in tandem with low
impact design principles. Within Utah,
discharges are typically limited to
between 0.1 cfs and 0.2 cfs per acre.
An LID approach to site development
produces a hydrologic condition that
more closely mimics the pre-
development hydrologic condition. Peak
flows are reduced and are less frequent (Figure 10); runoff volume is also reduced (WEF Press, 2012).
Developing the 90th Percentile Volume
Project Volume Retention Goal, Vgoal – The volume of runoff generated within the project’s limits of
disturbance over a 24-hour period during the 90th percentile storm event.
Water Quality Volume, WQV – The volume of runoff generated within a BMP’s drainage area over a 24-hour
period during the 90th percentile storm event.
The following steps may be used to determine the project volume retention goal and the water quality volume.
Figure 9: Typical hydrologic impact of development on-site hydrology.
Figure 10: General post development hydrograph with LID.

A Guide to Low Impact Development within Utah 17
Step 1: 90th Percentile Depth
Determine the 90th percentile precipitation depth.
1. Obtain long-term daily rainfall data from the following sources:
a. National Oceanic and Atmospheric Administration (NOAA): https://www.ncdc.noaa.gov/cdo-
web/datatools/selectlocation; or
b. Reliable historical local data; or
c. Any other reliable data source.
2. Sort data low to high.
3. Remove snowfall and small precipitation events (≤0.1 inch).
4. Use the Excel PERCENTILE function to calculate the 90th percentile rainfall depth.
A more in-depth discussion on determining the 90th percentile precipitation depth is found here:
https://deq.utah.gov/legacy/topics/fact-sheet/docs/handouts/2016/05may/calculation-90-percentile-storm-
event.pdf.
A reliable record of historical precipitation data should meet the following conditions:
1. Come from an active rain gage;
2. Have at least 30 years of data;
3. Have 90% data coverage for the period of record.
The 90th percentile depth for rain gages from NOAA that currently meet these criteria can be found in Appendix A.
MS4s may choose to calculate their depths from a different source. Planners and developers should verify with the
MS4 before relying on these reference values.
Step 2: Imperviousness
To determine the project’s volume retention goal, determine the imperviousness within the disturbance limits of
the project. To determine the water quality volume of a BMP’s drainage area, determine the imperviousness of the
drainage area. The imperviousness of the BMP drainage area will include any off-site impervious areas that are
part of the BMP’s drainage area.
Project imperviousness = Post-development impervious area / Project’s disturbance limits
BMP imperviousness = Post-development impervious area within BMP drainage area / BMP drainage area
Step 3: Volumetric Runoff Coefficient
Determine the volumetric runoff coefficient (RV).
The volumetric runoff coefficient (also referred to as just the ‘runoff coefficient’) is a calculation of the percentage
of rainfall that results in surface runoff. Runoff coefficients for small, frequent storms, such as for the 90th
percentile, are not equivalent to runoff coefficients for large, less-frequent storms such as the 10-yr event and
greater that are used with the Rational Method. The effects of infiltration, retention, and interception are
increased for the smaller storm events compared to the larger events. Because of this, runoff coefficients for
smaller storms are numerically smaller than for larger storms.
In 1983 data from over 50 sites nationwide was evaluated as part of the Nationwide Urban Runoff Program
(NURP) (Driscoll, 1983). From these sites, mean and median RV values were calculated and compared to the site’s

A Guide to Low Impact Development within Utah 18
imperviousness. This research led to the following conclusions that are also discussed by Schueler who did
additional analysis of the NURP sites:
1. “Most of the variation in mean RV among sites can be attributed to differences in the level of urbanization,
and in particular, to the site imperviousness.”
2. “RV’s were found to be relatively consistent at individual sites and were only weakly correlated with storm-
related variables such as precipitation volume, intensity, and duration.”
3. “The runoff coefficient could serve as a reliable estimator of runoff volumes, given an initial estimate of
rainfall volume.” (Schueler, Controlling Urban Runoff: A Practical Manual for Planning and Designing
Urban BMPs, 1987)
Various coefficients for smaller storms have also been developed using national datasets and through local
research. Municipalities are encouraged to research these and other runoff coefficients or develop their own in
determining which method to use within their jurisdiction for use with the 90th percentile storm. Deciding on a
single runoff coefficient methodology for a jurisdiction will simplify the design and review process.
Development of a runoff coefficient is done by monitoring the runoff volume produced from a storm event. The
runoff coefficient is the ratio between the monitored runoff volume and the total precipitation volume expressed
in the following equation and will vary depending on land use and imperviousness of the measured area:
𝑅𝑉 = 𝑉𝑅
𝑉𝑃
Where:
RV = Volumetric runoff coefficient, unitless
VR = Monitored runoff volume, cf
VP = Total precipitation volume, cf
The total precipitation volume can be determined using the following equation:
𝑉𝑃 =𝑑𝐴
12
Where:
d = Precipitation depth, in.
A = Drainage area, sf
It is not the intent of this manual or the Division of Water Quality to recommend specific methodologies. An in-
depth summary of runoff coefficients used throughout the country by municipalities and DOTs was developed by
the California Department of Transportation (Caltrans) and published as a Technical White Paper titled Runoff
Coefficient Evaluation for Volumetric BMP Sizing. It can be found here:
http://www.dot.ca.gov/design/hsd/guidance/CTSW-TM-15-312_03_01-
Runoff_Coeff_for_Vol_BMP_Sizing.pdf. This white paper specifically discusses Method 1 in more detail.
For all the equations presented below, i represents the percent of imperviousness of the drainage area in decimal
format (0.0 – 1.0).
Method 1 – Reese method
Comparing the imperviousness of 44 nationwide sites to their respective calculated volumetric runoff coefficient, a
simple linear regression equation was created to estimate the volumetric runoff coefficient for small urban
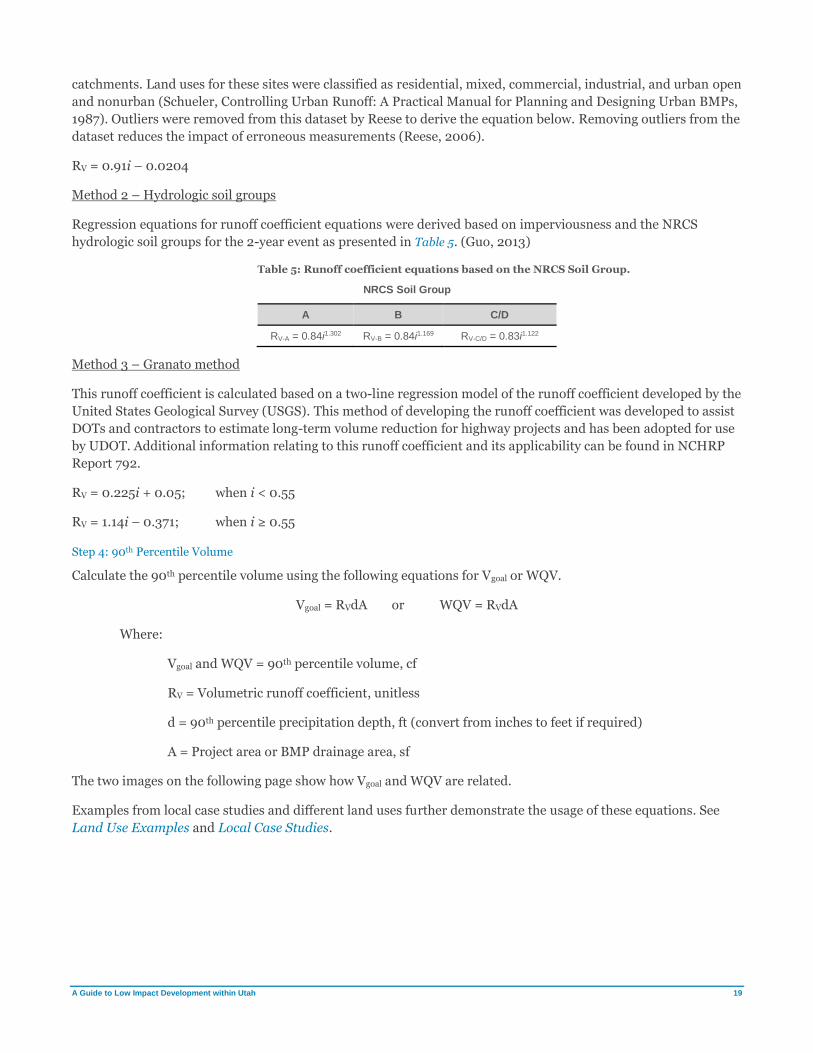
A Guide to Low Impact Development within Utah 19
catchments. Land uses for these sites were classified as residential, mixed, commercial, industrial, and urban open
and nonurban (Schueler, Controlling Urban Runoff: A Practical Manual for Planning and Designing Urban BMPs,
1987). Outliers were removed from this dataset by Reese to derive the equation below. Removing outliers from the
dataset reduces the impact of erroneous measurements (Reese, 2006).
RV = 0.91i – 0.0204
Method 2 – Hydrologic soil groups
Regression equations for runoff coefficient equations were derived based on imperviousness and the NRCS
hydrologic soil groups for the 2-year event as presented in Table 5. (Guo, 2013)
Table 5: Runoff coefficient equations based on the NRCS Soil Group.
NRCS Soil Group
A B C/D
RV-A = 0.84i1.302 RV-B = 0.84i1.169 RV-C/D = 0.83i1.122
Method 3 – Granato method
This runoff coefficient is calculated based on a two-line regression model of the runoff coefficient developed by the
United States Geological Survey (USGS). This method of developing the runoff coefficient was developed to assist
DOTs and contractors to estimate long-term volume reduction for highway projects and has been adopted for use
by UDOT. Additional information relating to this runoff coefficient and its applicability can be found in NCHRP
Report 792.
RV = 0.225i + 0.05; when i < 0.55
RV = 1.14i – 0.371; when i ≥ 0.55
Step 4: 90th Percentile Volume
Calculate the 90th percentile volume using the following equations for Vgoal or WQV.
Vgoal = RVdA or WQV = RVdA
Where:
Vgoal and WQV = 90th percentile volume, cf
RV = Volumetric runoff coefficient, unitless
d = 90th percentile precipitation depth, ft (convert from inches to feet if required)
A = Project area or BMP drainage area, sf
The two images on the following page show how Vgoal and WQV are related.
Examples from local case studies and different land uses further demonstrate the usage of these equations. See
Land Use Examples and Local Case Studies.
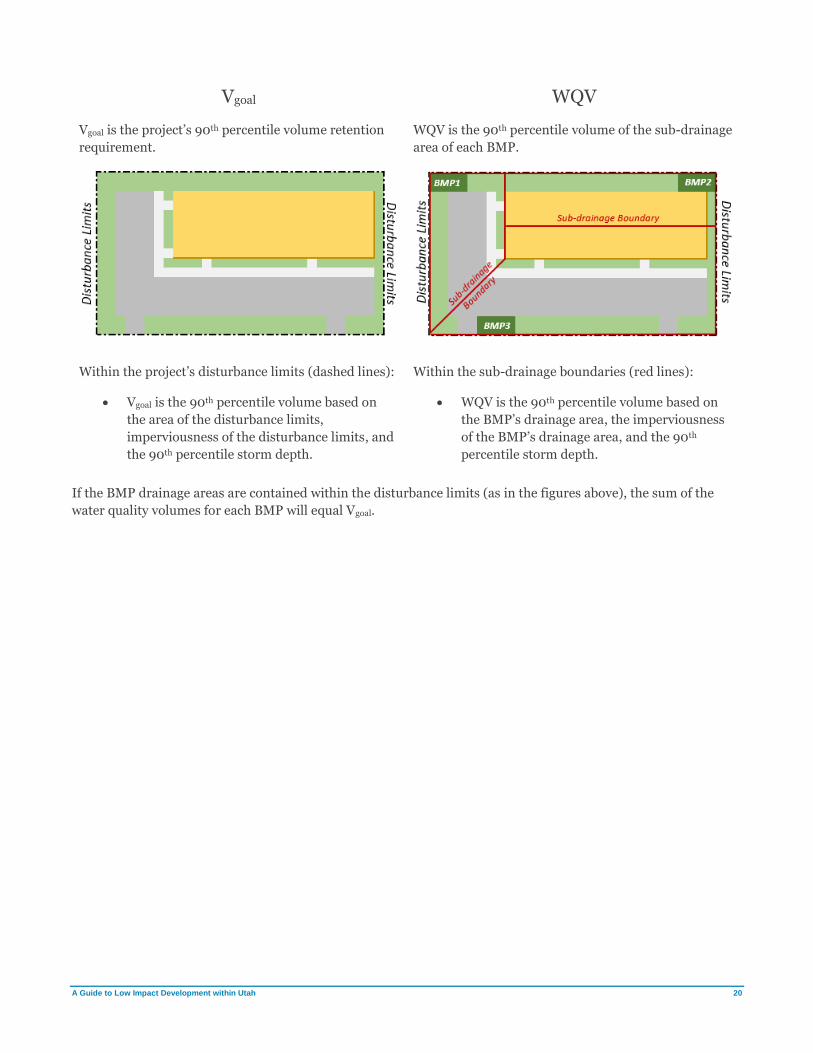
A Guide to Low Impact Development within Utah 20
Vgoal
Vgoal is the project’s 90th percentile volume retention
requirement.
WQV
WQV is the 90th percentile volume of the sub-drainage
area of each BMP.
Within the project’s disturbance limits (dashed lines):
• Vgoal is the 90th percentile volume based on
the area of the disturbance limits,
imperviousness of the disturbance limits, and
the 90th percentile storm depth.
Within the sub-drainage boundaries (red lines):
• WQV is the 90th percentile volume based on
the BMP’s drainage area, the imperviousness
of the BMP’s drainage area, and the 90th
percentile storm depth.
If the BMP drainage areas are contained within the disturbance limits (as in the figures above), the sum of the
water quality volumes for each BMP will equal Vgoal.
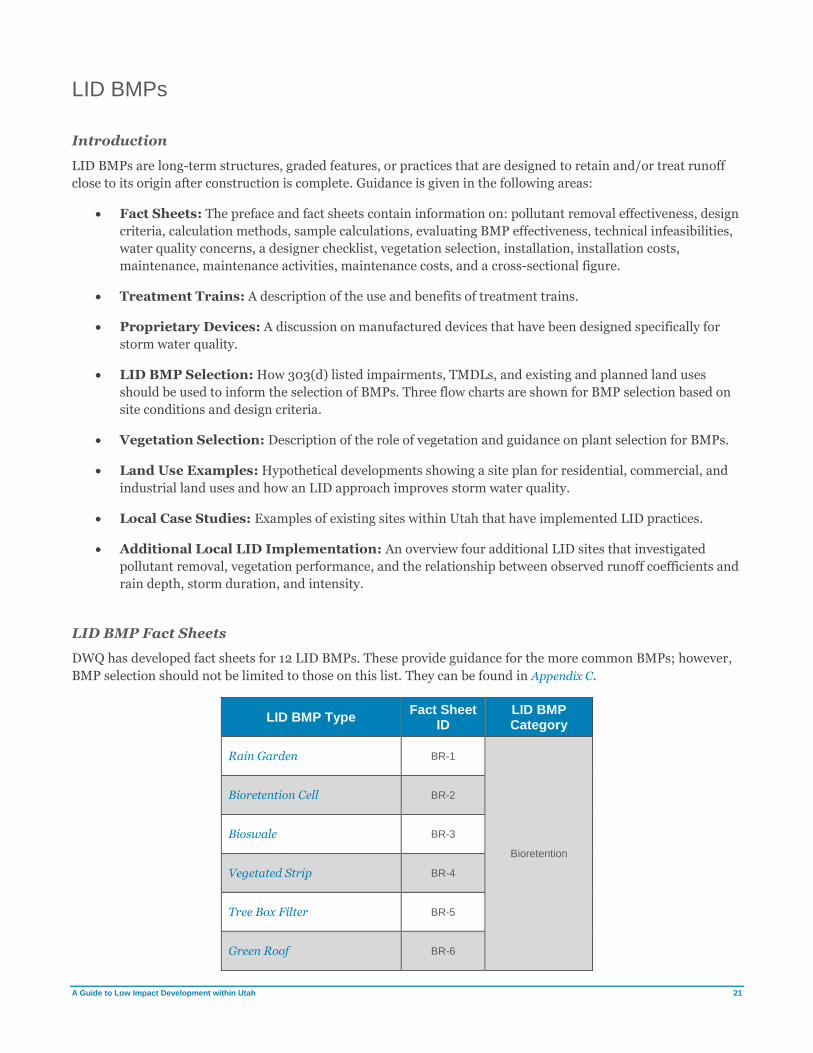
A Guide to Low Impact Development within Utah 21
LID BMPs
Introduction
LID BMPs are long-term structures, graded features, or practices that are designed to retain and/or treat runoff
close to its origin after construction is complete. Guidance is given in the following areas:
• Fact Sheets: The preface and fact sheets contain information on: pollutant removal effectiveness, design
criteria, calculation methods, sample calculations, evaluating BMP effectiveness, technical infeasibilities,
water quality concerns, a designer checklist, vegetation selection, installation, installation costs,
maintenance, maintenance activities, maintenance costs, and a cross-sectional figure.
• Treatment Trains: A description of the use and benefits of treatment trains.
• Proprietary Devices: A discussion on manufactured devices that have been designed specifically for
storm water quality.
• LID BMP Selection: How 303(d) listed impairments, TMDLs, and existing and planned land uses
should be used to inform the selection of BMPs. Three flow charts are shown for BMP selection based on
site conditions and design criteria.
• Vegetation Selection: Description of the role of vegetation and guidance on plant selection for BMPs.
• Land Use Examples: Hypothetical developments showing a site plan for residential, commercial, and
industrial land uses and how an LID approach improves storm water quality.
• Local Case Studies: Examples of existing sites within Utah that have implemented LID practices.
• Additional Local LID Implementation: An overview four additional LID sites that investigated
pollutant removal, vegetation performance, and the relationship between observed runoff coefficients and
rain depth, storm duration, and intensity.
LID BMP Fact Sheets
DWQ has developed fact sheets for 12 LID BMPs. These provide guidance for the more common BMPs; however,
BMP selection should not be limited to those on this list. They can be found in Appendix C.
LID BMP Type Fact Sheet
ID LID BMP Category
Rain Garden BR-1
Bioretention
Bioretention Cell BR-2
Bioswale BR-3
Vegetated Strip BR-4
Tree Box Filter BR-5
Green Roof BR-6

A Guide to Low Impact Development within Utah 22
LID BMP Type Fact Sheet
ID LID BMP Category
Pervious Surfaces PS-1 Pervious Surfaces
Infiltration Basin ID-1
Infiltration Devices
Infiltration Trench ID-2
Dry Well ID-3
Underground Infiltration Galleries
ID-4
Harvest and Reuse HR-1 Harvest and Reuse
Where possible, information that is relevant to all BMPs has been summarized below in this preface instead of
repeating identical information in each fact sheet.
Preface to Fact Sheets
Pollutant Removal Effectiveness
Pollutant removal effectiveness is determined from various sources and provides general guidance (Taylor &
Barrett, 2014; Filterra Bioretention, 2018; Minnesota Pollution Control Agency, 2018; WERF, 2016;
Charlesworth, Beddow, & Nnadi, 2017; APWA, 2012). Many factors contribute to a BMP’s pollutant removal
effectiveness such as infiltration capacity, climate, vegetation selection, and maintenance practices. Careful
collection and analysis of monitoring data is the only definitive method of determining actual pollutant removal
for any BMP.
Primary Functions
The BMP’s primary functions are listed as a quick reference. Bioretention is the process by which soils and plants
remove pollutants from runoff after it has entered the soil. Volume retention describes the BMP’s ability to retain
runoff and contribute to groundwater recharge. Biofiltration is the process by which pollutants are removed as
surface flows interact with grasses, and other vegetation.
Design Criteria
The design criteria for each BMP are based on generally accepted designs. The maximum and minimum ranges
are meant to provide a starting point for jurisdictions to develop their own standards, details, and designs. They
are not prescriptive. Deviation from the design criteria in these fact sheets is acceptable and encouraged if
alternative designs are supported by sound engineering practice, research, or have been shown through past
experience to be effective.
Calculation Methods
BMPs are sized for the water quality volume and/or the water quality flow of the BMP’s contributing drainage
area. The following equations are used for the BMPs in the fact sheets.
Manning’s Equation
Applicable BMPs: Bioswale, and Vegetated Strip

A Guide to Low Impact Development within Utah 23
𝑄 = 1.49
𝑛𝐴𝑅
23√𝑆
Where:
Q = Flow rate, cfs
n = Manning’s roughness coefficient, unitless
A = Cross-sectional area of flow, sf
R = Hydraulic radius, sf/ft
S = Longitudinal slope, ft/ft
Continuity Equation
Applicable BMPs: Bioswale, and Vegetated Strip
𝑄 = 𝐴𝑉
Where:
Q = Flow rate, cfs
A = Cross-sectional area of flow, sf
V = Flow velocity, ft/s
Storage volume within a media with a known porosity
Applicable BMPs: Rain Garden, Bioretention Cell, Pervious Surfaces, Infiltration Basin, and Infiltration Trench
𝑉𝑠𝑡𝑜𝑟𝑎𝑔𝑒 = 𝑛𝑉
Where:
Vstorage = Volume of runoff available for storage within media, cf
n = Media porosity, unitless
V = Volume of media layer, cf
Drawdown time
Applicable BMPs: Rain Garden, Bioretention Cell, Pervious Surfaces, Infiltration Basin, and Infiltration Trench
𝑡 =(𝐷𝑇𝑛𝑊 + 𝑑)
𝑘
Where:
t = Drawdown time, hrs
DT = Total depth of soil matrix, in
nW = Weighted average porosity of soil matrix based on soil layer depth

A Guide to Low Impact Development within Utah 24
d = Ponding depth, in
k = Design infiltration rate of existing soil or soil matrix, in/hr
Minimum footprint area
Applicable BMPs: Rain Garden, Bioretention Cell, Infiltration Basin, and Infiltration Trench
𝐴𝑚𝑖𝑛 =12𝑥𝑆𝐹𝑥𝑊𝑄𝑉
𝑘𝑡
Where:
12 = Conversion factor (inches to feet)
SF = Safety factor
WQV = Water quality volume, cf
k = Design infiltration rate of existing soil or soil matrix, in/hr
t = Drawdown time, hr
Water quality outlet elevation
Applicable BMPs: Rain Garden, Bioretention Cell, and Infiltration Basin
𝐸𝑙𝑒𝑊𝑄 =𝑊𝑄𝑉
𝐴𝑏𝑜𝑡𝑡𝑜𝑚
Where:
EleWQ = Elevation of the water quality volume above basin bottom where overflow is provided, ft
WQV = Water quality volume, cf
Abottom = Area of basin bottom, sf*
*Although stage storage calculations may determine the water quality elevation, using the basin bottom
will yield a conservative value.
Volume Reduction
For retention BMPs, the volume reduction is inherent in the sizing of the BMP. For example, a rain garden that is
designed to retain 1,000 cf is said to have a volume reduction of 1,000 cf. Volume reduction calculations for
bioswales and vegetated strips, however, may not be as simple to quantify due to the variable design
considerations such as longitudinal slope, flow rate, and infiltrating capacity of the soils. The information below
summarizes a few tools that have been developed by either national research groups or municipalities that may be
considered for use.
It is not the intent of this manual to give guidance on the use of these tools or to discuss their applicability at
length. Jurisdictions are encouraged to review and apply these tools as deemed appropriate or to develop their
own. Jurisdictions are also encouraged to monitor the volume reduction of their own bioswales and vegetated
strips to gain a more precise understanding of performance within their jurisdiction to be able to make better
informed design level and planning level decisions.

A Guide to Low Impact Development within Utah 25
Urban Drainage Flood Control District, Colorado – UD-BMP v3.07
An Excel spreadsheet developed by the Urban Drainage Flood Control District. A multivariable Storm Water
Management Model (SWMMM) analysis determines volume reduction based on the user’s input of the BMP’s
drainage area characteristics such as imperviousness and soil type.
The tool can be found by clicking on the link for UD-BMP v3.0 here: https://udfcd.org/software.
City of Stockton, California – Stormwater Quality Control Criteria Plan Volume Reduction Calculator
An Excel spreadsheet developed by the City of Stockton and the County of San Joaquin. User input determines
pre- and post-project volume runoff to determine the expected volume reduction.
The spreadsheet can be downloaded by clicking on the link for the Stormwater Quality Control Criteria Plan
Volume Reduction Calculator found here:
http://www.stocktongov.com/government/departments/municipalUtilities/utilStorm.html.
NCHRP 25-41 – Volume Performance Tool V.1.0 for Windows
An Excel spreadsheet developed by the National Cooperative Highway Research Program (NCHRP) that allows
users to define site characteristics and drainage area characteristics and determine an estimate of the volume
reduction percentage for various BMP types. Applicability of this tool is limited to projects within urban highway
environments.
The tool can be downloaded by clicking on the link for the .ISO CD-ROM Image found here:
http://www.trb.org/Main/Blurbs/172415.aspx.
Sample Calculations
The sample calculations provide one working configuration of a planning level design for each type of BMP. For
example, the sample calculations in the rain garden fact sheet assume that the soils infiltrate and that there are no
subsurface constraints. However, if a rain garden is required to be lined, an underdrain design and detention time
may need to be considered. Different approaches beyond what is shown in the examples might be required and
alternate calculation methods are acceptable if they are supported by sound engineering practice, research, or
have been shown through experience to be effective.
Consider the following assumptions when reviewing the sample calculations:
• The examples use hypothetical jurisdictional requirements and design criteria to show their role in BMP
design. An example may state that the jurisdiction requires 6 inches of freeboard for a BMP, but
jurisdictions are encouraged to develop and implement their own design standards.
• The examples have been prepared with the assumption that the BMPs are for water quality purposes only.
It is assumed that upstream bypasses have been provided for larger storm events or that overflow
structures within the BMP are provided.
• The examples state which method of determining the volumetric runoff coefficient is used for the sole
purpose of showing the calculations for the methods discussed in this manual. It is not intended to be an
endorsement of a methodology for each BMP type. The appropriate use of runoff coefficients will be
determined by jurisdictions.
See Step 3: Volumetric Runoff Coefficient in Developing the 90th Percentile Volume for additional information.
Evaluating BMP Effectiveness
To evaluate the performance of a BMP, it is necessary to know its purpose for the developed site and to
understand the goals for the BMP’s watershed. Visiting BMPs during storm events is a highly valuable method for
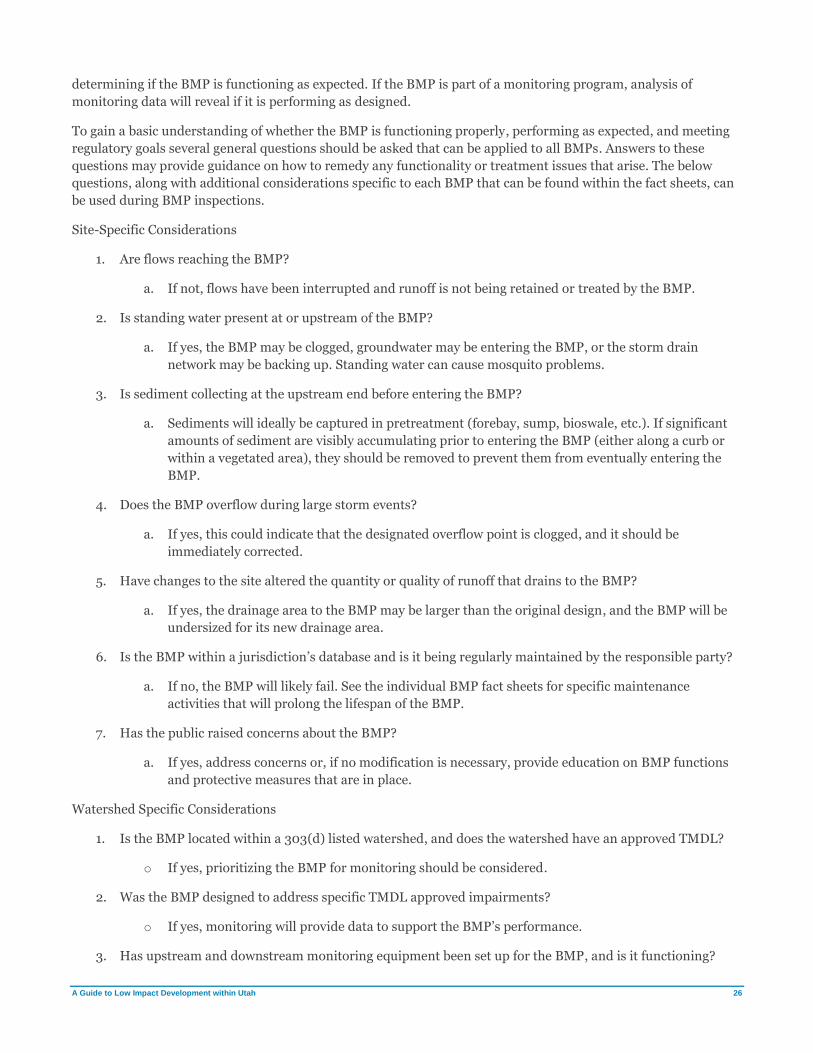
A Guide to Low Impact Development within Utah 26
determining if the BMP is functioning as expected. If the BMP is part of a monitoring program, analysis of
monitoring data will reveal if it is performing as designed.
To gain a basic understanding of whether the BMP is functioning properly, performing as expected, and meeting
regulatory goals several general questions should be asked that can be applied to all BMPs. Answers to these
questions may provide guidance on how to remedy any functionality or treatment issues that arise. The below
questions, along with additional considerations specific to each BMP that can be found within the fact sheets, can
be used during BMP inspections.
Site-Specific Considerations
1. Are flows reaching the BMP?
a. If not, flows have been interrupted and runoff is not being retained or treated by the BMP.
2. Is standing water present at or upstream of the BMP?
a. If yes, the BMP may be clogged, groundwater may be entering the BMP, or the storm drain
network may be backing up. Standing water can cause mosquito problems.
3. Is sediment collecting at the upstream end before entering the BMP?
a. Sediments will ideally be captured in pretreatment (forebay, sump, bioswale, etc.). If significant
amounts of sediment are visibly accumulating prior to entering the BMP (either along a curb or
within a vegetated area), they should be removed to prevent them from eventually entering the
BMP.
4. Does the BMP overflow during large storm events?
a. If yes, this could indicate that the designated overflow point is clogged, and it should be
immediately corrected.
5. Have changes to the site altered the quantity or quality of runoff that drains to the BMP?
a. If yes, the drainage area to the BMP may be larger than the original design, and the BMP will be
undersized for its new drainage area.
6. Is the BMP within a jurisdiction’s database and is it being regularly maintained by the responsible party?
a. If no, the BMP will likely fail. See the individual BMP fact sheets for specific maintenance
activities that will prolong the lifespan of the BMP.
7. Has the public raised concerns about the BMP?
a. If yes, address concerns or, if no modification is necessary, provide education on BMP functions
and protective measures that are in place.
Watershed Specific Considerations
1. Is the BMP located within a 303(d) listed watershed, and does the watershed have an approved TMDL?
o If yes, prioritizing the BMP for monitoring should be considered.
2. Was the BMP designed to address specific TMDL approved impairments?
o If yes, monitoring will provide data to support the BMP’s performance.
3. Has upstream and downstream monitoring equipment been set up for the BMP, and is it functioning?
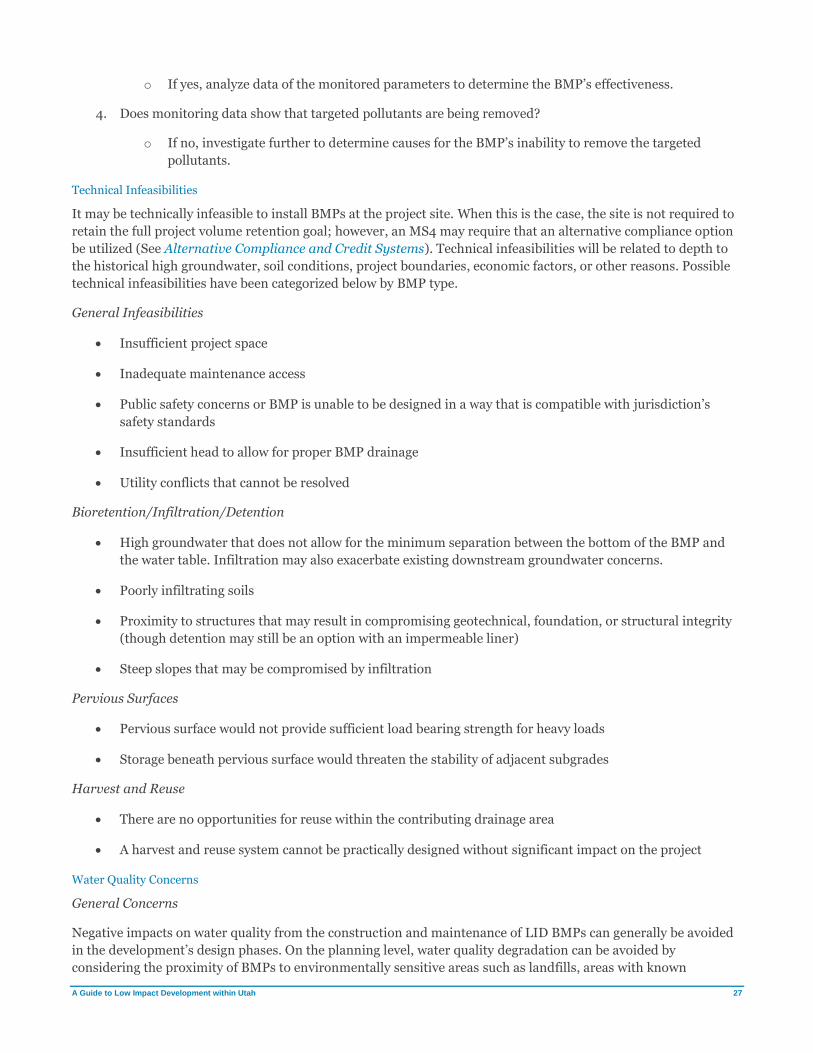
A Guide to Low Impact Development within Utah 27
o If yes, analyze data of the monitored parameters to determine the BMP’s effectiveness.
4. Does monitoring data show that targeted pollutants are being removed?
o If no, investigate further to determine causes for the BMP’s inability to remove the targeted
pollutants.
Technical Infeasibilities
It may be technically infeasible to install BMPs at the project site. When this is the case, the site is not required to
retain the full project volume retention goal; however, an MS4 may require that an alternative compliance option
be utilized (See Alternative Compliance and Credit Systems). Technical infeasibilities will be related to depth to
the historical high groundwater, soil conditions, project boundaries, economic factors, or other reasons. Possible
technical infeasibilities have been categorized below by BMP type.
General Infeasibilities
• Insufficient project space
• Inadequate maintenance access
• Public safety concerns or BMP is unable to be designed in a way that is compatible with jurisdiction’s
safety standards
• Insufficient head to allow for proper BMP drainage
• Utility conflicts that cannot be resolved
Bioretention/Infiltration/Detention
• High groundwater that does not allow for the minimum separation between the bottom of the BMP and
the water table. Infiltration may also exacerbate existing downstream groundwater concerns.
• Poorly infiltrating soils
• Proximity to structures that may result in compromising geotechnical, foundation, or structural integrity
(though detention may still be an option with an impermeable liner)
• Steep slopes that may be compromised by infiltration
Pervious Surfaces
• Pervious surface would not provide sufficient load bearing strength for heavy loads
• Storage beneath pervious surface would threaten the stability of adjacent subgrades
Harvest and Reuse
• There are no opportunities for reuse within the contributing drainage area
• A harvest and reuse system cannot be practically designed without significant impact on the project
Water Quality Concerns
General Concerns
Negative impacts on water quality from the construction and maintenance of LID BMPs can generally be avoided
in the development’s design phases. On the planning level, water quality degradation can be avoided by
considering the proximity of BMPs to environmentally sensitive areas such as landfills, areas with known

A Guide to Low Impact Development within Utah 28
groundwater contamination, and wellhead protection areas. Retention at these locations is not advised, as it has
the potential to mobilize contaminated groundwater and degrade down-gradient groundwater or drinking water
quality. Pollutants can become concentrated within the soils at BMP locations, which may further exacerbate
existing groundwater contamination. Installing BMPs without consideration to geotechnical conditions such as
high groundwater and poor soils can lead to a failed BMP that results in degraded water quality that in turn
interacts with groundwater and receiving waters. Compaction of soils at the bottom of a BMP or within a soil
matrix that is meant to infiltrate will likely result in standing water, vector issues, or algae. Poorly maintained
BMPs will result in many possible modes of failure such as standing water, vector issues, algae, flooding, failed
soils, or other issues which will compromise the integrity of groundwater or adjacent receiving waters.
Designer Checklist
The designer checklist provided on each BMP fact sheet may be used by those who are designing or reviewing the
design decisions that were made for each BMP. Engineering judgment should be used for all design decisions and
LID approaches. Consider including information from the designer checklist in the Storm Water Quality Report.
Vegetation
Ensuring that vegetation remains healthy will increase the likelihood that the BMP remains aesthetically pleasing
and performs as expected. See Vegetation Guidance by BMP Type for additional information.
Installation
LID BMPs should be taken offline during construction so that flows within its drainage area do not enter the BMP
until construction is complete. They should not be used as construction BMPs. Use as a construction BMP can
compromise functionality and decrease lifespan. They should not be allowed to become compacted during
construction.
Typical installation activities for each BMP can be found within each BMP fact sheet.
Installation Costs
Refer to each BMP fact sheet for a general list of construction items. The Green Values National Stormwater
Calculator summarizes BMP construction costs and can be found here:
http://greenvalues.cnt.org/national/cost_detail.php. Costs will vary.
Maintenance
Proper maintenance will significantly improve the functionality of the BMP and increase its life span.
Maintenance activities typically include semiannual (Spring and Fall) inspections but may be required more often
such as shortly after construction or after significant storm events. Documentation of maintenance activities is
encouraged to provide a record of inspection frequency, maintenance activities, and associated costs.
Maintenance agreements between the municipalities and the final owner of the BMP (if not the MS4) should
identify key maintenance elements such as: transfer of BMP ownership; a description of maintenance activities
and who is expected to perform them (owner, municipality, other); and, a method of resolution should violation of
the maintenance agreement occur.
A description of typical maintenance considerations for each BMP type is given below.
Bioretention/Infiltration/Detention/Harvest and Reuse
• Inspect for sediment buildup or pollutant accumulation within or upstream of BMP and remove if
present. Inspection of underground systems may require an access port such as a manhole.
• Inspect for and remove trash and debris.
• Determine cause of any standing water within BMP and remediate.

A Guide to Low Impact Development within Utah 29
• Ensure that vegetation is established and maintained.
• If underdrains have been installed, ensure that they are functioning properly.
• If irrigation system has been installed, ensure that it is functioning properly.
• For green roofs, additional inspection of the roof structure may be required.
Pervious Surfaces
• Inspect for clogging of pervious surfaces
o Vacuum or sweep the pavement to remove sediment and debris.
o Power wash if necessary. Prior to power washing, downgradient inlets (if present) need to be
protected to prevent sediments from entering storm drain system.
• Inspect for depressions. Depressions will indicate that the subsurface layers are failing or have failed.
Regrading may be required.
Maintenance Activities
Detailed descriptions of maintenance activities, inspection frequencies, actions that can be taken to resolve
maintenance issues, and the general level of effort associated with maintenance activities can be found in each
BMP fact sheet.
In determining the inspection effort, the following descriptions were used:
Low – Visual inspection only required to make determination of possible required maintenance activity.
Medium – Visual inspection and other physical activity is required, such as opening an observation or a
manhole lid; or, visual inspection and training is required, such as identifying invasive species, to make
determination of possible required maintenance activity.
High – Visual inspection, physical activity, and training is required to make determination of possible
required maintenance activity.
Maintenance Costs
Maintenance costs are tied to maintenance activities.
Inspection of BMPs requires either an onsite presence
that is tasked with performing the inspections or a
designated person or persons who must visit the BMP to
perform the inspection. In either case, the inspector(s)
will need to be trained to make correct determinations of
the next maintenance activity (if any) for any given
maintenance issue that is required to remedy a failing or
poorly maintained BMP (Figure 11). Permittees are
required and private owners are encouraged to track
operations and maintenance activities and associated
costs.
In general, the following items are considered when
considering maintenance costs: inspection frequency,
inspection duration, crew size, machinery costs, and
remediation. Remediation costs will vary widely based on
the action required.
Figure 11: Standing water after a rain event at a bioretention BMP.

A Guide to Low Impact Development within Utah 30
The Green Values National Stormwater Calculator summarizes a range of BMP maintenance costs and can be
found here: http://greenvalues.cnt.org/national/cost_detail.php.
Figures
The figures for each BMP show a general cross-section that is a starting point for site-specific design. Use of these
figures is appropriate for planning level design. For project design, the level of detail, the layout, and cross-
sections for the selected BMPs should meet the municipality’s CAD and design standards and include all
information required for construction.
Treatment Trains
Treatment trains are a configuration of BMPs in series
designed to achieve a pollutant reduction goal or a
volume retention goal. Treatment trains are commonly
used when a BMP can provide pretreatment to a
downstream BMP. An example of this is shown in Figure
12 at a site that is under development where a swale will
provide pretreatment for the downstream dry well.
Another scenario where a treatment train may be
appropriate is when additional BMPs are needed to
adequately provide volume retention. A scenario where
this applies is where a rain garden has insufficient space
to retain the entire water quality volume, but there is
available space for an upstream bioswale that can provide
additional retention. Site design practices can also be
part of a treatment train (WEF Press, 2012).
Treatment trains that keep runoff onsite have been found
to be more effective. For this reason, BMPs that provide
physical, chemical, and biological treatment are good candidates as these processes occur within BMPs that are
designed to capture runoff. Pollutant reduction primarily occurs within the most upstream BMP. This is due to the
theory of irreducible pollutant concentrations. Irreducible pollutant concentrations occur because of the BMP’s
inability to adsorb and degrade pollutants beyond a certain concentration (Schueler, Irreducible Pollutant
Concentrations Discharged from Stormwater Practices: The Practice of Watershed Protection, 2000). Treatment
train configuration should be considered carefully based on the water quality goals and targeted pollutants at the
site.
Proprietary Devices
Proprietary devices, such as tree box filters (Figure 13),
media filters, and underground chambers use proprietary
designs, soil mixes, aggregates, and other technologies to
accomplish volume retention and storm water treatment.
Consideration of proprietary devices, as with other LID
BMPs, should occur at the planning level. These devices
function well in highly urbanized areas where there is
limited room for other treatment options. Drainage areas
with high imperviousness will require that the device have a
larger footprint. A common design criterion for the size of
the proprietary devices is the flow-through rate and are often referred to as flow-through devices.
Figure 12: A vegetated swale that will provide pretreatment for a dry well.
Figure 13: Proprietary tree box filter
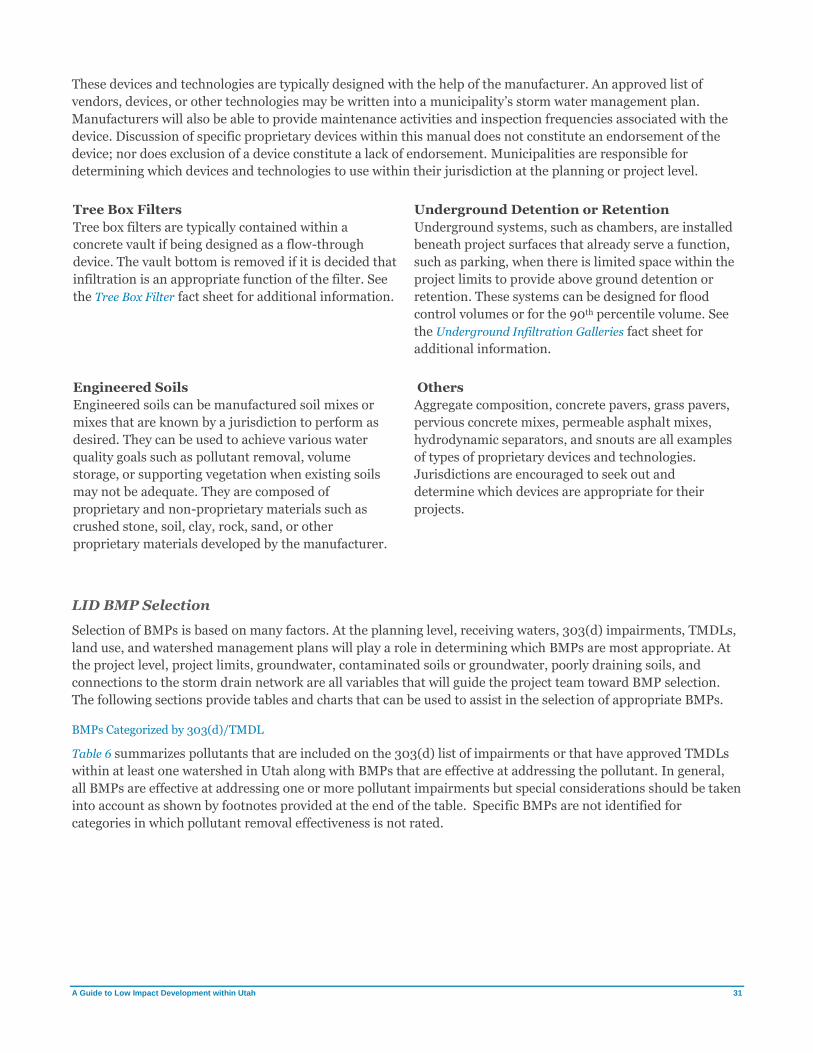
A Guide to Low Impact Development within Utah 31
These devices and technologies are typically designed with the help of the manufacturer. An approved list of
vendors, devices, or other technologies may be written into a municipality’s storm water management plan.
Manufacturers will also be able to provide maintenance activities and inspection frequencies associated with the
device. Discussion of specific proprietary devices within this manual does not constitute an endorsement of the
device; nor does exclusion of a device constitute a lack of endorsement. Municipalities are responsible for
determining which devices and technologies to use within their jurisdiction at the planning or project level.
Tree Box Filters
Tree box filters are typically contained within a
concrete vault if being designed as a flow-through
device. The vault bottom is removed if it is decided that
infiltration is an appropriate function of the filter. See
the Tree Box Filter fact sheet for additional information.
Underground Detention or Retention
Underground systems, such as chambers, are installed
beneath project surfaces that already serve a function,
such as parking, when there is limited space within the
project limits to provide above ground detention or
retention. These systems can be designed for flood
control volumes or for the 90th percentile volume. See
the Underground Infiltration Galleries fact sheet for
additional information.
Engineered Soils
Engineered soils can be manufactured soil mixes or
mixes that are known by a jurisdiction to perform as
desired. They can be used to achieve various water
quality goals such as pollutant removal, volume
storage, or supporting vegetation when existing soils
may not be adequate. They are composed of
proprietary and non-proprietary materials such as
crushed stone, soil, clay, rock, sand, or other
proprietary materials developed by the manufacturer.
Others
Aggregate composition, concrete pavers, grass pavers,
pervious concrete mixes, permeable asphalt mixes,
hydrodynamic separators, and snouts are all examples
of types of proprietary devices and technologies.
Jurisdictions are encouraged to seek out and
determine which devices are appropriate for their
projects.
LID BMP Selection
Selection of BMPs is based on many factors. At the planning level, receiving waters, 303(d) impairments, TMDLs,
land use, and watershed management plans will play a role in determining which BMPs are most appropriate. At
the project level, project limits, groundwater, contaminated soils or groundwater, poorly draining soils, and
connections to the storm drain network are all variables that will guide the project team toward BMP selection.
The following sections provide tables and charts that can be used to assist in the selection of appropriate BMPs.
BMPs Categorized by 303(d)/TMDL
Table 6 summarizes pollutants that are included on the 303(d) list of impairments or that have approved TMDLs
within at least one watershed in Utah along with BMPs that are effective at addressing the pollutant. In general,
all BMPs are effective at addressing one or more pollutant impairments but special considerations should be taken
into account as shown by footnotes provided at the end of the table. Specific BMPs are not identified for
categories in which pollutant removal effectiveness is not rated.
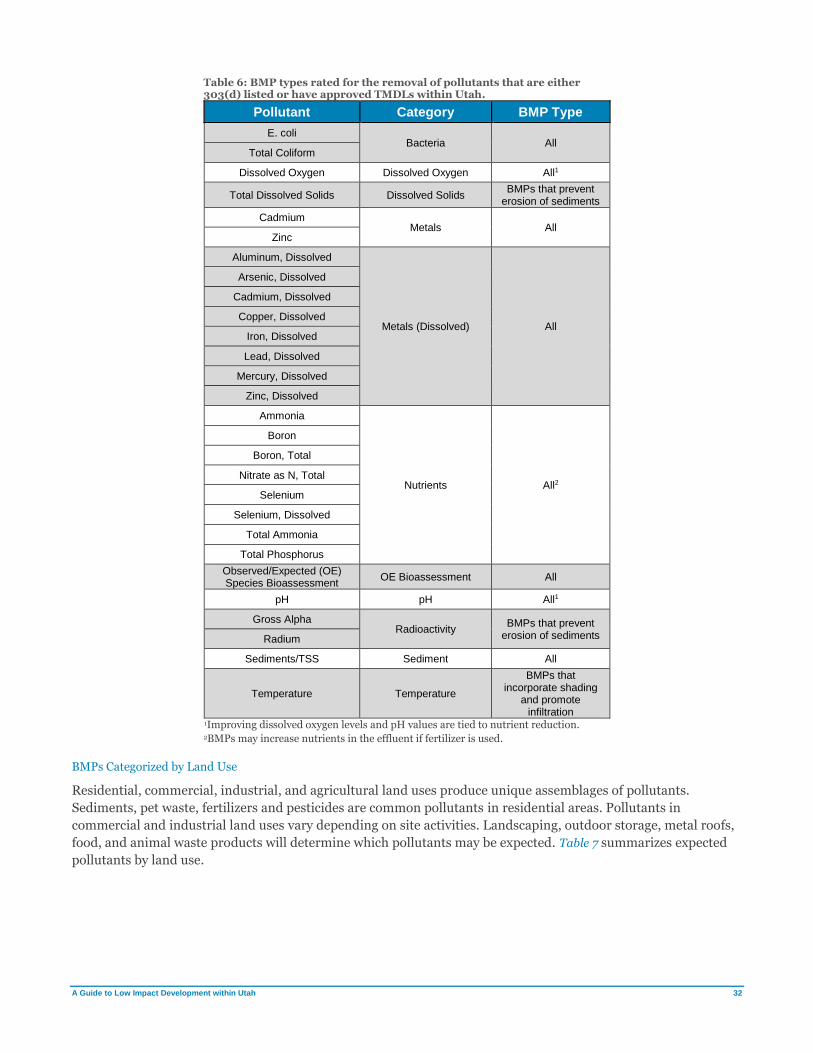
A Guide to Low Impact Development within Utah 32
Table 6: BMP types rated for the removal of pollutants that are either 303(d) listed or have approved TMDLs within Utah.
Pollutant Category BMP Type
E. coli Bacteria All
Total Coliform
Dissolved Oxygen Dissolved Oxygen All1
Total Dissolved Solids Dissolved Solids BMPs that prevent
erosion of sediments
Cadmium Metals All
Zinc
Aluminum, Dissolved
Metals (Dissolved) All
Arsenic, Dissolved
Cadmium, Dissolved
Copper, Dissolved
Iron, Dissolved
Lead, Dissolved
Mercury, Dissolved
Zinc, Dissolved
Ammonia
Nutrients All2
Boron
Boron, Total
Nitrate as N, Total
Selenium
Selenium, Dissolved
Total Ammonia
Total Phosphorus
Observed/Expected (OE) Species Bioassessment
OE Bioassessment All
pH pH All1
Gross Alpha Radioactivity
BMPs that prevent erosion of sediments Radium
Sediments/TSS Sediment All
Temperature Temperature
BMPs that incorporate shading
and promote infiltration
1Improving dissolved oxygen levels and pH values are tied to nutrient reduction. 2BMPs may increase nutrients in the effluent if fertilizer is used.
BMPs Categorized by Land Use
Residential, commercial, industrial, and agricultural land uses produce unique assemblages of pollutants.
Sediments, pet waste, fertilizers and pesticides are common pollutants in residential areas. Pollutants in
commercial and industrial land uses vary depending on site activities. Landscaping, outdoor storage, metal roofs,
food, and animal waste products will determine which pollutants may be expected. Table 7 summarizes expected
pollutants by land use.
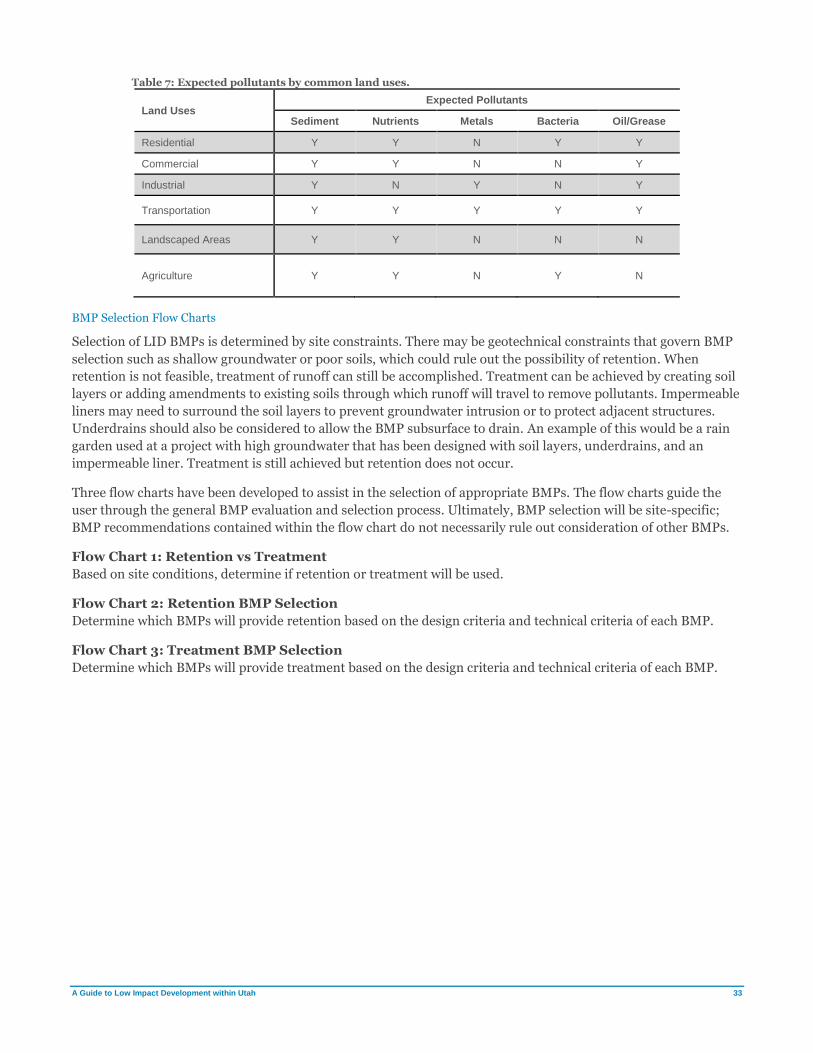
A Guide to Low Impact Development within Utah 33
Table 7: Expected pollutants by common land uses.
Land Uses Expected Pollutants
Sediment Nutrients Metals Bacteria Oil/Grease
Residential Y Y N Y Y
Commercial Y Y N N Y
Industrial Y N Y N Y
Transportation Y Y Y Y Y
Landscaped Areas Y Y N N N
Agriculture Y Y N Y N
BMP Selection Flow Charts
Selection of LID BMPs is determined by site constraints. There may be geotechnical constraints that govern BMP
selection such as shallow groundwater or poor soils, which could rule out the possibility of retention. When
retention is not feasible, treatment of runoff can still be accomplished. Treatment can be achieved by creating soil
layers or adding amendments to existing soils through which runoff will travel to remove pollutants. Impermeable
liners may need to surround the soil layers to prevent groundwater intrusion or to protect adjacent structures.
Underdrains should also be considered to allow the BMP subsurface to drain. An example of this would be a rain
garden used at a project with high groundwater that has been designed with soil layers, underdrains, and an
impermeable liner. Treatment is still achieved but retention does not occur.
Three flow charts have been developed to assist in the selection of appropriate BMPs. The flow charts guide the
user through the general BMP evaluation and selection process. Ultimately, BMP selection will be site-specific;
BMP recommendations contained within the flow chart do not necessarily rule out consideration of other BMPs.
Flow Chart 1: Retention vs Treatment
Based on site conditions, determine if retention or treatment will be used.
Flow Chart 2: Retention BMP Selection
Determine which BMPs will provide retention based on the design criteria and technical criteria of each BMP.
Flow Chart 3: Treatment BMP Selection
Determine which BMPs will provide treatment based on the design criteria and technical criteria of each BMP.
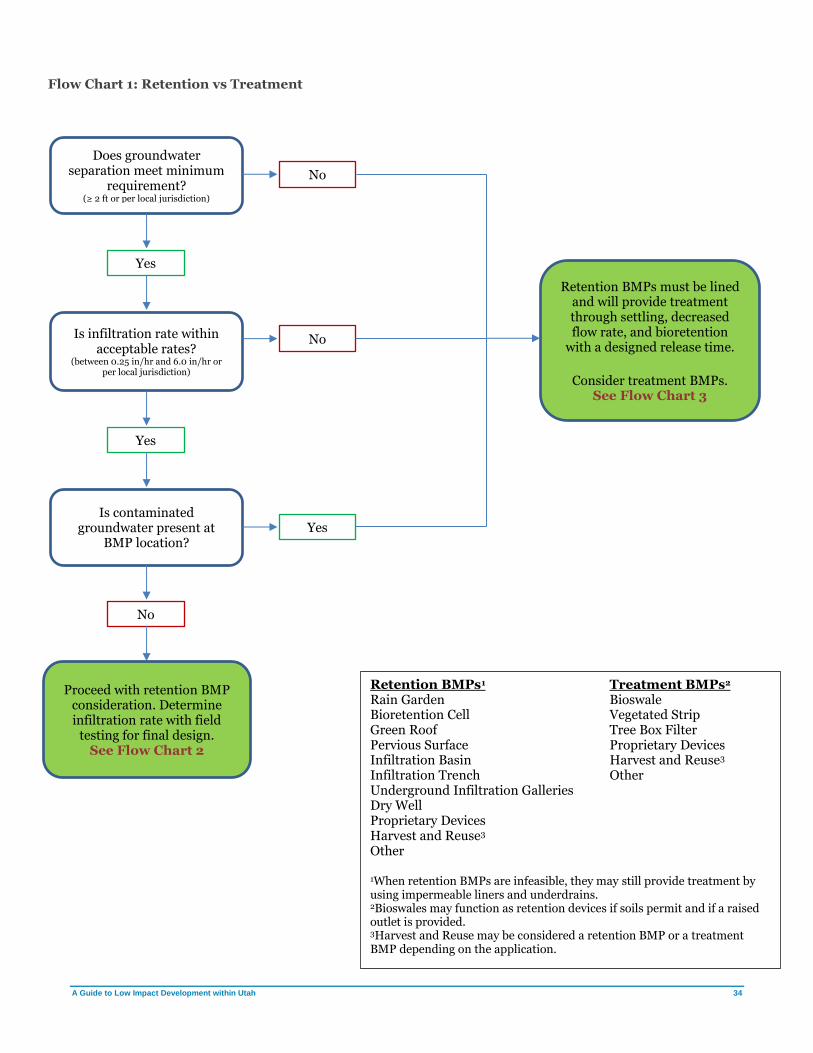
A Guide to Low Impact Development within Utah 34
Flow Chart 1: Retention vs Treatment
Does groundwater separation meet minimum
requirement? (≥ 2 ft or per local jurisdiction)
Yes
Is infiltration rate within acceptable rates?
(between 0.25 in/hr and 6.0 in/hr or per local jurisdiction)
No
Retention BMPs must be lined and will provide treatment through settling, decreased flow rate, and bioretention
with a designed release time.
Consider treatment BMPs.
See Flow Chart 3
No
Yes
Is contaminated groundwater present at
BMP location? Yes
No
Proceed with retention BMP consideration. Determine infiltration rate with field
testing for final design. See Flow Chart 2
Retention BMPs1 Treatment BMPs2 Rain Garden Bioswale Bioretention Cell Vegetated Strip
Green Roof Tree Box Filter Pervious Surface Proprietary Devices Infiltration Basin Harvest and Reuse3
Infiltration Trench Other Underground Infiltration Galleries Dry Well Proprietary Devices Harvest and Reuse3
Other
1When retention BMPs are infeasible, they may still provide treatment by using impermeable liners and underdrains. 2Bioswales may function as retention devices if soils permit and if a raised outlet is provided. 3Harvest and Reuse may be considered a retention BMP or a treatment BMP depending on the application.

A Guide to Low Impact Development within Utah 35
Flow Chart 2: Retention BMP Selection
Note: BMP recommendations contained within this flow chart does not necessarily rule out consideration of other BMPs.
Is BMP drainage area size greater than minimum for an infiltration basin (5.0 acres)?
No
Can the BMP drainage area be increased in size by
diverting flows or redesigning the site?
Yes Consider
infiltration basins.
No
Does open space exist for a rain garden or bioretention
cell?
Yes
Consider rain gardens or bioretention cells.
Can impervious surfaces be converted
to open space?
Yes
No
Does open space exist for infiltration trench
or dry well? No
Consider infiltration trench
or dry well. Yes
No Are green
roofs feasible?
Consider green roofs.
No
Consider harvest and reuse, underground
storage, or other.
Can impervious surfaces be converted to pervious surfaces?
Yes
Consider pervious surfaces.
No
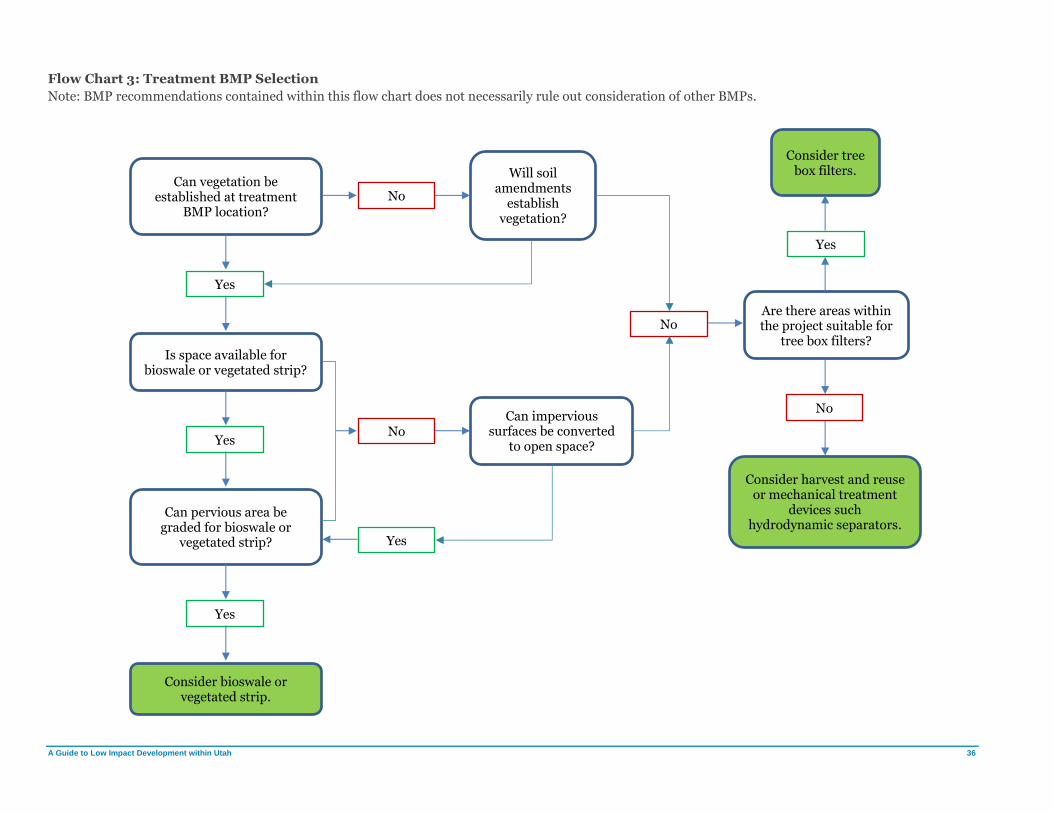
A Guide to Low Impact Development within Utah 36
Flow Chart 3: Treatment BMP Selection
Note: BMP recommendations contained within this flow chart does not necessarily rule out consideration of other BMPs.
Can vegetation be established at treatment
BMP location?
Yes
Is space available for bioswale or vegetated strip?
No
Will soil amendments
establish vegetation?
No Yes
Can pervious area be graded for bioswale or
vegetated strip? Yes
Yes
Consider bioswale or vegetated strip.
Can impervious surfaces be converted
to open space?
No Are there areas within the project suitable for
tree box filters?
Yes
Consider tree box filters.
No
Consider harvest and reuse or mechanical treatment
devices such hydrodynamic separators.
A Guide to Low Impact Development within Utah 37
Vegetation Selection
Benefits of Using Vegetation in BMPs
Vegetation plays a vital role in the viability of BMPs. In conjunction with engineered systems, they reduce
pollutants through plant uptake, protect soils from further erosion, increase percolation rates, provide habitat for
wildlife, increase aesthetic appeal of BMPs, contribute to mental health, and reduce heat retention.
Pollutant Reduction
Phytoremediation is another benefit of plant use in BMPs. Plants, can uptake pollutants through their root
systems and utilize the contaminants to promote vegetative growth above ground, thereby removing the
pollutants from soils and water. Generally, this method is more cost effective than other engineered approaches,
which may create secondary contaminated waste that must be treated and disposed of in special landfills and
through expensive treatment systems. Furthermore, when appropriate plants are selected, it does not have a
negative impact on the plant itself as the nutrients are utilized for proper growth and functions of the plant. In
conjunction with microbes, they break down otherwise harmful pollutants and either minimize pollutants to
acceptable levels or reduce them altogether.
The percent of vegetative coverage has a direct impact on the pollutant reduction performance of the BMP. During
a 2-year monitoring study of roadside vegetation by the Caltrans Division of Environmental Analysis, it was found
that a minimum coverage of at least 65% was needed for pollutant reduction to occur, but that there was a
significant decrease in pollutant reduction below 80% (Caltrans Division of Environmental Analysis, 2003). This
result is consistent with similar studies that have led to minimum vegetative requirements for various permittees
nationwide that range from 65% to 80%.
Protect Soils from Erosion
Soil erosion occurs when soil is removed through the action of wind and water at a greater rate than it is formed. Plants prevent soil erosion by providing protective cover, slowing down runoff and holding the soil in place. As raindrops fall directly on the soil the impact displaces small particles of soil causing erosion. Plants and plant litter protect the soil from the effects of raindrop impact. Vegetation that completely covers the soil and intercepts all falling raindrops on or close to the surface are the most effective in controlling soil erosion. Additionally, by slowing down runoff, fewer soil particles are carried downstream and surface water can soak into the soil. Plant cover also protects soil against wind erosion. A lack of wind breaks, such as trees, shrubs, and groundcovers, allows the wind to further displace soil particles for longer distances, increasing abrasion and erosion. Furthermore, plant roots help to bind the soil, reducing wind and water displacement. Roots also help to stabilize embankments and slopes, limiting the risk of landslides.
Mulch also adds additional protection from erosion, especially in newly seeded areas. Like vegetation, mulch protects the ground from wind and water erosion while seeds germinate and reduces the loss of soil moisture which, if not maintained, makes the soil more susceptible to wind erosion.
Increase Percolation Rates
Plant litter, root systems, and the microbes associated with the soil environment increase percolation rates
through soils. This occurs due to increased air pockets within the soil created as roots expand and contract and
decomposed vegetative material is incorporated into the soil. Additionally, the use of water by the plants as they
grow draws water through the soil to the roots and increases the permeability of soil over time through constant
microscopic movement within the soil itself. Together, these processes create voids in the soil structure allowing
water to freely move through the soil either into plant roots for uptake or down into the groundwater below.

A Guide to Low Impact Development within Utah 38
Provide Habitat for Wildlife
Vegetation plays a vital role in the quality of wildlife habitat. Plants offer wildlife food, shelter, water, and space
needed to exist. Edge areas, especially where water occurs, offers secluded places for wildlife to forage without
disturbing the BMPs. When wider habitat areas are provided, especially along edges, they provide a haven for
wildlife. Furthermore, when wildlife occupies the area they contribute to vegetation distribution and help to
control growth.
Increase Aesthetics
Form, line, color, and texture are the basic visual components of art, and their combination provides visual
interest and aesthetic appeal. A good mix of plants with their varied physical characteristics adds beauty and
aesthetics to the landscape. Some plants may have more value as a visual element in the landscape based on their
physical characteristics. Some characteristics are more visually dominant and have a higher visual value, some are
more functionally dominant, and some dominate simply by size. Upright forms, bright colors and coarse textures
are dramatic and have high visual impact. Low or prostrate forms, dull colors and fine textures are calm and have
low visual impact. The visual value of all plants is dependent on the distance from which they are viewed, the time
of year, the quality of light, the adjacent plants, and the plants' health.
Creatively using vegetation within BMPs reduces negative visual impacts of the BMP, makes them more visually
pleasing, and increases acceptance of BMP practices within urbanized areas, especially where residential areas are
involved. Each plant must be considered individually when selecting plants for a composition, but the entire
composition takes on greater importance than the individual plants. For this reason, it is important to think about
how the characteristics of each plant will relate to the plant or hardscape next to it.
Contribute to Mental Health
Plants generally have a positive influence on mental health. In increasingly urbanized and developed areas, they
provide respite and a sense of connectivity to nature.
Reduce Heat Retention
Vegetation also can mitigate the effect of heat islands created by development. By increasing areas for plants to
grow, including within BMPs, increased shade is provided. The added shade combined with evapotranspiration
naturally occurring from plants creates a cooling effect. Furthermore, trees and vines planted near buildings help
to provide shade and insulation to existing buildings which provide a cooling effect and helps to mitigate cooling
costs associated with urban living. One study that analyzed cost savings in Ft Collins, CO, Cheyenne, WY,
Bismarck, ND, Berkeley, CA, and Glendale, AZ showed that a net savings of $30-$90 per tree ($40-$120 when
adjusted for inflation) was achieved by planting trees in urban environments. (McPherson, Simpson, Peper, Maco,
& Xiao, 2005).
Coordinating with a local Utah State University extension or a local nursery can help ensure appropriate plants
are chosen for a project.
Vegetation Considerations
In choosing plant species for LID, several considerations need to be made to ensure establishment and long-term
plant health. Factors that should be considered include: adaptability of plants to the site conditions, water
consumption requirements, soil types, the ability to withstand air and soil pollutants, and heat and cold
tolerances.
Site Conditions
When selecting vegetation for LID sites, it is critical to consider the needs of the plants and match them to the
current and future site conditions. As the landscape transforms into a built environment, it is important to
understand that the minimum and maximum temperatures will change, and microclimates will be created. As the

A Guide to Low Impact Development within Utah 39
heat index increases, evapotranspiration rates will also increase. Reflected heat off pavement, concrete, and glass
can also burn plants. Furthermore, natural drainage patterns are altered as buildings and infrastructure are
developed changing the soil structure and porosity, nutrient availability, and availability of water. Therefore,
plants selected must be adaptable to and be tolerant of the changing site conditions. Their ability to improve
water, soil and air quality and reduce the heat island effect caused by development should also be considered.
Species native to the project area are often better suited to current site conditions; however, plant materials
adapted to the changing site conditions may also be a good choice.
Water Requirements
In the arid environment of Utah, it is critical that plants are drought tolerant. This not only helps reduce plant
stress, but conserves water. Plants that are not well adapted to the region will tend to be more stressed and
therefore, require more water, nutrient supplements, and overall management. The use of additional fertilizer to
aid stressed plants can contribute to water pollution. Plants that are not suitable to more arid environments are
generally not a good choice for Utah landscapes.
Many municipalities have landscape ordinances that require minimum vegetative cover or percentages of trees
and shrubs. In most cases, these landscape ordinances do not preclude the use of native or water wise vegetation.
Additional planning and careful selection may be needed to meet these and any other aesthetic requirements.
Fluctuation in soil moisture conditions is also a critical consideration. Typically, plants that can tolerate wide
fluctuations in soil moisture, including saturated conditions with standing water, are good choices for basins,
swales, bioretention cells, rain gardens, and tree box filters while plants needing good drainage are better suited to
basin slopes and upland areas.
Soil
Some plants prefer growing in consistently moist soils while others prefer dry soil with only intermittent changes
in moisture levels. Also, the soil’s alkalinity, salinity and soil structure are important factors. For example, plants
that tend to do well in dry, shallow, rocky soils with a higher tolerance for salt buildup will tend to do better in
rooftop gardens compared to plants that prefer acidic bog-like conditions that are better suited to a bioretention
cell or rain garden.
Another factor to consider is the soil’s structure as it impacts the root system of plants. Plants with shallow surface
roots would not be an appropriate choice for areas that may be inundated with heavy flows of surface water, while
those with deep taproots would be a better choice.
Plants that have a proven ability to tolerate soil compaction, increased heat, and reduced air flow are best suited
for landscape strips. Parking lots along streets require plants that can produce strong tap roots, especially for trees
which may otherwise blow over in wind gusts.
It is also important to consider the soil in relation to microbes and plant material, especially for tree box filters
and bioretention cells. Plants, soil, and microbes work symbiotically in these situations to alter or reduce the
quantity of pollutants collected in storm water and rain water. Some of the nutrients are utilized directly by the
plants and soil microbes reducing them to acceptable levels. Selecting plants that are effective at pollutant
reduction will ensure that the pollutants are not toxic to the plants.
Air Quality
Plant tolerance to air pollution is another important consideration. Some plants thrive in higher carbon pollutant
environments, for example, while others may experience stunted growth. Air pollutants to consider include:
carbon monoxide, ground-level ozone, lead, sulfur dioxide, particulate matter, and nitrogen dioxide.

A Guide to Low Impact Development within Utah 40
Heat and Cold Tolerance
In addition to soil and water considerations, heat and cold tolerances of plants should be considered. The map of
plant hardiness zones in Appendix D identifies areas by the lowest annual minimum temperature. Plants associated
with each zone are identified in Appendix E and are generally tolerant of the coldest temperatures in the area. The
other consideration is heat tolerance of plants, which in drier and hotter desert regions is equally important and
can be detrimental to plant health. This information can be found using the American Horticultural Society Heat
Zone Map for the United States (http://www.ahsgardening.org/gardening-resources/gardening-maps/heat-zone-
map). The map identifies the average number of days a specific area experiences extreme heat. Also, it is
important to consider the reflectivity of surfaces such as buildings and sidewalks on leaves and bark. Highly
reflective surfaces tend to increase the ambient temperature around plants and can injure them to the point of
plant death.
A plant selection matrix containing appropriate trees, grasses, shrubs, and groundcover for the LID BMPs covered
in this manual is provided in Appendix E.
If applicable to the site, vegetation for BMPs should meet the following conditions:
• Vegetation is adapted to the local climate, considering seasonal temperature ranges and average rainfall,
exposure to direct sun, frost, wind, and desired irrigation practices.
• Plants selected are tolerant of weather conditions at the specific site such as extreme high and low
temperatures, strong winds, sun, and snow. (Appendix E contains a matrix of example plants identified by
climate zones within Utah and BMPs for each.)
• Vegetation is tolerant of varied moisture conditions (wet and dry).
• Plants are adaptable to varying soil types and conditions.
• Species are non-invasive for the area and site conditions (will not readily spread by air, seed transport, or
root invasion).
• Flora is resistant to wildlife foraging such as deer, elk, and rabbits and local pests and diseases.
• Vegetation provides habitat value and linkages to larger open spaces on the fringe of urban developments.
• Site maintenance requirements (e.g., invasive root growth, pruning, thinning, dead-heading), site
accessibility, and the ability of the property owner to maintain the specific vegetation is feasible.
• Vegetation adheres to local design criteria such as height limitations and approved plant lists.
• Plants are readily available in local or regional nurseries.
• Flora has an attractive appearance and aesthetic value.
• Vegetation is appropriate for the type of pollution present and desired pollutant removal.
Vegetation Guidance by BMP Type
Bioretention/Bioswales/Infiltration/Detention
Typically, bioretention BMPs receive greater pollution due to storm runoff from streets and roadways; and these
BMPs receive water after every storm event. As a result, they require plants that:
• Have a greater ability for nutrient uptake and pollutant neutralization.
• Can survive in boggy and moist soils.
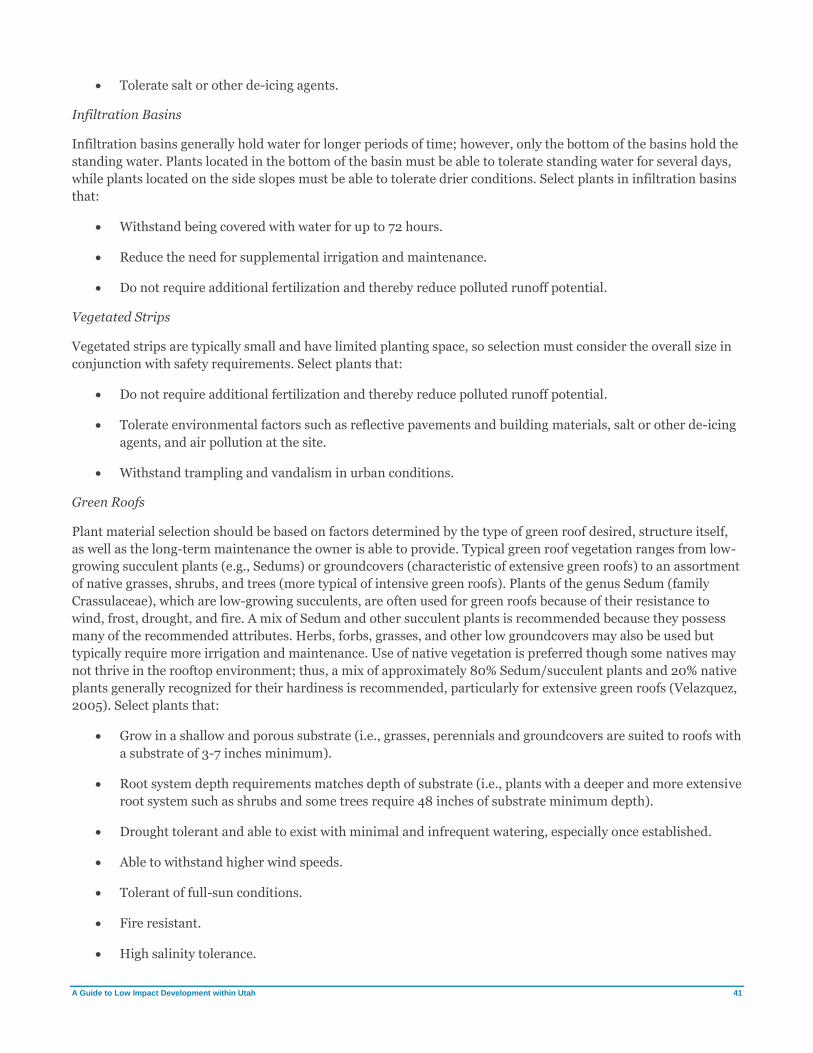
A Guide to Low Impact Development within Utah 41
• Tolerate salt or other de-icing agents.
Infiltration Basins
Infiltration basins generally hold water for longer periods of time; however, only the bottom of the basins hold the
standing water. Plants located in the bottom of the basin must be able to tolerate standing water for several days,
while plants located on the side slopes must be able to tolerate drier conditions. Select plants in infiltration basins
that:
• Withstand being covered with water for up to 72 hours.
• Reduce the need for supplemental irrigation and maintenance.
• Do not require additional fertilization and thereby reduce polluted runoff potential.
Vegetated Strips
Vegetated strips are typically small and have limited planting space, so selection must consider the overall size in
conjunction with safety requirements. Select plants that:
• Do not require additional fertilization and thereby reduce polluted runoff potential.
• Tolerate environmental factors such as reflective pavements and building materials, salt or other de-icing
agents, and air pollution at the site.
• Withstand trampling and vandalism in urban conditions.
Green Roofs
Plant material selection should be based on factors determined by the type of green roof desired, structure itself,
as well as the long-term maintenance the owner is able to provide. Typical green roof vegetation ranges from low-
growing succulent plants (e.g., Sedums) or groundcovers (characteristic of extensive green roofs) to an assortment
of native grasses, shrubs, and trees (more typical of intensive green roofs). Plants of the genus Sedum (family
Crassulaceae), which are low-growing succulents, are often used for green roofs because of their resistance to
wind, frost, drought, and fire. A mix of Sedum and other succulent plants is recommended because they possess
many of the recommended attributes. Herbs, forbs, grasses, and other low groundcovers may also be used but
typically require more irrigation and maintenance. Use of native vegetation is preferred though some natives may
not thrive in the rooftop environment; thus, a mix of approximately 80% Sedum/succulent plants and 20% native
plants generally recognized for their hardiness is recommended, particularly for extensive green roofs (Velazquez,
2005). Select plants that:
• Grow in a shallow and porous substrate (i.e., grasses, perennials and groundcovers are suited to roofs with
a substrate of 3-7 inches minimum).
• Root system depth requirements matches depth of substrate (i.e., plants with a deeper and more extensive
root system such as shrubs and some trees require 48 inches of substrate minimum depth).
• Drought tolerant and able to exist with minimal and infrequent watering, especially once established.
• Able to withstand higher wind speeds.
• Tolerant of full-sun conditions.
• Fire resistant.
• High salinity tolerance.

A Guide to Low Impact Development within Utah 42
• Lower maintenance requirements since access is limited.
• Are primarily non-deciduous to provide adequate foliage cover year-round and reduce erosion potential.
• Have good regenerative qualities (i.e., perennial or self-sowing).
• Are low maintenance (i.e., no fertilizers, pesticides, or herbicides, little or no mowing or trimming).
• Have growth patterns allowing vegetation to thoroughly cover the soil (at least 90% surface area coverage
should be achieved within 2 years).
• Are compatible with the aesthetic preferences of the owner and future building occupants who may utilize
the roof as a green space.
Steps to Selecting Vegetation for BMPs
To identify vegetation for specific sites and BMPs, consider the following steps:
1. Consider consulting with a landscape architect and/or horticulturalist to assist in the appropriate
selection and design for each BMP in conjunction with other professionals such as engineers and
architects.
2. Identify the hardiness zone(s) at the site.
3. Identify which BMPs will be used.
4. Determine if there are any microclimates within the site that need to be considered.
5. Identify plants that will best work for the BMP based on the hardiness zone and site’s microclimates (See
Appendix E Utah Plant Selection Matrix by Climate Zone and BMP for more information.)
6. Develop a landscape plan that considers site conditions, erosion protection, pollutant mitigation, human
use of and interaction with the site, creation of wildlife habitat, aesthetics, and site and BMP maintenance.
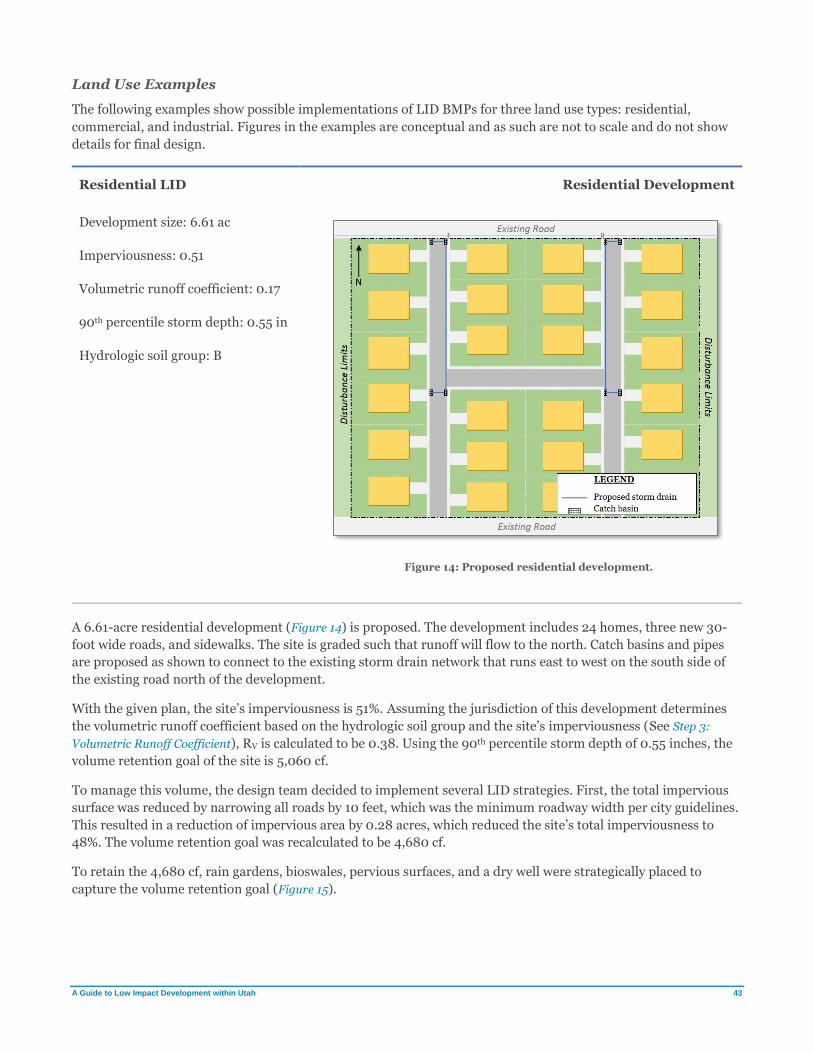
A Guide to Low Impact Development within Utah 43
Land Use Examples
The following examples show possible implementations of LID BMPs for three land use types: residential,
commercial, and industrial. Figures in the examples are conceptual and as such are not to scale and do not show
details for final design.
Residential LID Residential Development
Development size: 6.61 ac
Figure 14: Proposed residential development.
Imperviousness: 0.51
Volumetric runoff coefficient: 0.17
90th percentile storm depth: 0.55 in
Hydrologic soil group: B
A 6.61-acre residential development (Figure 14) is proposed. The development includes 24 homes, three new 30-
foot wide roads, and sidewalks. The site is graded such that runoff will flow to the north. Catch basins and pipes
are proposed as shown to connect to the existing storm drain network that runs east to west on the south side of
the existing road north of the development.
With the given plan, the site’s imperviousness is 51%. Assuming the jurisdiction of this development determines
the volumetric runoff coefficient based on the hydrologic soil group and the site’s imperviousness (See Step 3:
Volumetric Runoff Coefficient), RV is calculated to be 0.38. Using the 90th percentile storm depth of 0.55 inches, the
volume retention goal of the site is 5,060 cf.
To manage this volume, the design team decided to implement several LID strategies. First, the total impervious
surface was reduced by narrowing all roads by 10 feet, which was the minimum roadway width per city guidelines.
This resulted in a reduction of impervious area by 0.28 acres, which reduced the site’s total imperviousness to
48%. The volume retention goal was recalculated to be 4,680 cf.
To retain the 4,680 cf, rain gardens, bioswales, pervious surfaces, and a dry well were strategically placed to
capture the volume retention goal (Figure 15).
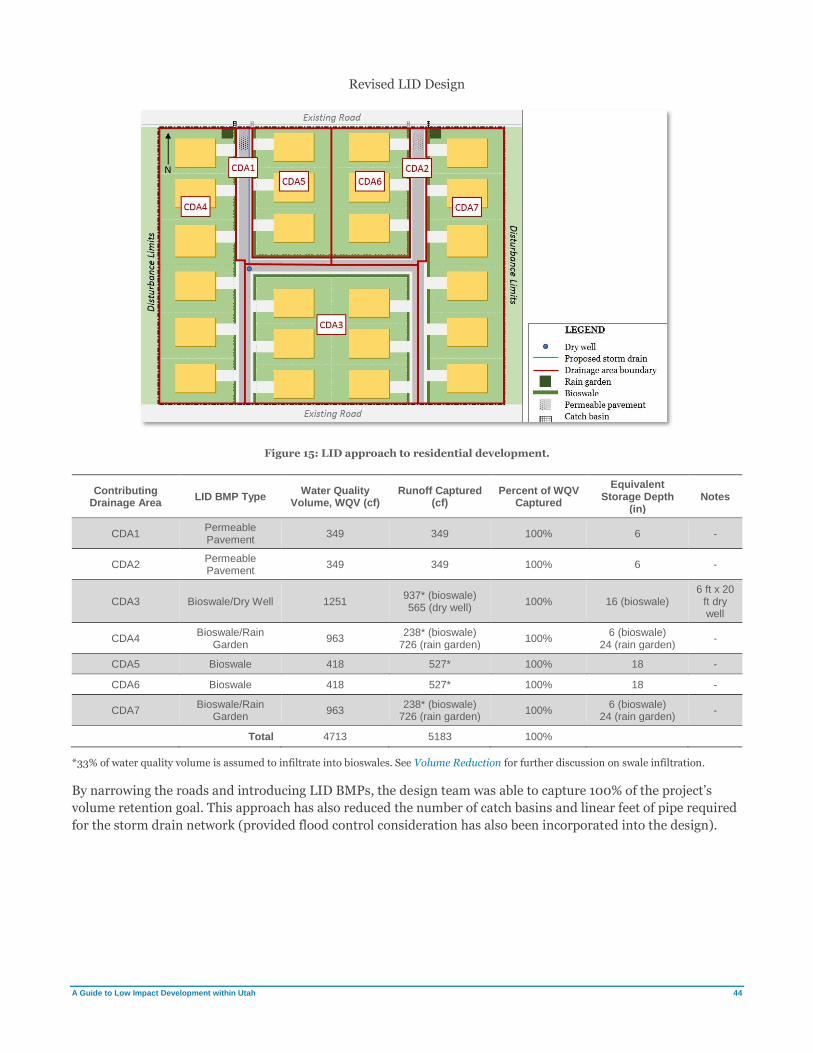
A Guide to Low Impact Development within Utah 44
Revised LID Design
Figure 15: LID approach to residential development.
Contributing Drainage Area
LID BMP Type Water Quality
Volume, WQV (cf) Runoff Captured
(cf) Percent of WQV
Captured
Equivalent Storage Depth
(in) Notes
CDA1 Permeable Pavement
349 349 100% 6 -
CDA2 Permeable Pavement
349 349 100% 6 -
CDA3 Bioswale/Dry Well 1251 937* (bioswale) 565 (dry well)
100% 16 (bioswale) 6 ft x 20
ft dry well
CDA4 Bioswale/Rain
Garden 963
238* (bioswale) 726 (rain garden)
100% 6 (bioswale)
24 (rain garden) -
CDA5 Bioswale 418 527* 100% 18 -
CDA6 Bioswale 418 527* 100% 18 -
CDA7 Bioswale/Rain
Garden 963
238* (bioswale) 726 (rain garden)
100% 6 (bioswale)
24 (rain garden) -
Total 4713 5183 100%
*33% of water quality volume is assumed to infiltrate into bioswales. See Volume Reduction for further discussion on swale infiltration.
By narrowing the roads and introducing LID BMPs, the design team was able to capture 100% of the project’s
volume retention goal. This approach has also reduced the number of catch basins and linear feet of pipe required
for the storm drain network (provided flood control consideration has also been incorporated into the design).
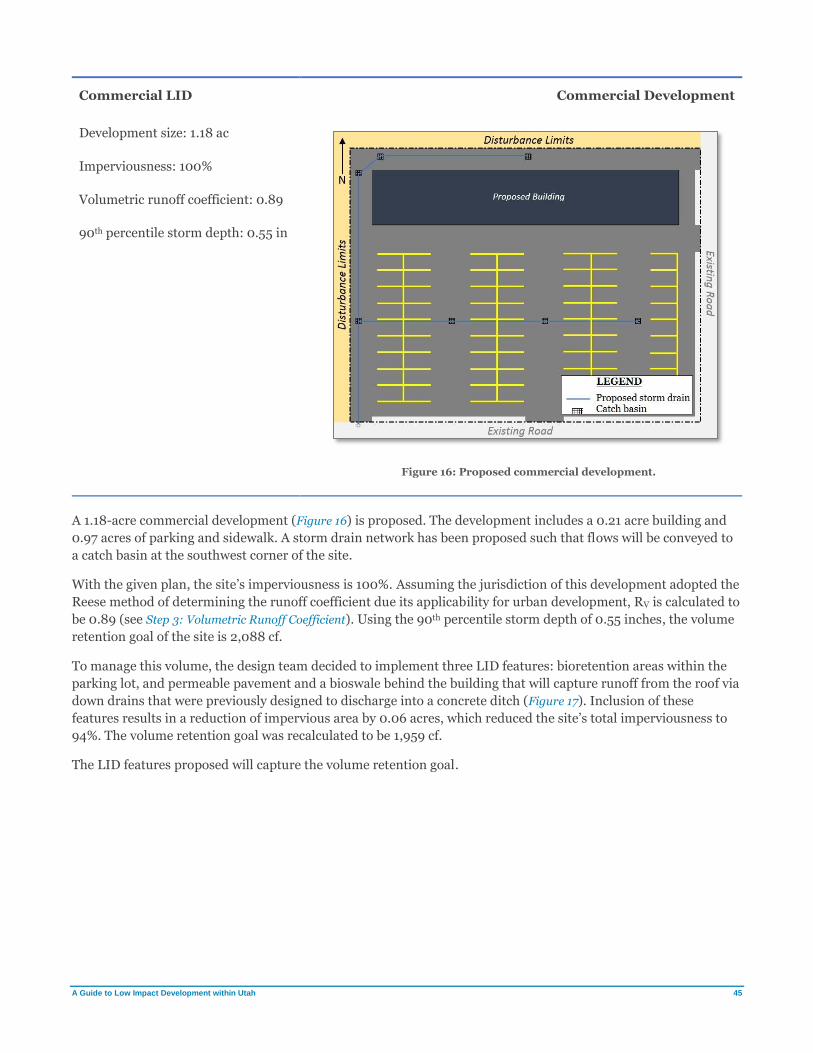
A Guide to Low Impact Development within Utah 45
Commercial LID Commercial Development
Development size: 1.18 ac
Figure 16: Proposed commercial development.
Imperviousness: 100%
Volumetric runoff coefficient: 0.89
90th percentile storm depth: 0.55 in
A 1.18-acre commercial development (Figure 16) is proposed. The development includes a 0.21 acre building and
0.97 acres of parking and sidewalk. A storm drain network has been proposed such that flows will be conveyed to
a catch basin at the southwest corner of the site.
With the given plan, the site’s imperviousness is 100%. Assuming the jurisdiction of this development adopted the
Reese method of determining the runoff coefficient due its applicability for urban development, RV is calculated to
be 0.89 (see Step 3: Volumetric Runoff Coefficient). Using the 90th percentile storm depth of 0.55 inches, the volume
retention goal of the site is 2,088 cf.
To manage this volume, the design team decided to implement three LID features: bioretention areas within the
parking lot, and permeable pavement and a bioswale behind the building that will capture runoff from the roof via
down drains that were previously designed to discharge into a concrete ditch (Figure 17). Inclusion of these
features results in a reduction of impervious area by 0.06 acres, which reduced the site’s total imperviousness to
94%. The volume retention goal was recalculated to be 1,959 cf.
The LID features proposed will capture the volume retention goal.
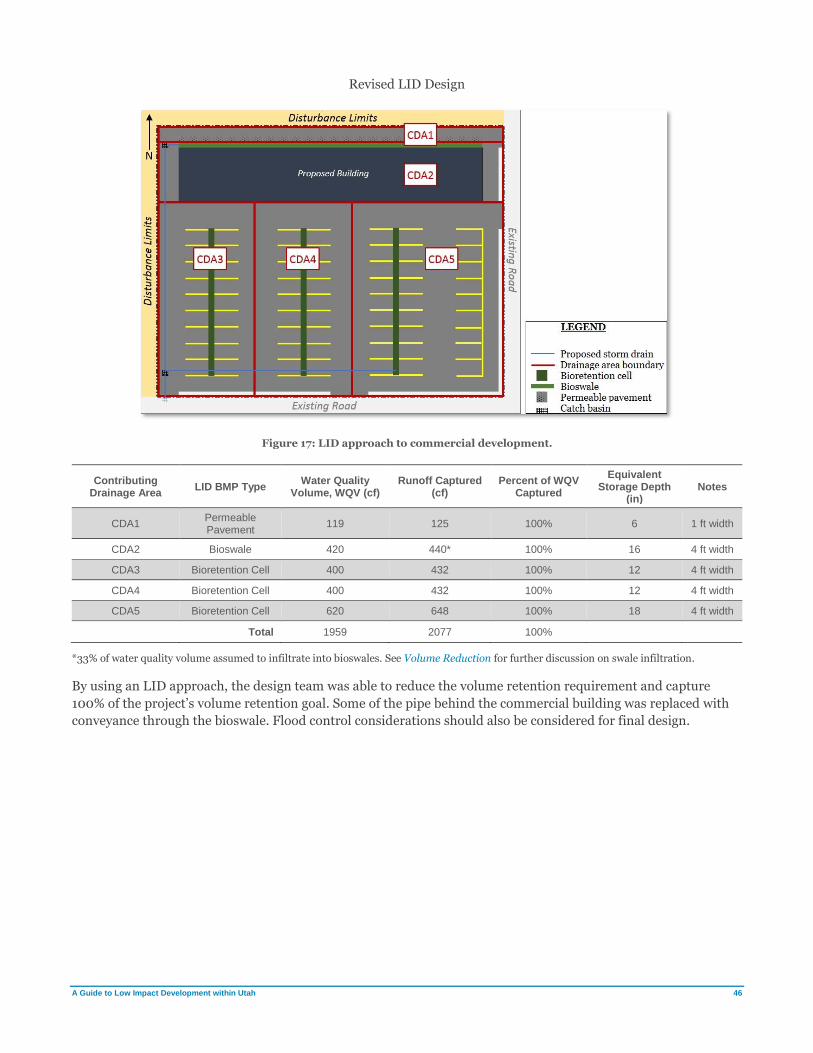
A Guide to Low Impact Development within Utah 46
Revised LID Design
Figure 17: LID approach to commercial development.
Contributing Drainage Area
LID BMP Type Water Quality
Volume, WQV (cf) Runoff Captured
(cf) Percent of WQV
Captured
Equivalent Storage Depth
(in) Notes
CDA1 Permeable Pavement
119 125 100% 6 1 ft width
CDA2 Bioswale 420 440* 100% 16 4 ft width
CDA3 Bioretention Cell 400 432 100% 12 4 ft width
CDA4 Bioretention Cell 400 432 100% 12 4 ft width
CDA5 Bioretention Cell 620 648 100% 18 4 ft width
Total 1959 2077 100%
*33% of water quality volume assumed to infiltrate into bioswales. See Volume Reduction for further discussion on swale infiltration.
By using an LID approach, the design team was able to reduce the volume retention requirement and capture
100% of the project’s volume retention goal. Some of the pipe behind the commercial building was replaced with
conveyance through the bioswale. Flood control considerations should also be considered for final design.
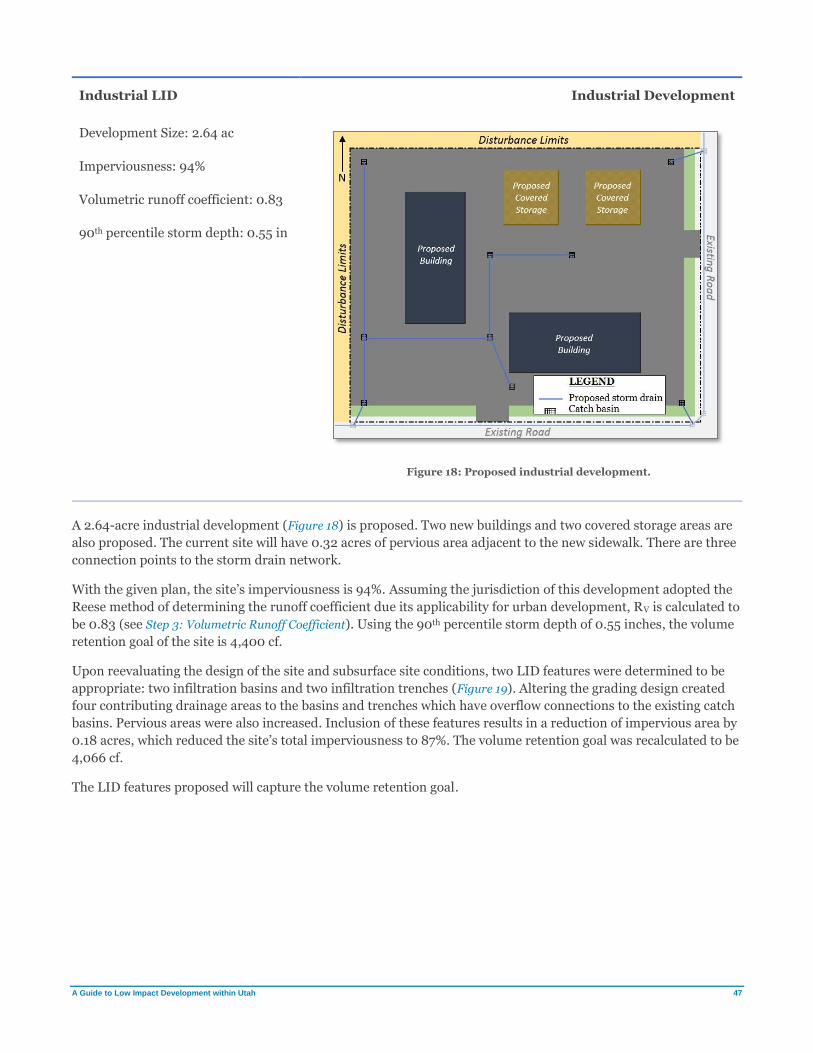
A Guide to Low Impact Development within Utah 47
Industrial LID Industrial Development
Development Size: 2.64 ac
Figure 18: Proposed industrial development.
Imperviousness: 94%
Volumetric runoff coefficient: 0.83
90th percentile storm depth: 0.55 in
A 2.64-acre industrial development (Figure 18) is proposed. Two new buildings and two covered storage areas are
also proposed. The current site will have 0.32 acres of pervious area adjacent to the new sidewalk. There are three
connection points to the storm drain network.
With the given plan, the site’s imperviousness is 94%. Assuming the jurisdiction of this development adopted the
Reese method of determining the runoff coefficient due its applicability for urban development, RV is calculated to
be 0.83 (see Step 3: Volumetric Runoff Coefficient). Using the 90th percentile storm depth of 0.55 inches, the volume
retention goal of the site is 4,400 cf.
Upon reevaluating the design of the site and subsurface site conditions, two LID features were determined to be
appropriate: two infiltration basins and two infiltration trenches (Figure 19). Altering the grading design created
four contributing drainage areas to the basins and trenches which have overflow connections to the existing catch
basins. Pervious areas were also increased. Inclusion of these features results in a reduction of impervious area by
0.18 acres, which reduced the site’s total imperviousness to 87%. The volume retention goal was recalculated to be
4,066 cf.
The LID features proposed will capture the volume retention goal.
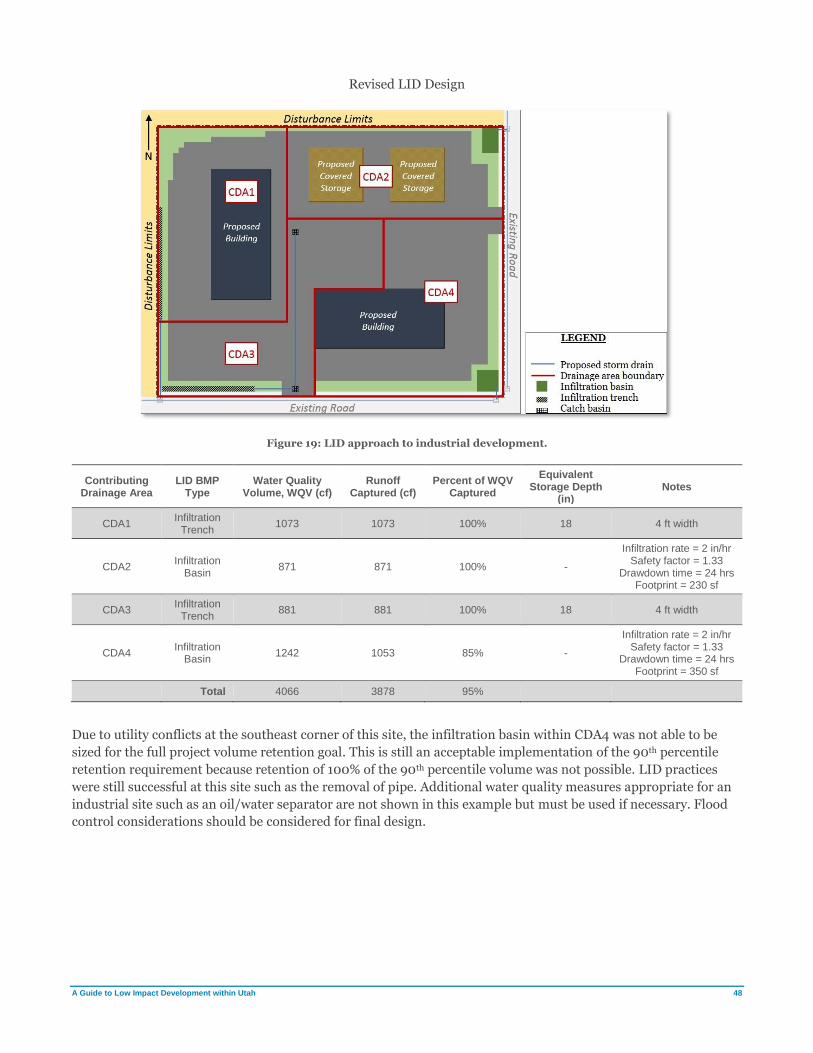
A Guide to Low Impact Development within Utah 48
Revised LID Design
Figure 19: LID approach to industrial development.
Contributing Drainage Area
LID BMP Type
Water Quality Volume, WQV (cf)
Runoff Captured (cf)
Percent of WQV Captured
Equivalent Storage Depth
(in) Notes
CDA1 Infiltration
Trench 1073 1073 100% 18 4 ft width
CDA2 Infiltration
Basin 871 871 100% -
Infiltration rate = 2 in/hr Safety factor = 1.33
Drawdown time = 24 hrs Footprint = 230 sf
CDA3 Infiltration
Trench 881 881 100% 18 4 ft width
CDA4 Infiltration
Basin 1242 1053 85% -
Infiltration rate = 2 in/hr Safety factor = 1.33
Drawdown time = 24 hrs Footprint = 350 sf
Total 4066 3878 95%
Due to utility conflicts at the southeast corner of this site, the infiltration basin within CDA4 was not able to be
sized for the full project volume retention goal. This is still an acceptable implementation of the 90th percentile
retention requirement because retention of 100% of the 90th percentile volume was not possible. LID practices
were still successful at this site such as the removal of pipe. Additional water quality measures appropriate for an
industrial site such as an oil/water separator are not shown in this example but must be used if necessary. Flood
control considerations should be considered for final design.
A Guide to Low Impact Development within Utah 49
Local Case Studies
Preface to Case Studies
The following case studies are examples of LID features that were designed with the purpose of collecting urban
storm water. They are significant because they demonstrate that within Utah’s semiarid climate, bioretention and
LID approaches can be successfully implemented. Two of the sites are within Salt Lake County and one is in
Grand County.
The sites discussed are:
➢ Bioretention Area at Mountview Park in Cottonwood Heights
A bioretention area within a large park captures runoff from parking lots within the park and from a
nearby residential area.
➢ Various LID BMPs at the Sandy City Public Works facility
Rain gardens, bioswales, vegetated swales, concrete pavers, and permeable asphalt detain and treat
runoff from a public works facility.
➢ Permaculture Garden at Utah State University Moab
As part of a landscaping renovation at the campus, impervious areas are converted to infiltrating
swales and increased pervious surfaces that sustains various plant life.
Note that each of these projects was designed and constructed prior to adoption of the 90th percentile storm water
retention requirement. As part of the evaluation of these sites, calculations using methods from the previous
section were performed to determine whether the sites would be able to successfully retain the 90th percentile
storm depth for the BMPs’ drainage areas. The bioretention area at Mountview is undersized for the 90th
percentile storm depth. The BMPs at the Sandy City Public Works were designed with the 90th percentile storm
volume in mind and four of the nine BMPs were able to be sized for the full water quality volume. Approximate
calculations for the 90th percentile storm volume for the Utah State University Moab site were also made.

A Guide to Low Impact Development within Utah 50
Bioretention Mountview Park – Cottonwood Heights
Location: 40.6274, -111.8449
Figure 20: Bioretention area at Mountview Park.
Contributing Drainage Area: 18.86
ac
Imperviousness: 65% (approx.)
Bioretention Footprint: 2,470 sf
Soil Type: A (Web Soil Survey)
This bioretention area is one of two constructed by The University of Utah for research purposes in the Spring
of 2012 to determine if bioretention is a feasible option in Utah’s semiarid climate (Heiberger, 2013). The
bioretention area at Mountview Park remains intact (Figure 20); however, the other bioretention site that was
constructed on The University of Utah campus has been removed.
The bioretention area is approximately 2,470 sf and has a depth of 4 ft. There are two layers within the
bioretention area: the top layer is 2 feet of native backfill soil; the bottom layer is 2 feet of a subsurface reservoir
layer composed of Utelite 3/4” medium grade aggregate with a porosity of 53%. Utelite aggregate was selected
due to its filtering and planting applications. The porosity of the top layer is 0.25, resulting in a storage capacity
of 1,235 cf. The reservoir layer allows for storage of up to 2,620 cubic feet. The total storage capacity is 3,853 cf.
The nearest rain gage with reliable historical data is the Cottonwood Weir rain gage. Its 90th percentile storm
depth is 0.86 inches. The drainage area’s total imperviousness is approximately 65%. The runoff coefficient was
determined to be 0.57. The water quality volume for this drainage area would be 33,553 cf. which means that
the existing bioretention area is undersized for the water quality volume.
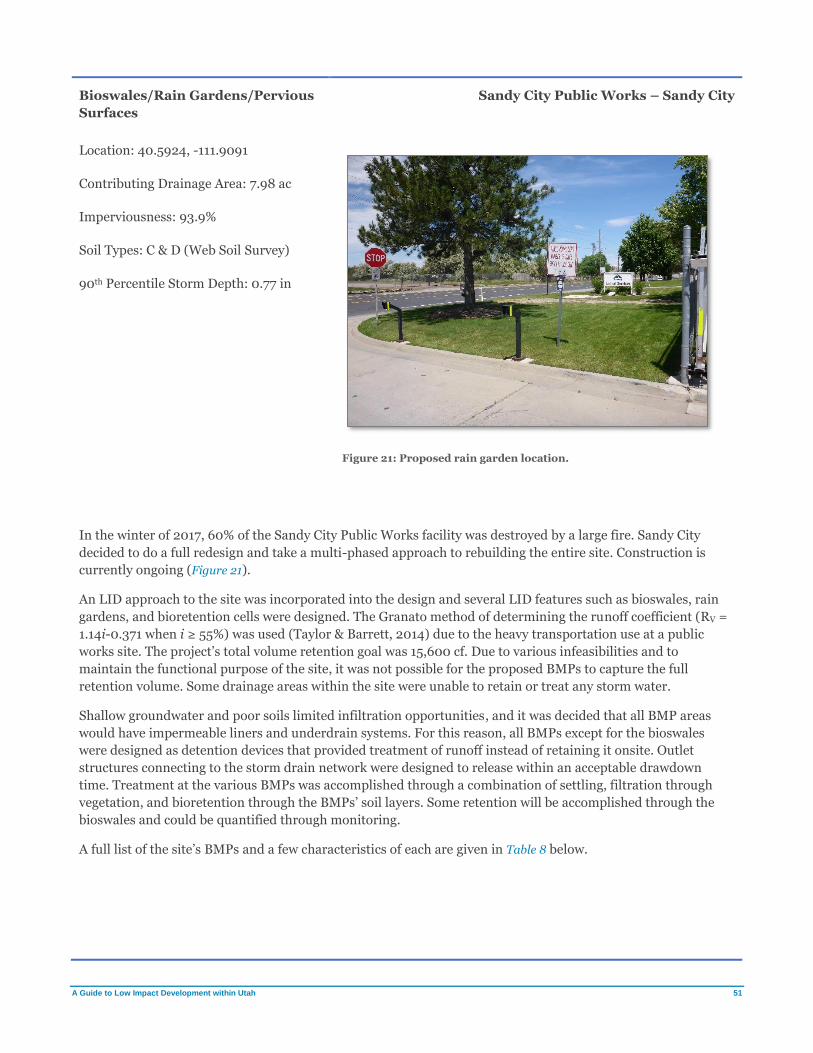
A Guide to Low Impact Development within Utah 51
Bioswales/Rain Gardens/Pervious
Surfaces
Sandy City Public Works – Sandy City
Location: 40.5924, -111.9091
Figure 21: Proposed rain garden location.
Contributing Drainage Area: 7.98 ac
Imperviousness: 93.9%
Soil Types: C & D (Web Soil Survey)
90th Percentile Storm Depth: 0.77 in
In the winter of 2017, 60% of the Sandy City Public Works facility was destroyed by a large fire. Sandy City
decided to do a full redesign and take a multi-phased approach to rebuilding the entire site. Construction is
currently ongoing (Figure 21).
An LID approach to the site was incorporated into the design and several LID features such as bioswales, rain
gardens, and bioretention cells were designed. The Granato method of determining the runoff coefficient (RV =
1.14i-0.371 when i ≥ 55%) was used (Taylor & Barrett, 2014) due to the heavy transportation use at a public
works site. The project’s total volume retention goal was 15,600 cf. Due to various infeasibilities and to
maintain the functional purpose of the site, it was not possible for the proposed BMPs to capture the full
retention volume. Some drainage areas within the site were unable to retain or treat any storm water.
Shallow groundwater and poor soils limited infiltration opportunities, and it was decided that all BMP areas
would have impermeable liners and underdrain systems. For this reason, all BMPs except for the bioswales
were designed as detention devices that provided treatment of runoff instead of retaining it onsite. Outlet
structures connecting to the storm drain network were designed to release within an acceptable drawdown
time. Treatment at the various BMPs was accomplished through a combination of settling, filtration through
vegetation, and bioretention through the BMPs’ soil layers. Some retention will be accomplished through the
bioswales and could be quantified through monitoring.
A full list of the site’s BMPs and a few characteristics of each are given in Table 8 below.
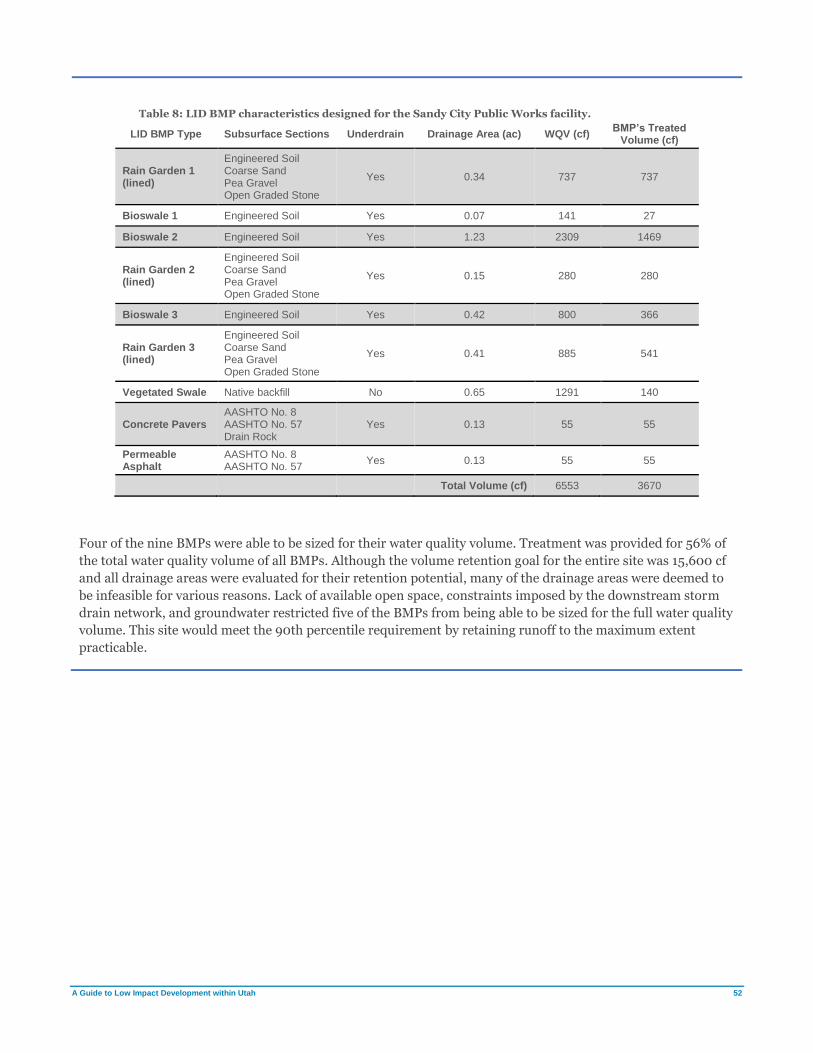
A Guide to Low Impact Development within Utah 52
Table 8: LID BMP characteristics designed for the Sandy City Public Works facility.
LID BMP Type Subsurface Sections Underdrain Drainage Area (ac) WQV (cf) BMP’s Treated
Volume (cf)
Rain Garden 1 (lined)
Engineered Soil Coarse Sand Pea Gravel Open Graded Stone
Yes 0.34 737 737
Bioswale 1 Engineered Soil Yes 0.07 141 27
Bioswale 2 Engineered Soil Yes 1.23 2309 1469
Rain Garden 2 (lined)
Engineered Soil Coarse Sand Pea Gravel Open Graded Stone
Yes 0.15 280 280
Bioswale 3 Engineered Soil Yes 0.42 800 366
Rain Garden 3 (lined)
Engineered Soil Coarse Sand Pea Gravel Open Graded Stone
Yes 0.41 885 541
Vegetated Swale Native backfill No 0.65 1291 140
Concrete Pavers AASHTO No. 8 AASHTO No. 57 Drain Rock
Yes 0.13 55 55
Permeable Asphalt
AASHTO No. 8 AASHTO No. 57
Yes 0.13 55 55
Total Volume (cf) 6553 3670
Four of the nine BMPs were able to be sized for their water quality volume. Treatment was provided for 56% of
the total water quality volume of all BMPs. Although the volume retention goal for the entire site was 15,600 cf
and all drainage areas were evaluated for their retention potential, many of the drainage areas were deemed to
be infeasible for various reasons. Lack of available open space, constraints imposed by the downstream storm
drain network, and groundwater restricted five of the BMPs from being able to be sized for the full water quality
volume. This site would meet the 90th percentile requirement by retaining runoff to the maximum extent
practicable.
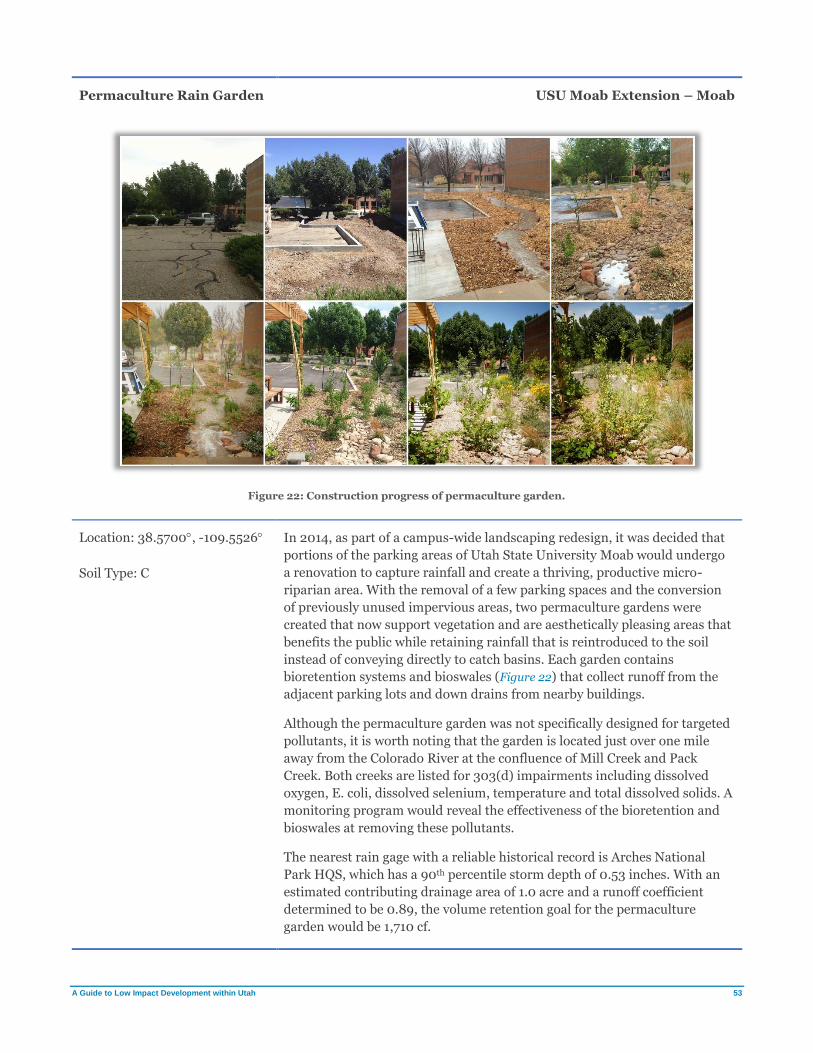
A Guide to Low Impact Development within Utah 53
Permaculture Rain Garden USU Moab Extension – Moab
Figure 22: Construction progress of permaculture garden.
Location: 38.5700, -109.5526 In 2014, as part of a campus-wide landscaping redesign, it was decided that
portions of the parking areas of Utah State University Moab would undergo
a renovation to capture rainfall and create a thriving, productive micro-
riparian area. With the removal of a few parking spaces and the conversion
of previously unused impervious areas, two permaculture gardens were
created that now support vegetation and are aesthetically pleasing areas that
benefits the public while retaining rainfall that is reintroduced to the soil
instead of conveying directly to catch basins. Each garden contains
bioretention systems and bioswales (Figure 22) that collect runoff from the
adjacent parking lots and down drains from nearby buildings.
Although the permaculture garden was not specifically designed for targeted
pollutants, it is worth noting that the garden is located just over one mile
away from the Colorado River at the confluence of Mill Creek and Pack
Creek. Both creeks are listed for 303(d) impairments including dissolved
oxygen, E. coli, dissolved selenium, temperature and total dissolved solids. A
monitoring program would reveal the effectiveness of the bioretention and
bioswales at removing these pollutants.
The nearest rain gage with a reliable historical record is Arches National
Park HQS, which has a 90th percentile storm depth of 0.53 inches. With an
estimated contributing drainage area of 1.0 acre and a runoff coefficient
determined to be 0.89, the volume retention goal for the permaculture
garden would be 1,710 cf.
Soil Type: C
A Guide to Low Impact Development within Utah 54
Additional Local LID Implementation
Daybreak, South Jordan
Daybreak is a mixed-use development located in South Jordan, Utah in the southwest corner of Salt Lake County.
The area for the development is planned to contain more than 20,000 residential units.
A variety of techniques were used to mitigate the effects of urbanization on storm water runoff quality. Among the
LID techniques used in the community are bioswales, dry wells, constructed wetlands, infiltration trenches,
infiltration basins, and detention basins. The community also stipulates that 40% of residential lots and 68% of
common open spaces consist of native, drought resistant plants. This strategy is designed to be able to retain the
100-year storm event.
Researchers conducted a water quality monitoring study on the development to determine the effectiveness of the
green infrastructure design. One sub-watershed utilized a series of bioswales while the other sub-watershed
deployed traditional storm water management techniques. Several constituents were monitored for water quality
including nitrogen, phosphorus, suspended solids, and heavy metals. The sub-watershed with bioswales showed
significantly reduced runoff volumes as well as large reductions in constituent and heavy metal concentrations
when compared to the traditional storm water sub-watershed. A promising finding of the study was that first flush
concentrations of copper were reduced, which is significant due to its removal difficulty and the proximity of
copper mines in the area. Reductions of other metals during the first flush are listed below. (Yang, Li, Wall,
Blackmore, & Wang, 2015)
Total suspended solids, TSS: 92% reduction
Total Nitrogen, TN: 87% reduction
Total Phosphorus, TP: 92% reduction
Zinc, Zn: 96% reduction
Lead, Pb: 96% reduction
Copper, Cu: 82% reduction
Utah State University Research Sites
Utah State University is currently conducting research on the effectiveness of LID techniques on storm water
pollutant removal and nutrient uptake. Several LID techniques are being monitored including bioswales, planter
boxes, dry wells, bioretention, vegetated filter strips, and membrane roofs at two sites in Logan and one site in
Salt Lake City (Dupont, McLean, Peralta, Null, & Jackson-Smith, 2017). The following pollutants are being
monitored:
Total Nitrogen, TN Dissolved Organic Carbon, DOC Nickel, Ni
Total Dissolved Nitrogen, TDN Electrical Conductivity, EC Copper, Cu
Total Phosphorus, TP pH Zinc, Zn
Total Dissolved Phosphorus, TDP Aluminum, Al Arsenic, As
Nitrate, NO3-N Chromium, Cr Cadmium, Cd
Ammonia, NH3-N Iron, Fe Lead, Pb
A summary of whether the monitored constituent levels decreased (D) or increased (I) is provided in Table 9.
Reasons for the increases in pollutant concentrations are uncertain and are currently being investigated. Of
particular concern to the researchers is the mobilization of arsenic, although levels are still significantly lower
than drinking water standards. In general, the use of organic matter and fertilizer to establish a BMP’s vegetation
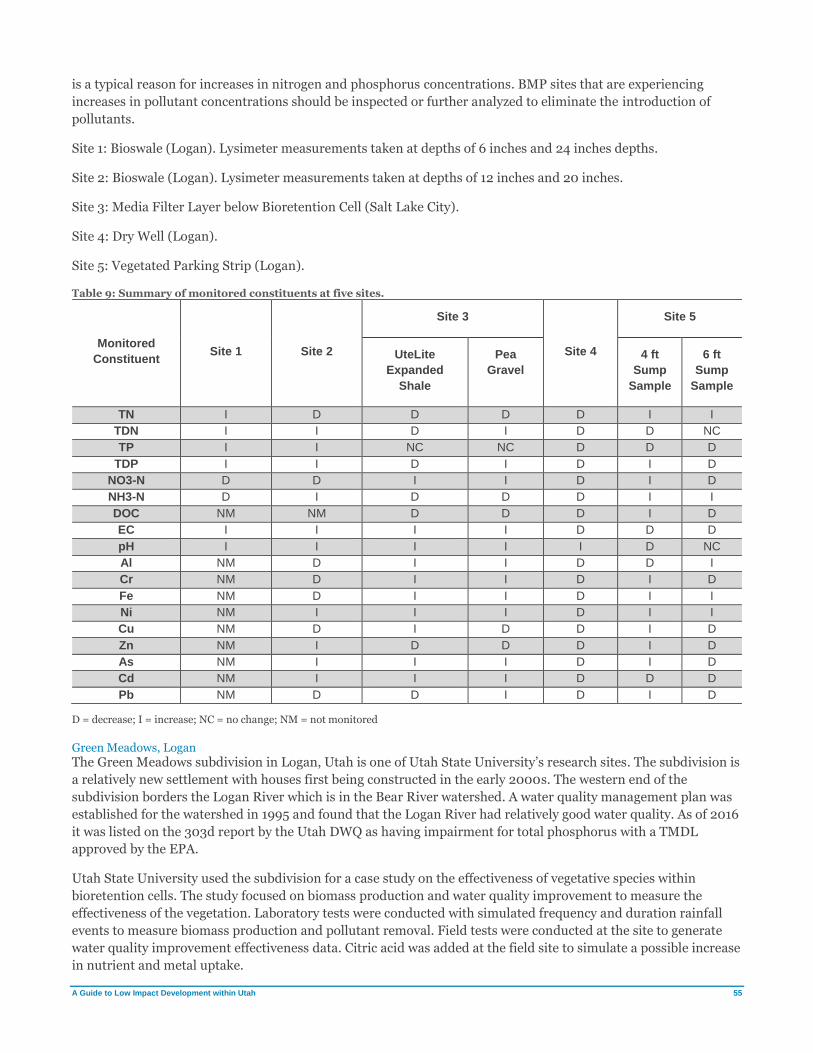
A Guide to Low Impact Development within Utah 55
is a typical reason for increases in nitrogen and phosphorus concentrations. BMP sites that are experiencing
increases in pollutant concentrations should be inspected or further analyzed to eliminate the introduction of
pollutants.
Site 1: Bioswale (Logan). Lysimeter measurements taken at depths of 6 inches and 24 inches depths.
Site 2: Bioswale (Logan). Lysimeter measurements taken at depths of 12 inches and 20 inches.
Site 3: Media Filter Layer below Bioretention Cell (Salt Lake City).
Site 4: Dry Well (Logan).
Site 5: Vegetated Parking Strip (Logan).
Table 9: Summary of monitored constituents at five sites.
Monitored
Constituent Site 1 Site 2
Site 3
Site 4
Site 5
UteLite
Expanded
Shale
Pea
Gravel
4 ft
Sump
Sample
6 ft
Sump
Sample
TN I D D D D I I
TDN I I D I D D NC
TP I I NC NC D D D
TDP I I D I D I D
NO3-N D D I I D I D
NH3-N D I D D D I I
DOC NM NM D D D I D
EC I I I I D D D
pH I I I I I D NC
Al NM D I I D D I
Cr NM D I I D I D
Fe NM D I I D I I
Ni NM I I I D I I
Cu NM D I D D I D
Zn NM I D D D I D
As NM I I I D I D
Cd NM I I I D D D
Pb NM D D I D I D
D = decrease; I = increase; NC = no change; NM = not monitored
Green Meadows, Logan
The Green Meadows subdivision in Logan, Utah is one of Utah State University’s research sites. The subdivision is
a relatively new settlement with houses first being constructed in the early 2000s. The western end of the
subdivision borders the Logan River which is in the Bear River watershed. A water quality management plan was
established for the watershed in 1995 and found that the Logan River had relatively good water quality. As of 2016
it was listed on the 303d report by the Utah DWQ as having impairment for total phosphorus with a TMDL
approved by the EPA.
Utah State University used the subdivision for a case study on the effectiveness of vegetative species within
bioretention cells. The study focused on biomass production and water quality improvement to measure the
effectiveness of the vegetation. Laboratory tests were conducted with simulated frequency and duration rainfall
events to measure biomass production and pollutant removal. Field tests were conducted at the site to generate
water quality improvement effectiveness data. Citric acid was added at the field site to simulate a possible increase
in nutrient and metal uptake.

A Guide to Low Impact Development within Utah 56
The USU study found that common reed and sedges were optimal plants for the area to improve storm water
quality. The field site showed significant retention and infiltration capacities throughout the study and 100%
pollutant removal from storm water runoff. Maximum nutrient and metal removal was shown to be possible at the
site if there was no discharge from the bioretention cells. In tests with added citric acid, metal solubility was
increased in the runoff but no enhanced metal uptake was observed. (Dupont & McLean, Optimizing Stormwater
BMP Performance, 2018)
Northern Utah Runoff Coefficients
Additional research at Utah State University evaluated runoff coefficients at four sites in northern Utah.
Monitoring of dozens of rain events took place from 2015 to 2017. Runoff coefficients were derived by dividing the
cumulative rainfall by the cumulative runoff values for the rain events at each site. The sites are identified as 1400
N, 1300 N, 1000 N, and 800 N.
Data from the sites was statistically analyzed to determine relationships between the observed runoff coefficients
and rain depth, storm intensity, and storm duration. Statistical significance (p values) and R squared values (the
strength of the relationship between the runoff coefficient and the other parameters) were calculated. At the 1400
N site and 1300 N sites, the relationships between the runoff coefficient and all three parameters were found to be
insignificant. The 1000 N site showed no statistical significance between the runoff coefficient and the storm
intensity but did show significance between the runoff coefficient and storm duration. The 800 N site showed
statistical significance between the runoff coefficient and both the storm duration and the storm intensity.
Although general trends do come out in the data (increased rain depth results in higher runoff coefficients) R
squared values were generally low due to the scattered nature of the data (Velásquez, 2018).
The range of imperviousness from these four sites is limited. The 1400 N and 1300 N sites were approximately
90% impervious and the 1000 N and 800 N sites were both approximately 65%. Jurisdictions will encounter a
wider variation of imperviousness for their developments. Developing regression equations for runoff coefficients
based on the 90th percentile storm depth that use the imperviousness as the control variable may be simpler to
apply jurisdiction-wide to projects since imperviousness will be the parameter with the greatest variability. See
Step 3: Volumetric Runoff Coefficient for more information on runoff coefficient equations that may be appropriate
for use on a jurisdictional level.

A Guide to Low Impact Development within Utah A-1
Appendix A 90th Percentile Storm Depths
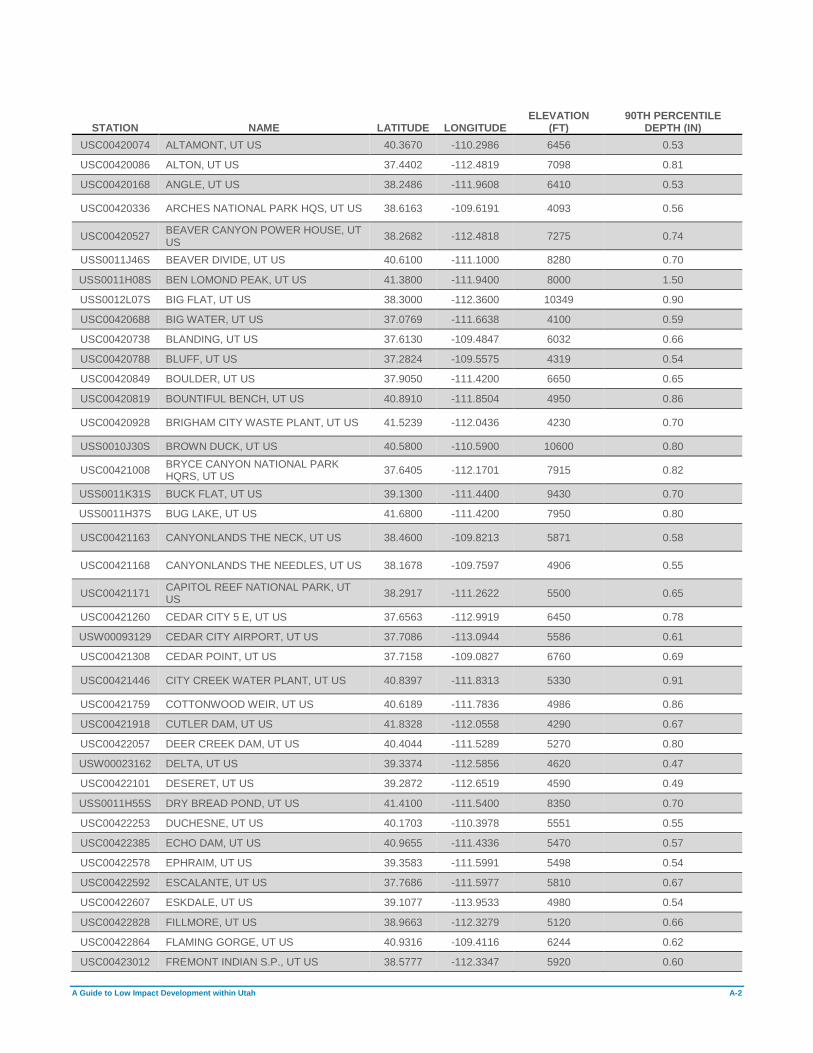
A Guide to Low Impact Development within Utah A-2
STATION NAME LATITUDE LONGITUDE ELEVATION
(FT) 90TH PERCENTILE
DEPTH (IN)
USC00420074 ALTAMONT, UT US 40.3670 -110.2986 6456 0.53
USC00420086 ALTON, UT US 37.4402 -112.4819 7098 0.81
USC00420168 ANGLE, UT US 38.2486 -111.9608 6410 0.53
USC00420336 ARCHES NATIONAL PARK HQS, UT US 38.6163 -109.6191 4093 0.56
USC00420527 BEAVER CANYON POWER HOUSE, UT US
38.2682 -112.4818 7275 0.74
USS0011J46S BEAVER DIVIDE, UT US 40.6100 -111.1000 8280 0.70
USS0011H08S BEN LOMOND PEAK, UT US 41.3800 -111.9400 8000 1.50
USS0012L07S BIG FLAT, UT US 38.3000 -112.3600 10349 0.90
USC00420688 BIG WATER, UT US 37.0769 -111.6638 4100 0.59
USC00420738 BLANDING, UT US 37.6130 -109.4847 6032 0.66
USC00420788 BLUFF, UT US 37.2824 -109.5575 4319 0.54
USC00420849 BOULDER, UT US 37.9050 -111.4200 6650 0.65
USC00420819 BOUNTIFUL BENCH, UT US 40.8910 -111.8504 4950 0.86
USC00420928 BRIGHAM CITY WASTE PLANT, UT US 41.5239 -112.0436 4230 0.70
USS0010J30S BROWN DUCK, UT US 40.5800 -110.5900 10600 0.80
USC00421008 BRYCE CANYON NATIONAL PARK HQRS, UT US
37.6405 -112.1701 7915 0.82
USS0011K31S BUCK FLAT, UT US 39.1300 -111.4400 9430 0.70
USS0011H37S BUG LAKE, UT US 41.6800 -111.4200 7950 0.80
USC00421163 CANYONLANDS THE NECK, UT US 38.4600 -109.8213 5871 0.58
USC00421168 CANYONLANDS THE NEEDLES, UT US 38.1678 -109.7597 4906 0.55
USC00421171 CAPITOL REEF NATIONAL PARK, UT US
38.2917 -111.2622 5500 0.65
USC00421260 CEDAR CITY 5 E, UT US 37.6563 -112.9919 6450 0.78
USW00093129 CEDAR CITY AIRPORT, UT US 37.7086 -113.0944 5586 0.61
USC00421308 CEDAR POINT, UT US 37.7158 -109.0827 6760 0.69
USC00421446 CITY CREEK WATER PLANT, UT US 40.8397 -111.8313 5330 0.91
USC00421759 COTTONWOOD WEIR, UT US 40.6189 -111.7836 4986 0.86
USC00421918 CUTLER DAM, UT US 41.8328 -112.0558 4290 0.67
USC00422057 DEER CREEK DAM, UT US 40.4044 -111.5289 5270 0.80
USW00023162 DELTA, UT US 39.3374 -112.5856 4620 0.47
USC00422101 DESERET, UT US 39.2872 -112.6519 4590 0.49
USS0011H55S DRY BREAD POND, UT US 41.4100 -111.5400 8350 0.70
USC00422253 DUCHESNE, UT US 40.1703 -110.3978 5551 0.55
USC00422385 ECHO DAM, UT US 40.9655 -111.4336 5470 0.57
USC00422578 EPHRAIM, UT US 39.3583 -111.5991 5498 0.54
USC00422592 ESCALANTE, UT US 37.7686 -111.5977 5810 0.67
USC00422607 ESKDALE, UT US 39.1077 -113.9533 4980 0.54
USC00422828 FILLMORE, UT US 38.9663 -112.3279 5120 0.66
USC00422864 FLAMING GORGE, UT US 40.9316 -109.4116 6244 0.62
USC00423012 FREMONT INDIAN S.P., UT US 38.5777 -112.3347 5920 0.60

A Guide to Low Impact Development within Utah A-3
STATION NAME LATITUDE LONGITUDE ELEVATION
(FT) 90TH PERCENTILE
DEPTH (IN)
USW00023170 HANKSVILLE, UT US 38.3692 -110.7145 43010 0.51
USC00423600 HANS FLAT RANGER STATION, UT US 38.2553 -110.1800 6600 0.58
USC00424100 HOVENWEEP NATIONAL MONUMENT, UT US
37.3858 -109.0750 5240 0.63
USC00424342 JENSEN, UT US 40.3610 -109.3463 4736 0.55
USC00424467 KAMAS, UT US 40.6438 -111.2822 6481 0.62
USC00424755 KODACHROME BASIN PARK, UT US 37.5141 -111.9883 5805 0.70
USC00424947 LA SAL 1 SW, UT US 38.3013 -109.2664 6787 0.61
USC00424968 LA VERKIN, UT US 37.2009 -113.2685 3194 0.74
USC00424856 LAKETOWN, UT US 41.8252 -111.3206 5980 0.63
USC00425065 LEVAN, UT US 39.5608 -111.8652 5298 0.58
USC00425138 LITTLE SAHARA RECREATION AREA, UT US
39.7268 -112.3069 5230 0.68
USC00425194 LOGAN 5 SW EXPERIMENTAL FARM, UT US
41.6661 -111.8913 4488 0.66
USC00425182 LOGAN RADIO KVNU, UT US 41.7350 -111.8564 4475 0.62
USC00425186 LOGAN UTAH ST U, UT US 41.7456 -111.8033 4790 0.67
USC00425252 LYTLE RANCH, UT US 37.1430 -114.0213 2787 0.84
USC00425402 MANTI, UT US 39.2583 -111.6307 5740 0.55
USC00425582 MEXICAN HAT, UT US 37.1497 -109.8675 4109 0.57
USC00425654 MILFORD, UT US 38.4017 -113.0162 5009 0.61
USC00425733 MOAB, UT US 38.5744 -109.5458 4053 0.55
USC00425826 MORGAN, UT US 41.0574 -111.6895 5100 0.62
USC00425837 MORONI, UT US 39.5266 -111.5872 5560 0.57
USC00425892 MOUNTAIN DELL DAM, UT US 40.7485 -111.7232 5420 0.77
USC00425969 MYTON, UT US 40.1941 -110.0616 5083 0.55
USC00426053 NATURAL BRIDGES N.M., UT US 37.6094 -109.9772 6508 0.65
USC00426123 NEOLA, UT US 40.4178 -110.0511 5950 0.59
USC00426357 OAK CITY, UT US 39.3758 -112.3341 5120 0.67
USC00426869 PINEVIEW DAM, UT US 41.2577 -111.8377 4940 0.94
USC00427260 RICHFIELD RADIO KSVC, UT US 38.7619 -112.0775 5300 0.50
USC00427271 RICHMOND, UT US 41.9063 -111.8100 4680 0.67
USC00427395 ROOSEVELT RADIO, UT US 40.2878 -109.9586 5014 0.50
USC00427559 SALINA 24 E, UT US 38.9129 -111.4165 7560 0.55
USW00024127 SALT LAKE CITY INTERNATIONAL AIRPORT, UT US
40.7781 -111.9694 4225 0.59
USC00427686 SANTAQUIN CHLORINATOR, UT US 39.9578 -111.7794 5160 0.75
USC00427714 SCIPIO, UT US 39.2454 -112.1066 5314 0.60
USC00427909 SNAKE CREEK POWERHOUSE, UT US 40.5452 -111.5041 6010 0.68
USC00428119 SPANISH FORK POWER HOUSE, UT US
40.0800 -111.6046 4720 0.75
USC00427516 ST. GEORGE, UT US 37.1190 -113.6068 2857 0.69
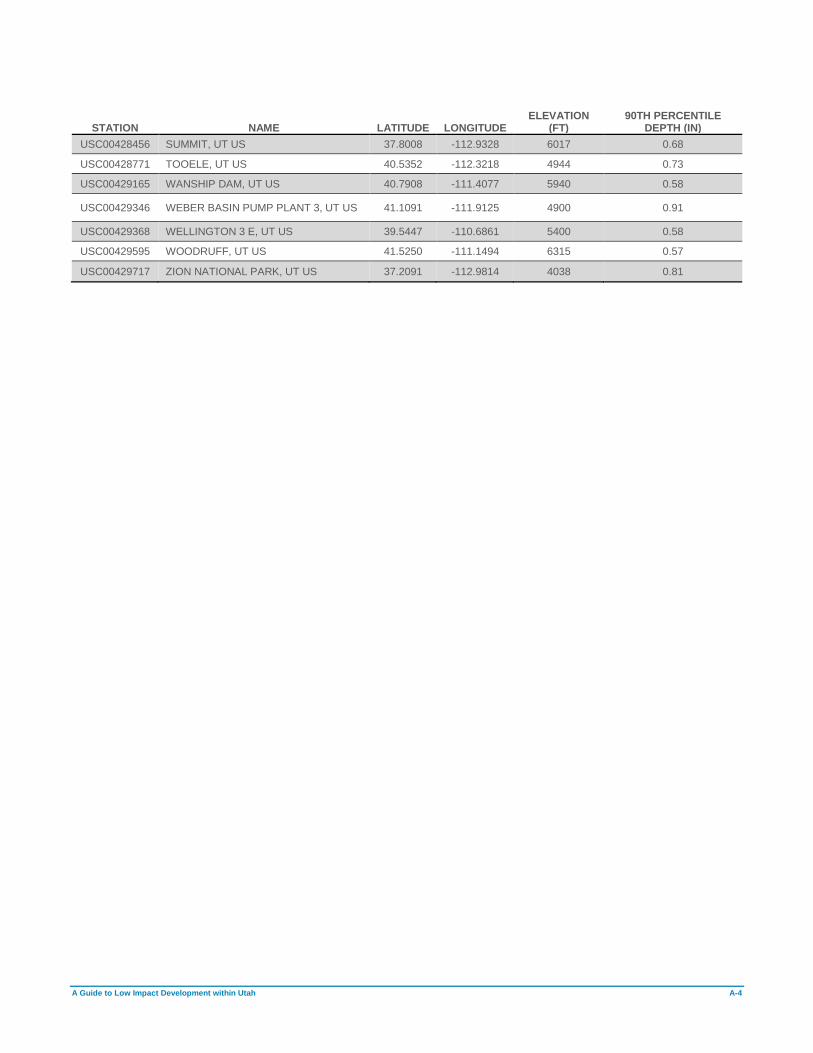
A Guide to Low Impact Development within Utah A-4
STATION NAME LATITUDE LONGITUDE ELEVATION
(FT) 90TH PERCENTILE
DEPTH (IN)
USC00428456 SUMMIT, UT US 37.8008 -112.9328 6017 0.68
USC00428771 TOOELE, UT US 40.5352 -112.3218 4944 0.73
USC00429165 WANSHIP DAM, UT US 40.7908 -111.4077 5940 0.58
USC00429346 WEBER BASIN PUMP PLANT 3, UT US 41.1091 -111.9125 4900 0.91
USC00429368 WELLINGTON 3 E, UT US 39.5447 -110.6861 5400 0.58
USC00429595 WOODRUFF, UT US 41.5250 -111.1494 6315 0.57
USC00429717 ZION NATIONAL PARK, UT US 37.2091 -112.9814 4038 0.81

A Guide to Low Impact Development within Utah B-1
Appendix B Storm Water Quality Report Template

A Guide to Low Impact Development within Utah B-2
Storm Water Quality Report – Template
This is an example of how the suggested report template is completed. Text highlighted in yellow is project
specific information. A blank word document of this template can be found here:
https://documents.deq.utah.gov/water-quality/stormwater/DWQ-2018-013750.docx
Date: 9/1/2019
Project Name: Garden Valley Condominiums
Project ID: 999999 ______
Design Engineer: John Doe, PE ______
Is the project within a watershed that is 303(d) listed? Yes
If yes:
Name of receiving water(s): Little Cottonwood Creek-2
Listed Impairment(s): pH; Cadmium, Dissolved; Copper, Dissolved
Does the watershed have an approved TMDL? Yes
If yes:
Approved TMDL(s): Zinc
I have reviewed the storm water quality design and find this report to be complete, accurate, and current.
[stamp required at final design phase]
Project Manager
[name], Project Manager
Storm Water Coordinator
[name], Designate Storm Water Coordinator
Maintenance
[name], Head of Maintenance
Landscaping
[name], Landscape Architect or Equivalent

A Guide to Low Impact Development within Utah B-3
Project Information
Type of Project (New Development, Redevelopment): New Development
Area of Land Disturbance (ac): 3.7
Project Impervious Area (ac): 2.9
Project Imperviousness (%): 68
Project Volumetric Runoff Coefficient, RV: 0.59
90th Storm Depth (in): ______0.64__
Project 90th Percentile Volume, Vgoal (cf): __5,110__
Subsurface Information
Groundwater
Depth to Groundwater (ft): ___17 ft___
Historical High Depth to Groundwater if known (ft): ___9 ft___
Source: ___Project groundwater monitoring___
Groundwater Contamination at Site: ___None______
Soil Information
Infiltration Rate (in/hr): ___1.5 in/hr___
Hydrologic Soil Group: ____A________
Source: ___Project geotechnical report__
Soil Contamination at Site: ___None____
Drinking Water
Within Drinking Water Source Area Protection: ___No___
Additional Relevant Site Information
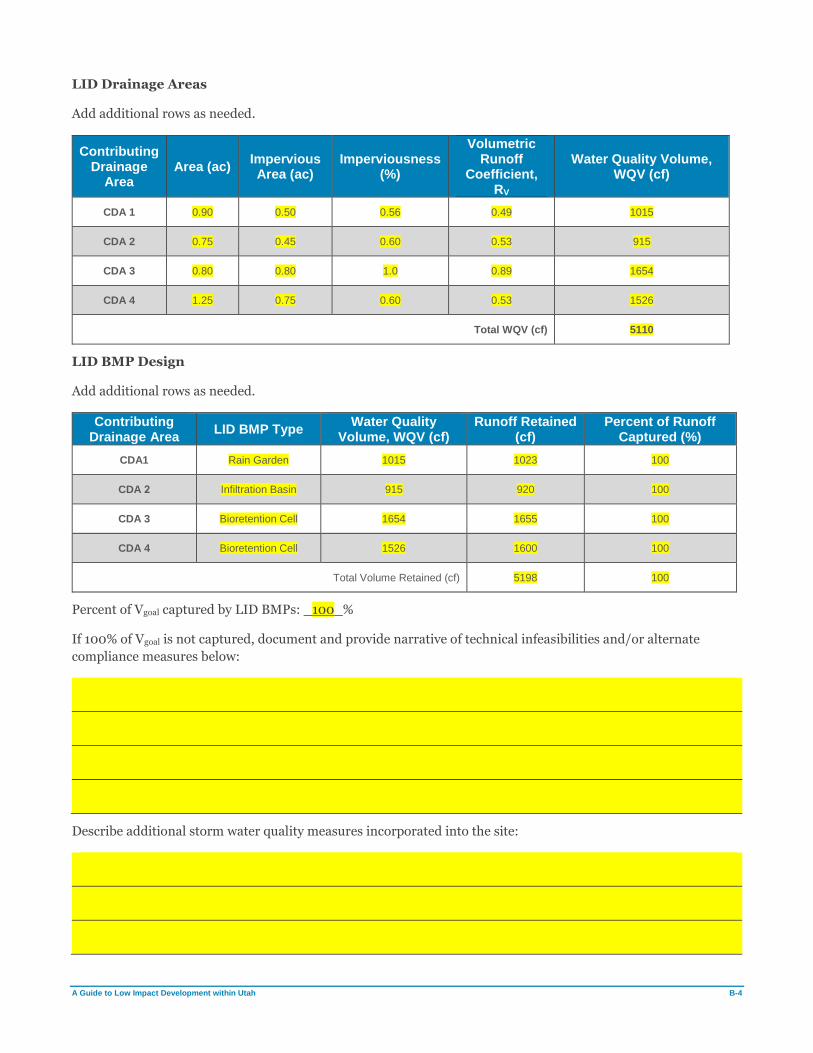
A Guide to Low Impact Development within Utah B-4
LID Drainage Areas
Add additional rows as needed.
Contributing Drainage
Area Area (ac)
Impervious Area (ac)
Imperviousness (%)
Volumetric Runoff
Coefficient, RV
Water Quality Volume, WQV (cf)
CDA 1 0.90 0.50 0.56 0.49 1015
CDA 2 0.75 0.45 0.60 0.53 915
CDA 3 0.80 0.80 1.0 0.89 1654
CDA 4 1.25 0.75 0.60 0.53 1526
Total WQV (cf) 5110
LID BMP Design
Add additional rows as needed.
Contributing Drainage Area
LID BMP Type Water Quality
Volume, WQV (cf) Runoff Retained
(cf) Percent of Runoff
Captured (%)
CDA1 Rain Garden 1015 1023 100
CDA 2 Infiltration Basin 915 920 100
CDA 3 Bioretention Cell 1654 1655 100
CDA 4 Bioretention Cell 1526 1600 100
Total Volume Retained (cf) 5198 100
Percent of Vgoal captured by LID BMPs: _100_%
If 100% of Vgoal is not captured, document and provide narrative of technical infeasibilities and/or alternate
compliance measures below:
Describe additional storm water quality measures incorporated into the site:

A Guide to Low Impact Development within Utah C-1
Appendix C LID BMP Fact Sheets
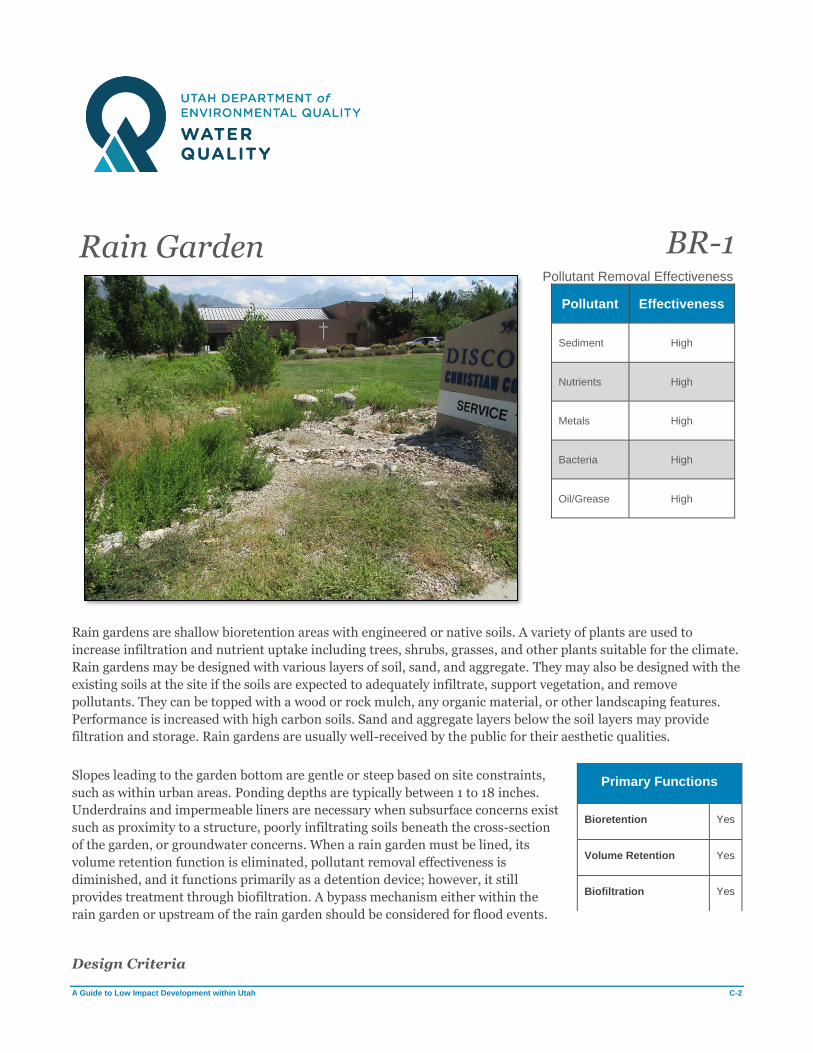
A Guide to Low Impact Development within Utah C-2
Rain Garden BR-1
Pollutant Removal Effectiveness
Pollutant Effectiveness
Sediment High
Nutrients High
Metals High
Bacteria High
Oil/Grease High
Rain gardens are shallow bioretention areas with engineered or native soils. A variety of plants are used to
increase infiltration and nutrient uptake including trees, shrubs, grasses, and other plants suitable for the climate.
Rain gardens may be designed with various layers of soil, sand, and aggregate. They may also be designed with the
existing soils at the site if the soils are expected to adequately infiltrate, support vegetation, and remove
pollutants. They can be topped with a wood or rock mulch, any organic material, or other landscaping features.
Performance is increased with high carbon soils. Sand and aggregate layers below the soil layers may provide
filtration and storage. Rain gardens are usually well-received by the public for their aesthetic qualities.
Slopes leading to the garden bottom are gentle or steep based on site constraints,
such as within urban areas. Ponding depths are typically between 1 to 18 inches.
Underdrains and impermeable liners are necessary when subsurface concerns exist
such as proximity to a structure, poorly infiltrating soils beneath the cross-section
of the garden, or groundwater concerns. When a rain garden must be lined, its
volume retention function is eliminated, pollutant removal effectiveness is
diminished, and it functions primarily as a detention device; however, it still
provides treatment through biofiltration. A bypass mechanism either within the
rain garden or upstream of the rain garden should be considered for flood events.
Design Criteria
Primary Functions
Bioretention Yes
Volume Retention Yes
Biofiltration Yes
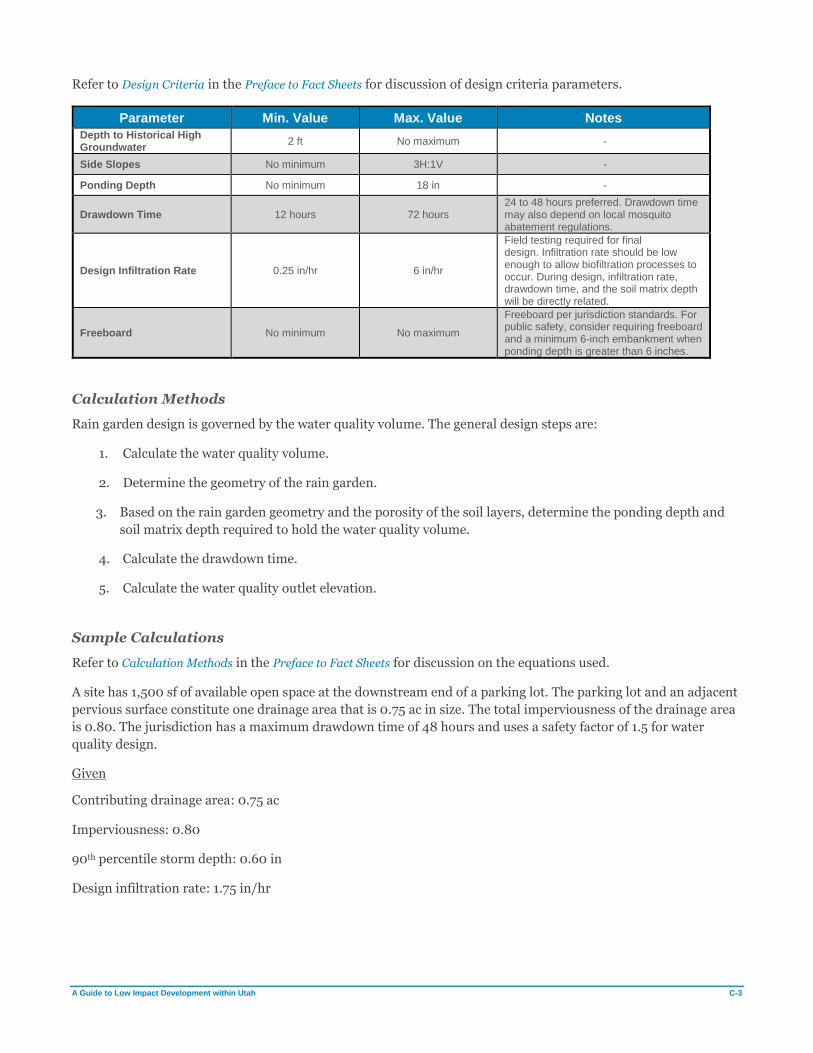
A Guide to Low Impact Development within Utah C-3
Refer to Design Criteria in the Preface to Fact Sheets for discussion of design criteria parameters.
Parameter Min. Value Max. Value Notes
Depth to Historical High Groundwater
2 ft No maximum -
Side Slopes No minimum 3H:1V -
Ponding Depth No minimum 18 in -
Drawdown Time 12 hours 72 hours 24 to 48 hours preferred. Drawdown time may also depend on local mosquito abatement regulations.
Design Infiltration Rate 0.25 in/hr 6 in/hr
Field testing required for final design. Infiltration rate should be low enough to allow biofiltration processes to occur. During design, infiltration rate, drawdown time, and the soil matrix depth will be directly related.
Freeboard No minimum No maximum
Freeboard per jurisdiction standards. For public safety, consider requiring freeboard and a minimum 6-inch embankment when ponding depth is greater than 6 inches.
Calculation Methods
Rain garden design is governed by the water quality volume. The general design steps are:
1. Calculate the water quality volume.
2. Determine the geometry of the rain garden.
3. Based on the rain garden geometry and the porosity of the soil layers, determine the ponding depth and
soil matrix depth required to hold the water quality volume.
4. Calculate the drawdown time.
5. Calculate the water quality outlet elevation.
Sample Calculations
Refer to Calculation Methods in the Preface to Fact Sheets for discussion on the equations used.
A site has 1,500 sf of available open space at the downstream end of a parking lot. The parking lot and an adjacent
pervious surface constitute one drainage area that is 0.75 ac in size. The total imperviousness of the drainage area
is 0.80. The jurisdiction has a maximum drawdown time of 48 hours and uses a safety factor of 1.5 for water
quality design.
Given
Contributing drainage area: 0.75 ac
Imperviousness: 0.80
90th percentile storm depth: 0.60 in
Design infiltration rate: 1.75 in/hr

A Guide to Low Impact Development within Utah C-4
Determine
The footprint and depth of a rain garden that can retain the water quality volume.
Calculations
Volumetric runoff coefficient, RV (See Sample Calculations)
RV = 0.91i – 0.0204 (Reese method)
RV = 0.91(0.80) – 0.0204
RV = 0.71
Water quality volume, WQV (See Developing the 90th Percentile Volume)
WQV = RVdA
WQV = (0.71)(0.60 in)(0.75 ac)(43,560 sf/ac) / (12 in/ft)
WQV = 1,160 cf
Minimum footprint, Amin (See Minimum footprint area)
Amin = (12)(Safety Factor)(WQV) / kt
Amin = (12)(1.50)(1,160 cf) / (1.75 in/hr)(48 hrs)
Amin = 250 sf
The water quality volume will infiltrate into the existing soil in 48 hours if the rain garden bottom is 250 square
feet. However, this does not mean that the rain garden bottom is required to be 250 square feet. A larger footprint
with a faster drawdown time may be acceptable and reduce the depth required to retain the water quality volume.
A rain garden with a bottom footprint of 1,160 sf, a 12-inch ponding depth will retain the water quality volume. If a
safety factor is desired, it should be accounted for by multiplying the water quality volume by the safety factor.
Rain Garden Effectiveness
Effective rain gardens provide an aesthetically pleasing method for retaining and treating storm water. Visiting
rain gardens during rain events will reveal if the garden is draining properly. Rain gardens are performing
properly if they are retaining their design volume and treating runoff. Creating and following through on
maintenance guidelines are critical to ensuring that a rain garden remains functional.
There are many possible indications that a rain garden has failed or is near failure, such as: ponding beyond the
design ponding depth during small storm events, drawdown time exceeds design drawdown time, larger than
expected sediment buildup within or upstream of the rain garden, irregular settling of the rain garden bottom
creating standing water, sloughing of side slopes, excessive and unmaintained vegetation, lack of vegetation, and
no maintenance or no record of maintenance. Although this is not an all-inclusive list, being aware of these items
will assist in determining what steps need to be taken to remediate a failing rain garden.
Designer Checklist
If the answer to these questions corresponds to a response box that is red, the BMP should either not be used or
additional measures need to be taken to address the issue.

A Guide to Low Impact Development within Utah C-5
Yes No
Does groundwater meet the minimum separation requirement? □ □
Is there available right-of-way, property, or easement? □ □
Is the design infiltration rate within acceptable rates? □ □
Is contaminated groundwater present? □ □
Is the drainage area to the rain garden less than 5 acres? (If no, consider an infiltration
basin or subdividing to create smaller drainage areas.) □ □
Do utility conflicts make installation of the rain garden technically infeasible? □ □
Do geotechnical conditions exist that would compromise the stability of the rain garden or
surrounding structures? □ □
Does the rain garden provide storage for 100% of the water quality volume? (If no, it may
still be appropriate to construct the rain garden if it is technically infeasible to capture
100% of the water quality volume.) □ □
Does an overflow outlet structure or bypass mechanism exist? □ □
Vegetation
Refer to Vegetation Guidance by BMP Type.
Installation
Excavation
Rain gardens, like other BMPs whose functionality is dependent on infiltration, will fail if proper care is not taken
during excavation and construction. Excavators and heavy machinery should not be used within the rain garden
area if infiltration is expected to occur through the rain garden bottom. Additional excavation beyond the rain
garden’s footprint may be required depending on site conditions to provide soil stability or to be able to tie-in to
the surrounding grade.
Activities During Construction
Avoid using heavy machinery within the rain garden footprint during construction as doing so will compact the
soils and diminish their infiltrating capabilities. Light machinery and even walking within the rain garden’s
footprint will also compromise infiltration. Compaction of native soils or backfill below the rain garden subsoils is
acceptable if doing so does not prevent infiltration from occurring.
Flows During Construction
Flows during construction should be diverted away from the rain garden to prevent construction site sediment
from clogging soils. Scheduling installation of the rain garden shortly after excavation will minimize the impact of
unnecessary storm water flows from entering the excavated area. The introduction of unwanted sediment can be
prevented by placing fiber rolls or silt fences around the rain garden perimeter during construction.
Additional Guidance
• Require certificates of compliance to verify that construction items meet specification requirements.
• Follow landscaping guidance to ensure that vegetation establishes after installation.
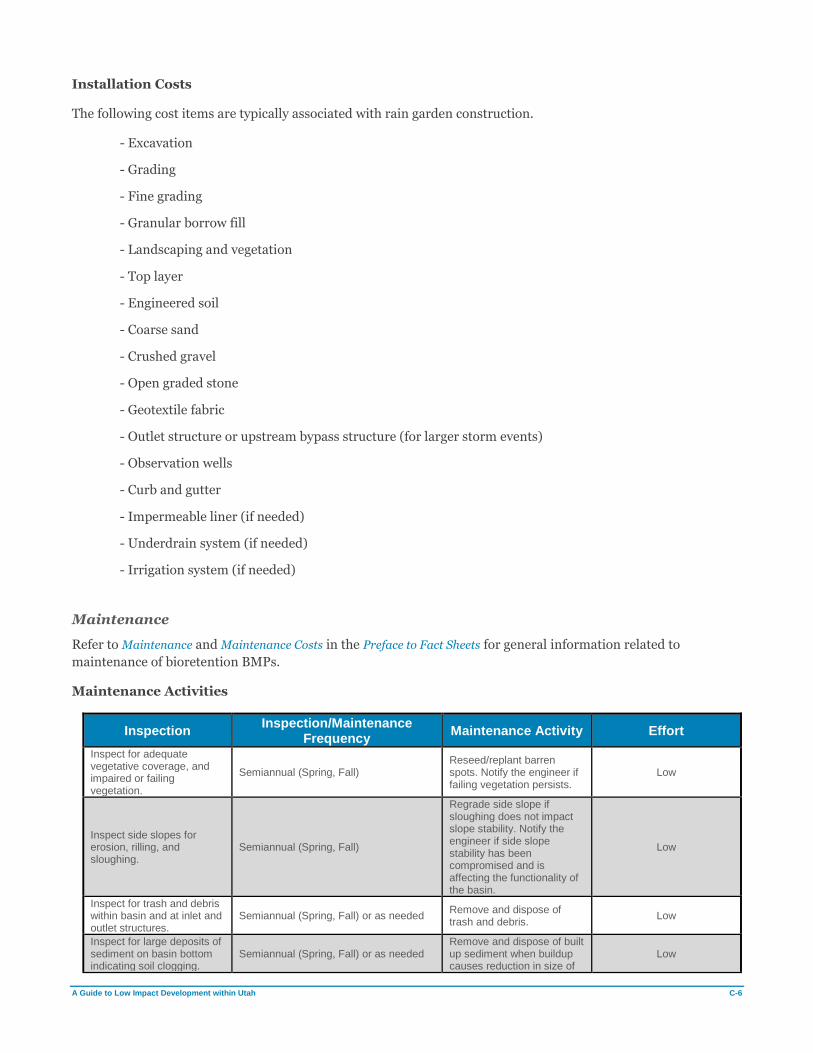
A Guide to Low Impact Development within Utah C-6
Installation Costs
The following cost items are typically associated with rain garden construction.
- Excavation
- Grading
- Fine grading
- Granular borrow fill
- Landscaping and vegetation
- Top layer
- Engineered soil
- Coarse sand
- Crushed gravel
- Open graded stone
- Geotextile fabric
- Outlet structure or upstream bypass structure (for larger storm events)
- Observation wells
- Curb and gutter
- Impermeable liner (if needed)
- Underdrain system (if needed)
- Irrigation system (if needed)
Maintenance
Refer to Maintenance and Maintenance Costs in the Preface to Fact Sheets for general information related to
maintenance of bioretention BMPs.
Maintenance Activities
Inspection Inspection/Maintenance
Frequency Maintenance Activity Effort
Inspect for adequate vegetative coverage, and impaired or failing vegetation.
Semiannual (Spring, Fall) Reseed/replant barren spots. Notify the engineer if failing vegetation persists.
Low
Inspect side slopes for erosion, rilling, and sloughing.
Semiannual (Spring, Fall)
Regrade side slope if sloughing does not impact slope stability. Notify the engineer if side slope stability has been compromised and is affecting the functionality of the basin.
Low
Inspect for trash and debris within basin and at inlet and outlet structures.
Semiannual (Spring, Fall) or as needed Remove and dispose of trash and debris.
Low
Inspect for large deposits of sediment on basin bottom indicating soil clogging.
Semiannual (Spring, Fall) or as needed Remove and dispose of built up sediment when buildup causes reduction in size of
Low
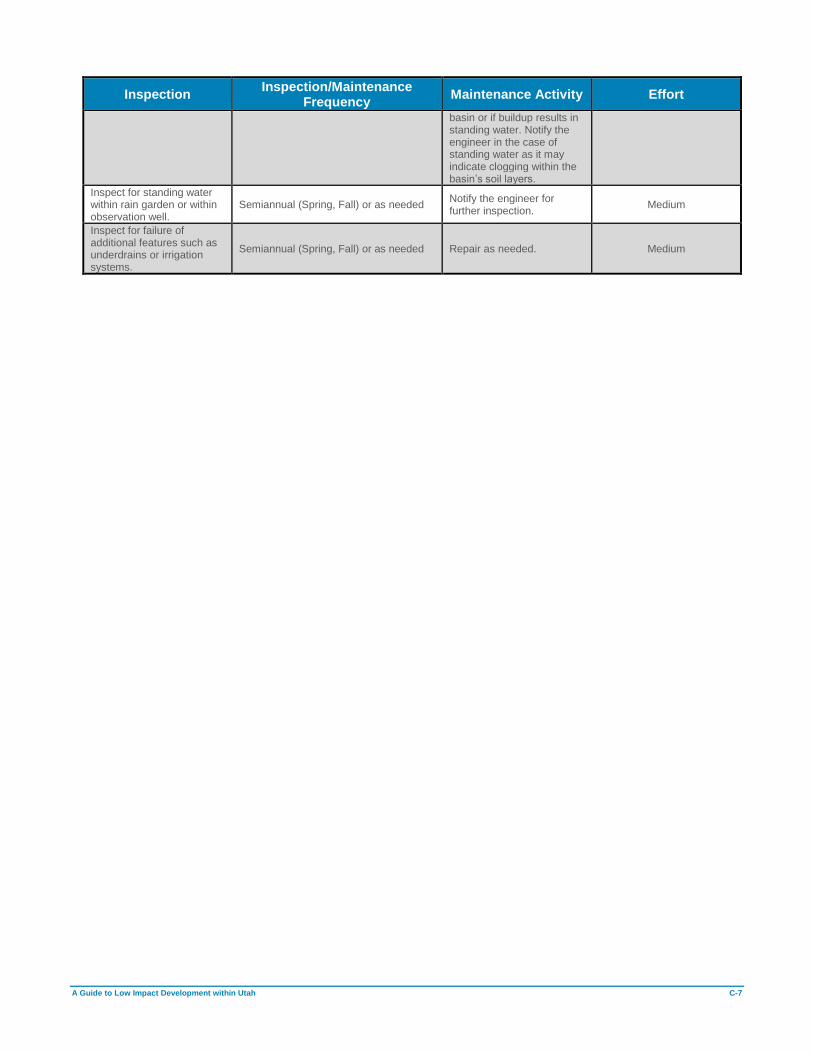
A Guide to Low Impact Development within Utah C-7
Inspection Inspection/Maintenance
Frequency Maintenance Activity Effort
basin or if buildup results in standing water. Notify the engineer in the case of standing water as it may indicate clogging within the basin’s soil layers.
Inspect for standing water within rain garden or within observation well.
Semiannual (Spring, Fall) or as needed Notify the engineer for further inspection.
Medium
Inspect for failure of additional features such as underdrains or irrigation systems.
Semiannual (Spring, Fall) or as needed Repair as needed. Medium
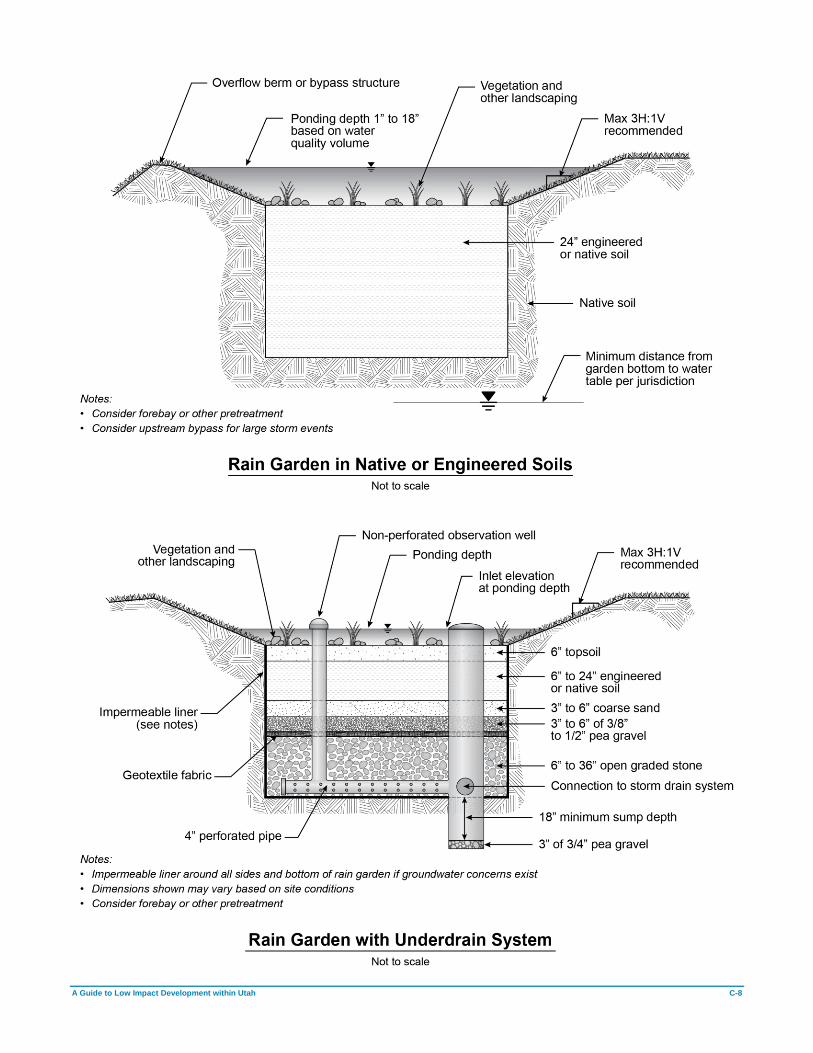
A Guide to Low Impact Development within Utah C-8
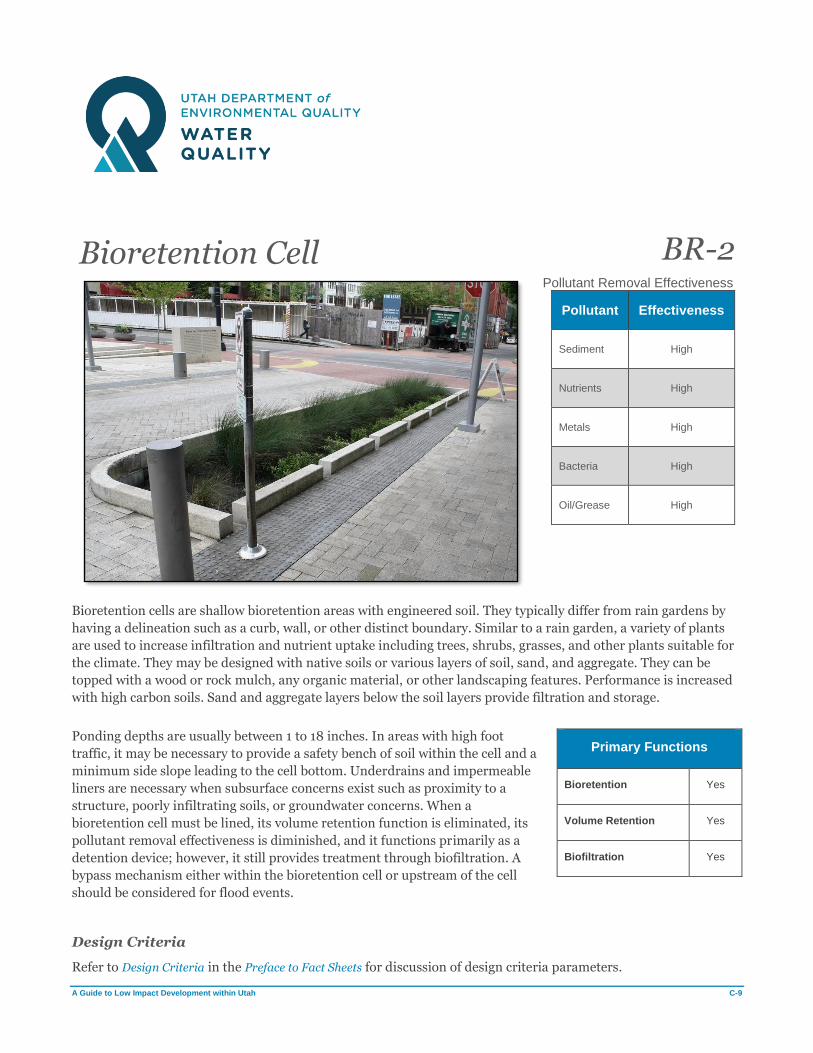
A Guide to Low Impact Development within Utah C-9
Bioretention Cell BR-2
Pollutant Removal Effectiveness
Pollutant Effectiveness
Sediment High
Nutrients High
Metals High
Bacteria High
Oil/Grease High
Bioretention cells are shallow bioretention areas with engineered soil. They typically differ from rain gardens by
having a delineation such as a curb, wall, or other distinct boundary. Similar to a rain garden, a variety of plants
are used to increase infiltration and nutrient uptake including trees, shrubs, grasses, and other plants suitable for
the climate. They may be designed with native soils or various layers of soil, sand, and aggregate. They can be
topped with a wood or rock mulch, any organic material, or other landscaping features. Performance is increased
with high carbon soils. Sand and aggregate layers below the soil layers provide filtration and storage.
Ponding depths are usually between 1 to 18 inches. In areas with high foot
traffic, it may be necessary to provide a safety bench of soil within the cell and a
minimum side slope leading to the cell bottom. Underdrains and impermeable
liners are necessary when subsurface concerns exist such as proximity to a
structure, poorly infiltrating soils, or groundwater concerns. When a
bioretention cell must be lined, its volume retention function is eliminated, its
pollutant removal effectiveness is diminished, and it functions primarily as a
detention device; however, it still provides treatment through biofiltration. A
bypass mechanism either within the bioretention cell or upstream of the cell
should be considered for flood events.
Design Criteria
Refer to Design Criteria in the Preface to Fact Sheets for discussion of design criteria parameters.
Primary Functions
Bioretention Yes
Volume Retention Yes
Biofiltration Yes

A Guide to Low Impact Development within Utah C-10
Parameter Min. Value Max. Value Notes
Depth to Historical High Groundwater
2 ft No maximum -
Ponding Depth No minimum 18 in -
Drawdown Time 12 hours 72 hours 24 to 48 hours preferred. Drawdown time
may also depend on local mosquito abatement regulations.
Design Infiltration Rate 0.25 in/hr 6 in/hr
Field testing required for final design. Infiltration rate should be low
enough to allow biofiltration processes to occur. During design, infiltration rate,
drawdown time, and the soil matrix depth will be directly related.
Freeboard No minimum No maximum
Freeboard per jurisdiction standards. For public safety, consider requiring freeboard and a minimum 6-inch embankment when
ponding depth is greater than 6 inches.
Calculation Methods
Bioretention cell design is governed by the water quality volume. The general design steps are:
1. Calculate the water quality volume.
2. Determine the geometry of the bioretention cell.
3. Based on the bioretention cell geometry and the porosity of the soil layers, determine the ponding depth
and soil matrix depth required to hold the water quality volume.
4. Calculate the drawdown time.
5. Calculate the water quality outlet elevation.
Sample Calculations
Refer to Calculation Methods in the Preface to Fact Sheets for discussion on the equations used.
A drainage area within a proposed roadway will be one-third of an acre with 90% imperviousness. It is proposed
that three bioretention cells be placed within the drainage area creating three sub-drainage areas. Each sub-
drainage area has the same imperviousness and ‘A’ soils are present.
Given
Contributing drainage area: 0.11 ac
Imperviousness: 0.90
Storm depth: 0.50 in
Design infiltration rate: 1.60 in/hr
Determine
The footprint and depth of the bioretention cells that can retain the water quality volume.
Calculations
Volumetric runoff coefficient, RV (See Sample Calculations)

A Guide to Low Impact Development within Utah C-11
RV-A = 0.84i1.302 (RV based on hydrologic soil group)
RV-A = 0.84(0.90)1.302
RV = 0.73
Water quality volume, WQV (See Developing the 90th Percentile Volume)
WQV = (0.73)(0.50 in) (0.11 ac)(43,560 sf/ac) / (12 in/ft)
WQV = 150 cf
Minimum footprint, Amin (See Minimum footprint area)
Amin = (12)(1.50)(150 cf) / (1.60 in/hr)(48 hrs)
Amin = 34 sf
The water quality volume will infiltrate into the existing soil in 48 hours if the footprint area of all bioretention
cells is 34 square feet. However, this does not mean that the bioretention cell footprint is required to be 34 square
feet. A larger footprint with a faster drawdown time is acceptable and will reduce the depth required to retain the
water quality volume.
If the bioretention cell were to require an engineered soil layer, the design below with a bottom footprint of 200 sf
will retain the water quality volume. If a safety factor is desired, it should be accounted for by multiplying the
water quality volume by the safety factor.
Layer Thickness, in Porosity Storage Volume, cf
Ponding 3 1.0 50
Top Soil 6 0.25 25
Engineered Soil
8 0.25 33.3
Coarse Sand 3 0.35 17.5
Pea Gravel 3 0.25 17.5
Aggregate Storage
4 0.4 26.7
Total 24 (soil layers) 0.37 (soil layers
weighted) 165 (includes
ponding)
Bioretention Cell Effectiveness
Effective bioretention cells provide an aesthetically pleasing method for retaining and treating storm water.
Inspecting bioretention cells during rain events will reveal if the cell is draining properly. Bioretention cells are
performing properly if they are retaining their design volume and treating runoff. Creating and following through
on maintenance guidelines are critical to ensuring that a bioretention cell remains functional.
There are many possible indications that a bioretention cell has failed or is near failure, such as: ponding beyond
the design ponding depth during small storm events, drawdown time exceeds design drawdown time, larger than
expected sediment buildup within or upstream of the cell, excessive and unmaintained vegetation, lack of
vegetation, obstructions at the inlet and outlet locations, and no maintenance or no record of maintenance.
Although this is not an all-inclusive list, being aware of these items will assist in determining what steps need to
be taken to remediate a failing bioretention cell.

A Guide to Low Impact Development within Utah C-12
Designer Checklist
If the answer to these questions corresponds to a response box that is red, the BMP should either not be used or
additional measures need to be taken to address the issue.
Yes No
Does groundwater meet the minimum separation requirement? □ □
Is there available right-of-way, property, or easement? □ □
Is the design infiltration rate within acceptable rates? □ □
Is contaminated groundwater present? □ □ Is the drainage area less than 5 acres? (If no, consider an infiltration basin or subdividing
to create smaller drainage areas.) □ □
Do utility conflicts make installation of the bioretention cell technically infeasible? □ □ Do geotechnical conditions exist that compromise the stability of the bioretention cell or
surrounding structures? □ □
Does the bioretention cell provide storage for 100% of the water quality volume? (If no, it
may still be appropriate to construct the bioretention cell if it is technically infeasible to
capture 100% of the water quality volume.) □ □
Does an overflow outlet structure or bypass mechanism exist? □ □
Vegetation
Refer to Vegetation Guidance by BMP Type.
Installation
Excavation
Bioretention cells, like other BMPs whose functionality is dependent on infiltration, will fail if proper care is not
taken during excavation and construction. Excavators and heavy machinery should not be used within the
excavated area if infiltration is expected to occur through the bioretention cell bottom. Additional excavation
beyond the footprint may be required depending on site conditions to provide soil stability or to be able to tie-in to
the surrounding grade.
Activities During Construction
Avoid using heavy machinery within the bioretention cell footprint during construction as doing so will further
compact the soils and diminish their infiltrating capabilities. Light machinery and even walking within the
bioretention cell’s footprint will also compromise infiltration. Compaction of native soils or backfill below the
bioretention cell subsoils is acceptable if doing so does not prevent infiltration from occurring.
Flows During Construction
Flows during construction should be diverted away from the bioretention cell to prevent construction site
sediment from clogging soils. Scheduling installation of the bioretention cell shortly after excavation will minimize
the impact of unnecessary storm water flows from entering the excavated area. The introduction of unwanted
sediment can be prevented by placing fiber rolls or silt fences around the bioretention cell perimeter during
construction.

A Guide to Low Impact Development within Utah C-13
Additional Guidance
• Require certificates of compliance to verify that construction items meet specification requirements.
• Follow landscaping guidance to ensure that vegetation establishes after installation.
Installation Costs
The following cost items are typically associated with bioretention cell construction.
- Excavation
- Landscaping and vegetation
- Top layer
- Engineered soil
- Coarse sand
- Crushed gravel
- Open graded stone
- Geotextile fabric
- Outlet structure or upstream bypass structure (for larger storm events)
- Observation wells
- Curb and gutter
- Impermeable liner (if needed)
- Underdrain system (if needed)
- Irrigation system (if needed)
Maintenance
Refer to Maintenance and Maintenance Costs in the Preface to Fact Sheets for general information related to
maintenance of bioretention BMPs.
Maintenance Activities
Inspection Inspection/Maintenance
Frequency Maintenance Activity Effort
Inspect for adequate vegetative coverage, and impaired or failing vegetation.
Semiannual (Spring, Fall) Reseed/replant barren spots. Notify the engineer if failing vegetation persists.
Low
Inspect for trash and debris within basin and at inlet and outlet structures.
Semiannual (Spring, Fall) or as needed Remove and dispose of trash and debris.
Low
Inspect for large deposits of sediment on bottom indicating soil clogging.
Semiannual (Spring, Fall) or as needed
Remove and dispose of built up sediment when buildup causes reduction in size of basin or if buildup results in standing water. Notify the engineer in the case of standing water as it may indicate clogging within the basin’s soil layers.
Low

A Guide to Low Impact Development within Utah C-14
Inspection Inspection/Maintenance
Frequency Maintenance Activity Effort
Inspect for standing water within bioretention cell or within observation well.
Semiannual (Spring, Fall) Notify the engineer for further inspection.
Medium
Inspect for failure of additional features such as underdrains or irrigation systems.
Semiannual (Spring, Fall) Repair as needed. Medium
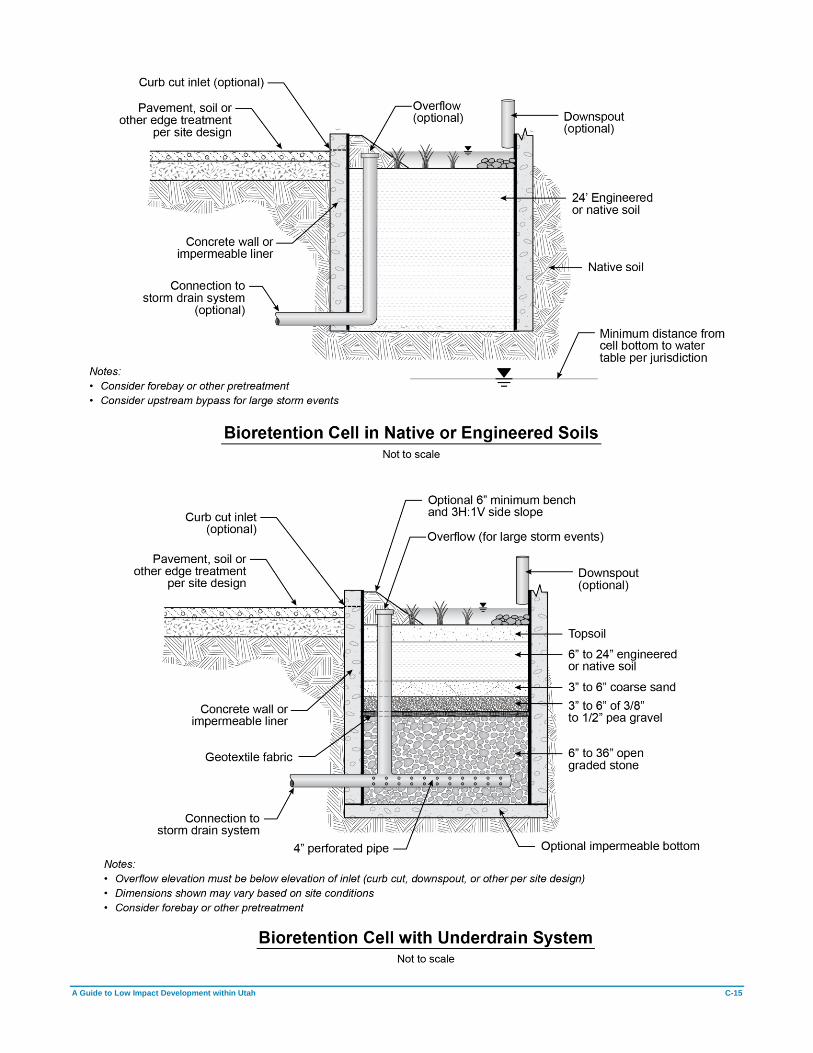
A Guide to Low Impact Development within Utah C-15
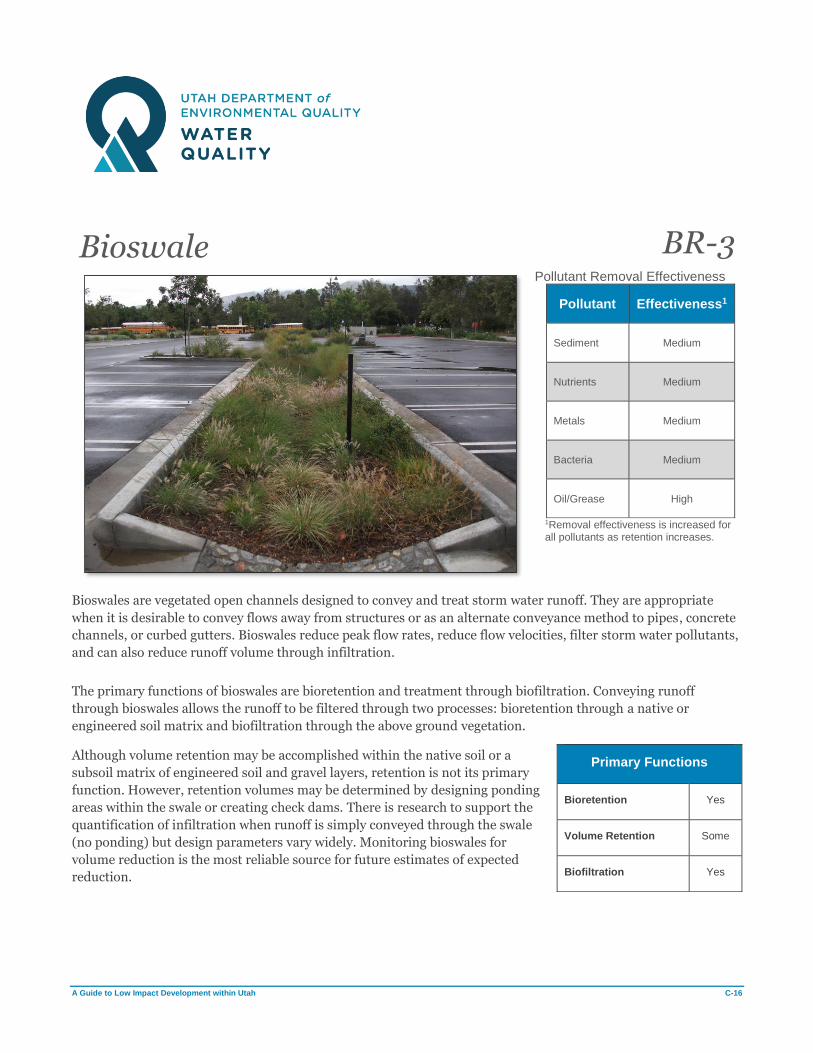
A Guide to Low Impact Development within Utah C-16
Bioswale BR-3
Pollutant Removal Effectiveness
Pollutant Effectiveness1
Sediment Medium
Nutrients Medium
Metals Medium
Bacteria Medium
Oil/Grease High
1Removal effectiveness is increased for all pollutants as retention increases.
Bioswales are vegetated open channels designed to convey and treat storm water runoff. They are appropriate
when it is desirable to convey flows away from structures or as an alternate conveyance method to pipes, concrete
channels, or curbed gutters. Bioswales reduce peak flow rates, reduce flow velocities, filter storm water pollutants,
and can also reduce runoff volume through infiltration.
The primary functions of bioswales are bioretention and treatment through biofiltration. Conveying runoff
through bioswales allows the runoff to be filtered through two processes: bioretention through a native or
engineered soil matrix and biofiltration through the above ground vegetation.
Although volume retention may be accomplished within the native soil or a
subsoil matrix of engineered soil and gravel layers, retention is not its primary
function. However, retention volumes may be determined by designing ponding
areas within the swale or creating check dams. There is research to support the
quantification of infiltration when runoff is simply conveyed through the swale
(no ponding) but design parameters vary widely. Monitoring bioswales for
volume reduction is the most reliable source for future estimates of expected
reduction.
Primary Functions
Bioretention Yes
Volume Retention Some
Biofiltration Yes

A Guide to Low Impact Development within Utah C-17
Design Criteria
Refer to Design Criteria in the Preface to Fact Sheets for discussion of design criteria parameters.
Parameter Min. Value Max. Value Notes
Length Based on hydraulic residence time No maximum -
Longitudinal Slope 0.50% 5% Underdrain recommended
below minimum slope
Bottom Width No minimum No maximum -
Side Slope No minimum 3H:1V Per jurisdiction requirements
Flow Velocity No minimum 1.0 ft/s Maximum permissible shear
stress may also dictate maximum flow velocity
Flow Depth No minimum 2/3 vegetation height Flow depths greater than
vegetation height will bypass the biofiltration processes
Freeboard No minimum No maximum Per jurisdiction requirements
Vegetation Coverage ≥ 65% Biofiltration is significantly reduced when vegetation coverage is less than 65%
Hydraulic Residence Time 5 min No maximum -
Calculation Methods
Bioswale design is governed by the water quality flow. The general design steps are:
1. Calculate the water quality flow.
2. Determine the geometry of the bioswale’s cross-section.
3. Determine the flow depth.
4. Determine volume retention within bioswale, if any.
5. Check flow velocity and hydraulic residence time.
Sample Calculations
Refer to Calculation Methods in the Preface to Fact Sheets for discussion on the equations used.
During the planning phase of a city roadway project it has been decided to remove curbs and instead allow one
acre of runoff to sheet flow into a 500 ft bioswale. There are 15 feet of available right-of-way between the edge of
pavement and the project limits. A 4-foot sidewalk is also proposed to be within the right-of-way. The city has a
requirement that there be no slopes greater than 6H:1V within five feet of the edge of pavement. The city’s storm
water requirements state that the 2-yr, 6-hr intensity must be used in determining the water quality flow rate. Per
city standards, 6 inches of freeboard will be required above the water quality flow depth.
Given
Contributing drainage area: 1.0 ac
Imperviousness: 0.85
90th percentile storm depth: 0.60 in

A Guide to Low Impact Development within Utah C-18
2-yr, 6-hr storm intensity: 0.16 in/hr
Design Goals
Determine an acceptable swale bottom width and flow depth. Design a soil matrix and determine the volume of
runoff that is expected to infiltrate into the bioswale.
Calculations
Volumetric runoff coefficient, RV (See Sample Calculations)
RV = 1.14i – 0.371 (Granato method when i ≥ 0.55)
RV = 1.14(0.85) – 0.371
RV = 0.60
Water quality flow, WQF
WQF = RViA
WQF = (0.60)(0.16 in/hr)(1.0 ac)
WQF = 0.10 cfs
Flow depth, yd (See Manning’s Equation)
The project team has decided that a 2-foot bottom width will be used for the bioswale. Per city standards, 6 inches
of freeboard will be required above the water quality flow depth. Other design information for the bioswale
includes:
Longitudinal slope: 2.0%
Side slopes: 3H:1V
Determine the flow depth during the design storm event by setting Manning’s equation equal to the WQF and
solving the equation for the flow depth, yd. This calculation is made easier using a goal seek function within a
spreadsheet.
yd = 1.8 in
Velocity, v (See Continuity Equation)
The city requires that flows remain below 1 ft/s to prevent scouring of the bioswale bottom. With the flow depth
known, the continuity equation can be used to determine the flow velocity. The cross-sectional area is calculated
to be 0.37 sf.
v = Q/A
v = (0.10 cfs) / (0.37 sf)
v = 0.26 ft/s
Minimum swale length, Lmin
The city also requires a 5-minute minimum hydraulic residence time to achieve the maximum desired
biofiltration. Using the velocity, a minimum swale length can be determined.
Lmin = (0.26 ft/s)(300 s)

A Guide to Low Impact Development within Utah C-19
Lmin = 79 ft
Any portion of the runoff that enters the swale within 79 ft of the downstream end of the swale will not receive the
optimal treatment.
With 6 inches of freeboard and a side slope of 3H:1V, the top width of the bioswale is 6.00 ft. With 15 feet of
available right-of-way, 6 of which are available for the swale, at the planning level there is adequate space for the
bioswale. If needed, the swale’s top width could be narrowed by decreasing the bottom width, which would also
result in a deeper flow depth.
Water quality volume, WQV (See Developing the 90th Percentile Volume)
WQV = (0.60)(0.60 in)(1.0 ac)(43,560 sf/ac) / (12 in/ft)
WQV = 1,302 cf
Volume Reduction
The swale will also include check dams that are 6 inches high to increase the volume retention. With a
longitudinal slope of 2%, a 6-inch check dam will create a triangular pool that is 25 ft long before overtopping the
check dam. The volume retained behind the check dam is calculated with the bottom width, the check dam height,
and the length of the check dam pool.
Vcheck dam = (2 ft)(25 ft )(0.5 ft) / 2
Vcheck dam = 12.50 cf
If the check dams are spaced every 50 feet, 10 check dams are possible, and the total volume retained by the check
dams will be 125 cf.
Additional volume retention can be achieved in any ponding areas that are designed into the swale.
Although methodologies have been developed to determine volume retention within a bioswale, the current body
of research varies widely and jurisdictions are encouraged to exercise engineering judgment (See Volume
Reduction).
A conservative design for the soil matrix below the swale will allow for the maximum possible percentage of the
water quality volume to be captured. For flood control purposes, zero infiltration may be assumed to prevent
downstream piping from being undersized if the bioswale’s volume reduction is overestimated. Accounting for the
ten check dams, the soil matrix below will provide storage for the remaining portion of the water quality volume
(1,182 cf). Whether the full remaining volume is captured can be determined by monitoring the bioswale for
volume retention.
Layer Thickness, in Porosity Storage Volume, cf
Engineered Soil
12 0.25 250
Coarse Sand 3 0.35 87.5
Pea Gravel 3 0.25 62.5
Aggregate Storage
20 0.4 667
Total 52 (soil layers) 0.35 (soil layers
weighted) 1067 (includes
ponding)

A Guide to Low Impact Development within Utah C-20
Bioswale Effectiveness
Bioswales are effective when they can accomplish their design goals of conveying flows to a downstream receiving
structure, BMP, or other receiving area. Flows through the swale should be relatively steady and uniform during a
rain event unless retention areas and check dams are part of the swale design. Established vegetation with
adequate coverage is an indication of a healthy bioswale along with minimal sediment and lack of invasive
vegetation.
Designer Checklist
If the answer to these questions corresponds to a response box that is red, the BMP should either not be used or
additional measures need to be taken to address the issue.
Yes No
If longitudinal slope is less than minimum, can an underdrain be installed? □ □
If an underdrain is needed, is sufficient hydraulic head available for proper drainage? □ □
Do flows result in a shear stress greater than the maximum permissible for selected
vegetation? □ □
Do utility conflicts make installation of the bioswale technically infeasible? □ □
Will the bioswale provide conveyance for larger storm events? (If yes, the geometry of the
bioswale will need to accommodate the larger events.) □ □
Is the bioswale providing pretreatment for a downstream BMP? □ □
Is the bioswale connecting directly to the storm drain network? (If yes, the outlet
structure elevation will need to be determined.) □ □
Vegetation
Refer to Vegetation Guidance by BMP Type.
Installation
Excavation
Bioswale construction is a relatively straightforward process of excavating the swale’s subsurface trench prior to
backfilling with any underdrain system, open graded stone, engineered soil, and geotextile fabric. Additional
excavation beyond the swale’s footprint may be required depending on site conditions to provide soil stability or
to be able to tie-in to the surrounding grade.
Activities During Construction
Crews should avoid stepping within the trench except when necessary as doing so will compact the native soil that
is expected to infiltrate runoff.
Flows During Construction
Flows during construction should be diverted away from the bioswale to prevent construction site sediment from
clogging soils and to prevent erosion of the swale bed. Scheduling installation of the bioswale shortly after
excavation will minimize the impact of unnecessary storm water flows from entering the excavated area. The
introduction of unwanted sediment can be prevented by placing fiber rolls or silt fences around the bioswale
perimeter during construction. Creating the upstream inlet or connection should be the last construction activity
before flows are permitted to be conveyed as designed through the bioswale.

A Guide to Low Impact Development within Utah C-21
Additional Guidance
• Require certificates of compliance to verify that construction items meet specification requirements.
• Follow landscaping guidance to ensure that vegetation establishes after installation.
Installation Costs
The following cost items are typically associated with bioswale construction.
- Excavation
- Grading
- Fine grading
- Granular borrow fill
- Landscaping and vegetation
- Top layer
- Engineered soil
- Open graded stone
- Geotextile fabric
- Impermeable liner
- Outlet structure or upstream bypass structure (for larger storm events)
- Observation wells
- Underdrain system (if needed)
- Outlet protection such as riprap or other (if needed)
Maintenance
Refer to Maintenance and Maintenance Costs in the Preface to Fact Sheets for general information related to
maintenance of bioretention BMPs.
Maintenance Activities
Inspection Inspection/Maintenance
Frequency Maintenance Activity Effort
Inspect for adequate vegetative coverage, and impaired or failing vegetation.
Semiannual (Spring, Fall) Reseed/replant barren areas. Notify engineer if issue persists.
Low
Inspect side slopes for erosion, rilling, and sloughing.
Semiannual (Spring, Fall)
Regrade side slope if slope stability is not affected by sloughing. Notify engineer if stability is affecting basin functionality.
Low
Inspect for standing water within bioswale or within observation well.
Semiannual (Spring, Fall) Notify engineer for further inspection.
Medium
Inspect for trash and debris at inlet and outlet structures.
Prior to mowing, at least semiannually
Remove trash and debris. Low
Inspect vegetation height. As needed Mow swale as needed. Low
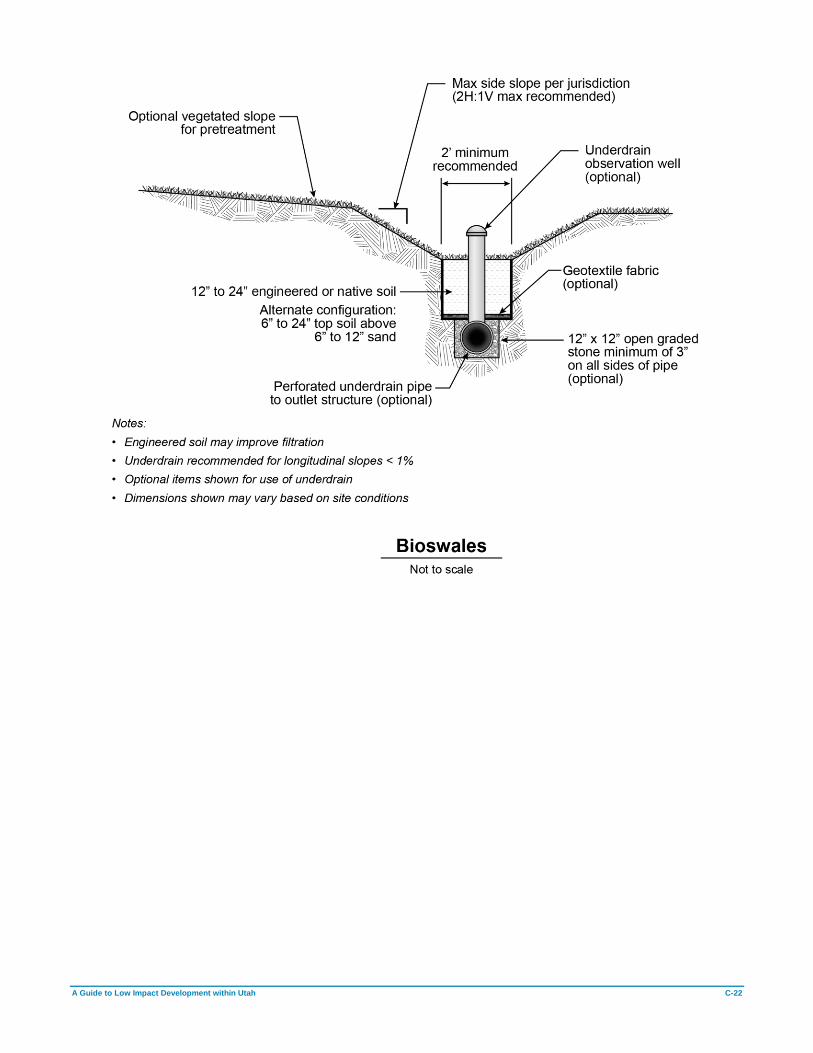
A Guide to Low Impact Development within Utah C-22
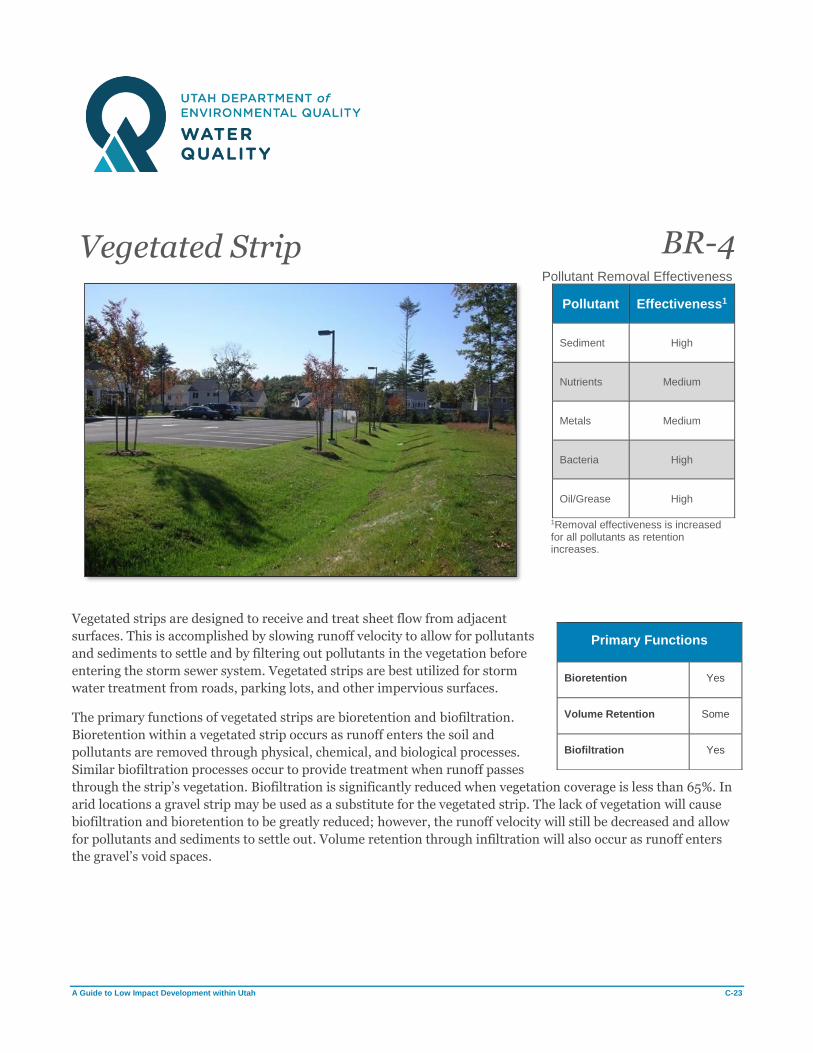
A Guide to Low Impact Development within Utah C-23
Vegetated Strip BR-4
Pollutant Removal Effectiveness
Pollutant Effectiveness1
Sediment High
Nutrients Medium
Metals Medium
Bacteria High
Oil/Grease High
1Removal effectiveness is increased for all pollutants as retention increases.
Vegetated strips are designed to receive and treat sheet flow from adjacent
surfaces. This is accomplished by slowing runoff velocity to allow for pollutants
and sediments to settle and by filtering out pollutants in the vegetation before
entering the storm sewer system. Vegetated strips are best utilized for storm
water treatment from roads, parking lots, and other impervious surfaces.
The primary functions of vegetated strips are bioretention and biofiltration.
Bioretention within a vegetated strip occurs as runoff enters the soil and
pollutants are removed through physical, chemical, and biological processes.
Similar biofiltration processes occur to provide treatment when runoff passes
through the strip’s vegetation. Biofiltration is significantly reduced when vegetation coverage is less than 65%. In
arid locations a gravel strip may be used as a substitute for the vegetated strip. The lack of vegetation will cause
biofiltration and bioretention to be greatly reduced; however, the runoff velocity will still be decreased and allow
for pollutants and sediments to settle out. Volume retention through infiltration will also occur as runoff enters
the gravel’s void spaces.
Primary Functions
Bioretention Yes
Volume Retention Some
Biofiltration Yes

A Guide to Low Impact Development within Utah C-24
Design Criteria
Refer to Design Criteria in the Preface to Fact Sheets for discussion of design criteria parameters.
Parameter Min. Value Max. Value Notes Length (direction of flow travel)
15 ft No maximum -
Longitudinal Slope No minimum 4H:1V Per jurisdiction requirements
Flow Velocity No minimum 1.0 ft/s Maximum permissible shear
stress may also dictate maximum flow velocity
Flow Depth No minimum 2/3 vegetation height Flow depths greater than
vegetation height will bypass the biofiltration processes
Freeboard No minimum No maximum Per jurisdiction requirements
Vegetation Coverage ≥ 65% Biofiltration is significantly reduced when vegetation coverage is less than 65%
Calculation Methods
Vegetated strip design is governed by the water quality flow. The general design steps are:
1. Calculate the water quality flow.
2. Determine the flow depth.
3. Check flow velocity.
Sample Calculations
Refer to Calculation Methods in the Preface to Fact Sheets for discussion on the equations used.
A roadway project is proposing to widen a road that is near a canal. Due to high groundwater and poor soils,
retention on-site is not feasible. Treatment is still an option, however, and the design team has decided to
establish vegetation within the twenty feet between the edge of pavement and the canal. The city’s storm water
requirements state that the 2-yr, 2-hr intensity must be used in determining the water quality flow rate.
Given
Contributing drainage area: 0.25 ac
Imperviousness: 1.00
2-yr, 2-hr storm intensity: 0.318 in/hr
Design Goals
Determine that the flow depth will be less than 1 inch.
Calculations
Volumetric runoff coefficient, RV (See Sample Calculations)
RV-A = 0.84i1.302 (RV based on hydrologic soil group)
RV = 0.84(1.0)1.302

A Guide to Low Impact Development within Utah C-25
RV = 0.84
Water Quality Flow, WQF
WQF = RViA
WQF = (0.84)(0.318 in/hr)(0.25 ac)
WQF = 0.067 cfs
There is available right-of-way for a 300-foot long strip that is 20 feet wide. The embankment side slope is 10H:1V
which corresponds to a 10% longitudinal slope for the vegetated strip.
Flow depth, yd (See Manning’s Equation)
Calculation of the flow depth is typically done using Manning’s equation setting the equation equal to the water
quality flow and solving for the flow depth.
yd = [(nQ)/1.49LS0.5]0.6
yd = [(0.2)(0.071 cfs) / (1.49)(300 ft)(0.02)0.5]0.6
yd = 0.04 in
Velocity, v (See Continuity Equation)
The city requires that flows remain below 1 ft/s to prevent scouring of the strip bottom. With the flow depth
known, the cross-sectional area is calculated to be 1.10 sf.
v = Q/A
v = 0.067 cfs / 1.10 sf
v = 0.06 ft/s
Volume Reduction
Although methodologies have been developed to determine volume retention within a bioswale, the current body
of research varies widely and jurisdictions are encouraged to exercise engineering judgment (See Volume
Reduction).
Vegetated Strip Effectiveness
Vegetated strips are effective when they can accomplish their design goals of conveying sheet flow to the receiving
area. Flows through the vegetated strip should be relatively steady and uniform during a rain event and should not
create rilling or other visible signs of erosion. Established vegetation with adequate coverage is an indication of a
healthy vegetated strip along with minimal sediment and lack of invasive vegetation.
Designer Checklist
If the answer to these questions corresponds to a response box that is red, the BMP should either not be used or
additional measures need to be taken to address the issue.
Yes No
Is the vegetated strip length greater than or equal to the minimum required length? □ □

A Guide to Low Impact Development within Utah C-26
Do flows result in a shear stress greater than the maximum permissible for selected
vegetation? □ □
Is the vegetated strip providing pretreatment for a downstream BMP? □ □
Is the slope in the direction of flow less than or equal to the jurisdiction’s standards? □ □
Vegetation
Refer to Vegetation Guidance by BMP Type.
Installation
Vegetated strips can be installed as part of normal construction activities. An appropriate grass such as turf sod
should be installed per specifications. If additional vegetation such as shrubs or bushes will be used within the
strip, follow landscaping guidance to ensure that vegetation establishes after installation. To maximize infiltration
performance, minimize use of heavy machinery.
Additional Guidance
• Require certificates of compliance to verify that construction items meet specification requirements.
Installation Costs
The following cost items are typically associated with bioswale construction.
- Grading
- Landscaping and vegetation
- Topsoil
- Engineered soil
- Shoulder dressing upstream of vegetated strip
Maintenance
Refer to Maintenance and Maintenance Costs in the Preface to Fact Sheets for general information related to
maintenance of bioretention BMPs.

A Guide to Low Impact Development within Utah C-27
Maintenance Activities
Inspection Inspection/Maintenance
Frequency Maintenance Activity Effort
Inspect upstream end of vegetated strip for sediment buildup that may be impeding sheet flow.
Semiannual (Spring, Fall) or as needed
Remove and dispose of sediment buildup.
Low
Inspect grass length. As needed Mow strip as needed. Low
Inspect for erosion, rilling, and sloughing.
Semiannual (Spring, Fall)
Regrade side slope if slope stability is not affected by sloughing. Notify engineer if stability is affecting basin functionality.
Low
Inspect for adequate vegetative coverage, and impaired or failing vegetation.
Semiannual (Spring, Fall) or as needed
Reseed/replant barren areas. Notify engineer if issue persists.
Low
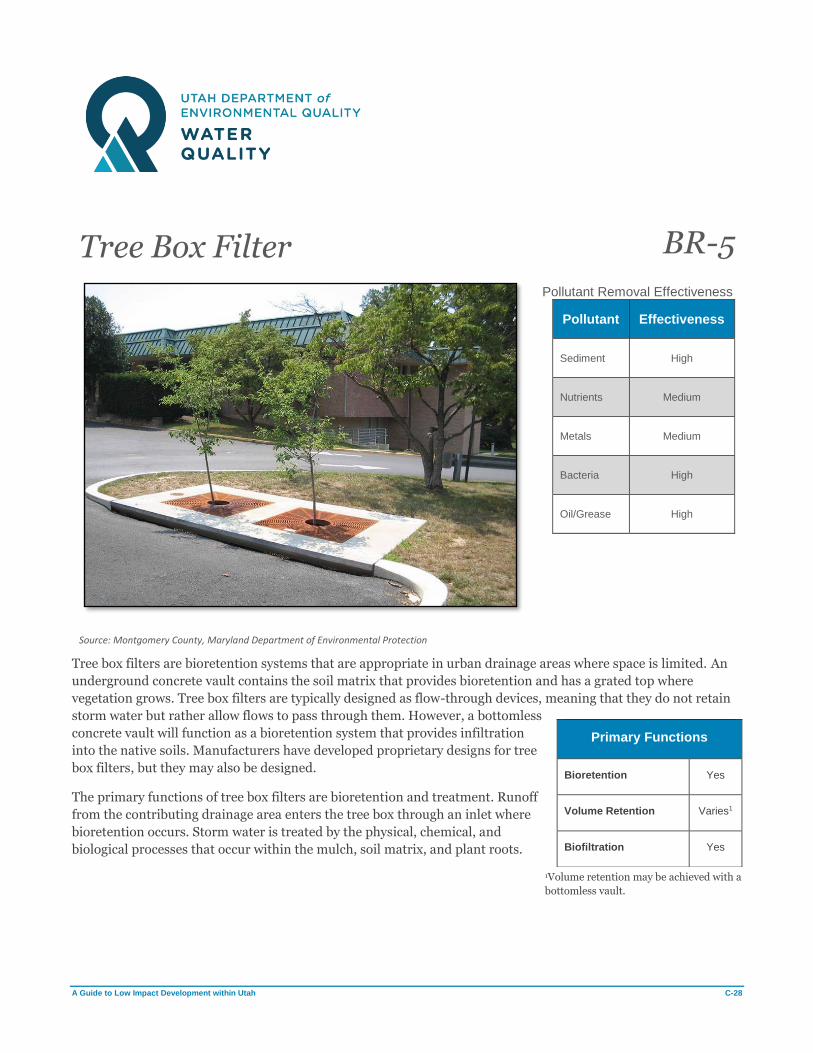
A Guide to Low Impact Development within Utah C-28
Tree Box Filter BR-5
Source: Montgomery County, Maryland Department of Environmental Protection
Pollutant Removal Effectiveness
Pollutant Effectiveness
Sediment High
Nutrients Medium
Metals Medium
Bacteria High
Oil/Grease High
Tree box filters are bioretention systems that are appropriate in urban drainage areas where space is limited. An
underground concrete vault contains the soil matrix that provides bioretention and has a grated top where
vegetation grows. Tree box filters are typically designed as flow-through devices, meaning that they do not retain
storm water but rather allow flows to pass through them. However, a bottomless
concrete vault will function as a bioretention system that provides infiltration
into the native soils. Manufacturers have developed proprietary designs for tree
box filters, but they may also be designed.
The primary functions of tree box filters are bioretention and treatment. Runoff
from the contributing drainage area enters the tree box through an inlet where
bioretention occurs. Storm water is treated by the physical, chemical, and
biological processes that occur within the mulch, soil matrix, and plant roots.
1Volume retention may be achieved with a
bottomless vault.
Primary Functions
Bioretention Yes
Volume Retention Varies1
Biofiltration Yes

A Guide to Low Impact Development within Utah C-29
Design Criteria
Refer to Design Criteria in the Preface to Fact Sheets for discussion of design criteria parameters. Tree box filters
may be proprietary devices; follow manufacturer specifications to determine design criteria on a case-by-case
basis.
Parameter Min. Value Max. Value Notes
Depth to Historical High Groundwater
2 ft No maximum May be less than 2 feet if tree box filter
has impermeable bottom.
Ponding Depth No minimum 12 in -
Drawdown Time 12 hours 72 hours 24 to 48 hours preferred. Drawdown time
may also depend on local mosquito abatement regulations.
Design Infiltration Rate 0.25 in/hr 6 in/hr
Field testing required for final design. Infiltration rate should be low
enough to allow biofiltration processes to occur. During design, infiltration rate,
drawdown time, and the soil matrix depth will be directly related.
Calculation Methods
Tree box filters are typically sized based on their water quality flow but may be sized for their water quality volume
when being designed for retention. Both design approaches are dependent on the contributing drainage area and
imperviousness. A larger contributing drainage area will require a larger tree box filter.
Tree Box Filter Effectiveness
Tree box filters are effective when they maintain their bioretention and biofiltration capabilities. Proper
inspection and maintenance of tree box filters will ensure that the chemical and biological processes that treat
runoff perform optimally. Qualified inspection crews are necessary to determine if soils and vegetation are
healthy.
The tree box must be able to function hydraulically. Flows must be able to pass through the filter without backing
up or maintenance will be required.
Designer Checklist
If the answer to these questions corresponds to a response box that is red, the BMP should either not be used or
additional measures need to be taken to address the issue.
Yes No
Is there adequate space for a tree box filter? □ □
Is there sufficient hydraulic head for tree box filter to connect to storm drain network? □ □
If retention is desired, will the design infiltration rate permit a reasonable drawdown
time? □ □
If retention is desired, is depth to the historical high groundwater from the filter bottom
greater than the jurisdiction’s minimum separation requirement? □ □
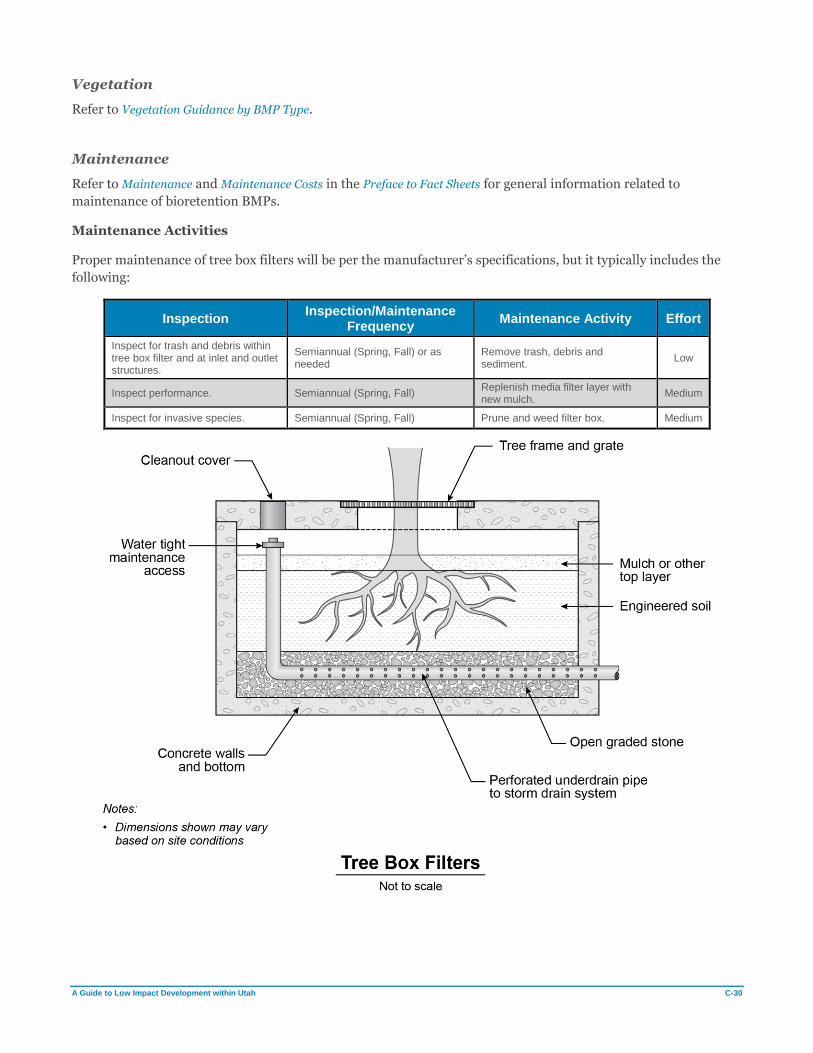
A Guide to Low Impact Development within Utah C-30
Vegetation
Refer to Vegetation Guidance by BMP Type.
Maintenance
Refer to Maintenance and Maintenance Costs in the Preface to Fact Sheets for general information related to
maintenance of bioretention BMPs.
Maintenance Activities
Proper maintenance of tree box filters will be per the manufacturer’s specifications, but it typically includes the
following:
Inspection Inspection/Maintenance
Frequency Maintenance Activity Effort
Inspect for trash and debris within tree box filter and at inlet and outlet structures.
Semiannual (Spring, Fall) or as needed
Remove trash, debris and sediment.
Low
Inspect performance. Semiannual (Spring, Fall) Replenish media filter layer with new mulch.
Medium
Inspect for invasive species. Semiannual (Spring, Fall) Prune and weed filter box. Medium

A Guide to Low Impact Development within Utah C-31
Green Roof BR-6
Pollutant Removal Effectiveness
Pollutant Effectiveness1
Sediment High
Nutrients Medium2
Metals High
Bacteria High
Oil/Grease -
1Removal effectiveness is increased for thicker soil layers. 2Use of organic matter to establish vegetation may increase nutrient leaching.
A green roof is a vegetated system that is designed to retain and treat rooftop runoff. The primary functions of
green roofs are bioretention, volume retention, and filtration. Green roofs capture storm water within the pore
space of the soil and vegetation and the moisture is then released through evapotranspiration.
Green roofs can be classified as either extensive or intensive systems. Extensive systems are those in which the soil
media is up to 6 inches in depth and support smaller grasses and other vegetative species that do not have deep
root systems. Intensive systems are those that support root systems greater than
6 inches such as those from trees and bushes.
The design of green roofs should be done with the coordination of qualified
landscaping, structural, and maintenance teams. Vegetation selection and the
proper maintenance of vegetation are critical items in the overall performance
and functionality of the green roof. The integrity of the roof structure must also
be accounted for as large volumes of plants, soils, water, and the weight of the
green roof structure will create additional loads on the building.
Primary Functions
Bioretention Yes
Volume Retention Yes
Biofiltration Yes

A Guide to Low Impact Development within Utah C-32
Design Criteria
Refer to Design Criteria in the Preface to Fact Sheets for discussion of design criteria parameters.
Parameter Extensive Intensive Notes
Drawdown Time 12 hours 12 hours -
Growth Media Depth < 6 in 6+ in -
Vegetation Low growing, low water-use
vegetation such as Sedum, herbs, grasses, and perennials
More complex gardens including the species listed for extensive
green roofs, but also incorporating trees and shrubs.
-
Load 12-54 lb/sf 72+ lb/sf -
Roof Slope 5:1 maximum 5:1 maximum -
Access Required for maintenance Required for maintenance -
Irrigation Simple irrigation. Only needed during droughts and plant establishment if
well designed. Complex irrigation -
Drainage Simple drainage system Complex drainage system -
Calculation Methods
Green roof design is governed by the water quality volume; however, special consideration must also be given to
vegetation selection and proper installation with the assistance of a landscape architect or other qualified person.
Special consideration must also be given to the structural design of the roof, with the assistance of a structural
engineer. Neither of those considerations are considered in this discussion of calculation methods. For the
purposes of determining if the green roof retains the water quality volume, the general design steps are:
1. Calculate the water quality volume.
2. Determine the porosity of the engineered soil used within the green roof and the retention volume within
the soil.
3. Determine the required footprint to retain the water quality volume.
Sample Calculations
Refer to Calculation Methods in the Preface to Fact Sheets for discussion on the equations used.
An extensive green roof system will be designed for a new building with a roof that is 0.37 acres. The entire roof
will drain to the green roof. It was decided that an extensive green roof system with a 6-inch soil matrix will be
used. Determine the footprint that will be needed to capture the water quality volume.
Given
Roof area: 0.37 ac
85th percentile storm depth: 0.60 in
Porosity of engineered soil: 0.25
Determine
Determine the footprint of the green roof.

A Guide to Low Impact Development within Utah C-33
Calculations
The footprint can be determined through iterative calculations. After iterative calculations, it was found that a
footprint of 3,405 square feet will capture the water quality volume.
Pervious area (green roof footprint): 3,405 sf (0.078 ac)
Imperviousness of rooftop: 0.79
Volumetric runoff coefficient, RV (See Sample Calculations)
RV = 0.91i – 0.0204 (Reese method)
RV = 0.91(0.79) – 0.0204
RV = 0.70
Water quality volume, WQV (See Developing the 90th Percentile Volume)
WQV = (0.70)(0.60 in)(16,117 sf) / (12 in/ft)
WQV = 562 cf
Determine the equivalent storage depth of the engineered soil.
dequivalent = (0.6 in)(0.25)
dequivalent = 1.5 in
Determine the required footprint of the green roof to capture the water quality volume.
Footprint = WQV / dequivalent
Footprint = 562 cf / (1.5 in)(12 in/ft)
Footprint = 4,496 sf
Green Roof Effectiveness
Green roofs provide an aesthetically pleasing method for retaining and treating storm water runoff. Healthy plants
and soils are indications that the green roof is performing as expected. Excessive drainage through the soil layer
may be an indication that the soils and vegetation are not retaining runoff; consequently, the evaporation and
transpiration processes are not occurring. Qualified horticulturists and/or green roof contractors should be
involved in determining the health and effectiveness of the green roof.
Designer Checklist
If the answer to these questions corresponds to a response box that is red, the BMP should either not be used or
additional measures need to be taken to address the issue.
Yes No
Has a landscape architect been involved in the vegetation selection? □ □
Has a structural engineer been involved in the green roof design? □ □
Are maintenance crews trained and aware of maintenance responsibilities? □ □
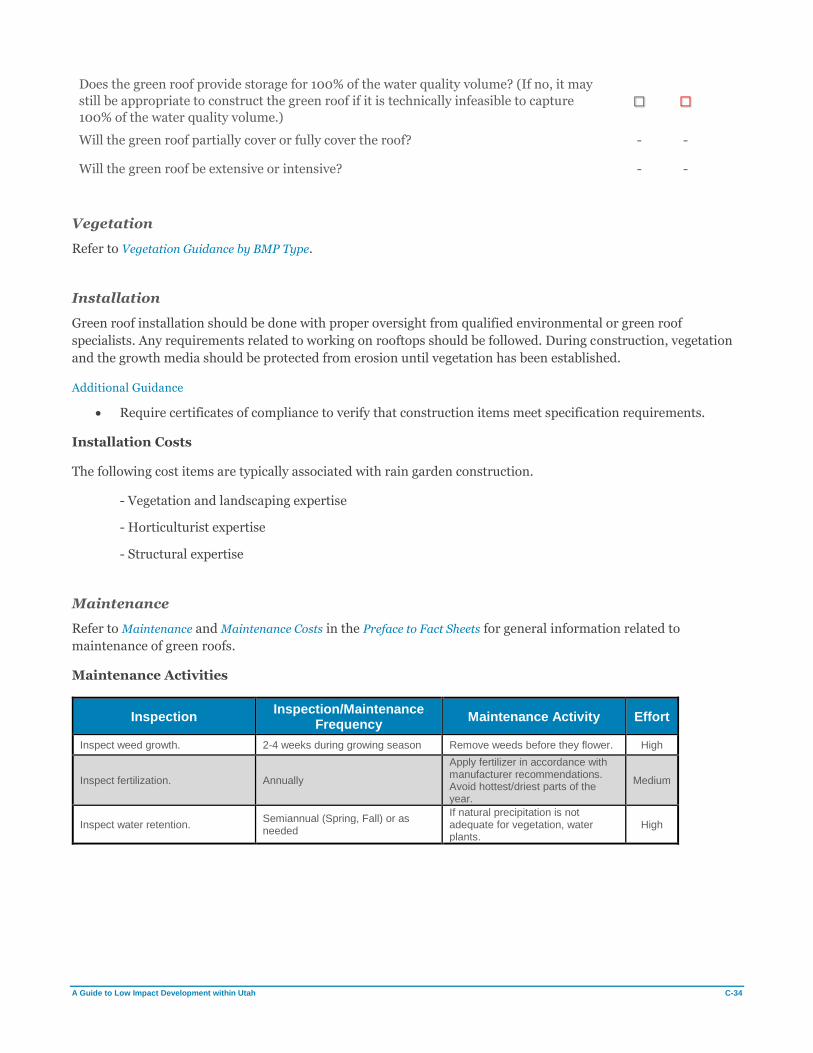
A Guide to Low Impact Development within Utah C-34
Does the green roof provide storage for 100% of the water quality volume? (If no, it may
still be appropriate to construct the green roof if it is technically infeasible to capture
100% of the water quality volume.) □ □
Will the green roof partially cover or fully cover the roof? - -
Will the green roof be extensive or intensive? - -
Vegetation
Refer to Vegetation Guidance by BMP Type.
Installation
Green roof installation should be done with proper oversight from qualified environmental or green roof
specialists. Any requirements related to working on rooftops should be followed. During construction, vegetation
and the growth media should be protected from erosion until vegetation has been established.
Additional Guidance
• Require certificates of compliance to verify that construction items meet specification requirements.
Installation Costs
The following cost items are typically associated with rain garden construction.
- Vegetation and landscaping expertise
- Horticulturist expertise
- Structural expertise
Maintenance
Refer to Maintenance and Maintenance Costs in the Preface to Fact Sheets for general information related to
maintenance of green roofs.
Maintenance Activities
Inspection Inspection/Maintenance
Frequency Maintenance Activity Effort
Inspect weed growth. 2-4 weeks during growing season Remove weeds before they flower. High
Inspect fertilization. Annually
Apply fertilizer in accordance with manufacturer recommendations. Avoid hottest/driest parts of the year.
Medium
Inspect water retention. Semiannual (Spring, Fall) or as needed
If natural precipitation is not adequate for vegetation, water plants.
High

A Guide to Low Impact Development within Utah C-35
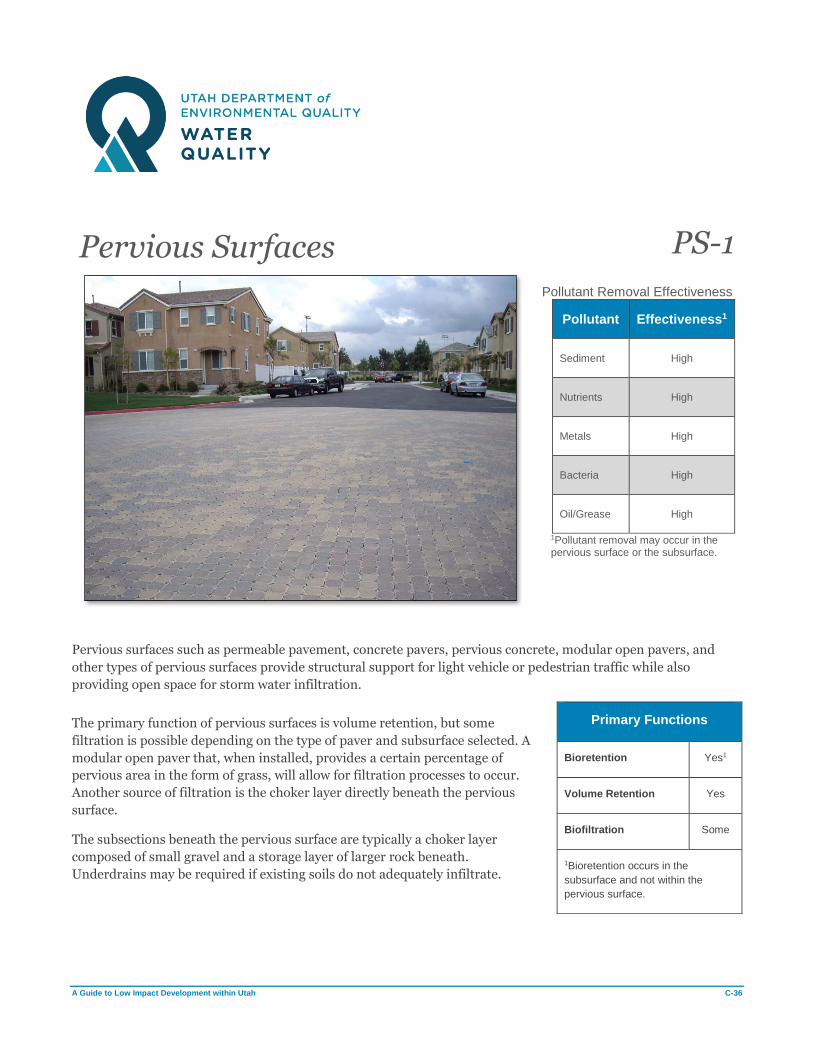
A Guide to Low Impact Development within Utah C-36
Pervious Surfaces PS-1
Pollutant Removal Effectiveness
Pollutant Effectiveness1
Sediment High
Nutrients High
Metals High
Bacteria High
Oil/Grease High
1Pollutant removal may occur in the pervious surface or the subsurface.
Pervious surfaces such as permeable pavement, concrete pavers, pervious concrete, modular open pavers, and
other types of pervious surfaces provide structural support for light vehicle or pedestrian traffic while also
providing open space for storm water infiltration.
The primary function of pervious surfaces is volume retention, but some
filtration is possible depending on the type of paver and subsurface selected. A
modular open paver that, when installed, provides a certain percentage of
pervious area in the form of grass, will allow for filtration processes to occur.
Another source of filtration is the choker layer directly beneath the pervious
surface.
The subsections beneath the pervious surface are typically a choker layer
composed of small gravel and a storage layer of larger rock beneath.
Underdrains may be required if existing soils do not adequately infiltrate.
Primary Functions
Bioretention Yes1
Volume Retention Yes
Biofiltration Some
1Bioretention occurs in the
subsurface and not within the
pervious surface.

A Guide to Low Impact Development within Utah C-37
Design Criteria
Refer to Design Criteria in the Preface to Fact Sheets for discussion of design criteria parameters.
Parameter Min. Value Max. Value Notes
Drain Time 12 hours 72 hours -
Design Infiltration Rate 0.25 in/hr 6 in/hr Field testing required for final
design.
Depth to Historical High Groundwater
2 ft No maximum -
Calculation Methods
Pervious surface design is governed by the water quality volume. The general design steps are:
1. Calculate the water quality volume.
2. Determine the required thickness of the subsection layers given their porosity and the footprint of the
pervious surface area.
Sample Calculations
Refer to Calculation Methods in the Preface to Fact Sheets for discussion on the equations used.
A development in the planning phase will have a 0.90-acre parking lot. It is proposed that the parking lot be
graded so that runoff is conveyed towards stalls that will be constructed with permeable asphalt.
Given
Contributing drainage area: 0.90 ac
Imperviousness: 0.95
85th percentile storm event: 0.53 in
Design infiltration rate: 0.5 in/hr
Design Goals
Determine an acceptable area size and depth of the permeable asphalt section.
Calculations
Volumetric runoff coefficient, RV (See Sample Calculations)
RV = 1.14i – 0.371 (Granato method when i ≥ 0.55)
RV = 1.14(0.95) – 0.371
RV = 0.71
Water quality volume, WQV (See Developing the 90th Percentile Volume)
WQV = (0.71)(0.53 in)(0.90 ac)(43,560 sf/ac) / (12 in/ft)
WQV = 1,230 cf

A Guide to Low Impact Development within Utah C-38
A permeable asphalt area that is 15 ft x 140 ft (2,100 sf) with the following properties will retain the water quality
volume and will have an acceptable drawdown time. See Storage volume within a media with a known porosity for
guidance on determining storage within soils.
Layer Thickness, in Porosity Storage Volume, cf
Permeable Asphalt
4 0.2 140
Choker Layer 4 0.4 280
Aggregate Storage
12 0.4 840
Total 20 0.37 (weighted) 1260
Drawdown time, t
t = Equivalent storage depth / Design infiltration rate
Weighted porosity, nW = 0.37
Equivalent storage depth = (20 in)(0.37)
Equivalent storage depth = 7.2 in
t = (7.2 in) / (0.5 in/hr)
t = 14.40 hrs
Pervious Surface Effectiveness
Pervious surfaces are effective when runoff from the design storm depth can enter the porous spaces of the
pervious surface and successfully infiltrate into the native soil or drain through an underdrain system. Visual
inspection of the pervious surface can reveal reasons for failure: for example, sediment-laden sheet flows that are
conveyed to the pervious surface, or a down drain might be introducing organic material. Both scenarios are likely
to contribute to clogging within the porous spaces of the pervious surface or within the sublayers.
Designer Checklist
If the answer to these questions corresponds to a response box that is red, the BMP should either not be used or
additional measures need to be taken to address the issue.
Yes No
Will an underdrain system be required? □ □
If an underdrain is needed, is there sufficient head for the underdrain system to drain? □ □
Has the proposed pervious surface performed successfully in similar climate conditions? □ □
A Guide to Low Impact Development within Utah C-39
Installation
Excavation
Pervious surfaces will fail if proper care is not taken during excavation and construction. Excavators and heavy
machinery should not be used if infiltration is expected to occur through the underlying soils beneath the pervious
surface’s subsection.
Activities During Construction
Avoid using heavy machinery on the revealed soil during construction. Crews should avoid unnecessarily walking
on the underlying soils when possible. Compaction of native soils or backfill below the pervious surface subsoils is
acceptable if doing so does not prevent infiltration from occurring.
Flows During Construction
Flows during construction should be diverted away from the exposed underlying soil to prevent erosion.
Scheduling installation of the pervious surface within a short time span after excavation will minimize the impact
of unnecessary storm water flows from entering the excavated area. The introduction of unwanted sediment and
storm water flows can be prevented by placing fiber rolls or silt fences around the excavated perimeter during
construction.
Additional Guidance
• Require certificates of compliance to verify that construction items meet specification requirements.
Installation Costs
The following cost items are typically associated with construction of pervious surfaces.
- Excavation
- Grading
- Fine grading
- Pervious surface
- Top layer
- Engineered soil
- Choker layer
- Open graded stone
- Geotextile fabric
- Impermeable liner
- Observation wells (if needed)
- Underdrain system (if needed)
Maintenance
Refer to Maintenance and Maintenance Costs in the Preface to Fact Sheets for general information related to
maintenance of pervious surfaces.

A Guide to Low Impact Development within Utah C-40
Maintenance Activities
Inspection Inspection/Maintenance
Frequency Maintenance Activity Effort
Inspect for sediment accumulation. Semiannual (Spring, Fall) Use vacuum sweeper followed by pressure washing.
Medium
Inspect for weed growth. Semiannual (Spring, Fall) Remove weeds. Low
Inspect for standing water on surface or within observation well (if used).
Semiannual (Spring, Fall) Notify engineer for further inspection.
Low
Inspect surface for deterioration. Annual Notify engineer for further inspection.
Low
Inspect exfiltration and drainage performance.
As needed, at least annually Notify engineer for further inspection.
Medium
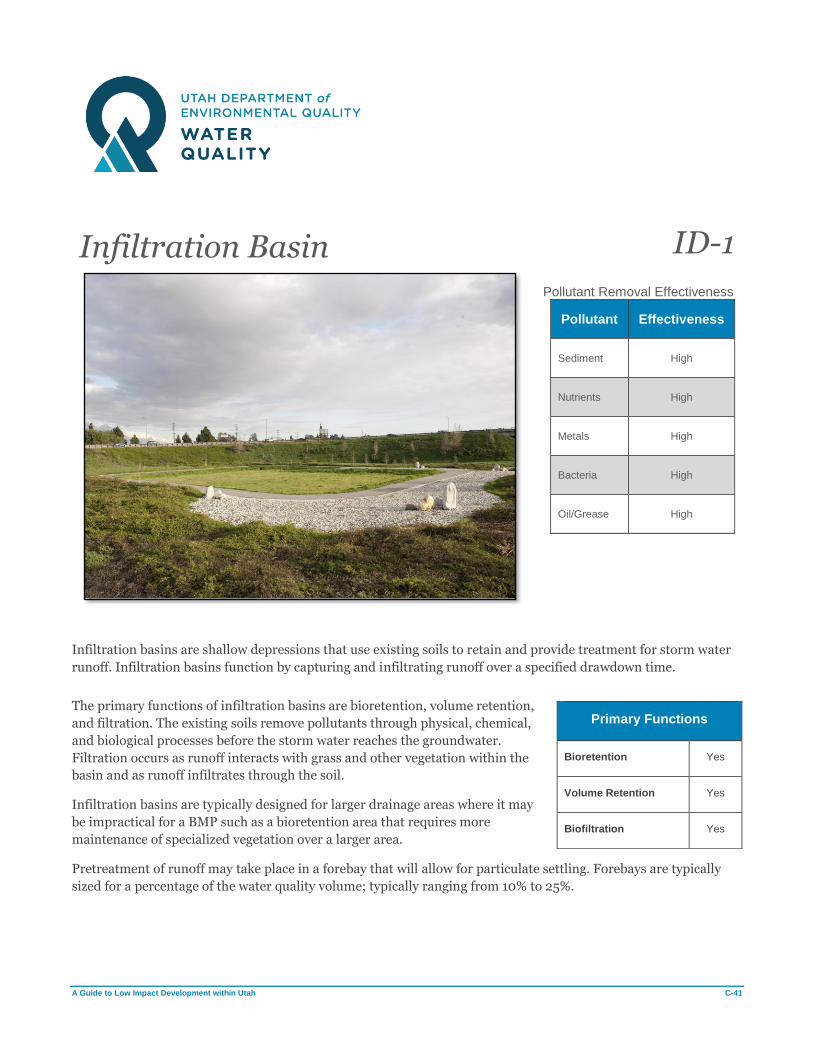
A Guide to Low Impact Development within Utah C-41
Infiltration Basin ID-1
Pollutant Removal Effectiveness
Pollutant Effectiveness
Sediment High
Nutrients High
Metals High
Bacteria High
Oil/Grease High
Infiltration basins are shallow depressions that use existing soils to retain and provide treatment for storm water
runoff. Infiltration basins function by capturing and infiltrating runoff over a specified drawdown time.
The primary functions of infiltration basins are bioretention, volume retention,
and filtration. The existing soils remove pollutants through physical, chemical,
and biological processes before the storm water reaches the groundwater.
Filtration occurs as runoff interacts with grass and other vegetation within the
basin and as runoff infiltrates through the soil.
Infiltration basins are typically designed for larger drainage areas where it may
be impractical for a BMP such as a bioretention area that requires more
maintenance of specialized vegetation over a larger area.
Pretreatment of runoff may take place in a forebay that will allow for particulate settling. Forebays are typically
sized for a percentage of the water quality volume; typically ranging from 10% to 25%.
Primary Functions
Bioretention Yes
Volume Retention Yes
Biofiltration Yes

A Guide to Low Impact Development within Utah C-42
Design Criteria
Refer to Design Criteria in the Preface to Fact Sheets for discussion of design criteria parameters.
Parameter Min. Value Max. Value Notes
Water Quality Volume 0.1 ac-ft (4356 cf) No maximum -
Freeboard 1 ft -
Overflow Spillway Length 3 ft spillway length -
Invert Slope 0% (flat basin bottom) -
Interior Side Slopes No minimum 3H:1V -
Drawdown Time 24 hours 72 hours 48 hours recommended
Design Infiltration Rate 0.25 in/hr 6 in/hr Field testing required for final
design.
Depth to Historical High Groundwater
2 ft No maximum -
Calculation Methods
Infiltration basin design is governed by the water quality volume. The general design steps are:
1. Calculate the water quality volume.
2. Determine the geometry of the infiltration basin.
3. Based on the basin geometry, determine the ponding depth required to hold the water quality volume.
4. Calculate the drawdown time.
Calculate the water quality outlet elevation.
Sample Calculations
Refer to Calculation Methods in the Preface to Fact Sheets for discussion on the equations used.
A 13.50-acre highway development routes all of its storm water to a single infiltration basin. A safety factor of 1.50
is required for infiltration design within the jurisdiction. Adjacent soils are ‘A’ and are part of the drainage area.
Given
Contributing drainage area: 13.50 ac
Imperviousness: 0.65
90th percentile storm depth: 0.55 in
Soil infiltration rate: 1.35 in/hr
Design Goals
Determine the bottom footprint of the infiltration basin and the elevation of the water quality outlet above the
basin bottom.
Calculations
Volumetric runoff coefficient, RV (See Sample Calculations)
RV-A = 0.84i1.302 (RV based on hydrologic soil group)
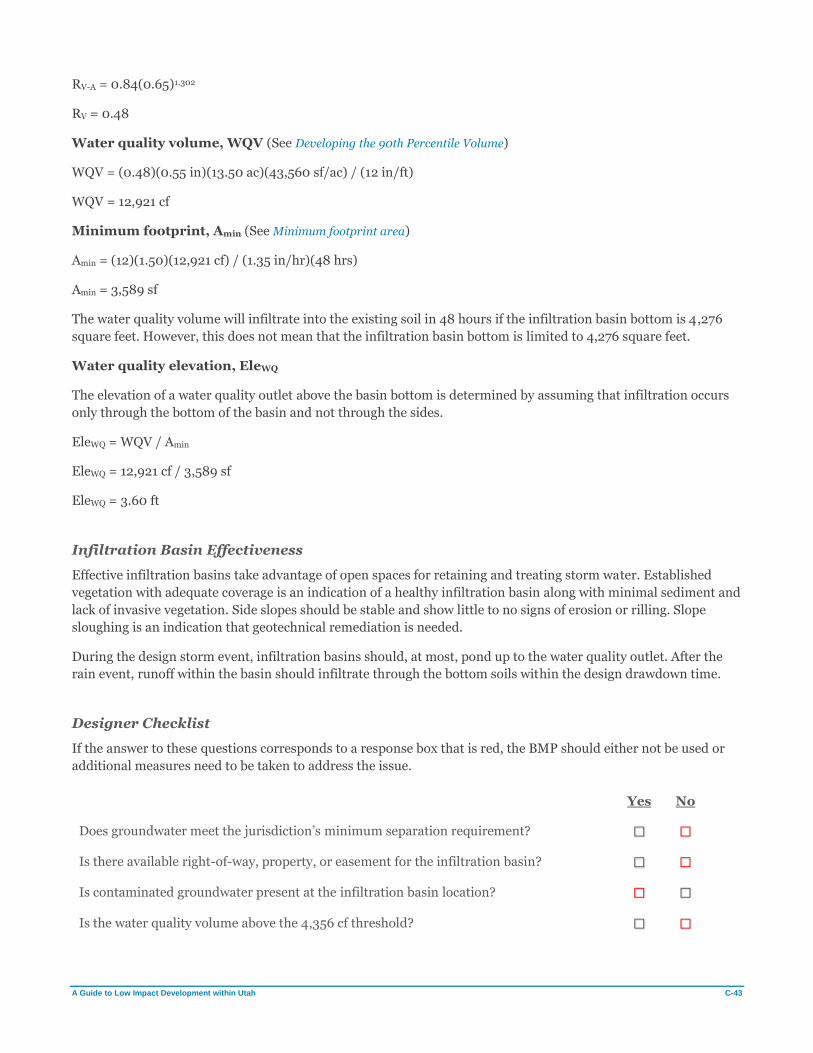
A Guide to Low Impact Development within Utah C-43
RV-A = 0.84(0.65)1.302
RV = 0.48
Water quality volume, WQV (See Developing the 90th Percentile Volume)
WQV = (0.48)(0.55 in)(13.50 ac)(43,560 sf/ac) / (12 in/ft)
WQV = 12,921 cf
Minimum footprint, Amin (See Minimum footprint area)
Amin = (12)(1.50)(12,921 cf) / (1.35 in/hr)(48 hrs)
Amin = 3,589 sf
The water quality volume will infiltrate into the existing soil in 48 hours if the infiltration basin bottom is 4,276
square feet. However, this does not mean that the infiltration basin bottom is limited to 4,276 square feet.
Water quality elevation, EleWQ
The elevation of a water quality outlet above the basin bottom is determined by assuming that infiltration occurs
only through the bottom of the basin and not through the sides.
EleWQ = WQV / Amin
EleWQ = 12,921 cf / 3,589 sf
EleWQ = 3.60 ft
Infiltration Basin Effectiveness
Effective infiltration basins take advantage of open spaces for retaining and treating storm water. Established
vegetation with adequate coverage is an indication of a healthy infiltration basin along with minimal sediment and
lack of invasive vegetation. Side slopes should be stable and show little to no signs of erosion or rilling. Slope
sloughing is an indication that geotechnical remediation is needed.
During the design storm event, infiltration basins should, at most, pond up to the water quality outlet. After the
rain event, runoff within the basin should infiltrate through the bottom soils within the design drawdown time.
Designer Checklist
If the answer to these questions corresponds to a response box that is red, the BMP should either not be used or
additional measures need to be taken to address the issue.
Yes No
Does groundwater meet the jurisdiction’s minimum separation requirement? □ □
Is there available right-of-way, property, or easement for the infiltration basin? □ □
Is contaminated groundwater present at the infiltration basin location? □ □
Is the water quality volume above the 4,356 cf threshold? □ □
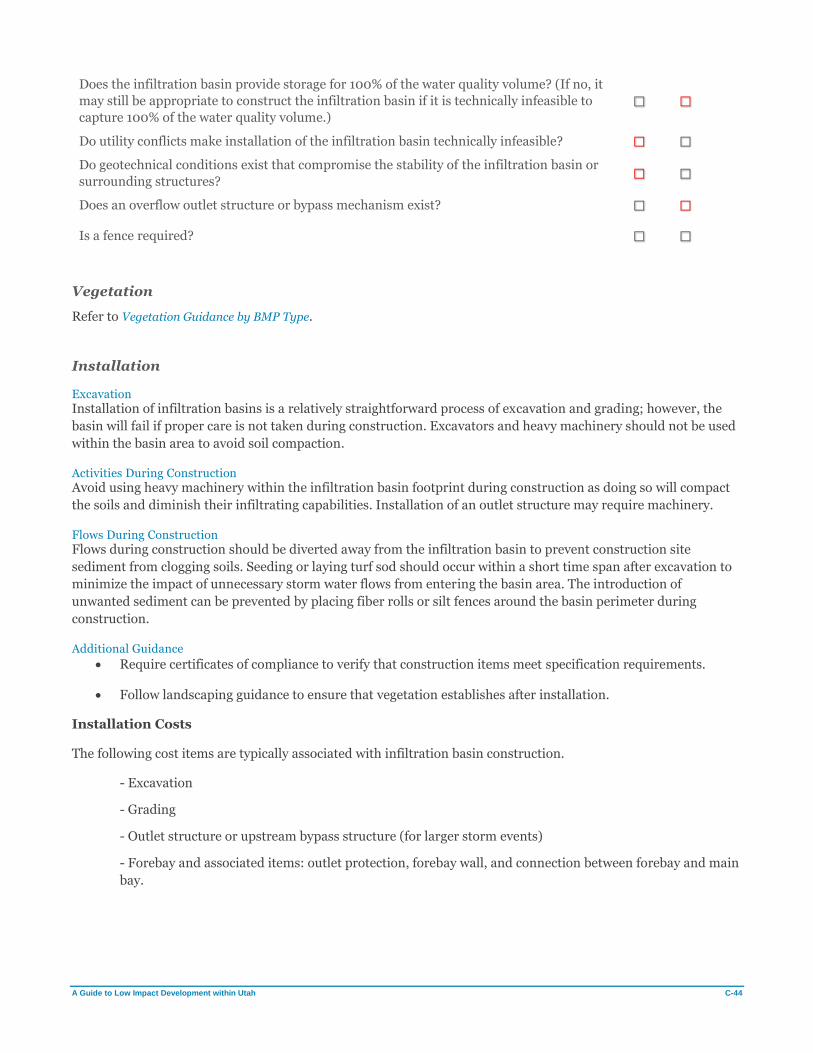
A Guide to Low Impact Development within Utah C-44
Does the infiltration basin provide storage for 100% of the water quality volume? (If no, it
may still be appropriate to construct the infiltration basin if it is technically infeasible to
capture 100% of the water quality volume.) □ □
Do utility conflicts make installation of the infiltration basin technically infeasible? □ □
Do geotechnical conditions exist that compromise the stability of the infiltration basin or
surrounding structures? □ □
Does an overflow outlet structure or bypass mechanism exist? □ □
Is a fence required? □ □
Vegetation
Refer to Vegetation Guidance by BMP Type.
Installation
Excavation
Installation of infiltration basins is a relatively straightforward process of excavation and grading; however, the
basin will fail if proper care is not taken during construction. Excavators and heavy machinery should not be used
within the basin area to avoid soil compaction.
Activities During Construction
Avoid using heavy machinery within the infiltration basin footprint during construction as doing so will compact
the soils and diminish their infiltrating capabilities. Installation of an outlet structure may require machinery.
Flows During Construction
Flows during construction should be diverted away from the infiltration basin to prevent construction site
sediment from clogging soils. Seeding or laying turf sod should occur within a short time span after excavation to
minimize the impact of unnecessary storm water flows from entering the basin area. The introduction of
unwanted sediment can be prevented by placing fiber rolls or silt fences around the basin perimeter during
construction.
Additional Guidance
• Require certificates of compliance to verify that construction items meet specification requirements.
• Follow landscaping guidance to ensure that vegetation establishes after installation.
Installation Costs
The following cost items are typically associated with infiltration basin construction.
- Excavation
- Grading
- Outlet structure or upstream bypass structure (for larger storm events)
- Forebay and associated items: outlet protection, forebay wall, and connection between forebay and main
bay.

A Guide to Low Impact Development within Utah C-45
Maintenance
Refer to Maintenance and Maintenance Costs in the Preface to Fact Sheets for general information related to
maintenance of infiltration BMPs.
Maintenance Activities
Inspection Inspection/Maintenance
Frequency Maintenance Activity Effort
Inspect for trash and debris at inlet and outlet structures.
Semiannual (Spring, Fall) or as needed
Remove and dispose of trash and debris.
Low
Inspect grass length. As needed Mow basin grass. Low
Inspect pre-treatment diversion structures for sediment build-up.
Semiannual (Spring, Fall) Remove and dispose of sediment buildup.
Low
Inspect topsoil for sediment buildup.
Semiannual (Spring, Fall) or as needed
Remove sediment. Low
Inspect for standing water above trench or within observation well (if used).
Semiannual (Spring, Fall) Notify engineer for further inspection.
Low
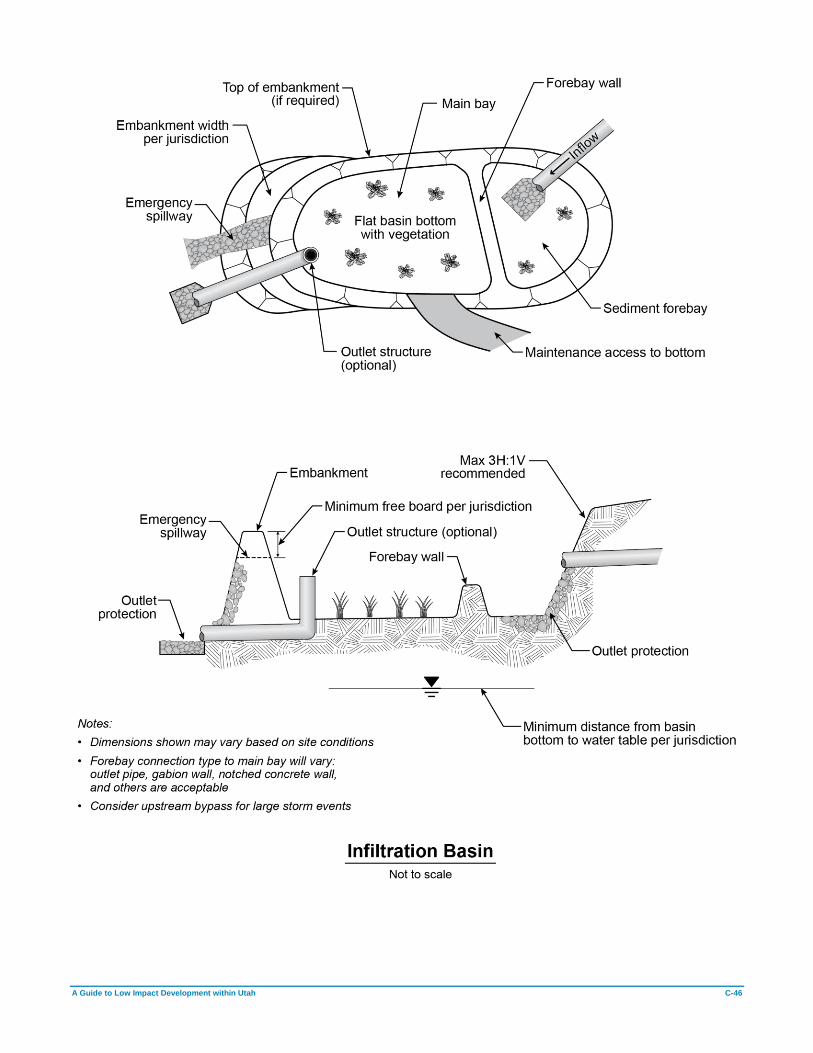
A Guide to Low Impact Development within Utah C-46
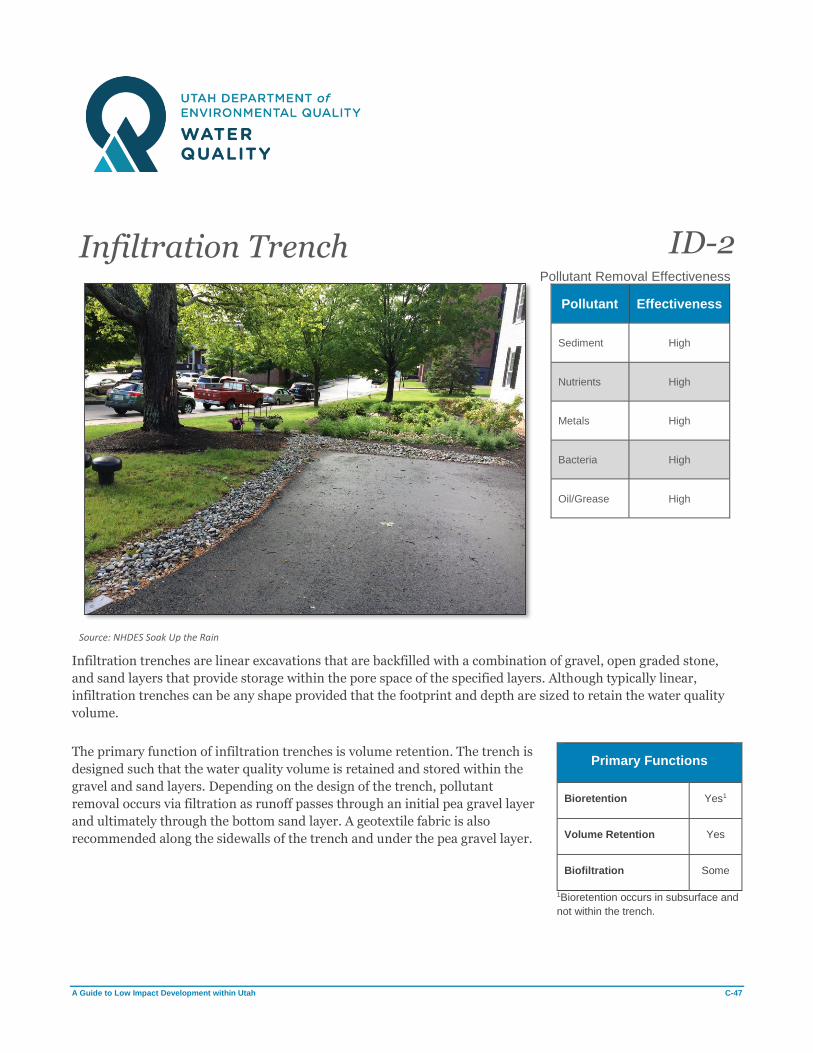
A Guide to Low Impact Development within Utah C-47
Infiltration Trench ID-2
Source: NHDES Soak Up the Rain
Pollutant Removal Effectiveness
Pollutant Effectiveness
Sediment High
Nutrients High
Metals High
Bacteria High
Oil/Grease High
Infiltration trenches are linear excavations that are backfilled with a combination of gravel, open graded stone,
and sand layers that provide storage within the pore space of the specified layers. Although typically linear,
infiltration trenches can be any shape provided that the footprint and depth are sized to retain the water quality
volume.
The primary function of infiltration trenches is volume retention. The trench is
designed such that the water quality volume is retained and stored within the
gravel and sand layers. Depending on the design of the trench, pollutant
removal occurs via filtration as runoff passes through an initial pea gravel layer
and ultimately through the bottom sand layer. A geotextile fabric is also
recommended along the sidewalls of the trench and under the pea gravel layer.
1Bioretention occurs in subsurface and
not within the trench.
Primary Functions
Bioretention Yes1
Volume Retention Yes
Biofiltration Some

A Guide to Low Impact Development within Utah C-48
Design Criteria
Refer to Design Criteria in the Preface to Fact Sheets for discussion of design criteria parameters.
Parameter Min. Value Max. Value Notes
Depth of Trench 2 ft No maximum Maximum depth determined by
jurisdiction.
Longitudinal Trench Slope 0% 1% -
Width 2 ft No maximum -
Drawdown Time 12 hours 72 hours -
Design Infiltration Rate 0.25 in/hr 6 in/hr Field testing required for final
design.
Depth to Historical High Groundwater
2 ft No maximum -
Calculation Methods
Infiltration trench design is governed by the water quality volume. The general design steps are:
1. Calculate the water quality volume.
2. Determine the trench footprint.
3. Based on the trench geometry, porosity of the trench layers, and ponding depth (if any), determine the
trench depth.
4. Calculate the drawdown time.
Sample Calculations
Refer to Calculation Methods in the Preface to Fact Sheets for discussion on the equations used.
A proposed park will have a concrete plaza that is 0.40 acres. Runoff from the plaza will flow towards a pervious
area. To meet the jurisdiction’s retention requirement, the design team proposes to install an infiltration trench
adjacent to the plaza.
Given
Contributing drainage area: 0.40 ac
Imperviousness: 1.00
90th percentile storm depth: 0.70 in
Design Goals
Determine that the geometry of an infiltration trench that will retain the water quality volume.
Calculations
Volumetric runoff coefficient, RV (See Sample Calculations)
RV = 0.91i – 0.0204 (Reese method)
RV = 0.91(1.0) – 0.0204
RV = 0.89
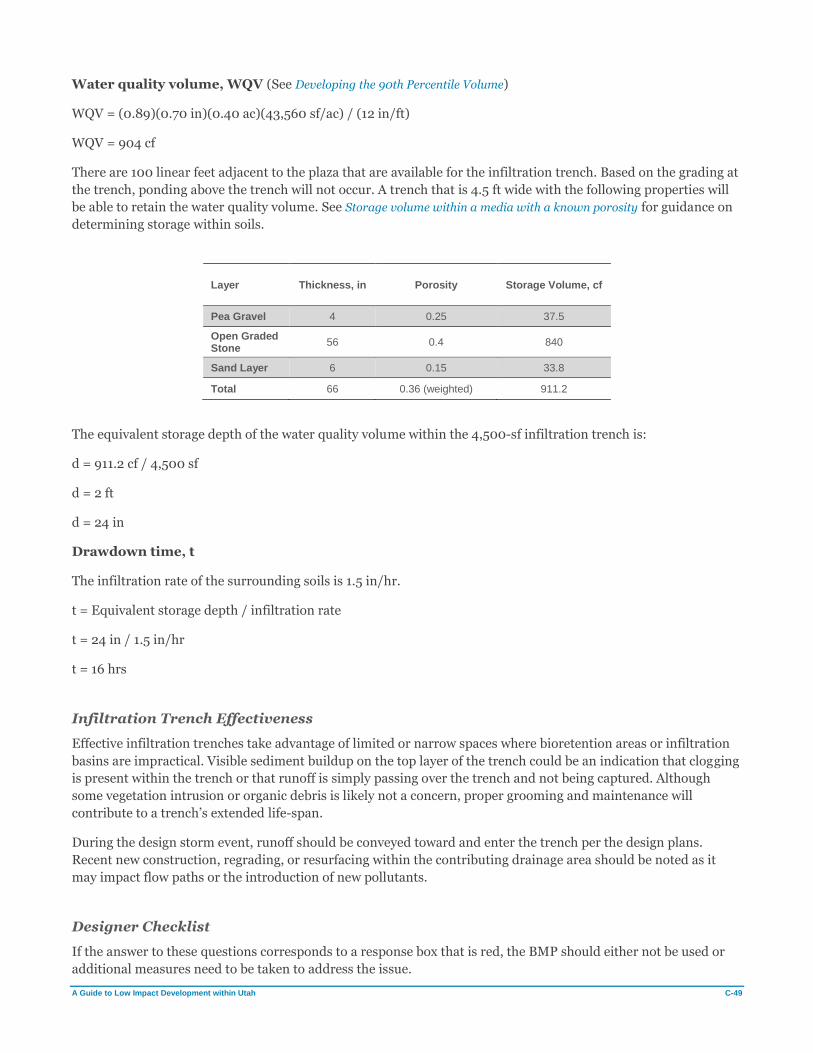
A Guide to Low Impact Development within Utah C-49
Water quality volume, WQV (See Developing the 90th Percentile Volume)
WQV = (0.89)(0.70 in)(0.40 ac)(43,560 sf/ac) / (12 in/ft)
WQV = 904 cf
There are 100 linear feet adjacent to the plaza that are available for the infiltration trench. Based on the grading at
the trench, ponding above the trench will not occur. A trench that is 4.5 ft wide with the following properties will
be able to retain the water quality volume. See Storage volume within a media with a known porosity for guidance on
determining storage within soils.
Layer Thickness, in Porosity Storage Volume, cf
Pea Gravel 4 0.25 37.5
Open Graded Stone
56 0.4 840
Sand Layer 6 0.15 33.8
Total 66 0.36 (weighted) 911.2
The equivalent storage depth of the water quality volume within the 4,500-sf infiltration trench is:
d = 911.2 cf / 4,500 sf
d = 2 ft
d = 24 in
Drawdown time, t
The infiltration rate of the surrounding soils is 1.5 in/hr.
t = Equivalent storage depth / infiltration rate
t = 24 in / 1.5 in/hr
t = 16 hrs
Infiltration Trench Effectiveness
Effective infiltration trenches take advantage of limited or narrow spaces where bioretention areas or infiltration
basins are impractical. Visible sediment buildup on the top layer of the trench could be an indication that clogging
is present within the trench or that runoff is simply passing over the trench and not being captured. Although
some vegetation intrusion or organic debris is likely not a concern, proper grooming and maintenance will
contribute to a trench’s extended life-span.
During the design storm event, runoff should be conveyed toward and enter the trench per the design plans.
Recent new construction, regrading, or resurfacing within the contributing drainage area should be noted as it
may impact flow paths or the introduction of new pollutants.
Designer Checklist
If the answer to these questions corresponds to a response box that is red, the BMP should either not be used or
additional measures need to be taken to address the issue.

A Guide to Low Impact Development within Utah C-50
Yes No
Does groundwater meet the jurisdiction’s minimum separation requirement? □ □
Is the infiltration rate of the existing soils within acceptable rates? □ □
Is contaminated groundwater present at the infiltration trench location? □ □
Do utility conflicts make installation of the infiltration trench technically infeasible?
□ □
Do geotechnical conditions exist that compromise the stability of the infiltration trench or
surrounding structures? □ □
Does the infiltration trench provide storage for 100% of the water quality volume? (If no,
it may still be appropriate to construct the infiltration trench if it is technically infeasible
to capture 100% of the water quality volume.) □ □
Does an overflow outlet structure or bypass mechanism exist, if needed? □ □
Vegetation
Vegetation is not typical for an infiltration trench.
Installation
Excavation
Excavation for infiltration trenches is typically linear but alternate geometries are possible. During excavation,
light machinery should be used to avoid excessive compaction.
Activities During Construction
Avoid using heavy machinery within the infiltration trench footprint during construction as doing so will compact
the soils and diminish their infiltrating capabilities.
Flows During Construction
Flows during construction should be diverted away from the infiltration trench to prevent construction site
sediment from clogging soils. The introduction of unwanted sediment can be prevented by placing fiber rolls or
silt fences around the trench perimeter during construction.
Additional Guidance
• Require certificates of compliance to verify that construction items meet specification requirements.
Installation Costs
The following cost items are typically associated with infiltration trench construction.
- Excavation
- Landscaping and vegetation
- Pea gravel
- Open graded stone
- Sand layer
- Geotextile separator

A Guide to Low Impact Development within Utah C-51
Maintenance
Refer to Maintenance and Maintenance Costs in the Preface to Fact Sheets for general information related to
maintenance of infiltration BMPs.
Maintenance Activities
Inspection Inspection/Maintenance
Frequency Maintenance Activity Effort
Inspect for trash and debris at inlet and outlet structures.
Semiannual (Spring, Fall) or as needed
Remove and dispose of trash and debris.
Low
Inspect grass length, if any, on top of trench.
As needed Mow trench grass. Low
Inspect pre-treatment diversion structures for sediment buildup.
Semiannual (Spring, Fall) or as needed
Remove and dispose of sediment build up.
Low
Inspect tree growth near trench. Semiannual (Spring, Fall) Remove trees in vicinity of the trench.
Low
Inspect for standing water above trench or within observation well.
Semiannual (Spring, Fall) Notify engineer for further inspection.
Low
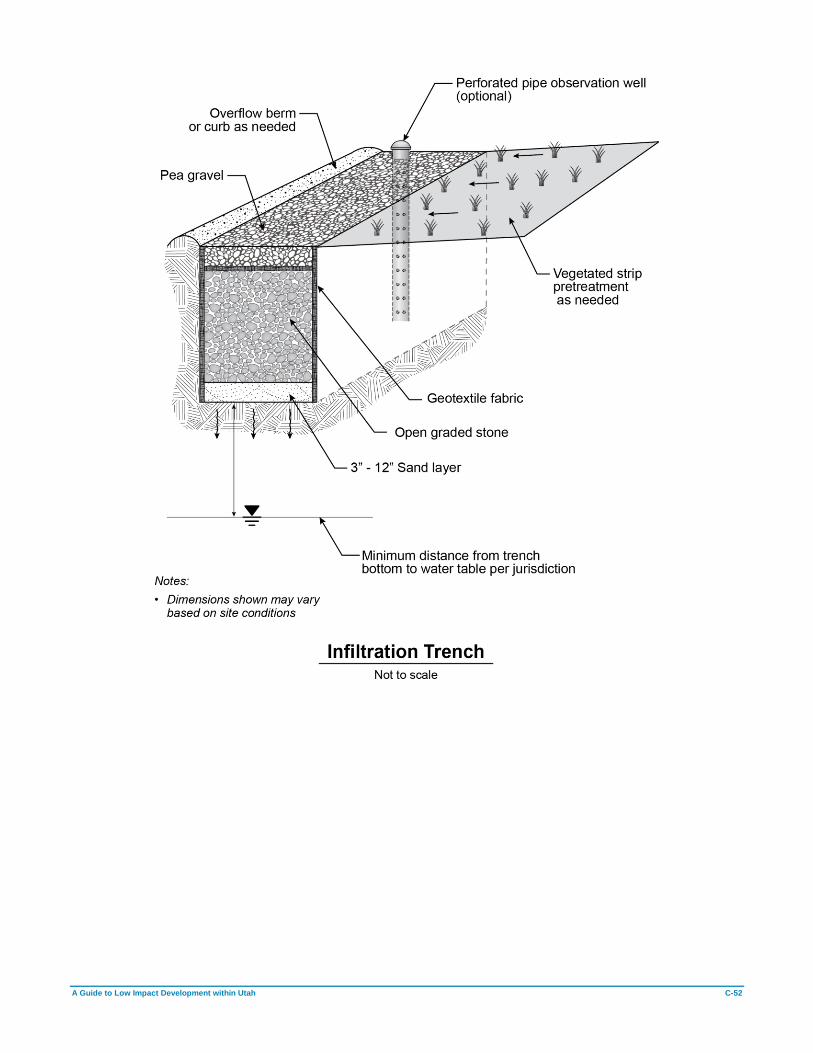
A Guide to Low Impact Development within Utah C-52
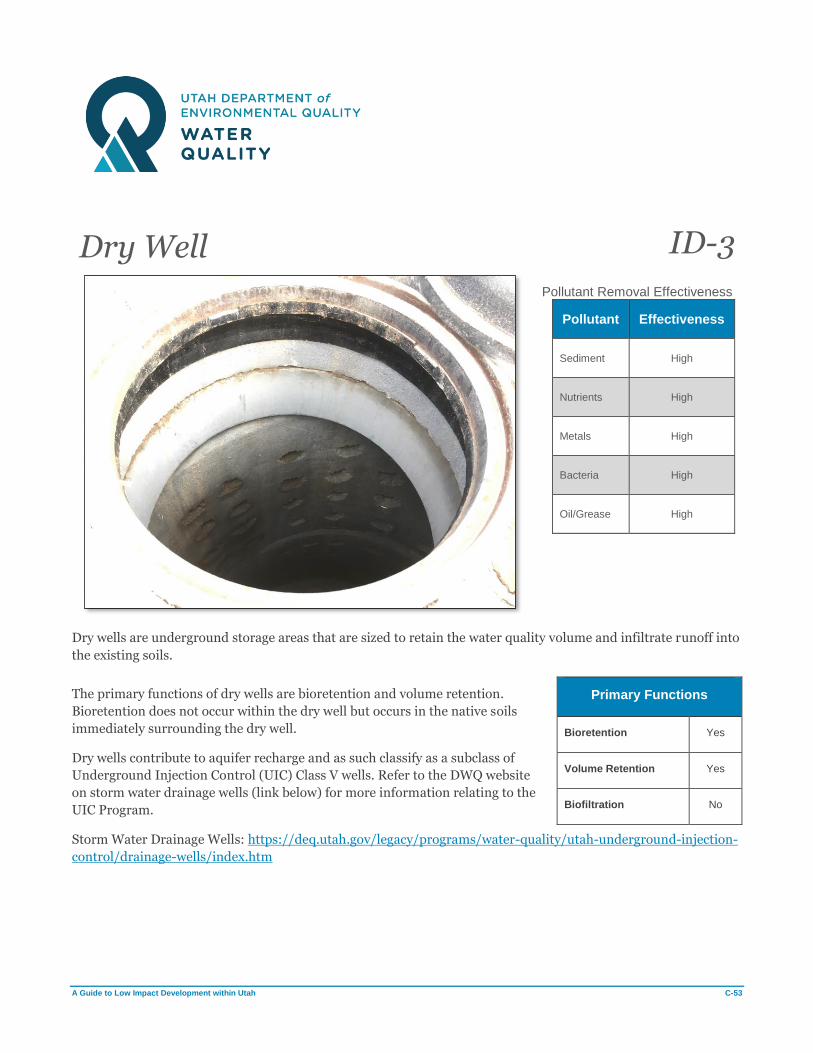
A Guide to Low Impact Development within Utah C-53
Dry Well ID-3
Pollutant Removal Effectiveness
Pollutant Effectiveness
Sediment High
Nutrients High
Metals High
Bacteria High
Oil/Grease High
Dry wells are underground storage areas that are sized to retain the water quality volume and infiltrate runoff into
the existing soils.
The primary functions of dry wells are bioretention and volume retention.
Bioretention does not occur within the dry well but occurs in the native soils
immediately surrounding the dry well.
Dry wells contribute to aquifer recharge and as such classify as a subclass of
Underground Injection Control (UIC) Class V wells. Refer to the DWQ website
on storm water drainage wells (link below) for more information relating to the
UIC Program.
Storm Water Drainage Wells: https://deq.utah.gov/legacy/programs/water-quality/utah-underground-injection-
control/drainage-wells/index.htm
Primary Functions
Bioretention Yes
Volume Retention Yes
Biofiltration No

A Guide to Low Impact Development within Utah C-54
Design Criteria
Refer to Design Criteria in the Preface to Fact Sheets for discussion of design criteria parameters.
Parameter Min. Value Max. Value Notes
Depth to Historical High Groundwater
2 ft No maximum -
Drawdown Time 24 hours 72 hours -
Building Setback 10 ft No maximum -
Design Infiltration Rate 0.25 in/hr 6 in/hr Field testing required for final
design.
Calculation Methods
Dry well design is governed by the water quality volume. The general design steps are:
1. Calculate the water quality volume.
2. Determine the dry well geometry.
3. Determine the drawdown time.
Sample Calculations
Refer to Calculation Methods in the Preface to Fact Sheets for discussion on the equations used.
A drywell is proposed at the downstream end of a swale that is being proposed adjacent to a new road.
Given
Contributing drainage area: 0.72 ac
Imperviousness: 0.40
90th percentile storm depth: 0.59 in
Infiltration rate of surrounding soil: 3 in/hr
Design Goals
Determine the dry well geometry required to hold the water quality volume.
Calculations
Volumetric runoff coefficient, RV (See Sample Calculations)
RV = 0.225i + 0.05 (Granato method when i < 0.55)
RV = 0.225(0.40) + 0.05
RV = 0.14
Water quality volume, WQV (See Developing the 90th Percentile Volume)
WQV = (0.14)(0.59 in)(0.72 ac)(43,560 sf/ac) / (12 in/ft)
WQV = 220 cf
A dry well that has a 6 ft radius and is 8 ft deep will hold 226 cf.

A Guide to Low Impact Development within Utah C-55
For a conservative estimate at the planning stage, the dry well’s drawdown time is based on the infiltration rate of
the surrounding soil and ignores the effects of the pressure head within the dry well. A more detailed
determination of the drawdown should be done for final design.
Drawdown time, t
t = Dry well depth / infiltration rate
t = (8 ft)(12 in/ft) / 3 in/hr
t = 32 hrs
Dry Well Effectiveness
Effective dry wells optimize infiltrating soils within limited space to retain storm water runoff while not
introducing stability concerns to nearby development or structures. The design storm volume within a functioning
dry well will drawdown within the design time and leave no standing water inside of the well. Pretreatment should
be provided prior to entering the dry well and the pretreatment method should be determined based on the
expected pollutants. Entry to the dry well should be unobstructed and free of debris that will restrict flows from
entering.
Designer Checklist
If the answer to these questions corresponds to a response box that is red, the BMP should either not be used or
additional measures need to be taken to address the issue.
Yes No
Does groundwater meet the jurisdiction’s minimum separation requirement? □ □
Is the infiltration rate of the existing soils within acceptable rates? □ □
Is contaminated groundwater present at the dry well location? □ □
Do utility conflicts make installation of the dry well technically infeasible? □ □
Do geotechnical conditions exist that compromise the stability of the dry well or
surrounding structures? □ □
Is pretreatment provided upstream of or within the dry well? □ □
Installation
Excavation
Excavate area in which dry well will be placed.
Activities During Construction
Take proper safety measures to cover the excavated dry well area before putting the dry well in place. If the dry
well is designed to infiltrate through the well bottom, place and level gravel within the excavation to provide a
foundation for the well structure.
Flows During Construction
Flows during construction can enter the dry well if the grated manhole lid contains a filtering material.
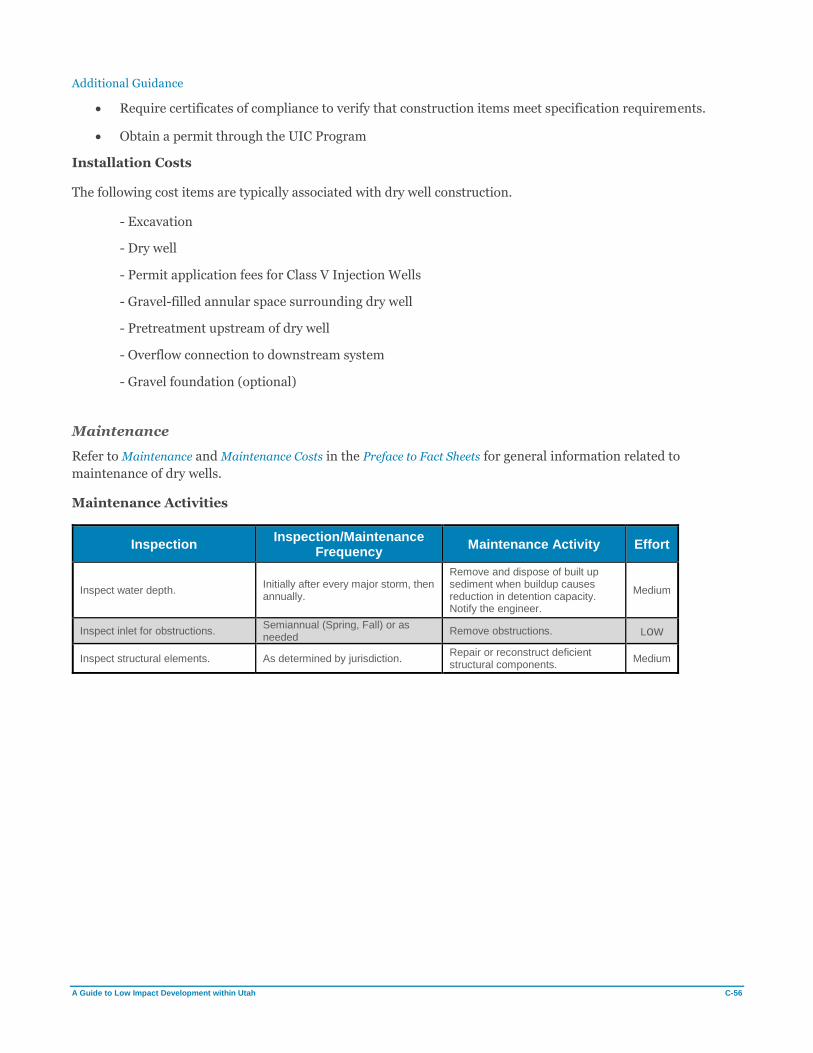
A Guide to Low Impact Development within Utah C-56
Additional Guidance
• Require certificates of compliance to verify that construction items meet specification requirements.
• Obtain a permit through the UIC Program
Installation Costs
The following cost items are typically associated with dry well construction.
- Excavation
- Dry well
- Permit application fees for Class V Injection Wells
- Gravel-filled annular space surrounding dry well
- Pretreatment upstream of dry well
- Overflow connection to downstream system
- Gravel foundation (optional)
Maintenance
Refer to Maintenance and Maintenance Costs in the Preface to Fact Sheets for general information related to
maintenance of dry wells.
Maintenance Activities
Inspection Inspection/Maintenance
Frequency Maintenance Activity Effort
Inspect water depth. Initially after every major storm, then annually.
Remove and dispose of built up sediment when buildup causes reduction in detention capacity. Notify the engineer.
Medium
Inspect inlet for obstructions. Semiannual (Spring, Fall) or as needed
Remove obstructions. Low
Inspect structural elements. As determined by jurisdiction. Repair or reconstruct deficient structural components.
Medium
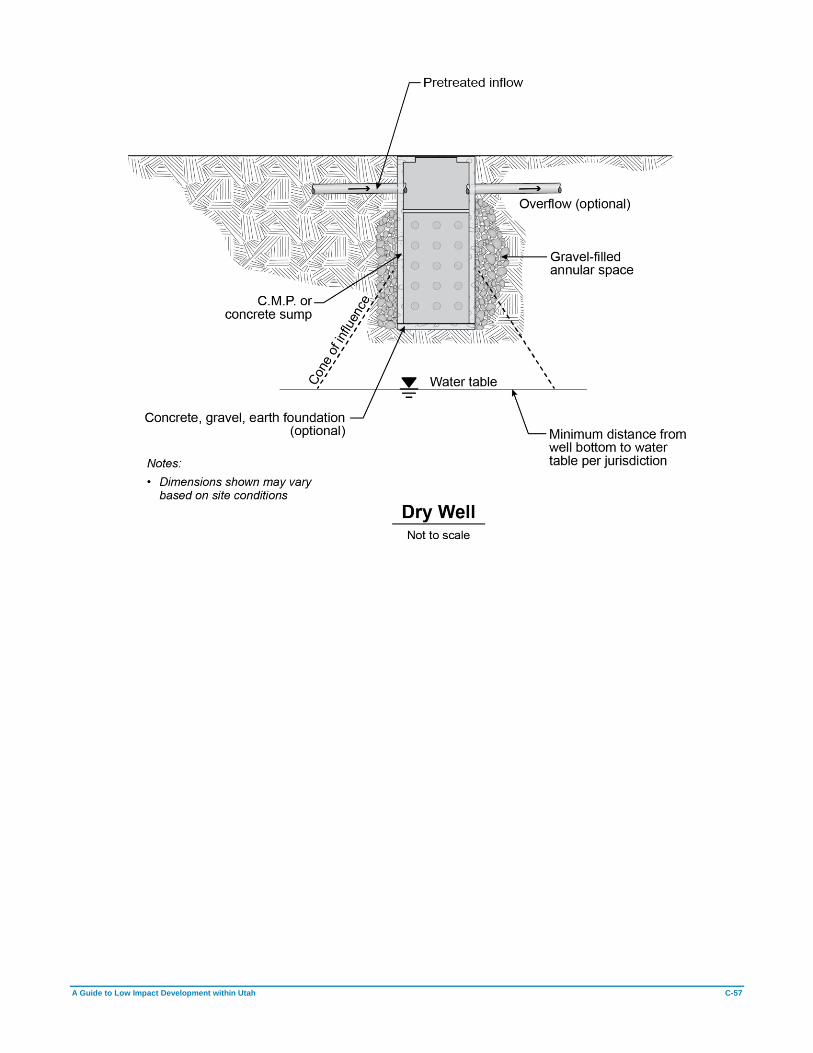
A Guide to Low Impact Development within Utah C-57
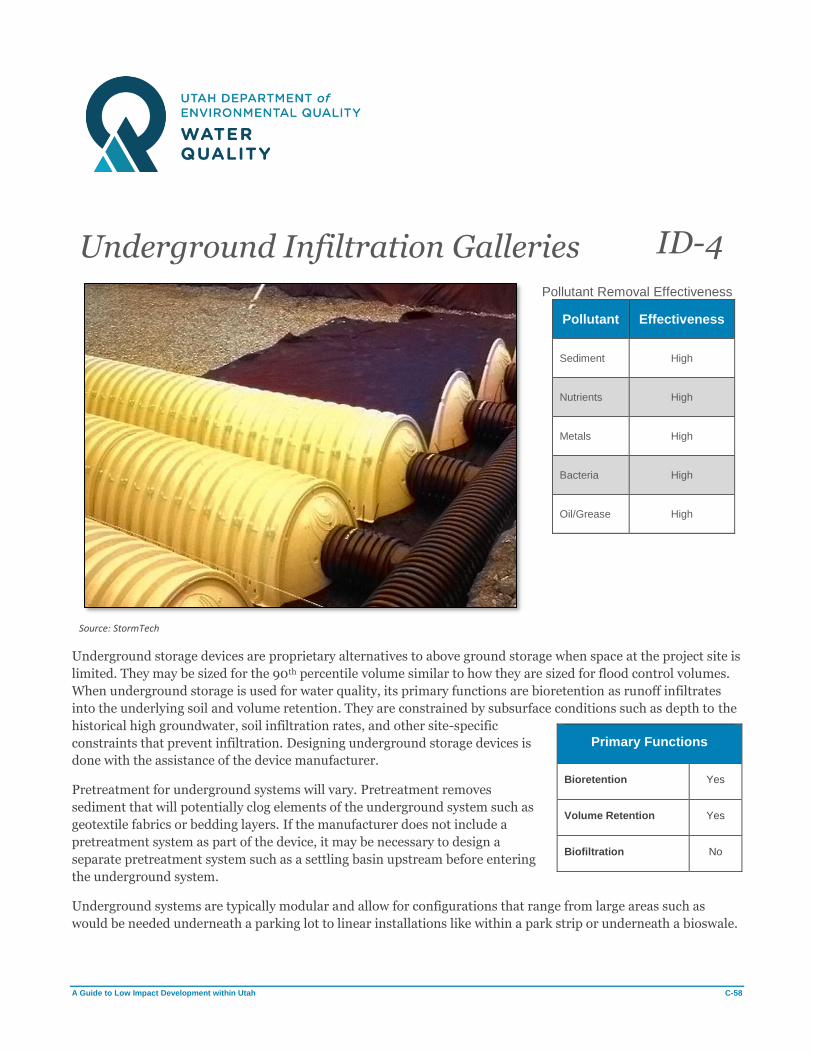
A Guide to Low Impact Development within Utah C-58
Underground Infiltration Galleries ID-4
Source: StormTech
Pollutant Removal Effectiveness
Pollutant Effectiveness
Sediment High
Nutrients High
Metals High
Bacteria High
Oil/Grease High
Underground storage devices are proprietary alternatives to above ground storage when space at the project site is
limited. They may be sized for the 90th percentile volume similar to how they are sized for flood control volumes.
When underground storage is used for water quality, its primary functions are bioretention as runoff infiltrates
into the underlying soil and volume retention. They are constrained by subsurface conditions such as depth to the
historical high groundwater, soil infiltration rates, and other site-specific
constraints that prevent infiltration. Designing underground storage devices is
done with the assistance of the device manufacturer.
Pretreatment for underground systems will vary. Pretreatment removes
sediment that will potentially clog elements of the underground system such as
geotextile fabrics or bedding layers. If the manufacturer does not include a
pretreatment system as part of the device, it may be necessary to design a
separate pretreatment system such as a settling basin upstream before entering
the underground system.
Underground systems are typically modular and allow for configurations that range from large areas such as
would be needed underneath a parking lot to linear installations like within a park strip or underneath a bioswale.
Primary Functions
Bioretention Yes
Volume Retention Yes
Biofiltration No

A Guide to Low Impact Development within Utah C-59
Design Criteria
Underground storage devices are proprietary devices; follow manufacturer specifications to determine design
criteria on a case-by-case basis.
Calculation Methods
Underground storage device design is governed by the water quality volume (when sizing for the water quality
event). It is not uncommon for manufacturers to provide sizing tools based on the desired storage volume. The
general design steps are:
1. Calculate the water quality volume.
2. Determine manufacturer’s recommendations given the water quality volume and other site conditions.
Underground Infiltration Effectiveness
With regular maintenance and inspection, it can be determined if the underground system is performing as
expected. As part of the design process, determine how the system will be inspected. Possible inspection methods
include the use of observation wells or structural vaults at tie-in locations with the site’s storm drain network.
Inspect for any soil displacement or movement at the perimeter of the system and any depressions above the
system.
Designer Checklist
If the answer to these questions corresponds to a response box that is red, the BMP should either not be used or
additional measures need to be taken to address the issue.
Yes No
Does groundwater meet the jurisdiction’s minimum separation requirement? □ □
Is the infiltration rate of the existing soils within acceptable rates? □ □
Is contaminated groundwater present? □ □
Do utility conflicts exist that make installation of the device technically infeasible? □ □
Do geotechnical conditions exist that compromise the stability of the device or
surrounding structures? □ □
Is pretreatment provided upstream of or within the underground storage device? □ □
Is the soil bearing capacity of the underlying soil sufficient for the system? □ □
Will the underground system support the expected loads above it? □ □
Installation
Excavation
Excavate the footprint of the underground system.
A Guide to Low Impact Development within Utah C-60
Activities During Construction
Avoid using heavy machinery within the excavated footprint during construction as doing so will compact the soils
and diminish their infiltrating capabilities. Avoid using heavy machinery on top of the underground system as
well. Follow all installation guidelines from the manufacturer.
Flows During Construction
Flows during construction should be diverted away from the excavated area to prevent construction site sediment
from clogging soils.
Additional Guidance
• Follow all manufacturer’s requirements.
Installation Costs
The following cost items are typically associated with installation of underground storage systems.
- Excavation
- Geotextile fabric
- Underground storage devices
- Aggregate (bedding, overlay, other as needed)
- Observation wells
- Pretreatment upstream of system (if not provided)
Maintenance
Underground systems are typically designed with accessible pretreatment areas such as a manhole. Refer to
manufacturer’s guidelines.
Maintenance Activities
Typical maintenance activity includes removal of sediment or debris within the pretreatment area. High pressure
washing of geotextile fabrics or replacement of filter fabrics may also be needed. Refer to manufacturer’s
guidelines for specific activities and frequency of inspections.
Manufacturers
The following table of manufacturers is for reference only and does not constitute an endorsement.
Manufacturer Device Type(s) URL
StormTech Chambers http://www.stormtech.com/
ACF Environmental Chambers R Tanks
https://www.acfenvironmental.com
ConTech Chambers https://www.conteches.com
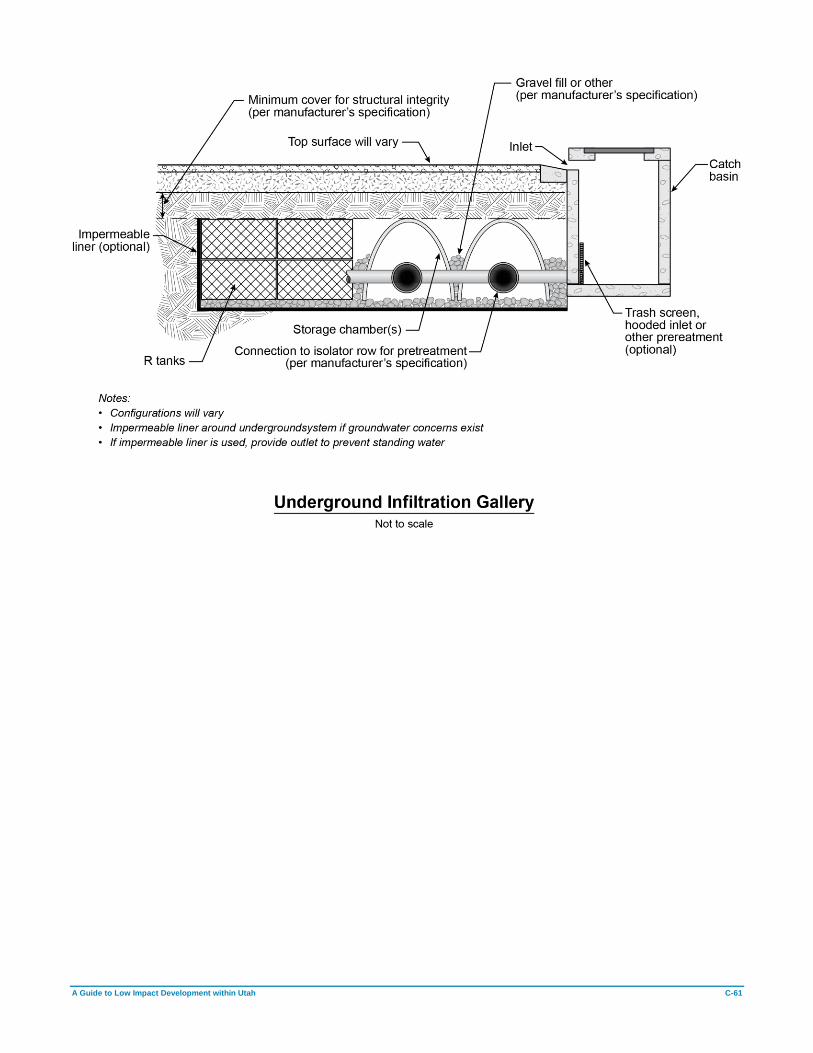
A Guide to Low Impact Development within Utah C-61

A Guide to Low Impact Development within Utah C-62
Harvest and Reuse HR-1
Pollutant Removal Effectiveness
Pollutant removal will vary
based on the ultimate use of the
harvested runoff.
Harvest and reuse refers to any type of runoff collection system that captures rainfall, stores it temporarily, and
reuses it for irrigation, landscaping, or other non-potable uses. Harvest and reuse systems inherently retain the
volume of runoff that it captures. Depending on the subsequent use after being captured, they also provide
bioretention and filtration to the released runoff.
Harvest and reuse systems may be used in lieu of directly connecting rooftop drains to storm sewer systems;
where downdrains discharge to impervious surfaces and the opportunity for
irrigation or landscaping exists; as part of a home owner’s irrigation plan; or for
any other non-potable purpose where storm water is determined to be
acceptable such as vehicle or machinery washing.
As of 2010, Utah’s legislative code 73-3-1.5 requires that if more than 100
gallons of rainwater (13.4 cf) are captured, it must be registered through the
Utah Division of Water Rights
(https://waterrights.utah.gov/forms/rainwater.asp). The code also limits the
total capture to 2,500 gallons (334.2 cubic feet). See the code for additional
requirements.
Primary Functions
Bioretention Varies
Volume Retention Yes
Biofiltration Varies

A Guide to Low Impact Development within Utah C-63
Design Criteria
Design criteria for harvest and reuse devices or systems will vary widely. The governing principles of harvest and
reuse are based on the system’s function and capacity. For example, a rain barrel that provides occasional
irrigation to a flower bed should be appropriately sized for the 90th percentile volume and be able to release the
volume within an appropriate time that does not flood out the flower bed. A larger harvest and reuse system, such
as an underground detention vault or above ground pond will be required to meet geotechnical or structural
design criteria. The applications of harvest and reuse systems are endless; specific design criteria should be
determined on a case-by-case basis with site-specific consideration.
Calculation Methods
Harvest and reuse systems are governed by the water quality volume. The general design steps are:
1. Calculate the water quality volume.
2. Size device for the water quality volume.
Sample Calculations
Refer to Calculation Methods in the Preface to Fact Sheets for discussion on the equations used.
A commercial development will have two buildings with roofs that are 2,500 square feet each. Rain barrels that
will release to flower beds will be included as part of the design. Each roof is considered one drainage area.
Given
Contributing drainage area: 2,500 sf
Contributing drainage area: 0.057 ac
Imperviousness: 1.00
90th percentile storm depth: 0.60 in
Design Goals
Capture all runoff from the 90th percentile storm within rain barrels.
Calculations
Volumetric runoff coefficient, RV (See Sample Calculations)
RV = 0.91i – 0.0204 (Reese method)
RV = 0.91(1.0) – 0.0204
RV = 0.89
Water quality volume, WQV (See Developing the 90th Percentile Volume)
WQV = (0.89)(0.60 in)(0.057 ac)(43,560 sf/ac) / (12 in/ft)
WQV = 111 cf
WQV = 832 gallons

A Guide to Low Impact Development within Utah C-64
If 55-gallon rain barrels are used, 15 rain barrels will be needed for each roof and the capture will need to be
registered with the Division of Water Rights.
Harvest and Reuse Effectiveness
The effectiveness of a harvest and reuse system is dependent on its use. Detention devices should be free of
standing water to prevent stagnation and vector concerns. Systems that provide irrigation or that are part of
landscaping features should be inspected regularly to ensure proper performance.
Designer Checklist
If the answer to these questions corresponds to a response box that is red, the BMP should either not be used or
additional measures need to be taken to address the issue.
Yes No
Will stagnation of runoff be prevented by frequent release of the harvested runoff? □ □
Does quantity of harvested runoff require registration with the Division of Water Rights? □ □
Installation
Installation of harvest and reuse systems will vary depending on its use. Rain barrels can simply be connected to a
down drain. More complicated systems require additional coordination.
Depending on the quantity of runoff being harvested, it will be necessary to register the detention device with the
Division of Water Rights.
Installation Costs
The following cost items are typically associated with harvest and reuse systems.
-Detention device
-Upstream connection to detention device
-Other items will be dependent on site-specific use
Maintenance
Refer to Maintenance and Maintenance Costs in the Preface to Fact Sheets for general information related to
maintenance of harvest and reuse systems.
Maintenance Activities
Inspection Inspection/Maintenance
Frequency Maintenance Activity Effort
Inspect for mosquitos. Semiannual (Spring, Fall) Implement larvicide or other remediation.
Low
Inspect harvesting device for leaking.
Semiannual (Spring, Fall) Replace harvesting device. Low
Inspect condition of system components.
Semiannual (Spring, Fall) Replace and repair components. Medium

A Guide to Low Impact Development within Utah C-65

A Guide to Low Impact Development within Utah D-1
Appendix D Utah Plant Hardiness Zones

84
84
189
80
15
70 50
Plant Hardiness ZonesSource Data:Plant Hardiness Zone, USDA 2018; County Boundaries, Roads, USGS 2018
0 25 50 75 10012.5Miles
NE
VA
DA
CO
LO
RA
DO
W Y O M I N G
I D A H O
A R I Z O N A
4a: -30 to -25 F4b: -25 to -20 F
5b: -15 to -10 F
HARDINESS ZONE
Lake/Pond
9b: 25 to 30 F5a: -20 to -15 F3b: -35 to -30 F
6a: -10 to -5 F6b: -5 to 0 F
7a: 0 to 5 F7b: 5 to 10 F
8a: 10 to 15 F8b: 15 to 20 F
9a: 20 to 25 F

A Guide to Low Impact Development within Utah E-1
Appendix E Utah Plant Selection Matrix by Climate Zone and BMP

Plants
Trees 3b 4a 4b 5a 5b 6a 6b 7a 7b 8a 8b 9a 9bBasin Bottom
Basin Edge
Basin Upland Swales Strips
Bioretention Cells/ Rain Gardens
Tree Box
FiltersGreen Roofs
Acer campestre Hedge Maple x x x x x x x x x x x xAcer campestre 'Carnival' Carnival Hedge Maple x x x x x x x x x x x xAcer ginnala Amur Maple x x x x x x x x x x x x x xAcer glabrum Rocky Mountain Maple x x x x x x x x x x x x x xAcer grandidentatum Bigtooth Maple x x x x x x x x x x x xAcer grandidentatum 'Schmidt' Rocky Mountain Glow Maple x x x x x x x x x x xAcer griseum Paperbark Maple x x x x x x x x x x xAcer microphyllum Big Leaf Maple x x x x x x x x xAcer negundo 'Sensation' Sensation Boxelder x x x x x x x x xAcer palmatum sp. Japanese Maples x x x x x x x x x xAcer palmatum "Garnet" Garnet Japanese Maple x x x x x x x x x x xAcer palmatum 'Bloodgood' Bloodgood Japanese Maples x x x x x x x x xAcer palmatum 'Trompenburg' Trompenburg Japanese Maple x x x x x x x x xAcer platanoides Norway Maple x x x x x x x x x xAcer platanoides ‘Columnare’ Columnar Norway Maple x x x x x x x x x xAcer platanoides 'Crimson Sentry' Crimson Sentry Norway Maple x x x x x x x x x x xAcer pseudoplatanus 'Esk Sunset' ESKIMO SUNSET Eskimo Sunset Sycamore Maple' x x x x x x x x xAcer pseudoplatanus 'Spaethii' Purple Sycamore Maple x x x x x x x x x x x xAcer pseudoplatanus 'Tunpetti' REGAL PETTICOAT Regal Petticoat Sycamore Maple x x x x x x x x x x x x x x xAcer rubrum Red Maple x x x x x x x x x x x x x x x x x x x xAcer saccharinum Silver Maple x x x x x x x x x x x x x x x x x xAcer tataricum Tatarian Maple x x x x x x x x x x x x x x xAcer tataricum ssp. Ginnala Amur Maple x x x x x x x x x x x x xAcer tataricum 'GarAnn' PP 15,023 HOT WINGS® Tatarian maple x x x x x x x x x x x x x x x xAcer x feemanii ‘Jeffersred’ Autumn Blaze Maple x x x x x x x x x x x x x x x xAesculus hippocastanum Horsechestnut x x x x x x x x x x x x x x xAesculus x arnoldiana 'Autumn Splendor' Autumn Splendor Horse Chestnut x x x x x x x x x x xAlnus incana sp. Tenufolia Thinleaf Alder x x x x x x xAlnus rubra Red Alder x x x x x xAlnus sinuata Sitka Alder x x x x x x xAmelanchier arborea Serviceberry x x x x x x x x x x x x xAmelanchier laevis 'Spring Flurry' Spring Flurry Serviceberry x x x x x x x xBetula alleghaniensis Yellow Birch x x x x x x x xBetula nigra River Birch x x x x x x x x x x x x x x x xBetula occidentalis Water Birch x x x x x x x x x x x xBetula papyrifera Paper Birch x x x x x x x x x x x x x xBetula pendula Silver Birch x x x x x x x x x x x x x xBetula pubescens White Birch x x x x x x x x x x x x x xCarpinus betulus 'Fastigiata' Pyramidal European Hornbeam x x x x x x x x x x x xCarpinus caroliniana American Hornbeam x x x x x x x x x x x x x xCarya cordiformis Bitternut Hickory x x x x x x x x x x x x xCarya glabra Pignut Hickory x x x x x x x x x x x x xCarya illinoinensis Pecan x x x x x x x x x x x x x xCarya ovata Shabgark Hickory x x x x x x x x x x xCarya lacinosa Shellbark Hickory x x x x x x x x xCatalpa speciosa Catalpa x x x x x x x x x x x x x xCeltis occidentalis Common Hackberry x x x x x x x x x x x x x x x xCeltis occidentalis 'Prairie Pride' Prairie Pride Hackberry x x x x x x x x x x x x x x x x x xCeltis tenuifolia Dwarf Hackberry x x x x x x x x x x xCercis canadensis Eastern Redbud x x x x x x x x x x x x x x xCercis canadensis 'Forest Pansy' Forest Pansy Redbud x x x x x x x x x x x x x x xCercis canadensis 'Ruby Falls' Ruby Falls Redbud x x x x x x x x x x x x xCercis canadensis 'The Rising Sun' Rising Sun Redbud x x x x x x x x x x x x x x xCercis occidentalis Western Redbud x x x x x x x x x x xChilopsis linearis Desert Willow x x x x x x x x xCitrus limon Lemon x x xCorylus colurna Turkish Filbert x x x x x x x x x xCotinus coggygria 'Grace' American Smoke Tree, Grace x x x x x x x x xCotinus coggygria 'Royal Purple' Royal Purple Smoketree x x x x x x x x xCrataegus arnoldiana Arnold Hawthorn x x x x x x x x x x x xCrataegus crusgalli Cockspur Hawthorn x x x x x x x x x x x
Zones Best Management Practices (BMPs)
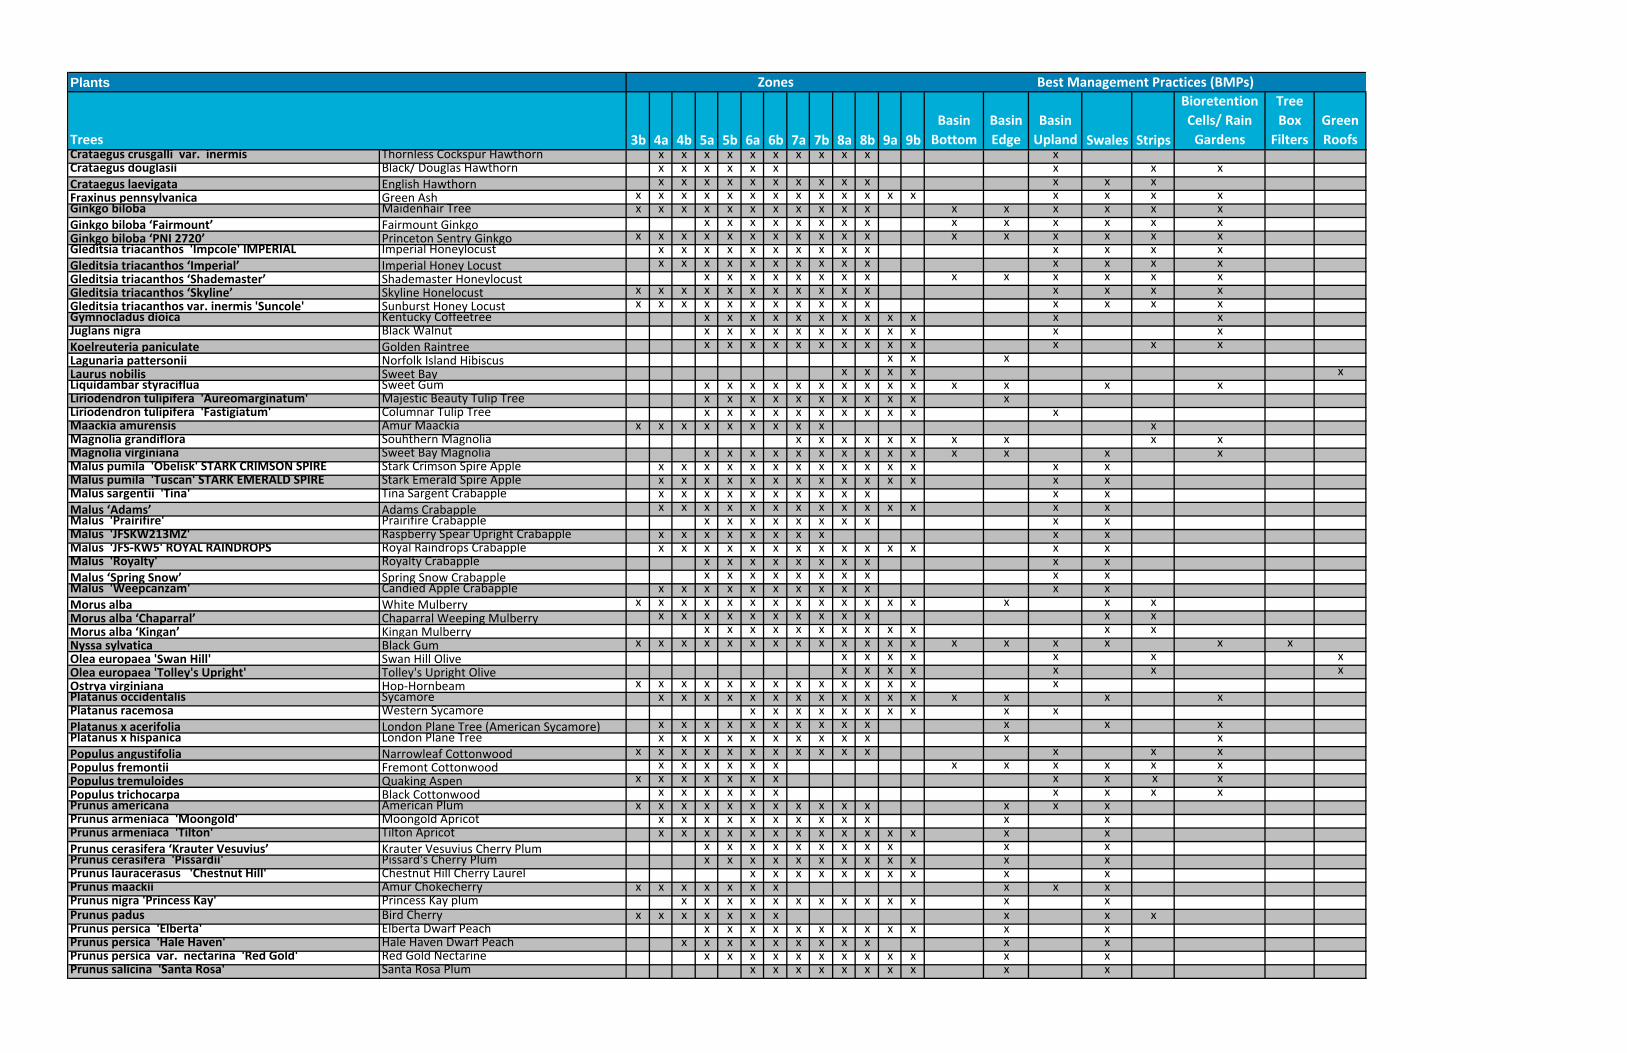
Plants
Trees 3b 4a 4b 5a 5b 6a 6b 7a 7b 8a 8b 9a 9bBasin Bottom
Basin Edge
Basin Upland Swales Strips
Bioretention Cells/ Rain Gardens
Tree Box
FiltersGreen Roofs
Zones Best Management Practices (BMPs)
Crataegus crusgalli var. inermis Thornless Cockspur Hawthorn x x x x x x x x x x xCrataegus douglasii Black/ Douglas Hawthorn x x x x x x x x xCrataegus laevigata English Hawthorn x x x x x x x x x x x x xFraxinus pennsylvanica Green Ash x x x x x x x x x x x x x x x x xGinkgo biloba Maidenhair Tree x x x x x x x x x x x x x x x x xGinkgo biloba ‘Fairmount’ Fairmount Ginkgo x x x x x x x x x x x x x xGinkgo biloba ‘PNI 2720’ Princeton Sentry Ginkgo x x x x x x x x x x x x x x x x xGleditsia triacanthos 'Impcole' IMPERIAL Imperial Honeylocust x x x x x x x x x x x x x xGleditsia triacanthos ‘Imperial’ Imperial Honey Locust x x x x x x x x x x x x x xGleditsia triacanthos ‘Shademaster’ Shademaster Honeylocust x x x x x x x x x x x x x xGleditsia triacanthos ‘Skyline’ Skyline Honelocust x x x x x x x x x x x x x x xGleditsia triacanthos var. inermis 'Suncole' Sunburst Honey Locust x x x x x x x x x x x x x x xGymnocladus dioica Kentucky Coffeetree x x x x x x x x x x x xJuglans nigra Black Walnut x x x x x x x x x x x xKoelreuteria paniculate Golden Raintree x x x x x x x x x x x x xLagunaria pattersonii Norfolk Island Hibiscus x x xLaurus nobilis Sweet Bay x x x x xLiquidambar styraciflua Sweet Gum x x x x x x x x x x x x x xLiriodendron tulipifera 'Aureomarginatum' Majestic Beauty Tulip Tree x x x x x x x x x x xLiriodendron tulipifera 'Fastigiatum' Columnar Tulip Tree x x x x x x x x x x xMaackia amurensis Amur Maackia x x x x x x x x x xMagnolia grandiflora Souhthern Magnolia x x x x x x x x x xMagnolia virginiana Sweet Bay Magnolia x x x x x x x x x x x x x xMalus pumila 'Obelisk' STARK CRIMSON SPIRE Stark Crimson Spire Apple x x x x x x x x x x x x x xMalus pumila 'Tuscan' STARK EMERALD SPIRE Stark Emerald Spire Apple x x x x x x x x x x x x x xMalus sargentii 'Tina' Tina Sargent Crabapple x x x x x x x x x x x xMalus ‘Adams’ Adams Crabapple x x x x x x x x x x x x x xMalus 'Prairifire' Prairifire Crabapple x x x x x x x x x xMalus 'JFSKW213MZ' Raspberry Spear Upright Crabapple x x x x x x x x x xMalus 'JFS‐KW5' ROYAL RAINDROPS Royal Raindrops Crabapple x x x x x x x x x x x x x xMalus 'Royalty' Royalty Crabapple x x x x x x x x x xMalus ‘Spring Snow’ Spring Snow Crabapple x x x x x x x x x xMalus 'Weepcanzam' Candied Apple Crabapple x x x x x x x x x x x xMorus alba White Mulberry x x x x x x x x x x x x x x x xMorus alba ‘Chaparral’ Chaparral Weeping Mulberry x x x x x x x x x x x xMorus alba ‘Kingan’ Kingan Mulberry x x x x x x x x x x x xNyssa sylvatica Black Gum x x x x x x x x x x x x x x x x x x xOlea europaea 'Swan Hill' Swan Hill Olive x x x x x x xOlea europaea 'Tolley's Upright' Tolley's Upright Olive x x x x x x xOstrya virginiana Hop‐Hornbeam x x x x x x x x x x x x x xPlatanus occidentalis Sycamore x x x x x x x x x x x x x x x xPlatanus racemosa Western Sycamore x x x x x x x x x xPlatanus x acerifolia London Plane Tree (American Sycamore) x x x x x x x x x x x x xPlatanus x hispanica London Plane Tree x x x x x x x x x x x xPopulus angustifolia Narrowleaf Cottonwood x x x x x x x x x x x x x xPopulus fremontii Fremont Cottonwood x x x x x x x x x x x xPopulus tremuloides Quaking Aspen x x x x x x x x x x xPopulus trichocarpa Black Cottonwood x x x x x x x x x xPrunus americana American Plum x x x x x x x x x x x x x xPrunus armeniaca 'Moongold' Moongold Apricot x x x x x x x x x x x xPrunus armeniaca 'Tilton' Tilton Apricot x x x x x x x x x x x x x xPrunus cerasifera ‘Krauter Vesuvius’ Krauter Vesuvius Cherry Plum x x x x x x x x x x xPrunus cerasifera 'Pissardii' Pissard's Cherry Plum x x x x x x x x x x x xPrunus lauracerasus 'Chestnut Hill' Chestnut Hill Cherry Laurel x x x x x x x x x xPrunus maackii Amur Chokecherry x x x x x x x x x xPrunus nigra 'Princess Kay' Princess Kay plum x x x x x x x x x x x x xPrunus padus Bird Cherry x x x x x x x x x xPrunus persica 'Elberta' Elberta Dwarf Peach x x x x x x x x x x x xPrunus persica 'Hale Haven' Hale Haven Dwarf Peach x x x x x x x x x x xPrunus persica var. nectarina 'Red Gold' Red Gold Nectarine x x x x x x x x x x x xPrunus salicina 'Santa Rosa' Santa Rosa Plum x x x x x x x x x x
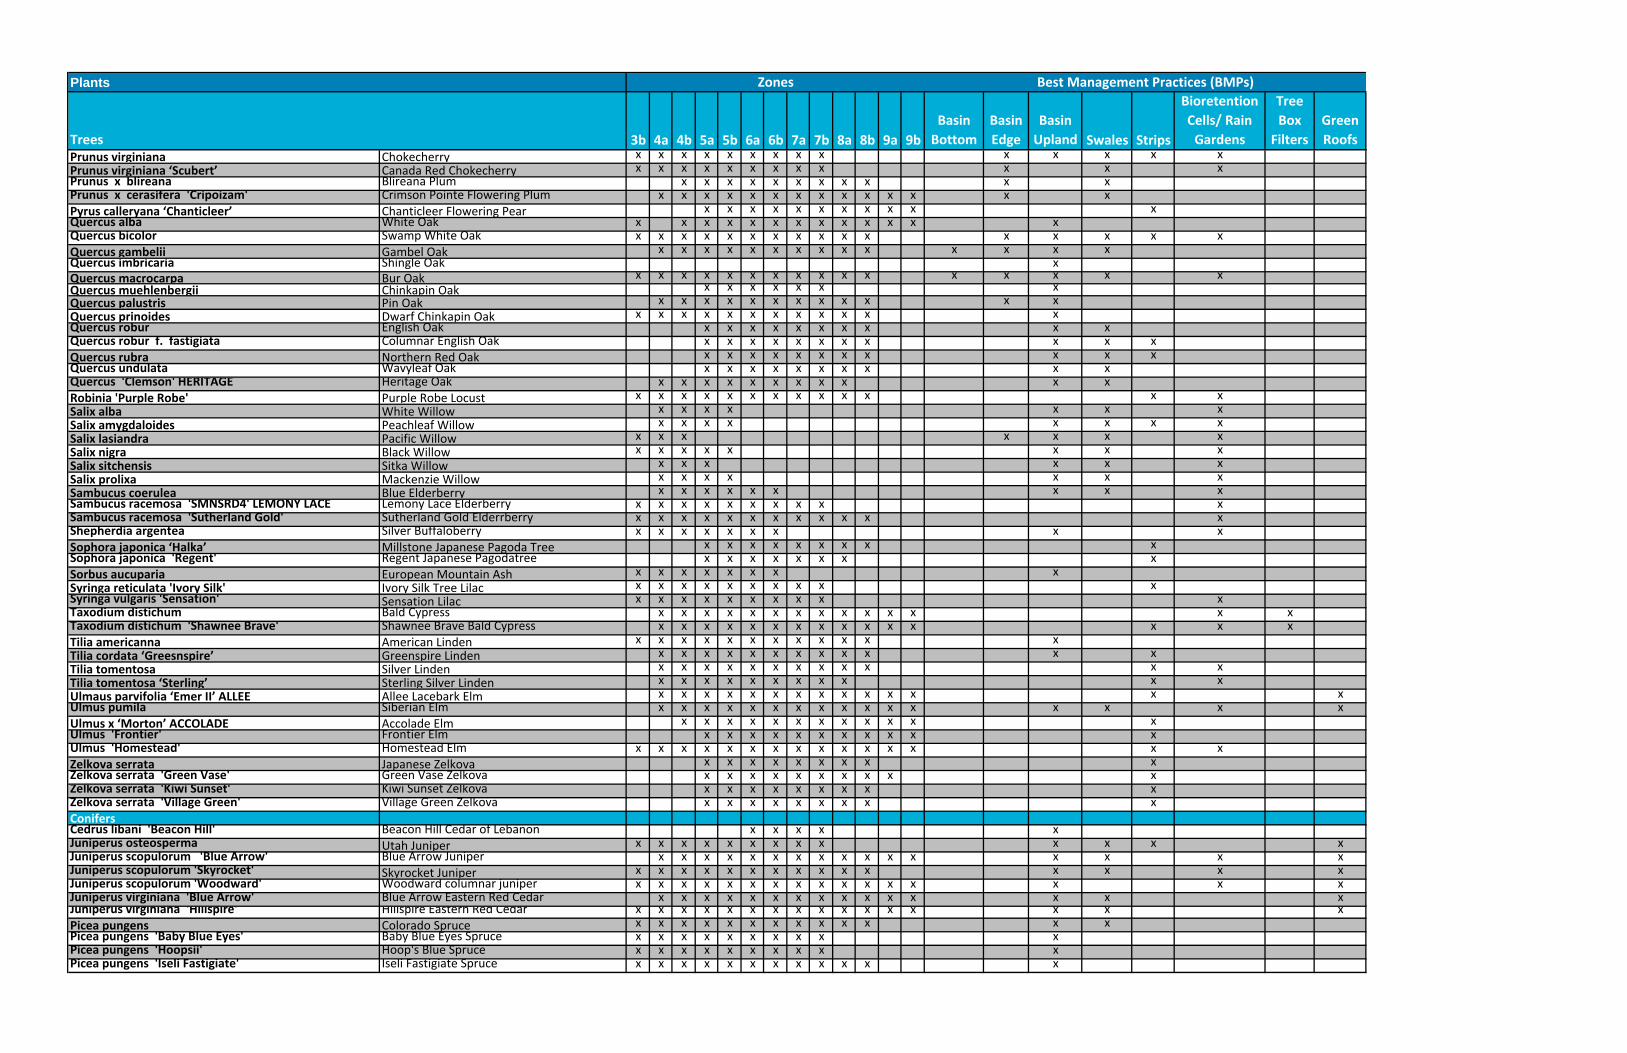
Plants
Trees 3b 4a 4b 5a 5b 6a 6b 7a 7b 8a 8b 9a 9bBasin Bottom
Basin Edge
Basin Upland Swales Strips
Bioretention Cells/ Rain Gardens
Tree Box
FiltersGreen Roofs
Zones Best Management Practices (BMPs)
Prunus virginiana Chokecherry x x x x x x x x x x x x x xPrunus virginiana ‘Scubert’ Canada Red Chokecherry x x x x x x x x x x x xPrunus x blireana Blireana Plum x x x x x x x x x x xPrunus x cerasifera 'Cripoizam' Crimson Pointe Flowering Plum x x x x x x x x x x x x x xPyrus calleryana ‘Chanticleer’ Chanticleer Flowering Pear x x x x x x x x x x xQuercus alba White Oak x x x x x x x x x x x x xQuercus bicolor Swamp White Oak x x x x x x x x x x x x x x x xQuercus gambelii Gambel Oak x x x x x x x x x x x x x xQuercus imbricaria Shingle Oak xQuercus macrocarpa Bur Oak x x x x x x x x x x x x x x x xQuercus muehlenbergii Chinkapin Oak x x x x x x xQuercus palustris Pin Oak x x x x x x x x x x x xQuercus prinoides Dwarf Chinkapin Oak x x x x x x x x x x x xQuercus robur English Oak x x x x x x x x x xQuercus robur f. fastigiata Columnar English Oak x x x x x x x x x x xQuercus rubra Northern Red Oak x x x x x x x x x x xQuercus undulata Wavyleaf Oak x x x x x x x x x xQuercus 'Clemson' HERITAGE Heritage Oak x x x x x x x x x x xRobinia 'Purple Robe' Purple Robe Locust x x x x x x x x x x x x xSalix alba White Willow x x x x x x xSalix amygdaloides Peachleaf Willow x x x x x x x xSalix lasiandra Pacific Willow x x x x x x xSalix nigra Black Willow x x x x x x x xSalix sitchensis Sitka Willow x x x x x xSalix prolixa Mackenzie Willow x x x x x x xSambucus coerulea Blue Elderberry x x x x x x x x xSambucus racemosa 'SMNSRD4' LEMONY LACE Lemony Lace Elderberry x x x x x x x x x xSambucus racemosa 'Sutherland Gold' Sutherland Gold Elderrberry x x x x x x x x x x x xShepherdia argentea Silver Buffaloberry x x x x x x x x xSophora japonica ‘Halka’ Millstone Japanese Pagoda Tree x x x x x x x x xSophora japonica 'Regent' Regent Japanese Pagodatree x x x x x x x xSorbus aucuparia European Mountain Ash x x x x x x x xSyringa reticulata 'Ivory Silk' Ivory Silk Tree Lilac x x x x x x x x x xSyringa vulgaris 'Sensation' Sensation Lilac x x x x x x x x x xTaxodium distichum Bald Cypress x x x x x x x x x x x x x xTaxodium distichum 'Shawnee Brave' Shawnee Brave Bald Cypress x x x x x x x x x x x x x x xTilia americanna American Linden x x x x x x x x x x x xTilia cordata ‘Greesnspire’ Greenspire Linden x x x x x x x x x x x xTilia tomentosa Silver Linden x x x x x x x x x x x xTilia tomentosa ‘Sterling’ Sterling Silver Linden x x x x x x x x x x xUlmaus parvifolia ‘Emer II’ ALLEE Allee Lacebark Elm x x x x x x x x x x x x x xUlmus pumila Siberian Elm x x x x x x x x x x x x x x x xUlmus x ‘Morton’ ACCOLADE Accolade Elm x x x x x x x x x x x xUlmus 'Frontier' Frontier Elm x x x x x x x x x x xUlmus 'Homestead' Homestead Elm x x x x x x x x x x x x x x xZelkova serrata Japanese Zelkova x x x x x x x x xZelkova serrata 'Green Vase' Green Vase Zelkova x x x x x x x x x xZelkova serrata 'Kiwi Sunset' Kiwi Sunset Zelkova x x x x x x x x xZelkova serrata 'Village Green' Village Green Zelkova x x x x x x x x xConifersCedrus libani 'Beacon Hill' Beacon Hill Cedar of Lebanon x x x x xJuniperus osteosperma Utah Juniper x x x x x x x x x x x x xJuniperus scopulorum 'Blue Arrow' Blue Arrow Juniper x x x x x x x x x x x x x x x xJuniperus scopulorum 'Skyrocket' Skyrocket Juniper x x x x x x x x x x x x x x xJuniperus scopulorum 'Woodward' Woodward columnar juniper x x x x x x x x x x x x x x x xJuniperus virginiana 'Blue Arrow' Blue Arrow Eastern Red Cedar x x x x x x x x x x x x x x xJuniperus virginiana 'Hillspire' Hillspire Eastern Red Cedar x x x x x x x x x x x x x x x xPicea pungens Colorado Spruce x x x x x x x x x x x x xPicea pungens 'Baby Blue Eyes' Baby Blue Eyes Spruce x x x x x x x x x xPicea pungens 'Hoopsii' Hoop's Blue Spruce x x x x x x x x x xPicea pungens 'Iseli Fastigiate' Iseli Fastigiate Spruce x x x x x x x x x x x x

Plants
Trees 3b 4a 4b 5a 5b 6a 6b 7a 7b 8a 8b 9a 9bBasin Bottom
Basin Edge
Basin Upland Swales Strips
Bioretention Cells/ Rain Gardens
Tree Box
FiltersGreen Roofs
Zones Best Management Practices (BMPs)
Picea pungens 'Mesa Verde' Mesa Verde Spruce x x x x x x x x x x x xPicea pungens 'The Blues' The Blues Blue Spruce xPicea pungens var. glauca 'MonWal' Sparkler Colorado Blue Spruce x x x x x x x x x x x xPinus mugo Mugo Pine x x x x x x x x x x x x xPinus mugo fastigiata 'Wells Dolly's Choice' Wells Dolly's Choice Mugo Pine x x x x x x x x x xPinus mugo 'Carsten's Wintergold' Carsten's Wintergold Mugo Pine x x x x x x x x x x x x xPinus mugo 'Jakobsen' Pinus mugo 'Jakobsen' x x x x x x x x x x x x xPinus nigra Austrian Pine x x x x x x x x x xPinus nigra ‘Arnold Sentinel’ Arnold Sentinel Austrian Pine x x x x x x x x x x xPinus ponderosa Ponderosa Pine x x x x x x x x x x x xPinus strobus 'Blue Shag' Blue Shag Eastern White Pine x x x x x x x x x x x xPinus sylvestris Scots Pine x x x x x x x x x x x xPseudotsuga menziesii Douglas Fir x x x x x x xThuja occidentalis American Arbovitae x x x x x x x x x x x x x x x xThuja occidentalis 'Hetz Midget' Hetz Midget Arborvitae x x x x x x x x x x x x xPlant Select, 2018; Conservation Garden Park, 2018; Charter Township of Canton, 2006; USDA-Natural Resources Conservation Service, 2000; Missouri Botanical Garden, 2018;
Plants For A Future, 2018; Monrovia, 2018; Growing Green Guide, 2018; Central Coast Low Impact Development Initiative; San Francisco Water Power Sewer, 2016

Plants
Shrubs 3b 4a 4b 5a 5b 6a 6b 7a 7b 8a 8b 9a 9bBasin Bottom
Basin Edge
Basin Upland Swales Strips
Bioretention Cells/ Rain Gardens
Tree Box Filters
Green Roofs
Alnus rugosa Speckled Alder x x x x x x x xAmelanchier alnifolia Saskatoon Serviceberry x x x x x x x x x x x x x x x x xAmelanchier alnifolia 'Obelisk' Standing Ovation Serviceberry x x x x x x x x x x x x xArctostaphylos x coloradensis Panchito Manzanita x x x x x x x x x xArctostaphylos x coloradensis ‘Chieftain' Chieftain Manzanita x x x x x x x x xAronia arbutifolia 'Brilliantissima' Brilliant Red Chokeberry x x x x x x x x x x x x x xAronia melanocarpa var. elata Black Chokeberry x x x x x x x x x x x x x x xArtemisia filifolia Sand Sagebrush x x x x x x x x x x xArtemisia nova Black Sagebrush x x x x x x x xAtriplex canescens Four‐Wing Saltbrush x x x x x x x x x x xBaccharis pilularis Coyote Brush x x x x x x xBerberis aquifolium Barberry x x x x x x x x x x x x x x xBerberis aquifolium repens Creeping Oregon Grape x x x x x x x x x x x x x xBerberis thunbergii f. atropurpurea Japanese Barberry x x x x x x x x x x x x xBerberis thunbergii f. atropururea 'Atropurpurea Nana' Crimson Pygmy Japanese Barberry x x x x x x x x x x x xBerberis thunbergii f. atropurpurea 'Golden Ring' Golden Ring Japanese Barberry x x x x x x x x x x x x x xBerberis thunbergii f. atropurpurea 'Helmond Pillar' Helmond Pillar Japanese Barberry x x x x x x x x x x x xBerberis thunbergii f. atropurpurea 'Rose Glow' Rose Glow Japanese Barberry x x x x x x x x x x x xBerberis thunbergii 'Goruzam' Golden Ruby Barberry x x x x x x x x x x x xBerberis thunbergii 'Maria' Sunjoy Gold Pillar Japanese Barberry x x x x x x x x x x x xBerberis thunbergii 'Orange Rocket' Orange Rocket Barberry x x x x x x x x x x x x x xBerberis thunbergii 'Pygruzam' Pygmy Ruby Japanese Barberry x x x x x x x x x x x xBetula pumila Bog Birch x x x x x x x x x x x x x xBuxus microphylla 'Golden Triumph' Golden Triumph Boxwood x x x x x x x x x x xBuxus microphylla 'Green Gem' Boxwood 'Green Gem' x x x x x x x x x x x x xCallistemon 'Little John' Little John Dwarf Bottlebrush x x x x x x xCaragana arborescens Siberian Peashrub x x x x x x x x x x x x x x xCaragana arborescens 'Pendula' Weeping Pea Shrub x x x x x x x x xCaragana frutex 'Globosa' Globe Peashrub x x x x x x x x x x x xCaryopteris x clandonensis 'Dark Knight' Dark Knight Bluebeard x x x x x x x x xCaryopteris x clandonensis 'Heavenly Blue' Heavenly Blue Bluebeard x x x x x x x x x x xCaryopteris x clandonensis 'Korball' Blue Balloon Caryopteris x x x x x x x x x x xCaryopteris x clandonensis 'Janice' Lil Miss Sunshine Bluebeard x x x x x x x x x x xCaryopteris x clandonensis 'MiniBleu' Petit Bleu Bluebeard x x x x x x x x x x xCeanothus americanus New Jersey Tea x x x x x x x x x x x xCeltis occidentalis Common Hackberry x x x x x x x x x x x x x x xCephalanthus occidentalis Buttonbush x x x x x x x x x x x x x xChrysothamnus (Ericameria) nauseosus var. nauseosus Baby Blue Rabbitbrush x x x x x x x x x x x x xCornus alba 'Cream Cracker' Cornus alba 'Cream Cracker' x x x x x x x x x x x x x x x xCornus alba 'Elegantissima' Variegated Red Twig Dogwood x x x x x x x x x x x x x xCornus amomum Silky Dogwood x x x x x x x x xCornus foemina Gray Dogwood x x x x xCornus sanguinea 'Midwinter Fire' Midwinter Fire Dogwood x x x x x x x x x xCornus sericea Red Twig Dogwood x x x x x x x x x x x x x x x x xCornus sericea 'Baileyi' Bailey Red Twig Dogwood x x x x x x x x x x x x x x xCornus sericea 'Budd's Yellow' Budd's Yellow Dogwood x x x x x x x x x x x x xCornus sericea 'Cardinal' Cardinal Red Twig Dogwood x x x x x x x x x x x x x x xCornus sericea 'Farrow' Artic Fire Dogwood x x x x x x x x x x x x xCornus sericea 'Flaviramea' Yellow Twig Dogwood x x x x x x x x x x x x x x xCornus sericea 'Isanti' Isanti Red Twig Dogwood x x x x x x x x x x x x x x xCornus sericea 'Kelseyi' Kelsey's Dwarf Red Twig Dogwood x x x x x x x x x x x x x x xCornus stolonifera 'Neil Z' PUCKER UP Pucker Up Red Twig Dogwood x x x x x x x x x x x x x x xCorylus americana American Filbert x x x x x x x x x x x x xCotinus coggygria 'Ancot' GOLDEN SPIRIT Smoke Tree, 'Golden spirit' x x x x x x x x x xCotoneaster adpressus 'Little Gem' Little Gem Cotoneaster x x x x x x x x xCotoneaster apiculatus Cranberry Cotoneaster x x x x x x x x xCotoneaster divaricatus Spreading Cotoneaster x x x x x x x x xCotoneaster integerrimus European Cotoneaster x x x x x x x xCotoneaster racemiflorus var. soongoricus Sungari redbead cotoneaster x x x x x x x x x x x xCotoneaster x suecicus 'Coral Beauty' Coral Beauty Cotoneaster x x x x x x x xFallugia paradoxa Apache Plume x x x x x x x x x x xForestiera neomexicana New Mexico Privet x x x x x x x x x x x x xForsythia x 'Meadlowlark" Meadowlark Forsythia x x x x x x x x x x x x x x xHamamelis virginiana Witch Hazel x x x x x x x x x x x xHelianthemum 'Ben Ledi' Ben Ledi Sun Rose x x x x x x x x x x x x x
Zones Best Management Practices (BMPs)
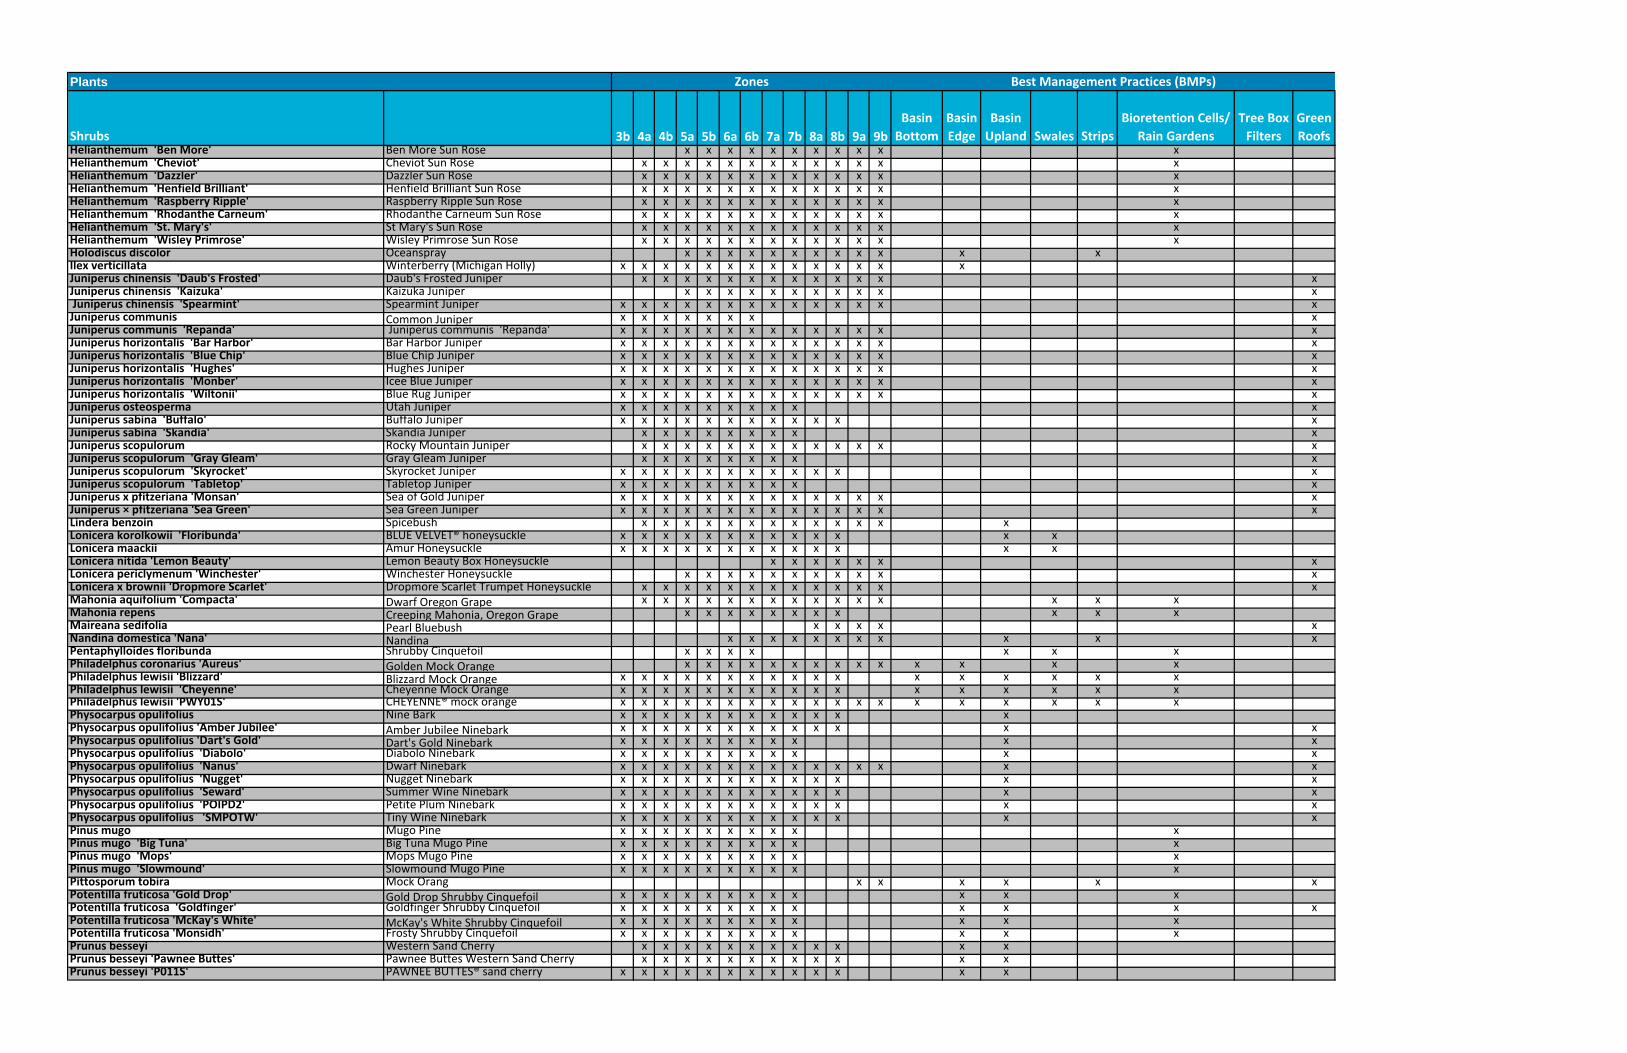
Plants
Shrubs 3b 4a 4b 5a 5b 6a 6b 7a 7b 8a 8b 9a 9bBasin Bottom
Basin Edge
Basin Upland Swales Strips
Bioretention Cells/ Rain Gardens
Tree Box Filters
Green Roofs
Zones Best Management Practices (BMPs)
Helianthemum 'Ben More' Ben More Sun Rose x x x x x x x x x x xHelianthemum 'Cheviot' Cheviot Sun Rose x x x x x x x x x x x x xHelianthemum 'Dazzler' Dazzler Sun Rose x x x x x x x x x x x x xHelianthemum 'Henfield Brilliant' Henfield Brilliant Sun Rose x x x x x x x x x x x x xHelianthemum 'Raspberry Ripple' Raspberry Ripple Sun Rose x x x x x x x x x x x x xHelianthemum 'Rhodanthe Carneum' Rhodanthe Carneum Sun Rose x x x x x x x x x x x x xHelianthemum 'St. Mary's' St Mary's Sun Rose x x x x x x x x x x x x xHelianthemum 'Wisley Primrose' Wisley Primrose Sun Rose x x x x x x x x x x x x xHolodiscus discolor Oceanspray x x x x x x x x x x x xIlex verticillata Winterberry (Michigan Holly) x x x x x x x x x x x x x xJuniperus chinensis 'Daub's Frosted' Daub's Frosted Juniper x x x x x x x x x x x x xJuniperus chinensis 'Kaizuka' Kaizuka Juniper x x x x x x x x x x x Juniperus chinensis 'Spearmint' Spearmint Juniper x x x x x x x x x x x x x xJuniperus communis Common Juniper x x x x x x x xJuniperus communis 'Repanda' Juniperus communis 'Repanda' x x x x x x x x x x x x x xJuniperus horizontalis 'Bar Harbor' Bar Harbor Juniper x x x x x x x x x x x x x xJuniperus horizontalis 'Blue Chip' Blue Chip Juniper x x x x x x x x x x x x x xJuniperus horizontalis 'Hughes' Hughes Juniper x x x x x x x x x x x x x xJuniperus horizontalis 'Monber' Icee Blue Juniper x x x x x x x x x x x x x xJuniperus horizontalis 'Wiltonii' Blue Rug Juniper x x x x x x x x x x x x x xJuniperus osteosperma Utah Juniper x x x x x x x x x xJuniperus sabina 'Buffalo' Buffalo Juniper x x x x x x x x x x x xJuniperus sabina 'Skandia' Skandia Juniper x x x x x x x x xJuniperus scopulorum Rocky Mountain Juniper x x x x x x x x x x x x xJuniperus scopulorum 'Gray Gleam' Gray Gleam Juniper x x x x x x x x xJuniperus scopulorum 'Skyrocket' Skyrocket Juniper x x x x x x x x x x x xJuniperus scopulorum 'Tabletop' Tabletop Juniper x x x x x x x x x xJuniperus x pfitzeriana 'Monsan' Sea of Gold Juniper x x x x x x x x x x x x x xJuniperus × pfitzeriana 'Sea Green' Sea Green Juniper x x x x x x x x x x x x x xLindera benzoin Spicebush x x x x x x x x x x x x xLonicera korolkowii 'Floribunda' BLUE VELVET® honeysuckle x x x x x x x x x x x x xLonicera maackii Amur Honeysuckle x x x x x x x x x x x x xLonicera nitida 'Lemon Beauty' Lemon Beauty Box Honeysuckle x x x x x x xLonicera periclymenum 'Winchester' Winchester Honeysuckle x x x x x x x x x x xLonicera x brownii 'Dropmore Scarlet' Dropmore Scarlet Trumpet Honeysuckle x x x x x x x x x x x x xMahonia aquifolium 'Compacta' Dwarf Oregon Grape x x x x x x x x x x x x x x xMahonia repens Creeping Mahonia, Oregon Grape x x x x x x x x x x xMaireana sedifolia Pearl Bluebush x x x x xNandina domestica 'Nana' Nandina x x x x x x x x x x xPentaphylloides floribunda Shrubby Cinquefoil x x x x x x xPhiladelphus coronarius 'Aureus' Golden Mock Orange x x x x x x x x x x x x x xPhiladelphus lewisii 'Blizzard' Blizzard Mock Orange x x x x x x x x x x x x x x x x xPhiladelphus lewisii 'Cheyenne' Cheyenne Mock Orange x x x x x x x x x x x x x x x x xPhiladelphus lewisii 'PWY01S' CHEYENNE® mock orange x x x x x x x x x x x x x x x x x x xPhysocarpus opulifolius Nine Bark x x x x x x x x x x x xPhysocarpus opulifolius 'Amber Jubilee' Amber Jubilee Ninebark x x x x x x x x x x x x xPhysocarpus opulifolius 'Dart's Gold' Dart's Gold Ninebark x x x x x x x x x x xPhysocarpus opulifolius 'Diabolo' Diabolo Ninebark x x x x x x x x x x xPhysocarpus opulifolius 'Nanus' Dwarf Ninebark x x x x x x x x x x x x x x xPhysocarpus opulifolius 'Nugget' Nugget Ninebark x x x x x x x x x x x x xPhysocarpus opulifolius 'Seward' Summer Wine Ninebark x x x x x x x x x x x x xPhysocarpus opulifolius 'POIPD2' Petite Plum Ninebark x x x x x x x x x x x x xPhysocarpus opulifolius 'SMPOTW' Tiny Wine Ninebark x x x x x x x x x x x x xPinus mugo Mugo Pine x x x x x x x x x xPinus mugo 'Big Tuna' Big Tuna Mugo Pine x x x x x x x x x xPinus mugo 'Mops' Mops Mugo Pine x x x x x x x x x xPinus mugo 'Slowmound' Slowmound Mugo Pine x x x x x x x x x xPittosporum tobira Mock Orang x x x x x xPotentilla fruticosa 'Gold Drop' Gold Drop Shrubby Cinquefoil x x x x x x x x x x x xPotentilla fruticosa 'Goldfinger' Goldfinger Shrubby Cinquefoil x x x x x x x x x x x x xPotentilla fruticosa 'McKay's White' McKay's White Shrubby Cinquefoil x x x x x x x x x x x xPotentilla fruticosa 'Monsidh' Frosty Shrubby Cinquefoil x x x x x x x x x x x xPrunus besseyi Western Sand Cherry x x x x x x x x x x x xPrunus besseyi 'Pawnee Buttes' Pawnee Buttes Western Sand Cherry x x x x x x x x x x x xPrunus besseyi 'P011S' PAWNEE BUTTES® sand cherry x x x x x x x x x x x x x
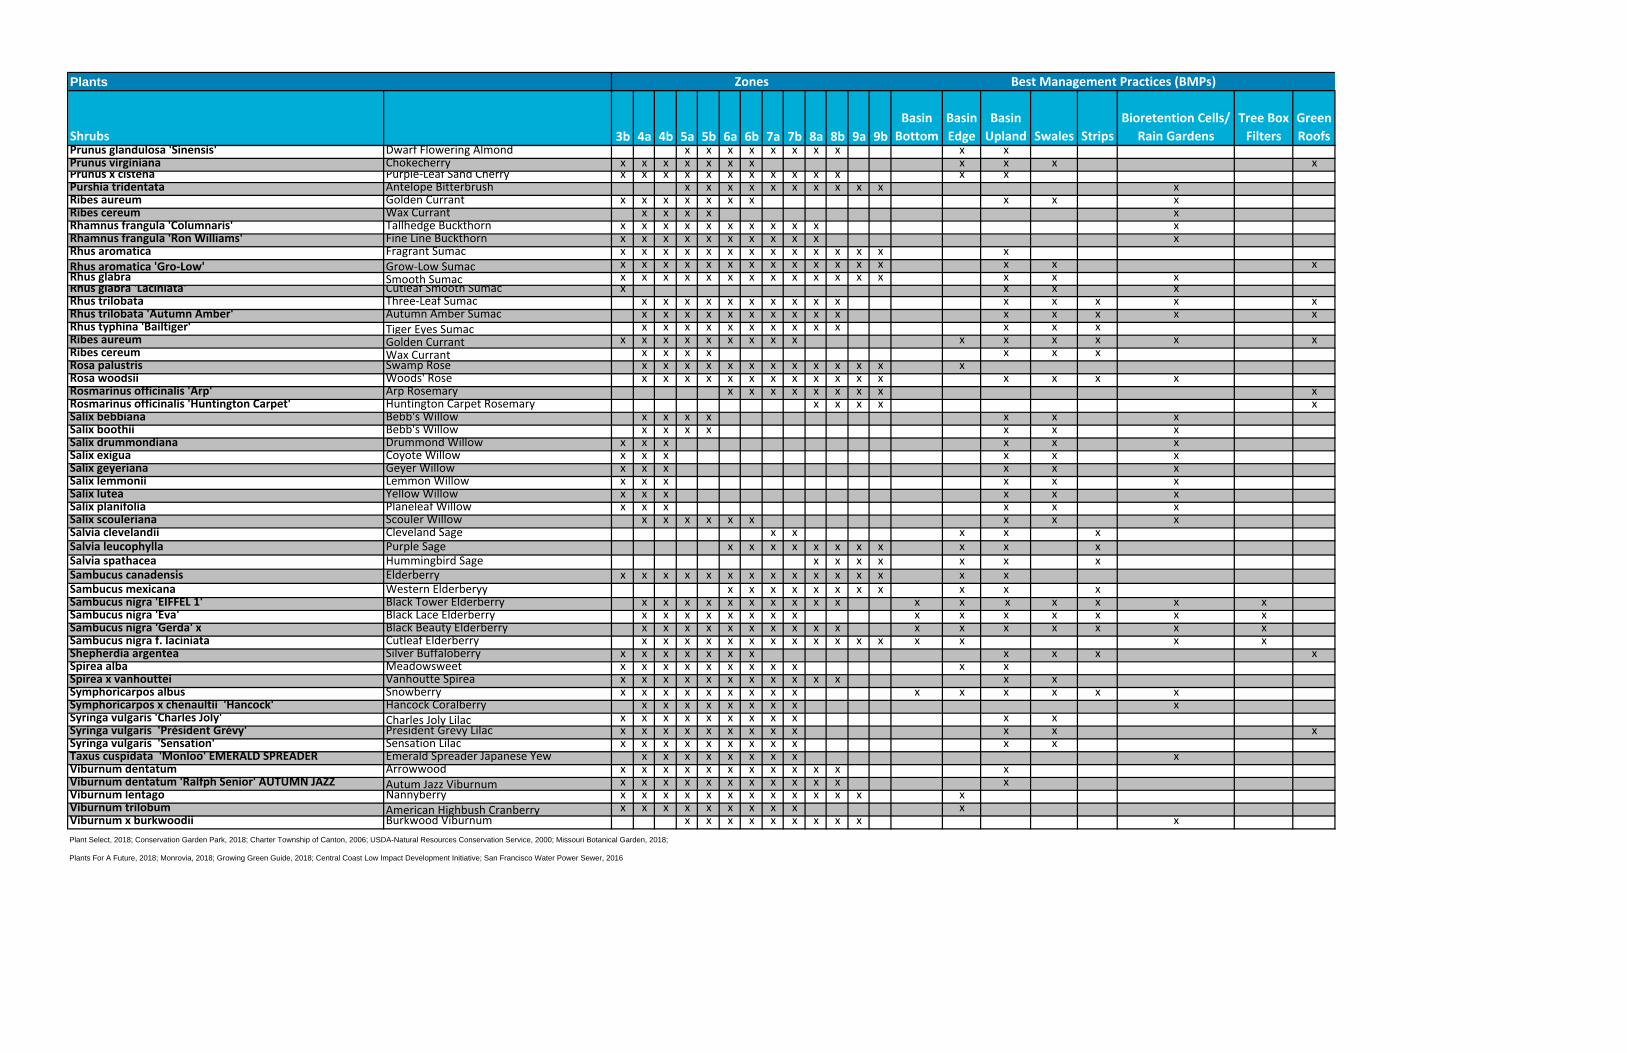
Plants
Shrubs 3b 4a 4b 5a 5b 6a 6b 7a 7b 8a 8b 9a 9bBasin Bottom
Basin Edge
Basin Upland Swales Strips
Bioretention Cells/ Rain Gardens
Tree Box Filters
Green Roofs
Zones Best Management Practices (BMPs)
Prunus glandulosa 'Sinensis' Dwarf Flowering Almond x x x x x x x x x xPrunus virginiana Chokecherry x x x x x x x x x x xPrunus x cistena Purple‐Leaf Sand Cherry x x x x x x x x x x x x xPurshia tridentata Antelope Bitterbrush x x x x x x x x x x xRibes aureum Golden Currant x x x x x x x x x xRibes cereum Wax Currant x x x x xRhamnus frangula 'Columnaris' Tallhedge Buckthorn x x x x x x x x x x xRhamnus frangula 'Ron Williams' Fine Line Buckthorn x x x x x x x x x x xRhus aromatica Fragrant Sumac x x x x x x x x x x x x x xRhus aromatica 'Gro‐Low' Grow‐Low Sumac x x x x x x x x x x x x x x x xRhus glabra Smooth Sumac x x x x x x x x x x x x x x x xRhus glabra 'Laciniata' Cutleaf Smooth Sumac x x x xRhus trilobata Three‐Leaf Sumac x x x x x x x x x x x x x x xRhus trilobata 'Autumn Amber' Autumn Amber Sumac x x x x x x x x x x x x x x xRhus typhina 'Bailtiger' Tiger Eyes Sumac x x x x x x x x x x x x xRibes aureum Golden Currant x x x x x x x x x x x x x x xRibes cereum Wax Currant x x x x x x xRosa palustris Swamp Rose x x x x x x x x x x x x xRosa woodsii Woods' Rose x x x x x x x x x x x x x x x xRosmarinus officinalis 'Arp' Arp Rosemary x x x x x x x x xRosmarinus officinalis 'Huntington Carpet' Huntington Carpet Rosemary x x x x xSalix bebbiana Bebb's Willow x x x x x x xSalix boothii Bebb's Willow x x x x x x xSalix drummondiana Drummond Willow x x x x x xSalix exigua Coyote Willow x x x x x xSalix geyeriana Geyer Willow x x x x x xSalix lemmonii Lemmon Willow x x x x x xSalix lutea Yellow Willow x x x x x xSalix planifolia Planeleaf Willow x x x x x xSalix scouleriana Scouler Willow x x x x x x x x xSalvia clevelandii Cleveland Sage x x x x xSalvia leucophylla Purple Sage x x x x x x x x x x xSalvia spathacea Hummingbird Sage x x x x x x xSambucus canadensis Elderberry x x x x x x x x x x x x x x xSambucus mexicana Western Elderberyy x x x x x x x x x x xSambucus nigra 'EIFFEL 1' Black Tower Elderberry x x x x x x x x x x x x x x x x xSambucus nigra 'Eva' Black Lace Elderberry x x x x x x x x x x x x x x xSambucus nigra 'Gerda' x Black Beauty Elderberry x x x x x x x x x x x x x x x x xSambucus nigra f. laciniata Cutleaf Elderberry x x x x x x x x x x x x x x x xShepherdia argentea Silver Buffaloberry x x x x x x x x x x xSpirea alba Meadowsweet x x x x x x x x x x xSpirea x vanhouttei Vanhoutte Spirea x x x x x x x x x x x x xSymphoricarpos albus Snowberry x x x x x x x x x x x x x x xSymphoricarpos x chenaultii 'Hancock' Hancock Coralberry x x x x x x x x xSyringa vulgaris 'Charles Joly' Charles Joly Lilac x x x x x x x x x x xSyringa vulgaris 'Président Grévy' President Grevy Lilac x x x x x x x x x x x xSyringa vulgaris 'Sensation' Sensation Lilac x x x x x x x x x x xTaxus cuspidata 'Monloo' EMERALD SPREADER Emerald Spreader Japanese Yew x x x x x x x x xViburnum dentatum Arrowwood x x x x x x x x x x x xViburnum dentatum 'Ralfph Senior' AUTUMN JAZZ Autum Jazz Viburnum x x x x x x x x x x x xViburnum lentago Nannyberry x x x x x x x x x x x x xViburnum trilobum American Highbush Cranberry x x x x x x x x x xViburnum x burkwoodii Burkwood Viburnum x x x x x x x x x xPlant Select, 2018; Conservation Garden Park, 2018; Charter Township of Canton, 2006; USDA-Natural Resources Conservation Service, 2000; Missouri Botanical Garden, 2018;
Plants For A Future, 2018; Monrovia, 2018; Growing Green Guide, 2018; Central Coast Low Impact Development Initiative; San Francisco Water Power Sewer, 2016
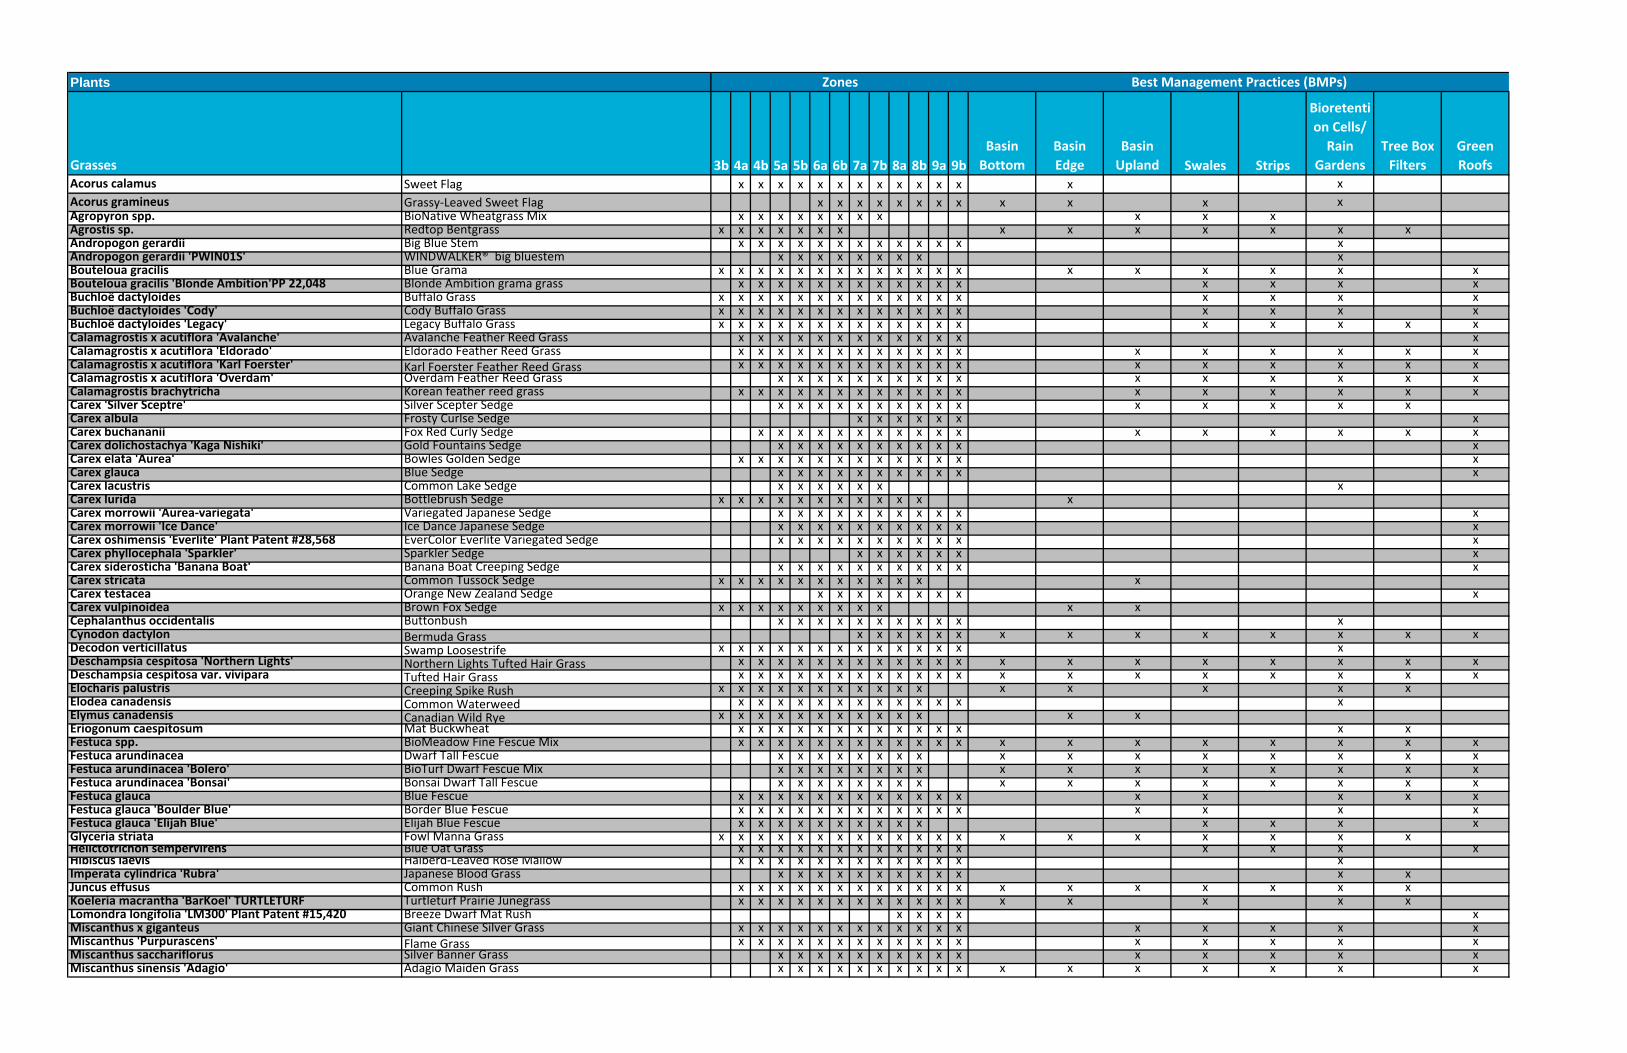
Plants
Grasses 3b 4a 4b 5a 5b 6a 6b 7a 7b 8a 8b 9a 9bBasin Bottom
Basin Edge
Basin Upland Swales Strips
Bioretention Cells/ Rain
GardensTree Box Filters
Green Roofs
Acorus calamus Sweet Flag x x x x x x x x x x x x x xAcorus gramineus Grassy‐Leaved Sweet Flag x x x x x x x x x x x xAgropyron spp. BioNative Wheatgrass Mix x x x x x x x x x x xAgrostis sp. Redtop Bentgrass x x x x x x x x x x x x x xAndropogon gerardii Big Blue Stem x x x x x x x x x x x x xAndropogon gerardii 'PWIN01S' WINDWALKER® big bluestem x x x x x x x x xBouteloua gracilis Blue Grama x x x x x x x x x x x x x x x x x x xBouteloua gracilis 'Blonde Ambition'PP 22,048 Blonde Ambition grama grass x x x x x x x x x x x x x x x xBuchloë dactyloides Buffalo Grass x x x x x x x x x x x x x x x x xBuchloë dactyloides 'Cody' Cody Buffalo Grass x x x x x x x x x x x x x x x x xBuchloë dactyloides 'Legacy' Legacy Buffalo Grass x x x x x x x x x x x x x x x x x xCalamagrostis x acutiflora 'Avalanche' Avalanche Feather Reed Grass x x x x x x x x x x x x xCalamagrostis x acutiflora 'Eldorado' Eldorado Feather Reed Grass x x x x x x x x x x x x x x x x x xCalamagrostis x acutiflora 'Karl Foerster' Karl Foerster Feather Reed Grass x x x x x x x x x x x x x x x x x xCalamagrostis x acutiflora 'Overdam' Overdam Feather Reed Grass x x x x x x x x x x x x x x x xCalamagrostis brachytricha Korean feather reed grass x x x x x x x x x x x x x x x x x xCarex 'Silver Sceptre' Silver Scepter Sedge x x x x x x x x x x x x x x xCarex albula Frosty Curlse Sedge x x x x x x xCarex buchananii Fox Red Curly Sedge x x x x x x x x x x x x x x x x xCarex dolichostachya 'Kaga Nishiki' Gold Fountains Sedge x x x x x x x x x x xCarex elata 'Aurea' Bowles Golden Sedge x x x x x x x x x x x x xCarex glauca Blue Sedge x x x x x x x x x x xCarex lacustris Common Lake Sedge x x x x x x xCarex lurida Bottlebrush Sedge x x x x x x x x x x x xCarex morrowii 'Aurea‐variegata' Variegated Japanese Sedge x x x x x x x x x x xCarex morrowii 'Ice Dance' Ice Dance Japanese Sedge x x x x x x x x x x xCarex oshimensis 'Everlite' Plant Patent #28,568 EverColor Everlite Variegated Sedge x x x x x x x x x x xCarex phyllocephala 'Sparkler' Sparkler Sedge x x x x x x xCarex siderosticha 'Banana Boat' Banana Boat Creeping Sedge x x x x x x x x x x xCarex stricata Common Tussock Sedge x x x x x x x x x x x xCarex testacea Orange New Zealand Sedge x x x x x x x x xCarex vulpinoidea Brown Fox Sedge x x x x x x x x x x xCephalanthus occidentalis Buttonbush x x x x x x x x x x xCynodon dactylon Bermuda Grass x x x x x x x x x x x x x xDecodon verticillatus Swamp Loosestrife x x x x x x x x x x x x x xDeschampsia cespitosa 'Northern Lights' Northern Lights Tufted Hair Grass x x x x x x x x x x x x x x x x x x x xDeschampsia cespitosa var. vivipara Tufted Hair Grass x x x x x x x x x x x x x x x x x x x xElocharis palustris Creeping Spike Rush x x x x x x x x x x x x x x x xElodea canadensis Common Waterweed x x x x x x x x x x x x xElymus canadensis Canadian Wild Rye x x x x x x x x x x x x xEriogonum caespitosum Mat Buckwheat x x x x x x x x x x x x x xFestuca spp. BioMeadow Fine Fescue Mix x x x x x x x x x x x x x x x x x x x xFestuca arundinacea Dwarf Tall Fescue x x x x x x x x x x x x x x x xFestuca arundinacea 'Bolero' BioTurf Dwarf Fescue Mix x x x x x x x x x x x x x x x xFestuca arundinacea 'Bonsai' Bonsai Dwarf Tall Fescue x x x x x x x x x x x x x x x xFestuca glauca Blue Fescue x x x x x x x x x x x x x x x x xFestuca glauca 'Boulder Blue' Border Blue Fescue x x x x x x x x x x x x x x x xFestuca glauca 'Elijah Blue' Elijah Blue Fescue x x x x x x x x x x x x x xGlyceria striata Fowl Manna Grass x x x x x x x x x x x x x x x x x x x xHelictotrichon sempervirens Blue Oat Grass x x x x x x x x x x x x x x x xHibiscus laevis Halberd‐Leaved Rose Mallow x x x x x x x x x x x x xImperata cylindrica 'Rubra' Japanese Blood Grass x x x x x x x x x x x xJuncus effusus Common Rush x x x x x x x x x x x x x x x x x x xKoeleria macrantha 'BarKoel' TURTLETURF Turtleturf Prairie Junegrass x x x x x x x x x x x x x x x x xLomondra longifolia 'LM300' Plant Patent #15,420 Breeze Dwarf Mat Rush x x x x xMiscanthus x giganteus Giant Chinese Silver Grass x x x x x x x x x x x x x x x x xMiscanthus 'Purpurascens' Flame Grass x x x x x x x x x x x x x x x x xMiscanthus sacchariflorus Silver Banner Grass x x x x x x x x x x x x x x xMiscanthus sinensis 'Adagio' Adagio Maiden Grass x x x x x x x x x x x x x x x x x
Zones Best Management Practices (BMPs)
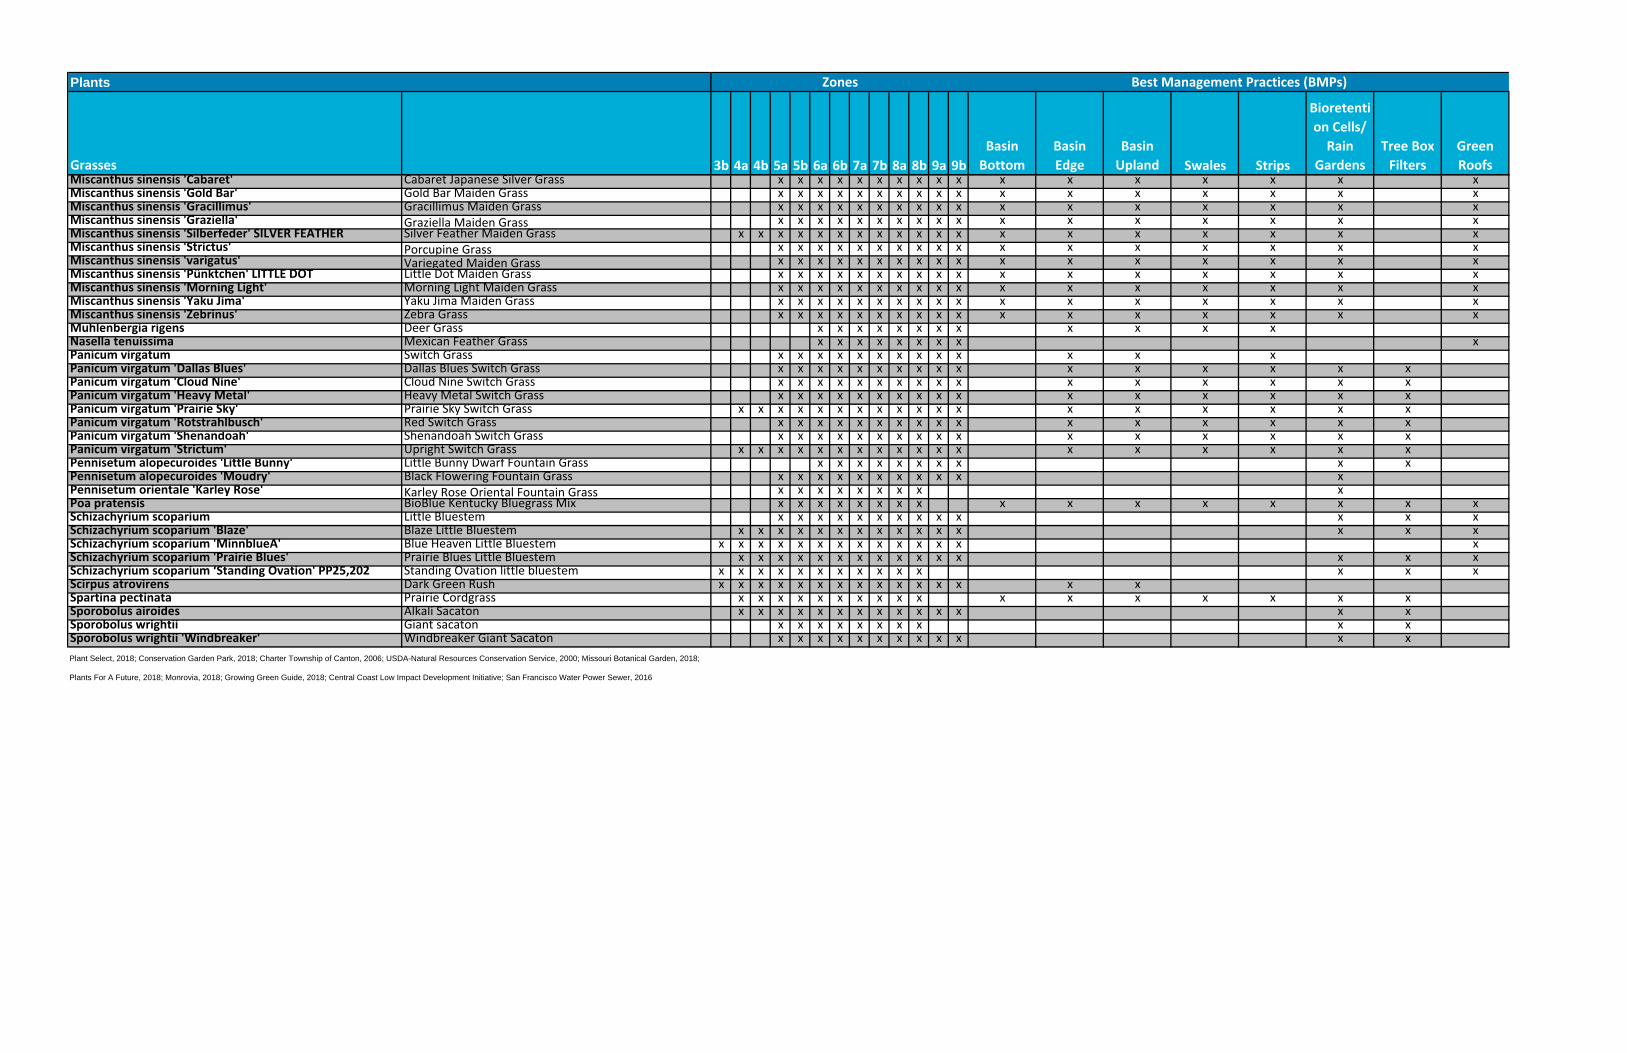
Plants
Grasses 3b 4a 4b 5a 5b 6a 6b 7a 7b 8a 8b 9a 9bBasin Bottom
Basin Edge
Basin Upland Swales Strips
Bioretention Cells/ Rain
GardensTree Box Filters
Green Roofs
Zones Best Management Practices (BMPs)
Miscanthus sinensis 'Cabaret' Cabaret Japanese Silver Grass x x x x x x x x x x x x x x x x xMiscanthus sinensis 'Gold Bar' Gold Bar Maiden Grass x x x x x x x x x x x x x x x x xMiscanthus sinensis 'Gracillimus' Gracillimus Maiden Grass x x x x x x x x x x x x x x x x xMiscanthus sinensis 'Graziella' Graziella Maiden Grass x x x x x x x x x x x x x x x x xMiscanthus sinensis 'Silberfeder' SILVER FEATHER Silver Feather Maiden Grass x x x x x x x x x x x x x x x x x x xMiscanthus sinensis 'Strictus' Porcupine Grass x x x x x x x x x x x x x x x x xMiscanthus sinensis 'varigatus' Variegated Maiden Grass x x x x x x x x x x x x x x x x xMiscanthus sinensis 'Pünktchen' LITTLE DOT Little Dot Maiden Grass x x x x x x x x x x x x x x x x xMiscanthus sinensis 'Morning Light' Morning Light Maiden Grass x x x x x x x x x x x x x x x x xMiscanthus sinensis 'Yaku Jima' Yaku Jima Maiden Grass x x x x x x x x x x x x x x x x xMiscanthus sinensis 'Zebrinus' Zebra Grass x x x x x x x x x x x x x x x x xMuhlenbergia rigens Deer Grass x x x x x x x x x x x xNasella tenuissima Mexican Feather Grass x x x x x x x x xPanicum virgatum Switch Grass x x x x x x x x x x x x xPanicum virgatum 'Dallas Blues' Dallas Blues Switch Grass x x x x x x x x x x x x x x x xPanicum virgatum 'Cloud Nine' Cloud Nine Switch Grass x x x x x x x x x x x x x x x xPanicum virgatum 'Heavy Metal' Heavy Metal Switch Grass x x x x x x x x x x x x x x x xPanicum virgatum 'Prairie Sky' Prairie Sky Switch Grass x x x x x x x x x x x x x x x x x xPanicum virgatum 'Rotstrahlbusch' Red Switch Grass x x x x x x x x x x x x x x x xPanicum virgatum 'Shenandoah' Shenandoah Switch Grass x x x x x x x x x x x x x x x xPanicum virgatum 'Strictum' Upright Switch Grass x x x x x x x x x x x x x x x x x xPennisetum alopecuroides 'Little Bunny' Little Bunny Dwarf Fountain Grass x x x x x x x x x xPennisetum alopecuroides 'Moudry' Black Flowering Fountain Grass x x x x x x x x x x xPennisetum orientale 'Karley Rose' Karley Rose Oriental Fountain Grass x x x x x x x x xPoa pratensis BioBlue Kentucky Bluegrass Mix x x x x x x x x x x x x x x x xSchizachyrium scoparium Little Bluestem x x x x x x x x x x x x xSchizachyrium scoparium 'Blaze' Blaze Little Bluestem x x x x x x x x x x x x x x xSchizachyrium scoparium 'MinnblueA' Blue Heaven Little Bluestem x x x x x x x x x x x x x xSchizachyrium scoparium 'Prairie Blues' Prairie Blues Little Bluestem x x x x x x x x x x x x x x xSchizachyrium scoparium ‘Standing Ovation' PP25,202 Standing Ovation little bluestem x x x x x x x x x x x x x xScirpus atrovirens Dark Green Rush x x x x x x x x x x x x x x xSpartina pectinata Prairie Cordgrass x x x x x x x x x x x x x x x x xSporobolus airoides Alkali Sacaton x x x x x x x x x x x x x xSporobolus wrightii Giant sacaton x x x x x x x x x xSporobolus wrightii 'Windbreaker' Windbreaker Giant Sacaton x x x x x x x x x x x xPlant Select, 2018; Conservation Garden Park, 2018; Charter Township of Canton, 2006; USDA-Natural Resources Conservation Service, 2000; Missouri Botanical Garden, 2018;
Plants For A Future, 2018; Monrovia, 2018; Growing Green Guide, 2018; Central Coast Low Impact Development Initiative; San Francisco Water Power Sewer, 2016

Plants
Perennials 3b 4a 4b 5a 5b 6a 6b 7a 7b 8a 8b 9a 9bBasin Bottom
Basin Edge
Basin Upland Swales Strips
Bioretention Cells/
Rain Gardens
Tree Box Filters
Green Roofs
Achillea millefolium 'Lilac Beauty' Lilac Beauty Yarrow x x x x x x x x x x x x x x x x x xAchillea millefolium 'Little Susie' Little Susie Yarrow x x x x x x x x x x x x x x x x x xAchillea millefolium 'Paprika' Paprika Yarrow x x x x x x x x x x x x x x x x x xAchillea millefolium 'Pink Grapefruit' Pink Grapefruit Yarrow x x x x x x x x x x x x x x x x x xAgalinus tenuifolia Slender False Foxglove x x x x x x x x x x x x x xAgastache 'Blue Fortune' Blue Fortune Hyssop x x x x x x x x x x xAgastache 'Desert Sunrise' Desert Sunrise Hummingbird Mint x x x x x x x x x x xAgastache 'Kudos Gold' Kudos Gold Dwarf Hummingbird Mint x x x x x x x x x x xAgastache 'Pink Pop' Pink Pop Hummingbird Mint x x x x x x x x x x xAgastache 'Pstessene' CORONADO® Red hyssop x x x x x x x x x x xAgastache 'Summer Glow' Giant Hyssop x x x x x x x x x x xAgastache aurantiaca Orange Hummingbird Mint x x x x x x x x x x xAgastache aurantiaca 'Apricot Sprite' Apricot Sprite Hyssop x x x x x x x x x x xAgastache aurantiaca 'Coronado' Coronado Hummingbird Mint x x x x x x x x x x xAgastache aurantiaca 'P012S' CORONADO® hyssop x x x x x x x x x x xAgastache cana 'Sinning' PP 13,673 SONORAN SUNSET® hyssop x x x x x x x x x x xAgastache foeniculum 'Golden Jubilee' Golden Jubilee Hyssop x x x x x x x x x x xAgastache rupestris Sunset hyssop x x x x x x x x x x x xAgastache x 'Blue Boa' Blue Boa Hummingbird Mint x x x x x x x x x x xAngelica atropurpurea Great Angelica x x x x x x x x xAguilegia caerulea Rocky Mountain Columbine x x x x x x x x x x x x x x x x x xAquilegia formosa Western Columbine x x x x x x x x x x x x x x x x x xAquilegia McKana Group McKana Hybrid Columbine x x x x x x x x x x x x x x x x x xAllium schoenoprasum Chives x x x x x x x x x x xArmeria maritima 'Bloodstone' Bloodstone Thrift x x x x x x x x x x x x x x x x x x xArmeria maritima 'Cotton Tail' Cotton Tail Thrift x x x x x x x x x x x x x x x x x x xArmeria maritima 'Düsseldorfer Stolz' DUSSELDORF PRIDE Dusseldorf Pride Thrift x x x x x x x x x x x x x x x x x x xArmeria maritima 'Rubifolia' Red Leaf Thrift x x x x x x x x x x x x x x x x x x xArmeria maritima 'Splendens' Splendens Common Thrift x x x x x x x x x x x x x x x x x x xAsarum caudatum Wild Ginger x x x x x x x x x x xAsclepias incarnata Swamp Milkweed x x x x x x x x xCeratostigma plumbaginoides Blue Plumbago x x x x x x x x x x xCoreopsis tripteris Tall Coreopsis x x x x x x x x x x x xDelosperma cooperi 'Eye Candy' Patent Applied For Eye Candy Ice Plant x x x x x x xDelosperma cooperi 'Jewel of Desert' Jewel of Desert Ice Plant x x x x x x x x x x xDelosperma cooperi 'Jewel of the Desert Garnet' Jewel of the Desert Garnet Icepant x x x x x x x x x x xDelosperma cooperi 'Jewel of the Desert Topaz' Jewel of the Desert Topaz Ice Plant x x x x x x x x x x xDelosperma cooperi 'Perfect Orange' Plant Patent Applied For Perfect Orange Ice Plant x x x x x x xDelosperma cooperi 'WOWDOY3' Plant Patent #25,600 Wheels of Wonder Orange Wonder Ice Plant x x x x x x x x x x xDelosperma cooperi 'WOWDRW5' Plant Patent #25,572 Wheels of Wonder Violet Wonder Ice Plant x x x x x x x x x x xEupatorium maculatum Spotted Joe‐Pye Weed x x x x x x x x x x xEupatorium perfoliatum Common Boneset x x x x x x x x x x x x xEuphorbia rigida Spurge x x x x x x x xGentiana andrewsii Bottle Gentian x x x x x x x x x xGuara lindheimeri Bee Blossom x x x x x x x x x x xHelenium autumnale Sneezeweed x x x x x x x x x x x x xHeuchera micrantha var. diversifolia 'Palace Purple' Palace Purple Coral Bells x x x x x x x x x x x x x xIris virginica shrevei Blue Flag Iris x x x x x x x x x x x x xLavandula angustifolia English Lavendar x x x x x x x x x x x xLavandula angustifolia 'Armtipp01' Plant Patent #24,827 Big Time Blue English Lavender x x x x x x x x x x x x xLavandula angustifolia 'Betty's Blue' Betty's Blue Lavender x x x x x x x x x x xLavandula angustifolia 'Granny's Bouquet' Granny's Bouquet Lavender x x x x x x x x x x x x x xLavandula angustifolia ‘Hidecote’ Hidcote True Lavender x x x x x x x x x x x xLavandula angustifolia 'Lavance Purple' Lavance Purple Lavender x x x x x x x x x x x x x xLavandula angustifolia 'Munstead' Munstead Lavender x x x x x x x x x x x xLavandula angustifolia 'Thumbelina Leight' Thumbelina Leigh English Lavender x x x x x x x x x x x x xLavandula angustifolia 'Pastor's Pride' Pastor's Pride Lavender x x x x x x x x x x x x xLavandula angustifolia ‘Wee One' Wee One dwarf English lavender x x x x x x x x x x x x x x
Zones Best Management Practices (BMPs)

Plants
Perennials 3b 4a 4b 5a 5b 6a 6b 7a 7b 8a 8b 9a 9bBasin Bottom
Basin Edge
Basin Upland Swales Strips
Bioretention Cells/
Rain Gardens
Tree Box Filters
Green Roofs
Zones Best Management Practices (BMPs)
Lavandula x ginginsii 'Goodwin Creek Gray' Goodwin Creek Gray Lavender x x x x x x x x xLavandula x intermedia 'Provence' Provence French Lavender x x x x x x x x x x x x xLobelia siphilitica Great Blue Lobelia x x x x x x x x x x x x xLudwigia alternifolia Seedbox x x x x x x x x x x x xMimulus cardinalis Scarlet Monkey Flower x x x x x x x xMimulus ringens Mondey Flower x x x x x x x x x x x xNepeta ‘Psfike' PP 18,904 LITTLE TRUDY® catmint x x x x x x x x x x x x xNepeta racemosa 'Blue Wonder' Blue Wonder Catmint x x xNepeta x faassenii 'Junior Walker' Junior Walker Catmint x x x x x x x x x x x xNepeta x faassenii 'Novanepjun' Plant Patent #23,074 Junior Walker Catmint x x x x x x x x x x x x xNepeta x faassenii 'Walker's Low' Walker's Low Catmint x x x x x x x x x x x x x x xOcimum basilicum 'Boxwood' Boxwood Basil x x xOcimum basilicum 'Fino Verde' Fino Verde Basil x x xOriganum distamnus Dittany of Crete x x x x x x xOriganum vulgare Oregano x x x x x x x x x x x xPeltandra virginica Arrow Arrum x x x x x x x x x x x xPenstemon 'Dark Towers' Dark Towers Penstemon x x x x x x x x xPenstemon 'Midnight Blue' Midnight Blue Penstemon x x x x x x x x x xPenstemon x 'Coral Baby' Coral Baby penstemon x x x x x x x x xPenstemon barbatus 'Elfin Pink' Elfin Pink Penstemon x x x x x x x x x x xPenstemon barbatus 'Navigator' Navigator Penstemon x x x x x x x x x x xPenstemon digitalis 'Husker Red' Husker Red Penstemon x x x x x x x x x x x xPenstemon fruticosus 'Purple Haze' Purple Haze Penstemon x x x x x x x x xPenstemon grandiflorus 'P010S' PRAIRIE JEWEL® penstemon x x x x x x x x x x x x x xPenstemon grandiflorus 'Prairie Jewel' Prairie Jewel Penstemon x x x x x x x x x x x x x xPenstemon heterophyllus 'Margarita BOP' Margarita BOP Penstemon x x x x x x x x xPenstemon linarioides ssp. coloradoensis 'P014S' SILVERTON® bluemat penstemon x x x x x x x x x x x x xPenstemon mensarum Grand Mesa beardtongue x x x x x x x x x x x x x xPenstemon pseudospectabilis Desert beardtongue x x x x x x x x x x xPenstemon rostriflorus Bridges' penstemon x x x x x x x x x xPenstemon x mexicali 'Carolyn's Hope' PPAF Carolyn's Hope pink penstemon x x x x x x x x x xPenstemon x mexicali 'Pike's Peak Purple' Pike's Peak Purple Beardtongue xPenstemon x mexicali 'Psmyers' SHADOW MOUNTAIN® penstemon x x x x x x x x x xPenstemon x mexicali 'PWIN02S' WINDWALKER® garnet penstemon x x x x x x x x x xPenstemon x mexicali 'P007S' PIKES PEAK PURPLE® penstemon x x x x x x x x x xPenstemon x mexicali 'P008S' RED ROCKS® penstemon x x x x x x x x x xPhysotegia virginiana Obedient Plant x x x x x x x x x x x x x xPontederia cordata Pickerel Weed x x x x x x x x x x x x x xPycnanthemum muticum Mountain Mint x x x x x x x x xPycanthemum virginianum Common Mountain Mint x x x x x x x x x xRudbeckia laciniata Wild Golden Glow x x x x x x x x x x x x x xRosa rugosa Pink Rugosa Rose x x x x x x x x x x x x x xRumex sanguineus ssp. sanguineus B+B392loody Sorrel/ Red Dock x x x x x x x x xSagittaria latifolia Common Arrowhead x x x x x x x x x x x xSalvia microphylla x greggii 'EGGBEN001' Plant Patent #24,152 Heatwave Glitter Sage x x x x x x x x xSalvia microphylla x greggii 'EGGBEN003' Plant Patent #24,155 Heatwave Glimmer Sage x x x x x x x x xSalvia microphylla x greggii "EGGBEN004' Plant Patent #24154 Heatwave Sparkle Sage x x x x x x x x xSalvia microphylla x greggii 'EGGBEN005' Plant Patent #24,151 Heatwave Blaze Sage x x x x x x x x xSalvia nemorosa 'Blue Marvel' Blue Marvel Sage x x x x x x x x x x x x xSalvia nemorosa 'Rose Marvel' Plant Patent Applied For Rose Marvel Salvia x x x x x x x x x x x xSantolina virens Green Lavender Cotton x x x x xSantolina virens 'Lemon Fizz' Lemon Fizz Lavender Cotton x x x x x x xSedum 'Cherry Tart' Plant Patent #24,603 Sunsparkler Cherry Tart Stonecrop x x x x x x x x x x x x xSedum '17‐03' Pink Plant Patent Applied For Purple Crush Stonecrop x x x x x x x x x x x x xSedum album chloroticum 'Baby Tears' Baby Tears Stonecrop x x x x x x x x x x x x xSedum aldolphii Golden Sedum x x x x xSedum oreganum Oregon Stonecrop x x x x x x x x x x x x x xSedum spathulifolium Broadleaf Stonecrop x x x x x x x x x x x x x x x
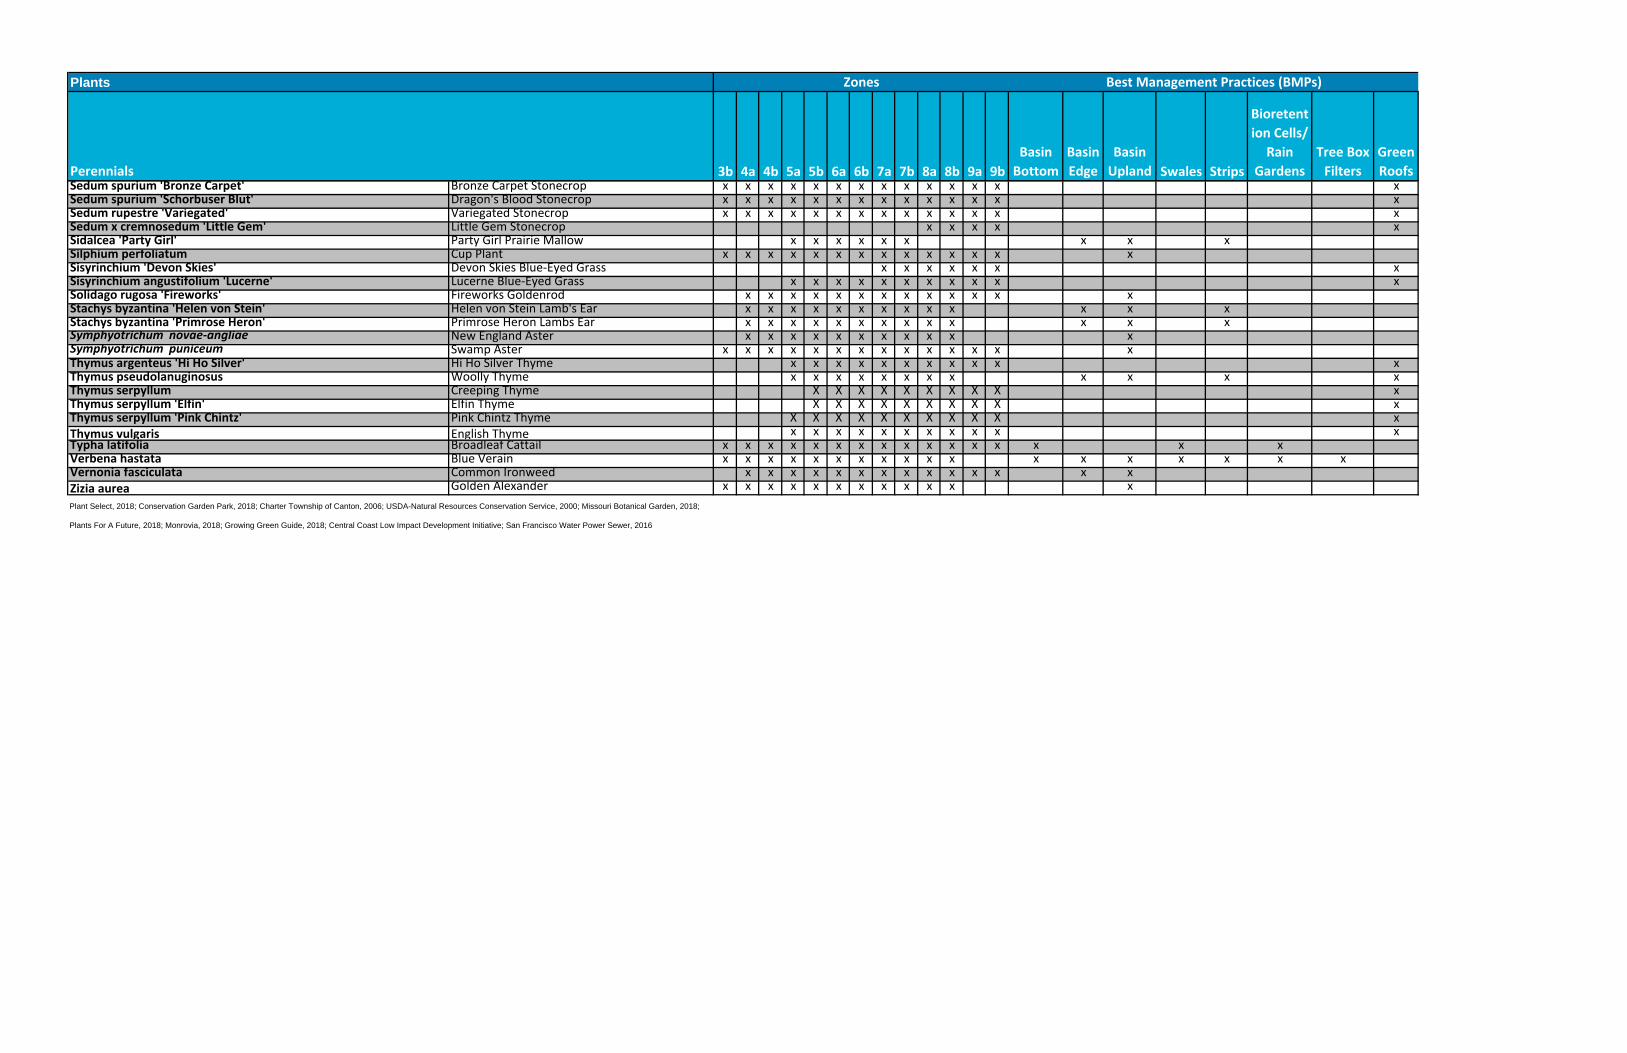
Plants
Perennials 3b 4a 4b 5a 5b 6a 6b 7a 7b 8a 8b 9a 9bBasin Bottom
Basin Edge
Basin Upland Swales Strips
Bioretention Cells/
Rain Gardens
Tree Box Filters
Green Roofs
Zones Best Management Practices (BMPs)
Sedum spurium 'Bronze Carpet' Bronze Carpet Stonecrop x x x x x x x x x x x x x xSedum spurium 'Schorbuser Blut' Dragon's Blood Stonecrop x x x x x x x x x x x x x xSedum rupestre 'Variegated' Variegated Stonecrop x x x x x x x x x x x x x xSedum x cremnosedum 'Little Gem' Little Gem Stonecrop x x x x xSidalcea 'Party Girl' Party Girl Prairie Mallow x x x x x x x x xSilphium perfoliatum Cup Plant x x x x x x x x x x x x x xSisyrinchium 'Devon Skies' Devon Skies Blue‐Eyed Grass x x x x x x xSisyrinchium angustifolium 'Lucerne' Lucerne Blue‐Eyed Grass x x x x x x x x x x xSolidago rugosa 'Fireworks' Fireworks Goldenrod x x x x x x x x x x x x xStachys byzantina 'Helen von Stein' Helen von Stein Lamb's Ear x x x x x x x x x x x x xStachys byzantina 'Primrose Heron' Primrose Heron Lambs Ear x x x x x x x x x x x x xSymphyotrichum novae‐angliae New England Aster x x x x x x x x x x xSymphyotrichum puniceum Swamp Aster x x x x x x x x x x x x x xThymus argenteus 'Hi Ho Silver' Hi Ho Silver Thyme x x x x x x x x x x xThymus pseudolanuginosus Woolly Thyme x x x x x x x x x x x xThymus serpyllum Creeping Thyme X X X X X X X X X xThymus serpyllum 'Elfin' Elfin Thyme X X X X X X X X X xThymus serpyllum 'Pink Chintz' Pink Chintz Thyme X X X X X X X X X X xThymus vulgaris English Thyme x x x x x x x x x x xTypha latifolia Broadleaf Cattail x x x x x x x x x x x x x x x xVerbena hastata Blue Verain x x x x x x x x x x x x x x x x x xVernonia fasciculata Common Ironweed x x x x x x x x x x x x x xZizia aurea Golden Alexander x x x x x x x x x x x xPlant Select, 2018; Conservation Garden Park, 2018; Charter Township of Canton, 2006; USDA-Natural Resources Conservation Service, 2000; Missouri Botanical Garden, 2018;
Plants For A Future, 2018; Monrovia, 2018; Growing Green Guide, 2018; Central Coast Low Impact Development Initiative; San Francisco Water Power Sewer, 2016
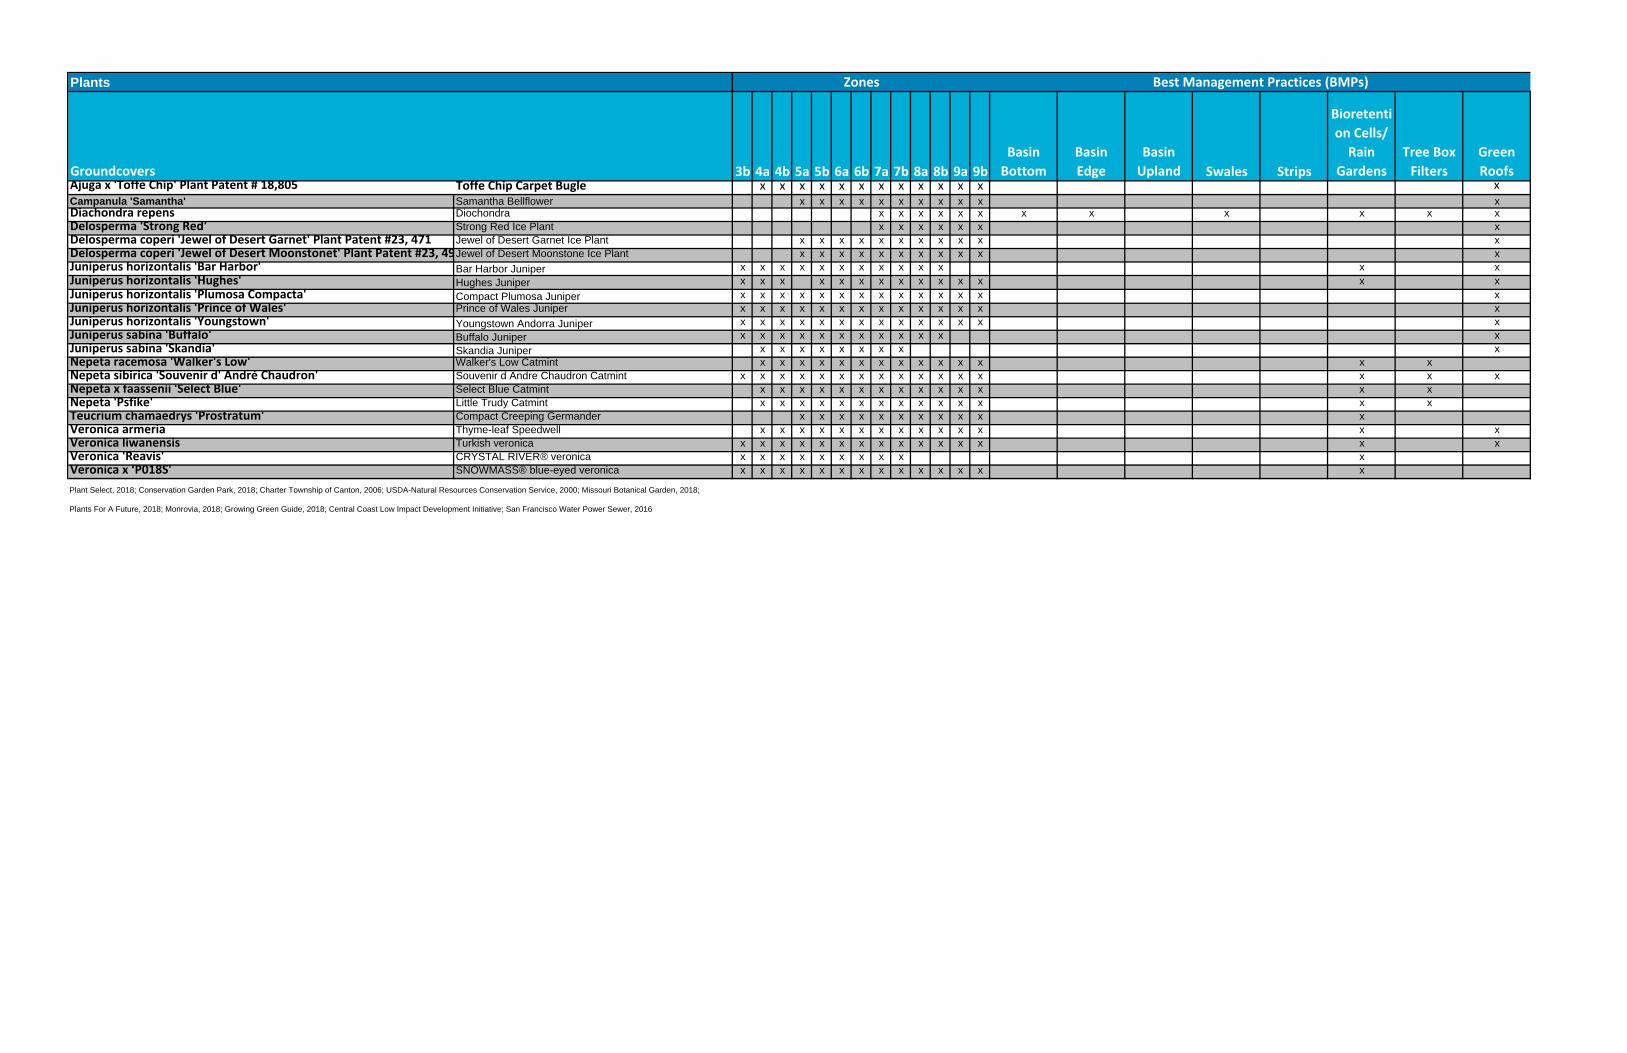
Plants
Groundcovers 3b 4a 4b 5a 5b 6a 6b 7a 7b 8a 8b 9a 9bBasin Bottom
Basin Edge
Basin Upland Swales Strips
Bioretention Cells/ Rain
GardensTree Box Filters
Green Roofs
Ajuga x 'Toffe Chip' Plant Patent # 18,805 Toffe Chip Carpet Bugle x x x x x x x x x x x x xCampanula 'Samantha' Samantha Bellflower x x x x x x x x x x xDiachondra repens Diochondra x x x x x x x x x x x x
Delosperma 'Strong Red' Strong Red Ice Plant x x x x x x x
Delosperma coperi 'Jewel of Desert Garnet' Plant Patent #23, 471 Jewel of Desert Garnet Ice Plant x x x x x x x x x x x
Delosperma coperi 'Jewel of Desert Moonstonet' Plant Patent #23, 49Jewel of Desert Moonstone Ice Plant x x x x x x x x x x x
Juniperus horizontalis 'Bar Harbor' Bar Harbor Juniper x x x x x x x x x x x x x
Juniperus horizontalis 'Hughes' Hughes Juniper x x x x x x x x x x x x x x
Juniperus horizontalis 'Plumosa Compacta' Compact Plumosa Juniper x x x x x x x x x x x x x x
Juniperus horizontalis 'Prince of Wales' Prince of Wales Juniper x x x x x x x x x x x x x x
Juniperus horizontalis 'Youngstown' Youngstown Andorra Juniper x x x x x x x x x x x x x x
Juniperus sabina 'Buffalo' Buffalo Juniper x x x x x x x x x x x x
Juniperus sabina 'Skandia' Skandia Juniper x x x x x x x x x
Nepeta racemosa 'Walker's Low' Walker's Low Catmint x x x x x x x x x x x x x x
Nepeta sibirica 'Souvenir d' André Chaudron' Souvenir d Andre Chaudron Catmint x x x x x x x x x x x x x x x x
Nepeta x faassenii 'Select Blue' Select Blue Catmint x x x x x x x x x x x x x x
Nepeta 'Psfike' Little Trudy Catmint x x x x x x x x x x x x x x
Teucrium chamaedrys 'Prostratum' Compact Creeping Germander x x x x x x x x x x x
Veronica armeria Thyme-leaf Speedwell x x x x x x x x x x x x x x
Veronica liwanensis Turkish veronica x x x x x x x x x x x x x x x
Veronica 'Reavis' CRYSTAL RIVER® veronica x x x x x x x x x x
Veronica x ‘P018S' SNOWMASS® blue-eyed veronica x x x x x x x x x x x x x x
Plant Select, 2018; Conservation Garden Park, 2018; Charter Township of Canton, 2006; USDA-Natural Resources Conservation Service, 2000; Missouri Botanical Garden, 2018;
Plants For A Future, 2018; Monrovia, 2018; Growing Green Guide, 2018; Central Coast Low Impact Development Initiative; San Francisco Water Power Sewer, 2016
Zones Best Management Practices (BMPs)

Plants
Vines 3b 4a 4b 5a 5b 6a 6b 7a 7b 8a 8b 9a 9bBasin Bottom
Basin Edge
Basin Upland Swales Strips
Bioretention Cells/ Rain
GardensTree Box Filters
Green Roofs
Aristolochia californica Pipe Vine x x x x x x
Campsis radicans f. flava Yellow Trumpetvine x x x x x x x x x x x
Clematis ligusticifolia Western White Clematis x x x x x x x x x x x x x x x x
Vitis labrusca 'Concord' Concord Grape x x x x x x x x x x x x
Vistis labrusca 'Niagara' Niagara Grape x x x x x x x x x x x x
Vitis labrusca 'Niagara' Niagara Grape x x x x x x x x x x x x
Vitis 'Himrod' Himrod Grape x x x x x x x x x x x x
Vistis 'St. Theresa' St. Theresa Grape x x x x x x x x x x x x
Vitis x ‘St. Theresa Seedless' St. Theresa seedless grape x x x x x x x x x x x x x x x x
Plant Select, 2018; Conservation Garden Park, 2018; Charter Township of Canton, 2006; USDA-Natural Resources Conservation Service, 2000; Missouri Botanical Garden, 2018;
Plants For A Future, 2018; Monrovia, 2018; Growing Green Guide, 2018; Central Coast Low Impact Development Initiative; San Francisco Water Power Sewer, 2016
Zones Best Management Practices (BMPs)
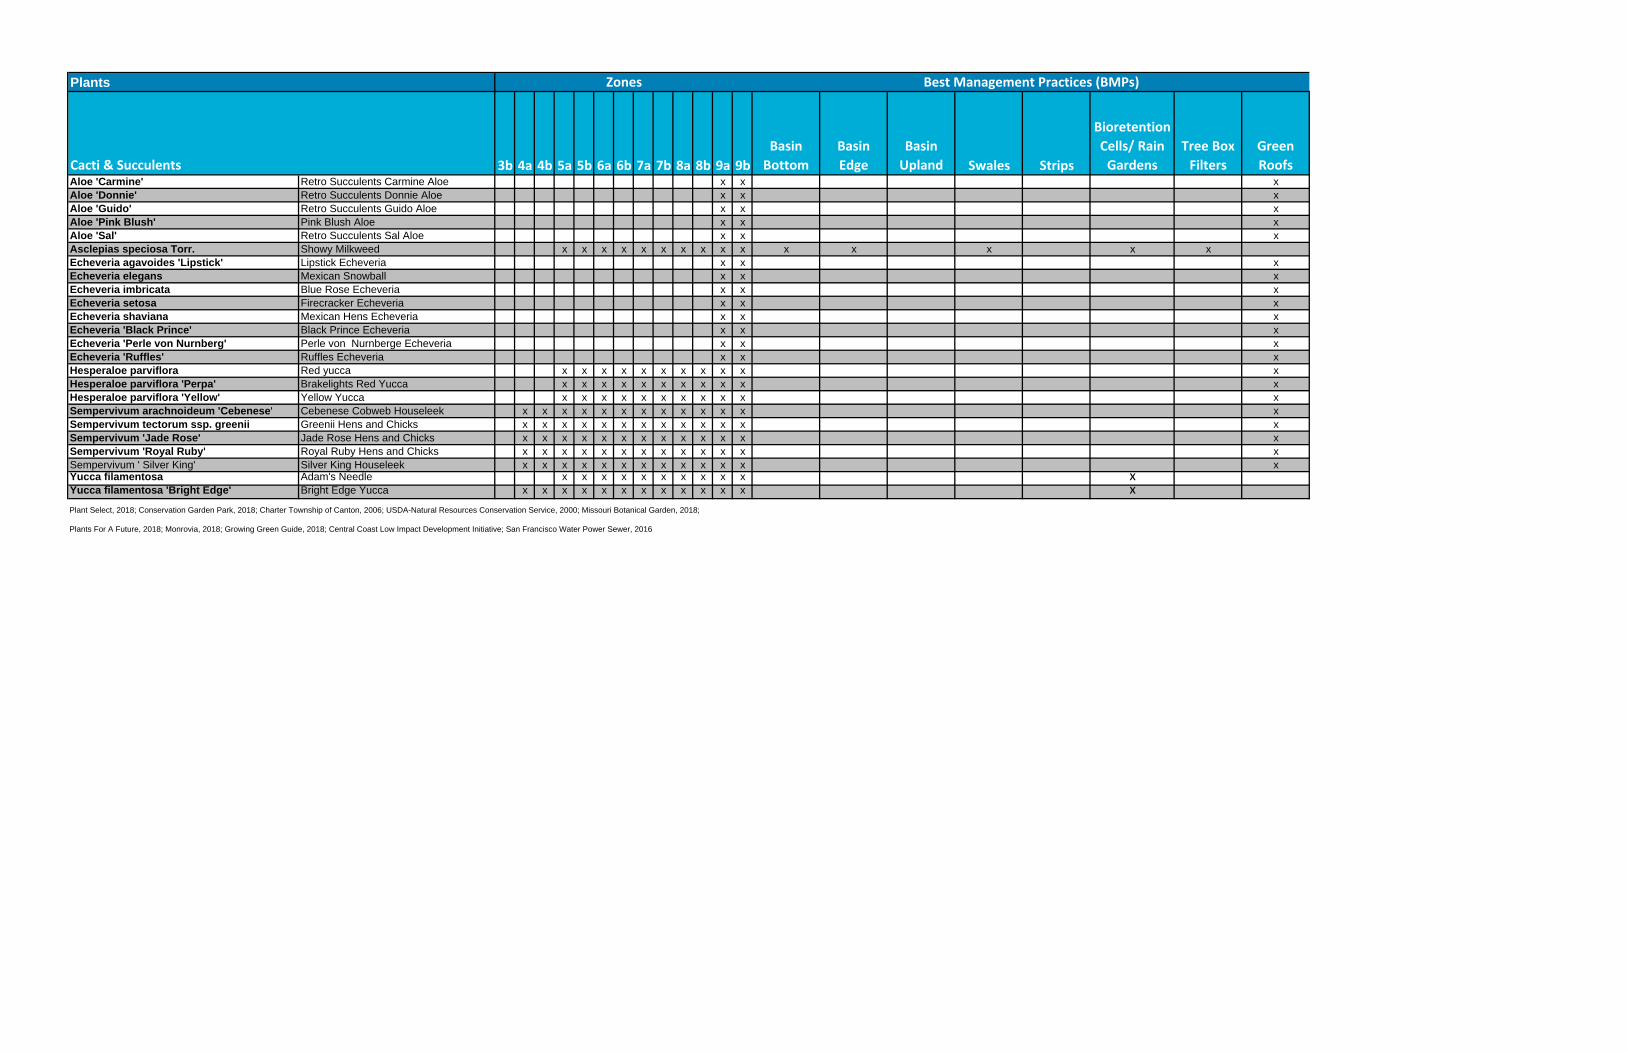
Plants
Cacti & Succulents 3b 4a 4b 5a 5b 6a 6b 7a 7b 8a 8b 9a 9bBasin Bottom
Basin Edge
Basin Upland Swales Strips
Bioretention Cells/ Rain Gardens
Tree Box Filters
Green Roofs
Aloe 'Carmine' Retro Succulents Carmine Aloe x x x
Aloe 'Donnie' Retro Succulents Donnie Aloe x x x
Aloe 'Guido' Retro Succulents Guido Aloe x x x
Aloe 'Pink Blush' Pink Blush Aloe x x x
Aloe 'Sal' Retro Succulents Sal Aloe x x x
Asclepias speciosa Torr. Showy Milkweed x x x x x x x x x x x x x x x
Echeveria agavoides 'Lipstick' Lipstick Echeveria x x x
Echeveria elegans Mexican Snowball x x x
Echeveria imbricata Blue Rose Echeveria x x x
Echeveria setosa Firecracker Echeveria x x x
Echeveria shaviana Mexican Hens Echeveria x x x
Echeveria 'Black Prince' Black Prince Echeveria x x x
Echeveria 'Perle von Nurnberg' Perle von Nurnberge Echeveria x x x
Echeveria 'Ruffles' Ruffles Echeveria x x x
Hesperaloe parviflora Red yucca x x x x x x x x x x x
Hesperaloe parviflora 'Perpa' Brakelights Red Yucca x x x x x x x x x x x
Hesperaloe parviflora 'Yellow' Yellow Yucca x x x x x x x x x x x
Sempervivum arachnoideum 'Cebenese' Cebenese Cobweb Houseleek x x x x x x x x x x x x x
Sempervivum tectorum ssp. greenii Greenii Hens and Chicks x x x x x x x x x x x x x
Sempervivum 'Jade Rose' Jade Rose Hens and Chicks x x x x x x x x x x x x x
Sempervivum 'Royal Ruby' Royal Ruby Hens and Chicks x x x x x x x x x x x x x
Sempervivum ' Silver King' Silver King Houseleek x x x x x x x x x x x x xYucca filamentosa Adam's Needle x x x x x x x x x x xYucca filamentosa 'Bright Edge' Bright Edge Yucca x x x x x x x x x x x x xPlant Select, 2018; Conservation Garden Park, 2018; Charter Township of Canton, 2006; USDA-Natural Resources Conservation Service, 2000; Missouri Botanical Garden, 2018;
Plants For A Future, 2018; Monrovia, 2018; Growing Green Guide, 2018; Central Coast Low Impact Development Initiative; San Francisco Water Power Sewer, 2016
Zones Best Management Practices (BMPs)

A Guide to Low Impact Development within Utah F-1
Appendix F References AHBL. (2017, November). Gap Analysis User Guide & Template. Sacramento: CASQA. APWA. (2012, October). Manual of Best Management Practices for Stormwater Quality. Retrieved from Mid-
America Regional Council: http://www.marc.org/Environment/Water-Resources/Local-Government-Resources/Stormwater-Best-Management-Practices
California Department of Transportation Division of Environmental Sciences. (2015). Runoff Coefficient Evaluation for Volumetric BMP Sizing. Sacramento.
California Regional Water Quality Control Board Los Angeles Region. (2016). NPDES PERMIT NO. CAS004001. Retrieved July 17, 2018, from https://www.waterboards.ca.gov/ losangeles/water_issues/programs/stormwater/municipal/ los_angeles_ms4/2016/OrderR4-2012-0175_corrected_120216.pdf
California Regional Water Quality Control Board San Diego Region. (2015). NPDES NO. CAS0109266. Retrieved July 17, 2018, from https://www.waterboards.ca.gov/ sandiego/water_issues/programs/stormwater/docs/ 2015-1118_AmendedOrder_R9-2013-0001_COMPLETE.pdf
Caltrans Division of Environmental Analysis. (2003). Roadside Vegetated Treatment Sites (RVTS) Study.
Central Coast Low Impact Development Initiative. (n.d.). LID Plant Guidance for Bioretention. Retrieved from Toolbox | CASQA - California Stormwater Quality Association.
Charlesworth, S. M., Beddow, J., & Nnadi, E. O. (2017). The Fate of Pollutants in Porous Asphalt Pavements, Laboratory Experiments to Investigate Their Potential to Impact Environmental Health. International Journal of Environmental Research.
Charter Township of Canton. (2006). Detention Basin Planting Guidelines. Canton: Charter Township of Canton Department of Municipal Services.
Conservation Garden Park. (2018). (West Jordan Conservation Garden Park) Retrieved August 2018, from http://conservationgardenpark.org
D.B. Booth, C. J. (1997). Urbanization of Aquatic Systems - Degradation Thresholds, Stormwater Detention, and the Limits of Mitigation. Water Resources Bulletin, pp. 1077-1090.
Driscoll, E. (1983). Rainfall/Runoff Relationships from the NURP Run-off Database. Montreal, Quebec: Presented at Stormwater and Quality Models Users Group Meeting.
Dupont, R. R., & McLean, J. (2018). Optimizing Stormwater BMP Performance. Retrieved August 27, 2018, from https://uwrl.usu.edu/environmental-quality/projects/stormwater
Dupont, R. R., McLean, J., Peralta, R., Null, S., & Jackson-Smith, D. (2017). NCER Assistance Agreement Annual Progress Report for Grant #83582401 - Assessment of Stormwater Harvesting via Manage Aquifer Recharge (MAR) to Develop New Water Supplies in the Arid West: The Salt Lake Valley Example. Utah State University.
Filterra Bioretention. (2018). Retrieved August 18, 2018, from https://www.conteches.com/ Stormwater-Management/Biofiltration-Bioretention/Filterra
Growing Green Guide. (2018). Retrieved August 2018, from Green Roof Plants: http://www.growinggreenguide.org/technical-guide/ design-and-planning/plant-selection/green-roofs/
Guo, J. (2013). Derivation and Calibration of Volume-Based Runoff Coefficients for Denver Metro Area, Colorado. Denver: Urban Drainage Flood Control District.
Heiberger, J. R. (2013). Infiltration and Potential Groundwater Recharge Performance of Stormwater Bioretention Designed for Semiarid Climates. Dissertation, University of Utah, Department of Civil and Environmental Engineering.
Kieser & Associates, LLC. (2009). A Scientifically Defensible Process for the Exchange of Pollutant Credits under Minnesota’s Proposed Water Quality Trading Rules.
Konrad, C., & Booth, D. (2002). Hydrologic Trends Associated with Urban Development in Western Washington Streams. Tacoma: United States Geologica Survey Water-Resources Investigations Reprot 02-4040.
Mark Grey, D. S. (2013, February 13). The Costs of LID. Retrieved July 15, 2018, from https://foresternetwork.com/daily/water/ stormwater-management/the-costs-of-lid/

A Guide to Low Impact Development within Utah F-2
McPherson, E., Simpson, J., Peper, P., Maco, E., & Xiao, Q. (2005). Municipal Forest Benefits and Costs in Five US Cities. Journal of Forestry, 411-416.
Minnesota Pollution Control Agency. (2017, August 24). Better Site Design. Retrieved July 21, 2018, from https://stormwater.pca.state.mn.us/ index.php/Better_site_design
Minnesota Pollution Control Agency. (2018, February 12). Information on Pollutant Removal by BMPs. Retrieved July 27, 2018, from https://stormwater.pca.state.mn.us/index.php/ Information_on_pollutant_removal_by_BMPs
Missouri Botanical Garden. (2018). Retrieved August 2018, from http://www.missouribotanicalgarden.org
Monrovia. (2018). Retrieved August 2018, from http://www.monrovia.com
Plant Select. (2018). (Denver Botanical Garden, Colorado State University) Retrieved August 2018, from Our Plants: http://plantselect.org/plants/our-plants/
Plants For A Future. (2018). Plants For A Future. Retrieved August 2018, from Crataegus arnoldiana PFAF Plant Database: https://pfaf.org/user/ Plant.aspx?LatinName=Crataegus+arnoldiana
Reese, A. (2006, July-August). Voodoo Hydrology. Stormwater - The Journal for Surface Water Quality.
San Francisco Water Power Sewer. (2016, May). San Francisco Stormwater Management Requirements and Design Guidelines. San Francisco, California.
Schueler, T. R. (1987). Controlling Urban Runoff: A Practical Manual for Planning and Designing Urban BMPs. Washington, D.C.: Metropolitan Washington Council of Governments.
Schueler, T. R. (2000). Irreducible Pollutant Concentrations Discharged from Stormwater Practices: The Practice of Watershed Protection. Ellicott City: Center for Watershed Protection.
Stormwater Retrofit Techniques for Restoring Urban Drainages in Massachusetts and New Hampshire: Small MS4 Permit Technical Support Document. (2011, April).
Taylor, S., & Barrett, M. (2014). Long-Term Performance and Life-Cycle Costs of Stormwater Best Management Practices. Washington, D.C.: Transportation Research Board.
United States Environmental Protection Agency. (2012, March). Terminology of Low Impact Development. Retrieved August 28, 2018, from https://www.epa.gov/sites/production/ files/2015-09/documents/bbfs2terms.pdf
USDA-Natural Resources Conservation Service. (2000). Stormwater Plant Materials. Boise: Boise Public Works.
Velásquez, R. A. (2018). Application of WINSLAMM to Evaluate the Effect of Green Infrastructure Implementation in Northern Utah.
WEF Press. (2012). Design of Urban Stormwater Controls. New York: Water Environment Federation; Environmental and Water Resources Institute of ASCE; McGraw-Hill Professional.
WERF. (2016). International Stormwater BMP Database. Retrieved July 28, 2018, from http://bmpdatabase.org/Docs/ 03-SW-1COh%20BMP%20Database%202016%20Summary%20Stats.pdf
Yang, B., Li, S., Wall, H. A., Blackmore, P., & Wang, Z. (2015). Green Infrastructure Design for improving Stormwater Quality: Daybreak community in the United States West. Retrieved from https://digitalcommons.usu.edu/roch/10