ENVIRONMENTAL EVALUATION FROM CRADLE TO GRAVE WITH CAD-INTEGRATED LCA TOOLS

Full Terms & Conditions of access and use can be found athttp://www.tandfonline.com/action/journalInformation?journalCode=cjep20
Download by: [Georgia Tech Library] Date: 01 October 2016, At: 13:08
Journal of Environmental Planning and Management
ISSN: 0964-0568 (Print) 1360-0559 (Online) Journal homepage: http://www.tandfonline.com/loi/cjep20
LCA of the South African sugar industry
Livison Mashoko , Charles Mbohwa & Valerie M. Thomas
To cite this article: Livison Mashoko , Charles Mbohwa & Valerie M. Thomas (2010) LCA ofthe South African sugar industry, Journal of Environmental Planning and Management, 53:6,793-807, DOI: 10.1080/09640568.2010.488120
To link to this article: http://dx.doi.org/10.1080/09640568.2010.488120
Published online: 28 Jul 2010.
Submit your article to this journal
Article views: 325
View related articles
Citing articles: 7 View citing articles

LCA of the South African sugar industry
Livison Mashokoa*, Charles Mbohwab and Valerie M. Thomasc
aLogistics and Quantitative Methods, CSIR: Built Environment, #A159-Bld 2, Meiring-NaudeAvenue, Brummeria, PO Box 395, Pretoria 0001, South Africa; bDepartment of Quality andOperations Management, University of Johannesburg, Auckland Park Bunting Road Campus,PO Box 524, Auckland Park 2006, Johannesburg, South Africa; cSchool of Industrial and
Systems Engineering, and School of Public Policy, Georgia Institute of Technology, 765 FerstDrive, Atlanta, Georgia, USA
(Received 18 May 2009; final version received 3 December 2009)
A life cycle assessment of sugar produced in South Africa evaluates theenvironmental impacts and energy consumption of the different life cycle phasesof sugar production. The system studied includes sugar cane farming, fertiliserand herbicide manufacture, cane burning, sugar cane transportation and sugarmanufacture. Inventory and impact assessment results show that non-renewableenergy consumption is 5350 MJ per tonne of raw sugar produced and 40% of thisis from fertiliser and herbicide manufacture. Reduction in the use or impact offertiliser for cane farming could bring considerable savings in terms of fossilenergy consumption and a reduction in greenhouse gas emissions.
Keywords: sugar; energy; farming; greenhouse gas; environmental
1. Introduction
South Africa is one of the world’s leading producers of high quality sugar,producing approximately 2.5 million tonnes per annum. The South African sugarindustry makes a significant contribution to the South African national economy,generating direct income of approximately 6 billion South African Rand (R) peryear (US$700 million or e500 million) (SASA 2008). The industry employsapproximately 85,000 people in cane production and processing, and alsoindirectly provides jobs in numerous support industries such as fertiliser, chemical,transport and food industries (SASA 2008). The sugar cane produced fromfarming areas is supplied to 14 mills in South Africa for processing into sugar.Most of the mills are located in the cane growing areas of KwaZulu Natal exceptfor two mills in Mpumalanga. Table 1 shows sugar production in South Africafrom 1994 to 2008.
The industry uses bagasse, the fibrous waste material remaining after the juicehas been extracted from the sugar cane, to provide process heat for the boilers.According to Tongaat Hulett Ltd., every 100 tonnes of sugar cane harvested andmilled produces 11.8 tonnes of sugar and 28–30 tonnes of bagasse with a moisturecontent of approximately 50% (Tongaat Hulett 2009). The sugar cane mills
*Corresponding author. Email: [email protected]
Journal of Environmental Planning and Management
Vol. 53, No. 6, September 2010, 793–807
ISSN 0964-0568 print/ISSN 1360-0559 online
� 2010 University of Newcastle upon Tyne
DOI: 10.1080/09640568.2010.488120
http://www.informaworld.com

co-generate electricity from bagasse mainly for their own consumption, with a smallamount exported to the small communities around the mills.
2. Methodology
The research methodology applied in this study is based on ISO (InternationalOrganisation for Standardisation) Standard 14044, in which a Life Cycle Assessment(LCA) is divided into four phases: goal and scope definition, inventory analysis,impact assessment, and interpretation. This study aims to:
. Compare the environmental performance of the sugar industry in South Africawith other sugar producing countries.
. Quantify the resource and energy consumption for the industry across thewhole life cycle.
. Identify opportunities for improving the environmental performance of thesystem.
. Develop an environmental model for use in further LCA studies.
The functional unit for this study is 1 tonne of raw sugar produced using currentSouth African technology. This technology produces about 35kWh of electricityfrom one tonne of cane crushed, essentially all of which is used in-house(Department of Minerals and Energy, Republic of South Africa 2004a, 2004b).
2.1. System boundaries
The system boundary consists of the growing and harvesting of sugar cane in SouthAfrica all the way to the production of sugar and co-generation of electricity frombagasse at the sugar mills. The system boundary ends at the production of raw sugarat the factory gate. The following subsystems are considered:
Table 1. Sugar production in South Africa.
Cane crushedSugar produced (M tonnes)
Season (M tonnes) Domestic consumption Export
1994/1995 14.2 1.2 0.31995/1996 15.2 1.2 0.31996/1997 19.0 1.1 0.91997/1998 20.1 1.2 1.01998/1999 20.8 1.2 1.21999/2000 19.2 1.1 1.22000/2001 21.7 1.1 1.42001/2002 21.7 1.1 1.12002/2003 20.9 1.2 1.32003/2004 18.5 1.2 1.02004/2005 17.3 1.1 0.92005/2006 19.1 1.1 1.12006/2007 18.4 1.2 0.82007/2008 17.9 1.3 0.8
Source: SASA (2008).
794 L. Mashoko et al.

(1) Cane cultivation and harvesting. Most of the cane is produced in KwaZuluNatal. Only 20% of the cane is under irrigation and most of the cane areasrely on rainfall (Department of Minerals and Energy, Republic of SouthAfrica 2004b). Fertilisers and herbicides are applied to the sugar cane and thequantities vary from one area to the other depending on soil type and rainfallamounts. Average fertiliser application rates were adopted for the study.
(2) Cane transportation to sugar mills is by both road and rail. Approximately94% of the cane is transported by trucks and the remaining 6% by rail.
(3) Fertiliser and herbicide manufacturing. The energy and other impacts offertiliser and herbicide manufacture are included.
(4) Sugar milling and electricity generation. All 14 sugar mills in South Africaare considered with an average cane throughput at each mill of 300 t/h(tonnes/hour) or 1.5 million tonnes of cane per annum over an eight tonine month crushing season during which time the mills operatecontinuously (Department of Minerals and Energy, Republic of SouthAfrica 2004b). At this throughput the boiler capacity was taken as over 160t/h of steam at a pressure of 3000 kPa (Kilopascal) (a) and a temperatureof 4008C. The steam is expanded through back pressure steam turbineprime movers and turbo alternators to 200 kPa (Department of Mineralsand Energy, Republic of South Africa 2004b).
The following subsystems are excluded from the study:
. The production, maintenance and decommissioning of capital goods such asbuildings and machinery.
. The production of cuttings used in the establishment of the sugar caneplantations.
. The distribution and transmission of generated electricity.
. The road and rail transportation infrastructure.
. The transportation of sugar to consumers and storage.
2.2. Data collection for the inventory
Data for the processes were obtained from the sugar plantations in Kwa ZuluNatal in South Africa. The data relating to the manufacture of fertilisers andherbicides were obtained from literature. Efforts were made to model the systemin such a way that it represents as far as possible current agricultural practicesand manufacturing technologies used in South Africa. The sugar mills, SugarMilling Research Institute (SMRI) and the South African Sugar Association(SASA) also contributed to the data. Part of the information was obtained fromdocuments from the Department of Minerals and Energy in South Africa. Datawere also obtained from the Eco-invent database in SimaPro and were comparedto other assessments carried out in other countries and were checked using massand energy balances. Data were also modified in SimaPro to be more relevant tothe South African industry; for example, electricity from South Africa wasmodelled in SIMAPRO in order to avoid use of electricity data from othercountries. In Figure 1 the sub-systems that are included in the study are showninside the border line.
Journal of Environmental Planning and Management 795

2.3. Impact assessment
The impact assessment stage involves the interpretation of the life cycle inventory toassess the impact of the system on human health and the environment. The impactassessments were done using SimaPro Software. Eco-indicator 99 impact assessmentmethodology was used rather than eco-indicator 95 or CML 2000 because
Figure 1. System boundary. The subsystems considered are shown inside the border line.
796 L. Mashoko et al.

eco-indicator 99 includes land use, particulate matter and fossil fuel depletion, all ofwhich are relevant to the system studied here (Pre, Product Ecology Consultants2006).
3. Life cycle inventory
Table 2 shows data and assumptions used for the lifecycle inventory. Table 3summarises resource inputs for sugar production. Tables 4 and 5 summariseemissions to soil and air and water, respectively. Table 6 summarises by-products ofsugar production, and Table 7 summarises external transport data.
3.1. Emissions from cane burning
Emissions for sugar cane burning were calculated assuming a yield of 280 kg of topsand dry leaves at 50% moisture per metric tonne of cane harvested (Wang et al.2008).
3.2. Fossil energy consumption
Energy consumption was compiled for the following stages: cane farming,transportation, cane burning, fertiliser and herbicide manufacture and sugarmanufacture per tonne of sugar produced. The fossil fuel consumed in the wholeprocess is a summation of the different quantities of fossil fuels consumed duringfarming, transportation and sugar manufacture. Energy required for producingfarming machinery was excluded from the study; agricultural inputs are consideredseparately below, as is cane transportation. Therefore, assuming an average of 8.46tonnes of cane used to produce 1 tonne of sugar, the total fossil energy required forfarming purposes is 372 MJ/t of sugar produced.
Fossil fuel energy for transportation was considered, taking into account bothroad and rail transportation. It is reported that 6% of the cane is transportedusing rail and 94% using road trucks. The energy consumption for rail in SouthAfrica was assumed to be 0.68 MJ/tkm (City of Cape Town 2005). The fuelconsumption for a truck was considered to be 0.075l per tkm, and the energycontent for diesel was taken as 37 MJ/litre (Ramjeawon 2004). The totaltransportation fossil energy required to produce a tonne of raw sugar wascalculated as 1893 MJ.
During sugar manufacture fossil fuel energy use is a result of coal used to start upboilers and to supplement bagasse supplies during the off-season. The coal consumedis multiplied by the net calorific value (NCV) of coal. Sugar industry data show thatapproximately 70.8 kg of coal is required to produce a tonne of sugar. The NCV ofSouth African coal is 19.739 MJ/kg (Thomas et al. 2000). Total energy use from coalwas calculated as 1397 MJ/t of raw sugar produced.
Fossil fuel energy for fertiliser and herbicide use was calculated using theenergy requirements to produce fertilisers and herbicides and application ratesused in South Africa. The application rate of fertiliser is 120 kg N, 30 kg P2O5and 125 kg K2O per hectare. The amount of land required to produce 1 tonne ofsugar is 0.15 ha (Department of Minerals and Energy, Republic of South Africa2004b). The total amount of energy consumed in fertiliser production was thenfound to be 1113 MJ per tonne of raw sugar that is produced. Including
Journal of Environmental Planning and Management 797

Table 2. Assumptions and data.
Value/assumptions References
1 Sugar cane agricultureCultivation area 400,000 ha Dept Minerals and
Energy, SA 2004bAverage cane harvest per hectare 60t (6 t of sugar) Dept Minerals and
Energy, SA 2004bIrrigation water requirements/ha 17,000m3 Ramjeawon 2004Electricity consumption/hafor irrigation
216k Wh Ramjeawon 2004
N2O emissions from soil 1.25% of nitrogen input IPCC 2006aNOx emissions from soil 0.5% of nitrogen input Ramjeawon 2004Fertiliser application/ha 120 kg N, 30 kg P2O5
and 125 kg K2O[Sugar industry data]
Herbicides use 26.9 g/MT of sugar cane Wang et al. 2008Herbicides loss in water bodies 0.2% Wang et al. 2008Nitrogen loss in water bodies 10% Ramjeawon 2004Phosphorus loss in surfacerunoff/ ha
1kg Ramjeawon 2004
Pesticide use 2.21g/MT of sugar cane Wang et al. 2008
2 Cane burningCane area burnt before harvesting- 90% - 360 000 ha
280 kg of leaves andtops burnt/hectare
Dept Minerals andEnergy, SA 2004b
3 Inorganic fertiliser and herbicidesEnergy required for 120 MJ Ramjeawon 2008herbicide production per kg
Fuel input to produce herbicide/kg 15% diesel, 70% coaland 15% electricity
Ramjeawon 2004
Energy required to produce 48 MJ Wang 2009N fertiliser/kg
Energy required to produce P2O5/kg 14 MJ Wang 2009Energy required to produce K2O/kg 8 MJ Wang 2009Fuel input in production of fertilisers natural gas, electricity,
coal, diesel
4 Cane transportationTransportation by road average distance 90km [Sugar industry data]Transportation by rail average distance 50km [Sugar industry data]Diesel consumption litres/t km 0.075l diesel 37MJ/litre City of Cape Town
2005Fertilisers and herbicidestransport distance
60 km
5 Sugar processing and electricity generationSugar produced/ha under cultivation 6.0t [Sugar industry data]Bagasse produced 27.8% of cane [Sugar industry data]Molasses produced/ha 4.1% of cane [Sugar industry data]Filter cake produced/ha 6.8% of cane [Sugar industry data](used as fertiliser)
Electricity exported to the grid 0.00 [Sugar industry data]Steam consumed/t of cane 520kg [Sugar industry data]Electricity consumption/t of cane 35kWh [Sugar industry data]Coal consumption/t of cane 8.4kg [Sugar industry data]Water used for cane processing/t cane 0.6m3 [Sugar industry data]Pollutant loadings of COD/t of cane 3320 [Sugar industry data]Pollutant loadings of BOD5/t of cane 1590
798 L. Mashoko et al.

herbicides, the total fossil energy required for agricultural inputs is 1140 MJ/t andthe total fossil fuel use is 5350 MJ per tonne of sugar.
3.3. Renewable energy use
This was calculated using the net calorific values (NCV) of bagasse of 7.670 MJ/kg.18,400 MJ of renewable energy from bagasse are required to produce a tonne ofsugar. The total energy consumption for the system, both renewable and non-renewable, is about 23,800 MJ/ tonne of sugar produced.
Table 3. Resource inputs for production of 1 tonne of raw sugar.
Resource Quantity
Sugar cane 846 tonnesRaw water 17000 m3
Land 0.15 haCoal 71 kg
Table 4. Emissions to soil from production of 1 tonne of raw sugar.
Emission typeQuantities
(kg/tonne sugar)
Ashes and slags 368Hazardous waste 0.03
Table 6. By-products (annual mean tonnes per tonne sugar).
Quantity
Filter cake 0.56 tMolasses 0.38 t
Table 5. Emissions to air and water.
kg per tonne of sugar
Air emissionsCH4 7.5CO2 (fossil) 196N2O 0.5SOx (as SO2) 2.18NOx (as NO2) 7.5NMVOC2 0.07Suspended particulate matter 0.85
Water emissionsBOD7 6.6COD 19NO3
7 12PO4
37, tot 0.15Suspended solids 0.05Fe 0.00126
Journal of Environmental Planning and Management 799

3.4. Emissions into the air
Emissions into the air for a tonne of sugar produced were calculated by summingup the emissions at each stage of the life cycle for all the parameters that wereunder study. Emissions were again compiled for all the stages under consideration:cane farming, cane burning, cane transportation, fertiliser and herbicidemanufacture and sugar manufacture. For nitrous oxide (N2O) the emissionswere summed up for emissions from soil, cane burning and bagasse combustion.The N2O emissions factor from the soil was taken to be 1.25% of the appliednitrogen (Ramjeawon 2008). N2O emissions from cane burning and bagassecombustion were calculated using assumptions from Wang et al. (2008). The totalN2O emissions into the air for the whole sugar life cycle were estimated to be0.47 kg per tonne of sugar produced.
Carbon dioxide (CO2) (fossil) emissions into the air were also summed up for allthe stages that have a significant contribution. The CO2 emissions from fossil fuelcombustion during farming operations, sugar cane transportation and combustionof coal during sugar manufacture were considered. The CO2 emission from caneburning was excluded because it was assumed the sugar cane releases the CO2 that itabsorbed during photosynthesis. For farming and cane transportation the carbondioxide produced was calculated using carbon content data obtained from the USEnvironmental Protection Agency (EPA) (USEPA 2005). Diesel carbon content perlitre is 0.734 g (USEPA 2005). Calculations then show that the CO2 emission per litreof diesel is 2.7 kg per litre of diesel burnt. This is true based on the assumption that99% of the carbon is oxidised and only 1% remains un-oxidised for oil and oilproducts, giving an oxidation factor of 0.99 (USEPA 2005).
Total carbon dioxide emission from cane farming and transportation are 27 kgand 137 kg per tonne of raw sugar respectively. During sugar manufacture most ofthe carbon dioxide produced is from coal combustion for process steam andelectricity. CO2 (fossil) from coal was calculated using a carbon content of 80%because coal from South Africa is mainly anthracite. Combustion of 70.8 kg of coal,if it is 80% carbon (anthracite), will result in 108 kg of carbon dioxide for everytonne of raw sugar produced. Total fossil carbon dioxide over the whole life cycle is383 kg/t of raw sugar produced.
Sulphur dioxide (SO2) emissions in the sugar life cycle emanate from the canefarming, cane burning cane transportation and during the combustion of coal toproduce steam for sugar processing. The SO2 from cane farming was calculatedconsidering the quantity of diesel consumed in relation to the diesel sulphur content.The sulphur content for diesel used in this study was 0.3% (de Vaal 2004).Calculations reveal that about 10.69 litres are required to produce a tonne of sugarand this in turn results in 0.06 kg of SO2 emitted into the atmosphere. The emissionfactor used to calculate SO2 emissions from cane burning was 0.4 per kg of dry leavesburnt (Wang et al. 2008).
Table 7. Data on external transport.
Transport TypeAverage
distance, km Additional data
Truck 90 50% empty returnsRail 50 Diesel train
800 L. Mashoko et al.
SO2 emissions from this stage are 0.95 kg. The SO2 produced during sugar canetransportation was calculated taking into account the amount of diesel consumedduring transportation of sugar cane to mills by road and rail, in this case 21.78 litresand 0.3% as the percentage of sulphur in the diesel. The result is 0.13 kg of SO2
produced per tonne of sugar during cane transportation. Most of the SO2 emissionsfor sugar manufacture are from coal with a sulphur content of 1.3% (Jeffrey 2005).With coal consumption for sugar manufacture at 70.8 kg per tonne of sugarproduced the amount of sulphur from coal burning is 0.96 kg per tonne of sugarproduced. The total SO2 produced per functional unit is 3.23 kg.
Methane emissions were calculated using the following assumptions: 2.7 g producedper kg of cane and tops burned according to IPCC guidelines (IPCC 2006b). Anaverage emission factor of 30g/1000 MJ of bagasse burnt was used for methaneemissions from bagasse combustion (IPCC 2006c). CH4 emissions from cane burningare 6.95 kg. Methane emissions from bagasse combustion are 0.6 kg. The totalmethane emissions for the whole life cycle per tonne of sugar produced are 7.55 kg.
Nitrogen oxides (NOx) emissions were also calculated for all the stages of sugar lifecycle. NOx emissions from cane burning were calculated using an emission factor of2.5g per kg of dry leaves and tops burned. The total NOx emissions amount to 7.51 kg.
4. Impact assessment
4.1. Global warming potential (GWP)
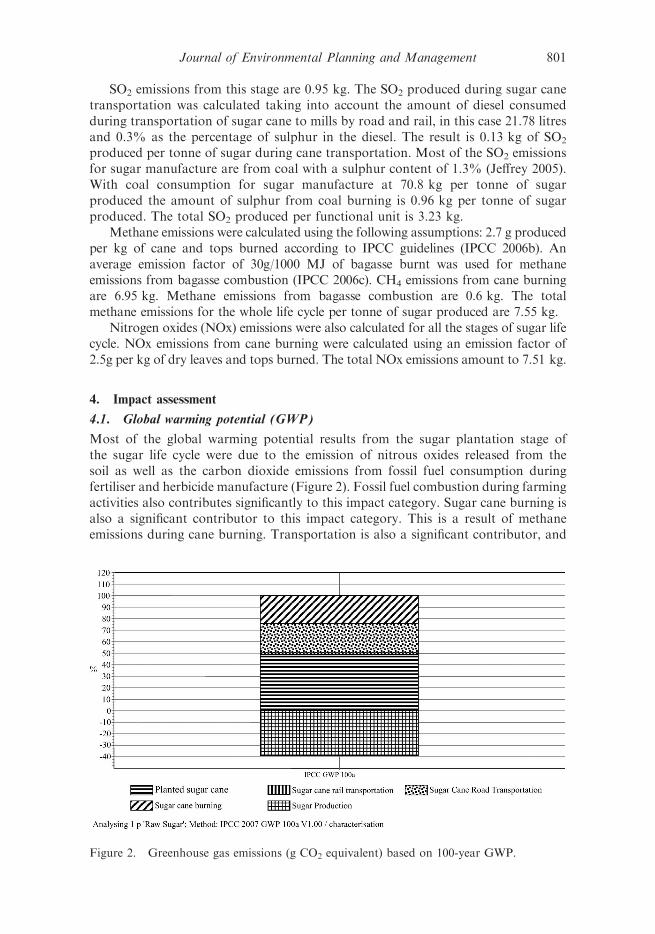
Most of the global warming potential results from the sugar plantation stage ofthe sugar life cycle were due to the emission of nitrous oxides released from thesoil as well as the carbon dioxide emissions from fossil fuel consumption duringfertiliser and herbicide manufacture (Figure 2). Fossil fuel combustion during farmingactivities also contributes significantly to this impact category. Sugar cane burning isalso a significant contributor to this impact category. This is a result of methaneemissions during cane burning. Transportation is also a significant contributor, and
Figure 2. Greenhouse gas emissions (g CO2 equivalent) based on 100-year GWP.
Journal of Environmental Planning and Management 801

sugar manufacture has a negative contribution as a result of avoided greenhousegas emissions when bagasse substitutes are used instead of coal during sugarmanufacture.
When global warming potentials over 20 years are considered instead of 100 years,sugar cane burning contributes more to global warming than sugar cane farming.
4.2. Fossil fuel use
The contribution of the different stages to fossil consumption use over the whole lifecycle of sugar is summarised in Figure 3.
Figure 3 shows road transportation is the highest contributor to fossil fuel useand it accounts for almost 50% of fossil energy due to fuel use. Planted sugar canealso has a significant contribution to fossil fuel use as a result of fuels used forfarming activities and fossil fuel use during fertilizer and herbicide production. Thisstage accounts for close to 34% of the life cycle fossil fuel use. Rail transportationhas a lesser contribution compared to road transportation because only about 6% ofthe sugar cane is transported by rail and the rest of it by road. Sugar manufacturemakes use of renewable bagasse for boilers and therefore its contribution is negativebecause it uses more renewable energy than fossil energy.
4.3. Ozone depletion and acidification
Ozone depletion is mainly a result of sugar cane transportation, followed by sugarcane farming. This is a result of air emissions from these processes. Figure 3 showsthat acidification and eutrophication are mainly a result of sulphur dioxide emissionsduring cane burning. Planted cane also contributes significantly to eutrophication asa result of nitrates from fertiliser application being washed into water sources. Roadtransportation also has a minor contribution to this impact category.
Figure 3. Results of characterisation and damage assessment.
802 L. Mashoko et al.

4.4. Ecotoxicity
Road transportation has the most significant contribution to this impact category, asillustrated in Figure 3. However, the overall contribution of the whole life cycle tothis impact category is minor.
4.5. Summary of impacts
Based on the inventory and impact assessment results, the following conclusions canbe drawn concerning the contribution of the different processes to the life cycle ofSouth African produced raw sugar.
. The greatest contributor to non-renewable fossil fuel consumption is roadtransportation. Therefore, optimisation of sugar cane delivery routes can yieldsignificant savings in fossil energy use.
. Fertilizer and herbicide manufacture are also significant contributors to thisimpact category.
. Sugar manufacture has a negative contribution to this impact category becauseit consumes far much more renewable energy than fossil fuel.
. Sugar cane farming has the greatest contribution to global warming andclimate change.
. Respiratory organics and respiratory inorganics are mainly from cane burningto allow for harvesting as a result of nitrous oxide emission from the soil andgreenhouse gas emission from fossil fuel consumption during farmingactivities.
. Acidification and eutrophication are mainly a result of sugar cane burning.
5. Discussion and recommendations
5.1. Comparison of results with other LCAs
The results of the study show some similarities with other studies about the sugarindustry in the African context. The study was also compared to other LCAs that werecarried out in the sugar industry in South Africa, although these were on bio-ethanoland green electricity from sugar cane bagasse (Blottnitz and Curran 2007). Comparisonof the results is feasible because the first stages of the system boundaries are the sameup to the point that the sugar cane enters the sugar mill. This study shows thatapproximately 34% of the fossil energy consumption is a result of cane farmingactivities, compared to the 75% attributed to cane farming in Mauritius (Ramjeawon2004). The total fossil energy consumption per tonne of cane for this study is 5350 MJcompared to 1995 MJ for Mauritius. In Mauritius, 0.12 ha of land is required toproduce a tonne of cane compared to 0.15 ha for South Africa; this is mainly becauseonly 20% of South African cane is irrigated and the rest is rain fed. In addition, mostelectricity and steam used in Mauritius is from more efficient use of renewable bagasse.
The two studies both show that the use of fertilisers and herbicides are thegreatest contributors to global warming through the use of fossil fuels in theirmanufacture. A total of 74% of the contribution to global warming impact is a resultof cane farming and harvesting activities compared to 80% in the Mauritian casestudy. In South Africa, the net energy gain, the ratio between electricity produced
Journal of Environmental Planning and Management 803

and the fossil fuel energy consumed in the system, is currently 4.2 as calculated in thisstudy. This is far less than the net energy gain realised in Mauritius, which is about13 (Ramjeawon 2008).
The LCA of ethanol in Brazil by Wang et al. (2008) shows that cane farmingactivities are responsible for 68% of the contribution to greenhouse gas emissionsand this further emphasises the importance of the cane farming stage of the life cycleof sugar with regard to global warming and climate change. The elimination of caneburning activities can help to reduce greenhouse gas emissions at this stage. Macedoet al. (2008) have also found that Brazilian sugar cane production, harvesting andtransportation consumes most of the energy from the lifecycle of ethanol producedfrom sugar. In Brazil, in 2002, 35% of the cane was harvested by machinery, whereasin South Africa it is entirely harvested manually.
It was difficult to compare the study with available South African case studiesbecause most of them centred more on the LCA of sugar from the perspective ofethanol production and electricity co-generation as opposed to sugar production perse (Blottnitz and Curran 2007, Blottnitz et al. 2002).
5.2. Recommendations
The following section explores the potential to reduce the environmental burdensthat result from the life cycle of sugar.
5.2.1. Fertiliser and herbicide use
The use of fertiliser and herbicides for sugar cane farming contribute to both globalwarming and fossil fuel consumption. Research should be directed at ways toimprove the output of sugar cane with less impact from fertilisers.
5.2.2. Transportation systems
Transportation of sugar cane to the sugar mills is an integral part of the sugar industrysupply chain. Inefficient transport processes can result in poor quality sugar if cut sugarcane is not delivered to the mills on time and at the right level of quality. It is thereforeimperative to ensure the efficiency of this process whilst at the same time reducing itseffect on the environment. Mostly road (94%) and to a lesser extent rail (6%)transportation systems are currently used to transport the sugar cane to the mills.Increased use of rail can reduce the environmental impacts but this is not feasible inmost of the cane growing areas in South Africa because of the hilly terrain. Howeveroptimisation of the sugar cane road delivery system in the sugar industries can alsoresult in cost savings and reduction in green house gas emissions.
5.2.3. Cane sugar burning
Open field burning of sugar cane, to allow for harvesting, is prevalent in SouthAfrica. This study shows that this is one of the main sources of greenhouse gases.The industry should consider phasing out cane burning for two reasons: toreduce greenhouse gas emissions and to use the cane tops and waste – estimatedto range from 10 to 20% of the amount of cane crushed (Samson et al. 2001) –as a fuel for the boilers to complement the use of bagasse. However, the South
804 L. Mashoko et al.

African Sugar Research Institute (SASRI) prefers the trash to be left in the fieldsto return nutrients to the soil. The effect of using trash for energy generationwould be a further reduction in net fossil energy use in sugar manufacturingsubstituted by renewable energy. There is a need to expedite the research anddevelopment of methods for harvesting the sugar cane leaves and the tops so thatthey can be used in boilers in the same way bagasse is used. The total amount ofwaste and tops produced can be expressed as a percentage of the total canecrushed.
5.2.4. Reduction in water use and land use
Only 20% of South African produced sugar cane is under irrigation and the restof the cane is rain fed. The result has been higher yields in irrigated areascompared to areas that rely on rainfall. However, improved water managementcould increase water use efficiency. Improper water pricing structures discourageimprovements in water use efficiency and these need to be examined. In irrigatedareas the adoption of centre pivot irrigation systems can improve water efficiency(Marcovitch 2006).
5.2.5. Improved co-generation of electric energy
The co-generation of electricity from bagasse burning has been a beneficialcharacteristic of the sugar industry for a long time. However, some of the benefitsof the process are not realised due to low process efficiencies. The power output inthe South African industry per tonne of sugar cane crushed is approximately 30 kWh(Department of Minerals and Energy, Republic of South Africa 2004a). Generatingefficiency for the sugar industry in South Africa could be increased up to 120 kWh/tonne using conventional steam plants running at higher pressures (Department ofMinerals and Energy, Republic of South Africa 2004a). The result would be afurther reduction in net energy use for sugar manufacture, thereby reducing carbondioxide emissions and also reducing use of fossil fuel. This presents the industry withan opportunity to produce more electricity than they consume, thereby exporting theexcess electricity to the grid.
5.2.6. Adoption of energy management practices
Efficient energy management systems can reduce energy consumption and reduceimpacts on climate change. Traditional sugar factory design has focused onachieving a fuel balance that minimises the purchase of supplementary coal andavoids the generation of excess bagasse (Clay 2005). Potential improvements couldinclude the use of lower grade vapours for heating purposes, an improvement insteam conditions, modifications of crystallisation pans, improved juice extractionmethods, improved boiler efficiency and reducing the moisture content of bagasse.
6. Conclusion
The LCA study showed that sugar cane farming has the greatest contribution toglobal warming and climate change (see Figure 2). Fertiliser and herbicidemanufacture has the highest contribution towards fossil energy depletion. The
Journal of Environmental Planning and Management 805

study also established that efficiency of energy generation at the sugar mills needs tobe improved. Reduction in fertiliser use and the phasing out of cane burning can helpreduce the industry’s contribution towards global warming by reducing the amountof greenhouse gas produced. The South African Sugar Industry consumes morefossil energy compared to the amount consumed in Mauritius and Brazil, based onthe studies that were used to make the comparisons. The findings and therecommendations of this study suggests that the sugar industry can significantlyimprove the environmental performance of its operations.
Acknowledgements
The authors wish to thank the Sugar Milling Research Institute and the South African SugarAssociation for providing data and for comments on this study.The authors also wish to thankthe University of Johannesburg Research Council, the National Research Foundation ofSouth Africa and the Anderson Interface Fund at the School of Industrial and SystemsEngineering at Georgia Tech for their financial support towards research on this paper.
References
Blottnitz, H. and Curran, M.A., 2007. A review of assessments conducted on bio ethanolsystems from an energy balance, CO2, and environmental life-cycle perspective. Journal ofcleaner production, 15 (7), 607–619.
Blottnitz, H., Theka, E., and Botha, T., 2002. Bio-ethanol as an octane enhancing fuel additivein Southern Africa: an examination of its ‘environmental friendliness’ from a life cycleperspective. Department of Chemical Engineering, University of Cape Town.
City of Cape Town, 2005. Cape Town energy and climate change strategy. City of Cape Town:Environmental Planning Department. [online] Available from: http://www.capetown.gov.za/en/EnvironmentalResourceManagement/publications/Documents/Energy_þ_Climate_Change_Strategy_2_-_10_2007_301020079335_465.pdf [Accessed 15 June 2009].
Clay, J., 2005. Sugarcane production and the environment. Better sugar meeting, WWF-US.[online] Available from: http://assets.panda.org/downloads/sugarcaneproductionandtheenvironment.pdf [Accessed 17 October 2009].
Department of Minerals and Energy, Republic of South Africa, 2004a. White Paper on therenewable energy policy of South Africa. Government gazette, Republic of South Africa,466. Pretoria. [online] Available from: http://www.naci.org.za/pdfs/Policies/White%20-Paper%20on%20renewable%20energy%20policy.pdf [Accessed 14 July 2009].
Department of Minerals and Energy, Republic of South Africa, 2004b. Assessment ofcommercially exploitable biomass resources: bagasse, wood & sawmill waste and pulp, inSouth Africa. Pretoria. Capacity building in energy efficiency and renewable energy. ReportNo. – 2.3.4 – 29. [online] Available from: http://www.wcapeenergy.net/Downloads/final_report_ biomass_ full.pdf [Accessed 14 July 2009].
de Vaal, P., 2004. Diesel and its properties. Department of Chemical Engineering, University ofPretoria.
IPCC (Intergovernmental Panel on Climate Change), 2006a. N2O emissions from managedsoils, and CO emissions from lime and urea application, Chapter 11. In: H.S. Eggleston, L.Buendia, K. Miwa, T. Ngara, and K. Tanabe, eds. IPCC Guidelines for nationalgreenhouse gas inventories, volume 4, prepared by the National Greenhouse GasInventories Programme. Hayama, Japan: IGES, 11.11.
IPCC, 2006b. IPCC guidelines for national greenhouse inventories, volume 4: agriculture andforestry, and other land use. IGES: Hayama, Japan.
IPCC, 2006c. IPCC guidelines for national greenhouse gas inventories, volume 2: energy. IGES:Hayama, Japan.
Jeffrey, L.S., 2005. Characterization of the coal reserves of South Africa. The journal of theSouth African Institute of Mining and Metallurgy, 105 (2), 95–102.
Macedo, I.C., Seabra, J.E.A., and Silva, R., 2008. Greenhouse gases emissions in theproduction and use of ethanol from sugarcane in Brazil: the 2005/2006 averages and aprediction for 2020. Biomass & bioenergy, 32 (7), 582–595.
806 L. Mashoko et al.

Marcovitch, J., 2006. Innovative technologies from Brazil and the challenge for south-south co-operation. Universidade de Sao Paulo.
Pre, Product Ecology Consultants, 2006. Introduction to LCA with SimaPro. March 2006.Amersfoort, The Netherlands. [online] Available from: http://www.simapro.de/uploads/media/SimaPro7IntroductionToLCA.pdf [Accessed 17 October 2009].
Ramjeawon, T., 2004. Life cycle assessment of cane sugar on the island of Mauritius. Theinternational journal of life cycle assessment, 9 (4), 254–260.
Ramjeawon, T., 2008. Life cycle assessment of electricity generation from bagasse inMauritius. Journal of cleaner production, 16, 1727–1734.
Samson, R., et al., 2001. Strategies for enhancing biomass utilization in the Philippines.National Renewable Energy Laboratory, NREL/SR-510-30813. Golden, CO: US Depart-ment of Energy.
SASA (South African Sugar Association), 2008. Facts and figures. [online] Available from:http://www.sasa.org.za/FactsandFigures128.aspx [Accessed 14 July 2009].
Thomas, C., Tenant, T., and Rolls, J., 2000. The GHG indicator: UNEP guidelines forcalculating greenhouse gas emissions for business and non-commercial organizations. Paris:UNEP Ozone and Action Unit. [online] http://www.unepfi.org/fileadmin/documents/ghg_indicator_2000.pdf [Accessed 20 September 2009]
Tongaat Hulett, 2009. South African sugar structure. [online] Available from: http://www.huletts.co.za [Accessed 2 February 2009].
USEPA (United States Environmental Protection Agency), 2005. Emission facts. Averagecarbon dioxide emissions resulting from gasoline and diesel fuel. (EPA420-F-05-001).
Wang, M., et al., 2008. Life cycle energy analysis and greenhouse gas emission implications ofBrazilian sugar cane production. International sugar journal, 110 (1317), 527–545.
Wang, M., 2009. GREET 1.8c.0. Argonne National Laboratory, US Department of Energy.[online] Available from: http://www.transportation.anl.gov/modeling_simulation/GREET/ [Accessed 10 October 2009].
Journal of Environmental Planning and Management 807
Copyright © 2022 FDOKUMEN