The use of LCA in selecting the best MSW management system
15
The use of LCA in selecting the best MSW management system Giovanni De Feo * , Carmela Malvano Department of Civil Engineering, University of Salerno, via Ponte don Melillo 1, 84084 Fisciano (SA), Italy article info Article history: Accepted 12 December 2008 Available online 24 January 2009 abstract This paper focuses on the study of eleven environmental impact categories produced by several munici- pal solid waste management systems (scenarios) operating on a provincial scale in Southern Italy. In par- ticular, the analysis takes into account 12 management scenarios with 16 management phases for each one. The only difference among ten of the scenarios (separated kerbside collection of all recyclables, glass excepted, composting of putrescibles, RDF pressed bales production and incineration, final landfilling) is the percentage of separated collection varying in the range of 35–80%, while the other two scenarios, for 80% of separate collection, consider different alternatives in the disposal of treatment residues (dry res- idue sorting and final landfilling or direct disposal in landfill). The potential impacts induced on the envi- ronmental components were analysed using the life cycle assessment (LCA) procedure called ‘‘WISARD” (Waste Integrated System Assessment for Recovery and Disposal). Paper recycling was the phase with the greatest influence on avoided impacts, while the collection logistics of dry residue was the phase with the greatest influence on produced impacts. For six impact categories (renewable and total energy use, water, suspended solids and oxydable matters index, eutrophication and hazardous waste production), for high percentages of separate collection a management system based on recovery and recycling but without incineration would be preferable. Ó 2008 Elsevier Ltd. All rights reserved. 1. Introduction The current state-of-the-art of solid waste disposal is based on the concept of integrated management. The European Union regu- lation proposes a hierarchical system based on four subsequent levels (EU, 2006): (1) reduction of solid waste production, (2) recovery of material, (3) recovery of energy and (4) landfill disposal. There is not sufficient knowledge of this hierarchy to develop an adequate management system due to the variables relating to the environmental, social and economic aspects along with the techni- cal aspects. In fact, when choosing the most appropriate solid waste management system for a certain territory, decision makers have to take adequately into account not only the technical aspects and implementation costs but also the environmental impacts pro- duced by the treatment and disposal processes as well as the opin- ion of the local communities. As a matter of fact, consensus of the local population is a prerequisite for the subsequent implementa- tion of a solid waste management plan (Rahardyan et al., 2004; De Feo et al., 2005). Environmental, economic and social variables are strongly cor- related to the process that leads to the choice of the ‘‘best” muni- cipal solid waste management system. For example, the local community could easily accept a management system that mini- mizes environmental impacts and management costs (De Feo et al., 2005). This paper focuses on the study of the environmental impacts (eleven categories were considered) produced by several municipal solid waste management systems operating on a provincial scale (the district of Avellino) in Southern Italy in the Campania region, an area suffering from a situation of weighty solid waste emer- gency over the last 15 years. In particular, the analysis carried out takes into account twelve management scenarios. The only dif- ference among ten of the scenarios is the percentage of separated collection, while the other two scenarios consider different alterna- tives in the disposal of treatment residues. The potential impacts induced on the environmental compo- nents were analysed using a life cycle assessment (LCA) procedure. LCA is a general methodological framework introduced to assess all the environmental impacts related to a product, process or activity by identifying, quantifying and evaluating the overall resources consumed as well as all the emissions and wastes released into the environment. In 1990, the society for environmental toxicology and chemistry (SETAC) defined the concept of LCA and developed a general meth- odology for the carrying out of LCA studies (Azapagic, 1999). The term ‘‘LCA” is used most frequently to describe all the cradle-to- grave approaches (Curran, 1996). A lot of these tools have been separately developed by different groups of specialists in order to support the decision maker within environmental management processes (SETAC, 1996). LCA methodology, as defined by SETAC 0956-053X/$ - see front matter Ó 2008 Elsevier Ltd. All rights reserved. doi:10.1016/j.wasman.2008.12.021 * Corresponding author. Tel.: +39 089 964113; fax: +39 089 964045. E-mail address: [email protected] (G. De Feo). Waste Management 29 (2009) 1901–1915 Contents lists available at ScienceDirect Waste Management journal homepage: www.elsevier.com/locate/wasman
-
Upload
independent -
Category
Documents
-
view
0 -
download
0
Transcript of The use of LCA in selecting the best MSW management system
Waste Management 29 (2009) 1901–1915
Contents lists available at ScienceDirect
Waste Management
journal homepage: www.elsevier .com/locate /wasman
The use of LCA in selecting the best MSW management system
Giovanni De Feo *, Carmela MalvanoDepartment of Civil Engineering, University of Salerno, via Ponte don Melillo 1, 84084 Fisciano (SA), Italy
a r t i c l e i n f o
Article history:Accepted 12 December 2008Available online 24 January 2009
0956-053X/$ - see front matter � 2008 Elsevier Ltd. Adoi:10.1016/j.wasman.2008.12.021
* Corresponding author. Tel.: +39 089 964113; fax:E-mail address: [email protected] (G. De Feo).
a b s t r a c t
This paper focuses on the study of eleven environmental impact categories produced by several munici-pal solid waste management systems (scenarios) operating on a provincial scale in Southern Italy. In par-ticular, the analysis takes into account 12 management scenarios with 16 management phases for eachone. The only difference among ten of the scenarios (separated kerbside collection of all recyclables, glassexcepted, composting of putrescibles, RDF pressed bales production and incineration, final landfilling) isthe percentage of separated collection varying in the range of 35–80%, while the other two scenarios, for80% of separate collection, consider different alternatives in the disposal of treatment residues (dry res-idue sorting and final landfilling or direct disposal in landfill). The potential impacts induced on the envi-ronmental components were analysed using the life cycle assessment (LCA) procedure called ‘‘WISARD”(Waste Integrated System Assessment for Recovery and Disposal). Paper recycling was the phase with thegreatest influence on avoided impacts, while the collection logistics of dry residue was the phase with thegreatest influence on produced impacts. For six impact categories (renewable and total energy use, water,suspended solids and oxydable matters index, eutrophication and hazardous waste production), for highpercentages of separate collection a management system based on recovery and recycling but withoutincineration would be preferable.
� 2008 Elsevier Ltd. All rights reserved.
1. Introduction
The current state-of-the-art of solid waste disposal is based onthe concept of integrated management. The European Union regu-lation proposes a hierarchical system based on four subsequentlevels (EU, 2006): (1) reduction of solid waste production, (2)recovery of material, (3) recovery of energy and (4) landfilldisposal.
There is not sufficient knowledge of this hierarchy to develop anadequate management system due to the variables relating to theenvironmental, social and economic aspects along with the techni-cal aspects. In fact, when choosing the most appropriate solidwaste management system for a certain territory, decision makershave to take adequately into account not only the technical aspectsand implementation costs but also the environmental impacts pro-duced by the treatment and disposal processes as well as the opin-ion of the local communities. As a matter of fact, consensus of thelocal population is a prerequisite for the subsequent implementa-tion of a solid waste management plan (Rahardyan et al., 2004;De Feo et al., 2005).
Environmental, economic and social variables are strongly cor-related to the process that leads to the choice of the ‘‘best” muni-cipal solid waste management system. For example, the localcommunity could easily accept a management system that mini-
ll rights reserved.
+39 089 964045.
mizes environmental impacts and management costs (De Feoet al., 2005).
This paper focuses on the study of the environmental impacts(eleven categories were considered) produced by several municipalsolid waste management systems operating on a provincial scale(the district of Avellino) in Southern Italy in the Campania region,an area suffering from a situation of weighty solid waste emer-gency over the last 15 years. In particular, the analysis carriedout takes into account twelve management scenarios. The only dif-ference among ten of the scenarios is the percentage of separatedcollection, while the other two scenarios consider different alterna-tives in the disposal of treatment residues.
The potential impacts induced on the environmental compo-nents were analysed using a life cycle assessment (LCA) procedure.LCA is a general methodological framework introduced to assess allthe environmental impacts related to a product, process or activityby identifying, quantifying and evaluating the overall resourcesconsumed as well as all the emissions and wastes released intothe environment.
In 1990, the society for environmental toxicology and chemistry(SETAC) defined the concept of LCA and developed a general meth-odology for the carrying out of LCA studies (Azapagic, 1999). Theterm ‘‘LCA” is used most frequently to describe all the cradle-to-grave approaches (Curran, 1996). A lot of these tools have beenseparately developed by different groups of specialists in order tosupport the decision maker within environmental managementprocesses (SETAC, 1996). LCA methodology, as defined by SETAC

Table 1MSW composition of the study area.
Fraction Percentage (%) Production (t/year)
Putrescibles (excl. garden) 30 42,053.212Putrescibles (garden) 12 16,821.284Paper and cardboard 30 42,053.212Plastics 14 19,624.832Glass 8 11,214.190Metals 3 4,205.321Textiles 2 2,803.547Undersieve 1 1,401.774Total 100 140,177.372
1902 G. De Feo, C. Malvano / Waste Management 29 (2009) 1901–1915
or by ISO (International Organization for Standardization), consistsof four steps (Curran, 1996; SETAC, 1996): (1) goal and scope def-inition, (2) inventory analysis, (3) impact assessment and (4)improvement assessment.
LCA can be useful and conveniently applied only to the life cyclerelated to the collection, treatment and landfill disposal of solidwaste. In this particular case, the reference flux is given by theamount of waste produced by a community, while the output isrepresented by the emission of pollutants due to the several partsof the MSW management system. Therefore, the LCA procedure ap-plied to the MSW management can be seen as a useful analysisinstrument aimed at the evaluation of possible actions. As a matterof fact, the European Commission’s Thematic Strategy on the pre-vention and recycling of waste outlines how adopting a life cycleperspective is essential for the sustainable management of wastes(Koneckny and Pennington, 2007).
The activity carried out in this study is part of a relatively recentfield of research, which is not only currently being developedthroughout Europe but is also continuously and rapidly becomingmore widespread. As a matter of fact, several authors have treatedthe topics of LCA in different countries and scenarios. For example,Heilmann and Winkler (2005) considered a city of 480,000 inhab-itants (Dresden, capital of Saxony, Germany), and studied the influ-ences of different waste collection systems (bank collection andkerbside collection) on the environmental performance of the mu-nicipal waste management system in comparison with a situationwith incineration without separate collection. Heilmann and Win-kler (2005) found that a material bank collection system is ecolog-ically preferable to a kerbside collection system. Even for lowrecovery rates, the material bank collection performed better thanthe kerbside collection system, except in terms of global warming.
Salhofer et al. (2005) considered a similar community in theprovince of Salzburg, Austria, and developed a comparison amongfour management scenarios combining two recycling levels (morerecycling and less recycling) with mechanical and biological treat-ment (MBT) and incineration. Salhofer et al. (2005) pointed outthat in the region analysed, where a high recycling rate had stillto be established, a further extension of recycling showed onlysmall environmental benefits.
An interesting contribution was presented by Wassermannet al. (2005) who studied the relevance of the environmental im-pact of past and existing landfills in comparison to municipalwaste landfills over landfills for incineration residues (MSWI land-fills) and future landfills for residues after mechanical biologicaltreatment (MBP landfills) across seven human health and environ-mental impact categories. Wassermann et al. (2005) demonstratedthat the environmental impacts of future MBP and MSWI landfillsare rather low, making up only a small fraction of the impacts pro-duced by former types of landfills.
Mendes et al. (2004) compared the environmental impact of theincineration and landfilling of municipal solid waste in São PauloCity, Brazil. They showed that a shift in waste treatment from land-filling to incineration would decrease the overall environmentalimpact while also allowing for energy recovery.
Ozeler et al. (2006) developed and compared different solidwaste management system scenarios for the municipal solid wastemanagement system of Ankara in Turkey. The results obtained inthis study have led the authors to the conclusion that LCA can besuccessfully applied to MSW management systems as a decisionsupport tool.
Three studies are particularly interesting due to the fact thatthey are related to the Italian case study. The first Italian LCA studyconsidered, proposed by Morselli et al. (2005), deals with an incin-eration plant in Coriano (Rimini, Italy). It is a medium-sized muni-cipal solid waste incinerator with three incinerator lines, whichcombusts approximately 450 ton/day of waste. Morselli et al.
(2005) emphasized that LCA is a useful approach to becomingaware of the most important indicators of the incineration processimpact, as well as giving important information about the sustain-ability of a process, compared to a set of other alternative activities,in particular in the application to waste management. Viotti et al.(2005) proposed a model for the implementation of integratedMSW management policies as well as an application of the modeladdressed to the specific scenario which characterizes the MSWmanagement system currently adopted in the district of Frosinone(Lazio, Italy). Viotti et al. (2005) found that the most severe im-pacts were related to the methane produced at the landfill and sug-gested that such effects might be substantially reduced by meansof a proper landfill gas control policy.
Finally, the research carried out by Arena et al. (2003) is par-ticularly important because it deals with the same region inSouthern Italy. Nevertheless, Arena et al. (2003) considered theentire region, while in this study only one of the five districtswas considered. As a matter of fact, the Italian legislation consid-ers the self-sufficiency of each district in terms of MSW manage-ment. Arena et al. (2003) performed an analytical comparisonbetween three selected scenarios with reference to some crucialenvironmental impact categories, including energy and materialconsumptions, climate change, acidification, air and water emis-sions as well as solid waste production. The results quantifiedthe poor performance of the landfilling option and the adoptedprocedure not only gave several changes in the proposed designand operating criteria but it also quantified the magnitude ofthe related improved environmental performances. Finally, Arenaet al. (2003) suggested the utilization of sorting devices for glassand aluminium recovery in the RDF production units, andstrongly lower limits for pollutants concentration in the flue gasfrom the RDF combustion facility.
2. Materials and methods
2.1. Study area and reference data
The aim of this study was to apply the LCA procedure to MSWmanagement on a provincial scale in order to choose the ‘‘best”management system in environmental terms (impacts minimisa-tion). The study area was the Province of Avellino in the Campaniaregion, in Southern Italy, with a surface area of 2792 km2 and apopulation of 422,292 inhabitants (National Institute of Statistics,1st January 2007). All the data necessary for the construction ofthe analysed scenarios were deduced from the database of thecompetent authorities: the Province of Avellino and the twoMSW management companies (Co.Sma.Ri AV1 and Co.Sma.Ri AV2).
The total MSW production was 140,177,372 kg, while the MSWcomposition was based on the presence of 42% of putrescibles, 30%of paper and cardboard, 14% of plastics, 8% of glass and 3% of met-als and 1% of textiles (Table 1).

G. De Feo, C. Malvano / Waste Management 29 (2009) 1901–1915 1903
2.2. The LCA WISARD procedure
Eleven environmental effect categories were analysed using theLCA procedure called ‘‘WISARD” (Waste Integrated System Assess-ment for Recovery and Disposal). The commercial WISARD LCA toolwas developed in France by the Ecobilan group. The tools underly-ing software platform and interface is used by Eco-Emballages inFrance, the English environmental protection agency, the Scottishenvironmental protection agency as well as authorities in NewZealand (Emery et al., 2007; Pricewaterhouse Coopers, 2006). Inthis research, separate databases were used to reflect Italian cir-cumstances, including energy sources.
The logical framework of WISARD allows the life cycle of MSWto be followed from its production, collection, treatment and finaldisposal in landfill with the aim of evaluating the matter and en-ergy consumption as well as pollutant emissions in each step ofthe management process. The collection of MSW produces severalimpacts due to the production and use of different types of bagsand containers, the use (and related consumptions) of transportvehicles, the construction, maintaining and demolition of transferstations, and transport to the treatment and final disposal plants.WISARD contains a database with information related to collectionlogistics, recycling facilities, composting plants, incinerators andlandfills.
The collection logistics phase takes into account the followingcontributions: construction and maintenance of trucks, trucksuse, containers, and fuel for transport, waste sacks/bags, construc-tion and demolition of transfer stations, operations of transfer sta-tion, off-road vehicles, and transportation after the transfer stationto the disposal or recovery facility.
The recycling phase contains the following contributions: con-struction and demolition of municipal recycling facilities (MRF),MRF utilities, generated transport for each type of material sorted,material recycling chain (recovery) for each type of material sorted,and avoided transport for each type of material sorted. The com-posting treatment contains the following contributions: compost-ing site construction, composting site direct impacts, compostspreading, and avoided impact for fertilizer (N, P2O5, K) productionand use, avoided impact for bark production and use.
The incineration treatment contains the following contribu-tions: incinerator construction and demolition, incineration plantutilities (e.g., grid electricity production and distribution, lime-stone quarrying and off road vehicles), incineration plant direct im-pacts such as air and water emissions directly resulting from wasteincineration, bottom ash transport, bottom ash recovery and/ordisposal, toxic waste transport, toxic waste landfilling, scrap ironrecycling (after incineration), avoided transport (scrap iron), gener-ated transport (scrap iron), and energy recovery from steam (steamand/or electricity recovery). The landfill disposal contains the fol-
Mu
Recycling
Plastics & Metals
Paper & Cardboard
Glass
Recycled materials
Recycling Recycling
Recyclables (45-20%)
Fig. 1. Flow chart of MSW ma
lowing contributions: construction and capping, landfill use (utili-ties, e.g., HDPE lining, gaseous emissions from off-road vehicles),landfill site direct impacts (from landfill gas uncontrolled emis-sions, flaring and combustion and leachate loss), leachate (sewagesludge treatment), and electricity production from landfill gas.
The WISARD database is quite limited for the types of recoveryfacilities available (e.g. new technologies such as gasification andpyrolysis are currently not available) as well as the recycling pro-cesses available under each recovery category (such as sorting-recycling) and the material reprocessing options. On the otherhand, the software tool gives a good indication of the environmen-tal benefits of different waste management systems (Emery et al.,2007).
WISARD develops calculations as well as mass and energy bal-ances on the basis of the amount of waste to be treated, wastecomposition and, obviously, organization of the managementsystem.
2.3. MSW management scenarios
The LCA study was developed considering twelve differentMSW management scenarios. They were obtained considering dif-ferent separated collection percentages, as well as various types oftreatment for the dry residue deriving from the MSW without thematerials being separated, collected and recycled or composted.The MSW management scenarios considered can be convenientlydivided into two categories: the first includes the scenarios from1 to 10 (Fig. 1) and is based on the incineration of the dry residue,while the second relates only to scenarios 11 (Fig. 2) and 12 (Fig. 3)and does not consider the thermal treatment of dry residue.
The first ten scenarios were based on a separated kerbside col-lection of paper and cardboard, putrescibles and dry residue, on acombined kerbside collection of plastics and metals and, finally,on a bring collection of glass with banks. The collected materialsof paper and cardboard, glass, plastics and metals are thentransported to recycling plants. Putrescibles, after collection, aretransported to a composting plant. The dry residue is firstly trans-formed into RDF pressed bales and secondarily transported to anincineration plant. Discards deriving from all the treatment pro-cesses are collected and transported to a landfill. The ten scenarios(1–10) differ only in the percentage of separated collection. Infact, scenario 1 was based on a 35% separated collection, which isthe lowest level allowed by Italian legislation, while scenario 10was based on an 80% separated collection, a threshold which is dif-ficult to achieve and only relates to a few and/or well organizedterritories. Scenarios 2–9 were progressively obtained by addinga 5% value to the separated collection of the previous scenario(Fig. 1).
nicipal Solid Waste
Dry Residue(20-65%)
Putrescibles (35-15%)
RDF plant
Composting
Compost
RDF incineration
Landfill
nagement scenarios 1–10.

Municipal Solid Waste
Sorting plant
CompostingRecycling
Plastics & Metals
Paper & Cardboard
Glass
CompostRecycled materials Landfill
Recycling Recycling
Recyclables (45%)
Dry Residue(20%)
Putrescibles (35%)
Fig. 2. Flow chart of MSW management scenario 11.
Municipal Solid Waste
CompostingRecycling
Plastics & Metals
Paper & Cardboard
Glass
CompostRecycled materials Landfill
Recycling Recycling
Recyclables (45%)
Dry Residue(20%)
Putrescibles (35%)
Fig. 3. Flow chart of MSW management scenario 12.
1904 G. De Feo, C. Malvano / Waste Management 29 (2009) 1901–1915
Management scenario 11 differs from scenarios 1–10 only forthe treatment of the dry residue, which is transported to a sortingplant for a supplementary recovery of materials, while the percent-age of separate collection is 80%, with the other separated materi-als being collected and treated in the same manner (Fig. 2).Management scenario 12 differs from scenario 11 with the dry res-idue being directly transported to a landfill (Fig. 3).
2.4. Basic assumptions
As shown in Table 2 average-sized vehicles were selected forthe collection of separated materials, estimating an average annualrun of about 30,000 km. An extension of 3414 km for the road net-work was assumed. Since the considered study area has an exten-sion of 2,798.36 km2, this assumption corresponds to 1.22 kmroads/km2.
Recycling mills were schematized as a ‘‘Facility Simple MRF”,with 10% of discards in landfill. While the dry residue sorting plant(adopted in scenario 11) was schematized as ‘‘Facility Dirty MRF”with 15% of recovered materials and 85% of discards in landfill.The principal characteristic of the recycling facilities adopted inthe MSW management scenarios developed are summarised in Ta-ble 3, which also reports the principal details of the compostingplant.
The facility for the production of RDF was simulated as amechanical and biological treatment (MBT) defining the composi-tion of the outlet material flow as reported in Table 4 which alsodescribes the RDF incinerator adopted in the MSW managementscenarios developed. Finally, Table 5 reports the principal charac-teristic of the landfill adopted in the MSW management scenariosdeveloped.
3. Results and discussion
The outputs from each option modelled were analysed undereleven environmental effect categories as suggested by the proce-dure WISARD with the aim of carrying out a synthetic study of thedata available (Pricewaterhouse Coopers, 2006). The impactassessment categories suggested are as follows: renewable energyuse, non-renewable energy use, total energy use, water, suspendedsolids and oxydable matters index, mineral and quarried matters,greenhouse gases, acidification, eutrophication, hazardous waste,non hazardous waste.
Attention was focused both on measuring the overall impactdue to the application of the entire MSW management systemadopted, as well as the evaluation of the specific contribution pro-duced by each phase of the MSW management system.
In fact, each system was subdivided in the following sixteenphases: glass collection logistics (GCL), glass collection recycling(GCR), glass collection disposal (GCD), paper collection logistics(PaCL), paper collection recycling (PaCR), paper collection disposal(PaCD), plastics and metals collection logistics (Pl&MCL), plasticsand metals collection recycling (Pl&MCR), plastics and metals col-lection disposal (Pl&MCD), putrescibles collection logistics (PCL),putrescibles collection composting (PCC), putrescibles collectiondisposal (PCD), dry residue collection logistics (DRCL), dry residuecollection recycling (DRCR), dry residue collection RDF incineration(DRCI), and dry residue collection disposal (DRCD).
Therefore, 192 management phases were considered (corre-sponding to the product of 16 phases for 12 scenarios), while2112 single impact values were analysed and compared (corre-sponding to the product of 11 impact categories for 192 manage-ment phases). Moreover, 132 total impact values were analysed

Table 2Characteristics of waste vehicles and lorries for glass collection adopted in the MSW management scenarios developed.
Waste vehicle (10 m3) – WISARD (Pricewaterhouse Coopers, 2006)General characteristics
Lifespan (km) Consumption (l/100 Km) Fuel200,000 90 (Urban) Diesel
Tyres CleaningReplacement frequency (/10000 km) Number of replacement Cleaning frequency (/1000 km) Water consumption (l)0.22 5 7 321
Vehicle emission factor (g/100 km)CO2 CO NMH CH4 Steam Particulates SOx NOx N2O NH3
246,685 272 630 0 97,200 14 68 4,500 0 0
OilEngine oil Hydraulic oil
Change frequency (�1000 km) 1.25 0.25Volume of oil (l) 22 100
Lorry for glass collection –WISARD (Pricewaterhouse Coopers, 2006)General characteristics
Lifespan (km) Consumption (l/100 Km) Fuel250000 60 (Urban) Diesel
Tyres CleaningReplacement frequency (*10000 km) Number of replacement Cleaning frequency (*1000 km) Water consumption (l)0.16 5.3 7 321
Vehicle emission factor (g/100 km)CO2 CO NMH CH4 Steam Particulates SOx NOx N2O NH3
164,314 272 660 0 64,800 14 45.3 4,200 0 0Oil
Engine oil Hydraulic oilChange frequency (�1000 km) 1 0Volume of oil (l) 22 0
G. De Feo, C. Malvano / Waste Management 29 (2009) 1901–1915 1905
and compared (corresponding to the product of 11 impact catego-ries and 12 management scenarios).
The goal of the study was to evaluate the results obtained (val-ues of avoided or produced impact) in order to point out the mostenvironmentally sound scenarios for each environmental impactcategory, as well as the trend associated with the percentage ofseparate collection (for the first ten MSW management scenarios),thus evaluating the positive and negative effects of recycling and/or composting (Table 6). The LCA software tool calculates impactvalues, performing mass and energy balances on the base of theamount of waste to be treated. For scenarios 1–10, these quantitiesvary linearly with the percentage of separate collection and there-fore impact values for each management phase also vary in thesame manner. Since the sum of linear function is a linear function,the total impact values for each category also have to vary linearly.As a matter of fact, as shown in Table 6, the coefficient of linear cor-relation between total impact value and percentage of separatecollection is practically one for all impact categories.
Moreover, for each impact category and MSW management sce-nario developed, the management phase with the greatest avoidedimpact (Table 7) and the management phase with the greatest pro-duced impact (Table 8) were pointed out.
Finally, scenarios 10, 11 and 12 were compared in order to pointout for what impact categories for high percentages of separatecollection a management system based on recovery and recyclingbut without incineration would be preferable.
3.1. Renewable energy use
The impact category ‘‘Renewable Energy Use” represents theenergy derived from sources that do not deplete natural resources.This includes hydroelectric, wind, solar or energy from biomass. InTable 6, the results were normalised and expressed in terms ofdomestic energy usage for heating, lighting and transport. In par-ticular, a consumption of 8.61 GJ/inhabitant/yr was assumed foran Equivalent Inhabitant (Pricewaterhouse Coopers, 2006).
As shown in the Table 6, all the MSW management scenariosconsidered gave negative results in terms of ‘‘Renewable EnergyUse”. Therefore, they represented an avoided impact as well asthe highest percentage corresponded to the highest avoided im-pact. The most environmentally sound scenario was number 11(‘‘80%S”: 80% separate collection, no RDF incineration, dries residuesorting).
As shown in Table 9, the following phases avoided impacts interms of ‘‘Renewable Energy Use”: all recycling contributions, dryresidue selection, RDF production and incineration. Since paper de-rives from renewable resources (wood), ‘‘Paper Collection Recy-cling” was the phase with the greatest avoided impact for eachimpact category and each MSW management scenario developed(Table 7). This fact depends on the lower renewable energy needsby production of recycled paper when compared with that of newpaper. In fact, it is well known that recycling saves energy. As amatter of fact, producing paper and cardboard from recycled mate-rials requires less energy than manufacturing the same goods fromvirgin materials (EPA, 2007).
On the other hand, the following phases had positive impacts(Table 9): collection logistics and landfilling, which produce posi-tive impacts for all considered impact categories, and composting.In particular, ‘‘Dry Residue Collection Logistics” was the manage-ment phase with the greatest produced impact for scenarios 1–9,while ‘‘Glass Collection Logistics” was the management phase withthe greatest produced impact for scenarios 10, 11 and 12 (Table 8).The phases with the greatest produced impact were related to‘‘Collection Logistics” because it takes into account contributionsthat lead to renewable energy consumption. For the three ‘‘80%”scenarios, the collection of glass gives the major contribution dueto the increasing of trucks, containers and waste sacks/bags re-quired for the glass collection compared with trucks, containersand waste sacks/bags required for the collection of dry residue.
As shown in Table 10, impacts produced from scenarios 10, 11and 12 differed only for the contributions given by the followingthree phases: ‘‘Dry Collection Residue Disposal” (DRCD), ‘‘Dry

Table 3Characteristic of the recycling facilities and composting plant adopted in the MSW management scenarios developed.
FR – MRF (packaging and newspaper 12 Kt/y) – WISARD (Pricewaterhouse Coopers, 2006)General characteristics Operation
Lifetime (yr) Treated tonnage(t/month)
Working time(d/months)
Type of facility Fuel consumption(l/month)
Water(m3/month)
Lubricants(l/month)
Strapping(kg/month)
10 1000 22 Semi-mechanized 0 480 2.8 2500
Sorting machines – P = power consumption (kW) – T = Working time (h/work day)Conveyors Magnet Eddy currents Screen Air conditioningP T P T P T P T P T30 14 5 14 5 14 10 14 20 16
Facility – Simple MRF (glass, plastics and non-metal) – WISARD (Pricewaterhouse Coopers, 2006)General characteristics Operation
Lifetime (yr) Treated tonnage(t/month)
Working time(d/months)
Type of facility Fuel consumption(l/month)
Water(m3/month)
Lubricants(l/month)
Strapping(kg/month)
20 1667 20.83 Semi-mechanized 0 375 2.8 2500
Sorting machines – P = power consumption (kW) – T = Working time (h/work day)Weigh bridge Conveyors Magnet Air conditioningP T P T P T P T0 16 11 16 5.8 16 1.1 16
FR – composting C1 – WISARD (Pricewaterhouse Coopers, 2006)General characteristics Compost utilisation
Lifetime (yr) Treated tonnage(t/month)
Working time(d/months)
Compost(kg/twaste)
Fuel consumption(l/t compost)
Heavy metal(% in compost)
Spreadingby tractor
Immobilisedin ground
25 2,417 20 380 0.5 100
Savings Distribution of N and P (% of compost element)Potassium fertilizer(% of K in compost)
Lime (calcium %in compost)
Magnesium fertilizer(% of Mg in compost)
Wood chips(kg/t of compost)
Fertilizedsaving
Mineralisednonbioavailablein ground
N P N P20 20 20 0 20 95 80 5
Balance of site inputs and outputsGarden greenwaste
Kitchenscraps
Wood andpruning
Straw Paper Cardboard Glass Ferrous Aluminium Plastics Othermaterials
Total (t/month) 17 676 0 0 392 225 317 92 2 268 428Recycled (t/
month)9 354 0 0 206 118 166 48 1 140 224
Rejected (t/month)
8 322 0 0 186 107 151 44 1 128 204
1906 G. De Feo, C. Malvano / Waste Management 29 (2009) 1901–1915
Residue Collection Recycling” (DRCR) (not present in scenario 12)and ‘‘Dry Residue Collection RDF Incineration” (DRCI) (not presentin scenarios 11 and 12). This is a general statement: it is valid forall the considered impact categories.
In particular, in terms of renewable energy saving, scenario 11(80%S) prevailed over numbers 10 and 12 because of the contri-bution (�36,036 Equivalent Inhabitants) of the dry residue sort-ing plant (‘‘Facility Dirty MRF” with 15% of recovered materials,Table 3), while in scenario 10 (80%) there were lower savingsof renewable energy due to the RDF production plant (MBT, Ta-ble 4) (�8,839 E.I.) and the RDF incineration plant (Table 4)(�2,040 E.I.). In scenario 12 (80%L), the three considered manage-ment phases produced insignificant use of renewable energy be-cause DRCR and DRCI did not exist and the landfill disposal ofthe dry residue does not produce a saving but only a limiteduse of renewable energy (+46 E.I.). Therefore, in terms of‘‘Renewable Energy Use”, for high percentages of separate collec-tion a management system based on recovery and recycling butwithout incineration would be preferable.
3.2. Non-renewable energy use
The impact category ‘‘Non-Renewable Energy Use” representsthe energy derived from fossil materials such as oil, coal, natural
gas or nuclear materials. In Table 6, the results were normalisedand expressed in terms of domestic energy usage for heating,lighting and transport. In particular, a consumption of 168.91 GJ/inhabitant/yr was assumed for an Equivalent Inhabitant (Pricewa-terhouse Coopers, 2006).
As shown in Table 6, all the MSW management scenarios con-sidered gave negative results in terms of ‘‘Non-Renewable EnergyUse”. Therefore, they also represented an avoided impact as wellas the highest percentage corresponded to the highest avoided im-pact. The most environmentally sound scenario was number 10(‘‘80%”: 80% separate collection, RDF production and incineration).
The following phases avoided impacts in terms of ‘‘Non Renew-able Energy Use” (Table 9): all recycling contributions, composting,dry residue selection, RDF production and incineration. Since plas-tics and metals derive from non-renewable resources (oil and min-erals), ‘‘Plastics and Metals Collection Recycling” was the phasewith the greatest avoided impact for each MSW management sce-nario developed (Table 7). This fact depends on the lower energyneeds by production of recycled plastics and metals when com-pared with new plastics and metals (EPA, 2007). On the other hand,the following phases had positive impacts (Table 9): only collectionlogistics and landfilling. In particular, ‘‘Dry Residue CollectionLogistics” was the management phase with the greatest producedimpact for all MSW management scenarios developed (Table 8)

Table 4Characteristic of the mechanical and biological treatment (MBT) and RDF incinerator adopted in the MSW management scenarios developed.
MBT (residue)General characteristics
Lifetime (yr) Treated tonnage (t/month) Working time (d/moths) Type of facility20 250,500 30 Mechanized
Percentage mass balance of site inputs and outputsInflow Outflow
Discards to landfill RDF to incineration Non ferrous metals Losses Stabilized organic fractionPutrescibles 11.81 0.00 0.00 0.00 - 6.85Putrescibles (exc. garden) 29.52 0.00 0.00 0.00 - 17.12Fines 1.52 0.00 0.00 0.00 - 0.88Non ferrous metal 2.95 0.00 0.00 2.95 - 0.00Paper 29.52 4.54 24.98 0.00 - 0.00Dense plastics 13.78 2.12 11.66 0.00 - 0.00Textiles 3.03 0.47 2.56 0.00 - 0.00Glass 7.87 7.87 0.00 0.00 - 0.00Total 100.00 15 39.20 2.95 18.00 24.85
RDF Incineration – WISARD (Pricewaterhouse Coopers, 2006)General characteristicsLifetime (yr) Treated tonnage (t/month)30 83,300
UtilitiesElectricity (kWh/moth) Fuel consumption (l/month) Natural gas (m3/month) Propane (kg/month) Diesel for off-road vehicle (l/month)0 0 75 0 0Material outputsWater (m3/month) Bottom ash Recovery (%) Iron scrap Aluminium scrap0 9,166 0 0 0Energy generation (output)Steam (MJ/month) Water Gas (%) Coal (%) Oil (%) Electricity (kWh/month)0 0 0 0 0 109,375,000Gas cleaning (input)Processed water (m3/month) Activated carbon (kg/month) Lime (quick, kg/month) Lime (slaked, kg/month) Fly ash (kg/month) Exhaust gases (Nm3/twaste)14,594 208,333 2,083,000 266,560 10,208 9,000
Table 5Characteristic of the landfill adopted in the MSW management scenarios developed.
Landfill – WISARD (Pricewaterhouse Coopers, 2006)General characteristics
Lifetime (yr) Treated tonnage (t/month) Working time (d/month)20 10,000 25Leachate Landfill gasProduced (l/t) Discharge (%) Treatment system Discharge (%) First treatment (%) Second treatment (%) Furnace output efficiency (%)85 10 Biological Treatment 30 70 0 32.5
CappingClay (t) Top soil (t) HDPE (t) Diesel (l)950,000 285,000 0 0
G. De Feo, C. Malvano / Waste Management 29 (2009) 1901–1915 1907
because it takes into account the construction and maintenance oftrucks, containers and waste sacks/bags, which contribute to theconsumption of non-renewable energy.
As shown in Table 10, in terms of non-renewable energy saving,scenario 10 (80%) prevailed over numbers 11 and 12 due to thesum of negative contributions of the RDF production plant(�1915 E.I.) and the RDF incineration plant (�1619 E.I.). This isdue to the fact that RDF production and incineration allows theconsumption of non-renewable resources for energy productionto be reduced, while in scenario 11 (80%S) there was a lower savingof non-renewable energy due to the dry residue sorting plant(�2968 E.I.). Finally, the landfill disposal of sorted dry residue inscenario 11 produced a reduced consumption of non-renewableenergy (+76 E.I.) as well as the direct dry residue landfill disposalin scenario 12 (+84 E.I.). Since there was a difference of only 2.6%between the avoided impacts of scenarios 10 and 11, for high per-centages of separate collection in terms of non-renewable energyuse, the presence or the absence of an incinerator plant is not sorelevant.
3.3. Total energy use
The impact category ‘‘Total Energy Use” represents a synthesisof the previous two scenarios considered, renewable and non-renewable energy use. In Table 6, the results were normalisedand expressed in terms of domestic energy usage for heating,lighting and transport. In particular, a consumption of 177.52 GJ/inhabitant/yr was assumed for an Equivalent Inhabitant (Pricewa-terhouse Coopers, 2006).
As shown in Table 6, all the MSW management scenarios con-sidered gave negative results in terms of ‘‘Total Energy Use”. There-fore, they also represented an avoided impact as well as the highestpercentage corresponded to the highest avoided impact. The mostenvironmentally sound scenario was 11 (80%S), the same as‘‘Renewable Energy Use”. In fact, both ‘‘Paper Collection Recycling”as well as ‘‘Plastics and Metals Collection Recycling” give their con-tribution to avoiding impacts in terms of total energy use. How-ever, ‘‘Paper Collection Recycling”, in particular, gives the majorcontribution, especially with regard to renewable energy use,

Table 6Summary of the numerical results obtained for each MSW management scenario developed in terms of avoided or produced impact.
Impact category MSW management scenario
35% (1) 40% (2) 45% (3) 50% (4) 55% (5) 60% (6) 65% (7) 70% (8) 75% (9) 80% (10) 80%S (11) 80%L (12)
Renewable energy use (Domestic energy usagefor heating, lighting and transport –equivalent inhabitant)
�428,695 �489,507 �543,589 �597,599 �650,858 �704,852 �725,547 �792,498 �860,128 �927,731 �952,854 �916,814aImpact (inhabitant equivalent) = �10,628 � (percentage of separate collection) � 60,995; R2 = 0.9946b �2.7%c +1.2%c
Non-renewable energy use (Domestic energyusage for heating, lighting and transport –equivalent inhabitant)
�14,934 �15,927 �17,227 �18,149 �18,912 �20,158 �21,379 �22,249 �23,494 �24,284 �23,655 �20,679aImpact (inhabitant equivalent) = �209.89 � (percentage of separate collection) � 7,602.8; R2 = 0.9983b +2.6%c +14.8%c
Total energy use (Domestic energy usage forheating, lighting and transport – equivalentinhabitant)
�30,725 �33,002 �37,316 �40,264 �43,030 �46,288 �48,253 �51,646 �55,425 �58,764 �59,117 �54,880aImpact (inhabitant equivalent) = �607.49 � (percentage of separate collection) � 9,640.4; R2 = 0.9979b �0.6%c +6.6%c
Water (Domestic use – equivalent inhabitant) �2,991 �3,589 �4,191 �4,785 �5,568 �6,168 �6,784 �7,388 �8,174 �8,756 �9,117 �8,876aImpact (inhabitant equivalent) = �129.18 � (percentage of separate collection) � 1,588.2; R2 = 0.9993b �4.1%c �1.4%c
Suspended solids and oxydable matters index(equivalent inhabitant)
�6,905 �7,905 �8,945 �10,075 �11,032 �12,031 �13,039 �14,044 �15,045 �15,894 �16,393 �15,874aImpact (inhabitant equivalent) = �201.53 � (percentage of separate collection) � 96,36; R2 = 0.9995b �3.1%c 0.1%c
Mineral and quarried matters (t) �1,279 �767 51 257 1,077 1,920 2,712 3,481 3,504 4,375 21,396 27,404aImpact (t) = 129.28 � (percentage
of separate collection) � 5,910.4;R2 = 0.9894b
+389.1c +526.4%c
Greenhouse gases (100 years – equivalentinhabitant)
58 �677 �108 �788 �969 �1,466 �1,444 �1,899 �2,077 �2,337 4,370 10,425aImpact (inhabitant equivalent) = �51.85 � (percentage of separate collection) + 1,810.7; R2 = 0.9328b +287.0%c +546.1%c
Acidification (equivalent inhabitant) �8,968 �9,247 �9,600 �9,871 �9,986 �10,337 �10,603 �10,710 �11,148 �11,321 �10,296 �4,237aImpact (inhabitant equivalent) = �51.61 � (percentage of separate collection) � 7,211.8; R2 = 0.9931b +9.1c +62.6%c
Eutrophication (equivalent inhabitant) �1,120 �1,291 �1,460 �1,634 �1,806 �1,979 �2,152 �2,314 �2,486 �2,593 �2,619 �2,517aImpact (inhabitant equivalent) = �33.47 � (percentage of separate collection) + 40.8; R2 = 0.9987b �1.0%c +2.9%c
Hazardous waste (t) �1,375 �1,427 �1,480 �1,543 �1,565 �1,617 �1,659 �1,702 �1,755 �1,807 �2,204 �1,642aImpact (t) = �9.32 � (percentage of separate collection) � 1,056.8; R2 = 0.9968b �22.0%c +9.1%c
Non hazardous waste (t) 21,023 21,488 22,038 22,511 23,065 23,676 24,263 24,732 25,387 25,824 42,317 43,470aImpact (t) = 108.89 � (percentage
of separate collection) + 17,139;R2 = 0.999b
+63.9%c +68.3%c
a The symbol ‘‘ ” (‘‘ ”) indicates an environmentally sound positive (negative) trends with % of separate collection (positive or negative effects of recycling and/or composting).b Linear correlation between percentage of separate collection (in the range 35–80%) and avoided or produced impact.c Percentage increase from avoided/produced impact related to the 80% scenery (‘‘+” indicates an environmental improvement; ‘‘�” indicates an environmental worsening).
1908G
.De
Feo,C.Malvano
/Waste
Managem
ent29
(2009)1901–
1915

Table 7Management phase with the greatest avoided impact for each impact category and for each MSW management scenario developed.
Impact category MSW management scenario35%(1)
40%(2)
45%(3)
50%(4)
55%(5)
60%(6)
65%(7)
70%(8)
75%(9)
80%(10)
80%S(11)
80%L(12)
Renewable energyuse (Domesticenergy usage forheating, lightingand transport –equivalentinhabitant)
PaCR PaCR PaCR PaCR PaCR PaCR PaCR PaCR PaCR PaCR PaCR PaCR�380,753 �441,945 �496,339 �550,732 �605,125 �659,518 �679,916 �747,908 �815,899 �883,891 �883,891 �883,891
Non-renewableenergy use(Domestic energyusage for heating,lighting andtransport –equivalentinhabitant)
Pl&MCR Pl&MCR Pl&MCR Pl&MCR Pl&MCR Pl&MCR Pl&MCR Pl&MCR Pl&MCR Pl&MCR Pl&MCR Pl&MCR�10,791 �12,140 �13,759 �15,378 �16,727 �18,345 �19,694 �21,313 �22,932 �24,281 �24,281 �24,281
Total energy use(Domestic energyusage for heating,lighting andtransport –equivalentinhabitant)
PaCR PaCR PaCR PaCR PaCR PaCR PaCR PaCR PaCR PaCR PaCR PaCR�14,973 �17,360 �19,514 �21,641 �23,795 �25,923 �26,779 �29,426 �32,073 �34,746 �34,746 �34,746
Water (Domestic use– equivalentinhabitant)
PaCR PaCR PaCR PaCR PaCR PaCR PaCR PaCR PaCR PaCR PaCR PaCR�4,201 �4,749 �5,297 �5,845 �6,575 �7,123 �7,671 �8,219 �8,950 �9,498 �9,498 �9,498
Suspended solids andoxydable mattersindex (equivalentinhabitant)
PaCR PaCR PaCR PaCR PaCR PaCR PaCR PaCR PaCR PaCR PaCR PaCR�6,825 �7,807 �8,821 �9,929 �10,863 �11,845 �12,827 �13,809 �14,791 �15,614 �15,614 �15,614
Mineral and quarriedmatters (t)
DRCR DRCR DRCR DRCR GCR GCR GCR GCR GCR GCR GCR GCR�7,200 �6,622 �6,043 �5,575 �5,490 �5,948 �6,446 �6,954 �7,452 �7,951 �7,951 �7,951
Greenhouse gases(100 years –equivalentinhabitant)
DRCR Pl&MCR Pl&MCR Pl&MCR Pl&MCR Pl&MCR Pl&MCR Pl&MCR Pl&MCR Pl&MCR Pl&MCR Pl&MCR�11,152 �12,280 �13,518 �15,346 �16,583 �18,416 �19,667 �21,499 �22,736 �24,569 �24,569 �24,569
Acidification(equivalentinhabitant)
Pl&MCR Pl&MCR Pl&MCR Pl&MCR Pl&MCR Pl&MCR Pl&MCR Pl&MCR Pl&MCR Pl&MCR Pl&MCR Pl&MCR-16,488 -18,641 -20,795 -22,948 -25,101 -27,255 -29,408 -31,561 -33,715 -35,868 -35,868 -35,868
Eutrophication(equivalentinhabitant)
PaCR PaCR PaCR PaCR PaCR PaCR PaCR PaCR PaCR PaCR PaCR PaCR�1,154 �1,328 �1,499 �1,675 �1,851 �2,029 �2,205 �2,369 �2,544 �2,655 �2,655 �2,655
Hazardous waste (t) DRCR DRCR DRCR DRCR Pl&MCR Pl&MCR Pl&MCR Pl&MCR Pl&MCR Pl&MCR Pl&MCR Pl&MCR�1,938 �1,791 �1,613 �1,496 �1,544 �1,686 �1,829 �1,971 �2,114 �2,256 �2,256 �2,256
Non hazardous waste(t)
PCC PCC PCC PCC PCC PCC PCC PCC PCC PCC PCC PCC�1,332 �1,437 �1,642 �1,846 �2,050 �2,155 �2,359 �2,564 �2,769 �2,974 �2,974 �2,974
DRCL = dry residue collection logistics; DRCD = dry residue collection disposal; DRCR = dry residue collection recycling; PaCR = paper collection recycling; Pl&MCR = plasticsand etals collection recycling; GCR = glass collection recycling; PCC = putrescibles collection composting; PCD = putrescibles collection disposal.
G. De Feo, C. Malvano / Waste Management 29 (2009) 1901–1915 1909
while ‘‘Plastics and Metals Collection Recycling” produces non-renewable energy conservation, but with a lower magnitude.
As shown in Table 9, the following phases avoided impacts interms of ‘‘Total Energy Use”: all recycling contributions, compost-ing, dry residue selection, RDF production and incineration. Inparticular, ‘‘Paper Collection Recycling” was the phase with thegreatest avoided impact for each impact category and MSW man-agement scenario developed (Table 7). On the other hand, only col-lection logistics and landfilling phases produced positive impacts.In particular, ‘‘Dry Residue Collection Logistics” was the phase withthe greatest produced impact for each impact category and MSWmanagement scenario developed (Table 8). These results agreewith the findings of Ozeler et al. (2006) who, among several man-agement options similar to those analysed, identified in the collec-tion stage the phase with the highest contribution to the netenergy use impact category. In comparison, Arena et al. (2003)pointed out that the contribution of the transport in terms of en-ergy use has little influence on the other treatment phases becausethey considered a very low level of separate collection (10%).
As shown in Table 10, in terms of total energy saving, scenario11 (80%S) prevailed over numbers 10 and 12 due to the negativecontribution (�4239 E.I.) of the dry residue sorting plant, whilein scenario 10 (80%), there were lower savings of total energydue to the RDF production plant (�2180 E.I.) and the RDF inciner-ation plant (�1635 E.I.). Finally, the landfill disposal of sorted dryresidue in scenario 11 produced a reduced consumption of totalenergy (+74 E.I.) as well as the direct dry residue landfill disposalin scenario 12 (+82 E.I.). In the light of the above considerations,in terms of ‘‘Total Energy Use”, for high percentages of separatecollection a management system based on recovery and recyclingbut without incineration would be preferable. Eriksson et al.(2005) and Emery et al. (2007) pointed out a similar conclusion.
3.4. Water
WISARD estimates the net amount of water used for plantsfunctioning or recovered by means of treatment processes. In Table6, the results were normalised and expressed in terms of domestic

Table 8Management phase with the greatest produced impact for each impact category and for each MSW management scenario developed.
Impact category MSW management scenario
35%(1)
40%(2)
45%(3)
50%(4)
55%(5)
60%(6)
65%(7)
70%(8)
75%(9)
80%(10)
80%S(11)
80%L(12)
Renewable energy use (Domestic energy usage forheating, lighting and transport – equivalentinhabitant)
DRCL DRCL DRCL DRCL DRCL DRCL DRCL DRCL DRCL GCL GCL GCL1,020 952 816 748 680 626 558 483 394 347 347 347
Non-renewable energy use (Domestic energy usage forheating, lighting and transport – equivalentinhabitant)
DRCL DRCL DRCL DRCL DRCL DRCL DRCL DRCL DRCL DRCL DRCL DRCL5,935 5,666 5,126 4,586 4,317 3,777 3,237 2,968 2,374 2,023 2,023 2,023
Total energy use (Domestic energy usage for heating,lighting and transport – equivalent inhabitant)
DRCL DRCL DRCL DRCL DRCL DRCL DRCL DRCL DRCL DRCL DRCL DRCL5,748 5,486 4,961 4,440 4,178 3,657 3,135 2,873 2,299 1,959 1,959 1,959
Water (Domestic use – equivalent inhabitant) DRCL DRCL DRCL DRCL DRCL DRCL DRCL DRCL DRCL DRCL DRCL DRCL676 639 584 530 493 438 384 329 274 237 237 237
Suspended solids and oxydable matters index(equivalent inhabitant)
DRCL DRCL DRCL DRCL DRCL DRCL DRCL DRCL DRCL PCD DRCD DRCD41 38 35 32 29 26 23 20 16 17 21 24
Mineral and quarried matters (t) DRCD DRCD PCD PCD PCD PCD PCD PCD PCD PCD DRCD DRCD9,412 8,711 8,510 9,412 10,413 11,414 12,615 13,716 13,818 15,019 18,424 21,727
Greenhouse gases (100 years – equivalent inhabitant) DRCL DRCL DRCL DRCL DRCL DRCL DRCL PCD PCD PCD DRCD DRCD10,003 9,269 8,535 7,828 6,929 6,222 5,502 5,415 5,832 6,249 8,053 10,527
Acidification (equivalent inhabitant) DRCL DRCL DRCL PCC PCC PCC PCC PCC PCC PCC PCC PCC17,001 15,743 14,485 14,569 16,007 17,445 18,883 20,322 21,760 23,198 23,198 23,198
Eutrophication (equivalent inhabitant) DRCL DRCL DRCL DRCL DRCL DRCL DRCL DRCL PCD PCD DRCD DRCD69 65 58 53 49 44 39 34 37 39 49 55
Hazardous waste (t) DRCI DRCI DRCI DRCI DRCI DRCI DRCI DRCI PaCR PaCR PaCR PaCR1,262 1,165 1,068 970 903 806 719 631 580 610 610 610
Non hazardous waste (t) DRCD DRCD PCD PCD PCD PCD PCD PCD PCD PCD DRCD DRCD11,020 10,019 9,219 10,021 11,023 12,024 13,026 14,028 15,030 16,032 20,040 21,046
DRCD = dry residue collection disposal; DRCL = dry residue collection logistics; DRCI = dry residue collection RDF incineration; DRCR = dry residue collection recycling;GCL = glass collection logistics; PaCR = paper collection recycling; Pl&MCR = plastics and metals collection recycling; PCC = putrescibles collection composting;PCD = putrescibles collection disposal.
Table 9Summary of produced (+) and avoided impacts (�) for each impact categories, for each MSW management phase and for all scenarios developed.
Impact category MSW management phase
Glass Paper Plasctics and metals Putrescibles Dry residue
GCL GCR GCD PaCL PaCR PaCD Pl&MCL Pl&MCR Pl&MD PCL PCC PCD DRCL DRCR DRCI DRCD
Renewable energy use + � + + � + + � + + + + + � � +Non-renewable energy use + � + + � + + � + + � + + � � +Total energy use + � + + � + + � + + � + + � � +Water + � + + � + + � + + + + + + + +Suspended solids and oxydable matters + � + + � + + � + + � + + � + +Mineral and quarried matters + � + + + + + � + + � + + � � +Greenhouse gases + � + + + + + � + + + + + � � +Acidification + � + + � + + � + + + + + � � +Eutrophication + � + + � + + � + + + + + � � +Hazardous waste + � + + + + + � + + + + + � + +Non hazardous waste + � + + + + + + + + � + + � + +
GCL = glass collection logistics; GCR = glass collection recycling; GCD = glass collection disposal; PaCL = paper collection logistics; PaCR = paper collection recycling;PaCD = paper collection disposal; Pl&MCL = plastics and metals collection logistics; Pl&MCR = plastics and metals collection recycling; Pl&MCD = plastics and metals col-lection disposal; PCL = putrescibles collection logistics; PCC = putrescibles collection composting; PCD = putrescibles collection disposal; DRCL = dry residue collectionlogistics; DRCR = dry residue collection recycling; DRCI = dry residue collection RDF incineration; DRCD = dry residue collection disposal.
1910 G. De Feo, C. Malvano / Waste Management 29 (2009) 1901–1915
consumption. In particular, a consumption of 683 m3/inhabitant/yrwas assumed for an Equivalent Inhabitant (Pricewaterhouse Coo-pers, 2006).
As shown in Table 6, all the MSW management scenarios con-sidered gave negative results in terms of ‘‘Water”. Therefore, foreach scenario there is a net saving of water or, in other terms, anavoided consumption. Moreover, the highest percentage corre-sponded to the highest avoided impact. The most environmentallysound scenario was 11 (80%S).
Only the recycling phases avoided water consumptions (Table9). In particular, ‘‘Paper Collection Recycling” was the phase withthe greatest avoided impact for each impact category and MSW
management scenario developed (Table 7). The highest percentagecorresponded to the highest saving of water. In fact, since the lifecycle for the production of recycled paper is shorter than the cor-responding life cycle for the production of new paper, producingrecycled paper require a lower consumption of water. Moreover,it is well known that paper mills require huge amounts of water(Byström and Lönnstedt, 1997). On the other hand, the followingphases had positive impacts: collection logistics and landfilling,composting, dry residue selection, RDF production and incinera-tion. In particular, ‘‘Dry Residue Collection Logistics” was the phasewith the greatest produced impact for each impact category andMSW management scenario developed. The highest percentage

Table 10Avoided or produced impacts for the three management scenarios with 80% of separate collection and for the management phases involving dry residue recycling (DRCR),incineration (DRCI) and disposal (DRCD).
Impact category MSW management scenario
80% (10) 80%S (11) 80%L (12)MSW management phase MSW management phase MSW management phase
DRCR DRCI DRCD total DRCR DRCI DRCD total DRCR DRCI DRCD total
Renewable energy use (equivalent inhabitant) �8,839 �2,040 7 �10,872 �36,036 0 41 �35,995 0 0 46 46Non-renewable energy use (equivalent inhabitant) �1,915 �1,619 13 �3,522 �2,968 0 76 �2,892 0 0 84 84Total energy use (equivalent inhabitant) �2,180 �1,635 12 �3,802 �4,230 0 74 �4,155 0 0 82 82Water (equivalent inhabitant) 20 119 3 142 �237 0 18 �219 0 0 22 22Suspended solids and oxydable matters index
(equivalent inhabitant)�6 6 4 4 �516 0 21 �495 0 0 24 24
Mineral and quarried matters (t) �2,206 �2,310 3,214 �1,302 �2,705 0 18,424 15,719 0 0 21,727 21,727Greenhouse gases (100 years – equivalent inhabitant) �3,351 �310 1,155 �2,506 �3,852 0 8,053 4,202 0 0 10,257 10,257Acidification (equivalent inhabitant) �4,901 �1,774 60 �6,615 �5,974 0 385 �5,589 0 0 469 469Eutrophication (equivalent inhabitant) �11 �19 8 �21 �96 0 49 �47 0 0 55 55Hazardous waste (t) �612 447 0.0062 �165 �563 0 0.04 �563 0 0 0.04 0Non hazardous waste (t) �397 190 3,607 3,400 �147 0 20,040 19,893 0 0 21,046 21,046
DRCR = dry residue collection recycling; DRCI = dry residue collection RDF incineration; DRCD = dry residue collection disposal.
G. De Feo, C. Malvano / Waste Management 29 (2009) 1901–1915 1911
corresponded to the lowest consumption of water because themagnitude of dry residue transport diminishes with the increasingof the separate collection percentage.
As shown in Table 10, in terms of water saving, scenario 11(80%S) prevailed over numbers 10 and 12 due to the negative con-tribution (�4239 E.I.) of the dry residue sorting plant. In fact,recovering material corresponds to water savings not consumedfor the production of new materials. In comparison, in scenario10 (80%), there were consumptions of water due to the RDF pro-duction plant (+20 E.I.), particularly for the stabilization of recov-ered putrescibles, the RDF incineration plant (+119 E.I.) and thelandfill disposal (+3 E.I.). Finally, the landfill disposal of sorteddry residue in scenario 11 produced a reduced consumption ofwater (+18 E.I.) as well as the direct dry residue landfill disposalin scenario 12 (+22 E.I.). Therefore, also in terms of ‘‘Water”, forhigh percentages of separate collection a management systembased on recovery and recycling but without incineration wouldbe preferable.
3.5. Suspended solids and oxydable matters index
The ‘‘Suspended Solids and Oxydable Matters Index” is ex-pressed in terms of the amount of biochemical oxygen demand(BOD) and suspended solids (TSS) one person emits into the envi-ronment per year. In Table 6, the results were normalised and ex-pressed in terms of Equivalent Inhabitants (E.I.). In particular, foran E.I. a production of 47.6 (kgTSS + kgBOD5)/inhabitant/yr was as-sumed (Pricewaterhouse Coopers, 2006). Obviously, this index isan indicator of water pollution.
As shown in Table 6, all the MSW management scenarios con-sidered gave negative results in terms of ‘‘Suspended Solids andOxydable Matters Index”. Therefore, for each scenario there is anavoided pollution. Moreover, the highest percentage correspondedto the highest avoided impact. Also for this effect category, themost environmentally sound scenario was 11 (80%S).
As shown in Table 9, the following phases avoided impacts interms of ‘‘Suspended Solids and Oxydable Matters Index”: all recy-cling contributions, composting, dry residue selection and RDF pro-duction. In particular, ‘‘Paper Collection Recycling” was the phasewith the greatest avoided impact for each impact category andMSW management scenario developed (Table 7). The highest per-centage corresponded to the highest reduction of suspended solidsand oxydable matters pollution. In fact, since the life cycle for theproduction of recycled paper is shorter than the corresponding lifecycle for the production of new paper, producing recycled paper
results in lower water pollution. On the other hand, the followingphases had positive impacts: collection logistics and landfilling,and RDF incineration. In particular, ‘‘Dry Residue Collection Logis-tics” was the management phase with the greatest produced im-pact for scenarios 1–9 (Table 8), because for the correspondinglevel of separate collection, the transport of dry residue producesa valuable organic water pollution, while ‘‘Putrescibles CollectionDisposal” was the management phase with the greatest producedimpact for scenario 10 and, finally, ‘‘Dry Residue Collection Dis-posal” was the management phase with the greatest produced im-pact for scenarios 11 and 12 (Table 8). In fact, the disposal ofputrescibles and dry residue determines the production of landfillleachate which is typically characterized by high concentrations ofsuspended solids and BOD.
As shown in Table 10, in environmentally sound terms, scenario11 (80%S) prevailed over numbers 10 and 12 due to the negativecontribution (�516 E.I.) of the dry residue sorting plant. In fact,recovering material avoids the organic pollution of water relatedto the production of new materials. All the other contributions re-lated to the three 80% scenarios were negligible. Therefore, also interms of ‘‘Suspended Solids and Oxydable Matters Index”, a man-agement system based on recovery and recycling but withoutincineration would be preferable for high percentages of separatecollection.
3.6. Mineral and quarried matters
The impact category of ‘‘Mineral and Quarried Matters” dealswith the depletion of non-renewable resources which is thedecreasing availability of natural resources such as fossil and min-eral resources. This impact category is expressed in terms of theamount of aluminium mineral (bauxite) and iron mineral one per-son consumes per year. In Table 6, the results were normalised andexpressed in terms of Equivalent Inhabitants (E.I.). In particular,consumptions of 0.060 tbauxite/inhabitant/yr and 0.300 tiron_mineral/inhabitant/yr were assumed for an E.I. (Pricewaterhouse Coopers,2006).
As shown in Table 6, in this case, on the contrary to the otherimpact categories considered, the impact levels are both positiveand negative, and with increasing values with the percentage ofseparate collection. Therefore, the best environmentally sound sce-nario is immediately identified in number 1, which corresponds toscenario with the lowest percentage of separate collection: 35%.
Since this impact category deals with the consumption of non-renewable resources, the disposal phase produces a loss of

1912 G. De Feo, C. Malvano / Waste Management 29 (2009) 1901–1915
resources and therefore positive impacts, while the recyclingphases related to non-renewable resources (glass, plastics andmetals) produce a recovery of resources and therefore negative im-pacts. As a matter of fact, the following phases avoided impacts interms of ‘‘Mineral and Quarried Matters” (Table 9): glass recycling,plastics and metals recycling, composting, dry residue selection,RDF production and incineration. In particular, ‘‘Dry Residue Col-lection Recycling” and ‘‘Glass Collection Recycling” were thephases with the greatest avoided impact: DRCR for the first fourscenarios, while GCR for the others (Table 7). On the other hand,the following phases had positive impacts (Table 9): collectionlogistics and landfilling, and paper recycling. In particular, ‘‘DryResidue Collection Disposal”(scenarios 1, 2, 11 and 12) and‘‘Putrescibles Collection Disposal” (scenarios 3–10) were the man-agement phases with the greatest produced impact (Table 8).
As shown in Table 10, in terms of non-renewable resources sav-ing, scenario 10 (80%) prevailed over numbers 11 and 12 becausethe sum of negative contributions of RDF production (�2206 t)and RDF incineration (�2310 t) compensated for the positive termsof dry residue disposal (+3214 t). Globally, 1302 t of non-renew-able resources were saved in scenario 10, while in scenario 11(80%S), the saving of non-renewable resources due to dry residuesorting (�2705 E.I.) was dominated by the consumption term ofthe landfill disposal (+18,424 t). Globally, 15,719 t of non-renew-able resources were consumed in scenario 11. Finally, the directdry residue landfill disposal in scenario 12 produced a consump-tion of 21,727 t of non-renewable resources. Therefore, in termsof ‘‘Mineral and Quarried Matters”, the absence of an incineratorplant is not environmentally sound for high percentages of sepa-rate collection.
3.7. Greenhouse gases
‘‘Greenhouse gases” (GHGs) refers to the gases (primarily watervapour, carbon dioxide, methane and nitrous oxide) present in theearth’s atmosphere which reduce the loss of heat into space andtherefore contribute to global temperatures through the green-house effect. This impact category was expressed in terms ofgreenhouse effect over 100 years. In Table 6, the results were nor-malised and expressed in terms of Equivalent Inhabitants (E.I.). Inparticular, a production of 8.680 teq.CO2/inhabitant/yr was assumedfor an E.I. (Pricewaterhouse Coopers, 2006).
As shown in Table 6, also in this case, analogously to ‘‘Mineraland Quarried Matters”, the impact levels are both positive and neg-ative, but with decreasing values with the percentage of separatecollection. Therefore, the best environmentally sound scenario isimmediately identified in number 10 which corresponds to thescenario with the highest percentage of separate collection: 80%.
The following phases avoided impacts in terms of GHGs (Table9): glass recycling, plastics and metals recycling, dry residue selec-tion, RDF production and incineration. In particular, ‘‘Dry ResidueCollection Recycling” and ‘‘Plastics and Metals Collection Recy-cling” were the phases with the greatest avoided impact: DRCRfor the first scenario and Pl&MCR for the other eleven scenarios(Table 7). In fact, recovering plastics and metals for recyclingavoids the production of GHGs (EPA, 2006). On the other hand,the following were the phases with produced impacts (Table 9):collection logistics and landfilling, paper recycling and composting.In particular, ‘‘Dry Residue Collection Logistics” (scenarios 1–7),‘‘Putrescibles Collection Disposal” (scenarios 8–10), and ‘‘Dry Resi-due Collection Disposal” (scenarios 11 and 12) were the manage-ment phases with the greatest produced impact (Table 8). In fact,it is well known that the combustion of fossil fuels associated withtransporting and methane emissions from landfills produce GHGs(EPA, 2006). For the first seven scenarios, the disposal of dry resi-due was more relevant than the disposal of putrescibles because
of the decreasing quantity of dry residue as well as the increasingquantity of putrescibles collected. While in scenario 11, theadopted dry residue sorting plant was schematized as ‘‘FacilityDirty MRF” with 85% of discards in landfill. Finally, in scenario12, dry residue is directly landfilled.
As shown in Table 10, in environmentally sound terms, scenario10 (80%) prevailed over numbers 11 and 12 because the sum ofnegative contributions of RDF production (�3351 E.I.) and RDFincineration (�310 E.I.) compensated for the positive terms ofdry residue landfilling (+1155 E.I). Globally, an equivalent contri-bution of 2506 inhabitants was avoided in scenario 10, while inscenario 11 (80%S), the saving of non-renewable resources due todry residue sorting (�2705 E.I.) was outclassed by the positive im-pact of the landfill disposal (+8053 E.I.). Globally, an equivalentcontribution of 4202 inhabitants was produced in scenario 11. Fi-nally, the direct dry residue landfill disposal in scenario 12 pro-duced an impact corresponding to GHG emissions of 10,257equivalent inhabitants. Therefore, in terms of GHGs, for high per-centages of separate collection the absence of an incinerator plantis not environmentally sound. Viotti et al. (2005) obtained similarresults. As a matter of fact, they pointed out the treatment of or-ganic matter and landfill disposal as the phase which affectedthe greenhouse gas emissions the most. Similarly, Arena et al.(2003) argued that the solution with RDF incineration is betterthan a total landfill disposal, reasoning in terms of climate changes.Also Emery et al. (2007) emphasized the role of the total incinera-tion of waste as a phase capable of producing a positive effect interms of greenhouse gas emissions.
3.8. Acidification
‘‘Acidification” is the process whereby air pollution, mainlyammonia, sulphur dioxide and nitrogen oxides, are converted intoacidic substances. Some of the principal effects of air acidificationinclude Lake Acidification and forest decline. In Table 6, the resultswere normalised and expressed in terms of an Equivalent Inhabi-tant (E.I.). In particular, an E.I. corresponds to 0.00186 teq.H+/inhab-itant/yr (Pricewaterhouse Coopers, 2006).
As shown in Table 6, all the MSW management scenarios con-sidered gave negative results in terms of ‘‘Acidification” whichmeans an avoided production of acidification gases. Moreover,the highest percentage of separate collection corresponded to thehighest avoided impacts; with scenario 10 being the most environ-mentally sound scenario in terms of acidification.
As shown in Table 9, the following phases avoided impacts interms of ‘‘Acidification”: all recycling contributions, dry residueselection, RDF production and incineration. In particular, ‘‘Plasticsand Metals Collection Recycling” was the phase with the greatestavoided impact for each MSW management scenario developed(Table 7). Moreover, the highest percentage corresponded to thehighest avoided impact. In fact, recycling plastics and metals savesemissions of acid gases at the manufacturing stage due to de-creased energy demand due to using secondary materials in man-ufacturing (Craighill and Powell, 1996). On the other hand, thefollowing phases had positive impacts (Table 9): collection logis-tics and landfilling, and composting. In particular, ‘‘Dry ResidueCollection Logistics” (scenarios 1–3) and ‘‘Putrescibles CollectionComposting” (scenarios 4–12) were the phases with the greatestproduced impact for each MSW management scenario developed(Table 8). In fact, for the first three scenarios the great amount ofdry residue collected (65–55%) requires many trucks for the trans-port with the consequent emissions of acid gases. While for theother scenarios with decreasing quantity of dry residue, the com-posting produces greater impacts regarding acidification potentialdue to a high emission of gaseous ammonia (Mendes et al., 2003).
G. De Feo, C. Malvano / Waste Management 29 (2009) 1901–1915 1913
As shown in Table 10, in environmentally sound terms, scenario10 (80%) prevailed over numbers 11 and 12 because of the sum ofnegative contributions of RDF production (�4901 E.I.) and RDFincineration (�1774 E.I.) which overcompensated for the low posi-tive terms of dry residue landfilling (+60 E.I). Globally, an equiva-lent contribution of 6615 inhabitants was avoided in scenario 10.While also in scenario 11 (80%S), the avoided impact due to thedry residue sorting (�5974 E.I.) outclassed the limited positive im-pact of the landfill disposal (+385 E.I.). Globally, an equivalent con-tribution of 5589 inhabitants was produced in scenario 11. Finally,the direct dry residue landfill disposal in scenario 12 produced animpact corresponding to 469 equivalent inhabitants. Since therewas a difference of only 9.1% between the avoided impacts of sce-narios 10 and 11, the presence or the absence of an incineratorplant is not as relevant for high percentages of separate collectionin terms of acidification. Emery et al. (2007) and Ozeler et al.(2006) obtained quite similar results.
3.9. Eutrophication
‘‘Eutrophication” is the enrichment of mineral salts and nutri-ents in marine or lake waters from natural processes and man-made activities such as farming (Emery et al., 2007). This includesabatement in a wastewater treatment plant. In Table 6, the resultswere normalised and expressed in terms of an equivalent numberof inhabitants (E.I.) based on their contribution of phosphorusemitted to the environment per person per year. In particular, aproduction of 13.05 kgeq. PO4/inhabitant/yr was assumed for anE.I. (Pricewaterhouse Coopers, 2006).
As shown in Table 6, all the MSW management scenariosconsidered gave negative results in terms of ‘‘Eutrophication”.Therefore, for each scenario there is avoided water pollution.Moreover, the highest percentage corresponded to the highestavoided impact. For this effect category, the most environmentallysound scenario was number 11 (80%S).
The following phases avoided impacts in terms of ‘‘Eutrophica-tion” (Table 9): all recycling contributions, dry residue selection,RDF production and incineration. In particular, ‘‘Paper CollectionRecycling” was the phase with the greatest avoided impact for eachimpact category and MSW management scenario developed (Table7). Moreover, the highest percentage corresponded to the highestreduction of eutrophication effects. In fact, since the life cycle forthe production of recycled paper is shorter than the correspondinglife cycle for the production of new paper, producing recycled papergenerates lower water pollution (Byström and Lönnstedt, 1997;EPA, 2007). On the other hand, the following phases had positiveimpacts (Table 9): collection logistics and landfilling, and compost-ing. In particular, ‘‘Dry Residue Collection Logistics” was the man-agement phase with the greatest produced impact for scenarios1–8, because for the corresponding level of separate collection,the transport of dry residue produces a valuable eutrophication ef-fect (Table 8). While, ‘‘Putrescibles Collection Disposal” was themanagement phase with the greatest produced impact for scenar-ios 9 and 10 and, finally, ‘‘Dry Residue Collection Disposal” wasthe management phase with the greatest produced impact for sce-narios 11 and 12. In fact, the disposal of putrescibles and dry resi-due determines the production of landfill leachate which isstrongly correlated to eutrophication effects.
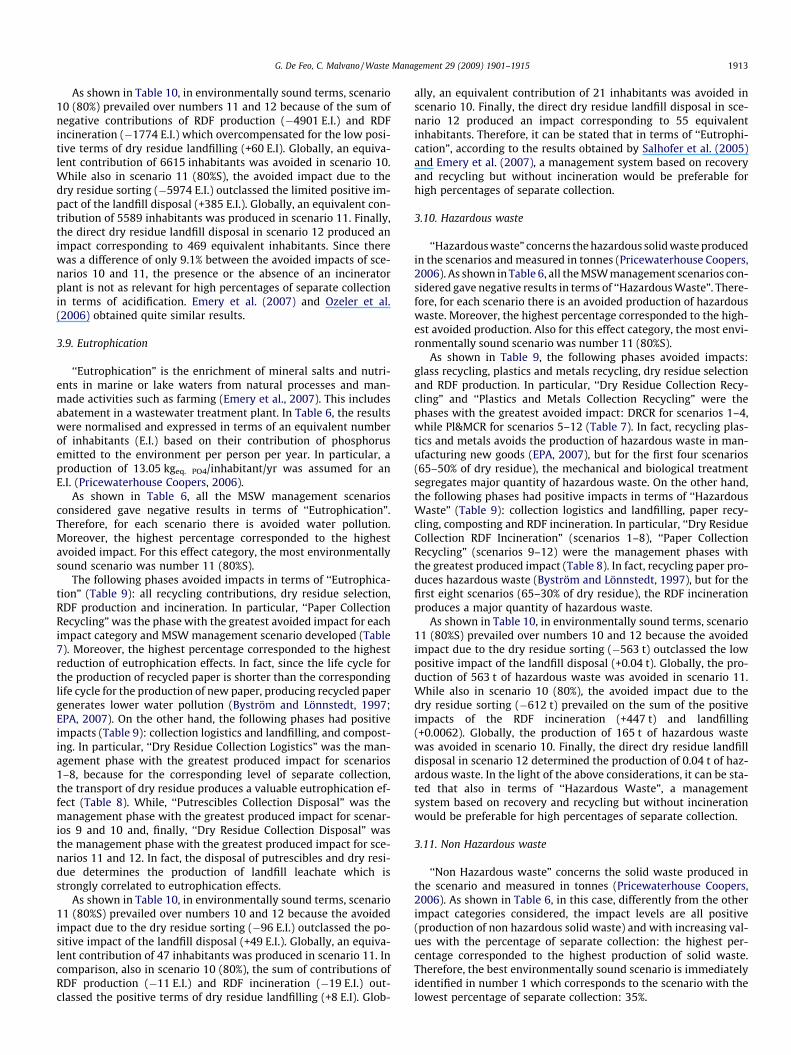
As shown in Table 10, in environmentally sound terms, scenario11 (80%S) prevailed over numbers 10 and 12 because the avoidedimpact due to the dry residue sorting (�96 E.I.) outclassed the po-sitive impact of the landfill disposal (+49 E.I.). Globally, an equiva-lent contribution of 47 inhabitants was produced in scenario 11. Incomparison, also in scenario 10 (80%), the sum of contributions ofRDF production (�11 E.I.) and RDF incineration (�19 E.I.) out-classed the positive terms of dry residue landfilling (+8 E.I). Glob-
ally, an equivalent contribution of 21 inhabitants was avoided inscenario 10. Finally, the direct dry residue landfill disposal in sce-nario 12 produced an impact corresponding to 55 equivalentinhabitants. Therefore, it can be stated that in terms of ‘‘Eutrophi-cation”, according to the results obtained by Salhofer et al. (2005)and Emery et al. (2007), a management system based on recoveryand recycling but without incineration would be preferable forhigh percentages of separate collection.
3.10. Hazardous waste
‘‘Hazardous waste” concerns the hazardous solid waste producedin the scenarios and measured in tonnes (Pricewaterhouse Coopers,2006). As shown in Table 6, all the MSW management scenarios con-sidered gave negative results in terms of ‘‘Hazardous Waste”. There-fore, for each scenario there is an avoided production of hazardouswaste. Moreover, the highest percentage corresponded to the high-est avoided production. Also for this effect category, the most envi-ronmentally sound scenario was number 11 (80%S).
As shown in Table 9, the following phases avoided impacts:glass recycling, plastics and metals recycling, dry residue selectionand RDF production. In particular, ‘‘Dry Residue Collection Recy-cling” and ‘‘Plastics and Metals Collection Recycling” were thephases with the greatest avoided impact: DRCR for scenarios 1–4,while Pl&MCR for scenarios 5–12 (Table 7). In fact, recycling plas-tics and metals avoids the production of hazardous waste in man-ufacturing new goods (EPA, 2007), but for the first four scenarios(65–50% of dry residue), the mechanical and biological treatmentsegregates major quantity of hazardous waste. On the other hand,the following phases had positive impacts in terms of ‘‘HazardousWaste” (Table 9): collection logistics and landfilling, paper recy-cling, composting and RDF incineration. In particular, ‘‘Dry ResidueCollection RDF Incineration” (scenarios 1–8), ‘‘Paper CollectionRecycling” (scenarios 9–12) were the management phases withthe greatest produced impact (Table 8). In fact, recycling paper pro-duces hazardous waste (Byström and Lönnstedt, 1997), but for thefirst eight scenarios (65–30% of dry residue), the RDF incinerationproduces a major quantity of hazardous waste.
As shown in Table 10, in environmentally sound terms, scenario11 (80%S) prevailed over numbers 10 and 12 because the avoidedimpact due to the dry residue sorting (�563 t) outclassed the lowpositive impact of the landfill disposal (+0.04 t). Globally, the pro-duction of 563 t of hazardous waste was avoided in scenario 11.While also in scenario 10 (80%), the avoided impact due to thedry residue sorting (�612 t) prevailed on the sum of the positiveimpacts of the RDF incineration (+447 t) and landfilling(+0.0062). Globally, the production of 165 t of hazardous wastewas avoided in scenario 10. Finally, the direct dry residue landfilldisposal in scenario 12 determined the production of 0.04 t of haz-ardous waste. In the light of the above considerations, it can be sta-ted that also in terms of ‘‘Hazardous Waste”, a managementsystem based on recovery and recycling but without incinerationwould be preferable for high percentages of separate collection.
3.11. Non Hazardous waste
‘‘Non Hazardous waste” concerns the solid waste produced inthe scenario and measured in tonnes (Pricewaterhouse Coopers,2006). As shown in Table 6, in this case, differently from the otherimpact categories considered, the impact levels are all positive(production of non hazardous solid waste) and with increasing val-ues with the percentage of separate collection: the highest per-centage corresponded to the highest production of solid waste.Therefore, the best environmentally sound scenario is immediatelyidentified in number 1 which corresponds to the scenario with thelowest percentage of separate collection: 35%.

1914 G. De Feo, C. Malvano / Waste Management 29 (2009) 1901–1915
The following phases avoided impacts in terms of ‘‘Non Haz-ardous Waste” (Table 9): glass recycling, composting, dry residueselection and RDF production. In particular, ‘‘Putrescibles Collec-tion Composting” was the phase with the greatest avoided impactfor each MSW management scenario developed (Table 7). In fact,the recovery of putrescibles for composting avoids that the great-est MSW component collected is directly landfilled. On the otherhand, the following were the phases with positive impacts (Table9): collection logistics and landfilling, paper recycling, plasticsand metals recycling, and RDF incineration. In particular, ‘‘DryResidue Collection Disposal” was the management phase withthe greatest produced impact for scenarios 1, 2, 11 and 12, while‘‘Putrescibles Collection Disposal” was the phase with the greatestproduced impact for scenarios 3–10 (Table 8). In fact, for the firstten scenarios, on the basis of the percentage production of dis-cards corresponding to the adopted MBT (15%, Table 4) and com-posting plant (48%, Table 3) as well as the separate collectionpercentages (Fig. 1), the MBT (RDF production) prevailed on thecomposting plant in terms of discards production for scenarios1 and 2. On the contrary for scenarios 3–10, the composting plantprevailed on the MBT. While in scenario 11, the adopted dry res-idue sorting plant was schematized as ‘‘Facility Dirty MRF” with85% of discards in landfill. Finally, in scenario 12, dry residue isdirectly landfilled.
As shown in Table 10, in environmentally sound terms, sce-nario 10 (80%) prevailed over number 11 and 12 because thesum of non-hazardous waste produced by RDF incineration(+190 t) and dry residue disposal (+3607 t) was partly compen-sated by the avoided impact in the production of RDF (�397 t).Globally, 3400 t of non-hazardous waste were produced in sce-nario 10. While in scenario 11 (80%S), the low avoided productionof non-hazardous waste of 147 t was dominated by the highwaste production for the dry residue landfilling (+18,424 t). Glob-ally, 19,893 t of non-hazardous waste were produced in scenario11. Finally, the direct dry residue landfill disposal in scenario 12produced 21,046 t of non-hazardous waste (not compensated byany other phase). Therefore, in terms of ‘‘Non Hazardous Waste”,the absence of an incinerator plant is not environmentally soundfor high percentages of separate collection.
4. Conclusions
The following particular outcomes based on the results ob-tained can be stated:
� Scenario number 11 (80% separate collection, no RDF incinera-tion, dry residue sorting) was the most environmentally soundoption for the following six impact categories: renewable energyuse, total energy use, water, suspended solids and oxydablematters index, eutrophication, and hazardous waste;
� Scenario number 10 (80% separate collection, RDF productionand incineration) was the most environmentally sound optionfor the following three impact categories: non-renewableenergy use, greenhouse gases, and acidification;
� Scenario number 1 (35% separate collection, RDF production andincineration) was the most environmentally sound option forthe following two impact categories: mineral and quarried mat-ters, and non-hazardous waste;
� For the following eight impact categories (of the eleven consid-ered), all the MSW management scenarios considered producednegative impacts, and the highest percentage of separate collec-tion corresponded to the highest avoided impact: RenewableEnergy Use, Non-Renewable Energy Use, Total Energy Use,Water, Suspended Solids and Oxydable Matters Index, Acidifi-cation, Eutrophication, and Hazardous Waste;
� For ‘‘Mineral and Quarried Matters” the MSW management sce-narios considered produced positive and negatives impacts, andthe highest percentage of separate collection corresponded tothe highest produced impact;
� For ‘‘Greenhouse Gases”, the MSW management scenarios con-sidered produced positive and negative impacts, and the highestpercentage of separate collection corresponded to the highestavoided impact;
� For ‘‘Non Hazardous Waste” all the MSW management scenariosconsidered produced positive impacts, and the highest percent-age of separate collection corresponded to the highest producedimpact;
� For the following six impact categories (of the eleven consid-ered), for high percentages of separate collection (80%), a man-agement system based on recovery and recycling but withoutincineration would be preferable: Renewable Energy Use, TotalEnergy Use, Water, Suspended Solids and Oxydable MattersIndex, Eutrophication and Hazardous Waste;
� ‘‘Paper Collection Recycling” was the system component withthe greatest avoided impact for 45.5% of the cases considered;
� ‘‘Dry Residue Collection Logistic” was the system componentwith the greatest produced for 54.5% of the cases considered.
The following outcomes on the LCA WISARD software tool canbe stated:
� WISARD tool gives a good indication of the environmental ben-efits of different waste management systems, as well as beingvery useful when comparing different alternatives;
� WISARD database is limited to the types of recovery facilitiesavailable, as well as the recycling processes available under eachrecovery category;
� WISARD is quite rigid, while a more general and flexible soft-ware tool with a broader database would be preferable.
Finally, the following general outcomes on LCA can be stated:
� LCA is a powerful tool when comparing the environmentalimpacts produced by several MSW management system understudy;
� One of the principal advantages of an LCA procedure is the pos-sibility to take into account the peculiarity of the geographicarea being studied, as well as the specific characteristics of thetreatment and disposal plants;
� Lack of required data can induce and arbitrarily force the assign-ing of values for some parameters, thus having a great influenceon the process.
Acknowledgments
The authors wish to thank the three anonymous referees fortheir precious suggestions as well as dr. Sacha A. Berardo for hisrevision.
References
Arena, U., Mastellone, M.L., Perugini, F., 2003. The environmental performance ofalternative solid waste management options: a life cycle assessment study.Chemical Engineering Journal 96, 207–222.
Azapagic, A., 1999. Life cycle assessment and its application to process selection,design and optimisation. Chemical Engineering Journal 73, 1–21.
Byström, S., Lönnstedt, L., 1997. Paper recycling: environmental and economicimpact. Resources, Conservation and Recycling 21, 109–127.
Craighill, A.L., Powell, J.C., 1996. Lifecycle assessment and economic evaluation ofrecycling: a case study. Resource, Conservation and Recycling 17, 75–96.
Curran, M.A., 1996. Environmental Life Cycle Assessment. McGraw-Hill, New-York,USA.

G. De Feo, C. Malvano / Waste Management 29 (2009) 1901–1915 1915
De Feo, G., Panza, D., Belgiorno, V., 2005. Public opinion and residents concerns,perception and attitudes toward MSW treatment and disposal plants. In:Proceedings of Sardinia 2005, Tenth International Waste Management andLandfill Symposium, CISA. Cagliari, Sardinia, Italy.
Emery, A., Davies, A., Griffiths, A., Williams, K., 2007. Environmental andeconomic modelling: a case study of municipal solid wastemanagement scenarios in wales. Resource, Conservation and Recycling49, 244–263.
EPA, 2006. Solid Waste Management and Greenhouse Gases. A Life-CycleAssessment of Emissions and Sinks, third ed. United States Environmentalprotection Agency, USA (September 2006).
EPA, 2007. Methodology for Estimating Municipal Solid Waste Recycling Benefits.United States Environmental Protection Agency, USA.
Eriksson, O., Carlsson Reich, M., Frostell, B., Bjorklund, A., Assefa, G., Sundqvist,J.O., Granath, J., Baky, A., Thyselius, L., 2005. Municipal solid wastemanagement from a systems perspective. Journal of Cleaner Production 13,241–252.
European Union, 2006. Directive 2006/12/EC of the European parliament and of thecouncil of 5 April 2006 on waste. Official Journal of the European Union27.4.2006, L114/9–L114/21.
Heilmann, A., Winkler, J., 2005. Influence of the source separation efficiencyof recyclable materials on the environmental performance of municipalwaste management systems. In: Proceedings of Sardinia 2005, TenthInternational Waste Management and Landfill Symposium, CISA. Cagliari,Sardinia, Italy.
Koneckny, K., Pennington, D.W., 2007. Life cycle thinking in waste management:summary of European commission’s Malta 2005 workshop and pilot studies.Waste Management 27, S92–S97.
Mendes, M.R., Aramaki, T., Hanaki, K., 2003. Assessment of the environmentalimpact of management measures for the biodegradable fraction of municipalsolid waste in Sao Paulo City. Waste Management 23, 403–409.
Mendes, M.R., Aramaki, T., Hanaki, K., 2004. Comparison of environmental impact ofincineration and landfilling in Sao Paulo City as determined by LCA. Resource,Conservation and Recycling 41, 47–63.
Morselli, L., Bartoli, M., Bertacchini, M., Brighetti, A., Luzi, J., Passarini, F., Masoni, P.,2005. Tools for evaluation of impact associated with MSW incineration: LCAand integrated environmental monitoring system. Waste Management 25, 191–196.
Ozeler, D., Yetis, U., Demirer, G.N., 2006. Life cycle assessment of municipal solidwaste management methods: Ankara case study. Environment International 32,405–411.
Pricewaterhouse Coopers, 2006. WISARD Reference Guide, version 3.7.Pricewaterhouse Coopers.
Rahardyan, B., Matsuto, T., Kakuta, Y., Tanaka, N., 2004. Residents’s concerns andattitudes towards solid waste management facilities. Waste Management 24,437–451.
Salhofer, S., Binner, E., Wassermann, G., 2005. Strategic environmental assessmentin waste management planning, an Austrian case study. In: Proceedings ofSardinia 2005, Tenth International Waste Management and LandfillSymposium, CISA. Cagliari, Sardinia, Italy.
Society of Environmental Toxicology and Chemistry (SETAC), 1996. Life CycleAssessment and Conceptually Related Programmes. SETAC-Europe WorkingGroup, CRP report, Brussels, Belgium.
Viotti, P., Marella, G., Leccese, M., Verde, K., 2005. Analysis of the environmentalperformance of the integrated MSW management in the district of Frosinone(Lazio) by means of LCA-Based software. In: Proceedings of Sardinia 2005, TenthInternational Waste Management and Landfill Symposium, CISA. Cagliari,Sardinia, Italy.
Wassermann, G., Binner, E., Mostbauer, P., Salhofer, S., 2005. Environmentalrelevance of landfills depending on different waste management strategies.In: Proceedings of Sardinia 2005, Tenth International Waste Management andLandfill Symposium, CISA. Cagliari, Sardinia, Italy.