Evaluation of Alternatives to Domestic Ion Exchange Water ...
Upload
khangminh22Category
view
1download
0
Use of LCA and design to study sustainablealternatives to plastic takeaway cutlery andcrockery
ANIRUDH MURALIDHARAN GAUTAMOutubro de 2017

Use of LCA and design to study sustainable alternatives to plastic takeaway cutlery and crockery
Anirudh Muralidharn Gautam
Dissertation submitted for graduation in the Masters in Sustainable Energies
Instituto Superior de Engenharia do Porto
Department of Mechanical Engineering
outubro de 2017


Master thesis for the completion of the second year of the
Masters in Sustainable Energies
Candidate: Anirudh Muralidharan Gautam, Nº1150077, [email protected]
Academic supervisor: Nídia Caetano
Co Supervisor: António Augusto Areosa Martins
Masters in Sustainable Energies
Department of Mechanical Engineering
outubro de 2017


v
Abstract
This thesis looks on alternatives to plastic takeaway cutlery and crockery from areca palm
and coconut tree by products. Most of the take away materials used today are made of plastic
that is disposed of upon single use. This presents a huge challenge in terms of waste
management and pollution. It is widely known that plastic is produced from polymers
generated by fossil oil that is explored from the soil and whose natural reserves are limited.
Due to its nature, it takes several hundred to thousand years to decompose plastics, releasing
toxic substances in the process.
This work focuses on reviving the methods and knowledge that existed in the southern and
central parts of the Indian subcontinent for producing sustainable goods used in everyday
life, aiming to make sustainable cutlery and crockery. The materials that are under study are
palm areca sheaths, coconut fibre, shells and banana fibres. A market analysis, design, life
cycle analysis and deeper research on the fabrication was made.
The life cycle analysis (LCA) was conducted from data obtained from the Eco invent v2
database. CML 2000 method was used to assess and compare the data. Existing data from
the database was considered to estimate the final impact through weighted averages. The
results show that the materials under study perform better than conventional plastic materials
with respect to emissions and other parameters. The main impact involved in the production
of the various products was found out to be transportation. When imported and produced in
bulk, costs and impacts of the suggested alternatives are lower than those of the conventional
products.
Comparing results for cardboard and palm areca boxes for example the Global warming
potential for the alternatives were 7.07E-02 compared to 11.2E-02 kg CO2 equivalent for
the conventional products. Similarly, when plastic plates and palm plates were compared
7.46E-08 and 4.62E-09 kg CFC 11 eq were the values for ozone layer depletion. Most other
results follow the same route which is a clear indication that most of our alternatives have a
good environmental performance for a lower or the same price

vi
Keywords
CML2000, crockery, cutlery, eco-friendly, LCA, sustainability

vii
Resumo:
Esta tese analisa as alternativas de talheres plásticos para uso doméstico e louças de
palmeiras areca e coqueiros por produtos. A maioria dos materiais removíveis utilizados hoje
são feitos de plástico que é descartado em uso único. Isso representa um enorme desafio em
termos de gerenciamento de resíduos e poluição. É amplamente conhecido que o plástico é
produzido a partir de polímeros gerados por óleo fóssil que é explorado a partir do solo e
cujas reservas naturais são limitadas. Devido à sua natureza, leva várias centenas a mil anos
para decompor os plásticos, liberando substâncias tóxicas no processo.
Este trabalho centra-se na revitalização dos métodos e conhecimentos que existiam nas
partes do Sul e central do subcontinente indiano para a produção de bens sustentáveis
utilizados no cotidiano, com o objetivo de fazer talheres e louças sustentáveis. Os materiais
que estão em estudo são bainhas de areca de palma, fibra de coco, conchas e fibras de banana.
Uma análise de mercado, design, análise do ciclo de vida e pesquisas mais profundas sobre
a fabricação foram feitas.
A análise do ciclo de vida (LCA) foi realizada a partir de dados obtidos do banco de dados
Eco invent v2. O método CML 2000 foi utilizado para avaliar e comparar os dados. Os dados
existentes do banco de dados foram considerados para estimar o impacto final através de
médias ponderadas. Os resultados mostram que os materiais em estudo são melhores que os
materiais plásticos convencionais em relação às emissões e outros parâmetros. O impacto
principal envolvido na produção dos vários produtos foi considerado transporte. Quando
importados e produzidos a granel, os custos e os impactos das alternativas sugeridas são
inferiores aos dos produtos convencionais.
Comparando resultados para caixas de papelão e caixas de palma, por exemplo, o potencial
de aquecimento global para as alternativas foi 7.07E-02 em comparação com 11.2E-02 kg
de equivalente de CO2 para os produtos convencionais. Da mesma forma, quando as placas
de plástico e as placas de palma foram comparadas, 7.46E-08 e 4.62E-09 kg CFC 11 eq
foram os valores para a depleção da camada de ozônio. A maioria dos outros resultados

viii
seguem a mesma rota, o que é uma indicação clara de que a maioria de nossas alternativas
tem um bom desempenho ambiental por um preço inferior ou igual
Palavras-Chave
ACV, CML2000, cutelaria, ecologico louça, sustentabilidade

ix
Declaration:
Anirudh Murildharan Gautam declares, on a commitment of honor, that this work is original and that all non-original contributions have been duly referenced, with identification of the sources
31 October 2017
Anirudh Muralidharan Gautam
Signature


xi
Index
ABSTRACT .............................................................................................................................................. V
RESUMO: ............................................................................................................................................. VII
DECLARATION:................................................................................................................................... IX
INDEX ..................................................................................................................................................... XI
INDEX OF FIGURES: ....................................................................................................................... XIII
INDEX OF TABLES ........................................................................................................................... XIII
NOMENCLATURE ........................................................................................................................... XVII
1. INTRODUCTION.......................................................................................................................... 1
1.1. OBJECTIVES ................................................................................................................................. 2 1.2. OUTLINE OF THE STUDY ............................................................................................................... 2 1.3. PHASES OF THE WORK .................................................................................................................. 3
2. RAW MATERIALS ....................................................................................................................... 5
2.1. ARECA CATECHU PALM ............................................................................................................... 5
2.2. COCONUT TREE ............................................................................................................................ 6
2.3. BANANA FIBERS ........................................................................................................................... 8
2.4. SAL TREE LEAVES ........................................................................................................................ 9
3. METHODS OF EXTRACTION AND PROCESSING ............................................................ 11
3.1. ARECA PALM PRODUCTS ............................................................................................................ 11
3.2. COCONUT COIR AND SHELLS ...................................................................................................... 12
3.2.1. EXISTING AGRICULTURAL PRACTICE.......................................................................................... 12
3.2.2. RETTING AND EXTRACTING THE FIBER ....................................................................................... 13 3.2.3. COCONUT SHELLS ...................................................................................................................... 15
3.3. BANANA FIBERS ........................................................................................................................ 15
3.4. SAL LEAVES ............................................................................................................................... 16
3.5. TRANSPORT, MARKETING AND STAKEHOLDER INVOLVED .......................................................... 17
4. DESIGN FOR THE CURRENT MARKET .............................................................................. 21
4.1. CONTAINERS AND WRAPS .......................................................................................................... 21
4.2. TAKE AWAY CUPS, PLATES AND BOWLS ..................................................................................... 22
4.3. COCONUT FIBER SPONGES .......................................................................................................... 23
5. LIFE CYCLE ASSESSMENT .................................................................................................... 25

xii
5.1. INTRODUCTION ........................................................................................................................... 25
5.2. GOAL OF THE STUDY .................................................................................................................. 26
5.3. SCOPE ......................................................................................................................................... 26
5.3.1. FUNCTIONAL UNIT ...................................................................................................................... 26
5.3.2. SYSTEM BOUNDARIES ................................................................................................................ 27 5.3.3. PROCESSES INCLUDED ................................................................................................................ 28
5.3.4. EXCLUDED PROCESSES ............................................................................................................... 29
5.3.5. DATA SOURCES .......................................................................................................................... 29
5.4. INVENTORY ANALYSIS ................................................................................................................ 30
5.4.1. PRIME MATERIAL EXTRACTION .................................................................................................. 30
5.4.2. TRANSPORTATION ...................................................................................................................... 30
5.4.3. PROCESSING ............................................................................................................................... 30
5.4.4. TRANSPORTATION AND SHIPPING ............................................................................................... 31
5.4.5. END OF LIFE CYCLE / DISPOSAL .................................................................................................. 31
5.4.6. ENERGY MIX ............................................................................................................................... 32
5.5. ENVIRONMENTAL IMPACT ASSESSMENT .................................................................................... 32
5.6. RESULTS ..................................................................................................................................... 33
5.7. COMPARISONS WITH COMMERCIALLY AVAILABLE PRODUCTS .................................................... 41
5.7.1. BOX COMPARISON ...................................................................................................................... 39
5.7.2. COMPARISONS WITH WRAPPING MATERIALS .............................................................................. 40
5.7.3. COMPARISONS WITH PLATES ...................................................................................................... 41
6. BUSINESS PLAN ......................................................................................................................... 43
6.1. INTRODUCTION ........................................................................................................................... 43
6.1.1. INNOVATION............................................................................................................................... 44
6.2. WHAT MAKES A PRODUCT A HIT? ............................................................................................... 45
6.2.1. WHY MOST NEW PRODCUTS FAIL? .............................................................................................. 45
6.2.2. WHAT MAKES OUR PRODUCTS A SMASH HIT ............................................................................... 46
6.3. MARKTET AND CROSSING THE CHASM ........................................................................................ 47
6.4. OPERATIONS AND MAINTAINING SUCCESS .................................................................................. 50
6.4.1. PRICE COMPARISONS PER FUNCTIONAL UNIT (ONE TON) ............................................................ 52
6.5. CONCLUSION OF THE BUSINESS STUDY ....................................................................................... 54
7. CONCLUSION ............................................................................................................................. 55
REFERENCES ........................................................................................................................................ 60
ANNEX A. ECO INVENT DATA......................................................................................................... 61
ANNEX B. CALCULATIONS AND RESULTS ..................................................................................65

xiii
Index of Figures:
Figure 1 - An Areca nut plantation in Kerala India, 2008. Image source Wikipedia, Areca catechu 6
Figure 2 - Coconut husks near a plantation. Image from www.palmpringusa.com ........................... 7
Figure 3 - Banana stem fiber being dried inside a plantation. Image credits bananafibereg.com ...... 8
Figure 4 - A man collecting Sal leaves inside a Sal forest. Image by Somennath Mukhopadhyay in
the world forestry congress 2015 ............................................................................................. 10
Figure 5 - (a) Areca nut sheath bundles near a plantation (b) Sheaths being processed .................. 12
Figure 6 - (a) A worker extracting coconuts. Image credits: stabroeknews.com (b) Coconuts being
dehusked. (c) Retting of coconuts in water. Image credits (b),(c): Alarmy stock photos ........ 13
Figure 7 - (a) Extracted and bundled coir (b) coir being spun into ropes (c) coir ropes of different
dimensions ................................................................................................................................ 14
Figure 8 - (a) Coconut shells being polished, image credits: http://www.dsource.in (b) Polished
shells, Image credits: https://www.pipii.co.uk ......................................................................... 15
Figure 9 - A sheet of banana paper. Image credits: www.techxlab.org ........................................... 16
Figure 10 - (a) Sal leaves being picked by a woman. Image credits: Flickriver (b) Bundled Sal leaves.
Image credits: tasteofnepal.blogspot.pt (2012/03) (c) Leaves being stitched: Image credits:
www.premagnetos.com ............................................................................................................ 16
Figure 11 - Sal leaf plates packed and ready for shipping. Image credits: tasteofnepal.blogspot.pt
(2012/03) .................................................................................................................................. 17
Figure 12 - Product logistical chain. ................................................................................................ 18
Figure 13 - Stake holder model from Tamul a palm plate company, Image credits: 2013 SEED
Winner – India. Seed case studies: Insights into entrepreneurial solutions for sustainable
development ............................................................................................................................. 19
Figure 14 - (a) Burger box /box from Palm areca (b) A cone from palm areca ............................... 22
Figure 15 - Palm Areca container .................................................................................................... 22
Figure 16 - (a) model for a palm areca cup (b) Finished plates and containers ............................... 23
Figure 17 - (a) Sal leaf cup design (b) Coconut cup design ............................................................. 23
Figure 18 - Design of the coconut fiber sponge ............................................................................... 24
Figure 19 - System boundaries (simplified) ..................................................................................... 27
Figure 20 - Electricity energy mix of Tamil Nadu from the Power for All publication 2016 ......... 32
Figure 21 – Environmental impacts for each life cycle stage for coconut coir ropes ...................... 34
Figure 22 - Environmental impacts for each life cycle stage for palm areca plates ......................... 35
Figure 23 - Environmental impacts for each life cycle stage for palm areca bowls ......................... 35
Figure 24 - Environmental impacts for each life cycle stage for coconut choir sponges ................. 35
Figure 25 - Environmental impacts for each life cycle stage for banana sheets .............................. 36
Figure 26 - Environmental impacts for each life cycle stage for coconut shell cups ....................... 36

xiv
Figure 27 - Environmental impacts for each life cycle stage for coconut bowls ............................. 37
Figure 28 - Comparisons between palm areca boxes and cardboard boxes with plastic film. ......... 39
Figure 29 - Comparisons between polished magazine paper, Sal leaf wraps and banana sheets for
wrapping ................................................................................................................................... 40
Figure 30 - Comparisons between palm areca plates and plastic plates ........................................... 41
Figure 31 - Disruption factor model ................................................................................................. 44
Figure 32 - The 9x effect explained by Gourville in Eager Sellers and Stony Buyers: Understanding
the Psychology of New-Product Adoption. Harvard Business review, JUNE 2006 ................ 45
Figure 33 - Gourville’s Behavioral framework from Eager Sellers and Stony Buyers: Understanding
the Psychology of New-Product Adoption. Harvard Business review, JUNE 2006 ................ 46
Figure 34 - Moore’s representation of the product adoption cycle from his book, Crossing the Chasm
2001. ......................................................................................................................................... 47
Figure 35 - A graphical version of crossing the chasm by Moore in his book, Crossing the Chasm,
2001 .......................................................................................................................................... 48
Figure 36 - Illustration of the methods of operation when launching a product, by Andrew, J.R. and
Sirkin, H.L. in the Harvard Business Review, from the September 2003 edition. ................... 51
Figure 37 - The impact of the bottom level disruption in the consumer pyramid as described by
Christiansen in The Great Leap: Driving Innovation from the Base of the Pyramid. MIT Sloan
Management Review 2002 ....................................................................................................... 52
Figure 38 – Impact factor for 1 kg plastic wrapping, ....................................................................... 62
Figure 39 – Impact factor for 1 kWh of electricity using nuclear power. ........................................ 62
Figure 40 – Impact factor for 1 kWh of electricity using wind power. ............................................ 62
Figure 41 – Impact factor for 1 kWh of electricity using lignite. ..................................................... 62
Figure 42 – Impact factor for 1 kWh of electricity using biomass. .................................................. 63
Figure 43 – Impact factor for 1 kWh of electricity using hydroelectric power plants. .................... 63
Figure 44 – Impact factor for 1 kWh of electricity using natural gas. ............................................. 63
Figure 45 – Impact factor for 1 kWh of electricity using landfill gas. ............................................. 63
Figure 46 – Impact factor for 1 kWh of electricity using photovoltaic systems. ............................. 64
Figure 47 – Impact factor for 1 kg of waste incinerated. ................................................................. 64
Figure 48 – Impact factor for transportation using a van, expressed in tkm, tones per km. ............. 64
Figure 49 – Impact factor for transportation, expressed in tkm, tones per km. ................................ 64

xv
Index of Tables
Table 1 - Number of elements corresponding to the functional unit chosen in this work ................ 27
Table 2 - Impact values of the various materials considered.............................................................39
Table 3 - Cost of manufacturing and the retail price of existing market .......................................... 53
Table 4 - Calcluations for the impact of electricity per kW ............................................................. 65
Table 5 - Continuation of the calucation of the impact of electricity per kW .................................. 66
Table 6 - Number of boxes ............................................................................................................... 67
Table 7 - Complied primary data for the product ............................................................................. 68
Table 8 - Price calculation for the products.......................................................................................66
Table 9 - Investment cost to set up the company...............................................................................67


xvii
Nomenclature
A.D.
Approx
B.C.
–
–
–
Anno Domini
Approximate
Before Christ
Cm
eq
INR
ml.
–
–
–
–
Centimetres
Equivalent
Indian National Rupees
Millilitres
MW
kg
km
–
–
–
Megawatts
Kilograms
Kilometres
kW
N.A.
–
–
Kilowatts
Data Not available


1
1. Introduction
The last few decades have seen the plastic industry take us by storm, and nowadays most of
the products and food consumed use plastic packaging. One of the most important examples
is the take away and the disposable cutlery and crockery industry.
McDonalds serves more than 3.8 million customers per day in the UK, corresponding to the
consumption of millions of burger boxes and disposable cups and wraps in the UK every
day 1]. When the whole world is considered, several millions of containers are being used
and disposed every day. Most plastic is non-biodegradable and its improper utilization and
disposal can be dangerous to the environment and result in adverse human health issues [2].
As an example, currently very small particles of plastics of various types, microplastics, are
accumulating in the oceans, already having a significant impact in wild life and potentially
in human health through fish consumption. The problem is particularly acute in the North
Pacific, as it is surrounded by heavily industrialized countries (China, US and Japan) [2]. It
is estimated that Americans throw away 25 billion Styrofoam coffee cups every year, and
2.5 million plastic beverage bottles every hour [3], most of them non-biodegradable and hard
to recycle. Moreover, the plastic cutlery is also a problem of similar magnitude. According
to the Clean Air Council [4], the amount of paper and plastic utensils that are thrown away
every year is enough to circle the equator 300 times. Circa 40 billion individual plastic
utensils, representing 14 and 18 billion plastic spoons are estimated to be produced every

2
year [4]. It is estimated that 64 billion paper and 73 billion Styrofoam & plastic cups and
plates were thrown away in 2003 in the USA, whereas single-use food/drink containers are
estimated at about 140,000 each second [5].
A few decades back, in southern India plastic was rarely used, people were using natural
products that were sustainable and had minimal environmental impact. This thesis aims to
analyse how the environmental performance of products from the disposable cutlery and
crockery industry can be improved by using renewable materials, biomass, waste materials
native to South India. Both the fabrication and the design of the new products will be
considered, and their environmental impacts will be assessed using the Life Cycle
Assessment (LCA) methodology The products analysed are mostly disposable cutlery
namely plates, take away containers, cups and other crockery.
1.1. Objectives
The main objectives of this work are to analyse the utilization of new raw materials, in
particular biomass, to produce cutlery and crockery disposable products that should have
lower environmental impact when compared to existing options, mainly based in plastic.
This study comprehends performing a life cycle analysis of the products, to quantify its
environmental performances and factors. The study allows to compare the life cycle impacts
from conventional products and the suggested alternative materials, showing that the
materials suggested have a better environmental performance than the conventional
materials. Consequently, it is presented and discussed a business plan on how to sell this
product in existing market conditions dominated by plastic products. The business plan is
mainly focused on replacing plastic containers from the takeaway and the home supplies
industries.
1.2. Outline of the study
To fulfil the objectives of the thesis, it was planned a series of activities that will be briefly
described before presenting the work.
An overview into the material that is suggested as alternatives: A basic outline of the
tree or plant from which the material is extracted, why and where the plant / tree is gown,
what is the main product from the plant or tree (chapter 2);
How the goods have been produced and used: This section deals with how the materials
were fabricated traditionally using both traditional and modern methods. It also dives into

3
how much can be produced per day in a small production center (chapter 3);
Possible designs with the materials discussed: This part provides certain designs that
are existing in the market for conventional products and applies them to the products from
the alternative materials discussed specifically for the take away and the home supplies
industry (chapter 4);
Life cycle approach: The life cycle approach gives a detailed insight into the impact
caused by each activity involved in the production process and assuming that the product
would be sold in Portugal. Data sets from the Eco Invent 2.1 Database and the CML2000
method was used for assessing the impacts. This section will later compare the results
from similar studies made for conventional plastic materials with the impacts that were
calculated for the alternative materials suggested (chapter 5);
Business plan: This section discusses how to device a business plan to sell this product
initially in Europe, especially Portugal, with the existing market conditions and hurdles.
Several products and studies from prominent economists were applied in this section
(chapter 6);
Conclusions: This section presents the main conclusions of this work (Chapter 7).
The following materials were considered:
• Palm areca (Areca catechu) sheaths;
• Sal (Shorea robusta) leaves;
• Coconut (Cocos nucifera) shells and fibre;
• Banana (genus Musa in particular Musa Acuminata) fibers.
1.3. Phases of the work
The realization of the objectives led to the following phases of work. This includes a set of
tasks; these are defined principally in several phases:
Creating Links: Establishing connections with companies and self-help groups,
obtaining links and information, taking an average of all information required;
Methodology and design: Obtaining information on the methods currently practiced
for manufacturing, establishing a middle ground for the information, contacting

4
designers for information and ideas and making simple designs for the new versions
of the products;
Life cycle analysis: Collecting data from the database. Obtaining secondary data from
organizations. Calculations for impact analysis and comparisons;
Business analysis: Case studies, brainstorming. Documenting the methods and ideas;
Documentation: Documenting all the above steps

5
2. Raw Materials
There are several materials that were discussed to produce sustainable cutlery and crockery;
they are the following: Palm areca sheaths and leaves, Sal leaves and coconut shells, fibres
and banana fibres. The origins of the materials are discussed below.
2.1. Areca Catechu palm
Areca, Areca Catechu, is derived from a local name from the Malabar Coast of India and
catechu is from another Malay name for this palm. Areca is an erect, unbranched palm
reaching heights of 12-30 m, depending upon the environmental conditions. The stem,
marked with scars of fallen leaves in a regular annulated form, becomes visible only when
the palm is about 3 years old. Girth depends on genetic variation and soil conditions. The
adult palm has 7-12 open leaves, each with a sheath, a rachis and leaflets. The leaf stalk
extends as the midrib until the end of the leaf and ends as leaflets [6]. The beetle nut palm
tree of the Areca nut family is generally cultivated in the south of India to produce betel nuts.
The seed of the betel palm (Areca catechu), is one of the most widely used materials in areas
of the western Pacific and parts of Africa and Asia. It is prepared with other substances as a
mixture for chewing and is used as a mild stimulant by more than 200 million people [7].
References to the betel nut appear in ancient Greek, Sanskrit, and Chinese texts from 100
B.C. Its prevalence in Persia by 600 A.D. is documented by Persian historians. Its use in

6
different parts of the Arab world by the eighth and ninth centuries is also well documented,
and it had become an important aspect of the economy and social life in India, Malaysia, the
Philippines, and New Guinea. Betel was brought to Europe by Marco Polo, around 1300, it
soon proved to be an important commodity in the western Pacific and a source of tax revenue
for the Dutch in the mid-1600s. It is commonly consumed as a food product in the southern
peninsula of the Indian subcontinent [8].
Figure 1 presents a photograph of an Areca Palm plantation. The trees are mainly cultivated
for beetle nut production. The rough part of the leaves is used for making slipper soles, hats
and as pulp for paper. The sheath that covers those leaves are extracted and used as a base
for making several products like bags, plates, cups and wrapping. The sheath is attached to
the leaves, once collected they are generally dried in shade to remove excess moisture and
sent for processing [7].
Figure 1 - An Areca nut plantation in Kerala India, 2008. Image source Wikipedia, Areca
catechu
This process of extraction from the plantations would be more sustainable if the resulting
wastes could be used as a raw material in other processes. To make the process more
sustainable, one could use the method of cultivating areca palms using permaculture. The
common price for one sheath (dried) is around 0.02 Euro and a plate 0.07 Euros.
2.2. Coconut tree
The coconut tree (Cocos nucifera) is a member of the family Arecaceae (palm family) and
the only species of the genus Cocos [9]. The term coconut can refer to the whole coconut
palm or just the fruit. India is one of the major world coconut producers, producing 11.1

7
million tons a year. Traditional areas of coconut cultivation in India are the states of Kerala,
Tamil Nadu, Karnataka, Puducherry, Andhra Pradesh, Goa, Maharashtra, Odisha, and West
Bengal, and the islands of Lakshadweep and Andaman and Nicobar. As per 2014-15
statistics from Coconut Development Board of Government of India, four southern states
combined account for almost 90% of the total production in the country: Tamil Nadu
(33.84%), Karnataka (25.15%), Kerala (23.96%), and Andhra Pradesh (7.16%) [10]. This
situation represents a huge potential in terms of harnessing the secondary material as raw
materials to obtain other products or even to generate energy. Figure 2 gives an idea of the
quantity of coconut residues, in this cases husks resulting from the process of obtaining the
coconut shells, where it is visible the large amount that are generated.
Figure 2 - Coconut husks near a plantation. Image from www.palmpringusa.com
Coir (also known as “Kokos” or “Coco”) is a natural seed-hair fibre obtained from the outer
shell (endocarp), or husk, of the coconut, extensively grown in tropical countries. Coir yarn
has been produced in the coastal belt of Kerala from ancient, but the first coir factory for the
manufacture of coir products was established in Kerala during 1858. Coir or coconut fibre
belongs to the group of hard structural fibres and is lignocellulosic [11].
The fibres extracted directly from the dried husks are rough and can be used as ropes for
domestic and some commercial use. The fibre extracted through the retting process can be
used for mattresses and other products such as mats, carpets and sponges for cleaning
through coarse and smooth fibres. The coconut is generally dehusked before export or being
used in most cases. The shell of the coconut is also used in making bowls, ladles and other
simple day to day products. Additional materials can be obtained from fallen coconut leaves.

8
Some applications include the construction of temporary shelters, and the hard part of the
leaf can be used for making broomsticks, cases, buttons and other similar products. Since
most of the products that we discuss about would end up in trash, the products would only
involve labor costs. A kilogram of retted coir costs nearly INR 8. Coconut shells cost close
to INR 1000 per tonne.
2.3. Banana fibers
The banana plant is the largest herbaceous flowering plant. The banana is an edible fruit –
botanically a berry produced by several kinds of large herbaceous flowering plants in the
genus Musa. All the above-ground parts of a banana plant grow from a structure usually
called a "corm”. What appears to be a trunk is a "false stem" or pseudo stem. The base of
the petiole widens to form a sheath; the tightly packed sheaths make up the pseudo stem,
which is all that supports the plant. The edges of the sheath meet when it is first produced,
making it tubular. As new growth occurs in the centre of the pseudo stem, the edges are
forced apart [12]. Figure 3 shows a typical banana plantation, where it is possible to observe
banana stems drying for further utilization as raw materials.
Figure 3 - Banana stem fiber being dried inside a plantation. Image credits bananafibereg.com
India leads the world in terms of banana production, with around 18% of the worldwide crop
of 139 million metric tons (2012). Maharashtra and Tamil Nadu are the leading banana
producing states. Although about 500,000 hectares are under banana cultivation, only 10%
of the banana stem waste is used. Typically, in banana cultivation, the stems of the plants
are chopped off and thrown away once the fruits are sold. These wasted stems typically lay
around in the farm, and clearing them from the land would cost a farmer about INR 3000 on
average. If farmers decide to supply banana stems to these fiber processing units, they would

9
not only clear waste without any cost, but also would sell them as it represents an extra
revenue source. They can set up a small-scale unit at a cost of INR 110,000, that would
employ a few semi-skilled workers [13]. The banana leaf is waterproof and has been used
for serving food, packing food, takeaway for several decades in South India because it
imparts flavor. Both fresh and dried banana leaves are used for takeaway food. The stem of
the banana plant is usually consumed in the states of Tamil Nadu and Kerala (South India),
but the outer part is thrown away. Retting of the other part of the stem through chemical or
mechanical methods can result in extraction of the fibers of the banana plants that could be
used as an alternative to even clothing and the packing industry. The fibers could also be
redesigned to use other materials for the making of several packings and take away materials.
The fiber could be processed to make take away cases and even packing materials by
extracting and compressing the fiber of the material.
2.4. Sal tree leaves
Sal (Shorea robusta) forests cover over 11 million hectares in India, Nepal and Bangladesh,
and these forests are conventionally managed for timber. Recently, interest in producing
multiple products from Sal forests has increased. Thus, a silvicultural regime for managing
Sal forest for multiple products is currently an important issue [14].
It is evident that Sal forests have the potential to yield other forest products too. A Sal tree,
in addition to timber and fuelwood, produces fodder, leaves for plates, seed for oil, resin or
latex from heartwood, and tannin and gum from bark. Besides, other plants species
commonly found in Sal forests are known to produce edible fruits, fodder and compost,
fibres, leaves for umbrellas, medicinal plants, thatch, grass, brooms and many other
products. The Sal tree has been cultivated in India for commercial purposes as it makes good
timber wood. About 30 percent of all the forest land are Sal trees. Apart from this, the Sal
trees also have tannin in their barks that can be used for tanning. Sal leaf products have been
one of the most important commodities of the tribal communities in the east and midlands
of India [14].
Sal seeds also have oil which has been used for both commercial and industrial uses. The
Sal leaf plate and bowls production was mainly restricted to the small communities, but the
industry started to boom in the late eighties when developers from Bengal came in and
started to commercialize the process. This has given a lifeline to the landless and

10
marginalized tribal communities. Only the matured leaves are collected, hence making the
process more sustainable, as shown in Figure 4. There are several stakeholders when it
comes to analysing or mapping the process, with the leaf collectors being the primary
stakeholders [14].
Figure 4 - A man collecting Sal leaves inside a Sal forest. Image by Somennath Mukhopadhyay
in the world forestry congress 2015
The model that is currently adopted follows the example of financial, social and
environmental sustainability. The issues currently are that there are middle men involved,
who earn more money in the process, and there is no middle ground for the tribal families to
earn more money.
11
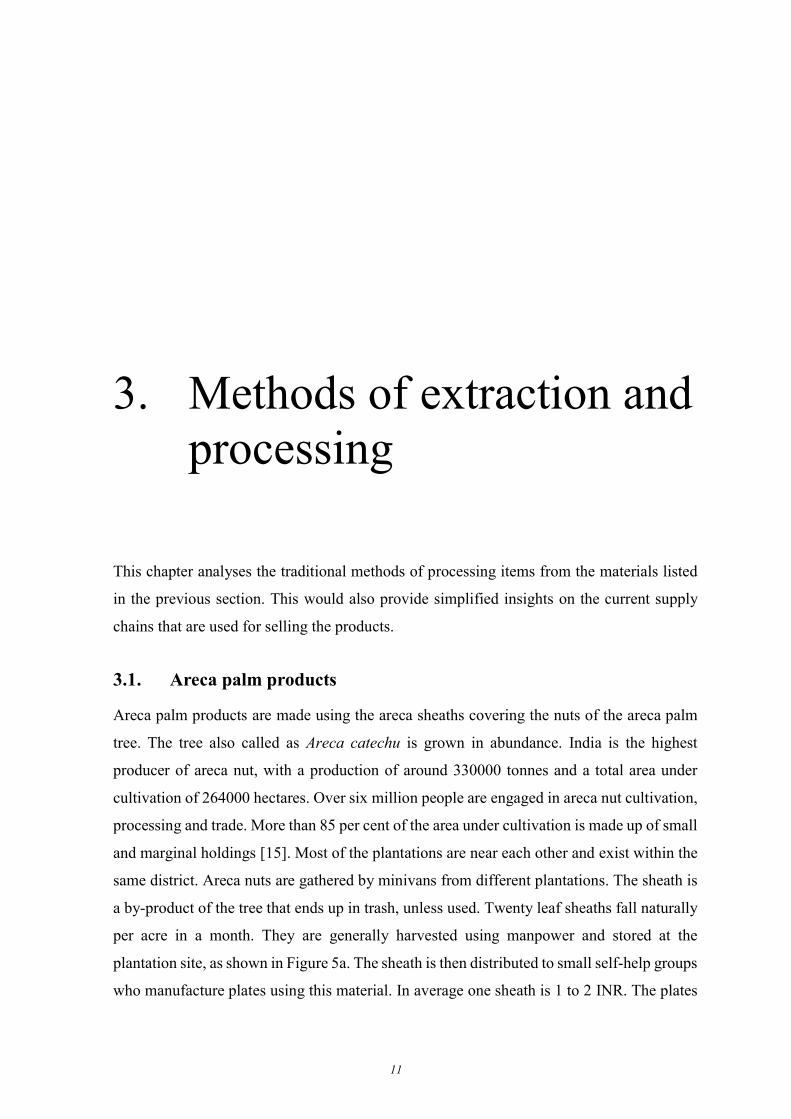
3. Methods of extraction and processing
This chapter analyses the traditional methods of processing items from the materials listed
in the previous section. This would also provide simplified insights on the current supply
chains that are used for selling the products.
3.1. Areca palm products
Areca palm products are made using the areca sheaths covering the nuts of the areca palm
tree. The tree also called as Areca catechu is grown in abundance. India is the highest
producer of areca nut, with a production of around 330000 tonnes and a total area under
cultivation of 264000 hectares. Over six million people are engaged in areca nut cultivation,
processing and trade. More than 85 per cent of the area under cultivation is made up of small
and marginal holdings [15]. Most of the plantations are near each other and exist within the
same district. Areca nuts are gathered by minivans from different plantations. The sheath is
a by-product of the tree that ends up in trash, unless used. Twenty leaf sheaths fall naturally
per acre in a month. They are generally harvested using manpower and stored at the
plantation site, as shown in Figure 5a. The sheath is then distributed to small self-help groups
who manufacture plates using this material. In average one sheath is 1 to 2 INR. The plates

12
are manufactured using a manually controlled mechanical press. Initially, the plates are
soaked in water for a few hours to increase the flexibility without breaking or damaging the
material. Then they are pressed using a mechanical press with minimal heat of about 55 to
85 degrees. They can be pressed either manually or automatically (hydraulic), as shown in
Figure 5b. The machines have a power range from 3 to 8 kW.
(a) (b)
Figure 5 - (a) Areca nut sheath bundles near a plantation (b) Sheaths being processed
The shapes of the product depend on the shape of the pressing mold. The machines can
produce up to 5000 to 8000 plates in a day. They are then dried under the sun. The end
products are sold for about 3 to 5 INR in retail. They are packed in plastic wraps, and
transported in boxes tied with coconut fibre ropes. The plates, if kept in a dry and clean place
with no influence of moisture, can last from 12 to 18 months.
3.2. Coconut coir and shells
India is one of the leading coconut producers in the world, producing around 13 billion nuts
per annum with a cultivation area of 1.91 million hectares [16]. Coconut is mostly cultivated
in the coastal regions of the country. The overall production rate is increasing with an
increase of around 25 % in the last decade. India accounts for 22.34 % of the world’s coconut
production and is one of the major players in the world’s coconut trade.
3.2.1. Existing agricultural practice
As ripened coconuts fall from the tree, they may simply be picked up from the ground. The
outer layers covering the coconut seed are processed and spun into fibers, commonly known
as coir. Coconuts still clinging to the 40-100 feet (12-30 meters) tall trees are harvested by

13
human climbers. If the climber picks the fruit by hand, he can harvest fruits from about 25
trees in a day. If the climber uses a bamboo pole with a knife attached to the end to reach
through the treetop vegetation and cut selected coconuts loose, he can harvest 250 trees per
day. Figure 6a shows the pole harvesting method.
Ripe coconuts are husked immediately, but unripe coconuts may be seasoned for a month
by spreading them in a single layer on the ground and keeping them dry. To remove the fruit
from the seed, the coconut is impaled on a steel-tipped spike to split the husk, as shown in
Figure 6b. The pulp layer is easily peeled off. A skilled husker can manually split and peel
about 2,000 coconuts per day. Modern husking machines can process 2,000 coconuts per
hour. Coconuts can be mechanically extracted to produce low quality fibre that is drawn and
then used to make ropes for several purposes. High quality fibres are used for producing
many fibres based products items. High quality fibres require the coconut fibres to be retted
before they are extracted from the skin [17-19].
(a) (b) (c)
Figure 6 - (a) A worker extracting coconuts. Image credits: stabroeknews.com (b) Coconuts
being dehusked. (c) Retting of coconuts in water. Image credits (b),(c): Alarmy stock photos
3.2.2. Retting and extracting the fiber
Extracted coconuts are generally dehusked, the husks are then immersed in salt water pits or
backwaters in nets tied with stones, as shown in Figure 6c. They are left to rest for a period
of 6 to 8 months for the bristles of husk to soften. Traditionally, workers beat the retted pulp
with wooden mallets to separate the fibres from the pith and the outer skin. In recent years,
motorized machines with flat beater arms operating inside steel drums are being increasingly
used. Separation of the bristle fibres is accomplished by hand or in a machine consisting of
a rotating drum fitted with steel spikes.

14
Retting is a curing process during which the husks are kept in an environment that
encourages the action of naturally occurring microbes. This action partially decomposes the
husk's pulp, allowing it to be separated into coir fibres and a residue called coir pith.
Freshwater retting is used for fully ripe coconut husks, and saltwater retting is used for green
husks. Immature husks can be dry milled without any retting. After passing through the
crushing machine, these green husks need only be dampened with water or soaked one to
two days before proceeding to the defibring step. Dry milling produces only mattress fibre.
Separation of the mattress fibres from the pith is completed by washing the residue from the
defibring process, and combing it by hand or tumbling it in a perforated drum or sieve. The
clean fibres are spread loosely on the ground to dry in the sun; bristle fibers that will not
immediately be further processed are rolled and tied into loose bundles for storage or
shipment. More mechanized producers may use a hydraulic press to create compact bales.
Similarly, mattress fibres and sponges may simply be baled with a hydraulic press. Figure 7
presents some of the steps of coir extraction and bundling process.
(a) (b) (c)
Figure 7 - (a) Extracted and bundled coir (b) coir being spun into ropes (c) coir ropes of
different dimensions
The fibres are combed with mechanical or manual carding tools, then loosely twisted into a
thick yarn (wick), and wound into bundles. Later, the wick can be re-spun into a finer yarn.
Techniques vary from simple hand spinning to the use of a hand-operated spinning wheel,
or a fully automated spinning machine. Depending on its intended final use, the yarn may be
shipped to customers, or multiple strands may be twisted into twine and bundled for
shipment. Both traditional manual and mechanical techniques are used to braid twine into

15
rope and to weave yarn into mats or nets. For some uses, such as upholstery padding, bristle
fibre is loosely spun into yarn and allowed to rest. Then the fibres, which have become curly,
are separated [17-19].
3.2.3. Coconut shells
Coconut shell cups have been traditionally used in the southern part of India and other south
Asian countries. Most of the shells are discarded, but traditionally these outer shells can be
used for making containers that could be used more than once. Once the copra or the white
part of the coconuts is extracted the shells can be used to make other products. Initially, the
outer part of the shell is soaked in water for a few hours. Once soaked the shells are taken
and then scrubbed with an abrasive material / sand / silica paper to remove the fibrous parts,
as shown in Figure 8. The soaking and scrubbing process is repeated until the rough parts of
the coconut shells are removed, and the rough edges are cut. The most common and
traditional usage for the shells is as bowls and cups.
(a) (b)
Figure 8 - (a) Coconut shells being polished, image credits: http://www.dsource.in (b) Polished
shells, Image credits: https://www.pipii.co.uk
3.3. Banana Fibers
The knowledge of extracting fibre and paper from banana is well known since the 13th
Century when Japanese started to process it for various uses [20]. However, it was a time-
consuming and costly process.

16
The stem is extracted by hand and then cut into halves. These sliced stem pieces are then
machined on fixed platforms that cut the stems into smaller pieces. The shredded pieces are
then cleaned and sun dried. Sodium hydroxide is then used while boiling the dried and cut
banana stem pieces. After they are strained and washed with more water, they are then
blended and mixed with a little water. This is then taken up on a mesh and left in the sun to
dry. Once dried, the banana paper production is complemented. An example of the finished
product is presented in Figure 9 [21].
Figure 9 - A sheet of banana paper. Image credits: www.techxlab.org
3.4. Sal leaves
The harvesting of the Sal leaves involves mainly the families of the tribes who live in and
around the forests, who collect the leaves during the picking season, as shown in Figure 10a.
One person can pick about 3000 leaves in 4 to 6 hours. Cutting the tree is prohibited. It takes
about four to 6 hours per day to collect the leaves to make the plates until 2 pm during the
afternoon next day. The peak season is from May to July for collecting the leaves. The leaves
that are collected are then sorted out in village from afternoon until the evening. They are
then stitched with cotton or coconut fiber using a sewing machine or stitched using a dried
thick blades of forest grass, as shown in Figure 10a, b and c.
(a) (b) (c)
Figure 10 - (a) Sal leaves being picked by a woman. Image credits: Flickriver (b) Bundled Sal
leaves. Image credits: tasteofnepal.blogspot.pt (2012/03) (c) Leaves being stitched: Image
credits: www.premagnetos.com

17
Then the plates that are made are left to dry in the process for the next few days under the
sun with a weight in the process. The dried plates are generally bundled into groups of
hundreds and then they are packed. These are half processed in this stage, they could be
used further for pressing or they are used for wrapping or as flat plates as such. They can
also be stitched to form cups, as shown in Figure 10c. The packed plates are then pressed.
In the pressing units, sizably cut polyethylene sheets are placed in between two stitched
plates. It is put under a manually or automatically operated heating die, heated through an
electric presser of low consumption. Due to the heat, the leaves take up the form of the die.
The heated die also serves as a disinfecting agent and makes them more hygienic to use. The
pressed units are then cooled and bundled. If the un pressed plates are not used for a long
time, they tend to dry out. They are then soaked in water for a few hours before they are
pressed. The machines can take up different types of sizes and shapes as per the order’s and
the customer’s wishes. The plates are generally 10 to 14 inches in diameter. In a similar way,
there are cups that are made of 3 to 5 inches in diameter [22].
The leaf plates are packed in bags, as shown in Figure 11, and then transported to the final
selling point, using the more appropriate transport forms. The initial extraction and making
charges are of 20 to 30 INR for a thousand plates and sold at about INR 350 after final
processing to the final store, and 1 plate costs close to 1 INR, depending on the place of
process and point of sale.
Figure 11 - Sal leaf plates packed and ready for shipping. Image credits:
tasteofnepal.blogspot.pt (2012/03)
3.5. Transport, marketing and stakeholder involved
Like for any other product, there are a lot of stakeholders involved in the process. Moreover,

18
the products are sold through various channels with involvement of middlemen. Figure 12
presents a simplified outlook of the logistic chain involved [23]. A stakeholder model taken
from SEED 2013 Tambul, is used as an example, presented in Figure 13, highlighting the
interdependences between the various stakeholders involved in the harvesting of raw
materials, their pre-processing, product manufacture, final treatments and final expedition to
the point of sale. It is clear from the figure the network like structure, involving not just the
stakeholders directly involved in the product life cycle but also other stakeholders, such as
consumers and regulatory/government bodies that have a direct interest and may benefit
from product production and selling.
Figure 12 - Product logistical chain.

19
Figure 13 - Stake holder model from Tamul a palm plate company, Image credits: 2013 SEED
Winner – India. Seed case studies: Insights into entrepreneurial solutions for sustainable
development


21
4. Design for the Current Market
This chapter discusses how new and renewable materials can be used in cutlery and crockery
industries to obtain more sustainable products, and the possible designs.
4.1. Containers and wraps
The main material used here is areca nut sheath/Sal leaf for boxes, cups and containers. An
example is a normal sized standard hamburger bun with dimensions: 2.5 centimeters in
height and 12 centimeters in width (Diameter) and 75 grams in weight, as shown in Figure
14a. An ideal box would be about 13 centimeters in length and breadth with the top part of
the box, being 12 centimeters in width. The height of the box is approximately 6 centimeters.
Depending on the size of the hamburger, the sizes could be altered and tweaked. A cone
made from palm areca sheath or Sal leaves is represented in Figure 14b.

22
(a) (b)
Figure 14 - (a) Burger box /box from Palm areca (b) A cone from palm areca
The wraps could be from banana fibre paper; to make them water proof to a certain extent,
a wax coating could be provided. Sal leaf wraps can also be used for making wraps for the
hamburgers as they are an excellent alternative to the banana fibre paper.
Areca nut 100 ml cups could be used for providing ice creams and smaller ones (15 ml) for
sauces and dips. Normal containers of 500 ml to 1 litre can also be made using palm areca.
Cubic and cuboid boxes both open and closed can be made using this material. An example
is presented in Figure 15. It is like take away carton containers from fast food chains.
Figure 15 - Palm Areca container
4.2. Take away cups, plates and bowls
The main materials used here would be again areca nut cups, that would have capacities from
180 to 330 ml. In this study, 250 ml plastic would be used, as shown in Figure 16a. Plastic
cups would be considered as they are used in most festivals and other events. The dimensions
are as follows: top diameter 7 cm, height 9 cm and bottom diameter 4.5 cm.

23
Initially the cups are cut and then pressed. They are then sealed using bio resins / natural
gum extracted from plants. Plates are also made from areca sheaths with dimensions for
comparisons of plastic cutlery and crockery standard plastic containers and aluminium foil
containers of 500 ml capacity, 4 inches and 8-inches diameter plates are considered), as
shown in Figure 17b.
(a) (b)
Figure 16 - (a) model for a palm areca cup (b) Finished plates and containers
Reusable cups made of coconut shells are approximately 250 to 350 ml in size, and they can
be used in restaurants. Two examples, one using Sal leaves and the other based on coconut
shells, are presented in Figure 17. They naturally vary in diameter and height, but portions
of equal or similar sizes can be sorted. They can be used from 50 to 100 times making them
perfect alternatives for PET cups, available in stores. Ladles are produced using imperfect
or damaged shells, one side of the shell is attached with reclaimed wood.
(a) (b)
Figure 17 - (a) Sal leaf cup design (b) Coconut cup design
4.3. Coconut fiber sponges
A normal synthetic fiber sponge for cleaning surfaces and dishes is made from polyurethane

24
or cellulose, in most cases with dimensions of 7 cm 5 cm 2 cm. The same dimensions
are considered for making coconut coir sponges using retted soft coir as shown in Figure 18.
They have the same usage as the synthetic sponge but are eco-friendly and can be washed
and used for growing plants after their life. They also can be incinerated, unlike plastic that
needs to be treated or recycled. Data regarding synthetic sponges was unavailable.
Figure 18 - Design of the coconut fiber sponge

25
5. Life Cycle Assessment
5.1. Introduction
Life Cycle Assessment (LCA) is the currently leading methodology to quantify and/or
compare the environmental impacts of producing, using and disposing of a product or
providing a service throughout its life cycle. In other words, LCA identifies the material and
energy usage, emissions and waste flows of a product, process or service over its entire life
cycle to determine its environmental performance. Although there are no mandatory rules or
requirements to perform a LCA study, normally the framework defined in the ISO standards
ISO 14040 and 14044 [24-25] will be considered in this work, as they are consensual and
widely used in practice. Besides supporting the work and calculations performed in a LCA
study, they also allow a direct comparison between studies and the identification of hotspots
for improvement. A complete description of the LCA methodology is beyond the goals of
this study, and can be found elsewhere [26-27].
In this work, a LCA study of the production of plates, cups, wraps, boxes, containers, bowls
and sponges produced using waste materials obtained from the processing of agricultural
products areca Palm sheaths, Sal leaves, coconut coir and banana fiber, will be performed.
These materials are widely available in the Southern part of the Indian subcontinent, and
their utilization represents an opportunity to valorize a residue, while producing goods that
should be more sustainable, when compared to existing products currently used and

26
produced using non-renewable resources. Whenever possible primary data is used combined
with data from Life Cycle Inventory databases.
5.2. Goal of the study
The goal of this study is to assess the potential life cycle environmental impacts of various
alternatives to currently used disposable cutlery and crockery, and a few products from the
home industry. A comparison with existing products will be performed if data and results
are available, those based on paper or plastics. The target audience for the report are the
interested parties (stakeholders) such as fast food chains and retailers, environmental
organizations, consumer organizations, as well as consumers themselves.
5.3. Scope
The scope of this work is to study the life cycle of the disposable cutlery and crockery
products made from the materials suggested above and compare it with plastic and cardboard
products existing in the. Ranging from material collection and transportation to processing
facilities, including production and distribution to bulk consumers, and final disposal.
5.3.1. Functional unit
A comparison of life cycle environmental impacts of a product must be based on a
comparable basis (the functional unit) to allow a fair comparison of the results.
The functional unit considered in this work is one ton of material shipped to Portugal. This
represents several different total numbers of single elements produced since the amount of
raw materials involved and the type and form of processing is different between them. In
Table 1 the total number of elements corresponding to the functional unit is given.

27
Table 1 - Number of elements corresponding to the functional unit chosen in this work
Raw material Product Functional unit (Pieces/ton)
Areca palm nut sheath
Burger boxes / Boxes-Closed (500 ml) 16667 Plates (20-25 cm dia) 25000 Cups / Bowls(6 cm dia) 62500 Open boxes(500 ml) 33334
Coconut shells Halves(270 to 450 ml) 10000
Coconut coir Ropes one ton
Sponges (653 cm3) 25000
Sal leaves Flat plates / Wraps (20 cm dia) 66667 Banana pulp Paper wraps (3020 cm2) 22222
5.3.2. System Boundaries
The system boundaries include all significant life cycle stages from raw material extraction,
manufacture, distribution use and reuse to the final management of the material waste. The
boundaries are established to include all inputs and outputs of the system. The flows
considered are materials or energy entering the product life cycle, and the emissions and
waste generated. In this work, a cradle-to-gate study was performed, considering all life
cycle stages and transportation steps from obtaining/extraction of raw materials to final
disposal, as shown in Figure 19.
Figure 19 - System boundaries (simplified)

28
5.3.3. Processes included
According to Figure 19 and the availability of data/information, the following processes
were considered in the LCA study:
Extraction/production of raw materials. In this process, it was included the
extraction of raw materials necessary to produce the products considered in this
work, including forestry and agriculture practices, and the preprocessing of the raw
materials.
Packaging. Primary packaging was included in the transportation of each final
products considered in this work. Secondary packaging (used for the distribution of
the products from the importer to the supermarket distribution center) has been
excluded due to consignments, being a mix of different supplies, depending on the
needs of the client. Pallets have also been excluded due to lack of data about their
material and reuse rates.
Production processes. The conversion of the raw materials into finished products is
included in the study, including energy consumption by the machines. It was
assumed that raw materials and product losses are minimal, thus they wre considered
in the calculations.
Impact of cardboard boxes for transport: The number of cardboard boxes were
calculated accordingly for each product and a weighted average was taken to obtain
the average impact. The data for the boxes were taken from a study made on
corrugated cardboard boxes used for vegetables and fruits. Two types of boxes
weighing 0.823 kg and 1 kg were considered for transportation [28].
Transport. Several transportation steps are considered between the various life cycle
stages. They include the transport of materials from their producer to the processing
centers, the transport of the finished products from the manufacturer to the importer;
the shipping to Portugal of 12320 kilometers and then to supermarket/client is
included. Transportation by a municipal waste collection vehicle to a waste
management facility has not been included due to lack of data.
End-of-life. The management of wastes is included in the study. The choice of end-
of-life process reflects the realistic options for the products, the most sensible being
burning for energy production or landfilling. Twenty percent of incineration and
eighty percent landfilling was considered. Recycling and composting has not been
included as not enough data was found to support this process.

29
5.3.4. Excluded processes
Certain elements of the life cycle have been excluded, to ensure that the scope of the study
remains feasible, due to the unavailability of data. Thus, the following materials and
processes have been excluded from this study:
Inks/ dyes. These materials are used to print the design/brand on each carrier and
have been excluded from the study due to lack of information about the inks and dyes
used and the small quantities required;
Retail storage of the carrier bags. Any environmental impacts associated with
storage activities at raw materials extraction and pre-processing sites, manufacture
units, the importers and supermarkets have been excluded;
Transport from the supermarket to the consumer. Consumer transportation to and
from the supermarket with the carrier bags has been excluded from the study, because
the weight of a carrier bag would have little or no effect on vehicle emissions and
fuel efficiency. Moreover, wide variations in distance travel and means of
transportation make it impossible to define an adequate value for the total distance
travelled;
Equipment and Buildings. The environmental impacts linked with the construction
and demolition of buildings, and the manufacture of machines, equipment and
vehicles should in effect be depreciated over the whole of their period of use. These
impacts are negligible when compared to the operational burden. Therefore, the
construction, maintenance and demolition of industrial buildings and the
manufacture of machines, equipment and vehicles have been excluded from the data
used in this study.
5.3.5. Data sources
A mix of primary data and secondary data obtained from the Eco Invent V2.1 life cycle
inventory database, available in version 7.3.3 of SimaproTM was used in this work. The
primary data regarding the process were obtained from the self-help groups and cottage
industries who work with these kinds of materials.
The materials are extracted and processed in India, especially in the state of Tamil Nadu. No

30
datasets were identified for India in terms of the whole cycle. Thus, European average data
was used, instead for the systems by adapting the values to the country of origin. The energy
supply mix was taken from the state of Tamil Nadu.
5.4. Inventory analysis
Inventory analysis was carried out in several steps considering the life cycle stages included
in this work. Almost all the products discussed have similar methods of production, therefore
no separate analysis for each one will be presented.
5.4.1. Prime material extraction
The raw materials are generally harvested by hand, collected and stored. The only energy
spent is manual labour. The raw materials obtained are a by-product of the cultivation and
maintenance of the plantations. Thus, the potential environmental impacts due to the
cultivation and maintenance of the trees or cultivars was not considered. People use their
own transport methods, as they live generally in locals situated near the plantations. They
walk to the site or they use bicycles for transport. The impact of these transportation means
is minimal and was not accounted for. In some cases, some energy is accounted for pre-
processing example, dehusking coconuts using a husking machine.
5.4.2. Transportation
The extracted materials are bundled and tied together using hand drawn coconut coir ropes,
and then shipped for distribution. Usually minivans are used for transportation within the
state or district. We assume that a ton of the material is transported in each trip for an average
distance of 100, 150 & 70 kilometres for Palm areca products, coconut shell and coir
products and Sal products, respectively. The emission norms of India are based on the
European standards. Currently most of the vehicles are running on Bharat Stage (BS) IV
standards, which has similar regulations to that of Euro IV [29].
5.4.3. Processing
Ground water drawn from wells is used to soak the materials, if needed, or they are retted
in tanks of salt water near back waters or in back waters for several months. Since no data is
available and the impacts are small, these impacts were not considered. The water that is
used for soaking is used again several times, and if fresh water is used, it can be re used for

31
watering the plants and cleaning. If the processing methods are small scale and distributed
in several villages, the impact would be low as the amount of water drawn from a single
point would be very low. Considering the following information, we conclude that the
impact with regards to water is low. The next step in processing would involve pressing/
spinning /stitching and cutting. If heated presses are used they reach anywhere between 60
to 80 degrees. Palm areca products are pressed and cut using machines operated using three
phase electricity that operates on 5.5 kW, Sal leaves are manufactured using semi-automated
machines that use mechanical power. Coconut husks are dehusked using a machine that runs
on 3.7 kW three phase electricity followed by pressing and cutting using a machine that
operates on 18.5 kW, the loose coir can be also be spun into ropes using a machine that uses
2.24 kW for spinning. The coconut shells are polished using a small motor run machine that
consumes about 0.25 kW. The banana paper is made from a unit that uses two machines that
consume 4.5 kW for cutting and blending the mixture. Hours required to produce the
functional unit of each product are mentioned in the annex.
5.4.4. Transportation and shipping
The processed materials are then packed and bundled as hundreds, tied down using coir
ropes and then transported across the country through open mini vans, in boxes. Some
agencies export them abroad, usually by ship. The minivans travel an average of 200
kilometers for all products except for Sal leaf wraps / plates / bowls, which travel 300
kilometers. A corrugated cardboard box of 0.823 grams is taken into consideration for the
materials. Palm areca plates are shipped in a box of different dimensions, weighing 1 kg and
the impact is extrapolated accordingly.
For international shipping, 12320 kilometres was considered for shipping to Portugal
(Lisbon). Once in Lisbon they should be shipped throughout Portugal, assuming an average
distribution distance of 100 km is considered since most of the population is near the coastal
regions.
5.4.5. End of life cycle / disposal
The products are biodegradable and they could be collected to grow mushrooms or used as
cattle fodder/gardening. In practice, they are collected and incinerated or disposed of in
landfills. It was assumed 20 percent incineration and 80 percent land filling, valid for
Portugal. Transportation from trash collection to points of incineration and landfills was also

32
included.
5.4.6. Energy mix
The electricity energy mix in the state of Tamil Nadu was used. The energy mix of Tamil
Nadu is a mixture from state, central and private energy sources, and it is shown in Figure
20. To calculate the impact due to electricity the energy mix was considered, and the impact
of all the types of electricity and a weighted average was taken, and the impact was
calculated accordingly [30].
Figure 20 - Electricity energy mix of Tamil Nadu from the Power for All publication 2016
5.5. Environmental Impact Assessment
To assess the potential environmental impact the CML 2000 methodology was used [31-32].
The following environmental indicators were selected in this work, and the set include most
of the indicators used in practice in LCA studies or products or services.
Global warming potential: The Global warming potential, GWP, is a measure of
total emissions greenhouse gases (for example, CO2, methane, nitrous oxide).
GWP is measured in terms of CO2 equivalents. It is relevant in this work as the
transportation steps and the machines energy consumption in processing is
relevant;
Depletion of Abiotic Resources: This impact category refers to the depletion of
nonliving (abiotic) resources such as fossil fuels, minerals, clay and peat. Abiotic
Coal - Lignite/similar -Thermal
44%
Gas Powered 2%
Nuclear 5%
Hydro ( Hydel+small)
9%
Wind31%
Solar5%
Biomass+Cogen4%
Energy split of tamil Nadu

33
depletion is measured in kilograms of Antimony (Sb) equivalents. As fossil fuels
are used this indicator is relevant;
Photochemical oxidation: The formation of photochemical oxidant smog is the
result of complex reactions between NOx and VOCs under the action of sunlight
(UV radiation), which leads to the formation of ozone in the troposphere. It is
measured using photo-oxidant creation potential (POCP) which is normally
expressed in ethylene equivalents. As fossil fuels are used, this indicator is
relevant;
Eutrophication: This is caused by the addition of nutrients to a soil or water
system which leads to an increase in biomass, damaging other lifeforms. Nitrogen
and phosphorus are the two nutrients most implicated in eutrophication.
Eutrophication is measured in terms of phosphate (PO43-) equivalents;
Acidification: This results from the deposition of acids which leads to a decrease
in the pH, a decrease in the mineral content of soil and increased concentrations
of potentially toxic elements in the soil solution. The major acidifying pollutants
are SO2, NOx, HCL and NH3. Acidification is measured in terms of SO2
equivalents;
Toxicity: Toxicity is the degree to which something can produce illness or
damage to an exposed organism. There are 4 different types of toxicity: human
toxicity, terrestrial ecotoxicity, marine aquatic ecotoxicity and fresh water
aquatic ecotoxicity. Toxicity is measured in terms of dichlorobenzene
equivalents.
5.6. Results
This section presents and discusses the results obtained of the various environmental impacts
for the several products considered in this work. Both single product and comparison
between similar products made with different raw materials will be considered here.
In Figure 21 to Figure 27 the relative importance of the various life cycle stages for the
various environmental indicators considered for each of the various products considered in
this work are presented. From the figures, it is possible to identify which are the life cycle
hotspots, which process is more relevant to each environmental indicator that should be
considered first for improvement, thus supporting decision making.

34
Transportation and shipping are the main contributors to each environmental impact
category. The utilization of vehicles with larger capacities, or using renewable fuels, or a
more efficient logistical system, in the acquisition of the raw materials, may help reduce
significantly the environmental impacts due to transportation and shipping. Other possibility
involves processing the raw materials as close as possible from plantations.
Figure 21 – Environmental impacts for each life cycle stage for coconut coir ropes
Figure 22 - Environmental impacts for each life cycle stage for palm areca plates

35
Figure 23 - Environmental impacts for each life cycle stage for palm areca bowls
Figure 24 - Environmental impacts for each life cycle stage for coconut choir sponges

36
Figure 25 - Environmental impacts for each life cycle stage for banana sheets
Figure 26 - Environmental impacts for each life cycle stage for coconut shell cups
-20%
0%
20%
40%
60%
80%
100%
Banana Sheets
Transport Electricity NaOH wrapping
Boxing shipping MSW In Landfill

37
Figure 27 - Environmental impacts for each life cycle stage for coconut bowls
Small variations between the relative importance of the various life cycle stages can be seen
between the various products. They are mainly due to differences in the production process,
machinery used to process the raw materials and obtain the final products.
Table 2 indicate the results obtained from the life cycle analysis for the products and shows
us the values in comparison with other materials. Some of the product’s impact seem to be
a bit higher than that of the conventional products, especially sal leaf wraps and flat plates
in comparison with magazine paper, the impact of this product can be reduced greatly if
procured and transported in bulk or when transported through trains from the points of
production to the points of export. This could not be considered in this analysis due to the
complexity of the process

38
Table 2. Impact values of the various materials considered
Impact Unit Coconut sponge Shell cups Plastic plates Palm plates Palm cups and bowls
Abiotic Depletion kg Sb eq 3.61E-04 8.15E-04 2.134844475 2.81E-04 9.02E-05 Acidification kg SO2 eq 3.16E-04 6.98E-04 0.40978921 2.78E-04 8.88E-05 Eutrophication kg PO4 eq 9.16E-05 1.72E-04 0.261561572 9.17E-05 2.86E-05 GWP 100 kg CO2 eq 5.27E-02 1.26E-01 Not available 4.13E-02 1.45E-02 Ozone layer depletion kg CFC-11 eq 6.53E-09 1.63E-08 7.46E-08 4.62E-09 1.54E-09 Human Toxicity kg 1,4-DB eq 2.60E-02 6.05E-02 0.649896947 2.12E-02 6.92E-03 Fresh water aquatic ecotox kg 1,4-DB eq 1.17E-02 2.17E-02 2 1.21E-02 3.79E-03 Marine aquatic ecotox kg 1,4-DB eq 6.11E+05 4.62E+05 0.709514182 2.50E+01 7.86E+00 Terrestrial ecotox kg 1,4-DB eq 4.02E+00 3.91E+00 0.000134245 1.19E-04 3.94E-05 Photochemical oxidation kg C2H4 eq 6.52E-01 4.95E-01 0.027728679 2.47E-05 7.66E-06
Impact Unit Magazine paper Banana wraps Sal leaf wraps/plates Palm boxes Cardbaord box
Abiotic Depletion kg Sb eq Not available 2.53E-06 0.000100107 4.38E-04 0.000749651 Acidification kg SO2 eq 0.003066667 2.48E-06 9.68E-05 4.32E-04 0.000519269 Eutrophication kg PO4 eq 0.0000185 2.70E-06 2.13E-05 1.56E-04 0.000271869 GWP 100 kg CO2 eq 0.00765 3.45E-04 0.017010725 7.07E-02 0.113697606 Ozone layer depletion kg CFC-11 eq 6.42E-10 2.41E-12 1.84E-09 6.95E-09 5.56E-09 Human Toxicity kg 1,4-DB eq Not available 2.68E-04 0.006908579 3.37E-02 0.055493039 Fresh water aquatic ecotox kg 1,4-DB eq Not available 4.35E-04 0.002316579 2.12E-02 0.018339193 Marine aquatic ecotox kg 1,4-DB eq Not available 8.69E-01 4.968627315 4.37E+01 79.64985933 Terrestrial ecotox kg 1,4-DB eq Not available 6.20E-07 4.42E-05 1.84E-04 0.000490151 Photochemical oxidation kg C2H4 eq 4.73E-05 6.05E-07 6.58E-06 4.11E-05 4.30E-05

39
5.7. Comparison with commercially available products
Following the definition of functional unit, when performing a comparison between different
products, it is important to ensure that they perform the same tasks, either between the
products considered in this work as the with other commercial available products. Thus,
three comparisons were performed:
Comparison between boxes made of palm areca and cardboard
Comparison between wrapping materials, in this case banana sheets, sal leaf warps
and paper.
Comparison between plastic plates and palm areca plates.
5.7.1. Box comparison
Figure 28 compares the values of each environmental impact normalized by the largest
value. The results show that palm areca boxes have lower environmental impacts when
compared with cardboard boxes in most categories, with differences that can larger than
40%, as for example in the global warming potential and abiotic depletion. For two
categories, ozone layer depletion and fresh water aquatic toxicity palm areca have larger
impacts that may due to the energy mix and transportation means considered in the
calculations. When transported in bulk it is expected that impacts will be lower for a single
product, and could it can be argued that the differences will be much more significant than
observed in Figure 28.
Figure 28 - Comparisons between palm areca boxes and cardboard boxes with plastic film.
0.00
20.00
40.00
60.00
80.00
100.00
Comparisons between palm and cardboard containers
Palm Areca Cardboar box

40
5.7.2. Comparisons with wrapping materials
Magazine paper was considered to make the comparisons with banana paper and sal leaf
wraps. The data available in the Printing & Writing Papers Life-Cycle Assessment Summary
Report was considered. Magazine paper was considered as it was the closest to any wrapping
paper in terms of thickness and material [33].
Figure 29 shows the results show the results of the comparison. For some environmental
impacts, it is not possible to include in comparison magazine paper, as their values were not
reported. Banana sheets are material with lower environmental impacts, when compared
with Sal leaves wrap that are worse when compared with magazine paper. This is mainly
due to the processing of the banana sheets that only involves manual labour without the use
of much machinery, in which case the environmental impacts of energy production and
emissions and impacts are minimal. It could be argued that banana papers seem to be less
impactful, if done on a large scale they must be completely mechanised, resulting in a large
impact compared to Sal leaves. The impact of Sal leaf wraps can also be brought down by
transport through freight train which is the most popular method, the impact for this mode
of transportation would be negligible and hence make it much more eco-friendly compared
to magazine paper
Figure 29 - Comparisons between polished magazine paper, Sal leaf wraps and banana sheets
for wrapping
0
20
40
60
80
100
Comparisons between various wrapping paper options
magazine paper Banana wraps Sal leaf wraps

41
5.7.3. Comparisons with plates
Plastic plates are compared with palm areca plates in Figure 30. GWP was not considered,
as the study used in the comparison report GWP20 and not GWP100 [34]. It can be
concluded that for most environmental indicators the palm areca plates are clearly better than
plastic plates. The exceptions are the ozone layer depletion and terrestrial ecotoxicity
categories. Considering that the analysis for plastic plates excludes the impact of producing
plastic from crude and transport of crude oil from the extraction points and refining the crude,
it can be argued that the impact of the plastic plates would be much higher with their
inclusion.
Figure 30 - Comparisons between palm areca plates and plastic plates
.
0
20
40
60
80
100
Comparisons between Plastic plates and areca plates
Plastic plates palm areca(40g)


43
6. Business Plan
The introduction of any new or improved product or service in the market should be planned
with care, to ensure its competitiveness and that a reasonable return of the investment is
reached for the investment made. In this work, a preliminary business plan for the new
products considered in this work is presented, considering its nature and target market, and
using several tools/methodologies to fulfil this goal. This study would mostly examine the
innovation, market, customer behavior, why products fail and several other factors. This
would eventually draw an initial road map on how to capture the market or, in simple words,
who to replace every disposable container with our product.
6.1. Introduction
Portugal has a population of 10.309 million (2016 estimate), with about 81.9% under the age
of 65 [35]. Plastic cutlery and crockery has entered our lives in the form of disposable
containers at shops and restaurants. It is estimated that a person in the USA uses an average
of 500 cups and about 230 paper plates per year. [36] Assuming the same average for
Portugal, and considering just 50 percent of the population under 65 use forms of disposable
containers, around 2047.5 million disposable plastic/paper cups and 941.85 million
paper/plastic plates a year would be used [36].
Most of these disposable materials are used only once and disposed of, many times directly

44
in the environment. Those which are put in the garbage are either incinerated or put in a
landfill, resulting also in significant environmental impacts. Moreover, currently disposable
containers are made using nonrenewable resources. Consumers are paying increasing
attention to the environmental impacts resulting from the products they use or and/or
consume, yet they are willing to change their way of life significantly to fulfill this goal.
Thus, already used products need to be produced more efficiently, or renewable materials
should be used instead. This provides us a huge business opportunity and also allows one to
make earth a cleaner place to live in.
6.1.1. Innovation
Our products would be viewed as innovations and not as inventions. An invention is product
creation; our product is an improvement on something that exists in the market. A more
traditional definition of innovation is "an invention that is commercialized." Innovations can
be broadly classified as:
Radical and incremental: An incremental innovation is an improvement of an
existing product whereas a radical innovation is often something completely new or
substantially different with disruptive capabilities.
Radical/Disruptive Innovation: For a product to be disruptive, it should have an
impact on one or multiple market aspects: technology, business models, customer
behavior, with the core focus on design and user experience.
The focus to make the product disruptive would be a key aspect in the business model. It
would be based on a focus on sustainability and corporate social responsibility aspects, as
shown in Figure 31.
Figure 31 - Disruption factor model
Technology
Behavior Business
Design

45
6.2. What makes a product a hit?
6.2.1. Why most new products fail?[37].
Most of the new companies or products that are launched fail to make any significant impact.
About 75% of consumer-packaged goods and retail products fail to make a profit in the first
year. This is in part because of the intransigence of consumer shopping habits. The
consultant Jack Trout has found that American families, on average, repeatedly buy the same
150 items, which constitute as much as 85% of their household needs; it’s hard to get
something new on the radar. Even bigwigs like P&G routinely whiff product rollouts. Less
than 3% of new consumer packaged goods exceed first-year sales of $50 million considered
the benchmark of a highly successful launch. Moreover, products that start out strong may
have trouble sustaining success [37].
This is mainly described by the 9 effect by Gourville, as shown in figure 29. Companies tend to
overrate their products by a factor of three, and the customer tends to devaluate the product or
innovation by a factor of three leading to 33 effect, the main reasons behind these behaviors are
presented in figure 29, are originated from the expected behaviors when faced to changes from the
various economical agents involved. Even though the study 9 factor could be highly debatable, the
factors that are mentioned are true. Upon thorough study of several products from many companies,
there is a significant amount of evidence and truth behind how the customers and companies behave
[38].
Figure 32 - The 9x effect explained by Gourville in Eager Sellers and Stony Buyers:
Understanding the Psychology of New-Product Adoption. Harvard Business review, JUNE 2006

46
6.2.2. What makes our product a smash hit?
The way to tackle the resistance to change to a new process or to adopt innovation is either
accept it or minimize if. Minimizing the resistance includes making behaviourally
compatible products or finding believers for the product.
There is a wide range on where the product could end up even after the groundwork is done.
Gourville’s behavioural framework [38] classifies a new product’s success or failure by
grouping them under four categories, based on the amount of behavioural changes it might
have on the customers with the other behaviourally compatible products in the market, and
the product changes with respect to the existing products already available in the market.
One could say that upon analyzing the behavioral framework of the type of product that we
offer, the product would fall under a smash hit as shown in Figure 33 [38]. This is because
the product change that is present is radical in terms of the materials used with a simple
design. The behavioral change that it brings is minimal because the products are simple
cutlery and crockery with an emphasis on design and a newer material.
Figure 33 - Gourville’s Behavioral framework from Eager Sellers and Stony Buyers:
Understanding the Psychology of New-Product Adoption. Harvard Business review, JUNE 2006

47
6.3. Market and crossing the chasm
A market is defined as the set of actual or potential customers for a given set of products or
services who have a common set of needs or wants, and who reference each other when
making a buying decision. The main issue when a product comes into a market is that is not
familiar to the potential costumers. Hence, millions of dollars are spent on marketing.
Making the product familiar involves several strategies, one of the most effective ways to
capture the market is to find Believers in the market. This would give us a clear idea on
whom to target first, how the market functions.
Many business plans are based on a traditional Product/Technology Adoption Life Cycle, in
which the costumers are divided in classes according to their behavior facing innovation
and/or the introduction of new products: Innovators, Early Adopters, Early Majority, Late
Majority, and finally Laggards [39]. In practice, the more appropriated way to develop a
market is to work the curve from left to right, progressively winning each group of users,
using each "captured" group as a reference for the next.
There are break in the curve, between each phase of the cycle, representing a disassociation
between any two groups; that is, "the difficulty any group will have in accepting a new
product if it is presented the same way as it was to the group to its immediate left." [39]. The
largest break, so large it can be considered a chasm, is between the Early Adopters and the
Early Majority, as shown in Figure 34. Many ventures fail trying to make it across this chasm.
To cross the chasm Moore in his paper [39], advocates that a company focus on a single
market, a beachhead, win domination over a small specific market and use it as a springboard
to adjacent extended markets to win.
Figure 34 - Moore’s representation of the product adoption cycle from his book, Crossing the
Chasm 2001.

48
Briefly, the way to cross the chasm requires the following steps using the D day analogy for
launching our product. Figure 35 represents all the phases that are described in detail below
[39].
Figure 35 - A graphical version of crossing the chasm by Moore in his book, Crossing the
Chasm, 2001
Target the point of attack: "Target a specific market niche as your point of attack and
focus all your resources on achieving the dominant leadership position in that
segment." Includes identifying the primary market identifiers: target customer,
reasons to buy, whole product and competition; and secondary market factors:
partners and allies, distribution, pricing, positioning, next target customer. Early
adopters would be the community who gives importance to sustainability and the
environmental issues, and are trying to do something about it. Targeting the younger
generations might be considered as an off move but could work wonders due to
reference marketing and parties happening in the communities where our products
could be promoted. Our identified niche would be through organic, vegan and
ecofriendly stores /restaurants, with also a heavy emphasis on advertising on digital
platforms.

49
Assemble an invasion force: Create the whole product, the product should focus on
tackling the consumer problems and the whole service should be centered around the
product. Our motto should be to think as a costumer and from there develop the
overall package and the user experience. Our products would go hand in hand in
helping maintain a clean environment and uplift local communities by actively
engaging them.
Define the battle: Create/Identify the competition, define positioning and
segmentation, build this into all your company communications. [39]. Keep in mind
competitors in every part of the customer curve, our main competition would be from
plastic disposable cutlery and crockery. Secondary competition would be from paper
cutlery and crockery (normal and recycled). From there, create the product on what
a pragmatist buyer considers an overall package. Consider several a set of alternative
ways of achieving the goal. The main advantage is the pricing of our products that
could match other alternatives to cutlery and crockery. Moreover, they will represent
products almost carbon neutral, eco-friendly, and that consider fair trade. Once our
products convince the early majority the company would move ahead in getting
certifications such as fair trade and ISO 14000, to better convince the next market
segments. In this phase, the communications focus is on reducing the fundamental
competitive claim to a two-sentence formula in every piece of company
communication always be sure to reinforce the second sentence of this claim, the one
that identifies your primary competition and how you are differentiated from it [39].
This will demonstrate the validity of your competitive claim (to conclude you are)
the indisputable leader.
Launch the invasion: distribution and pricing. The direct sales force is optimized for
creating demand. At its center is the consultative salesperson who works with the
client in needs analysis and then, supported by a team of specialists, develops and
proposes solutions, which, after additional interaction with the customer, and a
competitive procurement, turn into purchase orders. There would be a team of
designers who would be working with our corporate clients to deliver solutions and
another part where the customer/employee and stakeholder feedbacks would be
considered and changes made accordingly [39].
One could conclude that the technology adoption life cycle could be applied to almost all
the new and innovative products that are launched in the market. A perfect example would

50
be post it notes on how they crossed the chasm, they had found a niche market in the early
majority- Offices and corporations and familiarized their niche through free samples. Once
this was done they moved through the other niches of the early majority that caught on with
the bulk of the market chain later because of customers referring to other people from niche
markets.
6.4. Operations and maintaining success
There are several ways to bring a new product to market. It is here that most of the companies
make mistakes and choose the wrong method, even if the product is exceptional and if the
parent company has a sizeable chunk of the market share. One can classify them broadly in
three ways: integrator, orchestrator and a licensor as shown in Figure 36 and as discussed by
Andrew, J.R., Sirkin, H.L. in Harvard business review [40].
Since our business is based on suppliers, the model that would best suit us would be the
orchestration model initially. Once the brand name is established and sufficient profits and
funds are raised, the manufacturing communities could be imbibed inside the organization
to produce under the organization’s name later moving to an integrator. Since the market is
yet to be tested the safest bet to start would be as an orchestrator [40].
Diversification of the product is necessary for maintaining success, yet this represents a huge
dilemma amongst innovator’s and companies that are already established. In particular, they
must chose on move on and sell more sophisticated products for top tier loyal customers of
the brand and intermediate supporters, or if they would diversify the company product
portfolio to seek out the customers that still not use the company products Several successful
and unsuccessful cases were studied upon and the base refection that would best suit our
product is to initially to launch a simple base product that would be priced lower than our
competition for initially capturing the niche [41]. For seeking out the unendowed, reusable
coconut shell cutlery and crockery priced higher could be sold under a different name.

51
Figure 36 - Illustration of the methods of operation when launching a product, by Andrew, J.R.
and Sirkin, H.L. in the Harvard Business Review, from the September 2003 edition.
For entering the home industry, party grade disposable items with a lower thickness and
processing could be sold under a lower price based on coco fiber sponges and ropes. The
party grade items could be sold directly to customers or to party organizing sponsors (eg.
Superbock, MEO,etc). The bottom of the consumer pyramid, as described by Figure 37, is
essentially captured by the products that we offer, that are simple and inexpensive compared
to plastics under the party grade brand. Corporate products would focus more on the top of
the pyramid, where products will be modeled to their desire would be sold. The top of the
pyramid products would also be available to the public in stores and online, but they will
have aesthetic design, reusability and would be marked more on the price when compared
to our party grade brand.

52
Figure 37 - The impact of the bottom level disruption in the consumer pyramid as described by
Christiansen in The Great Leap: Driving Innovation from the Base of the Pyramid. MIT Sloan
Management Review 2002
Usage of several names (Brands) under the same brand would effectively stop
cannibalization and capture a wider group of customers that are still not using, or even aware
of the product. This would help us capture a sizable portion of the market. The bottom of
the consumer pyramid is essentially captured by the products that we offer, that are simple
and inexpensive, compared to plastics under the party grade brand [41].
6.4.1. Price comparisons per functional unit (One ton)
The wholesale price of the existing product was obtained from several rural self-help groups
working on similar products. Shipping, transport and distribution costs were also obtained
from several shipping and supply chain companies from Tamil Nadu. The price of the
suggested products is lower than the existing market products as in Table 3. The prices of
the existing products were taken from the products available in the Portuguese super markets
like Pingo doce, continente and Mini preco. The tabulations for the calculations are in annex
2. If marketing and operation costs were included, there would be a marginal rise in the cost
of each unit but would be still cheaper compared to existing products.

53
Table 3 - Cost of manufacturing and the retail price of existing market
Product Wholesale price for the
functional unit
(Eur)
Shipping
(Eur)
Transport
(Eur)
Distribution
(Eur)
Final
cost
(Eur)
Cost for 25
pieces
(Eur)
Existing product – Price 25
pieces
(Eur)
Palm boxes 833.4 73.21 10 20 936.61 1.40 2.5
palm plates 781.25 73.21 10 20 884.46 0.90 1.20
Palm bowls 781.25 73.21 10 20 884.46 0.35 1.0
Sal wraps 711.11 73.21 10 20 814.54 0.30 Not available
Coco shell
cups
900.2 73.21 10 20 1003.41 0.50 (5pieces) 1
Coir sponges 455.3 73.21 10 20 558.51 0.11 (5 pieces) 0.70 (5 pieces)

54
6.5. Conclusion of the business study
With the staggering number of disposable cutlery and crockery used if we could occupy just
1% of the market share in the launching months (Total Sales of about 30 million individual
pieces), at an average price of 5 cents per piece, a turnover of 1.5 Million euros could be
expected. To have 1% of the market share the above steps must be considered carefully and
1% of the market is a huge chunk for a start-up. A minimal investment must be made just to
get the supply chain established, including warehousing.
For the initial phase of the project as just being an orchestrator, a warehouse and a transport
network must be established, deals should also be negotiated with supermarket and fast food
chains, the initial investment would be around 8000 euros and upward for a micro scale
establishment. Once the company starts to get sales more money from turnover would be
pumped into the business to make it better.
Before jumping into production, marketing and selling, an opinion poll would be considered,
free samples will be distributed among potential customers and several test runs would be
carried out. The products would be launched slowly in a step by step manner to ensure
maximum market penetration. From sales analysis and customer reactions, the production
and distribution /sales would be carried out. Over procurement could be avoided in this
method. Rigorous quality testing standards must also be established in the process
The cost of operation, marketing would result in the price of our product costing the same
or marginally less than the conventional products in the market.

55
7. Conclusions
It is clear from the above environmental impact calculations and business plan analysis that
shipping the product from India to Portugal most of the environmental impact is lower when
compared to conventional disposable materials. The business plan provides further support
and adds to the claims to the results provided by the environmental impact analysis,
supporting the idea that producing and selling product described and studied in this work
would be a good idea. If marketed and launched properly, as the product can compete with
existing paper and plastic disposable cutlery and crockery. This work also establishes results
and calculates the life cycle analysis for the products discussed in the above sections. Table
2 verifies the same as most of the impacts are low compared to the conventional products.
One such example is the comparison of cardboard boxes and palm areca boxes, the results
indicated show a marked 40 percent reduced impact in most categories. The differences can
also be highlighted by the values obtained in the results between plastic plates and palm
areca plates, values for abiotic depletion and acidification are 2.134844475 and 0.40978921
versus the 2.81E-04 and 2.78E-04 respectively. This shows the in effectiveness of our
suggested alternatives, all the impacts could not be studied in detail and in-depth due to the
unavailability of compatible and complete LCA studies. Nevertheless, the results are obvious
and is clear indication that our alternatives fares better. This study might be of considerable
importance and impact as this is the first endeavour to carry out a life cycle analysis for such
products.


57
References
[1] http://www.mcdonalds.co.uk/ukhome/whatmakesmcdonalds/questions/running-the-business/facts-&-figures/how-many-meals-does-mcdonalds-serve-each-day-in-the-uk.html (accessed September 2017).
[2] Lytle, C. Le G. (2017). When the mermaids cry: the great plastic tide. Facts about plastic, 7 - Polystyrene (PS) – Used in Styrofoam containers, egg cartons, disposable cups and bowls, take-out food containers, plastic cutlery, and compact disc cases. http://plastic-pollution.org/ (accessed September 2017).
[3] Lytle, C. Le G. (2017). When the mermaids cry: the great plastic tide. Gyres and garbage patches. The victims: Animals; Food chain. http://plastic-pollution.org/ (accessed September 2017).
[4] Trent, N. (2011). Ending take out waste. Whole Foods Magazine. http://www.wholefoodsmagazine.com/blog/ending-take-out-waste/ (accessed September 2017).
[5] http://www.earthdistributors.com/learning/fastfacts.php Facts
[6] Orwa, C., Mutua, A., Kindt, R., Jamnadass, R., Simons, A. (2009). Agroforestree Database: a tree reference and selection guide version 4.0. World Agroforestry Centre, Kenya. http://www.worldagroforestry.org/treedb/AFTPDFS/Areca_catechu.PDF (accessed September 2017).
[7] Staples, G.W., Bevacqua, R. (2006) Areca catechu (betel nut palm), ver. 1.3. In: Elevitch C.R. (ed.). Species Profiles for Pacific Island Agroforestry. Permanent Agriculture Resources (PAR). Holualoa, Hawai’i. downloaded from http://agroforestry.org/free-publications/traditional-tree-profiles (accessed September 2017).
[8] Vasu, S. (2004). Betel chewing. National Library Board Singapore. http://eresources.nlb.gov.sg/infopedia/articles/SIP_883_2004-12-17.html (accessed September 2017).
[9] https://en.wikipedia.org/wiki/Coconut (accessed September 2017).
[10] Horticulture Division, Dept. of Agriculture & Cooperation, Ministry of Agriculture & Farmers Welfare, Government of India. All India final estimates of Area and Production of Coconut - 2015-16. http://www.coconutboard.gov.in/stat.htm (accessed September 2017).
[11] Rajan, A., & Abraham, T. E. (2007). Coir fiber process and opportunities. Journal of Natural Fibers. 4(1), 1–11. http://dx.doi.org/10.1300/J395v03n04_03
[12] https://en.wikipedia.org/wiki/Banana (accessed September 2017).

58
[13] Veerabathini, G. (n.d.) Producing Banana Fiber and Paper from Waste. http://www.ecoideaz.com/innovative-green-ideas/producing-banana-fiber-and-paper-from-waste (accessed September 2017).
[14] Gautam, K.H., Devoe, N.N. (2006). Ecological and anthropogenic niches of sal (Shorea robusta Gaertn. f.) forest and prospects for multiple-product forest management – a review. Forestry: An International Journal of Forest Research, 79(1), 81–101. https://doi.org/10.1093/forestry/cpi063
[15] Yes Bank. (2012). Arecanut: Economically attractive. http://www.thehindubusinessline.com/economy/agri-business/arecanut-economically-attractive/article3009671.ece (accessed September 2017).
[16] Sudalaimuthu, S., Senthilkumar, P., Sivakumar, B. (2008). Market Survey: Coconut industry in a nutshell, EFY Magazine. http://www.efymag.com/admin/issuepdf/Coconut-Jan08.pdf (accessed September 2017).
[17] Fremond, Y., Ziller, R., De Lamothe, M. De N. (1968). The Coconut Palm. Berne: International Potash Institute. 227 pp.
[18] Kew Royal Botanic Gardens. (2000). http://www.rbgkew.org.uk/ksheets/coir.html (October 2000).
[19] Punchihewa, P.G., Arancon, R.N. (2000). Coconut: Post-Harvest Operations Compendium. Food and Agriculture Organization of the United Nations (FAO). Asian and Pacific Coconut Community (APCC). http://www.fao.org/in-action/inpho/crop-compendium/en/ (accessed October 2017).
[20] Sudhira, H.S., Jacob, A. (2001). Reuse of by-products in coir industry: a case study. Internet Conference on Material Flow Analysis of Integrated Bio-Systems. Institute of Advanced Studies, United Nations University, Japan and UNESCO Microbial Resources Centre, Stockholm http://www.ias.unu.edu/proceedings/icibs/ic-mfa/jacob/paper.html.
[21] Singh, L., Bandyopadhyay, T.K. (2013). Handmade paper from banana stem. International Journal of Scientific & Engineering Research. 4(7), 2074. https://www.ijser.org/paper/Handmade-paper-from-banana-stem.html (accessed September 2017).
[22] Raghavan, R., Raghavan, R. (2008). TN paper unit woos Maharashtra for Banana stem waste. Shiral (Solapur), October 23, Fri Oct 24 2008. http://archive.indianexpress.com/news/tn-paper-unit-woos-maharashtra-for-banana-stem-waste/377178/ (accessed in September 2017).
[23] Heuer, A., Kloibhofer, M., Marquard, H. (2015). Tambul Leaf Plates: Creating youth employment in Assam while reducing plastic waste. SEED Case Studies: Insights into Entrepreneurial Solutions for Sustainable Development. https://doi.org/10.13140/rg.2.1.4263.9841.

59
[24] Matthews, H.S., Hendrickson, C.T., Matthews, D.H. (2015). Life Cycle Assessment: Quantitative Approaches for Decisions That Matter. Carnegie Mellon University. http://www.lcatextbook.com/
[25] Bauman, H., Tillman, A.-M. (2004). The Hitch Hiker's Guide to LCA: an orientation in life cycle assessment methodology and application. Lund: Studentlitteratur. 543 pp.
[26] Guinée, J.B. (2004). Handbook on Life Cycle Assessment: Operational Guide to the ISO Standards. Kluwer Academic Publishers.705 pp.
[27] ISO 14040: 2006 & ISO 14044: 2006 (2006). Environmental management — Life cycle assessment — Principles and framework. ISO/TC 207/SC 5.
[28] Albrecht, S., Brandstetter, P., Beck, T., Fullana-i-Palmer, P., Grönman, K., Baitz, M., Deimling, S., Sandilands, J., Fischer, M. (2013). An extended life cycle analysis of packaging systems or fruit and vegetable transport in Europe. Int J Life Cycle Assess 18(8), 1549-1567. https://doi.org/10.1007/s11367-013-0590-4.
[29] India: Heavy-duty: Emissions. http://www.transportpolicy.net/standard/india-heavy-duty-emissions/ (accessed September 2017).
[30] Deloitte. (2016). Power for all – Tamil Nadu. A joint initiative by the government of India and Tamil Nadu. http://www.powerforall.co.in/AccessFolder/PFA_Document/1_PFA_Tamilnadu09012017.pdf (accessed October 2017).
[31] CML - Department of Industrial Ecology. (2016). CML-IA Characterisation Factors. https://www.universiteitleiden.nl/en/research/research-output/science/cml-ia-characterisation-factors (accessed September 2017).
[32] Institute of Environmental Sciences (CML). (2016). Tools and Data. https://www.universiteitleiden.nl/en/science/environmental-sciences/tools-and-data (accessed September 2017).
[33] American Forest & Paper Association. (2010). Printing & Writing Papers: Life-Cycle Assessment Summary Report.
[34] Postacchini, L., Bevilacqua, M., Paciarotti, C., Mazzuto G. (2016). LCA methodology applied to the realization of a domestic plate: confrontation among the use of three different raw materials. Int. J. Productivity and Quality Management, 18(2/3), 325-346. https://doi.org/10.1504/IJPQM.2016.076713
[35] https://en.wikipedia.org/wiki/Demographics_of_Portugal (accessed September 2017).
[36] Less Waste Challenge Sustainability Tips. http://www.tomsofmaine.com/. , http://www.tomsofmaine.com/TomsOfMaine/v2/en-us/pages/less-waste/Less_Waste_Challenge_Sustainability_Tips.pdf (accessed September 2017).
[37] Schneider, J., Hall, J. (2011). Why Most Product Launches Fail. Harvard business review, April. https://hbr.org/2011/04/why-most-product-launches-fail (accessed October 2017).
[38] Gourville, J.T. (2006). Eager Sellers and Stony Buyers: Understanding the Psychology of New-Product Adoption. Harvard Business review, JUNE.

60
https://hbr.org/2006/06/eager-sellers-and-stony-buyers-understanding-the-psychology-of-new-product-adoption (accessed October 2017).
[39] Moore, G.A. (2001). Crossing the Chasm: Marketing and Selling High-Tech Products to Mainstream Customer, Harper Collins Publishers, New York.
[40] Andrew, J.R., Sirkin, H.L. (2003). Innovating for Cash, Harvard Business Review. September. https://hbr.org/2003/09/innovating-for-cash (accessed October 2017).
[41] Hart, S.L., Christensen, C.M. (2002). The Great Leap: Driving Innovation from the Base of the Pyramid. MIT Sloan Management Review 44(1), 51-56. https://dx.doi.org 10.1201/b14335-10.

61
Annex A. Eco Invent Data
This section contains the emission factors used in the calculation of the environmental
impact calculations, including energy generation. They were obtained using life cycle
inventory data obtained using the Eco Invent V2.1 database, avaliable in the LCA software
SimaproTM, and using the environmental impact assessment methodology CML 2000. The
information presented in each graphic is the following:
Figure 38 gives the impact factor for 1 kg of wrapping plastic
Figure 39 gives the impact factor for 1 kWh of electricity produced by nuclear power.
Figure 40 gives the impact factor for 1 kWh of electricity produced by wind power.
Figure 41 gives the impact factor for 1 kWh of electricity produced by lignite.
Figure 42 gives the impact factor for 1 kWh of electricity produced using biomass.
Figure 43 gives the impact factor for 1 kWh of electricity produced using
hydroelectric power plants.
Figure 44 gives the impact factor for 1 kWh of electricity produced using natural gas.
Figure 45 gives the impact factor for 1 kWh of electricity produced using landfill
gas.
Figure 46 gives the impact factor for 1 kWh of electricity produced photovoltaic
systems.
Figure 47 gives the impact factor for 1 kg of waste incinerated.
Figure 48 gives the impact factor for transportation using a van, expressed in tkm,
tonnes per km.
Figure 49 gives the impact factor for transportation by seaship, expressed in tkm,
tonnes per km.

62
Figure 38 – Impact factor for 1 kg plastic wrapping,
Figure 39 – Impact factor for 1 kWh of electricity using nuclear power.
Figure 40 – Impact factor for 1 kWh of electricity using wind power.
Figure 41 – Impact factor for 1 kWh of electricity using lignite.

63
Figure 42 – Impact factor for 1 kWh of electricity using biomass.
Figure 43 – Impact factor for 1 kWh of electricity using hydroelectric power plants.
Figure 44 – Impact factor for 1 kWh of electricity using natural gas.
Figure 45 – Impact factor for 1 kWh of electricity using landfill gas.

64
Figure 46 – Impact factor for 1 kWh of electricity using photovoltaic systems.
Figure 47 – Impact factor for 1 kg of waste incinerated.
Figure 48 – Impact factor for transportation using a van, expressed in tkm, tones per km.
Figure 49 – Impact factor for transportation, expressed in tkm, tones per km.

65
Annex B. Calculations and Results
The impact of electricity is calculated by taking the percentage of the different mixes in the electricity and averaged. The impacts were multiplied
with the percentage and the total impact was summed. The impact of electricity in total is multiplied with the number of kWh. Similarly, data is
multiplied with the number of kilometers transported and shipped. The same according to the number of boxes, ropes and plastic film required.
The impact of boxes was considered and the impact from boxes of different dimensions were extrapolated accordingly. Table 4 and 5 show the
calculation of the impact of electricity per kW
Table 4 – Calculations for the impact of electricity per kW
Electricity Impact calculations per kW Impact category Unit Coal % Product Gas % Product Nuclear % Product Hydro % Abiotic Depletion kg Sb eq 0.00904 0.442941 0.004004187 5.46E-03 0.021085 1.15E-04 5.39E-05 4.58E-02 2.47E-06 2.52E-05 9.43E-02
Acidification kg SO2 eq 0.00906 0.442941 0.004013045 6.09E-04 0.021085 1.28E-05 5.50E-05 4.58E-02 2.52E-06 1.70E-05 9.43E-02
Eutrophication kg PO4 eq 0.01 0.442941 0.00442941 1.02E-04 0.021085 2.15E-06 1.90E-05 4.58E-02 8.70E-07 6.48E-06 9.43E-02
GWP 100 kg CO2 eq 1.23 0.442941 0.54481743 6.40E-01 0.021085 1.35E-02 7.79E-03 4.58E-02 3.57E-04 1.11E-02 9.43E-02
Ozone layer depletion
kg CFC-11 eq 1.94E-09 0.442941 8.59306E-10 7.84E-08 0.021085 1.65E-09 1.72E-08 4.58E-02 7.88E-10 3.10E-10 9.43E-02

66
Electricity Impact calculations per kW Impact category Unit Coal % Product Gas % Product Nuclear % Product Hydro % Human Toxicity
kg 1,4-DB eq 0.923 0.442941 0.408834543 7.06E-02 0.021085 1.49E-03 1.11E-01 4.58E-02 5.08E-03 9.13E-03 9.43E-02
Fresh water aquatic ecotox
kg 1,4-DB eq 1.6 0.442941 0.7087056 3.63E-03 0.021085 7.65E-05 2.12E-02 4.58E-02 9.71E-04 2.20E-03 9.43E-02
Marine aquatic ecotox
kg 1,4-DB eq 3.20E+03 0.442941 1417.4112 3.46E+01 0.021085 7.30E-01 3.90E+01 4.58E-02 1.79E+00 2.90E+00 9.43E-02
Terrestrial ecotox
kg 1,4-DB eq 0.0021 0.442941 0.000930176 1.05E-04 0.021085 2.21E-06 3.90E-04 4.58E-02 1.79E-05 2.91E-05 9.43E-02
Photochemical oxidation
kg C2H4 eq 0.000346 0.442941 0.000153258 4.89E-05 0.021085 1.03E-06 2.51E-06 4.58E-02 1.15E-07 2.59E-06 9.43E-02
Table 5 – Continuation of the calculation of the impact of electricity per kW
Electricity Impact calculations per kW Impact Unit Wind % Product Solar % Product Biomass % Product Final Impact Abiotic Depletion kg Sb eq
8.22E-05 3.12E-01 2.57E-05 3.61E-04 4.72E-02 1.70E-05 1.52E-05 3.63E-02 5.52E-07 4.17E-03
Acidification kg SO2 eq 5.16E-05 3.12E-01 1.61E-05 2.46E-04 4.72E-02 1.16E-05 7.54E-04 3.63E-02 2.74E-05 4.09E-03 Eutrophication kg PO4 eq 2.47E-05 3.12E-01 7.71E-06 1.57E-04 4.72E-02 7.41E-06 1.03E-04 3.63E-02 3.74E-06 4.45E-03
GWP 100 kg CO2 eq
1.13E-02 3.12E-01 3.53E-03 5.09E-02 4.72E-02 2.40E-03 4.59E-02 3.63E-02 1.67E-03 5.67E-01
Ozone layer depletion
kg CFC-11 eq
6.12E-10 3.12E-01 1.91E-10 9.60E-09 4.72E-02 4.53E-10 8.36E-14 3.63E-02 3.04E-15 3.97E-09
Human Toxicity
kg 1,4-DB eq
6.23E-02 3.12E-01 1.95E-02 1.17E-01 4.72E-02 5.52E-03 2.82E-03 3.63E-02 1.02E-04 4.41E-01
Fresh water aquatic ecotox
kg 1,4-DB eq
1.47E-02 3.12E-01 4.59E-03 3.70E-02 4.72E-02 1.75E-03 7.05E-04 3.63E-02 2.56E-05 7.16E-01

67
Electricity Impact calculations per kW Impact Unit Wind % Product Solar % Product Biomass % Product Final Impact Marine aquatic ecotox
kg 1,4-DB eq
1.99E+01 3.12E-01 6.21E+00 8.15E+01 4.72E-02 3.85E+00 2.58E+00 3.63E-02 9.38E-02 1.43E+03
Terrestrial ecotox
kg 1,4-DB eq
1.59E-04 3.12E-01 4.97E-05 3.70E-04 4.72E-02 1.75E-05 9.69E-08 3.63E-02 3.52E-09 1.02E-03
Photochemical oxidation
kg C2H4 eq
3.63E-06 3.12E-01 1.13E-06 1.54E-05 4.72E-02 7.27E-07 2.31E-02 3.63E-02 8.40E-04 9.96E-04
Table 6 represents the number of pieces that are required to make up one ton of material, calculated from the weight of a single. This information
was obtained from the companies that produce similar products. The box dimensions were taken from the references for the box impact calculations.
Table 6 – Number of boxes
To manufacture one ton of material No of pieces/ton
Box dimensions (cm) Weight (kg) Number of boxes
Double box: 60 g 16667 60*40*24 0.823 29
plate (25cm): 40g 25000 51*51*26 1 27
Small bowl (6 cm)/cup (180 ml): 16g 666667 60*40*24 0.823 17
One open box: 30 g 33334 60*40*24 0.823 29
Coconut shells (400 ml) 10000 60*40*24 0.823 39
Coir sponges 25000 60*40*24 0.823 15
Coir ropes - - - -
Sal leaf wraps 66667 60*40*24 0.823 47
Banana paper 22222 60*40*24 0.823 5

68
The complete simplified data on the number of km that travels, to the energy required for processing and disposal is mentioned below in Table 7.
Table 7 – Complied primary data for the product
Materials Product Extraction Transport
(km)
Processing
(kWh)
Cardboard
boxes
(0.823 g)
Transport
(km)
Disposal
Collection Distribution Preprocessing Processing Local
Transport
Shipping Intl.
transport
Palm areca
Boxes Manual-
No energy
50 50 0 293 29 200
12320
100
20%Incineration &
80% landfills
Plates Manual-
No energy
50 50 0 220 27(1kg) 200
12320
100
20%Incineration &
80% landfills
Cups Manual-
No energy
50 50 0 196.4 16 200
12320
100
20%Incineration &
80% landfills
Coconut
Ropes Manual-
No energy
0 150 7.46 59.67 0 200
12320
100
20%Incineration &
80% landfills
Shells Manual-
No energy
0 150 7.46 15
39 200
12320
100
20%Incineration &
80% landfills
Sponges Manual-
No energy
0 150 7.46 37 15 200
12320
100
20%Incineration &
80% landfills
Sal leaves Plates/
wraps
Manual-
No energy
0 0 0 0 47 300
12320
100
20%Incineration &
80% landfills
Banana fibers Paper Manual-
No energy
10 60 0 13.5 5 200 12320 100 20%Incineration &
80% landfills

69
Table 8 shows the values of prices obtained from the companies, they are multiplied according to their functional units and the total price is then
calculated accordingly in Table 3 the prices are in euros converted through the formula converted into euros by = Functional unit *price of a single
product/75. The costs of banana sheath could not be obtained due to the unavailability of data.
Table 8 – Price calculation for the products
Product Base Price of the raw material Price of the finished product
(one unit -wholesale) -approx.
Functional unit Total price(INR)
Areca Palm boxes INR 1 per sheath INR 3.75 16667 62501.25
Areca palm plates INR 1 per sheath INR 2.34 25000 58600
Areca plam bowls /cups INR 1 per sheath INR 0.93 62500 58600
Sal leaf wraps , plates and
bowls
- INR 0.80 66667 53334
Coconut shells cups /bowls INR 1 per shell- semi polished INR 6.75 10000 67500
Coconut coir sponges INR 3 per kilo INR 1.34 25000 34150
Table 9 represents the amount of capital required to establish a small business as an orchestrator, with only a warehouse and a few other people
who work in the business. The supply network is operated through third party owners. Garage rent information was taken from casasapo.pt ,
procuring materials is the sum of the cost of the materials listed above . Work force pay is the amount that would be paid to two interns or the
owners who work for marketing and negotiation. Marketing cost was considering establishing a website, advertising on paper and social media,
using our warehouse to sell our products on amazon Spain and ebay. Repacking and Misc. costs include us boxing our products into new containers

70
and other office expenses.
Table 9 – Investment cost to set up the company
Expenditures Euros (approx)
Garage to rent and electricity 800
Procuring 1 ton ( All products ) and distribution 4500
Marketing – Initial , small sacle on newspapers and social media 500
Work force ( 2 people -Misc ) 1200
Repacking and other misc. office expenditures 500
Establishing and registering 500
Total 8000
Copyright © 2022 FDOKUMEN