Supply chain integrated LCA approach to assess environmental impacts of food production in Finland
17
AGRICULTURAL AND FOOD SCIENCE Vol. 18 (2009): 460–476. 460 © Agricultural and Food Science Manuscript received February 2009 Supply chain integrated LCA approach to assess environmental impacts of food production in Finland Kirsi Usva, Merja Saarinen, Juha-Matti Katajajuuri and Sirpa Kurppa MTT Agrifood Research Finland, Biotechnology and Food Research, FI-31600 Jokioinen, Finland, email: firstname.lastname@mtt.fi A process was started in the late 1990s to produce comprehensive environmental data on particular aspects of Finnish food production with the aim of analyzing the environmental impacts (at least climate change, acidification and eutrophication and some other impacts) of products and locating hot spots in production chains. A supply chain integrated life cycle assessment was carried out on fodder barley, hard cheese, oat flakes, potato flour, cream cheese potato gratin, beer, honey-marinated/sliced broiler fillet and greenhouse cu- cumber. Methodological improvements in assessing environmental impacts of food products were evaluated in relation to ISO14040 and 14044 standards. Methods improved, especially regarding quality of cultivation data and previously reported data from the literature, impact assessment and calculations for assessment of leaching from agriculture. As a generic conclusion on the share of contributions of the various phases of production chains to environmental impact: agriculture was the most important phase, especially in terms of eutrophication potential. Work in food LCA methodology has provided a sound base for future development in assessing environmental impacts of food products. In the future providing more and more environmental information on products for customers and consumers is setting new challenges for research. Key-words: life cycle assessment, LCA, food, supply chain integrated LCA, environmental impact
-
Upload
independent -
Category
Documents
-
view
0 -
download
0
Transcript of Supply chain integrated LCA approach to assess environmental impacts of food production in Finland
A G R I C U L T U R A L A N D F O O D S C I E N C E
Vol. 18 (2009): 460–476.
460
A G R I C U L T U R A L A N D F O O D S C I E N C E
Vol. 18 (2009): 460–476.
461
© Agricultural and Food Science Manuscript received February 2009
Supply chain integrated LCA approach to assess environmental impacts of food production in Finland
Kirsi Usva, Merja Saarinen, Juha-Matti Katajajuuri and Sirpa KurppaMTT Agrifood Research Finland, Biotechnology and Food Research,
FI-31600 Jokioinen, Finland, email: [email protected]
A process was started in the late 1990s to produce comprehensive environmental data on particular aspects of Finnish food production with the aim of analyzing the environmental impacts (at least climate change, acidification and eutrophication and some other impacts) of products and locating hot spots in production chains. A supply chain integrated life cycle assessment was carried out on fodder barley, hard cheese, oat flakes, potato flour, cream cheese potato gratin, beer, honey-marinated/sliced broiler fillet and greenhouse cu-cumber. Methodological improvements in assessing environmental impacts of food products were evaluated in relation to ISO14040 and 14044 standards. Methods improved, especially regarding quality of cultivation data and previously reported data from the literature, impact assessment and calculations for assessment of leaching from agriculture. As a generic conclusion on the share of contributions of the various phases of production chains to environmental impact: agriculture was the most important phase, especially in terms of eutrophication potential. Work in food LCA methodology has provided a sound base for future development in assessing environmental impacts of food products. In the future providing more and more environmental information on products for customers and consumers is setting new challenges for research.
Key-words: life cycle assessment, LCA, food, supply chain integrated LCA, environmental impact

A G R I C U L T U R A L A N D F O O D S C I E N C E
Vol. 18 (2009): 460–476.
460
A G R I C U L T U R A L A N D F O O D S C I E N C E
Vol. 18 (2009): 460–476.
461
Introduction
In the late 1990s the Finnish agro-food industry and trade companies, in co-operation with MTT Agrifood Research Finland, initiated a process to generate comprehensive environmental performance data on Finnish food production and supply systems. This national collaborative effort was expected to sup-port R&D and innovation in food production and to improve the environmental performance of products according to principles of social responsibility and integrated product policy (IPP). One important aim was to get the different parties involved in the supply chain to learn more about product-oriented environ-mental management and to assess environmental impacts and related benefits through learning by doing. It was also thought, at least by the financing body and MTT, that results could be used to improve environmental awareness of consumers.
Life cycle assessment (LCA) was first applied to feed barley (Katajajuuri et al. 2000) to develop the LCA method for agricultural production in Finland. After this pilot case LCAs were applied for several food products: oat flakes (Katajajuuri et al. 2003), potato flour (Voutilainen et al. 2003a), cream cheese gratinated potato (Voutilainen et al. 2003a), hard cheese (Voutilainen et al. 2003b), beer (Virtanen et al. 2006), honey marinated/sliced broiler fillet (Katajajuuri et al. 2006) and greenhouse grown cucumber (Katajajuuri et al. 2007). During the re-search processes intermediate products included in supply chains, including feed oat, silage, pasture, dry hay, feed concentrates, potato, oat, wheat, rape, turnip rape, milk and cream were also assessed.
ISO 14040 and 14044 (SFS 2006a, 2006b) standards were sources of general principles and the framework for LCA applications. According to ISO 14040 LCA is a systematic set of procedures for compiling and examining the inputs and outputs of materials and energy and the associated environ-mental impacts directly attributable to the function-ing of a product or service system throughout its lifecycle. Four phases of LCA were identified: 1) goal and scope definition, 2) inventory analysis, 3) impact assessment, and 4) interpretation. Bound-ary and functional unit settings, initial data require-
ments, allocation or system expansion to avoid allo-cation, and impact assessment methods are critical issues in LCA studies because they markedly affect results, and were considered within the four phases. Standards do not provide specific methodologies to handle these critical issues even though in applica-tions decisions on the methodologies have to be taken. Naturally, these decisions should be in line with the goals of the study.
LCA case studies were carried out using a sup-ply chain integrated LCA approach (Poikkimäki and Virtanen 2003), the theoretical background of which resides in industrial ecology, and operation-ally is linked to organization and business manage-ment. According to this approach, which is related to inventory analysis, central data on the supply chains should be based on empirical investigation of the actual processes. This approach, in practice implemented by working groups, was developed for tackling key problems associated with implementa-tion of LCA and utilization of results, including or-ganization of work, costs, data availability, and reli-ability and acceptability of the results (Loikkanen et al. 1999).
Results of previous studies have been published mainly in summary reports, in Finnish, and in in-ternational conference papers, and they are cur-rently being discussed intensively in the Finnish media. The media has a tendency to oversimplify complex issues, for example by comparing different case studies without discussion of their background. However, scientists are very aware of the sensitivity of LCA case studies regarding decision-making at different stages during a study and of limitations regarding generalization of LCA case study results, even to other products of the same product group.
In this paper, we provide an overview of the principal results of the case studies, illustrating the hot spots for environmental impacts of Finnish food products. The main contribution of this paper is to critically review methodology and its development. We will describe the main methodological princi-ples, exceptions to them and some methodological shifts. We will then analyze how solutions in dif-ferent cases at different times can affect the results and how they affect comparability of environmental impacts of studied products.
A G R I C U L T U R A L A N D F O O D S C I E N C E
Usva, K. et al. Supply chain integrated LCA of food in Finland
462
A G R I C U L T U R A L A N D F O O D S C I E N C E
Vol. 18 (2009): 460–476.
463
Methodological development in the LCA case studies
Definition of scope, boundary and functional unit
The LCA case studies targeted development of the supply chain processes. The specific objectives of the case studies were to analyze environmental burdens and impacts of products and to locate hot spots for environmental impacts along the production chain. Defining possibilities for improving environmental performance of the products was explicitly included in the case studies of hard cheese, beer and broilers. This was done by comparing cultivation methods for fodder crops and grass in the case of hard cheese, and dissecting improvement possibilities in the broiler case. It was suggested that the results of the studies could be exploited in product design and provision of information to customers.
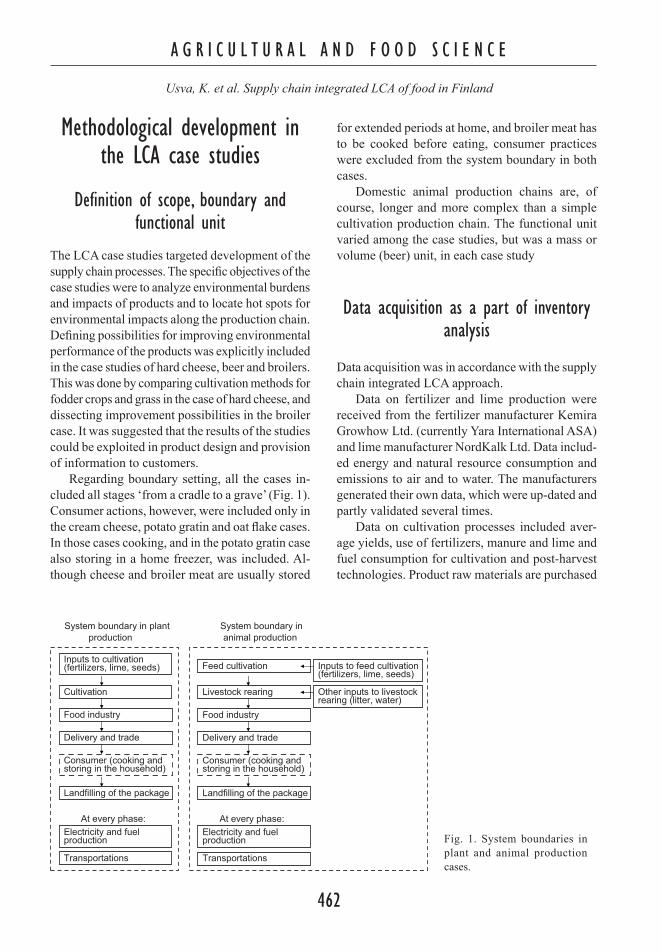
Regarding boundary setting, all the cases in-cluded all stages ‘from a cradle to a grave’ (Fig. 1). Consumer actions, however, were included only in the cream cheese, potato gratin and oat flake cases. In those cases cooking, and in the potato gratin case also storing in a home freezer, was included. Al-though cheese and broiler meat are usually stored
for extended periods at home, and broiler meat has to be cooked before eating, consumer practices were excluded from the system boundary in both cases.
Domestic animal production chains are, of course, longer and more complex than a simple cultivation production chain. The functional unit varied among the case studies, but was a mass or volume (beer) unit, in each case study
Data acquisition as a part of inventory analysis
Data acquisition was in accordance with the supply chain integrated LCA approach.
Data on fertilizer and lime production were received from the fertilizer manufacturer Kemira Growhow Ltd. (currently Yara International ASA) and lime manufacturer NordKalk Ltd. Data includ-ed energy and natural resource consumption and emissions to air and to water. The manufacturers generated their own data, which were up-dated and partly validated several times.
Data on cultivation processes included aver-age yields, use of fertilizers, manure and lime and fuel consumption for cultivation and post-harvest technologies. Product raw materials are purchased
Inputs to cultivation(fertilizers, lime, seeds)
Cultivation
Food industry
Delivery and trade
Consumer (cooking and storing in the household)
Landfilling of the package
Electricity and fuelproduction
Transportations
At every phase:
System boundary in plantproduction
Inputs to feed cultivation(fertilizers, lime, seeds)
Livestock rearing
Food industry
Delivery and trade
Consumer (cooking and storing in the household)
Landfilling of the package
Electricity and fuelproduction
Transportations
At every phase:
System boundary in animal production
Feed cultivation
Other inputs to livestockrearing (litter, water)
Fig. 1. System boundaries in plant and animal production cases.

A G R I C U L T U R A L A N D F O O D S C I E N C E
Usva, K. et al. Supply chain integrated LCA of food in Finland
462
A G R I C U L T U R A L A N D F O O D S C I E N C E
Vol. 18 (2009): 460–476.
463
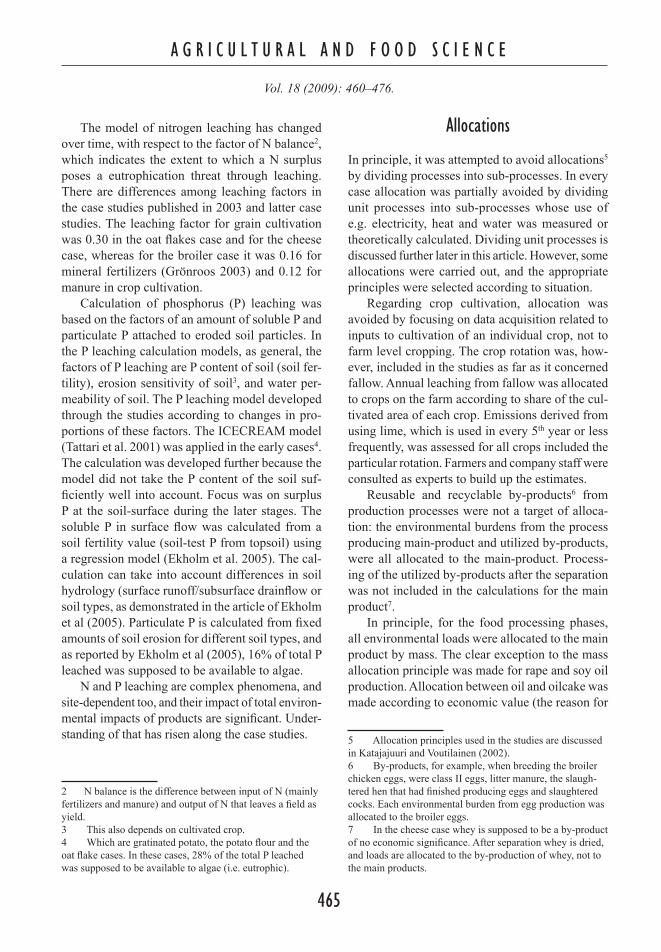
partly from contract cultivators and partly from the free market. Data sources varied from expert opinions and comprehensive theoretical models of farm procedures to farm-based real data, depending on data availability. In earlier studies, farm-based data were provided by surveying contract farmers as no follow-up data were available at that time. The most recent studies have included follow-up data on contract cultivators and use of the ProA-gria cultivation database1. The ProAgria database consists of cultivated field plot data that farmers provide annually on their farming procedures and input-output graphics. Figure 2 describes how the cultivation data sources have developed over time and LCA cases. Some cases, like beer, have two different data sources for cultivation (for malt bar-ley and starch barley cultivation).
Surveys were used to gather farm-based data. The method of choosing the survey sample varied over the studies. For example, in the oat flakes case, 40 contract farms were selected by the processing company. In the beer case, the data from starch barley farmers were collected. The sample size ranged from 20 farms selected to represent all the approximately 1000 milk farms producing feed in the cheese case study to thousands of malt barley parcels in the beer case.
In the cucumber LCA, survey data were ex-tensive and horticulture statistics were used from the Information Centre of the Finnish Ministry of Agriculture and Forestry (TIKE).
In the case studies it was not possible to en-hance the surveys to get specific information on fuel consumption for agricultural field machinery and post harvest processes, so theoretical models were used in each case.
In most of the first case studies only one sea-son was selected to represent the entire cultiva-tion phase. However, weather conditions varied considerably from year to year and yields changed accordingly. Consequently, in the later broiler and beer cases three consecutive seasons were included
1 ProAgria Agricultural Data Processing Centre ML Ltd maintains the ProAgria cultivation database the data for which are collected directly from Finnish farmers by the cultivation advisers of ProAgria. Most of the data are from 2004 and later years.
in the study. Moreover, in the cheese case, data from fodder cultivation in milk farms were col-lected during several years from 2003 onwards. Regarding cucumber cultivation, one year was as-sumed to be sufficient because the crop is produced under controlled conditions in greenhouses.
Data on soy (imported raw material) is crucial because soy is a very important feed crop. There were no possibilities to study soy production in situ and soy is a product that is hard to trace. Data from soy cultivation were taken from the published literature when they were needed (Cederberg 1998, Cederberg and Darelius 2000, Kulay and Silva 2005, Miller and Theis 2006). Between 2003 and 2006, LCA and other useful data were published more frequently, and the reliability of the data re-ported in the literature was improved for soy and other imported products.
Data on livestock rearing (in the broiler, hard cheese and cream cheese potato gratin cases) in-cluded, for example, feed consumption, production rates and energy consumption, collected directly from farms using surveys. In addition, follow-up production data were also used. Data were veri-fied and validated with the producers by phone and through farm visits.
Data on industrial processes centred on energy consumption (electricity and heat). The amount and quality of waste water and waste materials were monitored using follow-up data from enterprises. Also air emissions from heating and emissions to water from waste water treatment plants were col-lected. If real process data were not available, data from an appropriate literature source were used, e.g. emissions from production of oil products (Fortum Oil and Gas 2002).
Data on distribution of products were based on internal follow-up data from retail and logistics companies. Distribution was modelled on realistic delivery routes with initial loading, retail stops, and return logistics (including reusable packages and some recyclable materials).
Data on retail refrigeration and freezing were calculated using nominal electricity consumption for devices and actual turnover time of products. Data on household activities (when included) were based on energy consumption of domestic appli-

A G R I C U L T U R A L A N D F O O D S C I E N C E
Usva, K. et al. Supply chain integrated LCA of food in Finland
464
A G R I C U L T U R A L A N D F O O D S C I E N C E
Vol. 18 (2009): 460–476.
465
ances and estimated respective operating times us-ing appropriate data reported in the literature.
In summary, data on livestock rearing (when needed), industrial processes, distribution of prod-ucts and consumer activities (when included) were collected for all the case studies and varied little over time, whereas data acquisition for cultivation processes improved considerably over time.
Calculation of emissions to air and water
Greenhouse gas emissions from agricultural sources, including N2O and lime-based CO2 from soil, N2O and CH4 emissions from manure handling and CH4 from ruminants, were calculated according to IPCC requirements (IPCC 1997).
Ammonia (NH3) emissions from cultivation were based on estimations developed by the Finn-ish Environment Institute (Grönroos et al. 1998).
For the hard cheese study in 2003, ammonia (NH3) emissions from manure to air were cal-culated using equations reported by Grönroos et al (1998). For the broiler study, ammonia emis-sions from broiler manure were estimated by a)
calculating the emissions using the information on nitrogen balance in broiler manure and b) us-ing appropriate measured values published in the literature. Values for nitrogen balance calculation and information about manure handling were ac-quired using a detailed survey.
Up-to-date average Finnish electricity grid data were used for electricity consumption cal-culations. Also emissions from heating and water emissions from waste water treatment, as well as many other emission co-factors, including air emissions from vehicles, were taken from appro-priate literature or expert estimates, when locally measured data were not available.
In the first case study (fodder barley), field emissions to water were based on an expert es-timate and in the other cases on model calcula-tions. Nitrogen (N) and phosphorus (P) leaching calculations were based on nutrient balances of the soil and nationally applied P and N leaching models (Tattari et al. 2001, Ekholm et al. 2005). P and N leaching models are under continuous de-velopment.
60023002raey 0002
Feed
barle
ycu
ltiva
tion
Feed
culti
vatio
nP
otat
ocu
ltiva
tion
Pot
ato
culti
vatio
nO
at c
ultiv
atio
n
Mal
tbar
ley
culti
vatio
nS
tarc
hba
rley
culti
vatio
nC
ucum
ber
culti
vatio
nFe
edcu
ltiva
tion
Rap
esee
dcu
ltiva
tion
(mar
inad
e)
Cul
tivat
ion
data Profit calculations
Contract cultivation data
ProAgria cultivation database
Queries / Data collection directly from farmers
Statistical data
Expert opinion
Em
men
tal
chee
se
Che
ese
crea
mpo
tato
grat
in
Pot
ato
flour
Oat
flak
es
Bee
r
Cuc
umbe
r
Slic
edan
d m
arin
ated
broi
elrfi
llet
Feed
barle
y
Fig. 2. Data sources on field cul-tivation over time and different food LCA studies. LCA studies are represented in the first line and plant cultivation related to the cases in the second line (i.e. feed cultivation in the emmen-tal cheese case).
A G R I C U L T U R A L A N D F O O D S C I E N C E
Usva, K. et al. Supply chain integrated LCA of food in Finland
464
A G R I C U L T U R A L A N D F O O D S C I E N C E
Vol. 18 (2009): 460–476.
465
The model of nitrogen leaching has changed over time, with respect to the factor of N balance2, which indicates the extent to which a N surplus poses a eutrophication threat through leaching. There are differences among leaching factors in the case studies published in 2003 and latter case studies. The leaching factor for grain cultivation was 0.30 in the oat flakes case and for the cheese case, whereas for the broiler case it was 0.16 for mineral fertilizers (Grönroos 2003) and 0.12 for manure in crop cultivation.
Calculation of phosphorus (P) leaching was based on the factors of an amount of soluble P and particulate P attached to eroded soil particles. In the P leaching calculation models, as general, the factors of P leaching are P content of soil (soil fer-tility), erosion sensitivity of soil3, and water per-meability of soil. The P leaching model developed through the studies according to changes in pro-portions of these factors. The ICECREAM model (Tattari et al. 2001) was applied in the early cases4. The calculation was developed further because the model did not take the P content of the soil suf-ficiently well into account. Focus was on surplus P at the soil-surface during the later stages. The soluble P in surface flow was calculated from a soil fertility value (soil-test P from topsoil) using a regression model (Ekholm et al. 2005). The cal-culation can take into account differences in soil hydrology (surface runoff/subsurface drainflow or soil types, as demonstrated in the article of Ekholm et al (2005). Particulate P is calculated from fixed amounts of soil erosion for different soil types, and as reported by Ekholm et al (2005), 16% of total P leached was supposed to be available to algae.
N and P leaching are complex phenomena, and site-dependent too, and their impact of total environ-mental impacts of products are significant. Under-standing of that has risen along the case studies.
2 N balance is the difference between input of N (mainly fertilizers and manure) and output of N that leaves a field as yield.3 This also depends on cultivated crop.4 Which are gratinated potato, the potato flour and the oat flake cases. In these cases, 28% of the total P leached was supposed to be available to algae (i.e. eutrophic).
Allocations
In principle, it was attempted to avoid allocations5 by dividing processes into sub-processes. In every case allocation was partially avoided by dividing unit processes into sub-processes whose use of e.g. electricity, heat and water was measured or theoretically calculated. Dividing unit processes is discussed further later in this article. However, some allocations were carried out, and the appropriate principles were selected according to situation.
Regarding crop cultivation, allocation was avoided by focusing on data acquisition related to inputs to cultivation of an individual crop, not to farm level cropping. The crop rotation was, how-ever, included in the studies as far as it concerned fallow. Annual leaching from fallow was allocated to crops on the farm according to share of the cul-tivated area of each crop. Emissions derived from using lime, which is used in every 5th year or less frequently, was assessed for all crops included the particular rotation. Farmers and company staff were consulted as experts to build up the estimates.
Reusable and recyclable by-products6 from production processes were not a target of alloca-tion: the environmental burdens from the process producing main-product and utilized by-products, were all allocated to the main-product. Process-ing of the utilized by-products after the separation was not included in the calculations for the main product7.
In principle, for the food processing phases, all environmental loads were allocated to the main product by mass. The clear exception to the mass allocation principle was made for rape and soy oil production. Allocation between oil and oilcake was made according to economic value (the reason for
5 Allocation principles used in the studies are discussed in Katajajuuri and Voutilainen (2002).6 By-products, for example, when breeding the broiler chicken eggs, were class II eggs, litter manure, the slaugh-tered hen that had finished producing eggs and slaughtered cocks. Each environmental burden from egg production was allocated to the broiler eggs.7 In the cheese case whey is supposed to be a by-product of no economic significance. After separation whey is dried, and loads are allocated to the by-production of whey, not to the main products.

A G R I C U L T U R A L A N D F O O D S C I E N C E
Usva, K. et al. Supply chain integrated LCA of food in Finland
466
A G R I C U L T U R A L A N D F O O D S C I E N C E
Vol. 18 (2009): 460–476.
467
this is the high marketing value of the protein rich oilcake).
The most significant question concerns do-mestic animal production and allocation between milk and meat. Milk is the main product of cows in Finland, and allocating everything to the milk would be reasonable, but meat and milk production are integrated processes. In the hard cheese case, a comparison between different allocation proce-dures was performed. As a result the amount of extra fodder that the cows consumed when having calves was allocated to calves. The share of fod-der, the costs of which were covered selling the meat, was allocated to meat production, and the remainder was allocated to milk production. The final allocation was 88.5 % to milk, 9.5 % to meat and 2 % to calves. Allocation by mass would result in a 99 % share to milk and allocation according to economic value would result in a 91 % share to milk.
Uncertainty analysis
Uncertainty analysis was carried out only with respect to allocation between milk and meat in the cheese and potato gratin cases. The analysis included data and some of the calculation models, indicating the most important uncertainties for global warming potential were related to N2O and CH4 emissions. Furthermore, other important sources of uncertainty were nutrient leaching from fields, related to eutrophication, and NH3 from manure handling, related to acidification. Analysis was not extensive, but represented an initial attempt to identify the most marked uncertainties. Sensitivity analysis in that case was not carried out.
Impact assessment
In terms of environmental impacts, four main cat-egories were considered; global warming potential, eutrophication, acidification and tropospheric ozone formation (Table 1). Tropospheric ozone formation
was considered in the oat flakes case, the broiler case and the beer case, and the remaining categories were considered in all the case studies. The impact assessment method used within the categories varied. Global warming potential changed least and was supported by international scientific co-operation (IPCC 1994, 2001). Global warming is a global phenomenon, whereas impacts of eutrophication and acidification, in particular, are mainly local. In these categories the development of regional application of methods and site-specific factors for Finland were continuously improved (Seppälä et al. 2004, 2006).
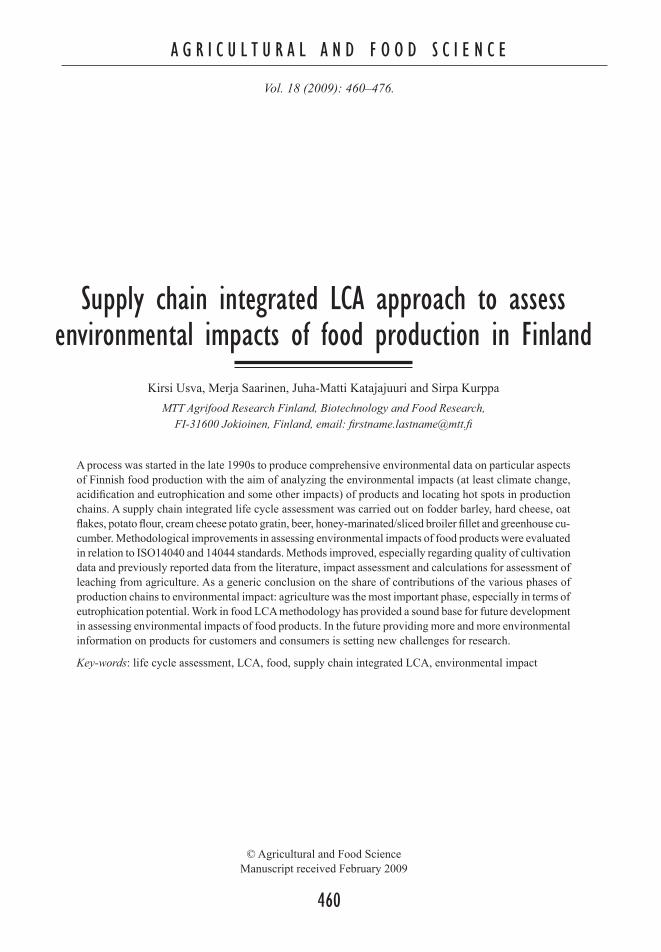
Case study results– environ-mental impacts of various food
product chains
The results of the case studies are shown in Fig-ure 3. In terms of eutrophication, emissions from cultivation, caused by movement of nitrogen and phosphorus to water, dominated. For animal based products, emissions from manure, in the form of am-monia, had a considerable effect on eutrophication. This makes the contribution of the agricultural phase even higher compared with the entire supply chain. Typically, the contribution of agriculture tended to be more than 95%. This is true also in the broiler case, when the agricultural impacts of the marinade chain are taken into account.
In terms of acidification also, the contribution of agriculture tended to be quite dominant. This was especially so for animal based products due to ammonia emissions from manure. An exception was potato gratin, where the retail contribution was very important due to the need for electric power and liquid nitrogen for freezing the product. In this case, the electricity consumption of the refrigera-tor was very high, being based on average product throughput of the cold stores. It is notable that this product is not a typical frozen product, but rather it has a very slow turnover time.

A G R I C U L T U R A L A N D F O O D S C I E N C E
Usva, K. et al. Supply chain integrated LCA of food in Finland
466
A G R I C U L T U R A L A N D F O O D S C I E N C E
Vol. 18 (2009): 460–476.
467
Tabl
e 1.
Impa
ct fa
ctor
s use
d in
LC
A F
ood
case
stud
ies.
Fo
dder
bar
ley
Oat
flak
esPo
tato
flou
rG
ratin
ated
pot
ato
Che
ese
Bee
rB
roile
r fille
tC
ucum
ber
Glo
bal w
arm
ing
pote
ntia
lkg
CO
2-eqv
kg-1
kg
CO
2-eqv
kg-1
kg
CO
2-eqv
kg-1
kg
CO
2-eqv
kg-1
kg
CO
2-eqv
kg-1
kg C
O2-e
qv k
g-1kg
CO
2-eqv
kg-1
kg C
O2-e
qv k
g-1
CO
21
11
11
11
1N
2O32
029
629
629
629
629
629
629
6C
H4
2523
2323
2323
2323
refe
renc
eIP
CC
199
4IP
CC
200
1IP
CC
200
1IP
CC
200
1IP
CC
200
1IP
CC
200
1IP
CC
200
1IP
CC
200
1Eu
troph
icat
ion
kg O
2 kg-1
kg P
O43-
-eqv
kg-1
kg P
O43-
-eqv
kg-1
kg P
O43-
-eqv
kg-1
kg P
O43-
-eqv
kg-1
kg P
O43-
-eqv
kg-1
kg P
O43-
-eqv
kg-1
kg P
O43-
-eqv
kg-1
NH
316
0.35
N
H3 to
air
0.
024
0.
040.
040.
04N
Hy (a
s NH
3)0.
023
0.02
30.
023
NH
4+ 15
0.33
NH
4+ to
air
0.
023
NO
x6
0
.008
0.0
08 0
.008
N
Ox t
o ai
r
0.00
8
0.01
50.
015
0.01
5N
-tot (
solu
ble)
220.
434
0−0
.42
0−0
.42
0−0
.42
0.42
0.42
0.42
NO
3-4.
40.
096
P-to
t (so
lubl
e)14
03.
04 0
−3.0
6 0
−3.0
6 0
3.06
3.06
3.06
3.06
P-to
t (de
posi
t)1.
531.
531.
53PO
43-46
1
C
OD
1
refe
renc
eLi
ndfo
rs e
t al.
1995
Sepp
älä
1999
aSe
ppäl
ä 19
99b
Sepp
älä
1999
bSe
ppäl
ä 19
99b
Sepp
älä
et a
l 200
4Se
ppäl
ä et
al 2
004
Sepp
älä
et a
l 200
4A
cidi
ficat
ion
kg S
O2-e
qv k
g-1kg
SO
2-eqv
kg-1
kg S
O2-e
qv k
g-1kg
SO
2-eqv
kg-1
kg S
O2-e
qv k
g-1A
E-eq
v kg
-1A
E-eq
v kg
-1A
E-eq
v kg
-1
HC
l0.
9
SO
21
0.52
0.46
30.
463
0.46
3SO
x( as
SO
2)0.
0163
50.
0163
50.
0163
5N
H3
1.1
0.85
0.53
50.
535
0.53
5N
Hy (a
s NH
3)0.
0264
60.
0264
60.
0264
6N
Ox
0.4
0.2
0.00
639
0.00
639
0.00
639
0.18
60.
186
0.18
6N
H4+
0.
8
re
fere
nce
Lind
fors
et a
l. 19
95
Sepp
älä
1999
aSe
ppäl
ä 19
99b
Sepp
älä
1999
bSe
ppäl
ä 19
99b
Sepp
älä
et a
l. 20
06Se
ppäl
ä et
al.
2006
Sepp
älä
et a
l. 20
06Tr
opos
pher
ic
ozon
e
kg C
2H4-e
qc k
g-1
10
00 m
2 × p
pm×
h kg
-1
1000
m2 ×
ppm
× h
kg-1
1000
m2 ×
ppm
× h
kg-1
CH
4
0.00
7
0.33
0.33
0.33
CO
0.
03
N
MV
OC
0.
6
0.27
0.27
0.27
NO
x
0.35
0.35
0.35
refe
renc
e
Virt
anen
et a
l. 20
02a,
200
2b
Hau
schi
ld e
t al.
2004
Hau
schi
ld e
t al.
2004
Hau
schi
ld e
t al.
2004

A G R I C U L T U R A L A N D F O O D S C I E N C E
Usva, K. et al. Supply chain integrated LCA of food in Finland
468
A G R I C U L T U R A L A N D F O O D S C I E N C E
Vol. 18 (2009): 460–476.
469
TotalEutroph.
(kg PO43-eqv)
Acid (kg AE-eqv)
GWP (kg CO2-eqv)
Smog (1000 m2*ppm*h)
Marinated broiler (1000 kg) 3.97 14.04 3634.99 10.53
consumer & waste management not included
Marinated broiler
020406080
100
Eutroph. (kg PO4
3-eqv)Acid
(kg AE-eqv)GWP
(kg CO2-eqv)Smog
(1000 m2*ppm*h)
Primary production (incl. inputs) Marinade/sauce chainFood industry Packaging Delivery and trade
%
Total Eutroph. (kg PO4
3-eqv)Acid
(kg AE-eqv)GWP
(kg CO2-eqv)Smog
(1000 m2×ppm×h)
Medium strength beer (1 000 l)
0.27 0.66 537.50 1.34
Medium strength beer
020406080
100
Eutroph. (kg PO4
3-eqv)Acid
(kg AE-eqv)GWP
(kg CO2-eqv)Smog
(1000 m2*ppm*h)
Primary production (incl. inputs) Food industryDelivery (incl. packaging), trade, consumer & waste management
%
Total Eutroph. (kg PO4
3-eqv)Acid
(kg AE-eqv)GWP
(kg CO2-eqv)Smog
(1000 m2*ppm*h)
Oat meal (1 000 kg) 1.42 0.98 834.15 0.15
Oat meal
020406080
100
Eutroph. (kg PO4
3-eqv)Acid
(kg AE-eqv)GWP
(kg CO2-eqv)Smog
(1000 m2*ppm*h)
Primary production (incl. inputs) Food industry PackagingDelivery and trade Consumer & waste management*
%
TotalEutroph.
(kg PO43-eqv)
Acid (kg AE-eqv)
GWP (kg CO2-eqv)
Cucumber (1 000 kg) (average) 0.84 5.96 3980.66
consumer & waste management not included
Cucumber
020406080
100
Eutroph. (kg PO4
3-eqv)Acid
(kg AE-eqv)GWP
(kg CO2-eqv)
Primary production (incl. inputs) Packaging Delivery and trade
%
Total Eutroph. (kg PO4
3-eqv)Acid
(kg AE-eqv)GWP
(kg CO2-eqv)
Potato flour (1000 kg) 1.92 0.95 659.66
Potato flour
020406080
100
Eutroph. (kg PO4
3-eqv)Acid
(kg SO2-eqv)GWP
(kg CO2-eqv)
Primary production (incl. inputs) Food industry PackagingDelivery and trade Waste management
%
Total Eutroph. (kg PO4
3-eqv)Acid
(kg AE-eqv)GWP
(kg CO2-eqv)
IQF potato gratin (1 000 kg) 1.15 7.18 4541.13
IQF Potato gratin
020406080
100
Eutroph.(kg PO4
3-eqv)Acid
(kg SO2-eqv)GWP
(kg CO2-eqv)
Primary production (incl. inputs) Marinade/sauce chainFood industry Packaging Delivery and trade Consumer
%
Total Eutroph. (kg PO4
3-eqv)Acid
(kg AE-eqv)GWP
(kg CO2-eqv)
Cheese (1 000 kg) 24.01 59.15 12972.68
consumer & waste management not included
Cheese
020406080
100
Eutroph. (kg PO4
3-eqv)Acid
(kg SO2-eqv)GWP
(kg CO2-eqv)
Primary production (incl. inputs) Food industryPackaging Delivery and trade
%
Fig. 3. Results of the food LCA case studies in different impact categories and the shares of the impacts in the phases of the chain.

A G R I C U L T U R A L A N D F O O D S C I E N C E
Usva, K. et al. Supply chain integrated LCA of food in Finland
468
A G R I C U L T U R A L A N D F O O D S C I E N C E
Vol. 18 (2009): 460–476.
469
The contributions of the supply chain phases to global warming potential (GWP) differ more between the product systems. There is some cor-relation between energy use and global warm-ing potential, but in the context of cattle based products, direct methane emissions from rumen fermentation represent the largest contribution in the agricultural phase. When household cooking was included in the systems, its contribution, es-pecially to global warming potential, was found to be quite high, with the positive exception of microwave use. Contribution of life cycle phases to GWP of food products is also discussed by Kata-jajuuri et al (2005). Overall, the contribution to the environmental im-pacts of food products from packaging and delivery was minor. The situation was similar regarding transport, which was mostly integrated into the respective production phases. The beer case was an exception in that the contribution of packaging and logistics was relatively much higher compared with the minor impacts of beer production.The previous generic conclusions on the magnitudes of the impacts during the different phases of the chain can be drawn from case studies. However, it is not reliable to make further comparisons among case studies (i.e. comparison of environ-mental impacts among products) because system boundaries, functional units, initial data quality (including age and time-related coverage of data), impact categories and impact category indicators were not the same throughout the studies (see next chapter). Furthermore, uncertainty and sensitivity analyses were not done.
Analysis of congruence of the case study methodology
We reviewed the case study methods from the point of view of comparability of the results, and the development of methods in relation to ISO 14040 and ISO 14044 standards. We previously developed, already, a heuristic protocol for assessing the risk
of the LCA results being far from correct for the benchmark approach (Nissinen et al. 2007) and ap-proaches developed by other scientists to evaluate the quality of LCA studies are numerous. However, there is not a one internationally accepted method for assessing the LCA works. A review method used in this paper is developed only for the purpose of this article, to assess the case study methods and point out some critical issues, and it is not actually a method developed for wider use.
We derived the basic criteria for the review from ISO 14040 and ISO 14044 standards regard-ing those aspects of LCA for which there are major differences between case studies in the methodo-logical development aspect and comparability of the results. It has to be underlined that the criteria do not fulfil all the requirements of the standards but concentrate on those aspects for which differ-ences occur. Thus, these can be used only in analy-sis of changes and their influence on compatibility of the method with a standard. The criteria are 1) functional unit (criterion 1), 2) system boundaries (criterion 2), allocation procedure (criterion 3), impact categories and impact category indicators (criterion 4) and data quality (criterion 5). The more detailed criteria and differences between the case studies related to the criteria are summarized in Table 2. In terms of data quality, the review is illustrated in Table 3. Impact category indicators are provided in Table 1.
Differences and changes between the case study methods
Regarding functional unit (criterion 1), there are no notable differences among the studies. All functional units used in the studies could be transformed into the same mass unit when making comparisons among products (criterion 1.2.). However, in the literature there is some speculation about functional units of food LCA from the point of view of quality aspects, but there is no consensus (e.g. Schau and Fet 2008). Nonetheless, quality aspects remain very important from the consumer choice point of view when comparability is essential.

A G R I C U L T U R A L A N D F O O D S C I E N C E
Usva, K. et al. Supply chain integrated LCA of food in Finland
470
A G R I C U L T U R A L A N D F O O D S C I E N C E
Vol. 18 (2009): 460–476.
471
Table 2. Differences between the case studies from the point of view of criteria 1−4. Sub-definitions of criteria are dis-played in the last column.
Criteria Fodder barley
Emmental cheese
Creamcheese potato gratin
Potato flour Oat flakes Beer Cucumber Marinated and sliced broiler fillet
1. Functional unit criteria1.1 consistence with the goal and scope of the study1)
y/? y/? y/? y/? y/? y/? y/? y/? 1.2. the same functional unit(s) in comparison between systems
1 000 kg 1 000 kg 10 000 pieces of product
10 000 pieces of product
10 000 kg 10 000 l 1 000 kg 1 000 kg
2. System boundary criterion: consistence with the goal and scope of the study1) y/n y/n y/y? y/n y/y? y/n y/n y/n
3. Allocation procedure criteria:3.1. representativeness in relation to fundamental input/output relationships and characteristics1)
?/? y?/? y?/? ?/? ?/? ?/? ?/? ?/?3.2. avoidance of allocation:
3.2.1. unit process dividing and data collecting related to sub-processes2)
y/n/-/-/- y/n/y/y/y y/n/y/y/y y/n/-/y/- y/n/-/y/- y/n/-/y/y y/n/-/-/- y/n/y/y/y3.2.2. product system expansion aim to include the additional functions related to the co-products 2)
n/n/-/-/- n/n/n/n/n n/n/n/n/n n/n/-/n/n n/n/-/n/n n/n/-/n/n n/n/-/-/n n/n/n/n/n3.3. allocation approach:
3.3.1. physical allocation2)
y/y/-/-/- y/y/y/y/y y/y/y/y/y y/y/-/y/y y/y/-/y/y y/y/-/y/y y/y/-/-/y y/y/y/y/y3.3.2. on the other way (e.g. econmic value) econmic allocation2)
n/n/-/-/- n/n/y/y/n n/n/y/y/n n/n/-/n/n n/n/-/n/n n/n/-/n/n n/n/-/-/n n/n/n/y/n3.4. sensitivity analysis related to allocation2)
n/n/-/-/- n/n/y/y/n n/n/y/n/n n/n/-/n/n n/n/-/n/n n/n/-/n/n n/n/-/-/n n/n/n/n/n4. Criterion of impact categories and impact category indicators:
4.1. comprehensiveness of impact category set? ? ? ? ? ? ? y
4.2. international acceptance of indicators3)
4.2.1. Global warming potentialy y y y y y y y
4.2.2. Eutrophicationn y4) y4) y4) y4) y4) y4) y4)
4.2.3. Acidificationn y4) y4) y4) y4) y4) y4) y4)
4.2.4. Trophosferic ozonenot included not included not included not included n y y y
4.3. sensitivity analysis n n n n n n n n4.4. uncertainty analysis
n n n n n n n n1) main goal/customer information, 2) input industry/cultivation/domestic animal production/feed and food industry/retail 3) at the time of the publishing, 4).national factors: an internationally accepted method used in definition (Seppälä et al. 2004, Seppälä et al 2006) y= yes, n=no, - = phase not included, ?= unambiguous assessment not possible

A G R I C U L T U R A L A N D F O O D S C I E N C E
Usva, K. et al. Supply chain integrated LCA of food in Finland
470
A G R I C U L T U R A L A N D F O O D S C I E N C E
Vol. 18 (2009): 460–476.
471
There are no major differences related to system boundaries (criterion 2) among the studies, although variation occurs in relation to consumer practices. It is not possible to identify the boundaries that are relevant from the point of view of consumer choice or customer information without consider-ing the overall goal and scope-setting of that class of study. The contribution of consumer practices, including shopping, storing, cooking and generat-ing organic waste is probably very significant in relation to total product chain. It is questionable to what extend this should be included in the LCA. Despite this, system boundaries of the studies are compatible with demand of the standard in relation to the main goal.
In general, allocation procedures vary among the studies, even though allocations in same phases of chains are pretty similar. The physical alloca-tion is more preferable according to standard and was the main allocation procedure throughout the studies (criterion 3.3.1.), but economic allocation (criterion 3.3.2.) was used in some of the cases and at some stages of the production chains.
Obviating allocation was achieved by dividing unit processes and collecting inventory data from sub-processes (criterion 3.2.1.) during most of the phases. However, allocation was often only partially bypassed by dividing unit processes into sub-proc-esses. The limit between dividing processes and al-location is not always clear, in e.g. dividing electric-ity consumption of an industrial plant according to different products. Various methods have been used for this division. In the broiler case the energy and water consumption of the plant was divided using electricity sub-measurements, calculations of the consumption for specific equipment, using their ca-pacities and information about through flow of the products, expert estimates and allocation by mass of the meat content of a product. Some of these methods simply divide a process into sub-processes (electricity sub-measurements), some are just allo-cation and the remainder lie somewhere between them. It has been considered important always to try to establish a more accurate basis for allocation than just physical (mass) allocation, even if there are no possibilities for dividing unit processes.
An additional option to obviate allocation is through system expansion (criterion 3.2.2.), a meth-od used in consequential LCA (e.g. Dalgaard and Halberg 2004) and proposed in the new version of the standard published in 2006 (SFS 2006a, 2006b). It was not used in these cases and it is doubtful if it is a suitable method for supply chain integrated LCA, in which a) the accounting the present envi-ronmental burdens of the product and b) the devel-opment of the system, are the main focuses. Also Thomassen et al (2008) state that the selection be-tween attributional (allocation) and consequential (system expansion) LCA should be done first of all according to the research problem.
Regarding comparability of impacts of prod-ucts, allocation is a difficult issue. It is usually said that allocation should be done using a standard principle, but in practice every product process has its own features and according to our experience allocation should be considered case by case.
In terms of representativeness of data after al-location, it is difficult to comment in relation to fun-damental input/output relationships and characteris-tics (criterion 3.1.) because there have not been any uncertainty and sensitivity analyses (criterion 3.4.) in the studies that would have included alternative allocation procedures. That significantly reduces comparability of results. Uncertainty analysis was carried out only related to allocation between milk and meat in the cheese and potato gratin case.
Comprehensiveness of the impact category set related to environmental issues of the product sys-tem (criterion 4) should be considered case by case as there are different kinds of environmental im-pacts in crop and animal production that set limits on comparability of results. For example, grazing significantly affects biodiversity in Finland, but there are only a limited number of internationally accepted impact category indicators on biodiversity (i.e. Schmidt 2008).
Assessment of global warming potential caused by a product is based on internationally accepted methods. Regarding the other impact categories, the situation is not so clear. Tropospheric ozone was as-sessed only in two cases, and the method changed between them. The latter was from the international
A G R I C U L T U R A L A N D F O O D S C I E N C E
Usva, K. et al. Supply chain integrated LCA of food in Finland
472
A G R I C U L T U R A L A N D F O O D S C I E N C E
Vol. 18 (2009): 460–476.
473
scientific literature (Hauschild et al. 2004), but there is no international consensus on the method.
Methods for assessing eutrophication and acidi-fication apply to conditions in Finland because both phenomena depend on site. Both indicators changed (Table 1) and are under development according to current scientific discussion. N and P leaching are complex phenomena, very site-dependent, and their impacts are significant. Understanding of the phe-nomena has increased as a result of the case stud-ies.
Differences and changes in quality of the case study data
Developments in data acquisition are probably the most significant aspect of developments in method-ology and comparability of case study results. Ac-cording to ISO 14044, standard data quality criteria should be specified to enable the goal and scope of the LCA to be met. The principal goal has been consistent throughout the studies, and each study has fulfilled expectations, but expectations have in-creased as expertise has improved over time. Quality of domestic cultivation data and also of literature data (i.e. soy cultivation) improved in particular. In Table 3 there is a summary of that development in relation to requirements of the standard.
An uncertainty analysis for the cream cheese potato gratin case generated four main sources of uncertainty: a) N2O emissions b) CH4 emissions c) nutrient washouts and d) treatment of manure as a source of NH3. Development in N2O and CH4 calculation methods are global issues and consider-able work has been done in the field. In domestic emission calculations, agricultural run-off-models and calculations have improved over the period of the case studies. For example, in the broiler case attention was paid to manure treatment practices.
The supply chain integrated LCA principle uses real data for the chain whenever possible. If real data cannot be used, the extent to which modelled data represent the actual processes is difficult to gauge. However, the representativeness of the data should always be checked. If the data cover the
whole phase, for example in an industrial phase, the data is collected from all the industrial plants producing the product, there is no problem. Un-fortunately it is not always possible to get all the data and a sample has to be taken. Selecting the sample is crucial to study results. Especially this is a problem in agriculture (cultivation data and possibly animal breeding data). Yields and use of inputs vary markedly between farms and years, and the cultivation phase is particularly significant in many chains. Thus an unrepresentative sample can distort the results and at a minimum the sensitivity analysis for sample definition should be done.
The problem of sampling is especially acute in the case of surveys. In the most recent studies, the beer and the broiler, the principal cultivation data source was contract cultivation data and the ProAgria database. In those cases all usable data were taken, representing thousands of hectares. The other issue is how well the data represent the focus of the study. In the case of contract culti-vation data, for many cases crops are purchased not only from contract farmers but also from other sources. The ProAgria database includes consider-able information, but only from farmers allied to the ProAgria Agricultural Data Processing Centre systems. There is insufficient information to assess how representative these samples are.
Data concerning consumer behaviour suffered from similar problems because the group was too big (every consumer using the food stuff) and a sample should have been taken and investigated. However, in the potato gratin and oat flakes cases, data from the literature were used for the household storage and cooking phases because it was consid-ered the real household-based data collection was too demanding to be done in the LCA-studies. In assessing the consumer phase many assumptions had to be made about equipment (freezer, stove, etc.) and behaviour. For this reason, those studies concerning consumers actions may provide only an estimate of the consumer phase. As long as the development of the production chain is the first goal of a LCA, such an assessment is sufficient, but for a specific consumer approach more infor-mation should be provided, including sensitivity analysis.

A G R I C U L T U R A L A N D F O O D S C I E N C E
Usva, K. et al. Supply chain integrated LCA of food in Finland
472
A G R I C U L T U R A L A N D F O O D S C I E N C E
Vol. 18 (2009): 460–476.
473
Conclusion
Finnish food LCA methodologies and develop-ment were assessed in this paper using criteria derived from ISO 14040 and ISO 14044. The most important milestones according to this evaluation were, 1) Initially more impact categories have been included in the studies and the methods for assess-ing the impacts have improved. Some site-specific characterization factors developed in Finland have been adopted, 2) Calculation methods for assessing leaching and eutrophication impact from agriculture were developed during the described food LCA stud-ies. However, further research is needed (Seppälä 1999b, Seppälä et al. 2004, 2006). 3) The quality of data has improved, especially regarding arable crop cultivation. Access to a comprehensive and continuously up-dated data source, the Pro Agria data bank, has become possible, and the extent of the data has increased to include broader time-scales (several cultivation years instead of only one). At the same time the quality and extent of published data and published food LCA studies has mark-edly increased. Roy et al. (2009) pointed out that development work in LCA methodology at the international level has increased the use of LCA in assessment of the environmental impacts. This is to be seen also in Food LCA Network (Halberg 2004, Nemecek and Gaillard 2009).
The relative proportions of life cycle phases varied among the different case studies. However, eutrophication potential was virtually completely attributable to the nitrogen and phosphorous emis-sions from cultivation and ammonia produced from manure. The shares of the supply chain phases to global warming potential (GWP) differed more. There is considerable correlation between energy use and GWP, but in the cheese case direct methane emissions from rumen fermentation made the most substantial contribution to the agricultural phase. These generic conclusions on the magnitudes of the impacts during the different phases of the chain can be drawn from case studies. However, it is not reli-able to make further comparison of environmental impacts because the differences in the methodolo-gies.
Moreover, Risku-Norja and Mäenpää (2007) highlighted the importance of food consumption patterns as being the most significant environmen-tal burdens derived from agriculture and are sus-ceptible to modification by changing the food raw material flows in the national economy. Heller and Keoleian (2003) evaluated the sustainability of the U.S. food system and indicated some hot spots in the life cycle phases of food production. According to them, the most important environmental burdens in food production that threaten the sustainability of the food system are linked to agriculture and are erosion, rate of groundwater withdrawal exceeding recharge, yield losses to pests and reduction in ge-netic diversity. Roy et al. (2009) evaluated several food LCA studies and concluded that agriculture represents the hot spot for food production.
These LCA studies produced useful and rele-vant information for actors in the supply chains to improve their practices in terms of environmental impacts. Knowledge creation and learning are the basis for environmental improvements and innova-tions. This learning process and knowledge creation is taking place in companies as a consequence of life cycle assessment projects. The relationship to life cycle management actions is discussed further by Poikkimäki (2006). Furthermore, the principal results of the studies have been published and have provided interesting information for the public au-dience. The process of developments in food LCA methodology has provided good groundwork for future advances and new applications in assessing environmental burdens of food products. Providing environmental information on products for custom-ers and consumers is setting new challenges for research and supply chains. These case studies and lessons learnt from them make it possible to meet these challenges.
Acknowledgements. The studies were a part of the Environ-mental Cluster Research Programme and national quality strategy for food in Finland, which includes the entire food chain from farm inputs to the consumer. The studies were financed by the Ministry of Environment and Ministry of Agriculture and Forestry, as well as by the participating companies and MTT.

A G R I C U L T U R A L A N D F O O D S C I E N C E
Usva, K. et al. Supply chain integrated LCA of food in Finland
474
A G R I C U L T U R A L A N D F O O D S C I E N C E
Vol. 18 (2009): 460–476.
475
ReferencesCederberg, C. 1998. Life cycle assessment of milk produc-
tion – a comparison of conventional and organic farm-ing. SIK-Rapport number 643. The Swedish Institute for Food and Biotechnology. 86 p.
Cederberg, C & Darelius, K. 2000. Livscykelanalys (LCA) av nöttkött – en studie av olika productionsfor-mer (in Swedish). Naturresursfrom, Landstinget, Hal-land. 85 p.
Dalgaard, R. & N. Halberg 2004. LCA of Danish milk - sys-tem expansion in practice. Life Cycle Assessment in the Agri-food sector. Proceeding from the 4h International Conference, October 6-8, 2003 Bygholm, Denmark. N.
Halberg. Horsens, Denmark, Danish Institute of Agricul-tural Sciences (DIAS). p. 285–288.
Ekholm, P., Turtola, E., Grönroos, J., Seuri, P. & Ylivainio, K. 2005. Phosphorus loss from different farming systems estimated from soil surface phosphorus balance. Agri-culture, Ecosystems and Environment 110: 266–278.
Fortum Oil & Gas. 2002. Ekotasetiedote 1.3.2002 (in Finnish).
Grönroos, J., Nikander, A., Syri, S. Rekolainen, S. & Ekvist, M. 1998. Maatalouden ammoniakkipäästöt (in Finnish). Suomen ympäristö 206. Suomen ympäristökeskus Hel-sinki. 65 p.
Grönroos, J. (ed.) 2003. Erilaisten maatalouskäytäntöjen ravinnehuuhtoumien arviointi. Osio 2. Hankkeen lop-puraportti Maa- ja metsätalousministeriölle 22.9.2003. 32 p.
Table 3. Criteria for data quality and development.Criteria for data quality Milestones & development Special
Time-related coverage Use of average of many years of cultiva-tion to even out fluctuations in cheese (cul-tivation in animal farms), broiler and beer cases.
Geographical coverage The geographical coverage of cultivation data varies due to different data sources. Geographical coverage is very difficult to assess as the data are not normally from the complete group of farmers producing the grain for the product.
Technological coverage no special changesPrecision Variances are under better control as the
data sources are more extensive (beer, cu-cumber, broiler).
Completeness no special changesRepresentativeness The representativeness of cultivation data varies
due to different data sources. Representativeness is very difficult to assess as the data are not nor-mally from the entire group of farmers producing the grain for the product.
Consistence The lack of data has hindered the consist-ency. The overall situation regarding data availability has improved considerably.
Reproducibility no special changesSource of the data Inventory data:
improvement in domestic cultivation • data source
improvement in many literature data • sources, especially important for soy cultivation
Emission calculation:
agricultural run-offs•
Considerable effort has been invested in fertilizer production data but it is very difficult to assess the improvement.
Uncertainty of information Very difficult to assess as uncertainty analyses were not done in every case.

A G R I C U L T U R A L A N D F O O D S C I E N C E
Usva, K. et al. Supply chain integrated LCA of food in Finland
474
A G R I C U L T U R A L A N D F O O D S C I E N C E
Vol. 18 (2009): 460–476.
475
Halberg, N. (ed.). 2004. Proceedings from the 4th Interna-tional Conference “Life Cycle Assessment in the Agri-Food Sector”, October 6-8, 2003, Bygholm, Denmark. Danish Institute of Agricultural Sciences Department of Agroecology. DIAS report, Animal Husbandry, no. 61, October 2004. 293 p.
Heller, M.C. and Keoleian, G.A. 2003. Assessing the sus-tainability of the US food system: a life cycle perspec-tive. Agricultural Systems 76: 1007–1041
Hauschild, M., Bastrup-Birk, A., Hertel, O., Schöpp, W. & Potting, J. 2004. Photochemical ozone formation. In: Potting, J. & Hauschild, M. (eds.). 2004. Background for spatial differentiation in life cycle assessment – the EDIP 2003 methodology. Institute of Product Develop-ment, Copenhagen. Environmental news 80.
IPCC 1994. Radiative Forcing of Climate Change – The 1994 Report of the Scientific assessment Group of IPCC (The Intergovernmental Panel on Climate Change). John Houghton, Meteorological Office, London Road, Brack-nell, U.K. 329 p.
IPCC 1997. Houghton J.T., Meira Filho L.G., Lim B., Trean-ton K., Mamaty I, Bonduki Y., Griggs D.J. & Callender B.A. 1997. Revised 1996 IPCC Guidelines for Nation-al Greenhouse Gas Inventories. Lontoo, IPCC, OECD & IEA. Available on the internet: http://www.ipcc-nggip.iges.or.jp/public/gl/invs1.htm.
IPCC 2001. Houghton, J., Ding, Y., Griggs, D., Noguer, M., van der Linden, P., Dai, X., Maskell, K. & Johnson, C. (eds) Climate Change 2001: The Scientific Basis. Con-tribution of working group I to the third assessment re-port of IPCC. 944 p.
Katajajuuri, J-M., Grönroos, J., Mikkola, A., Näkkilä, J., Voutilainen, P. 2007. Environmental Impacts of Finn-ish Greenhouse Cucumber Production Systems. Book of Proceedings, 5th International Conference LCA In Foods,25 - 26 April 2007, Gothenburg, Sweden. The Swedish Institute for Food and Biotechnology p. 133–137.
Katajajuuri, J-M., Grönroos, J., Usva, K., Virtanen, Y., Si-pilä, I., Venäläinen, E., Kurppa, S., Tanskanen, R., Mat-tila, T. ja Virtanen, H. 2006. Broilerin fileesuikaleiden tuotannon ympäristövaikutukset ja kehittämismahdol-lisuudet (in Finnish). Maa- ja elintarviketalous 90. MTT. Jokioinen. 118 p.
Katajajuuri, J-M., Loikkanen, T., Pahkala, K., Uusi-Kämppä, J., Voutilainen, P., Kurppa, S., Laitinen, P., Mikkola, H., Kivinen, T. ja S. Salo 2000. Ympäristöhallintaa tukevan tietopohjan kehittäminen osana maatilojen laatujärjest-elmää. Case: Rehuohran elinkaariarviointi (in Finnish). VTT Tiedotteita 2034. VTT Espoo. 134 p.
Katajajuuri, J.-M., Tuhkanen, H.-R. & Voutilainen, P. 2005. Contribution of life cycle stages to the global warm-ing potential of food products. Innovation by Life Cycle Management LCM 2005. International Conference, Pro-ceedings, Volume I. September 5-7, 2005, Barcelona, Spain. p. 414–418
Katajajuuri, J-M. & Voutilainen, P. 2002. LCA Case stud-ies on Finnish food production chains: management of secondary inflows and outflows (Extended abstract). In: SETAC Europe 10th LCA studies symposium ‘Recycling, close-loop economy, secondary resources’, December 2-3, 2002, Barcelona, Spain. p. 1–6.
Katajajuuri, J-M., Voutilainen, P, Tuhkanen, H-R. ja Hon-
kasalo, N. 2003. Elovena-kaurahiutaleiden ympäristö-vaikutukset (in Finnish). Maa- ja elintarviketalous 33. MTT. Jokioinen. 47 p.
Kulay, L. & Silva, G. 2005. Comparative screening LCA of agricultural stages of soy and castor bean. Innovation by life cycle management LCM 2005. International con-ference, proceedings, Volume 1. September 5-7, 2005, Barcelona, Spain. p 491–495.
Lindfors, L.-G., Christiansen, K., Hoffman, L., Virtanen, Y., Junttila, V., Hanssen, O.-J., Rønning, A., Ekvall, T. & Finnveden, G. 1995. Nordic Guidelines on Life-Cy-cle Assessment. Nordic Council of Ministers, Nord 20, Århus. 222 p.
Loikkanen, T. Mälkki, H., Virtanen, Y., Katajajuuri, J-M., Seppälä, J.,Leivonen, J., Reinikainen, A. 1999. Elinaar-iarviointi yritysten ja viranomaisten ympäristöhallinnan päätöksenteon tukena – nykytila ja kehittämistarpeet (in Finnish). Tekes Teknologiakatsaus 68/99. 73 p.
Miller, S. & Theis, T. 2006. Comparison of life cycle inven-tory databases. A case study using soybean production. Journal of industrial ecology 10: 133–147.
Nemecek, T. & Gaillard, G. (eds.) 2009. Proceedings of the 6th International Conference on LCA in the Agri-Food Sector - Towards a sustainable management of the Food Chain, November 12-14, 2008, Zurich, Swit-zerland. Agroscope Reckenholz-Tänikon Research Sta-tion ART, June 2009. 414 p.
Nissinen, A., Grönroos, J., Heiskanen, E., Honkanen, A., Katajajuuri, J-M., Kurppa, S., Mäkinen T., Mäenpää, I., Seppälä, J., Timonen, P, Usva, K., Virtanen, Y. and Vouti-lainen, P. 2007. Developing benchmarks for consumer-oriented life cycle assessment-based environmental in-formation on products, services and consumption pat-terns. Journal of Cleaner Production 15: 538–549
Poikkimäki, S. 2006. Look Closer to See Further. Exploring Environmental Life Cycle Management, LCM. Jyväskylä studies in business and economics 53. 153 p.
Poikkimäki, S & Virtanen, Y. 2003. Supply web integrated life cycle assessment. PTR report NO. 49.
Risku-Norja, H. & Mäenpää, I. 2007. MFA model to assess economic and environmental
consequences of food production and consumption. Eco-logical economics 60: 700 –711
Roy, P., Nei D., Orikasa, T., Xu, O., Okadome,H., Nakamu-ra, N., Shiina, T. 2009. A review of life cycle assess-ment (LCA) on some food products. Journal of Food En-gineering 90: 1–10
Schau E. M. and Fet A. M. 2008. LCA Studies of Food Prod-ucts as Background for Environmental Product Declara-tions. LCA for Food Products 13: 255–264
Schmidt, J.H. 2008. Development of LCIA characterisation factors for land use impacts on biodiversity. Journal of Cleaner Production 16: 1929–1942.
Seppälä, J. 1999a. Decision Analysis as a Tool for Life Cycle Impact Assessment. LCA Documents, Volume 4. Eco-Informa Press, ecomed publishers 1999. 174 p.
Seppälä, J. 1999b. Vaikutusten laskenta elinkaariarvio-innissa - vertailtavana DAIA- ja Ekoindikaattori 95 –menetelmät (in Finnish). Helsinki 1999, Suomen ym-päristökeskuksen moniste 172. 30 p.
Seppälä, J., Knuuttila, S. & Silvo, K. 2004. Eutrophica-tion of aquatic ecosystems. A new method for calcu-lationg th potential contributions of nitrogen and phos-

A G R I C U L T U R A L A N D F O O D S C I E N C E
Usva, K. et al. Supply chain integrated LCA of food in Finland
476
SELOSTUS
Toimintoverkkointegroitu elinkaariarviointi elintarviketuotannon ympäristövaikutusten arvioinnissa Suomessa
Kirsi Usva, Merja Saarinen, Juha-Matti Katajajuuri ja Sirpa KurppaMTT
phorus. The International Journal of Life Cycle Assess-ment 9: 90–100.
Seppälä, J., Posch, M., Johansson, M. & Hettelingh, J-P. 2006. Country-dependent characterisation factors for acidification and terrestrial eutrophication based on accumulated exceedance as an impact category indi-cator. The International Journal of Life Cycle Assess-ment 11: 403–416.
SFS 2006a. Finnish Standards Association. Environmen-tal management- Life cycle assessment-Principles and framework (ISO 14040-2006)
SFS 2006b. Finnish Standards Association. Environmen-tal management- Life cycle assessment-Requirement and quidelines (ISO 14044-2006)
Tattari, S., Bärlund, I., Rekolainen, S., Posch, M., Siimes, K., Tuhkanen, H-R. ja Yli-Halla, M. 2001. Modeling sed-iment yield and phosphorus transport in Finnish clayey soils. Transactions of the ASAE 44, 2: 297–307.
Thomassen, M. et al. 2008. Attributional and consequen-tial LCA of milk production. The International Journal of Life Cycle Assessment 13: 339–349.
Virtanen, Y., Ojaniemi, U., Poikkimäki, S. & Katajajuuri, J-M. 2002a. Life cycle assessment of potential envi-
ronmental impacts of Finnish beverage packaging sys-tems. 0.30l – 0.50l glass bottles, aluminium cans and PET bottles for beer, cider and carbonated soft drinks, Summary report. 101 p.
Virtanen, Y., Ojaniemi, U., Poikkimäki, S. & Katajajuuri, J-M. 2002b. Life cycle assessment of potential envi-ronmental impacts of Finnish beverage packaging sys-tems. 0.30l – 0.50l glass bottles, aluminium cans and PET bottles for beer, cider and carbonated soft drinks, Summary report, Appendices. 285 p.
Virtanen, Y., Usva, K. and Katajajuuri J-M 2006. Suoma-laisen keskioluen ympäristövaikutusten elinkaariarvio-inti, Tiivistelmä (in Finnish). Mallasohra –toimintoverkon kestävyyden parantamisen työkalut (MOKE). 8 p.
Voutilainen, P, Katajajuuri, J-M., Tuhkanen, H-R. ja Hon-kasalo, N. 2003a. Kesäpöytä Juustokermaperunoiden ja Pirkka-perunajauhon ympäristövaikutukset (in Finnish). Maa- ja elintarviketalous 34. MTT. Jokioinen. 54 p.
Voutilainen, P, Tuhkanen, H-R., Katajajuuri, J-M., Nou-siainen J. ja Honkasalo, N. 2003b. Emmental Sinileima –juuston tuotantoketjun ympäristövaikutukset ja paran-nusmahdollisuudet (in Finnish). Maa- ja elintarviketalo-us 35. MTT. Jokioinen. 91 p.
MTT:llä aloitettiin 1990-luvun lopulla tutkimuskoko-naisuus, jonka tarkoituksena oli tuottaa kattavasti tietoa suomalaisen ruuantuotannon ympäristövaikutuksista. Tavoitteena oli arvioida elintarvikkeiden ympäristö-vaikutuksia (vähintään ilmastonmuutos-, happamoi-tumis- ja rehevöitymisvaikutukset) sekä paikallistaa kriittiset pisteet tuotantoketjussa. Toimintoverkkoin-tegroitunut elinkaariarviointi toteutettiin rehuohralle, emmental-juustolle, kaurahiutaleille, perunajauhoille, juustokermaperunoille, oluelle, hunajamarinoiduille broilerfilesuikaleille ja kasvihuonekurkulle. Tutkimus-kokonaisuudessa kehitettyjä menetelmiä tutkittiin suh-teessa kansainvälisiin ISO14040 ja 14044 standardeihin. Menetelmät kehittyivät erityisesti viljelyaineistojen ja
kirjallisuustiedon laadun, vaikutusarvioinnin ja pelto-viljelyn vesistöhuuhtoumalaskennan suhteen. Tehtyjen elinkaariarviontien perusteella yleisenä johtopäätökse-nä ketjun eri vaiheiden merkityksestä elintarvikkeiden ympäristövaikutuksiin todettiin, että alkutuotanto oli suurimpia ympäristövaikutuksia aiheuttava tuotan-tovaihe, etenkin vesistöjen rehevöitymisvaikutuksen osalta. Tutkimuskokonaisuudessa toteutettu ruuan elinkaariarvioinnin menetelmäkehitys on luonut vahvan pohjan elintarvikkeiden ympäristövaikutusarvioinnin kehittämiselle myös tulevaisuudessa. Tulevaisuudessa lisääntyvä tuotekohtaisen ympäristövaikutustiedon tuottaminen asiakkaille ja kuluttajille luo tarvetta uu-delle tutkimukselle.