Net sugar transport is a multistep process. Evidence for cytosolic sugar binding sites in...
12
Biochemistry 1995, 34, 15395-15406 15395 Net Sugar Transport Is a Multistep Process. Evidence for Cytosolic Sugar Binding Sites in Erythrocytes? Erin K. Cloherty, Lisa A. Sultzman, Ralph J. Zottola, and Anthony Carruthers" Department of Biochemistry and Molecular Biology, Program in Molecular Medicine, Uniuersity of Massachusetts Medical School, Two Biotech, 373 Plantation Street, Worcester, Massachusetts 01605 Receiued April IO, 1995; Reuised Manuscript Receiued September 7, 1995@ ABSTRACT: Human erythrocyte net sugar transport is hypothesized to be rate-limited by reduced cytosolic diffusion of sugars and/or by reversible sugar association with intracellular macromolecules [Naftalin, R. J., Smith, P. M., & Roselaar, S. E. (1985) Biochim. Biophys. Acta 820, 235-2491. The present study examines these hypotheses. Protein-mediated 3-0-methylglucose uptake at 4 "C by human erythrocytes and by resealed, hypotonically lysed erythrocytes (ghosts) is inhibited by increasing solvent viscosity. Protein-mediated transport and transbilayer diffusion of the slowly transported substrate 6-NBD glucosamine are unaffected by increasing solvent viscosity. These findings suggest that protein-mediated 3-0- methylglucose transport is diffusion-limited in erythrocytes. More detailed analyses of red cell 3-0- methylglucose uptake (at 4 "C and at limiting extracellular sugar levels) reveal that net influx is a biexponential process characterized by rapid filling of a small compartment (Cl = 29 k 6% total cell volume; kl = 7.4 k 1.7 min-') and slow filling of a larger compartment (C2 = 71 k 6% total cell volume; k2 = 0.56 k 0.11 min-I). Erythrocyte D-glucose net uptake at 4 "C is also a biphasic process. Transmembrane sugar leakage is a monoexponential process indicating that multicomponent, protein- mediated uptake does not result from sugar uptake by two cell populations of differing cellular volume. Sugar exit at limiting 3-0-methylglucose concentrations is described by single exponential kinetics. This demonstrates that multicomponent sugar uptake does not result from influx into two populations of cells with widely different sugar transporter content. We conclude that biexponential sugar uptake results from slow (relative to transport) exchange of sugars between serial, intracellular sugar compartments. Biexponential sugar uptake is observed under equilibrium exchange conditions (intracellular sugar concentration = extracellular sugar concentration) but only at 3-0-methylglucose concentrations of less than 1 mM. Above this sugar concentration, exchange uptake is a monoexponential process. Because diffusion rates are independent of diffusant concentration, this suggests that multicomponent uptake results from high-affinity sugar binding within the cell. The concentration of cytosolic binding sites (30 pM, Kd(app) = 400 pM) was estimated from the equilibrium cellular 3-0-methylglucose space. Biexponential net 3-0-methylglucose uptake is also observed in human erythrocyte ghosts, in control human K562 cells, and in K562 cells induced to synthesize hemoglobin by prolonged exposure to hemin. This demonstrates that neither membrane-bound nor free cytosolic hemoglobin forms the sugar-binding complex. a-Toxin-permeabilized cells fill rapidly (within 5 s) with 3-0-methylglucose and L-glucose (a nontransported sugar), indicating that the glucose binding compartment does not extend across the entire intracellular margin of the plasma membrane. Rather, it must be restricted to domains of locally high-glucose transporter density. Immunofluorescence microscopy of erythrocytes indicates that GLUTl is not distributed uniformly across the cell surface, while the anion transporter shows a uniform cell surface distribution. Red cell hexokinase I and GLUTl appear not to colocalize in hypotonically lysed erythrocytes. The kinetics of sugar uptake and exit are quantitatively mimicked by a model in which newly imported sugars enter the bulk intracellular water only following interaction with an intracellular, sugar-binding complex. We conclude that steady state sugar transport assays in human erythrocytes measure two processes: rapid sugar translocation across the bilayer and slow sugar release into bulk cytosol. The conclusions of previous steady state analyses which assume net transport reflects only sugar translocation may require reconsideration. Erythrocyte sugar transport is characterized by a degree of kinetic complexity that is not easily explained by models that consider the process of net transport to reflect protein- mediated transmembrane sugar movements alone (Baker & ' This work was supported by NIH Grant DK 36081. * Author to whom correspondence should be addressed. Phone: 508 856 5570. Fax: 508 856 4289. E-mail: [email protected]. @ Abstract published in Advunce ACS Abstracts, November 15, 1995. 0006-2960/95/0434-15395$09.00/0 Naftalin, 1979; Carruthers, 1991; Helgerson & Carruthers, 1989; Naftalin & Holman, 1977; Naftalin & Rist, 1991; Naftalin et al., 1985). This has led to the hypothesis that transported sugars become reversibly complexed with intra- cellular macromolecules (Naftalin & Holman, 1977). If correct, this means that the observable steady state kinetics of erythrocyte sugar transport describe the sum of two processes (protein-mediated transport and intracellular sugar complexation) and that kinetic models for sugar transport 0 1995 American Chemical Society
Transcript of Net sugar transport is a multistep process. Evidence for cytosolic sugar binding sites in...

Biochemistry 1995, 34, 15395-15406 15395
Net Sugar Transport Is a Multistep Process. Evidence for Cytosolic Sugar Binding Sites in Erythrocytes?
Erin K. Cloherty, Lisa A. Sultzman, Ralph J. Zottola, and Anthony Carruthers"
Department of Biochemistry and Molecular Biology, Program in Molecular Medicine, Uniuersity of Massachusetts Medical School, Two Biotech, 373 Plantation Street, Worcester, Massachusetts 01605
Receiued April IO, 1995; Reuised Manuscript Receiued September 7, 1995@
ABSTRACT: Human erythrocyte net sugar transport is hypothesized to be rate-limited by reduced cytosolic diffusion of sugars and/or by reversible sugar association with intracellular macromolecules [Naftalin, R. J., Smith, P. M., & Roselaar, S . E. (1985) Biochim. Biophys. Acta 820, 235-2491. The present study examines these hypotheses. Protein-mediated 3-0-methylglucose uptake at 4 "C by human erythrocytes and by resealed, hypotonically lysed erythrocytes (ghosts) is inhibited by increasing solvent viscosity. Protein-mediated transport and transbilayer diffusion of the slowly transported substrate 6-NBD glucosamine are unaffected by increasing solvent viscosity. These findings suggest that protein-mediated 3-0- methylglucose transport is diffusion-limited in erythrocytes. More detailed analyses of red cell 3 -0- methylglucose uptake (at 4 "C and at limiting extracellular sugar levels) reveal that net influx is a biexponential process characterized by rapid filling of a small compartment (Cl = 29 k 6% total cell volume; kl = 7.4 k 1.7 min-') and slow filling of a larger compartment (C2 = 71 k 6% total cell volume; k2 = 0.56 k 0.11 min-I). Erythrocyte D-glucose net uptake at 4 "C is also a biphasic process. Transmembrane sugar leakage is a monoexponential process indicating that multicomponent, protein- mediated uptake does not result from sugar uptake by two cell populations of differing cellular volume. Sugar exit at limiting 3-0-methylglucose concentrations is described by single exponential kinetics. This demonstrates that multicomponent sugar uptake does not result from influx into two populations of cells with widely different sugar transporter content. We conclude that biexponential sugar uptake results from slow (relative to transport) exchange of sugars between serial, intracellular sugar compartments. Biexponential sugar uptake is observed under equilibrium exchange conditions (intracellular sugar concentration = extracellular sugar concentration) but only at 3-0-methylglucose concentrations of less than 1 mM. Above this sugar concentration, exchange uptake is a monoexponential process. Because diffusion rates are independent of diffusant concentration, this suggests that multicomponent uptake results from high-affinity sugar binding within the cell. The concentration of cytosolic binding sites (30 pM, Kd(app) = 400 pM) was estimated from the equilibrium cellular 3-0-methylglucose space. Biexponential net 3-0-methylglucose uptake is also observed in human erythrocyte ghosts, in control human K562 cells, and in K562 cells induced to synthesize hemoglobin by prolonged exposure to hemin. This demonstrates that neither membrane-bound nor free cytosolic hemoglobin forms the sugar-binding complex. a-Toxin-permeabilized cells fill rapidly (within 5 s) with 3-0-methylglucose and L-glucose (a nontransported sugar), indicating that the glucose binding compartment does not extend across the entire intracellular margin of the plasma membrane. Rather, it must be restricted to domains of locally high-glucose transporter density. Immunofluorescence microscopy of erythrocytes indicates that GLUTl is not distributed uniformly across the cell surface, while the anion transporter shows a uniform cell surface distribution. Red cell hexokinase I and GLUTl appear not to colocalize in hypotonically lysed erythrocytes. The kinetics of sugar uptake and exit are quantitatively mimicked by a model in which newly imported sugars enter the bulk intracellular water only following interaction with an intracellular, sugar-binding complex. We conclude that steady state sugar transport assays in human erythrocytes measure two processes: rapid sugar translocation across the bilayer and slow sugar release into bulk cytosol. The conclusions of previous steady state analyses which assume net transport reflects only sugar translocation may require reconsideration.
Erythrocyte sugar transport is characterized by a degree of kinetic complexity that is not easily explained by models that consider the process of net transport to reflect protein- mediated transmembrane sugar movements alone (Baker &
' This work was supported by NIH Grant DK 36081. * Author to whom correspondence should be addressed. Phone: 508
856 5570. Fax: 508 856 4289. E-mail: [email protected]. @ Abstract published in Advunce ACS Abstracts, November 15, 1995.
0006-2960/95/0434- 15395$09.00/0
Naftalin, 1979; Carruthers, 1991; Helgerson & Carruthers, 1989; Naftalin & Holman, 1977; Naftalin & Rist, 1991; Naftalin et al., 1985). This has led to the hypothesis that transported sugars become reversibly complexed with intra- cellular macromolecules (Naftalin & Holman, 1977). If correct, this means that the observable steady state kinetics of erythrocyte sugar transport describe the sum of two processes (protein-mediated transport and intracellular sugar complexation) and that kinetic models for sugar transport
0 1995 American Chemical Society
15396 Biochemistry, Vol. 34, No. 47, 1995
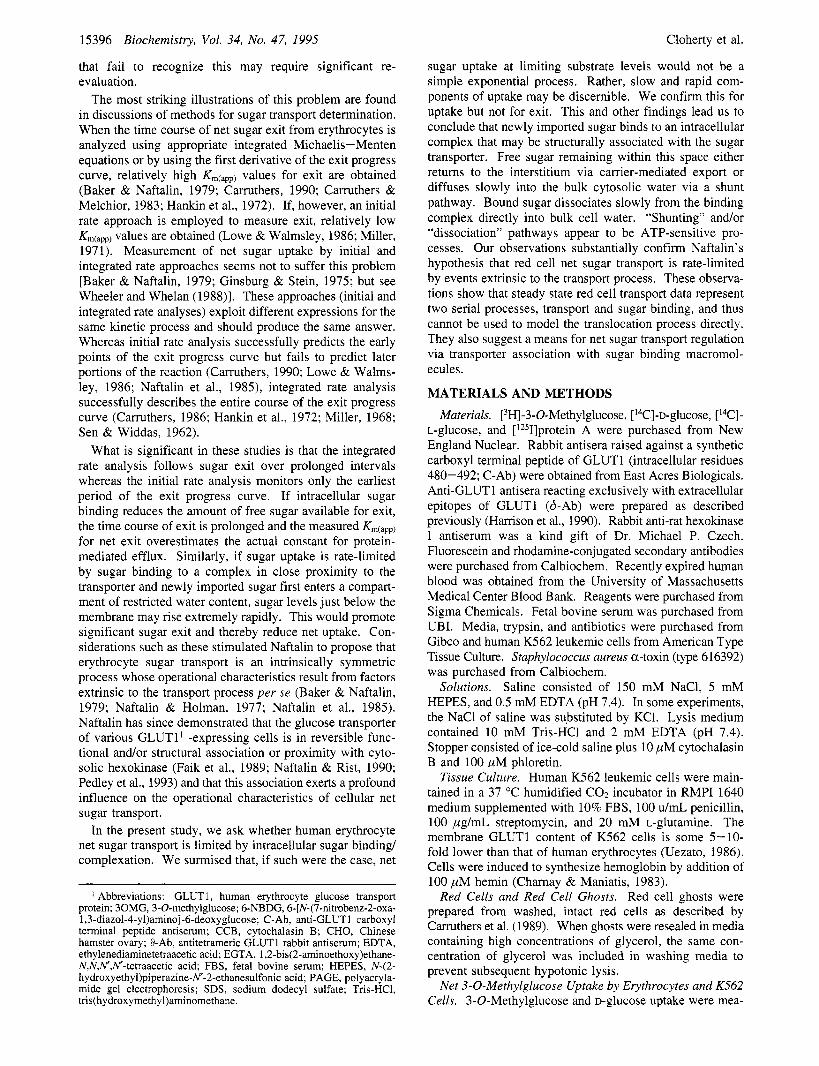
that fail to recognize this may require significant re- evaluation.
The most striking illustrations of this problem are found in discussions of methods for sugar transport determination. When the time course of net sugar exit from erythrocytes is analyzed using appropriate integrated Michaelis-Menten equations or by using the first derivative of the exit progress curve, relatively high Km(app) values for exit are obtained (Baker & Naftalin, 1979; Carruthers, 1990; Carruthers & Melchior, 1983; Hankin et al., 1972). If, however, an initial rate approach is employed to measure exit, relatively low Km(app) values are obtained (Lowe & Walmsley, 1986; Miller, 1971). Measurement of net sugar uptake by initial and integrated rate approaches seems not to suffer this problem [Baker & Naftalin, 1979; Ginsburg & Stein, 1975; but see Wheeler and Whelan (1988)l. These approaches (initial and integrated rate analyses) exploit different expressions for the same kinetic process and should produce the same answer. Whereas initial rate analysis successfully predicts the early points of the exit progress curve but fails to predict later portions of the reaction (Carruthers, 1990; Lowe & Walms- ley, 1986; Naftalin et al., 1985), integrated rate analysis successfully describes the entire course of the exit progress curve (Carruthers, 1986; Hankin et al., 1972; Miller, 1968; Sen & Widdas, 1962).
What is significant in these studies is that the integrated rate analysis follows sugar exit over prolonged intervals whereas the initial rate analysis monitors only the earliest period of the exit progress curve. If intracellular sugar binding reduces the amount of free sugar available for exit, the time course of exit is prolonged and the measured Km(app) for net exit overestimates the actual constant for protein- mediated efflux. Similarly, if sugar uptake is rate-limited by sugar binding to a complex in close proximity to the transporter and newly imported sugar first enters a compart- ment of restricted water content, sugar levels just below the membrane may rise extremely rapidly. This would promote significant sugar exit and thereby reduce net uptake. Con- siderations such as these stimulated Naftalin to propose that erythrocyte sugar transport is an intrinsically symmetric process whose operational characteristics result from factors extrinsic to the transport process per se (Baker & Naftalin, 1979; Naftalin & Holman, 1977; Naftalin et al., 1985). Naftalin has since demonstrated that the glucose transporter of various GLUT1’ -expressing cells is in reversible func- tional andor structural association or proximity with cyto- solic hexokinase (Faik et al., 1989; Naftalin & Rist, 1990; Pedley et al., 1993) and that this association exerts a profound influence on the operational characteristics of cellular net sugar transport.
In the present study, we ask whether human erythrocyte net sugar transport is limited by intracellular sugar binding/ complexation. We surmised that, if such were the case, net
Cloherty et al.
sugar uptake at limiting substrate levels would not be a simple exponential process. Rather, slow and rapid com- ponents of uptake may be discernible. We confirm this for uptake but not for exit. This and other findings lead us to conclude that newly imported sugar binds to an intracellular complex that may be structurally associated with the sugar transporter. Free sugar remaining within this space either returns to the interstitium via carrier-mediated export or diffuses slowly into the bulk cytosolic water via a shunt pathway. Bound sugar dissociates slowly from the binding complex directly into bulk cell water. “Shunting” and/or “dissociation” pathways appear to be ATP-sensitive pro- cesses. Our observations substantially confirm Naftalin’s hypothesis that red cell net sugar transport is rate-limited by events extrinsic to the transport process. These observa- tions show that steady state red cell transport data represent two serial processes, transport and sugar binding, and thus cannot be used to model the translocation process directly. They also suggest a means for net sugar transport regulation via transporter association with sugar binding macromol- ecules.
MATERIALS AND METHODS Materials. [3H]-3-O-Methylglucose, [ 14C]-~-glucose, [14C]-
L-glucose, and [‘251]protein A were purchased from New England Nuclear. Rabbit antisera raised against a synthetic carboxyl terminal peptide of GLUTl (intracellular residues 480-492; C-Ab) were obtained from East Acres Biologicals. Anti-GLUT1 antisera reacting exclusively with extracellular epitopes of GLUTl (&Ab) were prepared as described previously (Harrison et al., 1990). Rabbit anti-rat hexokinase I antiserum was a kind gift of Dr. Michael P. Czech. Fluorescein and rhodamine-conjugated secondary antibodies were purchased from Calbiochem. Recently expired human blood was obtained from the University of Massachusetts Medical Center Blood Bank. Reagents were purchased from Sigma Chemicals. Fetal bovine serum was purchased from UBI. Media, trypsin, and antibiotics were purchased from Gibco and human K562 leukemic cells from American Type Tissue Culture. Staphylococcus aureus a-toxin (type 6 16392) was purchased from Calbiochem.
Solutions. Saline consisted of 150 mM NaC1, 5 mM HEPES, and 0.5 mM EDTA (pH 7.4). In some experiments, the NaCl of saline was substituted by KCl. Lysis medium contained 10 mM Tris-HC1 and 2 mM EDTA (pH 7.4). Stopper consisted of ice-cold saline plus 10 pM cytochalasin B and 100 pM phloretin.
Tissue Culture. Human K562 leukemic cells were main- tained in a 37 “C humidified CO;! incubator in RMPI 1640 medium supplemented with 10% FBS, 100 u/mL penicillin, 100 pglmL streptomycin, and 20 mM L-glutamine. The membrane GLUTl content of K562 cells is some 5-10- fold lower than that of human erythrocytes (Uezato, 1986). Cells were induced to synthesize hemoglobin by addition of 100 p M hemin (Charnay & Maniatis, 1983).
Red Cells and Red Cell Ghosts. Red cell ghosts were prepared from washed, intact red cells as described by Carruthers et al. (1989). When ghosts were resealed in media containing high concentrations of glycerol, the same con- centration of glycerol was included in washing media to prevent subsequent hypotonic lysis.
Net 3-O-Methylglucose Uptake by Erythrocytes and K562 Cells. 3-O-Methylglucose and D-glucose uptake were mea-
’ Abbreviations: GLUTl, human erythrocyte glucose transport protein; 30MG, 3-O-methylglucose; 6-NBDG, 6-[N-(7-nitrobenz-2-oxa- 1,3-diazol-4-yl)amino]-6-deoxyglucose; C-Ab, anti-GLUT1 carboxyl terminal peptide antiserum; CCB, cytochalasin B; CHO, Chinese hamster ovary; %Ab, antitetrameric GLUTl rabbit antiserum; EDTA, ethylenediaminetetraacetic acid; EGTA, 1,2-bis(2-aminoethoxy)ethane- N,N,K,N‘-tetraacetic acid; FBS, fetal bovine serum: HEPES, N-(2- hydroxyethyl)piperazine-N’-2-ethanesulfonic acid; PAGE, polyacryla- mide gel electrophoresis; SDS, sodium dodecyl sulfate: Tris-HC1, tris(hydroxymethy1)aminomethane.

Intracellular Complexation of Imported Sugars
sured as described previously (Carmthers et al., 1989). K562 cells are not adherent and may thus be manipulated like erythrocytes. Sugar free cells (at ice temperature) were exposed to 5 volumes of saline (ice temperature) containing 50 pM 30MG plus [3H]30MG. Uptake was permitted to proceed over intervals as short as 5 s to intervals as long as 3 h, and then 50 volumes (relative to cell volume) of stopper solution was added to the cell suspension. Cells were sedimented by centrifugation (14000g for 1 min), washed once in stopper, collected by centrifugation, and extracted in 0.5 mL of 3% perchloric acid. The acid extract was centrifuged, and duplicate samples of the clear supernatant fluid were counted. Time zero uptake points were prepared by addition of stopper to cells prior to addition of medium containing sugar and radiolabel. Cells were immediately processed. Radioactivity associated with cells at time zero was subtracted from the activity associated with cells following the uptake period. All uptakes were normalized to equilibrium uptake where cells were exposed to sugar medium at 37 "C for 60 min prior to addition of stopper. Uptake assays were performed using solutions and tubes pre- equilibrated to 4 "C and were carried out in a thermostatically cooled block. In experiments where the effects of increasing medium glycerol content on 30MG transport were measured, uptake was measured at time zero, at 30 s at 4 "C, and at 60 min at 37 "C.
In experiments where red cells were permeabilized using a-toxin, it is impossible to wash cells following sugar uptake without rapid loss of intracellular sugar. Here, sugar uptake was measured as the disappearance of sugar from the incubation medium. Cells (permeabilized or nonpermeabi- lized) were resuspended at time zero to a final hematocrit of 50% in saline containing 50 pM [3H]30MG. Cells were sedimented at specific intervals by rapid centrifugation (14OOOg for 7 s) and samples (10 pL) of the supernatant counted. Parallel experiments were also made using [I4C]- L-glucose (a nontransported sugar) to determine the acces- sible water space of control and permeabilized erythrocytes.
Net 3-0-Methylglucose Exit by Erythrocytes. Erythrocytes were incubated in 50 pM [3H]30MG for 1 h at 37 "C, at which time equilibrium uptake is attained. Sugar-loaded cells were placed on ice, and aliquots were sedimented by centrifugation (14000g for 1 min). The supernatant was removed, exit was initiated by addition of 50 volumes (relative to packed cell volume) of ice-cold saline, and following the appropriate exit interval, exit was terminated by addition of 100 volumes of ice-cold stopper. Cells were sedimented by centrifugation, and the supernatant was aspirated and the cell pellet washed once more in 150 volumes of stopper. The final cell pellet was extracted in 0.5 mL of 3% perchloric acid and centrifuged, and duplicate samples of the clear supernatant were counted by liquid scintillation spectrometry. Time zero exit points were obtained by addition of stopper to cells prior to addition of saline.
Equilibrium Exchange 3-0-Methylglucose Uptake by Erythrocytes. In these experiments, intracellular 30MG concentration = extracellular 30MG concentration, and the rate of cellular equilibration with extracellular tracer-radio- labeled 30MG is monitored. The uptake assay is otherwise identical to net sugar uptake measurements. Cells were pre- equilibrated with varying 30MG concentrations (0-60 mM) by incubation in 10 volumes of equilibration medium for 1
Biochemistry, Vol. 34, No. 47, 1995 15397
h at 37 "C. Cells were collected by centrifugation and resuspended in 1 volume of ice-cold equilibration medium, and following equilibration to 4 "C, uptake was initiated by addition of labeled 30MG. Stopper contained sucrose at a concentration identical to the intracellular 30MG concentra- tion.
Net 6NBD Glucosamine Uptake by Erythrocytes. Uptake of 100 pM 6NBDG by erythrocytes at 24 "C was determined in duplicate at time zero and at 0.5, 1, 2 , 3, 4, 5 , and 22 h. Uptake was measured in the presence and absence of 50 pM CCB in saline and in saline containing 10, 20, 30, or 40% (v:vj glycerol. Following incubation in 6NBDG, 300 p L of cell suspension (25% hematocrit) was added to 1 mL of ice- cold stopper, and the cells were sedimented by centrifugation (1 min at 14000g). The supernatant was aspirated, and the cells were washed twice more in stopper, extracted in 500 p L of 3% perchloric acid, and centrifuged. The clear supernatant was diluted 20-fold in deionized water and its BNBDG content determined by fluorescence spectroscopy. Excitation was at 472 nm, emission was measured at 547 nm at 24 "C, and 6NBDG standards of 0- 1 p M were used. 6NBDG uptake follows a monoexponential time course.
Calculation of Rate Constants. All constants were com- puted by direct curve-fitting procedures using nonlinear regression of untransformed data. The software package used was KaleidaGraph 3.0 (Synergy Software, Reading, PA). For radiolabeled sugar uptake, all data were fitted to the equation
cpm, = cpm, + cpm,(l - + cpm2(l - (1)
where cpmt and cpmo are the counts associated with the cells at times t and zero, respectively, cpml and cpm2 are equilibrium counts associated with cell compartments 1 and 2, respectively, and kl and k2 are first-order rate constants describing the rate of equilibration of compartments 1 and 2, respectively. Where only a single cellular compartment for sugar penetration was presented, this analysis provides unique solutions for cpml and cpm2 but computes statistically indistinguishable solutions to kl and k2. In experiments where multiple cellular compartments are apparent, increas- ing the number of cellular compartments to three or greater does not statistically improve the quality of the computed fit.
For sugar exit experiments, all data were fitted to the equation
cpm, = cpm, + cpmle-k" + cpm2e+' ( 2 )
where cpm, and cpm, are the counts associated with the cells at times t and equilibrium, respectively, cpml and cpm2 are equilibrium counts associated with cell compartments 1 and 2, respectively, and kl and k2 are first-order rate constants describing the rate of loss of sugar from compartments 1 and 2, respectively. In the exit experiments reported here, only a single cellular compartment is apparent since the rate constants kl and k2 are indistinguishable.
Immunofluorescence Microscopy of Erythrocytes. Circular coverslips were washed in 70% ethanol and 1% HCl for 1 h, oven-dried, immersed in a 10% solution of polylysine for 5 min, and then air-dried overnight. Washed erythrocytes (10 pL, 50% Ht) were pipetted onto polylysine-coated coverslips positioned above 5 mL of saline in 50 mL Falcon

15398 Biochemistry, Vol. 34, No. 47, 1995 Cloherty et al.
reduce the rate of sugar transport. The strategy we adopted was that described by Blacklow et al. (1988) in which the “microviscosity” of the medium is increased by use of monomeric polyhydroxylated viscogenic species such as glycerol or sucrose. If the rate of sugar transport is limited by the frequency of collision between reactants (glucose transporter and transported sugar) and manipulation of medium viscosity exerts no additional effect on transport, relative medium viscosity and the relative second-order rate constant for transport are inversely related.
The second-order rate constant for transport (kcat/Km) is directly proportional to V,,,,,/K, (V, = kcat[GLUT1]) which is obtained as the rate constant for transport at limitingly low sugar concentrations (Stein, 1986). Figure 1 shows that human erythrocyte import of 50 p M 30MG is reduced by increasing extracellular glycerol levels. This effect is also seen in resealed erythrocyte ghosts containing glycerol at levels identical to those applied externally and cannot thus be ascribed to extracellular glycerol-induced cell shrinking. The sugar analog 6-NBD glucosamine (6NBDG) is trans- ported some 3300-fold more slowly at 24 “C than is 30MG at 4 “C (Figure l), suggesting that transport of this sugar is limited by events other than sugar/transporter encounter rate. Because of this, NBDG transport is expected to be less sensitive to altered medium viscosity. Cytochalasin B- inhibitable and cytochalasin B-insensitive NBDG uptakes are unaffected by addition of extracellular glycerol (Figure 1).
Is Erythrocyte Sugar Uptake a Multicomponent Process? We surmised that, if net sugar uptake were limited in some way by diffusion across an intracellular permeability barrier (e.g. an unstirred sugar layer) or by slow complexation with an intracellular species (e.g. binding to hemoglobin), this might be revealed over a complete time course of sugar uptake as multiple kinetic components of sugar equilibration between cytosol and interstitium. Figure 2 shows that the time course of 30MG uptake by erythrocytes at 4 OC is consistent with an overall process described by a rapid filling of a small compartment plus a slow filling of a larger cellular compartment. Figure 2 also shows that, when sugar uptake is inhibited using 50 p M cytochalasin B, leakage-mediated sugar import (at 37 “C) is consistent with a single component of sugar uptake. This latter observation rules out the possibility (see Discussion) that multicomponent sugar uptake results from sugar import into multiple cell populations of differing volumes. Net uptake of the natural, metabolizable transporter substrate D-glucose (100 pM) also shows biphasic kinetics (Table 1).
Is Erythrocyte Sugar Exit a Multicomponent Process? If multicomponent sugar uptake results from sugar import by two populations of cells (e.g. old and young) with differing transporter content or catalytic turnover, then sugar exit at limiting intracellular sugar concentrations must also display the same multicomponent kinetics. The reason for this is that red cell sugar transport is passive, and this requires that VJK, for entry = VJK, for exit (Krupka, 1989). Figure 2 shows that exit of 50 p M 30MG from human erythrocytes is consistent with a single (slow) efflux process. This suggests (see Discussion) that sugar uptake and exit occur within a uniform population of cells that contain two intracellular sugar compartments characterized by distinct sizes and kinetics.
Does Multicomponent Sugar Uptake Require Protein- Mediated Import? Cytochalasin B inhibition of sugar uptake
tubes. These tubes were then centrifuged at llOOg for 5 min to facilitate cell attachment to coverslips, and unattached cells were removed by addition and subsequent aspiration of saline (20 mL). Two additional saline washes were made, and then the erythrocyte-coated coverslips were transferred to six-well tissue culture dishes for immunohistochemical processing.
Antibody binding to cells was measured in cells that were either unfixed or fixed and permeabilized. Fixation was for 15 min in saline containing 4% paraformaldehyde, followed by two washes in saline containing 1% fetal bovine serum. Fixed cells were permeabilized by incubation for 15 min at room temperature in saline containing 0.05% Triton XlOO and 1% FBS followed by four washes in saline containing 1% FBS. Fixed and unfixed cells were then incubated for 60 min in saline containing 1% FBS plus C-Ab (1:5000 dilution) and/or plus %Ab (1:5000 dilution). Cells were washed three times in FBS saline and then incubated for 30 min with rhodamine-conjugated goat anti-rabbit (anti-C-Ab) IgGs (1 :250 dilution) or with fluorescein-conjugated rabbit anti-sheep (anti-&Ab) IgGs (1 :250 dilution). In experiments where both C-Ab and %Ab binding were measured simul- taneously, cells were subsequently exposed to rhodamine- conjugated goat anti-rabbit (anti-C-Ab) IgGs, followed by washing and exposure to fluorescein-conjugated rabbit anti- sheep (anti-&Ab) IgGs. Cells were then washed three times in saline, the coverslips mounted on a slide with 2.5% DABCO (Sigma Chemicals) and 90% glycerol, and the slides sealed with clear nail polish.
Erythrocyte anion transporters were labeled exofacially using fluorescein isothiocyanate as described by Matayoshi and Jovin (1991) and Sat0 et al. (1985). These cells were then attached to polylysine-coated coverslips for subsequent fluorescence microscopy. In some experiments, red cells were not attached to coverslips but were processed in dilute solution and mounted later for immunofluorescence micros- copy. Samples were visualized by fluorescence microscopy using a Nikon Diaphot 200 microscope with a Nikon Apo 6011.4 oil immersion lens. Images were digitized with 14- bit resolution using a thermoelectrically cooled CCD camera (Photometrics Ltd., Tuscon, AZ) and stored on magnetic media for subsequent analysis.
Analytical Procedures. Protein was determined by the Pierce BCA procedure. SDS slab (10% or 18%) PAGE of membrane proteins and GLUT1 were as described previously (Carruthers & Helgerson, 1989). Immunoblotting (Western) of proteins using C-Ab was as described in Hebert and Carruthers (1992). Medium viscosity was not measured directly; rather, the data were obtained from Blacklow et al. (1988).
Simulations. The time course of net sugar uptake via hypothetical, multicompartment transport models was simu- lated by fourth-order Runge-Kutta numerical integration using step intervals of 2 ms or less. The software package used was Stella I1 (v 3.05, High Performance Systems Inc., Hanover, NH).
RESULTS
Is Erythrocyte Sugar Transport Diffusion-Limited? If sugar transport is a diffusion-limited process, reducing the self-diffusion coefficient of the transported sugar by increas- ing the viscosity of the external or internal environments will

Intracellular Complexation of Imported Sugars Biochemistry, Vol. 34, No. 47, 1995 15399
1.2
1-
0.8- .- P
9 c 3 0.6-
* 0.4-
0.2-
0-
1.2 : A
' " ' " ' ' " " " ' " ' ' " ~ ~ " ' -
11
-0.8
:0.6
L0.4
10.2
-0
~ . . . . , . . . . , . . . . , . . . . , . . . . , . . . . r
-0.2
-0.15
-0.1
-0.05
0-0 0 10 20 30 40
[Glycerol] 90
FIGURE 1: Effect of increasing medium viscosity on erythrocyte sugar transport. (A) Effect of medium glycerol content on 30MG uptake by red cells (0) and by red cell ghosts (0). Ordinate: rate constant for 30MG uptake relative to that measured in the absence of glycerol. Abscissa: medium glycerol concentration (% wt:v) and relative medium viscosity [from Blacklow et al. (1988)l. Data are shown as mean f standard error of the mean of at least three separate determinations in duplicate or triplicate. Straight lines drawn through the points were computed by the method of least squares and correspond to the following: red cells, relative k = 1.0 - 0.025[glycerol], R = 0.997; ghosts, relative k = 0.979 - 0.024[glycerol], R = 0.994. First-order rate constants (Vmax/Km) for red cell and ghost 30MG uptake (computed from 30 s uptake measurements) are 2.76 2c 0.54 and 0.30 f 0.06 min-', respectively. The curved line drawn through the data is the relationship expected if an n-fold increase in medium viscosity results in an n-fold reduction in transport. (B) Effect of glycerol on NBDG uptake by red cells. Rate constants (per hour) for protein-mediated (cytocha- lasin B-inhibitable, 0) and leakage-mediated (cytochalasin B- insensitive, O) uptakes are shown relative to medium glycerol concentration and viscosity. Data are shown as mean f standard error of the mean of at least three separate determinations in duplicate or triplicate. At all glycerol concentrations, total NBDG uptake (cytochalasin B-insensitive uptake plus cytochalasin B- inhibited uptake) is significantly greater than cytochalasin B- insensitive uptake (p < 0.05; one-tailed paired t-test). There is no significant difference between cytochalasin B-inhibitable 6NBDG uptake at 0 and 40% glycerol. The solid and dashed curved lines drawn through the data are the relationships expected if an n-fold increase in medium viscosity results in an n-fold reduction in CCB- insensitive and CCB-sensitive transport, respectively. Straight lines drawn through the points were computed by the method of least squares.
also inhibits multicomponent sugar import (Figure 2 ) . This result is consistent with several hypotheses. (1) Only sugar import via the glucose transporter conveys sugar to bulk cell water via the small, rate-limiting compartment within the
-i 20,000
@ 15,000i 1 B 10,000
5 ' 5,000 I
0 2 4 6 8 1 0 1 2 time in minutes
4 ' , , 1 . . , , . , _ / . . . I . . . I . , . I . \ ' , I 0 2 4 6 8 1 0
time in minutes
FIGURE 2: Time course of 30MG (50 pM) uptake and exit by red blood cells. Uptake (0) and exit (V) were measured in the absence of CCB at 4 "C. Uptake was also measured in the presence of 50 pM cytochalasin B at 37 "C (0). (A) Raw uptake data. Ordinate: cpm [3H]30MG associated with cells. Abscissa: time in minutes. Curves drawn through net uptake and exit data (0 and V) are theoretical results predicted by the model shown in Figure 7. The curve drawn through CCB-inhibited uptake data was computed by nonlinear regression, assuming that uptake is a monoexponential process described by kl = 0.13 f 0.02 min-' and C1 = 28 761 f 3621 cpm (R = 0.99). Measurements were made in duplicate at each time point. (B) The data of part A replotted as log( 1-fractional equilibration) versus time. The curves drawn through the points are based on constants computed by direct, nonlinear regression analysis of uptake and exit data, assuming that uptake is a biexponential process while exit (and CCB-insensitive uptake) is a monoexponential process. These constants are (for CCB-inhibitable transport) as follows: uptake (0), k1 = 6.3 f 3.1 min-l, C1 = 5383 f 766 cpm, k2 = 0.138 If: 0.034 min-l, C2 = 14 757 f 1153 cpm, and R = 0.96; and exit (V), kl = 0.114 2c 0.016 min-I, CI = 12 750 + 428 cpm, and R = 0.98.
cell. ( 2 ) Cytochalasin B-inhibited net uptake is no longer rate-limited by the series barrier because the rate-limiting diffusionbinding step within the cell occurs more rapidly than does transbilayer sugar diffusion. (3) The barrier is lost at higher temperatures.
If a series barrier lies between the plasma membrane and bulk cytosol, then bypassing the glucose transporter by membrane permeabilization will not bypass the series barrier. We therefore treated erythrocytes with a-toxin (20 pg d-') and monitored 30MG and L-glucose uptake by control and treated cells. Figure 3 shows that 30MG and L-glucose immediately (within 5 s) equilibrate with cell water in a-toxin-treated cells. The extracellular medium used in these experiments is K-substituted saline in which Ca2+ levels are buffered to (0.1 pM using EGTA. This medium does not ablate multicomponent 30MG uptake in the absence of a-toxin (Figure 3). This suggests either that the series barrier
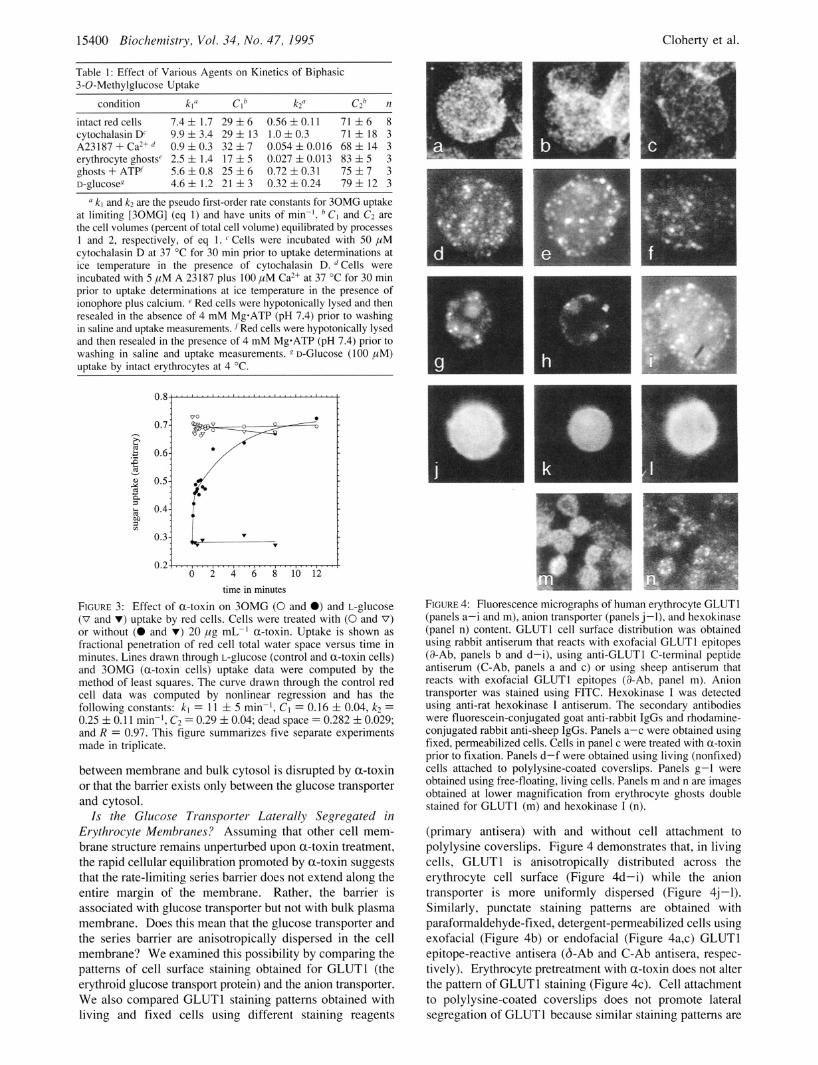
15400 Biochemistry, Vol. 34, No. 47, I995 Cloherty et al.
Table 1: Effect of Various Agents on Kinetics of Biphasic 3-0-Methylglucose Uptake
condition ha Cl" k2a C2" n
intact red cells 7.4 f 1.7 29 f 6 0.56 f 0.1 1 71 f 6 8 cytochalasin D' 9.9 f 3.4 29 f 13 1.0 f 0.3 71 f 18 3 A23187 + Ca2+ 0.9 f 0.3 32 f 7 0.054 f 0.016 68 f 14 3 erythrocyte ghostse 2.5 f 1.4 17 f 5 0.027 f 0.013 83 f 5 3 ghosts + ATPf 5.6 f 0.8 25 f 6 0.72 f 0.31 75 f 7 3 D-glucoseR 4.6 f 1.2 21 f 3 0.32 f 0 . 2 4 79 f 12 3
a kl and k2 are the pseudo first-order rate constants for 30MG uptake at limiting [30MG] (eq 1) and have units of min-'. CI and C2 are the cell volumes (percent of total cell volume) equilibrated by processes 1 and 2, respectively, of eq 1. Cells were incubated with 50 pM cytochalasin D at 37 "C for 30 min prior to uptake determinations at ice temperature in the presence of cytochalasin D. Cells were incubated with 5 pM A 23187 plus 100 pM Ca2+ at 37 "C for 30 min prior to uptake determinations at ice temperature in the presence of ionophore plus calcium. e Red cells were hypotonically lysed and then resealed in the absence of 4 mM Mg*ATP (pH 7.4) prior to washing in saline and uptake measurements. f Red cells were hypotonically lysed and then resealed in the presence of 4 mM Mg-ATP (pH 7.4) prior to washing in saline and uptake measurements. R D-Glucose (100 pM) uptake by intact erythrocytes at 4 "C.
time in minutes FIGURE 3: Effect of a-toxin on 30MG (0 and 0) and L-glucose (V and r) uptake by red cells. Cells were treated with (0 and 0) or without (0 and r) 20 pg mL-' a-toxin. Uptake is shown as fractional penetration of red cell total water space versus time in minutes. Lines drawn through L-glucose (control and a-toxin cells) and 30MG (a-toxin cells) uptake data were computed by the method of least squares. The curve drawn through the control red cell data was computed by nonlinear regression and has the following constants: kl = 11 f 5 min-', C1 = 0.16 f 0.04, k2 = 0.25 f 0.11 min-l, C2 = 0.29 f 0.04; dead space = 0.282 f 0.029; and R = 0.97. This figure summarizes five separate experiments made in triplicate.
between membrane and bulk cytosol is disrupted by a-toxin or that the barrier exists only between the glucose transporter and cytosol.
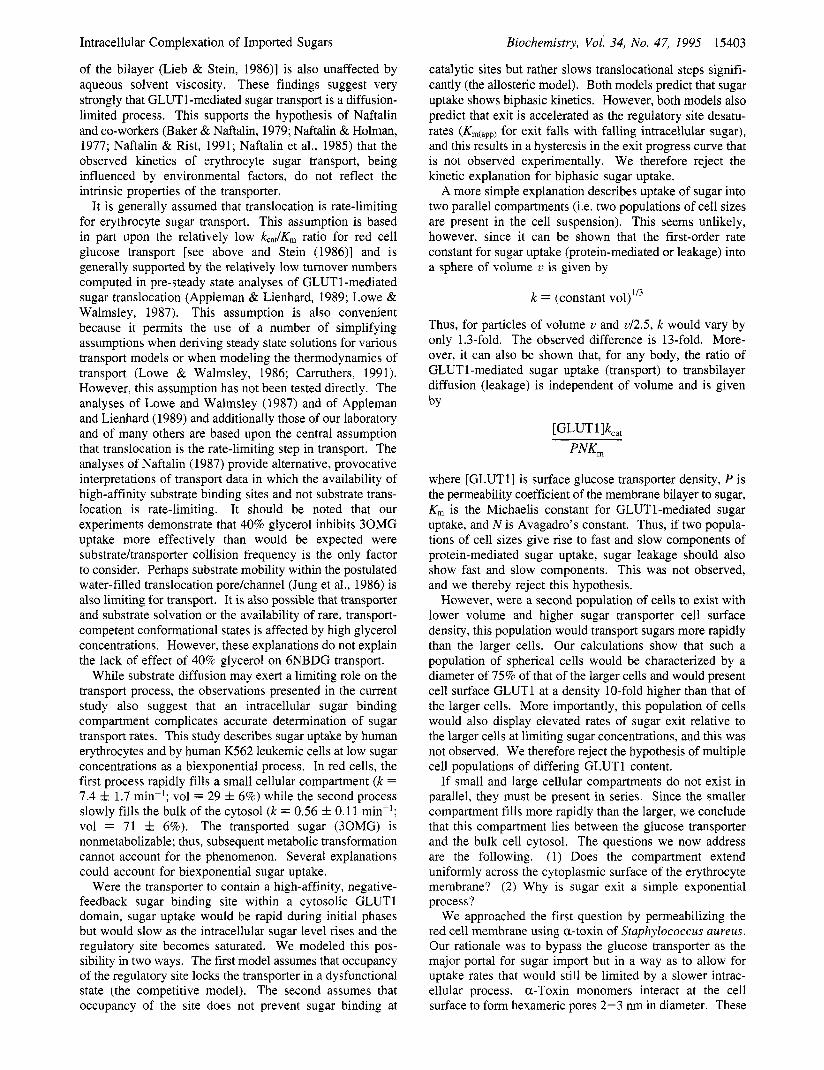
Is the Glucose Transporter Laterally Segregated in Erythrocyte Membranes? Assuming that other cell mem- brane structure remains unperturbed upon a-toxin treatment, the rapid cellular equilibration promoted by a-toxin suggests that the rate-limiting series barrier does not extend along the entire margin of the membrane. Rather, the barrier is associated with glucose transporter but not with bulk plasma membrane. Does this mean that the glucose transporter and the series barrier are anisotropically dispersed in the cell membrane? We examined this possibility by comparing the patterns of cell surface staining obtained for GLUTl (the erythroid glucose transport protein) and the anion transporter. We also compared GLUTl staining patterns obtained with living and fixed cells using different staining reagents
0 FIGURE 4: Fluorescence micrographs of human erythrocyte GLUTl (panels a-i and m), anion transporter (panels j-1), and hexokinase (panel n) content. GLUTl cell surface distribution was obtained using rabbit antiserum that reacts with exofacial GLUTl epitopes (&Ab, panels b and d-i), using anti-GLUT1 C-terminal peptide antiserum (C-Ab, panels a and c) or using sheep antiserum that reacts with exofacial GLUTl epitopes (%Ab, panel m). Anion transporter was stained using FITC. Hexokinase I was detected using anti-rat hexokinase I antiserum. The secondary antibodies were fluorescein-conjugated goat anti-rabbit IgGs and rhodamine- conjugated rabbit anti-sheep IgGs. Panels a-c were obtained using fixed, permeabilized cells. Cells in panel c were treated with a-toxin prior to fixation. Panels d-f were obtained using living (nonfixed) cells attached to polylysine-coated coverslips. Panels g-1 were obtained using free-floating, living cells. Panels m and n are images obtained at lower magnification from erythrocyte ghosts double stained for GLUTl (m) and hexokinase I (n).
(primary antisera) with and without cell attachment to polylysine coverslips. Figure 4 demonstrates that, in living cells, GLUTl is anisotropically distributed across the erythrocyte cell surface (Figure 4d-i) while the anion transporter is more uniformly dispersed (Figure 4j -1). Similarly, punctate staining patterns are obtained with paraformaldehyde-fixed, detergent-permeabilized cells using exofacial (Figure 4b) or endofacial (Figure 4a,c) GLUTl epitope-reactive antisera (&Ab and C-Ab antisera, respec- tively). Erythrocyte pretreatment with a-toxin does not alter the pattern of GLUTl staining (Figure 4c). Cell attachment to polylysine-coated coverslips does not promote lateral segregation of GLUTl because similar staining patterns are

Intracellular Complexation of Imported Sugars
0 ~ " ' ~ ~ ' " " ~ ' " ~ ' " ~ ' " ' ~ h
4 C
.J" -0.05: E 2 r= -0.1-
73 -0.15:
1
0 0 .a 2 -0.2: Y w -0.25- 3 v
0 c
-0.37,.
Biochemistry, Vol. 34, No. 47, 1995 15401
, , , , , , , , , . , t . , , r
FIGURE 5: Time course of 30MG uptake by control (V) and hemin- induced (A) K562 cells and by resealed human erythrocyte ghosts (0). Uptake is expressed as log( 1-fractional equilibration) versus time. Curves drawn through the data points were computed by nonlinear regression as described in the legend to Figure 2. The computed constants are as follows: control K562 cells and ghosts (solid line), kl = 6.6 min-I, C1 = 0.0787, k2 = 0.0567 min-', and C2 = 0.893; and hemin-induced K562 cells (dashed line), kl = 7.1 min-I, CI = 0.0627, k2 = 0.0567 min-I, and C2 = 0.921. These data summarize three separate experiments for each condition made in duplicate. When the data obtained between times 0.5 and 8 min are analyzed by the method of least squares, the resulting y- intercepts (-0.031 f 0.005, -0.026 f 0.008, and -0.039 0.003 for control and hemin-treated K562 cells and red cell ghosts, respectively) are significantly less than zero (p < 0.05, one-tailed t-test). observed in free-floating cells.
What Is the Nature of the Series Barrier? It has been suggested that transported sugars interact slowly and non- specifically with hemoglobin in red cells to form an Hb- sugar complex and that this interaction could affect the apparent kinetics of net sugar uptake by erythrocytes (Baker & Naftalin, 1979). We examined this in two ways. First, we monitored the kinetics of sugar uptake by resealed, human erythrocyte ghosts. Our results show that 30MG uptake, although slower, remains characteristically biexponential in substantially hemoglobin free erythrocyte ghosts (Figure 5) . Second, we compared the kinetics of sugar uptake by control human K562 leukemic cells and by K562 cells induced to synthesize hemoglobin by prolonged exposure to hemin. Both control and Hb-synthesizing K562 cells display two- component, 30MG uptake kinetics (Figure 5). The results obtained using erythrocyte ghosts demonstrate that, if Hb impacts uptake kinetics, it must be membrane-bound Hb that is responsible. The K562 studies demonstrate multicompo- nent sugar uptake in nucleated cells independent of cellular levels of Hb.
Even so, the erythrocyte ghost data suggest that transport (particularly the slow component of uptake) is slow relative to uptake by intact cells. We have shown previously (Helgerson & Carruthers, 1989) that normal uptake is restored upon inclusion of MgaATP during ghost resealing. We confirm this in the current study (Table 1). We also examined the effects of cytoskeletal disruption of erythrocyte sugar uptake kinetics. Table 1 summarizes our findings. Neither cytochalasin D nor the ionophore A 23 187 plus Ca2+ impacts the multicomponent nature of sugar import by erythrocytes, although treatment with A 23 187 plus Ca2+ slows the kinetics of uptake. This may be related to the ATP depletion promoted upon Ca-loading red cells using ionophore (Jacquez, 1983).
0.1 ' ' ' ' ' ' ' ' ' ' , , ' ' ' , , , , ' , , , , ' , , , , ' , , , ,
A
0 1 2 3 4 5
time in minutes
504 Y j t
5 10
8 0 " ' " ' ' ' I " ' " " " 1 ' " " ' "
I
0 2 4 6 8 1 0
[30MG] mM FIGURE 6: Is there a sugar binding complex inside the red cell? (A) Time course of equilibrium 30MG uptake by intact red cells. Exchange transport ([30MG]i = [30MG],) was measured at 0.1 (A), 1 (O), 10 (W), 30 (0), and 60 (0) mM 30MG. Uptake data are expressed as log( 1-fractional equilibration) versus time in minutes. The straight lines drawn through the data points were computed by the method of least squares and correspond to rate constants of 0.100 f 0.004, 0.158 f 0.006, 0.332 f 0.033, and 0.549 f 0.046 min-l for exchange uptake of 60,30, 10, and 1 mM 30MG, respectively. The curve drawn through the 0.1 mM 30MG data was computed by nonlinear regression as in Figure 2B and is characterized by the constants kl = 6.36 f 1.41 min-', CI = 0.261 f 0.037, k2 = 0.066 f 0.005 min-], and C2 = 0.738 f 0.063. This figure summarizes eight separate experiments made in duplicate. If the 0.1 mM 30MG data are ignored, these data correspond to V,,, and Km(appj for exchange uptake of 7.0 f 0.5 mmol of 30MG (liter of cell water)-' min-I and 12.1 f 2.7 mM, respectively ( R = 0.99). (B) Measurement of 30MG binding to cells by equilibrium 30MG space analysis. Ordinate: red cell 30MG space in femtoliters (0) and concentration of 30MG binding sites in micromolar (0). Abscissa: extracellular 30MG concentra- tion in micromolar. Data represent mean f standard error of the mean of three separate experiments made in triplicate. Curves drawn through the points were computed by using the constants described in the legend to Figure 7. Analysis of these data by nonlinear regression assuming simple Michaelis-Menten equilibrium binding kinetics results in the following constants: displaced red cell volume = 14.5 f 2.4 fL and Qappj = 205 f 130 pM 30MG; and maximum 30MG binding = 3 1.1 f 2.6 pM and Kd(appj = 446 * 138 pM 30MG.
If multicomponent sugar uptake results from a diffusion- limiting process, this effect should be independent of diffusant (sugar) concentration. Previous studies fail to show multicomponent sugar uptake under equilibrium exchange conditions (intracellular sugar concentration = extracellular sugar concentration). We confirm this here (Figure 6) for 30MG concentrations of 1 mM or greater. However, at lower sugar concentrations, multicomponent equilibrium exchange sugar uptake is demonstrable. This suggests that

15402 Biochemistry, Vol. 34, No. 47, 1995
the physical basis of this kinetic phenomenon derives from saturable sugar binding within the cell. The slow component of exchange uptake at 0.1 mM 30MG ( k = 0.07 min-’) is significantly slower that that measured for net 30MG uptake at 50 p M sugar in Table 1, suggesting that the kinetics of exchange and net uptake are different. However, this slow exchange component is only 2-fold lower than that observed for net uptake in Figure 2 and is 3-fold lower than that observed for net uptake in Figure 3. This suggests significant variation in the magnitude of the slow component for uptake. It is also possible that cells become ATP-depleted during the 1 h 30MG-loading preincubation prior to exchange uptake measurements. This would be consistent with the close agreement between k2 for exchange uptake by cells and k2 for net uptake by nominally ATP free ghosts (Figure 5 and Table 1).
Equilibrium uptake experiments can be used to quantitate 30MG “binding sites” within the erythrocyte. Cells were equilibrated with various levels (0-50 mM) of unlabeled 30MG, and then tracer quantities of labeled 30MG were added to the equilibrated suspension. If 30MG is bound by intracellular components in a saturable manner, the labeled 30MG space of the cell will fall with increasing unlabeled 30MG. Figure 6B summarizes the results of three experi- ments which demonstrate saturable 30MG binding with B,, = 31 pmol per liter of cell water (1.2 x IO6 sites per cell).
What Cellular Components Form the Sugar Transport/ Binding Complex? Glyceraldehyde-phosphate dehydroge- nase and phosphoglycerate kinase are reported to associate with the red cell membrane (Kliman & Steck, 1980; Lachaal et al., 1990; Mercer & Dunham, 1981). Immunoblot analysis of intact erythrocytes and of red cell membranes indicates that 28.8 * 1.7% ( n = 3) of total cellular hexokinase I is retained by erythrocyte ghosts. While 30MG is not expected to interact with hexokinase, this enzyme could form one component of a glycolytic particle that interacts with glucose following sugar transport into the cell. We therefore stained erythrocytes for GLUTl and hexokinase I to determine whether both cellular components colocalize. Hexokinase- staining patterns also reveal an anisotropic distribution within the cell (Figure 4n); however, this distribution does not colocalize with that obtained simultaneously for GLUTl within the same cell (Figure 4m).
Cloherty et al.
solution, the binding of a substrate to the active site of an enzyme involves more than a simple encounter. Binding may involve changes in ion pairing, in hydrogen-bonding partners, and in local solvent structure for both substrate and the active site. These exchanges will produce an enthalpic contribution to what for a small unsolvated species is normally considered to be a purely entropic diffusion phenomenon. An enthalpic contribution to the docking process will reduce the rate of association. Lower values of second-order rate constants for enzyme-substrate as- sociation are also expected if the substrate binds only to a rare conformation or solvation state of the active site.
If an enzyme-catalyzed reaction is limited by the rate of substrate-enzyme association, then reducing the rate of substrate diffusion in solution is expected to reduce the frequency of substrate-enzyme encounters. For small molecules such as glucose, this requires use of monomeric polyhydroxylated species such as sucrose or glycerol (Black- low et al., 1988). Polymeric species such as poly(ethy1ene glycol) or polyacrylamide, while effective in reducing the self-diffusion of larger molecules such as proteins, have little effect on the diffusion of smaller molecules (Stokes & Weeks, 1964). Since most enzymes are larger than the substrates upon which they act, the overall encounter rate between enzyme and substrate will be governed by the rate at which substrate diffuses.
Blacklow et al. (1988) have developed simple criteria for determining whether the rate of an enzyme-mediated reaction is affected directly by altered rates of substrate diffusion. First, the rate of the reaction should be reduced by increased solution (micro)viscosity. Second, if a “good substrate” reacts at or near the diffusion limit and this reaction is sensitive to solution viscosity, the use of a “poor substrate” (for which some other nondiffusive step is rate-limiting) provides an internal check for whether the viscogenic agent exerts additional (nonspecific) effects on the reaction.
Glucose and 30MG transport by human red cells are characterized by kcat/K, values of lo3 M-’ s-I at ice temperature and by kcat/K, values approaching lo5 M-’ s-’ at room temperature (Helgerson et al., 1989; Carmthers, 1990). At 37 “C, kcat/Km for D-glucose transport approaches lo6 M-’ s-’ (Lowe & Walmsley, 1986). At all temperatures, kCatlKm for 30MG transport is 2-4-fold lower than that for D-glucose transport while kCat/K, for D-galactose transport is lower than that for D-glucose by 1 order of magnitude (Stein, 1986). These differences reflect the apparent affinity of the erythrocyte sugar transport system for sugars which decreases in order D-glucose > 30MG >> D-galactose (Stein, 1986).
While these second-order rate constants are significantly lower than those expected of diffusion-limited enzymes, protein-mediated erythrocyte sugar transport satisfies the criteria of Blacklow et al. (1988) for establishing whether the rate of an enzyme-mediated reaction is affected directly by altered rates of substrate diffusion. The second-order rate constant for 30MG transport by cells and erythrocyte ghosts falls monotonically with increasing medium viscosity over the glycerol concentration range 0-30% (v:v). Transport of the poorly transported sugar 6-NBD glucosamine (which at 24 “C occurs 3300-fold more slowly than does transport of 30MG at 4 “C) is not significantly affected by increasing medium viscosity. Transbilayer diffusion of sugar [a process limited by the mobility of sugar within the hydrocarbon core
DISCUSSION
The results of the present study support the view that 30MG uptake by human erythrocytes is a diffusion- controlled process and that net sugar uptake and exit are limited by saturable sugar binding and reduced sugar mobility within a small, intracellular compartment that lies between the glucose transporter and the bulk cell sol.
A general criterion for assessment of the catalytic ef- ficiency of an enzyme is the kcat/K, ratio which estimates the second-order rate constant for an enzyme-catalyzed reaction. Theoretical approaches predict that the second- order rate constant for a diffusion-limited, enzyme-mediated reaction is in the range of 108-10’o M-’ s-l (Blacklow et al., 1988; Solc & Stockmayer, 1973). However, very few of the fastest enzyme-mediated reactions ever achieve this range of kCadK, (Hammes & Schimmel, 1970). Several reasons for this apparent discrepancy have been suggested. Unlike the diffusion of two small unsolvated species in
Intracellular Complexation of Imported Sugars
of the bilayer (Lieb & Stein, 1986)] is also unaffected by aqueous solvent viscosity. These findings suggest very strongly that GLUTl -mediated sugar transport is a diffusion- limited process. This supports the hypothesis of Naftalin and co-workers (Baker & Naftalin, 1979; Naftalin & Holman, 1977; Naftalin & Rist, 1991; Naftalin et al., 1985) that the observed kinetics of erythrocyte sugar transport, being influenced by environmental factors, do not reflect the intrinsic properties of the transporter.
It is generally assumed that translocation is rate-limiting for erythrocyte sugar transport. This assumption is based in part upon the relatively low k,,,/K, ratio for red cell glucose transport [see above and Stein (1986)l and is generally supported by the relatively low turnover numbers computed in pre-steady state analyses of GLUTl-mediated sugar translocation (Appleman & Lienhard, 1989; Lowe & Walmsley, 1987). This assumption is also convenient because it permits the use of a number of simplifying assumptions when deriving steady state solutions for various transport models or when modeling the thermodynamics of transport (Lowe & Walmsley, 1986; Carruthers, 1991). However, this assumption has not been tested directly. The analyses of Lowe and Walmsley (1987) and of Appleman and Lienhard (1989) and additionally those of our laboratory and of many others are based upon the central assumption that translocation is the rate-limiting step in transport. The analyses of Naftalin (1987) provide alternative, provocative interpretations of transport data in which the availability of high-affinity substrate binding sites and not substrate trans- location is rate-limiting. It should be noted that our experiments demonstrate that 40% glycerol inhibits 30MG uptake more effectively than would be expected were substrate/transporter collision frequency is the only factor to consider. Perhaps substrate mobility within the postulated water-filled translocation porekhannel (Jung et al., 1986) is also limiting for transport. It is also possible that transporter and substrate solvation or the availability of rare, transport- competent conformational states is affected by high glycerol concentrations. However, these explanations do not explain the lack of effect of 40% glycerol on 6NBDG transport.
While substrate diffusion may exert a limiting role on the transport process, the observations presented in the current study also suggest that an intracellular sugar binding compartment complicates accurate determination of sugar transport rates. This study describes sugar uptake by human erythrocytes and by human K.562 leukemic cells at low sugar concentrations as a biexponential process. In red cells, the first process rapidly fills a small cellular compartment (k = 7.4 f 1.7 min-’; vol = 29 f 6%) while the second process slowly fills the bulk of the cytosol (k = 0.56 f 0.1 1 min-’; vol = 71 k 6%). The transported sugar (30MG) is nonmetabolizable; thus, subsequent metabolic transformation cannot account for the phenomenon. Several explanations could account for biexponential sugar uptake.
Were the transporter to contain a high-affinity, negative- feedback sugar binding site within a cytosolic GLUTl domain, sugar uptake would be rapid during initial phases but would slow as the intracellular sugar level rises and the regulatory site becomes saturated. We modeled this pos- sibility in two ways. The first model assumes that occupancy of the regulatory site locks the transporter in a dysfunctional state (the competitive model). The second assumes that occupancy of the site does not prevent sugar binding at
Biochemistry, Vol. 34, No. 47, 1995 15403
catalytic sites but rather slows translocational steps signifi- cantly (the allosteric model). Both models predict that sugar uptake shows biphasic kinetics. However, both models also predict that exit is accelerated as the regulatory site desatu- rates (Km(app) for exit falls with falling intracellular sugar), and this results in a hysteresis in the exit progress curve that is not observed experimentally. We therefore reject the kinetic explanation for biphasic sugar uptake.
A more simple explanation describes uptake of sugar into two parallel compartments (i.e. two populations of cell sizes are present in the cell suspension). This seems unlikely, however, since it can be shown that the first-order rate constant for sugar uptake (protein-mediated or leakage) into a sphere of volume v is given by
k = (constant ~ 0 1 ) ” ~
Thus, for particles of volume u and d2.5, k would vary by only 1.3-fold. The observed difference is 13-fold. More- over, it can also be shown that, for any body, the ratio of GLUTl -mediated sugar uptake (transport) to transbilayer diffusion (leakage) is independent of volume and is given bY
where [GLUT11 is surface glucose transporter density, P is the permeability coefficient of the membrane bilayer to sugar, K, is the Michaelis constant for GLUTl-mediated sugar uptake, and N is Avagadro’s constant. Thus, if two popula- tions of cell sizes give rise to fast and slow components of protein-mediated sugar uptake, sugar leakage should also show fast and slow components. This was not observed, and we thereby reject this hypothesis.
However, were a second population of cells to exist with lower volume and higher sugar transporter cell surface density, this population would transport sugars more rapidly than the larger cells. Our calculations show that such a population of spherical cells would be characterized by a diameter of 75% of that of the larger cells and would present cell surface GLUTl at a density 10-fold higher than that of the larger cells. More importantly, this population of cells would also display elevated rates of sugar exit relative to the larger cells at limiting sugar concentrations, and this was not observed. We therefore reject the hypothesis of multiple cell populations of differing GLUT 1 content.
If small and large cellular compartments do not exist in parallel, they must be present in series. Since the smaller compartment fills more rapidly than the larger, we conclude that this compartment lies between the glucose transporter and the bulk cell cytosol. The questions we now address are the following. (1) Does the compartment extend uniformly across the cytoplasmic surface of the erythrocyte membrane? ( 2 ) Why is sugar exit a simple exponential process?
We approached the first question by permeabilizing the red cell membrane using a-toxin of Staphylococcus aureus. Our rationale was to bypass the glucose transporter as the major portal for sugar import but in a way as to allow for uptake rates that would still be limited by a slower intrac- ellular process. a-Toxin monomers interact at the cell surface to form hexameric pores 2-3 nm in diameter. These

15404 Biochemistry, Vol. 34, No. 47, 1995 Cloherty et al.
pores limit the passage of macromolecules but allow smaller molecular species ( < 1000 Da) to move freely across the membrane (Ahnert-Hilger et al., 1985; Bader et al., 1986; Fussle et al., 1981; Hildebrand et al., 1991). The large mass of the a-toxin monomer (>28 kDa) thus limits its distribution to the cell surface.
Our studies show that permeabilized erythrocytes fill within 5 s of exposure to extracellular sugar. This suggests that the series barrier does not extend uniformly across the endofacial surface of the membrane. Rather, it must be limited (structurally or functionally) to locations coincident with glucose transporter-mediated sugar entry. While our studies cannot eliminate the possibility that toxin-treated red cells lose the series barrier below the cell membrane, these same studies demonstrate that the characteristically aniso- tropic GLUT 1 cell surface distribution is maintained, sug- gesting that at least major structural elements remain in position in permeabilized erythrocytes. When examined in other cell types, a-toxin permeabilization neither disrupts membrane cycling processes nor depletes cellular enzyme activities (Baldini et al., 1991; Bauldry et al., 1992; Klarlund et al., 1993), indicating that fundamental cellular structure and function are retained by permeabilized cells. If the series barrier were an unstirred sugar layer acting to reduce the rate of cytosolic sugar diffusion, bypassing the glucose transporter by cell membrane permeabilization is not ex- pected to impact this phenomenon.
Because of the very high glucose transporter content of human red cells [6% of total erythrocyte surface area is occupied by GLUTl (Hebert & Carruthers, 1992)], we expected to observe uniform surface staining when eryth- rocytes were stained for GLUTl. Contrary to expectations, the GLUTl -staining patterns obtained. suggest that GLUTl distribution is restricted to surface domains of very high local transporter density. This contrasts with the uniform cell surface distribution of the anion transporter noted in the present study and previously in the study of Lieberman and Reithmeier (1988). It is probable, therefore, that the series barrier is coincident with locations of high GLUTl density. Occasionally, GLUTl -staining intensity coincides with red cell crenations. However, this is an unusual rather than normal occurrence. If GLUTl were restricted to crenations resulting from echinocytosis (Lin et al., 1994), the sugar binding complex would also have to colocalize within these structures.
The series barrier is not formed from macromolecules that are lost upon cellular lysis because multicomponent sugar uptake is still observed in erythrocyte ghosts which lack more than 95% cellular hemoglobin. Human K562 leukemic cells (a pre-erythroid cell line) also show multicomponent sugar uptake which is unaffected by subsequent cell induction to synthesize hemoglobin. This suggests that sugar binding to hemoglobin (whether free in bulk cytosol or anchored to the membrane) is not responsible for this phenomenon. While hypotonically lysed and washed erythrocytes retain a dis- proportionate amount of hexokinase I, suggesting a mem- brane association (28% on the basis of immunoblot analysis), the distribution of this enzyme does not coincide with that of GLUTl . Glycolytic enzymes are suggested to associate strongly with the erythrocyte membrane. These include glyceraldehyde-phosphate dehydrogenase and phosphoglyc- erate kinase (Kliman & Steck, 1980; Mercer & Dunham, 198 1). GAPDH and bacterial glucokinase have been shown
Cytosol
membrane ,) me;: binding bulk
Transpo*er compartment complex cytosol Outside (Co) (cb) (Ci)
I I L
SO
SO ' k l
k3 FIGURE 7: Model for net sugar transport by human erythrocytes. The upper diagram shows clusters of transporters in the membrane. Transporter/sugar collision frequency is postulated to be limited by increasing medium viscosity. Transporters deliver extracellular sugar ( S o ) to a submembranous compartment (C,) of limited free water content at a rate described by the pseudo first-order rate constant kl . Sugar within this compartment (S,) can exit rapidly via transport (k l ) , can leak slowly (k3, a first-order process) into bulk cytosol (Ci) to form Si, or can bind rapidly (k2, a second- order process) and reversibly to a sugar binding complex (Cb) to form bound sugar (SI,). Sb dissociates (k-2, a first-order process) either to S, or to Si. Si can access the sugar exit site either via leakage into C, (k3) or via binding (k2) to c b and subsequent dissociation (k-2) into C,. The lower diagram is a schematic representation of this model. In order to model the cytochalasin B-sensitive uptake and exit data of Figure 2, the following constants were used (see Materials and Methods for details): kl = 15 min-I, k2 = 120 000 M-I min-I, k-2 = 0.15 min-I, k3 = 0.1 min-I, Cb = 18 pmol of sugar binding sites per liter of cell water, C, = 2% cell free water volume, and Ci = 98% cell free water volume.
to associate in a nucleotide-dependent fashion with eryth- rocyte GLUTl in vitro (Lachaal et al., 1990; Lachaal & Jung, 1993).
At this time, the molecules that associate with erythrocyte GLUT 1 remain uncertain. Equilibrium 30MG space analy- sis indicates that erythrocytes contain some 1.2 x lo6 30MG binding sites per cell (30 pM; GLUT1:binding site molar ratio = 1:4). The apparent binding constant (Kd(app) = 200- 400 pM) is close to Km(app) for 30MG net uptake at this temperature (Helgerson et al., 1989). It is interesting that ATP depletion (e.g. ghost formation) reversibly slows the rapid (presumed translocation) step slightly but reduces the slower (presumed sugar shunting) step considerably. It is unclear whether the action of ATP on the slow phase of net uptake is related to ATP hydrolysis-dependent reversal of Ca2+ inhibition of sugar transport (Helgerson et al., 1989) or to the allosteric (hydrolysis-independent) modulation of transport resulting from nucleotide binding to GLUT 1 (Carruthers & Helgerson, 1989).
We have modeled erythrocyte sugar transport as a four- compartment process (Figure 7). The compartments are the extracellular water (C,), the endofacial, pericarrier space (Cm), the sugar binding compartment (C,), and the bulk,

Intracellular Complexation of Imported Sugars
cytosolic water (Ci). Sugar transporters are laterally segre- gated into domains of very high local transporter density. Below these domains lie the sugar binding complexes (Cb) which may form a complex with cytoplasmic domains of GLUTl so that sugar released at the exit site is rapidly bound to the complex. It is also possible that the hypothesized extrinsic “sugar binding complex” is, in fact, an intrinsic function of the transporter (GLUTl) complex per se.
Sugar bound to c b (Sb) can dissociate into either C, or Ci, the direction of net dissociation being determined by the sugar concentration gradient across the complex (&-Si). c b thus serves to bind sugars in a saturable fashion and “transports” bound sugars between C, and Ci. This transport function is essential for successful model fitting. Simulations of net transport demonstrate that both uptake and exit show marked biphasic kinetics when only a simple binding function is ascribed to c b (i.e. sb can dissociate only to S,).
When extracellular sugar levels are low, the pseudo first- order rate constant for saturable sugar transport (kl = V,,,/ K,) and the ratio of bound to free intracellular sugar [Sd (S, + Si)] are greatest. Here, net sugar movement between C, and Ci is rate-limited by the shunt pathway and by desorption from c b . At higher sugar levels where the pseudo first-order rate constant for transport falls significantly (GLUT 1-mediated transport saturates), slow desorption from binding sites and diffusion via the shunt pathway are no longer rate-limiting. Sugar exit is rate-limited by the availability of S,. At low sugar concentrations where the bound to free intracellular sugar ratio is greatest, S, availability is governed by desorption from the complex and by the shunt pathway (k3; Si - S,). Provided C, is small ( < 5 % cell water), this compartment will be difficult to measure accurately and sugar exit will appear monoexpo- nential with apparent first-order rate constant k3. The data of Figure 2 can be modeled by this scheme (see legend to Figure 7 for details of constants). The sugar binding properties of red cells (Figure 6B) are rather less well- modeled by this scheme. Although the 30MG spacehugar binding capacity of the red cell is well-approximated by the model, the predicted dissociation constant for 30MG binding (k-2/k2 = 1.25 pM) is significantly lower than measured &pp) [(200-400) & 140 pM]. This theoretical result may lie within observed experimental error (see Figure 6B), but it is also possible that the measured sugar binding properties of erythrocytes also reflect binding at other sites that do not limit transport and which are not yet considered in the model. For example, rapid (relative to k2 and k-2) but low-affinity and low-capacity binding of sugar to a species (e.g. hemoglobin) within the compartment Ci would not rate limit uptake or exit but would lead to increased Kd(app) and B,,,
We conclude that net sugar transport by human erythro- cytes and by human K562 cells is the sum of two sequential processes: sugar translocation and reversible sugar binding. Sugar binding may occur at either endofacial GLUTl sites or at a complex in very close association with the glucose transporter. Because of this, steady state sugar transport measurements report both translocation and binding steps and cannot be used directly to model the translocation process in isolation. This process also illustrates the potential for control of net sugar transport by reversible recruitment of sugar binding complexes to the transporter, a process previously shown to occur in thymocytes, CHO cells, and
for sugar binding to red cells. -
Biochemistry, Vol. 34, No. 47, 1995 15405
macrophages (Faik et al., 1989; Naftalin & Rist, 1989, 1990; Pedley et al., 1993) and suggested to occur in skeletal muscle (O’Doherty et al., 1994).
ACKNOWLEDGMENT
The comments of a reviewer were most helpful in the preparation of this manuscript.
REFERENCES
Ahnert-Hilger, G., Bhakdi, S . , & Gratzel, M. (1985) J. Biol. Chem. 260, 12730-12734.
Appleman, J. R., & Lienhard, G. E. (1989) Biochemistry 28,8221 - 9227.
Bader, M. F., Thierse, D., & Aunis, D. (1986) J. Biol. Chem. 261, 5777-5783.
Baker, G. F., & Naftalin, R. J. (1979) Biochim. Biophys. Acta 550, 474-484.
Baldini, G., Hohman, R., Charron, M. J., & Lodish, H. F. (1991) J. Biol. Chem. 266, 4037-4040.
Bauldry, S . A., Elsey, K. L., & Bass, D. A. (1992) J. Biol. Chem. 267, 25141-25152.
Blacklow, S . C., Raines, R. T., Lim, W. A., Zamore, P. D., & Knowles, J. R. (1988) Biochemistry 27, 1158-1 167.
Carruthers, A. (1986) J. Biol. Chem. 261, 11028- 11037. Carruthers, A. (1990) Physiol. Rev. 70, 1135-1176. Carruthers, A. (1991) Biochemistry 30, 3898-3906. Carruthers, A., & Melchior, D. L. (1983) Biochim. Biophys. Acta
728. 254-266. Carruthers, A., & Helgerson, A. L. (1989) Biochemistry 28, 8337-
8346. Carruthers, A., Hebert, D. N., Helgerson, A. L., Tefft, R. E., Naderi,
S., & Melchior, D. L. (1989) Ann. N. Y. Acad. Sci. 568, 52-67. Charnay, P., & Maniatis, T. (1983) Science 220, 1281-1283. Faik, P., Morgan, M., Naftalin, R. J., & Rist, R. (1989) Biochem.
Fussle, R., Bhakdi, S . , Sziegoleit, A., Tranumjensen, J., Krantz,
Ginsburg, H., & Stein, D. (1975) Biochim. Biophys. Acta 382,353-
Hammes, G. G., & Schimmel, P. R. (1970) Enzymes 2, 67-1 14. Hankin, B. L., Lieb, W. R., & Stein, W. D. (1972) Biochim.
Biophys. Acta 288, 114- 126. Harrison, S . A., Buxton, J. M., Helgerson, A. L., MacDonald, R.
G., Chlapowski, F. J., Carruthers, A., & Czech, M. P. (1990) J. Biol. Chem. 265, 5793-5801.
Hebert, D. N., & Carruthers, A. (1992) J. Biol. Chem. 267,23829- 23838.
Helgerson, A. L., & Carruthers, A. (1989) Biochemistry 28,4580- 4594.
Helgerson, A. L., Hebert, D. N., Naderi, S., & Carruthers, A. (1989) Biochemistrv 28. 6410-6417.
J. 260, 153-156.
T., & Wellensiek, H. (1981) J. Cell. Biol. 91, 83-94.
368.
Hildebrand, A:, Pohl, M., & Bhakdi, S . (1991) J. Biol. Chem. 266, 17 195- 17200.
Jacquez, J. A. (1983) Biochim. Biophys. Acta 727, 367-378. Jung, E. K. Y., Chin, J. J., & Jung, C. Y. (1986) J. Biol. Chem.
Klarlund, J. K., Khalaf, N., Kozma, L., & Czech, M. P. (1993) J.
Kliman, H. J., & Steck, T. L. (1980) J. Biol. Chem. 255, 6314-
Krupka, R. M. (1989) Biochem. J. 260, 885-891. Lachaal, M., & Jung, C. Y. (1993) J. Cell. Physiol. 156, 326-329. Lachaal, M., Berenski, C. J., Kim, J., & Jung, C. Y. (1990) J. Biol.
Chem. 265, 15449-15454. Lieb, W. R., & Stein, W. D. (1986) in Transport and difusion
across cell membranes, pp 69- 112, Academic Press, New York. Lieberman, D. M., & Reithmeier, R. A. (1988) J. Biol. Chem. 263,
10022- 10028. Lin, S . , Yang, E., & Huestis, W. H. (1994) Biochemistry 33, 7337-
7344.
262, 9155-9160.
Biol. Chem. 268, 7646-7649.
6321.
Lowe, A. G., & Walmsley, A. R. (1986) Biochim. Biophys. Acta 857, 146-154.
15406 Biochemistry, Vol. 34, No. 47, 1995
Lowe, A. G., & Walmsley, A. R. (1987) Biochim. Biophys. Acta
Matayoshi, E. D., & Jovin, T. M. (1991) Biochemistry 30, 3527-
Mercer, R. W., & Dunham, P. B. (1981) J. Gen. Physiol. 78, 547-
Miller, D. M. (1968) Biophys. J. 8, 1329-1338. Miller, D. M. (1971) Biophys. J. 11, 915-923. Naftalin, R. J. (1988) Biochim. Biophys. Acta 946, 43 1-438. Naftalin, R. J., & Holman, G. D. (1977) in Membrane transport in
red cells (Ellory, J. C., & Lew, V. L., Eds.) pp 257-300, Academic Press, New York.
903, 547-550.
3538.
568.
Naftalin, R. J., & Rist, R. J. (1989) Biochem. J. 260, 143-152. Naftalin, R. J., & Rist, R. J. (1990) Biochem. J. 265, 251-259. Naftalin, R. J., & Rist, R. J. (1991) Biochim. Biophys. Acta 1064,
37-48.
Cloherty et al.
Naftalin, R. J., Smith, P. M., & Roselaar, S. E. (1985) Biochim.
O’Doherty, R. M., Bracy, D. P., Osawa, H., Wasserman, D. H., &
Pedley, K. C., Jones, G. E., Magnani, M., Rist, R. J., & Naftalin,
Sato, Y., Chiba, T., & Suzuki, Y. (1985) Chem. Pharm. Bull. 33,
Sen, A. K., & Widdas, W. F. (1962) J. Physiol. 160, 392-403. Solc, K., & Stockmayer, W. H. (1973) Znt. J. Chem. Kinet. 5,733-
Stokes, R. H., & Weeks, I. A. (1964)Aust. J. Chem. 17,304-309. Uezato, T. (1986) Biochem. Znt. 12, 199-206. Wheeler, T. J., & Whelan, J. D. (1988) Biochemistry 27, 1441-1446.
Biophys. Acta 820, 235-249.
Granner, D. K. (1994) Am. J. Physiol. 266, E171-E178.
R. J. (1993) Biochem. J . 291, 515-522.
3935-3942.
752.
BI950792N