Monitoring Survey at the Portland Disposal Site, September ...
596
Monitoring Survey at the Portland Disposal Site September 2016 Disposal Area Monitoring System DAMOS Contribution 203 July 2021 In partnership with funded by: DAMOS Program Funds + EPA Funds under Interagency Agreement: DW-096-95829701
-
Upload
khangminh22 -
Category
Documents
-
view
0 -
download
0
Transcript of Monitoring Survey at the Portland Disposal Site, September ...

Monitoring Survey at the Portland Disposal Site September 2016
Disposal Area Monitoring System DAMOS
Contribution 203 July 2021
In partnership with funded by: DAMOS Program Funds + EPA Funds under Interagency Agreement: DW-096-95829701

REPORT DOCUMENTATION PAGE form approved OMB No. 0704-0188
Public reporting concern for the collection of information is estimated to average 1 hour per response including the time for reviewing instructions, searching existing data sources, gathering and measuring the data needed and correcting and reviewing the collection of information. Send comments regarding this burden estimate or any other aspect of this collection of information including suggestions for reducing this burden to Washington Headquarters Services, Directorate for information Observations and Records, 1215 Jefferson Davis Highway, Suite 1204, Arlington, VA 22202-4302 and to the Office of Management and Support, Paperwork Reduction Project (0704-0188), Washington, D.C. 20503.
1. AGENCY USE ONLY (LEAVE BLANK) 2. REPORT DATE July 2021
3. REPORT TYPE AND DATES COVERED Contribution, September 2016
4. TITLE AND SUBTITLE Monitoring Survey at The Portland Disposal Site September 2016
6. AUTHOR(S) Zach McKelvey, S. Kersey Sturdivant, Lisa Lefkovitz, Stacy Pala
5. FUNDING NUMBERS Contract No. W912WJ-12-D-0004
7. PERFORMING ORGANIZATION NAME(S) AND ADDRESS(ES) INSPIRE Environmental and Battelle 513 Broadway 141 Longwater Drive, Suite 202 Newport, RI 02840 Norwell, MA 02061
8. PERFORMING ORGANIZATION REPORT NUMBER
9. SPONSORING/MONITORING AGENCY NAME(S) AND ADDRESS(ES) US Army Corps of Engineers-New England District 696 Virginia Rd
Concord, MA 01742-2751
10. SPONSORING/MONITORING AGENCY REPORT NUMBER Contribution No. 203
11. SUPPLEMENTARY NOTES Available from DAMOS Program Manager, Evaluation Branch USACE-NAE, 696 Virginia Rd, Concord, MA 01742-2751
12a. DISTRIBUTION/AVAILABILITY STATEMENT Approved for public release; distribution unlimited
12b. DISTRIBUTION CODE
13. ABSTRACT A monitoring survey was conducted in September 2016 at the Portland Disposal Site (PDS) as part of the Disposal Area Monitoring System (DAMOS) Program. PDS is
a U.S. Environmental Protection Agency (USEPA) designated ocean disposal site that lies east of Cape Elizabeth, Maine. The 2016 monitoring effort involved a high-resolution acoustic survey to characterize seafloor topography and dredged material distribution, as well as a combined sediment profile imaging (SPI)/plan view imaging (PV) survey and benthic grab sampling to provide additional physical and chemical characterization and to assess benthic recolonization. The results of the 2016 survey were used to document changes at PDS since the previous survey in 2014 and the subsequent placement of over 120,800 m3 of dredged material at the site.
The high-resolution acoustic survey consisted of multibeam bathymetric, acoustic backscatter and side-scan sonar data acquisition. The bathymetric data indicated that the site displayed a highly irregular bottom topography, with a prominent northwest-southeast trending trough. Much of the site was dominated by bedrock outcrops (ledges) while the deeper areas of the site were generally smooth except for irregular relief in the areas where dredged material placement had been targeted. The 2016 acoustic survey focused on PDA 95, a target placement location in the southeast portion of PDS within the deep trough that received material since the last survey in 2014. There was a shallow mound and smoothed surface in the basin of PDA 95, between rock outcrops consistent with placement of dredged material. Existing bathymetry at PDS was evaluated in GIS and the portions of the site between apparent ledge outcrops was delineated. Hypothetical extents of future disposals were estimated assuming a maximum slope between the deposited materials and the ambient seafloor of 3 degrees (rise/run of 1/19) to leave a variable buffer zone between the mound and the site boundary. Site capacity based on placement of dredged material in the troughs was estimated to range from 6-12 million m3 for placement depth ranging from 5-15m thick respectively.
Sediment profile images and plan view images were collected from three placement target areas within PDS: PDA 95 located in the trough in the southeastern portion of the site, PDS Inactive located in the trough in the center of the site, and PDA A located on the bedrock ledge in the northern portion of the site. PDA 95 most recently received material between 2014 and 2016. PDS Inactive last received material in 1991. PDA A received a small amount of material since the last survey in 2014 but the last significant placement was completed in 2010.
The benthic communities at the two disposal locations within the deep trough (PDA 95 and PDS Inactive) were recovering consistent with the expected recovery paradigm, with full recovery expected within one year of completion of dredged material placement. Mature benthic communities have developed at both disposal locations, including the most recently used location (PDA 95). Both of these locations were statistically similar to the reference areas in terms of aRPD and successional stage. The benthic community at PDA A, located on a rocky outcrop had no evidence of direct impairment from past dredged material placement, but due to limited camera penetration and the presence of coarse sediments, only Stage 1 and Stage 2 taxa were identified at most stations.
Chemical analyses of sediment and the tissue of benthic infauna (clams and worms) revealed concentrations that were generally low but that showed some variability between the reference and the disposal areas, attributed primarily to the difference in physical characteristics of the sediment (disposal site sediments had higher percentages of fine-grained material). Tissue concentrations still remained two orders of magnitude below FDA Action Levels. While these results are limited, they do not indicate issues with site management and provide baseline measurements for reference to future studies.
Based on the findings of the 2016 survey, our recommendations are:
R1: Continue placement of dredged material at deeper, soft bottom areas of the site to support containment of material with adequate buffer to minimize impacts to existing hard bottom areas.
R2: Continue periodic confirmatory monitoring following additional placement of significant quantities of dredged material.
14. SUBJECT TERMS DAMOS, dredged material, PDS, Portland Disposal Site, acoustic, multibeam, SPI, PV, benthic, infauna, sediment chemistry, tissue chemistry
15. NUMBER OF TEXT PAGES: 67
16. PRICE CODE 17. SECURITY CLASSIFICATION OF REPORT Unclassified
18. SECURITY CLASSIFICATION OF THIS PAGE
19. SECURITY CLASSIFICATION OF ABSTRACT
20. LIMITATION OF ABSTRACT

MONITORING SURVEY AT THE PORTLAND DISPOSAL SITE
SEPTEMBER 2016
CONTRIBUTION #203
July 2021
Contract No. W912WJ-12-D-0004
Submitted to:
New England District U.S. Army Corps of Engineers
696 Virginia Road Concord, MA 01742-2751
Prepared by:
141 Longwater Drive, Suite 202
Norwell, MA 02061
513 Broadway
Newport, RI 02840

This report should be cited as: McKelvey, Z.; Sturdivant, S. K.; Lefkovitz, L. F.; Pala, S. L.E. 2021. Monitoring
Survey at the Portland Disposal Site, September 2016. DAMOS Contribution No. 203. Prepared by INSPIRE Environmental, Newport, RI. Prepared for the U.S. Army Corps of Engineers, New England District, Concord, MA. 149 pp. + Appendices.
Note on units of this report: As a scientific data summary, information and data are presented in the metric system. However, given the prevalence of English units in the dredging industry of the United States, conversions to English units are provided for general information in Section 1.0. A table of common conversions can be found in Appendix A.

i
TABLE OF CONTENTS
Page
LIST OF TABLES ................................................................................................................ iii LIST OF FIGURES ............................................................................................................... v LIST OF ACRONYMS .............................................................................................. x EXECUTIVE SUMMARY ................................................................................................. xii
1.0 INTRODUCTION .......................................................................................................... 1 1.1 Overview of the DAMOS Program and EPA Monitoring of ODMDS ............. 1 1.2 Introduction to the Portland Disposal Site ......................................................... 2 1.3 Historical Dredged Material Disposal Activity ................................................. 3 1.4 Previous Monitoring Events .............................................................................. 4 1.5 Recent Dredged Material Disposal Activity ...................................................... 4 1.6 2016 Survey Objectives ..................................................................................... 4
2.0 METHODS ................................................................................................................... 10 2.1 Navigation and On-Board Data Acquisition ................................................... 10 2.2 Acoustic Survey ............................................................................................... 10
2.2.1 Acoustic Survey Planning .................................................................... 10 2.2.2 Acoustic Data Collection ..................................................................... 11 2.2.3 Bathymetric Data Processing ............................................................... 11 2.2.4 Backscatter Data Processing ................................................................ 13 2.2.5 Side-Scan Sonar Data Processing ........................................................ 13 2.2.6 Acoustic Data Analysis ........................................................................ 13
2.3 Sediment Profile and Plan View Imaging ....................................................... 14 2.3.1 Sediment Profile Imaging .................................................................... 14 2.3.2 Plan View Imaging............................................................................... 15
2.3.2.1 SPI and PV Data Collection .......................................................... 16 2.3.3 Image Conversion and Calibration ...................................................... 16 2.3.4 SPI and PV Data Analysis ................................................................... 17
2.3.4.1 Sediment Profile Image Analysis Parameters ............................... 17 2.3.4.2 Plan View Analysis Parameters .................................................... 19
2.3.5 Statistical Methods ............................................................................... 19 2.4 Sediment Grab Collection and Analysis .......................................................... 22 2.5 Tissue Collection and Analysis ....................................................................... 23 2.6 Fishing Gear Assessment via Surface Marker Buoy ....................................... 23
3.0 RESULTS ..................................................................................................................... 28 3.1 Acoustic Survey ............................................................................................... 28
3.1.1 Bathymetry ........................................................................................... 28 3.1.2 Acoustic Backscatter and Side-Scan Sonar ......................................... 28 3.1.3 Comparison with Previous Bathymetry and Backscatter ..................... 29
3.2 Sediment Profile and Plan View Imaging ....................................................... 29 3.2.1 Reference Area Stations ....................................................................... 30
3.2.1.1 Physical Sediment Characteristics ................................................ 30

TABLE OF CONTENTS (CONTINUED)
Page
ii
3.2.1.2 Biological Conditions .................................................................... 30 3.2.2 Disposal Site Stations .......................................................................... 31
3.2.2.1 Physical Sediment Characteristics ................................................ 31 3.2.2.2 Biological Conditions .................................................................... 32
3.2.3 Comparison between Disposal and Reference Areas .......................... 32 3.2.3.1 Mean aRPD ................................................................................... 32 3.2.3.2 Successional Stage Rank ............................................................... 33
3.2.4 Temporal Comparisons ........................................................................ 34 3.2.4.1 Mean aRPD ................................................................................... 34
3.3 Sediment and Tissue Physical and Chemical Results ..................................... 35 3.3.1 Grain Size and Total Organic Carbon .................................................. 35 3.3.2 Sediment Chemistry ............................................................................. 35 3.3.3 Tissue Chemistry.................................................................................. 36
3.4 Benthic Community Analysis .......................................................................... 38 3.5 Fishing Gear Assessment ................................................................................. 38
4.0 DISCUSSION .............................................................................................................. 60 4.1 Placement of Dredged Material and Stability of Deposits .............................. 60 4.2 Biological Recovery of the Benthic Community and Sediment Quality ......... 61 4.3 Management Considerations ........................................................................... 62
5.0 CONCLUSIONS AND RECOMMENDATIONS ...................................................... 63
6.0 REFERENCES ............................................................................................................. 64 INDEX APPENDIX A TABLE OF COMMON CONVERSIONS APPENDIX B PDS DISPOSAL LOG DATA FROM OCT 2014 TO DEC 2015 APPENDIX C ACTUAL SPI/PV AND SEDIMENT GRAB REPLICATE
LOCATIONS APPENDIX D SPI/PV FIELD LOG APPENDIX E SEDIMENT PROFILE AND PLAN VIEW IMAGE ANALYSIS
RESULTS APPENDIX F GRAIN SIZE SCALE FOR SEDIMENTS APPENDIX G SEDIMENT CHEMISTRY LAB RESULTS APPENDIX H TISSUE CHEMISTRY LAB RESULTS APPENDIX I BENTHIC COMMUNITY ANALYSIS RESULTS

iii
LIST OF TABLES
Page
Table 1-1. Historical Disposal Activity at PDS .................................................................... 6
Table 1-2. Overview of Survey Activities at PDS ................................................................ 7
Table 1-3. Disposal Activity at PDS since October 2014 (per Scow Logs Provided by USACE, December 2016) ............................................................................. 9
Table 2-1. Accuracy and Uncertainty Analysis of Bathymetric Data ................................ 24
Table 2-2. PDS 2016 SPI, Sediment Grab, BCA, and Tissue Chemistry Station IDs, Sample IDs, and Target Coordinates ................................................................ 25
Table 2-3. Sample Containers, Sample Sizes, Preservative Requirements, and Holding Times for PDS Samples ...................................................................... 27
Table 3-1. Summary of PDS Reference Station Sediment Profile Imaging Results (Station Means), September 2016..................................................................... 39
Table 3-2. Summary of PDS Disposal Areas PDA A, PDA 95, and PDS Sediment Profile Imaging Results (Station Means), September 2016 ............................. 40
Table 3-3. Summary of Station Means by Sampling Location .......................................... 42
Table 3-4. Summary Statistics and Results of Inequivalence Hypothesis Testing for aRPD Values ..................................................................................................... 43
Table 3-5. Summary Statistics and Results of Inequivalence Hypothesis Testing for Successional Stage Values ................................................................................ 44
Table 3-6. Summary Statistics and Results of Inequivalence Hypothesis Testing for Temporal Change in aRPD Values ................................................................... 45
Table 3-7. Grain Size Data for PDS 2016 Sediments ......................................................... 46
Table 3-8. Percent Total Organic Carbon in PDS 2016 Sediments .................................... 47
Table 3-9. Total PAH and Total PCB in PDS 2016 Sediments.......................................... 48
Table 3-10. Chlorinated Pesticides Detected in PDS 2016 Sediments ................................ 49
Table 3-11. Metals Detected in PDS 2016 Sediments ......................................................... 51
Table 3-12. Lipids Data for PDS 2016 Tissue ..................................................................... 52
Table 3-13. Total PAH and Total PCB in PDS 2016 Tissue ............................................... 53
Table 3-14. Pesticides in PDS 2016 Clams and Worms ...................................................... 54
Table 3-15. Metals in PDS 2016 Clams and Worms ........................................................... 56
Table 3-16. Benthic Community Abundance and Diversity Metrics for PDS 2016 ........... 57
Table 3-17. Benthic Community Biomass by Phylum for PDS 2016 ................................. 58

LIST OF TABLES (CONTINUED)
Page
iv
Table 3-18. Surface Marker Buoys Observed During the 2016 PDS Multibeam Survey ............................................................................................................... 59

v
LIST OF FIGURES
Figure Page Figure 1-1. Location of the Portland Disposal Site (PDS) ........................................ 1 Figure 1-2. Overview of PDS on regional bathymetry with 2016 sampling
areas indicated ....................................................................................... 2 Figure 1-3. Location of reported disposal events at PDS from October 2014
through December 2015 ........................................................................ 3 Figure 2-1. PDS 2016 acoustic survey area and tracklines ....................................... 4 Figure 2-2. PDS 2016 target station locations for SPI, tissue, benthic, and
sediment sampling ................................................................................. 5 Figure 2-3. Operation of the sediment profile and plan view camera imaging
system .................................................................................................. 6 Figure 2-4. The stages of infaunal succession as a response of soft bottom
benthic communities to (A) physical disturbance or (B) organic enrichment; from Rhoads and Germano (1982) ..................................... 7
Figure 2-5. This representative plan view image shows the sampling relationship between plan view and sediment profile images. Note: plan view images differ between surveys and stations and the area covered by each plan view image may vary slightly between images and stations. ................................................................. 8
Figure 2-6. Surficial sediment grab and tissue trawl station locations at the PDS disposal areas ................................................................................ 9
Figure 2-7. Surficial sediment grab and tissue trawl station locations at the PDS reference areas ............................................................................. 10
Figure 3-1a. Bathymetric contour map of PDS PDA 95 – September 2016 ............... 11 Figure 3-1b. Bathymetric contour map of PDS reference areas – September
2016 ..................................................................................................... 12 Figure 3-2a. Bathymetric depth data over acoustic relief model of PDS PDA
95 – September 2016 ............................................................................ 13 Figure 3-2b. Bathymetric depth data over acoustic relief model of PDS
reference areas – September 2016 ........................................................ 14 Figure 3-3a. Mosaic of unfiltered backscatter data of PDS PDA 95 –
September 2016 .................................................................................... 15 Figure 3-3b. Mosaic of unfiltered backscatter data of PDS reference areas –
September 2016 .................................................................................... 16

LIST OF FIGURES (CONTINUED)
Figure Page
vi
Figure 3-4a. Filtered backscatter over acoustic relief model of PDS PDA 95 – September 2016 .................................................................................... 17
Figure 3-4b. Filtered backscatter over acoustic relief model of PDS reference areas – September 2016 ........................................................................ 18
Figure 3-5a. Side-scan mosaic of PDS PDA 95 – September 2016 ........................... 19 Figure 3-5b. Side-scan mosaic of PDS reference areas – September 2016 ................ 20 Figure 3-6. PDS disposal area elevation difference: 2016 vs. 2014 ......................... 21 Figure 3-7. Sediment grain size major mode (phi units) at the PDS reference
area stations ......................................................................................... 22 Figure 3-8. Sediment profile images from reference areas; (A) Station EREF-
02 with a well-developed aRPD in ambient fine sand over silt-clay; and (B) Station SREF-07 with small-scale boundary roughness caused by shallow burrowing ............................................... 23
Figure 3-9. Mean station camera prism penetration depths (cm) at the PDS reference area stations .......................................................................... 24
Figure 3-10. Mean station small-scale boundary roughness values (cm) at the PDS reference area stations .................................................................. 25
Figure 3-11. Plan view images from the reference areas at (A) Station EREF-03 depicting burrow openings and small tubes; and (B) Station SREF-07 depicting a cluster of small tubes .......................................... 26
Figure 3-12. Mean station aRPD depth values (cm) at the PDS reference area stations ................................................................................................. 27
Figure 3-13. Sediment profile images from reference areas; (A) Station EREF-01 with a shallow aRPD; and (B) Station SREF-10 with a deep aRPD .................................................................................................... 28
Figure 3-14. Infaunal successional stages found at the PDS reference area stations ................................................................................................. 29
Figure 3-15. Sediment profile images from (A) Station EREF-02 indicating Stage 2 on 3 fauna with shallow burrows and deep feeding voids; and (B) Station EREF-05 indicating Stage 1 on 3 fauna represented by small tubes at the sediment–water interface and feeding void at depth ............................................................................ 30
Figure 3-16. Mean depth (cm) of subsurface feeding voids at the PDS reference area stations .......................................................................... 31

LIST OF FIGURES (CONTINUED)
Figure Page
vii
Figure 3-17. Sediment grain size major mode (phi units) at the PDS disposal area stations ......................................................................................... 32
Figure 3-18. Sediment profile images depicting very fine sand layered over silt-clay from (A) Station PDS-18; and (B) Station PDA 95-33 ............ 33
Figure 3-19. Sediment profile images from disposal area PDA A (A) Station PDA A-01 depicting fine sand; (B) Station PDA A-03 depicting fine sand over silt-clay; and (C) Station PDA A-05 depicting very fine sand over silt/clay ......................................................................... 34
Figure 3-20. Mean station camera prism penetration depths (cm) at the PDS disposal area stations ............................................................................ 35
Figure 3-21. Sediment profile images from disposal areas; (A) Station PDA A-01 showing shallow prism penetration due to sediment consolidation; and (B) Station PDA A-04 showing shell fragments in the sediment ..................................................................... 36
Figure 3-22. Mean dredged material thickness at the PDS disposal area stations ................................................................................................. 37
Figure 3-23. Sediment profile images from disposal areas; (A) Station PDA 95-30 with dredged material being biologically reworked to resemble ambient sediment near sediment–water interface; (B) Station PDS-19 with a thick layer of dredged material extending beyond camera prism penetration depth; and (C) Station PDA A-05 with patchy dredged material ........................................................... 38
Figure 3-24. Mean station small-scale boundary roughness values (cm) at the PDS disposal area stations .................................................................... 39
Figure 3-25. (A) Sediment profile image from Station PDA A-05 depicting Stage 1 tubes at the sediment–water interface; and (B) plan view image from Station PDA 95-29 depicting burrows ............................... 40
Figure 3-26. Mean station aRPD depth values (cm) at the PDS disposal area stations ................................................................................................. 41
Figure 3-27. Sediment profile images depicting typical aRPD depth across disposal areas at (A) Station PDA A-03; (B) Station PDS-09; and (C) Station PDA 95-30 ......................................................................... 42
Figure 3-28. Infaunal successional stages found at the PDS disposal area stations ................................................................................................. 43

LIST OF FIGURES (CONTINUED)
Figure Page
viii
Figure 3-29. Sediment profile images showing evidence of Stage 3 fauna at (A) Station PDS-17 showing open feeding voids; and (B) Station PDA 95-28 showing infilled feeding voids ........................................... 44
Figure 3-30. Sediment profile images showing successional stages at (A) Station PDA A-02 showing Stage 1 transitioning to Stage 2 and (B) Station PDA A-05 showing Stage 2 fauna; and (C) Station PDA A-03 showing evidence of Stage 3 fauna ..................................... 45
Figure 3-31. Mean depth of subsurface feeding voids at the PDS disposal area stations ................................................................................................. 46
Figure 3-32. Boxplots showing the distribution of mean aRPD depths measured at the disposal site and reference area stations in the 2016 survey .......................................................................................... 47
Figure 3-33. Boxplots showing the distribution of mean aRPD depths measured at the disposal area stations and reference area stations in the 2014 and 2016 surveys ............................................................... 48
Figure 3-34. Map showing the location of reference areas CADS REF and PDS REF at which sediment was collected for laboratory bioaccumulation testing for Pepperell Cove (CADS REF) and York Harbor (PDS REF) sediments (USACE 2014, USACE 2015) ...... 49
Figure 3-35. Percent fines in sediments from PDS 2016 ........................................... 50 Figure 3-36. Percent total organic carbon in sediments from PDS 2016 .................... 51 Figure 3-37. Total PAH (μg/kg dry-wt.) in sediments from PDS 2016 ...................... 52 Figure 3-38. Total PCB (μg/kg dry-wt.) in sediments from PDS 2016 ...................... 53 Figure 3-39a. Total DDX (μg/kg dry-wt.) in sediments from PDS 2016 ..................... 54 Figure 3-39b. Chlordane (μg/kg dry-wt.) in sediments from PDS 2016 ...................... 55 Figure 3-39c. Dieldrin (μg/kg dry-wt.) in sediments from PDS 2016 .......................... 56 Figure 3-39d. Toxaphene (μg/kg dry-wt.) in sediments from PDS 2016 ..................... 57 Figure 3-40a. Arsenic (mg/kg dry-wt.) in sediments from PDS 2016 .......................... 58 Figure 3-40b. Cadmium (mg/kg dry-wt.) in sediments from PDS 2016 ....................... 59 Figure 3-40c. Chromium (mg/kg dry-wt.) in sediments from PDS 2016 ..................... 60 Figure 3-40d. Copper (mg/kg dry-wt.) in sediments from PDS 2016 .......................... 61 Figure 3-40e. Lead (mg/kg dry-wt.) in sediments from PDS 2016 .............................. 62 Figure 3-40f. Mercury (mg/kg dry-wt.) in sediments from PDS 2016 ........................ 63

LIST OF FIGURES (CONTINUED)
Figure Page
ix
Figure 3-40g. Nickel (mg/kg dry-wt.) in sediments from PDS 2016 ........................... 64 Figure 3-40h. Zinc (mg/kg dry-wt.) in sediments from PDS 2016 ............................... 65 Figure 3-41. Percent lipids in tissue from PDS 2016 ................................................. 66 Figure 3-42. Total PAH (μg/kg wet-wt.) in tissue from PDS 2016 ............................ 67 Figure 3-43. Total PCB (μg/kg wet-wt.) in tissue from PDS 2016 ............................ 68 Figure 3-44a. Total DDX (μg/kg wet-wt.) in tissue from PDS 2016 ........................... 69 Figure 3-44b. Endosulfan (μg/kg wet-wt.) in tissue from PDS 2016 ........................... 70 Figure 3-44c. Chlordane (μg/kg wet-wt.) in tissue from PDS 2016 ............................. 71 Figure 3-44d. Dieldrin (μg/kg wet-wt.) in tissue from PDS 2016 ................................ 72 Figure 3-45a. Arsenic (mg/kg wet-wt.) in tissue from PDS 2016 ................................ 73 Figure 3-45b. Cadmium (mg/kg wet-wt.) in tissue from PDS 2016 ............................. 74 Figure 3-45c. Chromium (mg/kg wet-wt.) in tissue from PDS 2016 ........................... 75 Figure 3-45d. Copper (mg/kg wet-wt.) in tissue from PDS 2016 ................................ 76 Figure 3-45e. Lead (mg/kg wet-wt.) in tissue from PDS 2016 .................................... 77 Figure 3-45f. Mercury (mg/kg wet-wt.) in tissue from PDS 2016 ............................... 78 Figure 3-45g. Nickel (mg/kg wet-wt.) in tissue from PDS 2016 ................................. 79 Figure 3-45h. Zinc (mg/kg wet-wt.) in tissue from PDS 2016 ..................................... 80 Figure 3-46. Surface marker buoy observations during the acoustic survey at
PDS – September 2016 ......................................................................... 81 Figure 4-1. Capacity estimates at PDS. ................................................................... 82

x
LIST OF ACRONYMS ACSM American Congress on Surveying and Mapping aRPD Apparent redox potential discontinuity ASCII American Standard Code for Information Interchange BCA Benthic Community Analysis CI Confidence interval CLT Central Limit Theorem DAMOS Disposal Area Monitoring System DGPS Differential Global Positioning System DO Dissolved oxygen EGN Empirical Gain Normalization Eh Redox potential (the potential generated between a platinum electrode and a
standard hydrogen electrode when placed into the medium being tested, where hydrogen is considered the reference electrode)
EIS Environmental Impact Statement ER-L Effects range low ER-M Effects range median FDA Food and Drug Administration GIS Geographic information system GPS Global Positioning System GRD Gridded data MBES Multibeam echo sounder MLLW Mean Lower Low Water MRU Motion reference unit NAD83 North American Datum of 1983 NAE USACE, New England Division NEF Nikon Electronic Format NOAA National Oceanic and Atmospheric Association NOS National Ocean Service ODMDS Ocean Dredged Material Disposal Site

LIST OF ACRONYMS (CONTINUED)
xi
PAH Polycyclic aromatic hydrocarbon
PCB Polychlorinated biphenyl
PDS Portland Disposal Site
PSD Photoshop Document
PV Plan View
QAPP Quality Assurance Project Plan
RTK Real time kinematic GPS
R/V Research vessel
SLR Single-lens reflex
SMMP Site Management and Monitoring Plan
SOD Sediment oxygen demand
SOP Standard Operating Procedures
SPI Sediment Profile Imaging
TIF Tagged image file
TOC total organic carbon
UNH/NOAA CCOM University of New Hampshire’s NOAA Center for Coastal and Ocean Mapping
USACE U.S. Army Corps of Engineers
USEPA U.S. Environmental Protection Agency
VDATUM Vertical Datum Transformation

xii
EXECUTIVE SUMMARY
A monitoring survey was conducted in September 2016 at the Portland Disposal Site (PDS) as part of the Disposal Area Monitoring System (DAMOS) Program. PDS is a U.S. Environmental Protection Agency (USEPA) designated ocean disposal site that lies east of Cape Elizabeth, Maine. The 2016 monitoring effort involved a high-resolution acoustic survey to characterize seafloor topography and dredged material distribution, as well as a combined sediment profile and plan view imaging (SPI/PV) survey and benthic grab sampling to provide additional physical and chemical characterization and to assess benthic recolonization. The results of the 2016 survey were used to document changes at PDS since the previous survey in 2014 and the subsequent placement of over 120,800 m3 of dredged material at the site.
The high-resolution acoustic survey consisted of multibeam bathymetric, acoustic backscatter, and side-scan sonar data acquisition. The 2016 acoustic survey focused on PDA 95, a target placement location in the southeast portion of PDS within the deep trough that received material since the last survey in 2014, and also included the two reference areas. The bathymetric data indicated that the survey area within PDS displayed a highly irregular bottom topography, with a prominent northwest-southeast trending trough. Much of the survey area within PDS was dominated by bedrock outcrops (ledges) while the deeper areas were generally smooth except for irregular relief in the areas where dredged material placement had been targeted. There was a shallow mound and smoothed surface in the basin of PDA 95, between rock outcrops consistent with placement of dredged material. Existing bathymetry at PDS was evaluated in GIS, and the portion of the site between apparent ledge outcrops was delineated. With future placement focused on the trough areas between outcrops, site capacity was estimated to range between 6-12 million m3 dependent on the assumed thickness of placement and assumed buffer to site boundaries and rock outcrops.
Sediment profile and plan view images were collected from three placement target areas within PDS: PDA 95 located in the trough in the southeastern portion of the site, PDS Inactive located in the trough in the center of the site, and PDA A located on the bedrock ledge in the northern portion of the site. PDA 95 most recently received material between 2014 and 2016. PDS Inactive last received material in 1991. PDA A received a small amount of material since the last survey in 2014, but the last significant placement was completed in 2010.
The benthic communities at the two disposal locations within the deep trough (PDA 95 and PDS Inactive) were recovering consistent with the expected recovery paradigm, with full recovery expected within one year of completion of dredged material placement. Mature benthic communities have developed at both disposal locations, including the most recently used location (PDA 95). Both of these locations were statistically similar to the reference areas in terms of aRPD and successional stage. The benthic community at PDA A, located on rocky outcrop had no evidence of direct impairment from past dredged material placement, but due to limited camera penetration and the presence of coarse sediments, only Stage 1 and Stage 2 taxa were identified at most stations.

EXECUTIVE SUMMARY (CONTINUED)
xiii
Chemical analyses of sediment and the tissue of benthic infauna (clams and worms) revealed concentrations that were generally low but that showed some variability between the reference and the disposal areas, attributed primarily to the difference in physical characteristics of the sediment (disposal site sediments had higher percentages of fine-grained material). Tissue concentrations were two orders of magnitude below FDA Action Levels. While these results are limited, they support the current management strategy for PDS and provide baseline measurements for reference to future studies.
Based on the findings of the 2016 survey, our recommendations are:
R1: Continue placement of dredged material at deeper, soft-bottom areas of the site to support containment of material with adequate buffer to minimize impacts to existing hard-bottom areas.
R2: Continue periodic confirmatory monitoring following additional placement of significant quantities of dredged material.
1
Monitoring Survey at the Portland Disposal Site September 2016
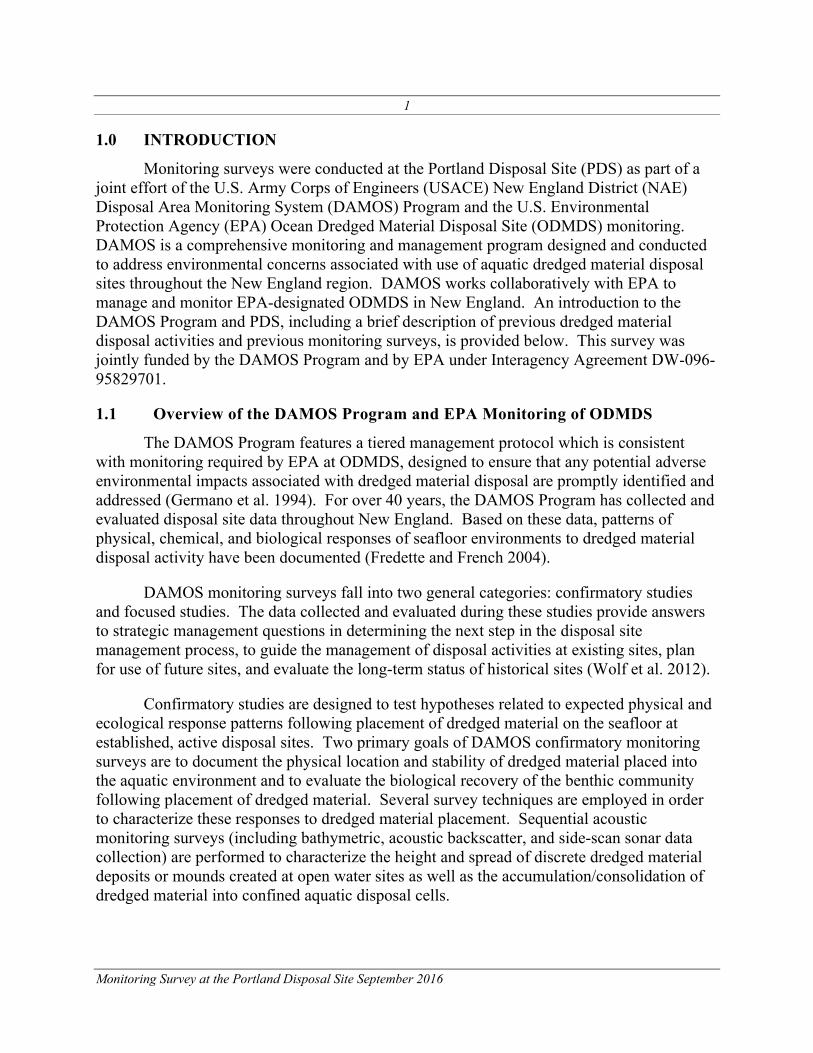
1.0 INTRODUCTION
Monitoring surveys were conducted at the Portland Disposal Site (PDS) as part of a joint effort of the U.S. Army Corps of Engineers (USACE) New England District (NAE) Disposal Area Monitoring System (DAMOS) Program and the U.S. Environmental Protection Agency (EPA) Ocean Dredged Material Disposal Site (ODMDS) monitoring. DAMOS is a comprehensive monitoring and management program designed and conducted to address environmental concerns associated with use of aquatic dredged material disposal sites throughout the New England region. DAMOS works collaboratively with EPA to manage and monitor EPA-designated ODMDS in New England. An introduction to the DAMOS Program and PDS, including a brief description of previous dredged material disposal activities and previous monitoring surveys, is provided below. This survey was jointly funded by the DAMOS Program and by EPA under Interagency Agreement DW-096-95829701.
1.1 Overview of the DAMOS Program and EPA Monitoring of ODMDS
The DAMOS Program features a tiered management protocol which is consistent with monitoring required by EPA at ODMDS, designed to ensure that any potential adverse environmental impacts associated with dredged material disposal are promptly identified and addressed (Germano et al. 1994). For over 40 years, the DAMOS Program has collected and evaluated disposal site data throughout New England. Based on these data, patterns of physical, chemical, and biological responses of seafloor environments to dredged material disposal activity have been documented (Fredette and French 2004).
DAMOS monitoring surveys fall into two general categories: confirmatory studies and focused studies. The data collected and evaluated during these studies provide answers to strategic management questions in determining the next step in the disposal site management process, to guide the management of disposal activities at existing sites, plan for use of future sites, and evaluate the long-term status of historical sites (Wolf et al. 2012).
Confirmatory studies are designed to test hypotheses related to expected physical and ecological response patterns following placement of dredged material on the seafloor at established, active disposal sites. Two primary goals of DAMOS confirmatory monitoring surveys are to document the physical location and stability of dredged material placed into the aquatic environment and to evaluate the biological recovery of the benthic community following placement of dredged material. Several survey techniques are employed in order to characterize these responses to dredged material placement. Sequential acoustic monitoring surveys (including bathymetric, acoustic backscatter, and side-scan sonar data collection) are performed to characterize the height and spread of discrete dredged material deposits or mounds created at open water sites as well as the accumulation/consolidation of dredged material into confined aquatic disposal cells.
2
Monitoring Survey at the Portland Disposal Site September 2016
Sediment profile (SPI) and plan view (PV) imaging surveys are performed in confirmatory studies to provide further physical characterization of the material and to support evaluation of seafloor (benthic) habitat conditions and recovery over time. Each type of data collection activity is conducted periodically at disposal sites, and the conditions found after a defined period of disposal activity are compared with the long-term data set at specific sites to determine the next step in the disposal site management process (Germano et al. 1994).
Focused studies are periodically undertaken within the DAMOS Program to evaluate candidate sites, as baseline surveys at new sites, to evaluate inactive or historical disposal sites and to contribute to the development of dredged material placement and monitoring techniques. Focused DAMOS monitoring surveys may also feature additional types of data collection activities as deemed appropriate to achieve specific survey objectives, such as grab sampling of sediment for physical and biological analysis, subbottom profiling, towed video, or sediment coring.
The EPA and USACE jointly prepare and update a Site Management and Monitoring Plan (SMMP) for PDS, as is required for all designated ODMDS (USEPA and USACE 2007). The SMMP identifies specific monitoring objectives that are reviewed in the design of survey. The 2016 PDS survey was a confirmatory study to monitor areas that had received dredged material since the last confirmatory survey of 2014 (Sturdivant and Carey 2017) and was also a focused investigation in support of the upcoming revision of the SMMP.
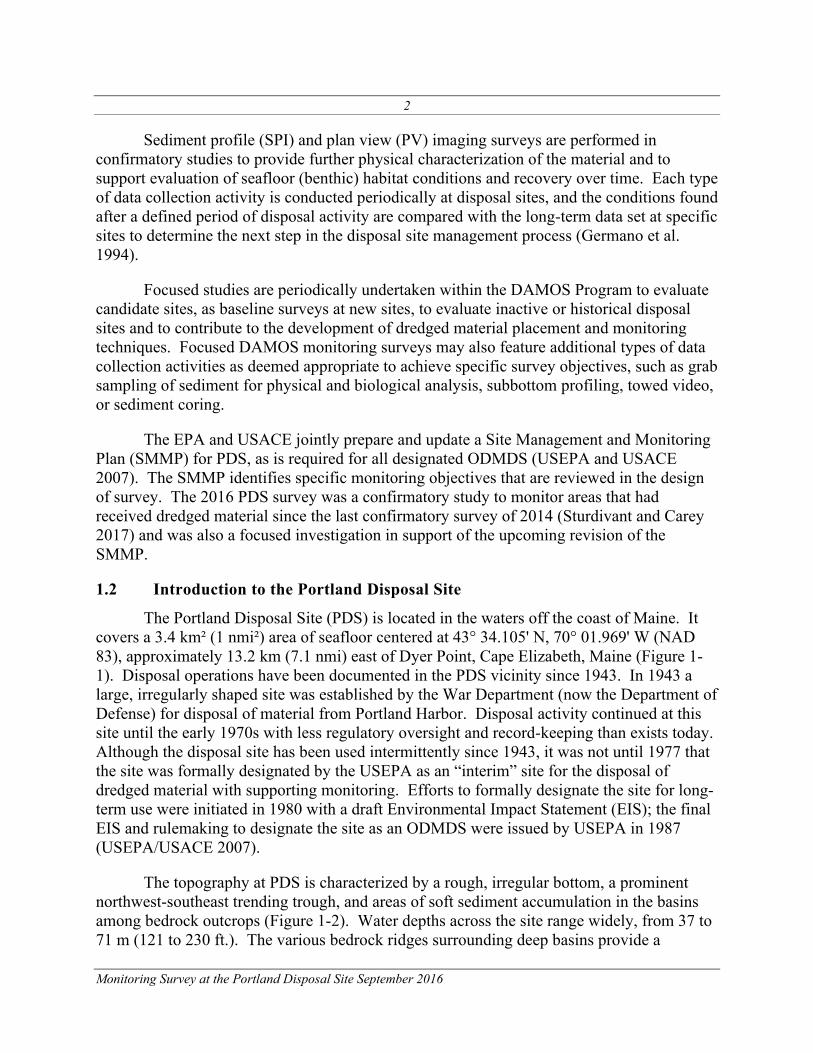
1.2 Introduction to the Portland Disposal Site
The Portland Disposal Site (PDS) is located in the waters off the coast of Maine. It covers a 3.4 km² (1 nmi²) area of seafloor centered at 43° 34.105' N, 70° 01.969' W (NAD 83), approximately 13.2 km (7.1 nmi) east of Dyer Point, Cape Elizabeth, Maine (Figure 1-1). Disposal operations have been documented in the PDS vicinity since 1943. In 1943 a large, irregularly shaped site was established by the War Department (now the Department of Defense) for disposal of material from Portland Harbor. Disposal activity continued at this site until the early 1970s with less regulatory oversight and record-keeping than exists today. Although the disposal site has been used intermittently since 1943, it was not until 1977 that the site was formally designated by the USEPA as an “interim” site for the disposal of dredged material with supporting monitoring. Efforts to formally designate the site for long-term use were initiated in 1980 with a draft Environmental Impact Statement (EIS); the final EIS and rulemaking to designate the site as an ODMDS were issued by USEPA in 1987 (USEPA/USACE 2007).
The topography at PDS is characterized by a rough, irregular bottom, a prominent northwest-southeast trending trough, and areas of soft sediment accumulation in the basins among bedrock outcrops (Figure 1-2). Water depths across the site range widely, from 37 to 71 m (121 to 230 ft.). The various bedrock ridges surrounding deep basins provide a
3
Monitoring Survey at the Portland Disposal Site September 2016
measure of protection from wave energy and subsurface currents, and thus act to contain the deposited dredged material. Dredged material disposal operations have specifically targeted these natural basins to enhance containment of dredged material. Sediments deposited at PDS have originated from dredging projects in Portland Harbor, Fore River, and many of the smaller rivers and harbors within the Casco Bay region of Maine.
1.3 Historical Dredged Material Disposal Activity
Records indicate that PDS has received approximately 1.9 million m³ (2.5 million yd³) of dredged material since the beginning of disposal activity tracking at this site in 1982. Historically, the largest users of the site were the USACE Royal River and Portland Harbor Federal navigation projects in 1996-1997 and 1998-1999, respectively.
Five distinct disposal locations have been targeted at PDS: PDA (Portland Disposal Area) A Mound, PDA B Mound, PDA 98 Mound, PDA 95 Mound, and PDS Inactive Mound (Figure 1-2). The PDA A Mound, previously referred to as the DG Mound because it was formed by disposal at the Disposal Ground (DG) buoy, has received material from numerous dredging projects over many years (1984-1989, 1991-1992, 1995-1998, 2001-2007; Table 1-1). The PDA 98 Mound was developed in 1998 and 1999 by the placement of sediment dredged from the Federal channel and several marine terminals in the Fore River and Portland Harbor (Table 1-1). Approximately 315,700 m³ (413,000 yd³) of material was directed to the PDA 98 Mound, a natural seafloor containment basin in the west-central portion of the site.
The PDA 95 Mound, formerly known as the Royal River Mound, is a moderate-sized disposal mound in the southeast corner of PDS formed from the placement of 61,700 m³ (80,700 yd³) of material. It was formed between 1995 and 1997 in water depths of 64 m (Table 1-1) as part of a capping demonstration project. Sediment dredged from the upper reaches of the Royal River in Yarmouth, Maine, which was determined to be suitable for unconfined open water disposal, was used to simulate material requiring cover and sequestration from the overlying water column. Coarser grained sediment from the lower reaches of the same river was used as capping dredged material in the demonstration project (Morris et al. 1998, SAIC 2003). Between August 2007 and March 2014, approximately 666,600 m³ (872,000 yd³) of material was deposited at PDS, with most material centered on the PDA 95 Mound between 2013 and 2014 (Sturdivant and Carey 2017).
The PDA B Mound has not developed a shape that can be distinguished from the rough topography of the ambient seafloor. This location has received relatively small volumes of dredged material; from 2012 to 2013, 2,800 m³ (3,700 yd³) was placed at PDA B Mound (Sturdivant and Carey 2017).
The PDS Inactive Mound forms a large irregular mound of dredged material in the center of the site. This location had disposal buoys from 1979 to 1984 and from 1990 to 1991 (SAIC 2002, Table 1-1).

4
Monitoring Survey at the Portland Disposal Site September 2016
Placement activity from 2008 through 2010 totaled 38,000 m³ (50,000 yd³) and was located at the PDA A Mound.
1.4 Previous Monitoring Events
Confirmatory surveys were performed at PDS in 2000, 2001, 2007, and 2014 (Sturdivant and Carey 2017), and a series of focused studies were conducted between 1991 and 2000 (Table 1-2). In addition to typical monitoring surveys employing acoustic and sediment profile imaging technologies, the focused investigations have included mussel bioaccumulation studies, oceanographic surveys, and monitoring of capping projects. A review of these monitoring events was provided in AECOM (2009) and is summarized in Table 1-2.
In August 2014, bathymetric, sediment profile and plan view imaging surveys were conducted around recent and historical disposal locations. The survey was designed to assess changes at the site after placement of approximately 666,600 m³ (872,000 yd³) of dredged material since the previous survey in 2007. Bathymetric data were collected over the entire site and showed patterns indicating that containment of dredged material is supported by placement in the deepest areas of the site with soft sediments surrounded by rock outcrops.
The August 2014 sediment profile and plan view imaging survey was performed at the PDA B Mound and the historical PDA 95 Mound. Recolonization at PDA 95 had continued as expected, with mature, Stage 3 communities found at all but two stations. The PDA B Mound displayed a recolonization pattern like that of the older mound, with mature, Stage 3 communities found at all but one station. Both mounds were found to have successional status and mean aRPD depths consistent with reference areas (Sturdivant and Carey 2017).
1.5 Recent Dredged Material Disposal Activity
Since the most recent DAMOS survey in August 2014, approximately 120,800 m³ (158,000 yd³) of material has been deposited at PDS. The majority of this material originated from the Royal River Boat Yard (Table 1-3) and was placed centered on the PDA 95 Mound (Figure 1-3). A small amount of material totaling approximately 700 m³ (900 yd³) was placed at the PDA A Mound (Figure 1-3).
A detailed record of scow disposal activity at PDS for the period from August 2014 to August 2016, including the origin of dredged material, the volume deposited, and the disposal location, is provided in Appendix B.
1.6 2016 Survey Objectives
The September 2016 survey at PDS was designed as a combined confirmatory survey to track the recent placement of dredged material and a focused investigation in support of the upcoming revision of the SMMP. The September 2016 survey was designed to:

5
Monitoring Survey at the Portland Disposal Site September 2016
• Characterize seafloor topography and surficial features over the most active portion of PDS (PDA 95) and two reference areas (SREF and EREF) by completing a high-resolution acoustic survey.
• Use SPI and PV imaging to further define the physical characteristics of surficial sediment and to assess the benthic recolonization status (community recovery of the bottom-dwelling animals) of the areas of the site with recent disposal activity, the older disposal mounds within the site (PDA 95, PDA A, PDS Inactive) and the reference areas (SREF and EREF).
• Provide an initial characterization of the surficial sediment quality over the site and reference areas through the collection of sediment for laboratory analysis of sediment chemistry, benthic community structure, and tissue chemistry of non-motile organisms.

6
Monitoring Survey at the Portland Disposal Site September 2016
Table 1-1.
Historical Disposal Activity at PDS
Mound Designation Years of Disposal Activity
PDS Inactive 1979-1984; 1990-1991
PDA A (formerly DG Buoy location)
1984-1989; 1991-1992; 1995-1998; 2001-2007; 2008-2010
PDA 95 1995-1997; 2013-2014
PDA 98 1998-1999
PDA B 2012-2013

7
Monitoring Survey at the Portland Disposal Site September 2016
Table 1-2.
Overview of Survey Activities at PDS
Date Purpose of Survey Bathymetry Area SPI Stations (location - #) Additional Studies
DAMOS Report/Contribution
No. Reference
1977-1978 Confirmatory Monitoring
Single-beam 1900 x 2100 m ---
Currents, mussel chemistry, sediment chemistry, grabs, fisheries
Annual Data Report, Supp. B
NUSC 1979 Supp. B
1979-1981 Confirmatory Monitoring --- --- Mussel chemistry 43 Feng 1984
January 1989 Confirmatory Monitoring
Single-beam 900 x 1100 m
PDA A - 43 REF - 39 --- 78 SAIC 1990
July 1992 Capping
demonstration (PDA A Area)
Single-beam 900 x 1100 m
PDA A - 42 REF - 39
Acoustic sediment density, grabs (chemistry) 108 Wiley 1996
1996 Oceanographic measurements --- ---
Tides, near-bottom currents, water temperature, turbidity, salinity
121 McDowell and Pace
1998
1995-1997
Capping demonstration
(Royal River Project Area)
Single-beam 800 x 800 m (1995)
Single-beam 1950 x 1000 m (1996)
PDA 95 - 33 Side-scan sonar, grabs, cores 123 Morris et al. 1998

8
Monitoring Survey at the Portland Disposal Site September 2016
Table 1-2. (continued)
Overview of Survey Activities at PDS
Date Purpose of Survey Bathymetry Area SPI Stations (location - #) Additional Studies
DAMOS Report/Contribution
No. Reference
1998-2000 Dredged material
fate, release to water column
Multibeam 17.7 km² trapezoid (1998)
Multibeam 2100 x 2100 m (2000)
PDA 98 - 28 Side-scan sonar, ADCP, sediment traps 153 SAIC 2004
July/September 2000
Confirmatory Monitoring
Multibeam 2100 x 2100 m
PDA 98 - 28 REF - 13 --- 136 SAIC 2002
August 2001 Confirmatory Monitoring ---
PDA A - 25 PDA 98 - 28 PDA A - 25
REF - 13
--- 140 SAIC 2003
August 2007 Confirmatory Monitoring
Multibeam 2100 x 2100 m
PDA 95 - 15 PDS 98 - 16 PDA A - 15
EREF - 7 SREF - 7
SEREF - 5
--- 179 AECOM 2009
August 2014 Confirmatory Monitoring
Multibeam 2100 x 2100
PDA B – 6 PDA 95 – 18
EREF – 4 SREF – 4
SEREF – 4
--- 200 Sturdivant & Carey 2017

9
Monitoring Survey at the Portland Disposal Site September 2016
Table 1-3.
Disposal Activity at PDS since October 2014 (per Scow Logs Provided by USACE, December 2016) Permit Number Project Name Target Site Code Permittee Total (m³) Permittee Total (yd³) 2014-2015 Disposal Season NAE-2002-1020 Royal River Boatyard - East PDA 95 4,962 6,490 NAE-2004-2397 Yankee Marina PDA 95 16,270 21,280 W912WJ-14-C-0022 Royal River Boat Yard PDA 95 61,126 79,950 NAE-2006-02255 Global Petroleum PDA 95 19,878 26,000 NAE-2008-02244 Yarmouth Boat Club Marina PDA 95 2,902 3,796 Total 2014-2015 105,138 137,516 2015-2016 Disposal Season NAE-2008-02244 Yarmouth Boat Club Marina PDA A & PDA 95 14,518 18,989 NAE-2014-01473 Lower Falls Landing Associates PDA 95 1,185 1,550 Total 2015-2016 15,703 20,539 Total 120,841 158,057

10
Monitoring Survey at the Portland Disposal Site September 2016
2.0 METHODS
The September 2016 survey at PDS was conducted by a team of investigators from INSPIRE Environmental, CR Environmental, and Battelle including ACSM-certified hydrographer Christopher Wright (#266) aboard the 55-foot R/V Jamie Hanna. The acoustic survey was conducted from 7- 8 September 2016. The SPI/PV imaging survey was conducted from 17-19 September 2016, and the sediment grab sampling from 20-21 September 2016. Detailed Standard Operating Procedures (SOPs) for data collection and processing are available in the Quality Assurance Project Plan (QAPP) for the DAMOS Program (Battelle 2015) and its Addendum (Battelle 2016).
2.1 Navigation and On-Board Data Acquisition
Navigation for the acoustic survey was accomplished using a Hemisphere VS-330 Real Time Kinematic Global Positioning System (RTK GPS) which received base station correction through the Keynet NTRIP broadcast. Horizontal position accuracy in fixed RTK mode was approximately 2 cm. A dual-antennae Hemisphere VS110 differential GPS (DGPS) was available if necessary as a backup. The GPS system was interfaced to a desktop computer running HYPACK hydrographic survey software. HYPACK continually recorded vessel position and GPS satellite quality and provided a steering display for the vessel captain to accurately maintain the position of the vessel along pre-established survey transects and targets. Vessel heading measurements were provided by an IxBlue Octans III fiber optic gyrocompass.
Navigation for the sediment grab sampling and SPI survey was accomplished using a Hemisphere R110 DGPS capable of sub-meter horizontal accuracy. Navigation data were recorded using HYPACK software.
2.2 Acoustic Survey
The acoustic survey included bathymetric, backscatter, and side-scan sonar data collection. The bathymetric data provided measurements of water depth that, when processed, were used to map the seafloor topography. Backscatter and side-scan sonar data provided images that supported characterization of surface sediment texture and roughness. Each of these acoustic data types is useful for assessing dredged material placement and surface sediment features.
2.2.1 Acoustic Survey Planning
The acoustic survey featured a high spatial resolution survey over the active portion of the site at PDA 95 Mound (700 × 700 m) and over two 600 x 600 m reference areas (SREF and EREF). INSPIRE hydrographers coordinated with USACE NAE scientists and reviewed alternative survey designs. Hydrographers obtained site coordinates, imported them into geographic information system (GIS) software, and created maps to aid design of a survey that would provide greater than 100-percent coverage within the survey area. Base

11
Monitoring Survey at the Portland Disposal Site September 2016
bathymetric data were obtained from the National Ocean Service Hydrographic Data Base to estimate the transect separation required to obtain full bottom coverage using an assumed beam angle limit of 90 degrees (45 degrees to port, 45 degrees to starboard). Transects spaced 80 m apart and cross-lines spaced 250 m apart were created to meet conservative beam angle constraints (Figure 2-1). The proposed survey area and design were then reviewed and approved by NAE scientists.
2.2.2 Acoustic Data Collection
The 2016 multibeam bathymetric survey of PDS was conducted 7-8 September 2016. Data layers generated by the survey included bathymetric, acoustic backscatter, and side-scan sonar and were collected using an R2Sonic 2022 broadband multibeam echo sounder (MBES). This 200-400 kHz system forms up to 256 1- to 2-degree beams (frequency dependent) distributed equiangularly or equidistantly across a 10- to 160-degree swath. For this survey, a frequency of 200 kHz and pulse length of 0.07 msec was selected to maximize the resolution of bathymetric data without compromising the quality of acoustic backscatter data. The MBES transducer was mounted amidships to the port rail of the survey vessel using a high strength adjustable boom. The primary GPS antenna was mounted atop the transducer boom. The transducer depth below the water surface (draft) and antenna height were checked and recorded at the beginning and end of data acquisition, and draft was confirmed using the “bar check” method.
An IxBlue Octans III motion reference unit (MRU) was interfaced to the MBES topside processor and to the acquisition computer. Precise linear offsets between the MRU and MBES were recorded and applied during acquisition. Depth and backscatter data were synchronized using pulse per second timing and transmitted to the HYPACK MAX® acquisition computer via Ethernet communications. Several patch tests were conducted during the survey to allow computation of angular offsets between the MBES system components.
The system was calibrated for local water mass speed of sound by performing sound velocity profile (SVP) casts at frequent intervals throughout the survey day using an AML, Inc. MinosX sound velocity profiler.
2.2.3 Bathymetric Data Processing
Bathymetric data were processed using HYPACK HYSWEEP® software. Processing components are described below and included:
• Adjustment of data for tidal elevation fluctuations
• Correction of ray bending (refraction) due to density variation in the water column
• Removal of spurious points associated with water column interference or system errors

12
Monitoring Survey at the Portland Disposal Site September 2016
• Development of a grid surface representing depth solutions
• Statistical estimation of sounding solution uncertainty
• Generation of data visualization products
Tidal adjustments were accomplished using RTK GPS verified against tide data using records obtained from the National Oceanic and Atmospheric Association’s (NOAA) Portland Tide Station (#8418150). Water surface elevations derived using RTK were adjusted to Mean Lower Low Water (MLLW) elevations using NOAA’s VDATUM Model.
Correction of sounding depth and position (range and azimuth) for refraction due to water column stratification was conducted using a series of twelve sound-velocity profiles acquired by the survey team. Data artefacts associated with refraction remain in the bathymetric surface model at a relatively fine scale (generally less than 5 to 10 cm) relative to the survey depth.
Bathymetric data were filtered to accept only beams falling within an angular limit of 55° to minimize refraction artefacts. Spurious sounding solutions were rejected based on the careful examination of data on a sweep-specific basis.
The R2Sonics 2022 MBES system was operated at 200 kHz. At this frequency, the system has a published beam width of 2.0°. Assuming an average depth of 63 m and a maximum beam angle of 55°, the average diameter of the beam footprint mid-swath was calculated at approximately 2.9 × 2.5 m (~7.45 m2). Data were reduced to a cell (grid) size of 3.0 × 3.0 m, acknowledging the system’s fine range resolution while accommodating beam position uncertainty. This data reduction was accomplished by calculating and exporting the average elevation for each cell in accordance with USACE recommendations (USACE 2013).
Statistical analysis of data as summarized on Table 2-1 showed negligible tide bias and vertical uncertainty substantially lower than values recommended by USACE (2013) or NOAA (2015). Note that the most stringent National Ocean Service (NOS) standard for this project depth (Special Order 1A) would call for a 95th percentile confidence interval (95% CI) of 0.64 m at the maximum site depth (77.9 m) and 0.54 m at the average site depth (63.3 m).
Reduced data were exported in ASCII text format with fields for Easting, Northing, and MLLW Elevation (meters). All data were projected to the Maine State Plane West FIPS 1802, NAD83 (metric). A variety of data visualizations were generated using a combination of ESRI ArcMap (V.10.1) and Golden Software Surfer (V.13.6). Visualizations and data products included:
• ASCII data files of all processed soundings including MLLW depths and elevations

13
Monitoring Survey at the Portland Disposal Site September 2016
• Contours of seabed elevation (50-cm and 1.0-m intervals) in a geospatial data file format suitable for plotting using GIS and computer-aided design software
• 3-dimensional surface maps of the seabed created using 2× vertical exaggeration and artificial illumination to highlight fine-scale features not visible on contour layers delivered in grid and tagged image file (TIF) formats, and
• An acoustic relief map of the survey area created using 2× vertical exaggeration, delivered in georeferenced TIF format.
2.2.4 Backscatter Data Processing
Backscatter data were extracted from cleaned MBES TruePix formatted files then used to provide an estimation of surface sediment texture based on seabed surface roughness. Mosaics of backscatter data were created using HYPACK’s implementation of GeoCoder software developed by scientists at the University of New Hampshire’s NOAA Center for Coastal and Ocean Mapping (UNH/NOAA CCOM). A seamless mosaic of unfiltered backscatter data was developed and exported in grayscale TIF format. Backscatter data were also exported in ASCII format with fields for Easting, Northing, and backscatter (dB). A Gaussian filter was applied to backscatter data to minimize nadir artefacts, and the filtered data were used to develop backscatter values on a 3-m grid. The grid was exported in ESRI binary GRD format to facilitate comparison with other data layers.
2.2.5 Side-Scan Sonar Data Processing
Side-scan sonar data were processed using Chesapeake Technology, Inc. Sonar Wiz software and GeoCoder software to generate a database of images that maximized both textural information and structural detail.
Seamless mosaics of side-scan sonar data were developed using SonarWiz and exported in grayscale TIF format using a resolution of 0.20-m per pixel. Data were adjusted using Empirical Gain Normalization (EGN) and manual gain adjustment methods to minimize nadir artefacts and facilitate visualization of fine seabed structures.
2.2.6 Acoustic Data Analysis
The processed bathymetric grids were converted to rasters, and bathymetric contour lines and acoustic relief models were generated and displayed using GIS. The backscatter mosaics and filtered backscatter grid were combined with acoustic relief models in GIS to facilitate visualization of relationships between acoustic datasets. This is done by rendering images and color-coded grids with sufficient transparency to allow three-dimensional acoustic relief model to be visible underneath.

14
Monitoring Survey at the Portland Disposal Site September 2016
2.3 Sediment Profile and Plan View Imaging
Sediment profile and plan view imaging is a monitoring technique used to provide data on the physical characteristics of the seafloor and the status of the benthic biological community (Germano et al. 2011).
A 45-station SPI/PV survey was performed at PDS (Figure 2-2), including 15 stations located within the boundary of the PDS 2016 survey area where recent disposal took place (PDA 95), 20 stations located over the older disposal mounds (PDS Inactive and PDA A) and five stations located at each of the two reference areas (SREF and EREF). SPI/PV station target locations are provided in Table 2-2 and SPI/PV station replicate locations are provided in Appendix C. The methodology for data acquisition and analysis for these images was consistent with the sampling methods described in detail in the Quality Assurance Project Plan (QAPP) (Battelle 2015) and INSPIRE standard operating procedures (SOPs).
2.3.1 Sediment Profile Imaging
The SPI technique involves deploying an underwater camera system to photograph a cross-section of the sediment–water interface. High-resolution SPI images were acquired using a Nikon® D7100 digital single-lens reflex (SLR) camera mounted inside an Ocean Imaging® Model 3731 pressure housing. The pressure housing sat atop a wedge-shaped steel prism with a glass front faceplate and a back mirror, mounted at a 45° angle. The camera lens looked down at the mirror, which reflected the image from the faceplate. The prism had an internal strobe mounted inside at the back of the wedge to provide illumination for the image; this chamber was filled with distilled water, so the camera always had an optically clear path. As the prism penetrated the seafloor, a trigger activated a time-delay circuit that fired an internal strobe to obtain a cross-sectional image of the upper 15–20 cm of the sediment column (Figure 2-3). The camera remained on the seafloor for approximately 20 seconds to ensure that successful images were obtained.
Test exposures of a X-Rite Color Checker Classic Color Calibration Target were made on deck at the beginning of the survey to verify that all internal electronic systems were working to design specifications and to provide a color standard against which final images could be checked for proper color balance. Test images were also captured to confirm proper camera settings for site conditions. Images were checked periodically throughout the survey to confirm that the initial camera settings were still resulting in the highest possible quality images. All camera settings were recorded in the field log, which was provided in the cruise report. For this survey, the ISO-equivalent was set at 640, shutter speed was 1/250, f-stop was f9, and storage was in compressed raw Nikon Electronic Format (NEF) files (approximately 30 MB each). Additional camera settings used were: white balance set to flash, color mode set to Adobe RGB, sharpening set to none, noise reduction off. Details of the camera settings for each digital image also are available in the associated parameters file embedded in each electronic image file.

15
Monitoring Survey at the Portland Disposal Site September 2016
Whenever the camera was brought back on board (typically after every third to fifth station), the frame counter was checked to ensure that the requisite number of replicates had been obtained. In addition, a prism penetration depth indicator on the camera frame was checked to verify that the optical prism had penetrated the bottom to a sufficient depth. If images were missed or the penetration depth was insufficient, the camera frame stop collars were adjusted and/or weights were added or removed, and additional replicate images were taken. Frame counts, time of image acquisition, water depth in feet, frame stop-collar positions, and the number of weights used, were recorded in the field log for each replicate image (Appendix D). The use of mud doors is also recorded in the field log if their use was necessitated. Visual checks and hand tightening checks of all nuts/bolts on the SPI/PV camera frame were conducted periodically to make sure nothing vibrated loose during the survey.
Prior to field operations, the internal clock in the digital SPI system was synchronized with the vessel’s GPS navigation system. Each image was assigned a unique time stamp in the digital file attributes by the camera’s data logger and cross-checked with the time stamp in the navigational system’s computer data file. In addition, the field crew kept redundant written sample logs (Appendix D). Images were downloaded periodically to verify successful sample acquisition and/or to assess the type(s) of sediment/depositional layer present at a given station. Digital image files were renamed with the appropriate station names immediately after downloading as a further quality assurance step.
2.3.2 Plan View Imaging
An Ocean Imaging® Model DSC16000 plan view underwater camera (PV) system with two Ocean Imaging® Model 400-37 Deep Sea Scaling lasers was attached to the sediment profile camera frame and used to collect plan view photographs of the seafloor surface. Both SPI and PV images were collected during each “drop” of the system. The PV system consisted of a Nikon® D-7100 SLR camera encased in an aluminum housing, a 24 VDC autonomous power pack, a 500 W strobe, and a bounce trigger. A weight was attached to the bounce trigger with a stainless-steel cable so that the weight hung below the camera frame; the scaling lasers projected two red dots that were separated by a constant distance (26 cm) regardless of the field-of-view of the PV system. The field-of-view can be varied by increasing or decreasing the length of the trigger wire and, thereby, the camera height above the bottom when the picture is taken. As the SPI/PV camera system was lowered to the seafloor, the weight attached to the bounce trigger contacted the seafloor prior to the camera frame reaching the seafloor and triggered the PV camera (Figure 2-3).
During set up and testing of the PV camera, the positions of lasers on the PV camera were checked and calibrated to ensure separation of 26 cm. Test images were also captured to confirm proper camera settings for site conditions. Images were checked periodically throughout the survey to confirm that the initial camera settings were still resulting in the highest possible quality images. All camera settings were recorded in the field log (Appendix D). For this survey, the ISO-equivalent was set at 400, shutter speed was 1/30, f-

16
Monitoring Survey at the Portland Disposal Site September 2016
stop was f14, and storage was in compressed raw NEF files (approximately 30 MB each). Additional camera settings used were: white balance set to flash, color mode set to Adobe RGB, sharpening set to none, noise reduction off. Details of the camera settings for each digital image also are available in the associated parameters file embedded in each electronic image file.
Prior to field operations, the internal clock in the digital PV system was synchronized with the vessel’s GPS navigation system and the SPI camera. Each image was assigned a unique time stamp in the digital file attributes by the camera’s data logger and cross-checked with the time stamp in the navigational system’s computer data file. In addition, the field crew kept redundant written sample logs (Appendix D). Throughout the survey, PV images were downloaded at the same time as SPI images and were evaluated for successful image acquisition and image clarity. Digital image files were renamed with the appropriate station names immediately after downloading as a further quality assurance step.
The ability of the PV system to collect usable images is dependent on the clarity of the water column. Water conditions during this survey allowed use of a 0.5 m (20˝) trigger wire, resulting in approximate image widths of 0.4 m.
2.3.2.1 SPI and PV Data Collection
The SPI/PV survey was conducted at PDS from 17-19 September 2016 aboard the R/V Jamie Hanna. At each station, the vessel was positioned at the target coordinates and the camera was deployed within a defined station tolerance of 10 m. Four replicate SPI and PV images were collected at each of the stations (Appendix C). The three replicates with the best quality images from each station were chosen for analysis (Appendix E).
The DGPS described above was interfaced to HYPACK® software via laptop serial ports to provide a method to locate and record sampling locations. Throughout the survey, the HYPACK® data acquisition system received DGPS data. The incoming data stream was digitally integrated and stored on the PC’s hard drive. The system provided a steering display to enable the vessel captain to navigate to the pre-established survey target locations. The navigator electronically recorded the vessel’s position when the equipment contacted the seafloor and the winch wire went slack. Each replicate SPI/PV position was recorded and time stamped. Actual SPI/PV sampling locations were recorded using this system.
2.3.3 Image Conversion and Calibration
Following completion of the field operations, the raw image files were color calibrated in Adobe Camera Raw® by synchronizing the raw color profiles to an X-Rite Color Checker Classic Color Calibration Target that was photographed prior to field operations with the SPI camera. The raw images were then converted to high-resolution Photoshop Document (PSD) format files, using a lossless conversion file process, maintaining an Adobe RGB (1998) color profile. The PSD images were then calibrated and

17
Monitoring Survey at the Portland Disposal Site September 2016
analyzed in Adobe Photoshop®. Image calibration was achieved by measuring the pixel length of a 5-cm scale bar printed on the X-Rite Color Checker Target, providing a pixel per centimeter calibration. This calibration information was applied to all SPI images analyzed. Linear and area measurements were recorded as the number of pixels and converted to scientific units using the calibration information.
2.3.4 SPI and PV Data Analysis
Computer-aided analysis of SPI/PV images provided a set of standard measurements to allow comparisons among different locations and surveys. The DAMOS Program has successfully used this technique for over 30 years to map the distribution of disposed dredged material and to monitor benthic recolonization at disposal sites.
Measured parameters for SPI and PV images were recorded in Microsoft Excel© spreadsheets. These data were subsequently checked by one of INSPIRE’s senior scientists as an independent quality assurance/quality control review before final interpretation was performed. Spatial distributions of SPI/PV parameters were mapped using ArcGIS.
2.3.4.1 Sediment Profile Image Analysis Parameters
The parameters discussed below were assessed and/or measured for each replicate SPI image. Descriptive comments were also made for each replicate image.
Sediment Type – The sediment grain size major mode and range were estimated visually using a visual grain size comparator created at a similar scale. Results were reported using the phi scale. A cross-walk between phi size classes, mm size ranges, and Udden-Wentworth size classes is provided in Appendix F. The presence and thickness of dredged material were also assessed.
Penetration Depth – The depth to which the camera penetrated the seafloor was measured to provide an indication of the sediment bearing capacity and shear strength. The penetration depth can range from a minimum of 0 cm (i.e., no penetration on hard substrata) to a maximum of 20 cm (full penetration of very soft substrata).
Surface Boundary Roughness – Surface boundary roughness is a measure of the vertical relief of features at the sediment–water interface. Surface boundary roughness was determined by measuring the vertical distance between the highest and lowest points of the sediment–water interface. The surface boundary roughness measured over the width of sediment profile images typically ranges from 0 to 4 cm and may be related to physical structures (e.g., ripples, rip-up structures) or biogenic features (e.g., burrow openings, fecal mounds, foraging depressions).
Mud Clasts – When fine-grained, cohesive sediments are disturbed, either by physical bottom scour or faunal activity (e.g., decapod foraging) intact clumps of sediment are often scattered across the seafloor. The number of clasts observed at the sediment–water interface

18
Monitoring Survey at the Portland Disposal Site September 2016
were counted and their oxidation state assessed. The detection of reduced mud clasts in an obviously aerobic setting suggests a recent origin (Germano 1983). Mud clasts that are artefacts of SPI sampling (mud clots can fall off the back of the prism or wiper blade) are not recorded in the analysis sheet, but may be noted in the “Comments” field.
Apparent Redox Potential Discontinuity (aRPD) Depth – The aRPD depth provides a measure of the integrated time history of the balance between near-surface oxygen conditions and biological reworking of sediments. Oxidized surface sediments contain particles coated with ferric hydroxide (an olive or tan color when associated with particles) (Fenchel 1969; Lyle 1983). As the particles are buried or moved down by biological activity they are exposed to reducing oxygen concentrations in subsurface porewaters and their oxic coating slowly changes color to dark gray or black (Fenchel 1969; Lyle 1983). The aRPD serves as a proxy for the RPD, the boundary between positive Eh and negative Eh regions of the sediment column (where Eh=0) that indicates a switch from dominantly aerobic to dominantly anaerobic processes. The mean aRPD measured in SPI has been shown to be a suitable proxy for the RPD with the depth of the actual Eh = 0 horizon generally either equal to or slightly shallower than the depth of the optical reflectance boundary (Rosenberg et al. 2001; Simone and Grant 2017). When biological activity is high, the aRPD depth increases; when it is low or absent, the aRPD depth decreases. The aRPD depth was measured by visually assessing color and reflectance boundaries within the images and, for each image, a mean aRPD was calculated.
Sediment Oxygen Demand – Sediment oxygen demand (SOD) represents the overall rate of oxygen consumption, biologically and chemically, by the sediment column. Organic loading to a system results in increased SOD and results in reduced sediments. The relative amount of organic enrichment is indicated by sediment color; darker coloration indicates that sediment is more reduced and has greater organic loading (Fenchel 1969; Rhoads 1974; Lyle 1983; Bull and Williamson 2001). SOD levels (i.e., none, low, medium, and high) were assessed for all images.
Low Dissolved Oxygen – Images in which dark gray or black reduced sediments were in contact with the water column across the entire length of the sediment–water interface were recorded as having low dissolved oxygen condition.
Sedimentary Methane – If organic loading is extremely high, porewater sulfate is depleted and methanogenesis occurs. The process of methanogenesis is indicated by the appearance of methane bubbles in the sediment column. These gas-filled voids are readily discernable in SPI images because of their irregular, generally circular aspect and glassy texture (due to the reflection of the strobe off the gas bubble).
Thiophilic Bacteria (Beggiatoa) – The presence of sulfur-oxidizing bacterial colonies indicates hypoxic dissolved oxygen concentrations in the water column at the benthic boundary-layer (Rosenberg and Diaz 1993). The presence and extent (e.g., threads, trace, patches, mat) of the Beggiatoa or Beggiatoa-like colonies were noted.

19
Monitoring Survey at the Portland Disposal Site September 2016
Infaunal Successional Stage – Infaunal successional stage is a measure of the biological community inhabiting the seafloor. Current theory holds that organism-sediment interactions in fine-grained sediments follow a predictable sequence of development after a major disturbance (e.g., dredged material disposal) (Pearson and Rosenberg 1978; Rhoads and Germano 1982; Rhoads and Boyer 1982). This continuum has been divided subjectively into four stages: Stage 0, indicative of a sediment column that is largely devoid of macrofauna, occurs immediately following a physical disturbance or in close proximity to an organic enrichment source; Stage 1 is the initial community of tiny, densely populated polychaete assemblages; Stage 2 is the start of the transition to head-down deposit feeders; and Stage 3 is the mature, equilibrium community of deep-dwelling, head-down deposit feeders (Figure 2-4). Successional stage was assigned by assessing the types of species or organism-related activities apparent in the images. Additional variables related to the infaunal community and their role in bioturbation are often important to consider as bioturbation is related not only to sediment oxygen dynamics, but also nutrient and contaminant fluxes (Reible and Thibodeaux 1999). In this study, the minimum and maximum linear distances from the sediment surface to feeding voids were measured.
2.3.4.2 Plan View Analysis Parameters
Plan view images provide a much larger field-of-view than SPI images and provide valuable information about the landscape ecology and sediment topography in the area where the pinpoint “optical core” of the sediment profile was taken (Figure 2-5). Unusual surface sediment layers, textures, or structures detected in any of the sediment profile images can be interpreted considering the larger context of surface sediment features; i.e., is a surface layer or topographic feature a regularly occurring feature and typical of the seafloor in this general vicinity or an isolated anomaly? The scale information provided by the underwater lasers allows accurate density counts of attached epifaunal colonies, sediment burrow openings, or larger macrofauna or fish which may have been missed in the sediment profile cross-section, as well as measurements of the percent cover of Beggiatoa colonies and other features of interest observable on the seafloor at the sampling location. Information on sediment transport dynamics and bedform wavelength were also available from PV image analysis.
For each replicate PV image, the field-of-view was calculated and the sediment type, oxidation state of surface sediment, presence and type of bedforms; presence and notes related to dredged material; estimations of the relative percent cover of burrows, tubes, tracks, macrophytes; types of epifauna, flora, and debris; quantitative measures of Beggiatoa percent cover; number of fish; and descriptive comments were recorded.
2.3.5 Statistical Methods
In order to meet the objective of this survey to assess the status of benthic community recolonization of the sediment at disposal areas relative to reference area conditions, statistical analyses were conducted to compare key SPI variables between sampled disposal locations (PDA A, PDA 95, and PDS) and reference areas (SREF and EREF). The aRPD
20
Monitoring Survey at the Portland Disposal Site September 2016
depth and successional stage measured in each image are the best indicators of infaunal activity measured by SPI and were, therefore, used in this comparative analysis. Standard boxplots were generated for visual assessment of the central tendency and variation in each of these variables within each disposal area and each reference area. Tests rejecting the inequivalence between the reference and disposal areas were conducted, as described in detail below.
The objective to look for differences has conventionally been addressed using a point null hypothesis of the form, “There is no significant difference in benthic conditions between the reference area and the disposal target areas.” However, there is always some difference (perhaps only to a very small decimal place) between groups, but the statistical significance of this difference may or may not be ecologically meaningful. On the other hand, differences may not be detected due to insufficient statistical power. Without a power analysis and specification of what constitutes an ecologically meaningful difference, the results of conventional point null hypothesis testing often provide inadequate information for ecological assessments (Germano 1999). An approach using an inequivalence null hypothesis will identify when groups are statistically similar, within a specified interval, which is more suited to the objectives of the DAMOS monitoring program.
For an inequivalence test, the null hypothesis presumes the difference is great; this is recognized as a “proof of safety” approach because rejection of the inequivalence null hypothesis requires sufficient proof that the difference was actually small (McBride 1999). The null and alternative hypotheses for the inequivalence hypothesis test are:
H0: d < -δ or d > δ (presumes the difference is great)
HA: -δ < d < δ (requires proof that the difference is small)
The test of this inequivalence (interval) hypothesis can be broken down into two one-sided tests (TOST) (McBride 1999, Schuirmann 1987). Assuming a symmetric distribution, the inequivalence hypothesis is rejected at α of 0.05 if the 90% confidence interval for the measured difference (or, equivalently, the 95% upper limit and the 95% lower limit for the difference) is wholly contained within the equivalence interval [-δ, +δ]. The statistics used to test the interval hypotheses shown here are based on the Central Limit Theorem (CLT) and basic statistical properties of random variables. A simplification of the CLT states that the mean of any random variable is normally distributed. Linear combinations of normal random variables are also normal so a linear function of means is also normally distributed. When a linear function of means is divided by its standard error the ratio follows a t-distribution with degrees of freedom associated with the variance estimate. Hence, the t-distribution can be used to construct a confidence interval around any linear function of means.
In this survey, five distinct locations were sampled; two were categorized as reference areas (EREF and SREF) and three were disposal locations (PDA A, PDA 95, and PDS). The

21
Monitoring Survey at the Portland Disposal Site September 2016
difference equation of interest was the linear contrast of the average of the two reference means minus each disposal area mean, or
d̂ = [1/2 x (MeanEREF + MeanSREF) – (MeanDisposal)] [Eq. 1]
where MeanDisposal was the mean for one of the disposal areas (PDA A, PDA 95, or PDS).
The two reference areas collectively represented ambient conditions, but if the means were different among these two areas, then pooling them into a single reference group would inflate the variance estimate because it would include the variability between areas, rather than only the variability between stations within each single homogeneous area. The effect of keeping the two reference areas separate had no effect on the grand reference mean when sample size was equal among these areas, but it ensured that the variance is truly the residual variance within a single population with a constant mean.
The difference equation, d̂ , for the comparison of interest was specified in Eq. 1 and the standard error of each difference equation used the fact that the variance of a sum is the sum of the variances for independent variables, or:
( )∑=
jjjj ncSdSE /)ˆ( 22
[Eq. 2]
where: cj = coefficients for the j means in the difference equation, d̂ [Eq. 1] (i.e., for equation 1 shown above, the coefficients were 1/2 for each of the 2 reference areas, and -1 for the disposal area).
2jS = variance for the jth area. If equal variances are assumed, the pooled
residual variance estimate equal to the mean square error from an ANOVA based on all groups involved, can be used for each 2
jS .
nj = number of stations for the jth area.
The inequivalence null hypothesis was rejected (and equivalence concluded) if the
confidence interval on the difference of means, d̂, was fully contained within the interval [–δ, + δ]. Thus, the decision rule was to reject H0 (the two groups were inequivalent) if:
δυα −≥−= )ˆ(ˆ, dSEtdDL and δυα ≤+= )ˆ(ˆ
, dSEtdDU [Eq. 3]

22
Monitoring Survey at the Portland Disposal Site September 2016
where: d̂ = observed difference in means between the Reference and Disposal Area.
υα ,t = upper (1-α)*100th percentile of a Student’s t-distribution with υ degrees of freedom (α = 0.05)
SE d̂ = standard error of the difference ([Eq. 2]) υ = degrees of freedom for the standard error. If a pooled residual variance estimate
was used, this was the residual degrees of freedom from an ANOVA on all groups (total number of stations minus the number of groups); if separate variance estimates were used, degrees of freedom were calculated based on the Welch-Satterthwaite estimation (Satterthwaite 1946; Zar 1996).
Validity of normality and equal variance assumptions was tested using Shapiro-Wilk’s test for normality on the area residuals (α = 0.05) and Levene’s test for equality of variances among areas (α =0.05). If normality was not rejected but equality of variances was, then normal parametric confidence bounds were calculated, using separate variance estimates for each group. If normality was rejected, then non-parametric bootstrapped estimates of the confidence bounds were calculated.
2.4 Sediment Grab Collection and Analysis
Surficial sediment samples were collected from 12 stations for analysis of grain size, total organic carbon (TOC), metals, PAHs, pesticides, and PCBs. At a subset of 6 of these stations, additional material was collected for analysis of benthic community structure. Sediment grab target locations are provided in Table 2-2 and Figure 2-2 and actual station locations and coordinates are provided in Figures 2-6, 2-7, and Appendix C. Navigation for the sediment grab collection was as described for the SPI methods above. All sediment sample collection and subsequent analyses were conducted in accordance with the Quality Assurance Project Plan for the DAMOS Program (Battelle 2015) and its Addendum (Battelle 2016).
Sediment samples for analytical chemistry and grain size analysis were collected using a 0.1 m2 Van Veen sampler. Samples for benthic community structure analysis (BCA) were collected using a 0.04 m2 Van Veen sampler.
Surficial sediment samples collected for analysis of grain size, total organic carbon (TOC), metals, PAHs, pesticides, and PCBs were stored chilled in appropriate containers and hand delivered to Battelle’s Norwell, MA facility for later delivery to the appropriate laboratories for chemical analyses as noted in Table 2-3.
The sediment grab samples for benthic community structure analysis (BCA) were sieved in the field and fixed with formalin at the time of collection. The fixed samples were

23
Monitoring Survey at the Portland Disposal Site September 2016
stored at room temperature and hand delivered to Battelle’s Norwell, MA facility for later shipment to the benthic sorting lab, Barry Vittor and Associates, as noted in Table 2-3.
2.5 Tissue Collection and Analysis
Samples for tissue analytical analysis were collected from multiple trawls targeting a subset of six sediment stations (Figures 2-6 and 2-7) using a clam rake with a 0.25-inch net. Attempts were made to collect a minimum of 30 g of tissue, as required for chemical analysis, within the maximum average sampling window of three hours allowed for tissue collection at each station. The primary target species for tissue chemistry analysis was the worm Nephtys incisa. Due to the presence of shell hash and rocks, no Nephtys were found at the inactive disposal location (Station PDS-16). No alternative species were found within the inactive area therefore no tissue samples were analyzed for this disposal area. These conditions were also found at stations within the reference areas. However, Astarte (common name chestnut clam) were found in sufficient abundance within both reference areas and were collected as a tissue alternate. Limited quantities of Nephtys were collected at the active disposal site stations (16 g at PDA 95-22 and 28 g at PDA 95-30) with just enough material to allow for chemical analyses. In addition, Asarte were found at one of the active disposal stations (PDA 95-30) and collected as a separate sample. Tissue target locations are provided in Table 2-2 and Figure 2-2 and actual station or trawl locations and coordinates are provided in Figures 2-6, 2-7, and Appendix C.
The worms and clam samples collected for tissue analysis were oxygenated and chilled in glass jars (separate jars for Nephtys incisa and Astarte) to depurate for 24 hours after collection as detailed in the DAMOS QAPP (Battelle 2015) and Addendum (Battelle 2016). The samples were hand delivered to Battelle’s Norwell facility for homogenization and splitting. Homogenized samples were later sent to the appropriate laboratories by Battelle for chemical analyses as noted in Table 2-3.
2.6 Fishing Gear Assessment via Surface Marker Buoy
During the PDS acoustic survey, each time a surface buoy marking fishing gear was observed alongside the vessel in and around the acoustic survey area, the location was time-stamped as a GPS fix within HYPACK. Each surface buoy was labeled based on its port/starboard position relative to the vessel's course and the marker buoy's color patterns. Real-time viewing of previously recorded buoys on the navigation system minimized duplicate records of individual marker buoys. A file of marker buoy GPS locations was created and was used to generate a map of surface marker buoy locations throughout PDS.

24
Monitoring Survey at the Portland Disposal Site September 2016
Table 2-1.
Accuracy and Uncertainty Analysis of Bathymetric Data Results (m)
Survey Date(s) Quality Control Metric Mean 95%
Uncertainty Range
9/8/2016 Cross-Line Swath Comparisons -0.04 0.50
Within Cell Uncertainty 0.29 0.73 0.00 - 7.17 Beam Angle Uncertainty (0 - 55d) -0.03 0.48 0.44 - 0.67
Notes: 1. The mean of cross-line nadir and full swath comparisons are indicators of tide bias. 2. 95% uncertainty values were calculated using the sums of mean differences and standard deviations
expressed at the 2-sigma level. 3. Within cell uncertainty values include biases and random errors. 4. Beam angle uncertainty was assessed by comparing cross-line data (55-degree swath limit) with a
reference surface created using mainstay transect data. 5. Swath and cell based comparisons were conducted using 3 m x 3 m cell averages. These analyses do
not exclude sounding variability associated with extreme (near vertical) terrain slopes.

25
Monitoring Survey at the Portland Disposal Site September 2016
Table 2-2.
PDS 2016 SPI, Sediment Grab, BCA, and Tissue Chemistry Station IDs, Sample IDs, and Target Coordinates
Station ID Sample ID X Y Latitude Longitude SPI Sediment Grab (Physical and
Chemical)
Biological Community
Analysis (BCA)
Tissue Chemistry
PDAA-01 PDS_16B1_SPI_PDAA-01 327685.3 82104.3 43.5718690 -70.0322720 √ PDAA-02 PDS_16B1_SPI_PDAA-02 327672.1 82008.1 43.5710040 -70.0324400 √ PDAA-03 PDS_16B1_SPI_PDAA-03 327756.6 82195.4 43.5726870 -70.0313840 √ PDAA-04 PDS_16B1_SPI_PDAA-04 327689.3 82184.1 43.5725870 -70.0322180 √ PDAA-05 PDS_16B1_SPI_PDAA-05 327872.9 82009.3 43.5710070 -70.0299540 √ PDS-06 PDS_16B1_SPI_PDS-06 327530.9 81625.7 43.5675670 -70.0342080 √ PDS-07 PDS_16B1_SPI_PDS-07 327884.0 81748.8 43.5686620 -70.0298300 √ PDS-08 PDS_16B1_SPI_PDS-08 328011.4 81674.3 43.5679860 -70.0282570 √ PDS-09 PDS_16B1_SPI_PDS-09 327579.8 81794.5 43.5690850 -70.0335930 √ PDS-10 PDS_16B1_SPI_PDS-10 327755.8 81732.0 43.5685160 -70.0314170 √ √ PDS-11 PDS_16B1_SPI_PDS-11 327637.7 81675.1 43.5680080 -70.0328820 √ PDS-12 PDS_16B1_SPI_PDS-12 327813.1 81743.6 43.5686180 -70.0307070 √ PDS-13 PDS_16B1_SPI_PDS-13 327902.5 81466.8 43.5661230 -70.0296160 √ PDS-14 PDS_16B1_SPI_PDS-14 327541.5 81870.5 43.5697700 -70.0340630 √ PDS-15 PDS_16B1_SPI_PDS-15 327759.2 81859.5 43.5696630 -70.0313690 √ PDS-16 PDS_16B1_SPI_PDS-16 327793.4 81628.1 43.5675790 -70.0309580 √ √ √ √3 PDS-17 PDS_16B1_SPI_PDS-17 327846.3 81508.4 43.5665000 -70.0303090 √ PDS-18 PDS_16B1_SPI_PDS-18 327972.9 81631.7 43.5676050 -70.0287350 √ PDS-19 PDS_16B1_SPI_PDS-19 327526.7 81771.3 43.5688780 -70.0342510 √ PDS-20 PDS_16B1_SPI_PDS-20 327625.2 81845.4 43.5695410 -70.0330280 √ √ PDA95-21 PDS_16B1_SPI_PDA95-21 328484.3 81015.6 43.5620400 -70.0224380 √ PDA95-22 PDS_16B1_SPI_PDA95-22 328361.4 80897.0 43.5609770 -70.0239650 √ √ √ √ PDA95-23 PDS_16B1_SPI_PDA95-23 328371.8 81106.8 43.5628650 -70.0238250 √ √ PDA95-24 PDS_16B1_SPI_PDA95-24 328208.1 80867.1 43.5607130 -70.0258640 √ PDA95-25 PDS_16B1_SPI_PDA95-25 328387.5 81262.3 43.5642640 -70.0236230 √ PDA95-26 PDS_16B1_SPI_PDA95-26 328276.2 81114.0 43.5629340 -70.0250080 √ PDA95-27 PDS_16B1_SPI_PDA95-27 328148.2 80987.6 43.5618010 -70.0265990 √ PDA95-28 PDS_16B1_SPI_PDA95-28 328335.3 81397.0 43.5654790 -70.0242620 √ PDA95-29 PDS_16B1_SPI_PDA95-29 328380.4 81157.9 43.5633250 -70.0237160 √

26
Monitoring Survey at the Portland Disposal Site September 2016
Station ID Sample ID X Y Latitude Longitude SPI Sediment Grab (Physical and
Chemical)
Biological Community
Analysis (BCA)
Tissue Chemistry
PDA95-30 PDS_16B1_SPI_PDA95-30 328279.4 81251.1 43.5641670 -70.0249610 √ √ √ √ PDA95-31 PDS_16B1_SPI_PDA95-31 328282.3 80989.6 43.5618130 -70.0249390 √ PDA95-32 PDS_16B1_SPI_PDA95-32 328470.6 81190.9 43.5636180 -70.0225990 √ PDA95-33 PDS_16B1_SPI_PDA95-33 328540.9 80970.3 43.5616300 -70.0217400 √ PDA95-34 PDS_16B1_SPI_PDA95-34 328224.7 81103.6 43.5628410 -70.0256460 √ PDA95-35 PDS_16B1_SPI_PDA95-35 328589.5 81189.1 43.5635970 -70.0211270 √ EREF-01 PDS_16B1_SPI_EREF-01 330549.0 82376.4 43.5742060 -69.9968060 √ √ EREF-02 PDS_16B1_SPI_EREF-02 330424.8 82230.7 43.5729000 -69.9983510 √ √ EREF-03 PDS_16B1_SPI_EREF-03 330897.0 82410.3 43.5744970 -69.9924960 √ √ EREF-04 PDS_16B1_SPI_EREF-04 330818.6 82446.2 43.5748230 -69.9934640 √ EREF-05 PDS_16B1_SPI_EREF-05 330733.6 82258.3 43.5731360 -69.9945280 √ √ √ SREF-06 PDS_16B1_SPI_SREF-06 327981.1 80350.4 43.5560710 -70.0287010 √ SREF-07 PDS_16B1_SPI_SREF-07 328107.2 80415.7 43.5566550 -70.0271360 √ √ √ √ SREF-08 PDS_16B1_SPI_SREF-08 327835.4 80119.8 43.5540020 -70.0305150 √ √ SREF-09 PDS_16B1_SPI_SREF-09 327980.6 80228.7 43.5549770 -70.0287130 √ SREF-10 PDS_16B1_SPI_SREF-10 327841.0 80427.2 43.5567680 -70.0304300 √ √ √ √
Notes 1. Grid coordinates are NAD_1983_StatePlane_Maine_West_FIPS_1802_Meters 2. Geographic coordinates are NAD83 decimal degrees 3. Due to the presence of shell hash and rocks, no Nephtys were found at the inactive disposal location Station PDS-16.

27
Monitoring Survey at the Portland Disposal Site September 2016
Table 2-3.
Sample Containers, Sample Sizes, Preservative Requirements, and Holding Times for PDS Samples
Sample Type
Compound Class
Minimum Sample
Size1 Container2 Preservation Holding
Time3
Total # of Samples (not including QC
samples)
Ship to (Laboratory)
Sediment Grain size 200 / 200 g 8 oz G 4 Chill:
4°±2°C 6 months 12 Katahdin
Sediment TOC 10 / 30 g 4 oz G Chill: 4°±2°C 28 days 12 Katahdin
Sediment Percent moisture 10 / 30 g From TOC
jar Chill: 4°±2°C 14 days 12 Katahdin
Sediment Metals 10 /30 g 4 oz G. Chill: 4°±2°C or Freeze -20°
6 months; Hg – 28 days
12 ESI
Sediment
PCB Congeners, Pesticides,
PAHs
30 / 90 g 8 oz G Chill: 4°±2°C or Freeze -20°
14 days chilled; 1 year frozen/ 40 days
12 Battelle
Rinsate Blank
PCB Congeners, Pesticides,
PAH
2 L 1-L Amber Glass
Chill: 4°±2°C
7 days/40 days 1 Battelle
Rinsate Blank Metals 100 mL 500 mL P or
G HNO3: 4°±2°C 6 months 1 ESI
Tissue
PCB Congeners, Pesticides, PAH, Total
Lipids
20/60 g 8 oz G Chill: 4°±2°C
14 days chilled; 1 year frozen/ 40 days
6 Battelle
Tissue Metals 10/30 g
From organics jar
(prior to compositing)
Chill: 4°±2°C
6 months; Hg – 28 days
6
Battelle (Homogenization –split for metals sent to ESI)
Sediment Benthic
Invertebrate Taxonomy
Entire grab Plastic
10% concentrated formalin.
N/A 6 BVA
1 “x”/“y” = minimum sample size for each sample / minimum sample size for each QC sample (matrix spike/matrix spike duplicate/analytical duplicate)
2 Container Types: G = Glass/Teflon-lined lid. P = Plastic. All sample bottles will be provided by the respective laboratory and will be pre-cleaned and certified.
3 "x" days/"y" days = maximum days from sampling to extraction/maximum days from extraction to analysis. 4 If large rocks or significant quantities of gravel are in the sample, then additional sediment is required for analysis.

28
Monitoring Survey at the Portland Disposal Site September 2016
3.0 RESULTS
The objectives of the September 2016 survey of PDS were to characterize seafloor topography and surficial features, define the physical characteristics of surface sediment, evaluate the recovery of the benthic community following recent placement of dredged material, and provide an initial characterization of surficial sediment quality. The bathymetric surveys conducted during 2016 were designed to aid in management of material placement and assessment of long-term stability. Since the most recent DAMOS survey in August 2014, approximately 120,800 m³ of material has been deposited at PDS. Survey tools included a high-resolution acoustic survey (multibeam bathymetry, acoustic backscatter, and side-scan sonar), sediment profile imaging (SPI), plan view imaging, and sediment and tissue sampling.
3.1 Acoustic Survey
3.1.1 Bathymetry
Only a portion of PDS was the target for acoustic bathymetry given that a full site survey was performed in 2014. High resolution MBES was performed around PDA 95 and the two reference areas (EREF and SREF; Figures 2-1, 3-1a, and 3-1b). Multibeam bathymetric data rendered as a depth-scaled acoustic relief model (color scale with hillshading) provided a more detailed representation of the PDA 95 topography (Figure 3-2a). The bathymetry of PDA 95 surveyed in September 2016 indicated a highly irregular bottom topography, with a prominent northwest-southeast trending trough that bifurcated in the center of the site at the edge of the survey area (Figure 3-2a). Water depths at PDA 95 ranged from approximately 36 to 78 m (Figure 3-2a). Patterns consistent with placement of dredged material were visible as a smoothed surface over underlying rock. There was a shallow mound and smoothed surface in the basin of PDA 95, between rock outcrops, at 60 m depth (Figure 3-2a).
The reference areas also had rugose bottom topography. The water depths at SREF ranged from approximately 50 to 73 m (Figure 3-1b). A deep trough transected the northwest portion of SREF in a northeast-southwest orientation (Figure 3-2b). The southeastern portion of SREF was dominated by bedrock outcrops (Figure 3-2b). At the EREF water depths ranged from 50 to 78 m (Figure 3-1b). A deep trough with a northwest-southeast trend cut through the center of EREF, bordered on either side by bedrock outcrops. The outcrop in the north of EREF contained fracture patterns with a southwest-northeast orientation (Figure 3-2b).
3.1.2 Acoustic Backscatter and Side-Scan Sonar
Unfiltered backscatter imagery of PDA 95 revealed an area with weaker backscatter returns associated with dredged material disposal (Figure 3-3a). Strong backscatter returns with sharp outlines that were consistent with rock or coarse-grained sediments were evident on the rock outcrops (light areas in Figure 3-3a). Weaker returns were found within the

29
Monitoring Survey at the Portland Disposal Site September 2016
basin of PDA 95 indicating finer-grained sediment typical of both the dredged material placed and ambient sediment (dark areas in Figure 3-3a). At PDA 95 the pattern of weak backscatter matched the recent placement activity.
Unfiltered backscatter imagery of SREF showed an area of stronger returns in the southern portion of the area consistent with rocky outcrops (light areas in Figure 3-3b). Weaker returns were visible in the northern portion of the area indicating finer grain sediments within the trough (dark areas in Figure 3-3b). EREF showed similar return characteristics with stronger returns on the rock outcrops in the north and south while weaker returns came from the trough transecting these outcrops (Figure 3-3b).
Filtered backscatter, which presents a quantitative assessment of surface characteristics independent of slope effects, showed that the strongest backscatter returns (-10 to -16 dB) occurred along the rock platforms at PDA 95 (ledge outcrops, Figure 3-4a). The weakest backscatter returns (-30 to -38 dB) were measured in the deeper areas of PDA 95 (Figure 3-4a). Within the area of dredged material placement, patterns in the backscatter intensity reveal some circular deposits consistent with placement. In the reference areas, the strongest backscatter returns (-9 to – 21 dB) occurred along rocky outcrops with the weakest returns (-26 to -32 dB) occurring in the troughs between outcrops (Figure 3-4b).
Side-scan sonar results also provided a clear representation of disposal activity over the central and eastern portions of the survey area (faint circular patterns). Side-scan results confirmed observations from the backscatter results, but with additional detail (Figure 3-5a). The side-scan sonar results have a higher resolution and are more responsive to minor surface textural features and slope than backscatter results. Details of rock surfaces were more apparent in the detailed images from side-scan sonar results (Figure 3-5a). Similarly, in the reference areas the side-scan sonar results gave higher details of the rock surfaces (Figure 3-5b).
3.1.3 Comparison with Previous Bathymetry and Backscatter
The bathymetric results in September 2016 were consistent with earlier survey results for PDS (Table 1-1, SAIC 2002, AECOM 2009, Sturdivant and Carey 2017). An elevation difference comparison between depths measured in 2014 and 2016 revealed that dredged material accumulated within the deep basin at the center of PDA 95 (Figure 3-6). The disposal material appeared to be successfully contained within the PDA 95 boundaries inside of the basin surrounded by bedrock outcrops.
3.2 Sediment Profile and Plan View Imaging
The following sections summarize the results for the reference areas (EREF and SREF) and for each of the disposal mounds surveyed (PDA 95, PDS Inactive, and PDA A). Detailed SPI and PV image analysis results are provided in Appendix E. Comparisons between reference areas and disposal mounds, as well as to the survey from 2014 are also provided in Section 3.2.3. Key ecological measures (aRPD and successional stage) were also

30
Monitoring Survey at the Portland Disposal Site September 2016
evaluated for statistical equivalence between reference and disposal areas sampled during the 2016 survey effort. Replicate stations for SPI and PV images were collected at the disposal mounds and reference areas (Figure 2-2). The area of seafloor captured in the PV images ranged from 0.6 to 2.4 m².
3.2.1 Reference Area Stations
3.2.1.1 Physical Sediment Characteristics
The reference area stations were similar in depth; SREF had a mean station depth of 66 m and ranged from 58 to 73 m, and stations at EREF ranged from 60 to 77 m with a mean depth of 70 m (Table 3-1). Stations at both reference areas were largely characterized by relatively soft sediments, with a predominant grain size of >4 to 4-3 (Table 3-1, Figure 3-7). Often very-fine sand was present as a depositional layer over silt-clay (Figure 3-8). At SREF it was not possible to determine grain size at Stations 6 and 9 due to poor penetration. These two stations occurred on bedrock outcrops, and were the only reference locations with poor prism penetration. Mean replicate camera prism penetration values among the reference area stations ranged from 0.0 to 12.5 cm, with a mean of 7.1 cm (standard deviation [SD] ±4.6) (Table 3-1, Figure 3-9). There was no evidence of dredged material at any of the stations sampled in the reference areas, and no evidence of low dissolved oxygen (DO) or sedimentary methane (Appendix E).
Small-scale boundary roughness ranged from 0.8 to 1.5 cm at the reference stations with a mean of 1.1 cm (SD±0.4) (Table 3-1, Figure 3-10). All of the small-scale topography observed at both reference areas was attributed to the surface and sub-surface activity of benthic organisms, evidenced as small burrow openings, pits, and mounds (Figure 3-11). Mean boundary roughness was similar between SREF (1.1 cm) and EREF (1.2 cm) (Table 3-1).
3.2.1.2 Biological Conditions
At the reference areas, aRPD depths ranged from 1.2 to 2.6 cm with a mean of 1.9 cm (SD±0.5) (Table 3-1, Figure 3-12, Figure 3-13). Mean aRPD depths were shallower at EREF (1.7 cm) compared to SREF (2.0 cm). The presence of consolidated and coarse sediments interfered with aRPD determinations at three stations in the SREF area (Stations 6, 7, and 9).
Stage 3 infauna were present at both reference areas. Most images were classified as Stage 2 -> 3 or Stage 2 on 3 (Table 3-1, Figure 3-14). Evidence for the presence of Stage 3 fauna included large-bodied infauna, deep subsurface burrows, and/or deep feeding voids (Figure 3-15). Stage 2 fauna are smaller than Stage 3 taxa and are active in the 2 - 4 cm zone below the sediment–water interface; they can coexist with the larger, deep-feeding Stage 3 organisms. The mean number of subsurface feeding voids, indicating Stage 3 fauna, ranged from 0.2 voids (SD±0.3) per station at EREF to 0.7 voids (SD±0.9) per station at SREF

31
Monitoring Survey at the Portland Disposal Site September 2016
(Table 3-1). When present, voids at the reference area stations were found deep within the sediment column; no voids were found shallower than 6 cm beneath the sediment–water interface (Figure 3-16).
Further indications of subsurface faunal activity from Stage 2 and 3 taxa were observed in the PV images as the presence of burrows and tubes (Figure 3-11). At EREF burrow density ranged from no burrows to abundant burrows (25-75% image coverage), and at SREF burrow density ranged from no burrows to present burrows (10-25% image coverage). Tube density on the seafloor was also variable at the reference areas. At SREF tube density ranged from no tubes to abundant tubes, and ranged from no tubes to sparse tubes (<10% image coverage) at EREF. Tracks across the seafloor, often created by epifauna (crabs, gastropods), were documented at every station in both reference areas (Figure 3-11). Shell fragments were seen in PV images at SREF but none were observed at EREF, and no fish or flora were present in the PV images at either reference area (Appendix E).
3.2.2 Disposal Site Stations
3.2.2.1 Physical Sediment Characteristics
The three disposal areas were similar in depth; PDA A had a mean station depth of 50 m ranging from 46 to 54 m, PDA 95 had a mean station depth of 63 m ranging from 57 to 69 m, and PDS Inactive had a mean station depth of 56 m ranging from 50 to 61 m (Table 3-2). Sediments at PDA 95 and PDS Inactive were primarily composed of very-fine sand layered over silt-clay with some stations containing fine sand over silt-clay (Figure 3-17, Figure 3-18). There was no discernible spatial trend for grain-size at PDS Inactive or PDA 95. The majority of stations at PDA A contained fine sand, occasionally as a depositional layer over silt-clay (Table 3-2, Figure 3-17, Figure 3-19). Mean replicate camera penetration values ranged between 13.6 to 19.4 cm, 7.7 to 20.6 cm, and 0.1 to 10.1 cm at PDA 95, PDA Inactive, and PDA A, respectively (Table 3-2, Figure 3-20). Mean camera prism penetration values were deeper at PDA 95 and PDS Inactive (16.0 and 13.5 cm, respectively) compared to PDA A at 5.1 cm. Shallow prism penetration values at PDA A were driven by sediment consolidation at Stations PDA A-01 and -02, and large shell fragments in the sediment at Station PDA A-04 (Figure 3-21).
Mean dredged material thickness varied across the three disposal areas (Figure 3-22). PDA A had a mean thickness of 6.4 cm (SD±2.6), PDA 95 had a mean of 16.0 cm (SD±1.9), and PDS Inactive had a mean of 13.0 cm (SD±1.8) (Table 3-2; Figure 3-23). At the majority of stations at each of the three disposal areas dredged material extended past the penetration depth of the prism. The exceptions were at Station 4 at PDA A where a lack of penetration resulted in an “indeterminate” designation (IND) and at Station 13 at PDS Inactive where only “trace” levels of dredged material were observed. There was no evidence of low DO or sedimentary methane at any of the three disposal mounds.

32
Monitoring Survey at the Portland Disposal Site September 2016
All three mounds were similar in small-scale boundary roughness values, with means of 1.2 cm (SD±0.4) at PDA A, 1.1 cm (SD±0.3) at PDA 95, and 1.4 cm (SD±0.4) at PDS Inactive (Table 3-2, Figure 3-24). Means of replicate small-scale boundary roughness ranged from 0.6 to 1.6 cm at PDA A, 0.6 to 1.9 cm at PDA 95, and 0.8 to 2.2 cm at PDS Inactive (Table 3-2). The majority of small-scale topography at each disposal mound was attributed to the surface and sub-surface activity of benthic organisms evidenced as small burrowing openings and pits (Figure 3-25).
3.2.2.2 Biological Conditions
Mean aRPD depths ranged from 1.3 to 1.4 cm at PDA A, 0.7 to 2.3 cm at PDA 95, and 0.8 to 3.3 cm at PDS Inactive (Table 3-2, Figure 3-26). Mean aRPD depths at each mound were similar; 1.4 cm (SD±0.07) at PDA A, 1.4 cm (SD±0.43) at PDA 95, and 1.5 cm (SD±1.24) at PDS Inactive (Table 3-2, Figure 3-27). Although aRPD depths at PDA A were similar to the other disposal mounds, it was not possible to optically distinguish the aRPD depth at two of the five stations at PDA A (Stations 01 and 05), and poor prism penetration prevented aRPD determination at PDA A-04 (Table 3-2) resulting in only two stations contributing to aRPD depth.
All stations at PDA 95 and PDS Inactive contained at least one replicate with evidence of Stage 3 fauna with most images being classified as Stage 2 on 3 and Stage 1 on 3 (Table 3-2, Figure 3-28, Figure 3-29). Most images at PDA A were classified as Stage 1 -> 2 or Stage 2 (Figure 3-30), with a successional designation undetermined at Station 4 due to poor prism penetration (Figure 3-20). When voids were present at PDA 95 and PDS Inactive they were typically found deep in the sediment column (>6 cm beneath the sediment–water interface) (Figure 3-31). There were only a few instances of shallow voids (<6 cm) at PDA 95 and PDS Inactive (Figure 3-31). At PDA A only one station (PDA A-03) contained subsurface feeding voids as evidence of Stage 3 fauna (Table 3-2, Figures 3-30, 3-31).
PV images documented the biological activity present on the seafloor at PDA A, PDA 95 and PDS Inactive. Burrows, indicating subsurface activity by Stage 2 and 3 fauna, were absent to abundant at PDA 95 and PDS Inactive and absent to present at PDA A (Appendix E). Sparse tubes were observed in PV images at PDA A and PDA 95, and were sparse to present at PDS Inactive. Tracks across the seafloor, often created by epifauna (crabs, gastropods), were seen at several stations at all three disposal areas. No fish or flora were present in the PV images across all three mounds (Appendix E).
3.2.3 Comparison between Disposal and Reference Areas
3.2.3.1 Mean aRPD
Area mean aRPD depths at PDA 95, PDA A, and PDS Inactive disposal areas were 1.4, 1.4, and 1.5 cm, respectively, comparable to the grand mean of the reference areas (1.8

33
Monitoring Survey at the Portland Disposal Site September 2016
cm; Table 3-3 and Figure 3-32). Station mean aRPD values in the reference areas ranged from 1.2 to 2.6 cm, and were deepest at SREF (2.0 cm compared to 1.7 cm at EREF; Figure 3-32). The standard deviation among stations of aRPD depths was 0.73 cm or less at all areas.
A statistical inequivalence test was performed to determine whether the differences observed in mean aRPD values between the two reference areas and each of the three disposal areas were significantly similar. The station mean aRPD data from all five locations were combined to assess normality and estimate pooled variance. Results for the normality test indicated that each area’s residuals, i.e., each observation minus the area mean, was significantly different from a normal distribution (Shapiro-Wilk’s test p-value = 0.002, alpha = 0.05). Levene’s test for equality of variances was not rejected (p = 0.326, alpha = 0.05), so a single pooled variance estimate could be used for all groups. The confidence interval for the difference equations were constructed using non-parametric bootstrapped estimates. Reference area SREF had only two useable aRPD results, and these were within the range of aRPD values observed at EREF. Group summaries would not be reliable based on only two observations for SREF, so the following statistical evaluations combined the two reference areas and treated reference as a single group (with n=7).
The confidence regions for the difference between the mean of the reference areas versus PDA 95 disposal area and versus PDS Inactive disposal area were each contained within the interval [-1 cm, +1 cm] (Table 3-4). The conclusion was that the aRPD values from each of these two disposal areas were significantly equivalent to the pooled reference areas in the 2016 survey, i.e., there was no difference in aRPD depth between the disposal and reference areas. The difference in means between reference and PDA 95 was 0.4 cm, and between reference and PDS was 0.3 with the pooled reference areas having aRPD values roughly equivalent to PDA 95 and PDS Inactive (Table 3-4). For the PDA A disposal area which had only two useable aRPD observations, reliable statistical results could not be generated. The difference in mean aRPD values between reference and PDA A was 0.4 cm.
3.2.3.2 Successional Stage Rank
Across both reference areas and all three disposal areas examined, Stage 3 fauna were found, often along with Stage 1 and Stage 2 fauna (Table 3-1, Table 3-2, Figures 3-14 and 3-28). To evaluate these successional stages numerically, a successional stage rank variable was applied to each image. A value of 3 was assigned to Stage 3, 2 on 3, or 1 on 3 designations, a value of 2 was applied to Stage 2 or 1 on 2, a value of 1 was applied to Stage 1, intermediate ranks were assigned to the transitional assemblages (2.5 for Stage 2 transitioning to Stage 3, and 1.5 for 1 transition to 2), and images from which the stage could not be determined were excluded from calculations. The maximum successional stage rank among replicates was used to represent the station value.
The successional stage rank variable was either Stage 2 transitioning to Stage 3, or Stage 3 across both reference areas and disposal areas PDA 95 and PDS Inactive. Three

34
Monitoring Survey at the Portland Disposal Site September 2016
stations from PDA A had successional stages that were Stage 2 or less: Station 1 and 2 had a successional stage transitional between Stage 1 and 2; and Station 5 had successional Stage 2. Reference area SREF had only three useable successional stage results, and these had the same range observed at EREF. Group summaries would not be reliable based on only three observations for SREF, so the following statistical evaluations combined the two reference areas and treated reference as a single group (with n=8). Bootstrapping was used to construct confidence intervals between the mean successional stage at disposal areas PDA A, PDA 95 and PDS Inactive versus the pooled reference areas.
The confidence region for the difference between the mean successional stage rank of the pooled reference areas (2.9) versus PDA 95 disposal area, and versus PDS Inactive disposal area were each contained within the interval [-0.5, +0.5 cm] (Table 3-5), which indicates that the mean successional stages at PDS Inactive and PDA 95 disposal areas were statistically equivalent to reference. The difference between the mean of the pooled reference areas and PDA A disposal area was 0.9 (Table 3-5). Bootstrapped confidence intervals would not be reliable based only on the four observations available for this area. However, when the mean itself is outside the equivalence interval of [-0.5, +0.5], we do not need statistics to conclude that the successional stage is statistically inequivalent from reference.
3.2.4 Temporal Comparisons
3.2.4.1 Mean aRPD
Area mean aRPD depths at PDA 95 disposal area in 2014 and 2016 were 1.6 and 1.4 cm, respectively; a decrease of 0.2 cm. EREF had a decrease in mean aRPD depth of 0.2 cm, from 1.9 cm in 2014 to 1.7 cm in 2016. There was an increase of 0.8 cm from 2014 to 2016 at SREF, from 1.2 to 2.0 cm (Table 3-6 and Figure 3-33).
The confidence interval for the change over time (2016 minus 2014) was calculated for disposal area PDA 95. The residuals within each time period for this area were approximately normally distributed (Shapiro-Wilk’s test p-value = 0.39, alpha 0.05). Levene’s test for equality of variances was not rejected so equal variances were used for PDA 95 (Levene’s test, p = 0.19, alpha 0.05). Due to small sample sizes in the reference areas (3 in 2014, 5 in 2016 for EREF and 4 in 2014, 2 in 2016 for SREF), statistical evaluation of temporal change is not appropriate; refer to results presented in Table 3-3 and Figure 3-33.
The 90% confidence interval for the change over time at the disposal area PDA 95 was [-0.42 cm to 0.01 cm] (Table 3-6) indicating that the two disposal area surveys had results that were significantly equivalent within +/- 1 cm. The reference areas had sample sizes that were too small to produce reliable statistical results. EREF showed a slight

35
Monitoring Survey at the Portland Disposal Site September 2016
decrease in aRPD values between 2014 and 2016, while SREF showed an increase of 0.8 cm in the mean aRPD values from 2014 to 2016.
3.3 Sediment and Tissue Physical and Chemical Results
Results for sediment analyses which include grain size, TOC, total PCB, total PAH, selected pesticides and metals and for tissue analyses which include lipids, total PCB, total PAH, selected pesticides and metals are provided below. Summary statistics for each of these parameters were calculated for samples collected from the active and inactive disposal areas and from the two reference areas and are provided in tables at the end of this section. Individual sediment sample results from each station are presented in figures and show the associated effects range low (ER-L) and effects range median (ER-M) values (Long et al. 1995) if available. Tissue figures include Food and Drug Administration (FDA) levels if available, which reflect tolerance levels in the edible portion of fish. For comparisons, tissue figures include laboratory bioaccumulation results (Nephthys and Macoma) for reference sediments collected for recent nearby dredged material disposal evaluations of Pepperell Cove (PDS REF) and York Harbor (CADS REF) sediment (Figure 3-34) (USACE 2014, USACE 2015). Full results and laboratory reports for all parameters are provided in Appendices F and G.
3.3.1 Grain Size and Total Organic Carbon
Grain size results for the both the active and inactive disposal locations and the two reference locations are summarized in Table 3-7 and presented in Figure 3-35. Percent fines, defined as the sum of the silt and clay fractions, ranged from 19 to 85% at the disposal locations with values above 50% at all stations except for Station PDS-20. Percent fines in samples collected from the reference locations ranged from 14 to 39% and were generally two to three times lower than percent fines found at the disposal locations. Total organic carbon results are summarized in Table 3-8 and presented in Figure 3-36. Similar to percent fines, percent TOC at the disposal locations (average 0.77%) was about two to three times higher than that found at the reference locations (average 0.19%).
3.3.2 Sediment Chemistry
Total PAH and total PCB in PDS sediments are summarized in Table 3-9. Total PAH and total PCB concentrations for individual stations are shown in Figures 3-37 and 3-38, respectively. Total PAHs were detected in all sediment samples from the both the active and inactive disposal locations at concentrations ranging from 744 to 4760 ug/kg. PAH concentrations at the reference locations were lower, ranging from 72.9 to 628 ug/kg. About half of the 18 PCB congeners analyzed were detected in samples collected from the disposal locations with total PCB concentrations ranging from 2.21 to 57.7 ug/kg. Fewer PCB congeners were detected in the reference area samples, and total PCB concentrations ranged from 1.02 to 2.27 ug/kg. Overall, both total PAH with total PCB concentrations for all samples were below the ER-L values with the exception of a slight exceedance for both parameters at one of the inactive disposal site locations. All concentrations were well below

36
Monitoring Survey at the Portland Disposal Site September 2016
the ER-M concentrations. Normalization of PAHs and PCBs to TOC did not change relative concentrations.
Chlorinated pesticides detected in sediments from the disposal locations and the reference areas are summarized in Table 3-10, and individual results for selected pesticides are shown in Figures 3-39 a-d. Of the 20 chlorinated pesticides analyzed, eight pesticides (4,4’-DDD, DDE, DDT; alpha chlordane, dieldrin, endosulfan II, gamma chlordane and toxaphene) were detected in at least one sediment sample from the disposal locations. Only three pesticides (4,4’ DDE, 4,4’ DDT and endosulfan II) were detected in sediment collected from the reference areas. Pesticides detected at both the disposal locations and reference areas were generally higher at the disposal locations, and in general results at the active and inactive disposal locations were similar. The sum of the DDTs was all well below ER-M but exceeded the ER-L values in all samples from the active disposal location and in one sample from the inactive. The sum of the DDTs was below the ER-L in sediment collected from the reference areas. Total chlordane exceeded the ER-L value at five of the six disposal locations sampled but was below the ER-M value at all locations. Chlordanes were not detected in sediment from the reference areas. Dieldrin detection limits exceeded the ER-L values but concentrations of dieldrin at the disposal locations were low, often detected below the detection limit (i.e., J flagged). Dieldrin was not detected in sediment from the reference areas. Normalization of pesticides to TOC did not change the relative concentrations.
The eight metals analyzed (As, Cd, Cr, Cu, Pb, Hg, Ni and Zn) were detected in all sediment samples collected from both the disposal locations and the reference areas. Metals concentrations are summarized in Table 3-11, and individual results for each metal are shown in Figures 3-40 a-h. All metals concentrations were well below ER-M values and most were below ER-L values. As and Ni concentrations slightly exceeded the ER-L value at one location from the active disposal location. Hg concentrations exceeded the ER-L at one location each from the active and inactive disposal locations. Metals concentrations in sediments from the reference areas were generally similar or lower than those found at the disposal locations and were always below ER-L values. Normalization of metals to percent fines did not change the relative concentrations.
3.3.3 Tissue Chemistry
The primary target species for tissue chemistry analysis was the worm, Nephtys incisa. However, this species was only obtained in sufficient quantities from stations within disposal area PDA95. An alternative species, the clam Asarte, was collected in sufficient quantities at the PDS Inactive area and at the reference areas as well as one station within PDA95. Tissue lipids results are summarized in Table 3-12 and in Figure 3-41. Percent lipids in the single worm sample analyzed from PDA 95-30 was 2.07%, and values in clams from the reference areas ranged from 0.85-1.09%. Clam tissue mass from the disposal site was insufficient for lipid analyses. No lipid data were available from the laboratory bioaccumulation tests.
37
Monitoring Survey at the Portland Disposal Site September 2016
Total PAH and PCBs in tissues are summarized in Table 3-13 and in Figures 3-42 and 3-43, respectively. PAHs were detected in both worm and clam tissue samples from both the disposal site and the reference areas. Total PAH concentrations ranged from 6.34 ug/kg in in clams from the reference area to 167 ug/kg in worms from the disposal site. PAHs in clams and worms from the laboratory bioaccumulation tests conducted on reference material collected nearby, as part of local dredging evaluations, were similar to PAH concentrations found in clams from the PDS disposal and reference areas and lower than the worm concentrations from the disposal site. Total PCBs ranged from a minimum of 1.32 ug/kg in clams to a maximum of 15.6 g ug/kg in worms. Total PCBs in clams and worms from the disposal site and from the reference areas followed similar trends as PAHs. However, the laboratory bioaccumulation tests showed similar PCB concentrations between the clams exposed to reference sediments in the field and clams exposed in the laboratory. PCB concentrations in worms exposed to reference sediments in the laboratory were more similar to PCB levels found in worms collected from the active disposal site and higher than PCBs found in worms collected at the reference areas. Total PCBs in both worms and clams were well below FDA fish consumption limits of 2,000 ug/kg. As another point of reference, total PCB concentrations in worms collected from the disposal site were more than an order of magnitude below the Historic Area Remediation Site (HARS)-specific worm bioaccumulation tissue PCB criterion of 113 ug/kg, which was established for determining the suitability of proposed dredged material for use as remediation material (USEPA 2003) at the offshore dredged material disposal site outside of New York Harbor.
Chlorinated pesticides detected in tissue from the disposal locations and the reference areas are summarized in Table 3-14 and individual results for selected pesticides are shown in Figures 3-44 a-d. Of the 20 chlorinated pesticides analyzed, seven pesticides (4,4’-DDD, DDE; alpha chlordane, dieldrin, endosulfan II, heptachlor, and methoxychlor) were detected in at least one tissue sample from the disposal site. Only three pesticides (4,4’ DDD, 4,4’ DDE and dieldrin) were detected in at least one clam sample collected from the reference areas. Concentrations of pesticides detected in clam and worm tissue from the disposal site were generally low and generally two to three orders of magnitude below FDA action limits. When detected, pesticides in the clam tissue from the reference areas were generally lower than concentrations found in clams from the disposal site and similar to concentrations found in the laboratory exposed bioaccumulation test clams and well below FDA limits. The exception was dieldrin, which was not detected in clam tissue from the disposal site but was detected in clam tissue from the both reference areas and at levels higher than observed in the laboratory exposed clams.
The eight metals analyzed (As, Cd, Cr, Cu, Pb, Hg, Ni and Zn) were detected in all tissue samples collected from the disposal site and the reference areas. Metals concentrations are summarized in Table 3-15, and individual results for each metal are shown in figures 3-45 a-h. Metals concentrations in clams and worms from the disposal site were variable but within the range of concentrations found in clams from the reference area and clams and worms exposed to reference sediment in the laboratory. The only FDA action level available
38
Monitoring Survey at the Portland Disposal Site September 2016
is for Hg in the edible portion of fish, and concentrations in the clams and worms were one to two orders of magnitude below the FDA fish consumption limit of 1 mg/kg.
3.4 Benthic Community Analysis
Benthic community characterization results can provide additional insight into the recovery of the benthic system. Species richness, abundance, density, and diversity metrics are provided along with dominant taxa in terms of abundance and biomass in Table 3-16; biomass by Phylum are provided in Table 3-17. Dominant taxa are those found in the highest abundance in each location; dominant phyla in biomass are the phyla that contributed the most to total biomass.
A total of 110 species were found over all stations (reference + site) with a mean species richness of 55 species per station (Appendix I). Total abundance overall was 3,303, with a mean of 551 individuals per station. Mean density was 13,763 ind/m2, diversity 3.1, and evenness 0.8. All average measures of the benthic community were similar between site and reference area samples (Table 3-17).
The reference area stations were dominated numerically by small bivalves (Yoldia limulata), tiny Rissoid snails (Onoba pelagica, maximum length 3 mm), and tube-building and burrowing deposit-feeding polychaete worms (Maldanids and Cirratulids). The reference area stations biomass was dominated by spoon clams (Periploma papyratium), wavy Astarte clams (Astarte undata), and polychaetes (Table 3-17).
PDS Inactive stations were dominated numerically by small deposit-feeding and suspension feeding worms (Cirratulids and Sabellids); and biomass while low, was dominated by small clams.
PDA 95 stations were dominated numerically by small polychaetes including deposit-feeders (Cirratulids, Galathowenia oculata, Aricidea quadrilobate, and spionids) and the small bivalve Corbula contracta (maximum length 12 mm); and biomass was dominated by the same polychaetes listed above.
While the composition of species found to dominate each location varied considerably, all stations were populated with deposit-feeding polychaetes and small suspension-feeding bivalves.
3.5 Fishing Gear Assessment
A total of 20 lobster trap-style surface marker boys were observed during the PDS multibeam survey (Figure 3-46). Fourteen were observed near and within the PDA 95 area and six were observed in the SREF reference area. The coordinates and a notation of the buoy colors were recorded (Table 3-18).

39
Monitoring Survey at the Portland Disposal Site September 2016
Table 3-1.
Summary of PDS Reference Station Sediment Profile Imaging Results (Station Means), September 2016
Area Station Water Depth
(m)
Grain Size
Major Mode (phi) a
Mean Prism Penetration Depth (cm)
Mean Boundary Roughness
(cm)
Dominant Type of
Boundary Roughness
Mean aRPD Depth (cm)
Mean Dredged Material
Thickness (cm)
Mean # of Subsurface
Feeding Voids
Mean of Maximum
Feeding Void
Depth (cm)
Methane Present?
Successional Stages Present b
EREF 1 77 4-3/>4 10.7 0.8 Biological 1.4 0.0 0.0 - No 2 2 -> 3 2 on 3 EREF 2 77 4-3/>4 12.5 1.8 Biological 2.6 0.0 0.7 11.1 No 2 2 on 3 2 on 3 EREF 3 63 4-3 7.6 0.9 Biological 1.7 0.0 0.0 - No 2 -> 3 2 -> 3 2 -> 3 EREF 4 60 >4 3.5 1.4 Biological 1.2 0.0 0.0 - No 2 2 on 3 IND EREF 5 75 4-3/>4 10.7 0.8 Biological 1.6 0.0 0.3 8.1 No 1 on 3 1 on 3 1 on 3 EREF Mean 70 9.0 1.2 1.7 0.0 0.2 9.6
Standard Deviation
3.5 0.4 0.0
SREF 6 64 IND 0.0 IND 0.0 - No IND IND IND SREF 7 69 4-3 8.6 0.8 Biological 0.0 0.3 7.8 No 2 -> 3 2 -> 3 2 on 3 SREF 8 64 4-3 5.6 1.2 Biological 1.5 0.0 0.0 - No 2 -> 3 2 -> 3 IND SREF 9 58 IND 0.0 IND 0.0 - No IND IND IND SREF 10 73 4-3/>4 11.6 1.5 Biological 2.5 0.0 1.7 11.0 No 2 -> 3 2 on 3 2 on 3 SREF Mean 66 5.1 1.1 2.0 0.0 0.7 9.4
Standard Deviation
5.2 0.4 0.0
ALL Max 77 12.5 1.8 2.6 0.0 1.7 11.1 REF Min 58 0.0 0.8 1.2 0.0 0.0 7.8
AREAS Mean 68 7.1 1.1 1.8 0.0 0.4 9.5
Standard Deviation
4.6 0.4 0.0
IND = Indeterminate a Grain Size: “/” indicates layer of one phi size range over another (see Appendix F) b Successional Stage: “on” indicates one Stage is found on top of another Stage (i.e., 1 on 3); “->” indicates one Stage is progressing to another Stage (i.e., 2 -> 3)

40
Monitoring Survey at the Portland Disposal Site September 2016
Table 3-2.
Summary of PDS Disposal Areas PDA A, PDA 95, and PDS Sediment Profile Imaging Results (Station Means), September 2016
Area Station Water Depth
(m)
Grain Size
Major Mode (phi) a
Mean Prism Penetration Depth (cm)
Mean Boundary Roughness
(cm)
Dominant Type of
Boundary Roughness
Mean aRPD Depth (cm)
Mean Dredged Material
Thickness (cm) c
Mean # of Subsurface
Feeding Voids
Mean of Maximum
Feeding Void Depth
(cm)
Methane Present?
Successional Stages Present b
PDA_A 1 52 3-2 4.2 1.4 Physical 4.2 0.0 - No 1 -> 2 1 -> 2 1 -> 2 PDA_A 2 53 3-2 4.9 0.8 Physical 1.4 4.9 0.0 - No 1 -> 2 1 -> 2 1 -> 2 PDA_A 3 46 3-2/>4 10.1 1.6 Biological 1.3 10.1 0.7 10.1 No 2 2 on 3 2 on 3 PDA_A 4 47 >4 0.1 0.6 Physical IND No IND IND IND PDA_A 5 54 4-3/>4 6.4 1.4 Physical 6.4 0.0 - No 2 2 2
Max 54 10.1 1.6 1.4 10.1 0.7 10.1 PDA_A Min 46 0.1 0.6 1.3 4.2 0.0 10.1
Mean 50 5.1 1.2 1.4 6.4 0.2 10.1
Standard Deviation 3.6 0.4 2.6
PDA_95 21 63 4-3/>4 13.7 1.0 Biological 1.5 13.7 1.0 9.6 No 2 -> 3 2 on 3 2 on 3 PDA_95 22 69 3-2/>4 18.3 0.8 Biological 2.3 18.3 1.0 14.5 No 1 on 3 1 on 3 2 on 3 PDA_95 23 64 4-3/>4 14.3 0.9 Biological 1.7 14.3 2.7 11.9 No 1 on 3 1 on 3 2 on 3 PDA_95 24 63 3-2/>4 15.1 0.8 Biological 1.8 15.1 0.0 - No 2 2 -> 3 2 -> 3 PDA_95 25 62 4-3/>4 16.2 0.6 Biological 0.9 16.2 0.0 - No 2 2 1 on 3 PDA_95 26 62 4-3/>4 15.6 0.7 Biological 0.9 15.6 1.3 14.1 No 2 2 1 on 3 PDA_95 27 61 3-2/>4 17.3 0.9 Biological 1.3 17.3 0.3 19.2 No 2 -> 3 1 on 3 2 on 3 PDA_95 28 58 3-2/>4 19.4 1.3 Biological 1.3 19.4 1.0 9.5 No 1 on 3 1 on 3 IND PDA_95 29 66 4-3/>4 14.6 1.1 Biological 0.7 14.6 0.3 12.9 No 1 on 3 1 on 3 2 on 3 PDA_95 30 63 4-3/>4 13.6 1.6 Biological 1.3 13.6 0.0 - No 2 2 2 -> 3 PDA_95 31 62 4-3/>4 17.0 1.3 Biological 1.6 17.0 0.0 - No 2 -> 3 1 on 3 2 on 3 PDA_95 32 64 4-3/>4 15.9 1.9 Physical 1.3 15.9 1.3 7.8 No 2 -> 3 1 on 3 2 on 3 PDA_95 33 69 4-3/>4 18.7 1.4 Biological 1.7 18.7 1.0 8.0 No 2 -> 3 1 on 3 1 on 3 PDA_95 34 61 3-2/>4 14.0 1.0 Biological 0.8 14.0 1.0 4.7 No 1 on 3 1 on 3 2 on 3 PDA_95 35 57 4-3/>4 17.0 1.1 Biological 1.4 17.0 1.0 9.0 No 1 -> 2 1 on 3 1 on 3
Max 69 19.4 1.9 2.3 19.4 2.7 19.2 PDA_95 Min 57 13.6 0.6 0.7 13.6 0.0 4.7
Mean 63 16.0 1.1 1.4 16.0 0.8 11.0
Standard Deviation 1.9 0.3 1.9

41
Monitoring Survey at the Portland Disposal Site September 2016
Table 3-2. (continued)
Summary of PDS Disposal Areas PDA A, PDA 95, and PDS Sediment Profile Imaging Results (Station Means), September 2016
Area Station Water Depth
(m)
Grain Size
Major Mode (phi) a
Mean Prism Penetration Depth (cm)
Mean Boundary Roughness
(cm)
Dominant Type of
Boundary Roughness
Mean aRPD Depth (cm)
Mean Dredged Material
Thickness (cm) c
Mean # of Subsurface
Feeding Voids
Mean of Maximum
Feeding Void Depth
(cm)
Methane Present?
Successional Stages Present b
PDS 6 53 4-3/>4 18.5 0.9 Biological 3.3 18.5 2.3 15.8 No 2 on 3 2 on 3 2 on 3 PDS 7 60 4-3/>4 13.3 1.6 Biological 1.4 13.3 0.3 4.9 No 2 -> 3 2 -> 3 2 on 3 PDS 8 55 4-3/>4 9.2 1.2 Biological 1.2 9.2 0.7 8.9 No 2 2 -> 3 1 on 3 PDS 9 55 4-3/>4 9.8 1.7 Physical 1.2 9.8 1.3 5.8 No 2 -> 3 1 on 3 2 on 3 PDS 10 57 4-3/>4 13.2 0.8 Biological 0.9 13.2 1.7 12.4 No 1 on 3 1 on 3 2 on 3 PDS 11 53 3-2/>4 14.5 1.5 Biological 1.6 14.5 2.3 10.2 No 1 on 3 2 on 3 2 on 3 PDS 12 55 4-3/>4 14.0 1.3 Biological 1.5 14.0 0.3 10.1 No 1 on 3 1 on 3 2 on 3 PDS 13 61 4-3/>4 20.6 1.6 Biological 2.5 trace 3.7 15.2 No 1 on 3 1 on 3 1 on 3 PDS 14 54 3-2/>4 12.7 1.8 Biological 2.1 12.7 1.3 12.1 No 2 1 on 3 2 on 3 PDS 15 58 3-2/>4 7.7 1.6 Biological 1.1 7.7 1.7 8.3 No 2 1 on 3 2 on 3 PDS 16 50 4-3/>4 14.1 2.2 Physical 0.8 14.1 4.3 11.3 No 1 on 3 1 on 3 1 on 3 PDS 17 58 4-3/>4 17.9 1.3 Biological 0.9 17.9 3.7 12.9 No 1 on 3 1 on 3 1 on 3 PDS 18 60 4-3/>4 14.1 0.8 Biological 0.9 14.1 1.3 7.4 No 1 on 3 1 on 3 1 on 3 PDS 19 58 4-3/>4 14.5 1.2 Biological 1.8 14.6 1.0 11.2 No 1 on 3 1 on 3 2 on 3 PDS 20 55 4-3/>4 7.8 1.0 Biological 0.9 7.8 1.0 7.0 No 1 on 3 1 on 3 1 on 3
Max 61 20.6 2.2 3.3 18.5 4.3 15.8 PDS Min 50 7.7 0.8 0.8 7.7 0.3 4.9
Mean 56 13.5 1.4 1.5 13.0 1.8 10.2
Standard Deviation 3.7 0.4 3.3
IND = Indeterminate a Grain Size: “/” indicates layer of one phi size range over another (see Appendix F) b Successional Stage: “on” indicates one Stage is found on top of another Stage (i.e., 1 on 3); “->” indicates one Stage is progressing to another Stage (i.e., 2 -> 3) c Dredged material extends below penetration depth

42
Monitoring Survey at the Portland Disposal Site September 2016
Table 3-3.
Summary of Station Means by Sampling Location
Mean aRPD Depth (cm) Maximum Successional Stage Rank Number of Feeding Voids Maximum Feeding Void Depth
(cm)
Site N1 Mean Standard Deviation Mean Standard Deviation N2 Mean Standard
Deviation Mean (n)² Standard Deviation
2016
Reference Areas
EREF 5 1.7 0.53 2.9 0.22 2 0.2 0.30 9.6 2.1 SREF 5¹ 2.0 0.73 2.8 0.29 2 0.7 0.88 9.4 2.2 Mean 1.8 2.9 0.4 9.5
Disposal Areas PDA A 5¹ 1.4 0.07 2.0 0.71 1 0.2 0.33 10.1 n/c PDA 95 15 1.4 0.43 2.9 0.18 11 0.8 0.72 11.0 4.0
PDS 15 1.5 0.70 3.0 0 15 1.8 1.24 10.2 3.2 Mean 1.5 3.0 0.9 10.5
2014
Reference Areas
EREF 4¹ 1.9 0.06 3.0 0 1 0.7 1.15 12.1 n/c SEREF 4 1.7 0.16 3.0 0 4 1.0 0.47 10.9 3.2 SREF 4 1.2 0.51 3.0 0 2 1.3 1.89 10.2 2.4 Mean 1.6 3.0 1.0 10.9
Disposal Areas PDA B 6¹ 2.2 0.48 3.0 0 5 1.3 0.93 11.8 2.6 PDA 95 18 1.6 0.30 2.9 0.26 12 0.6 0.64 9.7 3.6 Mean 1.9 3.0 1.0 10.3
1 Number of stations surveyed per area, including any stations which had no penetration (and indeterminate results). Useable N was 2 for SREF, 2 for PDA A, 3 for EREF, and 5 for PDA B 2 The number of feeding voids observed, useable N to determine means and standard deviations (applies to all column entries)

43
Monitoring Survey at the Portland Disposal Site September 2016
Table 3-4.
Summary Statistics and Results of Inequivalence Hypothesis Testing for aRPD Values
Difference Equation Observed Difference
(d̂) SE d̂ df for SE Confidence Bounds
(DL to DU)1 Results2
MeanREF – MeanPDA A 0.41 n/c3
MeanREF – MeanPDA 95 0.43 0.22 20 -0.11 to 0.78 s
MeanREF – MeanPDS 0.32 0.26 20 -0.16 to 0.77 s 1 DL and DU as defined in [Eq. 3] 2 s = Reject the null hypothesis of inequivalence: the two group means are significantly equivalent, within ± 1 cm.
d = Fail to reject the null hypothesis of inequivalence between the two group means, the two group means are different. 3 n/c = not calculable, insufficient data to calculate reliable statistical results for PDA A (where n = 2).

44
Monitoring Survey at the Portland Disposal Site September 2016
Table 3-5.
Summary Statistics and Results of Inequivalence Hypothesis Testing for Successional Stage Values
Difference Equation Observed Difference (d̂) SE d̂ df for
SE Confidence Bounds
(DL to DU)1 Results2
MeanREF – MeanPDA A 0.875 n/c3 d
MeanREF – MeanPDA 95 -0.06 0.09 21 -0.2 to 0.2 s
MeanREF – MeanPDS -0.125 0.08 21 -0.2 to -0.05 s 1 DL and DU as defined in [Eq. 3] 2 s = Reject the null hypothesis of inequivalence: the two group means are significantly equivalent, within ± 0.5.
d = Fail to reject the null hypothesis of inequivalence between the two group means, the two group means are different. 3 Insufficient data to calculate reliable statistical results for PDA A (where n = 4). However, the observed difference is greater than 0.5, so the two group means could never be significantly equivalent and we conclude that the group means are different.

45
Monitoring Survey at the Portland Disposal Site September 2016
Table 3-6.
Summary Statistics and Results of Inequivalence Hypothesis Testing for Temporal Change in aRPD Values
Difference Equation Observed Difference (d̂) SE d̂ df for
SE Confidence Bounds
(DL to DU)1 Results2
PDA 952016 – PDA 952014 -0.21 0.13 31 -0.42 to 0.01 s
EREF2016 – EREF2014 -0.16 n/c3
SREF2016 – SREF2014 0.83
1 DL and DU as defined in [Eq. 3] 2 s = Reject the null hypothesis of inequivalence: the two group means are significantly equivalent, within ± 1 cm.
d = Fail to reject the null hypothesis of inequivalence between the two group means, the two group means are different. 3 Insufficient data to calculate reliable statistical results for EREF (where n = 3 and 5), or for SREF (where n = 4 and 2).
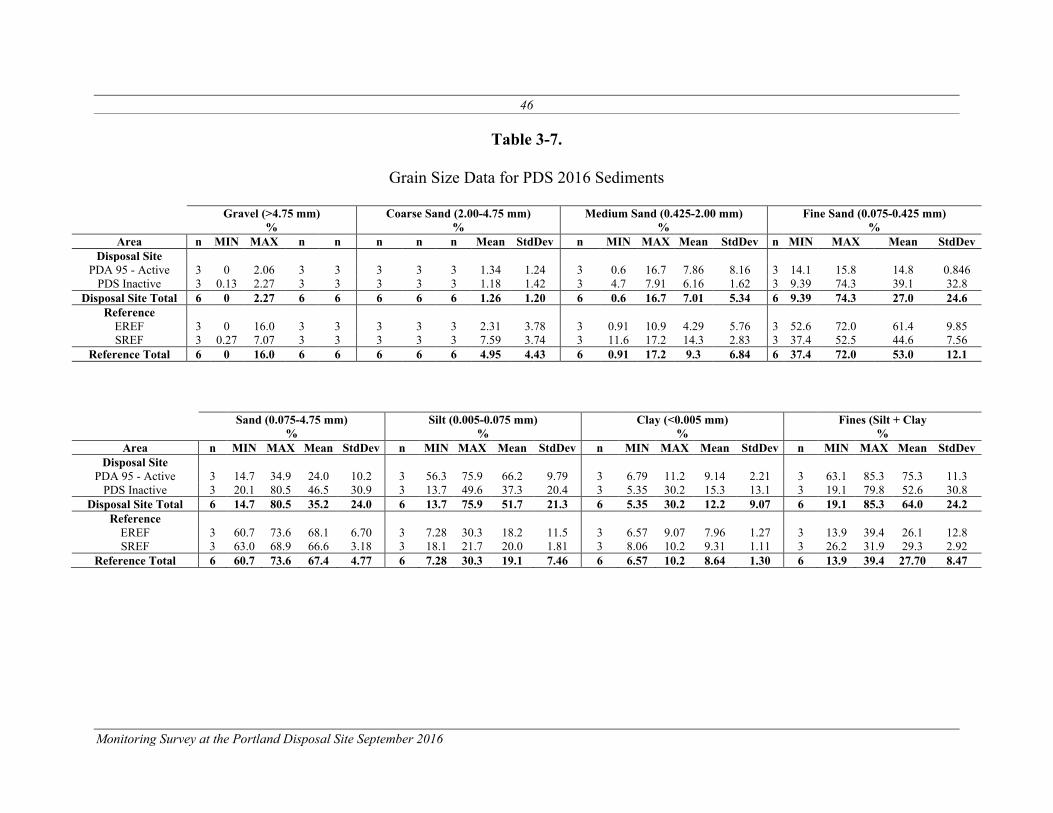
46
Monitoring Survey at the Portland Disposal Site September 2016
Table 3-7.
Grain Size Data for PDS 2016 Sediments
Gravel (>4.75 mm) Coarse Sand (2.00-4.75 mm) Medium Sand (0.425-2.00 mm) Fine Sand (0.075-0.425 mm) % % % %
Area n MIN MAX n n n n n Mean StdDev n MIN MAX Mean StdDev n MIN MAX Mean StdDev Disposal Site
PDA 95 - Active 3 0 2.06 3 3 3 3 3 1.34 1.24 3 0.6 16.7 7.86 8.16 3 14.1 15.8 14.8 0.846 PDS Inactive 3 0.13 2.27 3 3 3 3 3 1.18 1.42 3 4.7 7.91 6.16 1.62 3 9.39 74.3 39.1 32.8
Disposal Site Total 6 0 2.27 6 6 6 6 6 1.26 1.20 6 0.6 16.7 7.01 5.34 6 9.39 74.3 27.0 24.6 Reference
EREF 3 0 16.0 3 3 3 3 3 2.31 3.78 3 0.91 10.9 4.29 5.76 3 52.6 72.0 61.4 9.85 SREF 3 0.27 7.07 3 3 3 3 3 7.59 3.74 3 11.6 17.2 14.3 2.83 3 37.4 52.5 44.6 7.56
Reference Total 6 0 16.0 6 6 6 6 6 4.95 4.43 6 0.91 17.2 9.3 6.84 6 37.4 72.0 53.0 12.1
Sand (0.075-4.75 mm) Silt (0.005-0.075 mm) Clay (<0.005 mm) Fines (Silt + Clay % % % %
Area n MIN MAX Mean StdDev n MIN MAX Mean StdDev n MIN MAX Mean StdDev n MIN MAX Mean StdDev Disposal Site
PDA 95 - Active 3 14.7 34.9 24.0 10.2 3 56.3 75.9 66.2 9.79 3 6.79 11.2 9.14 2.21 3 63.1 85.3 75.3 11.3 PDS Inactive 3 20.1 80.5 46.5 30.9 3 13.7 49.6 37.3 20.4 3 5.35 30.2 15.3 13.1 3 19.1 79.8 52.6 30.8
Disposal Site Total 6 14.7 80.5 35.2 24.0 6 13.7 75.9 51.7 21.3 6 5.35 30.2 12.2 9.07 6 19.1 85.3 64.0 24.2 Reference
EREF 3 60.7 73.6 68.1 6.70 3 7.28 30.3 18.2 11.5 3 6.57 9.07 7.96 1.27 3 13.9 39.4 26.1 12.8 SREF 3 63.0 68.9 66.6 3.18 3 18.1 21.7 20.0 1.81 3 8.06 10.2 9.31 1.11 3 26.2 31.9 29.3 2.92
Reference Total 6 60.7 73.6 67.4 4.77 6 7.28 30.3 19.1 7.46 6 6.57 10.2 8.64 1.30 6 13.9 39.4 27.70 8.47

47
Monitoring Survey at the Portland Disposal Site September 2016
Table 3-8.
Percent Total Organic Carbon in PDS 2016 Sediments
Total Organic Carbon Percent (%)
Area n MIN MAX Mean StdDev Disposal Site
PDA 95 - Active 3 1.60% 2.40% 2.07% 0.42% PDS Inactive 3 0.50% 2.00% 1.11% 0.79% Disposal Site
Total 6 0.50% 2.40% 1.59% 0.77%
Reference
EREF 3 0.51% 0.94% 0.78% 0.24% SREF 3 1.00% 1.00% 1.00% 0.00%
Reference Total 6 0.51% 1.00% 0.89% 0.19%

48
Monitoring Survey at the Portland Disposal Site September 2016
Table 3-9.
Total PAH and Total PCB in PDS 2016 Sediments
Total PAH1 Total PCB2 µg/kg dry wt. Mean %
Detected µg/kg dry wt. Mean %
Detected Area n MIN MAX Mean StdDev n MIN MAX Mean StdDev Disposal Site
PDA 95 - Active 3 1,470 3,000 2,050 832 100 3 2.53 21.8 9.46 10.7 55.6 PDS Inactive 3 744 4,760 2,890 2,020 100 3 2.21 57.7 23.3 30.0 57.4 Disposal Site
Total 6 744 4,760 2,470 1,460 100 6 2.21 57.7 16.4 21.5 56.5 Reference
EREF 3 72.9 174 121 50.9 100 3 1.02 1.21 1.10 0.099 5.56 SREF 3 189 628 467 242 100 3 1.04 2.27 1.67 0.620 22.2
Reference Total 6 73 628 294 246 100 6 1.02 2.27 1.38 0.505 13.9 1Total PAH is the sum of the 18 PAH compounds analyzed (naphthalene, 2-methylnaphthalene, 1-methylnaphthalene, acenaphthylene, acenaphthene, fluorene, anthracene, phenanthrene, fluoranthene, pyrene, benzo(a)anthracene, chrysene, benzo(b)fluoranthene, benzo(k)fluoranthene, benzo(a)pyrene, indeno(1,2,3-cd)pyrene, dibenz(a,h)anthracene, and benzo(g,h,i)perylene). Non-detected compounds were summed using ½ the MDL. 2Total PCB is the sum of the 18 NOAA NS&T congeners multiplied by 2. Non-detected congeners were summed using ½ the MDL.

49
Monitoring Survey at the Portland Disposal Site September 2016
Table 3-10.
Chlorinated Pesticides Detected in PDS 2016 Sediments
4,4'-DDD 4,4'-DDE 4,4'-DDT
µg/kg dry wt. µg/kg dry wt. µg/kg dry wt.
Area n MIN MAX Mean StdDev n MIN MAX Mean StdDev n MIN MAX Mean StdDev Disposal Site
PDA 95 - Active 3 1.63 6.68 3.33 2.90 3 0.924 2.32 1.51 0.725 3 0.947 1.20 1.07 0.127 PDS Inactive 3 0.171 J 5.73 2.25 3.03 3 0.0998 J 1.18 0.585 0.548 3 0.101 U 1.19 0.535 0.577
Disposal Site Total 6 0.171 J 6.68 2.79 2.72 6 0.0998 J 2.32 1.05 0.766 6 0.101 U 1.20 0.804 0.476 Reference
EREF 3 0.0589 U 0.0696 U 0.0635 U N/A 3 0.0544 U 0.0644 U 0.0587 U N/A 3 0.288 0.355 0.316 0.0350 SREF 3 0.0582 U 0.07 U 0.0653 U N/A 3 0.0817 J 0.128 J 0.112 J 0.0262 3 0.307 0.412 0.373 0.0575
Reference Total 6 0.0582 U 0.07 U 0.0644 U N/A 6 0.0544 U 0.128 J 0.0853 0.0337 6 0.288 0.412 0.344 0.0529
alpha-chlordane Total chlordane1 dieldrin
µg/kg dry wt. µg/kg dry wt. µg/kg dry wt.
Area n MIN MAX Mean StdDev n MIN MAX Mean StdDev n MIN MAX Mean StdDev Disposal Site
PDA 95 - Active 3 0.103 J 0.188 J 0.138 J 0.0444 3 1.01 2.00 1.36 0.561 3 0.0547 U 0.291 J 0.137 0.134 PDS Inactive 3 0.0429 U 0.163 J 0.0851 0.0675 2 0.0762 1.66 0.954 0.806 3 0.0408 U 0.27 J 0.119 0.131
Disposal Site Total 6 0.0429 U 0.188 J 0.112 0.0588 5 0.0762 2.00 1.15 0.659 6 0.0408 U 0.291 J 0.128 0.119 Reference
EREF 3 0.0436 U 0.0516 U 0.0471 U N/A 3 U U U N/A 3 0.0415 U 0.049 U 0.0447 U N/A SREF 3 0.0432 U 0.0519 U 0.0484 U N/A 3 U U U N/A 3 0.041 U 0.0493 U 0.046 U N/A
Reference Total 6 0.0432 U 0.0519 U 0.0478 U N/A U U U N/A 6 0.041 U 0.0493 U 0.0454 U N/A

50
Monitoring Survey at the Portland Disposal Site September 2016
Table 3-10. (continued)
Chlorinated Pesticides Detected in PDS 2016 Sediments Endosulfan II gamma-chlordane Toxaphene
µg/kg dry wt. µg/kg dry wt. µg/kg dry wt.
Area n MIN MAX Mean StdDev n MIN MAX Mean StdDev n MIN MAX Mean StdDev Disposal Site
PDA 95 - Active 3 0.364 1.04 0.632 0.359 3 0.832 1.76 1.16 0.517 3 23.4 U 25,400 8,484 14,650 PDS Inactive 3 0.08 J 1.45 0.722 0.689 3 0.0386 U 1.45 0.850 0.729 3 23.7 U 19,300 12,108 10,528
Disposal Site Total 6 0.08 J 1.45 0.677 0.494 6 0.0386 U 1.76 1.01 0.591 6 23.4 U 25,400 10,296 11,581 Reference
EREF 3 0.0371 U 0.0438 U 0.04 U N/A 3 0.0393 U 0.0464 U 0.0424 U N/A 3 17.7 U 20.9 U 19.1 U N/A SREF 3 0.0367 U 0.112 J 0.0771 0.0379 3 0.0388 U 0.0467 U 0.0435 U N/A 3 17.5 U 21 U 19.6 U N/A
Reference Total 6 0.0367 U 0.112 J 0.0585 0.0315 6 0.0388 U 0.0467 U 0.0423 U N/A 6 17.5 U 21 U 19.4 U N/A U indicates not detected at or above Method Detection Limit J indicates analyte detected below Reporting Limit but above Method Detection Limit. 1 Total Chlordane is the sum of the individual isomers (i.e., alpha and gamma chlordane, heptachlor). Non-detected compounds were summed using ½ the MDL.

51
Monitoring Survey at the Portland Disposal Site September 2016
Table 3-11.
Metals Detected in PDS 2016 Sediments
Arsenic Cadmium Chromium Copper mg/kg dry wt. mg/kg dry wt. mg/kg dry wt. mg/kg dry wt.
Area n MIN MAX Mean StdDev n MIN MAX Mean StdDev n MIN MAX Mean StdDev n MIN MAX Mean StdDev Disposal Site
PDA 95 - Active 3 7.76 9.99 8.70 1.15 3 0.170 0.390 0.273 0.111 3 27.2 37.6 32.6 5.21 3 16.9 25.3 19.8 4.74 PDS Inactive 3 3.13 8.03 5.95 2.53 3 0.0400 0.290 0.147 0.129 3 10.7 28.4 21.8 9.67 3 5.86 18.1 13.8 6.87 Disposal Site
Total 6 3.13 9.99 7.33 2.32 6 0.0400 0.390 0.210 0.128 6 10.7 37.6 27.2 9.11 6 5.86 25.3 16.8 6.23
Reference
EREF 3 2.88 3.81 3.30 0.472 3 0.0300 0.0700 0.0467 0.0208 3 13.4 17.8 15.2 2.32 3 3.38 5.58 4.25 1.17 SREF 3 3.44 4.25 3.93 0.433 3 0.0400 0.0600 0.0533 0.0115 3 16.3 19.00 17.4 1.40 3 4.40 7.37 6.10 1.53
Reference Total 6 2.88 4.25 3.62 0.535 6 0.0300 0.0700 0.0500 0.0155 6 13.4 19.00 16.3 2.12 6 3.38 7.37 5.18 1.58 Lead Mercury Nickel Zinc mg/kg dry wt. mg/kg dry wt. mg/kg dry wt. mg/kg dry wt.
Area n MIN MAX Mean StdDev n MIN MAX Mean StdDev n MIN MAX Mean StdDev n MIN MAX Mean StdDev Disposal Site
PDA 95 - Active 3 16.8 37.1 24.6 10.9 3 0.0540 0.230 0.121 0.0952 3 18.8 22.7 20.8 1.95 3 63.3 91.2 75.8 14.18 PDS Inactive 3 7.27 30.1 22.4 13.1 3 0.0280 0.190 0.0947 0.0847 3 6.54 20.0 14.0 6.86 3 21.1 74.6 54.8 29.4 Disposal Site
Total 6 7.27 37.1 23.5 10.8 6 0.0280 0.230 0.108 0.0819 6 6.54 22.7 17.4 5.82 6 21.1 91.2 65.3 23.6
Reference
EREF 3 6.93 9.25 7.85 1.23 3 0.0150 0.0260 0.0193 0.00586 3 8.00 12.0 9.67 2.08 3 21.1 32.2 25.8 5.73 SREF 3 8.24 11.6 10.3 1.81 3 0.0250 0.0450 0.0377 0.0110 3 9.31 11.5 10.6 1.15 3 25.2 34.0 30.3 4.56
Reference Total 6 6.93 11.6 9.08 1.93 6 0.0150 0.0450 0.0285 0.0128 6 8.00 12.0 10.1 1.59 6 21.1 34.0 28.1 5.24

52
Monitoring Survey at the Portland Disposal Site September 2016
Table 3-12.
Lipids Data for PDS 2016 Tissue
Lipids
% Wet weight
Area Matrix n MIN MAX Mean StdDev
Disposal Site
PDA 95 - Active Clam 0 N/A N/A N/A N/A
PDA 95 - Active Worm 1 2.07 2.07 2.07 N/A
Disposal Site Total 1 2.07 2.07 2.07 N/A
Reference
EREF Clam 1 1.09 1.09 1.09 N/A
SREF Clam 1 0.850 0.850 0.850 N/A
Reference Total Clam 2 0.850 1.09 0.970 0.170

53
Monitoring Survey at the Portland Disposal Site September 2016
Table 3-13.
Total PAH and Total PCB in PDS 2016 Tissue
Total PAH Total PCB (18 Congener)
µg/kg wet wt. µg/kg wet wt.
Area Matrix n MIN MAX Mean StdDev Mean %
Detected n MIN MAX Mean StdDev
Mean %
Detected
Disposal Site
PDA 95 - Active Clam 1 32.2 32.2 32.2 N/A 72 1 4.84 4.84 4.84 N/A 11
PDA 95 - Active Worm 2 147 168 157 14.6 100 2 9.59 15.6 12.6 4.23 58
Disposal Site Total 3 32.2 168 116 72.9 91 3 4.84 15.6 10.0 5.37 43
Reference
EREF Clam 1 6.34 6.34 6.34 N/A 61 1 1.64 1.64 1.64 N/A 22
SREF Clam 2 7.00 10.2 8.61 2.27 78 2 1.32 1.47 1.39 0.109 22
Reference Total Clam 3 6.34 10.2 7.85 2.07 72 3 1.32 1.64 1.48 0.164 22
1Total PAH is the sum of the 18 PAH compounds analyzed (naphthalene, 2-methylnaphthalene, 1-methylnaphthalene, acenaphthylene, acenaphthene, fluorene, anthracene, phenanthrene, fluoranthene, pyrene, benzo(a)anthracene, chrysene, benzo(b)fluoranthene, benzo(k)fluoranthene, benzo(a)pyrene, indeno(1,2,3-cd)pyrene, dibenz(a,h)anthracene, and benzo(g,h,i)perylene). Non-detected compounds were summed using ½ the MDL. 2Total PCB is the sum of the 18 NOAA NS&T congeners multiplied by 2. Non-detected congeners were summed using ½ the MDL.

54
Monitoring Survey at the Portland Disposal Site September 2016
Table 3-14.
Pesticides in PDS 2016 Clams and Worms
4,4'-DDD 4,4'-DDE alpha-chlordane µg/kg wet weight µg/kg wet weight µg/kg wet weight
Area Matrix n MIN MAX Mean StdDev n MIN MAX Mean StdDev n MIN MAX Mean StdDev Disposal Site
PDA 95 - Active Clam 1 0.315 0.315 0.32 N/A 1 0.19 J 0.190 0.190 N/A 1 0.154 U 0.154 U 0.154 U N/A PDA 95 - Active Worm 2 1.62 2.37 2.00 0.53 2 1.280 1.79 1.54 0.361 2 0.529 0.669 0.599 0.099
Disposal Site Total 3 0.315 2.37 1.44 1.04 3 0.19 J 1.79 1.09 0.817 3 0.154 U 0.669 0.451 0.266
Reference EREF Clam 1 0.0421 U 0.0421 U 0.0421 U N/A 1 0.0545 J 0.0545 J 0.0545 J N/A 1 0.0421 U 0.0421 U 0.0421 U N/A SREF Clam 2 0.0421 U 0.0703 J 0.0562 0.0199 2 0.0975 J 0.140 0.119 0.0301 2 0.0421 U 0.0422 U 0.04215 U N/A
Reference Total Clam 3 0.0421 U 0.0703 0.0515 0.0163 3 0.0545 J 0.140 0.0973 0.0428 3 0.0421 U 0.0422 U 0.0421 U N/A
Total chlordane1 dieldrin Endosulfan II
µg/kg wet weight µg/kg wet weight µg/kg wet weight Area Matrix n MIN MAX Mean StdDev n MIN MAX Mean StdDev n MIN MAX Mean StdDev
Disposal Site PDA 95 - Active Clam 1 0.757 0.757 0.757 N/A 1 0.132 U 0.132 U 0.132 U N/A 1 0.242 U 0.242 U 0.242 U N/A PDA 95 - Active Worm 2 0.622 0.804 0.713 0.129 2 0.0588 U 0.0856 U 0.0722 U N/A 2 0.143 J 0.156 U 0.150 0.0092
Disposal Site Total 3 0.622 0.804 0.728 0.0945 3 0.0588 U 0.132 U 0.0921 U N/A 3 0.143 J 0.242 U 0.180 0.0538
Reference EREF Clam 1 U U U N/A 1 0.958 0.958 0.958 N/A 1 0.0662 U 0.0662 U 0.0662 U N/A SREF Clam 3 U U U N/A 2 0.906 0.996 0.951 0.0636 2 0.0661 U 0.0662 U 0.0662 U N/A
Reference Total Clam 4 U U U N/A 3 0.906 0.996 0.953 0.0452 3 0.0661 U 0.0662 U 0.0662 U N/A

55
Monitoring Survey at the Portland Disposal Site September 2016
Table 3-14. (continued)
Pesticides in PDS 2016 Clams and Worms
Heptachlor methoxychlor µg/kg wet weight µg/kg wet weight
Area Matrix n MIN MAX Mean StdDev n MIN MAX Mean StdDev Disposal Site
PDA 95 - Active Clam 1 0.548 0.548 0.548 N/A 1 2.44 U 2.44 U 2.44 U N/A PDA 95 - Active Worm 2 0.0684 U 0.0997 U 0.0841 U N/A 2 1.58 U 1.94 1.76 0.255
Disposal Site Total 3 0.0684 U 0.548 0.239 0.268 3 1.58 U 2.44 U 1.99 0.432
Reference EREF Clam 1 0.0421 U 0.0421 U 0.0421 U N/A 1 0.668 U 0.668 U 0.668 U N/A SREF Clam 2 0.0421 U 0.0422 U 0.0421 U N/A 2 0.668 U 0.669 U 0.669 U N/A
Reference Total Clam 3 0.0421 U 0.0422 U 0.0421 U N/A 3 0.668 U 0.669 U 0.668 U N/A
There were no detects in any of the tissue samples analyzed for 4,4'-DDT, aldrin, alpha-BHC, beta-BHC, delta-BHC, endosulfan I, endosulfan sulfate, endrin, gamma-chlordane, heptachlor epoxide, gamma HCH, and toxaphene.
U indicates not detected at or above Method Detection Limit. J indicates analyte detected below Reporting Limit but above Method Detection Limit. 1 Total Chlordane is the sum of the individual isomers (i.e., alpha and gamma chlordane, heptachlor). Non-detected compounds were summed using ½ the MDL.

56
Monitoring Survey at the Portland Disposal Site September 2016
Table 3-15.
Metals in PDS 2016 Clams and Worms
Arsenic Cadmium Chromium Copper mg/kg wet wt. mg/kg wet wt. mg/kg wet wt. mg/kg wet wt.
Area Matrix n MIN MAX Mean StdDev n MIN MAX Mean StdDev n MIN MAX Mean StdDev n MIN MAX Mean StdDev Disposal Site
PDA 95 - Active Clam 1 3.59 3.59 3.59 N/A 1 1.04 1.04 1.04 N/A 1 0.140 0.140 0.140 N/A 1 1.38 1.38 1.38 N/A PDA 95 - Active Worm 2 5.30 6.17 5.74 0.62 2 0.110 0.140 0.125 0.0212 2 0.0420 0.0700 0.0560 0.0198 2 0.670 0.960 0.815 0.205
Disposal Site Total 3 3.59 6.17 5.02 1.31 3 0.110 1.04 0.430 0.528 3 0.0420 0.140 0.0840 0.0505 3 0.670 1.38 1.00 0.357 Reference
EREF Clam 1 3.74 3.74 3.74 N/A 1 1.38 1.38 1.38 N/A 1 0.300 0.300 0.300 N/A 1 1.23 1.23 1.23 N/A SREF Clam 2 2.86 3.11 2.99 0.177 2 1.14 1.22 1.18 0.0566 2 0.0870 0.091 0.0890 0.00283 2 1.05 1.15 1.10 0.0707
Reference Total Clam 3 2.86 3.74 3.24 0.453 3 1.14 1.38 1.25 0.122 3 0.0870 0.300 0.159 0.122 3 1.05 1.23 1.14 0.0902 Lead Mercury Nickel Zinc mg/kg wet wt. mg/kg wet wt. mg/kg wet wt. mg/kg wet wt.
Area Matrix n MIN MAX Mean StdDev n MIN MAX Mean StdDev n MIN MAX Mean StdDev n MIN MAX Mean StdDev Disposal Site
PDA 95 - Active Clam 1 0.120 0.120 0.120 N/A 1 0.0450 0.0450 0.0450 N/A 1 0.380 0.380 0.380 N/A 1 7.64 7.64 7.64 N/A PDA 95 - Active Worm 2 0.160 0.220 0.190 0.0424 2 0.0050 0.0070 0.0060 0.0014 2 0.370 0.500 0.435 0.0919 2 19.60 25.5 22.6 4.17
Disposal Site Total 3 0.120 0.220 0.167 0.0503 3 0.0050 0.0450 0.0190 0.0225 3 0.370 0.500 0.417 0.0723 3 7.64 25.5 17.6 9.10 Reference
EREF Clam 1 0.140 0.140 0.140 N/A 1 0.0400 0.0400 0.0400 N/A 1 0.740 0.740 0.740 N/A 1 7.17 7.17 7.17 N/A SREF Clam 2 0.0950 0.100 0.0975 0.00354 2 0.0310 0.0320 0.0315 0.000707 2 0.500 0.630 0.565 0.0919 2 6.72 7.22 6.97 0.354
Reference Total Clam 3 0.0950 0.140 0.112 0.0247 3 0.0310 0.0400 0.0343 0.00493 3 0.500 0.740 0.623 0.1201 3 6.72 7.22 7.04 0.275

57
Monitoring Survey at the Portland Disposal Site September 2016
Table 3-16.
Benthic Community Abundance and Diversity Metrics for PDS 2016
Area Station Richness
(S)
Abundance
(N)
Mean
Density
(ind/m2)
Mean
Diversity
(H’)
Mean
Evenness
(J’)
Dominant Species in
Abundance
Dominant
Phylum in
Biomass
EREF 5 60 425 10625 3.0 0.7 Yoldia limatula Annelida
PDS Inactive 16 53 401 10025 3.3 0.8 Cirratulidae (LPIL) Mollusca
PDA 95 30 38 267 6675 2.9 0.8 Galathowenia oculata Annelida
PDA 95 22 61 1010 25250 2.7 0.6 Cirratulidae (LPIL) Annelida
SREF 7 58 665 16625 3.2 0.8 Maldanidae (LPIL) Mollusca
SREF 10 58 535 13375 3.3 0.8 Cirratulidae (LPIL) Mollusca
Mean across all samples 55 551 13763 3.1 0.8

58
Monitoring Survey at the Portland Disposal Site September 2016
Table 3-17.
Benthic Community Biomass by Phylum for PDS 2016 Biomass (g)
Area Station Annelida Mollusca Arthropoda Echinodermata Miscellaneous Total
EREF 5 0.7 0.7 0.2 0.3 0.2 2.1
PDS Inactive 16 0.2 0.3 0.2 0.0 0.2 0.9
PDA 95 30 0.4 0.3 0.0 0.0 0.0 0.7
PDA 95 22 1.0 0.0 0.0 0.0 0.1 1.2
SREF 7 0.6 0.9 0.0 0.0 0.0 1.5
SREF 10 0.6 0.7 0.0 0.0 0.3 1.6

59
Monitoring Survey at the Portland Disposal Site September 2016
Table 3-18.
Surface Marker Buoys Observed During the 2016 PDS Multibeam Survey
Buoy Description Date Time X Y Lat Long Yellow Green 9/8/2016 11:44:54 911226.4 81002.36 43.56239 -70.0277 Yellow/Green & White/Green 9/8/2016 11:50:19 911260.9 81196.27 43.56413 -70.0273 Yellow Green 9/8/2016 11:54:25 911250.2 81171.26 43.56391 -70.0274 Fluorescent Yellow Orange Green 9/8/2016 12:03:15 911502.3 81201.46 43.56418 -70.0243 Orange Red 9/8/2016 12:04:29 911507.9 80900.93 43.56147 -70.0242 Orange Red 9/8/2016 12:04:55 911450.1 80803.31 43.56059 -70.0249 Orange Red 9/8/2016 12:07:58 911505.7 80883.61 43.56132 -70.0243 Fluorescent Yellow Orange Green 9/8/2016 12:09:12 911505.4 81179.34 43.56398 -70.0243 Yellow Green 9/8/2016 12:22:14 911538.5 80659.22 43.5593 -70.0239 Fluorescent Yellow Orange Green 9/8/2016 12:30:52 911605.7 81045.68 43.56277 -70.023 Yellow Green 9/8/2016 12:35:56 911732.6 81010.04 43.56245 -70.0214 Yellow Green 9/8/2016 12:46:04 911851.2 81129.3 43.56352 -70.02 Orange Red 9/8/2016 12:53:18 911465.2 80890.66 43.56138 -70.0248 White Green 9/8/2016 13:05:14 911249 81359.92 43.56561 -70.0274 Orange Red 9/8/2016 14:35:07 911338.6 80149.55 43.55471 -70.0263 Green White 9/8/2016 14:46:28 911243.5 80525.21 43.55809 -70.0275 Green White 9/8/2016 14:46:43 911240.8 80471.28 43.55761 -70.0275 Yellow Green 9/8/2016 14:54:24 911066.2 80547.61 43.5583 -70.0297 Yellow Green 9/8/2016 15:04:21 910918.1 80231.21 43.55545 -70.0315 Green White 9/8/2016 15:33:17 911250.3 80469.91 43.5576 -70.0274
Notes 1. Grid coordinates are NAD_1983_StatePlane_Maine_West_FIPS_1802_Meters 2. Geographic coordinates are NAD83 decimal degrees

60
Monitoring Survey at the Portland Disposal Site September 2016
4.0 DISCUSSION
4.1 Placement of Dredged Material and Stability of Deposits
In the early years of PDS operations, placement was managed by a taut-wire moored target “DG” buoy. Dredging contractors focused on getting close to the target buoy, but not so close as to risk entanglement with the mooring line. This practice resulted in a potentially greater spatial extent of material spread around the target location during a given season. Advancements in electronic positioning coupled with the Corps’ Dredging Quality Management System (DQM) for logging the track of each scow and its release point has allowed for implementation of an electronic target location for managing placement of the dredged material with potentially less spread of material. The advent of high-resolution MBES bathymetric surveys have provided characterizations of the seafloor that allow detailed mapping of bedrock outcrops (Figure 1-2). Previous surveys at PDS acknowledged the need to focus future placement within soft bottom trough areas between bedrock outcrops to best contain placed material (Sturdivant & Carey 2017).
Since the previous 2014 monitoring survey, approximately 120,800 m³ of material has been placed at PDS. The majority of the dredged material placement events were centered on the PDA 95 Mound between bedrock outcrops (Figure 1-3). A small amount of material (700 m³) was placed at the PDA A Mound (Figure 1-3). Acoustic results indicated dredged material placed at PDA 95 was constrained to a discrete mound, and the sediment texture and roughness of this location was harder and rougher than surrounding native sediments (Figure 3-2a, Figure 3-4a).
All stations surveyed with SPI at the PDA 95 disposal mound exhibited a thick layer of dredged material that had consistent evidence of biological reworking of sediment near the sediment–water interface (Figure 3-23A). Dredged material was also present at all stations surveyed at PDA A (Appendix E). At PDA A, dredged material was found to be intermixed with fine sand, with patches of dredged material visible (Figure 3-23C). The PDS Inactive disposal mound was found to have dredged material present at all stations, with a trace at Station 13 (Figure 3-22). Despite not receiving any dredged material placement since 1991, the dredged material at PDS Inactive closely resembled that of PDA 95, with a distinct dredged material layer that had been reworked in the upper centimeters of the sediment column (Figure 3-23B).
Existing bathymetry at PDS was evaluated in GIS, and the portions of the site between apparent ledge outcrops was delineated. Hypothetical extents of future disposals were estimated assuming a maximum slope between the deposited materials and the ambient seafloor of 3 degrees (rise/run of 1/19) to leave a variable buffer zone between the mound and the site boundary. The relationships between buffer zone width, remaining site area and hypothetical deposit thickness were modeled and suggested maximal capacity at a thickness of approximately 15 m. The thicker deposit offset the larger buffer zone required for the side slope to avoid impacting hard bottom areas. Areas delimiting the potential extent of future

61
Monitoring Survey at the Portland Disposal Site September 2016
placements and volume capacities were calculated assuming uniform deposits of 5-m, 10-m and 15-m thickness (Figure 4-1).
Acoustic results and comparison to previous monitoring surveys indicate that the dredged material placed previously at the site was stable since the monitoring event in 2014 (Figure 3-7 in Sturdivant and Carey 2017). With active placement, material has accumulated at PDA (Figure 3-6). Sediment profile imagery revealed that the placed material was being slowly reworked into the sediment matrix by the benthic community (Figures 3-23 and 3-27). The water depth at PDS (37 to 71 m [121 to 230 ft]) and the presence of bedrock ridges provide a measure of protection from open ocean wave energy and subsurface currents, and thus act to enhance containment of the deposited dredged material.
4.2 Biological Recovery of the Benthic Community and Sediment Quality
The results of the 2016 SPI survey identified a benthic community at the PDA 95 and PDS Inactive disposal locations that was ecologically equivalent to the reference areas. Temporal aRPD comparison of the benthic communities at PDA 95 found equivalence between 2014 and 2016 despite recent disposal activity at the PDA 95 mound. These results suggest that the dredged material deposited at the site is being rapidly colonized and, as a result, does not differ from earlier observations and is similar to the ambient benthic community.
The PDA A disposal mound results showed a biological recovery that was not as mature as those observed at the other observed placement areas but was also marked by relatively coarse sediments and limited camera penetration, which inhibit the ability to detect deep burrowing fauna. As a result, the aRPD values could not be compared statistically, and successional stage was most likely underestimated. PDA A received a small amount of material since the last survey in 2014, but the last significant placement was completed in 2010. The presence of coarser sediments, shell fragments and thin layers of dredged material on bedrock limited interpretation of biological response at PDA A mound, but there was no evidence of direct impairment from the presence of dredged material (highly reduced sediments near the surface). The presence of coarse materials at the surface suggests exposure to higher current forcing from storms with some winnowing/armoring and the potential to ‘reset’ the successional stage.
Results of sediment and tissue chemistry also support lack of effect on the biological community at PDA 95 and PDA Inactive. While the sediment grain size within the disposal areas was two to three times finer than the sediment within the reference areas, the concentrations of most contaminants was similar to or only slightly higher than at the reference stations and generally lower than the ER-L benchmark. The exceptions were a number of the chlorinated pesticides, including total DDx (sum of DDT, DDE and DDD), dieldrin, total chlordane, and toxaphene, all of which were detected in sediment from at least one station from each of the disposal areas at concentrations greater than those found at the reference locations and at concentrations above the ER-L benchmark. Tissue concentrations,

62
Monitoring Survey at the Portland Disposal Site September 2016
however, were generally found to be similar in organisms collected at the disposal and reference areas and in all cases orders of magnitude below any FDA action levels for edible fish tissue. The latter would indicate that while there are measurable concentrations of many contaminants in sediments at the disposal areas, they are not bioaccumulating at appreciable levels.
4.3 Management Considerations
The patterns of dredged material on the seafloor at PDS were detectable with elevation difference calculations between years of placement, through distinct signatures in the backscatter and side-scan sonar, through the presence of elevated percent fines in the sediment, and with the optical observations from SPI. There was no identification of dredged material at either of the reference locations, and the sediment characteristics and topography were similar to the disposal areas. On this basis, the reference areas remain valid for comparison with disposal site conditions.
Biological results from the PDA 95 mound, that has received dredged material in recent years, suggest that recovery is consistent with reference area conditions and can continue to receive dredged material placement. It is reasonable to expect that PDS could accommodate additional placement of substantial volumes of dredged material (6 to 12 million m3) following the model of placement within the spaces between the exposed rock (Figure 4-1).
The results of sediment and tissue chemistry indicate that the levels of chlorinated pesticides in sediments should continue to be monitored periodically and compared to regional values and values measured in suitability testing of dredged material to inform management actions.
Lobster gear was observed at PDS both near the PDA 95 disposal location as well as at the SREF area. The presence of high densities of fixed fishing gear can make surveying challenging, but there is no evidence that the fishing activity is inconsistent with management of the site for disposal of dredged material.

63
Monitoring Survey at the Portland Disposal Site September 2016
5.0 CONCLUSIONS AND RECOMMENDATIONS
The September 2016 survey at PDS was designed to assess changes at the site after placement of approximately 120,800 m³ of dredged material since the previous survey conducted in 2014 as well as to provide additional site characterization data to aid in longer-term management of the site. The 2016 survey included collection of bathymetric data over a portion of the disposal site that received dredged material placed since 2014; collection of SPI and plan view imaging at three disposal target locations and two reference areas; and collection of benthic infauna, sediment, and tissue samples to further characterize the site and reference areas. All components of the survey were successfully performed and included the following results:
Dredged material placed at PDA 95 was constrained to a discrete mound centered on the target placement location.
Remaining site capacity was estimated to range between 6-12 million m3 for placement depth ranging from 5-15 m thick respectively while constraining placement to the deeper portions of the site between rock outcrops.
The benthic communities at the two disposal areas located within the deep trough (PDA 95 and PDS Inactive) were recovering consistent with the expected paradigm, with full recovery expected within one year of completion of dredged material placement. Mature benthic communities have developed at both disposal areas, including the most recently used location (PDA 95).
The benthic community at PDA A, located on rocky outcrops had no evidence of direct impairment from dredged material placement, but due to limited camera penetration and the presence of coarse sediments, Stage 1 and Stage 2 taxa were identified at most stations.
Chemical analyses of sediment and the tissue of benthic infauna (clams and worms) revealed concentrations that were generally low but that showed some variability between the reference and the disposal areas, attributed primarily to the difference in physical characteristics of the sediment (disposal site sediments had higher percentages of fine-grained material). Tissue concentrations were two orders of magnitude below FDA Action Levels. While these results are limited, they provide baseline measurements for reference to future studies.
Based on these results, the following are recommended:
R1: Continue placement of dredged material to deeper, soft bottom areas of the site to support containment of material with adequate buffer to minimize impacts to existing hard bottom areas.
R2: Continue periodic confirmatory monitoring following additional placement of
significant quantities of dredged material.

64
Monitoring Survey at the Portland Disposal Site September 2016
6.0 REFERENCES
AECOM. 2009. Monitoring Survey at the Portland Disposal Site, August 2007. DAMOS Contribution No. 179. U.S. Army Corps of Engineers, New England District, Concord, MA, 85 pp.
Battelle. 2015. Quality Assurance Project Plan (QAPP) for the Disposal Area Monitoring Study (DAMOS) Program (Version 2.0). Prepared by Battelle, Norwell, MA. USACE NAE Contract No. W912WJ-12-D-0004. Submitted to U.S. Army Corps of Engineers, New England District, Concord, MA, 50 pp. May 1, 2015.
Battelle. 2016. Addendum 1 to the Quality Assurance Project Plan (QAPP) for the Disposal Area Monitoring Study (DAMOS) Program (Version 2.0). USACE NAE Contract No. W912WJ-12-D-0004. Prepared by Battelle, Norwell, MA. Submitted to U.S. Army Corps of Engineers, New England District, Concord, MA, 19 pp. August 30, 2016.
Barnhardt, W. A.; Belknap, D. F.; Kelley, A. R.; Kelley, J. T.; Dickson, S. M. 1996. Surficial geology of the Maine inner continental shelf; Cape Elizabeth to Pemaquid Point, Maine: Maine Geological Survey, Geologic Map 96-9, map, scale 1:100,000.
Bull, D. C.; Williamson, R. B. 2001. Prediction of Principal Metal-Binding Solid Phases in Estuarine Sediments from Color Image Analysis. Environmental Science and Technology 35: 1658-1662.
Fenchel, T. 1969. The ecology of marine macrobenthos IV. Structure and function of the benthic ecosystem, its chemical and physical factors and the microfauna communities with special reference to the ciliated protozoa. Ophelia 6: 1-182.
Feng, S. Y. 1984. DAMOS Mussel Watch Program, Eastern Long Island Sound Disposal Site and Portland Disposal Site Monitoring Projects, 1979-1981. DAMOS Contribution No. 43. U.S. Army Corps of Engineers, New England Division, Waltham, MA, 69 pp.
Fredette, T. J.; French, G. T. 2004. Understanding the physical and environmental consequences of dredged material disposal: history in New England and current perspectives. Mar. Pollut. Bull. 49:93–102.
Germano, J. D. 1983. Infaunal succession in Long Island Sound: Animal sediment interactions and the effects of predation. Ph.D. dissertation, Yale University, New Haven, CT.
Germano, J. D. 1999. Ecology, statistics, and the art of misdiagnosis: The need for a paradigm shift. Environ. Rev. 7(4):167–190.

65
Monitoring Survey at the Portland Disposal Site September 2016
Germano, J. D.; Rhoads, D. C.; Lunz, J. D. 1994. An Integrated, Tiered Approach to Monitoring and Management of Dredged Material Disposal Sites in the New England Regions. DAMOS Contribution No. 87. U.S. Army Corps of Engineers, New England Division, Waltham, MA, 67 pp.
Germano, J. D.; Rhoads, D. C.; Valente, R. M.; Carey, D. A.; Solan, M. 2011. The use of sediment profile imaging (SPI) for environmental impact assessments and monitoring studies: lessons learned from the past four decades. Oceanogr. Mar. Biol. Ann. Rev. 49:235–285.
Kristensen, E.; Penha-Lopes, G.; Delefosse, M.; Valdemarsen, T.; Quintana, C.; Banta, G. T. 2012. What is bioturbation? The need for a precise definition for fauna in aquatic sciences. Mar. Ecol. Prog. Ser. 446: 285-302.
Long, E. R.; Macdonald, D.; Smith, S.; Calder, F. 1995. Incidence of adverse biological effects within ranges of chemical concentrations in marine and estuarine sediments. Environmental Management Vol. 19. No, 1, pp. 81-97.
Lyle, M. 1983. The brown-green colour transition in marine sediments: A marker of the Fe (III) – Fe(II) redox boundary. Limnology and Oceanography 28: 1026-1033.
McBride, G. B. 1999. Equivalence tests can enhance environmental science and management. Aust. New Zeal. J. Stat. 41(1):19–29.
McDowell, S. E.; Pace, S. D. 1998. Oceanographic Measurements at the Portland Disposal Site During Spring of 1996. DAMOS Contribution No. 121. U.S. Army Corps of Engineers, New England District, Concord, MA, 62 pp.
Morris, J. T., Saffert, H. L.; Murray, P. M. 1998. The Portland Disposal Site Capping Demonstration Project 1995-1997. DAMOS Contribution No. 123. U.S. Army Corps of Engineers, New England District, Concord, MA, 197 pp.
Naval Underwater Systems Center (NUSC). 1979. DAMOS Annual Data Report, 1978. Supplemental Report B: Portland Disposal Site. U.S. Army Corps of Engineers, New England Division, Waltham, MA, 46 pp.
NOAA. 2015. NOS Hydrographic Surveys Specifications and Deliverables. May 2015.
Pearson, T. H.; Rosenberg, R. 1978. Macrobenthic succession in relation to organic enrichment and pollution of the marine environment. Oceanography and Marine Biology an Annual Review 16: 229–311.
Rhoads, D.C. 1974. Organism-sediment relations on the muddy seafloor. Oceanography and Marine Biology an Annual Review 12: 263 300.

66
Monitoring Survey at the Portland Disposal Site September 2016
Rhoads, D. C.; Boyer, L. F. 1982. The effects of marine benthos on physical properties of sediments. pp. 3-52. In: Animal-Sediment Relations. McCall, P.L. and M.J.S. Tevesz (eds). Plenum Press, New York, NY.
Rhoads, D. C.; Germano, J. D. 1982. Characterization of organism-sediment relations using sediment profile imaging: An efficient method of Remote Ecological Monitoring of The Seafloor (REMOTS® System). Mar. Ecol. Prog. Ser. 8:115–128.
Reible, D.; Thibodeaux, L. 1999. Using Natural Processes to Define Exposure from Sediments, in Sediment Management Work Group; Contaminated Sediment Management Technical Papers, Sediment Management Work Group, http://www.smwg.org/index.htm.
Rosenberg, R.; Diaz, R. J. 1993. Sulfur bacteria (Beggiatoa spp.) mats indicate hypoxic conditions in the inner Stockholm Archipelago. Ambio 22: 32–36.
Rosenberg, R.; Nilsson, H. C.; Diaz, R. J. 2001. Response of benthic fauna and changing sediment redox profiles over a hypoxic gradient. Estuarine, Coastal and Shelf Science 53: 343-350.
SAIC. 1990. Monitoring Cruise at the Portland Disposal Site, January 1989. DAMOS Contribution No. 78. U.S. Army Corps of Engineers, New England District, Waltham, MA, 26 pp.
SAIC. 2002. Monitoring Survey at the Portland Disposal Site, Summer 2000. DAMOS Contribution No. 136. U.S. Army Corps of Engineers, New England District, Concord, MA, 54 pp.
SAIC. 2003. Monitoring Survey at the Portland Disposal Site, August 2001. DAMOS Contribution No. 140. U.S. Army Corps of Engineers, New England District, Concord, MA, 66 pp.
SAIC. 2004. Dredged Material Fate Study at the Portland Disposal Site, 1998-2000. DAMOS Contribution No. 153. U.S. Army Corps of Engineers, New England District, Concord, MA, 144 pp.
Satterthwaite, F. E. 1946. An Approximate Distribution of Estimates of Variance Components, Biometrics Bulletin, Vol. 2, No. 6, pp. 110-114.
Schuirmann, D. J. 1987. A comparison of the two one-sided tests procedure and the power approach for assessing the equivalence of average bioavailability. J. Pharmacokinet. Biopharm. 15:657–680.
Simone, M.; Grant, J. 2017. Visual assessment of redoxcline compared to electron potential in coastal marine sediments. Estuarine, Coastal and Shelf Science 188: 156-162.

67
Monitoring Survey at the Portland Disposal Site September 2016
Sturdivant, S. K.; Carey, D. A. 2017. Monitoring Survey at the Portland Disposal Site August 2014. DAMOS Contribution No. 200. U.S. Army Corps of Engineers, New England District, Concord, MA, 81 pp.
USACE. 2013. Engineering and Design - Hydrographic Surveying. Manual No. EM 1110-2-1003. November 2013.
USACE 2014. Sampling and Testing in Support of Dredged Material Suitability Determination York Harbor Federal Navigation Project, York, Maine. Prepared by Battelle. Dec. 2014.
USACE 2015. Sampling and Testing in Support of Dredged Material Suitability Determination Pepperrell Cove Federal Navigation Project, Kittery, Maine. Prepared by Battelle. Nov. 2015.
USEPA. 2003. Historic Area Remediation Site (HARS)-Specific Polychlorinated Biphenyl (PCB) Tissue Criterion. 40 CFR § 228.15(d)(6)(v)(E). March 17, 2003.
USEPA/USACE. 2007. Site Management and Monitoring Plan for the Portland Dredged Material Disposal Site. 62 pp.
Wiley, M. B. 1996. Monitoring Cruise at the Portland Disposal Site, July 1992. DAMOS Contribution No. 108. U.S. Army Corps of Engineers, New England District, Concord, MA, 46 pp.
Wolf, S.; Fredette, T. J.; Loyd, R. B. 2012. Thirty-Five Years of Dredged Material Disposal Area Monitoring – Current Work and Perspectives of the DAMOS Program. WEDA Journal of Dredging Engineering, Vol. 12, No. 2, p. 24-41.
Zar, J. H. 1996. Biostatistical Analysis, Third Edition. Prentice Hall, New Jersey. 662 pp. + Appendices

Monitoring Survey at the Portland Disposal Site September 2016
INDEX
accumulation, 1, 2 acoustic Doppler current profiler, 8 acoustic relief model, 13, 28 ambient, 3, 21, 29, 60, 61 ANOVA, 21, 22 apparent redox potential discontinuity
(aRPD), xii, 4, 18, 19, 29, 30, 32, 33, 34, 35, 39, 40, 42, 43, 45, 61
arsenic (As), 51, 56 backscatter, xii, 1, 10, 11, 13, 28, 29, 62 baseline, xiii, 2, 63 bathymetric survey, 11, 28, 60 bathymetry, xii, 7, 8, 28, 29, 60 bedform, 19 Beggiatoa, 18, 19 benthic, xii, xiii, 1, 2, 5, 14, 17, 18, 19, 20,
22, 27, 28, 30, 32, 38, 57, 58, 61, 63 benthic recolonization, xii, 4, 5, 17, 19 bioturbation, 19 bivalve, 38 boundary roughness, 17, 30, 32 buoy, 3, 6, 23, 38, 59, 60 burrow, 17, 19, 30, 31, 32 cadmium (Cd), 51, 56 capping, 3, 4, 7 carbon, 22, 35, 47 chemistry, 5, 7, 22, 23, 25, 35, 36, 61, 62 chromium (Cr), 51, 56 containment, xiii, 3, 4, 61, 63 contaminant, 19 copper (Cu), 51, 56 cores, 7, 19 cross-line, 11, 24 currents, 3, 7, 19, 61 density, 7, 11, 19, 31, 38, 57 depositional, 15, 30, 31 disposal mound, xii, 1, 3, 4, 5, 6, 10, 14,
17, 28, 29, 30, 31, 32, 60, 61, 62, 63 disposal site
Portland Disposal Site (PDS), xii, 1, 2, 3, 4, 5, 6, 7, 8, 9, 10, 11, 14, 16, 19, 20, 21, 23, 25, 26, 27, 28, 29, 31, 32, 33, 34, 35, 36, 37, 38, 39, 40, 41, 46, 47, 48, 49, 50, 51, 52, 53, 54, 55, 56, 57, 58, 59, 60, 61, 62, 63
dissolved oxygen (DO), 30, 31 dredged material, xii, xiii, 1, 2, 3, 4, 8, 10,
17, 19, 28, 29, 30, 31, 35, 37, 41, 60, 61, 62, 63
dredging, ii, 3, 37, 60 elevation difference, 29, 62 epifauna, 19, 31, 32 feeding void, 39, 40, 42 global positioning system (GPS), 10, 11,
12, 15, 16, 23 differential global positioning system
(DGPS), 10, 16 grain size, 17, 22, 27, 30, 35, 61
clay, 31, 35, 46 gravel, 27, 46 sand, 30, 31, 46, 60 silt, 30, 31, 35, 46 silt-clay, 30, 31
habitat, 2 hypoxic, 18 inequivalence, 20, 21, 33, 43, 44, 45 macrofauna, 19 mercury (Hg), 51, 56 methane, 18, 30, 31, 39, 40 multibeam
multibeam echo sounder (MBES), 11, 12, 13, 28, 60
National Oceanic and Atmospheric Administration (NOAA), 12, 13, 48, 53
native, 60 nickel (Ni), 51, 56 organics, 27 penetration depth, 15, 17, 31, 41 phi, 17, 39, 40, 41

INDEX (CONTINUED)
Monitoring Survey at the Portland Disposal Site September 2016
polyaromatic hydrocarbon (PAH), 27, 35, 37, 48, 53
polychaete, 19, 38 polychlorinated biphenyls (PCBs), 22,
36, 37 porewater, 18 prism penetration, 15, 30, 31, 32 PV
plan view imaging, xii, 2, 4, 5, 14, 15, 16, 17, 19, 28, 29, 31, 32, 63
real-time kinematic (RTK), 10, 12 recolonization, xii, 4, 5, 17, 19 reference area, xii, 4, 5, 7, 8, 10, 14, 19,
20, 21, 23, 28, 29, 30, 31, 32, 33, 34, 35, 36, 37, 38, 39, 61, 62, 63
remediation, 37 ripple, 17 rocks, 23, 26, 27 salinity, 7 sediment, xii, xiii, 2, 3, 4, 5, 7, 8, 10, 13,
14, 15, 17, 18, 19, 22, 23, 25, 27, 28, 29, 30, 31, 32, 35, 36, 37, 39, 40, 41, 60, 61, 62, 63
sediment grab sample, xii, 2, 7, 10, 22, 25, 27
side-scan sonar, xii, 1, 7, 8, 10, 11, 13, 28, 29, 62
Site Management and Monitoring Plan (SMMP), 2, 4
sound velocity profile (SVP), 11 sounding, 12, 24 SPI
sediment profile camera, 15
sediment profile imaging (SPI), xii, 2, 5, 7, 8, 10, 14, 15, 16, 17, 18, 19, 22, 25, 28, 29, 60, 61, 62, 63
SPI/PV sediment profile and plan view
imaging, xii, 10, 14, 15, 16, 17 statistical testing, 20, 34, 35, 43, 44, 45 successional stage, xii, 4, 19, 20, 29, 30,
31, 32, 33, 34, 61, 63 surface boundary roughness, 17, 30, 32 survey, xii, xiii, 1, 2, 4, 5, 7, 8, 10, 11, 12,
13, 14, 15, 16, 19, 20, 23, 24, 28, 29, 33, 38, 59, 60, 61, 63
taxa, xii, 30, 31, 38, 63 temperature, 7, 23 tide, 12, 24 topography, xii, 2, 3, 5, 10, 19, 28, 30, 32,
62 total organic carbon (TOC), 22, 27, 35,
36 tracks, 19, 31, 32 transducer, 11 transect, 10, 11, 24 transport, 19 turbidity, 7 U.S. Army Corps of Engineers, 1, 2, 3, 9,
10, 12, 35 U.S. Environmental Protection Agency,
xii, 2, 37 worm, xiii, 23, 36, 37, 38, 52, 53, 54, 55,
56, 63 worm tubes, 19, 31, 32, 38 zinc (Zn), 51, 56

MONITORING SURVEY AT THE PORTLAND DISPOSAL SITE
SEPTEMBER 2016
FIGURES
CONTRIBUTION #203
July 2021
Contract No. W912WJ-12-D-0004
Submitted to:
New England District U.S. Army Corps of Engineers
696 Virginia Road Concord, MA 01742-2751
Prepared by:
141 Longwater Drive, Suite 202 Norwell, MA 02061
315 Broadway Newport, RI 02840

i
LIST OF FIGURES
Page Figure 1-1. Location of the Portland Disposal Site (PDS) ................................................... 1
Figure 1-2. Overview of PDS on regional bathymetry with 2016 sampling areas indicated ............................................................................................................. 2
Figure 1-3. Location of reported disposal events at PDS from October 2014 through December 2015 .................................................................................... 3
Figure 2-1. PDS 2016 acoustic survey area and tracklines .................................................. 4
Figure 2-2. PDS 2016 target station locations for SPI, tissue, benthic, and sediment sampling ............................................................................................................. 5
Figure 2-3. Operation of the sediment profile and plan view camera imaging system ............................................................................................................... 6
Figure 2-4. The stages of infaunal succession as a response of soft bottom benthic communities to (A) physical disturbance or (B) organic enrichment; from Rhoads and Germano (1982) .................................................................... 7
Figure 2-5. This representative plan view image shows the sampling relationship between plan view and sediment profile images. Note: plan view images differ between surveys and stations and the area covered by each plan view image may vary slightly between images and stations. ............ 8
Figure 2-6. Surficial sediment grab and tissue trawl station locations at the PDS disposal areas ..................................................................................................... 9
Figure 2-7. Surficial sediment grab and tissue trawl station locations at the PDS reference areas ................................................................................................. 10
Figure 3-1a. Bathymetric contour map of PDS PDA 95 – September 2016 ........................ 11
Figure 3-1b. Bathymetric contour map of PDS reference areas – September 2016 ............ 12
Figure 3-2a. Bathymetric depth data over acoustic relief model of PDS PDA 95 – September 2016 ............................................................................................... 13
Figure 3-2b. Bathymetric depth data over acoustic relief model of PDS reference areas – September 2016 ................................................................................... 14
Figure 3-3a. Mosaic of unfiltered backscatter data of PDS PDA 95 – September 2016 ................................................................................................................. 15
Figure 3-3b. Mosaic of unfiltered backscatter data of PDS reference areas – September 2016 ............................................................................................... 16
Figure 3-4a. Filtered backscatter over acoustic relief model of PDS PDA 95 – September 2016 ............................................................................................... 17

ii
Figure 3-4b. Filtered backscatter over acoustic relief model of PDS reference areas – September 2016 ............................................................................................... 18
Figure 3-5a. Side-scan mosaic of PDS PDA 95 – September 2016 ..................................... 19
Figure 3-5b. Side-scan mosaic of PDS reference areas – September 2016 ......................... 20
Figure 3-6. PDS disposal area elevation difference: 2016 vs. 2014 ................................... 21
Figure 3-7. Sediment grain size major mode (phi units) at the PDS reference area stations ............................................................................................................. 22
Figure 3-8. Sediment profile images from reference areas; (A) Station EREF-02 with a well-developed aRPD in ambient fine sand over silt-clay; and (B) Station SREF-07 with small-scale boundary roughness caused by shallow burrowing ........................................................................................... 23
Figure 3-9. Mean station camera prism penetration depths (cm) at the PDS reference area stations ...................................................................................... 24
Figure 3-10. Mean station small-scale boundary roughness values (cm) at the PDS reference area stations ...................................................................................... 25
Figure 3-11. Plan view images from the reference areas at (A) Station EREF-03 depicting burrow openings and small tubes; and (B) Station SREF-07 depicting a cluster of small tubes..................................................................... 26
Figure 3-12. Mean station aRPD depth values (cm) at the PDS reference area stations ............................................................................................................. 27
Figure 3-13. Sediment profile images from reference areas; (A) Station EREF-01 with a shallow aRPD; and (B) Station SREF-10 with a deep aRPD ............... 28
Figure 3-14. Infaunal successional stages found at the PDS reference area stations ........... 29
Figure 3-15. Sediment profile images from (A) Station EREF-02 indicating Stage 2 on 3 fauna with shallow burrows and deep feeding voids; and (B) Station EREF-05 indicating Stage 1 on 3 fauna represented by small tubes at the sediment–water interface and feeding void at depth .................... 30
Figure 3-16. Mean depth (cm) of subsurface feeding voids at the PDS reference area stations ............................................................................................................. 31
Figure 3-17. Sediment grain size major mode (phi units) at the PDS disposal area stations ............................................................................................................. 32
Figure 3-18. Sediment profile images depicting very fine sand layered over silt-clay from (A) Station PDS-18; and (B) Station PDA 95-33 ................................... 33
Figure 3-19. Sediment profile images from disposal area PDA A (A) Station PDA A-01 depicting fine sand; (B) Station PDA A-03 depicting fine sand over silt-clay; and (C) Station PDA A-05 depicting very fine sand over silt/clay ............................................................................................................. 34
iii
Figure 3-20. Mean station camera prism penetration depths (cm) at the PDS disposal area stations ..................................................................................................... 35
Figure 3-21. Sediment profile images from disposal areas; (A) Station PDA A-01 showing shallow prism penetration due to sediment consolidation; and (B) Station PDA A-04 showing shell fragments in the sediment .................... 36
Figure 3-22. Mean dredged material thickness at the PDS disposal area stations ............... 37
Figure 3-23. Sediment profile images from disposal areas; (A) Station PDA 95-30 with dredged material being biologically reworked to resemble ambient sediment near sediment–water interface; (B) Station PDS-19 with a thick layer of dredged material extending beyond camera prism penetration depth; and (C) Station PDA A-05 with patchy dredged material ............................................................................................................ 38
Figure 3-24. Mean station small-scale boundary roughness values (cm) at the PDS disposal area stations ....................................................................................... 39
Figure 3-25. (A) Sediment profile image from Station PDA A-05 depicting Stage 1 tubes at the sediment–water interface; and (B) plan view image from Station PDA 95-29 depicting burrows ............................................................. 40
Figure 3-26. Mean station aRPD depth values (cm) at the PDS disposal area stations ....... 41
Figure 3-27. Sediment profile images depicting typical aRPD depth across disposal areas at (A) Station PDA A-03; (B) Station PDS-09; and (C) Station PDA 95-30 ....................................................................................................... 42
Figure 3-28. Infaunal successional stages found at the PDS disposal area stations ............. 43
Figure 3-29. Sediment profile images showing evidence of Stage 3 fauna at (A) Station PDS-17 showing open feeding voids; and (B) Station PDA 95-28 showing infilled feeding voids ................................................................... 44
Figure 3-30. Sediment profile images showing successional stages at (A) Station PDA A-02 showing Stage 1 transitioning to Stage 2 and (B) Station PDA A-05 showing Stage 2 fauna; and (C) Station PDA A-03 showing evidence of Stage 3 fauna ................................................................................ 45
Figure 3-31. Mean depth of subsurface feeding voids at the PDS disposal area stations ............................................................................................................. 46
Figure 3-32. Boxplots showing the distribution of mean aRPD depths measured at the disposal site and reference area stations in the 2016 survey ..................... 47
Figure 3-33. Boxplots showing the distribution of mean aRPD depths measured at the disposal area stations and reference area stations in the 2014 and 2016 surveys .................................................................................................... 48
Figure 3-34. Map showing the location of reference areas CADS REF and PDS REF at which sediment was collected for laboratory bioaccumulation testing

iv
for Pepperell Cove (CADS REF) and York Harbor (PDS REF) sediments (USACE 2014, USACE 2015) ....................................................... 49
Figure 3-35. Percent fines in sediments from PDS 2016 ..................................................... 50
Figure 3-36. Percent total organic carbon in sediments from PDS 2016 ............................. 51
Figure 3-37. Total PAH (μg/kg dry-wt.) in sediments from PDS 2016 ............................... 52
Figure 3-38. Total PCB (μg/kg dry-wt.) in sediments from PDS 2016 ............................... 53
Figure 3-39a. Total DDX (μg/kg dry-wt.) in sediments from PDS 2016 .............................. 54
Figure 3-39b. Chlordane (μg/kg dry-wt.) in sediments from PDS 2016 ................................ 55
Figure 3-39c. Dieldrin (μg/kg dry-wt.) in sediments from PDS 2016 ................................... 56
Figure 3-39d. Toxaphene (μg/kg dry-wt.) in sediments from PDS 2016 ............................... 57
Figure 3-40a. Arsenic (mg/kg dry-wt.) in sediments from PDS 2016 ................................... 58
Figure 3-40b. Cadmium (mg/kg dry-wt.) in sediments from PDS 2016 ................................ 59
Figure 3-40c. Chromium (mg/kg dry-wt.) in sediments from PDS 2016 .............................. 60
Figure 3-40d. Copper (mg/kg dry-wt.) in sediments from PDS 2016 .................................... 61
Figure 3-40e. Lead (mg/kg dry-wt.) in sediments from PDS 2016 ....................................... 62
Figure 3-40f. Mercury (mg/kg dry-wt.) in sediments from PDS 2016 .................................. 63
Figure 3-40g. Nickel (mg/kg dry-wt.) in sediments from PDS 2016 ..................................... 64
Figure 3-40h. Zinc (mg/kg dry-wt.) in sediments from PDS 2016 ........................................ 65
Figure 3-41. Percent lipids in tissue from PDS 2016 ........................................................... 66
Figure 3-42. Total PAH (μg/kg wet-wt.) in tissue from PDS 2016 ..................................... 67
Figure 3-43. Total PCB (μg/kg wet-wt.) in tissue from PDS 2016 ...................................... 68
Figure 3-44a. Total DDX (μg/kg wet-wt.) in tissue from PDS 2016 ..................................... 69
Figure 3-44b. Endosulfan (μg/kg wet-wt.) in tissue from PDS 2016 ..................................... 70
Figure 3-44c. Chlordane (μg/kg wet-wt.) in tissue from PDS 2016 ...................................... 71
Figure 3-44d. Dieldrin (μg/kg wet-wt.) in tissue from PDS 2016 .......................................... 72
Figure 3-45a. Arsenic (mg/kg wet-wt.) in tissue from PDS 2016 ......................................... 73
Figure 3-45b. Cadmium (mg/kg wet-wt.) in tissue from PDS 2016 ...................................... 74
Figure 3-45c. Chromium (mg/kg wet-wt.) in tissue from PDS 2016 ..................................... 75
Figure 3-45d. Copper (mg/kg wet-wt.) in tissue from PDS 2016 .......................................... 76
Figure 3-45e. Lead (mg/kg wet-wt.) in tissue from PDS 2016 .............................................. 77
Figure 3-45f. Mercury (mg/kg wet-wt.) in tissue from PDS 2016 ........................................ 78
Figure 3-45g. Nickel (mg/kg wet-wt.) in tissue from PDS 2016 ........................................... 79

v
Figure 3-45h. Zinc (mg/kg wet-wt.) in tissue from PDS 2016 ............................................... 80
Figure 3-46. Surface marker buoy observations during the acoustic survey at PDS – September 2016 ............................................................................................... 81
Figure 4-1. Capacity estimates at PDS. .............................................................................. 82

1
Monitoring Survey at the Portland Disposal Site September 2016
Figure 1-1. Location of the Portland Disposal Site (PDS)

2
Monitoring Survey at the Portland Disposal Site September 2016
Figure 1-2. Overview of PDS on regional bathymetry with 2016 sampling areas indicated

3
Monitoring Survey at the Portland Disposal Site September 2016
Figure 1-3. Location of reported disposal events at PDS from October 2014 through December 2015
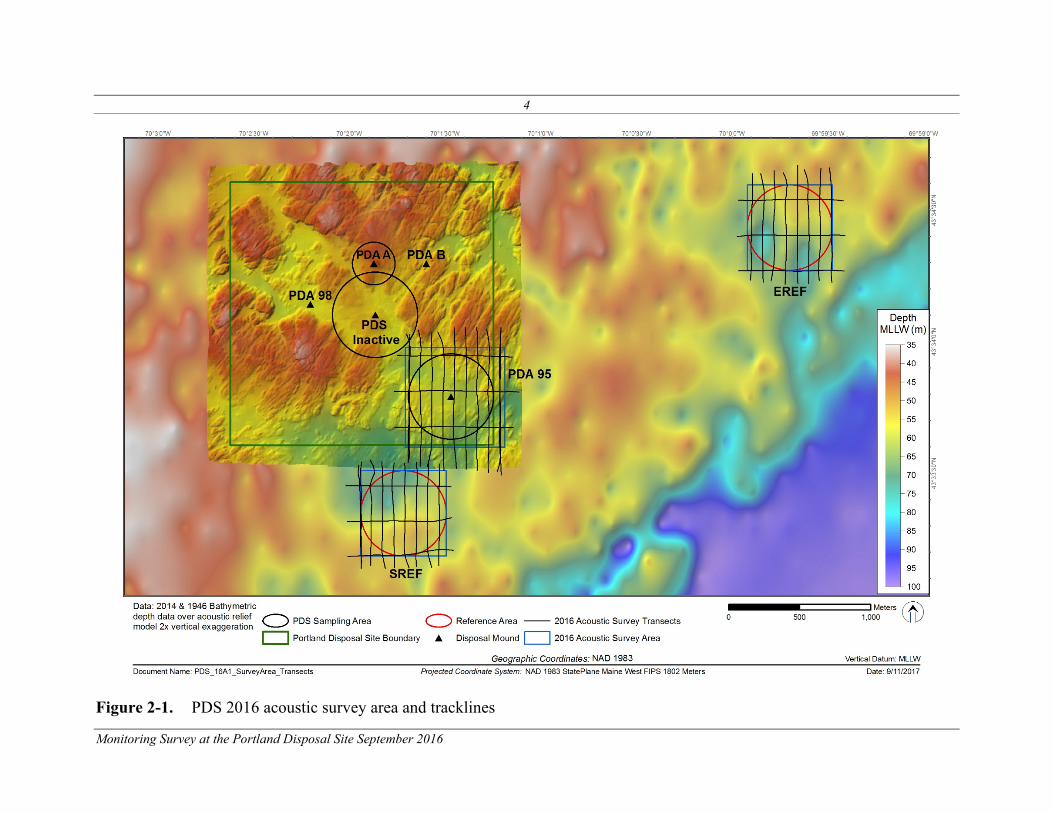
4
Monitoring Survey at the Portland Disposal Site September 2016
Figure 2-1. PDS 2016 acoustic survey area and tracklines

5
Monitoring Survey at the Portland Disposal Site September 2016
Figure 2-2. PDS 2016 target station locations for SPI, tissue, benthic, and sediment sampling

6
Monitoring Survey at the Portland Disposal Site September 2016
Figure 2-3. Operation of the sediment profile and plan view camera imaging system

7
Monitoring Survey at the Portland Disposal Site September 2016
Figure 2-4. The stages of infaunal succession as a response of soft bottom benthic communities to (A) physical disturbance or
(B) organic enrichment; from Rhoads and Germano (1982)

8
Monitoring Survey at the Portland Disposal Site September 2016
Figure 2-5. This representative plan view image shows the sampling relationship between plan view and sediment profile
images. Note: plan view images differ between surveys and stations and the area covered by each plan view image may vary slightly between images and stations.

9
Monitoring Survey at the Portland Disposal Site September 2016
Figure 2-6. Surficial sediment grab and tissue trawl station locations at the PDS disposal areas
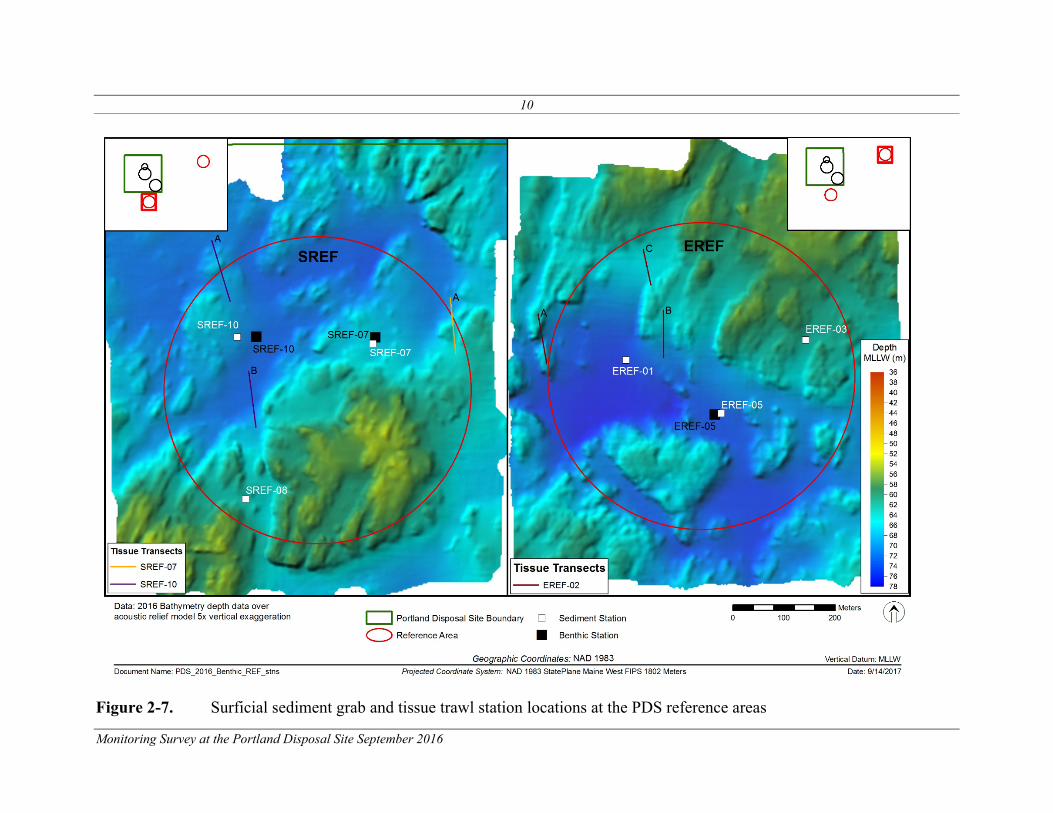
10
Monitoring Survey at the Portland Disposal Site September 2016
Figure 2-7. Surficial sediment grab and tissue trawl station locations at the PDS reference areas

11
Monitoring Survey at the Portland Disposal Site September 2016
Figure 3-1a. Bathymetric contour map of PDS PDA 95 – September 2016

12
Monitoring Survey at the Portland Disposal Site September 2016
Figure 3-1b. Bathymetric contour map of PDS reference areas – September 2016

13
Monitoring Survey at the Portland Disposal Site September 2016
Figure 3-2a. Bathymetric depth data over acoustic relief model of PDS PDA 95 – September 2016

14
Monitoring Survey at the Portland Disposal Site September 2016
Figure 3-2b. Bathymetric depth data over acoustic relief model of PDS reference areas – September 2016

15
Monitoring Survey at the Portland Disposal Site September 2016
Figure 3-3a. Mosaic of unfiltered backscatter data of PDS PDA 95 – September 2016
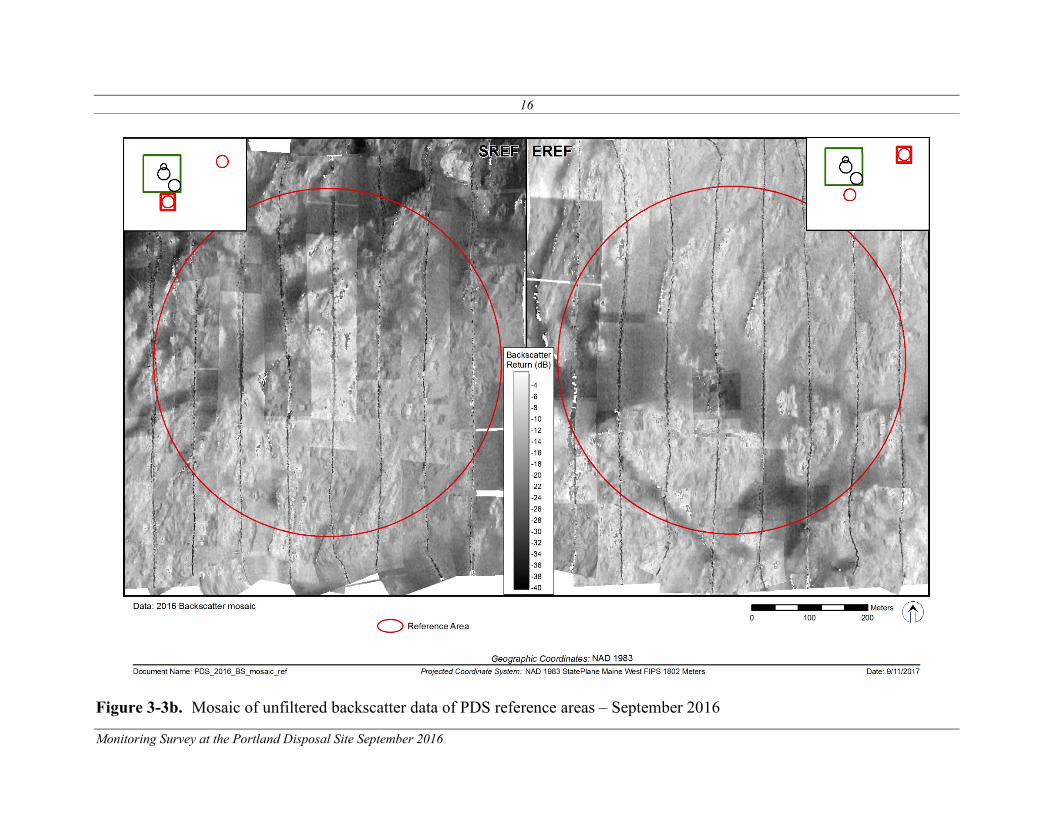
16
Monitoring Survey at the Portland Disposal Site September 2016
Figure 3-3b. Mosaic of unfiltered backscatter data of PDS reference areas – September 2016

17
Monitoring Survey at the Portland Disposal Site September 2016
Figure 3-4a. Filtered backscatter over acoustic relief model of PDS PDA 95 – September 2016

18
Monitoring Survey at the Portland Disposal Site September 2016
Figure 3-4b. Filtered backscatter over acoustic relief model of PDS reference areas – September 2016

19
Monitoring Survey at the Portland Disposal Site September 2016
Figure 3-5a. Side-scan mosaic of PDS PDA 95 – September 2016
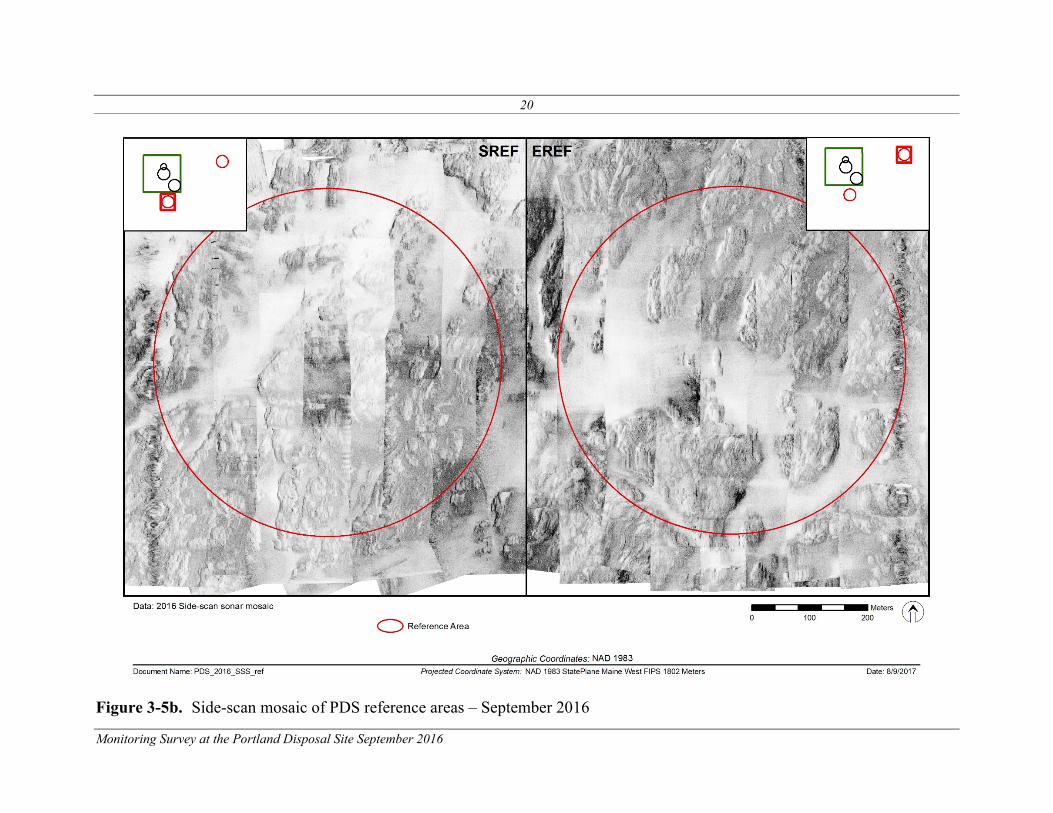
20
Monitoring Survey at the Portland Disposal Site September 2016
Figure 3-5b. Side-scan mosaic of PDS reference areas – September 2016
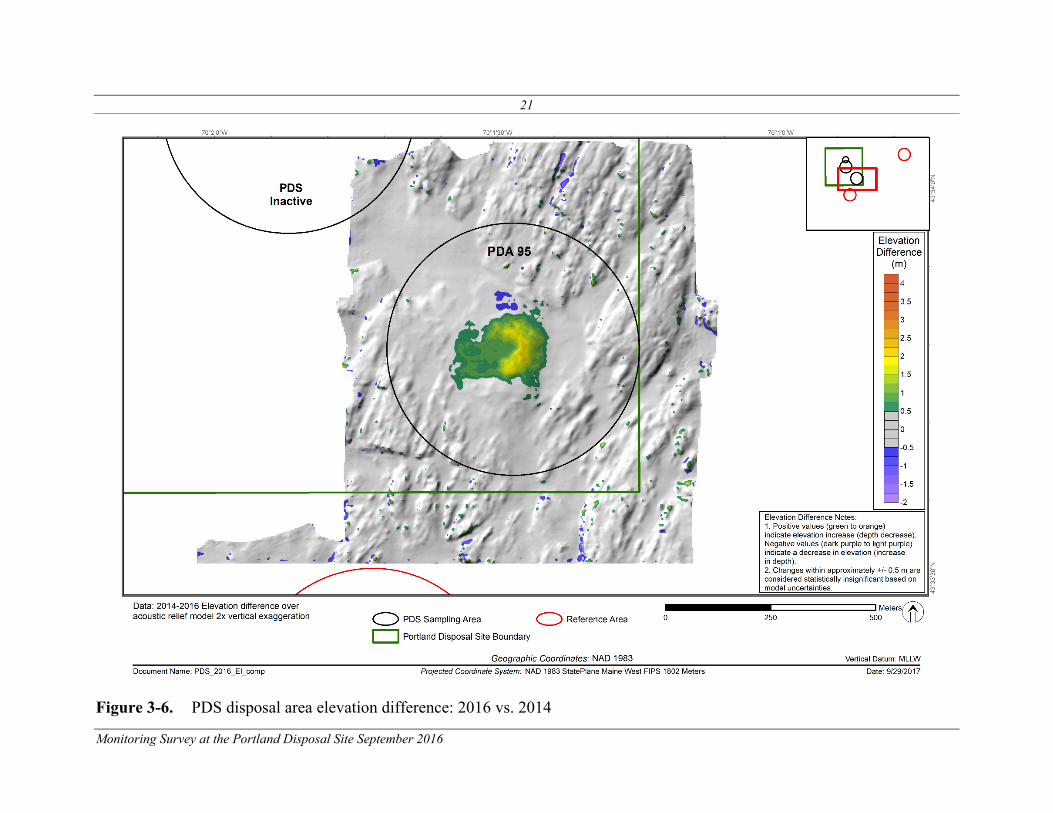
21
Monitoring Survey at the Portland Disposal Site September 2016
Figure 3-6. PDS disposal area elevation difference: 2016 vs. 2014

22
Monitoring Survey at the Portland Disposal Site September 2016
Figure 3-7. Sediment grain size major mode (phi units) at the PDS reference area stations

23
Monitoring Survey at the Portland Disposal Site September 2016
(A) (B)
Figure 3-8. Sediment profile images from reference areas; (A) Station EREF-02 with a well-developed aRPD in ambient fine
sand over silt-clay; and (B) Station SREF-07 with small-scale boundary roughness caused by shallow burrowing
SREF-07-B EREF-02-C
2 cm 2 cm
aRPD
Fine sand
Silt-clay

24
Monitoring Survey at the Portland Disposal Site September 2016
Figure 3-9. Mean station camera prism penetration depths (cm) at the PDS reference area stations

25
Monitoring Survey at the Portland Disposal Site September 2016
Figure 3-10. Mean station small-scale boundary roughness values (cm) at the PDS reference area stations

26
Monitoring Survey at the Portland Disposal Site September 2016
(A)
(B) Figure 3-11. Plan view images from the reference areas at (A) Station EREF-03 depicting
burrow openings and small tubes; and (B) Station SREF-07 depicting a cluster of small tubes
PV-SREF-07-D Image width ~ 0.5 m
PV-EREF-03-A Image width ~ 0.5 m
Mound
Burrows

27
Monitoring Survey at the Portland Disposal Site September 2016
Figure 3-12. Mean station aRPD depth values (cm) at the PDS reference area stations
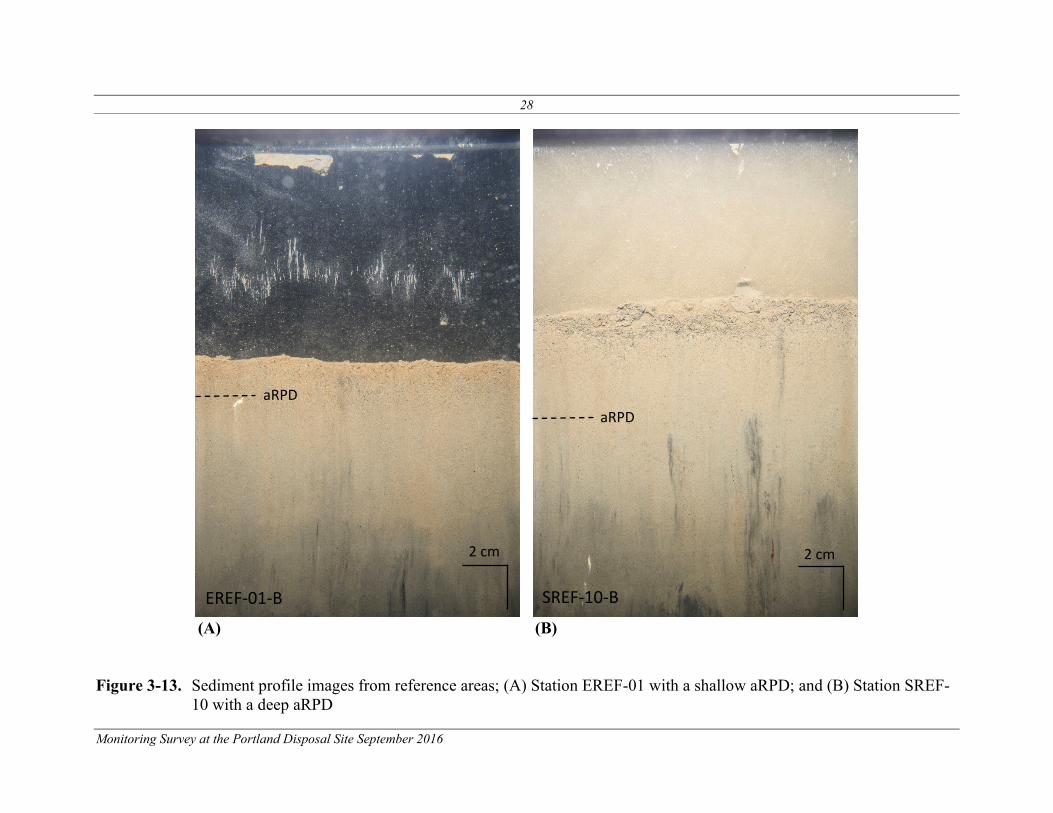
28
Monitoring Survey at the Portland Disposal Site September 2016
(A) (B)
Figure 3-13. Sediment profile images from reference areas; (A) Station EREF-01 with a shallow aRPD; and (B) Station SREF-
10 with a deep aRPD
SREF-10-B EREF-01-B
2 cm 2 cm
aRPD aRPD

29
Monitoring Survey at the Portland Disposal Site September 2016
Figure 3-14. Infaunal successional stages found at the PDS reference area stations

30
Monitoring Survey at the Portland Disposal Site September 2016
(A) (B)
Figure 3-15. Sediment profile images from (A) Station EREF-02 indicating Stage 2 on 3 fauna with shallow burrows and deep
feeding voids; and (B) Station EREF-05 indicating Stage 1 on 3 fauna represented by small tubes at the sediment–water interface and feeding void at depth
EREF-05-A EREF-02-A
2 cm 2 cm
Tubes
Void Void

31
Monitoring Survey at the Portland Disposal Site September 2016
Figure 3-16. Mean depth (cm) of subsurface feeding voids at the PDS reference area stations

32
Monitoring Survey at the Portland Disposal Site September 2016
Figure 3-17. Sediment grain size major mode (phi units) at the PDS disposal area stations
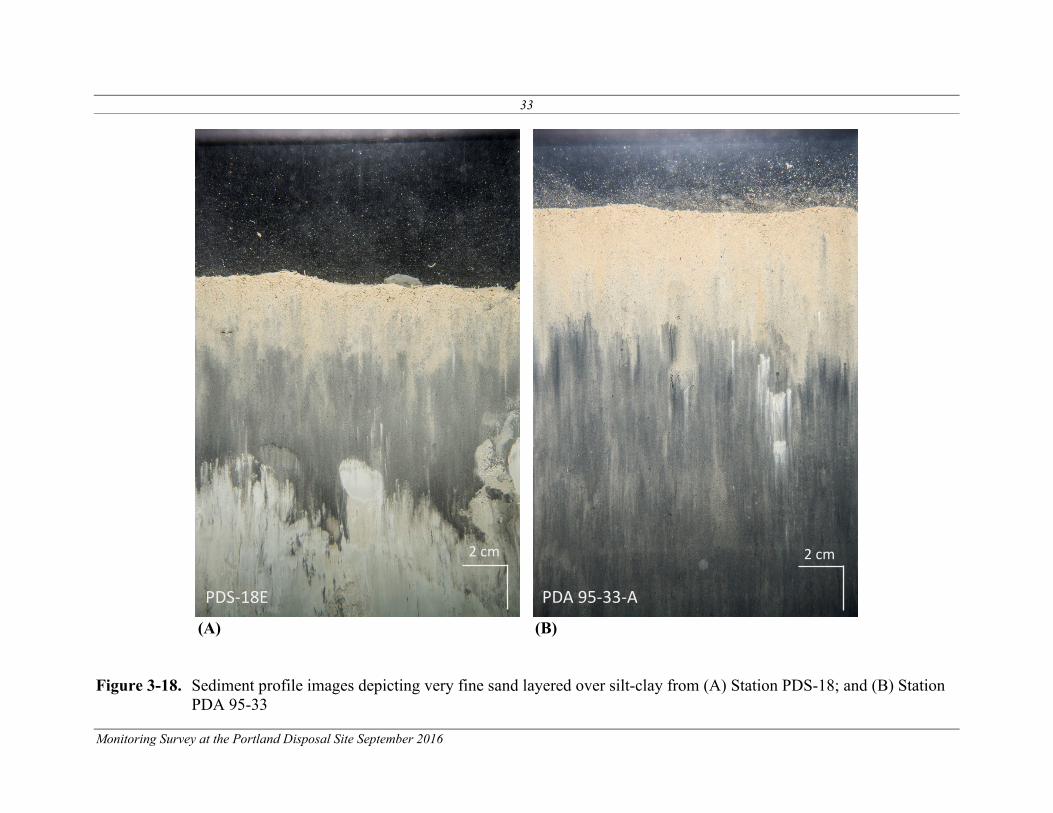
33
Monitoring Survey at the Portland Disposal Site September 2016
(A) (B)
Figure 3-18. Sediment profile images depicting very fine sand layered over silt-clay from (A) Station PDS-18; and (B) Station
PDA 95-33
PDA 95-33-A PDS-18E
2 cm 2 cm

34
Monitoring Survey at the Portland Disposal Site September 2016
(A) (B) (C)
Figure 3-19. Sediment profile images from disposal area PDA A (A) Station PDA A-01 depicting fine sand; (B) Station PDA A-03 depicting fine sand over silt-clay; and (C) Station PDA A-05 depicting very fine sand over silt/clay
PDA A-01-B PDA A-03-C PDA A-05-B
2 cm 2 cm 2 cm

35
Monitoring Survey at the Portland Disposal Site September 2016
Figure 3-20. Mean station camera prism penetration depths (cm) at the PDS disposal area stations

36
Monitoring Survey at the Portland Disposal Site September 2016
(A) (B)
Figure 3-21. Sediment profile images from disposal areas; (A) Station PDA A-01 showing shallow prism penetration due to
sediment consolidation; and (B) Station PDA A-04 showing shell fragments in the sediment
PDA A-04-C PDA A-01-C
2 cm 2 cm

37
Monitoring Survey at the Portland Disposal Site September 2016
Figure 3-22. Mean dredged material thickness at the PDS disposal area stations

38
Monitoring Survey at the Portland Disposal Site September 2016
(A) (B) (C)
Figure 3-23. Sediment profile images from disposal areas; (A) Station PDA 95-30 with dredged material being biologically reworked to resemble ambient sediment near sediment–water interface; (B) Station PDS-19 with a thick layer of dredged material extending beyond camera prism penetration depth; and (C) Station PDA A-05 with patchy dredged material
PDA 95-30-B PDS-19-B PDA A-05-A
2 cm 2 cm 2 cm

39
Monitoring Survey at the Portland Disposal Site September 2016
Figure 3-24. Mean station small-scale boundary roughness values (cm) at the PDS disposal area stations

40
Monitoring Survey at the Portland Disposal Site September 2016
(A) (B)
Figure 3-25. (A) Sediment profile image from Station PDA A-05 depicting Stage 1 tubes at the sediment–water interface; and
(B) plan view image from Station PDA 95-29 depicting burrows
PV-PDA 95-29-A PDA A-05-A
2 cm Burrows
Tubes
Image width ~ 0.4 m

41
Monitoring Survey at the Portland Disposal Site September 2016
Figure 3-26. Mean station aRPD depth values (cm) at the PDS disposal area stations

42
Monitoring Survey at the Portland Disposal Site September 2016
(A) (B) (C)
Figure 3-27. Sediment profile images depicting typical aRPD depth across disposal areas at (A) Station PDA A-03; (B) Station PDS-09; and (C) Station PDA 95-30
PDA A-03-C PDS-09-A PDA 95-30-A
2 cm 2 cm 2 cm
aRPD aRPD
aRPD

43
Monitoring Survey at the Portland Disposal Site September 2016
Figure 3-28. Infaunal successional stages found at the PDS disposal area stations

44
Monitoring Survey at the Portland Disposal Site September 2016
(A) (B)
Figure 3-29. Sediment profile images showing evidence of Stage 3 fauna at (A) Station PDS-17 showing open feeding voids;
and (B) Station PDA 95-28 showing infilled feeding voids
PDA 95-28-A PDS-17-F
2 cm 2 cm
Infilled Voids
Voids

45
Monitoring Survey at the Portland Disposal Site September 2016
(A) (B) (C)
Figure 3-30. Sediment profile images showing successional stages at (A) Station PDA A-02 showing Stage 1 transitioning to Stage 2 and (B) Station PDA A-05 showing Stage 2 fauna; and (C) Station PDA A-03 showing evidence of Stage 3 fauna
PDA A-02-A PDA A-05-A PDA A-03-D
2 cm 2 cm 2 cm
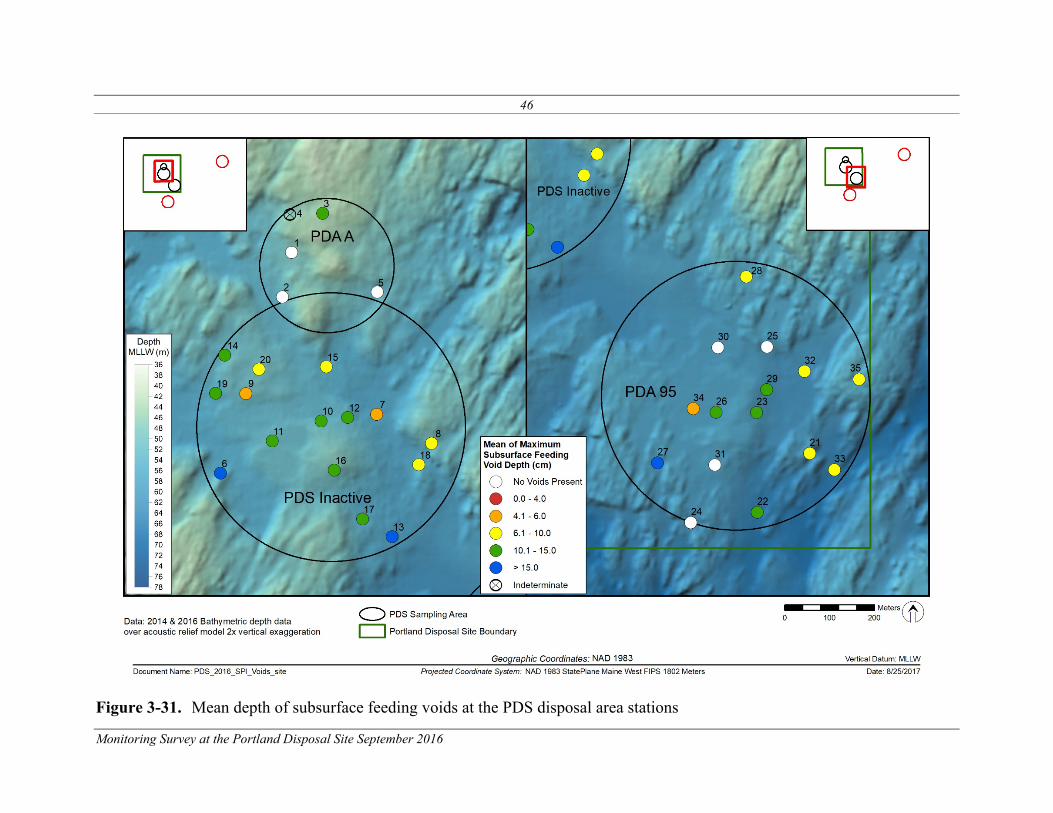
46
Monitoring Survey at the Portland Disposal Site September 2016
Figure 3-31. Mean depth of subsurface feeding voids at the PDS disposal area stations

47
Monitoring Survey at the Portland Disposal Site September 2016
Figure 3-32. Boxplots showing the distribution of mean aRPD depths measured at the disposal site and reference area stations
in the 2016 survey

48
Monitoring Survey at the Portland Disposal Site September 2016
Figure 3-33. Boxplots showing the distribution of mean aRPD depths measured at the disposal area stations and reference area
stations in the 2014 and 2016 surveys
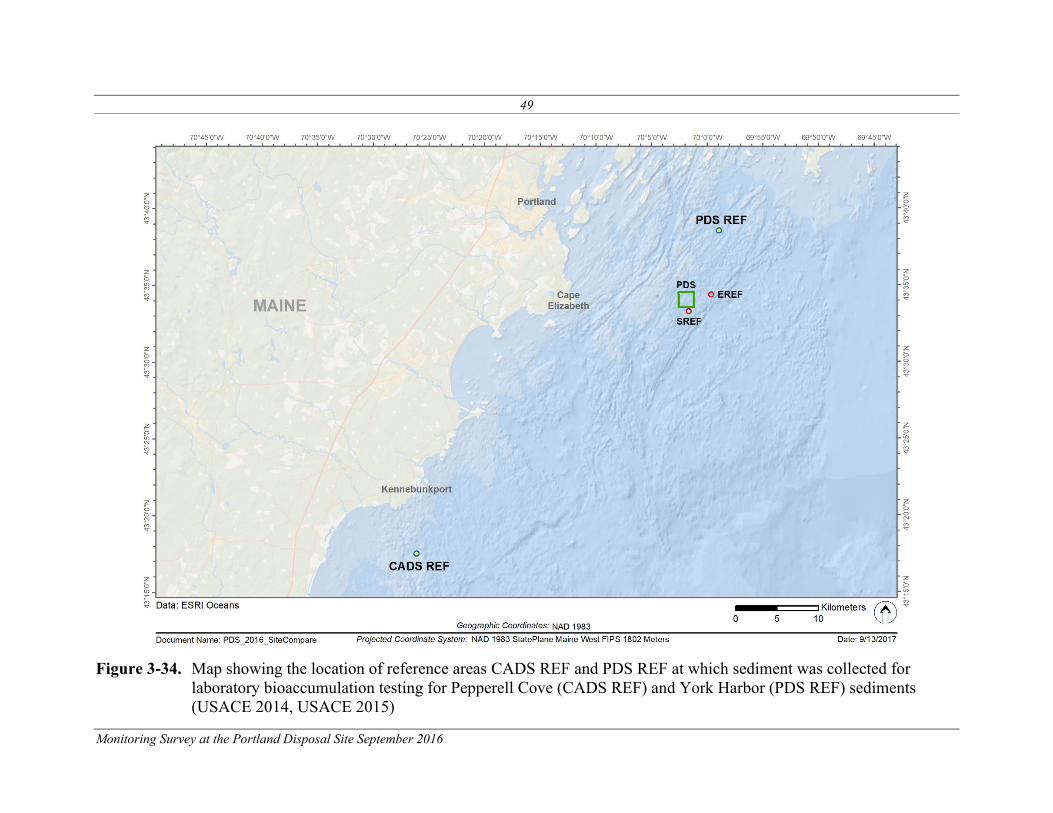
49
Monitoring Survey at the Portland Disposal Site September 2016
Figure 3-34. Map showing the location of reference areas CADS REF and PDS REF at which sediment was collected for laboratory bioaccumulation testing for Pepperell Cove (CADS REF) and York Harbor (PDS REF) sediments (USACE 2014, USACE 2015)

50
Monitoring Survey at the Portland Disposal Site September 2016
Figure 3-35. Percent fines in sediments from PDS 2016
Error bars represent one standard deviation around the mean.

51
Monitoring Survey at the Portland Disposal Site September 2016
Figure 3-36. Percent total organic carbon in sediments from PDS 2016
Error bars represent one standard deviation around the mean.

52
Monitoring Survey at the Portland Disposal Site September 2016
Figure 3-37. Total PAH (μg/kg dry-wt.) in sediments from PDS 2016

53
Monitoring Survey at the Portland Disposal Site September 2016
Figure 3-38. Total PCB (μg/kg dry-wt.) in sediments from PDS 2016

54
Monitoring Survey at the Portland Disposal Site September 2016
Figure 3-39a. Total DDX (μg/kg dry-wt.) in sediments from PDS 2016

55
Monitoring Survey at the Portland Disposal Site September 2016
Figure 3-39b. Chlordane (μg/kg dry-wt.) in sediments from PDS 2016

56
Monitoring Survey at the Portland Disposal Site September 2016
Figure 3-39c. Dieldrin (μg/kg dry-wt.) in sediments from PDS 2016
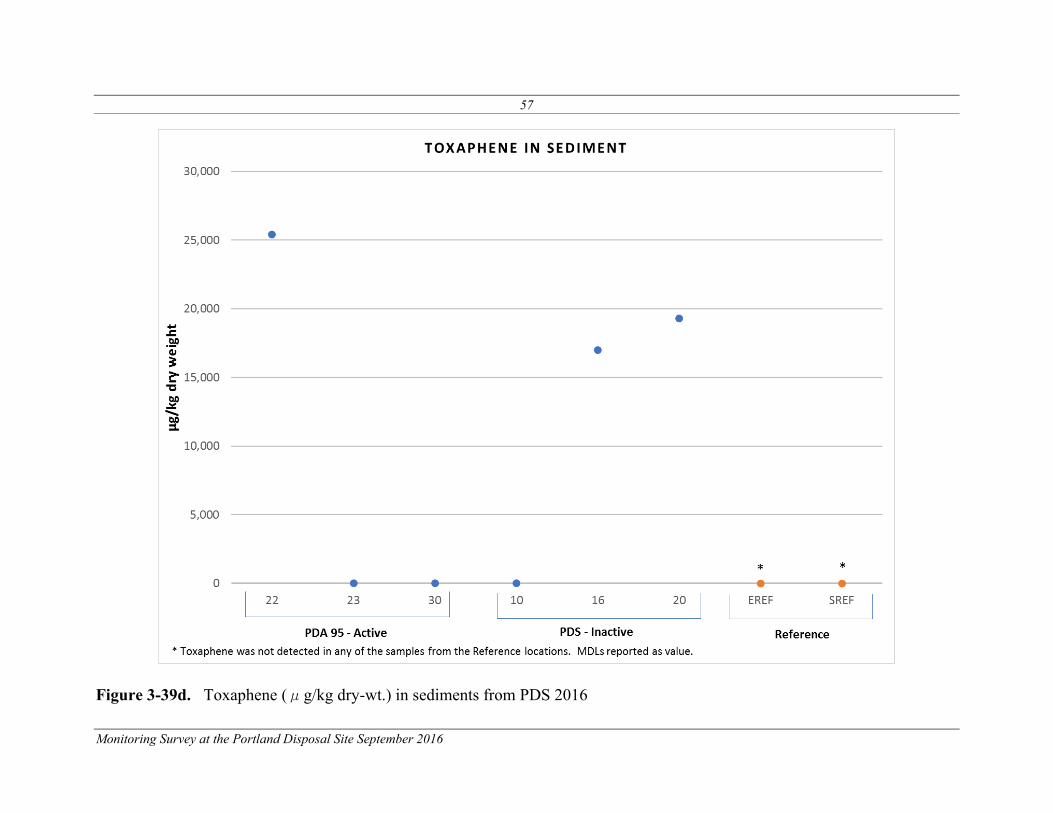
57
Monitoring Survey at the Portland Disposal Site September 2016
Figure 3-39d. Toxaphene (μg/kg dry-wt.) in sediments from PDS 2016

58
Monitoring Survey at the Portland Disposal Site September 2016
Figure 3-40a. Arsenic (mg/kg dry-wt.) in sediments from PDS 2016
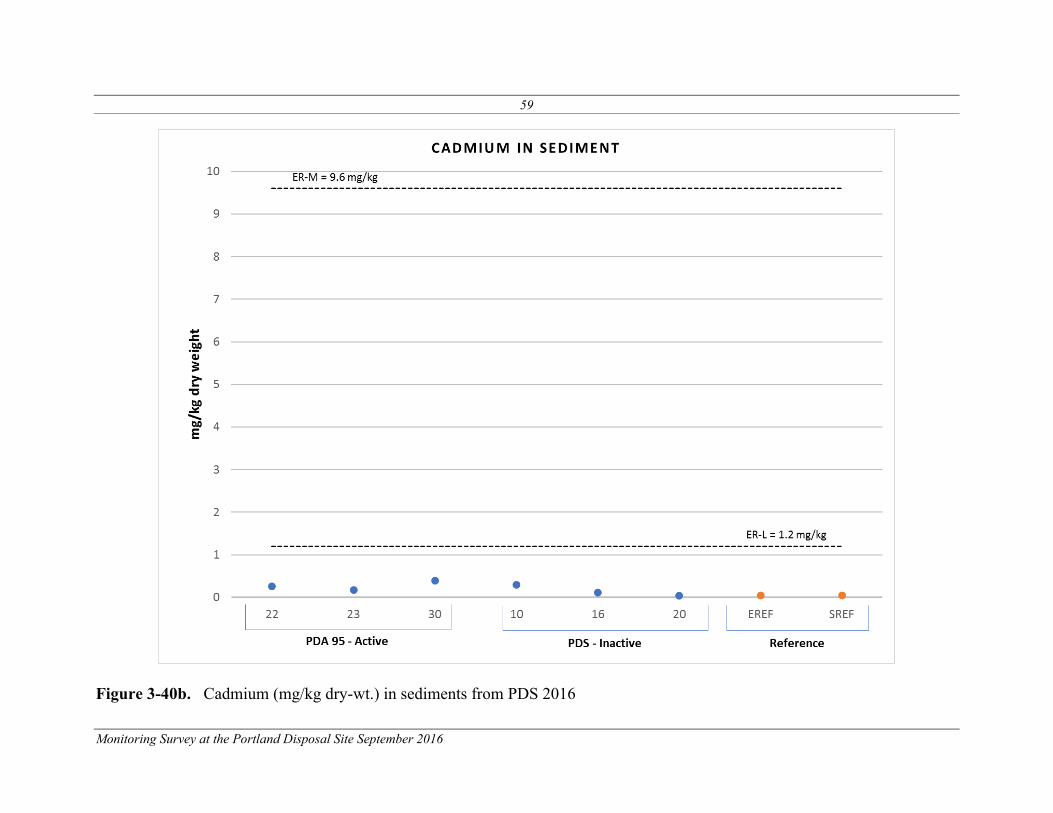
59
Monitoring Survey at the Portland Disposal Site September 2016
Figure 3-40b. Cadmium (mg/kg dry-wt.) in sediments from PDS 2016
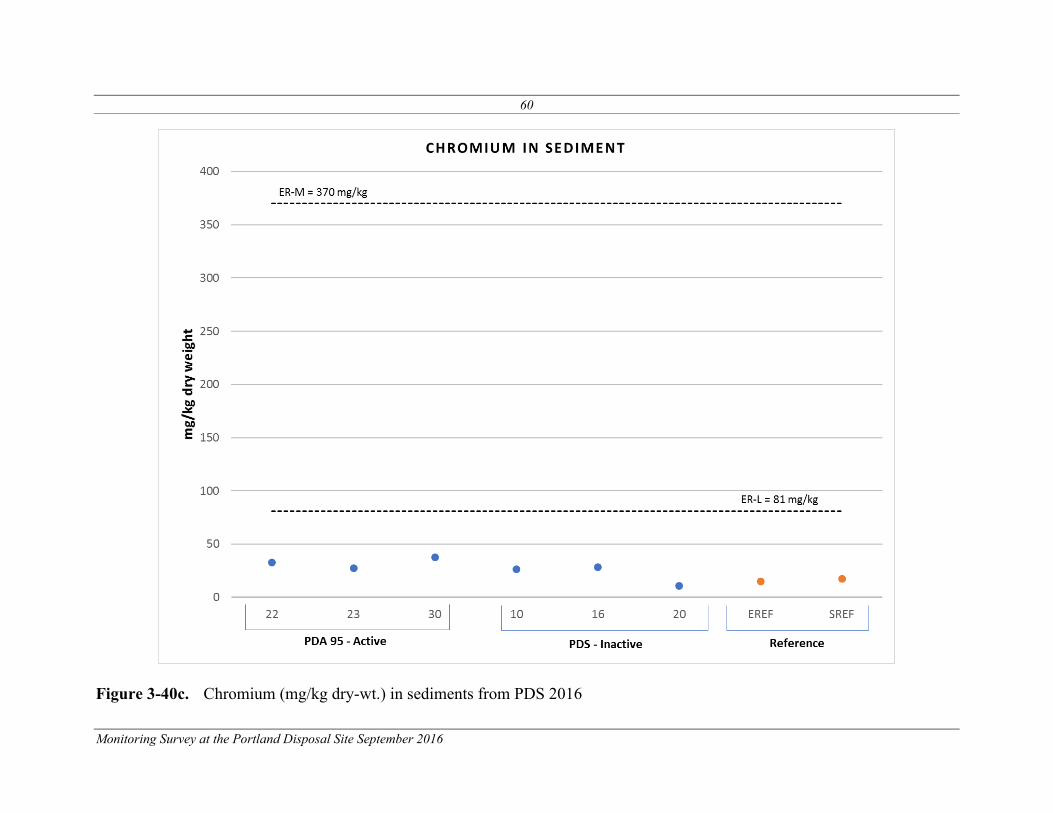
60
Monitoring Survey at the Portland Disposal Site September 2016
Figure 3-40c. Chromium (mg/kg dry-wt.) in sediments from PDS 2016

61
Monitoring Survey at the Portland Disposal Site September 2016
Figure 3-40d. Copper (mg/kg dry-wt.) in sediments from PDS 2016

62
Monitoring Survey at the Portland Disposal Site September 2016
Figure 3-40e. Lead (mg/kg dry-wt.) in sediments from PDS 2016

63
Monitoring Survey at the Portland Disposal Site September 2016
Figure 3-40f. Mercury (mg/kg dry-wt.) in sediments from PDS 2016
Error bars represent one standard deviation around the mean.

64
Monitoring Survey at the Portland Disposal Site September 2016
Figure 3-40g. Nickel (mg/kg dry-wt.) in sediments from PDS 2016
Error bars represent one standard deviation around the mean.

65
Monitoring Survey at the Portland Disposal Site September 2016
Figure 3-40h. Zinc (mg/kg dry-wt.) in sediments from PDS 2016
Error bars represent one standard deviation around the mean.

66
Monitoring Survey at the Portland Disposal Site September 2016
Figure 3-41. Percent lipids in tissue from PDS 2016

67
Monitoring Survey at the Portland Disposal Site September 2016
Figure 3-42. Total PAH (μg/kg wet-wt.) in tissue from PDS 2016
Error bars represent one standard deviation around the mean.

68
Monitoring Survey at the Portland Disposal Site September 2016
Figure 3-43. Total PCB (μg/kg wet-wt.) in tissue from PDS 2016
Error bars represent one standard deviation around the mean.

69
Monitoring Survey at the Portland Disposal Site September 2016
Figure 3-44a. Total DDX (μg/kg wet-wt.) in tissue from PDS 2016
Error bars represent one standard deviation around the mean.

70
Monitoring Survey at the Portland Disposal Site September 2016
Figure 3-44b. Endosulfan (μg/kg wet-wt.) in tissue from PDS 2016
Error bars represent one standard deviation around the mean.

71
Monitoring Survey at the Portland Disposal Site September 2016
Figure 3-44c. Chlordane (μg/kg wet-wt.) in tissue from PDS 2016
Error bars represent one standard deviation around the mean.

72
Monitoring Survey at the Portland Disposal Site September 2016
Figure 3-44d. Dieldrin (μg/kg wet-wt.) in tissue from PDS 2016
Error bars represent one standard deviation around the mean.
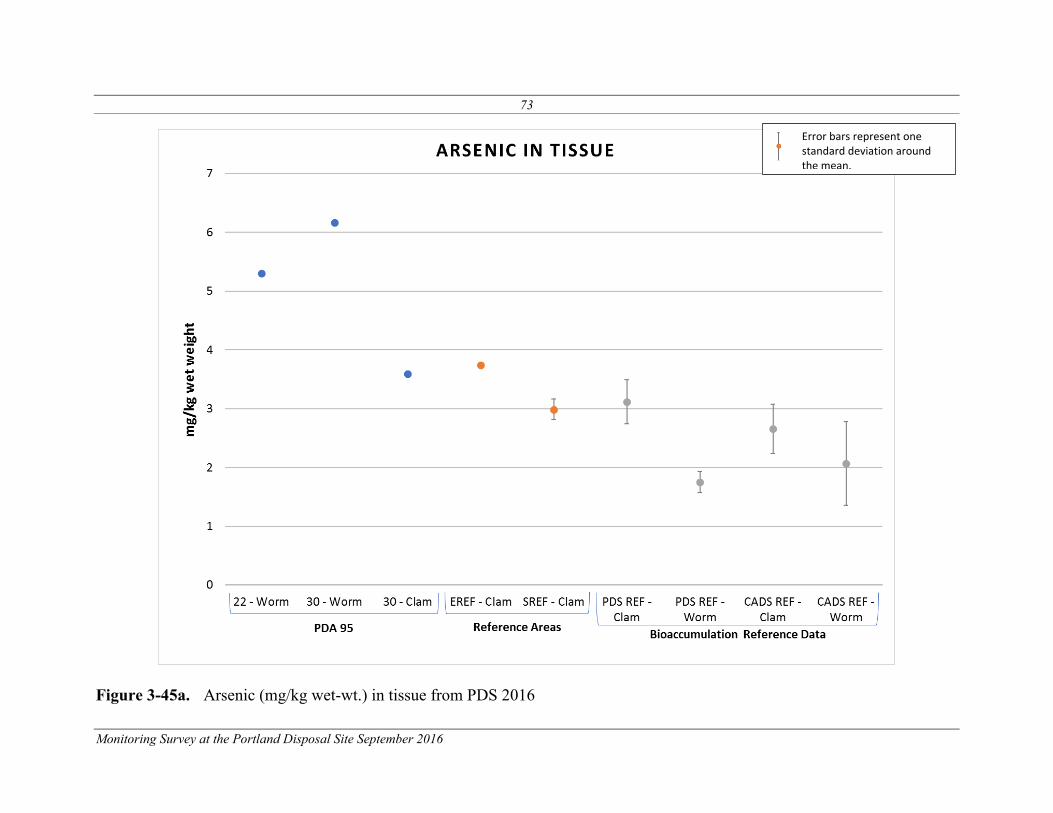
73
Monitoring Survey at the Portland Disposal Site September 2016
Figure 3-45a. Arsenic (mg/kg wet-wt.) in tissue from PDS 2016
Error bars represent one standard deviation around the mean.

74
Monitoring Survey at the Portland Disposal Site September 2016
Figure 3-45b. Cadmium (mg/kg wet-wt.) in tissue from PDS 2016
Error bars represent one standard deviation around the mean.

75
Monitoring Survey at the Portland Disposal Site September 2016
Figure 3-45c. Chromium (mg/kg wet-wt.) in tissue from PDS 2016
Error bars represent one standard deviation around the mean.

76
Monitoring Survey at the Portland Disposal Site September 2016
Figure 3-45d. Copper (mg/kg wet-wt.) in tissue from PDS 2016
Error bars represent one standard deviation around the mean.
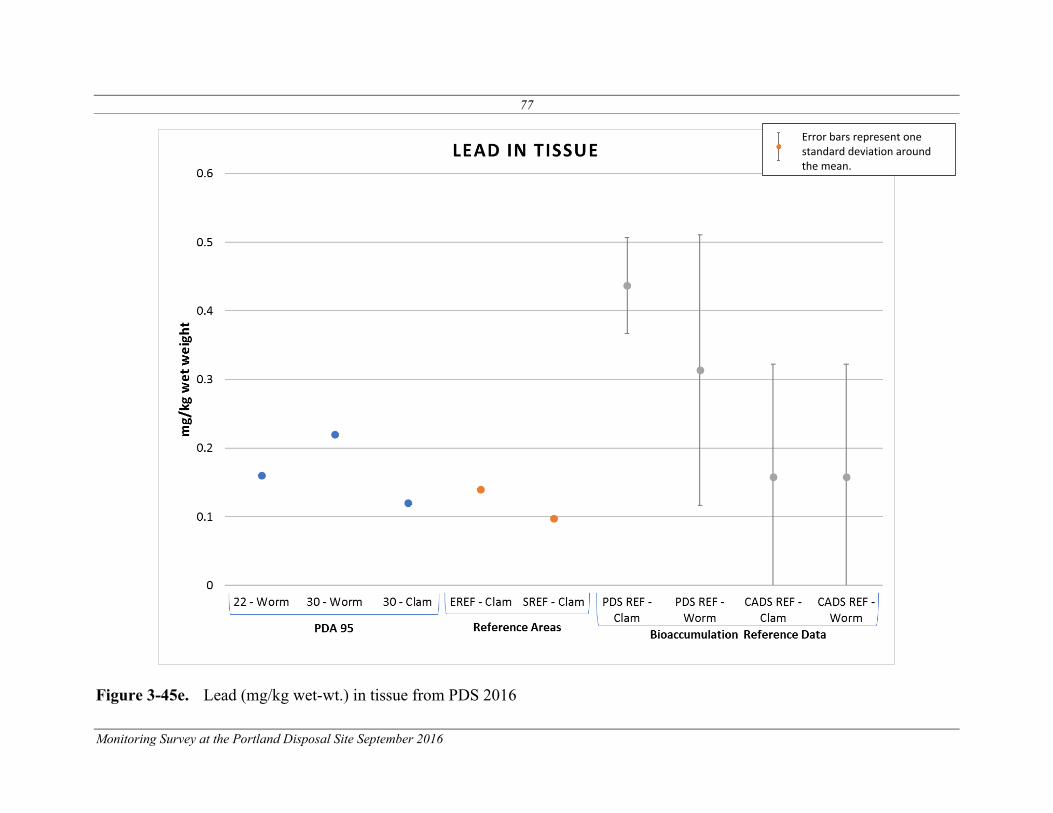
77
Monitoring Survey at the Portland Disposal Site September 2016
Figure 3-45e. Lead (mg/kg wet-wt.) in tissue from PDS 2016
Error bars represent one standard deviation around the mean.

78
Monitoring Survey at the Portland Disposal Site September 2016
Figure 3-45f. Mercury (mg/kg wet-wt.) in tissue from PDS 2016
Error bars represent one standard deviation around the mean.

79
Monitoring Survey at the Portland Disposal Site September 2016
Figure 3-45g. Nickel (mg/kg wet-wt.) in tissue from PDS 2016
Error bars represent one standard deviation around the mean.

80
Monitoring Survey at the Portland Disposal Site September 2016
Figure 3-45h. Zinc (mg/kg wet-wt.) in tissue from PDS 2016
Error bars represent one standard deviation around the mean.

81
Monitoring Survey at the Portland Disposal Site September 2016
Figure 3-46. Surface marker buoy observations during the acoustic survey at PDS – September 2016

82
Monitoring Survey at the Portland Disposal Site September 2016
Figure 4-1. Capacity estimates at PDS
Capacity ~6 million m3 with 5-m thick deposit
Capacity ~10 million m3 with 10-m thick deposit
Capacity ~12 million m3 with 15-m thick deposit
Hypothetical extents of future disposals were estimated assuming uniform deposits of 5-m, 10-m and 15-m thickness with a maximum slope between the deposited materials and the ambient seafloor of 3-degrees (rise/run of 1/19) to leave a variable buffer zone between the mound and the site boundary. The relationships between buffer zone width, remaining site area, and hypothetical deposit thickness were modeled and suggested maximal capacity at a thickness of approximately 15 m. The thicker deposit offset the larger buffer zone required for the side slope to avoid impacting hard bottom areas. Areas delimiting the potential extent of future placements between apparent ledge outcrops are shaded gray/white.

MONITORING SURVEY AT THE PORTLAND DISPOSAL SITE
SEPTEMBER 2016
APPENDICES
CONTRIBUTION #203
July 2021
Contract No. W912WJ-12-D-0004
Submitted to:
New England District U.S. Army Corps of Engineers
696 Virginia Road Concord, MA 01742-2751
Prepared by:
141 Longwater Drive, Suite 202 Norwell, MA 02061
315 Broadway Newport, RI 02840
Monitoring Survey at the Portland Disposal Site September 2016
LIST OF APPENDICES
APPENDIX A TABLE OF COMMON CONVERSIONS
APPENDIX B PDS DISPOSAL LOG DATA FROM OCT 2014 TO DEC 2015
APPENDIX C ACTUAL SPI/PV AND SEDIMENT GRAB REPLICATE
LOCATIONS
APPENDIX D SPI/PV FIELD LOG
APPENDIX E SEDIMENT PROFILE AND PLAN VIEW IMAGE ANALYSIS
RESULTS
APPENDIX F GRAIN SIZE SCALE FOR SEDIMENTS
APPENDIX G SEDIMENT CHEMISTRY LAB RESULTS
APPENDIX H TISSUE CHEMISTRY LAB RESULTS
APPENDIX I BENTHIC COMMUNITY ANALYSIS RESULTS
Monitoring Survey at the Portland Disposal Site September 2016
APPENDIX A
TABLE OF COMMON CONVERSIONS

Monitoring Survey at the Portland Disposal Site September 2016
APPENDIX A
TABLE OF COMMON CONVERSIONS
Metric Unit Conversion to English Unit English Unit Conversion to Metric Unit
1 meter
1 m
3.2808 ft 1 foot
1 ft
0.3048 m
1 square meter
1 m2
10.7639 ft2 1 square foot
1 ft2
0.0929 m2
1 kilometer
1 km
0.6214 mi 1 mile
1 mi
1.6093 km
1 cubic meter
1 m3
1.3080 yd3 1 cubic yard
1 yd3
0.7646 m3
1 centimeter
1 cm
0.3937 in 1 inch
1 in
2.54 cm

Monitoring Survey at the Portland Disposal Site September 2016
APPENDIX B
PDS DISPOSAL LOG DATA FROM OCT 2014 TO DEC 2015

Portland Disposal Site Disposal Logs Oct 2014 to December 2016
Placement
site name
Placement
locationProject name Permit number Target Site Code Placement date/time Placement latitude Placement longitude City/town State
Load voume
(cubic meters)
Load volume
(cubic yards)
DQM trip
numberPlacement ID
PDS PDA 95 Royal River Boat Yard W912WJ‐14‐C‐0022 PDS 14/15/16 10/21/2014 16:42 43.56288 ‐70.0244 Yarmouth ME 940 1,230 3729682 56635
PDS PDA 95 Royal River Boat Yard W912WJ‐14‐C‐0022 PDS 14/15/16 10/25/2014 15:20 43.56353 ‐70.02555 Yarmouth ME 940 1,230 3729698 56636
PDS PDA 95 Royal River Boat Yard W912WJ‐14‐C‐0022 PDS 14/15/16 10/26/2014 19:14 43.56312 ‐70.02465 Yarmouth ME 940 1,230 3729727 56637
PDS PDA 95 Royal River Boat Yard W912WJ‐14‐C‐0022 PDS 14/15/16 10/27/2014 17:59 43.5631 ‐70.02538 Yarmouth ME 940 1,230 4642477 56677
PDS PDA 95 Royal River Boat Yard W912WJ‐14‐C‐0022 PDS 14/15/16 10/27/2014 20:19 43.56292 ‐70.02465 Yarmouth ME 940 1,230 3729728 56638
PDS PDA 95 Royal River Boat Yard W912WJ‐14‐C‐0022 PDS 14/15/16 10/28/2014 21:15 43.5633 ‐70.02445 Yarmouth ME 940 1,230 3729750 56639
PDS PDA 95 Royal River Boat Yard W912WJ‐14‐C‐0022 PDS 14/15/16 10/29/2014 22:47 43.5629 ‐70.0245 Yarmouth ME 940 1,230 3729751 56640
PDS PDA 95 Royal River Boat Yard W912WJ‐14‐C‐0022 PDS 14/15/16 10/30/2014 23:05 43.56318 ‐70.0247 Yarmouth ME 940 1,230 3729762 56641
PDS PDA 95 Royal River Boat Yard W912WJ‐14‐C‐0022 PDS 14/15/16 10/31/2014 23:48 43.56315 ‐70.02417 Yarmouth ME 940 1,230 3729782 56642
PDS PDA 95 Royal River Boat Yard W912WJ‐14‐C‐0022 PDS 14/15/16 11/4/2014 3:34 43.56365 ‐70.02493 Yarmouth ME 940 1,230 3730083 56643
PDS PDA 95 Yankee Marina NAE‐2004‐2397 PDS 14/15/16 11/5/2014 12:15 43.56335 ‐70.02422 Yarmouth ME 581 760 1 56309
PDS PDA 95 Royal River Boat Yard W912WJ‐14‐C‐0022 PDS 14/15/16 11/5/2014 18:02 43.56268 ‐70.02515 Yarmouth ME 940 1,230 3730093 56644
PDS PDA 95 Royal River Boat Yard W912WJ‐14‐C‐0022 PDS 14/15/16 11/6/2014 17:30 43.5634 ‐70.02487 Yarmouth ME 940 1,230 3730105 56645
PDS PDA 95 Royal River Boat Yard W912WJ‐14‐C‐0022 PDS 14/15/16 11/7/2014 19:46 43.56238 ‐70.02455 Yarmouth ME 940 1,230 3730116 56646
PDS PDA 95 Royal River Boat Yard W912WJ‐14‐C‐0022 PDS 14/15/16 11/8/2014 19:30 43.56375 ‐70.02438 Yarmouth ME 940 1,230 3730117 56647
PDS PDA 95 Royal River Boat Yard W912WJ‐14‐C‐0022 PDS 14/15/16 11/9/2014 21:00 43.56377 ‐70.02395 Yarmouth ME 940 1,230 3730127 56648
PDS PDA 95 Yankee Marina NAE‐2004‐2397 PDS 14/15/16 11/10/2014 4:04 43.56337 ‐70.0244 Yarmouth ME 581 760 2 56310
PDS PDA 95 Yankee Marina NAE‐2004‐2397 PDS 14/15/16 11/10/2014 16:51 43.56288 ‐70.02397 Yarmouth ME 581 760 3 56311
PDS PDA 95 Royal River Boat Yard W912WJ‐14‐C‐0022 PDS 14/15/16 11/10/2014 20:41 43.5635 ‐70.02448 Yarmouth ME 940 1,230 3730137 56649
PDS PDA 95 Yankee Marina NAE‐2004‐2397 PDS 14/15/16 11/11/2014 16:57 43.56327 ‐70.02497 Yarmouth ME 581 760 4 56312
PDS PDA 95 Royal River Boat Yard W912WJ‐14‐C‐0022 PDS 14/15/16 11/11/2014 22:02 43.56388 ‐70.02438 Yarmouth ME 940 1,230 3730147 56650
PDS PDA 95 Yankee Marina NAE‐2004‐2397 PDS 14/15/16 11/12/2014 17:45 43.56328 ‐70.02433 Yarmouth ME 581 760 5 56313
PDS PDA 95 Royal River Boat Yard W912WJ‐14‐C‐0022 PDS 14/15/16 11/12/2014 23:08 43.56368 ‐70.0238 Yarmouth ME 940 1,230 3730157 56651
PDS PDA 95 Yankee Marina NAE‐2004‐2397 PDS 14/15/16 11/13/2014 17:07 43.56498 ‐70.02447 Yarmouth ME 581 760 6 56314
PDS PDA 95 Royal River Boat Yard W912WJ‐14‐C‐0022 PDS 14/15/16 11/13/2014 23:41 43.56357 ‐70.02548 Yarmouth ME 940 1,230 3730168 56652
PDS PDA 95 Royal River Boat Yard W912WJ‐14‐C‐0022 PDS 14/15/16 11/14/2014 23:55 43.5631 ‐70.02458 Yarmouth ME 940 1,230 3730169 56653
PDS PDA 95 Yankee Marina NAE‐2004‐2397 PDS 14/15/16 11/15/2014 20:00 43.56313 ‐70.02495 Yarmouth ME 581 760 7 56315
PDS PDA 95 Royal River Boat Yard W912WJ‐14‐C‐0022 PDS 14/15/16 11/16/2014 0:34 43.56283 ‐70.02395 Yarmouth ME 940 1,230 3730179 56654
PDS PDA 95 Royal River Boat Yard W912WJ‐14‐C‐0022 PDS 14/15/16 11/17/2014 10:09 43.56347 ‐70.02402 Yarmouth ME 940 1,230 3730189 56655
PDS PDA 95 Royal River Boat Yard W912WJ‐14‐C‐0022 PDS 14/15/16 11/19/2014 18:01 43.56325 ‐70.02363 Yarmouth ME 940 1,230 3730199 56656
PDS PDA 95 Royal River Boat Yard W912WJ‐14‐C‐0022 PDS 14/15/16 11/20/2014 18:40 43.56273 ‐70.02383 Yarmouth ME 940 1,230 3730209 56657
PDS PDA 95 Yankee Marina NAE‐2004‐2397 PDS 14/15/16 11/21/2014 14:27 43.5635 ‐70.02438 Yarmouth ME 581 760 8 56316
PDS PDA 95 Yankee Marina NAE‐2004‐2397 PDS 14/15/16 11/22/2014 3:07 43.5631 ‐70.02355 Yarmouth ME 581 760 9 56317
PDS PDA 95 Royal River Boat Yard W912WJ‐14‐C‐0022 PDS 14/15/16 11/23/2014 19:44 43.5628 ‐70.02452 Yarmouth ME 940 1,230 3730228 56658
PDS PDA 95 Yankee Marina NAE‐2004‐2397 PDS 14/15/16 11/24/2014 4:06 43.56358 ‐70.02467 Yarmouth ME 581 760 10 56318
PDS PDA 95 Royal River Boat Yard W912WJ‐14‐C‐0022 PDS 14/15/16 11/25/2014 22:38 43.56282 ‐70.0238 Yarmouth ME 940 1,230 3719412 56613
PDS PDA 95 Royal River Boat Yard W912WJ‐14‐C‐0022 PDS 14/15/16 11/26/2014 15:46 43.56258 ‐70.02413 Yarmouth ME 940 1,230 3730237 56660
PDS PDA 95 Yankee Marina NAE‐2004‐2397 PDS 14/15/16 11/28/2014 18:53 43.56348 ‐70.02488 Yarmouth ME 581 760 11 56319
PDS PDA 95 Yankee Marina NAE‐2004‐2397 PDS 14/15/16 11/29/2014 19:30 43.5635 ‐70.02478 Yarmouth ME 581 760 12 56320
PDS PDA 95 Royal River Boat Yard W912WJ‐14‐C‐0022 PDS 14/15/16 11/30/2014 0:57 43.563 ‐70.02422 Yarmouth ME 940 1,230 3719425 56614
PDS PDA 95 Royal River Boat Yard W912WJ‐14‐C‐0022 PDS 14/15/16 12/1/2014 17:46 43.5634 ‐70.02353 Yarmouth ME 940 1,230 3730247 56661
PDS PDA 95 Royal River Boat Yard W912WJ‐14‐C‐0022 PDS 14/15/16 12/2/2014 2:52 43.5625 ‐70.02435 Yarmouth ME 940 1,230 3719426 56615
PDS PDA 95 Yankee Marina NAE‐2004‐2397 PDS 14/15/16 12/2/2014 9:29 43.5634 ‐70.02465 Yarmouth ME 581 760 13 56321
PDS PDA 95 Royal River Boat Yard W912WJ‐14‐C‐0022 PDS 14/15/16 12/4/2014 12:37 43.56407 ‐70.02497 Yarmouth ME 940 1,230 3730256 56662
PDS Outlier Royal River Boat Yard W912WJ‐14‐C‐0022 PDS 14/15/16 12/4/2014 18:31 43.58265 ‐70.03685 Yarmouth ME 940 1,230 3719437 56616
PDS PDA 95 Yankee Marina NAE‐2004‐2397 PDS 14/15/16 12/5/2014 0:48 43.5634 ‐70.02465 Yarmouth ME 581 760 14 56322
PDS PDA 95 Royal River Boat Yard W912WJ‐14‐C‐0022 PDS 14/15/16 12/5/2014 5:20 43.56325 ‐70.02445 Yarmouth ME 940 1,230 3730265 56663
PDS PDA 95 Yankee Marina NAE‐2004‐2397 PDS 14/15/16 12/5/2014 13:45 43.56348 ‐70.02448 Yarmouth ME 581 760 15 56323
PDS PDA 95 Royal River Boat Yard W912WJ‐14‐C‐0022 PDS 14/15/16 12/5/2014 18:14 43.56278 ‐70.02475 Yarmouth ME 940 1,230 3719448 56617
PDS PDA 95 Royal River Boat Yard W912WJ‐14‐C‐0022 PDS 14/15/16 12/6/2014 7:07 43.56337 ‐70.02555 Yarmouth ME 940 1,230 3730266 56664
PDS PDA 95 Royal River Boat Yard W912WJ‐14‐C‐0022 PDS 14/15/16 12/6/2014 19:37 43.56277 ‐70.02435 Yarmouth ME 940 1,230 3719459 56618
PDS PDA 95 Royal River Boat Yard W912WJ‐14‐C‐0022 PDS 14/15/16 12/7/2014 19:15 43.56263 ‐70.02462 Yarmouth ME 940 1,230 3730275 56665
PDS PDA 95 Royal River Boat Yard W912WJ‐14‐C‐0022 PDS 14/15/16 12/8/2014 17:10 43.56317 ‐70.02517 Yarmouth ME 940 1,230 3719480 56619
PDS PDA 95 Yankee Marina NAE‐2004‐2397 PDS 14/15/16 12/12/2014 17:22 43.56373 ‐70.025 Yarmouth ME 581 760 16 56324
PDS PDA 95 Royal River Boat Yard W912WJ‐14‐C‐0022 PDS 14/15/16 12/12/2014 23:08 43.5626 ‐70.02425 Yarmouth ME 940 1,230 3730284 56667
PDS PDA 95 Yankee Marina NAE‐2004‐2397 PDS 14/15/16 12/13/2014 6:29 43.56338 ‐70.02497 Yarmouth ME 581 760 17 56325
PDS PDA 95 Royal River Boat Yard W912WJ‐14‐C‐0022 PDS 14/15/16 12/13/2014 14:14 43.5628 ‐70.02457 Yarmouth ME 940 1,230 3719491 56620
Page 1 of 4

Portland Disposal Site Disposal Logs Oct 2014 to December 2016
Placement
site name
Placement
locationProject name Permit number Target Site Code Placement date/time Placement latitude Placement longitude City/town State
Load voume
(cubic meters)
Load volume
(cubic yards)
DQM trip
numberPlacement ID
PDS PDA 95 Yankee Marina NAE‐2004‐2397 PDS 14/15/16 12/13/2014 19:27 43.56368 ‐70.0247 Yarmouth ME 581 760 18 56326
PDS PDA 95 Royal River Boat Yard W912WJ‐14‐C‐0022 PDS 14/15/16 12/13/2014 22:31 43.56335 ‐70.02502 Yarmouth ME 940 1,230 3730294 56668
PDS PDA 95 Yankee Marina NAE‐2004‐2397 PDS 14/15/16 12/14/2014 7:25 43.56385 ‐70.0252 Yarmouth ME 581 760 19 56327
PDS PDA 95 Royal River Boat Yard W912WJ‐14‐C‐0022 PDS 14/15/16 12/14/2014 14:17 43.56327 ‐70.02523 Yarmouth ME 940 1,230 3719502 56621
PDS PDA 95 Yankee Marina NAE‐2004‐2397 PDS 14/15/16 12/14/2014 20:20 43.56325 ‐70.0246 Yarmouth ME 581 760 20 56328
PDS PDA 95 Royal River Boat Yard W912WJ‐14‐C‐0022 PDS 14/15/16 12/14/2014 23:17 43.56303 ‐70.02467 Yarmouth ME 940 1,230 3730303 56669
PDS PDA 95 Yankee Marina NAE‐2004‐2397 PDS 14/15/16 12/15/2014 7:42 43.56368 ‐70.02525 Yarmouth ME 581 760 21 56329
PDS PDA 95 Royal River Boat Yard W912WJ‐14‐C‐0022 PDS 14/15/16 12/15/2014 14:46 43.56308 ‐70.02505 Yarmouth ME 940 1,230 3719503 56622
PDS PDA 95 Royal River Boat Yard W912WJ‐14‐C‐0022 PDS 14/15/16 12/16/2014 0:27 43.56312 ‐70.02473 Yarmouth ME 940 1,230 3730312 56670
PDS PDA 95 Yankee Marina NAE‐2004‐2397 PDS 14/15/16 12/16/2014 11:22 43.56388 ‐70.02508 Yarmouth ME 581 760 22 56330
PDS PDA 95 Royal River Boat Yard W912WJ‐14‐C‐0022 PDS 14/15/16 12/16/2014 12:30 43.5633 ‐70.0249 Yarmouth ME 940 1,230 3719514 56623
PDS PDA 95 Yankee Marina NAE‐2004‐2397 PDS 14/15/16 12/16/2014 23:56 43.56338 ‐70.02485 Yarmouth ME 581 760 23 56331
PDS PDA 95 Yankee Marina NAE‐2004‐2397 PDS 14/15/16 12/17/2014 10:46 43.56445 ‐70.02232 Yarmouth ME 581 760 24 56332
PDS PDA 95 Royal River Boat Yard W912WJ‐14‐C‐0022 PDS 14/15/16 12/17/2014 14:49 43.56328 ‐70.025 Yarmouth ME 940 1,230 3719515 56624
PDS PDA 95 Yankee Marina NAE‐2004‐2397 PDS 14/15/16 12/18/2014 11:42 43.56358 ‐70.02502 Yarmouth ME 581 760 25 56333
PDS PDA 95 Royal River Boat Yard W912WJ‐14‐C‐0022 PDS 14/15/16 12/18/2014 18:20 43.56302 ‐70.02488 Yarmouth ME 940 1,230 3719526 56625
PDS PDA 95 Yankee Marina NAE‐2004‐2397 PDS 14/15/16 12/18/2014 23:48 43.56325 ‐70.02485 Yarmouth ME 581 760 26 56334
PDS PDA 95 Royal River Boat Yard W912WJ‐14‐C‐0022 PDS 14/15/16 12/19/2014 3:04 43.56305 ‐70.02448 Yarmouth ME 940 1,230 3719537 56626
PDS PDA 95 Yankee Marina NAE‐2004‐2397 PDS 14/15/16 12/20/2014 1:04 43.56243 ‐70.02582 Yarmouth ME 581 760 27 56335
PDS PDA 95 Yankee Marina NAE‐2004‐2397 PDS 14/15/16 12/20/2014 13:57 43.56378 ‐70.02502 Yarmouth ME 581 760 28 56336
PDS PDA 95 Royal River Boat Yard W912WJ‐14‐C‐0022 PDS 14/15/16 12/20/2014 17:37 43.5631 ‐70.02523 Yarmouth ME 940 1,230 3719538 56627
PDS PDA 95 Royal River Boatyard ‐ East NAE‐2002‐1020 PDS 14/15/16 12/21/2014 7:13 43.56352 ‐70.02503 Yarmouth ME 226 295 3655590 56292
PDS PDA 95 Royal River Boatyard ‐ East NAE‐2002‐1020 PDS 14/15/16 12/21/2014 18:34 43.56368 ‐70.02483 Yarmouth ME 226 295 3655643 56293
PDS PDA 95 Royal River Boat Yard W912WJ‐14‐C‐0022 PDS 14/15/16 12/21/2014 19:42 43.56293 ‐70.0249 Yarmouth ME 940 1,230 3719549 56628
PDS PDA 95 Royal River Boat Yard W912WJ‐14‐C‐0022 PDS 14/15/16 12/22/2014 1:03 43.56317 ‐70.02502 Yarmouth ME 940 1,230 3730329 56671
PDS PDA 95 Royal River Boatyard ‐ East NAE‐2002‐1020 PDS 14/15/16 12/22/2014 7:04 43.56348 ‐70.02568 Yarmouth ME 226 295 3655660 56115
PDS PDA 95 Royal River Boat Yard W912WJ‐14‐C‐0022 PDS 14/15/16 12/22/2014 18:10 43.56327 ‐70.02497 Yarmouth ME 940 1,230 3719550 56629
PDS PDA 95 Royal River Boatyard ‐ East NAE‐2002‐1020 PDS 14/15/16 12/22/2014 19:13 43.5638 ‐70.0256 Yarmouth ME 226 295 3655695 56116
PDS PDA 95 Royal River Boat Yard W912WJ‐14‐C‐0022 PDS 14/15/16 12/22/2014 23:11 43.56312 ‐70.02503 Yarmouth ME 940 1,230 3730339 56672
PDS PDA 95 Royal River Boatyard ‐ East NAE‐2002‐1020 PDS 14/15/16 12/27/2014 11:22 43.56438 ‐70.02522 Yarmouth ME 226 295 3655696 56117
PDS PDA 95 Royal River Boatyard ‐ East NAE‐2002‐1020 PDS 14/15/16 12/27/2014 22:34 43.5641 ‐70.02487 Yarmouth ME 226 295 3655708 56118
PDS PDA 95 Royal River Boatyard ‐ East NAE‐2002‐1020 PDS 14/15/16 12/29/2014 14:48 43.56407 ‐70.02487 Yarmouth ME 226 295 3655719 56119
PDS PDA 95 Royal River Boat Yard W912WJ‐14‐C‐0022 PDS 14/15/16 12/29/2014 23:40 43.56348 ‐70.02493 Yarmouth ME 940 1,230 3972395 56673
PDS PDA 95 Royal River Boatyard ‐ East NAE‐2002‐1020 PDS 14/15/16 12/30/2014 1:16 43.5639 ‐70.02523 Yarmouth ME 226 295 3655720 56120
PDS PDA 95 Royal River Boatyard ‐ East NAE‐2002‐1020 PDS 14/15/16 12/30/2014 13:55 43.56345 ‐70.02513 Yarmouth ME 226 295 3655746 56121
PDS PDA 95 Royal River Boat Yard W912WJ‐14‐C‐0022 PDS 14/15/16 12/30/2014 15:34 43.56285 ‐70.025 Yarmouth ME 940 1,230 3719561 56630
PDS PDA 95 Royal River Boatyard ‐ East NAE‐2002‐1020 PDS 14/15/16 12/31/2014 0:51 43.5632 ‐70.02485 Yarmouth ME 226 295 3655763 56122
PDS PDA 95 Royal River Boat Yard W912WJ‐14‐C‐0022 PDS 14/15/16 12/31/2014 1:39 43.56358 ‐70.02407 Yarmouth ME 940 1,230 3749901 56674
PDS PDA 95 Royal River Boat Yard W912WJ‐14‐C‐0022 PDS 14/15/16 12/31/2014 15:37 43.56348 ‐70.02398 Yarmouth ME 940 1,230 3719572 56631
PDS PDA 95 Royal River Boatyard ‐ East NAE‐2002‐1020 PDS 14/15/16 12/31/2014 16:35 43.56385 ‐70.02447 Yarmouth ME 226 295 3655764 56123
PDS PDA 95 Royal River Boat Yard W912WJ‐14‐C‐0022 PDS 14/15/16 1/1/2015 2:19 43.56385 ‐70.0246 Yarmouth ME 940 1,230 3749902 56675
PDS PDA 95 Royal River Boatyard ‐ East NAE‐2002‐1020 PDS 14/15/16 1/1/2015 15:04 43.56393 ‐70.02467 Yarmouth ME 226 295 3655773 56124
PDS PDA 95 Royal River Boat Yard W912WJ‐14‐C‐0022 PDS 14/15/16 1/2/2015 20:44 43.56335 ‐70.02353 Yarmouth ME 940 1,230 3719583 56632
PDS PDA 95 Royal River Boatyard ‐ East NAE‐2002‐1020 PDS 14/15/16 1/3/2015 17:40 43.5635 ‐70.02498 226 295 3655782 56824
PDS PDA 95 Royal River Boat Yard W912WJ‐14‐C‐0022 PDS 14/15/16 1/3/2015 18:36 43.56268 ‐70.0248 Yarmouth ME 940 1,230 3719614 56678
PDS PDA 95 Royal River Boat Yard W912WJ‐14‐C‐0022 PDS 14/15/16 1/6/2015 21:10 43.56377 ‐70.0247 Yarmouth ME 940 1,230 3719645 56679
PDS PDA 95 Royal River Boat Yard W912WJ‐14‐C‐0022 PDS 14/15/16 1/10/2015 15:54 43.56365 ‐70.02403 Yarmouth ME 940 1,230 3719665 56680
PDS PDA 95 Global Petroleum NAE‐2006‐02255 PDS 14/15/16 1/17/2015 14:09 43.56355 ‐70.02522 South Portland ME 641 839 3956430 56702
PDS PDA 95 Global Petroleum NAE‐2006‐02255 PDS 14/15/16 1/20/2015 19:37 43.5636 ‐70.02612 South Portland ME 641 839 3956442 56703
PDS PDA 95 Global Petroleum NAE‐2006‐02255 PDS 14/15/16 1/22/2015 7:17 43.56188 ‐70.0235 South Portland ME 641 839 3956448 56704
PDS PDA 95 Global Petroleum NAE‐2006‐02255 PDS 14/15/16 1/23/2015 5:05 43.56243 ‐70.02473 South Portland ME 641 839 3956537 56705
PDS PDA 95 Global Petroleum NAE‐2006‐02255 PDS 14/15/16 1/30/2015 6:45 43.56345 ‐70.02592 South Portland ME 641 839 3956543 56706
PDS PDA 95 Global Petroleum NAE‐2006‐02255 PDS 14/15/16 2/6/2015 15:09 43.56395 ‐70.0247 South Portland ME 641 839 3956548 56707
PDS PDA 95 Global Petroleum NAE‐2006‐02255 PDS 14/15/16 2/14/2015 14:27 43.56228 ‐70.0243 South Portland ME 641 839 3956553 56708
PDS PDA 95 Global Petroleum NAE‐2006‐02255 PDS 14/15/16 2/24/2015 13:53 43.56365 ‐70.02522 South Portland ME 641 839 3956560 56709
PDS PDA 95 Global Petroleum NAE‐2006‐02255 PDS 14/15/16 2/25/2015 20:29 43.5636 ‐70.02518 South Portland ME 641 839 3956564 56710
PDS PDA 95 Global Petroleum NAE‐2006‐02255 PDS 14/15/16 2/26/2015 22:11 43.56372 ‐70.02535 South Portland ME 641 839 3956565 56711
Page 2 of 4
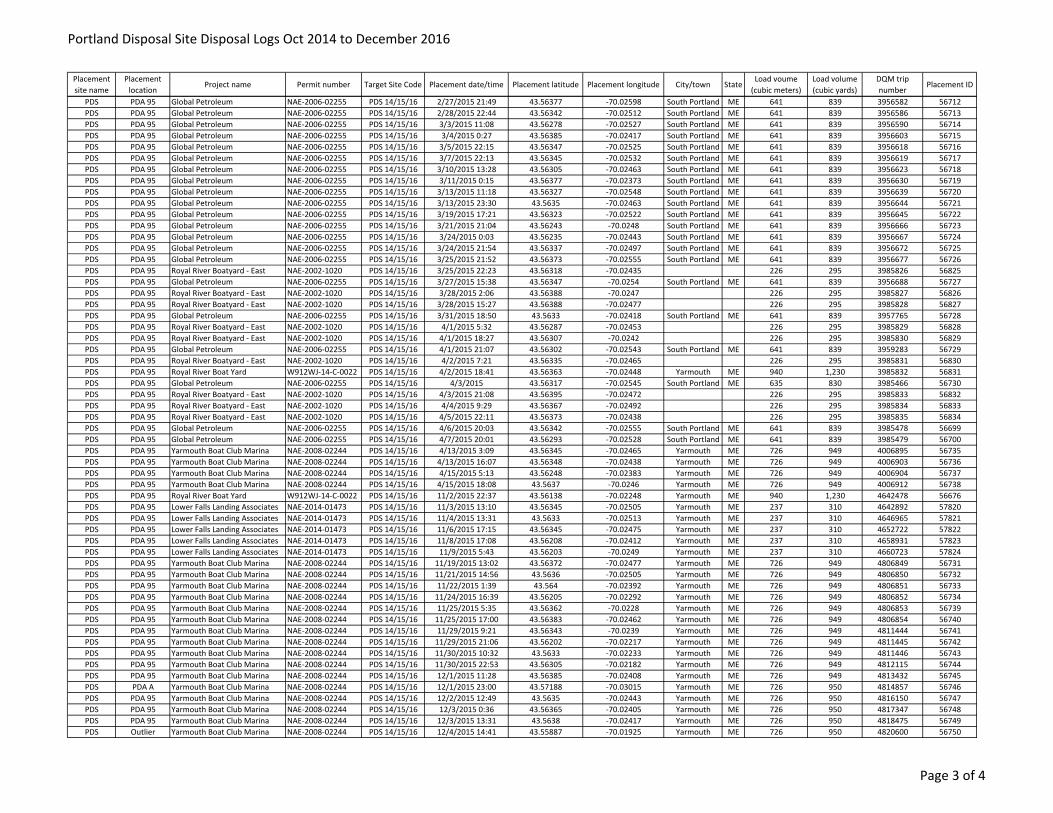
Portland Disposal Site Disposal Logs Oct 2014 to December 2016
Placement
site name
Placement
locationProject name Permit number Target Site Code Placement date/time Placement latitude Placement longitude City/town State
Load voume
(cubic meters)
Load volume
(cubic yards)
DQM trip
numberPlacement ID
PDS PDA 95 Global Petroleum NAE‐2006‐02255 PDS 14/15/16 2/27/2015 21:49 43.56377 ‐70.02598 South Portland ME 641 839 3956582 56712
PDS PDA 95 Global Petroleum NAE‐2006‐02255 PDS 14/15/16 2/28/2015 22:44 43.56342 ‐70.02512 South Portland ME 641 839 3956586 56713
PDS PDA 95 Global Petroleum NAE‐2006‐02255 PDS 14/15/16 3/3/2015 11:08 43.56278 ‐70.02527 South Portland ME 641 839 3956590 56714
PDS PDA 95 Global Petroleum NAE‐2006‐02255 PDS 14/15/16 3/4/2015 0:27 43.56385 ‐70.02417 South Portland ME 641 839 3956603 56715
PDS PDA 95 Global Petroleum NAE‐2006‐02255 PDS 14/15/16 3/5/2015 22:15 43.56347 ‐70.02525 South Portland ME 641 839 3956618 56716
PDS PDA 95 Global Petroleum NAE‐2006‐02255 PDS 14/15/16 3/7/2015 22:13 43.56345 ‐70.02532 South Portland ME 641 839 3956619 56717
PDS PDA 95 Global Petroleum NAE‐2006‐02255 PDS 14/15/16 3/10/2015 13:28 43.56305 ‐70.02463 South Portland ME 641 839 3956623 56718
PDS PDA 95 Global Petroleum NAE‐2006‐02255 PDS 14/15/16 3/11/2015 0:15 43.56377 ‐70.02373 South Portland ME 641 839 3956630 56719
PDS PDA 95 Global Petroleum NAE‐2006‐02255 PDS 14/15/16 3/13/2015 11:18 43.56327 ‐70.02548 South Portland ME 641 839 3956639 56720
PDS PDA 95 Global Petroleum NAE‐2006‐02255 PDS 14/15/16 3/13/2015 23:30 43.5635 ‐70.02463 South Portland ME 641 839 3956644 56721
PDS PDA 95 Global Petroleum NAE‐2006‐02255 PDS 14/15/16 3/19/2015 17:21 43.56323 ‐70.02522 South Portland ME 641 839 3956645 56722
PDS PDA 95 Global Petroleum NAE‐2006‐02255 PDS 14/15/16 3/21/2015 21:04 43.56243 ‐70.0248 South Portland ME 641 839 3956666 56723
PDS PDA 95 Global Petroleum NAE‐2006‐02255 PDS 14/15/16 3/24/2015 0:03 43.56235 ‐70.02443 South Portland ME 641 839 3956667 56724
PDS PDA 95 Global Petroleum NAE‐2006‐02255 PDS 14/15/16 3/24/2015 21:54 43.56337 ‐70.02497 South Portland ME 641 839 3956672 56725
PDS PDA 95 Global Petroleum NAE‐2006‐02255 PDS 14/15/16 3/25/2015 21:52 43.56373 ‐70.02555 South Portland ME 641 839 3956677 56726
PDS PDA 95 Royal River Boatyard ‐ East NAE‐2002‐1020 PDS 14/15/16 3/25/2015 22:23 43.56318 ‐70.02435 226 295 3985826 56825
PDS PDA 95 Global Petroleum NAE‐2006‐02255 PDS 14/15/16 3/27/2015 15:38 43.56347 ‐70.0254 South Portland ME 641 839 3956688 56727
PDS PDA 95 Royal River Boatyard ‐ East NAE‐2002‐1020 PDS 14/15/16 3/28/2015 2:06 43.56388 ‐70.0247 226 295 3985827 56826
PDS PDA 95 Royal River Boatyard ‐ East NAE‐2002‐1020 PDS 14/15/16 3/28/2015 15:27 43.56388 ‐70.02477 226 295 3985828 56827
PDS PDA 95 Global Petroleum NAE‐2006‐02255 PDS 14/15/16 3/31/2015 18:50 43.5633 ‐70.02418 South Portland ME 641 839 3957765 56728
PDS PDA 95 Royal River Boatyard ‐ East NAE‐2002‐1020 PDS 14/15/16 4/1/2015 5:32 43.56287 ‐70.02453 226 295 3985829 56828
PDS PDA 95 Royal River Boatyard ‐ East NAE‐2002‐1020 PDS 14/15/16 4/1/2015 18:27 43.56307 ‐70.0242 226 295 3985830 56829
PDS PDA 95 Global Petroleum NAE‐2006‐02255 PDS 14/15/16 4/1/2015 21:07 43.56302 ‐70.02543 South Portland ME 641 839 3959283 56729
PDS PDA 95 Royal River Boatyard ‐ East NAE‐2002‐1020 PDS 14/15/16 4/2/2015 7:21 43.56335 ‐70.02465 226 295 3985831 56830
PDS PDA 95 Royal River Boat Yard W912WJ‐14‐C‐0022 PDS 14/15/16 4/2/2015 18:41 43.56363 ‐70.02448 Yarmouth ME 940 1,230 3985832 56831
PDS PDA 95 Global Petroleum NAE‐2006‐02255 PDS 14/15/16 4/3/2015 43.56317 ‐70.02545 South Portland ME 635 830 3985466 56730
PDS PDA 95 Royal River Boatyard ‐ East NAE‐2002‐1020 PDS 14/15/16 4/3/2015 21:08 43.56395 ‐70.02472 226 295 3985833 56832
PDS PDA 95 Royal River Boatyard ‐ East NAE‐2002‐1020 PDS 14/15/16 4/4/2015 9:29 43.56367 ‐70.02492 226 295 3985834 56833
PDS PDA 95 Royal River Boatyard ‐ East NAE‐2002‐1020 PDS 14/15/16 4/5/2015 22:11 43.56373 ‐70.02438 226 295 3985835 56834
PDS PDA 95 Global Petroleum NAE‐2006‐02255 PDS 14/15/16 4/6/2015 20:03 43.56342 ‐70.02555 South Portland ME 641 839 3985478 56699
PDS PDA 95 Global Petroleum NAE‐2006‐02255 PDS 14/15/16 4/7/2015 20:01 43.56293 ‐70.02528 South Portland ME 641 839 3985479 56700
PDS PDA 95 Yarmouth Boat Club Marina NAE‐2008‐02244 PDS 14/15/16 4/13/2015 3:09 43.56345 ‐70.02465 Yarmouth ME 726 949 4006895 56735
PDS PDA 95 Yarmouth Boat Club Marina NAE‐2008‐02244 PDS 14/15/16 4/13/2015 16:07 43.56348 ‐70.02438 Yarmouth ME 726 949 4006903 56736
PDS PDA 95 Yarmouth Boat Club Marina NAE‐2008‐02244 PDS 14/15/16 4/15/2015 5:13 43.56248 ‐70.02383 Yarmouth ME 726 949 4006904 56737
PDS PDA 95 Yarmouth Boat Club Marina NAE‐2008‐02244 PDS 14/15/16 4/15/2015 18:08 43.5637 ‐70.0246 Yarmouth ME 726 949 4006912 56738
PDS PDA 95 Royal River Boat Yard W912WJ‐14‐C‐0022 PDS 14/15/16 11/2/2015 22:37 43.56138 ‐70.02248 Yarmouth ME 940 1,230 4642478 56676
PDS PDA 95 Lower Falls Landing Associates NAE‐2014‐01473 PDS 14/15/16 11/3/2015 13:10 43.56345 ‐70.02505 Yarmouth ME 237 310 4642892 57820
PDS PDA 95 Lower Falls Landing Associates NAE‐2014‐01473 PDS 14/15/16 11/4/2015 13:31 43.5633 ‐70.02513 Yarmouth ME 237 310 4646965 57821
PDS PDA 95 Lower Falls Landing Associates NAE‐2014‐01473 PDS 14/15/16 11/6/2015 17:15 43.56345 ‐70.02475 Yarmouth ME 237 310 4652722 57822
PDS PDA 95 Lower Falls Landing Associates NAE‐2014‐01473 PDS 14/15/16 11/8/2015 17:08 43.56208 ‐70.02412 Yarmouth ME 237 310 4658931 57823
PDS PDA 95 Lower Falls Landing Associates NAE‐2014‐01473 PDS 14/15/16 11/9/2015 5:43 43.56203 ‐70.0249 Yarmouth ME 237 310 4660723 57824
PDS PDA 95 Yarmouth Boat Club Marina NAE‐2008‐02244 PDS 14/15/16 11/19/2015 13:02 43.56372 ‐70.02477 Yarmouth ME 726 949 4806849 56731
PDS PDA 95 Yarmouth Boat Club Marina NAE‐2008‐02244 PDS 14/15/16 11/21/2015 14:56 43.5636 ‐70.02505 Yarmouth ME 726 949 4806850 56732
PDS PDA 95 Yarmouth Boat Club Marina NAE‐2008‐02244 PDS 14/15/16 11/22/2015 1:39 43.564 ‐70.02392 Yarmouth ME 726 949 4806851 56733
PDS PDA 95 Yarmouth Boat Club Marina NAE‐2008‐02244 PDS 14/15/16 11/24/2015 16:39 43.56205 ‐70.02292 Yarmouth ME 726 949 4806852 56734
PDS PDA 95 Yarmouth Boat Club Marina NAE‐2008‐02244 PDS 14/15/16 11/25/2015 5:35 43.56362 ‐70.0228 Yarmouth ME 726 949 4806853 56739
PDS PDA 95 Yarmouth Boat Club Marina NAE‐2008‐02244 PDS 14/15/16 11/25/2015 17:00 43.56383 ‐70.02462 Yarmouth ME 726 949 4806854 56740
PDS PDA 95 Yarmouth Boat Club Marina NAE‐2008‐02244 PDS 14/15/16 11/29/2015 9:21 43.56343 ‐70.0239 Yarmouth ME 726 949 4811444 56741
PDS PDA 95 Yarmouth Boat Club Marina NAE‐2008‐02244 PDS 14/15/16 11/29/2015 21:06 43.56202 ‐70.02217 Yarmouth ME 726 949 4811445 56742
PDS PDA 95 Yarmouth Boat Club Marina NAE‐2008‐02244 PDS 14/15/16 11/30/2015 10:32 43.5633 ‐70.02233 Yarmouth ME 726 949 4811446 56743
PDS PDA 95 Yarmouth Boat Club Marina NAE‐2008‐02244 PDS 14/15/16 11/30/2015 22:53 43.56305 ‐70.02182 Yarmouth ME 726 949 4812115 56744
PDS PDA 95 Yarmouth Boat Club Marina NAE‐2008‐02244 PDS 14/15/16 12/1/2015 11:28 43.56385 ‐70.02408 Yarmouth ME 726 949 4813432 56745
PDS PDA A Yarmouth Boat Club Marina NAE‐2008‐02244 PDS 14/15/16 12/1/2015 23:00 43.57188 ‐70.03015 Yarmouth ME 726 950 4814857 56746
PDS PDA 95 Yarmouth Boat Club Marina NAE‐2008‐02244 PDS 14/15/16 12/2/2015 12:49 43.5635 ‐70.02443 Yarmouth ME 726 950 4816150 56747
PDS PDA 95 Yarmouth Boat Club Marina NAE‐2008‐02244 PDS 14/15/16 12/3/2015 0:36 43.56365 ‐70.02405 Yarmouth ME 726 950 4817347 56748
PDS PDA 95 Yarmouth Boat Club Marina NAE‐2008‐02244 PDS 14/15/16 12/3/2015 13:31 43.5638 ‐70.02417 Yarmouth ME 726 950 4818475 56749
PDS Outlier Yarmouth Boat Club Marina NAE‐2008‐02244 PDS 14/15/16 12/4/2015 14:41 43.55887 ‐70.01925 Yarmouth ME 726 950 4820600 56750
Page 3 of 4

Portland Disposal Site Disposal Logs Oct 2014 to December 2016
Placement
site name
Placement
locationProject name Permit number Target Site Code Placement date/time Placement latitude Placement longitude City/town State
Load voume
(cubic meters)
Load volume
(cubic yards)
DQM trip
numberPlacement ID
PDS PDA 95 Yarmouth Boat Club Marina NAE‐2008‐02244 PDS 14/15/16 12/7/2015 17:08 43.5635 ‐70.02543 Yarmouth ME 726 950 4828547 56751
PDS PDA 95 Yarmouth Boat Club Marina NAE‐2008‐02244 PDS 14/15/16 12/8/2015 18:13 43.56343 ‐70.02402 Yarmouth ME 726 950 4833311 56752
PDS PDA 95 Yarmouth Boat Club Marina NAE‐2008‐02244 PDS 14/15/16 12/9/2015 18:38 43.56332 ‐70.02527 Yarmouth ME 726 950 4854898 56753
PDS PDA 95 Yarmouth Boat Club Marina NAE‐2008‐02244 PDS 14/15/16 12/11/2015 19:04 43.56298 ‐70.02423 Yarmouth ME 726 950 4854909 56754
Page 4 of 4
Monitoring Survey at the Portland Disposal Site September 2016
APPENDIX C
ACTUAL SPI/PV AND SEDIMENT GRAB REPLICATE LOCATIONS

Appendix C - Actual SPI/PV and Sediment Grab Replicate Locations Page 1 of 8
PDS 2016 ACTUAL SPI/PV STATION IDS/COORDINATES
Station ID Replicate Date Time X Y Latitude Longitude PDAA-01 A 9/17/2016 12:40:03 910858.7 82063.57 43.5719470 -70.0322402 PDAA-01 B 9/17/2016 12:40:48 910840.6 82064.54 43.5719559 -70.0324636 PDAA-01 C 9/17/2016 12:41:49 910859.7 82071.15 43.5720152 -70.0322280 PDAA-01 D 9/17/2016 12:43:01 910868.6 82062.52 43.5719374 -70.0321173 PDAA-02 A 9/17/2016 12:33:23 910838.3 81964.25 43.5710533 -70.0324949 PDAA-02 B 9/17/2016 12:34:13 910841.4 81962.71 43.5710394 -70.0324568 PDAA-02 C 9/17/2016 12:34:53 910833 81964.92 43.5710594 -70.0325605 PDAA-02 D 9/17/2016 12:35:36 910840.2 81966.72 43.5710755 -70.0324705 PDAA-03 A 9/17/2016 12:55:42 910921.1 82148.58 43.5727112 -70.0314655 PDAA-03 B 9/17/2016 12:56:37 910927.7 82150.79 43.5727310 -70.0313841 PDAA-03 C 9/17/2016 12:57:26 910933.1 82151.94 43.5727413 -70.0313171 PDAA-03 D 9/17/2016 12:58:28 910928 82153.1 43.5727518 -70.0313807 PDAA-04 A 9/17/2016 12:46:51 910854.9 82148.05 43.5727074 -70.0322860 PDAA-04 B 9/17/2016 12:47:44 910852.5 82141.05 43.5726444 -70.0323157 PDAA-04 C 9/17/2016 12:48:32 910849.1 82144.66 43.5726770 -70.0323568 PDAA-04 D 9/17/2016 12:49:21 910849 82146.87 43.5726969 -70.0323586 PDAA-05 A 9/17/2016 13:05:40 911049.8 81975.11 43.5711479 -70.0298767 PDAA-05 B 9/17/2016 13:06:52 911043.5 81966.72 43.5710725 -70.0299541 PDAA-05 C 9/17/2016 13:07:34 911038.5 81962.31 43.5710329 -70.0300161 PDAA-05 D 9/17/2016 13:08:30 911028.8 81967.49 43.5710797 -70.0301367 PDS-06 A 9/17/2016 7:30:53 910708.3 81576.38 43.5675640 -70.0341115 PDS-06 B 9/17/2016 7:31:51 910707.7 81578.97 43.5675873 -70.0341184 PDS-06 C 9/17/2016 7:32:36 910710.6 81577.85 43.5675772 -70.0340830 PDS-06 D 9/17/2016 7:33:29 910717.8 81577.53 43.5675742 -70.0339939 PDS-06 E 9/17/2016 7:46:17 910700.2 81570.37 43.5675100 -70.0342123 PDS-06 F 9/17/2016 7:47:04 910700.6 81577.9 43.5675778 -70.0342065 PDS-06 G 9/17/2016 7:47:56 910688.1 81590.89 43.5676949 -70.0343613 PDS-06 H 9/17/2016 7:48:56 910694.9 81567.66 43.5674857 -70.0342780 PDS-07 A 9/17/2016 10:53:54 911048.6 81702.36 43.5686930 -70.0298964 PDS-07 B 9/17/2016 10:54:34 911053.9 81710.56 43.5687667 -70.0298309 PDS-07 C 9/17/2016 10:55:25 911047 81709.79 43.5687599 -70.0299157 PDS-07 D 9/17/2016 10:56:09 911041.2 81706.09 43.5687266 -70.0299887 PDS-08 A 9/17/2016 10:07:44 911171.2 81637.29 43.5681055 -70.0283802 PDS-08 B 9/17/2016 10:08:42 911188.7 81636.71 43.5681000 -70.0281638 PDS-08 C 9/17/2016 10:09:25 911186.4 81631.8 43.5680558 -70.0281928 PDS-08 D 9/17/2016 10:10:09 911179.3 81632.76 43.5680646 -70.0282796 PDS-09 A 9/17/2016 11:38:50 910756.6 81748.31 43.5691108 -70.0335102 PDS-09 B 9/17/2016 11:39:34 910757.8 81745.57 43.5690861 -70.0334950 PDS-09 C 9/17/2016 11:40:22 910761.4 81753.21 43.5691549 -70.0334512 PDS-09 D 9/17/2016 11:41:31 910757.4 81751.9 43.5691431 -70.0335000 PDS-10 A 9/17/2016 11:12:44 910924.6 81687.34 43.5685596 -70.0314316 PDS-10 B 9/17/2016 11:13:26 910921 81685.79 43.5685457 -70.0314765 PDS-10 C 9/17/2016 11:14:16 910925.1 81690.66 43.5685895 -70.0314260 PDS-10 D 9/17/2016 11:15:01 910925.7 81695.99 43.5686374 -70.0314184 PDS-11 A 9/17/2016 8:07:33 910815.5 81642.78 43.5681601 -70.0327827 PDS-11 B 9/17/2016 8:08:15 910812.3 81629.54 43.5680410 -70.0328226

Appendix C - Actual SPI/PV and Sediment Grab Replicate Locations Page 2 of 8
PDS 2016 ACTUAL SPI/PV STATION IDS/COORDINATES Station ID Replicate Date Time X Y Latitude Longitude PDS-11 C 9/17/2016 8:09:02 910807.5 81627.08 43.5680189 -70.0328828 PDS-11 D 9/17/2016 8:10:04 910808.2 81635.52 43.5680949 -70.0328744 PDS-12 A 9/17/2016 11:02:46 910983.9 81695.03 43.5686279 -70.0306971 PDS-12 B 9/17/2016 11:03:41 910980 81697.66 43.5686517 -70.0307464 PDS-12 C 9/17/2016 11:04:22 910973 81703.16 43.5687013 -70.0308320 PDS-12 D 9/17/2016 11:05:06 910979 81699.07 43.5686644 -70.0307580 PDS-13 A 9/17/2016 8:47:33 911074.4 81428.94 43.5662316 -70.0295832 PDS-13 B 9/17/2016 8:48:11 911079 81411.91 43.5660782 -70.0295259 PDS-13 C 9/17/2016 8:48:50 911069.8 81420.21 43.5661531 -70.0296397 PDS-13 D 9/17/2016 8:49:29 911068.6 81424.92 43.5661955 -70.0296545 PDS-13 E 9/17/2016 10:36:26 911083 81429.08 43.5662327 -70.0294763 PDS-13 F 9/17/2016 10:37:17 911081.4 81434.1 43.5662779 -70.0294960 PDS-13 G 9/17/2016 10:38:03 911075.8 81419.97 43.5661508 -70.0295657 PDS-13 H 9/17/2016 10:38:50 911069.4 81421.45 43.5661642 -70.0296450 PDS-14 A 9/17/2016 12:13:49 910709.3 81834.03 43.5698831 -70.0340946 PDS-14 B 9/17/2016 12:14:40 910713.9 81832.66 43.5698707 -70.0340369 PDS-14 C 9/17/2016 12:15:27 910722.1 81837.08 43.5699103 -70.0339354 PDS-14 D 9/17/2016 12:16:21 910720.2 81830.46 43.5698508 -70.0339587 PDS-15 A 9/17/2016 11:18:54 910935.8 81808.12 43.5696466 -70.0312905 PDS-15 B 9/17/2016 11:19:41 910926.5 81819.99 43.5697535 -70.0314059 PDS-15 C 9/17/2016 11:20:26 910922.9 81816.78 43.5697247 -70.0314502 PDS-15 D 9/17/2016 11:21:12 910932 81828.42 43.5698293 -70.0313370 PDS-16 A 9/17/2016 8:29:41 910953.9 81577.3 43.5675687 -70.0310719 PDS-16 B 9/17/2016 8:30:16 910955 81582.45 43.5676151 -70.0310580 PDS-16 C 9/17/2016 8:30:58 910950.5 81581.7 43.5676084 -70.0311139 PDS-16 D 9/17/2016 8:31:44 910953.3 81582.47 43.5676153 -70.0310791 PDS-17 A 9/17/2016 8:38:35 911014.8 81457.83 43.5664925 -70.0303200 PDS-17 B 9/17/2016 8:39:16 911019.5 81456.64 43.5664817 -70.0302619 PDS-17 C 9/17/2016 8:40:03 911016 81460.82 43.5665194 -70.0303051 PDS-17 D 9/17/2016 8:40:49 911015.4 81458.18 43.5664956 -70.0303123 PDS-17 E 9/17/2016 10:46:09 911017.1 81468.57 43.5665891 -70.0302909 PDS-17 F 9/17/2016 10:46:52 911013.4 81465.99 43.5665659 -70.0303375 PDS-17 G 9/17/2016 10:47:34 911013.7 81470.93 43.5666104 -70.0303337 PDS-17 H 9/17/2016 10:48:17 911017.3 81471.11 43.5666120 -70.0302889 PDS-18 A 9/17/2016 8:54:20 911139.3 81590.01 43.5676804 -70.0287765 PDS-18 B 9/17/2016 8:55:01 911136.5 81590.16 43.5676818 -70.0288111 PDS-18 C 9/17/2016 8:55:40 911143.4 81590.02 43.5676804 -70.0287254 PDS-18 D 9/17/2016 8:56:21 911144.1 81591.54 43.5676941 -70.0287161 PDS-18 E 9/17/2016 10:26:34 911142.5 81589.48 43.5676756 -70.0287368 PDS-18 F 9/17/2016 10:27:23 911154.6 81596.54 43.5677389 -70.0285870 PDS-18 G 9/17/2016 10:28:06 911152.5 81582.67 43.5676141 -70.0286133 PDS-18 H 9/17/2016 10:28:49 911144.3 81588.32 43.5676651 -70.0287144 PDS-19 A 9/17/2016 12:24:07 910688.9 81748.83 43.5691165 -70.0343480 PDS-19 B 9/17/2016 12:24:58 910681.5 81733.07 43.5689747 -70.0344405 PDS-19 C 9/17/2016 12:25:48 910701.1 81735.03 43.5689921 -70.0341970 PDS-19 D 9/17/2016 12:26:40 910708.6 81741.43 43.5690496 -70.0341045 PDS-20 A 9/17/2016 11:30:19 910785.3 81802.84 43.5696012 -70.0331535

Appendix C - Actual SPI/PV and Sediment Grab Replicate Locations Page 3 of 8
PDS 2016 ACTUAL SPI/PV STATION IDS/COORDINATES Station ID Replicate Date Time X Y Latitude Longitude PDS-20 B 9/17/2016 11:31:03 910788.2 81805.32 43.5696235 -70.0331181 PDS-20 C 9/17/2016 11:32:04 910798.8 81809.93 43.5696648 -70.0329866 PDS-20 D 9/17/2016 11:32:53 910784.4 81808.64 43.5696534 -70.0331647 PDA95-21 A 9/19/2016 15:16:42 911646 80969.09 43.5620838 -70.0225177 PDA95-21 B 9/19/2016 15:17:28 911648.1 80974.03 43.5621282 -70.0224910 PDA95-21 C 9/19/2016 15:18:23 911643.8 80977.14 43.5621563 -70.0225448 PDA95-21 D 9/19/2016 15:19:06 911639.9 80981.21 43.5621930 -70.0225927 PDA95-22 A 9/19/2016 14:27:24 911528.8 80837.7 43.5609030 -70.0239700 PDA95-22 B 9/19/2016 14:28:15 911528 80838.07 43.5609063 -70.0239799 PDA95-22 C 9/19/2016 14:29:18 911528.6 80840.76 43.5609306 -70.0239732 PDA95-22 D 9/19/2016 14:30:23 911529.4 80844.75 43.5609665 -70.0239627 PDA95-22 E 9/19/2016 14:31:18 911528.1 80847.55 43.5609917 -70.0239789 PDA95-23 A 9/19/2016 13:43:14 911527.6 81060.04 43.5629043 -70.0239810 PDA95-23 B 9/19/2016 13:44:16 911521.2 81053.72 43.5628475 -70.0240605 PDA95-23 C 9/19/2016 13:45:17 911523.6 81056.76 43.5628748 -70.0240309 PDA95-23 D 9/19/2016 13:47:00 911528.2 81056.58 43.5628731 -70.0239729 PDA95-24 A 9/19/2016 14:18:52 911380.7 80814.46 43.5606961 -70.0258040 PDA95-24 B 9/19/2016 14:19:51 911371.4 80813.31 43.5606859 -70.0259195 PDA95-24 C 9/19/2016 14:20:49 911362.8 80817.2 43.5607210 -70.0260255 PDA95-24 D 9/19/2016 14:21:43 911357 80821.28 43.5607578 -70.0260973 PDA95-25 A 9/19/2016 13:00:15 911550.6 81206.68 43.5642238 -70.0236923 PDA95-25 B 9/19/2016 13:00:57 911545.1 81203.4 43.5641944 -70.0237614 PDA95-25 C 9/19/2016 13:01:38 911539.1 81203.27 43.5641933 -70.0238349 PDA95-25 D 9/19/2016 13:02:15 911534 81203.71 43.5641973 -70.0238985 PDA95-26 A 9/19/2016 13:52:31 911437 81060.7 43.5629116 -70.0251023 PDA95-26 B 9/19/2016 13:53:21 911435.7 81064.36 43.5629446 -70.0251182 PDA95-26 C 9/19/2016 13:54:11 911432.7 81066.57 43.5629645 -70.0251553 PDA95-26 D 9/19/2016 13:55:05 911429.8 81066.49 43.5629638 -70.0251907 PDA95-27 A 9/19/2016 14:09:16 911306 80947.77 43.5618971 -70.0267264 PDA95-27 B 9/19/2016 14:10:08 911306.5 80952.15 43.5619366 -70.0267192 PDA95-27 C 9/19/2016 14:10:59 911309.3 80951.06 43.5619267 -70.0266847 PDA95-27 D 9/19/2016 14:11:51 911306.9 80952.39 43.5619387 -70.0267152 PDA95-28 A 9/17/2016 13:48:19 911503.9 81362.85 43.5656302 -70.0242673 PDA95-28 B 9/17/2016 13:49:10 911504.7 81354.83 43.5655580 -70.0242580 PDA95-28 C 9/17/2016 13:50:13 911499.7 81354.04 43.5655510 -70.0243204 PDA95-28 D 9/17/2016 13:50:56 911494.2 81359.62 43.5656013 -70.0243877 PDA95-29 A 9/19/2016 13:33:26 911549.6 81111.36 43.5633659 -70.0237069 PDA95-29 B 9/19/2016 13:34:26 911547.7 81111.94 43.5633711 -70.0237311 PDA95-29 C 9/19/2016 13:35:24 911546.9 81112.16 43.5633731 -70.0237413 PDA95-29 D 9/19/2016 13:36:20 911543.6 81112.45 43.5633758 -70.0237812 PDA95-30 A 9/19/2016 12:03:53 911440.9 81205.38 43.5642138 -70.0250510 PDA95-30 B 9/19/2016 12:04:45 911435 81202.44 43.5641874 -70.0251235 PDA95-30 C 9/19/2016 12:05:29 911434.2 81204.39 43.5642050 -70.0251336 PDA95-30 D 9/19/2016 12:06:15 911433.1 81208.77 43.5642444 -70.0251475 PDA95-31 A 9/19/2016 14:36:30 911434.3 80943.14 43.5618535 -70.0251375 PDA95-31 B 9/19/2016 14:37:23 911439.7 80939.39 43.5618197 -70.0250718 PDA95-31 C 9/19/2016 14:38:17 911442.4 80931.17 43.5617456 -70.0250383

Appendix C - Actual SPI/PV and Sediment Grab Replicate Locations Page 4 of 8
PDS 2016 ACTUAL SPI/PV STATION IDS/COORDINATES Station ID Replicate Date Time X Y Latitude Longitude PDA95-31 D 9/19/2016 14:39:20 911437 80933.89 43.5617702 -70.0251047 PDA95-32 A 9/19/2016 13:24:17 911634.4 81152.29 43.5637330 -70.0226567 PDA95-32 B 9/19/2016 13:25:09 911641.8 81154.08 43.5637489 -70.0225647 PDA95-32 C 9/19/2016 13:26:04 911640.1 81152.93 43.5637386 -70.0225858 PDA95-32 D 9/19/2016 13:27:02 911634.9 81152.63 43.5637360 -70.0226503 PDA95-33 A 9/19/2016 15:25:23 911700.9 80932.59 43.5617544 -70.0218380 PDA95-33 B 9/19/2016 15:26:13 911713.3 80934.78 43.5617739 -70.0216849 PDA95-33 C 9/19/2016 15:27:03 911720.6 80929.61 43.5617273 -70.0215942 PDA95-33 D 9/19/2016 15:27:57 911716.5 80930.07 43.5617315 -70.0216449 PDA95-34 A 9/19/2016 14:00:29 911385.7 81069.06 43.5629876 -70.0257374 PDA95-34 B 9/19/2016 14:01:31 911382.7 81072.19 43.5630159 -70.0257737 PDA95-34 C 9/19/2016 14:02:25 911395.7 81072.77 43.5630209 -70.0256130 PDA95-34 D 9/19/2016 14:03:45 911404.6 81061.16 43.5629163 -70.0255033 PDA95-35 A 9/19/2016 13:12:38 911746.9 81139.75 43.5636183 -70.0212640 PDA95-35 B 9/19/2016 13:15:52 911756.1 81134.61 43.5635719 -70.0211513 PDA95-35 C 9/19/2016 13:16:42 911754.3 81136.28 43.5635870 -70.0211733 PDA95-35 D 9/19/2016 13:17:33 911753.3 81138.01 43.5636026 -70.0211854 EREF-01 A 9/19/2016 17:21:34 913724.7 82331.13 43.5743080 -69.9967539 EREF-01 B 9/19/2016 17:22:16 913723.9 82325.89 43.5742608 -69.9967638 EREF-01 C 9/19/2016 17:23:00 913721.9 82328.69 43.5742861 -69.9967884 EREF-01 D 9/19/2016 17:23:40 913721.5 82330.49 43.5743023 -69.9967937 EREF-02 A 9/19/2016 16:57:08 913582.2 82177.93 43.5729317 -69.9985220 EREF-02 B 9/19/2016 16:58:05 913589.8 82174.8 43.5729034 -69.9984279 EREF-02 C 9/19/2016 16:59:04 913591.2 82171.44 43.5728731 -69.9984101 EREF-02 D 9/19/2016 17:00:00 913586.8 82180.38 43.5729536 -69.9984639 EREF-02 E 9/19/2016 17:11:25 913592 82170.23 43.5728622 -69.9983998 EREF-02 F 9/19/2016 17:11:49 913590.9 82171.91 43.5728773 -69.9984138 EREF-02 G 9/19/2016 17:12:10 913589.6 82173.67 43.5728932 -69.9984299 EREF-02 H 9/19/2016 17:12:36 913588.3 82176.71 43.5729206 -69.9984462 EREF-03 A 9/19/2016 17:40:22 914072.6 82354.28 43.5745099 -69.9924457 EREF-03 B 9/19/2016 17:41:13 914073 82358.15 43.5745447 -69.9924406 EREF-03 C 9/19/2016 17:42:02 914073.4 82362.87 43.5745872 -69.9924353 EREF-03 D 9/19/2016 17:42:50 914073.1 82367.18 43.5746260 -69.9924388 EREF-03 E 9/19/2016 18:21:39 914074.5 82370.89 43.5746594 -69.9924217 EREF-03 F 9/19/2016 18:22:42 914078.9 82357.31 43.5745370 -69.9923682 EREF-03 G 9/19/2016 18:23:29 914078.3 82356.96 43.5745339 -69.9923755 EREF-03 H 9/19/2016 18:24:22 914083.2 82361.8 43.5745774 -69.9923150 EREF-04 A 9/19/2016 17:47:54 913987.9 82394.43 43.5748729 -69.9934932 EREF-04 B 9/19/2016 17:48:42 913988.2 82397.73 43.5749026 -69.9934890 EREF-04 C 9/19/2016 17:49:25 913989.7 82401.68 43.5749381 -69.9934710 EREF-04 D 9/19/2016 17:50:13 913990.3 82406.3 43.5749797 -69.9934629 EREF-04 E 9/19/2016 18:13:22 914004.9 82398.99 43.5749136 -69.9932828 EREF-04 F 9/19/2016 18:14:05 913991.9 82397.44 43.5748999 -69.9934440 EREF-04 G 9/19/2016 18:15:16 913993.7 82404.23 43.5749610 -69.9934219 EREF-04 H 9/19/2016 18:16:11 913992.4 82403.45 43.5749540 -69.9934370 EREF-05 A 9/19/2016 17:30:49 913904.9 82198 43.5731064 -69.9945264 EREF-05 B 9/19/2016 17:31:32 913906.6 82204.22 43.5731623 -69.9945047

Appendix C - Actual SPI/PV and Sediment Grab Replicate Locations Page 5 of 8
PDS 2016 ACTUAL SPI/PV STATION IDS/COORDINATES Station ID Replicate Date Time X Y Latitude Longitude EREF-05 C 9/19/2016 17:32:15 913909.9 82208.75 43.5732030 -69.9944642 EREF-05 D 9/19/2016 17:33:00 913912.9 82213.52 43.5732459 -69.9944260 SREF-06 A 9/19/2016 15:49:53 911139.4 80306.8 43.5561304 -70.0288015 SREF-06 B 9/19/2016 15:50:48 911142.6 80307.57 43.5561372 -70.0287619 SREF-06 C 9/19/2016 15:51:40 911138.7 80308.87 43.5561490 -70.0288093 SREF-06 D 9/19/2016 15:52:29 911134 80310.16 43.5561607 -70.0288679 SREF-07 A 9/19/2016 15:38:50 911261.9 80378.98 43.5567782 -70.0272834 SREF-07 B 9/19/2016 15:39:58 911269.3 80384.06 43.5568238 -70.0271920 SREF-07 C 9/19/2016 15:41:03 911283.1 80370.98 43.5567059 -70.0270215 SREF-07 D 9/19/2016 15:42:39 911283.2 80372.08 43.5567158 -70.0270202 SREF-07 E 9/19/2016 15:43:30 911280.2 80375.15 43.5567434 -70.0270570 SREF-08 A 9/19/2016 16:17:47 910996.4 80065.66 43.5539620 -70.0305756 SREF-08 B 9/19/2016 16:18:33 910991.5 80065.66 43.5539621 -70.0306360 SREF-08 C 9/19/2016 16:19:28 910989 80067.56 43.5539792 -70.0306670 SREF-08 D 9/19/2016 16:20:18 910990 80070.35 43.5540043 -70.0306550 SREF-09 A 9/19/2016 16:01:55 911135.4 80167.68 43.5548782 -70.0288541 SREF-09 B 9/19/2016 16:09:51 911140.6 80174.97 43.5549437 -70.0287889 SREF-09 C 9/19/2016 16:11:06 911136.7 80172.38 43.5549205 -70.0288377 SREF-09 D 9/19/2016 16:11:55 911133 80170.8 43.5549063 -70.0288836 SREF-10 A 9/19/2016 16:27:21 910999.1 80374.3 43.5567400 -70.0305363 SREF-10 B 9/19/2016 16:28:12 910998.6 80368.56 43.5566883 -70.0305421 SREF-10 C 9/19/2016 16:29:04 910996.2 80366.84 43.5566729 -70.0305728 SREF-10 D 9/19/2016 16:29:50 910997.5 80368.44 43.5566873 -70.0305559
Notes 1. Grid coordinates are NAD_1983_StatePlane_Maine_West_FIPS_1802_Meters 2. Geographic coordinates are NAD83 decimal degrees

Appendix C - Actual SPI/PV and Sediment Grab Replicate Locations Page 6 of 8
PDS 2016 ACTUAL GRAB STATION IDS/COORDINATES
FOR SEDIMENT CHEMISTRY ANALYSIS Station ID Date Time X Y Latitude Longitude Sed-PDS-10a 9/20/2016 9:05:17 910907.42 81684.77 43.56853671 -70.03164452 Sed-PDS-16b 9/20/2016 9:22:55 910953.05 81593.49 43.56771444 -70.03108151 Sed-PDS-20a 9/20/2016 8:55:02 910776.51 81794.25 43.56952403 -70.03326286 Sed-PDA95-22 9/20/2016 10:06:25 911533.33 80845.22 43.56097062 -70.02391429 Sed-PDA95-23 9/20/2016 9:54:33 911525.69 81058.67 43.56289197 -70.02400432 Sed-PDA95-30 9/20/2016 9:36:07 911438.82 81209.78 43.56425343 -70.02507639 Sed-EREF-01 9/20/2016 12:27:05 913717.2 82318.28 43.57419247 -69.99684657 Sed-EREF-03 9/20/2016 11:45:22 914068.49 82357.28 43.57453696 -69.99249658 Sed-EREF-05 9/20/2016 12:11:33 913903.36 82213.65 43.57324726 -69.99454459 Sed-SREF-07a 9/20/2016 10:19:45 911255.38 80367.17 43.55667199 -70.02736449 Sed-SREF-08 9/20/2016 11:20:40 911007.22 80063.59 43.5539432 -70.03044198 Sed-SREF-10 9/20/2016 10:34:06 910990.13 80380.63 43.5567971 -70.03064707
Notes 1. Grid coordinates are NAD_1983_StatePlane_Maine_West_FIPS_1802_Meters 2. Geographic coordinates are NAD83 decimal degrees
PDS 2016 ACTUAL GRAB STATION IDS/COORDINATES FOR BENTHIC COMMUNITY STRUCTURE ANALYSIS (BCA)
Station ID Date Time X Y Latitude Longitude BCA-PDS-16 9/20/2016 13:37:40 910955.7 81593.58 43.56772 -70.031 BCA-PDA95-22 9/20/2016 14:12:25 911525.4 80857.55 43.56108 -70.024 BCA-PDA95-30 9/20/2016 14:00:05 911444.4 81207.25 43.56423 -70.025 BCA_EREF-05 9/20/2016 13:15:34 913890.6 82211.16 43.57323 -69.9947 BCA-SREF-07 9/20/2016 14:28:35 911260.3 80379.31 43.55678 -70.0273 BCA-SREF-10 9/20/2016 14:41:53 911027.6 80380.65 43.5568 -70.0302
Notes 1. Grid coordinates are NAD_1983_StatePlane_Maine_West_FIPS_1802_Meters 2. Geographic coordinates are NAD83 decimal degrees

Appendix C - Actual SPI/PV and Sediment Grab Replicate Locations Page 7 of 8
PDS 2016 ACTUAL TRAWL STATION IDS/COORDINATES FOR TISSUE CHEMISTRY ANALYSIS Station ID Date Time X Y Latitude Longitude Tis-PDS-16a-sol 9/21/2016 9:18:21 910755.81 81610.65 43.56787177 -70.03352275 Tis-PDS-16a-eol 9/21/2016 9:20:26 910750.04 81739.7 43.56903341 -70.03359162 Tis-PDS-16b-sol 9/21/2016 9:49:06 910600.61 81746.05 43.56909271 -70.03544129 Tis-PDS-16b-eol 9/21/2016 9:51:10 910604.45 81824.15 43.56979562 -70.03539222 Tis-PDS-16c-sol 9/21/2016 10:11:11 910699.95 81851.68 43.57004205 -70.03420947 Tis-PDS-16c-eol 9/21/2016 10:13:24 910745.67 81967.34 43.57108243 -70.0336412 Tis-PDS-16d-sol 9/21/2016 10:38:25 910748.03 82085.95 43.57214999 -70.03360964 Tis-PDS-16d-eol 9/21/2016 10:40:30 910744.54 82201.21 43.57318748 -70.03365056 Tis-PDS-16e-sol 9/21/2016 11:07:41 911200.95 81787.06 43.56945306 -70.02800883 Tis-PDS-16e-eol 9/21/2016 11:10:15 911209.65 81947.3 43.57089523 -70.02789782 Tis-PDS-16f-sol 9/21/2016 16:49:05 911020.27 81906.66 43.57053225 -70.03024305 Tis-PDS-16f-eol 9/21/2016 16:51:12 911085.12 82034.37 43.57168079 -70.02943764 Tis-PDS-16g-sol 9/21/2016 17:10:01 910992.21 82154.12 43.57276002 -70.0305854 Tis-PDS-16g-eol 9/21/2016 17:12:05 911108.39 82200.53 43.57317603 -70.02914617 Tis-PDA95-22a-sol 9/21/2016 11:48:03 911536.45 80977.63 43.56216238 -70.02387286 Tis-PDA95-22a-eol 9/21/2016 11:50:08 911507.73 81106.25 43.56332051 -70.02422561 Tis-PDA95-22b-sol 9/21/2016 12:15:37 911539.75 80952.31 43.56193442 -70.02383255 Tis-PDA95-22b-eol 9/21/2016 12:17:42 911507.76 81111.05 43.56336372 -70.02422514 Tis-PDA95-22c-sol 9/21/2016 12:43:10 911502.44 80926.81 43.56170548 -70.0242949 Tis-PDA95-22c-eol 9/21/2016 12:45:20 911556.89 81067.8 43.56297367 -70.02361794 Tis-PDA95-22d-sol 9/21/2016 13:23:03 911524.29 81031.59 43.56264825 -70.02402222 Tis-PDA95-22d-eol 9/21/2016 13:25:06 911472.02 81184.36 43.56402412 -70.02466598 Tis-PDA95-22e-sol 9/21/2016 13:41:55 911517.01 81102.82 43.5632895 -70.02411082 Tis-PDA95-22e-eol 9/21/2016 13:44:07 911468.41 81245.92 43.56457827 -70.02470936 Tis-PDA95-22f-sol 9/21/2016 14:00:06 911509.03 81126.41 43.56350195 -70.0242091 Tis-PDA95-22f-eol 9/21/2016 14:02:10 911448.75 81264.97 43.56475004 -70.02495231 Tis-PDA95-22g-sol 9/21/2016 14:20:49 911554.11 80942.96 43.56185004 -70.02365501 Tis-PDA95-22g-eol 9/21/2016 14:22:55 911503.51 81105.63 43.563315 -70.02427786 Tis-PDA95-22h-sol 9/21/2016 14:35:44 911526 81015.59 43.56250421 -70.0240014 Tis-PDA95-22h-eol 9/21/2016 14:37:52 911503.16 81138.22 43.56360834 -70.0242815 Tis-PDA95-23a-sol 9/20/2016 16:11:29 911511.69 81110.41 43.56335789 -70.02417651 Tis-PDA95-23a-eol 9/20/2016 16:13:36 911527.55 81238.81 43.56451336 -70.02397747

Appendix C - Actual SPI/PV and Sediment Grab Replicate Locations Page 8 of 8
PDS 2016 ACTUAL TRAWL STATION IDS/COORDINATES FOR TISSUE CHEMISTRY ANALYSIS Station ID Date Time X Y Latitude Longitude Tis-PDA95-30a-sol 9/21/2016 14:58:50 911575.51 81339.19 43.56541613 -70.02338168 Tis-PDA95-30a-eol 9/21/2016 15:00:53 911518.73 81500.44 43.56686839 -70.02408109 Tis-PDA95-30b-sol 9/21/2016 15:24:18 911579.28 81260.13 43.56470446 -70.0233367 Tis-PDA95-30b-eol 9/21/2016 15:26:28 911541.28 81407.72 43.56603349 -70.02380393 Tis-PDA95-30c-sol 9/21/2016 15:50:44 911561.78 81312.07 43.56517224 -70.02355221 Tis-PDA95-30c-eol 9/21/2016 15:52:51 911524.66 81441.43 43.56633716 -70.02400894 Tis-PDA95-30d-sol 9/21/2016 16:11:07 911588.57 81342.05 43.56544167 -70.02321996 Tis-PDA95-30d-eol 9/21/2016 16:13:09 911540.44 81489.86 43.56677283 -70.02381258 Tis-PDA95-30a-sol 9/20/2016 16:42:21 911447.43 81189.12 43.56406734 -70.02497025 Tis-PDA95-30a-eol 9/20/2016 16:44:26 911426.81 81312.82 43.56518106 -70.02522288 Tis-EREF-02a-sol 9/21/2016 8:04:05 913561.46 82311.71 43.57413618 -69.9987748 Tis-EREF-02a-eol 9/21/2016 8:06:12 913544.81 82408.04 43.57500354 -69.99897852 Tis-EREF-02b-sol 9/21/2016 8:23:11 913790.44 82323.05 43.57423405 -69.99593974 Tis-EREF-02b-eol 9/21/2016 8:26:15 913789.91 82415.14 43.57506295 -69.99594396 Tis-EREF-02c-sol 9/21/2016 8:49:10 913765.77 82464.92 43.57551146 -69.99624155 Tis-EREF-02c-eol 9/21/2016 8:51:16 913750.77 82533.69 43.57613072 -69.99642551 Tis-SREF-07a-sol 9/20/2016 15:49:22 911417.1 80347.99 43.5564969 -70.02536337 Tis-SREF-07a-eol 9/20/2016 15:51:28 911406.42 80456.52 43.55747393 -70.02549327 Tis-SREF-10a-sol 9/20/2016 15:06:45 910975.87 80450.17 43.55742323 -70.03082215 Tis-SREF-10a-eol 9/20/2016 15:08:51 910940.31 80568.47 43.55848855 -70.03125988 Tis-SREF-10b-sol 9/20/2016 15:26:07 911026.68 80202.84 43.55519629 -70.03019832 Tis-SREF-10b-eol 9/20/2016 15:28:14 911012.19 80313.45 43.55619209 -70.03037541
Notes 1. Grid coordinates are NAD_1983_StatePlane_Maine_West_FIPS_1802_Meters 2. Geographic coordinates are NAD83 decimal degrees 3. sol = Start of Line; eol = End of Line

Monitoring Survey at the Portland Disposal Site September 2016
APPENDIX D
SPI/PV FIELD LOG

StationID Replicate Date Time Frame Stops_inchesWeights_per_
sideDepth_ft Comments QC_Notes
PDS‐06 A 9/17/2016 7:30:54 193 13 0 180Frame count = 192, color card shot,
focus good
PDS‐06 B 9/17/2016 7:31:46 194 13 0 180SPI Camera s/n 2621653, lens s/n
341587: f9, 1/250 ISO 640
PDS‐06 C 9/17/2016 7:32:35 195 13 0 180
PV Camera: s/n 27069619, lens s/n
532303: f14 ISO 400, 1/30 shutter,
1'8" trigger
PDS‐06 D 9/17/2016 7:33:29 196 13 0 180
PDS‐06 E 9/17/2016 7:46:18 197 13 0 175
PDS‐06 F 9/17/2016 7:47:16 198 13 0 175
PDS‐06 G 9/17/2016 7:47:57 199 13 0 175
PDS‐06 H 9/17/2016 7:48:57 200 13 0 175
PDS‐11 A 9/17/2016 8:07:34 201 14 3 175
PDS‐11 B 9/17/2016 8:08:16 202 14 3 175
PDS‐11 C 9/17/2016 8:09:03 203 14 3 175
PDS‐11 D 9/17/2016 8:10:05 204 14 3 175Lost top cotter pin on piston.
Replaced and continued.
PDS‐16 A 9/17/2016 8:29:42 205 14 3 163
PDS‐16 B 9/17/2016 8:30:18 206 14 3 163
PDS‐16 C 9/17/2016 8:31:00 207 14 3 163
PDS‐16 D 9/17/2016 8:31:45 208 14 3 163
PDS‐17 A 9/17/2016 8:38:37 209 14 3 180
PDS‐17 B 9/17/2016 8:39:18 210 14 3 180
PDS‐17 C 9/17/2016 8:40:04 211 14 3 180
PDS‐17 D 9/17/2016 8:40:51 212 14 3 180
PDS‐13 A 9/17/2016 8:47:34 213 14 3 197
PDS‐13 B 9/17/2016 8:48:13 214 14 3 197
PDS‐13 C 9/17/2016 8:48:51 215 14 3 197
PDS‐13 D 9/17/2016 8:49:30 216 14 3 197
PDS‐18 A 9/17/2016 8:54:21 217 14 3 195
PDS‐18 B 9/17/2016 8:55:03 218 14 3 195
PDS‐18 C 9/17/2016 8:55:42 219 14 3 195
PDS‐18 D 9/17/2016 8:56:23 220 14 3 195
Download. Prism water has
sediment intrusion. Replaced with
clean water
PDS‐08 A 9/17/2016 10:07:46 222 13 1 180
PDS‐08 C 9/17/2016 10:08:27 223 13 1 180
PDS‐08 B 9/17/2016 10:08:43 224 13 1 180
PDS‐08 D 9/17/2016 10:10:10 225 13 1 180
PDS‐18 E 9/17/2016 10:26:37 226 13 1 198
PDS‐18 F 9/17/2016 10:27:25 227 13 1 198
PDS‐18 G 9/17/2016 10:28:09 228 13 1 198
PDS‐18 H 9/17/2016 10:28:50 229 13 1 198
PDS‐13 E 9/17/2016 10:36:28 230 13 1 200
PDS‐13 F 9/17/2016 10:37:19 231 13 1 200
PDS‐13 G 9/17/2016 10:38:05 232 13 1 200
PDS‐13 H 9/17/2016 10:38:50 233 13 1 200
PDS‐17 E 9/17/2016 10:46:11 234 13 1 190
PDS‐17 F 9/17/2016 10:46:54 235 13 1 190
PDS‐17 G 9/17/2016 10:47:35 236 13 1 190
PDS‐17 H 9/17/2016 10:48:19 237 13 1 190
PDS‐07 A 9/17/2016 10:53:54 238 13 1 198
PDS‐07 B 9/17/2016 10:54:36 239 13 1 198
PDS‐07 C 9/17/2016 10:55:25 240 13 1 198
PDS‐07 D 9/17/2016 10:56:10 241 13 1 198
PDS‐12 A 9/17/2016 11:02:48 242 13 1 182
PDS‐12 B 9/17/2016 11:03:42 243 13 1 182
PDS‐12 C 9/17/2016 11:04:24 244 13 1 182
PDS‐12 D 9/17/2016 11:05:18 245 13 1 182
PDS‐10 A 9/17/2016 11:12:44 246 13 1 186
PDS‐10 B 9/17/2016 11:13:28 247 13 1 186
PDS‐10 C 9/17/2016 11:14:17 248 13 1 186
PDS‐10 D 9/17/2016 11:15:01 249 13 1 186
PDS‐15 A 9/17/2016 11:18:56 250 13 1 190
PDS‐15 B 9/17/2016 11:19:42 251 13 1 190
PDS‐15 C 9/17/2016 11:20:27 252 13 1 190
PDS‐15 D 9/17/2016 11:21:13 253 13 1 190
PDS‐20 A 9/17/2016 11:30:21 254 13 1 180
PDS‐20 B 9/17/2016 11:30:58 255 13 1 180
PDS‐20 C 9/17/2016 11:32:07 256 13 1 180
PDS‐20 D 9/17/2016 11:32:56 257 13 1 180 No penetration, likely hard bottom
PDS‐09 A 9/17/2016 11:38:50 258 13 1 180
PDS‐09 B 9/17/2016 11:39:35 259 13 1 180
PDS‐09 C 9/17/2016 11:40:23 260 13 1 180
PDS‐09 D 9/17/2016 11:41:32 261 13 1 180
Download, frame count 262, stops
shifted and weights added to 14 and
3
PDS‐14 A 9/17/2016 12:13:50 263 14 3 178
PDS‐14 B 9/17/2016 12:14:42 264 14 3 178
PDS‐14 C 9/17/2016 12:15:30 265 14 3 178
PDS 2016 SPI Field Log (Transcribed) Page 1 of 3

StationID Replicate Date Time Frame Stops_inchesWeights_per_
sideDepth_ft Comments QC_Notes
PDS‐14 D 9/17/2016 12:16:23 266 14 3 178
PDS‐19 A 9/17/2016 12:24:08 267 14 3 190
PDS‐19 B 9/17/2016 12:25:00 268 14 3 190
PDS‐19 C 9/17/2016 12:25:51 269 14 3 190
PDS‐19 D 9/17/2016 12:26:41 270 14 3 190
PDAA‐02 A 9/17/2016 12:33:14 271 14 3 175
PDAA‐02 B 9/17/2016 12:34:15 272 14 3 175
PDAA‐02 C 9/17/2016 12:34:55 273 14 3 175
PDAA‐02 D 9/17/2016 12:35:38 274 14 3 175
PDAA‐01 A 9/17/2016 12:40:05 275 14 3 170
PDAA‐01 B 9/17/2016 12:40:51 276 14 3 170
PDAA‐01 C 9/17/2016 12:41:52 277 14 3 170
PDAA‐01 D 9/17/2016 12:43:02 278 14 3 170
PDAA‐04 A 9/17/2016 12:46:52 279 14 3 155
PDAA‐04 B 9/17/2016 12:47:46 280 14 3 155
PDAA‐04 D 9/17/2016 12:48:24 281 14 3 155
PDAA‐04 C 9/17/2016 12:48:34 282 14 3 155
PDAA‐03 A 9/17/2016 12:55:44 283 14 3 150
PDAA‐03 B 9/17/2016 12:56:41 284 14 3 150
PDAA‐03 C 9/17/2016 12:57:27 285 14 3 150
PDAA‐03 D 9/17/2016 12:58:30 286 14 3 150
PDAA‐05 A 9/17/2016 13:05:42 287 14 3 178
PDAA‐05 B 9/17/2016 13:06:53 288 14 3 178
PDAA‐05 C 9/17/2016 13:07:37 289 14 3 178
PDAA‐05 D 9/17/2016 13:08:32 290 14 3 178 Download
PDA95‐28 A 9/17/2016 13:48:21 291 13 1 190
PDA95‐28 B 9/17/2016 13:49:12 292 13 1 190
PDA95‐28 C 9/17/2016 13:50:14 293 13 1 190
PDA95‐28 D 9/17/2016 13:50:58 294 13 1 190End of day due to weather. Back at
dock @ 14:50
PDA95‐30 A 9/19/2016 12:03:54 296 13 1 207
PDA95‐30 B 9/19/2016 12:04:45 297 13 1 207
PDA95‐30 C 9/19/2016 12:05:29 298 13 1 207
PDA95‐30 D 9/19/2016 12:06:15 299 13 1 207
Download, frame count 301, stops
moved to 13.5 and 1, replaced PV
D/L cable
PDA95‐25 A 9/19/2016 13:00:14 302 13.5 1 202
PDA95‐25 B 9/19/2016 13:00:59 303 13.5 1 202
PDA95‐25 C 9/19/2016 13:01:38 304 13.5 1 202
PDA95‐25 D 9/19/2016 13:02:15 305 13.5 1 202
PDA95‐35 A 9/19/2016 13:12:38 306 13.5 1 188
PDA95‐35 B 9/19/2016 13:15:54 307 13.5 1 188
PDA95‐35 C 9/19/2016 13:16:42 308 13.5 1 188
PDA95‐35 D 9/19/2016 13:17:33 309 13.5 1 188
PDA95‐32 A 9/19/2016 13:24:16 310 13.5 1 210
PDA95‐32 B 9/19/2016 13:25:09 311 13.5 1 210
PDA95‐32 C 9/19/2016 13:26:04 312 13.5 1 210
PDA95‐32 D 9/19/2016 13:27:33 313 13.5 1 210 EB20170228: Updated time from 13:17 to 13:27
PDA95‐29 A 9/19/2016 13:33:27 314 13.5 1 217
JRJ20170419: Changed to Station 29, Field log says
Station 25, SPILog says Station 29, NavLog says Station
PDA95‐29
PDA95‐29 B 9/19/2016 13:34:26 315 13.5 1 217
JRJ20170419: Changed to Station 29, Field log says
Station 25, SPILog says Station 29, NavLog says Station
PDA95‐29
PDA95‐29 C 9/19/2016 13:35:23 316 13.5 1 217
JRJ20170419: Changed to Station 29, Field log says
Station 25, SPILog says Station 29, NavLog says Station
PDA95‐29
PDA95‐29 D 9/19/2016 13:36:20 317 13.5 1 217
JRJ20170419: Changed to Station 29, Field log says
Station 25, SPILog says Station 29, NavLog says Station
PDA95‐29
PDA95‐23 A 9/19/2016 13:43:13 318 13.5 1 210
PDA95‐23 B 9/19/2016 13:44:16 319 13.5 1 210
PDA95‐23 D 9/19/2016 13:46:53 320 13.5 1 210
PDA95‐23 C 9/19/2016 13:47:17 321 13.5 1 210
PDA95‐26 A 9/19/2016 13:52:29 322 13.5 1 205
PDA95‐26 B 9/19/2016 13:53:20 323 13.5 1 205
PDA95‐26 C 9/19/2016 13:54:11 324 13.5 1 205
PDA95‐26 D 9/19/2016 13:55:04 325 13.5 1 205
PDA95‐34 A 9/19/2016 14:00:29 326 13.5 1 200
PDA95‐34 B 9/19/2016 14:01:30 327 13.5 1 200
PDA95‐34 C 9/19/2016 14:02:27 328 13.5 1 200
PDA95‐34 D 9/19/2016 14:03:34 329 13.5 1 200
PDA95‐27 A 9/19/2016 14:09:18 330 13.5 1 200
PDA95‐27 B 9/19/2016 14:10:06 331 13.5 1 200
PDA95‐27 C 9/19/2016 14:10:48 332 13.5 1 200
PDA95‐27 D 9/19/2016 14:11:50 333 13.5 1 200
PDA95‐24 A 9/19/2016 14:18:52 334 13.5 1 208
PDA95‐24 B 9/19/2016 14:19:51 335 13.5 1 208
PDA95‐24 C 9/19/2016 14:20:50 336 13.5 1 208
PDS 2016 SPI Field Log (Transcribed) Page 2 of 3

StationID Replicate Date Time Frame Stops_inchesWeights_per_
sideDepth_ft Comments QC_Notes
PDA95‐24 D 9/19/2016 14:21:43 337 13.5 1 208
PDA95‐22 A 9/19/2016 14:27:24 338 13.5 1 225
PDA95‐22 B 9/19/2016 14:28:16 339 13.5 1 225
PDA95‐22 C 9/19/2016 14:29:18 340 13.5 1 225
PDA95‐22 D 9/19/2016 14:30:22 341 13.5 1 225
PDA95‐22 E 9/19/2016 14:31:15 342 13.5 1 225
PDA95‐31 A 9/19/2016 14:36:29 343 13.5 1 204
PDA95‐31 B 9/19/2016 14:37:22 344 13.5 1 204
PDA95‐31 C 9/19/2016 14:38:16 345 13.5 1 204
PDA95‐31 D 9/19/2016 14:39:20 346 13.5 1 204 On deck, Download
PDA95‐21 A 9/19/2016 15:16:41 347 13.5 1 206
PDA95‐21 B 9/19/2016 15:17:28 348 13.5 1 206
PDA95‐21 C 9/19/2016 15:18:14 349 13.5 1 206
PDA95‐21 D 9/19/2016 15:19:06 350 13.5 1 206
PDA95‐33 A 9/19/2016 15:25:22 351 13.5 1 227
PDA95‐33 B 9/19/2016 15:26:14 352 13.5 1 227
PDA95‐33 C 9/19/2016 15:27:05 353 13.5 1 227
PDA95‐33 D 9/19/2016 15:27:57 354 13.5 1 227On deck, transit to SREF, frame
count 355
SREF‐07 A 9/19/2016 15:38:50 356 13.5 1 226
SREF‐07 B 9/19/2016 15:39:59 357 13.5 1 226
SREF‐07 C 9/19/2016 15:41:00 358 13.5 1 226
SREF‐07 D 9/19/2016 15:42:38 359 13.5 1 226
SREF‐07 E 9/19/2016 15:43:29 360 13.5 1 226
SREF‐06 A 9/19/2016 15:49:54 361 13.5 1 210
SREF‐06 B 9/19/2016 15:50:48 362 13.5 1 210
SREF‐06 C 9/19/2016 15:51:38 363 13.5 1 210
SREF‐06 D 9/19/2016 15:52:29 364 13.5 1 210 On deck, weights added
SREF‐09 A 9/19/2016 16:01:53 365 13.5 3 191
SREF‐09 B 9/19/2016 16:09:52 366 13.5 3 191
SREF‐09 C 9/19/2016 16:11:06 367 13.5 3 191
SREF‐09 D 9/19/2016 16:11:54 368 13.5 3 191
SREF‐08 A 9/19/2016 16:17:46 369 13.5 3 210
SREF‐08 B 9/19/2016 16:18:34 370 13.5 3 210
SREF‐08 C 9/19/2016 16:19:27 371 13.5 3 210
SREF‐08 D 9/19/2016 16:20:18 372 13.5 3 210
SREF‐10 A 9/19/2016 16:27:20 373 13.5 3 238
SREF‐10 B 9/19/2016 16:28:12 374 13.5 3 238
SREF‐10 C 9/19/2016 16:29:05 375 13.5 3 238
SREF‐10 D 9/19/2016 16:29:50 376 13.5 3 238 On deck, download, frame count 377
EREF‐02 A 9/19/2016 16:57:08 378 13.5 3 252
EREF‐02 B 9/19/2016 16:58:05 379 13.5 3 252
EREF‐02 C 9/19/2016 16:59:05 380 13.5 3 252
EREF‐02 D 9/19/2016 16:59:59 381 13.5 3 252
EREF‐02 E 9/19/2016 17:11:27 13.5 3 252 PV Only
EREF‐02 F 9/19/2016 17:12:03 13.5 3 252 PV Only
EREF‐02 G 9/19/2016 17:12:11 13.5 3 252 PV Only
EREF‐02 H 9/19/2016 17:12:37 13.5 3 252 PV Only, On Deck, frame count 384
EREF‐01 A 9/19/2016 17:21:34 385 13.5 3 252
EREF‐01 B 9/19/2016 17:22:16 386 13.5 3 252
EREF‐01 C 9/19/2016 17:23:01 387 13.5 3 252
EREF‐01 D 9/19/2016 17:23:41 388 13.5 3 252
EREF‐05 A 9/19/2016 17:30:50 389 13.5 3 245
EREF‐05 B 9/19/2016 17:31:32 390 13.5 3 245
EREF‐05 C 9/19/2016 17:32:16 391 13.5 3 245
EREF‐05 D 9/19/2016 17:32:59 392 13.5 3 245
EREF‐03 A 9/19/2016 17:40:22 393 13.5 3 207
EREF‐03 B 9/19/2016 17:41:12 394 13.5 3 207
EREF‐03 C 9/19/2016 17:42:02 395 13.5 3 207
EREF‐03 D 9/19/2016 17:42:48 396 13.5 3 207
EREF‐04 A 9/19/2016 17:47:55 397 13.5 3 198
EREF‐04 B 9/19/2016 17:48:42 398 13.5 3 198
EREF‐04 C 9/19/2016 17:49:26 399 13.5 3 198
EREF‐04 D 9/19/2016 17:50:09 400 13.5 3 198On deck, download, Frame count
401
EREF‐04 E 9/19/2016 18:13:22 402 14 5 195
EREF‐04 F 9/19/2016 18:14:06 403 14 5 195
EREF‐04 G 9/19/2016 18:15:12 404 14 5 195
EREF‐04 H 9/19/2016 18:16:11 405 14 5 195
EREF‐03 E 9/19/2016 18:21:36 406 14 5 200
EREF‐03 F 9/19/2016 18:22:41 407 14 5 200
EREF‐03 G 9/19/2016 18:23:24 408 14 5 200
EREF‐03 H 9/19/2016 18:24:18 409 14 5 200
PDS 2016 SPI Field Log (Transcribed) Page 3 of 3

Monitoring Survey at the Portland Disposal Site September 2016
APPENDIX E
SEDIMENT PROFILE AND PLAN VIEW IMAGE ANALYSIS RESULTS

Monitoring Survey at the Portland Disposal Site September 2016
Area Location StationID Replicate Date TimeWater
Depth (m)
Stop Collar Setting (in)
# of Weights (per side)
Image Width (cm)
Grain Size Major
Mode (phi)
Grain Size Minimum
(phi)
Grain Size Maximum
(phi)
Grain Size Range (phi)
Penetration Mean (cm)
Penetration Minimum
(cm)
Penetration Maximum
(cm)
Boundary Roughness
(cm)
Boundary Roughness
Type
Reference EREF EREF‐01 A 9/19/2016 17:21:42 77 13.5 3 14.53 4‐3/>4 >4 2 >4 to 2 11.21 10.76 11.60 0.84 Biological
Reference EREF EREF‐01 B 9/19/2016 17:22:26 77 13.5 3 14.53 4‐3/>4 >4 ‐1 >4 to ‐1 11.42 11.13 11.69 0.56 Biological
Reference EREF EREF‐01 C 9/19/2016 17:23:10 77 13.5 3 14.53 4‐3/>4 >4 1 >4 to 1 9.51 9.14 10.08 0.95 Biological
Reference EREF EREF‐02 A 9/19/2016 16:57:17 77 13.5 3 14.53 4‐3/>4 >4 1 >4 to 1 12.55 10.29 13.69 3.40 BiologicalReference EREF EREF‐02 B 9/19/2016 16:58:09 77 13.5 3 14.53 4‐3/>4 >4 2 >4 to 2 11.78 11.18 12.19 1.02 BiologicalReference EREF EREF‐02 C 9/19/2016 16:59:15 77 13.5 3 14.53 4‐3/>4 >4 0 >4 to 0 13.12 12.67 13.62 0.94 BiologicalReference EREF EREF‐03 A 9/19/2016 17:40:31 63 13.5 3 14.53 4‐3 >4 1 >4 to 1 6.33 6.02 6.74 0.72 BiologicalReference EREF EREF‐03 B 9/19/2016 17:41:21 63 13.5 3 14.53 4‐3/>4 >4 2 >4 to 2 7.47 6.93 8.06 1.12 BiologicalReference EREF EREF‐03 C 9/19/2016 17:42:12 63 13.5 3 14.53 4‐3 >4 0 >4 to 0 8.94 8.46 9.45 0.99 Biological
Reference EREF EREF‐04 A 9/19/2016 17:48:03 60 13.5 3 14.53 IND IND INDIND to IND
0.00 0.00 0.00 IND Physical
Reference EREF EREF‐04 B 9/19/2016 17:48:51 60 13.5 3 14.53 >4 >4 0 >4 to 0 5.42 4.65 6.10 1.45 BiologicalReference EREF EREF‐04 C 9/19/2016 17:49:35 60 13.5 3 14.53 >4 >4 0 >4 to 0 5.13 4.60 6.04 1.44 BiologicalReference EREF EREF‐05 A 9/19/2016 17:30:59 75 13.5 3 14.53 4‐3/>4 >4 0 >4 to 0 10.47 10.12 10.84 0.73 BiologicalReference EREF EREF‐05 B 9/19/2016 17:31:42 75 13.5 3 14.53 4‐3/>4 >4 2 >4 to 2 10.64 10.23 11.09 0.86 BiologicalReference EREF EREF‐05 C 9/19/2016 17:32:25 75 13.5 3 14.53 4‐3/>4 >4 1 >4 to 1 10.87 10.43 11.35 0.92 Biological
Disposal PDA95 PDA95‐21 A 9/19/2016 15:16:51 63 13.5 1 14.53 4‐3/>4 >4 0 >4 to 0 13.90 13.50 14.56 1.06 Biological
Disposal PDA95 PDA95‐21 B 9/19/2016 15:17:38 63 13.5 1 14.53 4‐3/>4 >4 0 >4 to 0 12.76 12.37 13.30 0.93 Biological
Disposal PDA95 PDA95‐21 C 9/19/2016 15:18:25 63 13.5 1 14.53 >4 >4 ‐1 >4 to ‐1 14.38 13.79 14.88 1.09 Biological
Disposal PDA95 PDA95‐22 A 9/19/2016 14:27:36 69 13.5 1 14.53 4‐3/>4 >4 0 >4 to 0 18.07 17.60 18.33 0.73 Biological
Disposal PDA95 PDA95‐22 B 9/19/2016 14:28:26 69 13.5 1 14.53 3‐2/>4 >4 1 >4 to 1 17.55 17.22 18.53 1.31 Biological
Disposal PDA95 PDA95‐22 C 9/19/2016 14:29:29 69 13.5 1 14.53 3‐2/>4 >4 1 >4 to 1 19.29 19.03 19.51 0.48 Biological
Disposal PDA95 PDA95‐23 A 9/19/2016 13:43:23 64 13.5 1 14.53 4‐3/>4 >4 1 >4 to 1 12.60 11.92 13.34 1.42 Biological
Disposal PDA95 PDA95‐23 B 9/19/2016 13:44:27 64 13.5 1 14.53 4‐3/>4 >4 1 >4 to 1 16.34 16.06 16.67 0.61 Biological
Disposal PDA95 PDA95‐23 C 9/19/2016 13:45:27 64 13.5 1 14.53 3‐2/>4 >4 0 >4 to 0 13.84 13.46 14.24 0.78 Biological
Disposal PDA95 PDA95‐24 A 9/19/2016 14:19:02 63 13.5 1 14.53 4‐3/>4 >4 2 >4 to 2 17.15 16.70 17.66 0.96 Biological
Disposal PDA95 PDA95‐24 B 9/19/2016 14:20:01 63 13.5 1 14.53 3‐2/>4 >4 0 >4 to 0 20.08 19.49 20.52 1.02 Biological
Disposal PDA95 PDA95‐24 C 9/19/2016 14:21:00 63 13.5 1 14.53 3‐2/>4 >4 1 >4 to 1 8.01 7.74 8.23 0.49 Biological
Disposal PDA95 PDA95‐25 A 9/19/2016 13:00:25 62 13.5 1 14.53 4‐3/>4 >4 ‐1 >4 to ‐1 16.03 15.90 16.29 0.39 Biological
Disposal PDA95 PDA95‐25 B 9/19/2016 13:01:07 62 13.5 1 14.53 4‐3/>4 >4 2 >4 to 2 16.78 16.38 17.27 0.89 BiologicalDisposal PDA95 PDA95‐25 C 9/19/2016 13:01:48 62 13.5 1 14.53 4‐3/>4 >4 1 >4 to 1 15.87 15.68 16.10 0.42 Biological
Disposal PDA95 PDA95‐26 A 9/19/2016 13:52:40 62 13.5 1 14.53 4‐3/>4 >4 0 >4 to 0 14.47 14.27 14.62 0.35 Biological
Disposal PDA95 PDA95‐26 B 9/19/2016 13:53:31 62 13.5 1 14.53 4‐3/>4 >4 0 >4 to 0 16.58 16.25 16.93 0.68 Biological
Appendix E ‐ Sediment Profile Image Analysis Results Page 1 of 20

Monitoring Survey at the Portland Disposal Site September 2016
Area Location StationID Replicate Date TimeWater
Depth (m)
Stop Collar Setting (in)
# of Weights (per side)
Image Width (cm)
Grain Size Major
Mode (phi)
Grain Size Minimum
(phi)
Grain Size Maximum
(phi)
Grain Size Range (phi)
Penetration Mean (cm)
Penetration Minimum
(cm)
Penetration Maximum
(cm)
Boundary Roughness
(cm)
Boundary Roughness
Type
Disposal PDA95 PDA95‐26 C 9/19/2016 13:54:22 62 13.5 1 14.53 4‐3/>4 >4 0 >4 to 0 15.72 15.19 16.32 1.13 Biological
Disposal PDA95 PDA95‐27 A 9/19/2016 14:09:29 61 13.5 1 14.53 4‐3/>4 >4 2 >4 to 2 15.08 13.91 15.76 1.85 BiologicalDisposal PDA95 PDA95‐27 B 9/19/2016 14:10:17 61 13.5 1 14.53 3‐2/>4 >4 1 >4 to 1 19.51 19.27 19.77 0.50 Biological
Disposal PDA95 PDA95‐27 C 9/19/2016 14:11:09 61 13.5 1 14.53 3‐2/>4 >4 2 >4 to 2 17.32 17.15 17.51 0.36 Biological
Disposal PDA95 PDA95‐28 A 9/17/2016 13:48:32 58 13 1 14.53 3‐2/>4 >4 ‐1 >4 to ‐1 15.86 14.88 16.72 1.83 Biological
Disposal PDA95 PDA95‐28 B 9/17/2016 13:49:23 58 13 1 14.53 3‐2/>4 >4 0 >4 to 0 21.80 IND IND IND INDDisposal PDA95 PDA95‐28 C 9/17/2016 13:50:26 58 13 1 14.53 3‐2/>4 >4 0 >4 to 0 20.48 20.08 20.83 0.75 Biological
Disposal PDA95 PDA95‐29 A 9/19/2016 13:33:37 66 13.5 1 14.53 4‐3/>4 >4 0 >4 to 0 15.05 14.65 16.42 1.77 Biological
Disposal PDA95 PDA95‐29 B 9/19/2016 13:34:37 66 13.5 1 14.53 4‐3/>4 >4 0 >4 to 0 14.23 13.88 14.78 0.90 Biological
Disposal PDA95 PDA95‐29 C 9/19/2016 13:35:34 66 13.5 1 14.53 4‐3/>4 >4 0 >4 to 0 14.41 14.17 14.77 0.60 Biological
Disposal PDA95 PDA95‐30 A 9/19/2016 12:04:02 63 13 1 14.53 4‐3/>4 >4 1 >4 to 1 13.33 13.13 13.59 0.47 Biological
Disposal PDA95 PDA95‐30 B 9/19/2016 12:04:54 63 13 1 14.53 4‐3/>4 >4 2 >4 to 2 12.77 10.42 13.90 3.47 Biological
Disposal PDA95 PDA95‐30 C 9/19/2016 12:05:37 63 13 1 14.53 4‐3/>4 >4 1 >4 to 1 14.76 14.20 15.16 0.96 Biological
Disposal PDA95 PDA95‐31 A 9/19/2016 14:36:40 62 13.5 1 14.53 4‐3/>4 >4 1 >4 to 1 15.55 15.16 15.90 0.74 Biological
Disposal PDA95 PDA95‐31 B 9/19/2016 14:37:33 62 13.5 1 14.53 4‐3/>4 >4 ‐1 >4 to ‐1 18.23 17.51 19.06 1.55 Biological
Disposal PDA95 PDA95‐31 C 9/19/2016 14:38:27 62 13.5 1 14.53 4‐3/>4 >4 1 >4 to 1 17.25 16.80 18.27 1.47 Biological
Disposal PDA95 PDA95‐32 A 9/19/2016 13:24:27 64 13.5 1 14.53 4‐3/>4 >4 1 >4 to 1 17.62 16.16 18.84 2.68 Physical
Disposal PDA95 PDA95‐32 B 9/19/2016 13:25:17 64 13.5 1 14.53 4‐3/>4 >4 0 >4 to 0 14.78 13.78 16.02 2.25 Physical
Disposal PDA95 PDA95‐32 C 9/19/2016 13:26:15 64 13.5 1 14.53 4‐3/>4 >4 2 >4 to 2 15.35 14.99 15.65 0.67 Biological
Disposal PDA95 PDA95‐33 A 9/19/2016 15:25:31 69 13.5 1 14.53 4‐3/>4 >4 0 >4 to 0 18.17 18.01 18.42 0.41 Biological
Disposal PDA95 PDA95‐33 B 9/19/2016 15:26:29 69 13.5 1 14.53 4‐3/>4 >4 2 >4 to 2 18.03 16.64 19.06 2.42 BiologicalDisposal PDA95 PDA95‐33 C 9/19/2016 15:27:15 69 13.5 1 14.53 4‐3/>4 >4 1 >4 to 1 20.01 19.38 20.78 1.40 Biological
Disposal PDA95 PDA95‐34 A 9/19/2016 14:00:39 61 13.5 1 14.53 3‐2/>4 >4 1 >4 to 1 13.58 13.34 13.81 0.47 Biological
Disposal PDA95 PDA95‐34 B 9/19/2016 14:01:41 61 13.5 1 14.53 3‐2/>4 >4 ‐2 >4 to ‐2 15.24 14.65 15.84 1.19 BiologicalDisposal PDA95 PDA95‐34 C 9/19/2016 14:02:37 61 13.5 1 14.53 3‐2/>4 >4 ‐1 >4 to ‐1 13.31 12.49 13.88 1.40 Biological
Disposal PDA95 PDA95‐35 B 9/19/2016 13:16:02 57 13.5 1 14.53 4‐3/>4 >4 2 >4 to 2 15.57 15.01 16.02 1.00 Biological
Disposal PDA95 PDA95‐35 C 9/19/2016 13:16:54 57 13.5 1 14.53 4‐3/>4 >4 2 >4 to 2 19.21 18.86 19.51 0.65 Biological
Disposal PDA95 PDA95‐35 D 9/19/2016 13:17:44 57 13.5 1 14.53 4‐3/>4 >4 1 >4 to 1 16.09 15.36 16.98 1.61 Biological
Disposal PDAA PDAA‐01 A 9/17/2016 12:40:14 52 14 3 14.53 3‐2 >4 ‐4 >4 to ‐4 5.47 4.87 6.10 1.24 Physical
Disposal PDAA PDAA‐01 B 9/17/2016 12:41:01 52 14 3 14.53 3‐2 >4 ‐5 >4 to ‐5 3.58 2.61 4.91 2.30 PhysicalDisposal PDAA PDAA‐01 C 9/17/2016 12:42:01 52 14 3 14.53 3‐2 >4 ‐2 >4 to ‐2 3.61 3.28 3.91 0.63 Physical
Appendix E ‐ Sediment Profile Image Analysis Results Page 2 of 20

Monitoring Survey at the Portland Disposal Site September 2016
Area Location StationID Replicate Date TimeWater
Depth (m)
Stop Collar Setting (in)
# of Weights (per side)
Image Width (cm)
Grain Size Major
Mode (phi)
Grain Size Minimum
(phi)
Grain Size Maximum
(phi)
Grain Size Range (phi)
Penetration Mean (cm)
Penetration Minimum
(cm)
Penetration Maximum
(cm)
Boundary Roughness
(cm)
Boundary Roughness
Type
Disposal PDAA PDAA‐02 A 9/17/2016 12:33:25 53 14 3 14.53 3‐2 >4 ‐4 >4 to ‐4 5.06 4.36 5.64 1.28 PhysicalDisposal PDAA PDAA‐02 B 9/17/2016 12:34:25 53 14 3 14.53 3‐2 >4 ‐3 >4 to ‐3 4.09 3.67 4.43 0.75 PhysicalDisposal PDAA PDAA‐02 C 9/17/2016 12:35:05 53 14 3 14.53 3‐2 >4 ‐2 >4 to ‐2 5.64 5.36 5.81 0.45 Biological
Disposal PDAA PDAA‐03 B 9/17/2016 12:56:50 46 14 3 14.53 3‐2 >4 ‐4 >4 to ‐4 9.99 9.42 10.39 0.97 Biological
Disposal PDAA PDAA‐03 C 9/17/2016 12:57:36 46 14 3 14.53 3‐2/>4 >4 ‐2 >4 to ‐2 8.81 7.72 9.57 1.85 Biological
Disposal PDAA PDAA‐03 D 9/17/2016 12:58:40 46 14 3 14.53 4‐3/>4 >4 ‐4 >4 to ‐4 11.37 10.26 12.15 1.90 Biological
Disposal PDAA PDAA‐04 A 9/17/2016 12:47:02 47 14 3 14.53 >4 >4 ‐4 >4 to ‐4 0.10 0.00 0.33 0.33 Physical
Disposal PDAA PDAA‐04 C 9/17/2016 12:48:44 47 14 3 14.53 >4 >4 ‐5 >4 to ‐5 0.25 0.00 0.83 0.83 Physical
Disposal PDAA PDAA‐04 D 9/17/2016 12:49:33 47 14 3 14.53 3‐2 >4 ‐4 >4 to ‐4 0.00 0.00 0.00 IND Physical
Disposal PDAA PDAA‐05 A 9/17/2016 13:05:51 54 14 3 14.53 3‐2 >4 ‐1 >4 to ‐1 7.09 5.71 7.89 2.18 Physical
Disposal PDAA PDAA‐05 B 9/17/2016 13:07:03 54 14 3 14.53 4‐3/>4 >4 ‐2 >4 to ‐2 5.64 4.98 6.27 1.29 Biological
Disposal PDAA PDAA‐05 C 9/17/2016 13:07:47 54 14 3 14.53 4‐3/>4 >4 ‐3 >4 to ‐3 6.36 5.83 6.68 0.85 PhysicalDisposal PDS PDS‐06 E 9/17/2016 7:46:30 53 13 0 14.53 4‐3/>4 >4 0 >4 to 0 16.67 16.13 17.37 1.23 BiologicalDisposal PDS PDS‐06 F 9/17/2016 7:47:17 53 13 0 14.53 4‐3/>4 >4 0 >4 to 0 19.15 18.77 19.69 0.92 BiologicalDisposal PDS PDS‐06 G 9/17/2016 7:48:08 53 13 0 14.53 3‐2/>4 >4 1 >4 to 1 19.67 19.32 19.97 0.65 Biological
Disposal PDS PDS‐07 A 9/17/2016 10:54:06 60 13 1 14.53 4‐3/>4 >4 ‐1 >4 to ‐1 14.44 13.87 14.75 0.89 Biological
Disposal PDS PDS‐07 B 9/17/2016 10:54:47 60 13 1 14.53 4‐3/>4 >4 0 >4 to 0 12.05 11.42 13.28 1.86 Biological
Disposal PDS PDS‐07 C 9/17/2016 10:55:38 60 13 1 14.53 4‐3/>4 >4 0 >4 to 0 13.50 12.59 14.62 2.03 Biological
Disposal PDS PDS‐08 A 9/17/2016 10:07:57 55 13 1 14.53 3‐2/>4 >4 1 >4 to 1 7.33 6.73 7.82 1.09 Biological
Disposal PDS PDS‐08 B 9/17/2016 10:08:55 55 13 1 14.53 4‐3/>4 >4 0 >4 to 0 10.84 10.20 11.56 1.35 Biological
Disposal PDS PDS‐08 C 9/17/2016 10:09:39 55 13 1 14.53 4‐3/>4 >4 0 >4 to 0 9.51 9.11 10.13 1.02 Physical
Disposal PDS PDS‐09 A 9/17/2016 11:39:03 55 13 1 14.53 4‐3/>4 >4 1 >4 to 1 8.66 7.91 9.75 1.84 Physical
Disposal PDS PDS‐09 B 9/17/2016 11:39:48 55 13 1 14.53 3‐2/>4 >4 1 >4 to 1 9.12 8.11 10.20 2.09 Physical
Disposal PDS PDS‐09 C 9/17/2016 11:40:36 55 13 1 14.53 4‐3/>4 >4 0 >4 to 0 11.71 11.12 12.41 1.29 BiologicalDisposal PDS PDS‐10 A 9/17/2016 11:12:56 57 13 1 14.53 4‐3/>4 >4 1 >4 to 1 13.86 13.46 14.24 0.78 Biological
Disposal PDS PDS‐10 B 9/17/2016 11:13:39 57 13 1 14.53 4‐3/>4 >4 0 >4 to 0 12.65 12.01 13.07 1.06 Biological
Disposal PDS PDS‐10 C 9/17/2016 11:14:29 57 13 1 14.53 4‐3/>4 >4 2 >4 to 2 12.97 12.83 13.33 0.49 Biological
Disposal PDS PDS‐11 A 9/17/2016 8:07:45 53 14 3 14.53 3‐2/>4 >4 ‐1 >4 to ‐1 14.44 13.84 15.09 1.25 Physical
Disposal PDS PDS‐11 B 9/17/2016 8:08:23 53 14 3 14.53 >4 >4 ‐1 >4 to ‐1 14.84 13.91 15.54 1.63 Biological
Disposal PDS PDS‐11 C 9/17/2016 8:09:07 53 14 3 14.53 3‐2/>4 >4 ‐1 >4 to ‐1 14.21 13.43 15.17 1.74 Biological
Disposal PDS PDS‐12 A 9/17/2016 11:03:00 55 13 1 14.53 4‐3/>4 >4 0 >4 to 0 14.46 13.68 15.33 1.66 Biological
Appendix E ‐ Sediment Profile Image Analysis Results Page 3 of 20

Monitoring Survey at the Portland Disposal Site September 2016
Area Location StationID Replicate Date TimeWater
Depth (m)
Stop Collar Setting (in)
# of Weights (per side)
Image Width (cm)
Grain Size Major
Mode (phi)
Grain Size Minimum
(phi)
Grain Size Maximum
(phi)
Grain Size Range (phi)
Penetration Mean (cm)
Penetration Minimum
(cm)
Penetration Maximum
(cm)
Boundary Roughness
(cm)
Boundary Roughness
Type
Disposal PDS PDS‐12 B 9/17/2016 11:03:54 55 13 1 14.53 4‐3/>4 >4 1 >4 to 1 13.46 12.69 14.11 1.42 Biological
Disposal PDS PDS‐12 C 9/17/2016 11:04:36 55 13 1 14.53 4‐3/>4 >4 1 >4 to 1 14.12 13.84 14.52 0.68 Biological
Disposal PDS PDS‐13 E 9/17/2016 10:36:39 61 13 1 14.53 4‐3/>4 >4 1 >4 to 1 19.30 18.27 19.80 1.53 Biological
Disposal PDS PDS‐13 F 9/17/2016 10:37:31 61 13 1 14.53 4‐3/>4 >4 2 >4 to 2 20.60 19.71 21.34 1.64 BiologicalDisposal PDS PDS‐13 G 9/17/2016 10:38:17 61 13 1 14.53 4‐3/>4 >4 1 >4 to 1 21.80 IND IND IND INDDisposal PDS PDS‐14 A 9/17/2016 12:14:01 54 14 3 14.53 3‐2/>4 >4 1 >4 to 1 6.96 6.10 7.60 1.50 BiologicalDisposal PDS PDS‐14 B 9/17/2016 12:14:52 54 14 3 14.53 3‐2 >4 1 >4 to 1 12.67 11.58 13.13 1.54 BiologicalDisposal PDS PDS‐14 C 9/17/2016 12:15:38 54 14 3 14.53 3‐2/>4 >4 0 >4 to 0 18.54 17.75 20.15 2.40 Biological
Disposal PDS PDS‐15 A 9/17/2016 11:19:08 58 13 1 14.53 3‐2/>4 >4 ‐4 >4 to ‐4 11.50 10.73 11.99 1.26 Biological
Disposal PDS PDS‐15 B 9/17/2016 11:19:55 58 13 1 14.53 3‐2 >4 1 >4 to 1 6.56 6.07 7.00 0.93 Biological
Disposal PDS PDS‐15 D 9/17/2016 11:21:27 58 13 1 14.53 3‐2/>4 >4 ‐5 >4 to ‐5 4.92 3.58 6.21 2.64 Physical
Disposal PDS PDS‐16 A 9/17/2016 8:29:53 50 14 3 14.53 4‐3/>4 >4 0 >4 to 0 15.45 13.55 16.58 3.04 Physical
Disposal PDS PDS‐16 B 9/17/2016 8:30:28 50 14 3 14.53 4‐3/>4 >4 0 >4 to 0 12.52 12.19 13.30 1.10 Biological
Disposal PDS PDS‐16 C 9/17/2016 8:31:10 50 14 3 14.53 4‐3/>4 >4 ‐3 >4 to ‐3 14.41 12.56 15.12 2.56 Physical
Disposal PDS PDS‐17 E 9/17/2016 10:46:23 58 13 1 14.53 4‐3/>4 >4 2 >4 to 2 14.72 13.52 15.80 2.28 Biological
Disposal PDS PDS‐17 F 9/17/2016 10:47:06 58 13 1 14.53 4‐3/>4 >4 1 >4 to 1 20.85 20.41 21.32 0.92 Biological
Disposal PDS PDS‐17 G 9/17/2016 10:47:48 58 13 1 14.53 4‐3/>4 >4 0 >4 to 0 18.09 17.77 18.62 0.85 Biological
Disposal PDS PDS‐18 E 9/17/2016 10:26:47 60 13 1 14.53 4‐3/>4 >4 2 >4 to 2 14.91 14.29 15.42 1.13 Biological
Disposal PDS PDS‐18 F 9/17/2016 10:27:37 60 13 1 14.53 4‐3/>4 >4 1 >4 to 1 17.09 16.76 17.46 0.70 BiologicalDisposal PDS PDS‐18 G 9/17/2016 10:28:20 60 13 1 14.53 4‐3/>4 >4 0 >4 to 0 10.24 9.93 10.48 0.55 Biological
Disposal PDS PDS‐19 A 9/17/2016 12:24:18 58 14 3 14.53 4‐3/>4 >4 2 >4 to 2 14.44 13.52 15.36 1.85 Biological
Disposal PDS PDS‐19 B 9/17/2016 12:25:11 58 14 3 14.53 4‐3/>4 >4 1 >4 to 1 14.97 14.78 15.26 0.48 Biological
Disposal PDS PDS‐19 C 9/17/2016 12:26:01 58 14 3 14.53 4‐3/>4 >4 ‐1 >4 to ‐1 14.24 13.68 14.87 1.19 Biological
Disposal PDS PDS‐20 A 9/17/2016 11:30:33 55 13 1 14.53 4‐3/>4 >4 1 >4 to 1 6.37 5.81 7.20 1.39 Biological
Disposal PDS PDS‐20 B 9/17/2016 11:31:10 55 13 1 14.53 4‐3/>4 >4 1 >4 to 1 10.98 10.67 11.41 0.74 BiologicalDisposal PDS PDS‐20 C 9/17/2016 11:32:18 55 13 1 14.53 4‐3/>4 >4 0 >4 to 0 5.93 5.52 6.32 0.81 BiologicalReference SREF SREF‐10 B 9/19/2016 16:28:22 73 13.5 3 14.53 4‐3/>4 >4 1 >4 to 1 13.53 12.86 14.17 1.31 BiologicalReference SREF SREF‐10 C 9/19/2016 16:29:14 73 13.5 3 14.53 4‐3/>4 >4 ‐1 >4 to ‐1 9.58 8.98 10.07 1.09 Biological
Reference SREF SREF‐06 A 9/19/2016 15:50:04 64 13.5 1 14.53 IND IND INDIND to IND
0.00 0.00 0.00 IND IND
Reference SREF SREF‐06 B 9/19/2016 15:50:59 64 13.5 1 14.53 IND IND INDIND to IND
0.00 0.00 0.00 IND IND
Reference SREF SREF‐06 C 9/19/2016 15:51:48 64 13.5 1 14.53 IND IND INDIND to IND
0.00 0.00 0.00 IND IND
Reference SREF SREF‐07 A 9/19/2016 15:39:00 69 13.5 1 14.53 4‐3 >4 2 >4 to 2 8.67 8.17 8.95 0.78 Biological
Reference SREF SREF‐07 B 9/19/2016 15:40:04 69 13.5 1 14.53 4‐3 >4 0 >4 to 0 8.48 8.01 8.87 0.86 BiologicalReference SREF SREF‐07 C 9/19/2016 15:40:57 69 13.5 1 14.53 4‐3/>4 >4 1 >4 to 1 8.56 8.21 8.83 0.62 Biological
Appendix E ‐ Sediment Profile Image Analysis Results Page 4 of 20

Monitoring Survey at the Portland Disposal Site September 2016
Area Location StationID Replicate Date TimeWater
Depth (m)
Stop Collar Setting (in)
# of Weights (per side)
Image Width (cm)
Grain Size Major
Mode (phi)
Grain Size Minimum
(phi)
Grain Size Maximum
(phi)
Grain Size Range (phi)
Penetration Mean (cm)
Penetration Minimum
(cm)
Penetration Maximum
(cm)
Boundary Roughness
(cm)
Boundary Roughness
Type
Reference SREF SREF‐08 A 9/19/2016 16:17:55 64 13.5 3 14.53 IND IND INDIND to IND
0.00 0.00 0.00 IND IND
Reference SREF SREF‐08 C 9/19/2016 16:19:38 64 13.5 3 14.53 4‐3 >4 ‐1 >4 to ‐1 9.78 9.29 10.31 1.02 BiologicalReference SREF SREF‐08 D 9/19/2016 16:20:28 64 13.5 3 14.53 4‐3 >4 ‐2 >4 to ‐2 7.01 6.47 7.76 1.29 Biological
Reference SREF SREF‐09 A 9/19/2016 16:02:03 58 13.5 3 14.53 IND IND INDIND to IND
0.00 0.00 0.00 IND IND
Reference SREF SREF‐09 B 9/19/2016 16:10:01 58 13.5 3 14.53 IND IND INDIND to IND
0.00 0.00 0.00 IND IND
Reference SREF SREF‐09 C 9/19/2016 16:11:15 58 13.5 3 14.53 IND IND INDIND to IND
0.00 0.00 0.00 IND IND
Reference SREF SREF‐10 D 9/19/2016 16:30:00 73 13.5 3 14.53 4‐3/>4 >4 1 >4 to 1 11.62 10.60 12.66 2.06 Biological
Appendix E ‐ Sediment Profile Image Analysis Results Page 5 of 20

Monitoring Survey at the Portland Disposal Site September 2016
Area Location StationID Replicate
Reference EREF EREF‐01 A
Reference EREF EREF‐01 B
Reference EREF EREF‐01 C
Reference EREF EREF‐02 AReference EREF EREF‐02 BReference EREF EREF‐02 CReference EREF EREF‐03 AReference EREF EREF‐03 BReference EREF EREF‐03 C
Reference EREF EREF‐04 A
Reference EREF EREF‐04 BReference EREF EREF‐04 CReference EREF EREF‐05 AReference EREF EREF‐05 BReference EREF EREF‐05 C
Disposal PDA95 PDA95‐21 A
Disposal PDA95 PDA95‐21 B
Disposal PDA95 PDA95‐21 C
Disposal PDA95 PDA95‐22 A
Disposal PDA95 PDA95‐22 B
Disposal PDA95 PDA95‐22 C
Disposal PDA95 PDA95‐23 A
Disposal PDA95 PDA95‐23 B
Disposal PDA95 PDA95‐23 C
Disposal PDA95 PDA95‐24 A
Disposal PDA95 PDA95‐24 B
Disposal PDA95 PDA95‐24 C
Disposal PDA95 PDA95‐25 A
Disposal PDA95 PDA95‐25 BDisposal PDA95 PDA95‐25 C
Disposal PDA95 PDA95‐26 A
Disposal PDA95 PDA95‐26 B
aRPD Mean (cm) aRPD > Pen Mud Clast Number Mud Clast StateMethane Present?
Number of Methane Bubbles
Dredged Material Present?
Mean depth below Sediment Surface of
top of Dredged Material Layer (cm)
Dredged Material Layer Mean
Thickness (cm)Dredged Material > Pen
1.66 No 0 No
1.24 No 0 No
1.31 No 0 No
2.14 No 0 No2.22 No 0 No3.42 No 0 No1.35 No 0 No2.08 No 0 No1.61 No 0 No
IND No 0 No
1.25 No 0 No1.25 No 0 No1.65 No 0 No1.68 No 0 No1.44 No 0 No
1.52 No 0 Yes 13.90 TRUE
1.51 No 0 Yes 12.76 TRUE
1.32 No 0 Yes 14.38 TRUE
2.03 No 0 Yes 18.07 TRUE
1.66 1 Red No 0 Yes 17.55 TRUE
3.30 No 0 Yes 19.29 TRUE
2.75 No 0 Yes 12.60 TRUE
0.99 No 0 Yes 16.34 TRUE
1.42 No 0 Yes 13.84 TRUE
2.22 2 Red No 0 Yes 17.15 TRUE
2.32 No 0 Yes 20.08 TRUE
0.75 No 0 Yes 8.01 TRUE
1.15 No 0 Yes 16.03 TRUE
0.64 No 0 Yes 16.78 TRUE1.00 No 0 Yes 15.87 TRUE
1.21 No 0 Yes 14.47 TRUE
0.52 1 Red No 0 Yes 16.58 TRUE
Appendix E ‐ Sediment Profile Image Analysis Results Page 6 of 20

Monitoring Survey at the Portland Disposal Site September 2016
Area Location StationID Replicate
Disposal PDA95 PDA95‐26 C
Disposal PDA95 PDA95‐27 ADisposal PDA95 PDA95‐27 B
Disposal PDA95 PDA95‐27 C
Disposal PDA95 PDA95‐28 A
Disposal PDA95 PDA95‐28 BDisposal PDA95 PDA95‐28 C
Disposal PDA95 PDA95‐29 A
Disposal PDA95 PDA95‐29 B
Disposal PDA95 PDA95‐29 C
Disposal PDA95 PDA95‐30 A
Disposal PDA95 PDA95‐30 B
Disposal PDA95 PDA95‐30 C
Disposal PDA95 PDA95‐31 A
Disposal PDA95 PDA95‐31 B
Disposal PDA95 PDA95‐31 C
Disposal PDA95 PDA95‐32 A
Disposal PDA95 PDA95‐32 B
Disposal PDA95 PDA95‐32 C
Disposal PDA95 PDA95‐33 A
Disposal PDA95 PDA95‐33 BDisposal PDA95 PDA95‐33 C
Disposal PDA95 PDA95‐34 A
Disposal PDA95 PDA95‐34 BDisposal PDA95 PDA95‐34 C
Disposal PDA95 PDA95‐35 B
Disposal PDA95 PDA95‐35 C
Disposal PDA95 PDA95‐35 D
Disposal PDAA PDAA‐01 A
Disposal PDAA PDAA‐01 BDisposal PDAA PDAA‐01 C
aRPD Mean (cm) aRPD > Pen Mud Clast Number Mud Clast StateMethane Present?
Number of Methane Bubbles
Dredged Material Present?
Mean depth below Sediment Surface of
top of Dredged Material Layer (cm)
Dredged Material Layer Mean
Thickness (cm)Dredged Material > Pen
0.83 1 Red No 0 Yes 15.72 TRUE
1.22 No 0 Yes 15.08 TRUE1.61 No 0 Yes 19.51 TRUE
0.92 No 0 Yes 17.32 TRUE
1.86 No 0 Yes 15.86 TRUE
IND No 0 Yes 21.80 TRUE0.81 No 0 Yes 20.48 TRUE
1.31 No 0 Yes 15.05 TRUE
0.45 No 0 Yes 14.23 TRUE
0.44 No 0 Yes 14.41 TRUE
1.35 No 0 Yes 13.33 TRUE
0.85 No 0 Yes 12.77 TRUE
1.64 No 0 Yes 14.76 TRUE
1.97 No 0 Yes 15.55 TRUE
1.32 No 0 Yes 18.23 TRUE
1.47 1 Ox No 0 Yes 17.25 TRUE
1.32 No 0 Yes 17.62 TRUE
1.32 No 0 Yes 14.78 TRUE
IND 2 Red No 0 Yes 15.35 TRUE
1.80 No 0 Yes 18.17 TRUE
1.31 No 0 Yes 18.03 TRUE2.05 No 0 Yes 20.01 TRUE
1.08 No 0 Yes 13.58 TRUE
0.49 No 0 Yes 15.24 TRUEIND No 0 Yes 13.31 TRUE
1.58 No 0 Yes 15.57 TRUE
1.13 No 0 Yes 19.21 TRUE
1.49 No 0 Yes 16.09 TRUE
IND No 0 Yes 5.47 TRUE
IND No 0 Yes 3.58 TRUEIND No 0 Yes 3.61 TRUE
Appendix E ‐ Sediment Profile Image Analysis Results Page 7 of 20

Monitoring Survey at the Portland Disposal Site September 2016
Area Location StationID Replicate
Disposal PDAA PDAA‐02 ADisposal PDAA PDAA‐02 BDisposal PDAA PDAA‐02 C
Disposal PDAA PDAA‐03 B
Disposal PDAA PDAA‐03 C
Disposal PDAA PDAA‐03 D
Disposal PDAA PDAA‐04 A
Disposal PDAA PDAA‐04 C
Disposal PDAA PDAA‐04 D
Disposal PDAA PDAA‐05 A
Disposal PDAA PDAA‐05 B
Disposal PDAA PDAA‐05 CDisposal PDS PDS‐06 EDisposal PDS PDS‐06 FDisposal PDS PDS‐06 G
Disposal PDS PDS‐07 A
Disposal PDS PDS‐07 B
Disposal PDS PDS‐07 C
Disposal PDS PDS‐08 A
Disposal PDS PDS‐08 B
Disposal PDS PDS‐08 C
Disposal PDS PDS‐09 A
Disposal PDS PDS‐09 B
Disposal PDS PDS‐09 CDisposal PDS PDS‐10 A
Disposal PDS PDS‐10 B
Disposal PDS PDS‐10 C
Disposal PDS PDS‐11 A
Disposal PDS PDS‐11 B
Disposal PDS PDS‐11 C
Disposal PDS PDS‐12 A
aRPD Mean (cm) aRPD > Pen Mud Clast Number Mud Clast StateMethane Present?
Number of Methane Bubbles
Dredged Material Present?
Mean depth below Sediment Surface of
top of Dredged Material Layer (cm)
Dredged Material Layer Mean
Thickness (cm)Dredged Material > Pen
1.43 No 0 Yes 5.06 TRUEIND No 0 Yes 4.09 TRUEIND No 0 Yes 5.64 TRUE
IND No 0 Yes 9.99 TRUE
1.34 No 0 Yes 8.81 TRUE
IND 1 Ox No 0 Yes 11.37 TRUE
IND TRUE No 0 IND IND
IND TRUE No 0 IND IND
IND TRUE No 0 IND IND
IND No 0 Yes 7.09 TRUE
IND No 0 Yes 5.64 TRUE
IND No 0 Yes 6.36 TRUE3.06 No 0 Yes 16.67 TRUE3.95 No 0 Yes 19.15 TRUE2.85 No 0 Yes 19.67 TRUE
2.01 No 0 Yes 14.44 TRUE
1.06 No 0 Yes 12.05 TRUE
1.13 No 0 Yes 13.50 TRUE
2.10 No 0 Yes 7.33 TRUE
0.95 No 0 Yes 10.84 TRUE
0.52 No 0 Yes 9.51 TRUE
1.72 No 0 Yes 8.66 TRUE
IND 1 Red No 0 Yes 9.12 TRUE
0.69 No 0 Yes 11.71 TRUE1.04 No 0 Yes 13.86 TRUE
0.73 No 0 Yes 12.65 TRUE
1.06 No 0 Yes 12.97 TRUE
1.61 No 0 Yes 14.44 TRUE
IND No 0 Yes 14.84 TRUE
IND No 0 Yes 14.21 TRUE
2.07 No 0 Yes 14.46 TRUE
Appendix E ‐ Sediment Profile Image Analysis Results Page 8 of 20

Monitoring Survey at the Portland Disposal Site September 2016
Area Location StationID Replicate
Disposal PDS PDS‐12 B
Disposal PDS PDS‐12 C
Disposal PDS PDS‐13 E
Disposal PDS PDS‐13 FDisposal PDS PDS‐13 GDisposal PDS PDS‐14 ADisposal PDS PDS‐14 BDisposal PDS PDS‐14 C
Disposal PDS PDS‐15 A
Disposal PDS PDS‐15 B
Disposal PDS PDS‐15 D
Disposal PDS PDS‐16 A
Disposal PDS PDS‐16 B
Disposal PDS PDS‐16 C
Disposal PDS PDS‐17 E
Disposal PDS PDS‐17 F
Disposal PDS PDS‐17 G
Disposal PDS PDS‐18 E
Disposal PDS PDS‐18 FDisposal PDS PDS‐18 G
Disposal PDS PDS‐19 A
Disposal PDS PDS‐19 B
Disposal PDS PDS‐19 C
Disposal PDS PDS‐20 A
Disposal PDS PDS‐20 BDisposal PDS PDS‐20 CReference SREF SREF‐10 BReference SREF SREF‐10 C
Reference SREF SREF‐06 A
Reference SREF SREF‐06 B
Reference SREF SREF‐06 C
Reference SREF SREF‐07 A
Reference SREF SREF‐07 BReference SREF SREF‐07 C
aRPD Mean (cm) aRPD > Pen Mud Clast Number Mud Clast StateMethane Present?
Number of Methane Bubbles
Dredged Material Present?
Mean depth below Sediment Surface of
top of Dredged Material Layer (cm)
Dredged Material Layer Mean
Thickness (cm)Dredged Material > Pen
1.14 1 Red No 0 Yes 13.46 TRUE
1.22 No 0 Yes 14.12 TRUE
3.13 No 0 Yes
1.88 No 0 YesIND No 0 Yes2.01 No 0 Yes 6.96 TRUE1.89 No 0 Yes 12.67 TRUE2.39 No 0 Yes 18.54 TRUE
1.19 No 0 Yes 11.50 TRUE
IND No 0 Yes 6.56 TRUE
1.05 No 0 Yes 4.92 TRUE
1.28 No 0 Yes 15.45 TRUE
0.36 No 0 Yes 12.52 TRUE
IND 1 Red No 0 Yes 14.41 TRUE
1.08 No 0 Yes 14.72 TRUE
IND No 0 Yes 20.85 TRUE
0.79 1 Red No 0 Yes 18.09 TRUE
0.74 1 Red No 0 Yes 14.91 TRUE
1.05 No 0 Yes 17.09 TRUE0.77 No 0 Yes 10.24 TRUE
2.31 No 0 Yes 14.44 TRUE
1.51 No 0 Yes 14.97 TRUE
1.56 1 Red No 0 Yes 14.24 TRUE
1.31 No 0 Yes 6.37 TRUE
0.63 No 0 Yes 10.98 TRUE0.67 No 0 Yes 5.93 TRUE3.51 No 0 No2.32 No 0 No
IND No 0 No
IND No 0 No
IND No 0 No
IND No 0 No
IND No 0 NoIND No 0 No
Appendix E ‐ Sediment Profile Image Analysis Results Page 9 of 20

Monitoring Survey at the Portland Disposal Site September 2016
Area Location StationID Replicate
Reference SREF SREF‐08 A
Reference SREF SREF‐08 CReference SREF SREF‐08 D
Reference SREF SREF‐09 A
Reference SREF SREF‐09 B
Reference SREF SREF‐09 C
Reference SREF SREF‐10 D
aRPD Mean (cm) aRPD > Pen Mud Clast Number Mud Clast StateMethane Present?
Number of Methane Bubbles
Dredged Material Present?
Mean depth below Sediment Surface of
top of Dredged Material Layer (cm)
Dredged Material Layer Mean
Thickness (cm)Dredged Material > Pen
IND No 0 No
IND No 0 No1.51 No 0 No
IND No 0 No
IND No 0 No
IND No 0 No
1.80 No 0 No
Appendix E ‐ Sediment Profile Image Analysis Results Page 10 of 20

Monitoring Survey at the Portland Disposal Site September 2016
Area Location StationID Replicate
Reference EREF EREF‐01 A
Reference EREF EREF‐01 B
Reference EREF EREF‐01 C
Reference EREF EREF‐02 AReference EREF EREF‐02 BReference EREF EREF‐02 CReference EREF EREF‐03 AReference EREF EREF‐03 BReference EREF EREF‐03 C
Reference EREF EREF‐04 A
Reference EREF EREF‐04 BReference EREF EREF‐04 CReference EREF EREF‐05 AReference EREF EREF‐05 BReference EREF EREF‐05 C
Disposal PDA95 PDA95‐21 A
Disposal PDA95 PDA95‐21 B
Disposal PDA95 PDA95‐21 C
Disposal PDA95 PDA95‐22 A
Disposal PDA95 PDA95‐22 B
Disposal PDA95 PDA95‐22 C
Disposal PDA95 PDA95‐23 A
Disposal PDA95 PDA95‐23 B
Disposal PDA95 PDA95‐23 C
Disposal PDA95 PDA95‐24 A
Disposal PDA95 PDA95‐24 B
Disposal PDA95 PDA95‐24 C
Disposal PDA95 PDA95‐25 A
Disposal PDA95 PDA95‐25 BDisposal PDA95 PDA95‐25 C
Disposal PDA95 PDA95‐26 A
Disposal PDA95 PDA95‐26 B
Dredged Material NotesLow DO Present?
Sediment Oxygen Demand
Beggiatoa Present?
Beggiatoa Type/Extent
# of Feeding Voids
Void Minimum
Depth (cm)
No High No 0
No High No 0
No High No 0
No High No 1 9.72No High No 1 11.60No High No 0No High No 0No High No 0No High No 0
No High No IND IND
No High No 0No High No 0No High No 1 7.88No High No 0No High No 0
Layer of milky white dredged material intermixed with dark sediment. Sandy sediment near SWI also contains dark, large grained sediments intermixed, suggesting image is all dredged material.
No High No 0
Layer of milky white dredged material intermixed with dark sediment. Sandy sediment near SWI also contains dark, large grained sediments intermixed, suggesting image is all dredged material.
No High No 2 8.11
Clay/milky white intermix beneath coarser sediment combined with dark, large grained sediment. No High No 1 9.72No distinct milky white dredged material present. Dark sediment with odd layering present throughout image suggests that entire image is dredged material being reworked.
No High No 1 8.72
No distinct milky white dredged material present. Dark sediment with odd layering present throughout image suggests that entire image is dredged material being reworked.
No High No 1 16.41
No distinct milky white dredged material present. Dark sediment with odd layering present throughout image suggests that entire image is dredged material being reworked.
No High No 1 16.63
Milky white and rust colored dredged material throughout the image. No High No 6 4.68
Distinct layer of milky white dredged material at and near SWI with darker sediments below. No High No 0
Distinct layer of milky white dredged material at and near SWI with darker sediments below. No High No 2 5.81
Sediment has layering similar to native but dark, coarse grained sediments throughout suggest sediment is dredged material being reworked.
No High No 0
Sediment has layering similar to native but dark, coarse grained sediments throughout suggest sediment is dredged material being reworked.
No High No 0
Sediment has layering similar to native but dark, coarse grained sediments throughout suggest sediment is dredged material being reworked.
No High No 0
Streaks of white dredged material throughout sediment. Dark, large grained sediment scattered throughout sediment column.
No High No 0
Unnatural layering of obvious dredged material. No High No 0Unnatural layering of obvious dredged material. No High No 0Large patches of milky white dredged material in sediment. Possible chunk of dredged material resting at SWI in background of image.
No High No 0
Large patches of milky white dredged material throughout sediment. No High No 0
Appendix E ‐ Sediment Profile Image Analysis Results Page 11 of 20

Monitoring Survey at the Portland Disposal Site September 2016
Area Location StationID Replicate
Disposal PDA95 PDA95‐26 C
Disposal PDA95 PDA95‐27 ADisposal PDA95 PDA95‐27 B
Disposal PDA95 PDA95‐27 C
Disposal PDA95 PDA95‐28 A
Disposal PDA95 PDA95‐28 BDisposal PDA95 PDA95‐28 C
Disposal PDA95 PDA95‐29 A
Disposal PDA95 PDA95‐29 B
Disposal PDA95 PDA95‐29 C
Disposal PDA95 PDA95‐30 A
Disposal PDA95 PDA95‐30 B
Disposal PDA95 PDA95‐30 C
Disposal PDA95 PDA95‐31 A
Disposal PDA95 PDA95‐31 B
Disposal PDA95 PDA95‐31 C
Disposal PDA95 PDA95‐32 A
Disposal PDA95 PDA95‐32 B
Disposal PDA95 PDA95‐32 C
Disposal PDA95 PDA95‐33 A
Disposal PDA95 PDA95‐33 BDisposal PDA95 PDA95‐33 C
Disposal PDA95 PDA95‐34 A
Disposal PDA95 PDA95‐34 BDisposal PDA95 PDA95‐34 C
Disposal PDA95 PDA95‐35 B
Disposal PDA95 PDA95‐35 C
Disposal PDA95 PDA95‐35 D
Disposal PDAA PDAA‐01 A
Disposal PDAA PDAA‐01 BDisposal PDAA PDAA‐01 C
Dredged Material NotesLow DO Present?
Sediment Oxygen Demand
Beggiatoa Present?
Beggiatoa Type/Extent
# of Feeding Voids
Void Minimum
Depth (cm)
Patches of milky white dredged material begin near SWI and continue to depth. No High No 4 7.18
Dredged material is not as obvious, but sediment does not appear to be similar grain size or layering as native. No High No 0Dredged material is not as obvious, but sediment does not appear to be similar grain size or layering as native. No High No 1 19.00
Dredged material is not as obvious, but sediment does not appear to be similar grain size or layering as native. No High No 0
Dredged material is not as obvious, but sediment does not appear to be similar grain size or layering as native. Some dissolution of shell in upper sediment layer.
No High No 1 8.65
Dredged material is not as obvious, but sediment does not appear to be similar grain size or layering as native. No High No 2 INDDredged material is not as obvious, but sediment does not appear to be similar grain size or layering as native. No High No 0Obvious dredged material layering beneath upper cm of sediment. Upper cm of sediment does not appear to be native but it is difficult to determine.
No High No 1 12.67
Entire image is dredged material. No High No 0
Entire image is dredged material. No High No 0
Obvious dredged material layering beneath upper cm of sediment. Upper cm of sediment does not appear to be native but it is difficult to determine.
No High No 0
Dredged material containing some patches of milky white clay. No High No 0
Obvious dredged material layering beneath upper cm of sediment. Upper cm of sediment does not appear to be native but it is difficult to determine.
No High No 0
Obvious dredged material layering beneath upper cm of sediment. Upper cm of sediment does not appear to be native but it is difficult to determine.
No High No 0
Dredged material being reworked. No High No 0
Dredged material with reworking beginning at SWI and beginning to move deeper. No High No 0
Entire image is dredged material. No High No 3 8.12Obvious dredged material layering beneath upper cm of sediment. Upper cm of sediment does not appear to be native but it is difficult to determine.
No High No 0
Entire image is dredged material. Distinct layering of different dredged material types. No High No 1 4.42
Patch of milky white dredged material beneath aRPD. I believe the rest of sediment is also dredged material being reworked.
No High No 0
Sediment appears to be reworked dredged material. No High No 1 3.82Sediment appears to be reworked dredged material. No High No 2 4.44
Coarse sediment resting on top of obvious dredged material suggests entire image is dredged material. No High No 1 4.90
Entire image is dredged material. Distinct layering of different dredged material types. No High No 1 3.92Entire image is dredged material. Distinct layering of different dredged material types. No High No 1 4.17Sediment is not obviously dredged material but presence of larger grained sediment throughout suggests that sediment is reworked dredged material.
No High No 2 7.72
Sediment is not obviously dredged material but presence of larger grained sediment throughout suggests that sediment is reworked dredged material.
No High No 1 8.91
Sediment is not obviously dredged material but presence of larger grained sediment throughout suggests that sediment is reworked dredged material.
No High No 0
Sediment does not match reference area sediment. No High No 0
Sediment does not match reference area sediment. No High No 0Sediment does not match reference area sediment. No High No 0
Appendix E ‐ Sediment Profile Image Analysis Results Page 12 of 20

Monitoring Survey at the Portland Disposal Site September 2016
Area Location StationID Replicate
Disposal PDAA PDAA‐02 ADisposal PDAA PDAA‐02 BDisposal PDAA PDAA‐02 C
Disposal PDAA PDAA‐03 B
Disposal PDAA PDAA‐03 C
Disposal PDAA PDAA‐03 D
Disposal PDAA PDAA‐04 A
Disposal PDAA PDAA‐04 C
Disposal PDAA PDAA‐04 D
Disposal PDAA PDAA‐05 A
Disposal PDAA PDAA‐05 B
Disposal PDAA PDAA‐05 CDisposal PDS PDS‐06 EDisposal PDS PDS‐06 FDisposal PDS PDS‐06 G
Disposal PDS PDS‐07 A
Disposal PDS PDS‐07 B
Disposal PDS PDS‐07 C
Disposal PDS PDS‐08 A
Disposal PDS PDS‐08 B
Disposal PDS PDS‐08 C
Disposal PDS PDS‐09 A
Disposal PDS PDS‐09 B
Disposal PDS PDS‐09 CDisposal PDS PDS‐10 A
Disposal PDS PDS‐10 B
Disposal PDS PDS‐10 C
Disposal PDS PDS‐11 A
Disposal PDS PDS‐11 B
Disposal PDS PDS‐11 C
Disposal PDS PDS‐12 A
Dredged Material NotesLow DO Present?
Sediment Oxygen Demand
Beggiatoa Present?
Beggiatoa Type/Extent
# of Feeding Voids
Void Minimum
Depth (cm)
Coarse sediment contains many dissolving shell fragments. No High No 0Coarse sediment contains many dissolving shell fragments. No High No 0Coarse sediment contains many dissolving shell fragments. No High No 0
Coarse sediment with shell fragments throughout and some streaks of fine clay. No High No 0
Milky white dredged material and fines throughout sediment. No High No 0
Milky white dredged material and fines throughout sediment. No High No 2 8.42
Not sufficient penetration to determine dredged material. Many shell fragements resting on SWI suggest that material has been dumped here.
No High No IND IND
Not sufficient penetration to determine dredged material. Many shell fragements resting on SWI suggest that material has been dumped here.
No High No IND IND
Not sufficient penetration to determine dredged material. Many shell fragements resting on SWI suggest that material has been dumped here.
No High No IND IND
Patches of milky white dredged material and fines throughout sediment. No High No 0
Patches of milky white dredged material and fines throughout sediment. No High No 0
Patches of milky white dredged material and fines throughout sediment. No High No 0Dredged material beneath coarse sediment that suggests all visible sediment is dredged material. No High No 2 14.97Dredged material beneath coarse sediment that suggests all visible sediment is dredged material. No High No 4 8.11Dredged material beneath coarse sediment that suggests all visible sediment is dredged material. No High No 1 13.10
Patches of milky white material beneath coarser sediment layer with dissolving shell. No High No 1 3.98
Presence of larger grained sediments throughout image suggest all sediment is dredged material being reworked. No High No 0
Presence of larger grained sediments throughout image suggest all sediment is dredged material being reworked. Some milky white dredged material at depth.
No High No 0
Coarse grained sediment filled with organics over organically enriched sediment suggest entire image is dredged material. No High No 0
Milky white dredged material and fines throughout sediment. No High No 2 8.19
Milky white dredged material and fines throughout sediment. No High No 0
Organically enriched sediment at depth with some organics throughout sediment suggesting image is all dredged material. No High No 0
Organically enriched sediment and patches of milky white dredged material. No High No 2 4.51
Milky white dredged material and fines throughout sediment. No High No 2 4.68Scattered milky white dredged material beneath aRPD boundary. Very organically enriched sediment at depth. No High No 3 12.98
Trace milky white dredged material with organics throughout sediment. No High No 0
Milky white dredged material throughout. No High No 2 8.50
Milky white dredged material throughout with coarser sediment resting on top. No High No 1 9.43
Organically enriched sediment and fines. No High No 3 3.60
Organically enriched sediment and fines. No High No 3 5.80
Fines and organically enriched sediment throughout. No High No 1 9.35
Appendix E ‐ Sediment Profile Image Analysis Results Page 13 of 20

Monitoring Survey at the Portland Disposal Site September 2016
Area Location StationID Replicate
Disposal PDS PDS‐12 B
Disposal PDS PDS‐12 C
Disposal PDS PDS‐13 E
Disposal PDS PDS‐13 FDisposal PDS PDS‐13 GDisposal PDS PDS‐14 ADisposal PDS PDS‐14 BDisposal PDS PDS‐14 C
Disposal PDS PDS‐15 A
Disposal PDS PDS‐15 B
Disposal PDS PDS‐15 D
Disposal PDS PDS‐16 A
Disposal PDS PDS‐16 B
Disposal PDS PDS‐16 C
Disposal PDS PDS‐17 E
Disposal PDS PDS‐17 F
Disposal PDS PDS‐17 G
Disposal PDS PDS‐18 E
Disposal PDS PDS‐18 FDisposal PDS PDS‐18 G
Disposal PDS PDS‐19 A
Disposal PDS PDS‐19 B
Disposal PDS PDS‐19 C
Disposal PDS PDS‐20 A
Disposal PDS PDS‐20 BDisposal PDS PDS‐20 CReference SREF SREF‐10 BReference SREF SREF‐10 C
Reference SREF SREF‐06 A
Reference SREF SREF‐06 B
Reference SREF SREF‐06 C
Reference SREF SREF‐07 A
Reference SREF SREF‐07 BReference SREF SREF‐07 C
Dredged Material NotesLow DO Present?
Sediment Oxygen Demand
Beggiatoa Present?
Beggiatoa Type/Extent
# of Feeding Voids
Void Minimum
Depth (cm)
Fines and organically enriched sediment throughout. No High No 0
Fines and organically enriched sediment throughout. Some small patches of milky white material. No High No 0
Trace dredged material. No High No 3 2.03
Trace dredged material. No High No 7 5.03Trace dredged material. No High No 1 INDMilky white dredged material and fines within sediment. No High No 1 6.65Milky white dredged material and fines within sediment. No High No 0Milky white dredged material and fines within sediment. No High No 3 5.55
Fines and organically enriched sediment throughout. No High No 3 10.97
Fines and organically enriched sediment throughout. No High No 0
Fines and organically enriched sediment throughout. No High No 2 1.90
Milky white dredged material and fines throughout sediment. No High No 4 4.65
Milky white dredged material and fines throughout sediment. No High No 2 3.94
Milky white dredged material and fines throughout sediment. No High No 7 4.91
Fine, organically enriched sediment with reworking. No High No 6 6.76
Milky white dredged material and fines throughout sediment. No High No 3 5.19
Milky white dredged material and fines throughout sediment. No High No 2 13.94
Milky white dredged material and fines throughout sediment. No High No 2 2.40
Milky white dredged material and fines throughout sediment. No High No 1 2.23Milky white dredged material and fines throughout sediment. No High No 1 5.73
Milky white dredged material and fines throughout sediment. No High No 2 8.13
Milky white dredged material and fines throughout sediment. No High No 0
Milky white dredged material and fines throughout sediment. No High No 1 11.37
Milky white dredged material and fines throughout sediment. No High No 1 4.60
Milky white dredged material and fines throughout sediment. No High No 1 9.16Milky white dredged material and fines throughout sediment. No High No 1 5.23
No High No 0No High No 1 9.68
No High No IND IND
No High No IND IND
No High No IND IND
No High No 0
No High No 0No High No 1 6.64
Appendix E ‐ Sediment Profile Image Analysis Results Page 14 of 20

Monitoring Survey at the Portland Disposal Site September 2016
Area Location StationID Replicate
Reference SREF SREF‐08 A
Reference SREF SREF‐08 CReference SREF SREF‐08 D
Reference SREF SREF‐09 A
Reference SREF SREF‐09 B
Reference SREF SREF‐09 C
Reference SREF SREF‐10 D
Dredged Material NotesLow DO Present?
Sediment Oxygen Demand
Beggiatoa Present?
Beggiatoa Type/Extent
# of Feeding Voids
Void Minimum
Depth (cm)
No High No IND IND
No High No 0No High No 0
No High No IND IND
No High No IND IND
No High No IND IND
No High No 4 7.09
Appendix E ‐ Sediment Profile Image Analysis Results Page 15 of 20

Monitoring Survey at the Portland Disposal Site September 2016
Area Location StationID Replicate
Reference EREF EREF‐01 A
Reference EREF EREF‐01 B
Reference EREF EREF‐01 C
Reference EREF EREF‐02 AReference EREF EREF‐02 BReference EREF EREF‐02 CReference EREF EREF‐03 AReference EREF EREF‐03 BReference EREF EREF‐03 C
Reference EREF EREF‐04 A
Reference EREF EREF‐04 BReference EREF EREF‐04 CReference EREF EREF‐05 AReference EREF EREF‐05 BReference EREF EREF‐05 C
Disposal PDA95 PDA95‐21 A
Disposal PDA95 PDA95‐21 B
Disposal PDA95 PDA95‐21 C
Disposal PDA95 PDA95‐22 A
Disposal PDA95 PDA95‐22 B
Disposal PDA95 PDA95‐22 C
Disposal PDA95 PDA95‐23 A
Disposal PDA95 PDA95‐23 B
Disposal PDA95 PDA95‐23 C
Disposal PDA95 PDA95‐24 A
Disposal PDA95 PDA95‐24 B
Disposal PDA95 PDA95‐24 C
Disposal PDA95 PDA95‐25 A
Disposal PDA95 PDA95‐25 BDisposal PDA95 PDA95‐25 C
Disposal PDA95 PDA95‐26 A
Disposal PDA95 PDA95‐26 B
Void Maximum
Depth (cm)
Successional Stage
Comment
2 ‐> 3Small worms and a medium sized tube at SWI. Infilled and open burrow beneath aRPD boundary but no visible stage 3 organisms or voids.
2Small burrows visible in upper cms of sediment. A dissolving shell also in upper cms of sediment. No visible evidence of stage 3 organisms.
2 on 3Small worms and tubes at SWI. Small burrows throughout sediment. Large burrow containing large worm visible just within image in bottom left corner.
10.28 2 on 3 Small worms and tubes at SWI. Open void beneath aRPD boundary.11.88 2 on 3 Medium sized tube in background of SWI. Open burrow with associated void at depth.
2 Small worms visible at SWI. Worms visible in burrows in upper cms of sediment. No evidence of stage 3 organisms.2 ‐> 3 Large anemones at SWI. Small worms also at SWI. No visible voids or worms in sediment.2 ‐> 3 No visible worms or evidence of burrowing/feeding in sediment. PV images show large anemones, however.2 ‐> 3 Small worms visible at SWI. No evidence of burrowing in sediment. However, PV images show large anemones at site.
IND IND No prism penetration. Possible cobble covered in hydroids visible in background of image.
2 on 3 Small tubes and worms at SWI. Pebbles and an anemone at SWI in background of image. Small burrows in sediment.2 Small tubes at SWI. Small burrows in sediment. Small pebbles and an object in background at SWI.
8.14 1 on 3 Small worms at SWI. Open void and burrow with worm beneath aRPD boundary.1 on 3 Small worms at SWI. Other images show evidence of stage 3 organisms in sediment.1 on 3 Small worms at SWI. Other images show evidence of stage 3 organisms in sediment.
2 ‐> 3 Many small worms at SWI. Evidence of bioturbation moving aRPD boundary deeper.
9.23 2 on 3Many small worms and tubes at SWI. Large, infilled burrow begins at SWI and moves to depth. Open voids at depth. Small sea star resting on SWI.
9.96 2 on 3 Small worms and tubes at SWI. Infilled burrows and an infilled void beneath aRPD boundary.
9.32 1 on 3 Partially collapsed void and visible worm in burrow beneath aRPD.
17.11 2 on 3 Many worms at SWI. Reduced mudclast appears to have been deposited by faceplate. Open burrows and void at depth.
17.02 1 on 3 Small worms at SWI. Open void and associated burrow at depth.
11.54 1 on 3A lot of bioturbation. Red clay intermixed with other sediments. Large, open burrows with many associated voids throughout sediment.
1 on 3A few small tubes at SWI. Shallow aRPD boundary with evidence of bioturbation moving boundary deeper. Patches of milky white dredged material near aRPD boundary.
12.27 2 on 3Large tubes in background of image at SWI. Layer of milky white dredged material begins at SWI and moves across image. Large, open burrow with associated voids beneath dredged material layer.
2 ‐> 3Mud clasts from camera resting on sediment. Small worms at SWI. Burrowing above aRPD boundary and evidence that bioturbation is moving the aRPD boundary deeper. No evidence of stage 3 organisms.
2 ‐> 3Bioturbation beginning at SWI, with an open burrow beginning at SWI and moving towards aRPD boundary. No evidence of stage 3 organisms.
2 Small worms at SWI. Small, shallow burrows with no evidence of biotubation beneath aRPD boundary.
2Small worms at SWI. Small burrows appear to be moving aRPD boundary deeper. Streaks of milky white dredged material present beneath aRPD boundary.
2 Small and medium‐sized tubes at SWI. Small burrows in upper cms of sediment. aRPD boundary near SWI.1 on 3 Small tubes at SWI. Burrowing and infilled burrows beneath aRPD boundary.
2 Tubes at SWI. Also, dredged material resting on top of SWI. Distinct milky white dredged material in patches throughout sediment.
2Shallow aRPD boundary with patches of milky white dredged material beneath. Open burrow with visible worm beneath aRPD boundary.
Appendix E ‐ Sediment Profile Image Analysis Results Page 16 of 20
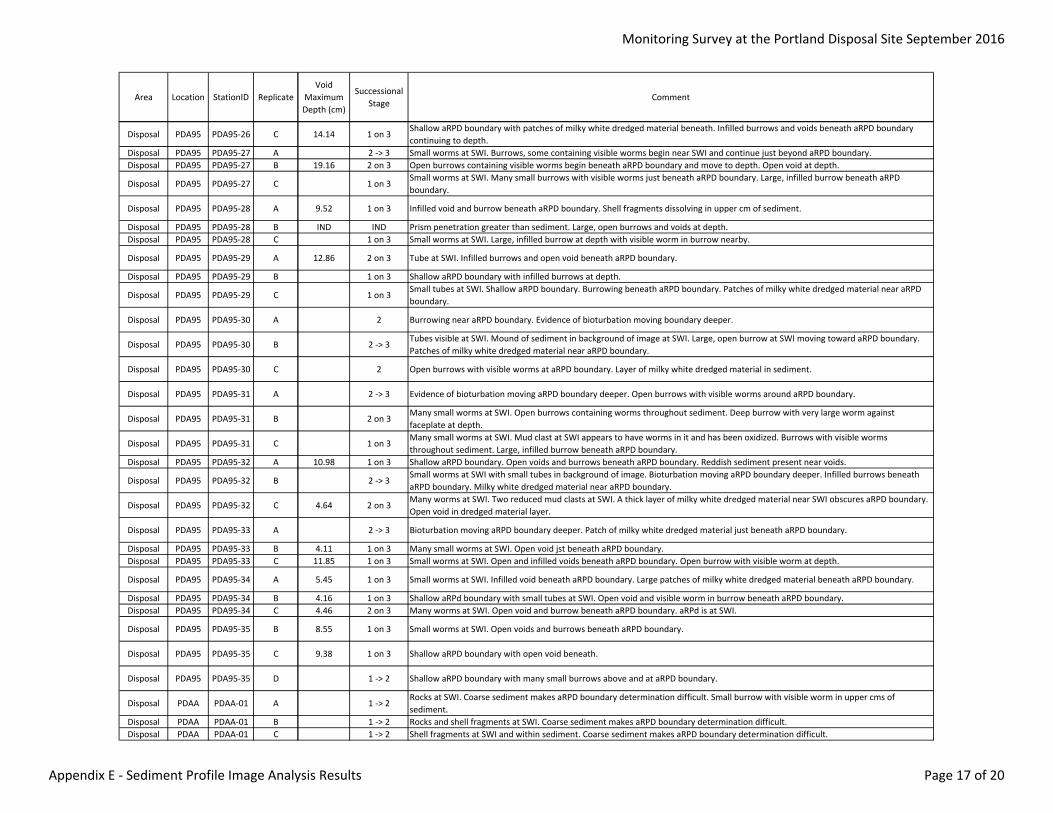
Monitoring Survey at the Portland Disposal Site September 2016
Area Location StationID Replicate
Disposal PDA95 PDA95‐26 C
Disposal PDA95 PDA95‐27 ADisposal PDA95 PDA95‐27 B
Disposal PDA95 PDA95‐27 C
Disposal PDA95 PDA95‐28 A
Disposal PDA95 PDA95‐28 BDisposal PDA95 PDA95‐28 C
Disposal PDA95 PDA95‐29 A
Disposal PDA95 PDA95‐29 B
Disposal PDA95 PDA95‐29 C
Disposal PDA95 PDA95‐30 A
Disposal PDA95 PDA95‐30 B
Disposal PDA95 PDA95‐30 C
Disposal PDA95 PDA95‐31 A
Disposal PDA95 PDA95‐31 B
Disposal PDA95 PDA95‐31 C
Disposal PDA95 PDA95‐32 A
Disposal PDA95 PDA95‐32 B
Disposal PDA95 PDA95‐32 C
Disposal PDA95 PDA95‐33 A
Disposal PDA95 PDA95‐33 BDisposal PDA95 PDA95‐33 C
Disposal PDA95 PDA95‐34 A
Disposal PDA95 PDA95‐34 BDisposal PDA95 PDA95‐34 C
Disposal PDA95 PDA95‐35 B
Disposal PDA95 PDA95‐35 C
Disposal PDA95 PDA95‐35 D
Disposal PDAA PDAA‐01 A
Disposal PDAA PDAA‐01 BDisposal PDAA PDAA‐01 C
Void Maximum
Depth (cm)
Successional Stage
Comment
14.14 1 on 3Shallow aRPD boundary with patches of milky white dredged material beneath. Infilled burrows and voids beneath aRPD boundary continuing to depth.
2 ‐> 3 Small worms at SWI. Burrows, some containing visible worms begin near SWI and continue just beyond aRPD boundary.19.16 2 on 3 Open burrows containing visible worms begin beneath aRPD boundary and move to depth. Open void at depth.
1 on 3Small worms at SWI. Many small burrows with visible worms just beneath aRPD boundary. Large, infilled burrow beneath aRPD boundary.
9.52 1 on 3 Infilled void and burrow beneath aRPD boundary. Shell fragments dissolving in upper cm of sediment.
IND IND Prism penetration greater than sediment. Large, open burrows and voids at depth.1 on 3 Small worms at SWI. Large, infilled burrow at depth with visible worm in burrow nearby.
12.86 2 on 3 Tube at SWI. Infilled burrows and open void beneath aRPD boundary.
1 on 3 Shallow aRPD boundary with infilled burrows at depth.
1 on 3Small tubes at SWI. Shallow aRPD boundary. Burrowing beneath aRPD boundary. Patches of milky white dredged material near aRPD boundary.
2 Burrowing near aRPD boundary. Evidence of bioturbation moving boundary deeper.
2 ‐> 3Tubes visible at SWI. Mound of sediment in background of image at SWI. Large, open burrow at SWI moving toward aRPD boundary. Patches of milky white dredged material near aRPD boundary.
2 Open burrows with visible worms at aRPD boundary. Layer of milky white dredged material in sediment.
2 ‐> 3 Evidence of bioturbation moving aRPD boundary deeper. Open burrows with visible worms around aRPD boundary.
2 on 3Many small worms at SWI. Open burrows containing worms throughout sediment. Deep burrow with very large worm against faceplate at depth.
1 on 3Many small worms at SWI. Mud clast at SWI appears to have worms in it and has been oxidized. Burrows with visible worms throughout sediment. Large, infilled burrow beneath aRPD boundary.
10.98 1 on 3 Shallow aRPD boundary. Open voids and burrows beneath aRPD boundary. Reddish sediment present near voids.
2 ‐> 3Small worms at SWI with small tubes in background of image. Bioturbation moving aRPD boundary deeper. Infilled burrows beneath aRPD boundary. Milky white dredged material near aRPD boundary.
4.64 2 on 3Many worms at SWI. Two reduced mud clasts at SWI. A thick layer of milky white dredged material near SWI obscures aRPD boundary. Open void in dredged material layer.
2 ‐> 3 Bioturbation moving aRPD boundary deeper. Patch of milky white dredged material just beneath aRPD boundary.
4.11 1 on 3 Many small worms at SWI. Open void jst beneath aRPD boundary.11.85 1 on 3 Small worms at SWI. Open and infilled voids beneath aRPD boundary. Open burrow with visible worm at depth.
5.45 1 on 3 Small worms at SWI. Infilled void beneath aRPD boundary. Large patches of milky white dredged material beneath aRPD boundary.
4.16 1 on 3 Shallow aRPd boundary with small tubes at SWI. Open void and visible worm in burrow beneath aRPD boundary.4.46 2 on 3 Many worms at SWI. Open void and burrow beneath aRPD boundary. aRPd is at SWI.
8.55 1 on 3 Small worms at SWI. Open voids and burrows beneath aRPD boundary.
9.38 1 on 3 Shallow aRPD boundary with open void beneath.
1 ‐> 2 Shallow aRPD boundary with many small burrows above and at aRPD boundary.
1 ‐> 2Rocks at SWI. Coarse sediment makes aRPD boundary determination difficult. Small burrow with visible worm in upper cms of sediment.
1 ‐> 2 Rocks and shell fragments at SWI. Coarse sediment makes aRPD boundary determination difficult.1 ‐> 2 Shell fragments at SWI and within sediment. Coarse sediment makes aRPD boundary determination difficult.
Appendix E ‐ Sediment Profile Image Analysis Results Page 17 of 20

Monitoring Survey at the Portland Disposal Site September 2016
Area Location StationID Replicate
Disposal PDAA PDAA‐02 ADisposal PDAA PDAA‐02 BDisposal PDAA PDAA‐02 C
Disposal PDAA PDAA‐03 B
Disposal PDAA PDAA‐03 C
Disposal PDAA PDAA‐03 D
Disposal PDAA PDAA‐04 A
Disposal PDAA PDAA‐04 C
Disposal PDAA PDAA‐04 D
Disposal PDAA PDAA‐05 A
Disposal PDAA PDAA‐05 B
Disposal PDAA PDAA‐05 CDisposal PDS PDS‐06 EDisposal PDS PDS‐06 FDisposal PDS PDS‐06 G
Disposal PDS PDS‐07 A
Disposal PDS PDS‐07 B
Disposal PDS PDS‐07 C
Disposal PDS PDS‐08 A
Disposal PDS PDS‐08 B
Disposal PDS PDS‐08 C
Disposal PDS PDS‐09 A
Disposal PDS PDS‐09 B
Disposal PDS PDS‐09 CDisposal PDS PDS‐10 A
Disposal PDS PDS‐10 B
Disposal PDS PDS‐10 C
Disposal PDS PDS‐11 A
Disposal PDS PDS‐11 B
Disposal PDS PDS‐11 C
Disposal PDS PDS‐12 A
Void Maximum
Depth (cm)
Successional Stage
Comment
1 ‐> 2 Small worms and a tube at SWI. Shell fragments at SWI and within sediment. Shallow aRPd boundary.1 ‐> 2 Shell fragments at SWI and within sediment. Coarse sediment makes aRPD boundary determination difficult.1 ‐> 2 A tube at SWI. Shell fragments at SWI and within sediment. Coarse sediment makes aRPD boundary determination difficult.
2Tubes at SWI and in background of image. Shell resting on sediment and throughout sediment. Coarse sediment makes aRPD determination difficult. A few small burrows in upper cms of sediment. Small bits of milky white dredged material in sediment.
2 on 3Many small tubes at SWI. Layer of milky white dredged material in sediment with many open burrows with large, visible worms beneath.
10.05 2 on 3Large mud clast containing worms, hydroids, and bivalves resting on SWI. Many hydroids and shells at SWI as well. Patch of milky white dredged material in sediment. Many shells and visible worms in sediment. Large, infilled voids and burrows at depth.
0.00 IND Large rocks at SWI. Prism penetration not enough to determine aRPD boundary or successional staging.
0.00 IND Large rocks at SWI. Prism penetration not enough to determine aRPD boundary or successional staging.
IND IND Large rocks and fragments of shell at SWI. No prism penetration.
2Small worms and small tubes at SWI. Shell fragments at SWI. Coarse sediment makes aRPD boundary determination difficult. Milky white dredged material in patches in sediment.
2A few small tubes at SWI. Large fragments of shell and other debris at SWI. Coarse sediment makes aRPD determination difficult. Patches of milky white dredged material in sediment.
2 Small tubes at SWI. Patches of milky white dredged material in sediment.15.74 2 on 3 Patches of milky white dredged material in sediment. Open voids at depth.17.81 2 on 3 Thick aRPD boundary with huge, open burrow descending out of image. Open voids throughout sediment below aRPD boundary.13.78 2 on 3 Open burrows with visible worms below aRPD boundary. Infilled burrows and a void at depth.
4.93 2 on 3Small worms and tubes at SWI. Infilled void at aRPD boundary Dissolving shells in upper cm of sediment. Two distinct patches of milky white dredged material below aRPD boundary.
2 ‐> 3Small worms and tubes at SWI. Open burrow with visible worm just beneath aRPD boundary. Milky white dredged material beneath aRPD boundary.
2 ‐> 3Small worms and tubes at SWI. Burrows above and at aRPD boundary pushing boundary deeper. Milky white dredged material beneath aRPD boundary.
2 ‐> 3 Open burrows with visible worms near aRPD boundary.
8.90 1 on 3SWI appears to have been recently disturbed. A few infilled burrows and voids at depth. Milky white dredged material throughout sediment.
2 Small worms and tubes at SWI. Small burrows visible in upper cms of sediment. Dredged material throughout visible sediment.
2 ‐> 3 Small burrows with visible worms throughout sediment. Bioturbation appears to be pushing aRPD boundary deeper.
6.13 2 on 3Small worms and tubes at SWI with reduced mudclast that appears to have fallen from prism. aRPD boundary appears to be right at SWI. Two infilled voids in sediment. Dredged material throughout sediment.
5.42 1 on 3 Shallow aRPD boundary with open voids beneath. Dredged material scattered throughout sediment.13.56 2 on 3 A few medium sized tubes at SWI. Open burrows and voids at depth. A few patches of milky white dredged material.
1 on 3Shallow aRPD boundary with evidence of bioturbation moving it deeper. Open burrows at depth. Trace milky white dredged material at depth.
11.22 1 on 3Open burrow and void beneath aRPD boundary. Also an infilled void beneath aRPD boundary. Trace milky white dredged material begins at SWI and continues to depth.
9.88 1 on 3 Burrows in upper cms of sediment with open void at depth. Patches of milky white dredged material throughout sediment.
10.80 2 on 3Medium sized tubes at SWI. Open burrows, some containing visible worms throughout sediment. SWI is disturbed and makes aRPD boundary deterimation difficult.
10.04 2 on 3 A few small tubes at SWI. Open voids and burrows at depth.
10.12 2 on 3Open burrows with visible worms beneath aRPD boundary. Infilled void beneath aRPD boundary. Very small spots of milky white dredged material at depth.
Appendix E ‐ Sediment Profile Image Analysis Results Page 18 of 20

Monitoring Survey at the Portland Disposal Site September 2016
Area Location StationID Replicate
Disposal PDS PDS‐12 B
Disposal PDS PDS‐12 C
Disposal PDS PDS‐13 E
Disposal PDS PDS‐13 FDisposal PDS PDS‐13 GDisposal PDS PDS‐14 ADisposal PDS PDS‐14 BDisposal PDS PDS‐14 C
Disposal PDS PDS‐15 A
Disposal PDS PDS‐15 B
Disposal PDS PDS‐15 D
Disposal PDS PDS‐16 A
Disposal PDS PDS‐16 B
Disposal PDS PDS‐16 C
Disposal PDS PDS‐17 E
Disposal PDS PDS‐17 F
Disposal PDS PDS‐17 G
Disposal PDS PDS‐18 E
Disposal PDS PDS‐18 FDisposal PDS PDS‐18 G
Disposal PDS PDS‐19 A
Disposal PDS PDS‐19 B
Disposal PDS PDS‐19 C
Disposal PDS PDS‐20 A
Disposal PDS PDS‐20 BDisposal PDS PDS‐20 CReference SREF SREF‐10 BReference SREF SREF‐10 C
Reference SREF SREF‐06 A
Reference SREF SREF‐06 B
Reference SREF SREF‐06 C
Reference SREF SREF‐07 A
Reference SREF SREF‐07 BReference SREF SREF‐07 C
Void Maximum
Depth (cm)
Successional Stage
Comment
1 on 3Small worms at SWI. Some brown flora resting on sediment surface. Large, infilled burrow at depth. Small patches of while dredged material at depth.
1 on 3 Small worms at SWI. Infilled burrow at depth. Small spots of milky white dredged material beneath aRPD boundary.
11.58 1 on 3Open void above aRPD boundary. Infilled voids beneath aRPD boundary. An open burrow with a visible worm just above aRPD boudnary. A small spot of milky white dredged material at depth.
18.74 1 on 3 Penetration almost greater than prism height. Open voids begin just beneath aRPD boundary and continue to depth.IND 1 on 3 Penetration greater than prism height. An open void in sediment. Open burrow with large, visible worm present as well.6.88 1 on 3 An open void at depth. Patches of dredged material in sediment.
2 A few tubes at SWI. No evidence of stage 3 organisms in image.17.28 2 on 3 A few small worms and tubes at SWI. Open and infilled voids begin just beneath aRPD boundary and move to depth.
11.88 2 on 3Shell fragment at SWI with small hydroid colonies forming. Small tubes and worms at SWI. Many open voids at depth. Dredged material throughout sediment below aRPD boundary.
2 Coarse sediment makes aRPD determination difficult. Patches of white dredged material.
4.75 1 on 3Small worms at SWI. Some chunks of cobble visible in background of image. Open void above and below aRPD boundary. Trace dredged material at depth.
14.03 1 on 3SWI appears recently disturbed. Open and infilled burrows and voids begin beneath aRPD boundary and continue to depth. Milky white dredged material at depth.
8.56 1 on 3A small tube at SWI. Large, open burrow with associated voids begins beneath aRPD boundary and continues to depth. Patches of milky white dredged material throughout sediment.
11.35 1 on 3Large mud clast at SWI. Large, partially infilled burrow begins at SWI and continues to depth. Many open and infilled voids throughout sediment.
11.67 1 on 3 Small tube visible at SWI. Large burrows with associated open and infilled voids begin at SWI and continue to depth.
9.36 1 on 3Open voids and infilled burrows present in sediment. Patches of milky white dredged material in upper cms of sediment and present as a layer at depth.
17.68 1 on 3 Shallow aRPD boundary with open and infilled voids at depth. Layer of partially bioturbated dredged material at depth.
13.76 1 on 3Shallow aRPD boundary with small worms at SWI. Infilled burrows and voids at depth. A layer of partially bioturbated dredged material at depth.
2.56 1 on 3 Open void just beneath aRPD boundary. Infilled burrows at depth in layer of bioturbated dredged material.5.92 1 on 3 Shallow aRPD boundary with small, open burrows and trace dredged material in sediment below.
10.72 2 on 3A few small tubes at SWI. Infilled burrows and voids beneath aRPD boundary. Trace milky white dredged material beneath aRPD boundary.
1 on 3Large, infilled burrows beneath aRPD boundary. Small burrows with visible worms also below aRPD boundary. Thick layer of milky white dredged material beneath aRPD boundary.
11.72 1 on 3 Small worms at SWI. Large, open burrow with associated void at depth. Dredged material layer at depth.
4.98 1 on 3 A small worm at SWI. Open burrow and void beneath aRPD boundary. Dredged material beneath aRPD boundary being reworked.
10.35 1 on 3 Shallow aRPD boundary with infilled burrows at depth. Trace milky white dredged material throughout sediment.5.57 1 on 3 Reduced clay stuck to faceplate. Open void with visible worm at depth.
2 ‐> 3 Open burrows with visible worms in sediment moving towards depth.9.88 2 on 3 Tubes at SWI. Open void and burrows at depth.
IND IND No prism penetration.
IND IND No prism penetration.
IND IND No prism penetration.
2 ‐> 3Small worms and tubes at SWI. Coarse grain makes determining aRPD boundary difficult. Many open burrows containing visible worms at depth.
2 ‐> 3 Small worms at SWI. Open burrows containing visible worms moving towards depth.7.82 2 on 3 Large, open void with visible worm at depth.
Appendix E ‐ Sediment Profile Image Analysis Results Page 19 of 20

Monitoring Survey at the Portland Disposal Site September 2016
Area Location StationID Replicate
Reference SREF SREF‐08 A
Reference SREF SREF‐08 CReference SREF SREF‐08 D
Reference SREF SREF‐09 A
Reference SREF SREF‐09 B
Reference SREF SREF‐09 C
Reference SREF SREF‐10 D
Void Maximum
Depth (cm)
Successional Stage
Comment
IND IND No prism penetration. Chunks of cobble visible in background of image.
2 ‐> 3 A few worms at SWI. Small burrows throughout sediment column.2 ‐> 3 Worms, medium sized tubes, and a small sea start at SWI. Small burrows in sediment.
IND IND No prism penetratin. Large cobbles in background of image.
IND IND No prism penetration.
IND IND No prism penetratin. A hydroid visible in background of image.
12.08 2 on 3 Small worms at SWI. Visible worms in burrows in sediment and open voids begin beneath aRPD boundary and continue to depth.
Appendix E ‐ Sediment Profile Image Analysis Results Page 20 of 20
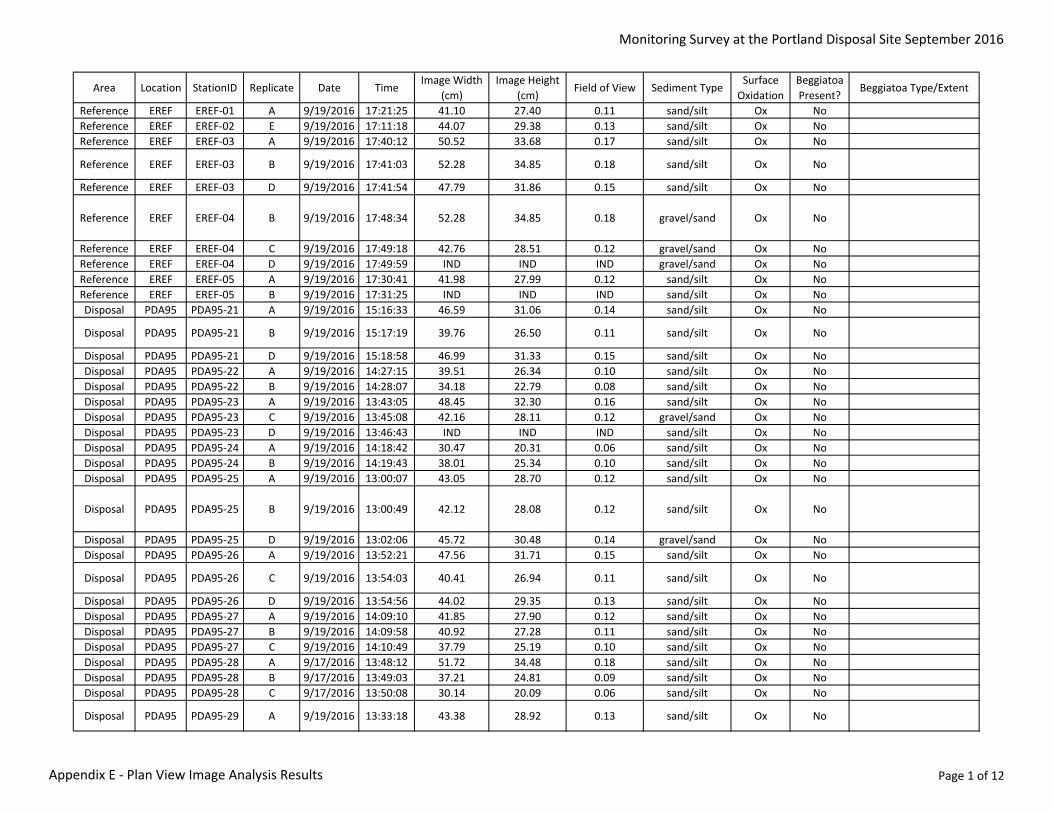
Monitoring Survey at the Portland Disposal Site September 2016
Area Location StationID Replicate Date TimeImage Width
(cm)Image Height
(cm)Field of View Sediment Type
Surface Oxidation
Beggiatoa Present?
Beggiatoa Type/Extent
Reference EREF EREF‐01 A 9/19/2016 17:21:25 41.10 27.40 0.11 sand/silt Ox NoReference EREF EREF‐02 E 9/19/2016 17:11:18 44.07 29.38 0.13 sand/silt Ox NoReference EREF EREF‐03 A 9/19/2016 17:40:12 50.52 33.68 0.17 sand/silt Ox No
Reference EREF EREF‐03 B 9/19/2016 17:41:03 52.28 34.85 0.18 sand/silt Ox No
Reference EREF EREF‐03 D 9/19/2016 17:41:54 47.79 31.86 0.15 sand/silt Ox No
Reference EREF EREF‐04 B 9/19/2016 17:48:34 52.28 34.85 0.18 gravel/sand Ox No
Reference EREF EREF‐04 C 9/19/2016 17:49:18 42.76 28.51 0.12 gravel/sand Ox NoReference EREF EREF‐04 D 9/19/2016 17:49:59 IND IND IND gravel/sand Ox NoReference EREF EREF‐05 A 9/19/2016 17:30:41 41.98 27.99 0.12 sand/silt Ox NoReference EREF EREF‐05 B 9/19/2016 17:31:25 IND IND IND sand/silt Ox NoDisposal PDA95 PDA95‐21 A 9/19/2016 15:16:33 46.59 31.06 0.14 sand/silt Ox No
Disposal PDA95 PDA95‐21 B 9/19/2016 15:17:19 39.76 26.50 0.11 sand/silt Ox No
Disposal PDA95 PDA95‐21 D 9/19/2016 15:18:58 46.99 31.33 0.15 sand/silt Ox NoDisposal PDA95 PDA95‐22 A 9/19/2016 14:27:15 39.51 26.34 0.10 sand/silt Ox NoDisposal PDA95 PDA95‐22 B 9/19/2016 14:28:07 34.18 22.79 0.08 sand/silt Ox NoDisposal PDA95 PDA95‐23 A 9/19/2016 13:43:05 48.45 32.30 0.16 sand/silt Ox NoDisposal PDA95 PDA95‐23 C 9/19/2016 13:45:08 42.16 28.11 0.12 gravel/sand Ox NoDisposal PDA95 PDA95‐23 D 9/19/2016 13:46:43 IND IND IND sand/silt Ox NoDisposal PDA95 PDA95‐24 A 9/19/2016 14:18:42 30.47 20.31 0.06 sand/silt Ox NoDisposal PDA95 PDA95‐24 B 9/19/2016 14:19:43 38.01 25.34 0.10 sand/silt Ox NoDisposal PDA95 PDA95‐25 A 9/19/2016 13:00:07 43.05 28.70 0.12 sand/silt Ox No
Disposal PDA95 PDA95‐25 B 9/19/2016 13:00:49 42.12 28.08 0.12 sand/silt Ox No
Disposal PDA95 PDA95‐25 D 9/19/2016 13:02:06 45.72 30.48 0.14 gravel/sand Ox NoDisposal PDA95 PDA95‐26 A 9/19/2016 13:52:21 47.56 31.71 0.15 sand/silt Ox No
Disposal PDA95 PDA95‐26 C 9/19/2016 13:54:03 40.41 26.94 0.11 sand/silt Ox No
Disposal PDA95 PDA95‐26 D 9/19/2016 13:54:56 44.02 29.35 0.13 sand/silt Ox NoDisposal PDA95 PDA95‐27 A 9/19/2016 14:09:10 41.85 27.90 0.12 sand/silt Ox NoDisposal PDA95 PDA95‐27 B 9/19/2016 14:09:58 40.92 27.28 0.11 sand/silt Ox NoDisposal PDA95 PDA95‐27 C 9/19/2016 14:10:49 37.79 25.19 0.10 sand/silt Ox NoDisposal PDA95 PDA95‐28 A 9/17/2016 13:48:12 51.72 34.48 0.18 sand/silt Ox NoDisposal PDA95 PDA95‐28 B 9/17/2016 13:49:03 37.21 24.81 0.09 sand/silt Ox NoDisposal PDA95 PDA95‐28 C 9/17/2016 13:50:08 30.14 20.09 0.06 sand/silt Ox No
Disposal PDA95 PDA95‐29 A 9/19/2016 13:33:18 43.38 28.92 0.13 sand/silt Ox No
Appendix E ‐ Plan View Image Analysis Results Page 1 of 12

Monitoring Survey at the Portland Disposal Site September 2016
Area Location StationID Replicate Date TimeImage Width
(cm)Image Height
(cm)Field of View Sediment Type
Surface Oxidation
Beggiatoa Present?
Beggiatoa Type/Extent
Disposal PDA95 PDA95‐29 D 9/19/2016 13:36:12 39.92 26.61 0.11 sand/silt Ox No
Disposal PDA95 PDA95‐30 A 9/19/2016 12:03:44 47.79 31.86 0.15 sand/silt Ox No
Disposal PDA95 PDA95‐30 B 9/19/2016 12:04:36 45.88 30.59 0.14 sand/silt Ox No
Disposal PDA95 PDA95‐31 A 9/19/2016 14:36:21 44.98 29.99 0.13 sand/silt >50% Ox No
Disposal PDA95 PDA95‐31 C 9/19/2016 14:38:09 48.69 32.46 0.16 sand/silt Ox No
Disposal PDA95 PDA95‐32 A 9/19/2016 13:24:08 46.37 30.92 0.14 sand/silt Ox No
Disposal PDA95 PDA95‐32 B 9/19/2016 13:24:58 42.16 28.11 0.12 sand/silt Ox No
Disposal PDA95 PDA95‐32 D 9/19/2016 13:26:51 45.35 30.23 0.14 sand/silt Ox NoDisposal PDA95 PDA95‐33 A 9/19/2016 15:25:12 42.25 28.17 0.12 sand/silt Ox NoDisposal PDA95 PDA95‐33 B 9/19/2016 15:26:08 44.02 29.35 0.13 sand/silt Ox NoDisposal PDA95 PDA95‐33 C 9/19/2016 15:26:56 42.30 28.20 0.12 sand/silt Ox NoDisposal PDA95 PDA95‐34 A 9/19/2016 14:00:20 47.62 31.75 0.15 sand/silt Ox NoDisposal PDA95 PDA95‐34 C 9/19/2016 14:02:18 38.73 25.82 0.10 gravel/sand Ox NoDisposal PDA95 PDA95‐34 D 9/19/2016 14:03:25 42.30 28.20 0.12 sand/silt Ox NoDisposal PDA95 PDA95‐35 A 9/19/2016 13:12:27 57.10 38.07 0.22 sand/silt Ox NoDisposal PDA95 PDA95‐35 B 9/19/2016 13:15:40 49.74 33.16 0.16 sand/silt Ox NoDisposal PDA95 PDA95‐35 C 9/19/2016 13:16:34 29.89 19.92 0.06 sand/silt Ox NoDisposal PDAA PDAA‐01 A 9/17/2016 12:39:57 33.39 22.26 0.07 gravel/sand Ox NoDisposal PDAA PDAA‐01 B 9/17/2016 12:40:44 39.04 26.03 0.10 gravel/sand Ox NoDisposal PDAA PDAA‐01 D 9/17/2016 12:42:33 48.99 32.66 0.16 gravel/sand Ox NoDisposal PDAA PDAA‐02 A 9/17/2016 12:33:07 43.00 28.67 0.12 gravel/sand Ox NoDisposal PDAA PDAA‐02 C 9/17/2016 12:34:48 33.71 22.47 0.08 gravel/sand Ox NoDisposal PDAA PDAA‐02 D 9/17/2016 12:35:31 39.96 26.64 0.11 sand/silt Ox NoDisposal PDAA PDAA‐03 A 9/17/2016 12:55:37 46.15 30.77 0.14 sand/silt Ox No
Disposal PDAA PDAA‐03 C 9/17/2016 12:57:20 36.04 24.03 0.09 gravel/sand Ox No
Disposal PDAA PDAA‐03 D 9/17/2016 12:58:21 41.53 27.69 0.12 cobble/gravel Ox NoDisposal PDAA PDAA‐04 A 9/17/2016 12:46:45 43.24 28.82 0.12 cobble/gravel Ox NoDisposal PDAA PDAA‐04 B 9/17/2016 12:47:36 43.00 28.67 0.12 gravel/sand Ox NoDisposal PDAA PDAA‐04 C 9/17/2016 12:48:26 IND IND IND gravel/sand Ox NoDisposal PDAA PDAA‐05 A 9/17/2016 13:05:34 36.69 24.46 0.09 sand/silt Ox NoDisposal PDAA PDAA‐05 C 9/17/2016 13:07:28 44.42 29.61 0.13 sand/silt Ox NoDisposal PDAA PDAA‐05 D 9/17/2016 13:08:22 47.62 31.75 0.15 sand/silt Ox NoDisposal PDS PDS‐06 A 9/17/2016 7:30:48 32.80 21.87 0.07 sand/silt Ox NoDisposal PDS PDS‐06 B 9/17/2016 7:31:38 39.84 26.56 0.11 sand/silt Ox No
Appendix E ‐ Plan View Image Analysis Results Page 2 of 12

Monitoring Survey at the Portland Disposal Site September 2016
Area Location StationID Replicate Date TimeImage Width
(cm)Image Height
(cm)Field of View Sediment Type
Surface Oxidation
Beggiatoa Present?
Beggiatoa Type/Extent
Disposal PDS PDS‐06 C 9/17/2016 7:32:26 57.86 38.58 0.22 sand/silt Ox NoDisposal PDS PDS‐07 A 9/17/2016 10:53:45 30.21 20.14 0.06 sand/silt Ox NoDisposal PDS PDS‐07 C 9/17/2016 10:55:18 33.14 22.09 0.07 sand/silt Ox NoDisposal PDS PDS‐08 A 9/17/2016 10:07:39 32.50 21.67 0.07 sand/silt Ox No
Disposal PDS PDS‐08 B 9/17/2016 10:08:34 45.03 30.02 0.14 sand/silt Ox No
Disposal PDS PDS‐08 C 9/17/2016 10:09:21 36.48 24.32 0.09 sand/silt Ox No
Disposal PDS PDS‐09 A 9/17/2016 11:38:44 35.75 23.83 0.09 sand/silt Ox NoDisposal PDS PDS‐09 B 9/17/2016 11:39:29 35.94 23.96 0.09 sand/silt Ox NoDisposal PDS PDS‐09 C 9/17/2016 11:40:17 40.88 27.25 0.11 sand/silt >50% Ox NoDisposal PDS PDS‐10 A 9/17/2016 11:12:38 34.63 23.09 0.08 sand/silt Ox NoDisposal PDS PDS‐10 D 9/17/2016 11:14:55 38.09 25.39 0.10 sand/silt Ox NoDisposal PDS PDS‐11 A 9/17/2016 8:07:27 31.30 20.87 0.07 sand/silt Ox NoDisposal PDS PDS‐11 B 9/17/2016 8:08:08 32.91 21.94 0.07 sand/silt Ox No
Disposal PDS PDS‐11 D 9/17/2016 8:09:55 43.29 28.86 0.12 sand/silt Ox No
Disposal PDS PDS‐12 A 9/17/2016 11:02:41 37.50 25.00 0.09 sand/silt Ox NoDisposal PDS PDS‐12 B 9/17/2016 11:03:36 IND IND IND sand/silt Ox NoDisposal PDS PDS‐12 C 9/17/2016 11:04:16 IND IND IND sand/silt Ox NoDisposal PDS PDS‐13 A 9/17/2016 8:47:27 34.18 22.79 0.08 sand/silt Ox NoDisposal PDS PDS‐13 F 9/17/2016 10:37:13 29.89 19.92 0.06 sand/silt Ox NoDisposal PDS PDS‐13 G 9/17/2016 10:37:57 30.98 20.65 0.06 sand/silt Ox NoDisposal PDS PDS‐14 A 9/17/2016 12:13:43 37.28 24.86 0.09 sand/silt Ox NoDisposal PDS PDS‐14 B 9/17/2016 12:14:35 38.27 25.52 0.10 sand/silt Ox NoDisposal PDS PDS‐14 C 9/17/2016 12:15:22 48.93 32.62 0.16 sand/silt Ox No
Disposal PDS PDS‐15 A 9/17/2016 11:18:46 45.24 30.16 0.14 sand/silt Ox No
Disposal PDS PDS‐15 B 9/17/2016 11:19:36 42.72 28.48 0.12 sand/silt Ox NoDisposal PDS PDS‐15 D 9/17/2016 11:21:08 44.88 29.92 0.13 sand/silt Ox NoDisposal PDS PDS‐16 A 9/17/2016 8:29:36 40.46 26.97 0.11 sand/silt Ox NoDisposal PDS PDS‐16 B 9/17/2016 8:30:10 IND IND IND sand/silt Ox NoDisposal PDS PDS‐16 C 9/17/2016 8:30:53 IND IND IND gravel/sand Ox NoDisposal PDS PDS‐17 A 9/17/2016 8:38:30 31.84 21.22 0.07 sand/silt Ox NoDisposal PDS PDS‐17 B 9/17/2016 8:39:11 28.80 19.20 0.06 sand/silt Ox NoDisposal PDS PDS‐17 E 9/17/2016 10:46:03 33.53 22.36 0.07 sand/silt Ox NoDisposal PDS PDS‐18 A 9/17/2016 8:54:14 50.32 33.55 0.17 sand/silt Ox No
Disposal PDS PDS‐18 C 9/17/2016 8:55:35 52.77 35.18 0.19 sand/silt Ox No
Disposal PDS PDS‐18 D 9/17/2016 8:56:16 IND IND IND sand/silt Ox NoDisposal PDS PDS‐19 A 9/17/2016 12:23:59 43.24 28.82 0.12 sand/silt Ox No
Appendix E ‐ Plan View Image Analysis Results Page 3 of 12
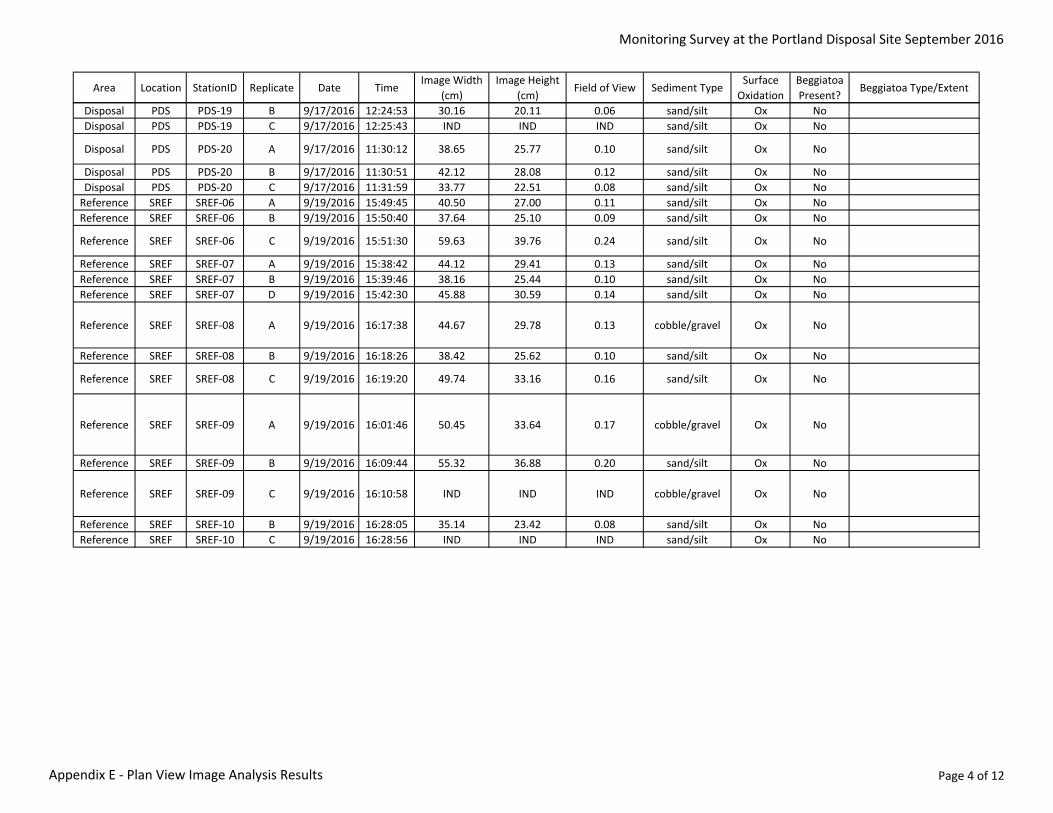
Monitoring Survey at the Portland Disposal Site September 2016
Area Location StationID Replicate Date TimeImage Width
(cm)Image Height
(cm)Field of View Sediment Type
Surface Oxidation
Beggiatoa Present?
Beggiatoa Type/Extent
Disposal PDS PDS‐19 B 9/17/2016 12:24:53 30.16 20.11 0.06 sand/silt Ox NoDisposal PDS PDS‐19 C 9/17/2016 12:25:43 IND IND IND sand/silt Ox No
Disposal PDS PDS‐20 A 9/17/2016 11:30:12 38.65 25.77 0.10 sand/silt Ox No
Disposal PDS PDS‐20 B 9/17/2016 11:30:51 42.12 28.08 0.12 sand/silt Ox NoDisposal PDS PDS‐20 C 9/17/2016 11:31:59 33.77 22.51 0.08 sand/silt Ox NoReference SREF SREF‐06 A 9/19/2016 15:49:45 40.50 27.00 0.11 sand/silt Ox NoReference SREF SREF‐06 B 9/19/2016 15:50:40 37.64 25.10 0.09 sand/silt Ox No
Reference SREF SREF‐06 C 9/19/2016 15:51:30 59.63 39.76 0.24 sand/silt Ox No
Reference SREF SREF‐07 A 9/19/2016 15:38:42 44.12 29.41 0.13 sand/silt Ox NoReference SREF SREF‐07 B 9/19/2016 15:39:46 38.16 25.44 0.10 sand/silt Ox NoReference SREF SREF‐07 D 9/19/2016 15:42:30 45.88 30.59 0.14 sand/silt Ox No
Reference SREF SREF‐08 A 9/19/2016 16:17:38 44.67 29.78 0.13 cobble/gravel Ox No
Reference SREF SREF‐08 B 9/19/2016 16:18:26 38.42 25.62 0.10 sand/silt Ox No
Reference SREF SREF‐08 C 9/19/2016 16:19:20 49.74 33.16 0.16 sand/silt Ox No
Reference SREF SREF‐09 A 9/19/2016 16:01:46 50.45 33.64 0.17 cobble/gravel Ox No
Reference SREF SREF‐09 B 9/19/2016 16:09:44 55.32 36.88 0.20 sand/silt Ox No
Reference SREF SREF‐09 C 9/19/2016 16:10:58 IND IND IND cobble/gravel Ox No
Reference SREF SREF‐10 B 9/19/2016 16:28:05 35.14 23.42 0.08 sand/silt Ox NoReference SREF SREF‐10 C 9/19/2016 16:28:56 IND IND IND sand/silt Ox No
Appendix E ‐ Plan View Image Analysis Results Page 4 of 12

Monitoring Survey at the Portland Disposal Site September 2016
Area Location StationID Replicate
Reference EREF EREF‐01 AReference EREF EREF‐02 EReference EREF EREF‐03 A
Reference EREF EREF‐03 B
Reference EREF EREF‐03 D
Reference EREF EREF‐04 B
Reference EREF EREF‐04 CReference EREF EREF‐04 DReference EREF EREF‐05 AReference EREF EREF‐05 BDisposal PDA95 PDA95‐21 A
Disposal PDA95 PDA95‐21 B
Disposal PDA95 PDA95‐21 DDisposal PDA95 PDA95‐22 ADisposal PDA95 PDA95‐22 BDisposal PDA95 PDA95‐23 ADisposal PDA95 PDA95‐23 CDisposal PDA95 PDA95‐23 DDisposal PDA95 PDA95‐24 ADisposal PDA95 PDA95‐24 BDisposal PDA95 PDA95‐25 A
Disposal PDA95 PDA95‐25 B
Disposal PDA95 PDA95‐25 DDisposal PDA95 PDA95‐26 A
Disposal PDA95 PDA95‐26 C
Disposal PDA95 PDA95‐26 DDisposal PDA95 PDA95‐27 ADisposal PDA95 PDA95‐27 BDisposal PDA95 PDA95‐27 CDisposal PDA95 PDA95‐28 ADisposal PDA95 PDA95‐28 BDisposal PDA95 PDA95‐28 C
Disposal PDA95 PDA95‐29 A
Dredged Material Present?
Dredged Material Notes Debris Bedforms Tubes Burrows Tracks
Sparse (<10%) Abundant (25‐75%) Sparse (<10%)Sparse (<10%) Abundant (25‐75%) Present (10‐25%)Sparse (<10%) Present (10‐25%) None
Sparse (<10%) Sparse (<10%) Sparse (<10%)
Sparse (<10%) Sparse (<10%) Sparse (<10%)
Cobble Sparse (<10%) Sparse (<10%) None
Cobble Sparse (<10%) None NoneCobble Sparse (<10%) None None
Sparse (<10%) Sparse (<10%) NoneIND IND IND
Sparse (<10%) Sparse (<10%) Present (10‐25%)
Cobble Sparse (<10%) Abundant (25‐75%) Sparse (<10%)
Sparse (<10%) Present (10‐25%) Sparse (<10%)None Sparse (<10%) Sparse (<10%)None Present (10‐25%) None
Sparse (<10%) Abundant (25‐75%) Present (10‐25%)Yes Rut Sparse (<10%) Sparse (<10%) None
Sparse (<10%) Present (10‐25%) NoneNone Present (10‐25%) None
Sparse (<10%) Sparse (<10%) NoneSparse (<10%) Present (10‐25%) Sparse (<10%)
Sparse (<10%) Sparse (<10%) None
Yes Cobble Mound None None NoneYes Sparse (<10%) Present (10‐25%) Sparse (<10%)
Yes None Present (10‐25%) Sparse (<10%)
Yes None Abundant (25‐75%) Present (10‐25%)Sparse (<10%) Present (10‐25%) None
Yes Sparse (<10%) Sparse (<10%) NoneSparse (<10%) Present (10‐25%) Sparse (<10%)
None Abundant (25‐75%) Sparse (<10%)IND IND IND
Sparse (<10%) Present (10‐25%) Sparse (<10%)
Sparse (<10%) Abundant (25‐75%) None
Appendix E ‐ Plan View Image Analysis Results Page 5 of 12

Monitoring Survey at the Portland Disposal Site September 2016
Area Location StationID Replicate
Disposal PDA95 PDA95‐29 D
Disposal PDA95 PDA95‐30 A
Disposal PDA95 PDA95‐30 B
Disposal PDA95 PDA95‐31 A
Disposal PDA95 PDA95‐31 C
Disposal PDA95 PDA95‐32 A
Disposal PDA95 PDA95‐32 B
Disposal PDA95 PDA95‐32 DDisposal PDA95 PDA95‐33 ADisposal PDA95 PDA95‐33 BDisposal PDA95 PDA95‐33 CDisposal PDA95 PDA95‐34 ADisposal PDA95 PDA95‐34 CDisposal PDA95 PDA95‐34 DDisposal PDA95 PDA95‐35 ADisposal PDA95 PDA95‐35 BDisposal PDA95 PDA95‐35 CDisposal PDAA PDAA‐01 ADisposal PDAA PDAA‐01 BDisposal PDAA PDAA‐01 DDisposal PDAA PDAA‐02 ADisposal PDAA PDAA‐02 CDisposal PDAA PDAA‐02 DDisposal PDAA PDAA‐03 A
Disposal PDAA PDAA‐03 C
Disposal PDAA PDAA‐03 DDisposal PDAA PDAA‐04 ADisposal PDAA PDAA‐04 BDisposal PDAA PDAA‐04 CDisposal PDAA PDAA‐05 ADisposal PDAA PDAA‐05 CDisposal PDAA PDAA‐05 DDisposal PDS PDS‐06 ADisposal PDS PDS‐06 B
Dredged Material Present?
Dredged Material Notes Debris Bedforms Tubes Burrows Tracks
Mound Sparse (<10%) Present (10‐25%) None
Sparse (<10%) Abundant (25‐75%) None
Yes Sparse (<10%) Abundant (25‐75%) None
Sparse (<10%) Abundant (25‐75%) Sparse (<10%)
Sparse (<10%) Abundant (25‐75%) None
Sparse (<10%) Abundant (25‐75%) Present (10‐25%)
Wood Sparse (<10%) Present (10‐25%) None
Sparse (<10%) Sparse (<10%) Sparse (<10%)Sparse (<10%) Sparse (<10%) NoneSparse (<10%) Sparse (<10%) NoneSparse (<10%) Sparse (<10%) None
Cobble Sparse (<10%) Sparse (<10%) NoneCobble Sparse (<10%) None None
Sparse (<10%) Present (10‐25%) NoneSparse (<10%) Abundant (25‐75%) NoneSparse (<10%) Abundant (25‐75%) NoneSparse (<10%) Present (10‐25%) None
Shell, Cobble Sparse (<10%) Sparse (<10%) Sparse (<10%)Shell, Cobble Sparse (<10%) Sparse (<10%) Sparse (<10%)Shell, Cobble Sparse (<10%) Sparse (<10%) None
Shell Sparse (<10%) Sparse (<10%) Present (10‐25%)Shell Sparse (<10%) Sparse (<10%) NoneShell Sparse (<10%) Present (10‐25%) Sparse (<10%)Shell None None Sparse (<10%)
Shell, Cobble Sparse (<10%) None Sparse (<10%)
Shell, Cobble Sparse (<10%) Sparse (<10%) Sparse (<10%)Shell, Cobble Sparse (<10%) None None
Shell Sparse (<10%) Sparse (<10%) Sparse (<10%)Shell, Cobble Sparse (<10%) Sparse (<10%) NoneShell, Cobble Sparse (<10%) Sparse (<10%) Sparse (<10%)
Shell Sparse (<10%) Sparse (<10%) Sparse (<10%)Shell Sparse (<10%) Present (10‐25%) Sparse (<10%)Shell Sparse (<10%) Present (10‐25%) None
Present (10‐25%) Present (10‐25%) Sparse (<10%)
Appendix E ‐ Plan View Image Analysis Results Page 6 of 12

Monitoring Survey at the Portland Disposal Site September 2016
Area Location StationID Replicate
Disposal PDS PDS‐06 CDisposal PDS PDS‐07 ADisposal PDS PDS‐07 CDisposal PDS PDS‐08 A
Disposal PDS PDS‐08 B
Disposal PDS PDS‐08 C
Disposal PDS PDS‐09 ADisposal PDS PDS‐09 BDisposal PDS PDS‐09 CDisposal PDS PDS‐10 ADisposal PDS PDS‐10 DDisposal PDS PDS‐11 ADisposal PDS PDS‐11 B
Disposal PDS PDS‐11 D
Disposal PDS PDS‐12 ADisposal PDS PDS‐12 BDisposal PDS PDS‐12 CDisposal PDS PDS‐13 ADisposal PDS PDS‐13 FDisposal PDS PDS‐13 GDisposal PDS PDS‐14 ADisposal PDS PDS‐14 BDisposal PDS PDS‐14 C
Disposal PDS PDS‐15 A
Disposal PDS PDS‐15 BDisposal PDS PDS‐15 DDisposal PDS PDS‐16 ADisposal PDS PDS‐16 BDisposal PDS PDS‐16 CDisposal PDS PDS‐17 ADisposal PDS PDS‐17 BDisposal PDS PDS‐17 EDisposal PDS PDS‐18 A
Disposal PDS PDS‐18 C
Disposal PDS PDS‐18 DDisposal PDS PDS‐19 A
Dredged Material Present?
Dredged Material Notes Debris Bedforms Tubes Burrows Tracks
Shell, Cobble Present (10‐25%) Sparse (<10%) NoneSparse (<10%) Present (10‐25%) Sparse (<10%)Sparse (<10%) Present (10‐25%) Present (10‐25%)Sparse (<10%) Present (10‐25%) None
Present (10‐25%) Abundant (25‐75%) Sparse (<10%)
Sparse (<10%) Abundant (25‐75%) Sparse (<10%)
Sparse (<10%) Sparse (<10%) Sparse (<10%)Sparse (<10%) Sparse (<10%) None
Cobble Sparse (<10%) Present (10‐25%) NonePresent (10‐25%) Sparse (<10%) Present (10‐25%)Present (10‐25%) Sparse (<10%) NonePresent (10‐25%) Sparse (<10%) NoneSparse (<10%) Sparse (<10%) Abundant (25‐75%)
Shell Sparse (<10%) Present (10‐25%) None
Sparse (<10%) Present (10‐25%) NoneIND IND IND
Shell Sparse (<10%) Sparse (<10%) Sparse (<10%)Sparse (<10%) Abundant (25‐75%) Sparse (<10%)Sparse (<10%) Abundant (25‐75%) Sparse (<10%)Sparse (<10%) Present (10‐25%) NoneSparse (<10%) Present (10‐25%) Sparse (<10%)
Present (10‐25%) Present (10‐25%) Sparse (<10%)Shell Present (10‐25%) Present (10‐25%) Sparse (<10%)
Cobble Sparse (<10%) Present (10‐25%) Sparse (<10%)
Cobble Sparse (<10%) Present (10‐25%) Present (10‐25%)Cobble Sparse (<10%) Abundant (25‐75%) Sparse (<10%)Cobble Sparse (<10%) Present (10‐25%) Sparse (<10%)
Sparse (<10%) Abundant (25‐75%) NoneShell, Cobble Sparse (<10%) None None
Sparse (<10%) Sparse (<10%) NonePresent (10‐25%) Present (10‐25%) NoneSparse (<10%) Present (10‐25%) Present (10‐25%)Sparse (<10%) Abundant (25‐75%) Present (10‐25%)
Cobble Sparse (<10%) Abundant (25‐75%) Present (10‐25%)
Cobble Sparse (<10%) Present (10‐25%) NonePresent (10‐25%) Present (10‐25%) Sparse (<10%)
Appendix E ‐ Plan View Image Analysis Results Page 7 of 12

Monitoring Survey at the Portland Disposal Site September 2016
Area Location StationID Replicate
Disposal PDS PDS‐19 BDisposal PDS PDS‐19 C
Disposal PDS PDS‐20 A
Disposal PDS PDS‐20 BDisposal PDS PDS‐20 CReference SREF SREF‐06 AReference SREF SREF‐06 B
Reference SREF SREF‐06 C
Reference SREF SREF‐07 AReference SREF SREF‐07 BReference SREF SREF‐07 D
Reference SREF SREF‐08 A
Reference SREF SREF‐08 B
Reference SREF SREF‐08 C
Reference SREF SREF‐09 A
Reference SREF SREF‐09 B
Reference SREF SREF‐09 C
Reference SREF SREF‐10 BReference SREF SREF‐10 C
Dredged Material Present?
Dredged Material Notes Debris Bedforms Tubes Burrows Tracks
Sparse (<10%) Present (10‐25%) Sparse (<10%)IND IND IND
Yes Sparse (<10%) Present (10‐25%) Sparse (<10%)
Present (10‐25%) Present (10‐25%) NoneSparse (<10%) Sparse (<10%) Sparse (<10%)
Cobble Abundant (25‐75%) Sparse (<10%) NoneAbundant (25‐75%) Sparse (<10%) None
Cobble Present (10‐25%) Sparse (<10%) Sparse (<10%)
Present (10‐25%) Present (10‐25%) Sparse (<10%)Present (10‐25%) Present (10‐25%) Sparse (<10%)Present (10‐25%) Sparse (<10%) None
Cobble Sparse (<10%) Sparse (<10%) None
Present (10‐25%) Sparse (<10%) Present (10‐25%)
Present (10‐25%) Present (10‐25%) Sparse (<10%)
Shell, Cobble Sparse (<10%) None None
Shell Sparse (<10%) Sparse (<10%) Sparse (<10%)
Cobble None None None
Sparse (<10%) Present (10‐25%) Sparse (<10%)Sparse (<10%) Sparse (<10%) None
Appendix E ‐ Plan View Image Analysis Results Page 8 of 12
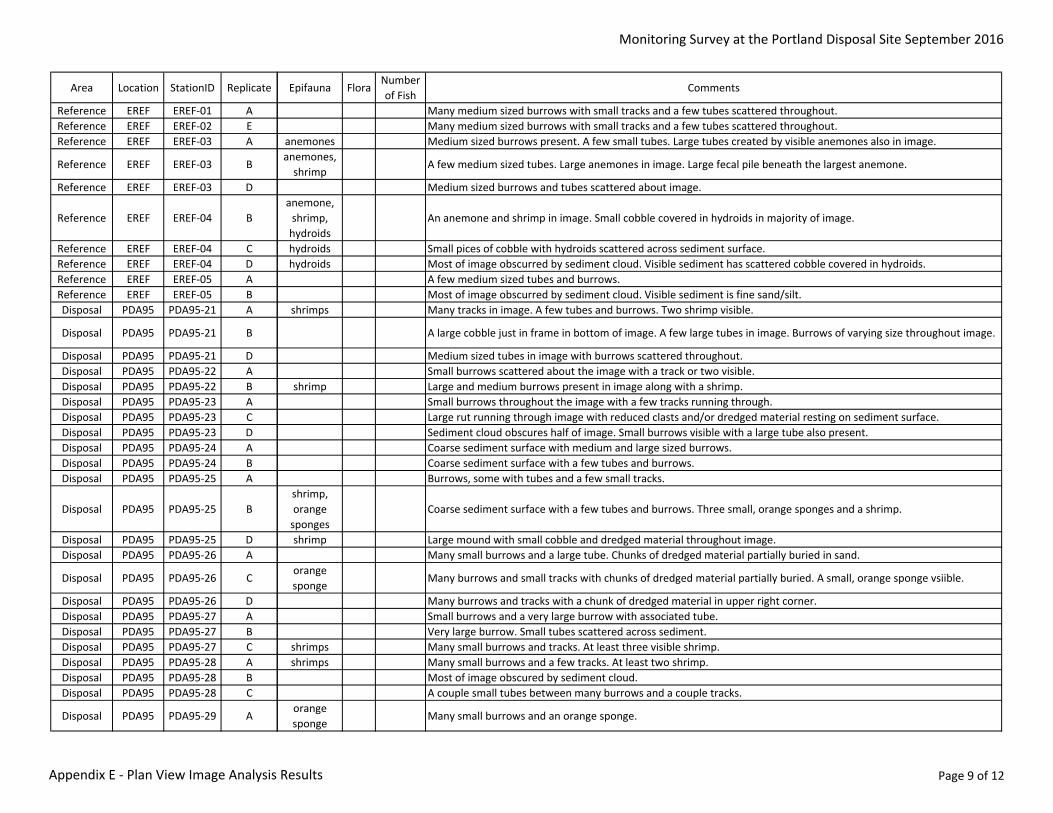
Monitoring Survey at the Portland Disposal Site September 2016
Area Location StationID Replicate
Reference EREF EREF‐01 AReference EREF EREF‐02 EReference EREF EREF‐03 A
Reference EREF EREF‐03 B
Reference EREF EREF‐03 D
Reference EREF EREF‐04 B
Reference EREF EREF‐04 CReference EREF EREF‐04 DReference EREF EREF‐05 AReference EREF EREF‐05 BDisposal PDA95 PDA95‐21 A
Disposal PDA95 PDA95‐21 B
Disposal PDA95 PDA95‐21 DDisposal PDA95 PDA95‐22 ADisposal PDA95 PDA95‐22 BDisposal PDA95 PDA95‐23 ADisposal PDA95 PDA95‐23 CDisposal PDA95 PDA95‐23 DDisposal PDA95 PDA95‐24 ADisposal PDA95 PDA95‐24 BDisposal PDA95 PDA95‐25 A
Disposal PDA95 PDA95‐25 B
Disposal PDA95 PDA95‐25 DDisposal PDA95 PDA95‐26 A
Disposal PDA95 PDA95‐26 C
Disposal PDA95 PDA95‐26 DDisposal PDA95 PDA95‐27 ADisposal PDA95 PDA95‐27 BDisposal PDA95 PDA95‐27 CDisposal PDA95 PDA95‐28 ADisposal PDA95 PDA95‐28 BDisposal PDA95 PDA95‐28 C
Disposal PDA95 PDA95‐29 A
Epifauna FloraNumber of Fish
Comments
Many medium sized burrows with small tracks and a few tubes scattered throughout.Many medium sized burrows with small tracks and a few tubes scattered throughout.
anemones Medium sized burrows present. A few small tubes. Large tubes created by visible anemones also in image.anemones, shrimp
A few medium sized tubes. Large anemones in image. Large fecal pile beneath the largest anemone.
Medium sized burrows and tubes scattered about image. anemone, shrimp, hydroids
An anemone and shrimp in image. Small cobble covered in hydroids in majority of image.
hydroids Small pices of cobble with hydroids scattered across sediment surface. hydroids Most of image obscurred by sediment cloud. Visible sediment has scattered cobble covered in hydroids.
A few medium sized tubes and burrows.Most of image obscurred by sediment cloud. Visible sediment is fine sand/silt.
shrimps Many tracks in image. A few tubes and burrows. Two shrimp visible.
A large cobble just in frame in bottom of image. A few large tubes in image. Burrows of varying size throughout image.
Medium sized tubes in image with burrows scattered throughout.Small burrows scattered about the image with a track or two visible.
shrimp Large and medium burrows present in image along with a shrimp.Small burrows throughout the image with a few tracks running through.Large rut running through image with reduced clasts and/or dredged material resting on sediment surface.Sediment cloud obscures half of image. Small burrows visible with a large tube also present.Coarse sediment surface with medium and large sized burrows.Coarse sediment surface with a few tubes and burrows.Burrows, some with tubes and a few small tracks.
shrimp, orange sponges
Coarse sediment surface with a few tubes and burrows. Three small, orange sponges and a shrimp.
shrimp Large mound with small cobble and dredged material throughout image.Many small burrows and a large tube. Chunks of dredged material partially buried in sand.
orange sponge
Many burrows and small tracks with chunks of dredged material partially buried. A small, orange sponge vsiible.
Many burrows and tracks with a chunk of dredged material in upper right corner.Small burrows and a very large burrow with associated tube.Very large burrow. Small tubes scattered across sediment.
shrimps Many small burrows and tracks. At least three visible shrimp.shrimps Many small burrows and a few tracks. At least two shrimp.
Most of image obscured by sediment cloud.A couple small tubes between many burrows and a couple tracks.
orange sponge
Many small burrows and an orange sponge.
Appendix E ‐ Plan View Image Analysis Results Page 9 of 12

Monitoring Survey at the Portland Disposal Site September 2016
Area Location StationID Replicate
Disposal PDA95 PDA95‐29 D
Disposal PDA95 PDA95‐30 A
Disposal PDA95 PDA95‐30 B
Disposal PDA95 PDA95‐31 A
Disposal PDA95 PDA95‐31 C
Disposal PDA95 PDA95‐32 A
Disposal PDA95 PDA95‐32 B
Disposal PDA95 PDA95‐32 DDisposal PDA95 PDA95‐33 ADisposal PDA95 PDA95‐33 BDisposal PDA95 PDA95‐33 CDisposal PDA95 PDA95‐34 ADisposal PDA95 PDA95‐34 CDisposal PDA95 PDA95‐34 DDisposal PDA95 PDA95‐35 ADisposal PDA95 PDA95‐35 BDisposal PDA95 PDA95‐35 CDisposal PDAA PDAA‐01 ADisposal PDAA PDAA‐01 BDisposal PDAA PDAA‐01 DDisposal PDAA PDAA‐02 ADisposal PDAA PDAA‐02 CDisposal PDAA PDAA‐02 DDisposal PDAA PDAA‐03 A
Disposal PDAA PDAA‐03 C
Disposal PDAA PDAA‐03 DDisposal PDAA PDAA‐04 ADisposal PDAA PDAA‐04 BDisposal PDAA PDAA‐04 CDisposal PDAA PDAA‐05 ADisposal PDAA PDAA‐05 CDisposal PDAA PDAA‐05 DDisposal PDS PDS‐06 ADisposal PDS PDS‐06 B
Epifauna FloraNumber of Fish
Comments
orange sponge
A large sediment mound surrounded by burrows, some with associated tubes. An orange sponge.
A few large tubes amongst many small burrows.orange sponges
Many burrows with small chunks of dredged material and some sponges.
Many small burrows and a huge burrow surrounde by reduced sediment. shrimp, orange sponges
Many small burrows, some with associated tubes scattered across sediment.
Many small burrows, some with associated tubes scattered across sediment. A couple tracks run across entire image.
shrimp, hydroids
Large piece of wood colonized by hydroids in image. Many medium sized burrows with a few associated tubes.
A few tubes and burrows. Cloud of sediment obscures some of image.A few small burrows and one very large burrow in the center of image.A few very large burrows in image.
shrimp Coarse sediment surface with a few burrows.A few pieces of cobble scattered about sediment surface.Sediment surface covered in gravel and cobble.Coarse sediment surface with medium sized burrows scattered throughout.Sediment surface contains burrows throughout.
shrimps Sediment surface contains burrows throughout.shrimp Coarse sediment surface contains scattered burrows.hydroids Sediment surface covered in scattered shell, gravel, and cobble. Some hydroids attached to a larger cobble.
Sediment surface covered in scattered shell, gravel, and cobble. Sediment surface covered in scattered shell, gravel, and cobble. A few large burrows with associated tubes.Sediment surface covered in scattered shell and gravel. Sediment surface covered in scattered shell and gravel. Sediment surface contains scattered shell. Many small burrows present.Scattered shell across sediment surface. A few tracks visible.
hydroids Sediment contains scattered shell and gravel, as well as a few larger cobbles. Large hydroid present in center of image.
hydroids Large cobble takes up most of image. Colonies of hydroids dense in image.hydroids Large cobble takes up most of image. Colonies of hydroids dense in image.
Scattered shell across sediment surface. A few tubes and burrows visible.hydroids Cobble and shell in image. Some cobble has associated hydroid colonies.
Shell fragments and a few chunks of cobble in image. Coarse sediment surface with scattered shell fragments throughout.
shrimp Large bivalve shell fragments in image. A shrimp is also present.Shell fragments and many small to medium burrows present.
hydroids Many small tubes and burrows. A couple large burrows. Some hydroid colones visible.
Appendix E ‐ Plan View Image Analysis Results Page 10 of 12

Monitoring Survey at the Portland Disposal Site September 2016
Area Location StationID Replicate
Disposal PDS PDS‐06 CDisposal PDS PDS‐07 ADisposal PDS PDS‐07 CDisposal PDS PDS‐08 A
Disposal PDS PDS‐08 B
Disposal PDS PDS‐08 C
Disposal PDS PDS‐09 ADisposal PDS PDS‐09 BDisposal PDS PDS‐09 CDisposal PDS PDS‐10 ADisposal PDS PDS‐10 DDisposal PDS PDS‐11 ADisposal PDS PDS‐11 B
Disposal PDS PDS‐11 D
Disposal PDS PDS‐12 ADisposal PDS PDS‐12 BDisposal PDS PDS‐12 CDisposal PDS PDS‐13 ADisposal PDS PDS‐13 FDisposal PDS PDS‐13 GDisposal PDS PDS‐14 ADisposal PDS PDS‐14 BDisposal PDS PDS‐14 C
Disposal PDS PDS‐15 A
Disposal PDS PDS‐15 BDisposal PDS PDS‐15 DDisposal PDS PDS‐16 ADisposal PDS PDS‐16 BDisposal PDS PDS‐16 CDisposal PDS PDS‐17 ADisposal PDS PDS‐17 BDisposal PDS PDS‐17 EDisposal PDS PDS‐18 A
Disposal PDS PDS‐18 C
Disposal PDS PDS‐18 DDisposal PDS PDS‐19 A
Epifauna FloraNumber of Fish
Comments
hydroids Many shell fragments and chunks of cobble with associated hydroids.Coarse sediment surface with many small burrows.Coarse sediment surface with many small burrows and tracks.Coarse sediment surface with many small burrows and a few larger burrows.
Many small tubes and burrows. Some reduced chunks resting on sediment, possible dredged material or mud clasts.
Many medium sized burrows with a few tracks and some material that could be dredged material or a mud clast.
Some small tubes and burrows with a couple tracks moving through.Rough sediment surface with small tubes and burrows.
hydroids Large burrow with reduced sediment around it. A few chunks of cobble with associated hydroids.Track running through middle of image. Many tubes and a few large burrows.
shrimp Many small tubes and a few burrows. anemone Rough sediment surface with an anemone just in image at bottom.
Many tracks in image with a few small tubes.shrimp,
gastropodLarge shell fragment with a very small gastropod and shrimp in image. Small burrows thorughout image.
shrimp Many burrows scattered across image.Unable to see much in image because of sediment cloud.Could not locate lasers. A few tubes, burrows, tracks, and shell fragments.All sizes of burrows throughout image.
shrimp Smaller burrows and tracks surrounding very large burrow in center of image.Coarse sediment surface with burrows scattered throughout.Many burrows with associated tubes scattered about.Many burrows with associated tubes scattered about.
shrimp Many burrows with associated tubes scattered about.hydroids, shrimp
Many burrows scattered in sediment between chunks of cobble with associated hydroid colonies.
hydroids A few chunks of cobble with many burrows and tracks throughout.hydroids Cobble chunks scattered about image with many burrows throughout.anemone A few chunks of cobble with burrows and associated tubes scattered across sediment.shrimp Sediment contains many burrows of all sizes, some with associated tubes.hydroids Most of image is hydroid covered cobble with some gravel and sand between.
Coarse sediment surface containing scattered burrows, some with tubes.Many small burrows with associated tubes in coarse sediment surface.Burrows and tracks throughout image.Burrows and tracks throughout image.
shrimp, gastropod
Burrows and tracks throughout image.
hydroids Huge piece of cobble with associated hydroids takes up majority of image.Burrows scattered throughout, many containing associated tubes.
Appendix E ‐ Plan View Image Analysis Results Page 11 of 12
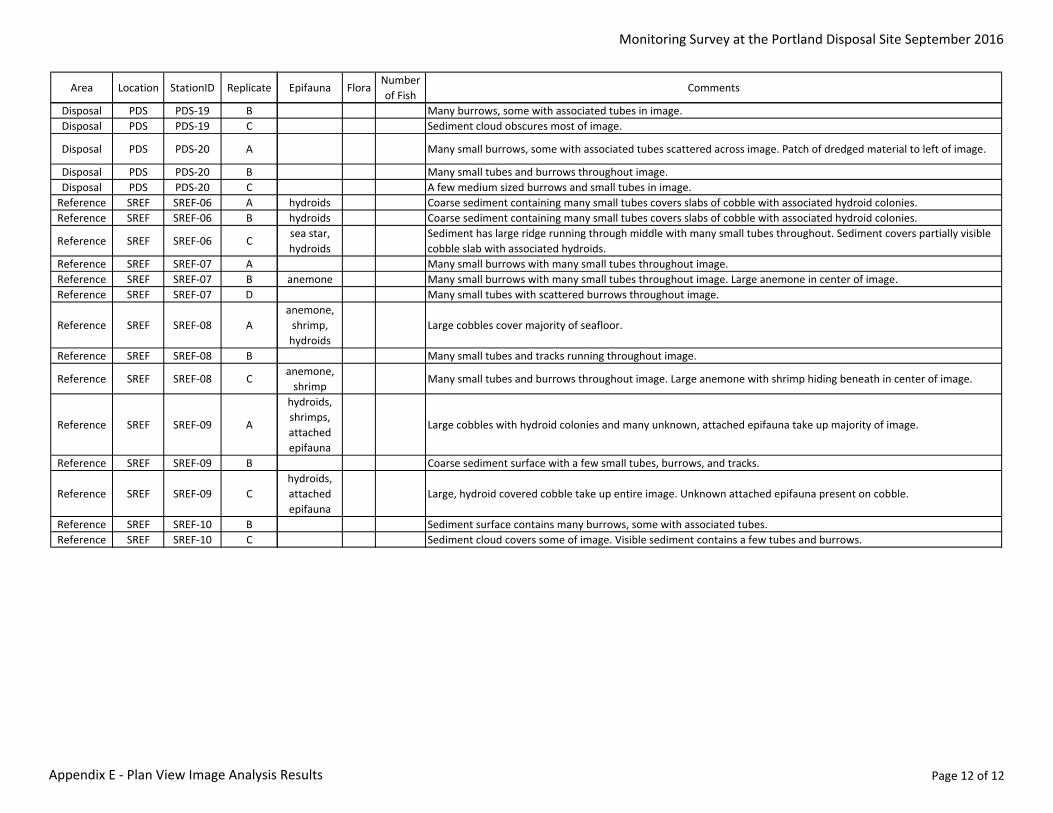
Monitoring Survey at the Portland Disposal Site September 2016
Area Location StationID Replicate
Disposal PDS PDS‐19 BDisposal PDS PDS‐19 C
Disposal PDS PDS‐20 A
Disposal PDS PDS‐20 BDisposal PDS PDS‐20 CReference SREF SREF‐06 AReference SREF SREF‐06 B
Reference SREF SREF‐06 C
Reference SREF SREF‐07 AReference SREF SREF‐07 BReference SREF SREF‐07 D
Reference SREF SREF‐08 A
Reference SREF SREF‐08 B
Reference SREF SREF‐08 C
Reference SREF SREF‐09 A
Reference SREF SREF‐09 B
Reference SREF SREF‐09 C
Reference SREF SREF‐10 BReference SREF SREF‐10 C
Epifauna FloraNumber of Fish
Comments
Many burrows, some with associated tubes in image.Sediment cloud obscures most of image.
Many small burrows, some with associated tubes scattered across image. Patch of dredged material to left of image.
Many small tubes and burrows throughout image.A few medium sized burrows and small tubes in image.
hydroids Coarse sediment containing many small tubes covers slabs of cobble with associated hydroid colonies.hydroids Coarse sediment containing many small tubes covers slabs of cobble with associated hydroid colonies.sea star, hydroids
Sediment has large ridge running through middle with many small tubes throughout. Sediment covers partially visible cobble slab with associated hydroids.Many small burrows with many small tubes throughout image.
anemone Many small burrows with many small tubes throughout image. Large anemone in center of image.Many small tubes with scattered burrows throughout image.
anemone, shrimp, hydroids
Large cobbles cover majority of seafloor.
Many small tubes and tracks running throughout image.anemone, shrimp
Many small tubes and burrows throughout image. Large anemone with shrimp hiding beneath in center of image.
hydroids, shrimps, attached epifauna
Large cobbles with hydroid colonies and many unknown, attached epifauna take up majority of image.
Coarse sediment surface with a few small tubes, burrows, and tracks.hydroids, attached epifauna
Large, hydroid covered cobble take up entire image. Unknown attached epifauna present on cobble.
Sediment surface contains many burrows, some with associated tubes.Sediment cloud covers some of image. Visible sediment contains a few tubes and burrows.
Appendix E ‐ Plan View Image Analysis Results Page 12 of 12

Monitoring Survey at the Portland Disposal Site September 2016
APPENDIX F
GRAIN SIZE SCALE FOR SEDIMENTS
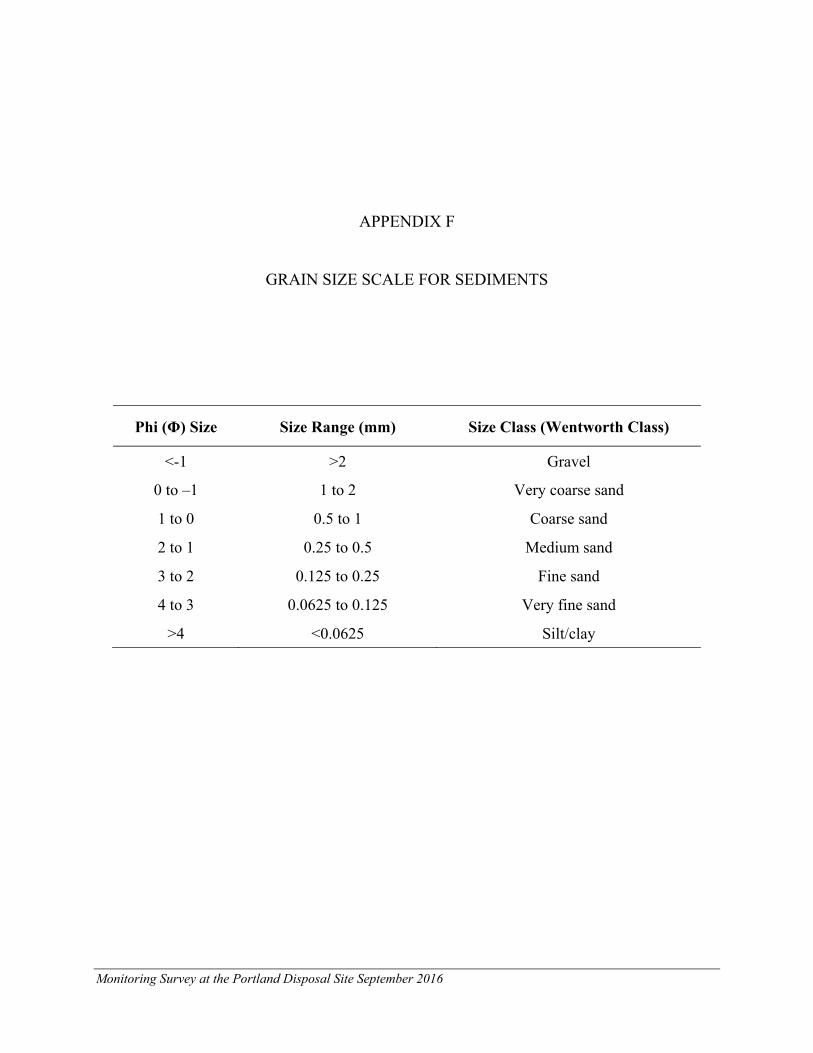
Monitoring Survey at the Portland Disposal Site September 2016
APPENDIX F
GRAIN SIZE SCALE FOR SEDIMENTS
Phi (Φ) Size Size Range (mm) Size Class (Wentworth Class)
<-1 >2 Gravel
0 to –1 1 to 2 Very coarse sand
1 to 0 0.5 to 1 Coarse sand
2 to 1 0.25 to 0.5 Medium sand
3 to 2 0.125 to 0.25 Fine sand
4 to 3 0.0625 to 0.125 Very fine sand
>4 <0.0625 Silt/clay
Monitoring Survey at the Portland Disposal Site September 2016
APPENDIX G
SEDIMENT CHEMISTRY LAB RESULTS

DAMOS 2016 ‐ Portland Disposal Site Sample Summary ‐ SEDIMENT
STATION_ID Field SAMPLE ID MATRIX LAB LAB_SAMPLE_ID
QC_BLK RAJ‐901 BLK Battelle K2640‐P
QC_BLK RAJ‐901 BLK ESI 28209‐011
QC_BLK RAJ‐901 BLK ESI 28209‐011D
QC_BLK RAJ‐901 BLK ESI 28209‐011S
QC_BLK RAJ‐901 BLK ESI 28209‐011SD
QC_BLK RAJ‐901 BLK ESI 28209‐012
QC_BLK RAJ‐901 BLK ESI 28209‐012D
QC_BLK RAJ‐901 BLK ESI 28209‐012S
QC_BLK RAJ‐901 BLK ESI 28209‐012SD
EREF‐01 RAJ‐012 SED Battelle K2642‐P
EREF‐01 RAJ‐012 SED ESI 28209‐014
EREF‐01 RAJ‐012 SED Katahdin SJ7652‐13
EREF‐03 RAJ‐010 SED Battelle K2639‐P
EREF‐03 RAJ‐010 SED ESI 28209‐010
EREF‐03 RAJ‐010 SED Katahdin SJ7652‐11
EREF‐05 RAJ‐011 SED Battelle K2641‐P
EREF‐05 RAJ‐011 SED ESI 28209‐013
EREF‐05 RAJ‐011 SED Katahdin SJ7652‐12
PDA95‐22 RAJ‐006 SED Battelle K2635‐P
PDA95‐22 RAJ‐006 SED ESI 28209‐006
PDA95‐22 RAJ‐006 SED Katahdin SJ7652‐7
PDA95‐23 RAJ‐005 SED Battelle K2634‐P
PDA95‐23 RAJ‐005 SED ESI 28209‐005
PDA95‐23 RAJ‐005 SED Katahdin SJ7652‐6
PDA95‐30 RAJ‐004 SED Battelle K2633MSD‐P
PDA95‐30 RAJ‐004 SED Battelle K2633MS‐P
PDA95‐30 RAJ‐004 SED Battelle K2633‐P
PDA95‐30 RAJ‐004 SED ESI 28209‐004
PDA95‐30 RAJ‐004 SED ESI 28209‐004D
PDA95‐30 RAJ‐004 SED ESI 28209‐004S
PDA95‐30 RAJ‐004 SED ESI 28209‐004SD
PDA95‐30 RAJ‐004 SED Katahdin SJ7652‐4
PDA95‐30 RAJ‐004 SED Katahdin SJ7652‐5
PDS‐10 RAJ‐002 SED Battelle K2631‐P
PDS‐10 RAJ‐002 SED ESI 28209‐002
PDS‐10 RAJ‐002 SED Katahdin SJ7652‐2
PDS‐16 RAJ‐003 SED Battelle K2632‐P
PDS‐16 RAJ‐003 SED ESI 28209‐003
PDS‐16 RAJ‐003 SED Katahdin SJ7652‐3
PDS‐20 RAJ‐001 SED Battelle K2630‐P
PDS‐20 RAJ‐001 SED ESI 28209‐001
PDS‐20 RAJ‐001 SED Katahdin SJ7652‐1
SREF‐07 RAJ‐007 SED Battelle K2636‐P
SREF‐07 RAJ‐007 SED ESI 28209‐007
Page 1 of 2

DAMOS 2016 ‐ Portland Disposal Site Sample Summary ‐ SEDIMENT
STATION_ID Field SAMPLE ID MATRIX LAB LAB_SAMPLE_ID
SREF‐07 RAJ‐007 SED Katahdin SJ7652‐8
SREF‐08 RAJ‐009 SED Battelle K2638‐P
SREF‐08 RAJ‐009 SED ESI 28209‐009
SREF‐08 RAJ‐009 SED Katahdin SJ7652‐10
SREF‐10 RAJ‐008 SED Battelle K2637DUP‐P
SREF‐10 RAJ‐008 SED Battelle K2637‐P
SREF‐10 RAJ‐008 SED ESI 28209‐008
SREF‐10 RAJ‐008 SED Katahdin SJ7652‐9
Page 2 of 2
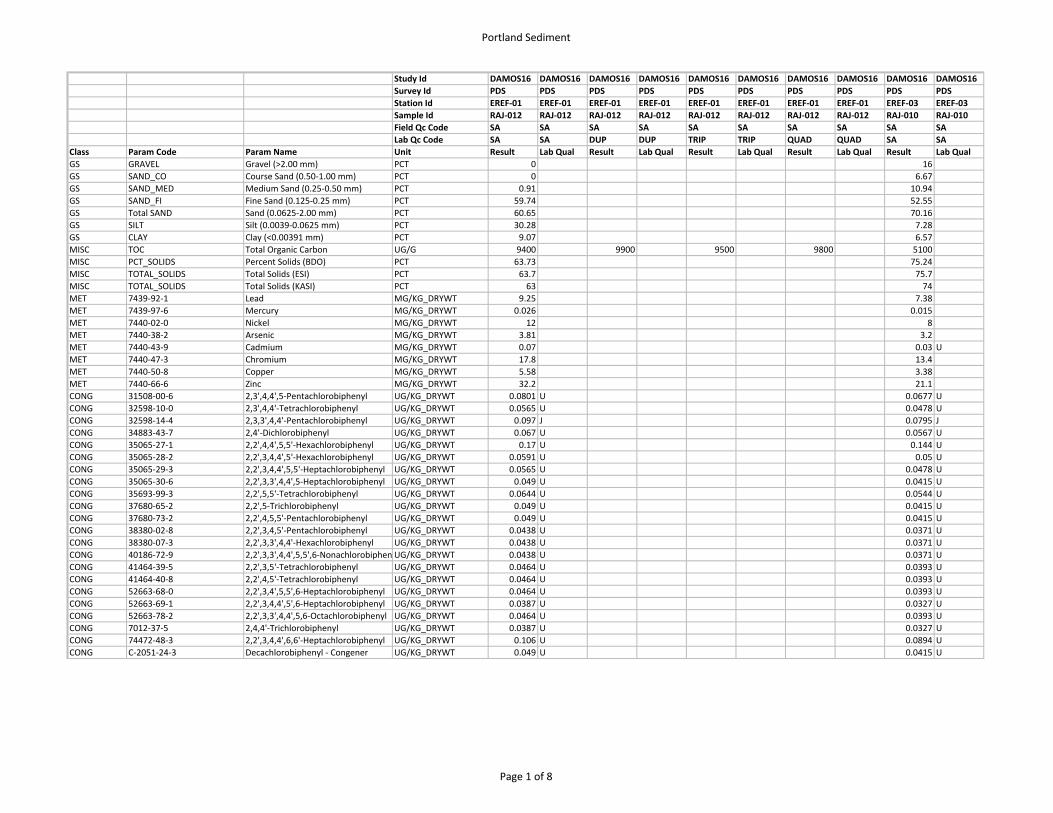
Portland Sediment
Study Id DAMOS16 DAMOS16 DAMOS16 DAMOS16 DAMOS16 DAMOS16 DAMOS16 DAMOS16 DAMOS16 DAMOS16
Survey Id PDS PDS PDS PDS PDS PDS PDS PDS PDS PDS
Station Id EREF‐01 EREF‐01 EREF‐01 EREF‐01 EREF‐01 EREF‐01 EREF‐01 EREF‐01 EREF‐03 EREF‐03
Sample Id RAJ‐012 RAJ‐012 RAJ‐012 RAJ‐012 RAJ‐012 RAJ‐012 RAJ‐012 RAJ‐012 RAJ‐010 RAJ‐010
Field Qc Code SA SA SA SA SA SA SA SA SA SA
Lab Qc Code SA SA DUP DUP TRIP TRIP QUAD QUAD SA SA
Class Param Code Param Name Unit Result Lab Qual Result Lab Qual Result Lab Qual Result Lab Qual Result Lab Qual
GS GRAVEL Gravel (>2.00 mm) PCT 0 16
GS SAND_CO Course Sand (0.50‐1.00 mm) PCT 0 6.67
GS SAND_MED Medium Sand (0.25‐0.50 mm) PCT 0.91 10.94
GS SAND_FI Fine Sand (0.125‐0.25 mm) PCT 59.74 52.55
GS Total SAND Sand (0.0625‐2.00 mm) PCT 60.65 70.16
GS SILT Silt (0.0039‐0.0625 mm) PCT 30.28 7.28
GS CLAY Clay (<0.00391 mm) PCT 9.07 6.57
MISC TOC Total Organic Carbon UG/G 9400 9900 9500 9800 5100
MISC PCT_SOLIDS Percent Solids (BDO) PCT 63.73 75.24
MISC TOTAL_SOLIDS Total Solids (ESI) PCT 63.7 75.7
MISC TOTAL_SOLIDS Total Solids (KASI) PCT 63 74
MET 7439‐92‐1 Lead MG/KG_DRYWT 9.25 7.38
MET 7439‐97‐6 Mercury MG/KG_DRYWT 0.026 0.015
MET 7440‐02‐0 Nickel MG/KG_DRYWT 12 8
MET 7440‐38‐2 Arsenic MG/KG_DRYWT 3.81 3.2
MET 7440‐43‐9 Cadmium MG/KG_DRYWT 0.07 0.03 U
MET 7440‐47‐3 Chromium MG/KG_DRYWT 17.8 13.4
MET 7440‐50‐8 Copper MG/KG_DRYWT 5.58 3.38
MET 7440‐66‐6 Zinc MG/KG_DRYWT 32.2 21.1
CONG 31508‐00‐6 2,3',4,4',5‐Pentachlorobiphenyl UG/KG_DRYWT 0.0801 U 0.0677 U
CONG 32598‐10‐0 2,3',4,4'‐Tetrachlorobiphenyl UG/KG_DRYWT 0.0565 U 0.0478 U
CONG 32598‐14‐4 2,3,3',4,4'‐Pentachlorobiphenyl UG/KG_DRYWT 0.097 J 0.0795 J
CONG 34883‐43‐7 2,4'‐Dichlorobiphenyl UG/KG_DRYWT 0.067 U 0.0567 U
CONG 35065‐27‐1 2,2',4,4',5,5'‐Hexachlorobiphenyl UG/KG_DRYWT 0.17 U 0.144 U
CONG 35065‐28‐2 2,2',3,4,4',5'‐Hexachlorobiphenyl UG/KG_DRYWT 0.0591 U 0.05 U
CONG 35065‐29‐3 2,2',3,4,4',5,5'‐Heptachlorobiphenyl UG/KG_DRYWT 0.0565 U 0.0478 U
CONG 35065‐30‐6 2,2',3,3',4,4',5‐Heptachlorobiphenyl UG/KG_DRYWT 0.049 U 0.0415 U
CONG 35693‐99‐3 2,2',5,5'‐Tetrachlorobiphenyl UG/KG_DRYWT 0.0644 U 0.0544 U
CONG 37680‐65‐2 2,2',5‐Trichlorobiphenyl UG/KG_DRYWT 0.049 U 0.0415 U
CONG 37680‐73‐2 2,2',4,5,5'‐Pentachlorobiphenyl UG/KG_DRYWT 0.049 U 0.0415 U
CONG 38380‐02‐8 2,2',3,4,5'‐Pentachlorobiphenyl UG/KG_DRYWT 0.0438 U 0.0371 U
CONG 38380‐07‐3 2,2',3,3',4,4'‐Hexachlorobiphenyl UG/KG_DRYWT 0.0438 U 0.0371 U
CONG 40186‐72‐9 2,2',3,3',4,4',5,5',6‐Nonachlorobiphen UG/KG_DRYWT 0.0438 U 0.0371 U
CONG 41464‐39‐5 2,2',3,5'‐Tetrachlorobiphenyl UG/KG_DRYWT 0.0464 U 0.0393 U
CONG 41464‐40‐8 2,2',4,5'‐Tetrachlorobiphenyl UG/KG_DRYWT 0.0464 U 0.0393 U
CONG 52663‐68‐0 2,2',3,4',5,5',6‐Heptachlorobiphenyl UG/KG_DRYWT 0.0464 U 0.0393 U
CONG 52663‐69‐1 2,2',3,4,4',5',6‐Heptachlorobiphenyl UG/KG_DRYWT 0.0387 U 0.0327 U
CONG 52663‐78‐2 2,2',3,3',4,4',5,6‐Octachlorobiphenyl UG/KG_DRYWT 0.0464 U 0.0393 U
CONG 7012‐37‐5 2,4,4'‐Trichlorobiphenyl UG/KG_DRYWT 0.0387 U 0.0327 U
CONG 74472‐48‐3 2,2',3,4,4',6,6'‐Heptachlorobiphenyl UG/KG_DRYWT 0.106 U 0.0894 U
CONG C‐2051‐24‐3 Decachlorobiphenyl ‐ Congener UG/KG_DRYWT 0.049 U 0.0415 U
Page 1 of 8

Portland Sediment
Study Id DAMOS16 DAMOS16 DAMOS16 DAMOS16 DAMOS16 DAMOS16 DAMOS16 DAMOS16 DAMOS16 DAMOS16
Survey Id PDS PDS PDS PDS PDS PDS PDS PDS PDS PDS
Station Id EREF‐01 EREF‐01 EREF‐01 EREF‐01 EREF‐01 EREF‐01 EREF‐01 EREF‐01 EREF‐03 EREF‐03
Sample Id RAJ‐012 RAJ‐012 RAJ‐012 RAJ‐012 RAJ‐012 RAJ‐012 RAJ‐012 RAJ‐012 RAJ‐010 RAJ‐010
Field Qc Code SA SA SA SA SA SA SA SA SA SA
Lab Qc Code SA SA DUP DUP TRIP TRIP QUAD QUAD SA SA
Class Param Code Param Name Unit Result Lab Qual Result Lab Qual Result Lab Qual Result Lab Qual Result Lab Qual
TOTAL_PCB_NST_CONGx2 Total NS&T PCB *2 (ND as 1/2 MDL) UG/KG_DRYWT 1.2091 1.0182
PEST 1024‐57‐3 heptachlor epoxide UG/KG_DRYWT 0.0516 U 0.0436 U
PEST 1031‐07‐8 Endosulfan sulfate UG/KG_DRYWT 0.0696 U 0.0589 U
PEST 309‐00‐2 aldrin UG/KG_DRYWT 0.049 U 0.0415 U
PEST 319‐84‐6 alpha‐BHC UG/KG_DRYWT 0.0464 U 0.0393 U
PEST 319‐85‐7 beta‐BHC UG/KG_DRYWT 0.0696 U 0.0589 U
PEST 319‐86‐8 delta‐BHC UG/KG_DRYWT 0.0516 U 0.0436 U
PEST 33213‐65‐9 Endosulfan II UG/KG_DRYWT 0.0438 U 0.0371 U
PEST 5103‐71‐9 alpha‐chlordane UG/KG_DRYWT 0.0516 U 0.0436 U
PEST 5103‐74‐2 gamma‐chlordane UG/KG_DRYWT 0.0464 U 0.0393 U
PEST 57‐74‐9 chlordane UG/KG_DRYWT
PEST 58‐89‐9 hexachlorocyclohexane, gamma UG/KG_DRYWT 0.0748 U 0.0633 U
PEST 60‐57‐1 dieldrin UG/KG_DRYWT 0.049 U 0.0415 U
PEST 72‐20‐8 endrin UG/KG_DRYWT 0.0565 U 0.0478 U
PEST 72‐43‐5 methoxychlor UG/KG_DRYWT 0.204 U 0.172 U
PEST 50‐29‐3 4,4'‐DDT UG/KG_DRYWT 0.355 0.288
PEST 72‐54‐8 4,4'‐DDD UG/KG_DRYWT 0.0696 U 0.0589 U
PEST 72‐55‐9 4,4'‐DDE UG/KG_DRYWT 0.0644 U 0.0544 U
PEST 76‐44‐8 heptachlor UG/KG_DRYWT 0.0853 U 0.0722 U
PEST 8001‐35‐2 Toxaphene UG/KG_DRYWT 20.9 U 17.7 U
PEST 959‐98‐8 Endosulfan I UG/KG_DRYWT 0.0544 U 0.046 U
SVOC 120‐12‐7 Anthracene UG/KG_DRYWT 3.38 0.826 J
SVOC 129‐00‐0 Pyrene UG/KG_DRYWT 25.8 10.4
SVOC 191‐24‐2 Benzo(G,H,I)Perylene UG/KG_DRYWT 11.8 5.67
SVOC 193‐39‐5 Indeno(1,2,3‐Cd)Pyrene UG/KG_DRYWT 11.3 4.39
SVOC 205‐99‐2 Benzo(B)Fluoranthene UG/KG_DRYWT 12.6 6.13
SVOC 206‐44‐0 Fluoranthene UG/KG_DRYWT 27.4 11
SVOC 207‐08‐9 Benzo(K)Fluoranthene UG/KG_DRYWT 15.6 6.48
SVOC 208‐96‐8 Acenaphthylene UG/KG_DRYWT 1.84 0.93
SVOC 218‐01‐9 Chrysene UG/KG_DRYWT 15.6 6.7
SVOC 50‐32‐8 Benzo(A)Pyrene UG/KG_DRYWT 16 6.82
SVOC 53‐70‐3 Dibenz(A,H)Anthracene UG/KG_DRYWT 2.01 0.969
SVOC 56‐55‐3 Benzo(A)Anthracene UG/KG_DRYWT 12 4.89
SVOC 83‐32‐9 Acenaphthene UG/KG_DRYWT 0.74 J 0.249 J
SVOC 85‐01‐8 Phenanthrene UG/KG_DRYWT 13.2 5.02
SVOC 86‐73‐7 Fluorene UG/KG_DRYWT 1.08 0.391 J
SVOC 90‐12‐0 1‐Methylnaphthalene UG/KG_DRYWT 0.857 J 0.43 J
SVOC 91‐57‐6 2‐Methylnaphthalene UG/KG_DRYWT 1.19 0.63 J
EPH 91‐20‐3 Naphthalene UG/KG_DRYWT 1.76 0.947TOTAL_PAH Total PAH (ND as 1/2 MDL) UG/KG_DRYWT 174.157 72.872
J value reported above MDL but below RL
U not detected above MDL; MDL value reported.
Page 2 of 8

Portland Sediment
Study Id
Survey Id
Station Id
Sample Id
Field Qc Code
Lab Qc Code
Class Param Code Param Name Unit
GS GRAVEL Gravel (>2.00 mm) PCT
GS SAND_CO Course Sand (0.50‐1.00 mm) PCT
GS SAND_MED Medium Sand (0.25‐0.50 mm) PCT
GS SAND_FI Fine Sand (0.125‐0.25 mm) PCT
GS Total SAND Sand (0.0625‐2.00 mm) PCT
GS SILT Silt (0.0039‐0.0625 mm) PCT
GS CLAY Clay (<0.00391 mm) PCT
MISC TOC Total Organic Carbon UG/G
MISC PCT_SOLIDS Percent Solids (BDO) PCT
MISC TOTAL_SOLIDS Total Solids (ESI) PCT
MISC TOTAL_SOLIDS Total Solids (KASI) PCT
MET 7439‐92‐1 Lead MG/KG_DRYWT
MET 7439‐97‐6 Mercury MG/KG_DRYWT
MET 7440‐02‐0 Nickel MG/KG_DRYWT
MET 7440‐38‐2 Arsenic MG/KG_DRYWT
MET 7440‐43‐9 Cadmium MG/KG_DRYWT
MET 7440‐47‐3 Chromium MG/KG_DRYWT
MET 7440‐50‐8 Copper MG/KG_DRYWT
MET 7440‐66‐6 Zinc MG/KG_DRYWT
CONG 31508‐00‐6 2,3',4,4',5‐Pentachlorobiphenyl UG/KG_DRYWT
CONG 32598‐10‐0 2,3',4,4'‐Tetrachlorobiphenyl UG/KG_DRYWT
CONG 32598‐14‐4 2,3,3',4,4'‐Pentachlorobiphenyl UG/KG_DRYWT
CONG 34883‐43‐7 2,4'‐Dichlorobiphenyl UG/KG_DRYWT
CONG 35065‐27‐1 2,2',4,4',5,5'‐Hexachlorobiphenyl UG/KG_DRYWT
CONG 35065‐28‐2 2,2',3,4,4',5'‐Hexachlorobiphenyl UG/KG_DRYWT
CONG 35065‐29‐3 2,2',3,4,4',5,5'‐Heptachlorobiphenyl UG/KG_DRYWT
CONG 35065‐30‐6 2,2',3,3',4,4',5‐Heptachlorobiphenyl UG/KG_DRYWT
CONG 35693‐99‐3 2,2',5,5'‐Tetrachlorobiphenyl UG/KG_DRYWT
CONG 37680‐65‐2 2,2',5‐Trichlorobiphenyl UG/KG_DRYWT
CONG 37680‐73‐2 2,2',4,5,5'‐Pentachlorobiphenyl UG/KG_DRYWT
CONG 38380‐02‐8 2,2',3,4,5'‐Pentachlorobiphenyl UG/KG_DRYWT
CONG 38380‐07‐3 2,2',3,3',4,4'‐Hexachlorobiphenyl UG/KG_DRYWT
CONG 40186‐72‐9 2,2',3,3',4,4',5,5',6‐Nonachlorobiphen UG/KG_DRYWT
CONG 41464‐39‐5 2,2',3,5'‐Tetrachlorobiphenyl UG/KG_DRYWT
CONG 41464‐40‐8 2,2',4,5'‐Tetrachlorobiphenyl UG/KG_DRYWT
CONG 52663‐68‐0 2,2',3,4',5,5',6‐Heptachlorobiphenyl UG/KG_DRYWT
CONG 52663‐69‐1 2,2',3,4,4',5',6‐Heptachlorobiphenyl UG/KG_DRYWT
CONG 52663‐78‐2 2,2',3,3',4,4',5,6‐Octachlorobiphenyl UG/KG_DRYWT
CONG 7012‐37‐5 2,4,4'‐Trichlorobiphenyl UG/KG_DRYWT
CONG 74472‐48‐3 2,2',3,4,4',6,6'‐Heptachlorobiphenyl UG/KG_DRYWT
CONG C‐2051‐24‐3 Decachlorobiphenyl ‐ Congener UG/KG_DRYWT
DAMOS16 DAMOS16 DAMOS16 DAMOS16 DAMOS16 DAMOS16 DAMOS16 DAMOS16 DAMOS16 DAMOS16
PDS PDS PDS PDS PDS PDS PDS PDS PDS PDS
EREF‐05 EREF‐05 PDA95‐22 PDA95‐22 PDA95‐23 PDA95‐23 PDA95‐30 PDA95‐30 PDA95‐30 PDA95‐30
RAJ‐011 RAJ‐011 RAJ‐006 RAJ‐006 RAJ‐005 RAJ‐005 RAJ‐004 RAJ‐004 RAJ‐004 RAJ‐004
SA SA SA SA SA SA SA SA SA SA
SA SA SA SA SA SA SA SA DUP DUP
Result Lab Qual Result Lab Qual Result Lab Qual Result Lab Qual Result Lab Qual
1.16 0 2.06 0 0
0.26 0 2.44 1.58 0.99
1.03 0.6 16.69 6.3 5.54
72.03 14.11 15.75 14.57 14.64
73.59 14.71 34.88 22.45 21.17
16.99 75.85 56.27 66.37 69.16
8.25 9.44 6.79 11.18 9.67
8900 24000 16000 22000 23000
71.48 48.2 56.94 49.25
72.4 46.4 55.6 46.9
70 46 57 51 47
6.93 19.9 16.8 37.1 35.1
0.017 0.079 0.054 0.23 0.23
9 20.8 18.8 22.7 21.6
2.88 8.36 7.76 9.99 9.48
0.04 0.26 0.17 0.39 0.388
14.3 32.9 27.2 37.6 35.5
3.8 17.3 16.9 25.3 23.8
24.2 72.8 63.3 91.2 87.1
0.0714 U 0.207 J 0.0893 U 1.2
0.0504 U 0.0797 J 0.071 J 0.455
0.0817 J 0.309 J 0.161 J 0.654
0.0597 U 0.0885 U 0.0747 U 0.0866 U
0.152 U 0.225 U 0.19 U 1.59
0.0527 U 0.259 J 0.147 J 1.38
0.0504 U 0.236 J 0.175 J 0.655
0.0437 U 0.0648 U 0.0547 U 0.358
0.0574 U 0.0851 U 0.0718 U 0.636
0.0437 U 0.0648 U 0.0547 U 0.0634 U
0.0437 U 0.173 J 0.145 J 1.42
0.0391 U 0.058 U 0.0489 U 0.357
0.0391 U 0.196 J 0.0489 U 0.26 J
0.0391 U 0.058 U 0.0489 U 0.294 J
0.0414 U 0.0613 U 0.0518 U 0.236 J
0.0414 U 0.0613 U 0.0518 U 0.288 J
0.0414 U 0.0613 U 0.0518 U 0.265 J
0.0345 U 0.0511 U 0.0431 U 0.195 J
0.0414 U 0.0613 U 0.0518 U 0.184 J
0.0345 U 0.0511 U 0.0431 U 0.125 J
0.0943 U 0.14 U 0.118 U 0.137 U
0.0437 U 0.174 J 0.15 J 1.1
Page 3 of 8

Portland Sediment
Study Id
Survey Id
Station Id
Sample Id
Field Qc Code
Lab Qc Code
Class Param Code Param Name Unit
TOTAL_PCB_NST_CONGx2 Total NS&T PCB *2 (ND as 1/2 MDL) UG/KG_DRYWT
PEST 1024‐57‐3 heptachlor epoxide UG/KG_DRYWT
PEST 1031‐07‐8 Endosulfan sulfate UG/KG_DRYWT
PEST 309‐00‐2 aldrin UG/KG_DRYWT
PEST 319‐84‐6 alpha‐BHC UG/KG_DRYWT
PEST 319‐85‐7 beta‐BHC UG/KG_DRYWT
PEST 319‐86‐8 delta‐BHC UG/KG_DRYWT
PEST 33213‐65‐9 Endosulfan II UG/KG_DRYWT
PEST 5103‐71‐9 alpha‐chlordane UG/KG_DRYWT
PEST 5103‐74‐2 gamma‐chlordane UG/KG_DRYWT
PEST 57‐74‐9 chlordane UG/KG_DRYWT
PEST 58‐89‐9 hexachlorocyclohexane, gamma UG/KG_DRYWT
PEST 60‐57‐1 dieldrin UG/KG_DRYWT
PEST 72‐20‐8 endrin UG/KG_DRYWT
PEST 72‐43‐5 methoxychlor UG/KG_DRYWT
PEST 50‐29‐3 4,4'‐DDT UG/KG_DRYWT
PEST 72‐54‐8 4,4'‐DDD UG/KG_DRYWT
PEST 72‐55‐9 4,4'‐DDE UG/KG_DRYWT
PEST 76‐44‐8 heptachlor UG/KG_DRYWT
PEST 8001‐35‐2 Toxaphene UG/KG_DRYWT
PEST 959‐98‐8 Endosulfan I UG/KG_DRYWT
SVOC 120‐12‐7 Anthracene UG/KG_DRYWT
SVOC 129‐00‐0 Pyrene UG/KG_DRYWT
SVOC 191‐24‐2 Benzo(G,H,I)Perylene UG/KG_DRYWT
SVOC 193‐39‐5 Indeno(1,2,3‐Cd)Pyrene UG/KG_DRYWT
SVOC 205‐99‐2 Benzo(B)Fluoranthene UG/KG_DRYWT
SVOC 206‐44‐0 Fluoranthene UG/KG_DRYWT
SVOC 207‐08‐9 Benzo(K)Fluoranthene UG/KG_DRYWT
SVOC 208‐96‐8 Acenaphthylene UG/KG_DRYWT
SVOC 218‐01‐9 Chrysene UG/KG_DRYWT
SVOC 50‐32‐8 Benzo(A)Pyrene UG/KG_DRYWT
SVOC 53‐70‐3 Dibenz(A,H)Anthracene UG/KG_DRYWT
SVOC 56‐55‐3 Benzo(A)Anthracene UG/KG_DRYWT
SVOC 83‐32‐9 Acenaphthene UG/KG_DRYWT
SVOC 85‐01‐8 Phenanthrene UG/KG_DRYWT
SVOC 86‐73‐7 Fluorene UG/KG_DRYWT
SVOC 90‐12‐0 1‐Methylnaphthalene UG/KG_DRYWT
SVOC 91‐57‐6 2‐Methylnaphthalene UG/KG_DRYWT
EPH 91‐20‐3 Naphthalene UG/KG_DRYWTTOTAL_PAH Total PAH (ND as 1/2 MDL) UG/KG_DRYWT
J value reported above MDL but below RL
U not detected above MDL; MDL value reported.
DAMOS16 DAMOS16 DAMOS16 DAMOS16 DAMOS16 DAMOS16 DAMOS16 DAMOS16 DAMOS16 DAMOS16
PDS PDS PDS PDS PDS PDS PDS PDS PDS PDS
EREF‐05 EREF‐05 PDA95‐22 PDA95‐22 PDA95‐23 PDA95‐23 PDA95‐30 PDA95‐30 PDA95‐30 PDA95‐30
RAJ‐011 RAJ‐011 RAJ‐006 RAJ‐006 RAJ‐005 RAJ‐005 RAJ‐004 RAJ‐004 RAJ‐004 RAJ‐004
SA SA SA SA SA SA SA SA SA SA
SA SA SA SA SA SA SA SA DUP DUP
Result Lab Qual Result Lab Qual Result Lab Qual Result Lab Qual Result Lab Qual
1.0691 4.0886 2.5295 21.774
0.046 U 0.0682 U 0.0576 U 0.0667 U
0.0621 U 0.092 U 0.0776 U 0.09 U
0.0437 U 0.0648 U 0.0547 U 0.0634 U
0.0414 U 0.0613 U 0.0518 U 0.06 U
0.0621 U 0.092 U 0.0776 U 0.09 U
0.046 U 0.0682 U 0.0576 U 0.0667 U
0.0391 U 0.364 0.492 1.04
0.046 U 0.123 J 0.103 J 0.188 J
0.0414 U 0.832 0.9 1.76
4.89 5.13 9.97
0.0667 U 0.0989 U 0.0835 U 0.0968 U
0.0437 U 0.0648 U 0.0547 U 0.291 J
0.0504 U 0.0747 U 0.063 U 0.0731 U
0.182 U 0.269 U 0.227 U 0.263 U
0.304 0.947 1.07 1.2
0.0621 U 1.69 1.63 6.68
0.0574 U 0.924 1.28 2.32
0.0761 U 0.113 U 0.0952 U 0.11 U
18.7 U 25400 23.4 U 27.1 U
0.0485 U 0.0719 U 0.0607 U 0.0704 U
1.52 29.3 22.3 67.6
17.4 227 287 529
7.98 99.4 97.4 175
6.25 92.5 101 170
8.71 120 130 226
18.2 237 317 489
9.66 121 135 231
1.29 12.9 13.3 31
10.9 126 148 252
11.4 125 129 238
1.38 21.6 22.2 37.6
8.04 99.5 110 208
0.411 J 8.06 12.8 16.9
8.67 100 99.8 204
0.706 J 11.8 10.9 26.1
0.567 J 5.8 4.31 15
0.763 J 9.5 6.08 24.5
1.21 23.2 19 58.3115.057 1469.56 1665.09 2999
Page 4 of 8
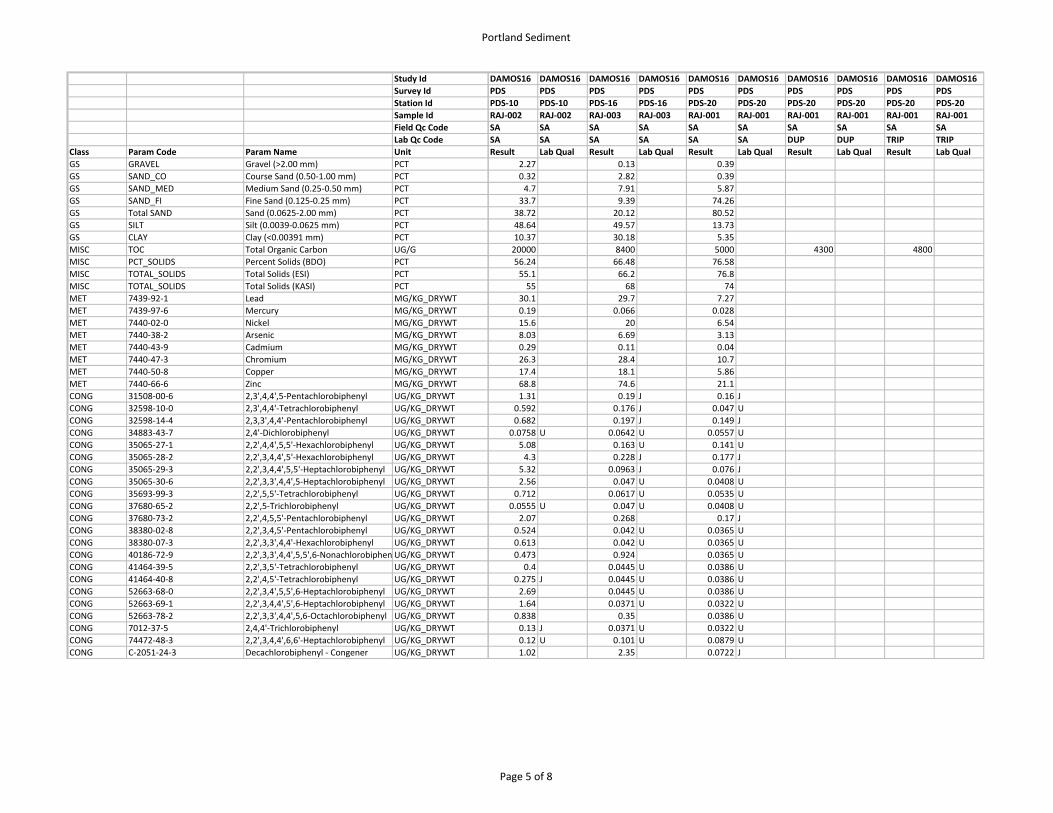
Portland Sediment
Study Id
Survey Id
Station Id
Sample Id
Field Qc Code
Lab Qc Code
Class Param Code Param Name Unit
GS GRAVEL Gravel (>2.00 mm) PCT
GS SAND_CO Course Sand (0.50‐1.00 mm) PCT
GS SAND_MED Medium Sand (0.25‐0.50 mm) PCT
GS SAND_FI Fine Sand (0.125‐0.25 mm) PCT
GS Total SAND Sand (0.0625‐2.00 mm) PCT
GS SILT Silt (0.0039‐0.0625 mm) PCT
GS CLAY Clay (<0.00391 mm) PCT
MISC TOC Total Organic Carbon UG/G
MISC PCT_SOLIDS Percent Solids (BDO) PCT
MISC TOTAL_SOLIDS Total Solids (ESI) PCT
MISC TOTAL_SOLIDS Total Solids (KASI) PCT
MET 7439‐92‐1 Lead MG/KG_DRYWT
MET 7439‐97‐6 Mercury MG/KG_DRYWT
MET 7440‐02‐0 Nickel MG/KG_DRYWT
MET 7440‐38‐2 Arsenic MG/KG_DRYWT
MET 7440‐43‐9 Cadmium MG/KG_DRYWT
MET 7440‐47‐3 Chromium MG/KG_DRYWT
MET 7440‐50‐8 Copper MG/KG_DRYWT
MET 7440‐66‐6 Zinc MG/KG_DRYWT
CONG 31508‐00‐6 2,3',4,4',5‐Pentachlorobiphenyl UG/KG_DRYWT
CONG 32598‐10‐0 2,3',4,4'‐Tetrachlorobiphenyl UG/KG_DRYWT
CONG 32598‐14‐4 2,3,3',4,4'‐Pentachlorobiphenyl UG/KG_DRYWT
CONG 34883‐43‐7 2,4'‐Dichlorobiphenyl UG/KG_DRYWT
CONG 35065‐27‐1 2,2',4,4',5,5'‐Hexachlorobiphenyl UG/KG_DRYWT
CONG 35065‐28‐2 2,2',3,4,4',5'‐Hexachlorobiphenyl UG/KG_DRYWT
CONG 35065‐29‐3 2,2',3,4,4',5,5'‐Heptachlorobiphenyl UG/KG_DRYWT
CONG 35065‐30‐6 2,2',3,3',4,4',5‐Heptachlorobiphenyl UG/KG_DRYWT
CONG 35693‐99‐3 2,2',5,5'‐Tetrachlorobiphenyl UG/KG_DRYWT
CONG 37680‐65‐2 2,2',5‐Trichlorobiphenyl UG/KG_DRYWT
CONG 37680‐73‐2 2,2',4,5,5'‐Pentachlorobiphenyl UG/KG_DRYWT
CONG 38380‐02‐8 2,2',3,4,5'‐Pentachlorobiphenyl UG/KG_DRYWT
CONG 38380‐07‐3 2,2',3,3',4,4'‐Hexachlorobiphenyl UG/KG_DRYWT
CONG 40186‐72‐9 2,2',3,3',4,4',5,5',6‐Nonachlorobiphen UG/KG_DRYWT
CONG 41464‐39‐5 2,2',3,5'‐Tetrachlorobiphenyl UG/KG_DRYWT
CONG 41464‐40‐8 2,2',4,5'‐Tetrachlorobiphenyl UG/KG_DRYWT
CONG 52663‐68‐0 2,2',3,4',5,5',6‐Heptachlorobiphenyl UG/KG_DRYWT
CONG 52663‐69‐1 2,2',3,4,4',5',6‐Heptachlorobiphenyl UG/KG_DRYWT
CONG 52663‐78‐2 2,2',3,3',4,4',5,6‐Octachlorobiphenyl UG/KG_DRYWT
CONG 7012‐37‐5 2,4,4'‐Trichlorobiphenyl UG/KG_DRYWT
CONG 74472‐48‐3 2,2',3,4,4',6,6'‐Heptachlorobiphenyl UG/KG_DRYWT
CONG C‐2051‐24‐3 Decachlorobiphenyl ‐ Congener UG/KG_DRYWT
DAMOS16 DAMOS16 DAMOS16 DAMOS16 DAMOS16 DAMOS16 DAMOS16 DAMOS16 DAMOS16 DAMOS16
PDS PDS PDS PDS PDS PDS PDS PDS PDS PDS
PDS‐10 PDS‐10 PDS‐16 PDS‐16 PDS‐20 PDS‐20 PDS‐20 PDS‐20 PDS‐20 PDS‐20
RAJ‐002 RAJ‐002 RAJ‐003 RAJ‐003 RAJ‐001 RAJ‐001 RAJ‐001 RAJ‐001 RAJ‐001 RAJ‐001
SA SA SA SA SA SA SA SA SA SA
SA SA SA SA SA SA DUP DUP TRIP TRIP
Result Lab Qual Result Lab Qual Result Lab Qual Result Lab Qual Result Lab Qual
2.27 0.13 0.39
0.32 2.82 0.39
4.7 7.91 5.87
33.7 9.39 74.26
38.72 20.12 80.52
48.64 49.57 13.73
10.37 30.18 5.35
20000 8400 5000 4300 4800
56.24 66.48 76.58
55.1 66.2 76.8
55 68 74
30.1 29.7 7.27
0.19 0.066 0.028
15.6 20 6.54
8.03 6.69 3.13
0.29 0.11 0.04
26.3 28.4 10.7
17.4 18.1 5.86
68.8 74.6 21.1
1.31 0.19 J 0.16 J
0.592 0.176 J 0.047 U
0.682 0.197 J 0.149 J
0.0758 U 0.0642 U 0.0557 U
5.08 0.163 U 0.141 U
4.3 0.228 J 0.177 J
5.32 0.0963 J 0.076 J
2.56 0.047 U 0.0408 U
0.712 0.0617 U 0.0535 U
0.0555 U 0.047 U 0.0408 U
2.07 0.268 0.17 J
0.524 0.042 U 0.0365 U
0.613 0.042 U 0.0365 U
0.473 0.924 0.0365 U
0.4 0.0445 U 0.0386 U
0.275 J 0.0445 U 0.0386 U
2.69 0.0445 U 0.0386 U
1.64 0.0371 U 0.0322 U
0.838 0.35 0.0386 U
0.13 J 0.0371 U 0.0322 U
0.12 U 0.101 U 0.0879 U
1.02 2.35 0.0722 J
Page 5 of 8

Portland Sediment
Study Id
Survey Id
Station Id
Sample Id
Field Qc Code
Lab Qc Code
Class Param Code Param Name Unit
TOTAL_PCB_NST_CONGx2 Total NS&T PCB *2 (ND as 1/2 MDL) UG/KG_DRYWT
PEST 1024‐57‐3 heptachlor epoxide UG/KG_DRYWT
PEST 1031‐07‐8 Endosulfan sulfate UG/KG_DRYWT
PEST 309‐00‐2 aldrin UG/KG_DRYWT
PEST 319‐84‐6 alpha‐BHC UG/KG_DRYWT
PEST 319‐85‐7 beta‐BHC UG/KG_DRYWT
PEST 319‐86‐8 delta‐BHC UG/KG_DRYWT
PEST 33213‐65‐9 Endosulfan II UG/KG_DRYWT
PEST 5103‐71‐9 alpha‐chlordane UG/KG_DRYWT
PEST 5103‐74‐2 gamma‐chlordane UG/KG_DRYWT
PEST 57‐74‐9 chlordane UG/KG_DRYWT
PEST 58‐89‐9 hexachlorocyclohexane, gamma UG/KG_DRYWT
PEST 60‐57‐1 dieldrin UG/KG_DRYWT
PEST 72‐20‐8 endrin UG/KG_DRYWT
PEST 72‐43‐5 methoxychlor UG/KG_DRYWT
PEST 50‐29‐3 4,4'‐DDT UG/KG_DRYWT
PEST 72‐54‐8 4,4'‐DDD UG/KG_DRYWT
PEST 72‐55‐9 4,4'‐DDE UG/KG_DRYWT
PEST 76‐44‐8 heptachlor UG/KG_DRYWT
PEST 8001‐35‐2 Toxaphene UG/KG_DRYWT
PEST 959‐98‐8 Endosulfan I UG/KG_DRYWT
SVOC 120‐12‐7 Anthracene UG/KG_DRYWT
SVOC 129‐00‐0 Pyrene UG/KG_DRYWT
SVOC 191‐24‐2 Benzo(G,H,I)Perylene UG/KG_DRYWT
SVOC 193‐39‐5 Indeno(1,2,3‐Cd)Pyrene UG/KG_DRYWT
SVOC 205‐99‐2 Benzo(B)Fluoranthene UG/KG_DRYWT
SVOC 206‐44‐0 Fluoranthene UG/KG_DRYWT
SVOC 207‐08‐9 Benzo(K)Fluoranthene UG/KG_DRYWT
SVOC 208‐96‐8 Acenaphthylene UG/KG_DRYWT
SVOC 218‐01‐9 Chrysene UG/KG_DRYWT
SVOC 50‐32‐8 Benzo(A)Pyrene UG/KG_DRYWT
SVOC 53‐70‐3 Dibenz(A,H)Anthracene UG/KG_DRYWT
SVOC 56‐55‐3 Benzo(A)Anthracene UG/KG_DRYWT
SVOC 83‐32‐9 Acenaphthene UG/KG_DRYWT
SVOC 85‐01‐8 Phenanthrene UG/KG_DRYWT
SVOC 86‐73‐7 Fluorene UG/KG_DRYWT
SVOC 90‐12‐0 1‐Methylnaphthalene UG/KG_DRYWT
SVOC 91‐57‐6 2‐Methylnaphthalene UG/KG_DRYWT
EPH 91‐20‐3 Naphthalene UG/KG_DRYWTTOTAL_PAH Total PAH (ND as 1/2 MDL) UG/KG_DRYWT
J value reported above MDL but below RL
U not detected above MDL; MDL value reported.
DAMOS16 DAMOS16 DAMOS16 DAMOS16 DAMOS16 DAMOS16 DAMOS16 DAMOS16 DAMOS16 DAMOS16
PDS PDS PDS PDS PDS PDS PDS PDS PDS PDS
PDS‐10 PDS‐10 PDS‐16 PDS‐16 PDS‐20 PDS‐20 PDS‐20 PDS‐20 PDS‐20 PDS‐20
RAJ‐002 RAJ‐002 RAJ‐003 RAJ‐003 RAJ‐001 RAJ‐001 RAJ‐001 RAJ‐001 RAJ‐001 RAJ‐001
SA SA SA SA SA SA SA SA SA SA
SA SA SA SA SA SA DUP DUP TRIP TRIP
Result Lab Qual Result Lab Qual Result Lab Qual Result Lab Qual Result Lab Qual
57.7113 10.1096 2.2082
0.0584 U 0.0494 U 0.0429 U
0.0787 U 0.0667 U 0.0579 U
0.0555 U 0.047 U 0.0408 U
0.0525 U 0.0445 U 0.0386 U
0.0787 U 0.0667 U 0.0579 U
0.0584 U 0.0494 U 0.0429 U
1.45 0.637 0.08 J
0.163 J 0.0494 U 0.0429 U
1.45 1.06 0.0386 U
8.26 5.42
0.0847 U 0.0717 U 0.0622 U
0.27 J 0.047 U 0.0408 U
0.0639 U 0.0542 U 0.047 U
0.23 U 0.195 U 0.169 U
1.19 0.101 U 0.314
5.73 0.847 0.171 J
1.18 0.475 0.0998 J
0.0965 U 0.0818 U 0.0709 U
23.7 U 17000 19300
0.0616 U 0.0522 U 0.0453 U
85.7 119 21
548 897 D 121
182 241 39.1
176 238 35.4
226 283 52.4
482 866 D 123
246 318 56.5
35.6 36 6.68
267 354 67.1
264 376 62.8
42.6 55 8.7
230 356 64
16.7 37.9 4.57
245 428 61
26.5 54.6 5.57
13.3 18.7 2.74
21.7 21.4 3.72
42 63.7 8.483150.1 4763.3 743.76
Page 6 of 8

Portland Sediment
Study Id
Survey Id
Station Id
Sample Id
Field Qc Code
Lab Qc Code
Class Param Code Param Name Unit
GS GRAVEL Gravel (>2.00 mm) PCT
GS SAND_CO Course Sand (0.50‐1.00 mm) PCT
GS SAND_MED Medium Sand (0.25‐0.50 mm) PCT
GS SAND_FI Fine Sand (0.125‐0.25 mm) PCT
GS Total SAND Sand (0.0625‐2.00 mm) PCT
GS SILT Silt (0.0039‐0.0625 mm) PCT
GS CLAY Clay (<0.00391 mm) PCT
MISC TOC Total Organic Carbon UG/G
MISC PCT_SOLIDS Percent Solids (BDO) PCT
MISC TOTAL_SOLIDS Total Solids (ESI) PCT
MISC TOTAL_SOLIDS Total Solids (KASI) PCT
MET 7439‐92‐1 Lead MG/KG_DRYWT
MET 7439‐97‐6 Mercury MG/KG_DRYWT
MET 7440‐02‐0 Nickel MG/KG_DRYWT
MET 7440‐38‐2 Arsenic MG/KG_DRYWT
MET 7440‐43‐9 Cadmium MG/KG_DRYWT
MET 7440‐47‐3 Chromium MG/KG_DRYWT
MET 7440‐50‐8 Copper MG/KG_DRYWT
MET 7440‐66‐6 Zinc MG/KG_DRYWT
CONG 31508‐00‐6 2,3',4,4',5‐Pentachlorobiphenyl UG/KG_DRYWT
CONG 32598‐10‐0 2,3',4,4'‐Tetrachlorobiphenyl UG/KG_DRYWT
CONG 32598‐14‐4 2,3,3',4,4'‐Pentachlorobiphenyl UG/KG_DRYWT
CONG 34883‐43‐7 2,4'‐Dichlorobiphenyl UG/KG_DRYWT
CONG 35065‐27‐1 2,2',4,4',5,5'‐Hexachlorobiphenyl UG/KG_DRYWT
CONG 35065‐28‐2 2,2',3,4,4',5'‐Hexachlorobiphenyl UG/KG_DRYWT
CONG 35065‐29‐3 2,2',3,4,4',5,5'‐Heptachlorobiphenyl UG/KG_DRYWT
CONG 35065‐30‐6 2,2',3,3',4,4',5‐Heptachlorobiphenyl UG/KG_DRYWT
CONG 35693‐99‐3 2,2',5,5'‐Tetrachlorobiphenyl UG/KG_DRYWT
CONG 37680‐65‐2 2,2',5‐Trichlorobiphenyl UG/KG_DRYWT
CONG 37680‐73‐2 2,2',4,5,5'‐Pentachlorobiphenyl UG/KG_DRYWT
CONG 38380‐02‐8 2,2',3,4,5'‐Pentachlorobiphenyl UG/KG_DRYWT
CONG 38380‐07‐3 2,2',3,3',4,4'‐Hexachlorobiphenyl UG/KG_DRYWT
CONG 40186‐72‐9 2,2',3,3',4,4',5,5',6‐Nonachlorobiphen UG/KG_DRYWT
CONG 41464‐39‐5 2,2',3,5'‐Tetrachlorobiphenyl UG/KG_DRYWT
CONG 41464‐40‐8 2,2',4,5'‐Tetrachlorobiphenyl UG/KG_DRYWT
CONG 52663‐68‐0 2,2',3,4',5,5',6‐Heptachlorobiphenyl UG/KG_DRYWT
CONG 52663‐69‐1 2,2',3,4,4',5',6‐Heptachlorobiphenyl UG/KG_DRYWT
CONG 52663‐78‐2 2,2',3,3',4,4',5,6‐Octachlorobiphenyl UG/KG_DRYWT
CONG 7012‐37‐5 2,4,4'‐Trichlorobiphenyl UG/KG_DRYWT
CONG 74472‐48‐3 2,2',3,4,4',6,6'‐Heptachlorobiphenyl UG/KG_DRYWT
CONG C‐2051‐24‐3 Decachlorobiphenyl ‐ Congener UG/KG_DRYWT
DAMOS16 DAMOS16 DAMOS16 DAMOS16 DAMOS16 DAMOS16 DAMOS16 DAMOS16
PDS PDS PDS PDS PDS PDS PDS PDS
PDS‐20 PDS‐20 SREF‐07 SREF‐07 SREF‐08 SREF‐08 SREF‐10 SREF‐10
RAJ‐001 RAJ‐001 RAJ‐007 RAJ‐007 RAJ‐009 RAJ‐009 RAJ‐008 RAJ‐008
SA SA SA SA SA SA SA SA
QUAD QUAD SA SA SA SA SA SA
Result Lab Qual Result Lab Qual Result Lab Qual Result Lab Qual
0.27 4.93 7.07
3.85 7.6 11.32
11.55 17.2 14.29
52.45 44.12 37.35
67.85 68.92 62.96
21.69 18.1 20.31
10.2 8.06 9.67
5800 10000 10000 10000
65.43 75.98 63.41
64.3 73.9 66.4
63 74 62
11.6 8.24 11.1
0.043 0.025 0.045
11.5 9.31 11
4.11 3.44 4.25
0.06 0.04 0.06
19 16.3 17
6.53 4.4 7.37
34 25.2 31.7
0.0778 U 0.067 U 0.15 J
0.0549 U 0.0473 U 0.0568 U
0.158 J 0.0934 J 0.166 J
0.0651 U 0.056 U 0.0673 U
0.165 U 0.142 U 0.171 U
0.108 J 0.0494 U 0.146 J
0.0675 J 0.0473 U 0.0842 J
0.0477 U 0.041 U 0.0493 U
0.0626 U 0.0538 U 0.0647 U
0.0477 U 0.041 U 0.0493 U
0.062 J 0.041 U 0.154 J
0.0426 U 0.0367 U 0.0441 U
0.0426 U 0.0367 U 0.0441 U
0.0426 U 0.0367 U 0.0441 U
0.0451 U 0.0388 U 0.0467 U
0.0451 U 0.0388 U 0.0467 U
0.0451 U 0.0388 U 0.0467 U
0.0376 U 0.0323 U 0.0389 U
0.0451 U 0.0388 U 0.0467 U
0.0376 U 0.0323 U 0.0389 U
0.103 U 0.0884 U 0.106 U
0.0643 J 0.041 U 0.0741 J
Page 7 of 8

Portland Sediment
Study Id
Survey Id
Station Id
Sample Id
Field Qc Code
Lab Qc Code
Class Param Code Param Name Unit
TOTAL_PCB_NST_CONGx2 Total NS&T PCB *2 (ND as 1/2 MDL) UG/KG_DRYWT
PEST 1024‐57‐3 heptachlor epoxide UG/KG_DRYWT
PEST 1031‐07‐8 Endosulfan sulfate UG/KG_DRYWT
PEST 309‐00‐2 aldrin UG/KG_DRYWT
PEST 319‐84‐6 alpha‐BHC UG/KG_DRYWT
PEST 319‐85‐7 beta‐BHC UG/KG_DRYWT
PEST 319‐86‐8 delta‐BHC UG/KG_DRYWT
PEST 33213‐65‐9 Endosulfan II UG/KG_DRYWT
PEST 5103‐71‐9 alpha‐chlordane UG/KG_DRYWT
PEST 5103‐74‐2 gamma‐chlordane UG/KG_DRYWT
PEST 57‐74‐9 chlordane UG/KG_DRYWT
PEST 58‐89‐9 hexachlorocyclohexane, gamma UG/KG_DRYWT
PEST 60‐57‐1 dieldrin UG/KG_DRYWT
PEST 72‐20‐8 endrin UG/KG_DRYWT
PEST 72‐43‐5 methoxychlor UG/KG_DRYWT
PEST 50‐29‐3 4,4'‐DDT UG/KG_DRYWT
PEST 72‐54‐8 4,4'‐DDD UG/KG_DRYWT
PEST 72‐55‐9 4,4'‐DDE UG/KG_DRYWT
PEST 76‐44‐8 heptachlor UG/KG_DRYWT
PEST 8001‐35‐2 Toxaphene UG/KG_DRYWT
PEST 959‐98‐8 Endosulfan I UG/KG_DRYWT
SVOC 120‐12‐7 Anthracene UG/KG_DRYWT
SVOC 129‐00‐0 Pyrene UG/KG_DRYWT
SVOC 191‐24‐2 Benzo(G,H,I)Perylene UG/KG_DRYWT
SVOC 193‐39‐5 Indeno(1,2,3‐Cd)Pyrene UG/KG_DRYWT
SVOC 205‐99‐2 Benzo(B)Fluoranthene UG/KG_DRYWT
SVOC 206‐44‐0 Fluoranthene UG/KG_DRYWT
SVOC 207‐08‐9 Benzo(K)Fluoranthene UG/KG_DRYWT
SVOC 208‐96‐8 Acenaphthylene UG/KG_DRYWT
SVOC 218‐01‐9 Chrysene UG/KG_DRYWT
SVOC 50‐32‐8 Benzo(A)Pyrene UG/KG_DRYWT
SVOC 53‐70‐3 Dibenz(A,H)Anthracene UG/KG_DRYWT
SVOC 56‐55‐3 Benzo(A)Anthracene UG/KG_DRYWT
SVOC 83‐32‐9 Acenaphthene UG/KG_DRYWT
SVOC 85‐01‐8 Phenanthrene UG/KG_DRYWT
SVOC 86‐73‐7 Fluorene UG/KG_DRYWT
SVOC 90‐12‐0 1‐Methylnaphthalene UG/KG_DRYWT
SVOC 91‐57‐6 2‐Methylnaphthalene UG/KG_DRYWT
EPH 91‐20‐3 Naphthalene UG/KG_DRYWTTOTAL_PAH Total PAH (ND as 1/2 MDL) UG/KG_DRYWT
J value reported above MDL but below RL
U not detected above MDL; MDL value reported.
DAMOS16 DAMOS16 DAMOS16 DAMOS16 DAMOS16 DAMOS16 DAMOS16 DAMOS16
PDS PDS PDS PDS PDS PDS PDS PDS
PDS‐20 PDS‐20 SREF‐07 SREF‐07 SREF‐08 SREF‐08 SREF‐10 SREF‐10
RAJ‐001 RAJ‐001 RAJ‐007 RAJ‐007 RAJ‐009 RAJ‐009 RAJ‐008 RAJ‐008
SA SA SA SA SA SA SA SA
QUAD QUAD SA SA SA SA SA SA
Result Lab Qual Result Lab Qual Result Lab Qual Result Lab Qual
1.6985 1.0357 2.2742
0.0502 U 0.0432 U 0.0519 U
0.0676 U 0.0582 U 0.07 U
0.0477 U 0.041 U 0.0493 U
0.0451 U 0.0388 U 0.0467 U
0.0676 U 0.0582 U 0.07 U
0.0502 U 0.0432 U 0.0519 U
0.0825 J 0.0367 U 0.112 J
0.0502 U 0.0432 U 0.0519 U
0.0451 U 0.0388 U 0.0467 U
0.0727 U 0.0626 U 0.0752 U
0.0477 U 0.041 U 0.0493 U
0.0549 U 0.0473 U 0.0568 U
0.198 U 0.17 U 0.205 U
0.4 0.307 0.412
0.0676 U 0.0582 U 0.07 U
0.128 J 0.0817 J 0.126 J
0.0829 U 0.0713 U 0.0857 U
20.4 U 17.5 U 21 U
0.0529 U 0.0455 U 0.0547 U
14.1 3.44 13.6
101 28.3 89.6
37.3 12.2 34
38.5 11.2 33.3
47.9 14.9 42.7
104 29.9 93.9
50.2 15.4 47.7
7.54 1.92 6.2
52.9 17.7 50.3
53.2 17 50.4
5.55 2.37 6.73
48.3 13 42.8
2.92 0.995 3.16
47.2 14.8 50.6
4.54 1.36 5.06
2.51 0.875 2.49
3.55 1.28 3.58
7.08 2.34 7.24628.29 188.98 583.36
Page 8 of 8

DAMOS 2016
Portland Disposal Site
Sediment PCB and Pesticides Results
Battelle Norwell
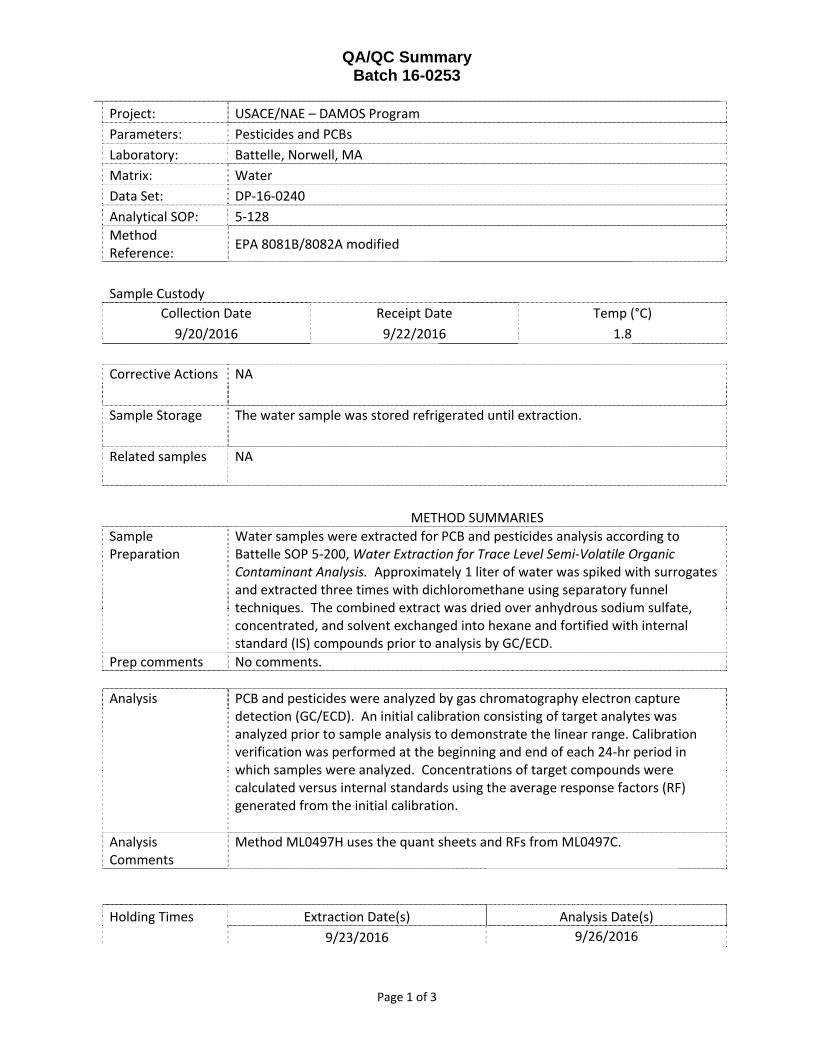
QA/QC Summary Batch 16-0253
Page 1 of 3
Project: USACE/NAE – DAMOS Program
Parameters: Pesticides and PCBs
Laboratory: Battelle, Norwell, MA
Matrix: Water
Data Set: DP‐16‐0240
Analytical SOP: 5‐128
Method Reference:
EPA 8081B/8082A modified
Sample Custody
Collection Date Receipt Date Temp (°C)
9/20/2016 9/22/2016 1.8
Corrective Actions NA
Sample Storage The water sample was stored refrigerated until extraction.
Related samples NA
METHOD SUMMARIES
Sample Preparation
Water samples were extracted for PCB and pesticides analysis according to Battelle SOP 5‐200, Water Extraction for Trace Level Semi‐Volatile Organic Contaminant Analysis. Approximately 1 liter of water was spiked with surrogates and extracted three times with dichloromethane using separatory funnel techniques. The combined extract was dried over anhydrous sodium sulfate, concentrated, and solvent exchanged into hexane and fortified with internal standard (IS) compounds prior to analysis by GC/ECD.
Prep comments No comments.
Analysis PCB and pesticides were analyzed by gas chromatography electron capture
detection (GC/ECD). An initial calibration consisting of target analytes was analyzed prior to sample analysis to demonstrate the linear range. Calibration verification was performed at the beginning and end of each 24‐hr period in which samples were analyzed. Concentrations of target compounds were calculated versus internal standards using the average response factors (RF) generated from the initial calibration.
Analysis Comments
Method ML0497H uses the quant sheets and RFs from ML0497C.
Holding Times Extraction Date(s) Analysis Date(s)
9/23/2016 9/26/2016

QA/QC Summary Batch 16-0253
Page 2 of 3
Procedural Blank (PB)
A PB was prepared with this analytical batch to ensure the sample extraction and analysis methods are free of contamination.
<5 X MDL Samples >5X PB
No exceedances noted.
No comments.
Laboratory Control Spike (LCS)
A LCS was prepared with this analytical batch. The percent recoveries of target analytes were calculated to measure accuracy.
40‐120% recovery
No exceedances noted.
The LCS was fortified with the GC/MS LCS solution. As such, several target analytes are not represented in the LCS on the data tables, and the LCS required a dilution. The GC/MS spike also includes several analytes which co‐elute with analytes on the SOP 5‐128 analyte list, specifically PCB 205, which co‐elutes with PCB 195, and PCB 31 which co‐elutes with PCB 28. A vertical integration was performed inside peak 28 at an inflection point. As there is no inflection point in the 195/205 combination, the fortified concentrations were added together and the entire peak was integrated to achieve a percent recovery. The achieved percent recovery is 92%; therefore, the exceedance does not apply. PCB 195 concentration = 0.5 ng/μL. PCB 205 concentration = 0.51 ng/μL. 50 μL spike yields 50.5 ng total. 46.245/50.5*100 = 91.57%
Surrogate Recovery
Surrogate compounds were added prior to extraction. The surrogate recoveries are calculated to measure extraction efficiency.
40‐120% recovery No exceedances noted.
No comments.
Initial Calibration (ICAL)
The GC/ECD was calibrated with six‐level quadratic non‐forced calibration curve for all compounds using an instrument response factor (RF).
R2 ≥ 0.995 No exceedances noted.
No comments.
Independent Calibration Check (ICC)
The independent check was run after each initial calibration to verify the calibration. This standard is from a different source than the ICAL.
≤ 20% difference individual and mean
No exceedances noted.
No comments.

QA/QC Summary Batch 16-0253
Page 3 of 3
Continuing Calibration Verification (CCV)
Continuing calibration standards were run every 24 hours to ensure that initial calibration is still valid.
≤ 20% difference individual; <15% difference mean
No exceedances noted.
No comments.

Project Client: USACE - North Atlantic DivisionProject Name: DAMOS WatersProject Number: 100087718
Client ID RAJ-901
Battelle ID K2640-PSample Type SACollection Date 09/20/16Extraction Date 09/23/16Analysis Date 09/26/16Analytical Instrument ECD% Moisture NA% Lipid NAMatrix WATSample Size 0.86Size Unit-Basis L_LIQUIDUnits UG/L_LIQUID
4,4'-DDD 0.001 U4,4'-DDE 0.001 U4,4'-DDT 0.001 Ualdrin 0.001 Ua-chlordane 0.001 Ug-chlordane 0.000 Ua-BHC 0.001 Ub-BHC 0.001 Ud-BHC 0.001 ULindane 0.001 Udieldrin 0.001 Uendosulfan I 0.001 Uendosulfan II 0.001 Uendosulfan sulfate 0.001 Uendrin 0.000 Uheptachlor 0.001 Uheptachlor epoxide 0.001 Umethoxychlor 0.001 UToxaphene 0.058 UTechnical ChlordaneCl2(8) 0.001 UCl3(18) 0.000 UCl3(28) 0.000 UCl4(44) 0.001 UCl4(49) 0.000 UCl4(52) 0.001 UCl4(66) 0.001 UCl5(87) 0.001 UCl5(101) 0.000 UCl5(105) 0.001 UCl5(118) 0.001 UCl6(128) 0.000 UCl6(138) 0.001 UCl6(153) 0.001 UCl7(170) 0.001 UCl7(180) 0.001 UCl7(183) 0.000 UCl7(184) 0.001 UCl7(187) 0.000 UCl8(195) 0.001 UCl9(206) 0.001 UCl10(209) 0.001 U
Surrogate Recoveries (%)
Not Surrogate CorrectedAnalyzed by Restucci Jr, Richard
8/28/2017 Main: L16-0253ECD-Master_128B-Final.xlsx

Project Client: USACE - North Atlantic DivisionProject Name: DAMOS WatersProject Number: 100087718
Client ID RAJ-901
Battelle ID K2640-PSample Type SACollection Date 09/20/16Extraction Date 09/23/16Analysis Date 09/26/16Analytical Instrument ECD% Moisture NA% Lipid NAMatrix WATSample Size 0.86Size Unit-Basis L_LIQUIDUnits UG/L_LIQUID
Cl3(34) 79Cl6(152) 76
Not Surrogate CorrectedAnalyzed by Restucci Jr, Richard
8/28/2017 Main: L16-0253ECD-Master_128B-Final.xlsx

Project Client: USACE - North Atlantic DivisionProject Name: DAMOS WatersProject Number: 100087718
Client ID Procedural Blank
Battelle ID CJ658PB-PSample Type PBCollection Date 09/23/16Extraction Date 09/23/16Analysis Date 09/26/16Analytical Instrument ECD% Moisture NA % Lipid NAMatrix WATERSample Size 1.00Size Unit-Basis L_LIQUIDUnits UG/L_LIQUID
4,4'-DDD 0.00053 U4,4'-DDE 0.00045 U4,4'-DDT 0.00063 Ualdrin 0.00053 Ua-chlordane 0.00044 Ug-chlordane 0.0004 Ua-BHC 0.00047 Ub-BHC 0.00055 Ud-BHC 0.00051 ULindane 0.00067 Udieldrin 0.00054 Uendosulfan I 0.00053 Uendosulfan II 0.00053 Uendosulfan sulfate 0.00044 Uendrin 0.00041 Uheptachlor 0.00053 Uheptachlor epoxide 0.00044 Umethoxychlor 0.00076 UToxaphene 0.05 UTechnical ChlordaneCl2(8) 0.00057 UCl3(18) 0.00037 UCl3(28) 0.00042 UCl4(44) 0.00053 UCl4(49) 0.00039 UCl4(52) 0.0005 UCl4(66) 0.0006 UCl5(87) 0.00046 UCl5(101) 0.00039 UCl5(105) 0.0006 UCl5(118) 0.00058 UCl6(128) 0.00042 UCl6(138) 0.00049 UCl6(153) 0.00049 UCl7(170) 0.00045 UCl7(180) 0.00046 UCl7(183) 0.00041 UCl7(184) 0.00058 UCl7(187) 0.00042 UCl8(195) 0.00043 UCl9(206) 0.00046 UCl10(209) 0.00045 U
Surrogate Recoveries (%)
Not Surrogate CorrectedAnalyzed by Restucci Jr, Richard
8/28/2017 PB: L16-0253ECD-Master_128B-Final.xlsx

Project Client: USACE - North Atlantic DivisionProject Name: DAMOS WatersProject Number: 100087718
Client ID Procedural Blank
Battelle ID CJ658PB-PSample Type PBCollection Date 09/23/16Extraction Date 09/23/16Analysis Date 09/26/16Analytical Instrument ECD% Moisture NA % Lipid NAMatrix WATERSample Size 1.00Size Unit-Basis L_LIQUIDUnits UG/L_LIQUID
Cl3(34) 74Cl6(152) 75
Not Surrogate CorrectedAnalyzed by Restucci Jr, Richard
8/28/2017 PB: L16-0253ECD-Master_128B-Final.xlsx

Project Client: USACE - North Atlantic DivisionProject Name: DAMOS WatersProject Number: 100087718
Client ID
Battelle IDSample TypeCollection DateExtraction DateAnalysis DateAnalytical Instrument% Moisture% LipidMatrixSample SizeSize Unit-BasisUnits
4,4'-DDD4,4'-DDE4,4'-DDTaldrina-chlordaneg-chlordanea-BHCb-BHCd-BHCLindanedieldrinendosulfan Iendosulfan IIendosulfan sulfateendrinheptachlorheptachlor epoxidemethoxychlorToxapheneTechnical ChlordaneCl2(8)Cl3(18)Cl3(28)Cl4(44)Cl4(49)Cl4(52)Cl4(66)Cl5(87)Cl5(101)Cl5(105)Cl5(118)Cl6(128)Cl6(138)Cl6(153)Cl7(170)Cl7(180)Cl7(183)Cl7(184)Cl7(187)Cl8(195)Cl9(206)Cl10(209)
Surrogate Recoveries (%)
Not Surrogate CorrectedAnalyzed by Restucci Jr, Richard
8/28/2017 PB: L16-0253ECD-Master_128B-Final.xlsx

Project Client: USACE - North Atlantic DivisionProject Name: DAMOS WatersProject Number: 100087718
Client ID
Battelle IDSample TypeCollection DateExtraction DateAnalysis DateAnalytical Instrument% Moisture% LipidMatrixSample SizeSize Unit-BasisUnits
Cl3(34)Cl6(152)
Not Surrogate CorrectedAnalyzed by Restucci Jr, Richard
8/28/2017 PB: L16-0253ECD-Master_128B-Final.xlsx

Project Client: USACE - North Atlantic DivisionProject Name: DAMOS WatersProject Number: 100087718
Client IDLaboratory Control
Sample
Battelle ID CJ659LCS-PSample Type LCSCollection Date 09/23/16Extraction Date 09/23/16Analysis Date 09/26/16Analytical Instrument ECD% Moisture NA% Lipid NAMatrix WATERSample Size 1.00Size Unit-Basis L_LIQUIDUnits UG/L_LIQUID Target % Recovery Qualifier
4,4'-DDD 0.107 D 0.13 854,4'-DDE 0.0794 D 0.13 644,4'-DDT 0.0771 D 0.13 61aldrin 0.00053 Ua-chlordane 0.076 D 0.13 60g-chlordane 0.0743 D 0.13 59a-BHC 0.00047 Ub-BHC 0.00055 Ud-BHC 0.00051 ULindane 0.00067 Udieldrin 0.0857 D 0.13 68endosulfan I 0.00053 Uendosulfan II 0.00053 Uendosulfan sulfate 0.00044 Uendrin 0.00041 Uheptachlor 0.00053 Uheptachlor epoxide 0.00044 Umethoxychlor 0.00076 UToxaphene 0.05 UTechnical Chlordane 0.769Cl2(8) 0.0214 0.03 86Cl3(18) 0.0205 0.03 82Cl3(28) 0.0253 0.03 101Cl4(44) 0.0226 0.03 90Cl4(49) 0.0222 0.03 89Cl4(52) 0.0231 0.03 92Cl4(66) 0.0249 0.03 100Cl5(87) 0.0217 0.03 87Cl5(101) 0.0233 0.03 93Cl5(105) 0.0254 0.03 102Cl5(118) 0.0235 0.03 94Cl6(128) 0.0237 0.03 95Cl6(138) 0.0228 0.03 91Cl6(153) 0.0196 0.03 78Cl7(170) 0.0239 0.03 96Cl7(180) 0.022 0.03 88Cl7(183) 0.0238 0.03 95Cl7(184) 0.00058 UCl7(187) 0.0225 0.03 90Cl8(195) 0.0462 0.03 185 NCl9(206) 0.0235 0.03 94Cl10(209) 0.023 0.03 92
Surrogate Recoveries (%)
Not Surrogate CorrectedAnalyzed by Restucci Jr, Richard
8/28/2017 LCS: L16-0253ECD-Master_128B-Final.xlsx

Project Client: USACE - North Atlantic DivisionProject Name: DAMOS WatersProject Number: 100087718
Client IDLaboratory Control
Sample
Battelle ID CJ659LCS-PSample Type LCSCollection Date 09/23/16Extraction Date 09/23/16Analysis Date 09/26/16Analytical Instrument ECD% Moisture NA% Lipid NAMatrix WATERSample Size 1.00Size Unit-Basis L_LIQUIDUnits UG/L_LIQUID Target % Recovery Qualifier
Cl3(34) 79Cl6(152) 79
Not Surrogate CorrectedAnalyzed by Restucci Jr, Richard
8/28/2017 LCS: L16-0253ECD-Master_128B-Final.xlsx
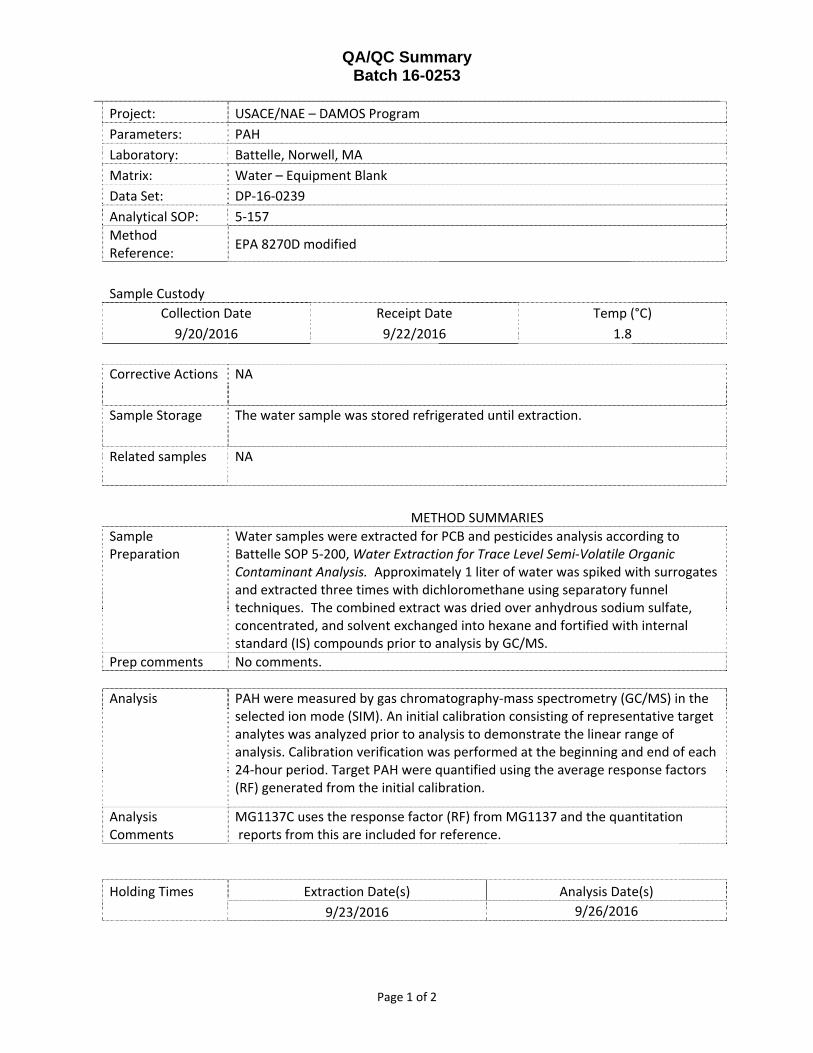
QA/QC Summary Batch 16-0253
Page 1 of 2
Project: USACE/NAE – DAMOS Program
Parameters: PAH
Laboratory: Battelle, Norwell, MA
Matrix: Water – Equipment Blank
Data Set: DP‐16‐0239
Analytical SOP: 5‐157
Method Reference:
EPA 8270D modified
Sample Custody
Collection Date Receipt Date Temp (°C)
9/20/2016 9/22/2016 1.8
Corrective Actions NA
Sample Storage The water sample was stored refrigerated until extraction.
Related samples NA
METHOD SUMMARIES
Sample Preparation
Water samples were extracted for PCB and pesticides analysis according to Battelle SOP 5‐200, Water Extraction for Trace Level Semi‐Volatile Organic Contaminant Analysis. Approximately 1 liter of water was spiked with surrogates and extracted three times with dichloromethane using separatory funnel techniques. The combined extract was dried over anhydrous sodium sulfate, concentrated, and solvent exchanged into hexane and fortified with internal standard (IS) compounds prior to analysis by GC/MS.
Prep comments No comments.
Analysis PAH were measured by gas chromatography‐mass spectrometry (GC/MS) in the
selected ion mode (SIM). An initial calibration consisting of representative target analytes was analyzed prior to analysis to demonstrate the linear range of analysis. Calibration verification was performed at the beginning and end of each 24‐hour period. Target PAH were quantified using the average response factors (RF) generated from the initial calibration.
Analysis Comments
MG1137C uses the response factor (RF) from MG1137 and the quantitation reports from this are included for reference.
Holding Times Extraction Date(s) Analysis Date(s)
9/23/2016 9/26/2016
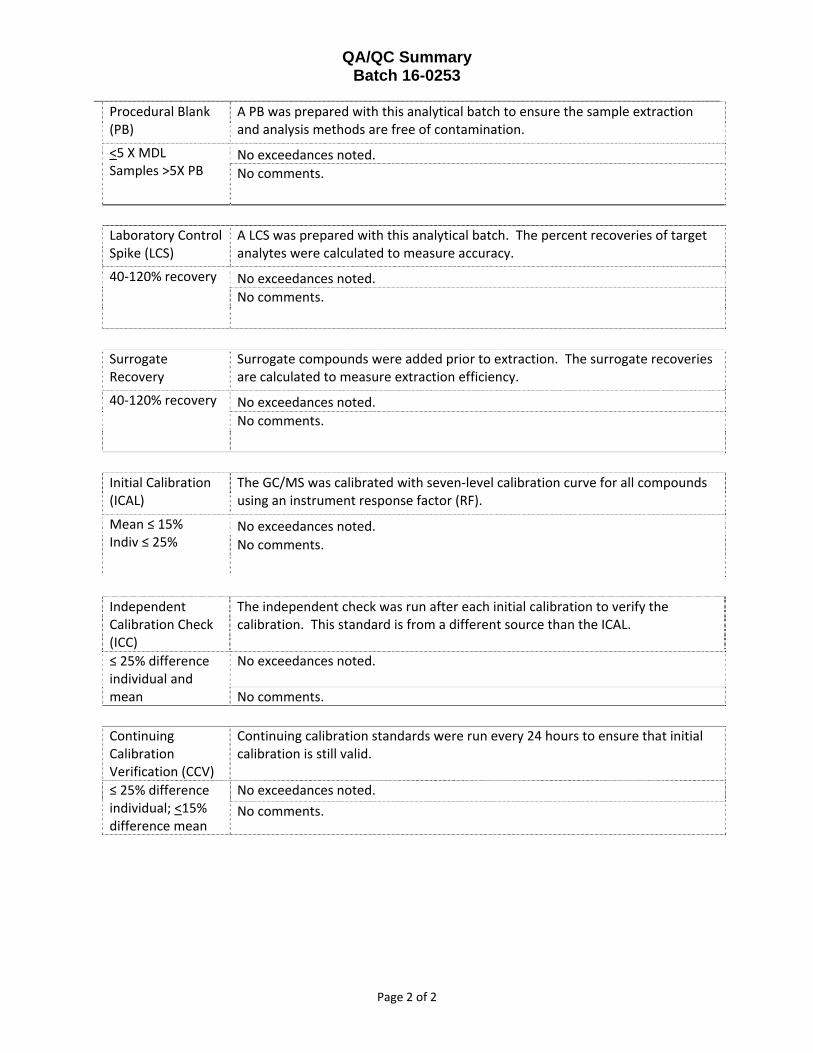
QA/QC Summary Batch 16-0253
Page 2 of 2
Procedural Blank (PB)
A PB was prepared with this analytical batch to ensure the sample extraction and analysis methods are free of contamination.
<5 X MDL Samples >5X PB
No exceedances noted.
No comments.
Laboratory Control Spike (LCS)
A LCS was prepared with this analytical batch. The percent recoveries of target analytes were calculated to measure accuracy.
40‐120% recovery
No exceedances noted.
No comments.
Surrogate Recovery
Surrogate compounds were added prior to extraction. The surrogate recoveries are calculated to measure extraction efficiency.
40‐120% recovery No exceedances noted.
No comments.
Initial Calibration (ICAL)
The GC/MS was calibrated with seven‐level calibration curve for all compounds using an instrument response factor (RF).
Mean ≤ 15% Indiv ≤ 25%
No exceedances noted.
No comments.
Independent Calibration Check (ICC)
The independent check was run after each initial calibration to verify the calibration. This standard is from a different source than the ICAL.
≤ 25% difference individual and mean
No exceedances noted.
No comments.
Continuing Calibration Verification (CCV)
Continuing calibration standards were run every 24 hours to ensure that initial calibration is still valid.
≤ 25% difference individual; <15% difference mean
No exceedances noted.
No comments.
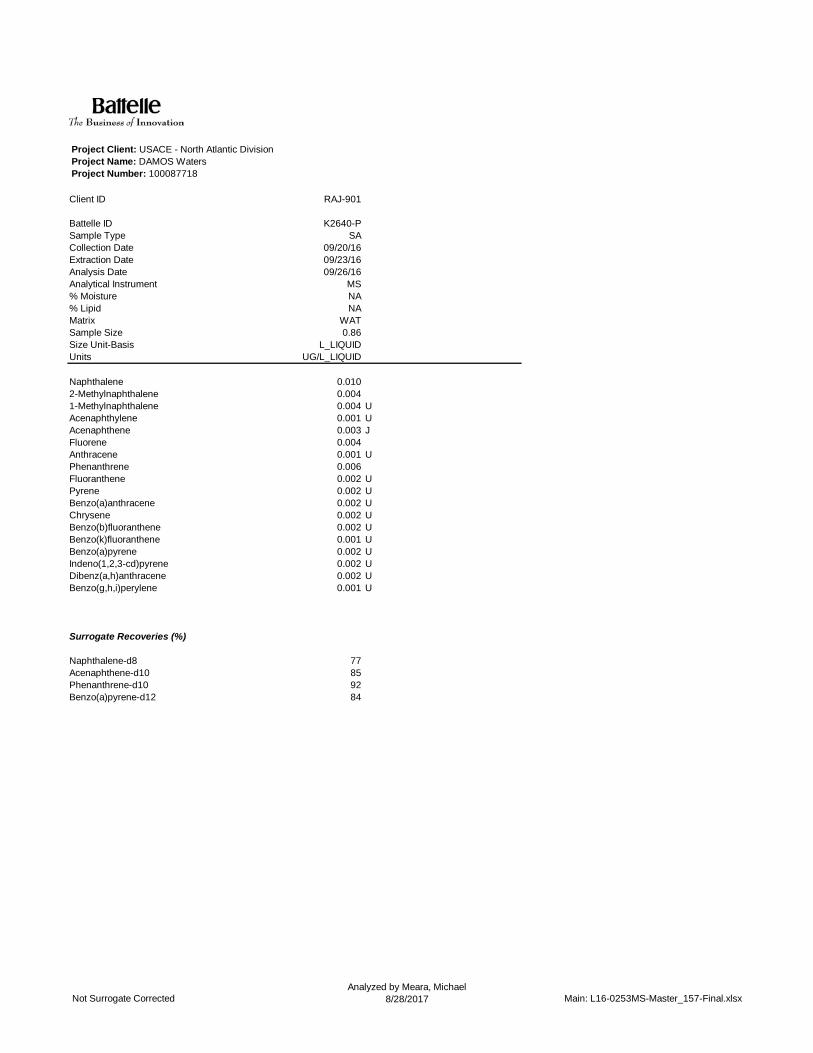
Project Client: USACE - North Atlantic DivisionProject Name: DAMOS WatersProject Number: 100087718
Client ID RAJ-901
Battelle ID K2640-PSample Type SACollection Date 09/20/16Extraction Date 09/23/16Analysis Date 09/26/16Analytical Instrument MS% Moisture NA% Lipid NAMatrix WATSample Size 0.86Size Unit-Basis L_LIQUIDUnits UG/L_LIQUID
Naphthalene 0.0102-Methylnaphthalene 0.0041-Methylnaphthalene 0.004 UAcenaphthylene 0.001 UAcenaphthene 0.003 JFluorene 0.004Anthracene 0.001 UPhenanthrene 0.006Fluoranthene 0.002 UPyrene 0.002 UBenzo(a)anthracene 0.002 UChrysene 0.002 UBenzo(b)fluoranthene 0.002 UBenzo(k)fluoranthene 0.001 UBenzo(a)pyrene 0.002 UIndeno(1,2,3-cd)pyrene 0.002 UDibenz(a,h)anthracene 0.002 UBenzo(g,h,i)perylene 0.001 U
Surrogate Recoveries (%)
Naphthalene-d8 77Acenaphthene-d10 85Phenanthrene-d10 92Benzo(a)pyrene-d12 84
Not Surrogate CorrectedAnalyzed by Meara, Michael
8/28/2017 Main: L16-0253MS-Master_157-Final.xlsx

Project Client: USACE - North Atlantic DivisionProject Name: DAMOS WatersProject Number: 100087718
Client ID Procedural Blank
Battelle ID CJ658PB-PSample Type PBCollection Date 09/23/16Extraction Date 09/23/16Analysis Date 09/26/16Analytical Instrument MS% Moisture NA % Lipid NAMatrix WATERSample Size 1.00Size Unit-Basis L_LIQUIDUnits UG/L_LIQUID
Naphthalene 0.00508 U2-Methylnaphthalene 0.00285 U1-Methylnaphthalene 0.00358 UAcenaphthylene 0.00119 UAcenaphthene 0.00137 UFluorene 0.00117 UAnthracene 0.00117 UPhenanthrene 0.0024 UFluoranthene 0.00152 UPyrene 0.00139 UBenzo(a)anthracene 0.00134 UChrysene 0.00138 UBenzo(b)fluoranthene 0.00135 UBenzo(k)fluoranthene 0.00126 UBenzo(a)pyrene 0.0015 UIndeno(1,2,3-cd)pyrene 0.00176 UDibenz(a,h)anthracene 0.0014 UBenzo(g,h,i)perylene 0.0012 U
Surrogate Recoveries (%)
Naphthalene-d8 80Acenaphthene-d10 84Phenanthrene-d10 86Benzo(a)pyrene-d12 78
Not Surrogate CorrectedAnalyzed by Meara, Michael
8/28/2017 PB: L16-0253MS-Master_157-Final.xlsx

Project Client: USACE - North Atlantic DivisionProject Name: DAMOS WatersProject Number: 100087718
Client ID
Battelle IDSample TypeCollection DateExtraction DateAnalysis DateAnalytical Instrument% Moisture% LipidMatrixSample SizeSize Unit-BasisUnits
Naphthalene2-Methylnaphthalene1-MethylnaphthaleneAcenaphthyleneAcenaphtheneFluoreneAnthracenePhenanthreneFluoranthenePyreneBenzo(a)anthraceneChryseneBenzo(b)fluorantheneBenzo(k)fluorantheneBenzo(a)pyreneIndeno(1,2,3-cd)pyreneDibenz(a,h)anthraceneBenzo(g,h,i)perylene
Surrogate Recoveries (%)
Naphthalene-d8Acenaphthene-d10Phenanthrene-d10Benzo(a)pyrene-d12
Not Surrogate CorrectedAnalyzed by Meara, Michael
8/28/2017 PB: L16-0253MS-Master_157-Final.xlsx

Project Client: USACE - North Atlantic DivisionProject Name: DAMOS WatersProject Number: 100087718
Client IDLaboratory Control
Sample
Battelle ID CJ659LCS-PSample Type LCSCollection Date 09/23/16Extraction Date 09/23/16Analysis Date 09/26/16Analytical Instrument MS% Moisture NA% Lipid NAMatrix WATERSample Size 1.00Size Unit-Basis L_LIQUIDUnits UG/L_LIQUID Target % Recovery Qualifier
Naphthalene 0.202 0.25 812-Methylnaphthalene 0.202 0.25 811-Methylnaphthalene 0.205 0.25 82Acenaphthylene 0.199 0.25 79Acenaphthene 0.21 0.25 84Fluorene 0.209 0.25 83Anthracene 0.208 0.25 83Phenanthrene 0.227 0.25 91Fluoranthene 0.232 0.25 93Pyrene 0.231 0.25 92Benzo(a)anthracene 0.219 0.25 87Chrysene 0.219 0.25 87Benzo(b)fluoranthene 0.224 0.25 89Benzo(k)fluoranthene 0.229 0.25 91Benzo(a)pyrene 0.207 0.25 83Indeno(1,2,3-cd)pyrene 0.219 0.25 87Dibenz(a,h)anthracene 0.235 0.25 94Benzo(g,h,i)perylene 0.225 0.25 90
Surrogate Recoveries (%)
Naphthalene-d8 80Acenaphthene-d10 84Phenanthrene-d10 88Benzo(a)pyrene-d12 81
Not Surrogate CorrectedAnalyzed by Meara, Michael
8/28/2017 LCS: L16-0253MS-Master_157-Final.xlsx

Project Client: USACE - North Atlantic DivisionProject Name: DAMOS - SedimentProject Number: 100087718
Client ID RAJ-001 RAJ-002 RAJ-003 RAJ-004
Battelle ID K2630-P K2631-P K2632-P K2633-PSample Type SA SA SA SACollection Date 09/20/16 09/20/16 09/20/16 09/20/16Extraction Date 09/26/16 09/26/16 09/26/16 09/26/16Analysis Date 09/30/16 09/30/16 09/30/16 09/30/16Analytical Instrument ECD ECD ECD ECD% Moisture 23.42 43.76 33.52 50.75% Lipid NA NA NA NAMatrix SED SED SED SEDSample Size 22.98 16.89 19.94 14.78Size Unit-Basis G_DRY G_DRY G_DRY G_DRYUnits UG/KG_DRY UG/KG_DRY UG/KG_DRY UG/KG_DRY
4,4'-DDD 0.171 J 5.730 0.847 6.6804,4'-DDE 0.100 J 1.180 0.475 2.3204,4'-DDT 0.314 1.190 0.101 U 1.200aldrin 0.041 U 0.056 U 0.047 U 0.063 Ua-chlordane 0.043 U 0.163 J 0.049 U 0.188 Jg-chlordane 0.039 U 1.450 1.060 1.760a-BHC 0.039 U 0.053 U 0.045 U 0.060 Ub-BHC 0.058 U 0.079 U 0.067 U 0.090 Ud-BHC 0.043 U 0.058 U 0.049 U 0.067 ULindane 0.062 U 0.085 U 0.072 U 0.097 Udieldrin 0.041 U 0.270 J 0.047 U 0.291 Jendosulfan I 0.045 U 0.062 U 0.052 U 0.070 Uendosulfan II 0.080 J 1.450 0.637 1.040endosulfan sulfate 0.058 U 0.079 U 0.067 U 0.090 Uendrin 0.047 U 0.064 U 0.054 U 0.073 Uheptachlor 0.071 U 0.097 U 0.082 U 0.110 Uheptachlor epoxide 0.043 U 0.058 U 0.049 U 0.067 Umethoxychlor 0.169 U 0.230 U 0.195 U 0.263 UToxaphene 19300.000 23.700 U 17000.000 27.100 UTechnical Chlordane 8.260 5.420 9.970Cl2(8) 0.056 U 0.076 U 0.064 U 0.087 UCl3(18) 0.041 U 0.056 U 0.047 U 0.063 UCl3(28) 0.032 U 0.130 J 0.037 U 0.125 JCl4(44) 0.039 U 0.400 0.045 U 0.236 JCl4(49) 0.039 U 0.275 J 0.045 U 0.288 JCl4(52) 0.054 U 0.712 0.062 U 0.636Cl4(66) 0.047 U 0.592 0.176 J 0.455Cl5(87) 0.037 U 0.524 0.042 U 0.357Cl5(101) 0.170 J 2.070 0.268 1.420Cl5(105) 0.149 J 0.682 0.197 J 0.654Cl5(118) 0.160 J 1.310 0.190 J 1.200Cl6(128) 0.037 U 0.613 0.042 U 0.260 JCl6(138) 0.177 J 4.300 0.228 J 1.380Cl6(153) 0.141 U 5.080 0.163 U 1.590Cl7(170) 0.041 U 2.560 0.047 U 0.358Cl7(180) 0.076 J 5.320 0.096 J 0.655Cl7(183) 0.032 U 1.640 0.037 U 0.195 JCl7(184) 0.088 U 0.120 U 0.101 U 0.137 UCl7(187) 0.039 U 2.690 0.045 U 0.265 JCl8(195) 0.039 U 0.838 0.350 0.184 JCl9(206) 0.037 U 0.473 0.924 0.294 JCl10(209) 0.072 J 1.020 2.350 1.100
Surrogate Recoveries (%)
Cl3(34) 68 73 67 66Cl6(152) 71 69 66 65
Not Surrogate CorrectedAnalyzed by Restucci Jr, Richard
8/28/2017 Main: S16-0255ECD-Master_128B-Final.xlsx

Project Client: USACE - North Atlantic DivisionProject Name: DAMOS - SedimentProject Number: 100087718
Client ID
Battelle IDSample TypeCollection DateExtraction DateAnalysis DateAnalytical Instrument% Moisture% LipidMatrixSample SizeSize Unit-BasisUnits
4,4'-DDD4,4'-DDE4,4'-DDTaldrina-chlordaneg-chlordanea-BHCb-BHCd-BHCLindanedieldrinendosulfan Iendosulfan IIendosulfan sulfateendrinheptachlorheptachlor epoxidemethoxychlorToxapheneTechnical ChlordaneCl2(8)Cl3(18)Cl3(28)Cl4(44)Cl4(49)Cl4(52)Cl4(66)Cl5(87)Cl5(101)Cl5(105)Cl5(118)Cl6(128)Cl6(138)Cl6(153)Cl7(170)Cl7(180)Cl7(183)Cl7(184)Cl7(187)Cl8(195)Cl9(206)Cl10(209)
Surrogate Recoveries (%)
Cl3(34)Cl6(152)
RAJ-005 RAJ-006 RAJ-007 RAJ-008
K2634-P K2635-P K2636-P K2637-PSA SA SA SA
09/20/16 09/20/16 09/20/16 09/20/1609/26/16 09/26/16 09/26/16 09/26/1610/01/16 10/01/16 10/01/16 10/01/16
ECD ECD ECD ECD43.06 51.8 34.57 36.59
NA NA NA NASED SED SED SED
17.13 14.46 19.66 19.01G_DRY G_DRY G_DRY G_DRY
UG/KG_DRY UG/KG_DRY UG/KG_DRY UG/KG_DRY
1.630 1.690 0.068 U 0.070 U1.280 0.924 0.128 J 0.126 J1.070 0.947 0.400 0.4120.055 U 0.065 U 0.048 U 0.049 U0.103 J 0.123 J 0.050 U 0.052 U0.900 0.832 0.045 U 0.047 U0.052 U 0.061 U 0.045 U 0.047 U0.078 U 0.092 U 0.068 U 0.070 U0.058 U 0.068 U 0.050 U 0.052 U0.084 U 0.099 U 0.073 U 0.075 U0.055 U 0.065 U 0.048 U 0.049 U0.061 U 0.072 U 0.053 U 0.055 U0.492 0.364 0.083 J 0.112 J0.078 U 0.092 U 0.068 U 0.070 U0.063 U 0.075 U 0.055 U 0.057 U0.095 U 0.113 U 0.083 U 0.086 U0.058 U 0.068 U 0.050 U 0.052 U0.227 U 0.269 U 0.198 U 0.205 U
23.400 U 25400.000 20.400 U 21.000 U5.130 4.8900.075 U 0.089 U 0.065 U 0.067 U0.055 U 0.065 U 0.048 U 0.049 U0.043 U 0.051 U 0.038 U 0.039 U0.052 U 0.061 U 0.045 U 0.047 U0.052 U 0.061 U 0.045 U 0.047 U0.072 U 0.085 U 0.063 U 0.065 U0.071 J 0.080 J 0.055 U 0.057 U0.049 U 0.058 U 0.043 U 0.044 U0.145 J 0.173 J 0.062 J 0.154 J0.161 J 0.309 J 0.158 J 0.166 J0.089 U 0.207 J 0.078 U 0.150 J0.049 U 0.196 J 0.043 U 0.044 U0.147 J 0.259 J 0.108 J 0.146 J0.190 U 0.225 U 0.165 U 0.171 U0.055 U 0.065 U 0.048 U 0.049 U0.175 J 0.236 J 0.068 J 0.084 J0.043 U 0.051 U 0.038 U 0.039 U0.118 U 0.140 U 0.103 U 0.106 U0.052 U 0.061 U 0.045 U 0.047 U0.052 U 0.061 U 0.045 U 0.047 U0.049 U 0.058 U 0.043 U 0.044 U0.150 J 0.174 J 0.064 J 0.074 J
61 67 67 7061 66 67 67
Not Surrogate CorrectedAnalyzed by Restucci Jr, Richard
8/28/2017 Main: S16-0255ECD-Master_128B-Final.xlsx

Project Client: USACE - North Atlantic DivisionProject Name: DAMOS - SedimentProject Number: 100087718
Client ID
Battelle IDSample TypeCollection DateExtraction DateAnalysis DateAnalytical Instrument% Moisture% LipidMatrixSample SizeSize Unit-BasisUnits
4,4'-DDD4,4'-DDE4,4'-DDTaldrina-chlordaneg-chlordanea-BHCb-BHCd-BHCLindanedieldrinendosulfan Iendosulfan IIendosulfan sulfateendrinheptachlorheptachlor epoxidemethoxychlorToxapheneTechnical ChlordaneCl2(8)Cl3(18)Cl3(28)Cl4(44)Cl4(49)Cl4(52)Cl4(66)Cl5(87)Cl5(101)Cl5(105)Cl5(118)Cl6(128)Cl6(138)Cl6(153)Cl7(170)Cl7(180)Cl7(183)Cl7(184)Cl7(187)Cl8(195)Cl9(206)Cl10(209)
Surrogate Recoveries (%)
Cl3(34)Cl6(152)
RAJ-009 RAJ-010 RAJ-011 RAJ-012
K2638-P K2639-P K2641-P K2642-PSA SA SA SA
09/20/16 09/20/16 09/20/16 09/20/1609/26/16 09/26/16 09/26/16 09/26/1610/01/16 10/01/16 10/01/16 10/01/16
ECD ECD ECD ECD24.02 24.76 28.52 36.27
NA NA NA NASED SED SED SED
22.85 22.59 21.43 19.11G_DRY G_DRY G_DRY G_DRY
UG/KG_DRY UG/KG_DRY UG/KG_DRY UG/KG_DRY
0.058 U 0.059 U 0.062 U 0.070 U0.082 J 0.054 U 0.057 U 0.064 U0.307 0.288 0.304 0.3550.041 U 0.042 U 0.044 U 0.049 U0.043 U 0.044 U 0.046 U 0.052 U0.039 U 0.039 U 0.041 U 0.046 U0.039 U 0.039 U 0.041 U 0.046 U0.058 U 0.059 U 0.062 U 0.070 U0.043 U 0.044 U 0.046 U 0.052 U0.063 U 0.063 U 0.067 U 0.075 U0.041 U 0.042 U 0.044 U 0.049 U0.046 U 0.046 U 0.049 U 0.054 U0.037 U 0.037 U 0.039 U 0.044 U0.058 U 0.059 U 0.062 U 0.070 U0.047 U 0.048 U 0.050 U 0.057 U0.071 U 0.072 U 0.076 U 0.085 U0.043 U 0.044 U 0.046 U 0.052 U0.170 U 0.172 U 0.182 U 0.204 U
17.500 U 17.700 U 18.700 U 20.900 U
0.056 U 0.057 U 0.060 U 0.067 U0.041 U 0.042 U 0.044 U 0.049 U0.032 U 0.033 U 0.035 U 0.039 U0.039 U 0.039 U 0.041 U 0.046 U0.039 U 0.039 U 0.041 U 0.046 U0.054 U 0.054 U 0.057 U 0.064 U0.047 U 0.048 U 0.050 U 0.057 U0.037 U 0.037 U 0.039 U 0.044 U0.041 U 0.042 U 0.044 U 0.049 U0.093 J 0.080 J 0.082 J 0.097 J0.067 U 0.068 U 0.071 U 0.080 U0.037 U 0.037 U 0.039 U 0.044 U0.049 U 0.050 U 0.053 U 0.059 U0.142 U 0.144 U 0.152 U 0.170 U0.041 U 0.042 U 0.044 U 0.049 U0.047 U 0.048 U 0.050 U 0.057 U0.032 U 0.033 U 0.035 U 0.039 U0.088 U 0.089 U 0.094 U 0.106 U0.039 U 0.039 U 0.041 U 0.046 U0.039 U 0.039 U 0.041 U 0.046 U0.037 U 0.037 U 0.039 U 0.044 U0.041 U 0.042 U 0.044 U 0.049 U
69 73 73 6867 71 72 68
Not Surrogate CorrectedAnalyzed by Restucci Jr, Richard
8/28/2017 Main: S16-0255ECD-Master_128B-Final.xlsx

Project Client: USACE - North Atlantic DivisionProject Name: DAMOS - SedimentProject Number: 100087718
Client ID Procedural Blank
Battelle ID CJ663PB-PSample Type PBCollection Date 09/26/16Extraction Date 09/26/16Analysis Date 09/30/16Analytical Instrument ECD% Moisture 35.92 % Lipid NAMatrix SEDIMENTSample Size 19.26Size Unit-Basis G_DRYUnits UG/KG_DRY
4,4'-DDD 0.069 U4,4'-DDE 0.0639 U4,4'-DDT 0.105 Ualdrin 0.0486 Ua-chlordane 0.0512 Ug-chlordane 0.046 Ua-BHC 0.046 Ub-BHC 0.069 Ud-BHC 0.0512 ULindane 0.0742 Udieldrin 0.0486 Uendosulfan I 0.054 Uendosulfan II 0.0435 Uendosulfan sulfate 0.069 Uendrin 0.0561 Uheptachlor 0.0846 Uheptachlor epoxide 0.0512 Umethoxychlor 0.202 UToxaphene 20.8 UTechnical ChlordaneCl2(8) 0.0665 UCl3(18) 0.0486 UCl3(28) 0.0384 UCl4(44) 0.046 UCl4(49) 0.046 UCl4(52) 0.0639 UCl4(66) 0.0561 UCl5(87) 0.0435 UCl5(101) 0.0486 UCl5(105) 0.046 UCl5(118) 0.0794 UCl6(128) 0.0435 UCl6(138) 0.0587 UCl6(153) 0.169 UCl7(170) 0.0486 UCl7(180) 0.0561 UCl7(183) 0.0384 UCl7(184) 0.105 UCl7(187) 0.046 UCl8(195) 0.046 UCl9(206) 0.0435 UCl10(209) 0.0486 U
Surrogate Recoveries (%)
Cl3(34) 75Cl6(152) 76
Not Surrogate CorrectedAnalyzed by Restucci Jr, Richard
8/28/2017 PB: S16-0255ECD-Master_128B-Final.xlsx

Project Client: USACE - North Atlantic DivisionProject Name: DAMOS - SedimentProject Number: 100087718
Client IDLaboratory Control
Sample
Battelle ID CJ664LCS-PSample Type LCSCollection Date 09/26/16Extraction Date 09/26/16Analysis Date 09/30/16Analytical Instrument ECD% Moisture 35.92% Lipid NAMatrix SEDIMENTSample Size 19.25Size Unit-Basis G_DRYUnits UG/KG_DRY Target % Recovery Qualifier
4,4'-DDD 7.78 7.80 1004,4'-DDE 7.48 7.79 964,4'-DDT 6.88 7.80 88aldrin 7.1 7.79 91a-chlordane 6.72 7.81 86g-chlordane 6.15 7.80 79a-BHC 7.15 7.80 92b-BHC 7.44 7.80 95d-BHC 7.68 7.80 98Lindane 7.32 7.79 94dieldrin 6.8 7.80 87endosulfan I 7.67 7.80 98endosulfan II 7.11 7.81 91endosulfan sulfate 6.83 7.80 88endrin 6.35 7.80 81heptachlor 7.54 7.80 97heptachlor epoxide 6.66 7.80 85methoxychlor 6.02 7.80 77Toxaphene 20.8 UTechnical Chlordane 104Cl2(8) 6.26 7.81 80Cl3(18) 5.95 7.82 76Cl3(28) 6.91 7.82 88Cl4(44) 6.62 7.82 85Cl4(49) 6.41 7.79 82Cl4(52) 6.6 7.80 85Cl4(66) 7.09 7.81 91Cl5(87) 6.12 7.77 79Cl5(101) 6.75 7.81 86Cl5(105) 6.45 7.82 82Cl5(118) 6.78 7.82 87Cl6(128) 6.68 7.82 85Cl6(138) 6.72 7.82 86Cl6(153) 6.18 7.82 79Cl7(170) 6.96 7.82 89Cl7(180) 6.84 7.82 87Cl7(183) 6.7 7.78 86Cl7(184) 6.99 7.81 90Cl7(187) 6.68 7.82 85Cl8(195) 6.9 7.82 88Cl9(206) 6.91 7.81 88Cl10(209) 6.64 7.82 85
Surrogate Recoveries (%)
Cl3(34) 80Cl6(152) 76
Not Surrogate CorrectedAnalyzed by Restucci Jr, Richard
8/28/2017 LCS: S16-0255ECD-Master_128B-Final.xlsx

Project Client: USACE - North Atlantic DivisionProject Name: DAMOS - SedimentProject Number: 100087718
Client ID 160826-03: SRM 1944
Battelle ID CJ665SRM-PSample Type SRMCollection Date 09/26/16Extraction Date 09/26/16Analysis Date 09/30/16Analytical Instrument ECD% Moisture 1.3% Lipid NAMatrix SEDIMENTSample Size 1.02Size Unit-Basis G_DRY Certified Passing ActualUnits UG/KG_DRY Value +/- %Difference %Difference Qualifier
4,4'-DDD 1944,4'-DDE 1224,4'-DDT 187aldrin 0.919 Ua-chlordane 21.7 16.51 0.83 35.03 31.4g-chlordane 95.6a-BHC 0.87 Ub-BHC 1.3 Ud-BHC 0.967 ULindane 1.4 Udieldrin 25.9endosulfan I 1.02 Uendosulfan II 62.2endosulfan sulfate 1.3 Uendrin 1.06 Uheptachlor 1.6 Uheptachlor epoxide 0.967 Umethoxychlor 3.81 UToxaphene 392 UTechnical Chlordane 600Cl2(8) 22.5 22.3 2.30 40.31 0.9Cl3(18) 53.9 51 2.60 35.1 5.7Cl3(28) 91.4 80.8 2.70 33.34 13.1Cl4(44) 70.9 60.2 2.00 33.32 17.8Cl4(49) 58.4 53 1.70 33.21 10.2Cl4(52) 102 79.4 2.00 32.52 28.5Cl4(66) 59.5 71.9 4.30 35.98 17.2Cl5(87) 27.6 29.9 4.30 44.38 7.7Cl5(101) 92.9 73.4 2.50 33.41 26.6Cl5(105) 29.6 24.5 1.10 34.49 20.8Cl5(118) 59.9 58 4.30 37.41 3.3Cl6(128) 10.6 8.47 0.28 33.31 25.1Cl6(138) 68.5 62.1 3.00 34.83 10.3Cl6(153) 77.2 74 2.90 33.92 4.3Cl7(170) 19.9 22.6 1.40 36.19 11.9Cl7(180) 47.4 44.3 1.20 32.71 7Cl7(183) 11.4 12.19 0.57 34.68 6.5Cl7(184) 1.98 UCl7(187) 21.9 25.1 1.00 33.98 12.7Cl8(195) 3.74 J 3.75 0.39 40.4 0.3Cl9(206) 9.08 9.21 0.51 35.54 1.4Cl10(209) 9.08 6.81 0.33 34.85 33.3
Surrogate Recoveries (%)
Cl3(34) 75Cl6(152) 73
Not Surrogate CorrectedAnalyzed by Restucci Jr, Richard
8/28/2017 SRM: S16-0255ECD-Master_128B-Final.xlsx

Project Client: USACE - North Atlantic DivisionProject Name: DAMOS - SedimentProject Number: 100087718
Client ID RAJ-004 RAJ-004
Battelle ID K2633-P K2633MS-PSample Type SA MSCollection Date 09/20/16 9/20/2016Extraction Date 09/26/16 9/26/2016Analysis Date 09/30/16 9/30/2016Analytical Instrument ECD ECD% Moisture 50.75 50.63% Lipid NA NAMatrix SED SEDSample Size 14.78 7.4Size Unit-Basis G_DRY G_DRYUnits UG/KG_DRY UG/KG_DRY Target % Recovery Qualifier
4,4'-DDD 6.68 30.500 20.29 1174,4'-DDE 2.32 21.100 20.28 934,4'-DDT 1.2 18.800 20.28 87aldrin 0.0634 U 16.700 20.28 82a-chlordane 0.188 J 16.600 20.31 81g-chlordane 1.76 15.400 20.28 67a-BHC 0.06 U 17.700 20.29 87b-BHC 0.09 U 19.400 20.29 96d-BHC 0.0667 U 20.000 20.28 99Lindane 0.0968 U 19.200 20.28 95dieldrin 0.291 J 17.000 20.28 82endosulfan I 0.0704 U 19.600 20.29 97endosulfan II 1.04 18.600 20.33 86endosulfan sulfate 0.09 U 18.800 20.29 93endrin 0.0731 U 16.700 20.28 82heptachlor 0.11 U 20.700 20.28 102heptachlor epoxide 0.0667 U 14.800 20.29 73methoxychlor 0.263 U 15.100 20.28 74Toxaphene 27.1 U 54.000 UTechnical Chlordane 9.97 270.000Cl2(8) 0.0866 U 15.700 20.31 77Cl3(18) 0.0634 U 14.400 20.35 71Cl3(28) 0.125 J 18.100 20.35 88Cl4(44) 0.236 J 16.900 20.35 82Cl4(49) 0.288 J 16.600 20.27 80Cl4(52) 0.636 17.200 20.29 82Cl4(66) 0.455 19.800 20.31 95Cl5(87) 0.357 15.700 20.21 76Cl5(101) 1.42 18.400 20.31 84Cl5(105) 0.654 18.100 20.33 86Cl5(118) 1.2 19.600 20.35 90Cl6(128) 0.26 J 16.400 20.35 79Cl6(138) 1.38 16.700 20.35 75Cl6(153) 1.59 15.300 20.35 67Cl7(170) 0.358 20.800 20.35 100Cl7(180) 0.655 16.700 20.35 79Cl7(183) 0.195 J 15.600 20.25 76Cl7(184) 0.137 U 17.600 20.31 87Cl7(187) 0.265 J 17.000 20.35 82Cl8(195) 0.184 J 16.300 20.35 79Cl9(206) 0.294 J 16.600 20.31 80Cl10(209) 1.1 21.700 20.35 101
Surrogate Recoveries (%)
Cl3(34) 66 73Cl6(152) 65 70
Not Surrogate CorrectedAnalyzed by Restucci Jr, Richard
8/28/2017 MS: S16-0255ECD-Master_128B-Final.xlsx

Project Client: USACE - North Atlantic DivisionProject Name: DAMOS - SedimentProject Number: 100087718
Client ID
Battelle IDSample TypeCollection DateExtraction DateAnalysis DateAnalytical Instrument% Moisture% LipidMatrixSample SizeSize Unit-BasisUnits
4,4'-DDD4,4'-DDE4,4'-DDTaldrina-chlordaneg-chlordanea-BHCb-BHCd-BHCLindanedieldrinendosulfan Iendosulfan IIendosulfan sulfateendrinheptachlorheptachlor epoxidemethoxychlorToxapheneTechnical ChlordaneCl2(8)Cl3(18)Cl3(28)Cl4(44)Cl4(49)Cl4(52)Cl4(66)Cl5(87)Cl5(101)Cl5(105)Cl5(118)Cl6(128)Cl6(138)Cl6(153)Cl7(170)Cl7(180)Cl7(183)Cl7(184)Cl7(187)Cl8(195)Cl9(206)Cl10(209)
Surrogate Recoveries (%)
Cl3(34)Cl6(152)
RAJ-004
K2633MSD-PMSD
9/20/20169/26/20169/30/2016
ECD49.64
NASED7.55
G_DRYUG/KG_DRY Target % Recovery Qualifier RPD (%) Qualifier
26.200 19.88 98 17.719.700 19.87 87 6.719.200 19.87 91 4.515.500 19.87 78 5.015.500 19.91 77 5.114.400 19.88 64 4.616.800 19.88 85 2.318.200 19.88 92 4.319.100 19.88 96 3.118.400 19.87 93 2.115.900 19.88 79 3.716.600 19.89 83 15.617.900 19.92 85 1.218.000 19.89 90 3.315.800 19.88 79 3.719.600 19.88 99 3.014.400 19.89 72 1.415.000 19.88 75 1.353.000 U
253.00014.500 19.91 73 5.313.000 19.95 65 8.816.600 19.95 83 5.815.000 19.95 74 10.315.000 19.87 74 7.815.300 19.89 74 10.317.600 19.91 86 9.914.400 19.81 71 6.816.600 19.91 76 10.017.200 19.93 83 3.618.200 19.95 85 5.715.800 19.95 78 1.316.100 19.95 74 1.314.800 19.95 66 1.519.800 19.95 97 3.015.600 19.95 75 5.215.600 19.85 78 2.616.800 19.91 84 3.516.200 19.95 80 2.515.700 19.95 78 1.315.600 19.91 77 3.820.400 19.95 97 4.0
7166
Not Surrogate CorrectedAnalyzed by Restucci Jr, Richard
8/28/2017 MS: S16-0255ECD-Master_128B-Final.xlsx

Project Client: USACE - North Atlantic DivisionProject Name: DAMOS - SedimentProject Number: 100087718
Client ID RAJ-008 RAJ-008
Battelle ID K2637-P K2637DUP-PSample Type SA QADUCollection Date 09/20/16 9/20/2016Extraction Date 09/26/16 9/26/2016Analysis Date 10/01/16 10/1/2016Analytical Instrument ECD ECD% Moisture 36.59 36.77% Lipid NA NAMatrix SED SEDSample Size 19.01 18.96Size Unit-Basis G_DRY G_DRYUnits UG/KG_DRY UG/KG_DRY RPD Qualifier
4,4'-DDD 0.07 U 0.070 U NA4,4'-DDE 0.126 J 0.155 J NA4,4'-DDT 0.412 0.410 0.5aldrin 0.0493 U 0.049 U NAa-chlordane 0.0519 U 0.052 U NAg-chlordane 0.0467 U 0.047 U NAa-BHC 0.0467 U 0.047 U NAb-BHC 0.07 U 0.070 U NAd-BHC 0.0519 U 0.052 U NALindane 0.0752 U 0.075 U NAdieldrin 0.0493 U 0.049 U NAendosulfan I 0.0547 U 0.055 U NAendosulfan II 0.112 J 0.044 U NAendosulfan sulfate 0.07 U 0.070 U NAendrin 0.0568 U 0.057 U NAheptachlor 0.0857 U 0.086 U NAheptachlor epoxide 0.0519 U 0.052 U NAmethoxychlor 0.205 U 0.205 U NAToxaphene 21 U 21.100 U NATechnical Chlordane NACl2(8) 0.0673 U 0.068 U NACl3(18) 0.0493 U 0.049 U NACl3(28) 0.0389 U 0.039 U NACl4(44) 0.0467 U 0.047 U NACl4(49) 0.0467 U 0.047 U NACl4(52) 0.0647 U 0.065 U NACl4(66) 0.0568 U 0.057 U NACl5(87) 0.0441 U 0.044 U NACl5(101) 0.154 J 0.082 J NACl5(105) 0.166 J 0.158 J NACl5(118) 0.15 J 0.081 U NACl6(128) 0.0441 U 0.044 U NACl6(138) 0.146 J 0.143 J NACl6(153) 0.171 U 0.171 U NACl7(170) 0.0493 U 0.049 U NACl7(180) 0.0842 J 0.074 J NACl7(183) 0.0389 U 0.039 U NACl7(184) 0.106 U 0.106 U NACl7(187) 0.0467 U 0.047 U NACl8(195) 0.0467 U 0.047 U NACl9(206) 0.0441 U 0.044 U NACl10(209) 0.0741 J 0.055 J NA
Surrogate Recoveries (%)
Cl3(34) 70 71Cl6(152) 67 67
Not Surrogate CorrectedAnalyzed by Restucci Jr, Richard
8/28/2017 DUP: S16-0255ECD-Master_128B-Final.xlsx

QA/QC Summary Batch 16-0255
Page 1 of 3
Project: USACE/NAE – DAMOS Program (Portland Disposal Site)
Parameters: PCB and Pesticides
Laboratory: Battelle‐Norwell, MA
Matrix: Sediment
Data Set: DP‐16‐0243
Analytical SOP: 5‐128
Method Reference:
EPA 8081B/8082A modified
Sample Custody
Collection Date Receipt Date Temp (°C)
9/20/2016 9/22/2016 1.8
Corrective Actions No comments.
Sample Storage Samples were stored frozen upon receipt.
Related Samples NA
METHOD SUMMARIES
Sample Preparation
Approximately 30 g of sediment sample was spiked with surrogates and serially extracted three times with dichloromethane using an orbital shaker table. The combined extracts were concentrated by Kuderna‐Danish and nitrogen evaporation techniques. Sample concentrates were further processed by alumina, activated copper cleanup, followed by size‐exclusion HPLC. Final extracts were fortified with internal standard (IS) compounds and submitted for PCB and pesticide analyses by GC/ECD.
Prep comments No comments. Analysis PCB and pesticides were analyzed by gas chromatography electron capture
detection (GC/ECD). An initial calibration consisting of target analytes was analyzed prior to sample analysis to demonstrate the linear range. Calibration verification was performed at the beginning and end of 10 injections or each 24 hour period (whichever is more frequent). Concentrations of target compounds were calculated versus internal standards using the average response factors (RF) generated from the initial calibration.
Analysis Comments
Method ML0497H utilizes the quant sheets and RFs from method ML0497C. Method MM0487 is used to report PCBs 170 and 209 from the secondary column.
Holding Times Extraction Date(s) Analysis Date(s)
9/26/2016 9/30/2016 – 10/1/2016; 10/8/2016

QA/QC Summary Batch 16-0255
Page 2 of 3
Procedural Blank (PB)
A PB was prepared with this analytical batch to ensure the sample extraction and analysis methods are free of contamination.
PB ≤5x MDL; Samples must be >5 X PB
No exceedances noted.
No comments.
Laboratory Control Spike (LCS)
A LCS was prepared with this analytical batch. The percent recoveries of target analytes were calculated to measure accuracy.
40‐120% recovery No exceedances noted.
No comments.
Surrogate Recovery
Surrogate compounds were added prior to extraction. The surrogate recoveries are calculated to measure extraction efficiency.
40‐120% recovery No exceedances noted.
No comments.
Matrix Spike (MS)/Matrix Spike Duplicate (MSD)
A matrix spike set was prepared with this analytical batch. The percent recoveries of target analytes were calculated to measure data quality in terms of accuracy. The relative percent difference (RPD) between the two samples was calculated to measure data quality in terms of precision.
40‐120% recovery ≤30% RPD Analyte conc. >5x background
No exceedances noted.
No comments.
Analytical Duplicate
A sample was prepared in duplicate with this analytical batch. The relative percent difference (RPD) between the two samples was calculated to measure data quality in terms of precision.
≤30% RPD Analyte conc. >5x MDL
No exceedances noted.
No comments.
Standard Reference Material (SRM)
A standard reference material was prepared with this batch to measure data in terms of analytical accuracy.
≤30% difference on average Analyte >5x MDL
No exceedances noted.
Matrix interference in the SRM on the primary column near PCBs 170 and 209 necessitated reporting these analytes from the secondary column for this batch.
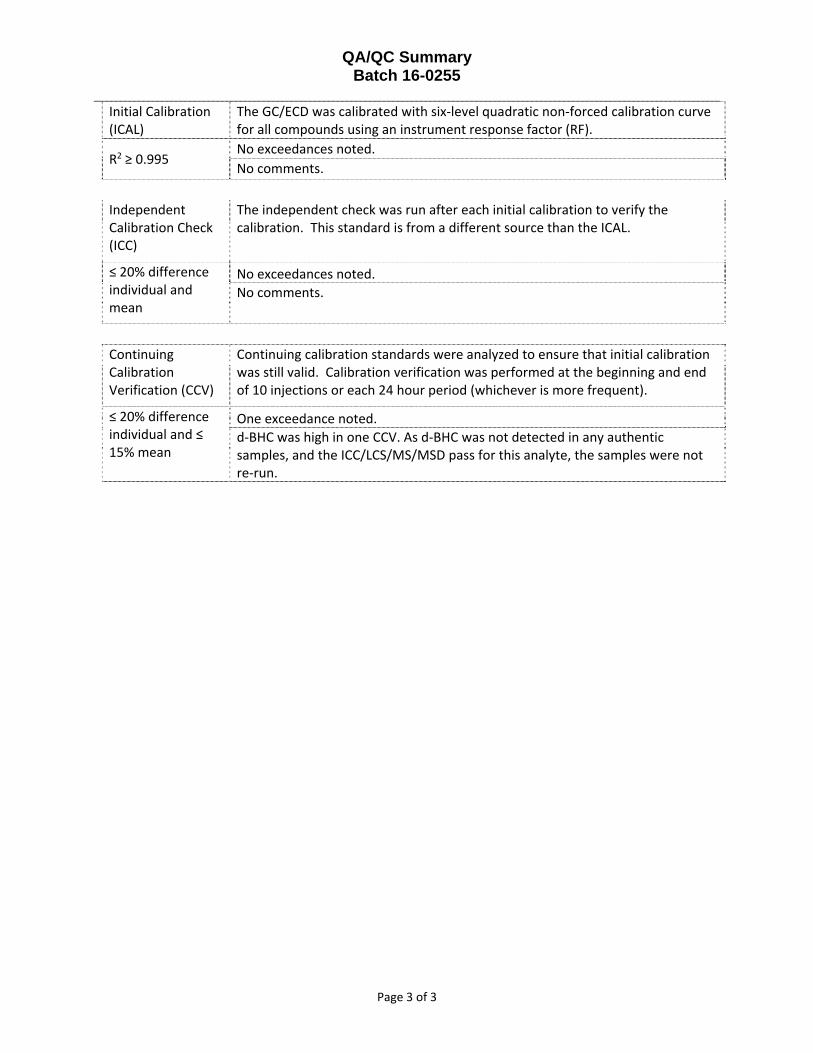
QA/QC Summary Batch 16-0255
Page 3 of 3
Initial Calibration (ICAL)
The GC/ECD was calibrated with six‐level quadratic non‐forced calibration curve for all compounds using an instrument response factor (RF).
R2 ≥ 0.995 No exceedances noted.
No comments.
Independent Calibration Check (ICC)
The independent check was run after each initial calibration to verify the calibration. This standard is from a different source than the ICAL.
≤ 20% difference individual and mean
No exceedances noted.
No comments.
Continuing Calibration Verification (CCV)
Continuing calibration standards were analyzed to ensure that initial calibration was still valid. Calibration verification was performed at the beginning and end of 10 injections or each 24 hour period (whichever is more frequent).
≤ 20% difference individual and ≤ 15% mean
One exceedance noted.
d‐BHC was high in one CCV. As d‐BHC was not detected in any authentic samples, and the ICC/LCS/MS/MSD pass for this analyte, the samples were not re‐run.

Project Client: USACE - North Atlantic DivisionProject Name: DAMOS - SedimentProject Number: 100087718
Client ID RAJ-001 RAJ-002 RAJ-003 RAJ-004
Battelle ID K2630-P K2631-P K2632-P K2633-PSample Type SA SA SA SACollection Date 09/20/16 09/20/16 09/20/16 09/20/16Extraction Date 09/26/16 09/26/16 09/26/16 09/26/16Analysis Date 10/01/16 10/01/16 10/01/16 10/01/16Analytical Instrument MS MS MS MS% Moisture 23.42 43.76 33.52 50.75% Lipid NA NA NA NAMatrix SED SED SED SEDSample Size 22.98 16.89 19.94 14.78Size Unit-Basis G_DRY G_DRY G_DRY G_DRYUnits UG/KG_DRY UG/KG_DRY UG/KG_DRY UG/KG_DRY
Naphthalene 8.480 42.000 63.700 58.3002-Methylnaphthalene 3.720 21.700 21.400 24.5001-Methylnaphthalene 2.740 13.300 18.700 15.000Acenaphthylene 6.680 35.600 36.000 31.000Acenaphthene 4.570 16.700 37.900 16.900Fluorene 5.570 26.500 54.600 26.100Anthracene 21.000 85.700 119.000 67.600Phenanthrene 61.000 245.000 428.000 204.000Fluoranthene 123.000 482.000 866.000 D 489.000Pyrene 121.000 548.000 897.000 D 529.000Benzo(a)anthracene 64.000 230.000 356.000 208.000Chrysene 67.100 267.000 354.000 252.000Benzo(b)fluoranthene 52.400 226.000 283.000 226.000Benzo(k)fluoranthene 56.500 246.000 318.000 231.000Benzo(a)pyrene 62.800 264.000 376.000 238.000Indeno(1,2,3-cd)pyrene 35.400 176.000 238.000 170.000Dibenz(a,h)anthracene 8.700 42.600 55.000 37.600Benzo(g,h,i)perylene 39.100 182.000 241.000 175.000
Surrogate Recoveries (%)
Naphthalene-d8 59 65 63 61Acenaphthene-d10 67 72 69 67Phenanthrene-d10 73 77 75 73Benzo(a)pyrene-d12 71 77 75 72
Not Surrogate CorrectedAnalyzed by Meara, Michael
8/28/2017 Main: S16-0255MS-Master_157-Final.xlsx

Project Client: USACE - North Atlantic DivisionProject Name: DAMOS - SedimentProject Number: 100087718
Client ID
Battelle IDSample TypeCollection DateExtraction DateAnalysis DateAnalytical Instrument% Moisture% LipidMatrixSample SizeSize Unit-BasisUnits
Naphthalene2-Methylnaphthalene1-MethylnaphthaleneAcenaphthyleneAcenaphtheneFluoreneAnthracenePhenanthreneFluoranthenePyreneBenzo(a)anthraceneChryseneBenzo(b)fluorantheneBenzo(k)fluorantheneBenzo(a)pyreneIndeno(1,2,3-cd)pyreneDibenz(a,h)anthraceneBenzo(g,h,i)perylene
Surrogate Recoveries (%)
Naphthalene-d8Acenaphthene-d10Phenanthrene-d10Benzo(a)pyrene-d12
RAJ-005 RAJ-006 RAJ-007 RAJ-008
K2634-P K2635-P K2636-P K2637-PSA SA SA SA
09/20/16 09/20/16 09/20/16 09/20/1609/26/16 09/26/16 09/26/16 09/26/1610/01/16 10/01/16 10/01/16 10/01/16
MS MS MS MS43.06 51.8 34.57 36.59
NA NA NA NASED SED SED SED
17.13 14.46 19.66 19.01G_DRY G_DRY G_DRY G_DRY
UG/KG_DRY UG/KG_DRY UG/KG_DRY UG/KG_DRY
19.000 23.200 7.080 7.2406.080 9.500 3.550 3.5804.310 5.800 2.510 2.490
13.300 12.900 7.540 6.20012.800 8.060 2.920 3.16010.900 11.800 4.540 5.06022.300 29.300 14.100 13.60099.800 100.000 47.200 50.600
317.000 237.000 104.000 93.900287.000 227.000 101.000 89.600110.000 99.500 48.300 42.800148.000 126.000 52.900 50.300130.000 120.000 47.900 42.700135.000 121.000 50.200 47.700129.000 125.000 53.200 50.400101.000 92.500 38.500 33.30022.200 21.600 5.550 6.73097.400 99.400 37.300 34.000
56 58 59 6161 68 67 6866 72 72 7365 73 73 73
Not Surrogate CorrectedAnalyzed by Meara, Michael
8/28/2017 Main: S16-0255MS-Master_157-Final.xlsx

Project Client: USACE - North Atlantic DivisionProject Name: DAMOS - SedimentProject Number: 100087718
Client ID
Battelle IDSample TypeCollection DateExtraction DateAnalysis DateAnalytical Instrument% Moisture% LipidMatrixSample SizeSize Unit-BasisUnits
Naphthalene2-Methylnaphthalene1-MethylnaphthaleneAcenaphthyleneAcenaphtheneFluoreneAnthracenePhenanthreneFluoranthenePyreneBenzo(a)anthraceneChryseneBenzo(b)fluorantheneBenzo(k)fluorantheneBenzo(a)pyreneIndeno(1,2,3-cd)pyreneDibenz(a,h)anthraceneBenzo(g,h,i)perylene
Surrogate Recoveries (%)
Naphthalene-d8Acenaphthene-d10Phenanthrene-d10Benzo(a)pyrene-d12
RAJ-009 RAJ-010 RAJ-011 RAJ-012
K2638-P K2639-P K2641-P K2642-PSA SA SA SA
09/20/16 09/20/16 09/20/16 09/20/1609/26/16 09/26/16 09/26/16 09/26/1610/01/16 10/01/16 10/01/16 10/01/16
MS MS MS MS24.02 24.76 28.52 36.27
NA NA NA NASED SED SED SED
22.85 22.59 21.43 19.11G_DRY G_DRY G_DRY G_DRY
UG/KG_DRY UG/KG_DRY UG/KG_DRY UG/KG_DRY
2.340 0.947 1.210 1.7601.280 0.630 J 0.763 J 1.1900.875 0.430 J 0.567 J 0.857 J1.920 0.930 1.290 1.8400.995 0.249 J 0.411 J 0.740 J1.360 0.391 J 0.706 J 1.0803.440 0.826 J 1.520 3.380
14.800 5.020 8.670 13.20029.900 11.000 18.200 27.40028.300 10.400 17.400 25.80013.000 4.890 8.040 12.00017.700 6.700 10.900 15.60014.900 6.130 8.710 12.60015.400 6.480 9.660 15.60017.000 6.820 11.400 16.00011.200 4.390 6.250 11.3002.370 0.969 1.380 2.010
12.200 5.670 7.980 11.800
63 68 66 6270 74 72 6875 78 77 7273 74 73 67
Not Surrogate CorrectedAnalyzed by Meara, Michael
8/28/2017 Main: S16-0255MS-Master_157-Final.xlsx

Project Client: USACE - North Atlantic DivisionProject Name: DAMOS - SedimentProject Number: 100087718
Client ID Procedural Blank
Battelle ID CJ663PB-PSample Type PBCollection Date 09/26/16Extraction Date 09/26/16Analysis Date 09/30/16Analytical Instrument MS% Moisture 35.92 % Lipid NAMatrix SEDIMENTSample Size 19.26Size Unit-Basis G_DRYUnits UG/KG_DRY
Naphthalene 0.179 U2-Methylnaphthalene 0.146 U1-Methylnaphthalene 0.195 UAcenaphthylene 0.322 UAcenaphthene 0.154 UFluorene 0.174 UAnthracene 0.225 UPhenanthrene 0.228 UFluoranthene 0.363 UPyrene 0.509 UBenzo(a)anthracene 0.312 UChrysene 0.54 UBenzo(b)fluoranthene 0.402 UBenzo(k)fluoranthene 0.545 UBenzo(a)pyrene 0.853 UIndeno(1,2,3-cd)pyrene 0.432 UDibenz(a,h)anthracene 0.404 UBenzo(g,h,i)perylene 0.524 U
Surrogate Recoveries (%)
Naphthalene-d8 79Acenaphthene-d10 82Phenanthrene-d10 84Benzo(a)pyrene-d12 69
Not Surrogate CorrectedAnalyzed by Meara, Michael
8/28/2017 PB: S16-0255MS-Master_157-Final.xlsx
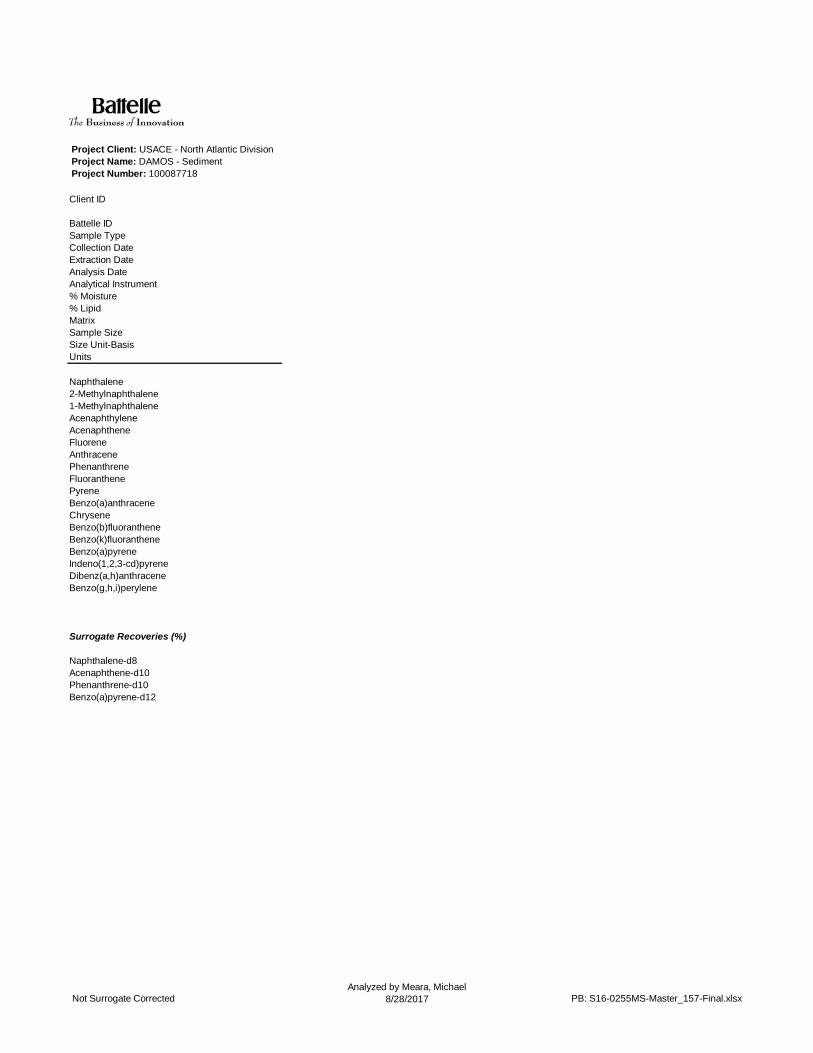
Project Client: USACE - North Atlantic DivisionProject Name: DAMOS - SedimentProject Number: 100087718
Client ID
Battelle IDSample TypeCollection DateExtraction DateAnalysis DateAnalytical Instrument% Moisture% LipidMatrixSample SizeSize Unit-BasisUnits
Naphthalene2-Methylnaphthalene1-MethylnaphthaleneAcenaphthyleneAcenaphtheneFluoreneAnthracenePhenanthreneFluoranthenePyreneBenzo(a)anthraceneChryseneBenzo(b)fluorantheneBenzo(k)fluorantheneBenzo(a)pyreneIndeno(1,2,3-cd)pyreneDibenz(a,h)anthraceneBenzo(g,h,i)perylene
Surrogate Recoveries (%)
Naphthalene-d8Acenaphthene-d10Phenanthrene-d10Benzo(a)pyrene-d12
Not Surrogate CorrectedAnalyzed by Meara, Michael
8/28/2017 PB: S16-0255MS-Master_157-Final.xlsx

Project Client: USACE - North Atlantic DivisionProject Name: DAMOS - SedimentProject Number: 100087718
Client IDLaboratory Control
Sample
Battelle ID CJ664LCS-PSample Type LCSCollection Date 09/26/16Extraction Date 09/26/16Analysis Date 09/30/16Analytical Instrument MS% Moisture 35.92% Lipid NAMatrix SEDIMENTSample Size 19.25Size Unit-Basis G_DRYUnits UG/KG_DRY Target % Recovery Qualifier
Naphthalene 59.6 78.14 762-Methylnaphthalene 59.6 78.14 761-Methylnaphthalene 60.1 78.12 77Acenaphthylene 55 78.17 70Acenaphthene 58.6 78.13 75Fluorene 58.3 78.19 75Anthracene 56.5 78.12 72Phenanthrene 62.7 78.09 80Fluoranthene 60.6 78.17 78Pyrene 60.6 78.13 78Benzo(a)anthracene 56.5 78.16 72Chrysene 62 78.09 79Benzo(b)fluoranthene 54.7 78.23 70Benzo(k)fluoranthene 62.9 78.12 81Benzo(a)pyrene 51.8 78.04 66Indeno(1,2,3-cd)pyrene 45.2 78.13 58Dibenz(a,h)anthracene 53.5 78.07 69Benzo(g,h,i)perylene 57.2 78.18 73
Surrogate Recoveries (%)
Naphthalene-d8 76Acenaphthene-d10 79Phenanthrene-d10 84Benzo(a)pyrene-d12 72
Not Surrogate CorrectedAnalyzed by Meara, Michael
8/28/2017 LCS: S16-0255MS-Master_157-Final.xlsx

Project Client: USACE - North Atlantic DivisionProject Name: DAMOS - SedimentProject Number: 100087718
Client ID 160826-03: SRM 1944
Battelle ID CJ665SRM-PSample Type SRMCollection Date 09/26/16Extraction Date 09/26/16Analysis Date 10/01/16Analytical Instrument MS% Moisture 1.3% Lipid NAMatrix SEDIMENTSample Size 1.02Size Unit-Basis G_DRY Certified Passing ActualUnits UG/KG_DRY Value +/- %Difference %Difference Qualifier
Naphthalene 9422-Methylnaphthalene 4901-Methylnaphthalene 354Acenaphthylene 526Acenaphthene 207Fluorene 212Anthracene 760Phenanthrene 4490 5270 219.76 34.17 14.8Fluoranthene 8180 8920 320.23 33.59 8.3Pyrene 8060 9700 420.01 34.33 16.9Benzo(a)anthracene 3440 4720 109.98 32.33 27.1Chrysene 4820 5900 369.99 36.27 18.3Benzo(b)fluoranthene 3520 3870 419.90 40.85 9Benzo(k)fluoranthene 3890 4390 640.06 44.58 11.4Benzo(a)pyrene 2950 4300 129.99 33.02 31.4Indeno(1,2,3-cd)pyrene 2710 2780 100.08 33.6 2.5Dibenz(a,h)anthracene 700 759 81.97 40.8 7.8Benzo(g,h,i)perylene 2840 2840 99.97 33.52 0
Surrogate Recoveries (%)
Naphthalene-d8 69Acenaphthene-d10 74Phenanthrene-d10 82Benzo(a)pyrene-d12 76
Surrogate CorrectedAnalyzed by Meara, Michael
8/28/2017 SRM: S16-0255MS-Master_157-Final.xlsx
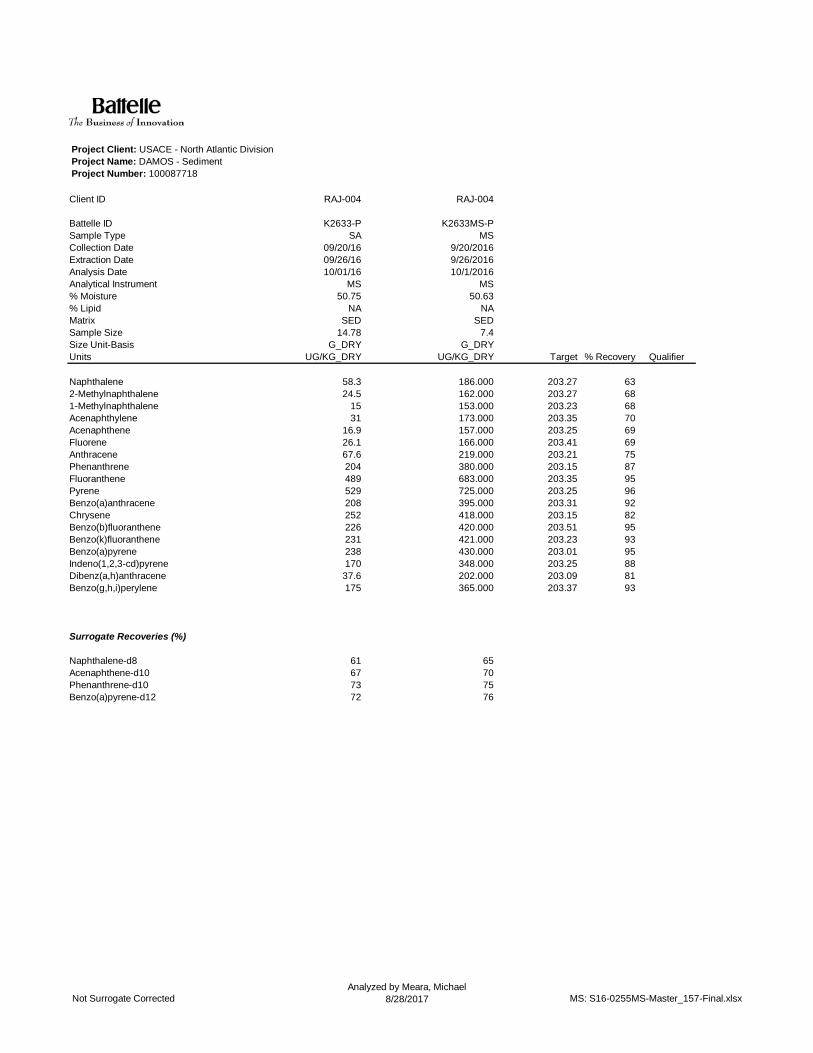
Project Client: USACE - North Atlantic DivisionProject Name: DAMOS - SedimentProject Number: 100087718
Client ID RAJ-004 RAJ-004
Battelle ID K2633-P K2633MS-PSample Type SA MSCollection Date 09/20/16 9/20/2016Extraction Date 09/26/16 9/26/2016Analysis Date 10/01/16 10/1/2016Analytical Instrument MS MS% Moisture 50.75 50.63% Lipid NA NAMatrix SED SEDSample Size 14.78 7.4Size Unit-Basis G_DRY G_DRYUnits UG/KG_DRY UG/KG_DRY Target % Recovery Qualifier
Naphthalene 58.3 186.000 203.27 632-Methylnaphthalene 24.5 162.000 203.27 681-Methylnaphthalene 15 153.000 203.23 68Acenaphthylene 31 173.000 203.35 70Acenaphthene 16.9 157.000 203.25 69Fluorene 26.1 166.000 203.41 69Anthracene 67.6 219.000 203.21 75Phenanthrene 204 380.000 203.15 87Fluoranthene 489 683.000 203.35 95Pyrene 529 725.000 203.25 96Benzo(a)anthracene 208 395.000 203.31 92Chrysene 252 418.000 203.15 82Benzo(b)fluoranthene 226 420.000 203.51 95Benzo(k)fluoranthene 231 421.000 203.23 93Benzo(a)pyrene 238 430.000 203.01 95Indeno(1,2,3-cd)pyrene 170 348.000 203.25 88Dibenz(a,h)anthracene 37.6 202.000 203.09 81Benzo(g,h,i)perylene 175 365.000 203.37 93
Surrogate Recoveries (%)
Naphthalene-d8 61 65Acenaphthene-d10 67 70Phenanthrene-d10 73 75Benzo(a)pyrene-d12 72 76
Not Surrogate CorrectedAnalyzed by Meara, Michael
8/28/2017 MS: S16-0255MS-Master_157-Final.xlsx

Project Client: USACE - North Atlantic DivisionProject Name: DAMOS - SedimentProject Number: 100087718
Client ID
Battelle IDSample TypeCollection DateExtraction DateAnalysis DateAnalytical Instrument% Moisture% LipidMatrixSample SizeSize Unit-BasisUnits
Naphthalene2-Methylnaphthalene1-MethylnaphthaleneAcenaphthyleneAcenaphtheneFluoreneAnthracenePhenanthreneFluoranthenePyreneBenzo(a)anthraceneChryseneBenzo(b)fluorantheneBenzo(k)fluorantheneBenzo(a)pyreneIndeno(1,2,3-cd)pyreneDibenz(a,h)anthraceneBenzo(g,h,i)perylene
Surrogate Recoveries (%)
Naphthalene-d8Acenaphthene-d10Phenanthrene-d10Benzo(a)pyrene-d12
RAJ-004
K2633MSD-PMSD
9/20/20169/26/201610/1/2016
MS49.64
NASED7.55
G_DRYUG/KG_DRY Target % Recovery Qualifier RPD (%) Qualifier
193.000 199.23 68 7.6167.000 199.23 72 5.7159.000 199.19 72 5.7213.000 199.31 91 26.1182.000 199.21 83 18.4182.000 199.37 78 12.2320.000 199.17 127 n 51.5 n467.000 199.11 132 n 41.1 n
1050.000 199.31 281 n 98.9 n1100.000 199.21 287 n 99.7 n
586.000 199.27 190 n 69.5 n576.000 199.11 163 n 66.1 n522.000 199.47 148 n 43.6 n548.000 199.19 159 n 52.4 n597.000 198.97 180 n 61.8 n437.000 199.21 134 n 41.4 n222.000 199.05 93 13.8441.000 199.33 133 n 35.4 n
67747979
Not Surrogate CorrectedAnalyzed by Meara, Michael
8/28/2017 MS: S16-0255MS-Master_157-Final.xlsx
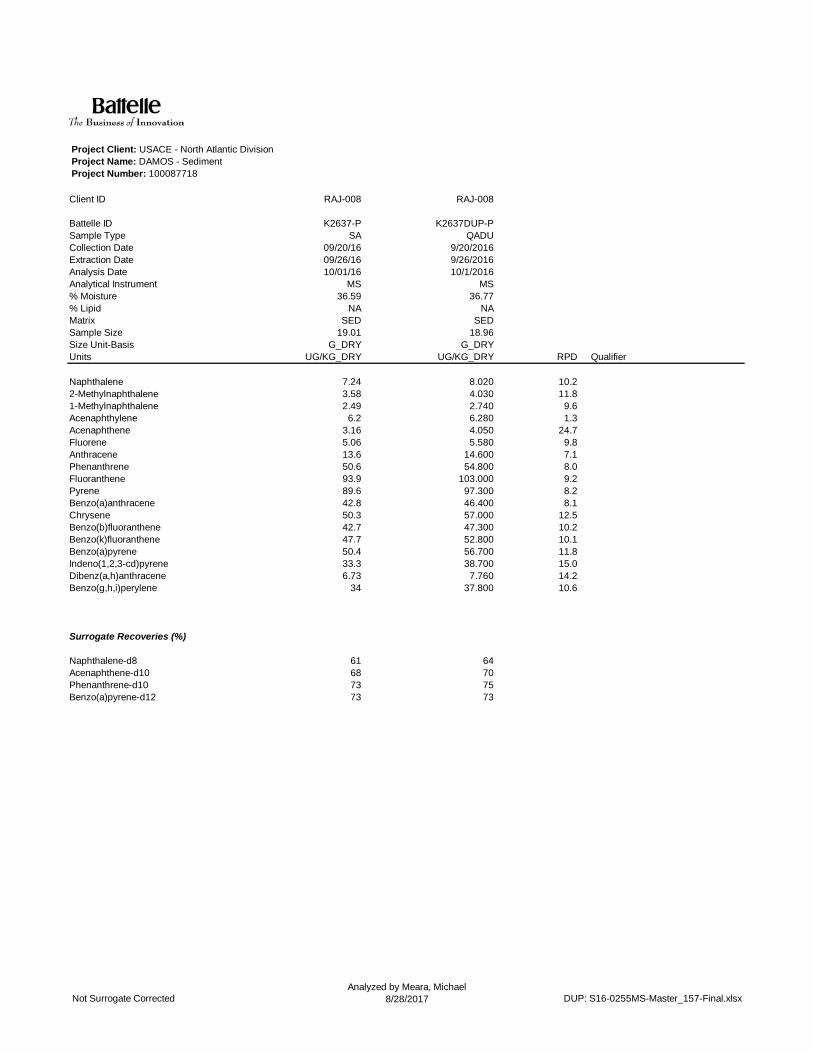
Project Client: USACE - North Atlantic DivisionProject Name: DAMOS - SedimentProject Number: 100087718
Client ID RAJ-008 RAJ-008
Battelle ID K2637-P K2637DUP-PSample Type SA QADUCollection Date 09/20/16 9/20/2016Extraction Date 09/26/16 9/26/2016Analysis Date 10/01/16 10/1/2016Analytical Instrument MS MS% Moisture 36.59 36.77% Lipid NA NAMatrix SED SEDSample Size 19.01 18.96Size Unit-Basis G_DRY G_DRYUnits UG/KG_DRY UG/KG_DRY RPD Qualifier
Naphthalene 7.24 8.020 10.22-Methylnaphthalene 3.58 4.030 11.81-Methylnaphthalene 2.49 2.740 9.6Acenaphthylene 6.2 6.280 1.3Acenaphthene 3.16 4.050 24.7Fluorene 5.06 5.580 9.8Anthracene 13.6 14.600 7.1Phenanthrene 50.6 54.800 8.0Fluoranthene 93.9 103.000 9.2Pyrene 89.6 97.300 8.2Benzo(a)anthracene 42.8 46.400 8.1Chrysene 50.3 57.000 12.5Benzo(b)fluoranthene 42.7 47.300 10.2Benzo(k)fluoranthene 47.7 52.800 10.1Benzo(a)pyrene 50.4 56.700 11.8Indeno(1,2,3-cd)pyrene 33.3 38.700 15.0Dibenz(a,h)anthracene 6.73 7.760 14.2Benzo(g,h,i)perylene 34 37.800 10.6
Surrogate Recoveries (%)
Naphthalene-d8 61 64Acenaphthene-d10 68 70Phenanthrene-d10 73 75Benzo(a)pyrene-d12 73 73
Not Surrogate CorrectedAnalyzed by Meara, Michael
8/28/2017 DUP: S16-0255MS-Master_157-Final.xlsx

Project Client: USACE - North Atlantic DivisionProject Name: DAMOS - SedimentProject Number: 100087718
Client ID
Battelle IDSample TypeCollection DateExtraction DateAnalysis DateAnalytical Instrument% Moisture% LipidMatrixSample SizeSize Unit-BasisUnits
Naphthalene2-Methylnaphthalene1-MethylnaphthaleneAcenaphthyleneAcenaphtheneFluoreneAnthracenePhenanthreneFluoranthenePyreneBenzo(a)anthraceneChryseneBenzo(b)fluorantheneBenzo(k)fluorantheneBenzo(a)pyreneIndeno(1,2,3-cd)pyreneDibenz(a,h)anthraceneBenzo(g,h,i)perylene
Surrogate Recoveries (%)
Naphthalene-d8Acenaphthene-d10Phenanthrene-d10Benzo(a)pyrene-d12
Not Surrogate CorrectedAnalyzed by Meara, Michael
8/28/2017 DUP: S16-0255MS-Master_157-Final.xlsx

QA/QC Summary Batch 16-0255
Page 1 of 3
Project: USACE/NAE – DAMOS Program (Portland Disposal Site)
Parameters: PAH
Laboratory: Battelle‐Norwell, MA
Matrix: Sediment
Data Set: DP‐16‐0244
Analytical SOP: 5‐157
Method Reference:
EPA 8270D modified
Sample Custody
Collection Date Receipt Date Temp (°C)
9/20/2016 9/22/2016 1.8
Corrective Actions No comments.
Sample Storage Samples were stored frozen upon receipt.
Related Samples NA
METHOD SUMMARIES
Sample Preparation
Approximately 30 grams of sediment sample was spiked with surrogates and serially extracted three times with dichloromethane using an orbital shaker table. The combined extracts were concentrated by Kuderna‐Danish and nitrogen evaporation techniques. Sample concentrates were further processed by alumina, activated copper cleanup, followed by size‐exclusion HPLC cleanup. The final cleaned extracts were concentrated, spiked with internal standards and submitted for PAH analysis by GC/MS.
Prep comments No comments. Analysis PAH were measured by gas chromatography‐mass spectrometry (GC/MS) in the
selected ion mode (SIM). An initial calibration consisting of representative target analytes was analyzed prior to analysis to demonstrate the linear range of analysis. Calibration verification was performed at the beginning and end of 10 injections or each 24‐hour period (whichever is more frequent). Target PAH were quantified using the average response factors (RF) generated from the initial calibration.
Analysis Comments
Method MG1137C uses the response factor (RF) from MG1137 and the quantitation reports from this are included for reference.
Holding Times Extraction Date(s) Analysis Date(s)
9/26/2016 9/30/2016 – 10/1/2016; 10/7/2016
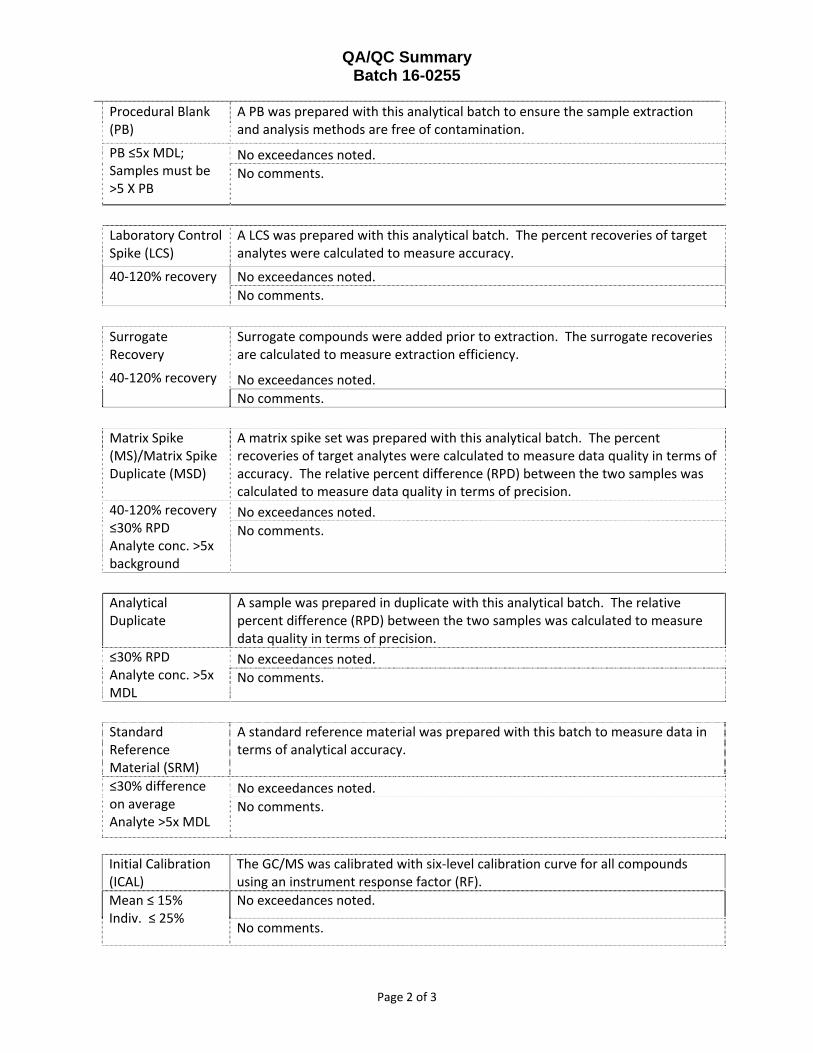
QA/QC Summary Batch 16-0255
Page 2 of 3
Procedural Blank (PB)
A PB was prepared with this analytical batch to ensure the sample extraction and analysis methods are free of contamination.
PB ≤5x MDL; Samples must be >5 X PB
No exceedances noted.
No comments.
Laboratory Control Spike (LCS)
A LCS was prepared with this analytical batch. The percent recoveries of target analytes were calculated to measure accuracy.
40‐120% recovery No exceedances noted.
No comments.
Surrogate Recovery
Surrogate compounds were added prior to extraction. The surrogate recoveries are calculated to measure extraction efficiency.
40‐120% recovery No exceedances noted.
No comments.
Matrix Spike (MS)/Matrix Spike Duplicate (MSD)
A matrix spike set was prepared with this analytical batch. The percent recoveries of target analytes were calculated to measure data quality in terms of accuracy. The relative percent difference (RPD) between the two samples was calculated to measure data quality in terms of precision.
40‐120% recovery ≤30% RPD Analyte conc. >5x background
No exceedances noted.
No comments.
Analytical Duplicate
A sample was prepared in duplicate with this analytical batch. The relative percent difference (RPD) between the two samples was calculated to measure data quality in terms of precision.
≤30% RPD Analyte conc. >5x MDL
No exceedances noted.
No comments.
Standard Reference Material (SRM)
A standard reference material was prepared with this batch to measure data in terms of analytical accuracy.
≤30% difference on average Analyte >5x MDL
No exceedances noted.
No comments.
Initial Calibration (ICAL)
The GC/MS was calibrated with six‐level calibration curve for all compounds using an instrument response factor (RF).
Mean ≤ 15% Indiv. ≤ 25%
No exceedances noted.
No comments.

QA/QC Summary Batch 16-0255
Page 3 of 3
Independent Calibration Check (ICC)
The independent check was run after each initial calibration to verify the calibration. This standard is from a different source than the ICAL.
≤ 25% difference individual and mean
No exceedances noted.
No comments.
Continuing Calibration Verification (CCV)
Continuing calibration standards were performed at the beginning and end of 10 injections or each 24‐hour period (whichever is more frequent) to ensure that initial calibration is still valid.
≤ 25% difference individual and ≤ 15% mean
No exceedances noted.
No comments.

DAMOS 2016
Portland Disposal Site
Sediment Metals Results
Envirosystems Inc (ESI)

CHEMICAL ANALYSISOF A MARINE SEDIMENT:
Tier III Sediment EvaluationDAMOS Portland Disposal Site (RDS) Survey
New England District Corps of EngineersApplication Number:
Prepared For:
Lisa LefkovitzBattelle
141 Longwater Dr. Suite 202
Norwell, MA 02061
Prepared By:
EnviroSystems, IncorporatedOne Lafayette Road
Hampton, New Hampshire 03842
EnviroSystems, Inc. Sample Delivery Group Reference 28209
DAMOS Portland Disposal Site Survey. Sediment Analysis. US Army Corps of Engineers Application Number ______. ESI Study 28209.
Page 1 of 41

LABORATORY STANDARDS STATEMENT
This study was performed by EnviroSystems, Incorporated at its facility in Hampton,New Hampshire. EnviroSystems’ laboratory is accredited by the State of New Hampshire underthe National Environmental Laboratory Accreditation (NELAC) program. Additionally, ESI isaccredited under the Department of Defense (DoD) ELAP program, ISO/IEC 17025:2005,Certificate Number L2340. All testing conducted by EnviroSystems as part of this program wascompliant with NELAC guidelines and standards. Additionally, this study was conducted inaccordance with guidelines presented in the 2004 version of the New England District’sRegional Implementation Manual (RIM) for Evaluation of Dredged Material Proposed forDisposal In New England Waters. Any deviations from specific elements of the RIM aredetailed in the Protocol Deviation Section of this Report.
For EnviroSystems, Inc. November 11, 2016Kenneth A. Simon DateTechnical Director
DAMOS Portland Disposal Site Survey. Sediment Analysis. US Army Corps of Engineers Application Number ______. ESI Study 28209.
Page 2 of 41

CHEMICAL ANALYSISOF A MARINE SEDIMENT:
DAMOS Portland Disposal Site (RDS) SurveyTier III Sediment Evaluation
1.0 SAMPLE COLLECTION, PRESERVATION AND STORAGE
Sediment samples and equipment blanks for chemical analysis were collected and provided byBattelle of Norwell, Massachusetts from locations specified within the project’s proposed footprint.Samples were received under chain of custody in sample containers appropriate for the specified analysis.Upon arrival at the laboratory, all samples received an internal sample control number and were loggedinto the project sample control system. Samples were placed in a secure sample holding location andstored at a temperature of 4±2EC until analysis.
2.0 ANALYSIS
Sample analysis was carried out following methods and protocol specified in the RIM byEnviroSystems, Inc. at its Hampton, NH facility. Review of the data report document showed that allsample holding times were met, unless otherwise qualified, that the analytical methods used in theanalysis were appropriate for the parameter and sample matrix and met New England District RegionalImplementation Manual requirements. Review of supporting quality assurance data documented that,ecept where qualified, all data collected meet all of the requirements of NELAC, for all NELAC accreditedparameters.
3.0 RESULTS
Analytical methods used in the analysis of sediment samples were analyzed using protocolrecommended in Tables 2 and 3 of the New England District RIM document with appropriate updatesrelated to current methods. Analytical methods used in the analysis of water samples were analyzed usingprotocol recommended in Table 5 of the New England District RIM document with appropriate updatesrelated to current methods. Trace metals were evaluated using EPA Method 6020, Inductively CoupledPlasma - Mass Spectrometry (ICP-MS), mercury was evaluated using EPA Method 245.7, Cold VaporAtomic Fluorescence Spectrometry. In cases where dilution of the sample extract was required the finalreporting limit remained below the RIM document specified limits and did not result in artificial “NonDetects.”
A full copy of the analytical report is included in the following data appendix
DAMOS Portland Disposal Site Survey. Sediment Analysis. US Army Corps of Engineers Application Number ______. ESI Study 28209.
Page 3 of 41

TABLE OF CONTENTS
Report Element Number ofPages
PageNumber
Laboratory Standards Statement 1 2
Sample Collection, Analysis and Results 1 3
Sediment Analysis
Trace Metals Analysis 13 5
QC Support
Trace Metals Sediment QC Support 9 18
Trace Metals Water QC Support 9 27
New England District Quality Control Summary Tables 2 36
ESI Analytical Report Review Checklist 1 38
Battelle QA Statement 1 39
Sample Support Documents
COC, Sample Receipt Record 2 40
Total Pages 41
DAMOS Portland Disposal Site Survey. Sediment Analysis. US Army Corps of Engineers Application Number ______. ESI Study 28209.
Page 4 of 41

SDG:28209Report No:USACE DAMOS Portland Disposal Site (RDS) SurveyProject:
RAJ-001Sample ID:SolidMatrix:09/20/16 0855Sampled:
INIT/Method/ReferenceDate of DateUnitsQuantResultParameterAnalysisPrepared Limit
AC /160.3 EPA 600/4/79/02010/14/16 093010/11/16 1715%0.1 76.828209-001Percent SolidsJLH/SW846 3rd Ed. 602010/13/16 210610/12/16 0900ug/g dry wt0.2 3.1328209-001Arsenic, totalJLH/SW846 3rd Ed. 602010/13/16 210610/12/16 0900ug/g dry wt0.02 0.0428209-001Cadmium, totalJLH/SW846 3rd Ed. 602010/13/16 210610/12/16 0900ug/g dry wt0.2 10.728209-001Chromium, totalJLH/SW846 3rd Ed. 602010/13/16 210610/12/16 0900ug/g dry wt0.2 5.8628209-001Copper, totalJLH/SW846 3rd Ed. 602010/13/16 210610/12/16 0900ug/g dry wt0.2 7.2728209-001Lead, totalJLH/EPA 245.710/18/16 103010/12/16 0900ug/g dry wt0.01 0.02828209-001Mercury, totalJLH/SW846 3rd Ed. 602010/13/16 210610/12/16 0900ug/g dry wt0.4 6.5428209-001Nickel, totalJLH/SW846 3rd Ed. 602010/13/16 210610/12/16 0900ug/g dry wt0.8 21.128209-001Zinc, total
Notes:
ESI___________________________________________________________________________________________________________________ EnviroSystems, Inc. P.O. Box 778 Hampton, NH 03842-0778 603-926-3345 fax 603-926-3521 www.envirosystems.com
DAMOS Portland Disposal Site Survey. Sediment Analysis. US Army Corps of Engineers Application Number ______. ESI Study 28209.
Page 5 of 41

SDG:28209Report No:USACE DAMOS Portland Disposal Site (RDS) SurveyProject:
RAJ-002Sample ID:SolidMatrix:09/20/16 0905Sampled:
INIT/Method/ReferenceDate of DateUnitsQuantResultParameterAnalysisPrepared Limit
AC /160.3 EPA 600/4/79/02010/14/16 093010/11/16 1715%0.1 55.128209-002Percent SolidsJLH/SW846 3rd Ed. 602010/13/16 211110/12/16 0900ug/g dry wt0.3 8.0328209-002Arsenic, totalJLH/SW846 3rd Ed. 602010/13/16 211110/12/16 0900ug/g dry wt0.03 0.2928209-002Cadmium, totalJLH/SW846 3rd Ed. 602010/13/16 211110/12/16 0900ug/g dry wt0.3 26.328209-002Chromium, totalJLH/SW846 3rd Ed. 602010/13/16 211110/12/16 0900ug/g dry wt0.3 17.428209-002Copper, totalJLH/SW846 3rd Ed. 602010/13/16 211110/12/16 0900ug/g dry wt0.3 30.128209-002Lead, totalJLH/EPA 245.710/18/16 103010/12/16 0900ug/g dry wt0.07 0.1928209-002Mercury, totalJLH/SW846 3rd Ed. 602010/13/16 211110/12/16 0900ug/g dry wt0.7 15.628209-002Nickel, totalJLH/SW846 3rd Ed. 602010/13/16 211110/12/16 0900ug/g dry wt1 68.828209-002Zinc, total
Notes:
ESI___________________________________________________________________________________________________________________ EnviroSystems, Inc. P.O. Box 778 Hampton, NH 03842-0778 603-926-3345 fax 603-926-3521 www.envirosystems.com
DAMOS Portland Disposal Site Survey. Sediment Analysis. US Army Corps of Engineers Application Number ______. ESI Study 28209.
Page 6 of 41

SDG:28209Report No:USACE DAMOS Portland Disposal Site (RDS) SurveyProject:
RAJ-003Sample ID:SolidMatrix:09/20/16 0922Sampled:
INIT/Method/ReferenceDate of DateUnitsQuantResultParameterAnalysisPrepared Limit
AC /160.3 EPA 600/4/79/02010/14/16 093010/11/16 1715%0.1 66.228209-003Percent SolidsJLH/SW846 3rd Ed. 602010/13/16 211710/12/16 0900ug/g dry wt0.3 6.6928209-003Arsenic, totalJLH/SW846 3rd Ed. 602010/13/16 211710/12/16 0900ug/g dry wt0.03 0.1128209-003Cadmium, totalJLH/SW846 3rd Ed. 602010/13/16 211710/12/16 0900ug/g dry wt0.3 28.428209-003Chromium, totalJLH/SW846 3rd Ed. 602010/13/16 211710/12/16 0900ug/g dry wt0.3 18.128209-003Copper, totalJLH/SW846 3rd Ed. 602010/13/16 211710/12/16 0900ug/g dry wt0.3 29.728209-003Lead, totalJLH/EPA 245.710/18/16 103010/12/16 0900ug/g dry wt0.03 0.06628209-003Mercury, totalJLH/SW846 3rd Ed. 602010/13/16 211710/12/16 0900ug/g dry wt0.6 20.028209-003Nickel, totalJLH/SW846 3rd Ed. 602010/13/16 211710/12/16 0900ug/g dry wt1 74.628209-003Zinc, total
Notes:
ESI___________________________________________________________________________________________________________________ EnviroSystems, Inc. P.O. Box 778 Hampton, NH 03842-0778 603-926-3345 fax 603-926-3521 www.envirosystems.com
DAMOS Portland Disposal Site Survey. Sediment Analysis. US Army Corps of Engineers Application Number ______. ESI Study 28209.
Page 7 of 41

SDG:28209Report No:USACE DAMOS Portland Disposal Site (RDS) SurveyProject:
RAJ-004Sample ID:SolidMatrix:09/20/16 0936Sampled:
INIT/Method/ReferenceDate of DateUnitsQuantResultParameterAnalysisPrepared Limit
AC /160.3 EPA 600/4/79/02010/14/16 093010/11/16 1715%0.1 46.928209-004Percent SolidsJLH/SW846 3rd Ed. 602010/13/16 201910/12/16 0900ug/g dry wt0.5 9.9928209-004Arsenic, totalJLH/SW846 3rd Ed. 602010/13/16 201910/12/16 0900ug/g dry wt0.05 0.3928209-004Cadmium, totalJLH/SW846 3rd Ed. 602010/13/16 201910/12/16 0900ug/g dry wt0.5 37.628209-004Chromium, totalJLH/SW846 3rd Ed. 602010/13/16 201910/12/16 0900ug/g dry wt0.5 25.328209-004Copper, totalJLH/SW846 3rd Ed. 602010/13/16 201910/12/16 0900ug/g dry wt0.5 37.128209-004Lead, totalJLH/EPA 245.710/18/16 103010/12/16 0900ug/g dry wt0.05 0.2328209-004Mercury, totalJLH/SW846 3rd Ed. 602010/13/16 201910/12/16 0900ug/g dry wt1 22.728209-004Nickel, totalJLH/SW846 3rd Ed. 602010/13/16 201910/12/16 0900ug/g dry wt2 91.228209-004Zinc, total
Notes:
ESI___________________________________________________________________________________________________________________ EnviroSystems, Inc. P.O. Box 778 Hampton, NH 03842-0778 603-926-3345 fax 603-926-3521 www.envirosystems.com
DAMOS Portland Disposal Site Survey. Sediment Analysis. US Army Corps of Engineers Application Number ______. ESI Study 28209.
Page 8 of 41

SDG:28209Report No:USACE DAMOS Portland Disposal Site (RDS) SurveyProject:
RAJ-005Sample ID:SolidMatrix:09/22/16 0954Sampled:
INIT/Method/ReferenceDate of DateUnitsQuantResultParameterAnalysisPrepared Limit
AC /160.3 EPA 600/4/79/02010/14/16 093010/11/16 1715%0.1 55.628209-005Percent SolidsJLH/SW846 3rd Ed. 602010/13/16 212310/12/16 0900ug/g dry wt0.4 7.7628209-005Arsenic, totalJLH/SW846 3rd Ed. 602010/13/16 212310/12/16 0900ug/g dry wt0.04 0.1728209-005Cadmium, totalJLH/SW846 3rd Ed. 602010/13/16 212310/12/16 0900ug/g dry wt0.4 27.228209-005Chromium, totalJLH/SW846 3rd Ed. 602010/13/16 212310/12/16 0900ug/g dry wt0.4 16.928209-005Copper, totalJLH/SW846 3rd Ed. 602010/13/16 212310/12/16 0900ug/g dry wt0.4 16.828209-005Lead, totalJLH/EPA 245.710/18/16 103010/12/16 0900ug/g dry wt0.02 0.05428209-005Mercury, totalJLH/SW846 3rd Ed. 602010/13/16 212310/12/16 0900ug/g dry wt0.8 18.828209-005Nickel, totalJLH/SW846 3rd Ed. 602010/13/16 212310/12/16 0900ug/g dry wt2 63.328209-005Zinc, total
Notes:
ESI___________________________________________________________________________________________________________________ EnviroSystems, Inc. P.O. Box 778 Hampton, NH 03842-0778 603-926-3345 fax 603-926-3521 www.envirosystems.com
DAMOS Portland Disposal Site Survey. Sediment Analysis. US Army Corps of Engineers Application Number ______. ESI Study 28209.
Page 9 of 41
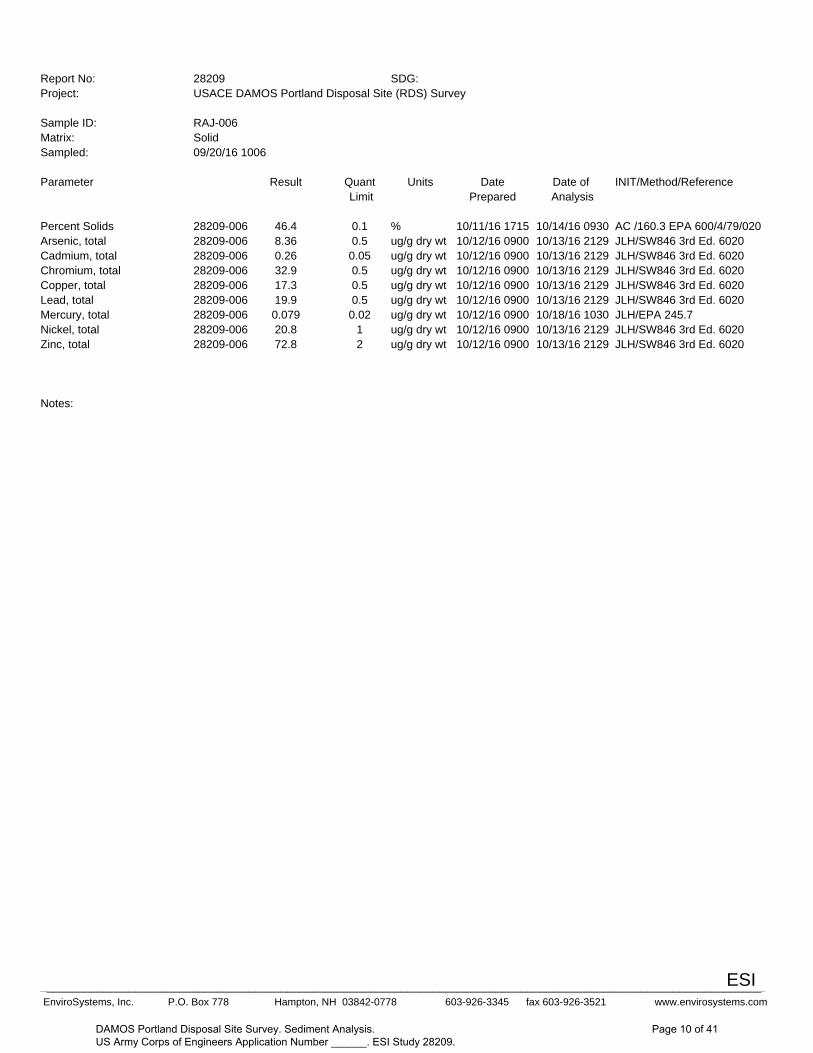
SDG:28209Report No:USACE DAMOS Portland Disposal Site (RDS) SurveyProject:
RAJ-006Sample ID:SolidMatrix:09/20/16 1006Sampled:
INIT/Method/ReferenceDate of DateUnitsQuantResultParameterAnalysisPrepared Limit
AC /160.3 EPA 600/4/79/02010/14/16 093010/11/16 1715%0.1 46.428209-006Percent SolidsJLH/SW846 3rd Ed. 602010/13/16 212910/12/16 0900ug/g dry wt0.5 8.3628209-006Arsenic, totalJLH/SW846 3rd Ed. 602010/13/16 212910/12/16 0900ug/g dry wt0.05 0.2628209-006Cadmium, totalJLH/SW846 3rd Ed. 602010/13/16 212910/12/16 0900ug/g dry wt0.5 32.928209-006Chromium, totalJLH/SW846 3rd Ed. 602010/13/16 212910/12/16 0900ug/g dry wt0.5 17.328209-006Copper, totalJLH/SW846 3rd Ed. 602010/13/16 212910/12/16 0900ug/g dry wt0.5 19.928209-006Lead, totalJLH/EPA 245.710/18/16 103010/12/16 0900ug/g dry wt0.02 0.07928209-006Mercury, totalJLH/SW846 3rd Ed. 602010/13/16 212910/12/16 0900ug/g dry wt1 20.828209-006Nickel, totalJLH/SW846 3rd Ed. 602010/13/16 212910/12/16 0900ug/g dry wt2 72.828209-006Zinc, total
Notes:
ESI___________________________________________________________________________________________________________________ EnviroSystems, Inc. P.O. Box 778 Hampton, NH 03842-0778 603-926-3345 fax 603-926-3521 www.envirosystems.com
DAMOS Portland Disposal Site Survey. Sediment Analysis. US Army Corps of Engineers Application Number ______. ESI Study 28209.
Page 10 of 41

SDG:28209Report No:USACE DAMOS Portland Disposal Site (RDS) SurveyProject:
RAJ-007Sample ID:SolidMatrix:09/20/16 1019Sampled:
INIT/Method/ReferenceDate of DateUnitsQuantResultParameterAnalysisPrepared Limit
AC /160.3 EPA 600/4/79/02010/14/16 093010/11/16 1715%0.1 64.328209-007Percent SolidsJLH/SW846 3rd Ed. 602010/13/16 213510/12/16 0900ug/g dry wt0.3 4.1128209-007Arsenic, totalJLH/SW846 3rd Ed. 602010/13/16 213510/12/16 0900ug/g dry wt0.03 0.0628209-007Cadmium, totalJLH/SW846 3rd Ed. 602010/13/16 213510/12/16 0900ug/g dry wt0.3 19.028209-007Chromium, totalJLH/SW846 3rd Ed. 602010/13/16 213510/12/16 0900ug/g dry wt0.3 6.5328209-007Copper, totalJLH/SW846 3rd Ed. 602010/13/16 213510/12/16 0900ug/g dry wt0.3 11.628209-007Lead, totalJLH/EPA 245.710/18/16 103010/12/16 0900ug/g dry wt0.01 0.04328209-007Mercury, totalJLH/SW846 3rd Ed. 602010/13/16 213510/12/16 0900ug/g dry wt0.5 11.528209-007Nickel, totalJLH/SW846 3rd Ed. 602010/13/16 213510/12/16 0900ug/g dry wt1 34.028209-007Zinc, total
Notes:
ESI___________________________________________________________________________________________________________________ EnviroSystems, Inc. P.O. Box 778 Hampton, NH 03842-0778 603-926-3345 fax 603-926-3521 www.envirosystems.com
DAMOS Portland Disposal Site Survey. Sediment Analysis. US Army Corps of Engineers Application Number ______. ESI Study 28209.
Page 11 of 41

SDG:28209Report No:USACE DAMOS Portland Disposal Site (RDS) SurveyProject:
RAJ-008Sample ID:SolidMatrix:09/20/16 1034Sampled:
INIT/Method/ReferenceDate of DateUnitsQuantResultParameterAnalysisPrepared Limit
AC /160.3 EPA 600/4/79/02010/14/16 093010/11/16 1715%0.1 66.428209-008Percent SolidsJLH/SW846 3rd Ed. 602010/13/16 215210/12/16 0900ug/g dry wt0.3 4.2528209-008Arsenic, totalJLH/SW846 3rd Ed. 602010/13/16 215210/12/16 0900ug/g dry wt0.03 0.0628209-008Cadmium, totalJLH/SW846 3rd Ed. 602010/13/16 215210/12/16 0900ug/g dry wt0.3 17.028209-008Chromium, totalJLH/SW846 3rd Ed. 602010/13/16 215210/12/16 0900ug/g dry wt0.3 7.3728209-008Copper, totalJLH/SW846 3rd Ed. 602010/13/16 215210/12/16 0900ug/g dry wt0.3 11.128209-008Lead, totalJLH/EPA 245.710/18/16 103010/12/16 0900ug/g dry wt0.02 0.04528209-008Mercury, totalJLH/SW846 3rd Ed. 602010/13/16 215210/12/16 0900ug/g dry wt0.5 11.028209-008Nickel, totalJLH/SW846 3rd Ed. 602010/13/16 215210/12/16 0900ug/g dry wt1 31.728209-008Zinc, total
Notes:
ESI___________________________________________________________________________________________________________________ EnviroSystems, Inc. P.O. Box 778 Hampton, NH 03842-0778 603-926-3345 fax 603-926-3521 www.envirosystems.com
DAMOS Portland Disposal Site Survey. Sediment Analysis. US Army Corps of Engineers Application Number ______. ESI Study 28209.
Page 12 of 41

SDG:28209Report No:USACE DAMOS Portland Disposal Site (RDS) SurveyProject:
RAJ-009Sample ID:SolidMatrix:09/20/16 1120Sampled:
INIT/Method/ReferenceDate of DateUnitsQuantResultParameterAnalysisPrepared Limit
AC /160.3 EPA 600/4/79/02010/14/16 093010/11/16 1715%0.1 73.928209-009Percent SolidsJLH/SW846 3rd Ed. 602010/13/16 215810/12/16 0900ug/g dry wt0.2 3.4428209-009Arsenic, totalJLH/SW846 3rd Ed. 602010/13/16 215810/12/16 0900ug/g dry wt0.02 0.0428209-009Cadmium, totalJLH/SW846 3rd Ed. 602010/13/16 215810/12/16 0900ug/g dry wt0.2 16.328209-009Chromium, totalJLH/SW846 3rd Ed. 602010/13/16 215810/12/16 0900ug/g dry wt0.2 4.4028209-009Copper, totalJLH/SW846 3rd Ed. 602010/13/16 215810/12/16 0900ug/g dry wt0.2 8.2428209-009Lead, totalJLH/EPA 245.710/18/16 103010/12/16 0900ug/g dry wt0.02 0.02528209-009Mercury, totalJLH/SW846 3rd Ed. 602010/13/16 215810/12/16 0900ug/g dry wt0.5 9.3128209-009Nickel, totalJLH/SW846 3rd Ed. 602010/13/16 215810/12/16 0900ug/g dry wt0.9 25.228209-009Zinc, total
Notes:
ESI___________________________________________________________________________________________________________________ EnviroSystems, Inc. P.O. Box 778 Hampton, NH 03842-0778 603-926-3345 fax 603-926-3521 www.envirosystems.com
DAMOS Portland Disposal Site Survey. Sediment Analysis. US Army Corps of Engineers Application Number ______. ESI Study 28209.
Page 13 of 41

SDG:28209Report No:USACE DAMOS Portland Disposal Site (RDS) SurveyProject:
RAJ-010Sample ID:SolidMatrix:09/20/16 1145Sampled:
INIT/Method/ReferenceDate of DateUnitsQuantResultParameterAnalysisPrepared Limit
AC /160.3 EPA 600/4/79/02010/14/16 093010/11/16 1715%0.1 75.728209-010Percent SolidsJLH/SW846 3rd Ed. 602010/13/16 220410/12/16 0900ug/g dry wt0.3 3.2028209-010Arsenic, totalJLH/SW846 3rd Ed. 602010/13/16 220410/12/16 0900ug/g dry wt0.03 ND28209-010Cadmium, totalJLH/SW846 3rd Ed. 602010/13/16 220410/12/16 0900ug/g dry wt0.3 13.428209-010Chromium, totalJLH/SW846 3rd Ed. 602010/13/16 220410/12/16 0900ug/g dry wt0.3 3.3828209-010Copper, totalJLH/SW846 3rd Ed. 602010/13/16 220410/12/16 0900ug/g dry wt0.3 7.3828209-010Lead, totalJLH/EPA 245.710/18/16 103010/12/16 0900ug/g dry wt0.01 0.01528209-010Mercury, totalJLH/SW846 3rd Ed. 602010/13/16 220410/12/16 0900ug/g dry wt0.5 8.0028209-010Nickel, totalJLH/SW846 3rd Ed. 602010/13/16 220410/12/16 0900ug/g dry wt1 21.128209-010Zinc, total
Notes:
ND = Not Detected
ESI___________________________________________________________________________________________________________________ EnviroSystems, Inc. P.O. Box 778 Hampton, NH 03842-0778 603-926-3345 fax 603-926-3521 www.envirosystems.com
DAMOS Portland Disposal Site Survey. Sediment Analysis. US Army Corps of Engineers Application Number ______. ESI Study 28209.
Page 14 of 41

SDG:28209Report No:USACE DAMOS Portland Disposal Site (RDS) SurveyProject:
RAJ-901Sample ID:WaterMatrix:09/20/16 1200Sampled:
INIT/Method/ReferenceDate of DateUnitsQuantResultParameterAnalysisPrepared Limit
JLH/EPA 200.810/14/16 105510/14/16 0800mg/L0.001 ND28209-011Arsenic, totalJLH/EPA 200.810/14/16 105510/14/16 0800mg/L0.0001 ND28209-011Cadmium, totalJLH/EPA 200.810/14/16 105510/14/16 0800mg/L0.001 ND28209-011Chromium, totalJLH/EPA 200.810/14/16 105510/14/16 0800mg/L0.0005 ND28209-011Copper, totalJLH/EPA 200.810/14/16 105510/14/16 0800mg/L0.0002 ND28209-011Lead, totalJLH/EPA 245.710/05/16 110010/05/16 0900ug/L0.01 ND28209-012Mercury, totalJLH/EPA 200.810/14/16 105510/14/16 0800mg/L0.001 ND28209-011Nickel, totalJLH/EPA 200.810/14/16 105510/14/16 0800mg/L0.002 ND28209-011Zinc, total
Notes:
ND = Not Detected
ESI___________________________________________________________________________________________________________________ EnviroSystems, Inc. P.O. Box 778 Hampton, NH 03842-0778 603-926-3345 fax 603-926-3521 www.envirosystems.com
DAMOS Portland Disposal Site Survey. Sediment Analysis. US Army Corps of Engineers Application Number ______. ESI Study 28209.
Page 15 of 41

SDG:28209Report No:USACE DAMOS Portland Disposal Site (RDS) SurveyProject:
RAJ-011Sample ID:SolidMatrix:09/20/16 1212Sampled:
INIT/Method/ReferenceDate of DateUnitsQuantResultParameterAnalysisPrepared Limit
AC /160.3 EPA 600/4/79/02010/14/16 093010/11/16 1715%0.1 72.428209-013Percent SolidsJLH/SW846 3rd Ed. 602010/13/16 221010/12/16 0900ug/g dry wt0.3 2.8828209-013Arsenic, totalJLH/SW846 3rd Ed. 602010/13/16 221010/12/16 0900ug/g dry wt0.03 0.0428209-013Cadmium, totalJLH/SW846 3rd Ed. 602010/13/16 221010/12/16 0900ug/g dry wt0.3 14.328209-013Chromium, totalJLH/SW846 3rd Ed. 602010/13/16 221010/12/16 0900ug/g dry wt0.3 3.8028209-013Copper, totalJLH/SW846 3rd Ed. 602010/13/16 221010/12/16 0900ug/g dry wt0.3 6.9328209-013Lead, totalJLH/EPA 245.710/18/16 103010/12/16 0900ug/g dry wt0.01 0.01728209-013Mercury, totalJLH/SW846 3rd Ed. 602010/13/16 221010/12/16 0900ug/g dry wt0.6 9.0028209-013Nickel, totalJLH/SW846 3rd Ed. 602010/13/16 221010/12/16 0900ug/g dry wt1 24.228209-013Zinc, total
Notes:
ESI___________________________________________________________________________________________________________________ EnviroSystems, Inc. P.O. Box 778 Hampton, NH 03842-0778 603-926-3345 fax 603-926-3521 www.envirosystems.com
DAMOS Portland Disposal Site Survey. Sediment Analysis. US Army Corps of Engineers Application Number ______. ESI Study 28209.
Page 16 of 41

SDG:28209Report No:USACE DAMOS Portland Disposal Site (RDS) SurveyProject:
RAJ-012Sample ID:SolidMatrix:09/20/16 1227Sampled:
INIT/Method/ReferenceDate of DateUnitsQuantResultParameterAnalysisPrepared Limit
AC /160.3 EPA 600/4/79/02010/14/16 093010/11/16 1715%0.1 63.728209-014Percent SolidsJLH/SW846 3rd Ed. 602010/13/16 221510/12/16 0900ug/g dry wt0.3 3.8128209-014Arsenic, totalJLH/SW846 3rd Ed. 602010/13/16 221510/12/16 0900ug/g dry wt0.03 0.0728209-014Cadmium, totalJLH/SW846 3rd Ed. 602010/13/16 221510/12/16 0900ug/g dry wt0.3 17.828209-014Chromium, totalJLH/SW846 3rd Ed. 602010/13/16 221510/12/16 0900ug/g dry wt0.3 5.5828209-014Copper, totalJLH/SW846 3rd Ed. 602010/13/16 221510/12/16 0900ug/g dry wt0.3 9.2528209-014Lead, totalJLH/EPA 245.710/18/16 103010/12/16 0900ug/g dry wt0.01 0.02628209-014Mercury, totalJLH/SW846 3rd Ed. 602010/13/16 221510/12/16 0900ug/g dry wt0.6 12.028209-014Nickel, totalJLH/SW846 3rd Ed. 602010/13/16 221510/12/16 0900ug/g dry wt1 32.228209-014Zinc, total
Notes:
ESI___________________________________________________________________________________________________________________ EnviroSystems, Inc. P.O. Box 778 Hampton, NH 03842-0778 603-926-3345 fax 603-926-3521 www.envirosystems.com
DAMOS Portland Disposal Site Survey. Sediment Analysis. US Army Corps of Engineers Application Number ______. ESI Study 28209.
Page 17 of 41

Quality Control Summary
Arsenic, totalParameter:USACE DAMOS Portland Disposal Site (RDS) SurveyProject:SolidMatrix:468SQC Batch No:
Pertains to samples:
Sample IDLab IDSample IDLab ID
RAJ-01128209-013RAJ-00128209-001RAJ-01228209-014RAJ-00228209-002
RAJ-00328209-003RAJ-00428209-004RAJ-00528209-005RAJ-00628209-006RAJ-00728209-007RAJ-00828209-008RAJ-00928209-009RAJ-01028209-010
PreparationControlBlank ResultLimit
MQug/g dry wt+/-
PassU0.050.05PB468S
LABORATORY CONTROL SAMPLE RECOVERY
TrueLab Control DupTrueLab Control ControlValueSample Result %RValueSample Result Limit ID
%Rug/g dry wtug/g dry wtug/g dry wtug/g dry wt%
Pass10025.025.110025.025.085-115LCS
Pass 8618.916.270-130SRM
DUPLICATE ANALYSIS
SampleDuplicateControlQRPDQResultQResultLimit
ug/g dry wtug/g dry wt% ID
Pass59.999.482028209-004
SPIKE SAMPLE ANALYSIS
SampleSpikeSpiked SampleControlQ%RQResultAddedResult Limit ID
ug/g dry wtug/g dry wtug/g dry wt%
Pass919.9953.959.180-12028209-004SPass969.9953.961.580-12028209-004SD
ESI _____________________________________________________________________________________________________________________
EnviroSystems, Inc. One Lafayette Road Hampton, NH 03843-0778 603-926-3345 fax 603-926-3521 www.envirosystems.com
DAMOS Portland Disposal Site Survey. Sediment Analysis. US Army Corps of Engineers Application Number ______. ESI Study 28209.
Page 18 of 41
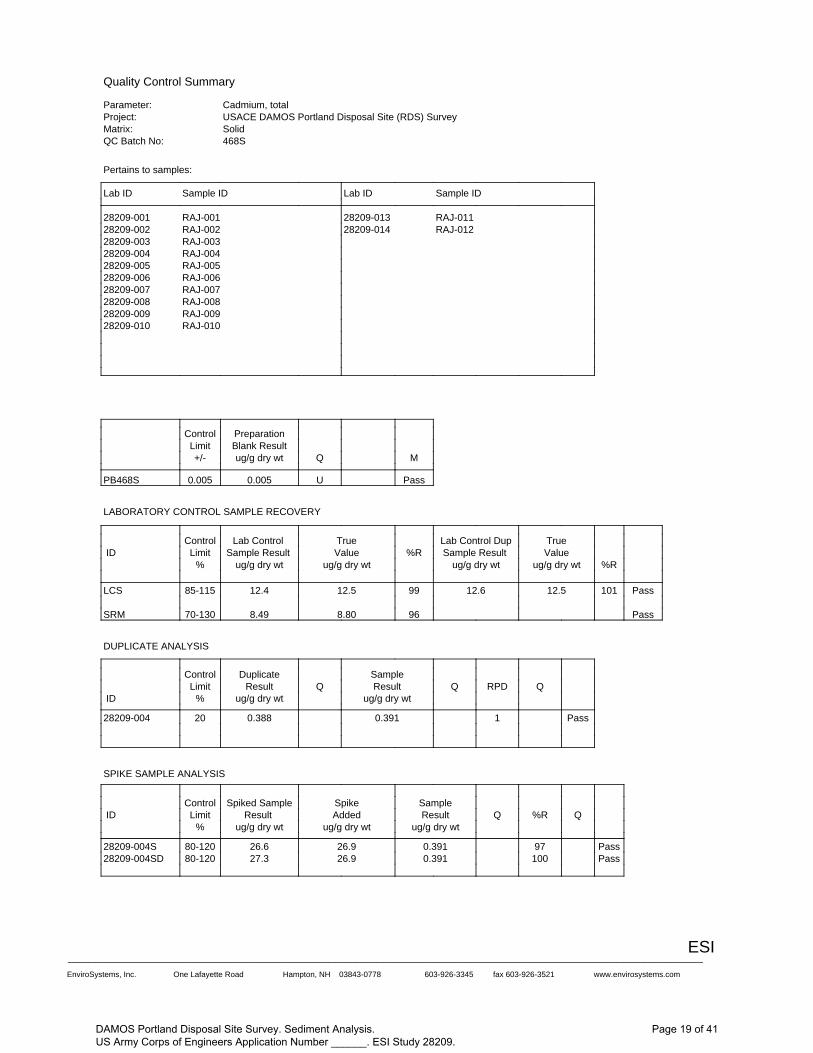
Quality Control Summary
Cadmium, totalParameter:USACE DAMOS Portland Disposal Site (RDS) SurveyProject:SolidMatrix:468SQC Batch No:
Pertains to samples:
Sample IDLab IDSample IDLab ID
RAJ-01128209-013RAJ-00128209-001RAJ-01228209-014RAJ-00228209-002
RAJ-00328209-003RAJ-00428209-004RAJ-00528209-005RAJ-00628209-006RAJ-00728209-007RAJ-00828209-008RAJ-00928209-009RAJ-01028209-010
PreparationControlBlank ResultLimit
MQug/g dry wt+/-
PassU0.0050.005PB468S
LABORATORY CONTROL SAMPLE RECOVERY
TrueLab Control DupTrueLab Control ControlValueSample Result %RValueSample Result Limit ID
%Rug/g dry wtug/g dry wtug/g dry wtug/g dry wt%
Pass10112.512.69912.512.485-115LCS
Pass 968.808.4970-130SRM
DUPLICATE ANALYSIS
SampleDuplicateControlQRPDQResultQResultLimit
ug/g dry wtug/g dry wt% ID
Pass10.3910.3882028209-004
SPIKE SAMPLE ANALYSIS
SampleSpikeSpiked SampleControlQ%RQResultAddedResult Limit ID
ug/g dry wtug/g dry wtug/g dry wt%
Pass970.39126.926.680-12028209-004SPass1000.39126.927.380-12028209-004SD
ESI _____________________________________________________________________________________________________________________
EnviroSystems, Inc. One Lafayette Road Hampton, NH 03843-0778 603-926-3345 fax 603-926-3521 www.envirosystems.com
DAMOS Portland Disposal Site Survey. Sediment Analysis. US Army Corps of Engineers Application Number ______. ESI Study 28209.
Page 19 of 41

Quality Control Summary
Chromium, totalParameter:USACE DAMOS Portland Disposal Site (RDS) SurveyProject:SolidMatrix:468SQC Batch No:
Pertains to samples:
Sample IDLab IDSample IDLab ID
RAJ-01128209-013RAJ-00128209-001RAJ-01228209-014RAJ-00228209-002
RAJ-00328209-003RAJ-00428209-004RAJ-00528209-005RAJ-00628209-006RAJ-00728209-007RAJ-00828209-008RAJ-00928209-009RAJ-01028209-010
PreparationControlBlank ResultLimit
MQug/g dry wt+/-
PassU0.050.05PB468S
LABORATORY CONTROL SAMPLE RECOVERY
TrueLab Control DupTrueLab Control ControlValueSample Result %RValueSample Result Limit ID
%Rug/g dry wtug/g dry wtug/g dry wtug/g dry wt%
Pass10020.019.910020.020.085-115LCS
Pass 7126618870-130SRM
DUPLICATE ANALYSIS
SampleDuplicateControlQRPDQResultQResultLimit
ug/g dry wtug/g dry wt% ID
Pass637.635.52028209-004
SPIKE SAMPLE ANALYSIS
SampleSpikeSpiked SampleControlQ%RQResultAddedResult Limit ID
ug/g dry wtug/g dry wtug/g dry wt%
Pass8537.643.174.480-12028209-004SPass9037.643.176.280-12028209-004SD
ESI _____________________________________________________________________________________________________________________
EnviroSystems, Inc. One Lafayette Road Hampton, NH 03843-0778 603-926-3345 fax 603-926-3521 www.envirosystems.com
DAMOS Portland Disposal Site Survey. Sediment Analysis. US Army Corps of Engineers Application Number ______. ESI Study 28209.
Page 20 of 41

Quality Control Summary
Copper, totalParameter:USACE DAMOS Portland Disposal Site (RDS) SurveyProject:SolidMatrix:468SQC Batch No:
Pertains to samples:
Sample IDLab IDSample IDLab ID
RAJ-01128209-013RAJ-00128209-001RAJ-01228209-014RAJ-00228209-002
RAJ-00328209-003RAJ-00428209-004RAJ-00528209-005RAJ-00628209-006RAJ-00728209-007RAJ-00828209-008RAJ-00928209-009RAJ-01028209-010
PreparationControlBlank ResultLimit
MQug/g dry wt+/-
PassU0.050.05PB468S
LABORATORY CONTROL SAMPLE RECOVERY
TrueLab Control DupTrueLab Control ControlValueSample Result %RValueSample Result Limit ID
%Rug/g dry wtug/g dry wtug/g dry wtug/g dry wt%
Pass9825.024.69925.024.785-115LCS
Pass 8338031570-130SRM
DUPLICATE ANALYSIS
SampleDuplicateControlQRPDQResultQResultLimit
ug/g dry wtug/g dry wt% ID
Pass625.323.82028209-004
SPIKE SAMPLE ANALYSIS
SampleSpikeSpiked SampleControlQ%RQResultAddedResult Limit ID
ug/g dry wtug/g dry wtug/g dry wt%
Pass8525.353.971.180-12028209-004SPass8725.353.972.080-12028209-004SD
ESI _____________________________________________________________________________________________________________________
EnviroSystems, Inc. One Lafayette Road Hampton, NH 03843-0778 603-926-3345 fax 603-926-3521 www.envirosystems.com
DAMOS Portland Disposal Site Survey. Sediment Analysis. US Army Corps of Engineers Application Number ______. ESI Study 28209.
Page 21 of 41

Quality Control Summary
Lead, totalParameter:USACE DAMOS Portland Disposal Site (RDS) SurveyProject:SolidMatrix:468SQC Batch No:
Pertains to samples:
Sample IDLab IDSample IDLab ID
RAJ-01128209-013RAJ-00128209-001RAJ-01228209-014RAJ-00228209-002
RAJ-00328209-003RAJ-00428209-004RAJ-00528209-005RAJ-00628209-006RAJ-00728209-007RAJ-00828209-008RAJ-00928209-009RAJ-01028209-010
PreparationControlBlank ResultLimit
MQug/g dry wt+/-
PassU0.050.05PB468S
LABORATORY CONTROL SAMPLE RECOVERY
TrueLab Control DupTrueLab Control ControlValueSample Result %RValueSample Result Limit ID
%Rug/g dry wtug/g dry wtug/g dry wtug/g dry wt%
Pass9925.024.810025.024.985-115LCS
Pass 9033029770-130SRM
DUPLICATE ANALYSIS
SampleDuplicateControlQRPDQResultQResultLimit
ug/g dry wtug/g dry wt% ID
Pass637.135.12028209-004
SPIKE SAMPLE ANALYSIS
SampleSpikeSpiked SampleControlQ%RQResultAddedResult Limit ID
ug/g dry wtug/g dry wtug/g dry wt%
Pass11437.153.998.580-12028209-004SPass10437.153.992.980-12028209-004SD
ESI _____________________________________________________________________________________________________________________
EnviroSystems, Inc. One Lafayette Road Hampton, NH 03843-0778 603-926-3345 fax 603-926-3521 www.envirosystems.com
DAMOS Portland Disposal Site Survey. Sediment Analysis. US Army Corps of Engineers Application Number ______. ESI Study 28209.
Page 22 of 41

Quality Control Summary
Mercury, totalParameter:USACE DAMOS Portland Disposal Site (RDS) SurveyProject:SolidMatrix:178SQC Batch No:
Pertains to samples:
Sample IDLab IDSample IDLab ID
RAJ-01128209-013RAJ-00128209-001RAJ-01228209-014RAJ-00228209-002
RAJ-00328209-003RAJ-00428209-004RAJ-00528209-005RAJ-00628209-006RAJ-00728209-007RAJ-00828209-008RAJ-00928209-009RAJ-01028209-010
PreparationControlBlank ResultLimit
MQug/g dry wt+/-
PassU0.010.01PB178S
LABORATORY CONTROL SAMPLE RECOVERY
TrueLab Control DupTrueLab Control ControlValueSample Result %RValueSample Result Limit ID
%Rug/g dry wtug/g dry wtug/g dry wtug/g dry wt%
Pass850.800.68830.800.6675-125LCS
Pass 1053.403.5770-130SRM
DUPLICATE ANALYSIS
SampleDuplicateControlQRPDQResultQResultLimit
ug/g dry wtug/g dry wt% ID
Pass00.230.232028209-004
SPIKE SAMPLE ANALYSIS
SampleSpikeSpiked SampleControlQ%RQResultAddedResult Limit ID
ug/g dry wtug/g dry wtug/g dry wt%
Pass850.231.721.7075-12528209-004SPass870.231.721.7275-12528209-004SD
ESI _____________________________________________________________________________________________________________________
EnviroSystems, Inc. One Lafayette Road Hampton, NH 03843-0778 603-926-3345 fax 603-926-3521 www.envirosystems.com
DAMOS Portland Disposal Site Survey. Sediment Analysis. US Army Corps of Engineers Application Number ______. ESI Study 28209.
Page 23 of 41

Quality Control Summary
Nickel, totalParameter:USACE DAMOS Portland Disposal Site (RDS) SurveyProject:SolidMatrix:468SQC Batch No:
Pertains to samples:
Sample IDLab IDSample IDLab ID
RAJ-01128209-013RAJ-00128209-001RAJ-01228209-014RAJ-00228209-002
RAJ-00328209-003RAJ-00428209-004RAJ-00528209-005RAJ-00628209-006RAJ-00728209-007RAJ-00828209-008RAJ-00928209-009RAJ-01028209-010
PreparationControlBlank ResultLimit
MQug/g dry wt+/-
PassU0.10.1PB468S
LABORATORY CONTROL SAMPLE RECOVERY
TrueLab Control DupTrueLab Control ControlValueSample Result %RValueSample Result Limit ID
%Rug/g dry wtug/g dry wtug/g dry wtug/g dry wt%
Pass10150.050.410150.050.585-115LCS
Pass 7976.160.170-130SRM
DUPLICATE ANALYSIS
SampleDuplicateControlQRPDQResultQResultLimit
ug/g dry wtug/g dry wt% ID
Pass522.721.62028209-004
SPIKE SAMPLE ANALYSIS
SampleSpikeSpiked SampleControlQ%RQResultAddedResult Limit ID
ug/g dry wtug/g dry wtug/g dry wt%
Pass8722.710811780-12028209-004SPass8722.710811780-12028209-004SD
ESI _____________________________________________________________________________________________________________________
EnviroSystems, Inc. One Lafayette Road Hampton, NH 03843-0778 603-926-3345 fax 603-926-3521 www.envirosystems.com
DAMOS Portland Disposal Site Survey. Sediment Analysis. US Army Corps of Engineers Application Number ______. ESI Study 28209.
Page 24 of 41

Quality Control Summary
Zinc, totalParameter:USACE DAMOS Portland Disposal Site (RDS) SurveyProject:SolidMatrix:468SQC Batch No:
Pertains to samples:
Sample IDLab IDSample IDLab ID
RAJ-01128209-013RAJ-00128209-001RAJ-01228209-014RAJ-00228209-002
RAJ-00328209-003RAJ-00428209-004RAJ-00528209-005RAJ-00628209-006RAJ-00728209-007RAJ-00828209-008RAJ-00928209-009RAJ-01028209-010
PreparationControlBlank ResultLimit
MQug/g dry wt+/-
PassU0.20.2PB468S
LABORATORY CONTROL SAMPLE RECOVERY
TrueLab Control DupTrueLab Control ControlValueSample Result %RValueSample Result Limit ID
%Rug/g dry wtug/g dry wtug/g dry wtug/g dry wt%
Pass10350.051.510350.051.385-115LCS
Pass 8265654170-130SRM
DUPLICATE ANALYSIS
SampleDuplicateControlQRPDQResultQResultLimit
ug/g dry wtug/g dry wt% ID
Pass591.287.12028209-004
SPIKE SAMPLE ANALYSIS
SampleSpikeSpiked SampleControlQ%RQResultAddedResult Limit ID
ug/g dry wtug/g dry wtug/g dry wt%
Pass8891.210818680-12028209-004SPass9291.210819180-12028209-004SD
ESI _____________________________________________________________________________________________________________________
EnviroSystems, Inc. One Lafayette Road Hampton, NH 03843-0778 603-926-3345 fax 603-926-3521 www.envirosystems.com
DAMOS Portland Disposal Site Survey. Sediment Analysis. US Army Corps of Engineers Application Number ______. ESI Study 28209.
Page 25 of 41

Metals by ICPMS and Mercury by CVAFEPA 200.8 SW846 6020 and EPA 245.7
MDL2016Lab Number:SolidSample Designation:07/07/16Date Analyzed:
Mercury EPA 245.707/19/16Date Analyzed:SolidMatrix:1Sample Amount (g):50Final Volume (mL)
RepRepRepRepRepRepRepTrue 7654321Value
ug/g ug/g ug/g ug/g ug/g ug/g ug/g ug/g 0.5070.4680.4790.5020.5060.4780.4930.5Aluminum, total
0.00960.01060.00960.00990.009750.01010.01090.01Antimony, total0.02510.02580.02480.02490.02450.02330.02450.025Arsenic, total0.1980.1930.1980.190.1920.1950.190.2Barium, total
0.01240.01260.01240.01180.01290.01250.01190.0125Beryllium, total0.04460.04280.0110.0110.04730.04190.04240.05Boron, total0.01220.01230.01240.01240.01270.01220.01230.0125Cadmium, total
1.351.251.251.51.351.251.41.25Calcium, total0.01970.01990.02010.0190.01950.01960.01960.02Chromium, total0.04960.04880.04940.05010.04970.04930.04790.05Cobalt, total0.02580.02470.02530.02580.02490.02540.02420.025Copper, total0.2510.2440.2560.2510.2580.2470.2490.25Iron, total
0.02460.0240.02530.02430.02460.02460.02390.025Lead, total1.251.21.31.251.31.21.21.25Magnesium, total
0.04930.0480.05010.04990.0490.04890.04880.05Manganese, total0.00560.004450.00460.00490.004550.00460.004550.005Mercury, total
0.004950.00520.004850.00470.00470.00490.00510.05Mercury, total (EPA 245.7)0.01910.01820.01720.01880.01930.01930.01770.02Molybdenum, total0.05070.04830.04950.04840.04940.05060.04890.05Nickel, total
1.21.051.351.251.31.051.11.25Potassium, total0.0240.02430.02760.02220.02850.03070.02150.025Selenium, total
0.02320.02320.02360.02340.02350.02340.02240.025Silver, total1.251.11.31.151.150.951.11.25Sodium, total
0.02540.02330.02480.02540.02750.02530.02680.025Strontium, total0.02070.02060.02220.02270.01980.02060.02120.025Thallium, total0.02390.02360.0240.02430.02570.02430.02450.025Tin, total0.04590.04640.0490.04910.04750.0480.04670.05Vanadium, total0.04860.04620.04730.04980.05090.04980.04870.05Zinc, total
DAMOS Portland Disposal Site Survey. Sediment Analysis. US Army Corps of Engineers Application Number ______. ESI Study 28209.
Page 26 of 41

Quality Control Summary
Arsenic, totalParameter:USACE DAMOS Portland Disposal Site (RDS) SurveyProject:WaterMatrix:498WQC Batch No:
Pertains to samples:
Sample IDLab IDSample IDLab ID
RAJ-90128209-011
PreparationControlBlank ResultLimit
MQmg/L+/-
PassU0.0010.001PB498W
LABORATORY CONTROL SAMPLE RECOVERY
TrueLab Control DupTrueLab Control ControlValueSample Result %RValueSample Result Limit ID
%Rmg/Lmg/Lmg/Lmg/L%
Pass1020.0250.02541010.0250.025285-115LCS
DUPLICATE ANALYSIS
SampleDuplicateControlQRPDQResultQResultLimit
mg/Lmg/L% ID
PassNCU0.001U0.0012028209-011
SPIKE SAMPLE ANALYSIS
SampleSpikeSpiked SampleControlQ%RQResultAddedResult Limit ID
mg/Lmg/Lmg/L%
Pass102U0.0010.0500.050980-12028209-011SPass102U0.0010.0500.051180-12028209-011SD
ESI _____________________________________________________________________________________________________________________
EnviroSystems, Inc. One Lafayette Road Hampton, NH 03843-0778 603-926-3345 fax 603-926-3521 www.envirosystems.com
DAMOS Portland Disposal Site Survey. Sediment Analysis. US Army Corps of Engineers Application Number ______. ESI Study 28209.
Page 27 of 41

Quality Control Summary
Cadmium, totalParameter:USACE DAMOS Portland Disposal Site (RDS) SurveyProject:WaterMatrix:498WQC Batch No:
Pertains to samples:
Sample IDLab IDSample IDLab ID
RAJ-90128209-011
PreparationControlBlank ResultLimit
MQmg/L+/-
PassU0.00010.0001PB498W
LABORATORY CONTROL SAMPLE RECOVERY
TrueLab Control DupTrueLab Control ControlValueSample Result %RValueSample Result Limit ID
%Rmg/Lmg/Lmg/Lmg/L%
Pass1010.01250.01261000.01250.012585-115LCS
DUPLICATE ANALYSIS
SampleDuplicateControlQRPDQResultQResultLimit
mg/Lmg/L% ID
PassNCU0.0001U0.00012028209-011
SPIKE SAMPLE ANALYSIS
SampleSpikeSpiked SampleControlQ%RQResultAddedResult Limit ID
mg/Lmg/Lmg/L%
Pass99U0.00010.02500.024880-12028209-011SPass100U0.00010.02500.025180-12028209-011SD
ESI _____________________________________________________________________________________________________________________
EnviroSystems, Inc. One Lafayette Road Hampton, NH 03843-0778 603-926-3345 fax 603-926-3521 www.envirosystems.com
DAMOS Portland Disposal Site Survey. Sediment Analysis. US Army Corps of Engineers Application Number ______. ESI Study 28209.
Page 28 of 41

Quality Control Summary
Chromium, totalParameter:USACE DAMOS Portland Disposal Site (RDS) SurveyProject:WaterMatrix:498WQC Batch No:
Pertains to samples:
Sample IDLab IDSample IDLab ID
RAJ-90128209-011
PreparationControlBlank ResultLimit
MQmg/L+/-
PassU0.0010.001PB498W
LABORATORY CONTROL SAMPLE RECOVERY
TrueLab Control DupTrueLab Control ControlValueSample Result %RValueSample Result Limit ID
%Rmg/Lmg/Lmg/Lmg/L%
Pass1020.0200.02031010.0200.020285-115LCS
DUPLICATE ANALYSIS
SampleDuplicateControlQRPDQResultQResultLimit
mg/Lmg/L% ID
PassNCU0.001U0.0012028209-011
SPIKE SAMPLE ANALYSIS
SampleSpikeSpiked SampleControlQ%RQResultAddedResult Limit ID
mg/Lmg/Lmg/L%
Pass101U0.0010.0400.04080-12028209-011SPass101U0.0010.0400.04080-12028209-011SD
ESI _____________________________________________________________________________________________________________________
EnviroSystems, Inc. One Lafayette Road Hampton, NH 03843-0778 603-926-3345 fax 603-926-3521 www.envirosystems.com
DAMOS Portland Disposal Site Survey. Sediment Analysis. US Army Corps of Engineers Application Number ______. ESI Study 28209.
Page 29 of 41

Quality Control Summary
Copper, totalParameter:USACE DAMOS Portland Disposal Site (RDS) SurveyProject:WaterMatrix:498WQC Batch No:
Pertains to samples:
Sample IDLab IDSample IDLab ID
RAJ-90128209-011
PreparationControlBlank ResultLimit
MQmg/L+/-
PassU0.00050.0005PB498W
LABORATORY CONTROL SAMPLE RECOVERY
TrueLab Control DupTrueLab Control ControlValueSample Result %RValueSample Result Limit ID
%Rmg/Lmg/Lmg/Lmg/L%
Pass1010.0250.02521000.0250.024985-115LCS
DUPLICATE ANALYSIS
SampleDuplicateControlQRPDQResultQResultLimit
mg/Lmg/L% ID
PassNCU0.0005U0.00052028209-011
SPIKE SAMPLE ANALYSIS
SampleSpikeSpiked SampleControlQ%RQResultAddedResult Limit ID
mg/Lmg/Lmg/L%
Pass100U0.00050.0500.050280-12028209-011SPass100U0.00050.0500.050180-12028209-011SD
ESI _____________________________________________________________________________________________________________________
EnviroSystems, Inc. One Lafayette Road Hampton, NH 03843-0778 603-926-3345 fax 603-926-3521 www.envirosystems.com
DAMOS Portland Disposal Site Survey. Sediment Analysis. US Army Corps of Engineers Application Number ______. ESI Study 28209.
Page 30 of 41

Quality Control Summary
Lead, totalParameter:USACE DAMOS Portland Disposal Site (RDS) SurveyProject:WaterMatrix:498WQC Batch No:
Pertains to samples:
Sample IDLab IDSample IDLab ID
RAJ-90128209-011
PreparationControlBlank ResultLimit
MQmg/L+/-
PassU0.00020.0002PB498W
LABORATORY CONTROL SAMPLE RECOVERY
TrueLab Control DupTrueLab Control ControlValueSample Result %RValueSample Result Limit ID
%Rmg/Lmg/Lmg/Lmg/L%
Pass1010.02500.0251010.0250.025285-115LCS
DUPLICATE ANALYSIS
SampleDuplicateControlQRPDQResultQResultLimit
mg/Lmg/L% ID
PassNCU0.0002U0.00022028209-011
SPIKE SAMPLE ANALYSIS
SampleSpikeSpiked SampleControlQ%RQResultAddedResult Limit ID
mg/Lmg/Lmg/L%
Pass99U0.00020.0500.049780-12028209-011SPass100U0.00020.0500.049880-12028209-011SD
ESI _____________________________________________________________________________________________________________________
EnviroSystems, Inc. One Lafayette Road Hampton, NH 03843-0778 603-926-3345 fax 603-926-3521 www.envirosystems.com
DAMOS Portland Disposal Site Survey. Sediment Analysis. US Army Corps of Engineers Application Number ______. ESI Study 28209.
Page 31 of 41

Quality Control Summary
Mercury, totalParameter:USACE DAMOS Portland Disposal Site (RDS) SurveyProject:WaterMatrix:176WQC Batch No:
Pertains to samples:
Sample IDLab IDSample IDLab ID
RAJ-90128209-012
PreparationControlBlank ResultLimit
MQug/L+/-
PassU0.010.01PB176W
LABORATORY CONTROL SAMPLE RECOVERY
TrueLab Control DupTrueLab Control ControlValueSample Result %RValueSample Result Limit ID
%Rug/Lug/Lug/Lug/L%
Pass1000.0250.0251040.0250.02685-115LCS
DUPLICATE ANALYSIS
SampleDuplicateControlQRPDQResultQResultLimit
ug/Lug/L% ID
PassNCU0.01U0.012028209-012
SPIKE SAMPLE ANALYSIS
SampleSpikeSpiked SampleControlQ%RQResultAddedResult Limit ID
ug/Lug/Lug/L%
Pass100U0.010.0250.02580-12028209-012SPass96U0.010.0250.02480-12028209-012SD
ESI _____________________________________________________________________________________________________________________
EnviroSystems, Inc. One Lafayette Road Hampton, NH 03843-0778 603-926-3345 fax 603-926-3521 www.envirosystems.com
DAMOS Portland Disposal Site Survey. Sediment Analysis. US Army Corps of Engineers Application Number ______. ESI Study 28209.
Page 32 of 41
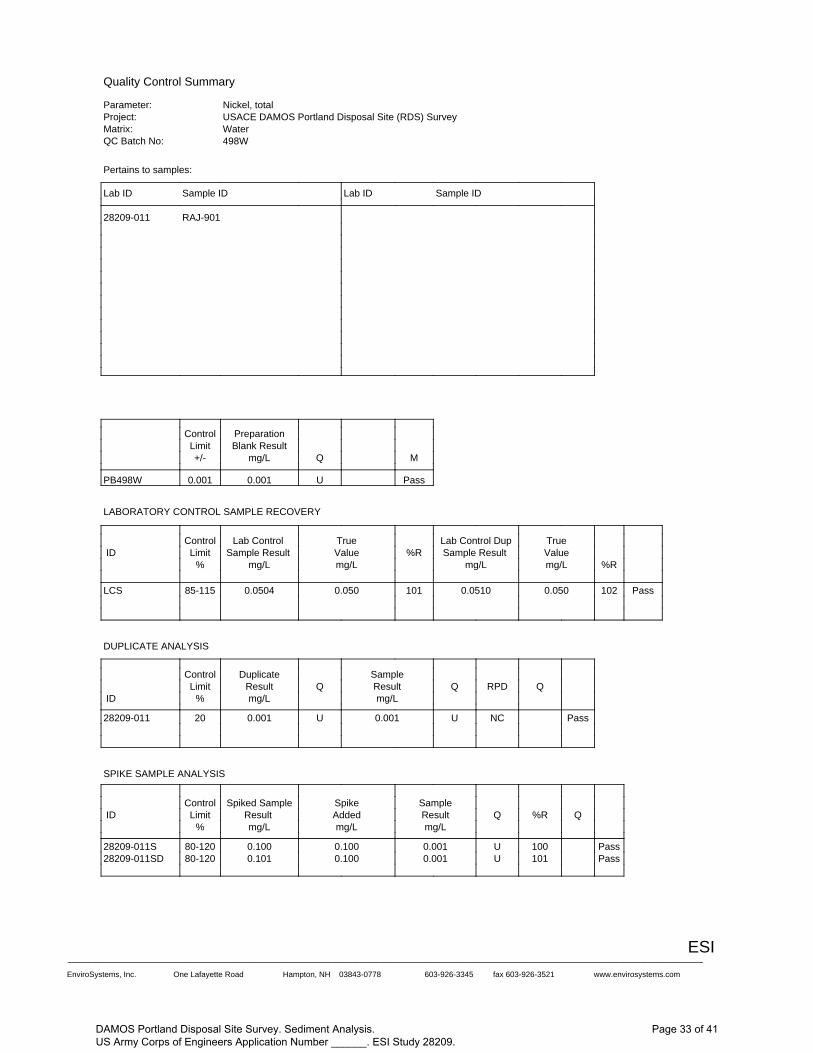
Quality Control Summary
Nickel, totalParameter:USACE DAMOS Portland Disposal Site (RDS) SurveyProject:WaterMatrix:498WQC Batch No:
Pertains to samples:
Sample IDLab IDSample IDLab ID
RAJ-90128209-011
PreparationControlBlank ResultLimit
MQmg/L+/-
PassU0.0010.001PB498W
LABORATORY CONTROL SAMPLE RECOVERY
TrueLab Control DupTrueLab Control ControlValueSample Result %RValueSample Result Limit ID
%Rmg/Lmg/Lmg/Lmg/L%
Pass1020.0500.05101010.0500.050485-115LCS
DUPLICATE ANALYSIS
SampleDuplicateControlQRPDQResultQResultLimit
mg/Lmg/L% ID
PassNCU0.001U0.0012028209-011
SPIKE SAMPLE ANALYSIS
SampleSpikeSpiked SampleControlQ%RQResultAddedResult Limit ID
mg/Lmg/Lmg/L%
Pass100U0.0010.1000.10080-12028209-011SPass101U0.0010.1000.10180-12028209-011SD
ESI _____________________________________________________________________________________________________________________
EnviroSystems, Inc. One Lafayette Road Hampton, NH 03843-0778 603-926-3345 fax 603-926-3521 www.envirosystems.com
DAMOS Portland Disposal Site Survey. Sediment Analysis. US Army Corps of Engineers Application Number ______. ESI Study 28209.
Page 33 of 41

Quality Control Summary
Zinc, totalParameter:USACE DAMOS Portland Disposal Site (RDS) SurveyProject:WaterMatrix:498WQC Batch No:
Pertains to samples:
Sample IDLab IDSample IDLab ID
RAJ-90128209-011
PreparationControlBlank ResultLimit
MQmg/L+/-
PassU0.0020.002PB498W
LABORATORY CONTROL SAMPLE RECOVERY
TrueLab Control DupTrueLab Control ControlValueSample Result %RValueSample Result Limit ID
%Rmg/Lmg/Lmg/Lmg/L%
Pass1010.0500.05071020.0500.050985-115LCS
DUPLICATE ANALYSIS
SampleDuplicateControlQRPDQResultQResultLimit
mg/Lmg/L% ID
PassNCU0.002U0.0022028209-011
SPIKE SAMPLE ANALYSIS
SampleSpikeSpiked SampleControlQ%RQResultAddedResult Limit ID
mg/Lmg/Lmg/L%
Pass103U0.0020.1000.10380-12028209-011SPass103U0.0020.1000.10380-12028209-011SD
ESI _____________________________________________________________________________________________________________________
EnviroSystems, Inc. One Lafayette Road Hampton, NH 03843-0778 603-926-3345 fax 603-926-3521 www.envirosystems.com
DAMOS Portland Disposal Site Survey. Sediment Analysis. US Army Corps of Engineers Application Number ______. ESI Study 28209.
Page 34 of 41

Trace MetalsTASK:EPA 200.8 SW846 6020 / EPA 245.7METHOD:Agilent 7800INSTRUMENT:MDL2016Lab Number:Freshwater WaterSample Designation:03/08/16Date Analyzed:WaterMatrix:50Sample Amount (mL):50Final Volume (mL):
MDLRepRepRepRepRepRepRepTrueCompound7654321Value
(ug/L)(ug/L)(ug/L)(ug/L)(ug/L)(ug/L)(ug/L)(ug/L)(ug/L)0.2921.8142.1021.91.9081.9192.0051.8282Aluminum0.0080.0930.0960.1010.0930.0980.0950.0970.1Antimony0.0240.2350.2350.2260.2430.2210.2430.2370.25Arsenic0.1621.9311.9772.0021.9241.951.9682.0882Barium0.0090.0450.0530.0470.0530.0480.050.0460.05Beryllium0.1521.9951.972.0041.9641.9121.9632.0822Boron0.0070.1230.1240.1250.1230.1280.1280.1280.125Cadmium4.7475151484848504750Calcium0.0240.1970.2130.20.1930.1890.2050.1920.2Chromium0.0220.510.5170.5090.4980.4960.5050.5010.5Cobalt0.0170.1970.1970.1950.20.1980.210.2070.25Copper0.0751.0340.9780.990.9730.9630.9850.9551Iron0.0060.2520.2520.2470.2530.2510.2520.2520.25Lead2.2875152505251525250Magnesium0.0110.4830.4930.4830.490.4870.4880.4910.05Manganese0.0080.0480.050.0480.0530.0490.0450.0520.05Mercury - EPA 6020
0.00160.00840.00840.00990.00880.00940.00860.00860.01Mercury - 245.70.0210.4870.4830.4740.4880.4880.4710.4870.5Nickel3.3574848464947494950Potassium0.0710.2430.1880.2380.2130.1910.1880.2310.25Selenium0.0140.250.2490.2370.2440.2480.2470.2520.25Silver2.9075052505049495050Sodium0.0410.2570.2650.2580.2660.2650.2750.2980.25Thallium0.0240.1850.1750.1840.190.1980.1970.1940.2Tin0.0310.4830.4870.470.4810.4790.4820.5050.5Vanadium0.0390.5410.5110.5140.5280.50.5240.5120.5Zinc
DAMOS Portland Disposal Site Survey. Sediment Analysis. US Army Corps of Engineers Application Number ______. ESI Study 28209.
Page 35 of 41

Table II-1: Completeness ChecklistQuality Assurance/Quality Control Questions Yes/No? Comments? 1. Was the report signed by the responsible applicant approved representative?
Yes2. Were the methods for sampling, chemical and biological testing described in the Sampling and Analysis Plan (SAP) and the Laboratory QA Plan (LQAP) followed? Yes
3. If not, were deviations documented?NA
4. Was the SAP approved by the New England District?Yes
5. Did the applicant use a laboratory with a LQAP on file at the New England District?Yes
6. Did the samples adequately represent the physical/chemical variability in the dredging area? Yes
7. Were the correct stations sampled (include the precision of the navigation method used)? Yes
8. Were the preservation and storage requirements in Chapter 8 of the EPA/Corps QA/QC Manual (EPA/USACE 1995) and EPA (2001d) followed? Yes
9. Were the samples properly labeled?Yes
10. Were all the requested data included?Yes
11. Were the reporting limits met?Yes
12. Were the chain-of-custody forms properly processed?Yes
13. Were the method blanks run and were the concentration below the acceptance criteria? Yes
14. Was the MDL study performed on each matrix (with this data submission) or within the last 12 months? Yes
15. Were the SRM/CRM analyses within acceptance criteria?Yes
16. Were the matrix spike/matrix spike duplicates run at the required frequency and was the percent recovery/RPD within the acceptance criteria? Yes
17. Were the duplicate samples analyzed and were the RPDs within the required acceptance criteria? Yes
18. For each analytical fraction of organic compounds, were recoveries for the internal standard within the acceptance criteria? NA
19. Were surrogate recoveries within the required acceptance criteria?NA
20. Were corrective action forms provided for all non-conforming data?NA
21. Were all the species-specific test conditions in Appendix V met?NA
22. Were the test-specific age requirements met for each test species?NA
23. Was the bulk physical/chemical testing performed on the sediments/composites that were biologically tested? NA
24. Were the mortality acceptance criteria met for the water column and sediment toxicity tests? NA
25. Were the test performance requirements in Table 11.3 of EPA (1994a) met?NA
DAMOS Portland Disposal Site Survey. Sediment Analysis. US Army Corps of Engineers Application Number ______. ESI Study 28209.
Page 36 of 41

Table II-5: Quality Control Summary for Analyses of Metals in Sediments, Tissue and Water Matrices
Method Reference Numbers: Various Reference NumbersCriteria Met? List results outside criteria Location of Results
Yes/No (Cross-reference results table indata report)
(Retained at Lab or in Data Package)
Linear Range Determination for ICP
Performed QuarterlyYes Retained at Lab
Initial Calibration for AA, Hg Performed Daily (Correlation Coefficient >0.995) Yes Retained at Lab
Calculation of Method Detection Limits (MDLs)
For each matrix, analyzed once per 12 month period (see Section 5.2 for MDL procedure)
Yes in Data Package
Hg: 80 to 120% recovery Other metals: 90 to 110% recovery
Initial Calibration Blank/ Continuing Calibration Blank
No target analytes > Instrument Detection Limit (IDL) Yes Retained at Lab
Standard Reference Materials Within the limits provided by vendor
Yes in Data Package
Method Blank No target analytes > RL
Yes in Data Package
Sample Spike/ Sample Duplicate One set per group of field samples. Must contain all target analytes. Recovery Limits (75 to 125%; RPD < 20% or < 35%)
Yes in Data Package
Analytical Replicates Analyze one sample in duplicate for each group of field samples (RPD < 30%)
Yes in Data Package
* The Quality Control Acceptance Criteria are general guidelines. If alternate criteria are used, they must be documented in this table.
Quality Control (QC) Element
Acceptance Criteria*
Initial Calibration Verification/ Continuing Calibration Verification Yes Retained at Lab
DAMOS Portland Disposal Site Survey. Sediment Analysis. US Army Corps of Engineers Application Number ______. ESI Study 28209.
Page 37 of 41

DAMOS Portland Disposal Site Survey. Sediment Analysis. US Army Corps of Engineers Application Number ______. ESI Study 28209.
Page 38 of 41

DAMOS Portland Disposal Site Survey. Sediment Analysis. US Army Corps of Engineers Application Number ______. ESI Study 28209.
Page 39 of 41

DAMOS Portland Disposal Site Survey. Sediment Analysis. US Army Corps of Engineers Application Number ______. ESI Study 28209.
Page 40 of 41

DAMOS Portland Disposal Site Survey. Sediment Analysis. US Army Corps of Engineers Application Number ______. ESI Study 28209.
Page 41 of 41

DAMOS 2016
Portland Disposal Site
Sediment Grain Size and TOC Results
Katahdin Analytical


SAMPLE DATA SUMMARY PACKAGE
Katahdin Analytical Services A000001

Katahdin Analytical Services A000002

DM-003 – Revision 7 – 12/22/2015
KATAHDIN ANALYTICAL SERVICES – INORGANIC DATA QUALIFIERS
The sampled date indicated on the attached Report(s) of Analysis (ROA) is the date for which a grab sample was collected or the date for which a composite sample was completed. Beginning and start times for composite samples can be found on the Chain-of-Custody. U Indicates the compound was analyzed for but not detected above the specified level. This level may be the Practical
Quantitation Level (PQL) (also called Limit of Quantitation (LOQ)), the Limit of Detection (LOD) or Method Detection Limit (MDL) as required by the client.
Note: All results reported as “U” MDL have a 50% rate for false negatives compared to those results reported as “U” PQL “U” LOQ or “U” LOD, where the rate of false negatives is <1%.
E Estimated value. This flag identifies compounds whose concentrations exceed the upper level of the calibration range of the
instrument for that specific analysis. J Estimated value. The analyte was detected in the sample at a concentration less than the laboratory Practical Quantitation
Level (PQL) (also called Limit of Quantitation (LOQ)), but above the Method Detection Limit (MDL). I-7 The laboratory’s Practical Quantitation Level (PQL) or LOQ could not be achieved for this parameter due to sample
composition, matrix effects, sample volume, or quantity used for analysis. A-4 Please refer to cover letter or narrative for further information. H_ Please note that the regulatory holding time for _______ is “analyze immediately”. Ideally, this analysis must be performed in
the field at the time of sample collection. _______ for this sample was not performed at the time of sample collection. The analysis was performed as soon as possible after receipt by the laboratory.
H1 - pH H2 - DO H3 - sulfite H4 - residual chlorine T1 The client did not provide the full volume of at least one liter for analysis of TSS. Therefore, the PQL of 2.5 mg/L could not be
achieved. T2 The client provided the required volume of at least one liter for analysis of TSS, but the laboratory could not filter the full one
liter volume due to the sample matrix. Therefore, the PQL of 2.5 mg/L could not be achieved. M1 The matrix spike and/or matrix spike duplicate recovery performed on this sample was outside of the laboratory acceptance
criteria. Sample matrix is suspected. The laboratory criteria was met for the Laboratory Control Sample (LCS) analyzed concurrently with this sample.
M2 The matrix spike and/or matrix spike duplicate recovery was outside of the laboratory acceptance criteria. The native sample
concentration is greater than four times the spike added concentration so the spike added could not be distinguished from the native sample concentration.
R1 The relative percent difference (RPD) between the duplicate analyses performed on this sample was outside of the laboratory
acceptance criteria (when both values are greater than ten times the PQL). MCL Maximum Contaminant Level NL No limit NFL No Free Liquid Present FLP Free Liquid Present NOD No Odor Detected TON Threshold Odor Number D-1 As required by Method 5210B, APHA Standard Methods for the Examination of Water and Wastewater (21st edition), the BOD
value reported for this sample is ‘qualified’ because the check standard run concurrently with the sample analysis did not meet the criteria specified in the method (198 +/- 30.5 mg/L). These results may not be reportable for compliance purposes.
D-2 The measured final dissolved oxygen concentrations of all dilutions were less than the method-specified limit of 1 mg/L. The
reported BOD result was calculated assuming a final oxygen concentration equal to 1 mg/L. The reported value should be considered a minimum value.
D-3 The dilution water used to prepare this sample did not meet the method and/or regulatory criteria of less than 0.2 or 0.4 mg/L
dissolved oxygen (DO) uptake over the five day period of incubation. These results may not be reportable for compliance purposes.
Katahdin Analytical Services A000003

Katahdin Analytical Services A000004

Katahdin Analytical Services A000005

Katahdin Analytical Services A000006
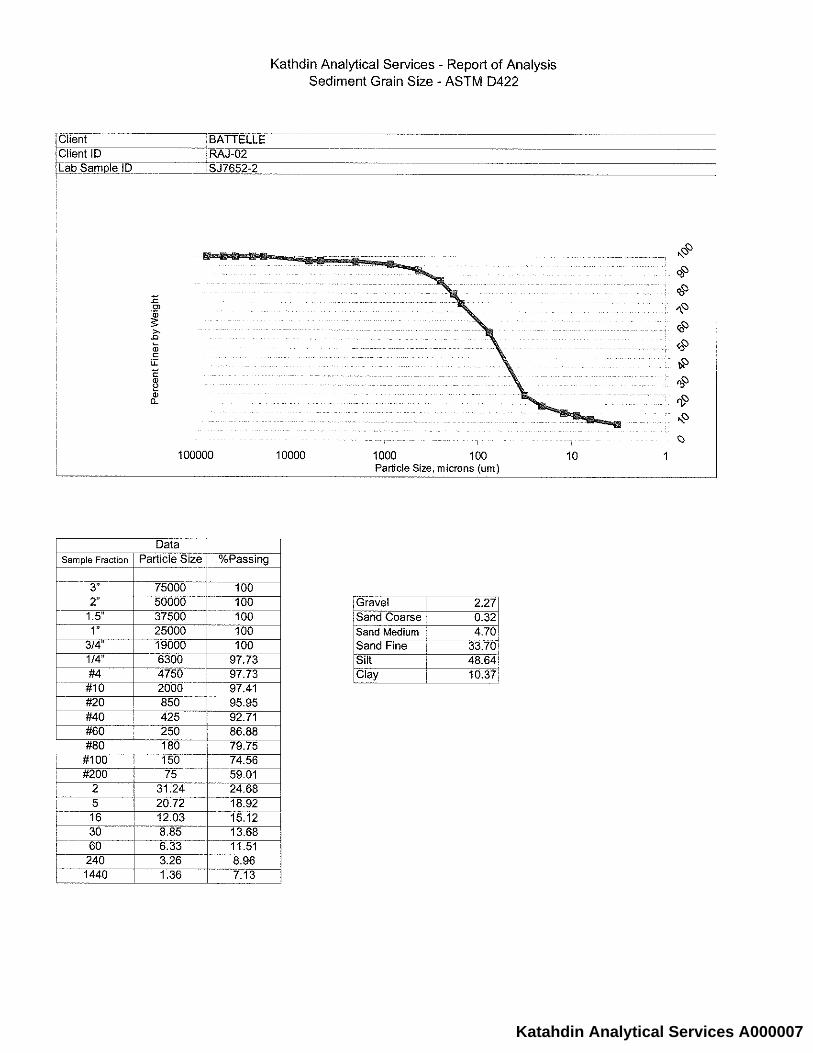
Katahdin Analytical Services A000007

Katahdin Analytical Services A000008

Katahdin Analytical Services A000009

Katahdin Analytical Services A000010

Katahdin Analytical Services A000011

Katahdin Analytical Services A000012

Katahdin Analytical Services A000013

Katahdin Analytical Services A000014

Katahdin Analytical Services A000015

Katahdin Analytical Services A000016

Katahdin Analytical Services A000017

Katahdin Analytical Services A000018
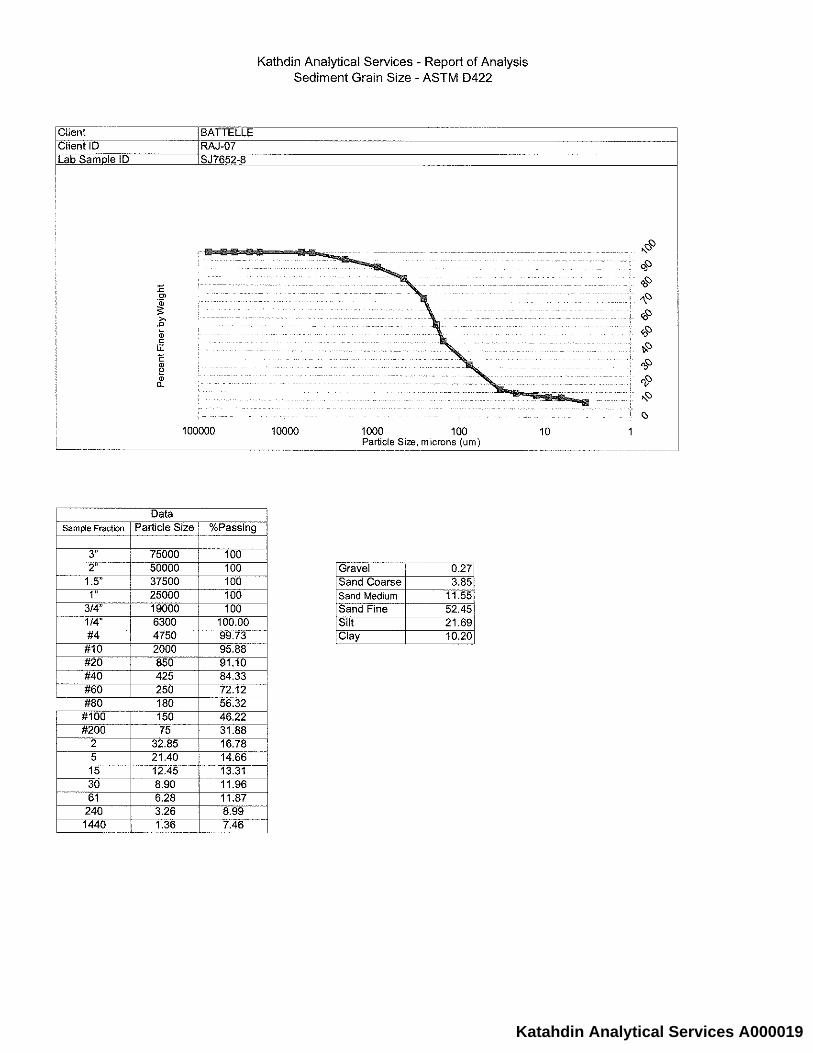
Katahdin Analytical Services A000019
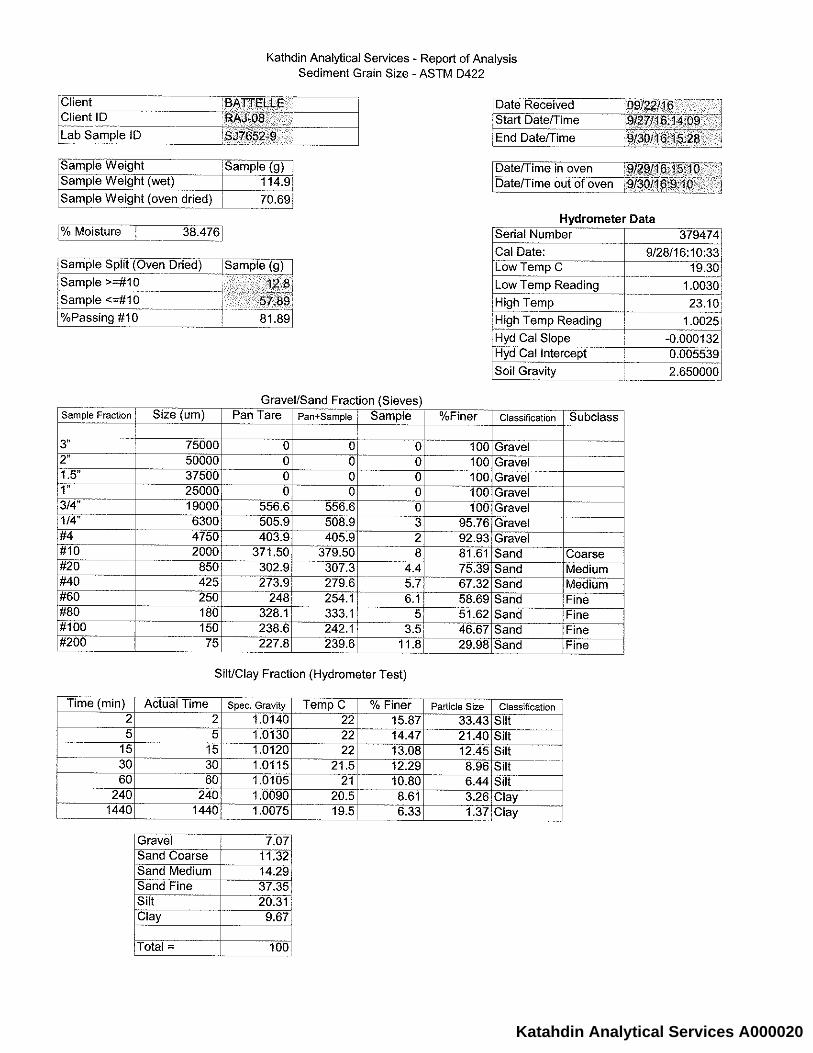
Katahdin Analytical Services A000020

Katahdin Analytical Services A000021

Katahdin Analytical Services A000022

Katahdin Analytical Services A000023
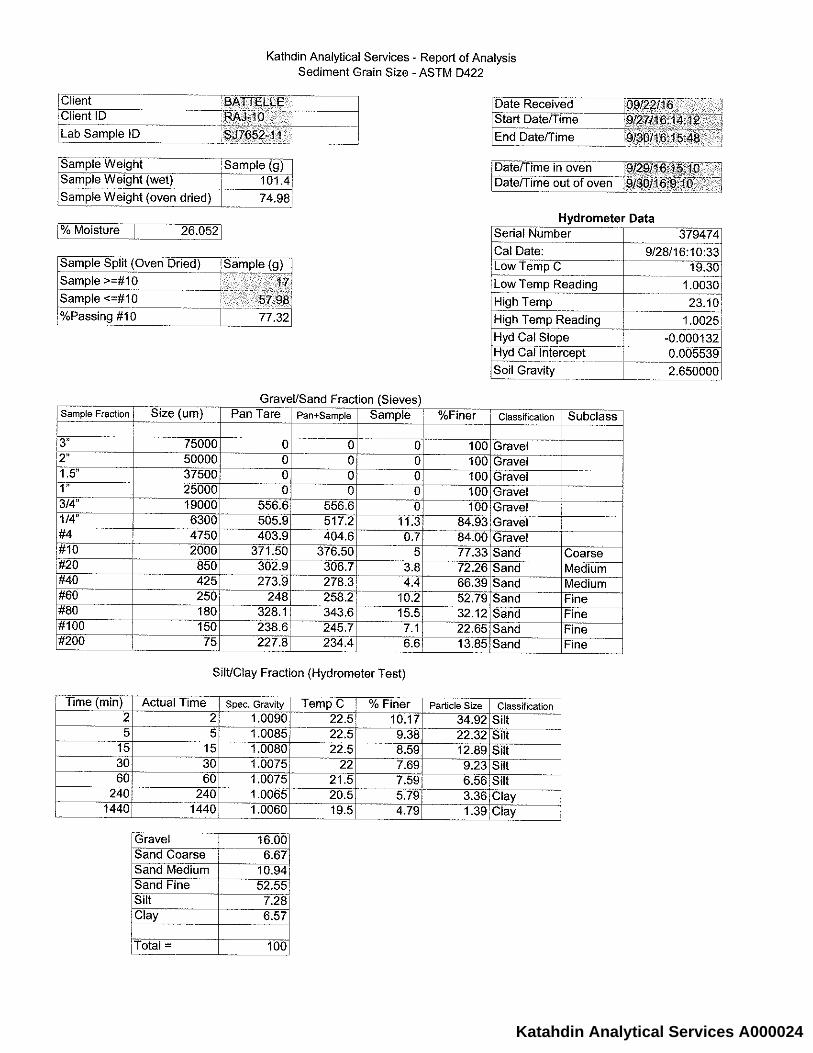
Katahdin Analytical Services A000024

Katahdin Analytical Services A000025

Katahdin Analytical Services A000026

Katahdin Analytical Services A000027

Katahdin Analytical Services A000028

Katahdin Analytical Services A000029

Katahdin Analytical Services A000030

Katahdin Analytical Services A000031

Katahdin Analytical Services A000032

Katahdin Analytical Services A000033

Katahdin Analytical Services A000034

Katahdin Analytical Services A000035

Katahdin Analytical Services A000036
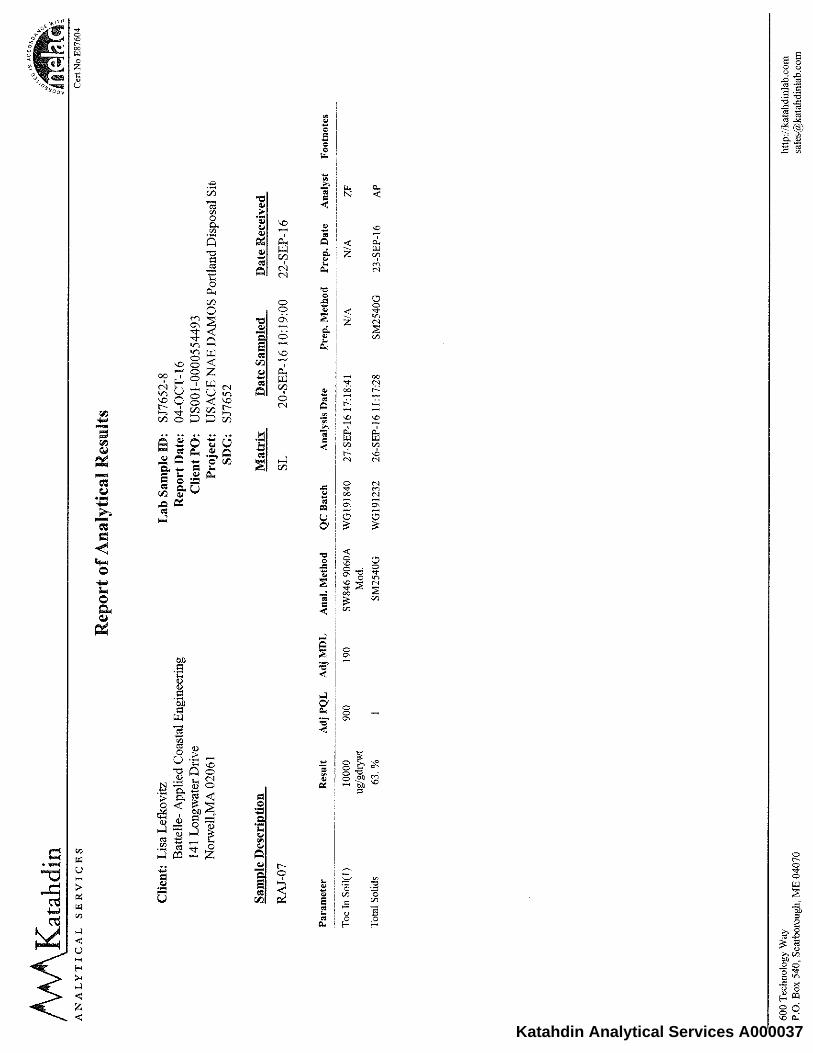
Katahdin Analytical Services A000037

Katahdin Analytical Services A000038

Katahdin Analytical Services A000039

Katahdin Analytical Services A000040

Katahdin Analytical Services A000041

Katahdin Analytical Services A000042

GRAIN SIZE
Katahdin Analytical Services 1000001

Sample Data Section
Katahdin Analytical Services 1000002

Katahdin Analytical Services 1000003

Katahdin Analytical Services 1000004

Katahdin Analytical Services 1000005

Katahdin Analytical Services 1000006

Katahdin Analytical Services 1000007

Katahdin Analytical Services 1000008

Katahdin Analytical Services 1000009
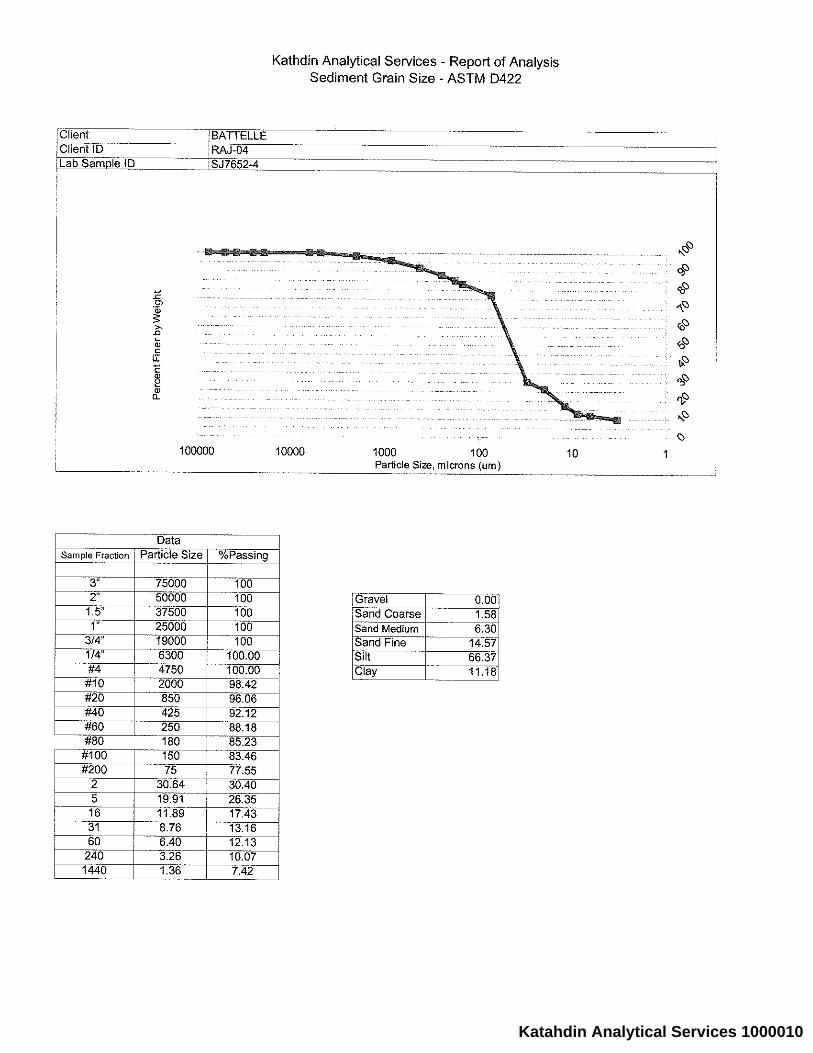
Katahdin Analytical Services 1000010

Katahdin Analytical Services 1000011

Katahdin Analytical Services 1000012

Katahdin Analytical Services 1000013

Katahdin Analytical Services 1000014

Katahdin Analytical Services 1000015

Katahdin Analytical Services 1000016

Katahdin Analytical Services 1000017

Katahdin Analytical Services 1000018

Katahdin Analytical Services 1000019

Katahdin Analytical Services 1000020
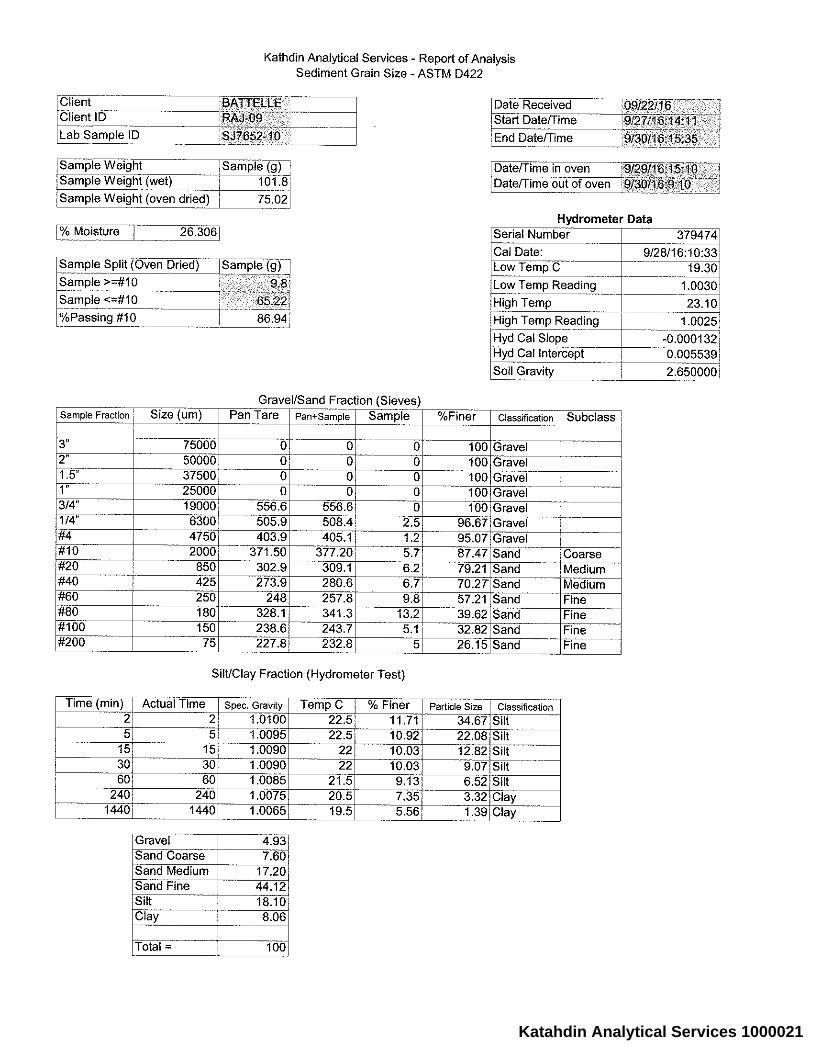
Katahdin Analytical Services 1000021

Katahdin Analytical Services 1000022

Katahdin Analytical Services 1000023

Katahdin Analytical Services 1000024

Katahdin Analytical Services 1000025

Katahdin Analytical Services 1000026

Katahdin Analytical Services 1000027
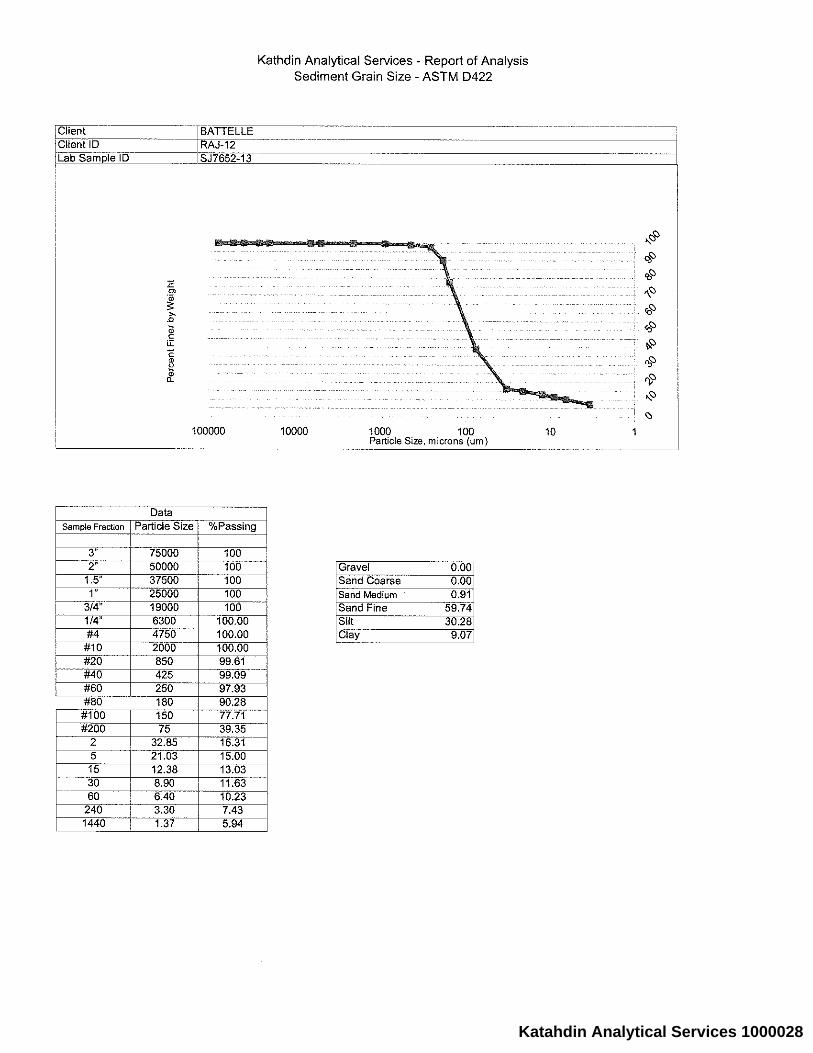
Katahdin Analytical Services 1000028

Raw Data Section
Katahdin Analytical Services 1000029

Katahdin Analytical Services 1000030

Katahdin Analytical Services 1000031
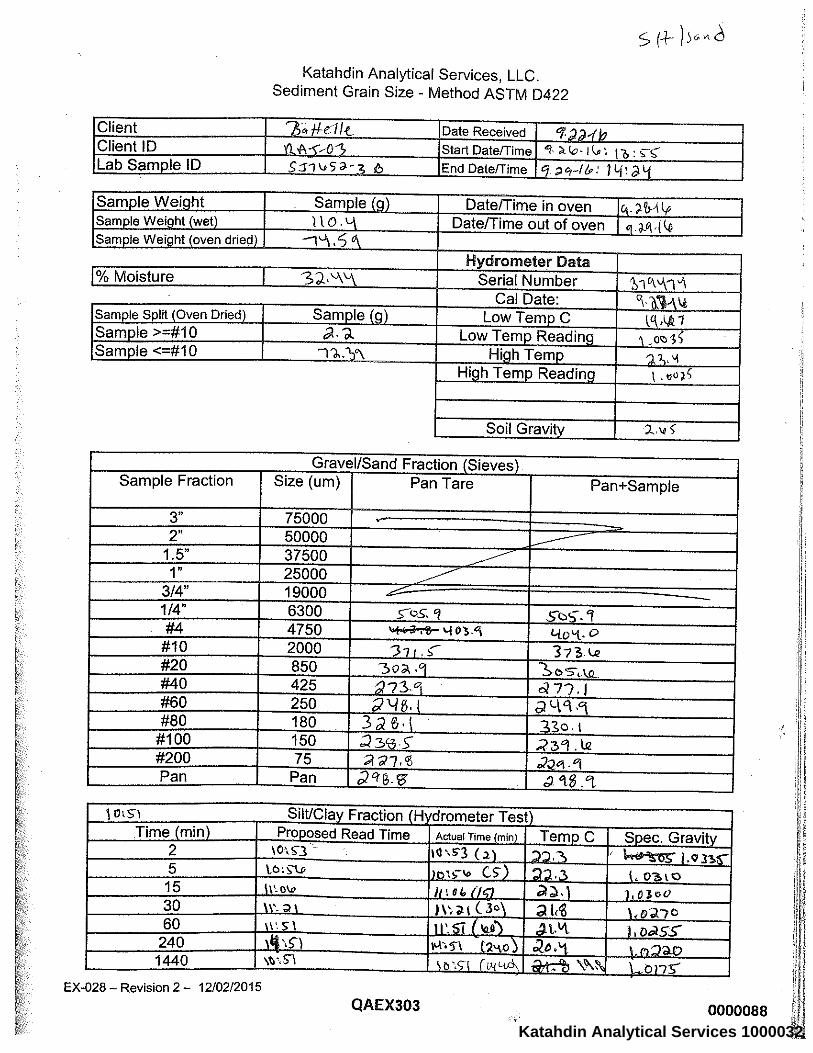
Katahdin Analytical Services 1000032
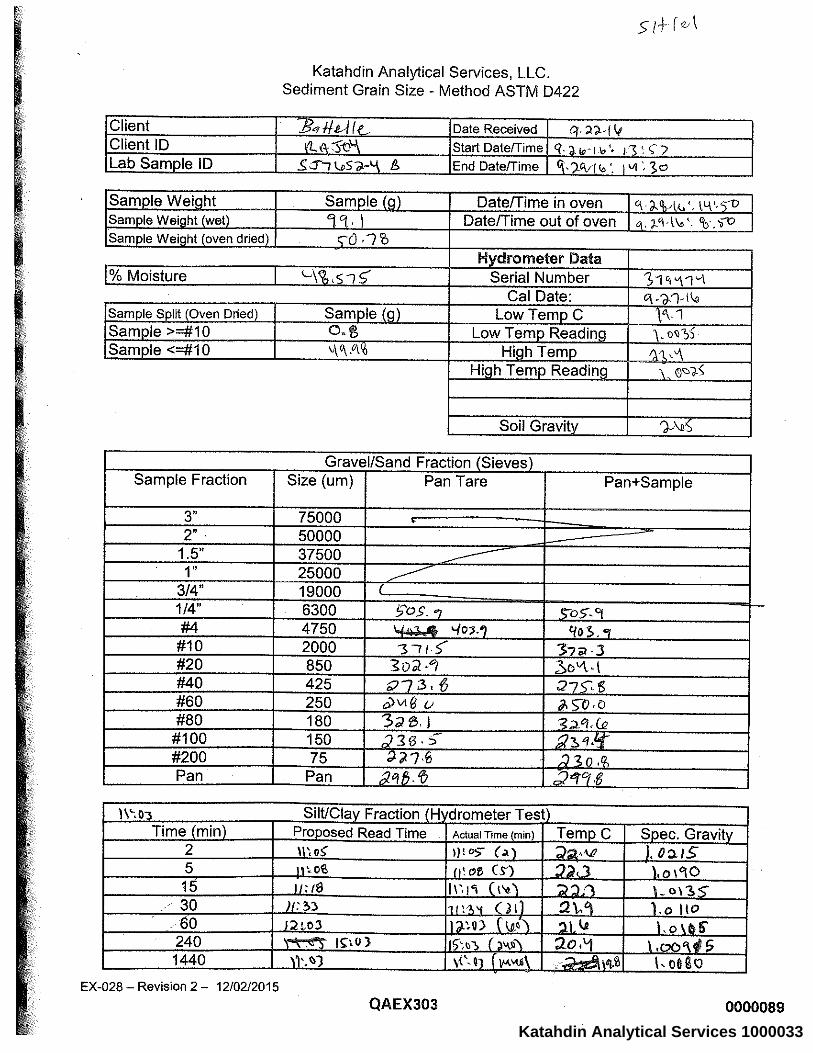
Katahdin Analytical Services 1000033

Katahdin Analytical Services 1000034

Katahdin Analytical Services 1000035

Katahdin Analytical Services 1000036

Katahdin Analytical Services 1000037

Katahdin Analytical Services 1000038

Katahdin Analytical Services 1000039
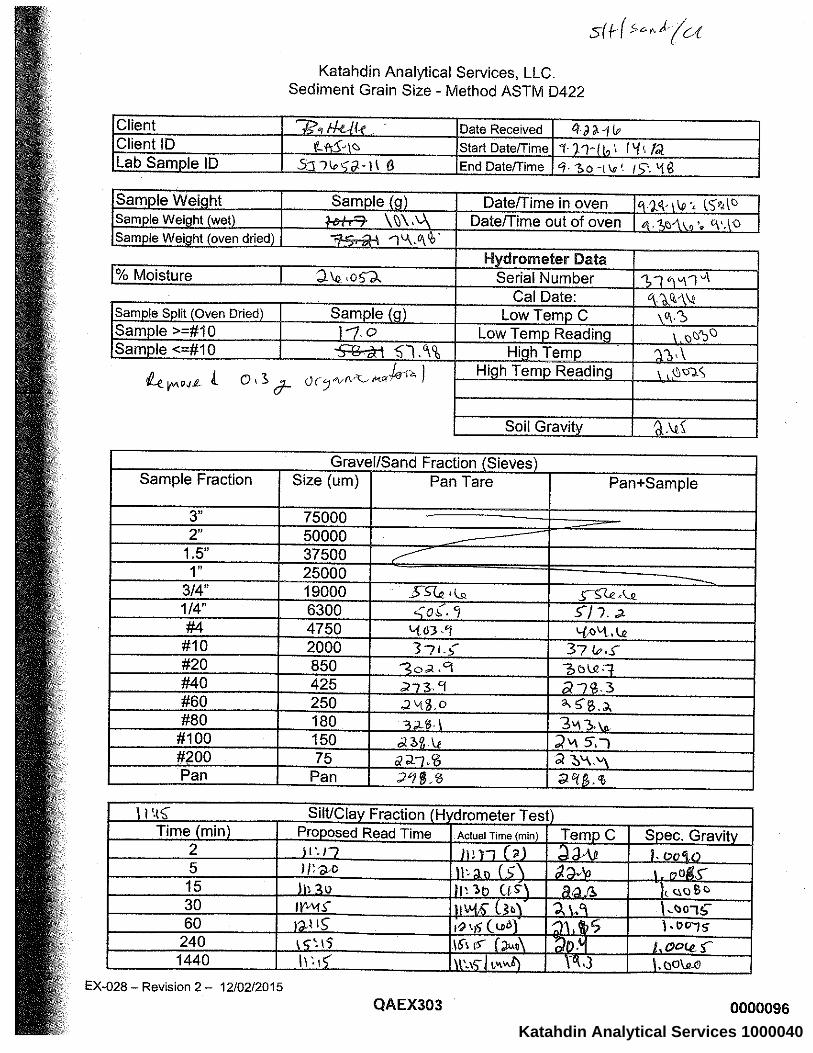
Katahdin Analytical Services 1000040
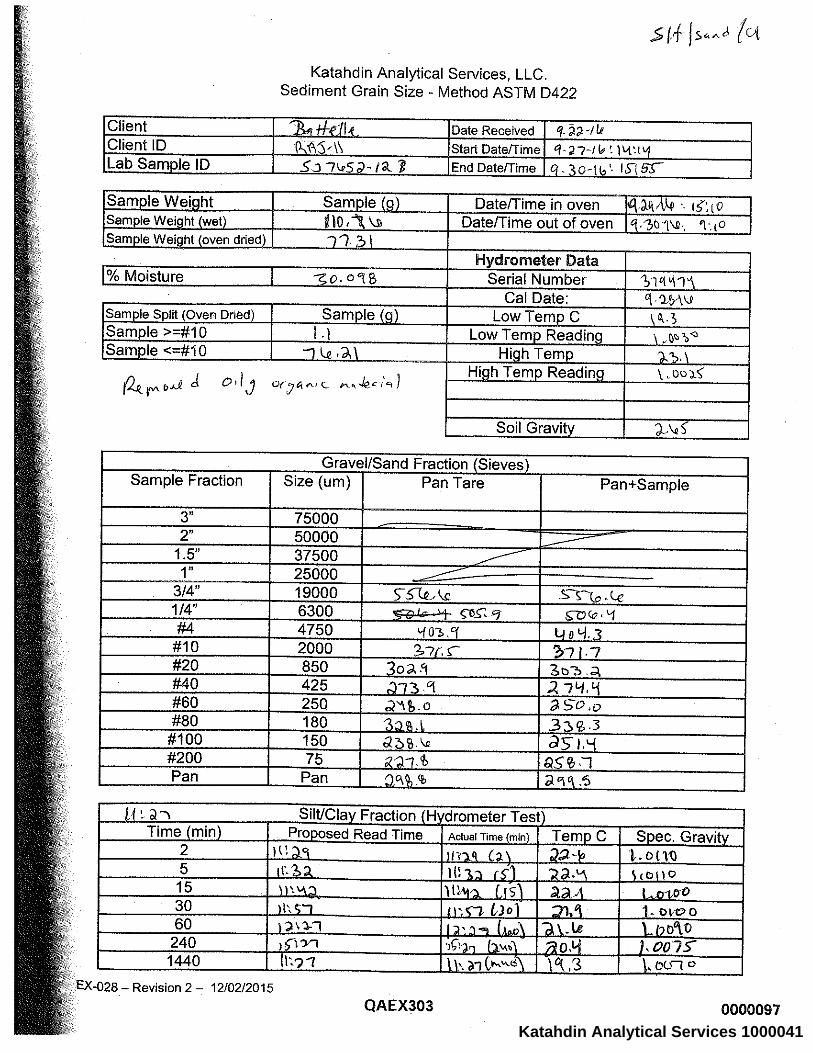
Katahdin Analytical Services 1000041

Katahdin Analytical Services 1000042

CONVENTIONAL AND PHYSICAL ANALYTICAL DATA
Katahdin Analytical Services 5000001

QC Summary Section
Katahdin Analytical Services 5000002

Katahdin Analytical Services 5000003

Katahdin Analytical Services 5000004

Katahdin Analytical Services 5000005

Katahdin Analytical Services 5000006
Sample Data Section
Katahdin Analytical Services 5000007

DM-003 – Revision 7 – 12/22/2015
KATAHDIN ANALYTICAL SERVICES – INORGANIC DATA QUALIFIERS
The sampled date indicated on the attached Report(s) of Analysis (ROA) is the date for which a grab sample was collected or the date for which a composite sample was completed. Beginning and start times for composite samples can be found on the Chain-of-Custody. U Indicates the compound was analyzed for but not detected above the specified level. This level may be the Practical
Quantitation Level (PQL) (also called Limit of Quantitation (LOQ)), the Limit of Detection (LOD) or Method Detection Limit (MDL) as required by the client.
Note: All results reported as “U” MDL have a 50% rate for false negatives compared to those results reported as “U” PQL “U” LOQ or “U” LOD, where the rate of false negatives is <1%.
E Estimated value. This flag identifies compounds whose concentrations exceed the upper level of the calibration range of the
instrument for that specific analysis. J Estimated value. The analyte was detected in the sample at a concentration less than the laboratory Practical Quantitation
Level (PQL) (also called Limit of Quantitation (LOQ)), but above the Method Detection Limit (MDL). I-7 The laboratory’s Practical Quantitation Level (PQL) or LOQ could not be achieved for this parameter due to sample
composition, matrix effects, sample volume, or quantity used for analysis. A-4 Please refer to cover letter or narrative for further information. H_ Please note that the regulatory holding time for _______ is “analyze immediately”. Ideally, this analysis must be performed in
the field at the time of sample collection. _______ for this sample was not performed at the time of sample collection. The analysis was performed as soon as possible after receipt by the laboratory.
H1 - pH H2 - DO H3 - sulfite H4 - residual chlorine T1 The client did not provide the full volume of at least one liter for analysis of TSS. Therefore, the PQL of 2.5 mg/L could not be
achieved. T2 The client provided the required volume of at least one liter for analysis of TSS, but the laboratory could not filter the full one
liter volume due to the sample matrix. Therefore, the PQL of 2.5 mg/L could not be achieved. M1 The matrix spike and/or matrix spike duplicate recovery performed on this sample was outside of the laboratory acceptance
criteria. Sample matrix is suspected. The laboratory criteria was met for the Laboratory Control Sample (LCS) analyzed concurrently with this sample.
M2 The matrix spike and/or matrix spike duplicate recovery was outside of the laboratory acceptance criteria. The native sample
concentration is greater than four times the spike added concentration so the spike added could not be distinguished from the native sample concentration.
R1 The relative percent difference (RPD) between the duplicate analyses performed on this sample was outside of the laboratory
acceptance criteria (when both values are greater than ten times the PQL). MCL Maximum Contaminant Level NL No limit NFL No Free Liquid Present FLP Free Liquid Present NOD No Odor Detected TON Threshold Odor Number D-1 As required by Method 5210B, APHA Standard Methods for the Examination of Water and Wastewater (21st edition), the BOD
value reported for this sample is ‘qualified’ because the check standard run concurrently with the sample analysis did not meet the criteria specified in the method (198 +/- 30.5 mg/L). These results may not be reportable for compliance purposes.
D-2 The measured final dissolved oxygen concentrations of all dilutions were less than the method-specified limit of 1 mg/L. The
reported BOD result was calculated assuming a final oxygen concentration equal to 1 mg/L. The reported value should be considered a minimum value.
D-3 The dilution water used to prepare this sample did not meet the method and/or regulatory criteria of less than 0.2 or 0.4 mg/L
dissolved oxygen (DO) uptake over the five day period of incubation. These results may not be reportable for compliance purposes.
Katahdin Analytical Services 5000008

Katahdin Analytical Services 5000009

Katahdin Analytical Services 5000010
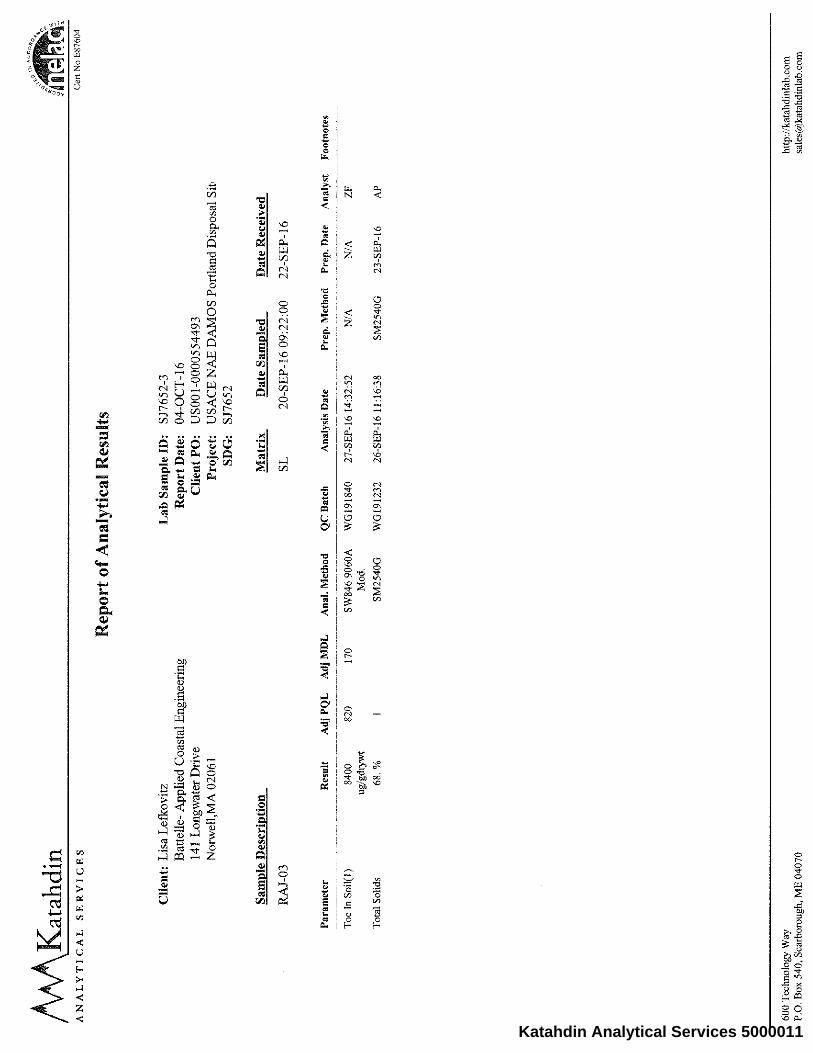
Katahdin Analytical Services 5000011

Katahdin Analytical Services 5000012
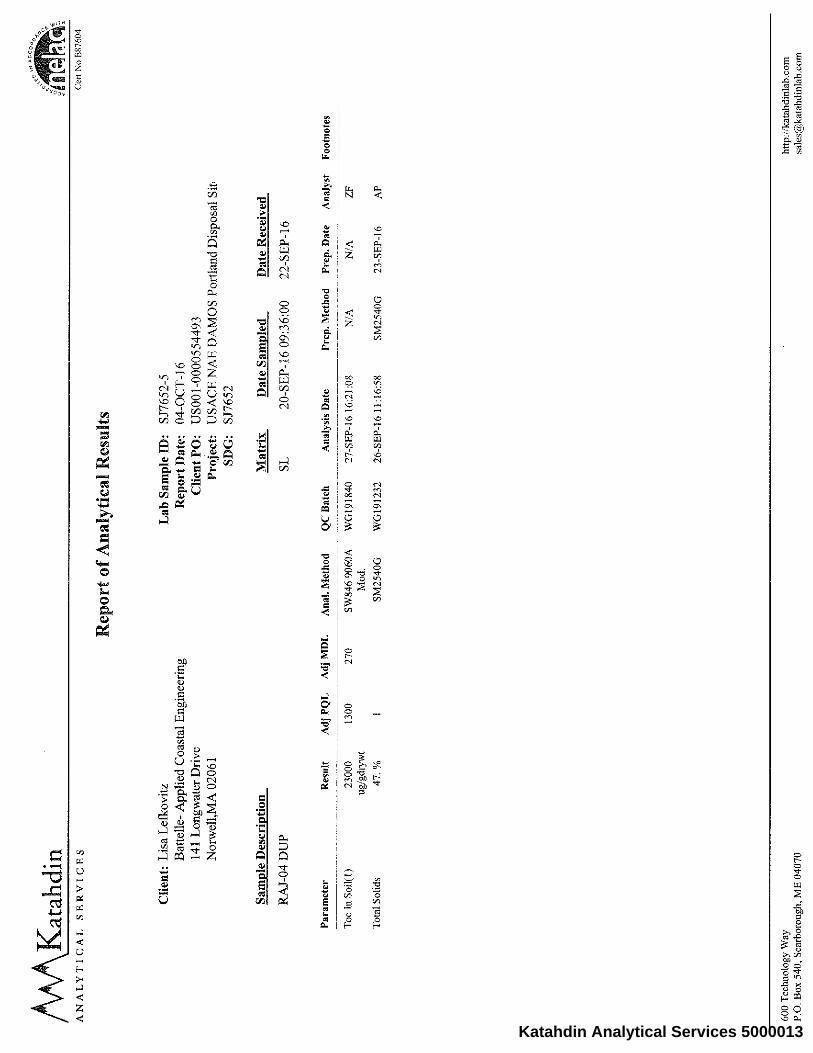
Katahdin Analytical Services 5000013

Katahdin Analytical Services 5000014
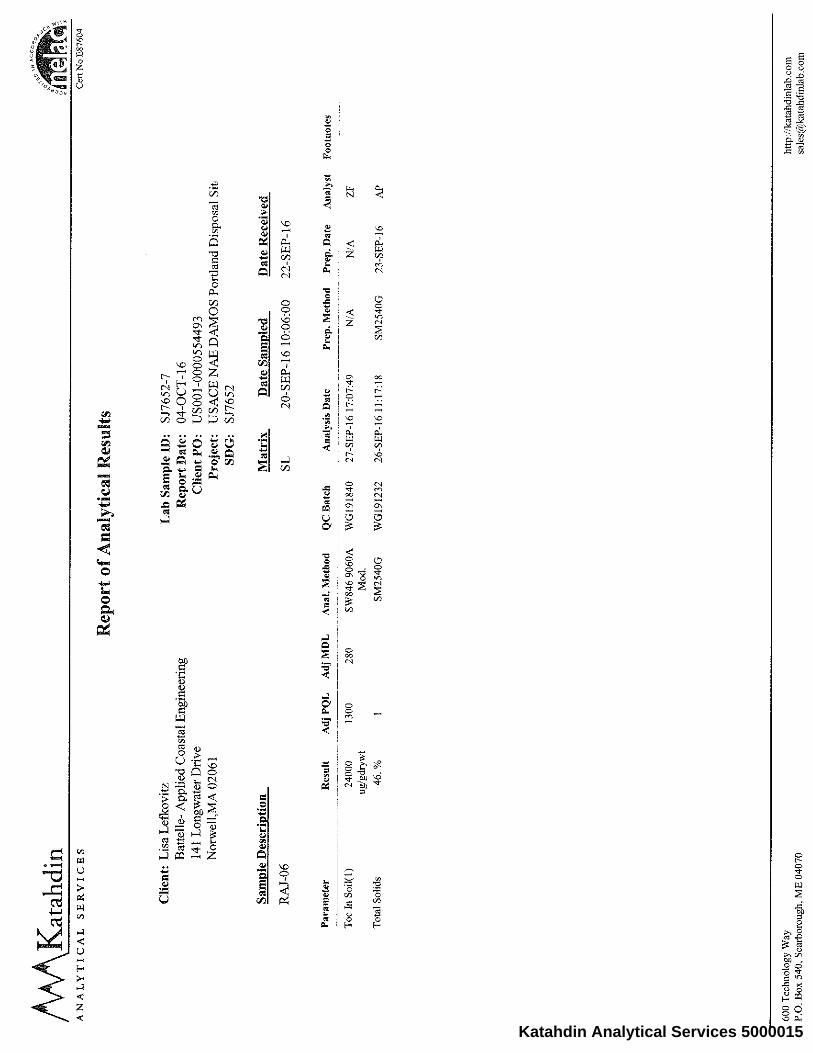
Katahdin Analytical Services 5000015

Katahdin Analytical Services 5000016

Katahdin Analytical Services 5000017

Katahdin Analytical Services 5000018

Katahdin Analytical Services 5000019

Katahdin Analytical Services 5000020
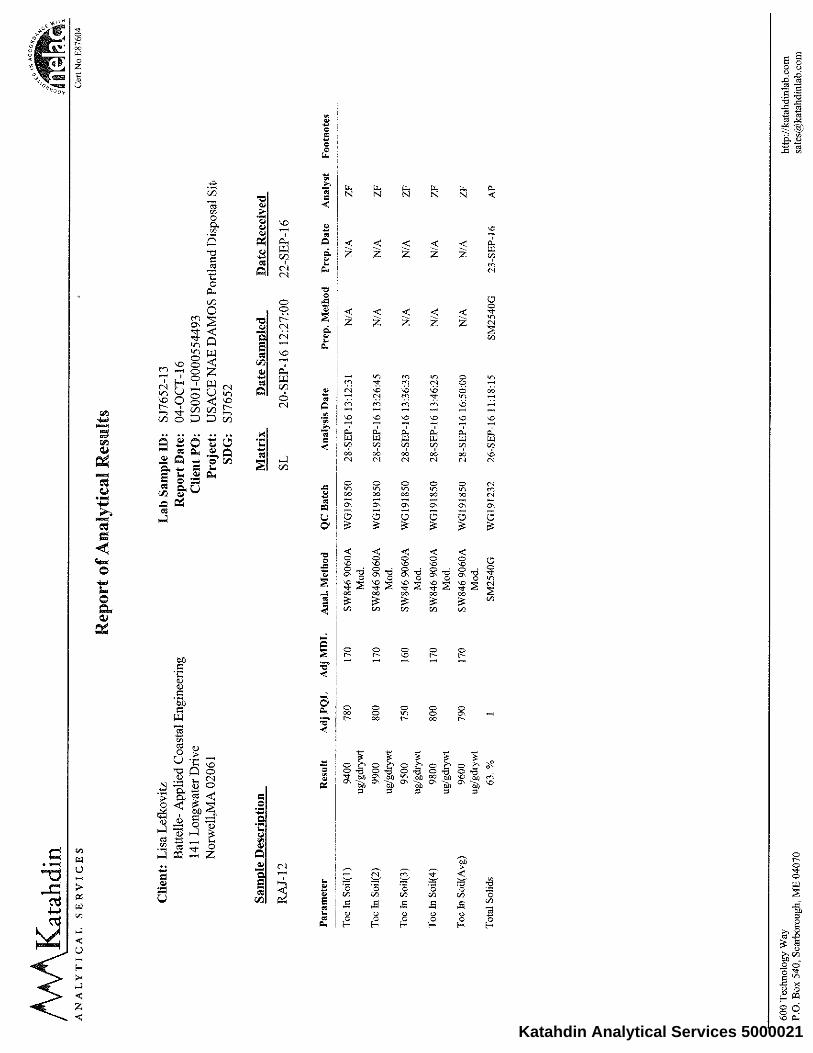
Katahdin Analytical Services 5000021

Raw Data Section
Katahdin Analytical Services 5000022

Katahdin Analytical Services 5000023
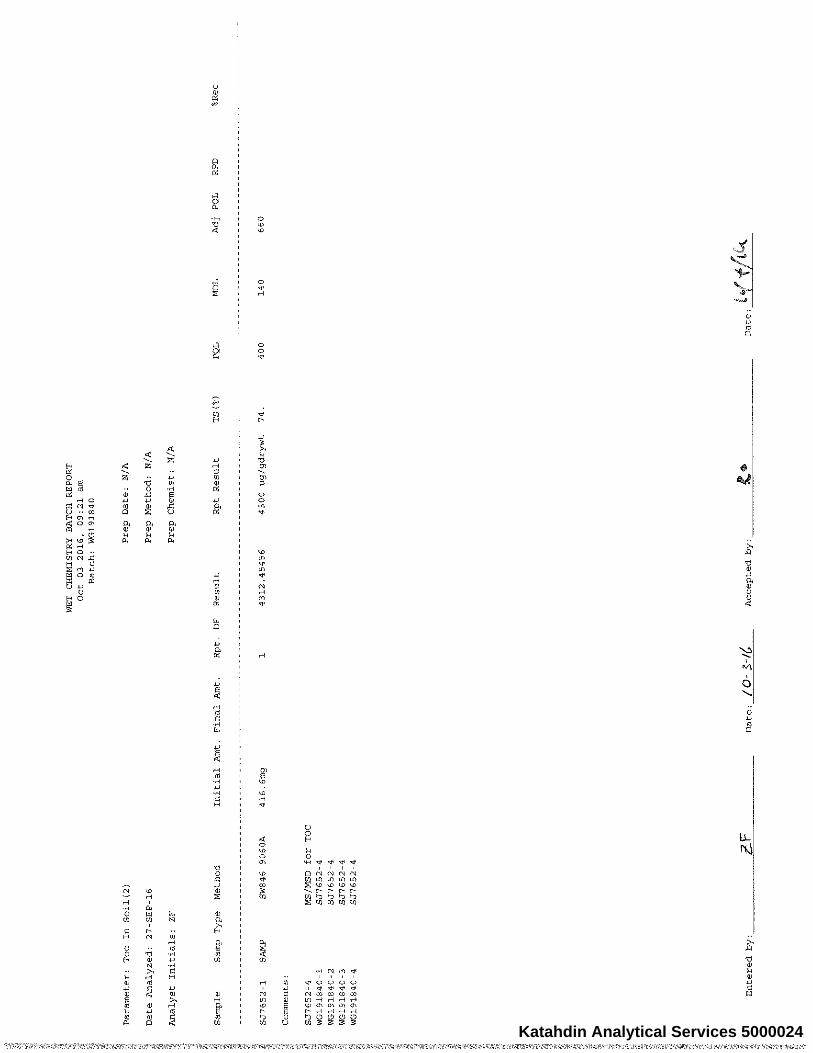
Katahdin Analytical Services 5000024

Katahdin Analytical Services 5000025

Katahdin Analytical Services 5000026

Katahdin Analytical Services 5000027

Katahdin Analytical Services 5000028

Katahdin Analytical Services 5000029

Katahdin Analytical Services 5000030

Katahdin Analytical Services 5000031

Katahdin Analytical Services 5000032

Katahdin Analytical Services 5000033

Katahdin Analytical Services 5000034

Katahdin Analytical Services 5000035

Katahdin Analytical Services 5000036

Katahdin Analytical Services 5000037

Katahdin Analytical Services 5000038

Katahdin Analytical Services 5000039

Katahdin Analytical Services 5000040
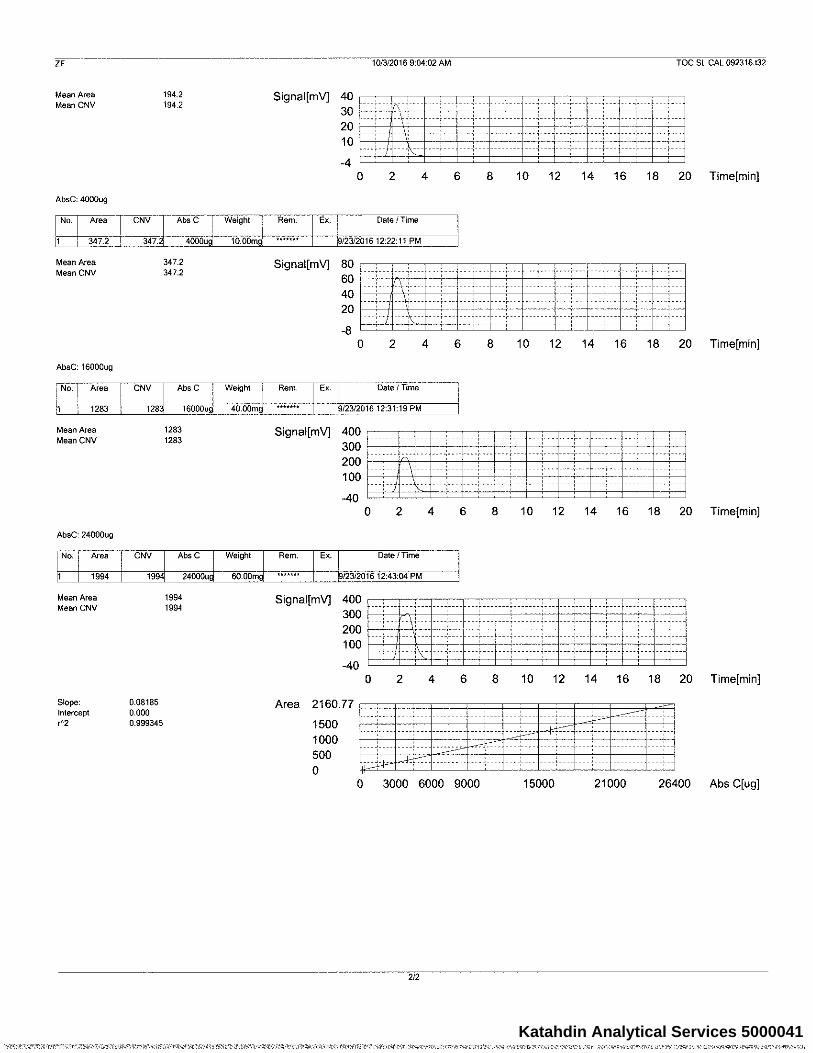
Katahdin Analytical Services 5000041
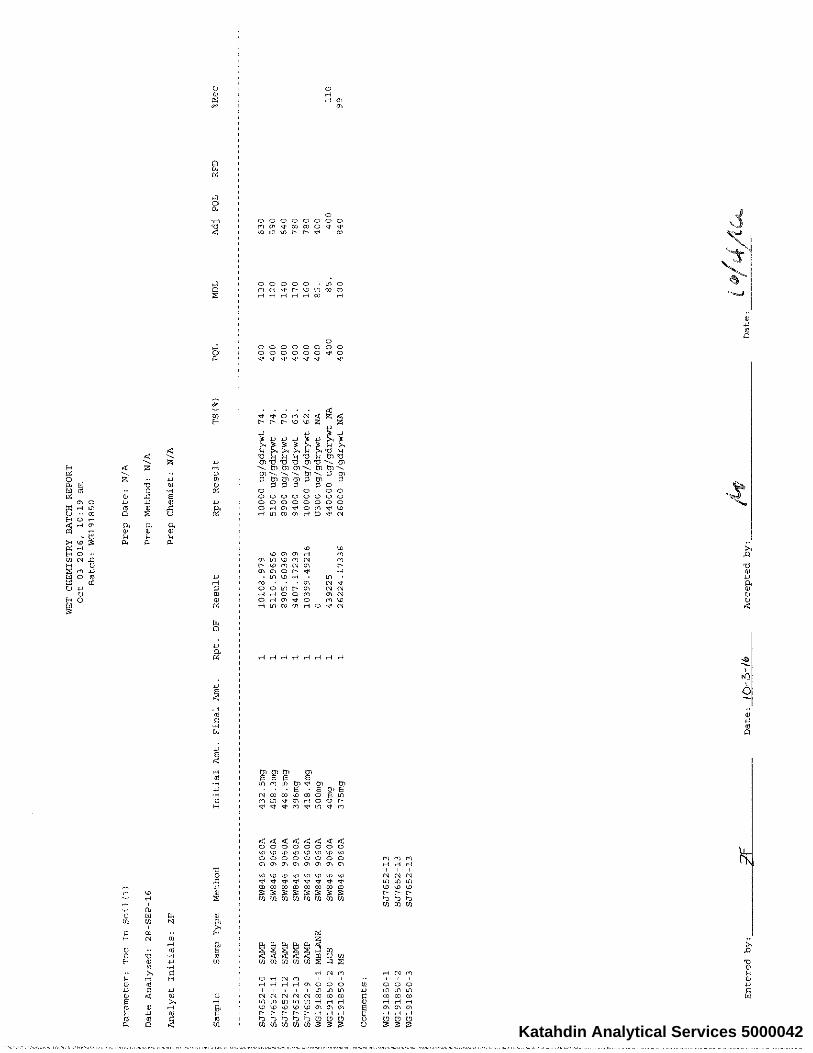
Katahdin Analytical Services 5000042

Katahdin Analytical Services 5000043
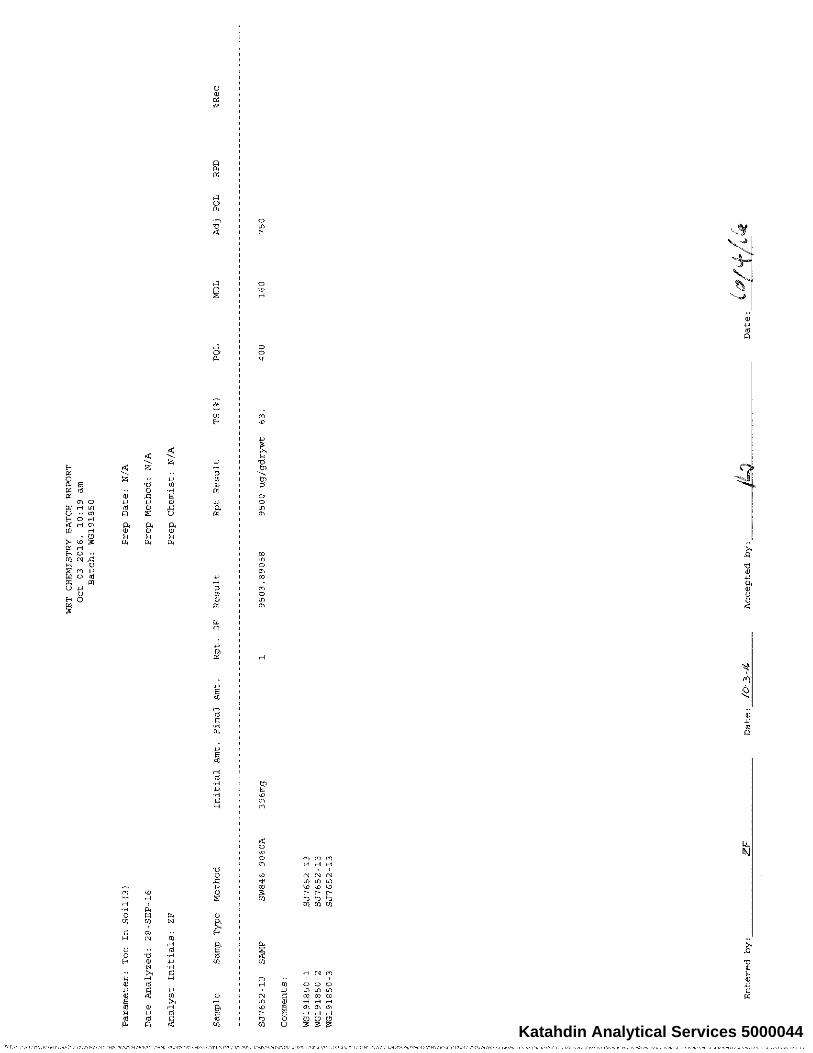
Katahdin Analytical Services 5000044

Katahdin Analytical Services 5000045

Katahdin Analytical Services 5000046

Katahdin Analytical Services 5000047

Katahdin Analytical Services 5000048

Katahdin Analytical Services 5000049
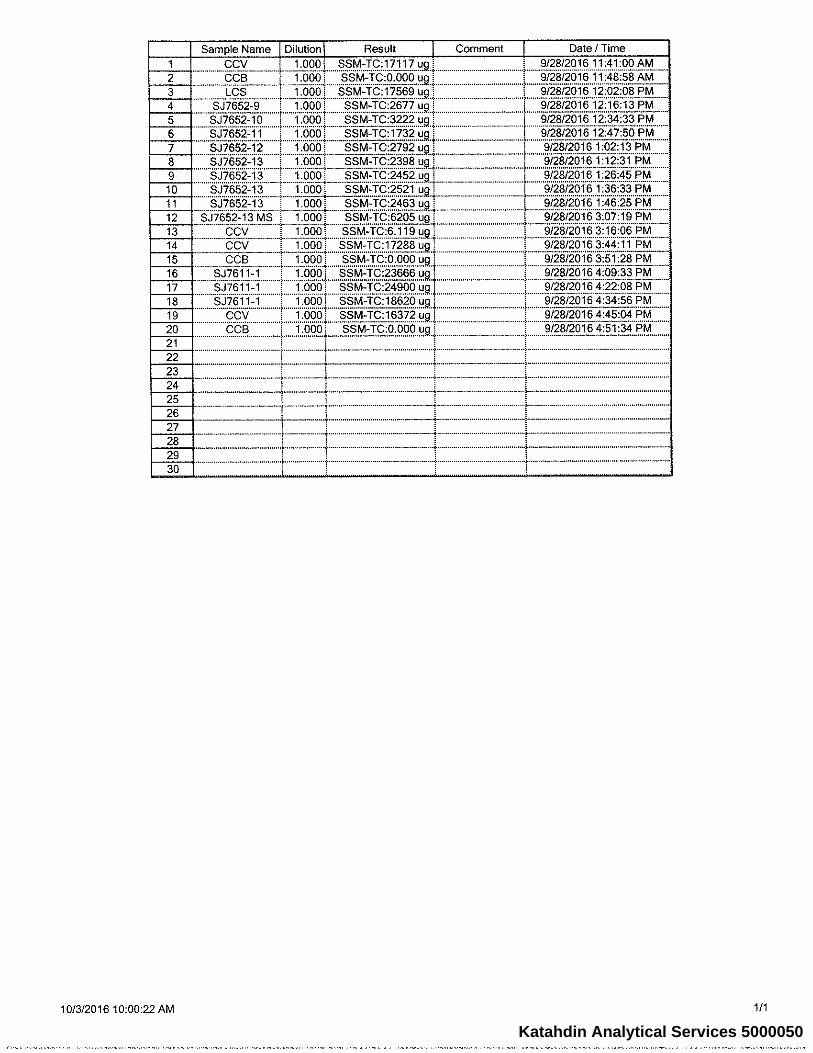
Katahdin Analytical Services 5000050

Katahdin Analytical Services 5000051

Katahdin Analytical Services 5000052

Katahdin Analytical Services 5000053
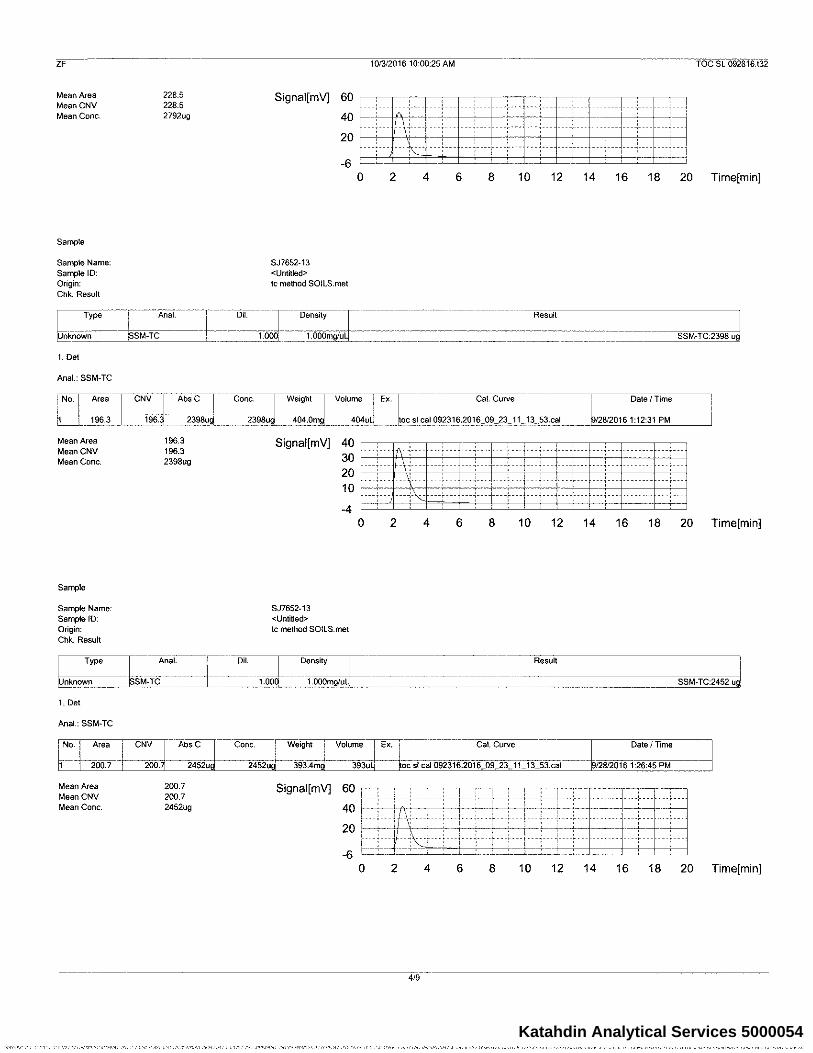
Katahdin Analytical Services 5000054

Katahdin Analytical Services 5000055

Katahdin Analytical Services 5000056

Katahdin Analytical Services 5000057

Katahdin Analytical Services 5000058

Katahdin Analytical Services 5000059

Katahdin Analytical Services 5000060
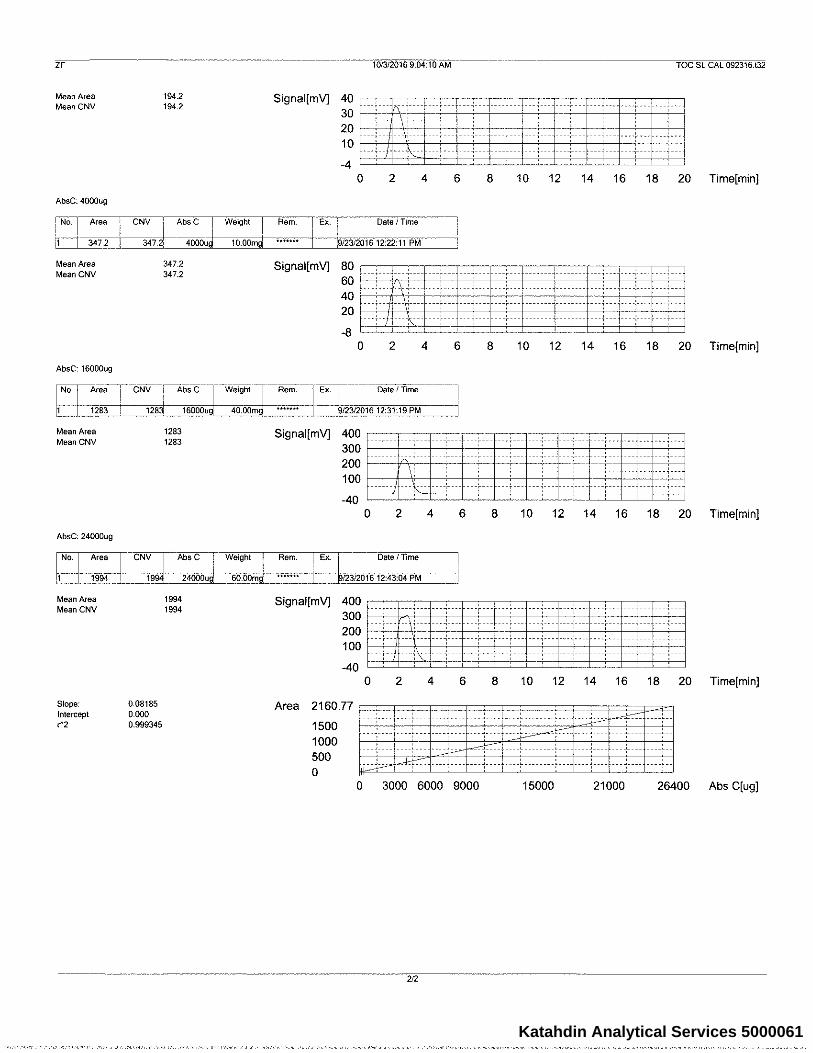
Katahdin Analytical Services 5000061

Katahdin Analytical Services 5000062

Katahdin Analytical Services 5000063

Katahdin Analytical Services 5000064

Monitoring Survey at the Portland Disposal Site September 2016
APPENDIX H
TISSUE CHEMISTRY LAB RESULTS

DAMOS 2016 ‐ Portland Disposal Site Sample Summary ‐ TISSUE
STATION_ID Field SAMPLE ID MATRIX
TAXON
NAME LAB LAB_SAMPLE_ID
EREF‐02 RAJ‐021 TS Astarte Battelle K2645‐BD
EREF‐02 RAJ‐021 TS Astarte Battelle K2645DUP‐BD
EREF‐02 RAJ‐021 TS Astarte Battelle K2645‐P
EREF‐02 RAJ‐021 TS Astarte ESI 28411‐009
EREF‐02 RAJ‐021 TS Astarte ESI 28411‐009D
EREF‐02 RAJ‐021 TS Astarte ESI 28411‐009S
EREF‐02 RAJ‐021 TS Astarte ESI 28411‐009SD
PDA95‐22 RAJ‐022 TS Nephtys Battelle K2646‐P
PDA95‐22 RAJ‐022 TS Nephtys ESI 28411‐010
PDA95‐30 RAJ‐023 TS Nephtys Battelle K2647‐BD
PDA95‐30 RAJ‐023 TS Nephtys Battelle K2647‐P
PDA95‐30 RAJ‐023 TS Nephtys ESI 28411‐011
PDA95‐30 RAJ‐024 TS Astarte Battelle K2648‐P
PDA95‐30 RAJ‐024 TS Astarte ESI 28411‐012
SREF‐07 RAJ‐020 TS Astarte Battelle K2644DUP‐P
SREF‐07 RAJ‐020 TS Astarte Battelle K2644‐P
SREF‐07 RAJ‐020 TS Astarte ESI 28411‐008
SREF‐10 RAJ‐019 TS Astarte Battelle K2643‐BD
SREF‐10 RAJ‐019 TS Astarte Battelle K2643MSD‐P
SREF‐10 RAJ‐019 TS Astarte Battelle K2643MS‐P
SREF‐10 RAJ‐019 TS Astarte Battelle K2643‐PSREF‐10 RAJ‐019 TS Astarte ESI 28411‐007

Portland Tissue
Study Id DAMOS16 DAMOS16 DAMOS16 DAMOS16 DAMOS16 DAMOS16 DAMOS16 DAMOS16
Survey Id PDS PDS PDS PDS PDS PDS PDS PDS
Station Id EREF‐02 EREF‐02 EREF‐02 EREF‐02 PDA95‐22 PDA95‐22 PDA95‐30 PDA95‐30
Sample Id RAJ‐021 RAJ‐021 RAJ‐021 RAJ‐021 RAJ‐022 RAJ‐022 RAJ‐023 RAJ‐023
Field Qc Code SA SA SA SA SA SA SA SA
Lab Qc Code SA SA DUP DUP SA SA SA SA
Taxon Name Astarte Astarte Astarte Astarte Nephtys Nephtys Nephtys Nephtys
Class Param Code Param Name Unit Result Lab Qual Result Lab Qual Result Lab Qual Result Lab Qual
CONG 31508‐00‐6 2,3',4,4',5‐Pentachlorobiphenyl UG/KG_WETWT 0.0542 U 0.387 0.586
CONG 32598‐10‐0 2,3',4,4'‐Tetrachlorobiphenyl UG/KG_WETWT 0.0842 U 0.202 0.388
CONG 32598‐14‐4 2,3,3',4,4'‐Pentachlorobiphenyl UG/KG_WETWT 0.0483 U 0.78 0.457
CONG 34883‐43‐7 2,4'‐Dichlorobiphenyl UG/KG_WETWT 0.12 U 0.284 U 0.195 U
CONG 35065‐27‐1 2,2',4,4',5,5'‐Hexachlorobiphenyl UG/KG_WETWT 0.0662 U 0.903 1.57
CONG 35065‐28‐2 2,2',3,4,4',5'‐Hexachlorobiphenyl UG/KG_WETWT 0.0542 U 0.626 1.12
CONG 35065‐29‐3 2,2',3,4,4',5,5'‐Heptachlorobiphenyl UG/KG_WETWT 0.0483 U 0.324 0.522
CONG 35065‐30‐6 2,2',3,3',4,4',5‐Heptachlorobiphenyl UG/KG_WETWT 0.0542 U 0.128 U 0.493
CONG 35693‐99‐3 2,2',5,5'‐Tetrachlorobiphenyl UG/KG_WETWT 0.0902 U 0.213 U 0.147 U
CONG 37680‐65‐2 2,2',5‐Trichlorobiphenyl UG/KG_WETWT 0.0542 U 0.128 U 0.0881 U
CONG 37680‐73‐2 2,2',4,5,5'‐Pentachlorobiphenyl UG/KG_WETWT 0.0542 U 0.445 0.792
CONG 38380‐02‐8 2,2',3,4,5'‐Pentachlorobiphenyl UG/KG_WETWT 0.0542 U 0.128 U 0.159 J
CONG 38380‐07‐3 2,2',3,3',4,4'‐Hexachlorobiphenyl UG/KG_WETWT 0.0602 U 0.142 U 0.153 J
CONG 40186‐72‐9 2,2',3,3',4,4',5,5',6‐Nonachlorobiphenyl UG/KG_WETWT 0.0639 J 0.373 0.574
CONG 41464‐39‐5 2,2',3,5'‐Tetrachlorobiphenyl UG/KG_WETWT 0.0483 U 0.114 U 0.0784 U
CONG 41464‐40‐8 2,2',4,5'‐Tetrachlorobiphenyl UG/KG_WETWT 0.0421 U 0.0997 U 0.0684 U
CONG 52663‐68‐0 2,2',3,4',5,5',6‐Heptachlorobiphenyl UG/KG_WETWT 0.164 0.0997 U 0.503
CONG 52663‐69‐1 2,2',3,4,4',5',6‐Heptachlorobiphenyl UG/KG_WETWT 0.0421 U 0.0997 U 0.185 J
CONG 52663‐78‐2 2,2',3,3',4,4',5,6‐Octachlorobiphenyl UG/KG_WETWT 0.0654 J 0.0856 U 0.126 J
CONG 7012‐37‐5 2,4,4'‐Trichlorobiphenyl UG/KG_WETWT 0.0662 U 0.156 U 0.108 U
CONG 74472‐48‐3 2,2',3,4,4',6,6'‐Heptachlorobiphenyl UG/KG_WETWT 0.0964 U 0.228 U 0.157 U
CONG C‐2051‐24‐3 Decachlorobiphenyl ‐ Congener UG/KG_WETWT 0.0776 J 0.156 U 0.189 J
TOTAL_PCB_NST_CONGx2 Total NS&T PCB *2 (ND as 1/2 MDL) UG/KG_WETWT 1.6447 9.5863 15.5625
CONGSURR CS‐37680‐68‐5 2,3',5'‐Trichlorobiphenyl PCT_REC 84 76 79
CONGSURR CS‐68194‐09‐2 2,2',3,5,6,6'‐Hexachlorobiphenyl PCT_REC 81 75 80
PEST 1024‐57‐3 heptachlor epoxide UG/KG_WETWT 0.0662 U 0.156 U 0.108 U
PEST 1031‐07‐8 Endosulfan sulfate UG/KG_WETWT 0.0483 U 0.114 U 0.0784 U
PEST 309‐00‐2 aldrin UG/KG_WETWT 0.0542 U 0.128 U 0.0881 U
PEST 319‐84‐6 alpha‐BHC UG/KG_WETWT 0.0902 U 0.213 U 0.147 U
PEST 319‐85‐7 beta‐BHC UG/KG_WETWT 0.0483 U 0.114 U 0.0784 U
PEST 319‐86‐8 delta‐BHC UG/KG_WETWT 0.0421 U 0.0997 U 0.0684 U
PEST 33213‐65‐9 Endosulfan II UG/KG_WETWT 0.0662 U 0.156 U 0.143 J
PEST 50‐29‐3 4,4'‐DDT UG/KG_WETWT 0.0483 U 0.114 U 0.0784 U
PEST 5103‐71‐9 alpha‐chlordane UG/KG_WETWT 0.0421 U 0.669 0.529
PEST 5103‐74‐2 gamma‐chlordane UG/KG_WETWT 0.0723 U 0.171 U 0.118 U
PEST 57‐74‐9 chlordane UG/KG_WETWT 3.42 2.71
PEST 58‐89‐9 hexachlorocyclohexane, gamma UG/KG_WETWT 0.0662 U 0.156 U 0.108 U
PEST 60‐57‐1 dieldrin UG/KG_WETWT 0.958 0.0856 U 0.0588 U
PEST 72‐20‐8 endrin UG/KG_WETWT 0.0483 U 0.114 U 0.0784 U
PEST 72‐43‐5 methoxychlor UG/KG_WETWT 0.668 U 1.58 U 1.94
PEST 72‐54‐8 4,4'‐DDD UG/KG_WETWT 0.0421 U 1.62 2.37
PEST 72‐55‐9 4,4'‐DDE UG/KG_WETWT 0.0545 J 1.28 1.79
PEST 76‐44‐8 heptachlor UG/KG_WETWT 0.0421 U 0.0997 U 0.0684 U
PEST 8001‐35‐2 Toxaphene UG/KG_WETWT 10.3 U 12.2 U 16.7 U
PEST 959‐98‐8 Endosulfan I UG/KG_WETWT 0.0602 U 0.142 U 0.0978 U
SVOC 120‐12‐7 Anthracene UG/KG_WETWT 0.117 U 1.76 1.56
Page 1 of 4

Portland Tissue
Study Id DAMOS16 DAMOS16 DAMOS16 DAMOS16 DAMOS16 DAMOS16 DAMOS16 DAMOS16
Survey Id PDS PDS PDS PDS PDS PDS PDS PDS
Station Id EREF‐02 EREF‐02 EREF‐02 EREF‐02 PDA95‐22 PDA95‐22 PDA95‐30 PDA95‐30
Sample Id RAJ‐021 RAJ‐021 RAJ‐021 RAJ‐021 RAJ‐022 RAJ‐022 RAJ‐023 RAJ‐023
Field Qc Code SA SA SA SA SA SA SA SA
Lab Qc Code SA SA DUP DUP SA SA SA SA
Taxon Name Astarte Astarte Astarte Astarte Nephtys Nephtys Nephtys Nephtys
Class Param Code Param Name Unit Result Lab Qual Result Lab Qual Result Lab Qual Result Lab Qual
SVOC 129‐00‐0 Pyrene UG/KG_WETWT 0.239 J 60.4 84.2
SVOC 191‐24‐2 Benzo(G,H,I)Perylene UG/KG_WETWT 0.476 J 4.6 6.01
SVOC 193‐39‐5 Indeno(1,2,3‐Cd)Pyrene UG/KG_WETWT 0.27 J 1.31 1.49
SVOC 205‐99‐2 Benzo(B)Fluoranthene UG/KG_WETWT 0.458 J 4.58 4.42
SVOC 206‐44‐0 Fluoranthene UG/KG_WETWT 0.367 J 39 33.8
SVOC 207‐08‐9 Benzo(K)Fluoranthene UG/KG_WETWT 0.425 J 3.66 3.81
SVOC 208‐96‐8 Acenaphthylene UG/KG_WETWT 0.117 U 0.446 J 0.732 J
SVOC 218‐01‐9 Chrysene UG/KG_WETWT 0.209 J 11.2 12.8
SVOC 50‐32‐8 Benzo(A)Pyrene UG/KG_WETWT 0.232 U 4.72 5.92
SVOC 53‐70‐3 Dibenz(A,H)Anthracene UG/KG_WETWT 0.0932 U 0.3 J 0.252 J
SVOC 56‐55‐3 Benzo(A)Anthracene UG/KG_WETWT 0.142 U 3.6 3.16
SVOC 83‐32‐9 Acenaphthene UG/KG_WETWT 0.117 U 1.24 0.336 J
SVOC 85‐01‐8 Phenanthrene UG/KG_WETWT 0.312 J 6.28 1.62
SVOC 86‐73‐7 Fluorene UG/KG_WETWT 0.105 U 0.858 0.451 J
SVOC 90‐12‐0 1‐Methylnaphthalene UG/KG_WETWT 0.383 J 0.529 J 1.32
SVOC 91‐57‐6 2‐Methylnaphthalene UG/KG_WETWT 0.6 0.65 1.79
EPH 91‐20‐3 Naphthalene UG/KG_WETWT 2.14 1.78 3.89
TOTAL_PAH Total PAH (ND as 1/2 MDL) UG/KG_WETWT 6.3406 146.913 167.561
SVOCSURR SV‐1146‐65‐2 Naphthalene‐d8 PCT_REC 77 71 78
SVOCSURR SV‐15067‐26‐2 Acenaphthene‐d10 PCT_REC 79 77 81
SVOCSURR SV‐1517‐22‐2 Phenanthrene‐d10 PCT_REC 81 82 85
SVOCSURR SV‐63466‐71‐7 Benzo(A)pyrene‐d12 PCT_REC 75 83 86
MET 7439‐92‐1 Lead MG/KG_WETWT 0.14 0.12 0.16 0.22
MET 7439‐97‐6 Mercury MG/KG_WETWT 0.04 0.038 0.005 0.007
MET 7440‐02‐0 Nickel MG/KG_WETWT 0.74 0.79 0.37 0.5
MET 7440‐38‐2 Arsenic MG/KG_WETWT 3.74 3.49 5.3 6.17
MET 7440‐43‐9 Cadmium MG/KG_WETWT 1.38 1.42 0.11 0.14
MET 7440‐47‐3 Chromium MG/KG_WETWT 0.3 0.4 0.042 0.07
MET 7440‐50‐8 Copper MG/KG_WETWT 1.23 1.25 0.67 0.96
MET 7440‐66‐6 Zinc MG/KG_WETWT 7.17 7.23 19.6 25.5
MET NBH008 Percent Moisture ‐ Metals PCT_MST 89.2 85.6 82.8
MISC LIPIDS Percent Lipids (B&D) PCT_WETWT 1.09 0.98 2.07MISC PCT_SOLIDS Percent Solids PCT 12.45 15.63 17.41
J value reported above MDL but below RL
U not detected above MDL; MDL value reported.
Page 2 of 4

Portland Tissue
Study Id
Survey Id
Station Id
Sample Id
Field Qc Code
Lab Qc Code
Taxon Name
Class Param Code Param Name Unit
CONG 31508‐00‐6 2,3',4,4',5‐Pentachlorobiphenyl UG/KG_WETWT
CONG 32598‐10‐0 2,3',4,4'‐Tetrachlorobiphenyl UG/KG_WETWT
CONG 32598‐14‐4 2,3,3',4,4'‐Pentachlorobiphenyl UG/KG_WETWT
CONG 34883‐43‐7 2,4'‐Dichlorobiphenyl UG/KG_WETWT
CONG 35065‐27‐1 2,2',4,4',5,5'‐Hexachlorobiphenyl UG/KG_WETWT
CONG 35065‐28‐2 2,2',3,4,4',5'‐Hexachlorobiphenyl UG/KG_WETWT
CONG 35065‐29‐3 2,2',3,4,4',5,5'‐Heptachlorobiphenyl UG/KG_WETWT
CONG 35065‐30‐6 2,2',3,3',4,4',5‐Heptachlorobiphenyl UG/KG_WETWT
CONG 35693‐99‐3 2,2',5,5'‐Tetrachlorobiphenyl UG/KG_WETWT
CONG 37680‐65‐2 2,2',5‐Trichlorobiphenyl UG/KG_WETWT
CONG 37680‐73‐2 2,2',4,5,5'‐Pentachlorobiphenyl UG/KG_WETWT
CONG 38380‐02‐8 2,2',3,4,5'‐Pentachlorobiphenyl UG/KG_WETWT
CONG 38380‐07‐3 2,2',3,3',4,4'‐Hexachlorobiphenyl UG/KG_WETWT
CONG 40186‐72‐9 2,2',3,3',4,4',5,5',6‐Nonachlorobiphenyl UG/KG_WETWT
CONG 41464‐39‐5 2,2',3,5'‐Tetrachlorobiphenyl UG/KG_WETWT
CONG 41464‐40‐8 2,2',4,5'‐Tetrachlorobiphenyl UG/KG_WETWT
CONG 52663‐68‐0 2,2',3,4',5,5',6‐Heptachlorobiphenyl UG/KG_WETWT
CONG 52663‐69‐1 2,2',3,4,4',5',6‐Heptachlorobiphenyl UG/KG_WETWT
CONG 52663‐78‐2 2,2',3,3',4,4',5,6‐Octachlorobiphenyl UG/KG_WETWT
CONG 7012‐37‐5 2,4,4'‐Trichlorobiphenyl UG/KG_WETWT
CONG 74472‐48‐3 2,2',3,4,4',6,6'‐Heptachlorobiphenyl UG/KG_WETWT
CONG C‐2051‐24‐3 Decachlorobiphenyl ‐ Congener UG/KG_WETWT
TOTAL_PCB_NST_CONGx2 Total NS&T PCB *2 (ND as 1/2 MDL) UG/KG_WETWT
CONGSURR CS‐37680‐68‐5 2,3',5'‐Trichlorobiphenyl PCT_REC
CONGSURR CS‐68194‐09‐2 2,2',3,5,6,6'‐Hexachlorobiphenyl PCT_REC
PEST 1024‐57‐3 heptachlor epoxide UG/KG_WETWT
PEST 1031‐07‐8 Endosulfan sulfate UG/KG_WETWT
PEST 309‐00‐2 aldrin UG/KG_WETWT
PEST 319‐84‐6 alpha‐BHC UG/KG_WETWT
PEST 319‐85‐7 beta‐BHC UG/KG_WETWT
PEST 319‐86‐8 delta‐BHC UG/KG_WETWT
PEST 33213‐65‐9 Endosulfan II UG/KG_WETWT
PEST 50‐29‐3 4,4'‐DDT UG/KG_WETWT
PEST 5103‐71‐9 alpha‐chlordane UG/KG_WETWT
PEST 5103‐74‐2 gamma‐chlordane UG/KG_WETWT
PEST 57‐74‐9 chlordane UG/KG_WETWT
PEST 58‐89‐9 hexachlorocyclohexane, gamma UG/KG_WETWT
PEST 60‐57‐1 dieldrin UG/KG_WETWT
PEST 72‐20‐8 endrin UG/KG_WETWT
PEST 72‐43‐5 methoxychlor UG/KG_WETWT
PEST 72‐54‐8 4,4'‐DDD UG/KG_WETWT
PEST 72‐55‐9 4,4'‐DDE UG/KG_WETWT
PEST 76‐44‐8 heptachlor UG/KG_WETWT
PEST 8001‐35‐2 Toxaphene UG/KG_WETWT
PEST 959‐98‐8 Endosulfan I UG/KG_WETWT
SVOC 120‐12‐7 Anthracene UG/KG_WETWT
DAMOS16 DAMOS16 DAMOS16 DAMOS16 DAMOS16 DAMOS16 DAMOS16 DAMOS16
PDS PDS PDS PDS PDS PDS PDS PDS
PDA95‐30 PDA95‐30 SREF‐07 SREF‐07 SREF‐07 SREF‐07 SREF‐10 SREF‐10
RAJ‐024 RAJ‐024 RAJ‐020 RAJ‐020 RAJ‐020 RAJ‐020 RAJ‐019 RAJ‐019
SA SA SA SA SA SA SA SA
SA SA SA SA DUP DUP SA SA
Astarte Astarte Astarte Astarte Astarte Astarte Astarte Astarte
Result Lab Qual Result Lab Qual Result Lab Qual Result Lab Qual
0.298 0.0671 J 0.0541 U 0.0542 U
0.308 U 0.0843 U 0.0841 U 0.0842 U
0.176 U 0.0662 J 0.0482 U 0.0482 U
0.439 U 0.12 U 0.12 U 0.12 U
0.242 U 0.0662 U 0.066 U 0.0661 U
0.198 U 0.0543 U 0.0541 U 0.0669 J
0.176 U 0.0483 U 0.0482 U 0.0516 J
0.198 U 0.0543 U 0.0541 U 0.0542 U
0.329 U 0.0903 U 0.09 U 0.0901 U
0.198 U 0.0543 U 0.0541 U 0.0542 U
0.198 U 0.0543 U 0.0541 U 0.0542 U
0.198 U 0.0543 U 0.0541 U 0.0542 U
0.22 U 0.0603 U 0.0601 U 0.0601 U
0.132 U 0.0362 U 0.0361 U 0.0664 J
0.33 0.0483 U 0.0482 U 0.0482 U
0.154 U 0.0422 U 0.042 U 0.0421 U
0.154 U 0.0422 U 0.042 U 0.0421 U
0.154 U 0.0422 U 0.042 U 0.0421 U
0.132 U 0.0525 J 0.0607 J 0.0581 J
0.242 U 0.0662 U 0.066 U 0.0661 U
0.352 U 0.0965 U 0.0962 U 0.0963 U
0.242 U 0.0662 U 0.066 U 0.0716 J
4.84 1.3173 1.1668 1.4711
79 81 75 88
79 82 82 89
0.242 U 0.0662 U 0.066 U 0.0661 U
0.176 U 0.0483 U 0.0482 U 0.0482 U
0.198 U 0.0543 U 0.0541 U 0.0542 U
0.329 U 0.0903 U 0.09 U 0.0901 U
0.176 U 0.0483 U 0.0482 U 0.0482 U
0.154 U 0.0422 U 0.042 U 0.0421 U
0.242 U 0.0662 U 0.066 U 0.0661 U
0.176 U 0.0483 U 0.0482 U 0.0482 U
0.154 U 0.0422 U 0.042 U 0.0421 U
0.264 U 0.0724 U 0.0722 U 0.0722 U
2.8
0.242 U 0.0662 U 0.066 U 0.0661 U
0.132 U 0.996 1.04 0.906
0.176 U 0.0483 U 0.0482 U 0.0482 U
2.44 U 0.669 U 0.667 U 0.668 U
0.315 0.0703 J 0.0857 J 0.0421 U
0.19 J 0.14 0.16 0.0975 J
0.548 0.0422 U 0.042 U 0.0421 U
18.9 U 10.3 U 10.2 U 10.3 U
0.22 U 0.0603 U 0.0601 U 0.0601 U
0.428 U 0.509 J 0.455 J 0.275 J
Page 3 of 4
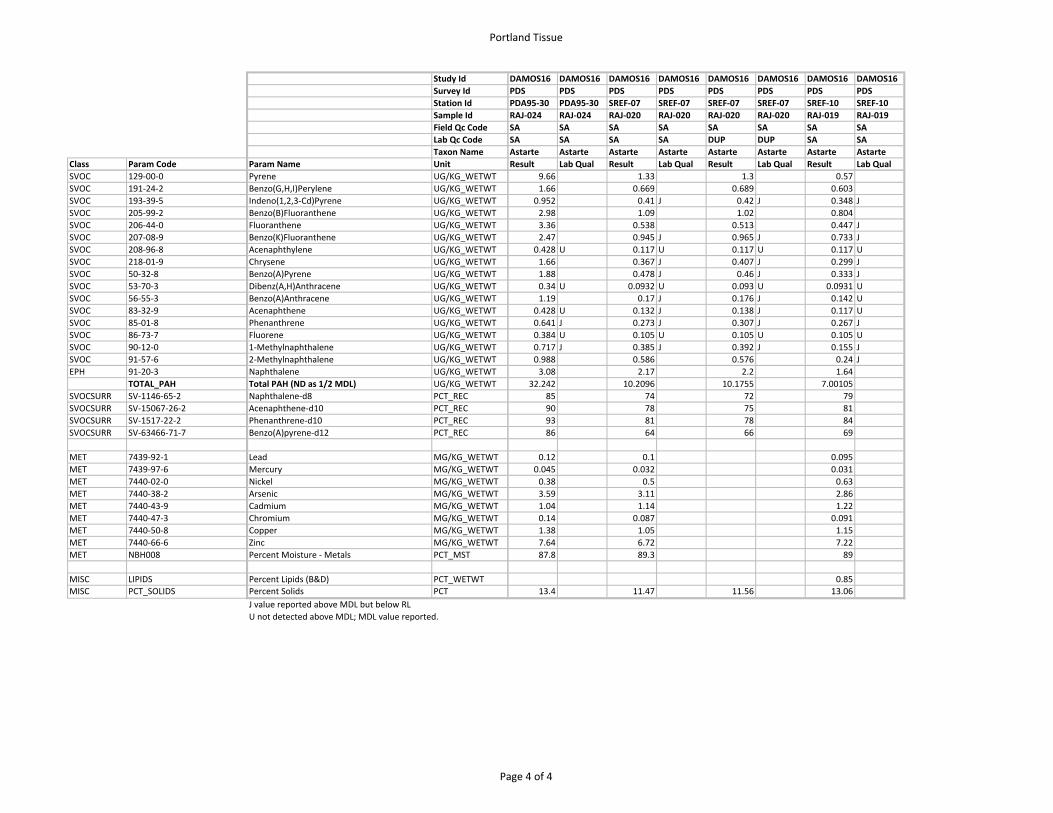
Portland Tissue
Study Id
Survey Id
Station Id
Sample Id
Field Qc Code
Lab Qc Code
Taxon Name
Class Param Code Param Name Unit
SVOC 129‐00‐0 Pyrene UG/KG_WETWT
SVOC 191‐24‐2 Benzo(G,H,I)Perylene UG/KG_WETWT
SVOC 193‐39‐5 Indeno(1,2,3‐Cd)Pyrene UG/KG_WETWT
SVOC 205‐99‐2 Benzo(B)Fluoranthene UG/KG_WETWT
SVOC 206‐44‐0 Fluoranthene UG/KG_WETWT
SVOC 207‐08‐9 Benzo(K)Fluoranthene UG/KG_WETWT
SVOC 208‐96‐8 Acenaphthylene UG/KG_WETWT
SVOC 218‐01‐9 Chrysene UG/KG_WETWT
SVOC 50‐32‐8 Benzo(A)Pyrene UG/KG_WETWT
SVOC 53‐70‐3 Dibenz(A,H)Anthracene UG/KG_WETWT
SVOC 56‐55‐3 Benzo(A)Anthracene UG/KG_WETWT
SVOC 83‐32‐9 Acenaphthene UG/KG_WETWT
SVOC 85‐01‐8 Phenanthrene UG/KG_WETWT
SVOC 86‐73‐7 Fluorene UG/KG_WETWT
SVOC 90‐12‐0 1‐Methylnaphthalene UG/KG_WETWT
SVOC 91‐57‐6 2‐Methylnaphthalene UG/KG_WETWT
EPH 91‐20‐3 Naphthalene UG/KG_WETWT
TOTAL_PAH Total PAH (ND as 1/2 MDL) UG/KG_WETWT
SVOCSURR SV‐1146‐65‐2 Naphthalene‐d8 PCT_REC
SVOCSURR SV‐15067‐26‐2 Acenaphthene‐d10 PCT_REC
SVOCSURR SV‐1517‐22‐2 Phenanthrene‐d10 PCT_REC
SVOCSURR SV‐63466‐71‐7 Benzo(A)pyrene‐d12 PCT_REC
MET 7439‐92‐1 Lead MG/KG_WETWT
MET 7439‐97‐6 Mercury MG/KG_WETWT
MET 7440‐02‐0 Nickel MG/KG_WETWT
MET 7440‐38‐2 Arsenic MG/KG_WETWT
MET 7440‐43‐9 Cadmium MG/KG_WETWT
MET 7440‐47‐3 Chromium MG/KG_WETWT
MET 7440‐50‐8 Copper MG/KG_WETWT
MET 7440‐66‐6 Zinc MG/KG_WETWT
MET NBH008 Percent Moisture ‐ Metals PCT_MST
MISC LIPIDS Percent Lipids (B&D) PCT_WETWTMISC PCT_SOLIDS Percent Solids PCT
J value reported above MDL but below RL
U not detected above MDL; MDL value reported.
DAMOS16 DAMOS16 DAMOS16 DAMOS16 DAMOS16 DAMOS16 DAMOS16 DAMOS16
PDS PDS PDS PDS PDS PDS PDS PDS
PDA95‐30 PDA95‐30 SREF‐07 SREF‐07 SREF‐07 SREF‐07 SREF‐10 SREF‐10
RAJ‐024 RAJ‐024 RAJ‐020 RAJ‐020 RAJ‐020 RAJ‐020 RAJ‐019 RAJ‐019
SA SA SA SA SA SA SA SA
SA SA SA SA DUP DUP SA SA
Astarte Astarte Astarte Astarte Astarte Astarte Astarte Astarte
Result Lab Qual Result Lab Qual Result Lab Qual Result Lab Qual
9.66 1.33 1.3 0.57
1.66 0.669 0.689 0.603
0.952 0.41 J 0.42 J 0.348 J
2.98 1.09 1.02 0.804
3.36 0.538 0.513 0.447 J
2.47 0.945 J 0.965 J 0.733 J
0.428 U 0.117 U 0.117 U 0.117 U
1.66 0.367 J 0.407 J 0.299 J
1.88 0.478 J 0.46 J 0.333 J
0.34 U 0.0932 U 0.093 U 0.0931 U
1.19 0.17 J 0.176 J 0.142 U
0.428 U 0.132 J 0.138 J 0.117 U
0.641 J 0.273 J 0.307 J 0.267 J
0.384 U 0.105 U 0.105 U 0.105 U
0.717 J 0.385 J 0.392 J 0.155 J
0.988 0.586 0.576 0.24 J
3.08 2.17 2.2 1.64
32.242 10.2096 10.1755 7.00105
85 74 72 79
90 78 75 81
93 81 78 84
86 64 66 69
0.12 0.1 0.095
0.045 0.032 0.031
0.38 0.5 0.63
3.59 3.11 2.86
1.04 1.14 1.22
0.14 0.087 0.091
1.38 1.05 1.15
7.64 6.72 7.22
87.8 89.3 89
0.8513.4 11.47 11.56 13.06
Page 4 of 4

DAMOS 2016
Portland Disposal Site
Tissue Lipid, PCB and Pesticides Results
Battelle Norwell

QA/QC Summary Batch 16-0287
Page 1 of 3
Project: USACE/NAE – DAMOS Program (Rockland and Portland Disposal Sites)
Parameters: PCB and Pesticides
Laboratory: Battelle‐Norwell, MA
Matrix: Tissue
Data Set: DP‐16‐0261
Analytical SOP: 5‐128
Method Reference:
EPA 8081B/8082A modified
Sample Custody
Collection Date Receipt Date Temp (°C)
9/14‐15/2016 9/20‐21/2016
9/16/2016 9/22/2016
1.9 1.8
Corrective Actions No corrective actions.
Sample Storage Tissue samples were stored frozen upon receipt.
Related Samples NA
METHOD SUMMARIES
Sample Preparation
Samples were homogenized, and approximately 10‐20 g of homogenate (depending upon mass available) was spiked with surrogates, dried with sodium sulfate, and serially extracted with dichloromethane using a Tissuemizer, orbital shaker table, and centrifuge. The combined extracts were dried over sodium sulfate and concentrated. Sample concentrates were further processed by alumina cleanup, followed by size‐exclusion HPLC cleanup, concentrated, and then spiked with internal standard. Extracts were submitted for PCB and pesticide analyses by GC/ECD.
Prep comments Samples K2624 and K2644 where inadvertently combined during the first extraction. The PM was notified and directed the samples be re‐weighed, spiked and caught up with the rest of the batch.
Analysis PCB and pesticides were analyzed by gas chromatography electron capture
detection (GC/ECD). An initial calibration consisting of target analytes was analyzed prior to sample analysis to demonstrate the linear range. Calibration verification was performed at the beginning and end of 10 injections or each 24‐hour period (whichever is more frequent). Concentrations of target compounds were calculated versus internal standards using the average response factors (RF) generated from the initial calibration.
Analysis Comments
Chromatographic interference on the primary column near PCBs 8, 138, and 180 necessitated the reporting of these analytes vs. the secondary column. All other target analytes are reported from the primary column. It should be noted that the secondary column is utilized for retention time confirmation only for all analytes except for PCBs 8, 138, and 180.

QA/QC Summary Batch 16-0287
Page 2 of 3
A nominal concentration of 0.2 μg/mL is used as the low standard for toxaphene. All authentic samples were analyzed for toxaphene.
Holding Times Extraction Date(s) Analysis Date(s)
10/21/2016 11/11‐12/2016 Procedural Blank (PB)
A PB was prepared with this analytical batch to ensure the sample extraction and analysis methods are free of contamination.
PB ≤5x MDL; Samples must be >5 X PB
No exceedances noted.
No comments.
Laboratory Control Spike (LCS)
A LCS was prepared with this analytical batch. The percent recoveries of target analytes were calculated to measure accuracy.
40‐120% recovery No exceedances noted.
No comments.
Surrogate Recovery
Surrogate compounds were added prior to extraction. The surrogate recoveries are calculated to measure extraction efficiency.
40‐120% recovery No exceedances noted.
No comments.
Matrix Spike (MS)/Matrix Spike Duplicate (MSD)
A matrix spike set was prepared with this analytical batch. The percent recoveries of target analytes were calculated to measure data quality in terms of accuracy. The relative percent difference (RPD) between the two samples was calculated to measure data quality in terms of precision.
40‐120% recovery ≤30% RPD Analyte conc. >5x background
No exceedances noted.
No comments.
Analytical Duplicate
A sample was prepared in duplicate with this analytical batch. The relative percent difference (RPD) between the two samples was calculated to measure data quality in terms of precision.
≤30% RPD Analyte conc. >5x MDL
No exceedances noted.
No comments.
Standard Reference Material (SRM)
A standard reference material was prepared with this batch to measure data in terms of analytical accuracy.
≤30% difference on average Analyte >10x MDL
No primary exceedances noted.
No comments.

QA/QC Summary Batch 16-0287
Page 3 of 3
Initial Calibration (ICAL)
The GC/ECD was calibrated with six‐level calibration curve for all compounds using an instrument response factor (RF).
R2 ≥ 0.995 No exceedances noted.
No comments.
Independent Calibration Check (ICC)
The independent check was run after each initial calibration to verify the calibration. This standard is from a different source than the ICAL.
≤ 20% difference individual and mean
No exceedances noted.
No comments.
Continuing Calibration Verification (CCV)
Continuing calibration standards were performed at the beginning and end of 10 injections or each 24‐hour period (whichever is more frequent) to ensure that initial calibration is still valid.
≤ 20% difference individual and ≤ 15% mean
No exceedances noted.
No comments.

Project Client: USACE - North Atlantic DivisionProject Name: DAMOS TissuesProject Number: 100087718
Client ID RAJ-019 RAJ-020 RAJ-021 RAJ-022
Battelle ID K2643-P K2644-P K2645-P K2646-PSample Type SA SA SA SACollection Date 09/20/16 09/20/16 09/21/16 09/21/16Extraction Date 10/21/16 10/21/16 10/21/16 10/21/16Analysis Date 11/12/16 11/12/16 11/12/16 11/12/16Analytical Instrument ECD ECD ECD ECD% Moisture 86.94 88.53 87.55 84.37% Lipid 0.54 0.52 0.61 1.13Matrix CLAM TISS CLAM TISS CLAM TISS WORM TISSSample Size 19.99 19.95 19.97 8.44Size Unit-Basis G_WET G_WET G_WET G_WETUnits UG/KG_WET UG/KG_WET UG/KG_WET UG/KG_WET
4,4'-DDD 0.042 U 0.070 J 0.042 U 1.6204,4'-DDE 0.098 J 0.140 0.055 J 1.2804,4'-DDT 0.048 U 0.048 U 0.048 U 0.114 Ualdrin 0.054 U 0.054 U 0.054 U 0.128 Ua-chlordane 0.042 U 0.042 U 0.042 U 0.669g-chlordane 0.072 U 0.072 U 0.072 U 0.171 Ua-BHC 0.090 U 0.090 U 0.090 U 0.213 Ub-BHC 0.048 U 0.048 U 0.048 U 0.114 Ud-BHC 0.042 U 0.042 U 0.042 U 0.100 ULindane 0.066 U 0.066 U 0.066 U 0.156 Udieldrin 0.906 0.996 0.958 0.086 Uendosulfan I 0.060 U 0.060 U 0.060 U 0.142 Uendosulfan II 0.066 U 0.066 U 0.066 U 0.156 Uendosulfan sulfate 0.048 U 0.048 U 0.048 U 0.114 Uendrin 0.048 U 0.048 U 0.048 U 0.114 Uheptachlor 0.042 U 0.042 U 0.042 U 0.100 Uheptachlor epoxide 0.066 U 0.066 U 0.066 U 0.156 Umethoxychlor 0.668 U 0.669 U 0.668 U 1.580 UToxaphene 10.300 U 10.300 U 10.300 U 12.200 UTechnical Chlordane 3.420Cl2(8) 0.120 U 0.120 U 0.120 U 0.284 UCl3(18) 0.054 U 0.054 U 0.054 U 0.128 UCl3(28) 0.066 U 0.066 U 0.066 U 0.156 UCl4(44) 0.048 U 0.048 U 0.048 U 0.114 UCl4(49) 0.042 U 0.042 U 0.042 U 0.100 UCl4(52) 0.090 U 0.090 U 0.090 U 0.213 UCl4(66) 0.084 U 0.084 U 0.084 U 0.202Cl5(87) 0.054 U 0.054 U 0.054 U 0.128 UCl5(101) 0.054 U 0.054 U 0.054 U 0.445Cl5(105) 0.048 U 0.066 J 0.048 U 0.780Cl5(118) 0.054 U 0.067 J 0.054 U 0.387Cl6(128) 0.060 U 0.060 U 0.060 U 0.142 UCl6(138) 0.067 J 0.054 U 0.054 U 0.626Cl6(153) 0.066 U 0.066 U 0.066 U 0.903Cl7(170) 0.054 U 0.054 U 0.054 U 0.128 UCl7(180) 0.052 J 0.048 U 0.048 U 0.324Cl7(183) 0.042 U 0.042 U 0.042 U 0.100 UCl7(184) 0.096 U 0.097 U 0.096 U 0.228 UCl7(187) 0.042 U 0.042 U 0.164 0.100 UCl8(195) 0.058 J 0.053 J 0.065 J 0.086 UCl9(206) 0.066 J 0.036 U 0.064 J 0.373Cl10(209) 0.072 J 0.066 U 0.078 J 0.156 U
Surrogate Recoveries (%)
Cl3(34) 88 81 84 76Cl6(152) 89 82 81 75
Not Surrogate CorrectedAnalyzed by Restucci Jr, Richard
8/28/2017 Main: T16-0287ECD-Master_128B-Final.xlsx

Project Client: USACE - North Atlantic DivisionProject Name: DAMOS TissuesProject Number: 100087718
Client ID
Battelle IDSample TypeCollection DateExtraction DateAnalysis DateAnalytical Instrument% Moisture% LipidMatrixSample SizeSize Unit-BasisUnits
4,4'-DDD4,4'-DDE4,4'-DDTaldrina-chlordaneg-chlordanea-BHCb-BHCd-BHCLindanedieldrinendosulfan Iendosulfan IIendosulfan sulfateendrinheptachlorheptachlor epoxidemethoxychlorToxapheneTechnical ChlordaneCl2(8)Cl3(18)Cl3(28)Cl4(44)Cl4(49)Cl4(52)Cl4(66)Cl5(87)Cl5(101)Cl5(105)Cl5(118)Cl6(128)Cl6(138)Cl6(153)Cl7(170)Cl7(180)Cl7(183)Cl7(184)Cl7(187)Cl8(195)Cl9(206)Cl10(209)
Surrogate Recoveries (%)
Cl3(34)Cl6(152)
RAJ-023 RAJ-024
K2647-P K2648-PSA SA
09/21/16 09/21/1610/21/16 10/21/1611/12/16 11/12/16
ECD ECD82.59 86.61.93 1.03
WORM TISS CLAM TISS12.29 5.47
G_WET G_WETUG/KG_WET UG/KG_WET
2.370 0.3151.790 0.190 J0.078 U 0.176 U0.088 U 0.198 U0.529 0.154 U0.118 U 0.264 U0.147 U 0.329 U0.078 U 0.176 U0.068 U 0.154 U0.108 U 0.242 U0.059 U 0.132 U0.098 U 0.220 U0.143 J 0.242 U0.078 U 0.176 U0.078 U 0.176 U0.068 U 0.5480.108 U 0.242 U1.940 2.440 U
16.700 U 18.900 U2.710 2.8000.195 U 0.439 U0.088 U 0.198 U0.108 U 0.242 U0.078 U 0.3300.068 U 0.154 U0.147 U 0.329 U0.388 0.308 U0.159 J 0.198 U0.792 0.198 U0.457 0.176 U0.586 0.2980.153 J 0.220 U1.120 0.198 U1.570 0.242 U0.493 0.198 U0.522 0.176 U0.185 J 0.154 U0.157 U 0.352 U0.503 0.154 U0.126 J 0.132 U0.574 0.132 U0.189 J 0.242 U
79 7980 79
Not Surrogate CorrectedAnalyzed by Restucci Jr, Richard
8/28/2017 Main: T16-0287ECD-Master_128B-Final.xlsx
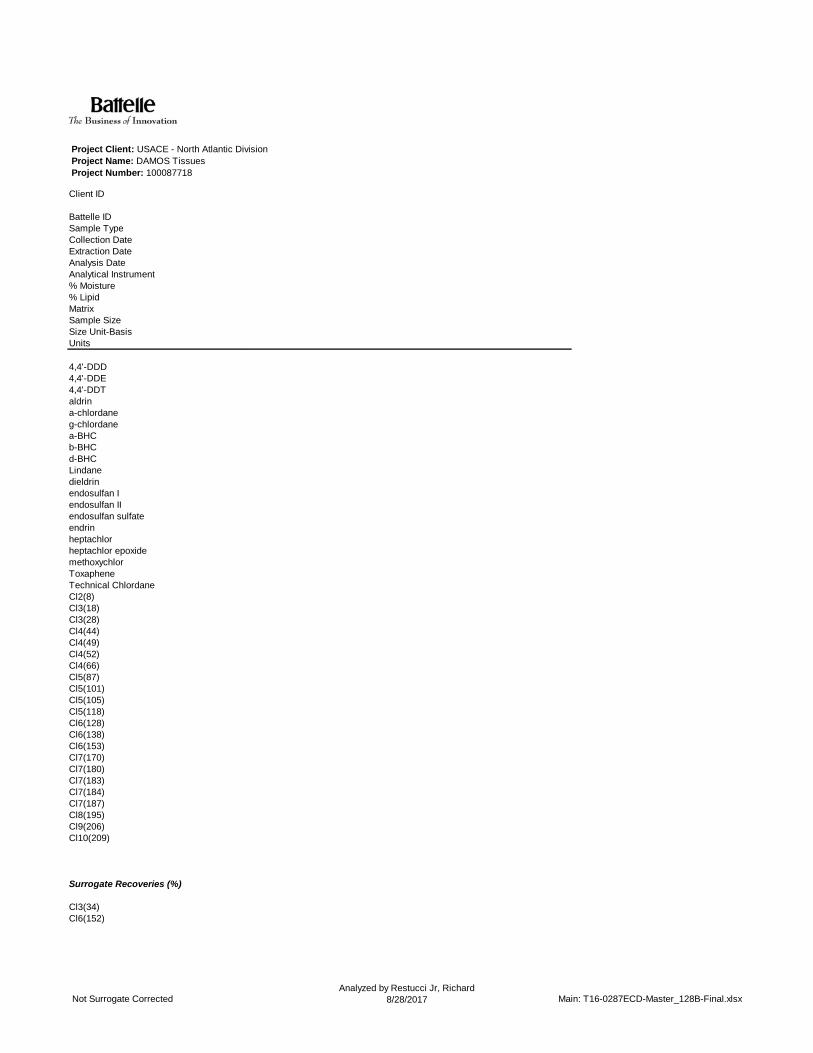
Project Client: USACE - North Atlantic DivisionProject Name: DAMOS TissuesProject Number: 100087718
Client ID
Battelle IDSample TypeCollection DateExtraction DateAnalysis DateAnalytical Instrument% Moisture% LipidMatrixSample SizeSize Unit-BasisUnits
4,4'-DDD4,4'-DDE4,4'-DDTaldrina-chlordaneg-chlordanea-BHCb-BHCd-BHCLindanedieldrinendosulfan Iendosulfan IIendosulfan sulfateendrinheptachlorheptachlor epoxidemethoxychlorToxapheneTechnical ChlordaneCl2(8)Cl3(18)Cl3(28)Cl4(44)Cl4(49)Cl4(52)Cl4(66)Cl5(87)Cl5(101)Cl5(105)Cl5(118)Cl6(128)Cl6(138)Cl6(153)Cl7(170)Cl7(180)Cl7(183)Cl7(184)Cl7(187)Cl8(195)Cl9(206)Cl10(209)
Surrogate Recoveries (%)
Cl3(34)Cl6(152)
Not Surrogate CorrectedAnalyzed by Restucci Jr, Richard
8/28/2017 Main: T16-0287ECD-Master_128B-Final.xlsx

Project Client: USACE - North Atlantic DivisionProject Name: DAMOS TissuesProject Number: 100087718
Client ID Procedural Blank
Battelle ID CJ817PB-PSample Type PBCollection Date 10/21/16Extraction Date 10/21/16Analysis Date 11/11/16Analytical Instrument ECD% Moisture 84.82 % Lipid NAMatrix TISSUESample Size 19.99Size Unit-Basis G_WETUnits UG/KG_WET
4,4'-DDD 0.041 U4,4'-DDE 0.041 U4,4'-DDT 0.047 Ualdrin 0.0528 Ua-chlordane 0.041 Ug-chlordane 0.0704 Ua-BHC 0.0878 Ub-BHC 0.047 Ud-BHC 0.041 ULindane 0.0644 Udieldrin 0.0352 Uendosulfan I 0.0586 Uendosulfan II 0.0644 Uendosulfan sulfate 0.047 Uendrin 0.047 Uheptachlor 0.041 Uheptachlor epoxide 0.0644 Umethoxychlor 0.651 UToxaphene 10 UTechnical ChlordaneCl2(8) 0.117 UCl3(18) 0.0528 UCl3(28) 0.0644 UCl4(44) 0.047 UCl4(49) 0.041 UCl4(52) 0.0878 UCl4(66) 0.082 UCl5(87) 0.0528 UCl5(101) 0.0528 UCl5(105) 0.047 UCl5(118) 0.0528 UCl6(128) 0.0586 UCl6(138) 0.0528 UCl6(153) 0.0644 UCl7(170) 0.0528 UCl7(180) 0.047 UCl7(183) 0.041 UCl7(184) 0.0938 UCl7(187) 0.041 UCl8(195) 0.0352 UCl9(206) 0.0352 UCl10(209) 0.0644 U
Surrogate Recoveries (%)
Not Surrogate CorrectedAnalyzed by Restucci Jr, Richard
8/28/2017 PB: T16-0287ECD-Master_128B-Final.xlsx
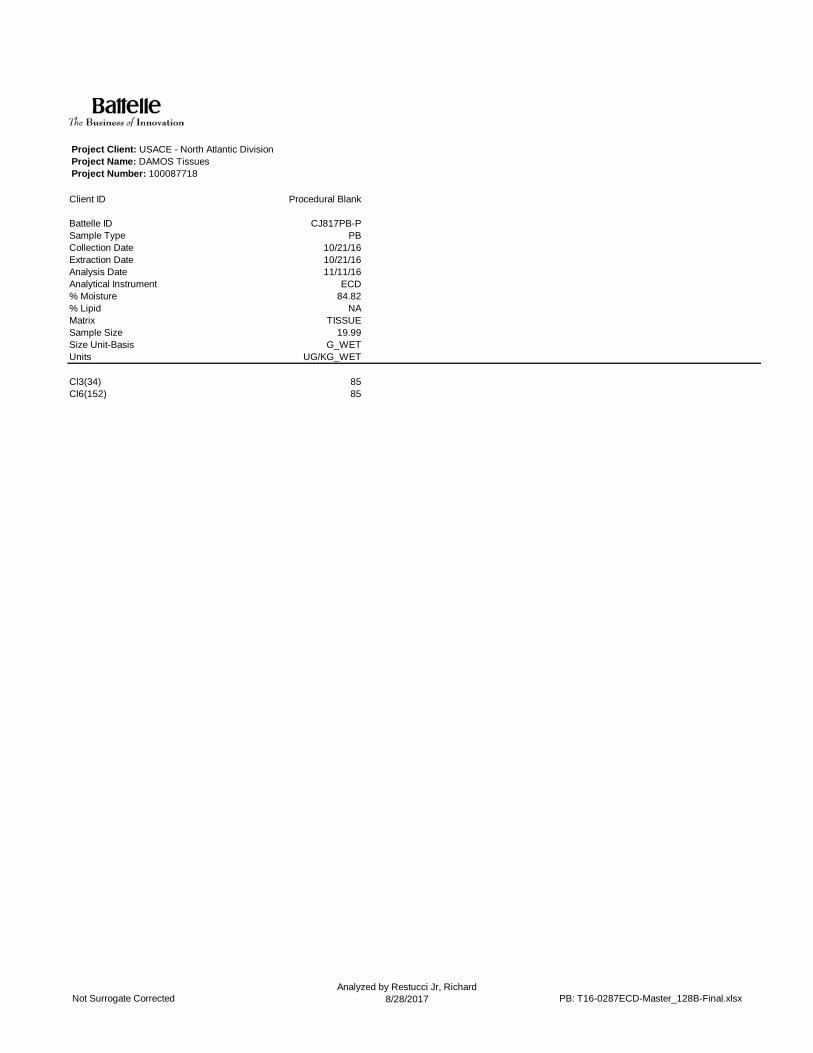
Project Client: USACE - North Atlantic DivisionProject Name: DAMOS TissuesProject Number: 100087718
Client ID Procedural Blank
Battelle ID CJ817PB-PSample Type PBCollection Date 10/21/16Extraction Date 10/21/16Analysis Date 11/11/16Analytical Instrument ECD% Moisture 84.82 % Lipid NAMatrix TISSUESample Size 19.99Size Unit-Basis G_WETUnits UG/KG_WET
Cl3(34) 85Cl6(152) 85
Not Surrogate CorrectedAnalyzed by Restucci Jr, Richard
8/28/2017 PB: T16-0287ECD-Master_128B-Final.xlsx

Project Client: USACE - North Atlantic DivisionProject Name: DAMOS TissuesProject Number: 100087718
Client ID
Battelle IDSample TypeCollection DateExtraction DateAnalysis DateAnalytical Instrument% Moisture% LipidMatrixSample SizeSize Unit-BasisUnits
4,4'-DDD4,4'-DDE4,4'-DDTaldrina-chlordaneg-chlordanea-BHCb-BHCd-BHCLindanedieldrinendosulfan Iendosulfan IIendosulfan sulfateendrinheptachlorheptachlor epoxidemethoxychlorToxapheneTechnical ChlordaneCl2(8)Cl3(18)Cl3(28)Cl4(44)Cl4(49)Cl4(52)Cl4(66)Cl5(87)Cl5(101)Cl5(105)Cl5(118)Cl6(128)Cl6(138)Cl6(153)Cl7(170)Cl7(180)Cl7(183)Cl7(184)Cl7(187)Cl8(195)Cl9(206)Cl10(209)
Surrogate Recoveries (%)
Not Surrogate CorrectedAnalyzed by Restucci Jr, Richard
8/28/2017 PB: T16-0287ECD-Master_128B-Final.xlsx

Project Client: USACE - North Atlantic DivisionProject Name: DAMOS TissuesProject Number: 100087718
Client ID
Battelle IDSample TypeCollection DateExtraction DateAnalysis DateAnalytical Instrument% Moisture% LipidMatrixSample SizeSize Unit-BasisUnits
Cl3(34)Cl6(152)
Not Surrogate CorrectedAnalyzed by Restucci Jr, Richard
8/28/2017 PB: T16-0287ECD-Master_128B-Final.xlsx

Project Client: USACE - North Atlantic DivisionProject Name: DAMOS TissuesProject Number: 100087718
Client ID 160720-01: Tilapia
Battelle ID CJ818LCS-PSample Type LCSCollection Date 10/21/16Extraction Date 10/21/16Analysis Date 11/11/16Analytical Instrument ECD% Moisture 80.12% Lipid 0.84Matrix TISSUESample Size 20.02Size Unit-Basis G_WETUnits UG/KG_WET Target % Recovery Qualifier
4,4'-DDD 4.83 5.00 974,4'-DDE 4.35 5.00 874,4'-DDT 4.67 5.00 93aldrin 4.42 5.00 88a-chlordane 4.41 5.01 88g-chlordane 3.96 5.00 79a-BHC 4.71 5.00 94b-BHC 4.81 5.00 96d-BHC 4.72 5.00 94Lindane 4.85 5.00 97dieldrin 4.57 5.00 91endosulfan I 4.32 5.00 86endosulfan II 4.55 5.01 91endosulfan sulfate 4.3 5.00 86endrin 4.48 5.00 90heptachlor 4.84 5.00 97heptachlor epoxide 4.36 5.00 87methoxychlor 4.33 5.00 87Toxaphene 10.2 UTechnical Chlordane 67.6Cl2(8) 4.15 5.00 83Cl3(18) 3.99 5.01 80Cl3(28) 4.22 5.01 84Cl4(44) 4.2 5.01 84Cl4(49) 4.07 5.00 81Cl4(52) 4.19 5.00 84Cl4(66) 4.23 5.00 85Cl5(87) 3.82 4.98 77Cl5(101) 4.12 5.00 82Cl5(105) 3.91 5.01 78Cl5(118) 4.01 5.01 80Cl6(128) 3.9 5.01 78Cl6(138) 3.92 5.01 78Cl6(153) 4.14 5.01 83Cl7(170) 4.05 5.01 81Cl7(180) 3.86 5.01 77Cl7(183) 3.95 4.99 79Cl7(184) 3.69 5.00 74Cl7(187) 3.85 5.01 77Cl8(195) 4.07 5.01 81Cl9(206) 4.32 5.00 86Cl10(209) 4.22 5.01 84
Surrogate Recoveries (%)
Not Surrogate CorrectedAnalyzed by Restucci Jr, Richard
8/28/2017 LCS: T16-0287ECD-Master_128B-Final.xlsx

Project Client: USACE - North Atlantic DivisionProject Name: DAMOS TissuesProject Number: 100087718
Client ID 160720-01: Tilapia
Battelle ID CJ818LCS-PSample Type LCSCollection Date 10/21/16Extraction Date 10/21/16Analysis Date 11/11/16Analytical Instrument ECD% Moisture 80.12% Lipid 0.84Matrix TISSUESample Size 20.02Size Unit-Basis G_WETUnits UG/KG_WET Target % Recovery Qualifier
Cl3(34) 80Cl6(152) 79
Not Surrogate CorrectedAnalyzed by Restucci Jr, Richard
8/28/2017 LCS: T16-0287ECD-Master_128B-Final.xlsx

Project Client: USACE - North Atlantic DivisionProject Name: DAMOS TissuesProject Number: 100087718
Client ID161005-01: SRM
1974C
Battelle ID CJ819SRM-PSample Type SRMCollection Date 10/21/16Extraction Date 10/21/16Analysis Date 11/11/16Analytical Instrument ECD% Moisture 90% Lipid 0.89Matrix TISSUESample Size 9.49Size Unit-Basis G_WET Certified Passing ActualUnits UG/KG_WET Value +/- %Difference %Difference Qualifier
4,4'-DDD 1.67 1.3 0.09 36.92 28.54,4'-DDE 2.37 1.85 0.02 31.08 28.14,4'-DDT 0.64aldrin 0.114 Ua-chlordane 0.898 1.2 0.05 34.17 25.2g-chlordane 0.714 0.741 0.01 31.75 3.6a-BHC 0.19 Ub-BHC 0.102 Ud-BHC 0.0886 ULindane 0.139 Udieldrin 0.173 J 0.285 0.02 37.37 39.3 nendosulfan I 0.127 Uendosulfan II 0.139 Uendosulfan sulfate 0.102 Uendrin 0.102 Uheptachlor 0.196 J 0.132 0.01 34.55 48.5 nheptachlor epoxide 0.139 Umethoxychlor 1.41 UToxaphene 21.6 UTechnical Chlordane 9.25Cl2(8) 0.253 U 0.191 0.00 31.57 17.3Cl3(18) 0.389 0.589 0.07 41.88 34Cl3(28) 1.55 1.47 0.02 31.36 5.4Cl4(44) 1.89 1.54 0.08 35.19 22.7Cl4(49) 2.06 1.76 0.02 31.14 17Cl4(52) 3.36 2.49 0.06 32.41 34.9 NCl4(66) 1.88 1.65 0.02 31.21 13.9Cl5(87) 1.84 2.08 0.02 30.96 11.5Cl5(101) 5.24 6.67 0.05 30.75 21.4Cl5(105) 1.43 1.57 0.03 31.91 8.9Cl5(118) 5.14 4.08 0.09 32.21 26Cl6(128) 1 0.801 0.01 31.37 24.8Cl6(138) 4.28 4.39 0.04 30.91 2.5Cl6(153) 7.85 6.76 0.12 31.78 16.1Cl7(170) 0.114 U 0.105 0.01 38.57 22.6Cl7(180) 0.759 0.594 0.01 31.35 27.8Cl7(183) 0.832 0.848 0.01 30.71 1.9Cl7(184) 7.33Cl7(187) 1.88 2.09 0.05 32.39 10Cl8(195) 0.0761 UCl9(206) 0.0761 UCl10(209) 0.139 U
Surrogate Recoveries (%)
Surrogate CorrectedAnalyzed by Restucci Jr, Richard
8/28/2017 SRM: T16-0287ECD-Master_128B-Final.xlsx

Project Client: USACE - North Atlantic DivisionProject Name: DAMOS TissuesProject Number: 100087718
Client ID161005-01: SRM
1974C
Battelle ID CJ819SRM-PSample Type SRMCollection Date 10/21/16Extraction Date 10/21/16Analysis Date 11/11/16Analytical Instrument ECD% Moisture 90% Lipid 0.89Matrix TISSUESample Size 9.49Size Unit-Basis G_WET Certified Passing ActualUnits UG/KG_WET Value +/- %Difference %Difference Qualifier
Cl3(34) 87Cl6(152) 80
Surrogate CorrectedAnalyzed by Restucci Jr, Richard
8/28/2017 SRM: T16-0287ECD-Master_128B-Final.xlsx

Project Client: USACE - North Atlantic DivisionProject Name: DAMOS TissuesProject Number: 100087718
Client ID RAJ-019 RAJ-019
Battelle ID K2643-P K2643MS-PSample Type SA MSCollection Date 09/20/16 9/20/2016Extraction Date 10/21/16 10/21/2016Analysis Date 11/12/16 11/12/2016Analytical Instrument ECD ECD% Moisture 86.94 88.73% Lipid 0.54 0.58Matrix CLAM TISS CLAM TISSSample Size 19.99 9.95Size Unit-Basis G_WET G_WETUnits UG/KG_WET UG/KG_WET Target % Recovery Qualifier
4,4'-DDD 0.0421 U 10.700 10.06 1064,4'-DDE 0.0975 J 9.480 10.05 934,4'-DDT 0.0482 U 11.300 10.05 112aldrin 0.0542 U 9.550 10.05 95a-chlordane 0.0421 U 9.370 10.07 93g-chlordane 0.0722 U 8.280 10.06 82a-BHC 0.0901 U 10.500 10.06 104b-BHC 0.0482 U 10.600 10.06 105d-BHC 0.0421 U 10.600 10.06 105Lindane 0.0661 U 11.200 10.05 111dieldrin 0.906 10.800 10.05 98endosulfan I 0.0601 U 10.100 10.06 100endosulfan II 0.0661 U 9.300 10.08 92endosulfan sulfate 0.0482 U 9.390 10.06 93endrin 0.0482 U 10.500 10.06 104heptachlor 0.0421 U 12.100 10.06 120heptachlor epoxide 0.0661 U 9.510 10.06 95methoxychlor 0.668 U 9.770 10.05 95Toxaphene 10.3 U 20.600 UTechnical Chlordane 152.000Cl2(8) 0.12 U 10.400 10.07 103Cl3(18) 0.0542 U 8.160 10.09 81Cl3(28) 0.0661 U 9.420 10.09 93Cl4(44) 0.0482 U 8.740 10.09 87Cl4(49) 0.0421 U 8.540 10.05 85Cl4(52) 0.0901 U 8.640 10.06 86Cl4(66) 0.0842 U 9.490 10.07 94Cl5(87) 0.0542 U 8.060 10.02 80Cl5(101) 0.0542 U 8.590 10.07 85Cl5(105) 0.0482 U 8.460 10.08 84Cl5(118) 0.0542 U 8.620 10.09 85Cl6(128) 0.0601 U 8.150 10.09 81Cl6(138) 0.0669 J 9.580 10.09 94Cl6(153) 0.0661 U 9.750 10.09 97Cl7(170) 0.0542 U 8.260 10.09 82Cl7(180) 0.0516 J 7.490 10.09 74Cl7(183) 0.0421 U 8.130 10.04 81Cl7(184) 0.0963 U 8.370 10.07 83Cl7(187) 0.0421 U 8.170 10.09 81Cl8(195) 0.0581 J 8.340 10.09 82Cl9(206) 0.0664 J 8.630 10.07 85Cl10(209) 0.0716 J 8.360 10.09 82
Surrogate Recoveries (%)
Not Surrogate CorrectedAnalyzed by Restucci Jr, Richard
8/28/2017 MS: T16-0287ECD-Master_128B-Final.xlsx

Project Client: USACE - North Atlantic DivisionProject Name: DAMOS TissuesProject Number: 100087718
Client ID RAJ-019 RAJ-019
Battelle ID K2643-P K2643MS-PSample Type SA MSCollection Date 09/20/16 9/20/2016Extraction Date 10/21/16 10/21/2016Analysis Date 11/12/16 11/12/2016Analytical Instrument ECD ECD% Moisture 86.94 88.73% Lipid 0.54 0.58Matrix CLAM TISS CLAM TISSSample Size 19.99 9.95Size Unit-Basis G_WET G_WETUnits UG/KG_WET UG/KG_WET Target % Recovery Qualifier
Cl3(34) 88 81Cl6(152) 89 78
Not Surrogate CorrectedAnalyzed by Restucci Jr, Richard
8/28/2017 MS: T16-0287ECD-Master_128B-Final.xlsx

Project Client: USACE - North Atlantic DivisionProject Name: DAMOS TissuesProject Number: 100087718
Client ID
Battelle IDSample TypeCollection DateExtraction DateAnalysis DateAnalytical Instrument% Moisture% LipidMatrixSample SizeSize Unit-BasisUnits
4,4'-DDD4,4'-DDE4,4'-DDTaldrina-chlordaneg-chlordanea-BHCb-BHCd-BHCLindanedieldrinendosulfan Iendosulfan IIendosulfan sulfateendrinheptachlorheptachlor epoxidemethoxychlorToxapheneTechnical ChlordaneCl2(8)Cl3(18)Cl3(28)Cl4(44)Cl4(49)Cl4(52)Cl4(66)Cl5(87)Cl5(101)Cl5(105)Cl5(118)Cl6(128)Cl6(138)Cl6(153)Cl7(170)Cl7(180)Cl7(183)Cl7(184)Cl7(187)Cl8(195)Cl9(206)Cl10(209)
Surrogate Recoveries (%)
RAJ-019
K2643MSD-PMSD
9/20/201610/21/201611/12/2016
ECD88.16
0.61CLAM TISS
10.07G_WET
UG/KG_WET Target % Recovery Qualifier RPD (%) Qualifier
10.700 9.94 108 1.99.410 9.93 94 1.1
10.600 9.93 107 4.69.200 9.93 93 2.19.110 9.95 92 1.18.150 9.94 82 0.0
10.300 9.94 104 0.011.100 9.94 112 6.510.100 9.94 102 2.910.800 9.93 109 1.810.600 9.94 98 0.0
9.920 9.94 100 0.09.130 9.96 92 0.09.180 9.94 92 1.1
10.200 9.94 103 1.011.200 9.94 113 6.0
9.320 9.94 94 1.19.530 9.94 93 2.1
20.400 U146.000
10.600 9.95 107 3.88.000 9.97 80 1.29.080 9.97 91 2.28.830 9.97 89 2.38.340 9.93 84 1.28.450 9.94 85 1.29.110 9.95 92 2.28.030 9.90 81 1.28.330 9.95 84 1.27.940 9.96 80 4.98.510 9.97 85 0.08.210 9.97 82 1.29.090 9.97 91 3.27.980 9.97 80 19.28.400 9.97 84 2.48.130 9.97 81 9.08.100 9.92 82 1.27.320 9.95 74 11.58.230 9.97 83 2.48.600 9.97 86 4.89.080 9.95 91 6.88.840 9.97 88 7.1
Not Surrogate CorrectedAnalyzed by Restucci Jr, Richard
8/28/2017 MS: T16-0287ECD-Master_128B-Final.xlsx

Project Client: USACE - North Atlantic DivisionProject Name: DAMOS TissuesProject Number: 100087718
Client ID
Battelle IDSample TypeCollection DateExtraction DateAnalysis DateAnalytical Instrument% Moisture% LipidMatrixSample SizeSize Unit-BasisUnits
Cl3(34)Cl6(152)
RAJ-019
K2643MSD-PMSD
9/20/201610/21/201611/12/2016
ECD88.16
0.61CLAM TISS
10.07G_WET
UG/KG_WET Target % Recovery Qualifier RPD (%) Qualifier
7980
Not Surrogate CorrectedAnalyzed by Restucci Jr, Richard
8/28/2017 MS: T16-0287ECD-Master_128B-Final.xlsx
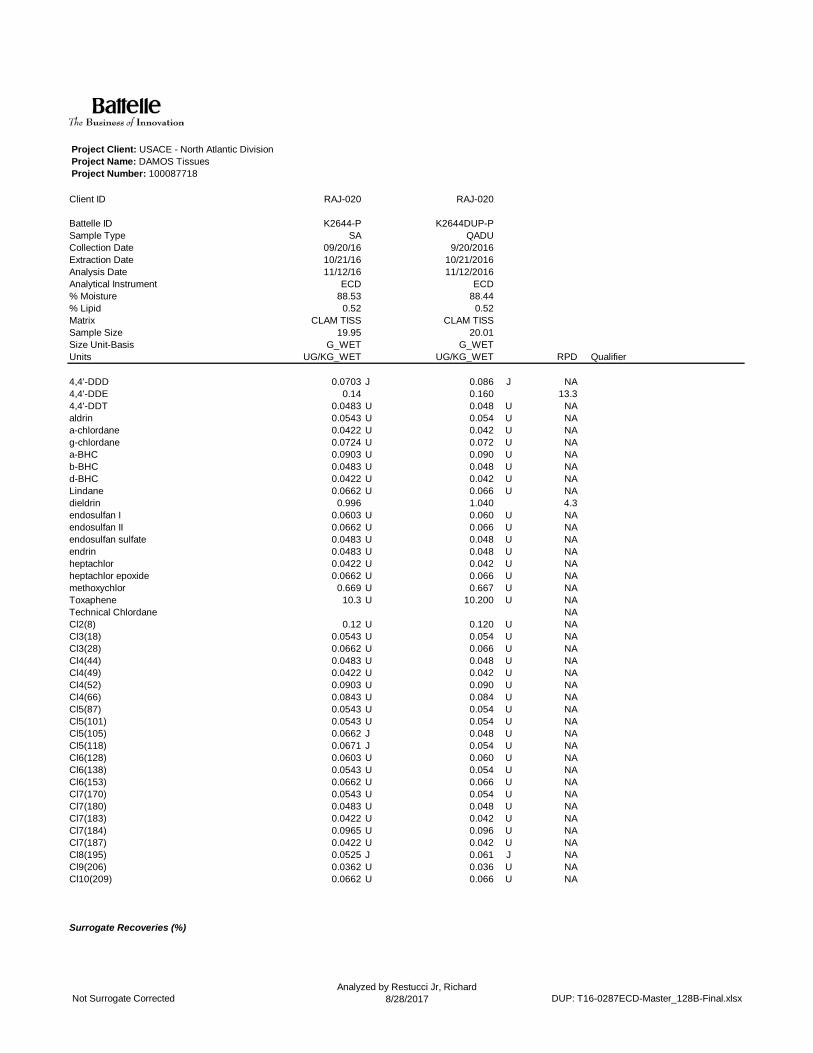
Project Client: USACE - North Atlantic DivisionProject Name: DAMOS TissuesProject Number: 100087718
Client ID RAJ-020 RAJ-020
Battelle ID K2644-P K2644DUP-PSample Type SA QADUCollection Date 09/20/16 9/20/2016Extraction Date 10/21/16 10/21/2016Analysis Date 11/12/16 11/12/2016Analytical Instrument ECD ECD% Moisture 88.53 88.44% Lipid 0.52 0.52Matrix CLAM TISS CLAM TISSSample Size 19.95 20.01Size Unit-Basis G_WET G_WETUnits UG/KG_WET UG/KG_WET RPD Qualifier
4,4'-DDD 0.0703 J 0.086 J NA4,4'-DDE 0.14 0.160 13.34,4'-DDT 0.0483 U 0.048 U NAaldrin 0.0543 U 0.054 U NAa-chlordane 0.0422 U 0.042 U NAg-chlordane 0.0724 U 0.072 U NAa-BHC 0.0903 U 0.090 U NAb-BHC 0.0483 U 0.048 U NAd-BHC 0.0422 U 0.042 U NALindane 0.0662 U 0.066 U NAdieldrin 0.996 1.040 4.3endosulfan I 0.0603 U 0.060 U NAendosulfan II 0.0662 U 0.066 U NAendosulfan sulfate 0.0483 U 0.048 U NAendrin 0.0483 U 0.048 U NAheptachlor 0.0422 U 0.042 U NAheptachlor epoxide 0.0662 U 0.066 U NAmethoxychlor 0.669 U 0.667 U NAToxaphene 10.3 U 10.200 U NATechnical Chlordane NACl2(8) 0.12 U 0.120 U NACl3(18) 0.0543 U 0.054 U NACl3(28) 0.0662 U 0.066 U NACl4(44) 0.0483 U 0.048 U NACl4(49) 0.0422 U 0.042 U NACl4(52) 0.0903 U 0.090 U NACl4(66) 0.0843 U 0.084 U NACl5(87) 0.0543 U 0.054 U NACl5(101) 0.0543 U 0.054 U NACl5(105) 0.0662 J 0.048 U NACl5(118) 0.0671 J 0.054 U NACl6(128) 0.0603 U 0.060 U NACl6(138) 0.0543 U 0.054 U NACl6(153) 0.0662 U 0.066 U NACl7(170) 0.0543 U 0.054 U NACl7(180) 0.0483 U 0.048 U NACl7(183) 0.0422 U 0.042 U NACl7(184) 0.0965 U 0.096 U NACl7(187) 0.0422 U 0.042 U NACl8(195) 0.0525 J 0.061 J NACl9(206) 0.0362 U 0.036 U NACl10(209) 0.0662 U 0.066 U NA
Surrogate Recoveries (%)
Not Surrogate CorrectedAnalyzed by Restucci Jr, Richard
8/28/2017 DUP: T16-0287ECD-Master_128B-Final.xlsx

Project Client: USACE - North Atlantic DivisionProject Name: DAMOS TissuesProject Number: 100087718
Client ID RAJ-020 RAJ-020
Battelle ID K2644-P K2644DUP-PSample Type SA QADUCollection Date 09/20/16 9/20/2016Extraction Date 10/21/16 10/21/2016Analysis Date 11/12/16 11/12/2016Analytical Instrument ECD ECD% Moisture 88.53 88.44% Lipid 0.52 0.52Matrix CLAM TISS CLAM TISSSample Size 19.95 20.01Size Unit-Basis G_WET G_WETUnits UG/KG_WET UG/KG_WET RPD Qualifier
Cl3(34) 81 75Cl6(152) 82 82
Not Surrogate CorrectedAnalyzed by Restucci Jr, Richard
8/28/2017 DUP: T16-0287ECD-Master_128B-Final.xlsx
Project Client: USACE - North Atlantic DivisionProject Name: DAMOS TissuesProject Number: 100087718
Client ID
Battelle IDSample TypeCollection DateExtraction DateAnalysis DateAnalytical Instrument% Moisture% LipidMatrixSample SizeSize Unit-BasisUnits
4,4'-DDD4,4'-DDE4,4'-DDTaldrina-chlordaneg-chlordanea-BHCb-BHCd-BHCLindanedieldrinendosulfan Iendosulfan IIendosulfan sulfateendrinheptachlorheptachlor epoxidemethoxychlorToxapheneTechnical ChlordaneCl2(8)Cl3(18)Cl3(28)Cl4(44)Cl4(49)Cl4(52)Cl4(66)Cl5(87)Cl5(101)Cl5(105)Cl5(118)Cl6(128)Cl6(138)Cl6(153)Cl7(170)Cl7(180)Cl7(183)Cl7(184)Cl7(187)Cl8(195)Cl9(206)Cl10(209)
Surrogate Recoveries (%)
Not Surrogate CorrectedAnalyzed by Restucci Jr, Richard
8/28/2017 DUP: T16-0287ECD-Master_128B-Final.xlsx

Project Client: USACE - North Atlantic DivisionProject Name: DAMOS TissuesProject Number: 100087718
Client ID
Battelle IDSample TypeCollection DateExtraction DateAnalysis DateAnalytical Instrument% Moisture% LipidMatrixSample SizeSize Unit-BasisUnits
Cl3(34)Cl6(152)
Not Surrogate CorrectedAnalyzed by Restucci Jr, Richard
8/28/2017 DUP: T16-0287ECD-Master_128B-Final.xlsx

QA/QC Summary Batch 16-0287
Page 1 of 3
Project: USACE/NAE – DAMOS Program (Rockland and Portland Disposal Sites)
Parameters: PAH
Laboratory: Battelle‐Norwell, MA
Matrix: Tissue
Data Set: DP‐16‐0268
Analytical SOP: 5‐157
Method Reference:
EPA 8270D modified
Sample Custody
Collection Date Receipt Date Temp (°C)
9/14‐15/2016 9/20‐21/2016
9/16/2016 9/22/2016
1.9 1.8
Corrective Actions No C/A.
Sample Storage Tissue samples were stored frozen upon receipt.
Related Samples NA
METHOD SUMMARIES
Sample Preparation
Samples were homogenized, and approximately 10‐20 g of homogenate (depending upon mass available) was spiked with surrogates, dried with sodium sulfate, and serially extracted with dichloromethane using a Tissuemizer, orbital shaker table, and centrifuge. The combined extracts were dried over sodium sulfate and concentrated. Sample concentrates were further processed by alumina cleanup, followed by size‐exclusion HPLC cleanup, concentrated, and then spiked with internal standard. Extracts were submitted for PAH analyses by GC/MS.
Prep comments Sample K2624 and K2644 where inadvertently combined during the first extraction. The PM was notified, and directed the samples be re‐weighed, spiked and caught up with the rest of the batch.
Analysis PAH were measured by gas chromatography‐mass spectrometry (GC/MS) in the
selected ion mode (SIM). An initial calibration consisting of representative target analytes was analyzed prior to analysis to demonstrate the linear range of analysis. Calibration verification was performed at the beginning and end of 10 injections or each 24‐hour period (whichever is more frequent). Target PAH were quantified using the average response factors (RF) generated from the initial calibration.
Analysis Comments
No comments.
Holding Times Extraction Date(s) Analysis Date(s)
10/21/2016 10/26‐27/2016
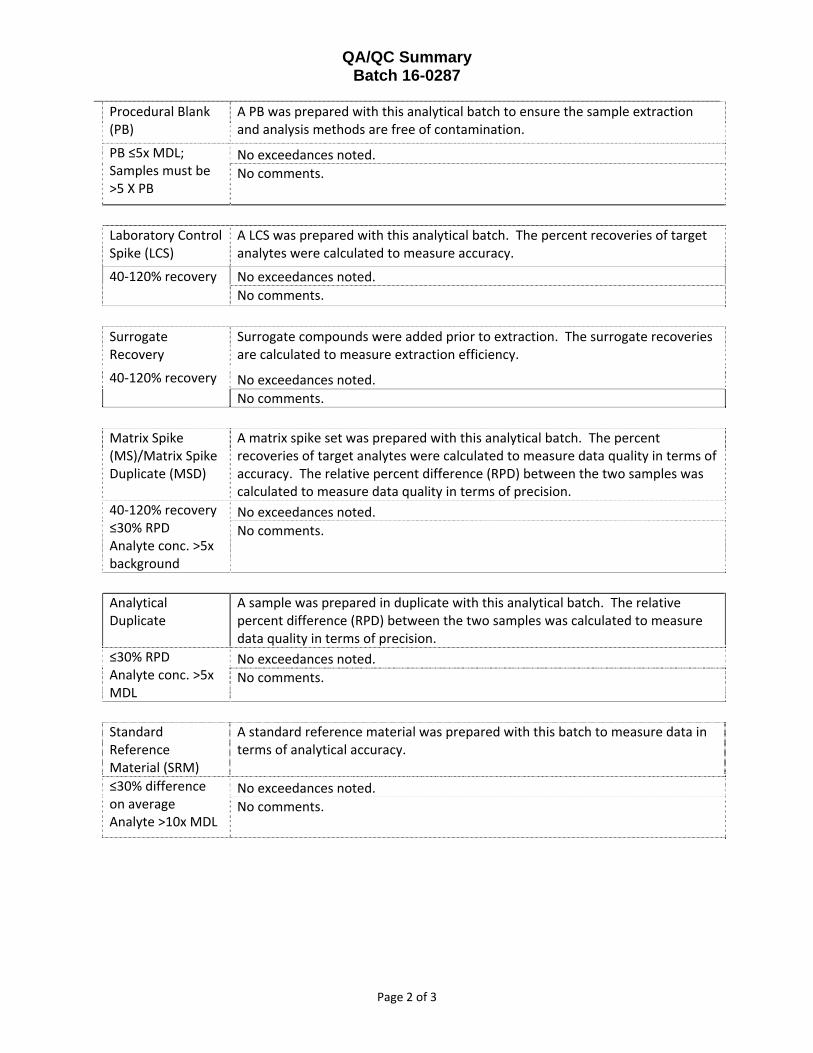
QA/QC Summary Batch 16-0287
Page 2 of 3
Procedural Blank (PB)
A PB was prepared with this analytical batch to ensure the sample extraction and analysis methods are free of contamination.
PB ≤5x MDL; Samples must be >5 X PB
No exceedances noted.
No comments.
Laboratory Control Spike (LCS)
A LCS was prepared with this analytical batch. The percent recoveries of target analytes were calculated to measure accuracy.
40‐120% recovery No exceedances noted.
No comments.
Surrogate Recovery
Surrogate compounds were added prior to extraction. The surrogate recoveries are calculated to measure extraction efficiency.
40‐120% recovery No exceedances noted.
No comments.
Matrix Spike (MS)/Matrix Spike Duplicate (MSD)
A matrix spike set was prepared with this analytical batch. The percent recoveries of target analytes were calculated to measure data quality in terms of accuracy. The relative percent difference (RPD) between the two samples was calculated to measure data quality in terms of precision.
40‐120% recovery ≤30% RPD Analyte conc. >5x background
No exceedances noted.
No comments.
Analytical Duplicate
A sample was prepared in duplicate with this analytical batch. The relative percent difference (RPD) between the two samples was calculated to measure data quality in terms of precision.
≤30% RPD Analyte conc. >5x MDL
No exceedances noted.
No comments.
Standard Reference Material (SRM)
A standard reference material was prepared with this batch to measure data in terms of analytical accuracy.
≤30% difference on average Analyte >10x MDL
No exceedances noted.
No comments.

QA/QC Summary Batch 16-0287
Page 3 of 3
Initial Calibration (ICAL)
The GC/MS was calibrated with six‐level calibration curve for all compounds using an instrument response factor (RF).
Mean ≤ 15% Indiv. ≤ 25%
No exceedances noted.
No comments.
Independent Calibration Check (ICC)
The independent check was run after each initial calibration to verify the calibration. This standard is from a different source than the ICAL.
≤ 25% difference individual and mean
No exceedances noted.
No comments.
Continuing Calibration Verification (CCV)
Continuing calibration standards were performed at the beginning and end of 10 injections or each 24‐hour period (whichever is more frequent) to ensure that initial calibration is still valid.
≤ 25% difference individual and ≤ 15% mean
No exceedances noted.
No comments.

Project Client: USACE - North Atlantic DivisionProject Name: DAMOS - Disposal Area Monitoring Study ProgramProject Number: 100087718
Client ID RAJ-019 RAJ-020 RAJ-021 RAJ-022
Battelle ID K2643-P K2644-P K2645-P K2646-PSample Type SA SA SA SACollection Date 09/20/16 09/20/16 09/21/16 09/21/16Extraction Date 10/21/16 10/21/16 10/21/16 10/21/16Analysis Date 10/26/16 10/27/16 10/27/16 10/27/16Analytical Instrument MS MS MS MS% Moisture 86.94 88.53 87.55 84.37% Lipid 0.54 0.52 0.61 1.13Matrix CLAM TISS CLAM TISS CLAM TISS WORM TISSSample Size 19.99 19.95 19.97 8.44Size Unit-Basis G_WET G_WET G_WET G_WETUnits UG/KG_WET UG/KG_WET UG/KG_WET UG/KG_WET
Naphthalene 1.640 2.170 2.140 1.7802-Methylnaphthalene 0.240 J 0.586 0.600 0.6501-Methylnaphthalene 0.155 J 0.385 J 0.383 J 0.529 JAcenaphthylene 0.117 U 0.117 U 0.117 U 0.446 JAcenaphthene 0.117 U 0.132 J 0.117 U 1.240Fluorene 0.105 U 0.105 U 0.105 U 0.858Anthracene 0.275 J 0.509 J 0.117 U 1.760Phenanthrene 0.267 J 0.273 J 0.312 J 6.280Fluoranthene 0.447 J 0.538 0.367 J 39.000Pyrene 0.570 1.330 0.239 J 60.400Benzo(a)anthracene 0.142 U 0.170 J 0.142 U 3.600Chrysene 0.299 J 0.367 J 0.209 J 11.200Benzo(b)fluoranthene 0.804 1.090 0.458 J 4.580Benzo(k)fluoranthene 0.733 J 0.945 J 0.425 J 3.660Benzo(a)pyrene 0.333 J 0.478 J 0.232 U 4.720Indeno(1,2,3-cd)pyrene 0.348 J 0.410 J 0.270 J 1.310Dibenz(a,h)anthracene 0.093 U 0.093 U 0.093 U 0.300 JBenzo(g,h,i)perylene 0.603 0.669 0.476 J 4.600
Surrogate Recoveries (%)
Naphthalene-d8 79 74 77 71Acenaphthene-d10 81 78 79 77Phenanthrene-d10 84 81 81 82Benzo(a)pyrene-d12 69 64 75 83
Not Surrogate CorrectedAnalyzed by Griffith, Lauren
8/28/2017 Main: T16-0287MS-Master_157-Final.xlsx

Project Client: USACE - North Atlantic DivisionProject Name: DAMOS - Disposal Area Monitoring Study ProgramProject Number: 100087718
Client ID
Battelle IDSample TypeCollection DateExtraction DateAnalysis DateAnalytical Instrument% Moisture% LipidMatrixSample SizeSize Unit-BasisUnits
Naphthalene2-Methylnaphthalene1-MethylnaphthaleneAcenaphthyleneAcenaphtheneFluoreneAnthracenePhenanthreneFluoranthenePyreneBenzo(a)anthraceneChryseneBenzo(b)fluorantheneBenzo(k)fluorantheneBenzo(a)pyreneIndeno(1,2,3-cd)pyreneDibenz(a,h)anthraceneBenzo(g,h,i)perylene
Surrogate Recoveries (%)
Naphthalene-d8Acenaphthene-d10Phenanthrene-d10Benzo(a)pyrene-d12
RAJ-023 RAJ-024
K2647-P K2648-PSA SA
09/21/16 09/21/1610/21/16 10/21/1610/27/16 10/27/16
MS MS82.59 86.61.93 1.03
WORM TISS CLAM TISS12.29 5.47
G_WET G_WETUG/KG_WET UG/KG_WET
3.890 3.0801.790 0.9881.320 0.717 J0.732 J 0.428 U0.336 J 0.428 U0.451 J 0.384 U1.560 0.428 U1.620 0.641 J
33.800 3.36084.200 9.6603.160 1.190
12.800 1.6604.420 2.9803.810 2.4705.920 1.8801.490 0.9520.252 J 0.340 U6.010 1.660
78 8581 9085 9386 86
Not Surrogate CorrectedAnalyzed by Griffith, Lauren
8/28/2017 Main: T16-0287MS-Master_157-Final.xlsx
Project Client: USACE - North Atlantic DivisionProject Name: DAMOS - Disposal Area Monitoring Study ProgramProject Number: 100087718
Client ID
Battelle IDSample TypeCollection DateExtraction DateAnalysis DateAnalytical Instrument% Moisture% LipidMatrixSample SizeSize Unit-BasisUnits
Naphthalene2-Methylnaphthalene1-MethylnaphthaleneAcenaphthyleneAcenaphtheneFluoreneAnthracenePhenanthreneFluoranthenePyreneBenzo(a)anthraceneChryseneBenzo(b)fluorantheneBenzo(k)fluorantheneBenzo(a)pyreneIndeno(1,2,3-cd)pyreneDibenz(a,h)anthraceneBenzo(g,h,i)perylene
Surrogate Recoveries (%)
Naphthalene-d8Acenaphthene-d10Phenanthrene-d10Benzo(a)pyrene-d12
Not Surrogate CorrectedAnalyzed by Griffith, Lauren
8/28/2017 Main: T16-0287MS-Master_157-Final.xlsx

Project Client: USACE - North Atlantic DivisionProject Name: DAMOS - Disposal Area Monitoring Study ProgramProject Number: 100087718
Client ID Procedural Blank
Battelle ID CJ817PB-PSample Type PBCollection Date 10/21/16Extraction Date 10/21/16Analysis Date 10/26/16Analytical Instrument MS% Moisture 84.82 % Lipid NAMatrix TISSUESample Size 19.99Size Unit-Basis G_WETUnits UG/KG_WET
Naphthalene 0.208 U2-Methylnaphthalene 0.179 U1-Methylnaphthalene 0.105 UAcenaphthylene 0.114 UAcenaphthene 0.114 UFluorene 0.102 UAnthracene 0.114 UPhenanthrene 0.167 UFluoranthene 0.144 UPyrene 0.217 UBenzo(a)anthracene 0.138 UChrysene 0.0878 UBenzo(b)fluoranthene 0.114 UBenzo(k)fluoranthene 0.0936 UBenzo(a)pyrene 0.226 UIndeno(1,2,3-cd)pyrene 0.102 UDibenz(a,h)anthracene 0.0908 UBenzo(g,h,i)perylene 0.114 U
Surrogate Recoveries (%)
Naphthalene-d8 81Acenaphthene-d10 87Phenanthrene-d10 89Benzo(a)pyrene-d12 70
Not Surrogate CorrectedAnalyzed by Griffith, Lauren
8/28/2017 PB: T16-0287MS-Master_157-Final.xlsx

Project Client: USACE - North Atlantic DivisionProject Name: DAMOS - Disposal Area Monitoring Study ProgramProject Number: 100087718
Client ID
Battelle IDSample TypeCollection DateExtraction DateAnalysis DateAnalytical Instrument% Moisture% LipidMatrixSample SizeSize Unit-BasisUnits
Naphthalene2-Methylnaphthalene1-MethylnaphthaleneAcenaphthyleneAcenaphtheneFluoreneAnthracenePhenanthreneFluoranthenePyreneBenzo(a)anthraceneChryseneBenzo(b)fluorantheneBenzo(k)fluorantheneBenzo(a)pyreneIndeno(1,2,3-cd)pyreneDibenz(a,h)anthraceneBenzo(g,h,i)perylene
Surrogate Recoveries (%)
Naphthalene-d8Acenaphthene-d10Phenanthrene-d10Benzo(a)pyrene-d12
Not Surrogate CorrectedAnalyzed by Griffith, Lauren
8/28/2017 PB: T16-0287MS-Master_157-Final.xlsx

Project Client: USACE - North Atlantic DivisionProject Name: DAMOS - Disposal Area Monitoring Study ProgramProject Number: 100087718
Client ID 160720-01: Tilapia
Battelle ID CJ818LCS-PSample Type LCSCollection Date 10/21/16Extraction Date 10/21/16Analysis Date 10/26/16Analytical Instrument MS% Moisture 80.12% Lipid 0.84Matrix TISSUESample Size 20.02Size Unit-Basis G_WETUnits UG/KG_WET Target % Recovery Qualifier
Naphthalene 39.7 50.09 792-Methylnaphthalene 40 50.09 801-Methylnaphthalene 40.1 50.08 80Acenaphthylene 37.9 50.11 76Acenaphthene 39.3 50.08 78Fluorene 38.7 50.12 77Anthracene 38 50.07 76Phenanthrene 40.4 50.06 81Fluoranthene 40.4 50.11 81Pyrene 40.1 50.08 80Benzo(a)anthracene 40.9 50.10 82Chrysene 40.9 50.06 82Benzo(b)fluoranthene 40.8 50.15 81Benzo(k)fluoranthene 41.9 50.08 84Benzo(a)pyrene 39.3 50.02 79Indeno(1,2,3-cd)pyrene 39.4 50.08 79Dibenz(a,h)anthracene 40.6 50.04 81Benzo(g,h,i)perylene 42.1 50.11 84
Surrogate Recoveries (%)
Naphthalene-d8 79Acenaphthene-d10 79Phenanthrene-d10 81Benzo(a)pyrene-d12 77
Not Surrogate CorrectedAnalyzed by Griffith, Lauren
8/28/2017 LCS: T16-0287MS-Master_157-Final.xlsx

Project Client: USACE - North Atlantic DivisionProject Name: DAMOS - Disposal Area Monitoring Study ProgramProject Number: 100087718
Client ID161005-01: SRM
1974C
Battelle ID CJ819SRM-PSample Type SRMCollection Date 10/21/16Extraction Date 10/21/16Analysis Date 10/26/16Analytical Instrument MS% Moisture 90% Lipid 0.89Matrix TISSUESample Size 9.49Size Unit-Basis G_WET Certified Passing ActualUnits UG/KG_WET Value +/- %Difference %Difference Qualifier
Naphthalene 1.092-Methylnaphthalene 0.998 J1-Methylnaphthalene 0.848 JAcenaphthylene 0.388 JAcenaphthene 0.926 JFluorene 1.62 2.31 0.04 31.73 29.9Anthracene 0.909 J 1.17 0.08 36.84 22.3Phenanthrene 17.4 19.6 0.40 32.04 11.2Fluoranthene 45.2 45.3 0.80 31.77 0.2Pyrene 25.5 23.9 1.60 36.69 6.7Benzo(a)anthracene 3.91 5.69 0.11 31.93 31.3Chrysene 16.5Benzo(b)fluoranthene 5.81Benzo(k)fluoranthene 4.48 4.82 0.03 30.62 7.1Benzo(a)pyrene 1.76 2.32 0.03 31.29 24.1Indeno(1,2,3-cd)pyrene 1.77Dibenz(a,h)anthracene 0.325 JBenzo(g,h,i)perylene 3.04 2.82 0.05 31.77 7.8
Surrogate Recoveries (%)
Naphthalene-d8 86Acenaphthene-d10 88Phenanthrene-d10 89Benzo(a)pyrene-d12 83
Surrogate CorrectedAnalyzed by Griffith, Lauren
8/28/2017 SRM: T16-0287MS-Master_157-Final.xlsx

Project Client: USACE - North Atlantic DivisionProject Name: DAMOS - Disposal Area Monitoring Study ProgramProject Number: 100087718
Client ID RAJ-019 RAJ-019
Battelle ID K2643-P K2643MS-PSample Type SA MSCollection Date 09/20/16 9/20/2016Extraction Date 10/21/16 10/21/2016Analysis Date 10/26/16 10/26/2016Analytical Instrument MS MS% Moisture 86.94 88.73% Lipid 0.54 0.58Matrix CLAM TISS CLAM TISSSample Size 19.99 9.95Size Unit-Basis G_WET G_WETUnits UG/KG_WET UG/KG_WET Target % Recovery Qualifier
Naphthalene 1.64 78.400 100.78 762-Methylnaphthalene 0.24 J 80.100 100.78 791-Methylnaphthalene 0.155 J 79.900 100.76 79Acenaphthylene 0.117 U 73.500 100.82 73Acenaphthene 0.117 U 78.700 100.77 78Fluorene 0.105 U 78.600 100.85 78Anthracene 0.275 J 69.600 100.75 69Phenanthrene 0.267 J 83.500 100.72 83Fluoranthene 0.447 J 86.400 100.82 85Pyrene 0.57 85.000 100.77 84Benzo(a)anthracene 0.142 U 86.400 100.80 86Chrysene 0.299 J 84.400 100.72 83Benzo(b)fluoranthene 0.804 85.600 100.90 84Benzo(k)fluoranthene 0.733 J 89.400 100.76 88Benzo(a)pyrene 0.333 J 71.800 100.65 71Indeno(1,2,3-cd)pyrene 0.348 J 79.400 100.77 78Dibenz(a,h)anthracene 0.0931 U 81.400 100.69 81Benzo(g,h,i)perylene 0.603 87.200 100.83 86
Surrogate Recoveries (%)
Naphthalene-d8 79 75Acenaphthene-d10 81 78Phenanthrene-d10 84 81Benzo(a)pyrene-d12 69 68
Not Surrogate CorrectedAnalyzed by Griffith, Lauren
8/28/2017 MS: T16-0287MS-Master_157-Final.xlsx
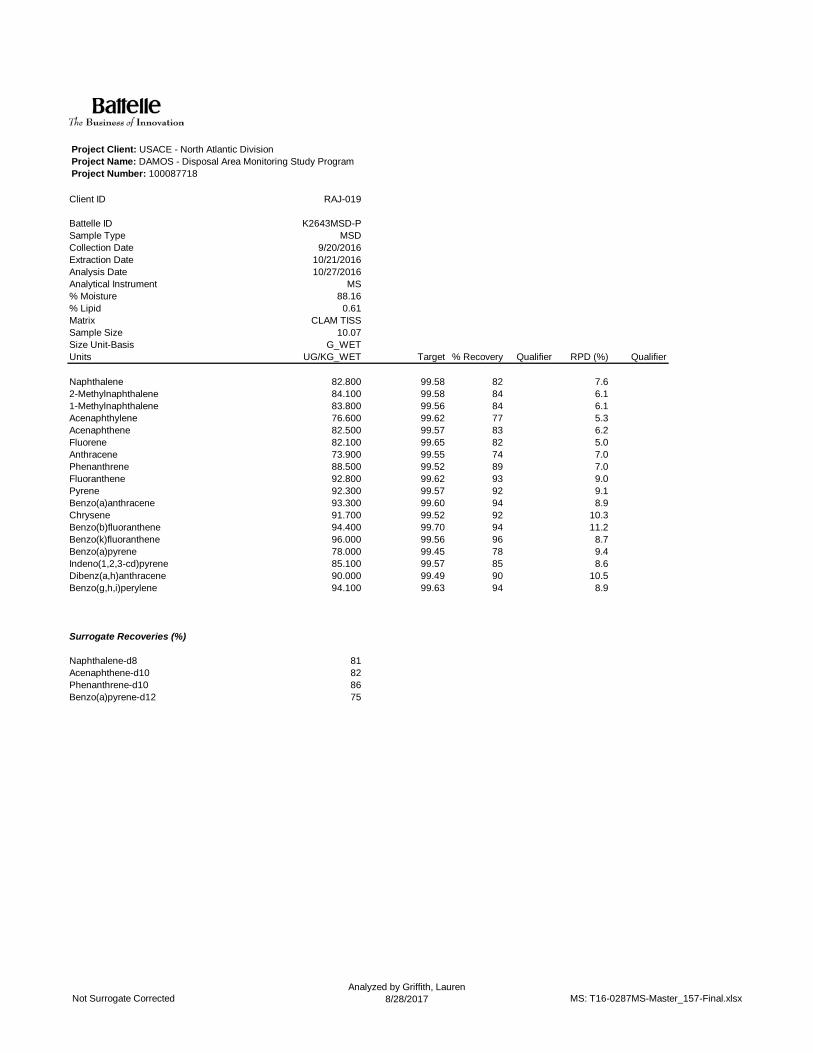
Project Client: USACE - North Atlantic DivisionProject Name: DAMOS - Disposal Area Monitoring Study ProgramProject Number: 100087718
Client ID
Battelle IDSample TypeCollection DateExtraction DateAnalysis DateAnalytical Instrument% Moisture% LipidMatrixSample SizeSize Unit-BasisUnits
Naphthalene2-Methylnaphthalene1-MethylnaphthaleneAcenaphthyleneAcenaphtheneFluoreneAnthracenePhenanthreneFluoranthenePyreneBenzo(a)anthraceneChryseneBenzo(b)fluorantheneBenzo(k)fluorantheneBenzo(a)pyreneIndeno(1,2,3-cd)pyreneDibenz(a,h)anthraceneBenzo(g,h,i)perylene
Surrogate Recoveries (%)
Naphthalene-d8Acenaphthene-d10Phenanthrene-d10Benzo(a)pyrene-d12
RAJ-019
K2643MSD-PMSD
9/20/201610/21/201610/27/2016
MS88.16
0.61CLAM TISS
10.07G_WET
UG/KG_WET Target % Recovery Qualifier RPD (%) Qualifier
82.800 99.58 82 7.684.100 99.58 84 6.183.800 99.56 84 6.176.600 99.62 77 5.382.500 99.57 83 6.282.100 99.65 82 5.073.900 99.55 74 7.088.500 99.52 89 7.092.800 99.62 93 9.092.300 99.57 92 9.193.300 99.60 94 8.991.700 99.52 92 10.394.400 99.70 94 11.296.000 99.56 96 8.778.000 99.45 78 9.485.100 99.57 85 8.690.000 99.49 90 10.594.100 99.63 94 8.9
81828675
Not Surrogate CorrectedAnalyzed by Griffith, Lauren
8/28/2017 MS: T16-0287MS-Master_157-Final.xlsx
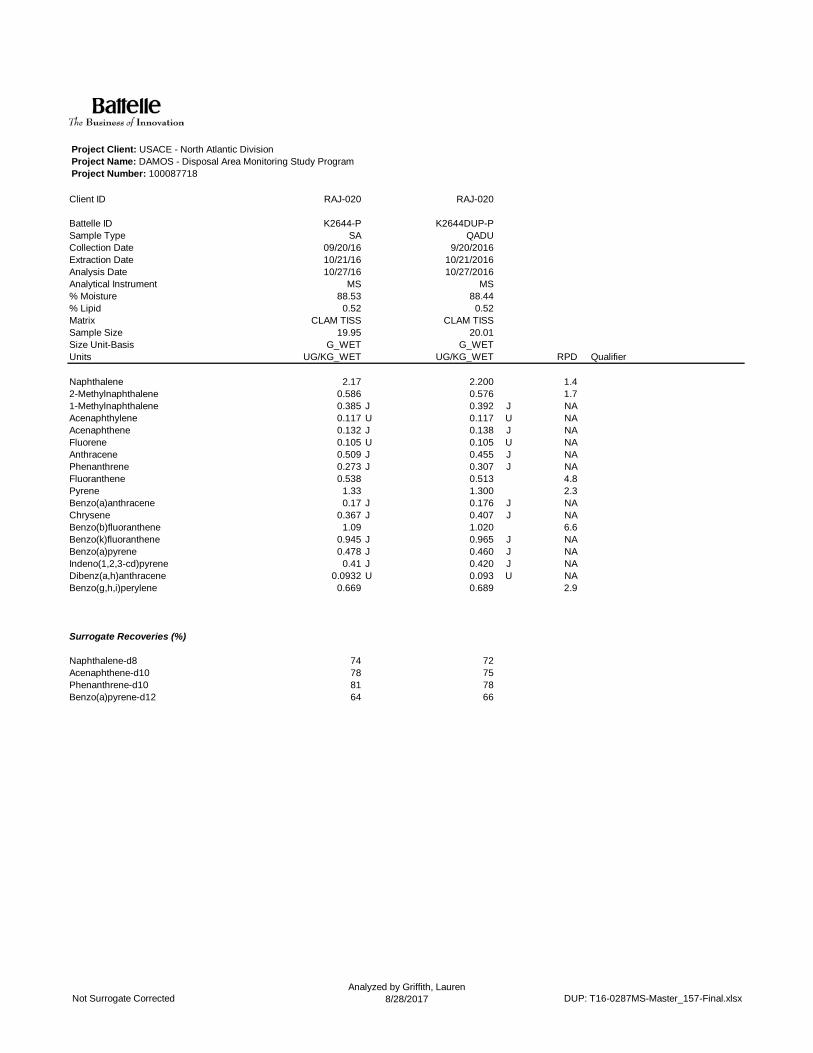
Project Client: USACE - North Atlantic DivisionProject Name: DAMOS - Disposal Area Monitoring Study ProgramProject Number: 100087718
Client ID RAJ-020 RAJ-020
Battelle ID K2644-P K2644DUP-PSample Type SA QADUCollection Date 09/20/16 9/20/2016Extraction Date 10/21/16 10/21/2016Analysis Date 10/27/16 10/27/2016Analytical Instrument MS MS% Moisture 88.53 88.44% Lipid 0.52 0.52Matrix CLAM TISS CLAM TISSSample Size 19.95 20.01Size Unit-Basis G_WET G_WETUnits UG/KG_WET UG/KG_WET RPD Qualifier
Naphthalene 2.17 2.200 1.42-Methylnaphthalene 0.586 0.576 1.71-Methylnaphthalene 0.385 J 0.392 J NAAcenaphthylene 0.117 U 0.117 U NAAcenaphthene 0.132 J 0.138 J NAFluorene 0.105 U 0.105 U NAAnthracene 0.509 J 0.455 J NAPhenanthrene 0.273 J 0.307 J NAFluoranthene 0.538 0.513 4.8Pyrene 1.33 1.300 2.3Benzo(a)anthracene 0.17 J 0.176 J NAChrysene 0.367 J 0.407 J NABenzo(b)fluoranthene 1.09 1.020 6.6Benzo(k)fluoranthene 0.945 J 0.965 J NABenzo(a)pyrene 0.478 J 0.460 J NAIndeno(1,2,3-cd)pyrene 0.41 J 0.420 J NADibenz(a,h)anthracene 0.0932 U 0.093 U NABenzo(g,h,i)perylene 0.669 0.689 2.9
Surrogate Recoveries (%)
Naphthalene-d8 74 72Acenaphthene-d10 78 75Phenanthrene-d10 81 78Benzo(a)pyrene-d12 64 66
Not Surrogate CorrectedAnalyzed by Griffith, Lauren
8/28/2017 DUP: T16-0287MS-Master_157-Final.xlsx

Project Client: USACE - North Atlantic DivisionProject Name: DAMOS - Disposal Area Monitoring Study ProgramProject Number: 100087718
Client ID
Battelle IDSample TypeCollection DateExtraction DateAnalysis DateAnalytical Instrument% Moisture% LipidMatrixSample SizeSize Unit-BasisUnits
Naphthalene2-Methylnaphthalene1-MethylnaphthaleneAcenaphthyleneAcenaphtheneFluoreneAnthracenePhenanthreneFluoranthenePyreneBenzo(a)anthraceneChryseneBenzo(b)fluorantheneBenzo(k)fluorantheneBenzo(a)pyreneIndeno(1,2,3-cd)pyreneDibenz(a,h)anthraceneBenzo(g,h,i)perylene
Surrogate Recoveries (%)
Naphthalene-d8Acenaphthene-d10Phenanthrene-d10Benzo(a)pyrene-d12
Not Surrogate CorrectedAnalyzed by Griffith, Lauren
8/28/2017 DUP: T16-0287MS-Master_157-Final.xlsx

DAMOS 2016
Portland Disposal Site
Tissue Metals Results
Envirosystems, Inc. (ESI)

CHEMICAL ANALYSISOF A MARINE SEDIMENT: Tissue Analysis
DAMOS- Disposal Area Monitoring Study Program
DAMOS 2016 (OPP202370)
Contract: W912WJ-12-D-0004
Prepared For:
Lisa LefkovitzBattelle
141 Longwater Dr. Suite 202
Norwell, MA 02061
Prepared By:
EnviroSystems, IncorporatedOne Lafayette Road
Hampton, New Hampshire 03842
EnviroSystems, Inc. Sample Delivery Group Reference 28411
DAMOS Disposal Area Monitoring Study Program. Tissue Analysis. Contract W912WJ-12-D-D0004. ESI Study 28411.
Page 1 of 56
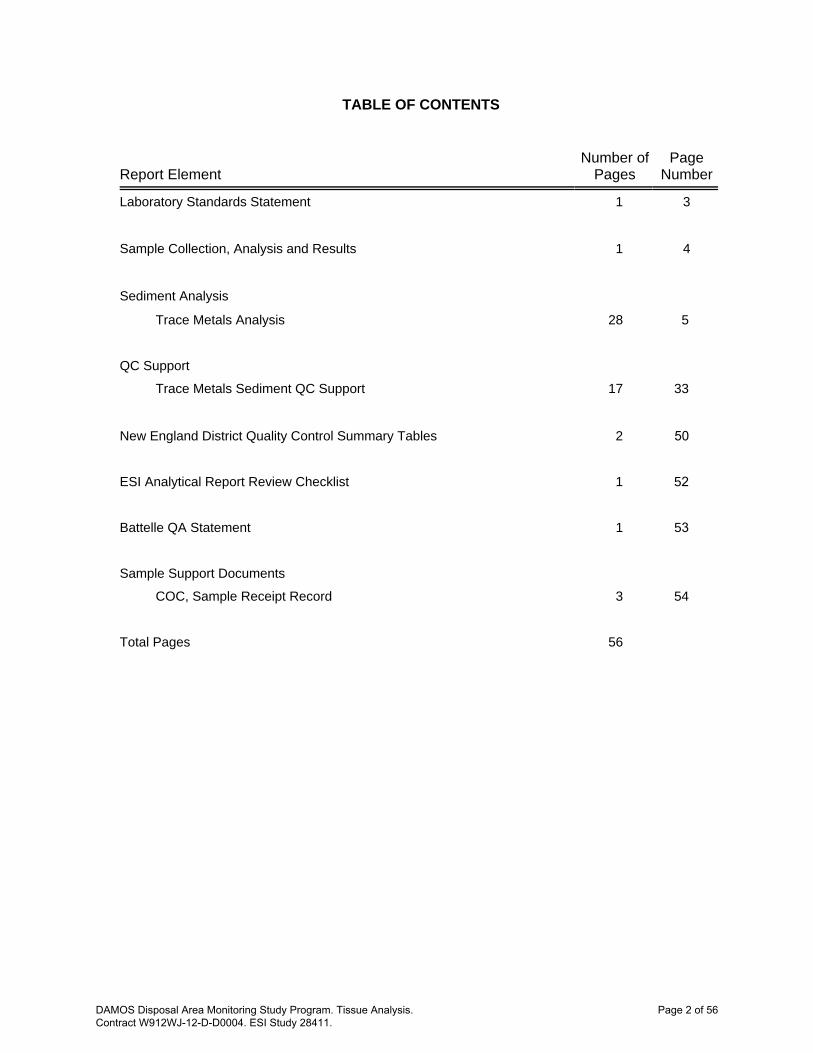
TABLE OF CONTENTS
Report ElementNumber of
PagesPage
Number
Laboratory Standards Statement 1 3
Sample Collection, Analysis and Results 1 4
Sediment Analysis
Trace Metals Analysis 28 5
QC Support
Trace Metals Sediment QC Support 17 33
New England District Quality Control Summary Tables 2 50
ESI Analytical Report Review Checklist 1 52
Battelle QA Statement 1 53
Sample Support Documents
COC, Sample Receipt Record 3 54
Total Pages 56
DAMOS Disposal Area Monitoring Study Program. Tissue Analysis. Contract W912WJ-12-D-D0004. ESI Study 28411.
Page 2 of 56

LABORATORY STANDARDS STATEMENT
This study was performed by EnviroSystems, Incorporated at its facility in Hampton,New Hampshire. EnviroSystems’ laboratory is accredited by the State of New Hampshire underthe National Environmental Laboratory Accreditation (NELAC) program. Additionally, ESI isaccredited under the Department of Defense (DoD) ELAP program, ISO/IEC 17025:2005,Certificate Number L2340. All testing conducted by EnviroSystems as part of this program wascompliant with NELAC guidelines and standards. Additionally, this study was conducted inaccordance with guidelines presented in the 2004 version of the New England District’sRegional Implementation Manual (RIM) for Evaluation of Dredged Material Proposed forDisposal In New England Waters. Any deviations from specific elements of the RIM aredetailed in the Protocol Deviation Section of this Report.
For EnviroSystems, Inc. December 19, 2016Kenneth A. Simon DateTechnical Director
DAMOS Disposal Area Monitoring Study Program. Tissue Analysis. Contract W912WJ-12-D-D0004. ESI Study 28411.
Page 3 of 56

CHEMICAL ANALYSISOF A MARINE SEDIMENT:
DAMOS Disposal Area Monitoring Study Tissue Analysis
1.0 SAMPLE COLLECTION, PRESERVATION AND STORAGE
Sediment samples and equipment blanks for chemical analysis were collected and provided byBattelle of Norwell, Massachusetts from locations specified within the project’s proposed footprint.Samples were received under chain of custody in sample containers appropriate for the specified analysis.Upon arrival at the laboratory, all samples received an internal sample control number and were loggedinto the project sample control system. Samples were placed in a secure sample holding location andstored at a temperature of 4±2EC until analysis.
2.0 ANALYSIS
Sample analysis was carried out following methods and protocol specified in the RIM byEnviroSystems, Inc. at its Hampton, NH facility. Review of the data report document showed that allsample holding times were met, unless otherwise qualified, that the analytical methods used in theanalysis were appropriate for the parameter and sample matrix and met New England District RegionalImplementation Manual requirements. Review of supporting quality assurance data documented that,ecept where qualified, all data collected meet all of the requirements of NELAC, for all NELAC accreditedparameters.
3.0 RESULTS
Analytical methods used in the analysis of tissue samples were analyzed using protocolrecommended in Tables 8 of the New England District RIM document with appropriate updates relatedto current methods. Trace metals were evaluated using EPA Method 6020, Inductively Coupled Plasma -Mass Spectrometry (ICP-MS), mercury was evaluated using EPA Method 245.7, Cold Vapor AtomicFluorescence Spectrometry. In cases where dilution of the sample extract was required the final reportinglimit remained below the RIM document specified limits and did not result in artificial “Non Detects.”
No deficiencies impacting data quality were noted.
A full copy of the analytical report is included in the following data appendix.
DAMOS Disposal Area Monitoring Study Program. Tissue Analysis. Contract W912WJ-12-D-D0004. ESI Study 28411.
Page 4 of 56

SDG:28411Report No:DAMOS- Disposal Area Monitoring Study ProgramProject:
K2622Sample ID:SolidMatrix:09/14/16 1245Sampled:
INIT/Method/ReferenceDate of DateUnitsQuantResultParameterAnalysisPrepared Limit
AC /160.3 EPA 600/4/79/02012/12/16 120012/10/16 1215%0.1 84.428411-001Percent MoistureJLH/SW846 3rd Ed. 602012/11/16 181012/11/16 0930ug/g0.03 6.6228411-001Arsenic, totalJLH/SW846 3rd Ed. 602012/11/16 181012/11/16 0930ug/g0.01 0.05328411-001Cadmium, totalJLH/SW846 3rd Ed. 602012/11/16 181012/11/16 0930ug/g0.03 0.07628411-001Chromium, totalJLH/SW846 3rd Ed. 602012/11/16 181012/11/16 0930ug/g0.1 0.6328411-001Copper, totalJLH/SW846 3rd Ed. 602012/11/16 181012/11/16 0930ug/g0.03 0.2728411-001Lead, totalJLH/EPA 245.712/11/16 143012/11/16 0930ug/g0.003 0.00828411-001Mercury, totalJLH/SW846 3rd Ed. 602012/11/16 181012/11/16 0930ug/g0.05 0.4628411-001Nickel, totalJLH/SW846 3rd Ed. 602012/11/16 181012/11/16 0930ug/g0.2 19.728411-001Zinc, total
Notes:
DAMOS Disposal Area Monitoring Study Program. Tissue Analysis. Contract W912WJ-12-D-D0004. ESI Study 28411.
Page 5 of 56

SDG:28411Report No:DAMOS- Disposal Area Monitoring Study ProgramProject:
K2623Sample ID:SolidMatrix:09/14/16 1356Sampled:
INIT/Method/ReferenceDate of DateUnitsQuantResultParameterAnalysisPrepared Limit
AC /160.3 EPA 600/4/79/02012/12/16 120012/10/16 1215%0.1 86.328411-002Percent MoistureJLH/SW846 3rd Ed. 602012/11/16 182812/11/16 0930ug/g0.03 5.9128411-002Arsenic, totalJLH/SW846 3rd Ed. 602012/11/16 182812/11/16 0930ug/g0.01 0.04928411-002Cadmium, totalJLH/SW846 3rd Ed. 602012/11/16 182812/11/16 0930ug/g0.03 0.1128411-002Chromium, totalJLH/SW846 3rd Ed. 602012/11/16 182812/11/16 0930ug/g0.1 0.6228411-002Copper, totalJLH/SW846 3rd Ed. 602012/11/16 182812/11/16 0930ug/g0.03 0.2928411-002Lead, totalJLH/EPA 245.712/11/16 143012/11/16 0930ug/g0.003 0.00828411-002Mercury, totalJLH/SW846 3rd Ed. 602012/11/16 182812/11/16 0930ug/g0.05 0.5028411-002Nickel, totalJLH/SW846 3rd Ed. 602012/11/16 182812/11/16 0930ug/g0.2 17.828411-002Zinc, total
Notes:
DAMOS Disposal Area Monitoring Study Program. Tissue Analysis. Contract W912WJ-12-D-D0004. ESI Study 28411.
Page 6 of 56
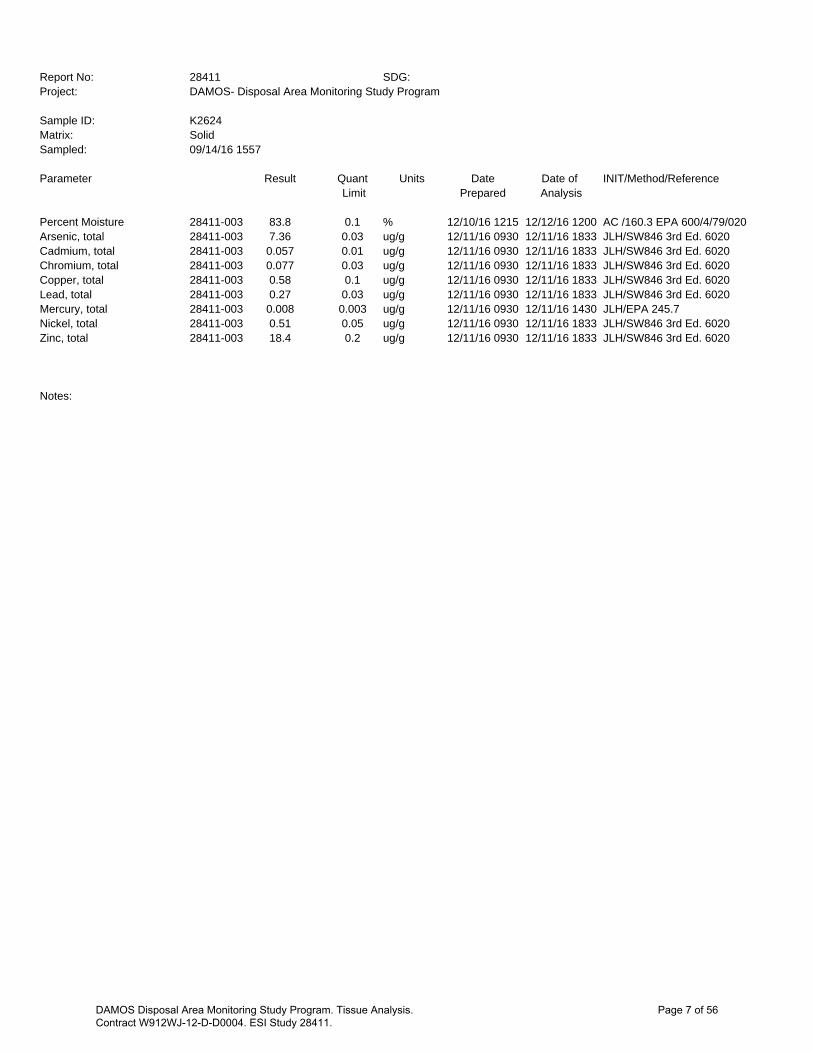
SDG:28411Report No:DAMOS- Disposal Area Monitoring Study ProgramProject:
K2624Sample ID:SolidMatrix:09/14/16 1557Sampled:
INIT/Method/ReferenceDate of DateUnitsQuantResultParameterAnalysisPrepared Limit
AC /160.3 EPA 600/4/79/02012/12/16 120012/10/16 1215%0.1 83.828411-003Percent MoistureJLH/SW846 3rd Ed. 602012/11/16 183312/11/16 0930ug/g0.03 7.3628411-003Arsenic, totalJLH/SW846 3rd Ed. 602012/11/16 183312/11/16 0930ug/g0.01 0.05728411-003Cadmium, totalJLH/SW846 3rd Ed. 602012/11/16 183312/11/16 0930ug/g0.03 0.07728411-003Chromium, totalJLH/SW846 3rd Ed. 602012/11/16 183312/11/16 0930ug/g0.1 0.5828411-003Copper, totalJLH/SW846 3rd Ed. 602012/11/16 183312/11/16 0930ug/g0.03 0.2728411-003Lead, totalJLH/EPA 245.712/11/16 143012/11/16 0930ug/g0.003 0.00828411-003Mercury, totalJLH/SW846 3rd Ed. 602012/11/16 183312/11/16 0930ug/g0.05 0.5128411-003Nickel, totalJLH/SW846 3rd Ed. 602012/11/16 183312/11/16 0930ug/g0.2 18.428411-003Zinc, total
Notes:
DAMOS Disposal Area Monitoring Study Program. Tissue Analysis. Contract W912WJ-12-D-D0004. ESI Study 28411.
Page 7 of 56

SDG:28411Report No:DAMOS- Disposal Area Monitoring Study ProgramProject:
K2625Sample ID:SolidMatrix:09/15/16 1438Sampled:
INIT/Method/ReferenceDate of DateUnitsQuantResultParameterAnalysisPrepared Limit
AC /160.3 EPA 600/4/79/02012/12/16 120012/10/16 1215%0.1 84.828411-004Percent MoistureJLH/SW846 3rd Ed. 602012/11/16 183912/11/16 0930ug/g0.03 7.6328411-004Arsenic, totalJLH/SW846 3rd Ed. 602012/11/16 183912/11/16 0930ug/g0.01 0.06128411-004Cadmium, totalJLH/SW846 3rd Ed. 602012/11/16 183912/11/16 0930ug/g0.03 0.05028411-004Chromium, totalJLH/SW846 3rd Ed. 602012/11/16 183912/11/16 0930ug/g0.1 0.5328411-004Copper, totalJLH/SW846 3rd Ed. 602012/11/16 183912/11/16 0930ug/g0.03 0.3128411-004Lead, totalJLH/EPA 245.712/11/16 143012/11/16 0930ug/g0.003 0.00828411-004Mercury, totalJLH/SW846 3rd Ed. 602012/11/16 183912/11/16 0930ug/g0.05 0.3728411-004Nickel, totalJLH/SW846 3rd Ed. 602012/11/16 183912/11/16 0930ug/g0.2 20.828411-004Zinc, total
Notes:
DAMOS Disposal Area Monitoring Study Program. Tissue Analysis. Contract W912WJ-12-D-D0004. ESI Study 28411.
Page 8 of 56

SDG:28411Report No:DAMOS- Disposal Area Monitoring Study ProgramProject:
K2626Sample ID:SolidMatrix:09/15/16 1548Sampled:
INIT/Method/ReferenceDate of DateUnitsQuantResultParameterAnalysisPrepared Limit
AC /160.3 EPA 600/4/79/02012/12/16 120012/10/16 1215%0.1 84.828411-005Percent MoistureJLH/SW846 3rd Ed. 602012/11/16 184512/11/16 0930ug/g0.03 7.6028411-005Arsenic, totalJLH/SW846 3rd Ed. 602012/11/16 184512/11/16 0930ug/g0.01 0.06928411-005Cadmium, totalJLH/SW846 3rd Ed. 602012/11/16 184512/11/16 0930ug/g0.03 0.05228411-005Chromium, totalJLH/SW846 3rd Ed. 602012/11/16 184512/11/16 0930ug/g0.1 0.6128411-005Copper, totalJLH/SW846 3rd Ed. 602012/11/16 184512/11/16 0930ug/g0.03 0.2628411-005Lead, totalJLH/EPA 245.712/11/16 143012/11/16 0930ug/g0.003 0.00928411-005Mercury, totalJLH/SW846 3rd Ed. 602012/11/16 184512/11/16 0930ug/g0.05 0.4028411-005Nickel, totalJLH/SW846 3rd Ed. 602012/11/16 184512/11/16 0930ug/g0.2 20.128411-005Zinc, total
Notes:
DAMOS Disposal Area Monitoring Study Program. Tissue Analysis. Contract W912WJ-12-D-D0004. ESI Study 28411.
Page 9 of 56

SDG:28411Report No:DAMOS- Disposal Area Monitoring Study ProgramProject:
K2627Sample ID:SolidMatrix:09/15/16 1630Sampled:
INIT/Method/ReferenceDate of DateUnitsQuantResultParameterAnalysisPrepared Limit
AC /160.3 EPA 600/4/79/02012/12/16 120012/10/16 1215%0.1 84.328411-006Percent MoistureJLH/SW846 3rd Ed. 602012/11/16 185112/11/16 0930ug/g0.03 6.9728411-006Arsenic, totalJLH/SW846 3rd Ed. 602012/11/16 185112/11/16 0930ug/g0.01 0.07528411-006Cadmium, totalJLH/SW846 3rd Ed. 602012/11/16 185112/11/16 0930ug/g0.03 0.07028411-006Chromium, totalJLH/SW846 3rd Ed. 602012/11/16 185112/11/16 0930ug/g0.1 0.6028411-006Copper, totalJLH/SW846 3rd Ed. 602012/11/16 185112/11/16 0930ug/g0.03 0.2628411-006Lead, totalJLH/EPA 245.712/11/16 143012/11/16 0930ug/g0.003 0.00828411-006Mercury, totalJLH/SW846 3rd Ed. 602012/11/16 185112/11/16 0930ug/g0.05 0.4228411-006Nickel, totalJLH/SW846 3rd Ed. 602012/11/16 185112/11/16 0930ug/g0.2 20.128411-006Zinc, total
Notes:
DAMOS Disposal Area Monitoring Study Program. Tissue Analysis. Contract W912WJ-12-D-D0004. ESI Study 28411.
Page 10 of 56

SDG:28411Report No:DAMOS- Disposal Area Monitoring Study ProgramProject:
K2643Sample ID:SolidMatrix:09/20/16 1506Sampled:
INIT/Method/ReferenceDate of DateUnitsQuantResultParameterAnalysisPrepared Limit
AC /160.3 EPA 600/4/79/02012/12/16 120012/10/16 1215%0.1 89.028411-007Percent MoistureJLH/SW846 3rd Ed. 602012/11/16 185712/11/16 0930ug/g0.03 2.8628411-007Arsenic, totalJLH/SW846 3rd Ed. 602012/11/16 185712/11/16 0930ug/g0.01 1.2228411-007Cadmium, totalJLH/SW846 3rd Ed. 602012/11/16 185712/11/16 0930ug/g0.03 0.09128411-007Chromium, totalJLH/SW846 3rd Ed. 602012/11/16 185712/11/16 0930ug/g0.1 1.1528411-007Copper, totalJLH/SW846 3rd Ed. 602012/11/16 185712/11/16 0930ug/g0.03 0.09528411-007Lead, totalJLH/EPA 245.712/11/16 143012/11/16 0930ug/g0.003 0.03128411-007Mercury, totalJLH/SW846 3rd Ed. 602012/11/16 185712/11/16 0930ug/g0.05 0.6328411-007Nickel, totalJLH/SW846 3rd Ed. 602012/11/16 185712/11/16 0930ug/g0.2 7.2228411-007Zinc, total
Notes:
DAMOS Disposal Area Monitoring Study Program. Tissue Analysis. Contract W912WJ-12-D-D0004. ESI Study 28411.
Page 11 of 56

SDG:28411Report No:DAMOS- Disposal Area Monitoring Study ProgramProject:
K2644Sample ID:SolidMatrix:09/20/16 1549Sampled:
INIT/Method/ReferenceDate of DateUnitsQuantResultParameterAnalysisPrepared Limit
AC /160.3 EPA 600/4/79/02012/12/16 120012/10/16 1215%0.1 89.328411-008Percent MoistureJLH/SW846 3rd Ed. 602012/11/16 190312/11/16 0930ug/g0.03 3.1128411-008Arsenic, totalJLH/SW846 3rd Ed. 602012/11/16 190312/11/16 0930ug/g0.01 1.1428411-008Cadmium, totalJLH/SW846 3rd Ed. 602012/11/16 190312/11/16 0930ug/g0.03 0.08728411-008Chromium, totalJLH/SW846 3rd Ed. 602012/11/16 190312/11/16 0930ug/g0.1 1.0528411-008Copper, totalJLH/SW846 3rd Ed. 602012/11/16 190312/11/16 0930ug/g0.03 0.1028411-008Lead, totalJLH/EPA 245.712/11/16 143012/11/16 0930ug/g0.003 0.03228411-008Mercury, totalJLH/SW846 3rd Ed. 602012/11/16 190312/11/16 0930ug/g0.05 0.5028411-008Nickel, totalJLH/SW846 3rd Ed. 602012/11/16 190312/11/16 0930ug/g0.2 6.7228411-008Zinc, total
Notes:
DAMOS Disposal Area Monitoring Study Program. Tissue Analysis. Contract W912WJ-12-D-D0004. ESI Study 28411.
Page 12 of 56

SDG:28411Report No:DAMOS- Disposal Area Monitoring Study ProgramProject:
K2645Sample ID:SolidMatrix:09/21/16 0804Sampled:
INIT/Method/ReferenceDate of DateUnitsQuantResultParameterAnalysisPrepared Limit
AC /160.3 EPA 600/4/79/02012/12/16 120012/10/16 1215%0.1 89.228411-009Percent MoistureJLH/SW846 3rd Ed. 602012/11/16 173412/11/16 0930ug/g0.03 3.7428411-009Arsenic, totalJLH/SW846 3rd Ed. 602012/11/16 173412/11/16 0930ug/g0.01 1.3828411-009Cadmium, totalJLH/SW846 3rd Ed. 602012/11/16 173412/11/16 0930ug/g0.030.3028411-009Chromium, totalJLH/SW846 3rd Ed. 602012/11/16 173412/11/16 0930ug/g0.1 1.2328411-009Copper, totalJLH/SW846 3rd Ed. 602012/11/16 173412/11/16 0930ug/g0.03 0.1428411-009Lead, totalJLH/EPA 245.712/11/16 143012/11/16 0930ug/g0.003 0.04028411-009Mercury, totalJLH/SW846 3rd Ed. 602012/11/16 173412/11/16 0930ug/g0.05 0.7428411-009Nickel, totalJLH/SW846 3rd Ed. 602012/11/16 173412/11/16 0930ug/g0.2 7.1728411-009Zinc, total
Notes:
DAMOS Disposal Area Monitoring Study Program. Tissue Analysis. Contract W912WJ-12-D-D0004. ESI Study 28411.
Page 13 of 56

SDG:28411Report No:DAMOS- Disposal Area Monitoring Study ProgramProject:
K2646Sample ID:SolidMatrix:09/21/16 1144Sampled:
INIT/Method/ReferenceDate of DateUnitsQuantResultParameterAnalysisPrepared Limit
AC /160.3 EPA 600/4/79/02012/12/16 120012/10/16 1215%0.1 85.628411-010Percent MoistureJLH/SW846 3rd Ed. 602012/11/16 190912/11/16 0930ug/g0.03 5.3028411-010Arsenic, totalJLH/SW846 3rd Ed. 602012/11/16 190912/11/16 0930ug/g0.01 0.1128411-010Cadmium, totalJLH/SW846 3rd Ed. 602012/11/16 190912/11/16 0930ug/g0.03 0.04228411-010Chromium, totalJLH/SW846 3rd Ed. 602012/11/16 190912/11/16 0930ug/g0.1 0.6728411-010Copper, totalJLH/SW846 3rd Ed. 602012/11/16 190912/11/16 0930ug/g0.03 0.1628411-010Lead, totalJLH/EPA 245.712/11/16 143012/11/16 0930ug/g0.003 0.00528411-010Mercury, totalJLH/SW846 3rd Ed. 602012/11/16 190912/11/16 0930ug/g0.05 0.3728411-010Nickel, totalJLH/SW846 3rd Ed. 602012/11/16 190912/11/16 0930ug/g0.2 19.628411-010Zinc, total
Notes:
DAMOS Disposal Area Monitoring Study Program. Tissue Analysis. Contract W912WJ-12-D-D0004. ESI Study 28411.
Page 14 of 56

SDG:28411Report No:DAMOS- Disposal Area Monitoring Study ProgramProject:
K2647Sample ID:SolidMatrix:09/21/16 1458Sampled:
INIT/Method/ReferenceDate of DateUnitsQuantResultParameterAnalysisPrepared Limit
AC /160.3 EPA 600/4/79/02012/12/16 120012/10/16 1215%0.1 82.828411-011Percent MoistureJLH/SW846 3rd Ed. 602012/11/16 191512/11/16 0930ug/g0.03 6.1728411-011Arsenic, totalJLH/SW846 3rd Ed. 602012/11/16 191512/11/16 0930ug/g0.01 0.1428411-011Cadmium, totalJLH/SW846 3rd Ed. 602012/11/16 191512/11/16 0930ug/g0.03 0.07028411-011Chromium, totalJLH/SW846 3rd Ed. 602012/11/16 191512/11/16 0930ug/g0.1 0.9628411-011Copper, totalJLH/SW846 3rd Ed. 602012/11/16 191512/11/16 0930ug/g0.03 0.2228411-011Lead, totalJLH/EPA 245.712/11/16 143012/11/16 0930ug/g0.003 0.00728411-011Mercury, totalJLH/SW846 3rd Ed. 602012/11/16 191512/11/16 0930ug/g0.05 0.5028411-011Nickel, totalJLH/SW846 3rd Ed. 602012/11/16 191512/11/16 0930ug/g0.2 25.528411-011Zinc, total
Notes:
DAMOS Disposal Area Monitoring Study Program. Tissue Analysis. Contract W912WJ-12-D-D0004. ESI Study 28411.
Page 15 of 56

SDG:28411Report No:DAMOS- Disposal Area Monitoring Study ProgramProject:
K2648Sample ID:SolidMatrix:09/21/16 1458Sampled:
INIT/Method/ReferenceDate of DateUnitsQuantResultParameterAnalysisPrepared Limit
AC /160.3 EPA 600/4/79/02012/12/16 120012/10/16 1215%0.1 87.828411-012Percent MoistureJLH/SW846 3rd Ed. 602012/11/16 192112/11/16 0930ug/g0.03 3.5928411-012Arsenic, totalJLH/SW846 3rd Ed. 602012/11/16 192112/11/16 0930ug/g0.01 1.0428411-012Cadmium, totalJLH/SW846 3rd Ed. 602012/11/16 192112/11/16 0930ug/g0.03 0.1428411-012Chromium, totalJLH/SW846 3rd Ed. 602012/11/16 192112/11/16 0930ug/g0.1 1.3828411-012Copper, totalJLH/SW846 3rd Ed. 602012/11/16 192112/11/16 0930ug/g0.03 0.1228411-012Lead, totalJLH/EPA 245.712/11/16 143012/11/16 0930ug/g0.003 0.04528411-012Mercury, totalJLH/SW846 3rd Ed. 602012/11/16 192112/11/16 0930ug/g0.05 0.3828411-012Nickel, totalJLH/SW846 3rd Ed. 602012/11/16 192112/11/16 0930ug/g0.2 7.6428411-012Zinc, total
Notes:
DAMOS Disposal Area Monitoring Study Program. Tissue Analysis. Contract W912WJ-12-D-D0004. ESI Study 28411.
Page 16 of 56

SDG:28411Report No:DAMOS- Disposal Area Monitoring Study ProgramProject:
K3515Sample ID:SolidMatrix:10/04/16 0857Sampled:
INIT/Method/ReferenceDate of DateUnitsQuantResultParameterAnalysisPrepared Limit
AC /160.3 EPA 600/4/79/02012/12/16 120012/10/16 1215%0.1 83.228411-013Percent MoistureJLH/SW846 3rd Ed. 602012/11/16 193812/11/16 0930ug/g0.03 6.0128411-013Arsenic, totalJLH/SW846 3rd Ed. 602012/11/16 193812/11/16 0930ug/g0.01 0.2128411-013Cadmium, totalJLH/SW846 3rd Ed. 602012/11/16 193812/11/16 0930ug/g0.03 0.1028411-013Chromium, totalJLH/SW846 3rd Ed. 602012/11/16 193812/11/16 0930ug/g0.1 2.3628411-013Copper, totalJLH/SW846 3rd Ed. 602012/11/16 193812/11/16 0930ug/g0.03 0.7528411-013Lead, totalJLH/EPA 245.712/11/16 143012/11/16 0930ug/g0.003 0.01628411-013Mercury, totalJLH/SW846 3rd Ed. 602012/11/16 193812/11/16 0930ug/g0.05 0.4428411-013Nickel, totalJLH/SW846 3rd Ed. 602012/11/16 193812/11/16 0930ug/g0.2 29.528411-013Zinc, total
Notes:
DAMOS Disposal Area Monitoring Study Program. Tissue Analysis. Contract W912WJ-12-D-D0004. ESI Study 28411.
Page 17 of 56
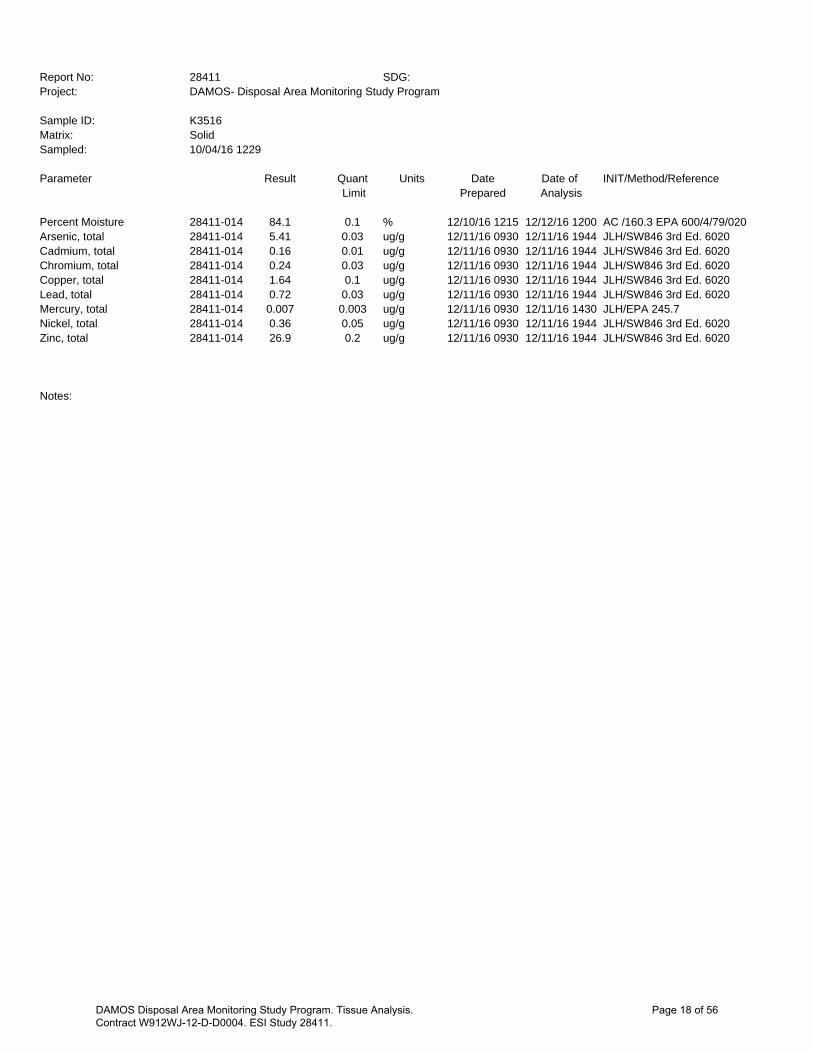
SDG:28411Report No:DAMOS- Disposal Area Monitoring Study ProgramProject:
K3516Sample ID:SolidMatrix:10/04/16 1229Sampled:
INIT/Method/ReferenceDate of DateUnitsQuantResultParameterAnalysisPrepared Limit
AC /160.3 EPA 600/4/79/02012/12/16 120012/10/16 1215%0.1 84.128411-014Percent MoistureJLH/SW846 3rd Ed. 602012/11/16 194412/11/16 0930ug/g0.03 5.4128411-014Arsenic, totalJLH/SW846 3rd Ed. 602012/11/16 194412/11/16 0930ug/g0.01 0.1628411-014Cadmium, totalJLH/SW846 3rd Ed. 602012/11/16 194412/11/16 0930ug/g0.03 0.2428411-014Chromium, totalJLH/SW846 3rd Ed. 602012/11/16 194412/11/16 0930ug/g0.1 1.6428411-014Copper, totalJLH/SW846 3rd Ed. 602012/11/16 194412/11/16 0930ug/g0.03 0.7228411-014Lead, totalJLH/EPA 245.712/11/16 143012/11/16 0930ug/g0.003 0.00728411-014Mercury, totalJLH/SW846 3rd Ed. 602012/11/16 194412/11/16 0930ug/g0.05 0.3628411-014Nickel, totalJLH/SW846 3rd Ed. 602012/11/16 194412/11/16 0930ug/g0.2 26.928411-014Zinc, total
Notes:
DAMOS Disposal Area Monitoring Study Program. Tissue Analysis. Contract W912WJ-12-D-D0004. ESI Study 28411.
Page 18 of 56

SDG:28411Report No:DAMOS- Disposal Area Monitoring Study ProgramProject:
K3517Sample ID:SolidMatrix:10/04/16 1514Sampled:
INIT/Method/ReferenceDate of DateUnitsQuantResultParameterAnalysisPrepared Limit
AC /160.3 EPA 600/4/79/02012/12/16 120012/10/16 1215%0.1 83.828411-015Percent MoistureJLH/SW846 3rd Ed. 602012/11/16 210112/11/16 1215ug/g0.03 5.0528411-015Arsenic, totalJLH/SW846 3rd Ed. 602012/11/16 210112/11/16 1215ug/g0.01 0.1528411-015Cadmium, totalJLH/SW846 3rd Ed. 602012/11/16 210112/11/16 1215ug/g0.03 0.1028411-015Chromium, totalJLH/SW846 3rd Ed. 602012/11/16 210112/11/16 1215ug/g0.1 1.4428411-015Copper, totalJLH/SW846 3rd Ed. 602012/11/16 210112/11/16 1215ug/g0.03 0.4328411-015Lead, totalJLH/EPA 245.712/11/16 153012/11/16 1215ug/g0.003 0.00928411-015Mercury, totalJLH/SW846 3rd Ed. 602012/11/16 210112/11/16 1215ug/g0.05 0.3528411-015Nickel, totalJLH/SW846 3rd Ed. 602012/11/16 210112/11/16 1215ug/g0.2 25.528411-015Zinc, total
Notes:
DAMOS Disposal Area Monitoring Study Program. Tissue Analysis. Contract W912WJ-12-D-D0004. ESI Study 28411.
Page 19 of 56

SDG:28411Report No:DAMOS- Disposal Area Monitoring Study ProgramProject:
K3518Sample ID:SolidMatrix:10/05/16 0950Sampled:
INIT/Method/ReferenceDate of DateUnitsQuantResultParameterAnalysisPrepared Limit
AC /160.3 EPA 600/4/79/02012/12/16 120012/10/16 1215%0.1 83.128411-016Percent MoistureJLH/SW846 3rd Ed. 602012/11/16 202612/11/16 1215ug/g0.03 6.0328411-016Arsenic, totalJLH/SW846 3rd Ed. 602012/11/16 202612/11/16 1215ug/g0.01 0.1928411-016Cadmium, totalJLH/SW846 3rd Ed. 602012/11/16 202612/11/16 1215ug/g0.03 0.09528411-016Chromium, totalJLH/SW846 3rd Ed. 602012/11/16 202612/11/16 1215ug/g0.1 2.2328411-016Copper, totalJLH/SW846 3rd Ed. 602012/11/16 202612/11/16 1215ug/g0.03 0.5428411-016Lead, totalJLH/EPA 245.712/11/16 153012/11/16 1215ug/g0.003 0.01628411-016Mercury, totalJLH/SW846 3rd Ed. 602012/11/16 202612/11/16 1215ug/g0.05 0.4228411-016Nickel, totalJLH/SW846 3rd Ed. 602012/11/16 202612/11/16 1215ug/g0.2 29.428411-016Zinc, total
Notes:
DAMOS Disposal Area Monitoring Study Program. Tissue Analysis. Contract W912WJ-12-D-D0004. ESI Study 28411.
Page 20 of 56

SDG:28411Report No:DAMOS- Disposal Area Monitoring Study ProgramProject:
K3519Sample ID:SolidMatrix:10/05/16 1435Sampled:
INIT/Method/ReferenceDate of DateUnitsQuantResultParameterAnalysisPrepared Limit
AC /160.3 EPA 600/4/79/02012/12/16 120012/10/16 1215%0.1 83.128411-017Percent MoistureJLH/SW846 3rd Ed. 602012/11/16 211912/11/16 1215ug/g0.03 5.9828411-017Arsenic, totalJLH/SW846 3rd Ed. 602012/11/16 211912/11/16 1215ug/g0.01 0.1928411-017Cadmium, totalJLH/SW846 3rd Ed. 602012/11/16 211912/11/16 1215ug/g0.03 0.1028411-017Chromium, totalJLH/SW846 3rd Ed. 602012/11/16 211912/11/16 1215ug/g0.1 2.2628411-017Copper, totalJLH/SW846 3rd Ed. 602012/11/16 211912/11/16 1215ug/g0.03 0.4328411-017Lead, totalJLH/EPA 245.712/11/16 153012/11/16 1215ug/g0.003 0.01628411-017Mercury, totalJLH/SW846 3rd Ed. 602012/11/16 211912/11/16 1215ug/g0.05 0.4128411-017Nickel, totalJLH/SW846 3rd Ed. 602012/11/16 211912/11/16 1215ug/g0.2 29.728411-017Zinc, total
Notes:
DAMOS Disposal Area Monitoring Study Program. Tissue Analysis. Contract W912WJ-12-D-D0004. ESI Study 28411.
Page 21 of 56

SDG:28411Report No:DAMOS- Disposal Area Monitoring Study ProgramProject:
K3520Sample ID:SolidMatrix:10/05/16 1435Sampled:
INIT/Method/ReferenceDate of DateUnitsQuantResultParameterAnalysisPrepared Limit
AC /160.3 EPA 600/4/79/02012/12/16 120012/10/16 1215%0.1 84.428411-018Percent MoistureJLH/SW846 3rd Ed. 602012/11/16 212512/11/16 1215ug/g0.03 5.1628411-018Arsenic, totalJLH/SW846 3rd Ed. 602012/11/16 212512/11/16 1215ug/g0.01 0.1828411-018Cadmium, totalJLH/SW846 3rd Ed. 602012/11/16 212512/11/16 1215ug/g0.03 0.1628411-018Chromium, totalJLH/SW846 3rd Ed. 602012/11/16 212512/11/16 1215ug/g0.1 1.5828411-018Copper, totalJLH/SW846 3rd Ed. 602012/11/16 212512/11/16 1215ug/g0.03 0.3928411-018Lead, totalJLH/EPA 245.712/11/16 153012/11/16 1215ug/g0.003 0.00828411-018Mercury, totalJLH/SW846 3rd Ed. 602012/11/16 212512/11/16 1215ug/g0.05 0.4728411-018Nickel, totalJLH/SW846 3rd Ed. 602012/11/16 212512/11/16 1215ug/g0.2 25.428411-018Zinc, total
Notes:
DAMOS Disposal Area Monitoring Study Program. Tissue Analysis. Contract W912WJ-12-D-D0004. ESI Study 28411.
Page 22 of 56

SDG:28411Report No:DAMOS- Disposal Area Monitoring Study ProgramProject:
K3521Sample ID:SolidMatrix:10/06/16 1426Sampled:
INIT/Method/ReferenceDate of DateUnitsQuantResultParameterAnalysisPrepared Limit
AC /160.3 EPA 600/4/79/02012/12/16 120012/10/16 1215%0.1 83.828411-019Percent MoistureJLH/SW846 3rd Ed. 602012/11/16 213112/11/16 1215ug/g0.03 4.6328411-019Arsenic, totalJLH/SW846 3rd Ed. 602012/11/16 213112/11/16 1215ug/g0.01 0.2028411-019Cadmium, totalJLH/SW846 3rd Ed. 602012/11/16 213112/11/16 1215ug/g0.03 0.07628411-019Chromium, totalJLH/SW846 3rd Ed. 602012/11/16 213112/11/16 1215ug/g0.1 1.6128411-019Copper, totalJLH/SW846 3rd Ed. 602012/11/16 213112/11/16 1215ug/g0.03 0.3728411-019Lead, totalJLH/EPA 245.712/11/16 153012/11/16 1215ug/g0.003 0.00728411-019Mercury, totalJLH/SW846 3rd Ed. 602012/11/16 213112/11/16 1215ug/g0.05 0.3328411-019Nickel, totalJLH/SW846 3rd Ed. 602012/11/16 213112/11/16 1215ug/g0.2 24.928411-019Zinc, total
Notes:
DAMOS Disposal Area Monitoring Study Program. Tissue Analysis. Contract W912WJ-12-D-D0004. ESI Study 28411.
Page 23 of 56

SDG:28411Report No:DAMOS- Disposal Area Monitoring Study ProgramProject:
K3522Sample ID:SolidMatrix:10/07/16 0827Sampled:
INIT/Method/ReferenceDate of DateUnitsQuantResultParameterAnalysisPrepared Limit
AC /160.3 EPA 600/4/79/02012/12/16 120012/10/16 1215%0.1 83.128411-020Percent MoistureJLH/SW846 3rd Ed. 602012/11/16 213712/11/16 1215ug/g0.03 6.4628411-020Arsenic, totalJLH/SW846 3rd Ed. 602012/11/16 213712/11/16 1215ug/g0.01 0.1728411-020Cadmium, totalJLH/SW846 3rd Ed. 602012/11/16 213712/11/16 1215ug/g0.03 0.09628411-020Chromium, totalJLH/SW846 3rd Ed. 602012/11/16 213712/11/16 1215ug/g0.1 2.4128411-020Copper, totalJLH/SW846 3rd Ed. 602012/11/16 213712/11/16 1215ug/g0.03 0.4728411-020Lead, totalJLH/EPA 245.712/11/16 153012/11/16 1215ug/g0.003 0.01728411-020Mercury, totalJLH/SW846 3rd Ed. 602012/11/16 213712/11/16 1215ug/g0.05 0.4228411-020Nickel, totalJLH/SW846 3rd Ed. 602012/11/16 213712/11/16 1215ug/g0.2 29.128411-020Zinc, total
Notes:
DAMOS Disposal Area Monitoring Study Program. Tissue Analysis. Contract W912WJ-12-D-D0004. ESI Study 28411.
Page 24 of 56

SDG:28411Report No:DAMOS- Disposal Area Monitoring Study ProgramProject:
K3523Sample ID:SolidMatrix:10/07/16 1105Sampled:
INIT/Method/ReferenceDate of DateUnitsQuantResultParameterAnalysisPrepared Limit
AC /160.3 EPA 600/4/79/02012/12/16 120012/10/16 1215%0.1 84.428411-021Percent MoistureJLH/SW846 3rd Ed. 602012/11/16 214312/11/16 1215ug/g0.03 5.6528411-021Arsenic, totalJLH/SW846 3rd Ed. 602012/11/16 214312/11/16 1215ug/g0.01 0.1628411-021Cadmium, totalJLH/SW846 3rd Ed. 602012/11/16 214312/11/16 1215ug/g0.03 0.1028411-021Chromium, totalJLH/SW846 3rd Ed. 602012/11/16 214312/11/16 1215ug/g0.1 2.3528411-021Copper, totalJLH/SW846 3rd Ed. 602012/11/16 214312/11/16 1215ug/g0.03 0.4128411-021Lead, totalJLH/EPA 245.712/11/16 153012/11/16 1215ug/g0.003 0.01728411-021Mercury, totalJLH/SW846 3rd Ed. 602012/11/16 214312/11/16 1215ug/g0.05 0.4128411-021Nickel, totalJLH/SW846 3rd Ed. 602012/11/16 214312/11/16 1215ug/g0.2 26.528411-021Zinc, total
Notes:
DAMOS Disposal Area Monitoring Study Program. Tissue Analysis. Contract W912WJ-12-D-D0004. ESI Study 28411.
Page 25 of 56

SDG:28411Report No:DAMOS- Disposal Area Monitoring Study ProgramProject:
K3524Sample ID:SolidMatrix:10/11/16 1025Sampled:
INIT/Method/ReferenceDate of DateUnitsQuantResultParameterAnalysisPrepared Limit
AC /160.3 EPA 600/4/79/02012/12/16 120012/10/16 1215%0.1 83.428411-022Percent MoistureJLH/SW846 3rd Ed. 602012/11/16 214812/11/16 1215ug/g0.03 5.6828411-022Arsenic, totalJLH/SW846 3rd Ed. 602012/11/16 214812/11/16 1215ug/g0.01 0.1628411-022Cadmium, totalJLH/SW846 3rd Ed. 602012/11/16 214812/11/16 1215ug/g0.03 0.09328411-022Chromium, totalJLH/SW846 3rd Ed. 602012/11/16 214812/11/16 1215ug/g0.1 2.2428411-022Copper, totalJLH/SW846 3rd Ed. 602012/11/16 214812/11/16 1215ug/g0.03 0.5028411-022Lead, totalJLH/EPA 245.712/11/16 153012/11/16 1215ug/g0.003 0.01928411-022Mercury, totalJLH/SW846 3rd Ed. 602012/11/16 214812/11/16 1215ug/g0.05 0.4428411-022Nickel, totalJLH/SW846 3rd Ed. 602012/11/16 214812/11/16 1215ug/g0.2 28.128411-022Zinc, total
Notes:
DAMOS Disposal Area Monitoring Study Program. Tissue Analysis. Contract W912WJ-12-D-D0004. ESI Study 28411.
Page 26 of 56
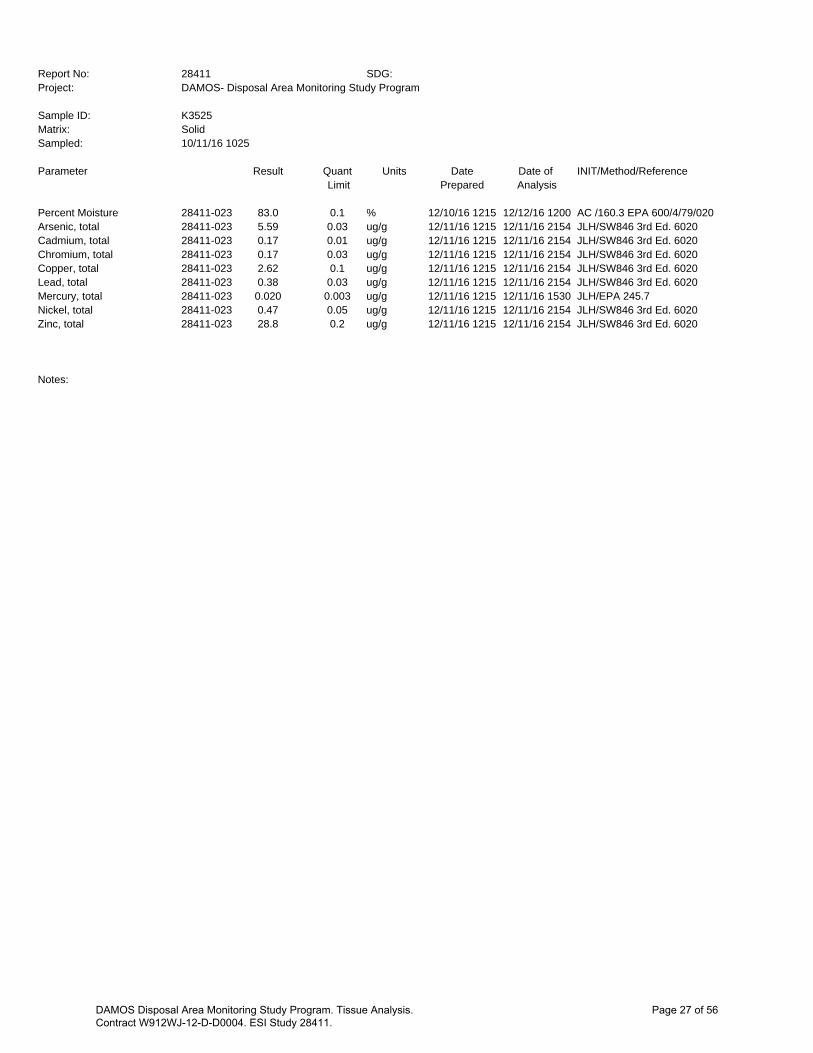
SDG:28411Report No:DAMOS- Disposal Area Monitoring Study ProgramProject:
K3525Sample ID:SolidMatrix:10/11/16 1025Sampled:
INIT/Method/ReferenceDate of DateUnitsQuantResultParameterAnalysisPrepared Limit
AC /160.3 EPA 600/4/79/02012/12/16 120012/10/16 1215%0.1 83.028411-023Percent MoistureJLH/SW846 3rd Ed. 602012/11/16 215412/11/16 1215ug/g0.03 5.5928411-023Arsenic, totalJLH/SW846 3rd Ed. 602012/11/16 215412/11/16 1215ug/g0.01 0.1728411-023Cadmium, totalJLH/SW846 3rd Ed. 602012/11/16 215412/11/16 1215ug/g0.03 0.1728411-023Chromium, totalJLH/SW846 3rd Ed. 602012/11/16 215412/11/16 1215ug/g0.1 2.6228411-023Copper, totalJLH/SW846 3rd Ed. 602012/11/16 215412/11/16 1215ug/g0.03 0.3828411-023Lead, totalJLH/EPA 245.712/11/16 153012/11/16 1215ug/g0.003 0.02028411-023Mercury, totalJLH/SW846 3rd Ed. 602012/11/16 215412/11/16 1215ug/g0.05 0.4728411-023Nickel, totalJLH/SW846 3rd Ed. 602012/11/16 215412/11/16 1215ug/g0.2 28.828411-023Zinc, total
Notes:
DAMOS Disposal Area Monitoring Study Program. Tissue Analysis. Contract W912WJ-12-D-D0004. ESI Study 28411.
Page 27 of 56

SDG:28411Report No:DAMOS- Disposal Area Monitoring Study ProgramProject:
K3526Sample ID:SolidMatrix:10/11/16 1210Sampled:
INIT/Method/ReferenceDate of DateUnitsQuantResultParameterAnalysisPrepared Limit
AC /160.3 EPA 600/4/79/02012/12/16 120012/10/16 1215%0.1 83.528411-024Percent MoistureJLH/SW846 3rd Ed. 602012/11/16 220012/11/16 1215ug/g0.03 5.6428411-024Arsenic, totalJLH/SW846 3rd Ed. 602012/11/16 220012/11/16 1215ug/g0.01 0.1528411-024Cadmium, totalJLH/SW846 3rd Ed. 602012/11/16 220012/11/16 1215ug/g0.03 0.1428411-024Chromium, totalJLH/SW846 3rd Ed. 602012/11/16 220012/11/16 1215ug/g0.1 2.3928411-024Copper, totalJLH/SW846 3rd Ed. 602012/11/16 220012/11/16 1215ug/g0.03 0.9428411-024Lead, totalJLH/EPA 245.712/11/16 153012/11/16 1215ug/g0.003 0.01828411-024Mercury, totalJLH/SW846 3rd Ed. 602012/11/16 220012/11/16 1215ug/g0.05 0.4728411-024Nickel, totalJLH/SW846 3rd Ed. 602012/11/16 220012/11/16 1215ug/g0.2 26.128411-024Zinc, total
Notes:
DAMOS Disposal Area Monitoring Study Program. Tissue Analysis. Contract W912WJ-12-D-D0004. ESI Study 28411.
Page 28 of 56

SDG:28411Report No:DAMOS- Disposal Area Monitoring Study ProgramProject:
K3527Sample ID:SolidMatrix:10/11/16 1424Sampled:
INIT/Method/ReferenceDate of DateUnitsQuantResultParameterAnalysisPrepared Limit
AC /160.3 EPA 600/4/79/02012/12/16 120012/10/16 1215%0.1 83.528411-025Percent MoistureJLH/SW846 3rd Ed. 602012/11/16 220612/11/16 1215ug/g0.03 5.7128411-025Arsenic, totalJLH/SW846 3rd Ed. 602012/11/16 220612/11/16 1215ug/g0.01 0.1628411-025Cadmium, totalJLH/SW846 3rd Ed. 602012/11/16 220612/11/16 1215ug/g0.03 0.1428411-025Chromium, totalJLH/SW846 3rd Ed. 602012/11/16 220612/11/16 1215ug/g0.1 2.8228411-025Copper, totalJLH/SW846 3rd Ed. 602012/11/16 220612/11/16 1215ug/g0.03 0.8428411-025Lead, totalJLH/EPA 245.712/11/16 153012/11/16 1215ug/g0.003 0.02028411-025Mercury, totalJLH/SW846 3rd Ed. 602012/11/16 220612/11/16 1215ug/g0.05 0.4928411-025Nickel, totalJLH/SW846 3rd Ed. 602012/11/16 220612/11/16 1215ug/g0.2 28.528411-025Zinc, total
Notes:
DAMOS Disposal Area Monitoring Study Program. Tissue Analysis. Contract W912WJ-12-D-D0004. ESI Study 28411.
Page 29 of 56

SDG:28411Report No:DAMOS- Disposal Area Monitoring Study ProgramProject:
K3528Sample ID:SolidMatrix:10/12/16 0814Sampled:
INIT/Method/ReferenceDate of DateUnitsQuantResultParameterAnalysisPrepared Limit
AC /160.3 EPA 600/4/79/02012/12/16 120012/10/16 1215%0.1 84.128411-026Percent MoistureJLH/SW846 3rd Ed. 602012/11/16 221212/11/16 1215ug/g0.03 5.5828411-026Arsenic, totalJLH/SW846 3rd Ed. 602012/11/16 221212/11/16 1215ug/g0.01 0.1928411-026Cadmium, totalJLH/SW846 3rd Ed. 602012/11/16 221212/11/16 1215ug/g0.03 0.2328411-026Chromium, totalJLH/SW846 3rd Ed. 602012/11/16 221212/11/16 1215ug/g0.1 2.9328411-026Copper, totalJLH/SW846 3rd Ed. 602012/11/16 221212/11/16 1215ug/g0.03 0.5828411-026Lead, totalJLH/EPA 245.712/11/16 153012/11/16 1215ug/g0.003 0.01628411-026Mercury, totalJLH/SW846 3rd Ed. 602012/11/16 221212/11/16 1215ug/g0.05 0.4928411-026Nickel, totalJLH/SW846 3rd Ed. 602012/11/16 221212/11/16 1215ug/g0.2 27.828411-026Zinc, total
Notes:
DAMOS Disposal Area Monitoring Study Program. Tissue Analysis. Contract W912WJ-12-D-D0004. ESI Study 28411.
Page 30 of 56

SDG:28411Report No:DAMOS- Disposal Area Monitoring Study ProgramProject:
K3529Sample ID:SolidMatrix:10/12/16 0955Sampled:
INIT/Method/ReferenceDate of DateUnitsQuantResultParameterAnalysisPrepared Limit
AC /160.3 EPA 600/4/79/02012/12/16 120012/10/16 1215%0.1 86.728411-027Percent MoistureJLH/SW846 3rd Ed. 602012/11/16 223012/11/16 1215ug/g0.03 4.5628411-027Arsenic, totalJLH/SW846 3rd Ed. 602012/11/16 223012/11/16 1215ug/g0.01 0.1628411-027Cadmium, totalJLH/SW846 3rd Ed. 602012/11/16 223012/11/16 1215ug/g0.03 0.07928411-027Chromium, totalJLH/SW846 3rd Ed. 602012/11/16 223012/11/16 1215ug/g0.1 1.4028411-027Copper, totalJLH/SW846 3rd Ed. 602012/11/16 223012/11/16 1215ug/g0.03 0.3028411-027Lead, totalJLH/EPA 245.712/11/16 153012/11/16 1215ug/g0.003 0.01028411-027Mercury, totalJLH/SW846 3rd Ed. 602012/11/16 223012/11/16 1215ug/g0.05 0.3028411-027Nickel, totalJLH/SW846 3rd Ed. 602012/11/16 223012/11/16 1215ug/g0.2 23.728411-027Zinc, total
Notes:
DAMOS Disposal Area Monitoring Study Program. Tissue Analysis. Contract W912WJ-12-D-D0004. ESI Study 28411.
Page 31 of 56

SDG:28411Report No:DAMOS- Disposal Area Monitoring Study ProgramProject:
K3530Sample ID:SolidMatrix:10/12/16 1118Sampled:
INIT/Method/ReferenceDate of DateUnitsQuantResultParameterAnalysisPrepared Limit
AC /160.3 EPA 600/4/79/02012/12/16 120012/10/16 1215%0.1 86.428411-028Percent MoistureJLH/SW846 3rd Ed. 602012/11/16 223612/11/16 1215ug/g0.02 4.3528411-028Arsenic, totalJLH/SW846 3rd Ed. 602012/11/16 223612/11/16 1215ug/g0.009 0.1328411-028Cadmium, totalJLH/SW846 3rd Ed. 602012/11/16 223612/11/16 1215ug/g0.02 0.1228411-028Chromium, totalJLH/SW846 3rd Ed. 602012/11/16 223612/11/16 1215ug/g0.09 1.0428411-028Copper, totalJLH/SW846 3rd Ed. 602012/11/16 223612/11/16 1215ug/g0.02 0.3128411-028Lead, totalJLH/EPA 245.712/11/16 153012/11/16 1215ug/g0.003 0.00528411-028Mercury, totalJLH/SW846 3rd Ed. 602012/11/16 223612/11/16 1215ug/g0.05 0.2828411-028Nickel, totalJLH/SW846 3rd Ed. 602012/11/16 223612/11/16 1215ug/g0.2 24.828411-028Zinc, total
Notes:
DAMOS Disposal Area Monitoring Study Program. Tissue Analysis. Contract W912WJ-12-D-D0004. ESI Study 28411.
Page 32 of 56

Quality Control Summary
Arsenic, totalParameter:DAMOS- Disposal Area Monitoring Study ProgramProject:SolidMatrix:494SQC Batch No:
Pertains to samples:
Sample IDLab IDSample IDLab ID
K264728411-011K262228411-001K264828411-012K262328411-002K351528411-013K262428411-003K351628411-014K262528411-004
K262628411-005K262728411-006K264328411-007K264428411-008K264528411-009K264628411-010
PreparationControlBlank ResultLimit
MQug/g+/-
PassU0.030.03PB494S
LABORATORY CONTROL SAMPLE RECOVERY
TrueLab Control DupTrueLab Control ControlValueSample Result %RValueSample Result Limit ID
%Rug/gug/gug/gug/g%
Pass1026.256.371006.256.2385-115LCS
Pass 9613.312.870-130SRM
DUPLICATE ANALYSIS
SampleDuplicateControlQRPDQResultQResultLimit
ug/gug/g% ID
Pass73.743.493028411-009
SPIKE SAMPLE ANALYSIS
SampleSpikeSpiked SampleControlQ%RQResultAddedResult Limit ID
ug/gug/gug/g%
Pass1003.746.139.8870-13028411-009SPass1003.746.139.8670-13028411-009SD
U = Below quantitation limit
DAMOS Disposal Area Monitoring Study Program. Tissue Analysis. Contract W912WJ-12-D-D0004. ESI Study 28411.
Page 33 of 56

Quality Control Summary
Cadmium, totalParameter:DAMOS- Disposal Area Monitoring Study ProgramProject:SolidMatrix:494SQC Batch No:
Pertains to samples:
Sample IDLab IDSample IDLab ID
K264728411-011K262228411-001K264828411-012K262328411-002K351528411-013K262428411-003K351628411-014K262528411-004
K262628411-005K262728411-006K264328411-007K264428411-008K264528411-009K264628411-010
PreparationControlBlank ResultLimit
MQug/g+/-
PassU0.010.01PB494S
LABORATORY CONTROL SAMPLE RECOVERY
TrueLab Control DupTrueLab Control ControlValueSample Result %RValueSample Result Limit ID
%Rug/gug/gug/gug/g%
Pass1043.123.251013.123.1685-115LCS
Pass 1050.820.8670-130SRM
DUPLICATE ANALYSIS
SampleDuplicateControlQRPDQResultQResultLimit
ug/gug/g% ID
Pass31.381.423028411-009
SPIKE SAMPLE ANALYSIS
SampleSpikeSpiked SampleControlQ%RQResultAddedResult Limit ID
ug/gug/gug/g%
Pass1081.383.064.6870-13028411-009SPass1091.383.064.7270-13028411-009SD
U = Below quantitation limit
DAMOS Disposal Area Monitoring Study Program. Tissue Analysis. Contract W912WJ-12-D-D0004. ESI Study 28411.
Page 34 of 56

Quality Control Summary
Chromium, totalParameter:DAMOS- Disposal Area Monitoring Study ProgramProject:SolidMatrix:494SQC Batch No:
Pertains to samples:
Sample IDLab IDSample IDLab ID
K264728411-011K262228411-001K264828411-012K262328411-002K351528411-013K262428411-003K351628411-014K262528411-004
K262628411-005K262728411-006K264328411-007K264428411-008K264528411-009K264628411-010
PreparationControlBlank ResultLimit
MQug/g+/-
PassU0.030.03PB494S
LABORATORY CONTROL SAMPLE RECOVERY
TrueLab Control DupTrueLab Control ControlValueSample Result %RValueSample Result Limit ID
%Rug/gug/gug/gug/g%
Pass1015.05.06985.04.9185-115LCS
Pass 720.500.3670-130SRM
DUPLICATE ANALYSIS
SampleDuplicateControlQRPDQResultQResultLimit
ug/gug/g% ID
Pass270.300.403028411-009
SPIKE SAMPLE ANALYSIS
SampleSpikeSpiked SampleControlQ%RQResultAddedResult Limit ID
ug/gug/gug/g%
Pass1170.304.906.0270-13028411-009SPass1060.304.905.5170-13028411-009SD
U = Below quantitation limit
DAMOS Disposal Area Monitoring Study Program. Tissue Analysis. Contract W912WJ-12-D-D0004. ESI Study 28411.
Page 35 of 56

Quality Control Summary
Copper, totalParameter:DAMOS- Disposal Area Monitoring Study ProgramProject:SolidMatrix:494SQC Batch No:
Pertains to samples:
Sample IDLab IDSample IDLab ID
K264728411-011K262228411-001K264828411-012K262328411-002K351528411-013K262428411-003K351628411-014K262528411-004
K262628411-005K262728411-006K264328411-007K264428411-008K264528411-009K264628411-010
PreparationControlBlank ResultLimit
MQug/g+/-
PassU0.10.1PB494S
LABORATORY CONTROL SAMPLE RECOVERY
TrueLab Control DupTrueLab Control ControlValueSample Result %RValueSample Result Limit ID
%Rug/gug/gug/gug/g%
Pass996.256.21976.256.0685-115LCS
Pass 954.023.8070-130SRM
DUPLICATE ANALYSIS
SampleDuplicateControlQRPDQResultQResultLimit
ug/gug/g% ID
Pass21.231.253028411-009
SPIKE SAMPLE ANALYSIS
SampleSpikeSpiked SampleControlQ%RQResultAddedResult Limit ID
ug/gug/gug/g%
Pass961.236.137.1170-13028411-009SPass981.236.137.2370-13028411-009SD
U = Below quantitation limit
DAMOS Disposal Area Monitoring Study Program. Tissue Analysis. Contract W912WJ-12-D-D0004. ESI Study 28411.
Page 36 of 56
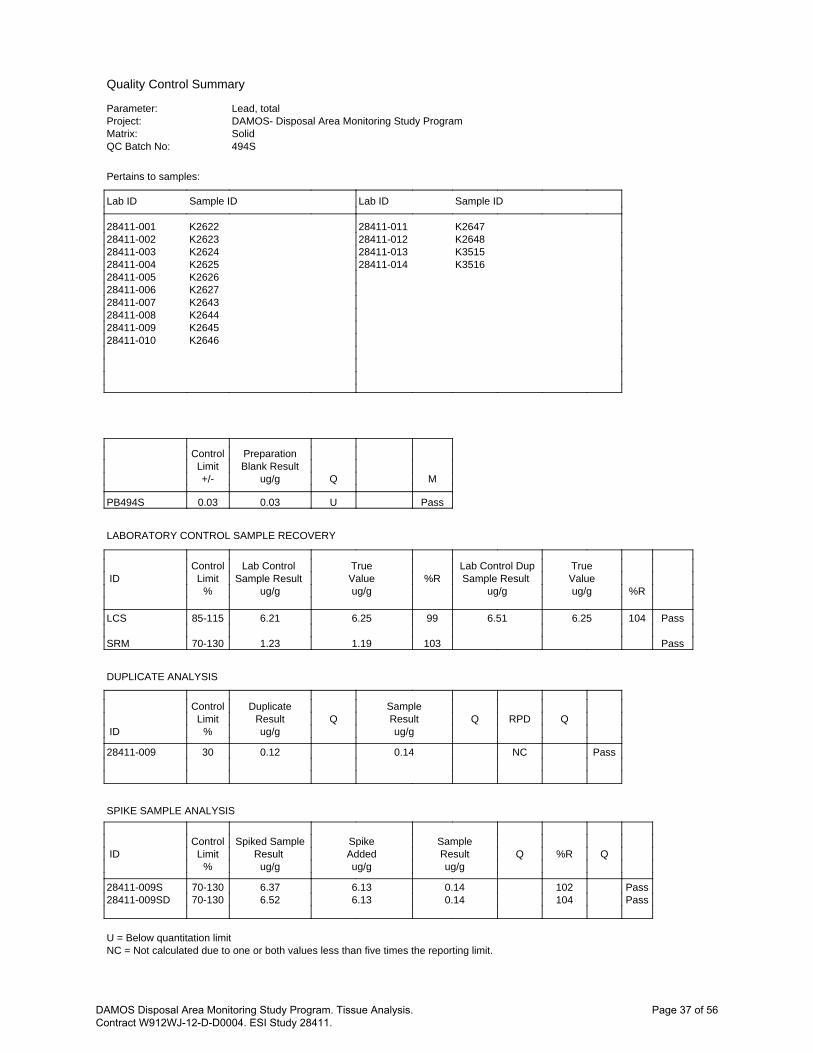
Quality Control Summary
Lead, totalParameter:DAMOS- Disposal Area Monitoring Study ProgramProject:SolidMatrix:494SQC Batch No:
Pertains to samples:
Sample IDLab IDSample IDLab ID
K264728411-011K262228411-001K264828411-012K262328411-002K351528411-013K262428411-003K351628411-014K262528411-004
K262628411-005K262728411-006K264328411-007K264428411-008K264528411-009K264628411-010
PreparationControlBlank ResultLimit
MQug/g+/-
PassU0.030.03PB494S
LABORATORY CONTROL SAMPLE RECOVERY
TrueLab Control DupTrueLab Control ControlValueSample Result %RValueSample Result Limit ID
%Rug/gug/gug/gug/g%
Pass1046.256.51996.256.2185-115LCS
Pass 1031.191.2370-130SRM
DUPLICATE ANALYSIS
SampleDuplicateControlQRPDQResultQResultLimit
ug/gug/g% ID
PassNC0.140.123028411-009
SPIKE SAMPLE ANALYSIS
SampleSpikeSpiked SampleControlQ%RQResultAddedResult Limit ID
ug/gug/gug/g%
Pass1020.146.136.3770-13028411-009SPass1040.146.136.5270-13028411-009SD
U = Below quantitation limitNC = Not calculated due to one or both values less than five times the reporting limit.
DAMOS Disposal Area Monitoring Study Program. Tissue Analysis. Contract W912WJ-12-D-D0004. ESI Study 28411.
Page 37 of 56

Quality Control Summary
Mercury, totalParameter:DAMOS- Disposal Area Monitoring Study ProgramProject:SolidMatrix:203SQC Batch No:
Pertains to samples:
Sample IDLab IDSample IDLab ID
K264728411-011K262228411-001K264828411-012K262328411-002K351528411-013K262428411-003K351628411-014K262528411-004
K262628411-005K262728411-006K264328411-007K264428411-008K264528411-009K264628411-010
PreparationControlBlank ResultLimit
MQug/g+/-
PassU0.0030.003PB203S
LABORATORY CONTROL SAMPLE RECOVERY
TrueLab Control DupTrueLab Control ControlValueSample Result %RValueSample Result Limit ID
%Rug/gug/gug/gug/g%
Pass1100.100.1101050.100.10575-125LCS
Pass 870.0610.05370-130SRM
DUPLICATE ANALYSIS
SampleDuplicateControlQRPDQResultQResultLimit
ug/gug/g% ID
Pass50.0400.0382528411-009
SPIKE SAMPLE ANALYSIS
SampleSpikeSpiked SampleControlQ%RQResultAddedResult Limit ID
ug/gug/gug/g%
Pass1080.0400.0980.14675-12528411-009SPass1050.0400.0980.14375-12528411-009SD
U = Below quantitation limit
DAMOS Disposal Area Monitoring Study Program. Tissue Analysis. Contract W912WJ-12-D-D0004. ESI Study 28411.
Page 38 of 56

Quality Control Summary
Nickel, totalParameter:DAMOS- Disposal Area Monitoring Study ProgramProject:SolidMatrix:494SQC Batch No:
Pertains to samples:
Sample IDLab IDSample IDLab ID
K264728411-011K262228411-001K264828411-012K262328411-002K351528411-013K262428411-003K351628411-014K262528411-004
K262628411-005K262728411-006K264328411-007K264428411-008K264528411-009K264628411-010
PreparationControlBlank ResultLimit
MQug/g+/-
PassU0.050.05PB494S
LABORATORY CONTROL SAMPLE RECOVERY
TrueLab Control DupTrueLab Control ControlValueSample Result %RValueSample Result Limit ID
%Rug/gug/gug/gug/g%
Pass10112.512.69812.512.385-115LCS
Pass 890.930.8370-130SRM
DUPLICATE ANALYSIS
SampleDuplicateControlQRPDQResultQResultLimit
ug/gug/g% ID
Pass80.740.793028411-009
SPIKE SAMPLE ANALYSIS
SampleSpikeSpiked SampleControlQ%RQResultAddedResult Limit ID
ug/gug/gug/g%
Pass1000.7412.313.070-13028411-009SPass990.7412.312.970-13028411-009SD
U = Below quantitation limit
DAMOS Disposal Area Monitoring Study Program. Tissue Analysis. Contract W912WJ-12-D-D0004. ESI Study 28411.
Page 39 of 56
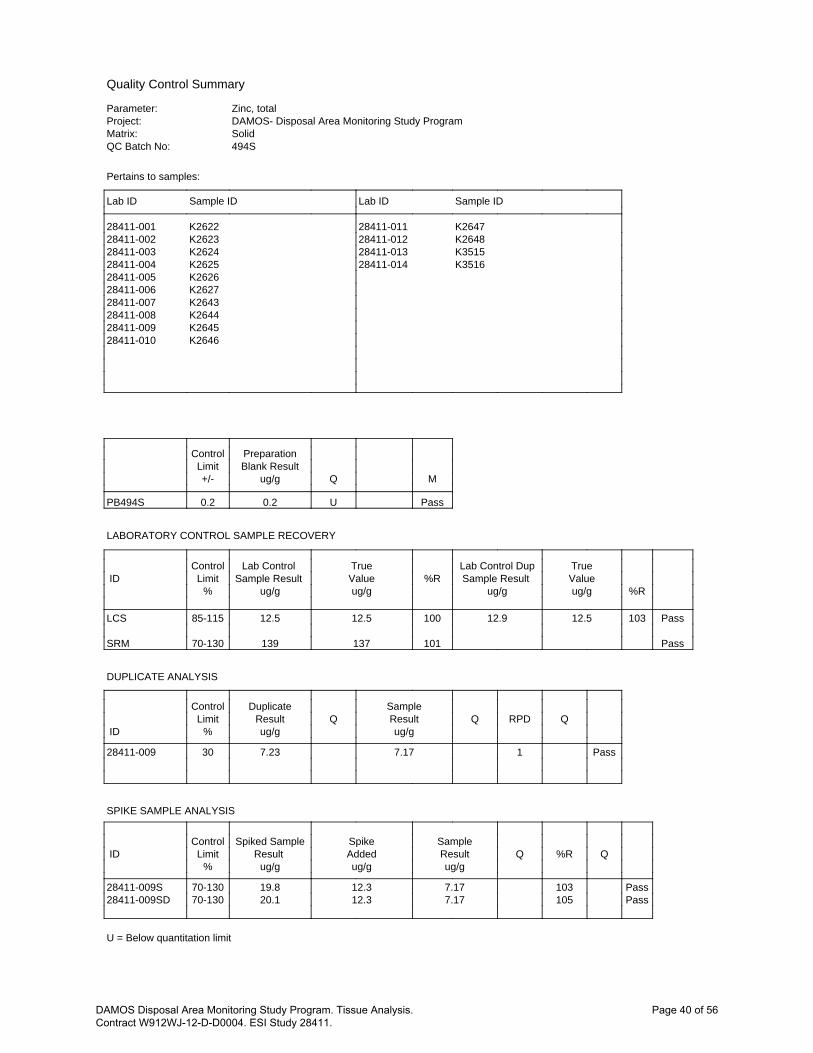
Quality Control Summary
Zinc, totalParameter:DAMOS- Disposal Area Monitoring Study ProgramProject:SolidMatrix:494SQC Batch No:
Pertains to samples:
Sample IDLab IDSample IDLab ID
K264728411-011K262228411-001K264828411-012K262328411-002K351528411-013K262428411-003K351628411-014K262528411-004
K262628411-005K262728411-006K264328411-007K264428411-008K264528411-009K264628411-010
PreparationControlBlank ResultLimit
MQug/g+/-
PassU0.20.2PB494S
LABORATORY CONTROL SAMPLE RECOVERY
TrueLab Control DupTrueLab Control ControlValueSample Result %RValueSample Result Limit ID
%Rug/gug/gug/gug/g%
Pass10312.512.910012.512.585-115LCS
Pass 10113713970-130SRM
DUPLICATE ANALYSIS
SampleDuplicateControlQRPDQResultQResultLimit
ug/gug/g% ID
Pass17.177.233028411-009
SPIKE SAMPLE ANALYSIS
SampleSpikeSpiked SampleControlQ%RQResultAddedResult Limit ID
ug/gug/gug/g%
Pass1037.1712.319.870-13028411-009SPass1057.1712.320.170-13028411-009SD
U = Below quantitation limit
DAMOS Disposal Area Monitoring Study Program. Tissue Analysis. Contract W912WJ-12-D-D0004. ESI Study 28411.
Page 40 of 56

Quality Control Summary
Arsenic, totalParameter:DAMOS- Disposal Area Monitoring Study ProgramProject:SolidMatrix:495SQC Batch No:
Pertains to samples:
Sample IDLab IDSample IDLab ID
K352728411-025K351728411-015K352828411-026K351828411-016K352928411-027K351928411-017K353028411-028K352028411-018
K352128411-019K352228411-020K352328411-021K352428411-022K352528411-023K352628411-024
PreparationControlBlank ResultLimit
MQug/g+/-
PassU0.030.03PB495S
LABORATORY CONTROL SAMPLE RECOVERY
TrueLab Control DupTrueLab Control ControlValueSample Result %RValueSample Result Limit ID
%Rug/gug/gug/gug/g%
Pass1016.256.311006.256.2885-115LCS
Pass 9813.313.170-130SRM
DUPLICATE ANALYSIS
SampleDuplicateControlQRPDQResultQResultLimit
ug/gug/g% ID
Pass16.036.123028411-016
SPIKE SAMPLE ANALYSIS
SampleSpikeSpiked SampleControlQ%RQResultAddedResult Limit ID
ug/gug/gug/g%
Pass1066.036.3112.7070-13028411-016SPass1076.036.2512.7070-13028411-016SD
U = Below quantitation limit
DAMOS Disposal Area Monitoring Study Program. Tissue Analysis. Contract W912WJ-12-D-D0004. ESI Study 28411.
Page 41 of 56

Quality Control Summary
Cadmium, totalParameter:DAMOS- Disposal Area Monitoring Study ProgramProject:SolidMatrix:495SQC Batch No:
Pertains to samples:
Sample IDLab IDSample IDLab ID
K352728411-025K351728411-015K352828411-026K351828411-016K352928411-027K351928411-017K353028411-028K352028411-018
K352128411-019K352228411-020K352328411-021K352428411-022K352528411-023K352628411-024
PreparationControlBlank ResultLimit
MQug/g+/-
PassU0.010.01PB495S
LABORATORY CONTROL SAMPLE RECOVERY
TrueLab Control DupTrueLab Control ControlValueSample Result %RValueSample Result Limit ID
%Rug/gug/gug/gug/g%
Pass1073.123.331063.123.3185-115LCS
Pass 1100.820.9070-130SRM
DUPLICATE ANALYSIS
SampleDuplicateControlQRPDQResultQResultLimit
ug/gug/g% ID
Pass20.190.193028411-016
SPIKE SAMPLE ANALYSIS
SampleSpikeSpiked SampleControlQ%RQResultAddedResult Limit ID
ug/gug/gug/g%
Pass1060.193.163.5470-13028411-016SPass1060.193.123.5170-13028411-016SD
U = Below quantitation limit
DAMOS Disposal Area Monitoring Study Program. Tissue Analysis. Contract W912WJ-12-D-D0004. ESI Study 28411.
Page 42 of 56

Quality Control Summary
Chromium, totalParameter:DAMOS- Disposal Area Monitoring Study ProgramProject:SolidMatrix:495SQC Batch No:
Pertains to samples:
Sample IDLab IDSample IDLab ID
K352728411-025K351728411-015K352828411-026K351828411-016K352928411-027K351928411-017K353028411-028K352028411-018
K352128411-019K352228411-020K352328411-021K352428411-022K352528411-023K352628411-024
PreparationControlBlank ResultLimit
MQug/g+/-
PassU0.030.03PB495S
LABORATORY CONTROL SAMPLE RECOVERY
TrueLab Control DupTrueLab Control ControlValueSample Result %RValueSample Result Limit ID
%Rug/gug/gug/gug/g%
Pass1035.05.141025.05.1285-115LCS
Pass 720.500.3670-130SRM
DUPLICATE ANALYSIS
SampleDuplicateControlQRPDQResultQResultLimit
ug/gug/g% ID
PassNC0.100.103028411-016
SPIKE SAMPLE ANALYSIS
SampleSpikeSpiked SampleControlQ%RQResultAddedResult Limit ID
ug/gug/gug/g%
Pass990.105.055.0970-13028411-016SPass1000.105.005.1070-13028411-016SD
U = Below quantitation limitNC = Not calculated due to one or both values less than five times the reporting limit.
DAMOS Disposal Area Monitoring Study Program. Tissue Analysis. Contract W912WJ-12-D-D0004. ESI Study 28411.
Page 43 of 56

Quality Control Summary
Copper, totalParameter:DAMOS- Disposal Area Monitoring Study ProgramProject:SolidMatrix:495SQC Batch No:
Pertains to samples:
Sample IDLab IDSample IDLab ID
K352728411-025K351728411-015K352828411-026K351828411-016K352928411-027K351928411-017K353028411-028K352028411-018
K352128411-019K352228411-020K352328411-021K352428411-022K352528411-023K352628411-024
PreparationControlBlank ResultLimit
MQug/g+/-
PassU0.10.1PB495S
LABORATORY CONTROL SAMPLE RECOVERY
TrueLab Control DupTrueLab Control ControlValueSample Result %RValueSample Result Limit ID
%Rug/gug/gug/gug/g%
Pass1026.256.381036.256.4285-115LCS
Pass 994.023.9970-130SRM
DUPLICATE ANALYSIS
SampleDuplicateControlQRPDQResultQResultLimit
ug/gug/g% ID
Pass32.232.303028411-016
SPIKE SAMPLE ANALYSIS
SampleSpikeSpiked SampleControlQ%RQResultAddedResult Limit ID
ug/gug/gug/g%
Pass982.236.318.4170-13028411-016SPass982.236.258.3870-13028411-016SD
U = Below quantitation limit
DAMOS Disposal Area Monitoring Study Program. Tissue Analysis. Contract W912WJ-12-D-D0004. ESI Study 28411.
Page 44 of 56

Quality Control Summary
Lead, totalParameter:DAMOS- Disposal Area Monitoring Study ProgramProject:SolidMatrix:495SQC Batch No:
Pertains to samples:
Sample IDLab IDSample IDLab ID
K352728411-025K351728411-015K352828411-026K351828411-016K352928411-027K351928411-017K353028411-028K352028411-018
K352128411-019K352228411-020K352328411-021K352428411-022K352528411-023K352628411-024
PreparationControlBlank ResultLimit
MQug/g+/-
PassU0.030.03PB495S
LABORATORY CONTROL SAMPLE RECOVERY
TrueLab Control DupTrueLab Control ControlValueSample Result %RValueSample Result Limit ID
%Rug/gug/gug/gug/g%
Pass1046.256.501046.256.5185-115LCS
Pass 1051.191.2570-130SRM
DUPLICATE ANALYSIS
SampleDuplicateControlQRPDQResultQResultLimit
ug/gug/g% ID
Pass30.540.563028411-016
SPIKE SAMPLE ANALYSIS
SampleSpikeSpiked SampleControlQ%RQResultAddedResult Limit ID
ug/gug/gug/g%
Pass1050.546.317.1670-13028411-016SPass1020.546.256.9270-13028411-016SD
U = Below quantitation limit
DAMOS Disposal Area Monitoring Study Program. Tissue Analysis. Contract W912WJ-12-D-D0004. ESI Study 28411.
Page 45 of 56

Quality Control Summary
Mercury, totalParameter:DAMOS- Disposal Area Monitoring Study ProgramProject:SolidMatrix:204SQC Batch No:
Pertains to samples:
Sample IDLab IDSample IDLab ID
K352728411-025K351728411-015K352828411-026K351828411-016K352928411-027K351928411-017K353028411-028K352028411-018
K352128411-019K352228411-020K352328411-021K352428411-022K352528411-023K352628411-024
PreparationControlBlank ResultLimit
MQug/g+/-
PassU0.0030.003PB204S
LABORATORY CONTROL SAMPLE RECOVERY
TrueLab Control DupTrueLab Control ControlValueSample Result %RValueSample Result Limit ID
%Rug/gug/gug/gug/g%
Pass1170.100.1171060.100.10675-125LCS
Pass 870.0610.05370-130SRM
DUPLICATE ANALYSIS
SampleDuplicateControlQRPDQResultQResultLimit
ug/gug/g% ID
Pass60.0160.0172528411-016
SPIKE SAMPLE ANALYSIS
SampleSpikeSpiked SampleControlQ%RQResultAddedResult Limit ID
ug/gug/gug/g%
Pass1040.0160.1010.12175-12528411-016SPass1060.0160.1000.12275-12528411-016SD
U = Below quantitation limit
DAMOS Disposal Area Monitoring Study Program. Tissue Analysis. Contract W912WJ-12-D-D0004. ESI Study 28411.
Page 46 of 56

Quality Control Summary
Nickel, totalParameter:DAMOS- Disposal Area Monitoring Study ProgramProject:SolidMatrix:495SQC Batch No:
Pertains to samples:
Sample IDLab IDSample IDLab ID
K352728411-025K351728411-015K352828411-026K351828411-016K352928411-027K351928411-017K353028411-028K352028411-018
K352128411-019K352228411-020K352328411-021K352428411-022K352528411-023K352628411-024
PreparationControlBlank ResultLimit
MQug/g+/-
PassU0.050.05PB495S
LABORATORY CONTROL SAMPLE RECOVERY
TrueLab Control DupTrueLab Control ControlValueSample Result %RValueSample Result Limit ID
%Rug/gug/gug/gug/g%
Pass10312.512.910412.513.085-115LCS
Pass 880.930.8270-130SRM
DUPLICATE ANALYSIS
SampleDuplicateControlQRPDQResultQResultLimit
ug/gug/g% ID
Pass20.420.413028411-016
SPIKE SAMPLE ANALYSIS
SampleSpikeSpiked SampleControlQ%RQResultAddedResult Limit ID
ug/gug/gug/g%
Pass980.4212.612.870-13028411-016SPass1000.4212.512.970-13028411-016SD
U = Below quantitation limit
DAMOS Disposal Area Monitoring Study Program. Tissue Analysis. Contract W912WJ-12-D-D0004. ESI Study 28411.
Page 47 of 56

Quality Control Summary
Zinc, totalParameter:DAMOS- Disposal Area Monitoring Study ProgramProject:SolidMatrix:495SQC Batch No:
Pertains to samples:
Sample IDLab IDSample IDLab ID
K352728411-025K351728411-015K352828411-026K351828411-016K352928411-027K351928411-017K353028411-028K352028411-018
K352128411-019K352228411-020K352328411-021K352428411-022K352528411-023K352628411-024
PreparationControlBlank ResultLimit
MQug/g+/-
PassU0.20.2PB495S
LABORATORY CONTROL SAMPLE RECOVERY
TrueLab Control DupTrueLab Control ControlValueSample Result %RValueSample Result Limit ID
%Rug/gug/gug/gug/g%
Pass10612.513.310512.513.185-115LCS
Pass 10713714670-130SRM
DUPLICATE ANALYSIS
SampleDuplicateControlQRPDQResultQResultLimit
ug/gug/g% ID
Pass029.429.43028411-016
SPIKE SAMPLE ANALYSIS
SampleSpikeSpiked SampleControlQ%RQResultAddedResult Limit ID
ug/gug/gug/g%
Pass11029.412.643.370-13028411-016SPass11329.412.543.570-13028411-016SD
U = Below quantitation limit
DAMOS Disposal Area Monitoring Study Program. Tissue Analysis. Contract W912WJ-12-D-D0004. ESI Study 28411.
Page 48 of 56

Metals by ICPMS and Mercury by CVAFEPA 200.8 SW846 6020 and EPA 245.7
MDL2016Lab Number:SolidSample Designation:07/07/16Date Analyzed:
Mercury EPA 245.707/19/16Date Analyzed:SolidMatrix:1Sample Amount (g):50Final Volume (mL)
RepRepRepRepRepRepRepTrue 7654321Value
ug/g ug/g ug/g ug/g ug/g ug/g ug/g ug/g 0.5070.4680.4790.5020.5060.4780.4930.5Aluminum, total
0.00960.01060.00960.00990.009750.01010.01090.01Antimony, total0.02510.02580.02480.02490.02450.02330.02450.025Arsenic, total0.1980.1930.1980.190.1920.1950.190.2Barium, total
0.01240.01260.01240.01180.01290.01250.01190.0125Beryllium, total0.04460.04280.0110.0110.04730.04190.04240.05Boron, total0.01220.01230.01240.01240.01270.01220.01230.0125Cadmium, total
1.351.251.251.51.351.251.41.25Calcium, total0.01970.01990.02010.0190.01950.01960.01960.02Chromium, total0.04960.04880.04940.05010.04970.04930.04790.05Cobalt, total0.02580.02470.02530.02580.02490.02540.02420.025Copper, total0.2510.2440.2560.2510.2580.2470.2490.25Iron, total
0.02460.0240.02530.02430.02460.02460.02390.025Lead, total1.251.21.31.251.31.21.21.25Magnesium, total
0.04930.0480.05010.04990.0490.04890.04880.05Manganese, total0.00560.004450.00460.00490.004550.00460.004550.005Mercury, total
0.004950.00520.004850.00470.00470.00490.00510.05Mercury, total (EPA 245.7)0.01910.01820.01720.01880.01930.01930.01770.02Molybdenum, total0.05070.04830.04950.04840.04940.05060.04890.05Nickel, total
1.21.051.351.251.31.051.11.25Potassium, total0.0240.02430.02760.02220.02850.03070.02150.025Selenium, total
0.02320.02320.02360.02340.02350.02340.02240.025Silver, total1.251.11.31.151.150.951.11.25Sodium, total
0.02540.02330.02480.02540.02750.02530.02680.025Strontium, total0.02070.02060.02220.02270.01980.02060.02120.025Thallium, total0.02390.02360.0240.02430.02570.02430.02450.025Tin, total0.04590.04640.0490.04910.04750.0480.04670.05Vanadium, total0.04860.04620.04730.04980.05090.04980.04870.05Zinc, total
DAMOS Disposal Area Monitoring Study Program. Tissue Analysis. Contract W912WJ-12-D-D0004. ESI Study 28411.
Page 49 of 56

Table II-1: Completeness ChecklistQuality Assurance/Quality Control Questions Yes/No? Comments? 1. Was the report signed by the responsible applicant approved representative?
Yes2. Were the methods for sampling, chemical and biological testing described in the Sampling and Analysis Plan (SAP) and the Laboratory QA Plan (LQAP) followed? Yes
3. If not, were deviations documented?NA
4. Was the SAP approved by the New England District?Yes
5. Did the applicant use a laboratory with a LQAP on file at the New England District?Yes
6. Did the samples adequately represent the physical/chemical variability in the dredging area? Yes
7. Were the correct stations sampled (include the precision of the navigation method used)? Yes
8. Were the preservation and storage requirements in Chapter 8 of the EPA/Corps QA/QC Manual (EPA/USACE 1995) and EPA (2001d) followed? Yes
9. Were the samples properly labeled?Yes
10. Were all the requested data included?Yes
11. Were the reporting limits met?Yes
12. Were the chain-of-custody forms properly processed?Yes
13. Were the method blanks run and were the concentration below the acceptance criteria? Yes
14. Was the MDL study performed on each matrix (with this data submission) or within the last 12 months? Yes
15. Were the SRM/CRM analyses within acceptance criteria?Yes
16. Were the matrix spike/matrix spike duplicates run at the required frequency and was the percent recovery/RPD within the acceptance criteria? Yes
17. Were the duplicate samples analyzed and were the RPDs within the required acceptance criteria? Yes
18. For each analytical fraction of organic compounds, were recoveries for the internal standard within the acceptance criteria? NA
19. Were surrogate recoveries within the required acceptance criteria?NA
20. Were corrective action forms provided for all non-conforming data?NA
21. Were all the species-specific test conditions in Appendix V met?NA
22. Were the test-specific age requirements met for each test species?NA
23. Was the bulk physical/chemical testing performed on the sediments/composites that were biologically tested? NA
24. Were the mortality acceptance criteria met for the water column and sediment toxicity tests? NA
25. Were the test performance requirements in Table 11.3 of EPA (1994a) met?NA
DAMOS Disposal Area Monitoring Study Program. Tissue Analysis. Contract W912WJ-12-D-D0004. ESI Study 28411.
Page 50 of 56

Table II-5: Quality Control Summary for Analyses of Metals in Sediments, Tissue and Water Matrices
Method Reference Numbers: Various Reference NumbersCriteria Met? List results outside criteria Location of Results
Yes/No (Cross-reference results table indata report)
(Retained at Lab or in Data Package)
Linear Range Determination for ICP
Performed QuarterlyYes Retained at Lab
Initial Calibration for AA, Hg Performed Daily (Correlation Coefficient >0.995) Yes Retained at Lab
Calculation of Method Detection Limits (MDLs)
For each matrix, analyzed once per 12 month period (see Section 5.2 for MDL procedure)
Yes in Data Package
Hg: 80 to 120% recovery Other metals: 90 to 110% recovery
Initial Calibration Blank/ Continuing Calibration Blank
No target analytes > Instrument Detection Limit (IDL) Yes Retained at Lab
Standard Reference Materials Within the limits provided by vendor
Yes in Data Package
Method Blank No target analytes > RL
Yes in Data Package
Sample Spike/ Sample Duplicate One set per group of field samples. Must contain all target analytes. Recovery Limits (75 to 125%; RPD < 20% or < 35%)
Yes in Data Package
Analytical Replicates Analyze one sample in duplicate for each group of field samples (RPD < 30%)
Yes in Data Package
* The Quality Control Acceptance Criteria are general guidelines. If alternate criteria are used, they must be documented in this table.
Quality Control (QC) Element
Acceptance Criteria*
Initial Calibration Verification/ Continuing Calibration Verification Yes Retained at Lab
DAMOS Disposal Area Monitoring Study Program. Tissue Analysis. Contract W912WJ-12-D-D0004. ESI Study 28411.
Page 51 of 56

DAMOS Disposal Area Monitoring Study Program. Tissue Analysis. Contract W912WJ-12-D-D0004. ESI Study 28411.
Page 52 of 56
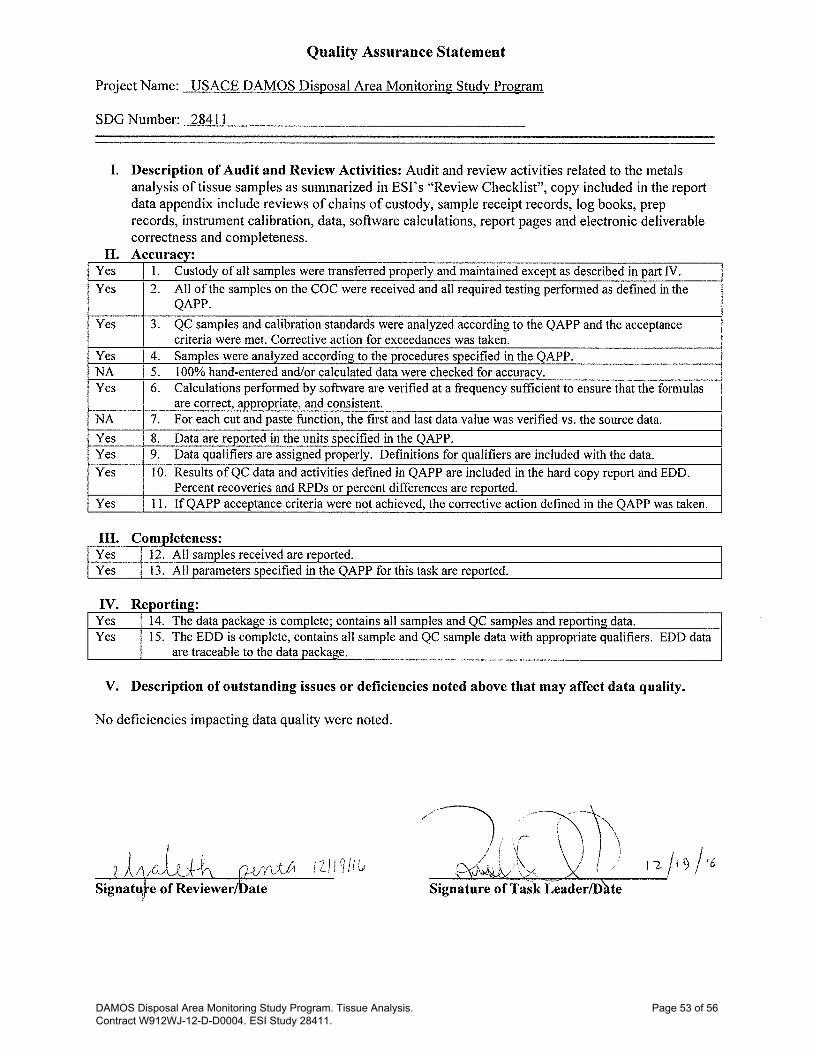
DAMOS Disposal Area Monitoring Study Program. Tissue Analysis. Contract W912WJ-12-D-D0004. ESI Study 28411.
Page 53 of 56

DAMOS Disposal Area Monitoring Study Program. Tissue Analysis. Contract W912WJ-12-D-D0004. ESI Study 28411.
Page 54 of 56

DAMOS Disposal Area Monitoring Study Program. Tissue Analysis. Contract W912WJ-12-D-D0004. ESI Study 28411.
Page 55 of 56

DAMOS Disposal Area Monitoring Study Program. Tissue Analysis. Contract W912WJ-12-D-D0004. ESI Study 28411.
Page 56 of 56

Monitoring Survey at the Portland Disposal Site September 2016
APPENDIX I
BENTHIC COMMUNITY ANALYSIS RESULTS

Monitoring Survey at the Portland Disposal Site September 2016
Station Name Phylum Class Order Family ID Number
RAJ‐013/EREF‐05 Nemertea Anopla Heteronemertea Lineidae Micrura (LPIL) 3
RAJ‐013/EREF‐05 Nemertea Anopla Heteronemertea Lineidae Lineidae (LPIL) 1
RAJ‐013/EREF‐05 Nemertea Nemertea (LPIL) 1
RAJ‐013/EREF‐05 Arthropoda Malacostraca Amphipoda Lysianassidae Lysianassidae (LPIL) 1
RAJ‐013/EREF‐05 Arthropoda Malacostraca Amphipoda Ampeliscidae Ampeliscidae (LPIL) 1
RAJ‐013/EREF‐05 Arthropoda Malacostraca Amphipoda Phoxocephalidae Harpinia propinqua 4
RAJ‐013/EREF‐05 Arthropoda Malacostraca Cumacea Diastylidae Diastylis sculpta 1
RAJ‐013/EREF‐05 Echinodermata Ophiuroidea Ophiurida Amphiuridae Amphiuridae (LPIL) 10
RAJ‐013/EREF‐05 Arthropoda Malacostraca Amphipoda Stenothoidae Metopella angusta 1
RAJ‐013/EREF‐05 Mollusca Gastropoda Neotaenioglossa Rissoidae Onoba pelagica 65
RAJ‐013/EREF‐05 Mollusca Bivalvia Veneroida Astartidae Astarte undata 58
RAJ‐013/EREF‐05 Mollusca Bivalvia Nuculoida Yoldiidae Yoldia limatula 66
RAJ‐013/EREF‐05 Mollusca Bivalvia Nuculoida Nuculidae Nucula proxima 17
RAJ‐013/EREF‐05 Mollusca Bivalvia Nuculida Nuculidae Ennucula tenuis 24
RAJ‐013/EREF‐05 Mollusca Bivalvia Nuculida Nuculidae Ennucula aegeensis 9
RAJ‐013/EREF‐05 Mollusca Bivalvia Myoida Corbulidae Corbula contracta 1
RAJ‐013/EREF‐05 Mollusca Bivalvia Pholadomyoida Periplomatidae Periploma papyratium 10
RAJ‐013/EREF‐05 Mollusca Bivalvia Veneroida Thyasiridae Thyasira flexuosa 2
RAJ‐013/EREF‐05 Mollusca Bivalvia Bivalvia (LPIL) 1
RAJ‐013/EREF‐05 Mollusca Gastropoda Gastropoda (LPIL) 1
RAJ‐013/EREF‐05 Mollusca Bivalvia Nuculanida Nuculanidae Nuculana pernula 1
RAJ‐013/EREF‐05 Mollusca Bivalvia Mytiloida Mytilidae Crenella decussata 3
RAJ‐013/EREF‐05 Mollusca Scaphopoda Dentaliida Dentaliidae Dentaliidae (LPIL) 1
RAJ‐013/EREF‐05 Mollusca Bivalvia Cardiida Cardiidae Parvicardium pinnulatum 3
RAJ‐013/EREF‐05 Mollusca Bivalvia Veneroida Carditidae Cyclocardia borealis 6
RAJ‐013/EREF‐05 Annelida Polychaeta Phyllodocida Nephtyidae Nephtyidae (LPIL) 1
RAJ‐013/EREF‐05 Annelida Polychaeta Terebellida Ampharetidae Anobothrus gracilis 4
RAJ‐013/EREF‐05 Annelida Polychaeta Scolecida Paraonidae Aricidea quadrilobata 1
RAJ‐013/EREF‐05 Annelida Polychaeta Opheliida Scalibregmatidae Scalibregma inflatum 2
RAJ‐013/EREF‐05 Annelida Polychaeta Terebellida Trichobranchidae Terebellides stroemi 5
RAJ‐013/EREF‐05 Annelida Polychaeta Spionida Spionidae Prionospio (LPIL) 23
RAJ‐013/EREF‐05 Annelida Polychaeta Terebellida Cirratulidae Chaetozone setosa 2
RAJ‐013/EREF‐05 Annelida Polychaeta Orbiniida Orginiidae Scoloplos armiger 1
RAJ‐013/EREF‐05 Annelida Polychaeta Oweniida Oweniidae Galathowenia oculata 2
RAJ‐013/EREF‐05 Annelida Polychaeta Terebellida Cirratulidae Cirratulidae (LPIL) 33
RAJ‐013/EREF‐05 Annelida Polychaeta Scolecida Maldanidae Maldanidae (LPIL) 12
RAJ‐013/EREF‐05 Annelida Polychaeta Terebellida Terebellidae Polycirrus eximius 1
RAJ‐013/EREF‐05 Annelida Polychaeta Cossurida Cossuridae Cossura soyeri 4
RAJ‐013/EREF‐05 Annelida Polychaeta Eunicida Lumbrineridae Ninoe nigripes 2
RAJ‐013/EREF‐05 Annelida Polychaeta Scolecida Paraonidae Aricidea (LPIL) 5
RAJ‐013/EREF‐05 Annelida Polychaeta Spionida Spionidae Prionospio steenstrupi 2
RAJ‐013/EREF‐05 Annelida Polychaeta Phyllodocida Syllidae Exogone rolani 1
RAJ‐013/EREF‐05 Annelida Oligochaeta Tubificida Naididae Naididae (LPIL) 6
RAJ‐013/EREF‐05 Annelida Polychaeta Phyllodocida Pholoidae Pholoe minuta 3
RAJ‐013/EREF‐05 Annelida Polychaeta Scolecida Capitellidae Mediomastus (LPIL) 1
BATTELLE ‐ USACE ‐ DAMOS RAW DATA NOVEMBER 2016
Appendix I‐ Benthic Community Taxonomy Results Page 1 of 8

Monitoring Survey at the Portland Disposal Site September 2016
Station Name Phylum Class Order Family ID Number
RAJ‐013/EREF‐05 Annelida Polychaeta Orbiniida Orbiniidae Orbiniidae (LPIL) 1
RAJ‐013/EREF‐05 Annelida Polychaeta Orbiniida Orbiniidae Leitoscoloplos (LPIL) 1
RAJ‐013/EREF‐05 Annelida Polychaeta Spionida Spionidae Spiophanes missionensis 7
RAJ‐013/EREF‐05 Annelida Polychaeta Eunicida Lumbrineridae Lumbrineridae (LPIL) 2
RAJ‐013/EREF‐05 Annelida Polychaeta Sabellida Sabellidae Euchone incolor 1
RAJ‐013/EREF‐05 Annelida Polychaeta Spionida Spionidae Spiophanes bombyx 1
RAJ‐013/EREF‐05 Annelida Polychaeta Oweniida Oweniidae Owenia fusiformis 2
RAJ‐013/EREF‐05 Annelida Polychaeta Scolecida Paraonidae Paraonidae (LPIL) 1
RAJ‐013/EREF‐05 Annelida Polychaeta Terebellida Cirratulidae Tharyx acutus 1
RAJ‐013/EREF‐05 Annelida Polychaeta Phyllodocida Phyllodocidae Phyllodocidae (LPIL) 1
RAJ‐013/EREF‐05 Annelida Polychaeta Phyllodocida Nephtyidae Nephtys incisa 1
RAJ‐013/EREF‐05 Annelida Polychaeta Phyllodocida Goniadidae Goniada (LPIL) 1
RAJ‐013/EREF‐05 Annelida Polychaeta Phyllodocida Syllidae Exogone verugera 1
RAJ‐013/EREF‐05 Annelida Polychaeta Phyllodocida Polynoidae Polynoidae (LPIL) 1
RAJ‐013/EREF‐05 Annelida Polychaeta Flabelligerida Flabelligeridae Pherusa affinis 1
RAJ‐014/PDS‐16 Mollusca Aplacophora Aplacophora (LPIL) 3
RAJ‐014/PDS‐16 Nemertea Anopla Heteronemertea Lineidae Lineidae (LPIL) 2
RAJ‐014/PDS‐16 Nemertea Nemertea (LPIL) 1
RAJ‐014/PDS‐16 Sipuncula Sipuncula (LPIL) 1
RAJ‐014/PDS‐16 Arthropoda Malacostraca Amphipoda Stenothoidae Metopella angusta 5
RAJ‐014/PDS‐16 Arthropoda Malacostraca Amphipoda Lysianassidae Lysianassidae (LPIL) 1
RAJ‐014/PDS‐16 Arthropoda Malacostraca Cumacea Nannastacidae Campylaspis sp. AA 11
RAJ‐014/PDS‐16 Arthropoda Malacostraca Cumacea Diastylidae Diastylis (LPIL) 1
RAJ‐014/PDS‐16 Mollusca Bivalvia Mytiloida Mytilidae Crenella decussata 4
RAJ‐014/PDS‐16 Mollusca Bivalvia Veneroida Astartidae Astarte undata 1
RAJ‐014/PDS‐16 Mollusca Bivalvia Nuculoida Nuculidae Nucula proxima 10
RAJ‐014/PDS‐16 Mollusca Bivalvia Nuculida Nuculidae Ennucula tenuis 11
RAJ‐014/PDS‐16 Mollusca Bivalvia Nuculida Nuculidae Ennucula aegeensis 1
RAJ‐014/PDS‐16 Mollusca Bivalvia Nuculoida Yoldiidae Yoldia limatula 7
RAJ‐014/PDS‐16 Mollusca Bivalvia Myoida Corbulidae Corbula contracta 9
RAJ‐014/PDS‐16 Mollusca Scaphopoda Dentaliida Dentaliidae Dentaliidae (LPIL) 2
RAJ‐014/PDS‐16 Mollusca Gastropoda Neotaenioglossa Rissoidae Onoba pelagica 35
RAJ‐014/PDS‐16 Mollusca Bivalvia Pholadomyoida Periplomatidae Periploma papyratium 3
RAJ‐014/PDS‐16 Mollusca Bivalvia Veneroida Thyasiridae Thyasira flexuosa 1
RAJ‐014/PDS‐16 Mollusca Bivalvia Pectinida Dimyidae Dimyidae (LPIL) 1
RAJ‐014/PDS‐16 Mollusca Bivalvia Veneroida Semelidae Semelidae (LPIL) 6
RAJ‐014/PDS‐16 Annelida Polychaeta Terebellida Cirratulidae Tharyx acutus 11
RAJ‐014/PDS‐16 Annelida Polychaeta Scolecida Capitellidae Mediomastus (LPIL) 6
RAJ‐014/PDS‐16 Annelida Polychaeta Terebellida Cirratulidae Cirratulidae (LPIL) 70
RAJ‐014/PDS‐16 Annelida Polychaeta Orbiniida Orbiniidae Leitoscoloplos (LPIL) 3
RAJ‐014/PDS‐16 Annelida Polychaeta Spionida Spionidae Spiophanes missionensis 6
RAJ‐014/PDS‐16 Annelida Polychaeta Oweniida Oweniidae Owenia fusiformis 3
RAJ‐014/PDS‐16 Annelida Polychaeta Terebellida Cirratulidae Aphelochaeta marioni 4
RAJ‐014/PDS‐16 Annelida Polychaeta Sabellida Sabellidae Euchone incolor 40
RAJ‐014/PDS‐16 Annelida Polychaeta Scolecida Paraonidae Aricidea (LPIL) 25
RAJ‐014/PDS‐16 Annelida Polychaeta Eunicida Lumbrineridae Ninoe nigripes 8
Appendix I‐ Benthic Community Taxonomy Results Page 2 of 8

Monitoring Survey at the Portland Disposal Site September 2016
Station Name Phylum Class Order Family ID Number
RAJ‐014/PDS‐16 Annelida Polychaeta Phyllodocida Nephtyidae Nephtyidae (LPIL) 9
RAJ‐014/PDS‐16 Annelida Polychaeta Scolecida Paraonidae Levinsenia gracilis 17
RAJ‐014/PDS‐16 Annelida Oligochaeta Tubificida Naididae Naididae (LPIL) 8
RAJ‐014/PDS‐16 Annelida Polychaeta Phyllodocida Phyllodocidae Eteone longa 3
RAJ‐014/PDS‐16 Annelida Polychaeta Spionida Spionidae Prionospio steenstrupi 2
RAJ‐014/PDS‐16 Annelida Polychaeta Scolecida Maldanidae Maldanidae (LPIL) 6
RAJ‐014/PDS‐16 Annelida Polychaeta Spionida Spionidae Prionospio (LPIL) 15
RAJ‐014/PDS‐16 Annelida Polychaeta Spionida Trochochaetidae Trochochaeta multisetosa 1
RAJ‐014/PDS‐16 Annelida Polychaeta Oweniida Oweniidae Galathowenia oculata 2
RAJ‐014/PDS‐16 Annelida Polychaeta Cossurida Cossuridae Cossura soyeri 8
RAJ‐014/PDS‐16 Annelida Polychaeta Phyllodocida Nephtyidae Nephtys incisa 6
RAJ‐014/PDS‐16 Annelida Polychaeta Scolecida Paraonidae Aricidea quadrilobata 9
RAJ‐014/PDS‐16 Annelida Polychaeta Opheliida Scalibregmatidae Scalibregma inflatum 1
RAJ‐014/PDS‐16 Annelida Polychaeta Flabelligerida Flabelligeridae Pherusa affinis 4
RAJ‐014/PDS‐16 Annelida Polychaeta Canalipalpata Sternaspidae Sternaspis scutata 1
RAJ‐014/PDS‐16 Annelida Polychaeta Phyllodocida Sphaerodoridae Sphaerodoridium minutum 5
RAJ‐014/PDS‐16 Annelida Polychaeta Eunicida Lumbrineridae Lumbrineridae (LPIL) 2
RAJ‐014/PDS‐16 Annelida Polychaeta Spionida Apistobranchidae Apistobranchus tullbergi 2
RAJ‐014/PDS‐16 Phoronida Phoronidae Phoronis (LPIL) 2
RAJ‐014/PDS‐16 Annelida Polychaeta Phyllodocida Goniadidae Goniada (LPIL) 2
RAJ‐014/PDS‐16 Annelida Polychaeta Terebellida Terebellidae Polycirrus eximius 3
RAJ‐014/PDS‐16 Annelida Polychaeta Spionida Spionidae Spionidae (LPIL) 1
RAJ‐015/PDA95‐30 Nemertea Anopla Heteronemertea Lineidae Lineidae (LPIL) 2
RAJ‐015/PDA95‐30 Nemertea Anopla Heteronemertea Lineidae Micrura (LPIL) 1
RAJ‐015/PDA95‐30 Echinodermata Ophiuroidea Ophiurida Amphiuridae Amphiuridae (LPIL) 2
RAJ‐015/PDA95‐30 Arthropoda Malacostraca Cumacea Diastylidae Leptostylis longimana 1
RAJ‐015/PDA95‐30 Arthropoda Malacostraca Cumacea Diastylidae Diastylis cornuifer 1
RAJ‐015/PDA95‐30 Arthropoda Malacostraca Amphipoda Pleustidae Pleustidae (LPIL) 1
RAJ‐015/PDA95‐30 Mollusca Scaphopoda Dentaliida Dentaliidae Dentaliidae (LPIL) 2
RAJ‐015/PDA95‐30 Mollusca Bivalvia Myoida Corbulidae Corbula contracta 34
RAJ‐015/PDA95‐30 Mollusca Bivalvia Nuculoida Yoldiidae Yoldia limatula 4
RAJ‐015/PDA95‐30 Mollusca Bivalvia Venerida Veneridae Pitar morrhuanus 7
RAJ‐015/PDA95‐30 Mollusca Bivalvia Cardiida Cardiidae Parvicardium pinnulatum 3
RAJ‐015/PDA95‐30 Annelida Polychaeta Oweniida Oweniidae Galathowenia oculata 40
RAJ‐015/PDA95‐30 Annelida Polychaeta Spionida Spionidae Spio setosa 1
RAJ‐015/PDA95‐30 Annelida Polychaeta Spionida Spionidae Prionospio (LPIL) 34
RAJ‐015/PDA95‐30 Annelida Polychaeta Sabellida Sabellidae Euchone incolor 28
RAJ‐015/PDA95‐30 Annelida Polychaeta Phyllodocida Nephtyidae Nephtys incisa 11
RAJ‐015/PDA95‐30 Annelida Polychaeta Terebellida Ampharetidae Anobothrus gracilis 1
RAJ‐015/PDA95‐30 Annelida Polychaeta Scolecida Paraonidae Aricidea (LPIL) 3
RAJ‐015/PDA95‐30 Annelida Polychaeta Terebellida Cirratulidae Cirratulidae (LPIL) 21
RAJ‐015/PDA95‐30 Annelida Polychaeta Terebellida Cirratulidae Tharyx acutus 4
RAJ‐015/PDA95‐30 Annelida Polychaeta Orbiniida Orbiniidae Leitoscoloplos foliosus 1
RAJ‐015/PDA95‐30 Annelida Polychaeta Eunicida Lumbrineridae Ninoe nigripes 3
RAJ‐015/PDA95‐30 Annelida Polychaeta Phyllodocida Pholoidae Pholoe minuta 13
RAJ‐015/PDA95‐30 Annelida Polychaeta Phyllodocida Goniadidae Goniada (LPIL) 1
Appendix I‐ Benthic Community Taxonomy Results Page 3 of 8
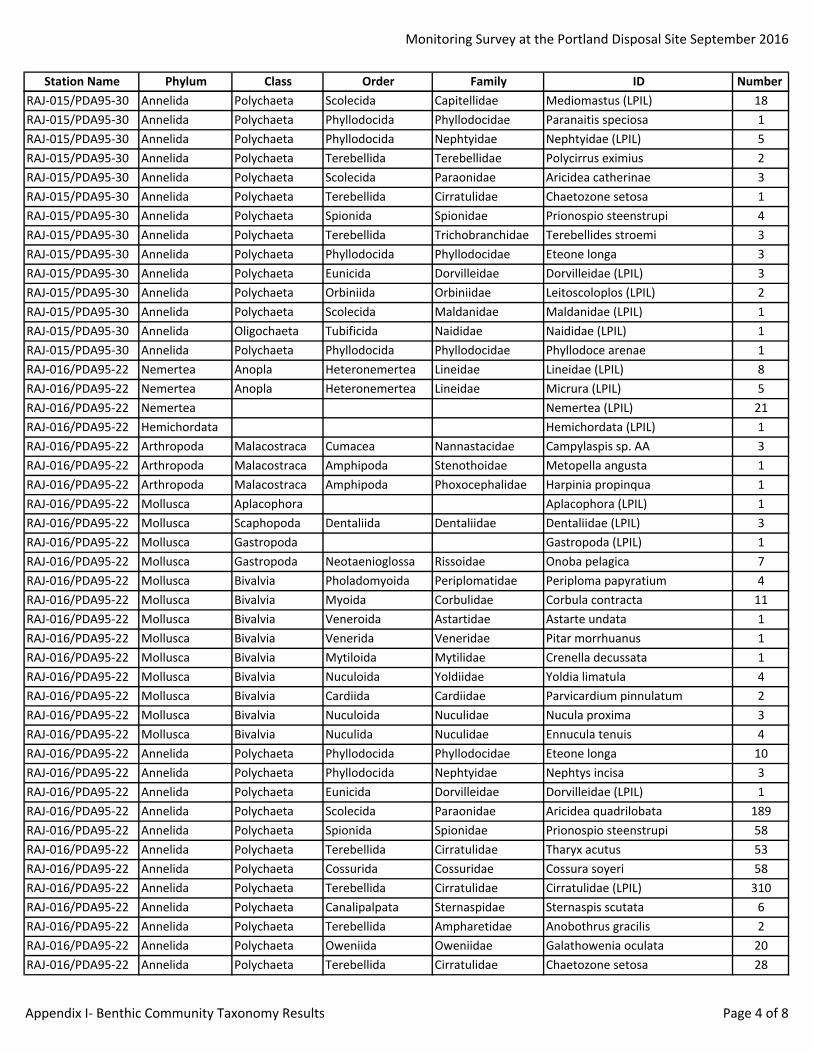
Monitoring Survey at the Portland Disposal Site September 2016
Station Name Phylum Class Order Family ID Number
RAJ‐015/PDA95‐30 Annelida Polychaeta Scolecida Capitellidae Mediomastus (LPIL) 18
RAJ‐015/PDA95‐30 Annelida Polychaeta Phyllodocida Phyllodocidae Paranaitis speciosa 1
RAJ‐015/PDA95‐30 Annelida Polychaeta Phyllodocida Nephtyidae Nephtyidae (LPIL) 5
RAJ‐015/PDA95‐30 Annelida Polychaeta Terebellida Terebellidae Polycirrus eximius 2
RAJ‐015/PDA95‐30 Annelida Polychaeta Scolecida Paraonidae Aricidea catherinae 3
RAJ‐015/PDA95‐30 Annelida Polychaeta Terebellida Cirratulidae Chaetozone setosa 1
RAJ‐015/PDA95‐30 Annelida Polychaeta Spionida Spionidae Prionospio steenstrupi 4
RAJ‐015/PDA95‐30 Annelida Polychaeta Terebellida Trichobranchidae Terebellides stroemi 3
RAJ‐015/PDA95‐30 Annelida Polychaeta Phyllodocida Phyllodocidae Eteone longa 3
RAJ‐015/PDA95‐30 Annelida Polychaeta Eunicida Dorvilleidae Dorvilleidae (LPIL) 3
RAJ‐015/PDA95‐30 Annelida Polychaeta Orbiniida Orbiniidae Leitoscoloplos (LPIL) 2
RAJ‐015/PDA95‐30 Annelida Polychaeta Scolecida Maldanidae Maldanidae (LPIL) 1
RAJ‐015/PDA95‐30 Annelida Oligochaeta Tubificida Naididae Naididae (LPIL) 1
RAJ‐015/PDA95‐30 Annelida Polychaeta Phyllodocida Phyllodocidae Phyllodoce arenae 1
RAJ‐016/PDA95‐22 Nemertea Anopla Heteronemertea Lineidae Lineidae (LPIL) 8
RAJ‐016/PDA95‐22 Nemertea Anopla Heteronemertea Lineidae Micrura (LPIL) 5
RAJ‐016/PDA95‐22 Nemertea Nemertea (LPIL) 21
RAJ‐016/PDA95‐22 Hemichordata Hemichordata (LPIL) 1
RAJ‐016/PDA95‐22 Arthropoda Malacostraca Cumacea Nannastacidae Campylaspis sp. AA 3
RAJ‐016/PDA95‐22 Arthropoda Malacostraca Amphipoda Stenothoidae Metopella angusta 1
RAJ‐016/PDA95‐22 Arthropoda Malacostraca Amphipoda Phoxocephalidae Harpinia propinqua 1
RAJ‐016/PDA95‐22 Mollusca Aplacophora Aplacophora (LPIL) 1
RAJ‐016/PDA95‐22 Mollusca Scaphopoda Dentaliida Dentaliidae Dentaliidae (LPIL) 3
RAJ‐016/PDA95‐22 Mollusca Gastropoda Gastropoda (LPIL) 1
RAJ‐016/PDA95‐22 Mollusca Gastropoda Neotaenioglossa Rissoidae Onoba pelagica 7
RAJ‐016/PDA95‐22 Mollusca Bivalvia Pholadomyoida Periplomatidae Periploma papyratium 4
RAJ‐016/PDA95‐22 Mollusca Bivalvia Myoida Corbulidae Corbula contracta 11
RAJ‐016/PDA95‐22 Mollusca Bivalvia Veneroida Astartidae Astarte undata 1
RAJ‐016/PDA95‐22 Mollusca Bivalvia Venerida Veneridae Pitar morrhuanus 1
RAJ‐016/PDA95‐22 Mollusca Bivalvia Mytiloida Mytilidae Crenella decussata 1
RAJ‐016/PDA95‐22 Mollusca Bivalvia Nuculoida Yoldiidae Yoldia limatula 4
RAJ‐016/PDA95‐22 Mollusca Bivalvia Cardiida Cardiidae Parvicardium pinnulatum 2
RAJ‐016/PDA95‐22 Mollusca Bivalvia Nuculoida Nuculidae Nucula proxima 3
RAJ‐016/PDA95‐22 Mollusca Bivalvia Nuculida Nuculidae Ennucula tenuis 4
RAJ‐016/PDA95‐22 Annelida Polychaeta Phyllodocida Phyllodocidae Eteone longa 10
RAJ‐016/PDA95‐22 Annelida Polychaeta Phyllodocida Nephtyidae Nephtys incisa 3
RAJ‐016/PDA95‐22 Annelida Polychaeta Eunicida Dorvilleidae Dorvilleidae (LPIL) 1
RAJ‐016/PDA95‐22 Annelida Polychaeta Scolecida Paraonidae Aricidea quadrilobata 189
RAJ‐016/PDA95‐22 Annelida Polychaeta Spionida Spionidae Prionospio steenstrupi 58
RAJ‐016/PDA95‐22 Annelida Polychaeta Terebellida Cirratulidae Tharyx acutus 53
RAJ‐016/PDA95‐22 Annelida Polychaeta Cossurida Cossuridae Cossura soyeri 58
RAJ‐016/PDA95‐22 Annelida Polychaeta Terebellida Cirratulidae Cirratulidae (LPIL) 310
RAJ‐016/PDA95‐22 Annelida Polychaeta Canalipalpata Sternaspidae Sternaspis scutata 6
RAJ‐016/PDA95‐22 Annelida Polychaeta Terebellida Ampharetidae Anobothrus gracilis 2
RAJ‐016/PDA95‐22 Annelida Polychaeta Oweniida Oweniidae Galathowenia oculata 20
RAJ‐016/PDA95‐22 Annelida Polychaeta Terebellida Cirratulidae Chaetozone setosa 28
Appendix I‐ Benthic Community Taxonomy Results Page 4 of 8
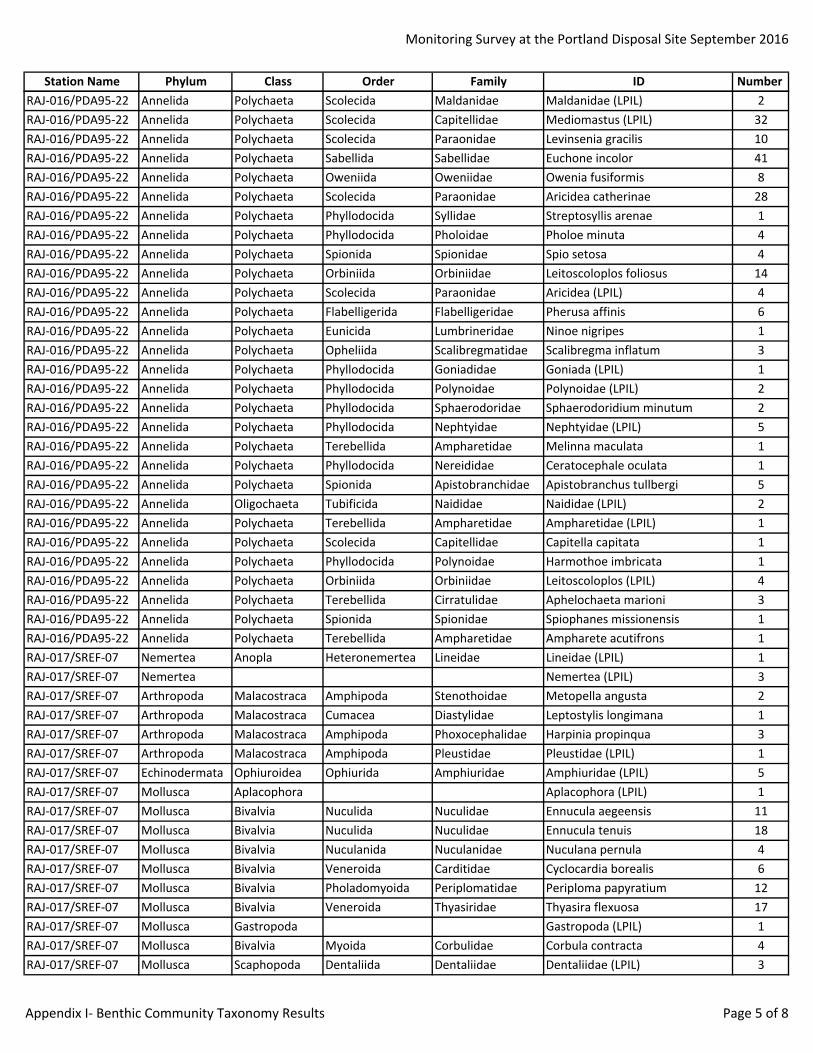
Monitoring Survey at the Portland Disposal Site September 2016
Station Name Phylum Class Order Family ID Number
RAJ‐016/PDA95‐22 Annelida Polychaeta Scolecida Maldanidae Maldanidae (LPIL) 2
RAJ‐016/PDA95‐22 Annelida Polychaeta Scolecida Capitellidae Mediomastus (LPIL) 32
RAJ‐016/PDA95‐22 Annelida Polychaeta Scolecida Paraonidae Levinsenia gracilis 10
RAJ‐016/PDA95‐22 Annelida Polychaeta Sabellida Sabellidae Euchone incolor 41
RAJ‐016/PDA95‐22 Annelida Polychaeta Oweniida Oweniidae Owenia fusiformis 8
RAJ‐016/PDA95‐22 Annelida Polychaeta Scolecida Paraonidae Aricidea catherinae 28
RAJ‐016/PDA95‐22 Annelida Polychaeta Phyllodocida Syllidae Streptosyllis arenae 1
RAJ‐016/PDA95‐22 Annelida Polychaeta Phyllodocida Pholoidae Pholoe minuta 4
RAJ‐016/PDA95‐22 Annelida Polychaeta Spionida Spionidae Spio setosa 4
RAJ‐016/PDA95‐22 Annelida Polychaeta Orbiniida Orbiniidae Leitoscoloplos foliosus 14
RAJ‐016/PDA95‐22 Annelida Polychaeta Scolecida Paraonidae Aricidea (LPIL) 4
RAJ‐016/PDA95‐22 Annelida Polychaeta Flabelligerida Flabelligeridae Pherusa affinis 6
RAJ‐016/PDA95‐22 Annelida Polychaeta Eunicida Lumbrineridae Ninoe nigripes 1
RAJ‐016/PDA95‐22 Annelida Polychaeta Opheliida Scalibregmatidae Scalibregma inflatum 3
RAJ‐016/PDA95‐22 Annelida Polychaeta Phyllodocida Goniadidae Goniada (LPIL) 1
RAJ‐016/PDA95‐22 Annelida Polychaeta Phyllodocida Polynoidae Polynoidae (LPIL) 2
RAJ‐016/PDA95‐22 Annelida Polychaeta Phyllodocida Sphaerodoridae Sphaerodoridium minutum 2
RAJ‐016/PDA95‐22 Annelida Polychaeta Phyllodocida Nephtyidae Nephtyidae (LPIL) 5
RAJ‐016/PDA95‐22 Annelida Polychaeta Terebellida Ampharetidae Melinna maculata 1
RAJ‐016/PDA95‐22 Annelida Polychaeta Phyllodocida Nereididae Ceratocephale oculata 1
RAJ‐016/PDA95‐22 Annelida Polychaeta Spionida Apistobranchidae Apistobranchus tullbergi 5
RAJ‐016/PDA95‐22 Annelida Oligochaeta Tubificida Naididae Naididae (LPIL) 2
RAJ‐016/PDA95‐22 Annelida Polychaeta Terebellida Ampharetidae Ampharetidae (LPIL) 1
RAJ‐016/PDA95‐22 Annelida Polychaeta Scolecida Capitellidae Capitella capitata 1
RAJ‐016/PDA95‐22 Annelida Polychaeta Phyllodocida Polynoidae Harmothoe imbricata 1
RAJ‐016/PDA95‐22 Annelida Polychaeta Orbiniida Orbiniidae Leitoscoloplos (LPIL) 4
RAJ‐016/PDA95‐22 Annelida Polychaeta Terebellida Cirratulidae Aphelochaeta marioni 3
RAJ‐016/PDA95‐22 Annelida Polychaeta Spionida Spionidae Spiophanes missionensis 1
RAJ‐016/PDA95‐22 Annelida Polychaeta Terebellida Ampharetidae Ampharete acutifrons 1
RAJ‐017/SREF‐07 Nemertea Anopla Heteronemertea Lineidae Lineidae (LPIL) 1
RAJ‐017/SREF‐07 Nemertea Nemertea (LPIL) 3
RAJ‐017/SREF‐07 Arthropoda Malacostraca Amphipoda Stenothoidae Metopella angusta 2
RAJ‐017/SREF‐07 Arthropoda Malacostraca Cumacea Diastylidae Leptostylis longimana 1
RAJ‐017/SREF‐07 Arthropoda Malacostraca Amphipoda Phoxocephalidae Harpinia propinqua 3
RAJ‐017/SREF‐07 Arthropoda Malacostraca Amphipoda Pleustidae Pleustidae (LPIL) 1
RAJ‐017/SREF‐07 Echinodermata Ophiuroidea Ophiurida Amphiuridae Amphiuridae (LPIL) 5
RAJ‐017/SREF‐07 Mollusca Aplacophora Aplacophora (LPIL) 1
RAJ‐017/SREF‐07 Mollusca Bivalvia Nuculida Nuculidae Ennucula aegeensis 11
RAJ‐017/SREF‐07 Mollusca Bivalvia Nuculida Nuculidae Ennucula tenuis 18
RAJ‐017/SREF‐07 Mollusca Bivalvia Nuculanida Nuculanidae Nuculana pernula 4
RAJ‐017/SREF‐07 Mollusca Bivalvia Veneroida Carditidae Cyclocardia borealis 6
RAJ‐017/SREF‐07 Mollusca Bivalvia Pholadomyoida Periplomatidae Periploma papyratium 12
RAJ‐017/SREF‐07 Mollusca Bivalvia Veneroida Thyasiridae Thyasira flexuosa 17
RAJ‐017/SREF‐07 Mollusca Gastropoda Gastropoda (LPIL) 1
RAJ‐017/SREF‐07 Mollusca Bivalvia Myoida Corbulidae Corbula contracta 4
RAJ‐017/SREF‐07 Mollusca Scaphopoda Dentaliida Dentaliidae Dentaliidae (LPIL) 3
Appendix I‐ Benthic Community Taxonomy Results Page 5 of 8

Monitoring Survey at the Portland Disposal Site September 2016
Station Name Phylum Class Order Family ID Number
RAJ‐017/SREF‐07 Mollusca Bivalvia Nuculoida Yoldiidae Yoldia limatula 32
RAJ‐017/SREF‐07 Mollusca Bivalvia Mytiloida Mytilidae Crenella decussata 35
RAJ‐017/SREF‐07 Mollusca Bivalvia Veneroida Astartidae Astarte undata 28
RAJ‐017/SREF‐07 Mollusca Gastropoda Neotaenioglossa Rissoidae Onoba pelagica 39
RAJ‐017/SREF‐07 Mollusca Bivalvia Cardiida Cardiidae Parvicardium pinnulatum 1
RAJ‐017/SREF‐07 Annelida Polychaeta Canalipalpata Sternaspidae Sternaspis scutata 7
RAJ‐017/SREF‐07 Annelida Polychaeta Scolecida Maldanidae Maldanidae (LPIL) 115
RAJ‐017/SREF‐07 Annelida Polychaeta Terebellida Cirratulidae Cirratulidae (LPIL) 80
RAJ‐017/SREF‐07 Annelida Polychaeta Terebellida Trichobranchidae Trichobranchus glacialis 2
RAJ‐017/SREF‐07 Annelida Polychaeta Eunicida Lumbrineridae Ninoe nigripes 12
RAJ‐017/SREF‐07 Annelida Polychaeta Terebellida Cirratulidae Monticellina dorsobranchialis 3
RAJ‐017/SREF‐07 Annelida Polychaeta Sabellida Sabellidae Euchone incolor 29
RAJ‐017/SREF‐07 Annelida Polychaeta Scolecida Paraonidae Levinsenia gracilis 14
RAJ‐017/SREF‐07 Annelida Polychaeta Scolecida Paraonidae Aricidea quadrilobata 43
RAJ‐017/SREF‐07 Annelida Polychaeta Terebellida Cirratulidae Tharyx acutus 14
RAJ‐017/SREF‐07 Annelida Polychaeta Phyllodocida Nereididae Ceratocephale oculata 1
RAJ‐017/SREF‐07 Annelida Oligochaeta Tubificida Naididae Naididae (LPIL) 17
RAJ‐017/SREF‐07 Annelida Polychaeta Phyllodocida Goniadidae Goniada (LPIL) 4
RAJ‐017/SREF‐07 Annelida Polychaeta Spionida Spionidae Prionospio steenstrupi 23
RAJ‐017/SREF‐07 Annelida Polychaeta Spionida Spionidae Prionospio (LPIL) 2
RAJ‐017/SREF‐07 Annelida Polychaeta Phyllodocida Syllidae Streptosyllis pettiboneae 1
RAJ‐017/SREF‐07 Annelida Polychaeta Cossurida Cossuridae Cossura soyeri 9
RAJ‐017/SREF‐07 Annelida Polychaeta Flabelligerida Flabelligeridae Brada villosa 1
RAJ‐017/SREF‐07 Annelida Polychaeta Terebellida Trichobranchidae Terebellides stroemi 5
RAJ‐017/SREF‐07 Annelida Polychaeta Opheliida Scalibregmatidae Scalibregma inflatum 3
RAJ‐017/SREF‐07 Annelida Polychaeta Phyllodocida Nephtyidae Nephtys incisa 2
RAJ‐017/SREF‐07 Annelida Polychaeta Phyllodocida Pholoidae Pholoe minuta 3
RAJ‐017/SREF‐07 Annelida Polychaeta Phyllodocida Nephtyidae Nephtyidae (LPIL) 6
RAJ‐017/SREF‐07 Annelida Polychaeta Scolecida Capitellidae Mediomastus (LPIL) 4
RAJ‐017/SREF‐07 Annelida Polychaeta Terebellida Cirratulidae Monticellina baptisteae 8
RAJ‐017/SREF‐07 Annelida Polychaeta Scolecida Paraonidae Aricidea (LPIL) 2
RAJ‐017/SREF‐07 Annelida Polychaeta Terebellida Cirratulidae Chaetozone setosa 7
RAJ‐017/SREF‐07 Annelida Polychaeta Terebellida Terebellidae Terebellidae (LPIL) 1
RAJ‐017/SREF‐07 Annelida Polychaeta Spionida Spionidae Spiophanes missionensis 5
RAJ‐017/SREF‐07 Annelida Polychaeta Eunicida Lumbrineridae Lumbrineridae (LPIL) 3
RAJ‐017/SREF‐07 Annelida Polychaeta Oweniida Oweniidae Galathowenia oculata 3
RAJ‐017/SREF‐07 Annelida Polychaeta Phyllodocida Phyllodocidae Eteone longa 3
RAJ‐017/SREF‐07 Annelida Polychaeta Sabellida Sabellidae Sabellidae (LPIL) 2
RAJ‐017/SREF‐07 Annelida Polychaeta Terebellida Ampharetidae Ampharetidae (LPIL) 1
RAJ‐017/SREF‐07 Annelida Polychaeta Terebellida Terebellidae Polycirrus eximius 1
RAJ‐017/SREF‐07 Annelida Polychaeta Flabelligerida Flabelligeridae Pherusa affinis 1
RAJ‐018/SREF‐10 Nemertea Anopla Heteronemertea Lineidae Lineidae (LPIL) 4
RAJ‐018/SREF‐10 Nemertea Anopla Heteronemertea Lineidae Micrura (LPIL) 2
RAJ‐018/SREF‐10 Nemertea Nemertea (LPIL) 8
RAJ‐018/SREF‐10 Sipuncula Sipuncula (LPIL) 7
RAJ‐018/SREF‐10 Nemertea Enopla Monostilifera Tetrastemmatidae Tetrastemma (LPIL) 17
Appendix I‐ Benthic Community Taxonomy Results Page 6 of 8

Monitoring Survey at the Portland Disposal Site September 2016
Station Name Phylum Class Order Family ID Number
RAJ‐018/SREF‐10 Arthropoda Malacostraca Amphipoda Phoxocephalidae Harpinia propinqua 4
RAJ‐018/SREF‐10 Arthropoda Malacostraca Cumacea Nannastacidae Campylaspis sp. AA 1
RAJ‐018/SREF‐10 Arthropoda Malacostraca Cumacea Leuconidae Eudorella pusilla 1
RAJ‐018/SREF‐10 Arthropoda Malacostraca Amphipoda Pleustidae Stenopleustes inermis 1
RAJ‐018/SREF‐10 Arthropoda Malacostraca Amphipoda Lysianassidae Lysianassidae (LPIL) 1
RAJ‐018/SREF‐10 Arthropoda Malacostraca Amphipoda Aoridae Leptocheirus pinguis 1
RAJ‐018/SREF‐10 Echinodermata Ophiuroidea Ophiurida Amphiuridae Amphiuridae (LPIL) 3
RAJ‐018/SREF‐10 Mollusca Aplacophora Aplacophora (LPIL) 5
RAJ‐018/SREF‐10 Mollusca Scaphopoda Dentaliida Dentaliidae Dentaliidae (LPIL) 1
RAJ‐018/SREF‐10 Mollusca Gastropoda Neotaenioglossa Rissoidae Onoba pelagica 22
RAJ‐018/SREF‐10 Mollusca Bivalvia Veneroida Astartidae Astarte undata 46
RAJ‐018/SREF‐10 Mollusca Bivalvia Myoida Corbulidae Corbula contracta 1
RAJ‐018/SREF‐10 Mollusca Bivalvia Mytiloida Mytilidae Crenella decussata 8
RAJ‐018/SREF‐10 Mollusca Bivalvia Veneroida Carditidae Cyclocardia borealis 4
RAJ‐018/SREF‐10 Mollusca Bivalvia Nuculanida Nuculanidae Nuculana pernula 1
RAJ‐018/SREF‐10 Mollusca Bivalvia Pholadomyoida Periplomatidae Periploma papyratium 17
RAJ‐018/SREF‐10 Mollusca Bivalvia Nuculoida Yoldiidae Yoldia (LPIL) 3
RAJ‐018/SREF‐10 Mollusca Bivalvia Nuculoida Yoldiidae Yoldia limatula 21
RAJ‐018/SREF‐10 Mollusca Bivalvia Veneroida Thyasiridae Thyasira flexuosa 20
RAJ‐018/SREF‐10 Mollusca Bivalvia Nuculoida Nuculidae Nucula proxima 38
RAJ‐018/SREF‐10 Mollusca Bivalvia Nuculida Nuculidae Ennucula tenuis 40
RAJ‐018/SREF‐10 Mollusca Bivalvia Nuculida Nuculidae Ennucula aegeensis 8
RAJ‐018/SREF‐10 Mollusca Gastropoda Cephalaspidea Scaphandridae Acteocina (LPIL) 5
RAJ‐018/SREF‐10 Mollusca Gastropoda Cephalaspidea Haminoeidae Haminoea solitaria 1
RAJ‐018/SREF‐10 Mollusca Gastropoda Pyramidelloida Pyramidellidae Pyramidellidae (LPIL) 1
RAJ‐018/SREF‐10 Annelida Polychaeta Terebellida Cirratulidae Cirratulidae (LPIL) 98
RAJ‐018/SREF‐10 Annelida Polychaeta Phyllodocida Nephtyidae Nephtyidae (LPIL) 3
RAJ‐018/SREF‐10 Annelida Polychaeta Phyllodocida Nephtyidae Nephtys incisa 8
RAJ‐018/SREF‐10 Annelida Polychaeta Terebellida Ampharetidae Ampharetidae (LPIL) 2
RAJ‐018/SREF‐10 Annelida Polychaeta Flabelligerida Flabelligeridae Pherusa (LPIL) 2
RAJ‐018/SREF‐10 Annelida Polychaeta Scolecida Paraonidae Levinsenia gracilis 6
RAJ‐018/SREF‐10 Annelida Polychaeta Terebellida Trichobranchidae Trichobranchus glacialis 2
RAJ‐018/SREF‐10 Annelida Polychaeta Scolecida Capitellidae Mediomastus (LPIL) 8
RAJ‐018/SREF‐10 Annelida Polychaeta Scolecida Maldanidae Maldanidae (LPIL) 23
RAJ‐018/SREF‐10 Annelida Polychaeta Terebellida Cirratulidae Tharyx acutus 16
RAJ‐018/SREF‐10 Annelida Polychaeta Flabelligerida Flabelligeridae Flabelligeridae (LPIL) 1
RAJ‐018/SREF‐10 Annelida Polychaeta Spionida Spionidae Prionospio steenstrupi 8
RAJ‐018/SREF‐10 Annelida Polychaeta Canalipalpata Sternaspidae Sternaspis scutata 13
RAJ‐018/SREF‐10 Annelida Polychaeta Terebellida Cirratulidae Chaetozone setosa 2
RAJ‐018/SREF‐10 Annelida Polychaeta Oweniida Oweniidae Galathowenia oculata 2
RAJ‐018/SREF‐10 Annelida Polychaeta Spionida Spionidae Spio setosa 2
RAJ‐018/SREF‐10 Annelida Polychaeta Eunicida Lumbrineridae Ninoe nigripes 6
RAJ‐018/SREF‐10 Annelida Polychaeta Scolecida Paraonidae Aricidea quadrilobata 19
RAJ‐018/SREF‐10 Annelida Polychaeta Flabelligerida Flabelligeridae Pherusa affinis 1
RAJ‐018/SREF‐10 Annelida Polychaeta Flabelligerida Flabelligeridae Brada villosa 2
RAJ‐018/SREF‐10 Annelida Oligochaeta Tubificida Naididae Naididae (LPIL) 3
Appendix I‐ Benthic Community Taxonomy Results Page 7 of 8

Monitoring Survey at the Portland Disposal Site September 2016
Station Name Phylum Class Order Family ID Number
RAJ‐018/SREF‐10 Annelida Polychaeta Phyllodocida Phyllodocidae Eteone longa 2
RAJ‐018/SREF‐10 Annelida Polychaeta Terebellida Trichobranchidae Terebellides stroemi 2
RAJ‐018/SREF‐10 Annelida Polychaeta Spionida Spionidae Spiophanes missionensis 1
RAJ‐018/SREF‐10 Annelida Polychaeta Phyllodocida Pholoidae Pholoe minuta 6
RAJ‐018/SREF‐10 Annelida Polychaeta Opheliida Scalibregmatidae Scalibregma inflatum 2
RAJ‐018/SREF‐10 Annelida Polychaeta Phyllodocida Polynoidae Harmothoe imbricata 2
RAJ‐018/SREF‐10 Annelida Polychaeta Terebellida Terebellidae Polycirrus eximius 1
Appendix I‐ Benthic Community Taxonomy Results Page 8 of 8