Influence of temperature on the electrical conductivity of leachate from municipal solid waste
Upload
khangminh22Category
view
1download
0
BIODRYING PROCESS: A SUSTAINABLE
TECHNOLOGY FOR MUNICIPAL SOLID WASTE
MANAGEMENT
A THESIS
Submitted by
ASHA P TOM
for the award of the degree
of
DOCTOR OF PHILOSOPHY
DIVISION OF CIVIL ENGINEERING
SCHOOL OF ENGINEERING
COCHIN UNIVERSITY OF SCIENCE AND TECHNOLOGY, KOCHI
OCTOBER 2018

Dedicated to
The God Almighty
DIVISION OF CIVIL ENGINEERING
SCHOOL OF ENGINEERING
COCHIN UNIVERSITY OF SCIENCE AND TECHNOLOGY
CERTIFICATE
This is to certify that the thesis entitled “BIODRYING PROCESS: A
SUSTAINABLE TECHNOLOGY FOR MUNICIPAL SOLID WASTE
MANAGEMENT” submitted by Asha P Tom to the Cochin University of Science
and Technology, Kochi for the award of the degree of Doctor of Philosophy is a
bonafide record of research work carried out by her under my supervision and
guidance at the Division of Civil Engineering, School of Engineering, Cochin
University of Science and Technology. The contents of this thesis, in full or in parts,
have not been submitted to any other University or Institute for the award of any
degree or diploma. All the relevant corrections and modifications suggested by the
audience during the pre-synopsis seminar and recommended by the Doctoral
Committee have been incorporated in the thesis.
Place: Kochi Prof. (Dr) Renu Pawels
Date: 22-10-2018 Research Guide
Professor
Division of Civil Engineering
School of Engineering
Cochin University of Science and
Technology, Kochi 682 022

DECLARATION
I hereby declare that the work presented in the thesis entitled “BIODRYING
PROCESS: A SUSTAINABLE TECHNOLOGY FOR MUNICIPAL SOLID
WASTE MANAGEMENT” is based on the original research work carried out by
me under the supervision and guidance of Dr. Renu Pawels, Professor, Division of
Civil Engineering, School of Engineering, Cochin University of Science and
Technology for the award of the degree of Doctor of Philosophy with Cochin
University of Science and Technology. I further declare that the contents of this thesis
in full or in parts have not been submitted to any other University or Institute for the
award of any degree or diploma.
Place: Kochi Asha P Tom
Date: 22-10-2018

i
ACKNOWLEDGEMENTS
I would like to express my deep sense of gratitude to my research guide Dr. Renu
Pawels. She gave me the freedom to choose this project, and the support and care
provided throughout the work helped me to complete the work. Her organizing
capacity was the inspiring factor without which such a project would not be possible
for me. I am very thankful for all the support and care you have provided me
throughout the research work, without that this journey would not have been possible.
I would like to express my sincere gratitude to Dr. Ajit Haridas, chief scientist,
National Institute of Interdisciplinary Science and Technology, CSIR,
Thiruvananthapuram for his valuable guidance and constant inspiration. His sound
knowledge in all fields of engineering and technology was the back bone and key
factor for the success of this research work. I would like to express my heartfelt
thanks to Dr. G. Madhu for the precious suggestions towards improving the research
work, and for the kind support throughout the research period. I would like to thank
Kerala State Council for Science Technology and Environment (KSCSTE) for the
financial support provided for the research. I am very thankful to the former director
Dr. Suresh Das and the present director Dr. Ajay Ghosh of National Institute of
Interdisciplinary Science and Technology, CSIR, Thiruvananthapuram for providing
me the laboratory facilities at NIIST Trivandrum. I would like to express my sincere
gratitude to Dr. Sreejith P. S. for the support provided during pre-synopsis
presentation. I would like to thank the Principal of School of Engineering,
Dr. M.R.Radhakrishna Panicker for the inspiration and support provided.
Also I would like to express my sincere gratitude to Dr. Glory Joseph, Dr. Subha V,
Dr. Sobha Cyrus, Dr. K.S. Beena, Dr. Benny Mathews Abraham, Sri. Arun Kumar T,
Dr. Deepa G Nair, Dr. Deepa Balakrishnan S, Smt. Seena Skaria, Sri Kunjumon V C
for the creative suggestions towards this research work. I would like to thank
Dr. J Ansari, Dr. V.B.Manilal, Dr. K.P Prathish, Dr. Krishmakumar B,
Smt.Vijayaprasad, Smt.Saharuba P Sri Shajikumar V.K., Dr. Savithri S,
Dr. Elizabeth Jacob and Sri. B Abdul Haleeem for the timely support provided
towards my research work.

ii
I would like to thank my friends Prasad, Pradeesh, Sayana, Cincy,Sony, Jyothi, Anu,
Mareena, Aquilla, Faizal, Paneer Selvam, Sumi, Priya, Anju, Aneesh, Anupama,
Godwin, Rahul, Chithran, Dipin, Dayal, Shibin, Jasmine, Siddarth, Swetha,
Parvathy, Athira, Remya, Shimi, Ashik, Ajith, Shakthi, Fahdad, Sanju, Anna,
Satheesh, Rajesh and Arun for their support towards this research.
I would like to express my love to my family and to all my dear ones without whose
support this may not be possible. Finally I remember God almighty for giving me all
these wonderful persons in my life to guide me and support me in this research work.
Asha P Tom

iii
ABSTRACT
Key words: Biodrying, moisture content, municipal solid waste, temperature
profile, weight reduction, volume reduction.
Municipal solid waste management is a major challenge in developing countries. The
world is facing another challenge of fast depleting fossil fuel resources which lead to
an extensive search for renewable energy resources. The above two strategies of a
proper municipal solid waste management system, as well as the need of renewable
energy resources, are highlighting the importance of technologies for municipal solid
waste to energy conversion. Municipal solid waste (MSW) is a renewable energy
resource since the energy content of MSW source stream is biogenic and also
promoting energy production from the MSW will reduce the landfill volume.
Municipal solid waste with high moisture content, high specific weight and low
calorific value is the typical characteristics observed in developing countries. The
high moisture content of the MSW is a critical issue which adversely affects the
calorific value and hence the waste to energy prospects of municipal solid waste.
In this scenario, the ‘Biodrying Technology’ is found to be a sustainable method for
the conversion of raw MSW substrate with high moisture content into the biodried
substrate with low moisture content and increased calorific value. Biodrying is an
aerobically controlled convective evaporation process which utilises the self heating
nature of municipal solid waste for drying purpose. The primary objective of the
current research is to develop a competent and well acclimatised ‘Pilot Scale
Biodrying Reactor’ for treating the mixed municipal solid waste of high moisture
content. The present research work has been carried out in four stages. In the first
stage the characterisation study of the municipal solid waste has been carried out to
check the feasibility of the same for biodrying reaction. The ‘Proximate Analysis' of
the different components of the mixed municipal solid waste substrate has been used
to evaluate the moisture content and volatile solids content. In the second stage, an
innovative ‘Pilot Scale Biodrying Reactor' has been structurally developed for
treating mixed municipal solid waste substrate of high moisture content. The
‘Biodrying Process Design' has also been carried out to achieve controlled aerobic
process inside the mixed municipal solid waste substrate so as to attain optimum self

iv
heating reactions. The instrumentation design has been done by considering the
critical process conditions. The third stage of research included six phases of
experimental investigations conducted in the innovative pilot scale biodrying reactor
system. The mechanism of biodrying reaction has been delineated through the
continuous monitoring of weight reduction, temperature profile, moisture reduction,
volume reduction and bulk density increase of the reactor matrix through the
investigation carried out in six phases. The calorific value of the biodried municipal
solid waste has been calculated in the fourth stage of research using the existing
empirical modelling equations, so as to assess its suitability for waste to energy
applications.
The innovative biodrying reactor developed for mixed municipal solid waste with
high moisture content has achieved a significant weight loss of 41 % in 11 days of
reaction. Maximum moisture reduction of 39 % and volume reduction of 44 % has
been achieved in the designed system in 11 days of process. Self heating temperature
of 50 0C to 60
0C has been developed in the designed biodrying reactor matrix, which
is ensuring hygienisation of the biodried output. The calorific value of municipal
solid waste has been increased from the initial value of 10.06 MJ/kg to the final value
of 28.35 MJ/kg which is promising towards waste to energy applications of municipal
solid waste.

v
CONTENTS
ACKNOWLEDGEMENTS ...................................................................................... i
ABSTRACT ........................................................................................................... iii
LIST OF TABLES .................................................................................................. xi
LIST OF FIGURES ............................................................................................... xii
LIST OF ABBREVIATIONS ............................................................................. xvii
LIST OF NOTATIONS ...................................................................................... xviii
CHAPTER 1 INTRODUCTION ................................................................ 1
1.1 General .................................................................................. 1
1.2 Present Scenario of Solid Waste Management
Technologies ........................................................................... 2
1.3 Objectives of the Research ..................................................... 7
1.4 Thesis Outline ........................................................................ 7
1.5 Organization of the Thesis ...................................................... 8
CHAPTER 2 LITERATURE REVIEW .................................................. 10
2.1 Introduction ......................................................................... 10
2.2 Waste Hierarchy .................................................................. 10
2.2.1 Waste Prevention and Minimisation ...................... 11
2.2.2 Reuse and Recycling ............................................. 11
2.2.3 Energy and Recovery ............................................. 12
2.2.4 Disposal ................................................................. 12
2.3 Municipal Solid Waste Value Chain ................................... 13
2.4 Solid waste Management Technologies ............................. 15
2.4.1 Anaerobic Digestion ............................................... 16
2.4.2 Composting ............................................................ 17
2.4.3 Incineration ............................................................. 19
2.4.4 Pyrolysis ................................................................. 21
2.4.5 Gasification ............................................................ 23
2.4.6 Landfilling .............................................................. 24
2.5 Existing Technological Gaps ................................................ 26
2.6 Waste to Energy Technologies ............................................. 27
2.7 Challenges of Treating Municipal Solid Waste with
High Moisture Content ......................................................... 29
2.8 Biodrying Process ................................................................. 32
2.8.1 Mechanism of Biodrying ....................................... 34

vi
2.8.2 Biodrying Process- Design Considerations for
Physical Parameters ................................................ 36
2.8.3 Biodrying Vs Thermal Drying .............................. 40
2.9 Evaluation of Biodrying Process at Different Levels ........... 42
2.9.1 Micro-Level ............................................................ 43
2.9.2 Particle Level .......................................................... 47
2.9.3 Macro- Level Studies ............................................ 51
2.10 Material Balance in Biodrying ............................................. 53
2.11 Heat Energy in Biodrying ..................................................... 54
2.12 Existing Biodrying Reactor Configurations ......................... 55
2.13 Condensation Prevention Techniques .................................. 57
2.13.1 Direct-Transfer Type Exchangers .......................... 58
2.13.2 Direct-Contact Heat Exchangers ........................... 58
2.13.3 Gas–Liquid Exchangers ......................................... 59
2.13.4 Single-Pass Exchangers –Counter flow
Exchanger ............................................................... 59
2.13.5 Cross flow Exchanger ............................................ 61
2.14 Literature Review-Summary ................................................ 66
CHAPTER 3 MUNICIPAL SOLID WASTE
CHARACTERISATION STUDY ..................................... 69
3.1 Municipal Solid Waste Database .......................................... 69
3.2 Materials and Methods ......................................................... 69
3.2.1 Proximate Analysis ................................................. 70
3.2.2 Weighted Average Method for Moisture Content ..... 71
3.2.3 Volatile Solids Content of Mixed Municipal
Solid Waste by Weighted Average Method ........... 71
3.3 Results and Discussions ....................................................... 72
3.4 Summary ............................................................................... 76
CHAPTER 4 BIODRYING REACTOR DEVELOPMENT ................. 77
4.1 General ................................................................................ 77
4.2 Structural Design of Pilot Scale Biodrying Reactor ............. 77
4.2.1 Dimensions of the Biodrying Reactor ................... 77
4.2.2 Material Selection for the Reactor Unit.................. 78
4.2.3 Reactor Chamber .................................................... 79
4.2.4 Insulation Chamber ................................................ 82
4.2.5 Inlet Design- Top Chamber .................................... 83
4.2.6 Outlet Design – Bottom Chamber .......................... 83

vii
4.3 Biodrying Process Design .................................................... 84
4.3.1 Air Flow Design ..................................................... 84
4.4 Heat Energy Requirement in Biodrying ............................... 87
4.5 Self Heating Process in Biodrying........................................ 89
4.6 Process Instrumentation Design and Reactor Operation ...... 90
CHAPTER 5 SIX PHASES OF EXPERIMENTAL
INVESTIGATIONS ON THE INNOVATIVE
PILOT SCALE BIODRYING REACTOR ...................... 94
5.1 Introduction .......................................................................... 94
5.2 Experimental Investigation- Phase 1 - Monitoring of
the Biodrying Process in the Innovative Pilot Scale
Reactor ................................................................................ 95
5.2.1 Objectives ............................................................... 95
5.2.2 Introduction ........................................................... 95
5.2.3 Materials and Methods ........................................... 95
5.2.4 Biodrying Reactor-Process and Working ............... 98
5.2.5 Results .................................................................. 100
5.2.5.1 Temperature Profile ............................. 100
5.2.5.2 Biological Profile ................................. 105
5.2.5.3 Weight Reduction ................................ 106
5.2.5.4 Moisture Profile .................................. 107
5.2.5.5 Volume Reduction ............................... 108
5.2.5.6 Bulk Density Increase in Biodrying
Process ................................................. 109
5.2.5.7 Zero Leachate Process ......................... 110
5.2.5.8 Chemical Analysis ............................... 110
5.2.6 Discussions ........................................................... 111
5.2.7 Summary ............................................................. 114
5.2.8 Limitations ........................................................... 115
5.2.9 Modifications ........................................................ 115
5.3 Experimental Investigation- Phase 2- Biodrying
Process in Modified Reactor ............................................... 116
5.3.1 Objectives ............................................................. 116
5.3.2 Introduction .......................................................... 116
5.3.3 Horizontal Air Flow System ................................. 116
5.3.4 Modified Biodrying Reactor................................. 118
5.3.5 Materials and Methods ......................................... 118
5.3.6 Results and Discussions ....................................... 121

viii
5.3.6.1 Effectiveness of the Modified
Reactor Design ..................................... 121
5.3.6.2 Leachate Free Process .......................... 123
5.3.6.3 Temperature Profile ............................. 123
5.3.6.4 Weight Reduction ............................... 126
5.3.6.5 Moisture Profile ................................... 128
5.3.6.6 Volume Reduction ............................... 130
5.3.6.7 Bulk Density ....................................... 131
5.3.7 Summary ............................................................. 133
5.3.8 Limitations ........................................................... 134
5.3.9 Further Modifications ........................................... 135
5.4 Experimental Investigation- Phase 3- Effect of Specific
Air Flow Rate and Reactor Matrix Height on Biodrying
Reaction .............................................................................. 135
5.4.1 Objectives ............................................................. 135
5.4.2 Introduction ......................................................... 135
5.4.3 Materials and Methods ......................................... 135
5.4.4 Results and Discussions ....................................... 137
5.4.4.1 Temperature Profile ............................. 138
5.4.4.2 Weight Reduction ................................ 141
5.4.4.3 Moisture Profile ................................... 143
5.4.4.4 Volume Reduction ............................... 145
5.4.4.5 Bulk Density ........................................ 146
5.4.5 Summary ............................................................. 148
5.4.6 Limitations ........................................................... 149
5.4.7 Further Process advancement ............................... 149
5.5 Experimental Investigation- Phase 4- Combined Effect
of Packing and Reactor Matrix Height on Biodrying
Process ................................................................................ 149
5.5.1 Objectives ............................................................ 149
5.5.2 Introduction ......................................................... 150
5.5.3 Materials and Methods ......................................... 150
5.5.4 Results and Discussions ....................................... 150
5.5.4.1 Temperature Profile ............................. 151
5.5.4.2 Weight Reduction ................................ 154
5.5.4.3 Moisture Profile .................................. 155
5.5.4.4 Volume Reduction ............................... 157
5.5.4.5 Bulk Density ....................................... 159
5.5.5 Summary ............................................................. 160

ix
5.5.6 Limitations ............................................................ 161
5.5.7 Further Process Advancement ............................. 161
5.6 Experimental Investigation- Phase- 5- Effect of
Increasing the Specific Air Flow Rate on the Biodrying
Process Efficiency .............................................................. 162
5.6.1 Objectives ............................................................. 162
5.6.2 Introduction ......................................................... 162
5.6.3 Materials and Methods ......................................... 162
5.6.4 Results and Discussions ....................................... 163
5.6.4.1 Temperature Profile ............................. 163
5.6.4.2 Weight Reduction ................................ 166
5.6.4.3 Moisture Profile ................................... 168
5.6.4.4 Volume Reduction ............................... 169
5.6.4.5 Bulk Density ....................................... 171
5.6.4.6 Air Porosity ......................................... 173
5.6.6 Summary .............................................................. 175
5.6.7 Limitations ............................................................ 176
5.6.8 Further Advancements ......................................... 176
5.7 Experimental Investigation- Phase-6- Down Flow
Mode of Aeration in Biodrying Process ............................. 176
5.7.1 Objectives ............................................................. 176
5.7.2 Introduction .......................................................... 176
5.7.3 Materials and Methods ......................................... 176
5.7.4 Results and Discussions ....................................... 179
5.7.4.1 Weight Reduction ................................ 179
5.7.4.2 Temperature Profile ............................. 180
5.7.4.3 Moisture Profile ................................... 181
5.7.4.4 Volume Reduction -Down Flow
Mode of Aeration ................................. 181
5.7.4.5 Bulk Density Profile ............................ 182
5.7.4.6 Leachate Production ............................ 183
5.7.5 Summary ............................................................. 183
5.7.6 Limitations ............................................................ 184
5.7.7 Future Recommendations ..................................... 184
5.8 Overall Assessment of Six Phases of Experimental
Investigations ...................................................................... 184
5.8.1 General ................................................................. 184
5.8.2 Weight Reduction ................................................. 185
5.8.3 Moisture Reduction ............................................. 186

x
5.8.4 Volume Reduction ................................................ 188
5.8.5 Bulk Density ......................................................... 189
5.8.6 Assessment of Sixth Phase of Study .................... 190
5.8.7 Temperature Cumulation Index ............................ 191
5.8.8 Mass Balance Analysis in Biodrying ................... 193
5.8.8.1 Moisture Reduction Basis .................... 193
5.8.8.2 CO2 Emission Loss Based Mass
Balance Analysis .................................. 194
CHAPTER 6 CALORIFIC VALUE OF RAW VS BIODRIED
SUBSTRATE .................................................................... 197
6.1 Introduction ........................................................................ 197
6.1.1 Proximate Analysis ............................................... 197
6.1.2 Physical Composition Analysis ............................ 198
CHAPTER 7 SUMMARY AND CONCLUSIONS ............................... 203
7.1 Summary ............................................................................. 203
7.2 Conclusions ........................................................................ 205
7.3 Limitations of the Study ..................................................... 209
7.4 Scope for Further Studies ................................................... 209
REFERENCES .................................................................................................. 211
ANNEXURE I .................................................................................................... 233
ANNEXURE II .................................................................................................. 234
LIST OF PUBLICATIONS BASED ON THIS THESIS ............................... 235
CURRICULAM VITAE

xi
LIST OF TABLES
Table Title Page No
1.1 Municipal Solid Waste Generation Estimated Based on
Direct Sampling .................................................................................... 4
1.2 Municipal Solid Waste Scenario in Kerala -2006 ................................ 5
2.1 Technologies for Thermo-chemical Conversion of MSW for
Electricity Production ........................................................................ 24
2.2 The Relative Composition of Household Waste in Low,
Medium and High- Income Countries ................................................ 30
2.3 Glucose Reduction Reaction ............................................................... 46
4.1 The Structural Dimensions of the Reactor .......................................... 78
4.2 Process Design Calculations ............................................................... 87
4.3 Heat Requirements of Biodrying Process ........................................... 88
5.2.1 Composition of the Synthetic Municipal Solid Waste
Substrate in Phase1 ............................................................................. 97
5.2.2 Chemical Analysis Results- Phase 1 ........................................................ 111
5.3.1 Mixed Municipal Solid Waste Substrate Composition- Phase 2 ........... 121
5.4.1 Substrate Composition- Phase 3 ....................................................... 136
5.5.1 Proportion of MSW - Phase 4 ........................................................... 150
5.6.1 Composition of Mixed MSW ........................................................... 163
5.7.1 Composition of MSW substrate ........................................................ 178
5.8.1 Input Vs Output Parameters for Five Phases .................................... 185
5.8.2 Mass Balance Calculations ............................................................... 194
5.8.3 Measured Emission Loss .................................................................. 195
6.1 Composition of Different Components of Mixed Municipal
Solid Waste ....................................................................................... 199
6.2 Lower Heat Value of MSW- Comparison of Five Phases
of Biodrying Process ......................................................................... 199
6.3 Average Lower Heat Value of Mixed MSW in kJ/kg-
Comparison of Five Phases of Studies Before and After
Biodrying Process ............................................................................. 200
6.4 The Calorific Value of Raw and Biodried MSW-Phase 6 ................ 201
6.5 Existing Data on MSW and RDF Comparison ................................. 202

xii
LIST OF FIGURES
Figure Title Page No
2.1 Waste Hierarchy Tripod...................................................................... 10
2.2 MSW Value Chain .............................................................................. 13
2.3 Municipal Solid Waste Treatment Technologies ............................. 16
2.4 Flow Diagram for the Production of Electricity from Fast
Pyrolysis of Municipal Solid Waste ................................................... 22
2.5 Correlation of Moisture Content and Calorific Value of MSW ......... 31
2.6 The Process Flow Diagram of Biodrying ........................................... 35
2.7 Different Phases in the Biodrying Process ......................................... 36
2.8 Thermal Drying and Biodrying .......................................................... 41
2.9 Different Levels of the Biodrying Process ......................................... 43
2.10 Growth Phases of Micro-organisms ................................................... 45
2.11 The Schematic Representation of the Complexity of
Biotechnological Processes. ...................................................................... 47
2.12 Biodrying Process Flow Diagram ....................................................... 52
2.13 Mass Balance Flow Diagram .............................................................. 53
2.14 Herof System ..................................................................................... 56
2.15 Static Enclosed Chamber with Perforated Pipes Blowing and
Pulling Air Alternately ....................................................................... 56
2.16 Rotating Drum Reactor ...................................................................... 57
2.17 a-Double-Pipe Heat Exchanger with Pure Counter Flow; (b-f)
Plate –Fin Exchangers with Counter Flow Core and Cross
Flow Headers ...................................................................................... 59
2.18 Temperature Distributions in a Counter Flow Heat Exchanger
of Single-Phase Fluids ........................................................................ 60
2.19 (a) Hot-side Solid and Fluid Temperature Excursion; (b)
Balanced (Ch=Cc)Regenerator Temperature Distributions at
the Switching Instant .......................................................................... 61
2.20 (a) Plate-fin Unmixed Cross Flow Heat Exchanger; (b)
Serpentine (one tube row) Tube-Fin Unmixed Cross Flow
Heat Exchanger .................................................................................. 62
2.21 Temperature Distributions at Inlets and Outlets of an
Unmixed Cross Flow heat exchanger ................................................. 63

xiii
2.22 Symbolic Representation of Various Degrees of Mixing in a
Single-Phase Cross Flow Exchanger .................................................. 64
3.1 Moisture Content (%) and Volatile Solids Content (%) of the
Organic Component of Municipal Solid Waste .................................. 72
3.2 Moisture Content (%) and Volatile Solids Content (%) of
Paper and Cardboard Component of Municipal Solid Waste ............. 73
3.3 Moisture Content (%) and Volatile Solids Content (%) of
Plastics Component of Municipal Solid Waste .................................. 74
3.4 Moisture content (%) and Volatile Solids Content (%) of the
Textiles Component of Municipal Solid Waste .................................. 75
4.1 Pilot Scale Biodrying Reactor............................................................. 79
4.2 Structural Design of Pilot Scale Biodrying Reactor ........................... 81
4.3 Empty Reactor Chamber ..................................................................... 82
4.4 Closed View of Reactor ..................................................................... 83
4.5 Filled Reactor ...................................................................................... 83
4.6 Tanner Diagram .................................................................................. 85
4.7 Psychrometric Chart ........................................................................... 86
4.8 Schematic Diagram of Biodrying Process .......................................... 92
5.2.1 The Different Components of Collected MSW .................................. 94
5.2.2 Temperature Probes Inserted into the Biodrying Reactor .................. 99
5.2.3 Biodrying Reactor Before and After 33 days of Biodrying
Reaction ............................................................................................ 100
5.2.4 Temperature Profile Inside the Biodrying Reactor in the
Initial Six Hours of Reaction- Phase 1.............................................. 101
5.2.5 Temperature Profile Inside the Biodrying Reactor in First 10
Days of Reaction –Phase 1 ............................................................... 102
5.2.6 Temperature Profile Along the Height of Biodrying reactor
During 33 Days of Reaction - Phase1 ............................................... 103
5.2.7 Temperature Contour Plot- Phase 1 .................................................. 104
5.2.8 Weight Reduction Profile in the Biodrying Reactor- Phase1. .......... 106
5.2.9 Average Moisture Content Vs Time- Phase 1 .................................. 107
5.2.10 Volume Reduction- Phase 1 ............................................................. 108
5.2.11 Bulk Density Profile- Phase 1 ........................................................... 109
5.2.12 Phase1-Condensation Process in Top Region of Reactor ................. 115

xiv
5.3.1 Principle of HAF system................................................................... 117
5.3.2 Design Details of HAF system ......................................................... 119
5.3.3 Modified Biodrying Reactor- Phase 2 .............................................. 120
5.3.4 Reactor at the Beginning and End of Biodrying Process-
Phase 2 .............................................................................................. 122
5.3.5 Temperature Profile During the First Eight Hours of
Reaction- Phase 2.............................................................................. 124
5.3.6 Temperature Profile in 15 days – Phase 2 ........................................ 125
5.3.7 Temperature Contour- Phase 2 ......................................................... 125
5.3.8 Temperature Contour for 15 days- Phase 1 ...................................... 126
5.3.9 Weight Reduction Profile- Phase 2 ................................................... 127
5.3.10 Weight reduction % Vs Time - Comparison of First and
Second Phase of studies .................................................................... 128
5.3.11 Average Moisture Profile- Phase 2 ................................................... 129
5.3.12 Average Moisture Content-Variation in 15 Days for First and
Second Phases ................................................................................... 129
5.3.13 Volume Reduction in Biodrying –Phase 2 ....................................... 130
5.3.14 Bulk Volume Reduction-Comparison of First and Second
Phases................................................................................................ 131
5.3.15 Bulk Density Profile- Phase 2 ........................................................... 132
5.3.16 Bulk Density Profile – Comparison of First and Second Phases ........... 133
5.4.1 Filled Reactor Core- Phase 3 ............................................................ 137
5.4.2 Temperature Profile During the First Eight Hours of Reaction
- Phase 3 ............................................................................................ 139
5.4.3 Temperature profile in 15 days – Phase 3......................................... 139
5.4.4 Temperature Contour- Phase 3 ......................................................... 140
5.4.5 Weight Reduction profile- Phase 3 ................................................... 142
5.4.6 Weight Reduction Profile -Comparison of Second and Third
Phase ................................................................................................. 142
5.4.7 Average Moisture Profile during the Biodrying Process-
Phase 3 .............................................................................................. 143
5.4.8 Average Variations in Moisture Profile- Comparison of Phase -2
and Phase -3 ...................................................................................... 144
5.4.9 Volume Reduction in Biodrying- Phase 3 ........................................ 145

xv
5.4.10 Volume Reduction Profile - Second and Third Phase ...................... 146
5.4.11 Bulk Density Profile of Third Phase ................................................. 147
5.4.12 Comparison of Bulk Density Profile for the Second and Third
Phase of studies ................................................................................. 147
5.5.1 Temperature Profile – Phase 4 .......................................................... 152
5.5.2 Contour Plot - Phase 4 ...................................................................... 153
5.5.3 Weight Reduction - Phase 4.............................................................. 154
5.5.4 Weight Reduction Profile –Comparison of Third and Fourth
Phases................................................................................................ 155
5.5.5 Moisture Profile –Phase 4 ................................................................. 156
5.5.6 Moisture Profile -Third and Fourth Phase ........................................ 157
5.5.7 Volume Reduction Profile –Phase 4 ................................................. 158
5.5.8 Volume Reduction – Third and Fourth Phase of Study .................... 158
5.5.9 Bulk Density Profile- Phase 4 ........................................................... 159
5.5.10 Bulk Density Profile of Phase 3 and Phase 4.................................... 160
5.6.1 Temperature Profile of Fifth Phase ................................................... 164
5.6.2 Contour Plot - Fifth Phase ................................................................ 165
5.6.3 Weight Reduction in the Fifth Phase ................................................ 166
5.6.4 Weight Reduction % Vs Time- Phase 4 and Phase 5 ....................... 167
5.6.5 Average Moisture Profile - Fifth Phase ........................................... 168
5.6.6 Moisture Profile -Phase 4 and Phase 5 ............................................. 169
5.6.7 Volume Reduction – Phase 5 ............................................................ 170
5.6.8 Volume Reduction Percentage Vs Time-Phase 4 and Phase 5 ......... 171
5.6.9 Bulk Density Profile- Phase 5 ........................................................... 172
5.6.10 Bulk density Vs Time- Phase 4 and Phase 5 .................................... 172
5.6.11 Air Porosity Reduction With Respect to Time Phase 4 and
Phase 5 .............................................................................................. 174
5.7.1 Schematic Sectional View- Modified Design for the Down
Flow Aeration System ...................................................................... 177
5.7.2 Weight Reduction-Sixth Phase with Down Flow Mode of
Aeration ............................................................................................ 179
5.7.3 Temperature Profile-Down Flow Mode of Aeration- Phase 6 ......... 180

xvi
5.7.4 Average Moisture Profile- Phase 6- Down Flow Mode of
Aeration ..................................................................................... 181
5.7.5 Volume Reduction-Phase 6 - Down Flow Mode of Aeration .......... 182
5.7.6 Bulk Density Profile-Phase 6 - Down Flow Mode of Aeration ........ 182
5.8.1 Weight Reduction Profile ................................................................. 185
5.8.2 Moisture Profile ................................................................................ 187
5.8.3 Volume Reduction ........................................................................... 188
5.8.4 Bulk Density Profile ......................................................................... 189
5.8.5 Assessment of Sixth Phase of Study ................................................. 191
5.8.6 Temperature Cumulation Index in Six Phases of Biodrying
Process .............................................................................................. 191
6.1 Graphical Representation of Calorific value of MSW Substrate
Before and After the Biodrying Process .................................................. 201

xvii
LIST OF ABBREVIATIONS
MSW - Municipal Solid Waste
V.S. - Volatile Solids
R.D.F. - Refuse Derived Fuel
S.R.F - Solid Recovered Fuel
K.S.U.D.P - Kerala State Urban Development Programme
M.C. - Moisture Content
DGMFC - Digital Flow Mass Flow Controller.
CPCB - Central Pollution Control Board
ASTM - American Society for Testing Materials

xviii
LIST OF NOTATIONS
𝜗𝑜2 - Number of molecules of oxygen 𝜗𝑐𝑜2 - Number of molecules of carbon dioxide 𝜗𝐻2𝑂 - Number of molecules of water 𝜗𝑁𝐻3 - Number of molecules of ammonia.
TCI - Temperature cumulation Index
Tm - Mean matrix temperature (°C)
Ti - Temperature of air inlet (°C)
∆𝑡 - Time interval (day)
Wtloss( kg) - The water losses at time t
WM0 (kg) - The wet materials at the initial time
WMt (kg) - Wet materials at time t,
w0 (%) - Water content at initial time
wt (%) - Water content at time t
Eloss, (kg) - Total net emission loss at time t
LOtloss - Leachate weight
LHV - Lower heating value (kcal/kg)
W - Moisture content (%)
Ppl - Plastics (wt %),
Pfo - Food waste (wt %),
Ppa - Paper and card board (wt %)
Pte - Textiles (wt %)
Pmi - Miscellaneous component (wt %)

1
CHAPTER 1
INTRODUCTION
1.1 GENERAL
The management of municipal solid waste (MSW) is a major challenge throughout
the world, and especially in the rapidly growing cities and towns of developing
countries (Foo, 1997). The rapid urbanization followed by the industrial development
and construction activities is supposed to be the major reason for MSW accumulation
(Chattopadhyay et al., 2007). Solid waste management includes the generation,
storage, collection, transfer and transport, processing, and disposal in accordance with
the best principles of health, economics, engineering, conservation, aesthetics, and
other environmental and public considerations (Tchobanoglous et. al.,1993). The
developing countries face unique issues in municipal solid waste management like
open dumping, burning without air, water pollution control measures and breeding of
flies in waste dumping yards which cause major environmental and public health
problems (Ogawa, 2000). The management of solid waste at different stages like
generation, storage, collection, transfer and transport, processing and disposal stages
in developing nations need an environmentally sound technology development which
pertains to the best principles of public health (Ramachandra, 2006; Ramachandra
and Varghese, 2003; Ramachandra and Bachamanda, 2007). The developing
countries sought technical assistance from the developed nations in solid waste
treatment technologies with the assumption that solid waste management problem can
be solved with mechanisation (Lardinios and Van de Klundert, 1997). The ‘blind
technology transfer’ of machinery from developed countries to the developing

2
countries and its subsequent failure has brought attention to the need for appropriate
technology (Beukering et al., 1999) to suit the regional conditions like type of waste,
composition and treatment. Waste to energy (WTE) technology has the potential to
reduce the volume of the original waste by 90%, depending on the composition by
recovering the energy (Wang et al., 2009; Kathiravale et al., 2003). The net energy
yield from municipal solid waste depends upon the composition, the density, and
relative percentage of moisture of the waste (IEA,2003; Fobil et.al., 2005).
Technological development is essential for the conversion of raw municipal solid
waste into an energy enriched product so that it is suitable for energy producing
applications.
1.2. PRESENT SCENARIO OF SOLID WASTE MANAGEMENT TECHNOLOGIES
The solid waste from different sources like residential, industrial, institutional,
commercial, construction and demolition, and municipal services constitute municipal
solid waste (MSW) in India. The urbanisation trends, constant change in consumption
pattern and social behaviour is increasing the generation of municipal solid waste in the
country, beyond the assimilative capacity of existing municipal solid waste
management system. The pollution of water resources, the proliferation of vectors of
communicable diseases, foul odours and the release of toxic metabolites are making
waste dumping sites as hazardous regions. Therefore the landfilling of municipal solid
waste is not at all a sustainable technological option especially in localities where the
land scarcity is a major issue. The amount of municipal solid waste is expected to
increase significantly in the near future as the country strives to attain an industrialized
nation status by the year 2020 (Sharma and Shah, 2005; CPCB, 2004; Shekdar et al.,

3
1992). The current municipal solid waste management system in the country is capable
of collecting 70 % of the total municipal waste generated and out of that only 12.45% is
treated. Approximately 17.55 % of the municipal solid waste remains uncollected and
57.55 % of the collected municipal solid waste is disposed in dumping yards without
proper treatment (Hoornweg and Bhada-Tata, 2012). All these circumstances points
out that need for research and development in the field of MSW management. The
world is facing another challenge of fast depleting fossil fuel resources which lead to an
extensive search for renewable energy resources. The above two strategies of search for
a proper municipal solid waste management system as well as the need of renewable
energy resources are emphasizing the importance of technologies for municipal solid
waste to energy conversion. Municipal solid waste (MSW) is considered as a renewable
energy resource since the energy content of MSW source stream is biogenic. The
energy production from MSW will reduce the landfill volume considerably (USEPA,
2006a; EIA, 2007). The present research set the goal to develop a sustainable treatment
technology for the municipal solid waste management.
The increasing quantities of plastics and non-biodegradable packaging materials in
the municipal solid waste are making the management options more complicated. The
previous study results have shown that about 0.1 million tonnes of municipal solid
waste has been generated in India every day and it is increasing annually at a rapid
rate (CPHEEO, 2000; Sharholy et. al., 2008). The present investigation is carried out
in Kerala the consumer oriented state of India which produces large volume of
municipal solid waste. Considering an annual increase of 1–1.33% of municipal solid
waste (Pappu et al., 2007; Shekdar, 1999; Bhide and Shekdar, 1998) the total

4
municipal solid waste generation in present Kerala state can be estimated as
0.606 kg/capita/day. The database for MSW composition based on direct sampling at
Table.1.1 Municipal Solid Waste Generation Estimated Based on Direct Sampling
SlNo. MSW Generation sources
Quantum of MSW Generation
(Tonnes/day)
Kollam Kochi Thrissur Kozhikkode
1 Domestic sources 95 134.7 75.75 100.12
2 Commercial establishments 1 32.99 13.02 28.16
3 Marriage & community halls 1 4.75 2.12 1.56
4 Hotel & Restaurants 19 29.9 14.57 24.07
5 Markets 6 20.39 11.01 12.08
6 Institutions/ schools, offices 7 14.75 5.51 10.62
7 Street sweepings 14 31.3 13.87 19.28
8 Hospitals(Non-infectious) 2 4.22 3.6 6.64
9 Slaughterhouse 2 5.26 2.25 -
10 Construction& Demolition 7 17.0 13.6 11.0
Total 154 295.26 155.3 213.53
Per capita generation
(kg/day) 0.393 0.482 0.478 0.477
(Varma, 2006)
four cities of Kerala state as obtained from literature review is summarised in
Table. 1.1 (Varma, 2006). It is observed that 55.8% of municipal solid waste of the
Kerala state is coming from domestic sources. Next source contributing more to
MSW is the hotels and commercial establishments. MSW generation rate from
different sources gives an overview of the nature of municipal solid waste of Kerala.
The physical composition of typical MSW at the collection point and dumping sites
obtained from the previous study have shown that on an average 71.74% of the MSW
of Kerala state is putrescible organic matter as shown in Table 1.2 (KSUDP, 2006 ;
Varma, 2006).

5
Table 1.2. Municipal Solid Waste Scenario in Kerala -2006
Composition Changanasseri Kottayam Kannur Aluva Trivandrum Average
Paper 10.2 6.8 8.2 9.72 2.25 7.43
Plastics 4.9 4.25 6.67 6.94 2.79 5.11
Metals 0.2 2.00 1.40 1.38 1.02 1.20
Glass 0.50 2.25 1.60 1.00 1.30 1.33
Rubber&
Leather 0.60 2.20 1.67 1.77 2.11 1.67
Compostable
organics 76.60 73.45 68.73 70.83 69.09 71.74
Others-
Textiles,
Inerts
&domestic
hazardous
7.00 9.05 11.73 8.36 21.44 11.52
The study of the chemical characteristics of typical MSW of the state has revealed
that moisture content of MSW is very high with an average value of 69.7% (KSUDP,
2006; Varma, 2006). The heavy moisture laden nature of municipal solid waste and
mixed mature of MSW collection were identified as the important factors to be
considered in the municipal solid waste management system for the Kerala state.
Mixed municipal solid waste in raw state has a heating value in the range of
8-12 MJ/kg of which is one third of the calorific value of coal (25-30 MJ/kg).
Municipal solid waste composition comprised of high moisture content, high specific
weight and low calorific value is the typical characteristics observed in developing
countries (Ramachandra and Bachamanda, 2007). The lower calorific value of
municipal solid waste due to high moisture content is an important factor affecting
the waste to energy prospects of municipal solid waste (Daskalopoulos et. al., 1997).
The moisture content in waste is adding up septic conditions and hence handling
problems in municipal solid waste systems. Also, the use of auxiliary fuel is often

6
necessary for the combustion of heavy moisture laden substrate which increases the
economics of the energy production processes (Cheng et. al., 2007; Cheng and Hu,
2010; Nie, 2008).
In this scenario the ‘Biodrying Technology' is found to be a sustainable method for
the conversion of raw MSW substrate with high moisture content into an energy
enriched biodried substrate. Biodrying is an aerobically controlled convective
evaporation process which utilises the self heating nature of municipal solid waste for
drying purpose (Velis et. al., 2009). The reduction of weight, moisture content and
bulk volume together with the bulk density augmentation and self-sanitisation at high
temperature is achieved in the biodrying process. The famous waste management
hierarchy (Tchobanoglous et. al., 1993) of giving priority to 3R's namely reduce,
recycle and reuse is followed in biodrying technology, since it promotes efficient
sorting, storage, transportation and end use of waste as a renewable energy source.
Biodrying process is different from composting in that composting is a complete
stabilisation process, where there is no final energy value of the product (Nellist et.
al., 1993). In contrary to that the biodrying reactor partially stabilises the waste at the
lowest possible residence time to produce high quality solid recovered fuel (SRF), by
increasing the energy content (Adani et. al.,2002). It was reported that biodrying
process has increased the potential for thermal recovery of solid waste (Rada et. al.,
2007a). Many researchers have demonstrated that the time taken for the biodrying
process is very less while compared to that for bio-stabilization (Sugni et. al., 2005).
Biodrying is a new technology with only limited research activities (Tambone et. al.,
2011) and hence further research and development are necessary to explore the
process in detail.

7
1.3 OBJECTIVES OF THE RESEARCH
The primary objective of the current research is to develop a competent and
well acclimatised ‘Pilot Scale Biodrying Reactor’ for treating the mixed
municipal solid waste of high moisture content. The selected secondary
objectives to full fill the primary objective were enlisted below.
To study the characteristics of the municipal solid waste based on the
proximate analysis.
The structural and process design of the pilot scale biodrying reactor by
considering the practical as well as technical feasibility.
To investigate the biodrying process in detail by the continuous
monitoring of the process parameters resulting from different phases of
experimental investigations and further design modifications to achieve
the optimum condition.
To study the impact of down flow mode of aeration and its effect on the
biodrying process.
To assess the potential of the calorific value of biodried output to study
its suitability in waste to energy applications.
1.4. THESIS OUTLINE
The present research work has been carried out in four stages.
The characterisation study of the municipal solid waste has been carried out in
the first stage to check the feasibility of the same for biodrying reaction. The
‘Proximate Analysis' of the different components of the mixed municipal solid
waste substrate has been used to evaluate the moisture content and volatile
solids content.
In the second stage, an innovative ‘Pilot Scale Biodrying Reactor' has been
structurally developed for treating mixed municipal solid waste substrate of
high moisture content. The ‘Biodrying Process Design' has also been carried
out to achieve controlled aerobic process inside the mixed municipal solid
waste substrate so as to attain optimum self heating reactions. The
instrumentation design has been done by considering the critical process
conditions.

8
Six phases of experimental investigations have been conducted in the
innovative pilot scale biodrying reactor system in the third stage. The
mechanism of biodrying reaction has been delineated through the continuous
monitoring of ‘Weight Reduction’, ‘Temperature Profile’, ‘Moisture Profile’, ‘Volume Reduction’ and ‘Bulk density Increase’ of the reactor matrix through
the investigation carried out in six phases.
The first five phases of experimental investigation have been conducted in the
up flow mode of aeration.
o In the first phase, the biodrying process in the pilot scale system has been
monitored to assess the efficiency of the designed system.
o The second phase of experimental investigation has been carried out by
modifying the design of the biodrying reactor so as to increase the process
efficiency.
o The effect of specific air flow rate variation and reactor matrix height on
biodrying reaction has been studied in the third phase.
o In the fourth phase, the combined effect of packing and reactor matrix
height on biodrying process has been investigated.
o In the fifth phase, the effect of the increase in specific air flow rate on
biodrying process efficiency has been investigated.
The down flow mode of aeration and its impact on biodrying reaction has been
investigated in the sixth phase.
The calorific value of the biodried municipal solid waste has been calculated in
the fourth stage of research using the existing empirical modelling equations, so
as to assess its suitability for waste to energy applications.
1.5 ORGANIZATION OF THE THESIS
The current thesis has been organised into seven chapters.
Chapter 1 gives an introduction to the research which provides an overview of the
present scenario of municipal solid waste management. The main objectives of the

9
research are highlighted and an overview of the thesis outline as well as the
organisation of the same has been described.
Chapter 2 describes the detailed literature review of the research.
Chapter 3 illustrates the characterization study of the municipal solid waste by
proximate analysis and the suitability of the selected municipal solid waste substrate
for active biological reaction.
In Chapter 4, the design and development of the innovative pilot scale biodrying
reactor unit have been described.
The Chapter 5 deals with the six phases of experimental investigations to explore the
biodrying process in the innovatively developed pilot scale biodrying reactor.
The Chapter 6 of the research included the calorific value assessment of the biodried
product using existing empirical modelling equations.
In Chapter 7, the summary and conclusions derived from the research have been
presented. The conclusions highlighted that the biodrying process efficiency achieved
in the innovative reactor was successful in converting the raw municipal solid waste
into an energy-enriched renewable energy source.

10
CHAPTER 2
LITERATURE REVIEW
2.1 INTRODUCTION
The detailed literature review has been carried out to study the different solid waste
management technologies existing in the world. The pros and cones of each one have
been studied in detail. The evolution of the research topic ‘Biodrying Technology' as
a sustainable solution for treating municipal solid waste with high moisture content
has been described.
2.2 WASTE HIERARCHY
Fig.2.1 Waste Hierarchy Tripod
(Tchnolobanoglous et.al.,1993)

11
2.2.1 Waste Prevention and Minimisation
The waste hierarchy tripod (Fig.2.1) points out that prevention is the most desirable
waste management option, as it eliminates the need for handling, transporting,
recycling and disposal of waste. Also, it helps the optimisation of environmental
resources. Minimisation is any process or activity that avoids, reduces or eliminates
waste at its source or results in other options like reuse, recycling etc.
(Tchnolobanoglous et.al.,1993). Two management options namely waste prevention
and minimisation can be applied at all stages in the life cycle of a product. A
sustainable technology for municipal solid waste treatment should be able to
minimise the waste quantity.
2.2.2 Reuse and Recycling
Reuse is preferred over recycling though the purpose is same for both as energy and
matter are saved. But the efficiency of the product may reduce in reuse and also
certain products become hazardous in the long run. This point out the versatility of
waste prevention and minimisation over other methods of waste management.
Recycling involves the treatment or reprocessing of discarded waste to make it
adequate for reuse. It conserves resources and energy but sometimes tedious, time
consuming and result in net energy loss. The recovery of material value in waste has
been approached in two significantly different ways: (1) By source separation and
separate collection systems; and (2) recovery by mechanical processing and sorting of
mixed residual waste at central facilities (Cimpan et.al., 2015). The inherent
limitations of the source separation became apparent with increased heterogeneity of

12
the MSW stream. Also, the public willingness to participate in the source separated
collection as well as the costs of collecting separately are major factors affecting the
MSW management systems. Material mixing followed by sorting has been adopted in
recent times as a way to reduce the collection complexity and also to minimise the
public participation (USEPA, 2011; WRAP, 2011b).
2.2.3 Energy and Recovery
Biofuel production is increasing at a rapid rate in developed and developing
countries. One of the main reason for supporting biofuel production is the need for
renewable energy production to substitute the conventional fossil fuels in an attempt
to mitigate climate change and reduce dependency on energy imports (Bureau et
al.,2010). The developing countries like India are yet to move ahead in the field of
biofuel energy production. Presently the municipal solid waste and general industrial
and agricultural wastes are the main sources of biomass in India. Therefore energy
production and recovery from municipal solid waste is an important factor in the
renewable energy production and economic development of the region.
2.2.4 Disposal
The bulk volume of municipal solid waste requires large areas of land for disposing
the same. Specially the bulk volume of waste generated in developing nations is very
high, which give rise to additional problems of land pollution, water pollution, growth
and transmission of disease producing vectors etc. The landfilling of huge quantities
of MSW without treatment is not at all a good choice since land scarcity is a serious
issue in urban areas (Varma, 2006).

13
2.3 MUNICIPAL SOLID WASTE VALUE CHAIN
The MSW value chain conventionally consists of three broad aspects, namely,
collection & transportation (C&T), processing and finally the disposal of waste. A
holistic approach to waste management includes efforts to reduce the quantity of
waste generated at all points, which includes waste reduction at the source to the
disposal point. The C&T system includes door-to-door collection of segregated waste
from households followed by transportation to waste processing plants in covered
vehicles. The processing of waste involves the application of appropriate technology,
depending upon the quantity and quality of wastes, so as to reduce the overall
quantity of waste reaching the landfill sites. Technologies that derive value from the
waste to the extent possible should be applied and finally the refuse from the
processing plant is collected and disposed of at the scientifically engineered landfills
(Tchnolobanoglous et.al.,1993). Every segment of MSW management entails cost,
and hence there is a need to manage all the three segments of the MSW value
chain(Fig.2.2) in the most efficient manner.
Fig. 2.2 MSW Value Chain
(Tchnolobanoglous et.al.,1993)
The municipal solid waste collection is an important aspect in maintaining public
health in cities around the world. The amount of MSW collected varies widely by
region and income level; collection within cities can also differ greatly. Collection

14
rates range from a low value of 41% in low-income countries to a high value of 98%
in high-income countries (Tchnolobanoglous et.al., 1993). Waste collection is the
collection of solid waste from the point of production (residential, industrial
commercial, institutional) to the point of treatment or disposal. The municipal solid
waste collection is carried out in several ways as given below.
1. House-to-House: Waste collectors visit the individual house to collect
garbage. The user pays a fee for this service.
2. Community Bins: Users bring their garbage to community bins that are
placed at fixed points in a neighbourhood or locality. MSW is picked up by
the municipality, or its designate, according to a set schedule.
3. Kerb side-Pick-up: Users leave their garbage directly outside their homes
according to a garbage pick-up schedule set with the local authorities.
4. Self Delivered: MSW generators deliver the waste directly to disposal sites or
transfer stations, or hire third-party operators.
5. Contracted Service: Businesses hire firms who arrange collection schedules
and charges with customers (Tchnolobanoglous et.al., 1993).
The municipal solid waste collection efficiencies are also seen to be poor, at around
70 % in most Indian cities and continue to be predominantly manual in nature.
Transfer stations are rarely used, and the same vehicle that collects refuse from the
individual communal bins is also responsible for taking it to the processing or the
disposal site. Collection and transportation activities constitute approximately 80–
95% of the total budget of municipal solid waste management (MSWM). Hence it
forms a critical component in determining the economics of the entire MSWM
system. Another important factor to be considered in the design of municipal solid
waste treatment technologies for a country like India is the waste segregation and

15
storage of the collected MSW. The source sorted collection is not practically
happening in developing countries. The decomposable and non-decomposable wastes
are often disposed of at common communal dustbin/disposal centre in developing
countries (High Powered Expert Committee Report, GOI 2011) The degree of source
separation impacts the total amount of material recycled and the quality of secondary
materials that can be supplied. Therefore municipal solid waste collection without
segregation is an important practical factor to be considered for the design of
municipal treatment systems in the developing countries.. The inefficiency of source
separation was observed as a major cause for the failure of the conventional treatment
facilities. This points out the need for the development of technologies for managing
mixed municipal solid waste.
2.4. SOLID WASTE MANAGEMENT TECHNOLOGIES
The waste remaining after waste minimisation, reuse and recycling should be treated to
reduce the negative impacts to the environment. The different solid waste treatment
technologies can be categorised mainly into three types namely biological, thermal and
landfilling as shown in Fig. 2.3 (Tan et.al., 2014). The thermal treatment methods used
for municipal solid waste management are incineration, pyrolysis and gasification. In
biological treatment methods or biochemical conversion processes, the micro-
organisms (either added or inherently available in the substrate) are used to degrade the
waste into various components in the form of solid matter, slurry and gas. Biological
technologies are termed the most economical and environmentally safe means of
obtaining energy from MSW. Biochemical conversion of waste can be grouped into
two namely anaerobic digestion/fermentation and aerobic digestion /composting.

16
Fig.2.3 Municipal Solid Waste Treatment Technologies
(Tan et.al., 2014)
2.4.1 Anaerobic Digestion
Anaerobic digestion is a biodegradation reaction where the organic compounds are
degraded by the microorganisms in the absence of air. This is a complex process that
requires specific environmental conditions and particular bacterial populations to
decompose the organic waste to the end product. This produces a valuable high energy
biogas (CH4 and CO2) and a mixture of gases (Lastella et. al., 2002). The process of
anaerobic digestion consists of four main biological and chemical stages: hydrolysis,
acidogenesis, acetogenesis, and methanogenesis (Demirbas, 2010). In the first step,
hydrolysis, the complex chain of organic compounds is broken down into basic structural
molecules, such as fatty acids, monosaccharides, amino acids, and related compounds.
The process is followed by acidogenesis, where the further breakdown of the remaining
components by acidogenic (fermentative) bacteria takes place. At this stage, gases such
as CO2, CH4, and NH3 are produced. The third stage of anaerobic digestion is

17
acetogenesis, during which simple molecules created through the acidogenesis phase are
further digested by acetogens to produce largely acetic acid, as well as carbon dioxide
and hydrogen. The last stage of anaerobic digestion is methanogenesis during which the
methanogens bacteria convert the intermediate products into CO2, CH4, and water
(Tchnobanoglous et.al., 1993; Tan et. al., 2015). The amount of methane obtained from
the anaerobic digester is about 2–5 times higher than that obtained from landfills. This is
due to the uncontrolled operation parameters in landfills which reduce the methane
capture efficiency (Otoma et.al., 1997). Biogas can be utilised as energy source for power
combustion engines towards electricity generation, space heating, water heating and
process heating.
The major limitation of anaerobic digester is that it could only digest particular
organic waste, which does not solve the issue of other waste components. Hence it is
necessary to segregate biodegradable organic waste before it can be used in the
anaerobic process. The different types of organic waste will result in different gas
yields. Therefore this technology may not serve as an efficient technology for
heterogeneous MSW management and electricity generation because MSW contains
different compositions of waste which are not sorted at the source. The problem of
sorting of heavy moisture laden waste at the source is also difficult which is a
drawback to apply this technology on a large scale.
2.4.2 Composting
Composting is a biological method where the organic component of MSW is
aerobically treated to create a product called compost, at relatively low-cost, which is

18
suitable for agricultural purposes (Eriksen et al., 1999; Wolkowski, 2003). During
composting, readily degradable substrates are rapidly consumed and the heating
process releases significant energy. Depending on the degradability of the organic
substrate, the oxygen supply and heat loss, the temperature of the material can rise up
to 70 °C or more which eliminate the pathogens from the material (Neklyudov et al.,
2006). The development of composting technology has been attributed to the
economic as well as environmental factors, such as municipal landfill capacity and
cost associated with landfilling and transportation of materials. Also other factors like
the adoption of legislation to protect the environment, decreasing the use of
commercial fertilizers and increasing the capacity for household waste recycling are
leading to development of composting technology (He et al., 1992; Otten, 2001;
Hansen et al., 2006; Zhang et al., 2006). Composting of MSW reduces the volume of
the waste, kills pathogens, decreases the germination of weeds in agricultural fields,
and destroys the malodorous compounds (Jakobsen, 1995). The major disadvantages
of composting are that the compost derived from the organic fraction of municipal
solid waste can contain metals, persistent organic pollutants, as well as microbial and
fungi toxins, whose exposure in certain scenarios impose serious health risks leading
to rejection of compost (Domingo and Nadal 2009). A case study on heavy metal
distribution in soil and plant in municipal solid waste compost amended plots (Ayari
et al., 2010) has revealed that there was an important transfer of metal ions from soils
to wheat plants. Thus the composting method of solid waste disposal has to be
analysed for detrimental effects, especially if industrial wastes are dumped into
municipal landfills. Less market value for the fertiliser output from the composting
plants is also a limitation for commercial scale composting plants.

19
2.4.3 Incineration
Incineration is a thermal treatment method where the controlled burning of waste
materials at a temperature of 870oC–1200°C for a sufficient time will oxidise about
99% of the organic matter to produce high pressure steam for power generation.
Waste incineration reduces the volume and weight of the waste by 90% and 70%
respectively (Murphy and McKeogh, 2006). Incineration is the primary approach of
waste treatment technology that converts biomass to electricity. The end product
derived from the combustion of waste is hot combusted gas, that composed primarily
of nitrogen (N2), CO2, water, (H2O), flue gas, oxygen (O2) and non-combustible
residues (Tchnobanoglous et. al., 1993). The hot flue gases will enter the heat
exchanger as a hot stream to generate steam from water. Electricity is generated
through the Rankine cycle in the steam turbine.
The single steam cycle normally only produces electricity, while the cogeneration of
steam and electricity requires an extracting steam cycle. The biomass requires prior
preparation and processing, such as pre-drying to remove the high moisture content of
the waste before it enters the combustion chamber to be combusted with air.
Controlled incineration systems for electricity and heat productions are similar to
most fossil-fuel fired power plants. A typical controlled incineration system for
energy production consists of the waste storage chamber, boiler/incinerator, steam
turbine/generator, flue gas cleaning system/chimneys and residue treatment system
(Weitz et. al., 2002; Johnke, 2002; Korobitsyn, 1999; Tsai and Chou 2006). Waste to
energy (WTE) production through incineration can occur in four main stages namely
waste pre-treatment, waste combustion, gas scrubbing (including air pollution) and

20
electricity/steam generation. The organic components of the MSW are converted into
syngas and other products while the mineral components are converted into slag or
vitrified slag or ash which is a byproduct. Steam is fed into a steam turbine where it
flows over series of turbine blades which cause the turbine to rotate. The turbine is
connected to an electric generator which rotates to produce electricity. The burning of
the waste on a grate or to fluidise it with air will achieve complete combustion. The
condensing turbines can be used to cool steam so as to increase the power production
(Korobitsyn, 1999; Morris,m 1998). The generated heat of combustion is recovered in
a waste heat boiler for steam generation. The incineration process produces an
effectively sterile ash residue and the pretreatment before combustion will transform
this ash into other useful products. MSW incineration system is a stable technology of
energy production from wastes which is capable of reducing the amounts of dioxin
and other dangerous substances produced. The heating value of the MSW is an
important parameter which greatly contributes to the efficiency of the incineration
plant. Incineration of MSW operating at uncontrollably high temperature can produce
a net energy of about 544 kWh/tone of MSW but environmentally more damaging.
Combustion of MSW at uncontrolled temperatures produces chlorinated dibenzo-p-
dioxins and corrosive gases that could destroy the steam pipes and cause health
related problems. Thus with a controlled temperature in the range of 250-300 °C, the
efficiency achieved has been reduced to 15-16% (Johnke, 2002; CoE, CED, 2010).
On the other hand, to increase the efficiency of the system, a more heat-resistant
material could be used for the steam pipes to withstand these high temperatures.
There could also be a dual generating system which involves both gas turbines and
waste incineration. Natural gas can be used to power the turbines to produce

21
electricity. The exhaust gas of high temperature between 500°C-600°C from the
turbines is then used for further heating of the steam produced by the incinerator to
about 400°C. These systems can increase the efficiency to about 20–30%
(Tchobanoglous et. al., 1993; Barducci, 1990; Elango et.al., 2007).
The cost of investment and operation of incinerators is often high. The high costs of
power generated from this technology can be significantly reduced if concessionary
loans that attract low discount rates and grants are sourced to finance such projects.
Murphy and McKeogh have reported that in any MSW incineration system, about
15% of the wastes is available as electricity. Again, MSW from 1,000,000 person
equivalent could power 12,400 cars; provide electricity for 30,900 houses and heat
15,100 houses Europe and United States (Murphy and McKeogh, 2006).
2.4.4 Pyrolysis
Pyrolysis is the thermal decomposition of waste in the absence of oxygen. The
products of pyrolysis include bio-char, bio-oil and gases (methane, hydrogen, carbon
monoxide, and carbon dioxide). The processes involved in pyrolysis can be grouped
into three categories as slow pyrolysis, fast (or flash) pyrolysis at high temperatures
and flash pyrolysis at low temperatures. At low temperatures below 450°C, pyrolysis
may produce bio-char while at high temperatures above 800°C, a significant amount
of gases may evolve (Mohan et. al., 2006). However, at an intermediate temperature
and relatively high heating rates, the main product is bio-oil. Flash pyrolysis is
currently the most widely used pyrolysis technology. Slow pyrolysis takes several
hours to complete and results in bio-char as the main product (Katyal, 2007). On the

22
other hand, fast pyrolysis yields about 60% bio-oil and takes seconds for complete
pyrolysis. Also it gives 20% bio-char and 20% synthetic gas or Syngas (Mohan et. al.,
2006; Katyal, 2007). Pyrolysis can produce a net energy of 571 kWh/tonne MSW
from either the gas or bio-oil produced (Otoma et. al., 1997; Ruth, 1998). The
schematic representation of the production of electricity from fast pyrolysis of MSW
is shown in Fig.2.4.
Fig.2.4 Flow Diagram for the Production of Electricity from Fast Pyrolysis of
Municipal Solid Waste.
Pyrolysis oil has many advantages over gasification and incineration due to the ease
of handling, storage and combustion in an existing power station. The pyrolysis
produces lesser byproducts (10–40%), multiple products (liquid, solid and gas) and
has the least economic burden and environmental problems compared to incineration

23
(Mohan et. al., 2006; Katyal, 2007). On the contrary, there are some major drawbacks
associated with pyrolysis. The particle size of the feed required for pyrolysis smaller
and hence the MSW should be converted into smaller sizes (≤2 mm particle size)
before pyrolysis inorder to obtain the best yield and appropriate products after the
reaction (Mohan et. al., 2006).
2.4.5 Gasification
Gasification is a thermo-chemical method in which there is partial combustion of the
MSW at high temperatures in a controlled environment which virtually converts
almost all the MSW into gas and chars (Arena, 2012). During the gasification
process, the waste is combusted with a controlled amount of oxygen supply in the
operating temperature range of 780°C to 1650°C. The process occurs in two stages. In
the first stage, the MSW is partially combusted to get producer gas (CO2 + H2O) and
char. The CO2 and H2O are chemically reduced by the char (or charcoal) so that
carbon monoxide (CO) and hydrogen gas (H2) is produced in the second stage. The
composition of the resulting gas is 18–20% H2, 18–21% CO, 2–3% CH4, 8–10% CO2,
and the rest is nitrogen (Appel et. al., 1971; Williams and Larson, 1992; Belgiorno et.
al., 2003). The final products of the process are ash, carbon, hydrogen, nitrogen,
sulphur, CH4 and oxygen. The solid by-products of the gasification reaction are
known as char and it mainly consisted of carbon and ash. The by-products are then
gasified in the second gasification process using steam and oxygen. The second
gasification process also provides the required heat energy for the earlier processes.
The syngas is sent to the power generation plant to produce energy, such as steam and
electricity. Pre-treatment or initial drying (Rada et.al., 2012) of the waste as well as

24
the quantity of oxidant will increase the heating value of the gas produced. This is
achieved due to the reduction of heat demand for the process. The heat demand is
high when the waste has high moisture content. When pure oxygen is used as the
gasification agent, nitrogen diluent is eliminated thus gas with medium calorific value
of 10–20 MJ Nm−3
is produced (Belgiorno et. al., 2003; Williams and Larson, 1992).
The temperature residence time and the composition of major products formed from
the three thermo-chemical conversion technologies were enlisted in Table 2.1.
Table.2.1. Technologies for Thermo-chemical Conversion of MSW for Electricity
Production
Technology Temperature Residence
Time
Product
Composition (%) Liquid Char gas
Flash Pyrolysis Moderate Short 75 12 13
Incineration Low Long 30 35 35
Gasification High Long 5 10 85
(Johnke, 2002; Barducci and Neri 1997).
2.4.6 Landfilling
The landfill is a land that is built up from deposits of solid refuse in layers covered by
soil. It consists of a random mixture of food scraps and other kitchen waste, paper,
plastic, metals, and glass. The organic waste dumped in a landfill site will decompose
with time, but the inorganic constituents will be remaining for a long time. Since each
landfill has its own particular constituents and the leachate quality of a particular
landfill also changes over time; a flexible design is required to treat the varied
influent stream. The main environmental problem associated with the landfill is the
pollution of ground water. The study by Esmaeili et al.(2010) has revealed that soil

25
column had ample capacity to adsorb metal contaminants and hence the
determination of soil potential in landfill site selection is inevitable. The methane gas
per mole has a global warming potential 3.7 times that of carbon dioxide (Daniel and
Dilip, 1990). The methane emissions were reduced using the clay capping in earlier
studies which has been replaced by a new technique 'Phytocapping' nowadays. The
study conducted at Rockhampton's Lakes Creek Landfill site in Australia
(Venkatraman and Ashwath., 2009) has concluded that phytocaps could reduce the
surface methane emissions by a factor 4 to 5 times more than the adjacent site. Also,
the thick cap (1400 mm) reduces surface methane emissions 45% more than the thin
cap (700 mm). A Comparative study of municipal solid waste treatment technologies
using life cycle assessment method (Zaman, 2010) has concluded that landfill with
energy recovery facilities is environmentally favourable. However, the large land
requirement, difficult emission control system and long time span, are the limitations.
Therefore the untreated MSW should not be allowed to reach the landfill.
The land filling can be considered as a waste to energy (WTE) technology when the
generated CH4 (commonly known as biogas) is captured and utilised for energy
generation. Landfill gas recovery system (LFGRS) is well suited to a high percentage
of biodegradable matter with high moisture content (Tan et.al., 2015). Average gas
recovery rates range from 120 to 150 m3/Tonne of dry MSW, equivalent to a heating
value of 2500 MJ/T (The Japan Institute of Energy, 2008). It helps in the mitigation of
greenhouse gas (GHG) emissions from waste by converting the CH4 and crucial factor
to successful waste management. Landfill gas comprises 50% methane and 50% carbon
dioxide with an energy content of 18–19 MJ/m3 (Weitz et.al., 1995; Bramryd and
Binder, 2001). Methane is a powerful greenhouse gas, with substantial amounts being

26
derived from unutilised methane production from landfill sites. The recovery of
methane results in the stabilisation of the landfill site allowing faster reuse of the land,
and also it serves to lessen the impacts of biospheric methane emissions on global
warming (Bramryd and Binder, 2001; Brorson and Larson, 1999; Wilson, 2007). But
the uncontrolled operation parameters reduce the methane capture efficiency of
landfills (Otoma et.al., 1997). The CH4 recovery for electricity production is the least
feasible regarding the economics from landfill (Williams and Larson, 1992).
2.5 EXISTING TECHNOLOGICAL GAPS
The technological aspects of various treatment technologies like anaerobic digestion,
composting, incineration, gasification, pyrolysis and sanitary landfilling were studied.
Considering the different technological options, it was observed that composting is a
simple and cost effective technology for treating the organic fraction of MSW.
However this method is not very suitable for waste with high moisture content as the
problem of fly and odour nuisance prevails. Also the land area requirements for
compost plants are very large and longer time is required for the process. If the waste
segregation if not properly carried out it will make the compost toxic, which prevents
its safe application to agriculture (P.U.Asnani, 2006). The anaerobic digestion of the
organic portion of municipal solid waste (MSW) is another cheap method of waste
treatment adopted. The biogas from the process is used as a fuel. But the economic
development and modernization changed the homogeneity and quantity of the MSW
which is leading to the failure of anaerobic digesters using MSW feed. Also the
proper maintenance of the anaerobic reactor is a major challenge. The incineration
technology with high capital cost and maintenance cost makes it economically non-

27
viable. So it is adopted only for treating hazardous waste like hospital waste, mainly
because it requires large investments even for small scale plants. But if the heat
energy recovery is possible, the cost can be accommodated. The lower calorific value
of raw MSW with high moisture content is the major challenge for heat energy
production. Pyrolysis /Gasification for MSW treatment also suffers energy recovery
issues for solid waste with high moisture content. The increased moisture content of
the waste is also affecting the sorting and storage of raw MSW and also result in
increased volume of waste.
Landfilling is the final disposal method of municipal solid waste which is also
causing economic barriers due to the scarcity of land. The long distance
transportation requirements to the landfill are creating serious health, environmental,
social and economic issues. The other methods of municipal solid waste management
like recycling and reuse can be done only if the MSW is sorted. The implementation
of waste to energy technology (WTE) for the mixed municipal solid waste
management needs to be studied.
2.6 WASTE TO ENERGY TECHNOLOGIES
Technologies for the recovery of energy from the waste materials into useable heat,
electricity, or fuel are generally called waste to energy technologies (WTE). Waste to
energy (WTE) technology has the potential to reduce the volume of the original waste
by 90%, depending on the composition by recovering the energy (Wang 2009,
Kathiravale, 2003). In the hierarchy of solid waste management, WTE is ranked
before the final disposal, indicating the limitations of this option regarding the

28
economic and environmental benefits (Finnveden et. al., 2005). Waste to energy
(WTE) processes recover the energy from the waste through either direct combustion
(e.g., incineration, pyrolysis and gasification) or production of combustible fuels in
the form of methane, hydrogen and other synthetic fuels (e.g., anaerobic digestion,
mechanical biological treatment and refuse derived fuel) (Cheng and Hu, 2010).
Mechanical Biological Treatment is a combination of mechanical separation
techniques and biological treatments (aerobic and/or anaerobic), primarily used to
deal with municipal solid waste and reduce the environmental impact of disposing of
it in landfill (Defra 2011c, WRAP 2011a). The detailed study of the waste to energy
plants in different countries of the world has revealed that refuse-derived fuel
production plants as well as incineration plants are the major energy producers in the
field of municipal solid waste treatment systems. Incineration and gasification are the
two primary WTE technologies that have been used successfully throughout the
world. It is estimated that about 130 million tonnes of MSW are combusted annually
in more than 600 WTE facilities worldwide, producing electricity and steam for
district heating and recovered metals for recycling (Themelis, 2003). Waste to energy
plants with incineration has widely accepted as a solid waste management option,
complementing landfilling and composting (American Society of Mechanical
Engineers, 2008; Denison, 1996: Themelis, 2003; United Nations Environment
Programme, 1996; Cheng and Hu, 2010).
Studies on the end use application of refuse derived fuel(RDF) has revealed that the
RDF produced in WTE plants can substitute a major portion of fossil fuel in cement
manufacturing units, which is successfully implemented in European countries (Kara
et. al., 2009; cross ref: Lechtenberg and Partner, 2008). The unique nature of a

29
cement kiln, with flame temperature burning more than 2000°C means that waste
materials are destroyed without producing waste ash or harmful emissions. The high
temperature in the cement kiln is seemed to be ideal for thermal destruction of
residuals without causing adverse environmental impacts (Genon and Brizio, 2008).
Also energy is recovered in the burning process; it is an excellent use of the waste
material (Lagan Cement, 2008). The use of RDF in cement plants as a substitute for
coal promotes the use of renewable energy which is the key strategy for reducing the
greenhouse gas (GHG) emissions (Sozen et al., 2007). The scarcity of land and the
uncontrolled contamination due to exhaust gas and leachate emissions have made
landfill, particularly of organics, no longer a sustainable option (Hartmann and
Ahring, 2006). Waste to energy method also faces some technological gaps. Waste
availability and the sustainability of the waste resource are important factors to keep
the WTE technology operating. The marketability of the produced renewable energy
resources is also very important to ensure the economic potential of WTE. It is now
accepted that no single solution exists for the management of MSW and with an
integrated approach it is most likely to succeed (Earle et al., 1995).
2.7 CHALLENGES OF TREATING MUNICIPAL SOLID WASTE WITH
HIGH MOISTURE CONTENT
The composition of the waste varies based on region. The organic components
constituting the major proportion of MSW in developing countries, while the paper
and plastic content is higher in developed countries. In developed countries the
disposable material, magazines and packed food are used in large quantities and this

30
generates the municipal solid waste having higher calorific value, lower specific
density and lower moisture content.
In the case of developing countries the use of fresh vegetables is more compared to
packed food and this result in a waste composition comprised of high moisture
content, high specific weight and low calorific value (Ramachandra and Bachamanda,
2007). The difference in waste composition of high-income, medium-income and
low-income nations is listed in Table. 2.2.
Table 2.2 The Relative Composition of Household Waste in Low, Medium and
High- Income Countries
Parameters Low-income
Countries
Medium-income
countries
High- income
Countries
Organic (%) 40-85 20-65 20-30
Paper (%) 1-10 15-30 15-40
Plastics (%) 1-5 2-6 2-10
Metal (%) 1-5 1-5 3-13
Glass (%) 1-10 1-10 4-10
Rubber, leather etc. (%) 1-5 1-5 2-10
Others (%) 15-60 15-50 2-10
Moisture content (%) 40-80 40-60 5-20
Specific weight (kg/m3) 250-500 170-330 100-170
Calorific value (kcal/kg) 800-1100 1000-1300 1500-2700
(INTOSAI Working Group on Environmental Auditing, 2002).
The incineration of MSW with high moisture content encounters a range of problems,
including difficulty in ignition, unsteady and unstable combustion flame, incomplete
combustion of the waste, and increased formation of air pollutants. Supplementary
fuel, which would significantly increase the operating cost, is often necessary for

31
incineration of waste having high moisture and low energy content (Cheng et al.,
2007; Cheng and Hu, 2010; Nie, 2008).
The moisture content of waste greatly affects incinerator operation because the
moisture will lower the calorific value of the waste. The increase of waste moisture
will decrease the calorific value of waste, resulting in the reduction of energy
production (Patumsawad and Cliffe, 2002; Tan et.al., 2014). The correlation of
moisture to waste calorific value is shown in Fig. 2.5. In another context, the waste
composition also plays an important role in selecting waste to energy technology for
MSW treatment. The incinerator could treat a larger variety of waste and to a large
extent these waste do not need segregation.
Fig. 2.5 Correlation of Moisture Content and Calorific Value of MSW
(Tan et. al., 2014)
The design and operation of all the energy systems of municipal solid waste are
largely influenced by the heating value of MSW. Mixed MSW has a heating value of
about one-third of the calorific value of coal (8-12 MJ/kg for MSW and 25-30 for
MJ/kg for coal) (International Energy Agency, IEA 2003). The net energy yield from
municipal solid waste depends upon the density, composition and relative percentage

32
of moisture of the same (Fobil, 2005). It is essential to develop a technology to make
the raw municipal solid waste with high moisture content into a product which is
suitable for waste to energy applications. The detailed literature study in this search
has lead to the identification of “Biodrying Technology" as a solution to the treatment
of municipal solid waste with high moisture content. The present research work is an
attempt to achieve the goal of converting raw MSW into an energy value product by
biodrying process, which promotes the end use of the municipal solid waste.
2.8 BIODRYING PROCESS
Biodrying is an aerobic convective evaporation process which reduces the moisture
content of the waste, with minimum aerobic degradation (Velis et. al., 2009). This
process is different from composting in that the output of the composting process is
stabilised organic matter, but the output of the biodrying process is only partially
stabilised, which is useful for energy production (Rada et. al., 2005). Composting
stabilises the organic material of municipal solid waste and no final energy value for
the product (Nellist et. al., 1993). When compared with Composting (40-60 days) the
biodrying process requires much less time, in the range of 13-18 days (Roca-Perez et
al., 2009). The biodrying reactor pre-treats the waste at the lowest possible residence
time to produce high quality solid recovered fuel (SRF), by increasing the energy
content (Adani et al., 2002). The biodrying process has a good impact on solid waste
management since self heating and odour reduction takes place simultaneously
(Tambone et. al., 2011). The refuse-derived fuel from the biodrying process has been
reported as the best CO2 free alternative fuel (Flamme, 2006; Mohn et. al., 2008;
Staber et. al.2008). Biodrying process increases the potential for thermal recovery of
solid waste (Rada et. al., 2002; Sugni et. al., 2005). The biodrying process followed

33
by the Refuse Derived Fuel production (RDF) can replace or reduce the use of fossil
fuel consumption in industrial areas, if the pilot plants are placed close to industrial
areas.
The incineration of biodried material can be carried out efficiently and heat recovery
can be another energy producing option from this technology. The pyrolysis and
gasification of auto thermal biodried municipal solid waste was found to be
satisfactory as a biofuel (Zawadzka et. al., 2010). Secondary benefits of biodrying
include making the output more suitable for short-term storage and transport both by
partially bio-stabilising it and by reducing its moisture content (MC) below the
necessary threshold for biodegradation. A study on full-scale biodrying reactor using
municipal solid waste has reported a moisture reduction of 20% in 14 days period
(Debicka and Zygadlo, 2017).
Partial sanitisation of the output is also accomplished for the bulk of the biodried
product. The sanitisation to high standards is not necessary, since biodried product is
not to be applied on land but to be thermally recovered (Adani et al., 2002; Calcaterra
et al., 2000; Rada et al., 2005; Sugni et al., 2005; Wiemer and Kern, 1994). The
biodrying of food waste has resulted in higher biodrying performance with low
proportion of bulking agent (Mohammed et. al., 2017).
A study of the life cycle analysis of mixed municipal solid waste has concluded that,
the most environment friendly integrated system of mixed municipal waste
management is mechanical biological treatment (MBT) system with biodrying and
refuse derived fuel (RDF) co-incineration (Vladimir and Tatiana 2011). The aeration
rate of 0.5 L.kg-1
DM.min-1
provided on biodrying of MSW has resulted in maximum

34
water loss (Yuvan et.al., 2018). In a biodrying study where exhaust air recirculation
was used, it was observed that the end product did not meet the requirement of RDF
standard (Somsai et. al.,2017). The homogeneous output from the biodrying process
is a challenge which needs further investigations (Rada et. al., 2002; Sugni et. al.,
2005).
2.8.1 Mechanism of Biodrying
The principle of biodrying process is that effective utilisation of the heat energy produced
during the self heating reaction of municipal solid waste can be used for evaporation of
water from the same. The source of energy for the self heating reaction is the easily
biodegradable ingredients and the heat released during aerobic degradation of the same
can be used for drying. In another view point in the biodrying process the transition of the
substrate takes place, when the required heat is generated on the biochemical path (Bartha
et. al., 2002). The basic process flow during the biodrying process is shown in Fig. 2.6.
The core process in biodrying is that the heat energy produced in the debris is heated
and at the same time, the water from the particle surface evaporates. The desired
effect is a decrease in the water content especially at the interfaces of the material, so
that it is dried. But the aerobic degradation takes place only in an aqueous
environment, which will limit the reaction. The different stages of the biodrying
process are shown in Fig. 2.7. There are four phases in the biodrying process that are
recognised as follows (Bartha and Brummack, 2007).

35
Fig. 2.6 The Process Flow Diagram of Biodrying.
1. Start phase
2. Heating-up Phase
3. The drying Phase and
4. Cool-down Phase
In the ‘start up' and ‘warm-up' phase the aerobic reactions are most active with a
sudden rise in temperature of the reactor matrix. During this initial heating
phase, there is essentially no difference in the process targets compared to the
conventional degradation process. Here the fast and strong temperature increase is the
requirement for the optimised process.
The waste reduction phase is the second one in the biological drying stage, when
Aerobic Biodegradation Reaction
Heating up of the reactor matrix
Heat release through evaporation
Drying of reactor matrix
Aerobic process inhibition
Partial stabilisation of reactor matrix

36
most of the drying takes place and the largest water removal is achieved, which is
designated as a ‘drying phase’. As the drying progresses, water limitation arises and
eventually the temperature declines and the drying performance reduces. This is the
third phase in the biodrying process that is ‘cool-down phase’ which needs to be
minimised for the process.
Fig .2.7 Different Phases in the Biodrying Process
2.8.2 Biodrying Process- Design Considerations for Physical Parameters
The mode of ventilation, as well as the rate is crucial in all the biological aerobic
decomposition processes. The biodegradation of solid waste takes place at low air
flow rates, but at high rates of air flow the moisture loss is more and biodegradation is
slower, which is the process favouring biodrying of the waste (Sugni et. al., 2005).
The study conducted on auto thermal drying mixture of sewage sludge and organic
fraction of MSW in batch bioreactor concluded that the initial moisture content as
well as the amount of supplied air are the critical parameters for the biodrying process
(Liliana et. al., 2010).
Temperature
1
Start and warm
up phase Drying phase Cooling phase
2
3
4
Water

37
In the biodrying process using a mixture of pulp and paper sludge has reported that
air flow direction changes through the perforated pipes distributed throughout the pile
increased the dry solids content from 30.5 to 41.6% in 13 days of reaction (Frei et al.,
2004b). A full scale biodrying system using a mixture of dairy manure, sawdust and
shavings as the substrate has used an intermittent mode of aeration which is
controlled based on the pile temperature. The moisture content in the process has
reduced from the initial value of 70% to final value of 40% in 21 days of reaction
(Wright and Inglis, 2002).
The biological decomposition in the biodrying process generates some quantity of
water, but aeration at higher rates removes the moisture faster than the rate of
generation, which is favouring the drying process (Richard et. al., 2002). A study on
the effect of air flow rate and turning on biodrying of dewatered sludge has shown
that under the same mode of turning, higher air flow rate has reduced the temperature
of the substrate, while compared to that at lower air flow rate (Zhao et. al., 2010). The
higher air flow rate and lower turning frequency had resulted in a similar temperature
accumulation, when the lower air flow rate and higher turning frequency was
provided. Investigations conducted on the rotary biodrying process, to analyse the
effect of duration of air flow rate on drying of household solid waste has revealed that
weight loss has no significant effect on air flow rate (Somsai et. al., 2016). But air
flow rate is very relevant in the case of static reactors where no turning is provided.
Continuous negative ventilation was reported as a preferable mode of ventilation for
biodrying of MSW, but special care is required to prevent aqueous pollution if it is
used in municipal solid waste treatment plants (Shao et al., 2012). The daily inversion

38
of airflow in the biodrying process has eliminated the marked temperature differences
inside the reactor matrix and leads to a homogeneous final product (Sugni et. al.,
2004). An experimental study conducted on auto thermal drying of organic fraction of
municipal solid waste has found out that the best drying conditions were achieved for
horizontal reactor system with automatic regulation of air flow (Zawadzka et. al.,
2009). A limited number of studies exist on aeration levels for the biodrying process
especially using mixed municipal solid waste substrate. Hence further investigations
are required to study the effect of aeration rate on biodrying process of mixed
municipal solid waste.
Temperature is also an important factor affecting the biodrying process. Biodrying
reaction is found to increase the potential for thermal recovery of solid waste (Rada et
al., 2007a). The self heating reaction and the rising and falling trend of temperature
profile considerably influence the rate of evaporation as well as the moisture
convection through the matrix. A strategy based on temperature feedback control is
recommended to be more promising for biodrying technology (Zang et. al., 2008).
Investigations on sludge biodrying have revealed that temperature is the most
important indicator of biomass utility. High temperatures (> 55ºC) enhance the
moisture removal and increase the vapour pressure of the air flow passing through the
matrix, which carry more moisture away through the exhaust air (Frei et al., 2004b;
Navaee- Ardeh et al., 2006). The bio-generated heat from a slowly biodegradable
fraction of bulking agents contributed more to enhance the matrix temperature in
sludge biodrying (Zhao et al., 2011). The detailed investigations are required to
delineate the temperature profile of biodrying process when municipal solid waste
substrate is used. A study on the importance of calorific value of waste as a parameter

39
for determining fuel efficiency has been mentioned that the lower calorific value of
municipal solid waste (only 20% of coal) is due to high moisture content which is
critical for its use as a fuel (Daskalopoulos et. al., 1997). Also the moisture content in
waste is adding up septic conditions due to air voids and hence handling problems.
The lower calorific value and handling problems of solid waste can be managed by
the biodrying method of solid waste treatment. The biodrying process followed by
mechanical treatment applied to remove the fine fraction of municipal solid waste
with low calorific content has produced final solid recovered fuel (SRF) with a net
heating value (NHV) comparable to that of brown coal (NHV of 16,000–19,000
kJ/Kg) (Adani et al., 2002; cross ref: Wiemer and Kern,1995). The study of energy
recovery criteria for MSW management in Romania has shown that the co-
combustion of refuse derived fuel (RDF) with other waste is a good solution to the
lower heating value (LHV) of RDF (Rada et. al., 2010).
The need for temporary storage or transportation of municipal solid waste before its
use as fuel could lead to undesired problems of spontaneous ignition, odour emission,
leachate and biogas production, with the consequence of materials damage,
environmental contamination and health effects for the workers and inhabitants
(Yasuhara et. al., 2010). The microbial activity in the biodegradable organic matter
contained in MSW/SRF is responsible for these impacts. But the process of biodrying
reduces the moisture content to inhibit microbial activity and hence helps to reduce
potential impacts of municipal solid waste when stored or transported (Garg et. al.,
2009; Velis et. al., 2009). The biodrying process has resulted in the enhancement of
sorting efficiency of municipal solid waste from the initial 34% to final 71% (Zhang
et.al., 2009). In the biodrying process, the moisture content of waste is reduced to

40
about 30 to 45% and hence sorting and storage issues can be reduced to a great extent
in addition to the reduction of landfill volume (Frei et. al., 2006). A theoretical
modelling study has shown that the moisture content of the mixed waste plays a
dominant role in the recycling rates of packaging materials such as paper, plastics and
glass. The dry basis yields of recycling rate have been increased by 32.8% for paper,
50% for plastics and 44.6% for glass (Magrinho and Semiao 2008).
2.8.3 Biodrying Vs Thermal Drying
There is another concept called thermal drying, where the conventional drying
technology of the water withdrawal is implemented for drying waste materials. Here the
maximum permissible material temperature is limited by the temperature resistance of the
components.
This is done in situations, where it is important to prevent the qualitative change in
the mechanical or chemical properties of the substrate. Biodrying is different from
thermal drying in that, here the dependence of the biological production of heat from
the water content in the material surfaces leads to significant differences in the
drying. The basic difference between thermal drying and biological drying is
illustrated in Fig. 2.8.

41
Fig. 2.8 Thermal Drying and Biodrying
The thermal drying process is divided into three sections (Kroll, 1978). In the first drying
section (marked I, Fig.2.8, heating the material evaporates the water from the surface
with a constant speed. The water content increases linearly, as long as water from pores
and capillaries of the material flows outwards to the surface. In the second phase (marked
II, Fig.2.8) there is no longer the supply of enough water to the surface, so the
evaporation surface is shifted into the material inside. At this point the heat transfer
resistance of the material is increased and hence the drying speed drops. This section ends
with a non-hygroscopic material with the complete drying. In the case of hygroscopic
materials, the last section of closing exists till sorption equilibrium is achieved between
the material and the drying air (III: The third drying section).
Biodrying
Dry
ing
sp
eed
Water content
Thermal drying
III
I
I
II
I
2
3
4

42
Biodrying principle is that most of the heat production takes place in the presence of
water on the surface, i.e. in the area of the first drying section. The reduction of biological
activity due to the increased water limitation of micro-organisms leads to a decline in the
drying speed. Once the surfaces are dried, there is practically a standstill of the heat
production. The heat stored in the material can be used for drying only from this point
onwards. This gives rise to the second drying section (Bartha 2008).
2.9 EVALUATION OF BIODRYING PROCESS AT DIFFERENT LEVELS
Application of process control engineering in biodrying is challenging. The main
difficulty is the two-fold role of the waste matrix, being both (1) the mass to be dried,
and (2) the substrate supporting the microbial activity, which in turn provides heat for
the biodrying. The biodrying reactors use a combination of engineered physical and
biochemical processes. Reactor design includes a container coupled with an aeration
system; containers can be either enclosed or open tunnel-halls, or rotating drums. The
biochemical side of biodrying reaction consisted of aerobic biodegradation of readily
decomposable organic matter and on the physical side; convective moisture removal
is achieved through controlled excessive aeration.
During biological drying a large number of sub-processes are running at the same
time which depend on each other and hence it is a highly complex system. The
recognition of fundamental contexts in a reactor waste system is the basis for all
further process evaluation and technology development. This needs firstly the
systematic study of the existing knowledge of the process and the theoretical
development of the missing factors based on the experimental investigations. The aim

43
of the theoretical studies is to evaluate the basic intervention possibilities for the
process about the practical use. Five steps of the biodrying process have been
identified as shown in (Fig. 2.9) (Bartha et al., 2002).
Fig.2.9 Different Levels of the Biodrying Process
It is simply assumed that the underlying sub-processes are of homogeneous
behaviour. First of all, the ‘microbial activity’ has been qualitatively studied. The
core process, the ‘aerobic biological degradation’, has been described in the second
step. In a third step, the ‘decisive process exchanges on particle level’ has been
studied. In the fourth stage the ‘homogenous debris’ assumption has been described.
Finally in the fifth stage the study of considering the single unit of ‘the reactor with
the entire waste’ has been done.
2.9.1 Micro-Level
The biodrying process is based on the aerobic degradation of native organic
substances. Generally all biosynthetic processes are varying widely in nature
(Schlegel, 1992). Their degradation speed will be very different for different type of

44
raw materials. Different raw materials can be classified as highly degradable (sugar,
starch, proteins, fats), medium biodegradable (hemicellulose and cellulose) and
poorly biodegradable (Lignine, resins, tannins). The degradation of organic matter is
based on the activity of micro-organisms. The cells of microorganisms can be
considered as the smallest continuously working reactors owing to their capability to
make material conversion (Wolf, 1991). The term "micro-organism" points to the
small size of the individual particle to the average in the µm range. Because of their
low weight micro-organisms are slightly worn by air currents. They are therefore
present everywhere, only the environment decides their spreading (Schlegel, 1992).
The seeding of residual waste is not necessary for biodrying since the optimum
population is inherent in the materials.
The growth of microorganisms is only possible in an aqueous environment, where all
the reactants, nutrients and oxygen are available to aerobic microorganisms in
dissolved form. Therefore a phase change is required for the reduction of fixed or
gaseous organic substances and under certain circumstances it is the rate-limiting step
in the overall process. The principle of growth of microbes in a discontinuous culture
is explained in the literature (Schlegel, 1992) as shown in Fig.2.10. There are four
typical growth phases resulting from the mixture of micro-organism substrate and the
prevailing environmental conditions. In the first phase called the ‘lag-phase' already
existing group of microorganisms in the raw substrate will be adapted to a new
environment. Many factors such as the type of pre-culture, the composition of media
or the age of the cells, have an influence on the time needed for the cells and their
transport systems for the conversion of new substrates for the formation of required
metabolic enzymes for substrate reduction.

45
Fig. 2.10 Growth Phases of Micro-organisms
This progress with the changeover and the cells are proliferated. In the second phase of
‘exponential' growth the highest possible growth rate is achieved, and as long as no
substrate limitation is present, it remains constant. The third ‘stationary’ phase is reached
when the mass of the micro-organisms no longer changes. There is a dynamic
equilibrium between the die and the creation of individual cells. In addition to a substrate
limitation the high population density, an oxygen limitation or the accumulation of toxic
metabolic products (product inhibition) leads to the transition from the exponential phase
into the stationary phase (Schlegel, 1992). In the last ‘lethal’ phase, the cell count
decreases due to the consumption of toxic substances or conditions.
The energy gain in aerobic degradation is significantly higher since the complete
removal of the original substances can be achieved, while the anaerobic degradation is
always incomplete in terms of oxidised reaction products. This can be clarified based
on the example of the glucose reduction as shown in Table 2.3. Microorganisms can
be classified according to different criteria. In relation to the temperature optimisation
Time
Exponential
Phase
Log
N
Lag
Phase Stationary
Phase
μ
Growth Velocity
μ
Cell number (N)
Lethal
Phase

46
the microorganisms role in biodrying is divided as (1) Psychrophile, micro-organisms
reach their maximum growth rates below 20°C; (2) Mesophilic microorganisms
between 20°C and 42°C and (3) Thermophilic organisms above 40 °C with a growth
limit at 70 °C (Schlegel, 1992).
Table. 2.3 Glucose Reduction Reaction
Reaction Stoichiometric reduction equation Energy Gain
Aerobic degradation C6H12O6 + 6O2 6 CO2 + 6 H2O + 2880 kJ
Anaerobic degradation C6H12O6 3 CO2 + 3CH4 + 405 kJ
The thermophilic organisms have the highest absolute growth rate and also the highest
reduction performance. The mining performance of populations in the transition area
between the mesophilic and thermophilic will be small because of the unfavourable
temperature for both groups. The sanitization is of great importance during the
treatment of waste with critical pathogenic components. In the case of composting of
bio-waste, the most living cells of pathogenic microorganisms were killed off at
temperatures above 60°C in a few hours of time (Knoblauch, 2001). One hour heating
in the range of 50°C to 55°C temperature will kill most of the common parasites and
pathogens (Gottas, 1956).
In the case of biodrying treatment where municipal solid waste with readily
degradable biogenic substances is used a similar hygienisation effect can be expected.
However partial sanitisation of the output is also reasonable for the bulk of the
biodried product since sanitisation to high standards is not necessary as its end use is
thermal energy recovery (Adani et al., 2002; Calcaterra et al., 2000).

47
Regarding the optimum pH value behaviour of the biodrying process, most of the
microorganisms are neutrophils (pH-value 7) or may prefer slightly alkaline conditions
(pH-value 8). Many micro-organisms produce organic acids as a metabolic product,
but they cannot tolerate this. Therefore the compliance of a specific pH value has an
important role to play in biodrying reaction. Hence in the case of static biodrying
processes, the mixing of materials before treatment and dilution of the acids by
addition of water is a technical possibility to reduce such problems.
2.9.2 Particle Level
Aerobic degradation processes for diverse types of substrates with different sizes have
various levels of complexity. The biological treatment of mixed municipal waste is
assumed to be a highly complex system, where both from the substrate side as well as
from the micro-organisms side wide variations exist (Fig.2.11). Therefore
a quantitative formal kinetic description of the reduction is impossible.
Fig. 2.11 The Schematic Representation of the Complexity of Biotechnological
Processes

48
The scale of the process is a significant factor affecting the results of experiments
depending on the material and heat exchange processes. In the literature, there are
many mathematical models for the kinetics of the aerobic degradation processes and
its technical implementation for a range of substrates. It is a critical fact that there is
currently a wide variation between the results from the modelling of biological
processes and the implementation of results in practice. The limited suitability for
practical use of the models developed has resulted in this situation. The interaction of
the entire population of micro-organisms for a given substrate composition denote
observable characteristics of the individual process parameters. Temperature is the
key factor for the description of the biological processes. It is to be noted that the
temperature measured in the medium of a thermodynamic state is a special case of the
microbial activity. The value of the temperature can be found by the formal context as
given by the equation below.
Reduction of heat production Heat stored (heat production - heat dissipation -
heat losses) Heat capacity Temperature explained
The temperature may not be regarded as an objective guide size since it is affected by
other process parameters. Also, the gas phase concentration of measured carbon
dioxide is unsuitable as a guide size because it depend on the process control and this
can be done through the formal context as given below.
Reduction of CO2 production Ventilation set current CO2 concentration CO2
concentration explained

49
The weight reduction due to biodegradation and the heat production coupled with
carbon dioxide production initially appear as a single independent dimension for the
description of the biological activity. For the theoretical and rough accounting of the
process, the composition of the material is required. The stoichiometric equation of
the complete aerobic degradation can be specified in a general form:
𝐶𝑎𝐻𝑏𝑂𝑐𝑁𝑑 + 𝜗𝑜2. 𝑂2 → 𝜗𝑐𝑜2. 𝐶𝑂2 + 𝜗𝐻2𝑂 . 𝐻2𝑂 + 𝜗𝑁𝐻3. 𝑁𝐻3 ----------- (2.1)
Where - a, b,c, d are the stoichiometric number for chemical formula 𝜗𝑜2- Number of molecules of oxygen 𝜗𝑐𝑜2 - Number of molecules of carbon dioxide 𝜗𝐻2𝑂 - Number of molecules of water 𝜗𝑁𝐻3 - Number of molecules of ammonia.
The organic material is usually represented with a general formula. In the literature
there are different formulae for organic substances with non-specific substances, and
also for the mixed municipal solid waste substrate. The validity of the reduction
equation 2.1 can be made measurable parameters, especially from the consuming of
oxygen and carbon dioxide production, and also by directly measuring the reduction
in weight. In the present research, the weight reduction is taken as the monitoring
parameter for assessing the biodegradation and the moisture reduction for assessing
the drying performance. During the aerobic degradation, the amount of water
produced is insignificant. A group of substances included in fats and oils produce
more water while considering the mass of the organic matter reduced. But in the

50
biodrying process, the water production is significant which move to the gas phase
and thus the efficiency of the overall process is reduced.
The ratio between the water production and the measurable carbon dioxide
production is given by the following formula (mol/mol):
YH2OCO2 = |ϑH2O||ϑCO2| ---------------------------------------------------------------- (2.2)
YH2OCO2 - Molar yield of water and measurable CO2 production
The quantity energy released from the aerobic degradation can be approximately
obtained from the calorific value of the specified degraded material. The reference
database for waste mixtures reported that the calorific value of mixed municipal solid
waste varies between 18,000 - 21,000 kJ/kg OTS (Haug, 1993; Krogmann, 1994;
Paar, 2000). The CO2 related reaction enthalpy can be calculated on this basis, i.e., the
heat released during the formation of a unit quantity of CO2 is determined by:
|∆hB| = HoYCO2/OTS -------------------------------------------------------------- (2.3)
Where ∆hB – reaction enthalpy kJ/mol CO2
H0- Calorific value (kJ/kg)
OTS- Organic components (kg)
For glucose with a calorific value of 16,000 kJ/kg, this reaction enthalpy is obtained
as; |∆hB| = 480 kJ/molCO2

51
By integrating basic knowledge of composting, the optimal start conditions of aerobic
degradation are limited as given below (Haug, 1993; Krogmann, 1994).
Water content - 50-55 %-percent (minimum required in the
degradable substance)
Pore Ratio (Porosity) - 25-30 Vol% (to ensure the flow capability)
PH-value - 6 to 8
C/N-ratio - 25 to 35:1.
Since the biodrying also has the same core process, these requirements apply without
restriction.
2.9.3 Macro- Level Studies
The principle of the biodrying process is that the dry and usually cold air is passed
preferably from bottom to top through the debris. The biodegradation reaction heats
the air up and at the same time load it with water vapour (Fig. 2.12). The basic view
of the conservation of a bulk pile is a heterogeneous model. In a differential volume
of element dV, the solid and liquid phase exists on the one side and on the other side
a gas phase. They are separated from each other by the gas phase as shown in
Fig.2.12. In the gaseous phase an infinite expansion in x and y direction can be
assumed (Bartha, 2008).
The major advantage of biodrying compared to the classic convective drying with
warm air is that not only a top layer of particles but all the particles are exposed to dry
air theoretically due to self heating reactions.

52
Fig. 2.12. Biodrying Process Flow Diagram
(Peuker and Stahl, 2002).
A thermodynamic equilibrium between the liquid and the gas phase take place locally
at the particle level, when sufficiently low flow velocity of the dry air occurs. The
drying air for the biodrying process can vary from dry air up to the saturation water
vapour. In this sense, the biological drying is perceived as a special case of the flow-
through drying. The energy for the evaporation of the water is attained by the
biological activity of micro-organisms, i.e. energy will be provided from within the
drying material which is the major significance of the process. This is an important
difference compared to the conventional drying, in which the energy required for
drying is stored at the beginning by a preheated solid-liquid matrix or the drying
energy is transported into the debris by the passage of warm air. The effective drying
performance can be measured by different means like measuring the water transferred
through air, by measuring the weight loss and moisture reduction, or by measuring
steam production of exhaust air. In the case of reversal of temperature profile (falling
temperature) in the debris, a re-aeration of water vapour is required to prevent the
formation of condensation (Peuker and Stahl, 2002). Hence 100% saturation of
exhaust air may be avoided to prevent temperature fall at the top layer of the reactor.

53
2.10 MATERIAL BALANCE IN BIODRYING
The most important material balance for the drying process is the water balance. The
balanced water exists either as a liquid on the surfaces of the hard substance or as
water vapour in the gas phase. Mass balance for the designed biodrying processes is
presented in the flow diagram (Fig.2.13). The corresponding equations used for
calculation are
Fig. 2.13 Mass Balance Flow Diagram
The water losses at time t (Wtloss, kg) are calculated by:
Wtloss = (WM0 × w0) - (WMt × wt) ------------------------------------------- (2.4)
Where WM0 (kg) and WMt (kg) are the wet materials at the initial time and time t,
respectively, w0 (%) and wt (%) are water content at initial time and time t, respectively.
Total net emission losses at time t (Eloss, kg) are given by
Eloss = WM0 - WMt - Wtloss - LO
tloss------------------------------------------- (2.5)

54
Where LOtloss is leachate weight, that is absent in the up flow biodrying reactor unit
Also the actual emission loss based mass balance analysis can be done (Bartha, 2008;
Zhang, 2008) and both the results can be compared to analyse the biodrying process
in detail.
2.11 HEAT ENERGY IN BIODRYING
The temperature gradient in the flow direction can be studied through the heat
balance calculations, for the same volume of the element as considered in the mass
balance. As per previous investigations (Peuker and Stahl, 2002), the specific
enthalpy is not linear in biodrying reaction which depends on the temperature; the
heat balance equation is a nonlinear inhomogeneous partial differential equation that
cannot be solved analytically. Therefore the study of temperature cumulation effect
will explore the self heating reaction in biodrying (Zhao et. al., 2010). The
temperature cumulation index can be calculated using mean matrix temperature(Tm)
and temperature of air inlet (Ti) which is given by:
Temperature cumulation index (TCI) = ∑(𝑇𝑚 − 𝑇𝑖). ∆𝑡 ------------------------- (2.6.)
Where Tm = mean matrix temperature (°C), Ti = temperature of air inlet (°C) and ∆𝑡 = Time interval (day)

55
2.12 EXISTING BIODRYING REACTOR CONFIGURATIONS
The biodrying mechanical-biological treatment (MBT) plants are operational named
“Biocubi” aerobic drying process and Herof process. But the processes are neither
fully understood nor optimised (Adani et.al., 2002). Almost 20 commercial references
of biodrying units are operational in MBT plants for different feed materials in
Europe, with overall capacity of 2,000,000 Mg/a-1
(Herhof GmbH, 2008; Shanks,
2007). Though many biodrying systems exist in the world for treatment of different
types of substrates in MBT plants and other waste treatment units, mixed municipal
solid waste treatment systems are lacking. There is only one biodrying configuration
available in the world for treatment of mixed municipal solid waste that is the
patented Wehrle Werk system which is operated on mixed municipal solid waste. It
uses mechanical pre-treatment followed by percolation (“Bio-percolat”) and
anaerobic digestion, aiming at 32 easily degradable materials (Juniper, 2005).
Biodrying configurations existing for commercial MBT plants in Europe are Herof
System “Rotte boxes ®” in Germany and Eco-deco “Biocubi®” in Italy. Herof
System “Rotte boxes” utilises the costly air recirculation system, since the air is not
fully allowed to be efficiently exhausted in the reactor chamber due to the design
limitation of the closed chamber (Fig.2.14).
The simplified reactor design consist of static enclosed chamber with air blowers
blowing air through bottom perforated pipes are used (Fig.2.15). The pipe C2 blows
and pulls air alternately while the pipes C1 and C2 work conversely. The design lacks
the process control since the air blowers are used.

56
Fig.2.14 Herof System [with enclosed box (1) with air flow (2) exhaust air
recirculation (4, 5, 6, 7) leachate collection system (3) and biofilter]
Fig.2.15 Static Enclosed Chamber with Perforated Pipes Blowing and Pulling
Air Alternately. (Frei et al., 2004b)
Another rotating biodrying reactor system consists of cylindrical rotating drum with
one perforated pipe as shown in Fig. 2.16 (Bartha, 2008).The rotation of the reactor is
supposed to give more homogeneous output than static reactor. Considering the
energy balance of the process the energy required for rotation will make the process
expensive.

57
Fig.2.16 Rotating Drum Reactor
The technology transfer for bioconversion technologies could be possible, but wide
differences are evident and hence uncritical exploration of the results of reactor
designs, scales, substrates and operating regimes may be misleading (Velis et. al.,
2009). The blind technology transfer from developed countries to the developing
countries and its subsequent failure has brought attention to the need for appropriate
technology development to suit the regional conditions like type of waste,
composition, treatment, etc.(Beukering et. al., 1999).
2.13 CONDENSATION PREVENTION TECHNIQUES
The prevention of air saturation of the exhaust air is very necessary in biodrying
process so that re-wetting of reactor top can be avoided. A number of methods for
preventing condensation in reactors have been studied. A detailed study was
conducted to select a proper method of heat exchange so as to avoid condensation
above the top of the reactor matrix.

58
2.13.1 Direct-Transfer Type Exchangers
In this type, heat transfers continuously from the hot fluid to the cold fluid through a
dividing wall. Although a simultaneous flow of two (or more) fluids is required in the
exchanger, there is no direct mixing of the two (or more) fluids because each fluid
flows in separate fluid passages. In general, there are no moving parts in such heat
exchangers. This type of exchanger is designated as a recuperative heat exchanger or
simply as a recuperator.
2.13.2 Direct-Contact Heat Exchangers
In a direct-contact exchanger, two fluid streams come into direct contact, exchange
heat, and are then separated. Common applications of a direct-contact exchanger
involve mass transfer in addition to heat transfer, such as in evaporative cooling and
rectification; applications involving only sensible heat transfer are rare. The enthalpy
of phase change in such an exchanger generally represents a significant portion of the
total energy transfer. The phase change generally enhances the heat transfer rate.
Compared to indirect contact recuperators and regenerators, in direct-contact heat
exchangers, (1) very high heat transfer rates are achievable, (2) the exchanger
construction is relatively inexpensive, and (3) the fouling problem is generally
nonexistent, due to the absence of a heat transfer surface (wall) between the two
fluids. However, the applications are limited to those cases where a direct contact of
two fluid streams is permissible.

59
2.13.3 Gas–Liquid Exchangers
In this type of heat exchanger, one fluid is a gas (more commonly, air) and the other
a low-pressure liquid (more commonly, water) are readily separable after the energy
exchange. In either cooling of liquid (water) or humidification of gas (air)
applications, liquid partially evaporates and the vapour is carried away with the gas.
In these exchangers, more than 90 % of the energy transfer is by virtue of mass
transfer (due to the evaporation of the liquid), and convective heat transfer is a minor
mechanism. A ‘‘wet’’ (water) cooling tower with forced- or natural-draft airflow is
the most common application. Other applications are the air-conditioning spray
chamber, spray drier, spray tower, and spray pond.
2.13.4 Single-Pass Exchangers –Counter flow Exchanger
In a counter flow or counter current exchanger, as shown in Fig. 2.17., the two fluids
flow parallel to each other but in opposite directions within the core (Shah, 1981).
The temperature variation of the two fluids in such an exchanger may be idealized as
one-dimensional, as shown in Fig.2.17.
Fig. 2.17 a) -Double-Pipe Heat Exchanger with Pure Counter Flow; (b-f) Plate
–Fin Exchangers with Counter Flow Core and Cross Flow Headers.
(Shah,1981)

60
As shown later, the counter flow arrangement is thermodynamically superior to any
other flow arrangement. It is the most efficient flow arrangement, producing the
highest temperature change in each fluid compared to any other two-fluid flow
arrangements for a given overall thermal conductance (UA), fluid flow rates, and
fluid inlet temperatures. Moreover, the maximum temperature difference across the
exchanger wall thickness (between the wall surfaces exposed on the hot and cold
fluid sides) either at the hot or cold-fluid end is the lowest, and produce minimum
thermal stresses in the wall for an equivalent performance compared to any other flow
arrangements. However, with plate-fin heat exchanger surfaces, there are
manufacturing difficulties associated with the true counter flow arrangement. This is
because it is necessary to separate the fluids at each end, and the problem of inlet and
outlet header design is complex. Some header arrangements are shown in
Fig.2.17 (b–f). Also, the overriding importance of other design factors causes most
commercial heat exchangers to be designed for flow arrangements different from
single-pass counter flow if extremely high exchanger effectiveness is not required.
Fig.2.18 Temperature Distributions in a Counter Flow Heat Exchanger of
Single-Phase Fluids

61
Typical temperature distributions for a counter flow regenerator are shown in
Fig.2.18. In Fig.2.18 Ch=(mcp)h is the heat capacity rate of the hot fluid, Cc is the heat
capacity rate of the cold fluid ,and specific heats cp are treated as constant. The
symbol T is used for temperature; the subscripts h and c denote hot and cold fluids,
and subscripts i and o represent the inlet and outlet of the exchanger (Shah, 1981).
2.13.5 Cross flow Exchanger
In this type of exchanger, as shown in Fig. 2.19, the two fluids flow in directions
normal to each other. Typical fluid temperature variations are idealized as two-
dimensional and are shown in Fig. 2.19 for the inlet and outlet sections only.
Thermodynamically, the effectiveness for the cross flow exchanger falls in between
that for the counter flow and parallel flow arrangements. The largest structural
temperature difference exists at the ‘‘corner’’ of the entering hot and cold fluids, such
Fig. 2.19 (a) Hot-side Solid and Fluid Temperature Excursion; (b) Balanced
(Ch=Cc)Regenerator Temperature Distributions at the Switching
Instant
(Shah,1991b)

62
as point as in Fig. 2.20. This is one of the most common flow arrangements used for
extended surface heat exchangers, because it greatly simplifies the header design at
the entrance and exit of each fluid. If the desired heat exchanger effectiveness is high
(such as greater than 80 %), the size penalty for the cross flow exchanger may
become excessive. In such a case, a counter flow unit is preferred.
In a cross flow arrangement, mixing of either fluid stream may or may not occur,
depending on the design. A fluid stream is considered unmixed when it passes
through individual flow channels or tubes with no fluid mixing between adjacent flow
channels. In this case within the exchanger, temperature gradients in the fluid exist in
at least one direction (in the transverse plane) normal to the main fluid flow direction.
Fig. 2.20 (a) Plate-fin Unmixed Cross Flow Heat Exchanger; (b) Serpentine
(one tube row) Tube-Fin Unmixed Cross Flow Heat Exchanger.
(shah,1981).

63
A fluid stream is considered completely mixed when no temperature gradient exists in
the transverse plane, either within one tube or within the transverse tube row within
the exchanger. Ideally, the fluid thermal conductivity transverse to the flow is treated
as zero for the unmixed-fluid case and infinity for the mixed-fluid case.
Fluids 1 and 2 in Fig. 2.20(a) are unmixed. Fluid 1 in Fig.2.20 (b) is unmixed, while
fluid 2 is considered mixed because there is only one flow channel. The temperature
of an unmixed fluid, such as fluid 1 in Fig.2.20, is a function of two coordinates z and
y within the exchanger, and it cannot be treated as constant across a cross section (in
the y direction) perpendicular to the main flow direction x. Typical temperature
distributions of the unmixed fluids at exchanger outlet sections are shown in Fig.2.21.
The outlet temperature from the exchanger on the unmixed side is defined as a mixed
mean temperature that would be obtained after complete mixing of the fluid stream at
the exit. For the cases of Fig. 2.19, it is idealized that there is no variation of the
temperature of either fluid in the x direction. The temperature of a mixed fluid (fluid
2 in Fig. 19 (b) is mainly dependent on the coordinate y. The temperature change per
pass (in the x direction) of fluid 2 in Fig. 2.17 is small compared to the total. In a
multiple-tube-row tubular cross flow exchanger, the tube fluid in any one tube is
considered mixed at any cross section.
Fig.2.21 Temperature Distributions at Inlets and Outlets of an Unmixed Cross
Flow heat exchanger (Shah 1981)

64
However, when split and distributed in different tube rows, the incoming tube fluid is
considered unmixed between the tube rows. Theoretically, it would require an infinite
number of tube rows to have a truly unmixed fluid on the tube side. In reality, if the
number of tube rows is greater than about four, it will practically be an unmixed side.
For the heat exchanger system with fewer than about four or five tube rows, the tube
side is considered partially unmixed or partially mixed. Note that when the number of
tube rows is reduced to one, the tube fluid is considered mixed.
Mixing thus implies that a thermal averaging process takes place at each cross section
across the full width of the flow passage. Even though the truly unmixed and truly
mixed cases are the extreme idealized conditions of a real situation in which some
mixing exists, the unmixed condition is nearly satisfied in many plate-fin and tube-fin
(with flat fins) exchanger applications.
Fig. 2.22 Symbolic Representation of Various Degrees of Mixing in a sSngle-
Phase Cross flow exchanger. (Shah 1981)

65
It was observed that for the same surface area and fluid flow rates, (1) the exchanger
effectiveness generally decreases with increasing mixing on any fluid side, although
counter examples can be found in the multi-pass case; and (2) if the fluid with
maximum specific heat capacity is placed on the unmixed fluid side, the exchanger
effectiveness and performance will be higher than that for placing the same on the
mixed fluid side. Seven idealized combinations of flow arrangements for a single-
pass cross flow exchanger are shown symbolically in Fig.2.22. The flow
arrangements are: (a) Both fluids unmixed. A cross flow plate-fin exchanger with
plain fins on both sides represents the ‘‘both fluids unmixed’’ case. (b) One fluid
unmixed, the other mixed. A cross flow plate-fin exchanger with fins on one side and
a plain gap on the other side would be treated as the unmixed–mixed case: (c) Both
fluids mixed. This case is practically less important, and represents a limiting case of
some multi pass shell-and-tube exchangers (d) one fluid unmixed and coupled in
identical order, the other partially mixed. Here identical order refers to the fact that a
fluid coupled in such order leaves the first row at the point where the other fluid
enters (leaves) the first row, and enters the other row where the second fluid enters
(leaves) that row (see the stream AA in Fig. 2.22(d).
A tube-fin exchanger with flat fins represents the case of tube fluid partially mixed,
the fin fluid unmixed. When the number of tube rows is reduced to one, this
exchanger reduces to the case of out-of-tube (fin) fluid unmixed the tube fluid mixed
(case b). When the number of tube rows approaches infinity (in reality greater than
four), the exchanger reduces to the case of both fluids unmixed (case a). (e) One fluid
partially unmixed, the other partially mixed. The case of one fluid (fluid 1) partially
unmixed (i.e., mixed only between tube rows) and the other (fluid 2) partially mixed

66
(Fig.2.22.e) is of less practical importance for single-pass cross flow exchangers.
When the number of tube rows is reduced to one, this exchanger is reduced to the
case of out-of-tube fluid unmixed, the tube fluid mixed.
2.14. LITERATURE REVIEW-SUMMARY
The technological options for different municipal solid waste treatment methods have
been studied in detail. It was observed that waste to energy technologies for
municipal solid waste treatment are the need of time to prevent the accumulation of
the same in landfills and dumping yards. Mixed municipal solid waste treatment
technologies are better for situations where the segregated collection of municipal
solid waste at source is lacking. Another advantage of mixed municipal solid waste
treatment systems is that high calorific value of components like plastics and textiles
which will increase the total energy value of the solid waste. Also the inherent
bulking agents like paper, textiles and plastic can be utilised for the biodrying process
with the use of mixed municipal solid waste as substrate. Thermal methods are most
suitable for treating municipal solid waste in mixed condition. Raw municipal solid
waste with high moisture content and low calorific value is challenging while
considering the feasibility of thermal treatment methods. In this scenario, the
“Biodrying Technology” is a sustainable option for converting raw municipal solid
waste with high moisture content into a product with low moisture content and high
calorific value, which can be used for waste to energy applications. The biodried
municipal solid waste facilitates the energy recover from incinerators and also it
avoids the need of auxiliary fuel for starting combustion. The production of refuse
derived fuel (RDF) from biodried output has the potential to partially substitute the

67
fossil fuels in industrial applications which will help to substantially reduce the
amount of the waste going to landfill. The major application of RDF produced from
MSW is in thermal power plants, cement kilns and industrial processes. The detailed
evaluation of the mechanism of biodrying process has revealed that it is a complex
reaction that has different levels. The aerobic degradation of organic substances by
microbes is a deciding factor in biodrying reaction. The cells of microorganisms can
be considered as the smallest continuously working reactors and the growth of
microorganisms require an optimum physico-chemical environment. Four phases of
microbial growth namely lag phase, exponential phase, stationary phase and lethal
phase decides the process control strategy in biodrying. The thermophilic organisms
have the highest absolute growth rate and also the highest moisture reduction
performance and also the mesophilic organisms actively participate in biodrying
reaction. One hour heating of the substrate in the range of 50 °C to 55 °C temperature
will kill most of the common parasites and pathogens which is the suitable
temperature range for effective sanitization of biodried output. However partial
sanitisation of the output is also reasonable for the bulk of the biodried product. This
is due to the fact that sanitisation to high standards is not necessary as the end use of
biodried material is in thermal energy recovery. The pH of the substrate is an
important factor affecting the microbial reaction, and hence in the case of static
biodrying processes, the mixing of materials before treatment will ensure maintaining
optimum pH range. The pilot scale reactor system can be used in the present study so
that it can simulate the actual conditions in commercial scale units. The process
temperature profile and weight loss profile studies in the innovatively designed pilot
scale biodrying reactor are very valuable for further research activities in this field.

68
The volume reduction, bulk density enhancement and the moisture reduction of
municipal solid waste with high moisture content is a matter of high importance in
solid waste management practices, which is making the biodrying process versatile.

69
CHAPTER 3
MUNICIPAL SOLID WASTE CHARACTERISATION STUDY
3.1 MUNICIPAL SOLID WASTE DATABASE
The municipal solid waste components in this study were categorised into different
types based on the data base of municipal solid waste (MSW) for Kerala state
(KSUDP, 2006; Varma, 2006). The database has revealed that on an average about
71.74 % of municipal solid waste of the region is organic in nature. The major portion
of organic waste is constituted by the food waste and the remaining part is the garden
waste, which is contributing to the high moisture content of MSW of the region. The
characterisation relevant to the biodrying process mainly consisted of the study of
physical parameters, which determines the energy potential of MSW. The individual
components of municipal solid waste have been analysed to find out the moisture
content (%) and the volatile solids content.
3.2. MATERIALS AND METHODS
The components of mixed municipal solid waste have been categorised as organic,
paper and cardboard, plastics and textiles. The metals and inert components were not
considered in this study since the energy value is negligible for the same. The
proximate analysis has been carried out for individual components of mixed
municipal solid waste.

70
3.2.1 Proximate Analysis
Proximate analysis includes the measurement of moisture content and volatile matter
content of the mixed municipal solid waste. The measurement has been carried out
for individual components of municipal solid waste. The individual results have been
applied by weighted average method so that the results for mixed municipal solid
waste can be obtained.
Moisture Content
Moisture content is determined for triplicate numbers of samples on a particular day of
collection. The dishes used for the analysis were preheated at 1050 C for 24 hrs. The
percentage moisture content of the individual component of MSW has been determined
by taking 1kg of the thoroughly mixed samples in a pre-weighed dish. The samples were
dried in a hot air oven at 1050C till a constant weight is achieved (ASTM- D 3173-
87,1996).The percentage moisture content is calculated as the percentage loss in weight
before and after drying. The equation for calculation is given as
% Moisture content = [(Wet weight- Dry weight)/Wet weight] × 100
Volatile Matter Content
The triplicate samples of individual components of MSW used in the moisture
determination were weighed and placed in a muffle furnace for 7 minutes at 950°C
(ASTMD-3175-89).The samples are weighed after the combustion to determine the
dry ash content. The volatile solids content can be calculated as given below.
% Volatile Solids = [(Dry sample weight-Ash weight)/ Dry sample weight] ×100

71
3.2.2 Weighted Average Method for Moisture Content
Weighted average method includes applying the weightage to the experimental results
based on the composition of the municipal solid waste. The composition of municipal
solid waste has been taken from the existing database. In the present study previous
results has been taken from the available database (Varma, 2006; KSUDP, 2006).
The results of moisture analysis have shown the wide differences in the organic
component of MSW which is most contributing to the moisture content. The moisture
content of mixture of the specified components of MSW is calculated as given below.
Moisture content of typical mixture of different components of municipal solid waste
is calculated as= Σ (Ai × Ci)
Where, Ai - average moisture content of a particular component
Ci- average composition of a particular component of msw*
(*KSUDP, 2006)
3.2.3 Volatile Solids Content of Mixed Municipal Solid Waste by Weighted
Average Method
Volatile solids content of typical mixture of different components of municipal solid
waste is calculated as= Σ (Bi × Ci)
Where, Bi - average volatile solids content of a particular component
Ci - average composition of a particular component of msw* (*KSUDP, 2006)

72
3.3. RESULTS AND DISCUSSIONS
The experiments were conducted on different days and for different combinations of
waste as available on that particular day. This method is selected to understand the
varying nature of the waste characteristics and to obtain a statistical range for the
analysing parameters. The graphical representation of the proximate analysis results
for organic portion of the municipal solid waste is shown in Fig.3.1.
Fig.3.1 Moisture Content (%) and Volatile Solids Content (%) of the Organic
Component of Municipal Solid Waste
The daily average value of moisture content of organic portion varies from 77.38 %
to 84.02 %. The organic component of municipal solid waste is having high variation
in moisture characteristics. The average value of moisture content of organic
component (average of samples A1 to A6) is calculated as 80.76 %. The daily
79.8 84.02 81.48
77.38 81.03 80.82
90.45 94.96 94.42 97.40 95.98
91.25
0
20
40
60
80
100
120
Sample
A1
Sample
A2
Sample
A3
Sample
A4
Sample
A5
Sample
A6
% V
ari
ati
on
Sample label
Moisture content(%)
Volatile solids(%)

73
average value of volatile solids content of organic portion varied from 90.45 % to
97.4 %. The average value of volatile matter of organic samples (A1 to A6) has been
obtained as 94.07 %. The higher percentage of volatile matter indicates the energy
value of the component, and hence it is beneficial. These experimental results
confirmed that high moisture content of the organic portion of municipal solid waste
is the main reason for the reduced calorific value of the MSW since its volatile
content is high.
The results of proximate analysis carried out for paper and cardboard component of
MSW is shown in Fig. 3.2.
Fig. 3.2 Moisture Content (%) and Volatile Solids Content (%) of Paper and
Cardboard Component of Municipal Solid Waste.
It was observed that the variation observed in moisture content of different paper
samples is negligible. The average moisture content of 10.48 % has been obtained for
10 10.5 11 10.3 10 11.1
91.84 92.25 92.39 92.34 91 92.5
0
10
20
30
40
50
60
70
80
90
100
Sample
P1
Sample
P2
Sample
P3
Sample
P4
Sample
P5
Sample
P6
% v
aria
tion
Sample Label
Moisture
content (%)
Volatile
solids(%)
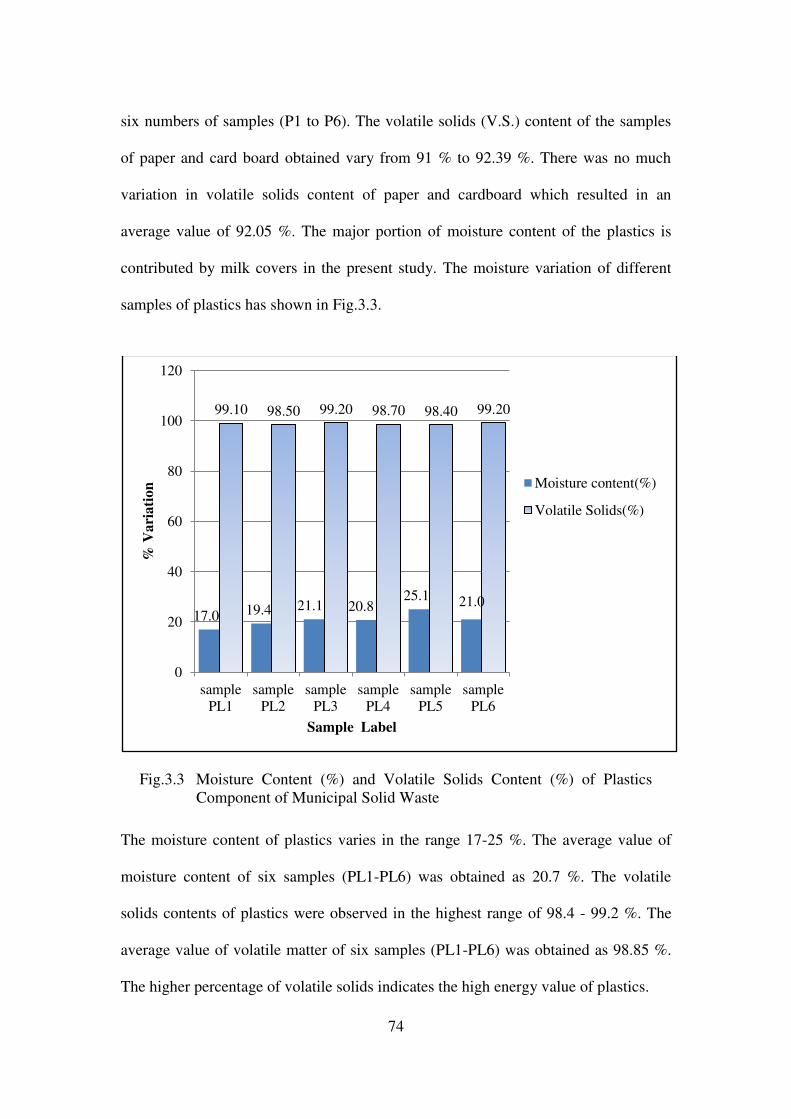
74
six numbers of samples (P1 to P6). The volatile solids (V.S.) content of the samples
of paper and card board obtained vary from 91 % to 92.39 %. There was no much
variation in volatile solids content of paper and cardboard which resulted in an
average value of 92.05 %. The major portion of moisture content of the plastics is
contributed by milk covers in the present study. The moisture variation of different
samples of plastics has shown in Fig.3.3.
Fig.3.3 Moisture Content (%) and Volatile Solids Content (%) of Plastics
Component of Municipal Solid Waste
The moisture content of plastics varies in the range 17-25 %. The average value of
moisture content of six samples (PL1-PL6) was obtained as 20.7 %. The volatile
solids contents of plastics were observed in the highest range of 98.4 - 99.2 %. The
average value of volatile matter of six samples (PL1-PL6) was obtained as 98.85 %.
The higher percentage of volatile solids indicates the high energy value of plastics.
17.0 19.4 21.1 20.8 25.1 21.0
99.10 98.50 99.20 98.70 98.40 99.20
0
20
40
60
80
100
120
sample
PL1
sample
PL2
sample
PL3
sample
PL4
sample
PL5
sample
PL6
% V
ari
ati
on
Sample Label
Moisture content(%)
Volatile Solids(%)

75
The results obtained for proximate analysis for textiles were shown in Fig. 3.4. The
moisture variation has been observed in the range 10.1 % to 11.79 %. The average
value of moisture content of samples (T1 - T6) was obtained as 11.16 %. The volatile
solids content of textiles were obtained in the range 94.36 % to 95.1 %. The average
value of volatile solids of textiles was 94.76%, which is advantageous for energy
production.
Fig.3.4 Moisture content (%) and Volatile Solids Content (%) of the Textiles
Component of Municipal Solid Waste
The components of MSW like metals, rubber, glass, leather, inert particles, etc. are
about 10.73% of total MSW (KSUDP, 2006) and their moisture contribution is
considered as negligible when compared to other components. Hence their moisture
content is assumed as zero for the present study.
11.43 11.79 11.50 11.65 10.10 10.50
94.54 95.10 94.90 94.70 95.00 94.36
0
10
20
30
40
50
60
70
80
90
100
sample
T1
sample
T2
sample
T3
sample
T4
sample
T5
sample
T6
% V
aria
tion
Sample Label
Moisture
content(%)
Volatile
solids(%)

76
The weighted average value of moisture content of typical mixed municipal solid
waste is obtained as
Σ (Ai × Ci) = 61 %
The weighted average value of volatile solids content of typical mixed municipal
solid waste is obtained as
Σ (Bi × Ci) = 90.2 %
3.4. SUMMARY
The proximate analysis of different components of mixed municipal solid waste has
revealed that it has an average moisture content of 61 %. This is the optimum range
required to start the biodrying reaction. Also, the high volatile matter content of
90.2 % has been obtained for the mixed municipal solid waste, which is indicating the
suitability of the biodried output in energy producing applications.

77
CHAPTER 4
BIODRYING REACTOR DEVELOPMENT
4.1 GENERAL
An innovative pilot scale reactor has been developed by considering the feasibility of
the structural strength aspect, as well as the selected process conditions. The
developed biodrying reactor unit mainly consisted of four parts called reactor
chamber, insulation chamber, top chamber and bottom chamber (Fig.4.3). The
structural dimensions of the pilot scale reactor chamber have been selected based on
the critical bulk density of the municipal solid waste substrate.The study of bulk
density distribution in composting piles has reported that bulk density and porosity
are influenced by the combined effects of subsidence, loss of organic matter due to
biological degradation process, and change of water content due to transport
processes (Ginkel et al., 1999).
4.2 STRUCTURAL DESIGN OF PILOT SCALE BIODRYING REACTOR
4.2.1 Dimensions of the Biodrying Reactor
The design details of the biodrying reactor chamber were enlisted in Table.4.1. The
volume of the reactor chamber has to accommodate the critical conditions of the
substrate. Therefore critical bulk density of 200 kg/m3
has been taken for the present
study which is taken from the available municipal solid waste database (Varma,
2006). The volume required to hold 100 kg waste under critical conditions of bulk
density has been obtained as 0.50 m3. The additional volume has been considered to

78
hold the exhaust gases and including that the total volume of biodrying reactor has
been obtained as 0.565 m3. The cylindrical shaped reactor has been selected since the
circular shape is good for uniformity of the reactor matrix as the corners can be
avoided. The height of the reactor was limited to 2.0 m at the selected diameter of
0.60 m. Also the practical feasibility of working as well as the moulding and strength
aspect of the reactor material has been considered.
Table 4.1 The Structural Dimensions of the Reactor.
Particulars Quantity Unit
* Total Density of municipal solid waste (minimum) 207.06 kg/m3
Critical total density of municipal solid waste taken for design 200 kg/m3
Weight of MSW 100 kg
Volume required to accommodate 100 kg 0.50 m3
An extra volume of 10-15 % is required to hold the exhaust
gases, Considering an average of 13 % additional Volume 0.565 m
3
Selecting a cylindrical shaped reactor with diameter of 0.60 m, the
height required 2.0 m
(*Varma, 2006)
4.2.2 Material Selection for the Reactor Unit
The material used to fabricate the reactor was selected based on the strength aspect,
corrosion possibilities, economic considerations, and the fabrication possibilities. The
fibre coated mild steel was found to be suitable for insulation chamber, bottom
chamber and top cap. The fibre coating is provided so that the corrosion of the
insulation chamber can be prevented. The material selected for the moisture analysis
chamber of reactor is acrylic, it has high strength, non-corrosive and the visibility of
the process inside the reactor is an added advantage.

79
Fig.4.1 Pilot Scale Biodrying Reactor
4.2.3 Reactor Chamber
The moisture reduction during the biodrying process is taking place in the reactor
chamber (Fig.4.1). The structural details of the pilot scale reactor unit have been
plotted in Fig.4.2. The different images during the operating stages of the reactor are
shown in Fig. 4.3, Fig.4.4 and Fig 4.5.
Design Thickness for Acrylic chamber
The acrylic material was available only in sheets of various thicknesses. So the sheets
were to be fabricated into the tubular shape of the moisture analysis chamber. For
thepresent design, 2 mm thick acrylic sheets were selected and circular tube of 60 cm
diameter and 20 cm height was fabricated, after checking the strength against hoop
stress exerted by 100 kg of municipal solid waste.

80
Youngs Modulus of Elasticity, E= 3.2×10⁹
N/m2
Poissons ratio µ= 0.30
Hoop stress, σ1= (P ×r) ÷t
Longitudinal stress, σ2 = (P×r )÷2t
Pressure, P = Load/Area= 1000/(π/4×0.6×0.6)
= 3538.57 N/m2
t - The thickness of acrylic provided =2 mm.
r- Radius of reactor = 0.3 m
σ1 = P× r ÷t
= 3538.57×0.3 ÷ (.002)
= 5.307×10⁶
N/m2
σ 2 = P×r÷2t
= 3538.57×0.3÷ (2×.002)
= 2.6535×10⁶
N/m2
Ultimate tensile strength of the acrylic = 70×106
N/m2
Hence the thickness provided is sufficient. . The acrylic material of 2mm thick was
found to be strong enough to resist the hoop stress due to MSW.

81
Fig.4.2 Structural Design of Pilot Scale Biodrying Reactor

82
Fig.4.3 Empty Reactor Chamber
4.2.4 Insulation Chamber
The insulation chamber of dimension 1.5 m ×1.5 m × 2.0 m has been designed for
the biodrying reactor configuration as shown in Fig. 4.2. This chamber was designed
in such a way that the insulation property of air is utilised to insulate the reactor
chamber from ambient environment (Fig.4.4). The insulation of the reactor chamber
is necessary to prevent the energy loss taking place through the walls of the reactor.
This will simulate the process taking place in bigger scale plants. In commercial scale
plants the ratio of surface area of reactor exposed to atmosphere and volume of the
substrate will be less compared to the lab scale one. Hence inorder to simulate the
actual process conditions taking place in bigger scale plants the design of insulation
chamber is very essential. The dimensions are fixed by considering the safety during
reactor feeding and emptying.

83
4.2.5 Inlet Design- Top Chamber
The inlet design for the top chamber of the reactor was challenging. A number of
alternative designs have been considered for the design of inlet of biodrying reactor
like single chamber model (Rada et.al., 2005a) multi-chamber model (Frei et. al.,
2004b), rotary chamber model(Bartha ,2008) etc. Finally the most suited innovative
top chamber reactor was designed as inlet for this study. The reactor feeding from the
top was found to be effective for safety and easiness in operation. The designed inlets
consist of airtight removable top chamber fabricated of the fibre coated mild steel
(Fig.4.4).
Fig.4.4. Closed View of Reactor Fig.4.5. Filled Reactor
4.2.6 Outlet Design – Bottom Chamber
The outlet of the reactor was another important configuration which affects the
smooth working of the reactor. The reactor outlet was designed effectively to serve
the double purpose of provision for mechanical aeration was well as the provision for
emptying the reactor after the process. The outlet consisted of a bottom chamber with
a perforated top plate for supplying the required quantity of air for the

84
reaction(Fig.4.1). The bottom chamber has been supported on a hydraulic scissor lift
which is provided for slow emptying of the reactor (Fig.4.4, Fig.4.5). The reactor was
designed with side supports so that it will remain static throughout the operation.
4.3 BIODRYING PROCESS DESIGN
The major assumptions considered in the psychrometric design of the biodrying
reactor in the present investigation is
1. The reactor matrix is homogeneous and adiabatic in terms of physical
properties on a macroscopic scale.
2. Temperature and moisture concentration gradients exist along the height of
the reactor matrix only. These parameters were considered uniform along the
diameter of the reactor matrix. This assumption makes it possible the use of
one dimensional analysis of parameters (i.e., along the height of reactor).
3. Self heating inside the reactor matrix was assumed to be at a uniform rate and
hence the temperature development inside the entire reactor feed is assumed
to be in the range of 50°C to 60°C.
4. The psychrometric design for the present study had neglected the
condensation reactions inside the biodrying reactor.
5. The effects of shrinkage other than changes in the density and thermal
properties of the reactor matrix were neglected. The mass diffusivity of the
reactor matrix was considered as a function of biodrying conditions only and
hence it was held constant for a particular biodrying zone in reactor. Also the
particle dimension of the reactor feed was limited to 20 cm and particle
thickness limit was taken as 5 mm in the present investigation.
4.3.1 Air Flow Design
The drying of the MSW is affected by the rate of air flow and the resulting self
heating biodegradation reactions (Annexure-1). The inlet air flow conditions of 25 ºC
and 90 % relative humidity (RH) was selected as the critical conditions. The design of

85
air flow is done by considering the critical moisture content of MSW as 70%. Tanner
diagram (Fig.4.6) is used to assess the limit of moisture content required for
combustion of an organic material without adding auxiliary fuels (Babcock and
Wilcox, 1992). In the present study the moisture content of 45% was fixed as the
target for design purpose which is within the maximum limit of 50% as shown in
tanner diagram. The moisture content of biodried output has been considered as 45 %
for design which is the requirement for energy producing applications of a material.
The proper air flow control is critical for the biodrying process. Psychrometric chart
developed by Carrier (1911) has been used in the present study to analyse the process
involving moist air and determine the air flow requirements of process (Fig.4.7). The
biodrying process design calculations were shown in Table.4.2.The thermodynamic
table has also been referred for air density calculations which are also considered for
the design purpose. The psychrometric chart for high temperature range has been
referred as the temperature rise in the range 500C – 60
0C is expected from the
designed reactor unit (Fig.4.7).In the proposed design of reactor, the maximum air
flow rates required for achieving the desired biodried output within 10, 11, and 15
days were obtained as 40 L/m,37 L/m and 27 L/m respectively.
Fig.4.6. Tanner Diagram (Babcock and Wilcox, 1992)

86
Fig.4.7. Psychrometric Chart
(Carrier,1911)

87
Table 4.2 Process Design Calculations
Process critical conditions considered
Temperature of inlet air to reactor 25 ˚C
RH of inlet air 90 %
Self heating Temperature rise 50 ˚C
Moisture content of MSW 70 %
Quantity of MSW 100 kg
Quantity of water removal required, for 45% moisture of
biodried product 45.45 kg
Using the Psychrometric Chart (Fig.4.2)
Input air 25˚C, 90 % RH
Humidity of drying air 0.018 kg/kg of air
Specific volume of air 0.87 m3/kg
Humidity of self-heated air at 50˚C, at RH 100% 0.086 kg/kg of air
Therefore water removed 0.068 kg/kg of air
i.e., 0.87 m3 air remove 0.068 kg water
therefore, the amount of air to remove 45 kg water 581.49 kg air
From thermodynamic table, density of inlet air at 25˚ C 1 kg/m3
Air flow for ten days 58.15 kg per day
2.42 kg per hour
0.04008 kg/minute
0.040081434 m3/minute
Air flow for10 days 40 litre/minute
Air flow for 11 days 37 litre/minute
Air flow for 15 days 27 litre/minute
4.4 HEAT ENERGY REQUIREMENT IN BIODRYING
The heat energy required to raise the temperature of a material by Ѳ ºC is given by
the equation (Bach et al., 1987; Silusar and Armisheva, 2013).
Heat Energy Equation is given by
Q = mcѲ -------------------------------------------------------------------------- (4.1)

88
Where c -specific heat capacity of material (kJ/kg ˚C)
m- mass (kg),
Ѳ - Change in temperature (ºC)
Table 4.3 Heat Requirements of Biodrying Process
Particulars Quantity Unit
Initial moisture content of MSW 70 %
Expected moisture content of biodried output 45 %
Weight of MSW 100 kg
Water content in 100 kg 70 kg
The total quantity of Water to be removed 45.45 kg
Water removal required from 1 kg of MSW 0.4545 kg
Initial temperature of MSW matrix 25 ˚C
Temperature rise expected in biodrying process 50 ˚C
specific heat capacity of water, Cw 4.186 kJ/kg ˚C
specific heat capacity of MSW, Cs 1.25 kJ/kg ˚C
Ѳ- change in temperature 25 ˚C
Heat energy required by 1 kg of MSW
(Heat energy required to raise the temperature of MSW by 50˚C+ heat energy required to raise the temperature of water by 50˚C)
82.63 kJ
Total heat energy Required to raise the temperature of 100 kg
MSW to 50˚C 8263 kJ
The initial moisture content of the municipal solid waste has been considered as 70 %
and the expected moisture content of the biodried output has been taken as 45 % for
design of the heating regime. The initial temperature of the reactor feed has been
considered as 25ºC. The specific heat capacity of water is taken as the standard value
and the specific heat capacity of municipal solid waste has been calculated based on
the proportion of different components of MSW.

89
4.5 SELF HEATING PROCESS IN BIODRYING
The heat energy released during the complete decomposition of the organic matter is
given by the equation
(C6H10O4) x + 6.5O2→ (C6H10O4) x-1 + 6CO2 + 5 H2O + 2578.6 kJ----- (4.2)
The reaction kinetics for the organic matter degradation can be represented by first-
order equation (4.3)
Ct = 1 − 𝑒−[0.00632×1.066(𝑇−20)]×𝑡 ----------------------------------------- (4.3 )
(Keener et. al., 1998)
Where Ct represents the mass of oxidised organic material, in relation to total amount
of organic matter provided (kg/kg) at any time t (day)
T (ºC) is the process temperature.
Other constants in kinetic equation were taken as per Di Maria et. al., 2008.
The components other than organic materials in the waste can be assumed as the
inherent bulking agents inside organic waste.
The functional unit considered for the present study is 100-200 kg per day of mixed
municipal waste undergoing biodrying process. The components other than organic
materials in the waste can be assumed as the inherent bulking agents inside organic
waste. The average organic matter concentration is 70 % and maximum temperature
rise is assumed to take place in initial five days of reaction. It is assumed that the
maximum heating takes place in 5 days of reaction.

90
As per kinetic equations, 19.3% degradation of readily degradable organic matter
occurs in 5 days, when averageself heating temperature is 50°C,
The maximum heat energy generated in biodrying= 25317.50 kJ........... (4.4)
As per kinetic equations, 10.4% degradation of readily degradable organic matter
occurs in 5 days when averageself heating temperature is 40°C,
The maximum heat energy generated in biodrying= 14036.12 kJ..................(4.5)
4.6 PROCESS INSTRUMENTATION DESIGN AND REACTOR OPERATION
The process instrumentation design has been carried out based on the results obtained
from critical conditions in process design. The schematic diagram of the process flow
along with instrumentation is shown in Fig. 4.10. The process air flow was provided
through the bottom air inlet chamber to the top of the reactor. The air supply unit
consists of an air compressor followed by a digital gas mass flow controller
(DGMFC) [Sierra, USA], which assisted in maintaining the required rate of air flow
throughout the process (Fig. 4.8). The monitoring of temperature development in the
process was carried out by using temperature sensing probes of PT-100 (SAKS, India)
at eight different locations along the height of the reactor unit.The insertion lengths of
probes were 10 cm inside into the reactor. The integration of temperature data for
10cm insertion length of sensor is possible using the designed data acquisition
software, and also the data storage was carried out. Six numbers of temperature
probes were provided at 20-30 cm intervals along the height of the reactor matrix.

91
The remaining two probes were used to measure the air temperature, one for
measuring inlet air temperature and the other one for outlet air temperature. The
order of insertion of temperature probes has been in such a manner that probe
numbers 1 to 8 were inserted in order from bottom to top of biodrying reactor unit.
The humidity transmitter (Kimo, France) was used to measure the relative humidity
of the inlet air as well as the exhaust air at specific intervals of time. The CO2analyser
(Testo, India) was provided to continuously monitor the carbon dioxide
production(Fig.4.8). The load cell of capacity 1000 kg (SAKS, India) was provided to
continuously monitor the weight loss from the reactor which can be used to assess the
moisture loss from the reactor.
The entire reactor unit along with the insulation chamber has been placed over the
load cell. The electronic measurement devices were connected to the data acquisition
system (DAQ), which records data at every second of time and hence the process
monitoring was effective. Also, the manual analysis of moisture content was carried
out at intervals during the working stage of the reactor. In addition to that, the volume
reduction in the innovative biodrying reactor was monitored on a daily basis, by
measuring the reduction of height along the reactor matrix.

92
Fig. 4.8 Schematic Diagram of Biodrying Process
The working of the designed biodrying reactor can be explained with the help of the
schematic diagram as shown in Fig. 4.8. The reactor chamber was fixed above the
bottom chamber in air tight manner, which is placed inside the insulation chamber.
The reactor feeding was carried out from the top chamber of the reactor into the

93
reactor chamber after thoroughly mixing the substrate (Annexure-II). All the
instrument probes are fitted into the reactor at the corresponding locations. The
airflow at the required rate is supplied through the perforated top plate of the bottom
chamber. Continuous process monitoring has been done using the data acquisition
system. When the required process is result is achieved, the bottom chamber has to be
dismantled from the moisture analysis chamber by removing the flanged connection
and by operating the scissor lift below the bottom chamber .This leads to removal of
biodried substrate from the reactor chamber. The removed substrate can be stored
inside the lower platform of the insulation chamber.
94
CHAPTER 5
SIX PHASES OF EXPERIMENTAL INVESTIGATIONS ON
THE INNOVATIVE PILOT SCALE BIODRYING REACTOR
5.1 INTRODUCTION
Six phases of experimental investigations have been conducted in the innovative pilot
scale biodrying reactor system. The mechanism of biodrying reaction has been
delineated through six phases of experiments. The continuous monitoring of weight
reduction, temperature profile, moisture content, volume reduction and bulk density
increase of the reactor matrix has been carried out.
The first five phases of experimental investigation have been conducted in the up
flow mode of aeration. In the first phase, the biodrying process in the pilot scale
system has been monitored to assess the efficiency of the designed system. The
second phase of experimental investigation has been carried out by modifying the
biodrying reactor design so as to increase the process efficiency. The effect of
specific air flow rate variation and reactor matrix height on the biodrying reaction has
been studied in the third phase. In the fourth phase, the combined effect of packing
and reactor matrix height on biodrying process has been investigated. The effect of
the increase in specific air flow rate on biodrying process efficiency has been studied
in the fifth phase. The down flow mode of aeration and its impact on biodrying
reaction has been investigated in the sixth phase.

95
5.2 EXPERIMENTAL INVESTIGATION- PHASE I - MONITORING OF THE
BIODRYING PROCESS IN THE INNOVATIVE PILOT SCALE REACTOR
5.2.1 Objectives
First experiment was conducted with the major objective of identifying the feasible
operating conditions of the reactor, as well as to analyse the critical process
parameters affecting the biodrying process. In order to achieve the major objective of
the research the continuous monitoring and analysis of the different process
parameters for the designed biodrying reactor unit has been carried out in the first
phase.
5.2.2 Introduction
Pilot scale investigations are necessary to study the science and engineering aspect of
biodrying process. Though a number of pilot scale plants exist for biodrying process
reactors for mixed municipal solid waste treatment are very scarce (Velis et. al.,
2009). The detailed technological study is essential to understand the applications of
biodrying reaction for mixed municipal solid waste management.
5.2.3 Materials and Methods
The study area selected for the present investigation is Kerala state. The compositions
of municipal solid waste for this study was selected referring the typical municipal
solid waste composition data base of Kerala state (Varma 2006). The mixed
municipal solid waste for the reactor has been collected in a systematic manner
(Fig.5.2.1). The organic materials were collected from the National Institute of

96
Interdisciplinary Science and Technology (NIIST) campus, Thiruvananthapuram
where the reactor was installed. It included the raw as well as cooked food waste,
green leaves, dried leaves etc. These materials were separately stored in bins.
Fig.5.2.1 The Different Components of Collected MSW.
The weight of the organic materials in these bins has been measured in the electronic
balance. The bigger sized components were chopped into smaller size so that proper
packing and mixing can be carried out. The paper and cardboard waste has been also
collected from the NIIST campus and cut into smaller size. The paper waste includes
news paper, print paper, magazine covers, card board etc. They are separately weighted
and stored in bins. The plastic waste mainly includes the milk covers and packing covers
of different types. They are also separately collected and weighted. The textile waste has
been collected from the nearby stitching centers and stored in separate bins

97
Table. 5.2.1 Composition of the Synthetic Municipal Solid Waste Substrate in
Phase-1
Component Particulars Weight
(kg)
Subtotal
(kg)
Grand Total
(kg)
Organic
components
Raw food waste 15
78.4
112
Cooked food waste 45.4
Fibers 10
Dried leaves 4
Fresh leaves 4
Paper and
Cardboard
News paper 8.44
13.44 Print Paper 2
Cardboard 3
Paper and
Cardboard
Crushed bottles 3
10.1 Milk Covers 4.1
Plastic Covers 3
Textiles Cotton 7.1
10.1 Polyester, Nylon 3
The sampling has been carried out for individual components of MSW. Firstly the
organic components were mixed thoroughly and samples were taken for moisture
analysis. Similarly the sampling is carried out for the other components also. After
sampling the mixing of the different components like organic materials, paper and
cardboard, plastics and textiles has been carried out in the required proportion. The
synthetic municipal solid waste substrate of 112 kg was prepared in the laboratory as
per the composition shown in Table 5.2.1.
Mixed municipal solid waste of 109 kg has been used as the reactor feed in the first
phase of study. The particle size of waste components was limited to a maximum value
of 20 cm and the maximum thickness was 5 mm. The proportion of different
components in the mixed municipal solid waste consisted of 70 % organic components,
12 % paper and cardboard, 9 % plastics and 9 % textile materials. These components

98
were thoroughly mixed, so that relatively homogeneous moisture content is maintained.
The initial moisture content of the mixed municipal solid waste substrate in the present
study has been calculated as 61.25 %. The moisture content of metals and inert
materials were assumed to be negligible and hence not considered in this study. The
samples of mixed municipal substrate were ground and sieved through 2 mm mesh
sieve (Garcia et al., 1991) for measuring the water soluble carbon. Then 5 gm of
individual samples were digested using potassium dichromate method (Walkley and
Black, 1934) in the reflux apparatus and the titration was carried out using ferrous
ammonium sulphate in order to get the water soluble carbon in the sample. The total
nitrogen content was analyzed in the biodried output by using Kjeldahl method as per
IS 5194-2002.
5.2.4. Biodrying Reactor-Process and Working
The reactor design consist of an inner circular acrylic reaction chamber of 0.60 m
diameter and 2.0 m height, with a capacity of treating 0.565 m3 of waste in one batch
The proportionally mixed synthetic municipal solid waste of 109 kg with bulk density
of 173 kg/m3 and initial moisture content of 61.25 % was fed through the top chamber
of the reactor. The temperature probes were inserted at 30 cm intervals along the
height of the reactor. Temperature measuring probe numbers 2,3,4,5 and 6 were
inserted in to the reactor feed at heights of 30 cm, 60 cm, 90 cm, 120 cm and 150 cm
respectively from the reactor bottom (Fig 5.2.2). Temperature of the inlet air was
measured by probe 1. The probes 7 and 8 were inserted at the top chamber and air
outlet respectively to monitor the exhaust air temperature. The air flow was provided
at the required rate through the digital mass flow controller into the bottom chamber

99
Fig. 5.2.2 Temperature Probes Inserted into the Biodrying Reactor.
of the reactor. After filling the reactor the top chamber was fixed air tight and the CO2
analyser and humidity probes were inserted on the top chamber. The volumetric air
flow through the controller was designed as 40 liter per minute (L/m) for the first phase
of experiment as per the psychrometric design. This accounts for a specific air flow rate
of 0.528 m3/kg.day supplied into the biodrying reactor. The continuous observations
and monitoring of the instrument readings as well as the reactor process conditions
were carried out for a perid of 33 days. The biodrying reaction reduced and almost
stopped by 21 days. Inorder to assess the further process the reaction continued for
further 12 days. Then it is stopped as no further drying reaction exist.
After filling the reactor with synthetic sample of municipal solid waste weighing
109 kg, it was observed that the temperature probe- 5 at 150 cm height from bottom
of reactor chamber was above the reactor matrix. The reactor was equipped with
standard control and measurement devices. The height of the reactor matrix was
observed as 1.38 meters.

100
5.2.5. Results
The biodrying reactor before and after 33 days of biodrying process is shown in
Fig. 5.2.3.
a) Filled Reactor Before Biodrying b) Biodrying Reactor After Process
Fig. 5.2.3 Biodrying Reactor Before and After 33 days of Biodrying Reaction-
Phase 1.
It can be seen that the volume of mixed municipal solid waste (MSW) substrate has
been considerably reduced. There exist visible demarcated zones of dry and wet
region of substrate inside the reactor matrix. The top portion of the reactor matrix was
wet, while the bottom portion was dried.
5.2.5.1. Temperature Profile
Self heating nature of the municipal solid waste is effectively utilised in biodrying
process, which help to prevent the septic nature of waste as well as to preserve the
waste for long time without odour production. Temperatures profile in biodrying
process has been recorded in every second through the data acquisition system. The
variation of temperature in every ten minute has been monitored and studied in detail.
The temperature variation at every ten minute interval of time has been plotted at

101
various heights from the air inlet (30 cm, 60 cm, 90 cm, 120 cm, 150 cm and
240 cm) along with inlet air and outlet air temperature variations (Fig. 5.2.4).
Three different approaches were considered for the analysis of temperature profile.
Firstly the initial six hour variation of temperature along the height of reactor was
plotted against time as shown in Fig.5.2.4. The graph clearly indicates that the initial
six hour period is very critical for biodrying process. The probes at 60 cm and 90 cm
distance from the air inlet have showed a sudden temperature rise of 10ºC in the
initial six hour period.
16:30 17:30 18:30 19:30 20:30 21:30 22:30 23:30 00:302526272829303132333435363738394041424344
Tem
per
atu
re (
0C
)
Time (pm)
Probe 1 - Air Inlet
Probe 2- 30cm ht.from air inlet
Probe 3 - 60 cm ht.from air inlet
Probe 4 - 90cmfrom air inlet
Probe 5 - 120cm from air inlet
Probe 6 - 150cmfrom air inlet
Probe7 - 240cm from air inlet
Probe 8 - Air Outlet
Fig. 5.2.4 Temperature Profile Inside the Biodrying Reactor in the Initial Six
Hours of Reaction- Phase 1.
The second consideration in temperature analysis was to study the profile formations
in the first ten day period of biodrying reaction (Fig.5.2.5). The temperature probes
above 90 cm, have recorded temperature fall, since the condensed water was dripping

102
downwards in to the reactor feed through the side walls. This is the main visible
reason for lower temperature in this zone. Also the relative humidity has reached
saturation value in the substrate top region. The rising trend of temperature continued
for first three days in probes 3 and 4 placed at distances of 60 cm and 90 cm
respectively from the air inlet (Fig.5.2.5). Then it started a decreasing trend, while the
temperature in probe at distance of 30 cm form air inlet maintained the increasing
trend up to six days and the maximum temperature observed was 48ºC in this probe.
The observed values of temperature by the end of 10 days of reaction were 42.9oC,
43oC and 33
oC at heights of 30 cm, 60 cm and 90 cm respectively from the air inlet.
0 1 2 3 4 5 6 7 8 9 10 11 12
25
30
35
40
45
50
55
60
Tem
per
ature
(oC
)
Time (days))
Probe 1 - Air inlet
Probe 2 - 30cm ht.from air inlet
Probe 3 - 60 cm ht.from air inlet
Probe 4 - 90 cm ht.from air inlet
Probe 5 - 120 cm ht.from air inlet
Probe 6 - 150 cm ht.from air inlet
Probe 7 - 240cm from air inlet
Probe 8 - Air Outlet
Fig. 5.2.5 Temperature Profile Inside the Biodrying Reactor in First 10 Days of
Reaction –Phase 1.
Finally the temperature profile for a period of 33 days has been plotted along the
reactor height. Two well defined peaks of temperature rise were observed in thirty
three days of observation (Fig.5.2.6). The first cycle of temperature rise lasted till the

103
third day on the probes 3 and 4. The probe 2 has recorded temperature rise till the
sixth
day and after that a falling trend of temperature has been observed till the 15th
day of the process. The falling trend of temperature has resulted due to active
biodrying process and the resulting evaporative cooling. The second cycle of
temperature profile has started on the probes 2 and 3 after 16th
day of process at a rate
of 5ºC to10ºC rise per day. The rising trend continued only for a short duration of one
day, and after that the temperature profile has shown falling trend (at a less rate 1 ºC
to 2 ºC per day). The third cycle of temperature started after 16 days of biodrying
reaction. In this cycle temperature rise and fall occurred on the probes 2 and 3. The
rise and fall of temperature within the narrow range of 1ºC to 2ºC rise recorded on all
the probes in this cycle and continued till the end of monitoring period of thirty three
days of biodrying process.
0 2 4 6 8 10 12 14 16 18 20 22 24 26 28 30 32 34
20
25
30
35
40
45
50
55
60
Te
mp
era
ture
( 0C
)
Time (days)
Probe 1- Air Inlet
Probe 2- 30cm ht.from air inlet
Probe 3- 60 cm ht.from air inlet
Probe 4 - 90cm ht.from air inlet
Probe 5 - 120 cm ht.from air inlet
Probe 6 - 150cm ht.from air inlet
Probe 7 - 240 cm ht.from air inlet
Probe 8 - Air Outlet
Fig. 5.2.6 Temperature Profile Along the Height of Biodrying reactor During
33 Days of Reaction - Phase1.

104
In the third temperature cycle fungus growth was prominent throughout the reactor
feed top. The fungus growth was in a cyclic manner with fungus rising up when
temperature falls and when the temperature rises fungus falls.
The temperature contour for entire biodrying process monitoring has been plotted in
Origin Pro-8 software as shown in Fig. 5.2.7. It is clearly evident from the
temperature contour that maximum self heating at a peak temperature of 59ºC has
existed in the core region of reactor matrix at 50 cm to 80 cm height from air inlet.
Also this peak temperature self heating has been sustained for a duration of four days
(i.e., from the second day till the sixth day of process). This clearly indicated that the
initial period is critical for the biodrying process, during which the maximum self
heating process has to be explored.
0 2 4 6 8 10 12 14 16 18 20 22 24 26 28 30 32
0
20
40
60
80
100
120
140
160
180
200
Time in Days
Rea
cto
r m
atr
ix h
eig
ht fr
om
air
inle
t (c
m)
20.00
25.00
30.00
35.00
40.00
45.00
50.00
55.00
60.00
Fig.5.2.7 Temperature Contour Plot- Phase 1.

105
Such a detailed temperature profile analysis is innovative in the field of biodrying
process which is very useful for the design of commercial scale biodrying reactors.
5.2.5.2 Biological Profile
The growth of fungus has been observed on the inner side wall of the transparent
cylindrical reactor from fourth day of reaction onwards. Growth of fungus species
were observed on the reactor feed top. The species included 80 % Agaricus bisporous
and other species were of minor quantity. The population of fungi increased in size
and number as the biodrying reaction proceeded and finally the species Agaricus
bisporus started growing above the reactor matrix top, by the seventeenth day of
reaction. In addition to that rotifer worms were also observed in large numbers,
during the short cycle of temperature rise that occurred from sixteenth day of reaction
onwards. From seventeenth day of reaction onwards a microbial competition was
observed between fungi and rotifer worms for survival. The rotifer worms were
observed in large numbers during the period of temperature rise, but during the same
period the Agaricus bisporus species started falling down on the reactor matrix top.
The exact reverse of this situation was observed during the period of temperature fall,
when large numbers of fungi species Agaricus bisporus standing erect on the top of
reactor matrix and the number of rotifer worms decreased. This competition of
microbial organisms continued throughout the short cycles of temperature rise and
fall till the end of monitoring period of 33 days. It was observed that most of the
paper inside the reactor matrix at the top most 20 cm height has been degraded by the
fungi while below that biodried and preserved paper was visible where the fungus
was unavailable for degradation.

106
5.2.5.3 Weight Reduction
The biodrying reactor is placed over the load cell and the weight reduction has been
continuously monitored. The weight loss is calculated in every second of time and the
data has been transferred through the data acquisition system and reading taken on the
monitor of computer. The results of weight reduction were plotted against time
(Fig.5.2.8). The weight of the reactor matrix was reduced by 37 kg in the initial 20
days of biodrying process, i.e., an average weight reduction of 1.85 kg/day was
obtained in this period.
The cumulative weight loss achieved in the biodrying process was 33.94 %, which is less
than the actual evaporation loss because of the high rate of condensation of evaporated
water back in to the reactor. It was observed that the weight reduction was significant
only till the 20th day of experiment and after that weight loss was negligible.
0 2 4 6 8 10 12 14 16 18 20 22 24 26 28 30 32 34
70
75
80
85
90
95
100
105
110
Weig
ht
of
msw
(kg)
Time (Days)
Weight vs time
Fig. 5.2.8 Weight Reduction Profile in the Biodrying Reactor- Phase1.

107
5.2.5.4 Moisture Profile
Six numbers of representative samples were collected from the reactor matrix on
selected days that included samples from the two sampling ports (40cm and 80 cm
from the air inlet) and also from the reactor feed top. The average value of moisture
analysis results of the six samples were plotted against time, along with standard
deviation error bars (Fig. 5.2.9).
Fig. 5.2.9 Average Moisture Content Vs Time- Phase 1.
Average moisture content of the mixed MSW substrate at the end of 33 days of
experiment was observed to be 48.5 %, which is a reduction of 20.81 % (the initial
moisture content was 61.25 %). The error bars shown in standard deviation vary in
the range 4.61-11.63, which is due to the non-uniform distribution of moisture inside
35
40
45
50
55
60
65
0 5 10 15 20 25 30 35
Mo
istu
re C
onte
nt
(%)
Time (Days)
Moisture
content vs
time

108
the reactor matrix. The main cause of non-homogeneous moisture distribution inside
the biodrying reactor was the condensation of evaporated water back in to the top of
reactor matrix. The major achievement of the present pilot scale biodrying reactor
design was that leachate production was completely eliminated in the process and the
bottom zone of the reactor matrix was completely in a dry state after the reaction.
This is the most important factor in the treatment of municipal solid waste with high
moisture content.
5.2.5.5 Volume Reduction
Municipal solid waste accumulated in large volume is a critical factor affecting the
handling, and storage of the same in addition to the difficulty in landfilling operations.
Fig.5.2.10 Volume Reduction- Phase 1.
The designed biodrying process was found to be very efficient in bulk volume
reduction with the matrix height reduced from initial value of 1.38 m to final value of
0.15
0.2
0.25
0.3
0.35
0.4
0.45
0 5 10 15 20 25 30 35
Volu
me
(m
3)
Time (Days)
MSW Volume
vs Time

109
0.60 m. The volume has been reduced from the initial value of 0.39 m3 to final value
of 0.169 m3 in 33 days of biodrying process (Fig. 5.2.10. It is a reduction of 56.5% of
volume in 33 days of biodrying reaction.
5.2.5.6 Bulk Density Increase in Biodrying Process
Bulk density is a significant factor affecting the energy density of a fuel. The in situ
bulk density has been calculated on a dry basis as follows.
Bulk density (dry basis) = Bulk density(wet basis)(1+ moisture content) …… (5.1)
In the present study, the bulk density has from the initial value of 173.59 kg/m3
to
final value of 251 kg/m3 at the end of ten days of process (Fig.5.2.11).
Fig. 5.2.11 Bulk Density Profile- Phase1.
150
170
190
210
230
250
270
0 5 10 15 20 25 30 35
Bulk
Den
sity
(k
g/m
3)
Time (days)
Bulk Density
vs Time

110
Bulk density profile was showing a decreasing trend in the period from 10 to 20 days,
and after that it started increasing again. The major increase in bulk density was
achieved in the initial ten days of reaction itself. During the entire process of
biodrying in 33 days, the bulk density of the mixed municipal solid waste substrate
has been increased from the initial value of 173.59 kg/m3
to the final value of 263.69
kg/m3
(Fig. 5.2.11.).
The monitoring of the biodrying process has been carried out for 33 days and the bulk
density has increased by 52 % at the end of 33 days of reaction. The weight reduction
became negligible after 20 days of biodrying process but the bulk density was
increasing beyond 20 days of reaction and hence further process monitoring has been
carried out till 33 days.
5.2.5.7 Zero Leachate Process
High rate of leachate production is the critical constraint in municipal solid waste
treatment units. Beyond that leachate production is the major factor affecting the
landfiiling operations adversely. The innovatively designed biodrying reactor was
able to achieve has complete elimination of the leachate production and that is the
most important achievement in the treatment of municipal solid waste with high
moisture content.
5.2.5.8 Chemical Analysis
Water soluble carbon analysis results verified the formation of two well defined zones
inside the reactor matrix. The average value of water soluble carbon in the biodried

111
bottom zone was 8.5 mg/gm, while the same in the biodegraded zone was only 3.9
mg/gm (Table 5.2.2). The Kjeldahl Nitrogen content in the bottom and top zones of
the reactor matrix was found to be 7.65 mg/gm and 22.07 mg/gm respectively. This
large variation in Kjeldahl nitrogen also verified the existence of well demarcated
zones within the same reactor matrix. The pH values were almost the same
throughout the reactor matrix, with slight deviations and hence the moisture presence
has facilitated biodegradation reactions in the top region of the matrix.
Table. 5.2.2 Chemical Analysis Results- Phase 1
Sl
No Sample
Water Soluble
Carbon (mg/gm)
Total Nitrogen
(Kjeldahl
method) mg/gm
pH
1 Dried Samples at bottom (Preserved) 8.5 7.65 6.38
2 Wet Samples at Top (degraded) 3.9 22.07 6.85
5.2.6 Discussions
In the first phase the monitoring of the innovative pilot scale biodrying reactor unit
for treating mixed municipal solid waste has been carried out for duration of 33 days.
The different parameters considered for the process analysis includes the substrate
temperature, weight, moisture content, volume, and bulk density. The temperature
development in the process was assumed to be in the range 50 °C to 60 °C for the
psychrometric design, but the same was achieved only in the bottom region of the
reactor matrix. This is primarily due to the active condensation of the evaporated
water back in to the top region of matrix. The core region of reactor matrix initially at
50 cm to 80 cm height from air inlet was most effective in biodrying process, with a
maximum temperature rise up to 59°C (Fig. 5.5).

112
This high temperature heating ensured that the resulting product is free from
pathogens, since one hour heating in the range of 50°C to 55°C temperature will kill
most of the common parasites and pathogens (Gottas, 1956). However, the formation
of different zones of varying temperature is unavoidable in the biodrying process, as
plotted in the temperature contour though the assumption of uniform temperature
development has been considered in the design stage. Considering the effect of
reaction time on temperature development, it was found that maximum temperature
rise is taking place within the first six days of reaction and hence biodrying process is
most effective in this period. The cyclic nature of temperature profile with two well
defined peaks clearly indicated that as time proceeds reactions similar to composting
took place inside the reactor.
The biological processes inside the biodrying reactor can be explained by studying
the temperature profile as well as the chemical analysis results. The development of
thermophilic range of temperature inside the reactor matrix showed that the raw
substrate has enough carbon resource and nitrogen for metabolism of
microorganisms. First stage of quick temperature rise has been attributed to the high
rate of aerobic respiration process by the microbial species. This confirmed that the
inherent moisture content of the mixed municipal solid waste substrate prepared was
optimum for aerobic reactions, which is a favourable condition for the biodrying
process. The nitrification process became prominent after 15 days of biodrying
process which contributed to the second cycle of temperature rise. The mineralization
of organic nitrogen in to NH4+ started in the region of optimum moisture presence
that is clearly indicated by the average Kjeldhal Nitrogen content of 22.07 mg/g in

113
samples collected from the top region of reactor matrix, while that was only 7.65
mg/g in the bottom samples.
Weight reduction is a significant parameter in municipal solid waste treatment
facilities towards achieving the easiness for transportation, handling and storage.
Hence the biodrying reactor developed with a considerable reduction in weight of the
mixed MSW substrate is a promising accomplishment in solid waste management
systems. However the weight reduction in the present case study was 33.94 % which
can be improved by modifying the design with the provision of condensation
prevention measures in the future. The average moisture reduction in the developed
process was only 20.81 % mainly due to the condensation of the evaporated water
back in to the reactor through the top side walls, which resulted in increased rate of
degradation reactions and lesser rate of biodrying reactions. The non-homogeneous
moisture reduction is the major limitation of the process which resulted in long error
bars in the standard deviation values of moisture analysis results as shown in the
moisture plot.
Bulk volume reduction was a major achievement in the present study; a reduction of
56.5 % of reactor matrix volume has been observed in the entire process. But it is
evident that 40 % of the volume reduction was achieved in the initial 20 day period of
time, which points out the fact that biodrying process optimization has to be done in
the initial short duration of time unlike the composting process. Bulk Density
augmentation is another promising result obtained from the innovative biodrying
process. The bulk density and hence the energy density of the mixed municipal solid
waste has been increased up to 52 % in the entire process. This is a very important

114
development towards fulfilling the objective of feasible technological solutions in the
field of waste to energy conversion processes.
5.2.7 Summary
In the first phase of experiment the innovatively designed pilot scale biodrying
reactor for treating mixed municipal solid waste substrate with high moisture content
has been demonstrated. The various parameters considered in the process analysis are
temperature, weight loss, moisture content, volume, and bulk density. It was observed
that high temperature of 59 °C was obtained in the reactor matrix in region of 50 cm
to 80 cm height from air inlet, in the biodrying process due to the self heating of
substrate. This ensured the antiseptic nature of the process output, but maintaining the
high temperature range throughout the reactor matrix can ensure homogeneity of the
output. Considering the weight reduction in the process, maximum weight reduction
of 33.94 % has been achieved in the initial twenty day period of reaction and after
that weight loss was found to be negligible. The moisture reduction in the process
was 20.81 %. Comparing the weight reduction and moisture loss of first phase of
study it is evident that biodegradation process was also prominent along with the
biodrying process. Hence further innovation is required in this factor so that the
biodrying process rules out the biodegradation process and the energy value of output
can be preserved. This may be achieved by the provision of condensation prevention
methods in the top region of the designed reactor unit. Bulk volume reduction of
56.5% along with bulk density augmentation of 52.3% was the major
accomplishment of the first phase of experiment. The major constraint observed in
the first study was that keeping the optimum balance between biodegradation process

115
and biodrying process, so that better drying is possible. In addition to that the initial
ten to fifteen day period was found to be critical in deciding the efficiency of the
biodrying process and hence process optimization has to be carried out in that period.
Fig. 5.2.12 Phase1-Condensation Process in Top Region of Reactor.
5.2.8 Limitations
The major limitation observed in the first phase of experiment was that the efficiency
of moisture removal in the biodrying process has been affected due to the exhaust air
saturation and the resulting condensation of evaporated water back in to the reactor in
the top region of the reactor matrix (Fig. 5.2.12).
5.2.9 Modifications
Inorder to avoid the condensation problem at the top region of the reactor matrix the
next phase study has to be carried out by incorporating design modifications.

116
5.3 EXPERIMENTAL INVESTIGATION- PHASE 2- BIODRYING PROCESS
IN MODIFIED REACTOR
5.3.1 Objectives
The major objective of the second phase of study was to improve the moisture
removal efficiency of the biodrying reactor by controlling the condensation process at
the top region of the reactor matrix. The secondary objective was to reduce the
reaction time of the process.
5.3.2 Introduction
The second phase of investigation included the study of the feasible options for
condensation prevention methods for reactors. The condensation prevention design
has been incorporated at the reactor outlet and the airflow rate is maintained the same
as the previous experiment.
5.3.3 Horizontal Air Flow System
The different methods for preventing condensation in reactor were studied. The major
challenge was to select the feasible one by considering the safety aspect, since the
waste materials produces explosive gaseous emissions. A detailed literature study has
been conducted to select mixed cross flow with horizontal air flow (HAF) system.
The principle of HAF unit is that it utilizes the air that moves in a coherent horizontal
pattern. It needs energy only enough to overcome the turbulence and friction loss to
keep it moving (Fig.5.3.1). The moving air will replace the depleted air with fresh air,
which helped to considerably reduce the odour from the process. This system will

117
reduce the condensation reaction at the top region of the reactor matrix, since
saturated air will be diluted with fresh air.
Fig.5.3.1 Principle of HAF system.
The different components of the fabricated HAF system has been shown in Fig.
5.3.2. In this system the HAF unit has been fabricated along with the exhaust air
chamber. The top and bottom plates of the HAF unit helped to fix it along with the
PVC pipe unit for exhaust air. The air holes on the exhaust air chamber will allow the

118
fresh air to enter in it and then it is mixed with the exhaust air from the biodrying
reactor. The diluted air will be sucked out through the HAF unit.
5.3.4 Modified Biodrying Reactor
In the second phase of experiment the biodrying reactor design has been modified
with the addition of innovatively designed horizontal air flow (HAF) system
(Fig.5.3.3). The reactor modification has been done with the aim of eliminating the
condensation of evaporated water back in to the reactor matrix. The air dilution effect
of the HAF system is kept in such a way that the relative humidity of the exhaust air
is limited in the range of 75%-85 %
5.3.5 Materials and Methods
Mixed municipal solid waste substrate of 126 kg was synthetically prepared in the
laboratory, by mixing the raw waste in proportion as shown in Table.5.3.1. Different
components of the mixed municipal solid waste substrate were thoroughly mixed to
yield a homogeneous mixture and 124 kg from this mixture has been used as the
reactor feed.

119
Fig.5.3.2 Design Details of HAF system.

120
Fig.5.3.3.Modified Biodrying Reactor- Phase 2.

121
Table. 5.3.1 Mixed Municipal Solid Waste Substrate Composition- Phase 2
Component Particulars Weight
(kg)
Subtotal
(kg)
Grand Total
(kg)
Organic
components
Raw food waste 22
91.9
126
Cooked food waste 55
Fibers 5
Dried leaves 6
Fresh leaves 4
Paper and
Cardboard
News paper 7.6
12.6 Print Paper 2
Cardboard 3
Plastics
Crushed bottles 2.8
8.8 Milk Covers 3
Plastic Covers 3
Textiles Cotton 10
12.6 Polyester, Nylon 2.6
The initial process conditions for the second phase of experiment include air supply at
the volumetric rate of 40 L/m. The corresponding specific air flow rate was 0.465
m3/kg.day. It was observed that the reactor matrix is having initial moisture content of
65.5 %. The biodrying reactor of 60 cm diameter was filled with the substrate up to a
height of 1.4 m and the initial volume of the feed was calculated as 0.396 m3. Initial
bulk density of the reactor matrix was obtained as 189 kg/m3.
5.3.6. Results and Discussions
The filled biodrying reactor at the beginning and end of 15 days of process in the
second phase is shown in Fig. 5.3.4. The results considered for the process analysis
were based on the parameters like temperature, weight loss, moisture content, relative
humidity, volume reduction and bulk density augmentation. The major objective of
the second experimental phase was to prevent saturation of air at the top region of the
reactor matrix.

122
a) Before Biodrying process b) After biodrying process
Fig.5.3.4. Reactor at the Beginning and End of Biodrying Process-Phase 2.
5.3.6.1 Effectiveness of the Modified Reactor Design
It was observed that till the end of 15 days of process no condensation problem was
observed in the top region of the reactor, and the exhaust air relative humidity has
been sustained in the range of 75 % to 85 % during the entire reaction period. It was a
major achievement in the second phase of experiment. The top side walls of the
reactor was visibly free form water drops (Fig. 5.3.4). Only the side wall
condensation has occurred, which is very less when compared to the volume of the
reactor matrix. It is to be noted that the actual field conditions in the scaling up
process of reactors, the surface area to volume ratio is very less and hence the side
wall condensation can be neglected.

123
5.3.6.2 Leachate Free Process
The leachate production is the major issue faced by most of the municipal waste
treatment systems. The designed biodrying process was versatile with since the
leachate production has been completely eliminated in the process.
5.3.6.3 Temperature Profile
The initial eight hour variation of temperature has been plotted against time (Fig.
5.3.5). In the second study the maximum temperature rise has been shifted to the
bottom portion of the reactor near to the air inlet. The maximum temperature of 41ºC
has been recorded at the probe 30 cm distant from the air inlet.
It was observed from the temperature profile study that a temperature gradient has
existed along the height of the self heating reactor matrix (Fig.5.3.6). In the second
experimental phase high temperature lasted for a longer time (10 to 12 days) which
has resulted in increasing the drying efficiency of the process as observed in the
contour plot (Fig. 5.3.7). It was noted that in the second study the temperature rise
along the height of the reactor is less compared to that in the first phase.

124
17:30 18:30 19:30 20:30 21:30 22:30 23:30 00:30
24
26
28
30
32
34
36
38
40
42
Te
mp
era
ture
(0C
)
Time (pm)
Probe1- Air Inlet
probe2-30cm from air inlet
Probe3-60 cm from air inlet
Probe4-90 cm from air inlet
Probe5- 120cm from air inlet
Probe6- 150cm from air inlet
Probe7- Top chamber (240cm from air inlet)
Probe8- Air Outlet
Fig. 5.3.5 Temperature Profile During the First Eight Hours of Reaction-
Phase 2.
The comparison study of the temperature profile of the first and second phase of
investigations has helped to understand the biodrying process in detail. The
temperature contour for 15 days of biodrying process for the two studies were
analysed (Fig.5.3.7 & Fig.5.3.8). The formation of temperature gradient was observed
along the height of the self heating reactor matrix in both phases of experiment. In the
first phase high temperature (in the range of 55 °C -59
°C) has lasted for a short
duration of 4 days. In the second phase the high temperature heating continued for
long duration of 11 days in the second experiment (Fig. 5.3.7). The second phase of
experiment was more effective in self heating with the exception that, the top region
of reactor matrix,( above 90 cm from the air inlet) was not able to achieve high range
of temperature.

125
0 1 2 3 4 5 6 7 8 9 10 11 12 13 14 15 16 17
20
25
30
35
40
45
50
55
60
Tem
per
atu
re (
0C
)
Time (days)
Probe1- Air Inlet
Probe2-30cm Ht.from Air Inlet
Probe3-60cm Ht.from Air Inlet
Probe4-90cm Ht.from Air Inlet
Probe5-120cm Ht.from Air Inlet
Probe6-150cm Ht.from Air Inlet
Probe7-240 cm Ht.from Air Inlet
Probe8-Air Outlet
Fig. 5.3.6 Temperature Profile in 15 days – Phase 2.
0 1 2 3 4 5 6 7 8 9 10 11 12 13 14 15
0
20
40
60
80
100
120
140
160
180
200
Time (Days)
Re
acto
r m
atr
ix h
eig
ht
fro
m a
ir in
let
(cm
)
20.00
25.00
30.00
35.00
40.00
45.00
50.00
55.00
60.00
Fig .5.3.7 Temperature Contour- Phase 2.

126
0 1 2 3 4 5 6 7 8 9 10 11 12 13 14 15
0
20
40
60
80
100
120
140
160
180
200
Time (Days)
Rea
cto
r m
atri
x h
eig
ht
fro
m a
ir i
nle
t (c
m)
20.00
25.00
30.00
35.00
40.00
45.00
50.00
55.00
60.00
Fig .5.3.8 Temperature Contour for 15 days- Phase 1.
5.3.6.4 Weight Reduction
The greatest achievement in the second phase of experiment is that the condensation
prevention measure incorporated in the design was able to eliminate saturation of air
above the reactor matrix. The steep slope of the weight loss profile of the substrate
shows increased process efficiency (Fig. 5.3.9). Weight reduction has been monitored
continuously using electronic load cell. The entire reactor unit is placed over the load
cell. The weight loss is calculated in every second of time and the data transferred
through the data acquisition system and reading taken on the monitor of computer. In
the second phase, the weight of the reactor matrix has been reduced from the initial
value of 124 kg to 75.4 kg in 15 days of reaction. This accounts for a reduction of
39.2 % of the weight. That is an increase of 7 % in weight reduction when compared
to the first study, where 32 % weight loss has been resulted in 15 days of experiment.

127
0 1 2 3 4 5 6 7 8 9 10 11 12 13 14 15 16 1770
80
90
100
110
120
130
Wei
gh
t (k
g)
Time(Days)
Weight Vs Time
Fig. 5.3.9 Weight Reduction Profile- Phase 2.
The weight reduction percentage has been plotted against time for the first and second
studies for 15 days of reaction and is shown in Fig. 5.3.10. It has been observed that on
an average weight reduction rate was 1.85 kg/day in first phase of experiment while
that was increased to 3.24 kg/day in the second experiment. The weight of the reactor
matrix has been reduced from the initial value of 124 kg to 75.4 kg in 15 days of the
process which accounts for a total weight reduction of 39.2 %. The weight reduction
was 32% in the first study for the same duration. Therefore the second phase of study
was more effective in weight reduction when compared to the first one.

128
0 2 4 6 8 10 12 14 160
5
10
15
20
25
30
35
40w
eig
ht
red
uct
ion
%(w
i-w
f)*
10
0/w
i)
Time(Days))
Weight Reduction (%) vs Time- Phase 1
Weight Reduction (%)vs Time- Phase 2
wi-Initial weight
wf-Final Weight
Fig. 5.3.10 Weight reduction % Vs Time-Comparison of First and Second
Phase of studies.
5.3.6.5 Moisture Profile
The average value of moisture content has been plotted against time along with the
standard deviation bars (Fig.5.3.11). The initial moisture content of 65.5 % has been
reduced to 43.9 % in the entire process time of 15 days. Moisture reduction of 33 %
has been resulted from the second study which is much higher than the same period
reduction of 22 % obtained in the first phase of experiment. Also the second phase of
study was found to be very successful in completely eliminating the condensation of
evaporated water in the top region of reactor matrix, which resulted in retrieving a
more or less homogeneous output from the process.

129
Fig. 5.3.11 Average Moisture Profile- Phase 2.
The moisture reduction profiles of the first and second phases of experiments were
compared as shown in Fig.5.3.12.
Fig. 5.3.12 Average Moisture Content- Variation in 15 Days for First and
Second Phases.
40
45
50
55
60
65
70
0 2 4 6 8 10 12 14 16
Mois
ture
Conte
nt
(%)
Time (Days)
Moisture
content vs
Time- Phase2
35
40
45
50
55
60
65
70
0 2 4 6 8 10 12 14 16
Mois
ture
Conte
nt
(%)
Time (Days)
Moisture
content vs
time- Phase1
Moisture
content vs
Time- Phase 2

130
The uniformity of the biodried output in terms of moisture reduction was better in
second study (standard deviation (S.D) 2.6-4.8), when compared with first study
(S.D, 4.61 -11.63). There exists a region of side wall condensation in a thin wet layer
of reactor feed where the moisture content is 49 %. This side wall condensation can
be neglected since in commercial scale reactors the ratio of surface area to volume is
very less.
5.3.6.6 Volume Reduction
Bulk volume of the mixed municipal solid waste is a major crisis faced by most of
the municipal solid waste treatment units. The modified biodrying process in the
second phase was able to achieve a volume reduction of 42.85 % in 15 days of
reaction as shown in Fig. 5.3.13.
Fig. 5.3.13 Volume Reduction in Biodrying –Phase 2.
0.18
0.21
0.24
0.27
0.3
0.33
0.36
0.39
0.42
0 2 4 6 8 10 12 14 16
Volu
me
of
Subst
rate
(m
3)
volume
Vs time
Time (Days)

131
The mixed MSW substrate volume has reduced by 44.2 % and 42.86 % (Fig. 5.3.14),
in first and second studies respectively at the end of 15 days of reaction. Hence
comparable results were obtained for two phases in terms of volume reduction.
Fig. 5.3.14 Bulk Volume Reduction-Comparison of First and Second Phases.
5.3.6.7 Bulk Density
The energy value of any material is affected by the bulk density. The higher the bulk
density of fuel the more the energy value will be. The in situ bulk density has been
calculated as per equation 5.1.
Bulk density has been increased from the initial value of 189 kg/m3 to the final value
of 233 kg/m3 at the end of 15 days of biodrying reaction in the second phase of
experiment (Fig.5.3.15). The maximum bulk density during the entire process period
occurred by the tenth day of reaction (258 kg/m3), and after that bulk density
0.18
0.21
0.24
0.27
0.3
0.33
0.36
0.39
0.42
0 2 4 6 8 10 12 14 16
Volu
me
of
Subst
rate
( m
3)
volume Vs time-
Phase1
volume Vs time-
Phase2
Time (Days)

132
decreased to 233 kg/m3. This clearly indicated a decline in microbial reactions after
the tenth day of biodrying process. The increase of bulk density is 23 % at the end of
15 days of reactions in the modified process (Fig. 5.3.15).
Fig. 5.3.15 Bulk Density Profile- Phase 2.
The comparison of first and second phases of study has shown that the first
experiment has resulted in 35.09 % increase in bulk density during the period of 15
days (Fig.5.3.16). Therefore first phase of experiment was more successful in terms
of bulk density improvement. It is due to the fact that presence of moisture due to
condensation of evaporated water back in to the reactor facilitated high rate of
microbial activity, which increased the biodegradation process along with the
biodrying process in the first phase of experiment. The variation of these two
processes leads to better drying efficiency.
170
190
210
230
250
270
0 2 4 6 8 10 12 14 16
Bulk
Den
sity
( K
g/m
3)
Time (Days)
Bulk Density vs
Time-phase2

133
Fig. 5.3.16 Bulk Density Profile – Comparison of First and Second Phases.
5.3.7 Summary
The reactor design has been modified in the second phase with the provision of
innovatively designed heat exchanging system to avoid exhaust air saturation. It was
observed that the modified design was able to achieve complete elimination of
condensation in the top region of the reactor matrix by maintaining the relative
humidity of exhaust air in the range 75 % to 85 %. Also the maximum temperature
rise of 59.2 °C lasted for a long duration of 7 days in the modified design. In
addition to that the second study was very successful with a weight reduction of
39.2% occurred in 15 days of experiment, while that was 32 % in the first experiment
for the same duration.
170
190
210
230
250
270
0 2 4 6 8 10 12 14 16
Bulk
Den
sity
(K
g/m
3)
Time (Days)
Bulk Density vs
time- Phase1
Bulk Density vs
Time-Phase2

134
The moisture content of the mixed municipal solid waste substrate has reduced from
the initial value of 65.5 % to final 43.9 % in the second experimental phase. A moisture
reduction of 33 % has been achieved in the second study during 15 days of reaction,
which is much higher than moisture reduction of 22% in the first experiment. Also the
volume reduction of 42.85 % and bulk density increase of 23 % occurred in fifteen days
of biodrying process in the second phase with humidity control. The fifteen day results
of volume reduction and bulk density increase was more in the first phase, with a
reduction of 44.2 % of volume and 35.09 % increase in bulk density. This may be due
to the fact that moisture presence facilitated high rate of biodegradation process along
with the biodrying process in the first study that resulted in increased bulk density of
the reactor matrix. Considering the biodrying reaction the second phase of study with
humidity control measure incorporated in the biodrying reactor design was more
successful .The predominance of biodrying reaction over the biodegradation process is
favourable for waste to energy conversion technology.
5.3.8 Limitations
The temperature gradient formation has been observed in the first and second phase.
The temperature gradient has to be minimised to achieve more or less uniform
heating of the biodried material. In the first phase temperature rise was in vertical
direction along the reactor height, while it was in horizontal direction along the time
axis in the second phase.

135
5.3.9 Further Modifications
It needs further study to analyse whether it is possible to maintain uniform self
heating in static biodrying process. The self heating process with respect to the
increase in filled height of reactor matrix needs to be studied for further process
improvement.
5.4. EXPERIMENTAL INVESTIGATION- PHASE 3- EFFECT OF SPECIFIC
AIR FLOW RATE AND REACTOR MATRIX HEIGHT ON BIODRYING
REACTION
5.4.1. Objectives
The major objective in the third phase of experiment was to study the effect of
variation in specific air flow rate and increasing the reactor matrix height on the
biodrying process efficiency.
5.4.2 Introduction
In the third phase of study the increased reactor matrix height on biodrying process
has been studied. Also the reducing specific air flow rate on temperature profile of the
reactor matrix has been studied in detail. The effect of both these factors in elevating
the temperature throughout the reactor matrix and especially in the top zone of the
reactor matrix has been investigated.
5.4.3. Materials and Methods
In the third phase of study, the addition of weight has resulted in increasing the height
of reactor pile by 25 cm. Municipal solid waste substrate of 172.55 kg has been

136
synthetically prepared in the laboratory, by mixing the raw waste in proportion as
given in Table. 5.4.1.
Table. 5.4.1 Substrate Composition- Phase 3.
Component Particulars Weight
(kg)
Subtotal
(kg)
Grand Total
(kg)
Organic
components
Raw food waste 38
124.56
173
Cooked food waste 56
Fibers 3
Dried leaves 12.56
Fresh leaves 15
Paper and
Cardboard
News paper 12
19 Print Paper 3
Cardboard 4
Plastics
Crushed bottles 3
13.84 Milk Covers 7.84
Plastic Covers 3
Textiles Cotton 11
17.4 Polyester 6.4
Different components of the mixed municipal solid waste substrate were thoroughly
mixed to yield a homogeneous mixture an 167 kg from this mixture was used as the
reactor feed (Table 5 .4.1). The inlet air supply was given at a volumetric rate of
40 L/m, which accounts for a specific air flow rate of 0.345 m3/kg.day, which is
lesser than that of previous study. The innovatively designed horizontal air flow
system (HAF) system has been provided in this phase also so that the exhaust air
humidity is in the range 75-85 %. The initial moisture content of the substrate was
calculated by weighted average method by summation of the moisture contents of the
individual component present in the mixed municipal solid waste.

137
Fig.5.4.1 Filled Reactor Core- Phase 3.
It was observed that the reactor matrix is having high initial moisture content of
62.45 %. The biodrying reactor of 60 cm diameter was filled with the substrate up to
a height of 1.65 m. The initial volume feed was calculated as 0.466 m3and the initial
bulk density of the filled reactor matrix was obtained as 220.20 kg/m3.The process
instrumentation design was kept similar to the second phase of experiment.
5.4.4. Results and Discussions
The condensation problem has been completely eliminated at the top region of the
reactor similar to second phase. The reactor matrix height has been reduced from the
initial 1.65 m to final 1.01m at the end of 15 days of reaction. Leachate production

138
has been completely eliminated in the bottom chamber, like the previous studies. It
was observed that biodegradation reactions occurred in the bottom zone which has
resulted in visible patches of wet zones. Minimising the degradation process is found
to be beneficial for the biodrying purpose. At the same time high temperature
development favours active hygienisation of the reactor matrix.
5.4.4.1 Temperature Profile
It was observed that in the first eight hours of reaction the maximum rise of
temperature occurred (Fig.5.4.2). The maximum temperature rise in the initial hours
has been similar to that of second phase with a maximum temperature of 48.9ºC
recorded at the probe 30 cm distant from the air inlet. The temperature profile for 15
days of biodrying process has revealed the existence of temperature gradient along
the height of the self heating reactor matrix (Fig. 5.4.3). Peak temperature of 65.5ºC
has been recorded at 30 cm from air inlet by the sixth day in this phase of experiment.
Active self heating has observed throughout the reactor matrix in this study, where the
temperature of the substrate has been increased to a maximum value of 59ºC at 90 cm
from the air inlet. In the previous phase of experiments temperature has not raised
above 45ºC in the same probe. Therefore self heating process was more prominent
throughout the reactor matrix ensured effective sanitisation in the third phase of study.

139
16:30 17:30 18:30 19:30 20:30 21:30 22:30 23:30 00:302526272829303132333435363738394041424344
Tem
pera
ture
(0C
)
Time (pm)
Probe 1 - Air Inlet
Probe 2- 30cm ht.from air inlet
Probe 3 - 60 cm ht.from air inlet
Probe 4 - 90cmfrom air inlet
Probe 5 - 120cm from air inlet
Probe 6 - 150cmfrom air inlet
Probe7 - 240cm from air inlet
Probe 8 - Air Outlet
Fig. 5.4.2 Temperature Profile During the First Eight Hours of Reaction- Phase 3.
.
0 2 4 6 8 10 12 14 16
25
30
35
40
45
50
55
60
65
70
Tem
per
atu
re(0
C)
Time(days)
Probe1-air inlet
Probe2 -30cm from air inlet
Probe3-60cm from air inlet
Probe4-90cm from air inlet
Probe5-120cm from air inlet
Probe6-150cm from air inlet
Probe7-240cm from air inlet
Probe8-Air outlet
Fig. 5.4.3 Temperature profile in 15 days – Phase 3.
It was noted that more self heating reaction spreaded along the height of reactor
matrix in the third phase, which is advantageous while compared to the second study.

140
Also the analysis of temperature contour of third phase has revealed that the self
heating process has been prominent along the horizontal time axis was well as in
vertical direction (along height of reactor) (Fig.5.4.4).
0 1 2 3 4 5 6 7 8 9 10 11 12 13 14 15
0
20
40
60
80
100
120
140
160
180
200
Time (Days)
Rea
cto
r M
atri
x H
eig
ht
fro
m A
ir I
nle
t (c
m)
20.00
25.00
30.00
35.00
40.00
45.00
50.00
55.00
60.00
65.00
Fig. 5.4.4 Temperature Contour- Phase 3.
The high temperature core formation was observed at two locations in the third phase
as seen in contour plot (Fig.5.4.4). This shows localised zones of active
biodegradation inside the reactor matrix in the third phase of study.
The third study was successful in maintaining high temperature throughout the
reactor matrix. The temperature rise above 60°C indicates the active biodegradation
reactions in some local zones inside the reactor matrix. This is useful for sanitation of
the biodried product. It was found that the third phase of experiment was successful

141
in raising the temperature at the top region of the reactor, while compared to the
second phase of investigation (Fig. 5.4.4). The peak temperature inside the reactor
matrix went on increasing and a maximum value of 65.5ºC has been recorded at the
probe 30 cm from air inlet. The stratification of temperature has been increased along
the reactor matrix height.
5.4.4.2 Weight Reduction
Weight reduction has been monitored continuously using electronic load cell. The
entire reactor unit is placed over the load cell. The weight loss is calculated in every
second of time and the data transferred through the data acquisition system and
reading taken on the monitor of computer. In this phase, the weight of the reactor
matrix has been reduced from the initial value of 167 kg to 108.6 kg in 15 days of the
process (Fig.5.4.5.). The third phase has resulted in weight reduction of 34.89 %
weight in 15 days of reaction. The weight loss profile during the biodrying process
was plotted against time for the second and third phase of investigations as shown in
Fig. 5.4. 6.

142
0 2 4 6 8 10 12 14 16100
110
120
130
140
150
160
170
Wei
ght
(kg)
Time(Days)
Weight vs Time
Fig. 5.4.5 Weight Reduction profile- Phase 3.
The total weight loss percentage was 39 % in the second phase while it was 34.9 % in
the third phase of study.
0 2 4 6 8 10 12 14 1670
80
90
100
110
120
130
140
150
160
170
wei
gh
t (k
g)
Time(Days)
Weight vs Time- Phase 2
Weight vs Time- Phase 3
Fig. 5.4.6 Weight Reduction Profile -Comparison of Second and Third Phase.

143
5.4.4.3 Moisture Profile
The biodrying process is advantageous over the conventional drying process since
biological heat is used for moisture reduction. The average value of moisture content
has been plotted against time along with the standard deviation bars as shown in
Fig. 5.4.7. The initial moisture content of 62.45 % has been reduced to a final value
of 43.5 % in the entire biodrying process in 15 days of reaction. This accounts for a
moisture reduction of 30.3 % in the third phase of experiment. In the third phase the
standard deviation of moisture analysis results was in the range 1-5 (Fig.5.4.7).
Fig. 5.4.7 Average Moisture Profile during the Biodrying Process- Phase 3.
The comparison study of moisture profile for the second and third phase
investigations has been carried out (Fig. 5.4.8). It was observed that a moisture
reduction of 33 % and 30 % has been achieved in the second and third phase of
reaction respectively. The final moisture content of the substrate was 43.9 % and
30
35
40
45
50
55
60
65
70
0 2 4 6 8 10 12 14 16
Mois
ture
Con
tent
(%)
Time (Days)
Moisture content
vs Time

144
43.5 % in the second and third phase respectively (Fig.5.4.8). It was observed that
non-uniform moisture distribution of the biodried product is unavoidable while
dealing with the solid substrate like mixed MSW in static biodrying reactors.
The higher compaction due to the increased depth of reactor matrix favoured local
zones of active biodegradation in the third phase of study. Therefore reactor matrix
height is one of the factors deciding the biodrying process. The air flow in biodrying
process should be such that it not only enough to activate the biodegradation reaction
but also to promote drying reaction.
Fig. 5.4.8 Average Variations in Moisture Profile- Comparison of
Phase -2 and Phase -3.
30
35
40
45
50
55
60
65
70
75
0 2 4 6 8 10 12 14 16
Mois
ture
Con
tent
(%)
Time (Days)
Average
moisture
content vs
Time- Phase 2
Average
moisture
content vs
Time- Phase 3

145
5.4.4.4 Volume Reduction
In the third phase of study the bulk volume of the mixed municipal solid waste
substrate has been reduced from the initial value of 0.466 m3 to final value of 0.285
m3
in the third phase of biodrying process (Fig.5.4.9).
Fig.5.4.9 Volume Reduction in Biodrying- Phase 3.
This accounts for a volume reduction of 38.84 % in 15 days of biodrying reaction.
The volume reduction during the second and third phase of study has been plotted
against time as shown in Fig.5.4.10. Bulk volume reduction of 43 % has been
achieved in 15 days of the process in the second phase while that was 39 % in the
third study (Fig. 5.4.10). The non-uniform subsidence of the reactor pile was also
observed in the third phase of investigation.
0.15
0.20
0.25
0.30
0.35
0.40
0.45
0.50
0 2 4 6 8 10 12 14 16
Volu
me
(m3)
Time (Days)
Volume Vs Time

146
Fig. 5.4.10. Volume Reduction Profile - Second and Third Phase.
5.4.4.5 Bulk Density
The in situ bulk density has been calculated as per equation 5.1. In the third phase, the
bulk density has been increased from the initial 220.20 kg/m3 to final value of 265.14
kg/m3 at the end of 15 days. The maximum bulk density of 280.94 kg/m
3 has been
achieved by the tenth day of biodrying process and after that it started decreasing.
The increase of bulk density is 21 % at the end of 15 days of reaction in the third
phase of study (Fig. 5.4.11).
0
5
10
15
20
25
30
35
40
45
50
0 2 4 6 8 10 12 14 16
Volu
me
reduct
ion %
[(V
i-V
f)*100/V
i]
Volume Vs Time-
Phase 2
Volume Vs Time-
Phase 3
Time (Days)
Vi - Initial Volume
Vf - Final Volume

147
Fig. 5.4.11 Bulk Density Profile of Third Phase.
The bulk density results for the second and third phase of investigations were plotted
as shown in Fig. 5.4.12.
Fig. 5.4.12 Comparison of Bulk Density Profile for the Second and Third
Phase of studies.
200
210
220
230
240
250
260
270
280
290
0 2 4 6 8 10 12 14 16
Bulk
Den
sity
( k
g/m
3)
Time (Days)
∆Bulk
Density vs
Time
0
5
10
15
20
25
30
35
40
45
50
0 2 4 6 8 10 12 14 16
Bulk
den
sity
incr
ease
% [
(ρf-
ρi)*
100/ρ
i]
Time (Days)
Bulk Density
increase vs
Time- Phase 2
Bulk Density
increase vs
Time- Phase 3
ρi- Iniital Bulk
Density.
ρf -Final Bulk
Density

148
It can be observed that 26 % increase of bulk density has been achieved in the second
phase, while that was 22 % in the third study (Fig.5.4.12).
5.4.5 Summary
The third phase of experiment has resulted in high temperature rise and better self
heating throughout the reactor matrix. Active self heating in vertical direction along
the height of reactor matrix, as well as during the entire reaction time has been
achieved in the third phase of experiment. Maximum temperature of 65.5°C has been
recorded in the zone at 30 cm from the air inlet. High temperature heating has
resulted in hygienisation of the biodried output and hence safe handling and sorting of
the same is possible. A number of high temperature core formations inside the reactor
matrix have revealed the formation of local zones of biodegradation. The weight of
the reactor matrix has been reduced from the initial value of 167 kg to 108.6 kg in 15
days of the process, which is a reduction of 34.89 %. The moisture reduction was
30 % in the third phase of investigation.
The third phase has resulted in volume reduction of 38.84 % in 15 days of biodrying
reaction. Also bulk density increase of 21 % has been achieved in the third study.
Comparing the results of second and third studies it can be seen that the third experiment
was successful in terms of self heating profile. Considering the homogeneity of biodried
output the second phase was more advantageous. This is mainly due to the formation of
local zones of degradation inside the reactor matrix. The self heating reaction has a
positive influence when the filled height of reactor feed is increased. The biodrying
process using solid substrate like mixed MSW substrate, it was observed that the effect of
reactor matrix height as well as the specific air flow rate is important factors deciding the
homogeneity of the biodried output.

149
5.4.6 Limitations
The increased non-homogeneity of the biodried output was the major limitation
observed in the third phase of study while compared to the second one. The local
zones of biodegradation has to be avoided to get a homogeneous biodried output
5.4.7. Further Process advancement
The temperature profile change with respect to filled height of reactor matrix needs
more investigations. It needs further study to analyse whether further increase of
height of reactor matrix will affect or not the self heating profile as well as the
homogeneity of the output.
5.5 EXPERIMENTAL INVESTIGATION- PHASE 4- COMBINED EFFECT
OF PACKING AND REACTOR MATRIX HEIGHT ON BIODRYING
PROCESS
5.5.1 Objectives
The major objective in the fourth phase was to study the combined effect of increased
filled height of the reactor matrix and the substrate packing on the biodrying process.
5.5.2 Introduction
It needs investigation on the effect of increasing reactor matrix height on biodrying
process. In the present phase the reactor matrix height has been increased and loose
packing of substrate has been provided.

150
5.5.3 Materials and Methods
Mixed municipal solid waste substrate of 218 kg has been synthetically prepared in
the laboratory, by mixing the raw waste in proportion as given in Table. 5.5.1. The
different components are thoroughly mixed and from the mixture 172 kg has been
used as feed for filling the reactor. The height of reactor matrix has been increased by
35 cm so that the reactor was fully filled to 2.0 m height which is the maximum
capacity of the biodrying reactor. The substrate was loosely packed and the full
volume of 0.565 m3 was filled in the fourth study.
The volumetric air flow has been maintained at the same rate of 40 L/m used in the
previous study. The corresponding specific air flow rate was 0.335 m3/kg.day. The initial
moisture content of the mixed MSW substrate was calculated by the weighted average
method.
Table. 5.5.1 Proportion of MSW- Phase 4
Component Particulars Weight
(kg)
Subtotal
(kg)
Grand Total
(kg)
Organic
components
Raw food waste 60
151.9
217.55
Cooked food waste 70
Fibers 5
Dried leaves 10
Fresh leaves 6.9
Paper and
Cardboard
News paper 13
26.04 Print Paper 6
Cardboard 7.04
Plastics
Crushed bottles 2.36
17.36 Milk Covers 8.3
Plastic Covers 6.7
Textiles Cotton 13
21.7 Polyester 8.7
151
It was observed that the reactor matrix is having initial moisture content of 66.4 %.
Initial bulk density of the filled reactor matrix was obtained as 220.20 kg/m3.
5.5.4 Results and Discussions
5.5.4.1 Temperature Profile
The detailed temperature profile of the biodrying reaction in the fourth phase of study
is shown in Fig. 5.5.1. It was observed that increase in reactor fill has not resulted in
increase of the self heating temperature in the fourth study. In fourth study the peak
temperature attained was 58°C, which is less than the third study where 65°C has
been achieved. The peak temperature in the fourth study has been recorded in the
probe placed at 60 cm from the air inlet. Self heating was not effective in fourth study
when compared with the third study that is visible from the contour plot as shown in
Fig.5.5.2. The loose packing of the reactor feed has resulted in air channelisation and
short circuiting, which affected the aerobic reactions due to lack of air flow inside the
reactor matrix.
The effect of air flow on self heating reaction has been studied by conducting a series
of air reduction as well as air evacuation tests in the fourth phase of experiment. The
air evacuation test has been carried out through the air inlet chamber on the 5th
and
6th
day of experiment . In air evacuation test the air was ejected using a vacuum pump
at a rate of 15 L/m, and it was found that a sudden temperature rise took place inside
the reactor matrix.

152
0 1 2 3 4 5 6 7 8 9 10 11
20
22
24
26
28
30
32
34
36
38
40
42
44
46
48
50
52
54
56
58
60
Air reduction test-3
Air evacuation test-2
Te
mp
era
ture
(0C
)
Time (Days)
Probe1- Air Inlet
Probe 2 -30 cm from air inlet
Probe 3- 60 cm from air inlet
Probe 4- 90 cm from air inlet
Probe 5-120 cm from air inlet
Probe 6- 150 cm from air inlet
Probe 7- 240 cm from air inlet
Probe 8- Air outlet
Air evacuation test-1
Fig. 5.5.1 Temperature Profile – Phase 4.
In fourth phase of experiment, five hours of evacuation test has been conducted on
the fifth day of reaction. The temperature rise of 13.5°C has been observed in the
probe at 30 cm distant from air inlet, whereas a drop of 6°C in temperature has been
observed in the probe at 90 cm distant from inlet (Fig.5.5.1). On the sixth day also air
evacuation test has been carried out for a period of one hour. A temperature rise of
13ºC has been observed on the probe at 30 cm from air inlet, and a temperature fall of
10°C has been recorded at the probe 90 cm from air inlet. In other probes no much
variation was observed in the temperature profile. The air reduction test has been
conducted on the 10th
day of the fourth phase of experiment by reducing the air flow
to 15 L/m. The air reduction test for nine hours has resulted in temperature rise at all
probes in the reactor matrix irrespective of location (Fig.5.5.1). Temperature rise of

153
9.4°C (from 26.6°C to 36°C) has been recorded on the probe at 30 cm from air inlet
during the air reduction test. The temperature rise was 5°C on the probe at 60cm and
2°C on the probe at 90 cm.
0 1 2 3 4 5 6 7 8 9 10 11
0
40
80
120
160
200
240
Time(Days)
Hei
ght
from
air
inle
t (c
m)
20.00
25.00
30.00
35.00
40.00
45.00
50.00
55.00
60.00
Fig. 5.5.2 Contour Plot - Phase 4.
The loose packing of the reactor matrix with respect to increased height as well as the
lower specific air flow rate provided in the fourth phase has resulted in lower
temperature rise than third phase. The loose packing of the bulk sized substrate inside
the reactor matrix has resulted in short circuiting of air supply. Considering the fourth
phase of experiment (initial reactor matrix height of 2.0 m) the temperature rise at the
probe at 30 cm from air inlet was found to be very less (Fig.5.5.2) compared to that in
the third study. The peak value of temperature has been recorded by the third day of
reaction at the probe 3 held at 60 cm from the air inlet.

154
5.5.4.2 Weight Reduction
Weight reduction has been monitored continuously using electronic load cell. The
entire reactor unit is placed over the load cell. The weight loss is calculated in every
second of time and the data transferred through the data acquisition system and reading
taken on the monitor of computer. The weight of the mixed municipal solid waste
substrate has been reduced from the initial 172 kg to the final 136.9 kg in 11 days of
reaction in the fourth phase as shown in Fig. 5.5.3. This accounts for a reduction of
20.04 % in weight of the substrate in the biodrying reaction.
0 1 2 3 4 5 6 7 8 9 10 11 12
135
140
145
150
155
160
165
170
175
Wei
ght
(kg)
Time(Days)
Weight vs Time
Fig.5.5.3 Weight Reduction - Phase 4.
Weight reduction profile for 11 days of reaction has been plotted for third and fourth
phase experiments as shown in Fig. 5.5.4. Weight reduction obtained in the fourth
study was 20.04% which is lesser than that of 28.1% achieved in the third study
during the same duration. Weight reduction of 28.1% has been achieved during 11

155
days duration in the third phase of experiment. Therefore the insufficient air supply
has affected the self heating reaction in the fourth phase of experiment. Also the air
channelisation occurred due to loose packing of the reactor matrix which is one of the
factor that reduced the biodrying process efficiency.
0 2 4 6 8 10 12
0
5
10
15
20
25
30
Wei
gh
t re
du
ctio
n(%
) [(
Wi-
Wf)*
10
0/W
i ]
Time (Days)
Weight reduction (%) - Phase 3
Weight reduction (%) - Phase 4
Wi - initial weight
Wf -final weight
Fig. 5.5.4 Weight Reduction Profile –Comparison of Third and Fourth
Phases.
5.5.4.3 Moisture Profile
In the fourth phase, the moisture content of the municipal solid waste substrate has
been reduced from the initial value of 66.4 % to the final value of 55.02 % in 11 days
of biodrying reaction (Fig.5.5.5). It was observed that the moisture content has been
reduced by reduction of 17 % in the fourth phase. The statistical analysis of the

156
moisture results has revealed that a high value of standard deviation (S.D) in the
range 6-18 was observed, as shown in Fig. 5.5.5.
Fig.5.5.5 Moisture Profile –Phase 4.
The average moisture reduction profiles for the third and fourth phase of studies were
compared in Fig.5.5.6. It was observed that average value of moisture content was
reduced by 24.26 % in 11 days of reaction in the third study, which is higher than the
same period moisture reduction in the fourth study. The non-uniformity of the
biodried output has also increased in the fourth study while compared with the third
study. Therefore the aim of producing uniform nature of biodried output has not
achieved in the fourth phase of experiment.
35
40
45
50
55
60
65
70
75
0 1 2 3 4 5 6 7 8 9 10 11 12
Mois
ture
Conte
nt
(%)
Time (Days)
Moisture
content vs
time- Phase 4

157
Fig. 5.5.6 Moisture Profile -Third and Fourth Phase.
5.5.4.4 Volume Reduction
The biodrying reactor was filled to the full height of 2.0 m in the fourth phase which
accounts for bulk volume of 0.565 m3 as plotted in Fig.5.5.7. The final height of the
mixed msw substrate inside the reactor was 1.13 m, which included the bulk volume
of 0.319 m3. The volume reduction achieved in the fourth phase was of 43.5 % after
11 days of biodrying reaction. Volume reduction profile for third and fourth phase of
studies were plotted as shown in Fig.5.5.8. It was observed that volume reduction in
the fourth phase of experiment was 43.5 % while that was 35.1 % in the third phase
of study after 11 days of reaction. Therefore Volume reduction is in the fourth phase
is considerably higher than that in the third experiment The volume reduction is an
indication of active biological decomposition and hence biodegradation process was
prominent along with biodrying process in the fourth phase. Also it is an indication
35
40
45
50
55
60
65
70
75
0 1 2 3 4 5 6 7 8 9 10 11 12
Mois
ture
Conte
nt
(%)
Time (Days)
Moisture
content vs
Time- Phase 3
Moisture
content vs
time- Phase 4

158
that air supply is insufficient in the biodrying process which has triggered the
degradation reactions.
Fig.5.5.7 Volume Reduction Profile –Phase 4.
Fig. 5.5.8 Volume Reduction – Third and Fourth Phase of Study.
0
5
10
15
20
25
30
35
40
45
50
0 1 2 3 4 5 6 7 8 9 10 11 12
Vo
lum
e re
duct
ion (
%)[
(V
i-V
f)10
0/V
i]
Volume
vs time-
Phase 4
Time (Days)
0
5
10
15
20
25
30
35
40
45
50
0 1 2 3 4 5 6 7 8 9 10 11
Vo
lum
e re
duct
ion (
%)
Volume
vs Time-
Phase 3
Volume
vs time-
Phase 4
Time (Days)

159
5.5.4.5 Bulk Density
Bulk density of the solid substrate like mixed municipal solid waste is an important
factor affecting the air controlled processes like biodrying. The in situ bulk density
has been calculated on a dry basis as per equation 5.1.
The initial in situ bulk density of the substrate was 182.88 kg/m3 that has been
increased to 280 kg/m3
in 11 days of biodrying reaction (Fig.5.5.9). It accounts for an
increase of 53.1% of bulk density in the fourth phase of biodrying experiment.
Fig.5.5.9 Bulk Density Profile- Phase 4.
The bulk density profiles for the third and fourth phase of study during the initial 11
days of reaction have been plotted as shown in Fig.5.5.10. In the third phase of
experiment bulk density increase was only 27.58 %. It is clearly evident that bulk
density increase is higher in the fourth phase while compared with third phase.
170
190
210
230
250
270
290
310
0 1 2 3 4 5 6 7 8 9 10 11 12
Bulk
D
ensi
ty (
kg/m
3)
Time (Days)
Bulk Density
vs Time-
Phase 4

160
Fig. 5.5.10 Bulk Density Profile of Phase 3 and Phase 4.
5.5.5 Summary
The fourth phase of experiment was very successful in terms of volume reduction and
bulk density enhancement with 43.5 % reduction in volume and 53.1% increase in
bulk density achieved in 11 days of reaction. On the other hand the weight reduction
and moisture reduction was less than the previous studies with only 20.4 % reduction
in weight and 17 % loss in moisture content obtained in 11 days of biodrying
reaction. This investigation has revealed the fact that air scarcity in biodrying reactor
has lead to biodegradation reactions more than biodrying reactions. The comparison
of the third and fourth phase studies was very advantageous to understand the
limitations of biodrying process. The air channelisation due to loosely packed reactor
feed has lead to anaerobic conditions at some portion of the reactor matrix. The air
evacuation and reduction experiments helped to identify the effect of air scarcity in
biodrying reaction. The temperature profile variations also confirmed that biodrying
170
190
210
230
250
270
290
310
0 1 2 3 4 5 6 7 8 9 10 11 12
Bulk
Den
sity
( k
g/m
3)
Time (Days)
Bulk
Densityvs
Time- Phase 3
Bulk Density
vs Time-
Phase 4

161
process was more effective in third phase while compared to fourth phase. The
increased the reactor matrix height and the loose packing of substrate has favoured
biodegradation process in the fourth study which has decelerated drying reaction. The
present investigations have concluded that reactor matrix heights as well as packing
of reactor matrix are important factors affecting the biodrying process efficiency.
5.5.6 Limitations
The biodrying process efficiency has been reduced due to the increased reactor matrix
height at the selected specific air flow rate. The loosely packed reactor feed has not
reduced the heterogeneity of the product and rather it resulted in air channelisation
and short circuiting.
5.5.7 Further Process Advancement
The next of phase of investigations has to be carried out to improve the biodrying
process efficiency. Since there is no further improvement of biodrying process in the
fourth phase at the selected specific air flow rate it should be increased in the next
investigation.

162
5.6 EXPERIMENTAL INVESTIGATION- PHASE- 5- EFFECT OF INCREASING
THE SPECIFIC AIR FLOW RATE ON THE BIODRYING PROCESS
EFFICIENCY
5.6.1 Objectives
The fifth phase of experiment has been conducted in order to study the effect of
increased rate of air flow on the biodrying performance.
5.6.2 Introduction
Air flow was provided at a rate of 40 L/m in the previous studies, which has been
increased to 80 L/m in the fifth phase. The initial temperature increasing phase of
biodrying reaction is critical for removing the bound water such as vicinal water and
water of hydration; whereas the free water that can be evaporated by airflow is very
less (Vesilind, 1994). Therefore airflow rate is an important factor affecting the
biodrying process which needs investigation.
5.6.3 Materials and Methods
In the fifth phase of study the pilot scale reactor was filled with 180 kg of mixed
MSW substrate. The filled height of the reactor matrix was 2.0 m. The preparation of
synthetic mixed MSW substrate for the fifth phase consisted of 66 % of organic
components, 17 % of Paper components, 7.5 % of plastics and 9.5% of textiles as
shown in Table.5.6.1. The process air supply has been doubled from the previous
value of 40 L/m to 80 L/m in the fifth phase of experiment. This accounts for a
specific air flow rate of 0.640 m3/kg.day.

163
Table 5.6.1 Composition of Mixed MSW
Component Particulars Weight
(kg)
Subtotal
(kg)
Grand Total
(kg)
Organic
components
Raw food waste 36
125.4
190
Cooked food waste 67
Fibers 5
Dried leaves 7.4
Fresh leaves 10
Paper and
Cardboard
News paper 16
32.3 Print Paper 5.3
Cardboard 11
Plastics
Crushed bottles 3
14.25 Milk Covers 10
Plastic Covers 1.25
Textiles Cotton 10
18 Polyester 8
5.6.4 Results and Discussions
5.6.4.1 Temperature Profile
It was observed that doubling the air flow rate has a cooling effect on the substrate,
which reduced the peak temperature value to 50°C in the fifth phase of study.
Detailed temperature profile along the height of the reactor matrix is shown in Fig.
5.6.1. It was observed that maximum temperature of 50°C has been recorded in the
probe at 60 cm from air inlet by the third day. The temperature rise was less inside the
reactor matrix when compared with the previous studies.

164
0 1 2 3 4 5 6 7 8 9 10 11 12
20
25
30
35
40
45
50
Air Stop Test-1
Air Stop Test-3
Air Stop Test-2
Te
mp
era
ture
(0C
)
Time(Days)
Probe 1- Air inlet
Probe 2 -20 cm from air inlet
Probe 3- 60 cm from air inlet
Probe 4- 80 cm from air inlet
Probe 5 -120 cm from air inlet
Probe 6- 200 cm from air inlet
Probe -7- 240 cm from air inlet
Probe 8- Exhaust air
Air reduction Test-1
Fig.5.6.1 Temperature Profile of Fifth Phase.
The detailed investigations on temperature profile have been carried out by
conducting a number of air reduction test as well as air stop test during the fifth phase
of experiment. Air stop test has been carried out for four hours on the fourth day,
which has increased the temperature from 44°C to 50°C on the probe 3 kept at 60 cm
from the air inlet. Also the air stop test was conducted for 5 hours duration on the 8th
day of experiment, which has resulted in heating up the pile (Fig.5.6.1). Maximum
temperature rise of 12°C has been observed in the probe at a distance of 20 cm from
air inlet port (30°C to 42°C). Also the probes at 60 cm and 80 cm from air inlet port
have recorded a rise of 5.5°C.

165
0 1 2 3 4 5 6 7 8 9 10 11
0
20
40
60
80
100
120
140
160
180
200
220
240R
ea
cto
r m
atr
ix h
eig
ht fr
om
air
inle
t (c
m)
20.00
25.00
30.00
35.00
40.00
45.00
50.00
55.00
60.00
Time (Days)
Fig.5.6.2 Contour Plot - Fifth Phase.
Another air stop test has conducted on the 10th
day of second experiment and the
maximum temperature rise during this period was 6°C observed on the probe at a
distance of 20 cm from the air inlet. It was observed that the temperature rise during
air off period has decreased suddenly from 12°C on the 8th
day to 5°C on the 10th
day.
The air reduction test has been conducted on the 7th
day of reaction, by reducing the
air flow to 25 L/m for a period of three hours. The air reduction period has recorded a
sudden temperature rise of 5°C (37.1°C to 42.4°C) throughout the matrix as shown in
Fig 5.6.1. Therefore the dominance of drying over decomposition has decreased
considerably by the 10th
day of reaction, which is indicating the vicinity of the end
point of biodrying reaction. The important result observed in these air stop/reduction
investigations is that it helped to decide the end point or duration of the biodrying
reactions. These investigations points out the limiting time of biodrying reaction i.e.,

166
when the decomposition process overtakes the drying process. The temperature
contour of the fifth phase of experiment is plotted in Fig.5.6.2, which shows the self
heating temperature distribution inside the reactor matrix. It was observed that
temperature in the core region of the reactor matrix has shown an increase in both
horizontal direction with respect to time as well as in vertical direction with respect
to reactor matrix height. The temperature rise is shifted to 40ºC to 50ºC range in this
phase, while compared to previous phases temperature peak was lesser.
5.6.4.2 Weight Reduction
.Weight reduction has been monitored continuously using electronic load cell. The
entire reactor unit is placed over the load cell. The weight loss is calculated in every
second of time and the data transferred through the data acquisition system and
reading taken on the monitor of computer. It was observed that, the weight reduction
has significantly increased by doubling the air flow rate and this facilitated moisture
removal at an accelerated rate in the fifth phase.
0 1 2 3 4 5 6 7 8 9 10 11 12100
110
120
130
140
150
160
170
180
190
We
igh
t (k
g)
Time(Days)
Weight vs Time
Fig.5.6.3 Weight Reduction in the Fifth Phase.

167
Weight reduction profile for fourth and fifth phase of investigations were plotted as in
Fig.5.6.4. It was observed that the weight of the mixed municipal solid waste substrate
has been reduced from the initial value of 180 kg to the final value of 106.8 kg in 11 days
of biodrying reaction as shown in Fig.5.6.3. This accounts a weight reduction of 40.67 %
in 11 days of the process. It is a major achievement in the fifth phase of study where the
highest weight loss has been reported, while considering the previous studies.
0 2 4 6 8 10 12
0
5
10
15
20
25
30
35
40
45
Wi-Initial weight
Wf-Final weight
Wei
gh
t re
du
ctio
n(%
) [
(Wi-W
f)*1
00
/Wi]
Time(Days)
Weight reduction % vs time- Phase 4
Weight reduction % vs time- Phase 5
Fig. 5.6.4 Weight Reduction % Vs Time- Phase 4 and Phase 5.
In the fourth phase of experiment conducted at an airflow rate of 40 L/m, the weight
reduction of 20.41 % has been obtained after 11 days of controlled biodrying
reactions. A weight reduction of 40.67 % has been achieved after 11 days of reaction
in the fifth phase of experiment. It shows that better weight reduction due to
evaporative cooling took place at the optimum air flow rate whereas, air scarcity lead
to deceleration of biodrying reaction.

168
5.6.4.3 Moisture Profile
The moisture reduction profile for the fifth phase of study is shown in Fig.5.6.5. The
moisture content has been reduced from the initial value of 60.06 % to final value of
36.74 % in 11 days of reaction. It can be observed that doubling the air flow rate in the
fifth phase was more effective in terms of moisture reduction with average moisture
reduction of 38.83 % achieved in 11 days of reaction. It is the highest reduction in the
shortest period of time, while considering the previous phases of experiments.
Fig. 5.6.5 Average Moisture Profile - Fifth Phase.
The standard deviation (S.D.) of moisture analysis results was considerably less in
this experiment with S.D values in the range 2-7, that indicates more homogeneous
nature of the biodried output.
30
35
40
45
50
55
60
65
0 1 2 3 4 5 6 7 8 9 10 11 12
Aver
age
Mois
ture
Con
tent
(%)
Time (Days)
Average Moisture
Content Vs Time -
Phase 5

169
The moisture profiles for the fourth and fifth phase of investigations were plotted in
Fig.5.6.6. The non-homogeneity in moisture distribution of biodried output is higher
in fourth phase with standard deviation (S.D) of 15 at the end of 11 days, while
compared to 4.9 in the fifth phase. The maximum drying efficiency has been obtained
in the fifth phase of study when the air flow rate is doubled.
Fig.5.6.6 Moisture Profile -Phase 4 and Phase 5.
5.6.4.4 Volume Reduction
The volume reduction profile obtained in the fifth phase of study is shown in Fig.5.6.7.
The reactor was filled to the maximum capacity of 2.0 m height in fifth phase of study
and the initial filled volume was 0.565 m3. After 11 days of biodrying reaction the
height of reactor matrix has been reduced to 1.24 m with the final volume of 0.35 m3.
The volume reduction was 38 % in 11 days of biodrying reaction in the fifth phase.
20
30
40
50
60
70
80
0 1 2 3 4 5 6 7 8 9 10 11 12
Aver
age
Mois
ture
Conte
nt
(%)
Time (Days)
Average Moisture
Content Vs Time
Phase4- 40L/m
Average Moisture
Content Vs Time -
Phase 5- 80 L/m

170
Fig. 5.6.7 Volume Reduction – Phase 5.
The volume reduction for the fourth and fifth phase of investigations has been
compared in Fig.5.6.8. It can be observed that the volume reduction achieved with in
the fourth phase was higher than that achieved in the fifth phase. This clearly shows
the significance of doubling the air flow rate on biodrying reaction. The
biodegradation and biodrying process together contribute to volume reduction.
However the biodegradation process contributes more to volume reduction than the
biodrying process. The volume reduction achieved in 11 days of the biodrying
reaction was 38 % in the fifth phase of experiment, while it was 43.5 % in the fourth
phase (Fig. 5.6.8). Therefore the rate of air supply is an important limiting factor
deciding the extent of biodrying and biodegradation reactions.
0.300
0.350
0.400
0.450
0.500
0.550
0.600
0 1 2 3 4 5 6 7 8 9 10 11 12
Bulk
Volu
me
(m3)
Time (Days)
Volume vs
Time- Phase 5

171
Fig. 5.6.8 Volume Reduction Percentage Vs Time-Phase 4 and Phase 5.
5.6.4.5 Bulk Density
The in situ bulk density has been calculated as per equation 5.1. The in situ bulk
density of the substrate has been increased from the initial value of 198.7 kg/m3 to
final value of 222.89 kg/m3 in the entire experiment period of 11 days in the fifth
phase (Fig.5.6.9). Maximum bulk density of 257 kg/m3 has been observed by the 5
th
day of reaction and after that it decreased which a common trend is observed in all the
studies. Bulk density increase was only 12 % in the fifth phase of study where the
high airflow rate of 80 L/m has used. This is pointing out the fact that though volume
reduction of 38 % has occurred, the drying process was very efficient which is
reflected in the in situ bulk density of the substrate.
0
5
10
15
20
25
30
35
40
45
50
0 1 2 3 4 5 6 7 8 9 10 11 12
Volu
me
Red
uct
ion (%
)
Time (Days)
Volume Reduction
vs Time-Phase4- 40
L/m
Volume Reduction
vs Time- Phase 5-
80 L/m

172
Fig.5.6.9 Bulk Density Profile- Phase 5.
Considering the bulk density profile for the fourth and fifth phases of experiments, it
can be observed that the maximum increase of bulk density has occurred within the
initial five to six days of reaction (Fig.5.6.10). It reveals the fact that biological
reactions are most active in this period. The peak temperature formation also
confirms the same. After that the initial period of active reaction the moisture
deficiency slows down the biological reaction.
Fig. 5.6.10 Bulk density Vs Time- Phase 4 and Phase 5.
160
180
200
220
240
260
0 2 4 6 8 10 12
Bulk
Den
sity
(kg/m
3)
Time (Days)
Bulk Density
Vs Time-
Phase 5
160
180
200
220
240
260
280
300
0 2 4 6 8 10 12
Bulk
Den
sity
(kg/m
3)
Time (Days)
Bulk Density
Vs Time-
Phase4 - 40
L/m
Bulk Density
Vs Time-
Phase5- 80
L/m

173
The bulk density profile for the fourth and fifth phase of experiments are very
significant in delineating biodrying process. It is clear from the graph that bulk
density increase is more in fourth phase when compared with fifth study. The
maximum bulk density value of 286 kg/m3 has been achieved on the sixth day in the
fourth phase of experiment. (Fig.5.6.10). In the case of fifth experimental phase, the
maximum bulk density increase was 29.38 % which is obtained by the 5th
day. In the
falling zone of bulk density profile of the fifth experiment, after the initial 5-6 days, a
reduction of 13.42 % in bulk density has been observed, which improved the air
circulation. But the bulk density fall was only 4 % in the experiment conducted at
40 L/m of air flow. The comparisons of the fourth and fifth phase of experiments are
extremely helpful to decide the limiting conditions in biodrying technology
development.
5.6.4.6 Air Porosity
The air porosity study has been carried out for fourth and fifth phase of investigations
where the volumetric air flow rate was doubled. The air porosity variation of the
fourth and fifth experiments will help to find out the physical relationship among the
solid, liquid and gaseous phases of substrate in biodrying process (Schulze 1962;
Hillel 1982; Jury et al., 1991; Van Ginkel et al., 1999).
The air porosity is calculated by using the following equations.
E=1-(𝛾/𝛾𝑑) ……………….(5.6.1) ,
where E – Total porosity

174
𝛾 – Total bulk density
𝛾𝑑- Dry density
Ew (Porosity of water)= (100−average moisture)×extra moisture100×1000 ----(5.6.2)
Ea (air porosity) = E - EW………………….. (5.6.3)
It can be seen that in the fourth phase of experiment with air flow rate of 40 L/m , the
air porosity reduction is 57.44 % at the end of 11 days of reaction (Fig.5.6.11).
Fig. 5.6.11 Air Porosity Reduction With Respect to Time -Phase 4 and
Phase 5.
0
10
20
30
40
50
60
70
0 1 2 3 4 5 6 7 8 9 10 11 12
Air
poro
sity
red
uct
ion (
%)
[pi-
pf)
100/p
i]
Time (Days)
Air porosity
reduction
(%)Vs Time
Phase4- 40 L/m
Air porosity
reduction (%)
Vs Time-
phase5-80 L/m
pi-initial porosity
pf- final porosity

175
It shows a decline in biological activity after the initial reaction period of two days.
On the other hand, doubling the airflow rate has decreased the air porosity reduction
to 31.38 %which is shown in the plot. The even nature of biological reactions during
the entire period of 11 days of process has been observed form the air porosity
reduction graph of fifth phase of experiment. Therefore, the regular temperament of
biological reaction obtained at higher air flow rate is useful to get a more
homogeneous product, with enhanced utilisation of self heating process.
5.6.6 Summary
The fifth phase of experiment with high airflow rate of 80 L/m was found to be efficient
in terms of biodrying reaction. Weight reduction of 40.7 % and moisture reduction of
38.8 % were the major achievements in the fifth phase. The higher air flow rate has
resulted in decreasing the rate of self heating. It was observed that the lower the airflow
rate the lesser the biodrying efficiency, but the higher the air flow rate the lesser the
biological heating. These contradictory conditions noted in the fourth and fifth phases of
investigations points out that air flow rate is an important aspect in static biodrying
reactors. The fourth experiment at lower air flow rate of 40 L/m was more successful in
terms of volume reduction and bulk density increase. Also the self heating process was
better at lower air flow rate with maximum temperature development of 58 ºC. The self
heating temperature rise in the fifth experiment was lesser with peak value of 50 ºC. It
was observed that when the air flow rate was doubled by keeping the same reactor matrix
height under selected experimental conditions, the biodrying process efficiency has been
increased up to 2.3 times. The air flow variation studies conducted at selected intervals
during these investigations are relevant in limiting the process time under particular
experimental conditions.

176
5.6.7 Limitations
The self heating and temperature rise inside the reactor matrix was lesser in the fifth
phase, which is a limitation while considering the sanitisation point of view.
5.6.8 Further Advancements
The mode of aeration on biodrying process has to be studied to delineate the process
variations.
5.7 EXPERIMENTAL INVESTIGATION- PHASE-6- DOWN FLOW MODE
OF AERATION IN BIODRYING PROCESS
5.7.1 Objectives
In the sixth phase of experiment the air flow direction has been changed from the up
flow mode to the down flow mode, in order to study the effect of the mode of aeration
on biodrying process.
5.7.2 Introduction
Homogeneous output from the biodrying reaction necessitates uniform temperature
rise. The lower part of the reactor matrix was drier compared to the upper parts in the
previous phases of experiments, where up flow mode of aeration was used. An
innovative small scale reactor system has been designed and run to study the
biodrying process variation in down flow mode (Fig.5.7.1).

177
Fig. 5.7.1 Schematic Sectional View- Modified Design for the Down Flow
Aeration System.
The rewetting of the dried reactor matrix in the top region is observed to be reason for
temperature gradient inside the reactor matrix in up flow mode of aeration. In order to
avoid this limitation down flow mode of aeration has been used in the sixth phase of
study.
5.7.3 Materials and Methods
The reactor unit consisted of an acrylic reactor chamber which is having a height of
124 cm and diameter of 60 cm. The top portion of reactor is sealed air tight. The
entire system is placed over a wooden pallet which is shifted to the insulation
chamber for reaction. The leachate collection system was provided at the bottom. The
CO2 analyser was kept at the air outlet at bottom portion of the reactor. The
temperature probes were fitted along the height of the reactor at 20 cm distance apart.
The air supply was provided in a controlled manner through the digital gas mass flow
controller which is supplied at the top region of the reactor matrix. The entire reactor
unit has been placed inside the insulation chamber of dimensions 1.5 m × 1.5 m.
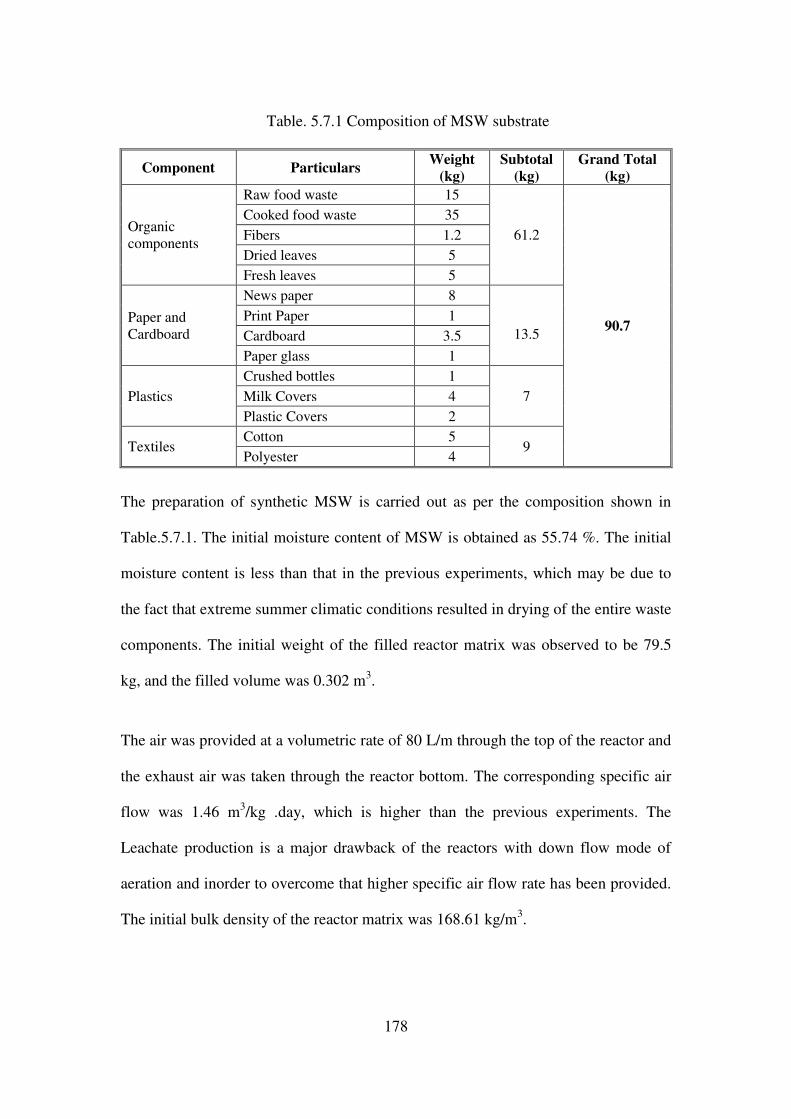
178
Table. 5.7.1 Composition of MSW substrate
Component Particulars Weight
(kg)
Subtotal
(kg)
Grand Total
(kg)
Organic
components
Raw food waste 15
61.2
90.7
Cooked food waste 35
Fibers 1.2
Dried leaves 5
Fresh leaves 5
Paper and
Cardboard
News paper 8
13.5
Print Paper 1
Cardboard 3.5
Paper glass 1
Plastics
Crushed bottles 1
7 Milk Covers 4
Plastic Covers 2
Textiles Cotton 5
9 Polyester 4
The preparation of synthetic MSW is carried out as per the composition shown in
Table.5.7.1. The initial moisture content of MSW is obtained as 55.74 %. The initial
moisture content is less than that in the previous experiments, which may be due to
the fact that extreme summer climatic conditions resulted in drying of the entire waste
components. The initial weight of the filled reactor matrix was observed to be 79.5
kg, and the filled volume was 0.302 m3.
The air was provided at a volumetric rate of 80 L/m through the top of the reactor and
the exhaust air was taken through the reactor bottom. The corresponding specific air
flow was 1.46 m3/kg .day, which is higher than the previous experiments. The
Leachate production is a major drawback of the reactors with down flow mode of
aeration and inorder to overcome that higher specific air flow rate has been provided.
The initial bulk density of the reactor matrix was 168.61 kg/m3.

179
5.7.4 Results and Discussions
5.7.4.1 Weight Reduction
The weight of the reactor matrix has been measured using the electronic load cell.
The entire reactor unit is placed over it and the readings were taken at every second
which is transferred through the data acquisition system in to the monitor of
computer. In this experiment the weight of the reactor matrix has been reduced from
the initial value of 79.5 kg to final 45.8 kg in 12 days of reaction (Fig.5.7.2).
0 2 4 6 8 10 12
45
50
55
60
65
70
75
80
Wei
gh
t (k
g)
Time(Days)
Weight Vs Time- Phase 6
Fig. 5.7.2 Weight Reduction-Sixth Phase with Down Flow Mode of Aeration.
The total weight loss was 33.7 kg, which accounts for an average per day weight
reduction of 2.86 kg/day. The down flow aeration at higher specific air flow rate in
this experiment was more effective in terms of weight reduction with 42.39 %
achieved in 12 days of reaction

180
5.7.4.2 Temperature Profile
Self heating sanitization of the product is one of the objectives of biodrying process.
The self heating temperature peak achieved in the sixth phase was 47.7ºC during 12
days of biodrying process (Fig.5.7.3). The high specific air flow rate has resulted in
cooling of the reactor matrix to some extent, which may be one of the reasons for low
temperature development. It was observed that the down flow mode of aeration has
resulted in more air short circuit zones inside the reactor matrix than the up flow
mode of aeration.
0 2 4 6 8 10 12 14
20
22
24
26
28
30
32
34
36
38
40
42
44
46
48
50
Tem
pera
ture
(0C
)
Time (Days)
Probe 1- air inlet
Probe 2- matrix top
Probe 3-20 cm from air inlet
Probe 4- 40 cm from air inlet
Probe 5- 80 cm from air inlet
Probe 6- 100 cm from air inlet
Probe 7- Air outlet
Fig. 5.7.3. Temperature Profile-Down Flow Mode of Aeration- Phase 6.

181
5.7.4.3 Moisture Profile
The moisture reduction is plotted against time as shown in Fig.5.7.4. The down flow
aeration at a high rate has not helped to increase the uniformity of moisture
distribution inside the reactor matrix. The standard deviation of moisture results
varies in the range 1.6-14. The non-uniform moisture reduction, points out that air
channelization as well as short circuits inside the reactor matrix. The moisture of the
reactor matrix has been decreased form initial value of 55.74 % to final value of
32.63 %, i.e., the average moisture content has been reduced by 41.5 %. Though it is
higher when compared to that at up flow aeration experiment at 40 L/m, the
haphazard variation of moisture within the matrix is a drawback of the process.
Fig.5.7.4 Average Moisture Profile- Phase 6- Down Flow Mode of Aeration.
5.7.4.4 Volume Reduction -Down Flow Mode of Aeration
The volume reduction in the process was found to be 34.57 %. The initial volume of
0.302 m3 has been reduced in to 0.198 m
3 in 12 days (Fig.5.7.5).
15
20
25
30
35
40
45
50
55
60
0 2 4 6 8 10 12
Mois
ture
Conte
nt
(%)
Time (Days)
Moisture
content
vs time-
Phase 6

182
Fig. 5.7.5. Volume Reduction-Phase 6- Down Flow Mode of Aeration.
The pile height reduced from 1.07 m to 0.70 m and the volume reduction has been
significant.
5.7.4.5 Bulk Density Profile
The in situ bulk density has been calculated as per equation 5.1. The initial bulk
density of 168.8 kg/m3
has been increased to 214.51 kg/m3 in the first day of reaction
and after that it started a decreasing trend. This shows lack of oxygen inside the
reactor matrix after the initial settlement and that may be the reason for uneven
drying. The bulk density went on decreasing after this and at the end of 12 days of
reaction it was 174.56 kg/m3. The bulk density increase at the end of reaction was
only 3.41 % (Fig.5.7.6). This is entirely different from that obtained in the up flow
biodrying process, where sufficient increase in bulk density has been occurred. The
sixth phase of experiment has resulted in drying together with biodrying.
0.170
0.190
0.210
0.230
0.250
0.270
0.290
0.310
0 2 4 6 8 10 12
Bulk
Volu
me
(m3)
Time (Days)
Volume vs
Time-Phase 6

183
Fig.5.7.6. Bulk Density Profile-Phase 6 -Down flow mode of aeration.
5.7.4.6 Leachate Production
Leachate production was observed to be very less and mainly it occurred in the initial
four days and it was negligible to measure.
5.7.5 Summary
In the sixth phase of experiment with down flow mode of aeration at a high specific
flow rate of 1.46 m3/kg.day, it was observed that along with the biodrying process,
drying process also occurred at random locations inside the reactor matrix.
Considering the overall weight reduction and moisture removal efficiency sixth phase
is better than previous experiments with weight reduction of 42.39% and moisture
reduction of 41.5% achieved in 12 days of reaction. The homogeneity of the biodried
product is affected badly which is a drawback of the sixth phase of experiment. The
heterogeneity of moisture value was very high due to the air channelization and short
circuiting.
140
160
180
200
220
240
260
0 2 4 6 8 10 12 14
Bulk
Den
sity
(kg/m
3)
Time (Days)
Bulk Density Vs
Time- Phase -6

184
5.7.6 Limitations
The major limitation of the sixth experiment was the highly non-uniform moisture
distribution of the biodried substrate. Also the temperature peak was not achieved
which points out that the self heating was not utilized fully for drying purpose.
5.7.7 Future Recommendations
The improvement of the process for homogeneity of the product by mixing of the
reactor matrix through an energy efficient way needs to be studied in future. The non-
uniform drying is due to the fact that faster drying of the matrix has reduced the
preferential flow in the lower part of the reactor. Inorder to overcome that the pilot
scale reactor configuration can be provided with segmented air flow reducing
downwards (Navaee-Ardeh et. al., 2006).
5.8 OVERALL ASSESSMENT OF SIX PHASES OF EXPERIMENTAL
INVESTIGATIONS
5.8.1 General
The input as well as output parameters of five phases of experimental investigations
were listed in Table.5.8.1. The detailed study of the individual parameters for first
five phases of experiments has been carried out.

185
Table 5.8.1 Input vs Output Parameters for Five Phases
Study
No
Duration
(Days)
Peak
Tempera
ture of
Reactor
matrix
(0C)
Weight(kg) Moisture (%) Volume (m3)
Bulk Density
(kg/m3)
Input Output Input Output Input Output Input Output
1 33 59 109 72 61.25 48.5 0.39 0.18 173.3 263.9
2 15 59.9 124 75.8 65.5 43.9 0.39 0.22 189 231.3
3 15 65.5 167 109 62.45 43.5 0.46 0.28 220.2 267.7
4 11 58 172 136.9 66.4 57.1 0.56 0.31 182.8 264.1
5 11 50 180 106.8 60.06 36.74 0.56 0.35 198.9 222.8
5.8.2 Weight Reduction
The weight reduction achieved in five phases of investigations has been shown in
Fig.5.8.1. It can be seen that the weight reduction has been considerably increased
from 33.94% in the first phase of experiment to 39.2% in the second phase where the
air saturation has been avoided by condensation prevention.
Fig.5.8.1 Weight Reduction Profile.
33.94(33 days)
39.2 (15 days)
34.9 (15 days)
22 (11days)
40.7(11 days)
0
5
10
15
20
25
30
35
40
45
Study 1 Study 2 Study 3 Study 4 Study 5
wei
gh
t re
du
ctio
n (
%)
weight
reduction (%)

186
The process duration has been reduced from 33 to 15 days in the second phase of
experiment which is a major achievement. The modified design with horizontal air
flow system (HAF) was efficient in accelerating the biodrying reaction. The weight
reduction in the third phase of experiment has been decreased slightly where the
maximum self heating temperature rise up to 65 ºC has been achieved inside the
reactor matrix. Therefore high thermophilic temperature in biodrying process is not
necessary for weight reduction and efficient moisture reduction. On the other hand
high range of temperature may be advantageous in view of disinfection and safety in
handling and working conditions of the biodried output. Both these situations have to
be considered to achieve the ideal process conditions in biodrying reaction.
Considering the fourth phase of experiment, it can be seen that the weight reduction
has been considerably reduced to 22 %. In the fourth phase, the increased height of
reactor matrix at loose packing will not contribute to biodrying process efficiency and
there was no further improvement in self heating process. It is partly due to the air
insufficiency and partly due to air channelisation inside the reactor matrix.In the fifth
phase of experiment the volumetric air flow rate has been increased from 40L/m to
80L/m (specific air flow rate increased from 0.335m3/kg.day to 0.640m
3/kg.day) that
has to achieve a better weight reduction profile. The weight of reactor feed has been
reduced by 40.7 % in 11 days of biodrying reaction.
5.8.3 Moisture Profile
Moisture reduction profiles for the five phases of experiments have been plotted as
shown in Fig. 5.8.2. In the first phase of experiment the moisture reduction was
20.8% in 33 days of reaction, which is increased to 33 % in the second phase. The
duration

187
Fig.5.8.2 Moisture Profile.
of the second experiment was reduced to 15 days which is a major success of the
modified design with horizontal air flow system(HAF) in the top region of the
reactor. The third phase of experiment has also resulted in considerable moisture
reduction of 30 %. The high self heating has not contributed more to moisture
reduction. It is pointing out that biodegradation process is required just enough to
evaporate the moisture and more degradation will not accelerate the biodrying
reaction. In the fourth study the moisture reduction has shown a decreasing trend
which is mainly due to the scarcity of air supply and air channelisation problems
along the height of the reactor matrix.
The fifth experiment has been conducted to overcome the air scarcity by doubling the
volumetric airflow rate from 40 L/m to 80 L/m (specific air flow rate increased from
0.335m3/kg.day to 0.640m
3/kg.day). This fifth phase has achieved more uniform
20.81 (33 days)
33(15 days)
30(15days)
17(11 days)
39(11 days)
0
5
10
15
20
25
30
35
40
45
Study 1 Study 2 Study 3 Study 4 Study 5
Mois
ture
Red
uct
ion (
%)
Moisture
Reduction(%)

188
biodried product at high efficiency. The fifth phase has resulted in 39% moisture
reduction in 11 days of biodrying reaction.
5.8.4 Volume Reduction
The volume reduction in biodrying reaction is advantageous in handling bulk of
municipal solid waste. The first and fourth phases of experiments have the lower
moisture reduction results while it has higher volume reduction (Fig.5.8.3).
Fig.5.8.3 Volume Reduction.
The volume of the reactor fill was reduced by with 56.67 % in 33 days of reaction in
the first experiment and 43.54 % reduction was achieved in the fourth experiment in
11 days of reaction. It was observed that faster drying process resulted in volume
56.7(33 days)
42.9(15 days)
38.8(15 days)
43.5(11 days)
38.1(11 days)
0
10
20
30
40
50
60
Study 1 Study 2 Study 3 Study 4 Study 5
Volu
me
Red
uct
ion (
%)
Volume Reduction (%)

189
reduction; along with that the biological reaction shows a decreasing trend. The
volume reduction in the second and third experiments was significant with 42.93 %
and 38.84 %in 15 days of reaction. The fifth phase of experiment has achieved 38%
volume reduction in 11 days of reaction.
5.8.5 Bulk Density
Bulk density increase is an important indication of the biological reaction in packed
reactors. The bulk density increase in the present experiments also revealed the nature
of reactions inside the matrix (Fig.5.8.4). The first phase of experiment has resulted in
maximum bulk density increase of 52.3 % in 33 days of reaction.
Fig.5.8.4. Bulk Density Profile.
52.3 (33 days)
23(15 days) 21(15 days)
46.3(11 days)
12(11 days)
0
10
20
30
40
50
60
Study 1 Study 2 Study 3 Study 4 Study 5
Bulk
Den
sity
Incr
esae
(%
)
Bulk Density
Increase (%)

190
The bulk density increase has drastically reduced to 23 % and 21% in the second and
third phase of studies. These results point out that the accelerated rate of moisture
reduction in these phases lead to moisture deficiency. The moisture deficiency has
decelerated the biological reactions in the reactor matrix. In the fourth experiment
again bulk density increase was prominent with 46.3% increase, which is mainly due
to activation of degradation reaction and air scarcity. The fifth phase has resulted in
bulk density increase of 12% in 11 days of reaction. In the fifth phase the accelerated
moisture removal has affected the biological degradation reaction and hence bulk
density increase was lesser while compared to other experiments.
5.8.6 Assessment of Sixth Phase of Study
The sixth phase of study with down flow mode of aeration at a high specific air flow
rate of 1.46 m3/kg.day has resulted in weight reduction of 42.39 % in 12 days of
reaction. This phase of study has resulted in moisture reduction of 41.5% in 12 days
of reaction. However the biological drying as well as air drying has occurred in the
sixth phase, which is evident from the non- uniform moisture content of the output. In
the sixth phase of experiment the volume has reduced by 34.57% in 12 days of
reaction. The bulk density increase was very less with 3.41% increase achieved in 12
days of reaction. Bulk density increase was lower in the sixth phase because the air
drying reaction occurred together with biodrying reaction. The weight reduction,
moisture reduction, volume reduction and bulk density increase of sixth phase of
study has been shown in fig. 5.8.5.

191
Fig.5.8.5 Assessment of Sixth Phase of Study.
5.8.7 Temperature Cumulation Index
Biodrying is a self heating process where the biological heat is used for drying
purpose. In the case of highly ventilated process like biodrying, the self heating
reaction can be delineated through the analysis of temperature cumulation index. The
temperature cumulation index has been calculated for all the phases using mean
matrix temperature(Tm) and temperature of air inlet (Ti) which is given by:
Temperature cumulation index (TCI) = ∑(𝑇𝑚 − 𝑇𝑖). ∆𝑡 ------------ (5.8.1)
Where Tm = mean matrix temperature (°C), Ti = temperature of air inlet (°C) and ∆𝑡 = Time interval (day) [ ∆𝑡 = 1, for the present study].
42.39 41.5
34.57
3.41
0
5
10
15
20
25
30
35
40
45
Weight
Reduction
Moisture
Reduction
Volume
Reduction
Bulk Density
Increase
Par
amet
er v
aria
tion (
%)
Parameter variation(%)

192
The temperature cumulation index for all the phases during 11-15 day period has
been plotted as shown in Fig. 5.8.6. In the first phase of experiment, the lower drying
rate and presence of moisture content due to condensation reaction has accelerated the
biological reaction. In the second study the heat accumulation was lesser than that in
the first study during the period of 15 days. It is evident from the graph that the slope
of the temperature accumulation index is very steep in the first and third phases of
studies while compared to the other phases (Fig. 5.8.6).
Fig.5.8.6 Temperature Cumulation Index in Six Phases of Biodrying Process.
This indicates the rate of heating with respect to time is very high in these phases
while compared to the other ones. Considering the moisture reduction in biodrying
process the fifth experiment was more effective. Therefore too steep and too flat
0
20
40
60
80
100
120
140
160
0 2 4 6 8 10 12 14 16
Tem
per
atu
re c
um
ula
tion
in
dex
Time (days)
cumulative
temperature-
phase 1
cumulative
temperature-
phase 2
cumulative
temperature-
phase 3
cumulative
temperature-
phase 4
cumulative
temperature-
phase 5
cumulative
temperature-
phase 6

193
nature of temperature cumulation index plot does not favour biodrying reaction.
Therefore heat accumulation is positively affecting the moisture reduction in
biodrying reaction in the initial process duration, while it is negatively affecting
moisture reduction as reaction time increases.
It can be explained on the basis of convective evaporation process in biodrying
reaction. Air convection may eventually dry the surface of the particle, reaching the
hygroscopic limit, resulting in less water to evaporate. For further drying, the bound
moisture has to migrate from the particle interior to its surface, which is governed by
heat dissipating diffusion mechanisms (Roy et. al., 2006). Therefore not only the heat
accumulation reaction but also the heat dissipation plays a major role in accelerating
biodrying mechanism. The rate of air flow, initial temperature rise, and the duration
of biodrying reaction together constitute better heat dissipating diffusion mechanism.
5.8.8 Mass Balance Analysis in Biodrying
The mass balance calculations were carried out in two ways. Firstly the weight loss
and moisture loss based mass balance study has been carried out. Secondly the CO2
emission loss based mass balance analysis has been done and both the results have
been compared to analyze the biodrying process in detail.
5.8.8.1 Moisture Reduction Basis
Mass balance for the designed biodrying processes is calculated by the following
equations

194
The water losses at time t (Wtloss, kg) are calculated by:
Wtloss = (WM0 × w0) - (WMt × wt) --------------------------------- (5.1)
Where WM0 (kg) and WMt (kg) are the wet materials at the initial time and time t,
respectively, w0 (%) and wt (%) are water contents at initial time and time t,
respectively.
Table.5.8.2 Mass Balance Calculations
Expt
No.
Initial
weight
(kg)
Final
weight
(kg)
Weight
Loss
(kg)
Initial
moisture
content
(%)
Final
moisture
content
(%)
Initial
Water
(kg)
Final
Water
(kg)
Water
Loss
(kg)
Net
Emission
Loss (kg)
1 109.00 72.00 37.00 61.25 48.50 66.76 34.92 31.84 5.16
2 124.00 75.40 48.60 65.50 43.90 81.22 33.10 48.12 0.48
3 167.00 109.00 58.00 62.45 43.50 104.29 47.42 56.88 1.12
4 172.00 135.00 37.00 66.40 57.20 114.21 77.22 36.99 0.01
5 180.00 106.80 73.20 60.06 36.74 108.11 39.24 68.87 4.33
6 79.50 45.80 33.70 55.74 32.60 44.31 14.93 29.38 4.32
Net emission losses at time t (Eloss, kg) are given by,
Eloss = WM0 - WMt - Wtloss - LO
tloss----------------------------------------- .(5.2)
Where LOtloss is leachate weight, which is negligible in the present study. The mass
balance calculations were enlisted in Table.5.8.2.
5.8.8.2 CO2 Emission Loss Based Mass Balance Analysis
The mass balance analysis has also been carried out by using the data achieved
through CO2 analyser. The details were enlisted in Table 5.8.3.

195
Table.5.8.3 Measured Emission Loss
Experiment
No.
CO2 (% )
Average
CO2
(kg)
Emission
loss(kg)
Net emission due to
other gases
1 0.758 4.98 5.16 0.18
2 0.075 0.48 0.48 0
3 0.125 0.821 1.12 0.299
4 0.0145 0.01 0.095 0.085
5 0.325 4.27 4.33 0.06
6 0.257 3.38 4.32 0.94
The mass balance calculations helped to explore the difference between the biodrying
processes in the different phases of experiments. In the first phase of experiment the
net emission loss is higher where the process duration was the longest (Table.5.8.2
and Table.5.8.3). Therefore degradation reactions are more active as time progress in
biodrying process, especially when the rate of moisture reduction is not enough to
decelerate biological reaction.
In the second phase of experiment moisture reduction was faster due to elimination of
condensation in top region of the biodrying reactor. This resulted in reducing the
experiment duration from 33 days in the first experiment to 15 days in the second
phase. Active drying in short period was observed with reduction in CO2 production.
In the third experiment emission loss was higher than that of second one where the
increased volume of the matrix has resulted in active degradation reaction at some
points inside the reactor matrix. During the fourth phase of experiment the emission
loss has decreased and the moisture reduction has shown a decreasing trend. This is
mainly due the air scarcity which gave rise to zones of anaerobic condition inside the
reactor matrix. The present investigations revealed that an optimum balance of
aerobic and anaerobic conditions inside the reactor matrix is an essential requirement

196
for efficient biodrying reaction. The sixth phase was effective in terms of drying
reaction, but the biological heat utilisation was lesser. The high rate of air circulation
cooled the heated air. Therefore along with the biodrying reaction air drying process
has also occurred.

197
CHAPTER 6
CALORIFIC VALUE OF RAW VS BIODRIED SUBSTRATE
6.1. INTRODUCTION
Waste to energy (WTE) technologies have the potential to reduce the volume of the
original waste by 90%, depending on the composition by recovering the energy
(Wang, 2009; Kathiravale, 2003). Recovering energy from municipal solid waste is
feasible by a means of a number of energy generation processes like incineration,
pyrolysis, gasification etc. The design and operation of all the energy systems of
municipal solid waste are largely influenced by the heating value of MSW. Mixed
MSW has a heating value of about one third of the calorific value of coal (8-12 MJ/kg
for MSW and 25-30 for MJ/kg for coal) (International Energy Agency, IEA 2003,
Municipal solid waste and its role in sustainability). The net energy yield depends
upon the density, composition and relative percentage of moisture of the waste (Fobil,
2005). Therefore moisture reduction in biodrying process and the resulting energy
value increase is required to assess the end use possibilities of biodried output. The
lower calorific value of municipal solid waste can be calculated based on a number of
available modelling equations, which is described in the following section.
6.1.1 Proximate Analysis
Proximate analysis method for calculating the lower calorific value of municipal solid
waste is used by a number of researchers. The available modelling equations are
given below.

198
LHV = 45V- 6W ----------------------------- (6.1) (JNMSWF,1991)
LHV = 44.75V- 5.85W + 21.2 ------------- (6.2) (JNMSWF,1991)
Where LHV: lower heating value (kcal/kg)
Where V-volatile solids (%)
W- Moisture content (%)
6.1.2 Physical Composition Analysis
Physical composition method of energy assessment is widely used for calculating
energy value of heterogeneous municipal solid waste. The available modelling
equations based on physical composition are given below.
Modelling Equation- 1
LHV = [88.2Ppl +40.5(Pfo +Ppa)](100−𝑊𝑊 )- 6W -------------- (6.3) [JNMSWF,1991]
Modelling Equation- 2
LHV= (38.52Ppa + 92.09Ppl + 49.24Pte + 38.34Pwo + 37.55Pfo+64.07 Pmi) (100−𝑊𝑊 )-6W -------------------------------------------- (6.4) [Lin 2000]
Where LHV: lower heating value (kcal/kg)
Ppl: Plastics (wt %), Pfo : food waste (wt %), Ppa : paper and card board (wt %)
W: moisture content (%), Pte : textiles (wt %)
Pwo : wood (wt %), Pmi : miscellaneous component (wt %)
In the present study equations based on physical composition is used (equations 6.3
and 6.4) for energy calculations of raw & biodried MSW. The composition of the
mixed municipal solid waste substrate as well as the moisture content before and after
the process for five phases of experiments has been listed in Table.6.1.

199
Table 6.1 Composition of Different Components of Mixed Municipal Solid Waste
Expt
No.
Organic
components Paper Plastics Textiles
Initial
Moisture
content
(%)
Final
Moisture
content
(%)
Weight
(kg) Pfo%
Weight
(kg) Ppa%
Weight
(kg) Ppl%
Weight
(kg) Pte%
1 78.40 70.00 13.44 12.00 10.08 9.00 10.0800 9.00 61.25 48.50
2 91.98 73.00 12.60 10.00 8.82 7.00 12.6000 10.00 65.50 43.90
3 124.56 72.00 19.03 11.00 13.84 8.00 15.5700 9.00 62.45 43.50
4 151.90 70.00 26.04 12.00 21.70 10.00 17.3600 8.00 66.40 57.20
5 125.40 66.00 32.30 17.00 14.25 7.50 18.0500 9.50 60.06 36.74
The lower heating value of the mixed municipal solid waste before and after the
biodrying process is calculated using two modelling equations 6.3 & 6.4. The table
6.2 shows lower heat value of MSW in five phases of study.
Table.6.2 Lower Heat Value of MSW- Comparison of Five Phases of
Biodrying Process.
Expt
No.
Process
Duration
Lower Heat Value in kcal/kg
Modelling Equation-1 Modelling Equation-2
Raw MSW Biodried MSW Raw MSW Biodried MSW
1 33 2235.74 3874.74 2392.58 4152.43
2 15 1263.51 4588.54 1383.99 4938.97
3 15 2070.77 4998.56 2215.14 5311.62
4 11 1728.42 2801.73 1830.92 2954.65
5 11 2314.94 6538.73 2493.56 7012.77
The average heating value obtained from the two modelling equations for raw as well
as biodried Municipal solid waste has been expressed in kJ/kg as shown in Table. 6.3.
The calorific value of raw municipal solid waste varies from7446 kJ/kg to
10059.38 kJ/kg. The incineration of MSW with low calorific value encounters a
range of problems including difficulty in ignition, unsteady and unstable combustion
flame, incomplete combustion of the waste, and increased formation of air pollutants.

200
Supplementary fuel, which would significantly increase the operating cost, is often
necessary for incineration of such high moisture, low energy content waste (Cheng et.
al.,2007; Cheng and Hu, 2009; Nie, 2008; Cheng and Hu 2010).
Table. 6.3 Average Lower Heat Value of Mixed MSW in kJ/kg- Comparison
of Five Phases of Studies Before and After Biodrying Process
Expt No. Lower Calorific Value (kJ/kg)
Raw MSW Before Biodrying Biodried MSW
1 9682.45 16792.84
2 5538.58 19931.55
3 8966.12 21568.90
4 7446.14 12042.34
5 10059.38 28349.73
In this scenario the biodried substrate is useful for energy production since its
calorific value has increased. Graphical Representation of Calorific value of MSW
Substrate Before and After the Biodrying Process for five phases of study varies
from 12.04 MJ/kg to 28.35 MJ/kg as represented in Fig.6.1.
The biodrying process of municipal solid waste with high moisture content has
reported an increase of lower heating value up to 2 times the initial value in previous
study of Shao et.al., 2010. The maximum calorific value of 28349.73 kJ/kg obtained
in fifth phase of study was 2.8 times the initial calorific value of 10059.38 kJ/kg. The
calorific value of raw as well as biodried substrate in the sixth phase of study has
been shown in Table.6.4

201
Fig.6.1 Graphical Representation of Calorific value of MSW Substrate
Before and After the Biodrying Process
Table 6.4 The Calorific Value of Raw and Biodried MSW-Phase 6
EXPT NO. Lower Calorific Value (kJ/kg)
Raw MSW Biodried MSW
6 12331.43 33138.27
It was observed that the calorific value of raw substrate was higher in the sixth phase
with a value of 12331.43 kJ/kg. The biodrying process along with the drying process
in the sixth phase has facilitated higher moisture reduction but its distribution was
non-homogeneous.
9.68
7.44
8.97 7.45
10.06
16.79
22.11 21.56
12.04
28.35
0
5
10
15
20
25
30
Study 1 Study 2 Study 3 Study 4 Study 5
Cal
ori
fic
Val
ue(
MJ/
kg)
Raw MSW
Biodried
MSW

202
The energy value of biodried output has been compared with that specified in existing
RDF standards as shown in Table. 6.5. It can be observed that the energy value of
biodried output has increased upto the RDF standards in the present investigations. It
is promising for the application of biodried output for energy producing applications.
Table.6.5 Existing Data on MSW and RDF Comparison
Main properties of renewable fuels MSW RDF
Gross calorific value (kJ/kg of waste) 10,159.8 18,280.8
Gross calorific value (kJ/kg of dry waste) 18,973.1 23,444.6
Gross calorific value (kJ/kg of dry-ash free waste) 26,518.9 26,948.7
Low calorific value (kJ/kg of waste) 8325.9 16,660.7
Low calorific value (kJ/kg of dry waste) 17,677.1 22,061.2
Low calorific value (kJ/kg of dry-ash free Waste) 24,990.2 25,409.9
Moisture (%) 46.46 22.07
Non-combustible material (% wt dry basis) 15.23 10.10
Specific weight (kg/m3) 208.0 130.8
(Montejo et al., 2011.)

203
CHAPTER 7
SUMMARY AND CONCLUSIONS
7.1 SUMMARY
Municipal solid waste is a readily available resource, which can be used for
renewable energy production. The major hindrance towards the use of energy
producing applications of municipal solid waste is the high moisture content and low
calorific value. The search for a technology which will convert the raw MSW in to an
energy enriched material as well as the need of technologies for mixed municipal
solid waste treatment has led to ‘Biodrying Process’ as a sustainable option.
The main objective of the present study was the development of biodrying technology
as a sustainable method for municipal solid waste management. The novel features of
the biodrying reactor are vertical tubular design with up-flow mode of aeration,
continuous process monitoring with data acquisition system, an innovative design of
horizontal air flow system for condensation prevention, provision of temperature
probes for continuous monitoring along the reactor matrix, a unique design of bottom
chamber for optimum air circulation inside the reactor matrix and provision for
easier unloading of the biodried material etc. Better performance was brought into the
system through a series of improvisations wherein the performance of various
elements of the configuration was investigated independently and for maximum
efficiency.

204
The investigation studies on the pilot scale biodrying reactor have been conducted in
six phases. In the first phase of study, the specific air flow rate of 0.528 m3/kg.day
was provided and process monitoring has been carried out for 33 days. The major
limitation of first study was that moisture removal efficiency in the biodrying process
has been affected due to exhaust air saturation. The biodrying reactor unit has been
modified with Horizontal Air Flow system (HAF) in the second phase for prevention
of condensation. This study has resulted in better drying efficiency in short duration
of 15 days at a specific air flow rate of 0.460 m3/kg.day.
In the third phase, the effect of variation in specific air flow rate and increased reactor
matrix height on biodrying reaction has been studied. Self heating temperature was better
in this phase with a peak value of 65°C achieved in this phase. The increase in non-
homogeneity of the biodried output was the major limitation of this study. The fourth
phase has conducted to study the effect of further increase in reactor fill and the effect of
substrate packing on the biodrying process. The loose packing of substrate was provided
here while compared to previous study. The peak self heating temperature of 58°C was
observed in this phase, which is lesser that in the previous study.
In the fifth phase, the effect of increase in specific air flow rate has been studied. The
volumetric air flow rate has doubled to 80 L/m and fully filled reactor has been used
in this study. The self heating was lesser with a peak value of 50ºC recorded in this
phase of study. The sixth phase of study has conducted to study the effect of down
flow mode of aeration. The final stage of the research included the study of energy
value assessment of the biodried product. It was observed that the calorific value of
raw municipal solid waste has increased in all the six phases of studies.

205
7.2 CONCLUSIONS
Studies on the developed biodrying reactor have shown that it can be effectively used
for mixed municipal solid waste management. From this study, the following major
conclusions can be made:
Characterisation Study
The characterisation study has revealed that the typical municipal solid waste of the
study area has an average moisture content of 61% and volatile solids content of
90 %. It indicates that the MSW substrate selected for the present investigation is
having optimum conditions for active biodrying reaction.
Feasibility of Biodrying process in the Developed Reactor- Phase 1
The first phase of study has facilitated active biodrying reactions at the bottom region
of reactor matrix and biodegradation reaction at the top region of reactor matrix. It
was due to the condensation of evaporated water back into the reactor top region.
Weight reduction of 33.94 % , moisture reduction of 20.81%, Bulk density increase
of 52 % and volume reduction of 56.5 % has been achieved in 33 days of biodrying
reaction. The maximum temperature of 59.5°C has been attained by the reactor matrix
in this phase.

206
Effect of Modified Reactor with Horizontal Air Flow System on Biodrying
Process – Phase 2
In the second phase of study, the modified reactor with horizontal air flow (HAF)
system was successful with complete elimination of condensation reaction at the top
region of reactor matrix. Better process efficiency with a weight reduction of 39 %
and a moisture reduction of 33 % has been achieved in 15 days of reaction, at a
specific air flow rate of 0.460 m3/kg.day. Also bulk density increase of 24 % and
volume reduction of 43 % has been achieved in the same duration. Peak temperature
of 59.9°C has been developed inside the reactor matrix and the self heating process
was prominent along the time axis in this phase. The major achievement in this phase
is that the process efficiency obtained in shorter duration period of 15 days
Effect of Specific Air Flow Rate and Increased Reactor Matrix Height on
Biodrying Process – Phase 3
The increased reactor matrix height and a lower specific air flow rate of
0.350 m3/kg.day has resulted in increased self heating temperature with a peak value
of 65.5°C inside the reactor matrix. In this phase, weight reduction of 35 %, moisture
reduction of 30 %, bulk density increase of 21 % and volume reduction of 39 % has
been achieved in 15 days of biodrying reaction. The moisture reduction has not
increased, though high temperature heating occurred, which is mainly due to the
formation of localized zones of biodegradation inside the reactor matrix.

207
Combined Effect of Substrate Packing and Rector Matrix Height on the
Biodrying Process –Phase 4
Weight reduction of 20.4 % and moisture reduction of 17 % has been achieved in 11
days of biodrying reaction at a specific air flow rate of 0.345 m3/kg.day in the fourth
phase of study. The air scarcity in biodrying reactor has lead to biodegradation
reaction more than biodrying reaction. Therefore, the volume has been reduced to
43.5% and the bulk density has been increased to 46.3 % in 11 days of biodrying
reaction which is more than the previous studies. The peak value of self heating
temperature has reduced to 58.1 °C, which is lesser than that in the previous study.
The loosely packed reactor feed has not reduced the heterogeneity of the product and
rather it resulted in air channelisation and short circuiting.
Effect of Increase in Air flow Rate on Biodrying Process- Phase 5
In the fifth phase weight reduction of 41 %, moisture reduction of 39 %, volume
reduction of 38 % and bulk density increase of 12 % has been achieved after 11 days
of operation. The moisture reduction has been increased by 2.3 times that of fourth
phase, when the air flow rate was doubled under the selected experimental conditions
This study was most successful in terms of biodrying process efficiency and
uniformity of the biodried product
Effect of Down Flow Mode of Aeration on Biodrying Process- Phase 6
The sixth phase with down flow mode of aeration at a high rate of 1.45 m3/kg.day
was effective with weight reduction of 42.39 %, moisture reduction of 41.5 % and
volume reduction of 34.57 % in 12 days of reaction. The moisture distribution was

208
highly heterogeneous inside the reactor matrix, which is pointing out non-
homogeneous biodrying reaction inside the reactor matrix. The higher rate of specific
air flow has cooled down the reactor matrix and hence the self heating temperature
was lesser with a peak value of 47.7 ºC. The bulk density increase was 3.41 % which
is very less while compared to other phases of experiments. This point out that air
drying has also occurred along with the biodrying in the sixth phase of study.
Potential of High Calorific Value of Biodried MSW for Energy Production
The calorific value of the biodried municipal solid waste has been increased from
10.06 MJ/kg to 28.35 MJ/kg in the fifth phase of study. This is an increase of 2.8
times the calorific value of raw MSW which is beneficial for energy producing
applications. The energy enriched biodried material can be easily transported, stored,
sorted and can be used as fuel in waste to energy plants. The biodried municipal solid
waste is the suitable renewable fuel for incineration plants with energy recovery in
the form of heat and electricity.
This research findings has established that biodrying can serve as an innovative
technology in the field of treatment of municipal solid waste which is a major
challenge to environmental engineers.

209
7.3 LIMITATIONS OF THE STUDY
The major limitation of the study was the heterogeneous nature of biodried output.
The predominance of biodegradation over the biodrying in some localized zones of
reactor has caused non homogeneous biodried output. The moisture distribution along
the reactor matrix was not uniform mainly due to temperature gradient formation
observed in biodrying process. The temperature rise was not uniform in horizontal as
well as in vertical direction along the reactor matrix due to the static reactor used for
biodrying process. Also the loosely packed reactor has resulted in air channelisation
and short circuiting.
7.4 SCOPE FOR FURTHER STUDIES
Feasibility Study for Further Process Improvement of the Biodrying Reactor
Temperature gradation has been observed inside the reactor matrix, which requires
further studies to get homogeneous output and uniform self heating inside the
biodrying reactor matrix. The provision of mixing devices to achieve uniform mixing
inside the reactor for better biodrying process efficiency has to be studied. The
mixing can also be carried out in rotary type reactors, which needs further studies.
Also the effect of mode of aeration on the biodrying process has to be studied in
detail to delineate further process variations.

210
The Feasibility Studies for the End Use Application of Biodried Output
Suitability of Biodried MSW as a Renewable Energy Source
The use of biodried substrate as a raw material for incinerators with heat recovery has
to be studied. The potential of biodried material for use as a biofuel in gasification
plants for energy production needs further investigations. The renewable energy of
the biodried material for production of refuse derived fuel has to be studied which can
replace or reduce the use of fossil fuel consumption in various industries like cement
industry, brick industry etc.
Utilization of Biodried MSW for Production of Sustainable Construction
Materials
The potential use of biodried MSW as a raw material, filler, and additive in
developing construction material like bricks, hollow bricks, solid bricks, pavement
blocks and tiles has to be studied.

211
REFERENCES
1. Adani, F., Baido, D., Calaterra, E. and Genevini, P. (2002). The influence
of biomass temperature on biostabilization-biodrying of municipal solid waste.
Bioresource Technology 83, 173-179.
2. Adani, F., Tambone, F. and Gotti, A. (2004). Biostabilization of
municipal solid waste. Waste Management 24, 775-783.
3. American Society of Mechanaical Engineers (2008). Waste-to-Energy: A
Renewable Energy Source from Municipal Solid Waste; White Paper
Submitted to Congreaa; New York, NY.
4. Appel, H,R., Fu, Y,C., Friedman, S, P., Yavorsky, M. and Wender, I. (1971). Converting organic wastes to oil, US Bureau of Mines Report of
Investigation, No. 7560.
5. Archer, E., Baddeley, A., Klein, A., Schwager, J. and Whiting, K., (2005). Mechanical-Biological Treatment: A Guide for Decision Makers”.CD-
ROM,V1, March 2005, Juniper Consultancy Services U.K.
6. Arena, U. (2012). Process and technological aspects of municipal solid
waste gasification: a review, Waste Management, 32, 625–639.
7. Asnani P.U. (2006). Solid Waste Management. Indian Infrastructure
Report 2006. Oxford 708 university press, New Delhi, India.
8. ASTM D 3173-87 (1996). Standards test method for moisture in the
analysis of sample of coal and coke, in gaseous fuels; coke. Section 5,
Annual book of ASTM standards.
9. ASTM D 3175- 89 (2011). Standard Test Method for Volatile Matter in the
Analysis Sample of Coal and Coke.
10. Ayari, F., Hamdi, H., Jedidi, N., Gharbi, R. and Kossai, R. (2010). Heavy
metal distribution in soil and plant in municipal solid waste compost amended
plots. Int. J. Environ. Sci. Tech., 7 (3), 465-472, Summer 2010 ISSN: 1735-
1472.
11. Babcock and Wilcox (1992). Steam Its Generation and Use, 40th edition, The
Babcock and Wilcox Company, USA.

212
12. Bach, P.D., Nalasaki, K., Shoda, M. and Kubota, H. (1987). Thermal
balance in composting operations. Journal of Fermentation Technology, 65
(2), 199-209.
13. Bailey, J.E. and Ollis, D, F. Biochemical Engineering Fundamentals.
McGraw-Hill International Editions Inc., Singapore, 1986.
14. Barducci, G. (1990). Gasification of wastes and refuse-derived fuel:
leading edge technology for energy and the environment, Proceedings of
Energy from Biomass Contractors Meeting, Florence, Italy, 20–22
November 1990, 1990, pp. 347–371.
15. Barducci, G. (1992). The RDF gasifier of Florentine area (Gréve in
Chianti Italy), The First Italian–Brazilian Symposium on Sanitary and
Environmental Engineering.
16. Barducci, P., and Neri, G. (1997). An IGCC plant in Italy for power
generation from biomass, Bioelettrica Internal Report.
17. Bartha, B., and Brummack, J. (2007). Investigations on the separability
of dynamically dried municipal solid waste. In: Kuehle-Weidemeir, M.
(Ed.), International Symposium MBT 2007, Hanover, Germany 22–24 May
2007, pp. 350–360.
18. Bartha, B.K. and Brummack, J. (2006). Development of a control strategy
for biotechnological processes in waste treatment. In: Kühle-Weidemeier,
M. (Hrsg.): Waste Research Days,. Göttingen: Cuvillier,
19. Bartha, B.K., Brummack, J. and Kloden, W (2002). Control of a reactor
for the treatment of waste with biogenic components. Final report on the
DBU project 14736, Dresden University of Technology.
20. Bartha, B.K. (2008). “Development of a Control Strategy for the
Treatment of Biological Waste in a Dynamic Reactor”, Ph.D.Thesis,
Technische Universitat Dresden, Dresden, p. 265.
21. Baykara, S,Z., and Bilgen, E. (1981). A feasibility study on solar
gasification of Albertan coal, Alternative Energy Sources IV, 6, Ann Arbor
Sci, New York.
22. Belgiorno, V., De, G,F., Della, R,C., and Napoli, R,M,A. (2003). Energy
from gasification of solid wastes, Waste Management 23, 1–15.
23. Beukering, P.V., Sekher, M., Gerlagh, R. and Kumar, V. (1999).
Analyzing urban solid waste in developing countries: a perspective on

213
Bangalore, India, Working Paper No. 24. Collaborative Research in the
Economics of Environment and Development (CREED), London
24. Bhide, A.D. and Shekdar, A.V. (1998). Solid waste management in Indian
urban centers. International Solid Waste Association Times (ISWA) (1),
26–28.
25. Bilgin, M. and Tulun, S. (2015). Biodrying for municipal solid waste:
Volume and weight reduction. Environmental Technology (United
Kingdom), 36(13), 1691-1697.
26. Braber, K. (1995). Anaerobic digestion of municipal solid waste: a
modern waste disposal option on the verge of breakthrough. Biomass
Bioenerg. 9 (1–5), 365–376.
27. Bramryd, T. and Binder, M. (2001). Environmental impacts of landfill
bioreactor cells in comparison to former landfill techniques. Water, Air,
and Soil Pollution 129, 289–303.
28. Brorson, T. and Larson, G. (1999). Environmental Management — How
to Implement an Environmental Management System within a Company or
Other Organization, EMSAB, Stockholm.
29. Bureau, C. J., Disdier, C.A., Gauroy, C. and Treguer, D. (2010). A
quantitative assess of the determinants of the net energy value of biofuels.
Energy Policy,38,2282-2290.
30. Cai, L., Gao, D., Chen, T., Liu, H., Zheng, G. and Yang, Q. (2012).
Moisture variation associated with water input and evaporation during
sewage sludge biodrying. Bioresource Technology, 117, 13-19.
31. Calcaterra, E., Baldi, M. and Adani, F. (2000). An innovative technology
for municipal solid waste energy recovery. In: CIPA (Ed.), CIPA- Centro di
Ingegneria per la Protezione dell’ Ambiente. CIPA, Milano, Italy, pp.123-
135.
32. Yunus, A, Çengel., and Michael, A. Boles. A. Thermodynamics: An
Engineering Approach. McGraw-Hill Education. ISBN 0-07-121688-X,
2015.
33. Center of Excellence (CoE) on Solid Waste & Waste Water Management, Strategy & Framework for MSW Management. Centre
for Environment and Development, Thiruvananthapuram, November2010.
(Availableathttp://www.cedindia.org/wp-content/uploads/2010/11/strategy-
1.pdf. accessed 10.10.11).

214
34. Central Pollution Control Board (CPCB) (1999). ‘Status of solid waste
generation, collection, treatment and disposal in metro cities’. Central
Pollution Control Board, Delhi.
35. Central Pollution Control Board (CPCB) (2004). “Management of
Municipal Solid Waste”-Ministry of Environment and Forest, New Delhi,
India.
36. Central Public Health and Environmental Engineering Organisation (CPHEEO) (2000). “Manual on Municipal Solid Waste Management”,
Central Public Health and Environmental Engineering Organisation,
Ministry of Urban Development, New Delhi.
37. Chattopadhyay, S., Dutta, A., and Ray, S. (2007). Existing municipal
solid waste management of Kolkata-Deficiencies and solutions. Journal of
IAEM, 34 (3), 161-167.
38. Cheng , H., Zhang, Y., Meng, A. and Li, Q. (2007). Municipal solid
waste fueled power generation in China: A case study of waste-to-energy in
Changchun city. Environ. Sci, Technol. 41, 7509-7515.
39. Cheng, H. and Hu, Y. (2010). Municipal solid waste (MSW) as a
renewable source of energy: Current and future practices in China.
Bioresource Technology, 101, 3816-3824.
40. Cheng, H., Hu,Y. and Zhao, J. (2009). Meeting China’s water shortage
crisis: current practices and challenges. Environ.Sci. Technol. 43, 240-244.
41. Cheng, H., Zhang, Y., Meng, A. and Li, Q. (2007). Municipal solid waste
fueled power generation in China: A case study of waste-to- energy in
Changchun city. Environ. Sci. Technol. 41, 7509-7515.
42. Cherubini, F., Bargigli, S. and Ulgiati, S. (2009). Life cycle assessment
(LCA) of waste management strategies: landfilling, sorting plant and
incineration, Energy 34, 2116–2123.
43. Choi , H.L., Richard, T.L. and Ahn, H.K. (2001). Composting high
moisture materials: biodrying poultry manure in a sequentially fed reactor.
Compost Sci. Util. 9, 303-311.
44. Cimpan, C., Maul, A., Jansen, M., Pretz, T. and Wenzel, H. (2015).
Central sorting and recovery of MSW recyclable materials: A review of
technological state-of-the art, cases, practice and implications for materials
recycling. Journal of Environmental Management, 156, 181-199.

215
45. Cocarta, D,M., Rada, E,C., Ragazzi, M,A., Badea, T. and Apostol, A. (2009). Contribution for a correct vision of health impact from municipal
solid waste treatments, Environmental Technology 30 (2009) 963–968.
46. Daniel, A,L. and Dilip, R, A. (1990). Relative contributions of greenhouse
gas emissions to global warming. Nature, 344, 529-531.
47. Daskalopoulos, E., Badr, O. and Probert, S.D., 1997.“Economic and
Environmental Evaluations of WasteTreatment and Disposal Technologies
for Municipal Solid Waste”.Applied Energy, Vol. 58, No. 4, pp. 209-255.
48. Debicka, M., and Zygadlo, M., (2017). Full-scale biodrying process of
municipal solid waste, E3S Web of Conferences 17, 00018.
49. Defra. 2011c. Recycling of Catering and food waste – Evidence Project
Final Report. London: Defra.
50. Demirbas A. (2011). Waste management, waste resource facilities and
waste conversion processes. Energy Convers Manage 52(2):1280–7. http://
dx.doi.org/10.1016/j.enconman.2010.09.025.
51. Denison, R, A. (1996). Environmental lifee-cycle comparison of recycling,
landfilling and incineration: a review of recent studies. Annu. Rev. Energ.
Environ,21, 191-237.
52. Diaz, L,F., Savage, G,M., Eggerth, L,L. and Golueke, C, G. (1996).
Solid Waste Management for Economically Developing Countries, ISWA,
Copenhagen.
53. DiBlasi, C. (2000). Dynamic behaviour of stratified downdraft gasifier,
Chemical Engineering Science 55, 2931–2944.
54. Di Maria, F., Benavoli, M. and Zoppitelli, M. (2008). Thermodynamic
analysis of the energy recovery from the aerobic bioconversion of solid
urban waste organic fraction. Waste Management, 28, 805-812.
55. Directive, 2007/76/EC of the European Parliament and of the Council of 4
December 2000 on the incineration of waste.
56. Domingo, J,L. and Nadal, M. (2009). Domestic waste composting
facilities: A Review of human health risks. Environment International, 35,
382-389.

216
57. Dong-Qing, Z.,Pin-Jing, He. and Li-Ming, Shao (2008). “Sorting
Efficiency and Combustion Properties of Municipal Solid Waste during
Biodrying”, Waste Management’,Vol.29, Issue 11, Pp.2816-2823.
58. Earle, J.F.K., Chynoweth, D.P. and Nordstedt, R.A. (1995). Anaerobic
bioconversion: biogasification of municipal solid waste. Florida
Cooperative Extension Service, Institute of Food and Agricultural
Sciences, University of Florida. Bulletin 267.
59. Edelmann, W., Baier, U. and Engeli, H. (2005). Environmental aspects of
the anaerobic digestion of the organic fraction of municipal solid wastes.
Water Sci. Technol. 52 (1–2), 203–208.
60. Edelmann, W. and Engeli, H. (1993). Combined digestion and
composting of organic industrial and municipal wastes in Switzerland.
Water Sci. Technol. 27 (2), 169– 182.
61. Edelmann, W., Schleiss, K. and Joss, A. (2000). Ecological, energetic and
economic comparison of anaerobic digestion with different competing
technologies to treat biogenic wastes. Water Sci. Technol. 41 (3), 263–273.
62. Ekinci, K., Keener, H.M. and Akbolat, D. (2006). Effects of feedstock,
airflow rate, and recirculation ratio on performance of composting systems
with air recirculation. Bioresour. Technol.97, 922-932.
63. Elango, D., Pulikesi, M., Baskaralingam, P., Ramamurthi, V. and
Sivanesan, S. (2007). Production of biogas from municipal solid waste
with domestic sewage, Journal of Hazardous Materials 141, 301–304.
64. Energy Information Administration (EIA) (2007). Methodology for
Allocating Municipal Solid Waste to Biogenic and Non-Biogenic Energy;
Office of Coal, Nuclear, Electric and Alternate Fuels, U.S. Department of
Energy: Washington, Dc.
65. Eriksen, G., Coale, F. and Bollero, G. (1999). Soil nitrogen dynamics and
maize production in municipal solid waste amended soil. Agron. J. 91,
1009–1016.
66. Esmaeili, M, B., Karbassi, A, R., Baghvand, A., Saeedi, M. and
Pejman, A, H. (2010). Potential of natural bed soil in adsorption of heavy
metals in industrial waste landfill. Int.J. Environ. Sci. Tech., 7 (3), 545-552,
Summer 2010 ISSN: 1735-1472.
67. Falkovich, G. Fluid Mechanics, a short course for physicists. Cambridge
University Press, 2011, ISBN 978-1-107-00575-4.

217
68. Finnveden G, Johansson J, Lind P and Moberg A (2005). Life cycle
assessment of energy from solid waste – part 1: general methodology and
results. J Clean Prod, 13 (3):213–29.
69. Finstein, M,S., Miller, F,C. and Strom, P.F. (1986). Waste treatment
composting as a controlled system. Biotechnology, 8, 363-398.
70. Flamme, S. (2006). “The Biogenic Content in Substitute Fuels. Mineral
Process, 47, 40-45.
71. Fobil, J, N., Carboo, D. and Armah, N, A. (2005). Evaluation of
municipal solid waste (MSW) for utilisation in energy production in
developing countries. Int. J. Environmental Technology and Management,
5, 76- 87.
72. Foo, T.S. (1997). Recycling of domestic waste: early experiences in
Singapore. Habitat International 21, 277-289.
73. Di Maria., F., Postrioti, L., Micale. C., Sordi, A. and Marconi, M.
(2014). Energy recovery from low temperature heat produced during
aerobic biological treatment. Energy Procedia, 45, 81-90.
74. Frei, K.M., Cameron, D., Jasmin, S. and Stuart, P.R. (2006). Novel
sludge drying process for cost-effective on-site sludge management. Pulp
and Paper Canada, 107 (4), 47-53.
75. Frei, K.M., Stuart, P.R. and Cameron, D. (2004b). “Novel drying
process using forced aeration through a porous biomass matrix”. Dry.
Technol. 22, 1191–1215.
76. Fricke, K., Santen, H. and Wallmann, R. (2005). Comparison of selected
aerobic and anaerobic procedures for MSW treatment. Waste Manage. 25,
799–810.
77. Garcia, C., Hernandez, T. and Costa, F. (1991). Study on water extract of
sewage sludge composts, Soil Sci. Plant Nutr., 37 (3), 399-408.
78. Garg, A., Smith, R., Hill, D., Longhurst, P,J., Pollard, S,J,T. and
Simms, J. (2009). An integrated appraisal of energy recovery options in
the United Kingdom using solid recovered fuel derived from municipal
solid waste. Waste Manage. 29, 2289-2297.
79. Genon, G. and Brizio, E. (2008). Perspectives and limits for cement kilns
as a destination for RDF. Waste management, 28, 2375-8235.

218
80. Ginkal, Van, J.T., Raats, C, P, A., Haneghem and Van, I, A. (1999).
Bulk density and porosity distributions in a compost pile. Netherlands
Journal of Agricultural science, 47, 105-121.
81. Gottas, Harold, B. (1956). Composting- Sanitary Disposal and
Reclamation of Organic Wastes .World Health Organization,Monogrpah
Series Number 31, Geneva, p.81.
82. Guardia, A.D., Petiot, C. and Rogeau, D. (2008). Influence of aeration
rate and biodegradability fractionation on composting kinetics. Waste
Manage. 28, 73-84.
83. Handbook of fundamentals (1967). American Society of Heating,
Refrigerating and Air-conditioning Engineers, New York.
84. Hansen, T., Bhander, G., Christensen, T., Bruun, S. and Jensen, L. (2006).
Life cycle of environmental impacts of application of processed organic
municipal solid waste on agricultural land (EASEWASTE). Waste Manag.
Res. 124, 153–166.
85. Hargreaves, J.C. , Adl, M.S., and Warman, P.R . (2008). A review of the
use of composted municipal solid waste in agriculture, Agric. Ecosyst.
Environ. 123,1–14.
86. Hartmann, H. and Ahring, B.K. (2006). Strategies for the anaerobic
digestion of the organic fraction of municipal solid waste: an overview.
Water Sci. Technol. 53 (8), 7–22.
87. Haug, R, T. (1993). The Practical Handbook of Composting Engineering,
Chap.2, 10, Lewis Pub.
88. He, X., Traina, S. and Logan, T. (1992). Chemical properties of municipal
solid waste compost. J. Environ. Qual. 21, 318–329.
89. Herhof GmbH (2008). Reference Plants. Available at: http://www.herhof.
com/en/business-divisions/stabilat/reference-plants.html.
90. High Powered Expert Committee (2011). Report on Indian Urban
Infrastructure and Services, Ministry of Urban Development.Government
of India.
91. Hoffmann, B. (2005). New possibilities and limitations for the processing
of waste from human settlements. Neue moglichkeiten der aufberei tung
von siedlungsabfallen und ihre Grenzen. Aufbereitungs- Tech./ Mineral
Process. 46, 8-19.

219
92. Hoornweg, D. and Bhada-Tata, P. “What a waste: A global review of
solid waste management”.The World Bank, Washington, DC, 2012.
https://openknowledge.worldbank.org/handle/10986/17388.
93. Hsu, J, H. and Lo, S, L., (1999). Recycling of separated pig manure:
characterisation of maturity and chemical fractionation of elements during
composting. Water Sci. Technol., 40, 121-127.
94. Huet, J., Druilhe, C., Tremier, A., Benoist, J, C. and Debenest, G.
(2012). The impact of compaction, moisture content, particle size and type
of bulking agent on initial physical properties of sludge-bulking agent
mixtures before composting. Bioresource Technology, vol.114,pp.428-436.
95. International Energy Agency IEA (2003). Municipal Solid Waste and its
Role in Sustainability: A position paper. In: Bioenergy (ed.)
www.ieabioenergy.com/media/ 40_IEAPositionPaper MSW.pdf
96. Iglesias-Jimenez, E. and Alvarez, C. (1993). Apparent availability of
nitrogen in composted municipal refuse. Biol. Fert. Soils 16, 313–318.
97. Incropera, Frank., P. DeWitt and David P. Fundamentals of Heat and
Mass Transfer (3rd ed.). John Wiley & Sons, 1990. p. 28. ISBN 0-471-
51729-1.
98. International Organisation of Supreme audit institutions (INTOSAI) (2002). Towards auditing waste management. Report of INTOSAI
Working Group on Environmental Auditing, INTOSAI, Norway
99. Iqbal, M. K., Shafiq, T. and Ahmed, K. (2010). “Characterisation of
bulking agents and its effects on physical properties of compost.
Bioresource. Technol. 101, 1913-1919.
100. IS 5194 (2002). Indian standard method for determination of Nitrogen -
Kjeldahl method.
101. Jakobsen, S. (1995). Aerobic decomposition of organic wastes 2. Value of
compost as fertilizer. Resour. Conserv. Recy. 13, 57–71.
102. James I. Chang, Y. and J.Chen (2010). “Effects of bulking agents on
food waste composting”. Bioresource Technology, vol.101, pp.5917-5924.
103. Jewell, W.J., Dondero, N.C., van Soest, P.J., Cummings, R.T., Vegara, W.W. and Linkenheil, R. (1984). “High Temperature Stabilization and
Moisture Removal from Animal Wastes for By-Product Recovery”, Final

220
Report for the Cooperative State Research Service, SEA/CR 616-15-168,
USDA, Washington, DC, USA, p. 169.
104. JNMSWF (1991). Design Guide for the Facility of Solid Waste Disposal,
Tokyo. Japan National Municipal Solid Waste Foundation.
105. Johnke, B. Current situation of waste incineration and energy recovery in
Germany in: V.I. Grover, V.K. Grover, W. Hogland (Eds.), Recovering
Energy from Waste: Various Aspects, Science Publishers, 2002, Plymouth,
UK, pp. 195–2000.
106. Kara, M., Gunay, E., Tabak, Y. and Yildiz, S. (2009). Perspectives for
pilot scale study of RDF in Istanbul, Turkey. Waste Management, 29,
2976-2982.
107. Kara, M. (2012). Environmental and economic advantages associated
with the use of RDF in cement kilns. Resources, Conservation and
Recycling, 68, 21-28.
108. Kathiravale, S., Abu., M. P., Yunus, M. M. and Abd-Kadir, K.Z. (2003). Energy potential from municipal solid waste in Malaysia.
Renewable Energy, 29, 559-567.
109. Katyal, S. (2007). Effect of carbonization temperature on combustion
reactivity of bagasse char, Energy Sources Part A, 29, 1477–1485.
110. Keener. H. M., Elwell. D, L., Das, K. and Hansen, R, C. (1998).
Specifying design/operating of composting system using pilot scale data.
Applied Engineering in Agriculture, 13, 767-772.
111. Knoblauch, A. (2001). Investigation of industrial composting processes
with focus on sanitation of bio-waste. Dissertation, Dresden University of
Technology.
112. Korobitsyn, M, A., Jellema, P. and Hirs, G,G. (1999). Possibilities for
gas turbine and waste incinerator integration, Energy 24, 783–793.
113. Krogmann, U. Composting. Bonn: Economica, 1994.
114. Kroll, K. Dryer and drying process. Berlin, Heidelberg, Springer, 1978.

221
115. Kerala State Urban Development Programme (KSUDP) (2006). Solid
waste management of Kollam, Kochi, Thrissur and Kozhikkode
Corporations of Kerala. Dft. Detailed Project Report. Local Self
Government Department, Government of Kerala & Asian Development
Bank (Personal communication)
116. Lardinios, I. and Van de Klundert, A. (1997). ‘Integrated sustainable
waste management’, Paper for the Programme Policy Meeting Urban
Waste Expertise Programme, April, pp.1–6.
117. Lastella G, Testa C, Cornacchia G, Notornicola M, Voltasio F and Sharma V, K. (2002) Anaerobic digestion of semi-solid organic waste:
biogas production and its purification. Energy Convers Manage, 43(1):63–75.
118. Liliana, K., Zawdzka, A. and Ledakowicz, S. (2010). “Autothermal
Drying of Sewage Sludge and Organic Fraction of Municipal Solid Waste
in Batch Bioreactor”,A thesis work.
119. Lin, C, H. Model to evaluate lower heat value of solid waste in Taiwan.
Tung Nan Institute of Technology, Taipei, Taiwan, ROC, 2000.
120. Ling Zhao, Wei-Mei Gu, Pin-Jing He and Li-Ming Shao (2010). Effect
of air-flow rate and turning frequency on bio-drying of dewatered sludge.
Water Research, 44, 6144-6152.
121. Ling Zhao, Wei-Mei Gu, Pin-Jing He and Li-Ming Shao (2011).
“Biodegradation potential of bulking agents used in sludge bio-drying and
their contribution to bio-generated heat”. Water Research vol.45, pp.2322-
2330.
122. Lopes, W.S., Leite, V.D. and Prasad, S. (2004). Influence of inoculum on
performance of anaerobic reactors for treating municipal solid waste.
Bioresour. Technol. 94,261-266.
123. Lu, Cai, Ding Gao., Tong-Bin Chen., Hong-Tao Liu., Guo-Di Zheng. and Qi-Wei, Yang. (2012). Moisture variation associated with water input
and evaporation during sewage sludge bio-drying. Bioresource
Technology, 11, 13-19.
124. Lu, Y.J., Wu, X. W. and Guo, J.F. (2009). Characteristics of municipal
solid waste and sewage sludge co-composting. Waste Manage.
29,1152-1157.

222
125. Magrinho, A. and Semiao, V. (2008). On the effect of MSW moisture content
on meeting target recycling rates. Waste Management, 28 (2), 310-317.
126. Mason, I.G. (2006). Mathematical modelling of the composting process: A
review. Waste Management 26, 3-21.
127. Meissl, K. and Smidt, E. (2007). High quality composts from anaerobic
digestion residues. Biocycle 48 (3), 55–58.
128. Ministry of Environment and Forests (MoEF) (2000). The Gazatte of
India. Municipal Solid Waste (Management and Handling) Rules, New
Delhi, India.
129. Mohaibes, M. and Heinonen-Tanski, H. (2004). Aerobic thermophilic
treatment of farm slurry and food wastes. Bioresour. Technol. 95, 245–254.
130. Mohajer,A., Tremier,A., Barrington,S., Martinez,J., Teglia, C. and Carone, M. (2009). “Microbial oxygen uptake in sludge as influenced by
compost physical parameters. Waste Management .vol.29, 2257- 2264.
131. Mohammed, M., Ozbay, I., Karademir, A., Isleyen, M., (2017). Pre-
treatment and utilization of food waste as energy source by bio-drying
process. Energy Procedia, 128, 100-107.
132. Mohan, D., Pittman, J, C, U and Steele, P, H. (2006). Pyrolysis of
wood/biomass for bio-oil: a critical review, Energy & Fuels 20 (2006)
848–889.
133. Mohn, J., Szidat, S., Fellner, J., Rechberger, H., Quartier, R., Buchmann, B. and Emmenegger, L. (2008). Determination of biogenic
and fossil CO2 emitted by waste incineration based on 14
CO2 and mass
balances. Bioresour. Technol., 99, 6471–6479.
134. Montejo, C. Costa, P. Ramos, M. and del Carmen Marquez. Analysis
and comparison of municipal solid waste and reject fraction as fuels for
incineration plants. Applied Thermal Engineering, 2011, doi:
10.1016/j.applthermaleng.2011.03.041.
135. Morris, M. Electricity production from solid waste fuels using advanced
gasification technology, Swana's Waste con. 1998/ISWA World Congress,
North Carolina, USA.
136. Mueller, A.C. Heat exchangers in Handbook of Heat Transfer,W.M.
Rohsenow and J.P.Hartnett, eds., McGraw-Hill, New York, 1973,Chapter 18.

223
137. Murphy, J, D. and McKeogh, E. (2006). The benefits of integrated
treatment of wastes for the production of energy. Energy 31, 294–310.
138. Navaee- Ardeh, S., Bertrand, F. and Stuart, P.R. (2010). Key variables
analysis of a novel continuous biodrying process for drying mixed sludge.
Bioresour. Technol.101, 3379-3387.
139. Navaee-Ardeh, S., Bertrand, F. and Stuart, P. (2006). Emerging
biodrying technology for the drying of pulp and paper mixed sludges.
Drying Technology, 24, 863-878.
140. Negoi, R, M., Ragazzi, M., Apostol, T., Rada, E, C. and Marculescu, C. (2009). Biodrying of Romanian municipal solid waste: An analysis of its
viability. U.P.B. Sci.Bull.,Series C, 71(4), 2009.
141. Neklyudov, A.D., Fedotov, G.N. and Ivankin, A.N. (2006). Aerobic
processing of organic waste into composts. Appl. Biochem. Microbiol. 42
(4), 341–353.
142. Nellist M.E. and Brook, R.C. “Drying Wheat by Continuous Ventilation
with Unheated Air in a Favourable Location”. AFRC Institute of
Engineering Research, Silsole, 1987, UK.p.18.
143. Nellist, M.E., Lamond, W.J., Pringle, R.T. and Burfort, D. “Storage and
Drying of Comminuted Forest Residues”.. AFRC Sisloe Research Institute,
Silsoe, 1993, UK. p.82.
144. Nie, Y. (2008). Development and prospects of municipal solid
waste(MSW) incineration in China, Front. Environ. Sci.Eng. China 2, 1-7.
145. Ofori-Boateng, C., Lee, K.T. and Mensah, M. (2013). The prospects of
electricity generation from municipal solid waste (MSW) in Ghana: A better
waste management option. Fuel processing Technology, 110, 94-102.
146. Ogawa, H. (2000). Sustainable solid waste management in developing
countries. In: 7th ISWA International Congress and Exhibition. World
helath Organization. Kuala Lumpur, Malayisa. Online: http://www.soc.
titech.ac.jp/uem/waste/swmfogawal.htm (29 July).
147. Otoma, S., Mori, Y., Terazono, A., Aso, T. and Sameshima, R. (1997).
Estimation of energy recovery and reduction of CO2 emissions in municipal
solid power generation, Resources, Conservation and Recycling, 20, 95–117.
148. Otten, L. (2001). Wet–dry composting of organic municipal solid waste:
current status in Canada. Can. J. Civil Eng. 28 (Suppl. 1), 124–130.

224
149. Paar, S. (2000). The Dombelüftungsverfahren. Dissertation, Dresden
University of Technology.
150. Pappu, A., Saxena, M. and Asokar, S.R. (2007). Solid Waste Generation
inIndia and Their Recycling Potential in Building Materials. Journal of
Building and Environment 42 (6), 2311–2324.
151. Patumsawad, S. and Cliffe, K. R. (2002). Experimental study on fluidised
bed combustion of high moisture municipal solid waste. Energy Convers
Manage, 43(17):2329–40.
152. Peuker, U.A. and Stahl, W. (2002) Through flow drying of preheated
heaps Drying phase during mechanical-thermal dehumidification process.
Chemie-Ingenieur-Technik, 74, No. 3, pp. 350-355.
153. Pimsler, R. (2004). Building recycling: Sustainable reuse of existing
structures, New Life Journal, April-May2004.
154. Pinjing, H., Jiafu, T., Dongqing, Z., Yang, Z. and Liming, S. (2010).
Release of Volatile Organic Compounds during Bio-drying of Municipal
Solid Waste, Journal of Environmental Sciences, vol. 22(5),pp.752–759.
155. Poggi-Varaldo, H.M., Gómez-Cisneros, E., Fernández-Villagómez, G., Esparza-García, F. and Rinderknecht-Seijas, N. (1999). Aerobic post-
composting of digestates from anaerobic digestion of paper mill sludge and
the organic fraction of municipal wastes. In: Mata-Alvarez, J., Tilche, A.,
Cecchi, F. (Eds.), Proceedings of the Second International Symposium on
Anaerobic Digestion of Solid Wastes, 15th– 18th June, vol. 1. Barcelona,
Spain, pp. 258–265.
156. Prescott, L,M., Harley, J,P. and Klein, D,A. Microbiology, second ed.,
W.C. Communications Inc., USA, 1993.
157. Rada, E, C., Franzinelli, A., Taiss, M., Ragazzi, M., Panaitescu, V. and Apostol, T. (2007a). Lower heating value dynamics during municipal solid
waste bio-drying. Environmental Technology, 28, 463-469.
158. Rada, E, C., Ragazzi, M., Panaitescu, V. and Apostol, T. (2005). An
example of collaboration for a technology transfer: municipal solid waste
biodrying. In: Maragherita di Pula, S. (Ed.), Proceedings Sardinia 2005.
Tenth International Waste Management and Landfill Symposium. Cagliari,
Itly, 3-7 October, Paper 044.

225
159. Rada, E, C., Venturi, M., Ragazzi, M., Apostol, T., Stan, C. and Marculescu, C. (2010). Bio-drying role in changeable scenarios of
Romanian MSW management. Waste Biomass Valor’, 01, 271-279.
160. Rada, E,C., Ragazzi, M. and Badea, A. (2012). MSW bio-drying:
design criteria from a 10 years research, UPB Scientific Bulletin, Series D:
Mechanical Engineering, 74, 209–216.
161. Ragazzi, M. and Rada, E, C. (2012). Multi-step approach for comparing
the local air pollution contributions of conventional and innovative MSW
thermo-chemical treatments. Chemosphere 89, 694–701.
162. Ramachandra, T, V. and Bachamanda, S. (2007). Environmental audit of
Municipal Solid Waste Management. Int. J. Environmental Technology and
Management, Vol. 7, Nos.3/4,369-389.
163. Ramachandra, T.V. Management of Municipal Solid Waste, Capital
Publishing Company, New Delhi, 2006.
164. Ramachandra, T.V. and Varghese, S.K. (2003). Exploring possibilities of
achieving sustainability in solid waste management, Indian Journal of
Environmental Health, Vol. 45, No. 4, pp.255–264.
165. Ravindranath, N, H. (1993). Biomass gasification: environmentally
sound technology for decentralized power generation, a case study from
India, Biomass and Bioenergy 4, 49–60.
166. Richard, T.L., Hamelers, H, V, M., Veeken, A. and Silva, T. (2002).
Moisture Relationships in Composting Processes. Compost Science &
Utilization, Vol.10,(4), 286-302.
167. Roca-Pérez L, Martínez, C. and Marcilla, P. (2009). Composting rice
straw with sewage sludge and compost effects on the soil-plant system.
J.Chemosphere, 75(6):781-787.
168. Rogoff, M. (2013). ‘Sustainable materials management’: a new
international solid waste paradign. Waste Manage. Res. 31, 1187-1189.
169. Roy, G., Jasmine, S. and Stuart, P.R. (2006). Technical modeling of a
batch biodrying reactor for pulp and paper mill sludge. In: 17th
CHISA
International Congress of Chemical and Process Engineering, Prague,
Czech Republic.

226
170. Ruth, L, A. (1998). Energy from municipal solid waste: a comparison with
coal combustion technology, Progress in Energy and Combustion Science
24, 545–564.
171. Schlegel, H.G. General Microbiology. Stuttgart, New York: Thieme, 1992.
172. Shah, R.K. Heat Exchangers in Encyclopedia of Energy Technology and
the Environment, A.Bisionand S.G.Bootseds., Wiley, New York, 1994,
pp.1651-1670.
173. Shah, R.K. Classification of heat exchangers in Heat Exchangers:
Thermal-Hydraulic Fundamentals and Design, S.Kakac,A.E. Bergles,and
F.Mayinger,eds., Hemisphere Publishing, Wasington, Dc, 1981, pp.9-46.
174. Shah, R.K. Compact Heat exchanger Technology and applications in Heat
Exchanger Engineering ,Vol.2,Compact Heat Exchangers: Techniques for
Size Reduction, E.A. Foumeny and P.J. Heggs.eds., Ellis Horwood,
London, 1991a, pp.1-29.
175. Shah, R.K. Industrial heat exchangers- functions and types in Industrial
Heat Exchangers ,J.M. Buchlin, ed., Lecture Series No.1991-04,von
Karman Institute for Fluid Dynamics, Belgium, 1991b.
176. Shanks (2007). The intelligent Transfer Station. A Method for the
Treatment of Municipal Solid Waste. Shanks Sistema Eco-deco, UK p.6.
177. Shao, L,M., Xiao H., Yang, N., Fang, J,J., Lu, U, F. and Pin-Jing, H. (2012). Biodrying of municipal solid waste under different ventilation
modes: drying efficiency and aqueous pollution. Waste Management &
Research 30(12) 1272–1280
178. Shao, L-M.,Ma, Z-H.,Zhang, H., Zhang, D-Q. and He, P-J. (2010). Bio-
drying and size sorting of municipal solid waste with high water content for
improving energy recovery.,Waste Management, Volume 30,Pages 1165-
1170.
179. Sharholy., Mufeed, Kafeel, Ahmad., Gauhar, Mahmood and Trivedi, R.C. (2008). “Municipal solid waste management in Indian cities – A
review”. Waste Management 28, 459–467.
180. Sharma, S. and Shah, K. W. (2005). “Generation and Disposal of Solid
Waste in Hoshangabad”. In: Book of Proceedings of the Second
International Congress of Chemistry and Environment, Indore, India,
pp.749-751.

227
181. Shekdar, A.V. (1999). “Municipal Solid Waste Management –the Indian
Perspective, Journal of Indian Association for Environmental Management
26(2), 100-108.
182. Shekdar, A.V., Krishnaswamy, K.N., Tikekar, V.G. and Bhide, A.D. (1992). “Indian Urban Solid Waste Management Systems –Jaded Systems
in need of resource augmentation. Journal of Waste Management 12(4),
379-387.
183. Shen, Y., Ren, L., Li,G., Chen, T. and Guo, R. (2011). Influence of aeration
on CH4, N2O and NH3 emissions during aerobic composting of a chicken
manure and high C/N waste mixture. Waste Management, 31, 33-38.
184. Silusar, N. and Armisheva, G. (2013). Energy resources recovery on
municipal solid waste disposal. Sinks a Vital Element of Modern Waste
Management, 2nd
International Conference of Final sinks.16-18 may2013,
Finland.
185. Skourides, I., Theophilou, C., Loizides, M., Hood, P. and Smith, S.R. (2006). “Optimisation of advanced technology for production of consistent
auxiliary fuels from biodegradable municipal waste for industrial
purposes”. In: Waste 2006 –Sustainable Waste and Resource Management.
Stratford-upon-Avon, UK, 19–21September 2006, Paper 2B-14.40.
186. Slack, R.J., Gronow, J.R., and Voulvoulis, N. (2005). Household
hazardous waste in municipal landfills: contaminants in leachate - Review.
Science of the Total Environment, vol.337, pp.119 – 137.
187. Somsai , K., Tondee, T. and Kerdsuwan , S. (2016). Effect of air flow on
moisture removal of rotator biodrying reactors. Jurnal Teknologi (Sciences
and Engineering), 78, 5-6,57-63.
188. Somsai, K., Tondee, T., Kerdsuwan, S., (2017). Effect of Recirculation
on Moisture Removal Efficiency in Combined Hydrolytic- Aerobic Rotary
Bio-Drying Process. MATEC Web of conferences, 108,,02007..
189. Sozen, A., Gulseven, Z. and Arcaklioglu E. (2007). Forecasting based on
sectoral energy consumption of GHGS in turkey and mitigation policies.
Energy Policy 35(12), 6491-6505.
190. Staber, W., Flamme, S. and Fellner, J. (2008). Methods for determining
the biomass content of waste, Waste Manage. Res. 26, pp.78–87.

228
191. Sugni, M., Calcaterra, E. and Adani, F. (2005). Biostabilization –
biodrying of municipal solid waste by inverting air-flow. Bioresource
Technology, 96 (2005) 1331-1337.
192. Tambone, F., Scalgia, B., Scotti, S. and Aadani, F. (2011). “Effects of
biodrying process on municipal solid waste properties”. Bioresource
Technology 102 (2011) 7443-7450.
193. Tan, S.T., Lee, C.T., Hashim, H., Ho, W.S. and Lim, J.S. (2014).
Optimal process network for municipal solid waste management in
Iskandar Malaysia. J.CleanProd, 71:48–58.
194. Tan, S,T., Ho, W,S., Hashim, H., Lee, C,T., Taib, M, R. and Ho, C, S. (2015). Energy, economic and environmental (3E) analysis of waste-to-
energy (WTE) strategies for municipal solid waste (MSW) management in
Malaysia. Energy Conversion and Management, 102,111-120.
195. Tchnobanoglous, G., Theisen, H. and Vigil, S.A. Integrated solid waste
management: engineering principles and management issues. Nek York:
McGraw-Hill, 1993.
196. The Japan Institute of Energy. The Asian Biomass Handbook: a
guidebook for biomass production and utilization; 2008.
197. Themelis, N J. (2003). An overview of the global waste-to-energy
industry. Waste manage. World 3, 40-47.
198. Themelis, N, J. and Kim ,Y,H. (2002). Material and energy balance in a
large-scale aerobic bioconversion cell. Waste Management & Research, 20,
234-242.
199. Themelis, N.J. (2003). An overview of the global waste-to-energy
industry. Waste Management World (July–August), 40–47.
200. Thipse, S.S., Sheng, C., Booty, M, R., Magee, R,S. and Dreizin, E,L.
(2001). Synthetic fuel for imitation of municipal solid waste in
experimental studies of waste incineration. Chemosphere, 44, 1071-1077.
201. Toledo, P.G., Davis, H.T. and Scriven, L.E. (1995). Hyper dispersive
Flow Liquid Thin Films in Fractal Porous Media. Colloids Surf.104:73.
202. Tsai, W,T. and Chou, Y,H. (2006). An overview of renewable energy
utilization from municipal solid waste (MSW) incineration in Taiwan,
Renewable & Sustainable Energy Reviews, 10, 491–502.

229
203. Turan, N.G. and Ergun, O.N. (2008). The effects of aeration
modifications on municipal solid waste composting. Fresenius
Environmental Bulletin, 17, 778-785.
204. U.S. Environmental Protection Agency (2006a). Electricity from
Municipal Solid Waste, http:// www.epa.gov/cleanenergy/muni.htm.
205. UNEP (1994). Landfill for hazardous industrial wastes: a training manual.
Training Report No. 17, UNEP.
206. United Nations Environment Programme (1996). International Source
Book on Environmentally Sound Technologies for Municipal Solid Waste
Management. United Nations Environment Programme,Osaka/Shiga.
207. USEPA (2011). Municipal Solid Waste in the United States: 2011 Facts
and Figures. United States Environmental Protection Agency, Office for
Solid Waste, Washington DC.
208. Varma, A. (2006). A technical report on ‘Status of Municipal Solid Waste
Generation in Kerala and their Characteristics’ Suchitwa Mission,
Government of Kerala.
209. Velis, C., Longhurst, P., Drew, G, H., Smith, R. and Pollard, S, J, T.
(2009). Biodrying for mechanical-biological treatment of wastes: A review
of process science and engineering. Bioresource Technology, 100, 2747-
2761.
210. Velis, C., Wagland, S., Longhurst, P., Robson, B., Sinfield, K., Wise S., and Pollard, S. (2013). Solid Recovered Fuel: Materials flow analysis and
fuel property development during the mechanical processing of biodried
waste, Environmental Science & Technology, 47, 2957- 2965.
211. Venkatraman, K. and Ashwath, N. (2009). Phytocapping: Importance of
Tree Selection and Soil Thickness. Water Air Soil Pollut: Focus 9:421–430.
212. Vesilind, P, A. (1994). The role of water in sludge dewatering. Water
Environment Research, 66, 4-11.
213. Vladimir, K. and Tatiana, T. (2011). Mixed Municipal Waste
Management in the Czech Republic from the point of view of the LCA
Method”.Int.J.LifeCycleAssess, Vol.16, pp.113-124.

230
214. Walkley, A. and Black, I, A. (1934). An examination of Degtjareff
method for determining soil organic matter and a proposed modification of
the chromic acid titration method. Soil science, 37, 29-38.
215. Wang, L., Gang, H., Gong, X. and Bao, L. (2009). Emission reductions
potential for energy from municipal solid waste incineration in Chongqing.
Renewable Energy, 34, 2074–2079.
216. Weitz, K., Barlaz, M., Ranjitjan, R., Brill, D., Thomeloe, S. and Ham, R., (1999). Life cycle management of municipal solid waste. Int.J LCA
4,195-201.
217. Weitz, K,A., Thorneloe, S,A., Nishtala, S,R. and Yarkosky, S. (2002).
The impact of municipal solid waste management on greenhouse gas
emissions in the United States, Journal of the Air & Waste Management
Association, 52,1000–1011.
218. Wiemer, K. and Kern, M. ‘Mechanical–Biological Treatment of Residual
Waste Based on the Dry Stabilate Method’.M.I.C. Baeza-Verlag,
Witzenhausen,Germany, 1995.
219. Williams, R, H., and Larson, E, D. Advanced gasification-based biomass
power generation, in: B.J. Johansson, H. Kelly, A.K.N. Reddy, R.H.
Williams (Eds.), Renewables for Fuels and Electricity, Island Press,
Washington, D.C., 1992, pp. 729–786.
220. Wilson, D, C. (2007). Development drivers for waste management, Waste
Management & Research, 25, 198–207.
221. Wimmer, W., Ostad-Ahmad-Ghorabi, H., Pamminger, R. and Huber, M. (2008). “Product innovation through eco design”. Int. J. Sustainable
Design, Vol. 1, No. 1, pp.75–92.
222. Wolf, K, H. Kinetics in bioprocess engineering. Hamburg: Behr.,1991.
223. Wolkowski, R. (2003). Nitrogen management considerations for land
spreading municipal solid waste compost. J. Environ. Qual. 32, 1844–1850.
224. Won, Yang., Hyung-sik, Nam., and Sangmin, Choi.(2007). “Improvement
of operating conditions in waste incinerators using engineering tools”. Waste
Management vol. 27 pp.604–613.
225. WRAP, 2011a. New estimates for household food and drink waste in the
UK. Banbury, UK: Waste & Resources Action Programme.

231
226. WRAP, (2011b). Recovering Value from MRFs. Waste and Resources
Action Programme (WRAP), Banbury, Oxon,UK.
227. Wright P. (2002). “Biodrying dairy manure.”In:International Symposium on
Composting and Utilisation.Colombus,OH,USA,6-8 May 2002,pp.996-1007.
228. Yasuhara, A., Amano, Y. and Shibamoto, T. (2010). Investigation of the
self-heating and spontaneous ignition of refuse-derived fuel (RDF) during
storage. Waste Management, 30(7), 1161-1164.
229. Yin, C.Y. (2011). “Prediction of higher heating values of biomass from
proximate and ultimate analyses’’. Fuel, 90: 1128-1132.
230. Yuan, J., Zhang, D.,Li, Y., Li,J.,Luwo, W.,Zhang, H.,Wang, G., LiG.,(2018). Effects of the aeration pattern, aeration rate,and turning
frequency on municipal solid waste biodrying performance.J Environ
Manage, July15, 218, pp416-424.
231. Zaman, A. U. (2010). “Comparative study of municipal solid waste
treatment technologies using life cycle assessment method”, Int. J. Environ.
Sci. Tech., 7 (2), 225-234, Spring 2010.
232. Zawadzka, A., Krzystek, L., and Ledakowicz, S. (2010). “Autothermal
biodrying of municipal solid waste with high moisture content”. Chemical
Papers 64 (2) 265–268.
233. Zawadzka, A., Liliana Krzystek, and Stanislaw Ledakowicz (2009).
“Autothermal Drying of Organic Fraction of Municipal Solid
Waste”.‘Environmental Protection Engineering’, Vol.35, No.3, pp.123-134.
234. Zerbock, O . Urban solid waste management: waste reduction in developing
nations, Written for the Requirements of CE 5993 Field Engineering in the
Developing World, Michigan Technological University, 2003.
235. Zhang, B., Dixon, N. and El-Hamalawi, A. (2010). Development and
evaluation of a phase relationship for MSW. Proceedings of the ICE-Waste
and Resource Management, 163(2),pp. 67-75.
236. Zhang, D, Q., He, P, J., Jin, T, F. and Shao, L, M. (2008). Bio-drying of
municipal solid waste with high water content by aeration procedures
regulation and inoculation. Bioresource Technology, 99, 8796-8802.
237. Zhang, Dongqing, He , Pinjing_, Shao Liming, Jin Taifeng and Han Jingyao (2008). Biodrying of municipal solid waste with high water

232
content by combined hydrolytic- aerobic technology. Journal of
Environmental Sciences 20, 1534–1540.
238. Zhang, D-Q., He, P-J. and Shao L-M. (2009). Sorting efficiency and
combustion properties of municipal solid waste during bio-drying. Waste
Management, 29(11), 2816-2823.
239. Zhang, H.Y., Gu, J., Wang, G,Q., Hao, L.W. and Wu, X.O. (2014).
Influence of aeration modes on aerobic bio-drying of municipal solid waste
(MSW). Advanced Materials Research, 2014 (1010-1012), 934-938.
240. Zhang, M., Heaney, D., Henriquez, B., Solberg, E. and Bittner, E.
(2006). A four year study on influence of biosolids/ MSW co-compost
application in less productive soils in Alberta: nutrient dynamics. Compost
Sci. Util. 14 (1), 68–80.
241. Zhang, Y., Li, W.W., Zeng, G.M., Tang,L, Feng, C,L., Huang, D, L. and Li, Y,P. (2009). Novel neural network-based prediction model for
quantifying hydroquinone in compost with biosensor measurements.
Environmental Engineering Science, 26, 1063-1070.
242. Zhao, L., Gu, Wei-Mei., He, Pin-Jing., and Shao, Li-Ming. (2010).
Effect of air-flow rate and turning frequency on bio-drying of dewatered
sludge. Water Research, Vol 44, issue 20, 6144-6152.
243. Zhao, W., Huppes, G. and Voet, E. (2011). Eco-efficiency of greenhouse
gas emissions mitigation of municipal solid waste management: A case
study of Tianjin, China.Waste managemnt, 31(6)pp 1407-1415.

233
ANNEXURE-I
AIR SUPPLY SYSTEM IN BIODRYING PROCESS
Air Compressor Storage Tank
Digital Gas Mass Flow Controller

234
ANNEXURE- II
DIFFERENT STAGES IN CONVERSION OF RAW MSW TO
BIODRIED MSW
Waste storage Waste Proportioning Waste Mixing
Filling the Biodrying
Reactor
Biodried Output

235
LIST OF PUBLICATIONS BASED ON THIS THESIS
REFEREED JOURNALS
1. Asha P. Tom., Renu Pawels., Ajit Haridas., 2016. Biodrying process: A
sustainable technology for treatment of municipal solid waste with high
moisture content. Waste Management, 49, 64-72.
2. Asha P. Tom., Ajit Haridas., Renu Pawels., 2016. Biodrying Process Efficiency:-
Significance of Reactor Matrix Height. Procedia Technology, 25, 130-137.
3. Renu Pawels, Asha P.Tom, 2013.Assessment of technological options for
solid waste treatment in Kerala. International Journal of Scientific and
research publications, Volume 3, Issue 8, August 2013, ISSN 2250-3153.
4. Asha P. Tom, Ajit Haridas, Renu Pawels, 2017. Exploration of biodrying
process for mixed municipal solid waste management, Journal of Solid Waste
Technology and Management (Accepted for publication).
CONFERENCES
International
1. Asha, P. Tom, Ajit Haridas, Renu Pawels. Exploration of biodrying process
for mixed municipal solid waste management. Presented in the 32nd
International Conference on Solid Waste Technology and Management,
March19-22, 2017, Philadelphia, U.S.A.

236
2. Asha P Tom, Ajit Haridas, Renu Pawels, 2016. Biodrying Process
Efficiency:-Significance of Reactor Matrix Height, Global Colloquium in
Recent Advancement and Effectual Researches in Engineering, Science and
Technology (RAEREST 2016), April 22-24, 2016.
3. Asha, P. Tom, Renu Pawels, Ajit Haridas, 2015. Biodrying process - A
sustainable technology for municipal solid waste management. Proceedings of
the International Conference on Recent Advances in Civil Engineering,
January 2016.
4. Asha, P. Tom, Renu Pawels, Ajit Haridas, 2015. Biodrying process-
Assessment of three case studies in Pilot Scale Reactor, Proceedings of the
international conference ‘New Horizons in Biotechnology, 2015, November
21-23.
5. Asha P.Tom, Renu Pawels. “Solid Waste treatment Technologies-Challenges
and Opportunities of Kerala”, Asian conference on Civil, Material &
Environmental Science (ACCMES -142 -2013), Tokyo, Page: 343-351
6. Asha P Tom, Renu Pawels, Ajit Haridas, 2017.Biodrying process variations
based on air flow regulation strategy. Proceedings of the international
conference Global Waste management, Hyderabad, 1474-1483.

237
National
1. Asha, P. Tom, Renu Pawels, Ajit Haridas, 2016. Development of Sustainable
Solid Waste Management Technology for Kerala. Proceedings of the 28th
Kerala Science congress, January 2016, 748-761.
2. Asha, P. Tom, Renu Pawels, 2010. Assessment of Solid Waste Management
Technologies. Proceedings of the National Conference on Recent Advances in
Civil Engineering, RACE 2010.

ASHA P TOM Periakottil House,
Vazhakulam P. O
Muvattupuzha,
Ernakulam Dist
Kerala-686670
Ph: 04852260624
Mob: 9744910087
Civil Engineer with 10 years of experience in research project, teaching, design and
construction field.
Personal
Name : Asha P Tom
Date of Birth : 02-05-1981
Sex : Female
Father : P.A.Thomman
Permanent Address : Periakottil house,
Vazhakulam P.O.,
Muvattupuzha,
Ernakulam Dist., Kerala-686670
Experience
1. KSCSTE Project co-investigator at a joint project of CSIR, NIIST and
Cochin University of Science and Technology
Duration : May 2013- Dec31 2016
Post Held : Research scholar and Co-investigator in Kerala
State Council for Science, Technology and
Environment (KSCSTE) funded project
2. Holy Kings College of Engineering & Technology, Muvattupuzha.
Duration : From September 2011- April 2013
Post Held : Associate Professor in Civil Engineering
Subjects handled : Engineering Mechanics
Surveying, Basic Civil Engineering.

3. Ilahia College of Engineering & Technology, Muvattupuzha.
Duration : From December 2009- August2011
Post Held : Lecturer in Civil Engineering
Subjects handled : Engineering Mechanics
Environmental Impact Assessment,
Environmental Engineering (Theory and
Practical), Surveying.
4. Lecturer in Civil Engineering
Institution: SCMS School of Engineering, Angamaly.
Duration : From October 2008- September 2009
Post Held : Lecturer in Civil Engineering
Subjects handled : Surveying-I, Survey Lab, Civil Engineering
Drawing, EIA studies, Environmental Engineering
(Theory& Practical).
5. Larsen and Toubro Constructions, Chennai, Tamil Nadu
Duration : From December 2006- April 2008
Post Held : Senior Design Engineer
Nature of Work : Design of Water Supply/Treatment plant systems.
Duties : Design of Pipelines and Pump houses, treatment plant
Components, Surge analysis, Route selection and alignment of
Pipelines-Both for tendering as well as execution.
6. Sobha Developers Pvt.Ltd. Bangalore
Duration : From November 2003-November2004
Post Held : Site Engineer
Nature of work : Project Quantity Surveyor
Duties : Estimation, Costing, Billing, site office
management, material handling.
Education
PhD (Pursuing)
M.Tech (Environmental Engineering) from College of Engineering,
Trivandrum, Kerala University with 8.75 CGPA (2004-2006)
B.Tech Civil Engineering from M.A.College of Engineering M.G.University
with 80.4 % aggregate (1999-2003)
Software Knowledge
Primavera-6, GIS, Auto CAD.
Copyright © 2022 FDOKUMEN