Forecast generation model of municipal solid waste using ...
190
-
Upload
khangminh22 -
Category
Documents
-
view
0 -
download
0
Transcript of Forecast generation model of municipal solid waste using ...


Circulation: 500
pISSN 2383 - 3572 eISSN 2383 - 3866
Aims and Scope
Global Journal of Environmental Science and Management (GJESM) is an international scholarly refereed
research journal which aims to promote the theory and practice of environmental science and management.
A broad outline of the journal's scope includes; peer reviewed original research articles, case and technical
reports, reviews and analyses papers, short communications and notes to the editor, in interdisciplinary
information on the practice and status of research in environmental science and management, both natural
and man-made. The main aspects of research areas include, but are not exclusive to; environmental
chemistry and biology, environments pollution control and monitoring, transport and fate of pollutants in the
environment, concentrations and dispersion and trace of wastes in air, water, and soil, point and non-point
sources pollution, heavy metals and organic compounds in the environment, atmospheric pollutants and
trace gases, solid and hazardous waste management; soil biodegradation and bioremediation of
contaminated sites; environmental impact assessment, industrial ecology, ecological and human risk
assessment; improved energy management and auditing efficiency and environmental standards and
criteria.
Vision and Mission
Global Journal of Environmental Science and Management (GJESM) publishes original. Peer-reviewed and
technical environmental articles serve those environmental science and management through the on time
quarterly publication with reliable information. GJESM is an integral partner with the scientific and technical
communities, delivering superior information products and services that foster communication, build insights and
enables individual and collective advancement in environmental research. Providing environmental science and
management information to the general public with descriptions of contemporary advances in environmental
issues to be used in improving environmental protection and management.
Abstracting and Indexing
Web of Science (ESCI); Scopus; Scimago Journal Rank (SJR); ProQuest (Agricultural and Environmental Science +
Natural Science Collection+ Ulrichsweb); Chemical Abstract (CAS); CABI Abstract; Global Health Abstract; Agricola;
Committee on Publication Ethics (COPE); PubMed-NCBI; DOAJ; Open J-Gate; Google Scholar; Academia.edu;
Geomar; WorldCat; Academic Resource Index; Environmental XPRT; Information Matrix for the Analysis of Journals
(MIAR); Bibliothek Humburg; ScienceMedia; JournalTOCs; MSRT; ISC; RICeST; SID; Civilica; Magiran.
Serial# 28


CONTENTS
Volume 7, Number 4, Autumn 2021
1. Application of amorphous zirconium (hydr)oxide/MgFe layered double hydroxides composite in fixed-bed column for phosphate removal from water 485
A. Nuryadin; T. Imai (JAPAN/ INDONESIA)
2. Modelling the impact of environmental responsibility on the development of enterprises 503
M. Pinskaya; O. Meleshchenko; O. Kovalchuk; O. Karpenko; E. Kompanets (UKRAINE)
3. Estimation and mapping of the contribution of nitric acid to atmospheric corrosion of zinc 523
J.O. Castillo-Miranda; F.J. Rodríguez-Gómez; J. Genescá-Llongueras; L.G. Ruiz-Suárez; J.A. García-Reynoso (MÉXICO)
4. Simulation and analysis of marine hydrodynamics based on the El Niño scenario 543
M. Ikhwan; R. Wafdan; Y. Haditiar; M. Ramli; Z. A. Muchlisin; S. Rizal (INDONESIA)
5. Pre-sowing treatment of vetch hairy seeds, viсia villosa using ultraviolet irradiation 555
A. Semenov; T. Sakhno; O. Hordieieva; Y. Sakhno (UKRAINE/ USA)
6. Mitigation of environmental impacts in ornamental rock and limestone aggregate quarries in arid and semi-arid areas
565
M.A. Peñaranda Barba; V. Alarcón Martínez; I. Gómez Lucas; J. Navarro Pedreño (SPAIN)
7. Analysis of legislative acts in water management 587
J. Nesiba; R. Cuhlova (CZECH REPUBLIC)
8. Resident-based learning model for sustainable resident participation in municipal solid waste management program
599
A. Ghazali; J.H. Tjakraatmadja; Sunarti; E.Y.D. Pratiwi (INDONESIA)
9. Characteristics and combustion kinetics of fuel pellets composed of waste of polyethylene terephthalate and biomass
625
K. Manatura; U. Samaksaman (THAILAND)
10. Wastewater-based epidemiology for novel Coronavirus detection in wastewater 643 G. Saini; P.S. Deepak (INDIA)

Submission of manuscript
Corresponding Author Signature:
COVERING LETTER

Global J. Environ. Sci. Manage. 7(4): 485-502, Autumn 2021
*Corresponding Author:Email: [email protected]: +81-836-85-9300 Fax: +81-836-85-9301
Global Journal of Environmental Science and Management (GJESM)
Homepage: https://www.gjesm.net/
ORIGINAL RESEARCH PAPER
Application of amorphous zirconium (hydr)oxide/MgFe layered double hydroxides composite in fixed-bed column for phosphate removal from water
A. Nuryadin1,2, T. Imai1,*
1Graduate School of Sciences and Technology for Innovation, Yamaguchi University, Yamaguchi, 755-8611, Japan2Department of Physics Education, Mulawarman University, Samarinda, 75123, Indonesia
BACKGROUND AND OBJECTIVES: Fixed-bed column has been considered an industrially feasible technique for phosphate removal from water. Besides the adsorption capacity, the effectiveness of an adsorbent is also determined by its reusability efficiency. In this study, phosphate removal by a synthesized amorphous zirconium (hydr)oxide/MgFe layered double hydroxides composite in a fixed-bed column system was examined.METHODS: The effects of flow rate, bed height, phosphate concentration, solution pH, and adsorbent particle size on the phosphate adsorption ability were examined through a series of continuous adsorption experiments. The appropriate breakthrough curve models, phosphate adsorption from real anaerobic sludge and synthetic seawater, column regeneration and reusability, and adsorption mechanism were also investigated for practical application feasibility. FINDINGS: The results showed that the increased bed height and phosphate concentration, and reduced flow rate, pH, and adsorbent particle size were found to increase the column adsorption capacity. The optimum adsorption capacity of 25.15 mg-P/g was obtained at pH 4. The coexistence of seawater ions had a positive effect on the phosphate adsorption capacity of the composite. Nearly complete phosphate desorption, with a desorption efficiency of 91.7%, could be effectively achieved by 0.1 N NaOH for an hour. Moreover, the initial adsorption capacity was maintained at approximately 83% even after eight adsorption-desorption cycles, indicating that the composite is economically feasible. The high phosphate adsorption capacity of the composite involves three main adsorption mechanisms, which are electrostatic attraction, inner-sphere complexation, and anion exchange, where the amorphous zirconium hydr(oxide) on the surface of the layered double hydroxides likely increased the number of active binding sites and surface area for adsorption.CONCLUSION: The amorphous zirconium (hydr)oxide/MgFe layered double hydroxides composite, with its high adsorption capacity and superior reusability, has the potential to be utilized as an adsorbent for phosphorus removal in practical wastewater treatment. This study provides insights into the design of amorphous zirconium (hydr)oxide/MgFe layered double hydroxides composite for phosphorus removal and recovery in a practical system.
©2021 GJESM. All rights reserved.
ARTICLE INFO
Article History:Received 04 January 2021Revised 02 March 2021Accepted 11 April 2021
Keywords:Adsorbent regenerationAmorphous zirconiaFixed-bed columnLayered double hydroxidesPhosphate adsorptionPhosphate adsorption mechanism
ABSTRAC T
DOI: 10.22034/gjesm.2021.04.01
NUMBER OF REFERENCES
39NUMBER OF FIGURES
9NUMBER OF TABLES
4
Note: Discussion period for this manuscript open until January 1, 2022 on GJESM website at the “Show Article.

486
A. Nuryadin and T. Imai
INTRODUCTIONPhosphates are vital for the sustainability
of organisms and several industrial activities. However, their widespread use, along with the increase in population, has induced superfluous levels of phosphates in the aquatic environment, leading to water eutrophication (Dash et al., 2020). Thus, it is essential to minimize or eliminate phosphorus contaminations from wastewater prior to its discharge into the receiving water body to maintain water quality and improve human health. Additionally, the global increase in food demand and limited carrying capacity of land has increased the dependence on phosphorus, which is used to increase agricultural productivity to fulfill human and livestock needs (March et al., 2016). As phosphorus is a non-renewable natural resource and cannot be substituted by other resources (Wang et al., 2021), the recovery of phosphates from wastewater is important for the sustainability of global phosphorus reserves.
In the last decade, numerous phosphate removal techniques have been designed, ranging from adsorption and chemical precipitation to the application of polyphosphate-accumulating organisms (PAOs) (Ramasahayam et al., 2014). Among these techniques, adsorption is constantly gaining popularity owing to its simplicity and the possibility of phosphorus recovery from wastewater (Zou et al., 2020). However, the cost-effectiveness depends on the reusability of the adsorbent (Kumar et al., 2019). Consequently, adsorbents with high chemical stability are being preferred for phosphorus adsorption because of their stability during the desorption process under various stripping agent chemistry conditions, which usually use a solution with extreme acidity or alkalinity.
Nuryadin et al. (2021) synthesized a composite of amorphous zirconium (hydr)oxide/MgFe layered double hydroxides (am-Zr/MgFe-LDH) using a novel two-stage synthesis. A series of batch experiments showed that the uncalcined am-Zr/MgFe-LDH composite with a Zr:Fe ratio of 1:5 showed a high adsorption performance towards phosphates and retained good removal efficiency over eight adsorption-desorption cycles. The high adsorption capacity is related to the high surface area and large number of hydroxyl groups on the composite as a consequence of small crystal size and low
agglomeration of amorphous zirconium (hydr)oxide (am-Zr) in the composite. However, batch settings are not suitable for large-scale applications and continuously generated wastewater (Taka et al., 2020). Therefore, it is important to understand the application of the composite in continuous fixed-bed column adsorption to investigate its performance in practical applications. Fixed-bed column adsorption is very popular in wastewater treatment because of its continuous, high yield, simple, and economical operation and the ability to be scaled-up from the laboratory-scale (Jiang et al., 2018; Kumar et al., 2011). Sun et al. (2014) found that MgFe-LDH in a fixed-bed column had a high phosphate adsorption capacity and acceptable desorption efficiency. However, no studies have been conducted on the phosphate removal performance of the am-Zr/MgFe-LDH composite in a fixed-bed column.
In this study, the effects of design parameters essential for practical applications, such as flow rate, bed height, influent phosphate concentration, pH, and adsorbent particle size on the am-Zr/MgFe-LDH composite performance for phosphate removal were examined. Furthermore, the three most widely used models, Thomas, Yoon-Nelson, and modified dose-response (MDR) models were applied to interpret the phosphate adsorption breakthrough data. The applicability of the composite for real anaerobic sludge and phosphate-enriched seawater and its reusability were also evaluated. In addition, an adsorption mechanism of phosphate on the composite was proposed for designing a practical system for the removal and recovery of phosphorus. The objective of the current study is to investigate the phosphate adsorption performance and reusability of a fixed-bed column filled with the am-Zr/MgFe-LDH composite. This study has been carried out in Environmental Planning Laboratory, Graduate School of Sciences and Technology for Innovation, Yamaguchi University, Ube, Japan during 2018-2020.
MATERIALS AND METHODSAdsorbent and adsorbate preparation
Analytical grade FeCl3·6H2O (99.0% pure), MgCl2·6H2O (98.0% pure), ZrOCl2·8H2O (99.0% pure), Na2CO3 (99.8% pure), NaOH (97.0% pure) were purchased from Wako Pure Chemical Industries, Ltd. for preparing the am-Zr/MgFe-LDH composite, and used directly in this study without further purification.

487
Global J. Environ. Sci. Manage., 7(4): 485-502, Autumn 2021
A composite with a Zr:Fe molar ratio of 1.5:1 was synthesized using an established method (Nuryadin et al., 2021). Briefly, a solution containing Mg2+ and Fe3+ ions with a molar ratio of 3:1 was poured into 200 mL of deionized (DI) water. The solution pH was maintained at ~10 using a solution of 1 M NaOH and 1 M Na2CO3 with a 3:1 volume ratio under vigorous stirring for 30 min. The separated and neutralized gel obtained was then mixed with ZrOCl2·8H2O (Zr to Fe molar ratio of 1.5:1) in 500 mL of DI water. Simultaneously, a 25% NaOH solution was used to precipitate the am-Zr under constant stirring until a pH of ~10 was obtained. After aging at 353 K for 24 h, the composite was filtered, washed with DI water for neutralization, and then dried in an oven at 353 K for 24 h. The dried composite was ground in a mortar and sieved to the desired particle size.
K2HPO4 (99.0% pure) was obtained from Wako Pure Chemical Industries, Ltd., Japan. A phosphate stock solution (500 mg-P/L) was prepared by dissolving an appropriate amount of K2HPO4 in 1 L of DI water. The stock solution was diluted to the desired working solution using DI water. The pH of the working solution was adjusted using 0.1 M HCl and NaOH solutions and monitored using a pH meter (Horiba, LAQUA SS131 D-71).
Adsorbent characterizationThe X-ray diffraction (XRD) pattern of the
adsorbent, with particle size of d ≤ 0.1 mm, was recorded on a Rigaku Ultima IV Protectus diffractometer using Cu-Kα radiation at 40 kV. Fourier transform infrared (FTIR) spectra of the composites before and after adsorption were recorded on a Jasco FT/IR-4600 spectrophotometer. The X-ray photoelectron spectroscopy (XPS) spectra were obtained using a Thermo Scientific K-alpha X-ray photoelectron spectrometer and fitted with XPSPEAK41 and Origin 9.4 software. The high-resolution scans of XPS focused on Mg, Fe, Zr, C, and O. The pH at the point of zero charge (pHpzc) of the composite was investigated using potentiometric mass titration (PMT), as described by Bourikas et al. (2003). Three different doses of the composite (5, 15, and 25 g/L) were immersed in Erlenmeyer flasks containing 100 mL of 0.03 M KNO3 and shaken under an N2 atmosphere at 200 rpm for 24 h. In each flask, 0.5 mL of 1 M KOH was added to deprotonate sites in the composite surface, and the shaken samples were
titrated using a 0.1 M HNO3 solution. The titration curve was constructed by plotting the pH value as a function of HNO3 volume.
Adsorption experimentContinuous fixed-bed column adsorption experi-
ments were conducted at room temperature (~298 K) using a non-jacketed liquid chromatography column (Sigma-Aldrich, Co.) with an inner diameter of 1.0 cm and a length of 10 cm. Fig. 1 shows a schematic diagram of the fixed-bed column system used in this study. A 1 cm thick glass wool was placed on the top and bottom of the sample to prevent the adsorbent from being washed out by the liquid flow. A particular weight (0.7, 1.0, and 1.4 g) of the composite with a maximum particle size of 106 µm was packed into the column to attain the desired bed height (h) (1.0, 1.5, and 2.0 cm). The artificial influent phosphate solution with various concentrations (Co) (5 mg-P/L, 12 mg-P/L, and 20 mg-P/L) at pH 7 was pumped in an up-flow configuration through the packed composite inside the column at varying flow rates (Q) (1.5, 2.5, and 3.5 mL/min) using a peristaltic pump (EYELA MP-1000). The effects of phosphate solution pH (4, 7, and 10) and composite particle size (d) (≤ 0.1, 0.1-0.5, and 0.5-1.0 mm) on phosphate adsorption were examined. To obtain the breakthrough curves, the effluent solutions were automatically collected at specified intervals using a fraction collector (Advantec SF-3120) for measuring phosphate concentrations. In this study, the breakthrough time was assigned when the ratio of effluent to influent phosphate concentration (C/Co) was 10%. An exhaustion time is the time when the influent solution passes through the adsorbent without any significant decrease in concentration (Marzbali and Esmaieli, 2017). A preliminary experiment showed that the breakthrough curves became relatively flat after C/Co reached approximately 85% and the phosphate adsorption became insignificant. Therefore, the exhaustion time in this study was determined to be the time when C/Co reached 85%.
Breakthrough curves of phosphate adsorption were constructed by plotting the ratio of effluent phosphate concentration at an interval time to influent phosphate concentration (C/Co) as a function of time (t). The breakthrough curves demonstrate the mass transfer characteristics of phosphate onto the

488
Column study of phosphate adsorption by am-Zr/MgFe-LDH
packed composite. The total amount of adsorbed phosphate, qadsorbed (mg), during adsorption and the equilibrium adsorption capacity, qe (mg/g), were calculated as follows (Eqs. 1 and 2, respectively) (Gouran-Orimi et al., 2018).
00
0
11000
et t
adsorbed t
QC Cq dtC
=
=
= -
∫ (1)
adsorbede
qqm
=
(2)
Where, Q is the flow rate (mL/min), C0 and C are the influent and effluent phosphate concentrations (mg/L), respectively, te is the time required to reach exhaustion time (min), and m is the weight of the composite packed inside the column (g).
Regeneration and reusability experimentBefore the regeneration experiment, the
exhausted bed in the column was washed with DI water at a flow rate of 2.5 mL/min for 1 h to remove residual phosphorus. Subsequently, 0.1 M NaOH was pumped in the opposite direction to desorb the adsorbed phosphate. In this study, regeneration was done until the effluent concentration reached approximately 0.5 mg-P/L and it was assumed that the column had been regenerated. In the first cycle of desorption, the desorption effluent solutions were collected at the pre-determined intervals to obtain the desorption curve. The amount of phosphorus eluted from the composite (EAP) (mg/g) was calculated using the following equations (Eqs. 3 and
4) (Nguyen et al., 2015):
1 desorbedEAP qm
= 3)
2
1
ndesorbed qq
q CV=
=∑ (4)
Where, m is the weight of adsorbent in the column (g), qdesorbed is the total amount of desorbed phosphate (mg), Vq is the effluent volume of the q -th fraction (L), and n2 is the number of the last fraction in the desorption operation. Desorption and regeneration experiments were conducted for eight cycles of the adsorption-desorption process.
RESULTS AND DISCUSSIONFixed-bed column adsorption studies
The effect of phosphate solution flow rate on the phosphate adsorption on the composite in the column was investigated at three different flow rates (1.5, 2.5, and 3.5 mL/min), where the bed height (1.5 cm) and the influent phosphate concentration (12 mg-P/L) were kept constant. Fig. 2a shows the effect of the flow rate on the breakthrough curve of phosphate adsorption on the composite. The increase in flow rate from 1.5 to 3.5 mL/min resulted in reduction in the breakthrough time from 14.9 to 5.5 h and in the exhaustion time from 24.0 to 8.9 h. The increase in the flow rate led to an increase in the volume speed, leading to a reduction in the time required to reach breakthrough and exhaustion states. The adsorption capacity, calculated using Eq. 2, decreased from 20.40 to 18.23 mg-P/g as the flow rate increased from 1.5 to 3.5 mL/min (Table 1). At a high flow rate, the phosphate anions have a short
Fig. 1: Schematic diagram of lab‐scale fixed‐bed column adsorption system
Fig. 1: Schematic diagram of lab-scale fixed-bed column adsorption system

489
Global J. Environ. Sci. Manage., 7(4): 485-502, Autumn 2021
residence time in the bed, where composite particles in the fixed-bed column have a short contact time with the phosphate anions as the solution flows through the bed (Gouran-Orimi et al., 2018). Consequently, the possibility of phosphate anions passing through the column before being completely adsorbed increased because of the insufficient contact time for adsorption equilibrium. In addition, the steepness of the breakthrough curves increased with the increase in flow rate. The different slope of the breakthrough
curves was due to the retention process. A high flow rate led to an increase in mass transfer rate, increasing the amount of phosphate captured onto the adsorbent surface in the beginning of operation. This caused an early saturation with a steeper slope given in the breakthrough curves.
Breakthrough curves resulting from fixed-bed column experiments at different bed heights (1.0, 1.5, and 2.0 cm) with a constant flow rate (2.5 mL/min) and influent phosphate concentration (12 mg-
Fig. 2: The Effect of (a) flow rate (h = 1.5 cm, Co = 12 mg‐P/L, pH = 7, and d ≤ 0.1 mm), (b) bed height (Q = 2.5 mL/min, Co = 12 mg‐P/L, pH = 7, and d ≤ 0.1 mm), (c) influent phosphate concentration (h = 1.5 cm, Q = 2.5 mL/min,
pH = 7, and d ≤ 0.1 mm), (d) solution pH (h = 1.5 cm, Q = 2.5 mL/min, Co = 12 mg‐P/L, and d ≤ 0.1 mm), and (e) composite particle size (m = 1.01 g cm, Q = 2.5 mL/min, Co = 12 mg‐P/L, and pH = 7), on the fixed‐bed column
studies
Fig. 2: The Effect of (a) flow rate (h = 1.5 cm, Co = 12 mg-P/L, pH = 7, and d ≤ 0.1 mm), (b) bed height (Q = 2.5 mL/min, Co = 12 mg-P/L, pH = 7, and d ≤ 0.1 mm), (c) influent phosphate concentration (h = 1.5 cm, Q = 2.5 mL/min, pH = 7, and d ≤ 0.1 mm), (d) solution pH (h = 1.5 cm, Q = 2.5 mL/min, Co = 12 mg-P/L, and d ≤ 0.1 mm), and (e) composite particle size (m = 1.01 g cm, Q = 2.5 mL/min, Co = 12 mg-P/L, and pH =
7), on the fixed-bed column studies

490
A. Nuryadin and T. Imai
P/L) are depicted in Fig. 2b. The figure demonstrates that the breakthrough and exhaustion times were extended when the bed height increased. Table 1 shows that the adsorption capacity increased from 18.75 to 19.56 mg-P/g as the bed height increased from 1.0 to 2.0 cm. This was predictable as there were more active binding sites at a higher bed height, and these increased the adsorption areas (Mohan and Dutta, 2020). Furthermore, a higher bed height provides a longer packed composite through which the phosphate anions pass, which allows a longer residence time of phosphate, enabling it to be deeply adsorbed within the composite. The bed height of 2.0 cm had a flatter breakthrough curve than the lower bed height, which might be due to a broad mass transfer zone provided by a high bed height.
Fig. 2c shows the adsorption curves of various influent phosphate concentrations (5, 12, and 20 mg-P/L) at a constant bed height (1.5 cm) and flow rate (2.5 mL/min). An increase in influent phosphate concentration from 5 to 20 mg-P/L decreased the breakthrough time from 18.7 to 4.4 h and exhaustion time from 28.7 to 7.8 h. The concentration gradient between the solution and adsorbent surface increased at high phosphate concentrations, which increased the driving force for phosphate adsorption (Lee et al., 2019). Under these conditions, the limited active binding sites in the column were inhibited
rapidly, and saturated conditions were achieved in a short period. This led to a steeper breakthrough curve at higher influent phosphate concentrations. This steeper curve at the high load of phosphate anions signifies that the am-Zr/MgFe-LDH is likely favorable for phosphate adsorption. The adsorption capacity increased from 17.08 to 19.13 mg-P/g when the influent phosphate concentration was raised from 5 to 20 mg-P/L. A higher influent concentration of phosphate can deliver more phosphate anions into the outer and inner surface of the composite to attach with the adsorption sites, which is possibly the reason for an increase in adsorption capacity with influent concentration increasing. In addition, a high concentration gradient at high influent phosphate concentration can overcome the mass transfer resistance in the adsorbent surface, leading to an increase in the adsorption capacity.
Another important parameter that affects the dynamic phosphate adsorption process in a fixed-bed column is the pH solution. Fig. 2d shows the effect of phosphate solution pH (4, 7, and 10) on phosphate adsorption breakthrough curves, while maintaining a constant bed height (1.5 cm), flow rate (2.5 mL/min), and influent phosphate concentration (12 mg-P/L). It can be seen clearly that the breakthrough time was reached in a longer time at a lower pH. The breakthrough time increased from 6.9 to 10.0
Table 1: Fixed-bed column parameters for phosphate adsorption on am-Zr/MgFe-LDH composite
No.. 𝑄𝑄𝑄𝑄 (mL/min)
ℎ (cm)
𝐶𝐶𝐶𝐶𝑜𝑜𝑜𝑜 (mg-P/L)
𝑚𝑚𝑚𝑚 (g) pH 𝑑𝑑𝑑𝑑
(mm) 𝑡𝑡𝑡𝑡𝑏𝑏𝑏𝑏 (h)
𝜏𝜏𝜏𝜏 (h)
𝑡𝑡𝑡𝑡𝑒𝑒𝑒𝑒 (h)
𝑞𝑞𝑞𝑞𝑒𝑒𝑒𝑒 (mg-P/g)
1 1.5 1.5 12 1.01 7 ≤ 0.1 14.9 17.33 24.0 20.40 2 2.5 1.5 12 1.01 7 ≤ 0.1 9.1 10.65 13.5 19.04 3 3.5 1.5 12 1.01 7 ≤ 0.1 5.5 7.19 8.9 18.23
4 2.5 1.0 12 0.68 7 ≤ 0.1 4.8 7.24 10.7 18.75 2.5 1.5 12 1.01 7 ≤ 0.1 9.1 10.65 13.5 19.04
5 2.5 2.0 12 1.36 7 ≤ 0.1 12.1 14.48 19.0 19.56
6 2.5 1.5 5 1.01 7 ≤ 0.1 18.7 22.28 28.7 17.08 2.5 1.5 12 1.01 7 ≤ 0.1 9.1 10.65 13.5 19.04
7 2.5 1.5 20 1.01 7 ≤ 0.1 4.4 6.04 7.8 19.13
8 2.5 1.5 12 1.01 4 ≤ 0.1 10.0 12.82 25.0 25.15 2.5 1.5 12 1.01 7 ≤ 0.1 9.1 10.65 13.5 19.04
9 2.5 1.5 12 1.01 10 ≤ 0.1 6.9 8.63 11.5 15.73 2.5 1.5 12 1.01 7 ≤ 0.1 9.1 10.65 13.5 19.04
10 2.5 1.8 12 1.01 7 0.1−0.5 4.2 7.51 16.0 15.80 11 2.5 2.0 12 1.01 7 0.5−1 0.5 4.49 19.0 12.45
Table 1: Fixed-bed column parameters for phosphate adsorption on am-Zr/MgFe-LDH composite

491
Global J. Environ. Sci. Manage., 7(4): 485-502, Autumn 2021
h with decreasing pH from 10 to 4. As shown in Table 1, a higher adsorption capacity (25.15 mg-P/g) was obtained at a lower pH (acidic solution). The adsorption capacity decreased significantly when the influent pH increased from 4 to 10, signifying that pH played a key role which affected the physical-chemical interaction between the phosphate and composite surface. The adsorbent surface was positively charged at low pH, attracting the negatively charged phosphate anions. Conversely, the number of hydroxyl ions (OH-) increased at higher pH, which competed with phosphate anions to occupy more active binding sites on the adsorbent surface and led to the reduction of phosphate adsorption onto the composite surface (He et al., 2016). The lower pH showed a broader tailing edge in the breakthrough curve shape, reflecting that the phosphate adsorption onto composite bed in lower pH was extended with a slow adsorption.
The effect of composite particle size on the breakthrough curve of phosphate adsorption was investigated by isolating the composite into three groups of particle sizes using sieves with apertures of different sizes (≤ 0.1 mm, 0.1–0.5 mm, and 0.5–1.0 mm). The bed height (1.5 cm), flow rate (2.5 mL/min), and influent phosphate concentration (12 mg-P/L) were kept constant. Fig. 2e shows the breakthrough curves of phosphate adsorption resulting from different composite particle sizes. The bed performance of the smallest particle size (≤ 0.1 mm) was better than that of the larger particle sizes, particularly for the initial part of the curve. The reduction in particle size led to a longer breakthrough time but a shorter exhaustion time. As the particle size of the composite increased, the surface area per unit volume decreased. Consequently, the number
of active binding sites on the surface of composite with large particle size, that directly interact with the phosphate ions in the solution, smaller than the composite with a lower particle size resulted in an earlier breakthrough time corresponding to the completion of surface adsorption. However, after the breakthrough point was achieved in the large particle composite, the pore adsorption continued at a lower rate, which resulted in a delayed exhaustion time. Additionally, for smaller particle sizes with a higher surface area (Oguz, 2017), phosphate adsorption mostly occurred on the surface of the composite with a large number of exposed active binding sites. A decrease in particle size appears to have increased the sharpness of the breakthrough curves and delayed the breakthrough time.
Table 2 summarizes the phosphate adsorption capacity of am-Zr/MgFe-LDH composite in this study and calcined MgFe-LDH as well as other Zr-based adsorbents in fixed-bed column adsorption. It was demonstrated that am-Zr/MgFe-LDH composite was found to have higher adsorption capacity than calcined MgFe-LDH and positively comparable to most of the Zr-based adsorbents reported in the literature. This result confirmed that the combination of am-Zr and MgFe-LDH resulted in favorable modification in the adsorbent surface for effective phosphate adsorption. The high phosphate adsorption capacity of am-Zr/MgFe-LDH composite can be associated with the development of a high amount of hydroxyl groups in the adsorbent surface by am-Zr, where the hydroxyl groups act as the effective binding sites for phosphate anions.
Breakthrough curve modelingGenerally, the modeling of breakthrough curves
Table 2: Comparison of the phosphate adsorption capacity of am-Zr/MgFe-LDH composite with various adsorbents in fixed-bed column
Adsorbent Experimental condition 𝑞𝑞𝑞𝑞𝑒𝑒𝑒𝑒
(mg-P/g) Reference 𝑄𝑄𝑄𝑄 (mL/min)
ℎ (cm)
𝐶𝐶𝐶𝐶𝑜𝑜𝑜𝑜 (mg-P/L) pH 𝑑𝑑𝑑𝑑
(mm) Zr-FPS 1.77 1.6 0.411 2.01 - 1.73 Awual et al., 2011 Zirconium ferrite 0.083 - 20 7 0.7 2.6 Biswas et al., 2008 A-Zr-NP 6 4.8 20 5.4 - 5.59 Husein et al., 2017 Zr(IV)-loaded SOW gel 0.083 - 20 7 0.075−0.15 10 Biswas et al., 2008 Zr(IV)-loaded okara 12 9 5.5 7.6 0.3−0.15 14.97 Nguyen et al., 2015 Zr(IV)-loaded okara 12 23 5.6 3 1−0.6 16.43 Nguyen et al., 2015 Calcined MgFe-LDH 0.4 12 20 - 0.075−0.028 21.09 Sun et al., 2014 CS-Zr-PEPA 6 12 2.4 6.5 - 32.50 Chen et al., 2020 Am-Zr/MgFe-LDH 2.5 1.5 12 4 ≤ 0.1 25.15 Present study
Table 2: Comparison of the phosphate adsorption capacity of am-Zr/MgFe-LDH composite with various adsorbents in fixed-bed column

492
Column study of phosphate adsorption by am-Zr/MgFe-LDH
resulting from fixed-bed column adsorption is essential for designing a column adsorption system for practical applications. To describe the behavior of dynamic phosphate adsorption onto the am-Zr/MgFe-LDH composite in a fixed-bed column system, three nonlinear mathematical model equations, Yoon-Nelson (Eq. 5) (Yoon and Nelson, 1984), Thomas (Eq. 6) (Thomas, 1944), and MDR models (Eq. 7) (Yan et al., 2001) were used.
YN YNo
ln C k t kC C
τ
= - -
(5)
o Th ThTh oln 1 C k q m k C t
C Q - = -
(6)
omdr
0
ln ln ln 1000C QtC a a q m
C C = - -
(7)
Where, kTh and kYN are the Thomas kinetic coefficient (L/mg min) and the Yoon-Nelson kinetic coefficient (1/min), respectively, qTh and qmdr are the predicted adsorption capacities (mg/g), τ is the time required for 50% phosphate adsorption breakthrough (min), and a is an MDR model parameter.
The main parameters of each mathematical model obtained by non-linear fitting of the breakthrough data under different experimental conditions are presented in Table 3. A simple Yoon-Nelson model was applied to examine the phosphate adsorption behavior of the packed composite. This model assumes that the decrease in the adsorption probability of
each molecule is proportional to the adsorption probability of the molecule and the probability of molecule breakthrough on the adsorbent (Sotelo et al., 2012). Although this model is based on the adsorption probability, the R2 (0.864-0.984) values showed a good fit with the experimental data. Additionally, the predicted values of τ were similar to those obtained from experiments (Table 1), except for d values of 0.1-0.5 and 0.5-1.0 nm, where the breakthrough curves deviated from ideal adsorption system with an S-shaped profile characteristic. The τ values decreased with increasing flow rate, influent phosphate concentration, pH, and adsorbent particle size, and by decreasing the bed height. Conversely, the kYN values indicated opposite trends in τ values. For instance, increasing the flow rate or decreasing the bed height resulted in an increase in phosphate ions passing the packed adsorbent for a given period of time. Consequently, kYN increased and τ decreased.
The Thomas and MDR models were also applied to the experimental phosphate adsorption curves to depict the entire breakthrough curve. The Thomas model is based on the assumption that adsorption is only controlled by the surface reaction between the adsorbate and adsorbent surface, where the effects of intra-particle diffusion and external film resistances are neglected (Chittoo and Sutherland, 2020). The MDR model was developed based on mathematical issues to reduce the error resulting from the Thomas model (Sana and Jalila, 2017). The values of predicted qTh and qmdr were close to the experimental q values (percentage errors < 3%), except for d values of 0.5-1.0 nm. Additionally, their trends in response to
Table 3: Yoon-Nelson, Thomas, and MDR model parameters for phosphate adsorption by am-Zr/MgFe-LDH composite in fixed-bed column at various experimental conditions
Experimental conditions No.
Yoon-Nelson Thomas MDR 𝑘𝑘𝑘𝑘YN
(×10-2) 𝜏𝜏𝜏𝜏 𝑅𝑅𝑅𝑅2 𝑘𝑘𝑘𝑘Th (×10-3) 𝑞𝑞𝑞𝑞Th 𝑅𝑅𝑅𝑅2 𝑞𝑞𝑞𝑞mdr 𝑎𝑎𝑎𝑎 𝑅𝑅𝑅𝑅2
1 0.96 17.33 0.958 0.76 19.91 0.958 19.94 8.157 0.966 2 1.59 10.65 0.962 1.29 19.02 0.962 19.01 8.583 0.969 3 1.92 7.19 0.984 1.55 18.44 0.984 18.31 7.796 0.990 4 1.82 7.11 0.961 1.01 19.10 0.972 18.79 4.845 0.985 5 0.95 14.48 0.960 0.76 19.49 0.960 19.45 6.987 0.970 6 0.70 22.28 0.974 1.33 17.16 0.974 17.10 8.693 0.981 7 2.19 6.21 0.968 0.81 19.05 0.964 19.05 6.980 0.975 8 0.81 12.83 0.916 0.48 24.67 0.926 24.66 4.418 0.953 9 1.89 8.40 0.974 1.16 15.84 0.978 15.73 6.840 0.986
10 0.52 8.66 0.943 0.42 15.61 0.943 15.33 2.516 0.985 11 0.25 5.78 0.864 0.21 10.21 0.864 10.80 1.370 0.931
Table 3: Yoon-Nelson, Thomas, and MDR model parameters for phosphate adsorption by am-Zr/MgFe-LDH composite in fixed-bed column at various experimental conditions

493
Global J. Environ. Sci. Manage., 7(4): 485-502, Autumn 2021
various experimental conditions were similar to those of the experimental q. However, the Thomas model was not completely fit with the experimental curves as the phosphate adsorption on the am-Zr/MgFe-LDH composite involved intra-particle diffusion as the rate-limiting step. The slow intra-particle diffusion of phosphate on the composite pores was signified by the considerably slow adsorption from the C/Co ratio of 0.85 to reach 1 (Chu, 2004). As can be seen from Table 3, the MDR model showed larger R2 values than those of the Yoon-Nelson and Thomas models for all experimental conditions. This indicates that the phosphate adsorption behavior of the packed am-Zr/MgFe-LDH composite in a fixed-bed column system was better described by the MDR model in each experimental condition. As the MDR model based on the Thomas model, the results suggest that adsorption follows the Langmuir isotherm, which suggests that the driving forces obey second-order reversible reaction kinetics with no axial dispersion in the column (Sana and Jalila, 2017).
Phosphate adsorption from real municipal anaerobic sludge filtrate and synthetic seawater
The anaerobic sludge used in this study was collected from an eastern municipal wastewater treatment plant in Ube, Japan. Before use in the column adsorption test, the sludge was allowed to stand for 24 h for deposition, and the supernatant was filtered using a 0.45 µm filter membrane. The effect of seawater ions on phosphate adsorption in seawater was also investigated using synthetic phosphate-containing seawater (P seawater). As 99% of the seawater electrolyte concentration consists of NaCl, Na2SO4, KCl, MgCl2, and CaCl2, synthetic seawater was prepared using these salts, corresponding to a salinity of 15 PSU (Zhang et al., 2020). The 15 PSU
salinity was chosen to represent the salinity of the mesohaline estuary (salinity ranges from 5 to 18 PSU), an area that has great potential to be eutrophic and needs attention (Brush, 2009). For comparison, phosphate adsorption was also conducted in synthetic phosphate-containing water (P water). The details of the sludge, synthetic P seawater, and P water are listed in Table 4. In this experiment, an adsorbent particle size range of 0.1–0.5 mm was used to prevent column clogging by extremely small particles present in the sludge filtrate. Each water sample was pumped through the 1.0 g of adsorbent column at flow rate of 2.5 mL/min.
Fig. 3 shows a comparison of the breakthrough curves for phosphate adsorption onto the composite-packed column using real anaerobic sludge filtrate, synthetic P water, and seawater. The earlier breakthrough of phosphate adsorption in anaerobic sludge might be due to the high concentration of carbonate (CO3
2-), which is signified by high alkalinity (Table 4). Nuryadin et al. (2021) found that CO3
2- (or bicarbonate) was highly competitive with phosphate for the active binding sites on the adsorption surface. Furthermore, the presence of extremely fine suspended solids that passed through the filter during filtration in the filtrate could interfere with the transfer of phosphate from the bulk liquid to the am-Zr/MgFe-LDH composite surface (Sun et al., 2014). The adsorption capacity of the sludge filtrate (8.99 mg-P/L) was lower than that in synthetic P water (13.12 mg-P/L). However, phosphate adsorption was not negatively affected by the seawater ions, but was enhanced after the breakthrough point passed. The adsorption capacity in synthetic P seawater was 19.99 mg-P/L. The positively charged seawater ions (such as Na+, Mg2+, Ca2+, and K+) in the solution were easily attracted by an adsorbent surface that became more
Table 4: The details of anaerobic sludge filtrate, synthetic P water, and synthetic P seawater used in fixed-bed column phosphate adsorption.
Anaerobic sludge filtrate Synthetic P seawater Synthetic P water Parameter Value Parameter Value Parameter Value pH 8.51 pH 8.10 pH 8.51 Phosphate (PO4-P) 14.24 mg/L Phosphate (PO4-P) 14.58 mg/L Phosphate (PO4-P) 14.23 mg/L TSS 168.67 mg/L NaCl 10519.20 mg/L COD 400.00 mg/L MgCl2 2094.64 mg/L Chloride (Cl−) 574.82 mg/L Na2SO4 1704.48 mg/L Nitrate (NO3
−-N) 14.58 mg/L CaCl2 488.31 mg/L Alkalinity (CaCO3) 109.70 mg/L KCl 298.21 mg/L
Table 4: The details of anaerobic sludge filtrate, synthetic P water, and synthetic P seawater used in fixed-bed column phosphate adsorption

494
A. Nuryadin and T. Imai
negatively charged after initial phosphate adsorption. This increased positive charge on the adsorbent surface and promoted subsequent phosphate adsorption. According to the results, the composite adsorption capacity reduced due to the highly carbonated wastewater in the continuous adsorption system. However, it exhibited more favorable phosphate adsorption in synthetic seawater.
Column regeneration and reusabilityThe effectiveness of the adsorbent for practical
applications depends on the adsorption capacity and efficiency of adsorbent regeneration and reusability. However, the reuse of an adsorbent requires a desorption agent to desorb phosphate from the adsorbent for regeneration. To ensure that the adsorbent was saturated with phosphate before the regeneration study, a phosphate solution (Co = 12 mg-P/L, pH = 7) was pumped (Q = 2.5 mL/min) to the column (h = 1.5 cm, d ≤ 0.1 mm) for 24 h. The exhausted composite was regenerated with 0.1 N NaOH at a flow rate of 2.5 mL/min. The effluent
Fig. 3: Breakthrough curves for phosphate adsorption from anaerobic sludge filtrate, synthetic P water, and
synthetic P seawater (m = 1.01 g, Q = 2.5 mL/min, d = 0.1‐0.5 mm)
Fig. 3: Breakthrough curves for phosphate adsorption from anaerobic sludge filtrate, synthetic P water, and synthetic P seawater (m = 1.01 g, Q = 2.5 mL/min, d = 0.1-0.5 mm)
Fig. 4: Continuous phosphate desorption curve on am‐Zr/MgFe‐LDH composite column by 0.1 N NaOH (h = 1.5 cm and Q = 2.5 mL/min).
Fig. 4: Continuous phosphate desorption curve on am-Zr/MgFe-LDH composite column by 0.1 N NaOH (h = 1.5 cm and Q = 2.5 mL/min)

495
Global J. Environ. Sci. Manage., 7(4): 485-502, Autumn 2021
phosphate concentrations in a continuous desorption curve of phosphate at particular time points were determined and are shown in Fig. 4.
The desorption curve was an asymmetrically shaped curve with significantly high desorption at the beginning, followed by a flattened decline. The regeneration study was conducted for 8 h when the effluent concentration was 0.51 mg-P/L. Fig. 4 shows that the maximum phosphate concentration was obtained within 5–10 min, indicating that the majority of the phosphate amount desorbed during this period. The flattened curve was observed after a one-hour desorption, indicating that almost complete desorption was achieved after 1 h with a desorption efficiency (100 % × qdesorbed/qadsorbed) of 91.7% and an effluent concentration of 13.82 mg-P/L. However, a total regeneration of 98.8% was achieved after an eight-hour operation. The regenerated column was reused for subsequent adsorption to assess the reusability of the column, and its breakthrough curves and regeneration capacity after eight adsorption-desorption cycles are shown in Fig. 5. A significant decrease in the column adsorption capacity (~8.0%) was observed in the second cycle, as depicted by the earlier breakthrough point after the first cycle (Fig. 5a). These breakthrough points appeared to shift slowly to an earlier time, signifying a slow decrease in the adsorption capacity after the second cycle (Fig. 5b). The gradual decrease in adsorption performance is attributed to the loss of active binding sites from
the previous adsorption process, particularly in the first cycle, by strongly attached phosphate, which is difficult to desorb. The decrease in adsorption capacity from the first to the eighth cycle was approximately 17%, indicating that the composite may be suitable for practical applications.
Adsorption mechanismThe possible mechanism of phosphate adsorption
by the composite was further investigated using FTIR, XRD, point of zero charge (PZC), and XPS analyses. The functional groups of the composite before and after adsorption were identified using FTIR spectroscopy, and the spectra are shown in Fig. 6a. The intense and broadband centered at 3430 cm-1 and the band at 1640 cm-1 could be attributed to strong OH stretching and structural OH bending vibrations due to the presence of structural hydroxyl groups and physically adsorbed water molecules in the samples, respectively (Su et al., 2013; Tang et al., 2018). The bands of the Zr-OH bending vibration were observed at approximately 1353 cm-1 and 1565 cm-1, and the band of CO3
2- antisymmetric stretching in the interlayer was detected at 1358 cm-1 (Dou et al., 2012; Magri et al., 2019; Zhang et al., 2013). These bands were weakened after phosphate adsorption, indicating that phosphate anions were successfully adsorbed by replacing hydroxyl bonds and by exchanging some carbonate anions in the LDH interlayer. In addition, phosphate adsorption
Fig. 5: Column reusability study: (a) phosphate adsorption breakthrough curve on am‐Zr/MgFe‐LDH composite for each consecutive eight adsorption‐desorption cycles at a flow rate 2.5 mL/min, and (b) column adsorption capacity
calculated for each adsorption cycle (the numbers above the bar are adsorption retain ratio of phosphate adsorption capacity)
Fig. 5: Column reusability study: (a) phosphate adsorption breakthrough curve on am-Zr/MgFe-LDH composite for each consecutive eight adsorption-desorption cycles at a flow rate 2.5 mL/min, and (b) column adsorption capacity calculated for each adsorption cycle (the
numbers above the bar are adsorption retain ratio of phosphate adsorption capacity)

496
A. Nuryadin and T. Imai
in the composite was confirmed by the appearance of a new peak near 1057 cm-1 after the adsorption process, which could be attributed to the P=O bond (Zha et al., 2018).
Fig. 6b shows a comparison between the XRD patterns of the composite, before and after phosphate adsorption. The patterns exhibited the presence of an LDH structure with a typical halo pattern of amorphous zirconium hydroxide. There was no significant change in the structure and no additional characteristic peak was observed in the patterns after the adsorption process. However, the structure showed a lower crystallinity. The decrease in crystallinity confirmed the occurrence of phosphate adsorption, which caused a disordered structure in the composite surface.
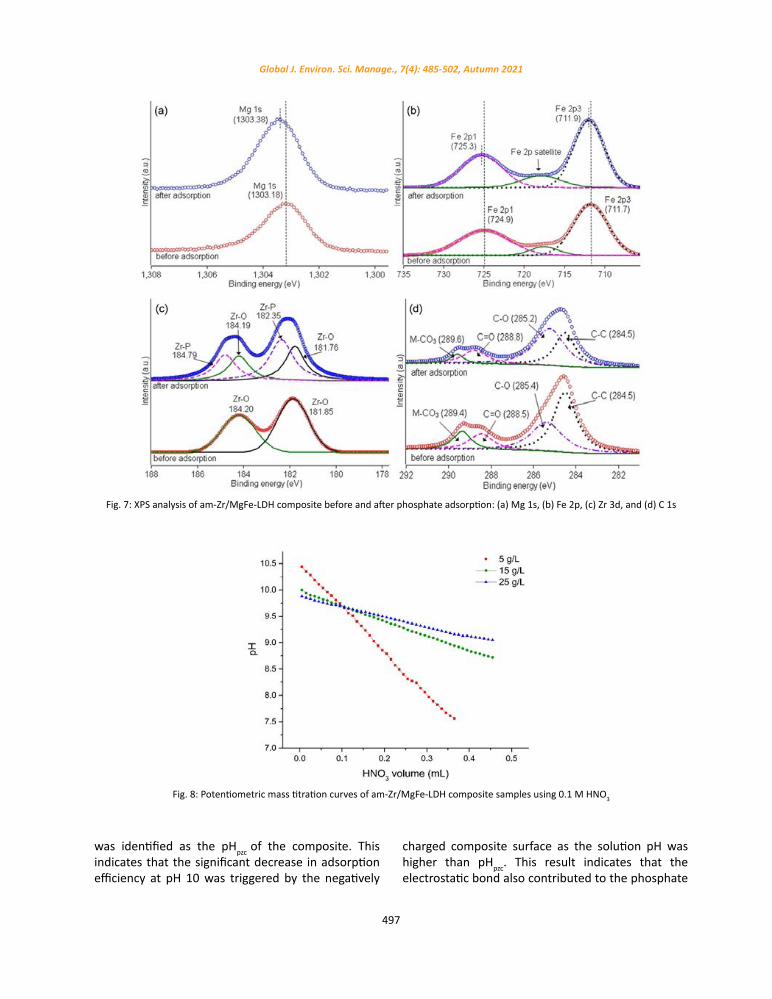
The phosphate adsorption mechanism was further evaluated by deconvolution of the XPS spectra. As depicted in Fig. 7a and Fig. 7b, the peaks of the Mg 1s and Fe 2p spectra shifted to higher binding energies after phosphate adsorption by about 0.2 eV for Mg 1s, 0.4 eV for Fe 2p1, and 0.2 eV for Fe 2p3. This enhancement of binding energy values was caused by electron withdrawal from the negatively charged O atoms of the phosphate species to the valence band of Mg s1 and Fe 2p and the formation of Mg-O-P and Fe-O-P through surface complexation (Hong et al., 2019; Liu et al., 2019). This indicated that the surface of LDH in the composite was also involved in the phosphate adsorption process. As presented
in Fig. 7c, the two peaks centered at 181.85 eV and 184.20 eV were assigned to Zr-O-Zr bonds of Zr 3d 5/2 and Zr 3d3/2 in the composite, respectively. The main peaks of Zr 3d were shifted to a higher binding energy of approximately 0.2 eV after phosphate adsorption, indicating that electron transfer occurred in the valence band and Zr-O-P inner-sphere complexation was formed by substituting the hydroxyl groups of am-Zr (Zhang et al., 2019). This shift also can be attributed to the overlap from two new Zr-P peaks in higher binding energies (182.35 eV and 184.79 eV) which formed through ligand exchange (Zong et al., 2016). These indicated that phosphate was adsorbed chemically on the composite surface. As shown in Fig. 7d, the C 1s spectra of the composite can be divided into four different peaks: C-C (284.5 eV), C-O (285.2 eV), C=O (288.8 eV), and metal carbonate (M-CO3) (289.6 eV) (Lai et al., 2020). After phosphate adsorption, the relative area of the metal carbonate decreased from 14.7% to 5.2%. This signified that the carbonate in the LDH interlayer took part in the phosphate adsorption process via ion and ligand exchange.
Nuryadin et al. (2021) reported that the adsorption was high at low pH (particularly at pH 2 and 3) and decreased at higher pH (notably at pH 10). To explain this condition, the pHpzc of the composite was investigated by PMT, and the plotted experimental curves are shown in Fig. 8. The curves show an intersection point at a pH of approximately 9.7, which
Fig. 6: (a) FTIR spectra and (b) XRD patterns of am‐Zr/MgFe‐LDH composite before and after adsorption
Fig. 6: (a) FTIR spectra and (b) XRD patterns of am-Zr/MgFe-LDH composite before and after adsorption
497
Global J. Environ. Sci. Manage., 7(4): 485-502, Autumn 2021
was identified as the pHpzc of the composite. This indicates that the significant decrease in adsorption efficiency at pH 10 was triggered by the negatively
Fig. 7: XPS analysis of am‐Zr/MgFe‐LDH composite before and after phosphate adsorption: (a) Mg 1s, (b) Fe 2p, (c) Zr 3d, and (d) C 1s
Fig. 7: XPS analysis of am-Zr/MgFe-LDH composite before and after phosphate adsorption: (a) Mg 1s, (b) Fe 2p, (c) Zr 3d, and (d) C 1s
charged composite surface as the solution pH was higher than pHpzc. This result indicates that the electrostatic bond also contributed to the phosphate
Fig. 8: Potentiometric mass titration curves of am‐Zr/MgFe‐LDH composite samples using 0.1 M HNO3
Fig. 8: Potentiometric mass titration curves of am-Zr/MgFe-LDH composite samples using 0.1 M HNO3

498
A. Nuryadin and T. Imai
adsorption mechanism between the composite surface and phosphate anions, particularly at pH values lower than 9.7.
Based on the analysis of adsorption in varying pH solutions, FTIR spectra, XRD patterns, and XPS spectra, the potential adsorption mechanisms involved in the composite during the adsorption process were found to mainly consist of electrostatic attraction between the positively charged adsorbent surface and phosphate anions (particularly at low pH), inner-sphere complex formation between metal hydroxides and phosphate anions on the adsorbent surface, and exchange of carbonate anions in the LDH interlayer. The proposed phosphate-adsorption mechanism is illustrated in Fig. 9. The presence of am-Zr on the surface of the LDH likely increased the adsorption capacity of the composite. The zirconium species, which is in amorphous form, have a massive number of hydroxyl groups as the active binding sites for the phosphate anions. Moreover, the crystallization of am-Zr on the LDH matrix was presumably suppressed during synthesis, leading to the formation of nanosized am-Zr (Nuryadin et al., 2021). The nanosized materials are preferable for adsorbent because the crystal has a large surface area for adsorption sites. Therefore, we suggest that
the high phosphate adsorption of the composite is mainly associated with the presence of highly hydrated am-Zr collaborated with the ability of MgFe-LDH for adsorbing phosphate by anion exchange and surface adsorption.
CONCLUSIONThis study involves the application of a synthesized
am-Zr/MgFe-LDH composite as a phosphate sorbent in a continuous fixed-bed column system as well as the investigation of the feasibility of its reusability using NaOH solution in regeneration process. The results of the column experiments showed that the phosphate adsorption capacity of the composite was affected by the flow rate, bed height, influent phosphate concentration, influent pH, and composite particle size. The increase in the flow rate, pH, and adsorbent particle size, decreased the phosphate adsorption capacity of the composite. Contrarily, the phosphate adsorption capacity of the composite increased with increasing bed height and influent phosphate concentration in the fixed-bed column system. The highest adsorption capacity of 25.15 mg-P/L was obtained when the influent pH was 4, indicating that the adsorption of phosphate onto the composite surface is favorable in acidic. From the
Fig. 9: Proposed mechanism of phosphate adsorption on am‐Zr/MgFe‐LDH composite
Fig. 9: Proposed mechanism of phosphate adsorption on am-Zr/MgFe-LDH composite

499
Global J. Environ. Sci. Manage., 7(4): 485-502, Autumn 2021
non-linear fitting of the breakthrough data, the MDR model was found to be the best model for predicting the experimental phosphate adsorption behavior of a packed composite in a fixed-bed column system, as compared to the Yoon-Nelson and Thomas models. The phosphate adsorption capacity of the composite decreased when it was used in wastewater with a high (bi)carbonate concentration. However, it exhibited a more effective phosphate adsorption in synthetic seawater. The column regeneration studies revealed that 91.7 % of adsorbed phosphorus was desorbed during the one-hour desorption, and 83% of the fresh composite adsorption ability could be retained even after eight adsorption-desorption cycles. The pHpzc, FTIR, XRD, and XPS analyses indicated that electrostatic attraction, inner-sphere complexation, and anion exchange played an important role in phosphate adsorption. The am-Zr/MgFe-DH composite has the potential to be utilized as an adsorbent for phosphorus removal from aqueous solutions as it has high phosphate adsorption capacity and reusability. Although, this study provides helpful information for the design of a practical system for phosphorus removal and recovery, some considerations should be taken to improve the performance of the composite adsorption system in future work. First, the application of economical pretreatment to reduce (bi)carbonate from wastewater before process, such as chemical precipitation, since (bi)carbonate is the most competitive anion for phosphate adsorption onto the composite. Second, the use of adsorption byproduct to create an economic adsorption system, such as the processing of desorbed phosphorus in the regeneration process to a valuable product like hydroxyapatite, or the application of saturated composite as the slow release phosphate fertilizer.
AUTHOR CONTRIBUTIONSA. Nuryadin performed the literature review,
conception and design, acquisition of data, analysis and interpretation of data, drafting of the manuscript, and statistical analysis. T. Imai performed conception and design, critical revision of the manuscript for important intellectual content, supervision, and support for administrative, technical, and material.
ACKNOWLEDGEMENTA. Nuryadin expresses his gratitude to the support
of the Indonesian Ministry of Research, Technology,
and Higher Education (RISTEK-DIKTI), as well as the Project Implementation Unit (PIU) of the Islamic Development Bank (IsDB) 4in1 Project of Mulawarman University for providing the scholarship. The authors would also like to thank T. Suzuki for assistance with FTIR analysis and Editage for English language editing.
CONFLICT OF INTERESTThe authors declare no potential conflict of
interest regarding the publication of this work. In addition, the ethical issues including plagiarism, informed consent, misconduct, data fabrication and, or falsification, double publication and, or submission, and redundancy have been completely witnessed by the authors.
ABBREVIATIONS
aA modified dose-response model parameter
A-Zr-NPAlginate-/Zirconium-Grafted Newspaper Pellets
am-Zr amorphous zirconium (hydr)oxideam-Zr/MgFe-LDH
amorphous zirconium (hydr)oxide/MgFe layered double hydroxides
C CarbonC Effluent concentrationCo Influent concentrationCa2+ Calcium ionCaCl2 Calcium chlorideCaCO3 Calcium carbonateCl- Chloride ioncm CentimeterCO3
2- Carbonate ionCOD Chemical oxygen demand
CS-Zr-PEPAPolyethyene polyamine grafted chitosan-zirconium(IV) composite beads
Cu-Kα Copper K-alphad Particle sizeDI DeionizedEAP Eluted amount of phosphoruseV Electron voltFe IronFeCl3·6H2O Iron(III) chloride hexahydrateFTIR Fourier transform infraredg Gram

500
A. Nuryadin and T. Imai
h Hourh Bed heightHCl Hydrochloric acidHNO3 Nitric acidK KelvinK+ Potassium ionK2HPO4 Dipotassium hydrogen phosphateKCl Potassium chlorideKNO3 Potassium nitrateKOH Potassium hydroxidekTh Thomas kinetic coefficientkV KilovoltKYN Yoon-Nelson kinetic coefficientL LiterLDH Layered double hydroxidesM Molarm MassMDR Modified dose-responseMg Magnesiummg milligrammg-P Milligram as phosphorusMg2+ Magnesium ionMgCl2 Magnesium chlorideMgCl2·6H2O Magnesium chloride hexahydrate
MgFe-LDHMagnesium iron layered double hydroxides
min MinutemL Millilitermm MillimeterN NormalN2 Nitrogen
n2Number of the last fraction in the desorption operation
Na+ Natrium ionNa2CO3 Sodium carbonateNa2SO4 Sodium sulfateNaCl Sodium chlorideNaOH Sodium Hydroxidenm Nanometer NO3
--N Nitrate as nitrogenO Oxygen
OH HydroxylOH- Hydroxyl ionP Phosphorus
P seawaterSynthetic phosphate-containing seawater
P water Synthetic phosphate-containing waterPAOs polyphosphate-accumulating organismspHpzc pH at the point of zero chargePMT Potentiometric mass titrationPO4-P Phosphate as phosphorusPSU Practical salinity unitPZC Point of zero charge Q Flow rateqadsorbed Total amount of adsorbed phosphateqdesorbed Total amount of desorbed phosphateqe Equilibrium adsorption capacity
Qmdr
Predicted adsorption capacity of modified dose-response model
qth
Predicted adsorption capacity of Thomas model
R2 Coefficient of determinationrpm Rotation per minutet Time tb Breakthrough timete Time required to reach exhaustion timeTSS Total suspended solidVq Effluent volume of the q -th fractionXPS X-ray photoelectron spectroscopyXRD X-ray diffractionZr ZirconiumZr(IV)-loaded okara
Soybean residue (okara) loaded with zirconium(IV)
Zr(IV)-loaded SOW gel
Saponified orange waste gel loaded with zirconium(IV)
Zr-FPSFiber containing phosphonate and sulfonate (FPS) loaded with zirconium(IV)
ZrOCl2·8H2O Zirconyl chloride octahydrateµm Micrometer
τTime required for 50% adsorption breakthrough
% Percent

501
Global J. Environ. Sci. Manage., 7(4): 485-502, Autumn 2021
REFERENCESAwual, M.R.; Jyo, A.; Ihara, T.; Seko, N.; Tamada, M.; Lim, K.T.,
(2011). Enhanced trace phosphate removal from water by zirconium(IV) loaded fibrous adsorbent. Water Res., 45:4592–4600 (9 pages).
Biswas, B.K.; Inoue, K.; Ghimire, K.N.; Harada, H.; Ohto, K.; Kawakita, H., (2008). Removal and recovery of phosphorus from water by means of adsorption onto orange waste gel loaded with zirconium. Bioresour. Technol., 99:8685–8690 (6 pages).
Bourikas, K.; Vakros, J.; Kordulis, C.; Lycourghiotis, A., (2003). Potentiometric mass titrations: Experimental and theoretical establishment of a new technique for determining the point of zero charge (PZC) of metal (Hydr)Oxides. J. Phys. Chem. B., 107(35): 9441–9451 (11 pages).
Brush, G.S., (2009). Historical Land Use, Nitrogen, and Coastal Eutrophication: A Paleoecological Perspective. Estuaries Coasts., 32(1):18-28 (11 pages).
Chen, Z.; Luo, H.; Rong, H., (2020). Development of polyaminated chitosan-zirconium(IV) complex bead adsorbent for highly efficient removal and recovery of phosphorus in aqueous solutions. Int. J. Biol. Macromol., 164:1183–1193 (11 pages).
Chittoo, B.S.; Sutherland, C., (2020). Column breakthrough studies for the removal and recovery of phosphate by lime-iron sludge: Modeling and optimization using artificial neural network and adaptive neuro-fuzzy inference system. Chinese J. Chem. Eng., 28(7):1847-1859 (13 pages).
Chu, K.H., (2004). Improved fixed bed models for metal biosorption. Chem. Eng. J., 97(2-3):233-239 (7 pages).
Dash, S.; Borah, S.S.; Kalamdhad, A.S., (2020). Study of the limnology of wetlands through a one-dimensional model for assessing the eutrophication levels induced by various pollution sources. Ecol. Modell., 416:108907 (15 pages).
Dou, X.; Mohan, D.; Pittman, C.U.; Yang, S., (2012). Remediating fluoride from water using hydrous zirconium oxide. Chem. Eng. J., 198-199:236-245 (10 pages).
Gouran-Orimi, R.; Mirzayi, B.; Nematollahzadeh, A.; Tardast, A., (2018). Competitive adsorption of nitrate in fixed-bed column packed with bio-inspired polydopamine coated zeolite. J. Environ. Chem. Eng., 6(2):2232-2240 (9 pages).
He, Y.; Lin, H.; Dong, Y.; Liu, Q.; Wang, L., (2016). Simultaneous removal of phosphate and ammonium using salt–thermal-activated and lanthanum-doped zeolite: fixed-bed column and mechanism study. Desalin. Water Treat., 57(56):27279-27293 (15 pages).
Hong, X.; Zhu, E.; Ye, Z.; Hui, K.S.; Hui, K.N., (2019). Enhanced phosphate removal under an electric field via multiple mechanisms on MgAl-LDHs/AC composite electrode. J. Electroanal. Chem., 836:16-23 (8 pages).
Husein, D.Z.; Al-Radadi, T.; Danish, E.Y., (2017). Adsorption of phosphate using alginate-/zirconium-grafted newspaper pellets: fixed-bed column study and application. Arab. J. Sci. Eng., 42:1399–1412 (14 pages).
Jiang, D.; Chu, B.; Amano, Y.; Machida, M., (2018). Removal and recovery of phosphate from water by Mg-laden biochar: Batch and column studies. Colloids Surfaces A Physicochem. Eng. Asp. 558:429-437 (9 pages).
Kumar, P.S.; Korving, L.; van Loosdrecht, M.C.M.; Witkamp, G.J., (2019). Adsorption as a technology to achieve ultra-low concentrations of phosphate: Research gaps and economic
analysis. Water Res. X. 4:100029 (17 pages).Kumar, R.; Bhatia, D.; Singh, R.; Rani, S.; Bishnoi, N.R., (2011).
Sorption of heavy metals from electroplating effluent using immobilized biomass Trichoderma viride in a continuous packed-bed column. Int. Biodeterior. Biodegradation. 65(8):1133-1139 (7 pages).
Lai, Y.T.; Huang, Y.S.; Chen, C.H.; Lin, Y.C.; Jeng, H.T.; Chang, M.C.; Chen, L.J.; Lee, C.Y.; Hsu, P.C.; Tai, N.H., (2020). Green treatment of phosphate from wastewater using a porous bio-templated graphene oxide/MgMn-layered double hydroxide composite. iScience. 23(5):101065 (24 pages).
Lee, S.Y.; Choi, J.W.; Song, K.G.; Choi, K.; Lee, Y.J.; Jung, K-W., (2019). Adsorption and mechanistic study for phosphate removal by rice husk-derived biochar functionalized with Mg/Al-calcined layered double hydroxides via co-pyrolysis. Compos. Part B Eng., 176:107209 (15 pages).
Liu, R.; Chi, L.; Wang, X.; Wang, Y.; Sui, Y.; Xie, T.; Arandiyan, H., (2019). Effective and selective adsorption of phosphate from aqueous solution via trivalent-metals-based amino-MIL-101 MOFs. Chem. Eng. J., 357:159-168 (10 pages).
Magri, V.R.; Duarte, A.; Perotti, G.F.; Constantino, V.R.L., (2019). Investigation of thermal behavior of layered double hydroxides intercalated with carboxymethylcellulose aiming bio-carbon based nanocomposites. Chem. Eng., 3(2):55 (17 pages).
March, M.D.; Toma, L.; Stott, A.W.; Roberts, D.J., (2016). Modelling phosphorus efficiency within diverse dairy farming systems − pollutant and non-renewable resource?. Ecol. Indic., 69:667-676 (10 pages).
Marzbali, M.H.; Esmaieli, M., (2017). Fixed bed adsorption of tetracycline on a mesoporous activated carbon: Experimental study and neuro-fuzzy modeling. J. Appl. Res. Technol., 15(5):454-463 (10 pages).
Mohan, R.; Dutta, R.K., (2020). Continuous fixed-bed column assessment for defluoridation of water using HAp-coated-limestone. J. Environ. Chem. Eng., 8(4):103840 (9 pages).
Nguyen, T.A.H.; Ngo, H.H.; Guo, W.S.; Pham, T.Q.; Li, F.M.; Nguyen, T.V.; Bui, X.T., (2015). Adsorption of phosphate from aqueous solutions and sewage using zirconium loaded okara (ZLO): Fixed-bed column study. Sci. Total Environ. 523:40-49 (10 pages).
Nuryadin, A.; Imai, T.; Kanno, A.; Yamamoto, K.; Sekine, M.; Higuchi, T., (2021). Phosphate adsorption and desorption on two-stage synthesized amorphous-ZrO2/Mg-Fe layered double hydroxide composite. Mater. Chem. Phys., 266:124559 (10 pages).
Oguz, E., (2017). Fixed-bed column studies on the removal of Fe3+ and neural network modelling. Arab J. Chem., 10(3):313-320 (8 pages).
Ramasahayam, S.K.; Guzman, L.; Gunawan, G.; Viswanathan, T., (2014). A comprehensive review of phosphorus removal technologies and processes. J. Macromol. Sci. Part A., 51(6):538-545 (8 pages).
Sana, D.; Jalila, S., (2017). A comparative study of adsorption and regeneration with different agricultural wastes as adsorbents for the removal of methylene blue from aqueous solution. Chinese J. Chem. Eng., 25(9):1282-1287 (6 pages).
Sotelo, J.L.; Ovejero, G.; Rodríguez, A.; Álvarez, S.; García, J., (2012). Removal of atenolol and isoproturon in aqueous solutions by adsorption in a fixed-bed column. Ind. Eng. Chem. Res., 51(13):5045-5055 (11 pages).
Su, Y.; Cui, H.; Li, Q.; Gao, S.; Shang, J.K., (2013). Strong adsorption

502
A. Nuryadin and T. Imai
of phosphate by amorphous zirconium oxide nanoparticles. Water Res., 47(14):5018-5026 (9 pages).
Sun, X.; Imai, T.; Sekine, M.; Higuchi, T.; Yamamoto, K.; Kanno, A.; Nakazono, S., (2014). Adsorption of phosphate using calcined Mg3–Fe layered double hydroxides in a fixed-bed column study. J. Ind. Eng. Chem., 20(5):3623-3630 (8 pages).
Taka, A.L.; Klink, M.J.; Mbianda, X.Y.; Naidoo, E.B., (2020). Chitosan nanocomposites for water treatment by fixed-bed continuous flow column adsorption: a review. Carbohydr. Polym. 255:117398 (15 pages).
Tang, N.; He, T.; Liu, J., Li, L.; Shi, H.; Cen, W.; Ye, Z., (2018). New insights into co2 adsorption on layered double hydroxide (LDH)-based nanomaterials. Nanoscale Res. Lett., 13:55 (7 pages).
Thomas, H.C., (1944). Heterogeneous ion exchange in a flowing system. J. Am. Chem. Soc., 66(10):1664-1666 (3 pages).
Wang, X.; Miao, J.; You, S.; Ren, N., (2021). Statistical entropy analysis as a proxy method for quantitative evaluation of phosphorus of a food-based bioethanol system. Resour. Conserv. Recycl., 164:105125 (9 pages).
Yan, G.; Viraraghavan, T.; Chen, M., (2001). A new model for heavy metal removal in a biosorption column. Adsorpt. Sci. Technol., 19(1):25-43 (19 pages).
Yoon, Y.H.; Nelson, J.H., (1984). Application of Gas Adsorption Kinetics I. A theoretical model for respirator cartridge service life. Am. Ind. Hyg. Assoc. J., 45(8):509-516 (8 pages).
Zha, Z.; Ren, Y.; Wang, S.; Qian, Z.; Yang, L.; Cheng, P.; Han, Y.; Wang, M., (2018). Phosphate adsorption onto thermally dehydrated aluminate cement granules. RSC Adv., 8(34):19326-19334 (9 pages).
Zhang, H.; Elskens, M.; Chen, G.; Snoeck, C.; Chou, L., (2020). Influence of seawater ions on phosphate adsorption at the surface of hydrous ferric oxide (HFO). Sci. Total Environ., 721:137826 (8 pages).
Zhang, L.; Wang, Z.; Xu, X.; Chen, C.; Gao, B.; Xiao, X., (2019). Insights into the phosphate adsorption behavior onto 3D self-assembled cellulose/graphene hybrid nanomaterials embedded with bimetallic hydroxides. Sci. Total Environ., 653:897-907 (11 pages).
Zhang, Q.; Du, Q.; Jiao, T.; Pan, B.; Zhang, Z.; Sun, Q.; Wang, S.; Wang, T.; Gao, F., (2013). Selective removal of phosphate in waters using a novel of cation adsorbent: zirconium phosphate (ZrP) behavior and mechanism. Chem. Eng. J., 221:315-321 (7 pages).
Zong, E.; Liu, X.; Jiang, J.; Fu, S.; Chu, F., (2016). Preparation and characterization of zirconia-loaded lignocellulosic butanol residue as a biosorbent for phosphate removal from aqueous solution. Appl. Surf. Sci., 387:419-430 (12 pages).
Zou, Y.; Zhang, R.; Wang, L.; Xue, K.; Chen, J., (2020). Strong adsorption of phosphate from aqueous solution by zirconium-loaded Ca-montmorillonite. Appl. Clay. Sci. 192:105638 (10 pages).
AUTHOR (S) BIOSKETCHES
Nuryadin, A., Ph.D. Candidate, Graduate School of Sciences and Technology for Innovation, Yamaguchi University, Yamaguchi, Japan.Department of Physics Education, Mulawarman University, Samarinda, 75123, Indonesia. Email: [email protected]
Imai, T., Ph.D., Professor, Graduate School of Sciences and Technology for Innovation, Yamaguchi University, Yamaguchi, Japan.
Email: [email protected]
HOW TO CITE THIS ARTICLE
Nuryadin, A.; Imai, T., (2021). Application of amorphous zirconium (hydr)oxide/MgFe layered double hydroxides composite for phosphate removal from water. Global J. Environ. Sci. Manage., 7(4): 485-502.
DOI: 10.22034/gjesm.2021.04.01
url: https://www.gjesm.net/article_243376.html
COPYRIGHTS
©2021 The author(s). This is an open access article distributed under the terms of the Creative Commons Attribution (CC BY 4.0), which permits unrestricted use, distribution, and reproduction in any medium, as long as the original authors and source are cited. No permission is required from the authors or the publishers.

Global J. Environ. Sci. Manage. 7(4): 503-522, Autumn 2021
*Corresponding Author:Email: [email protected]: +79163528460 Fax: +79163528460
Global Journal of Environmental Science and Management (GJESM)
Homepage: https://www.gjesm.net/
ORIGINAL RESEARCH PAPER
Modelling the impact of environmental responsibility on the development of enterprises
M. Pinskaya1,* O. Meleshchenko2, O. Kovalchuk3, O. Karpenko4, E. Kompanets4
1Financial Research Institute of the Ministry of Finance of the Russian Federation, Moscow, Russian Federation2Taras Shevchenko National University of Kyiv, Kyiv, Ukraine3Kyiv National University of Culture and Arts, Kyiv, Ukraine4Dragomanov National Pedagogical University, Kyiv, Ukraine
BACKGROUND AND OBJECTIVES: The requirements of stakeholders for the qualitative transformation of the approaches of industrial enterprises – environmental users to introduction of economic activities cause an increase in the role of environmental responsibility as their strategic priority for development. The purpose of the study is to improve the practical tools for calculating and developing strategies for the development of environmental responsibility of industrial enterprises.METHODS: In the study, tools for assessing the level of environmental initiative of an industrial enterprise as an integrated indicator of environmental initiative are suggested. It is expressed as the arithmetic mean of ten factors of environmentally proactive behavior of industrial enterprises. To achieve the objectives of the study, methods of criterion-qualitative assessment are suggested, such as expert assessment and survey. The assessment system includes ten factors rated on a 10-point scale and weighted by significance. The integrated indicator of the environmental initiative acquires values within, is a stimulant of environmental responsibility. FINDINGS: One justified a scientific and methodological approach to assessing the level of environmental responsibility or the industrial enterprise, including calculation of the corresponding taxonomic indicator with consideration of the quantitative factors of its environmental responsibility and the qualitative and quantitative factors of environmental initiative. This enables the possibility to assess the relevant state of environmental responsibility and determine the volumes for further correction of the ecological strategy for the development of the industrial enterprise.CONCLUSION: As a conclusion, practical recommendations are made for the implementation of organizational and economic support of environmental responsibility in the development strategy of an industrial enterprise taking into account the impact of its environmental initiative and environmental duty. The level of environmental responsibility of industrial enterprises taken into account when developing recommendations on adjustment of their environmental strategy of development is determined, which as a whole allowed to form organizational and economic support for environmental responsibility of the enterprises under study. Thus, an enterprise, which only ensures compliance with environmental emission standards (compensation strategy or sufficiency strategy) cannot be characterized by a high level of environmental responsibility. To ensure a high level of environmental responsibility, an industrial enterprise must rely on a proactive strategy or a strategy for sustainable use of nature.
©2021 GJESM. All rights reserved.
ARTICLE INFO
Article History:Received 19 January 2021Revised 04 April 2021Accepted 05 May 2021
Keywords:Environmental initiativeEnvironmental responsibilityIntegrated indicatorSocial activityStrategy
ABSTRAC T
DOI: 10.22034/gjesm.2021.04.02
NUMBER OF REFERENCES
28NUMBER OF FIGURES
3NUMBER OF TABLES
9
Note: Discussion period for this manuscript open until January 1, 2022 on GJESM website at the “Show Article.

504
M. Pinskaya et al.
INTRODUCTIONIn the context of increasing environmental
problems in the 21st century, enterprises, which use natural resources, face the task to strike a balance between economic development and minimizing the negative environmental impacts of economic activity. The requirements of stakeholders, concerning the qualitative transformation of approaches, taken by industrial enterprises, which use natural resources, to their economic activity, give rise to the role of environmental responsibility, as their strategic development priority (Zare et al., 2016). The issue regarding the observance of environmental responsibility principles becomes increasingly relevant at the level of interaction between the community and enterprises in the areas, where the latter are located (Hadj, 2020). Since industrial enterprises particularly place the greatest stress on the environment, it is important to provide an organizational-economic mechanism for ensuring their environmental responsibility in due course (Panyam et al., 2018). The need for ecologically friendly and equitable economic development remains the most difficult issue in the context of growing environmental-economic problem (Hovardas, 2016). The pursuit of the sustainable development of the ecological-economic system, providing a wide range of technological capabilities and high productiveness of business activities requires today’s organizations to be more involved in managing these processes (Chen and Hamilton, 2020). The projection of the concept of sustainable development on the enterprise level causes the escalation of ecological and socio-economic conflict, which, on the one hand, is aimed at profit maximization, and on the other hand, is stemming from the requirements of the social sector and ecological control authorities to increase the social and ecological standards of economic activity (Fujii and Managi, 2016). However, the ecological efficiency is determined not only by the industrial base. It can be achieved by changing goals and targets, which are being pursued by industries, operational management and the methods of its implementation (Hong et al., 2016). It is, therefore, necessary to refuse outright the purely consumerist approach and to follow a policy that takes account of ecological and social factors (Singh et al., 2016). Consequently, the top management of industrial companies should be aware of the fact that positive or negative assessment
of the ecological activity of a company on the part of stakeholders and, first of all, the local community significantly affects the future success of products on the market, and business competitiveness as well (Malá et al., 2017).
Thus, in the context of increasing environmental problems in the 21st century, the enterprises, which use natural resources around the world, face an important task to strike a balance between the development of their economic activities and minimizing environmental problems, which arise due to these activities (Yue et al., 2020). The concept of socio-environmental responsibility of business was originally interpreted as the enhanced principle “polluter pays”, well-known in the economics of nature use, which evolved into the requirement of environmental entrepreneurship initiative (Jovovic et al., 2017). At the same time, experts introduced a broad interpretation of the principle of sustainability within the “Sustainable Development Triangle” (Ji and Long, 2016). According to this approach, modern-day business activities are challenged to combine three interrelated goals in practice, namely, economic efficiency, environmental responsibility and social activity (Sáez-Martínez et al., 2016). All highly-developed countries nowadays recognize the need for theoretical underpinning and taking practical steps to shape enterprise environmental policy, which would envisage the care for nature conservation, environmental quality, the wise use of existing and potential natural resources, maintaining the ecological balance of nature and ensuring the living conditions of human (Elsawah et al., 2017). In accordance with these statements, the logical response of companies to the demands of public opinion would be the observance of environmental responsibility principles at all stages of industrial activity (Zhu and Zhao, 2018). At the same time, a range of issues still remains insufficiently developed in scientific literature. Among them, in particular, are the issues related to the meaning of the concept of industrial enterprise’s environmental responsibility, assessing its level, determining the nature of the impact, exerted by environmental initiative and commitment, on the level of environmental responsibility. Consequently, one should continue to study the issue related to the organizational-economic mechanism for ensuring environmental responsibility of industrial enterprises according to

505
Global J. Environ. Sci. Manage., 7(4): 503-522, Autumn 2021
the requirements of stakeholders, as well as the issue of choosing an appropriate development strategy, considering ecological factors. The relevance of the research problem, its practical importance and the deficient theoretical elaboration of the mentioned aspects led to the choice of the topic, objective and tasks of the research paper. The purpose of this study is to improve the practical tools for calculating and developing strategies for the development of environmental responsibility of industrial enterprises. This study were set to achieve the theoretical foundations and the current condition of the system of ecological responsibility of the industrial enterprises; to develop the scientific and methodological approach to assessing the level of ecological responsibility of the industrial enterprises with the consideration of the level of their ecological initiative and ecological responsibility; to calculate the integrated indicator of environmental responsibility for Volkswagen AG; to justify the scientific basis for choosing an environmental strategy for the development of the industrial enterprises in terms of considering the impact of the existing level of environmental responsibility of the enterprise in these strategies. This study was conducted for for Volkswagen AG (Germany, Poland) in the period of 2012-2018.
MATERIALS AND METHODSThe local community can act both as an object
of environmental responsibility, and as a fully-fledged entity in the process of its formation at an industrial enterprise (Domenech and Bahn-Walkowiak, 2019). The assessment system should provide a general idea about the level of industrial enterprise’s environmental responsibility, confirmed by outcomes, social (non-financial) reports, statistical data, as well as to form the information base for further analysis, detecting potential risks and the decision-making process (Borland et al., 2016). To assess the environmental initiative of an enterprise, one considers it appropriate to use the questionnaire method, as the concept of enterprise’s environmental initiative is distinctly subjective. A questionnaire refers to the qualitative methods of information assessment and has a range of advantages, such as the ability to cover large target groups, a high level of result formalization, the minimal impact of the researcher on the interviewee, responsiveness, and
disadvantages, associated with the need for data verification, consistency check, etc. That is why a questionnaire should be necessarily combined with the evaluation of statistical error or the consistency of experts’ opinions (Jiang et al., 2019). It is time to review the key advantages and disadvantages of expert methods. A direct estimation method can be applied, when the subjects of examination, which determine the final results, are directly comparable since these subjects are of similar nature and therefore have a common benchmark standard (Wang et al., 2016a). The method of direct estimation makes it possible to take into account the degree of predominance of a particular indicator in relation to others (Graafland, 2018). But when estimating the composite index of effectiveness, the wrong estimate of the indicator with lower value, if its position relative to other indicators has been determined correctly, can lead to the serious distortion of the final result (Wang et al., 2016b).
The ranking method and its types can be applied in the following cases:§to arrange any kinds of objects or phenomena in
time or space (Wilmer et al., 2018);§to arrange objects according to any indicator,
which does not need to be accurately measured (Cao et al., 2017);
§if a particular indicator should be measured, but can not be measured at the moment for practical or theoretical reasons (Anthony et al., 2016).Environmental initiative of industrial enterprises
is a category that is difficult to quantify. Given this statement, it is advisable to use high-quality, heuristic research methods to assess it. Thus, the integrated indicator of environmental initiative is determined on the basis of the method of expert survey conducted among employees of the enterprise under study and environmentalists. During this study, a survey to determine the scores of the level of environmental initiative of enterprises in each assessment category was conducted among 50 employees of the industrial enterprise under study, including middle managers and technical staff. Experts were asked to assign ranks (from 10 - the most significant, to 1 - the least significant) to each of the assessment categories. This choice of the target audience of the survey was due to the need to ensure the impartiality of expert opinions. Thus, none of the experts was interested in certain results of the survey, their opinion was completely

506
Environmental responsibility on the development of enterprises
independent. When assessing the objects of a survey, experts often disagree on the problem to be solved. In this regard, there is a need to quantify the level of agreement of experts. Obtaining a quantitative measure of agreement allows a more reasonable interpretation of the reasons for differences of opinion. To this end, the level of agreement between the opinions of experts was determined through the use of the concordance coefficient. The concordance coefficient determines the degree of agreement of expert assessments, varies in the range of 0 < K < 1, with 0 meaning complete disagreement, and 1 meaning complete agreement. The results of the survey are considered statistically significant at K > 0.55. The calculated concordance coefficient for the enterprise under study is higher than its control value of K = 0.77, thus, it can indicate a high level of agreement of experts. Therefore, the results of the conducted study are credible and suitable for further use. Given that the environmental responsibility of industrial enterprises is considered as a system of their environmental duty and environmental initiative, the indicators of the level of environmental responsibility are suggested to be divided into two blocks — the block of environmental duty and the block of environmental initiative. At the same time, by the nature of the impact on the level of environmental responsibility, all indicators are divided into stimulants, the increase of which contributes to the increase of the level of environmental responsibility, and disincentives, the increase of which causes a decrease of the level of environmental responsibility.
During the second stage, the standardization of indicators is carried out using Eqs. 1, 2 and 3.
k
kikik V
yyr
−=
(1)
Where,
∑=
=z
iikk y
zy
1
1 (2)
21
1
2)(1
−= ∑
=
z
iikikk yy
zV (3)
Where, k=1,2...,n; iky - the value of the index k for the unit i; ky - arithmetic mean value of the index k; kV - standard deviation of the index k; ikr - the
standardized value of the index k for the unit i.The highest values of incentives and the lowest
values of disincentives form the coordinates of desired development benchmark using Eqs. 4, 5 and 6.
0 maxt ikr r= , if index к is an incentive; (4)
ikrrt
min0 = , if index к is a disincentive. (5)
The development benchmark will therefore have coordinates:
),...,,( 002010 nrrrD = (6)
To obtain the taxonomic index of development the following equations are used. According to interpretation, the closer its value is to 1, the higher level of development it shows as Eqs.7, 8, 9 and 10.
0
01bbp i
i −= (7)
Where, tnrrb
n
Vtivi ,..,2,1,)(
21
1
200 =
−= ∑
=
(8)
000 2Vbb += (9)
∑=
=t
iib
tb
100
1 (10)
Where, 0b - the distance between separate points-units and the point 0D , which presents the development benchmark, 0V - standard deviation of the index
0ib . For Volkswagen Aktiengesellschaft, the overall
taxonomic environmental responsibility index will change by 1.79%, along with the change of index from the environmental commitment block by 1% and the constant value of the index from the environmental initiative block. If the environmental initiative index changes by 1% while the environmental commitment index remains sustainable, the overall taxonomic environmental responsibility index will change by 1.27%. In the light of the above, for the researched Volkswagen Aktiengesellschaft, both environmental commitment and environmental initiative blocks have relatively equal impact on the resultant environmental responsibility index, with a slight prevalence of environmental commitment block. The composite taxonomic environmental responsibility

507
Global J. Environ. Sci. Manage., 7(4): 503-522, Autumn 2021
index, constructed from the environmental commitment and environmental initiative blocks, synthetically characterizes the changes in property values of the researched groups. One of the important advantages of this indicator is the characterization of direction and the scope of changes in the processes described by a set of initial data. The taxonomic method enables one to determine the level of environmental responsibility of industrial enterprises by assessing the distance from the coordinates of the benchmark-point to the standardized values of indicators. The factitious benchmark has been defined by taking into account the differentiation of incentive and disincentive features of impact on the object under study. Through series of manipulations, the calculated distance has been transformed into the index with range (0; 1). Thus, the level of ecological responsibility of the enterprises is proposed to be assessed using the taxonomy method, which is used to reduce the factor space, manifesting itself in the aggregation of the information space, in the result of which one observes the formation of a general index. The methodology for the assessment of industrial enterprise’s environmental responsibility, presented in this research, makes it possible to specify the areas of ecological strategy, which need improvement, as well as to define the level of its sustainability. It also provides a basis for the comparison of the actual level of environmental responsibility among different companies, which can be performed in further researches.
RESULTS AND DISCUSSIONIt is believed that in order to build an effective
system of nature management, it is necessary to form new strategic areas of intersubjective relationships in the natural resource block of the economy, which will allow to create a certain margin of safety of the economy from negative external or internal influences. It is believed that this important strategic area is a multilevel approach to management decision-making, which takes into account the external and internal environment of the main industrial enterprises polluting the region, the creation of intersectoral partnership in the field of environmental protection. In modern economic conditions, the basis is created for the implementation of environmental management actions through the business environment, which must take into account
the emerging contradictions of stakeholders. It is there that the most complete interaction of regional and local (enterprise level) levels of transition to sustainable development takes place. It is the environmental responsibility of industrial enterprises that is the key to taking into account the environmental interests of their stakeholders. The transition of economic systems at the macro, meso and micro levels to the path of sustainable development is due to the importance of preserving the environment not only for the existing generation, but also for future generations. Analysis of environmental costs as a component of assessing the level of environmental initiative of industrial enterprises allows to assess the functioning of the environmental management system, to monitor environmental protection costs, to analyze the relationship of environmental characteristics with financial and economic indicators of company activities. At each stage of the process of implementation of the environmental initiative of an industrial enterprise, the costs for the generation of adequate reporting information, effective management decisions and further optimization of environmental costs should be monitored. It should be stressed that the process of optimizing environmental costs should, in addition to the objectives of the enterprise, take into account the requirements of the local community and other stakeholders. Optimization should not cause deterioration of the environment due to reduced costs for the restoration of the damaged state of the environment. Environmental responsibility of industrial enterprises is one of the fundamental factors for shifts towards sustainable development at both micro and macro levels. Environmental responsibility of an industrial enterprise is defined as a set of mechanisms, tools, measures for the implementation of its environmental initiative and environmental duty. Environmental duty is defined as a set of environmental obligations to the local community and administrative bodies. The environmental initiative of an enterprise is considered as a set of measures of the environmental program of the enterprise, which go beyond normatively established requirements and meet requirements of the local community concerning environmental protection. This creates an appropriate categorical framework in the field of research of environmental responsibility of industrial enterprises for theoretical cognition of its forms
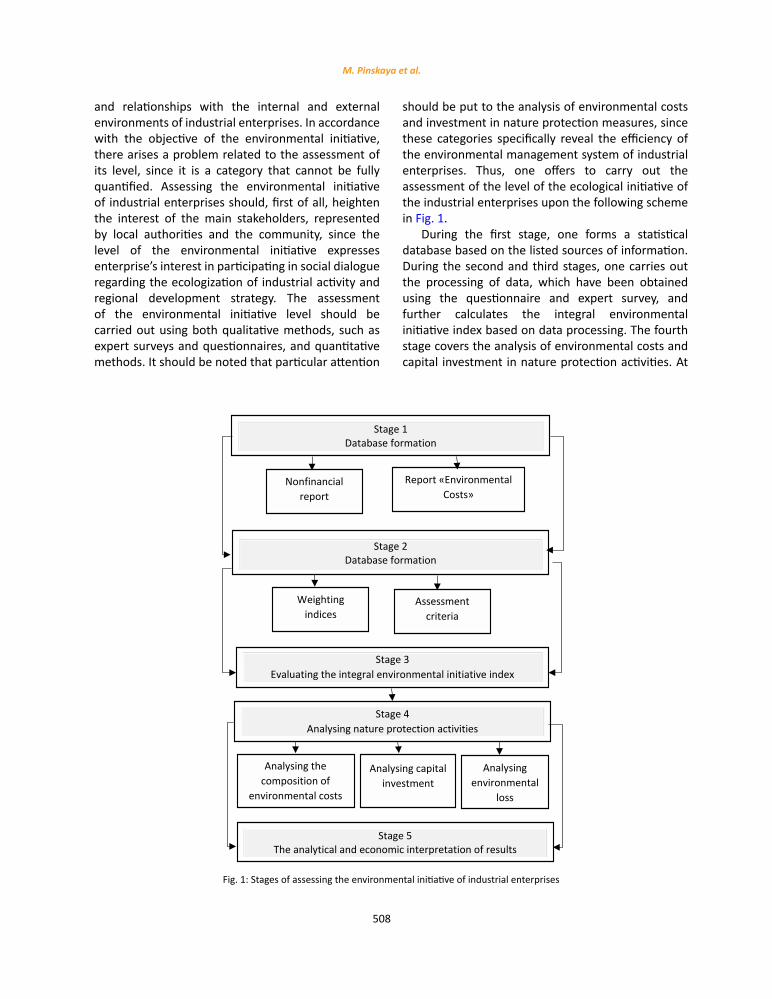
508
M. Pinskaya et al.
and relationships with the internal and external environments of industrial enterprises. In accordance with the objective of the environmental initiative, there arises a problem related to the assessment of its level, since it is a category that cannot be fully quantified. Assessing the environmental initiative of industrial enterprises should, first of all, heighten the interest of the main stakeholders, represented by local authorities and the community, since the level of the environmental initiative expresses enterprise’s interest in participating in social dialogue regarding the ecologization of industrial activity and regional development strategy. The assessment of the environmental initiative level should be carried out using both qualitative methods, such as expert surveys and questionnaires, and quantitative methods. It should be noted that particular attention
should be put to the analysis of environmental costs and investment in nature protection measures, since these categories specifically reveal the efficiency of the environmental management system of industrial enterprises. Thus, one offers to carry out the assessment of the level of the ecological initiative of the industrial enterprises upon the following scheme in Fig. 1.
During the first stage, one forms a statistical database based on the listed sources of information. During the second and third stages, one carries out the processing of data, which have been obtained using the questionnaire and expert survey, and further calculates the integral environmental initiative index based on data processing. The fourth stage covers the analysis of environmental costs and capital investment in nature protection activities. At
Fig. 1: Stages of assessing the environmental initiative of industrial enterprises
Stage 1 Database formation
Nonfinancial report
Report «Environmental Costs»
Stage 2 Database formation
Weighting indices
Assessment criteria
Stage 3 Evaluating the integral environmental initiative index
Stage 4 Analysing nature protection activities
Analysing the composition of
environmental costs
Analysing capital investment
Analysing environmental
loss
Stage 5 The analytical and economic interpretation of results
Fig. 1: Stages of assessing the environmental initiative of industrial enterprises

509
Global J. Environ. Sci. Manage., 7(4): 503-522, Autumn 2021
the last stage, one suggests the economic-analytical interpretation of attained results, more specifically, the analysis of growth rate and dynamic pattern of indices, obtained during the researched period. It is time to consider the process of calculating the integral environmental initiative index. The fundamental phase of this process is to form a system of evaluation categories, which would reveal the most substantial and significant aspects of the environmental initiative activities of industrial enterprises and meet the main international ecological standards. As to the system of evaluation categories for assessing the environmental initiative of industrial enterprises, special attention should be paid to the existence and scope of the compensatory policy. Since ecologically responsible development strategy always includes environmental restoration from damages caused by industrial activity, one considers it appropriate to add a corresponding category to the range of enterprise initiatives. It is called-activity, concerning the compensations for environmental damage to the community. Thus, one proposed a system of evaluation categories for determining the level of the ecological initiative of the industrial enterprises
(Table 1).It includes 10 entries and can be implemented
within the process of expert survey and the analysis of enterprise non-financial reports. The given system enables one to take into account both the external indicators of environmental activities and the subjective evaluations of experts. This makes it possible to conduct the most optimized assessment of the enterprise environmental initiative level and specify the priority areas for activities, which are of particular interest to the main stakeholders of industrial enterprises led by the local community. Сonsequently, the implementation of enterprise’s own environmental initiative requires a specific set of methods depending on the peculiarities of industrial activity. The role of the environmental initiative of industrial enterprises in the implementation of their environmental responsibility is to restore the damaged environment and provide compensations for environmental damage to the community. It is implemented through a series of measures taken beyond the regulatory requirements. The issue of environmental responsibility assessment is one of the most essential problems of managing the socially
Table 1: The system for assessing the environmental initiative of industrial enterprises
Evaluation category Key assessment criteria
Activity, concerning the compensations for environmental damage to the community
Compensatory ecological payments to employees, availability of sanitary protection zone of the enterprise, environmental restoration
Undertaking the environmental activities and measures
Own initiatives to improve environmental education of the community, environmental enhancement due to the public activities, held during the entire analyzed period
Atmospheric air protection Availability of air quality monitoring system, amount of capital investment in this field, the quality of air cleaning equipment
Optimization of waste management areas Waste disposal policy, the level of waste utilization, amount of capital investment in this field
Protection of water bodies, which are used by the enterprise
Activities aimed at restoration of the damaged coastline, availability of wastewater quality monitoring system, amount of capital investment in this field
Willingness to cooperate with the community Conducting public hearings and consultations, ensuring feedback, availability of community engagement programs
Condition of the surrounding area Pollution condition of the surrounding area, restoration and landscaping activities, sanitary protection zones
Non-financial reporting, full disclosure of the environmental information
The frequency of non-financial reports publication, their compliance with international standards, the quality and transparency of the reported information
Effectiveness of environmental management system
Availability of ISO Series Certificates, amount of capital investment in this field
Conducting an internal environmental audit The frequency of internal ecological audits, corrective actions and removal of disadvantages, which were revealed during the audit
Table 1: The system for assessing the environmental initiative of industrial enterprises

510
Environmental responsibility on the development of enterprises
responsible practices of industrial enterprises. This question remains relevant both for all stakeholders and for industrial enterprises themselves. The gradually increasing amount of industrial companies, which claim themselves to be highly supportive of environmental responsibility principles, cause the need for verifying if the information about the level of their environmental responsibility is factually accurate. Consequently, it is a crucial task nowadays to develop a methodology for the assessment of environmental responsibility, which would be accessible and easily understandable for all interested parties. The enhanced and comprehensive assessment of the environmental responsibility of the industry, corporation, or a particular enterprise cannot be carried out independently by the concerned parties alone, for the reason of resource sufficiency, mainly information and time. Thus, one of the major tasks of this research was to develop the methodology for assessing the environmental responsibility of industrial enterprises, which would be relatively easy to use and contain accessible information database. Сonsidering the details given above, one suggests the following scheme to be used for assessing the environmental responsibility of an industrial enterprise. During the first stage, one carries out the qualitative and quantitative analysis of indicators, calculates the numerical score of the enterprise environmental initiative level and the coefficients-indices of environmental commitment and environmental initiative for the researched enterprises, defines their incentive or disincentive impact on the resultant index. The standardization of the calculated coefficients, caused by the different dimensions of initial data, is performed at the second stage. One determines the benchmark indices, calculates the partial taxonomic indices for the environmental responsibility and environmental initiative levels. During the third stage, one conducts the comprehensive evaluation of the obtained indices, determines the impact of each partial index on the overall level of environmental responsibility of the researched industrial enterprises, identifies the resources for further development and improvement. The generalized algorithmic scheme, which displays the procedure for the assessment of environmental responsibility (ER), is shown in Fig. 2. The suggested method for the assessment of environmental responsibility is based on the determination of
so-called taxonomic distance, that is, the distance between points in multivariable space, the dimension of which is determined by the number of features describing the object under study. The undoubtful advantage of a taxonomic method is the procedure of the so-called standardization of indicators, as a result of which the object properties, represented by different qualitative and quantitative indicators, are transformed into a single standardized measurement system. The algorithm for determining the taxonomic index of development includes several stages. At the first stage, one forms an observation matrix, which contains the most complete property characteristic of the researched set. The metrics, included in the matrix, are diverse since these metrics describe different object properties and are measured in different units.
After the standardization procedure, all selected indices should be divided into incentives and disincentives based on their impact on the level of environmental responsibility. Indices, high values of which are desirable in terms of the chosen aspect of the research, are considered to be incentives. In this research, one have examined 10 indices from two blocks, environmental commitment and environmental initiative, among which all indicators of the environmental commitment block are characterized by an incentive effect, proceeding from their mathematical expressions. Among the indices of the environmental initiative block, some are characterized by disincentive features. This includes, in particular, the share of stranded environmental costs (environmental fines, penalties, other sanctions) and the share of running NE (nature environment) protection costs, as its growth indicates the obsolescence of cleaning equipment and low efficiency. Other indices of the environmental initiative block are characterized by an incentive impact on the resultant index, proceeding from their mathematical expressions. Following the strategy of cleaner production, which is expressed in waste management, reducing emissions into the atmosphere and water is considered the main area of implementation of the environmental duty of industrial enterprises. It should be stressed that in recent years a high interest in the implementation of measures to improve energy efficiency, due to high prices for fuel and energy resources has become a characteristic feature for industrial enterprises.
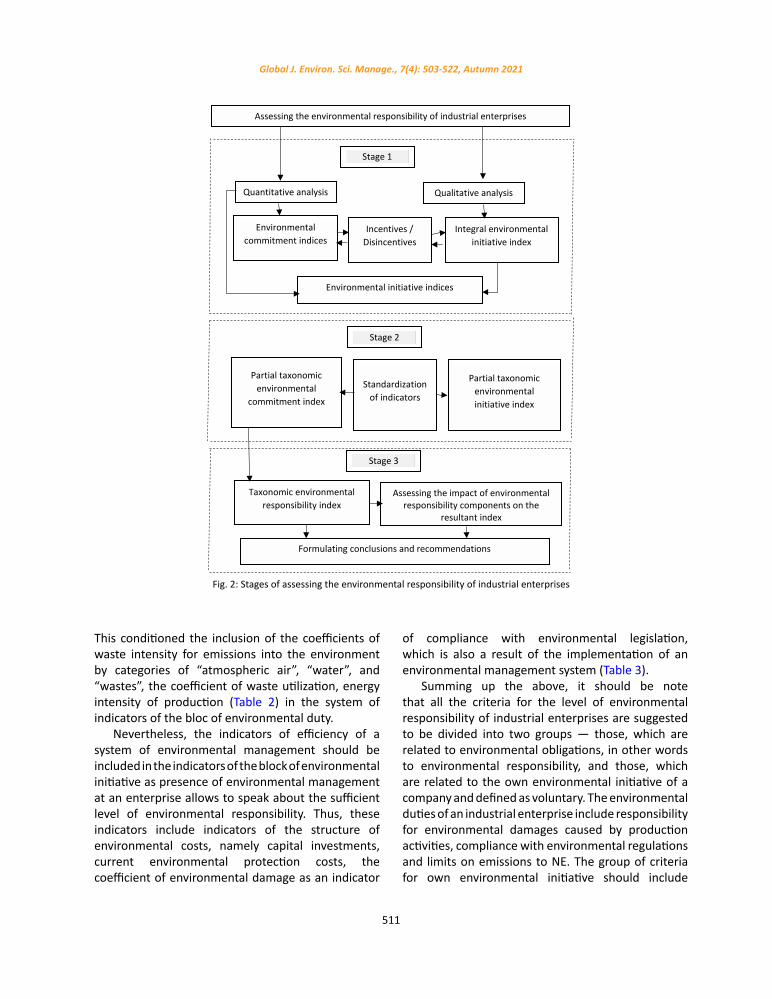
511
Global J. Environ. Sci. Manage., 7(4): 503-522, Autumn 2021
This conditioned the inclusion of the coefficients of waste intensity for emissions into the environment by categories of “atmospheric air”, “water”, and “wastes”, the coefficient of waste utilization, energy intensity of production (Table 2) in the system of indicators of the bloc of environmental duty.
Nevertheless, the indicators of efficiency of a system of environmental management should be included in the indicators of the block of environmental initiative as presence of environmental management at an enterprise allows to speak about the sufficient level of environmental responsibility. Thus, these indicators include indicators of the structure of environmental costs, namely capital investments, current environmental protection costs, the coefficient of environmental damage as an indicator
of compliance with environmental legislation, which is also a result of the implementation of an environmental management system (Table 3).
Summing up the above, it should be note that all the criteria for the level of environmental responsibility of industrial enterprises are suggested to be divided into two groups — those, which are related to environmental obligations, in other words to environmental responsibility, and those, which are related to the own environmental initiative of a company and defined as voluntary. The environmental duties of an industrial enterprise include responsibility for environmental damages caused by production activities, compliance with environmental regulations and limits on emissions to NE. The group of criteria for own environmental initiative should include
Fig. 2: Stages of assessing the environmental responsibility of industrial enterprises
Assessing the environmental responsibility of industrial enterprises
Stage 1
Quantitative analysis Qualitative analysis
Environmental commitment indices
Incentives / Disincentives
Integral environmental initiative index
Environmental initiative indices
Stage 2
Partial taxonomic environmental
commitment index
Standardization of indicators
Partial taxonomic environmental initiative index
Stage 3
Taxonomic environmental responsibility index
Assessing the impact of environmental responsibility components on the
resultant index
Formulating conclusions and recommendations
Fig. 2: Stages of assessing the environmental responsibility of industrial enterprises

512
M. Pinskaya et al.
two subgroups of indicators — activities concerning protection and restoration of the damaged nature environment, the existence of environment quality monitoring system, environmental management system, and the effectiveness of communication with
stakeholders. The results of the calculation of the integrated indicator of the environmental initiative for 2012-2018 are given in Table 4.
However, in addition to the directly integrated indicator of environmental initiative, considerable
Indicator name (yik ), nature of impact on the level of environmental responsibility (stimulator/disincentive)
Calculation procedure Notations
Coefficient of waste intensity by category of "air emissions", stimulator, (y1 ) P
Wy A−=11
11 →y
AW — total air emissions, thousands of tons; P — volume of manufactured products, thousands of tons
Coefficient of waste intensity by category of “discharges into water bodies”, stimulator, (y3 )
PWy о−=12
12 →y
0W – total discharges into water bodies, thousands
of tons
Coefficient of waste intensity by category of “waste”, stimulator, (y3 ) P
Wy −=13
13 →y W — total wastes, thousands of tons
Coefficient of waste utilization, stimulator, (y4 ) WWy w=4
14 →y
wW — volume of waste used, thousands of tons
Coefficient of energy intensity of production, stimulator, (y5) C
Ey −=15
15 →y
E — energy costs for the manufacture of products, thousands of euros; C— net cost of manufactured products, thousands of euros
Table 2: Indicators for assessing the level of environmental responsibility of industrial enterprises — block of environmental commitment
Table 3: Indicators for assessing the level of environmental responsibility of industrial enterprises — block of environmental initiative
Indicator name (yik), nature of impact on the level of environmental responsibility (stimulator/ destimulator)
Calculation procedure Notations
Share of capital investments in environmental measures in the total costs of NE protection, stimulator, (y6)
These indicators will enable management to assess the operation of the environmental management system, the level of implementation of objectives of enterprise “greening”, to monitor the costs of NE protection, and to analyze the relationship of environmental characteristics with financial and economic indicators of an enterprise.
Share of current costs for NE protection in the total costs of NE protection, destimulator, (y7)
Share of unrecovered environmental costs paid from profits, destimulator, (y8)
Coefficient of environmental loss capacity of production, stimulator, (y9)
T— amount of accrued environmental tax, thousands of euros; S — sanctions for violation of environmental legislation, thousands of euros.
Integrated indicator of environmental initiative, stimulator, (y10)
It reflects the activities of an enterprise for the implementation of self-initiated measures to protect the environment. It includes expert assessments of measures to compensate the community for losses from NE pollution, optimization of waste management, the state of the surrounding area in the sanitary zone of an enterprise, etc.
CSTy +
−=19
19 →y
Table 3: Indicators for assessing the level of environmental responsibility of industrial enterprises — block of environmental initiative

513
Global J. Environ. Sci. Manage., 7(4): 503-522, Autumn 2021
attention should also be paid to the environmental costs of industrial enterprises (Table 5), priority areas of environmental financing.
At the fourth stage, one сonstructs the benchmark vector of development with coordinates
tr0 . It also involves determination of the taxonomic environmental responsibility index for Volkswagen Aktiengesellschaft for the period 2012-2018. First of all, one should form an observation matrix (Table 6).
To convert the observation matrix into a dimensionless form, it is necessary to standardize its elements using the equations (1-3) to obtain a new matrix (Table 7). In accordance with the results of grouping indices into incentives and disincentives with the help of the equations (4-6), one forms a reference vector with the corresponding coordinates:
0D =(1.179; 1.392; 1.501; 1.556; 1.274; 1.689; -0.897;
-1.328; 1.603; 1.018).Based on the calculated values, one determined
the distance between the elements of a standardized matrix and the elements of the reference vector using Formula 8. Further calculations of intermediary indices and the taxonomic index, which reflects the dynamics of environmental responsibility in 2012-2018, were conducted using the Excel software package and are shown in Table 8.
As a result of the made analysis of the assessment of the levels of significance of the suggested categories, the following conclusions can be drawn. Experts have identified the following most important assessment categories, which have the greatest impact on the level of environmental initiative of an enterprise: activities to compensate the community for environmental damage, protection of air and
Table 4: Data for the analysis of the block of ecological initiative of the enterprise under study for 2012–2018
Environmental costs, thousands of euros 2012 2013 2014 2015 2016 2017 2018
Environmental payments 69,300.0 82,100.0 96,100.0 148,300.0 145,850,0 193,715.7 216,961.6
including fines, sanctions 19,000.0 22,620.0 32,650.0 45,300.0 73,000.0 0.0 0.0
Capital investment in environmental measures 235,469.0 307,600.0 289,102.0 693,883.0 1,034,304.0 430,945.6 486,968.5
Current costs of NE protection 26,984.5 21,612.1 16,707.1 12,114.0 18,384.1 15,331.8 16,865.0
Total costs of NE protection 331,753.5 411,312.1 401,909.1 854,297.0 1,198,538.1 639,993.1 720,795.1
Costs by category, thousands of euros 2011 2012 2013 2014 2015 2016 2017
Atmospheric air protection 142,000.0 237,200.0 325,600.0 718,400.0 730,250.0 209,957.6 228,853.8
Return water treatment 55,000.0 36,500.0 29,800.0 24,100.0 30,080.0 8,793.0 9,408.5
Waste management 78,000.0 106,600.0 133,800.0 161,000.0 169,000.0 22,636.1 269,935.0
Environmental management 7,600.0 10,800.0 7,200.0 5,900.0 5,500.0 372.5 383.7
Table 4: Data for the analysis of the block of ecological initiative of the enterprise under study for 2012–2018
Table 5: Coefficients characterizing the level of environmental initiative of the enterprise under study for 2012–2018
Indicators 2012 2013 2014 2015 2016 2017 2018
Share of capital investments in environmental measures in the total costs of NE protection 0.710 0.748 0.719 0.812 0.863 0.673 0.676
Share of current costs of NE protection in the total costs of NE protection 0.081 0.053 0.042 0.014 0.015 0.024 0.023
Share of unrecovered environmental costs 0.274 0.276 0.340 0.305 0.501 0.000 0.000
Coefficient of environmental loss capacity of production 0.996 0.997 0.997 0.996 0.997 0.996 0.996
Integrated indicator of environmental initiative 0.361 0.305 0.401 0.508 0.489 0.546 0.549
Table 5: Coefficients characterizing the level of environmental initiative of the enterprise under study for 2012–2018
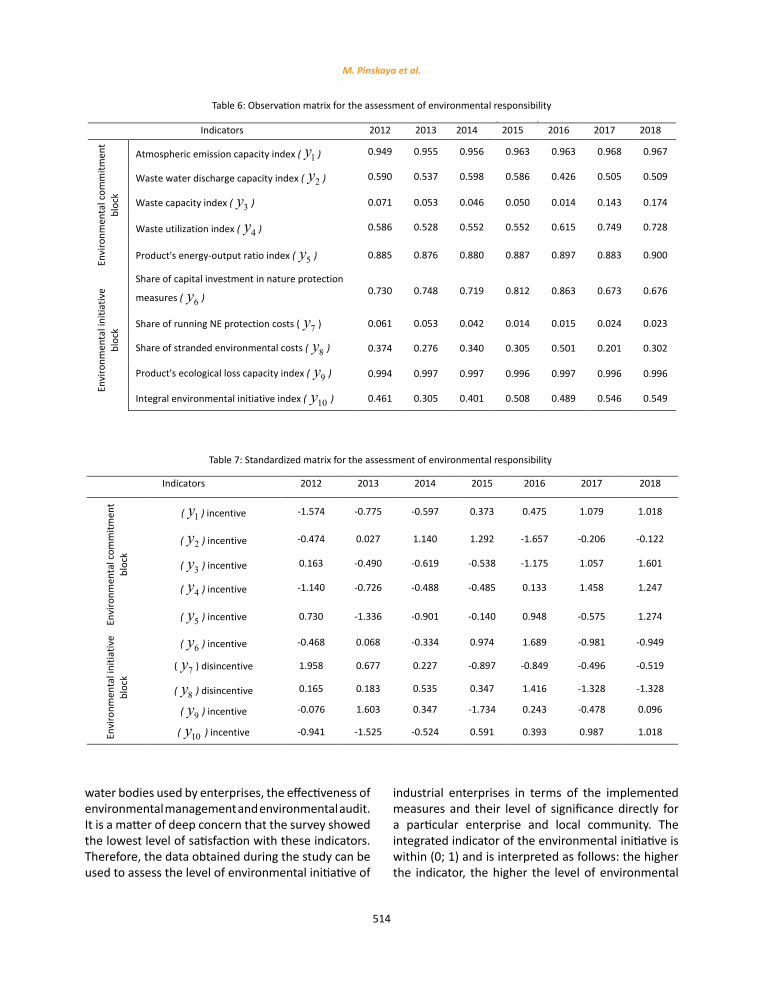
514
M. Pinskaya et al.
water bodies used by enterprises, the effectiveness of environmental management and environmental audit. It is a matter of deep concern that the survey showed the lowest level of satisfaction with these indicators. Therefore, the data obtained during the study can be used to assess the level of environmental initiative of
industrial enterprises in terms of the implemented measures and their level of significance directly for a particular enterprise and local community. The integrated indicator of the environmental initiative is within (0; 1) and is interpreted as follows: the higher the indicator, the higher the level of environmental
Table 6: Observation matrix for the assessment of environmental responsibility Indicators 2012 2013 2014 2015 2016 2017 2018
Envi
ronm
enta
l com
mitm
ent
bloc
k
Atmospheric emission capacity index ( ) 0.949 0.955 0.956 0.963 0.963 0.968 0.967
Waste water discharge capacity index ( ) 0.590 0.537 0.598 0.586 0.426 0.505 0.509
Waste capacity index ( ) 0.071 0.053 0.046 0.050 0.014 0.143 0.174
Waste utilization index ( ) 0.586 0.528 0.552 0.552 0.615 0.749 0.728
Product's energy-output ratio index ( ) 0.885 0.876 0.880 0.887 0.897 0.883 0.900
Envi
ronm
enta
l ini
tiativ
e
bloc
k
Share of capital investment in nature protection
measures ( ) 0.730 0.748 0.719 0.812 0.863 0.673 0.676
Share of running NE protection costs ( ) 0.061 0.053 0.042 0.014 0.015 0.024 0.023
Share of stranded environmental costs ( ) 0.374 0.276 0.340 0.305 0.501 0.201 0.302
Product's ecological loss capacity index ( ) 0.994 0.997 0.997 0.996 0.997 0.996 0.996
Integral environmental initiative index ( ) 0.461 0.305 0.401 0.508 0.489 0.546 0.549
1y
2y
3y
4y
5y
6y
7y
8y
9y
10y
Table 6: Observation matrix for the assessment of environmental responsibility
Table 7: Standardized matrix for the assessment of environmental responsibility
Indicators 2012 2013 2014 2015 2016 2017 2018
Envi
ronm
enta
l com
mitm
ent
bloc
k
( ) incentive -1.574 -0.775 -0.597 0.373 0.475 1.079 1.018
( ) incentive -0.474 0.027 1.140 1.292 -1.657 -0.206 -0.122
( ) incentive 0.163 -0.490 -0.619 -0.538 -1.175 1.057 1.601
( ) incentive -1.140 -0.726 -0.488 -0.485 0.133 1.458 1.247
( ) incentive 0.730 -1.336 -0.901 -0.140 0.948 -0.575 1.274
Envi
ronm
enta
l ini
tiativ
e bl
ock
( ) incentive -0.468 0.068 -0.334 0.974 1.689 -0.981 -0.949
( ) disincentive 1.958 0.677 0.227 -0.897 -0.849 -0.496 -0.519
( ) disincentive 0.165 0.183 0.535 0.347 1.416 -1.328 -1.328
( ) incentive -0.076 1.603 0.347 -1.734 0.243 -0.478 0.096
( ) incentive -0.941 -1.525 -0.524 0.591 0.393 0.987 1.018
1y
2y
3y
4y
5y
6y7y
8y9y
10y
Table 7: Standardized matrix for the assessment of environmental responsibility

515
Global J. Environ. Sci. Manage., 7(4): 503-522, Autumn 2021
initiative of the industrial enterprise under study. Thus, using the suggested methodology, one obtained the partial taxonomic indices of environmental commitment and environmental initiative for the researched enterprises, as well as the overall taxonomic environmental responsibility index. Since the taxonomic indicators of the level of ecological responsibility of the studied industrial enterprises have multi-directional dynamics, one considers it appropriate to use the method of economic and mathematical modeling for the explanation of the influence of the blocks of environmental responsibility and environmental initiative on the resulting indicator (Gast et al., 2017). One of the possible ways to evaluate the quality of property package for result analysis is to apply generalized Harrington desirability function (Bombiak and Marciniuk-Kluska, 2018; Cai et al., 2018). The interpretation of obtained results using this approach is one of the easiest ways to transform the natural values of individual responses into the dimensionless scale of desirability and priority (Xu et al., 2020). To construct a generalized function means to generate the obtained values of property indices (which have different units of measurement, including qualitative, esthetic, psychological and personal features) into a dimensionless desirability scale. The function of the desirability scale is to set up a correspondence between the obtained values of property indices and expert’s evaluations of desirability for a particular index. A standard scale contains five valuation levels in the total range from 0 to 1, which reflect different desirability rates. The value 0.37 is a critical point, where unsatisfactory indices turn into satisfactory ones. The distinct advantage of this scale in the interpretation of the numerical values of environmental responsibility is its versatility, the ability to evaluate calculated data in a quality manner for separate companies and the entire industry. The desirability scale has a range from 0 to 1. Under this approach to valuation, it is convenient to use the additional scores 0.2 and 0.8 to make the desirability function more “sensitive” to the changes of informative index x within the “satisfactory” area and less sensitive out of it. Then, one should analyze the values and dynamics of calculated environmental responsibility indices. Table 4 shows that the environmental responsibility of Volkswagen Aktiengesellschaft in the period 2012-2018 was at the sufficient level. Since the taxonomic indicators
of the level of ecological responsibility of the studied industrial enterprises have multi-directional dynamics, one considers it appropriate to use the method of economic and mathematical modeling for the explanation of the influence of the blocks of environmental responsibility and environmental initiative on the resulting indicator. As noted in (Sharma and Gupta, 2020), multiplicative models, and Cobb–Douglas production function, in particular, reflect the development of socio-economic systems in the most objective way, avoiding the influence of subjective factor. It helps to detect isolated factors influencing the resultant index, which is the objective of this study. For the given two-factor regression, the partial elasticity coefficient indicates, how much the taxonomic environmental initiative index will change in percentage terms, if one of the factors changes by one percent while the other factor keeps the constant values. It helps to identify leaders and outsiders in the field of corporate environmental responsibility and provides a basis for the construction of development benchmark vectors, taking into account ecological factors. To implement environmental responsibility policy at an industrial enterprise one should coordinate objectives, tasks, areas of activity for the whole range of its subsystems. The deliberate integration of environmental responsibility principles into the enterprise development strategy requires designing a coherent, systematic plan for achieving this aim. The procedure of implementing environmental responsibility at an industrial enterprise should therefore take place according to a certain scheme. To implement environmental responsibility at an industrial enterprise, the following steps must be taken: using the developed mechanism for its implementation, it is necessary to analyze the internal and external factors, which affect company’s capability to undertake particular environmental activities. The next step is to examine the ability of an industrial enterprise to impose the key principles of environmental responsibility on economic activity. Provided that an enterprise is capable of environmental responsibility implementation, the next step would cover the search for methods and tools, the formation of an appropriate organizational-economic mechanism for ensuring environmental responsibility of industrial enterprises. The whole range of selected tools should be based on the well-defined information base of research. Thus, one

516
M. Pinskaya et al.
can proceed to the next step of the scheme, that is, the creation of the information base. The final step provides control over the effectiveness of previous steps.
The key outcomes, which can be achieved by implementing the system of environmental responsibility, include the following:§improvement of the natural environment;§reduced number of fines and penalties for the
violations of established limits on discharges into NE;
§improved communication with representatives of the external environment of an enterprise;
§positive environmentally-conscious reputation of a company;
§optimization of investment policy in the field of NE protection;
§higher environmental compatibility of enterprise’s production system.Particular attention should be put to the
implementation of the developed environmental responsibility system into the general development strategy. Talking about a large industrial company, when designing its strategy, one often defines the key directions for the development, upon which separate mini-strategies are similarly being designed and further integrated into the general one, therefore implementing the integrated approach to solving this task. One of the key factors, which influence the choice of a development strategy for any industrial company, is competitive growth. For industrial enterprises, the ecological compatibility of production systems and demonstration of environmental responsibility serve as one of such factors. However, the major problem for the existing types of development strategies is still the lack of a long-term vision of the environmental component. It is obvious that designing an organization’s development strategy from the perspective of environmental responsibility concept is that integrant, which is essential for the fulfilment of core business tasks.
As it is commonly known, the concept of an environmentally responsible industrial enterprise involves the existence of a separate environmental strategy, which is part of its overall development strategy. A decision to develop such a strategy is usually enhanced by the following facts:§consumer requirements for the open information
about the ecological safety of production are
increasingly spreading out across the world;§banks and insurance organizations take into
account company’s business reputation, which includes its ecological status when making decisions on granting of credits or choosing an insurance policy;
§ ecological control, provided by the government, is getting increasingly tightened;
§strengthening the international standards of environmental management, etc.Thus, the organizational-economic system for
ensuring the environmental responsibility of an industrial enterprise should become an integral part of its development strategy. When designing the development strategy of an industrial enterprise, which is aimed at adherence to the concept of environmental responsibility, it is essential to take into account not only external factors, which reflect the state control, consumer opinion, ecological status of competitors, but also observe the internal principles of ecological safety. Only in this case, an organization will be able to achieve balanced environmental management and economic growth at the same time (Fig. 3).
Thus, designing an organization’s strategy following the environmental responsibility principles is that integral part of its general economic policy, without which it is impossible to meet the targets of economic development for a separate enterprise and a country as a whole. When choosing a strategy for the development of industrial enterprises, one should take into account regional ecological development strategies. In fact, the harmonious combination of ecologization tasks at the local and regional levels makes it possible to achieve sustainable socio-economic development. Thus, the adjustment of an enterprise’s development strategy should be made in two directions – in accordance with the level of industrial enterprise’s environmental responsibility and taking into account the ecological living conditions of inhabitants in a particular region. Inhabitants, who live in districts with different living conditions, will have consequently different requirements for the development of their settlement areas and, accordingly, for the main industrial enterprises-pollutants of the environment. Thus, the inhabitants of areas with worsened and strained living conditions will demand ecologization strategy and environmental improvement, while

517
Global J. Environ. Sci. Manage., 7(4): 503-522, Autumn 2021
the local communities in areas with satisfactory living conditions will pay greater attention to environmental initiatives, the implementation of new environmentally friendly ways to manufacture products at industrial enterprises. In the light of
the above, it becomes evident that the type of the development strategy of an enterprise is related to its environmental responsibility level and the ecological living conditions of inhabitants since the community acts as a full participant in the process of designing
Fig. 3: Organizational-economic support of environmental responsibility of industrial enterprises
Subjects of environmental responsibility
External environment Internal environment
International treaties
Legislation Administrative
authorities Local communities
Local communities
Investors Media
organisations Customers Suppliers
Production sphere
Trade unions Shareholders
Environmental management
system Ecological
conscientiousness Environmental
policy
Environmental commitment Environmental initiative
Environmental responsibility
Leve
l of
com
mun
ity
Leve
l of a
n en
terp
rise
Environmental certification and standardization
Ranking by the level of
ecological safety of production
system
Economic-ecological analysis of
activity
Questionnaires, expert
surveys
Ecological audit
Nonfinancial reports
Strategic environmental
planning
Environmental quality
monitoring
Fig. 3: Organizational-economic support of environmental responsibility of industrial enterprises

518
M. Pinskaya et al.
and implementing the environmentally-friendly strategy for the development of industrial enterprises. Thus, the choice of a development strategy for an industrial enterprise should be adjusted, having into consideration its environmental responsibility level and the ecological conditions of the region. An enterprise, which only adheres to the regulatory requirements for ecological quality (sufficiency strategy), can not have a high level of environmental responsibility. Moreover, against the background of increasing ecological decay, the reduction of emissions to the efficacy level (compromise strategy) is only a mean step of environmental responsibility. To this end,
the environmental situation in the regions of Poland and Germany, where the enterprises of Volkswagen Aktiengesellschaft are located, was analyzed in terms of territorial concentration of production, economic development of land, population density, environmental pollution, the level of adverse natural and anthropogenic processes. All regions of the countries under study were divided into 4 types according to the level of favorable living conditions: 1 - satisfactory conditions; 2 - deteriorating conditions; 3 - stressful conditions; 4 - environmental disaster zone. A highly responsible industrial company in respect of the environment should be guided by the balanced
Table 8: Taxonomic indices of environmental responsibility, environmental commitment and environmental initiative for the period 2012-2018
Indicators 2012 2013 2014 2015 2016 2017 2018 Overall taxonomic environmental responsibility index 0.683 0.673 0.678 0.684 0.691 0.701 0.712 Partial taxonomic environmental commitment index 0.618 0.591 0.598 0.585 0.538 0.614 0.679 Partial taxonomic environmental initiative index 0.668 0.690 0.684 0.745 0.653 0.632 0.683
Table 8: Taxonomic indices of environmental responsibility, environmental commitment and environmental initiative for the period 2012-2018
Table 9: Ecological strategy for the development of industrial enterprises*
level of environmental responsibility Areas of enterprise activity Type of an ecological
strategy
Type of territory depending on ecological
living conditions
Unsatisfactory (0-0.37]
Purification of emissions, discharges, development of a strategy concerning waste management at the end of the manufacturing-technological cycle. Undertaking pollution abatement measures. Compliance with the requirements for disclosure of external environmental reporting.
Protective strategy Regulatory environmental management
3.4
Satisfactory (0.37-0.63]
Reduction of emissions to the regulatory level. Internal ecological audit (of different types and purposes). Long-term environmental measures, including technological changes. Responsibility of department managers to uphold ecological parameters of the production system.
Compensation strategy (sufficiency strategy) Effective environmental management
2.3
Sufficient (above 0.63)
Preventive reduction of environmental emissions. Adherence to the eco-standards of the products in the international markets. Including the concept of sustainable development in the company's reporting. External and internal ecological audit of the enterprise.
Proactive strategy (balanced nature management strategy) Management of the environmentally responsible organization
1; 2; 3
*All regions of the country were divided into 4 groups according to the level of favourable living conditions: 1- satisfactory conditions; 2- worsened conditions; 3 – strained conditions; 4- ecological disaster zone.
Table 9: Ecological strategy for the development of industrial enterprises*
519
Global J. Environ. Sci. Manage., 7(4): 503-522, Autumn 2021
nature management strategy, which responds to the trends in the field of strategic management and sustainable development (Table 9).
In this way, the choice of ecological strategies for the development of industrial companies can have various scenarios. However, companies, possessing outmoded equipment and poor state of technology in use, are not able to perform the prompt implementation of the proactive strategy. For that reason, one highly recommends the researched industrial companies, ranking as temporarily satisfactory, to align with the compensation strategy. In addition, one considers it appropriate to formulate for each of the researched companies a set of recommendations for increasing their environmental responsibility level. The key advantages of each type of suggested development strategies in relation to the external and internal environment of the company are as; 1) sufficiency strategy – the reduction of costs, increase in transparency (public control); 2) compromise strategy – the social comprehensiveness, establishing a social dialogue with stakeholders; 3)balanced nature management strategy - uniqueness (the specific nature of organization), the efficient cooperation between the business community, government and public organizations. In general, to optimize the environmental losses of the enterprise, the following measures are recommended: accelerated depreciation of fixed assets, which have environmental significance (treatment facilities, environmental quality monitoring systems), as well as obsolete production equipment; material and intangible incentives for staff in the area of development of engineering solutions and innovation proposals for the greening of production activities and environmental management system, energy efficiency and optimization of waste management; compliance with ISO and EMAS standards in the area of environmental protection, control over the effectiveness of the system of environmental responsibility in enterprises using a number of scientifically sound indicators suggested in the study. It should be emphasized that in addition to optimizing the environmental strategy of an enterprise, these measures will create a positive image of a company, increase the competitiveness of products through “green” advantages, which is especially important in European markets.
CONCLUSIONBased on the conducted study, the following
conclusions can be made.1) The scientific-methodical approach to assessing
the level of environmental responsibility of an industrial enterprise is substantiated, which provides for the calculation of the relevant taxonomic indicator taking into account the quantitative factors of its environmental commitment (taxonomic indicator of environmental commitment) and qualitative and quantitative factors of environmental initiative (taxonomic indicator of environmental initiative), as well as their stimulating or destimulating effect on the level of environmental responsibility of an industrial enterprise. 2) The thus obtained numerical values of the taxonomic indicator of the level of environmental responsibility of an industrial enterprise allow to assess its current state and determine the scope and nature of the impact of mandatory and initiative components on the overall level of environmental responsibility for further correction. 3) Based on a critical analysis of the content of development strategies of industrial enterprises in the environmental sphere, there was identified the need to take into account in these strategies the current level of their environmental responsibility differentiated by the desirability scale, and environmental living conditions in the cities where these enterprises are located. This makes it possible to take into account both economic and environmental-social factors when selecting an environmental strategy for the development of industrial enterprises. 4) The level of environmental responsibility of industrial enterprises taken into account when developing recommendations on adjustment of their environmental strategy of development is determined, which as a whole allowed to form organizational and economic support for environmental responsibility of the enterprises under study.
AUTHOR CONTRIBUTIONSM. Pinskaya performed an experimental design
and analyzed the data. O. Meleshchenko defined the concept and methodology of the research. O. Kovalchuk ranked the data into tables and figures. O. Karpenko performed the literature survey. E. Kompanets customized the manuscript to meet the requirements of the journal.

520
M. Pinskaya et al.
ACKNOWLEDGMENTThis study was carried out within the framework of
the research project [0113UK007514] “Formation of a mechanism for effective regulation and management of activity of enterprises”, The European Academy of Sciences LTD, London, UK.
CONFLICT OF INTERESTThe authors declare no potential conflict of
interest regarding the publication of this work. In addition, the ethical issues including plagiarism, informed consent, misconduct, data fabrication and, or falsification, double publication and, or submission, and redundancy have been completely witnessed by the authors.
ABBREVIATIONS
b0
Distance between separate point-units and the point D0, which presents the development benchmark
C Net cost of manufactured products, thousands of euros
D0 Development benchmark
E Energy costs for the manufacture of products, thousands of euros
EMAS Eco-Management and Audit Scheme
Eqs. Formula
ER Corporate Environmental Responsibility
etc And so on (et cetera)
f Environmental responsibility dependence function
Fig. Figure
Fp Fisher’s test
HR Human resources
ISO International Organization for Standardization
K Concordance coefficient
k Number of indicators
max Maximum value
min Minimum value
n Interval value
NE Nature environment
P Volume of manufactured products, thousands of tons
R2 Determination coefficient
rik Standardized value of the index k for the unit i
S Sanctions for violation of environmental legislation, thousands of eurosThe amount of accrued environmental tax, thousands of euros
t Time lag
0V Standard deviation of the index 0ib
kV The standard deviation of the index k
AWTotal emissions into the atmosphere, thousands of tons
0W Total discharges into water bodies, thousands of tons
W Total wastes, thousands of tons
wW Volume of waste used, thousands of tons
1y Atmospheric emission capacity index
2y Wastewater discharge capacity index
3y Waste capacity index
4y Waste utilization index
5y Product’s energy-output ratio index
6yShare of capital investment in nature protection measures
7y Share of running NE protection costs
Share of stranded environmental costs
9y Product’s ecological loss capacity index
10y Integral environmental initiative index
iky Value of the index k for the unit i
ky The arithmetic mean value of the index k
z Integer
REFERENCESAnthony, B.J.; Majid, M.A., (2016). Development of a green ICT
model for sustainable enterprise strategy. J. Soft Comput. Decis. Support Syst., 3(3): 1-12 (12 pages).

521
Global J. Environ. Sci. Manage., 7(4): 503-522, Autumn 2021
Bombiak, E.; Marciniuk-Kluska, A., (2018). Green human resource management as a tool for the sustainable development of enterprises: Polish young company experience. Sustainability, 10(6): 1739-1749 (11 pages).
Borland, H.; Ambrosini, V.; Lindgreen, A.; Vanhamme, J., (2016). Building theory at the intersection of ecological sustainability and strategic management. J. Bus. Ethics, 135(2): 293-307 (15 pages).
Cai, W.; Liu, C.; Zhang, C.; Ma, M.; Rao, W.; Li, W.; Gao, M., (2018). Developing the ecological compensation criterion of industrial solid waste based on emergy for sustainable development. Energy. 157: 940-948 (9 pages).
Cao, S.; Shang, D.; Yue, H.; Ma, H., (2017). A win-win strategy for ecological restoration and biodiversity conservation in Southern China. Environ. Res. Lett., 12(4): 404-411 (8 pages).
Domenech, T.; Bahn-Walkowiak, B., (2019). Transition towards a resource efficient circular economy in Europe: policy lessons from the EU and the member states. Ecol. Econ., 155: 7-19 (13 pages).
Sharma, G.; Gupta, S., (2020). Modelling the impact of corporate sustainability on economic performance with reference to Indian financial industry. World Rev. Entrepreneurship, Manage. Sustainable Develop., 16(3): 317-328 (12 pages).
Xu, F.; Yang, M.; Li, Q.; Yang, X., (2020). Long-term economic consequences of corporate environmental responsibility: Evidence from heavily polluting listed companies in China. Bus. Strategy Environ., 29(6): 2251-2264 (14 pages).
Elsawah, S.; Pierce, S.A.; Hamilton, S.H.; Van Delden, H.; Haase, D.; Elmahdi, A.; Jakeman, A.J., (2017). An overview of the system dynamics process for integrated modelling of socio-ecological systems: Lessons on good modelling practice from five case studies. Environ. Model. Software. 93: 127-145 (19 pages).
Fujii, H.; Managi, S., (2016). Research and development strategy for environmental technology in Japan: A comparative study of the private and public sectors. Technol. Forecast. Soc. Change, 112: 293-302 (10 pages).
Gast, J.; Gundolf, K.; Cesinger, B., (2017). Doing business in a green way: A systematic review of the ecological sustainability entrepreneurship literature and future research directions. J. Cleaner Prod., 147: 44-56 (13 pages).
Graafland, J.J., (2018). Ecological impacts of the ISO14001 certification of small and medium sized enterprises in Europe and the mediating role of networks. J. Cleaner Prod., 174: 273-282 (10 pages).
Hadj, T.B., (2020). Effects of corporate social responsibility towards stakeholders and environmental management on responsible innovation and competitiveness. J. Cleaner Prod., 250: 119-130 (12 pages).
Hovardas, W.; Jiang, R.; Yang, C.; Zhang, F.; Su, M.; Liao, Q., (2016). Establishing an ecological vulnerability assessment indicator system for spatial recognition and management of ecologically vulnerable areas in highly urbanized regions: A case study of Shenzhen, China. Ecol. Indic., 69: 540-547 (8 pages).
Hovardas, T., (2016). Two paradoxes with one stone: A critical reading of ecological modernization. Ecol. Econ., 130: 1-7 (7 pages).
Ji, X.; Long, X., (2016). A review of the ecological and socioeconomic effects of biofuel and energy policy recommendations. Renewable Sustainable Energy Rev., 61: 41-52 (12 pages).
Jiang, Z.; Ding, Z.; Zhang, H.; Cai, W.; Liu, Y., (2019). Data-driven ecological performance evaluation for remanufacturing process. Energy Convers. Manage., 198: 111-124 (15 pages).
Jovovic, R.; Draskovic, M.; Delibasic, M.; Jovovic, M., (2017). The concept of sustainable regional development–institutional aspects, policies and prospects. J. Int. Stud., 10(1): 255-266 (12 pages).
Malá, D.; Sedliacikova, M.; Dušak, M.; Kaščáková, A.; Musová, Z.; Klementová, J., (2017). Green logistics in the context of sustainable development in small and medium enterprises. Drvna industrija: Znanstveni časopis za pitanja drvne tehnologije, 68(1): 69-79 (11 pages).
Panyam, V.; Dave, T.; Layton, A., (2018). Understanding ecological efficiency and robustness for network design using thermodynamic power cycles. In ASME 2018 international design engineering technical conferences and computers and information in engineering conference. American Society of Mechanical Engineers Digital Collection. 110-118 (9 pages).
Sáez-Martínez, F.J.; Díaz-García, C.; Gonzalez-Moreno, A., (2016). Firm technological trajectory as a driver of eco-innovation in young small and medium-sized enterprises. J. Cleaner Prod., 138: 28-37 (10 pages).
Singh, S.; Olugu, E.U.; Musa, S.N., (2016). Development of sustainable manufacturing performance evaluation expert system for small and medium enterprises. Procedia CIRP, 40: 608-613 (6 pages).
Chen, Z.; Hamilton, T., (2020). What is driving corporate social and environmental responsibility in China? An evaluation of legacy effects, organizational characteristics, and transnational pressures. Geoforum, 110: 116-124 (9 pages).
Wang, Q.; Qiu, S.; Yuan, X.; Zuo, J.; Cao, D.; Hong, J.; Zheng, Y., (2016). Stability of ecological industry chain: an entropy model approach. Environ. Sci. Pollut. Res., 23(14): 14316-14326 (11 pages).
Wang, Q.; Yuan, X.; Zuo, J.; Zhang, J.; Hong, J.; Lin, C., (2016). Optimization of Ecological Industrial Chain design based on reliability theory–a case study. J. Cleaner Prod., 124: 175-182 (8 pages).
Wilmer, H.; Augustine, D.J.; Derner, J.D.; Fernández-Giménez, M.E., Briske, D.D.; Roche, L.M.; Miller, K.E, (2018). Diverse management strategies produce similar ecological outcomes on ranches in Western Great Plains: social-ecological assessment. Rangeland Ecol. Manage., 71(5): 626-636 (11 pages).
Zare, R.; Nouri, J.; Abdoli, M.A.; Atabi, F., (2016). Application integrated fuzzy TOPSIS based on LCA results and the nearest weighted approximation of FNs for industrial waste management-aluminum industry: Arak-Iran. Indian J. Sci. Technol., 9(2): 2-11 (10 pages).
Yue, B.; Sheng, G.; She, S.; Xu, J., (2020). Impact of consumer environmental responsibility on green consumption behavior in china: The role of environmental concern and price sensitivity. Sustainability, 12(5): 174-189 (16 pages).

522
M. Pinskaya et al.
AUTHOR (S) BIOSKETCHESPinskaya, M., Doctor of Economics, Associate Professor, Financial Research Institute of the Ministry of Finance of the Russian Federation, Moscow, Russian Federation. Email: [email protected]
Meleshchenko, O., Doctor of Philology, Professor, Taras Shevchenko National University of Kyiv, Kyiv, Ukraine. Email: [email protected]
Kovalchuk, O., Candidate of social communication, Assistant, Kyiv National University of Culture and Arts, Kyiv, Ukraine. Email: [email protected]
Karpenko, O., Doctor of Pedagogical Sciences, Professor, Dragomanov National Pedagogical University, Kyiv, Ukraine. Email: [email protected]
Kompanets, E., Candidate of Agricultural Sciences, Associate Professor, Dragomanov National Pedagogical University, Kyiv, Ukraine. Email: [email protected]
HOW TO CITE THIS ARTICLE
Pinskaya, M.; Meleshchenko, O.; Kovalchuk, O.; Karpenko, O.; Kompanets, E., (2021). Modelling the impact of environmental responsibility on the development of enterprises. Global J. Environ. Sci. Manage., 7(4): 503-522.
DOI: 10.22034/gjesm.2021.04.02
url: https://www.gjesm.net/article_243912.html
COPYRIGHTS
©2021 The author(s). This is an open access article distributed under the terms of the Creative Commons Attribution (CC BY 4.0), which permits unrestricted use, distribution, and reproduction in any medium, as long as the original authors and source are cited. No permission is required from the authors or the publishers.

Global J. Environ. Sci. Manage. 7(4): 523-542, Autumn 2021
*Corresponding Author:Email: [email protected]: +52 55562 25225 Fax: + 52 55562 25228
Global Journal of Environmental Science and Management (GJESM)
Homepage: https://www.gjesm.net/
ORIGINAL RESEARCH PAPER
Estimation and mapping of the contribution of nitric acid to atmospheric corrosion of zinc
J.O. Castillo-Miranda1,*, F.J. Rodríguez-Gómez1, J. Genescá-Llongueras2, L.G. Ruiz-Suárez3, J.A. García-Reynoso3
1Departamento de Ingeniería Metalúrgica, Facultad de Química, Universidad Nacional Autónoma de México, Circuito Exterior s/n, Ciudad Universitaria, C.P. 04510, Ciudad de México, México2Polo Universitario de Tecnología Avanzada, Universidad Nacional Autónoma de México, Vía de la Innovación 410 PIIT Autopista Monterrey-Aeropuerto Km. 10 C.P. 66629, Apodaca, Nuevo León, México3Centro de Ciencias de la Atmósfera, Universidad Nacional Autónoma de México, Circuito de la Investigación Cientifica, Ciudad Universitaria, C.P. 04510, Ciudad de México, México
BACKGROUND AND OBJECTIVES: Atmospheric zinc corrosion in the Mexico City Metropolitan area has long been attributed mainly to the effect of pollutants such as sulfur dioxide. There are changes in the urban atmosphere’s chemical composition due to the implementation of air quality policies focused on reducing the emission of sulfur dioxide and other pollutants. This study’s objectives were to estimate and map the contribution of nitric acid on zinc’s atmospheric corrosion process.METHODS: The impact of nitric acid on zinc is feasible to estimate using a function for a multi-pollutant situation. This function contemplates the sum of two contributions: one of nitric acid and another that includes sulfuric acid and climatic parameters. The multi-pollutant function is suitable to apply in areas without the strong influence of chlorides and tropical and subtropical climates, comparable to the Mexico City Metropolitan area. FINDINGS: The results showed that spatial and temporal estimation of corrosion rates in grams per square meter of zinc was made for 2015-2019, using data modeling in a geographic information system. The maps of corrosion rates allowed us to visualize that, in general, the “southwest” zone has the most significant effects and that the lowest corrosion rates were presented in 2019 as an outcome of the implementation of air quality programs. Furthermore, a contribution of nitric acid up to 32% to the zinc corrosion rate was estimated.CONCLUSION: The construction of corrosion rate maps provides a spatial and temporal estimate that allows visualizing areas where zinc materials are at risk corrosion due to the dispersion of atmospheric pollutants and climatic parameters. Likewise, it can represent a decision-making tool for the implementation of atmospheric corrosion studies of materials.
©2021 GJESM. All rights reserved.
ARTICLE INFO
Article History:Received 04 January 2021Revised 09 April 2021Accepted 24 April 2021
Keywords:Air pollutionDamage to materialsGeographic information systems
(GIS)Multi-pollutant functionUrban atmosphere
ABSTRAC T
DOI: 10.22034/gjesm.2021.04.03
NUMBER OF REFERENCES
74NUMBER OF FIGURES
6NUMBER OF TABLES
3
Note: Discussion period for this manuscript open until January 1, 2022 on GJESM website at the “Show Article.

524
J.O. Castillo-Miranda et al.
INTRODUCTIONThe atmospheric corrosion process of hot-dip
zinc-coated steel occurs in environments influenced by industrial activities with emissions of sulfur dioxide (SO2), nitrogen oxides (NOx), and hydrogen sulfide (H2S). In marine environments, the reaction occurs with chlorides, together with carbon dioxide (CO2) and water (H2O) (Friel, 1986). The hydrogen potential (pH) of the aqueous surface film depends on the atmospheric concentration of SO2 and NOx, essential for the corrosion process because it controls the dissolution of the passive oxyhydroxide surface (Graedel, 1989; Graedel and Frankenthal, 1990). Corrosive atmospheric trace substances, such as SO2, nitrogen dioxide (NO2), and hydrogen chloride (HCl), accelerate metallic corrosion by acidifying the surface electrolyte and accelerate metal corrosion (Johansson, 1990). Knotková and Bartoň (1992) analyzed the contribution of acid deposition as a heterogeneous dynamic system of atmospheric corrosion metals. Kucera and Fitz (1995) considered that an acid effect in the atmosphere due to a multi-pollutant situation was the cause of the damage to materials. The deterioration of various materials, to some extent, is caused by acid gases such as SO2, nitric acid (HNO3), and HCl (Ferm et al., 2005). Current studies indicate that the corrosion effect of HNO3 exceeds SO2, with a factor between 2 and 20 depending on the exposed material (Tidblad et al., 2009). Atmospheric corrosion metals has long been attributed to SO2 and chlorides (Cl-), which has been demonstrated in laboratory weathering exposures and proven in field exposures. So, the promulgation of environmental protection laws in industrialized countries, in addition to the efforts inside the limits of the Convention of the United Nations Economic Commissions for Europe (UN ECE) on Long-range Transboundary Air Pollution (CLRTAP), led to a notable decrease in SO2 levels. However, the concentration levels of other air pollutants, such as NOx and ozone (O3), remained or even increased slightly. Therefore, the effect of SO2 needs to be considered in a multi-pollutant situation with other polluting gases such as NO2 and O3, including particles (Oesch and Faller, 1997; Tidblad et al., 2002a). The levels of environmental concentration for HNO3 are lower concerning SO2; however, depending on the aggressiveness, HNO3 can be compared to SO2 in a multi-pollutant situation (Tidblad et al., 2009).
Atmospheric sulfur levels have been better controlled, and there has been a considerable reduction in SO2 emissions, while the concentration of NOx and HNO3 has increased due to emissions from automobile traffic (Graedel and Frankental, 1990; Pantani et al., 1998). HNO3 has higher concentrations in urban areas than in rural areas, but they are lower than NO2 in urban areas (Ferm et al., 2005). The current study’s main objective is to estimate nitric acid’s spatial and temporal contribution to zinc’s atmospheric corrosion in the Mexico City Metropolitan Area (MCMA) for 2015-2019., Maps of corrosion rates in grams per square meter (g/m2) were constructed to achieve this objective. Also, the maps provide a spatial estimate of the corrosion risk of zinc materials when exposed to a polluted atmosphere. This study was carried out in the Mexico City Metropolitan Area in 2020.
The behavior of HNO3 in the atmosphere of the Mexico City Metropolitan area
The Mexico City Metropolitan Area (MCMA) is located between north 19° 03’ to 19° 54’ latitude and 98° 38’ to 99° 31’ west longitude. It is part of an endorheic basin, with an average altitude of 2,240 meters above sea level. It is in the “East” area of the region known as the Transverse Neovolcanic System. The latitude of the MCMA can accelerate the photochemical reactions of pollutants in the atmosphere due to intense solar radiation. Likewise, there are anticyclonic systems in the area that keep the sky clear and increase the photochemical capacity of the atmosphere (SMA, 2008). MCMA is one of the largest megacities worldwide, as it has a population of more than 21 million people (UN, 2016). MCMA lies in central Mexico, at a tropical latitude where the climate is semi-dry temperate tropical in the northeast region; in the center, the temperate subhumid predominates, and in the upper, semi-cold subhumid type regions. Generally, the main entry of wind is located in the north, although there may be wind flow from south to north (Jáuregui, 2000; INEGI, 2007). The rainy season with high relative humidity occurs from May to October (Jáuregui and Romales, 1996), causing the levels of some pollutants to drop due to atmospheric instability. The upper levels of precipitation are registered in the mountainous areas and the lowest mainly in the northeast (INEGI, 2007). A study of the chemical composition of rain samples in Mexico City through multiple regression

525
Global J. Environ. Sci. Manage., 7(4): 523-542, Autumn 2021
analysis for the period 1994-2000 showed that the contribution of Cl- (chloride-based sea salt) with sodium ion (Na+) and potassium ion (K+) was 2.2 percentage (%) at the prediction of the hydrogen ion (H+) concentration. It allows us to assume that the chlorides found in rainwater come from sources other than sea salt. Likewise, Mexico City is placed at more than 300 kilometres (km) from the nearest shore, surrounded by high mountains. The Sierra Madre Oriental, with mountains above 4000 meters above sea level, is located near the Gulf of Mexico coast, where heavy rains are produced that intervene in further eliminating sea salt aerosols (Báez et al., 2006). A study of the humid atmospheric deposition in the 2013-2016 period in the MCMA indicated that the calcium Ca2+ and Cl- ions represented total annual deposits of 8% to 9% and 3% to 8% (Avila, 2018). The presence of chlorides could be attributed to emissions of approximately 30,000 small, medium, and heavy industries located in the northern part of the MCMA and the residential use of hypochlorite. There are hypochlorite production, ferrous and non-ferrous foundries, glass producers, motor vehicle manufacturers (a foundry), automobile assembly, plant factories, lime, brick, ceramics, cement, and tires (García et al., 2009). The altitude of the MCMA leads to a lower oxygen content of the air, approximately 23% lower than at sea level. It causes the combustion processes to operate poorly and diffuse a greater quantity of pollutants into the atmosphere, together with the surrounding mountain chain, which favors its stagnation (Molina and Molina, 2002). In 2016, Mexico City registered 2.3 million vehicles; the most abundant are those for private use, such as cars, Sport Utility Vehicle (SUVs), and motorcycles, which account for 83% of the total fleet. Total emissions of nitrogen oxides from this vehicle fleet represented a total of 60,907 Megagrams per year [Mg/y], with private cars and trucks being the main generators with an amount of 52,437 [Mg/y], which represents 86% of the total (SEDEMA, 2018a). The concentrations of SO2 and NO2 in the ambient air remained during 2017 below the limit concentrations required by the Official Mexican Environmental Health Standards. The Tula-Tepeji corridor remains the most important source of sulfur dioxide for Mexico City. An analysis of the trend indicated that since 2000, SO2 concentrations maintained a downward trend, while nitrogen oxides did not show a significant trend. NO2 contributes
about 60% of the total concentration of nitrogen oxides. Also, acid rain samples were recorded in the rainy season at places south and east of Mexico City (SEDEMA, 2018b). Studies on the monitoring of the atmospheric concentration of HNO3 in the MCMA and its spatial distribution are scarce. HNO3 shows a behavior similar to ozone, reaching a maximum level during the day and a low level at night. Also, it tends to increase its concentration from north-northeast to south-southwest (Moya et al., 2004; Zheng et al., 2008; Wood et al., 2009; Cuevas, 2014). A map of the annual average concentration of HNO3 micrograms per cubic meter (µg/m3) for the year 2007 shows that the highest concentration levels are located in the northwest area of the MCMA (Castillo-Miranda et al., 2017). The climatic conditions in the MCMA area are as follows: In 2015, average temperature 16.4 °C. April hottest 18.7 °C. Relative humidity (RH) average 62%, atypical rain during march and April (35 and 17 mm). Average precipitation 672 millimeters (mm). Barometric pressure average 584 milimeters of mercury (mmHg) (581-588 interval). Average wind speed 2.0 meters per second (m/s), highest values during October 2.3 m/s (SEDEMA, 2016). In 2016, average temperature 16.2 °C, May hottest 19.5 °C. RH 57% average. Average precipitation 965 mm. Barometric pressure average 585 mmHg (575 - 591 interval). Average wind speed 2.1 m/s (SEDEMA, 2017). In 2017, average temperature 16.8 °C, May hottest 19.7 °C. RH 54% average. Average precipitation 965 mm. Barometric pressure average 585 mmHg (580 - 591 interval). Average wind speed 2.1 m/s (SEDEMA, 2018c). In 2018, average temperature 16.7 °C, May hottest 19.4 °C. RH 57.1% average. Average precipitation 786.2 mm. Barometric pressure average 584.9 mmHg (583 - 589 interval). Average wind speed 2.0 m/s (SEDEMA, 2020b). In 2019, average temperature 17.4 °C. RH 53.2%, Average precipitation 565.3 mm. Average wind speed 2.1 m/s (CONAGUA, 2019). For pollutant SO2 has a reduction between 2015 to 2019 from near 70 parts per billion (ppb) go 47 ppb. In case of the NO2 from near 130 ppb to 110 ppb (SEDEMA, 2020c).
Effects of nitric acid on zinc corrosionIn the modern urban atmosphere, the
concentration levels of SO2 tend to decrease, increasing the relative importance of other trace gases such as NO2. The importance of NO2 lies in being the

526
Mapping of corrosion of zinc
precursor of HNO3 that participates in the materials’ degradation processes (Graedel and Schwartz, 1977; Svensson and Johansson, 1993). HNO3 is a molecule that quickly adsorbs to surfaces, specifically if there is water on the surface. Due to its high solubility in water, HNO3 is rapidly deposited on surfaces and in water droplets (Seinfeld and Pandis, 2016; Finlayson-Pitts and Pitts Jr., 2000). It experiences dry and wet deposition rapidly, with deposition rates in the range of 1-5 cm/s (Finlayson-Pitts and Pitts Jr., 2000). The atmospheric removal processes for nitric acid gas are by wet and dry deposition. The estimated half-life for dry and wet nitric acid deposition is 1.5 to 2 days and 2 to 3 days, respectively. There is also an efficient removal of nitric acid during precipitation events (Hamilton and Crabbe, 2009). Laboratory studies (Edney and Stiles, 1986; Svensson and Johansson, 1993) have been conducted on the effect of SO2, NOx, and oxidants on the early stages of the galvanized steel atmospheric corrosion. This corrosion is due to the dry deposition of SO2 and HNO3, and HNO3 is likewise a source of wet NO3 (Edney et al., 1986). They also found that the deposition rate was 0.02 centimeter per second (cm/s) for NO2, and HNO3 was 2.0 (m/s). The only relevant role of atmospheric nitrogen is likely to serve as an acidifying species in the precipitation and deposited aerosol particles, as shown in Fig. 1.
Nitric acid is the main gaseous component that dissolves in the aqueous surface layer, and nitrates
come from both particles and the quantity of precipitation. Trace amounts of nitrates in the zinc corrosion layers were discovered, and it was possibly zinc nitrate ( Zn(NO3)2 ) (Graedel, 1989). Friel (1986) obtained nitrate ions in low concentrations from the zinc corrosion layers. Oesch and Faller (1997) reported the formation of basic zinc nitrate Zn5(NO3)2(OH)8 • 2H2O, which is formed when zinc is exposed to parts per million (ppm) levels of NO2. HNO3 has a very high dry deposition rate (Vd) that is generally independent of relative humidity and is rapidly adsorbed on most surfaces, making it relatively more harmful for dry and hot climates (Kucera, 2003; Tidblad et al., 2012). Deposited nitrate particles are associated with coarse particles. These coarse particles are commonly alkaline and can also contain sodium chloride. This composition makes them a sink for nitric acid. The reaction can be carried out in the atmosphere or deposited particles (Tidblad et al., 2012). Laboratory experiments and data from the literature show that the relatively high (Vd) of HNO3 has mainly been attributed to the extreme adherence and reactivity of HNO3 (Samie, 2007b). Also, the solubility of HNO3 in water, according to Henry’s law coefficients (2.1 x 10⁵ mole per liter atmosphere (mol/L atm), is higher than SO2 and NO2, which have 1.24 and 0.01 mol/L atm, respectively (Seinfeld and Pandis, 2016; Oesch, 1996). It allows a high solubility of HNO3 in the electrolytic layer and increases the corrosion rate (Samie et al., 2007b). HNO3 is soluble in water,
Fig. 1: A schematic representation of the processes involved in the formation
of components containing nitrogen during the atmospheric zinc corrosion (Graedel, 1989)
Fig. 1: A schematic representation of the processes involved in the formation of components containing nitrogen during the atmospheric zinc corrosion (Graedel, 1989)

527
Global J. Environ. Sci. Manage., 7(4): 523-542, Autumn 2021
and the concentration in urban environments is relatively low (1-4) µg/m3 compared to SO2 (1-20) µg/m3. Nitrate salts ( 3NO− ) are formed when metals react with HNO3; however, nitrate salts are soluble in water, and this may be one reason for the rare occurrence of nitrates in layers of corrosion products (Samie et al., 2007a). Pure zinc plates were exposed in the field for a year, within the Model for Multi-pollutant Impact and Assessment of Threshold Levels for Cultural Heritage (MULTI-ASSESS) and Regional Air Pollution in Developing Countries (RAPIDC) programs in Europe, Asia, and Africa. The Fourier transform spectroscopy (FTIR) technique demonstrated the presence of nitrates as corrosion products. Likewise, nitrates with high solubility are found in greater quantity on the plate’s backside since they are less affected by precipitates. Furthermore, essential nitrates (Zn5(NO3)2(OH)8 • 2H2O) are generally more soluble in acidic solutions than in water. Therefore, the pH decreases in the absorption layer when acidic contaminants dissolve. Consequently, the essential nitrates are dissolved and removed from the surface by the presence of rain. Accordingly, the zinc front side corrodes more because it has a less protective layer of basic nitrate (Samie et al., 2007a).
Damage functionsThe development of various exposure studies has
shown that atmospheric corrosion is a phenomenon that varies considerably in each locality (Guttman and Sereda, 1968). The development and use of a damage function applying the fundamental principles of thermodynamics and kinetics of atmospheric corrosion allow predicting galvanized steel structures corrosion rates due to dry and wet deposition (Spence and Haynie, 1990). The dose-response functions should reflect the physicochemical nature of atmospheric corrosion and each parameter’s contribution to the global effect (Leuenberger-Minger et al., 2002). Since atmospheric corrosion affects all structures exposed to potentially corrosive environments, many countries have established programs dedicated to understanding and monitoring (Roberge et al., 2002). In some cases, atmospheric exposure programs are conducted to assess the corrosivity of specific atmospheres. This type of information can help choose coatings or corrosion protection systems at particular sites (Dean Jr., 2005). A set of exhibition programs such as International
testing program [] (ISOCORRAG), Ibero-American Map of Atmospheric Corrosiveness (MICAT), International Co-operative Programme on Effects on Materials, including Historical and Cultural Monuments (ICP materials), Model for Multi-pollutant Impact, and MULTI-ASSESS and RAPIDC have been developed in the last decades in different parts of the world. The International Testing Program (ISOCORRAG) began in 1987-1989 with International Organization for Standardization/Technical Committees 156 (ISO/TC 156) test methods and procedures to provide environmental and corrosion data. It includes 53 test sites in 14 countries located in Europe, Argentina, Canada, Japan, New Zealand, and the United States (Knotková, 1993). However, the ISOCORRAG and MICAT programs lack data on gases other than SO2 and wet deposition (Tidblad et al., 2009). However, atmospheric corrosivity can be estimated with consistent environmental information to establish damage functions, based on a statistical analysis of the databases’ information (Morcillo et al., 2002). The ICP Materials program had its first stage (1987–1995), where dose-response functions were developed with long-term data on corrosion and contamination to investigate the effect of acid deposition on materials. It includes non-marine sites, lacks data on the dry deposition of chlorides and HNO3 and particles. In this period, SO2 concentrations were still relatively high but decreasing. It led to the need for a new multi-pollutant exposure program (1997–2001). This program aimed to determine both the effect of SO2 and other important air pollutants such as HNO3 and particles. In the 2002-2003 period, the MULTI-ASSESS project included HNO3 and particles as mandatory parameters (Tidblad et al., 2012). Also, RAPIDC project included measurements of HNO3 and particulate matter. Also, the program was set up with 18 sites in the South and Southeast of Asia and South Africa, which have tropical and subtropical climates. Both the MULTI-ASSESS Program and RAPIDC are the most suitable for investigating the effects of multiple pollutants in non-marine environments (Tidblad et al., 2009). After one year (2002-2003), zinc RAPIDC exposure’s corrosion is lower than expected compared to values calculated (Tidblad et al., 2007) using the best available dose-response functions. However, due to the relatively high measured SO2 levels, it was correct to use functions for the dominant SO2 situation developed within the ICP Materials program (Tidblad

528
J.O. Castillo-Miranda et al.
et al., 2001). The International Organization for Standardization (ISO) ISO 9223 standard is intended to evaluate the corrosivity category for metals. This category explicitly describes the corrosiveness of outer atmospheres through the development of dose-response functions. Considering the above, the dose-response function for zinc is supported on data after one year of exposure. It can, therefore, only be used for classification objects (Zn, N=116, R2=0.78), using Eq. 1 (Tidblad et al., 2002b).
CZn = 0.0053 SO2 0.43 TOW0.53 exp {fZn} + 0.00071
Cl0.68 TOW0.30 exp{0.11T} (1)fZn (T) = 0 when T≤ 10 °C, otherwise -0.032(T-10)
Where;CZn = Corrosion attack after 1 year of exposure
in µm of zinc; T=Temperature in °C; TOW=Time of wetness in hour per year (h/y); SO2= SO2 deposition in milligram per square meter day (mg/m2day); Cl= Cl- deposition in mg/m2/day.
Corrosivity mappingMapping the regional distribution of corrosivity
is a method that provides general information on corrosion, rational use, and selection of material protection measures. The mapping must be based on the knowledge of the deterioration and kinetic processes based on external factors, and it generalizes the information supported on local environmental conditions. Likewise, it requires available information on the levels of atmospheric environmental components and converts it into values on the effects of corrosion. The above is achieved using damage equations (dose-response functions) obtained from empirical procedures applied to data processing using GIS technologies (Knotková and Kreislova, 2007). The classification of the different atmospheric basins based on corrosivity serves to select optimal metallic materials and coatings for adequate protection against corrosion in a country (Genescá and Rodríguez, 1992). The atmospheric corrosion maps for metals in Mexico were designed according to the ISO 9223 classification system. They required annual mean corrosion values in test stations, meteorological data, and atmospheric pollution such as SO2 and chloride ions (Cl-) (Mariaca et al., 1999). Corrosivity maps were constructed for zinc, copper, and aluminum in the MCMA, by characterizing the
atmospheric aggressiveness on these materials based on the ISO 9223 standard. Furthermore, atmospheric aggressiveness does not necessarily correspond to the most polluted areas since it depends on the relative humidity and wetting time (Muñoz and Uruchurtu, 2002).
MATERIALS AND METHODSSelection of the dose-response function
The dose-response functions are empirical expressions and then simplifications that indicate the relationship between the rate of corrosion or deterioration and the levels of pollutants combined with climatic parameters (Kucera, 2004). At first, the dose-response functions were more focused on SO2, as the main stimulator of corrosion. These functions were denoted as dose-response functions for the dominant SO2 situation. However, as there have been changes in the atmosphere’s chemical composition, there are higher levels of concentration of nitrogen, ozone, and particles than of SO2. The above made it possible to propose “multi-pollutant” type functions. Multi-pollutant functions are preferable at high levels of particulate and nitrogen pollutants in the air. The above occurs in urban atmospheres dominated by traffic (Kucera, 2005). Other important factors in applying the multi-pollutant dose-response function are chloride concentration [Cl-] and Temperature (T). This function is applicable in geographic areas without the influence of chlorides, have been developed and suggested to be implemented in countries with tropical and subtropical climates, characteristic of the MCMA. Likewise, in these climates, the corrosion rate of zinc in field tests consisting of a rack for placing zinc samples and holding passive samplers for gases is lower compared to the corrosion rates obtained with the best available dose-response functions (Tidblad et al, 2007). Table 1 shows the annual average concentration levels of SO2, NO2, and Cl- and the yearly average temperature obtained from the monitoring stations located in the MCMA in the period 2015-2019 (SEDEMA, 2020a). The concentration levels of SO2, in general, are low and are more noticeable for the year 2019. The concentration levels of NO2 are higher than SO2. The Cl- concentration is less than 5 milligrams per liter (mg/L), and the temperature is greater than 10 °C, which suggests the use of a multi-pollutant dose-response function that includes the effect of HNO3.

529
Global J. Environ. Sci. Manage., 7(4): 523-542, Autumn 2021
Dose-response functions are importantly applied to map areas of increased risk corrosion and to calculate corrosion costs. Furthermore, it is possible to estimate the loss of mass of zinc for a multi-pollutant situation (Kucera et al., 2007). The statistical processing of data from materials exposed in the field generated a dose-response function for the loss of zinc mass after one year of exposure, using Eq. 2 (Kucera, 2005).
ML = 3.53 + 0.471[SO2]0.22 e 0.018RH+f(T) +0.041Rain
[H+] + 1.37[HNO3] (2)
f(T) = 0.062(T-10) when T ≤ 10˚C, f(T) = -0.021(T-10) otherwise
Where ML is the corrosion rate in g/m2, [SO2] and [HNO3] is the concentration in micrograms per cubic meter (µg/m3), RH is the relative humidity in %, Rain is the amount of precipitation in millimeters (mm), [H+] is the H+ concentration of rainfall in mg/L, and T is the temperature in °C. Eq. 2 shows an evident effect of HNO3 on zinc corrosion and represents the sum of two contributions, one from HNO3 and the other from corrosion-enhancing factors including SO2 (Samie et al, 2007a). They also found a relatively good correlation between the extrapolated zinc mass loss, based on laboratory exposures, and the dose-response function based on a statistical analysis of field data. The multi-pollutant function includes nitric acid that any MCMA monitoring station does not measure. Eq. 3 developed within the MULTI-ASSESS project can be used to calculate the annual concentration of HNO3 when there are no values (Kucera, 2005):
[HNO3] = 516 • e-3400/(T+273) ([NO2] • [O3] •RH)0.5 (3)
Where [HNO3], [NO2] and [O3] is the concentration in µg/m3; RH is the relative humidity in %, and T is the temperature in degree Celsius (°C). The oxidation process from NO2 to HNO3 described in equations (4-
21) contemplates the chemical species of Eq. 3. The NO2 molecule absorbs sunlight at wavelengths
<430 nm and can break one of the NO bonds and generate the reactive ground-state oxygen atom, the triplet-P oxygen atom, O (3P), and a NO molecule, using Eq. 4 (Seinfeld, 1980).
NO2 + hν → NO + O(3P) (4)
The exceptionally reactive triplet-p oxygen atom formed regularly collides with oxygen molecules to form ozone, using Eq. 5.
O(3P) + O2 + M → O3 + M (5)
Under typical polluted atmosphere conditions, the ozone molecule will often react with NO to regenerate NO2, using Eq. 6.
O3 + NO → NO2 + O2 (6)
Ozone can also photolyze, using Eqs. 7 and 8.
O3 + hν → O2 (1∆, 3∑ ) + O(1D, 3P) (7)
O3 + hν → O2 (1∆, 3∑ ) + O(3P) (8)
The singlet-D oxygen atom is considerably more reactive than the ground-state triplet-P oxygen atom, using Eq. 9. Apart from deactivation.
O(1D) + M → O(3P) + M (9)
It reacts with water to form the hydroxyl radical, using Eq. 10.
O(1D) + H2O → 2OH· (10)
Ozone can react with nitrogen dioxide to produce
280-350 nm
450-700 nm
Table 1: Measurements of [SO2], [NO2], [Cl-] and T annual average in the period 2015-2019
Parameter Year
2015 2016 2017 2018 2019 SO2 (µg/m3) 8.45 8.48 9.63 8.54 6.87 NO2 (µg/m3) 36.46 35.28 36.61 36.30 31.58 Cl- (mg/L) 0.45 0.29 0.25 0.24 0.21 T (°C) 16.51 16.42 16.44 16.26 17.17
Table 1: Measurements of [SO2], [NO2], [Cl-] and T annual average in the period 2015-2019

530
Mapping of corrosion of zinc
symmetrical nitrogen trioxide, using Eq. 11.
O3 + NO2 → NO3 + O2 (11)
The NO3 species forms dinitrogen pentaoxide, by reaction with nitrogen dioxide, using Eq. 12.
NO3 + NO2 → N2O5 (12)
Dinitrogen pentaoxide can rearrange to form NO3 and NO2 or maybe react with water to form nitric acid, using Eqs. 13 and 14.
N2O5 → NO3 + NO2 (13)
N2O5 + H2O → 2HONO2 (14) The subsequent reaction can take place between
oxygen atoms and NO2, using Eq. 15.
NO2 + O(3P) → NO+ O2 (15)
In addition, NO and NO3 can react to regenerate NO2, using Eq. 16.
NO3 + NO → 2NO2 (16)
Nitrous acid is generated by using Eq. 17.
NO + NO2 + H2O → 2HONO (17)
And can react bimolecular to regenerate the original reactants, using Eq. 18.
HONO + HONO → NO + NO2 + H2O (18)
Photolysis of nitrous acid in the wavelength range 280-400 nm guide to producing hydroxyl radical and NO, using Eq. 19.
HONO + hν → OH· + NO (19)
The hydroxyl radical may react with NO and NO2 to yield nitrous and nitric acid using Eqs. 20 and 21, respectively.
OH· + NO → HONO (20)
OH· + NO2 → HONO2 (21)
Applied methodMapping of the corrosion rates was carried out
through the following procedure: Integration of the available data from measurements of concentrations of sulfur dioxide (SO2), estimated nitric acid (HNO3), relative humidity (RH), rainfall, or amount of precipitation (PP), temperature (T) and the acidity of the rain [H+]. The data and results were applied in suitable mathematical functions to construct, by interpolation, maps of their spatial distribution. Subsequently, with these values, the multi-pollutant function corresponding to zinc is applied to obtain the corrosion layers. A description of these steps is presented in the following paragraphs.
Damage function parameter databaseThe database was integrated with the multi-
pollutant function parameters to calculate the corrosion rate in the period 2015-2019. These parameters are obtained from the different monitoring stations as described down below. For this study, SO2 data generated by the Red Automática de Monitoreo Atmosférico (Automatic Atmospheric Monitoring Network, RAMA) for the period (2015-2019) are used. The estimation of HNO3 required annual average values per hour of the parameters: Nitrogen dioxide (NO2) and ozone (O3) from the (RAMA); in addition to temperature (T) and relative humidity (RH) from the databases of the Red de Meteorología y Radiación Solar (Atmospheric Monitoring Network and the Meteorology and Solar Radiation Network, REDMET). The values of the acidity of the precipitation [H+] and the amount of rainfall or rain (PP) included in the multi-pollutant function were obtained from data reported by the Red de Depósito Atmosférico (Atmospheric Deposit Network, REDDA) for the period (2015-2019). The values of temperature (T) and relative humidity (RH) included in the dose-response function were obtained from the database of the Red de Meteorología y Radiación Solar (Meteorology and Radiation Network, REDMET) for the period (2015-2019) (SEDEMA, 2020a).
Creating layers using geographic information systemsSelecting the interpolation method
Geographic information systems (GIS) are an indispensable technology for capturing, storing, analyzing, modeling and displaying spatially

531
Global J. Environ. Sci. Manage., 7(4): 523-542, Autumn 2021
referenced data (Moreno, 2006a). Conesa (1996) indicated that GIS could process large databases with information about the land surface globally and globally. One of a GIS’s purposes is to provide a spatial framework to support decisions about the efficient use of the earth’s resources and manage the anthropogenic environment (Zeiler, 1999). The kriging method combined with deterministic modeling improves the spatial analysis of acid deposition (Venkatram, 1988). Modeling temperature and relative humidity were interpolated using the kriging method, and the standard deviation (SD) was used to measure the spatial uncertainty (Phillips and Marks, 1996). The inverse distance weighting (IDW) and kriging spatial interpolation techniques are regularly used to estimate pollutant concentration levels in areas with limited sample points. The value of each parameter is determined by cross-validation until the least mean square error (RMSE) is obtained (Rojas-Avellaneda, 2007; Diem and Comrie, 2002). Pollutant concentration maps using the kriging method are used in the European Monitoring and Evaluation Materials Program (EMEP) (Denby et al., 2005). Modeling the temporal behavior of SO2 using the ordinary kriging method provides an estimate of the air quality in Europe. It is suggested to use a semivariogram with a spherical model to obtain the SO2 layer (Denby et al., 2010). In this study, spatial representation was developed using Aeronautical Reconnaissance Coverage Geographic Information System (ArcGIS) software (ArcGIS, 2014). ArcGIS uses the extension called “geostatistical analysis”. It employs advanced tools to perform exploratory analysis of spatial data and a wizard with which statistical surfaces are constructed. The layers’ construction was decided to build vector layers with both IDW and ordinary kriging for each of the parameters. The selection of the interpolation method for each parameter was based on obtaining the lowest value of the Root Mean Square (RMS) of the cross-validation. The coefficient of determination R2 of the relationship observed value vs. predicted value resulting from the cross-validation is obtained. The ordinary kriging interpolation method was used to obtain the layers of the following parameters, with their corresponding annual coefficient of determination R2: [SO2]: 2015 = 0.60; 2016 = 0.52; 2017 = 0.76; 2018 = 0.71 and 2019 =0. 67. [HNO3]: 2015 = 0.55; 2016 = 0.76; 2017 = 0.73; 2018 = 0.60 and 2019 = 0.60. HR: 2015 = 0.02;
2016 = 0.17 and 2018 = 0.15. T: 2015 = 0.44; 2016 = 0.60; 2017 = 0.41; PP: 2016 = 0.67; 2017 = 0.87; 2018 = 0.70 and 2019 = 0.72. [H+]: 2017 = 0.01; 2018 = 0.20 and 2019 = 0.21. The IDW interpolation method was employed to obtain the following parameters’ layers, with their corresponding annual coefficient of determination R2: HR: 2017 = 0.03 and 2019 = 0.01. T: 2018 = 0.40 and 2019 = 0.32. PP: 2015 = 0.26. [H+] 2015 = 0.09 and 2016 = 0.52.
RESULTS AND DISCUSSIONLayer maps of the parameters of the dose-response function and the corrosion rate
The representation of the maps of the dose-response function parameters focuses mainly on SO2 as one of the main factors in the corrosion process and HNO3 regarding corrosion in the urban atmosphere. The sulfur dioxide [SO2] layers for the period 2015-2019 are shown in Fig. 2. The figure indicates spatially that the highest [SO2] levels are located to the “northwest” and the lowest to the “east, northeast” and “southeast” and a lesser extent south of the MCMA. From a temporal perspective, the highest levels of [SO2] are present in 2017 and 2018, while the lowest levels occur in the year 2019, followed by 2015 and 2016. The [HNO3] layers for the period 2015-2019 are represented in Fig. 3. The figure shows spatially that the highest [HNO3] levels are located in the “central” and “southwest” areas and the lowest in the “east” and “northeast” areas of the MCMA. From a temporal viewpoint, the highest [HNO3] levels are in 2015 and 2016, while the lowest levels are in 2016, followed by 2018. The importance of the annual change in the levels of HNO3 concentration observed in the maps allows visualizing the urban atmosphere’s complexity in relation to its acidity.
The corrosion layers for zinc used in the evaluation were constructed using the “raster calculator” tool included in the ArcGIS 10.2.2 spatial analysis extension. It performs analysis operations with mathematical functions. The process consists of applying the multi-pollutant function, introducing the raster layers of the corresponding parameters. These layers represent the terrestrial space’s property through a set of square cells of the same size, called pixels. The raster model is appropriate to represent continuous variables in space, such as meteorological variables and air pollution (Moreno, 2006b). The corrosion rate maps construction results are shown in Figs. 4 and 5.

532
J.O. Castillo-Miranda et al.
Fig. 2: Maps of concentration layers of the annual average of sulfur dioxide [SO2] (µg/m3) for the period 2015-2019 in the MCMA
Monitoring StationMCMA
Fig. 2: Maps of concentration layers of the annual average of sulfur dioxide [SO2] (µg/m3) for the period 2015-2019 in the MCMA
The layers of the corrosion rates employing the multi-pollutant function of equation 2 for 2015-2019 are shown in Fig. 4. The images show a corrosion rate of 5.81-8.19 of mass loss (g/m2). Spatially, the highest corrosion rates are located in the “southwest” of the
MCMA. On the other hand, the lowest corrosion rates are seen in the “northeast-southeast” of the MCMA. The highest corrosion rates present in 2015 and 2016, while the lowest corrosion rate occurs in the year 2019. Likewise, the corrosion rates’ layers using the

533
Global J. Environ. Sci. Manage., 7(4): 523-542, Autumn 2021
Fig. 3: Maps of concentration layers of the annual average of [HNO3] (µg/m3) for the period 2015-2019 in the MCMA
Fig. 3: Maps of concentration layers of the annual average of [HNO3] (µg/m3) for the period 2015-2019 in the MCMA
multi-pollutant function of equation 2, without the component that includes HNO3 for 2015-2019, are shown in Fig. 5. The images establish a corrosion rate interval of [4.86-6.64] of mass loss (g/m2). Spatially, the corrosion rates represent the same trend as in Fig.
4. The highest rates are located in the “southwest” of the MCMA, although the area covered is smaller. Meanwhile, the lowest corrosion rates are seen in the “northeast-southeast” of the MCMA, covering larger areas. In the same way, temporarily, the highest

534
J.O. Castillo-Miranda et al.
Fig. 4: Corrosion rate maps (g/m2) of zinc, for a multi-pollutant situation for the period 2015-2019 in the MCMA Fig. 4: Corrosion rate maps (g/m2) of zinc, for a multi-pollutant situation for the period 2015-2019 in the MCMA
corrosion rates present in 2015 and 2016, while the lowest corrosion rate occurred in 2019. The highest corrosion rates are presented in the years 2015 and 2016. It is probably due to the high levels of [HNO3] observed in Fig. 3. In contrast, the lowest corrosion
rate occurred in 2019. The above is probably due to both sulfur dioxide and nitrogen dioxide, which present the lowest concentration levels in the 2015-2019 period. However, the fact that the corrosion rate for 2019 is the lowest in magnitude compared

535
Global J. Environ. Sci. Manage., 7(4): 523-542, Autumn 2021
Fig. 5: Corrosion rate maps (g/m2) of zinc, for a multi-pollutant situation without the HNO3 component for the period 2015-2019 in the MCMA
Fig. 5: Corrosion rate maps (g/m2) of zinc, for a multi-pollutant situation without the HNO3 component for the period 2015-2019 in the MCMA
to other years, in percentage terms, has a significant influence on the corrosion rate for this year. The low perdetermination coefficient values R2 were obtained mainly in constructing the climatic parameters’ layers, possibly due to the nature and variability of
the data obtained from the monitoring networks. The HNO3 percentage contribution layers to the annual zinc corrosion rate are shown in Fig. 6. The impact is determined by combining the layers of corrosion rates of Figs. 4 and 5 in a percentage relationship
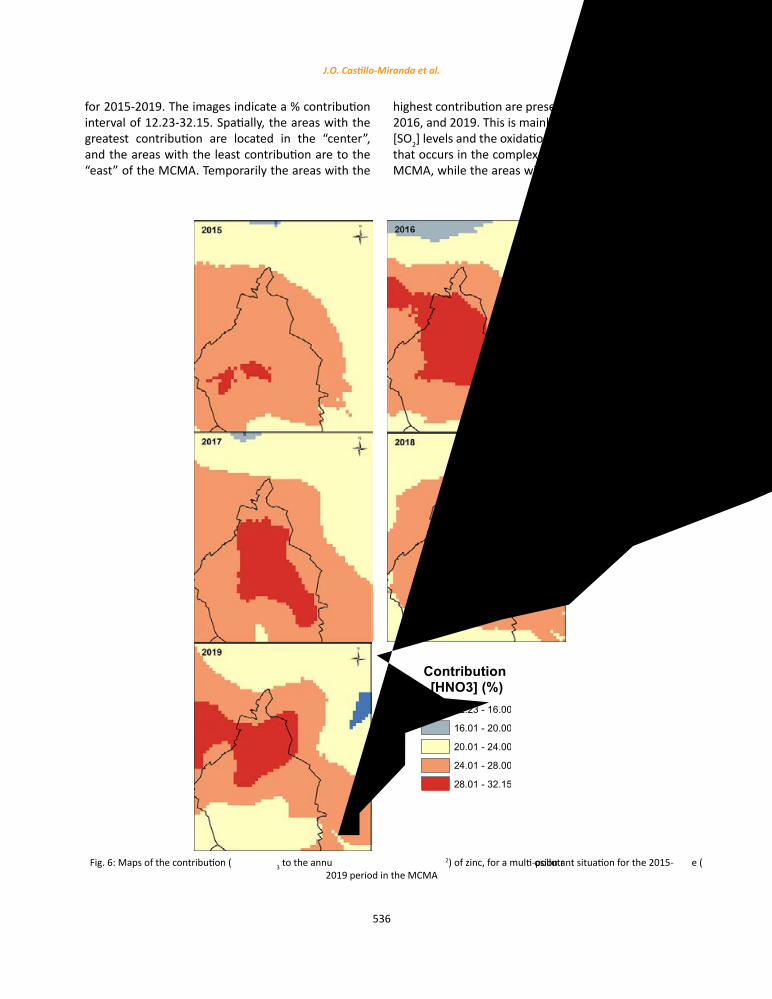
536
J.O. Castillo-Miranda et al.
Fig. 6: Maps of the contribution (%) of HNO3 to the annual zinc corrosion rate (g/m2) of zinc, for a multi-pollutant situation for the 2015-2019 period in the MCMA
Contribution [HNO3] (%)
12.23 - 16.00
16.01 - 20.00
20.01 - 24.00
24.01 - 28.00
28.01 - 32.15
Fig. 6: Maps of the contribution (%) of HNO3 to the annual zinc corrosion rate (g/m2) of zinc, for a multi-pollutant situation for the 2015-2019 period in the MCMA
for 2015-2019. The images indicate a % contribution interval of 12.23-32.15. Spatially, the areas with the greatest contribution are located in the “center”, and the areas with the least contribution are to the “east” of the MCMA. Temporarily the areas with the
highest contribution are presented in the years 2015, 2016, and 2019. This is mainly due to the decrease in [SO2] levels and the oxidation process of NO2 to HNO3 that occurs in the complex urban atmosphere of the MCMA, while the areas with the lowest contribution

537
Global J. Environ. Sci. Manage., 7(4): 523-542, Autumn 2021
Table 2 Environmental data including temperature (T ), relative humidity (RH), precipitation (Rain and pH) and gaseous pollutants (HNO3 and SO2).
(Tidblad et al., 2007)
Country Test site name SO2 (μg/m3) Temperature (°C) Relative
humidity (%) Rain (mm) pH HNO3 (μg/m3)
India Bhubaneswar-u 4 26.5 69 425 6.0 1.3 India Bhubaneswar-r 3 26.5 69 425 6.0 1 Thailand Bangkok 11 29.3 76 1,371 6.8 2.3 Thailand Phrapradaeng 59 29.3 73 1,335 6.2 1.5 Vietnam Hanoi 15 24.7 79 1,556 5.8 0.8 Vietnam Ho Chi Minh 21 28.3 74 1,441 6.2 0.9 Vietnam Mytho 2 27 81 1,222 6.4 0.3 China Chongqing 99 18.5 70 1,162 4.5 1.3 China Tie Shan Ping 51 18.5 90 1,133 4.2 1.8 China Hong Kong 16 22.9 78 2,092 4.6 1.8 Malaysia Kuala Lumpur 12 28 78 2,776 4.3 3.8 Malaysia Tanah Rata 0 18.1 91 2,433 5.1 0.1 South Africa Johannesburg 18 17.2 78 417 4.8 2.1 Zambia Kitwe 92 22.6 58 1,083 4.7 0.9 Zambia Magoye 0 22.2 62 826 7.0 0.5 Zimbabwe Harare 16 18.9 63 798 6.6 0.7
Table 2 Environmental data including temperature (T), relative humidity (RH), precipitation (Rain and pH) and gaseous pollutants (HNO3 and SO2). (Tidblad et al., 2007)
Table 3. Estimation of the % contribution of HNO3 to the zinc corrosion rate (g/m2) for different test sites
Country Test site name ML (g/m2) of zinc, for a multi-pollutant situation
ML (g/m2) of zinc, for a multi-pollutant situation without the HNO3
component
Contribution % HNO3
Malaysia Tanah Rata 4.46 4.32 3.17 Vietnam Mytho 5.61 5.20 7.90 Zimbabwe Harare 6.73 5.77 16.61 Zambia Kitwe 8.43 7.19 17.14 Vietnam Hanoi 7.33 6.23 17.58 Zambia Magoye 4.22 3.53 19.39 China Chongqing 10.63 8.85 20.12 Vietnam Ho Chi Minh 7.17 5.94 20.75 China Tie Shan Ping 13.66 11.19 22.04 India Bhubaneswar−r 6.39 5.02 27.31 China Hong Kong 10.84 8.38 29.44 Thailand Phrapradaeng 8.49 6.43 31.96 India Bhubaneswar−u 6.89 5.11 34.84 South Africa Johannesburg 9.79 6.91 41.61 Malaysia Kuala Lumpur 16.71 11.50 45.25 Thailand Bangkok 8.78 5.63 55.98
Table 3. Estimation of the % contribution of HNO3 to the zinc corrosion rate (g/m2) for different test sites
% are located in the year 2016. The difference is due to the annual concentration levels of HNO3 compared to SO2 and the other climatic parameters of the dose-response function.
On the other hand, in the latitudinal position of the MCMA, solar radiation is intense and accelerates photochemical reactions of pollutants in the atmosphere such as ozone and aerosols. Since ozone is involved in the formation of nitric acid, empirical equation 3 derived for other conditions
must be reevaluated. There are limitations modeling atmospheric corrosion by empirical equations obtained in other situations. For example, in many cases, the weather when the exposure starts is relevant. It is different to start an atmospheric exposure in summer than in winter. Also, using annual mean temperature values for the MCMA has temperatures below 10 °C for many periods throughout the year. This effect is probably related to the time of wetness (TOW), an important variable that is not explicitly

538
J.O. Castillo-Miranda et al.
considered in the MULTI- ASSESS equation. Table 2 shows gaseous pollutant and environmental data from a network of test sites that includes 12 sites in Asia (India, Vietnam, Thailand, Malaysia, and China, including Hong Kong) and four test sites in Africa (South Africa, Zambia, and Zimbabwe). Implemented by the RAPIDC program and funded by the Swedish International Development Agency (SIDA), in order to obtain corrosion values for materials including zinc after one year of exposure (2002-2003) (Tidblad et al., 2007).
Table 3 shows the estimate of the % contribution of HNO3 to the zinc corrosion rate (g/m2). This is possible, using the values from Table 2 in equation 2 and combining in a percentage relationship the corrosion rate (g/m2) of zinc in a multi-pollutant situation with the multi-pollutant situation without the HNO3 component. Table 3 shows a contribution interval % HNO3 of 3.17 - 55.98 with a great difference in the climatic and pollution values of the test sites. Johannesburg 41.61%, Kuala Lumpur 45.25% and Bangkok 55.98% show the highest HNO3 contribution % values corresponding to the highest measured HNO3 values. While Tanah Rata 3.17% and Mytho 7.90% have the lowest % contribution values of HNO3 in relation to the lowest values of HNO3 measured.
Comparing the interval of % contribution of HNO3 of 12.23-32.15 observed in fig. 6 with the interval of values of 3.17-55.98 of Table 3, it is highlighted that it is possible to place it at an intermediate level with respect to the values of Table 3. However, the values in Table 3 are from more than a decade ago; there was already evidence of a significant contribution % of HNO3 to the zinc corrosion process. However, at that time there was an important attention to SO2.
CONCLUSIONMost studies on atmospheric zinc corrosion and
galvanized steel carried out in Mexico and the Mexico City Metropolitan Area have focused on contaminants such as sulfur dioxide and sodium chloride, coupled with meteorological factors such as those responsible for damage to urban infrastructure and objects made of zinc or galvanized Steel. This work estimates nitric acid’s contribution to zinc corrosion in the Mexico City Metropolitan Area. This contribution is represented as a component that includes HNO3 in the dose-response functions for a multi-pollutant situation. In the multi-pollutant case, other factors also intervene,
such as sulfur dioxide, relative humidity, amount of precipitation, temperature, and the acidity of the rain. The construction of corrosion rate maps using dose-response functions for a multi-pollutant situation in equation (2) provides a spatial and temporal estimate of the variation in corrosion rates in 2015-2019. This estimate allows visualizing areas where zinc materials are at risk corrosion due to the dispersion of atmospheric pollutants and climatic parameters. The construction of percentage maps shows the contribution (%) of HNO3. HNO3 contributes at least 12% and up to 32% to the zinc corrosion rate. These layers show that the years 2015, 2016, and 2019 present the highest contribution percentages. The equation (2) is applicable in geographic areas without the influence of chlorides and countries with tropical and subtropical climates, characteristic of the MCMA. Therefore, it is likely that the corrosion rate values obtained with the multi-pollutant dose-response function in this work are overestimated. It is desirable to have specific multi-pollutant dose-response functions for the MCMA that adequately represent the dispersion of pollutants and climatic parameters of the study area’s urban atmosphere. It would be possible to implement an Exposure Program on the effects of atmospheric zinc corrosion, with specific attention to HNO3. There is a relatively good correlation between the extrapolated loss of zinc mass resulting from laboratory exposures and the dose-response function based on statistical analysis. Therefore, the corrosion rates estimated for zinc in this work are very likely to represent an approximate value of the corrosion rates for zinc that can be found in field tests. This due to the absence of field tests.
AUTHOR CONTRIBUTIONSJ.O. Castillo-Miranda conceived the original
idea, performed the literature review, analyzed and interpreted the data, prepared the manuscript text, and manuscript edition. F.J. Rodríguez-Gómez worked out the technical details, analyzed and interpreted the data, prepared the manuscript text, and manuscript edition. J. Genescá-Llongueras encouraged to investigate a specific aspect, helped in the literature review and manuscript preparation. L.G. Ruiz-Suárez developed the theoretical formalism and supervised the findings of this work. J.A. García-Reynoso helped shape the study, analysis and contributed to the interpretation of the results.

539
Global J. Environ. Sci. Manage., 7(4): 523-542, Autumn 2021
ACKNOWLEDGMENTSJ.O. Castillo-Miranda is grateful to “PROGRAMA
DE BECAS POSDOCTORALES UNAM-DGAPA” for the postdoctoral scholarship and the authors (J.O. Castillo-Miranda and F.J. Rodríguez-Gómez) would like to thank the UNAM Facultad de Química, Departamento de Ingeniería Metalurgica. The authors want to acknowledge the contribution of Carlos Arroyave, Professor Emeritus University of Antioquia and Dr. Farid Samie, Shell Global Solutions, Houston Texas, USA (TA2 Materials and Corrosion Engineering).
CONFLICT OF INTERESTThe authors declare no potential conflict of
interest regarding the publication of this work. In addition, the ethical issues including plagiarism, informed consent, misconduct, data fabrication and, or falsification, double publication and, or submission, and redundancy have been completely witnessed by the authors.
ABBREVIATIONS% Percentage
°C Degree Celsius
µg/L Micrograms per liter
µg/m3 Micrograms per cubic meter
ArcGISAeronautical reconnaissance coverage Geographic Information System
Ca2+ Calcium ion
Cl- Chlorides
CLRTAP Long-range Transboundary Air Pollution
cm/s Centimeters per second
CO2 Carbon dioxide
DGAPA-UNAMDirección General de Asuntos del Personal Académico de la Universidad Nacional Autónoma de México
EMEP European Monitoring and Evaluation Materials Program
Eq. Equation
Fig. Figure
FTIR Fourier transform spectroscopy
g/m2 Grams per square meter
GIS Geographic information systems
h/y Hour per year
H+ Hydrogen ion
H2O Water
H2S Hydrogen sulfide
HCl Hydrogen chloride
HNO3 Nitric acid
ICP materialsCo-operative programme on effects on materials, including historic and cultural monuments
IDW Inverse distance weighting
ISO International Organization for Standardization
ISOCORRAG The International Testing Program
ISO/TC 156International Organization for Standardization/Technical Committees 156
K+ Potassium ion
km Kilometres
m/s Meters per second
MCMA Mexico City Metropolitan Area
mg/L Milligrams per liter
mg/m2/day Milligrams per square meter day
Mg/y Megagrams per year
MICAT Ibero-American Map of Atmospheric Corrosiveness
ML Corrosion rate
mm Millimeters
mmHg Milimeters of mercury
mol/L atm Mole per liter atmosphere
MULTI-ASSESSModel for multi-pollutant impact and assessment of threshold levels for cultural heritage
Na+ Sodium ion
NO2 Nitrogen dioxide
NO3- Nitrate ion
NOx Nitrogen oxides
O3 Ozone
pH Hydrogen potential
PP Precipitation or rain
ppb Parts per billon
ppm Parts per million
R2 Coefficient of determination
Rain Amount of precipitation
RAMA Automatic Atmospheric Monitoring Network
RAPIDC Regional Air Pollution in Developing Countries

540
J.O. Castillo-Miranda et al.
REDDA Atmospheric Deposit Network
REDMETAtmospheric Monitoring Network and the Meteorology and Solar Radiation Network
RH Relative humidity
RMS Root Mean Square
RMSE Least mean square error
SD Standard deviation
SIDA Swedish International Development Agency
SO2 Sulfur dioxide
SUV Sport utility vehicle
T Temperature
TOW Time of Wetness
UN ECE Convention of the United Nations Economic Commissions for Europe
Vd Deposition rate
Zn(NO3)2 Zinc nitrate
Zn5(NO3)2(OH)8 • 2H2O
Basic nitrate o essential nitrate
REFERENCESArcGIS, (2014). Software ArcGIS ArcMap Version 10.2.2. Environ-
mental Systems Research Institute (ESRI). New York, USA.Avila, D., (2018). Influencia de las condiciones meteorológicas en
el depósito atmosférico húmedo en la Zona Metropolitana de la Ciudad de México. Tesis, Programa de Maestría en Ingeniería Ambiental – Aire. UNAM. (131 pages).
Báez, P.A.; Belmont, D.R.; García, R.M.; Torres, M.C.B.; Padilla, H.G., (2006). Rainwater chemical composition at two sites in Central. Atmos. Res., 80: 67–85 (19 pages).
Castillo-Miranda, J.O.; Torres-Jardón, R.; García-Reynoso, J.A.; Mar-Morales, B.E.; Rodríguez- Gómez, F.J.; Ruiz-Suárez, L.G., (2017). Mapping recession risk for cultural heritage stone In Mexico City due to dry and wet deposition of urban air pollut-ants. Atmósfera 30(3): 189-207 (19 pages).
CONAGUA, (2019). Coordinación General del Servicio Meteorológi-co Nacional de la Comisión Nacional del Agua (CONAGUA), 2019. El reporte del clima en México. Reporte anual 2019. Subgerencia de climatología y servicios climáticos y el área de vinculación e información climatológica y meteorológica (79 pages).
Conesa, G.C., (1996). Areas de aplicación medioambientales de los ‘SIG’. Modelización y avances recientes. Papeles de Geografía. 23-24: 101-115 (15 pages).
Cuevas, J.A., (2014). Correlación entre ácido nítrico gaseoso y ozono en un sitio receptor de smog fotoquímico de la Ciudad de México. Tesis, Posgrado en Ciencias de la Tierra (Maestría). UNAM. (88 pages).
Dean Jr., S.H., (2005). Atmospheric. In: Corrosion test and stan-dards: Aplication and interpretation (R. Baboian Ed). ASTM In-ternational. 159-169 (11 pages).
Denby, B.; Horálek, J.; Walker, S.; Eben, K; Fiala, J., (2005). Interpo-lation and assimilation methods for European scale air quality
assessment and mapping, part 1: Review and recommenda-tions. Europ. Topic Centre Air Climate Change. 14-18 (5 pages).
Denby, B.; Sundvor, I.; Cassiani, M.; De Smet, P.; De Leeuw, P.; Horálek, J., (2010). Spatial mapping of ozone and SO2 trends in Europe. Sci. Total Environ, 408(20): 4795-4806 (12 pages).
Diem J.E.; Comrie, A.C., (2002). Predictive mapping of air pollution involving sparse spatial observations. Environ. Pollut., 119(1): 99-117 (19 pages).
Edney, E.O.; Stiles, D.C.; Spence, J.W.; Haynie, H.; Wilson, W.E., (1986). A Laboratory study to evaluate the impact of NOx, SOx, and oxidants on atmospheric corrosion of galvanized Steel, in: Materials degradation caused by acid rain: developed from the 20th state-of-the-art symposium of the American Chemical So-ciety. Baboian, R., Editor. ACS Symposium 318, ACS, Washington, DC. 172-193 (22 pages).
Edney, E.O.; Stiles, D.C., (1986). Laboratory investigations of the im-pact of dry deposition of SO2 and wet deposition of acidic spe-cies on the atmospheric corrosion of galvanized Steel. Atmos. Environ., 20(3): 541–548 (8 pages).
Ferm, M.; De Santis, F.; Varotsos, C., (2005). Nitric acid measure-ments in connection with corrosion studies. Atmos. Environ., 39(35): 6664–6672 (9 pages).
Finlayson-Pitts, B.J.; Pitts Jr., J.N., (2000). Chemistry of the upper and lower atmosphere theory, experiments, and applications. Academic Press. (969 pages).
Friel, J.J., (1986). Atmospheric corrosion products on Al, Zn, and AlZn metallic coatings. Corrosion, 42(7): 422-426 (5 pages).
García, R.; Belmont, R.; Padilla, H.; Torres, Ma. del C.; Baez, A.P., (2009). Determination of inorganic ions and trace elements in total suspended particles at three urban zones in the Mexico City Metropolitan Area and one rural site. Atmos. Res., 94(2): 313–319 (7 pages).
Genescá, J.; Rodriguez, C., (1992). Calibracion de la agresividad de la atmósfera del suroeste de la Ciudad de México, Rev. Int. Con-tam. Ambient. 8(2): 81-90 (10 pages).
Graedel, T.E.; Schwartz, N., (1977). Air quality reference data for corrosion assessment, Mater. Perform., 16(8): 17-25 (9 pages).
Graedel, T.E., (1989). Corrosion mechanisms for zinc exposed to the atmosphere. J. Electrochem. Soc., 136(4):193C-203C (11 pages).
Graedel, T.E.; Frankenthal, R.P., (1990). Corrosion mechanism for iron and low steels exposed to the atmosphere. J. Electrochem. Soc., 137(8): 2385-2394 (10 pages).
Guttman, H.; Sereda, P.J., (1968). Measurement of atmospheric factors affecting the corrosion of metals. Metal corrosion in the atmospheres, ASTM STP 435, ASTM International, West Consho-hocken, PA, 326-359 (34 pages).
Hamilton, R.; Crabbe, H., (2009). Chapter 1 Environment, Pollution and effects, In: The effects of air pollution on cultural heritage. Watt, J., Tidblad, J., Kucera, V., Hamilton, R. (Editors). Springer. 1-27 (27 pages).
INEGI, (2007). Instituto nacional de estadística, geografía e historia. Anuario estadístico de los Estados Unidos Mexicanos. Edición 2007 (158 pages).
Jáuregui, O.E., (2000). El clima de la Ciudad de México, Temas se-lectos de geografía de México. Plaza y Valdés. México, D.F. (133 pages).
Jáuregui, E.; Romales E., (1996). Urban effects on convective precipitation in Mexico city. Atmos. Environ., 30(20): 3383-3389 (7 pages).
Johansson, L.G., (1990). Synergistic effects of air pollutants on the

541
Global J. Environ. Sci. Manage., 7(4): 523-542, Autumn 2021
atmospheric corrosion of metals and calcareous stones. Ma. Chem., 30: 113-122 (10 pages).
Knotková, D.; Bartoň, K., (1992). Effects of acid deposition on cor-rosion of metals. Atmos. Environ., 26ª(17): 3169 3177 (9 pages).
Knotková, D., (1993). Atmospheric corrosivity classification. Results from the international testing program ISOCORRAG, Corrosion control for low-cost reliability, 12th international corrosion con-gress, progress industries plant operations, NACE international, Houston, Texas. 2: 561–568 (8 pages).
Knotková, D.; Kreislova, K., (2007). Chapter 3: Corrosivity of atmo-spheres – derivation and use of information, In: Environmental deterioration of materials. Editor: Moncmanová, A., WIT Press. 73-102 (30 pages).
Kucera, V.; Fitz, S., (1995). Direct and indirect air pollution effects on materials including cultural monuments. Water Air Soil pol-lut., 85: 153-165 (13 pages).
Kucera, V., (2003). Changing pollution situation and its effect on material corrosion, In: Effects of air pollution on cultural heri-tage and its mitigation. Cultural heritage research: a Pan-Euro-pean challenge. Proceedings of the 5th EC conference, May 16-18, 2002, Cracow, Poland, 23-29 (7 pages).
Kucera, V., (2004). Mapping of effects on materials ICP materials, In: Manual on methodologies and criteria for Modelling and Mapping Critical Loads and Levels and Air Pollution Effects, Risks and Trends, IV·1-IV·9 (9 pages).
Kucera, V., (2005). EU 5FP RTD Project model multi-pollutant im-pact and assessment of threshold levels for cultural heritage, final report (52 pages).
Kucera, V.; Tidblad, J.; Kreislova, K.; Knotkova, D.; Faller, M.; Reiss, D.; Snethlage, R.; Yates, T.; Henriksen, J.; Schreiner, M.; Melcher, M.; Ferm, M., Lefèvre, R-A.; Kobus, J., (2007). UN/ECE ICP Mate-rials: Dose-response functions for the multi-pollutant situation, Water, Air Soil Pollut., 7(1): 249-258 (10 pages).
Leuenberger-Minger, A.U.; Faller, M.; Richner, P., (2002). Runoff of copper and zinc caused by atmospheric corrosion, Mater Cor-ros., 53(3): 157–164 (8 pages).
Mariaca, L.; Genescá, J.; Uruchurtu, J.; Hernandez, L.S., (1999). Corrosividad atmosférica (MICAT-MÉXICO). Plaza y Valdes, (209 pages).
Molina, L.T.; Molina, M.J., (2002). Air quality in the Mexico meg-acity (an integrate assessment); Kluwer Academic Publishers. 33-35 (3 pages).
Moreno, A., (2006a). Los sistemas de información geográfica. Una breve presentación, En: Sistemas y análisis de la información geográfica (A. Moreno, Coordinador) Editorial Ra-ma, 3-17 (15 pages).
Moreno, A., (2006b). Las capas raster conceptos básicos, tipos de tratamientos y visualización. En: Sistemas y análisis de la infor-mación geográfica (A. Moreno, Coordinador) Editorial Ra-ma, 587-598 (12 pages).
Moya, M.; Grutter, M.; Baez, A., (2004). Diurnal variability of size differentiated inorganic aerosols and their gas phase precursors during january and february of 2003 near downtown Mexico City. Atmos. Environ., 38(33): 5651–5661 (11 pages).
Muñoz, L.R.; Uruchurtu, C.J., (2002). Caracterización de la agresivi-dad atmosférica sobre los materiales metalicos estructurales en la zona metropolitana de la ciudad de México. Revista interna-cional de contaminación ambiental, 18(001), Universidad Nacio-nal Autónoma de México, 27-32 (6 pages).
Oesch, S., (1996). Effect of SO2, NO2, NO and O3 on the corrosión of unalloyed carbon steel and weathering Steel - the results of lab-
oratory exposures. Corrosion Sci., 38(8): 1357–1368 (12 pages).Oesch, S.; Faller, M., (1997). Environmental effects on materials:
the effect of the air pollutants SO2, NO2, NO and O3 on the cor-rosion of copper, zinc and aluminium. A short literature survey and results of laboratory exposures. Corrosion Sci., 39(9): 1505-1530 (26 pages).
Pantani, M.; Sabbioni, C.; Bruzzi, L.; Manco, D., (1998). Air pollution deposition on stones of artistic interest. Trans. Ecol. Environ., 21: 675-684 (10 pages).
Phillips, L.D.; Marks, G.D., (1996). Spatial uncertainty analysis: propagation of interpolation errors in spatially distributed mod-els. Ecol. Model., 91(1-3): 213-229 (17 pages).
Roberge, P.R.; Klassen, R.D.; Haberecht, P.W., (2002). Atmospheric corrosivity modeling-a review. Mater. Des., 23(3): 321-330 (10 pages).
Rojas-Avellaneda, D., (2007). Spatial interpolation techniques for estimating levels of pollutant concentrations in the atmosphere. Revista Mexicana de Física. 53(6): 447-454 (8 pages).
Samie, F.; Tidblad, J.; Kucera, V.; Leygraf, C., (2007a). Atmospheric corrosion effects of HNO3 a comparison of laboratory and field exposed copper, zinc, and carbon steel. J. Electrochem. Soc., 154(5): C249-C254 (6 pages).
Samie, F.; Tidblad J.; Kucera, V.; Leygraf, C., (2007b). Atmospheric corrosion effects of HNO3—Comparison of laboratory-exposed copper, zinc and carbon steel. Atmos. Environ., 41(23): 4888–4896 (9 pages).
SEDEMA, (2016). Secretaría del medio ambiente de la ciudad de México (SEDEMA), 2016. Calidad del aire en la ciudad de Méxi-co, informe 2015. Dirección general de gestión de la calidad del aire, Dirección de monitoreo atmosférico. México, D. F. Julio.
SEDEMA, (2017). Secretaría del medio ambiente de la ciudad de México (SEDEMA), 2017. Calidad del aire en la ciudad de Méxi-co, informe 2016. Dirección General de Gestión de la Calidad del Aire, Dirección de monitoreo atmosférico. Ciudad de México.
SEDEMA, (2018a). Secretaría del medio ambiente de la ciudad de México (SEDEMA), 2018. Inventario de emisiones de la ciudad de México 2016. Dirección general de gestión de la calidad del aire, Dirección de programas de calidad del aire e inventario de emisiones. Ciudad de México. Septiembre 2018.
SEDEMA, (2018b). Secretaría del medio ambiente de la ciudad de México (SEDEMA), 2018. Calidad del aire en la ciudad de Méxi-co, informe 2017. Dirección general de gestión de la calidad del aire, Dirección de monitoreo atmosférico. Ciudad de México. Octubre.
SEDEMA, (2018c). Secretaría del medio ambiente de la ciudad de México (SEDEMA), 2018. Calidad del aire en la ciudad de Méxi-co, informe 2017. Dirección general de gestión de la calidad del aire, Dirección de monitoreo atmosférico. Ciudad de México. Octubre.
SEDEMA, (2020a). Calidad del aire. Secretaria del Medio Ambiente del Gobierno de la Ciudad de México. Recovered 20200728.
SEDEMA, (2020b). Secretaría del medio ambiente de la ciudad de México (SEDEMA), 2020. Calidad del aire en la ciudad de Méx-ico, Informe 2018. Dirección general de calidad del aire, Direc-ción de Monitoreo de Calidad del Aire.
SEDEMA, (2020c). Calidad del aire. Secretaria del Medio Ambiente del Gobierno de la Ciudad de México. Recovered 20210418.
Seinfeld J.H.; S.N. Pandis, (2016). Atmospheric chemistry and phys-ics from air pollution to climate change. Jonh Wiley and Sons. (1226 pages).
Seinfeld, J.H., (1980). Lectures in Atmospheric Chemistry. Am. Insti-

542
J.O. Castillo-Miranda et al.
tute Chem. Eng., 12(76), (98 pages).SMA, (2008). Secretaría del Medio Ambiente del Gobierno del Distri-
to Federal. Informe de la Calidad del Aire en la Zona metropolitana del valle de México, Estados y tendencias 1990-2007 (50 pages).
Spence, J.W.; Haynie, F.H., (1990). Derivation of a damage function for galvanized steel structures: corrosion kinetics and thermody-namic considerations,” in Corrosion testing and evaluation: Silver Anniversary Volume, ed. R. Baboian and S. Dean (West Consho-hocken, PA: ASTM International); 208-224 (17 pages).
Svensson, J.E.; Johansson, L.G., (1993). A laboratory study of the ini-tial stages of the atmospheric corrosion of zinc in the presence of NaCl; influence of SO2 and NO2. Corrosion Sci., 34(5): 721-740 (20 pages).
Tidblad, J.; Kucera, V.; Mikhailov, A.A.; Henriksen, J.; Kreislova, K.; Yates, T.; Stöckle, B.; Schreiner, M., (2001). UN ECE ICP Materials: Dose-response functions on dry and wet acid deposition effects after 8 years of exposure. Water, Air Soil Pollut., 130: 1457-1462 (6 pages).
Tidblad, J.; Kucera, V.; Mikhailov, A.A.; Henriksen, J.; Kreislova, K.; Yates, T.; Singer, B., (2002a). “Field exposure results on trends in atmospheric corrosion and pollution,” Outdoor atmospheric cor-rosion, ASTM STP 1421, H. E. Townsend, Ed., American society for testing and materials international, West Conshohocken, PA. (14 pages).
Tidblad, J.; Kucera, V.; Mikhailov, A.A.; Knotkova, D., (2002b). “Im-provement of the ISO classification system based on dose-re-sponse functions describing the corrosivity of outdoor atmo-spheres,” Outdoor Atmospheric Corrosion, ASTMSTP 1421, H.E. Townsend, Ed., American Society for Testing and Materials Inter-national, West Conshohocken, PA. (15 pages).
Tidblad, J.; Kucera, V.; Samie, F.; Das, S.N.; Bhamornsut, C.; Peng, L.C.; Lung So, K.; Dawei, Z.; Hong Lien, L.T.; Schollenberger, H.; Lungu, C. V.; Simbi, D., (2007). Exposure programme on atmospheric cor-
rosion effects of acidifying pollutants in tropical and subtropical climates, Water Air Soil Pollut., 7: 241–247 (7 pages).
Tidblad, J.; Kucera, V.; Sherwood, S., (2009). Chapter 3: Corrosion, In: The effects of air pollution on cultural heritage. Watt, J.; Tidblad, J.; Kucera, V.; Hamilton, R. (Editors), Springer. 53-103 (51 pages).
Tidblad J.; Kucera, V.; Ferm, M.; Kreislova, K.; Brüggerhoff, S.; Doytchinov, S.; Screpanti, A.; Grøntoft, T.; Yates, T.; De la Fuente, D.; Roots, O.; Lombardo, T.; Simon, S.; Faller, M.; Kwiatkowski, L.; Kobus, J.; Varotsos, C.; Tzanis, C.; Krage, L.; Schreiner, M.; Melcher, M.; Grancharov, I.; Karmanova, N.; (2012). Effects of air pollution on materials and cultural heritage: ICP Materials celebrates 25 years of research. Int. J. Corrosion. 2012, Article ID 496321 (16 pages).
UN, (2016). The world’s cities in 2016 – Data booklet (ST/ESA/ SER.A/392). United Nations, Department of Economic and Social Affairs, Population Division.
Venkatram, A., (1988). On the use of kriging in the spatial analysis of acid precipitation data. Atmos. Environ., 22(9): 1963-1975 (13 pages).
Wood, E.C.; Herndon, S.C.; Onasch, T.B.; Kroll, J.H.; Canagaratna, M.R.; Kolb, C.E.; Worsnop, D.R.; Neuman, J.A.; Seila, R.; Zavala, M.W.; Knighton, B., (2009). A case study of ozone production, nitrogen oxides, and the radical budget in Mexico City, Atmos. Chem. Phys., 9: 2499-2516 (17 pages).
Zeiler, M., (1999). Modeling our world The ESRI guide to geodata-base design. Environmental systems research institute, Inc. 2-4, 24-27, 46-47 (2 pages).
Zheng, J.; Zhang, R.; Fortner, E.C.; Volkamer, R.M.; Molina, L.; Aiken, A.C.; Jimenez, J.L.; Gaeggeler, K.; Dommen, J.; Dusanter, S.; Ste-vens, P.S.; Tie, X., (2008). Measurements of HNO3 and N2O5 using ion drift-chemical ionization mass spectrometry during the MILA-GRO/MCMA-2006 campaign. Atmos. Chem. Phys., 8: 6823-6838 (16 pages).
AUTHOR (S) BIOSKETCHES
Castillo-Miranda, J.O., Ph.D., Postdoctoral stay, Departamento de Ingeniería Metalúrgica, Facultad de Química, Universidad Nacional Autónoma de México, Circuito Exterior s/n, Ciudad Universitaria, C.P. 04510, Ciudad de México, México. Email: [email protected]íguez-Gómez, F.J., Ph.D., Professor, Departamento de Ingeniería Metalúrgica, Facultad de Química, Universidad Nacional Autónoma de México, Circuito Exterior s/n, Ciudad Universitaria, C.P. 04510, Ciudad de México, México. Email: [email protected]á-Llongueras, J., Ph.D., Professor, Polo Universitario de Tecnología Avanzada, Universidad Nacional Autónoma de México, Vía de la Innovación 410 PIIT Autopista Monterrey-Aeropuerto Km. 10 C.P. 66629, Apodaca, Nuevo León, México. Email: [email protected]árez, L.G., Ph.D., Professor, Centro de Ciencias de la Atmósfera, Universidad Nacional Autónoma de México, Circuito de la Investigación Cientifica, Ciudad Universitaria, C.P. 04510, Ciudad de México, México. Email: [email protected]ía-Reynoso, J.A., Ph.D., Professor, Centro de Ciencias de la Atmósfera, Universidad Nacional Autónoma de México, Circuito de la Investigación Cientifica, Ciudad Universitaria, C.P. 04510, Ciudad de México, México. Email: [email protected]
HOW TO CITE THIS ARTICLE
Castillo-Miranda, J.O.; Rodríguez-Gómez, F.J.; Genescá-Llongueras, J.; Ruiz-Suárez, L.G.; García-Reynoso, J.A., (2021). Estimation and mapping of the contribution of nitric acid to atmospheric corrosion of zinc. Global J. Environ. Sci. Manage., 7(4): 523-542.
DOI: 10.22034/gjesm.2021.04.03
url: https://www.gjesm.net/article_243716.html
COPYRIGHTS
©2021 The author(s). This is an open access article distributed under the terms of the Creative Commons Attribution (CC BY 4.0), which permits unrestricted use, distribution, and reproduction in any medium, as long as the original authors and source are cited. No permission is required from the authors or the publishers.
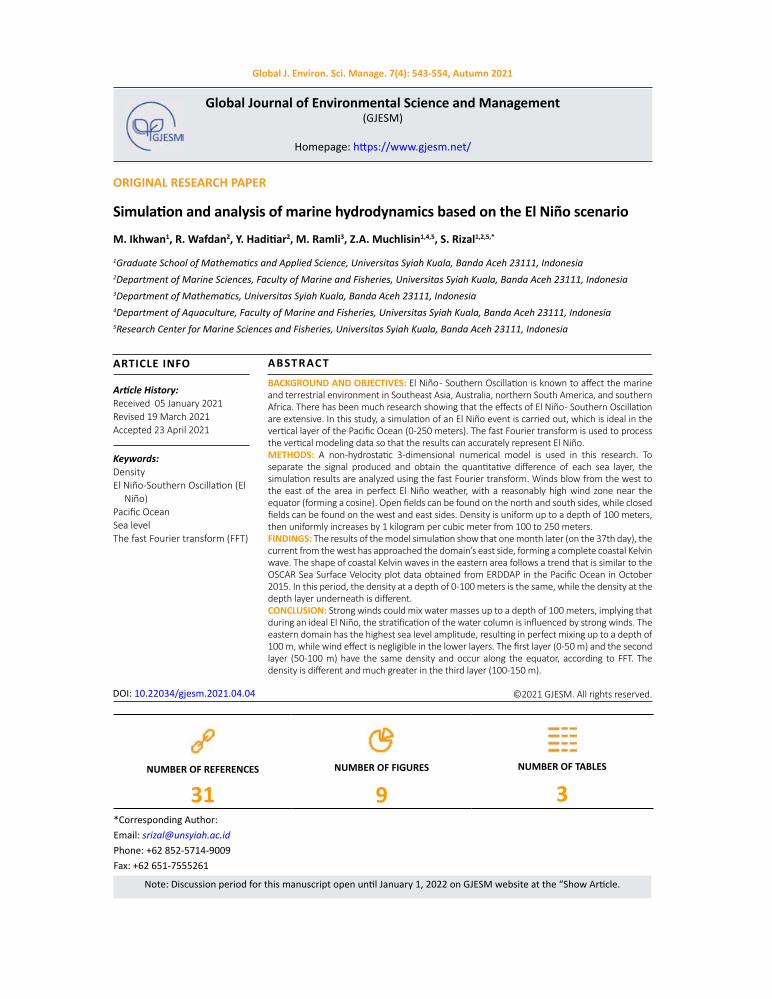
Global J. Environ. Sci. Manage. 7(4): 543-554, Autumn 2021
*Corresponding Author:Email: [email protected]: +62 852-5714-9009 Fax: +62 651-7555261
Global Journal of Environmental Science and Management (GJESM)
Homepage: https://www.gjesm.net/
ORIGINAL RESEARCH PAPER
Simulation and analysis of marine hydrodynamics based on the El Niño scenario
M. Ikhwan1, R. Wafdan2, Y. Haditiar2, M. Ramli3, Z.A. Muchlisin1,4,5, S. Rizal1,2,5,*
1Graduate School of Mathematics and Applied Science, Universitas Syiah Kuala, Banda Aceh 23111, Indonesia2Department of Marine Sciences, Faculty of Marine and Fisheries, Universitas Syiah Kuala, Banda Aceh 23111, Indonesia3Department of Mathematics, Universitas Syiah Kuala, Banda Aceh 23111, Indonesia4Department of Aquaculture, Faculty of Marine and Fisheries, Universitas Syiah Kuala, Banda Aceh 23111, Indonesia5Research Center for Marine Sciences and Fisheries, Universitas Syiah Kuala, Banda Aceh 23111, Indonesia
BACKGROUND AND OBJECTIVES: El Niño - Southern Oscillation is known to affect the marine and terrestrial environment in Southeast Asia, Australia, northern South America, and southern Africa. There has been much research showing that the effects of El Niño - Southern Oscillation are extensive. In this study, a simulation of an El Niño event is carried out, which is ideal in the vertical layer of the Pacific Ocean (0-250 meters). The fast Fourier transform is used to process the vertical modeling data so that the results can accurately represent El Niño.METHODS: A non-hydrostatic 3-dimensional numerical model is used in this research. To separate the signal produced and obtain the quantitative difference of each sea layer, the simulation results are analyzed using the fast Fourier transform. Winds blow from the west to the east of the area in perfect El Niño weather, with a reasonably high wind zone near the equator (forming a cosine). Open fields can be found on the north and south sides, while closed fields can be found on the west and east sides. Density is uniform up to a depth of 100 meters, then uniformly increases by 1 kilogram per cubic meter from 100 to 250 meters. FINDINGS: The results of the model simulation show that one month later (on the 37th day), the current from the west has approached the domain’s east side, forming a complete coastal Kelvin wave. The shape of coastal Kelvin waves in the eastern area follows a trend that is similar to the OSCAR Sea Surface Velocity plot data obtained from ERDDAP in the Pacific Ocean in October 2015. In this period, the density at a depth of 0-100 meters is the same, while the density at the depth layer underneath is different.CONCLUSION: Strong winds could mix water masses up to a depth of 100 meters, implying that during an ideal El Niño, the stratification of the water column is influenced by strong winds. The eastern domain has the highest sea level amplitude, resulting in perfect mixing up to a depth of 100 m, while wind effect is negligible in the lower layers. The first layer (0-50 m) and the second layer (50-100 m) have the same density and occur along the equator, according to FFT. The density is different and much greater in the third layer (100-150 m).
©2021 GJESM. All rights reserved.
ARTICLE INFO
Article History:Received 05 January 2021Revised 19 March 2021Accepted 23 April 2021
Keywords:DensityEl Niño-Southern Oscillation (El
Niño)Pacific OceanSea levelThe fast Fourier transform (FFT)
ABSTRAC T
DOI: 10.22034/gjesm.2021.04.04
NUMBER OF REFERENCES
31NUMBER OF FIGURES
9NUMBER OF TABLES
3
Note: Discussion period for this manuscript open until January 1, 2022 on GJESM website at the “Show Article.

544
M. Ikhwan et al.
INTRODUCTIONEl Niño - Southern Oscillation (ENSO) is a
manifestation of the inter-annual variability, but it is associated with major changes in the pacific atmosphere through a phenomenon known as southern oscillation (Chen et al., 2019a; Trenberth, 2019). Warming of the tropical Pacific Ocean surface and strengthening equatorial trade winds characterize El Niño events, which occur every few years. During El Niño years, such as 2015/2016, winds from the west are typically symmetrical (Sundararajan, 2020).
The El Niño outbreak in 2015/2016 was caused by a series of westerly wind events in boreal springs. There has been much research showing that the effects of ENSO are extensive. Doughty et al. (2021) reported that ENSO affects the tropical forests of the Amazon, which are the world’s major CO2 players, where the rates of photosynthesis, fluorescence, and greenness were above average during El Niño (2009/2010) and below normal during La Nina (2010/2011). Hao et al. (2018) shows that ENSO causes dry and hot summer events in such as northern South America, southern Africa, Southeast Asia and Australia. Meanwhile, in East Asia’s subtropical forests, El Niño can increase the growth of individual trees through increased sunlight (Li et al., 2020). In the fishing sector, El Niño can cause anomalous fish migration patterns, such as changes in latitudinal migration of sardinella along the African coast (López-Parages et al., 2020). Pécastaing and Chávez (2020) also reported that ENSO makes coastal communities vulnerable to poverty, especially for communities in Peru’s arid ecosystems. It must be taken into account that going forward, the potential for El Niño is projected to increase drastically due to the effects of global warming associated with the flattening of thermoclines in the equatorial Pacific (Yeh et al., 2009; Chen et al., 2019b). El Niño also has relatively strong connections to other oceans. Siswanto et al. (2020) imply that low and high trophic level marine organisms in the eastern Indian Ocean were also affected by ENSO. Yue et al. (2020) reported that the zone of anomaly induced by wind advection during El Niño affects the Walker circulation and sea surface salinity in the Indian Ocean. In addition, ENSO caused changes in the circulation of the tropical Pacific Walker due to warming in the Indian and Atlantic Oceans (Behera et al., 2021). El Niño affects salinity so that one of the parameters to determine the occurrence of El Niño is sea surface salinity
(Sharma, 2018). So far, Sundararajan (2020) stated that the wind is an equinoctial symmetry in the 2015 El Niño year. This affects the magnitude of the tidal currents in the Pacific. According to Hu et al. (2013), ENSO behavior is influenced by the low-frequency variability of the tropical Pacific climate. These variations include increased warming and local wind variability in the Pacific Ocean’s tropical parts (Hu et al., 2013). Since the late 1970s, the ENSO frequency has shifted, with the ENSO frequency being high (2-4 years) in 1962-1975 and low (4-6 years) in 1980-1993 (An and Wang, 2000; Fedorov and Philander, 2000). In 1999-2000, the correlation between warm water volume around the equator and ENSO was also seen to be weaker. According to Horii et al. (2012) and McPhaden (2012), this condition relates to the divergence of winds in the central Pacific that inhibits the eastward spread of sea surface temperature anomalies. Weak east-west sea surface temperature gradient provides relaxation to trade winds. Consequently, with weak trade wind conditions, the equatorial upwelling, which carries cooler, high-density water to the pacific surface, is also reduced (Kumar and Hu, 2014). Rizal et al. (2019; 2020) found that variations in density gradients influence the form of lee waves and baroclinic currents that contribute to the mainstream in a basin. According to recent studies, the ENSO regime continues to change spatially over time, and this is due to local wind variability. The aim of this study is to determine the properties of the sea level and density as a result of El Niño, which is best modeled using a non-hydrostatic 3D numerical model. The impact of the wind on the sea level and density at each layer is investigated in this paper. In this case, there are two methods for analyzing the data. To begin, graphically, by depicting the density in each layer. Second, by comparing the magnitudes of each layer density and sea level of first layer using the fast Fourier transform (FFT) process. To date, to the authors’ knowledge, there is no research that has examined this issue in detail using the FFT. This study also contributes to the Pacific’s subsurface investigation. This study has been carried out in the Ocean Modelling Laboratory, Department of Marine Sciences, Universitas Syiah Kuala, Indonesia in 2020.
MATERIALS AND METHODSWinds from the west are generally symmetrical
during El Nino years as was the case in 2015/2016.

545
Global J. Environ. Sci. Manage., 7(4): 543-554, Autumn 2021
A sequence of westerly wind events in boreal spring triggered the most recent El Niño outbreak in 2015/2016. Downwelling oceanic Kelvin waves were caused by the associated wind forcing, minimizing the upwelling of cold subsurface waters in the eastern Pacific cold tongue and resulting in surface warming in the central and eastern Pacific (Timmermann et al., 2018). The emergence of Downwelling is a product of the effect of winds on the Pacific’s surface. As a result, it is important that we obtain a model of the Pacific’s surface layer. It’s also crucial to understand how much wind is always blowing. Meanwhile, the most recent El Niño outbreak, which occurred in 2015/2016, was triggered by a series of westerly wind events in boreal spring. In the pacific model, this condition is applied as a force. The three-
dimensional numerical model is efficient enough to represent low-resolution circulating currents. The current model is based on hydrostatic primitive equations, such as those proposed by Cha et al. (2018) and Peng et al. (2020). Cha et al. (2018) used a three-dimensional model to observe a distinct low-frequency mode of the tropical Pacific sea level and display its connection to global ocean warming. Meanwhile, this research employs a non-hydrostatic technique that has previously been used to model tides in the Malacca Strait (Haditiar et al., 2020), internal wave (Rizal et al., 2019), and Lee waves (Rizal et al., 2020). A non-hydrostatic method may be used to explain the mechanism of the Lee wave, as well as the internal wave. Numerical experiments were carried out based on Kämpf (2010). This study has a domain model with a horizontal boundary of 2,000 × 2,000 km and a uniform depth of 250 m (see Fig. 1(a)).
The lateral grid distance is Δx = Δy = 20 km, while the vertical grid distance is Δz = 50 m so that it forms five layers with time step Δt = 120 seconds. In the west and east, closed boundaries are defined, likened to a dry area (coast). Furthermore, the north and south sides of the model domain are given open boundaries. The sea’s initial condition is at rest, and this model uses a free-surface so that the numerical time steps will last a long time. The seawater density at 100 m and above from the bottom is 1027 kg/m3, while below it is 1028 kg/m3. The internal gravity wave phase velocity associated with this density configuration is c = 0.75 m/s. This value is obtained using the equatorial beta-plane approximation using Eq. 1.
f yβ= (1)
where, y is the meridional coordinate, and β is the set of β = 2.5 × 10⁻¹¹ 1/ms. This model is given a wind force from the Westside, which consists of wind stress moving eastward in the form of cosine in the y-direction (Fig. 1(b)). The maximum magnitude is 0.1 Pa at the equator, and the wind stress force is applied within 200 km from the west side. Wind stress magnitude will be stopped after the first five days of simulation.
Cyclic boundary conditions are used in open boundaries on the North (ny and ny+1) and South sides (0 and 1). This cyclic boundary condition uses
(a)
(b)
Fig. 1: Model setup (a) domain model, (b) wind stress force
Fig. 1: Model setup (a) domain model, (b) wind stress force

546
Marine Hydrodynamics based on the El Niño Scenario
the “mirror” condition for the meridional flow component (i-index) in Eq. 2 and 3 (Haditiar et al., 2019).
( ) ( ),0, , ,v i k v i ny k= − (2)
( ) ( ), 1, ,1,v i ny k v i k+ = − (3)
The advanced turbulence closure scheme introduced by Smagorinsky (1963) was applied to parameterize lateral eddy viscosity and diffusivity (Ah). Here is the equation using Eq. 4.
𝐴𝐴𝐴𝐴ℎ = 𝑐𝑐𝑐𝑐1Δ𝑥𝑥𝑥𝑥Δ𝑦𝑦𝑦𝑦��𝜕𝜕𝜕𝜕𝜕𝜕𝜕𝜕𝜕𝜕𝜕𝜕𝑥𝑥𝑥𝑥�2
+ �𝜕𝜕𝜕𝜕𝜕𝜕𝜕𝜕𝜕𝜕𝜕𝜕𝑦𝑦𝑦𝑦�2
+ 0,5 �𝜕𝜕𝜕𝜕𝜕𝜕𝜕𝜕𝜕𝜕𝜕𝜕𝑦𝑦𝑦𝑦
+𝜕𝜕𝜕𝜕𝜕𝜕𝜕𝜕𝜕𝜕𝜕𝜕𝑥𝑥𝑥𝑥�2
𝐷𝐷𝐷𝐷𝐸𝐸𝐸𝐸 = �2𝜋𝜋𝜋𝜋2𝐴𝐴𝐴𝐴𝑧𝑧𝑧𝑧𝑓𝑓𝑓𝑓
=7.6
�sin|𝜑𝜑𝜑𝜑|𝑈𝑈𝑈𝑈10
(U10 = � 𝜏𝜏𝜏𝜏𝑤𝑤𝑤𝑤𝑤𝑤𝑤𝑤𝑤𝑤𝑤𝑤𝑤𝑤𝑤𝑤
𝜌𝜌𝜌𝜌𝑎𝑎𝑎𝑎𝑤𝑤𝑤𝑤𝑎𝑎𝑎𝑎𝐶𝐶𝐶𝐶𝑤𝑤𝑤𝑤, where
𝜌𝜌𝜌𝜌𝑎𝑎𝑎𝑎𝑎𝑎𝑎𝑎𝑎𝑎𝑎𝑎 = 1.25 dan 𝐶𝐶𝐶𝐶𝑑𝑑𝑑𝑑 = 2.6 x 10⁻³),
𝑓𝑓𝑓𝑓(𝑡𝑡𝑡𝑡) = ∑ 𝐴𝐴𝐴𝐴𝑎𝑎𝑎𝑎 cos(2𝜋𝜋𝜋𝜋𝐹𝐹𝐹𝐹𝑎𝑎𝑎𝑎𝑡𝑡𝑡𝑡 + 𝜃𝜃𝜃𝜃𝑎𝑎𝑎𝑎)𝑛𝑛𝑛𝑛𝑎𝑎𝑎𝑎=1
(4)
Where, c1 is a parameter with a value between 0.1 and 0.2. The value of c1 chosen in this study was 0.1. The simulation was run several times with the procedure listed in Table 1.
RESULTS AND DISCUSSIONThis El Niño model simulation is run for 60 days
with time step Δt = 120 seconds. This simulation generates current, sea level, and density data, which will be analyzed to determine sea level and density. Furthermore, the data is stored every 12 hours of simulation. In this article, the simulation output data for day 37 is analyzed because the coastal Kelvin waves have formed correctly on the East side (Fig. 2). The formation of coastal Kelvin waves in the eastern region follows a similar pattern as the OSCAR Sea Surface Velocity plot data obtained from ERDDAP in October 2015 in the Pacific Ocean (Fig. 3). Fig. 2 simulation and Fig. 3 observation are not identical. Since, Fig. 2 is based on ideal bathymetry, wind, and shoreline, whereas Fig. 3 is based on real bathymetry, wind, and shoreline.
The plot of sea level simulation results on the 37th day can be seen in Fig. 4. From the sea-level value in Fig. 4(a), the sea level value is taken at x = 400 km, called the western part, x = 1200 km is called
Table 1: The procedure for achieving outcomes
Process In-process information
1 To get the sea level and density performance, run the Kämpf model simulation in Fortran. 2 Display and retrieve/sample the desired performance data for sea level and density. 3 The output is displayed after searching for the FFT value.
Table 1: The procedure for achieving outcomes
Fig. 2: Currents plot on the 37th day of simulation
Fig. 2: Currents plot on the 37th day of simulation

547
Global J. Environ. Sci. Manage., 7(4): 543-554, Autumn 2021
the middle part, and x = 1980 km is called the eastern part. In the three sections, the results are obtained, as shown in Fig. 4(b). Sea level in the western part is negative around the equator and is positive in areas far from the equator. Furthermore, in the middle part, the sea level value shows the same properties as the sea level value in the western part. However, in the western part, sea level has a steeper graph at the equator than in the middle. In contrast to the two sea-level values, the data in the eastern part can be observed that all values are positive, but at the
equator, it forms a peak with a value of 1.58 cm while on the North and South sides, which are far from the equator a value of 0.24 cm. The variation in sea level away from the equator is influenced by local and remote responses (Chang et al., 2013).
Fig. 5 shows the density value of seawater at the equator. It can be observed that the densities at 0-50 m and 50-100 m depths show a similar pattern of change on the 37th day. The density at these two depths shows the same properties after being given a wind force until the end of the
Fig. 3: Sea surface velocity on October 2015
Fig. 3: Sea surface velocity on October 2015
(a)
(b)
Fig. 4: Sea level (a) plot on the 37th day of simulation, (b) value at the equator on the 37th day
(a)
(b)
Fig. 4: Sea level (a) plot on the 37th day of simulation, (b) value at the equator on the 37th day
Fig. 4: Sea level (a) plot on the 37th day of simulation, (b) value at the equator on the 37th day

548
M. Ikhwan et al.
Fig. 5: The value of density at the equator at 37 days of simulation
Fig. 5: The value of density at the equator at 37 days of simulation
(a)
(b)
Fig. 6: The FFT value at the equator on the 37th day of (a) the sea level, (b) the density
Fig. 6: The FFT value at the equator on the 37th day of (a) the sea level, (b) the density
(a)
(b)
Fig. 6: The FFT value at the equator on the 37th day of (a) the sea level, (b) the density

549
Global J. Environ. Sci. Manage., 7(4): 543-554, Autumn 2021
simulation, in contrast to the density at a depth of 100-250 m. Densities at a depth of 100-150 m have begun to show changes in density values ranging between 1027.4 kg/m3 and 1027.8 kg/m3. At a depth of 150-200 m and 200-250 m, the density, in general, does not change significantly but shows a different pattern. This simulation generates current, sea level, and density data, which will be analyzed to determine sea level and density. The formation of Ekman and Kelvin waves is used to compare experiments theoretically. During the El Nino phase, Kelvin waves are thought to migrate into the eastern Pacific Ocean (Kämpf, 2010; Capotondi et al., 2019). Meanwhile, the Ekman layer (DE) can be approximated using Eq. 5 (Kämpf, 2010).
2
102 7.6
sinz
EAD U
fπ
ϕ= = (5)
The Ekman layer is related to a three-dimensional wind-driven circulation model, such as the one used in experiment. The Ekman layer is a thin layer that allows the wind’s effects to continue to function. If the highest wind stress is wind = 0.1 pa and the wind speed is U10 = 5.5 m/s, the Ekman layer (DE) at the equator is the deepest, while it can reach 220 meters at 200 km from the equator using Eq. 6.
(U10 = wind
air dCτr , where 31.25 dan 2.6 x1 0 )air dCr −= = (6)
Meanwhile, the most recent El Niño outbreak,
Table 2: Amplitude, frequency, and phase of sea level values
i Western
As F θ
1 0.00338 0.10000 0.03100 2 0.00338 10.00000 -0.03100 3 0.00115 0.00000 3.14159 4 0.00108 0.20000 -3.07910 5 0.00108 9.90000 3.07910 6 0.00032 0.30000 0.09086 7 0.00032 9.80000 -0.09086
i Middle
As F θ
1 0.00179 0.10000 0.03096 2 0.00179 10.00000 -0.03096 3 0.00115 0.00000 0.00000 4 0.00096 0.20000 -3.07977 5 0.00096 9.90000 3.07977 6 4.00000 0.00055 0.30000 7 99.00000 0.00055 9.80000
i Eastern
As F θ
1 0.00693 0.00000 0.00000 2 0.00321 0.10000 -3.11051 3 0.00321 10.00000 3.11051 4 0.00108 0.20000 0.06226 5 0.00108 9.90000 -0.06226 6 0.09305 0.00011 0.30000 7 -0.09305 0.00011 9.80000
Table 2: Amplitude, frequency, and phase of sea level values

550
Marine Hydrodynamics based on the El Niño Scenario
Table 3: Amplitude, frequency, and phase of the density values
i 0-50 m Depth
Ad F θ
1 1027.18267 0.00000 0.00000 2 0.03675 0.10000 -1.78340 3 0.03675 10.00000 1.78340 4 0.02330 0.20000 -1.82001 5 0.02330 9.90000 1.82001 6 0.01407 0.30000 -2.18821 7 0.01407 9.80000 2.18821
i 50-100 m Depth
Ad F θ
1 1027.18668 0.00000 0.00000 2 0.03566 0.10000 -1.76912 3 0.03566 10.00000 1.76912 4 0.02291 0.20000 -1.82199 5 0.02291 9.90000 1.82199 6 0.01371 0.30000 -2.14562 7 0.01371 9.80000 2.14562
i 100-150 m Depth
Ad F θ
1 1027.68937 0.00000 0.00000 2 0.03006 0.10000 2.86144 3 0.03006 10.00000 -2.86144 4 0.02565 0.40000 -1.70419 5 0.02565 9.70000 1.70419 6 0.01878 0.20000 -2.77093 7 0.01878 9.90000 2.77093
i 150-200 m Depth
Ad F θ
1 1027.97072 0.00000 0.00000 2 0.00600 0.10000 2.55146 3 0.00600 10.00000 -2.55146 4 0.00473 0.40000 -1.98551 5 0.00473 9.70000 1.98551 6 0.00452 0.30000 -1.79668 7 0.00452 9.80000 1.79668
i 200-250 m Depth
Ad F θ
1 1027.98959 0.00000 0.00000 2 0.00216 0.10000 -0.52145 3 0.00216 10.00000 0.52145 4 0.00136 0.20000 0.34275 5 0.00136 9.90000 -0.34275 6 0.00103 0.50000 2.48266 7 0.00103 9.60000 -2.48266
Table 3: Amplitude, frequency, and phase of the density values
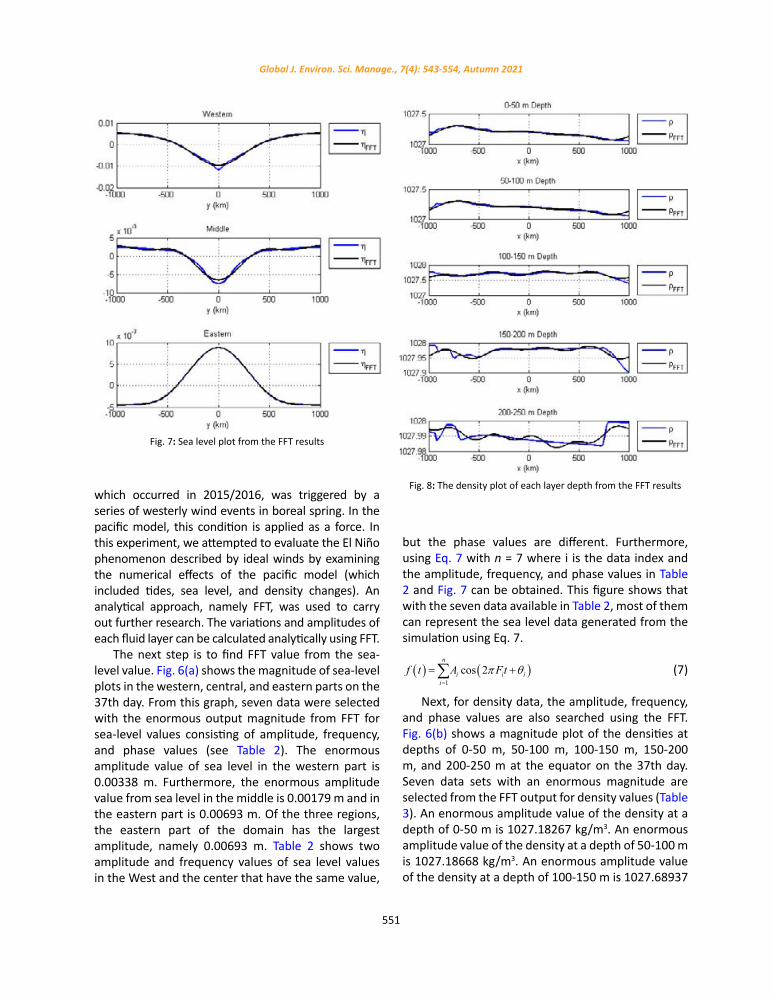
551
Global J. Environ. Sci. Manage., 7(4): 543-554, Autumn 2021
Fig. 7: Sea level plot from the FFT results
Fig. 8: The density plot of each layer depth from the FFT results
Fig. 7: Sea level plot from the FFT results
Fig. 8: The density plot of each layer depth from the FFT resultswhich occurred in 2015/2016, was triggered by a series of westerly wind events in boreal spring. In the pacific model, this condition is applied as a force. In this experiment, we attempted to evaluate the El Niño phenomenon described by ideal winds by examining the numerical effects of the pacific model (which included tides, sea level, and density changes). An analytical approach, namely FFT, was used to carry out further research. The variations and amplitudes of each fluid layer can be calculated analytically using FFT.
The next step is to find FFT value from the sea-level value. Fig. 6(a) shows the magnitude of sea-level plots in the western, central, and eastern parts on the 37th day. From this graph, seven data were selected with the enormous output magnitude from FFT for sea-level values consisting of amplitude, frequency, and phase values (see Table 2). The enormous amplitude value of sea level in the western part is 0.00338 m. Furthermore, the enormous amplitude value from sea level in the middle is 0.00179 m and in the eastern part is 0.00693 m. Of the three regions, the eastern part of the domain has the largest amplitude, namely 0.00693 m. Table 2 shows two amplitude and frequency values of sea level values in the West and the center that have the same value,
but the phase values are different. Furthermore, using Eq. 7 with n = 7 where i is the data index and the amplitude, frequency, and phase values in Table 2 and Fig. 7 can be obtained. This figure shows that with the seven data available in Table 2, most of them can represent the sea level data generated from the simulation using Eq. 7.
( ) ( )1
cos 2n
i i ii
f t A Ftπ q=
= +∑ (7)
Next, for density data, the amplitude, frequency, and phase values are also searched using the FFT. Fig. 6(b) shows a magnitude plot of the densities at depths of 0-50 m, 50-100 m, 100-150 m, 150-200 m, and 200-250 m at the equator on the 37th day. Seven data sets with an enormous magnitude are selected from the FFT output for density values (Table 3). An enormous amplitude value of the density at a depth of 0-50 m is 1027.18267 kg/m3. An enormous amplitude value of the density at a depth of 50-100 m is 1027.18668 kg/m3. An enormous amplitude value of the density at a depth of 100-150 m is 1027.68937

552
M. Ikhwan et al.
Fig. 9: The density value of the FFT results at y = 0
Fig. 9: The density value of the FFT results at y = 0
kg/m3. An enormous amplitude value of the density at a depth of 150-200 m is 1027.97072 kg/m3. An enormous amplitude value of the density at a depth of 200-250 m is 1027.98959 kg/m3. Of the five layers of depth, the depth of 150-200 m has the largest amplitude with a value of 1027.98959 kg/m3.
Table 3 can also be observed that the amplitude, frequency, and phase at a depth of 0-50 m and 50-100 m have almost the same values. Then, using Eq. 7 with n = 7 and the amplitude, frequency, and phase values in Table 3, the graph is obtained in Fig. 8. This figure shows that with the seven data available in Table 3, most of them can already represent the density data generated from the simulation.
If the graph of each layer is shifted to y = 0, the result is shown in Fig. 9. From the figure, it can be seen that the density values of the FFT results for a depth of 0-50 m and 50-100 m are almost coincided, which means that the density at a depth of 0-50 m and 50-100 m has the same change pattern after being given a wind force on the sea surface.
CONCLUSIONIn the 37 days of simulations of an ideal El Niño
event in the Pacific Ocean, the current has entered the East and created a complete coastal Kelvin wave. In the eastern region, the shape of coastal Kelvin waves follows a pattern similar to the OSCAR Sea Surface Velocity plot data obtained from ERDDAP in the Pacific Ocean in October 2015. Around the equator, the sea-level value is negative in the western and middle regions, but positive in areas far from the equator. The western part’s sea-level value, on the other hand, has
a steeper graph at the equator than the middle. The FFT findings also reveal that there are two amplitude and frequency values for the sea level values in the West and East that are the same, but the phase values are different. The eastern part of the domain has the highest amplitude of the three parts, according to FFT data. In addition, there are two amplitude and frequency values from sea level values in the West and East that are the same, but the phase values are different. Both graphically and from the FFT, densities at depths of 0-50 m and 50-100 m display a similar pattern of changes on the 37th day. Despite having given the wind force until the end of the simulation, the density at these two depth layers has the same properties as the density at the depth below, which is different from the density at the depth below. It’s caused by wind forces operating at a depth of 0-100 meters. Meanwhile, wind impact is very weak or non-existent at depths of 100-150 m, 150-200 m, and 200-250 m. The density does not change significantly between 150-200 m and 200-250 m, but it does follow a different pattern. The vertical density stratification decreases from five to four layers in general. At depths of 0-50 m and 50-100 m, the amplitude, frequency, and phase are nearly identical.
AUTHOR CONTRIBUTIONSM. Ikhwan performed the literature review,
running the model, analyzed and interpreted the data, prepared the manuscript text, and manuscript edition. R. Wafdan performed the literature review, running the model, analyzed and interpreted the data, prepared the manuscript text, and manuscript edition. Y. Haditiar performed the literature review, prepared numerical code, prepared the manuscript text, and manuscript edition. M. Ramli performed the literature review, analyzed and interpreted the data, prepared the manuscript text, and manuscript edition. Z.A. Muchlisin performed the literature review, prepared the manuscript text, and manuscript edition. S. Rizal performed the literature review, experimental design, analyzed and interpreted the data, prepared the manuscript text, and manuscript edition.
ACKNOWLEDGEMENTThis study is funded by Universitas Syiah Kuala,
Banda Aceh, Ministry of Education and Culture, Indonesia, under the scheme of the Professor

553
Global J. Environ. Sci. Manage., 7(4): 543-554, Autumn 2021
research [contract number: 11/UN11.2.1/PT.01.03/PNBP/2020] and ‘Program Riset Unggulan Universitas Syiah Kuala Percepatan Doktor’ [contract number: 300/UN11.2/PP/PNBP/SP3/2019].
CONFLICT OF INTERESTThe authors declare no potential conflict of
interest regarding the publication of this work. In addition, the ethical issues including plagiarism, informed consent, misconduct, data fabrication and, or falsification, double publication and, or submission, and redundancy have been completely witnessed by the authors.
ABBREVIATIONS ∆t Time-step, s∆x, ∆y , ∆z Distance spacing, m
β Meridional variation of Coriolis parameter, β = 2.5 × 10⁻¹¹ 1/ms
r Seawater density, kg/m3
q Phase of density, degreeτ Wind stress, paAd Amplitude of density, kg/m3
Ah Horizontal eddy viscosity, m2/sAs Amplitude of sea level, m
c Phase speed of internal gravity waves, m/s
c1Free parameter for turbulence closure scheme, non-dimensional
DE The Ekman layer ENSO El Niño – Southern OscillationEq. Equationf Coriolis parameter, 1/sF Frequency of density, HzFig. FigureFFT Fast Fourier TransformHz Hertzkg/m3 kilogram per meter cubickm kilometersm meters1/ms one per meter secondm/s meter per secondPa Pascal
U10Wind speed at 10 m above sea level, m/s
u,v Currents, m/s
y Meridional coordinate, m
REFERENCESAn, S.I.; Wang, B., (2000). Interdecadal change of the structure
of the ENSO mode and its impact on the ENSO frequency. J. Clim., 13(12): 2044-2055 (12 pages).
Behera, S.K.; Doi, T.; Luo, J.J., (2021). Air–sea interaction in tropical Pacific: The dynamics of El Niño/Southern Oscillation. Tropical and Extratropical Air-Sea Interactions. Elsevier.
Capotondi, A.; Sardeshmukh, P.D.; Lorenzo, E.D.; Subramanian, A.C; Miller, A.F., (2019). Predictability of US West Coast Ocean Temperatures is not solely due to ENSO. Sci. Rep., 9: 10993 (10 pages).
Cha, S.; Moon, J.; Song, Y.T., (2018). A recent shift toward an El Niño-like ocean state in the tropical Pacific and the resumption of ocean warming. Geophysical Research Letters, 45: 11,885– 11,894 (10 pages).
Chang, Y.T.; Du, L.; Zhang, S.W.; Huang, P.F., (2013). Sea level variations in the tropical Pacific Ocean during two types of recent El Niño events. Global Planet. Change, 108: 119–127 (9 pages).
Chen, N.; Thual, S.; Stuecker, M.F., (2019a). El Niño and the Southern Oscillation: Theory. Reference Module in Earth Systems and Environmental Sciences. Elsevier.
Chen, N.; Thual, S.; Hu, S., (2019b). El Niño and the Southern Oscillation: Observation. Reference Module in Earth Systems and Environmental Sciences. Elsevier.
Doughty, R.; Xiao, X.; Qin, Y.; Wu, X.; Zhang, Y.; Moore, B., (2021). Small anomalies in dry-season greenness and chlorophyll fluorescence for Amazon moist tropical forests during El Niño and La Niña. Remote Sens. Environ., 253: 112196 (8 pages).
Fedorov, A.V.; Philander, S.G., (2000). Is El Niño changing? Science, 288(5473): 1997-2002 (6 pages).
Haditiar, Y; Putri, M.R.; Ismail, N.; Muchlisin, Z.A.; Rizal, S., (2019). Numerical Simulation of Currents and Volume Transport in the Malacca Strait and Part of South China Sea. Eng. J., 23(6): 129–143 (5 pages).
Haditiar, Y; Putri, M.R.; Ismail, N.; Muchlisin, Z.A.; Ikhwan, M.; Rizal, S., (2020). Numerical study of tides in the Malacca Strait with a 3-D model. Heliyon, 6: e04828 (16 pages).
Hao, Z.; Hao, F.; Singh, V.P.; Zhang, X., (2018). Quantifying the relationship between compound dry and hot events and El Niño–southern Oscillation (ENSO) at the global scale. J. Hydrol., 567: 332–338 (7 pages).
Horii, T.; Ueki, I.; Hanawa, K., (2012). Breakdown of ENSO predictors in the 2000s: Decadal changes of recharge/discharge-SST phase relation and atmospheric intraseasonal forcing. Geophys. Res. Lett., 39(10): L10707 (5 pages).
Hu, Z.Z.; Kumar, A.; Ren, H.L.; Wang, H.; L’Heureux, M.; Jin, F.F., (2013). Weakened interannual variability in the tropical Pacific Ocean since 2000. J. Clim., 26(8): 2601-2613 (13 pages).
Kämpf, J., (2010). Advanced ocean modelling: using open-source software. Springer Science & Business Media., New York.
Kumar, A.; Hu, Z.Z., (2014). Interannual and interdecadal variability of ocean temperature along the equatorial Pacific in conjunction with ENSO. Clim. Dyn., 42(5-6): 1243-1258 (16 pages).
Li, J.; Huang, J.G.; Tardif, J.C.; Liang, H.; Jiang, S.; Zhu, H.; Zhou, P., (2020). Spatially heterogeneous responses of tree radial growth to recent El Niño southern-oscillation variability across East Asia subtropical forests. Agric. For. Meteorol., 287: 107939 (12 pages).

554
M. Ikhwan et al.
López-Parages, J.; Auger, P.A.; Rodríguez-Fonseca, B.; Keenlyside, N.; Gaetan, C.; Rubino, A.; Arisido, M.W.; Brochier, T., (2020). El Niño as a predictor of round sardinella distribution along the northwest African coast. Prog. Oceanogr., 186: 102341 (40 pages).
McPhaden, M.J., (2012). A 21st century shift in the relationship between ENSO SST and warm water volume anomalies. Geophys. Res. Lett., 39(9): L09706 (5 pages).
Pécastaing, N.; Chávez, C., (2020). The impact of El Niño phenomenon on dry forest-dependent communities’ welfare in the northern coast of Peru. Ecol. Econ., 178: 106820 (10 pages).
Peng, Q.; Xie, S.; Wang, D.; Kamae, Y.; Zhang, H.; Hu, S.; Zheng, X.; Wang, W., (2020). Eastern Pacific Wind Effect on the Evolution of El Niño: Implications for ENSO Diversity. Journal of Climate, 33(8): 3197-3212 (6 pages).
Rizal, S.; Iskandar, T.; Muhammad; Haditiar, Y.; Ilhamsyah, Y.; Setiawan, I.; Sofyan, H., (2019). Numerical study of the internal wave behaviour in the vertical ocean slice model. J. Eng. Sci. Technol., 14(5): 2836-2846 (11 pages).
Rizal, S.; Wafdan, R.; Haditiar, Y.; Ramli, M.; Halfiani, V., (2020). Numerical study of lee waves characteristics in the ocean. J. Eng. Sci. Technol., 15(2): 1056-1078 (23 pages).
Sharma, N., (2018). Salinity from SMAP radiometer can monitor El Nino. J. Mar. Syst., 187: 141–145 (5 pages).
Siswanto, E.; Horii, T.; Iskandar, I.; Gaol, J.L.; Setiawan, R.Y.; Susanto, R.D., (2020). Impacts of climate changes on the phytoplankton
biomass of the Indonesian Maritime Continent. J. Mar. Syst., 212: 103451 (15 pages).
Smagorinsky, J., (1963). General circulation experiments with the primitive equations: I. The basic experiment. Mon. Weather Rev., 91(3): 99-164 (66 pages).
Sundararajan, S., (2020). Equatorial upper mesospheric mean winds and tidal response to strong El Niño and La Niña. J. Atmos. Solar-Terrestrial Phys., 202: 105270 (7 pages).
Timmermann, A.; An, S.; Kug, J.; Jin, F.; Cai, W.; Capotondi, A.; Cobb, K.M.; Lengaigne, M.; McPhaden, M.J; Stuecker, M.F.; Stein, K.; Wittenberg, A.T.; Yun, K.; Bayr, T.; Chen, H.; Chikamoto, Y.; Dewitte, B.; Dommenget, D.; Grothe, P.; Guilyardi, E.; Ham, Y; Hayashi, M.; Ineson, S.; Kang, D.; Kim, S.; Kim, W.; Lee, J.; Li, T.; Luo, J.; McGregor, S.; Planton, Y.; Power, S.; Rashid, H.; Ren, H; Santoso, A.; Takahashi, K.; Todd, A.; Wang, G.; Wang, G.; Xie, R.; Yang, W.; Yeh, S.; Yoon, J.; Zeller, E.; Zhang, X., (2018). El Niño�Southern Oscillation complexity. Nature, 559: 535–545 (11 pages).
Trenberth, K.E., (2019). El Niño Southern Oscillation (ENSO). Encyclopedia of Ocean Sciences., 6: 420-432 (13 pages).
Yeh, S.W.; Kug, J.S.; Dewitte, B.; Kwon, M.H.; Kirtman, B.P.; Jin, F.F., (2009). El Niño in a changing climate. Nature, 461(7263): 511-514 (4 pages).
Yue, W.; Lin, L.; Xiaotong, Z., (2020). Influence of El Niño events on sea surface salinity over the central equatorial Indian Ocean. Environ. Res., 182: 109097 (7 pages).
AUTHOR (S) BIOSKETCHES
Ikhwan, M., Ph.D. Candidate, Graduate School of Mathematics and Applied Science, Universitas Syiah Kuala, Banda Aceh 23111, Indonesia. Email: [email protected]
Wafdan, R., M.Sc., Instructor, Department of Marine Sciences, Faculty of Marine and Fisheries, Universitas Syiah Kuala, Banda Aceh 23111, Indonesia. Email: [email protected]
Haditiar, Y., Ph.D., Assistant Professor, Department of Marine Sciences, Faculty of Marine and Fisheries, Universitas Syiah Kuala, Banda Aceh 23111, Indonesia. Email: [email protected]
Ramli, M., Ph.D., Professor, Department of Mathematics, Universitas Syiah Kuala, Banda Aceh 23111, Indonesia. Email: [email protected]
Muchlisin, Z.A., Ph.D., Professor, 1Graduate School of Mathematics and Applied Science, Universitas Syiah Kuala, Banda Aceh 23111, Indonesia. 2Department of Aquaculture, Faculty of Marine and Fisheries, Universitas Syiah Kuala, Banda Aceh 23111, Indonesia. 3Research Center for Marine Sciences and Fisheries, Universitas Syiah Kuala, Banda Aceh 23111, Indonesia. Email: [email protected]
Rizal, S., Ph.D., Professor, 1Graduate School of Mathematics and Applied Science, Universitas Syiah Kuala, Banda Aceh 23111, Indonesia. 2Department of Marine Sciences, Faculty of Marine and Fisheries, Universitas Syiah Kuala, Banda Aceh 23111, Indonesia. 3Research Center for Marine Sciences and Fisheries, Universitas Syiah Kuala, Banda Aceh 23111, Indonesia. Email: [email protected]
HOW TO CITE THIS ARTICLE
Ikhwan, M.; Wafdan, R.; Haditiar, Y.; Ramli, M.; Muchlisin, Z.A.; Rizal, S., (2021). Simulation and analysis of marine hydrodynamics based on the El Niño scenario. Global J. Environ. Sci. Manage., 7(4): 543-554.
DOI: 10.22034/gjesm.2021.04.04
url: https://www.gjesm.net/article_243711.html
COPYRIGHTS
©2021 The author(s). This is an open access article distributed under the terms of the Creative Commons Attribution (CC BY 4.0), which permits unrestricted use, distribution, and reproduction in any medium, as long as the original authors and source are cited. No permission is required from the authors or the publishers.

Global J. Environ. Sci. Manage. 7(4): 555-564, Autumn 2021
*Corresponding Author:Email: [email protected]: +1 30228 76925 Fax: +1 30228 76925
Global Journal of Environmental Science and Management (GJESM)
Homepage: https://www.gjesm.net/
ORIGINAL RESEARCH PAPER
Pre-sowing treatment of vetch hairy seeds, viсia villosa using ultraviolet irradiation
A. Semenov1, T. Sakhno1,2, O. Hordieieva2, Y. Sakhno3,*
1Department of Commodity Science, Poltava University of Economics and Trade, Poltava, Ukraine2Department of Agro-Technology and Ecology, Poltava State Agrarian Academy, Poltava, Ukraine3Department of Plant and Soil Sciences, University of Delaware, Newark, DE 19713, USA
BACKGROUND AND OBJECTIVES: Aiming to increase crop yield the antimicrobial/bacterial or fungicidal pre-sowing seed treatment received more attention in modern agronomy. Ultraviolet-C irradiation of pre-sowing seeds is an environmentally friendly method that became of great importance in recent years. It is, hereafter, being shown that, along with known antimicrobial use, there is additional important advantage of Ultraviolet-C irradiation of pre-sowing seeds. It was revealed that Ultraviolet-C radiation on Vetch Hairy seeds stimulates seeds germination and vigour.METHODS: Various doses of Ultraviolet-C irradiation of seeds were used. The main sowing qualities of seeds were determined: seed vigour and germination, as well as the content of photosynthetic pigments in plant leaves and the main parameters of the kinetic values of hydration – moisture and hydration rate.FINDINGS: It was found that ultraviolet-C radiation has a positive effect on sowing qualities and content of photosynthetic pigments in plant leaves of Vetch vary. The most effective dose of ultraviolet irradiation applied to vetch hairy seeds; vicia villosa was 1000 J/m2. At this dose the seed vigour increases by 23.6%, germination by 15.1%, the mass of germinated seeds by 17.3%, the content of a- and b-chlorophyll by 12.4%, and 17.5%, respectively, the carotenoid content increased by 13.9%. The parameters of seeds hydration kinetics such as moisture content and hydration rate were determined. It was revealed that the hydration rate of seeds increased significantly in the first 100-minute time range. Later in time the hydration rate progressively decreased, achieving a saturated moisture content after 700 minutes. Additionally, it was found that Ultraviolet-C irradiation decreases the imbibition damage.CONCLUSION: The results indicated that ultraviolet-C irradiation has a positive effect on sowing qualities of Vetch Hairy seeds, thus, could be proposed as a promising candidate for application in treatment pre-sowing agriculture seeds.
©2021 GJESM. All rights reserved.
ARTICLE INFO
Article History:Received 11 February 2021Revised 27 April 2021Accepted 06 June 2021
Keywords:Pre-sowing treatmentGerminationHydration rateMoisture contentSeed vigourultraviolet irradiation (UV-C radiation)
ABSTRAC T
DOI: 10.22034/gjesm.2021.04.05
NUMBER OF REFERENCES
31NUMBER OF FIGURES
4NUMBER OF TABLES
2
Note: Discussion period for this manuscript open until January 1, 2022 on GJESM website at the “Show Article.

556
A. Semenov et al.
INTRODUCTIONThe main centre of origin of the hairy vetch (vicia
villosa) is Southwest Asia. However, this cultivar was found to be spread to the Mediterranean Sea and then to European countries, including England, Scandinavia and the Baltics. The widespread cultivation of Hairy Vetch in Ukraine makes it possible to obtain early spring forage during winter sowing and late summer forage during spring sowing. Hairy Vetch – a valuable legume, which on a number of biological and economic characteristics stands out among annual forage crops. There are twenty-two species of vetch in Ukraine, the most commonly used for the production of vicia sativa L., Vicia villosa Roth and the Pannonian vulture – Vicia pannonica Grantz. Hairy vetch is a source of vegetable protein, one of the best precursors for winter and spring cereals. It is part of most annual legume-cereal mixtures grown for green fodder, hay, silage, haylage. Biomass with a high protein content is well digestible and is a valuable feed for all farm animals. From the point of view of accelerating productivity in colder climes and obtaining the needed biomass yield (Wilke and Snapp, 2008; Campiglia et al., 2012), Vetch seeds are unreliable and therefore there are not many studies regarding the requirements of this species (Aarssen et al., 1986). At first stage of germination for seed multiplication Vetch species faces problems associated with low sowing qualities of seeds (Jacobsen et al., 2010). The change of various parameters such as dormancy, temperature, humidity, as well as methods of pre-sowing stimulation of seeds may improve the sowing quality of seeds in various environmental conditions. Commercially available widespread chemical methods of pre-sowing seed treatment have environmental impact and only physical methods (i.e. use of electromagnetic radiation) are proved to be eco-friendly. In some studies, a limited number of chemicals were used, but majority of them were replaced with appropriate physical methods of processing, such as magnetic field, gamma radiation, electric field, laser radiation, ultrasound and optical irradiation (Govindaraj et al., 2017; Thakur et al., 2019; Ri et al., 2019; Lazim and Ramadhan, 2020). The optical irradiation became of great interest in recent years that stimulate the growth and increase the tolerance of plants towards negative external factors therefore increasing the crops yield. Particularly, the pre-sowing treatment of agricultural
seeds with ultraviolet radiation attracted significant attention (Neelamegam and Sutha 2015; Mariz-Ponte et al., 2018). Thus, the study (Thomas and Puthur, 2017) described the effect of ultraviolet radiation on seeds during pre-sowing treatment to increase crop productivity, yield quality, as well as plant resistance to various biotic and abiotic stresses. Backer et al., 2018 discussed the mechanisms of plant growth stimulation by inoculating plants with rhizobacteria that stimulate plant growth, or treating plants with microbial-to-plant signalling compounds. Other authors of publication (Brown et al., 2001) described the treatment of cabbage seeds with Ultraviolet-C (UV-C) radiation at doses of 3.6 kJ/m2, which ensured resistance to bacteriosis (black rot) and improved quality and growth of cabbage. In study (Kacharava et al., 2009), an increase in the germination of seeds of black beans (Phaseolus vulgaris) under the influence of UV-C radiation was investigated. UV radiation at a dose of 460 mW/cm2 for 60 minutes enhanced the growth and accumulation of biomass in beans. The application of UV-C radiation led to an increase in plant height by 11–39%. All these effects of pre-treatment of seeds with optical radiation in the UV-C range are associated with the changes in biological properties (Semenov et al., 2017). The mechanisms of such effects themselves were investigated using various methods and models. However, no unambiguous explanation of these actions has been found until today. Temperature and moisture content (hydration) are the most important factors influencing seed germination. The water absorption kinetics during seeds hydration affects the biological properties during growth and the quality of the final product (Turhan et al., 2002). The positive effect of various doses of pre-sowing UV-C irradiation on the sowing quality of seeds has been considered in many studies (Turhan et al., 2002; Neelamegam and Sutha, 2015; Rocha et al., 2015; Thomas and Puthur, 2017; Mariz-Ponte et al., 2018; Sadeghianfar et al., 2019; Korotkova et al., 2020; Hernandez-Aguilar et al., 2021). It was found that the optimal doses of irradiation of winter wheat (Semenov et al., 2020), carrots (Semenov et al., 2019) and rapeseed (Semenov et al., 2018) are 400–600 J/m2, 120–150 J/m2 and 120 J/m2, respectively. Reviewing literature in this area it is possible to note that despite an extensive study (Neelamegam and Sutha, 2015; Thomas and Puthur, 2017; Korotkova et al., 2020),

557
Global J. Environ. Sci. Manage., 7(4): 555-564, Autumn 2021
as it was understood, this study is dealing with pre-sowing treatment of vetch hairy seeds (Vicia villosa) by use of Ultraviolet-C radiation has not been reported yet. Aiming to fill this research gap the objective of this study was focused on determination of hairy seeds (Vicia villosa) sowing quality (i.e. vigour and germination) by pre-sowing treatment of seeds using different doses of ultraviolet radiation. In addition, the hydration rate was evaluated, for treated and not treated pre-sowing seeds by ultraviolet radiation. The study was performed in the scientific and technical centre of Poltava University of Economics and Trade, Ukraine in 2019–2020.
MATERIALS AND METHODSFor conducting research, Hairy Vetch (Vicia villosa)
of Poltava-77 variety was used, which is determined by the national standard for the conditions of the Forest-Steppe and Steppe of Ukraine. During pre-sowing treatment, Hairy Vetch seeds were irradiated using low-pressure ZW20D15W type ultraviolet lamps with a power of 20 W at an emission spectrum the C region: 200–280 nm. Irradiation was carried out with the following doses of 50, 120, 500, 1000 and 3000 J/m2 and controlled using a Tensor-31 radiometer. Seed vigour and germination of seeds of control (without irradiation) and irradiated samples were determined by germinating 4 samples of 50 seeds each in Petri dishes on moistened filter paper in accordance with the International Safe Transit Association (ISTA) standard. The content of photosynthetic pigments in vetch leaves in the phase of three true leaves was established using a spectrophotometer, determining the optical density of the chlorophyll and carotene extract at 665, 649, and 440 nm (absorption maxima of chlorophyll a (Ca), chlorophyll b (Cb), and carotenoids (Ck), respectively). The concentration of pigments was calculated using Eqs. 1 to 3 (Porra, 2002).
Са = 11,63D665 – 2.39 D649, mg/L (1)
Cb = 20,11 D649 – 5,18 D665, mg/L (2)
Cк = 4,695 D440 – 0,268 Ca+b, mg/L (3)
To determine the moisture content (hydration), samples of Hairy Vetch seeds in an amount of 10 ± 0.5 g were soaked in 200 ml of distilled water at each
dose of UV-C radiation. The soaked samples were removed from the water at intervals of half an hour and an hour. The samples were placed on absorbent paper to remove excess water, and then weighed using a precision analytical balance, model WLC 0.2, TM Radwag, Poland with an accuracy of 0.001 g. Eqs. 4 to 5 were used for determination of such parameters as moisture content (MC) and hydration rate (HR) (Shafaei et al., 2016):
100%f i
i
W WMC
W−
= ×
(d. b. %) (4)
( ) ( )tt tMC MCHR
t+D −
=D
(d. b. %/min) (5)
At each value of the UV-C radiation dose, a hydration procedure was carried out, which lasted 12 hours. At this stage, the change in weight and, accordingly, the content of saturated moisture in the sample were determined. In order to reduce the measurement error of hydration indicators, the studies were carried out in triplicates. The appropriate statistical processing was used for interpretation of obtained experimental data.
RESULTS AND DISCUSSION Determination of seed vigour and germination
Analysis of the seed vigour and germination of Hairy Vetch indicates the dependence of its sowing qualities on the energy dose of ultraviolet radiation (Table 1). At an irradiation dose of 500 J/m2, the following results were obtained: in comparison with the control samples, the seed vigour was increased by 10.8% and the germination was increased by 6.6%. The maximal changes were observed at irradiation doses of 1000 J/m2: the seed vigour was increased by 23.6% and the germination was increased by 15.1%.
Less significant effect was observed at an irradiation dose of 3000 J/m2: in comparison with the control samples, the seed vigour was increased by 18.2% and the germination was increased by 9.6%. The obtained regularities of the pre-sowing effect on biological indicators (seed vigour and germination) are in good agreement consistent with the results of study (Kalsa and Abebie, 2012), where the effect of hydro- and osmotic priming in pre-sowing treatment on Hairy Vetch seeds was investigated.

558
Pre-sowing treatment of vetch seeds
Determination of biometric indicators (mass of germinated seeds)
The positive effect of UV-C irradiation on Hairy Vetch’s growth processes was also noted. An effective change in their biometric parameters was observed at high doses of UV-C irradiation of seeds - 1000 J/m2 and 3000 J/m2 (Table 2).
The maximum stimulating effect of UV-C irradiation on growth processes was obtained with a dose of 1000 J/m2: in comparison with the control samples the mass of germinated seeds increased by 17.3% (Table 2). At the same time, the root length and seedling length were increased by 18.1%, and 6.1%, respectively. At an irradiation dose of 3000 J/m2: the mass of germinated seeds was 5% less than the maximum value obtained, and the root length and seedling length were decreased by 5.1% and 1.3%, respectively. At doses up to 500 J/m2, changes in the biometric parameters of Hairy Vetch seedlings were insignificant and varied within the experimental error.
Determination of Chlorophyll The intensity of photosynthesis is determined
by the amount of plant pigments – chlorophylls and carotenoids, and an increase in these parameters
lead to an increase in the vegetative mass of plants. Pre-sowing UV-C irradiation of seeds affects the content of photosynthetic pigments in Hairy Vetch leaves (phase of three true leaves) (Fig. 1).
The concentrations of chlorophyll a and chlorophyll b in the leaves of the shaggy branch maximally increase (by 12.4% and 17.5%, respectively, compared with the control samples) under UV-C irradiation of seeds with doses of 1000 J/m2. The content of carotenoids also increased by 13.9%. The obtained results agree with a number of works (Salama et al., 2011; Geeta et al., 2014; Li, et al. 2020). In (Li et al., 2020), the amount of chlorophyll in the leaves of Hairy Vetch was determined. It was found that, depending on the year of sowing, fluctuations in the amount of chlorophyll can reach 10% or more. It follows from (Geeta et al., 2014) that the content of total chlorophyll and chlorophyll a and b increased upon UV-B irradiation of germinated seeds for 1 h by 7.31%, 4.52%, and 14.92%, respectively. At the same time, the chlorophyll content decreased by 5.85%, 3.29%, and 11.19% compared to the control samples after an additional 3 hours of irradiation. A decrease in the content of chlorophylls was observed in a study (Salama et al., 2011), where, after irradiation with 254 nm, the content of chlorophyll a and b
Table 1: Influence of UV-C irradiation on the sowing quality of vetch hairy
Radiation dose (J/m2) Seed vigour, (%) Germination (%)
Control samples (without irradiation) 74, 0 83,0 50 75,0 83,0
120 76,5 85,0 500 82,0 88,5
1000 91,5 95,5 3000 87,5 91,0 LSD05 3,8 4,1
Table 1: Influence of UV-C irradiation on the sowing quality of vetch hairy
Table 2: Biometric indicators of seedlings of sowing Hairy Vetch after 14 days
Radiation dose (J/m2)
Root length (cm)
Shoot length (cm)
Weight 50 pcs Germinated seeds (g)
Control samples (without irradiation) 3,97 6,43 4,90 50 4,00 6,35 4,86
120 4,02 6,50 4,98 500 4,15 6,63 5,16
1000 4,69 6,82 5,75 3000 4,45 6,73 5,46 LSD05 0,21 0,30 0,28
Table 2: Biometric indicators of seedlings of sowing Hairy Vetch after 14 days

559
Global J. Environ. Sci. Manage., 7(4): 555-564, Autumn 2021
and total chlorophyll decreased by 79, 43, and 74%, while the content of carotenoids increased by 91%. The results showed that the content of chlorophyll a, chlorophyll b and total chlorophyll decreased with UV-C irradiation.
Determination of hydration kineticsBesides, the hydration characteristics that affect
the quality indicators of production were studied (Turhan et al., 2002). According to the literature (Kumar et al., 2021; Turhan et al., 2002; Shafaei et
Fig. 1: Content of chlorophylls a, b and carotenoids in hairy vetch leaves (phase of three true leaves)
1.13 1.12 1.16 1.191.27 1.26
0.63 0.610.66 0.69
0.74 0.71
0.36 0.36 0.37 0.38 0.41 0.4
0
0.2
0.4
0.6
0.8
1
1.2
1.4
0 50 120 500 1000 3000
Concen
tration (m
g/g)
Irradiation (J/m2)
Chlorophyl a Chlorophyl b Carotenoids
Fig. 1: Content of chlorophylls a, b and carotenoids in hairy vetch leaves (phase of three true leaves)
Fig. 2: Dependence of hydration on time at radiation doses: 0; 120; 500 and 1000 J/m2
0
0.1
0.2
0.3
0.4
0.5
0.6
0.7
0.8
0.9
0 200 400 600 800
Water absorption (g)
Hydration (time), min0 120 500 1000
Fig. 2: Dependence of hydration on time at radiation doses: 0; 120; 500 and 1000 J/m2

560
A. Semenov et al.
al., 2016, 2021), it can be concluded that a better understanding of hydration kinetics is achieved through accurate modelling. It helped to initiate the development of several mathematical models for describing hydration characteristics (Shafaei et al., 2016). The dependence of the kinetics of
swelling of Hairy Vetch seeds on the dose of UV-C irradiation limits the process of their awakening and germination, and therefore, germination and yield. The time dependence of water absorption at various irradiation doses is shown in Fig. 2.
When hydrated, water slowly diffuses into
Fig. 3: The dependence of the change in the rate of water absorption on time at doses: 0; 120; 500 and 1000 J/m2
0
0.0005
0.001
0.0015
0.002
0.0025
0.003
0 100 200 300 400 500 600 700
Hydration rate (d
.b./min)
Hydration (time), min
0 120 500 1000Fig. 3: The dependence of the change in the rate of water absorption on time at doses: 0; 120; 500 and 1000 J/m2
Fig. 4: Dependence of the change in the rate of water absorption on humidity at irradiation doses: 0, 120, 500 and 1000 J/m2
0
0.0005
0.001
0.0015
0.002
0.0025
0.003
0 0.2 0.4 0.6 0.8 1
Hydration rate (d
.b./min)
Moisture content (d.b.)
0 120 500 1000
Fig. 4: Dependence of the change in the rate of water absorption on humidity at irradiation doses: 0, 120, 500 and 1000 J/m2

561
Global J. Environ. Sci. Manage., 7(4): 555-564, Autumn 2021
the granular structure of the grain and after a certain period of time reaches a constant level. It is understood that as the hydration time increases, so does the moisture content of the Hairy Vetch grain. It was also found that water absorption decreases over time with increasing hydration time and radiation dose. Moreover, this dependence is broken after 9 hours of hydration. The study of the dependence of the rate of hydration is associated with the fact that often too rapid water absorption occurs due to a high gradient of water potential, which can lead to a decrease in seed germination after soaking (Semenov et al., 2021). The results are presented based on the forecast of an artificial neural network (ANN) model, where the input parameters are the radiation dose and the hydration time, and the output parameters are the moisture content and the rate of hydration. Figs. 3 and 4. Irradiation dose and hydration time were used as input parameters, and moisture content and hydration rates were used as output parameters.
The forecast of the ANN model shows (Figs. 3 and 4) that in the initial phase of hydration the rate sharply increased and gradually and slowly decreased in the middle and until the saturated moisture content was reached. As can be seen from Figs. 3 and 4, the rate of hydration decreases with increasing radiation dose under the same experimental conditions.
Pre-sowing irradiation with various doses of UV-C leads to a decrease in water absorption, which reduces damage to the seed coat during rapid water absorption (damage by imbibition) and ultimately leads to an increase in germination energy and seed germination. Thus, UV-C irradiation in most cases reduces the rate of water uptake by the seeds as the dose is increased, which prevents damage to the seed membrane during rapid water uptake and thus allows a higher percentage of Hairy Vetch seeds to germinate.
CONCLUSIONS Pre-sowing treatment of seeds with UV-C
radiation has a positive effect on sowing qualities and biometric indicators. UV-irradiated seeds germinate 1.5-2.0 times faster than non-irradiated seeds. In addition, UV irradiation promotes seed germination both under optimal conditions and under stress. The most effective dose of UV radiation of Vicky seeds is 1000 J/m2. At this dose vigour and laboratory germination increased by 23.6%
and 15.1%, respectively. The weight of germinated seeds increased by 17.3% while the content of chlorophyll, chlorophyll b and carotenoids increased by 12.4%, 17.5% and 13.9%respectively. The kinetic parameters of hydration of irradiated seeds were defined by moisture content and hydration rate. This in turn, causing faster water absorption and thus more efficient seed hydration, positively affecting sowing qualities and other agronomic traits. The results of the analysis showed that the rate of seed hydration increased significantly in the initial phase and gradually and slowly decreased in the middle and end of the hydration procedure. Water absorption increased significantly with increasing hydration time from 0 to 700 minutes, following increase of irradiation dose, water absorption decreased, limiting this pattern after 9 hours. Improved water absorption after UV-C irradiation during germination cannot be considered as the only factor responsible for enhanced germination. It is established that one of the reasons for the rapid germination of seeds is the initiation of processes associated with germination during pre-hydration. The increase in germination energy during UV-C irradiation of seeds is the result of many mechanisms caused by irradiation, including efficient water absorption. Rapid absorption of water at an early stage can lead to the so-called seeds imbibition, which is manifested in the disruption of structural integrity of the membranes. In addition, the results of the study showed that pre-sowing treatment of seeds with UV irradiation reduces the rate of hydration thereby suspending seeds imbibition during rapid water absorption. However, at higher doses of UV irradiation the germination potential decreases. These studies demonstrated that UV-C radiation of pre-sowing seeds increases germination not only by UV degradation of pathogens originally present on seeds surface but also explains the nature of seeds hydration rate that changes with time of treatment. Since the report shows clear evidence that UV treated seeds at given dose do not promote seeds biodegradation while contrarily, increase germination, it may potentially lead to expansion of this research to other cultivars.
AUTHOR CONTRIBUTIONSA. Semenov developed experimental design
of equipment of ultraviolet action, conducted experiments, analysed and interpreted the data. T.

562
Pre-sowing treatment of vetch seeds
Sakhno performed the literature review, participated in experiments and translated. O. Hordieieva performed some of the remained experiments, compiled data. Y. Sakhno prepared the manuscript text, and manuscript edition.
ACKNOWLEDGMENTSPart of this work was partially supported by
a research grant from the U.S. Department of Agriculture [NIFA award 2018-67021-27965].
CONFLICT OF INTERESTThe authors declare no potential conflict of
interest regarding the publication of this work. In addition, the ethical issues including plagiarism, informed consent, misconduct, data fabrication and, or falsification, double publication and, or submission, and redundancy have been completely witnessed by the authors.
ABBREVIATIONS% PercentDt Hydration time min ANN Artificial neural networkCa Chlorophyll a Cb Chlorophyll b Ck Carotenoids cm centimetre
D Optical density or absorbance at three wavelengths: 440, 649, 665 nm
d.b. Content dry basis Eqs. Equationset.al others Fig. FigureFigs. Figuresg Gramh HourHR Hydration time (d. b./min)J JoulesJ/cm2 Joules per Square Centimetre J/m2 Joules per Square meterskJ/m2 Kilojoule per Square meters L litre
LSD05 Least Significant Differencem2 Square metersMC Moisture contentMC(t) Moisture content at time (t) (d. b. %)
MC(t+Dt) Moisture content at time (t + Dt) (d. b. %)
mg Milligrammg/L Milligram per litremin Minute MR Moisture ratiomW/cm2 Mill watts per centimetre squared nm Manometer pcs Pieces
UV-CUltraviolet C irradiances are defined as the wavelength range of (100 u λ < 280) nm.
W Watts
Wf Mass of wet seed of Hairy Vetch (grams)
Wi Initial mass seed of Hairy Vetch (grams)
REFERENCESAarssen L.W.; Hall I.V.; Jensen, K.I.N., (1986). The biology of
Canadian weed: Vicia angustifolia L., V. cracca L., V. sativa L., V. tetrasperma (L.) Schreb.and V. villosa Roth. Can. J. Plant Sci. 66: 711–737 (27 pages).
Backer, R.; Rokem, J.S.; Ilangumaran, G.; Lamont, J.; Praslickova, D.; Ricci, E.; Subramanian, S.; Smith, D.L., (2018). Plant growthpromoting rhizobacteria: Context, mechanisms of action, and roadmap to commercialization of biostimulants for sustainable agriculture. Front. Plant Sci., 9: 1473 (17 pages).
Brown, J.; Lu, T.; Stevens, C.; Khan, V.; Lu, J.; Wilson, C.; Droby, S., (2001). The effect of low dose ultraviolet light-C seed treatment on induced resistance in cabbage to black rot (Xanthomonas campestris pv. campestris). Crop Protect., 20(10): 873–883 (11 pages).
Campiglia, E.; Radicetti, E.; Mancinelli, R., (2012). Weed control strategies and yield response in a pepper crop (Capsicum annuum L.) mulched with hairy vetch (Vicia villosa Roth.) and oat (Avena sativa L.) residues. Crop Protect., 33: 65–73 (9 pages).
Geeta; S.; Goyal, A.K., (2014). Response of UV-B Radiation on Germination Percentage, Growth Pattern and Chlorophyll Content at seedling stage of Capsicum annum L. Int. J. Sci. Res. Public. 4(8): 1-5 (5 pages).
Govindaraj, M.; Masilamani, P.; Albert, A.V.; Bhaskaran M., (2017). Effect of physical seed treatment on yield and quality of crops: A review. Agric. Rev., 38(1): 1-14 (14 pages).
Jacobsen, K. L.; Gallagher, R. S.; Burnham, M.; Bradley, B. B.; Larson,

563
Global J. Environ. Sci. Manage., 7(4): 555-564, Autumn 2021
Z. M.; Walker, C. W., (2010). Mitigation of seed germination impediments in hairy vetch. Agron. J., 102: 1346–1351 (6 pages).
Hernandez-Aguilar, C.; Dominguez-Pacheco, A.; Tenango, M. P.; Valderrama-Bravo, C.; Hernández, M. S.; Cruz-Orea, A.; Ordonez-Miranda, J., (2021). Characterization of Bean Seeds, Germination, and Phenolic Compounds of Seedlings by UV-C Radiation. J. Plant. Growth. Regul., 40:642–655 (14 pages).
Kacharava, N.; Chanishvili, Sh.; Badridze, G.; Chkhubianishvili, E.; Janukashvili N., (2009). Effect of seed irradiation on the content of antioxidants in leaves of Kidney bean, Cabbage and Beet cultivars. Aust. J. Crop. Sci., 3(3): 137-145 (9 pages).
Kalsa, K.K.; Abebie, B., (2012). Influence of seed priming on seed germination and vigor traits of Vicia villosa ssp. dasycarpa (Ten.). Afr. J. Agric. Res., 7(21): 3202-3208 (7 pages).
Korotkova, I.; Semenov, A.; Sakhno, T., (2020). The Ultraviolet Radiation: Disinfection and Stimulation Processes. Lambert: Academic Publishing. 1-56 (56 pages).
Kumar Y.; Singh L.; Sharanagat V.S.; Tarafdar, А., (2021). Artificial neural network (ANNs) and mathematical modelling of hydration of green chickpea. Inf. Process. Agric., 8(1): 75-86 (12 pages).
Lazim, S. K.; Ramadhan, M. N., (2020). Effect of Microwave and UV-C Radiation on Some Germination Parameters of Barley Seed Using Mathematical Models of Gompertz and Logistic: Analysis study. Basrah J. Agric. Sci., 33(2): 28–41 (14 pages).
Lee, S. B.; Kim, J. H.; Yun, J. C.; Lee, M.H., (2014). Availability of hairy vetch (Vicia villosa Roth) as leguminous green manure crops for organic rice cultivation in reclaimed saline land. In: Rahmann, G., Aksoy, U. (Eds.) Building Organic Bridges, Johann Heinrich von Thünen-Institut, Braunschweig, Germany, 3, Thuenen Report. 20: 949–952 (4 pages).
Li, Rui.; Zhang, Zhixin.; Tang, Wei.; Huang, Yafeng.; Coulter, J. A.; Nan, Zhibiao., (2020). Common vetch cultivars improve yield of oat row intercropping on the Qinghai-Tibetan plateau by optimizing photosynthetic performance. Eur. J. Agron., 117: 126088 (13 pages).
Mariz-Ponte, N.; Mendes, R.J.; Sario, S.; Melo, P.; Santos, C., (2018). Moderate UV-A supplementation benefits tomato seed and seedling invigoration: a contribution to the use of UV in seed technology. Sci. Hortic-Amsterdam., 235: 357–366 (10 pages).
Neelamegam, R.; Sutha, T., (2015). UV-C Irradiation Effect on Seed Germination, Seedling Growth and Productivity of Groundnut (Arachis hypogaea L.). Int. J. Curr. Microbiol. App. Sci., 4(8): 430–443 (14 pages).
Porra, R.J., (2002). The chequered history of the development and use of simultaneous equations for the accurate determination of chlorophylls a and b. Photosynth. Res., 73: 149–156 (8 pages).
Renzi, J.P.; Chantre, G.R.; Smýkal, P.; Presotto, A.D.; Zubiaga, L.; Garayalde, A.F.; Cantamutto, M.A., (2020). Diversity of Naturalized Hairy Vetch (Vicia villosa Roth) Populations in Central Argentina as a Source of Potential Adaptive Traits for Breeding. Front. Plant. Sci., 11: 189 (14 pages).
Rocha, A. B. O., Honório, S. L., Messias, C. L., Otón, M., & Gómez, P. A. (2015). Effect of UV-C radiation and fluorescent light to control postharvest soft rot in potato seed tubers. Scientia Horticulturae, 181, 174–181 (8 pages).
Ri, P.; Choe, S.; Jang Y., (2019). Study on laser pre-sowing treatment of rice seeds by free-falling transport method. Inf. Process.
Agric., 6(4): 515-521 (7 pages).Salama, H.M.H.; Al-Watban, A.A.; Al-Fughom, A.T., (2011). Effect
of ultraviolet radiation on chlorophyll, carotenoid, protein and proline contents of some annual desert plants. Saudi. J. Biol. Sci., 18, 79–86 (8 pages).
Sadeghianfar, P.; Nazari, M.; Backes, G., (2019). Exposure to Ultraviolet (UV-C) Radiation Increases Germination Rate of Maize (Zea maize L.) and Sugar Beet (Beta vulgaris) Seeds. Plants. 8(2):49 (6 pages).
Semenov, A.; Sakhno T.; Semenova K., (2021). Influence of UV Radiation on Physical and Biological Properties of Rapeseed in Pre-Sowing Treatment. Int. J. Innovative Technol Exploring Eng., 10(4): 217-223 (7 pages).
Semenov, A.; Korotkova, I.; Sakhno, T.; Marenych, M.; Нanhur, V.; Liashenko, V.; Kaminsky, V., (2020). Effect of UV-C radiation on basic indices of growth process of winter wheat (Triticum aestivum L.) seeds in pre-sowing treatment. Acta agri. Slovenica, 116(1): 49-58 (10 pages).
Semenov, A.; Korotkova, I.; Sakhno, T.; Marenych, N., (2019). The exploiting of agronomic potential of UV-C irradiation for increasing the pre-sowing qualities of the carrot seeds. Ukrainian Black Sea Region Agrarian Science. 1(101): 47-52 (6 pages).
Semenov, A.; Kozhushko, G.; Sakhno, T., (2018). Influence of pre-sowing UV-radiation on the energy of germination capacity and germination ability of rapeseed. Technol. Audit Product. Reserves. 5/1(43): 61-65 (5 pages).
Semenov, A.O.; Kozhushko G.M.; Sakhno T.V., (2017). Analysis of the role of UV radiation on the development and productivity of different cultures. Light Eng. Electr., 2: 3-16 (14 pages).
Shafaei, S.M.; Nourmohamadi-Moghadami, A.; Kamgar, S., (2016). Development of artificial intelligence based systems for prediction of hydration characteristics of wheat. Comput. Electron. Agric., 128: 34–45 (12 pages).
Shafaei, S. M.; Nourmohamadi-Moghadami, A.; Kamgar, S., (2021). Manifestation of neuro-fuzzy simulation environment for prognostication of water absorption kinetics of soybean grains in thermo-ultrasonication-assisted soaking process. J. Food. Process. Eng., e13680 (16 pages).
Thakur, M.; Sharma, P.; Anand, A., (2019). Seed Priming-Induced Early Vigor in Crops: An Alternate Strategy for Abiotic Stress Tolerance. In: Hasanuzzaman M., Fotopoulos V. (eds) Priming and Pretreatment of Seeds and Seedlings. Springer, Singapore. 163-180 (18 pages).
Thomas, T. T. D.; Puthur, J. T., (2017). UV radiation priming: a means of amplifying the inherent potential for abiotic stress tolerance in crop plants. Environ. Exp. Bot., 138: 57–66 (37 pages).
Tosti, G.; Benincasa, P.; Farneselli, M.; Pace, R.; Tei, F.; Guiducci, M.; Thorup-Kristensen, K., (2012). Green manuring effect of pure and mixed barley - hairy vetch winter cover crops on maize and processing tomato N nutrition. Europ. J. Agronomy., 43: 136–146 (11 pages).
Turhan, M.; Sayar, S.; Gunasekaran, S., (2002). Application of Peleg model to study water absorption in chickpea during soaking. J. Food. Eng., 53: 153–159 (7 pages).
Wilke, B. J.; Snapp, S. S., (2008). Winter cover crops for local ecosystems: Linking plant traits and ecosystem function. J. Sci. Food. Agric., 88: 551–557 (7 pages).

564
A. Semenov et al.
AUTHOR (S) BIOSKETCHESSemenov, A., Ph.D., Associate Professor, Department of Commodity Science, Poltava University of Economics and Trade, Poltava, Ukraine. E-mail: [email protected]
Sakhno, T., Ph.D., Professor, 1Department of Commodity Science, Poltava University of Economics and Trade, Poltava, Ukraine; 2Department of Agro-Technology and Ecology, Poltava State Agrarian Academy, Poltava, Ukraine.E-mail: [email protected]
Hordieieva, O., Ph.D., Associate Professor, Department of Agro-Technology and Ecology, Poltava State Agrarian Academy, Poltava, Ukraine. E-mail: [email protected]
Sakhno, Y., Ph.D., Assistant Professor, Department of Plant and Soil Sciences, University of Delaware, Newark, DE 19713, USA.Email: [email protected]
HOW TO CITE THIS ARTICLE
Semenov, A.; Sakhno, T.; Hordieieva, O.; Sakhno, Y., (2021). Pre-sowing treatment of vetch hairy seeds, viсia villosa using ultraviolet irradiation. Global J. Environ. Sci. Manage., 7(4): 555-564.
DOI: 10.22034/gjesm.2021.04.05
url: https://www.gjesm.net/article_244274.html
COPYRIGHTS
©2021 The author(s). This is an open access article distributed under the terms of the Creative Commons Attribution (CC BY 4.0), which permits unrestricted use, distribution, and reproduction in any medium, as long as the original authors and source are cited. No permission is required from the authors or the publishers.

Global J. Environ. Sci. Manage. 7(4): 565-586, Autumn 2021
*Corresponding Author:Email: [email protected]: +34 6366 81773 Fax: +34 8689 12319
Global Journal of Environmental Science and Management (GJESM)
Homepage: https://www.gjesm.net/
CASE STUDY
Mitigation of environmental impacts in ornamental rock and limestone aggregate quarries in arid and semi-arid areas
M.A. Peñaranda Barba1,*, V. Alarcón Martínez2, I. Gómez Lucas1, J. Navarro Pedreño1
1Departamento de Agroquímica y Medio Ambiente. Universidad Miguel Hernández de Elche Edif. Alcudia. Avda. de la Univer-sidad, Alicante, Spain2Departamento de Organización Industrial y Electrónica. Escuela Superior de Ingeniería y Tecnología, Universidad Internacional de la Rioja, Madrid, Spain
BACKGROUND AND OBJECTIVES: Open-pit mining is an important activity to obtain mineral resources that supply society with raw materials to improve people’s quality of life. However, this extractive activity causes negative environmental impacts and, it is therefore necessary to identify and evaluate these impacts in order to design preventive and control measures to reduce them and thus safeguard the environment and natural resources. In the Region of Murcia, in Spain, as well as other Mediterranean areas with similar climatic conditions, there is a great deal of mining activity linked to the building sector, in which mainly ornamental rock (marble and marble limestone) and limestone aggregates are used. All of this has given rise to numerous active and abandoned mines, where no restoration process has been carried out, generating strong impacts on the environment.METHODS: In this study, 8 environmental impact assessments studies of ornamental rock and aggregate quarries in the Region of Murcia were analysed to identify the negative impacts on the abiotic and biotic environment, landscape, socio-economic and socio-cultural environment, and infrastructures and analysing preventive and control measures. FINDINGS: According to the environmental impact assessment studies analysed, the importance of the most significant environmental impacts has been calculated, indicating whether the impacts are critical, severe, moderate or compatible, and based on it, preventive and corrective measures are proposed together in an impact mitigation management system based in flow charts that will serve to more easily apply and control these measures, in order to prevent them from causing significant or irreversible damage to the environment. Analysing these measures, it has been observed that 90% of the measures applied to control the different negative environmental factors in this type of quarry are the same.CONCLUSION: Open-pit mining extraction systems have a series of similar characteristics that allow a systematic approach to be established when analysing the impacts. With the use of flowcharts, it becomes easier to apply measures to reduce environmental impacts and in addition, these diagrams, allow at the same time the easy incorporation of updates due to changing regulations.
©2021 GJESM. All rights reserved.
ARTICLE INFO
Article History:Received 02 February 2021Revised 21 April 2021Accepted Published: 27 May 2021
Keywords:Environmental impact assessmentFlow chartsMitigation methodologyOpen-pit miningPreventive measuresReducing impacts
ABSTRAC T
DOI: 10.22034/gjesm.2021.04.06
NUMBER OF REFERENCES
60NUMBER OF FIGURES
9NUMBER OF TABLES
6
Note: Discussion period for this manuscript open until January 1, 2022 on GJESM website at the “Show Article.

566
M.A. Peñaranda Barba et al.
INTRODUCTIONOpen-pit mining have been considered as an
activity that represents a social and economic benefit for the regions and improve the quality of life of the inhabitants, thus constituting an important element for development. However, quarrying, like other mining-related works, causes negative impacts on the environment and strong ecological changes in the affected ecosystems (Sheoran et al., 2010; Sort and Alcañiz, 1996). The level of destruction caused by open pit mining is ten times greater than that caused by other types of mining (Zhou et al., 2018). It is important the identification and assessment these risk in order to design strategies that avoid, mitigate and compensate for these impacts (Luna, 2015). The increase in human capacity to transform the natural environment has led to an imbalance between the damage caused and the capacity of the environment to recover from it. It is clear that this type of exploitation cannot be dispensed with, as it supplies society with the raw materials necessary to improve its quality of life (Parrota and Knowles, 2001). The abandonment of open-pit quarries, without any kind of rehabilitation or recovery of their initial state, is the main source of impacts (Darwish et al., 2010; Khabali and Kamal, 2013). Open-pit mining negatively affects the environment in a variety of ways, from exploration and blasting, transport and disposal of waste rocks (Lad and Samant, 2014). In addition, the exploitation of open-pit quarries causes other environmental impacts: affectation and disappearance of vegetation, fauna, soil and landscape degradation; disruption of animal habitats; changes in air quality, dust pollution; increase of particulate matter in the air; loss of water resources due to degradation of aquifers, diversion of underground streams, changes in the water table and water pollution; contamination of rivers; diversion and blockage of natural drainage systems; production of large volumes of highly polluting waste; noise and vibration; landscape alteration, visual pollution of waste dumps and degradation of large areas that take thousands of years to restore; land use conflict (Maponga and Munyanduri, 1998; Stehouwer et al., 2006; Fierro, 2012; ; Karbassi and Heidari, 2015; Karbassi, and Pazoki, 2015). Moreover, it can also affect the health conditions of the surrounding population. Today, awareness of the limitation of natural resources, as well as that of the various elements which constitute ecosystems, makes it
necessary to solve the problems for the demand of raw materials in accordance with the conservation of nature, in such a way as to safeguard the environment and natural resources in order to be able to pass them on to future generations (Montes de Oca and Ulloa, 2013). To achieve greener mining with fewer impacts, it is necessary to improve the pollution produced by activities in the air and water and those produced by noise, as well as the need to recover the land and its uses after the activities on the exploitations (Zhou et al., 2020). For all these reasons, Spain created the Law 21, (2013), on environmental assessment, amended by Law 9, (2018), which states that an environmental impact assessment is essential for the protection of the environment. This is an adaptation of the national legislation to the existing legislation in the European Union. It facilitates the incorporation of sustainability criteria in strategic decision-making and guarantees adequate prevention of the specific environmental impacts that may be generated, while at the same time establishing effective mechanisms for correction or compensation of the damage. In Spain, the mining activity achieve account 3,280 million euros (M€) in 2017 (MET, 2018). In the Region of Murcia, the exploitation of geological resources has always been linked to the extraction of minerals and rocks. Specifically, it is represented by the extraction of marble, marble limestone and limestone aggregates, which are used by building companies in multiple applications, ranging from the production of concrete, mortar and asphalt agglomerates, to the construction of bases and sub-bases for roads, ballast and sub-ballast for railway tracks, or breakwaters for the defence and construction of ports. The consequence of obtaining them is linked to the damage caused to rural areas and the natural environment during the different phases of exploitation, concerning for the correct development, conservation of the environment and, obligations under legislation have evolved over the years (Casas, 2018). Quarries are found in all the territories of the Region of Murcia, but the Norwest area and the Mula basin stand out due to their great variety of ornamental rock, and the Fortuna-Abanilla area due to its large production of limestone aggregates. The aim of this study is to create an impact mitigation management system based in flow charts with corrective and preventive measures that can be easily applied in ornamental rock and aggregate quarries in arid and semi-arid areas. To this

567
Global J. Environ. Sci. Manage., 7(4): 565-586, Autumn 2021
end, several environmental impact assessment (EIA) studies of quarries in the Region of Murcia have been analysed, the importance of the impacts they produce has been calculated and the measures used to mitigate these impacts have been taken into account. The conventional methods used to mitigate impacts are characterized by being a cumbersome, slow and expensive process. So, in this study, a decision support system is proposed that minimizes these problems. This study has been carried out in the Region of Murcia, Spain during 2020-2021.
European and national legal framework The evolution of the regulations up to the current
situation implies the need to study and define a systematic methodology for impact assessment and mitigation. The environmental assessment is a well-established instrument that accompanies mining development, ensuring that it is sustainable and inclusive. At the international level, environmental assessment regulation is under the Espoo Convention, (1991), and it’s Protocol on Strategic Environmental Assessment, (UN, 2003). In the European Unión, it is regulated by Directive 42, (2001), by Directive 92, (2011), and by Directive 52, (2014). At the national level, in Spain, it is regulated by Law 21, (2013), on environmental assessment, modified by Law 9, (2018). This regulation includes the obligation to carry out an EIA of the projects. The EIA, aims to incorporate environmental aspects in decision making and seeks sustainable development and environmental protection (Enriquez-de-Salamanca, 2021). In addition, it is considered as an instrument to support decision making (Retief et al., 2020). According to Pchalek (2019), the objective of the EIA is to point out suitable alternatives, minimizing and compensating impacts. According to Glasson and Therivel, (2019), the EIA is a process in which the possible environmental impacts of a project are evaluated in a phase prior to decision-making to promote healthy environmental management. Therefore, the minimization of environmental impacts is a standard procedure in mining operations (Falck, 2016). Environmental management is the key to sustainability in mining (Yildiz, 2020), it is necessary to carry out a sustainable management of natural resources to create the minimum negative results on the environment (Elvan, 2013). Mining has an important role in the sustainable development
of natural resources, given by the important environmental and social impacts that it can generate (Ghorbani and Kuan, 2017). Directive 52, (2014). This indicates that EIA has to identify, describe and assess the significant effects of a project on the following factors: population and human health; biodiversity, paying particular attention to species and habitats protected under Council Directive, (1992) and Directive 147, (2009); land, soil, water, air and climate; material assets, cultural heritage and landscape; and the interaction between the factors referred previously. In addition, Law 9, (2018) makes compulsory to carry out an environmental impact study in the ordinary EIA. The EIA study is intended to prevent possible natural damage, establishing corrective measures and ensuring the possibility of compatibility of the extractive activity with the conservation of the environment and developing methods of recovery and monitoring of impacts on soil and water (Casas, 2018). The objective of EIA in mining is to identify, predict and prevent environmental alterations caused by extractive activities, from research and mining exploitation to the processing of the minerals to be processed (Astorga et al., 2003). The main objective is to ensure that environmental considerations are explicitly expressed and included in the decision-making process and to anticipate and avoid, minimise and compensate for negative effects on the environment (Mora-Barrantes, 2016). Among the main objectives are: to ensure that environmental considerations are explicitly expressed and included in the decision-making process; to anticipate and avoid, minimise and compensate for significant negative biophysical, social and other relevant effects of the development proposal; to protect the productivity and capacity of natural systems and their ecological processes; to promote sustainable development by optimising the use of resources and management opportunities (Johnson and Bell, 1975). In addition to the EIA, a complementary environmental assessment must be carried out in accordance with the “Methodological Guide for Environmental Impact Assessment in Natura 2000 Network” (MET,2019), for Sites of Community Interest (SCI) and Special Areas of Conservation (SAC), which are protected areas integrated in the Natura 2000 Network (RN2000) designated for hosting an area of one or more types of natural Habitats of Community Interest (HIC) and/or habitats of the

568
Mitigation of environmental impacts in open-pit mining
species listed in Law 42, (2007), modified by Law 33, (2015), which transposes the Habitat Directive of the European union.
MATERIALS AND METHODSIn order to know the environmental impacts and
the measures to mitigate them, a methodological procedure is used to identify mining actions, such as environmental impacting components and environmental factors susceptible to receive impacts. The environmental impacts were identified, characterised, assessed and evaluated. In this way, premises are established to ensure that quarries carry out environmentally friendly mining operations. In order to identify impacts, it is necessary to analyse the different environmental factors that undergo variations. In most studies for the identification and assessment of impacts, the impact assessment method of Conesa et al. (2010) is used, this is an ad hoc method described in their book “Methodological guide for environmental impact assessment”. However, this methodology predates the latest legislative amendments. Nevertheless, it provides a solid basis on which to develop EIA studies. Castelo et al. (2019), after having analysed various methodologies to assess risks in open pit mining, has verified that evaluating these risks depends on a number of data that are difficult to obtain or on general quantitative methods or the data are of uncertain reproducibility, in addition, they depend on multiple occasions of the evaluator and their experience and if more reliability is required, experienced teams or expensive processes are needed, so there is no method to respond quickly and that is reproducible and reliable to date. So, following the method described above, the project
actions that may cause impacts are identified, and then the impacts are assessed in a qualitative manner, characterised by a series of attributes such as synergy, effect, accumulation, periodicity and recoverability. This technique is based on the cause-effect matrix method, which according to Garmendia et al. (2005) is the most widely used tool for determining impacts, derived from the Leopold matrix (Leopold, 1971) with qualitative results. This matrix is based on relating project actions with the environmental factors of the project, identifying the magnitude and importance of the potential effects on a certain environmental factor and the one generated for a certain project action. Once the impacts have been identified in the impact identification matrix and their causes, each of the impacts identified are evaluated according to a series of parameters to determine their importance in an impact assessment matrix. The importance will take values between 13 and 100 depending on the scores given to each parameter. The definition of these impacts together with their importance is shown in Table 1 and it will be concluded in the EIA study whether the development of the project is acceptable or not.
The methodology followed in this article is based on the analysis of EIA studies by several authors (Handjaba, 2012; Khabali and Kamal, 2013; Luna, 2015; Gómez, 2016; Villalba, 2017; Miñarro, 2018; Casas, 2018; Moreno, 2021), in order to apply techniques to mitigate and reduce the negative effects caused by the extraction of ornamental rock (marble and marble limestone) and limestone aggregates in open-pit quarries and their abandonment without any type of restoration. In this study the EIA studies of 8 quarries found in the Region of Murcia, which is an arid and semi-arid region, have been analysed. To identify
Table 1: Classification of impacts and its importance
Classification of impacts Importance
Compatible It is the one whose recovery is immediate after the cessation of the activity and does not require preventive or corrective measures. 13-25
Moderate It is one whose recovery does not require intensive preventive or corrective measures and in which the achievement of the initial environmental conditions requires a certain amount of time.
25-50
Severe It is one in which the recovery of the environmental conditions requires the adoption of preventive or corrective measures, and in which, even with these measures, recovery requires a long period of time.
50-75
Critic It is one whose magnitude is higher than the acceptable threshold. It results in a permanent loss of the quality of environmental conditions, with no possibility of recovery, even with the adoption of preventive and corrective measures.
75-100
Table 1: Classification of impacts and its importance

569
Global J. Environ. Sci. Manage., 7(4): 565-586, Autumn 2021
the most significant impacts on these quarries, the importance of each activity in the different phases of a quarry with respect to the different environmental factors has been calculated. For this, the lowest and highest data have been collected on the importance that each mining activity can take in each of the different phases of exploitation in relation to each environmental factor in each of the 8 analysed quarries. The components usually considered in this inventory are the abiotic and biotic environment, the perceptual environment, the socio-economic environment and the socio-cultural environment and infrastructures. The different phases in a quarry are: phase I, of preparation, in which the roads and accesses are adapted and the clearing of the vegetation and the drainage and sewers are carried out; phase II, of operation, in which the start-up is carried out by loading and blasting, the transport of materials, the creation of fissures, the auxiliary and processing operations and the maintenance of machines, an occupation and change of use is carried out of the land, the fencing and enclosure of the quarry and spills and dumps are generated; and phase III, of restoration, in which in which remodelling and revealing is carried out and there is vehicle traffic. Once the most important impacts that occur in quarry operations have been obtained, preventive and control measures are proposed to reduce or eliminate these impacts based on the different components of the environment (these measures have also been obtained from impact studies analysed) and flow diagrams are created to facilitate the application of corrective and preventive measures with respect to the pollutants existing in the quarries (dust, noise, oils and lubricants, reject materials and other quarry waste). In addition, a diagram will be created to control the topsoil, another to improve the environment and human health and one to improve the health and safety of workers and another to improve the surfaces altered by the quarrying activity and reduce the impact on the landscape, fauna and flora. This detailed study establishes a methodology that can be applied generally in other regions and open-pit mining operations, facilitating systematic monitoring and the proposal of impact mitigation measures.
Study areaThe Region of Murcia is located in the Southeast
of the Iberian Peninsula, and forms part of the eastern part of the Betic Mountain Range. The area, according to the National Geographic Institute (IGN, 2020), is structurally divided into two zones: External Zones, subdivided into the Prebetic and Subbetic domains, and the Internal Zone, which is divided into three domains that rode on top of each other but were later transformed into extensional detachment faults. These domains are, from bottom to top, Nevado, Filábride, Alpujárride and Maláguide. All these domains are represented in the Region of Murcia. In addition to the materials of the Betic Mountain Range linked to the main tectonics, there are other post-orogenic materials that are well developed in the inner depressions and alluvial valleys: the tertiary basins of Campo de Cartagena, Mula, Fortuna, Calasparra syncline, Moratalla, Lorca and Rambla de Tarragoya stand out, and among the latter, the Plio-Quaternary valley of the Guadalentín-Segura. Mining in Murcia is mainly represented by the ornamental rock and aggregate sector. According to the Mining Service of the Autonomous Community of the Region of Murcia (CREM, 2019), the number of existing mines in the Region of Murcia is 227, all of them carried out by open-pit mining methods. Of these, 98 are still active. Fig. 1 shows the municipalities in which there are ornamental rock quarries and the most representative ones in which there are aggregate quarries.
There were 122 ornamental rock quarries in the Region, of which 42 are active (CREM, 2019). Specifically, these ornamental rocks are different varieties of marble and marble limestones. Their location is shown in Table 2, which shows the type of ornamental rock that exists in each municipality. The ornamental rock, in the Northeast and the Altiplano, is associated with the Jurassic layers of the Subbetic and Prebetic Eocene, large thicknesses of limestones and dolomites, with a wide variety of colours: creams, browns and reds. Marbles, strictly speaking, appear in the Betic alignments of the Alpujarride of the Cabezo Gordo in Torre Pacheco. Aggregate quarries are distributed throughout all the districts of the Region, there are 74 quarries and 32 of them are active. The most representative limestone aggregate quarries are located in the Fortuna-Abanilla district and in the district of the metropolitan area of Murcia, in Santomera, with 44 percent (%) of production, and in the district of Campo de Cartagena, in Fuente Álamo,

570
M.A. Peñaranda Barba et al.
with 14% of production. Of the total production in quarries in the Region, approximately 74.8% corresponds to the aggregate extraction subsector.
The Region of Murcia has a Mediterranean climate with arid features: hot, dry summers, mild winters, although with frequent frosts in the interior, and rainfall in spring and autumn. The general characteristic of this climate is its scarcity of rainfall, concentrated in a few days of the year, with maximum rainfall in autumn. These rains, usually torrential, are produced when a mass of warm, humid air from the Mediterranean Sea enters the area and, on colliding with the coastal mountain ranges and rising, comes into contact with another mass of cold air and precipitates. These rains must be considered precisely because of the high erosive power they can unleash when it comes to recovering mining areas. According to Köppen’s climate classification, (Köppen, 1936), the following climate types can be distinguished in the region: warm semi-arid (BSh), cold semi-arid (BSk) and Mediterranean (Csa). In the BSh climate, the mean annual temperature is above 18 degrees
Celsius (°C) and precipitation is low, solar evaporation exceeds precipitation, it is a hot and dry climate; in the BSk climate, the mean annual temperature is below 18°C, precipitation is also low and evaporation, like BSh, also exceeds precipitation, this climate is cold and dry; in CSa, the average temperature of the coldest month is below 18°C and above -3°C and that of the warmest month is above 10°C, the temperature of the warmest month is above 22°C and average temperatures above 10°C occur in less than four months of the year. Precipitation exceeds evaporation and there is seasonal rainfall. The summer is dry, so the minimum rainfall is quite marked and coincides with the period of highest temperatures. The rainiest season is not necessarily winter. Table 3 shows the average annual temperatures, in ºC, and rainfall, in litres per square meter (l/m²), for 2019 in the study sites, the table is based on data obtained from the Murcia regional statistics portal (CREM, 2020). With regard to the winds, the west/northwest-south/east orientation (WNW-SE) of the great Betic relief lines channels the winds from the Atlantic, while the winds
Fig. 1: Geographic location of the study area in the most representative municipalities in the Murcia region of Spain with ornamental rock and aggregate quarries
Fig. 1: Geographic location of the study area in the most representative municipalities in the Murcia region of Spain with ornamental rock and aggregate quarries

571
Global J. Environ. Sci. Manage., 7(4): 565-586, Autumn 2021
from the north/northwest orientation (N-NW), which predominate during the winter, are dry and cold due to their long route. The Mediterranean squalls associated with convection phenomena give rise to a regime of easterly winds, with humid characteristics on the eastern flank of the region, which gradually dry out towards the interior. This situation predominates in spring and summer, extending into autumn. Wind speed is generally moderate, except on the coast, where it is higher due to its exposure to easterly winds. Relative humidity varies according to proximity to the sea. Inland it varies between 52 and 63% and on the coast between 71 and 76%. These climatic characteristics create a high rate of evapotranspiration which results in a permanent water deficit. This situation is generalised throughout the Region of Murcia.
The Region of Murcia is the most arid area of the Iberian Peninsula and is part of the Segura Hydrographic Basin. The drainage network of the Region is structured around the Segura river and its tributaries, the Guadalentín, the Argos and the
Quipar. Groundwater comes from the fraction of precipitation that infiltrates due to the action of gravity. The Segura basin has been one of the first in the exploitation of groundwater, which has allowed unirrigated areas to be transformed into irrigated areas. There are currently ten different aquifer systems in the Region: Jumilla-Yecla, Calasparra, Cieza-Abanilla, Mula-Aledo, Caravaca-Moratalla, Bullas-Coy, Puentes-Valdeinfierno, Segura-Guadalentín, Cartagena and Mazarrón-Águilas (SITMURCIA, 2019). In general terms, in the Region of Murcia, there are more than two thousand plant species, which represents approximately 33% of the total number of species on the Iberian Peninsula, giving rise to a wide regional spectrum and making it one of the richest in Spain. The area occupied by crops exceeds 50% of the total and the rest is dominated by scrubland and tree species. With regard to scrubland, there is noble scrubland, with species such as Pistacia, Quercus, Rhamnus, Chamaerops, Arbutus, etc., and the characteristic scrubland of regressive stages such as rosemary (Salvia imantopus), esparto grassland
Table 2: Types of ornamental rock currently exploited in the Region of Murcia and their geographical distribution. Source: own elaboration according to data obtained from the Ministry of Business, Industry and Spokesperson of the Region of Murcia
District Municipality Ornamental rock
Region of Lorca Lorca Oolitic limestones Crinoid limestones
Campo de Cartagena-Mar Menor Torre Pacheco Greyish-white or greyish-white limestones, with white and ochre veining
Mula basin Mula
Light and grey massive dolomites White to pinkish coloured limestones Reddish nodular limestones Limestones with Nummulites Limestone with algae Limestones with large Nummulites
Northwest
Calasparra Dark brown dolomites
Caravaca and Moratalla
Greyish and brown dolomites Greyish limestones White and cream massive limestones Massive sandy limestones Calcarenites
Cehegín Cream-coloured massive limestone Brecciated and massive limestones varying from red to dark grey
Vega del Segura Cieza Brown dolomites
Abanilla-Fortuna basin Fortuna and Abanilla White limestone Reddish massive limestone Tertiary limestone
Altiplano Jumilla and Yecla Dark-coloured massive dolomite Honey-coloured dolomite White limestone
Table 2: Types of ornamental rock currently exploited in the Region of Murcia and their geographical distribution. Source: own elaboration according to data obtained from the Ministry of Business, Industry and Spokesperson of the Region of Murcia

572
Mitigation of environmental impacts in open-pit mining
(Stipa tenacissima), thyme (Thymus), etc. From the coast to the inland mountain ranges, in a south-east-north-west direction, the wooded area increases and, therefore, the diversity of forest systems. The tree formations consist of frugal species, such as pines, junipers and xerophytic oaks. The wooded hills are made up of conifers and the broadleaved forests are mainly composed of kermes oaks, although they also appear in mixtures with other broadleaved and resinous species. The mid-mountain and foothill areas in the centre, north-west and north-east of the Region, include quercines (quercus), although these areas are highly altered. The intensive use of vegetation cover has led to significant deforestation, accentuated by climatic conditions. The fauna presents a very heterogeneous territory with a great variety of habitats, which contributes to maintaining a significant biodiversity of species such as Phartet (Aphanius iberus), Great Bustards (Otis tarda), Otters (Lutrinae), Shelducks (Tadorna), Vultures, Birds of Prey, Salamanders (Caudata), etc. Linked to the forest ecosystems, there are unique species such as the mountain goat (Capra pyrenaica), the Trompet Bullfinch (Bucanetes githagineus) and Dupont’s Lark (Chersophilus duponti), as well as other species included in the annexes of the Habitats Directive and the Birds Directive, especially bats. There are also 51 species of mammals, both terrestrial and marine, many of them threatened or under some kind of conservation status. On the other hand, there are not many reptile and amphibian species, there are only 20 reptile species and 11 amphibian species and they are decreasing due to several negative factors that are influencing the region such as the aridity of the area, the use of water resources, the intensive
agriculture, the introduction of invasive species, etc. Regarding to birdlife, there are almost 300 species, only one third of which are sedentary. According to the Council Directive, (1992), 42% of the regional area is classified as HIC (SITMURCIA, 2019).
RESULTS AND DISCUSSIONMain impacts from ornamental rock and limestone aggregate quarries in the Region of Murcia
In EIA studies, the description of the Environmental Inventory must take into consideration the components of the environment that intervene or may potentially be affected by the activities of the project to be environmentally assessed (Garmendia, 2005). The following tables show the most significant impacts that are usually produced by ornamental rock and limestone aggregate quarries in the Region of Murcia, in arid and semi-arid areas, according to the EIA studies analysed (Table 4, 5 and 6). These tables indicate the values that the impacts usually take, these values are previously defined in table 2 according to the classification of the impact. The impacts represented in Tables 4, 5 and 6 are those that generate a negative impact.
Analysing this phase, it is obtained that the environmental factors that can cause a severe impact on quarries in arid and semi-arid areas are noise and vibrations in the phase of adaptation of roads and accesses, the loss of soil quality in the clearing of the land, the loss of water quality when creating drains and aquifers, the alteration of flora and vegetation in the adaptation of roads and accesses and the clearing of vegetation and a visual impact on the creation of roads and accesses. In the elimination of the existing vegetation to carry out work in the
Table 3: Average annual temperature and annual rainfall by region with quarries
District Municipality Approximate annual average temperature 2019 (ºC)
Approximate annual rainfall in 2019 (l/m²)
Region of Lorca Lorca 17,5 318
Campo de Cartagena-Mar Menor Torre Pacheco and Fuente Álamo 18,6 419,5
Metropolitan area of Murcia Santomera 18,5 523,9 Mula basin Mula 18 455
Northwest Calasparra, Caravaca, Moratalla, Cehegín 15,4 493,2
Vega del Segura Cieza 17,3 475 Fortuna-Abanilla Fortuna and Abanilla 18,8 575 Altiplano Jumilla and Yecla 16 430
Table 3: Average annual temperature and annual rainfall by region with quarries
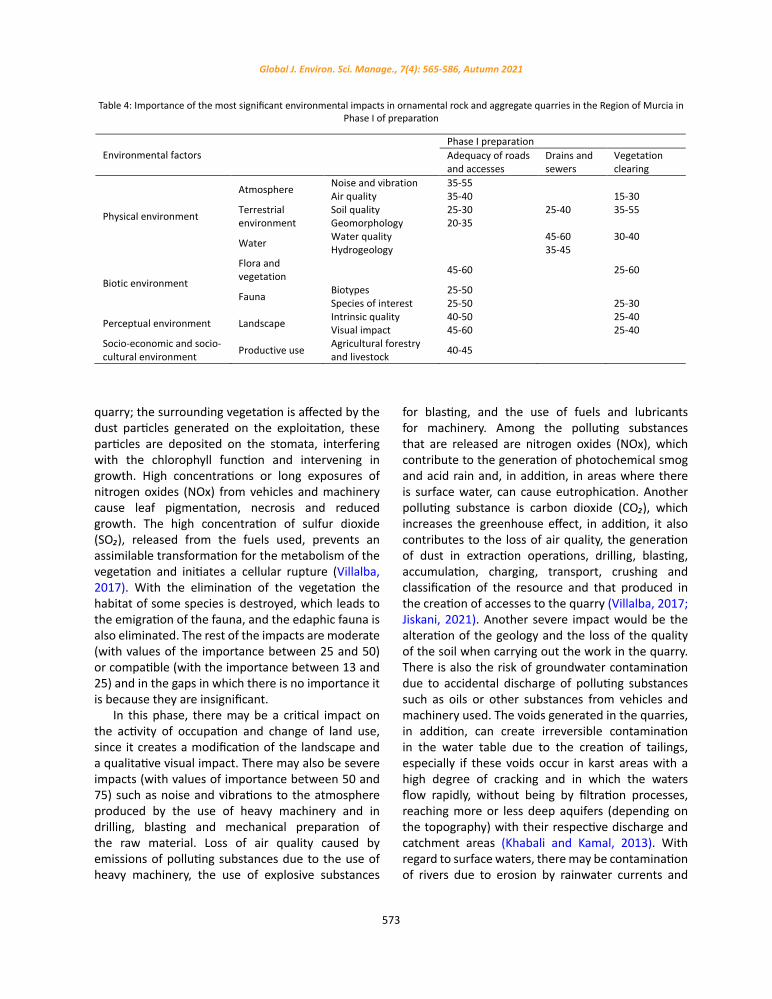
573
Global J. Environ. Sci. Manage., 7(4): 565-586, Autumn 2021
quarry; the surrounding vegetation is affected by the dust particles generated on the exploitation, these particles are deposited on the stomata, interfering with the chlorophyll function and intervening in growth. High concentrations or long exposures of nitrogen oxides (NOx) from vehicles and machinery cause leaf pigmentation, necrosis and reduced growth. The high concentration of sulfur dioxide (SO₂), released from the fuels used, prevents an assimilable transformation for the metabolism of the vegetation and initiates a cellular rupture (Villalba, 2017). With the elimination of the vegetation the habitat of some species is destroyed, which leads to the emigration of the fauna, and the edaphic fauna is also eliminated. The rest of the impacts are moderate (with values of the importance between 25 and 50) or compatible (with the importance between 13 and 25) and in the gaps in which there is no importance it is because they are insignificant.
In this phase, there may be a critical impact on the activity of occupation and change of land use, since it creates a modification of the landscape and a qualitative visual impact. There may also be severe impacts (with values of importance between 50 and 75) such as noise and vibrations to the atmosphere produced by the use of heavy machinery and in drilling, blasting and mechanical preparation of the raw material. Loss of air quality caused by emissions of polluting substances due to the use of heavy machinery, the use of explosive substances
for blasting, and the use of fuels and lubricants for machinery. Among the polluting substances that are released are nitrogen oxides (NOx), which contribute to the generation of photochemical smog and acid rain and, in addition, in areas where there is surface water, can cause eutrophication. Another polluting substance is carbon dioxide (CO₂), which increases the greenhouse effect, in addition, it also contributes to the loss of air quality, the generation of dust in extraction operations, drilling, blasting, accumulation, charging, transport, crushing and classification of the resource and that produced in the creation of accesses to the quarry (Villalba, 2017; Jiskani, 2021). Another severe impact would be the alteration of the geology and the loss of the quality of the soil when carrying out the work in the quarry. There is also the risk of groundwater contamination due to accidental discharge of polluting substances such as oils or other substances from vehicles and machinery used. The voids generated in the quarries, in addition, can create irreversible contamination in the water table due to the creation of tailings, especially if these voids occur in karst areas with a high degree of cracking and in which the waters flow rapidly, without being by filtration processes, reaching more or less deep aquifers (depending on the topography) with their respective discharge and catchment areas (Khabali and Kamal, 2013). With regard to surface waters, there may be contamination of rivers due to erosion by rainwater currents and
Table 4: Importance of the most significant environmental impacts in ornamental rock and aggregate quarries in the Region of
Murcia in Phase I of preparation
Environmental factors Phase I preparation Adequacy of roads and accesses
Drains and sewers
Vegetation clearing
Physical environment
Atmosphere Noise and vibration 35-55 Air quality 35-40 15-30
Terrestrial environment
Soil quality 25-30 25-40 35-55 Geomorphology 20-35
Water Water quality 45-60 30-40 Hydrogeology 35-45
Biotic environment
Flora and vegetation 45-60 25-60
Fauna Biotypes 25-50 Species of interest 25-50 25-30
Perceptual environment Landscape Intrinsic quality 40-50 25-40 Visual impact 45-60 25-40
Socio-economic and socio-cultural environment Productive use Agricultural forestry
and livestock 40-45
Table 4: Importance of the most significant environmental impacts in ornamental rock and aggregate quarries in the Region of Murcia in Phase I of preparation

574
M.A. Peñaranda Barba et al.
Tabl
e 5:
Impo
rtan
ce o
f the
mos
t sig
nific
ant e
nviro
nmen
tal i
mpa
cts i
n or
nam
enta
l roc
k an
d ag
greg
ate
quar
ries i
n th
e Re
gion
of M
urci
a in
Pha
se II
of e
xplo
itatio
n
En
viro
nmen
tal f
acto
rs
Phas
e II
of o
pera
tion
Blas
t sta
rt
and
char
ge
Tran
spor
t of
mat
eria
ls
Auxi
liary
and
pr
oces
sing
oper
atio
ns
Crea
tion
of
fissu
res
Occ
upat
ion
and
chan
ge o
f lan
d us
e La
ndfil
l of t
ailin
gs,
was
te ro
ck d
umps
Fe
ncin
g an
d en
clos
ures
Med
ium
ph
ysic
al
Atm
osph
ere
Noi
se a
nd v
ibra
tion
35-6
5 40
-55
45-6
0
45
-50
Ai
r qua
lity
20-2
5 50
-55
40-5
0 40
-45
40
-50
Terr
estr
ial
envi
ronm
ent
Soil
qual
ity
25
-30
40
-60
40-4
5
Ge
olog
y 25
-35
25-6
0
Soil
scie
nce
25-3
5
25
-30
25-3
0
Ge
omor
phol
ogy
30-3
5
30
-40
W
ater
W
ater
qua
lity
30-3
5 30
-40
35
-45
30
-55
Biot
ic e
nviro
nmen
t Fl
ora
Plan
t for
mat
ions
40-5
0
25
-30
Spec
ies o
f int
eres
t
25
-35
Faun
a
Biot
ypes
35-4
0
25
-30
40
-45
Spec
ies o
f int
eres
t 25
-35
30-4
0 30
-35
45
-50
35
-45
Med
ium
pe
rcep
tual
La
ndsc
ape
Visu
al im
pact
50
-55
55
-90
40
-45
Soci
o-ec
onom
ic a
nd
soci
o-cu
ltura
l en
viro
nmen
t
Recr
eatio
nal u
se:
Tour
ism, h
untin
g an
d sp
ortin
g ac
tiviti
es
35-5
0
25-3
0
Prod
uctiv
e us
e:
Fore
stry
, agr
icul
ture
and
live
stoc
k
40
-50
Hum
an h
ealth
and
safe
ty
50
-65
Co
mm
unic
atio
n ro
utes
: mob
ility
40-5
0
Land
use
40-4
5 45
-50
Tabl
e 5:
Impo
rtan
ce o
f the
mos
t sig
nific
ant e
nviro
nmen
tal i
mpa
cts i
n or
nam
enta
l roc
k an
d ag
greg
ate
quar
ries i
n th
e Re
gion
of M
urci
a in
Pha
se II
of e
xplo
itatio
n

575
Global J. Environ. Sci. Manage., 7(4): 565-586, Autumn 2021
the wind, since they can carry substances from the vehicles and machinery used and can lead to the loss of ecosystems. Due to the noise, vibrations and dust produced in the quarries, fauna is displaced and redistributed and habitats can be altered due to the possible contamination of groundwater and rivers. In the generation of holes and slag heaps, the visual quality of the landscape is lost and, in addition, visual intrusion occurs due to the use of machinery. The emission of noise, vibration, dust and water pollution can cause harmful effects on workers, those generated cause eye irritation, congestion and lung diseases and SO₂ and dust particles in suspension, produce allergies and infections in the respiratory system. The rest of the impacts are moderate (with values of the importance between 25 and 50) or compatible (with the importance between 13 and 25) and in the gaps in which there is no importance it is because they are insignificant.
In this phase, all the impacts obtained would be moderate, except for the noise and vibrations produced by vehicle traffic, which could become severe. The rest of the impacts not indicated would be compatible or insignificant. In this phase, the contribution of land is of interest, which can generate occasional air pollution due to suspended particles generated by the unloading of trucks. Dust has a negative impact on air pollution in the atmosphere, but also on water and land resources, as it interrupts the natural processes of flora and fauna and causes
irreversible effects on human health (Timofeeva and Murzin, 2020). Reducing the noise and vibrations produced in many operations such as removal of the surface soil, drilling, blasting, excavation, crushing, handling and transport and other operations with machinery is important to the health of people and their well-being and that of the ecosystem, as high levels negatively influence species by increasing stress levels, modifying their habitat and masking other sounds they need for their survival (Jain et al., 2016). Another factor that negatively influences the environment is mining waste, because if they are not treated properly they contaminate the water, the atmosphere, the soil and the occupied land. (Chen et al., 2020).
Preventive measures to control and mitigate environ-mental impacts
Once the impacts that usually occur in ornamental rock and aggregate quarries in the region of Murcia have been obtained and analysed, the measures that are usually applied to control and reduce these impacts have been analysed on the basis of the environmental impact studies studied and it has been found that 90% of the measures that are applied to control the different negative environmental factors are always the same. These measures are described below, and in relation to them, flow diagrams will be proposed to simplify their control and application in the quarries. In order to control the visual impact
Environmental factors Phase III restoration
Vehicle traffic Remodelling Revegetation
Medium physical
Atmosphere Noise and vibration 45-55 25-30 Air quality 35-45 25-35
Terrestrial environment
Soil quality 45-50 40-50 40-45 Geomorphology 30-35
Water Water quality 45-50
Medium biotic
Flora Plant formations 30-40 25-35 25-30 Species of interest 45-50 30-40 25-35
Fauna Biotypes 30-35 40-45 Species of interest 45-50 30-35 30-40
Medium perceptual Landscape Intrinsic quality 45-50 25-30
Visual impact 35-45 30-40 30-35
Socio-economic and socio-cultural environment
Productive use: Forestry, agriculture and livestock 25-30
Human health and safety 40-50 30-40 Communication routes: mobility 45-50 Land use 40-45
Table 6: Importance of the most significant environmental impacts in ornamental rock and aggregate quarries in the Region of Murcia in Phase III of restoration

576
M.A. Peñaranda Barba et al.
and the modification of the landscape, the original forms of the accesses that are not essential for access to the restoration of the land must be restored by means of disabling and environmental recovery. In addition, as work on the slopes is completed, a slope ageing product should be applied that simulates the chromatic characteristics of the environment. Efforts should also be made to work in areas of low visibility from main roads and urban centres. The measures that are usually applied to reduce dust are: clearing land and opening roads, as far as possible, on days when the force of the wind does not imply a high risk of suspension of materials; carrying out effective maintenance of access roads to avoid the formation of dust and the accumulation of mud on the roads due to the transit of lorries; maintaining tracks and squares with a sufficient degree of humidity to avoid the dust deposited on them becoming suspended, using, if necessary, substances that consolidate and maintain the humidity of the soil. Another option is to irrigate with water tankers, as water is not normally
available in mining areas and rainfall in the Region of Murcia is scarce; workplaces should be kept clean to prevent the accumulation of dust that can later be put into suspension. When there are accumulations of dust in different parts of the quarry, these shall be removed as soon as possible; in addition, the provisions of Order ITC 2585, (2007) on protection of workers against dust, in relation to silicosis, in the extractive industries. The suspension of dust in vehicle and machinery transit operations must also be controlled by irrigation, paying special attention to the quarry site, access tracks and unpaved areas, in order to affect human beings and the surrounding flora and fauna as little as possible. In order to make it easier to control dust, a flow chart has been drawn up with some proposed measures (Fig. 2).
To control noise and vibrations in quarries, the engines of machines that are going to be on standby for long periods of time should be switched off, the noisiest operations should be planned so that they do not coincide in time to avoid a large amount of noise and vibrations, and noise should be made on working days and intermittently. Except in emergency situations, work should not be carried out at night. The machinery used must comply with the permitted noise emissions, in this case regulated by Royal Decree 212, (2002). Blasting must be carried out in the middle of the day. In addition, to reduce the effect of air waves and vibrations from blasting, bottom-loading cartridges should be primed with non-electric detonators, detonating cord should not be used in the open air and the connection and sequencing between blast holes on the surface should be done with non-electric connectors so that the sequencing time is different from one another. In addition, if mechanical preparation plants are present, noise protection screens should be provided. The correct operation and commissioning of the vehicles on the operation must be checked, carrying out the corresponding gas emission controls and equipment checks established by the manufacturers. This will reduce noise and the emission of polluting gases, as well as reducing the risk of breakdowns and potential accidental spillage of polluting liquids. Periodic inspections of machinery must comply with Law 34, (2007), with respect to air quality and protection of the atmosphere and with Decree 1439, (1972) with respect to noise. In order to control oil and lubricant spills, the use of vehicles should be optimised to allow for the maximum
Fig. 2: Flowchart to reduce dust on roads and workplaces
Fig. 2: Flowchart to reduce dust on roads and workplaces

577
Global J. Environ. Sci. Manage., 7(4): 565-586, Autumn 2021
operationally possible fuel savings. Equipment and vehicles must be more efficient and less polluting, more efficient vehicles and heavy equipment produce less pollution and reduce greenhouse gas emissions since their engines are cleaner, so older equipment must be replaced (Jiskani el al., 2021). Repairs or oil changes of machines should be carried out in specialised workshops. In the event of accidental spillage of these materials, they must be cleaned and collected, deposited in containers for subsequent removal by an authorised waste manager, so that they do not affect runoff water or water that may infiltrate. Used oils and any other waste qualified as such from the exploitation must be compulsorily removed by an authorised hazardous waste manager. To reduce SO₂, CO₂ and NOx emissions as far as possible, the speed of machinery will be reduced to 10km/h in the area, in addition to choosing machinery
that is equipped with catalytic converters that reduce emissions as much as possible, and the days on which the atmospheric phenomenon of thermal inversion occurs will also be taken into account so that accumulations of emissions do not form in the area due to a lack of ventilation (Villalba, 2017). To make it easy to implement these measures, a flow chart for noise and vibration reduction (Fig. 3) and a flow chart for fuels and lubricants (Fig. 4) have been developed.
A simple flow chart (Fig. 5) is proposed to control topsoil. The measures to be applied for this would be as follows: the topsoil should be removed, stockpiled and adequately maintained for later use in restoration. This removal must be carried out with care to avoid its deterioration by compaction and thus to preserve the soil structure, the existence of microorganisms, etc. For this reason, the passage of machinery over this soil should be avoided. During storage, it must
Fig. 3: Flow chart to reduce noise and vibrations in mining
Fig. 3: Flow chart to reduce noise and vibrations in mining

578
M.A. Peñaranda Barba et al.
Fig. 4: Flow chart for reducing fuels and lubricants in mining
Fig. 4: Flow chart for reducing fuels and lubricants in mining
Fig. 5: Flow chart to control topsoil in mining
Fig. 5: Flow chart to control topsoil in mining
be protected from wind, water erosion and pollutants that alter the vegetative capacity. Stockpiles should not exceed 1.5m in height and slope gradients should not exceed 20º to avoid erosion (Casas, 2018; Moreno, 2020). The removal and stockpiling should be done differentiating the different soil horizons in order to be able to restore them in the restoration with the same original arrangement. Where feasible,
the original soil flora will be preserved, in order to try to maintain a fertile layer on the surface to facilitate vegetation growth and control runoff erosion in the short term in sloping areas. If topsoil is to be stockpiled for more than 12 months, it should be stabilised with a mixture of leguminous and grass seeds to protect it from erosion and preserve its soil characteristics.

579
Global J. Environ. Sci. Manage., 7(4): 565-586, Autumn 2021
In order to control waste material in quarries, an inner spoil heap must be created to deposit the tailings generated in the exploitation, which will progress as the exploitation pit progresses. The pit must be filled to the level of the surrounding ground surface with the tailings from the limestone rejects. The topsoil, previously removed and reserved, shall be spread over the tailings from the rejects located inside the shaft, in order to subsequently proceed with the revegetation of the land. If there is no topsoil from the mining activity, a topsoil with similar characteristics to the existing one must be placed. When work is finished in the mining areas or work is stopped for more than one year, all types of material, machinery, waste and remains that may be left in the area must be collected and taken to a landfill site, leaving the area in a perfectly clean condition. Revegetation should be attempted with native and fast-growing species. Exotic species should be avoided, as they are susceptible to becoming invasive. Planting will include, when the soils require it due to insufficient stockpiles or inadequate quality, topsoil, fertilisers and amendments, and of course,
the necessary tillage. When the revegetation work is completed, care of the topsoil has to be carried out, including replacing dead plants during the following years, installing protective structures to prevent trampling and additional foot watering. A simple flow chart has been proposed to control the reject material (Fig. 6).
In quarries there are reject materials that must be removed from the work areas so that they do not contaminate the environment; these can produce, among other things, water, soil and atmospheric pollution. For this purpose, the most common measures that are usually applied are shown together with a flow chart (Fig. 7) to make it easier to control them. Solid waste should be disposed of in controlled landfills. Leftover materials and non-hazardous waste should be deposited in authorised landfills. If there is a layer of debris prior to the removal of usable soil, this should also be taken to authorised landfill sites or put to an appropriate use. Perimeter channels can be planned to prevent water from the outside from entering exploitation. Small mammals and other vertebrates that may fall into ditches or holes created
Fig. 6: Flow chart for controlling reject material from mining
Fig. 6: Flow chart for controlling reject material from mining

580
M.A. Peñaranda Barba et al.
on the exploitation must be released after daily checks prior to the start of exploitation work. For the collection of water from the interior, a ditch can be built to collect the water in a settling basin, so that the water laden with fines does not reach the natural drainage network. The clean water from the settling basin will be pumped and discharged directly into the drainage network. If the water table is below the excavation level and with the above measures, the mining activity will not affect the drainage network or any aquifer. If necessary, an artificial drainage network
must be created to ensure trafficability and to channel the resulting runoff. The processing and use of waste, in addition to not polluting the environment, serves to compensate for the scarcity of resources, which means that I have great social, environmental and economic benefits. In addition, there is a strategic commitment to the circular economy that supports waste minimization (Jiskani et al., 2021).
It is crucial to consider the environmental and human health, one to improve the health and safety of workers for which the measures given below are
Fig. 7: Flow chart to control and reduce other quarry waste in quarries
Fig. 7: Flow chart to control and reduce other quarry waste in quarries

581
Global J. Environ. Sci. Manage., 7(4): 565-586, Autumn 2021
usually used and based on them a flow chart has been created for easy application (Fig. 8) and another to improve the surfaces altered by the quarrying activity and reduce the impact on the landscape, fauna and flora for which other measures also described below have been established and have been collected in Fig. 9. Beacons and barriers must be placed indicating danger zones on the site, access points, speed limits, etc. Workers must wear the appropriate work clothes and personal protective equipment necessary for
the performance of their tasks. The collaboration of forestry agents must be ensured so that the works are carried out with the least possible risk of fire. The evolution of the slopes must be monitored as the work progresses. The bottom layer of the backfill must be made up of the materials with the highest granulometry, in order to favour the stability and drainage of the whole deposit. No people or material should be in the vicinity of the working slope during the removal of the material. Fire must not be used in
Fig. 8: Flow chart for improving the health and safety of workers in quarrying
Fig. 8: Flow chart for improving the health and safety of workers in quarrying

582
M.A. Peñaranda Barba et al.
the area during the mining phase. Woody materials from the opening of roads and tracks must be removed so that they do not pose a fire risk once dry. In addition, to avoid sparks, malfunctioning machinery must be replaced. The necessary extinguishing media must be provided to prevent the spread of fire. Non-flammable species should also be selected from among the species suitable for revegetation in this area.
For the preservation of the fauna, the roads must be used by both vehicles and people and not use areas not designed for traffic. In order for the fauna species to gradually adapt to the changes in their habitat, the removal of soil and vegetation must be done progressively and slowly. Every day before work begins, it must be checked that there are no animals in the ditches or holes. If an area is to be enclosed, small mammals must be allowed to pass through
Fig. 9: Flow chart to improve disturbed areas in mining and reduce the impact on landscape, fauna and flora
Fig. 9: Flow chart to improve disturbed areas in mining and reduce the impact on landscape, fauna and flora

583
Global J. Environ. Sci. Manage., 7(4): 565-586, Autumn 2021
at points where areas with natural vegetation are interconnected. Design of a hollow compatible with the morphology of the environment both during the exploitation phase and in the final phase of restoration. In order to foster natural regeneration over time, conservative as well as preservative actions must be carried to protect biodiversity through the greening of areas (Jiskani et al., 2021). Existing roads and tracks should be used, opening new roads only if strictly necessary. It is important to plan earthworks to reduce disturbed areas. If necessary, retaining walls should be built to prevent soil slides and possible landslides.
The use of this flow charts, which can be widely applied in open-pit mining activities, allow to reduce the impacts of this activity. Moreover, they serve as tools before starting the exploitation and aid to prevent possible effects.
CONCLUSIONOpen-pit mining extraction systems have a series
of similar characteristics that allow a systematic approach to be established when analysing the impacts. Many authors use different methodologies to assess, prevent and mitigate risks, so there is no single and simple method to respond quickly and that is easy to reproduce and reliable to date, so an impact mitigation system has been presented that allows evaluating the impacts of quarries in arid and semi-arid areas (most of the time the impacts are the same in areas with similar climatic conditions), but at the same time it includes proposals established through the use of flow charts that allow the development of actions to mitigate the negative effects of the exploitation during the active phase and once it finishes. In addition, the use of these charts before starting mining allows to prevent some possible environmental impacts. In this study, were found that 90% of the preventive and corrective measures applied in environmental impact studies in quarries in arid and semi-arid zones are the same. Several environmental impact studies have been first analysed to create these charts, taking into account the importance of the most significant environmental impacts in this type of quarries in the different exploitation phases (preparation, operation and restoration) in order to identify the impacts, the negative effects that they produce. The flow charts propose in a simple way measures to reduce
dust on roads and workplaces, noise, fuels and lubricants in mining activities, measures to control topsoil and reject materials in open-pit mines and measures to control other wastes. In addition, some measures have been created to improve the safety and health of workers in quarrying and to improve disturbed areas affected by mining, reducing the impact on landscape, fauna and flora. In this study, a number of preventive and corrective measures have been taken in order to avoid or, when appropriate, moderate the impacts indicated above, considering the components of the environment that intervene o could potentially be affected by mining: physical and biotic environment, perceptual environment, socio-economic and socio-cultural environment. However, as it can be deduced from the preliminary analysis of the legislative framework, the mitigation of environmental impacts is subject to possible new modifications that will have to be incorporated into the methodological framework of the EIAs. In this sense, the establishment of flow charts allows their easy incorporation and updating in a simpler way, as well as their subsequent application and evaluation during and after exploitation. Moreover, future actions will achieve the development of a software, modelling the environmental impact studies based on the framework established by these flow charts. Another future action is to establish the Environmental Surveillance Plan (ESP), since in it, it is about establishing a system that guarantees compliance with the indications, preventive and corrective measures, it tries to define the fundamental elements that must be controlled to meet its objectives. In this specific case, the function of the ESP is to establish a control system, that is, to monitor during the preparation, exploitation and restoration phases of the project.
AUTHOR CONTRIBUTIONSM.A. Peñaranda Barba performed the literature
review, experimental design, analysed and interpreted the data, prepared the manuscript text, compiled the data and manuscript preparation and manuscript edition. V. Alarcón Martínez compiled the data and manuscript preparation, helped in the literature review and manuscript preparation and helped in the manuscript text. J. Navarro Pedreño performed the literature review, manuscript edition, helped in the literature review and manuscript

584
M.A. Peñaranda Barba et al.
preparation and helped to prepared the manuscript text. I. Gómez Lucas helped in literature review and helped to prepared the manuscript text.
ACKNOWLEDGMENTSThe authors thank management and professors
of Department of Agro-chemistry and Environment, University Miguel Hernandez of Elche for their constant support in helping to write this manuscript.
CONFLICT OF INTERESTThe authors declare no potential conflict of
interest regarding the publication of this work. In addition, the ethical issues including plagiarism, informed consent, misconduct, data fabrication and, or falsification, double publication and, or submission, and redundancy have been completely witnessed by the authors.
ABBREVIATIONSBSh Warm semi-aridBSk Cold semi-arid
CREM Statical portal of the Region of Murcia
CO₂ Carbon dioxideCsa MediterraneanEIA Environmental impact assessmentESP Environmental Surveillance PlanHIC Habitats of community interestIGN National Geographic Institutel/m² Liters per square meterMET Ministry for Ecological TransitionM€ Million eurosN-NW north/northwest orientationNOx Nitrogen oxidesRN2000 Natura 2000 networkSAC Special areas of conservationSCI Sites of community interest
SITMURCIA Territorial information system of the Region of Murcia
SO₂ Sulfur dioxide
WNW-SE west/northwest-south/east orientation
ºC Degrees Celsius% Percent
REFERENCESAstorga, A.; Aguilar, G.; and Hernández, G., (2003). Manual técnico
de EIA: lineamientos generales para Centroamérica. IUCN, San José, CR.
Casas, L., (2018). Estudio de impacto ambiental de la cantera “La Esperanza”. Master´s Thesis, Polytechnic University of Cartagena, ES.
Castelo, J.; Rebbah, R.; Duarte, J.; Baptista, J.S, (2019). Risk Assessment in the Open Pit Mining Industry. Stud. Syst. Decis. Control. 202: 13-21 (9 pages).
Chen, J.; Jiskani, I.M.; Jinliang, C.; Yan, H, (2020). Evaluation and future framework of green mine construction in China based on the DPSIR model. Sustain. Environ. Res. 30: 1-10 (10 pages).
Conesa, V.; Conesa, L.; and Conesa, V., (2010). Methodological guide for environmental impact assessment. Mindi-Prensa, Madrid, ES.
Council Directive, (1992). on the conservation natural habitats and wild fauna and flora, Off. J. Eur. Communities. 206: 7-50 (43 pages).
CREM., (2019). Evolution of the main features of the mining sector. Department of business, Industry and Spokesperson of the Region of Murcia. Murcia, ES.
CREM, (2020). Climatology. Department of business, Industry and Spokesperson of the Region of Murcia. Murcia, ES.
Darwish, T.; Khater, C.; Jomaa, I.; Stehouwer, R.; Shaban, A.; Hamze, M., (2010). Environmental Impact of Quarries on Natural Resources in Lebanon. Land. Degrad. Develop. 22: 345-358 (14 pages).
Decree 1439, (1972)., on the approval of motor vehicles with regard to the noise produced by them. Boletín Oficial del Estado, Madrid, ES. 138: 10215-10216 (2 pages).
Directive 42, (2001)., of the European Parliament and of the Council, of 27 June 2001, on the assessment of the effects of certain plans and programmes on the environment. Off. J. Eur. Communities. 197: 30-37 (8 pages).
Directive 147, (2009)., of the European Parliament and of the Council, of 10 November 2009, on the conservation of wild birds. Off. J. Eur. Union. 20: 7-25 (19 pages).
Directive 92, (2011)., of the European Parliament and of the Council, of 13 December 2011, on the assessment of the effects of certain public and private projects on the environment. Off. J. Eur. Union. 26: 1-21 (21 pages).
Directive 52, (2014)., of the European Parliament and of the Council, of 16 April 2014, amending Directive 2011/92/EU on the assessment of the effects of certain public and private projects on the environment, Off. J. Eur. Union. 124: 1-18 (18 pages).
Enríquez de Salamanca, A., (2021). Project justification and EIA: Anything goes? Environ. Impact. Assess. Rev. 87: 1-4 (4 pages).
Elvan, O.D., (2013). The legal environmental risk analysis (LERA) sample of mining and the environment in Turkish legislation. Resour. Pol. 38(3): 252–257 (6 pages).
Espoo Convention, (1991). Convention on Environmental Impact Assessment in a Transboundary Context. Espoo, FI.
Falck, W.E., (2016). Social was licensing in mining—between ethical dilemmas and economic risk management. Min. Econ., 29: 97–104 (8 pages).
Fierro, J., (2012). Políticas mineras en Colombia. ILSA, CO.Garmendia, A.; Salvador, A.; Crespo, C.; Garmendia, L., (2005).

585
Global J. Environ. Sci. Manage., 7(4): 565-586, Autumn 2021
Environmental Impact Assessment. Pearson Educación, S.A., Madrid, ES.
Ghorbani, Y.; Kuan, S.H., (2017). A review of sustainable development in the Chilean mining sector: past, present and future. Int. J. Min. Reclamat. Environ. 31(2): 137–165 (29 pages).
Glasson, J.; Therivel, R., (2019). Introduction to Environmental Impact Assessment. 5th ed. Routledge, London.
Gómez, I., (2016). Propuesta metodológica para la evaluación del impacto ambiental en la explotación a cielo abierto “cantera Begoña” Final Project Thesis. Department of Agrochemistry and Environment, The University Miguel Hernandez of Elche, ES.
Handjaba, J., (2012). Estudio minero-ambiental de la cantera El Cacao. Cien. Futuro., 2(4): 49-58 (10 pages).
IGN, (2020). Geology and tectonics of the Betic Cordillera. Ministry of Transport, Mobility and Urban Agenda, Madrid, ES.
Jain, R.K.; Cui, Z.C.; Domen, J.K., (2016). Environmental Impact of Mining and Mineral Processing. Elsevier Inc., Boston, USA.
Jiskani, M.I.; Cai, Q.; Zhou, W.; Shah, S.A., (2021). Green and climate-smart mining: A framework to analyze open-pit mines for cleaner mineral production. Resour. Policy., 71: 1-13 (13 pages).
Johnson, F.; Bell, D., (1975). Guidelines for the identification of potential environmental impacts in the construction and operation of a reservoir. Department of Forestry, Agricultural Experiment Station, University of Illinois at Urbana-Champaign, Illinois, US.
Karbassi, A.R.; Heidari, M., (2015). An investigation on role of salinity, pH and DO on heavy metals elimination throughout estuarial mixture. Global J. Environ. Sci. Manage., 1(1): 41-46 (6 pages).
Karbassi, A.R.; Pazoki, M., (2015). Environmental qualitative assessment of rivers sediments. Global J. Environ. Sci. Manage., 1(2): 109-116 (8 pages).
Khabali, H.; Kamal, EK., (2013). Quarrying in coastal Kenikra and its area of influence: environmental impact study. Est. andaluces., 30: 1-26 (26 pages).
Köppen, W., (1936). The Geographical System of Climates. Borntraeger Science Publishers, Berlin, DE.
Lad, R.J.; Samant, J.S., (2014). Environmental and social impact of stone quarrying- a case study of Kolhapur District. Int. J. Curr. Res. 6(3): 5664-5669 (6 pages).
Law 34, (2007)., of 15 November, on air quality and atmospheric protection. Boletín Oficial del Estado. Madrid, ES. 275: 46962-46987 (26 pages).
Law 42, (2007)., of 13 December, on Natural Heritage and Biodiversity. Boletín Oficial del Estado, Madrid, ES. 299: 51275-51327 (53 pages).
Law 33, (2015)., of 21 September, which amends Law 42/2007, of 13 December, on Natural Heritage and Biodiversity. Boletín Oficial del Estado, Madrid, ES. 227: 83588- 83632 (45 pages).
Law 21, (2013)., of 9 December, on environmental assessment. Boletín Oficial del Estado, Madrid, Spain. 296: 98151-98227 (77 pages).
Law 9, (2018). 5 December, amending Law 21/2013, of 9 December, on environmental assessment, Law 21/2015, of 20 July, amending Law 43/2003, of 21 November, on Forestry and Law 1/2005, of 9 March, regulating the greenhouse gas emission allowance trading scheme. Boletín Oficial del Estado, Madrid, ES. 294: 119858-119905 (48 pages).
Leopold, L.; Clarke, F.; Hanshaw, B.; Balsley, J., (1971). A Procedure for Evaluating Environmental Impact. Geological Survey Circular 645, Washington, US.
Luna, JA., (2015). El impacto Ambiental por la actividad de explotación de canteras en la localidad de Usme y sus principales medidas de manejo. Master´s thesis, Military University Nueva Granada. Bogotá, CO.
Maponga, O.; Munyanduri, N., (2001). Sustainability of the dimension stone industry in Zimbabwe - challenges and opportunities. Nat. Resour. Forum. 25: 203-213 (11 pages).
MET, (2018). Estadística Minera de España 2017. Ministry for Ecological Transition. Madrid, ES.
MET, (2019). Methodological Guide for Environmental Impact Assessment in Natura 2000 Network. Madrid, ES.
Miñarro, A., (2018). Estudio de impacto ambiental de la cantera “La Chica”. Final Project Thesis. Department of Mining, Geological and Cartographic Engineering, Polytechnic University of Cartagena, ES.
Montes de Oca-Risco, A.; Ulloa-Carcassés, M., (2013). Recovery of areas damaged by mining in the Los Guaos Quarry. Revista Luna. Azul., 37: 74-88 (15 pages).
Mora-Barrantes, J.; Molina-león, O.; Sibaja-Brenes, J., (2016). Application of a method for the environmental impact assessment of university construction projects. Tecnol. Marcha., 29(3): 132-145 (14 pages).
Moreno, M.A., (2021). Estudio de impacto ambiental de una cantera de calizas en el valle de Escombreras. Master´s Thesis, Polytechnic University of Cartagena, ES.
Order ITC 2585, (2007)., of 30 August, approving Complementary Technical Instruction 2.0.02 “Protection of workers against dust, in relation to silicosis, in the extractive industries”, to the General Regulations on Basic Standards for Mining Safety. Boletín Oficial del Estado, Madrid, ES. 215: 36828-36833 (6 pages).
Parrota, J.A.; Knowles, O.H., (2001). Restoring tropical forests on lands mined for bauxite: Examples from the Brazilian. Ecol. Eng. 17: 219-239 (21 pages).
Pchalek, M., (2019). The legalization of unpermitted projects in the light of requirements of the EIA directive. Eur. Energy. Environ. Law. Rev. 28(3): 101–106 (6 pages).
Retief, F.P.; Fischer, T.B.; Alberts, R.C.; Roos, C.; Cilliers, D.P., (2020). An administrative justice perspective on improving EIA effectiveness. Impact. Assess. Proj. Apprais. 38(2): 151–155 (55 pages).
Royal Decree 212, (2002). 22 February 2002, regulating noise emissions in the environment due to certain outdoor machinery. Boletín Oficial del Estado, Madrid, ES. 52: 8196-8238 (43 pages).
Sheoran, V.; Sheoran, A.S; Poonia, P., (2010). Role of hyperaccumulators in phytoextraction of metals from contaminated mining sites: A Review. Crit. Rev. Env. Sci. Technol. 41(2): 168-214 (47 pages).
SITMURCIA, (2019). Advance of the territorial management plan for mineral resources in the Region of Murcia. Regional Ministry of Employment, Universities, Enterprise and Environment, Murcia, ES.
Sort, X.; Alcañiz, J.M., (1996). Contribution of sewage sludge to erosion control in the rehabilitation of limestone quarries. Land Degrad. Dev. 7(1): 69-76 (8 pages).
Stehouwer, R.; Day, R.; Macneal, E., (2006). Nutrient and trace
https://onlinelibrary.wiley.com/doi/10.1002/(SICI)1099-145X(199603)7:1%3C69::AID-LDR217%3E3.0.CO;2-2
https://onlinelibrary.wiley.com/doi/10.1002/(SICI)1099-145X(199603)7:1%3C69::AID-LDR217%3E3.0.CO;2-2

586
M.A. Peñaranda Barba et al.
AUTHOR (S) BIOSKETCHES
Peñaranda Barba, M.A., Ph.D. Candidate, Departamento de Agroquímica y Medio Ambiente. Universidad Miguel Hernández de Elche Edif, Alcudia, Avda, de la Universidad, Alicante, Spain. Email: [email protected]
Alarcón Martínez, V., Ph.D., Professor, Departamento de Organización Industrial y Electrónica. Escuela Superior de Ingeniería y Tecnología, Universidad Internacional de la Rioja, Madrid, Spain. Email: [email protected]
Gómez Lucas, I., Ph.D., Professor, Departamento de Agroquímica y Medio Ambiente. Universidad Miguel Hernández de Elche Edif, Alcudia, Avda, de la Universidad, Alicante, Spain. Email: [email protected]
Navarro Pedreño, J., Ph.D., Professor, Departamento de Agroquímica y Medio Ambiente. Universidad Miguel Hernández de Elche Edif, Alcudia, Avda, de la Universidad, Alicante, Spain. Email: [email protected]
HOW TO CITE THIS ARTICLE
Peñaranda Barba, M.A.; Alarcón Martínez, V.; Gómez Lucas, I.; Navarro Pedreño, J., (2021). Mitigation of environmental impacts in ornamental rock and limestone aggregate quarries in arid and semi-arid areas. Global J. Environ. Sci. Manage., 7(4): 565-586.
DOI: 10.22034/gjesm.2021.04.06
url: https://www.gjesm.net/article_244150.html
COPYRIGHTS
©2021 The author(s). This is an open access article distributed under the terms of the Creative Commons Attribution (CC BY 4.0), which permits unrestricted use, distribution, and reproduction in any medium, as long as the original authors and source are cited. No permission is required from the authors or the publishers.
element leaching following mine reclamation with biosolids. J. Environ. Qual. 35: 1118-1126 (9 pages).
Timofeeva, S.S.; Murzin, M.A., (2020). Assessing the environmental risk of mining enterprises by the integral indicator of dust emission. Earth. Environ. Sci. 408: 1–5 (5 pages).
UN, (2003). Protocol on Strategic Environmental Assessment to the Convention on Environmental Impact Assessment in a Transboundary Context. United Nations. Kiev, UA (28 pages).
Villalba, V., (2017). Estudio de Impacto Ambiental de un proyecto de rehabilitación de una cantera en el término municipal de Alfarp (Valencia). Master’s thesis. Department of Road, Canal and Port
Engineering, Polytechnic University of Valencia, Valencia, ES.Yildiz, T., (2020). The impacts of EIA procedure on the mining sector
in the permit process of mining operating activities & Turkey analysis. Resour. Pol. 67: 1-17 (17 pages).
Zhou, W.; Yin, W.; Peng, X.; Liu, F.; Yang, F., (2018). Comprehensive evaluation of land reclamation and utilisation schemes based on a modified VIKOR method for surface mines. Int. J. Min. Reclam. Environ., 32: 93-108 (15 pages).
Zhou, Y.; Zhou, W.; Lu, X.; Jiskani, I.M.; Cai, Q.; Liu, P.; Li, L., (2020). Evaluation Index System of Green Surface Mining in China. Min. Metall. Explor. 37: 1093-1103 (11 pages).
Global J. Environ. Sci. Manage. 7(4): 587-598, Autumn 2021
*Corresponding Author:Email: [email protected]: +4207 2317 8438 Fax: +4207 2317 8438
Global Journal of Environmental Science and Management (GJESM)
Homepage: https://www.gjesm.net/
CASE STUDY
Analysis of legislative acts in water management
J. Nesiba1, R. Cuhlova2,*
1Department of Social Studies, Faculty of Regional Development and International Studies, Mendel University in Brno, Brno, Czech Republic2Department of Corporate Economy, Faculty of Economics and Administration Masaryk University, Brno, Czech Republic
BACKGROUND AND OBJECTIVES: This paper focuses on the development of Czech laws of water resource protection. The presented research examines the statistical data of the number and type of legislative acts concerning to water protection issued in the Czech Republic during the period 1990-2019. Several types of legislative acts are followed in administrative law and statistically compared by the development in time and its type. The survey focuses on general water protection acts, water sewage management, agriculture sector, hygiene standards, and the protection of the basins of Czech rivers (e.g., blue water and gray water).METHODS: The analysis firstly concerns to the development of the number of legislative acts during 1990-2019 and secondly discusses a diversification of the legislative acts types (laws, decrees, resolutions, regulations, and strategic plans). A total of 12,272 legislative acts is analyzed during three phases of Czech modern history: 1990-1992 (Czechoslovakia), 1993-2003 (Czech Republic before its accession to the European Union), and 2004-2019 (Czech Republic in the European Union). FINDINGS: Statistical elaboration of legislative acts proves that it is possible to determine different types of water management over time. Protection of water resource management in the Czech Republic was forming from crisis management (1990-1992), via operational management (1993-2003) to strategic management (2004-2019). Current trends after 2020 show a new trend towards integral management.CONCLUSION: Findings provide better understanding of changeable importance of water protection and management attitudes in the Czech Republic in reaction to the development of society.
©2021 GJESM. All rights reserved.
ARTICLE INFO
Article History:Received 28 January 2021Revised 23 April 2021Accepted 12 May 2021
Keywords:Crisis ManagementCzech RepublicIntegral ManagementLegislative ActOperational ManagementStrategic ManagementWater Management
ABSTRAC T
DOI: 10.22034/gjesm.2021.04.07
NUMBER OF REFERENCES
29NUMBER OF FIGURES
4NUMBER OF TABLES
1
Note: Discussion period for this manuscript open until January 1, 2022 on GJESM website at the “Show Article.

588
J. Nesiba and R. Cuhlova
INTRODUCTIONEnvironmental state protection can be monitored
from the volume of individual laws and their impact compared to other regulations that accompany them (Keizer and Shapiro, 2019). The nature of the regulations reflects the quality of government decision-making (Povitkina and Bolkvatze, 2019). The statistical comparison of laws reflects the long-term quality of the government approaches to water conservation issues. The presented case study focuses on the development of Czech laws of water resource protection and statistically observes all Czech administrative and legislative acts about water protection (laws, decrees, regulations, resolutions, strategic plans) focusing on blue water (i.e., freshwater surface and groundwater), and gray water (i.e., polluted water, sewerage problematics). The study primarily focuses on the quantitative evaluation of legislative acts. The examined period of legislative acts (1990-2019) is divided according to the milestones represented by major political events in Czech history: 1989 (the end of the socialist regime), 1993 (the establishment of an independent Czech Republic), and 2004 (Czech accession to the EU). A comparison of the legislative processes in the surveyed stages reveals a different approach to water protection issue. A research question (Q1) asks whether there are differences in the relative statistical evaluation of all Czech adopted legislative acts documenting different approaches to drinking water protection management in individual periods (1990-1992, 1993-2003, 2004-2019). Statistical analysis of publicly available data has been chosen as a main criterion for evaluation of all administrative and legislative regulations associated with the protection of drinking water in the Czech Republic (Czechoslovakia) from public sources. The final
evaluation of administrative law is based on 12,272 legislative acts. Table 1 presents the classification of legislative acts from 1945 till 2019 according to administrative sectors.
Relevant data for the observed period (1990 - 2019) were selected from the set of legislative acts of the Czech Law. According to political changes of the country, such as a split of Czechoslovakia in 1993 and the entry to EU in 2004, the presented approach uses a differentiation of three periods (1990-1992, 1993-2003, 2004-2019) for a relative data comparison. The international Water Exploitation Index (WEI) stands for a dependent indicator (Dikovitsky and Shishaev, 2019). The analysis is considering a relation between individual laws, e.g. how many laws has an EU Member State adopted from the EU administration. This kind of data analysis is applied much more often in political science, sociology of law and also in management. The applied method is based on modern trends in the sociology of law (DeGroot et al., 1994). Statistics in legislative acts and openly accessible meta data can be used to identify new multilevel dimensions of law (Dikovitsky and Shishaev, 2019). A quantitative survey of legislative acts and their comparison by the legislative type and the WEI indicator in observed periods is used for the analysis. Different approaches to water protection have been demonstrated by quantitative statistics. According to the mutual ratio of individual legislative acts in three periods, different approaches to water protection can be interpreted by using management tools. Discussions about functional models that are implemented in the management of public institutions evoke another issue. According to the current studies (Boin and Christensen, 2008), the public sector is focusing on new ways of managing and defining “public interest.” One of the factors
Table 1: Legislative Acts Classification Based on Administrative Sector
Administrative Sector (1945-2019)
Laws (including amendments) Public regulations Governmental decrees All
legislative acts Environment 135 1036 470 1641 Water 58 198 60 316 Waste 42 112 50 204 Agriculture 289 894 572 1755 Forestry 39 131 85 255 Healthcare 256 736 511 1503 Other Sections 458 3456 2684 6598 Total 1277 6563 4432 12 272
Table 1: Legislative Acts Classification Based on Administrative Sector

589
Global J. Environ. Sci. Manage., 7(4): 587-598, Autumn 2021
shaping new management approaches is based on written documents guaranteeing a central role in the performance of the governmental power to the administration. Public management is inspired from private management in a way of “New Public Management”. A view in one specific sector can survey several diverse goals and methods of public management. There is also a trend of empirical accounts of public institutions consistently identifying leadership as a crucial explanatory variable (Deverell, 2012). The division of management into crisis, operational, and strategic components means that a sustainable and responsible organization can be maintained. A similar management process in the number of decisions on a specific topic can be observed in a legislative act within the EU. One of the criteria for dividing management into crisis, operational or strategic is the volume and type of legislative acts issued in the specified sector. Therefore, this approach also applies to political decisions professionally driven to solve real problems. Water supply as well as the policy of protection of drinking water resources in today’s state are subjects to professional supervision. The protection of water resources in democratic states is not burdened by the ideology but rather by maximalization of the “public good” protection (Schmidt and Matthews, 2017). The aim of the current study is to find out whether there are statistical differences in all adopted legislative acts regarding to water protection topics demonstrating different approaches towards drinking water protection management. The study was performed in the Czech Republic for three time periods (1990-1992, 1993-2003 and 2004-2019).
Background of water protection in postwar Czechoslovakia (1945-1989)
A specific political interest for protection of water resources did not exist in Czechoslovakia after 1945. Subordination of water protection to economic and industrial development was expressed after 1948 by so-called Five-Year Plans where water was primarily defined as a secondary raw material for industry or agriculture. Furthermore, the socialist system did not deal with this topic in any detail (Palát et al., 2010). Several partial decrees of the Czechoslovak Government were the first impulses of water protection in the early 1950s. The construction of waterworks and water supply municipal and
agricultural networks was massively supported as an indicator of improving the local economy and life in a centrally planned economy. In line with this upward trend, the need for conceptual management of natural resources arose in the middle of the 1950s (Nesiba and Smolik, 2019). The first specific laws (Czechoslovakia Act No. 1/1955, Act. No. 11/1955, Act. No. 25/1955) regarding to nature and water protection were approved that time together with the declaration of the first National Nature Parks of Czechoslovakia (e.g., “National Park of High Tatras” proclaimed by the Slovak National Council in 1948). Subsequently, the National Assembly of the Republic of Czechoslovakia issued the State Nature Protection Act No. 40/1956 on August 1, 1956. Only nineteen paragraphs however dealt with the protection of nature and the water management of Czechoslovakia insufficiently. The law continuously introduced specific sanction mechanisms for the control. This first approach towards protection can be called as a ”passive“ legislation, with a very small strategic framework. Other national parks and a network of protected landscape areas were gradually created. Nature protection was subsequently issued in the Constitutional Act of the Czechoslovak Republic in 1960 where it was defined by the public property – primary forest fund, watercourses, and natural healing resources (Czechoslovakia Act. No. 100/1960). Several ecological disasters, such as the release of poisonous substances into water or air, are associated with the lack of control at that time. It became apparent from the 1960s that the laws and institutions of the 1950s were no longer sufficient to water protection. Simultaneously, new scientific findings were made on the ecosystems function (Carson, 1962). Even the United Nations began to establish nature protection departments. These ideas became popular political themes across national borders so-called “Iron Curtain.” Environmental problems that required a comprehensive approach have been gradually accepted as a topic of international meetings during the Cold War. After the first environmental conference in Stockholm in 1972, the strategic document “Action Plan” concerning to the environmental protection and defining the framework for the future joint action of the international community, including the Czechoslovak Socialist Republic, was adopted. The UN General Assembly followed up the Stockholm Conference by adopting several resolutions to

590
Legislative acts in water management
address among other things the absence of a more substantial institutional background. That is why the first-ever UN coordinating, consulting, and expert body dedicated to environmental protection, the UN Environment Program, was created. Water protection became a public issue across the international environment. The environment began to be so damaged by massive production that the public started to control political actions and approved laws in this regard. New scientific findings and models of development also served as a basis for the Stockholm Conference (Meadows et al., 1972). In connection to this development, some associations were naturally engaged in nature conservation in Czechoslovakia (e.g., the “Slovak Union of Nature and Landscape Conservation” was established in 1969, and the “Czech Union for Nature Conservation” was established in 1979). In the 1970s and 1980s, the Government established majority of protected landscape areas and national parks (in function till nowadays). In 1978, the “Ecological Society” was established at the Academy of Sciences. The protection zones of drinking water were increasing together with the development of towns and their supply management. In the second half of the 1980s, water protection has become a society-wide standard with more explicit rules and sanctions of limited managerial instruments under the socialist regime. The Five-Year Plan of the Czechoslovak Socialist Republic in 1986 committed to expand and protect all water sources as well as to ensure water protection against pollution (Czechoslovakia Act. No 81/1986) were however insufficient. The actual strategic nature and water conservation planning did not exist. Therefore, it was necessary to pass completely new laws to protect water after the fall of the communist regime in 1989. The emergence of completely new laws after 1989 demonstrates a deep change in the water management style.
The phase of crisis management (1990-1992)The period 1990-1992 asked for a big change in
the approach to water protection. Proposition of new laws representing a complete change the way water protection is approached quickly emerged. Crisis management is defined as the identification of threats to an organization and its stakeholders and it requires decisions to be made within a short time frame (Bundy et al., 2016). It should prevent the crisis itself
or respond to the first signals of the coming problems (Kouzmin, 2008). Another definition evaluates crisis management as a process of crisis identification and the enterprise’s subsequent stabilization (Pedersen et al., 2020). Crisis management manifests in more practical steps rather than theory and it is therefore necessary to look for clear criteria of crisis and crisis management (Deverell, 2012). During the period of crisis, increasing communication, and one-way direction of orders to solve problems can be observed from top to bottom (Frandsen and Johansen, 2011). The crisis means that new and precisely targeted legislative acts are being issued. Czechoslovak legislative acts were not sufficient to protect nature and water which resulted in increasing volume of approved legislative acts. In order to protect nature as quickly as possible, there was a pressure to intensively adopt many laws in the shortest possible time. During 1990-1992, a political representation, a civic movement, and a specialized institution for nature protection were established. After an insufficient approach of the socialist government, pressure on water protection standards in Czechoslovakia emerged. Many laws, regulations, or restrictions had been created to replace the unsatisfactory socialist norms. Specialized environmental institutions were established, e.g. the Ministry of the Environment. From all legislative acts of that time, the “Nature and Landscape Protection Act” (Act No 114/1992) is the most significant document. It defined protected areas as well as sanction mechanisms. Its quality is demonstrated by the variations of this law till nowadays. During the whole measured period (1990-2019), the most legislative measures on average per year were carried out.
The phase of operational management (1993-2003)Before the establishment of the independent
Czech Republic (1.1.1993), it was directly settled into the principle of the Czech Constitution that this supreme law protects natural resources and their careful use (Czech Republic Act No. 1/1993). The Charter of Fundamental Rights and Freedoms in the Czech Republic states that everyone has the right to a favorable environment and the right for complete information on the state of the environment and natural resources (Czech Republic Act No. 2/1993). A new conceptual direction of nature and water protection began to emerge. This approach can be

591
Global J. Environ. Sci. Manage., 7(4): 587-598, Autumn 2021
called as operational management, generally capable of rapid change. Operational management is involved in coordinating and developing new processes while reevaluating current structures. Operational management enable a gradual transition from one management style to another, depending on the conditions, within a time frame of three to five years (Ansoff et al., 2019). This situation occurred with the Czech Republic’s accession negotiations to the EU. Due to the adopted legislative acts, Czech legislative acts moved to a harmonization stage with European law. Therefore, this transition can be observed as operational management. In the second half of the 1990s, there were two political tendencies in the Czech Republic concerning to water protection. On the one hand, privatization of waterworks took place, on the other hand, the adoption of European laws happened. Mass privatization of Czech municipal (regional, state) waterworks took the effective control instrument away. Public political power lost the opportunity to effectively manage waterworks in large part of Czech cities (Nesiba and Smolík, 2018). This situation was overwhelmed by the Czech future membership in the EU. The politicians focused on operational management and Czech and European law needed to be operationally harmonized. Therefore, at the end of the 1990‘, the gradual implementation of operative management in the whole system of legislative standards could be observed. Operational management manifested itself in several European operational regulations that were growing. The effort to unify with European water protection law was also based on the experts analyzes of the time (McAdam et al., 2011). Several legislative acts concerning to the EU requirements (Council Directive 98/83/EC, 2000/60/ES, Czech Republic Act No 258/2000) have been approved. It was a parallel process together with harmonization of European legislative standards. The obligation to change basic national standards for wastewater management upon accession to the EU was a typical example that required changes in principal legislative Acts in the country (Council Directive 91/271/EEC, Czech Republic Act No. 185/2001, Act No. 254/2001, Act No. 274/2001). These laws were followed by several changes that clarified the paragraph wording and responded to the needs of water protection (especially with the development of new technologies and industrial risks) (Czech Republic Act No. 20/2004).
Among other dozens of standards concerning to water protection, it is necessary to mention the Act introducing protection into the Czech legislation within the framework of the Natura 2000 system (Czech Republic Act No. 218/2004). Generally, the Czech Republic has committed itself to complete the harmonization of water protection into EU legislation as a condition for Czech accession to the EU which also concerned the unification of water protection conditions, namely Annex V, Sections 7b-7c.
The emergence of strategic management (2004-2019)
Strategic management relates to long-term planning. An important factor in strategic management is the precise setting of goals and timeframe. Strategic planning is considered as the cornerstone of any organization, and the institution’s strategy also forms the entire structure of the organization (Menguc et al., 2010). It is common for all strategic management theories to define objectives and goals and to determine how to achieve them (Gleeson, 2019). Empirical studies confirm that strategic management is the most comprehensive management tool in SME enterprises (Zeemering, 2018), corporations (Monday et al., 2015) as well as public sector (Joyce, 2015). In the case of strategic management, specific and measurable goals are set because they can be compared with the actual situation after the specified time has elapsed (Ansoff et al., 2019). The stability of the main legislative documents in terms of a larger space for their regulations and interpretations is one of the criteria (Menguc et al., 2010). This approach is called as sustainable and responsible management (Bryson and George, 2020). After the Czech Republic accessed to the EU in 2004, water protection has been gradually becoming a public topic. It is also a phase of decline of legislative acts and the growth of strategic plans. The number of legal standards has gradually increased (Directive 2006/11/ES Directive 2006/118/EC). Compared to previous periods, a more significant number of legislative measures concerning to the strategic interests of the Czech Republic were approved. Discussed topics of environmental security, food security or strategic national security relate to the protection of water resources and water systems. The surveyed period (2004-2019) is characterized not only by law-making but mainly by national government decrees, public regulations, and strategic plans (Palát

592
J. Nesiba and R. Cuhlova
et al., 2010). Several impulses have contributed to the policy of strategic decision-making for water protection management in the Czech Republic as an EU member from 2004. The European Commission sets goals and plans for next five years for each policy sector. Moreover, a multiannual financial framework of the EU (so-called seven-year budget) was set for periods 2000-2006, 2007-2013, 2014-2020. So far, in each programming period, one line was devoted to water protection issues. The second impulse came from scientific research published to investigate the global impact of climate change and the rise of green policy; e.g. “Stern Report on Global Warming on the Impact of Climate Change on the World Economy“ and “Fourth Assessment Report of the Intergovernmental Panel on Climate Change“ received considerable public attention. For this purpose, many Czech expert platforms have been created to inform the general public about ongoing measurements. The third impulse can be seen in the framework of the United Nations global policy. The UN documents such as the “Paris Climate Change Agreement” of 2015 and the subsequent commitment approved by the UN General Assembly entitled “Transforming our world: the 2030 Agenda for Sustainable Development” are among the most critical decisions. At the heart of this document, the indicators embodied in seventeen “Sustainable Development Goals” are calling for strategic planning of water protection. The number of laws is declining but the number of government regulations, public regulations, and strategic plans is increasing. Strategic plans are the sub-legal norm as an effective instrument for private and public institutions. The goal-setting theory proposes that organizations with set goals perform better as their activities and resources are focused on addressing core issues and employees can understand the firm priorities (Jung and Lee 2013; Locke and Latham, 2002). Studies confirm managerial strategic planning as the most effective instruments (George et al., 2019). Based on the UN decision, the Czech Republic adopted a strategic framework for strategic planning until 2030 (Government Resolution No.292/2017). It had been followed by a long-term preparation process (consultations between political representatives, experts, and the general public) that resulted in the ”Implementation Plan of the Czech Republic Strategic Framework 2030“ (Government Resolution No.669/2018) and “Implementation the 2030
Agenda for Sustainable Development” (Government Resolution No.670/2018). The “Agenda 2030” was therefore adopted in the Czech Republic. Currently, the Czech Government has approved several types of following strategic plans:
umbrella strategy papers (12), strategic plans and concepts (185), implementing strategy papers (82), following strategy papers (5)
The number of the strategic documents is increasing as observed by the State Program of Nature Conservation and Landscape Protection of the Czech Republic (2009), Waste Management Plan 2015-2024 (2015), Environmental Security Concept 2016-2020, with a view to 2030 (2016), Czech Republic Action Plan for the Development of Organic Farming 2016-2022 (2016), Concept for the protection against drought consequences for the territory of the Czech Republic (2017). Since 2019, water protection has affected 24 strategic plans, although many of them collide with strategic plans. For the last years, the construction of the Danube-Oder-Labe canal is being prepared in the Czech Republic. It is a case where strategic water protection documents and transport strategies directly contradict each other (Palát et al., 2010). A new type of management is needed to set priorities after 2020.
Situation after 2020 The situation in this area is changing rapidly due to
the trends in social and political development in the Czech Republic. Global climate change, temperature, drought, soil quality and ecological problems affect water management in the Czech Republic (Kavan et al., 2021). Restrictions resulting from the pandemic Covid-19 have only frozen this situation for a while, but development trends start to show the need of the Czech government to move to legal action again (towards crisis management). This situation can be documented not only by political decisions. From the regional level, there is a tendency to buy out privatized waterworks back from private sector (municipality, regions, e.g. statutory city Plzeň in 2018, Liberec in 2019, etc.). A number of parliamentary political parties in the Czech Republic are supporting the possibility of amending the entire Constitution of the Czech Republic where water protection rights
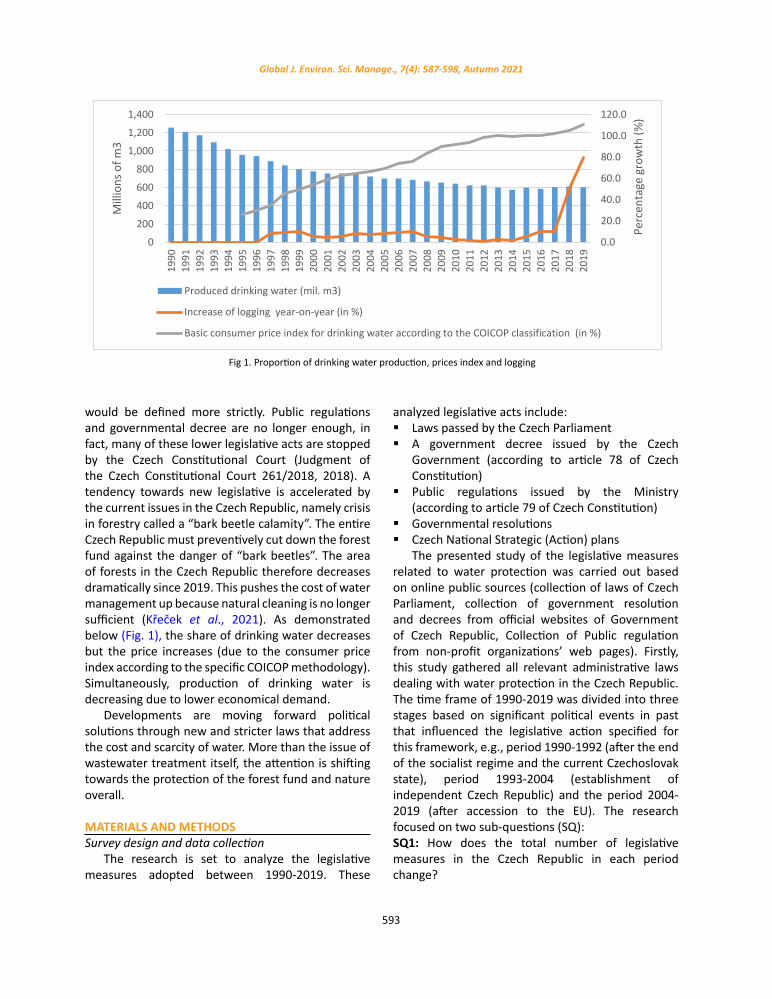
593
Global J. Environ. Sci. Manage., 7(4): 587-598, Autumn 2021
would be defined more strictly. Public regulations and governmental decree are no longer enough, in fact, many of these lower legislative acts are stopped by the Czech Constitutional Court (Judgment of the Czech Constitutional Court 261/2018, 2018). A tendency towards new legislative is accelerated by the current issues in the Czech Republic, namely crisis in forestry called a “bark beetle calamity”. The entire Czech Republic must preventively cut down the forest fund against the danger of “bark beetles”. The area of forests in the Czech Republic therefore decreases dramatically since 2019. This pushes the cost of water management up because natural cleaning is no longer sufficient (Křeček et al., 2021). As demonstrated below (Fig. 1), the share of drinking water decreases but the price increases (due to the consumer price index according to the specific COICOP methodology). Simultaneously, production of drinking water is decreasing due to lower economical demand.
Developments are moving forward political solutions through new and stricter laws that address the cost and scarcity of water. More than the issue of wastewater treatment itself, the attention is shifting towards the protection of the forest fund and nature overall.
MATERIALS AND METHODSSurvey design and data collection
The research is set to analyze the legislative measures adopted between 1990-2019. These
analyzed legislative acts include: Laws passed by the Czech Parliament A government decree issued by the Czech
Government (according to article 78 of Czech Constitution)
Public regulations issued by the Ministry (according to article 79 of Czech Constitution)
Governmental resolutions Czech National Strategic (Action) plans
The presented study of the legislative measures related to water protection was carried out based on online public sources (collection of laws of Czech Parliament, collection of government resolution and decrees from official websites of Government of Czech Republic, Collection of Public regulation from non-profit organizations’ web pages). Firstly, this study gathered all relevant administrative laws dealing with water protection in the Czech Republic. The time frame of 1990-2019 was divided into three stages based on significant political events in past that influenced the legislative action specified for this framework, e.g., period 1990-1992 (after the end of the socialist regime and the current Czechoslovak state), period 1993-2004 (establishment of independent Czech Republic) and the period 2004-2019 (after accession to the EU). The research focused on two sub-questions (SQ):SQ1: How does the total number of legislative measures in the Czech Republic in each period change?
Fig 1. Proportion of drinking water production, prices index and logging
0.0
20.0
40.0
60.0
80.0
100.0
120.0
0
200
400
600
800
1,000
1,200
1,400
1990
1991
1992
1993
1994
1995
1996
1997
1998
1999
2000
2001
2002
2003
2004
2005
2006
2007
2008
2009
2010
2011
2012
2013
2014
2015
2016
2017
2018
2019
Perc
enta
ge g
row
th (%
)
Mill
ions
of m
3
Produced drinking water (mil. m3)
Increase of logging year-on-year (in %)
Basic consumer price index for drinking water according to the COICOP classification (in %)
Fig 1. Proportion of drinking water production, prices index and logging

594
Legislative acts in water management
SQ2: How do the ratios among laws, government decrees, and public regulations at the administrative, and legislative levels change?The hypotheses are set as: H1: When the number of laws in the given period increases, it refers to crisis management principles. H2: When the number of laws decreases, it refers to the principles of strategic management as the number of government decrees, public regulations, and strategic plans (with a clearly defined time frame) increase.
The presented study does not examine water quality (such as contamination or protection methods). The survey is methodologically incorporated with Law and Management Approach that explores legislative opportunities and managerial strategy. Societies can optimize their management legally and develop strategies that give them a competitive advantage (Roquilly, 2009).
RESULTS AND DISCUSSIONOverall, all types of legislative acts can be
evaluated on the resulting figure that is compiled from 1948 to 2019. Fig. 2 illustrates the gradual change of the legislative acts.
Apart from these absolute numbers, a different comparison can be observed by a look at the relative numbers, i.e. with respect to the yearly averages. Following Fig. 3 demonstrates the gradually increased number of legislative measures. The statistic sum represents the total number of all legislative measures
(laws, government decrees, public restrictions) and the year average, i.e., how many water protection standards in the Czech Republic were approved in relative numbers.
To answer the Q1, the number of legislative acts was increasing gradually on yearly average. In the first examined period 1990-1992, the average is three legislative acts per year. In the second period 1993-2003, 3.4 legislative acts are calculated as the average per year. In the last period 2004-2019, the average increased to 4.7. It can be stated that the adoption of legislative acts in 2004-2019 was mean the most often. Different situation occurs if having a look on type and character of legal norms (Dikovitsky and Shishaev, 2019). Administrative laws are issued as the highest regulatory conduct of the state. The number of laws in one area indicates the urgency of solving an issue and it can be deduced that the area shows the need for a crisis management approach. Therefore, in a longitudinal comparison, if more laws are issued for a specific sector in a certain period, it represents an attitude of crisis management. In the case of ambiguity of specific laws interpretation, insufficient law, or preparation of new laws, government decrees are issued. That is a situation of an operational solution (e.g., harmonization of the interconnection of several management sectors). If the number of laws decreases but the number of Government Decrees increases, it is a situation of operational management (McAdam et al., 2011). To continue, if the number of government regulations in a given
Fig. 2. Legislative acts about water protection in Czech Republic 1948-2019
0
2
4
6
8
10
12
14
16
1948
1950
1954
1956
1959
1961
1964
1966
1970
1973
1975
1977
1979
1987
1989
1991
1993
1996
1998
2000
2002
2004
2006
2008
2010
2012
2014
2016
All Laws Governmental Decrees Public Regulations
Fig. 2. Legislative acts about water protection in Czech Republic 1948-2019

595
Global J. Environ. Sci. Manage., 7(4): 587-598, Autumn 2021
area decreases but the number of Public Regulations of individual ministries regulations increases, this is another level of management. If the number of national strategic documents grows in this situation, strategic management is demonstrated. The type of legal norms varies according to the political attitude to water protection. It shows the result of the proper legislative acts diversification among other acts in every period and their comparison. The change in the legislative approach is confirmed by the WEI which has been measured by European institutions
since 1990. Decreasing WEI indicators identify more responsible and strategic approach to water use in the Czech Republic and correspond to presented average-per-year number of legislative acts (Fig. 4).
Laws The findings show the most significant number
of laws in the period 1990-1992. The lowest number of other legislative acts (decrees, regulations) was passed. Contrary, in the years 2004-2019, the number of laws decreased, and the number of implementing
Fig. 3. Increasing number of all legislative acts (laws, government decree, public regulations)
15
37
70
3
3.4
4.7
0 10 20 30 40 50 60 70 80
1990-1992
1993-2003
2004-2019
Legislative Acts by Average per Year Total Number of Legislative Acts
Fig. 3. Increasing number of all legislative acts (laws, government decree, public regulations)
Fig. 4: Changes in legislative acts (average per year) and Water Exploitation Index (WEI)
1990-1992 1993-2003 2004-2019Laws 2.3 1 0.75Government Decrees 1.3 0.5 0.5Public Regulations 1.3 1.8 3.1WEI 22.3 15.9 10.6
0
5
10
15
20
25
0
0.5
1
1.5
2
2.5
3
3.5
Aver
age
WEI
num
ber
Aver
age
legi
slativ
e ac
ts
Fig. 4: Changes in legislative acts (average per year) and Water Exploitation Index (WEI)

596
J. Nesiba and R. Cuhlova
regulations, government decrees, and public regulations increased. The ratio of laws to regulations and decrees was high in period of crisis management. The function of law is more valid than in terms of decrees or regulations (Schmidt and Matthews, 2017). There is no need to implement the law accurately and adapt it to the changing conditions in a crisis. In the period 1993-2003, the number of laws is declining. These laws were passed in line with EU interests as Czech laws were operationally adapted to European norms. This attitude towards water protection can be called as operational management. In the period 2004-2019, the situation was changing and laws were not issued so often. However, the regulations and decrees gained importance as part of strategical (action) plans.
Government decreesThe government decrees were 1.3 at the yearly
average from 1990 till 1992. From 1993 till 2003, the average was reduced to 0.5. This average volume remained the same in the following period 2004–2019. As defined above, this trend illustrates the operational management. Czech legislative acts were implemented with the interest of harmonization with the European law upon the Czech Republic’s accession to the EU.
Public regulationsThe average number of public regulations in the
monitored area proliferated due to both laws and governance decrees. Between 1990 and 1992, the average was 1.3. It gradually increased to 1.8 in the next monitored period 1993-2003 and the average reached even 3.1 in the last period after 2004. That indicates a change in the approach to water protection towards the operational management. However, combined with the fact that strategic national plans are growing in the same period, the role of strategic management should be considered. It was confirmed that the total sum of legislative acts for water protection in the Czech Republic has been increasing from 1990 till 2019. The research positively answered the research question (Q1), whether other types of management for water protection can be found in the statistical evaluation of legislative acts on bird protection. Different management methods can be indicated in the three monitored periods - crisis, operational and strategic management approach. To answer how the number of legislative acts has changed (SQ1);
crisis management during 1990-1992 focused on the most potent policy instrument, namely the passage of laws made by Czech (Czechoslovakia) Parliament. Crisis management manifested itself in an attempt to politically change the overall public attitude to water protection in Czechoslovakia. The governmental laws were the common instrument (Roquilly, 2009). On the other side, the least sub-legal standards (Government Decrees, Public Regulations) were used (and any water protection strategy was not formulated at the same time at all). In the following period 1993-2003, the number of governmental decrees and public regulations increased due to the implementation of Czech laws. These were adopted due to the accession negotiations with the EU. Government regulations and public ordinances clarified the new laws to be harmonized with EU law. In the last period 2004-2019, the number of laws was decreasing but the number of strategies and strategic plans was simultaneously growing. It was also shown (SQ2) that in the monitored time, the ratio between individual legislative norms changed, and the number of implemented regulations (government decrees, public regulations) to the already existing laws increased. Moreover, the number of Czech strategic plans has proved to be presented. The research findings demonstrate the development of approved legislative acts. The relationship between laws, regulations and decrees can refer to three types of management - crisis, operational and strategic. These types of management can be assigned to the three stages of legislative development in the Czech Republic by a qualitative evaluation. Crisis management was characterized by the accelerated passing of laws in 1990-1992. Operational management was characterized by an effort to harmonize Czech and European standards in the years 1993-2003. That created an emphasis on the operational alignment of Czech laws with European legislation and the number of government decrees and public regulations increased. In the years 2004-2019, the number of laws decreased but contrary, the number of strategic plans as the basis of strategic management increased. During this period, there were tendencies towards strategic management of water protection in the Czech Republic. After 2020, there is a new period of legislative development in drinking water protection. The Czech Republic is a country with specific location in Europe. No river from foreign territory flows into the Czech Republic. Therefore, water protection is related to the overall protection of

597
Global J. Environ. Sci. Manage., 7(4): 587-598, Autumn 2021
nature (Kavan et al., 2021; Křešek et al., 2021). Forests in the Czech Republic are now being deforestrated due to the “bark beetle calamity”. Therefore, water management in the future should take into account the overall concept of nature and forest protection. The closest characteristic in the field of management is the so-called integral management that combines strategic plans with the creation of specific laws. The incorporation of the protection of drinking water into the Constitution of the Czech Republic is the first and currently happening step.
CONCLUSIONThe types, quantities and mutual ratio of legislative
acts dealing with water protection are changing in the Czech Republic. The presented analysis examined and evaluated 12,272 legislative acts. The changes in legislative acts correspond with different attitudes towards water protection and water management. As quantitative research standards in the Czech legislation has shown that there have been changes corresponding to three types of management (1990-1992, 1993-2003, 2004-2019). These legislative changes reflect the development of society and correspond to the overall social changes in the approach to nature protection. From a quantitative point of view, these approaches to nature protection can be linked to a qualitative approach where three different stages of water protection in the Czech Republic - crisis, operational and strategic management can be named. In conclusion, the recommendations for future development are delivered. A new type of integrated management should be implemented in water protection decision-making. This approach will link both strategic documents (so they do not contradict to each other), as well as these documents will be associated with the creation of specific laws. Public regulations and governmental decrees will serve as channels for the transfer of information between the strategy and the legislature.
AUTHOR CONTRIBUTIONSJ. Nesiba prepared the research design, analyzed
and interpreted the data. R. Cuhlova performed the literature review and prepared the manuscript text.
ACKNOWLEDGMENTSThe authors express their gratitude to the
Masaryk University and Mendel University in Brno
for providing facilities in organizing and conducting the work. This study did not receive any specific grant from funding agencies in the public and commercial centers.
CONFLICT OF INTERESTThe authors declare no potential conflict of
interest regarding the publication of this work. In addition, the ethical issues including plagiarism, informed consent, misconduct, data fabrication and, or falsification, double publication and, or submission, and redundancy have been completely witnessed by the authors.
ABBREVIATIONS
COICOP Classification of Individual Consumption by Purpose
e.g. For example
et al., And others
EU European Union
Fig. Figure
i.e. That is
SQ sub-question
SQ1 Sub-question 1
SQ2 Sub-question 2
Q1 Question 1
UN United Nations
WEI Water Exploitation Index
REFERENCESAnsoff, H.I.; Kipley, D.; Lewis, A.; Helm-Stevens, R., Ansoff, R.,
(2019). Implanting Strategic Management. 3rd Ed., Palgrave Macmillan. ISBN 978-3-319-99598-4.
Boin, A.; Christensen, T., (2008). The Development of public institutions reconsidering the role of leadership. Adm. Soc., 40(3): 271-297 (27 pages).
Bryson, J.; George, B., (2020). Strategic Management in Public Administration. In Oxford Research Encyclopedia: Politics, Oxford University Press, 1–26 (26 pages).
Bundy J.; Pfarrer, M.D.; Cole, C.E.; Coombs, W.T., (2016). Crises and Crisis Management: Integration, Interpretation, and Research Development. J. Manage., 43(6): 1661-1692 (32 pages).
Carson, R., (1962). Silent Spring, Harcourt: Houghton Mifflin. ISBN 978-0-618-24906-0.
DeGroot, M.H.; Fienberg, S.E.; Kadane, J.B. (eds.), (1994). Statistics and the Law. New York, Wiley.
Deverell, E., (2012). Investigating the Roots of Crisis Management Studies and Outlining Future Trajectories for the Field. J. Homeland Secur. Emergency Manage., 9(1), Art. 24.
Dikovitsky V.V.; Shishaev M.G., (2019). Automated Extraction of

598
J. Nesiba and R. Cuhlova
Deontological Statements Through a Multilevel Analysis of Legal Acts. In: Silhavy, R.; Silhavy, P.; Prokopova, Z. (eds.) Computational and Statistical Methods in Intelligent Systems. CoMeSySo 2018. Advances in Intelligent Systems and Computing, 859. Springer, Cham.
Frandsen, F.; Johansen, W., (2011). The study of internal crisis communication: towards an integrative framework. Corporate Commun. Int. J., 16(4): 347-361 (15 pages).
George, B.; Walker, R.; Monster, J., (2019). Does Strategic Planning Improve Organizational Performance? A Meta-Analysis. Public Adm. Rev., 79(6): 810-819 (20 pages).
Gleeson, P., (2019). Strategic Management With Long and Short Term Objectives. Chron.
Joyce, P., (2015). Strategic Management in the Public Sector. London: Routledge. ISBN 978-0-4155-2763-7.
Jung, CH.S.; Geon, L., (2013). Goals, Strategic Planning, and Performance in Government Agencies. Public Manage. Rev., 15(6): 787–815 (29 pages).
Kavan, Š.; Kročová, Š.; Pokorný, J., (2021). Assessment of the Readiness and Resilience of Czech Society against Water-Related Crises. Hydrology. 8(1): 14-30 (17 pages).
Keiser D.A.; Shapiro J.S., (2019). Consequences of the Clean Water Act and the Demand for Water. Q. J. Econ., 134 (1): 349–396 (48 pages).
Kouzmin, A., (2008). Crisis Management in Crisis? Admin Theory Praxis, 30(2): 155-183 (28 pages).
Křeček, J.; Nováková, J.; Palán, L.; Pažourková, E.; Stuchlík, E., (2021). Role of forests in headwater control with changing environment and society. Int. Soil Water Conserv. Res., 9(1): 143-157 (15 pages).
Locke, E.A.; Latham, G.P., (2002). Building a Practically Useful Theory of Goal Setting and Task Motivation: A 35-Year Odyssey. Am. Psychol., 57(9): 705–17 (13 pages).
McAdam R., Walker, T.; Hazlett, S.A., (2011). An inquiry into the strategic-operational role of performance management in local government. Int. J. Public Sector M., 24(4): 303-324 (22 pages).
Meadows, D.H.; Meadows, D.L.; Randers, J.; Behrens, W.W., (1972).
The Limits to growth; a report for the Club of Rome’s project on the predicament of mankind. New York: Universe Book. ISBN 0-87663-165-0.
Menguc, B.; Auh, S.; Ozanne, L., (2010) The Interactive Effect of Internal and External Factors on a Proactive Environmental Strategy and its Influence on a Firm’s Performance. J. Bus. Ethics., 94: 279–298 (20 pages).
Monday, J.U.; Akinola, G. O.; Ologbenla, P.; Oluwatobilola K.A., (2015). Strategic management and firm performance: A study of selected manufacturing companies in Nigeria. Eur. J. Bus. Manage., 7(2): 161-171 (11 pages).
Nesiba, J.; Smolík, J., (2019). Ethical management in regional and corporate water management in the Czech Republic. [in Czech: Etický management v regionálním a korporátním vodárenství v ČR.] In: Conference proceedings from XXII. International colloquium on regional sciences. Brno: Masaryk University, 680-689 (10 pages).
Palát, M.; Prax, A.; Palát, Jr.M.; Rožnovský, J., (2010). Causes and Consequences of a Flood Wave on the Lower Reach of the Dyje River Near Břeclav. Soil Water Res., 5: 121-127 (7 pages).
Povitkina, M.; Bolkvadze K., (2019). Fresh pipes with dirty water: How quality of government shapes the provision of public goods in democracies. Eur. J. Political Res., 58(4): 1191-1212 (22 pages).
Roquilly, CH., (2009). From Legal Monitoring to Legal Core Competency: How to Integrate the Legal Dimension into Strategic Management. In Masson, A.; Shariff, M.J. (eds), Legal Strategies. How Corporations Use Law to Improve Performance. Springer-Verlag Berlin Heidelberg.
Pedersen, C.L., Ritter, T., Di Benedetto, C.A., (2020). Managing through a crisis: Managerial implications for business-to-business firms. Ind. Mark. Manage., 88: 314–322 (9 pages).
Schmidt, J.J.; Matthews, N., (2017). Global Challenges in Water Governance: Environments, Economies, Societies. Palgrave Macmillan.
Zeemering, E.S., (2018). Sustainability management, strategy and reform in local government. Public M. Rev., 20(1): 136-153 (18 pages).
AUTHOR (S) BIOSKETCHES
Nesiba, J., Ph.D., Assistant Professor, Department of Social Studies, Faculty of Regional Development and International Studies, Mendel University in Brno, Brno, Czech Republic. Email: [email protected]
Cuhlova, R., Ph.D., Assistant Professor, Department of Corporate Economy, Faculty of Economics and Administration, Masaryk University, Brno, Czech Republic. Email: [email protected]
HOW TO CITE THIS ARTICLE
Nesiba, J.; Cuhlova, R., (2021). Analysis of legislative acts in water management. Global J. Environ. Sci. Manage., 7(4) 587-598.
DOI: 10.22034/gjesm.2021.04.07
url: https://www.gjesm.net/article_244129.html
COPYRIGHTS
©2021 The author(s). This is an open access article distributed under the terms of the Creative Commons Attribution (CC BY 4.0), which permits unrestricted use, distribution, and reproduction in any medium, as long as the original authors and source are cited. No permission is required from the authors or the publishers.

Global J. Environ. Sci. Manage. 7(4): 599-624, Autumn 2021
*Corresponding Author:Email: [email protected]: +62 813251 15551 Fax: +6222 25 10102
Global Journal of Environmental Science and Management (GJESM)
Homepage: https://www.gjesm.net/
CASE STUDY
Resident-based learning model for sustainable resident participation in municipal solid waste management program
A. Ghazali, J.H. Tjakraatmadja, Sunarti*, E.Y.D. Pratiwi
School of Business and Management, Institut Teknologi Bandung, Bandung City, Indonesia
BACKGROUND AND OBJECTIVES: Encouraging resident participation in the Municipal Solid Waste Management system still becomes a challenge for cities in developing countries. Previous studies showed that existing education strategies ineffective and insufficient to change resident behavior sustainably. Therefore, this study aimed to develop a resident-based learning model to encourage sustainable resident participation in waste management programs at the household level using the Community of Practice approach.METHODS: This study was a conceptual model study using a case study as the research strategy. The case being analyzed was Kawasan Bebas Sampah (Zero Waste Area) program implemented in Bandung City, Indonesia. The primary data was collected through field observation on the 8 Kawasan bebas sampah and in-depth interviews with 63 key informants comprising 31 key actors in the educational programs and 32 informants as resident representatives, conducted from January 2020 – November 2020. Additional data from the quantitative method was gathered in April 2021, focusing on surveying resident’s habits toward waste management as evidence of the program result. FINDINGS: The findings showed that the education strategy implemented in Bandung City, Indonesia presented effective results, based on waste reduction rate reaching up to 0, 47% at the city level from 2019 to 2020. The survey provided evidence that the education program has succeeded in forming new habits for residents. Averagely 60% of respondents in each sample area have the habits and up to > 90% for the areas with more durable education program. Some critical points for education strategy implementations are identified. First, collaboration and supports from key stakeholders such as facilitators, local leaders, and educators become the enabler of the program. Second, key stakeholders need to identify knowledge and value needs before the program started. Third, the learning activities are conditioned to facilitate practice-based and dialogue-based learning through group and non-group learning activities. Fourth, local cadres are vital to sustaining the education program.CONCLUSION: This study has succeeded in giving a new strategic approach to improve resident participation in municipal solid waste management. The resident-based learning model proposed in this study offered a more effective strategy for other cities in developing countries to improve the sustainable participation of residents in their waste management system. However, some adjustments may be required for residents with different characteristics. Future studies may focus on testing and refining the model to improve its applicability.
©2021 GJESM. All rights reserved.
ARTICLE INFO
Article History:Received 17 February 2021Revised 29 April 2021Accepted 5 June 2021
Keywords:Household participationKawasan bebas sampah (KBS)Municipal solid waste
managementWaste management behaviorWaste management sustainability
ABSTRAC T
DOI: 10.22034/gjesm.2021.04.08
NUMBER OF REFERENCES
57NUMBER OF FIGURES
9NUMBER OF TABLES
8
Note: Discussion period for this manuscript open until January 1, 2022 on GJESM website at the “Show Article.

600
A. Ghazali et al.
INTRODUCTIONHousehold waste is to be the most dominant
component of Municipal Solid Waste (MSW) in many developing countries (Esmaeilizadeh et al., 2020; Jouhara et al., 2017; Speier et al., 2018;), which reached up to 55 – 85 % of MSW composition (Banerjee and Sarkhel, 2019). It indicated the crucial role of resident participation in the MSWM system (Kamaruddin et al., 2017). Sustainable waste management at the household level remains a challenge due to high reliance on resident behavior (Jiang et al., 2021; Moh and Manaf, 2017; Mukama et al., 2016;), which has become the core problem in many cities in developing countries (Azevedo et al., 2021; Banerjee and Sarkhel, 2019; Gundupalli et al., 2017). Previous studies showed that education becomes one of the most critical factors to change resident behavior (Meng et al., 2019; Liu et al., 2019). However, existing education for residents in developing countries was considered ineffective and insufficient (Moh and Manaf, 2017; Wang et al., 2018). Education cannot directly influence resident behavior toward waste management (Wang et al., 2018). It is mediated by personal factor such as awareness (Chen and Gao, 2020; Lissah et al., 2021; Pierini et al., 2021), attitude (Lissah et al., 2021; Liu et al., 2019; Wang et al., 2018), and moral norms (Wang et al., 2018) to effectively nurture resident willingness to participate and change their behavior (Liu et al., 2019; Meng et al., 2019; Wang et al., 2018). It is expected that the waste management behavior finally becomes their habit (Liao et al., 2018; Moh and Manaf, 2017; Xu et al., 2017). Education strategy should be improved to be more effective and impactful to promote personal factors (Chen and Gao, 2020; Pierini et al., 2021; Wang et al., 2018; Zheng et al., 2020). This situation raises a question, what education strategy is more effective and impactful to nurture sustainable change on resident waste management behavior? Some studies offered several approaches for resident-based education improvements. Wang et al. (2018) recommended more informative and frequently shared information campaigns using posters and social media to reach more broadened communities, but Zheng (2020) found that media publicity has an insignificant impact and extensive publicity is not the solution. As indicated by Jiang et al. (2021), publicity was to be a communication channel to strengthen willingness.
So, it may become a supporting system, instead of being the primary education approach. Pierini et al. (2021) proposed a relatively new strategy for resident-based waste management education through the citizen science concept while Pei (2019) and Zheng et al. (2020) advocated neighborhood ties, community attachment, and social connections, which highly rely on community empowerment for effective education. Chikowore (2020) added active community involvement as a behavioral change driver for sustainable waste management practice. It is expected that education can build new habits (Liao et al., 2018; Xu et al., 2017). In Knowledge Management (KM), intensive interaction and community engagement for educational purposes can be facilitated by a Community of Practice (CoP). The CoP concept was firstly introduced by Wenger et al. (2002), who contended that CoP becomes the source of learning and knowledge sharing for a particular community. A CoP is underpinned by the notion of social learning theory emphasizing informal learning groups with intensive interaction to deal with shared problems of the members (Denscombe, 2008; Stein, 2005). CoP is developed based on knowledge domain, comprising community identity determined by shared problems among members (Dessne and Byström, 2015; Madsen and Noe, 2012) and the community objectives (Middlemiss and Parrish, 2010; Reed et al., 2014). So, CoP can be implemented in various domain, including waste management. Both shared problems and community objectives influence knowledge and value being shared, improved, and maintained by the communities (Li et al., 2009; Madsen and Noe, 2012). The main goal of the learning activity is to prevent knowledge gap among members, so that the shared knowledge should be transferred to all the members and improve their practice (Li et al., 2009). CoP enables social learning in two forms: collective learning and individual learning (Madsen and Noe, 2012; Tran et al., 2018). The learning group in CoP can be formed naturally or intentionally to reach specific group objectives (Wenger et al., 2002). As the learning interaction is conducted intensively (Stein, 2005), the members become experts on their problemd (Ghazali et al., 2017). In the learning process, personal elements play a vital role, especially the leaders. Wenger et al. (2002) and Reed et al. (2014) indicated collaborative leadership for CoP success, meaning that the leadership should be
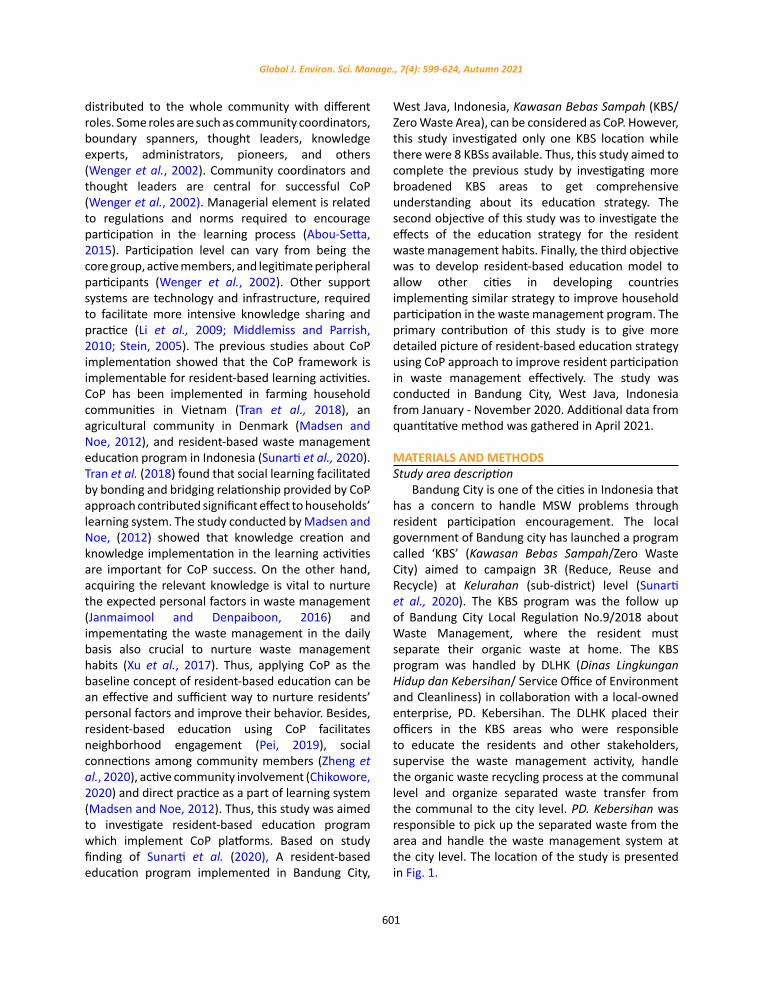
601
Global J. Environ. Sci. Manage., 7(4): 599-624, Autumn 2021
distributed to the whole community with different roles. Some roles are such as community coordinators, boundary spanners, thought leaders, knowledge experts, administrators, pioneers, and others (Wenger et al., 2002). Community coordinators and thought leaders are central for successful CoP (Wenger et al., 2002). Managerial element is related to regulations and norms required to encourage participation in the learning process (Abou-Setta, 2015). Participation level can vary from being the core group, active members, and legitimate peripheral participants (Wenger et al., 2002). Other support systems are technology and infrastructure, required to facilitate more intensive knowledge sharing and practice (Li et al., 2009; Middlemiss and Parrish, 2010; Stein, 2005). The previous studies about CoP implementation showed that the CoP framework is implementable for resident-based learning activities. CoP has been implemented in farming household communities in Vietnam (Tran et al., 2018), an agricultural community in Denmark (Madsen and Noe, 2012), and resident-based waste management education program in Indonesia (Sunarti et al., 2020). Tran et al. (2018) found that social learning facilitated by bonding and bridging relationship provided by CoP approach contributed significant effect to households’ learning system. The study conducted by Madsen and Noe, (2012) showed that knowledge creation and knowledge implementation in the learning activities are important for CoP success. On the other hand, acquiring the relevant knowledge is vital to nurture the expected personal factors in waste management (Janmaimool and Denpaiboon, 2016) and impementating the waste management in the daily basis also crucial to nurture waste management habits (Xu et al., 2017). Thus, applying CoP as the baseline concept of resident-based education can be an effective and sufficient way to nurture residents’ personal factors and improve their behavior. Besides, resident-based education using CoP facilitates neighborhood engagement (Pei, 2019), social connections among community members (Zheng et al., 2020), active community involvement (Chikowore, 2020) and direct practice as a part of learning system (Madsen and Noe, 2012). Thus, this study was aimed to investigate resident-based education program which implement CoP platforms. Based on study finding of Sunarti et al. (2020), A resident-based education program implemented in Bandung City,
West Java, Indonesia, Kawasan Bebas Sampah (KBS/Zero Waste Area), can be considered as CoP. However, this study investigated only one KBS location while there were 8 KBSs available. Thus, this study aimed to complete the previous study by investigating more broadened KBS areas to get comprehensive understanding about its education strategy. The second objective of this study was to investigate the effects of the education strategy for the resident waste management habits. Finally, the third objective was to develop resident-based education model to allow other cities in developing countries implementing similar strategy to improve household participation in the waste management program. The primary contribution of this study is to give more detailed picture of resident-based education strategy using CoP approach to improve resident participation in waste management effectively. The study was conducted in Bandung City, West Java, Indonesia from January - November 2020. Additional data from quantitative method was gathered in April 2021.
MATERIALS AND METHODSStudy area description
Bandung City is one of the cities in Indonesia that has a concern to handle MSW problems through resident participation encouragement. The local government of Bandung city has launched a program called ‘KBS’ (Kawasan Bebas Sampah/Zero Waste City) aimed to campaign 3R (Reduce, Reuse and Recycle) at Kelurahan (sub-district) level (Sunarti et al., 2020). The KBS program was the follow up of Bandung City Local Regulation No.9/2018 about Waste Management, where the resident must separate their organic waste at home. The KBS program was handled by DLHK (Dinas Lingkungan Hidup dan Kebersihan/ Service Office of Environment and Cleanliness) in collaboration with a local-owned enterprise, PD. Kebersihan. The DLHK placed their officers in the KBS areas who were responsible to educate the residents and other stakeholders, supervise the waste management activity, handle the organic waste recycling process at the communal level and organize separated waste transfer from the communal to the city level. PD. Kebersihan was responsible to pick up the separated waste from the area and handle the waste management system at the city level. The location of the study is presented in Fig. 1.

602
Resident-based learning model
The KBS program was initiated in 2015 by local NGOs at the ‘RW’ (Rukun Warga/community association) level. There were started from one RW and then expanded after a year. In 2019, the program was officially started as government’s program and reaching more expansive areas (kelurahan level). It was chosen 8 Kelurahans to be KBS models named KBS Sukaluyu, KBS Cihaurgeulis, KBS Neglasari, KBS Kebon Pisang, KBS Babakan Sari, KBS Kujangsari, and KBS Gempolsari. There was no exact data about how many households living in the KBS areas. Public statistics mostly provided number of group family. One household sometimes contains 2 – 4 families with only one waste disposal system. Each KBS commonly consists of 1,000 – 9,500 families. In total, the family groups living in all KBS areas were approximately 34,877 families. Assumed that each household contain 3 families, the total households were about 11, 625 households, spreading into 8 – 12 RWs/KBS. The whole residents in KBS areas were supposed to be exposed by the education program. Due to limited time, personal resources, and local leader problems, some RWs within KBSs did not get proper education. Before the program was started, all chosen areas implemented Collect – Transfer – Dispose system, similar with the municipal waste
management system implemented in other cities in Indonesia. With the new system, the program’s primary goal is to encourage residents’ involvement, especially on waste separation. If the chosen areas have spaces, the organic recycling centers are built within the area to enable the waste collector recycling the organic waste. The residents were also allowed to utilize the recycling tools if they want to. If there is no space available, the separated waste will be transferred to a recycling center at the city level. The recycling center was built within an RW/several RWs, so waste collectors quickly put the separated waste into recycling tools. The government provided a transfer system to put the separated waste from the KBS to the recycling center at the city level. The waste management system in KBS areas is presented in Fig. 2.
Study design and data collectionThe study’s unit of analysis was the KBS program
for residentials in Bandung City, which comprised 8 KBSs areas. This study was a conceptual model study using case study as research strategy. There were employed multiple methods to gather the data for better understanding toward cases (Yin, 2014). This study’s main method was qualitative, conducted from
Fig. 1: Geographic location of the study area in Bandung City, West Java, Indonesia
Fig. 1: Geographic location of the study area in Bandung City, West Java, Indonesia

603
Global J. Environ. Sci. Manage., 7(4): 599-624, Autumn 2021
January 2020 – November 2020. The quantitative data collection was gathered afterwards in April 2021 to get evidence about the effect of KBS program. It used abductive approach, as the data collection was applied to examine a phenomenon, recognize patterns and themes, locate the finding into a conceptual framework to modify existing theory which was subsequently tested through additional data collection (Saunders, 2019). The primary techniques to gather the data were in-depth interviews and field observation. It was added a survey about habits about waste management as education strategy evidence. For qualitative data analysis, the content
analyzed and synthesized was from the verbatim version of the interviews and field observation. The data was then triangulated and synthesized to build the resident-based education model. Therefore, this study can be considered as a conceptual model study (Jaakkola, 2020) using a directed Qualitative Content Analysis (QCA) approach (Assarroudi et al., 2018). Data triangulation was conducted to improve the internal validity of the qualitative research. There were five types of data triangulation for internal validity in qualitative research: data source, method, researcher, theory, and data type triangulation (Miles et al., 2014). For this study, the triangulation was based on the data
Fig. 2: Waste Management system in KBS areas
Fig. 2: Waste Management system in KBS areas
Table 1: Key Informants of the study
No Data
Co
llect
ion
Position
Number of Informants for every KBS
Suka luyu
Cihaur geulis
Negla sari
Kebon Pisang
Suka miskin
Babakan Sari
Kujang Sari
Gempol Sari
Number of Participants
1
Inte
rvie
ws
Mentor 1 1 - 1 1 1 1 1
63 2 Supervisor 2 2 2 2 2 1 1 1
3 Local leaders 2 1 3 1 - 1 2 1
4 Residents 3 3 3 3 3 3 3 3
5
Surv
ey
Residents 40 103 71 60 89 70 27 30 490
Table 1: Key Informants of the study

604
A. Ghazali et al.
source and method variation. The data source for qualitative method was from different persons with various roles, interviewed at different times and from different places. The data collection methods were from in-depth interviews, observation, and documents. For qualitative data, it was chosen 63 key informants consisting of 31 key actors in the educational programs and 32 informants as resident representatives. The sample selection technique was purposive sampling for the key actors in the educational programs and random sampling for the resident representatives. The informant selection from the key actors was based on the following criteria: 1) involve actively in the KBS activity for a considerable time, 2) have an essential role in the KBS activity, formally or informally. Therefore, the key actors from each KBS can be different because of the selection criteria consideration. The data collection was ended when the data gathered has been saturated. The survey respondents involved 490 residents as representatives of each KBS area which got sufficient educational exposure. The respondents were chosen using purposive-random sampling in which it was chosen residents who have been exposed by the education program. The key informants of the study are presented in Table 1.
Data analysisAccording to Jaakkola (2020), a conceptual model
study develops a model by identifying the existing elements or variables and then establishing the causal linkages of the elements. Main data was from qualitative method while quantitative data became
the evidence to support the qualitative findings. The main elements were identified based on generic categories resulted from the qualitative data analysis process. CoP main concepts become the preliminary codes as the initial categories/sub-categories. The data analysis process was started as the interview recordings were transcribed to get the verbatim version. The Directed QCA (Qualitative Content Analysis) approach was applied to code the verbatim data using A Computer-Assisted qualitative data software (CAQDAS) named NVIVO 12. While Miles et al. (2014) provided six classic steps of qualitative data analysis, Assarroudi et al. (2018) introduced 16 steps of directed QCA comprising three main phases: the preparation phase, the organization phase, and reporting phase to increase the trustworthiness of directed QCA approach. In this study, it is combined the two versions by grouping some steps altogether. The learning model in this study was developed by determining the input, process, and output elements leading to resident participation improvement in the MSWM program based on the findings. The whole process of research methodology was presented in Fig. 3.
RESULTS AND DISCUSSIONPersonal elements and their roles
According to the interviews and field observation, stakeholders who have crucial roles in the KBS program were identified. All stakeholders involved and their roles in the KBS program are shown in Table 2.
There were 8 KBSs chosen based on their
Fig. 3: Qualitative data analysis process using Directed QCA (Assarroudi et al., 2018; Miles et al., 2014)
Specify unit of analysis and select samples
Decide main categories based on CoP key concept and define
Operational Definition
Developing open‐ended questions according to study’s aim and directed questions based on main categories
Conduct interview and transcribe the data
Read transcribed interviews several times and Extract
meaning
Group preliminary codes and new main and sub‐
categories, according to similarities, difference and patterns that result generic
Determine formative matrix of main and
subcategories
Code contents using main and sub‐categories as preliminary codes and derive new main
categories and sub‐categories based on findings
Establish links between
generic and main
categories
Fig. 3: Qualitative data analysis process using Directed QCA (Assarroudi et al., 2018; Miles et al., 2014)

605
Global J. Environ. Sci. Manage., 7(4): 599-624, Autumn 2021
achievement in various local championships conducted by local government for RW level. In 2019, the 8 KBSs had intensive guidance from DLHK as program organizer and owner. DLHK organized the program and collaborated with PD. Kebersihan to manage the waste further. For every KBS, DLHK provided a ‘mentor’ as a knowledge expert and a thought leader at the same time, accompanied by two ‘supervisors’ chosen from the residents. The mentors collaborated with the government representative in Kelurahan (Structural local leaders) including ‘KASIE EKBANG’ (Kepala Seksi Ekonomi Pembangunan/Economic Development Section Chief), ‘PKK’ (housemother organization), ‘RW chiefs’, ‘RT chiefs’ (Rukun tetangga/neighborhood/the lower level of RW), and ‘Karang Taruna’ (Youth Organization). They bridge the educators to the residents, organize the residents and also educate the residents. In some KBSs, there were also NGOs who support the program and other outsiders. Finally, the key actors who also become the target of education programs were residents and waste collectors. Residents should separate their waste at home, while waste collectors should be responsible for waste collection waste transfer and waste recycling at communal level. When the KBS first started, the
structural local leaders (RT/RW chiefs, PKK chief) played a vital role in the community because mentors were outsider, so they need to be introduced and allowed to interact with the residents. Once the local structural leaders were not active in bridging the education mission by mentors, there will be no learning activities in the related RW areas. These unexposed areas were found in many RWs in KBS Kujangsari, KBS Gempolsari and small number of RWs in other KBSs. It showed that structural local leaders played a role as community organizers and boundary spanner at the same time (Wenger et al., 2002). This finding confirmed the importance of active community involvement to be change driver in the community as suggested by Chikowore (2020) and existence of boundary spanners to bridge difference between multi stakeholders as suggested by Reed et al., (2014). Wenger et al. (2002) also emphasized the importance of community organizers at initial process of CoP development. To help mentors educating the residents, there were supervisors, recruited from the residents interested in joining the program. The supervisors stay in the area to supervise waste management practice conducted by the residents and waste collectors. Unlike the mentors, supervisors and waste collectors were mainly
Table 2: KBS Program stakeholders
Organization Stakeholders Roles in KBS Program Status of the Roles
Government Party
DLHK administrator, knowledge sharing and infrastructure facilitator mandatory
PD. Kebersihan waste management operator at city level supporting function mentors official thought leader, knowledge expert mandatory
supervisors supervising and monitoring the waste management activities, boundary spanner, knowledge expert
mandatory
(Lurah/KASIE EKBANG)
field representative of Kelurahan, facilitator, community organizer,
supporting function Structural local leaders under Kelurahan
mandatory
RW/RT Chiefs facilitator, community organizer, pioneer encouraged PKK members community organizer, local cadre voluntary
Local Residents
karang taruna voluntary educator, local cadre voluntary
residents Waste management operator at household level encouraged
waste Collector Waste management operator at communal level mandatory
NGOs e.g. YPBB, GSSI External (boundary spanner) voluntary
Outsider environmental communities, temporary knowledge experts voluntary (only found in KBS Kebon
Pisang) visiting Students voluntary educator
Table 2: KBS Program stakeholders

606
Resident-based learning model
joined because of occupation instead of enthusiasm toward the program. Local government and mentors should prepare their readiness by organizing formal knowledge sharing activities with all supervisors and waste collectors before the program started. This event was mainly to encourage their motivation in doing their task and give them basic skills on waste management practice. However, the study found that some waste collectors did not do their job, causing abandoned recycling infrastructure in the area. Some informants stated that it can be because either waste collectors had not enough skills to utilize the tools, or they did not want to recycle the organic waste. It is also implied by 7 informants that waste collectors mixed their separated waste, causing residents’ reluctance in separating waste anymore. This finding confirmed the importance of internal motivation (passion) to join the CoP for successful learning process as suggested by Abou-setta (2015). As waste collectors and supervisors were recruited, they should be educated intensively to nurture their internal motivation. The other personal element involved was local cadres who helped the educator team and local leaders educating a vast number of residents. Local cadres played a role as knowledge experts and community organizers at the same time. This requirement is crucial, especially for KBS that covers a wide area. Moreover, the leaders who were active typically has a limited territory (e.g., KBS Sukaluyu, KBS Kujangsari, KBS Kebon Pisang), and limited time length of service, causing their inability to reach other areas outside their territory and disable them to conduct sustainable learning activities. Thus, the program needs more leaders in a smaller group (such as within an RW) to work effectively. Local cadres’ existence confirmed Wenger et al. (2002)’s
suggestion about small groups to facilitate personal relationship among peripheral members. Thus, neighborhood ties, community engagement and social interaction as proposed by Pei (2019) and Zheng et al. (2020) can still be facilitated. However, local cadres were commonly chosen from the local organization members such as PKK, Karang Taruna. Some KBSs even obliged the organization members to be the cadres causing possibility of internal motivation absence on the local cadres as suggested by Abou-setta (2015). Improvement can be achieved by allowing any residents who have enthusiasm toward the domain to join. Thus, local cadres are chosen not due to their activeness in the local organization under the structural government body, but their enthusiasm toward the program. Moreover, they played as knowledge experts for the residents so that intensive knowledge sharing activities with primary educators are required. In 2020, DLHK only continued the guidance to 2 KBSs: KBS Sukamiskin and KBS Cihaurgeulis. The other KBSs can continue the program and PD. Kebersihan still handled the waste management at city level. Only Lurah at KBS Neglasari continued the program officially (sub-district level), while other KBSs mostly continued it independently without kelurahan guidance. As a result, only some RWs/RTs which stay active, if they have local leaders to organize them. This confirmed the vital role of community organizer as suggested by Wenger et al. (2002). However, most local leaders were from RW chiefs and or RT chiefs which have limited territory (RT or RW level). So, they cannot affect other RT/RWs outside their coverage, causing limited area to continue the program. The detailed information about leadership existence in each KBs is presented in Table 3.
Table 3: Leadership existence in every KBS
KBS Facilitators Community Organizers
Thought Leaders
Knowledge Experts
Boundary Spanners Pioneers
KBS Sukaluyu √ - - - - √
KBS Cihaurgeulis √ √ √ √ √ √
KBS Neglasari √ √ - - - √
KBS Kebon Pisang - √ √ √ √ √
KBS Sukamiskin √ √ √ √ √ √
KBS Babakan Sari - - - - √ √
KBS Kujangsari - √ √ √ - √
KBS Gempolsari - - - - - √
Table 3: Leadership existence in every KBS

607
Global J. Environ. Sci. Manage., 7(4): 599-624, Autumn 2021
Knowledge domainKnowledge domain consisted of community
shared problems, program objectives, and knowledge and value in the learning activities. According to the interviews and field observation, it is found that the shared problems for all KBSs were similar. First, most residents’ mindset was not pro to the waste separation. Second, the residents had low awareness and no willingness to separate their waste. As a result, the participation rate on waste separation at the household level was low. The programs’ objectives were to encourage sustainable residents’ participation in waste separation at home by changing their mindset toward waste management, giving separation skills for the residents, and recycling skills for waste collectors and local leaders. The local leaders are encouraged to educate their residents by being role models to initiate waste separation and recycling at their homes. To reach the objectives,
educator team was mandated to educate residents, waste collectors and local leaders by disseminating several information, especially technical knowledge about organic waste separation. The educator team should also educate waste collectors and local leaders about recycling techniques of organic waste. Even though the main content of education was focused on technical knowledge, the educator team was permitted to implement other approaches to reach the objectives based on their initiatives. Therefore, it was found various other knowledge and value being shared as the educational contents. According to the observation and interviews, their decision to share specific additional knowledge and value were based on the educators’ knowledge and value toward waste management and their consideration toward the residents’ interest. For example, the educators who educate residents from low-income economic level will approach them by informing economic benefits
Table 4: The educational contents in the KBS
Type of knowledge and Value
KBS Sukaluyu
KBS Cihaurgeulis
KBS Neglasari
KBS Kebon Pisang
KBS Sukamiskin
KBS Babakan
Sari
KBS Kujangsari
KBS Gempol Sari
1. Technical knowledge of waste segregation for residents, mainly for organic waste
√ √ √ √ √ √ √ √
2. Technical knowledge of organic waste recycling for waste collectors and local leaders
√ √ √ √ √ √ √ √
3. Practical tips to reduce and recycle organic waste √ √
4. Recycling technique of inorganic waste √ √ √ √
5. Impacts of waste for environment and health √ √ √ √ √
6. Benefits of organic waste for planting √ √ √ √
7. Economic benefits of inorganic waste √ √ √ √
8. Local regulation about waste segregation √ √ √
9. Individual and social roles to environmental protection
√ √ √
10. Social Religious value toward personal obligation to environment
√ √
11. Cleanliness for aesthetics √
Table 4: The educational contents in the KBS

608
A. Ghazali et al.
of waste. They also activate waste banks to facilitate valuable inorganic waste sale from the residents as found in KBS Kebon Pisang, KBS Sukamiskin, KBS Kujangsari, and KBS Gempolsari. Education in KBS Kebon Pisang were concerned about cleanliness for aesthetics because one of the RWs in the KBS has been famous for their Mural Art village. Some educators shared environmental values, religious obligations, and responsibility toward environmental protection and organic waste benefits because they were more into the contents. It showed educators’ preference and their knowledge influence their decision to choose what content will be shared. The detailed information about knowledge and value being shared as the educational contents in KBSs is presented in Table 4.
Previous studies showed that some of mentioned knowledge and value in Table 4 were crucial to encourage residents to participate in waste management. The knowledge about harmful impacts of waste to environment and health, was found only in 5 KBSs. According to previous studies, this knowledge was crucial to improve personal awareness toward waste management (Moh and Manaf, 2017) which had significant effect to waste separation and recycling behavior of residents in other countries such as China (Fan et al., 2019; Meng et al., 2019) and Singapore (Fan et al., 2019). Sharing knowledge about waste management benefits was found in different places. KBSs which highlighted additional income from waste did not campaign benefits of organic waste for planting, and vice versa. It was probably because of educator consideration toward the residents’ characteristic as suggested by Knickmeyer (2019) and Sunarti et al. (2021) who stated that educational approach should be adjusted to residents’ typicality. Previous studies confirmed that economic profit became the powerful driver of waste management behavior (Chen and Gao, 2020), thought it may be more impactful for low-income residents (Sunarti et al., 2021). The combination of awareness to waste management and perceived benefits will nurture strong motivation to participation (Wadehra and Mishra, 2018). Other educational contents being shared were about individual and social roles to environmental protection and social religious value toward personal obligation to environment, found in 4 KBSs. These two contents highlighted
that knowledge about the individual and social responsibilities was associated with personal moral responsibility (Zebua and Suhardini, 2021; Wang et al., 2020). Previous studies, such as Mukama (2016) and Liu et al. (2019) prove that personal moral responsibility and motivation had crucial effect to attitude toward waste management. Combination among awareness, personal moral responsibility and attitude was also proven to be influential to encourage willingness to participate in waste management in China (Meng et al., 2019; Zhang et al., 2019). In fact, personal moral responsibilities which were nurtured through social-religious value have affected sustainable waste management behavior of community members in Malaysia (Tiew et al., 2015). As implied by Aboul-Enein (2017) and Zebua and Suhardini (2021), educating residents through a religious value approach is vital especially for the religious communities as Bandung City residents. Some educators in KBS Sukaluyu, KBS Cihaurgeulis and KBS Sukamiskin also socialized local regulation about waste separation obligation, while educators in other KBS areas stated that they did not want to encourage the residents through law enforcement because they want the residents to separate voluntarily. This consideration may be true, but past studies, for instance Xu et al. (2017) and Ma et al. (2018), found that regulation was influential for initial encouragement to improve their skill and form new habits. The importance of habituation for learning approach was also mentioned by 9 informants from 7 to build sustainable participation on waste separation. But habituation without enlightening them about the value are not strong enough to sustain the participation, as indicated by 5 of resident representatives, who stated that they only followed the rules. They intended to end the separation activity once the rules were not enforced anymore. Even though previous literature showed significant effects of educational contents being shared by educators initiatively, there was no obligation for the educators to share the whole. The primary educational contents they shared were about technical knowledge. It indicated no identification of knowledge needs being done before the KBS started. Wenger et al. (2002) stated that one of the basic strategies to enable the CoP to achieve its goals is by identifying knowledge needs at the first step based on the shared problems. Wenger’s

609
Global J. Environ. Sci. Manage., 7(4): 599-624, Autumn 2021
statement was agreed by the study conducted by Janmaimool and Denpaiboon (2016) who indicated that knowledge relevance influence what personal factors will be nurtured. Thus, identifying knowledge and value needs should be done at first place. The findings from this study showed that the educational contents being shared by educators in the KBSs (Table 4) are vital to nurture waste management behavior. The crucial knowledge and value for waste management behavior improvement should be combined altogether to be effective (Sunarti et al., 2021). To confirm the driving factors of resident behavior in KBS area, the informants from residents’ representatives were asked to what factors causing them to keep participating in the waste management program for more than months. The result of driving factors is presented in Fig. 4.
The participants who have separated their waste for more than months mentioned at least 2 driving force that keep them participating in the waste separation program. For instance, a resident decided to participate in KBS program for an extended period because of three primary reasons: social value, regulation, and environmental awareness at the same time. Other resident representative stated that they stay participated because they get used to do it (habits) and they felt the benefits, especially for its cleanliness (environmental value). Beside the driving force resident participation, some insights about residents’ rejection in participation were
also identified. Some supervisors stated that the residents often complained about the separation because they have paid for the waste disposal. Other reasons were because they think that waste separation was supposed to be waste collectors’ job. These findings indicated low personal responsibility toward environment and their low understanding to the consequence of their behavior to the environment. These findings may indicate that the residents have not got the required knowledge in the knowledge sharing activities.
Knowledge sharing activitiesThe immediate concern in the KBS program is to
improve resident mindset and awareness to waste management, so they will be willing to participate and change their habits sustainably. There are some scheduled knowledge-sharing activities conducted in all KBS to reach the objectives. According to the study findings, there were some characteristics of learning activities found: 1) some activities were formal, given to all/specific stakeholders, without regular schedule (eventual), 2) some activities need certain requirement to join (informal membership), 3) activities with certain requirements have regular meeting schedule and specific activities conducted, 4) All activities have dialogue-based and/or practice-based learning. Based on the characteristics of knowledge sharing activities in the KBS areas, the activities were classified into two main forms: non-
Fig. 4: The driving force of residents’ participation in KBS program
Fig. 4: The driving force of residents’ participation in KBS program

610
A. Ghazali et al.
group and group learning activities. Non-group and group learning activities were presented in Table 5 and Table 6.
According to Table 5, educational contents were dominated by technical knowledge of waste management. A minor portion has been given for sharing knowledge about waste impacts on the environment, social and personal obligation to environmental protection and other essential contents. Regulation socialization was conducted to encourage learning from habituation to enable the
residents sensing the benefits as they experience it directly. Sensing the benefits may be limited when they were not informed about the value of the waste management activity through dialogue. Therefore, the perceived value driving resident participation was dominated by environmental value (cleanliness) and economic value which they felt directly (Fig. 4). Non-group learning activities tended to lack intensiveness and iterative cycle because most activities were held 1-3 times/year (eventual). Other knowledge sharing activities were also too short (e.g., DTDE), causing
Table 5: Profile of Non-group Learning Activities in KBS Program
Organizers Type of Learning Educational Contents
Freq of Learning Targets Knowledge
Sharing Mentors, Supervisors, Kelurahan, NGOs
Recycle Training for organic waste - Technical knowledge about waste recycling (household composters) - Technical knowledge about waste separation - Background of the program (waste issues) - Regulation socialization
1 – 3 times/year
Local Leaders (RWs, RTs, PKK, Karang Taruna, Kelurahan)
Practice-based learning
Mentor and supervisors
1. Program Socialization in Kelurahan
1 – 3 times/year
Dialogue-based learning
2. Program Socialization embedded in local leader meetings (RW meetings, RT meetings)
Eventual (according to meeting schedules)
Dialogue-based learning
Mentors, Supervisors, Kelurahan, NGOs
1. Recycle Training for organic waste
- Technical knowledge about waste recycling and waste separation - Background of the program (waste issues) - Regulation socialization
1 time before the program started and then being monitored in the field by the supervisors
Waste Collectors
Practice-based learning
2. Socialization about technical skill of waste separation and waste issues in Bandung City
Practice-based learning
Mentor and Supervisors accompanied with PKK members
1. Door to Door Education (DTDE)
- Technical knowledge about waste separation - Impacts of waste for environment and health - Regulation socialization
1 – 3 times / household, each time took 10 – 15 minutes
Residents Dialogue-based learning
2. Socialization through community activities (Senam Lansia/ elderly Workout, arisan, pengajian, Gerakan Pungut Sampah (GPS)/Trash Pick Motion)
- Technical knowledge about waste separation - Program socialization
At least every month Residents
Practice-based and dialogue-based learning
Table 5: Profile of Non-group Learning Activities in KBS Program
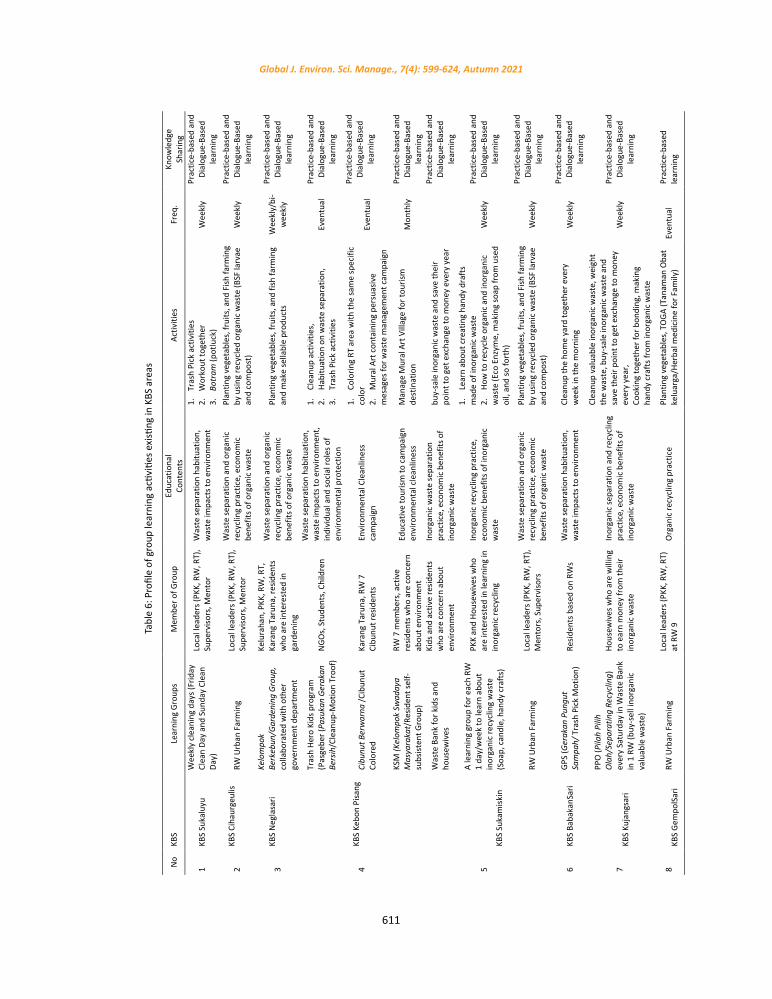
611
Global J. Environ. Sci. Manage., 7(4): 599-624, Autumn 2021
No
KBS
Lear
ning
Gro
ups
Mem
ber o
f Gro
up
Educ
atio
nal
Cont
ents
Ac
tiviti
es
Freq
. Kn
owle
dge
Shar
ing
1 KB
S Su
kalu
yu
Wee
kly
clea
ning
day
s (Fr
iday
Cl
ean
Day
and
Sund
ay C
lean
Da
y)
Loca
l lea
ders
(PKK
, RW
, RT)
, Su
perv
isors
, Men
tor
Was
te se
para
tion
habi
tuat
ion,
w
aste
impa
cts t
o en
viro
nmen
t
1.
Tras
h Pi
ck a
ctiv
ities
2.
W
orko
ut to
geth
er
3.
Botr
am (p
otlu
ck)
Wee
kly
Prac
tice-
base
d an
d Di
alog
ue-B
ased
le
arni
ng
2 KB
S Ci
haur
geul
is
RW U
rban
Far
min
g Lo
cal l
eade
rs (P
KK, R
W, R
T),
Supe
rviso
rs, M
ento
r
Was
te se
para
tion
and
orga
nic
recy
clin
g pr
actic
e, e
cono
mic
be
nefit
s of o
rgan
ic w
aste
Plan
ting
vege
tabl
es, f
ruits
, and
Fish
farm
ing
by u
sing
recy
cled
org
anic
was
te (B
SF la
rvae
an
d co
mpo
st)
Wee
kly
Prac
tice-
base
d an
d Di
alog
ue-B
ased
le
arni
ng
3 KB
S N
egla
sari
Kelo
mpo
k Be
rkeb
un/G
arde
ning
Gro
up,
colla
bora
ted
with
oth
er
gove
rnm
ent d
epar
tmen
t
Kelu
raha
n, P
KK, R
W, R
T,
Kara
ng T
arun
a, re
siden
ts
who
are
inte
rest
ed in
ga
rden
ing
Was
te se
para
tion
and
orga
nic
recy
clin
g pr
actic
e, e
cono
mic
be
nefit
s of o
rgan
ic w
aste
Plan
ting
vege
tabl
es, f
ruits
, and
fish
farm
ing
and
mak
e se
llabl
e pr
oduc
ts
Wee
kly/
bi-
wee
kly
Prac
tice-
base
d an
d Di
alog
ue-B
ased
le
arni
ng
4 KB
S Ke
bon
Pisa
ng
Tras
h He
ro K
ids p
rogr
am
(Pas
gebe
r (Pa
suka
n Ge
raka
n Be
rsih
/Cle
anup
-Mot
ion
Troo
f) N
GOs,
Stu
dent
s, C
hild
ren
Was
te se
para
tion
habi
tuat
ion,
w
aste
impa
cts t
o en
viro
nmen
t, in
divi
dual
and
soci
al ro
les o
f en
viro
nmen
tal p
rote
ctio
n
1.
Clea
nup
activ
ities
, 2.
Ha
bitu
atio
n on
was
te se
para
tion,
3.
Tr
ash
Pick
act
iviti
es
Even
tual
Pr
actic
e-ba
sed
and
Dial
ogue
-Bas
ed
lear
ning
Cibu
nut B
erw
arna
/Cib
unut
Co
lore
d Ka
rang
Tar
una,
RW
7
Cibu
nut r
esid
ents
En
viro
nmen
tal C
lean
lines
s ca
mpa
ign
1.
Colo
ring
RT a
rea
with
the
sam
e sp
ecifi
c co
lor
2.
Mur
al A
rt c
onta
inin
g pe
rsua
sive
mes
ages
for w
aste
man
agem
ent c
ampa
ign
Even
tual
Prac
tice-
base
d an
d Di
alog
ue-B
ased
le
arni
ng
KSM
(Kel
ompo
k Sw
aday
a M
asya
raka
t/Re
siden
t sel
f-su
bsist
ent G
roup
)
RW 7
mem
bers
, act
ive
resid
ents
who
are
con
cern
ab
out e
nviro
nmen
t
Educ
ativ
e to
urism
to c
ampa
ign
envi
ronm
enta
l cle
anlin
ess
Man
age
Mur
al A
rt V
illag
e fo
r tou
rism
de
stin
atio
n M
onth
ly
Prac
tice-
base
d an
d Di
alog
ue-B
ased
le
arni
ng
Was
te B
ank
for k
ids a
nd
hous
ewiv
es
Kids
and
act
ive
resid
ents
w
ho a
re c
once
rn a
bout
en
viro
nmen
t
Inor
gani
c w
aste
sepa
ratio
n pr
actic
e, e
cono
mic
ben
efits
of
inor
gani
c w
aste
buy-
sale
inor
gani
c w
aste
and
save
thei
r po
int t
o ge
t exc
hang
e to
mon
ey e
very
yea
r
Prac
tice-
base
d an
d Di
alog
ue-B
ased
le
arni
ng
5
KBS
Suka
misk
in
A le
arni
ng g
roup
for e
ach
RW
1 da
y/w
eek
to le
arn
abou
t in
orga
nic
recy
clin
g w
aste
(S
oap,
can
dle,
han
dy c
raft
s)
PKK
and
Hous
ewiv
es w
ho
are
inte
rest
ed in
lear
ning
in
inor
gani
c re
cycl
ing
Inor
gani
c re
cycl
ing
prac
tice,
ec
onom
ic b
enef
its o
f ino
rgan
ic
was
te
1.
Lear
n ab
out c
reat
ing
hand
y dr
afts
m
ade
of in
orga
nic
was
te
2.
How
to re
cycl
e or
gani
c an
d in
orga
nic
was
te (E
co E
nzym
e, m
akin
g so
ap fr
om u
sed
oil,
and
so fo
rth)
Wee
kly
Prac
tice-
base
d an
d Di
alog
ue-B
ased
le
arni
ng
RW
Urb
an F
arm
ing
Loca
l lea
ders
(PKK
, RW
, RT)
, M
ento
rs, S
uper
viso
rs
Was
te se
para
tion
and
orga
nic
recy
clin
g pr
actic
e, e
cono
mic
be
nefit
s of o
rgan
ic w
aste
Plan
ting
vege
tabl
es, f
ruits
, and
Fish
farm
ing
by u
sing
recy
cled
org
anic
was
te (B
SF la
rvae
an
d co
mpo
st)
Wee
kly
Prac
tice-
base
d an
d Di
alog
ue-B
ased
le
arni
ng
6 KB
S Ba
baka
nSar
i GP
S (G
erak
an P
ungu
t Sa
mpa
h/ T
rash
Pic
k M
otio
n)
Resid
ents
bas
ed o
n RW
s W
aste
sepa
ratio
n ha
bitu
atio
n,
was
te im
pact
s to
envi
ronm
ent
Clea
nup
the
hom
e ya
rd to
geth
er e
very
w
eek
in th
e m
orni
ng
Wee
kly
Prac
tice-
base
d an
d Di
alog
ue-B
ased
le
arni
ng
7 KB
S Ku
jang
sari
PPO
(Pila
h Pi
lih
Ola
h/Se
para
ting
Recy
clin
g)
ever
y Sa
turd
ay in
Was
te B
ank
in 1
RW
(buy
-sel
l ino
rgan
ic
valu
able
was
te)
Hous
ewiv
es w
ho a
re w
illin
g to
ear
n m
oney
from
thei
r in
orga
nic
was
te
Inor
gani
c se
para
tion
and
recy
clin
g pr
actic
e, e
cono
mic
ben
efits
of
inor
gani
c w
aste
Clea
nup
valu
able
inor
gani
c w
aste
, wei
ght
the
was
te, b
uy-s
ale
inor
gani
c w
aste
and
sa
ve th
eir p
oint
to g
et e
xcha
nge
to m
oney
ev
ery
year
, Co
okin
g to
geth
er fo
r bon
ding
, mak
ing
hand
y cr
afts
from
inor
gani
c w
aste
Wee
kly
Prac
tice-
base
d an
d Di
alog
ue-B
ased
le
arni
ng
8 RW
Urb
an F
arm
ing
Loca
l lea
ders
(PKK
, RW
, RT)
at
RW
9
Org
anic
recy
clin
g pr
actic
e Pl
antin
g ve
geta
bles
, TO
GA (T
anam
an O
bat
kelu
arga
/Her
bal m
edic
ine
for F
amily
) Ev
entu
al
Prac
tice-
base
d le
arni
ng
KBS
Gem
polS
ari
Tabl
e 6:
Pro
file
of g
roup
lear
ning
acti
vitie
s exi
sting
in K
BS a
reas

612
A. Ghazali et al.
little chance to share more knowledge, no possibility to have intensive interaction as typical activity in CoP (Tran et al., 2018; Wenger et al., 2002). Such learning activities also did not meet the requirements of expected education strategy as suggested by Chikowore (2020); Zheng et al. (2020) and Pei (2019). Meanwhile, group-based learning provided more intensive interaction with regular activities to allow bonding establishment as expected.
Table 6 presented some group-based joint activities conducted regularly. Weekly group activities allowed intensive and iterative learning processes, building bonding, community engagement and intensive communication among members which are impactful to encourage collective participation in waste management in other cities (Chen and Gao, 2020; Pei, 2019). Intensive and iterative learning activities enabled the members to sense their community identity (Li et al., 2009; Madsen and Noe, 2012; Wenger et al., 2002), nurture their sense of belonging, and build trust among members (Reed et al., 2014) which are essential to enable effective knowledge sharing. Moreover, most activities combined practice-based and dialogue-based learning for habituation and sharing required knowledge and value which are suggested by previous study for CoP success (Tran et al., 2018). In the learning group, the members are encouraged to learn by doing intensively enabling the members to sense the benefits of the waste management activities directly in the long term. According to the interview, 9 informants from 7 KBSs agreed that habituation is the best way to build new behavior for the residents related to waste management. The habituation is required to allow the residents to learn by doing, making the behavior familiar to them, and eventually building their new behavior by transforming the iterative practice into their new habits (Sunarti et al., 2021). According to literature, habituation through learning by doing practice is significant in affecting waste management behavior (Ulhasanah and Goto, 2018) and has been proven in changing residents’ behavior toward waste separation in many countries such as in China (Liao et al., 2018; Xu et al., 2017). Learning by doing was also suggested by Madsen and Noe (2012) for successful CoP based on their study about CoP in agricultural farmers. The group learning activities which were based on economic orientation such as Waste Banks and PPO are required but
cannot stand independently without non-economic-oriented activities. Dependence on extrinsic benefits such as only expecting money is disfavored because earning money from waste may have some limitations, such as marketing and product quality, as indicated by some informants. Moreover, the income was relatively low, which encouraged only low-income residents as indicated by previous studies (Almasi et al., 2019; Meng et al., 2019). In fact, the obstacles faced often cause low interest for several low-income residents as well, as found in KBS Kebon Pisang, KBS Sukaluyu and KBS Neglasari. Once they found a better way to make money, they will leave the activity. It indicated the vital role of balanced motivation between intrinsic motivation and extrinsic motivation for sustainable participation (Chen and Gao, 2020; Sunarti et al., 2021). Waste bank can be very useful when it becomes education approach for children as conducted in KBS Kebon Pisang. Through Trash Hero Kids and PASGEBER program, KBS Kebon Pisang has educated their youth since their childhood. This approach was positive for program sustainability because the children can be cadres in the future. Besides several positive impacts found in the group learning activities, some weaknesses were also identified. First, some learning groups are only accessible for local structural leaders (e.g., Kelompok Berkebun in KBS Neglasari and KSM in KBS Kebon Pisang). The learning groups were supposed to allow other members (including peripheral members) to join as they have enthusiasm toward the knowledge domain to regenerate more local cadres. Local cadres may not only from the structural organization under local leaders but also peripheral members who have readiness toward the domain. Second, the educational contents of the existing group learning activities were mostly still focused on technical knowledge of waste separation and waste recycling. More portions should be provided for other important contents such as waste impacts to environment and health, social and personal behavioral consequences that result responsibility to environmental conservation in dialogue-based learning activities. Less attention to fundamental knowledge being shared causes residents’ mindset focusing solely on extrinsic factors they sense (e.g., to obey the rules, to meet social norms, expect economic benefits), which was not enough to encourage sustainable participation (Issock et al., 2020; Lawrence et al., 2020; Zhang et al.,

613
Global J. Environ. Sci. Manage., 7(4): 599-624, Autumn 2021
2019). Third, the group learning was varied between KBSs. Combining several types of group learnings in every KBS to cover diverse groups of residents can be beneficial, such as groups for kids, housewives, youth, and any other possible groups, according to the potency of the area.
Managerial elementsManagerial elements were related to regulation
and norms to support mutual interactions and leadership with various roles to complement each other. Based on study findings, there is no obligation for the residents to involve in the joint activities even though waste separation practice is mandatory for all residents, according to the local regulation. The involvement in the community activities is only voluntary, while it is mandatory for local leaders and educators. Low enthusiasm and less perceived value toward the knowledge domain caused a few residents willing to join the learning activities. Therefore, non-group learning activities are still required to reach all residents for early campaign including for disseminating regulation about waste separation mandatory. Previous study found that dissemination of regulation was significant in encouraging participation in the waste management, if the participation mandatory (Liu et al., 2019). When the regulation about waste management practice was not mandatory, regulation publicity was proven to be insignificant in encouraging participation (Meng et al., 2019). As the mandatory for direct practice will encourage participation and habituation, the follow up should be involvement in the group learning activities to share knowledge and value more deeply and improve their practice. Social norms can be the tool to encourage their participation in the group learning activities. According to research findings, when residents within the same areas are close enough, they tend to feel shame when they were different from others. This cultural value was adopted by local cadres and educators when encouraging the residents in waste separation. This finding confirmed the study conducted by Chen and Gao (2020) who found that neighborhood influenced other people’s decision-making to participate in the recycling activity of households in China. This social norm should also be utilized to encourage group-learning participation for more effective learning result.
Infrastructure elementsThere were two primary facilities required in
waste management: organic waste bins and recycling facilities. According to the field observation, some KBS programs provided an organic waste bin for each house for the residents who have separated their waste (e.g., KBS Cihaurgeulis, KBS Neglasari). KBS Sukamiskin provided big-sized bins that cover several houses. Most residents’ representatives implied that they did not depend on waste bins to decide whether they want to separate or not. As presented in Fig. 4, most driving forces of their behavior beside habits were related to perceived value such as economic, environmental, social-religious, and health value. There were only 2 residents who stated that they would be more motivated to separate their waste if they get specific bins. It indicated that waste bins were not the primary driving force of the behavior. Instead, it may become the support system to moderate the separation behavior. Educators informed that residents did not have to provide brand-new waste bins for separation. They can use anything, such as secondhand buckets for the bins. In terms of recycling facilities, all informants stated no problems because DLHK provided all the required facilities for the recycling process including vehicles to carry the waste. Some recycling facilities were placed at recycling points at the communal level, while others were placed between housings. Some recycling facilities have different products, according to residents’ interests and or personal resource recycling skills. When the RWs or RTs had no space to put the facilities in the KBS areas, the separated waste will be handled by the government to be recycled further at the city level. The existing recycling facilities are presented in Table 7.
Commonly, all the KBSs (except KBSs guided by DLHK) relied on waste collectors to manage the recycling process unless the areas had local experts as found in KBS Kebon Pisang. The role of waste collectors was crucial if there were recycling facilities available in the area. However, most informants agreed that recycling facilities did not become the primary facilities they should have. Residents who sense the internal benefits, such as social-religious, environmental, and health value, implied that it does not matter if they cannot get concrete benefits from their separation activity; they will continue the separation activity

614
A. Ghazali et al.
because they have got the benefits directly. In contrast, residents who were mainly motivated by economic benefits for the activity will expect recycling products or money from selling/utilizing the inorganic recycling products. Different finding was found by the study conducted by Meng et al. (2019) and Trihadiningrum et al. (2017) who found that accessibility to separation and availability of recycling facilities were significant factors of waste management activities of residents in China and Indonesia. However, it was supported by previous study conducted by Lawrence (2020) who found that strong intrinsic motivation was enough to keep long-term participation of residents in Trinidad-
Table 7: Recycling facilities, the placement, and the end products
No Recycling facilities Placement Middle Products End products/utilization
1 Bata Terawang (Aerob Composter) Recycling Point compost Vegetables, flowers
2 BSF (Black Soldier Fliers) Recycling Point Animal feed Fish
3 Biopore/Loseda (organic waste holes) Between housings Compost directly to land
4 Takakura (portable Composter) Household compost Vegetables, flowers
5 Biodigester Recycling Point Gas Electricity
6 Waste Bank Recycling Point Earn money
7 Windrow Recycling Point compost Vegetables, flowers
8 hydroponic Recycling Point Vegetables
Table 7: Recycling facilities, the placement, and the end products
Fig. 5: Waste generation at Bandung City which was relatively decreased after education implementation (Source: PD. Kebersihan Archives)
0
200
400
600
800
1000
1200
1400
2015 2016 2017 2018 2019 2020
8661015
11021289 1340 1333
Waste Gen
eration (ton
s/da
y)
Year
Fig. 5: Waste generation at Bandung City which was relatively decreased after education implementation (Source: PD. Kebersihan Archives)
Tobago without external driver. Thus, recycling facilities in KBSs are optional if it is feasible, and it is suitable as residents’ expectation. The primary point is that the education should improve residents’ intrinsic and extrinsic perceived value of waste management to avoid dependency on facilities. When the intrinsic perceived value was higher, residents tend to be more effortless in supporting the program. In terms of technology utilization, there was no found technological involvement, except Whatsapp group. The group was utilized merely for information dissemination among local leaders. According to the interviews with the local leaders, most members were

615
Global J. Environ. Sci. Manage., 7(4): 599-624, Autumn 2021
passive in knowledge sharing in the platform. Instead, face-to-face and direct interaction are more dominant and more required because they live in the same areas. There were also no knowledge repositories found as the storage for the activity documentation, regulations of the communities required to be easily retrieved
anytime to support knowledge sharing (Koeglreiter et al., 2006). Knowledge repositories are required, especially for educators, to enable knowledge retrieval and performance re-evaluation for improvement. Thus, knowledge repositories can be crucial for the core members.
Fig. 6: Waste separation habits of residents in KBS area
0.00
10.00
20.00
30.00
40.00
50.00
60.00
70.00
80.00
Everyday
Often
Rarely
Never
Everyday
Often
Rarely
Never
Everyday
Often
Rarely
Never
Everyday
Often
Rarely
Never
Everyday
Often
Rarely
Never
Everyday
Often
Rarely
Never
Everyday
Often
Rarely
Never
Everyday
Often
Rarely
Never
KBSSukaluyu
KBSCihaurgeulis
KBSNeglasari
KBSKebonpisang
KBSSukamiskin
KBSBabakanSari
KBSKujangsari
KBSGempolsari
Percen
tage of R
espo
nd
Organic Waste Separation Habits inorganic Waste Separation HabitsFig. 6: Waste separation habits of residents in KBS area
Fig. 7: Waste recycling habits of residents in KBS area
0.00
10.00
20.00
30.00
40.00
50.00
60.00
70.00
80.00
Everyday
Often
Rarely
Never
Everyday
Often
Rarely
Never
Everyday
Often
Rarely
Never
Everyday
Often
Rarely
Never
Everyday
Often
Rarely
Never
Everyday
Often
Rarely
Never
Everyday
Often
Rarely
Never
Everyday
Often
Rarely
Never
KBSSukaluyu
KBSCihaurgeulis
KBSNeglasari
KBSKebonpisang
KBSSukamiskin
KBSBabakanSari
KBSKujangsari
KBSGempolsari
Percen
tage of R
espo
nd
Organic Waste Recycling Habits Inorganic Waste Recycling Habits
Fig. 7: Waste recycling habits of residents in KBS area

616
A. Ghazali et al.
Resident waste management behavior after education strategy Implementation
The effects of the resident-based education using CoP approach was gathered through secondary documents from the governments and survey to get information about resident waste management behavior. The information become the evidence to show the effectiveness of the resident-based education to improve resident changing behavior effectively. The profile of waste generation at city level from 2015 to 2020 is presented in Fig. 5.
Waste generation showed in Fig. 5 indicated waste reduction from 2019 to 2020 up to 0,47 % after slowing down from 2018 to 2019. Further evidence is given related to waste management habits of respondents who become resident representatives within KBS areas as presented in Fig. 6.
Data from the survey as presented in Fig. 6 showed that some KBSs presented high percentage of waste separation habits, averagely more than 60%. KBS Cihaurgeulis and KBS Sukamiskin showed higher percentage than other KBSs (>90%) because the two KBSs still get guidance from the government so that they get sufficient, intensive, and regular education with infrastructure supports. However most other KBSs (except KBS Gempolsari) which had no official guidance from government still showed relatively
positive habits. Organic separation habits in all KBSs are higher than inorganic waste separation habits because the program focused mainly on organic waste separation. Inorganic waste separation was allowed and facilitated but not the main campaign, similar with recycling activities. The data of recycling habits of residents in KBS areas was presented in Fig. 7.
Recycling habits (Fig. 7) were relatively low for both organic and inorganic waste, except KBS Gempolsari. This was because the program’ key objectives focusing on waste separation. The recycling process was mainly handled by waste collectors or PD. Kebersihan. KBS Gempolsari showed quite higher percentage on organic waste recycle because the local leader encouraged residents to dispose their vegetable waste on recycling tools he provided around their neighborhood. The resident representatives implied that they get used to dispose vegetables in the recycling points without thinking about waste management. It indicated that they did not know the value of their activity, proven from the low percentage of the separation habits which are supposed to be higher as well. The local leaders played as a pioneer and community organizer but there is no thought leader available so there were no learning activities once DLHK ended the
Fig. 8: Waste reduction habits of residents in KBS area
0.00
10.00
20.00
30.00
40.00
50.00
60.00
70.00
Everyd
ayOften
Rarely
Never
Everyd
ayOften
Rarely
Never
Everyd
ayOften
Rarely
Never
Everyd
ayOften
Rarely
Never
Everyd
ayOften
Rarely
Never
Everyd
ayOften
Rarely
Never
Everyd
ayOften
Rarely
Never
Everyd
ayOften
Rarely
Never
KBSSukaluyu
KBSCihaurgeulis
KBSNeglasari
KBSKebonpisang
KBSSukamiskin
KBSBabakanSari
KBSKujangsari
KBSGempolsari
Percen
tage of R
espo
nd
Fig. 8: Waste reduction habits of residents in KBS area

617
Global J. Environ. Sci. Manage., 7(4): 599-624, Autumn 2021
guidance. This finding confirmed the vital role of two key leaders’ existence for effective CoP: community organizers and thought leaders, as indicated by Wenger et al. (2002). The thought leader is needed to facilitate proper knowledge and value sharing. Another waste management activity being surveyed was waste reduction habits as presented in Fig. 8.
Even though waste reduction is not the main campaign in the KBS program, most KBS areas showed higher percentage of waste reduction habits. KBS Sukaluyu showing higher percentage of waste reduction can be due to their long experience in waste management. All informants from KBS Sukaluyu stated that their area was the pilot for KBS program since 2015, initiated by an NGO named YPBB. This finding confirmed the requirement of long-term education as suggested by Azevedo et al. (2021) who indicated that one of weaknesses of waste management in developing countries was the absence of regular agenda of public campaigns. CoP approach meets this requirement because CoP suggested long-term and regular learning activities (Wenger et al., 2002). The findings about waste management behavior of residents in KBSs become the evidence that the educational strategy was effective and powerful in changing resident behavior sustainably. The percentage can be higher if all required educational contents got sufficient portions and the education is lengthened (not only one year) to allow intensive interaction. A longer period of education enables the educators to nurture more local cadres from the learning activities, add personal elements and nurture key leaders. A long-term education also provides more chance for the educators to share important educational contents sufficiently. If these requirements are met, zero waste area can be achieved.
Resident-based learning model developmentAccording to the analysis to critical elements of
KBS program using CoP approach, it was generated generic codes which were developed through grouping the codes based on their similarities, differences, and roles in the input-process-output and support system. The main and sub-main elements were grouped and result new main categories. To determine the causal links among categories, the roles of each new main elements are determined. Based on the discussion section, it was found that
some key stakeholders’ support become the input because they played a vital role in initiating the program. The key stakeholders refer to government support as facilitator, and educators (mentors and supervisors), local leaders and waste collector who should be ready in the beginning. The readiness for facilitators included providing supporting elements such as infrastructures to support learning, educators, and operational support. The facilitators may also need 3rd parties such as NGOs and environmental communities to help conducting learning activities for educators and local leaders’ readiness. The readiness for educators and local leaders included ownership of knowledge and value being shared which were changing their personal factors to encourage their waste management behavior. Those referred to understand personal responsibility, environmental awareness, perceived value of waste management activity, attitude, willingness to participate and waste management behavior. They also need to have waste management skills to enable practice. Waste management readiness can be called waste management literacy, rooted from environmental literacy concept introduced by Roth (1992). Environmental literacy comprises four dimensions: knowledge, skills, affect and behavior (Coyle, 2005; Roth, 1992; Scholz, 2011). In the waste management context, the value is added as part of knowledge, consisting of economic, environmental, social, and religious value, which are vital to encourage waste management behavior. Environmental literacy involved behavior as the observable form of the learning result. To build the resident-based learning model using CoP approach, this study referred to the basic model of CoP proposed by (Scarso et al., 2009). Because knowledge domain contains community shared problems, community objectives, knowledge, and value needs for the educational contents, it is placed to be CoP baseline. The core process is the learning activities which should be conducted both group and non-group using two learning approaches: practice-based learning and dialogue-based learning. The group learning is mainly separated into two major groups: groups for key stakeholders and local cadre development from residents. Since residentials commonly contain thousand households, it requires subgroup division, based on residents’ characteristics. The group can be based on interest on certain waste management option, age group or profession, such

618
A. Ghazali et al.
Tabl
e 8:
Con
tent
synt
hesis
pro
cess
for m
odel
dev
elop
men
t
No
Prel
imin
ary
Code
s Su
b-pr
elim
inar
y Co
des
New
mai
n ca
tego
ries
Grou
p of
cod
es
Gene
ric C
ateg
orie
s Ro
les
1 Pe
rson
al R
esou
rces
•
Lead
ers
• Le
ader
s with
var
ious
role
s •
Loca
l Cad
res
• W
aste
Col
lect
ors a
s ope
rato
r an
d ed
ucat
ion
targ
et
• Re
siden
ts
as
educ
atio
n ta
rget
• Su
ppor
ts fr
om le
ader
s and
was
te
colle
ctor
s to
the
prog
ram
initi
atio
n •
Faci
litat
or
• Co
mm
unity
Coo
rdin
ator
s •
Thou
ght l
eade
r •
Know
ledg
e ex
pert
•
Boun
dary
span
ner
• Pi
onee
r •
Know
ledg
e ex
pert
read
ines
s to
supp
ort e
duca
tion
prog
ram
su
stai
nabi
lity
• W
aste
Col
lect
or re
adin
ess t
o su
ppor
t pro
gram
initi
atio
n •
Resid
ent r
eadi
ness
for s
usta
inab
le
prog
ram
• Ke
y st
akeh
olde
rs’ s
uppo
rt
• Fa
cilit
ator
•
Com
mun
ity c
oord
inat
ors/
orga
nize
rs
• Th
ough
t lea
der
• Kn
owle
dge
expe
rt
• Lo
cal c
adre
s •
Pion
eers
•
Loca
l cad
res’
lear
ning
syst
em
• W
aste
col
lect
ors’
lear
ning
syst
em
• Re
siden
ts’ l
earn
ing
syst
em
• Fa
cilit
ator
read
ines
s •
Educ
ator
s’ w
aste
m
anag
emen
t lite
racy
•
Loca
l lea
ders
’ was
te
man
agem
ent l
itera
cy
• Lo
cal c
adre
s’ le
arni
ng
syst
em
• Lo
cal c
adre
s’ w
aste
m
anag
emen
t lite
racy
•
Was
te c
olle
ctor
s’ le
arni
ng
syst
em
• W
aste
col
lect
ors’
was
te
man
agem
ent l
itera
cy
• Re
siden
ts’ l
earn
ing
syst
em
• Re
siden
ts’ w
aste
m
anag
emen
t lite
racy
Inpu
t
Gro
up-le
arni
ng
activ
ities
(M
ain
Proc
ess)
Gro
up-le
arni
ng
activ
ities
(In
itial
pha
se
Proc
ess)
Gro
up a
nd n
on-
grou
p le
arni
ng
activ
ities
(M
ain
Proc
ess)
Out
put
2
Know
ledg
e Do
mai
n •
The
shar
ed p
robl
ems
of t
he
CoP
that
de
term
ines
th
e co
mm
unity
iden
tity
•
The
obje
ctiv
es o
f the
CoP
• N
egat
ive
resid
ents
’ min
dset
to
was
te se
para
tion
• Re
siden
ts’ L
ow w
illin
gnes
s to
was
te se
para
tion
•
Low
par
ticip
atio
n ra
te o
n w
aste
se
para
tion
• Su
stai
nabl
e re
siden
ts’
part
icip
atio
n in
was
te se
para
tion
at
hom
e
• P
robl
ems t
o be
solv
ed b
y le
arni
ng
• Re
siden
ts’ w
aste
man
agem
ent l
itera
cy
Know
ledg
e an
d va
lue
need
s Re
siden
ts’ w
aste
man
agem
ent
liter
acy
Lear
ning
Ba
selin
e
O
utpu
t
Tabl
e 8:
Con
tent
synt
hesis
pro
cess
for m
odel
dev
elop
men
t

619
Global J. Environ. Sci. Manage., 7(4): 599-624, Autumn 2021
No
Prel
imin
ary
Code
s Su
b-pr
elim
inar
y Co
des
New
mai
n ca
tego
ries
Grou
p of
cod
es
Gene
ric C
ateg
orie
s Ro
les
• Ed
ucat
iona
l con
tent
s •
Tech
nica
l kno
wle
dge
of w
aste
m
anag
emen
t •
Impa
cts o
f was
te fo
r env
ironm
ent
and
heal
th
• Ec
onom
ic, e
nviro
nmen
tal,
soci
al,
and
relig
ious
val
ue o
f was
te
man
agem
ent
• In
divi
dual
and
soci
al ro
les t
o en
viro
nmen
tal p
rote
ctio
n •
Loca
l reg
ulat
ion
abou
t was
te
man
agem
ent
• W
aste
man
agem
ent s
kills
•
Envi
ronm
enta
l aw
aren
ess
• Pe
rson
al re
spon
sibili
ty
• Pe
rcei
ved
valu
e of
was
te m
anag
emen
t ac
tivity
•
Attit
ude
• Pe
rson
al re
spon
sibili
ty
• W
illin
gnes
s to
part
icip
ate
• Pe
rson
al re
spon
sibili
ty
• W
aste
man
agem
ent s
kills
•
Habi
tuat
ion
• Kn
owle
dge
and
Valu
e ne
eds
• W
aste
man
agem
ent l
itera
cy
Lear
ning
Ba
selin
e
3 Kn
owle
dge
Shar
ing
activ
ities
•
Know
ledg
e sh
arin
g ac
tiviti
es to
ena
ble
know
ledg
e flo
w
• M
echa
nism
of b
ondi
ng,
inte
nsiv
e in
tera
ctio
n,
com
mun
ity e
ngag
emen
t
• Gr
oup
lear
ning
•
Non
-gro
up L
earn
ing
• Pr
actic
e-ba
sed
lear
ning
•
Dial
ogue
-bas
ed le
arni
ng
• Gr
oup
Lear
ning
to n
urtu
re lo
cal
cadr
es
• Ef
fect
ive
know
ledg
e sh
arin
g •
Prac
tice-
base
d le
arni
ng
• Di
alog
ue-b
ased
lear
ning
• Ty
pe o
f lea
rnin
g ac
tiviti
es
• Le
arni
ng a
ppro
ach
• Co
re p
roce
ss
• Le
arni
ng a
ppro
ach
• Ha
bitu
atio
n •
Lear
ning
pro
cess
•
Loca
l cad
re d
evel
opm
ent
Lear
ning
Pr
oces
s
4 M
anag
eria
l Ele
men
t •
Iden
tifie
d re
gula
tion
and
norm
s th
at
supp
ort
join
t in
tera
ctio
ns
• W
aste
Sep
arat
ion
prac
tice
thro
ugh
law
enf
orce
men
t •
Soci
al n
orm
s of j
oint
act
iviti
es
• Re
gula
tions
and
Nor
ms
• Ha
bitu
atio
n •
Know
ledg
e to
war
d re
gula
tions
and
nor
ms
• Pr
actic
e-ba
sed
lear
ning
Supp
ortiv
e Sy
stem
5 In
fras
truc
ture
•
Soci
al M
edia
for k
now
ledg
e re
posit
orie
s •
Was
te b
ins f
or w
aste
se
para
tion
prac
tice
• Re
cycl
ing
tool
faci
litie
s •
Recy
clin
g pr
oduc
t ut
iliza
tion
faci
litie
s
• Kn
owle
dge
shar
ing
supp
ort
• Pr
actic
e-ba
sed
lear
ning
•
Enco
urag
e w
illin
gnes
s to
part
icip
ate
• En
cour
age
attit
ude
• Te
chno
logy
for K
now
ledg
e re
posit
orie
s •
Prac
tice-
base
d le
arni
ng
• W
aste
man
agem
ent l
itera
cy
• W
aste
Sep
arat
ion
faci
litie
s •
Was
te R
ecyc
ling
faci
litie
s
• Te
chno
logy
for K
now
ledg
e re
posit
orie
s •
Lear
ning
pro
cess
•
Was
te m
anag
emen
t fa
cilit
ies
Supp
ortiv
e Sy
stem
Lear
ning
pr
oces
s
Supp
ortiv
e Sy
stem
Conti
nued
Tab
le 8
: Con
tent
synt
hesis
pro
cess
for m
odel
dev
elop
men
t
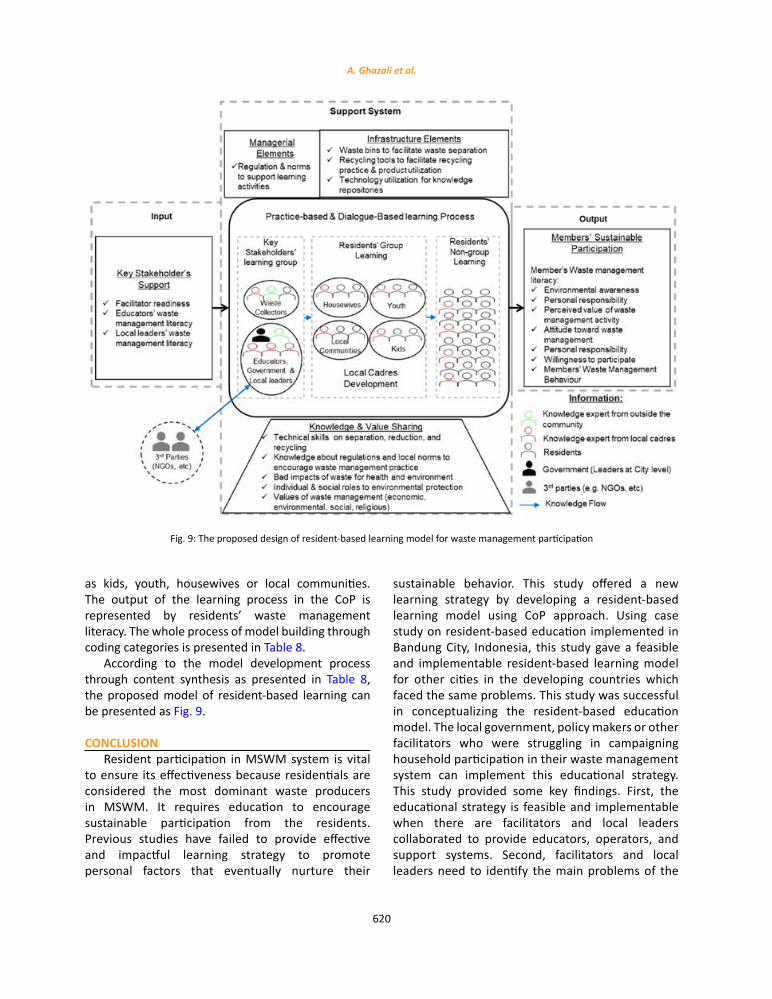
620
A. Ghazali et al.
as kids, youth, housewives or local communities. The output of the learning process in the CoP is represented by residents’ waste management literacy. The whole process of model building through coding categories is presented in Table 8.
According to the model development process through content synthesis as presented in Table 8, the proposed model of resident-based learning can be presented as Fig. 9.
CONCLUSIONResident participation in MSWM system is vital
to ensure its effectiveness because residentials are considered the most dominant waste producers in MSWM. It requires education to encourage sustainable participation from the residents. Previous studies have failed to provide effective and impactful learning strategy to promote personal factors that eventually nurture their
Fig. 9: The proposed design of resident‐based learning model for waste management participation
Fig. 9: The proposed design of resident-based learning model for waste management participation
sustainable behavior. This study offered a new learning strategy by developing a resident-based learning model using CoP approach. Using case study on resident-based education implemented in Bandung City, Indonesia, this study gave a feasible and implementable resident-based learning model for other cities in the developing countries which faced the same problems. This study was successful in conceptualizing the resident-based education model. The local government, policy makers or other facilitators who were struggling in campaigning household participation in their waste management system can implement this educational strategy. This study provided some key findings. First, the educational strategy is feasible and implementable when there are facilitators and local leaders collaborated to provide educators, operators, and support systems. Second, facilitators and local leaders need to identify the main problems of the
621
Global J. Environ. Sci. Manage., 7(4): 599-624, Autumn 2021
residents related to waste management practice before the program started to determine the learning main objectives. Second, key stakeholders together with educators should identify knowledge and value needs based on their residents’ characteristics to reach residents’ waste management literacy. Third, support systems are required to facilitate and support practice-based and dialogue-based learning for effective resident learning activities. Fourth, local cadres are vital to sustain the waste management program. Fifth, educational strategy using CoP approach highlighted a long-term small group learning to facilitate intensive interaction and engagement among members for impactful learning outcomes. This study provides essential insights to understand how to build a resident-based educational program as a learning activities platform for residentials to result sustainable participation in the MSWM process. There are some limitations which need improvement for further research. First, the proposed model was still hypothesis. It needs further studies to test the relationship among elements in the model. Second, the findings were highly based on cultural characteristics of Bandung city, Indonesia. Other cities with different culture may need some adjustments to implement the model. Third, samples for quantitative data were chosen purposively based on their history being exposed by the learning program. So, the survey finding may not represent the entire residents in Bandung city and Indonesia. Future research can focus on investigating other type of resident-based learning programs which meet CoP characteristics for comparison.
AUTHOR CONTRIBUTIONSA. Ghazali conducted the literature review,
research design, analyzed and interpreted the data, and developed the model, J.H. Tjakraatmadja analyzed and interpreted the data, developed the model, review the manuscript. Sunarti conducted the literature review, collected, analyzed the data, and prepared the manuscript text, Eka Yunita Dian Pratiwi collected and analyzed the data.
ACKNOWLEDGEMENTThe authors wish to acknowledge the financial
support provided by Institut Teknologi Bandung (ITB) through the Program ‘Penelitian, Pengabdian
kepada Masyarakat dan Inovasi’ ITB (P3MI-ITB) with the contract number [082/I1.C12/SK/PL/2020]. The authors also wish to acknowledge valuable support from Rony S.Y Zebua for the reference management in this paper.
CONFLICT OF INTERESTThe authors declare no potential conflict of
interest regarding the publication of this work. In addition, the ethical issues including plagiarism, informed consent, misconduct, data fabrication and, or falsification, double publication and, or submission, and redundancy have been completely witnessed by the authors.
ABBREVIATIONS 3R Reduce, reuse, recycleBSF Black soldier flyCoP Community of practice
CAQDAS Computer assisted qualitative data software
DLHK Dinas Lingkungan Hidup dan Kebersihan
DTDE Door to door educationGPS Gerakan pungut sampahGSSI Generasi semangat selalu ikhlasK3 Kebersihan, ketertiban, keindahanKANG PISMAN Kurangi pisahkan manfaatkan
KASIE EKBANG Kepala seksi ekonomi pembangunan
KBS Kawasan bebas sampahKM Knowledge managementKSM Kelompok swadaya masyarakat
MSWM Municipal solid waste management
MSW Municipal solid wasteNGO Non-government organization
NVIVOA qualitative data analysis software provided by QSR International
PASGEBER Pasukan gerakan bersih
PD Kebersihan Kebersihan perusahaan daerah kebersihan
PKK Pemberdayaan dan Kesejahteraan Keluarga

622
A. Ghazali et al.
PPO Pilah pilih olah
P3MI-ITBPenelitian, Pengabdian kepada Masyarakat dan Inovasi Institut Teknologi Bandung
QCA Directed content analysis
QGIS Quantum Geographic Information System
RT Rukun tetangga/hamlet
RW Rukun warga/ community association
TOGA Tanaman obat keluarga
YPBB Yayasan Pengelolaan Biosains dan Bioteknologi
REFERENCESAbou-Setta, A., (2015). Revisiting communities of practice - the
case of Egyptian graffitists. Higher Educ. Skills Work-Based Learn., 5(2): 135–151 (17 pages).
Aboul-Enein, B.H., (2017). “The earth is your mosque”: narrative perspectives of environmental health and education in the Holy Quran. J. Environ. Stud. Sci., 8: 22–31 (10 pages).
Almasi, A.; Mohammadi, M.; Azizi, A.; Berizi, Z.; Shamsi, K.; Shahbazi, A.; Mosavi, S.A., (2019). Assessing the knowledge, attitude and practice of the kermanshahi women towards reducing, recycling and reusing of municipal solid waste. Resour. Conserv. Recycl., 141: 329–338 (10 pages).
Assarroudi, A.; Heshmati Nabavi, F.; Armat, M.R.; Ebadi, A.; Vaismoradi, M., (2018). Directed qualitative content analysis: the description and elaboration of its underpinning methods and data analysis process. J. Res. Nurs., 23(1): 42–55 (14 pages).
Azevedo, B.D.; Scavarda, L.F.; Caiado, R.G.G.; Fuss, M., (2021). Improving urban household solid waste management in developing countries based on the German experience. Waste Manage., 120: 772–783 (12 pages).
Banerjee, S.; Sarkhel, P., (2019). Municipal solid waste management, household and local government participation: a cross country analysis. J. Environ. Plann. Manage., 63(2): 210–235 (26 pages).
Chen, L.; Gao, M., (2020). A new learning interaction rule for municipal household waste classification behavior based on multi-agent-based simulation. J. Cleaner Prod., 271: (13 pages).
Chikowore, N., (2020). Factors influencing household waste management practices in Zimbabwe. J. Mater. Cycles Waste Manage., 23: 386–393 (8 pages).
Coyle, K., (2005). Environmental literacy in america. NEETF, Washington (128 pages).
Denscombe, M., (2008). Communities of practice: a research paradigm for the mixed methods approach. J. Mixed Methods Res., 2(3): 270–283 (14 pages).
Dessne, K.; Byström, K., (2015). Imitating CoPs: imposing formality on informality. J. Am. Soc. Inf. Sci. Technol., 66(11): 2277–2284 (8 pages).
Esmaeilizadeh, S.; Shaghaghi, A.; Taghipour, H., (2020). Key informants’ perspectives on the challenges of municipal solid waste management in Iran: a mixed method study. J. Mater.
Cycles Waste Manage., 22(4): 1284–1298 (15 pages). Fan, B.; Yang, W.; Shen, X., (2019). A comparison study of
‘motivation–intention–behavior’ model on household solid waste sorting in China and Singapore. J. Cleaner Prod., 211: 442–454 (13 pages).
Ghazali, A.; Tretiakov, A.; Pringgabayu, D.; Ramdlany, D.M.A., (2017). Analyzing knowledge construction in online health group discussion. J. Inf. Knowl. Manage., 16(1): 1–19 (19 pages).
Gundupalli, S.P.; Hait, S.; Thakur, A., (2017). A review on automated sorting of source-separated municipal solid waste for recycling. Waste Manage., 60: 56–74 (9 pages).
Issock, P.B.I.; Roberts-Lombard, M.; Mpinganjira, M., (2020). Normative influence on household waste separation: the moderating effect of policy implementation and sociodemographic variables. Soc. Marketing Q., 26(2): 93–110 (18 pages).
Janmaimool, P.; Denpaiboon, C., (2016). Evaluating determinants of rural Villagers’ engagement in conservation and waste management behaviors based on integrated conceptual framework of Pro-environmental behavior. Life Sci. Soc. Policy, 12(12): 1–20 (20 pages).
Jaakkola, E., (2020). Designing conceptual articles: four approaches. AMS Rev., 10: 18–26 (9 pages).
Jiang, P.; Fan, Y. Van; Klemeš, J.J., (2021). Data analytics of social media publicity to enhance household waste management. Resour. Conserv. Recycl., 164: (12 pages).
Jouhara, H.; Czajczyńska, D.; Ghazal, H.; Krzyżyńska, R.; Anguilano, L.; Reynolds, A.J.; Spencer, N., (2017). Municipal waste management systems for domestic use. Energy, 139: 485–506 (22 pages).
Kamaruddin, M.A.; Yusoff, M.S.; Rui, L.M.; Isa, A.M.; Zawawi, M.H.; Alrozi, R., (2017). An overview of municipal solid waste management and landfill leachate treatment: Malaysia and Asian perspectives. Environ. Sci. Pollut. Res., 24: 26988–27020 (23 pages).
Knickmeyer, D., (2020). Social factors influencing household waste separation: A literature review on good practices to improve the recycling performance of urban areas. J. Cleaner Prod., 245: 1–41 (41 pages).
Lawrence, K.; Cooper, V.; Kissoon, P., (2020). Sustaining voluntary recycling programmes in a country transitioning to an integrated solid waste management system. J. Environ. Manage., 257: 1–7 (7 pages).
Li, L.C.; Grimshaw, J.M.; Nielsen, C.; Judd, M.; Coyte, P.C.; Graham, I.D., (2009). Evolution of Wenger’s concept of community of practice. Implementation Sci., 4(11): 1–8 (8 pages).
Liao, C.; Zhao, D.; Zhang, S.; Chen, L., (2018). Determinants and the moderating effect of perceived policy effectiveness on residents’ separation intention for rural household solid waste. Int. J. Environ. Res. Public Health, 15(4): 1–17 (17 pages).
Lissah, S.Y.; Ayanore, M.A.; Krugu, J.K.; Aberese-Ako, M.; Ruiter, R.A.C., (2021). Managing urban solid waste in Ghana: Perspectives and experiences of municipal waste company managers and supervisors in an urban municipality. PLoS ONE, 16(3): 1–18 (18 pages).
Liu, X.; Wang, Z.; Li, W.; Li, G.; Zhang, Y., (2019). Mechanisms of public education influencing waste classification willingness of urban residents. Resour. Conserv. Recycl., 149: 381–390 (10 pages).

623
Global J. Environ. Sci. Manage., 7(4): 599-624, Autumn 2021
Ma, J.; Hipel, K.W.; Hanson, M.L., (2018). An evaluation of the social dimensions in public participation in rural domestic waste source-separated collection in Guilin, China. Environ. Monit. Assess., 190(35): 1–14 (14 pages).
Madsen, M.L.; Noe, E., (2012). Communities of practice in participatory approaches to environmental regulation. Prerequisites for implementation of environmental knowledge in agricultural context. Environ. Sci. Policy, 18: 25–33 (9 pages).
Meng, X.; Tan, X.; Wang, Y.; Wen, Z.; Tao, Y.; Qian, Y., (2019). Investigation on decision-making mechanism of residents’ household solid waste classification and recycling behaviors. Resour. Conserv. Recycl., 140: 224–234 (11 pages).
Middlemiss, L.; Parrish, B.D., (2010). Building capacity for low-carbon communities: the role of grassroots initiatives. Energy Policy, 38(12): 7559–7566 (8 pages).
Miles, M.B.; Huberman, A.M.; Saldana, J., (2014). Qualitative data analysis: a methods sourcebook (3rd ed.). SAGE Publications, California (408 pages).
Moh, Y.C.; Abd Manaf, L., (2017). Solid waste management transformation and future challenges of source separation and recycling practice in Malaysia. Resour. Conserv. Recycl., 116: 1–14 (14 pages).
Mukama, T.; Ndejjo, R.; Musoke, D.; Musinguzi, G.; Halage, A.A.; Carpenter, D.O.; Ssempebwa, J.C., (2016). Practices, concerns, and willingness to participate in solid waste management in two urban slums in Central Uganda. J. Environ. Public Health, 2016(6830163): 1–7 (7 pages).
Pei, Z., (2019). Roles of neighborhood ties, community attachment and local identity in residents’ household waste recycling intention. J. Cleaner Prod., 241: (9 pages).
Pierini, V.I.; Mazzeo, N.; Cazenave, M.; Semmartin, M., (2021). Waste generation and pro-environmental behaviors at household level: A citizen science study in Buenos Aires (Argentina). Resour. Conserv. Recycl., 170: (7 pages).
Reed, M.G.; Godmaire, H.; Abernethy, P.; Guertin, M.A., (2014). Building a community of practice for sustainability: strengthening learning and collective action of Canadian biosphere reserves through a national partnership. J. Environ. Manage., 145: 230–239 (10 pages).
Roth, C.E., (1992). Environmental literacy: its roots, evolution and directions in the 1990s. Ohio (51 pages).
Saunders, M.N., (2019). Understanding research philosophies and approaches Cite this publication. In M. N. Saunders, P. Lewis, A. Thornhill, & A. Bristow (Eds.), Research Methods for Business Students (8th ed., pp. 128–170). Pearson Education, Harlow (46 pages).
Scarso, E.; Bolisani, E.; Salvador, L., (2009). A systematic framework for analysing the critical success factors of communities of practice. J. Knowl. Manage., 13(6): 431–447 (17 pages).
Scholz, R.W., (2011). Environmental literacy in science and society. Journal of Integrative Environmental Sciences (Vol. 10). Cambridge University Press, Cambridge (631 pages).
Speier, C.J.; Mondal, M.M.; Weichgrebe, D., (2018). Evaluation of compositional characteristics of organic waste shares in municipal solid waste in fast-growing metropolitan cities of India. J. Mater. Cycles Waste Manage., 20(4): 2150–2162 (13 pages).
Stein, E.W., (2005). A Qualitative study of the characteristics of
a community of practice for knowledge management and its success factors. Int. J. Knowl. Manage., 1(3): 1–24 (24 pages).
Sunarti, S.; Tjakraatmadja, J.H.; Ghazali, A.; Rahardyan, B., (2020). Community of Practice (COP) on waste management learning activities: case study on kawasan bebas sampah (KBS) Bandung. J. Manajemen Teknol., 19(1): 37–58 (12 pages).
Sunarti; Tjakraatmadja, J.H.; Ghazali, A.; Rahardyan, B., (2021). Increasing resident participation in waste management through intrinsic factors cultivation. Global J. Environ. Sci. Manage., 7(2): 287–316 (30 pages).
Tiew, K.G.; Ahmad Basri, N.E.; Watanabe, K.; Abushammala, M.F.M.; Bin Ibrahim, M.T., (2015). Assessment of the sustainability level of community waste recycling program in Malaysia. J. Mater. Cycles Waste Manage., 17(3): 598–605 (8 pages).
Tran, T.A.; James, H.; Pittock, J., (2018). Social learning through rural communities of practice: Empirical evidence from farming households in the Vietnamese Mekong Delta. Learn. Cult. Social Interact., 16: 31–44 (14 pages).
Trihadiningrum, Y.; Laksono, I.J.; Dhokhikah, Y.; Moesriati, A.; Radita, D.R.; Sunaryo, S., (2017). Community activities in residential solid waste reduction in Tenggilis Mejoyo District, Surabaya City, Indonesia. J. Mater. Cycles Waste Manage., 19: 526–535 (10 pages).
Ulhasanah, N.; Goto, N., (2018). Assessment of citizens’ environmental behavior toward municipal solid waste management for a better and appropriate system in indonesia: a case study of Padang city. J. Mater. Cycles Waste Manage., 20(2): 1257–1272 (16 pages).
Wadehra, S.; Mishra, A., (2018). Encouraging urban households to segregate the waste they generate: Insights from a field experiment in Delhi, India. Resour. Conserv. Recycl., 134: 239–247 (9 pages).
Wang, Q.; Long, X.; Li, L.; Kong, L.; Zhu, X.; Liang, H., (2020). Engagement factors for waste sorting in China: The mediating effect of satisfaction. J. Cleaner Prod., 267: 1–9 (9 pages).
Wang, Z.; Guo, D.; Wang, X.; Zhang, B.; Wang, B., (2018). How does information publicity influence residents’ behaviour intentions around e-waste recycling? Resour. Conserv. Recycl., 133: 1–9 (9 pages).
Wenger, E.; McDermott, R.A.; Snyder, W.M., (2002). Cultivating communities of practice: a guide to managing knowledge. Harvard Business Press, Boston (284 pages).
Xu, L.; Ling, M.; Lu, Y.; Shen, M., (2017). Understanding household waste separation behaviour: testing the roles of moral, past experience, and perceived policy effectiveness within the theory of planned behaviour. Sustainability. 9(4): 1–27 (27 pages).
Zebua, R.S.Y.; Suhardini, A.D., (2021). Model Pembelajaran Pendidikan Karakter: Panduan Operasional untuk Pembelajaran Online dan dilengkapi Contoh Implementasi pada Mapel PAI & BP. Nas Media Pustaka, Yogyakarta (172 pages).
Zhang, B.; Lai, K. hung; Wang, B.; Wang, Z., (2019). From intention to action: how do personal attitudes, facilities accessibility, and government stimulus matter for household waste sorting?. J. Environ. Manage., 233(1): 447–458 (12 pages).
Zheng, J.; Ma, G.; Wei, J.; Wei, W.; He, Y.; Jiao, Y.; Han, X., (2020). Evolutionary process of household waste separation behavior based on social networks. Resour. Conserv. Recycl., 161: (14 pages).

624
A. Ghazali et al.
AUTHOR (S) BIOSKETCHES
Ghazalia, A., Ph.D., Assistant Professor, School of Business and Management, Institut Teknologi Bandung, Bandung City, Indonesia.Email: [email protected]
Tjakraatmadjaa, J.H., Ph.D., Professor, School of Business and Management, Institut Teknologi Bandung, Bandung City, Indonesia.Email: [email protected]
Sunartia, Ph.D. Candidate, Instructor, School of Business and Management, Institut Teknologi Bandung, Bandung City, Indonesia.Email: [email protected]
Pratiwia, E.Y.D., M.Sc. Student, School of Business and Management, Institut Teknologi Bandung, Bandung City, Indonesia.Email: [email protected]
HOW TO CITE THIS ARTICLE
Ghazalia, A.; Tjakraatmadjaa, J.H.; Sunartia; Pratiwia, E.Y.D., (2021). Resident-based learning model for sustainable resident participation in municipal solid waste management program. Global J. Environ. Sci. Manage., 7(4): 599-624.
DOI: 10.22034/gjesm.2021.04.08
url: https://www.gjesm.net/article_244273.html
COPYRIGHTS
©2021 The author(s). This is an open access article distributed under the terms of the Creative Commons Attribution (CC BY 4.0), which permits unrestricted use, distribution, and reproduction in any medium, as long as the original authors and source are cited. No permission is required from the authors or the publishers.

Global J. Environ. Sci. Manage. 7(4): 625-642, Autumn 2021
*Corresponding Author:Email: [email protected] Phone: +66 5596 2754Fax: +66 5596 2750
Global Journal of Environmental Science and Management (GJESM)
Homepage: https://www.gjesm.net/
ORIGINAL RESEARCH PAPER
Characteristics and combustion kinetics of fuel pellets composed of waste of polyethylene terephthalate and biomass
K. Manatura1, U. Samaksaman2,*
1Department of Mechanical Engineering, Faculty of Engineering at Kamphaeng Saen, Kasetsart University, Kamphaeng Saen campus, Nakhonpatom, Thailand2Department of Natural Resources and Environment, Faculty of Agriculture Natural Resources and Environment, Naresuan University, Phitsanulok, Thailand
BACKGROUND AND OBJECTIVES: The needs of fuel pellets from varied feed stocks have opened up opportunities and challenges for pellets production from non-woody biomass. Wastes of plastic recycling and wood sawing contained a high potential for energy source and suited for pelletizing as a solid fuel.METHODS: The characteristics and combustion kinetics of fuel pellets made using a mixture of waste of polyethylene terephthalate and biomass (Tectona grandis Linn.f) with a polyethylene terephthalate to biomass ratio of 9:1. The investigation covered physico-chemical properties and their functional group analysis, heavy metal concentration and ionic leachability testing, and ash analysis. In this context, thermogravimetric analysis was used in an atmosphere of oxygen gas, over a temperature range of 50-800 oC and at different heating rates. The work ends with discussion of the kinetics study via three comparative evaluations and the feasibility of fuel pellets for energy utilization. FINDINGS: Pelletizing with this ratio (9:1) was present the durability of PET/biomass pellets, a uniform dimension, ease handling, storage, and transportation common as woody pellets. Some technical challenges such as low moisture content and high volatile matter content were feedstock dependent. The major characteristics were a combination of those from both the constituent materials. Functional groups of the pellets were contributed by terephthalate and lignocellulose. The addition of a small amount of biomass in pellets could improve their thermal decomposition behavior. The properties of the polyethylene terephthalate/biomass pellets indicated that were fit for combustion with a high heating value equal to 19.20 MJ/kg. Heavy metals and ionic contaminants were below the maximum limits of the standards because of the cleanliness of the raw materials. However, the minor effects of earth materials and a caustic soda detergent were resulted in the alteration of residue chemicals. The pellets had lower ignition, devolatilization, and burnout temperatures than the original polyethylene terephthalate waste; likewise, the peak and burnout temperatures shifted to a lower zone. The activation energy values obtained using the Kissinger-Akahira-Sunose, Ozawa-Flynn-Wall, and Starink models were similar and in the range 142–146 kJ/mol.CONCLUSION: These findings may provide crucial information on fuel pellets from blended polyethylene terephthalate/biomass to assist the design and operation of a co-combustion system with traditional solid fuels. Such modifications of fuel pellets suggest the possibility of operating in large-scale furnace applications and can further be upgraded to other fuels production via modern bioenergy conversion processes.
©2021 GJESM. All rights reserved.
ARTICLE INFO
Article History:Received 02 February 2021Revised 21 April 2021Accepted 22 May 2021
Keywords:BiomassCharacteristicsCombustionKineticsPelletsPolyethylene terephthalate (PET)Thermogravimetric analyzer (TGA)
ABSTRAC T
DOI: 10.22034/gjesm.2021.04.09
NUMBER OF REFERENCES
58NUMBER OF FIGURES
6NUMBER OF TABLES
9
Note: Discussion period for this manuscript open until January 1, 2022 on GJESM website at the “Show Article.
626
K. Manatura and U. Samaksaman
INTRODUCTIONThe use of plastics has increased tremendously
around the world due to their compatible properties in diversified applications, as well as being relatively cheap and safe. Post-consumption plastic is regarded as a major waste source and creates unhealthy conditions for humans and the environment (Patnaik et al., 2020). The ever-rising amount of plastic waste has tended to increase polyethylene terephthalate (PET) waste. PET usage has rapidly grown in daily life applications such as bottling carbonated soft drinks, beverages, and other liquids and as food containers, microwave trays, and food packaging films. Furthermore, it is appropriate for lightweight, large-capacity, and shatter-resistant containers which are mainly found in the shipping industry (Sinha et al., 2010). Used PET bottles can be recycled using a mechanical recycling process that uses shredding and crushing to convert a bottle into flakes (Jabłońska et al., 2019). In this process, purification and decontamination of the PET-flake are important methods followed by washing (with a detergent) and water soaking, centrifuging, drying, and separating foreign plastics. PET-flake from these processes can be utilized as raw-PET for producing goods with both up- and down-cycling processes (Tolinski, 2011). Nevertheless, secondary waste from a mechanical recycling plant occurs as the process releases undesired materials such as dust, sludge, debris, tiny pieces, and microplastics, as mentioned waste of PET. These amount to 3-5% by weight (%wt) of the PET bottle in a mechanical recycling plant and it is feasible to recover energy and importantly reduce the amount of waste landfill (Beata et al., 2019; Surenderan et al., 2018). Biomass is considered one of the most important renewable sources and is produced in large amounts in industry, agriculture, and forestry (Becidan et al., 2007). It can be directly used or used cooperatively with coal and other solid fuels (Ahn et al., 2014; Basu et al., 2011; Nussbaumer, 2003; Sajdak et al., 2019). Teak sawdust (Tectona grandis Linn.f) provides as a waste of wood industry in the sub-regional area of northern Thailand. It is used as a fuel for firing in pottery furnaces and biomass power plants. Furthermore, it is used as a mixture material for mushroom and vegetable plantation. Pelletizing is one process for handling powder-like materials such as dust, sludge, debris, tiny pieces, and microplastic as well as biomass and sawdust to become fuel
pellets. Moreover, it has been widely used for mass and energy densification to overcome the disadvantages associated with raw material use (Mostafa et al., 2019). To avoid the resource wastage and environment contamination, fuel pellets production is proposed to utilize the waste of PET and biomass. Currently, waste of PET and teak sawdust for alternative use is mainly received from local factories. Efforts are being made to understand as the study novelty in the co-densification of the mixtures of dusty PET waste and sawdust invite new chalanges to pelletization process. In addition, the detailed studies of fuel pellets from varied feedstocks with different morphology and characteristics are opened up opportunities and challenges (Pradhan et al., 2018). Thus, the co-densification of waste of PET and teak sawdust can be discussed. The use of this type of fuel in co-firing processes reduces greenhouse gas emission and cheaper than traditional fuels (coal, lignite) and sometimes get income by a surcharge (Jabłońska et al., 2019). Previous works, the pyrolysis-gasification of biomass/PET feedstock has been extensively studied by numerous researchers (Abnisa and Wan Daud, 2014; Bu et al., 2018; Madadian et al., 2017; Narobe et al., 2014; Robinson et al., 2016). They reported that the composition and fraction of the feedstock have an important influence on the distribution, composition, and characteristics of the gas, liquid, and solids (Block et al., 2019; Çepelioğullar and Pütün, 2013). Chattopadhyay et al. (2009), reported a significant interaction or synergistic effect between plastics and biomass (paper) under pyrolysis in a thermogravimetric analyzer (TGA). Paper-biomass started to decompose at a lower temperature (below 100 °C) than plastics and rapidly degraded at 350 °C. At higher temperature, PET started with an initial degradation temperature of 200 °C followed by a curve of rapid degradation at around 420-490 °C and a small amount at around 500-550 °C. Since the chemicals in plastic easily break up at higher temperatures, increased mass loss is observed more rapidly at a high temperature. Plastics/biomass composited with a mixed plastics (HDPE, PP, PET) to biomass ratio of 9:1 had the best performance with a slightly decreased mass loss during thermal degradation of 5% at a lower temperature and significantly decreased mass loss of over 95% at 500 °C. This may be due to the higher ratio of plastic in the mixture contains lower moisture, ash, and fixed

627
Global J. Environ. Sci. Manage., 7(4): 625-642, Autumn 2021
carbon contents than for a low ratio of plastics in fuel pellets (Martı́n-Gullón et al., 2001). Energy required for the pyrolysis of multicomponent mixtures of waste PET and solid biomass increased with increase in amount of plastic content in the mixture due to the pyrolysis of PET plastic needs more energy than wood (Wang et al., 2021). Combustion of multicomponent mixtures acquired lower the activation energy than pyrolysis, therefore the leads of a minimum biomass supplied as part of plastic wastes instead of a minimum plastic waste supplied as part of biomass needs to be examined further. It is noticed that the study in fraction of these materials (PET/biomass) has not fully explored. The approach has to account for the behavior of PET/biomass during combustion. TGA is a worldwide method to analysis thermal behavior of materials such as food, feedstock, chemical, soil, fertilizer, plastic, advance polymers, biomass, solid fuels such as coal, lignite, shale oil, and so on. TGA is one of the most extensive practices for the preliminary prediction of thermal behavior and kinetics for complex solid fuels (Govindan et al., 2018; Yuan et al., 2017). In TGA, the thermal decomposition of the sample under a selective environment is analyzed by determining its mass loss during an increased temperature duration (Chandrasekaran et al., 2017; Xie et al., 2019). The mass loss is used to determine kinetic parameters including the activation energy, pre-exponential factor, and reaction mechanism. Two common approaches applied for kinetic analysis are the model-fitting and model-free (iso-conversional) methods. The analysis is accurate and convenient for iso-conversional methods compared to model-fitting methods (Bu et al., 2018). Only few data on heating rates assuming negligible mass transfer are required to estimate the activation energy in terms of the degree of conversion (Vyazovkin and Wight, 1999; Xu and Chen, 2013). Many iso-conversional methods, such as the Friedman, Ozawa-Flynn-Wall (OFW), Kissinger-Akahira-Sunose (KAS), and Starink methods have been used for the kinetic analysis of oxidative and non-oxidative processes in various types of solid fuels, including coal and biomass (Chen et al., 2017; Sharara and Sadaka, 2014; Slopiecka et al., 2012). There is a need for research into the utilization of waste of PET by pelletizing in combination with local biomass that could be applied in process of waste to energy. It is a new study pathway revealed with the novel materials, techniques of analysis, and
evaluation. The important properties and crucial data of characteristics of fuel pellets from blended PET/biomass with a view towards energy recovery in the combustion process are also considered. Moreover, this study aims to determine their functional group, heavy metals and ionic contaminants, and residue composition as well as evaluation of the kinetic parameters by iso-conversional methods (OFW, KAS, and Starink methods). It is expected that the knowledge of the characteristics and combustion behavior of the PET/biomass pellets and in particular the precise estimation of kinetics, will provide essential guidance for further work. This study has been carried out in Phitsanulok province, Thailand in 2019.
MATERIALS AND METHODSRaw materials and pelletizing
The waste of PET was sourced from a bulk of waste plastics at a PET bottle recycling plant in Surin province, Thailand. The similar case of mechanical recycling processes for used PET bottles was demonstrated by Jabłońska et al. (2019). The sample of PET waste contained different sizes of PET plastic from <0.5 to 1.5 mm (sieve size no. 14-35). Biomass (teak sawdust; Tectona grandis Linn.f) was sourced from a saw mill in Phrae province, Thailand. Both the PET waste and biomass were dried before pellet production. The fuel pellets of PET/biomass was produced using a flat-die pelletizing machine. Prior to pelletizing, the machine was warmed using a mixture of PET/biomass as a pre-pelleting material. Then, the mixture of PET and biomass (9:1, w/w) was fed at a continuous rate of 1 kg/min. About 10%wt of water was added during the process to prevent materials from sticking. Pellets were approximately 1.0 cm in diameter and 2.4 cm in length, as shown in Fig. 1. Then, pellets were dried in an air oven at 65 °C for 12 hours.
Proximate, ultimate, and calorific value testsThe samples of PET waste, biomass, and PET/
biomass pellets were analyzed to determine their physical and chemical properties with three replications. The moisture content (MC) was measured by weighting mass before and after heat in a hot-air oven at 105 °C for 24 hours. Volatile matter (VM) of sample was measured by weighting mass before and after the covered sample-containing crucible in

628
Characteristics and combustion kinetics of PET/biomass pellets
a muffle furnace at 900±10 °C for 4 minutes (CEN/TS 15148). The sample in uncovered crucible was heated at 550±10 °C for 2 hours to determine the ash content (CEN/TS 14775). The fixed carbon (FC) was found by subtraction; FC = 100 - (MC + VM + ash). The carbon (C), hydrogen (H), nitrogen (N), and sulfur (S) contents of samples were determined using a TrueSpec Micro (Leco, CHNS628) and the oxygen (O) content was calculated based on dry ash-free basis by using the formula; O = 100 - (C + H + N + S + ash), more details found as Samaksaman et al. (2021). In addition, the high heating value (HHV) was carried out based on analysis of the calorific value using a bomb calorimeter (Leco, AC-500) in an atmosphere of oxygen.
Fourier transform infrared spectrometry (FTIR)Raw materials and PET/biomass pellets were
tested for the determination of the functional groups of polyethylene terephthalate (polyester group) and biomass components (lignocellulose group) using FTIR technique (Perkin Elmer, Spectrum GX). The IR spectra were recorded at wavenumbers in the range 4,000 to 400/cm at a resolution of 1/cm. The data were interpreted using the Perkin Elmer Spectrum version 10.5.2 software.
Heavy metal and ionic leachability testsThe PET waste and biomass may become
contaminated with heavy metals and minerals during the process of mechanical recycling and sawing. These metals may cause scratching and corrosion of machinery. Heavy metals concentration such as copper (Cu), zinc (Zn), chromium (Cr), cadmium (Cd), and lead (Pb) were investigated. The procedure was detailed in a previous work of Samaksaman et al. (2015). Samples of PET waste, biomass, and PET/biomass pellets were digested using an acidic solution (a mixture of hydrochloric and nitric acids), followed by dilution with deionized (DI) water and filtration. Atomic absorption spectrometry (GBC, Avanta PM) was used in the subsequent analysis. The standardized curves with coefficient of determination (R2) values of 0.95-0.99 were used to evaluate heavy metal concentrations. The leachability test was used to determine the concentration of ionic leachates from the samples. The test applies quantity analysis of elements for seven anions leachate (AnL): fluoride (F-), chloride (Cl-), nitrite (NO2
-), bromide (Br-), nitrate (NO3
-), phosphate (PO43-), and sulfate (SO4
2-); and for six cations leachate (CaL): lithium (Li+), sodium (Na+), ammonium (NH4
+), potassium (K+), magnesium (Mg2+), and calcium (Ca2+). One gram of each sample
Fig. 1: A flat-die pelletizing machine and the PET/biomass pellets
Fig. 1: A flat-die pelletizing machine and the PET/biomass pellets

629
Global J. Environ. Sci. Manage., 7(4): 625-642, Autumn 2021
was placed in a centrifuge tube and mixed with 10 ml DI water. A shaking incubator (JSR, Jssi-300C) was used for extraction at 250 rpm at room temperature for 12 hours. Then the sample was filtered twice using a paper filter before passing through a nylon filter. Prior to measurement, dilution of the sample (1:100 v/v) with ≥18 (mW) DI water was carefully conducted in a clean room. The sample solution was analyzed for anions and cations using ion chromatography (Dionex DX500). All experiments were done three replications.
Ash composition analysisX-ray fluorescence (XRF) spectroscopy is a rapid
method used to determine the composition in solid samples like ash and residue. It is a non-destructive technique and suitable for ash samples from the combustion test. The ash samples were the as-receive samples from the combustion of raw materials and pellets within a muffle furnace at 815 °C for 2 hours (Xing et al., 2016). The test was employed using an energy dispersive XRF (EDXRF, Horiba XGT-5200 X-ray Analytical Microscope) with Rh X-ray tube, 1.2 mm of XGT diameter, and 30 kV of X-ray tube voltage.
Thermogravimetric analysisA simultaneous thermal analyzer (Mettler-
Toledo, TGA-DSC II) was used to measure the thermal decomposition of samples. Thermogravimetric analysis and derivative thermogravimetry (DTG) were used to analyze samples of PET waste, biomass, and PET/biomass pellets. Raw materials were analyzed in an atmosphere of oxygen, over a temperature range of 50-800 °C at a heating rate of 15 °C/min. The PET/biomass pellets were analyzed under the same conditions as the raw materials but various heating rates of 5, 10, 15, and 20 °C/min.
Kinetic analysisThe combustion of carbonaceous material is
considered in term of a gas-solid heterogeneous reaction. The conversion (X) of PET waste, biomass, and pellets during the combustion process can be defined using Eq. 1.
0
0
t
f
m mXm m
−=
− (1)
Where, m0, mt, and mf are the initial sample mass, the sample mass at time t, and the sample mass left
after ending process, respectively. The combustion rate of the materials can be represented using Eq. 2.
( ) ( )dX k T f Xdt
= (2)
Where, k is the combustion rate constant and f(x) is the reaction model expressing the dependence of the combustion rate. The combustion rate constant (k) is temperature-dependent and generally is described using the Arrhenius formula using Eq. 3 (Mishra et al., 2019).
/aE RTk Ae−= (3)
Where, Ea is the activation energy (kJ/mol), A is the pre-exponential factor (s-1), T is the absolute temperature (K), and R is the universal gas constant, 8.314 kJ/(kmol·K). A heterogeneous function of the uniform kinetic reaction of the first order (n = 1), f(x) can be written using Eq. 4.
( )( ) 1f X X= − (4)
Thus, the rate constant can be expanded using Eq. 5.
/ (1- )E RTdX Ae Xdt
−= (5)
In non-isothermal analysis, the heating rate varies with the reaction time and temperature at a constant heating rate, dT
dtβ = that can be rewritten as Eq. 6.
/ (1- )E RTdX A e XdT β
−= (6)
The integral form of f(X) can be represented as g(X) by integrating Eq. (6) with respect to temperature as shown in Eqs. 7 and 8.
0
/
0( )
( )X T E RT
T
dX Ag X e dTf X β
−= =∫ ∫ (7)
2
0( ) (X)
X uAE AEg X u e du pR Rβ β
− −= =∫ (8)
Kissinger-Akahira-Sunose method The Kissinger-Akahira-Sunose (KAS) method
(Akahira and Sunose, 1971) is an iso-conversional method that uses an approximation of p(X) = x-2e-x in Eq. (8) to determine Ea as shown in Eq. 9.

630
K. Manatura and U. Samaksaman
2ln ln(X)
a aAE ET Rg RTβ = −
(9)
Plotting 2lnTβ
versus 1/T will obtain the slope
and intercept that can be used to estimate Ea and A, respectively.
Ozawa-Flynn-Wall methodThe Ozawa-Flynn-Wall (OFW) method is a model-
free method applying Doyle’s approximation in Eq. (8) to evaluate the activation energy (Tran et al., 2014) as shown in Eq. 10.
ln( ) ln 5.3305 1.052(X)
a aAE ERg RT
β = − −
(10)
Ea was determined using the least square regression line as the slope of 1.052Ea/R by plotting the graph between ln (β) on the y-axis versus 1/T on the x-axis.
Starink methodThe Starink method is a model-free method like
the KAS and OFW methods; however, the value it produces for Ea is more accurate than from using the other two methods (Gai et al., 2013). The Starink equation is shown in Eq. 11.
1.8ln 1.0037 as
ECT RTβ = −
(11)
Plotting a linear graph of 1.8lnTβ
and 1/T enables
the values of Ea and A to be determined from the slope and intercept, respectively.
Thermodynamic analysisThermodynamic parameters can be presented by
the change in the enthalpy (ΔH), Gibbs free energy (ΔG), and entropy (ΔS) (Manatura, 2019). In brief, ΔH represents an endothermic or exothermic reaction which is the nature of the reaction process. ΔG indicates the energy related to a chemical reaction
that can be used to do work and ΔS measures the irreversibility of the system. The parameters can be calculated using Eqs. 12-14.
aH E RTD = − (12)
ln B pa p
K TG E RT
hA
D = + (13)
p
H GST
D −DD = (14)
Where, KB, h, and Tp are the Boltzmann constant = 1.381 × 10⁻²³ J/K, Plank constant = 6.626 × 10⁻³⁴ J.s and peak temperature, respectively.
RESULTS AND DISCUSSIONProperties and fuel characteristics
Table 1 shows that the proximate and ultimate analysis for entire PET waste, biomass, and PET/biomass pellet samples. The PET waste had lower moisture and ash content compared to the biomass. The PET waste contained large amounts of volatile matter due to the nature of the plastic material (Luo et al., 2018; Zhao et al., 2016). The PET/biomass pellets also contained a large amount of volatile matter (83.19%). However, it had higher ash content (4.62%) and fixed carbon (6.83%) than the biomass. These changes in the physical properties of the pellets were due to the mixing ratio and the pelletizing process. Subsequently, the HHV of pellets was 19.20 MJ/kg via the calorimetric test and was slightly different from the HHV of pellets via calculation (Huang and Lo, 2020). Mass and energy densification by pelletizing could overcome the disadvantages of PET waste and biomass. The H/C and O/C atomic ratios of PET waste, biomass, and pellet samples were in the range of 0.08–0.13 and 0.85–1.47, respectively. The H/C value for the PET waste was different compared to the biomass and was linked to the H/C value of the PET/biomass pellets. The PET/biomass pellets had a
Table 1: Properties of the raw materials and PET/biomass pellets
Sample Proximate analysis (%wt) Ultimate analysis (%wt)
H/C O/C HHV (MJ/kg) MC VM FC Ash C H N O S
PET 5.09 87.80 5.02 2.09 38.41 3.02 0.08 56.40 ND 0.08 1.47 21.77 Biomass 7.78 78.33 8.26 5.63 47.58 6.32 0.06 40.41 ND 0.13 0.85 17.39 Pellets 5.36 83.19 6.83 4.62 39.33 3.35 0.07 49.43 ND 0.09 1.26 19.20
ND: not detected
Table 1: Properties of the raw materials and PET/biomass pellets

631
Global J. Environ. Sci. Manage., 7(4): 625-642, Autumn 2021
higher H/C value mainly due to the PET composition. The percentage of N showed similar results in the range 0.06-0.08% for the raw materials, while the percentage of S was untraceable in all samples. Previous works reported that C and H contents in PET samples were higher compared to the current study (Luo et al., 2018; Surenderan et al., 2018; Zhao et al., 2016). The N and S content was substantially low. Low emissions of oxides of nitrogen (NOx) and sulfurdioxide (SO2) could be expected when this PET/biomass pellet was used as fuel in the combustion or co-combustion processes (Edo et al., 2016). The current results from the proximate and ultimate analysis suggested that the purity of the PET waste was an important factor in determining their characteristics. Compared to PET waste from bottles, the pure-PET had less contaminants and decay materials from the mechanical process, it would be clearly resulted as a previous work by Jabłońska et al. (2019). In the pelletizing of PET waste and biomass into a fuel pellet, the PET plastic played a key role in the compaction and made the pellets harden, as seen in Fig. 1. In conclusion for this sub-section, the PET/biomass pellets could be used as alternative sources and in combination with solid fuels in the same manner as refuse-derived fuel (RDF) and solid recovered fuel (SRF).
FTIR resultsThe FTIR technique allowed the identification of
the functional groups present in the polyethylene terephthalate (polyester group) and biomass components (lignocellulose group). Fig. 2a-c illustrates the IR spectra of samples of PET waste, biomass, and PET/biomass pellets. The identified vibrational groups are summarized in the Table 2. The bands were in agreement with previous works (Chen et al., 2013; Lopes et al., 2018; Manatura, 2020; Pereira et al., 2017; Taleb et al., 2020). The IR spectrum of PET waste (Fig. 2a) contained bands at 2,916/cm (C-H, stretch), 1,714/cm (C=O, stretch), and 1,338-1,408/cm (C-O, stretch). The main observation at 1,247/cm and 1,125/cm affirmed the terephthalate group (OOCC6H4-COO). The same results for the PET functional groups were suggested by previous researchers (Chen et al., 2013; Pereira et al., 2017). In addition, the IR bands of the PET waste at around 1,090, 950-1,016, 796, and 439/cm, represented groups of Si-O asymmetric, Si-O(H) asymmetric, Si-O symmetric, and Si-O-Si bending, respectively (Capeletti and Zimnoch, 2016; Pereira et al., 2017). These results were due to the characteristics of soil and sand that remained in the PET waste from the mechanical recycling process of the PET bottles. The IR spectrum of the biomass sample in Fig. 2b shows
Fig. 2: IR spectra of samples; (a) PET waste, (b) biomass, and (c) PET/biomass pellets
Fig. 2: IR spectra of samples; (a) PET waste, (b) biomass, and (c) PET/biomass pellets

632
Characteristics and combustion kinetics of PET/biomass pellets
a band at 3,324/cm (O-H group) due to the water content in the biomass sample. In addition, there were bands at 2,898/cm (C-H stretch), 1,734/cm (C=O, stretch), 1,593/cm (C=C, aromatic skeleton vibration), 1,442/cm (C-H, CH2, stretch, and CH3, asystematic), 1,231/cm (C-C, C-O, and C=O, stretch), 1,026/cm (C-O, stretch), and 559/cm (C-H, bend). Similar results for the functional groups of lignocellulosic materials have been reported using FTIR in teak hardwood, coffee grounds, and sugarcane bagasse (Lopes et al., 2018; Manatura, 2020; Taleb et al., 2020). The PET/biomass pellets characterization interpreted the mixture between PET waste and biomass as seen in Fig. 2c. While functional groups were contributed by both raw materials, the mixture was mainly characterized by the functional groups from the PET waste at around 1,252-1,239/cm, represented groups of terephthalate. Even though the biomass made up a small proportion of the pellets, some biomass characteristics were evident in the band at 1,578/cm that showed vibration of the aromatic skeleton with stretching (C=C) of lignin and at 1,022/cm representing C-O stretching of the ester methyl group of lignin. However, silica group occurred bands at 1,016, 723, and 459/cm in the sample of PET/biomass pellets due to the contamination was resulted from earth materials as found in the sample of PET waste.
Heavy metal concentration and ionic leachabilityTable 3 summarizes the results of heavy
metal concentration and ionic contaminants of the raw materials and PET/biomass pellets. The concentrations of Pb, Zn, Cr, and Cu in all tests of raw material samples were below regulatory levels and none of the tests yielded evidence of Cd. These results confirmed that the heavy metals (Cd~Cu<Pb<Cr<Zn) content in PET/biomass pellets were below the limits set by some European countries (Finland, Italy, France and the Netherlands) for alternative solid fuels such as RDF and SRF (Zhao et al., 2016). In addition, the contaminant leaching of AnL and CaL was also investigated and reported in Table 4. The PET waste had a high content of chloride (Cl-) of around 3.99 ppm and the other six tested anions were recorded in the range from non-detectable to 0.33 ppm, while for the cations, sodium (Na+) was the highest (28.35 ppm). The biomass sample had a substantially amount of the phosphate (PO4
3-
) anion at 58.58 ppm with lesser amounts of the other three cations-potassium (K+) at 28.57 ppm, sodium (Na+) at 16.21 ppm, and magnesium (Mg2+) at 7.42 ppm. The experimental results showed that pellets characterization regarding ionic leachability was based on the combined properties of the PET waste and biomass. The major ionic elements in
Table 2: Characteristics bands of the PET waste, biomass, and pellets obtained by FTIR
Wavenumber (1/cm) Characteristics bands
PET Biomass Pellets - 3,324 3,340 Hydroxyl (O-H) groups
2,916 - 2,960 C–H stretching in aromatic methoxyl groups and methylene groups - 2,898 - C-H stretching in the methyl groups
- 1,734 - Stretching of C=O of the carbonyl, carboxyl, and acetyl groups, and of xylans
1,714 - 1,713 The non-conjugated carbonyl group stretching - 1,593 1,578 Aromatic skeleton vibration (C=C) of lignin
- 1,442 - C-H deformation in lignin and carbohydrates, CH2 stretching, and CH3 asystematic
1,338-1,408 - 1,337-1,408 Stretching of C-O group deformation of the O-H group and bending and wagging vibrational modes of the ethylene glycol segment
1,247&1,125 - 1,252-1,239 Terephthalate group (OOCC6H4-COO) - 1,231 C-C, C-O, and C=O stretching
1,090 - 1,083 Si-O asymmetric - 1,026 1,022 Stretching of C-O of the ester-methyl group of lignin
950-1,016 - 1,016 Si-O(H) asymmetric 796 - 723 Si-O symmetric
- 559 - C-H bending 439 - 459 Si-O-Si bending
Table 2: Characteristics bands of the PET waste, biomass, and pellets obtained by FTIR

633
Global J. Environ. Sci. Manage., 7(4): 625-642, Autumn 2021
the pellets were not higher than in the original biomass for PO4
3-, Cl-, F-, SO42-, K+, Mg2+, and Ca2+
and furthermore, were not higher than in the PET waste for Cl- and Na+. The high sodium (Na+) cation level in the PET waste and the pellets might have been affected by the caustic soda (NaOH) detergent used during the cleaning step in the mechanical recycling process for the PET bottles.
Ash compositionThe ash composition analysis obtained by
EDXRF technique showed in Table 5. The ashes from combustion of biomass, PET, and PET/biomass pellets would consist of the most common oxides which formed during the sintering process (Lu et al., 2015). Silicon oxide (SiO2), iron (III) oxide (Fe2O3), calcium oxide (CaO), magnesium oxide (MgO), and aluminium oxide (Al2O3) were the major components of all ash samples. The content of SiO2 in biomass ash was 48.88%wt or more suggested by Xing et al. (2016) for the raw materials of biomass, which was much lower
than PET (78.24%wt) and pellets (80.68%wt). While the lower SiO2 (10.32%wt) composition of waste from PET bottles washing has been reported by Jabłońska et al. (2019). SiO2 composition occurred in the samples of waste PET and PET/biomass pellets due to the contamination was mainly resulted from earth materials. The biomass ash had a substantially amount of phosphorus (V) oxide (P2O5), and potassium oxide (K2O) were 6.14% and 4.23%, respectively. Chromium (III) oxide (Cr2O3), copper oxide (CuO), zinc oxide (ZnO), titanium dioxide (TiO2) were found in the ash of pellets sample. These metal-oxides fractions in the ash were supposed the effect of aggregation of metal elements with oxygen during combustion process (Samaksaman et al., 2015). The appearance of metal elements such as CrO, CuO, ZnO, and TiO2 might be released during the process of PET-bottle grinding and PET/biomass pelletizing. Sulfur trioxide (SO3) was also found in the low value. Trace metals such as manganese (IV) oxide (MnO2), strontium oxide (SrO), zirconium dioxide (ZrO2), and tantalum (V) oxide
Table 3: The results of heavy metal concentration
Sample Heavy metal concentration (mg/kg)
Pb Zn Cd Cr Cu Limits a 200 500 5 100 300 PET ND 3.5 ND 9.4 5.0 Biomass ND 0.7 ND 1.6 1.4 Pellets 0.8 7.4 ND 5.2 ND
a The limits set by European countries for the RDF and SRF. ND: not detected
Table 3: The results of heavy metal concentration
Table 4: The results of anionic and cationic leachability
Sample AnL (ppm) CaL (ppm)
F- Cl- NO2- Br- NO3
- PO43- SO4
2- Li+ Na+ NH4+ K+ Mg2+ Ca2+
PET 0.06 3.99 ND ND ND ND 0.33
ND 28.35 ND 0.55 1.52 1.82 Biomass 0.32 4.61 ND ND ND 58.58 1.75 ND 16.21 ND 28.57 7.42 3.88 Pellets 0.06 3.25 ND ND ND 16.96 0.62 ND 20.88 ND 10.70 2.71 2.03
AnL: Anions leachate; CaL: Cations leachate; ND: not detected
Table 4: The results of anionic and cationic leachability
Table 5: Composition of the different ash samples
Sample Ash composition (%wt)
MgO Al2O3 SiO2 P2O5 SO3 K2O CaO TiO2 Cr2O3 MnO2 Fe2O3 CuO ZnO SrO ZrO2 Ta2O5 PET 3.29 4.23 78.24 0.15 0.27 0.75 3.93 0.95 0.08 0.10 7.88 0.05 0.04 ND 0.03 ND Biomass 9.21 10.02 48.88 6.14 0.64 4.23 16.08 0.49 0.06 0.08 4.11 0.01 0.01 0.02 0.01 0.01 Pellets 2.86 2.63 80.68 1.27 0.13 0.65 3.80 0.53 0.45 ND 6.94 0.03 0.03 ND ND ND ND: not detected
Table 5: Composition of the different ash samples

634
K. Manatura and U. Samaksaman
Fig. 3: (a) TGA and (b) DTG for combustion of waste of PET (PET), biomass (Biomass), and pellets (PET/biomass) at
15 °C/min
Fig. 3: (a) TGA and (b) DTG for combustion of waste of PET (PET), biomass (Biomass), and pellets (PET/biomass) at 15 °C/min
Fig. 4: (a) TGA and (b) DTG for combustion of pellets at 5-20 °C/min
Fig. 4: (a) TGA and (b) DTG for combustion of pellets at 5-20 °C/min

635
Global J. Environ. Sci. Manage., 7(4): 625-642, Autumn 2021
(Ta2O5) were untraceable in the ash of pellets sample. It is proven that the ash characterization of pellets exhibited unique characters based on the combined properties of the PET waste and biomass. Overall, the results of properties and fuel characteristics, FTIR, heavy metal concentration and ionic leachability, and ash composition made the PET/biomass pellets useful in a co-firing process with traditional solid fuels. Moreover, the PET/biomass pellets can further be upgraded to other fuels production via modern bioenergy conversion processes.
TGA and DTG resultsThe combustion characteristics of PET waste
and the raw biomass at 15 °C/min are shown in the TG and DTG curves in Fig. 3. Both waste of PET and biomass are different in chemical structure, but the tests could be compared because used the same condition of oxygen atmosphere and a heating rate. The reaction temperature varied in the range 100 to 800 °C. It was clear that the biomass characteristics differed noticeably compared to those of the PET. For the biomass, below 150 °C represented removing vapor and light volatile matter (Ahmad et al., 2017). The mass loss of about 5.80% was represented as the water content in biomass (Fig. 3a). The clear mass loss of the biomass commenced from 190 up to 500 °C. Two clear peaks were observed during combustion with maximum mass loss rates of 0.0027 s-1 at 317 °C and 0.0014 s-1 at 437 °C, respectively. The first and second peaks were caused by the release of volatile matter in the temperature range from 148 to 372 °C and combustion of the remaining char,
respectively (Ahn et al., 2014). For all samples of the PET waste and PET/biomass pellets, no obvious mass loss was detected below 266 °C. However, a small peak was observed with 0.0003 s-1 at 325 °C for the mixed PET with biomass related to the level of higher volatiles in the biomass. The distinct mass loss and rate of mass loss of the PET waste and the pellets started at 278 °C and finished at around 458 °C. Two peaks were observed in Fig. 3b, with the first peak being for PET waste and pellets that were very similar to each other with a maximum mass loss rate of 0.0034 s-1 at 419 °C. The second peak had the same peak temperature (Tp) at 454 °C with the mass loss rate for pellets of 0.0026 s-1 and for PET waste of 0.0020 s-1, respectively. It was clear that the biomass blending supported reactivity of the process. In addition, the experimental results affirmed that the decomposition of material with complex structure depended on the loss of chemical bonding and properties of materials. The combustion properties of the PET waste, biomass, and pellets are listed in Table 6. The ignition temperature (Tig) and peak temperature (Tp) of PET were consistent with Das and Tiwari (2019). The results indicated that a low content (10%wt) of biomass mixed with PET improved Tig by lowering it. There were no obvious changes in other properties such as the burnout temperature (Tb), higher reactivity (Ravg), and maximum derivative thermogravimetric value (DTGmax). The effects of the heating rate (5, 10, 15 and 20 °C/min) on mass loss and the rate of mass loss in terms of combustion temperature are shown in Fig. 4. The mass loss and rate of mass loss curves
Table 6: Thermal decomposition of samples in combustion at 15 °C/min
Sample Tig (°C) Tb (°C) Tp (°C) DTGmax (1/s) Ravg (1/(s⋅K)) PET 390 475 419 -0.0034 -4.92E-06 Biomass 278 458 317 -0.0027 -4.56E-06 Pellets 380 471 420 -0.0035 -4.99E-06
Table 6: Thermal decomposition of samples in combustion at 15 °C/min
Table 7: Combustion characteristics of pellets in combustion at various heating rates
Hearing rate (°C/min) Tig (°C) Tb (°C) Tp (°C) DTGmax (1/s) 5 360 460 398 -0.0012
10 378 460 411 -0.0021 15 380 471 420 -0.0035 20 398 499 426 -0.0053
Table 7: Combustion characteristics of pellets in combustion at various heating rates

636
K. Manatura and U. Samaksaman
were parallel and similar. A higher heating rate required a larger temperature range for complete combustion because there was not sufficient time for the biomass to combust (Manatura et al., 2018). Table 7 shows the combustion characteristics of pellets for the four heating rates. With an increased heating rate, the values of Tig, Tb, and Tp increased as did DTGmax, indicating that the lower heating rate produced more effective combustion than the higher heating rate (Lu and Chen, 2015).
Kinetic analysisThe iso-conversional KAS, OFW and Starink
methods from Eq. (9)-(11) were used to determine the kinetic factors (Ea and A) in this study. The typical linear regression lines of the KAS, OFW, and Starink methods fitted with conversion (X) in the range 0.2 to 0.8 are shown in Fig. 5. The estimates of Ea and A from the models were very close in value, as shown in Table 8. The quality of linear fitting is shown by R2, with the values being mostly higher than 0.96 which implied the simulations had a good fit with the experimental data. Fig. 6 illustrates the variation of Ea in terms of X. The kinetic factors Ea and A showed similar trends by increasing first for X values of 0.2 to 0.7, then decreasing at 0.8. The minimum and maximum Ea values were at X values of 0.2 and 0.7, respectively. It was noticed that a rapid increase in Ea occurred between X values in the range 0.6-0.7 because almost all the volatile matter was expelled from the char residue. Moreover, Ea rapidly dropped for X values in the range 0.7-0.8 due to the sudden char combustion at the higher temperature in the oxygenated atmosphere (Das and Tiwari, 2019). The average Ea value for pellets was in the range 142 to 146 kJ/mol for all prediction models, with these values in accordance with previous work of Das and Tiwari (2019), as was the average value of A represented in the range 6.70×10¹² to 1.83×10¹⁵ min-1.
Thermodynamic parametersTo design a high performance macro-scale
combustor requires not only choosing suitable bio-fuels and kinetic parameters but also requires
Fig. 5: Linear regression lines; (a) KAS, (b) OFW, and (c) Starink at various conversions (X)
Fig. 5: Linear regression lines; (a) KAS, (b) OFW, and (c) Starink at
various conversions (X)
Fig. 6: Ea vs X for the KAS, OFW, and Starink
Fig. 6: Ea vs X for the KAS, OFW, and Starink
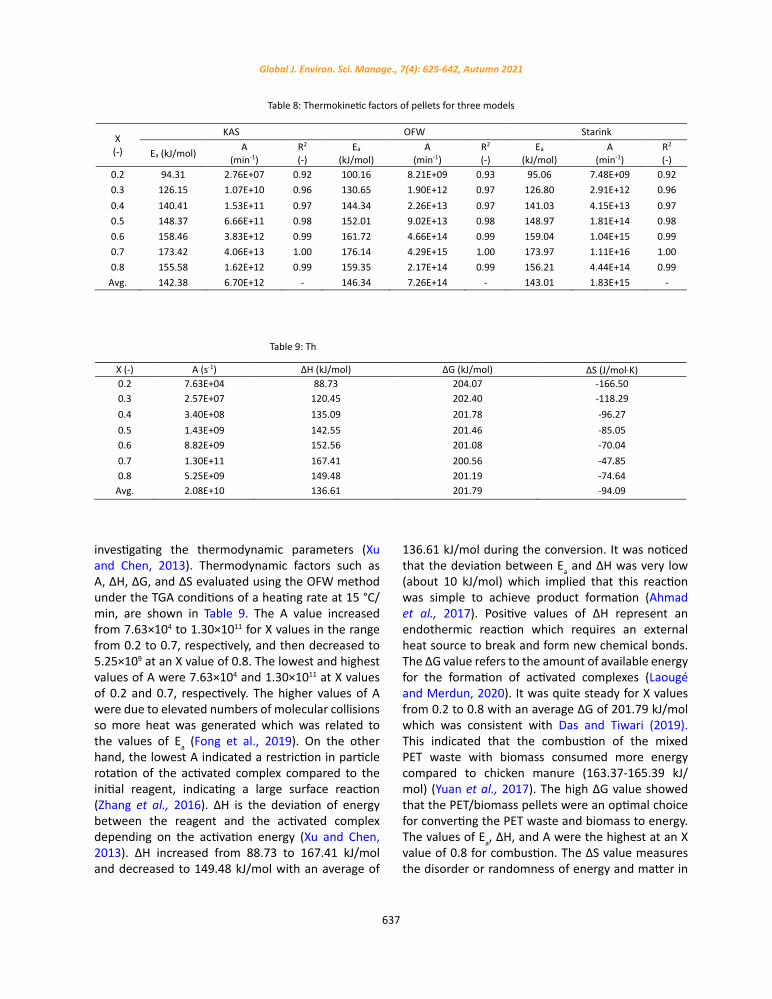
637
Global J. Environ. Sci. Manage., 7(4): 625-642, Autumn 2021
investigating the thermodynamic parameters (Xu and Chen, 2013). Thermodynamic factors such as A, ΔH, ΔG, and ΔS evaluated using the OFW method under the TGA conditions of a heating rate at 15 °C/min, are shown in Table 9. The A value increased from 7.63×10⁴ to 1.30×10¹¹ for X values in the range from 0.2 to 0.7, respectively, and then decreased to 5.25×10⁹ at an X value of 0.8. The lowest and highest values of A were 7.63×10⁴ and 1.30×10¹¹ at X values of 0.2 and 0.7, respectively. The higher values of A were due to elevated numbers of molecular collisions so more heat was generated which was related to the values of Ea (Fong et al., 2019). On the other hand, the lowest A indicated a restriction in particle rotation of the activated complex compared to the initial reagent, indicating a large surface reaction (Zhang et al., 2016). ΔH is the deviation of energy between the reagent and the activated complex depending on the activation energy (Xu and Chen, 2013). ΔH increased from 88.73 to 167.41 kJ/mol and decreased to 149.48 kJ/mol with an average of
136.61 kJ/mol during the conversion. It was noticed that the deviation between Ea and ΔH was very low (about 10 kJ/mol) which implied that this reaction was simple to achieve product formation (Ahmad et al., 2017). Positive values of ΔH represent an endothermic reaction which requires an external heat source to break and form new chemical bonds. The ΔG value refers to the amount of available energy for the formation of activated complexes (Laougé and Merdun, 2020). It was quite steady for X values from 0.2 to 0.8 with an average ΔG of 201.79 kJ/mol which was consistent with Das and Tiwari (2019). This indicated that the combustion of the mixed PET waste with biomass consumed more energy compared to chicken manure (163.37-165.39 kJ/mol) (Yuan et al., 2017). The high ΔG value showed that the PET/biomass pellets were an optimal choice for converting the PET waste and biomass to energy. The values of Ea, ΔH, and A were the highest at an X value of 0.8 for combustion. The ΔS value measures the disorder or randomness of energy and matter in
Table 8: Thermokinetic factors of pellets for three models
X (-)
KAS OFW Starink
Ea (kJ/mol) A (min-1)
R2
(-) Ea
(kJ/mol) A
(min-1) R2
(-) Ea
(kJ/mol) A
(min-1) R2
(-) 0.2 94.31 2.76E+07 0.92 100.16 8.21E+09 0.93 95.06 7.48E+09 0.92 0.3 126.15 1.07E+10 0.96 130.65 1.90E+12 0.97 126.80 2.91E+12 0.96 0.4 140.41 1.53E+11 0.97 144.34 2.26E+13 0.97 141.03 4.15E+13 0.97 0.5 148.37 6.66E+11 0.98 152.01 9.02E+13 0.98 148.97 1.81E+14 0.98 0.6 158.46 3.83E+12 0.99 161.72 4.66E+14 0.99 159.04 1.04E+15 0.99 0.7 173.42 4.06E+13 1.00 176.14 4.29E+15 1.00 173.97 1.11E+16 1.00 0.8 155.58 1.62E+12 0.99 159.35 2.17E+14 0.99 156.21 4.44E+14 0.99
Avg. 142.38 6.70E+12 - 146.34 7.26E+14 - 143.01 1.83E+15 -
Table 8: Thermokinetic factors of pellets for three models
Table 9: Thermodynamic analysis of pellets at 15 °C/min
X (-) A (s-1) ΔH (kJ/mol) ΔG (kJ/mol) ΔS (J/mol⋅K) 0.2 7.63E+04 88.73 204.07 -166.50 0.3 2.57E+07 120.45 202.40 -118.29 0.4 3.40E+08 135.09 201.78 -96.27 0.5 1.43E+09 142.55 201.46 -85.05 0.6 8.82E+09 152.56 201.08 -70.04 0.7 1.30E+11 167.41 200.56 -47.85 0.8 5.25E+09 149.48 201.19 -74.64
Avg. 2.08E+10 136.61 201.79 -94.09
Table 9: Thermodynamic analysis of pellets at 15 °C/min

638
K. Manatura and U. Samaksaman
a system and shows how near of far the state of the sample is from its own thermodynamic equilibrium. Entropy also shows the degree of arrangement of the carbon layers in samples (Xu and Chen, 2013). Positive values indicate a high affinity of the sorbent and negative values indicate that the adsorption process is mainly driven by ΔS. In the current study, the ΔS values were negative regardless of the model and process used. The higher values of ΔS occurred between X values of 0.2 and 0.3 (-166.50 and -118.29 J/(mol.K)), respectively. It was observed that the trend for ΔS was opposite that of Ea, ΔH, and ΔG.
CONCLUSIONIncrease in fuel pellets demand coupled with
rising environmental issues of the secondary waste from the plastic recycling system have attracted researcher to explore. Fuel pellets production by pelletizing is an efficient method for manipulating waste of PET from a mechanical recycling plant and local biomass like teak sawdust. It is a useful tool to manage the waste of PET and biomass in terms of dusty forms (macro-, meso-, micro-, and nano-sizes) and plays a role on reduce the loads of plastic waste pollution that releases into the soil, public water, as well as air emissions. Notice, the reduction of loads of plastic waste dumps into landfills and to prevent the improper disposal of plastic waste are considered. In further, it can adapt into a concept of waste to energy following by converting to fuel pellets and using with industrial furnaces i.e. using as substituent fuels in cement kiln, boiler, power plant, incinerator, and so on. Pelletizing was employed to convert waste of PET and biomass into a potential solid fuel with the fit ratio of 9:1 (PET:biomass). This ratio gives the durability of PET/biomass pellets, a uniform dimension, ease handling, storage, and transportation common as woody pellets. Some technical challenges such as low moisture content and high volatile matter content were feedstock dependent. The PET/biomass pellets had characteristics and physico-chemical properties that were a combination of those of the PET waste and biomass. A high heating value of the PET/biomass pellets (HHV = 19.20 MJ/kg) was obtained from the results of pelletizing the complex solid fuels. The HHV value was slightly decreased by adding biomass. The complex structure of ethylene terephthalate and lignocellulose was clearly identified by FTIR technique. Heavy metals (Cd~Cu<Pb<Cr<Zn) and
ionic (7 AnLs and 6 CaLs) contaminants had lower concentration than the limitation of the regulations. The results of ash composition affirmed that the ash of PET/biomass pellets was a non-hazardous residue which was unique characters based on feedstock. Therefore, the PET/biomass pellets can be used without harms of the environment and health impacts. Earth materials (SiO2 composition) and a detergent (Na+ element of caustic soda) from step PET flake cleaning had a slightly effect on the alteration of residue chemicals. However, biomass supplied as part of PET plastic waste improve combustion kinetics such as Tig, Tb, Ravg, and DTGmax. Lower ignition temperature, burnout temperature, reactivity, and DTGmax were affected by the blended biomass in the PET/biomass pellets that could be attributed to the combined effect of terephthalate and lignocellulose groups present in the pellet matrix. Subsequently, the combustion characteristics and kinetics of PET/biomass pellet samples were examined via the iso-conversional methods of KAS, OFW, and Starink. The results exhibited similar trends and values for the activation energy (Ea) of 142.38, 146.34, and 143.01 kJ/mol, respectively, with the values of conversion ranged from 0.2 to 0.8. The thermodynamic factors of DH, DG, and DS were 136.61 kJ/mol, 201.79 kJ/mol, and -94.09 J/mol×K, respectively. These findings may provide comprehensive knowledge to assist the design and operation of a combustion system for adding PET/biomass pellets in a co-firing process with traditional solid fuels. Moreover, PET/biomass pellets can further be upgraded to other fuels production via modern bioenergy conversion processes.
AUTHOR CONTRIBUTIONSK. Manatura performed the literature review,
writing original draft, conceptualization, methodology, investigation, data analysis, visualization, and manuscript edition. U. Samaksaman performed the literature review, experimental design, analyzed and interpreted the data, research summary and recommendation, and manuscript edition.
ACKNOWLEDGEMENTThis study was supported by grants from the
Faculty of Engineering at Kamphaeng Saen, Kasetsart University, Kamphaeng Saen campus, Thailand [Project No. 10/2020] and Naresuan University, Thailand (R2560C032). The authors also thank the

639
Global J. Environ. Sci. Manage., 7(4): 625-642, Autumn 2021
Kasetsart University Research and Development Institute (KURDI), Bangkok, Thailand for English-editing assistance.
CONFLICT OF INTERESTThe authors declare no potential conflict of
interest regarding the publication of this work. In addition, the ethical issues including plagiarism, informed consent, misconduct, data fabrication and, or falsification, double publication and, or submission, and redundancy have been completely witnessed by the authors.
ABBREVIATIONS % Percentage% wt Weight percentage°C Degrees celsius
°C/min Heating rate (degree of temperature per time)
ΔG Gibbs free energyΔH EnthalpyΔS EntropyA The pre-exponential factorAl2O3 Aluminium oxideAnL Anions leachate
βThe heating rate varies with the reaction time and temperature at a constant heating rate
Br- Bromidecm Centimeter
1/cm The unit of wavenumber of IR spectrum
C CarbonCaL Cations leachateCaO Calcium oxideCa2+ CalciumCd CadmiumCl- ChlorideCr ChromiumCr2O3 Chromium (III) oxideCu CopperCuO Copper oxideCEN/TS 15148
Method for the determination of the content of volatile matter
CEN/TS 14775
Method for the determination of ash content
DI water The deionized waterDTG Derivative thermogravimetry
DTGmax.Maximum derivative thermogravimetric value (1/s)
Ea The activation energy (kJ/mol)Eq. Equation
EDXRF Energy dispersive X-ray fluorescence spectroscopy
f(x) The reaction model expressing the dependence of the combustion rate
F- FluorideFC Fixed carbon Fe2O3 Iron (III) oxide
FTIR Fourier transform infrared spectrometry
g(X) The integral form of f(X)h Plank constant 6.626 × 10⁻³⁴ (J.s)H HydrogenHDPE High density polyethyleneHHV High heating valueH/C Hydrogen to carbon atomic ratioIR Infrared radiationk The combustion rate constantkg/min Kilogram per minutekV KilovoltageK Degrees KelvinK+ Potassium
KBThe Boltzmann constant 1.381 × 10-
23 (J/K)
KAS The Kissinger-Akahira-Sunose method
K2O Potassium oxideLi+ Lithiummg/kg Miligram per kilogramml Millilitermm MillimetermW Milliohm
min-1. The unit of A interm of minute (pre-exponential factor)
m0 The initial sample mass

640
K. Manatura and U. Samaksaman
mfThe sample mass left after ending process
mt The sample mass at time tMC Moisture contentMJ/kg Megajoules per kilogramMgO Magnesium oxideMg2+ MagnesiumMnO2 Manganese (IV) oxideN NitrogenNa+ SodiumNaOH Sodium hydroxide (caustic soda)NH4
+ AmmoniumNOx Oxides of nitrogenNO2
- NitriteNO3
- NitrateO OxygenOFW The Ozawa-Flynn-Wall methodO/C Oxygen to carbon atomic ratioppm Part per millionPb LeadPET Polyethylene terephthalatePET/biomass The mixture of PET and biomass
PO43- Phosphate
PP PolypropyleneP2O5 Phosphorus(V) oxide
R The universal gas constant 8.314 (kJ/(kmol·K))
R2 The coefficient of determination value
Ravg Higher reactivityRDF Refuse derived fuelRh X-ray Rhodium X-ray tube
s-1 The unit of A interm of second (pre-exponential factor)
S SulfurSiO2 Silicon oxideSO2 SulfurdioxideSO3 Sulfur trioxideSO4
2- SulfateSrO Strontium oxide
SRF Solid recovered fuelStarink The Starink methodT The absolute temperature (K)Ta2O5 Tantalum (V) oxideTiO2 Titanium dioxideTb Burnout temperatureTig Ignition temperatureTp Peak temperatureTGA Thermogravimetric analysisv/v The volume ratioVM Volatile matterX The conversion of samplesXRF X-ray fluorescence spectroscopyXGT diameter The X-ray irradiation diameter
Zn ZincZnO Zinc oxideZrO2 Zirconium dioxide
REFERENCESAbnisa, F.; Wan Daud, W., (2014). A review on co-pyrolysis of
biomass: An optional technique to obtain a high-grade pyrolysis oil. Energy Convers. Manage. 87: 71-85 (15 pages).
Ahmad, M.; Mehmood, M.; Ye, G.; Al-Ayed, O.; Ibrahim, M.; Rashid, U.; Luo, H.; Qadir, G.; Nehdi, I., (2017). Thermogravimetric analyses revealed the bioenergy potential of Eulaliopsis binata. J. Therm. Anal. Calorim. 130: 1237-1247 (11 pages).
Ahn, S.; Choi, G.; Kim, D., (2014). The effect of wood biomass blending with pulverized coal on combustion characteristics under oxy-fuel condition. Biomass. Bioenerg. 71: 144-154 (11 pages).
Akahira, T.; Sunose, T., (1971). Method of determining activation deterioration constant of electrical insulating materials. Res. Rep. Chiba. Inst. Technol. (Sci. Technol.) 16: 22-31 (10 pages).
Basu, P.; Butler, J.; Leon, M., (2011). Biomass co-firing options on the emission reduction and electricity generation costs in coal-fired power plants. Renew. Energy 36: 282-288 (7 pages).
Beata, J.; Paweł, K.; Maroš, K.; Tomasz, D., (2019). Physical and chemical properties of waste from PET bottles washing as a component of solid fuels. Energa. 12: 1-17 (17 pages).
Becidan, M.; Várhegyi, G.; Hustad, J.; Skreiberg, Ø., (2007). Thermal decomposition of biomass wastes. A kinetic study. Ind. Eng. Chem. Res. 46(8): 2428-2437 (10 pages).
Block, C.; Ephraim, A.; Weiss-Hortala, E.; Minh, D.; Nzihou, A.; Vandecasteele, C., (2019). Co-pyrogasification of Plastics and Biomass, a Review. Waste Biomass Valorization. 10: 483-509 (17 pages).
Bu, Q.; Liu, Y,; Liang, J,; Morgan, H.; Yan, L.; Xu, F.; Mao, H., (2018). Microwave-assisted co-pyrolysis of microwave torrefied biomass with waste plastics using ZSM-5 as a catalyst for high quality bio-

641
Global J. Environ. Sci. Manage., 7(4): 625-642, Autumn 2021
oil. J. Anal. Appl. Pyrol. 134: 536-543 (8 pages).Capeletti, L.; Zimnoch, J., (2016). Fourier Transform Infrared and
Raman Characterization of Silica-Based Materials.Çepelioğullar, Ö.; Pütün, A., (2013). Thermal and kinetic behaviors
of biomass and plastic wastes in co-pyrolysis. Energy Convers. Manage. 75: 263-270 (8 pages).
Chandrasekaran, A.; Ramachandran, S.; Subbiah, S., (2017). Determination of kinetic parameters in the pyrolysis operation and thermal behavior of Prosopis juliflora using thermogravimetric analysis. Bioresour. Technol. 233: 413-422 (10 pages).
Chattopadhyay, J.; Kim, C.; Kim, R.; Pak, D., (2008). Thermogravimetric characteristics and kinetic study of biomass co-pyrolysis with plastics. Korean J. Chem. Eng. 25(5): 1047-1053 (7 pages).
Chen, L.; Wang, S.; Meng, H.; Wu, Z.; Zhao, J., (2017). Synergistic effect on thermal behavior and char morphology analysis during co-pyrolysis of paulownia wood blended with different plastics waste. Appl. Therm. Eng. 111: 834-846 (14 pages).
Chen, Z.; Hay, J.; Jenkins, M., (2013). The thermal analysis of poly(ethylene terephthalate) by FTIR spectroscopy. Thermochim. Acta 552: 123-130 (8 pages).
Das, P.; Tiwari, P., (2019). Thermal degradation study of waste polyethylene terephthalate (PET) under inert and oxidative environments. Thermochim. Acta. 654: 191–202 (12 pages).
Edo, M.; Budarin, V.; Aracil, I.; Persson, P.; Jansson, S., (2016). The combined effect of plastics and food waste accelerates the thermal decomposition of refuse-derived fuels and fuel blends. Fuel 180: 424-432 (9 pages).
Fong, M.; Loy, A.; Chin, B.; Lam, M.; Yusup, S.; Jawad, Z., (2019). Catalytic pyrolysis of Chlorella vulgaris: Kinetic and thermodynamic analysis. Bioresour. Technol. 289: 121689.
Gai, C.; Dong, Y.; Zhang, T., (2013). The kinetic analysis of the pyrolysis of agricultural residue under non-isothermal conditions. Bioresour. Technol. 127: 298-305 (8 pages).
Govindan, B.; Jakka, S.; Radhakrishnan, T,; Tiwari, A.; Sudhakar, T.; Shanmugavelu, P.; Kalburgi, A.; Sanyal, A.; Sarkar, S., (2018). Investigation on kinetic parameters of combustion and oxy-combustion of calcined pet coke employing thermogravimetric analysis coupled to artificial neural network modeling. Energy Fuels 32(3): 3995-4007 (13 pages).
Huang, Y.; Lo, S., (2020). Predicting heating value of lignocellulosic biomass based on elemental analysis. Energy 191: 116501.
Jabłońska, B.; Kiełbasa, P.; Korenko, M.; Dróżdż, T., (2019). Physical and chemical properties of waste from PET bottles washing as a component of solid fuels. Energies. 12(11): 1-17 (17 pages).
Laougé, Z.; Merdun, H., (2020). Pyrolysis and combustion kinetics of Sida cordifolia L. using thermogravimetric analysis. Bioresour. Technol. 299: 122602.
Lopes, J.; Garcia, R.; Souza, N., (2018). Infrared spectroscopy of the surface of thermally-modified teak juvenile wood. Maderas, Cienc. Technol., 20(4): 737-746 (10 pages).
Lu, C.; Chen, J.; Chuang, K.; Wey, M., (2015). The different properties of lightweight aggregates with the fly ashes of fluidized-bed and mechanical incinerators. Constr. Build. Mater. 101(1): 380-388 (9 pages).
Lu, J.; Chen, W., (2015). Investigation on the ignition and burnout temperatures of bamboo and sugarcane bagasse by thermogravimetric analysis. Appl. Energy 160: 49-57 (9 pages).
Luo, J.; Li, Q.; Meng, A.; Long, Y.; Zhang, Y., (2018). Combustion characteristics of typical model components in solid waste on a macro-TGA. J. Therm. Anal. Calorim. 132: 553-562 (10 pages).
Madadian, E.; Crowe, C.; Lefsrud, M., (2017). Evaluation of composite fiber-plastics biomass clinkering under the gasification conditions. J. Clean. Prod. 164: 137-145 (9 pages).
Manatura, K., (2019). Napier grass pyrolysis: Kinetic and thermodynamics analysis. RMUTI J. Sci. Technol. 12(2): 1-13 (13 pages).
Manatura, K., (2020). Inert torrefaction of sugarcane bagasse to improve its fuel properties. Case Stud. Therm. Eng. 19: 1-9 (9 pages).
Manatura, K.; Lu, J.; Wu, K., (2018). Thermal decomposition and kinetic modeling of torrefied Cryptomeria japonica in a CO2 environment. Biofuels 9: 693-703 (11 pages).
Martı́n-Gullón, I.; Esperanza, M.; Font, R., (2001). Kinetic model for the pyrolysis and combustion of poly-(ethylene terephthalate) (PET). J. Anal. Appl. Pyrol., 58-59: 635-650 (16 pages).
Mishra, R.; Sahoo, A.; Mohanty, K., (2019). Pyrolysis kinetics and synergistic effect in co-pyrolysis of Samanea saman seeds and polyethylene terephthalate using thermogravimetric analyser. Bioresour. Technol., 289: 121608.
Mostafa, M.; Hu, S.; Wang, Y.; Su, S.; Hu, X.; Elsayed, S.; Xiang, J., (2019). The significance of pelletization operating conditions: An analysis of physical and mechanical characteristics as well as energy consumption of biomass pellets. Renew. Sustain. Energy Rev., 105: 332-348 (17 pages).
Narobe, M.; Golob, J.; Klinar, D.; Francetič, V.; Likozar, B., (2014). Co-gasification of biomass and plastics: Pyrolysis kinetics studies, experiments on 100kW dual fluidized bed pilot plant and development of thermodynamic equilibrium model and balances. Bioresour. Technol., 162: 21-29 (9 pages).
Nussbaumer, T., (2003). Combustion and co-combustion of biomass: Fundamentals, technologies, and primary measures for emission reduction. Energy Fuels. 17: 1510-1521 (12 pages).
Patnaik, S.; Kumar, S.; Panda, A., (2020). Thermal degradation of eco-friendly alternative plastics: kinetics and thermodynamics analysis. Environ. Sci. Pollut. Res. Int., 27: 14991–15000 (10 pages).
Pereira, A.; da Silva, M.; Lima Júnior, É.; Paula, A.; Tommasini, F.; (2017). Processing and Characterization of PET Composites Reinforced With Geopolymer Concrete Waste. Mater. Res., 20(2): 411-420 (10 pages).
Pradhan, P.; Mahajani, S.; Arora, A., (2018). Production and utilization of fuel pellets from biomass: A review. Fuel Process. Technol., 181: 215-232 (18 pages).
Robinson, T.; Bronson, B.; Gogolek, P.; Mehrani, P., (2016). Comparison of the air-blown bubbling fluidized bed gasification of wood and wood–PET pellets. Fuel 178: 263-271 (9 pages).
Sajdak, M.; Kmieć, M.; Micek, B.; Hrabak, J., (2019). Determination of the optimal ratio of coal to biomass in the co-firing process: feed mixture properties. Int. J. Environ. Sci. Technol., 16: 2989-3000. (12 pages).
Samaksaman U.; Kuo J.; Peng T.; Wey M., (2015). Determination of emission characteristics during thermal treatment of lube oil and heavy metal co-contaminated soil by fluidized bed combustion, J. Environ. Eng., 141(10): 1-12 (12 pages).
Samaksaman, U.; Pattaraprakorn, W.; Neramittagapong, A.; Kanchanatip, E., (2021). Solid fuel production from macadamia

642
K. Manatura and U. Samaksaman
nut shell: effect of hydrothermal carbonization conditions on fuel characteristics. Biomass Conv. Bioref., 1-8 (8 pages).
Sharara, M.; Sadaka, S., (2014). Thermogravimetric analysis of swine manure solids obtained from farrowing, and growing-finishing farms. J. Sustain. Bioenergy Syst., 4(1): 75-86 (12 pages).
Sinha, V.; Patel, M.; Patel, J., (2010). PET waste management by chemical recycling: A review. J. Polym. Environ., 18: 8-25 (18 pages).
Slopiecka, K.; Bartocci, P.; Fantozzi, F., (2012). Thermogravimetric analysis and kinetic study of poplar wood pyrolysis. Appl. Energy 97: 491-497 (7 pages).
Surenderan, L.; Saad, J.; Zhou, H.; Neshaeimoghaddam, H.; Abdul Rahman, A., (2018). Characterization studies on waste plastics as a feedstock for energy recovery in Malaysia. Int. J. Eng. Technol., 7(4): 534-537 (4 pages).
Taleb, F.; Ammar, M.; Mosbah, M.; Salem, R.; Moussaoui, Y., (2020). Chemical modification of lignin derived from spent coffee grounds for methylene blue adsorption. Sci. Rep., 10: 11048 (13 pages).
Tolinski, M., (2011). Plastics and sustainability, towards a peaceful coexistence between bio-based and fossil fuel-based plastics, CH7, Processing: Increasing efficiency in the use of energy and materials. Scrivener Publishing, ISBN: 978-0-470-93878-2 (19 pages).
Tran, K.; Bach, Q.; Trinh, T.; Seisenbaeva, G., (2014). Non-isothermal pyrolysis of torrefied stump–A comparative kinetic evaluation. Appl. Energy. 136: 759-766 (8 pages).
Vyazovkin, S.; Wight, C., (1999). Model-free and model-fitting approaches to kinetic analysis of isothermal and nonisothermal
data. Thermochim. Acta. 340-341: 53-68 (16 pages).Wang, Z.; Burra, K.; Lei, T.; Gupta, A., (2021). Co-pyrolysis of waste
plastic and solid biomass for synergistic production of biofuels and chemicals-A review. Prog. Energy Combust. Sci., 84: 1-51 (51 pages).
Xie, C.; Liu, J.; Buyukada, M.; Evrendilek, F.; Samaksaman, U.; Kuo, J.; Ozyurt, O., (2019). Parametric assessment of stochastic variability in co-combustion of textile dyeing sludge and shaddock peel. Waste Manage., 96: 128-135 (8 pages).
Xing, P.; Mason, P.; Chilton, S.; Lloyd, S.; Jones, J.; Williams, A.; Nimmo, W.; Pourkashanian, M., (2016). A comparative assessment of biomass ash preparation methods using X-ray fluorescence and wet chemical analysis. Fuel. 182: 161-165 (5 pages).
Xu, Y.; Chen, B., (2013). Investigation of thermodynamic parameters in the pyrolysis conversion of biomass and manure to biochars using thermogravimetric analysis. Bioresour. Technol., 146: 485-493 (5 pages).
Yuan, X.; He, T.; Cao, H.; Yuan, Q., (2017). Cattle manure pyrolysis process: kinetic and thermodynamic analysis with isoconversional methods. Renew. Energy. 107: 489-496 (8 pages).
Zhang, S.; Dong, Q.; Zhang, L.; Xiong, Y., (2016). Effects of water washing and torrefaction on the pyrolysis behavior and kinetics of rice husk through TGA and Py-GC/MS. Bioresour. Technol., 199: 352-361 (10 pages).
Zhao, L.; Giannis, A.; Lam, W.; Lin, S.; Yin, K.; Yuan, G.; Wang, J., (2016). Characterization of Singapore RDF resources and analysis of their heating value. Sustain. Environ. Res., 26: 51-54 (4 pages).
AUTHOR (S) BIOSKETCHES
Manatura, K., Ph.D., Assistant Professor, Department of Mechanical Engineering, Faculty of Engineering at Kamphaeng Saen, Kasetsart University, Kamphaeng Saen campus, Nakhonpatom, Thailand. Email: [email protected]
Samaksaman, U., Ph.D., Instructor, Department of Natural Resources and Environment, Faculty of Agriculture Natural Resources and Environment, Naresuan University, Phitsanulok, Thailand. Email: [email protected]
HOW TO CITE THIS ARTICLE
Manatura, K.; Samaksaman, U., (2021). Characteristics and combustion kinetics of fuel pellets composed of waste of polyethylene terephthalate and biomass. Global J. Environ. Sci. Manage., 7(4): 625-642.
DOI: 10.22034/gjesm.2021.04.09
url: https://www.gjesm.net/article_244128.html
COPYRIGHTS
©2021 The author(s). This is an open access article distributed under the terms of the Creative Commons Attribution (CC BY 4.0), which permits unrestricted use, distribution, and reproduction in any medium, as long as the original authors and source are cited. No permission is required from the authors or the publishers.

Global J. Environ. Sci. Manage. 7(4): 643-658, Autumn 2021
*Corresponding Author:Email: [email protected]: +91 828 705 1260 Fax: +91 828 705 1260
Global Journal of Environmental Science and Management (GJESM)
Homepage: https://www.gjesm.net/
REVIEW PAPER
Wastewater-based epidemiology for novel Coronavirus detection in wastewater
G. Saini*, P.S. Deepak
Department of Civil Engineering, Sharda University, Greater Noida, Uttar Pradesh, India
The entire world is reeling under the worst pandemic of last 100 years. Over 128 million people have been infected with it and 2.8 million deaths have already taken place, till 30th March 2021. The identification of materials positive cases is the first step towards its containment and treatment. However, testing of individuals is an extensive, expensive and time-consuming exercise. In addition, societal taboos are also associated with infected individuals resulting in very few people volunteering for testing, esp. in the developing and under-developed world. An alternative approach that circumvents individual testing is the wastewater-based epidemiology. A state-of-the-art review of this method is provided in context of its utility for COVID-19 detection. This technique relies on collecting and testing samples from sewers and/or wastewater treatment plants for the presence of pathogens and then using that data to determine and predict the spread of the infection, thereby allowing the provision of appropriate containment and treatment steps. The study covers key aspects of wastewater-based epidemiology application for COVID-19 detection including its need, detailed process of detection and assessment, data analysis, economics and challenges to its application. Findings from a number of case studies are presented to elucidate the utility of this technique. It is clearly seen that WBE-based approach is a much better strategy as compared to individual testing and can be adopted to prevent further spread of Covid-19. The work is expected to further emphasize the application of this method for COVID (and other pandemic) detection and implementing containment strategies. This is clearly a much more economical and non-intrusive approach as compared to the individual testing.
©2021 GJESM. All rights reserved.
ARTICLE INFO
Article History:Received 17 January 2021Revised 28 February 2020Accepted 31 March 2020
Keywords:Covid-19 (Coronavirus disease)InfectionPandemicPolymerase chain reaction (PCR)Polymerase chain reaction (PCR)Ribonucleic Acid (RNA)Wastewater-based epidemiology
(WBE)
ABSTRAC T
DOI: 10.22034/gjesm.2021.04.10
NUMBER OF REFERENCES
81NUMBER OF FIGURES
1NUMBER OF TABLES
1
Note: Discussion period for this manuscript open until January 1, 2022 on GJESM website at the “Show Article.

644
G. Saini and P.S. Deepak
INTRODUCTIONCoronaviruses are “nonsegmented, enveloped,
positive-sense, single-strand ribonucleic acid viruses”, and are part of the Coronaviridae family (Weiss and Leibowitz, 2011). There have been seven types of coronaviruses discovered which causes human sickness. The names of known coronaviruses till date are the alpha coronaviruses HCoV-229E and HCoV-NL63, the beta coronaviruses HCoV-OC43 and HCoV-HKU1, MERS-CoV which causes Middle east respiratory syndrome and SARS-CoV which causes Severe acute respiratory syndrome. SARS-CoV-2 is the 7th type and the most recent one to be found out (Lima, 2020). Four of these viruses i.e., alpha coronaviruses and beta coronaviruses induce (mild) respiratory symptoms. The other two viruses (Middle East respiratory syndrome or MERS, and Severe Acute Respiratory Syndrome or SARS) have been a cause for pandemics with a high fatality rate (Kooraki et al., 2020). This is the third time, in last two decades, that a coronavirus infection has taken place (Guarner, 2020). The upsurge of SARS-CoV occurred in 2002 (Zhong et al., 2003), MERS-CoV in 2012 (Nassar et al., 2018), followed by the SARS-CoV-2 in 2019. SARS-Cov-2 was declared a pandemic by the World Health Organization (WHO) on 11th March, 2020 (Cucinotta et al., 2020). As of March 8, 2021 – 117.47 million cases were recorded globally, in which 2.61 million fatalities were reported (Worldometer, 2021a). The SARS-CoV-2 is extremely infectious as compared to SARS-CoV and MERS-CoV. While, the mortality rate associated with the MERS-CoV was higher than that of both SARS-CoV and SARS-CoV-2, the SARS-CoV-2 spread extremely rapidly and infected a very large number of people globally (Meo et al., 2020). Respiratory droplets and direct contact are the major pathways for the spread of SARS-CoV-2 (WHO, 2020). With the median of 2.79 and interquartile range (IQR) of 1.16, the R0 was calculated to be around 3.28, which implies that an infected person will spread to another 3.28 cases (Liu et al., 2020). The main strategies for control of this pandemic include isolation of positive cases, tracing of contacts (people who were in physical contact with the infected individual), and social/physical distancing (MacIntyre, 2020). The essence of wastewater-based epidemiology (WBE), known as Wastewater based epidemiology is that infected people shed the virus through excreta and the virus ends up in the wastewater treatment plant where the virus can be detected. This is a community-based method
that allows early and reliable detection of infections, and can help in intervention and control of infection spread. Not only viruses, the illegal use of drugs also can be monitored through the sewage. Some countries like China (Cyranoski, 2018), Spain (Huerta-Fontela et al., 2008), France (Karolak et al., 2010), and Canada (Metcalfe et al., 2010) use sewage to monitor the illicit use of drugs. Some research studies (Young et al., 2020; Chen et al., 2020; Xiao et al., 2020) have demonstrated that RNA of SARS-CoV-2 is perceivable in the feces of COVID-19 patients. Chen et al. 2020 showed that RNA of SARS-CoV-2 can be diagnosed in human feces a few days to a week ahead of the symptoms onset. This is not the first-time wastewater-based epidemiology has come into rescue to monitor epidemic breakouts. It proved as a promising approach in Brazil and Israel for detecting diseases like polio (Michael-Kordatou et al., 2020) . Sewage surveillance system of Israel, developed in 1989 by their national health authorities to notice poliovirus in wastewater, allowed them to track polio in urban wastewater treatment plants and sewage trunk lines at the time of the re-emergence of polio in 2013, and enabled them to react quickly (Brouwer et al., 2018). It can also be used to access a situation when a new virus enters the community (Sinclair et al., 2011). The biggest advantage of the wastewater-based surveillance for Covid- 19 is the unbiased results. It detects the virus even when the person is asymptomatic or presymptomatic. In addition, testing of sewage ensures that a composite of different human excretions (including, urine, feces, sweat, dead cells, saliva, etc.) is investigated thus providing a broader coverage of infections. Netherlands was one of the first countries to detect the traces of Covid-19 in sewage treatment plants (Hart et al., 2020). Other countries which adopted the wastewater surveillance for routine Covid-19 detection are Australia, New Zealand, Netherlands (Aguiar-Oliveira et al., 2020). Nonetheless, WBE is not without its share of disadvantages, for example, it cannot help in finding specific infected individual in a community. Currently, wastewater treatment facilities serve only 27% of the global population hence decreasing the chances of surveillance of Covid by WBE alone (Mandal et al., 2020). Even with these issues, WBE can be used, esp. in countries/cities with better sewage treatment facilities, as an economic technique for detection and trend analysis. This study provides a state-of-the-art comprehensive review of the application of

645
Global J. Environ. Sci. Manage., 7(4): 643-658, Autumn 2021
WBE-based approach for detection of coronavirus in wastewater. The necessity for this approach is first established, followed by detailed description of the process of detection of Coronavirus in the water. This work was conducted in Greater Noida, Uttar Pradesh, India during November 2020 to March 2021.
Need of WBE for COVID-19 SurveillanceThe rapid spread of Covid-19 around the world
warranted extensive and rapid testing of the suspected cases. However, the testing rate was very slow as compared to the rate of spread and lagged it by a big margin. This is especially true for developing and underdeveloped countries. Further, the test results are not a current indicator, but rather a lagging indicator of the infection spread. Testing was originally only carried out for the symptomatic individuals. Unfortunately, it may take up to 2 weeks’ post-infection for the symptoms to show and there is delay between testing and results. This means that an infected person (whether symptomatic or asymptomatic) may already have infected a large number of individuals even before the detection if carried out. WBE offers a measure of determining the presence and spread trend of the infection, without disturbing anyone. It should be noted that in the initial phases, there was a stigma associated with the Covid infected individuals, which deterred many potentially infected people from getting tested or revealing the test results. On January 30, 2020, India recorded its first case of Covid-19 (Perappadan, 2020). In the
last 13 months, 11.2 million cases were recorded, in which 0.15 million fatalities were reported, in India (Worldometer, 2021b). The testing rate should rapidly increase in a country like India where the disease can spread very quickly. There are presently two types of testing methods which are under use: A viral test which shows positive if a person has a current infection, and an antibody test, which shows a positive result if a person had the infection in the past (CDC, 2021a). In general, people only get themselves tested when they start showing symptoms like fever, cough, and headache. So, people who are asymptomatic and presymptomatic can spread the disease unintentionally which is a major concern. This suggests that there is a need of testing method which detects small loads of virus in the body and give results without a need for symptoms to show. Moreover, the surveillance of Covid-19 in wastewater will provide a picture of the community as a whole and help in better hotspot detection. And this type of detection methods does not need the approval of the infected person, as people may be cynical about getting themselves tested due to fear of social stigma.
Process of testing COVID-19 in wastewaterEven though there is no standard testing
methodology, different studies have followed different methods to detect Covid-19 in the wastewater treatment plants. A summary of the generic steps involved in the process of COVID-19 testing in wastewater is presented in the Fig. 1.
Fig. 1: Process of testing COVID-19 in wastewater
Fig. 1: Process of testing COVID-19 in wastewater

646
WBE for coronavirus detection
Wastewater samplingWater sampling is the first step towards detection
of Novel Coronavirus in STP. Sampling wastewater for SARS-CoV-2 is used to evaluate trends of infection within the citizenry contributing water to the sewer system (CDC, 2021b). There are two types of wastewater sample collection methods commonly used for this purpose: Grab sampling and Composite sampling. The grab sampling, as the name suggests collects the sample at a time. In comparison, the Composite sampling, involves collecting various individual discrete samples over a specified period of time – usually 24 hours (CDC, 2021b). The composite sampling can be done both manually and automatically. For detection of SARS-CoV-2, both grab and composite sampling methods were used. Sherchan et al., 2020 collected the samples by grab sampling method early in the morning, from 7-11 am. In a study in the Gujrat state of India, Kumar et al., 2020 used the grab sampling method to collect the samples at 11:30am on 8th and 27th May 2020, using sterile bottles. In Netherlands, Medema et al. 2020 collected the samples by using composite sampling method in February and March in different selected cities such as Amsterdam, Den Haag, Utrecht, Apeldoorn, Amersfoort, Schiphol. The first Covid-19 case was reported officially after 3 weeks from the first sample round. Nemudryi et al., 2020 used the automatic composite sampling method. The researchers collected the samples with the use of Liquistation CSF34 (Endress+Hauser), an automatic flow proportional sampler located at their facility doorway. In a study in Australia, Ahmed et al. 2020 collected samples using the Composite sampling method.
Inactivation and removal of CoronavirusGetting to know the inactivation or removal
process of Coronavirus in the samples can help in establishing better steps to decrease the probability of spread. WHO stated that Covid-19 has a fragile outer membrane as it is known to be an enveloped virus (WHO, 2020). And generally enveloped viruses are environmentally unstable and known to be more vulnerable to oxidants like chlorine. Wang et al. 2020 suggested some effective disinfection technologies for deactivating SARS-CoV-2 virus from sewage. The disinfectants included chemicals such as, Chlorine (Cl2), Sodium hypochlorite (NaOCl), Ozone (O3), and
Chlorine dioxide (ClO2) and also physical scheme like, UV irradiation. Each disinfection method has its own merits and demerits, so the selection of appropriate disinfection method depends upon various factors like cost, energy consumption, operating parameters, and disinfectants’ toxicity. Wang et al. 2005 suggested that chlorine is a better disinfectant when compared to chlorine dioxide. It states that SARS-CoV inactivation is completed with 10 mg/L chlorine after 30 minutes of disinfection whereas chlorine requires 40 mg/L in 30 min. Pasteurization is a process where samples are treated with mild heat usually less than 1000 C in order to inactivate any live pathogens. Heat pasteurization of wastewater samples was conducted to decrease the biosafety risk from procedures that generate bioaerosols during the processing of wastewater samples (CDC, 2021c). Wu et al. 2020 pasteurized the samples at 600 C for 90 minutes as a preliminary step before opening the sample containers to increase the protocol safety. Former studies on SARS-CoV-1 suggest that a heat inactivation of 30 minutes at 60°C is adequate for virus inactivation by more than 6 log units (Rabenau et al., 2005). Extra precautions were taken by increasing the pasteurization time.
Virus concentrationVirus concentration is the process of enumerating
the quantity of virus in a specified sample volume. The methods which were used in various studies are polyethylene glycol (PEG) precipitation (Lewis et al., 1988; Bibby et al., 2013), skimmed milk flocculation (SMF) (Calgua et al., 2013), ferric chloride precipitation – (FeCl3) (Falman et al., 2013), ultracentrifugation (Prata et al., 2012), ultrafiltration (Hill et al., 2007), and glass wool filtration (Cashdollar et al., 2007). The effective method of virus concentration should ideally be technically simple, rapid and should have the ability to process large volume of water, repeatable, reproducible and predominantly cost and time effective. As yet, there is no concentration method which meets all these criteria (Michael-Kordatou et al., 2020). Ahmed et al. 2020 used two methods for the process of concentration, including direct RNA extraction from electronegative membrane and ultrafiltration. For the first step, the researchers used a RNeasy power microbiome kit®. For ultrafiltration, centrifugation was followed by a QIAcube Connect platform. Westhaus et al. 2020 started their process of concentration by centrifugation at 4700g for 30

647
Global J. Environ. Sci. Manage., 7(4): 643-658, Autumn 2021
minutes without a break. Then by using centrifugal ultrafiltration units, the purified wastewater was concentrated. 15 mL of wastewater sample was then added to the filter unit, followed by centrifugation at 3500g for 15 minutes. The concentrated supernatant was then harvested. The step was repeated twice until the quantity of 45 ml of sample was completely concentrated. The pellet was then cleaned to remove any aqueous remains, by deionized water and was centrifuged at 4700g for 5 min. La Rosa et al. 2020 used the PEG – polyethylene glycol precipitation method to concentrate the sample. The researchers followed the WHO guidelines for environmental surveillance of poliovirus (WHO, 2003), by modifying the protocol for the enveloped virus. The sample was first centrifuged and, then mixed with dextran and PEG. It is then left in a separation funnel at 40
C. The interphase and base layer were collected dropwise, and the concentrate was added from the initial centrifugation to the pellet. WHO protocol intends to follow the chloroform treatment at this stage and was left out to conserve the integrity of the enveloped viruses. Sherchan et al. 2020 used two sample concentration methods to enhance the possibility of SARS-CoV-2 occurrence in wastewater. Ultrafiltration, the first process, started with 250 ml sample centrifugation for 30 min. at 3000 g to extract large particles. A centrifugal filter (Centricon® Plus-70) was used to concentrate 70-140 mL of the 250 mL supernatant with a nominal molecular weight limit (NMWL) of about 100 kDa through centrifugation. In order to recover 350 μL of the viral concentrate, the filter unit was inverted and then centrifuged for 2 min at 1000g. Using a pipette, the viral concentrate was then extracted from the sample reservoir. Adsorption-elution was the second method and was carried out with the use of electronegative membrane. 2.5 M MgCl2 was used to attain a final concentration of 25mM MgCl2 in all the samples. Then samples were then passed through an electronegative filter (90 mm diameter and 0.45-μm pore size) attached to a glass filter holder assembly. The viruses were eluted with 10 mL of 1.0 mM sodium hydroxide (pH 10.8). The eluate was recovered for neutralization, in a tube consisting of 50 μL of 100 mM sulfuric acid and 100μL of 100× Tris-EDTA buffer. Later 10 mL of this eluate was centrifuged, containing an ultrafiltration membrane (NMWL = 30 kDa) to obtain approximately 650 μL of final volume. However, the viral recovery
yield can be affected by the volume of wastewater to be concentrated. According to Bibby et al. 2013, PEG precipitation was proven to be a highly efficient method for virus concentration. Falman et al. 2019 suggested that for recovery of poliovirus type 1, SMF was found to be more efficient with a recovery of 106 ± 24.8% while the PEG yielded 59.5 ± 19.4% recovery in wastewater.
RNA extractionThe main aim of method of RNA extraction is
to acquire the RNA without any damage from the sample matrix. The most widely used methods for RNA extraction are organic extraction using Phenol-guanidine isothiocyanate, silica-membrane dependent spin column techniques and the use of paramagnetic particles. The fundamental steps in RNA extraction using organic solvents are as follows (Johnson, 2021):
1. Cell lysis: Cell lysis is the process which releases the RNA of the cell by breaking down the cell membranes’ outer boundary (Michael-Kordatou et al., 2020). It is carried out by using viral, enzymatic, or osmotic mechanisms (Listwan et al., 2010). Through the use of chaotropic agents containing buffers or reagents like guanidinium isothiocyanate, guanidinium chloride, sodium dodecyl sulphate, sarcosyl, urea, phenol or chloroform, the aim of cell lysis is accomplished. And to maintain the integrity of RNA during lysis, solutions such as TRIzol or RNAlater or Qiazol (DiToro et al., 2018) may also be used.
2. Denaturation of DNA and proteins: Denaturation refers to the three-dimensional structure loss of the biological molecule viz. DNA or proteins. To break down DNA, DNase can be used whereas proteinase K can be enumerated to digest proteins. Another way to remove the proteins is through repeated organic extraction through the use of phenol and chloroform. This can be achieved by sample dissolution in buffers containing guanidinium salts.
3. Denaturation and Inactivation of RNases: By using chaotropic agents such as phenol and chloroform, RNAses can be denatured and inactivated.
4. Separation or Removal of cellular components: Addition of chloroform and subsequently centrifuging the solution can be done in order to
648
G. Saini and P.S. Deepak
isolate RNA from other cellular components. This divides the solution within two phases known as aqueous and organic phases where, RNA is present in aqueous phase.
5. Precipitation: Isopropyl alcohol is often used to recover RNA from aqueous phase whereas by using ammonium acetate preferential precipitation of RNA can be done. And Lithium chloride can also be used to for selective precipitation of RNA from DNA and proteins.RNA extraction can be done through various
methods like Magnetic bead technology, Silica technology, Lithium chloride, and urea isolation (Johnson, 2021). But during the process of identification of SARS – CoV – 2, mostly commercial kits have so far been used. Some of the kits used for RNA extraction are RNeasy kits, ZR Viral RNA kit, Combination of RNeasy Power Microbiome Kit and RNeasy Power Water Kit. RNA extraction can also be done by combining two specific kits: RNeasy Power Water Kit and RNeasy Power Microbiome Kit (Ahmed et al., 2020). To accommodate the electronegative membrane, a 5 ML bead tube from RNeasy Power Water Kit was used and a Precellys 24 tissue homogenizer to integrate the samples differing from 3 x 20 s at 8000 rpm at an interval of 10 seconds. From there on the RNeasy Power Microbiome kit was used to extract RNA, as per the manufacturer’s instructions. NucleoSpin RNA Virus kit was used to isolate RNA by following the manufacturer’s instructions (Westhaus et al., 2020). Nemudryi et al. 2020 used RNeasy mini kit to extract RNA. RNA extraction was carried out from samples of concentrated sewage sample using viral RNA kit to get the final volume (Sherchan et al., 2020). Apart from the above kits, the CDC has given a list of viable RNA extraction kits (CDC, 2021d). Some of them are QIAcube® QIAcube, Roche MagNA Pure LC®, Roche MagNA Pure 24, Roche MagNA Pure 96.
RNA quantificationSome detection approaches and quantification
of viruses in sewage are epifluorescence microscopy, transmission electron microscopy, throbbing gel electrophoresis, immunofluorescence test, flow cytometry, conventional cell culture and molecular techniques. Molecular methods include conventional polymerase chain reaction (cPCR), Reverse transcription polymerase chain reaction (RT-PCR),
Real-time quantitative polymerase chain reaction (RT-qPCR), Multiplex PCR and sequencing (Corpuz et al., 2020).
For SARS-CoV-2 detection in sewage and its quantification, PCR-based methods have been predominantly used. All these methods use the same principle except for RT- qPCR, where the process starts with RNA material in place of DNA, and RT- PCR requires a reverse transcription step before qPCR (Corpuz et al., 2020). The “q” in qPCR stands for quantitative, which means that qPCR tests not only detect the virus’s genetic information but also quantify the amount of genetic information (Bustin and Nolan, 2020). Several studies in Australia (Ahmed et al., 2020), France (Wurtzer et al., 2020a), Spain (Randazzo et al., 2020), and Italy (La Rosa et al., 2020) have detected and quantified SARS-CoV-2 by qPCR. With N_Sarbeco and NIID_2019-nCOV_N primers both being nucleocapsid protein gene specific, RT-qPCR was conducted for specific detection and quantification (Ahmed et al., 2020). For reverse transcription and the QPCR, a single-step RT-QPCR was used. Raw sewage and wastewater treatment plant (WWTP) samples were acquired in Israel, and when tested using the RT-qPCR assay, a few of the samples were found positive. The Ct value of less than 40 was obtained in one out of two sewage samples taken from the sewer networks of hospitals treating Covid-19 patients, three out of three isolation facilities (Bar-Or et al., 2020). Wurtzer et al. 2020b examined the incidences of SARS-COV-2 in Paris by collecting samples from three different WWTP inlets during the period of 5 March 2020 to 23 April 2020 and tested using RT-qPCR assay. It was found that all the tested samples were positive. The researchers also attempted to associate a relation between quantified number of SARS-CoV-2 genomes in wastewater and carrier numbers. They noticed a significant link between genome units’ number of COVID 19 cases reported. They also indicated that monitoring wastewater would serve as a backup and early identification method for SARS-CoV-2 spread. Kumar et al. 2020, in India, examined RNAs of SARS-CoV-2 with the use of TaqPathTM Covid-19 RT-PCR Kit for detection of ORF1ab, Ngene and S gene and s gene. Medema et al. 2020 from Netherlands quantified by performing qRT-PCR on serial 10 – fold dilutions of quantified synthetic double stranded DNA.

649
Global J. Environ. Sci. Manage., 7(4): 643-658, Autumn 2021
RNA amplificationThe nucleic acids PCR amplification and detection
of the products is concurrently achieved in qPCR method (Cobo et al., 2012). This is a quantitative method because it measures the target sequence unlike conventional PCR methods that provide qualitative data through gel electrophoresis (Kadri et al., 2020). qPCR not only provides quantitative data but also shows high sensitivity and is mostly independent of the amount of reagent concentration (Watzinger et al., 2006). RT-qPCR can also be used for RNA amplification (Ahmed et al., 2020). Kumar et al. 2020, applied amplification in a reaction mixture of 25 μL which consists of 7 μL to extract nucleic acids of each sample. 2 μL TaqPath™ COVID-19 Control and purified 5 μL sample were used as the positive and negative controls, respectively. For no template control, nuclear free water has been used. One of the other molecular methods used for amplification is Reverse transcription loop-mediated isothermal amplification (RT-LAMP). The core aspect of the RT-LAMP is a reverse transcription step (RNA to DNA), after which 6 primers attach to the target gene of interest. These 6 primers get attached to the target DNA at an appropriate temperature, and they loop around to create circular constructs that help in extending the DNA. For primers to bind, each loop opens up a new site further amplifying the gene. RT-LAMP allows a rapid and exponential increase in the gene of interest. When probes, dyes, or a fluorophore are added to the mixture, a visible change during the reaction can be detected by eye or with use of special apparatus (Watzinger et al., 2006). LAMP method has an upper hand over RT-qPCR in the point of temperature. LAMP reactions take place at a single isothermal temperature range of 63 0C to 65 0C, whereas rapid cycling of multiple temperatures is needed in RT-qPCR method to amplify nucleic acids. This method has also shown substantial potential results by producing them in less than an hour, and on some occasions within 11 minutes (Augustine et al., 2020). Another digital PCR method known as ddPCR - Droplet Digital PCR technology works by using a water– oil emulsion droplet system. In such system, droplets are formed to create the partition that separates the template DNA molecules. In the plate where PCR reaction takes place, the droplets serve the basic purpose as individual test tubes or wells but in smaller space. In the ddPCR technique, the mass
sample key partitioning is a critical part. The nucleic acid samples are divided into several thousands of droplets (nanoliter-sized) and PCR amplification is carried out in each of these droplets. The sample requirement is one of the merits for this method. It requires smaller sample size as compared to other digital PCR systems which are commercially available. Reduced cost and preserving precious samples are some of the other merits of this method. This method has shown to have less consumable costs and more accuracy than RT-qPCR (Bio-Rad, 2021).
Data analysisThe results of the studies which were conducted
have been reported in one of the following ways (Michael-Kordatou et al., 2020).
§“Absence or presence of the virus in the form of Ct values reported directly by the qPCR instrument”
§“Gene copies/volume of sample, with the use of a quantitative calibration curve of Ct values against known concentrations of the virus for the calculation of the gene copies present in a certain sample volume (relative quantification)”.The Ct (cycle threshold) is defined as the number of
cycles required for the fluorescent signal to cross the threshold. Ct levels and the amount of target nucleic acid are inversely proportional to each other (i.e. the lower the value of Ct level, the greater is the amount of target nucleic acid) (Yagci et al., 2020). A patient is considered to be Covid-19 positive if the Ct value is below 40. However, the Indian council of Medical Research (ICMR) does not recommend reliance on Ct values to determine the infectious status of a Covid-19 patient (ICMR, 2020). Some factors which can adversely affect the Ct values are the temperature of transportation, the time between collection and receipt in the lab. Ct values of asymptomatic/mild cases are similar to that of Ct values of severe cases. The number of viral genomes of SARS-CoV-2 per ml of human fecal material are between 6,00,000 to 30,00,000 assuming fecal load of 100-400 g feces/day/person with a density of 1.06 g/mL (Hart et al., 2020). The number of persons infected can be found by using Eq. 1 (Ahmed et al., 2020).
RNA copies liters wastewater* liter wastewater day
Persons Infected g feces RNA copies*
person day g feces
=
−
(1)

650
WBE for coronavirus detection
Eq. 1 has been utilized to calculate the potential number of cases in Brisbane North and Brisbane South primary health networks. The Monte Carlo simulation estimated the median number of infections, which ranged from 1,090 on 27 March 2020 to 171 on 1 April 2020 in the catchment basin. The sensitivity analysis indicated a strong correlation ((−0.977)) between the number of infections and prevalence with log10 SARS-CoV-2 RNA copies in human feces samples.
Accuracy of WBE-based analysisThe accuracy of the results depends upon some
of the key variables like seasonal temperature, per person water use, community demographics, average in-sewer travel time and degradation rate of biomarkers as these variables affect the accuracy of data (Hart et al., 2020). These factors influence the precision of the results because the survival of SARS-CoV-2 is influenced by these factors. Chin et al. 2020 revealed that when the stability of SARS-CoV-2 was determined at different temperatures, it was found that at 4o C the virus was highly stable and on day 14, there was only ~0.7 -log unit reduction of infectious titer. But when the incubation temperature was increased to 70o C, the time taken for inactivation of virus was brought down to 5 Minutes. Chin et al. 2020 also states that SARS-CoV-2 is highly stable over a wide-range of pH values (3-10). Noble et al. 1997 which conducted studies on survival of viruses in wastewater discovered that higher molecular weight of dissolved matter has an impact on their survival. Hart et al. 2020 also stated that when calibrated carefully, the wastewater surveillance method at worst can detect 1 infected person in 114 individuals and at best can detect one infected case in 2 million uninfected individuals. This shows the advantage of this detection method over the traditional testing methods as they would require significant amount of time and resources. Medema et al. 2020 highlighted the ability of wastewater surveillance when spread of the disease was low. An investigation was carried out in Netherlands, for the SARS-CoV-2 presence in wastewater of both domestic and airport, at the start of the pandemic, to find out the effectiveness of sewage surveillance for monitoring. No samples of February 6, 2020 were tested positive i.e. three weeks before the first case was reported. And a N1 fragment was found in the samples of March 5. It indicates that the wastewater
can help in finding out the entry of new type of virus or can raise an alarm before the wide spread of virus in the community.
Economics of Covid-19 testingPer assay costs of both clinical and wastewater-
based epidemiology may be different among different countries due to government regulations, labor costs and medical/testing infrastructure. The estimated cost of a test kit which contains key reagents that are essentially identical (qRT PCR buffers, probes, etc.) is available for $10 - $20 USD (Hart et al., 2020). Expenses for reagents required for primary checkup of the community through municipal wastewater was calculated by multiplying the total number of wastewater treatment plants and cost of reagents. The study concludes that countries like Germany can test the people by using 0.014% of the cost required for clinical testing, and in America by 0.00006% of cost required for clinical testing (Hart et al., 2020). These calculations show that WBE costs way less than the cost of clinical test. The price of a RT-PCR test in all states across India ranges from INR 400 to INR 2100, whereas the test was made free in the state of Assam but in order to obtain the report in 24 hours, INR 2200 has to be paid (Timesnow News, 2020). The costs initially ranged between INR 4500 to INR 6000, but once the number of testing labs increased, the cost was brought down significantly. In India approximately 222 million people were tested as of March 8, 2021 (ICMR, 2021), which means that 16.30% people have been tested. Assuming the present cost, it would cost approximately between INR 54,000 Crores and INR 2.83.500 Crores, i.e. USD 7.4 Billion and USD 38.7 Billion to get every person in India tested. WBE-based detection offers a much more economical alternative that will allow the analysis of infection spread without the necessity of testing of all the individuals. In general, the WBE-based approach is to be applied at a broader scale and then subsequently narrowed down to sub-areas of interest (generally locations with higher infection levels). For example, when applied over a city, this approach will indicate the state of spread and its trend (increasing or decreasing). By sub-dividing the city into various sections (or zones), areas with higher occurrence or faster rate of spread can be determined. Targeted individual testing can then be
651
Global J. Environ. Sci. Manage., 7(4): 643-658, Autumn 2021
carried out to isolate the cases and prevent further spread. This is certainly much less expensive than testing all individuals within the city.
ChallengesThe foremost challenge to the application of
WBE-based approach is the locations from where sampling can be done. These locations are generally the sewage treatment plants and in some cases, the sewer network. Unfortunately, the developing and underdeveloped countries have low prevalence of sewers and STPs. For example, there are only 920 sewage treatment plants in India. Furthermore, out of 61,754 MLD sewage generated, 38,791 MLD remains untreated (International Institute of Health and Hygiene, 2021). Approximately only 37% of the total sewage is passing through the wastewater treatment plants and only those places can be used for community testing through WBE. This leaves a large fraction of the Indian population out of the loop of community-level testing. Another challenge would be the process and test protocol. There are studies being conducted to find out the best and accurate process for detection of virus (Brouwer et al., 2018). Nevertheless, the process is sensitive to key variables like temperature, in-sewer travel time, season, rainfall, sampling time, etc. and data may be affected if not calibrated carefully (Brouwer et al., 2018). For Covid-19 detection through WBE, there are several tests available with varying level of results. A standardized protocol is needed for Covid-19 detection for community based assessment. In addition, the RT-PCR based testing is expensive and requires skilled personnel, both of which are roadblocks for successful implementation in underdeveloped world. Biosensors may be a better approach for real-time monitoring in the sewer networks. Finally, there are still some concerns over the correlation between the results obtained from WBE and actual spread. This may be a function of the population being catered by the sampled WWTP, movement of tourists (esp. for smaller towns), testing method used, etc. (Zahedi et al., 2021). Further studies in these directions are needed.
Case Studies of WBE application for Coronavirus detection
In different case studies and research conducted
around the world, the observations of viral load were made and, in some instances, WBE helped in detecting Covid-19 infected cases in real time (Table 1). In a study conducted in Paris, the concentration of vRNA in raw sewage was found to be 5.104 genome units /L during an early stage when total confirmed cases in Paris were 91 (Wurtzer et al., 2020b). Wu et al., 2020 suggested that the concentrations indicated a much higher COVID-19 prevalence (0.1%−5%) than confirmed clinical cases (0.026%). The study implies that WBE can help in finding the hotspots of spread in a much better way than the clinical testing. In another study in India, the estimated maximum concentration was 3.5 x 10² copies/L in the month of May 2020 (Kumar et al. 2020). According to Foladori et al., 2020, the analytical data does not give the correct information of the viral load as it is variable to number of cases. It is also suggesting that the load can be up to 4 orders of magnitude, from 5·103 to 107.6 copies/mL and there is a need of further research to get the exact values. There are cases when the testing of wastewater for detection of Covid-19 helped prevent the outbreak of the disease. In University of Arizona, daily screening of sewage was conducted (Pineda and Leingang, 2020). On 25 August 2020, the official found the traces of coronavirus. They immediately got the 311 people in the dorm tested on 26 August 2020 and found two students who were infected with the virus (although they were asymptomatic). They sent the infected students into isolation and the next day the samples were clear of the traces. It helped the authorities to stop the outbreak of virus to other students living in the same dorm. Two recent developments have taken place: the availability of the vaccines and the detection of new strains. Multiple vaccines have been approved, in different countries, and mass-vaccination programs have also been started to protect the frontline workers and people at-risk as a priority. On the other hand, new strains have emerged and have led to an upsurge in the new cases. Globally, around half million new cases are being reported daily. This shows that while human beings have come up ways to tackle the virus, its mutations have allowed it to continue the infection. This calls for a concerted effort in detection, containment, treatment and prevention. WBE-based testing is a cornerstone of such efforts.

652
G. Saini and P.S. Deepak
Tabl
e 1:
A su
mm
ary
of c
ase
stud
ies o
f WBE
app
licati
on fo
r Cov
id-1
9 de
tecti
on in
was
tew
ater
Plac
e of
stud
y Lo
catio
n of
sam
ple
colle
ctio
n
Proc
ess o
f Sa
mpl
e co
llect
ion
and
Date
s of
col
lect
ion
Viru
s con
cent
ratio
n m
etho
d RN
A ex
trac
tion
met
hod
RNA
quan
tific
atio
n &
am
plifi
catio
n m
etho
d G
enom
e va
lue
/ C t
valu
e Re
fere
nce
Ahm
edab
ad,
Guj
arat
In
dia
Was
tew
ater
tr
eatm
ent p
lant
Co
mpo
site
and
Gra
b; 8
th
May
202
0 –
27th
May
202
0 U
se o
f PEG
Co
mm
erci
al a
vaila
ble
kit (
Nuc
leoS
pin®
RN
A Vi
rus)
RT-P
CR u
sing
TaqP
ath™
Co
vid-
19 R
T-PC
R Ki
t M
axim
um c
once
ntra
tion
of 3
.5 ×
102 c
opie
s/L
Kum
ar e
t al.,
(2
020)
Aust
ralia
O
ne su
burb
an
pum
ping
stat
ion
and
two
WW
TPs
Conv
entio
nal r
efrig
erat
ed
auto
sam
pler
an
d Su
bmer
sible
in-s
itu h
igh
freq
uenc
y au
tosa
mpl
er a
s w
ell a
s gra
b sa
mpl
ing;
24th
Fe
brua
ry 2
020
– 5th
Apr
il 20
20
Dire
ct R
NA
extr
actio
n fr
om e
lect
rone
gativ
e m
embr
anes
An
d U
ltraf
iltra
tion
Com
bina
tion
of tw
o ki
ts (R
Nea
sy p
ower
w
ater
Kit
and
RNea
sy
pow
er m
icro
biom
e Ki
t.
RT-q
PCR
Max
imum
of 1
2 co
pies
/ 10
0ml
Ahm
ed e
t al.,
(2
020)
Braz
il
Sew
age
trea
tmen
t pl
ants
, hos
pita
l w
aste
wat
er a
nd
sew
ers n
etw
ork
Ten-
hour
com
posit
e sa
mpl
es; 1
5th A
pril
2020
U
ltrac
entr
ifuga
tion
Met
hod
Usin
g Q
IAam
p® V
iral
RNA
Min
i kit
and
a Q
IAcu
be®
auto
mat
ed
syst
em.
RT-q
PCR
SARS
-CoV
-2 R
NA
was
de
tect
ed in
5 o
f 12
sam
ples
, Ct v
alue
s:
36.3
to 3
9.8
Prad
o et
al.,
(2
020)
Ita
ly
Thre
e W
WTP
s Co
mpo
site;
3rd
Feb
ruar
y 20
20 –
2nd
Apr
il 20
20
PEG-
dext
ran
met
hod
Nuc
liSEN
S m
iniM
AG
sem
i-aut
omat
ed
extr
actio
n sy
stem
.
PCR
usin
g Ki
t Pla
tinum
™
Supe
rFi™
Gre
en P
CR M
aste
r M
ix
6 of
12
WW
TP’S
test
ed
wer
e po
sitiv
e.
La R
osa
et a
l.,
(202
0)
Paris
, Fra
nce
Thre
e W
WTP
s Co
mpo
site;
5th
Mar
ch 2
020
– 23
rd A
pril
2020
U
ltra
cent
rifug
atio
n an
d ex
trac
tion
Usin
g Po
wer
Feca
l Pro
ki
t, Q
IAsy
mph
ony
auto
mat
ed e
xtra
ctor
Usin
g Fa
st v
irus 1
-ste
p M
aste
r mix
4x
3x
106
GU
/L o
n pe
ak
Wur
tzer
et a
l.,
(202
0b)
Isra
el
Hosp
ital t
reat
ing
SARS
-CO
V-2
patie
nts,
Isol
atio
n fa
cilit
y, S
ewer
ne
twor
k,
Was
tew
ater
tr
eatm
ent p
lant
Usin
g Au
tom
atic
sam
pler
; 10
th M
arch
202
0 –
21st
Apr
il 20
20
Cent
rifug
atio
n, a
nd
usin
g po
lyet
hyle
ne
glyc
ol (P
EG)
Usin
g vi
ral R
NA
extr
actio
n ki
t (RN
easy
m
ini k
it- Q
IAGE
N a
nd
Easy
MAG
)
Reve
rse
tran
scrib
ed a
nd
qPCR
and
Ste
p O
ne P
lus r
eal-
time
PCR
syst
em
10 o
ut o
f 26
colle
cted
sa
mpl
es te
sted
pos
itive
w
ith C
t val
ues:
32
.76
to 3
8.5
Bar O
r et a
l.,
(202
0)
Japa
n
Five
tim
es fr
om a
w
aste
wat
er
trea
tmen
t pla
nt a
nd
Thre
e tim
es fr
om a
riv
er
Grab
sam
plin
g; 1
7th M
arch
20
20 –
7th
May
202
0
Elec
tron
egat
ive
mem
bran
e-vo
rtex
(E
MV)
met
hod
and
adso
rptio
n-di
rect
RN
A ex
trac
tion
met
hod
Usin
g Q
IAam
p Vi
ral
RNA
Min
i Kit
in a
Q
IAcu
be a
utom
ated
pl
atfo
rm
Usin
g Th
erm
al C
ycle
r Dic
e Re
al T
ime
Syst
em T
P800
Ct v
alue
: 39.
96, 2
.4×1
03 co
pies
/L in
the
wat
er
sam
ple
Hara
mot
o et
al.,
(2
020)
Ista
nbul
, Tu
rkey
W
WTP
s and
Man
ho
les
Com
posit
e an
d G
rab
sam
plin
g; 2
1st A
pril
2020
–
25th
Apr
il 20
20
Cent
rifug
atio
n U
sing
Path
ogen
M
ini K
it RT
-qPC
R Fi
ve o
ut o
f Sev
en sa
mpl
es
colle
cted
from
WW
TP
wer
e po
sitiv
e
Koca
mem
i et a
l.,
(202
0)

653
Global J. Environ. Sci. Manage., 7(4): 643-658, Autumn 2021
Tabl
e 1:
A su
mm
ary
of c
ase
stud
ies o
f WBE
app
licati
on fo
r Cov
id-1
9 de
tecti
on in
was
tew
ater
Plac
e of
stud
y Lo
catio
n of
sam
ple
colle
ctio
n
Proc
ess o
f Sa
mpl
e co
llect
ion
and
Date
s of
col
lect
ion
Viru
s con
cent
ratio
n m
etho
d RN
A ex
trac
tion
met
hod
RNA
quan
tific
atio
n &
am
plifi
catio
n m
etho
d G
enom
e va
lue
/ C t
valu
e Re
fere
nce
Loui
sian
a, U
SA
Two
WW
TPs
Com
posit
e an
d G
rab;
13th
Janu
ary
2020
– 8
th A
pril
2020
Ultr
afilt
ratio
n an
d Ad
sorp
tion–
elut
ion
met
hod
usin
g an
el
ectr
oneg
ativ
e m
embr
ane
Use
of P
seud
omon
as
bact
erio
phag
e
RT-q
PCR
usin
g a
CFX9
6 Re
alTi
me
PCR
Inst
rum
ent
3.1×
103 -
7.5×
103 c
opie
s/L
Sher
chan
et a
l. (2
020)
Engl
and
WW
TP
Com
posit
e; 1
4th Ja
nuar
y 20
20 –
12th
May
202
0 Ce
ntrif
ugat
ion
RNA
extr
acte
d fr
om
the
Nat
iona
l In
stitu
te fo
r Bio
logi
cal
Stan
dard
s and
Con
trol
RT-q
PCR
3.50
- 4.
20 L
og10
gc/
L M
artin
et a
l. (2
020)
Sout
heas
tern
Vi
rgin
ia, U
SA
Nin
e W
WTP
s Co
mpo
site
and
Gra
b; 9
th
Mar
ch 2
020
– 26
th Ju
ly 2
020
n In
nova
Prep
Co
ncen
trat
ing
Pipe
tte
Sele
ct
and
elec
tron
egat
ive
filtr
atio
n
Usin
g N
ucliS
ENS
easy
Mag
RT
- dig
ital d
ropl
et P
CR
98 o
ut o
f 198
wat
er
sam
ples
wer
e fo
und
posit
ive.
Gonz
alez
et a
l. (2
020)
Nor
th R
hine
-W
estp
halia
G
erm
any
Nin
e W
WTP
s Co
mpo
site;
8th
Apr
il 20
20
Amic
on®
Ultr
a-15
Ce
ntrif
ugal
Filt
er U
nit
Nuc
leoS
pin
RNA
Viru
s ki
t
One
Step
RT-
qPCR
usin
g Lu
na
Uni
vers
al P
robe
One
-Ste
p RT
-qPC
R Ki
t or L
ight
Cycl
er®
Mul
tiple
x RN
A Vi
rus M
aste
r an
d th
e CF
X96
Real
-Tim
e Sy
stem
, with
a C
1000
Tou
ch
Ther
mal
Cyc
ler.
3 -
20 g
ene
equi
vale
nts
per m
L in
the
inflo
w, a
nd
2.7
- 37
gene
equ
ival
ents
in
the
WW
TP e
fflue
nt
Wes
thau
s et a
l. (2
020)
Sant
iago
, Chi
le
Two
WW
TPs
Com
posit
e; M
arch
202
0 –
June
202
0 U
ltrac
entr
ifuga
tion
Usin
g th
e Q
IAam
pÒ
Vira
l RN
A M
ini k
it
Usin
g th
e Ta
qMan
201
9-nC
oV A
ssay
Kit
v1
Ct v
alue
s: 2
8.1-
37.
7 Am
puer
o et
al.
(202
0)
Net
herla
nds
WW
TPs
Com
posit
e; 7
th F
ebru
ary
2020
– 2
5th M
arch
202
0 U
ltraf
iltra
tion
Usin
g th
e RN
easy
Po
wer
Mic
robi
ome
Kit
and
Biom
erie
ux
Nuc
lisen
s kit
RT-q
PCR
14−3
0 ge
ne c
opie
s (gc
)/m
L M
edem
a et
al.
(202
0)
Sout
hern
N
evad
a,
USA
WW
TP a
nd fr
om
lake
G
rab
and
Com
posit
e; M
arch
20
20 –
May
202
0
Prim
ary
conc
entr
atio
n w
ith h
ollo
w fi
ber
ultr
afilt
ratio
n (H
FUF)
an
d se
cond
ary
conc
entr
atio
n w
ith
Cent
ricon
ul
traf
iltra
tion
Pure
link
Vira
l RN
A/DN
A M
ini K
it q-
PCR
4.5
x 10
9 gc/
L Ge
rrity
et a
l. (2
020)

654
G. Saini and P.S. Deepak
RECOMMENDATIONGiven the unique advantages offered by the WBE-
based approach, it should be the preferred choice for Covid-19 detection and spread analysis, globally. This pandemic has severely affected the entire world and hence a global approach is required to its containment and remediation. It is expected that countries with more resources will come forward to help the lesser-endowed nations in terms of scientific and technical know-how, testing kits and other accessories needed for testing and control. Formation of a collaborative group (Covid19WBEC) is a welcome step in this direction. WBE-based detection, followed by human testing in areas with high concentration of cases and mass-scale vaccination is likely to be the key to overcome this pandemic.
CONCLUSIONA global pandemic has engulfed the humanity
and has infected 128 million people (so far), killing millions in a very brief span of 15 months. Unfortunately, despite the best efforts, it is yet to be controlled. The first step in the fight against Covid-19 is its detection. Unfortunately, the targeted human testing is expensive, intrusive and a lagging indicator of the infection. An alternate approach such as, wastewater based epidemiology may act as a potential solution. Here, a comprehensive literature review focusing on the application of wastewater based epidemiological approach to the detection of Covid-19 is presented. This method obviates the need for extensive, non-targeted individual testing and helps in determining the spread and its trend at a much lower cost, in a non-intrusive and timely manner. It has been established, through various studies, that WBE-based Covid-19 detection can provide an early indication of the spread as compared to direct-human testing, thus providing significant lead time. These results can then be used to focus, in a targeted manner, on areas with high level of viral spread leading to human testing, and containment and treatment efforts. This approach has been applied in different geographies (Table 1) and has proven to be an asset in containing Covid-19 and preventing further spread of the infection, saving lives and resources in the process. Different variations of PCR-based assays have been utilized in these studies to a varying degree of success. With the availability of multiple vaccines globally,
this approach can be coupled with the targeted vaccination program to prevail over this pandemic. The biggest challenge to this approach is the non-availability of representative sampling locations, especially in developing and underdeveloped countries. This brings the focus back on the lack of extensive sanitation programs in such countries. Standardized protocols and knowledge/resource sharing, through concerted global efforts, is expected to enhance the application of this technique in different parts of the world and is likely to aid humanity’s fight against Covid-19.
AUTHOR CONTRIBUTIONS
P.S. Deepak wrote the first draft of the manuscript and helped with updates (as needed), including the post-review activities. G. Saini developed the concept, supervised the manuscript preparation and edited it.
ACKNOWLEDGMENTSThe authors acknowledge the anonymous
colleagues and reviewers for their valuable comments and suggestions that helped improve this manuscript.
CONFLICT OF INTERESTThe authors declare no potential conflict of
interest regarding the publication of this work. In addition, the ethical issues including plagiarism, informed consent, misconduct, data fabrication and, or falsification, double publication and, or submission, and redundancy have been completely witnessed by the authors.
ABBREVIATIONS
CDC Centers for Disease Control and Prevention
Cl2 ChlorineClO2 Chlorine dioxide
cPCR Conventional polymerase chain reaction
Ct Threshold Cycle
ddPCR Droplet Digital polymerase chain reaction
DNA Deoxyribonucleic acidFeCl3 Ferric chlorideICMR Indian council of Medical ResearchIQR Interquartile range

655
Global J. Environ. Sci. Manage., 7(4): 643-658, Autumn 2021
kDa KilodaltonsMERS Middle East respiratory syndromeMLD millions of liter per dayNaOCl Sodium hypochloriteNMWL Nominal molecular weight limitO3 OzonePCR Polymerase chain reactionPEG Polyethylene glycol
qPCR Quantitative polymerase chain reaction
RNA Ribonucleic acid
RT-LAMP Reverse transcription loop-mediated isothermal amplification
RT-PCR Reverse transcription polymerase chain reaction
RT-qPCR Real-time quantitative polymerase chain reaction
SARS Severe acute respiratory syndromeSARS-CoV-2
Severe acute respiratory syndrome coronavirus 2
SMF Skimmed milk flocculationvRNA Viral Ribonucleic AcidWBE Wastewater based epidemiologyWHO World health organizationWWTP Waste water treatment plant
REFERENCESAguiar-Oliveira, M. L.; Campos, A.; R Matos, A.; Rigotto, C.; Sotero-
Martins, A.; Teixeira, P.; Siqueira, M. M., (2020). Wastewater-Based Epidemiology (WBE) and Viral Detection in Polluted Surface Water: A Valuable Tool for COVID-19 Surveillance-A Brief Review. Int. J. Environ. Res. Public Health, 17(24): 9251 (19 pages).
Ahmed, W.; Angel, N.; Edson, J.; Bibby, K.; Bivins, A.; O’Brien, J.W.; Choi, P.M.; Kitajima, M.; Simpson, S. L.; Li, J.; Tscharke, B.; Verhagen, R.; Smith, W.; Zaugg, J.; Dierens, L.; Hugenholtz, P.; Thomas, K.V.; Mueller, J.F., (2020). First confirmed detection of SARS-CoV-2 in untreated wastewater in Australia: A proof of concept for the wastewater surveillance of COVID-19 in the community. Sci. Total Environ., 728: 138764 (9 pages).
Ampuero, M.; Valenzuela, S.; Valiente-Echeverría, F.; Soto-Rifo, R.; Barriga, G.P.; Chnaiderman, J.; Rojas, C.; Guajardo-Leiva, S.; Díez, B.; Gaggero, A., (2020). SARS-CoV-2 detection in sewage in Santiago. Chile. MedRxiv (10 pages).
Augustine, R.; Hasan, A.; Das, S.; Ahmed, R.; Mori, Y.; Notomi, T.; Kevadiya, B.D.; Thakor, A.S., (2020). Loop-Mediated Isothermal Amplification (LAMP): A Rapid, Sensitive, Specific, and Cost-Effective Point-of-Care Test for Coronaviruses in the Context of
COVID-19 Pandemic. Biology, 9(8):182 (17 pages). Bar Or, I.; Yaniv, K.; Shagan, M.; Ozer, E.; Erster, O.; Mendelson,
E., (2020). Regressing SARS-CoV-2 sewage measurements onto COVID-19 burden in the population: a proof-of-concept for quantitative environmental surveillance. MedRxiv (11 pages).
Bibby, K.; Peccia, J., (2013). Identification of viral pathogen diversity in sewage sludge by metagenome analysis. Environ. Sci. Technol., 47(4): 1945–1951 (7 pages).
Bio-Rad, (2021). Droplet Digital™ PCR (ddPCR™) Technology. Brouwer, A.F.; Eisenberg, J.N.; Pomeroy, C.D.; Shulman, L.M.;
Hindiyeh, M.; Manor, Y.; Grotto, I.; Koopman, J.S.; Eisenberg, M.C., (2018). Epidemiology of the silent polio outbreak in Rahat, Israel, based on modeling of environmental surveillance data. Proc. Natl. Acad. Sci. U.S.A., 115(45):E10625–E10633 (9 pages).
Bustin, S.A.; Nolan, T., (2020). RT-qPCR Testing of SARS-CoV-2: A Primer. Int. J. Mol. Sci., 21(8): 3004. (9 pages).
Calgua, B.; Rodriguez-Manzano, J.; Hundesa, A.; Suñen, E.; Calvo, M.; Bofill-Mas, S.; Girones, R., (2013). New methods for the concentration of viruses from urban sewage using quantitative PCR. J. Virol. Methods, 187(2): 215–221 (7 pages).
Cashdollar, J.L.; Wymer, L., (2013). Methods for primary concentration of viruses from water samples: a review and meta-analysis of recent studies. J. Appl. Microbiol., 115(1): 1–11 (11 pages).
CDC, (2021a). COVID-19 Testing Overview. Centers for Disease Control and Prevention.
CDC, (2021b). Developing a Wastewater Surveillance Sampling Strategy. Centers for Disease Control and Prevention.
CDC, (2021c). Wastewater Surveillance Testing Methods. Centers for Disease Control and Prevention.
CDC, (2021d). CDC 2019-Novel Coronavirus (2019-nCoV). Centers for Disease Control and Prevention. Real-Time RT-PCR Diagnostic Panel, CDC-006-00019, revision: 06 CDC/DDID/NCIRD/ Division of Viral Diseases Effective: 12/01/2020.
Chen, Y.; Chen, L.; Deng, Q.; Zhang, G.; Wu, K.; Ni, L.; Yang, Y.; Liu, B.; Wang, W.; Wei, C.; Yang, J.; Ye, G.; Cheng, Z., (2020). The presence of SARS-CoV-2 RNA in the feces of COVID-19 patients. J. Med. Virol., 92(7): 833–840 (8 pages).
Chin, A.; Chu, J.; Perera, M.; Hui, K.; Yen, H. L.; Chan, M.; Peiris, M.; Poon, L., (2020). Stability of SARS-CoV-2 in different environmental conditions. Lancet. Microbe, 1(1): e10 (2 pages).
Cobo, F., (2012). Application of molecular diagnostic techniques for viral testing. Open Virol. J., 6: 104–114 (11 pages).
Corpuz, M.; Buonerba, A.; Vigliotta, G.; Zarra, T.; Ballesteros, F.; Jr, Campiglia, P.; Belgiorno, V.; Korshin, G.; Naddeo, V., (2020). Viruses in wastewater: occurrence, abundance and detection methods. Sci. Total Environ., 745: 140910 (27 pages).
Cucinotta, D.; Vanelli, M., (2020). WHO declares COVID-19 a pandemic. Acta Biomed: Atenei Parmensis, 91(1): 157–160 (4 pages).
Cyranoski, D., (2018). China expands surveillance of sewage to police illegal drug use. Nature 559: 310-311 (2 pages).
DiToro, D.; Winstead, C. J.; Pham, D.; Witte, S.; Andargachew, R.; Singer, J.R.; Wilson, C.G.; Zindl, C.L.; Luther, R.J.; Silberger, D.J.; Weaver, B.T.; Kolawole, E.M.; Martinez, R.J.; Turner, H.; Hatton, R.D.; Moon, J.J.; Way, S.S.; Evavold, B.D.; Weaver, C.T., (2018). Differential IL-2 expression defines developmental fates of follicular versus nonfollicular helper T cells. Science, 361(6407):
https://www.cdc.gov/coronavirus/2019-ncov/cases-updates/wastewater-surveillance/testing-methods.html

656
G. Saini and P.S. Deepak
eaao2933 (29 pages). Falman, J.C.; Fagnant-Sperati, C.S.; Kossik, A.L.; Boyle, D.S.;
Meschke, J.S., (2019). Evaluation of secondary concentration methods for Poliovirus detection in Wastewater. Food Environ. Virol., 11(1): 20–31. (12 pages).
Foladori, P.; Cutrupi, F.; Segata, N.; Manara, S.; Pinto, F.; Malpei, F.; Bruni, L.; La Rosa, G., (2020). SARS-CoV-2 from feces to wastewater treatment: What do we know? A review. Sci. Total Environ., 743: 140444. (13 pages).
Gerrity, D.; Papp, K.; Stoker, M.; Sims, A.; Frehnera, W., (2020). Early-pandemic wastewater surveillance of SARS-CoV-2 in Southern Nevada: Methodology, occurrence, and incidence/prevalence considerations. Water Res X. 10: 100086 (11 pages).
Gonzalez, R.; Curtis, K.; Bivins, A.; Bibby, K.; Weir, M.H.; Yetka, K.; Thompson, H.; Keeling, D.; Mitchell, J.; Gonzalez, D., (2020). COVID-19 surveillance in Southeastern Virginia using wastewater-based epidemiology. Water Res, 186: 116296. (32 pages).
Guarner, J., (2020). Three emerging Coronaviruses in two decades. Am. J. Clin. Pathol., 153(4): 420–421 (2 pages).
Haramoto, E.; Malla, B.; Thakali, O.; Kitajima, M., (2020). First environmental surveillance for the presence of SARS-CoV-2 RNA in wastewater and river water in Japan. Sci. Total Environ., 737: 140405. (9 pages).
Hart, O.E.; Halden, R.U., (2020). Computational analysis of SARS-CoV-2/COVID-19 surveillance by wastewater-based epidemiology locally and globally: Feasibility, economy, opportunities andchallenges. Sci. Total Environ., 730: 138875 (9 pages).
Hill, V.R.; Kahler, A.M.; Jothikumar, N.; Johnson, T.B.; Hahn, D.; Cromeans, T.L., (2007). Multistate evaluation of an ultrafiltration-based procedure for simultaneous recovery of enteric microbes in 100-liter tap water samples. Appl. Environ. Microbiol., 73(13): 4218–4225 (8 pages).
Huerta-Fontela, M.; Galceran, M.T.; Martin-Alonso, J.; Ventura, F., (2008). Occurrence of psychoactive stimulatory drugs in wastewaters in north-eastern Spain. Sci. Total Environ., 397(1-3): 31-40 (10 pages).
ICMR, (2020). Evidence based advisory on correlation of COVID-19 disease severity with Ct values of the real time RT-PCR Test. Indian Council of Medical Research.
ICMR, (2021). SARS-CoV-2 (COVID-19) testing status. International Institute of Health and Hygiene, (2021). ENVIS
Centre on hygiene, sanitation, sewage treatment systems and technology, National status of waste water generation and treatment.
Johnson, M., (2012). RNA Extraction., Mater. Meth., 2: 201. Kadri, K., (2020). Polymerase chain reaction (PCR): principle and
applications. Synthetic Biology - New Interdisciplinary Science (18 pages).
Karolak, S.; Nefau, T.; Bailly, E.; Solgadi, A.; Levi, Y., (2010). Estimation of illicit drugs consumption by wastewater analysis in Paris area (France). Forensic Sci. Int., 200(1-3): 153–160 (8 pages).
Kocamemi, A.B.; Kurt. H.; Hacıoglu. S.; Yaralı. C.; Saatci. A.M.; Pakdemirli, B.; Yaykıran, S., (2020). First data-set on SARS-CoV-2 detection for Istanbul wastewaters in Turkey. Medrxiv (10 pages).
Kooraki, S.; Hosseiny, M.; Myers, L.; Gholamrezanezhad, A., (2020). Coronavirus (COVID-19) outbreak: What the Department of Radiology should know. J. Am. Coll. Radiol.: JACR, 17(4): 447–451 (5 pages).
Kumar, M.; Patel, A.K.; Shah, A.V.; Raval, J.; Rajpara, N.; Joshi, M.; Joshi, C.G., (2020). First proof of the capability of wastewater surveillance for COVID-19 in India through detection of genetic material of SARS-CoV-2. Sci. Total Environ., 746: 141326 (8 pages).
La Rosa, G.; Iaconelli, M.; Mancini, P.; Bonanno Ferraro, G.; Veneri, C.; Bonadonna, L.; Lucentini, L.; Suffredini, E., (2020). First detection of SARS-CoV-2 in untreated wastewaters in Italy. Sci. Total Environ., 736: 139652 (6 pages).
Lewis, G.D.; Metcalf, T.G., (1988). Polyethylene glycol precipitation for recovery of pathogenic viruses, including hepatitis A virus and human rotavirus, from oyster, water, and sediment samples. Appl. Environ. Microbiol., 54(8): 1983–1988 (6 pages).
Listwan, P.; Pédelacq, J.D.; Lockard, M.; Bell, C.; Terwilliger, T.C.; Geoffrey S.W., (2010). The optimization of in vitro high-throughput chemical lysis of Escherichia coli. Application to ACP domain of the polyketide synthase ppsC from Mycobacterium tuberculosis. J. Struct. Funct. Genomics, 11: 41–49 (9 pages).
Liu, Y.; Gayle, A.A.; Wilder-Smith, A.; Rocklöv, J., (2020). The reproductive number of COVID-19 is higher compared to SARS coronavirus. J. Travel Med., 27(2): taaa021 (4 pages).
MacIntyre, C.R., (2020). Case isolation, contact tracing, and physical distancing are pillars of COVID-19 pandemic control, not optional choices. Lancet Infect. Dis., 20(10): 1105–1106 (2 pages).
Mandal, P.; Gupta, A. K.; Dubey, B.K., (2020). A review on presence, survival, disinfection/removal methods of coronavirus in wastewater and progress of wastewater-based epidemiology. J. Environ. Chem. Eng., 8(5): 104317 (11 pages).
Lima, C.M.A.O., (2020). Information about the new coronavirus disease (COVID-19). Radiol. Bras., 53(2): V-VI. (2 pages).
Martin, J.; Klapsa, D.; Wilton, T.; Zambon, M.; Bentley, E.; Bujaki, E.; Fritzsche, M.; Mate, R.; Majumdar, M. (2020). Tracking SARS-CoV-2 in sewage: evidence of changes in virus variant predominance during COVID-19 pandemic. Viruses, 12(10): 1144 (17 pages).
Medema, G.; Heijnen, L.; Elsinga, G.; Italiaander, R.; Brouwer, A., (2020). Presence of SARS-Coronavirus-2 RNA in sewage and correlation with reported COVID-19 prevalence in the early stage of the epidemic in the Netherlands. Environ. Sci. Technol. Lett., 7 (7): 511-516 (6 pages).
Meo, S.A.; Alhowikan, A.M.; Al-Khlaiwi, T.; Meo, I.M.; Halepoto, D.M.; Iqbal, M.; Usmani, A.M.; Hajjar, W.; Ahmed, N., (2020). Novel coronavirus 2019-nCoV: prevalence, biological and clinical characteristics comparison with SARS-CoV and MERS-CoV. Eur. Rev. Med. Pharmacol. Sci., 24(4): 2012–2019 (8 pages).
Metcalfe, C.; Tindale, K.; Li, H.; Rodayan, A.; Yargeau, V., (2010). Illicit drugs in Canadian municipal wastewater and estimates of community drug use. Environ. Pollut., 158(10): 3179–3185 (7 pages).
Michael-Kordatou, I.; Karaolia, P.; Fatta-Kassinos, D., (2020). Sewage analysis as a tool for the COVID-19 pandemic response and management: the urgent need for optimised protocols for

657
Global J. Environ. Sci. Manage., 7(4): 643-658, Autumn 2021
SARS-CoV-2 detection and quantification. J. Environ. Chem. Eng., 8(5): 104306 (24 pages).
Nassar, M.S.; Bakhrebah, M.A.; Meo, S.A.; Alsuabeyl, M.S.; Zaher, W.A., (2018). Middle East Respiratory Syndrome Coronavirus (MERS-CoV) infection: epidemiology, pathogenesis and clinical characteristics. Eur. Rev. Med. Pharmacol. Sci., 22(15): 4956–4961 (6 pages).
Nemudryi, A.; Nemudraia, A.; Wiegand, T.; Surya, K.; Buyukyoruk, M.; Cicha, C.; Vanderwood, K.K.; Wilkinson, R.; Wiedenheft, B., (2020). Temporal detection and phylogenetic assessment of SARS-CoV-2 in municipal wastewater. Cell Rep. Med., 1(6): 100098 (11 pages).
Noble, R.T.; Fuhrman, J.A., (1997). Virus decay and its causes in coastal waters. Appl. Environ. Microbiol., 63(1) : 77–83 (7 pages).
Perappadan, B.S., (2020). India’s first coronavirus infection confirmed in Kerala.
Pineda, P.; Leingang, R., (2020). University of Arizona wastewater testing finds virus at dorm, prevents outbreak, Arizona Republic.
Prado, T.; Fumian, T.M.; Mannarino, C.F.; Maranhão, A.G.; Siqueira, M.M.; Miagostovich, M.P., (2020). Preliminary results of SARS-CoV-2 detection in sewerage system in Niterói municipality, Rio de Janeiro, Brazil. Mem. Inst. Oswaldo Cruz, 115: e200196 (3 pages).
Prata, C.; Ribeiro, A.; Cunha, Â.; Gomes, N.C.; Almeida, A., (2012). Ultracentrifugation as a direct method to concentrate viruses in environmental waters: virus-like particle enumeration as a new approach to determine the efficiency of recovery. Environ. Monit. Assess. JEM, 14(1): 64–70 (7 pages).
Rabenau, H.F.; Cinatl, J.; Morgenstern, B.; Bauer, G.; Preiser, W.; Doerr, H.W., (2005). Stability and inactivation of SARS coronavirus. Med. Microbiol. Immun., 194(1-2): 1–6 (6 pages).
Randazzo, W.; Truchado, P.; Cuevas-Ferrando, E.; Simón, P.; Allende, A.; Sánchez, G., (2020). SARS-CoV-2 RNA in wastewater anticipated COVID-19 occurrence in a low prevalence area. Water Res., 181: 115942 (9 pages).
Sherchan; S.P.; Shahin, S.; Ward, L.M.; Tandukar, S.; Aw, T.G.; Schmitz, B.; Ahmed, W.; Kitajima, M., (2020). First detection of SARS-CoV-2 RNA in wastewater in North America: A study in Louisiana, USA. Sci. Total Environ., 743: 140621 ( 7 pages).
Sinclair, R.G.; Choi, C.Y.; Riley, M.R.; Gerba, C.P., (2008). Pathogen surveillance through monitoring of sewer systems. Adv. Appl. Microbiol., 65: 249–269 (21 pages).
Timesnow News, (2020). COVID-19: How much does RT-PCR test cost? Find state-wise price here.
Wang, J.; Shen, J.; Ye, D.; Yan, X.; Zhang, Y.; Yang, W.; Li, X.; Wang, J.; Zhang, L.; Pan, L., (2020). Disinfection technology of hospital wastes and wastewater: Suggestions for disinfection strategy during coronavirus Disease 2019 (COVID-19) pandemic in China. Environ. Pollut., 262: 114665. (11 pages).
Wang, X.W.; Li, J.S.; Guo, T.K.; Zhen, B.; Kong, Q.X.; Yi, B.; Li, Z.; Song, N.; Jin, M.; Xiao, W.J.; Zhu, X.M.; Gu, C.Q.; Yin, J.; Wei, W.; Yao, W.; Liu, C.; Li, J.F.; Ou, G.R.; Wang, M.N.; Fang, T.Y.; Li, J.W., (2005). Concentration and detection of SARS coronavirus in sewage from Xiao Tang Shan Hospital and the 309th Hospital. J. Virol. Methods, 128(1-2): 156–161 (6 pages).
Watzinger, F.; Ebner, K.; Lion, T., (2006). Detection and monitoring
of virus infections by real-time PCR. Mol. Aspects Med., 27(2-3): 254–298 (45 pages).
Weiss, S.R.; Leibowitz, J.L., (2011). Coronavirus pathogenesis. Adv. Virus Res., 81: 85–164 (80 pages).
Westhaus, S.; Weber, F.A.; Schiwy, S.; Linnemann, V.; Brinkmann, M.; Widera, M.; Greve, C.; Janke, A.; Hollert, H.; Wintgens, T.; CiIesek, S., (2021). Detection of SARS-CoV-2 in raw and treated wastewater in Germany - Suitability for COVID-19 surveillance and potential transmission risks. Sci. Total Environ., 751: 141750 (13 pages).
WHO, (2003). Guidelines for environmental surveillance of poliovirus circulation. World Health Organization Publication.
WHO, (2020). Water, sanitation, hygiene, and waste management for SARS-CoV-2, the virus that causes COVID-19.
Worldometer, (2021a). Coronavirus cases of World. Worldometer, (2021b). Coronavirus cases of India. Wu, F.; Zhang, J.; Xiao, A.; Gu, X.; Lee, WL.; Armas, F.; Kauffman,
K.; Hanage, W.; Matus, M.; Ghaeli, N.; Endo, N.; Duvallet, C.; Poyet, M.; Moniz, K.; Washburne, A.D.; Erickson, T.B.; Chai, P.R.; Thompson, J.; Alm, E. J., (2020). SARS-CoV-2 titers in wastewater are higher than expected from clinically confirmed cases. mSystems. 5(4):e00614-20 (9 pages).
Wurtzer, S.; Marechal, V.; Mouchel, J. M.; Moulin, L. (2020a). Time course quantitative detection of SARS-CoV-2 in Parisian wastewaters correlates with COVID-19 confirmed cases. MedRxiv. (4 pages).
Wurtzer, S.; Marechal, V.; Mouchel, J.M.; Maday, Y.; Teyssou, R.; Richard, E.; Almayrac, J.L.; Moulin, L., (2020b). Evaluation of lockdown effect on SARS-CoV-2 dynamics through viral genome quantification in waste water, Greater Paris, France, 5 March to 23 April 2020. Euro Surveill., 25(50): 2000776. (7 pages).
Xiao, F.; Tang, M.; Zheng, X.; Liu, Y.; Li, X.; Shan, H., (2020). Evidence for Gastrointestinal Infection of SARS-CoV-2. Gastroenterology, 158(6): 1831–1833.e3 (7 pages).
Yagci, A.K.; Sarinoglu, R.C.; Bilgin, H.; Yanılmaz, Ö.; Sayın, E.; Deniz, G.; Guncu, M.M.; Doyuk, Z.; Barıs, C.; Kuzan, B.N.; Aslan, B.; Korten, V.; Cimsit, C., (2020). Relationship of the cycle threshold values of SARS-CoV-2 polymerase chain reaction and total severity score of computerized tomography in patients with COVID 19. Int. J. Infect. Dis., 101: 160–166 (7 pages).
Young, B.E.; Ong, S.; Kalimuddin, S.; Low, J.G.; Tan, S.Y.; Loh, J.; Ng, O.T.; Marimuthu, K.; Ang, L.W.; Mak, T.M.; Lau, S.K.; Anderson, D.E.; Chan, K.S.; Tan, T.Y.; Ng, T.Y.; Cui, L.; Said, Z.; Kurupatham, L.; Chen, M.I.; Chan, M., (2020). Epidemiologic features and clinical course of patients infected with SARS-CoV-2 in Singapore. Singapore 2019 Novel Coronavirus Outbreak Research Team, J. Am. Med. Assoc., 323(15): 1488–1494 (7 pages).
Zahedi, A.; Monis, P.; Deere, D.; Ryan, U., (2021). Wastewater-based epidemiology- surveillance and early detection of waterborne pathogens with a focus on SARS-Cov-2, Cryptosporidium and Giardia. Parasitol. Res. (22 pages).
Zhong, N.S.; Zheng, B.J.; Li, Y.M.; Poon.; Xie, Z.H.; Chan, K.H.; Li, P.H.; Tan, S.Y.; Chang, Q.; Xie, J.P.; Liu, X.Q.; Xu, J.; Li, D.X.; Yuen, K.Y.; Peiris.; Guan, Y., (2003). Epidemiology and cause of severe acute respiratory syndrome (SARS) in Guangdong, People’s Republic of China, in February, 2003. Lancet, 362(9393): 1353–1358 (6 pages).

658
G. Saini and P.S. Deepak
AUTHOR (S) BIOSKETCHES
Saini, G., Ph.D., Associate Professor, Department of Civil Engineering, Sharda University, Greater Noida, Uttar Pradesh, India.
Email: [email protected]
Deepak, P.S., B.Tech., Department of Civil Engineering, Sharda University, Greater Noida, Uttar Pradesh, India.
Email: [email protected]
HOW TO CITE THIS ARTICLE
Saini, G.; Deepak, P.S., (2021). Wastewater-based epidemiology for novel Coronavirus detection in wastewater. Global J. Environ. Sci. Manage., 7(4): 643-658.
DOI: 10.22034/gjesm.2021.04.10
url: https://www.gjesm.net/article_243222.html
COPYRIGHTS
©2021 The author(s). This is an open access article distributed under the terms of the Creative Commons Attribution (CC BY 4.0), which permits unrestricted use, distribution, and reproduction in any medium, as long as the original authors and source are cited. No permission is required from the authors or the publishers.


Manuscript Title:
Corresponding Author:
Please check all that apply.
New author(s) have been added.
There is a change in the order of authorship.
An author wishes to remove his/her name. An author’s name may only be removed at his/her own request in writing.
ORIGINAL AUTHORSHIP
List ALL AUTHORS in the same order as the original (first) submission.
Print Name Print Name
Name (1) Name (6)
Name (2) Name (7)
Name (3) Name (8)
Name (4) Name (9)
Name (5) Name (10)
NEW AUTHORSHIP
List the ALL AUTHORS in same order as the new version.
Print Name Print Name
Name (1) Name (6)
Name (2) Name (7)
Name (3) Name (8)
Name (4) Name (9)
Name (5) Name (10)
I attest that:
1. The manuscript is not currently under consideration, in press, or published elsewhere, and the research reported will not be submitted for publication elsewhere until a final decision has been made as to its acceptability by the journal (posting of submitted material on a web site may be considered prior publication-note this in your cover letter).
2. The manuscript is truthfully original work without fabrication, fraud, or plagiarism.3. I have made an important scientific contribution to the study and am thoroughly familiar with the primary data. 4. I have read the complete manuscript and take responsibility for the content and completeness of the manuscript and
understand that I share responsibility if the paper, or part of the paper, is found to be faulty or fraudulent.
Corresponding Author Signature Name Date
CHANGE OF AUTHORSHIP FORM