Composting of Municipal Solid Waste: An Empirical Analysis of Existing Plants
7
Transactions of the ASABE Vol. 56(5): © 2013 American Society of Agricultural and Biological Engineers ISSN 2151-0032 DOI 10.13031/trans.56.9819 1 COMPOSTING OF MUNICIPAL SOLID WASTE: AN EMPIRICAL ANALYSIS OF EXISTING PLANTS R. Gamberini, B. Rimini, P. Nicandri ABSTRACT. Thousands of tonnes of municipal solid waste (MSW) are produced every day, and consignment to landfill represents the most common disposal choice. However, sanitary problems and the increasing demand for dedicated spaces have directed the efforts of researchers and practitioners toward the study of alternative approaches to waste manage- ment. Composting is one possible way to treat the organic portion of MSW, and the efficient design and management of composting plants ensure that they are economically sustainable. Analyzing established or pioneering solutions allows guidelines to be drawn up for the design of new plants and/or the management of existing ones. In this article, a set of engineering indices for the technical and economic analysis of composting plants is first presented and then applied to data collected from ten existing plants, divided into two groups: plants mainly composting the organic fraction of house- hold solid waste with reduced levels of the organic fraction of agro-industrial waste, green waste, and sludge (Group A); and plants only composting green waste (Group B). For Group A plants, more complex technological solutions are re- quired, given the need to manage larger portions of untreated waste and leachate, along with odor problems. This means that the need for space (particularly covered space), facilities, operators, and initial investment is greater, and annual operating costs are higher. However, Group A plants can also charge more for processing waste. Keywords. Composting, Engineering indices, Municipal solid waste, MSW, Technical and economic analysis. housands of tonnes of municipal solid waste (MSW) are produced every day (e.g., about 90,000 tonnes per day in Italy in 2007), and land- fill often represents the most common disposal choice. As cited by Pognani et al. (2009), 67%, 69%, 61%, 63%, and 75% of the total MSW produced in Europe, Afri- ca, America, Asia, and Oceania, respectively, is assigned to landfill. However, some industrialized countries have re- cently passed laws to progressively reduce the portion of MSW assigned to landfill (such as European Council Di- rective 99/31/EC on the landfill of waste and its amending acts). This choice is driven by several motivations: the growing amount of space required (also difficult to find due to residents’ objections) and problems with unutilized me- thane production, insects and rodents, odors from volatile organic compounds, and leachate (Moldes et al., 2007). Composting, therefore, represents an alternative treatment for the organic portion of MSW (Ribeiro et al., 2000; Soumare et al., 2002). Published reports on composting mainly: (1) give details on the processing conditions required to ensure a good final product (Woodbury and Breslin, 1992; Ciavatta et al., 1993; Haug, 1993; Tuomela et al., 2000; Castaldi et al., 2005; Diaz et al., 2007; Smidt et al., 2008; Som et al., 2009; Rogger et al., 2010; Kranert et al., 2010; Raj and Antil, 2011); (2) discuss the effects of compost use on land (De- portes et al., 1995; Pichtel and Anderson, 1997; Adani et al., 2007, 2009; Eggerth et al., 2007; Wright et al., 2008; Aslam et al., 2008; Courtney and Mullen, 2008; Herrera et al., 2008); or (3) describe the facilities available for imple- menting the aforementioned chemical processes (Haug, 1993; Diaz et al., 2007; Kumar et al., 2009; Rasapoor et al., 2009; Maresova and Kollarova, 2010; Zhao et al., 2011). This article belongs to the third category. Specifically, it presents a set of engineering indices for the technical and economic analysis of established or pioneering composting technologies and applies them to data collected from ten well-performing composting plants. Like the work carried out by Kumar et al. (2009) on composting of household organic solid waste, this article aims to provide designers and managers a set of useful technical and economic engi- neering indices for industrial composting of the organic fraction of MSW. While such indices are available for other fields, e.g., ceramics (Gamberini and Regattieri, 2008), to the best of our knowledge they are not available in the lit- erature on composting plants. MATERIALS AND METHODS As mentioned above, the aim of this research is to de- velop a set of engineering indices to support designers and managers of composting plants. Data collected from exist- ing plants are presented and discussed in order to identify trends and develop a reference database for further studies. The engineering indices are calculated as follows: Submitted for review in June 2012 as manuscript number SE 9819; approved for publication by the Structures & Environment Division of ASABE in September 2013. The authors are Rita Gamberini, Researcher, Bianca Rimini, Full Professor and Paolo Nicandri, Post-Graduate Fellow, Department of Sciences and Methods for Engineering, University of Modena and Reggio Emilia, Reggio Emilia, Italy. Corresponding author: Rita Gamberini, Via Amendola 2, Padiglione Morselli, 42100 Reggio Emilia, Italy; phone: +0039-522-522633; e-mail: [email protected]. T
-
Upload
independent -
Category
Documents
-
view
7 -
download
0
Transcript of Composting of Municipal Solid Waste: An Empirical Analysis of Existing Plants

Transactions of the ASABE
Vol. 56(5): © 2013 American Society of Agricultural and Biological Engineers ISSN 2151-0032 DOI 10.13031/trans.56.9819 1
COMPOSTING OF MUNICIPAL SOLID WASTE: AN EMPIRICAL ANALYSIS OF EXISTING PLANTS
R. Gamberini, B. Rimini, P. Nicandri
ABSTRACT. Thousands of tonnes of municipal solid waste (MSW) are produced every day, and consignment to landfill represents the most common disposal choice. However, sanitary problems and the increasing demand for dedicated spaces have directed the efforts of researchers and practitioners toward the study of alternative approaches to waste manage-ment. Composting is one possible way to treat the organic portion of MSW, and the efficient design and management of composting plants ensure that they are economically sustainable. Analyzing established or pioneering solutions allows guidelines to be drawn up for the design of new plants and/or the management of existing ones. In this article, a set of engineering indices for the technical and economic analysis of composting plants is first presented and then applied to data collected from ten existing plants, divided into two groups: plants mainly composting the organic fraction of house-hold solid waste with reduced levels of the organic fraction of agro-industrial waste, green waste, and sludge (Group A); and plants only composting green waste (Group B). For Group A plants, more complex technological solutions are re-quired, given the need to manage larger portions of untreated waste and leachate, along with odor problems. This means that the need for space (particularly covered space), facilities, operators, and initial investment is greater, and annual operating costs are higher. However, Group A plants can also charge more for processing waste.
Keywords. Composting, Engineering indices, Municipal solid waste, MSW, Technical and economic analysis.
housands of tonnes of municipal solid waste (MSW) are produced every day (e.g., about 90,000 tonnes per day in Italy in 2007), and land-fill often represents the most common disposal
choice. As cited by Pognani et al. (2009), 67%, 69%, 61%, 63%, and 75% of the total MSW produced in Europe, Afri-ca, America, Asia, and Oceania, respectively, is assigned to landfill. However, some industrialized countries have re-cently passed laws to progressively reduce the portion of MSW assigned to landfill (such as European Council Di-rective 99/31/EC on the landfill of waste and its amending acts). This choice is driven by several motivations: the growing amount of space required (also difficult to find due to residents’ objections) and problems with unutilized me-thane production, insects and rodents, odors from volatile organic compounds, and leachate (Moldes et al., 2007). Composting, therefore, represents an alternative treatment for the organic portion of MSW (Ribeiro et al., 2000; Soumare et al., 2002).
Published reports on composting mainly: (1) give details on the processing conditions required to ensure a good final product (Woodbury and Breslin, 1992; Ciavatta et al., 1993; Haug, 1993; Tuomela et al., 2000; Castaldi et al., 2005;
Diaz et al., 2007; Smidt et al., 2008; Som et al., 2009; Rogger et al., 2010; Kranert et al., 2010; Raj and Antil, 2011); (2) discuss the effects of compost use on land (De-portes et al., 1995; Pichtel and Anderson, 1997; Adani et al., 2007, 2009; Eggerth et al., 2007; Wright et al., 2008; Aslam et al., 2008; Courtney and Mullen, 2008; Herrera et al., 2008); or (3) describe the facilities available for imple-menting the aforementioned chemical processes (Haug, 1993; Diaz et al., 2007; Kumar et al., 2009; Rasapoor et al., 2009; Maresova and Kollarova, 2010; Zhao et al., 2011).
This article belongs to the third category. Specifically, it presents a set of engineering indices for the technical and economic analysis of established or pioneering composting technologies and applies them to data collected from ten well-performing composting plants. Like the work carried out by Kumar et al. (2009) on composting of household organic solid waste, this article aims to provide designers and managers a set of useful technical and economic engi-neering indices for industrial composting of the organic fraction of MSW. While such indices are available for other fields, e.g., ceramics (Gamberini and Regattieri, 2008), to the best of our knowledge they are not available in the lit-erature on composting plants.
MATERIALS AND METHODS As mentioned above, the aim of this research is to de-
velop a set of engineering indices to support designers and managers of composting plants. Data collected from exist-ing plants are presented and discussed in order to identify trends and develop a reference database for further studies. The engineering indices are calculated as follows:
Submitted for review in June 2012 as manuscript number SE 9819;
approved for publication by the Structures & Environment Division ofASABE in September 2013.
The authors are Rita Gamberini, Researcher, Bianca Rimini, Full Professor and Paolo Nicandri, Post-Graduate Fellow, Department ofSciences and Methods for Engineering, University of Modena and ReggioEmilia, Reggio Emilia, Italy. Corresponding author: Rita Gamberini, ViaAmendola 2, Padiglione Morselli, 42100 Reggio Emilia, Italy; phone:+0039-522-522633; e-mail: [email protected].
T

2 TRANSACTIONS OF THE ASABE
SOFAIWGWOFHSW
CCP
(1)
where CP = percentage of compost obtained (%) C = annual tonnes of compost obtained as output from a
composting plant (tonnes year-1) OFHSW = tonnes of the organic fraction of household
solid waste (i.e., food waste) collected and treated in a composting plant in a year (tonnes year-1)
GW = tonnes of green waste (i.e., waste produced dur-ing maintenance of gardens or green areas) col-lected and treated in a composting plant in a year (tonnes year-1)
OFAIW = tonnes of the organic fraction of agro-industrial waste (i.e., organic portion of production waste from companies or in rural areas, such as fruit residue from the production of juices or resi-due from maintaining areas dedicated to groves) collected and treated in a composting plant in a year (tonnes year-1)
S = tonnes of sludge accepted annually by a composting plant (tonnes year-1).
While OFHSW and GW are commonly part of MSW, OFAIW and S are sometimes accepted by composting plants managing MSW in accordance with the existing laws of each country. We have included them here for the sake of completeness. Obviously, when these portions of waste are banned by existing laws, they should be omitted from equa-tion 1, as well as from equations 2 and 3:
SOFAIWGWOFHSW
UWUWP
(2)
where UWP = percentage of untreated waste at the end of the
process (%) UW = annual amount of waste that is sent to landfill at
the end of the process or transferred to other plants for further treatment (tonnes year-1).
SOFAIWGWOFHSW
LLP
(3)
where LP = percentage of leachate generated (%) L = annual amount of leachate produced during the
composting process (tonnes year-1). We also looked at the following trends:
Compost selling price in relation to compost screen-ing size.
Compost selling price in relation to CP. Space required (total, paved only, and paved and cov-
ered) in relation to tonnes of waste treated. Number of machines needed in relation to tonnes of
waste treated. Number of staff needed in relation to tonnes of waste
treated. Tariffs adopted for accepting waste. Investment required for setting up the activity in the
plant.
Annual operating costs. Index of public support in relation to the distance of
the plant from the nearest village. These indices were studied for existing plants by means of a data collection form that was divided into ten subject are-as:
The first section asked for general information about the plant (i.e., company name, plant name, address, country, contact persons) and then for data on the amount of treata-ble waste, the year the plant opened, and the distance from the nearest village. The opening year was recorded in order to compare plants designed and managed in the same oper-ating period. The distance from the nearest village was rec-orded in order to evaluate the degree of support the plants had from the local community.
The second and third sections of the data collection form were about facilities and equipment. Specifically, for each item, the name, activity performed, quantity required, oper-ating hours per day, energy consumption during work, pur-chase cost, and expected useful life were requested. Maintenance data were also recorded to evaluate the influ-ence of these activities on the plant’s operation in terms of idle time, resources required, and costs incurred, and to learn how many plants have a structured maintenance plan rather than waiting for faults to occur.
Section four recorded the amount of space (covered and not covered but paved) and infrastructure required.
Section five looked at the type and quantity of operators working in the plant, describing their specializations along with their hourly cost.
Some plants were characterized by a high degree of au-tomation, and their main operations were performed not by humans but by automated facilities, controlled by specific hardware and software tools, as defined in sections six and seven of the data collection form, respectively. Specifically, the number, type, purchase cost, and updates required by the software used, along with the maintenance and assis-tance necessary to ensure good performance and longevity of the information technology (IT) tools were recorded.
The focus then moved to production cycle data, particu-larly the different steps involved, including time required along with treatable input waste and output obtained. For each input or output item, its type, quantity, and value were recorded.
Finally, data on patents and certifications obtained by the plant as well as the degree of support from the local community were collected.
RESULTS AND DISCUSSION The data collection form was used to collect data from
ten well-performing plants in Italy, numbered 1 to 10 in table 1, that were similar to plants all over Europe. Plants 1 to 6 were assigned to Group A and were used to treat OF-HSW, GW, and small portions of OFAIW and S, while the plants 7 to 10 were assigned to Group B and were used only for the treatment of GW. Group A plants had a treat-ment capacity in the range [5,000; 67,000] tonnes year-1, while the treatment capacity of Group B plants was in the
56(5): 3
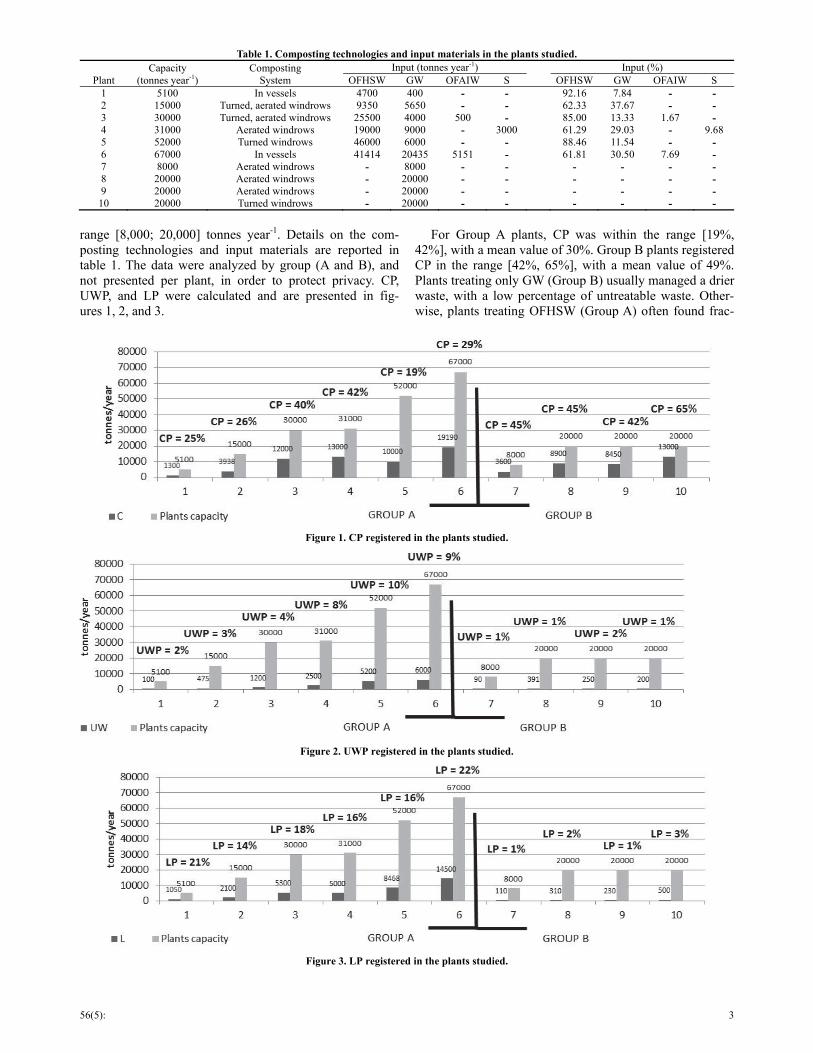
range [8,000; 20,000] tonnes year-1. Details on the com-posting technologies and input materials are reported in table 1. The data were analyzed by group (A and B), and not presented per plant, in order to protect privacy. CP, UWP, and LP were calculated and are presented in fig-ures 1, 2, and 3.
For Group A plants, CP was within the range [19%, 42%], with a mean value of 30%. Group B plants registered CP in the range [42%, 65%], with a mean value of 49%. Plants treating only GW (Group B) usually managed a drier waste, with a low percentage of untreatable waste. Other-wise, plants treating OFHSW (Group A) often found frac-
Table 1. Composting technologies and input materials in the plants studied.
Plant Capacity
(tonnes year-1) Composting
System Input (tonnes year-1)
Input (%)
OFHSW GW OFAIW S OFHSW GW OFAIW S 1 5100 In vessels 4700 400 - - 92.16 7.84 - - 2 15000 Turned, aerated windrows 9350 5650 - - 62.33 37.67 - - 3 30000 Turned, aerated windrows 25500 4000 500 - 85.00 13.33 1.67 - 4 31000 Aerated windrows 19000 9000 - 3000 61.29 29.03 - 9.68 5 52000 Turned windrows 46000 6000 - - 88.46 11.54 - - 6 67000 In vessels 41414 20435 5151 - 61.81 30.50 7.69 - 7 8000 Aerated windrows - 8000 - - - - - - 8 20000 Aerated windrows - 20000 - - - - - - 9 20000 Aerated windrows - 20000 - - - - - - 10 20000 Turned windrows - 20000 - - - - - -
Figure 1. CP registered in the plants studied.
Figure 2. UWP registered in the plants studied.
Figure 3. LP registered in the plants studied.
4 TRANSACTIONS OF THE ASABE
tions of residue incorrectly mixed with the organic portion that should have been directed to composting. As a result, Group A plants registered higher values of UWP and LP. Specifically, UWP and LP were in the ranges [2%, 10%] and [14%, 22%], respectively, with mean values of 6% and 18%, respectively. Group B plants registered values of UWP and LP in the ranges [1%, 2%] and [1%, 3%], respec-tively, with mean values of 1% and 2%, respectively.
Variations in CP were related to the concurrent action of a range of factors. The main factors were the composting technology (for example, efficient aeration of treated waste can accelerate the process) and the quality of the allocated waste. Specifically, when compost is produced from OF-HSW, GW, OFAIW, and S, particles of plastic, glass, and metal appear in the final product, if they are not separated at the start. Hence, the amount of obtainable compost is strictly related to the amount of organic input that contains small amounts of UW. These UW particles can be eliminat-ed by screening, during which a portion of the compost obtained is lost. The less need there is for this operation, the less the good final product is lost.
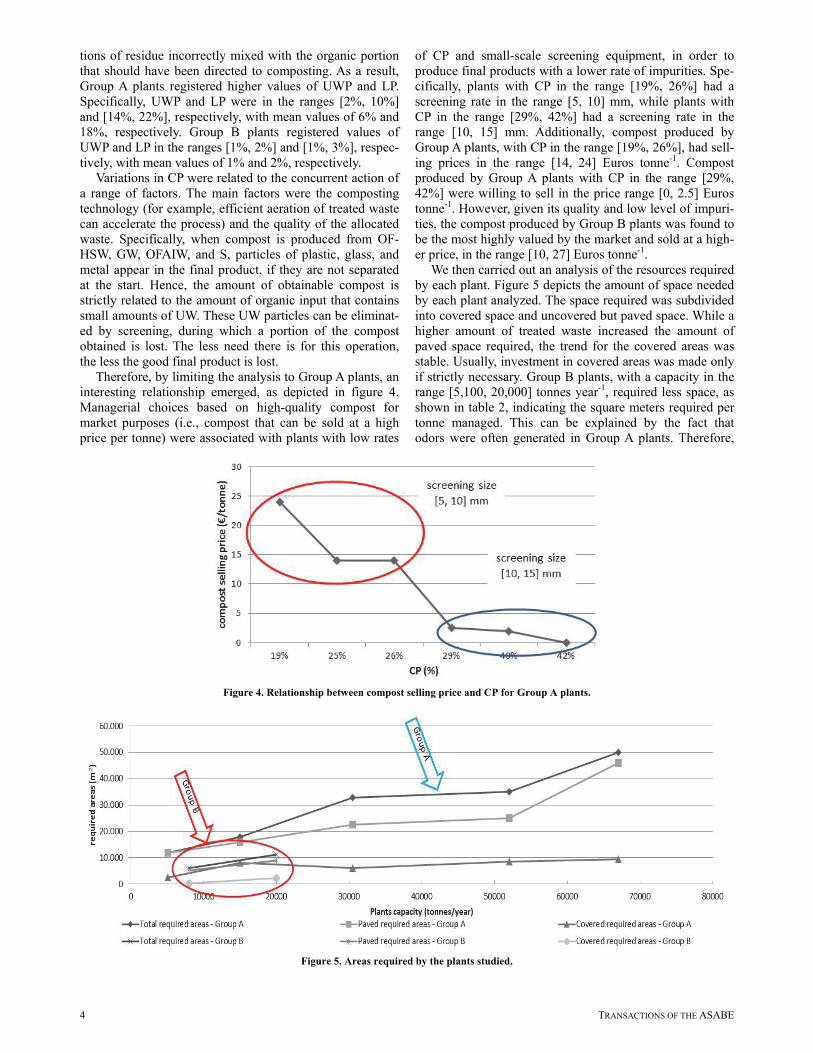
Therefore, by limiting the analysis to Group A plants, an interesting relationship emerged, as depicted in figure 4. Managerial choices based on high-quality compost for market purposes (i.e., compost that can be sold at a high price per tonne) were associated with plants with low rates
of CP and small-scale screening equipment, in order to produce final products with a lower rate of impurities. Spe-cifically, plants with CP in the range [19%, 26%] had a screening rate in the range [5, 10] mm, while plants with CP in the range [29%, 42%] had a screening rate in the range [10, 15] mm. Additionally, compost produced by Group A plants, with CP in the range [19%, 26%], had sell-ing prices in the range [14, 24] Euros tonne-1. Compost produced by Group A plants with CP in the range [29%, 42%] were willing to sell in the price range [0, 2.5] Euros tonne-1. However, given its quality and low level of impuri-ties, the compost produced by Group B plants was found to be the most highly valued by the market and sold at a high-er price, in the range [10, 27] Euros tonne-1.
We then carried out an analysis of the resources required by each plant. Figure 5 depicts the amount of space needed by each plant analyzed. The space required was subdivided into covered space and uncovered but paved space. While a higher amount of treated waste increased the amount of paved space required, the trend for the covered areas was stable. Usually, investment in covered areas was made only if strictly necessary. Group B plants, with a capacity in the range [5,100, 20,000] tonnes year-1, required less space, as shown in table 2, indicating the square meters required per tonne managed. This can be explained by the fact that odors were often generated in Group A plants. Therefore,
Figure 5. Areas required by the plants studied.
Figure 4. Relationship between compost selling price and CP for Group A plants.

56(5): 5
most of the operations for the composting process took place in covered areas.
Figure 6 depicts the trends for machines required by analyzing Group A and Group B plants separately. A further subdivision was applied to plants where waste was handled by operators guiding mechanical diggers (plants 1, 3, 4, and 6; Group A.1) and plants where waste was handled by au-tomated machines during different phases of the process (plants 2 and 5; Group A.2). The number of workers re-quired is depicted in figure 7. Plants from Groups A.1 and B used fewer resources. In Group A.2, operators were needed to monitor and maintain the automated machines, either on an ongoing basis or when faults occurred.
Our economic analysis began by looking at plant reve-nue. Having studied the selling price of compost and its relation to screening size (as shown in fig. 4), we then looked at tariffs for processing waste in composting plants. They were in the following ranges:
OFHSW = [62, 107] Euros tonne-1. GW = [15, 70] Euros tonne-1 for Group A and [30, 42.5]
Euros tonne-1 for Group B. OFAIW and S = [50, 65] Euros tonne-1. There were several reasons for the size of these ranges:
the contracting capacity of each plant, the timing of cus-tomer requests, the availability of alternative plants where customers could find similar services at a lower price, and the availability of waste. A portion of GW was necessary to ensure a good-quality final product in plants mainly treat-ing OFHSW, i.e., Group A in this study. Therefore, when GW was scarce, plants accepted it, even at low tariffs.
We then analyzed costs, subdividing them into initial in-vestment costs and annual operating costs. The trend for initial investment required in relation to the amount of treatable waste is depicted in figure 8, while the plants’ annual operating costs are depicted in figure 9. The analysis
Table 2. Covered, paved, and total areas required per tonne of managed waste in plants with capacity in the range [5,100, 20,000]tonnes year-1.
Plant Capacity
(tonnes year-1) Covered Area (m2 tonne-1)
Paved Area (m2 tonne-1)
Total Area (m2 tonne-1)
1 5100 0.48 2.35 2.35 2 15000 0.53 1.07 1.20 7 8000 0.03 0.64 0.75
8, 9, 10 20000 0.11 0.45 0.57
Figure 6. Facilities required in the plants studied.
Figure 7. Workers required in the plants studied.
Figure 8. Initial investment required in the plants studied.

6 TRANSACTIONS OF THE ASABE
was based solely on the data collected with the form de-scribed in the Methods and Materials section. Additional factors, e.g., taxes (both for plant construction and in each annual budget), were disregarded. We concluded that for an annual amount of treated waste of 30,000 tonnes, automat-ed solutions should be considered, as they could result in lower costs. Cases of limited initial resources refer to Group B plants that require low initial investments and lower annual costs. Waste treated by Group A plants often had a portion of inorganic waste, incorrectly allocated, that complicated the composting process, particularly the steps concerning the treatment of UW and L. As a consequence, plants composting only GW (i.e., those in Group B) re-quired lower initial investment. Similar considerations may be discovered by analyzing the annual operating costs de-picted in figure 9. Differences between the cost per man-aged tonne for Group A and Group B plants are highlighted in table 3.
Finally, the relationship between the distance of the plant to the nearest village and an index of community sup-port is depicted in figure 10. Specifically, complaints re-ceived were evaluated and ranked. The results obviously
showed that the greater the distance, the higher the level of support. However, we also discovered that, for Group A plants, 4 km is the distance beyond which most people ac-cept the plant with few complaints. This distance can be reduced to 3 km for the construction of Group B plants.
CONCLUSIONS Thousands of tonnes of municipal solid waste are pro-
duced every day, and landfill is often the most common disposal choice. However, composting is an interesting alternative for the organic portion of the waste.
This article has reviewed existing well-performing solu-tions for composting, using a structured data collection form and analyzing the data collected, in order to draw up some useful guidelines for designers and managers of com-posting plants. It has taken a sample of ten well-performing composting plants and proposed a set of engineering indi-ces for designers and managers to use for benchmark anal-ysis of new and existing plants.
Specifically, the collected data were analyzed by divid-ing the sample into two groups: plants mainly composting OFHSW along with reduced portions of OFAIW, GW, and S (Group A); and plants only composting GW (Group B). For Group A plants, more complex technological solutions were required, given the need to manage larger portions of UW and L, along with odor problems. As a consequence, the space required (especially covered areas), the initial investment, and annual operating costs were higher. Group A plants also needed more facilities and operators. Howev-er, Group A plants were able to charge a higher tariff for waste processing. Finally, improved results could be
Figure 9. Annual operative cost in the plants studied.
Table 3. Initial investment and annual operating costs per tonne of managed waste in plants with capacity in the range [5100, 20000]tonnes year-1.
Plant Capacity
(tonnes year-1)
Initial Investment
(Euros tonne-1)
Annual Operating Cost (Euros tonne-1
year-1) 1 5100 201.37 27.83 2 15000 282.02 38.40 7 8000 91.99 19.86
8, 9, 10 20000 69.26 16.51
Figure 10. Index of support for the plants studied.
56(5): 7
achieved by selecting the correct degree of automation. For the plants analyzed, 30,000 tonnes year-1 appeared to be the crucial capacity, requiring the design of both low-automation and high-automation solutions on a case-by-case basis in order to select the best performing solutions. For lower capacities, low-automation solutions are pre-ferred. On the contrary, for higher capacities, high-automation solutions are encouraged.
ACKNOWLEDGEMENTS This research was been financed by the European Com-
mission contribution to the project LIFE-RELS: Innovative chain for energy recovery from waste in natural parks (Pro-ject No. LIFE08 ENV/IT/000388). Further information is available at: www.life-rels.eu.
REFERENCES Adani, F., P. Genevini, G. Ricca, F. Tambone, and E. Montoneri.
2007. Modification of soil humic matter after four years of compost application. Waste Mgmt. 27(2): 319-324.
Adani, F., F. Tambone, and P. Genevini. 2009. Effect of compost application rate on carbon degradation and retention in soils. Waste Mgmt. 29(1): 174-179.
Aslam, D. N., J. S. VanderGheynst, and T. R. Rumsey. 2008. Development of models for predicting carbon mineralization and associated phytotoxicity in compost-amended soil. Bioresource Tech. 99(18): 8735-8741.
Castaldi, P., G. Alberti, R. Merella, and P. Melis. 2005. Study of the organic matter evolution during municipal solid waste composting aimed at identifying suitable parameters for the evaluation of compost maturity. Waste Mgmt. 25(2): 209-213.
Ciavatta, C., M. Govi, L. Pasotti, and P. Sequi. 1993. Changes in organic matter during stabilization of compost from municipal solid wastes. Bioresource Tech. 43(2): 141-145.
Courtney, R. G., and G. J. Mullen. 2008. Soil quality and barley growth as influenced by the land application of two compost type. Bioresource Tech. 99(8): 2913-2918.
Deportes, I., J.-L. Benoit-Guyod, and D. Zmirou. 1995. Hazard to man and the environment posed by the use of urban waste compost: A review. Sci. Total Environ. 172(2-3): 197-222.
Diaz, L. F., M. de Bertoldi, W. Bidlingmaier, and E. Stentiford, eds. 2007. Compost Science and Technology. Oxford, U.K.: Elsevier.
Eggerth, L. L., L. F. Diaz, M. T. F. Chang, and L. Iseppi. 2007. Chapter 12: Marketing of composts. In Compost Science and Technology, 325-355. Oxford, U.K.: Elsevier.
Gamberini, R., and A. Regattieri. 2008. Double pressing for porcelain stoneware tiles: An exploratory analysis. Ind. Mgmt. and Data Syst. 108(8): 1081-1100.
Haug, R. T. 1993. The Practical Handbook of Compost Engineering. Boca Raton, Fla.: CRC Press.
Herrera, F., J. E. Castillo, A. F. Chica, and L. López Bellido. 2008. Use of municipal solid waste compost (MSWC) as a growing medium in the nursery production of tomato plants. Bioresource Tech. 99(2): 287-296.
Kranert, M., R. Gottschall, C. Bruns, and G. Hafner. 2010. Energy or compost from green waste? A CO2 based assessment. Waste
Mgmt. 30(4): 697-701. Kumar, P. R., A. Jayaram, and R. K. Somashekar. 2009. Assessment
of the performance of different compost models to manage urban household organic solid wastes. Clean Tech. Environ. Policy 11(4): 473-484.
Maresova, K., and M. Kollarova. 2010. Influence of compost covers on the efficiency of biowaste composting process. Waste Mgmt. 30(12): 2469-2474.
Moldes, A., Y. Cendón, and M. T. Barral. 2007. Evaluation of municipal solid waste compost as a plant growing media component, by applying mixture design. Bioresource Tech. 98(16): 3069-3075.
Pichtel, J., and M. Anderson. 1997. Trace metal bioavailability in municipal solid waste and sewage sludge composts. Bioresource Tech. 60(3): 223-229.
Pognani, M., G. D’Imporzano, B. Scaglia, and F. Adani. 2009. Substituting energy crops with organic fraction of municipal solid waste for biogas production at farm level: A full-scale plant study. Process Biochem. 44(8): 817-821.
Raj, D., and R. S. Antil. 2011. Evaluation of maturity and stability parameters of composts prepared from agro-industrial wastes. Bioresource Tech. 102(3): 2868-2873.
Rasapoor, M., T. Nasrabadi, M. Kamali, and H. Hoveidi. 2009. The effects of aeration rate on generated compost quality, using aerated static pile method. Waste Mgmt. 29(2): 570-573.
Ribeiro, H. M., E. Vasconcelo, and J. Q. Dos Santos. 2000. Fertilisation of potted geranium with a municipal solid waste compost. Bioresource Tech. 73(3): 247-249.
Rogger, C., F. Beaurain, and T. S. Schmidt. 2010. Composting projects under the clean development mechanism: Sustainable contribution to mitigate climate change. Waste Mgmt. 30(1): 138-146.
Smidt, E., K. Meissl, M. Schmutzer, and B. Hinterstoisser. 2008. Co-composting of lignin to build up humic substances: Strategies in waste management to improve compost quality. Ind. Crops and Prod. 27(2): 196-201.
Som, M.-P., L. Lemée, and A. Amblès. 2009. Stability and maturity of a green waste and biowaste compost assessed on the basis of a molecular study using spectroscopy, thermal analysis, thermodesorption, and thermochemolysis. Bioresource Tech. 100(19): 4404-4416.
Soumare, M., A. Demeyer, F. M. G. Tack, and M. G. Verloo. 2002. Chemical characteristics of Malian and Belgian solid waste compost. Bioresource Tech. 81(2): 97-101.
Tuomela, M., M. Vikman, A. Hatakka, and M. Itävaara. 2000. Biodegradation of lignin in a compost environment: A review. Bioresource Tech. 72(2): 169-183.
Woodbury, P. B., and V. T. Breslin. 1992. Assuring compost quality: Suggestions for facility managers, regulators, and researchers. Biomass and Bioenergy 3(3-4): 213-225.
Wright, A. L., T. L. Provin, F. M. Hons, D. A. Zuberer, and R. H. White. 2008. Compost impacts on dissolved organic carbon and available nitrogen and phosphorus in turfgrass soil. Waste Mgmt. 28(6): 1057-1063.
Zhao, S., F. Lian, and L. Duo. 2011. EDTA-assisted phytoextraction of heavy metals by turfgrass from municipal solid waste compost using permeable barriers and associated potential leaching risk. Bioresource Tech. 102(2): 621-626.