Overview of Municipal Solid Waste Generation, Composition ...
Upload
khangminh22Category
view
1download
0
© 2017 Rouf Ahmad Bhat, Moonisa Aslam Dervash, Mohammad Aneesul Mehmood and Khalid Rehman Hakeem. This
open access article is distributed under a Creative Commons Attribution (CC-BY) 3.0 license.
American Journal of Environmental Sciences
Original Research Paper
Municipal Solid Waste Generation and its Management, a
Growing Threat to Fragile Ecosystem in Kashmir Himalaya
1Rouf Ahmad Bhat,
1Moonisa Aslam Dervash,
1Mohammad Aneesul Mehmood and
2Khalid Rehman Hakeem
1Division of Environmental Sciences,
Sher-e-Kashmir University of Agricultural Sciences and Technology, Shalimar, Kashmir-190025, India 2Department of Biological Sciences, Faculty of Science, King Abdulaziz University, Jeddah, Saudi Arabia
Article history
Received: 16-08-2017 Revised: 04-12-2017 Accepted: 13-12-2017 Corresponding Authors: Khalid Rehman Hakeem Department of Biological Sciences, Faculty of Science, King Abdulaziz University, Jeddah, Saudi Arabia Email: [email protected]
Abstract: The Kashmir valley is facing tremendous pressure associated with
problems of growing waste generation. Thus, the aim of the present research was
to generate baseline data for adequate waste management and associated problems.
For the collection of samples, 20 houses were randomly selected in the main town
from each district and segregated into compostable, recyclable, combustible and
inert categories. All the samples were transported with immense care to the
laboratory for further analysis. Waste generation for the four districts with an
average of 0.526 kg/capita/day in Srinagar, 0.479 kg/capita/day in Anantnag,
0.400 kg/capita/day in Ganderbal and 0.397 kg/capita/day in Budgam were
determined during the current investigation. The total waste generated on annual
basis observed in all the four districts was observed to be 57,199.99 Metric Tonnes
(MT) with the highest (236,732.75 MT) in Srinagar and the lowest of (42,840.00
MT) in Budgam. The waste constituent accounted highest 20-22% for food waste
followed by cardboard and paper (11-15%), wooden items (11-14%). The major
fraction of category waste comprised of recyclable (62-64%), followed by
compostable (20-21%) and minor comprised of inert materials (3-4%). In general,
poor to negligible systems of waste collection, transportation and disposal were
observed in all four districts. Srinagar was found as the lone district practicing
landfilling of MSW in Achan area. Thus, the need of hour is to save the scenic
beauty of fragile ecosystem from waste disposal hazard after adopting various
strategies like segregation of waste at the source and statutory provisions.
Keywords: Waste, Recyclable, Food Waste, Waste Category, Fragile Ecosystem,
Kashmir
Introduction
Most of the cities and health resorts in the world are experiencing unplanned urban sprawl and heavy pressure
of population. The net result is an enormous generation of solid wastes. The quantity of generated solid waste
mainly depends on population, economic growth and the
efficiency of the reuse and recycling system. In 1947, cities and towns in India generated an estimated 6
million tons of solid waste which rose to 48 million tons in 1997 (NEERI, 1999). Rapid population growth and
expanding urbanization have caused a drastic increase of
the municipal solid waste generation and the variety of the waste composition (Nguyen et al., 2011). Municipal
Solid Waste (MSW) consists of all types of solid waste generated by households and commercial establishments
and collected usually by local government bodies
(Bhada-Tata and Hoornweg, 2011). The majority of
substances composing MSW in developing countries include paper, kitchen waste, plastics, metals, textiles,
rubber and glass. According to The solid waste composition in most Asian countries is highly
biodegradable, mainly composed of an organic fraction
with high moisture content (Visvanathan et al., 2004). Food waste, plastic/foam, paper, rubber/leather,
wood/grass, metal, glass and textiles are the common MSW components. The generation of municipal solid
waste in the mountainous regions has serious cascading effects on the lower valley. The generation of MSW
during peak tourist influx (Hindu Pilgrimage; Yatra) at
forest areas was too high, which could alter all environmental parameters if proper disposal could not
occur at right time (Bhat et al., 2012). Often production of solid waste is the most serious threat to the fragile

Rouf Ahmad Bhat et al. / American Journal of Environmental Sciences 2017, 13 (6): 388.397
DOI: 10.3844/ajessp.2017.388.397
389
ecology of the mountainous environments (Jain, 1994). The increasing Municipal Solid Waste Management (MSWM)
problems and its disposal strikes environment and health
hazard due to prevailing scenario of waste handling practices and disposal (Bhat et al., 2012). Besides this,
seasonal tourist inflow adds significantly to the demands on resource base and contributes considerably to the
generation of MSW. Ecological impacts such as land
degradation, water and air pollution are related to improper management of MSW (Khajuria et al., 2008).
MSWM encompasses planning, engineering,
organization, administration, financial and legal aspects of
activities associated with generation, storage, collection,
transfer and transport, processing and disposal of
municipal solid wastes in an environmentally compatible
manner adopting principles of economy, aesthetics,
energy and conservation (Tchobanoglous et al., 1993). In
this regard situation in India is grim as more than 25% of
the MSW is not collected at all; 70% of the Indian cities
lack adequate capacity to transport it and there are no
sanitary landfills to dispose-off the waste (NEERI,
1999). In the last few decades, the amount of waste
generated per capita has recorded an annual increase at a
rate of 1 to 1.33% (Shekdar, 1999). If this rate of
increase continues, India will probably experience a rise
in waste generation from less than 40,000 tons per year
to over 125,000 tons by 2030 (Srishti, 2000). If an
adequate MSWM strategy is not in place, human and
environmental health would be jeopardized. It has been
generally observed that less attention is being given
towards the increasing soil pollution due to improper
management of solid waste in Jammu and Kashmir.
The wastes are mostly thrown into open fields, on
roads and in water bodies. The improper waste
management has changed the structure and quality
parameters of water bodies. The water holding capacity
has been reduced due accumulation of wastes at bottom.
Wastes have a well defined history to change the
physicochemical structure of soils and water. Least
attention has been given to the MSWM in under-
developed countries and in Kashmir particular. So far
only one scientific landfill unit has been constructed in
Kashmir region. The study has been conducted to
provide appropriate status of MSW generation records
and waste management strategy in four adjacent districts
in Kashmir region of Jammu and Kashmir.
Methodology
Study Areas
Srinagar is the largest city and the summer capital of
the state Jammu and Kashmir. It lies on both the sides of
river Jhelum, which is called Vyeth in Kashmir. The
river passes through the city and meanders through the
valley, moving onward and deepening in the Dal Lake.
There are a number of lakes and swamps in and around
the Srinagar city. These include the Dal, the Nigeen, the
Anchar, Khushal Sar, Gil Sar and Hokersar. Srinagar has
a humid subtropical climate, much cooler than what is
found in the rest of India, due to its moderately high
elevation and northerly position. Winters are cool, with
average day temperature of 2.5°C (36.5°F) and
temperatures below freezing at night. Moderate to heavy
snowfall occurs in winter and summers are warm with
average day temperature of 24.1°C (75.4°F). The
average annual rainfall is around 710 millimeters. Spring
is the wettest season while autumn is the driest.
Ganderbal district is at a distance of 21 km from
Srinagar city. It is rich in landscape and is often called
the District of Lakes, as it possesses the highest number
of lakes in the state of Jammu and Kashmir. It is spread
across the river Sind. The river is considered as the
lifeline of the district. The river provides water for
irrigation, 80% population of the district is engaged with
farming. Ganderbal district possesses all the typical
characteristics of the climate of Kashmir Valley as a
whole. In the heat of July, the breeze of the Sind River is
a welcome relief. The famous fresh water lakes located
in district Ganderbal are Manasbal Lake, Gangabal Lake
etc. The geographical coordinates and population
according to Census, 2011 of study areas (four districts
of Kashmir Valley) are depicted in Table 1.
Anantnag, locally known as Islamabad, is a district in
the state of Jammu and Kashmir. It is located 65 km
approximately from Srinagar city. It is the third most
populous district in Kashmir valley. Anantnag features a
moderate climate. Anantnag's climate is largely defined by
its geographic location, with the towering Karokaram to its
east and the Pirpanjal range to the south. It can be generally
described as cool in the spring and autumn, mild in the
summer and cold in the winter. The base of Pirpanjal is
describing the origin of mighty river Jhelum. The
geographical locations of study areas are depicted in Fig. 1.
District Budgam has tremendous tourism potential
that has largely remained untapped so far. The attractive
places that can be visited are Doodpather, Yusmarg,
Tosmaidan, Nilnag and Khag. Here also the climate
remains mild due to surrounding topography. The
landscape is mostly agricultural type irrigated with fresh
waters of river Doodhganga.
Waste Collection and Pretreatment
For the collection of samples; 20 houses were randomly selected in the main town from each district. Each household were provided by 10 Kg capacity of polythene bag in the morning at 10.00 a.m. The same bags full of wastes were collected next day at 10.00.a.m, thus helping us to assess the amount of wastes generated
from these units in 24 h. The exercise was repeated five times i.e., after every 5 days of gap in a month.

Rouf Ahmad Bhat et al. / American Journal of Environmental Sciences 2017, 13 (6): 388.397
DOI: 10.3844/ajessp.2017.388.397
390
Table 1: Population and geographical attributes of sampling stations
Name of district Geographical coordinates Population
Srinagar 34°5′24″N 74°47′24″E 1,250,173 Anatnag 33.73°N 75.15°E 1,069,749 Budgam 34°1′12″N 74°46′48″E 755,331 Ganderbal 33.73°N 75.15°E 297,003
Fig. 1: Geographical locations of sampling stations
All the samples were transported with immense care
to the laboratory for determination of moisture (at 105◦C)
as per the standard methods (Gaxiola et al., 1995;
Rampal et al., 2002; Benitez et al., 2003; Bhat et al.,
2014). To investigate the composition and constituents
of generated wastes; the samples collected were
manually sorted and segregated into compostable,
recyclable, combustible and inert categories. For the
generation of MSW on per capita/day basis population of
all the four districts has been calculated using the
district-village population criteria.
Laboratory Analysis
For each type of waste, triplicate samples were
analysed for moisture content, net weight composition (%)
and net weight (Kg) or dried weight (Kg). The moisture
content (%) of the samples was determined with the
following standard procedure and formula adopted by
(Aarne et al., 1994). It was determined after drying the
waste material at 105°C for 24 h (and at a temperature of
70 to 75°C in case of combustible material). The dried
sample was expressed as a percentage of total weight. The
formulas used for the measurement of above mentioned
parameters are given below:
( )
( )
( )
% 100
– 100
( )
100
w d
w
w
w
Weight of particular
constituent of MSWNet weight composition
Total weight of constituents
W WMoisture content
W
Moisture content WNet weight Kg W
= ×
= ×
×
= −
(where, Ww represents wet weight of the waste and Wd
dried weight of waste).
Results and Discussion
Waste Generation
The MSW generated, reflected remarkable
differences in waste constituents, composition with
respect to population and location (district). The data

Rouf Ahmad Bhat et al. / American Journal of Environmental Sciences 2017, 13 (6): 388.397
DOI: 10.3844/ajessp.2017.388.397
391
depicted in Table 2 revealed that among the four
districts, Srinagar generated the highest amount of
waste with an average 0.526 kg/person/day of MSW
followed by Anantnag (0.479 kg/person/day) and
Ganderbal (0.400 kg/capita/day). The generation of
MSW was recorded least in case of Budgam with an
average of 0.397 kg/capita/day. The quantity of MSW
generated per year in Srinagar city was highest (236,
732.75 MT) followed by Anantnag (184, 467.34 MT),
Budgam (107,251.20 MT) and least was observed in
district Ganderbal (42,840.00 MT) data is shown in
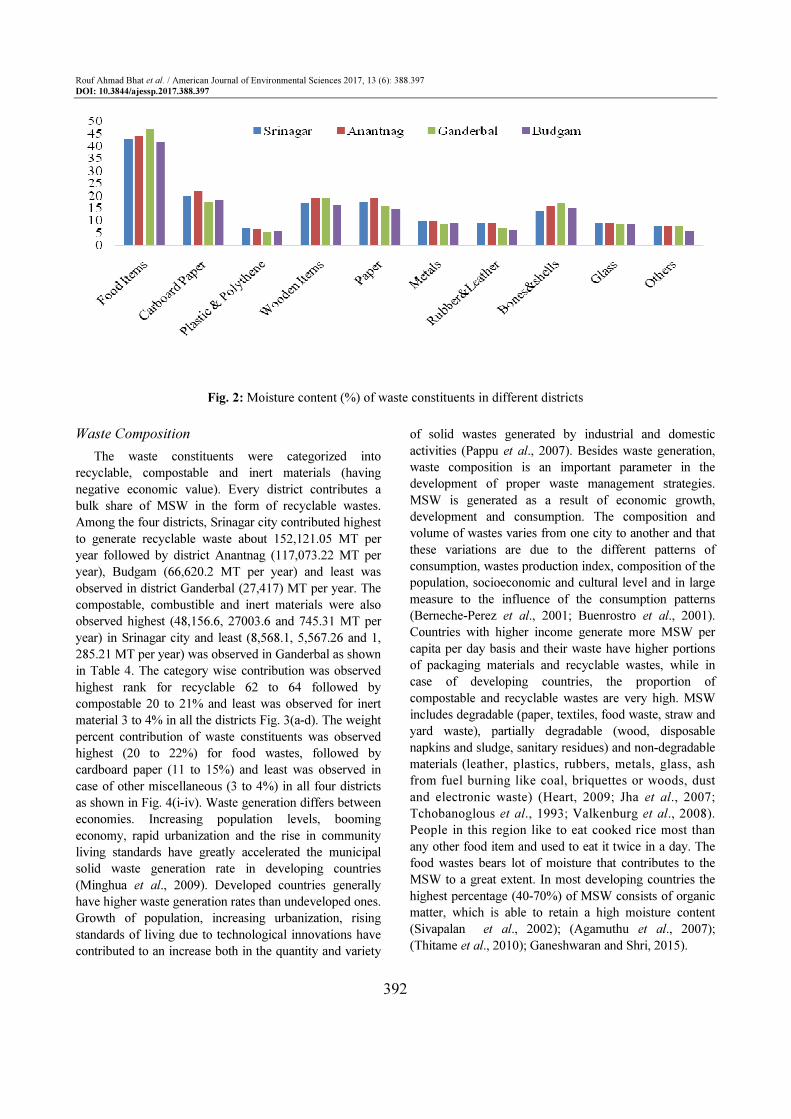
Table 3. High moisture content (Fig. 2) was recorded
in food items in all four districts in the range of 41 to
47%. The cardboard paper contained moisture content
in the range of 18 to 22%. In all the districts, the
moisture content was observed least in case of plastic
and polythene of about 6 to 7%. The Kashmir valley
as a part of developing country (India) is a very
beautiful region of sate Jammu and Kashmir. The rate
at which MSW is generated here may destruct the
quality of scenic beauty and ecosystem structures. The
purpose of this research was to evaluate the quantity,
composition, sources of waste generated, their current
disposal practices, management strategies and the
problems associated with municipal solid wastes in
four districts of Kashmir Valley. Rapid economic and
population growth is responsible for the generation of
solid waste. Similar findings regarding waste
generation differences among socioeconomic areas
where the higher socioeconomic classes generated
higher waste (Asase, 2011). The Srinagar city is the
most developed district among the four districts and it
is the commercial hub of Kashmir Valley. The basic
requirements for sustaining living standard are easily
available in Srinagar city which is responsible for
enhancing the waste generation in this particular
district. Municipal or domestic wastes are frequently
generated from numerous sources where inconsistent
human behaviours are encountered. Several studies
indicate that much of the municipal solid waste from
developing countries are generated from households (55-
80%), followed by commercial or market areas (10-30%)
with varying quantities from streets, industries, institutions
(Nabegu, 2010; Nagabooshnam, 2011; Okot-Okumu,
2012). MSWM is a major issue affecting both developed
and undeveloped economies due to the increasing amount
of wastes generated annually. Increases in waste
generation are often associated with economic growth,
higher industrialization, rise in population and higher
standards of living (Minghua et al., 2009).
Furthermore, there are various types of industries,
huge markets, shopping malls, transport yards, hotels,
restaurants, congested built-up, huge population etc.,
located in the vicinity area that also boost generation
rates of MSW. Economic development, urbanization
and improving living standard in cities of developing
countries have lead to increase in the quantity and
complex composition of MSW (Khajuria et al., 2010).
The tourist influx both foreigners and national in
Srinagar city could be attributed to high rates of
MSW. Rapid population growth and expanding
urbanization have caused a drastic increase of the
MSW generation and the variety of the waste
composition (Nguyen et al., 2011).
Table 2: The mean (kg/capita/day) MSW generation in different districts
Waste constituents Srinagar Anantnag Ganderbal Budgam
Food items 0.107 0.095 0.08 0.085
Cardboard paper 0.080 0.053 0.049 0.050
Plastic and polythene 0.063 0.055 0.043 0.041
Wooden items 0.060 0.065 0.052 0.057
Paper 0.055 0.048 0.041 0.037
Metals 0.053 0.051 0.042 0.041
Rubber and leather 0.015 0.010 0.010 0.021
Bones and shells 0.047 0.056 0.051 0.045
Glass 0.025 0.031 0.020 0.010
Others 0.021 0.015 0.012 0.010
Total 0.526 0.479 0.40 0.397
Table 3: MSW generated (Metric Tons per year) in different districts along with population status
District Population Waste Generated in (MT)
Srinagar 1,250,173 236,732.75 Anantnag 1,069,748 184,467.34 Ganderbal 297,503 42,840.00 Budgam 755,331 107,951.90 Total 3,372,755 571,991.99
Rouf Ahmad Bhat et al. / American Journal of Environmental Sciences 2017, 13 (6): 388.397
DOI: 10.3844/ajessp.2017.388.397
392
Fig. 2: Moisture content (%) of waste constituents in different districts
Waste Composition
The waste constituents were categorized into
recyclable, compostable and inert materials (having
negative economic value). Every district contributes a
bulk share of MSW in the form of recyclable wastes.
Among the four districts, Srinagar city contributed highest
to generate recyclable waste about 152,121.05 MT per
year followed by district Anantnag (117,073.22 MT per
year), Budgam (66,620.2 MT per year) and least was
observed in district Ganderbal (27,417) MT per year. The
compostable, combustible and inert materials were also
observed highest (48,156.6, 27003.6 and 745.31 MT per
year) in Srinagar city and least (8,568.1, 5,567.26 and 1,
285.21 MT per year) was observed in Ganderbal as shown
in Table 4. The category wise contribution was observed
highest rank for recyclable 62 to 64 followed by
compostable 20 to 21% and least was observed for inert
material 3 to 4% in all the districts Fig. 3(a-d). The weight
percent contribution of waste constituents was observed
highest (20 to 22%) for food wastes, followed by
cardboard paper (11 to 15%) and least was observed in
case of other miscellaneous (3 to 4%) in all four districts
as shown in Fig. 4(i-iv). Waste generation differs between
economies. Increasing population levels, booming
economy, rapid urbanization and the rise in community
living standards have greatly accelerated the municipal
solid waste generation rate in developing countries
(Minghua et al., 2009). Developed countries generally
have higher waste generation rates than undeveloped ones.
Growth of population, increasing urbanization, rising
standards of living due to technological innovations have
contributed to an increase both in the quantity and variety
of solid wastes generated by industrial and domestic
activities (Pappu et al., 2007). Besides waste generation,
waste composition is an important parameter in the
development of proper waste management strategies.
MSW is generated as a result of economic growth,
development and consumption. The composition and
volume of wastes varies from one city to another and that
these variations are due to the different patterns of
consumption, wastes production index, composition of the
population, socioeconomic and cultural level and in large
measure to the influence of the consumption patterns
(Berneche-Perez et al., 2001; Buenrostro et al., 2001).
Countries with higher income generate more MSW per
capita per day basis and their waste have higher portions
of packaging materials and recyclable wastes, while in
case of developing countries, the proportion of
compostable and recyclable wastes are very high. MSW
includes degradable (paper, textiles, food waste, straw and
yard waste), partially degradable (wood, disposable
napkins and sludge, sanitary residues) and non-degradable
materials (leather, plastics, rubbers, metals, glass, ash
from fuel burning like coal, briquettes or woods, dust
and electronic waste) (Heart, 2009; Jha et al., 2007;
Tchobanoglous et al., 1993; Valkenburg et al., 2008).
People in this region like to eat cooked rice most than
any other food item and used to eat it twice in a day. The
food wastes bears lot of moisture that contributes to the
MSW to a great extent. In most developing countries the
highest percentage (40-70%) of MSW consists of organic
matter, which is able to retain a high moisture content
(Sivapalan et al., 2002); (Agamuthu et al., 2007);
(Thitame et al., 2010); Ganeshwaran and Shri, 2015).

Rouf Ahmad Bhat et al. / American Journal of Environmental Sciences 2017, 13 (6): 388.397
DOI: 10.3844/ajessp.2017.388.397
393
(a) (b)
(c) (d)
Fig. 3: (a) Srinagar (b) Anantnag (c) Ganderbal (d) Budgam weight percentage contribution of waste constituents
(a) (b)
(c) (d)
Fig. 4: (a) Srinagar (b) Anantnag (c) Ganderbal (d) Budgam waste category contribution (%) in different districts

Rouf Ahmad Bhat et al. / American Journal of Environmental Sciences 2017, 13 (6): 388.397
DOI: 10.3844/ajessp.2017.388.397
394
Table 4: Category of MSW for waste management systems
Metric Tons (MT) --------------------------------------------------------------------------------------------------------------------- Category of waste Srinagar Anantnag Ganderbal Budgam
Recyclable 152,121.05 117,073.22 27,417.00 66,620.20 Compostable 48,156.60 36,585.30 8,568.10 23,113.13 Combustible 27,003.76 25,032.00 5,569.26 15,499.39 Inert material 9,451.31 5,776.63 1,285.21 2,719.19
Srinagar city is a developed hub and occupy highest
position as for as basic and other facilities are concerned.
The developed structure in the form of gadget
availability is highest in Srinagar city. People used to
buy all the new gadgets in and other daily need items
contained tin containers, cardboards, paper boxes,
plastics items and paper and polythene wrappers. The
waste composition depends on a wide range of factors
such as habitats, culture tradition, lifestyle, climate and
income (Gupta et al., 1998). Waste constituents (egg
shells, bones, etc.) contributed very much to the
recyclable waste materials. The major fraction of MSW
comprised of organics (44%) followed by recyclables
namely paper, plastics, glass and metals; total: 43%
(Mohee et al., 2015; Ojeda-Benitez et al., 2003). From
the waste composition data, the recyclability,
combustibility or biodegradability of the waste streams
can be identified and these can be subsequently used for
designing and implementing appropriate waste
management technologies. Small Island Developing
States (SIDS) regions whereby it can be observed that the
waste compositions differ only slightly among the three
geographic regions owing to possible similarities in
consumption patterns adopted by people living in SIDS
(Chandrappa and Das, 2012). The high contribution of
recyclable materials in the MSW generated in these
districts could be due to the excessive use of plastic items,
glass, paper, cardboard, etc. Recyclable materials
contributed most in MSW (Mohee et al., 2015). Food is
the lifeline to every form of life and is the most important
consumable on daily basis; with the result it contributes
lot to the MSW. Food waste is a major constituent with
high percentage among the all constituents of MSW
(Agamuthu et al., 2007; Bhat et al., 2013).
Waste Collection
Waste collection is a most vital useful component of the waste management system. Waste collection, transfer and transport are important but expensive municipal services (Faccio et al., 2011). The lack of a proper waste collection system absolutely disrupts the waste management course. Waste collection is a highly visible
municipal service that involves large expenditures and difficult operational problems, plus it is expensive to operate in terms of environmental costs i.e., emissions, noise and traffic congestions (Faccio et al., 2011). The waste collection is only performed in Srinagar city and is
almost negligible in other districts in Kashmir valley. The Srinagar Municipal Corporation (SMC) has the mandate for waste management system in Srinagar city. The SMC
has provided the small waste-bins to every household and the same bins were collected in daily routine basis. The collected waste is transported into the landfill site near Achan area in the Srinagar outskirts. Waste segregations into different categories viz., composting, recycling,
combustible, etc. yet not practiced in Srinagar, though the authority is collecting and dumping the waste since 1984. The other districts (Anantnag, Budgam and Ganderbal) were lacking this facility as collection of waste is done around the main towns and dumped into the nearby water bodies, open fields or sometimes dumped directly
into the fresh water bodies.
The unwanted practices like dumping at prohibited
areas viz., fresh water bodies, agriculture lands, forests,
road sides and burning of wastes could lead to
environmental pollution; the health and environmental
implications are associated with SWM are mounting in
urgency, particularly in the context of developing
countries (Marshall and Farahbakhsh, 2013). These
practices may indirectly alter the physicochemical
characteristics of fresh water bodies and soils. The
degraded waste could lead to release leachate having
high concentration of chemical and other toxic
substances. In most of the developing countries, MSW
disposal has been a chronic problem and are being
continuously added to water bodies hence affect the
physiochemical quality of water making it unfit for use
of livestock and other organisms (Sadek and El-Fadel,
2000; Muhibbu-Din et al., 2011). Besides, unscientific
dumping of waste could choke the flowing water bodies
and likely could affect the normal water holding
potential of static water bodies. These practices are
common and pose severe ecological and health effects
due to the release of toxic emissions during burning and
the spread of diseases from illegal dumping (ADB,
2014). All these shortcomings also affect the waste
transfer and transport processes. Since the vehicles used
for the transfer and transport of waste suffer from poor
maintenance, the effectiveness of the transfer and
transport processes is greatly reduced. Following the
transfer process, the wastes are then transported for
ultimate disposal into the sea or in dump sites since
transfer stations are almost non-existent in many SIDS
(UNEP, 1999); (ADB, 2014).
Rouf Ahmad Bhat et al. / American Journal of Environmental Sciences 2017, 13 (6): 388.397
DOI: 10.3844/ajessp.2017.388.397
395
Transportation
Dumping of MSW on the roadside or in other public
places is a regular practice in developing countries;
cleanness is an important movement in the waste-
management system. In Srinagar city, once collected,
MSW is carried out by using different types of vehicles
depending on the distances to be covered by them.
Larger vehicles carry the waste from the collection
points to the disposal sites. The transportation of garbage
from the transfer stations is done generally using trucks.
In large areas, open trucks, covered trucks, closed
containers and some compactors are in use, whereas in
smaller access areas hand-carts are in use. Usually liquid
is spill out from the vehicles carrying the MSW which
turns the clean roads into focal point of disease carried
by various mobile vectors like insects. Same is the case
with other districts as well. Comparing to Srinagar City,
the other districts are very poor as for as transportation
of MSW are concerned. They usually carry out the MSW
in agricultural tractors with the result littering of MSW is
common. These districts have large number of fresh
water bodies in their surrounding areas. The MSW in
these districts are either dumped in the vicinity of water
bodies or sometimes directly thrown into the water
bodies. The sanitary or scientific landfill is a concept far
beyond the scope in these districts.
Disposal
Almost all municipal waste collected from different
areas is taken to lone landfill site located in Achan area
of Srinagar outskirts. The landfill site is located very
close to the Anchar Lake with water table not more than
1 m depth. Before 2007, the MSW were dumped to the
same location without having any engineering or
sanitary landfill. There could be a clear case of
contamination of Anchar lake and this could be one
possible reason behind the premature aging of Anchar
lake. The operation and maintenance at Achan sanitary
landfill is very poor. Though the authorities have
installed 3 numbers of leachate treatment plants, but
could not control the spill out leachate from the site and
posing an enormous health threat to local populations
due to soil, ground and surface water contamination
from untreated leachate. The most commonly reported
danger to the human health from these landfills is from
the use of groundwater that has been contaminated by
leachate (Rajkumar et al., 2010). The waste covering at
Achan land fill site is very poor which results emanating
of stench and make whole vicinity prone to health
hazard. Paddy and many types of vegetables and crops
are grown in the vicinity. There could be a possible
contamination from the landfill to the crops and
vegetables grown near to the landfill site. The main
environmental problem associated with the disposal sites
are the potential risks posed to the soil and number of
contaminants including heavy metals readily penetrate
and eventually they contaminate the soil and affect
vegetation abundance of the area (Ali et al., 2014). The
authorities is not yet taking any step to collect the methane
(CH4) gas which is more than 40 times potent of global
warming gas than carbon-dioxide (CO2) generating from
the landfill site. A landfill generates 50-65% by volume
CH4 gas hence is a concern to the local authorities as well
as country level. CH4 and nitrous oxide (N2O) emissions are
associated with microbial processes in MSW and are
strongly affected by oxygen (O2) status, moisture, pH,
temperature and organic carbon (C) and Nitrogen (N) form
and availability (Hellebrand, 1998; Beck-Friis et al., 2000;
2003; Jäckel et al., 2005; Zhu et al., 2008). MSW
decomposition, only large landfill sites will be able
produce methane at a high level over a long period of
time (IEA, 2008). The other districts yet not have
constructed any landfill site for the scientific disposal
of MSW. The collected waste is directly dumped into
the open fields sometimes disposed off near to the fresh
water bodies. In general there is a poor waste
management scenario in Kashmir Valley.
Conclusion
Economic development, unplanned urbanization
patterns and material consumption drastically enhance
the MSW generation rates. The poor waste management
strategies, economic development lack of infrastructure,
material, consumption levels and unawareness were
responsible for increasing and littering of MSW in
Kashmir Valley and could leads to the permanent
degradation of environmental quality. Srinagar is the
unique district practicing landfilling of MSW in Achan
area, with ample shortcomings in the form of leachate
spill out, site location, improper handling of operation
and maintenance. The valley is facing tremendous
pressure associated with problems of growing waste
generation. The need of hour is to save the scenic beauty
of fragile ecosystem from the waste disposal hazard.
Acknowledgements
The authors would like to express their sincere
gratitude to the scholars of Division of Environmental
Sciences, Sher-e-Kashmir University of Agricultural
Sciences and Technology, Shalimar-Kashmir for their
kind help during the study period of this research work.
Author’s Contributions
All authors equally contributed in this work.

Rouf Ahmad Bhat et al. / American Journal of Environmental Sciences 2017, 13 (6): 388.397
DOI: 10.3844/ajessp.2017.388.397
396
Ethics
This article is original and contains unpublished
material. The corresponding author confirms that all of
the other authors have read and approved the manuscript
and there are no ethical issues involved.
References
Aarne, P.V., J.P. Jeffrey and F.W. Ruth, 1994. Environmental Engineering. 3rd Edn., Boston: Butterworth Heinemann.
ADB, 2014. Solid Waste management in the pacific. Appropriate technologies. Asian Development Bank.
Agamuthu, P., S.H. Fauziah, K.M., Khidzir and A.A. Noorazamimah, 2007. Sustainable waste management Asian perspectives. Proceedings of the International Conference on Sustainable Solid Waste Management, Sep. 5-7, Chennai, India, pp: 15-26.
Ali, S.M., P. Pervaiz, B. Afzal, N. Hamid and A. Yasmin, 2014. Open dumping of municipal solid waste and its hazardous impacts on soil and vegetation diversity at waste dumping sites of Islamabad city. J. King Saud Uni. Sc., 26: 59-65.
Asase, M.A.D., 2011. Solid waste separation at source:
A case study of the Kumasi Metropolitan Area.
thesis submitted to the Chemical Engineering
Department, Kwame Nkrumah University of
Science and Technology, Kumasi, in partial
fulfillment of the requirements for the Degree of
Doctor of Philosophy, Faculty of Chemical and
Materials Engineering, College of Engineering.
Beck-Friis, B., M. Pell, U. Sonesson, H. Jönsson and H.
Kirchmann, 2000. Formation and emission of N2O
and CH4 from compost heaps of organic household
wastes. Environ. Monit. Assess., 62: 317-331.
Beck-Friis, B., S. Smårs, H. Jönsson, Y. Eklind and H.
Kirchmann, 2003. Composting of source separated
household organics at different oxygen levels:
Gaining an understanding of the emission dynamics.
Compost. Sci. Util., 11: 41-50.
Benitez, S.O., C.A., de-Vega and M.E.R. Barreto, 2003.
Characterization and quantification of household
solid waste in a Maxican city. Res. Conserv. Recy.,
39: 211-222.
Berneche-Perez, G., S.C. Salvadro, G.A. Marıa, D.V.
Artruro and S.S.M. Elena, 2001. Solid waste
characterization study in the Guadalajara
metropolitan zone, Mexico. Waste Manage. Res.,
19: 413-424.
Bhada-Tata, P. and D. Hoornweg, 2011. A compilation of
global MSW generation rates and composition:
projections and policy recommendations. Proceedings
of the Waste Safe 2011 2nd International Conference
on Solid Waste Management in the Developing
Countries, Feb. 13-15, Khulna, Bangladesh.
Bhat, R.A., A.N. Kamili and S.A. Bandh, 2013.
Characterisation and composition of Municipal
Solid Waste (MSW) generated in Yusmarg: A
health resort of Kashmir valley: A Glance at the
World. Waste Manage., 33: 774-777.
Bhat, R.A., G.A. Dar, A. Jehangir, B.A. Bhat and A.R.
Yousuf, 2012. Municipal solid waste generation and
present scenario of waste management during Yatra
season in Pahalgam: A tourist health resort of
Kashmir valley. Int. J. Cur. Res., 4: 004-009.
Bhat, R.A., R. Nazir, S. Ashraf, M. Ali and S.A.
Bandh et al., 2014. Municipal solid waste
generation rates and its management at Yusmarg
forest ecosystem, a tourist resort in Kashmir. Waste
Manage. Res., 32: 165-169.
Buenrostro, O., B. Gerardo and B. Gerardo, 2001. Urban
solid waste generation and disposal in Mexico: A
case study. Waste Manage. Res., 19: 169-176.
Chandrappa, R. and D.B. Das, 2012. Waste Quantities
and Characteristics. In: Solid Waste Management,
Chandrappa, R. and D.B. Das (Eds.), Springer-
Verlag, Heidelberg, pp: 53.
Faccio, M., A. Persona and G. Zanin, 2011. Waste
collection multi objective model with real time
traceability data. J. Waste Manage., 31: 2391-2405.
Ganeshwaran, P. and S.D. Shri, 2015. A solid waste
management in Coimbatore city. ARPN J. Eng.
Applied Sci., 10: 6177-6183.
Gaxiola, H., P.Y. de-Consume and B.E. Mexicali, 1995.
Tesisinedita de maestris en arquitectura. Universidad
Autonoma de Baja California, Maxicali.
Gupta, S., M. Krishna, R.K. Prasad, S. Gupta and A.
Kansal, 1998. Solid waste management in India:
Options and opportunities. Res. Conserv. Recy., 24:
137-154.
Heart, S., 2009. Electronic waste: An emerging issue in
solid waste management in Australia. Int. J.
Environ. Waste Manage., 3: 120-134.
Hellebrand, H.J., 1998. Emission of nitrous oxide and
other trace gases during composting of grass and
green waste. J. Agr. Eng. Res., 69: 365-375.
IEA, 2008. Turning a liability into an asset: Landfill
methane utilization potential in India. Int. Energy
Agency.
Jäckel, U., K. Thummes and P. Kämpfer, 2005.
Thermophilic methane production and oxidation in
compost. Fems Microbiol. Ecol., 52: 175-184.
Jain, P.K., 1994. Waste management in Delhi. Civil
Affairs, 31: 51-57.
Jha, K., A.C. Sharma, N. Singh, R. Ramesh and R.
Purvaja et al., 2007. Greenhouse gas emissions from
municipal solid waste management in Indian mega-
cities: A case study of Chennai landfill sites.
Chemosphere, 71: 750-758.

Rouf Ahmad Bhat et al. / American Journal of Environmental Sciences 2017, 13 (6): 388.397
DOI: 10.3844/ajessp.2017.388.397
397
Khajuria, A., Y. Yamamoto and T. Morioka, 2008. Solid
waste management in Asian countries: Problems and
issues. Waste Manage. Environ., 109: 643-653.
Khajuria, A., Y. Yamamoto and T. Morioka, 2010.
Estimation of municipal solid waste generation and
landfill area in Asian developing countries. J.
Environ. Bio., 31: 649-654.
Marshall, R.E. and K. Farahbakhsh, 2013. Systems
approaches to integrated solid waste management in
developing countries. Waste Manage., 33: 988-1003.
Minghua, Z., F. Xiumin, A. Rovetta, H. Qichang and F.
Vicentini et al., 2009. Municipal solid waste
management in Pudong New Area, China. Waste
Manage., 29: 1227-1233.
Mohee, R., S. Mauthoor, Z.M.A. Bundhoo, G. Somaroo
and N. Soobhany et al., 2015. Current status of solid
waste management in small island developing states:
A review. Waste Manage., 43: 539-549.
Muhibbu-Din, O.I., A.O. Aduwo and A.A. Adedeji,
2011. Study of physiochemical parameter of effluent
impacted stream at obafemi awolowo university Ile-
Ife, Nigeria. Obafemi Awolowo University, Ile-Ife,
Osun State, Nigeria.
Nabegu, A.B., 2010. An analysis of municipal solid
waste in Kano metropolis, Nigeria. J. Hum. Ecolo.,
31: 111-119.
Nagabooshnam, J.K.., 2011. Solid waste generation and
composition in Gaborone, Botswana, Potential for
resource recovery. PhD Thesis, Linkoping University.
NEERI, 1999. Report on “strategy paper on solid waste
management in India. Nguyen, P.T., M. Yasuhiro and F. Takeshi, 2011.
Assessment of plastic waste generation and its potential recycling of household solid waste in Can Tho City, Vietnam. Environ. Monit. Asses., 175: 23-35.
Ojeda-Benitez, S., C.A. de-Vega and M.E. Ramırez-Barreto, 2003. Characterization and quantification of household solid wastes in a Mexican city. Res. Cons. Rec., 39: 211-222.
Okot-Okumu, J., 2012. Solid Waste Management in African cities - East Africa. 1st Edn., INTECH Open Access Publisher. ISBN-10: 953510795X.
Pappu, A., M. Saxena and S.R. Asolekar, 2007. Solid wastes generation in India and their recycling potential in building materials.
Rajkumar, N., T. Subramani and L. Elango, 2010.
Groundwater contamination due to municipal solid
waste diposal: A GIS based study in Erode City. Int.
J. Environ. Sci., 1: 39-55. Rampal, R.K., J. Kour and R. Jamwal, 2002. Solid
waste Generation in Government Hospitals of Jammu city India. Pollution Res., 21: 39-43.
Sadek, S. and M. El-Fadel, 2000. The Normandy Landfill: A case study in solid waste management. J. Nat. Resour. Life Sci. Educ., 29: 155-61.
Shekdar, S., 1999. Municipal solid waste management the Indian perspective. J. Indian Association Environ. Management, 26: 100-108.
Sivapalan, K., M.Y. Noor, S. AbdHalims, S. Kamurazzaman and A.R. Rakmi, 2002. Comprehensive characteristics of the MSW generated in Kuala Lumpur. Proceedings of the Regional Symposium on Environment and Nature Resources, pp: 359-368.
Srishti, 2000. Fifth Srishti survey of medical waste disposal practices in health care units of Delhi. New Delhi.
Tchobanoglous, G., H. Theisen, S.A. Vigil, 1993. Integrated Solid Waste Management, Engineering Principles and Management Issues, McGraw Hill International edition. McGraw-Hill Companies, Singapore.
Thitame, S.N., G.M. Pondhe and D.C. Meshram, 2010. Characterisation and composition of Municipal Solid Waste (MSW) generated in Sangamner City, District Ahmednagar, Maharashtra, India. Environ. Monit. Assess., 170: 1-5.
UNEP, 1999. Guidelines for municipal solid waste management planning in small island developing states in the Pacific region. Apia, Samoa: South Pacific Regional Environment Programme.
Valkenburg, C., C.W. Walton, B.L. Thompson, M.A. Gerber and S. Jones et al., 2008. Municipal Solid Waste (MSW) to liquid fuels synthesis, Volume 1: Availability of feedstock and Technol. PNNL 18144, Pacific Northwest National Laboratory, Richland, WA.
Visvanathan, C., J. Trankler, K. Joseph, C. Chiemchaisri and B.F.A. Basnayake et al., 2004. Municipal solid waste management in Asia. Asian Regional Research Program on Environmental Technology (ARRPET). Asian Institute of Technology publications.
Zhu, D., P.U. Asnani, C. Zurbrugg, S. Anapolsky and S. Mani, 2008. Improving Solid Waste Management in India: A Sourcebook for 740. Policy Makers and Practitioners; WBI Development Studies; World Bank Institute, The World Bank: Washington, DC, USA, pp: 739-741.
Copyright © 2022 FDOKUMEN