![4.1.1] plane waves](https://static.fdokumen.com/doc/165x107/6322513728c445989105b845/411-plane-waves.jpg)
Earthquake source parameters at the sumatran fault zone: Identification of the activated fault plane
20
Cent. Eur. J. Geosci. • 2(4) • 2010 • 455-474 DOI: 10.2478/v10085-010-0016-5 Central European Journal of Geosciences Earthquake Source Parameters at the Sumatran Fault Zone: Identification of the Activated Fault Plane Research Article Madlazim Kasmolan 12* , Bagus Jaya Santosa 1 , Jonathan M. Lees 3 , Widya Utama 1 1 Physics Department, Faculty Mathematics and Science of ITS Jl. Arif Rahman Hakim I, Surabaya 60111, Indonesia 2 Physics Department, Faculty Mathematics and Science of The State University of Surabaya (UNESA) Jl. Ketintang, Surabaya 60231, Indonesia 3 Department of Geological Sciences University of North Caroline at Chapel Hill Seismology and Volcanology, USA. Received 20 April 2010; accepted 27 May 2010 Abstract: Fifteen earthquakes (M 4.1–6.4) occurring at ten major segments of the Sumatran Fault Zone (SFZ) were analyzed to identify their respective fault planes. The events were relocated in order to assess hypocenter uncertainty. Earthquake source parameters were determined from three-component local waveforms recorded by IRIS-DMC and GEOFON broadband IA networks. Epicentral distances of all stations were less than 10˚. Moment tensor solutions of the events were calculated, along with simultaneous determination of centroid position. Joint analysis of hypocenter position, centroid position, and nodal planes produced clear outlines of the Sumatran fault planes. The preferable seismotectonic interpretation is that the events activated the SFZ at a depth of approximately 14–210 km, corresponding to the interplate Sumatran fault boundary. The identification of this seismic fault zone is significant to the investigation of seismic hazards in the region. Keywords: Sumatran Fault Zone • three-component local waveform inversion • earthquake source parameters • fault plane © Versita Warsaw 1. Introduction Data from fifteen earthquakes (M 4.1–6.4) oc- curring in the Sumatran Fault Zone (SFZ) and reported by IRIS-DMC and GEOFON IA lo- cal stations, were retrieved from websites http: //www.iris.edu/dms/wilber.htm and http://geofon.gfz- potsdam.de/geofon/new/_netabs/ia_req.html respectively, for study. The selected events occurred along ten * E-mail: [email protected] segments of the SFZ from the 1st of December 2006, to the 1st of October 2009. The SFZ accommodates most of the right-lateral strain caused by relative slab movement and is considered to have been an active tectonic zone since the Mid-Miocene [1]. The SFZ, which extends along the entire island of Suma- tra, is partitioned into three segments, southern, central and northern, respectively. The fault zone is a thrust with a component of dextral movement. The SFZ prob- ably dates to the Middle Miocene and the opening of the Andaman Sea, although the relative motions of the sur- rounding major plates have changed little since the Mid- dle Eocene [2]. The SFZ runs the length of the Barisan 455
-
Upload
independent -
Category
Documents
-
view
2 -
download
0
Transcript of Earthquake source parameters at the sumatran fault zone: Identification of the activated fault plane

Cent. Eur. J. Geosci. • 2(4) • 2010 • 455-474DOI: 10.2478/v10085-010-0016-5
Central European Journal of Geosciences
Earthquake Source Parameters at the SumatranFault Zone: Identification of the Activated Fault Plane
Research Article
Madlazim Kasmolan12∗, Bagus Jaya Santosa1, Jonathan M. Lees3, Widya Utama1
1 Physics Department, Faculty Mathematics and Science of ITS Jl. Arif Rahman Hakim I,Surabaya 60111, Indonesia
2 Physics Department, Faculty Mathematics and Science of The State University of Surabaya (UNESA) Jl. Ketintang,Surabaya 60231, Indonesia
3 Department of Geological SciencesUniversity of North Caroline at Chapel Hill Seismology and Volcanology, USA.
Received 20 April 2010; accepted 27 May 2010
Abstract: Fifteen earthquakes (Mw 4.1–6.4) occurring at ten major segments of the Sumatran Fault Zone (SFZ) wereanalyzed to identify their respective fault planes. The events were relocated in order to assess hypocenteruncertainty. Earthquake source parameters were determined from three-component local waveforms recordedby IRIS-DMC and GEOFON broadband IA networks. Epicentral distances of all stations were less than 10˚.Moment tensor solutions of the events were calculated, along with simultaneous determination of centroidposition. Joint analysis of hypocenter position, centroid position, and nodal planes produced clear outlines ofthe Sumatran fault planes. The preferable seismotectonic interpretation is that the events activated the SFZ at adepth of approximately 14–210 km, corresponding to the interplate Sumatran fault boundary. The identificationof this seismic fault zone is significant to the investigation of seismic hazards in the region.
Keywords: Sumatran Fault Zone • three-component local waveform inversion • earthquake source parameters • fault plane
© Versita Warsaw
1. Introduction
Data from fifteen earthquakes (Mw 4.1–6.4) oc-curring in the Sumatran Fault Zone (SFZ) andreported by IRIS-DMC and GEOFON IA lo-cal stations, were retrieved from websites http:
//www.iris.edu/dms/wilber.htm and http://geofon.gfz-potsdam.de/geofon/new/_netabs/ia_req.html respectively,for study. The selected events occurred along ten
∗E-mail: [email protected]
segments of the SFZ from the 1st of December 2006, tothe 1st of October 2009. The SFZ accommodates most ofthe right-lateral strain caused by relative slab movementand is considered to have been an active tectonic zonesince the Mid-Miocene [1].The SFZ, which extends along the entire island of Suma-tra, is partitioned into three segments, southern, centraland northern, respectively. The fault zone is a thrustwith a component of dextral movement. The SFZ prob-ably dates to the Middle Miocene and the opening of theAndaman Sea, although the relative motions of the sur-rounding major plates have changed little since the Mid-dle Eocene [2]. The SFZ runs the length of the Barisan
455
Earthquake Source Parameters at the Sumatran Fault Zone: Identification of the Activated Fault Plane
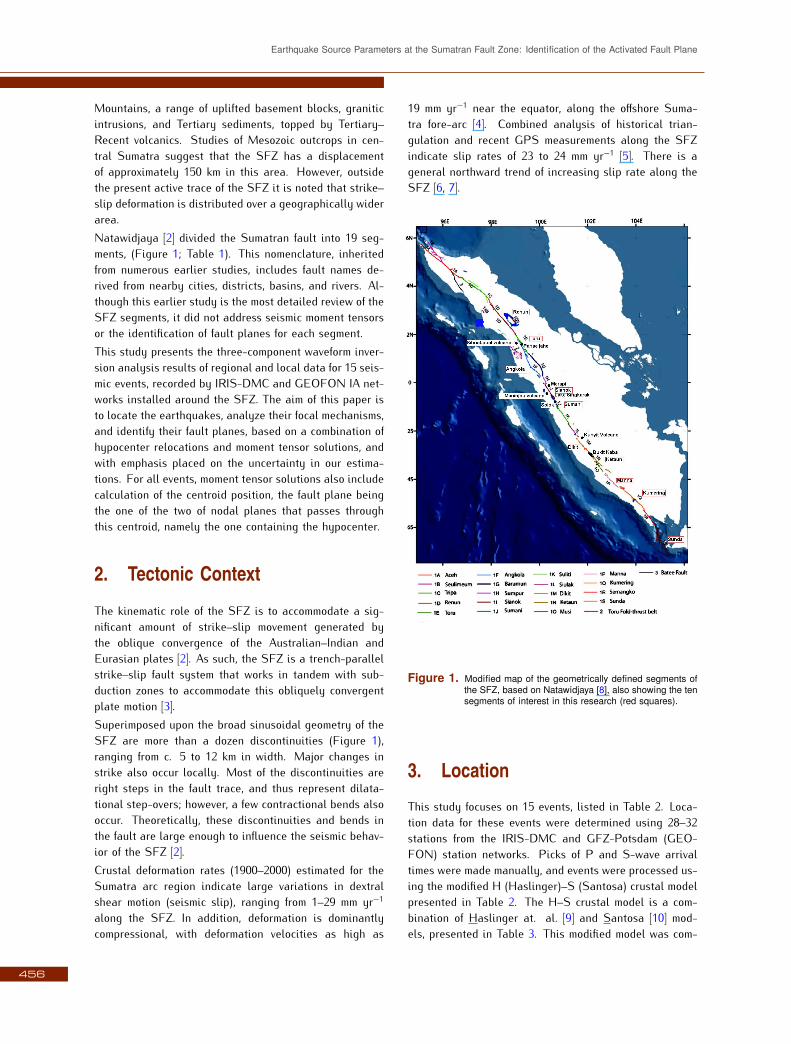
Mountains, a range of uplifted basement blocks, graniticintrusions, and Tertiary sediments, topped by Tertiary–Recent volcanics. Studies of Mesozoic outcrops in cen-tral Sumatra suggest that the SFZ has a displacementof approximately 150 km in this area. However, outsidethe present active trace of the SFZ it is noted that strike–slip deformation is distributed over a geographically widerarea.Natawidjaya [2] divided the Sumatran fault into 19 seg-ments, (Figure 1; Table 1). This nomenclature, inheritedfrom numerous earlier studies, includes fault names de-rived from nearby cities, districts, basins, and rivers. Al-though this earlier study is the most detailed review of theSFZ segments, it did not address seismic moment tensorsor the identification of fault planes for each segment.This study presents the three-component waveform inver-sion analysis results of regional and local data for 15 seis-mic events, recorded by IRIS-DMC and GEOFON IA net-works installed around the SFZ. The aim of this paper isto locate the earthquakes, analyze their focal mechanisms,and identify their fault planes, based on a combination ofhypocenter relocations and moment tensor solutions, andwith emphasis placed on the uncertainty in our estima-tions. For all events, moment tensor solutions also includecalculation of the centroid position, the fault plane beingthe one of the two of nodal planes that passes throughthis centroid, namely the one containing the hypocenter.
2. Tectonic Context
The kinematic role of the SFZ is to accommodate a sig-nificant amount of strike–slip movement generated bythe oblique convergence of the Australian–Indian andEurasian plates [2]. As such, the SFZ is a trench-parallelstrike–slip fault system that works in tandem with sub-duction zones to accommodate this obliquely convergentplate motion [3].Superimposed upon the broad sinusoidal geometry of theSFZ are more than a dozen discontinuities (Figure 1),ranging from c. 5 to 12 km in width. Major changes instrike also occur locally. Most of the discontinuities areright steps in the fault trace, and thus represent dilata-tional step-overs; however, a few contractional bends alsooccur. Theoretically, these discontinuities and bends inthe fault are large enough to influence the seismic behav-ior of the SFZ [2].Crustal deformation rates (1900–2000) estimated for theSumatra arc region indicate large variations in dextralshear motion (seismic slip), ranging from 1–29 mm yr−1
along the SFZ. In addition, deformation is dominantlycompressional, with deformation velocities as high as
19 mm yr−1 near the equator, along the offshore Suma-tra fore-arc [4]. Combined analysis of historical trian-gulation and recent GPS measurements along the SFZindicate slip rates of 23 to 24 mm yr−1 [5]. There is ageneral northward trend of increasing slip rate along theSFZ [6, 7].
Figure 1. Modified map of the geometrically defined segments ofthe SFZ, based on Natawidjaya [8], also showing the tensegments of interest in this research (red squares).
3. Location
This study focuses on 15 events, listed in Table 2. Loca-tion data for these events were determined using 28–32stations from the IRIS-DMC and GFZ-Potsdam (GEO-FON) station networks. Picks of P and S-wave arrivaltimes were made manually, and events were processed us-ing the modified H (Haslinger)–S (Santosa) crustal modelpresented in Table 2. The H–S crustal model is a com-bination of Haslinger at. al. [9] and Santosa [10] mod-els, presented in Table 3. This modified model was com-
456
Madlazim Kasmolan, Bagus Jaya Santosa, Jonathan M. Lees,Widya Utama
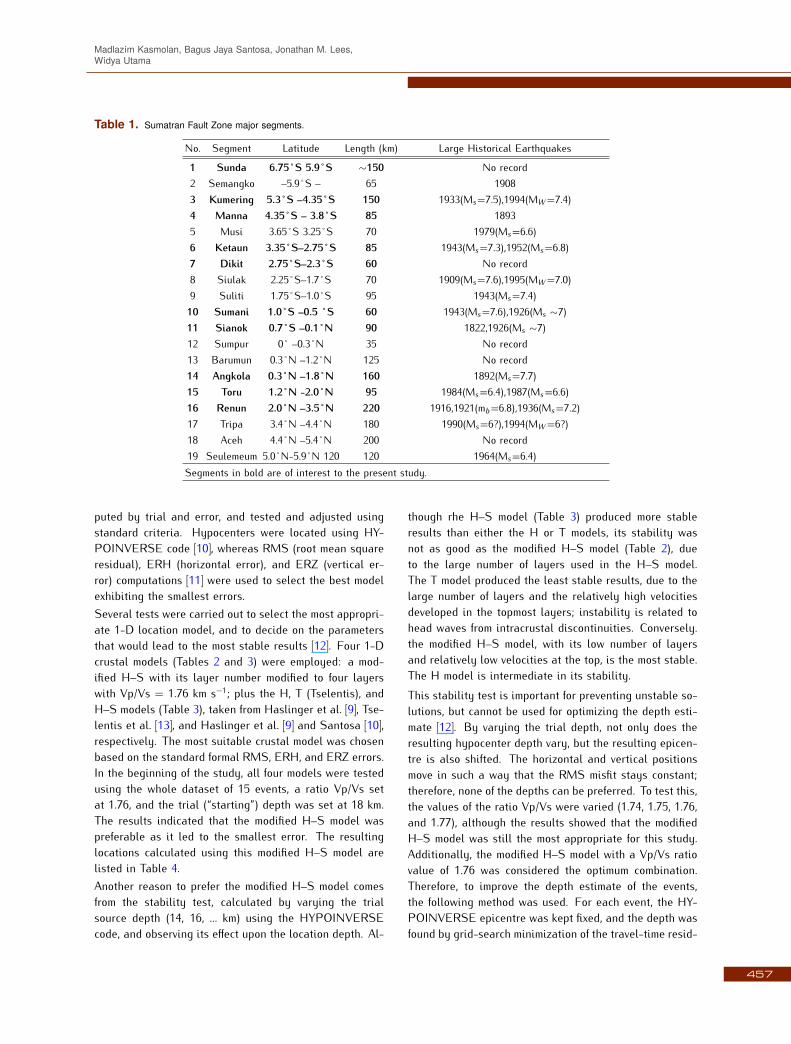
Table 1. Sumatran Fault Zone major segments.
No. Segment Latitude Length (km) Large Historical Earthquakes
1 Sunda 6.75˚S 5.9˚S ∼150 No record2 Semangko –5.9˚S – 65 19083 Kumering 5.3˚S –4.35˚S 150 1933(Ms=7.5),1994(MW =7.4)4 Manna 4.35˚S – 3.8˚S 85 18935 Musi 3.65˚S 3.25˚S 70 1979(Ms=6.6)6 Ketaun 3.35˚S–2.75˚S 85 1943(Ms=7.3),1952(Ms=6.8)7 Dikit 2.75˚S–2.3˚S 60 No record8 Siulak 2.25˚S–1.7˚S 70 1909(Ms=7.6),1995(MW =7.0)9 Suliti 1.75˚S–1.0˚S 95 1943(Ms=7.4)10 Sumani 1.0˚S –0.5 ˚S 60 1943(Ms=7.6),1926(Ms ∼7)11 Sianok 0.7˚S –0.1˚N 90 1822,1926(Ms ∼7)12 Sumpur 0˚ –0.3˚N 35 No record13 Barumun 0.3˚N –1.2˚N 125 No record14 Angkola 0.3˚N –1.8˚N 160 1892(Ms=7.7)15 Toru 1.2˚N -2.0˚N 95 1984(Ms=6.4),1987(Ms=6.6)16 Renun 2.0˚N –3.5˚N 220 1916,1921(mb=6.8),1936(Ms=7.2)17 Tripa 3.4˚N –4.4˚N 180 1990(Ms=6?),1994(MW =6?)18 Aceh 4.4˚N –5.4˚N 200 No record19 Seulemeum 5.0˚N-5.9˚N 120 120 1964(Ms=6.4)Segments in bold are of interest to the present study.
puted by trial and error, and tested and adjusted usingstandard criteria. Hypocenters were located using HY-POINVERSE code [10], whereas RMS (root mean squareresidual), ERH (horizontal error), and ERZ (vertical er-ror) computations [11] were used to select the best modelexhibiting the smallest errors.Several tests were carried out to select the most appropri-ate 1-D location model, and to decide on the parametersthat would lead to the most stable results [12]. Four 1-Dcrustal models (Tables 2 and 3) were employed: a mod-ified H–S with its layer number modified to four layerswith Vp/Vs = 1.76 km s−1; plus the H, T (Tselentis), andH–S models (Table 3), taken from Haslinger et al. [9], Tse-lentis et al. [13], and Haslinger et al. [9] and Santosa [10],respectively. The most suitable crustal model was chosenbased on the standard formal RMS, ERH, and ERZ errors.In the beginning of the study, all four models were testedusing the whole dataset of 15 events, a ratio Vp/Vs setat 1.76, and the trial (“starting”) depth was set at 18 km.The results indicated that the modified H–S model waspreferable as it led to the smallest error. The resultinglocations calculated using this modified H–S model arelisted in Table 4.Another reason to prefer the modified H–S model comesfrom the stability test, calculated by varying the trialsource depth (14, 16, … km) using the HYPOINVERSEcode, and observing its effect upon the location depth. Al-
though rhe H–S model (Table 3) produced more stableresults than either the H or T models, its stability wasnot as good as the modified H–S model (Table 2), dueto the large number of layers used in the H–S model.The T model produced the least stable results, due to thelarge number of layers and the relatively high velocitiesdeveloped in the topmost layers; instability is related tohead waves from intracrustal discontinuities. Conversely.the modified H–S model, with its low number of layersand relatively low velocities at the top, is the most stable.The H model is intermediate in its stability.This stability test is important for preventing unstable so-lutions, but cannot be used for optimizing the depth esti-mate [12]. By varying the trial depth, not only does theresulting hypocenter depth vary, but the resulting epicen-tre is also shifted. The horizontal and vertical positionsmove in such a way that the RMS misfit stays constant;therefore, none of the depths can be preferred. To test this,the values of the ratio Vp/Vs were varied (1.74, 1.75, 1.76,and 1.77), although the results showed that the modifiedH–S model was still the most appropriate for this study.Additionally, the modified H–S model with a Vp/Vs ratiovalue of 1.76 was considered the optimum combination.Therefore, to improve the depth estimate of the events,the following method was used. For each event, the HY-POINVERSE epicentre was kept fixed, and the depth wasfound by grid-search minimization of the travel-time resid-
457

Earthquake Source Parameters at the Sumatran Fault Zone: Identification of the Activated Fault Plane
ual. This useful trick, which decouples the depth by fixingthe epicenter, aims to overcome the unfavorable fact thatthe time residuals are affected much less by the depth vari-ation than by the epicentre variation [12], meaning that thedepth resolution is low if both the depth and the horizontalposition are retrieved. Moreover, the grid search is freedfrom limitations caused by linearization in the HYPOIN-VERSE code. Hypocenters calculated for the 15 eventsare listed in Table 4.
4. Data Processing
Waveforms analyzed in this article were taken from sev-enteen regional broadband stations (Figure 2) in two net-works; namely five stations of the IRIS-DMC network, andtwelve stations of the GEOFON network. The first-motionpolarities were read from all broadband records, with closeattention paid to the consistency of the three componentsin order to avoid erroneous orientation of the sensor, orproblematic azimuths [14].The waveforms were processed using Seismic AnalysisCode (SAC) software [15], in which the instrument cor-rection was initially removed on the selected seismo-grams. The moment tensor inversions were conductedin displacement, meaning that the velocity recordingswere integrated once, and acceleration recordings twice,with all recordings filtered using a band pass of 0.015–0.09 Hz. Complete three-component waveforms were em-ployed without separation of specific wave groups; thesewaveforms were resampled at all stations into 9567 points,with a time step of 0.04 sec. Waveforms were not shifted toartificially match the first arrival time, because a simpleshift of the whole waveform is not the appropriate cor-rection if the misfit comes from an inaccurate location orthe local velocity structure at the station. The only casewhere such a shift might be acceptable is when the sta-tion timing is grossly wrong, say, by a few seconds. Sucha situation can be detected by checking the location Presiduals for all stations used in the moment tensor cal-culations. No such failure was detected during the courseof this research.
5. Moment Tensors (MT)
Moment tensors of fifteen events were calculated using thewaveform inversion of three-component broadband recordsderived from the of IRIS-DMC and GEOFON-IA networks.These networks belong to the Incorporated Research Insti-tutions for Seismology and GFZ German Research Centrefor Geosciences, respectively; more details on the present
status of the networks and their stations can be found attheir respective websites.Moment tensor calculations for this study were conductedusing a 1-D crustal velocity model [9, 10] (Table 3),with the stations (Figure 2), and frequency range (0.015–0.09 Hz) used varying for each event. The different fil-ters used provide different signal-to-noise ratios, relatedto smaller magnitudes and different location and depths.Low frequencies were preferred in this case because themodeling is less dependent (inherently) on earth crustalstructure.
RGR
KSI
PPI
SBSI
TRSI
LWLIBLSI
PDSI
MNSI
KASI
MDSI
RBSI
PSI
BTDF
IPM
KOM
KUM
Figure 2. Map of the stations used for the MT calculation (red text= IRIS-DMC, blue text = GEOFON).
The ISOLA software used, which combines the computa-tional speed of Fortran and the user friendly nature ofMatlab [16], makes use of the inverse-problem formula-tion [17] based on six elementary MTs. This equation isused to quickly evaluate the correlation between observedand synthetic waveforms; Green’s functions are calculatedusing the discrete-wavenumber method [18, 19]. The matchbetween the observed and best-fitting synthetic data ischaracterized by the overall variance reduction: varred=1-E/O, where E=Σ(Oi –Si)2, O= Σ(Oi)2, and O and Sstand for the observed and synthetic data. The code also
458
Madlazim Kasmolan, Bagus Jaya Santosa, Jonathan M. Lees,Widya Utama
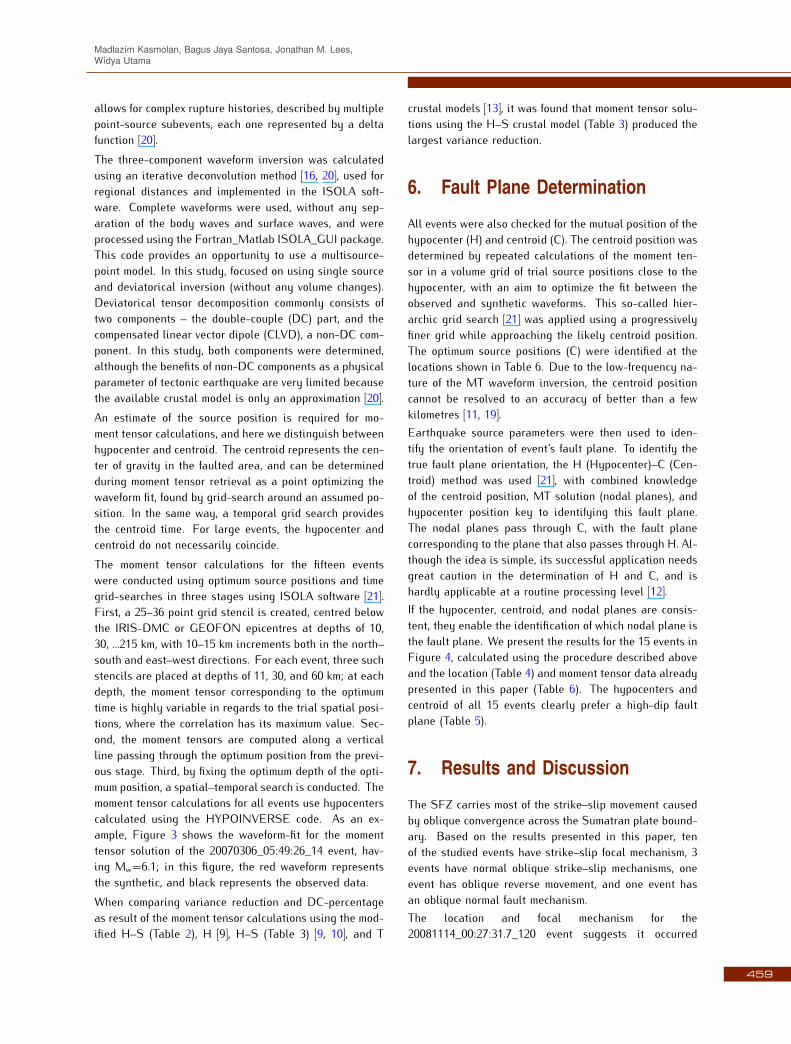
allows for complex rupture histories, described by multiplepoint-source subevents, each one represented by a deltafunction [20].The three-component waveform inversion was calculatedusing an iterative deconvolution method [16, 20], used forregional distances and implemented in the ISOLA soft-ware. Complete waveforms were used, without any sep-aration of the body waves and surface waves, and wereprocessed using the Fortran_Matlab ISOLA_GUI package.This code provides an opportunity to use a multisource-point model. In this study, focused on using single sourceand deviatorical inversion (without any volume changes).Deviatorical tensor decomposition commonly consists oftwo components – the double-couple (DC) part, and thecompensated linear vector dipole (CLVD), a non-DC com-ponent. In this study, both components were determined,although the benefits of non-DC components as a physicalparameter of tectonic earthquake are very limited becausethe available crustal model is only an approximation [20].An estimate of the source position is required for mo-ment tensor calculations, and here we distinguish betweenhypocenter and centroid. The centroid represents the cen-ter of gravity in the faulted area, and can be determinedduring moment tensor retrieval as a point optimizing thewaveform fit, found by grid-search around an assumed po-sition. In the same way, a temporal grid search providesthe centroid time. For large events, the hypocenter andcentroid do not necessarily coincide.The moment tensor calculations for the fifteen eventswere conducted using optimum source positions and timegrid-searches in three stages using ISOLA software [21].First, a 25–36 point grid stencil is created, centred belowthe IRIS-DMC or GEOFON epicentres at depths of 10,30, …215 km, with 10–15 km increments both in the north–south and east–west directions. For each event, three suchstencils are placed at depths of 11, 30, and 60 km; at eachdepth, the moment tensor corresponding to the optimumtime is highly variable in regards to the trial spatial posi-tions, where the correlation has its maximum value. Sec-ond, the moment tensors are computed along a verticalline passing through the optimum position from the previ-ous stage. Third, by fixing the optimum depth of the opti-mum position, a spatial–temporal search is conducted. Themoment tensor calculations for all events use hypocenterscalculated using the HYPOINVERSE code. As an ex-ample, Figure 3 shows the waveform-fit for the momenttensor solution of the 20070306_05:49:26_14 event, hav-ing Mw=6.1; in this figure, the red waveform representsthe synthetic, and black represents the observed data.When comparing variance reduction and DC-percentageas result of the moment tensor calculations using the mod-ified H–S (Table 2), H [9], H–S (Table 3) [9, 10], and T
crustal models [13], it was found that moment tensor solu-tions using the H–S crustal model (Table 3) produced thelargest variance reduction.
6. Fault Plane Determination
All events were also checked for the mutual position of thehypocenter (H) and centroid (C). The centroid position wasdetermined by repeated calculations of the moment ten-sor in a volume grid of trial source positions close to thehypocenter, with an aim to optimize the fit between theobserved and synthetic waveforms. This so-called hier-archic grid search [21] was applied using a progressivelyfiner grid while approaching the likely centroid position.The optimum source positions (C) were identified at thelocations shown in Table 6. Due to the low-frequency na-ture of the MT waveform inversion, the centroid positioncannot be resolved to an accuracy of better than a fewkilometres [11, 19].Earthquake source parameters were then used to iden-tify the orientation of event’s fault plane. To identify thetrue fault plane orientation, the H (Hypocenter)–C (Cen-troid) method was used [21], with combined knowledgeof the centroid position, MT solution (nodal planes), andhypocenter position key to identifying this fault plane.The nodal planes pass through C, with the fault planecorresponding to the plane that also passes through H. Al-though the idea is simple, its successful application needsgreat caution in the determination of H and C, and ishardly applicable at a routine processing level [12].If the hypocenter, centroid, and nodal planes are consis-tent, they enable the identification of which nodal plane isthe fault plane. We present the results for the 15 events inFigure 4, calculated using the procedure described aboveand the location (Table 4) and moment tensor data alreadypresented in this paper (Table 6). The hypocenters andcentroid of all 15 events clearly prefer a high-dip faultplane (Table 5).
7. Results and Discussion
The SFZ carries most of the strike–slip movement causedby oblique convergence across the Sumatran plate bound-ary. Based on the results presented in this paper, tenof the studied events have strike–slip focal mechanism, 3events have normal oblique strike–slip mechanisms, oneevent has oblique reverse movement, and one event hasan oblique normal fault mechanism.The location and focal mechanism for the20081114_00:27:31.7_120 event suggests it occurred
459
Earthquake Source Parameters at the Sumatran Fault Zone: Identification of the Activated Fault Plane
Figure 3. Waveform fit for one moment tensor solution; the red waveform is synthetic, and the black waveform is observed data.
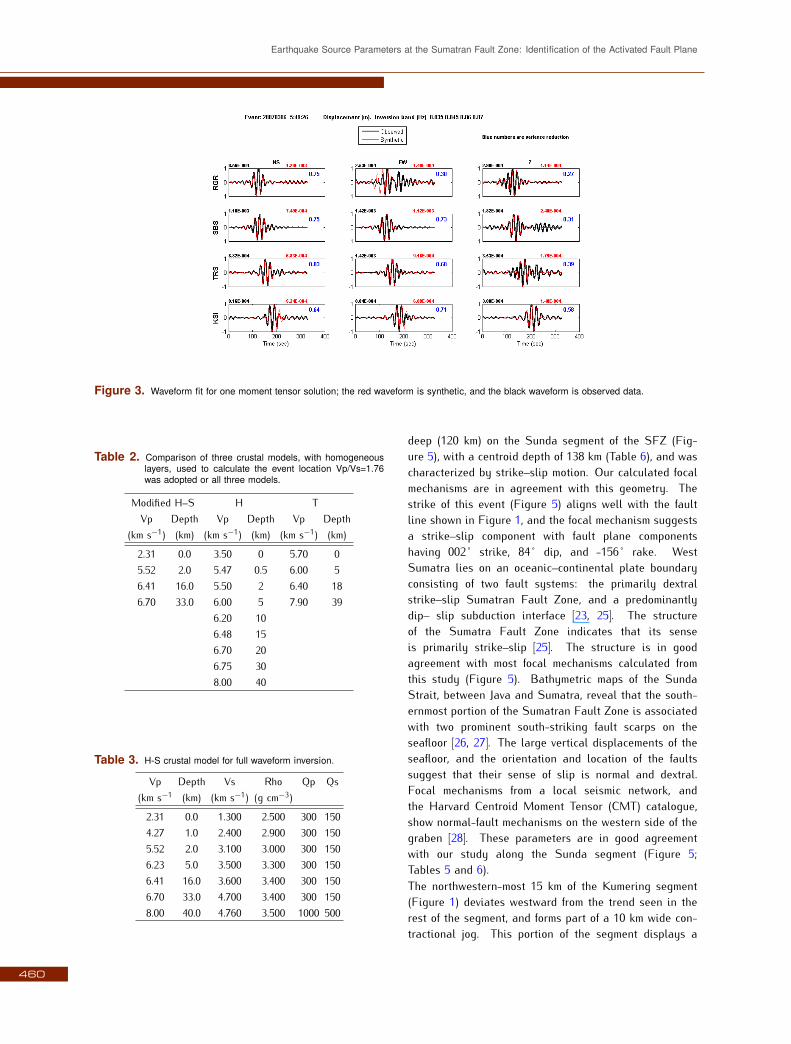
Table 2. Comparison of three crustal models, with homogeneouslayers, used to calculate the event location Vp/Vs=1.76was adopted or all three models.
Modified H–S H TVp Depth Vp Depth Vp Depth
(km s−1) (km) (km s−1) (km) (km s−1) (km)
2.31 0.0 3.50 0 5.70 05.52 2.0 5.47 0.5 6.00 56.41 16.0 5.50 2 6.40 186.70 33.0 6.00 5 7.90 39
6.20 106.48 156.70 206.75 308.00 40
Table 3. H-S crustal model for full waveform inversion.
Vp Depth Vs Rho Qp Qs(km s−1 (km) (km s−1) (g cm−3)
2.31 0.0 1.300 2.500 300 1504.27 1.0 2.400 2.900 300 1505.52 2.0 3.100 3.000 300 1506.23 5.0 3.500 3.300 300 1506.41 16.0 3.600 3.400 300 1506.70 33.0 4.700 3.400 300 1508.00 40.0 4.760 3.500 1000 500
deep (120 km) on the Sunda segment of the SFZ (Fig-ure 5), with a centroid depth of 138 km (Table 6), and wascharacterized by strike–slip motion. Our calculated focalmechanisms are in agreement with this geometry. Thestrike of this event (Figure 5) aligns well with the faultline shown in Figure 1, and the focal mechanism suggestsa strike–slip component with fault plane componentshaving 002˚ strike, 84˚ dip, and -156˚ rake. WestSumatra lies on an oceanic–continental plate boundaryconsisting of two fault systems: the primarily dextralstrike–slip Sumatran Fault Zone, and a predominantlydip– slip subduction interface [23, 25]. The structureof the Sumatra Fault Zone indicates that its senseis primarily strike–slip [25]. The structure is in goodagreement with most focal mechanisms calculated fromthis study (Figure 5). Bathymetric maps of the SundaStrait, between Java and Sumatra, reveal that the south-ernmost portion of the Sumatran Fault Zone is associatedwith two prominent south-striking fault scarps on theseafloor [26, 27]. The large vertical displacements of theseafloor, and the orientation and location of the faultssuggest that their sense of slip is normal and dextral.Focal mechanisms from a local seismic network, andthe Harvard Centroid Moment Tensor (CMT) catalogue,show normal-fault mechanisms on the western side of thegraben [28]. These parameters are in good agreementwith our study along the Sunda segment (Figure 5;Tables 5 and 6).The northwestern-most 15 km of the Kumering segment(Figure 1) deviates westward from the trend seen in therest of the segment, and forms part of a 10 km wide con-tractional jog. This portion of the segment displays a
460
Madlazim Kasmolan, Bagus Jaya Santosa, Jonathan M. Lees,Widya Utama
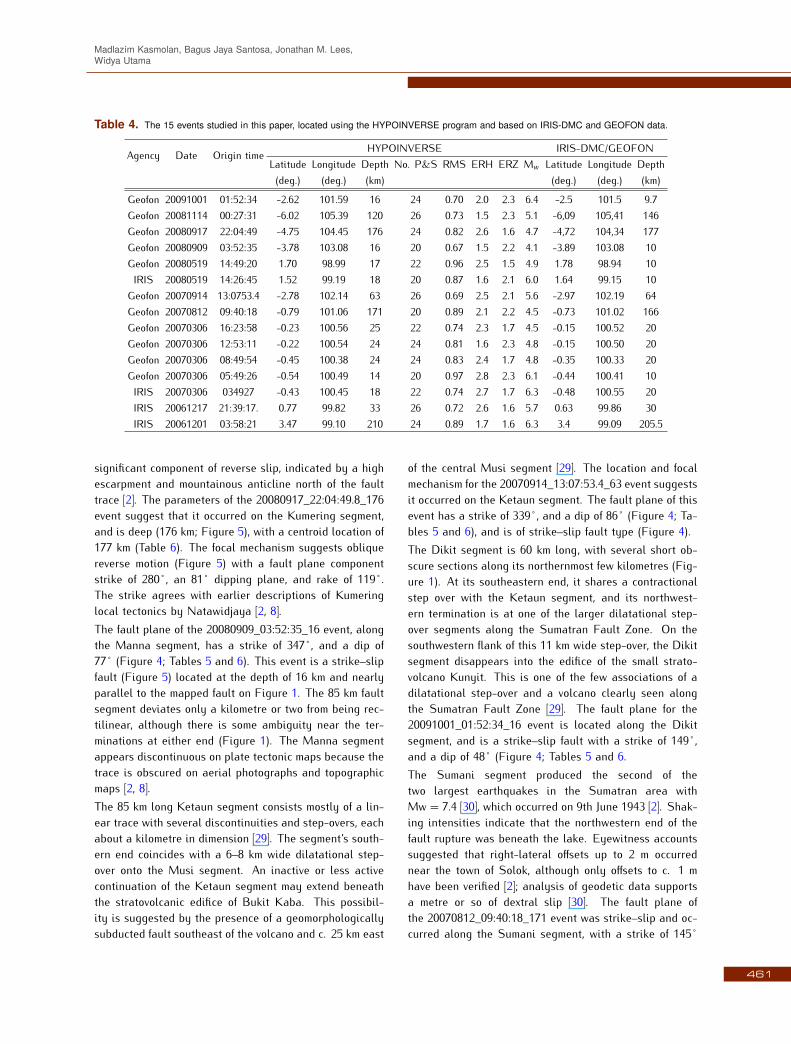
Table 4. The 15 events studied in this paper, located using the HYPOINVERSE program and based on IRIS-DMC and GEOFON data.
Agency Date Origin time HYPOINVERSE IRIS-DMC/GEOFONLatitude Longitude Depth No. P&S RMS ERH ERZ Mw Latitude Longitude Depth(deg.) (deg.) (km) (deg.) (deg.) (km)
Geofon 20091001 01:52:34 -2.62 101.59 16 24 0.70 2.0 2.3 6.4 -2.5 101.5 9.7Geofon 20081114 00:27:31 -6.02 105.39 120 26 0.73 1.5 2.3 5.1 -6,09 105,41 146Geofon 20080917 22:04:49 -4.75 104.45 176 24 0.82 2.6 1.6 4.7 -4,72 104,34 177Geofon 20080909 03:52:35 -3.78 103.08 16 20 0.67 1.5 2.2 4.1 -3.89 103.08 10Geofon 20080519 14:49:20 1.70 98.99 17 22 0.96 2.5 1.5 4.9 1.78 98.94 10IRIS 20080519 14:26:45 1.52 99.19 18 20 0.87 1.6 2.1 6.0 1.64 99.15 10
Geofon 20070914 13:0753.4 -2.78 102.14 63 26 0.69 2.5 2.1 5.6 -2.97 102.19 64Geofon 20070812 09:40:18 -0.79 101.06 171 20 0.89 2.1 2.2 4.5 -0.73 101.02 166Geofon 20070306 16:23:58 -0.23 100.56 25 22 0.74 2.3 1.7 4.5 -0.15 100.52 20Geofon 20070306 12:53:11 -0.22 100.54 24 24 0.81 1.6 2.3 4.8 -0.15 100.50 20Geofon 20070306 08:49:54 -0.45 100.38 24 24 0.83 2.4 1.7 4.8 -0.35 100.33 20Geofon 20070306 05:49:26 -0.54 100.49 14 20 0.97 2.8 2.3 6.1 -0.44 100.41 10IRIS 20070306 034927 -0.43 100.45 18 22 0.74 2.7 1.7 6.3 -0.48 100.55 20IRIS 20061217 21:39:17. 0.77 99.82 33 26 0.72 2.6 1.6 5.7 0.63 99.86 30IRIS 20061201 03:58:21 3.47 99.10 210 24 0.89 1.7 1.6 6.3 3.4 99.09 205.5
significant component of reverse slip, indicated by a highescarpment and mountainous anticline north of the faulttrace [2]. The parameters of the 20080917_22:04:49.8_176event suggest that it occurred on the Kumering segment,and is deep (176 km; Figure 5), with a centroid location of177 km (Table 6). The focal mechanism suggests obliquereverse motion (Figure 5) with a fault plane componentstrike of 280˚, an 81˚ dipping plane, and rake of 119˚.The strike agrees with earlier descriptions of Kumeringlocal tectonics by Natawidjaya [2, 8].The fault plane of the 20080909_03:52:35_16 event, alongthe Manna segment, has a strike of 347˚, and a dip of77˚ (Figure 4; Tables 5 and 6). This event is a strike–slipfault (Figure 5) located at the depth of 16 km and nearlyparallel to the mapped fault on Figure 1. The 85 km faultsegment deviates only a kilometre or two from being rec-tilinear, although there is some ambiguity near the ter-minations at either end (Figure 1). The Manna segmentappears discontinuous on plate tectonic maps because thetrace is obscured on aerial photographs and topographicmaps [2, 8].The 85 km long Ketaun segment consists mostly of a lin-ear trace with several discontinuities and step-overs, eachabout a kilometre in dimension [29]. The segment’s south-ern end coincides with a 6–8 km wide dilatational step-over onto the Musi segment. An inactive or less activecontinuation of the Ketaun segment may extend beneaththe stratovolcanic edifice of Bukit Kaba. This possibil-ity is suggested by the presence of a geomorphologicallysubducted fault southeast of the volcano and c. 25 km east
of the central Musi segment [29]. The location and focalmechanism for the 20070914_13:07:53.4_63 event suggestsit occurred on the Ketaun segment. The fault plane of thisevent has a strike of 339˚, and a dip of 86˚ (Figure 4; Ta-bles 5 and 6), and is of strike–slip fault type (Figure 4).The Dikit segment is 60 km long, with several short ob-scure sections along its northernmost few kilometres (Fig-ure 1). At its southeastern end, it shares a contractionalstep over with the Ketaun segment, and its northwest-ern termination is at one of the larger dilatational step-over segments along the Sumatran Fault Zone. On thesouthwestern flank of this 11 km wide step-over, the Dikitsegment disappears into the edifice of the small strato-volcano Kunyit. This is one of the few associations of adilatational step-over and a volcano clearly seen alongthe Sumatran Fault Zone [29]. The fault plane for the20091001_01:52:34_16 event is located along the Dikitsegment, and is a strike–slip fault with a strike of 149˚,and a dip of 48˚ (Figure 4; Tables 5 and 6.The Sumani segment produced the second of thetwo largest earthquakes in the Sumatran area withMw = 7.4 [30], which occurred on 9th June 1943 [2]. Shak-ing intensities indicate that the northwestern end of thefault rupture was beneath the lake. Eyewitness accountssuggested that right-lateral offsets up to 2 m occurrednear the town of Solok, although only offsets to c. 1 mhave been verified [2]; analysis of geodetic data supportsa metre or so of dextral slip [30]. The fault plane ofthe 20070812_09:40:18_171 event was strike–slip and oc-curred along the Sumani segment, with a strike of 145˚
461

Earthquake Source Parameters at the Sumatran Fault Zone: Identification of the Activated Fault Plane
and a dip of 63˚ (Figure 4; Tables 5 and 6).The Sianok segment is predominantly straight, having acontinuous segment that extends c. 90 km from the north-east shore of Lake Singkarak, along the southwest flank ofthe great stratovolcano Merapi, and up to to a 10 km wideright step-over at the Equator [2]. Its southernmost 18 km,on the flank of Lake Singkarak, has an arcuate shape,and thus must have a significant normal component dip-ping down toward the lake. Geomorphic expression of theSFZ is particularly interesting along the Sianok segmentbecause it traverses the flank of Merapi volcano and theyoung, 200 m thick pyroclastic flow deposit of Maninjouvolcano [29]. In this study, we analyzed five events alongthis segment – a main shock and four aftershocks (Table 5).Four events are strike–slip and one event exhibited normaloblique strike–slip motion (Figure 5).
Figure 4. Fault plane identification of 15 events that occurred onten segments of the SFZ (Table 6). Two nodal planes (redand green planes) passing through the centroid (LAT=0and LON=0), both according to MT solutions presented inthis paper, and the hypocenters (black stars are hypocen-ters from this paper (Table 4), blue stars are hypocenterscalculated by EMSC and BMKG-Indonesia). These arethe favorable cases, as in each case the hypocenter oc-curs on one of the nodal planes (green planes), and thusindicates the fault plane.
The location and focal mechanism for the20061217_21:39:17_33 event suggests it occurred onthe Angkola segment. This was a shallow event (33 km),with a centroid location of 35 km (Table 6) and character-ized by a strike–slip component. Again, this event and itsstrike line (Figure 5) agrees well with the Angkola fault,shown in Figure 1. The fault plane component strikes at164˚, with a dip of 74˚, and a rake of -177˚ (Figure 4;Tables 5 and 6). The fault traces at Angkola displayclear geomorphic evidence of strike–slip. The Angkolasegment of the Sumatran Fault Zone produced the famousearthquake of 1892, during the establishment of thefirst primary triangulation network in the region [29].Natawidjaja [2] used offsets of tributaries on the AngkolaRiver at about 0.55˚N to demonstrate right-lateral offsetsranging from 200 to 1200 m along this segment.
Right-lateral slip near the northern end of the Toru seg-ment generated the Mw=6.4 Pahae Jahe earthquake of1984. This segment has produced other major histor-ical earthquakes, a Mw = 6.0 event occurred on 28thMarch 28 2005, and a Mw=6.2 event occurred on 7thApril 2005. Many aftershocks have also occurred alongthe segment. A 30 km wide caldera is truncated by theToru fault, with one half lying northwest of the Sibual-buali volcano and northeast of the fault, and the otherhalf of the caldera, lying southwest of the fault, likelyconcealed beneath young volcanic deposits. The geomor-phic expression of the fault in the vicinity of the trun-cated caldera is unusually complex, with significant com-ponents of dip–slip occurring on faults that splay north-ward from the main trace into the caldera [2]. In this study,two events were analyzed from this segment, occurring on20080519_14:26:45_18 and 20080519_14:49:20_17, repre-senting one main shock and one aftershock having thesame strike of 154˚; the main shock showed a dip of 79˚,whereas the aftershock had a dip of 74˚ (Table 6). Bothevents demonstrate strike–slip fault types (Figure 5). Lo-cation and focal mechanism for these events suggest thatboth occurred on Toru segment.
The location and focal mechanism of the20061201_03:58:21_210 event suggests that it oc-curred on Renun segment. The fault plane of this event,of a normal oblique fault type (Figure 5), has a strike of017˚ and a dip of 89˚ (Figure 4; Tables 5 and 6). At 225km long, the Renun segment is the longest segment ofthe Sumatran Fault Zone. Much of the Renun segmenttraverses the thick pyroclastic flow deposit along thewestern flank of the 80 km long Toba caldera. This 73 000year old caldera is alleged to be the largest Quaternarycaldera on Earth [29]. The regional expression of theRenun segment is linear, except for a dogleg alongits northwestern-most 30 km, where the segment forms
462

Madlazim Kasmolan, Bagus Jaya Santosa, Jonathan M. Lees,Widya Utama
Figure 5. CMT results, showing epicentres (events (yyyymmdd_hh:mm:ss_depth (km); white rectangles), seismicity (red points), strike line(black line), and fault type.
the southwestern flank of the Alas Valley graben. Thisgraben, 45 km long and 9 km wide, is one of the largestgraben along the Sumatran Fault Zone.
8. Conclusion
The regional moment tensor solutions calculated for theSFZ in this paper are shown in Figure 5, along with focalmechanisms that represent the only double couple of mo-ment tensors. The final dataset consists of ten events withstrike–slip mechanism, three events with normal obliquestrike–slip mechanisms, one event with oblique reversemotion, and one event with an oblique normal fault type.
The hypocenters of all fifteen events clearly show strikesthat parallel Sumatra Island to be the fault plane withapproximate depths of about 14–210 km. In this sense,these results support the hypothesis that the interplateboundary of the Sumatra Fault Zone plays the role of anactive surface.
Acknowledgement
We would like to express our gratitude to those whohelped us to finish this research. We want to thank IRIS-DMC, GFZ-Potsdam GEOFON (Germany), and BMKG(Indonesia), all of which permitted us to download wave-form data recorded by IA network stations. Furthermore,we would like to thank Prof. Dr. Jiri Zahradnik andDr. Efthimios Sokos, who gave us guidance in under-standing the ISOLA-GUI and HC-plot software, and inapplying this software to estimate earthquake source pa-rameters using three-component local waveforms (http:
//seismo.geology.upatras.gr/isola). The authors wouldlike to thank Dr. Fredy Alferdo who provided exampledata input and a manual for the HYPOINVERSE soft-ware. This research is part of author’s PhD project, and issupported by a BPPS, provided by the Human ResourcesDirectorate General of the Higher Education Ministry ofNational Education (DIKTI), Indonesia.
463
Earthquake Source Parameters at the Sumatran Fault Zone: Identification of the Activated Fault Plane
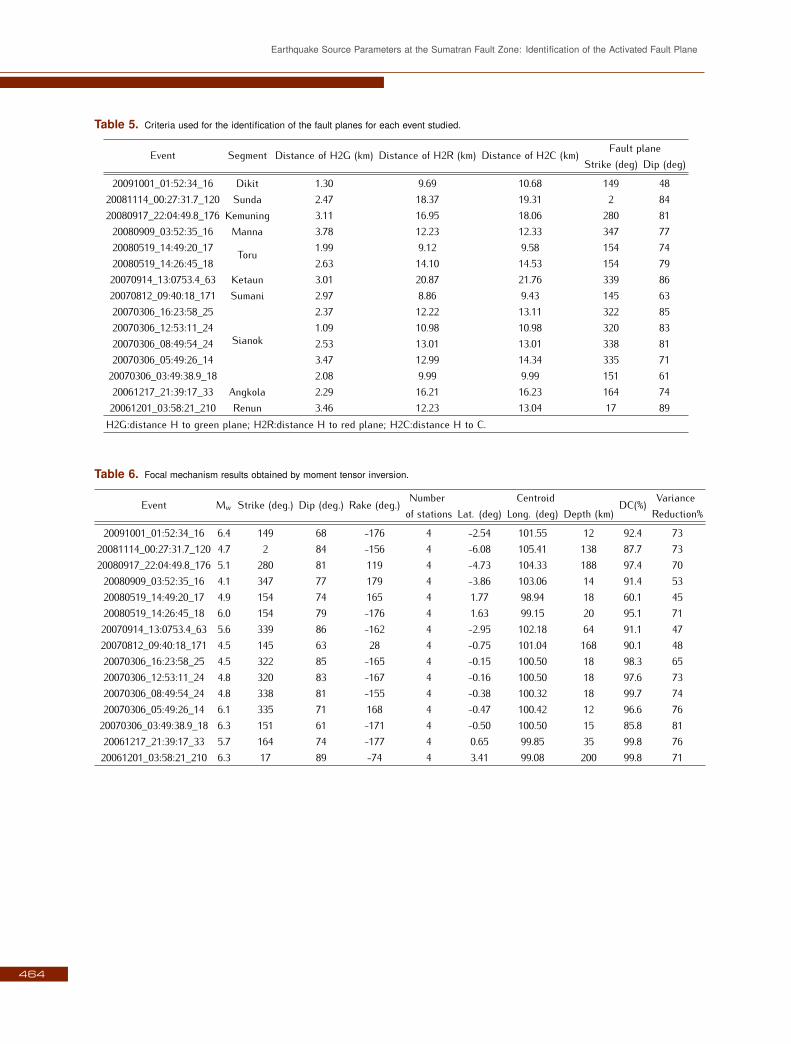
Table 5. Criteria used for the identification of the fault planes for each event studied.
Event Segment Distance of H2G (km) Distance of H2R (km) Distance of H2C (km) Fault planeStrike (deg) Dip (deg)
20091001_01:52:34_16 Dikit 1.30 9.69 10.68 149 4820081114_00:27:31.7_120 Sunda 2.47 18.37 19.31 2 8420080917_22:04:49.8_176 Kemuning 3.11 16.95 18.06 280 8120080909_03:52:35_16 Manna 3.78 12.23 12.33 347 7720080519_14:49:20_17 Toru 1.99 9.12 9.58 154 7420080519_14:26:45_18 2.63 14.10 14.53 154 7920070914_13:0753.4_63 Ketaun 3.01 20.87 21.76 339 8620070812_09:40:18_171 Sumani 2.97 8.86 9.43 145 6320070306_16:23:58_25
Sianok
2.37 12.22 13.11 322 8520070306_12:53:11_24 1.09 10.98 10.98 320 8320070306_08:49:54_24 2.53 13.01 13.01 338 8120070306_05:49:26_14 3.47 12.99 14.34 335 71
20070306_03:49:38.9_18 2.08 9.99 9.99 151 6120061217_21:39:17_33 Angkola 2.29 16.21 16.23 164 7420061201_03:58:21_210 Renun 3.46 12.23 13.04 17 89
H2G:distance H to green plane; H2R:distance H to red plane; H2C:distance H to C.
Table 6. Focal mechanism results obtained by moment tensor inversion.
Event Mw Strike (deg.) Dip (deg.) Rake (deg.) Number Centroid DC(%) Varianceof stations Lat. (deg) Long. (deg) Depth (km) Reduction%
20091001_01:52:34_16 6.4 149 68 -176 4 -2.54 101.55 12 92.4 7320081114_00:27:31.7_120 4.7 2 84 -156 4 -6.08 105.41 138 87.7 7320080917_22:04:49.8_176 5.1 280 81 119 4 -4.73 104.33 188 97.4 7020080909_03:52:35_16 4.1 347 77 179 4 -3.86 103.06 14 91.4 5320080519_14:49:20_17 4.9 154 74 165 4 1.77 98.94 18 60.1 4520080519_14:26:45_18 6.0 154 79 -176 4 1.63 99.15 20 95.1 7120070914_13:0753.4_63 5.6 339 86 -162 4 -2.95 102.18 64 91.1 4720070812_09:40:18_171 4.5 145 63 28 4 -0.75 101.04 168 90.1 4820070306_16:23:58_25 4.5 322 85 -165 4 -0.15 100.50 18 98.3 6520070306_12:53:11_24 4.8 320 83 -167 4 -0.16 100.50 18 97.6 7320070306_08:49:54_24 4.8 338 81 -155 4 -0.38 100.32 18 99.7 7420070306_05:49:26_14 6.1 335 71 168 4 -0.47 100.42 12 96.6 76
20070306_03:49:38.9_18 6.3 151 61 -171 4 -0.50 100.50 15 85.8 8120061217_21:39:17_33 5.7 164 74 -177 4 0.65 99.85 35 99.8 7620061201_03:58:21_210 6.3 17 89 -74 4 3.41 99.08 200 99.8 71
464

Madlazim Kasmolan, Bagus Jaya Santosa, Jonathan M. Lees,Widya Utama
Figure 6. Waveform fit for the moment tensor solution 070306_03:49:38.9_18; the red waveform is synthetic, and black waveform is observeddata. Inversion band 0.001 – 0.04 Hz.
Figure 7. Waveform fit for the moment tensor solution 070306_05:49:26_14; the red waveform is synthetic, and the black waveform is observeddata. Inversion band 0.035 – 0.07 Hz.
465
Earthquake Source Parameters at the Sumatran Fault Zone: Identification of the Activated Fault Plane
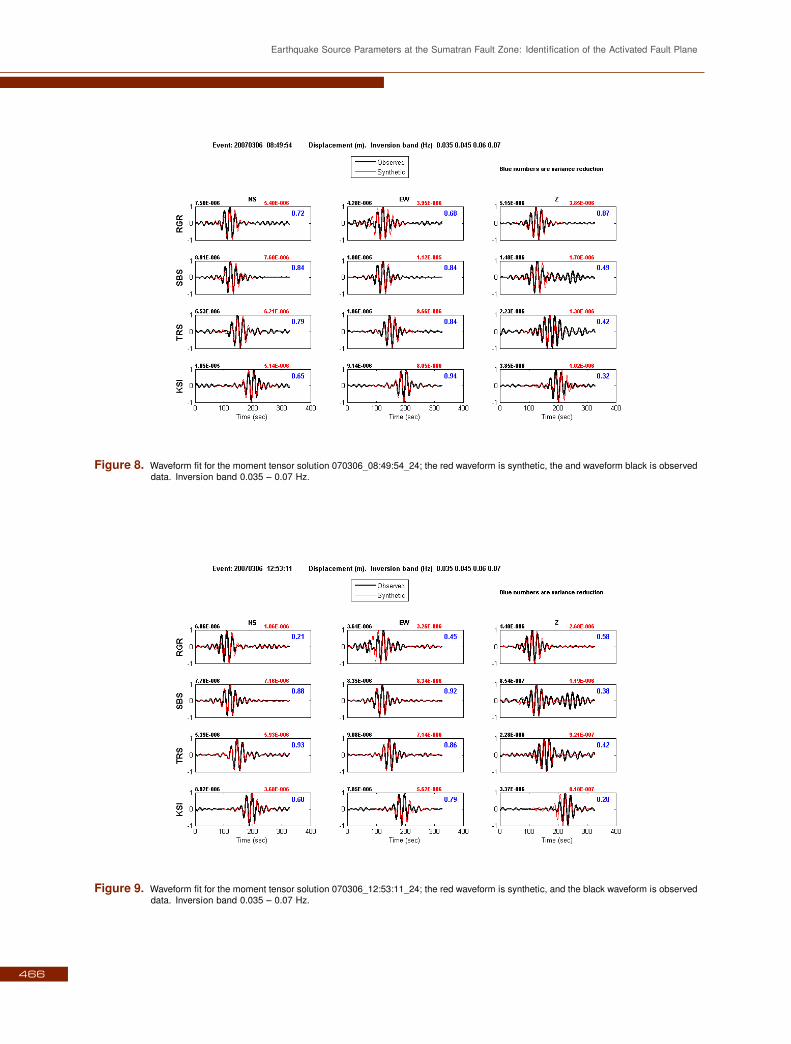
Figure 8. Waveform fit for the moment tensor solution 070306_08:49:54_24; the red waveform is synthetic, the and waveform black is observeddata. Inversion band 0.035 – 0.07 Hz.
Figure 9. Waveform fit for the moment tensor solution 070306_12:53:11_24; the red waveform is synthetic, and the black waveform is observeddata. Inversion band 0.035 – 0.07 Hz.
466
Madlazim Kasmolan, Bagus Jaya Santosa, Jonathan M. Lees,Widya Utama
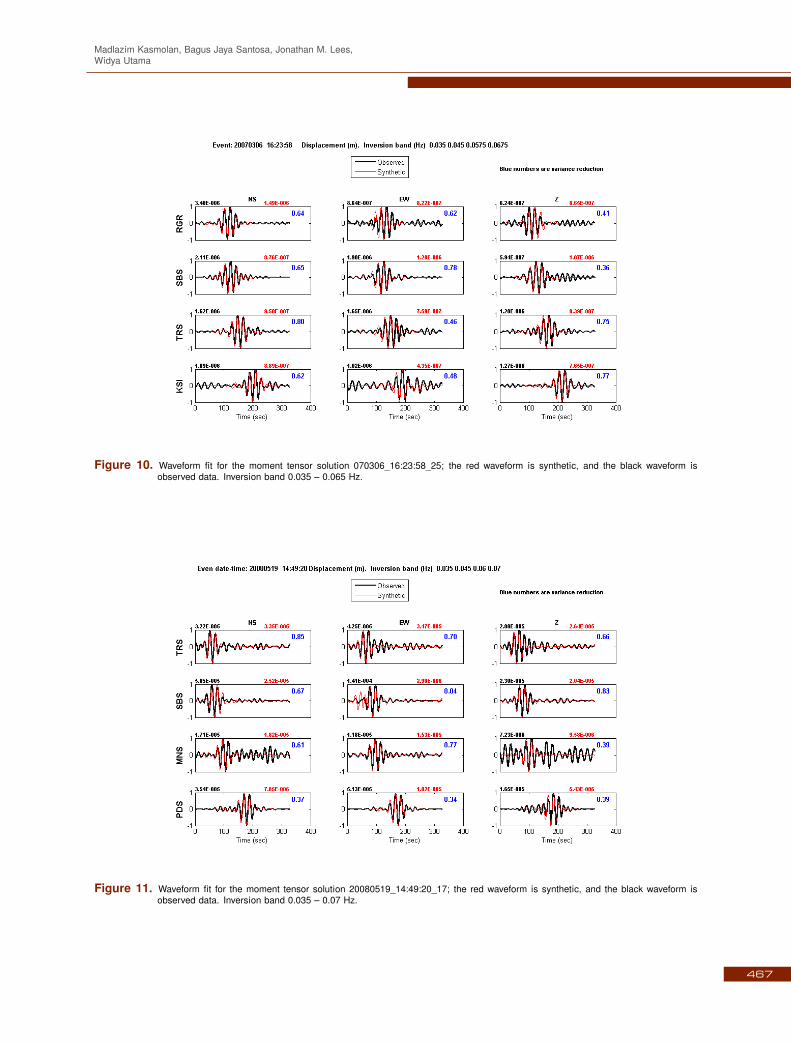
Figure 10. Waveform fit for the moment tensor solution 070306_16:23:58_25; the red waveform is synthetic, and the black waveform isobserved data. Inversion band 0.035 – 0.065 Hz.
Figure 11. Waveform fit for the moment tensor solution 20080519_14:49:20_17; the red waveform is synthetic, and the black waveform isobserved data. Inversion band 0.035 – 0.07 Hz.
467
Earthquake Source Parameters at the Sumatran Fault Zone: Identification of the Activated Fault Plane
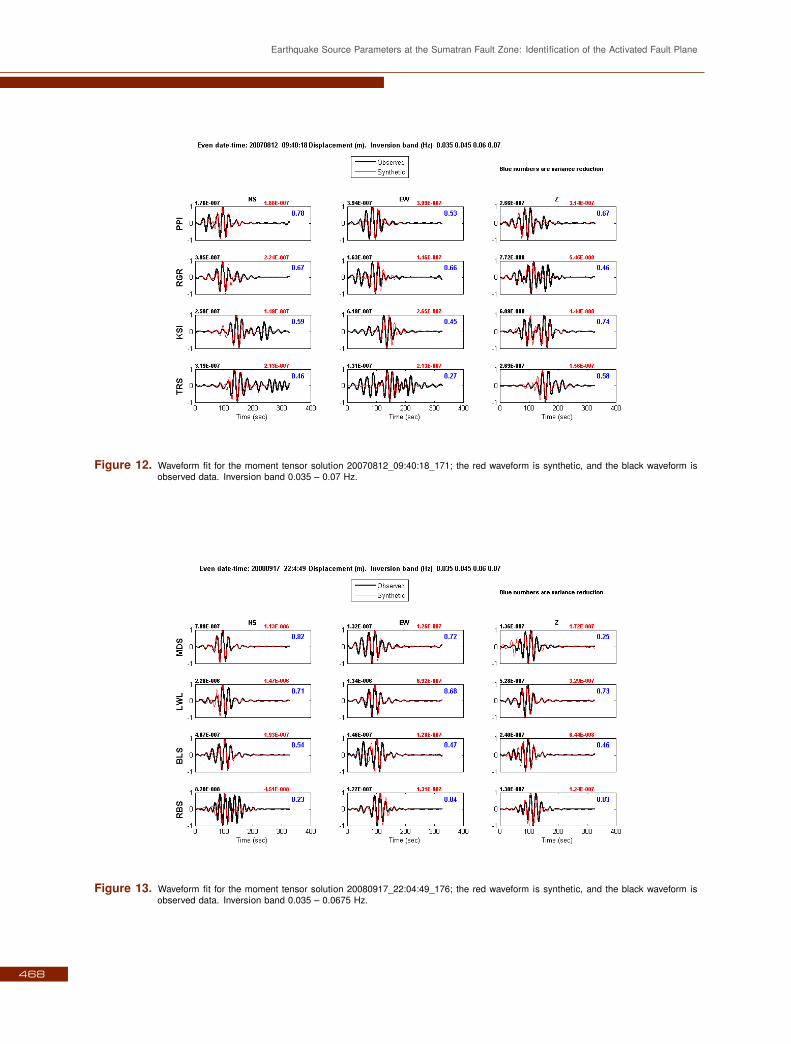
Figure 12. Waveform fit for the moment tensor solution 20070812_09:40:18_171; the red waveform is synthetic, and the black waveform isobserved data. Inversion band 0.035 – 0.07 Hz.
Figure 13. Waveform fit for the moment tensor solution 20080917_22:04:49_176; the red waveform is synthetic, and the black waveform isobserved data. Inversion band 0.035 – 0.0675 Hz.
468

Madlazim Kasmolan, Bagus Jaya Santosa, Jonathan M. Lees,Widya Utama
Figure 14. Waveform fit for the moment tensor solution 20081114_00:27:31_120; the red waveform is synthetic, and the black waveform isobserved data. Inversion band 0.035 – 0.07 Hz.
Figure 15. Waveform fit for the moment tensor solution 20061201_03:58:21_210; the red waveform is synthetic, and the black waveform isobserved data. Inversion band 0.02 – 0.06 Hz.
469

Earthquake Source Parameters at the Sumatran Fault Zone: Identification of the Activated Fault Plane
Figure 16. Waveform fit for the moment tensor solution 20091001_01:52:34_16; the red waveform is synthetic, and the black waveform isobserved data. Inversion band 0.015 – 0.0415 Hz.
Figure 17. Waveform fit for the moment tensor solution 20061217_21:39:17_33; the red waveform is synthetic, and the black waveform isobserved data. Inversion band 0.02 – 0.055 Hz.
470

Madlazim Kasmolan, Bagus Jaya Santosa, Jonathan M. Lees,Widya Utama
Figure 18. Waveform fit for the moment tensor solution 20080519_14:26:45_18; the red waveform is synthetic, and the black waveform isobserved data. Inversion band 0.02 – 0.06 Hz.
Figure 19. Waveform fit for the moment tensor solution 20070914_13:07:53.4_63; the red waveform is synthetic, and the black waveform isobserved data. Inversion band 0.035 – 0.07 Hz.
471

Earthquake Source Parameters at the Sumatran Fault Zone: Identification of the Activated Fault Plane
Figure 20. Waveform fit for the moment tensor solution 20080909_03:52:35_16; the red waveform is synthetic, and the black waveform isobserved data. Inversion band 0.035 – 0.07 Hz.
472

Madlazim Kasmolan, Bagus Jaya Santosa, Jonathan M. Lees,Widya Utama
References
[1] McCarthy A.J., Elders C.F., Cenozoic Deformationin Sumatra: Oblique Subduction and the Develop-ment of the Sumatran Fault System. In: Fraser, A.J.,Matthews, S.J., Murphy, R.W. (Eds.), Petroleum Geol-ogy of Southeast Asia. Geol. Soc. Spec. Pubs, 1997,126, 355–363
[2] Natawidjaya D.H, Neotectonics of the SumatraFault and Paleogeodesy of the Sumatra SubductionZone, PhD thesis, California Institute of TechnologyPasadena, USA, 2002
[3] Yeats R., Sieh K., Allen C., The Geology of Earth-quakes, Oxford University Press, New York, 1997
[4] Lasitha S., Radhakrishna M., Sanu T.D., Seismicallyactive deformation in the Sumatra–Java Trench-arcregion: Geodynamic Implications, Current Science,2006, 90, 690–696
[5] Prawirodirdjo L., Bock Y., McCaffrey R., and e. al.,Geodetic observations of interseismic strain segmen-tation at the Sumatra subduction zone, Geophys. Res.Lett., 1997, 24, 2601–2604
[6] McCaffrey R., Slip vectors and stretching of theSumatran fore arc, Geology, 1991, 19, 881–884
[7] Bellier O., Sebrier M., Is the slip rate variation onthe Great Sumatran Fault accommodated by fore-arcstretching? Geophys. Res. Lett., 1995, 22, 1969–1972
[8] Natawidjaya D.H, The Sumatran Fault Zone -from Source to Hazard, Journal of Earthquake andTsunami, 2007, 1, 21–47
[9] Haslinger F., Kissling E., Ansorge J., Hatzfeld D., Pa-padimitriou E., Karakostas V., Makropoulos K., KahleH.-G., Peter, Y., 3D crustal structure from local earth-quake tomography around the Gulf of Arta (Ionianregion, NW Greece), Tectonophysics, 1999, 304, 201–218
[10] Santosa B.J., Analyzing the seismogram of earth-quakes on Sumatra-Java Subduction plane at CHTOobservation station, Journal MIPA, 2005, 13, 23–29
[11] Klein F.W, HYPOINVERSE, a program for VAX andPro-350 computers to solve for earthquake locationsand magnitudes, U.S. Geological Survey Open-FileReport, 1985, 85–515
[12] Serpetsidaki A., Sokos E., Tselentis G.A., ZahradnikJ., Seismic sequence near Zakynthos Island, Greece,April 2006: identification of the activated fault plane,Tectonophysics, 2010, 480, 23–32
[13] Tselentis G.A., Melis N.S., Sokos E., Papatsimpa K.,The Egion June 15, 1995 (6.2 ML) earthquake, West-ern Greece, Pure Appl. Geophysics.,1996, 147, 83–98
[14] Zahradnik J., Jansky J., and Plicka V., Detailed Wave-
form Inversion for Moment Tensors of M ∼4 Events:Examples from the Corinth Gulf, Greece, Bull. Seism.Soc. Am., 2008, 98, 2756–2771
[15] Goldstein P., Snoke A., SAC Availabil-ity for the IRIS Community, IRIS Consor-tium, DMS Electronic Newsletter, 2005,7,www.iris.edu/news/newsletter/vol7no1/page1.htm
[16] Sokos E., Zahradník J., ISOLA a Fortran code and aMatlab GUI to perform multiple-point source inver-sion of seismic data, Computers & Geosciences, 2008,34, 967–977
[17] Kikuchi M., Kanamori H., Inversion of complex bodywaves – III, Bull. Seism. Soc. Am., 1991, 81, 2335–2350
[18] Bouchon M., A review of the discrete wavenumbermethod, Pure Appl. Geophys, 2003, 160, 445–465
[19] Coutant O., Program of numerical simulation AXI-TRA, Laboratoire de Géophysique Interne et Tectono-physique Report, University of Joseph Fourier, 1990(in French)
[20] Zahradnik J., Serpetsidaki A., Sokos, E., TselentisG.A., Iterative deconvolution of regional waveformsand a double-event interpretation of the Leadaearthquake, Greece, Bull. Seism. Soc. Am., 2005, 95,159–172
[21] Zahradnik J., Sokos E., Tselentis G.-A., Martakis N.,Non-double-couple mechanism of moderate earth-quakes near Zakynthos, Greece, April 2006; expla-nation terms of complexity, Geophys. Prospect, 2008,56, 341–356
[22] Zahradnik J., Gallovic F., Sokos E., Serpetsidaki A.and Tselentis G.A., Quick Fault-Plane Identificationby a Geometrical Method: Application to the Mw 6.2Leonidio Earthquake, 6 January 2008, Greece. Seis-mological Research Letters, 2008, 79, 653–662
[23] Fitch T., Plate convergence, transcurrent faults, andinternal deformation adjacent to southeast Asia andthe western Pacific, Journal of Geophysical Research,1972, 77, 4432–4462
[25] McCaffrey R., Slip vectors and stretching of theSumatran fore arc, Geology, 1991, 19, 881–884
[25] Diament M., Harjono H., Karta K., Deplus C., DahrinD., Zen Jr. M.T., Gerard M., Lassal O., Martin A.,Malod J., Mentawai fault zone off Sumatra: a newkey to the geodynamics of western Indonesia, Geol-ogy, 1992, 20, 259–262
[26] Zen Jr. M., Dahrin D., Diament M., Harjono H., KartaK., Deplus C., Gerard M., Lassal O., Malod J., MartinA., Mantawai-90 cruise result: the Sumatra obliquesubduction and strike slip fault zones. In: PrasetyoH. (Ed.), Geodynamic Processes in the Forearc SliverPlate and General Topics, Indonesian Assoc. of Geo-phys., Bandung, 1991, 46
473

Earthquake Source Parameters at the Sumatran Fault Zone: Identification of the Activated Fault Plane
[27] Pramumijoyo S., Sebrier M., Neogene and Quater-nary fault kinematics around the Sunda Strait area,Indonesia, J. Southeast Asian Earth Sci., 1991, 6, 137–145
[28] Harjono H., Diament M., Dubois J., Larue M., Seis-micity of the Sunda Strait: Evidence for crustal exten-sion and volcanological implicationa, Tectonics, 1991,10, 17–30
[29] Kerry S., Natawidjaya D., Neotectonics of the Suma-tra fault, Indonesia, Journal of Geophysical Research,2002, 105, 298–309
[30] Pacheco J.F., Lynn R.S., Scholz C.H., Nature of seis-mic coupling along simple plate boundaries of thesubduction type, Journal of Geophysical Research,1993, 98, 14133–14159
474