
Impact of AIDS on rural livelihoods in Benue State, Nigeria ...
Upload
khangminh22Category
view
0download
0
Journal of Emerging Trends in Engineering and Applied Sciences (JETEAS) 3(6):904-913(ISSN: 2141-7016)
904
Assessment of Surface Water Quality of River Benue at Makurdi
1Apeh, S. and 2Ekenta O.E.
1Civil Engineering Department Federal Polytechnic Idah. 2Civil Engineering Department, Nnamdi Azikiwe University, Awka.
Corresponding Author: Apeh, S. ___________________________________________________________________________ Abstract A reach of River Benue (at Makurdi) one of the two major rivers in Nigeria was monitored for a period of six months covering both dry and rainy seasons of the year for pollution modeling due to multi-usage of the river - human consumption and industrial usage. Five samples were taken from each of the following sources: Benue Brewery Limited (point source); Benue Links Limited (heavy concentration of people) non- point source; Makurdi Abattoir (point source); Makurdi water works, non-point source; Wadata (heavy concentration of people) non-point source. The process of field sampling, laboratory analysis and regression modeling of flow depth and pollution concentration revealed the following: Pollution in River Benue is influenced by natural regimes such as rainfall and discharges; physical and chemical pollutions increased with rainfall while microbial pollution is inversely proportional to rainfall. Microbial pollution of the river is more severe than physical and chemical pollution and has more effect on public health. Unlike time, there is no trend in degree of pollution with respect to space. A positive non-linear relationship exists between water related diseases at Makurdi and coli form organisms in the river. Non-linear models for physical and chemical pollution, linear and polynomial models for flow depth and water pollutions were formulated. The models yielded values of coefficients of correlation(R) ranging from 0.6785 to 0.9994 implying good fitting. The regression models are reliable for monitoring and prediction of water quality in this area, with both cost and time saving advantages. __________________________________________________________________________________________ Keywords: Assessment, Surface Water Quality, Modeling, River Benue. __________________________________________________________________________________________ INTRODUCTION Water is among the major essentials that nature provides to sustain life for plants, animals and humans. Water is undoubtedly the most precious natural resources that exist on our planet. The total quantity of fresh water on earth could satisfy all the needs of the human population if it were evenly distributed and accessible. Without water, life on earth would be non-existent, it is essential for everything on our planet to grow and prosper. Water pollution manifests itself in form of impairment of the quality of the water. The pollution of water directly or indirectly affects public health. Various studies have shown that some chemicals are so harmful that even in trace amounts they can cause illness or even death in humans (Ugada, 1986; Hertz man, 1995). Klein (1969) reported that the consumption of water with excess TDS has laxative effects on humans. Pi and others (2002) linked induction of oxidative stress in humans to chronic exposure to arsenic in drinking water. According to Claudio (2002), Consumers of fish and crabs from river contaminated with poly chlorinated biphenyls (PCBS) are prone to cardiovascular disease, endocrine disruption and cancers such as breast cancer and leukemia. Childhood brain tumors have been shown to be associated with water contaminated with nitrites and nitrates (Mueller and others, 2001). Most water-bone diseases plaguing man are caused
by pathogenic microbial organisms. In fact, the relationship between polluted water and diseases was firmly established with the whole cholera epidemic in 1854 in London, England (Henry, 1989). Viruses, bacteria, parasites and protozoa are among the micro organisms involved in microbial pollution of water. Industrial growth is fast increasing globally and so also is the water demand for industrial productions or processes. This has put more pressure on the limited available water resources. Water bodies are constantly used as receptacles for the untreated waste water or poorly treated effluents accruing from industrial activities, which has rendered many water bodies unsuitable for both primary and/or secondary usage. In advanced countries, environmental monitoring agencies are more effective and environmental laws are strictly followed. General environmental quality monitoring is compulsory and the monitoring of the quality of water resources is done on regular basis. (Neal and Robson, 2000: USEPA, 2000; Robson and Neal, 1997; USEPA, 1996; USEPA, 1995; USGS, 1995; USEPA, 1991). As a result, any abnormal changes in the environmental or water quality indices can be detected and appropriate action taken before the outbreak of epidemics. The case is quite the opposite in many developing countries. Environmental laws where there are any, are rarely implemented. Industrial growth and its associated
Journal of Emerging Trends in Engineering and Applied Sciences (JETEAS) 3(6): 904-913 © Scholarlink Research Institute Journals, 2012 (ISSN: 2141-7016) jeteas.scholarlinkresearch.org
Journal of Emerging Trends in Engineering and Applied Sciences (JETEAS) 3(6):904-913(ISSN: 2141-7016)
905
environmental problems such as soil, plant and air contamination is fast increasing (Fakayode, and Onianwa, 2002; Onianwa and Fakayode, 2000). Report of general water quality contamination in several cities in Nigeria abound (Olajire and Imeokparia, 2001; Biney et al, 1994), yet, little is known about the effect of effluent discharge on the water quality of numerous rivers and streams in the country. The high rate of untreated effluent discharged into River Benue at Makurdi is alarming coupled with some rural dwellers that use the river as their toilet while some people use the same river as their main source of drinking water calls for attention. River Benue is one of the two major rivers in Nigeria. It starts from the Cameroon mountains and flows westwards through Makurdi to meet the River Niger at Lokoja in Kogi State. Along the Makurdi new bridge, the river is 1.194km wide with an average depth and cross-sectional area of 7.82m and 4608.42m2 respectively (Akpen and Eze, 2006). Makurdi town, located in the Benue valley experiences a typical tropical climate with distinct dry and wet seasons. The wet season, this lasts for seven months starts from April and ends in October. There is however usually one or more early heavy rain in January, February or March. The dry season begins in November and ends in March. Within the same period, the area experiences two distinct weather situations; while harmattan, with cool and chilly weather is experienced from December to early February; hot weather and high temperatures are experienced between the later part of February and early April. Fig. 1.0: Drainage map of Nigeria Source:-www.britenicca .com The river of study is subjected to various sources of pollution; industrial wastes from the Benue Brewery Limited (BBL) and Nigeria, Bottling Company (NBC) all located along Gboko road are channeled into the River Benue. Also wastes from the New Garage market and the abattoir near the new bridge are washed into the river, other sources of pollution of the river are faeces from humans defecating
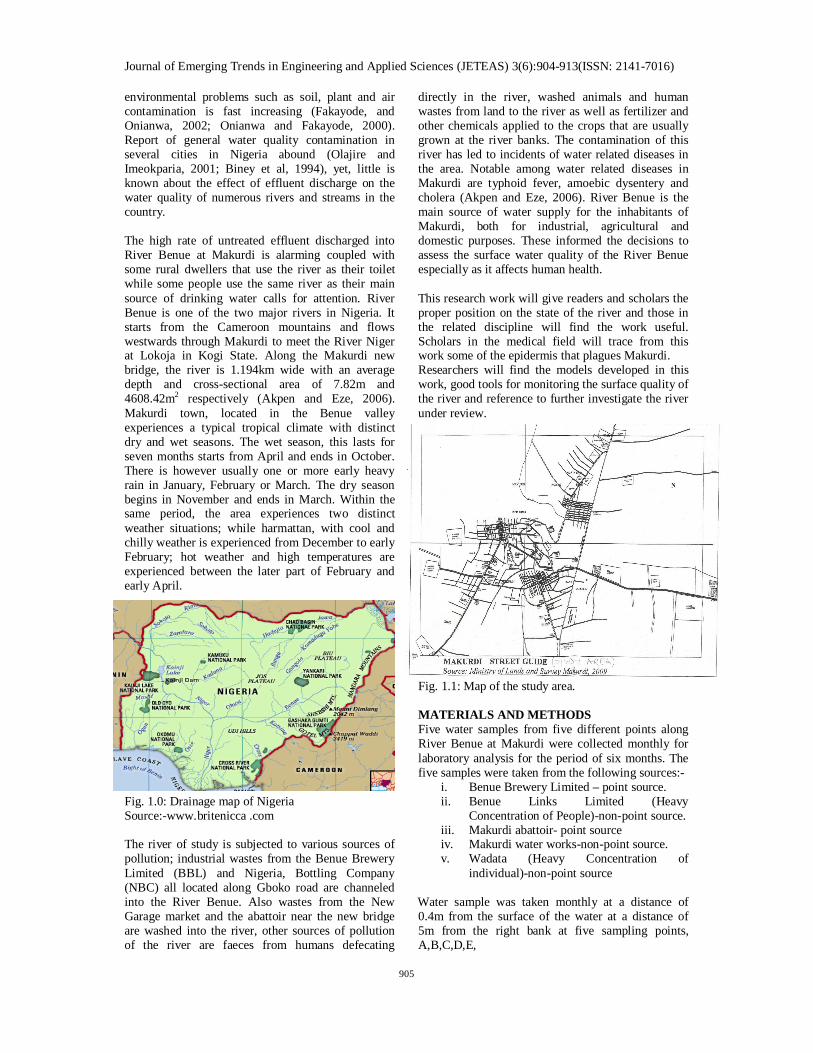
directly in the river, washed animals and human wastes from land to the river as well as fertilizer and other chemicals applied to the crops that are usually grown at the river banks. The contamination of this river has led to incidents of water related diseases in the area. Notable among water related diseases in Makurdi are typhoid fever, amoebic dysentery and cholera (Akpen and Eze, 2006). River Benue is the main source of water supply for the inhabitants of Makurdi, both for industrial, agricultural and domestic purposes. These informed the decisions to assess the surface water quality of the River Benue especially as it affects human health. This research work will give readers and scholars the proper position on the state of the river and those in the related discipline will find the work useful. Scholars in the medical field will trace from this work some of the epidermis that plagues Makurdi. Researchers will find the models developed in this work, good tools for monitoring the surface quality of the river and reference to further investigate the river under review. Fig. 1.1: Map of the study area. MATERIALS AND METHODS Five water samples from five different points along River Benue at Makurdi were collected monthly for laboratory analysis for the period of six months. The five samples were taken from the following sources:-
i. Benue Brewery Limited – point source. ii. Benue Links Limited (Heavy
Concentration of People)-non-point source. iii. Makurdi abattoir- point source iv. Makurdi water works-non-point source. v. Wadata (Heavy Concentration of
individual)-non-point source Water sample was taken monthly at a distance of 0.4m from the surface of the water at a distance of 5m from the right bank at five sampling points, A,B,C,D,E,

Journal of Emerging Trends in Engineering and Applied Sciences (JETEAS) 3(6):904-913(ISSN: 2141-7016)
906
Point A is upstream of the point where effluents from BBL and NBC enter the river. B is downstream of A at a distance of 2km. But C, downstream of B is below the Makurdi new bridge a distance of 2.5km from B. D is at the Makurdi water works 1.5km downstream of C.E is a point downstream of the new garage market at a distance of 3km from D. The sampling period covered show a sketch of the location six months from April-September 2010. Laboratory Analysis The following Physio-chemical properties of each water sample was investigated using relevant equipment- Hatch CO150, Hatch DR2000 spectrophotometer, HA-4P-MGI, Model 9071 DO2 meter: Temperature, Turbidity, Conductivity, Colour, Total dissolved solids, Salinity, pH, Phosphate, Sulphides, Iron, Total hardness, Magnesium hardness, Calcium hardness; Biochemical oxygen demand and Microbial parameters such as, Coli forms.
RESULTS ANALYSIS AND DISCUSSION Results for Water Quality Analysis
Fig. 1.2: Temperature Concentration as a function of time. From the plot (Fig. 1.2), BBL had the highest temperature followed by abattoir, Benue links, then Wadata and Water Works. High temperature in April could be due to lack of rain fall, intensity of the sun light and the reaction between industrial waste from the Brewery and NBC. Low temperatures between June and August from Benue Links and Wadata could be due to increase in the volume of water due to rainfall and reduction in the intensity of the sun. Fig 1.3: Colour Concentration as a function of time.
Fig 1.3 shows that all the samples tested had high colours but BBL and abattoir had the highest from April to September. This could be due to effluent from BBL (point source) and abattoir (point source. Water works had the least colours). This could be due to the self cleansing capacity of the river. Fig 1.4: Turbidity Concentration as a function of time Fig 1.4 shows that June had the highest turbidity BBL and Abattoir contributed most to this. In June, much rainfall was observed leading to an increase in the volume and flow rate of the river which could probably lead to higher value of turbidity. Samples from Benue Links, Wadata and Water Works have relatively low turbidity which could be as a result of the absence of constant disturbance like deposition of effluents and also due to relatively uniform flow at those areas.
Fig. 1.5: Total Solids Concentration as function of time Fig 1.6: Suspended solids as a function of the time Fig. 1.6 shows that BBL and Abattoir had the highest suspended solid, almost all through the sampling period April-September. This could principally be

Journal of Emerging Trends in Engineering and Applied Sciences (JETEAS) 3(6):904-913(ISSN: 2141-7016)
907
due to effluent discharged from these industries. Wadata, Water Works have little, may be due to the self cleansing capacity of the river.
Fig 1.7: Total dissolved solids as a function of time. Fig 1.7 shows that Abattoir had the highest TDS in June (may be due to animal bones and waste from slaughtered animal).
Fig. 1.8: Hardness as a function of time
Fig. 1.9: Conductivity as a function of time Fig1.9 shows that BBL had the highest conductivity in May and the least in September. The least conductivity in September could be attributable to high volume of water due to heavy rainfall.
Fig.1.10: pH as a function of time
Fig. 1.10 shows that all the sample had pH between 6 and 8 except Benue Links which was slightly higher than 8. This could be as a result of waste from heavy concentration of people.
Fig. 1.11: Hardness as a function of time Fig1.11 reveals that BBL had the highest hardness value in April (340mg/L) and other points values ranging from 50mg/L to 300mg/L while water work had the least, may be due to the self cleansing capacity of the river. NIS maximum hardness value for potable water is 150mg/L and only Water Works and Wadata fall within that range. Fig.1.12: Calcium concentration as a function of time Fig. 1.12 shows that the trend is the same with BBL having the highest calcium content (240mg/L) in April and Water Works having the least in May and June respectively. The reduction in the quantity of calcium downstream is as a result of the self purification of the river through the distance.
Fig. 1.13: Magnesium concentration as a function of time Fig. 1.13: shows that Nigerian Industrial Standard for potable drinking water was exceeded. The standard is 0.20mg/L while BBL had 100mg/L in April slowing that the effluent from these industries BBL and NBC have a lot of magnesium and was not treated before being discharged.

Journal of Emerging Trends in Engineering and Applied Sciences (JETEAS) 3(6):904-913(ISSN: 2141-7016)
908
Fig. 1.14: Chloride as a function of time Fig. 1.14 shows that Nigerian Industrial Standard for drinking water quality was exceeded. The standard is 250mg/L. BBL had 468.7mg/L in April and Water Works had the least in August.
Fig. 1.15:Sulphate concentration as a function of time Fig 1.15 shows that Nigerian Industrial Standard for sulphate is 100mg/L and the highest from all the sampling point was 73.3mg/L from Benue Links in April.
Fig. 1.16: Nitrate concentration as a function of time Fig. 1.16 shows that Maximum nitrate permitted by Nigerian Industrial Standard is 50mg/L. it is only Water Works and Wadata that have values less than that showing no pollution by nitrate, the rest sampling points are nitrate polluted. Possible source of nitrate pollution is the brewery and NBC.
Fig1.17 Floride (mg/L) as a function of time.
Fig 1.17 reveals that Maximum permissible by Nigerian Industrial Standard is 1.5mg/L for drinking water all the sampling points are not polluted with fluoride. The highest is 0.15 in May and June for BBL.
Fig. 1.18: Iron concentration as a function of time Fig. 1.18 shows that Nigerian Industrial Standard for iron in 0.3mg/L. Only Water Works and Wadata are not polluted with iron by Nigerian Industrial Standard.
Fig. 1.19: Zinc concentration as a function of time Nigerian Industrial Standard for zinc is 3mg/L. Fig1.19 reveal that all the sampling points have values less than 3mg/L showing no pollution.
Fig1.20 Chromium concentration as a function of time.
Fig. 1.20: Chromium as a function of time. Fig. 1.20 reveals that all the sampling points have values less than 0.05mg/L (NIS for chromium) showing no pollution. Fig 1.21 phenol (mg/L) as a function of time

Journal of Emerging Trends in Engineering and Applied Sciences (JETEAS) 3(6):904-913(ISSN: 2141-7016)
909
Fig. 1.21 shows that all the sampling points have very high values of phenol compare to NIS (0.001mg/L) in July showing pollution with phenol. Fig. 1.22: COD concentration as a function of time Fig 1.22 shows that BBL had the highest COD in April and Water Works had the least in May. BBL had the highest COD because the effluents from the industry react with the oxygen and thereby increasing its demand. Fig. 1.23: DO2 concentration as function of time Fig. 1.23 shows that DO2 (i) was highest in Water Works. Fig. 1.24: DO2(ii) concentration as a function of time Fig1.24 shows that DO2 (ii) Water Works has the highest. Fig1.25 BOD Concentration as a function of time Fig. 1.25: shows that Abattoir had the highest BOD (160mg/L) in April and Water Works had the least (7.3mg/L) in May
Fig. 1.26: Total coliform as a function of time Fig. 1.26 shows pollution. Highest of 1800 per 100ml for BBL from April-September shows remarkable pollution. Table 1. Comparison of Laboratory Results with WHO Standards
The maximum and/or minimum values of the various parameters irrespective of which month or sampling point they occur were isolated for comparison with WHO standards as shown in the table 1. Trend Analysis The results of TSS concentration measurement as a function of time are presented in fig 3.4TSS values were high during the rainy months as indicated by the rise from April and May to a peak in June. There was however a drop in TSS concentration in July probably because of the short dry period (usually referred to August break). The TSS concentration at the abattoir was consistently higher than other sampling points reaching a maximum of 460 mg/l in June. The least value of TSS was recorded at the water works in April. The relatively low TSS in the dry month and high values in the rainy season showed that increased rainfall results in an increase of surface run-off. Hence more suspended solids were washed into the river. Also the high current resulting from an increase in volume of water due to heavy rainfall lead to suspension of solid particles originally settled at the bottom of the river. Apart from the large run-off contributing area of the abattoir over that of the entire study area, recreational and commercial
S/N Quality Indicator
Concentration (This Study)
Who Limit Remarks
1. Colour 550 pt. co. colour s
15 colour units Pollution
2. Conductivity 99.4 μs/cm 400 μs/cm No Pollution
3. Calcium 180 mg/l 75m/l Pollution
4. Magnesium 60 mg/l 30mg/l Pollution
5. TDS 144.7 mg/l 30 mg/l No Pollution
6. PH 6.62-85 6.5-8.5 No Pollution
7. Total Iron 1.2 mg/l 0.1 mg/l Pollution
8. Chloride 46 mg/l 200 mg/l No Pollution
9. DO 4.5 mg/l 5 mg/l (min)
10. TSS 468 mg/l 20 mg/l Pollution
11. Coli form 1800MPN 0 Pollution

Journal of Emerging Trends in Engineering and Applied Sciences (JETEAS) 3(6):904-913(ISSN: 2141-7016)
910
activities such as fishing and transportation of goods and people across the river are concentrated at this point. Hence, there is greater suspension of settled sediments at these points. There was however no consistency in the degree of pollution at the other points with respect to the area contributing to run-off. This is due to the introduction of surface run-off into the river at different points along the river. The high TSS value observed during the rainy season is similar to the trend reported by Odokuma and Okpowasili (1997) in the new Calabar River. However, Okah (1999) observed a reverse trend for the Imo River system. The following are discernable from the plots. First pollution of River Benue is influenced from natural regimes such as rainfall and discharges, chemical pollutant concentration generally decrease in the dry season due to fewer materials discharged into the river from surface run-off. Also, there is no consistency in the degree of pollution with respect to space due to the introduction of surface washes at different points along the reach of the river investigated. The microbial parameters should have a reverse trend to that of physico-chemical parameters. Their concentrations were higher during the dry season than the rainy season similar to Nwaogazie and Ogelle (1997) observation at the Obinna River. The low concentration in the rainy season is due to the effect of dilution as a result of increase in rainfall and hence volume of water in the river. Just as the case of physico-chemical pollutions, there was no trend in the degree of microbial pollution with respect to space. Table 2. Water Related Disease Cases at Makurdi
Source: Federal Medical Centre Makurdi, 2010. From table 2 Water-related disease cases were reported in May and June, the least value of 38 cases was observed in September. The decrease in cases of water-related diseases after June is due to the effects of dilution as justified by the reduction in coli from organisms with increase in rainfall in fig 4.10. The relatively high values recorded from March through June may be due to the residual effect of infections during the preceding dry season (November-March). Higher coli forms were observed during the dry season hence the tendency for greater number of water-related disease cases. Table 2 also reveals that
microbial pollution has greater effect on public health as most of the reported water-related disease cases are from microbial pathogens. The observation conforms to the work of Feachem and others (1978) who reported that hazards from microbial pollution of water to health in the tropics were on a higher scale than from chemical pollution. The summary of the model is shown in table 3. The high coefficient of correlation (r) implies the regression models are representative of the observed field/laboratory data and so there are reliable tools for prediction of water quality in the study area. To verify the models, the models predictions and the observed data points are presented in fig 1.27 to1.37. The observed data points lie either on the regressed model or close to the curves justifying their reliability as prediction tools in the area. MODELING OF RIVER WATER QUALITY Assumption of Simple Regression Model The following are the basic assumptions of the simple linear regression model.
1. Normality: for any value Xί, the error term has a normal distribution.
2. Zero mean: for any value of Xί, E (ei) = 0. 3. Hanoscedastivity: the variance of eί denoted
by oe2 is the same for all x. 4. No serial correlation: the error terms are
independent of one another. 5. Independence of eί and xί: the error terms
are independent of the values of the independent variable x.
Fig. 1.27: Regression model of colour against flow depth
Fig 1.28 Regression model of total solids against flow depth
Mar Apr May Jun Jul Aug Sept Total
Typhoid\ fever 9 8 7 11 6 10 5 56
Schistosomiasis 0 0 0 1 0 0 0 1
Gastro Enteritis 25 18 26 15 12 10 8 114
Bacillary Dysentery 7 22 20 10 16 13 10 98
Diarrhea 16 13 9 26 20 18 15 117
Total 57 61 62 62 54 51 38 386

Journal of Emerging Trends in Engineering and Applied Sciences (JETEAS) 3(6):904-913(ISSN: 2141-7016)
911
Fig 1.29 Regression model of conductivity against flow depth Fig 1.30 Regression model of suspended solids against flow depth Fig 1.31 Regression model of turbidity against flow depth Fig 1.32 Regression model of temperature against flow depth Fig 1.33 Regression model of TSS against flow depth
Fig 1.34 Regression model of colour against TDS.
Fig 1.35 Regression model of TSS against TDS. Fig 1.36 Rainfall Distribution for Makurdi Fig 1.37 Flow Depth Hydrograph.

Journal of Emerging Trends in Engineering and Applied Sciences (JETEAS) 3(6):904-913(ISSN: 2141-7016)
912
Table 3. Summary of the Models
LIMITATIONS OF THE STUDY 1) Samples for laboratory investigation were limited to six month due to the time frame of the study. 2) Number of samples were limited to five (5) and the tested parameters to the present scope because of equipment and cost. CONCLUSION AND RECOMMENDATIONS The results of the research reveal consistent microbial pollution which is greater during the dry season. H Chemical and physical pollution occasionally occur but is not as severe as microbial pollution and is generally higher in the rainy season Water related diseases (WD) reported such as typhoid fever, cholera, Schistosomiasis and bacillary dysentery normally result from infections by pathogenic microbes, which implies the microbial pollution has effect on public health. The following recommendations for abating pollution and its effect on public health are hereby presented: i. Proper disposal of animal and human wastes will help in reducing microbial pollution. ii. NBC and BBL should implement FEPA (2002) guidelines by treating their wastes to meet the minimum standards before discharging into the river to minimize chemical pollution. iii. Public enlightenment campaigns should be intensified to educate the people on the dangers inherent in taking water from the river without any form of treatment. As routine, regular water quality assessment should be carried out and the treatment method modified accordingly to ensure safe water at the tap. Rapid assessment of water quality can be done using the models developed in this study. To ensure that what is discharged from the various sample points is pollution free (i.e., the pollution is
reduced to a safe level), the following is recommended. Industries should have primary units of treatment
or even some specific units of treatment within their premises and send wastes to CETP after wards only.
Government should set up CONCEPTS OF COMMON EFFLUENT TREATMENT PLANTS (CETP) where liquid effluents from a group of industries can be collected and treated in combination in one treatment plant and the various industries made to pay for the effluent sent to the plant via tankers, and/or pipes depending on the pollution load.
Figure: 1.38 Concept of common effluent treatment plant (CETPSource: Rao (2002). - Parliament should adopt enabling legislation to
control pollution including discharges to surface water with penalties against defaulters.
- Industries should have laboratories where wastes are tested and classified before being sent to the treatment unit.
- Industrial wastes of acidic or alkaline nature should be neutralized before disposal preferably in a tank or pond.
REFERENCES Akpen, G.D and Eze, R.A.M (2006), “Water Pollution Modeling of the River Benue in the Reach of Makurdi Town” Journal of Nigeria Society of Engineers, NSE Technical Transaction Vol. 41 No.2. APHA (1994), “Standard Methods for the Examination of Water and Waste Water 18th ed. American Public Health Association. Biney et al (1994), “Report of General Water Quality Contamination in Several Uses in Nigeria” NIS. Charles A. (1992), “The Effect of Peptone on the Survival of Water Pollution Indicators Bacteria” Journal of the Nigeria Association of Hydro Geologists, Vol. 2 No. 1 & 2 pp 47-48.
Dependent Variable Y
Independent Variable X
Regression model R2 R
Colour Flow depth Y = -0.3056X2 + 3.7144X + 539.46 0.9965 0.9982
Total solids Flow depth Y = 2.9962X2 + 55.628X – 143.46 0.6785 0.8237
TDS Flow depth Y = -3.2924X2 + 53.374X – 22.567 0.8124 0.9013
Conductivity Flow depth Y = -0.561 + 71.334 0.1098 0.3313
Suspended solid
Flow depth Y = -2.0638X2 + 38.339X – 104.32 0.7177 0.8472
Turgidity Flow depth Y = -3.795X2 + 55.936X + 284.37 0.9125 0.9600
Temperature Flow depth Y = 0.2073X + 31.845 0.1433 0.3785
TSS Flow depth Y = -0.016X2 + 3.1933X + 467.89 0.9404 0.9700
Colour TDS Y = -0.0501X + 551.33 0.9759 0.9878
TSS TDS Y = 1.3497X + 390.34 0.6962 0.8344
Conductivity TDS Y = 0.1999X + 53.379 0.8341 0.9133
WD FC Y = -0.0516X2 + 3.5062X – 3.9782 0.8682 0.9318 Waste from
Primary Clarifier
Equalization Tank
Anaerobic Treatment
Oxidation Pond
Clarifier ASTP
Proportioning of wastes
Air flotation if required
Return sludge
Sludge collection and
Sewage
Effluent

Journal of Emerging Trends in Engineering and Applied Sciences (JETEAS) 3(6):904-913(ISSN: 2141-7016)
913
Fakayode and Onianwa, (2002), “An Ecological Study of Cross River Estuary”, Unpublished PhD Dissatation. Feachem, R. Cheal, M. and Duncan, M (1978), Waste Waters and Health in hot Climates, John Wiley and Sons Chi Chester, Journal of the Nigeria Association of Hydro Geologists, Vol. 2 No. 1 & 2 pp 19. Foster, F and Morgan, K. (1971), “E-Coli in Water: Journal of the Nigerian Association of Hydro Geologists, Vol. 2 No. 1 & 2 pp 54-55. Henry, L. (1989), “Water Quality Assessment Report”, WIS. Hertz man, C. (1995), “Environmental and Health in Central and Eastern Europe. A Report for Environmental Action Programme for Central and Eastern Europe”. World Bank. Washington D.C USA pp 41. Klein, L. (1969), River Pollution III: Butter Norths and Co Ltd London. Moses, B.S (1979), “The Cross River Nigeria, it’s Ecology and Fisheries” in Proceedings of the International Conference on Kainji Lake and River Basin Development in Africa. Lake Kainji Research Institute, New Bussa, Nigeria. Pp 335-370. Mueller, B.A, Newton, C. Holly E.A and Martins, S.P. (2001), “ Residential Water Source and the Risk of Childhood Brain Tumors” Environmental Health Perspectives. National Institute of Environmental health Sciences. Vol. 109 No. 6 pp 551-556. Nwaogozie, I.L (1990) “Pollution Modeling. A Necessity for Provision of Water for all in Nigeria” Nig. J. Tech Res. Vol. 2 pp 49-55. Nwaogozie, I.L and Ogelle, E. (1997), “Water Quality Modeling of Rice Irrigated Obina River, Uzo Umani” J. Water, Air and Soil Pollution. Kluwer Academics Publishers, Netherlands, Vol. 100 pp 197-222. Odokuma, I.O and Okpokwasili, G.C (1997), “Seasonal Influences of the Organic Pollution Monitoring of the New Calabar River, Nigeria” Environmental Monitoring and Assessment, Kluwer Academic Publishers, Netherlands, Vol. 45 pp 45-56. Okah (1999), “The Origin of Dissolved Solids in Groundwater and Sea Water”. Journal of the Nigerian Association of Hydro-geologists, Vol 2. No. 1&2. Olajire and Imeokparia. (2001), “Seasonal Influences of the Organic Pollution Monitoring of New Calabar River Nigeria”, NIS.
Pi, J., Hirashi, Y.; Kumagai Y. Sun G. Yoshida, T.; Aikawa, H. Rich, C.H and Shimojo, N (2002), “Evidence for Induction of Oxidative Stress Caused by Chronic Exposure of Chinese Residents to Arsenic Contained Drinking Water Environmental Heath Perspectives, vol. 110, No. 4 (April 2002), Pp 331-336. WHO (1993), Guideline for Drinking water vol. 1 Recommendation 2nd ed. World Heath Organization, Geneva.
Copyright © 2022 FDOKUMEN