Nutrients in Drinking Water - WHO | World Health Organization
Upload
khangminh22Category
view
0download
0
water
Article
Drinking Water Quality Mapping Using WaterQuality Index and Geospatial Analysis in PrimarySchools of Pakistan
Jamil Ahmed 1,2,*, Li Ping Wong 1,* , Yan Piaw Chua 3 and Najeebullah Channa 2
1 Centre for Epidemiology and Evidence-Based Practice, Department of Social and Preventive Medicine,Faculty of Medicine, University of Malaya, Kuala Lumpur 50603, Malaysia
2 US-Pakistan Center for Advanced Studies in Water, Mehran University of Engineering & Technology,Jamhsoro 76062, Pakistan; [email protected]
3 Faculty of Education, University of Malaya, Kuala Lumpur 50603, Malaysia; [email protected]* Correspondence: [email protected] or [email protected] (J.A.);
[email protected] (L.P.W.)
Received: 23 September 2020; Accepted: 28 November 2020; Published: 2 December 2020 �����������������
Abstract: Primary school children in the developing world often lack potable water, which mayresult in a high burden of water-related diseases and poor school performance. The present studyaimed to characterize the drinking water quality in primary schools of Pakistan. We used amultistage random-sampling method to select 425 primary schools from selected districts of Sindhprovince. Standard methods were used to characterize water quality. The results were comparedwith maximum acceptable values recommended by the Pakistani National Environmental QualityStandards (Pak NEQS) and the World Health Organization (WHO) drinking water quality standards.Groundwater (62%) and surface water (38%) were identified as two major drinking water sources inthe selected schools with varying levels of water quality. Among all parameters, dissolved oxygen(DO), pH, and nitrate remained within WHO and Pak NEQS water quality standard limit, while totaldissolved solids (TDS) (33%), electrical conductivity (EC) (46%), chloride (34%), turbidity (27%), andhardness (11%) samples exceeded standard limits. All dissolved salts had moderate to strong positivecorrelations with TDS and EC values. Based on a water quality index (WQI), 74% of primary schoolshad access to excellent or good quality drinking water compared to 26% of schools that had access toeither poor, very poor or unsuitable drinking water. Among all three regions, more schools fromSouth Sindh had either poor, very poor or unsuitable drinking water (33%) compared to the Central(25%) and North zones (15%). Hence, water from these locations is unfit for human consumptionand these schools need better water quality management plans to stop the spread of water-relateddiseases in primary school children.
Keywords: WQI; water quality; physicochemical parameters; primary school children
1. Introduction
Drinking water quality is a major concern for human health and wellbeing. The water qualityis affected by water contaminants which ultimately affect human health. Physiochemical andmicrobiological parameters are important determinants for assessing industrial, irrigation, and domesticwater quality. Among the physicochemical properties of drinking water, the common parameters usedto present drinking water quality are pH, TDS, turbidity, hardness, nitrate, EC, chloride, phosphate,etc. The drinking water quality is compromised if their values exceed concentrations above thestandard limits set by Pakistan Enviromental Protection agency (EPA) and World Health Organization(WHO) [1–3].
Water 2020, 12, 3382; doi:10.3390/w12123382 www.mdpi.com/journal/water
Water 2020, 12, 3382 2 of 18
The deterioration in the drinking water quality results from the entry of chemicals into the freshwaterbodies and water supply system through natural and anthropogenic activities. The naturalgeogenic contamination of water is governed by the presence and concentration of various chemicalconstituents which are mostly derived from the geological formation of the particular region, whilethe anthropogenic contamination mainly occurs by the use of pesticides and herbicides in agriculture,leaching of poisonous toxins, septic tank, waste disposal, coal mining and petroleum refining, etc. [4–6].
The lack of improved access to safe water destabilizes families in various ways such as youngchildren dying of preventable diseases. Other serious impacts include poorer cognitive functioningand a lower level of academic success [3–5]. Because of the history of poor health in childhood and theburden of recurring sicknesses later in life, these children ultimately have fewer chances for successlater in life [3–5].
A household survey in Pakistan revealed that only 20% of the population had access to cleanwater [6]. The major sources of water contamination are primarily poor sewage systems, industrialwastes, pesticides, and fertilizers [6,7]. In Pakistan, old sewage infrastructure and the failure of localgovernments to separate sewage lines from drinking water supplies leads to the high risk for thetransmission of water-related pollutants to the community [8]. Contaminants can be introduced intothe water distribution network during times of low pressure or when service is cut off completely [9].In addition, community centers such as schools, shops, and office building sites often lack on-site waterstorage and must rely on alternate water sources such as springs, stored rainwater, and private watervendors. Local water suppliers are mostly unregistered, with no water quality monitoring. Due tounhygienic handling, the drinking water is vulnerable to secondary- and cross-contamination [10–12].Water from unprotected springs and wells is often unfit for human consumption [8].
Inadequate sewage treatment and sanitation contribute to water contamination and pose a directrisk of fecal–oral disease transmission [12]. Almost half of the Pakistani population lack improvedsanitation systems, and this is significant between urban and rural areas [6,7]. A school-based studyin Pakistani schools showed that the improved sanitation system was accessible to 52% of schools;however, only 32% of the toilets were functional and routinely maintained [7]. Overall, the impact ofinadequate sanitation is sizable; a recent study reported that the unimproved water and sanitationservice cost the Pakistani economy around USD 5.7 billion, equivalent to almost 4% of its GDP [8].
In school settings, learning would be optimal when both the students’ learning needs and healthoutcomes are accomplished. The recent Demographic and Health Survey (PDHs 2017–2018) in Pakistanshowed poor school performance indicators (enrollment, illness, dropout, absenteeism, etc.) and ahigh prevalence of waterborne diseases that mainly included diarrhea [13].
Schools are an important setting to study as children spend a significant amount of time in schoolsettings and thus consume much of their daily intake of water from school water sources. However,there is a lack of information regarding drinking water quality in schools. Thus, the goal of thisstudy is to systematically assess drinking water quality in the schools of Sindh providence, Pakistan.We focused on Sindh province as other studies have found poor water quality in community watersources, and poorer school performance as compared to the rest of the country [6,13].
The WQI has been widely used to characterize both groundwater and surface water in terms ofsuitability for irrigation and drinking [10,14–17]. There are several different methods used to calculatea WQI, based on the intended use [15,18,19]. Some studies have incorporated geographical informationsystem (GIS) methods to effectively present the WQI data [18,20,21].
2. Materials and Methods
2.1. Study Setting and Sampling
Sindh province is located in the southeastern part of the country and is the second largest provincewith a population of around 4.8 million [13]. The Sindh province is divided into three climatic regions,i.e., South, North, and Central. Furthermore, it is subdivided into 29 districts [13]. The province
Water 2020, 12, 3382 3 of 18
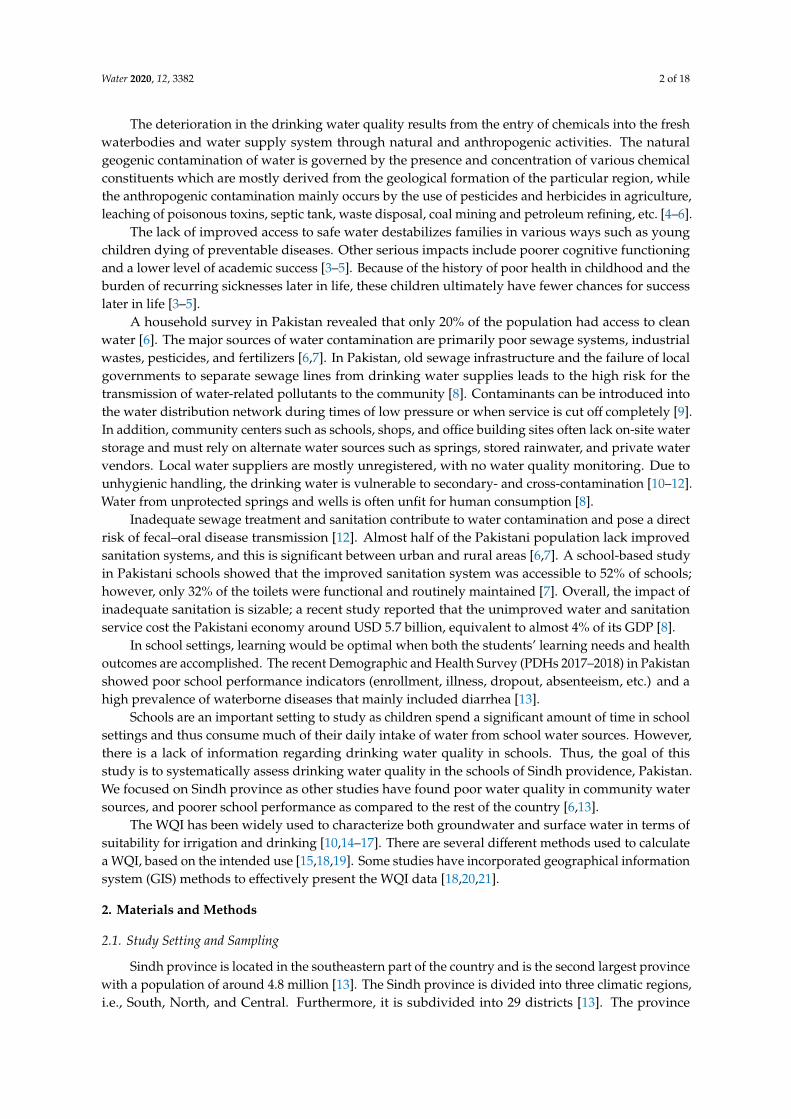
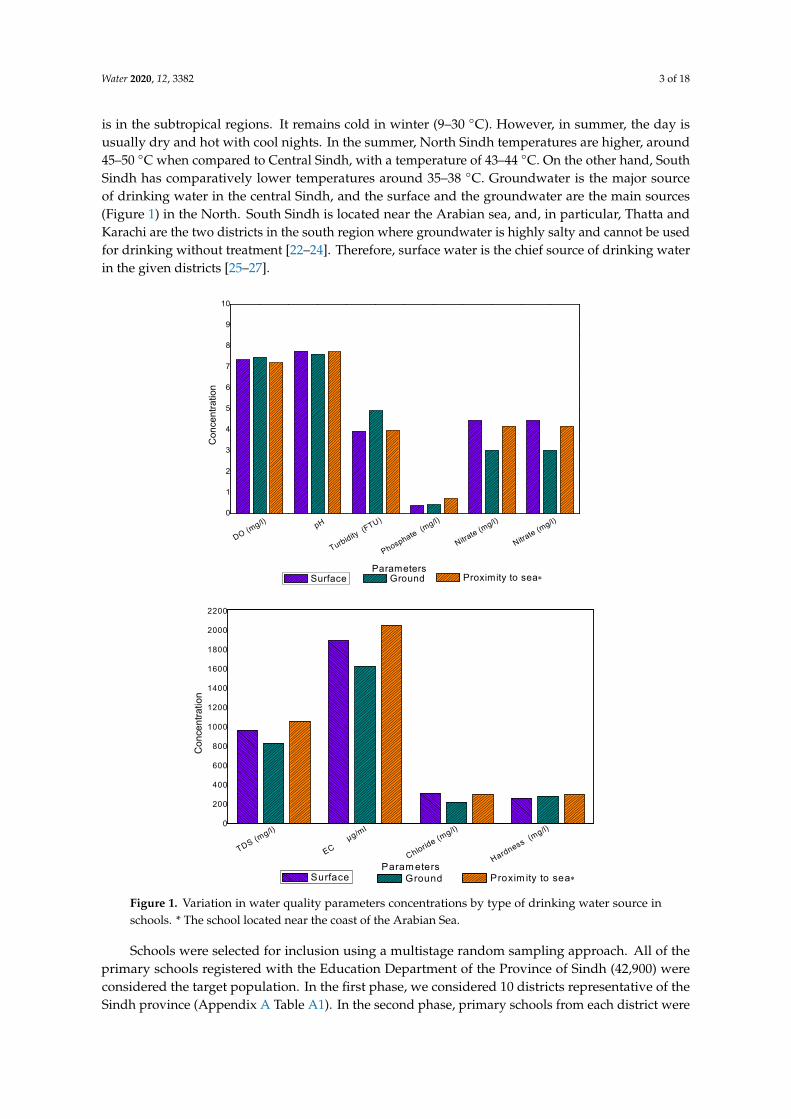
is in the subtropical regions. It remains cold in winter (9–30 ◦C). However, in summer, the day isusually dry and hot with cool nights. In the summer, North Sindh temperatures are higher, around45–50 ◦C when compared to Central Sindh, with a temperature of 43–44 ◦C. On the other hand, SouthSindh has comparatively lower temperatures around 35–38 ◦C. Groundwater is the major sourceof drinking water in the central Sindh, and the surface and the groundwater are the main sources(Figure 1) in the North. South Sindh is located near the Arabian sea, and, in particular, Thatta andKarachi are the two districts in the south region where groundwater is highly salty and cannot be usedfor drinking without treatment [22–24]. Therefore, surface water is the chief source of drinking waterin the given districts [25–27].
Water 2020, 12, x FOR PEER REVIEW 3 of 20
the day is usually dry and hot with cool nights. In the summer, North Sindh temperatures are higher, around 45–50 °C when compared to Central Sindh, with a temperature of 43–44 °C. On the other hand, South Sindh has comparatively lower temperatures around 35–38 °C. Groundwater is the major source of drinking water in the central Sindh, and the surface and the groundwater are the main sources (Figure 1) in the North. South Sindh is located near the Arabian sea, and, in particular, Thatta and Karachi are the two districts in the south region where groundwater is highly salty and cannot be used for drinking without treatment [22–24]. Therefore, surface water is the chief source of drinking water in the given districts [25–27].
DO (mg/l) pH
Turbidity (FTU)
Phosphate (mg/l)
Nitrate (m
g/l)
Nitrate (m
g/l)0
1
2
3
4
5
6
7
8
9
10
Ground Proximity to sea
Con
cent
ratio
n
Parameters Surface
TDS (mg/l)
EC µg/ml
Chloride (mg/l)
Hardness (mg/l)
0
200
400
600
800
1000
1200
1400
1600
1800
2000
2200
Ground Proxim ity to sea
Con
cent
ratio
n
Parameters Surface
Figure 1. Variation in water quality parameters concentrations by type of drinking water source inschools. * The school located near the coast of the Arabian Sea.
Schools were selected for inclusion using a multistage random sampling approach. All of theprimary schools registered with the Education Department of the Province of Sindh (42,900) wereconsidered the target population. In the first phase, we considered 10 districts representative of theSindh province (Appendix A Table A1). In the second phase, primary schools from each district were
Water 2020, 12, 3382 4 of 18
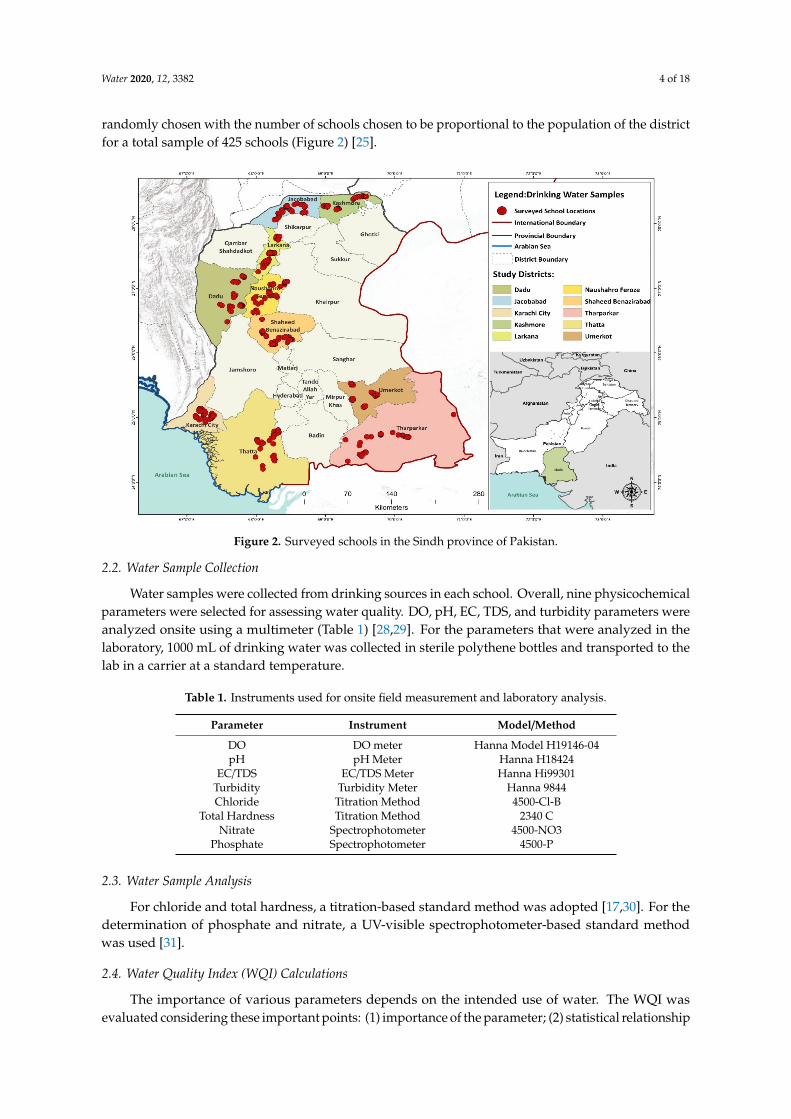
randomly chosen with the number of schools chosen to be proportional to the population of the districtfor a total sample of 425 schools (Figure 2) [25].
Water 2020, 12, x FOR PEER REVIEW 4 of 20
Figure 1. Variation in water quality parameters concentrations by type of drinking water source in schools. * The school located near the coast of the Arabian Sea.
Schools were selected for inclusion using a multistage random sampling approach. All of the primary schools registered with the Education Department of the Province of Sindh (42,900) were considered the target population. In the first phase, we considered 10 districts representative of the Sindh province (Appendix A Table A1). In the second phase, primary schools from each district were randomly chosen with the number of schools chosen to be proportional to the population of the district for a total sample of 425 schools (Figure 2) [25].
Figure 2. Surveyed schools in the Sindh province of Pakistan.
2.2. Water Sample Collection
Water samples were collected from drinking sources in each school. Overall, nine physicochemical parameters were selected for assessing water quality. DO, pH, EC, TDS, and turbidity parameters were analyzed onsite using a multimeter (Table 1) [28,29]. For the parameters that were analyzed in the laboratory, 1000 mL of drinking water was collected in sterile polythene bottles and transported to the lab in a carrier at a standard temperature.
Table 1. Instruments used for onsite field measurement and laboratory analysis.
Parameter Instrument Model/Method DO DO meter Hanna Model H19146-04 pH pH Meter Hanna H18424
EC/TDS EC/TDS Meter Hanna Hi99301 Turbidity Turbidity Meter Hanna 9844 Chloride Titration Method 4500-Cl-B
Total Hardness Titration Method 2340 C Nitrate Spectrophotometer 4500-NO3
Phosphate Spectrophotometer 4500-P
Figure 2. Surveyed schools in the Sindh province of Pakistan.
2.2. Water Sample Collection
Water samples were collected from drinking sources in each school. Overall, nine physicochemicalparameters were selected for assessing water quality. DO, pH, EC, TDS, and turbidity parameters wereanalyzed onsite using a multimeter (Table 1) [28,29]. For the parameters that were analyzed in thelaboratory, 1000 mL of drinking water was collected in sterile polythene bottles and transported to thelab in a carrier at a standard temperature.
Table 1. Instruments used for onsite field measurement and laboratory analysis.
Parameter Instrument Model/Method
DO DO meter Hanna Model H19146-04pH pH Meter Hanna H18424
EC/TDS EC/TDS Meter Hanna Hi99301Turbidity Turbidity Meter Hanna 9844Chloride Titration Method 4500-Cl-B
Total Hardness Titration Method 2340 CNitrate Spectrophotometer 4500-NO3
Phosphate Spectrophotometer 4500-P
2.3. Water Sample Analysis
For chloride and total hardness, a titration-based standard method was adopted [17,30]. For thedetermination of phosphate and nitrate, a UV-visible spectrophotometer-based standard methodwas used [31].
2.4. Water Quality Index (WQI) Calculations
The importance of various parameters depends on the intended use of water. The WQI wasevaluated considering these important points: (1) importance of the parameter; (2) statistical relationship
Water 2020, 12, 3382 5 of 18
between parameters concentration and corresponding index; (3) associated water quality parameters;and (4) classification of water quality (excellent, good, poor, very poor, water unsuitable for drinking).Here, the water quality parameters are studied from the point of view of suitability for humanconsumption. The ‘standards’ (standard values of various parameters) for the drinking water usedin this study are those recommended by the World Health Organization (WHO) and Government ofPakistan Environmental Protection Agency (EPA) standards recommended for drinking water qualitywere employed [22,23]. A WQI was calculated using previously used methods [16,18,19]. The WQIcalculations include three successive steps. First, each parameter was assigned a weight (wi) accordingto its relative importance in the overall quality of drinking water as shown in Table 2, and the weight foreach parameter was assigned based on previous studies [16,18]. The weights were then transformed torelative weights, so they added up to one using the equation:
Wi = wi/n∑
i=1
wi (1)
A “quality rating” (qi) was calculated as:
qi = (Ci/Si) × 100 (2)
where Ci is the concentration of parameter i and Si is the WHO standard value for parameter i [23].A sub-index is calculated as the product of the quality rating and the relative weight:
SIi = wi × qi (3)
The overall WQI is the sum of these sub-indices overall parameters used [15,16,18]. Classificationsare assigned based on the value of the WQI (Table 3).
Table 2. Raw and relative weights for each water quality parameters [14,18,20,32].
Parameter WHO Standard [23] Pakistan EPAStandard [15] Weight (wi) Relative Weights (Wi)
DO mg/L 5 * 5 0.16TDS (mg/L) 1000 1000 5 0.16EC (uS/cm) 1500 * 4 0.12
pH 6.5–8.5 6.5–8.5 4 0.12Turbidity (NTU) 5 5 2 0.06Chloride (mg/L) 250 250 3 0.09Hardness (mg/L) 500 500 2 0.06Phosphate (mg/L) 5 * 1 0.03
Nitrate (mg/L) 50 50 5 0.16Σ wi = 31 Σ Wi = 1.00
wi: Weight assigned; Wi: Relative weight; Σ Wi = sum of all relative weights; * = Pakistan Environmental ProtectionAgency (EPA) guidelines not available.
Table 3. Characterization of water quality based on water quality index (WQI) value [33,34].
Class WQI Value Water Quality Status
A <50 ExcellentB 51–100 GoodC 101–200 Poor waterD 201–300 Very Poor WaterE >300 Water unsuitable for drinking
Water 2020, 12, 3382 6 of 18
3. Results and Discussion
3.1. Characteristics of Drinking Water
Drinking water samples of 425 primary schools from the point of use were collected,and approximately one-third of schools reported that the water is available throughout the yearfrom the main source. Onsite water treatment systems were available at 6% of the schools. However,none of these schools had tested the drinking water’s quality during the past two years.
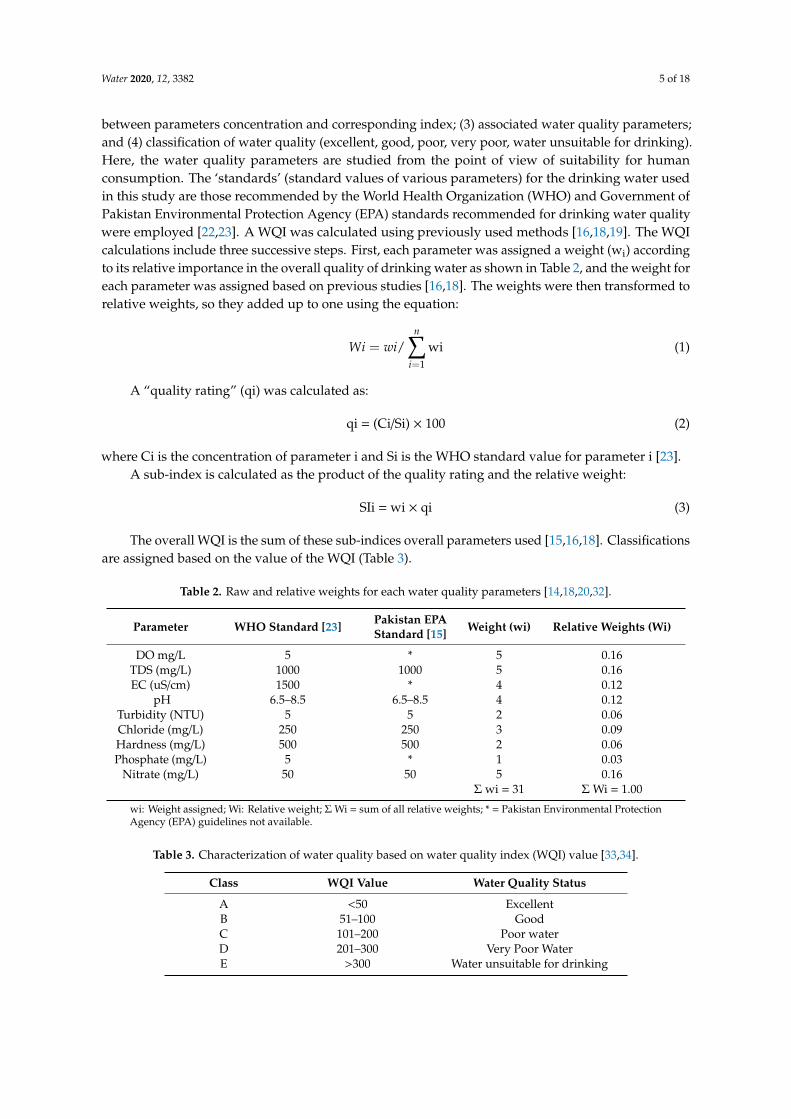
The average concentrations for drinking water quality parameters (DO, TDS, EC, pH, Turbidity,Chloride, Hardness, Phosphate, and Nitrate) were generated for each school by zone as shown inTables 4–6. Among zones, the schools in the South zone had the poorest water quality. The averageTDS, turbidity, and chloride concentrations in south zone districts (Sujawla, Umerkot, and Tharparkar)exceeded the WHO and Pakistan Environmental Protection Agency (EPA) guideline values [22,23].The Pearson correlation results showed that all the dissolved salts indicated a strong positive correlationwith TDS and EC values.
Table 4. Water quality parameters of South Sindh.
DistrictTharparkar Thatta Karachi Umerkot
n = 42 n = 40 n = 40 n = 45
Statistics Average Max Min Average Max Min Average Max Min Average Max Min
DO mg/L 7.1 8.0 6.0 7.3 8.0 6.2 7.0 8.0 6.4 7.6 8.4 7.0
TDS (mg/L) 1083.1 3440.0 130.0 1192.7 3730.0 390.0 930.0 2360.0 260.0 667.2 2220.0 240.0
EC (uS/cm) 2098.5 6600.0 250.0 2292.1 7190.0 760.0 1805.6 4550.0 510.0 1330.6 4380.0 470.0
PH 7.8 8.4 6.9 7.6 8.3 6.8 7.9 8.7 7.2 7.9 8.6 7.0
Turbidity(NTU) 2.3 8.2 0.3 15.8 44.7 0.4 2.1 8.4 0.0 7.8 46.0 0.3
Chloride(mg/L) 350.9 2161.8 25.0 349.5 937.2 87.5 249.2 487.3 37.5 202.3 371.3 67.0
Hardness(mg/L) 199.9 650.0 31.0 346.9 775.0 103.0 258.3 600.0 58.0 217.7 400.0 70.0
Phosphate(mg/L) 0.5 2.1 0.0 0.8 2.0 0.0 0.7 1.2 0.0 0.3 1.2 0.0
Nitrate (mg/L) 5.7 27.0 0.0 1.3 20.9 0.0 7.0 20.7 0.0 2.3 9.8 0.0
Table 5. Water quality parameters of North Sindh.
District.Larkana Jacobabad Kashmore
n = 42 n = 40 n = 42
Statistics Average Max Min Average Max Min Average Max Min
DO mg/L 7.2 8.1 6.3 7.3 8.0 6.3 7.5 8.2 6.8
TDS (mg/L) 741.2 2510.0 240.0 835.2 1910.0 180.0 931.7 2500.0 130.0
EC (uS/cm) 1395.7 4860.0 480.0 1628.2 3670.0 360.0 1818.2 4830.0 250.0
PH 7.5 8.2 7.0 7.5 8.3 7.0 7.8 8.4 7.1
Turbidity (NTU) 2.5 9.4 0.3 1.4 8.3 0.0 8.7 46.0 0.9
Chloride (mg/L) 166.5 937.2 25.0 206.2 649.0 12.5 250.6 691.0 29.0
Hardness (mg/L) 154.7 425.0 30.0 261.5 775.0 25.0 309.4 622.0 20.0
Phosphate (mg/L) 0.5 1.0 0.0 0.5 1.0 0.0 0.2 0.8 0.0
Nitrate (mg/L) 1.5 5.9 0.0 0.4 2.5 0.0 2.5 8.1 0.0
Water 2020, 12, 3382 7 of 18
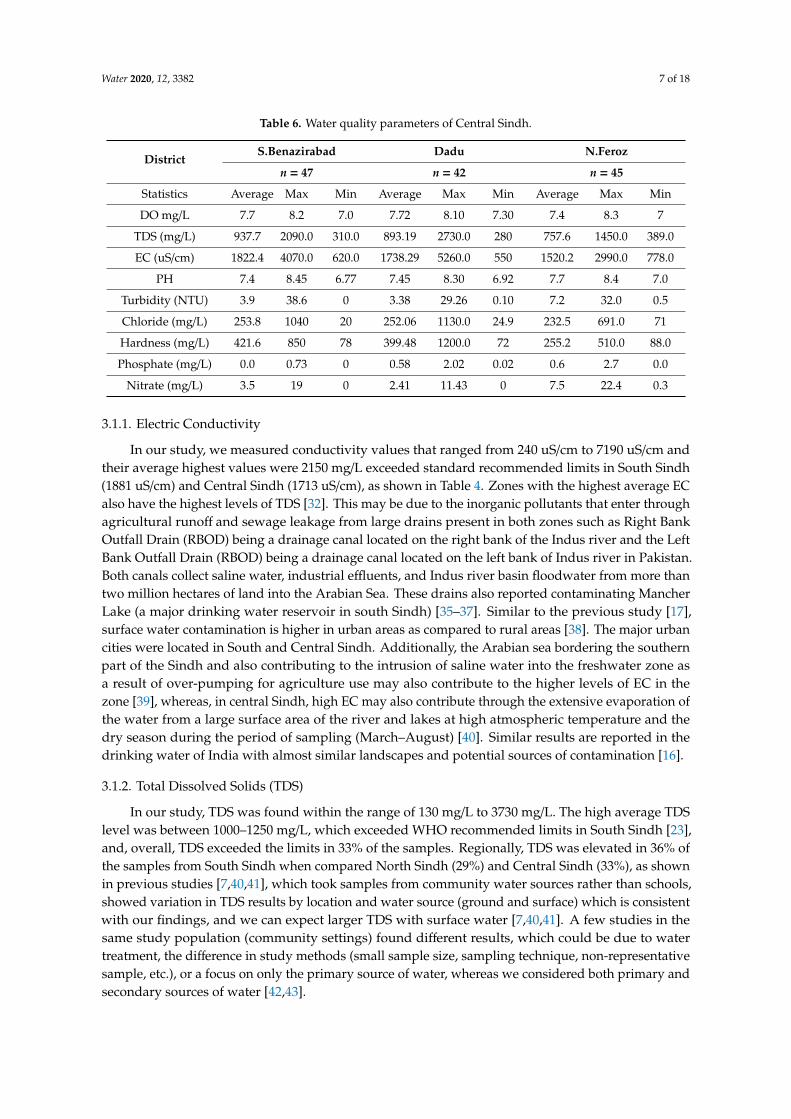
Table 6. Water quality parameters of Central Sindh.
DistrictS.Benazirabad Dadu N.Feroz
n = 47 n = 42 n = 45
Statistics Average Max Min Average Max Min Average Max Min
DO mg/L 7.7 8.2 7.0 7.72 8.10 7.30 7.4 8.3 7
TDS (mg/L) 937.7 2090.0 310.0 893.19 2730.0 280 757.6 1450.0 389.0
EC (uS/cm) 1822.4 4070.0 620.0 1738.29 5260.0 550 1520.2 2990.0 778.0
PH 7.4 8.45 6.77 7.45 8.30 6.92 7.7 8.4 7.0
Turbidity (NTU) 3.9 38.6 0 3.38 29.26 0.10 7.2 32.0 0.5
Chloride (mg/L) 253.8 1040 20 252.06 1130.0 24.9 232.5 691.0 71
Hardness (mg/L) 421.6 850 78 399.48 1200.0 72 255.2 510.0 88.0
Phosphate (mg/L) 0.0 0.73 0 0.58 2.02 0.02 0.6 2.7 0.0
Nitrate (mg/L) 3.5 19 0 2.41 11.43 0 7.5 22.4 0.3
3.1.1. Electric Conductivity
In our study, we measured conductivity values that ranged from 240 uS/cm to 7190 uS/cm andtheir average highest values were 2150 mg/L exceeded standard recommended limits in South Sindh(1881 uS/cm) and Central Sindh (1713 uS/cm), as shown in Table 4. Zones with the highest average ECalso have the highest levels of TDS [32]. This may be due to the inorganic pollutants that enter throughagricultural runoff and sewage leakage from large drains present in both zones such as Right BankOutfall Drain (RBOD) being a drainage canal located on the right bank of the Indus river and the LeftBank Outfall Drain (RBOD) being a drainage canal located on the left bank of Indus river in Pakistan.Both canals collect saline water, industrial effluents, and Indus river basin floodwater from more thantwo million hectares of land into the Arabian Sea. These drains also reported contaminating MancherLake (a major drinking water reservoir in south Sindh) [35–37]. Similar to the previous study [17],surface water contamination is higher in urban areas as compared to rural areas [38]. The major urbancities were located in South and Central Sindh. Additionally, the Arabian sea bordering the southernpart of the Sindh and also contributing to the intrusion of saline water into the freshwater zone asa result of over-pumping for agriculture use may also contribute to the higher levels of EC in thezone [39], whereas, in central Sindh, high EC may also contribute through the extensive evaporation ofthe water from a large surface area of the river and lakes at high atmospheric temperature and thedry season during the period of sampling (March–August) [40]. Similar results are reported in thedrinking water of India with almost similar landscapes and potential sources of contamination [16].
3.1.2. Total Dissolved Solids (TDS)
In our study, TDS was found within the range of 130 mg/L to 3730 mg/L. The high average TDSlevel was between 1000–1250 mg/L, which exceeded WHO recommended limits in South Sindh [23],and, overall, TDS exceeded the limits in 33% of the samples. Regionally, TDS was elevated in 36% ofthe samples from South Sindh when compared North Sindh (29%) and Central Sindh (33%), as shownin previous studies [7,40,41], which took samples from community water sources rather than schools,showed variation in TDS results by location and water source (ground and surface) which is consistentwith our findings, and we can expect larger TDS with surface water [7,40,41]. A few studies in thesame study population (community settings) found different results, which could be due to watertreatment, the difference in study methods (small sample size, sampling technique, non-representativesample, etc.), or a focus on only the primary source of water, whereas we considered both primary andsecondary sources of water [42,43].
Water 2020, 12, 3382 8 of 18
The climate of the study province (Sindh) remains predominately arid with very low rainfallaveraging <200 mm annually, resulting in minimum variation in water quality parameters. In thisregion, the natural process such as ion exchange processes in aquifer and solubility of rocks hascontributed considerably to increasing EC and TDS values [43], which were noticed in our studysamples (Tables 4 and 5). Comparatively, the increase in TDS and EC concentration in surface watersource rather than groundwater indicates industrial and residential wastewater contamination whichpossibly mixes into surface water [7,35]. The excessive TDS effect on drinking water taste may lead tounwanted gastrointestinal irritation and physiological reaction. Previous studies in this area have alsoconfirmed high EC and TDS [44–46], which raises serious concerns regarding the health of children inprimary schools of Sindh province.
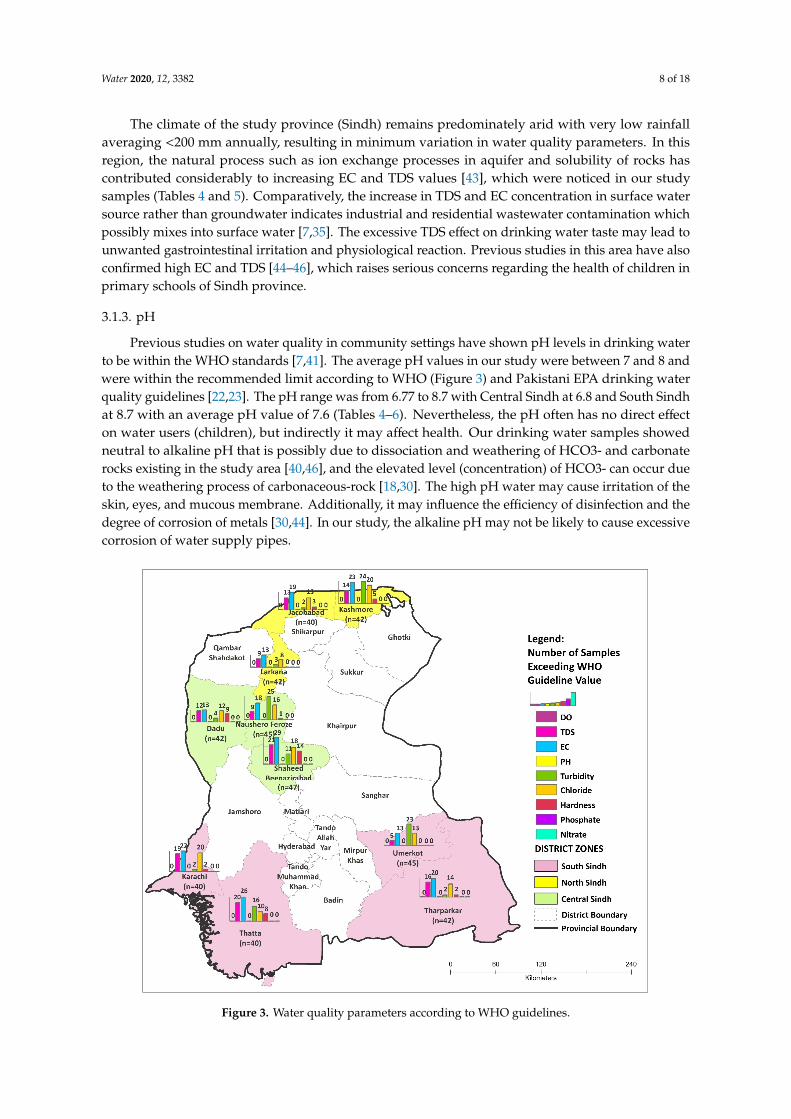
3.1.3. pH
Previous studies on water quality in community settings have shown pH levels in drinking waterto be within the WHO standards [7,41]. The average pH values in our study were between 7 and 8 andwere within the recommended limit according to WHO (Figure 3) and Pakistani EPA drinking waterquality guidelines [22,23]. The pH range was from 6.77 to 8.7 with Central Sindh at 6.8 and South Sindhat 8.7 with an average pH value of 7.6 (Tables 4–6). Nevertheless, the pH often has no direct effecton water users (children), but indirectly it may affect health. Our drinking water samples showedneutral to alkaline pH that is possibly due to dissociation and weathering of HCO3- and carbonaterocks existing in the study area [40,46], and the elevated level (concentration) of HCO3- can occur dueto the weathering process of carbonaceous-rock [18,30]. The high pH water may cause irritation of theskin, eyes, and mucous membrane. Additionally, it may influence the efficiency of disinfection and thedegree of corrosion of metals [30,44]. In our study, the alkaline pH may not be likely to cause excessivecorrosion of water supply pipes.Water 2020, 12, x FOR PEER REVIEW 2 of 20
Figure 3. Water quality parameters according to WHO guidelines.
3.1.4. Turbidity
In our study, the average highest concentration of turbidity was observed between 7.5 and 9.5 NTU (Tables 4–6). The drinking water in schools of South Sindh had higher turbidity (Table 4) when compared to the other two zones. The average turbidity in this region (27 NTU) exceeded WHO and Pakistani EPA drinking water quality guidelines [22,23]. The turbidity was also elevated in Central Sindh (31%) compared to South (26%) and North Sindh (23%), as shown in Figure 1. Previous studies in community settings showed little variation in the results which may be due to the smaller sample size and non-representative sample (rural specific or urban specific) in those studies apart from the difference in study settings (community instead of school settings) [11,40,45,46]. In our study, the schools in South Sindh with high turbid water are also more vulnerable to microbiological contamination since the pathogens attached themselves to the suspended particles in turbid drinking water. These suspended particles then shield pathogens from disinfectants and interfere with the disinfection process [45,47].
3.1.5. Chloride
In our study, chloride ranged from 12.5 mg/L to 1130 mg/L, whereas the highest average concentration of chloride was between 250–351 mg/L (Table 4). The South Sindh zone had the highest number of schools with drinking water that exceeded standard limits (250 mg/L) [22,23]. Overall, chloride exceeded the recommended limit (Figure 3) in 36% of the samples in Central Sindh compared to 34% of the samples in South and 33% of the samples in North Sindh, as shown in Table 5. In the present study, the schools with a high level of chloride in drinking water can put children at risk for developing heart, kidney, and liver problems on long-term exposure [30,44]. The high chloride level can also bring corrosivity, especially when chloride combines with sodium to form
Figure 3. Water quality parameters according to WHO guidelines.
Water 2020, 12, 3382 9 of 18
3.1.4. Turbidity
In our study, the average highest concentration of turbidity was observed between 7.5 and9.5 NTU (Tables 4–6). The drinking water in schools of South Sindh had higher turbidity (Table 4)when compared to the other two zones. The average turbidity in this region (27 NTU) exceededWHO and Pakistani EPA drinking water quality guidelines [22,23]. The turbidity was also elevated inCentral Sindh (31%) compared to South (26%) and North Sindh (23%), as shown in Figure 1. Previousstudies in community settings showed little variation in the results which may be due to the smallersample size and non-representative sample (rural specific or urban specific) in those studies apartfrom the difference in study settings (community instead of school settings) [11,40,45,46]. In ourstudy, the schools in South Sindh with high turbid water are also more vulnerable to microbiologicalcontamination since the pathogens attached themselves to the suspended particles in turbid drinkingwater. These suspended particles then shield pathogens from disinfectants and interfere with thedisinfection process [45,47].
3.1.5. Chloride
In our study, chloride ranged from 12.5 mg/L to 1130 mg/L, whereas the highest averageconcentration of chloride was between 250–351 mg/L (Table 4). The South Sindh zone had the highestnumber of schools with drinking water that exceeded standard limits (250 mg/L) [22,23]. Overall,chloride exceeded the recommended limit (Figure 3) in 36% of the samples in Central Sindh comparedto 34% of the samples in South and 33% of the samples in North Sindh, as shown in Table 5. In thepresent study, the schools with a high level of chloride in drinking water can put children at risk fordeveloping heart, kidney, and liver problems on long-term exposure [30,44]. The high chloride levelcan also bring corrosivity, especially when chloride combines with sodium to form sodium chloride,which may damage plumbing, water heaters, and other appliances causing toxic metals to leach intothe drinking water [30]. However, chloride contamination can easily be removed using reverse osmosis(RO) in drinking water treatment systems [23,32].
The possible source of chloride in groundwater contamination in South Sindh could be due tothe saltwater intrusion (Figure 4). In addition, the studies reported that the coastal aquifers (southernSindh) are overexploited; this may possibly lead to the saline intrusion, which increases Na and Clconcentrations in the coastal aquifers [46,47]. Elevated chloride in surface water contamination may bedue to wastewater from industries (specifically sugar mills in South Sindh) and effluent from largedrains in both zones (e.g., right bank outfall drainage and left bank outfall drainage) [46–48]. We wereunable to find similar studies, but studies in similar geographic locations showed little variation in thechloride concentration in drinking water [40,49]. In addition, deviation of Cl- in surface water from thestandard is a result of anthropogenic activities such as fertilizers and coal containing sulfide along withminerals with sulfate derivatives from air pollutants [40]. Moreover, the elevated Cl- concentrationmight be due to surface water infiltration contaminated with salts and also results from geologic matterthrough dissolution of alkaline earth metal salts [31].
Water 2020, 12, 3382 10 of 18
Water 2020, 12, x FOR PEER REVIEW 5 of 20
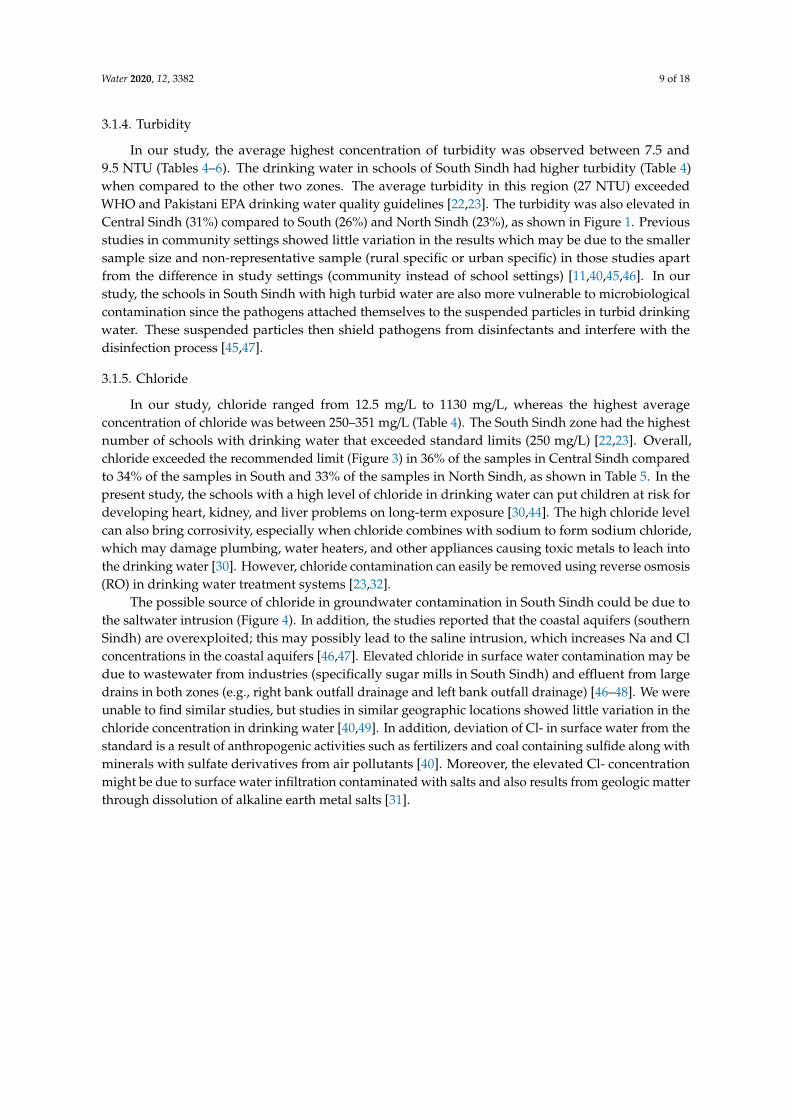
Figure 4. Water Quality Index of the primary schools of Sindh.
The WQI of schools (Figure 4) in central Sindh that primarily used groundwater indicated an overall good quality drinking water; over half (53%) of the schools have excellent drinking water, 21% possess good quality drinking water, followed by 18% with poor water, 6% with very poor water, and 1% with water that is unsuitable for drinking. The WQI in North Sindh, where both groundwater and surface water are used for drinking, indicated god quality water, with just under half the samples rated good (49%), followed by excellent quality (36%), poor (13%), and very poor (1%). In the southern part of Sindh province, which depends mainly on surface water, almost a third of schools in each group have access to either excellent water (33%), good water (34%), or poor water (29%), while few school children consumed water which was of very poor or unsuitable to drink quality (3%). Among all three regions, schools in central Sindh have greater access to drinking water with excellent quality (54%), while schools of the southern districts of Sindh were more vulnerable with 33% of school children consuming poor or very poor to unsuitable drinking water. The southern part of Sindh adjoins the seacoast where drinking water quality deteriorates (Figure 5) due to the dumping of urban and industrial waste. This area also has limited freshwater resources [50,51].
Figure 4. Water Quality Index of the primary schools of Sindh.
3.1.6. Hardness
The average concentration (Tables 4–6) of hardness (291 mg/L) remained within the standardlimits; however, some samples in all three zones (Central Sindh 24, South 12, and North 8 samples)exceeded the recommended limit [22,23]. More samples were found exceeding hardness limits inCentral Sindh (19%) compared to South (7%) and North (6%) Sindh (Figure 3). Sources of elevatedhardness are generally the same as for chloride. The hardness in water mainly indicates availability ofmagnesium and calcium ions which exist mainly in sandy rocks specifically found in limestone [31].
Our results are consistent with a local study [49] and studies done in Iran and India [16,17]. Whilethe concentration of hardness is different from studies performed in other provinces, this may be due tothe difference in landscape, main drinking water source, or potential sources of contamination [14,44].
3.1.7. Dissolved Oxygen (DO) Nitrate and Phosphate
Among all the parameters, the average concentration of DO (7.3 mg/L), nitrate (3.2 mg/L),and phosphate (1.3 mg/L), as shown in Tables 4–6, were within standard limits [22,23]. These findingswere similar to the available studies [11,40,41]. However, few samples exceed the standard limit forphosphate and nitrogen. The potential sources of phosphate and nitrate contamination are sewage andrunoff from animal farms and fertilizers. In our study, the drinking water in rural areas with agriculturalland and unimproved sewage system were most vulnerable to these contaminants. The nitrogen in
Water 2020, 12, 3382 11 of 18
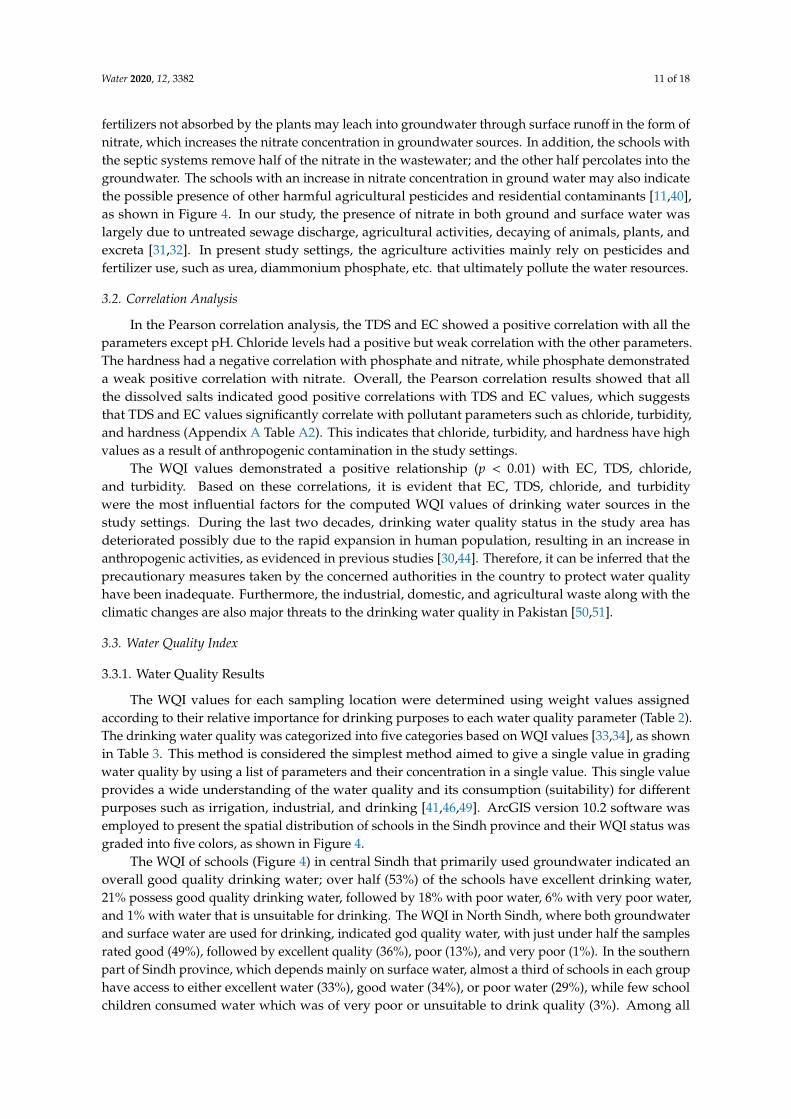
fertilizers not absorbed by the plants may leach into groundwater through surface runoff in the form ofnitrate, which increases the nitrate concentration in groundwater sources. In addition, the schools withthe septic systems remove half of the nitrate in the wastewater; and the other half percolates into thegroundwater. The schools with an increase in nitrate concentration in ground water may also indicatethe possible presence of other harmful agricultural pesticides and residential contaminants [11,40],as shown in Figure 4. In our study, the presence of nitrate in both ground and surface water waslargely due to untreated sewage discharge, agricultural activities, decaying of animals, plants, andexcreta [31,32]. In present study settings, the agriculture activities mainly rely on pesticides andfertilizer use, such as urea, diammonium phosphate, etc. that ultimately pollute the water resources.
3.2. Correlation Analysis
In the Pearson correlation analysis, the TDS and EC showed a positive correlation with all theparameters except pH. Chloride levels had a positive but weak correlation with the other parameters.The hardness had a negative correlation with phosphate and nitrate, while phosphate demonstrateda weak positive correlation with nitrate. Overall, the Pearson correlation results showed that allthe dissolved salts indicated good positive correlations with TDS and EC values, which suggeststhat TDS and EC values significantly correlate with pollutant parameters such as chloride, turbidity,and hardness (Appendix A Table A2). This indicates that chloride, turbidity, and hardness have highvalues as a result of anthropogenic contamination in the study settings.
The WQI values demonstrated a positive relationship (p < 0.01) with EC, TDS, chloride,and turbidity. Based on these correlations, it is evident that EC, TDS, chloride, and turbiditywere the most influential factors for the computed WQI values of drinking water sources in thestudy settings. During the last two decades, drinking water quality status in the study area hasdeteriorated possibly due to the rapid expansion in human population, resulting in an increase inanthropogenic activities, as evidenced in previous studies [30,44]. Therefore, it can be inferred that theprecautionary measures taken by the concerned authorities in the country to protect water qualityhave been inadequate. Furthermore, the industrial, domestic, and agricultural waste along with theclimatic changes are also major threats to the drinking water quality in Pakistan [50,51].
3.3. Water Quality Index
3.3.1. Water Quality Results
The WQI values for each sampling location were determined using weight values assignedaccording to their relative importance for drinking purposes to each water quality parameter (Table 2).The drinking water quality was categorized into five categories based on WQI values [33,34], as shownin Table 3. This method is considered the simplest method aimed to give a single value in gradingwater quality by using a list of parameters and their concentration in a single value. This single valueprovides a wide understanding of the water quality and its consumption (suitability) for differentpurposes such as irrigation, industrial, and drinking [41,46,49]. ArcGIS version 10.2 software wasemployed to present the spatial distribution of schools in the Sindh province and their WQI status wasgraded into five colors, as shown in Figure 4.
The WQI of schools (Figure 4) in central Sindh that primarily used groundwater indicated anoverall good quality drinking water; over half (53%) of the schools have excellent drinking water,21% possess good quality drinking water, followed by 18% with poor water, 6% with very poor water,and 1% with water that is unsuitable for drinking. The WQI in North Sindh, where both groundwaterand surface water are used for drinking, indicated god quality water, with just under half the samplesrated good (49%), followed by excellent quality (36%), poor (13%), and very poor (1%). In the southernpart of Sindh province, which depends mainly on surface water, almost a third of schools in each grouphave access to either excellent water (33%), good water (34%), or poor water (29%), while few schoolchildren consumed water which was of very poor or unsuitable to drink quality (3%). Among all

Water 2020, 12, 3382 12 of 18
three regions, schools in central Sindh have greater access to drinking water with excellent quality(54%), while schools of the southern districts of Sindh were more vulnerable with 33% of schoolchildren consuming poor or very poor to unsuitable drinking water. The southern part of Sindh adjoinsthe seacoast where drinking water quality deteriorates (Figure 5) due to the dumping of urban andindustrial waste. This area also has limited freshwater resources [50,51].Water 2020, 12, x FOR PEER REVIEW 6 of 20
Figure 5. Water Quality Index showing population density, agriculture density, and proximity to the sea.
3.3.2. Discussion on Water Quality Index
Overall, 74% of primary schools have access to excellent or good quality drinking water compared to 26% of schools with access to either poor, very poor, or unsuitable drinking water. However, there was no significant difference observed between private and public schools (Figure 6). Previous local studies revealed that the drinking water at some locations in Sindh Province is not fit for drinking [7,40,50]. Other studies have found variable results. A study of groundwater in Iran found that 52% of consumers had excellent or good quality of drinking water, while 48% of the population consume poor to unsuitable drinking water [17]. A study in south India found that water quality varied from Excellent to Poor, with significant seasonal variation due to weather (temperature and rainy season) and pilgrims, who brought enormous pressure on the basic requirement fulfillments like shelter, food, and waste disposal [19]. A similar study of surface water sources used for drinking showed that the majority of the samples at upstream locations were of excellent quality for drinking compared to poor quality at downstream locations, demonstrating the significant impact of diffuse and point sources of pollutants in these regions [38]. The results of these three studies vary compared to our study, mainly due to their focus on single water source (surface or groundwater), difference in WQI methodology, climatic conditions and variation in the source of pollutants, i.e., agriculture pesticide vs. industrial effluent.
Figure 5. Water Quality Index showing population density, agriculture density, and proximity tothe sea.
3.3.2. Discussion on Water Quality Index
Overall, 74% of primary schools have access to excellent or good quality drinking water comparedto 26% of schools with access to either poor, very poor, or unsuitable drinking water. However,there was no significant difference observed between private and public schools (Figure 6). Previouslocal studies revealed that the drinking water at some locations in Sindh Province is not fit fordrinking [7,40,50]. Other studies have found variable results. A study of groundwater in Iran foundthat 52% of consumers had excellent or good quality of drinking water, while 48% of the populationconsume poor to unsuitable drinking water [17]. A study in south India found that water qualityvaried from Excellent to Poor, with significant seasonal variation due to weather (temperature andrainy season) and pilgrims, who brought enormous pressure on the basic requirement fulfillmentslike shelter, food, and waste disposal [19]. A similar study of surface water sources used for drinkingshowed that the majority of the samples at upstream locations were of excellent quality for drinkingcompared to poor quality at downstream locations, demonstrating the significant impact of diffuseand point sources of pollutants in these regions [38]. The results of these three studies vary comparedto our study, mainly due to their focus on single water source (surface or groundwater), differencein WQI methodology, climatic conditions and variation in the source of pollutants, i.e., agriculturepesticide vs. industrial effluent.
Water 2020, 12, 3382 13 of 18Water 2020, 12, x FOR PEER REVIEW 7 of 20
Dadu
Kashmore
N.Feroz
S.Benazi
rabad
Jacob
abad
Thatta
Tharpa
rkar
karach
i
Larka
na
Umerkot
020406080
100120140160180200220240260280300
Private Scchools
Water unsuitable for drinking
Very Poor Water
Poor water
Good
Aver
age
WQ
I Sco
re
Name of Districts Public Schools
Excellent
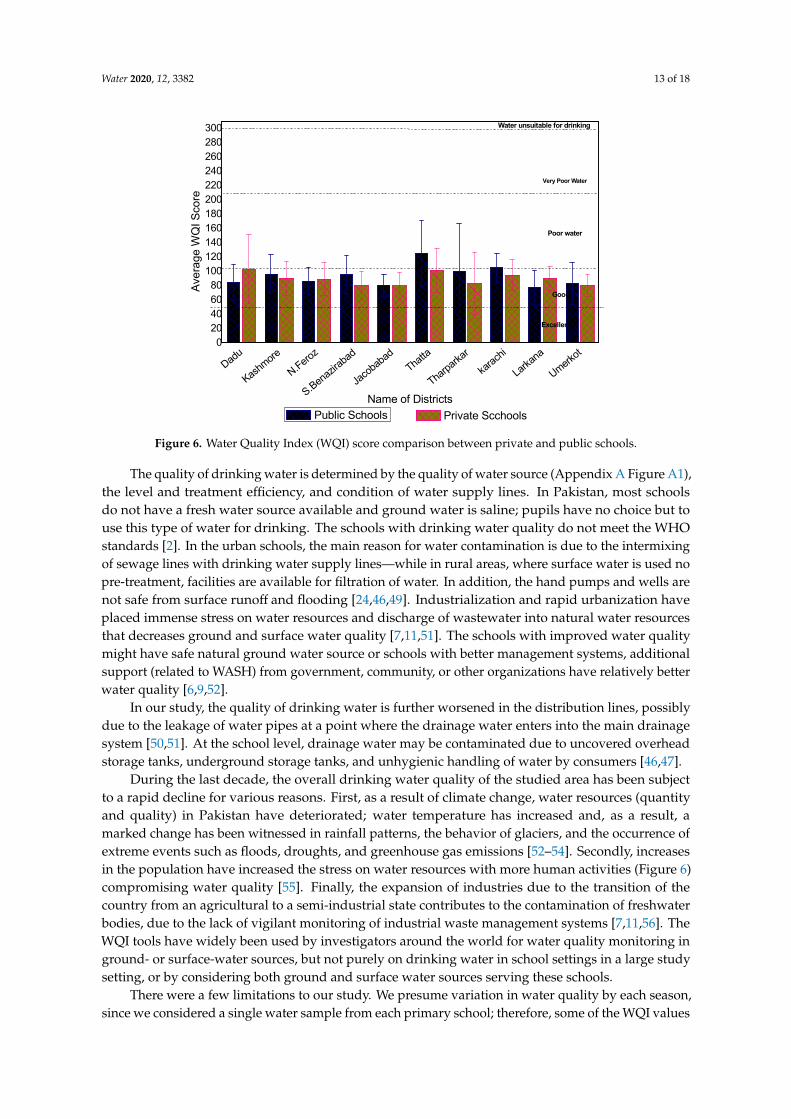
Figure 6. Water Quality Index (WQI) score comparison between private and public schools.
The quality of drinking water is determined by the quality of water source (Appendix A Figure A1), the level and treatment efficiency, and condition of water supply lines. In Pakistan, most schools do not have a fresh water source available and ground water is saline; pupils have no choice but to use this type of water for drinking. The schools with drinking water quality do not meet the WHO standards [2]. In the urban schools, the main reason for water contamination is due to the intermixing of sewage lines with drinking water supply lines—while in rural areas, where surface water is used no pre-treatment, facilities are available for filtration of water. In addition, the hand pumps and wells are not safe from surface runoff and flooding [24,46,49]. Industrialization and rapid urbanization have placed immense stress on water resources and discharge of wastewater into natural water resources that decreases ground and surface water quality [7,11,51]. The schools with improved water quality might have safe natural ground water source or schools with better management systems, additional support (related to WASH) from government, community, or other organizations have relatively better water quality [6,9,52].
In our study, the quality of drinking water is further worsened in the distribution lines, possibly due to the leakage of water pipes at a point where the drainage water enters into the main drainage system [50,51]. At the school level, drainage water may be contaminated due to uncovered overhead storage tanks, underground storage tanks, and unhygienic handling of water by consumers [46,47].
During the last decade, the overall drinking water quality of the studied area has been subject to a rapid decline for various reasons. First, as a result of climate change, water resources (quantity and quality) in Pakistan have deteriorated; water temperature has increased and, as a result, a marked change has been witnessed in rainfall patterns, the behavior of glaciers, and the occurrence of extreme events such as floods, droughts, and greenhouse gas emissions [52–54]. Secondly, increases in the population have increased the stress on water resources with more human activities (Figure 6) compromising water quality [55]. Finally, the expansion of industries due to the transition of the country from an agricultural to a semi-industrial state contributes to the contamination of freshwater bodies, due to the lack of vigilant monitoring of industrial waste management systems [7,11,56]. The
Figure 6. Water Quality Index (WQI) score comparison between private and public schools.
The quality of drinking water is determined by the quality of water source (Appendix A Figure A1),the level and treatment efficiency, and condition of water supply lines. In Pakistan, most schoolsdo not have a fresh water source available and ground water is saline; pupils have no choice but touse this type of water for drinking. The schools with drinking water quality do not meet the WHOstandards [2]. In the urban schools, the main reason for water contamination is due to the intermixingof sewage lines with drinking water supply lines—while in rural areas, where surface water is used nopre-treatment, facilities are available for filtration of water. In addition, the hand pumps and wells arenot safe from surface runoff and flooding [24,46,49]. Industrialization and rapid urbanization haveplaced immense stress on water resources and discharge of wastewater into natural water resourcesthat decreases ground and surface water quality [7,11,51]. The schools with improved water qualitymight have safe natural ground water source or schools with better management systems, additionalsupport (related to WASH) from government, community, or other organizations have relatively betterwater quality [6,9,52].
In our study, the quality of drinking water is further worsened in the distribution lines, possiblydue to the leakage of water pipes at a point where the drainage water enters into the main drainagesystem [50,51]. At the school level, drainage water may be contaminated due to uncovered overheadstorage tanks, underground storage tanks, and unhygienic handling of water by consumers [46,47].
During the last decade, the overall drinking water quality of the studied area has been subjectto a rapid decline for various reasons. First, as a result of climate change, water resources (quantityand quality) in Pakistan have deteriorated; water temperature has increased and, as a result, amarked change has been witnessed in rainfall patterns, the behavior of glaciers, and the occurrence ofextreme events such as floods, droughts, and greenhouse gas emissions [52–54]. Secondly, increasesin the population have increased the stress on water resources with more human activities (Figure 6)compromising water quality [55]. Finally, the expansion of industries due to the transition of thecountry from an agricultural to a semi-industrial state contributes to the contamination of freshwaterbodies, due to the lack of vigilant monitoring of industrial waste management systems [7,11,56]. TheWQI tools have widely been used by investigators around the world for water quality monitoring inground- or surface-water sources, but not purely on drinking water in school settings in a large studysetting, or by considering both ground and surface water sources serving these schools.
There were a few limitations to our study. We presume variation in water quality by each season,since we considered a single water sample from each primary school; therefore, some of the WQI values
Water 2020, 12, 3382 14 of 18
might be strongly affected by variations along the year and suggest that this work must be improvedby collecting data during a more extended period to identify these processes and its repercussions.Additionally, we assessed water quality using the WQI tool based on physicochemical parameters only.Future studies should consider metals and microbial parameters for better understanding of drinkingwater quality in school settings.
4. Conclusions
We used physicochemical parameters to characterize the drinking water quality using a WQI andanalyzed the spatial patterns of WQI among primary schools of Sindh province in Pakistan. The WQIis considered a simple method to evaluate overall water quality and has been widely used. This is thefirst study conducted in school settings that used the WQI method to determine drinking-water quality.The study findings revealed that almost a third of schools do not have access to suitable drinkingwater for children. The main parameters found to contribute to poor water quality were EC, TDS,turbidity, hardness, and chloride indicating contamination of surface and groundwater sources throughdischarges from industrial, domestic sewage, residential, and agricultural runoff. Improved access tosafe water and sanitation in schools is crucial to stop the transmission of water-related diseases. In orderto ensure safe drinking water in schools, we recommend the regular monitoring of drinking watersources and, where needed, the use of low cost, simple and sustainable drinking water purificationapproaches, for example, chlorination, solar disinfection, and boiling. Furthermore, longitudinalstudies may be considered in the future, which include metals, microbials, and physicochemicalparameters to gain a better insight into the drinking water quality in present settings.
Author Contributions: Conceptualization, J.A. and L.P.W.; methodology, J.A., N.C., and L.P.W.; software, J.A.,L.P.W., Y.P.C., and N.C.; formal analysis, J.A., L.P.W., Y.P.C., and N.C.; investigation, J.A. and N.C.; data curation,Y.P.C., L.P.W., and N.C.; writing—original draft preparation, J.A., L.P.W., Y.P.C., and N.C.; writing—review andediting, J.A., L.P.W., and N.C.; Writing—review and editing, Y.P.C., L.P.W., and J.A.; supervision, Y.P.C. and L.P.W.;project administration L.P.W. and J.A.; funding acquisition, J.A. All authors have read and agreed to the publishedversion of the manuscript.
Funding: This study was financially supported by the USAID (Seed Grant No: P-II/07).
Acknowledgments: The researchers wanted to acknowledge USAID for providing monetary support; US-PakistanCenter for Advance Studies in Water, Mehran University of Engineering and Technology for providing the platformto accomplish this research project. Division of Public Health at the University of Utah and School of CommunityHealth Sciences at the University of Nevada, Reno for providing technical support.
Conflicts of Interest: The authors declare no conflict of interest.
Appendix A
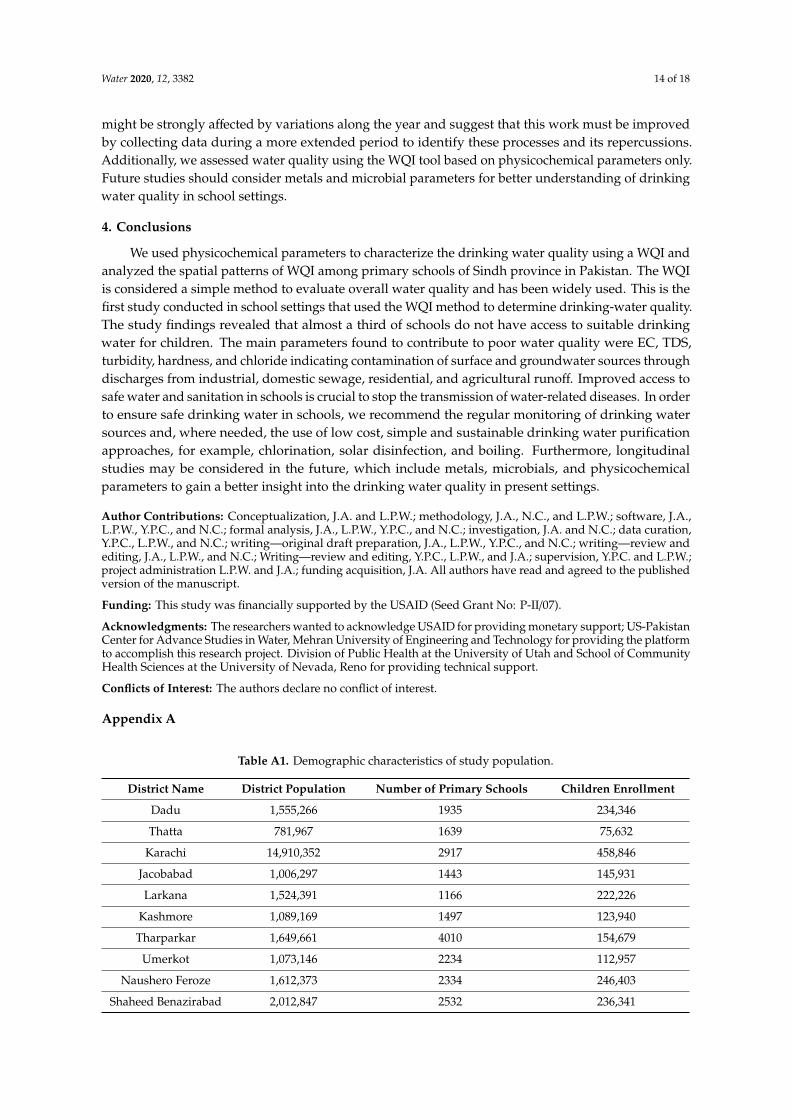
Table A1. Demographic characteristics of study population.
District Name District Population Number of Primary Schools Children Enrollment
Dadu 1,555,266 1935 234,346
Thatta 781,967 1639 75,632
Karachi 14,910,352 2917 458,846
Jacobabad 1,006,297 1443 145,931
Larkana 1,524,391 1166 222,226
Kashmore 1,089,169 1497 123,940
Tharparkar 1,649,661 4010 154,679
Umerkot 1,073,146 2234 112,957
Naushero Feroze 1,612,373 2334 246,403
Shaheed Benazirabad 2,012,847 2532 236,341
Water 2020, 12, 3382 15 of 18
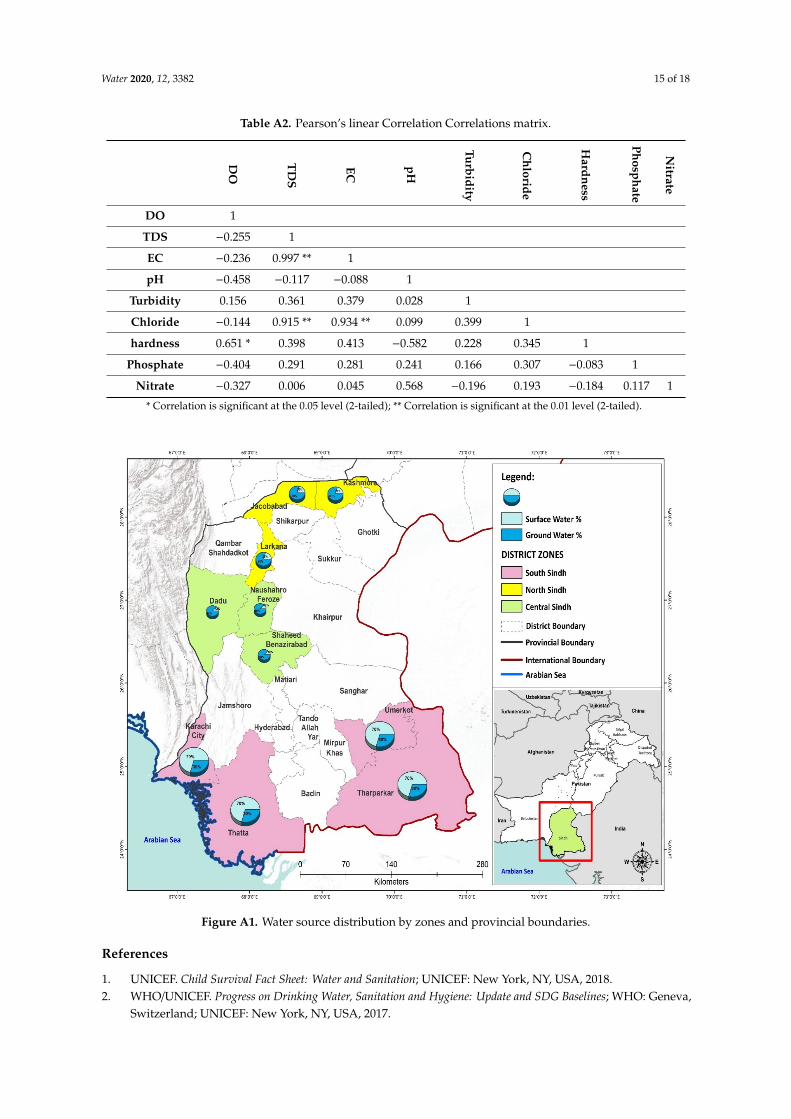
Table A2. Pearson’s linear Correlation Correlations matrix.
DO
TD
S
EC
pH
Turbidity
Chloride
Hardness
Phosphate
Nitrate
DO 1
TDS −0.255 1
EC −0.236 0.997 ** 1
pH −0.458 −0.117 −0.088 1
Turbidity 0.156 0.361 0.379 0.028 1
Chloride −0.144 0.915 ** 0.934 ** 0.099 0.399 1
hardness 0.651 * 0.398 0.413 −0.582 0.228 0.345 1
Phosphate −0.404 0.291 0.281 0.241 0.166 0.307 −0.083 1
Nitrate −0.327 0.006 0.045 0.568 −0.196 0.193 −0.184 0.117 1
* Correlation is significant at the 0.05 level (2-tailed); ** Correlation is significant at the 0.01 level (2-tailed).
Water 2020, 12, x FOR PEER REVIEW 9 of 20
Tharparkar 1,649,661 4010 154,679 Umerkot 107,3146 2234 112,957
Naushero Feroze 1,612,373 2334 246,403 Shaheed Benazirabad 2,012,847 2532 236,341
Table A2. Pearson’s linear Correlation Correlations matrix.
DO
TDS
EC
pH
Turbidity
Chloride
Hardness
Phosphate
Nitrate
DO 1 TDS −0.255 1 EC −0.236 0.997 ** 1 pH −0.458 −0.117 −0.088 1
Turbidity 0.156 0.361 0.379 0.028 1 Chloride −0.144 0.915 ** 0.934 ** 0.099 0.399 1 hardness 0.651 * 0.398 0.413 −0.582 0.228 0.345 1
Phosphate −0.404 0.291 0.281 0.241 0.166 0.307 −0.083 1 Nitrate −0.327 0.006 0.045 0.568 −0.196 0.193 −0.184 0.117 1
* Correlation is significant at the 0.05 level (2-tailed); **. Correlation is significant at the 0.01 level (2-tailed).
Figure A1. Water source distribution by zones and provincial boundaries.
Figure A1. Water source distribution by zones and provincial boundaries.
References
1. UNICEF. Child Survival Fact Sheet: Water and Sanitation; UNICEF: New York, NY, USA, 2018.2. WHO/UNICEF. Progress on Drinking Water, Sanitation and Hygiene: Update and SDG Baselines; WHO: Geneva,
Switzerland; UNICEF: New York, NY, USA, 2017.
Water 2020, 12, 3382 16 of 18
3. Trinies, V.; Chang, H.H.; Garn, J.V.; Freeman, M.C. The Impact of a School-Based Water, Sanitation, andHygiene Program on Absenteeism, Diarrhea, and Respiratory Infection: A Matched–Control Trial in Mali.Am. J. Trop. Med. Hyg. 2016, 94, 1418–1425. [CrossRef]
4. Garn, J.V.; Brumback, B.A.; Drews-Botsch, C.D.; Lash, T.L.; Kramer, M.R.; Freeman, M.C. Estimating theEffect of School Water, Sanitation, and Hygiene Improvements on Pupil Health Outcomes. Epidemiology 2016,27, 752–760. [CrossRef]
5. Garn, J.V.; Trinies, V.; Toubkiss, J.; Freeman, M.C. The Role of Adherence on the Impact of a School-BasedWater, Sanitation, and Hygiene Intervention in Mali. Am. J. Trop. Med. Hyg. 2017, 96, 984–993. [CrossRef]
6. Nabi, G.; Ali, M.; Khan, S.; Kumar, S. The crisis of water shortage and pollution in Pakistan: Risk to publichealth, biodiversity, and ecosystem. Environ. Sci. Pollut. Res. 2019, 26, 10443–10445. [CrossRef]
7. Daud, M.K.; Nafees, M.; Ali, S.; Rizwan, M.; Bajwa, R.A.; Shakoor, M.B.; Arshad, M.U.; Chatha, S.A.S.;Deeba, F.; Murad, W.; et al. Drinking Water Quality Status and Contamination in Pakistan. BioMed. Res. Int.2017, 2017, 7908183. [CrossRef]
8. Amin, R.; Zaidi, M.B.; Bashir, S.; Khanani, R.; Nawaz, R.; Ali, S.; Khan, S. Microbial contamination levels inthe drinking water and associated health risks in Karachi, Pakistan. J. Water Sanit. Hyg. Dev. 2019, 9, 319–328.[CrossRef]
9. Nawaz, S.; Ali, Y. Factors Affecting the Performance of Water Treatment Plants in Pakistan. Water Conserv.Sci. Eng. 2018, 3, 191–203. [CrossRef]
10. Adimalla, N.; Li, P.; Venkatayogi, S. Hydrogeochemical Evaluation of Groundwater Quality for Drinkingand Irrigation Purposes and Integrated Interpretation with Water Quality Index Studies. Environ. Process.2018, 5, 363–383. [CrossRef]
11. Soomro, M.; Khokhar, M.; Hussain, W.; Hussain, M. Drinking Water Quality Challenges in Pakistan; PakistanCouncil of Research in Water Resources: Lahore, Pakistan, 2011; pp. 17–28.
12. Zahid, J. Impact of Clean Drinking Water and Sanitation on Water Borne Diseases in Pakistan; SustainableDevelopment Policy Institute: Islamabad, Pakistan, 2018; pp. 1–23.
13. NIPS. Pakistan Demographic and Health Survey, 2017–2018; National Institute of Population Studies (NIPS)Pakistan: Islamabad, Pakistan; ICF: Rockville, MD, USA, 2019; p. 573.
14. Ali, W.; Nafees, M.; Turab, S.A.; Khan, M.Y.; Rehman, K. Drinking water quality assessment using waterquality index and geostatistical techniques, Mardan District, Khyber Pakhtunkhwa, Pakistan. J. Him.Earth Sci. 2019, 52, 56–85.
15. Hamlat, A.; Guidoum, A. Assessment of groundwater quality in a semiarid region of Northwestern Algeriausing water quality index (WQI). Appl. Water Sci. 2018, 8, 220. [CrossRef]
16. Ponsadailakshmi, S.; Sankari, S.G.; Prasanna, S.M.; Madhurambal, G. Evaluation of water quality suitabilityfor drinking using drinking water quality index in Nagapattinam district, Tamil Nadu in Southern India.Groundw. Sustain. Dev. 2018, 6, 43–49. [CrossRef]
17. Soleimani, H.; Nasri, O.; Ojaghi, B.; Pasalari, H.; Hosseini, M.; Hashemzadeh, B.; Kavosi, A.; Masoumi, S.;Radfard, M.; Adibzadeh, A.; et al. Data on drinking water quality using water quality index (WQI) andassessment of groundwater quality for irrigation purposes in Qorveh & Dehgolan, Kurdistan, Iran. Data Brief2018, 20, 375–386. [CrossRef]
18. Sener, S.; Sener, E.; Davraz, A. Evaluation of water quality using water quality index (WQI) method and GISin Aksu River (SW-Turkey). Sci. Total Environ. 2017, 584, 131–144. [CrossRef]
19. Suvarna, B.; Reddy, Y.S.; Sunitha, V.; Reddy, B.M.; Prasad, M.; Reddy, M.R. Data on application of waterquality index method for appraisal of water quality in around cement industrial corridor, YerraguntlaMandal, Y.S.R. District, A.P South India. Data Brief 2020, 28, 104872. [CrossRef]
20. Ketata, M.; Gueddari, M.; Bouhlila, R. Use of geographical information system and water quality index toassess groundwater quality in El Khairat deep aquifer (Enfidha, Central East Tunisia). Arab. J. Geosci. 2011, 5,1379–1390. [CrossRef]
21. Sadat-Noori, M.; Ebrahimi, K.; Liaghat, A. Groundwater quality assessment using the Water Quality Indexand GIS in Saveh-Nobaran aquifer, Iran. Environ. Earth Sci. 2013, 71, 3827–3843. [CrossRef]
22. Environmental protection agency, Government of Pakistan. National standard for drinking water quality.Gaz. Pak. 2010, 1062, 3207–3208.
23. Sayato, Y. WHO guidelines for drinking-water quality. Eisei Kagaku 1989, 35, 307–312. [CrossRef]
Water 2020, 12, 3382 17 of 18
24. School Education Department. G.o.S. Water, Sanitation & Hygiene (WASH) in Public Sector SchoolsStrategic Plan for Sindh. Available online: http://www.sindheducation.gov.pk/Contents/Menu/WASH%20in%20Public%20Sector.pdf (accessed on 12 May 2020).
25. School Education and Literacy Department, Government of Sindh. 2019. Available online: http://www.sindheducation.gov.pk/ (accessed on 12 May 2020).
26. Malik, S.M.; Awan, H.; Khan, N. Mapping vulnerability to climate change and its repercussions on humanhealth in Pakistan. Glob. Health 2012, 8, 31. [CrossRef]
27. Pakistan Demographics Profile. Mundi Index. 2019. Available online: https://www.indexmundi.com/
pakistan/demographics_profile.html (accessed on 12 May 2020).28. Maskooni, E.K.; Naseri-Rad, M.; Berndtsson, R.; Nakagawa, K. Use of Heavy Metal Content and Modified
Water Quality Index to Assess Groundwater Quality in a Semiarid Area. Water 2020, 12, 1115. [CrossRef]29. Iticescu, C.; Georgescu, L.P.; Murariu, G.; Topa, C.; Timofti, M.; Pintilie, V.; Arseni, M. Lower Danube Water
Quality Quantified through WQI and Multivariate Analysis. Water 2019, 11, 1305. [CrossRef]30. Shrestha, A.; Basnet, N. An evaluation of physicochemical analysis and water quality index of Ratuwa River
of Damak, Jhapa, Nepal. Int. J. Rec. Res. Rev. 2018, 11, 1–9.31. Reyes-Toscano, C.A.; Alfaro-Cuevas-Villanueva, R.; Cortés-Martínez, R.; Morton-Bermea, O.;
Hernández-Álvarez, E.; Buenrostro-Delgado, O.; Ávila-Olivera, J.A. Hydrogeochemical Characteristicsand Assessment of Drinking Water Quality in the Urban Area of Zamora, Mexico. Water 2020, 12, 556.[CrossRef]
32. WHO. World Report on Disability 2011; World Health Organization: Geneva, Switzerland, 2011.33. Kachroud, M.; Trolard, F.; Kefi, M.; Jebari, S.; Bourrié, G. Water Quality Indices: Challenges and Application
Limits in the Literature. Water 2019, 11, 361. [CrossRef]34. Sharma, P.; Meher, P.K.; Kumar, A.; Gautam, Y.P.; Mishra, K.P. Changes in water quality index of Ganges
river at different locations in Allahabad. Sustain. Water Qual. Ecol. 2014, 3, 67–76. [CrossRef]35. Waseem, A.; Arshad, J.; Iqbal, F.; Sajjad, A.; Mehmood, Z.; Murtaza, G. Pollution Status of Pakistan:
A Retrospective Review on Heavy Metal Contamination of Water, Soil, and Vegetables. BioMed Res. Int. 2014,2014, 813206. [CrossRef]
36. Abbas, M.; Parveen, Z.; Iqbal, M.; Riazuddin, M.; Iqbal, S.; Ahmed, M.; Bhutto, R. Monitoring of toxic metals(cadmium, lead, arsenic and mercury) in vegetables of Sindh, Pakistan. Kathmandu Univ. J. Sci. Eng. Technol.2010, 6, 60–65. [CrossRef]
37. Shakir, S.K.; Azizullah, A.; Murad, W.; Daud, M.K.; Nabeela, F.; Rahman, H.; Rehman, S.U.; Häder, D.-P.Toxic Metal Pollution in Pakistan and Its Possible Risks to Public Health. Rev. Environ. Contam. Toxicol. 2016,1–60. [CrossRef]
38. Brindha, K.; Vaman, K.V.N.; Srinivasan, K.; Babu, M.S.; Elango, L. Identification of surface water-groundwaterinteraction by hydrogeochemical indicators and assessing its suitability for drinking and irrigational purposesin Chennai, Southern India. Appl. Water Sci. 2013, 4, 159–174. [CrossRef]
39. Ganeshkumar, B.; Jaideep, C. Groundwater quality assessment using Water Quality Index (WQI)approach–Case study in a coastal region of Tamil Nadu, India. Int. J. Environ. Sci. Res. 2011, 1,50–55.
40. Bhatti, N.; Siyal, A.; Qureshi, A. Groundwater quality assessment using water quality index: A Case study ofNagarparkar, Sindh, Pakistan. Sindh Univ. Res. J. 2018, 50, 227–234.
41. Solangi, G.S.; Siyal, A.A.; Babar, M.M.; Siyal, P. Evaluation of drinking water quality using the waterquality index (WQI), the synthetic pollution index (SPI) and geospatial tools in Thatta district, Pakistan.Desalin. Water Treat. 2019, 160, 202–213. [CrossRef]
42. Panjwani, S.K. Drinking Water Quality and Environmental Monitoring in Rural Areas of District Malir,Karachi. Master’s Thesis, University of Oulu Faculty of Technology, Oulu, Finland, March 2018.
43. Shahab, A.; Shihua, Q.; Rashid, A.; Hasan, F.; Sohail, M. Evaluation of Water Quality for Drinking andAgricultural Suitability in the Lower Indus Plain in Sindh Province, Pakistan. Pol. J. Environ. Stud. 2016, 25,2563–2574. [CrossRef]
44. Arain, M.B.; Ullah, I.; Niaz, A.; Shah, N.; Shah, A.; Hussain, Z.; Tariq, M.; Afridi, H.I.; Baig, J.A.; Kazi, T.G.Evaluation of water quality parameters in drinking water of district Bannu, Pakistan: Multivariate study.Sustain. Water Qual. Ecol. 2014, 3, 114–123. [CrossRef]
Water 2020, 12, 3382 18 of 18
45. Rahmanian, N.; Ali, S.H.B.; Homayoonfard, M.; Ali, N.J.; Rehan, M.; Sadef, Y.; Nizami, A.-S. Analysis ofPhysiochemical Parameters to Evaluate the Drinking Water Quality in the State of Perak, Malaysia. J. Chem.2015, 2015, 716125. [CrossRef]
46. Solangi, G.S.; Siyal, A.A.; Babar, M.M.; Siyal, P. Groundwater quality mapping using geographic informationsystem: A case study of District Thatta, Sindh. Mehran Univ. Res. J. Eng. Tech. 2017, 36, 14. [CrossRef]
47. Khan, S.; Aziz, T.; Noor-Ul-Ain, A.K.; Ahmed, I. Drinking Water Quality in 13 Different Districts of Sindh,Pakistan. Health Care Curr. Rev. 2018, 6, 2.
48. Qureshi, A.L.; Mahessar, A.A.; Leghari, M.E.-U.-H.; Lashari, B.K.; Mari, F.M. Impact of Releasing Wastewaterof Sugar Industries into Drainage System of LBOD, Sindh, Pakistan. Int. J. Environ. Sci. Dev. 2015, 6, 381–386.[CrossRef]
49. Khan, A.; Qureshi, F.R. Groundwater Quality Assessment through Water Quality Index (WQI) in NewKarachi Town, Karachi, Pakistan. Asian J. Water Environ. Pollut. 2018, 15, 41–46. [CrossRef]
50. Ahmed, J.; Wong, L.P.; Piaw, C.Y.; Channa, N.; Mahar, R.B.; Yasmin, A.; Vanderslice, J.; Garn, J. QuantitativeMicrobial Risk Assessment of Drinking Water Quality to Predict the Risk of Waterborne Diseases inPrimary-School Children. Int. J. Environ. Res. Public Health 2020, 17, 2774. [CrossRef]
51. Ahmed, J.; Wong, L.P.; Chua, Y.P.; Yasmin, A.; Channa, N.; Van Derslice, J.A. Estimation of Hepatitis A VirusInfection Prevalence Through Drinking Water Supply of Primary Schools of Sindh, Pakistan. Zahedan J. Res.Med Sci. 2020, 20, 98412. [CrossRef]
52. Hussain, M.; Butt, A.R.; Uzma, F.; Ahmed, R.; Irshad, S.; Rehman, A.; Yousaf, B. A comprehensive review ofclimate change impacts, adaptation, and mitigation on environmental and natural calamities in Pakistan.Environ. Monit. Assess. 2019, 192, 48. [CrossRef]
53. Hussain, M.; Mumtaz, S. Climate change and managing water crisis: Pakistan’s perspective. Rev. Environ. Health2014, 29, 71–77. [CrossRef]
54. Khan, A.J.; Koch, M.; Tahir, A.A. Impacts of Climate Change on the Water Availability, Seasonality andExtremes in the Upper Indus Basin (UIB). Sustainablity 2020, 12, 1283. [CrossRef]
55. Dawadi, S.; Ahmad, S. Evaluating the impact of demand-side management on water resources underchanging climatic conditions and increasing population. J. Environ. Manag. 2013, 114, 261–275. [CrossRef]
56. Safdar, M.T. Sugarcane and Punjab, Pakistan: Production, Processing and Challenges. Available online:https://ethicalsugar.files.wordpress.com/2014/02/ethical-sugar-sugarcane-in-punjab-pakistan.pdf (accessedon 30 November 2020).
Publisher’s Note: MDPI stays neutral with regard to jurisdictional claims in published maps and institutionalaffiliations.
© 2020 by the authors. Licensee MDPI, Basel, Switzerland. This article is an open accessarticle distributed under the terms and conditions of the Creative Commons Attribution(CC BY) license (http://creativecommons.org/licenses/by/4.0/).
Copyright © 2022 FDOKUMEN