Drinking Water and Wastewater Master Plan – Rota ...
237
DRAFT FINAL Drinking Water and Wastewater Master Plan – Rota, Commonwealth of the Northern Mariana Islands Prepared for Commonwealth Utilities Corporation Prepared by 238 East Marine Corps Drive, Suite 201 Hagatña, Guam 96910 9193 S. Jamaica St. Englewood, Colorado 80112 June 2015 Draft
-
Upload
khangminh22 -
Category
Documents
-
view
0 -
download
0
Transcript of Drinking Water and Wastewater Master Plan – Rota ...

DRAFT F INAL
Drinking Water and Wastewater Master Plan –
Rota, Commonwealth of the Northern Mariana Islands
Prepared for
Commonwealth Utilities Corporation
Prepared by
238 East Marine Corps Drive, Suite 201 Hagatña, Guam 96910
9193 S. Jamaica St.
Englewood, Colorado 80112
June 2015
Draft

Draft

DRAFT FINAL DRINKING WATER AND WASTEWATER MASTER PLAN, ROTA, CNMI iii
Acknowledgements The Commonwealth Utilities Corporation Drinking Water and Wastewater Master Plans project team would like to acknowledge the contribution and collaboration of the many individuals who contributed to the success of this project.
Water Task Force Pete Sasamoto, Manager Kate Delafield, Legal Counsel
CNMI Bureau of Coastal and Environmental Quality David Rosario, MPH, Director, Division of Environmental Quality & Wastewater Program Manager Joe Kaipat, Drinking Water and Ground Water Programs Derek Chambers, PE, MPH, Captain, U.S. Public Health Service, Technical Advisor to DEQ Manny Borja, Environmental Engineer
Region 9 Environmental Protection Agency John Tinger, Alternate EPA Project Coordinator Adam Howell, Project Staff Michael Lee, Project Coordinator/Wastewater Coordinator Barry Pollock, Alternate EPA Project Coordinator (Retired) John McCarroll, Manager, Pacific Islands Office Carl Goldstein, CNMI Program Manager
Commonwealth Utilities Corporation Abe Utu Malae, Executive Director (through 2012) Alan W. Fletcher, Executive Director Charles Warren, Chief Financial Officer (through 2014) John Reigel, PE, Water & Wastewater Chief Engineer Robert Lorenz, PE, Captain, U.S. Public Health Service, Chief Engineer (through March 2012) Brian G. Bearden, PE, Lieutenant Commander, U.S. Public Health Service, Project Manager Ken Esplin, PE, Commander, U.S. Public Health Service (retired) Larry Manacop, Senior Engineer Christy Lazaro, Senior Engineer Joel Hoepner, Field and Engineering Support Travis Spaeth, PE, Operations Engineer Birhen Martinez, Engineer Yvonne Cabrera, Engineer Nicolette Villagomez, Engineer James Benevente, Engineer Heidi Yelin, Laboratory Manager Richard Wasser, Acting Water and Wastewater Division Manager Bernard Keremius, Water Operations Manager
Draft

ACKNOWLEDGEMENTS
iv DRAFT FINAL DRINKING WATER AND WASTEWATER MASTER PLAN, ROTA, CNMI
Commonwealth Utilities Corporation (continued) Charles Manglona, CUC Rota Resident Director Ric Saavedra, Rota Direct Responsible Charge (DRC) Water System Operator (2012 ‐ 2014) Ray Muna, Rota Direct Responsible Charge (DRC) Water System Operator (2014 ‐ present) CUC Engineering CUC Laboratory CUC Field Operations CUC Wastewater Treatment Operations
Dueñas, Camacho & Associates John P. Dueñas, Project Manager Thomas P. Camacho, Structural Engineering Kenneth M. Rekdahl, Chief of Special Projects Ernie Villarin, Project Engineer Jeff Bell, Project Engineer William Concepcion, GIS Manager Chelsea Steed, GIS Specialist
CH2M Kenneth A. Thompson, Assistant Project Manager Jane Mailand, Project Administrator Katie L. Chamberlain, PE, Wastewater Engineering / Asset Management Kerry J. Meyer, PE, Water Engineering Tuck Wai Lee, Wastewater Treatment Kevin Bral, PE, Groundwater Management Lindsay Atkinson, PE, Engineering Support Joshua McIlwain, Engineering Support Rene Santin, Engineering Support Rex T. Hesner, Asset Management (retired) Dennis E. Jackson, PE, Financial Lead Sarah Stone, PE, Financial Support
EFC Engineers & Architects Efrain F. Camacho, GWUDI Support Martha Camacho, GWUDI Support Julita Enriquez, Administrative Support
Daniel D. Swavely Consulting Services, Inc. Daniel D. Swavely, Planning Consultant
Draft

DRAFT FINAL DRINKING WATER AND WASTEWATER MASTER PLAN, ROTA, CNMI v
Executive Summary
The Commonwealth Utilities Corporation (CUC) took over the management of the Commonwealth of the Northern Mariana Islands (CNMI) water and wastewater utilities from the Department of Public Works in the late 1980s. Since the time of the transfer of management responsibilities, utility staff have encountered extensive infrastructure problems, and capital and operational budgets have been insufficient to address the problems. In 2008, the United States Environmental Protection Agency (EPA) and the CUC entered into Stipulated Order Number One for Injunctive Relief that required the development of a comprehensive, long‐term water and wastewater Master Plans to identify specific issues and improvements to both the water and wastewater infrastructure on the islands of Saipan, Rota, and Tinian.
The most significant problems with the Rota water system were potential public health concerns associated with:
Lack of flexibility in moving treated water to all parts of the island and difficulty in accessing and maintaining facilities
Failure to comply with Safe Drinking Water Act water quality requirements
The most significant problems with the Rota wastewater system were potential public health concerns associated with:
Lack of central sewer systems in Song Song and Sinapalo
The Rota Drinking Water and Wastewater Master Plan is the first step toward compliance with Stipulated Order No. 1. Development of the Master Plan resulted in a roadmap that identified new capital projects, replaced and repaired existing facilities, modified operational procedures, and assessed current staffing levels and related policies.
The development process, listed below, identified projects that were not only required to meet the Stipulated Order, but projects that would also provide a long‐term benefit to CUC with regard to operation of CUC’s water and wastewater infrastructure:
• Literature review
Field data collection
• Documentation of findings in technical memorandums
• Analysis of the data
• Project identification and prioritization
Not all projects identified as part of the project identification process are included in the Capital Improvements Plan (CIP) projects due to budget and scheduling restraints. It is not feasible for all projects identified and scored not to be completed within the 20‐year CIP implementation period specified by the Stipulated Order.
The Financial Plan is a companion document that discusses the capital and operating funding needs for the wastewater system and the rate impact on existing and future customers.
Draft

EXECUTIVE SUMMARY
vi DRAFT FINAL DRINKING WATER AND WASTEWATER MASTER PLAN, ROTA, CNMI
Goals for the Rota Drinking Water and Wastewater Master Plan Master Plans for the water and wastewater systems on Saipan, Rota, and Tinian have been developed to provide a roadmap for CUC to implement to meet the requirements of the Stipulated Order. The Rota Drinking Water and Wastewater Master Plan sets quantifiable milestones that the EPA Region 9 staff can use for tracking compliance. CUC’s overarching goal for the Master Plan is to meet Stipulated Order requirements through a realistic implementation plan that also addresses real needs and promotes operational improvements. CUC’s desired outcomes for the Rota water system include the following:
• A system fully compliant with the Safe Drinking Water Act for primary drinking water standards
Reduction of non‐revenue water to the industry‐level best practice (less than 10 percent)
Improved flexibility to provide drinking water throughout the system and maintenance of infrastructure
CUC’s desired outcomes for the Rota wastewater system include the following:
• Develop a system needs assessment for the wastewater systems in Song Song and Sinapalo
Design and construct, if required, the wastewater systems for Song Song and Sinapalo
The Rota Drinking Water and Wastewater Master Plan addresses these outcomes as described in the following sections.
Compliance with Safe Drinking Water Act Regulations The Groundwater under the Direct Influence (GWUDI) Study was conducted on the Main Cave during the wet seasons in July through December 2012 and 2013. Prior to the start of the GWUDI study, the CUC team installed temporary enclosures that protected the water in the Main Cave from contamination from the external environment. The EPA and CNMI Division of Environmental Quality (DEQ) determined, based on the 2‐year study, that the Main Cave is non‐GWUDI. However, CUC needs to install permanent protective enclosures to properly seal the cave from external sources of contamination. Rota Capital Improvement Plan (CIP) Project 5, Main Cave Enclosure, is scheduled in the third 5‐year CIP phase. The use of the Onan Cave, the other water source on Rota, has been discontinued due to the inability to properly seal the cave from external contamination sources.
Improved Flexibility to Distribute Water and Maintain System The ability to properly maintain the water pipelines and appurtenances from the Main and Onan Caves has become increasingly difficult due to stricter enforcement of environmental regulations and permitting by the U.S. Fish and Wildlife Service. This problem will be addressed through the Rota Water System Reconfiguration Program over four phases. Phase I will begin during the first 5‐year CIP period with the final work completed during the third 5‐year CIP period. The complexity of the system reconfiguration required that multiple phases be developed. This approach allows the reconfigured system to be fully functional at the end of each phase. The system will avoid highly sensitive environmental areas and will maximize the use of existing right‐of‐way parcels. Additionally, funds will be made available for distribution system valve replacement (third 5‐year CIP period) and rehabilitation of three wells (fourth 5‐year CIP period).
Draft

EXECUTIVE SUMMARY
DRAFT FINAL DRINKING WATER AND WASTEWATER MASTER PLAN, ROTA, CNMI vii
Central Sewer Systems for Song Song and Sinapalo CUC does not operate a sewer system on Rota, so there have been concerns raised about potential impacts on the underlying groundwater and coastal areas adjacent to Song Song and Sinapalo. To begin to address these concerns, Wastewater System Needs Assessment projects for both areas have been incorporated into the third 5‐year CIP period.
Recommended Capital Improvement Plan and Operations and Maintenance Projects Based on Stipulated Order requirements, goals that CUC has set for its water and wastewater systems on Rota and information collected as part to the Master Plan development, the following CIP and O&M projects are recommended.
Water and Wastewater Capital Improvement Projects The Rota Drinking Water and Wastewater Master Plan project evaluated and ranked 16 drinking water system improvement and four wastewater system improvement projects. After the initial ranking was completed, water storage tanks were evaluated against a second set of criteria based on additional management asset information received for the tanks at the highest risk of failure. Using the additional information, some tanks were moved up on the priority list as this could have a very significant impact on the public health and safety of the community and CUC staff.
During the development of the drinking water and wastewater master plan, a number of operation and maintenance (O&M) enhancements were identified that have been included in this document. Table ES‐1 provides a high‐level summary of the capital improvement projects evaluated and operational improvements that have been documented for Rota.
Table ES‐1. Projects Identified by the Master Plan
System
Total Number of Capital Improvement Projects Evaluated
Number of Capital Improvement Projects
in 20‐year Plan Capital Improvement Costs over 20 Years
Number of O&M Projects
Water 16 7 $7,143,000 55
Wastewater 4 2 $120,000 NA
Based on the projected funding available from EPA State Revolving Fund (SRF) grants, one project for the Rota water system will be implemented during the first 5‐year CIP period from 2016 through 2020 (see Table ES‐2).
Table ES‐2. 20‐Year Water CIP Projects and Associated Costs
Project Location
Project #a Project Descriptionb
1st 5‐Year CIP (FY2016‐2020)c
2nd 5‐Year CIP (FY2021‐2025)c
3rd 5‐Year CIP (FY2026‐2030)c
4th 5‐Year CIP (FY2031‐2035)c
Saipan 1 West Project $ 669,000
Saipan 2 Island‐wide Pressure Zone Isolation Project
$ 1,054,000
Saipan 3 Remove and Replace San Vicente 1.0‐Million Gallons (MG) Tank
$ 2,633,000
Saipan 4 Annual Leak Detection and Repair $ 2,500,000
Draft

EXECUTIVE SUMMARY
viii DRAFT FINAL DRINKING WATER AND WASTEWATER MASTER PLAN, ROTA, CNMI
Table ES‐2. 20‐Year Water CIP Projects and Associated Costs
Project Location
Project #a Project Descriptionb
1st 5‐Year CIP (FY2016‐2020)c
2nd 5‐Year CIP (FY2021‐2025)c
3rd 5‐Year CIP (FY2026‐2030)c
4th 5‐Year CIP (FY2031‐2035)c
Saipan 27 Upgrade Isley Tank – Old (CCB) $ 1,563,000
Saipan 29 Replace Dan Dan 0.5‐MG Tank $ 2,876,000
Saipan 32 Upgrade As Matuis (Marpi) 1.0‐MG Tank
$ 1,398,000
Rota 1 Rota Water System Reconfiguration Phase I
$ 877,000
Tinian 4 Upgrade HMT (0.5‐MG) $ 388,000
5‐Year Total $ 13,988,000
Saipan 5 Fina‐Sisu Waterline Replacement $ 1,731,000
Saipan 6 New Meter Installation (24‐hr and non‐24‐hr zones)
$ 1,525,000
Saipan 7 Chinatown/Sugar King Waterline Replacement
$ 1,585,000
Saipan 8 Replace Talofofo Waterline $ 220,000
Saipan 9 Airport‐owned Tank Modification $ 8,000
Saipan 10 Isley II Booster System Upgrades $ 979,000
Saipan 14 Interim Agag Vacuum Controls $ 29,000
Saipan 18 Install Air Relief and Vacuum Valves $ 33,000
Saipan 20 Generator Upgrades $ 378,000
Saipan 32 Upgrade As Matuis (Marpi) 1.0‐MG Tank $ 1,615,000
Rota 1 Rota Water System Reconfiguration Phase I $ 309,000
Rota 2 Rota Water System Reconfiguration Phase II $ 2,521,000
Tinian 1 Improvements to Maui II Well $ 60,000
Tinian 2 Upgrade QMT Tank (0.25‐MG) $ 163,000
5‐Year Total $ 11,156,000
Saipan 7 Chinatown/Sugar King Waterline Replacement
$ 3,107,000
Saipan 8 Replace Talofofo Waterline $ 2,101,000
Saipan 11 Wireless Ridge Waterline Replacement
$ 1,755,000
Saipan 16 System‐wide SCADA Project $ 800,000
Rota 2 Rota Water System Reconfiguration Phase II
$ 2,522,000
Rota 3 Rota Water System Reconfiguration Phase III
$ 572,000
Draft

EXECUTIVE SUMMARY
DRAFT FINAL DRINKING WATER AND WASTEWATER MASTER PLAN, ROTA, CNMI ix
Table ES‐2. 20‐Year Water CIP Projects and Associated Costs
Project Location
Project #a Project Descriptionb
1st 5‐Year CIP (FY2016‐2020)c
2nd 5‐Year CIP (FY2021‐2025)c
3rd 5‐Year CIP (FY2026‐2030)c
4th 5‐Year CIP (FY2031‐2035)c
Rota 4 Rota Water System Reconfiguration Phase IV
$ 141,000
Rota 5 Main Cave Enclosure $ 69,000
Rota 6 Replacement of Old Valves on Distribution Lines
$ 89,000
5‐Year Total $11,156,000
Saipan 12 Isley to As‐Perdido Transmission Line Replacement
$ 7,544,000
Saipan 13 As Lito Distribution Projectd $ 333,000
Saipan 15 Well Upgrades $ 2,208,000
Saipan 16 System‐wide SCADA Project $ 643,000
Saipan 25 Emergency Backup Power for Water Supply Systems
$ 130, 000
Rota 7 Well Facility Upgrade $43,000
5‐Year Total $10,901,000
Discretionary Project Funds $ 382,000 $ 144,000 $ 144,000 $ 399,000
Total Project Costs $ 14,370,000 $ 11,300,000 $ 11,300,000 $ 11,300,000
Available Budget $ 14,370,000 $ 11,300,000 $ 11,300,000 $ 11,300,000
aThe project numbers correspond to the project prioritization rankings developed in Section 4.4.1. Projects were added to the 20‐year CIP in order of highest priority to lowest priority (1 being the highest priority) when possible. Some projects with high capital costs were excluded from the CIP to include more projects, some of which had a lower project priority ranking. The high risk tanks were incorporated into the 20‐year CIP regardless of the tank project priority ranking to ensure that these tank projects are included in the first two 5‐year phases of the CIP.
bComplete project descriptions for the Rota drinking water system can be found in Appendix Q. cAll costs have been rounded to the nearest thousand. Actual cost estimates for Rota drinking water system projects can be found in Appendix T. dOnly engineering costs were included in the 20‐year CIP.
Draft

EXECUTIVE SUMMARY
x DRAFT FINAL DRINKING WATER AND WASTEWATER MASTER PLAN, ROTA, CNMI
Based on the projected funding available from EPA SRF grants, two projects for the Rota wastewater system will be implemented during the second 5‐year CIP period from 2021 through 2025 (see Table ES‐3).
Table ES‐3. 20‐Year Wastewater CIP Capital Costs
Project Location
Project # Project Descriptiona
1st 5‐Year CIP (FY2016‐
2020)
2nd 5‐Year CIP (FY2021‐
2025)
3rd 5‐Year CIP (FY2026‐
2030)
4th 5‐Year CIP (FY2031‐
2035)
Saipan 1 Replacement of Existing Dilapidated Sewerlines
$ 3,630,000
Saipan 2 Island‐wide New Sewer Service Connections
$ 1,555,000
Saipan 3 SCADA Phase I: Pilot Study $ 521,000
Saipan 4 Upgrade Generators $ 432,000
Saipan 5 Upgrades of Various Lift Stations $ 4,366,000
Saipan 6 SCADA Phase II: Design $ 195,000
Saipan 7 I&I Reduction $ 1,859,000
Saipan 8 Garapan Lift Station Elimination $ 1,210,000
5‐Year Total $13,768,000
Saipan 9 FOG Phase II: FOG Disposal Facility Design & Construction
$ 3,260,000
Saipan 10 As Terlaje Sewerline Replacement & Lift Station Elimination
$ 3,461,000
Saipan 11 S‐3 Force Main Replacement $ 378,000
Saipan 12 Sadog Tasi Hygiene Facility $ 303,000
Saipan 13 Lower Sadog Tasi Sewer Collection System
$ 863,000
Saipan 14 Inventory Upgrades $ 550,000
Saipan 16 Lower Base Phase IIb: Southern Tanapag and Chalan Pale Arnold Sewer Collection System
$ 1,344,000
Rota R1 Phase I: Wastewater System Needs Analysis ‐ Song
$ 60,000
Rota R2 Phase I: Wastewater System Needs Analysis ‐ Sinapalo
$ 60,000
5‐Year Total $10,279,000
Saipan 15 Isa Drive Sewer Realignment $ 3,318,000
Saipan 17 Afetna Sewer Collection System Upgrades & Expansion
$ 2,102,000
Draft

EXECUTIVE SUMMARY
DRAFT FINAL DRINKING WATER AND WASTEWATER MASTER PLAN, ROTA, CNMI xi
Table ES‐3. 20‐Year Wastewater CIP Capital Costs
Project Location
Project # Project Descriptiona
1st 5‐Year CIP (FY2016‐
2020)
2nd 5‐Year CIP (FY2021‐
2025)
3rd 5‐Year CIP (FY2026‐
2030)
4th 5‐Year CIP (FY2031‐
2035)
Saipan 19 Wireless Road Phase I: Gravity Sewer System
$ 2,076,000
Saipan 20 As Perdido Road Sewer Collection System
$ 441,000
Saipan 21 Saipan Wastewater Equipment Maintenance Facility
$ 2,340,000
Tinian T1 Phase I: Wastewater System Needs Analysis
$ 60,000
5‐Year Total $10,337,000
Saipan 18 Sludge Composting $10,550,000
5‐Year Total $10,550,000
Discretionary Project Funds $ 602,000 $ 1,021,000 $ 963,000 $ 750,000
Total Project Costs $14,370,000 $11,300,000 $11,300,000 $11,300,000
Available Budget $14,370,000 $11,300,000 $11,300,000 $11,300,000
a Complete wastewater project descriptions for Rota can be found in Appendix U.
b All costs have been rounded to the nearest thousand. Actual cost estimates can be found in Appendix X.
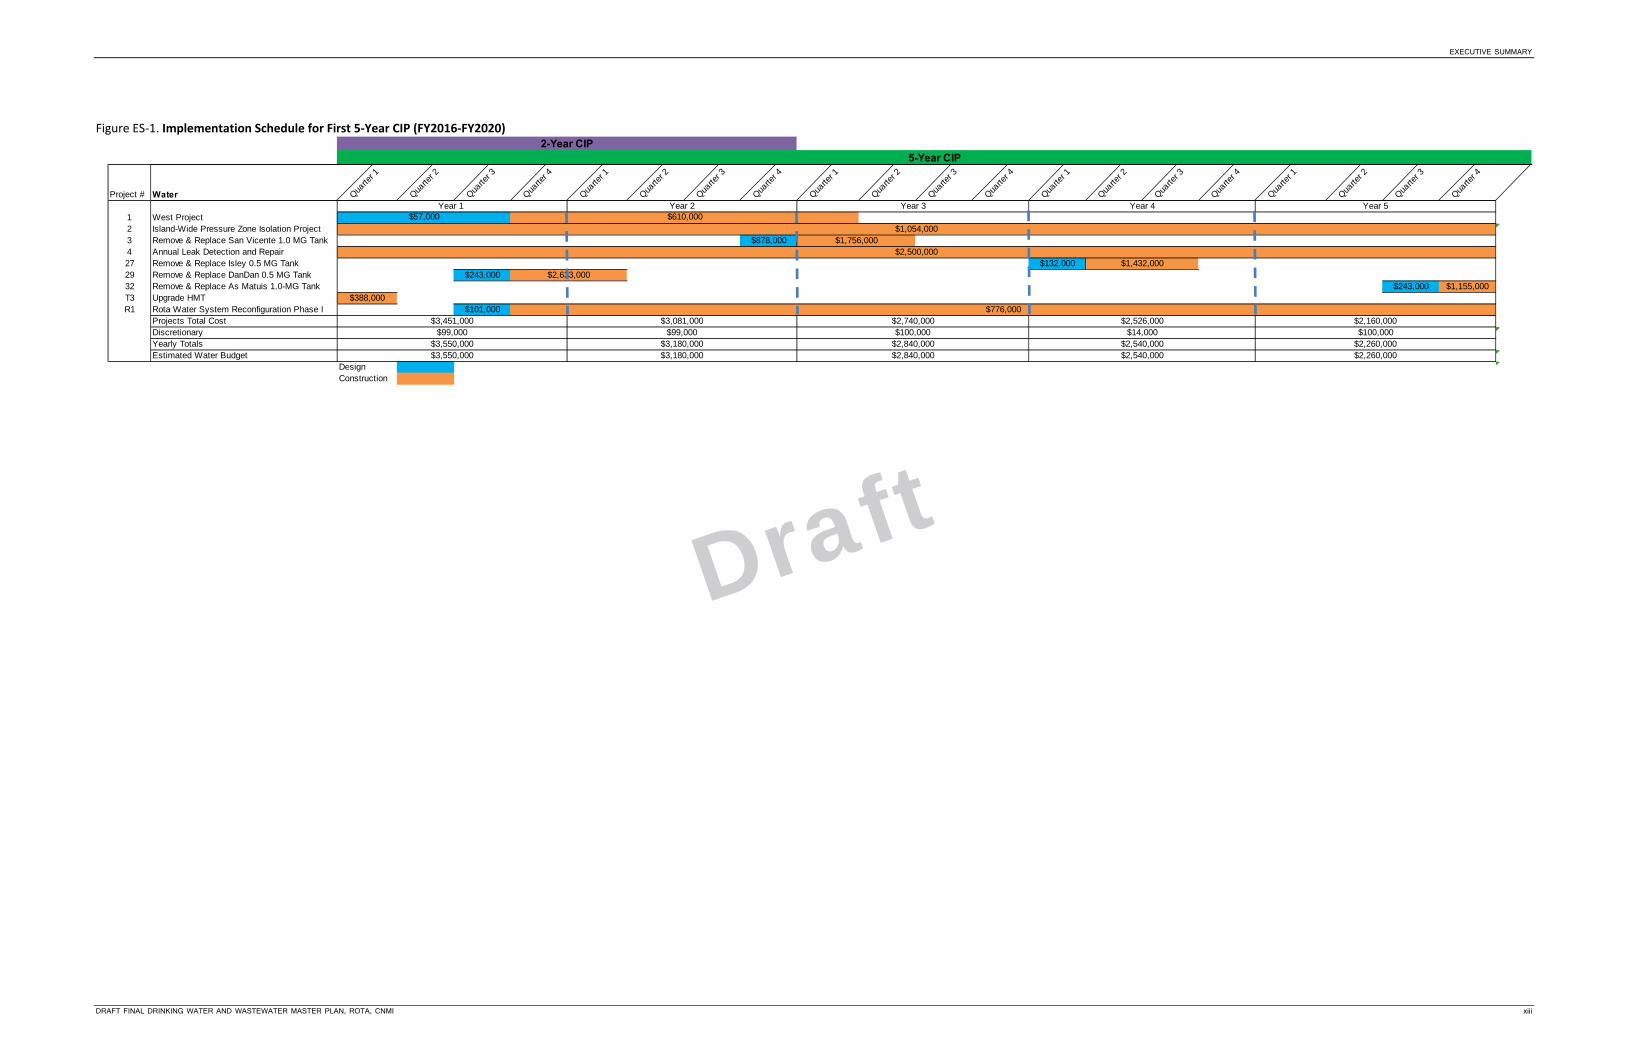
Project Implementation Approach Figure ES‐1 provides an implementation schedule for the first of four 5‐year CIP periods developed for the Rota Water Master Plan. No wastewater system projects are scheduled for Rota in the first 5‐year CIP period.
Draft

Draft
EXECUTIVE SUMMARY
DRAFT FINAL DRINKING WATER AND WASTEWATER MASTER PLAN, ROTA, CNMI xiii
Figure ES‐1. Implementation Schedule for First 5‐Year CIP (FY2016‐FY2020)
5-Year CIP2-Year CIP
Project # Water Quarte
r 1
Quarte
r 2
Quarte
r 3
Quarte
r 4
Quarte
r 1
Quarte
r 2
Quarte
r 3
Quarte
r 4
Quarte
r 1
Quarte
r 2
Quarte
r 3
Quarte
r 4
Quarte
r 1
Quarte
r 2
Quarte
r 3
Quarte
r 4
Quarte
r 1
Quarte
r 2
Quarte
r 3
Quarte
r 4
1 West Project #######2 Island-Wide Pressure Zone Isolation Project #REF!3 Remove & Replace San Vicente 1.0 MG Tank $878,000 #######4 Annual Leak Detection and Repair #######27 Remove & Replace Isley 0.5 MG Tank $132,000 #######29 Remove & Replace DanDan 0.5 MG Tank $243,000 #######32 Remove & Replace As Matuis 1.0-MG Tank $243,000 $1,155,000 #######T3 Upgrade HMT $388,000 #######R1 Rota Water System Reconfiguration Phase I $101,000 $0
Projects Total CostDiscretionary #REF!Yearly Totals #######Estimated Water Budget #REF!
Design #REF!Construction
Year 1 Year 2 Year 3 Year 4 Year 5$57,000 $610,000
$1,054,000$1,756,000
$2,500,000
$2,540,000 $2,260,000$3,550,000 $3,180,000 $2,840,000 $2,540,000 $2,260,000
$99,000 $99,000 $100,000 $14,000 $100,000
$3,550,000 $3,180,000 $2,840,000
$1,432,000
$776,000$3,451,000 $3,081,000 $2,740,000 $2,526,000 $2,160,000
$2,633,000
Draft

Draft

EXECUTIVE SUMMARY
DRAFT FINAL DRINKING WATER AND WASTEWATER MASTER PLAN, ROTA, CNMI xv
Operation and Maintenance List Throughout the course of developing this Master Plan, a number of non‐capital improvement recommendations were identified that fall under general operation and maintenance activities. Thirty‐three O&M activities apply to the drinking water system and the overall utility system on Rota.
Because CUC does not operate or maintain any wastewater infrastructure on the island of Rota, no wastewater O&M recommendations are provided.
Tanks
Schedule API tank inspections at 5‐year intervals and perform a hydraulic analysis to optimize placement of a tank should its replacement be warranted.
Repair the altitude valve at the Ginanlangan Tank as an interim recommendation until the
Rota Water System Reconfiguration Phase I project relocates the Ginanlangan Tank.
Repair the altitude valve at the Kaan Tank as an interim recommendation until Rota Water
System Reconfiguration Phase II project decommissions the Kaan Tank.
Compare the 20‐year lifecycle cost of steel and concrete in the context of available funding to determine the tank material of choice on a project‐by‐project basis. Given the current poor condition of the majority of CUC steel tanks and the corrosive effects of the local environment, the use of concrete is recommended.
The hydraulics and inlet and outlet configuration of any new or rehabilitated tank must be carefully analyzed, taking into account factors such as mixing, system controls, and operations. The following are suggested for tank hydraulic configurations:
Use of separate inlet and outlet lines should be considered, having the inlet and outlet
located at opposite ends of the tank.
Install provisions for tank bypass to allow periodic cleaning and physical inspection of the
tank.
Consider tank baffling or alternative mixing technology, particularly for tanks with storage
capacity of 1 million gallons or more.
Carefully design inlet controls, such as pressure‐sustaining valves and/or altitude valves,
with great care given to avoid overdesign. In addition, due consideration must be given to
accommodate low‐flow bypasses.
Wells
Do not apply tape to the outer cover of the motors (e.g., SQ‐5).
Evaluate well pump depth placement to ensure there is a 10‐foot clear zone between the bottom of the motor and bottom of the well.
Evaluate wells that have a high potential for sanding and select an appropriate pump and motor for that environment (e.g., KG‐4).
Evaluate the need to install a cooling sleeve over the motor and add a sacrificial anode. The sleeve will increase the flow across the motor and will reduce the calcium precipitation onto the outside of the motor. The sacrificial anode will help to protect against pitting due to aggressive water (chloride) (e.g., SQ‐5 and MQ‐8).
Draft

EXECUTIVE SUMMARY
xvi DRAFT FINAL DRINKING WATER AND WASTEWATER MASTER PLAN, ROTA, CNMI
Chlorination Facilities
Install an automatic chlorine tank switchover.
Install amperometric chlorine analyzers at the entry point into the distribution.
Booster Pump Stations
Maintain pumping redundancy at the Sinapalo III booster pump station by keeping a spare pump and motor on island.
Upgrade the Sinapalo III booster pump station in the interim by equipping it with two pumps each sized to handle the full peak demand estimated at 200 gpm at 175 ft. The pump station should be equipped with a variable frequency drive (VFD) to maintain a constant pressure head to the customer, standby power, and a secure enclosure.
Water Distribution
Continue to conduct routine clearing around the concrete pedestals that support aboveground transmission pipelines to control the root intrusion.
Routine painting of the site piping is recommended.
Wherever feasible, serve CUC water customers by a distribution line connected to a storage tank. Pressure‐reducing valves (PRVs) are suggested to reduce high pressures to preferred service pressures.
Install individual household pressure regulators in those situations when high pressures cannot be avoided.
Some of the smaller and isolated areas within the CUC system cannot be included in a tank service area. These areas currently use a booster pump system to provide the needed pressure (head). For such systems, the following are recommended:
Size pump systems and pneumatic tanks according to the 10 States Standards.
Locate air relief valves (ARVs) at the upper portion of the areas served by the booster pump.
Pay careful attention to conditions on the suction side of the pump system. The pump should not cause a drop in system pressure below the recommended pressure.
Install a soft starter or variable frequency drive (VFD) to avoid upstream and downstream transient flows.
Pressure‐Reducing Valves
Specify aluminum or stainless steel pilot piping for reapers, upgrades, and replacements.
Install a pressure reducing/sustaining valve (PRSV) at the existing upper PRV as a short‐term correction to vacuum and pump cavitations between the Ginanlangan to Kaan Tanks.
Conduct additional training on the maintenance and operation of PRVs.
Water Meters
Purchase and evaluate both the Sensus accuSTREAM and the Badger Disc Meter while continuing to test the Sensus iPerl meter, then select a system‐wide meter based on actual performance.
Risk Assessments
Perform electrical system condition assessments for the booster station, similar to that accomplished for the wastewater lift station electrical equipment in Saipan. After condition data
Draft

EXECUTIVE SUMMARY
DRAFT FINAL DRINKING WATER AND WASTEWATER MASTER PLAN, ROTA, CNMI xvii
are collected in the field, update the asset hierarchy with revised Likelihood of Failure (LOF) scores.
It is recommended that as condition/material/age is determined for transmission pipes and distribution pipes, the asset hierarchy and COF and LOF scores be updated accordingly.
Water Quality Monitoring Equipment
At primary disinfection facilities (i.e., entry points into the distribution system), install amperometric chlorine meters with data recorders to provide a continuous measurement of chlorine residual entering the distribution system.
Land Ownership Survey, map, and document by title or written declaration CUC ownership of all easements, right‐of‐way corridors, and real estate (land parcels) on public lands containing CUC water system assets. The following process is recommended for documenting CUC’s real property interests utilizing the GIS program where appropriate:
Meet with the Department Public Lands (DPL) to discuss CUC’s real estate ownership goals, intention to seek titles to real properties containing CUC water (and WW) system assets, and the process to achieve these requirements.
Establish a prioritized list of CUC water system assets by island that need real estate ownership documentation, keeping DPL in the information loop.
Determine the general real estate requirements for each prioritized asset, such as parcel size and easement/right of way width.
Using the GIS program/database, generate a conceptual layout of the real estate requirements of each water system asset (in order of priority for documentation).
Submit partial requests (demands) to DPL for survey, mapping, and grant of title to the real property or declaration of easement/right of way containing each CUC water system asset. CUC requests should be made in manageable increments in consultation with DPL and in the predetermined order of priority for real property ownership documentation.
Provide for the orderly filing of real property information at CUC and for the input and maintenance of the real estate information in the GIS program database.
Recommendations for Improving Risk Scores Complete additional work to the asset hierarchy file that will result in more accurate and complete risk scores for many CUC assets for which little information was known. The following items should be considered if more accurate risk scores are desired:
Engage EMCE to perform condition assessments for booster stations, similar to what was accomplished for the wastewater pump station electrical equipment. After condition data are collected in the field, the asset hierarchy should be updated with revised LOF scores.
Reconcile the asset hierarchy with regard to identification of transmission and distribution system pipes (i.e., document the pipe age and material in individual service areas and neighborhoods, and update COF and LOF scores).
Draft

EXECUTIVE SUMMARY
xviii DRAFT FINAL DRINKING WATER AND WASTEWATER MASTER PLAN, ROTA, CNMI
System Control Elevations Wherever feasible, serve CUC water customers by a distribution line connected to a storage
tank. PRVs are suggested to reduce high pressures to proper service pressures.
Some of the smaller or isolated areas within the CUC system cannot be included in a TSA. These areas currently use a booster pump system to provide the needed pressure (head). For such systems, the following are recommended:
Size pump systems and pneumatic tanks according to the 10 States Standards.
Locate air relief valves (ARVs) at the upper portion of the areas served by the booster pump.
Pay careful attention to conditions on the suction side of the pump system. The pump should not cause a drop in system pressure below the recommended pressure listed.
Install a soft starter or VFD to avoid upstream and downstream transient flows.
GIS Use and Operation
Update the GIS when major or significant system components are replaced or added.
Survey, map, and document by title or written declaration CUC ownership of all easements, right‐of‐way corridors, and real estate (land parcels) on public lands containing CUC water system assets. The following process is recommended for documenting CUC’s real property interests utilizing the GIS program where appropriate:
Meet with the Department Public Lands (DPL) to discuss CUC’s real estate ownership goals, intention to seek titles to real properties containing CUC water (and wastewater) system assets, and the process to achieve these requirements.
Establish a prioritized list of CUC water system assets by island that need real estate ownership documentation, keeping DPL in the information loop.
Determine the general real estate requirements for each prioritized asset, such as parcel size and easement/right of way width.
Using the GIS program/database, generate a conceptual layout of the real estate requirements of each water system asset (in order of priority for documentation).
Submit partial requests (demands) to DPL for survey, mapping, and grant of title to the real property or declaration of easement/right of way containing each CUC water system asset. CUC requests should be made in manageable increments in consultation with DPL and in the predetermined order of priority for real property ownership documentation.
Provide for the orderly filing of real property information at CUC and for the input and maintenance of the real estate information in the GIS program database.
Risk Assessment
Continue to ensure that critical system knowledge is recorded and stored such that any new employee can easily access and understand the information.
Update the asset hierarchy at the same time new information is obtained or as assets are improved upon or removed from the system.
Review and revise as necessary the asset hierarchy every year; review likelihood of failure (LOF) scores annually as well.
Review consequence of failure (COF) scores every 3 to 5 years to ensure levels of service have not drastically changed.
Draft

EXECUTIVE SUMMARY
DRAFT FINAL DRINKING WATER AND WASTEWATER MASTER PLAN, ROTA, CNMI xix
Organizational Structure
Continue to refine the Engineering function under the direction (and office) of the Chief Engineer.
Integrate the Water Task Force into the water and wastewater engineering support groups under the Chief Engineer while maintaining 24‐hour water for all customers as a key mission and goal.
Place the GIS and modeling functions under the direct supervision of the Chief Engineer and managed by one staff member trained in GIS and systems modeling.
Assign an engineer whose dedicated, primary duty is to provide engineering support to water and wastewater systems operations.
Resident Professional and Technical Workforce Development and Training
Identify current CUC employees who have demonstrated a high potential for advancement to professional, technical, or high‐level operational positions required for the management and operation of CUC’s water and wastewater systems; develop and implement a program customized for each candidate to pursue a targeted, high‐level position.
Identify and contact professionals and technicians who were former CNMI residents and recruit those who indicate a desire to relocate back to the CNMI.
Track local islanders who are pursuing higher education on the U.S. mainland or elsewhere and target them for incentivized recruitment efforts.
Offer internships to CNMI students seeking higher education abroad and who wish to spend summers in the CNMI in CUC Engineering and Operations.
Visit local high schools during “Career Day” to promote employment at CUC as a career opportunity under various professional, technical, and operations positions.
Approach Northern Marianas College to develop a technical curriculum for current and prospective CUC employees.
Conduct periodic training workshops for all CUC engineers and engineering technicians on the capabilities and features of the GIS and system modeling programs.
Dealing with Absenteeism
Educate and support middle and lower level supervisors regarding attendance policies and enforcement.
Discontinue “sick leave” accruals and adopt the more common Paid Time Off or Personal Leave concept.
Revise the Reduction in Force (RIF) approach to favor/give preference to retaining employees based on merit rather than seniority.
Conduct “all hands” meetings to address common issues.
Elevating the Standard of Level of Care of CUC Facilities
Develop and post written guidelines and performance standards defining the minimum level of care required at CUC facilities.
Draft
EXECUTIVE SUMMARY
xx DRAFT FINAL DRINKING WATER AND WASTEWATER MASTER PLAN, ROTA, CNMI
Summary The Rota Drinking Water and Wastewater Master Plan provides a comprehensive evaluation of the condition of existing assets, discusses EPA regulatory compliance with the GWUDI Rule, creates a 20‐year capital improvement plan with an implementation schedule, and identifies a number of recommended operational practices for CUC to consider incorporating into its drinking water and wastewater programs. The CIP assumes that only EPA State Revolving Fund (SRF) funding will be available and will decrease over time. This assumption was based on the companion document, the “Financial Plan for Drinking Water and Wastewater Systems,” which clearly demonstrated that the citizens of Saipan, Rota, and Tinian do not have any additional capacity with which to absorb additional utility costs based on the ratio of utility bills to revenue. This situation will continue until there is a significant improvement for the overall economies of the three islands.
The EPA SRF grants for drinking water and wastewater are in a single fund, which allows CUC to prioritize how the dollars are allocated between the two CIP programs. The four 5‐year CIP implementation schedules for the water and wastewater systems assume that the fund will be allocated equally. If a situation arises where there is an urgent unmet need in one of the CIP programs, CUC, with concurrence with DEQ and EPA, should have the right to reallocate funds to meet this unexpected need. Any additional non EPA grant funds that CUC obtains will be used based on the conditions of the specific grant and if the grant is flexible in its application, if flexibility allows will allow the current CIP programs to be expedited.
The goal of the Drinking Water and Wastewater Master Plan is to provide a cost‐effective and implementable roadmap to reduce water loss, maintain regulatory compliance, and plan for future growth. The two biggest constraints to the speed in which this Master Plan will be implemented will be available funding and political support, both which are out of the control of CUC. CUC staff are highly capable in all aspects of the drinking water and wastewater systems from design to operations and maintenance, so with adequate funding and local political support the future of the drinking water and wastewater systems in Rota is very bright.
Structure of the Master Plan This Drinking Water and Wastewater Master Plan for Rota provides the details associated with the information presented in this Executive Summary:
Section 1 introduces the document and provides background information.
Section 2, titled “Project Scope,” is a detailed discussion of each of the items specified in the project scope that highlights key tasks and activities.
Section 3 provides information collected or developed to supplement the items described in Section 2, with the intended result being a more complete and accurate Master Plan.
Section 4 describes the Master Plan itself, summarizing the drinking water system Stipulated Order requirements, the planning and design criteria, and ultimate recommendations that address the requirements and criteria.
Section 5 describes the Master Plan itself, summarizing the wastewater system Stipulated Order requirements, the planning and design criteria, and ultimate recommendations that address the requirements and criteria.
Draft

DRAFT FINAL DRINKING WATER AND WASTEWATER MASTER PLAN, ROTA, CNMI xxi
Contents
Section Page
Acknowledgements ...................................................................................................................... iii
Executive Summary ....................................................................................................................... v
Contents ....................................................................................................................................... vii
Acronyms and Abbreviations ..................................................................................................... xxix
1 Project Information ........................................................................................................ 2‐1 1.1 Background ................................................................................................................ 2‐1 1.2 Introduction ............................................................................................................... 2‐1
2 Project Scope .................................................................................................................. 2‐1 2.1 Chartering Meeting ................................................................................................... 2‐3 2.2 Drinking Water Infrastructure System Condition Assessment .................................. 2‐5
2.2.1 Literature Review ......................................................................................... 2‐5 2.2.2 Condition Assessment of Existing Water Facilities ....................................... 2‐7 2.2.3 Water Distribution Hydraulic Model .......................................................... 2‐62 2.2.4 Water System Infrastructure Geographic Information System ................. 2‐79 2.2.5 Asset Risk Assessment ................................................................................ 2‐86
2.3 Wastewater Infrastructure System Condition Assessment .................................. 2‐103
3 Master Planning Criteria ................................................................................................. 3‐1 3.1 Twenty‐Year Population Projections ......................................................................... 3‐3
3.1.1 Estimating Rota’s Current Population as of January 2012 ........................... 3‐3 3.1.2 Projecting Rota’s Population as a Result Economic Growth
through Business Initiatives by the CGCNMI and Local Businesses ............. 3‐5 3.1.3 Projecting Rota’s Population as a Result Economic Growth
Generated by External Stimuli ..................................................................... 3‐6 3.1.4 Projecting Rota’s Population as a Result Economic Growth
Generated by Local Initiatives and External Stimuli ..................................... 3‐7 3.1.5 Projecting Rota’s Population for Year 2015 ................................................. 3‐7 3.1.6 Projecting Rota’s Population for Year 2020 ................................................. 3‐8 3.1.7 Projecting Rota’s Population for Year 2030 ............................................... 3‐10 3.1.8 Summary of Actual and Estimated Population Data
for 2000 through 2030 ............................................................................... 3‐12 3.1.9 Allocating Rota Islandwide Population Projections
among Census Designated Places for Year 2015 ....................................... 3‐13 3.1.10 Allocating Rota Islandwide Population Projections
among Census Designated Places for Year 2020 ....................................... 3‐14 3.1.11 Allocating Rota Islandwide Population Projections
among Census‐Designated Places for Year 2030 ....................................... 3‐15 3.1.12 Population by Rota Water Regions for Years 2015, 2020
and 2030 for High and Low Ranges ............................................................ 3‐15 3.1.13 Population by Rota Sewersheds for Years 2015, 2020 and 2030 .............. 3‐15
Draft

CONTENTS
xxii DRAFT FINAL DRINKING WATER AND WASTEWATER MASTER PLAN, ROTA, CNMI
3.2 Water Demand and 20‐Year Projections ................................................................ 3‐29 3.2.1 Production and Metered per Capita Demands .......................................... 3‐29 3.2.2 Tank Service Area Population Projections ................................................. 3‐30
3.3 Wastewater Flow Projections ................................................................................. 3‐31 3.4 Status of “Construction Works in Progress” ........................................................... 3‐33 3.5 Assessment of Current CUC Management Policies, Procedures,
and Operating Rules and Regulations for Water and Wastewater Systems .......... 3‐35 3.5.1 Management Organization ........................................................................ 3‐35 3.5.2 Workforce Issues ....................................................................................... 3‐37 3.5.3 Automation and Technology ..................................................................... 3‐38 3.5.4 Recommendations ..................................................................................... 3‐40
4 Drinking Water System Master Plan ............................................................................... 4‐1 4.1 Stipulated Order Planning and Compliance Requirements
for the Drinking Water Master Plan ......................................................................... 4‐3 4.2 Water System Planning and Design Criteria ............................................................. 4‐7
4.2.1 Design Period ............................................................................................... 4‐7 4.2.2 Phased Upgrades ......................................................................................... 4‐7 4.2.3 System Pressures ......................................................................................... 4‐8 4.2.4 System Control Elevations ........................................................................... 4‐8 4.2.5 Distribution System Piping and Appurtenances .......................................... 4‐9 4.2.6 Distribution Storage ................................................................................... 4‐10 4.2.7 Water Tank Construction ........................................................................... 4‐10 4.2.8 Supply ........................................................................................................ 4‐10 4.2.9 Water Treatment (Disinfection) ................................................................ 4‐11 4.2.10 Water Quality ............................................................................................. 4‐11 4.2.11 Summary of Water System Key Design Criteria ......................................... 4‐12
4.3 Drinking Water System Recommendations ............................................................ 4‐15 4.3.1 Drinking Water System Project Identification and Prioritization .............. 4‐15 4.3.2 Cost Development of Drinking Water System Prioritized Projects ........... 4‐25 4.3.3 CIP Project Identification and Costs ........................................................... 4‐29 4.3.4 Prioritized Water System Modifications/Improvements Program ............ 4‐30
4.4 Drinking Water System Operations and Maintenance Improvement Recommendations .................................................................................................. 4‐35 4.4.1 Tanks .......................................................................................................... 4‐35 4.4.2 Wells .......................................................................................................... 4‐35 4.4.3 Chlorination Facilities ................................................................................ 4‐35 4.4.4 Booster Pump Stations .............................................................................. 4‐36 4.4.5 Water Distribution ..................................................................................... 4‐36 4.4.6 Pressure‐Reducing Valves .......................................................................... 4‐36 4.4.7 Water Meters ............................................................................................. 4‐36 4.4.8 Risk Assessments ....................................................................................... 4‐36 4.4.9 Water Quality Monitoring Equipment ....................................................... 4‐37
Draft

CONTENTS
DRAFT FINAL DRINKING WATER AND WASTEWATER MASTER PLAN, ROTA, CNMI xxiii
5 Wastewater System Master Plan .................................................................................... 5‐1 5.1 Stipulated Order Planning and Compliance Requirements
for the Wastewater Master Plan ............................................................................... 5‐3 5.2 Wastewater System Planning and Design Criteria .................................................... 5‐5 5.3 Wastewater Collection and Treatment System Recommendations ......................... 5‐7
5.3.1 Wastewater System Project Identification and Prioritization ...................... 5‐7 5.3.2 Cost Development of Wastewater System Prioritized Projects ................. 5‐12 5.3.3 Prioritized Water System Modifications/Improvements Program ............ 5‐16
References ................................................................................................................................. xxix
Appendices
A Chlorine Treatment Operations Manual
B Tank Inspection Forms
C Water System Hydraulic Profile
D Hydraulic Model Inputs
E Rota Water Distribution and Transmission System
F Pressure Logger Manufacturer Cut Sheet
G Existing Model Output
H Technical Details in Creating the GIS Geodatabase
I GPS Equipment
J Base Map Source Descriptions
K Asset Feature Class Descriptions
L Sample Tabular Database of Selected Water System Components
M Asset Inventory Assessment Presentation
N Water System Asset Hierarchy
O Policy Enforcement Communications regarding Absenteeism
P DOI & OIA Grant Projects
Q Complete Water Project List
R CNMI Safe Drinking Water Infrastructure Grant Program Guidance
S CUC Water Project Scoring Criteria
T Water Project Cost Estimates
U Complete Wastewater Project List
V CNMI Construction Grant Priority System
W CUC Wastewater Project Scoring Criteria
X Wastewater Project Cost Estimates
Draft

CONTENTS
xxiv DRAFT FINAL DRINKING WATER AND WASTEWATER MASTER PLAN, ROTA, CNMI
Figures
ES‐1 Implementation Schedule for First 5‐Year CIP (FY2016‐FY2020) ..................................... xiii
1.2‐1 Master Planning Process ................................................................................................. 2‐1
2.2.2‐1 Typical Well Fencing ........................................................................................................ 2‐9
2.2.2‐2 Typical Well Control Panel ............................................................................................. 2‐11
2.2.2‐3 Main Cave Fencing ........................................................................................................ 2‐12
2.2.2‐4 Onan Cave Overflow ...................................................................................................... 2‐13
2.2.2‐5 Chlorination System at the Kaan Tank .......................................................................... 2‐15
2.2.2‐6 Chlorination System along the Onan Cave Transmission Line ...................................... 2‐15
2.2.2‐7 Kaan Tank Active Chlorine Cylinders ............................................................................. 2‐16
2.2.2‐8 Ginanlangan Tank Site ................................................................................................... 2‐17
2.2.2‐9 Kaan Transmission Line and Concrete Pedestal ............................................................ 2‐21
2.2.2‐10 Transmission Line Intersection of the Main and Onan Caves ....................................... 2‐21
2.2.2‐11 Abandoned Transmission Line Shown Below New 10‐Inch Line ................................... 2‐22
2.2.2‐12 Main Cave Temporary Insect Screen Photo 1 ............................................................... 2‐35
2.2.2‐13 Main Cave Temporary Insect Screen Photo 2 ............................................................... 2‐36
2.2.2‐14 Online Water Quality Monitoring Station ..................................................................... 2‐40
2.2.2‐15 Overall OWQM Data for Main Cave .............................................................................. 2‐44
2.2.2‐16 Rainfall Events at Main Cave ......................................................................................... 2‐46
2.2.2‐17 Laboratory Data for Main Cave ..................................................................................... 2‐47
2.2.2‐18 Maintenance Log and Corresponding Turbidity and Rainfall Data for Main Cave ........ 2‐48
2.2.2‐19 Main Cave Turbidity and Precision Histograms for 9/17 Rainfall Event ....................... 2‐49
2.2.2‐20 Main Cave Turbidity and Precision Histograms for 1/5 Rainfall Event ......................... 2‐50
2.2.2‐21 Rota Main Cave Conductivity Data ................................................................................ 2‐55
2.2.2‐22 Rota Main Cave Turbidity Data ..................................................................................... 2‐57
2.2.2‐23 Rota Main Cave Bacteriological Data ............................................................................ 2‐59
2.2.2‐24 Rota Main Cave Turbidity and Rainfall Data ................................................................. 2‐60
2.2.3‐1 Pressure Logging Data Taken Immediately Downstream of Kaan Tank ........................ 2‐66
2.2.3‐2 Model Results Immediately Downstream of the Kaan Tank ......................................... 2‐66
2.2.3‐3 Pressure Logging Data Taken in the Song Song Village ................................................. 2‐67
Draft

CONTENTS
DRAFT FINAL DRINKING WATER AND WASTEWATER MASTER PLAN, ROTA, CNMI xxv
2.2.3‐4 Model Results from Song Song ...................................................................................... 2‐67
2.2.3‐5 Residential Diurnal Pattern ............................................................................................ 2‐69
2.2.3‐6 Model Output of HGL from Ginanlagan to Kaan Tank ................................................... 2‐70
2.2.3‐7 Model Output of HGL from Ginanlangan to Sinapalo .................................................... 2‐71
2.2.3‐8 Model Output of HGL from Ginanlangan to Sinapalo II and III ...................................... 2‐72
2.2.3‐9 Ginanlangan Tank Hydraulic Grade and Inflow/Outflow ............................................... 2‐73
2.2.3‐10 Photo of the Ginanlangan Tank ..................................................................................... 2‐73
2.2.3‐11 Photo of the Kaan Tank Overflowing during the Wet Season ....................................... 2‐74
2.2.3‐12 Main Cave to Kaan Tank—Ideal Operating Condition ................................................... 2‐75
2.2.3‐13 Main Cave to Kaan Tank—Existing Operating Condition ............................................... 2‐75
2.2.3‐14 Main Cave to Ginanlangan—Ideal Operating Condition ............................................... 2‐76
2.2.3‐15 Main Cave to Ginanlangan—Existing Operating Condition ........................................... 2‐76
2.2.3‐16 Hydraulic Profile between the New Haofna Tank and the New Booster Pump Station 2‐78
2.2.4‐1 Critical Components of the Rota Water System ............................................................ 2‐83
2.2.4‐2 Photographs of Selected Water System Components (Fire Hydrants) .......................... 2‐84
2.2.4‐3 Map of Rota Water ........................................................................................................ 2‐85
2.2.5‐1 Combining the Top‐Down and Bottom‐Up Asset Management Approaches ............... 2‐88
2.2.5‐2 Sample Asset Hierarchy ................................................................................................. 2‐90
2.2.5‐3 Risk Scores for All CUC (Saipan, Rota, and Tinian) Water System Level 5 Assets – Part 1 (scores 12 and over) .................................................................. 2‐96
2.2.5‐4 Risk Scores for All CUC (Saipan, Rota, and Tinian) Water System Level 5 Assets – Part 2 (scores under 12). ..................................................................... 2‐97
2.2.5‐5 Risk Scores for Rota and Tinian Drinking Water Sources ............................................... 2‐98
2.2.5‐6 Risk Scores for Saipan, Rota, and Tinian Water System Storage Tanks ......................... 2‐98
2.2.5‐7 Risk Scores for Rota and Tinian Transmission and Distribution Pipes ........................... 2‐99
3.1‐1 Actual, Estimated, and Projected Population Data from 2000 through 2030 ............... 3‐12
3.1.11‐1 Rota 2010 Census of Population, Housing, and Group Quarters by Census Designated Places ......................................................................................... 3‐27
3.5.1‐1 Commonwealth Utilities Corporation Upper Management Organizational Structure ................................................................................................ 3‐36
3.5.4‐1 Proposed Commonwealth Utilities Corporation Engineering Organization Chart ........ 3‐40
4.3.1‐1 Rota Water System Project Scores and Ranking ............................................................ 4‐21
Draft

CONTENTS
xxvi DRAFT FINAL DRINKING WATER AND WASTEWATER MASTER PLAN, ROTA, CNMI
4.3.1‐2 Tinian Water System Project Scores and Ranking ......................................................... 4‐22
4.3.1‐3 Saipan Water System Project Scores and Ranking ........................................................ 4‐23
4.3.1‐4 Tank CIP Project Scores versus Tank Risk Scores .......................................................... 4‐25
4.3.3‐1 Project Sequencing for First 5‐Year CIP (FY2016‐FY2020) ............................................. 4‐31
5.1.1‐1 Rota Wastewater System Project Scores and Ranking ................................................. 5‐11
Tables
ES‐1 Projects Identified by the Master Plan .............................................................................. vii
ES‐2 20‐Year Water CIP Projects and Associated Costs ............................................................ vii
ES‐3 20‐Year Wastewater CIP Capital Costs ................................................................................ x
2.2.1‐1 Literature Review ............................................................................................................ 2‐5
2.2.1‐2 Information‐Gathering Meetings .................................................................................... 2‐6
2.2.2‐1 Tank Assessment Summary ........................................................................................... 2‐18
2.2.2‐2 Water Line Inventory (Pipes 4‐inches or Greater in Size) ............................................. 2‐20
2.2.2‐3 Water Meter Company Contact Information ................................................................ 2‐23
2.2.2‐4 Summary of Water Meters Researched by DCA/CH2M ................................................ 2‐29
2.2.2‐5 CUC Production and Meter Data ................................................................................... 2‐33
2.2.2‐6 Homesteads and Respective Pipe Materials and Years Installed .................................. 2‐33
2.2.2‐7 Main Cave Shaft Baseline Microparticulate Analysis .................................................... 2‐43
2.2.2‐8 Maintenance Log Dates and Descriptions ..................................................................... 2‐48
2.2.2‐9 Results of the Criteria Used for GWUDI Determination ................................................ 2‐49
2.2.2‐10 Maui II Maintenance Activities ...................................................................................... 2‐52
2.2.2‐11 GWUDI Phase II Investigation Sampling Results ........................................................... 2‐59
2.2.2‐12 Rota Main Cave MPA Primary and Secondary Bio‐indicators ....................................... 2‐60
2.2.3‐1 Rota Tank Summary ...................................................................................................... 2‐63
2.2.3‐2 CUC Production and Meter Data ................................................................................... 2‐64
2.2.3‐3 CUC Demand versus Model Inflow ................................................................................ 2‐65
2.2.4‐1 Geodatabase Asset Feature Class Categories ............................................................... 2‐81
2.2.5‐1 Key Concepts of Asset Management ............................................................................. 2‐87
2.2.5‐2 CUC Levels of Service for the Drinking Water System................................................... 2‐90
2.2.5‐3 Consequence of Failure (COF) Scoring Matrix ............................................................... 2‐92
Draft

CONTENTS
DRAFT FINAL DRINKING WATER AND WASTEWATER MASTER PLAN, ROTA, CNMI xxvii
2.2.5‐4 Likelihood of Failure Scoring Matrix .............................................................................. 2‐93
2.2.5‐5 Frequency Distribution of CUC Water Risk Scores ........................................................ 2‐95
2.2.5‐6 Risk Score Ranges for Distribution System Appurtenances for Rota ............................. 2‐99
3.1.1‐1 Population of Rota from 2000 through 2010 .................................................................. 3‐3
3.1.1‐2 Legal Aliens in the Commonwealth of the Northern Mariana Islands as of April 2010 ................................................................................................................ 3‐4
3.1.4‐1 Likelihood of Population Increases Due to Various Factors by 2015, 2020, and 2030.................................................................................................. 3‐7
3.1.9‐1 Rota Census Designated Places and Year 2010 Census ................................................. 3‐13
3.1.9‐2 Rota Population Projections for Year 2015 by Census Designated Place ‐ High Range ..................................................................... 3‐16
3.1.9‐3 Rota Population Projections for Year 2015 by Census Designated Place ‐ Medium Range ............................................................... 3‐17
3.1.9‐4 Rota Population Projections for Year 2015 by Census Designated Place ‐ Low Range ...................................................................... 3‐18
3.1.10‐2 Rota Population Projections for Year 2020 by Census Designated Place ‐ Medium Range ............................................................... 3‐20
3.1.10‐3 Rota Population Projections for Year 2020 by Census Designated Place ‐ Low Range ...................................................................... 3‐21
3.1.11‐1 Rota Population Projections for Year 2030 by Census Designated Place ‐ High Range ..................................................................... 3‐22
3.1.11‐2 Rota Population Projections for Year 2030 by Census Designated Place ‐ Medium Range ............................................................... 3‐23
3.1.11‐3 Rota Population Projections for Year 2030 by Census Designated Place ‐ Low Range ...................................................................... 3‐24
3.1.12‐1 Rota Population Projections by CDP for 2015, 2020, and 2030 High and Low Ranges ..................................................................................................... 3‐25
3.2‐1 Basis for Per‐Capita Use Rate......................................................................................... 3‐29
3.2.2‐2 Projected Population per Village for Rota ..................................................................... 3‐30
3.2.2‐3 Projected Population per Tank Service Area for Rota ................................................... 3‐30
3.2.2‐4 Projected Population Water Demands per Tank Service Area for Rota ........................ 3‐30
3.4‐1 Ongoing CUC Water and Wastewater Projects as of May 11, 2012 .............................. 3‐33
4.1‐1 Stipulated Order Requirements ....................................................................................... 4‐3
4.2.4‐1 Existing and Proposed Hydraulic Grades for Rota ........................................................... 4‐9
Draft

CONTENTS
xxviii DRAFT FINAL DRINKING WATER AND WASTEWATER MASTER PLAN, ROTA, CNMI
4.2.11‐2 Rota Water System Key Design Criteria ........................................................................ 4‐12
4.3.1‐1 Water Project Scoring Criteria and Weighting .............................................................. 4‐19
4.3.2‐1 Capital and O&M Cost Assumption Summary ............................................................... 4‐29
4.3.3‐1 Assumed Available Budget for Capital Improvement Projects ..................................... 4‐30
4.3.3‐2 20‐Year Water CIP Projects and Associated Costs ........................................................ 4‐33
5.1.1‐1 Wastewater Project Scoring Criteria and Weighting .................................................... 5‐10
5.1.2‐1 Capital and O&M Cost Assumption Summary ............................................................... 5‐15
5.1.3‐1 Assumed Available Budget for Capital Improvement Projects ..................................... 5‐16
5.1.3‐2 20‐Year Wastewater CIP Capital Costs .......................................................................... 5‐17
Draft
DRAFT FINAL DRINKING WATER AND WASTEWATER MASTER PLAN, ROTA, CNMI xxix
Acronyms and Abbreviations
°C Degrees Celsius
ADCP Acoustic Doppler Current Profiler
AMI Advanced Metering Infrastructure
AMR Automatic Meter Reading
AMWA Association of Metropolitan Water Agencies
AOR Actual Oxygenation Rate
API American Petroleum Institute
ARV Air relief valve
AST Aboveground storage tank
ATS Automatic transfer switch
BFP Belt Filter Press
BOD5 5‐Day Biochemical Oxygen Demand
BPS Booster pump station
CCTV Closed‐circuit television
CDP Census Designated Place
CFU Colony‐Forming Units
CIP Capital Improvement Plan
Cl Chlorine
cm/s Centimeters per second
CMU Concrete masonry unit
CNMI Commonwealth of the Northern Marianas
COF Consequence of Failure
CORS Continuously Operating Reference Stations
CUC Commonwealth Utility Corporation
CW CNMI‐Only Transitional Worker
DCA Dueñas Camacho & Associates, Inc.
DEQ Division of Environmental Quality
DIA Diameter
DIP Ductile Iron Pipe
DO Dissolved Oxygen
DPL Department of Public Lands
EPA U.S. Environmental Protection Agency
EPS Extended Period Simulation
Draft

ACRONYMS AND ABBREVIATIONS
xxx DRAFT FINAL DRINKING WATER AND WASTEWATER MASTER PLAN, ROTA, CNMI
F/M Food‐to‐Microorganism Ratio
FEMA Federal Emergency Management Agency
FOG Fats, Oils, and Grease
FSS Flocculated Suspended Solids
ft Foot, Feet
GIS Geographic information system
GPD Gallons per Day
gpm Gallons per minute
GPS Global positioning system
HDPE High Density Polyethylene
HGL Hydraulic Grade Line
HID High‐intensity discharge
HP Horse Power
HRT Hydraulic Retention Time
I/I Inflow and infiltration
in Inch
IPS Influent Pump Station
IWA International Water Association
lb Pound
LOF Likelihood of Failure
LOS Level(s) of service
MCC Motor control cabinet
MG Million Gallons
mg/L Milligrams per Liter
mgd Million gallons per day
MLSS Mixed Liquor Suspended Solids
MMC Motor control center
MPA Microscopic Particulate Analysis
MT MultiTrode
MVA Marianas Visitors Bureau
NA Not Applicable
NDPES National Discharge Pollutant Elimination System
NEC National Electrical Code
NH3 Ammonia
NO Not operational
Draft
ACRONYMS AND ABBREVIATIONS
DRAFT FINAL DRINKING WATER AND WASTEWATER MASTER PLAN, ROTA, CNMI xxxi
NO3 Nitrate
NPDES National Pollutant Discharge Elimination System
NTU Nephelometric Turbidity Unit
O&M Operations and maintenance
O2 Oxygen
P Phosphorus
Pro2D Professional Process Design
PRV Pressure reducing valve
PRSV Pressure‐reducing/sustaining valve
psi Pounds per square inch
PSV Pressure‐sustaining valve
PVC Polyvinyl chloride
RAS Recycled Return Activated Sludge
SCADA Supervisory control and data acquisition
SDW Safe Drinking Water
SOP Standard Operating Procedure
SOPAC Pacific Islands Applied Geoscience Commission
SOR Standard Oxygenation Required
SOTE Standard Oxygen Transfer Efficiency
sq. ft. Square feet
SRT Solids Retention Time
SS Stainless steel
SSF Slow sand filter
SVI Sludge Volume Index
TDH Total dynamic head
TDS Total Dissolved Solids
TKN Total Kjeldahl Nitrogen
TM Technical Memorandum
TNTC Too numerous to count
TSA Tank Service Area
TSS Total Suspended Solids
TVSS Transient voltage surge suppressors
USCIS U.S. Citizenship and Immigration Services
V Volt
VFD Variable Frequency Drive
Draft
ACRONYMS AND ABBREVIATIONS
xxxii DRAFT FINAL DRINKING WATER AND WASTEWATER MASTER PLAN, ROTA, CNMI
VSS Volatile Suspended Solids
WAS Waste Activated Sludge
WET Whole Effluent Toxicity
WQ Water Quality
WW Wastewater
WWTP Wastewater Treatment Plant
ZID Zone of Initial Dilution
Draft

DRAFT FINAL DRINKING WATER AND WASTEWATER MASTER PLAN, ROTA, CNMI 2-1
SECTION 1
Project Information
1.1 Background The Commonwealth Utilities Corporation (CUC) was formed in the late 1980s, at which time it took over the Commonwealth of the Northern Mariana Islands’ (CNMI’s) water and wastewater utilities operation from the Department of Public Works (DPW) for the purpose of managing the utility programs and services. From the time CUC received the wastewater infrastructure, extensive problems have existed with the system infrastructure, including excessive sewer overflows during dry and wet periods, and underfunded operational budgets. In 2008 the U.S. Environmental Protection Agency (EPA) and CUC entered into Stipulated Order Number One for Preliminary Injunctive Relief (Civil Case No. CV 08‐0051). The Stipulated Order required, in part, that CUC develop and submit for EPA approval a comprehensive drinking water and wastewater Master Plan to determine current and future infrastructure needs for a 20‐year period and to provide a long‐term master plan for CUC drinking water and wastewater system improvements for the three major islands of CNMI: Saipan, Rota, and Tinian.
1.2 Introduction This document is submitted to fulfill one of the requirements for Stipulated Order Number One. This Master Plan focuses on findings and recommendations for the Island of Rota. (Findings and recommendations for Saipan and Tinian have been submitted as separate Master Plans.) The individual technical memoranda (TMs) that were compiled to form this Master Plan were part of an overall process that initiated with the gathering of raw data from field assessments, information requests, and knowledge transfer from CUC. After the initial data collection phase, the next step was the processing of the raw data into organized information in TM format. The information was in turn analyzed through a variety of techniques, such as hydraulic modeling. The output from the analytical process was assembled into a consolidated list of potential capital improvement projects that were scored against an array of criteria to conform project prioritization to U.S. Environmental Protection Agency (EPA) requirements and CUC business objectives. Figure 1.2‐1 provides a graphical representation of that process.
Figure 1.2‐1. Master Planning Process
Draft

Draft

DRAFT FINAL DRINKING WATER AND WASTEWATER MASTER PLAN, ROTA, CNMI 2-1
SECTION 2
Project Scope
No CUC‐owned wastewater infrastructure exists on Rota; wastewater disposal and treatment is achieved through the use of private septic systems. As such, this section includes only a water system assessment; it does not include a wastewater system assessment. In the event that CUC wishes to construct wastewater collection and treatment facilities, wastewater master plan information is included in Section 5.
The contents of Section 2, “Project Scope,” are as follows:
2.1 Chartering Meeting ................................................................................................................ 2‐3 2.2 Drinking Water Infrastructure System Condition Assessment .............................................. 2‐5
2.2.1 Literature Review ...................................................................................................... 2‐5 2.2.2 Condition Assessment of Existing Water Facilities ................................................... 2‐7 2.2.3 Water Distribution Hydraulic Model ...................................................................... 2‐62 2.2.4 Water System Infrastructure Geographic Information System .............................. 2‐79 2.2.5 Asset Risk Assessment ............................................................................................ 2‐86
2.3 Wastewater Infrastructure System Condition Assessment ............................................... 2‐103
Draft

Draft

2. PROJECT SCOPE
DRAFT FINAL DRINKING WATER AND WASTEWATER MASTER PLAN, ROTA, CNMI 2-3
2.1 Chartering Meeting On August 22, 2011, a chartering meeting was held at CUC’s Dan Dan office to kick off the Drinking Water and Wastewater Master Plans project. Those in attendance at the chartering meeting from CUC included management, engineering, field, operational, and laboratory staff members. Also in attendance were members from the Master Plan consulting team (project team) including project management and support staff from Dueñas, Camacho & Associates, Inc. (DCA), CH2M, EMCE Consulting Engineers, and EFC Engineers & Architects. The primary objectives for the chartering meeting were to introduce the consulting team to CUC staff; gain a common understanding of the project objectives; review the scope of work, deliverables, and schedule; and discuss CUC’s expectation and desired outputs from the project.
The chartering meeting was held during the initial 2 weeks of field inspections that were performed by the project team with assistance from CUC engineering and operations staff members. Initial results from the field findings, particularly with regard to lift station, drinking water well, and booster station inspections on Saipan, were also presented during this chartering meeting.
The agenda for the meeting including the following items:
Team Introductions/Attendance Roster
Scope of Work
Project Schedule and Milestones
First 90‐Day Activities
Saipan Well Inspections – Preliminary Results
Identification of Problem Areas – System‐wide
CUC Expectations
Key points discussed during the chartering meeting are summarized below:
The Master Plans will be developed with an eye toward providing dual benefits to CUC, that is, not only will the Master Plans meet Stipulated Order requirements, but they will also, for example, assist with operational improvements.
The Financial and Rate Impact Analysis and Financial Plan will help to pair capital improvement projects with available funding sources. The project team will meet with the Water Task Force (WTF) to gather information for use in constructing a Master Plan that is not duplicative of ongoing WTF projects and integrates existing and planned work that is consistent with the conclusions of the planning study.
Possible funding sources for CUC may include the U.S. Departments of Homeland Security, Housing and Urban Development, Commerce, and Agriculture, as well as EPA.
CUC staff discussed their expectations for the Master Plan project, as summarized below:
As required by the National Environmental Policy Act, all recommendations must demonstrate a real need and not be recommended solely to satisfy the Stipulated Order.
Existing water basemaps will be updated and a new wastewater basemap will be developed.
All recommended projects must be vetted by CUC staff prior to inclusion in the final Master Plan.
Development of a dynamic and relevant Master Plan will require regular interaction between the project team and CUC staff. The project team will need continued support from the plant operators as well.
Draft

Draft

2. PROJECT SCOPE
DRAFT FINAL DRINKING WATER AND WASTEWATER MASTER PLAN, ROTA, CNMI 2-5
2.2 Drinking Water Infrastructure System Condition Assessment
In June 2012, the project team conducted field condition assessments of existing drinking water infrastructure in Rota. The purpose of the condition assessments was to identify defective or deteriorated system components in need of repair, rehabilitation, or replacement. The water infrastructure condition assessment, discussed in this section, included the following elements:
Wellheads, Springs, and Source Water Protective Structures
Treatment (Chlorination) Facilities
Water Storage Tanks
Booster Pump Stations (Pumps and Pump Stations) and Associated Aboveground Piping
Pipelines
Pressure‐Reducing
Drinking Water Meters
This section of the Master Plan also includes discussions on leak detection, cross connections, and water meters.
2.2.1 Literature Review The documents listed in Table 3.2.1‐1 were reviewed with regard to the Rota Water and Wastewater Master Plan.
TABLE 2.2.1‐1. Literature Review
Document Prepared by Year
CUC‐RFP‐11‐007 CUC 2010
Sanitary Survey ‐ PWS ID# MP0000003 CUC Rota CNMI Division of Environmental Quality 2008
Executive Summary for the Water Infrastructure Development Plan for the Islands of Saipan, Tinian and Rota
Winzler & Kelly & Belt Collins 2003
Feasibility Study: Privatisation of Various Utilities of the Commonwealth of the Northern Mariana Islands
CH2M 1997
Management Audit of the CUC Metzler 1994
Stipulated Order No.1 Environmental Protection Agency 2008
Electric, Water and Wastewater Rate Study Economist.com 2007
Drinking Water Regulations Commonwealth Utility Corporation 2004
Northern Mariana Islands Administrative Code (NMIAC) ‐ CUC Commonwealth Utility Corporation 2004
2011 DWINS – Drinking Water Infrastructure Needs Survey and Assessment for Saipan, Rota, and Tinian (a.k.a., SRF Priority Projects)
CUC 2011
CNMI Safe Drinking Water Infrastructure Grant Program CNMI Division of Environmental Quality (DEQ)
2000
Historical Air Force Construction Handbook Air Force Civil Engineer Support Agency 2007
Draft
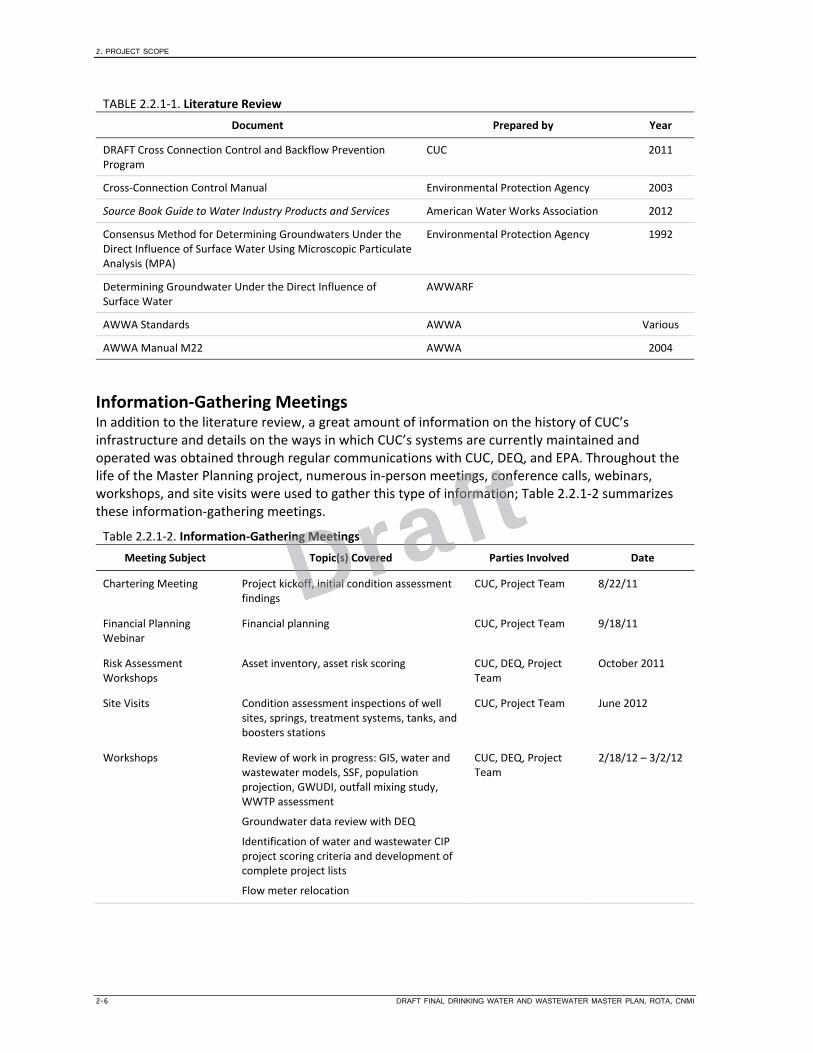
2. PROJECT SCOPE
2-6 DRAFT FINAL DRINKING WATER AND WASTEWATER MASTER PLAN, ROTA, CNMI
TABLE 2.2.1‐1. Literature Review
Document Prepared by Year
DRAFT Cross Connection Control and Backflow Prevention Program
CUC 2011
Cross‐Connection Control Manual Environmental Protection Agency 2003
Source Book Guide to Water Industry Products and Services American Water Works Association 2012
Consensus Method for Determining Groundwaters Under the Direct Influence of Surface Water Using Microscopic Particulate Analysis (MPA)
Environmental Protection Agency 1992
Determining Groundwater Under the Direct Influence of Surface Water
AWWARF
AWWA Standards AWWA Various
AWWA Manual M22 AWWA 2004
Information‐Gathering Meetings In addition to the literature review, a great amount of information on the history of CUC’s infrastructure and details on the ways in which CUC’s systems are currently maintained and operated was obtained through regular communications with CUC, DEQ, and EPA. Throughout the life of the Master Planning project, numerous in‐person meetings, conference calls, webinars, workshops, and site visits were used to gather this type of information; Table 2.2.1‐2 summarizes these information‐gathering meetings.
Table 2.2.1‐2. Information‐Gathering Meetings
Meeting Subject Topic(s) Covered Parties Involved Date
Chartering Meeting Project kickoff, initial condition assessment findings
CUC, Project Team 8/22/11
Financial Planning Webinar
Financial planning CUC, Project Team 9/18/11
Risk Assessment Workshops
Asset inventory, asset risk scoring CUC, DEQ, Project Team
October 2011
Site Visits Condition assessment inspections of well sites, springs, treatment systems, tanks, and boosters stations
CUC, Project Team June 2012
Workshops Review of work in progress: GIS, water and wastewater models, SSF, population projection, GWUDI, outfall mixing study, WWTP assessment
Groundwater data review with DEQ
Identification of water and wastewater CIP project scoring criteria and development of complete project lists
Flow meter relocation
CUC, DEQ, Project Team
2/18/12 – 3/2/12
Draft

2. PROJECT SCOPE
DRAFT FINAL DRINKING WATER AND WASTEWATER MASTER PLAN, ROTA, CNMI 2-7
Table 2.2.1‐2. Information‐Gathering Meetings
Workshops Review of water and wastewater models; review of water and wastewater project scoring criteria; GWUDI site visits; CIP project scoring for water and wastewater
CUC, DEQ, WTF, Project Team
6/4/12 – 6/15/12
GWUDI Site Visits Installation and startup of GWUDI sites CUC, Ken Thompson (CH2M), s::can
7/9/12 – 7/19/12
GWUDI Webinars Review of GWUDI data collection Project Team, CUC, DEQ, EPA
9/18/12, 11/8/12, 12/5/2013, 1/29/13, 9/25/2013, 11/6/2013
Project Prioritization Webinar
Selection of projects for cost development, and eventual inclusion in CIP
CUC, Project Team 10/25/12
Response to EPA Comments Conference Call
Reviewed project team’s responses to EPA comments on Work In Progress Master Plan document
CUC, EPA, Project Team
11/8/12
CIP Project Cost Estimation Webinar
Reviewed cost estimation methods for CIP projects
CUC, Project Team 11/8/12
Workshops
Workshop
GWUDI determination; review of water and wastewater CIP project cost estimates; development of CIP implementation schedule; financial model; organizational management interviews; leak detection data gathering
CIP Water Prioritization and Ranking
CUC, DEQ, WTF, Project Team
CUC, DEQ, EPA, Project team
12/3/12 – 12/14/12
2/9/15 – 2/13/2015
2.2.2 Condition Assessment of Existing Water Facilities As part of the development of the Rota Drinking Water and Wastewater Master Plan, a comprehensive physical inventory and assessment of the public drinking water systems facilities/components on the island was conducted.
The project team performed field condition assessments of the existing drinking water infrastructure in June 2012. The purpose of the condition assessments was to identify defective or deteriorated system components in need of repair, rehabilitation, or replacement. The water infrastructure condition assessment included the following elements from Stipulated Order Section B1, Assessments for Master Plan; Part 55, Condition Assessment of Drinking Water Systems:
a. Wellheads
b. Wellhead Protective Structures
c. Treatment Systems
d. Storage Tanks
e. Pump and Pump Stations
f. Transmission Lines and Distribution System Lines
g. Drinking Water Meters
Draft

2. PROJECT SCOPE
2-8 DRAFT FINAL DRINKING WATER AND WASTEWATER MASTER PLAN, ROTA, CNMI
The findings from these field condition assessments are qualitative in nature. The qualitative findings were an important piece of information used by the project team in conjunction with CUC input and hydraulic modeling results when developing the overall numeric risk scores for each asset. The assignment of quantitative scores for the physical condition, likelihood of failure, and overall risk of failure for all drinking water system assets was accomplished during the risk assessment workshops (see Appendix N).
The information collected as part of the condition assessments was also incorporated into the geographic information system (GIS) asset database. The GIS database provides both location information as well as recent condition information collected during the field assessments.
This section includes a description of the site assessment methodology, results, and recommendations for each type of water infrastructure asset inspected on Rota. This section also includes an analysis of cross connections, leak detection, water supply/sources, hydraulic modeling, and the development of the Rota water system GIS.
Wellhead and Wellhead Protective Structures Inspection and Condition Assessment In addition to wellheads and wellhead protective structures, this section also includes the assessment of springs and their associated protective structures, such as pump houses and fences.
Data Gathering The condition of drinking water sources was determined through a literature review, discussions with CUC Operations and Engineering staff, and site visits to the three wells and two natural springs, Onan Cave and Main Cave. Access for inspection of the three wells and two springs was provided by CUC personnel during normal working hours. While the project team was able to access all well and spring facilities, it encountered the following limitations:
Submersible pumps were not able to be inspected because CUC did not have equipment available to pull them from the well.
Electrical panels were only visually inspected because there was not a certified electrician available for the site visit from either the project team or CUC.
For the most part, the make and model of the check valves, isolation valves, meters, and pumps at the wells were not readily visible to the project team. In nearly all cases, these equipment details were either painted over, corroded, or the tags were removed. Information on the size and make of each valve was ascertained by project team based on the configurations and orientations of the valves and connecting pipelines. Information on the pumps was derived from CUC records.
Assessment Methodology The project team used the site investigation forms to record data collected during the site inspections. The well and spring inspection forms are broken out into the following categories:
Wellhead or Spring
Piping and Associated Equipment
Protective Structure (if applicable)
General Comments
Operation and Maintenance Comments
The project team consisted of two consulting personnel (one civil engineer and one electrical engineer) and was assisted by CUC Operations staff. CUC personnel provided access to the wells,
Draft

2. PROJECT SCOPE
DRAFT FINAL DRINKING WATER AND WASTEWATER MASTER PLAN, ROTA, CNMI 2-9
well control panel buildings, and springs. The project team completed the assessment forms and took photographs. Interviews with CUC personnel were conducted on‐site to derive equipment information (when not visible) and collect critical operation and maintenance information on the facilities being inspected.
The three active, deep wells within the Rota CUC water system are used as an alternate water source during the dry season, which is typically 3 months out of the year. The springs in the Main and Onan Caves provide 100 percent of the water for Rota during the remaining 9 months of the year, typically beginning in August following the start of the rainy season in July. Once the water in the springs reaches its maximum flow, the water produced significantly exceeds water demand for the island. Because there is no practical way to capture or store the excess water, it is allowed to flow into the environment.
There is concern that the springs in both caves are groundwater and suspected to be under the direct influence of surface water (GWUDI). To address this concern, the Main Cave was included in the GWUDI investigation, which began in September 2012 and concluded in January 2014. The results of the investigation are discussed in detail later in this section.
Wellhead and Protective Structures Assessment Findings The project team inspected the three active deep wells on Rota; a brief narrative of the findings is presented in the following subsections.
Civil All well sites were surrounded by a 2‐in mesh, 6‐foot high chain‐link fence (see Figure 2.2.2‐1). The gates were locked with padlocks.
Figure 2.2.2‐1. Typical Well Fencing
The wellheads inspected were in good condition. No ponding or large cracks were observed on the wellhead slabs. The wellheads commonly consisted of an 8‐ to 10‐inch riser elevated 10 to 18 inches above the wellhead slab.
Structural and Architectural There were no structural enclosures at any of the well sites.
Draft

2. PROJECT SCOPE
2-10 DRAFT FINAL DRINKING WATER AND WASTEWATER MASTER PLAN, ROTA, CNMI
Well Pumps Well pumps could not be investigated during site inspections due to the time and cost required for CUC operations staff to pull the pumps.
CUC has very limited information on pump failures and replacement for their drinking water system, but were able to provide the project team with a report from 2012 from Franklin Electric for three pumps that failed in Saipan. This information is provided here for informational purposes as many of the recommendations may be applied to Rota. Below is a short summary of the failure analysis and recommendations.
KG‐4: The 10 HP pump motor failure at this well occurred because the diaphragm cavity was full of mud and sand debris, which is a common problem when the motor bottom is less than 10 feet from the bottom of the well or the water is very sandy. The excessive amount of mud and sand caused the motor to overheat and fail.
The recommendation from Franklin Electric was to check the well condition and if needed to install a different type of pump more suitable for sandy conditions.
SQ‐5: The 7.5 HP pump motor failure at this well was caused by overheating due to tape being applied by CUC to the area of the pump motor outer shell where welding had been done. In addition, there was also corrosion on the outer shell of the motor where the tape had not been applied.
The recommendations from Franklin Electric were to not apply tape to the outer motor shell to reduce the potential for overheating the motor. In addition, CUC should install a cooling sleeve over the motor and add a sacrificial anode. The sleeve will increase the flow across the motor and will reduce the calcium precipitation onto the outside of the motor. The sacrificial anode will help to protect against pitting due to aggressive water (chloride). In addition, the SubMonitor System trip point should be lowered and the data logger activated.
MQ‐8: The 5 HP pump motor failure at this well was caused by a significant amount of calcium and related corrosion on the outer shell of the pump motor causing the motor’s electrical components to short out and fail. The large calcium deposits reduced the dissipation of heat from the motor causing the motor to overheat, filling solution to dissipate, and the bearings to overheat.
The recommendation from Franklin Electric is to install a cooling sleeve over the motor and add a sacrificial anode. The sleeve will increase the flow across the motor and will reduce the calcium precipitation onto the outside of the motor. The sacrificial anode will help to protect against pitting due to aggressive water (chloride). In addition, the SubMonitor System trip point should be lowered and the data logger activated.
Controls Pump controls are provided by a local control panel that has a manual on/off position (see Figure 2.2.2‐2). The pumps run based on manual control. There is no automated control system. Upon start up, the well water supplies are manually bled though a bypass valve located along the well discharge manifold.
Draft
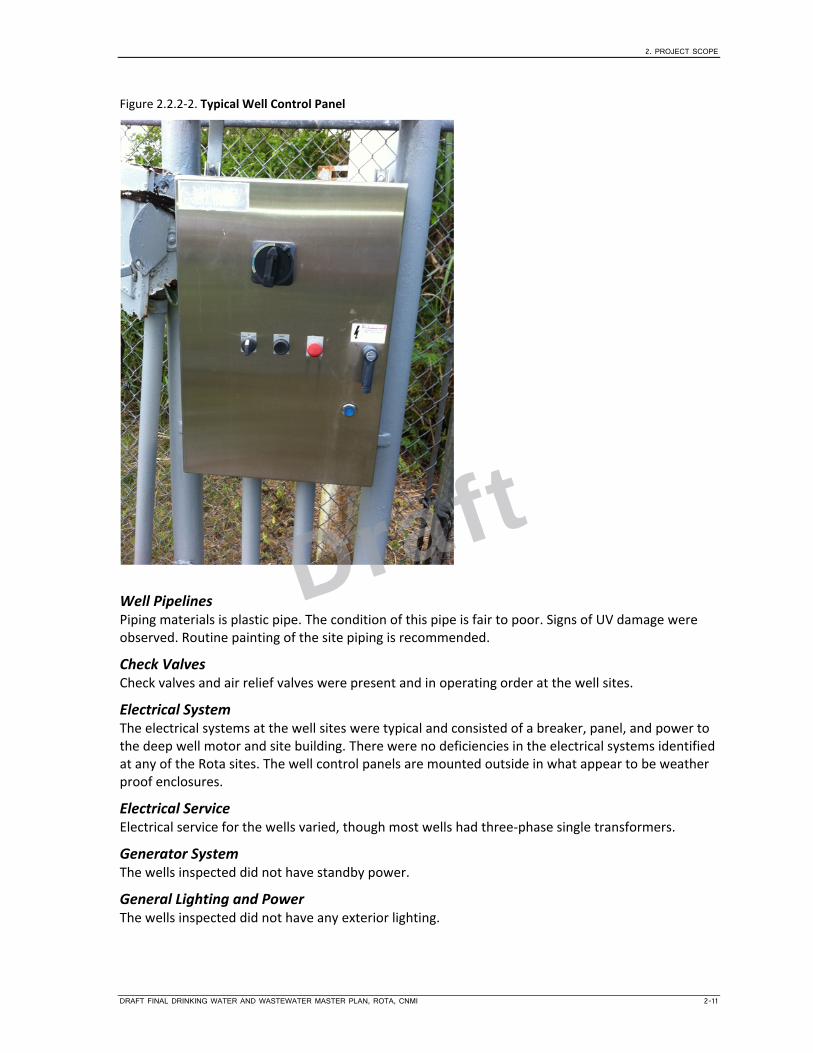
2. PROJECT SCOPE
DRAFT FINAL DRINKING WATER AND WASTEWATER MASTER PLAN, ROTA, CNMI 2-11
Figure 2.2.2‐2. Typical Well Control Panel
Well Pipelines Piping materials is plastic pipe. The condition of this pipe is fair to poor. Signs of UV damage were observed. Routine painting of the site piping is recommended.
Check Valves Check valves and air relief valves were present and in operating order at the well sites.
Electrical System The electrical systems at the well sites were typical and consisted of a breaker, panel, and power to the deep well motor and site building. There were no deficiencies in the electrical systems identified at any of the Rota sites. The well control panels are mounted outside in what appear to be weather proof enclosures.
Electrical Service Electrical service for the wells varied, though most wells had three‐phase single transformers.
Generator System The wells inspected did not have standby power.
General Lighting and Power The wells inspected did not have any exterior lighting.
Draft
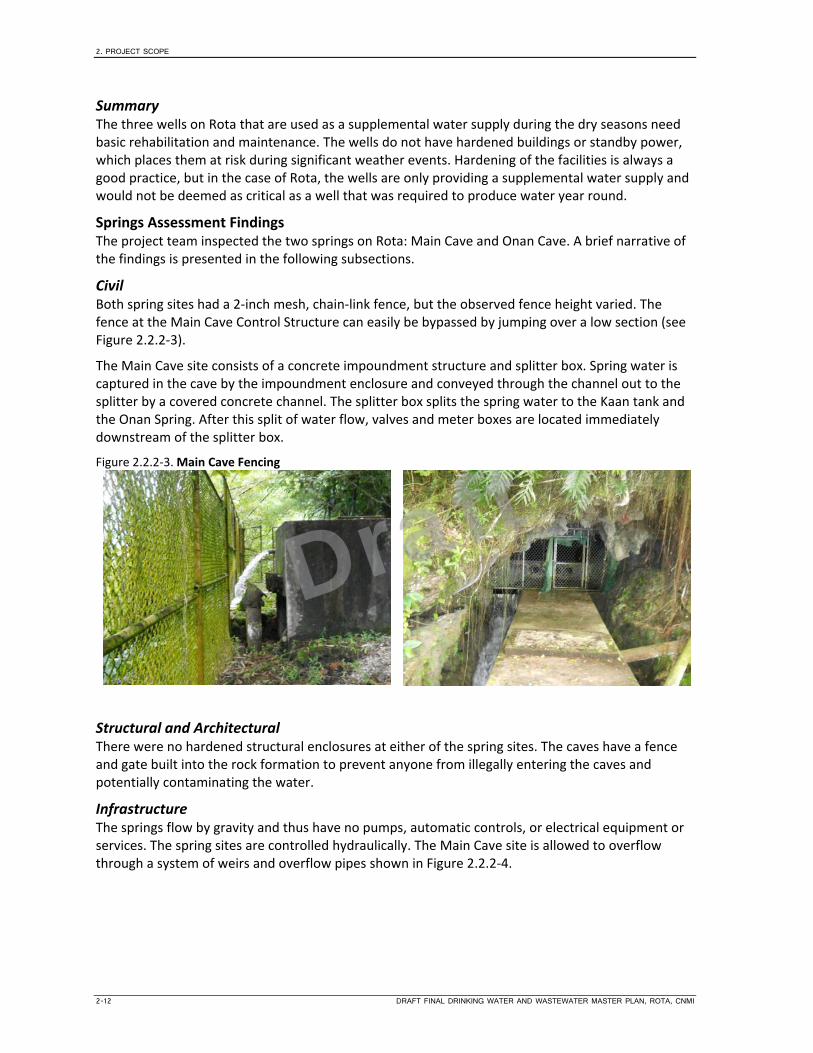
2. PROJECT SCOPE
2-12 DRAFT FINAL DRINKING WATER AND WASTEWATER MASTER PLAN, ROTA, CNMI
Summary The three wells on Rota that are used as a supplemental water supply during the dry seasons need basic rehabilitation and maintenance. The wells do not have hardened buildings or standby power, which places them at risk during significant weather events. Hardening of the facilities is always a good practice, but in the case of Rota, the wells are only providing a supplemental water supply and would not be deemed as critical as a well that was required to produce water year round.
Springs Assessment Findings The project team inspected the two springs on Rota: Main Cave and Onan Cave. A brief narrative of the findings is presented in the following subsections.
Civil Both spring sites had a 2‐inch mesh, chain‐link fence, but the observed fence height varied. The fence at the Main Cave Control Structure can easily be bypassed by jumping over a low section (see Figure 2.2.2‐3).
The Main Cave site consists of a concrete impoundment structure and splitter box. Spring water is captured in the cave by the impoundment enclosure and conveyed through the channel out to the splitter by a covered concrete channel. The splitter box splits the spring water to the Kaan tank and the Onan Spring. After this split of water flow, valves and meter boxes are located immediately downstream of the splitter box.
Figure 2.2.2‐3. Main Cave Fencing
Structural and Architectural There were no hardened structural enclosures at either of the spring sites. The caves have a fence and gate built into the rock formation to prevent anyone from illegally entering the caves and potentially contaminating the water.
Infrastructure The springs flow by gravity and thus have no pumps, automatic controls, or electrical equipment or services. The spring sites are controlled hydraulically. The Main Cave site is allowed to overflow through a system of weirs and overflow pipes shown in Figure 2.2.2‐4.
Draft

2. PROJECT SCOPE
DRAFT FINAL DRINKING WATER AND WASTEWATER MASTER PLAN, ROTA, CNMI 2-13
Figure 2.2.2‐4. Onan Cave Overflow
Springs Assessment Summary Based on the field assessments and the GWUDI study (discussed later), the primary recommendation is to harden the Rota Cave against surface related contamination and to abandoned the Onan Cave because of the inability to properly seal it. The outer structure around the Rota Main Cave should be hardened with a taller fence to improve security against intruders. If in the future unauthorized intrusion becomes a problem, CUC could consider deploying a solar powered video camera with cellular communications.
Treatment Systems Inspection and Condition Assessment The two drinking water treatment (i.e., chlorination) facilities in Rota are located at the Kaan tank and along the Onan Cave transmission line. Both sites were inspected by the project team to assess the existing physical condition and develop recommendations for improvements. This section describes the methodologies used, data assessed, and results from the condition assessment inspection.
Data Gathering The condition of the drinking water distribution system was determined through a literature review, discussions with CUC operations and engineering staff, and site visits for the treatment (chlorination) facilities located in Rota. Access to the chlorination facilities was provided by CUC personnel.
Draft

2. PROJECT SCOPE
2-14 DRAFT FINAL DRINKING WATER AND WASTEWATER MASTER PLAN, ROTA, CNMI
Assessment Methodology The project team physically inspected each chlorination site and evaluated the following:
Chlorinator
Chlorine Tanks and Manifold
Operation and Maintenance History
No booster pumps, chlorine analyzer, or chlorine alarms have been installed at either site.
The inspection team consisted of two civil engineers who were assisted by CUC operations and engineering personnel. CUC personnel provided access to the chlorination facilities. The project team completed the assessment form and took photographs; interviews with CUC personnel were conducted on‐site to derive equipment information (when not visible) and collect critical operation and maintenance information on the facility being inspected.
Treatment (Chlorination) System Design Criteria For chlorine disinfection there is a minimum contact time (CT) required to meet the groundwater treatment rule that is based on pH and temperature. Based on the historical CUC Water Quality Laboratory data, the pH of the groundwater in Saipan ranges between 6 and 9, so the CT values for typical water temperatures are:
20 degrees Centigrade (68 degrees Fahrenheit): 3 mg‐min/L
25 degrees Centigrade (77 degrees Fahrenheit): 2 mg‐min/L
Entry points into the distribution system must achieve the required CT prior to delivery to the first customer. The Kaan Tank and Onan Cave transmission line chlorination points are considered the entry point into the distribution system.
CUC Operations staff have a DEQ‐approved Standard Operating Procedure (SOP – Revised October 2010) for the operations and maintenance for all treatment (chlorination) systems that can be found in Appendix A. The purpose of the SOP is to ensure that these systems are properly monitored and maintained to ensure the maximum protection for the end users.
Treatment (Chlorination) System Condition Assessment Findings The project team inspected the chlorination systems at the Kaan Tank and Onan Cave transmission line. Disinfection is accomplished at the sites via the use of chlorine gas. The main components of this system are discussed below.
Chlorinator and Injection Pump The chlorinator regulates the delivery of chlorine gas that is to be mixed with the source water. Both sites are equipped with a rotameter manufactured by Regal. The control of the gas flow is accomplished by manually turning a knob located at the top of the rotameter to adjust the position of the float to the desired output, which is determined by daily water usage. At the time of the site inspection, the rotameter was functional, although no chlorine ejector pump was in place at either site. This was explained by the fact that the chlorine injector pumps at both sites were removed because the operators eliminated the need for this pump by instead making use of the pressure differential between the transmission line and the ejector.
The pressure differential over the dormant pressure‐reducing valve (PRV) along the Main Cave/Kaan Tank transmission line is large enough to generate a vacuum in the ejector. To generate the vacuum a large amount of flow, estimated at 700 gpm, is needed. Because this amount of flow is not
Draft

2. PROJECT SCOPE
DRAFT FINAL DRINKING WATER AND WASTEWATER MASTER PLAN, ROTA, CNMI 2-15
available during the dry season, this chlorine treatment system is not used during the dry season. Figure 2.2.2‐5 is a photo of the chlorination system at the Kaan tank.
Figure 2.2.2‐5. Chlorination System at the Kaan Tank
The pressure differential over the abandoned PRV along the Onan Cave/Ginanlangan Tank transmission line is also large enough to generate a vacuum in the ejector. To generate the vacuum a large amount of flow, estimated at 700 gpm, is also needed. The combined flows from the Main Cave and Onan Cave have been enough to keep the Onan Cave transmission line chlorination system operating year round. Figure 2.2.2‐6 is a photo of the chlorination system along the Onan Cave transmission line.
Figure 2.2.2‐6. Chlorination System along the Onan Cave Transmission Line
Draft
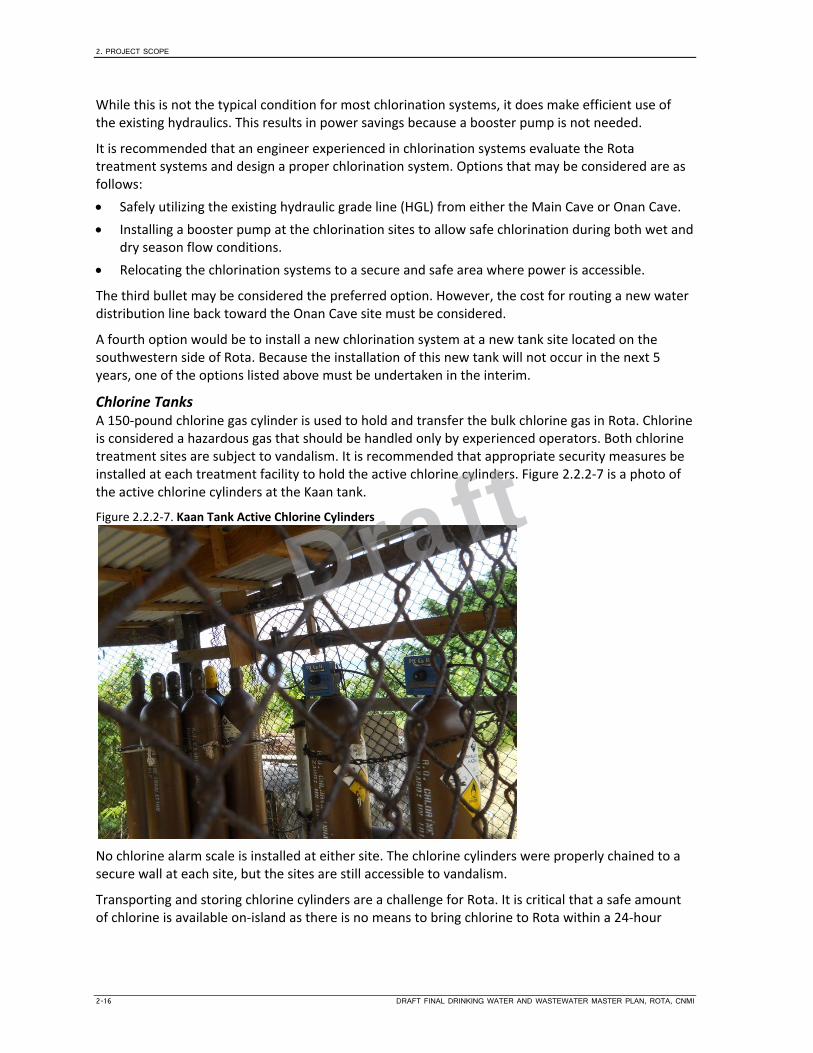
2. PROJECT SCOPE
2-16 DRAFT FINAL DRINKING WATER AND WASTEWATER MASTER PLAN, ROTA, CNMI
While this is not the typical condition for most chlorination systems, it does make efficient use of the existing hydraulics. This results in power savings because a booster pump is not needed.
It is recommended that an engineer experienced in chlorination systems evaluate the Rota treatment systems and design a proper chlorination system. Options that may be considered are as follows:
Safely utilizing the existing hydraulic grade line (HGL) from either the Main Cave or Onan Cave.
Installing a booster pump at the chlorination sites to allow safe chlorination during both wet and dry season flow conditions.
Relocating the chlorination systems to a secure and safe area where power is accessible.
The third bullet may be considered the preferred option. However, the cost for routing a new water distribution line back toward the Onan Cave site must be considered.
A fourth option would be to install a new chlorination system at a new tank site located on the southwestern side of Rota. Because the installation of this new tank will not occur in the next 5 years, one of the options listed above must be undertaken in the interim.
Chlorine Tanks A 150‐pound chlorine gas cylinder is used to hold and transfer the bulk chlorine gas in Rota. Chlorine is considered a hazardous gas that should be handled only by experienced operators. Both chlorine treatment sites are subject to vandalism. It is recommended that appropriate security measures be installed at each treatment facility to hold the active chlorine cylinders. Figure 2.2.2‐7 is a photo of the active chlorine cylinders at the Kaan tank.
Figure 2.2.2‐7. Kaan Tank Active Chlorine Cylinders
No chlorine alarm scale is installed at either site. The chlorine cylinders were properly chained to a secure wall at each site, but the sites are still accessible to vandalism.
Transporting and storing chlorine cylinders are a challenge for Rota. It is critical that a safe amount of chlorine is available on‐island as there is no means to bring chlorine to Rota within a 24‐hour
Draft

2. PROJECT SCOPE
DRAFT FINAL DRINKING WATER AND WASTEWATER MASTER PLAN, ROTA, CNMI 2-17
period. The empty and full cylinders are stored at the Kaan tank, as seen in Figure 2.2.2‐7, and at the Ginanlangan tank site, shown in Figure 2.2.2‐8.
Figure 2.2.2‐8. Ginanlangan Tank Site
Chlorine Manifold System At both chlorination sites on Rota the chlorine tank is connected to the rotameter through a manifold consisting of a Regal regulator, ejector, and vacuum tubing. Both of the manifold systems were functioning properly at the time of inspection, although the regulators were being operated manually and were not utilizing an automatic chlorine tank switchover. Each of the Rota chlorination sites only had one regulator, which had to be manually switched over once a chlorine tank is empty.
Water Quality Monitoring Equipment No continuous online chlorine monitoring equipment was observed at either site. It is recommended that for primary disinfection facilities (i.e., entry points into the distribution system) reagent‐free chlorine meters with data recorders are installed to provide a continuous measurement of chlorine residual entering the distribution system. The data should be collected on a monthly basis and entered into a database for trending analysis and assessment of long‐term chlorine storage needs. Alternatively, the data could be transferred via cellular communications and viewed real‐time using the GWUDI investigation website.
Treatment (Chlorination) System Assessment Summary The following recommendations were identified as part of the two chlorination facility inspections:
Install a properly secured and designed facility to store the active chlorine cylinders. Part of this new facility development should be a feasibility study that evaluates the use of alternate disinfection products such as sodium hypochlorite.
Evaluate the existing system and design a proper chlorination system that safely utilizes the existing HGL of the transmission line. This evaluation should be performed by an engineer experienced in chlorination systems.
Install an automatic chlorine tank switchover.
Install reagent‐free chlorine analyzers at the entry points into the distribution system.
Draft

2. PROJECT SCOPE
2-18 DRAFT FINAL DRINKING WATER AND WASTEWATER MASTER PLAN, ROTA, CNMI
Storage Tank Inspection and Condition Assessment The two tanks on Rota were inspected by the project team to assess the existing physical condition and develop recommendations for improvements to the water storage tanks. This section describes the methodologies used, data assessed, and results from the condition assessment inspections.
Data Gathering The tank inspection assessments were based on available as‐built data provided by CUC and field inspections performed by the project team. Limited data were available, thus the tank assessments relied largely on field inspections.
Assessment Methodology Two engineers (one civil and one structural) inspected each tank. CUC personnel provided access to the tank sites. The completed assessment form identified the tank and deficiencies observed during the inspection. Noted deficiencies were based on the project team’s experience with tank inspections of related scope. Deficiencies observed include, but are not limited to, the following:
Vegetation within and adjacent to the tank site boundaries
Cracking/spalling of tank foundation
Corrosion of exterior tank shell/roof surfaces
Severity of corrosion to anchor bolts and anchor bolt supports
Condition of mechanical and electrical components
Condition of interior structural members (if accessible)
The approach used during the site inspection consisted of visual findings, which were documented by photographs of each specific deficiency (Appendix X). Each photograph, along with the approximate location of the deficiency, has been recorded on a plan drawing for the tanks inspected.
Storage Tank Condition Assessment Findings Table 2.2.2‐1 presents a brief summary of the findings from the Rota tank assessments. Detailed information collected during the tank inspections is provided in Appendix B along with table ranking the severity of each individual tank based on its deficiencies. The results from the field investigations, in addition to the many other sources of information gathered and developed as part of this Master Plan, were used to aid in the determination of prioritized capital improvement projects (see Section 4.3.1: Drinking Water System Project Identification and Prioritization). During the inspections, the tanks were rated on a qualitative scale as either Low, Moderate, High, or Severe condition. Final recommendations, based on condition assessment findings, are provided in Table 2.2.2‐1.
Table 2.2.2‐1. Tank Assessment Summary
Asset Name Year Built Assessment Condition Final Recommendation
Kaan 1.0MG 1980 Severe Remove and Relocate
Ginanlangan 0.5MG Unknown Severe Follow up assessment for bolt and seal replacement
Draft

2. PROJECT SCOPE
DRAFT FINAL DRINKING WATER AND WASTEWATER MASTER PLAN, ROTA, CNMI 2-19
Internal Tank Condition Assessments An internal inspection of the Ginanlangan tank was conducted by the project team on June 2nd, 2014. CUC personnel were able to secure the tank for an internal inspection. A structural engineer from the project team performed the internal inspection accompanied by two other project team personnel. A copy of this internal inspection report is provided in Appendix B.
Based on the severe condition of the Kaan tank and the recommended CIP approach for Rota, a follow‐up internal inspection was not conducted for the Kaan tank. This tank has been off line and is recommended for replacement and relocation as part of the CIP projects. The Kaan is not essential for operations, as this tank is offline for all or most of the year.
Pump and Pump Stations Inspection and Condition Assessment The single booster pump station facility in Rota is located in the Sinapalo III homestead. This booster pump station was inspected by the project team to assess its existing physical condition and develop recommendations for improvements. This section describes the methodologies used, data assessed, and findings from the condition assessment inspection.
Data Gathering The condition of the drinking water distribution system was determined through a literature review, discussions with CUC operations and engineering staff, and a site visit of the booster pump station. Access to the booster pump station was provided by CUC personnel.
Assessment Methodology The Booster Pump Station inspection was broken out into the following categories:
Civil (e.g., security, vegetation, site condition)
Structural/Architectural (e.g., building)
Mechanical
Electrical (e.g., lighting, generator, control panel)Sin
Operation and Maintenance
The project team consisted of two consulting civil engineers who were assisted by CUC operations and engineering personnel. CUC personnel provided access to the Sinapalo III booster pump station. Interviews with CUC personnel were conducted on‐site to derive equipment information (when not visible) and collect critical operation and maintenance information on the facility being inspected.
Pump and Pump Stations Condition Assessment Findings The project team inspected the Sinapalo III booster pump station as part of the Master Planning Project.
Civil The site was fenced by a standard 2‐inch mesh, 6‐foot high chain‐link fence with a padlock for security. The grounds at the site were well maintained.
Structural and Architectural There are no structural improvements at the site.
Pump System One booster pump is located at the site. The existing motor, which appeared to be larger than the original motor, may have been swapped as part of an effort to provide continuous service. The size of the pump is unknown. The pump is in poor condition and there is no redundancy onsite.
Draft

2. PROJECT SCOPE
2-20 DRAFT FINAL DRINKING WATER AND WASTEWATER MASTER PLAN, ROTA, CNMI
It is important to note that the logistics for replacing these pumps and motors does not allow for a quick (i.e., 1‐day) turnaround. In the event a failure occurs, continuous water supply to Sinapalo II and II homesteads will be in jeopardy. It is critical that pumping redundancy be maintained at this site, thus it is recommended that a spare pump and motor be kept on island.
Control System The pump is a constant speed pump operated via a manual control system.
Piping and Valves The piping and valves at the pump station are a mix of galvanized and ductile iron pipe. All piping and valves appeared to be in fair condition.
Electrical System There is no standby power generation of lighting at the site.
Pump and Pump Stations Assessment Summary The overall rating of the condition of the booster pump station discussed and determined during the risk assessment workshops (see Appendix N) was based on the condition assessment findings in addition to CUC input. Remaining service life of the booster pump station was not evaluated. The following is a summary of existing conditions and recommended upgrades:
Complete refurbishment of the Sinapalo pump station is needed in the short term. This refurbishment should include two new pumps each sized to deliver 100 percent of the demand, standby power, and a secure enclosure.
A new pump station is proposed at the Ginanlangan tank site. This long‐term upgrade will replace the need for the Sinapalo pump station.
Transmission Line and Distribution Line Condition Assessment The water distribution system in Rota was built in the late 1980s and is considered relatively new and is in good condition. The water transmission system was built in the late 1980s and is considered to be in fair condition.
Pipelines Table 2.2.2‐2 presents a breakdown of all the water lines 4 inches or greater in the distribution system.
Table 2.2.2‐2. Water Line Inventory (Pipes 4‐inches or Greater in Size)
Material* Line Size (in)
4 6 8 10 12 Total (ft)
DIP 891 21,690 22,581
PVC 20,408 88,795 96,165 41,246 10,750 257,364
SP 39,135 39,135
Total (ft) 20,408 128,821 117,855 41,246 10,750 319,080
* DIP ‐ Ductile Iron Pipe, SP ‐ Steel Pipe, PVC ‐ Polyvinyl Chloride Pipe
The total length of the Rota CUC distribution/transmission system is 319,080 feet. Approximately 80 percent of the system is distribution lines, with the remaining 20 percent being the transmission lines from the Main Cave and Onan Cave.
Draft

2. PROJECT SCOPE
DRAFT FINAL DRINKING WATER AND WASTEWATER MASTER PLAN, ROTA, CNMI 2-21
The transmission system is aboveground with the pipes being secured to concrete pedestals. The DIP transmission line is in fair condition. No failure of this line has been reported as a result of its age or installation. The failures of this line that have occurred have been as a result of failed PRVs. Figures 2.2.2‐9 through 2.2.2‐11 are photographs of the transmission lines.
Figure 2.2.2‐9. Kaan Transmission Line and Concrete Pedestal
Figure 2.2.2‐10. Transmission Line Intersection of the Main and Onan Caves
Draft

2. PROJECT SCOPE
2-22 DRAFT FINAL DRINKING WATER AND WASTEWATER MASTER PLAN, ROTA, CNMI
Figure 2.2.2‐11. Abandoned Transmission Line Shown Below New 10‐Inch Line
The concrete pedestals that the transmission lines are secured to show signs of root intrusion. CUC conducts routine clearing around these pedestals to control the root intrusion.
Discussion on water loss and leakage within the transmission and distribution lines is included in the section “Leak Detection and Drinking Water Conservation Programs.”
Pressure‐Reducing and Pressure‐Sustaining Valves Three pressure‐reducing valves (PRVs) are located within the Rota water distribution system. In addition, three PRVs are located along the Main Cave to Kaan Tank transmission line. All of the PRVs inspected were in need of repair:
The first PRV downstream of the Ginanlangan tank is operating, but there was evidence of cavitation heard. This PRV appears to be oversized.
The second PRV downstream of the Ginanlangan tank is not operating and is presently bypassed.
The PRV located downstream of the Kaan tank had a leaking pilot and is in need of repair.
The transmission line PRV located by the Kaan tank was in poor condition and in need of repair.
The remaining PRVs located along the Main Cave/ Kaan transmission line were not visually inspected; based on interviews with CUC operators, these PRVs are not in working order.
Transmission Line and Distribution Line Assessment Summary The following recommendations are made for the distribution and transmission PRVs:
• Refurbishment/replacement of all PRVs in the Rota water system is needed. Analysis on the size of each PRV is also needed to select the appropriate valve.
• CUC should specify aluminum or stainless steel pilot piping for reapers, upgrades, and replacements.
• Additional training on the maintenance and operation of PRVs is recommended.
Draft

2. PROJECT SCOPE
DRAFT FINAL DRINKING WATER AND WASTEWATER MASTER PLAN, ROTA, CNMI 2-23
Drinking Water Meters For many years, CUC has been inundated with defective water meters, a result of poor field documentation, substandard contract (third‐party) meter installations, failed meter performance, and slow replacement of failed meters. Replacement of failed meters and installation of new meters on unmetered and unregistered accounts has been ongoing since March 12, 2011. While significant progress has been made, more progress could have been accomplished had not numerous meters continued to fail. Meter failure rates range from 64 percent for meters installed prior to 2007 to 18 percent of meters installed in 2010, which, while improved, is higher than industry standard.
Details on the identification and evaluation of alternative water meters are described below.
Survey of Available Metering Equipment To assist CUC in identifying and evaluating a water meter that would be more reliable than those currently in use, which have an extraordinarily high failure rate, CUC requested assistance from DCA/CH2M. DCA/CH2M contacted the vendors in Table 2.2.2‐3 for information on water meters. Many of the companies on the list were identified by surveying DCA/CH2M’S network of engineers to learn which meters (and metering companies) have been successfully used in the past for similar water utilities. Others were extracted from the American Water Works Association’s Source Book Guide to Water Industry Products and Services. One company was added after contacting a client from a region with similar water conditions.
Table 2.2.2‐3. Water Meter Company Contact Information
Company Corporate Office or
Distributor Contact Information
Neptune Distributor Jered Lindstrom
Product Specialist
HD Supply Waterworks
Mobile: 360.600.7603
Fax: 877.487.4944
E‐Mail Address: [email protected]
Metron Corporate Office Steve Kielley
Director of Business Development ‐ Northwest Territory
Phone: (720) 641‐5256
Fax: (970) 726‐9004
E‐mail: [email protected]
Sensus Corporate Office Anibal Miranda
Sales & Marketing Director for Mexico, Caribbean and Central America
Priv. de Sostenes Rocha 2313 Frac. Rincones de la Cima Chihuahua, Chih., 31200, Mexico
T: +52 614‐413‐0013 C: +52 1 614‐427‐9797 [email protected] www.sensus.com
Mueller Distributor Consolidated Supply Co.
503‐620‐7050
Master Corporate Office 101 Regency Parkway
Mansfield, TX 76063
1‐800‐765‐6518
Draft

2. PROJECT SCOPE
2-24 DRAFT FINAL DRINKING WATER AND WASTEWATER MASTER PLAN, ROTA, CNMI
Table 2.2.2‐3. Water Meter Company Contact Information
Company Corporate Office or
Distributor Contact Information
Elster Corporate Office 1100 SW 38th Avenue
Ocala, FL 34474
1‐866‐896‐8858
Badger Meter Corporate Office Badger Meter, Inc.
Tammie Stewart
Sales Support Specialist
800‐876‐3837 ext 15992
414‐371‐5992 direct
414‐371‐5752 fax
Each vendor was asked to present product information on meters that would perform under the following conditions:
Possibly brackish water
Warm soil
Systems with water loss (leakage and tampering)
An application with integrated backcheck measures
Compatible with existing system
Based on information provided by the vendors, DCA/CH2M reviewed the following meters:
Neptune T‐10
Metron Farnier Spectrum 30D
Sensus iPERL
Sensus accuSTREAM
Mueller MVR
Master Multi‐Jet
Elster V100
Badger Meter Disc Meter
Badger Meter E‐Series
Water Meter Evaluation The following section describes specific water meter products for potential integration into CUC’s water system and is based on the product data provided by the manufacturers. The description of each product includes basic operation, composition materials, tamper information, and the estimated price per unit.
Draft

2. PROJECT SCOPE
DRAFT FINAL DRINKING WATER AND WASTEWATER MASTER PLAN, ROTA, CNMI 2-25
Neptune T‐10 Meter Description: This model is a positive displacement, nutating disc meter with a tamperproof seal and lead‐free maincase. The meter is adaptable to ARB®V, ProRead™ (ARB VI) AutoDetect, E‐Coder® (ARB VII), E‐Coder) R900i ™, TRICON®/S, TRICON/E®3, encoders. The model is also available with an integrated double‐check backflow device to prevent contamination.
Estimated Unit Price: $126.42
Estimated Unit Price with Backflow Device and ProRead Register: $348.57
Metron Farnier Spectrum 30D Meter Description: The Spectrum Meters have been designed to replace limited range displacement and multi‐jet meters. The meter is a single‐element, composite (reinforced plastic) meter that utilizes the innov8 electronic register. The innov8 register uses a magnetic sensor to track the impeller rotation and exerts no drag on the measurement. The meter is compatible with almost any automatic meter reading (AMR)/advanced metering infrastructure (AMI) system. It is designed to perform in adverse water conditions, such as the presence of sand or small debris particles in the water, and is uninterrupted by UV radiation and external magnetic fields. The Spectrum employs a tamper‐resistant and tamper‐evident register housing to prevent corruption.
Estimated Unit Price: $125.00
Neptune Double Check T-10 Meter Backflow Meter
Metron Farnier Spectrum 30D Meter
Draft

2. PROJECT SCOPE
2-26 DRAFT FINAL DRINKING WATER AND WASTEWATER MASTER PLAN, ROTA, CNMI
Sensus iPERL Meter Description: With no moving parts, the iPERL water management system is based on electromagnetic flow measurement technology. The integrated construction of an iPERL system prevents removal of the register to obtain free water. The magnetic tamper and low field alarms both indicate any attempt to tamper with the magnetic field of the iPERL system. The measuring device comprises a polyphenylene sulfide alloy flowtube with externally‐threaded spud ends. iPERL systems are compatible with the Sensus AMR/AMI systems currently used by CUC.
Estimated Unit Price: $133.20
Sensus accuSTREAM Meter Description: This magnetic drive positive displacement meter uses an oscillating piston to measure a wide range of flows for a variety of residential applications or similar service needs. Meters and encoders are compatible with current Sensus and various competitive AMR/AMI systems. Maincases are made of composite material with externally‐threaded spuds. Registers are housed in a bonnet of synthetic polymer. Measuring chambers are a corrosion‐resistant thermoplastic material formulated for long‐term performance and suitable for aggressive water conditions. A unique locking system prevents customer removal of the register to obtain free water.
Estimated Unit Price: $92.35
Sensus iPERL Meter
Sensus accuSTREAM Meter
Draft
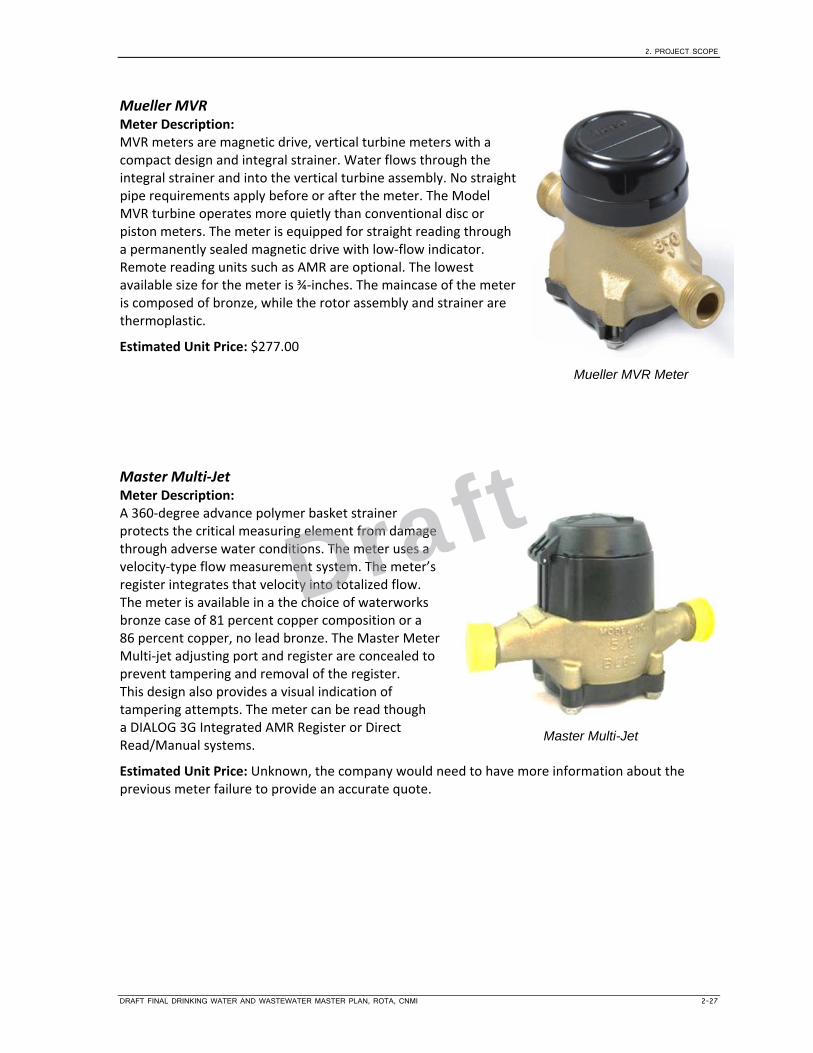
2. PROJECT SCOPE
DRAFT FINAL DRINKING WATER AND WASTEWATER MASTER PLAN, ROTA, CNMI 2-27
Mueller MVR Meter Description: MVR meters are magnetic drive, vertical turbine meters with a compact design and integral strainer. Water flows through the integral strainer and into the vertical turbine assembly. No straight pipe requirements apply before or after the meter. The Model MVR turbine operates more quietly than conventional disc or piston meters. The meter is equipped for straight reading through a permanently sealed magnetic drive with low‐flow indicator. Remote reading units such as AMR are optional. The lowest available size for the meter is ¾‐inches. The maincase of the meter is composed of bronze, while the rotor assembly and strainer are thermoplastic.
Estimated Unit Price: $277.00
Master Multi‐Jet Meter Description: A 360‐degree advance polymer basket strainer protects the critical measuring element from damage through adverse water conditions. The meter uses a velocity‐type flow measurement system. The meter’s register integrates that velocity into totalized flow. The meter is available in a the choice of waterworks bronze case of 81 percent copper composition or a 86 percent copper, no lead bronze. The Master Meter Multi‐jet adjusting port and register are concealed to prevent tampering and removal of the register. This design also provides a visual indication of tampering attempts. The meter can be read though a DIALOG 3G Integrated AMR Register or Direct Read/Manual systems.
Estimated Unit Price: Unknown, the company would need to have more information about the previous meter failure to provide an accurate quote.
Mueller MVR Meter
Master Multi-Jet
Draft
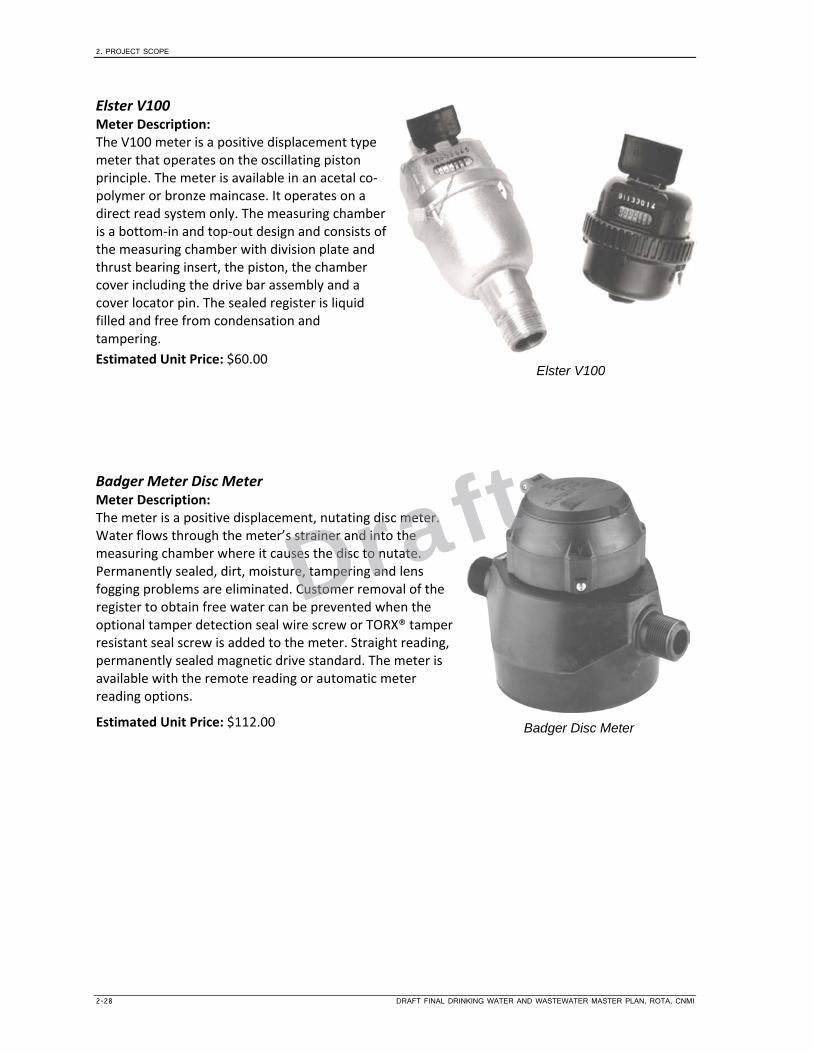
2. PROJECT SCOPE
2-28 DRAFT FINAL DRINKING WATER AND WASTEWATER MASTER PLAN, ROTA, CNMI
Elster V100 Meter Description: The V100 meter is a positive displacement type meter that operates on the oscillating piston principle. The meter is available in an acetal co‐polymer or bronze maincase. It operates on a direct read system only. The measuring chamber is a bottom‐in and top‐out design and consists of the measuring chamber with division plate and thrust bearing insert, the piston, the chamber cover including the drive bar assembly and a cover locator pin. The sealed register is liquid filled and free from condensation and tampering.
Estimated Unit Price: $60.00
Badger Meter Disc Meter Meter Description: The meter is a positive displacement, nutating disc meter. Water flows through the meter’s strainer and into the measuring chamber where it causes the disc to nutate. Permanently sealed, dirt, moisture, tampering and lens fogging problems are eliminated. Customer removal of the register to obtain free water can be prevented when the optional tamper detection seal wire screw or TORX® tamper resistant seal screw is added to the meter. Straight reading, permanently sealed magnetic drive standard. The meter is available with the remote reading or automatic meter reading options.
Estimated Unit Price: $112.00
Elster V100
Badger Disc Meter
Draft

2. PROJECT SCOPE
DRAFT FINAL DRINKING WATER AND WASTEWATER MASTER PLAN, ROTA, CNMI 2-29
Badger Meter E‐Series Meter Description: The E‐Series is an electronic meter that can provide information on water usage and other data such as rate of flow and reverse flow indication, and eliminates measurement errors due to sand, suspended particles, and pressure fluctuations. The LCD display shows total volume and alarm conditions and can toggle to display rate of flow. E‐Series meters feature a stainless steel, lead‐free meter housing, an engineered plastic and stainless steel metering insert, a meter‐control circuit board with associated wiring, LCD, and battery. The meter is not compatible with the Versi‐wand Probe or any other touch systems. A transmitter system such as the Badger ORION or Itron system is required for the meter to function.
Estimated Unit Cost: Unknown, the company would also need to know which transmitter system would be used.
Cost Summary The cost summary for each of the water meters previously discussed is captured in Table 2.2.2‐4. Some of the meters incur an additional cost to be compatible with CUC’s water system. In these cases, the costs for system compatibility were identified separately from the meter unit costs in the summary table.
Table 2.2.2‐4. Summary of Water Meters Researched by DCA/CH2M
Company Model Estimated Cost System Compatibility
Cost
Neptune T‐10 $126.42 $0
Neptune T‐10
(with backflow device) $348.57 $0
Metron Farnier Spectrum 30D $125.00 $15.00
Sensus iPerl $133.20 $21.60
Sensus accuSTREAM $92.35 $0
Mueller MVR $277.00 $16.00
Master Multi‐Jet Unknown Unknown
Elster V100 $60.00 N/A
Badger Meter Disc Meter $112.00 $0
Badger Meter E‐Series Unknown Unknown
Badger Meter E Series
Draft
2. PROJECT SCOPE
2-30 DRAFT FINAL DRINKING WATER AND WASTEWATER MASTER PLAN, ROTA, CNMI
Drinking Water Meter Evaluation Results Based on the information collected from meter companies and DCA/CH2M’s knowledge of CUC’s water system, the project team’s recommendation is for CUC to purchase and evaluate both the Sensus accuSTREAM and the Badger Disc meter. Currently, CUC is testing the Sensus iPerl meter. CUC should select a system‐wide meter based on actual performance of one or more of the three meters in the field.
Cross‐Connection Control Program Inspection and Condition Assessment The EPA and CUC define a cross connection as any actual or potential connection between the public water supply and a source of contamination or pollution. To develop a degree‐of‐hazard (used for the selection of a backflow protection device), the terms contaminant, pollutant, and lethal hazard must be defined. These terms are defined as follows:
Pollutant (Non‐health Hazard) – A foreign substance that, if permitted to get into the public water system, will degrade its quality so as to constitute a moderate hazard, or impair the usefulness or quality of the water to a degree that does not create an actual hazard to the public health, but which does adversely and unreasonably affect such water for domestic use.
Contaminant (Health Hazard) – A substance that will impair the quality of the water to a degree that it creates a serious health hazard to the public, leading to poisoning or the spread of disease.
Lethal Hazard (Health Hazard) – Sewage and radioactive materials are considered Lethal Hazards because of the epidemic possibility associated with sewage and the tremendous dangers associated with radioactive material.
The degree of protection must be a function of the degree of hazard. CUC has established the following list of protections as they relate to the degree of hazard:
High Hazard (Health Hazard)
Air gap, reduce pressure principal device, or combination thereof
Low Hazard (Non‐Health Hazard)
Air gap, atmospheric vacuum breaker, pressure vacuum breaker, double check valve, reduce pressure principal device, or combination thereof
Two hydraulic conditions may lead to a backflow event through a cross connection. One is back‐siphonage, where a substance is introduced into the system by a sudden or gradual reduction of water pressure. A back‐siphoning effect could also be generated by an increase in velocity. The second condition is backpressure, which is when the customer’s pressure is greater than the system pressure. Both back‐siphonage and backpressure conditions are known to exist in the CUC Rota water system.
To control back‐siphonage, the “10 States Standards” require a minimum of 20 psi at ground level in all points of the distribution system under all conditions of flow. The 10 States Standards also specify that each utility have a program conforming to the States’ requirements to detect and eliminate cross connections.
A Cross‐Connection Program is required as part of the Stipulated Order, Section A5, Drinking Water Operations and Maintenance at CUC; Paragraph 38, Cross Connection Control and Backflow Prevention Program. CUC has submitted a Draft Cross Connection Control and Backflow Prevention Program document to EPA. This draft program is discussed in subsequent sections.
Draft

2. PROJECT SCOPE
DRAFT FINAL DRINKING WATER AND WASTEWATER MASTER PLAN, ROTA, CNMI 2-31
Past Findings No past findings of cross connections in Rota were identified in the literature reviewed.
CUC Draft Cross‐Connection Control and Backflow Prevention Program CUC has prepared a Draft Cross‐connection Control and Backflow Prevention Program document (2011) that uses existing generic guidance developed by EPA for cross‐connection programs. This draft program sets the stage for the responsibilities and administrative requirements associated with the program. The draft program also discusses hazards and the requisite protections associated with these hazards. Testing and training are also discussed.
While this draft program sets the stage for dealing with cross connections, the following program elements require revision, approval, and adoption by CUC:
Standard backflow preventer installation details.
Inclusion of a list of approved backflow preventer manufacturers and models. While the Foundation for Cross Connection Control and Hydraulic Research (FCCCHR) is stated as the basis for the training, annual certification and approved manufacturers for the units themselves must be discussed.
A more detailed discussion on the specific types of hazard encountered in CNMI. For example, agricultural use of a pesticide is considered a high hazard. The level of protection should be greater than that of a check valve or double check. The type of backflow commonly associated with this activity is back‐siphonage. For this condition, an atmospheric vacuum breaker, pressure vacuum breaker, or spill‐resistant vacuum breaker may be used depending on the type of backflow.
The draft program does not list the spill‐resistant vacuum breaker as a recognized cross‐connection device.
Additional discussion on the cross‐connection program is provided in the Recommendations section below.
Cross‐Connection Control Program Assessment Findings The following cross‐connection assessment is based on visits conducted to well and booster pump sites and to various fire hydrant and water meter locations throughout the CUC Rota water system. The areas of cross connection can be split into two categories: 1) system cross connections and 2) point‐of‐use cross connections. A system cross connection is one that occurs within the CUC water system; a point‐of‐use cross connection is one that occurs downstream of the customer water meter.
System Cross‐Connection Findings The following potential cross connections were identified on Rota:
A vacuum was identified during the site assessments between the two main PRVs leading from Sinapalo to the Song village.
Hydraulic modeling of the line from the Main Cave to Kaan Tank indicated that a vacuum is created along this line.
Hydraulic modeling of the line from the Main Cave to Ginanlangan Tank indicated that a vacuum is created along this line.
Point‐of‐Use Cross‐Connection Findings No point‐of‐use cross connections were identified on Rota.
Draft

2. PROJECT SCOPE
2-32 DRAFT FINAL DRINKING WATER AND WASTEWATER MASTER PLAN, ROTA, CNMI
Cross‐Connection Control Program Assessment Summary Section 2.2.7, the modeling portion of this Master Plan, presents recommendations for the three potential cross connections listed above.
Leak Detection and Drinking Water Conservation Programs Non‐revenue water is categorized as “lost” water; or water that is not being metered or paid for. A non‐revenue water rate in Rota of 83 percent is a major issue for CUC, and the implementation of an island‐wide leak and detection program is vital to sustainable operation. The program should consist of regular leak detection activities to identify pipelines that are abandoned but still connected to the distribution system and other sources of water loss (e.g., improper connections, damaged/cracked pipe, or leaky valves). The details of the program should be developed in conjunction with CUC personnel and in consideration of CUC practices and should include a program to research and implement new leak detection approaches.
A Leak Detection and Reduction Program is required as part of the Stipulated Order, Section A5, Drinking Water Operations and Maintenance at CUC; Paragraph 34, Repair Leaks in Drinking Water Distribution Systems.
Background During the wet season groundwater is collected from the Main Cave and Onan Cave, is transmitted to the Kaan Tank and Ginanlangan Tank, and then distributed to customers within the distribution system. During the dry season, water from both caves is limited and transmitted only to the Ginanlangan Tank. The three groundwater wells located in the Sinapalo Homestead area also supply supplemental water to the Ginanlangan Tank during the dry season. Disinfection for the Ginanlangan Tank service area is provided along the Onan Cave transmission line to serve customers between the Onan Cave and Ginanlangan Tank. The amount of water produced is measured using flow meters installed at the Main Cave, Onan Cave, and each of the three water wells. These meters are manually read at various times during the month, and those values are combined to measure the overall water production for all of Rota during a given time period. Once the water enters the distribution system, it is categorized as either metered or non‐revenue water.
Simply put, metered water is water consumed by an end user that has been measured through the use of a water meter. Metered account charges for customers are based on set rates and total consumption, and generate an income for the utility. Non‐revenue water is the exact opposite, i.e., it is water that does not generate any income and is considered “lost” in the system. Lost water can mean many different things but it is normally defined as:
Leaks: due to damaged pipes, improper connections, or faulty appurtenances.
Overflow from water tanks.
Non‐metered customers: customers that are legally connected to the distribution system that do not have a meter installed at the point of use but rather pay a bulk water charge. Agricultural use is an example of legal non‐revenue water use.
Illegal connections (theft): people illegally connect to the system at some point along the distribution system.
Abandoned pipelines: when new pipelines are installed, connections to out‐of‐service pipelines are not severed.
Leak Detection Assessment Table 2.2.2‐5 presents a summary of the production, metered, and non‐revenue water in Rota. Non‐revenue water represents a large percentage, nearly 83 percent, of total water production on Rota.
Draft

2. PROJECT SCOPE
DRAFT FINAL DRINKING WATER AND WASTEWATER MASTER PLAN, ROTA, CNMI 2-33
Table 2.2.2‐5. CUC Production and Meter Data
Month‐ Year
Monthly Billing Gallons
Production Gallons
Daily Billing (gal)
Daily Production
(gal)
Average Billing GPM
Average Production
GPM Percent
Unmetered
Oct‐11 5,840,235 34,804,754 194,675 1,160,158 135 806 83%
Nov‐11 6,340,637 34,804,754 211,355 1,160,158 147 806 82%
Dec‐11 6,120,989 34,804,754 204,033 1,160,158 142 806 82%
Jan‐12 6,049,549 34,804,755 201,652 1,160,159 140 806 83%
Mar‐12 5,579,661 34,804,755 185,989 1,160,159 129 806 84%
Average1 5,986,214 34,804,754 199,540 1,160,158 139 806 83%
1. The date provided for February 2012 indicated a negative value for the amount billed this month. This was an apparent error in the information provided and was not used for this analysis.
System age, pipe materials, condition, and regularity of leak detection projects can be used to determine the portion that leaks represent. According to the EPA and depending on the pipe material, the average lifetime of a pipeline is anywhere from 15 to 100 years.
The Sinapalo booster pump station is the only pump station in the Rota water system. Raw water is produced at an elevation higher than that of the two tanks, allowing for gravity flow to the tanks. There is no power cost for the transmission of the raw water in Rota. While this is the most ideal condition, it leads to a high rate of water loss as there is no significant cost and therefore no significant consequence when too much water is transmitted to the tanks. The lack of consequences associated with tank overflow and the cost to implement the upgrades needed to correct the overflows have resulted in continual large overflows at the tanks.
Table 2.2.2‐6 lists the homesteads throughout Rota and the respective pipe ages. The waterlines in the homesteads are relatively new, with the age of pipeline in Rota being 10 to 25 years old. Over 80 percent of the waterlines 4 inches and greater are PVC; this PVC pipe is performing well. The remaining 20 percent of the Rota water pipes are steel and make up the transmission lines from the two caves. These transmission lines are built above grade and are not considered a major source of water loss, particularly when compared to the amount of water allowed to overflow at the water storage tanks. There have been cases of persons illegally tapping into this aboveground transmission line and using the raw water for irrigation; this water is categorized as non‐revenue water for CUC.
Table 2.2.2‐6. Homesteads and Respective Pipe Materials and Years Installed
Homestead/Location Year Installed Material
Song 1997 PVC
Sinapalo I 1994 PVC
Sinapalo II 1994 PVC
Sinapalo III 2004 PVC
Teneto 1998 PVC
Main Cave 1987 Metal Pipe
Onan Cave 1989 Welded Steel
Draft

2. PROJECT SCOPE
2-34 DRAFT FINAL DRINKING WATER AND WASTEWATER MASTER PLAN, ROTA, CNMI
Leak Detection Assessment Findings The primary source for water loss in Rota is the overflow of the Ginanlangan and Kaan tanks. It is estimated that nearly half, i.e., 300 to 400 gpm, of the total water production is lost from this overflow.
Leak Detection Assessment Summary The amount of leaks within the Rota system is estimated to be small when compared to the amount of water that overflows the tanks. Correcting the overflowing tanks will require upgrades to the water transmission line, tank controls, and relocation of the Sinapalo pump station. These upgrades represent a significant improvement for Rota’s water infrastructure and are considered a higher priority than implementing a leak detection program at this time. CUC should continue its routine meter reading and day‐to‐day observation of the water system.
Water Conservation Program Assessment Water conservation programs that involve the customer base are typically implemented when there is an existing shortage of water or a concern for water shortages in the future. Neither of these situations are the case for Rota, so there has been little incentive for CUC to implement a large water conservation program. The non‐revenue water that has been previously discussed is the most important issue for CUC to tackle to conserve its valuable water resources for the future. Once the non‐revenue water problem has been corrected, CUC may want to consider implementing additional water conservation measures as needed, but should weigh this against the loss of potential revenue. Experiences in the western United States have been that, when conservation practices have been implemented, utilities need to increase water rates to account for lost revenue. The response has been universal outrage from a public who feels that it is being penalized for saving water. This may not be the case with CUC as the reduction of water production will equate to a large energy reduction, thus potentially lowering rates or allowing the creation of reserve accounts.
Two recognized approaches for water conservation include 1) the installation of water‐saving devices in the interior and exterior of the home and 2) the use of a water conservation rate structure that encourages customers to reduce their water usage.
Water Conservation Devices The installation of water saving devices in the home, such as low‐flush toilets and low‐flow water fixtures would provide CUC with a one‐time reduction to annual water use by that customer. External water savings, typically associated with landscape irrigation, can be accomplished through the use of timers that allow night‐time irrigation, rain shut‐off valves, and general best practices in irrigation system design.
Water Conservation Program Assessment Summary Developing and implementing a water conservation program in Rota is not recommended at this point in time.
Water Source/Supply Investigation and Assessment Groundwater Under the Direct Influence (GWUDI) is defined by EPA as water that (1) shows significant and relatively rapid shifts in water characteristics such as turbidity, conductivity, pH, or temperature (which also change in groundwater but at a much slower rate) that closely correlate to climatological or surface water conditions, or (2) the presence of insects or other macro‐organisms, algae, organic debris, or large‐diameter pathogens such as Giardia lamblia. The GWUDI investigation and assessment was conducted to determine whether the groundwater supplies in Rota used by CUC for its drinking water system are under the direct influence of surface water. Groundwater
Draft

2. PROJECT SCOPE
DRAFT FINAL DRINKING WATER AND WASTEWATER MASTER PLAN, ROTA, CNMI 2-35
supply selection and criteria evaluation were based on EPA and DEQ guidelines for GWUDI determination.
Groundwater Source Selection and Evaluation CNMI DEQ, in consultation with EPA Region 9 staff, identified and required the Main Cave groundwater source in Rota to be evaluated as part of the GWUDI Investigation.
For 9 months of the year, the primary water supplies for Rota are the Onan Cave and Main Cave, which are natural springs fed by rain falling on the highest parts of the island. These springs are protected sources in that there are no unsewered areas within the watershed. There is a concern that there may be a direct influence on water quality during storm events from surface runoff and potential contamination entering the Main Cave and Onan Cave entrances because they are not properly sealed. The CNMI DEQ selected the Main Cave for the study, understanding that both caves when properly sealed would have similar influences from stormwater run‐off. In anticipation of the GWUDI evaluation, the CUC staff temporarily sealed off the cave with insect screens as shown in Figures 2.2.2‐12 and 2.2.2‐13. A project in the CUC Water Master Plan 20‐year Capital Improvements Plan (CIP) has been identified to seal the Main Cave with a more permanent structure. The Rota GWUDI online water quality monitoring (OWQM) station and weather station were located downstream of the Main Cave at the Kaan Tank. The raw water flows directly through a steel pipeline from the Main Cave to the Kaan Tank and is sampled prior to storage and chlorine disinfection.
Figure 2.2.2‐12. Main Cave Temporary Insect Screen Photo 1
Draft

2. PROJECT SCOPE
2-36 DRAFT FINAL DRINKING WATER AND WASTEWATER MASTER PLAN, ROTA, CNMI
Figure 2.2.2‐13. Main Cave Temporary Insect Screen Photo 2
GWUDI Criteria To determine CNMI’s groundwater supplies that are under the direct influence of surface water, criteria were developed based on the EPA’s general guidance for the Surface Water Treatment Rule, specifically the “Consensus Method for Determining Groundwaters under the Direct Influence of Surface Water Using Microscopic Particulate Analysis (MPA)” (1992). The criteria developed specifically for the determination of groundwater supplies on Saipan, Rota, and Tinian also relied on additional information contained in the AWWARF report “Determining Groundwater under the Direct Influence of Surface Water,” as well as input from CNMI DEQ. Additionally, the criteria were considered against the specific hydrologic conditions of CNMI.
Overview The final judgment of whether the Main Cave spring is GWUDI will be made by DEQ in consultation with EPA based on the following five criteria developed from EPA guidance documentation:
Historical Records of Waterborne Disease Outbreaks
Turbidity Excursions
Microscopic Particulate Analysis (MPA)
Storm‐Related Water Quality Excursions
Well Construction
These criteria have been reviewed by the drinking water scientific community and substantial weight was placed upon the MPA as an indicator of surface water intrusion. Guidelines for the risks associated with MPA data are to be used in the final GWUDI determination. The following is the scoring system for GWUDI determination based on the risk associated with the MPA findings:
High Risk MPA. The groundwater source is considered GWUDI if the MPA shows high risk and at least one other indicator (criteria) is consistent with GWUDI.
Draft

2. PROJECT SCOPE
DRAFT FINAL DRINKING WATER AND WASTEWATER MASTER PLAN, ROTA, CNMI 2-37
Medium Risk MPA. The groundwater source is considered GWUDI if at least three other indicators (criteria) are consistent with GWUDI. If only one or two indicators (criteria) show positive results, then the MPA must be repeated. If the repeat MPA results in a medium to low risk then the groundwater source is considered not GWUDI but is subject to continued evaluation.
Low Risk MPA. The groundwater source is not considered GWUDI. However, if three other indicators (criteria) show positive results for GWUDI, the MPA must be repeated after a rainfall event. If the result of that MPA again shows low risk, the groundwater source is not GWUDI; if the risk is medium to high, then the groundwater source will be considered GWUDI.
The GWUDI criteria based upon EPA guidance and developed specifically for this study are described below.
GWUDI Criterion No.1 – Historical Records of Waterborne Disease Outbreaks A history of known or suspected waterborne disease outbreaks from organisms associated with surface water (e.g., Giardia, Cryptosporidium, coccidia) attributed to the source is considered evidence of GWUDI. It is believed that there are no historical records that such outbreaks have occurred on Rota. A consultation with the appropriate public health officials on CNMI should be conducted to confirm whether there is information of any historical outbreaks caused by Giardia, Cryptosporidium, or other protozoan parasite.
Comment: The GWUDI Investigation Team contacted CNMI DEQ and confirmed that there has been no recorded instance of waterborne disease outbreaks on Rota.
GWUDI Criteria No. 2 – Turbidity Excursions True groundwater has low turbidity even following storm events. This is due to hydrogeological settings that provide adequate filtration to physically remove particulate matter. Confining layers, when present, can prevent downward flow of surface water containing particulates. Therefore a history of elevated turbidities associated with a source is considered evidence of GWUDI.
The following are general rules for turbidity in groundwater:
True groundwater typically shows a turbidity level of 0.3 NTU.
A turbidity level ranging from 0.3 to 1.0 NTU is an indicator of possible GWUDI; however, this must be considered with additional information, such as the nature of the materials causing the turbidity.
A turbidity level greater than 1.0 NTU is an indicator of GWUDI. Again, final determination must be considered with additional information.
Continuous turbidity data for six months at significantly low levels of resolution (0.1 NTU) and accuracy (+/‐ 0.05 NTU), was obtained as part of the GWUDI study and is presented in the “Water Quality and Weather Data Analysis” section below.
GWUDI Criteria No. 3 – Microscopic Particulate Analysis True groundwater is characterized by a lack of microbial pathogens, especially larger pathogens such as Giardia and Cryptosporidium. Hydrogeological settings can provide filtration to physically remove these organisms and other materials of similar size. Confining layers, when present, can prevent downward flow of surface water containing particulate matter. For these reasons, true groundwater should not have materials or organisms found in surface water or at the soil surface. These include microalgae (containing diatoms), insect parts, pollen, rotifers, Giardia cysts, Cryptosporidium cysts, coccidia, and other, larger (> 5 to 10 micron) microorganisms. Identification of these and like
Draft

2. PROJECT SCOPE
2-38 DRAFT FINAL DRINKING WATER AND WASTEWATER MASTER PLAN, ROTA, CNMI
materials in groundwater samples using MPA to determine the presence or absence of these materials will be evident of GWUDI.
Comment: An MPA sample was collected and analyzed using EPA‐approved methodology. The results are discussed in the Water Quality and Weather Data Analysis
GWUDI Criteria No. 4 – Storm‐Related Water Quality Excursions Demonstration of water quality changes in groundwater temporarily associated with storm events or other events at the surface (sewage or chemical spills) could be evidence of GWUDI. Storm event (meteorological/rain) data will be compared with turbidity and other water quality data to assess temporal associations or correlations.
For microbiological contaminants, detection of indicator organisms following an event in wells that were negative prior to the event is indicative of GWUDI. Turbidity fluctuations of greater than 0.5 to 1.0 NTU over the course of a year or associated with a storm or spill event, temperature changes greater than 1 to 2 degrees associated with a storm event, or water chemistry changes greater than +/‐ 50 percent of typical ranges may also be indicative of surface water influence.
GWUDI Criteria No.5 – Well/Cave Construction An improper surface seal can allow surface contamination to enter the caves housing the natural springs. Results of sanitary surveys should be consulted for the Main Cave. Evidence of defects in the surface seal or other surface fractures indicate the potential for GWUDI.
Comment: DEQ and EPA Sanitary Survey information plus on‐site inspections were used to conduct this assessment. The Main Cave is a natural spring, so the most significant manmade concern is the proper sealing of the caves from external contamination. Temporary sealing using insect nets was completed prior to beginning the investigation.
GWUDI Phase I Study The GWUDI Study for the Rota Main Cave was conducted in two phases:
Phase I – September 2012 through January 2013
Phase II – September 2013 through January 2014
The start of the study for both phases was determined by the availability of water from the Main Cave to the Kaan reservoir. The study started late due to the lack of water flow going from the Main Cave to the Kaan Reservoir. The study ended in January 2013 which signifies the end of the rainy season when GWUDI is most prevalent.
Laboratory Analysis Laboratory analysis was performed by CUC both weekly (for turbidity, pH, conductivity, and temperature) and monthly (for total coliform and E. coli). Samples were taken at the Kaan Tank OWQM station and processed at the CUC laboratory located in Saipan.
Data from the laboratory analysis were used as quality assurance/quality control (QA/QC) measures for the online water quality monitoring (OWQM) program. The OWQM sensors were calibrated on and checked against the QA/QC measurements to determine the validity of the data received from the online water quality monitoring equipment. The data were used to perform instrument calibrations monthly or in some cases more frequently.
Draft

2. PROJECT SCOPE
DRAFT FINAL DRINKING WATER AND WASTEWATER MASTER PLAN, ROTA, CNMI 2-39
Weekly Sampling The GWUDI investigation goal was to collect weekly samples at the Kaan Tank OWQM station. During the course of the GWUDI investigation, there were long periods when air travel to Rota was either halted or severely limited. These problems made it difficult for the GWUDI Investigation Team and CUC to achieve the weekly QA/QC sampling. The following water quality parameters were analyzed for the weekly samples that were collected:
Turbidity
Conductivity
pH
Temperature
Total Coliform
E. coli
Monthly Sampling Monthly sampling and analysis for the following water quality parameters occurred during the study:
Hardness (CUC)
Chloride (CUC)
Alkalinity (CUC)
Calcium (CUC)
Nitrate (DEQ)
Microscopic Particulate Analysis One sample was collected from the Kaan Tank OWQM station on November 6, 2012 and sent to Biover Laboratories for MPA testing. The sample was taken to establish a baseline for the Main Cave. The goal was to collect a second sample that would have been based on the 2‐inch/24‐hour criterion in the Quality Assurance Project Plan (QAPP), which states that samples must be taken after at least 2 inches of rainfall within a 24‐hour time period. The types of microparticulates, the total count of each, and the risk determination data sheet for the Main Cave is located in the QAPP. Unfortunately, delays associated with low flows from the Main Cave, travel restrictions, and limited rain events prohibited the collection of the second MPA sample.
The risk level of surface water contamination were assigned to the Main Cave based on the MPA results and using guidance provided in the EPA document “Consensus Method for Determining Groundwaters under the Direct Influence of Surface Water Using Microparticulate Analysis (MPA)” (EPA 910/9‐92‐029).
Draft
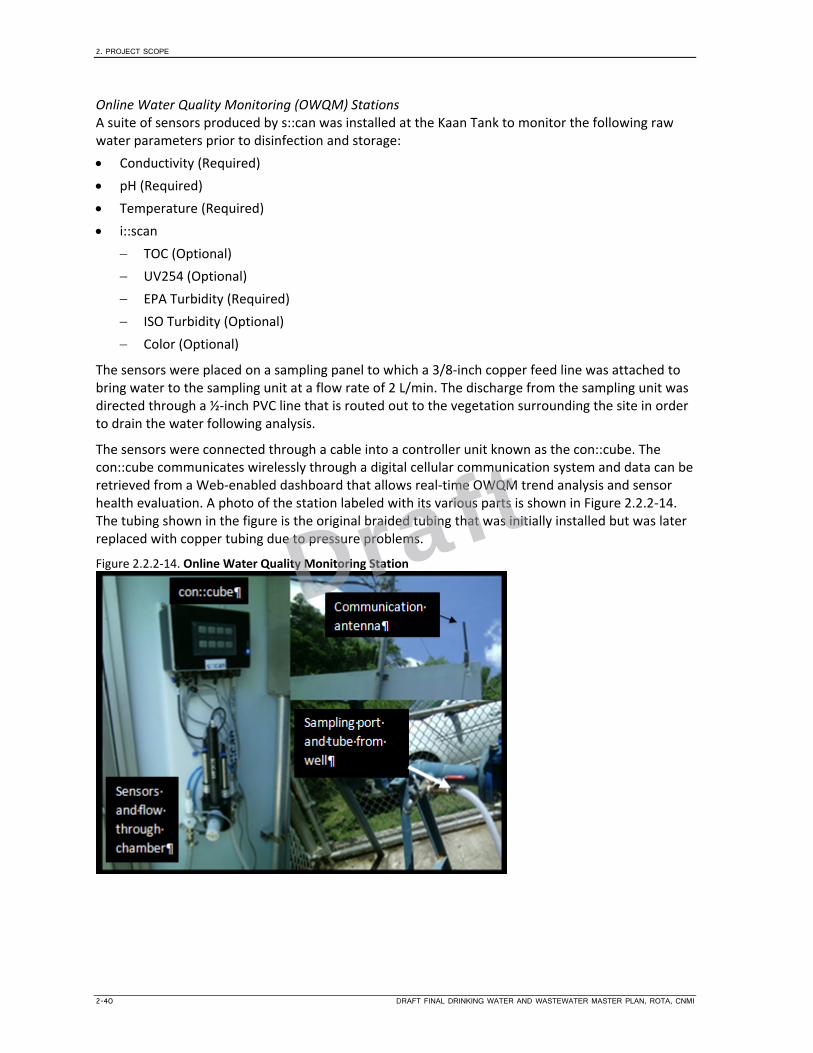
2. PROJECT SCOPE
2-40 DRAFT FINAL DRINKING WATER AND WASTEWATER MASTER PLAN, ROTA, CNMI
Online Water Quality Monitoring (OWQM) Stations A suite of sensors produced by s::can was installed at the Kaan Tank to monitor the following raw water parameters prior to disinfection and storage:
Conductivity (Required)
pH (Required)
Temperature (Required)
i::scan
TOC (Optional)
UV254 (Optional)
EPA Turbidity (Required)
ISO Turbidity (Optional)
Color (Optional)
The sensors were placed on a sampling panel to which a 3/8‐inch copper feed line was attached to bring water to the sampling unit at a flow rate of 2 L/min. The discharge from the sampling unit was directed through a ½‐inch PVC line that is routed out to the vegetation surrounding the site in order to drain the water following analysis.
The sensors were connected through a cable into a controller unit known as the con::cube. The con::cube communicates wirelessly through a digital cellular communication system and data can be retrieved from a Web‐enabled dashboard that allows real‐time OWQM trend analysis and sensor health evaluation. A photo of the station labeled with its various parts is shown in Figure 2.2.2‐14. The tubing shown in the figure is the original braided tubing that was initially installed but was later replaced with copper tubing due to pressure problems.
Figure 2.2.2‐14. Online Water Quality Monitoring Station
Draft
2. PROJECT SCOPE
DRAFT FINAL DRINKING WATER AND WASTEWATER MASTER PLAN, ROTA, CNMI 2-41
Instrument Selection. The GWUDI Investigation Team evaluated a number of potential sensor technologies that could be used for the GWUDI analysis. The evaluation included incorporating the knowledge that the team has obtained in working with EPA Water Security Division for the past 6 years on the $70‐million Water Security initiative to design, implement, and evaluate contamination warning systems. Online water quality monitoring was a significant part of that effort, which included sensor performance evaluation. The two instrument suites that were considered for the final evaluation were the Hach/YSI and s::can suites of instruments. The result of the evaluation was to select the suite of s::can instruments based on past instrument performance, vendor support, and ability to use the instruments for distribution system monitoring at the Kaan Tank following the GWUDI Investigation. In addition, the sensors were reagent free, which allowed the waste stream to be drained onto the ground.
Instrument Maintenance. Maintenance activities such as sensor cleaning and calibration, software upgrades, and infrastructure upgrades and repair were tracked and logged in spreadsheet format throughout the study. Important maintenance activities and the corresponding dates they were performed are presented in the Kaan Tank OWQM Data Analysis sections below.
Pressure Problems. The pressure in the steel pipeline from the Main Cave to the Kaan Tank required special attention to reliably bring water into the OWQM station. The OWQM station water line initially had a standard pressure regulator installed that failed once the flow increased in the pipeline from the Main Cave. The CUC Rota Operations Team installed a PRV to reduce the pressure to 80 psi, which is the maximum pressure allowed for the OWQM station. The result of the pressure reduction was the release of entrained air that impacted the noise for the turbidity measurement.
Instrument Failures. There were no major equipment failure during the Phase I GWUDI study.
Weather Stations Previous to the study, no reliable weather station data was available for Rota. A weather station was installed at the Kaan Tank site to continuously monitor rain and temperature associated with the spring at the Main Cave. Ideally, the GWUDI Investigation Team would have preferred to install the weather station on the plateau which feeds the Main Cave, but a secure site was not available.
Instrument Selection. The GWUDI Investigation Team identified a low‐cost weather station made by HOBO that would provide continuous and reliable rainfall and temperature data. The team was sensitive to the cost of the station because it is highly unlikely that CUC will continue to use the weather station after the conclusion of the GWUDI Investigation.
Instrument Maintenance. Little maintenance was required for the weather station other than the regular removal of leaves and debris that would occasionally clog the rain bucket. The weather station was equipped with a data logger that stored the collected rain and temperature data until it was manually retrieved. The data was then converted using the HOBOware Pro software and analyzed using Microsoft Excel.
Instrument Failures. There were a few instances where data from the weather station were either not retrieved properly or the data logger malfunctioned and the data were lost.
Draft
2. PROJECT SCOPE
2-42 DRAFT FINAL DRINKING WATER AND WASTEWATER MASTER PLAN, ROTA, CNMI
Water Quality and Weather Data Analysis Results for the MPA, OWQM, and QA/QC laboratory data analysis for the Main Cave are presented below. OWQM instruments collected measurements every minute throughout the duration of the investigation. The collection of such a large amount of data allowed for an accurate and detailed description of the water quality of the groundwater supplies and the effect, if any, that rainfall events had on water quality. Rainfall and ambient temperature data was also collected continuously and the average temperature and total daily rainfall at the Kaan Tank are presented. When presenting all of the collected data in graph form, it is difficult to discern whether a rainfall event had an effect on the Main Cave water quality. Therefore the graphs are presented as follows:
MPA Data. An MPA baseline sample was collected for the Main Cave. The data from the baseline sample collected did not indicate the presence of surface related microparticulates.
OWQM and Rainfall Data. Four graphs present the conductivity, turbidity, pH, temperature, and QC data for each parameter along with rainfall occurring in the Main Cave watershed. These graphs present general trends in the Main Cave water quality and also identify where any issues or problems occurred with the monitoring equipment.
Rainfall Events. The two highest rainfall events occurred on September 17, 2012 and January 5, 2013. The graphs present the turbidity and rainfall data for 1 week after a significant rainfall event, as this data is most relevant to the EPA criteria.
Laboratory Data. Three graphs present the calcium, chloride, hardness, alkalinity, E. coli, and total coliform data for the Main Cave. One graph presents the effect that the rain events had on the presence of E. coli and total coliform.
Maintenance Log. Because turbidity is a major criterion for GWUDI determination, this graph was created to show where any maintenance (e.g., instrument cleaning, replacement, or problems) occurred over the course of the study and the effect that the maintenance had on the turbidity.
The graphs for the Main Cave are presented below with a brief discussion of the data.
Data Collection Issues. During the initial operation of the OWQM station there were a number of problems due to infrequent cleaning, difficulty in performing QA/QC testing, and high pressure problems. The result was that the turbidity data was elevated above the QA/QC values collected in the field. Turbidity levels rose to and stayed around the 2 NTU, which is a contradiction to the QA/QC data that shows the turbidity levels remained around 0.3 NTU during that same period.
Draft

2. PROJECT SCOPE
DRAFT FINAL DRINKING WATER AND WASTEWATER MASTER PLAN, ROTA, CNMI 2-43
MPA Analysis. Table 2.2.2‐7 presents the MPA results and shows that the test was negative for presence of microparticulates.
Table 2.2.2‐7. Main Cave Shaft Baseline Microparticulate Analysis
Sample Date 11/4/2012
Sample Site Main Cave
Sample Size 5265 L
Primary Bio‐indicators
Giardia 0 in 5265 L Cryptosporidium 0 in 5265 L
Coccidia 0 /100 gal Diatoms 0 /100 gal
Other Algae 0 /100 gal Insect/Larvae 0 /100 gal
Rotifers 0 /100 gal Plant Debris 0 /100 gal
Secondary Indicators
Amorphous Debris TNTC /100 gal Minerals 0 /100 gal
Plant Pollen 3 /100 gal Nematodes 0 /100 gal
Crustacea 0 /100 gal Amoeba 0 /100 gal
Cilliates/Flagellates 0 /100 gal Other Organisms 0 /100 gal
OWQM and Rainfall Data. The CUC Rota Team installed a PRV to improve the pressure issues that were affecting the OWQM sensors, increased the sensor cleaning frequency, and purchased field‐testing equipment to allow for more frequent calibrations of the sensors. The data obtained after mid‐November show a dramatic improvement in the online turbidity measurement and a close correlation to the field QA/QC calibrations (see Figure 2.2.2‐15). The only problem observed was the impact of entrained air being released after the PRV installation, which increased noise in the turbidity measurement. Draft

2. PROJECT SCOPE
2-44 DRAFT FINAL DRINKING WATER AND WASTEWATER MASTER PLAN, ROTA, CNMI
Figure 2.2.2‐15. Overall OWQM Data for Main Cave
Draft
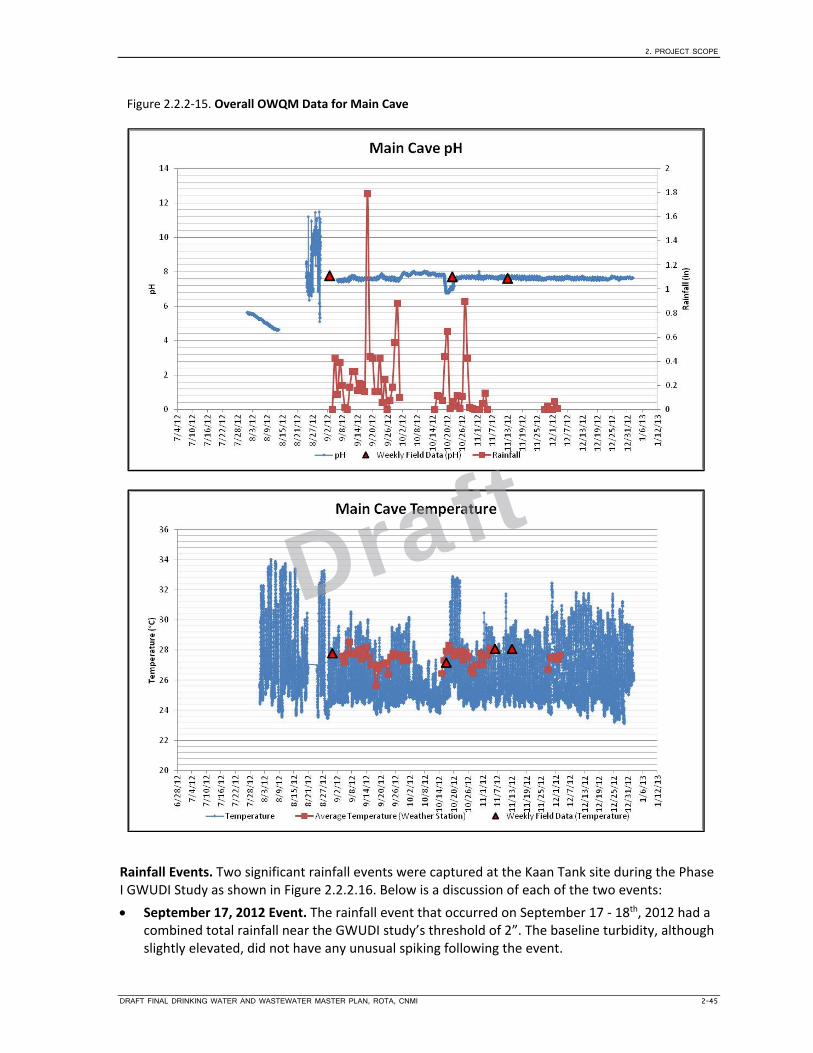
2. PROJECT SCOPE
DRAFT FINAL DRINKING WATER AND WASTEWATER MASTER PLAN, ROTA, CNMI 2-45
Figure 2.2.2‐15. Overall OWQM Data for Main Cave
Rainfall Events. Two significant rainfall events were captured at the Kaan Tank site during the Phase I GWUDI Study as shown in Figure 2.2.2.16. Below is a discussion of each of the two events:
September 17, 2012 Event. The rainfall event that occurred on September 17 ‐ 18th, 2012 had a combined total rainfall near the GWUDI study’s threshold of 2”. The baseline turbidity, although slightly elevated, did not have any unusual spiking following the event.
Draft

2. PROJECT SCOPE
2-46 DRAFT FINAL DRINKING WATER AND WASTEWATER MASTER PLAN, ROTA, CNMI
January 6, 2013 Event. The rainfall event on January 5‐6, 2013 was similar to the previous one, but was also followed by a number of smaller rain events during the week. During the week of monitoring the i::scan cleaning brush stuck, blocking the turbidity sensor light pathway. The result was erroneous data. Similar to the earlier event, the turbidity did not demonstrate any unusual spikes associated with the rainfall event.
MPA Sample. The baseline MPA sample collected on November 16, 2012 had an overall low risk assigned as shown in Table 2.2.2‐9. The groundwater source is considered low risk for surface water influence. The team was unable to travel to Rota in time to collect a storm related MPA sample.
Figure 2.2.2‐16. Rainfall Events at Main Cave
Draft

2. PROJECT SCOPE
DRAFT FINAL DRINKING WATER AND WASTEWATER MASTER PLAN, ROTA, CNMI 2-47
Laboratory Data. Laboratory data for the Main Cave are shown in Figure 2.2.2‐17. Water quality parameters such as calcium, hardness, etc. remained consistent throughout the measurement period and were not directly affected by rainfall events. Microbe data, on the other hand, shows small spikes in total coliform during some of the sample periods. Because of instrument failure, it is difficult to determine whether the spikes occurred directly following a rainfall event.
Figure 2.2.2‐17. Laboratory Data for Main Cave
Draft

2. PROJECT SCOPE
2-48 DRAFT FINAL DRINKING WATER AND WASTEWATER MASTER PLAN, ROTA, CNMI
Maintenance Log. Maintenance performed on the instrumentation at the Main Cave site was logged and is presented in Table 2.2.2‐8. Transportation to Rota can be difficult and therefore regular maintenance was not completed as often as it was at stations on Saipan. Regular maintenance includes the removal of biofilm and recalibration of the sensors as the growth of biofilm on the sensor elements causes a drift in the turbidity, as shown in Figure 2.2.2‐18. Maintenance point B shows the effects of cleaning as the turbidity drops down to around 0.5 NTU, but quickly drifts up due to biofilm growth. Although the sensors were cleaned at point C, incorrect calibration led to readings that were greater than 1.0 NTU.
Table 2.2.2‐8. Maintenance Log Dates and Descriptions (corresponds to Figure 2.2.2‐15 above)
Date Maintenance Performed Issue Resolved
A 8/22/2012 Con::cube troubleshooting (8/22), software upgrade (8/24)
System was offline
B 8/31/2012 Replaced pH probe, cleaned sensor Reduced biofilm
C 10/22/2012 Cleaned sensors Reduced biofilm
1/8/2013 Cleaned sensors Reduced biofilm
Figure 2.2.2‐18. Maintenance Log and Corresponding Turbidity and Rainfall Data for Main Cave
Summary A plan was developed based on criteria set forth by the EPA to determine whether the Main Cave is under the direct influence of surface water and would therefore require higher levels of treatment. Heavy weight was placed on the baseline MPA to determine the overall risk level of the supply. Online water quality monitoring equipment was installed at the Kaan Tank site to continuously gather data for conductivity, turbidity, pH, and temperature; trends were observed over the course of the 6‐month study. A major indication of surface water influence is a 0.5 to 1.0 NTU change in
Draft

2. PROJECT SCOPE
DRAFT FINAL DRINKING WATER AND WASTEWATER MASTER PLAN, ROTA, CNMI 2-49
turbidity or a +/‐ 50 percent change in the other water quality parameters following a rainfall event. Table 2.2.2‐9 summarizes the results of the criteria used for GWUDI determination.
Final Results and Sensor Precision. The GWUDI Determination Study Program stipulates that continuous turbidity data quality must be obtained at low levels of resolution (0.1 NTU) and accuracy (+/‐ 0.05 NTU) for 6 months to a year. The figures presented in the previous sections provide the long‐term turbidity data from the Main Cave GWUDI site and Figures 2.2.2‐19 through 2.2.2‐20 below present the frequency of turbidity values and precisions between sensor readings during rainfall events. The turbidity and precision graphs for the September 17 event illustrate the tight precision between readings throughout the storm event, which occurred shortly after start‐up when the instrument was clean and well calibrated. The turbidity and precision graphs for the January 5 rain event illustrates lower sensor precision between readings. This was expected since the instrument calibration was discontinued after Christmas because the rainy season was considered to have been done as of December 31.
The increase in the precision of the sensors between readings increased over time due to software upgrades, increased cleaning efficiency and maintenance, and regular calibrations. This is clearly demonstrated in the figures between the two rainfall events at the Kaan Tank OWQM Station.
Table 2.2.2‐9. Results of the Criteria Used for GWUDI Determination
Site ID
Criteria 1: History of Waterborne Disease Outbreak
Criteria 2: Turbidity Excursions
(Turbidity Levels Observed)
Criteria 3: Risk Level for Surface Influence
(based on MPA results) Criteria 4: Storm‐Related WQ Excursions
0 to 0.3 NTU
0.4 to 1.0 NTU
>1.0 NTU High Medium Low
Detection of Indicator Organisms
Temper‐ature
Changes > 2°
Turbidity Fluctuation +/‐ 0.5 to 1 NTU
Water chemistry
(i.e., Conducti‐vity or pH) Changes +/‐ 50%
Rota Main Cave
NO X X NO NO NO NO
Figure 2.2.2‐19. Main Cave Turbidity and Precision Histograms for 9/17 Rainfall Event
Draft

2. PROJECT SCOPE
2-50 DRAFT FINAL DRINKING WATER AND WASTEWATER MASTER PLAN, ROTA, CNMI
Figure 2.2.2‐20. Main Cave Turbidity and Precision Histograms for 1/5 Rainfall Event
Recommendations and Future Considerations. CNMI DEQ, in consultation with EPA Region 9 staff, will make a final determination on whether or not the Main Cave investigated during this study is GWUDI or require additional data collection. If additional studies are required, we would recommend that the testing begin in July 2013 to coincide with the start of the rainy season. Based on the GWUDI Investigation Team’s review of the data collected, we do not feel that additional testing of the Main Cave is warranted.
EPA Region 9 and CNMI DEQ Phase I Determination After reviewing the results from the Phase I GWUDI study for the Kaan Tank site, the decision was that insufficient information had been collected to make a final determination. Due to Main Cave water availability, the study lasted for 3 months instead of the proposed 6 months. Secondly, the collection of an MPA sample following a significant rainfall event was not collected. The recommendation was to continue the study throughout the 2013 rainy season.
Draft

2. PROJECT SCOPE
DRAFT FINAL DRINKING WATER AND WASTEWATER MASTER PLAN, ROTA, CNMI 2-51
GWUDI Phase II Study Based on the inconclusive results from the GWUDI Phase I Investigation, EPA Region 9 and CNMI DEQ requested that CUC perform additional work on the one site previously evaluated on Rota:
Main Cave
The primary spring, Main Cave, constitutes the Rota portion of the GWUDI Phase II Investigation.
Sampling Program The sampling program for the GWUDI Phase II Investigation was conducted in accordance of the revised Quality Assurance Project Plan (QAPP). A summary of the sampling program is provided below:
Online Water Quality Monitoring. Continuous online water quality monitoring (OWQM) sampling for turbidity, conductivity, pH, and temperature was conducted throughout the GWUDI Phase II Investigation. Sampling equipment specifications are located in the QAPP. Data were collected every 2 minutes for each water quality parameter and transferred using cellular communications to a central database. The central database was hosted in the CH2M Denver Data Processing Center, and information on water quality trends was available to all stakeholders using a web‐based, encrypted dashboard.
Weather Station. Continuous data for rainfall and external temperature were collected for a portion of the study until it failed in September 2013. After that, data from both Guam and the Tinian International Airport was used for the study. The weather station data was manually collected monthly, processed, and presented during study update presentations with all key stakeholders.
Laboratory Data. The CUC Water Quality Laboratory conducted total coliform and E. coli analysis for the Rota Main Cave Spring as part of the GWUDI Phase II Investigation. The samples were collected either by the CUC Operations Team on Rota. All sample collectors were trained on proper techniques by the CUC Laboratory Director.
Field Calibration Data. The frequency of field calibration data collection, described below, was in accordance with the QAPP.
Turbidity
o High drift (>0.3 NTU/week): Quality control (QC) readings were taken twice weekly (typically Tuesday and Friday) for these sites. The Tuesday sample was used for instrument calibration.
o Stable (<0.3 NTU/week): QC readings were taken once weekly and used for instrument calibration.
o Very stable (<0.3 NTU/2 weeks): QC readings were taken every two weeks and used for instrument calibration.
pH
o pH readings were taken either weekly or bi‐weekly based on the turbidity testing program. The data were used for instrument calibration.
Conductivity
o Conductivity readings were taken either weekly or bi‐weekly based on the turbidity testing program. The data were used for instrument calibration.
Draft

2. PROJECT SCOPE
2-52 DRAFT FINAL DRINKING WATER AND WASTEWATER MASTER PLAN, ROTA, CNMI
Temperature
o Temperature readings were taken either weekly or bi‐weekly based on the turbidity testing program. The data were used for instrument calibration.
Turbidity
o The Rota Main Cave turbidity was very low and stable throughout the study. Unfortunately the CUC Operations team was not able to conduct bi‐weekly sampling as required by the QAPP.
Data Analysis and Results Data collection was conducted based on the approved QAPP during the GWUDI Phase II Investigation.
During the GWUDI Phase I Investigation, the data collected from the Rota Main Cave were determined to be inconclusive and required an additional rainy season of study. The primary reason was the lack of flow available from the Main Cave down to the Kaan Reservoir where the OWQM station was located. In preparation for the Phase II GWUDI Study, the sensors were upgraded and a panel was installed, and the system was started up on July 1, 2013 using water back flowing from the Kaan Reservoir. The station optimization and debugging was completed and water flow was established at a rate of 50 gpm from the Main Cave down to the Kaan Reservoir site on September 25, 2014. Continuous OWQM data was collected through January 2014.
Power Outages. The Rota Main Cave requires no power due the water elevation.
Maintenance Activities. The GWUDI Field Team maintained detailed records of any on‐site or remote changes that were made at the station during the course of the investigation. This information is very important during the analysis of the data as it can often reflect and capture changes such as:
Short‐term water quality changes during maintenance operations
Baseline water quality shift associated with cleaning and recalibration of the instruments
Non‐instrument related problems, such as unusual site conditions (i.e., unusual pump noises, flow reversals)
Table 2.2.2‐10 provides the detailed notes associated with all maintenance activities and site visits.
Table 2.2.2‐10. Maui II Maintenance Activities
Date
Type Infrastructure Software Sensors Who What Why
7/1/13 Software and Sensors
Ken Thompson/ CH2M, Brittany Baker/s::can
Changed electrode on pH probe, changed autobrush, changed i::scan, updated software to 2.0, cleaned conductivity probe, cleaned filter, installed CDMA modem, installed new software license, and calibrated all sensors. Downloaded rainfall data.
Phase II GWUDI Investigation Startup
9/30/2013 9:00 a.m.
Software and Sensors
Ken Thompson ‐ CH2M, George Fercher – s::can
Installed new "P" bristles. Changes brush settings to 360/3/20. Flushed system. Function‐check failed. Zero‐reference performed. Reflashed con::cube with latest moni::tool, and re‐installed vpn‐profile and put new license into place.
Optimization
Draft
2. PROJECT SCOPE
DRAFT FINAL DRINKING WATER AND WASTEWATER MASTER PLAN, ROTA, CNMI 2-53
Significant maintenance activities during the GWUDI Phase II Investigation resulted from CDMA and Software Failure (September 30).
Online Water Quality Monitoring and Weather Data. Continuous OWQM data were collected for turbidity, pH, conductivity, and temperature throughout the period of investigation. The station was considered to be collecting stable data after September 25, 2014 following installation, start‐up, minor optimization, and a minimal flow rate of 50 GPM was transferred from the Kaan Reservoir. The most important parameters collected for determining GWUDI or treatment for microbes were turbidity and conductivity. The data for pH and temperature is available, but not included in the graphs of the OWQM data below (Figures 2.2.2‐21 and 2.2.2‐22).
Weather station data were collected continuously for rainfall and temperature throughout the GWUDI Phase II Investigation until the electronics failed in the weather station in September 2013. The team used the weather data from both Guam and Tinian after the system failed. The Guam weather data available includes daily rainfall and average temperature; the Tinian rainfall and temperature data was collected every minute. Based on discussions with Rota operations staff, the weather data from Guam appears to be more reflective of the conditions experienced on Rota. The data are provided below in biweekly graphs and discussed below:
Conductivity. Conductivity in the Main Cave on Rota remained between 230 and 250 µSiemens throughout the study once water was available for testing. Rainfall events had no effect on conductivity.
Turbidity. Turbidity in the Main Cave was naturally low, maintaining around 0.1 NTU throughout the entirety of the study. A spike in turbidity occurred on the 14th of October with a max turbidity occurring at approximately 14 NTU. The spike occurred a day after a heavy rainfall event of 1 inch. Some additional spikes occurred in January after a series of large rain events reaching a maximum of 3 NTU. The turbidity spikes were short term and the baseline quickly reestablished itself around 0.1 NTU.
Rainfall. The weather station on Rota recorded rainfall data through September but was removed due to instrument malfunction. The remaining data was taken from the weather station on Tinian, which is approximately 67 miles north‐northeast from Rota and is exposed to similar weather patterns. The island received constant rain throughout October with two events of 0.9 inches occurring in the middle and late in the month.
Draft

Draft
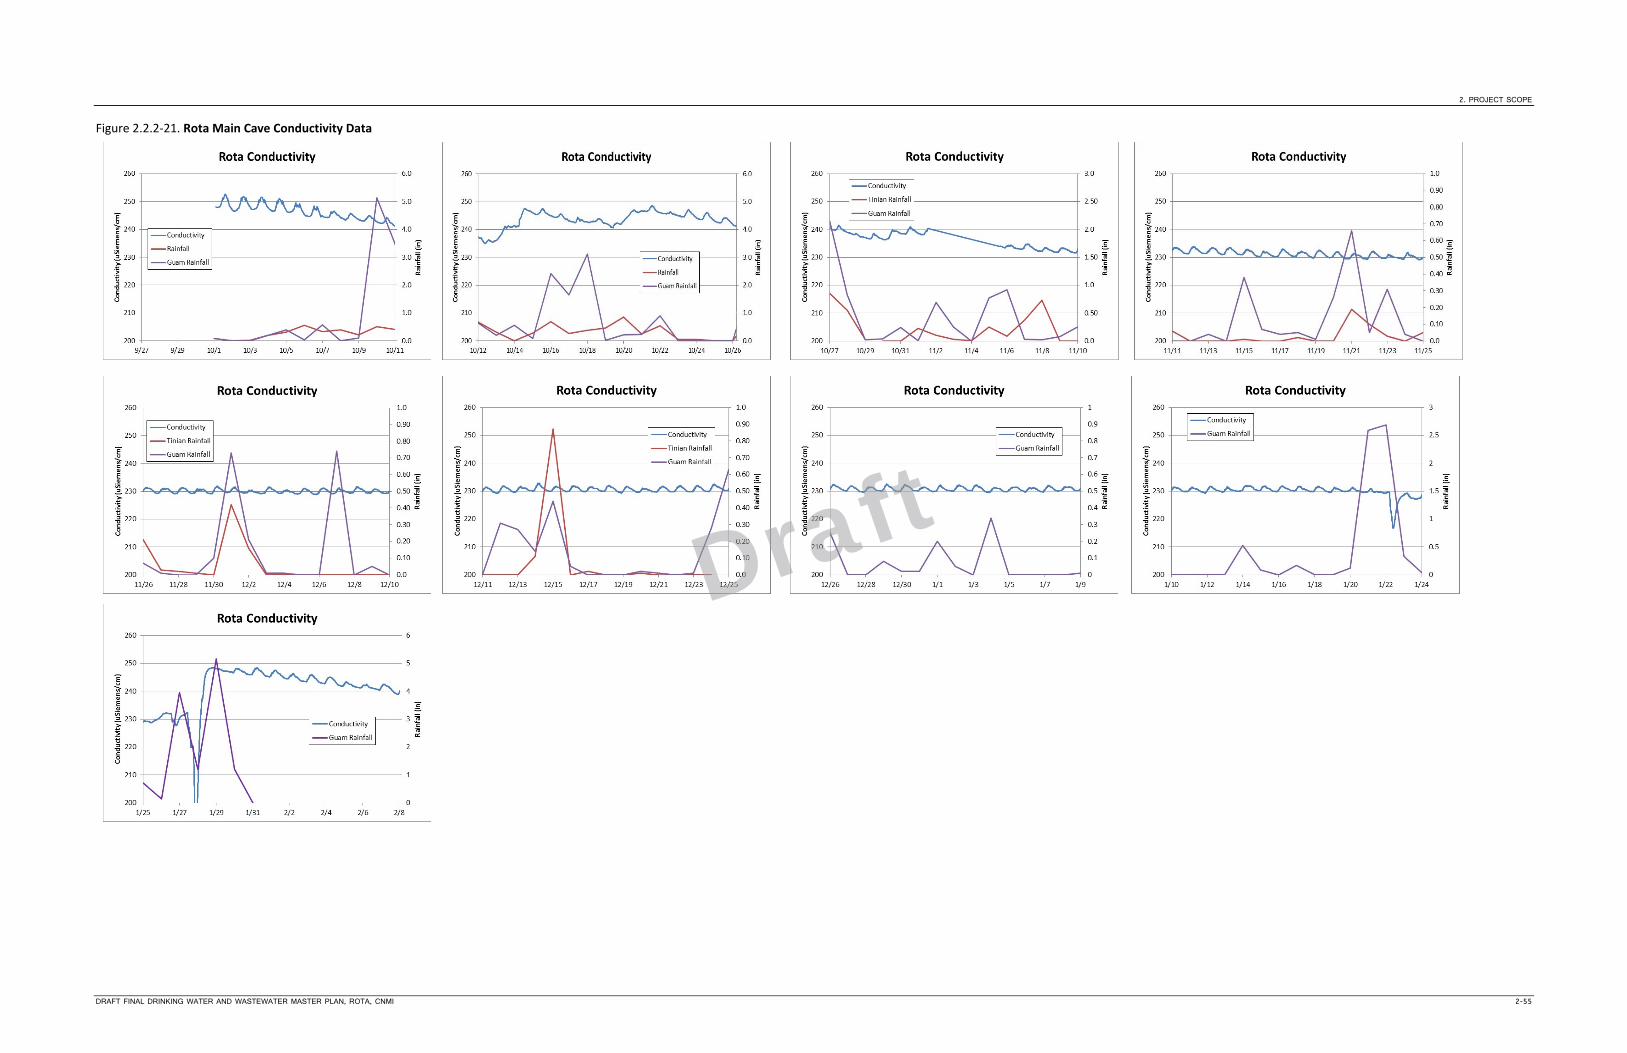
2. PROJECT SCOPE
DRAFT FINAL DRINKING WATER AND WASTEWATER MASTER PLAN, ROTA, CNMI 2-55
Figure 2.2.2‐21. Rota Main Cave Conductivity Data
Draft

Draft

2. PROJECT SCOPE
DRAFT FINAL DRINKING WATER AND WASTEWATER MASTER PLAN, ROTA, CNMI 2-57
Figure 2.2.2‐22. Rota Main Cave Turbidity Data
Draft

Draft

2. PROJECT SCOPE
DRAFT FINAL DRINKING WATER AND WASTEWATER MASTER PLAN, ROTA, CNMI 2-59
Calibration Results. No calibration data was recorded during the period of the investigation.
Bacteriological Results. Weekly bacteriological samples were taken for total coliform and E. coli during the course of the GWUDI Phase II Investigation. Table 2.2.2‐11 and Figure 2.2.2‐23 illustrate the results of the sampling, discussed below:
Total Coliform. Ten samples for total coliform were collected during the Phase II GWUDI Study with values ranging from 1.0 to 48.7 colonies.
Fecal Coliform. Ten samples for E. coli were collected during the Phase II GWUDI Study with eight positive samples. The positive samples included two samples with counts of 1.0 colonies.
Table 2.2.2‐11. GWUDI Phase II Investigation Sampling Results
Date Total Coliform Date E. Coli
10‐23‐14 48.7 10‐23‐14 1.0
10‐24‐14 24.6 10‐24‐14 <1
10‐25‐14 15.8 10‐25‐14 <1
10‐28‐14 22.8 10‐28‐14 <1
11‐4‐14 17.5 11‐4‐14 <1
11‐11‐14 9.6 11‐11‐14 1.0
11‐12‐14 6.3 11‐12‐14 <1
11‐18‐14 1.0 11‐18‐14 <1
11.25.14 6.3 11‐25‐14 <1
12‐4‐14 22.8 12‐4‐14 <1
Figure 2.2.2‐23. Rota Main Cave Bacteriological Data Draft

2. PROJECT SCOPE
2-60 DRAFT FINAL DRINKING WATER AND WASTEWATER MASTER PLAN, ROTA, CNMI
MPA Results: October 12, 2013. The graph of the turbidity and rainfall data associated with the MPA sampling period is shown in Figure 2.2.2‐24.
Figure 2.2.2‐24. Rota Main Cave Turbidity and Rainfall Data
The results of the MPA test for October 13, 2013 are provided in Table 2.2.2‐12.
Table 2.2.2‐12. Rota Main Cave MPA Primary and Secondary Bio‐indicators
Type Value Type Value
Primary Bio‐indicators
Giardia 0 in 1624 L Cryptosporidium 0 in 1624 L
Coccidia 0 / 100 gal Diatoms 0 / 100 gal
Other Algae 0 / 100 gal Insect/Larvae 0 / 100 gal
Rotifers 1 / 100 gal Plant Debris 0 / 100 gal
Secondary Bio‐indicators
Amorphous Debris TNTC / 100 gal Minerals 0 / 100 gal
Plant Pollen 1 / 100 gal Nematodes 3/ 100 gal
Crustacea 0 / 100 gal Amoeba 0 / 100 gal
Ciliates/Flagellates 0 / 100 gal Other Organisms 0 / 100 gal
The overall risk of surface water contamination was low, which is the primary criterion for whether a groundwater is under the direct influence of surface water.
MPA Sample
Draft

2. PROJECT SCOPE
DRAFT FINAL DRINKING WATER AND WASTEWATER MASTER PLAN, ROTA, CNMI 2-61
Summary General Observations. Some general observations that the team observed as part of the GDUWI Phase II investigation for all three islands were as follows:
Power Outages
No Impact on the Rota Main Cave
Chlorination Stations
Impact
o Loss of continuous chlorination can have a negative impact on public health.
Consideration
o Add continuous chlorine monitoring equipment with data and alerts sent back to the operations center. The GWUDI OWQM stations, with the addition of a chlorine sensor, can provide these data along with additional water quality parameters that are useful for operations.
Microbiological Sample Collection
Impact
o Collecting samples from a tap that has been contaminated will cause extra work for operations and laboratory staff due to false positives.
Consideration
o Either flame or disinfect the sample tap (based on sample tap material) before starting the sampling process.
MPA Results. The MPA results for the sample taken for the Rota Main Cave during the GWUDI Phase II Study demonstrated low risk for potential contamination associated with surface water. The MPA results are given the highest weight in the EPA criteria for the determination of whether groundwater is under the influence of surface water. With this understanding, it is also acknowledged that other concerns associated with turbidity excursions and elevated bacterial levels may also require additional treatment or mitigation for some of the specific surface waters evaluated as part of the Phase II GWUDI Investigation on Rota. These specific areas of concern are discussed below for the Maui II groundwater supply.
Total Coliform. The Rota Main Cave has a relatively low background of total coliform that is more than likely associated with insects that have been able to penetrate the temporary screens around the cave. Two samples collected contained E. coli with seven of those samples having values of 1.0 colony‐forming units.
Recommendations. The recommended improvement for permanent hardening, along with continuous chlorination and chlorine monitoring, of the Main Cave should reduce the low levels of total coliform.
EPA Region 9 and CNMI DEQ Phase II Determination Evaluation of the results from the GWUDI Phase II investigation revealed three categories into which the twelve Saipan, Tinian, and Rota groundwater sources fit:
Draft

2. PROJECT SCOPE
2-62 DRAFT FINAL DRINKING WATER AND WASTEWATER MASTER PLAN, ROTA, CNMI
Category 1 – Non‐GWUDI. The majority of the groundwater wells, with the exception of Puerto Rico 164, fell into this category based on the results from the MPA analyses, OWQM sampling for turbidity and conductivity, and bacteriological analyses.
Category 2 – Potentially GWUDI. Two of the groundwater sources fit into this category based on the direct relationship established between turbidity excursions and significant rain events. This is a borderline consideration because no MPA analysis showed any surface water indicator organisms and thus were considered to be low risk.
Category 3 – Non‐GWUDI with Elevated Bacteriological Samples. Three of the groundwater supplies fit this category and will require that reliable disinfection be in place and potentially a diversion scheme or automated shut down be implemented in the event of elevated turbidity excursions.
EPA Region 9 and CNMI DEQ staff determined that the Rota Main Cave fell into Category 1 – Non‐GWUDI. This determination for the Main Cave was provided in a letter dated October 20, 2014. The letter was titled, “Saipan GWUDI Determinations; Stipulated Order One; Paragraph 43 Additional GWUDI sampling on Saipan, Rota, and Tinian. Preliminary Injunctive relief (Civil Case No. CV 08‐0051).” The letter states EPA and DEQ agree with CUC’s assessment that the Main Cave is not GWUDI based on the results from the MPA analysis, on‐line water quality monitoring for turbidity and conductivity, and bacteriological analysis. The MPA results for the Rota Main Cave during the GWUDI Phase II Study demonstrated low risk for potential contamination associated with surface water.
2.2.3 Water Distribution Hydraulic Model Section 57 of the Stipulated Order requires a hydraulic capacity assessment of the CUC distribution system including sources, transmission lines, storage, pumps and booster pump stations, and distribution system lines. The model must be run at current conditions and with future population projections forecasted for 20 years to ensure adequate quantity and pressure for 24‐hour drinking water. Per the Stipulated Order, the model must provide extended time (multiple‐day) analyses of the drinking water systems’ hydraulics.
This section of the Rota Master Plan presents the water hydraulic model development, existing flow metering based on customer meters and well production flow meters, results of the water pressure metering, model calibration, existing water distribution system capacity analysis, booster pump station capacity review, and recommendations to improve the hydraulics, operations, pressure and capacity of the water distribution system. Information on the condition of the water assets may be found in Section 2.2, Drinking Water Infrastructure System Condition Assessment.
Discussion and analysis on the ability of CUC to provide 24‐hour water is presented in this section. The overall cost for the recommended improvements is presented in the CIP section (Section 4.3.1 of this Master Plan.
Model Software The new model platform chosen is WaterCAD as CUC already had this software platform in‐house as it is used for Saipan and Tinian. Because Rota had never had a hydraulic model developed for its system, it is appropriate to use the same software platform for all three islands.
Draft

2. PROJECT SCOPE
DRAFT FINAL DRINKING WATER AND WASTEWATER MASTER PLAN, ROTA, CNMI 2-63
Base Map/Model Development An existing water system basemap had been prepared and maintained by CUC Engineering, and a comprehensive GIS database was built using this basemap. The entire island of Rota was modeled as one system (i.e., the model was not broken into smaller basins). Prior to model development a hydraulic profile was developed. (A copy of this profile is provided in Appendix C; the model inputs are provided in Appendix D.) The model input summary provides the following:
• Number of junctions
• Pipe sizes and lengths
• Number of tanks, pumps, and PRVs
Distribution System The primary water supplies for the Island of Rota are the Onan and Main Caves, which are natural springs fed from rain falling on the highest parts of the island. The water distribution system consists of water mains 4 inches and larger emanating from the Ginanlangan (Sinapalo) Tank and the Kaan Tank. One section of the water cave transmission line is also considered part of the distribution system because customers pull water directly from it. Appendix E presents the water distribution and transmission system for Rota.
Asset Inventory The project team conducted an asset inventory of all water booster stations, water storage tanks, and PRVs from August through December 2011. Data collected as part of this asset inventory were used to assess the condition of the assets and in model development. Prior to model development, the project team learned a great deal about the Rota water system through the asset inventory workshops conducted with CUC. Information on active and inactive tanks, PRV settings, pump station operations, as well as control operations was collected and discussed and is reflected in this Master Plan.
Tank Service Areas Rota's water system was considered one service area for the purposes of the distribution system model. Two water tanks—Ginanlangan and Kaan—are located at different grades. During the dry season the entire island is fed from the Ginanlangan tank as the lower grade (Kaan) tank is shut down. During the wet season, the Kaan tank is activated, but is not truly setting the hydraulic grade. Further discussion on this is provided in the model results section of this Master Plan.
Table 2.2.3‐1 lists characteristics of the Ginanlangan and Kaan tanks located on Rota.
Table 2.2.3‐1. Rota Tank Summary
Service Area Tank Material and Size Tank Finished Elevation (ft)
Ginanlangan Tank Steel 0.5 MG 604
Kaan Tank Steel 1.0 MG 225
Ginanlangan Tank The Ginanlangan tank serves the village of Sinapalo, which includes the airport. During the dry season this tank serves the entire island of Rota. Water is supplied to this tank by the Onan Cave and through the four water wells located in Sinapalo. These wells are only activated as needed during the dry season. Two PRVs set the downstream hydraulic grade in this Tank Service Area (TSA).
Draft

2. PROJECT SCOPE
2-64 DRAFT FINAL DRINKING WATER AND WASTEWATER MASTER PLAN, ROTA, CNMI
Kaan Tank The Kaan Tank serves the Song Song village and lower regions of Rota, which include Teteto and Teneto villages. One PRV is located immediately downstream of the Kaan tank. Water is supplied to this TSA through the Onan Cave.
Hydraulic Profiles The project team conducted several meetings with CUC operations and engineering personnel during the development of the hydraulic profile. DEQ personnel also provided feedback. The profile shows the following:
• Hydraulic grade of the storage tanks
• Elevation of major demand areas
• Wells within TSA
• Simple schematic of the transmission and distribution lines
• Major PRV, PSV and isolation valves
• Major pump stations
• Chlorine injection points
Appendix C includes the hydraulic profile for Rota. This profile was used to build the system water model.
Water Meter and Groundwater Production Data The project team collected and reviewed water meter and production data for October 2011 through March 2012.
CUC uses a system of meter reading routes for customer billing; these sources of data were used to reflect system demands.
CUC collects and tabulates production data from the well supply monthly, using these data to reflect system production. The project team reviewed data from October 2011 through March 2012. Some of the well site production flows were assumptions made by CUC due to faulty water meters. These assumptions were also used by the project team to compare metered system flows against the well production flow data. The cave production data varied from month to month based on whether the wells were active. Table 2.2.3‐2 presents a summary of the water meter and well flow data.
Table 2.2.3‐2. CUC Production and Meter Data
Month
Monthly Billing Gallons
Production Gallons
Daily Billing (gal)
Daily Production
(gal)
Average Billing GPM
Average Production GPM
Percent Unmetere
d
Oct‐11 5,840,235 34,804,754 194,675 1,160,158 135 806 83%
Nov‐11 6,340,637 34,804,754 211,355 1,160,158 147 806 82%
Dec‐11 6,120,989 34,804,754 204,033 1,160,158 142 806 82%
Jan‐12 6,049,549 34,804,755 201,652 1,160,159 140 806 83%
Mar‐12 5,579,661 34,804,755 185,989 1,160,159 129 806 84%
Average1 5,986,214 34,804,754 199,540 1,160,158 139 806 83%
1. The date provided for February 2012 indicated a negative value for the amount billed this month. This was an apparent error in the information provided and thus was not used for this analysis.
Draft
2. PROJECT SCOPE
DRAFT FINAL DRINKING WATER AND WASTEWATER MASTER PLAN, ROTA, CNMI 2-65
Pressure Data The project team deployed Environmental Data Services (EDS) pressure loggers though the CUC water system. (Appendix F includes a manufacturer cut sheet for the type of pressure logger used for data collection.) A logger, deployed during the dry season, metered the HGL of the Ginanlangan tank. Pressure loggers were also deployed at two separate areas: one downstream of the Song Song Village and the other upstream of the Song Song Village.
Pressure loggers were not deployed in the Sinapalo village. The Ginanlangan tank is kept full to provide pressure to the areas immediately surrounding this tank. The HGL sees little fluctuation, so pressure data in this area would not provide useful information. Further discussion on the Sinapalo village hydraulics is provided in the model results section of this Master Plan. The data collected from the pressure loggers was used for model calibration.
Calibration The water demand and water production used in the models were based on existing meter data, cave production data, and pressure data.
Water Balance To run a meaningful extended period simulation (EPS), the continuity principle must be satisfied. Simply put, the continuity equation stated the following:
Change in storage = [Inflow – Outflow] X Time
While this relation appears simple, it is crucial in calibrating a water model. If too much inflow is provided, the model will yield erroneous pressure results. These errors may be not seen if the model is run for a short period of time (e.g., 1 or 2 days) as the storage within the system can mask the results. This can be seen with the Extended Period Simulation model results.
Balancing the system is an iterative process; it starts with the known inflow and demands. As stated earlier, 80 percent of the water on Rota is non‐revenue water. This makes accurately balancing the model a difficult task, as it is unknown where a majority of the water demand is being used. Additional demand was placed at agricultural areas and areas known to have older leaky pipes. Table 2.2.3‐3 presents the daily inflow and outflow used for Rota.
Table 2.2.3‐3. CUC Demand versus Model Inflow
Service Area CUC Average Production
Data (gpm) Average Daily Demand
(gpm) Percent Difference
Ginanlagan1 860 170 80%
Kaan2 ‐ ‐ ‐
Note: 1. A large amount of water is lost through the constant overflowing of the Ginanlangan tank. This loss is estimated to be at least 300 gpm. 2. Water consumed in this service area is supplied via the Ginanlangan tank. Demand and production were grouped into the Ginanlangan tank.
Once the model results indicate a smooth diurnal pattern and the amount of inflow and outflow are balanced with the data provided, the model is considered calibrated with respect to flow.
Draft

2. PROJECT SCOPE
2-66 DRAFT FINAL DRINKING WATER AND WASTEWATER MASTER PLAN, ROTA, CNMI
Pressure Balance A balanced model must be calibrated to real‐world pressure data. Once the field pressure data and model were within 5 percent of each other, the model was considered pressure balanced. Figure 2.2.3‐1 presents the pressure data downstream of the Kaan Tank, and Figure 2.2.3‐2 presents EPS model results from the same area. Figure 2.2.3‐3 presents the pressure data in the Song Song village, and Figure 2.2.3‐4 presents EPS model results from the same area.
Figure 2.2.3‐1. Pressure Logging Data Taken Immediately Downstream of Kaan Tank
Figure 2.2.3‐2. Model Results Immediately Downstream of the Kaan Tank
0102030405060708090
11/6/2012 8:55
11/6/2012 16:00
11/6/2012 23:05
12/6/2012 6:10
12/6/2012 13:15
12/6/2012 20:20
13/06/2012 03:25:00
13/06/2012 10:30:00
13/06/2012 17:35:00
14/06/2012 00:40:00
14/06/2012 07:45:00
14/06/2012 14:50:00
14/06/2012 21:55:00
15/06/2012 05:00:00
15/06/2012 12:05:00
15/06/2012 19:10:00
16/06/2012 02:15:00
16/06/2012 09:20:00
16/06/2012 16:25:00
16/06/2012 23:30:00
17/06/2012 06:35:00
17/06/2012 13:40:00
17/06/2012 20:45:00
18/06/2012 03:50:00
Pressure
Time
Draft

2. PROJECT SCOPE
DRAFT FINAL DRINKING WATER AND WASTEWATER MASTER PLAN, ROTA, CNMI 2-67
Figure 2.2.3‐3. Pressure Logging Data Taken in the Song Song Village
Figure 2.2.3‐4. Model Results from Song Song
Model Assumptions The following assumptions were made in the development of the water model:
The models were developed using CUC water system basemap and a review of CUC as‐builts.
The models were calibrated using 2011‐2012 cave production data and CUC customer meter data. It is assumed that the 2011‐2012 data is representative of “existing conditions” for Rota's water service area.
0102030405060708090100
18/06/2012 10:05:00
18/06/2012 13:10:00
18/06/2012 16:15:00
18/06/2012 19:20:00
18/06/2012 22:25:00
19/06/2012 01:30:00
19/06/2012 04:35:00
19/06/2012 07:40:00
19/06/2012 10:45:00
19/06/2012 13:50:00
19/06/2012 16:55:00
19/06/2012 20:00:00
19/06/2012 23:05:00
20/06/2012 02:10:00
20/06/2012 05:15:00
20/06/2012 08:20:00
20/06/2012 11:25:00
20/06/2012 14:30:00
20/06/2012 17:35:00
20/06/2012 20:40:00
20/06/2012 23:45:00
21/06/2012 02:50:00
21/06/2012 05:55:00
21/06/2012 09:00:00
Pressure
Time
Draft
2. PROJECT SCOPE
2-68 DRAFT FINAL DRINKING WATER AND WASTEWATER MASTER PLAN, ROTA, CNMI
The existing condition models are intended to be used for high‐level master planning purposes. The models are not intended to perform spot inspection at individual households. Each node in the model represents a cluster of demands; as such it does not reflect each and every CUC customer.
The model assumes that the metered water demand is distributed evenly throughout the TSA. This assumption may in some cases place a higher or lower demand in areas. Without pressure data, it is difficult to fine tune distribution of demand between water meters. It should also be stated that the metered flow only represents about 20 percent of the water produced.
The model’s default friction valves for PVC, DIP, and asbestos cement pipe were used. In reality, these values vary and can change over time, but were held constant at the default model values for the purpose of this conceptual level modeling effort. These values can be updated in the future if additional data collected by CUC indicate that other values would be more accurate for the water system analysis.
Water demand data was only available for 20 percent of the water system. The model was calibrated based on an approach where the system demand was forced to match the well production data. To meet this mass/flow balance requirement, water demands were inferred/estimated for nearly 80 percent of the system.
Data Gaps and Potential Sources of Error With any modeling effort, it is important to capture the data gaps and sources of potential error in the model so that the model accuracy can be improved upon over time and model results can be interpreted within the context of the quality of the input data. The following summarizes some of the data gaps and potential sources of error for the modeling effort:
As can be seen from Table 2.2.3‐2, the amount of non‐revenue water is extremely high, with an average of 83 percent non‐revenue water island‐wide.
This difference between produced water and metered water posed a challenge for hydraulic modeling. The project team distributed the metered demand within the tank service areas, but was still left with an additional 80 percent of water to distribute. The following assumptions were used to distribute the water demands in the hydraulic model:
Agricultural uses are not completely metered throughout Rota and some agriculture areas are billed based on a flat usage rate, making determining the agricultural demands challenging. Current aerial photographs were used to identify where agriculture use exists. An agricultural land use demand was applied to the model node closest to the identified agricultural areas. The actual water demands applied to the agricultural node were based on the size of the area of agricultural land use, engineering estimates of agricultural water demands, and the iterative process of balancing water demand and production.
Leakage through existing/aged infrastructure account for some fraction of the overall water loss. Additional “fake” demand nodes were placed at nodes in areas known to have aging water supply infrastructure to account for water loss via leakage.
Metering data are limited and there are errors in the flow meter data collection process as a result of frequent meter failure.
Draft

2. PROJECT SCOPE
DRAFT FINAL DRINKING WATER AND WASTEWATER MASTER PLAN, ROTA, CNMI 2-69
Existing Water System Model In any modeling undertaking, the static condition must first be understood to properly gage the existing water system. In reality, water systems are constantly changing based on demand and inflow. The static condition assumes that the demand and inflow is held constant for an instantaneous moment. This snapshot allows the modeler to evaluate hydraulic grades to see if they are consistent with measured and theoretical field conditions.
Existing Water System Model Extended Period Simulations Once the static condition is set, the modeler may begin to analyze the model under an EPS. Such a condition is critical for mass balance. The static analysis does not analyze the inflow verses outflow, which is critical in evaluating a water system. An EPS helps set the following:
• Mass balance between the inflow and outflow is essential for model calibration. As discussed earlier, approximately 80 percent of water in Rota is non‐revenue water. If non‐revenue water is not considered in the model, then actual head losses and water balance will not be correct. Further discussion on this is provided under model calibration.
• It is not possible to fully calibrate a water model unless there is some change in condition. For the purposes of this analysis the project team used pressure as the variable. The change in system pressure resulting from demand was used to calibrate the model. Field data from the pressure data loggers were used for this purpose.
Diurnal Patterns To run an EPS, diurnal patterns are needed. Typical diurnal patterns for residential uses have two peaks: one in the morning and one around 6 p.m. To generate a residential diurnal demand pattern for the model, the project team used the approach developed for the Saipan Master Plan. Wastewater flow leading to Saipan’s Tottotville sewer pump station was measured over one week and the daily trend was extracted. It was assumed the wastewater diurnal curve tracked closely with residential water demand. Tottotville was chosen as it is on 24‐hour water service and is a relatively newer subdivision with majority residential use. Figure 2.2.3‐5 presents the Tottotville residential diurnal patter developed.
Figure 2.2.3‐5. Residential Diurnal Pattern
0
0.5
1
1.5
2
0 1 2 3 4 5 6 7 8 9 10 11 12 13 14 15 16 17 18 19 20 21 22 23 24
Hours
Draft

2. PROJECT SCOPE
2-70 DRAFT FINAL DRINKING WATER AND WASTEWATER MASTER PLAN, ROTA, CNMI
This pattern was applied to all residential uses within Rota. Other diurnal patters include the following:
• Commercial and government patterns assumed demand during working hours with peaks occurring at noon. Low to no flow was assumed during the early morning hours.
Fixed (continuous flow) demand patterns were used for areas suspected of having heavy water loss through leaks and agricultural use.
Future Distribution Model Extended Period Simulations The model results shown below are for the distribution system, i.e., the distribution water lines serving CUC customers. The distribution system includes the two water tanks.
Correction of the constant overflow of water from the Ginanlangan results in a 300 to 400 gpm reduction in demand. This reduction may be considered a reserve and be allocated for future needs.
The model demands used in the EPS model runs reflect a maximum water production of 1.2 MGD. This production is larger than the 2030 water demand projections and therefore representative of future distribution and transmission system conditions.
Results Distribution System The following sections provide important findings based on the existing model analysis. A copy of the profile generated through the existing model can be found in Appendix G. All models were run for 5 days. The results shown below represent a snapshot in time where a notable observation was made. The profiles shown include the ground elevation and HGL at various distances along the profile.
Flow from Ginanlangan to Kaan The profile in Figure 2.2.3‐6 indicates that water is flowing from the Ginanlangan to the Kaan tank. The Kaan tank is not online in this profile. The HGL is set by the Ginanlangan tank. The profile indicates the HGL is adjusted from the two PRVs. What is not presented in the profile is the operation adjustment performed immediately upstream of the first (higher grade) PRV. Operations must manually choke a valve upstream of this PRV to avoid cavitations at the Sinapalo pump station. A pressure‐sustaining valve (PSV) was placed into the model to simulate the choked valve.
Figure 2.2.3‐6. Model Output of HGL from Ginanlagan to Kaan Tank
Draft
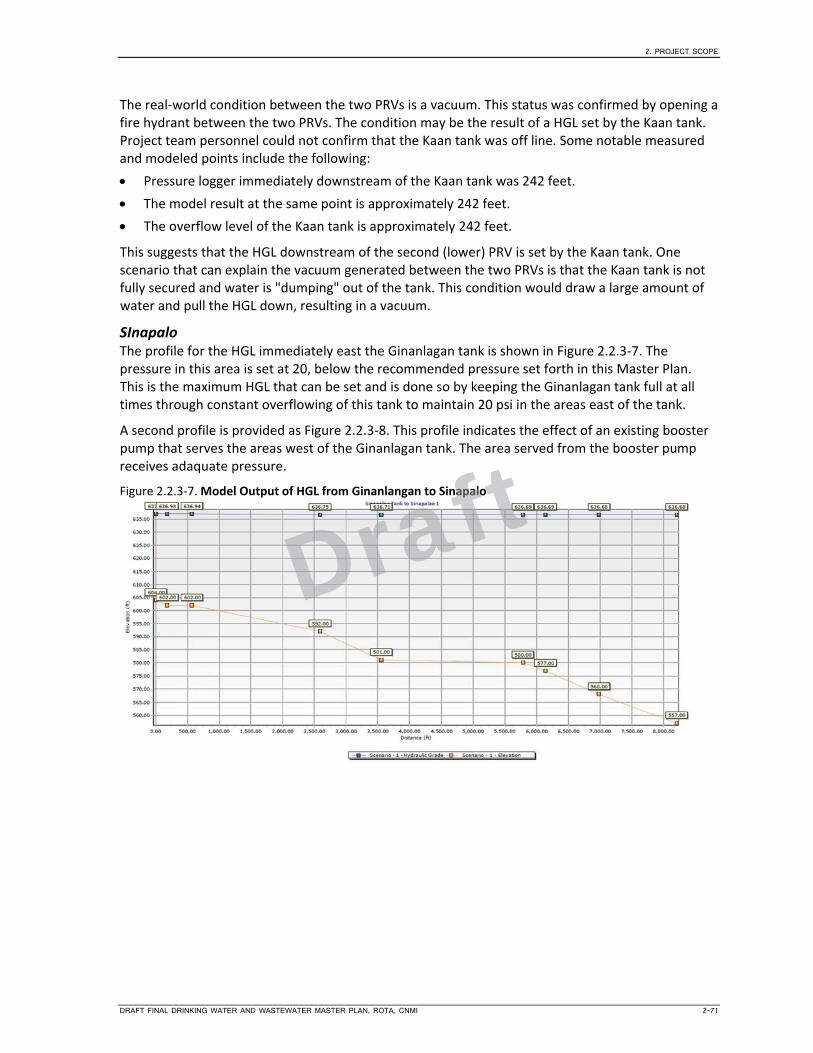
2. PROJECT SCOPE
DRAFT FINAL DRINKING WATER AND WASTEWATER MASTER PLAN, ROTA, CNMI 2-71
The real‐world condition between the two PRVs is a vacuum. This status was confirmed by opening a fire hydrant between the two PRVs. The condition may be the result of a HGL set by the Kaan tank. Project team personnel could not confirm that the Kaan tank was off line. Some notable measured and modeled points include the following:
Pressure logger immediately downstream of the Kaan tank was 242 feet.
The model result at the same point is approximately 242 feet.
The overflow level of the Kaan tank is approximately 242 feet.
This suggests that the HGL downstream of the second (lower) PRV is set by the Kaan tank. One scenario that can explain the vacuum generated between the two PRVs is that the Kaan tank is not fully secured and water is "dumping" out of the tank. This condition would draw a large amount of water and pull the HGL down, resulting in a vacuum.
SInapalo The profile for the HGL immediately east the Ginanlagan tank is shown in Figure 2.2.3‐7. The pressure in this area is set at 20, below the recommended pressure set forth in this Master Plan. This is the maximum HGL that can be set and is done so by keeping the Ginanlagan tank full at all times through constant overflowing of this tank to maintain 20 psi in the areas east of the tank.
A second profile is provided as Figure 2.2.3‐8. This profile indicates the effect of an existing booster pump that serves the areas west of the Ginanlagan tank. The area served from the booster pump receives adaquate pressure.
Figure 2.2.3‐7. Model Output of HGL from Ginanlangan to Sinapalo
Draft

2. PROJECT SCOPE
2-72 DRAFT FINAL DRINKING WATER AND WASTEWATER MASTER PLAN, ROTA, CNMI
Figure 2.2.3‐8. Model Output of HGL from Ginanlangan to Sinapalo II and III
Recommendations Flow from Ginanlangan to Kaan A short‐term correction to vacuum and pump cavitations is to install a pressure‐reducing/sustaining valve (PRSV) at the existing upper PRV. A future solution for this problem is to remove the Kaan Tank from the CUC water system and allow the Ginanlangan Tank to serve the entire island as is it presumably does so during the dry seasons. Model results indicate that the Ginanlangan tank can adequately serve the entire island of Rota.
Sinapalo The current system is operating just below the criteria setpoint established for pressure. Below are the suggested upgrades to the Ginanlangan tank and Sinapalo service area:
Repair the altitude valve at the Ginanlangan Tank.
Relocate and upgrade the booster pump and increase its service area to include the areas east of the Ginanlagan Tank.
Storage Analysis The graphs in this section present the hydraulic grades, inflow, and outflow from the storage tanks used in the water distribution system. The results shown are for 5‐day runs. In some cases, it took 24 hours for the model to balance due to the initial elevation condition of the tank. Discussion on the operating condition of each tank is also provided. Refer to the 20‐year flow projections for information on future tank sizing.
Ginanlangan Tank The HGL of the Ginanlangan tank tops off at 637 (see Figure 2.2.3‐9). The finished grade of this tank is 604. The observed condition in the field is shown in the photograph of the overflow (Figure 2.2.3‐10).
Draft

2. PROJECT SCOPE
DRAFT FINAL DRINKING WATER AND WASTEWATER MASTER PLAN, ROTA, CNMI 2-73
Figure 2.2.3‐9. Ginanlangan Tank Hydraulic Grade and Inflow/Outflow
Figure 2.2.3‐10. Photo of the Ginanlangan Tank
Draft
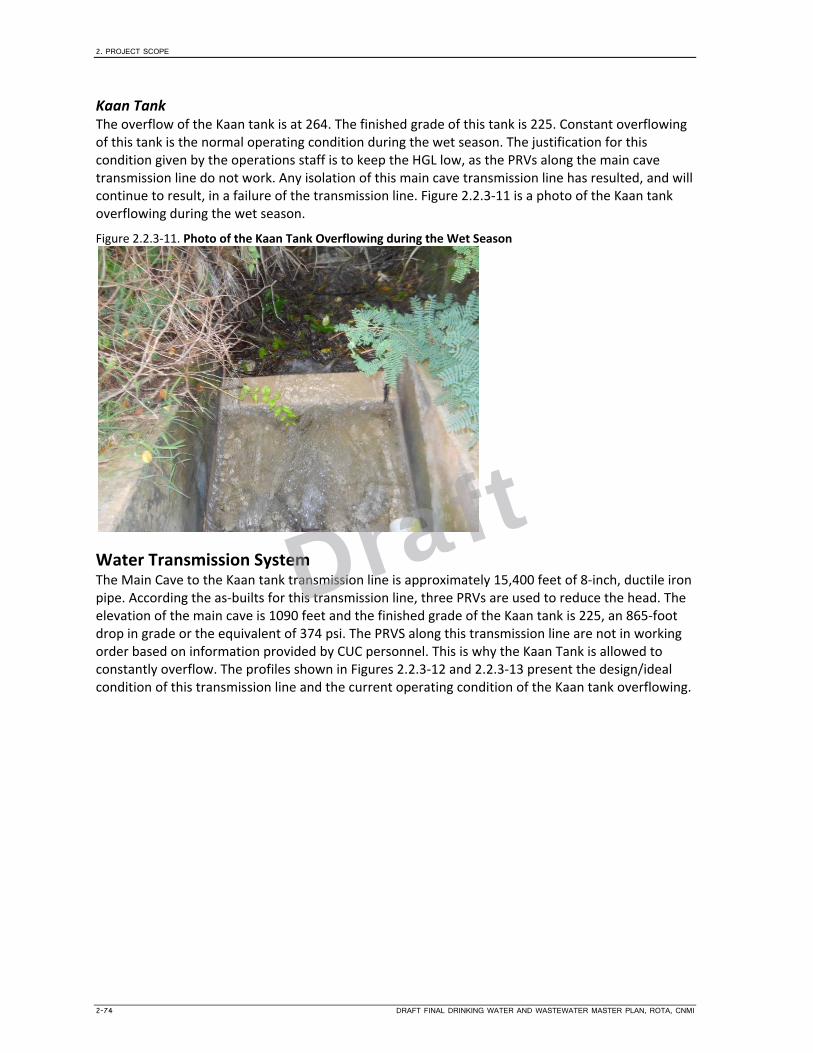
2. PROJECT SCOPE
2-74 DRAFT FINAL DRINKING WATER AND WASTEWATER MASTER PLAN, ROTA, CNMI
Kaan Tank The overflow of the Kaan tank is at 264. The finished grade of this tank is 225. Constant overflowing of this tank is the normal operating condition during the wet season. The justification for this condition given by the operations staff is to keep the HGL low, as the PRVs along the main cave transmission line do not work. Any isolation of this main cave transmission line has resulted, and will continue to result, in a failure of the transmission line. Figure 2.2.3‐11 is a photo of the Kaan tank overflowing during the wet season.
Figure 2.2.3‐11. Photo of the Kaan Tank Overflowing during the Wet Season
Water Transmission System The Main Cave to the Kaan tank transmission line is approximately 15,400 feet of 8‐inch, ductile iron pipe. According the as‐builts for this transmission line, three PRVs are used to reduce the head. The elevation of the main cave is 1090 feet and the finished grade of the Kaan tank is 225, an 865‐foot drop in grade or the equivalent of 374 psi. The PRVS along this transmission line are not in working order based on information provided by CUC personnel. This is why the Kaan Tank is allowed to constantly overflow. The profiles shown in Figures 2.2.3‐12 and 2.2.3‐13 present the design/ideal condition of this transmission line and the current operating condition of the Kaan tank overflowing.
Draft
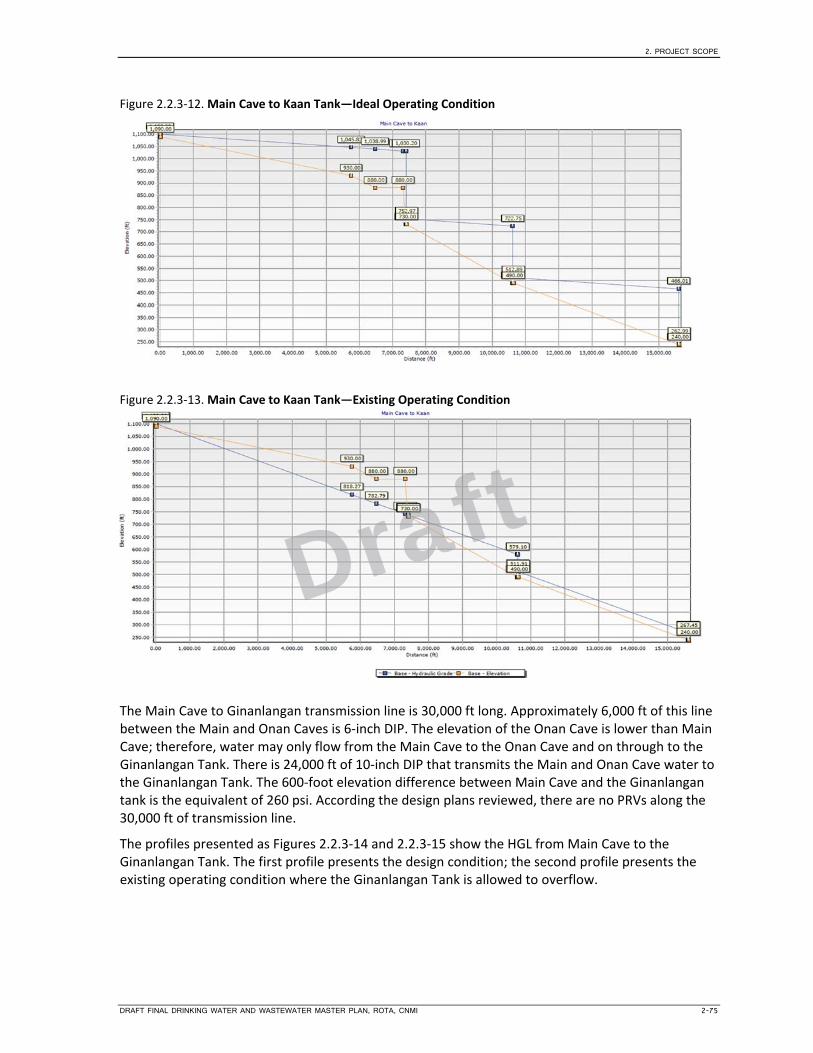
2. PROJECT SCOPE
DRAFT FINAL DRINKING WATER AND WASTEWATER MASTER PLAN, ROTA, CNMI 2-75
Figure 2.2.3‐12. Main Cave to Kaan Tank—Ideal Operating Condition
Figure 2.2.3‐13. Main Cave to Kaan Tank—Existing Operating Condition
The Main Cave to Ginanlangan transmission line is 30,000 ft long. Approximately 6,000 ft of this line between the Main and Onan Caves is 6‐inch DIP. The elevation of the Onan Cave is lower than Main Cave; therefore, water may only flow from the Main Cave to the Onan Cave and on through to the Ginanlangan Tank. There is 24,000 ft of 10‐inch DIP that transmits the Main and Onan Cave water to the Ginanlangan Tank. The 600‐foot elevation difference between Main Cave and the Ginanlangan tank is the equivalent of 260 psi. According the design plans reviewed, there are no PRVs along the 30,000 ft of transmission line.
The profiles presented as Figures 2.2.3‐14 and 2.2.3‐15 show the HGL from Main Cave to the Ginanlangan Tank. The first profile presents the design condition; the second profile presents the existing operating condition where the Ginanlangan Tank is allowed to overflow.
Draft

2. PROJECT SCOPE
2-76 DRAFT FINAL DRINKING WATER AND WASTEWATER MASTER PLAN, ROTA, CNMI
Figure 2.2.3‐14. Main Cave to Ginanlangan—Ideal Operating Condition
Figure 2.2.3‐15. Main Cave to Ginanlangan—Existing Operating Condition
Recommendations Main Cave to Kaan Tank
Repairing or replacing the PRVs along the Main Cave to Kaan Tank transmission line and repairing/replacing the altitude valve at the Kaan tank will restore this transmission and tank operating to its initial design state, correcting the overflow.
The existing condition profile reflects a negative pressure from stations 10+00 to 70+00. This can be the case if the Kaan tank is allowed to overflow. This is a modeled condition and must be verified in the field. It is recommended that CUC personnel inspect between these stations to confirm of a vacuum is present. If a vacuum is present, then modification to the operating condition, such as using the Ginanlangan Tank to serve all of Rota, should be done.
It is worthwhile to reiterate that the entire island of Rota may be served from the Ginanlangan tank. If this is the standard operating condition, then the Kaan tank and supply line are no longer needed.
Draft

2. PROJECT SCOPE
DRAFT FINAL DRINKING WATER AND WASTEWATER MASTER PLAN, ROTA, CNMI 2-77
Main Cave to Ginanlangan Tank
Based on the existing condition profile of the Main Cave to Ginanlangan Tank transmission line, there is negative pressure from stations 50+00 to 70+00. This is also the location where CUC Operations have installed the chlorination system. This chlorination system relies on the pressure differential between a gate valve to activate the chlorinator. This modeled condition must be verified in the field. It is recommended that CUC personnel inspect between these stations to confirm a vacuum is present; if so, a modification to operations should be done. This modification may be to repair the existing altitude valve supplying the tank. The recommended correction to this is to relocate and upgrade the Sinapalo pump station so that it can serve the larger Sinapalo area, allowing allow the Ginanlangan tank level to fluctuate with the daily demand.
Booster Pump Station The Sinapalo water booster pump station is used to boost the pressure in the area west of the Ginanlangan tank, also known as Sinapalo II and III. No information was provided on this pump station. The modeled condition for this pump station was 30 gpm at 168 feet, which is the equivalent of a 5 hp motor.
Recommendations It is recommended that this pump station be upgraded in the interim. This pump station should be equipped with two pumps each sized to handle the full peak demand estimated at 200 gpm at 175 ft. This design point will need to be verified by the engineer of record. It is also recommended that the pump station be equipped with a variable frequency drive (VFD) to maintain a constant pressure head to the customers.
Coordination with DEQ and U.S. Fish and Wildlife Service personnel uncovered concerns with the cave transmission lines. The transmission line between the Main and Onan Caves was of particular concern. This existing transmission line runs through sensitive habitats and is difficult to maintain. An upgrade to this line would also require extensive earthwork within environmentally sensitive areas. In addition to this restriction, the transmission line between the Onan Cave and the Ginanlangan Tank runs through private property. The following alternatives were discussed by the project team, CUC engineering, DEQ, and Fish and Wildlife:
Repair and upgrade of the existing transmission lines between the caves and the Ginanlangan Tank.
Reroute the Main Cave transmission line to a new water tank and abandon the transmission line between the caves and the Ginanlangan tank.
Due to environmental permit restrictions, alternative 2 was selected. This alternative will require significant modification to the way in which the Main Cave water is transmitted throughout the island. This alternative is best implemented in the following phases:
Phase I: New Ginanlangan tank
Phase II: New Haofna tank (to replace the Kaan tank)
Phase III: New pump station
Figure 2.2.3‐16 presents the new hydraulic profile between the Haofna tank and the new booster pump station.
Draft

2. PROJECT SCOPE
2-78 DRAFT FINAL DRINKING WATER AND WASTEWATER MASTER PLAN, ROTA, CNMI
Figure 2.2.3‐16. Hydraulic Profile between the New Haofna Tank and the New Booster Pump Station
The following sections outline the requirements for this revision and suggested implementation phases.
Phase I Relocate the 0.5‐MG Ginanlangan tank to a higher area located along the access road to Mount Sabana. This new Ginanlangan tank location will be labeled as Ginalangan‐2. The suggested location is at elevation 685, approximately 80 feet higher than the current tank location. Approximately 900 feet of 12‐inch water line will be needed to connect the Ginalangan‐2 Tank to the existing distribution system. An additional 500 feet of 8‐inch water line will be needed to extend the Onan Cave transmission line to the existing distribution system. The existing hydraulic grade from the Onan cave is adequate to gravity feed the new Ginalangan‐2 Tank. The existing water well transmission lines will need to be tied into this new transmission line as well. Two new PRVs will be needed along the distribution lines leading to the airport and the bird sanctuary areas.
The logistics to acquire the right of way for the Phase II improvement should begin during Phase I.
The existing Ginanlangan tank and Sinapalo pump station may be decommissioned once the new tank, waterlines, and PRVs are in place. The new tank location will provide improved pressure for the Sinapalo village. This new tank will also set the permanent hydraulic grade for this area.
Phase II Install a new 1.0 MG tank in the Haofna area. This tank will be designated as Haofna Tank and replace the existing Kaan Tank. The Haofna Tank will serve as the primary water storage tank for the ultimate water system configuration. This phase will require 7,500 feet of new 6‐inch transmission line between Main Cave and the Haofna Tank. Approximately 4,400 feet of new 8‐inch distribution piping and one new PRV will be needed to connect the Haofna Tank to the existing water distribution system. In addition, power supply to the Haofna water tank site will be needed to support a new chlorination system and SCADA control.
Once the Haofna Tank and water lines are constructed, the existing Kaan tank may be demolished, and the transmission line between the Main Cave and Kaan Tank can be abandoned.
Draft
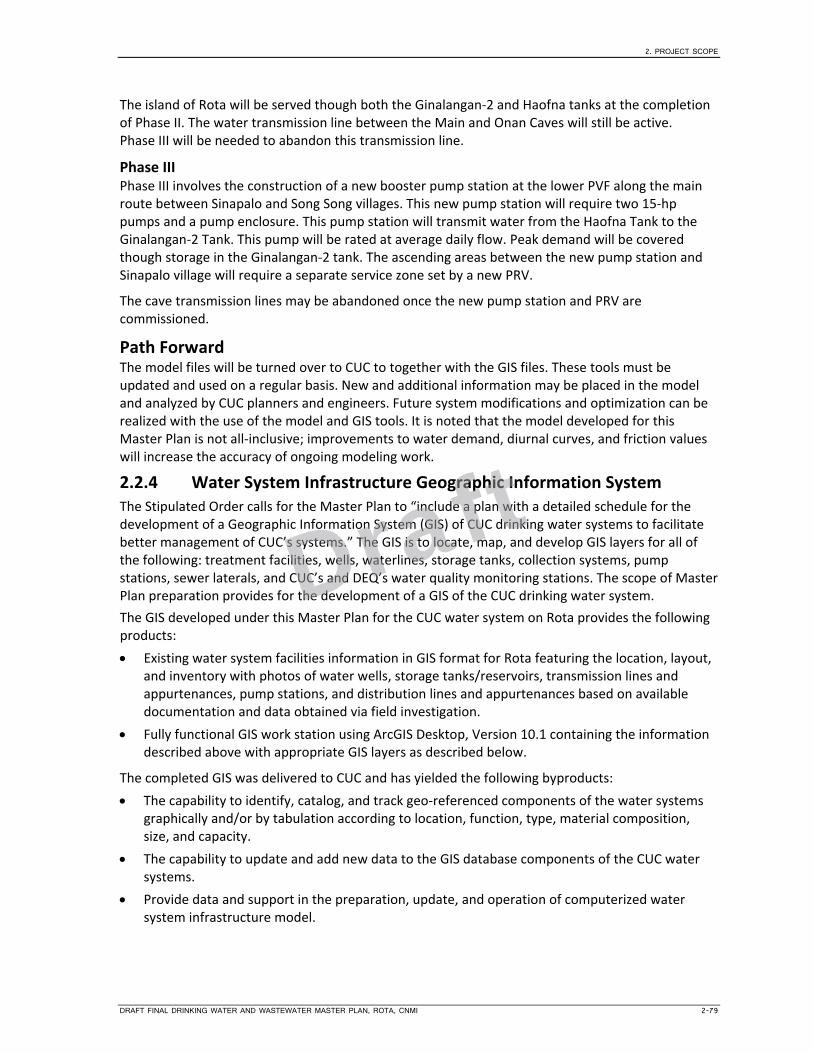
2. PROJECT SCOPE
DRAFT FINAL DRINKING WATER AND WASTEWATER MASTER PLAN, ROTA, CNMI 2-79
The island of Rota will be served though both the Ginalangan‐2 and Haofna tanks at the completion of Phase II. The water transmission line between the Main and Onan Caves will still be active. Phase III will be needed to abandon this transmission line.
Phase III Phase III involves the construction of a new booster pump station at the lower PVF along the main route between Sinapalo and Song Song villages. This new pump station will require two 15‐hp pumps and a pump enclosure. This pump station will transmit water from the Haofna Tank to the Ginalangan‐2 Tank. This pump will be rated at average daily flow. Peak demand will be covered though storage in the Ginalangan‐2 tank. The ascending areas between the new pump station and Sinapalo village will require a separate service zone set by a new PRV.
The cave transmission lines may be abandoned once the new pump station and PRV are commissioned.
Path Forward The model files will be turned over to CUC to together with the GIS files. These tools must be updated and used on a regular basis. New and additional information may be placed in the model and analyzed by CUC planners and engineers. Future system modifications and optimization can be realized with the use of the model and GIS tools. It is noted that the model developed for this Master Plan is not all‐inclusive; improvements to water demand, diurnal curves, and friction values will increase the accuracy of ongoing modeling work.
2.2.4 Water System Infrastructure Geographic Information System The Stipulated Order calls for the Master Plan to “include a plan with a detailed schedule for the development of a Geographic Information System (GIS) of CUC drinking water systems to facilitate better management of CUC’s systems.” The GIS is to locate, map, and develop GIS layers for all of the following: treatment facilities, wells, waterlines, storage tanks, collection systems, pump stations, sewer laterals, and CUC’s and DEQ’s water quality monitoring stations. The scope of Master Plan preparation provides for the development of a GIS of the CUC drinking water system.
The GIS developed under this Master Plan for the CUC water system on Rota provides the following products:
Existing water system facilities information in GIS format for Rota featuring the location, layout, and inventory with photos of water wells, storage tanks/reservoirs, transmission lines and appurtenances, pump stations, and distribution lines and appurtenances based on available documentation and data obtained via field investigation.
Fully functional GIS work station using ArcGIS Desktop, Version 10.1 containing the information described above with appropriate GIS layers as described below.
The completed GIS was delivered to CUC and has yielded the following byproducts:
The capability to identify, catalog, and track geo‐referenced components of the water systems graphically and/or by tabulation according to location, function, type, material composition, size, and capacity.
The capability to update and add new data to the GIS database components of the CUC water systems.
Provide data and support in the preparation, update, and operation of computerized water system infrastructure model.
Draft
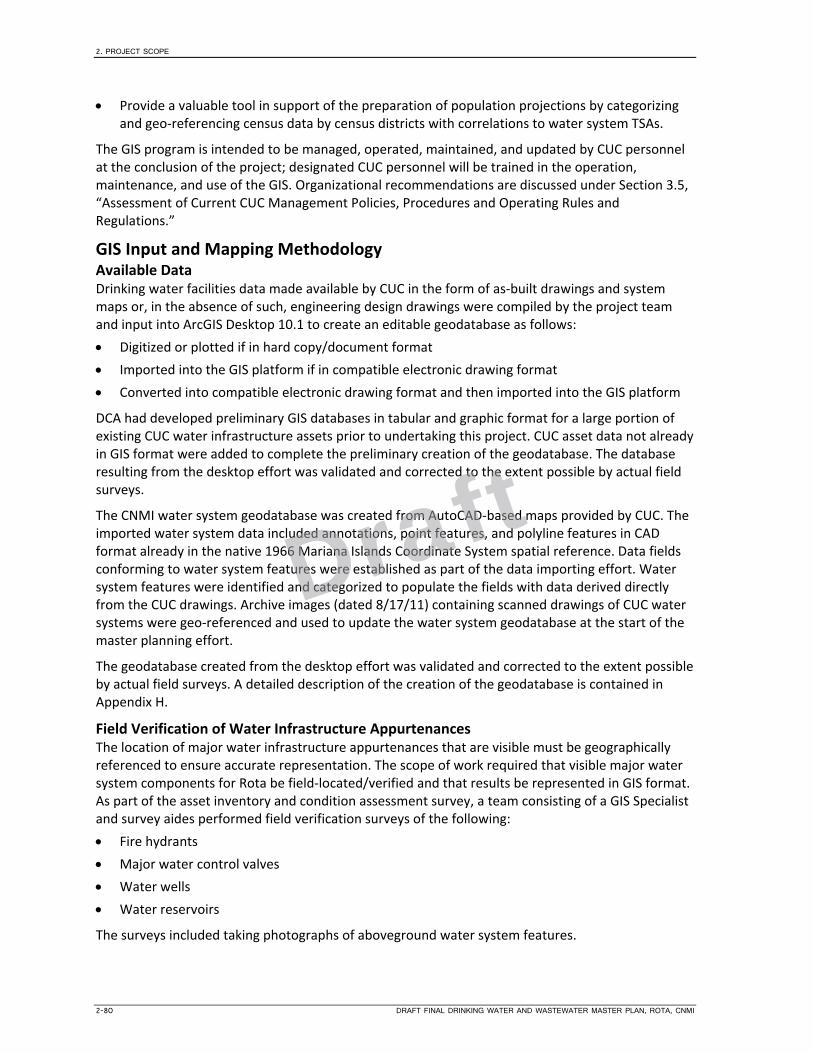
2. PROJECT SCOPE
2-80 DRAFT FINAL DRINKING WATER AND WASTEWATER MASTER PLAN, ROTA, CNMI
Provide a valuable tool in support of the preparation of population projections by categorizing and geo‐referencing census data by census districts with correlations to water system TSAs.
The GIS program is intended to be managed, operated, maintained, and updated by CUC personnel at the conclusion of the project; designated CUC personnel will be trained in the operation, maintenance, and use of the GIS. Organizational recommendations are discussed under Section 3.5, “Assessment of Current CUC Management Policies, Procedures and Operating Rules and Regulations.”
GIS Input and Mapping Methodology Available Data Drinking water facilities data made available by CUC in the form of as‐built drawings and system maps or, in the absence of such, engineering design drawings were compiled by the project team and input into ArcGIS Desktop 10.1 to create an editable geodatabase as follows:
Digitized or plotted if in hard copy/document format
Imported into the GIS platform if in compatible electronic drawing format
Converted into compatible electronic drawing format and then imported into the GIS platform
DCA had developed preliminary GIS databases in tabular and graphic format for a large portion of existing CUC water infrastructure assets prior to undertaking this project. CUC asset data not already in GIS format were added to complete the preliminary creation of the geodatabase. The database resulting from the desktop effort was validated and corrected to the extent possible by actual field surveys.
The CNMI water system geodatabase was created from AutoCAD‐based maps provided by CUC. The imported water system data included annotations, point features, and polyline features in CAD format already in the native 1966 Mariana Islands Coordinate System spatial reference. Data fields conforming to water system features were established as part of the data importing effort. Water system features were identified and categorized to populate the fields with data derived directly from the CUC drawings. Archive images (dated 8/17/11) containing scanned drawings of CUC water systems were geo‐referenced and used to update the water system geodatabase at the start of the master planning effort.
The geodatabase created from the desktop effort was validated and corrected to the extent possible by actual field surveys. A detailed description of the creation of the geodatabase is contained in Appendix H.
Field Verification of Water Infrastructure Appurtenances The location of major water infrastructure appurtenances that are visible must be geographically referenced to ensure accurate representation. The scope of work required that visible major water system components for Rota be field‐located/verified and that results be represented in GIS format. As part of the asset inventory and condition assessment survey, a team consisting of a GIS Specialist and survey aides performed field verification surveys of the following:
Fire hydrants
Major water control valves
Water wells
Water reservoirs
The surveys included taking photographs of aboveground water system features.
Draft

2. PROJECT SCOPE
DRAFT FINAL DRINKING WATER AND WASTEWATER MASTER PLAN, ROTA, CNMI 2-81
Field Survey Equipment Field surveys were conducted using the Ashtech MobileMapper 100, a handheld global positioning system (GPS) survey and mapping device designed for GIS data collection and mapping. This GPS device has real‐time submeter (decimeter/centimeter) accuracy when operated in conjunction with companion data collection and post‐processing software and within 200 kilometers of National Geodetic Survey Continuously Operating Reference Stations (CORS), of which there are two on Saipan and three on Guam. The GPS survey equipment included a camera that enabled the operator to capture a photo of the asset along with a geo‐referenced reading of its location. (See Appendix I for a description of the GPS equipment used in the field surveys.)
Field Surveys GPS surveys of the CUC Rota water system were conducted from February 15 to February 18, 2012.
Concurrent Asset Inventory The GPS field surveys were integrated with the asset inventory data gathering task of the master planning effort, which included recording the asset description, size, capacity, and condition.
GIS Mapping Process The CUC water system assets were mapped using the most recent available rectified aerial maps for the base background. Base map source descriptions are provided in Appendix J. CUC drinking water system asset data imported from documents and contained in the geodatabase were either validated by or revised to coincide with GPS field survey results.
GIS Geodatabase Construct The GIS geodatabase is categorized by asset feature class, each of which is supported by data fields providing information about the asset. Table 2.2.4‐1 describes the specific features of the CUC drinking water system components contained in the geodatabase. Appendix K contains the Asset Feature Class descriptions and data fields for drinking water system assets. See Appendix L for a sample database of selected water system components.
Rota Water System Infrastructure The GIS geodatabase development and mapping of the CUC water system assets for Rota has been completed and delivered to CUC The following figures are sample plots of GIS‐based water system map and are presented at the end of this section:
Figure 2.2.4‐1 is a GIS‐based map of critical components of the CUC system in Rota.
Figure 2.2.4‐2 is a file of photo inserts of selected water system components.
Figure 2.2.4‐3 is a GIS‐based map of the Rota water system with Water Service District overlays.
Table 2.2.4‐1. Geodatabase Asset Feature Class Categories
CUC Drinking Water System Features Used
Abandoned Water Lines
Abandoned Appurtenances (Points)
Water Casings (waterline encasements)
Water Line Construction (Improvements)
Water Network Control Valves
Water Service (Connection) Valves
Draft

2. PROJECT SCOPE
2-82 DRAFT FINAL DRINKING WATER AND WASTEWATER MASTER PLAN, ROTA, CNMI
Table 2.2.4‐1. Geodatabase Asset Feature Class Categories
CUC Drinking Water System Features Used
Water (Asset) Elevation
Water Fittings
Water (Fire) Hydrants
Water (Service) Laterals
Water (Distribution) Mains
Water Network Structures (treatment plants, etc.)
Water Operational Areas (Ops area boundaries)
Water Pressure Zones
Water Pumps
Water Sampling Stations
Water Service Connections (e.g., meter locations)
Water System Valves (non‐pressure valves)
Water DEQ Test Stations
Water Well Points
Water Point Sources
Denotes Asset Feature Class categories populated with data
GIS Use and Operation The development of the GIS program for the CUC Rota water is complete and is currently being used to support other master planning tasks. The GIS system is now functional as follows:
The GIS will identify, catalog, and track geo‐referenced components of the existing water system(s) for, Rota graphically and/or by tabulation according to location, function, type, material composition, size, and capacity.
The GIS database with additional and new data on components of the CUC Rota water infrastructure system. Asset feature classes have been created for future use as noted in Table 2.2.4‐1.
The GIS will provide supporting data for the setup and operation of the computerized water and wastewater system infrastructure models.
The turnover of the complete, final GIS workstation and training were conducted in December 2012. The fully functional GIS work station consists of computer hardware, ArcGIS software (and license) and the completed geodatabase files.
Draft

2. PROJECT SCOPE
DRAFT FINAL DRINKING WATER AND WASTEWATER MASTER PLAN, ROTA, CNMI 2-83
Figure 2.2.4‐1. Critical Components of the Rota Water System
Draft

2. PROJECT SCOPE
2-84 DRAFT FINAL DRINKING WATER AND WASTEWATER MASTER PLAN, ROTA, CNMI
Figure 2.2.4‐2. Photographs of Selected Water System Components (Fire Hydrants)
Draft

2. PROJECT SCOPE
DRAFT FINAL DRINKING WATER AND WASTEWATER MASTER PLAN, ROTA, CNMI 2-85
Figure 2.2.4‐3. Map of Rota Water
Draft

2. PROJECT SCOPE
2-86 DRAFT FINAL DRINKING WATER AND WASTEWATER MASTER PLAN, ROTA, CNMI
Land Ownership Section 8194, “Title to Property; Easement Rights of the Commonwealth Code” (CNMI Law Revision Commission) provides for the conveyance or real property to CUC and grants CUC the right of perpetual access to and use of all easements on Public Lands within which CUC assets/facilities are located, except for lands owned by the Commonwealth Port Authority. The law further provides that the Department of Public Lands (DPL) shall grant, as a ministerial act without further consideration, such titles to CUC within 28 days of a demand by the Corporation. Such a grant may be made subject to survey, the cost of which shall be borne by DPL.
The project team recommends that easements, right‐of‐way corridors, and real estate (land parcels) on public lands containing CUC water system assets be surveyed, mapped, and CUC ownership documented by title or written declaration. The GIS program developed for CUC under this Master Plan contains all the information in geo‐referenced layers necessary to determine the real estate requirements for each CUC water system asset. The project team also recommends include that CUC undertake the following process for documenting its real property interests utilizing the GIS program where appropriate:
1. Meet with DPL to discuss CUC’s real estate ownership goals, intention to seek titles to real properties containing CUC water system assets, and the process to achieve these requirements.
2. Establish a prioritized list of CUC water system assets for Rota that need real estate ownership documentation, keeping DPL in the information loop.
3. Determine the general real estate requirements for each prioritized asset, such as parcel size and easement/right of way width.
4. Using the GIS program/database, generate a conceptual layout of the real estate requirements of each water system asset (in order of priority for documentation).
5. Submit partial requests (demands) to DPL for survey, mapping, and grant of title to the real property or declaration of easement/right of way containing each CUC water system asset. CUC requests should be made in manageable increments in consultation with DPL and in the predetermined order of priority for real property ownership documentation.
6. Provide for the orderly filing of real property information at CUC and for the input and maintenance of the real estate information in the GIS program database.
The process of establishing real property ownership by CUC can then be followed by valuation of CUC’s real property assets with this information subsequently reflected in future CUC financial statements.
2.2.5 Asset Risk Assessment This section presents the results of the asset risk assessment performed by the project team and CUC on the Rota water system. The analysis of risk assessment results helped to form the basis of the recommendations for the CIP projects. This risk assessment activity was performed in a workshop setting with CUC staff. Risk assessment for water and wastewater assets for all three islands (Saipan, Rota, and Tinian) were performed during these workshops, as such reference to both water and wastewater risk assessment processes and all three islands are mentioned in this section of the report. The detailed results from the Saipan water system, Saipan wastewater system, and Tinian water system can be found in their respective Master Plans that have been developed by the project team.
Asset risk assessment is part of a greater asset management approach. Asset management concepts are presented below to provide context for the activities of the project team.
Draft

2. PROJECT SCOPE
DRAFT FINAL DRINKING WATER AND WASTEWATER MASTER PLAN, ROTA, CNMI 2-87
Asset Management Asset management is defined as “an integrated set of processes to minimize the lifecycle costs of infrastructure assets, at an acceptable level of risk, while continuously delivering established levels of service”(AMWA, 2007). It is composed of four key elements:
• Integrating Processes. The integration of processes is a continuous business practice that includes investigation, assessment, evaluation, prioritization, and decision‐making about utility infrastructure maintenance, operation, and development to meet the stated levels of service of the utility in an economically responsible manner.
• Minimizing Lifecycle Costs. Lifecycle costs consist of planning, design, capital, operations and maintenance (O&M), and salvage costs. Asset management focuses on identifying risk so that costs can be minimized while maintaining the desired levels of service.
• Establishing Levels of Service. Levels of service provide a utility with established metrics for judging performance and progress. Levels of service categories encompass measures for regulatory compliance, system reliability, fiscal impacts, and workplace and environmental safety.
• Identifying an Acceptable Level of Risk. Acceptable risk levels must be defined based on the condition of existing infrastructure, the likelihood of infrastructure failure, and the consequence associated with infrastructure failure. Risk is managed by understanding the risks that exist for a utility, how risk affects levels of service, and the cost to mitigate risk.
Asset management is a rigorous and defensible decision‐making process that results in better managed risk, improved public confidence, improved internal utility coordination and communication, effective information and knowledge transfer and retention, and improved regulatory compliance (AMWA, 2007). Table 2.2.5‐1 provides key concepts for effective asset management.
Table 2.2.5‐1. Key Concepts of Asset ManagementAdapted from AMWA, 2007
Knowledge of: Mission of the utility and its levels of service
Assets and their characteristics
Physical condition of assets
Performance of assets
Ability to: Optimize O&M activities
Assess risk
Identify and evaluate risk mitigation options
Prioritize options within available budget
Predict future demands
Effectively manage information and employ decision support tools
The activities employed to arrive at the results of this asset risk assessment used many of the concepts detailed in Table 2.2.5‐1.
Draft

2. PROJECT SCOPE
2-88 DRAFT FINAL DRINKING WATER AND WASTEWATER MASTER PLAN, ROTA, CNMI
Asset Management Strategy Asset management can be implemented using either of two approaches: “bottom‐up” or “top‐down.” Both focus on assessing risks, where risks are associated with not meeting established levels of service and then identifying mitigation measures to reduce the identified risks. Explanations of asset management approaches and concepts were presented at each of the asset assessment workshops and included as Appendix M.
The bottom‐up approach focuses first on collecting detailed data to analyze utility assets. The data collected include detailed characteristics of assets (e.g., age, material, manufacturer, size, and capacity), field condition assessments, estimation of remaining useful life, determination of asset replacement costs, and other detailed information. The project team performed a survey of representative utility assets to build a baseline condition assessment database. Critical assets, such as water tanks, were surveyed in their entirety. During workshops, this baseline proved useful by providing a comparison profile for similar assets with no assessment history. The project team used the following sources of information to build the complete list of assets: condition assessments of tanks, booster pump stations, and chlorination facilities; GIS; hydraulic model; and information gathered during CUC workshops and meetings.
The top‐down approach focuses on analysis first at a system or facility level where institutional knowledge and existing data are readily available. This differs from the bottom‐up approach that focuses on detailed data collection. The project team used both approaches for the water and wastewater risk assessment by using the information for the detailed assets field assessments and leveraging institutional knowledge from CUC staff to complete the risk analysis process. Figure 2.2.5‐1 provides a high‐level overview of the top‐down, bottom‐up interaction.
Figure 2.2.5‐1. Combining the Top‐Down and Bottom‐Up Asset Management Approaches Source: AMWA 2007
Refine projections with additional data
Focus on assets with highest risk
Top-DownFacility Level
1. Use known data and existing knowledge
2. Assess consequence & likelihood of failure to determine risk
3. Identify gaps and priority needs
Bottom-Up
Element Level3. Populate asset
register2. Perform condition
and performance assessments
1. Collect detailed asset information
Refine capital planning and O&M activities
Refine capital planning and O&M activities
Refine projections with additional dataRefine projections with additional data
Focus on assets with highest riskFocus on assets with highest risk
Top-DownFacility Level
1. Use known data and existing knowledge
2. Assess consequence & likelihood of failure to determine risk
3. Identify gaps and priority needs
Top-DownFacility Level
1. Use known data and existing knowledge
2. Assess consequence & likelihood of failure to determine risk
3. Identify gaps and priority needs
Bottom-Up
Element Level3. Populate asset
register2. Perform condition
and performance assessments
1. Collect detailed asset information
Bottom-Up
Element Level3. Populate asset
register2. Perform condition
and performance assessments
1. Collect detailed asset information
Bottom-Up
Element Level3. Populate asset
register2. Perform condition
and performance assessments
1. Collect detailed asset information
Refine capital planning and O&M activities
Refine capital planning and O&M activities
Refine capital planning and O&M activities
Refine capital planning and O&M activities
Draft

2. PROJECT SCOPE
DRAFT FINAL DRINKING WATER AND WASTEWATER MASTER PLAN, ROTA, CNMI 2-89
Goal of an Asset Management Program Typically, the goal of an asset management program is for a utility to continue providing a targeted level of service to its customers while determining the lowest‐cost methods of reducing risk of infrastructure failure. The primary goal of the asset management task performed by CUC is to understand the relative risks of infrastructure failure so that this information can be utilized to identify needed capital projects in the Master Plan. This asset management task includes both CUC’s “vertical assets” (e.g., aboveground structures such as booster pump stations) and “horizontal assets” (e.g., underground pipes for water distribution).
Asset Assessment Approaches The project team used an industry‐standard asset management approach, which included the following steps:
• Develop Level of Service categories
• Develop an Asset Hierarchy
• Develop Consequence of Asset Failure and Likelihood of Asset Failure scoring matrices
• Score relative risks of asset failure based on the matrices
• Rank assets by greatest risk
Each step of this approach is discussed in greater detail below.
Level of Service Categories Levels of service (LOS) are based on CUC’s mission and service goals, and are established at a utility‐wide level. Performance measures, on the other hand, are generally established at lower levels within the organization and are used to determine whether the LOS targets are being met. LOS can be qualitative or quantitative and must align with customer expectations. LOS must meet the following criteria and above all, they must be:
• Meaningful—Provide a clear, meaningful picture of performance to staff and stakeholders
• Measurable—Be measurable either qualitatively or quantitatively
• Consistent—Be uniform and reproducible by others
• Useful—Assist with improved management of utility
• Unique—Be specific enough to describe an attribute that is distinct from other LOS criteria
• Limited in number to prevent overlap and to afford an overview of utility performance
LOS categories should be limited in number—to six or so—to keep them manageable and to effectively evaluate assets within the asset hierarchy. Each LOS category should have a clearly defined target LOS.
The project team established the LOS categories and corresponding target values shown in Table 2.2.5‐2 with feedback from CUC. Once the LOS targets were established, CUC assigned a weighting factor, or a relative measure of importance, to each LOS category. The team then developed an asset hierarchy and scoring matrices for consequence and likelihood of failure of an asset.
CUC’s mission statement, which was used to develop the LOS, is stated on the utility’s website: “The Commonwealth Utilities Corporation is dedicated to providing reliable, environmentally sensitive and efficient Power, Water, and Wastewater Treatment services for the people of the CNMI at the lowest reasonable cost while providing safety to the public, employees, and the community.”
Draft

2. PROJECT SCOPE
2-90 DRAFT FINAL DRINKING WATER AND WASTEWATER MASTER PLAN, ROTA, CNMI
Table 2.2.5‐2. CUC Levels of Service for the Drinking Water System
Level of Service Category Target Value
Financial Impact Weighting Factor: 20%
Less than $1,000 required to remediate the asset failure.
System Reliability Weighting Factor: 25%
No loss of service. Would not cause widespread water discoloration, taste, or odor. No water leaks (maintain water conservation).
Regulatory Compliance/Health Weighting Factor: 45%
Primary and secondary drinking water standards met. No federal permit violations. No potential adverse health effects.
Public Image and Customer Service Weighting Factor: 10%
Would not trigger complaints or media coverage. Affects no more than one customer and no major customers. Fire protection not impacted. No traffic interruption.
Asset Hierarchy An asset hierarchy is a catalog of utility assets that illustrates how the assets are related. The relationships between assets are organized in a parent‐child format (Figure 2.2.5‐2). The parent‐child relationship can be established based on location or function. An asset hierarchy does not need a complete inventory of all assets, but it should be developed to a level at which data are consistent, typically the fourth (subcomponent) or fifth (element) levels. Initially, an asset hierarchy should use available information as its basis, including staff knowledge and data collected to date. As more detailed asset data are gathered over time (through bottom‐up activities), the hierarchy should be refined to ensure its accuracy.
The full asset hierarchy for Rota’s water system is included as Appendix N. The project team determined which assets should be developed to a fourth level of detail based on available information.
Figure 2.2.5‐2. Sample Asset Hierarchy
Risk Assessment Risk assessment is a key element to a successful asset management program because it is the balancing point between minimizing cost and maintaining level of service. A decision to keep costs low, at any price, results in impacts to the level of service from failing infrastructure, just as a decision to provide an increased level of service with no regard to cost can result in inappropriate use of resources. Therefore, utilities must understand the need to balance service and cost.
Level 1 System Water SystemLevel 2 Subsystem Treatment Plant
Level 3 Component Intake structureLevel 4 Subcomponent Screening
Level 5 Element Screen 1Level 5 Element Screen 2Level 5 Element Screen 3
Level 3 Component ClarificationLevel 4 Subcomponent Clarifier 1
Level 5 Element StructureLevel 5 Element Mechanical
Level 3 Component Chemical systemLevel 4 Subcomponent Sodium hydroxide
Level 5 Element Pumps Level 5 Element Day tank
Draft

2. PROJECT SCOPE
DRAFT FINAL DRINKING WATER AND WASTEWATER MASTER PLAN, ROTA, CNMI 2-91
Risk Definition and Quantification Risk may be expressed as a function of the consequence and likelihood of an event. Consequence is the impact to different levels of service that result from an asset failure. For example, the consequence of a pump station failure could be insufficient capacity to distribute drinking water to Rota residents, resulting in a dissatisfied customer base. Likelihood of failure is the potential for an asset to fail. For example, an old, corroded pump would be more likely to fail than a new pump made from more reliable materials.
The simple mathematical calculation used in the risk‐based evaluation of CUC assets is expressed as follows:
Risk = Consequence × Likelihood
In assessing risk, consequence and likelihood are defined and quantified separately, then combined to calculate the risk of a specific asset. An asset that has a low consequence associated with its failure but a high likelihood of failure could have a lower overall risk compared to an asset that has a very high consequence of failure and a low likelihood of failure. In some cases, paying more attention to an asset or a group of assets in good condition could be of greater importance because failure might result in highly undesirable consequences, such as serious injury or loss of life.
Table 2.2.5‐3 shows the consequence matrix and scoring system used to evaluate CUC water assets. The consequences of the failure of an asset are expressed in terms of the LOS categories. Those categories include maintaining system reliability, complying with regulations (e.g., Health hazard criteria, CNMI Safe Drinking Water Infrastructure Grant Program Documentation), maintaining safe conditions for the public and CUC employees, minimizing financial impacts, and maintaining the vitality of the island. Each category was weighted by the project team according to its importance in meeting CUC goals. A numerical score, ranging from 1 to 10, was assigned to each category. For all categories, a score of 1 (negligible) was given to the LOS target. If the LOS target was still met after an asset failure, then the consequence of the failure on that particular level of service category was deemed negligible. For example, a health and safety LOS consequence, when no potential for injuries or adverse health effects associated with an asset failure was anticipated (that is, the target LOS), received a score of 1. Conversely, if the potential existed for loss of life as the result of an asset failure, the score for the severe consequence was 10.
Table 2.2.5‐4 is the likelihood of failure scoring matrix used to evaluate CUC assets. Similar to the consequence of failure matrix, likelihood‐of‐failure categories were developed to characterize the likelihood of failure of an asset. Physical condition, performance, and the ease or difficulty of performing O&M were used to assess the likelihood of failure. Scores ranging from 1 to 10 were assigned to each category of likelihood of failure. A score of 1 represented a negligible chance of failure. For example, a brand new pump would likely have a negligible chance of failure and would be given a score of 1 for likelihood of failure under physical condition. However, an old, corroded pump with a history of failures might be given a score of 10 under physical condition, indicating a high likelihood of failure. The LOF category scores were determined based on the results of the condition assessment inspections performed by the project team with input from GIS and modeling activities and CUC staff’s knowledge of asset condition and performance histories. The weighting factor reflects the relative importance for each category.
Draft
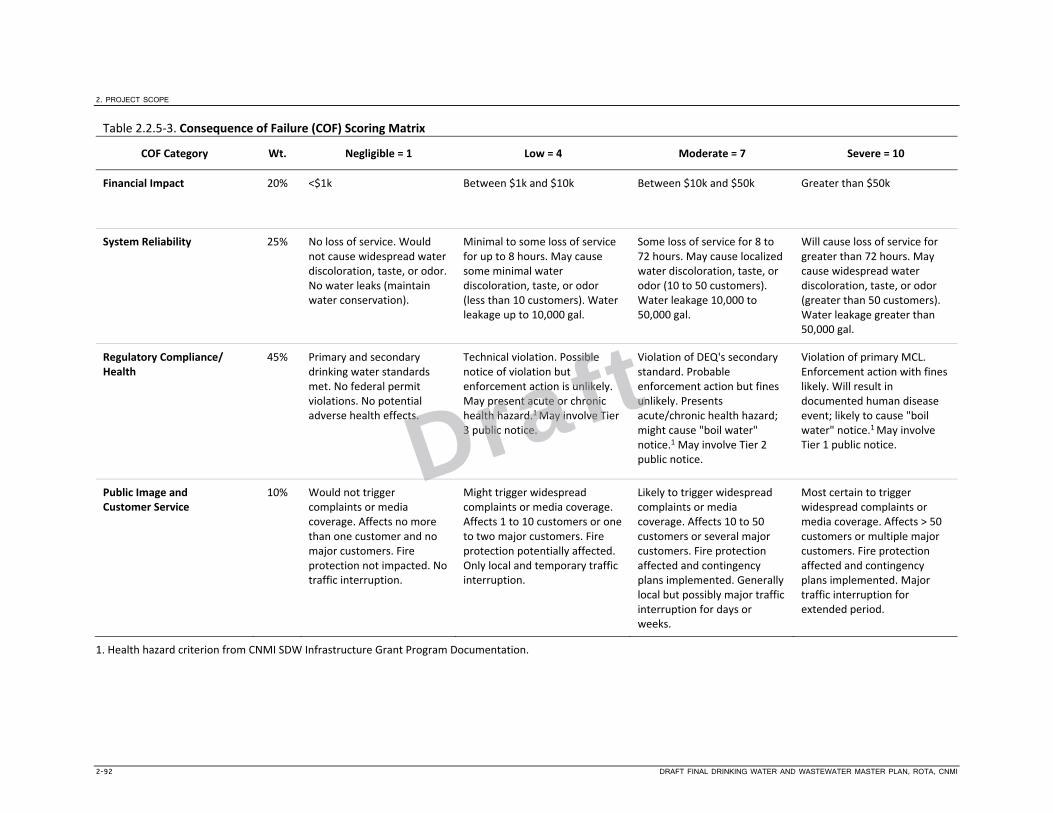
2. PROJECT SCOPE
2-92 DRAFT FINAL DRINKING WATER AND WASTEWATER MASTER PLAN, ROTA, CNMI
Table 2.2.5‐3. Consequence of Failure (COF) Scoring Matrix
COF Category Wt. Negligible = 1 Low = 4 Moderate = 7 Severe = 10
Financial Impact 20% <$1k Between $1k and $10k Between $10k and $50k Greater than $50k
System Reliability 25% No loss of service. Would not cause widespread water discoloration, taste, or odor. No water leaks (maintain water conservation).
Minimal to some loss of service for up to 8 hours. May cause some minimal water discoloration, taste, or odor (less than 10 customers). Water leakage up to 10,000 gal.
Some loss of service for 8 to 72 hours. May cause localized water discoloration, taste, or odor (10 to 50 customers). Water leakage 10,000 to 50,000 gal.
Will cause loss of service for greater than 72 hours. May cause widespread water discoloration, taste, or odor (greater than 50 customers). Water leakage greater than 50,000 gal.
Regulatory Compliance/ Health
45% Primary and secondary drinking water standards met. No federal permit violations. No potential adverse health effects.
Technical violation. Possible notice of violation but enforcement action is unlikely. May present acute or chronic health hazard.1 May involve Tier 3 public notice.
Violation of DEQ's secondary standard. Probable enforcement action but fines unlikely. Presents acute/chronic health hazard; might cause "boil water" notice.1 May involve Tier 2 public notice.
Violation of primary MCL. Enforcement action with fines likely. Will result in documented human disease event; likely to cause "boil water" notice.1 May involve Tier 1 public notice.
Public Image and Customer Service
10% Would not trigger complaints or media coverage. Affects no more than one customer and no major customers. Fire protection not impacted. No traffic interruption.
Might trigger widespread complaints or media coverage. Affects 1 to 10 customers or one to two major customers. Fire protection potentially affected. Only local and temporary traffic interruption.
Likely to trigger widespread complaints or media coverage. Affects 10 to 50 customers or several major customers. Fire protection affected and contingency plans implemented. Generally local but possibly major traffic interruption for days or weeks.
Most certain to trigger widespread complaints or media coverage. Affects > 50 customers or multiple major customers. Fire protection affected and contingency plans implemented. Major traffic interruption for extended period.
1. Health hazard criterion from CNMI SDW Infrastructure Grant Program Documentation.
Draft

2. PROJECT SCOPE
DRAFT FINAL DRINKING WATER AND WASTEWATER MASTER PLAN, ROTA, CNMI 2-93
Table 2.2.5‐4. Likelihood of Failure Scoring Matrix
Likelihood Category
Wt 1 2 4 7 10
Physical Condition 50% Very good No corrective maintenance required
Good Few minor deficiencies and minimal corrective maintenance required
Fair Several minor deficiencies noted and corrective maintenance required
Poor Major deficiencies and significant corrective maintenance or rehabilitation required
Very poor Asset may be unserviceable, needs replacement or major rehabilitation
Performance 30% Sufficient capacity to meet average and peak capacity requirements; appropriate utilization and function
Sufficient capacity to meet average and peak capacity requirements, but under‐utilized or oversized, resulting in inefficiencies
Sufficient capacity to meet current average capacity requirements but does not meet functional requirements or is over‐utilized
Able to meet current average capacity demands but not peak demands
Unable to meet current average capacity requirements
Ease/Difficulty of O&M
20% Site is easily accessed; equipment is easily accessible; spares are available; CUC may do maintenance in‐house.
Site is easily accessed; equipment is easily accessible; spares mostly available; CUC may do maintenance in‐house.
Site has some access constraints; equipment not easily accessed (requires mobilization of equipment); some spares available; maintenance may require a third party
Site is difficult to access; equipment not easily accessed (requires mobilization of equipment); no spares at CUC (but on island), maintenance likely to require a third party
Severely constrained site access; extremely difficult to access equipment (requires mobilization of equipment), no spares at CUC or on‐island, maintenance requires a third party
Draft

2. PROJECT SCOPE
2-94 DRAFT FINAL DRINKING WATER AND WASTEWATER MASTER PLAN, ROTA, CNMI
Asset Risk Assessment Approach Using the consequence and likelihood categories, in conjunction with field data and institutional knowledge from CUC staff, the project team employed a Microsoft Excel® spreadsheet to calculate relative risk scores for CUC’s assets. The risk scoring process was used to evaluate assets objectively and comprehensively for the Rota Master Plan. To validate this process, the project team presented a summary overview of the preliminary risk scores to CUC staff in a workshop setting. CUC staff provided feedback about the relative risk profile of assets based on visual displays of risk scores that allowed comparison of related assets at a common hierarchical level. After validating nearly all of the scoring, CUC staff recalibrated underlying assumptions where results lay outside expectations. The scoring for those specific assets was adjusted and the new scores incorporated into the final tabulations. The end result was a high level of confidence in the asset risk ranking by CUC staff. Appendix N contains the CUC asset hierarchy and risk scoring spreadsheet developed during the project. It illustrates how an asset’s overall consequence score was calculated by multiplying the weighting factors by each associated consequence score to get an overall consequence score, ranging from a low of 1 to a maximum of 10. Similarly, the likelihood of failure score was calculated by multiplying the weighting factors and the associated likelihood of failure score to get an overall likelihood score.
The asset risk score, then, is the product of the consequence score multiplied by the likelihood of failure score, with one (1) being the lowest possible score and 100 being the highest.
COF (or LOF) = sum of (Wi x Si), where,
Wi = the weight for each COF (or LOF) category (percentage)
Si = the score for each COF (or LOF) category (scale of 1 to 10)
The maximum COF (or LOF) score is therefore 10. The risk score is derived from the Risk = COF × LOF (maximum score = 100).
The risk scoring took place at the CUC offices on the following days:
Thursday, October 27, 2011 – Water Facilities (Saipan, Rota, and Tinian)
Thursday, November 3, 2011 – Water and Wastewater Facilities final scoring and adjustments
Note that Rota wastewater facilities were not evaluated; Rota employs privately owned and maintained septic fields only.
Water Asset Risk Scoring Figures 2.2.5‐3 through 2.2.5‐7 illustrate the relative risk scores for key groups of CUC water assets. Upper and lower boundaries were defined for identifying risk categories (i.e., low, medium, and high risk) based on the range and spread of risk scores for all of CUC’s water assets on all three islands. Identification of risk score boundaries also took into consideration the fact that a relatively small number of assets should be identified as “high risk,” otherwise it is unrealistic for CUC to focus on reducing the risk at these high risk assets due to financial restrictions. Table 2.2.5‐5 summarizes the frequency distribution of water asset risk scores.
Assets that have a risk score greater than or equal to 50 have been labeled as high‐risk assets and should be the top priorities for CUC in the immediate future. Those assets with a risk score between 22 and 50 are identified as medium risk assets, and assets with a risk score less than or equal to 22 are considered low risk assets. The categorization of CUC’s assets into these three risk categories will aid CUC in implementing a long‐term capital improvement plan, which is discussed in Section 4.3 of this Master Plan. The high, medium, and low risk assets are delineated in Figures 2.2.5‐3 through 2.2.5‐7 with red and yellow horizontal lines that break the assets into categorized risk groups.
Draft
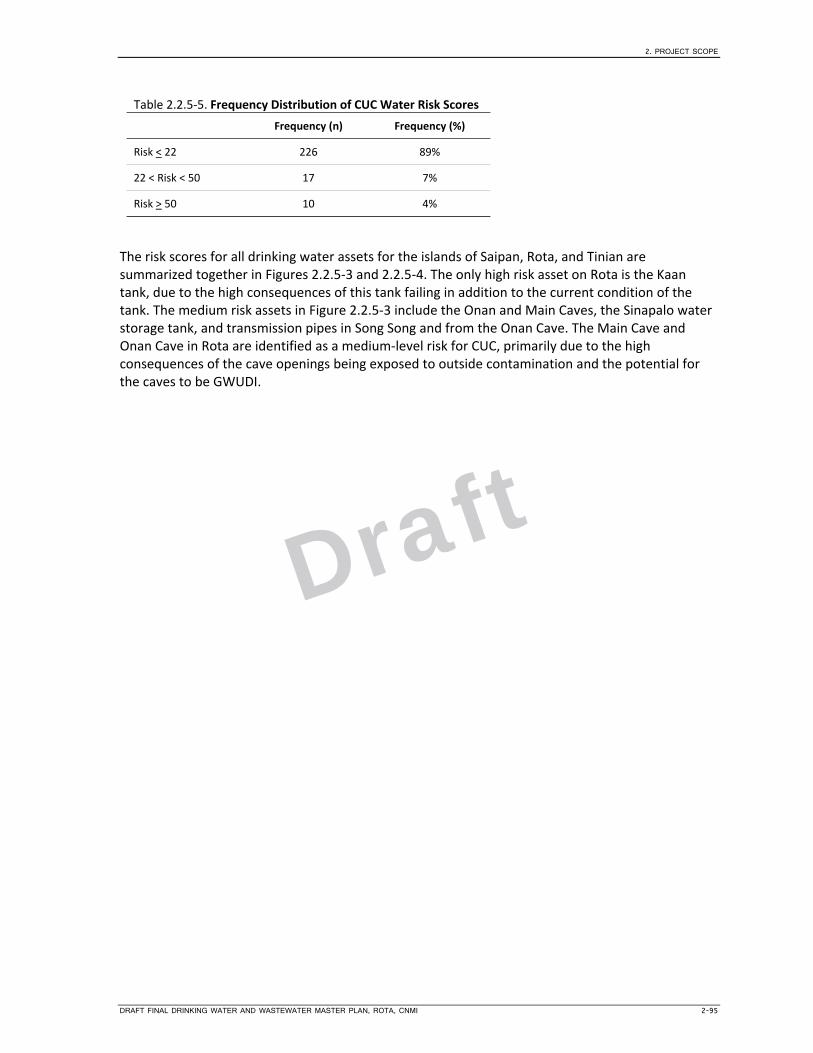
2. PROJECT SCOPE
DRAFT FINAL DRINKING WATER AND WASTEWATER MASTER PLAN, ROTA, CNMI 2-95
Table 2.2.5‐5. Frequency Distribution of CUC Water Risk Scores
Frequency (n) Frequency (%)
Risk < 22 226 89%
22 < Risk < 50 17 7%
Risk > 50 10 4%
The risk scores for all drinking water assets for the islands of Saipan, Rota, and Tinian are summarized together in Figures 2.2.5‐3 and 2.2.5‐4. The only high risk asset on Rota is the Kaan tank, due to the high consequences of this tank failing in addition to the current condition of the tank. The medium risk assets in Figure 2.2.5‐3 include the Onan and Main Caves, the Sinapalo water storage tank, and transmission pipes in Song Song and from the Onan Cave. The Main Cave and Onan Cave in Rota are identified as a medium‐level risk for CUC, primarily due to the high consequences of the cave openings being exposed to outside contamination and the potential for the caves to be GWUDI.
Draft
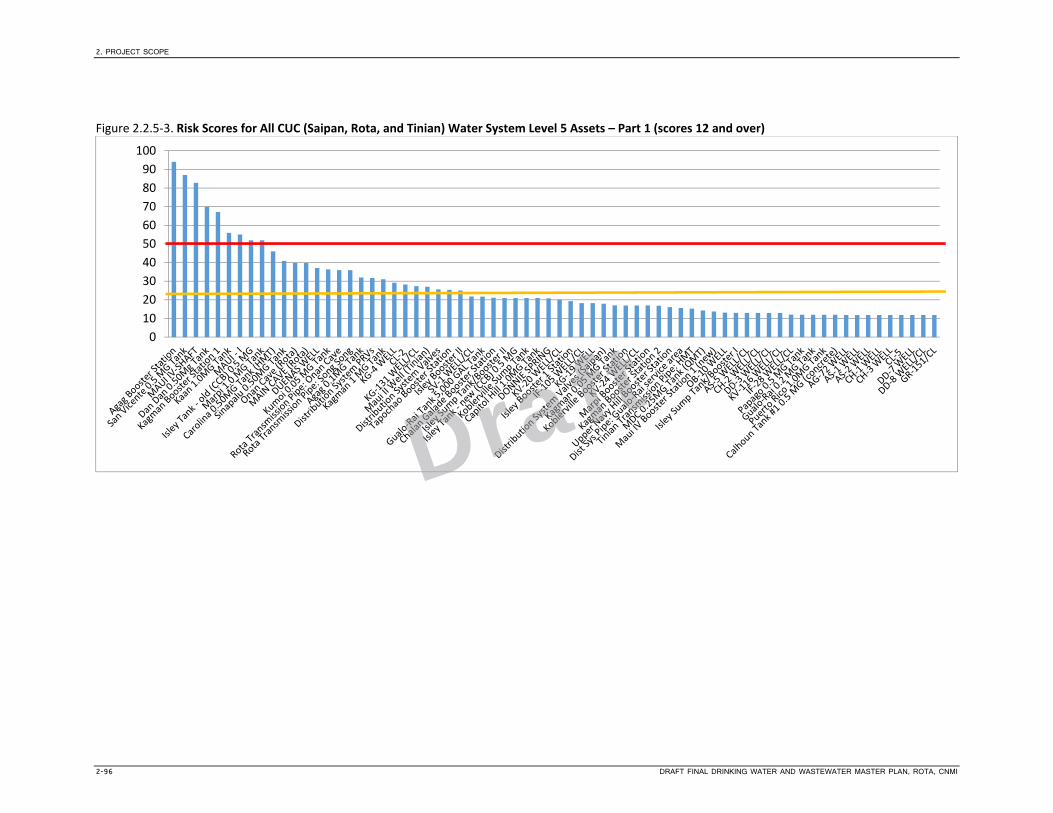
2. PROJECT SCOPE
2-96 DRAFT FINAL DRINKING WATER AND WASTEWATER MASTER PLAN, ROTA, CNMI
Figure 2.2.5‐3. Risk Scores for All CUC (Saipan, Rota, and Tinian) Water System Level 5 Assets – Part 1 (scores 12 and over)
0
10
20
30
40
50
60
70
80
90
100
Draft

2. PROJECT SCOPE
DRAFT FINAL DRINKING WATER AND WASTEWATER MASTER PLAN, ROTA, CNMI 2-97
Figure 2.2.5‐4. Risk Scores for All CUC (Saipan, Rota, and Tinian) Water System Level 5 Assets – Part 2 (scores under 12).
0102030405060708090
100
Draft

2. PROJECT SCOPE
2-98 DRAFT FINAL DRINKING WATER AND WASTEWATER MASTER PLAN, ROTA, CNMI
Figure 2.2.5‐5. Risk Scores for Rota and Tinian Drinking Water Sources
Figure 2.2.5‐6. Risk Scores for Saipan, Rota, and Tinian Water System Storage Tanks
0
10
20
30
40
50
60
70
80
90
100
Draft

2. PROJECT SCOPE
DRAFT FINAL DRINKING WATER AND WASTEWATER MASTER PLAN, ROTA, CNMI 2-99
Figure 2.2.5‐7. Risk Scores for Rota and Tinian Transmission and Distribution Pipes
Figure 2.2.5‐7 summarizes the risk scores assigned to the transmission and distribution pipes within the Rota and Tinian distribution systems. The transmission pipes are considered to be those higher‐capacity pipes that convey raw water from a water storage tank to a distribution system that delivers treated (chlorinated) water to an area or neighborhood. The distribution pipes include those smaller capacity pipes within a service area that deliver water to individual customers. The appurtenances of the Rota distribution system and their associated risk scores are not included in Figure 2.2.5‐7; all of these appurtenances are classified as low‐risk assets. The range of scores calculated for these assets, which includes air relief valves (ARVs), blowoff valves, hydrants, meters, pressure relief valves (PRVs), sample taps, and other valves, are summarized in Table 2.2.5‐6 for the Rota distribution system.
Table 2.2.5‐6. Risk Score Ranges for Distribution System Appurtenances for Rota
Min Max
ARVs 1.5 4.3
Blowoff Valves 1.5 4.3
Hydrants 3.3 4.4
Meters 1.5 7.3
PRVs 8.0 31.7
Sampling Taps N/A N/A
Valves 2.4 25.6
0
5
10
15
20
25
30
35
40
Draft

2. PROJECT SCOPE
2-100 DRAFT FINAL DRINKING WATER AND WASTEWATER MASTER PLAN, ROTA, CNMI
Summary of Risk Assessment Key Findings and Recommendations The key information provided by the risk assessment exercise is the prioritization of assets based on relative risk scores and the identification of high‐risk assets. There was only a single asset, the Kaan tank, classified as high risk for Rota. Several medium‐risk assets were identified (see Figure 2.2.5‐3). The information provided by the assessment was critical to the project team during the process of identifying short‐term and long‐term capital improvement projects (see Section 4.3). The project team analyzed the risk assessment results in conjunction with the condition assessment information, hydraulic modeling results, and CUC staff’s knowledge of the system to develop the list of projects, as well as O&M improvements, deemed necessary.
Condition Assessment Recommendations The risk assessment results can also be used to help guide future condition assessment activities. The assets with the relatively high risk score that have not had a detailed inspection should be considered for future inspection activities to identify any repairs and rehabilitation required to decrease the likelihood of asset failure.
Recommendations for Improving Risk Scores This section provides recommendations for CUC to consider if it wishes to continue with a risk‐based asset management program in the future. The recommendations include asset management best practices as well as specific recommendations for CUC that were developed based on the information gathered during the asset risk scoring workshops and analysis of the asset hierarchy risk scores.
There is additional work to the asset hierarchy file that, if completed, will result in more accurate and complete risk scores for many CUC assets for which little information was known. The following items should be considered if more accurate risk scores are desired:
Currently, the LOF scores for water system motor control centers (MCCs) and generator are estimates based on assessments done on electrical equipment throughout the Saipan water system. The project team did not perform a complete electrical condition assessment for these assets on Rota. It is recommended that CUC perform electrical system condition assessments for the booster station, similar to what was accomplished for the wastewater lift station electrical equipment in Saipan. After condition data are collected in the field, the asset hierarchy should be updated with revised LOF scores.
The risk scores for the water system’s transmission pipes and distribution pipes are currently best guesses based on the project team’s engineering judgment to assign LOF scores. It is recommended that as condition/material/age is determined for water lines, the asset hierarchy be updated accordingly. The COF scores for the drinking water system’s transmission and distribution pipes may not be completely accurate. During the risk assessment workshops with CUC, COF scores were assigned without the benefit of having the completed tank service area schematics to review. To update the COF scores, the following information is needed:
Redundant sources of water for certain areas; this will affect the system reliability and public image COF score
Population in the tank service area neighborhoods; this will affect the public image COF score
Knowledge Transfer Knowledge transfer is a concern among CUC staff, mainly due to the relatively high turnover rate of experienced technical and maintenance staff at CUC. The majority of CUC staff responsible for operating and maintaining the water and wastewater systems have been with the utility for a very
Draft

2. PROJECT SCOPE
DRAFT FINAL DRINKING WATER AND WASTEWATER MASTER PLAN, ROTA, CNMI 2-101
brief time. Currently a vast amount of system knowledge is kept in the memory of specific employees and not necessarily written down or recorded consistently. The risk assessment process was a good start to addressing the issue of knowledge transfer between the more experienced staff and newer employees. The development of the asset hierarchy was the first step to transfer all of this knowledge from an individual’s memory to a document. It is good practice to continue to ensure that critical system knowledge is written down, recorded, and stored such that any new employee can easily access and understand the information. Now that the asset hierarchy has been developed, this Excel©‐based tool is a simple and effective way to manage assets. As new information is obtained or as assets are improved upon or removed from the system, the asset hierarchy should be updated. The asset hierarchy and LOF scores should be reviewed every year and revised as needed. The COF scores do not require updating as frequently, but every 3 to 5 years the COF scoring matrix should be reviewed to ensure levels of service have not drastically changed.
Draft

Draft
2. PROJECT SCOPE
DRAFT FINAL DRINKING WATER AND WASTEWATER MASTER PLAN, ROTA, CNMI 2-103
2.3 Wastewater Infrastructure System Condition Assessment
CUC does not operate or maintain any wastewater infrastructure on the island of Rota, so condition assessments of Rota’s wastewater assets is not applicable to this Master Plan.
Draft

Draft

DRAFT FINAL DRINKING WATER AND WASTEWATER MASTER PLAN, ROTA, CNMI 3-1
SECTION 3
Master Planning Criteria
The contents of Section 3, “Master Planning Criteria,” are as follows:
3.1 Twenty‐Year Population Projections ...................................................................................... 3‐2 3.1.1 Estimating Rota’s Current Population as of January 2012 ........................................ 3‐2 3.1.2 Projecting Rota’s Population as a Result Economic Growth
through Business Initiatives by the CGCNMI and Local Businesses .......................... 3‐4 3.1.3 Projecting Rota’s Population as a Result Economic Growth
Generated by External Stimuli .................................................................................. 3‐5 3.1.4 Projecting Rota’s Population as a Result Economic Growth
Generated by Local Initiatives and External Stimuli .................................................. 3‐6 3.1.5 Projecting Rota’s Population for Year 2015 .............................................................. 3‐6 3.1.6 Projecting Rota’s Population for Year 2020 .............................................................. 3‐7 3.1.7 Projecting Rota’s Population for Year 2030 .............................................................. 3‐9 3.1.8 Summary of Actual and Estimated Population Data
for 2000 through 2030 ............................................................................................ 3‐11 3.1.9 Allocating Rota Islandwide Population Projections
among Census Designated Places for Year 2015..................................................... 3‐12 3.1.10 Allocating Rota Islandwide Population Projections
among Census Designated Places for Year 2020..................................................... 3‐13 3.1.11 Allocating Rota Islandwide Population Projections
among Census‐Designated Places for Year 2030 .................................................... 3‐14 3.1.12 Population by Rota Water Regions for Years 2015, 2020
and 2030 for High and Low Ranges ......................................................................... 3‐14 3.1.13 Population by Rota Sewersheds for Years 2015, 2020 and 2030 ............................ 3‐14
3.2 Water Demand and 20‐Year Projections .............................................................................. 3‐27 3.2.1 Production and Metered per Capita Demands ....................................................... 3‐27 3.2.2 Tank Service Area Population Projections .............................................................. 3‐28
3.3 Wastewater Flow Projections .............................................................................................. 3‐29 3.4 Status of “Construction Works in Progress” ........................................................................ 3‐31 3.5 Assessment of Current CUC Management Policies, Procedures,
and Operating Rules and Regulations for Water and Wastewater Systems ........................ 3‐33 3.5.1 Management Organization ..................................................................................... 3‐33 3.5.2 Workforce Issues ..................................................................................................... 3‐35 3.5.3 Automation and Technology ................................................................................... 3‐36 3.5.4 Recommendations .................................................................................................. 3‐38
Draft

Draft
3. MASTER PLANNING CRITERIA
DRAFT FINAL DRINKING WATER AND WASTEWATER MASTER PLAN, ROTA, CNMI 3-3
3.1 Twenty‐Year Population Projections The population projections for Rota (as well as for Saipan and Tinian) are intended for use in planning new and improved water and wastewater infrastructure. Consequently, the data of primary concern are number of residents and where they will reside. Other situations that generate a temporary demand for water and wastewater services, such as places of employment, other places of congregation, and tourist venues, are not included in this analysis.
Three factors will affect the population growth of Rota:
• Natural growth rate through births and deaths.
• Immigration and emigration resulting from economic growth due to initiatives by the government of CNMI and the local business community. The immigration and emigration include aliens as well as inter‐island migration among residents.
• Immigration and emigration resulting from economic growth generated by external stimuli, such as that by the U.S federal government and international parties.
While some interrelationships exist among these factors, they can be analyzed separately for purposes of determining the affect that each exerts on population growth for the short term (2015), medium term (2020), and long term (2030). Further, each of the three factors influences population growth differently for Rota than it does for Saipan or Tinian.
The basis for the Rota population projection is the year 2010 census for CNMI and growth rates established by the U.S. Census Bureau, which have been adopted by the Central Statistics Division of the CNMI Department of Commerce (Andrew, 2013).
3.1.1 Estimating Rota’s Current Population as of January 2012 Before population projections could be developed for Rota, it was first necessary to determine the current population as of January 2012 (the beginning of this population projection effort). Rota has witnessed a precipitous decline in population over the past 12 years. As shown in Table 3.1.1‐1, between 2000 and 2010 alone, population declined by 23 percent.
Table 3.1.1‐1. Population of Rota from 2000 through 2010
Year Census Change since 2000 (percent) Source
2000 3,283 ‐‐ U.S. Census Bureau
2010 2,527 ‐23.0 U.S. Census Bureau
Advancing the year 2010 population count to year 2012 is difficult because the last census count in April 2010 included approximately 21,000 aliens who were legal under the former CNMI immigration policies (see Table 3.1.1‐2). This figure was estimated by the U.S. Department of Interior in a report issued the same month as the year 2010 census.
No data are available to allocate these aliens among Rota, Saipan and Tinian. However, in discussions with officials from Tinian and Rota where the relatively small land area and low population permit empirical evidence, it is estimated that approximately 800 aliens (Liu, 2012) resided on Tinian and approximately 600 aliens (Mendiola, 2012) resided on Rota during 2010, leaving approximately 19,459 (say, 19,500) on Saipan.
Draft
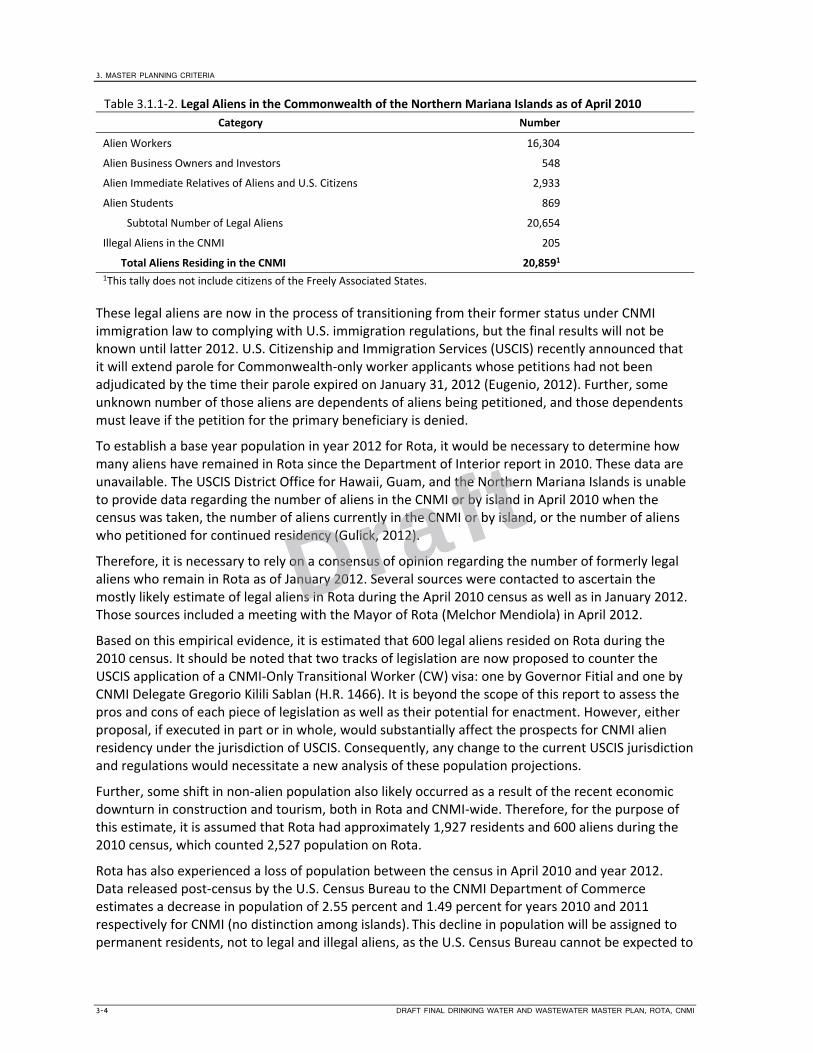
3. MASTER PLANNING CRITERIA
3-4 DRAFT FINAL DRINKING WATER AND WASTEWATER MASTER PLAN, ROTA, CNMI
Table 3.1.1‐2. Legal Aliens in the Commonwealth of the Northern Mariana Islands as of April 2010
Category Number
Alien Workers 16,304
Alien Business Owners and Investors 548
Alien Immediate Relatives of Aliens and U.S. Citizens 2,933
Alien Students 869
Subtotal Number of Legal Aliens 20,654
Illegal Aliens in the CNMI 205
Total Aliens Residing in the CNMI 20,8591 1This tally does not include citizens of the Freely Associated States.
These legal aliens are now in the process of transitioning from their former status under CNMI immigration law to complying with U.S. immigration regulations, but the final results will not be known until latter 2012. U.S. Citizenship and Immigration Services (USCIS) recently announced that it will extend parole for Commonwealth‐only worker applicants whose petitions had not been adjudicated by the time their parole expired on January 31, 2012 (Eugenio, 2012). Further, some unknown number of those aliens are dependents of aliens being petitioned, and those dependents must leave if the petition for the primary beneficiary is denied.
To establish a base year population in year 2012 for Rota, it would be necessary to determine how many aliens have remained in Rota since the Department of Interior report in 2010. These data are unavailable. The USCIS District Office for Hawaii, Guam, and the Northern Mariana Islands is unable to provide data regarding the number of aliens in the CNMI or by island in April 2010 when the census was taken, the number of aliens currently in the CNMI or by island, or the number of aliens who petitioned for continued residency (Gulick, 2012).
Therefore, it is necessary to rely on a consensus of opinion regarding the number of formerly legal aliens who remain in Rota as of January 2012. Several sources were contacted to ascertain the mostly likely estimate of legal aliens in Rota during the April 2010 census as well as in January 2012. Those sources included a meeting with the Mayor of Rota (Melchor Mendiola) in April 2012.
Based on this empirical evidence, it is estimated that 600 legal aliens resided on Rota during the 2010 census. It should be noted that two tracks of legislation are now proposed to counter the USCIS application of a CNMI‐Only Transitional Worker (CW) visa: one by Governor Fitial and one by CNMI Delegate Gregorio Kilili Sablan (H.R. 1466). It is beyond the scope of this report to assess the pros and cons of each piece of legislation as well as their potential for enactment. However, either proposal, if executed in part or in whole, would substantially affect the prospects for CNMI alien residency under the jurisdiction of USCIS. Consequently, any change to the current USCIS jurisdiction and regulations would necessitate a new analysis of these population projections.
Further, some shift in non‐alien population also likely occurred as a result of the recent economic downturn in construction and tourism, both in Rota and CNMI‐wide. Therefore, for the purpose of this estimate, it is assumed that Rota had approximately 1,927 residents and 600 aliens during the 2010 census, which counted 2,527 population on Rota.
Rota has also experienced a loss of population between the census in April 2010 and year 2012. Data released post‐census by the U.S. Census Bureau to the CNMI Department of Commerce estimates a decrease in population of 2.55 percent and 1.49 percent for years 2010 and 2011 respectively for CNMI (no distinction among islands). This decline in population will be assigned to permanent residents, not to legal and illegal aliens, as the U.S. Census Bureau cannot be expected to
Draft

3. MASTER PLANNING CRITERIA
DRAFT FINAL DRINKING WATER AND WASTEWATER MASTER PLAN, ROTA, CNMI 3-5
have followed the CNMI immigration situation as closely as this Master Plan. For purposes of this projection, legal and illegal aliens will be held to be without growth between 2010 and 2012.
The natural decrease for permanent residents between years 2010 and 2012 yields a change in population of:
• For year 2011 = 1,927 less 2.55 percent = 1,878
• For year 2012 = 1,878 less 1.49 percent = 1,850
With respect to the estimated 600 aliens who resided on Rota in 2010, the Mayor of Rota estimates that 450 remained as of January 2012. Therefore, the alien count as of January 2012 will be set at 450, and it is unnecessary to project the natural birth rate of aliens on Rota between 2010 and 2012.
In sum, the estimated population on Rota for January 2012 is 2,445 based on the following:
• Year 2010 permanent residents of 1,927 plus years 2011 and 2012 reduction of 2.55 percent and 1.49 percent, respectively = 1,850
• Plus aliens of 450
• Therefore, 1,850 plus 450 = 2,300 for year 2012
3.1.2 Projecting Rota’s Population as a Result Economic Growth through Business Initiatives by the CGCNMI and Local Businesses
The government of CNMI and the Rota business community engage in several initiatives that promote economic development and, therefore, population growth through the need for workers beyond those available as residents of CNMI. Once the local labor market is exhausted, due to either too few workers or unavailable skills, immigrant workers will be needed. These initiatives include tourism, Article 12 changes in land ownership, and development of additional casinos. Note that this report does not assess the direct and indirect economic benefits of each initiative nor evaluate the benefits and risks associated with each. Instead, this report summarizes the initiatives, estimates a timeline for implementation, and projects population growth as a result:
• Tourism. As air travel to Rota is currently limited, a viable tourism industry is difficult to incubate. Nonetheless, Rota’s spectacular scuba diving sites, the Bird Sanctuary and golfing at Rota Resort and Country Club continue to attract some visitors. In the absence of reliable and more frequent air service, however, this industry in not expected to grow appreciably, particularly to a scale that would substantially increase population beyond the available workforce. Consequently, no additional population is projected as a result of tourism for the 2015, 2020, and 2030 horizons.
• Article 12. Changes in Article 12 of the CNMI constitution are proposed to open the ownership of land to other than CNMI citizens. This initiative will likely spur economic growth within several business sectors by allowing foreign investors to own and develop real estate. While this initiative is still in its infancy of deliberation and of uncertain outcome with neither details nor timeline yet established, it is unlikely to have any effect for the short term or medium term. However, it could definitely create the type of economic growth that will increase population in the long term by affording commercial development opportunities. The probability for second homes or retirement homes to aliens with commensurate visa privileges is unlikely, due to the absence of full scale medical facilities. Even if Article 12 amendments did occur, the timeline would be long and the likely impact would be modest. Overall, no additional population is expected through this initiative for the year 2015 and 2020 horizons; however, relaxed requirements for land ownership could affect the year 2030 projections by 50 people.
Draft
3. MASTER PLANNING CRITERIA
3-6 DRAFT FINAL DRINKING WATER AND WASTEWATER MASTER PLAN, ROTA, CNMI
• Retirement Residences. Rota is giving thought to the possibility of the island as a venue for retirement homes. However, that goal must be supported by significant improvements in air service and medical facilities before any retirement industry can be attempted. Consequently, no additional population is expected as a result of retirement homes for the horizon years.
• Casinos. Although one small casino closed, another one is being planned in conjunction with the Rota Resort and Country Club. Informal discussions indicate a possible large casino operation supported by chartered air service from Asia within the next 5 years. This scale of investment would make a difference in Rota’s economy as well as its population, as new employees (and possibly their families) would be required. Consequently, an increase in 250 people is projected by 2020 and another 250 by 2030.
• Agriculture. Rota has always maintained a viable agriculture business, and the potential for expansion is feasible. However, it has been difficult to increase production beyond the local market due to unreliable transportation to other markets, although shipping to nearby Guam could be resumed with relatively little investment. Still, Rotanese are expected to fill new employment created by export agriculture. Consequently, no additional population is expected as a result of agriculture for the horizon years.
3.1.3 Projecting Rota’s Population as a Result Economic Growth Generated by External Stimuli
With respect to impacts resulting from the relationship between the government of CNMI and the U.S. federal government, the most likely areas of dramatic influence include increased (or reduced) annual federal funding, exceptions to immigration laws and regulations, new foreign trade treaties, changes in international and interstate commerce laws and regulations, and flow‐over from the proposed military build‐up on Guam. These types of events are generally slow to materialize and impossible to predict years in advance. Inasmuch as annual federal funding has been stable, the USCIS has just recently taken control in the CNMI, tourist visa waivers for Chinese and Russians are in place, and changes in foreign and interstate policies take years to formulate and become effective, no dramatic impact to population is reasonably expected from these potential stimuli by either 2015 or 2020, but change may emerge by 2030. Although the military build‐up on Guam is likely to occur before 2020, analyses by others indicates that such prosperity on Guam and the resultant availability of jobs there would probably draw workers (and possibly their families) away from CNMI.
Other external stimuli to CNMI’s economy and population growth as a result of international influence include changes in the U.S. dollar and foreign currency exchange that could prompt major investment and travel, and some form of favored‐island status granted by another country that could lead to foreign investment and population growth through either alien residents and/or employment. None of these forms of external stimuli are likely to result in additional population by either 2015 or 2020, but could materialize by 2030.
Draft
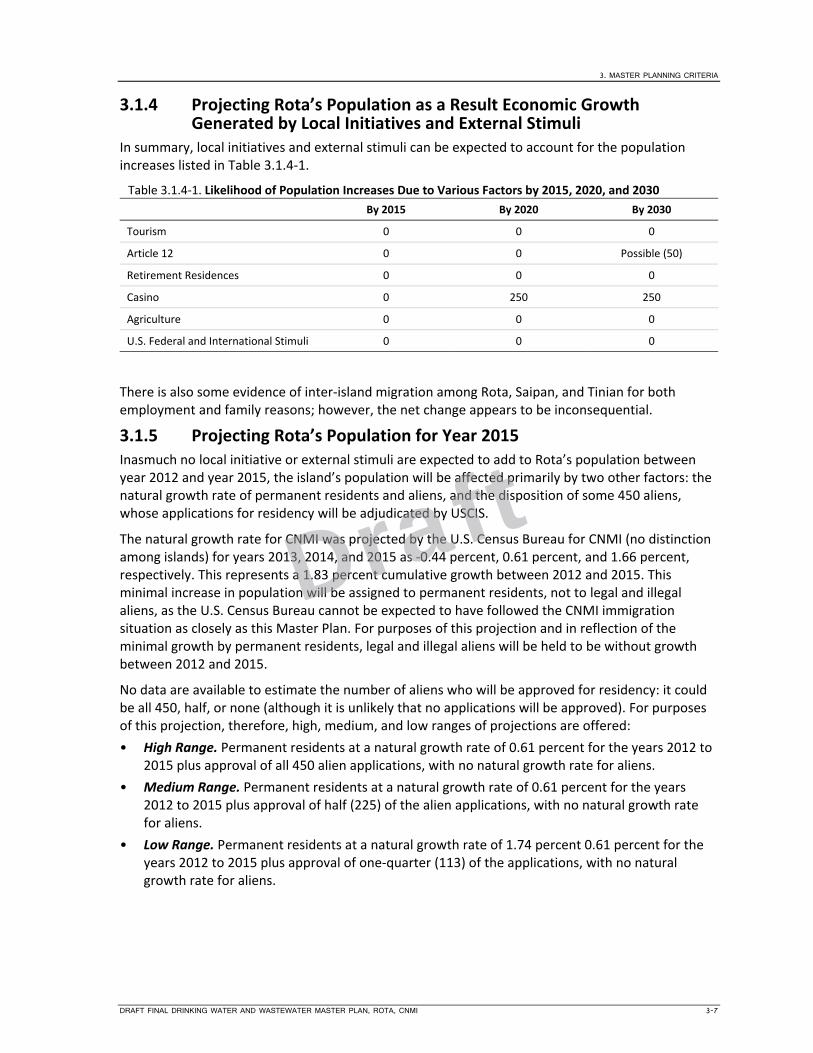
3. MASTER PLANNING CRITERIA
DRAFT FINAL DRINKING WATER AND WASTEWATER MASTER PLAN, ROTA, CNMI 3-7
3.1.4 Projecting Rota’s Population as a Result Economic Growth Generated by Local Initiatives and External Stimuli
In summary, local initiatives and external stimuli can be expected to account for the population increases listed in Table 3.1.4‐1.
Table 3.1.4‐1. Likelihood of Population Increases Due to Various Factors by 2015, 2020, and 2030
By 2015 By 2020 By 2030
Tourism 0 0 0
Article 12 0 0 Possible (50)
Retirement Residences 0 0 0
Casino 0 250 250
Agriculture 0 0 0
U.S. Federal and International Stimuli 0 0 0
There is also some evidence of inter‐island migration among Rota, Saipan, and Tinian for both employment and family reasons; however, the net change appears to be inconsequential.
3.1.5 Projecting Rota’s Population for Year 2015 Inasmuch no local initiative or external stimuli are expected to add to Rota’s population between year 2012 and year 2015, the island’s population will be affected primarily by two other factors: the natural growth rate of permanent residents and aliens, and the disposition of some 450 aliens, whose applications for residency will be adjudicated by USCIS.
The natural growth rate for CNMI was projected by the U.S. Census Bureau for CNMI (no distinction among islands) for years 2013, 2014, and 2015 as ‐0.44 percent, 0.61 percent, and 1.66 percent, respectively. This represents a 1.83 percent cumulative growth between 2012 and 2015. This minimal increase in population will be assigned to permanent residents, not to legal and illegal aliens, as the U.S. Census Bureau cannot be expected to have followed the CNMI immigration situation as closely as this Master Plan. For purposes of this projection and in reflection of the minimal growth by permanent residents, legal and illegal aliens will be held to be without growth between 2012 and 2015.
No data are available to estimate the number of aliens who will be approved for residency: it could be all 450, half, or none (although it is unlikely that no applications will be approved). For purposes of this projection, therefore, high, medium, and low ranges of projections are offered:
• High Range. Permanent residents at a natural growth rate of 0.61 percent for the years 2012 to 2015 plus approval of all 450 alien applications, with no natural growth rate for aliens.
• Medium Range. Permanent residents at a natural growth rate of 0.61 percent for the years 2012 to 2015 plus approval of half (225) of the alien applications, with no natural growth rate for aliens.
• Low Range. Permanent residents at a natural growth rate of 1.74 percent 0.61 percent for the years 2012 to 2015 plus approval of one‐quarter (113) of the applications, with no natural growth rate for aliens.
Draft

3. MASTER PLANNING CRITERIA
3-8 DRAFT FINAL DRINKING WATER AND WASTEWATER MASTER PLAN, ROTA, CNMI
With these assumptions, the population projections for Rota for year 2015 are as follows:
• Year 2015 high range: 2,334
Year 2012 permanent residents of 1,850 less year 2013 @ ‐0.44 percent, plus year 2014 @ 0.61 percent, plus year 2015 @ 1.66 percent = 1,850 + 34 = 1,884
Year 2012 aliens of 450 at no natural growth
Therefore, 1,884 + 450 = 2,334
• Year 2015 medium range: 2,109
Year 2012 permanent residents of 1,850 less year 2013 @ ‐0.44 percent, plus year 2014 @ 0.61 percent, plus year 2015 @ 1.66 percent = 1,850 + 34 = 1,884
Year 2012 aliens of 225 at no natural growth
Therefore, 1,884 + 225 = 2,109
• Year 2015 low range: 2,216
Year 2012 permanent residents of 1,850 less year 2013 @ ‐0.44 percent, plus year 2014 @ 0.61 percent, plus year 2015 @ 1.66 percent = 1,850 + 34 = 1,884
Year 2012 aliens of 113 at no natural growth
Therefore, 1,884 + 113 = 1,997
With these assumptions, the population projections for Rota for Year 2015 are as follows:
• Year 2015 high range: 2,334
• Year 2015 medium range: 2,109
• Year 2015 low range: 1,997
With respect to the variance in permanent residents between the 2010 census and the 2015 estimate, this component of Rota’s population declined by 2.23 percent (2,527 census less 600 aliens = 1,927 permanent residents in year 2010 versus 1,884 in year 2015).
3.1.6 Projecting Rota’s Population for Year 2020 Inasmuch as only one local initiative, a new casino, is expected to add 250 people to Rota’s population between year 2015 and year 2020, the island’s population will be affected primarily by two other factors: the natural growth rate of permanent residents and aliens and the disposition of 450 aliens, whose applications for residency will be adjudicated by USCIS.
The natural growth rate for CNMI was projected by the U.S. Census Bureau for CNMI (no distinction among islands) for years 2016 through 2020 as:
• 2015 – 2016 @ 2.12 percent
• 2016 – 2017 @ 2.02 percent
• 2017 – 2018 @ 1.93 percent
• 2018 – 2019 @ 1.84 percent
• 2019 – 2020 @ 1.76 percent (Andrew, 2013) for a 5‐year average growth of 1.93 percent
Draft

3. MASTER PLANNING CRITERIA
DRAFT FINAL DRINKING WATER AND WASTEWATER MASTER PLAN, ROTA, CNMI 3-9
There is no ostensible reason to expect the CNMI’s population to grow that quickly. With immigration now permanently under the control of the U.S. federal government and prospects for robust economic growth still elusive, it is unlikely that CNMI’s natural growth rate could grow at a pace approaching population stability (i.e., 2.1 percent). Nonetheless, in the absence of evidence to the contrary and the precaution taken to overestimate rather than underestimate for purposes of planning long‐term infrastructure improvements, the U.S. Census Bureau projections will be used for this report.
With respect to natural growth rates for aliens, U.S. Citizenship and Immigration Service regulations have resulted in controlled stays within the CNMI for visa holders, thereby greatly reducing the opportunity for long term residency and the attendant likelihood of family‐making. Further, because the process of applying the new CW visa to aliens is still underway and the estimated number of aliens in the CNMI was always speculative, any natural increase attributed to aliens would be de minimis. Consequently, this segment of Rota’s population is not projected to grow.
The natural increase for permanent residents between years 2016 and 2020 yields a change in population of:
• For year 2016 = 1,884 plus 2.12 percent = 1,924
• For year 2017 = 1,924 plus 2.03 percent = 1,963
• For year 2018 = 1,963 plus 1.93 percent = 2,001
• For year 2019 = 2,001 plus 1.84 percent = 2,038
• For year 2020 = 2,038 plus 1.76 percent = 2,074
With respect to the variance in permanent residents between the 2010 census and the 2020 projections, this component of Rota’s population increased by 7.63 percent (2,527 census less 600 aliens = 1,927 permanent residents in year 2010 versus 2,074 in year 2020).
With these assumptions, the population projections for Rota for year 2020 are as follows:
• Year 2020 high range: 2,774
Year 2020 permanent residents = 2,074
Year 2020 aliens of 450
Therefore, 2,074 + 450 + 250 new = 2,774
• Year 2020 medium range: 2,549
Year 2020 permanent residents = 2,074
Year 2020 aliens of 225
Therefore, 2,074 + 225 + 250 new = 2,549
• Year 2020 low range: 2,437
Year 2020 permanent residents = 2,074
Year 2020 aliens of 113
Therefore, 2,074 + 113 + 250 new = 2,437
With these assumptions, the population projections for Rota for year 2020 are:
• Year 2020 high range: 2,774
• Year 2020 medium range: 2,549
• Year 2020 low range: 2,437
Draft

3. MASTER PLANNING CRITERIA
3-10 DRAFT FINAL DRINKING WATER AND WASTEWATER MASTER PLAN, ROTA, CNMI
3.1.7 Projecting Rota’s Population for Year 2030 Year 2030 population projections reflect two local initiatives: Article 12 amendments at 50 additional people and an expansion of the proposed casino at 250 people.
The natural growth rate for the CNMI was projected by the U.S. Census Bureau (no distinction among islands) for years 2021 through 2030 as:
• 2020 – 2021 @ 1.65 percent
• 2021 – 2022 @ 1.53 percent
• 2022 – 2023 @ 1.43 percent
• 2023 – 2024 @ 1.34 percent
• 2024 – 2025 @ 1.27 percent
• 2025 – 2026 @ 1.21 percent
• 2026 – 2027 @ 1.17 percent
• 2027 – 2028 @ 1.13 percent
• 2028 – 2029 @ 1.09 percent
• 2029 – 2030 @ 1.07 percent (Andrew, 2013)
Subject to the additional population expected as a result of local initiatives and external stimuli, these projections reflect likely growth rates for permanent residents.
With respect to natural growth rates for aliens, U.S. Citizenship and Immigration Service regulations are expected to continue to control the stays within the CNMI for visa holders, thereby greatly reducing the opportunity for long‐term residency and the attendant likelihood of family‐making. Any natural increase attributed to aliens would be de minimis. Consequently, this segment of Rota’s population is not projected to grow.
The natural increase for permanent residents between years 2021 and 2030 yields a change in population of:
• For year 2021 = 2,074 plus 1.65 percent = 2,108
• For year 2022 = 2,108 plus 1.53 percent = 2,140
• For year 2023 = 2,140 plus 1.43 percent = 2,171
• For year 2024 = 2,171 plus 1.34 percent = 2,200
• For year 2025 = 2,200 plus 1.27 percent = 2,228
• For year 2026 = 2,228 plus 1.21 percent = 2,255
• For year 2027 = 2,255 plus 1.17 percent = 2,281
• For year 2028 = 2,281 plus 1.13 percent = 2,307
• For year 2029 = 2,307 plus 1.09 percent = 2,332
• For year 2030 = 2,332 plus 1.07 percent = 2,357
With respect to the variance in permanent residents between the 2010 census and the 2030 projection, this component of Rota’s population increased by 22.31 percent (2,527 census less 600 aliens = 1,927 permanent residents in year 2010 versus 2,357 in year 2030).
Draft
3. MASTER PLANNING CRITERIA
DRAFT FINAL DRINKING WATER AND WASTEWATER MASTER PLAN, ROTA, CNMI 3-11
With these assumptions, the population projections for Rota for year 2030 are as follows:
• Year 2030 high range: 3,107
Year 2030 permanent residents of 2,357
Year 2030 aliens of 450
Year 2030 new growth from local initiatives and external stimuli of 300
Therefore: 2,357 + 450 + 300 = 3,107
Year 2030 medium range: 2,882
Year 2030 permanent residents of 2,357
Year 2030 aliens of 225
Year 2030 new growth from local initiatives and external stimuli of 300
Therefore: 2,357 + 225 + 300 = 2,882
• Year 2030 low range: 2,770
Year 2030 permanent residents of 2,357
Year 2030 aliens of 113
Year 2030 new growth from local initiatives and external stimuli of 300
Therefore: 2,357 + 113 + 300 = 2,770
With these assumptions, the population projections for Rota for year 2030 are:
• Year 2030 high range: 3,107
• Year 2030 medium range: 2,882
• Year 2030 low range: 2,770
Draft
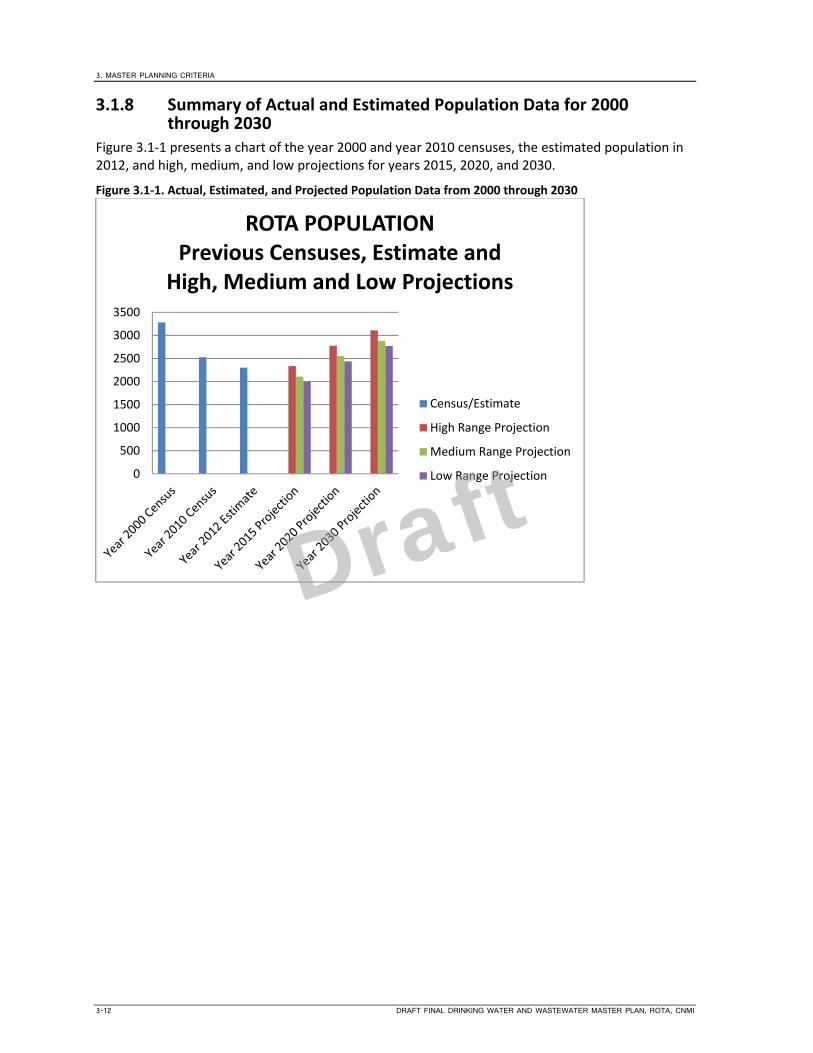
3. MASTER PLANNING CRITERIA
3-12 DRAFT FINAL DRINKING WATER AND WASTEWATER MASTER PLAN, ROTA, CNMI
3.1.8 Summary of Actual and Estimated Population Data for 2000 through 2030
Figure 3.1‐1 presents a chart of the year 2000 and year 2010 censuses, the estimated population in 2012, and high, medium, and low projections for years 2015, 2020, and 2030.
Figure 3.1‐1. Actual, Estimated, and Projected Population Data from 2000 through 2030
0
500
1000
1500
2000
2500
3000
3500
ROTA POPULATIONPrevious Censuses, Estimate and
High, Medium and Low Projections
Census/Estimate
High Range Projection
Medium Range Projection
Low Range Projection
Draft
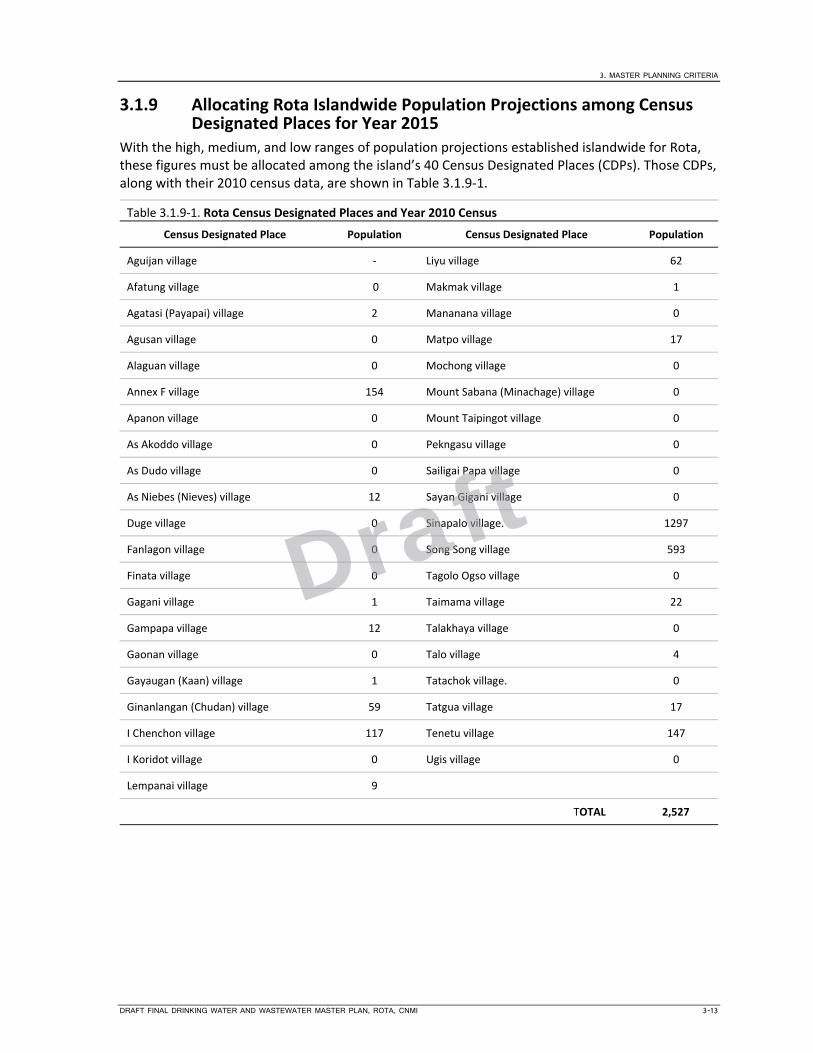
3. MASTER PLANNING CRITERIA
DRAFT FINAL DRINKING WATER AND WASTEWATER MASTER PLAN, ROTA, CNMI 3-13
3.1.9 Allocating Rota Islandwide Population Projections among Census Designated Places for Year 2015
With the high, medium, and low ranges of population projections established islandwide for Rota, these figures must be allocated among the island’s 40 Census Designated Places (CDPs). Those CDPs, along with their 2010 census data, are shown in Table 3.1.9‐1.
Table 3.1.9‐1. Rota Census Designated Places and Year 2010 Census
Census Designated Place Population Census Designated Place Population
Aguijan village ‐ Liyu village 62
Afatung village 0 Makmak village 1
Agatasi (Payapai) village 2 Mananana village 0
Agusan village 0 Matpo village 17
Alaguan village 0 Mochong village 0
Annex F village 154 Mount Sabana (Minachage) village 0
Apanon village 0 Mount Taipingot village 0
As Akoddo village 0 Pekngasu village 0
As Dudo village 0 Sailigai Papa village 0
As Niebes (Nieves) village 12 Sayan Gigani village 0
Duge village 0 Sinapalo village. 1297
Fanlagon village 0 Song Song village 593
Finata village 0 Tagolo Ogso village 0
Gagani village 1 Taimama village 22
Gampapa village 12 Talakhaya village 0
Gaonan village 0 Talo village 4
Gayaugan (Kaan) village 1 Tatachok village. 0
Ginanlangan (Chudan) village 59 Tatgua village 17
I Chenchon village 117 Tenetu village 147
I Koridot village 0 Ugis village 0
Lempanai village 9
TOTAL 2,527
Draft
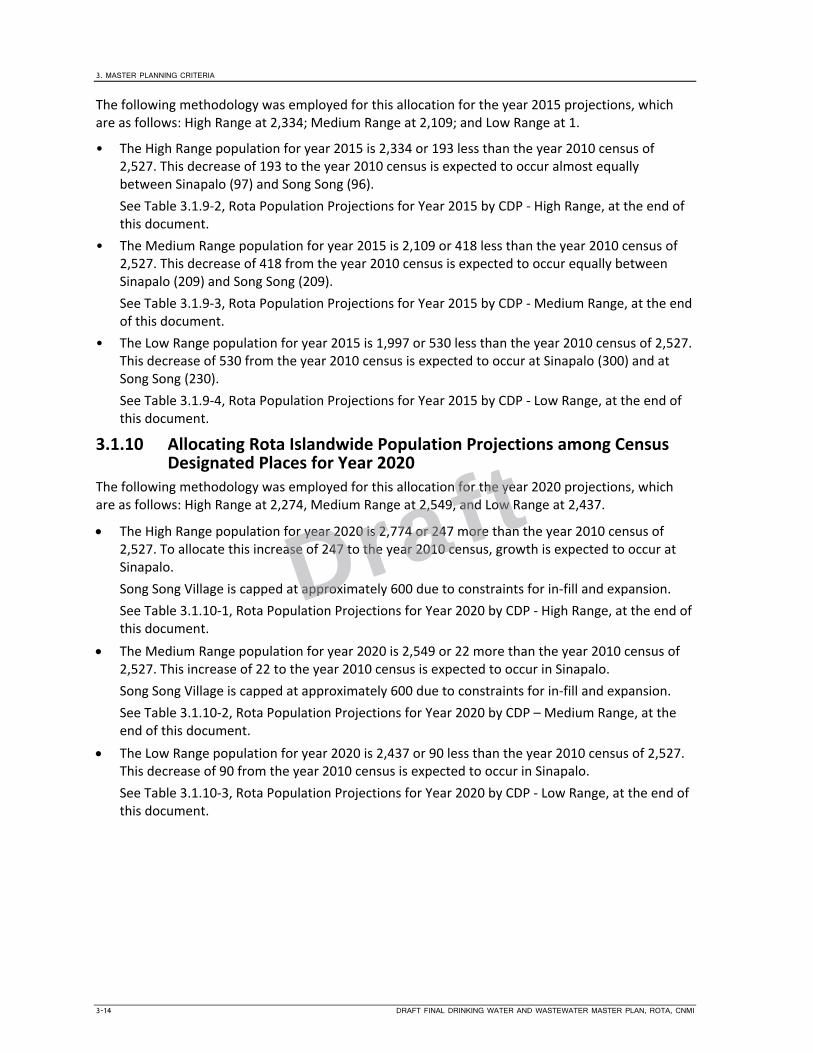
3. MASTER PLANNING CRITERIA
3-14 DRAFT FINAL DRINKING WATER AND WASTEWATER MASTER PLAN, ROTA, CNMI
The following methodology was employed for this allocation for the year 2015 projections, which are as follows: High Range at 2,334; Medium Range at 2,109; and Low Range at 1.
• The High Range population for year 2015 is 2,334 or 193 less than the year 2010 census of 2,527. This decrease of 193 to the year 2010 census is expected to occur almost equally between Sinapalo (97) and Song Song (96).
See Table 3.1.9‐2, Rota Population Projections for Year 2015 by CDP ‐ High Range, at the end of this document.
• The Medium Range population for year 2015 is 2,109 or 418 less than the year 2010 census of 2,527. This decrease of 418 from the year 2010 census is expected to occur equally between Sinapalo (209) and Song Song (209).
See Table 3.1.9‐3, Rota Population Projections for Year 2015 by CDP ‐ Medium Range, at the end of this document.
• The Low Range population for year 2015 is 1,997 or 530 less than the year 2010 census of 2,527. This decrease of 530 from the year 2010 census is expected to occur at Sinapalo (300) and at Song Song (230).
See Table 3.1.9‐4, Rota Population Projections for Year 2015 by CDP ‐ Low Range, at the end of this document.
3.1.10 Allocating Rota Islandwide Population Projections among Census Designated Places for Year 2020
The following methodology was employed for this allocation for the year 2020 projections, which are as follows: High Range at 2,274, Medium Range at 2,549, and Low Range at 2,437.
The High Range population for year 2020 is 2,774 or 247 more than the year 2010 census of 2,527. To allocate this increase of 247 to the year 2010 census, growth is expected to occur at Sinapalo.
Song Song Village is capped at approximately 600 due to constraints for in‐fill and expansion.
See Table 3.1.10‐1, Rota Population Projections for Year 2020 by CDP ‐ High Range, at the end of this document.
The Medium Range population for year 2020 is 2,549 or 22 more than the year 2010 census of 2,527. This increase of 22 to the year 2010 census is expected to occur in Sinapalo.
Song Song Village is capped at approximately 600 due to constraints for in‐fill and expansion.
See Table 3.1.10‐2, Rota Population Projections for Year 2020 by CDP – Medium Range, at the end of this document.
The Low Range population for year 2020 is 2,437 or 90 less than the year 2010 census of 2,527. This decrease of 90 from the year 2010 census is expected to occur in Sinapalo.
See Table 3.1.10‐3, Rota Population Projections for Year 2020 by CDP ‐ Low Range, at the end of this document.
Draft

3. MASTER PLANNING CRITERIA
DRAFT FINAL DRINKING WATER AND WASTEWATER MASTER PLAN, ROTA, CNMI 3-15
3.1.11 Allocating Rota Islandwide Population Projections among Census‐Designated Places for Year 2030
The following methodology was employed for this allocation for the year 2030 projections, which are as follows: High Range at 3,107, Medium Range at 2,882, and Low Range at 2770.
The High Range population for year 2030 is 3,107 or 580 more than the year 2010 census of 2,527. To allocate this increase of 580 to the year 2010 census, the following projections were made:
First, with this projected sizeable gain in population over the 10‐year period between 2020 and 2030, an increase of 925 is expected to occur in Sinapalo.
Second, an increase of approximately 175 each at Duge Village, Gampapa Village, and Ginanlangan (Chudan) Village, each of which has a new homestead.
Third, Song Song Village is capped at approximately 600 due to constraints for in‐fill and expansion.
See Table 3.1.11‐1, Rota Population Projections for Year 2030 by Census Designated Place ‐ High Range, at the end of this document.
The Medium Range population for year 2030 is 2,882 or 355 more than the year 2010 census of 2,527. The full allocation of this increase of 355 is expected to occur at Sinapalo.
Song Song Village is capped at approximately 600 due to constraints for in‐fill and expansion.
See Table 3.1.11‐2, Rota Population Projections for Year 2030 by Census Designated Place ‐ Medium Range, at the end of this document.
The Low Range population for year 2030 is 2,770 or 243 more than the year 2010 census of 2,527. To account for this increase of 243 to the year 2010 census, the entire increase is allocated to Sinapalo. Song Song Village is capped at approximately 600 due to constraints for in‐fill and expansion.
See Table 3.1.11‐3, Rota Population Projections for Year 2030 by Census Designated Place ‐ Low Range, at the end of this document.
Figure 3.1.11‐1 presents a map of Rota’s CDPs along with year 2010 census population, housing units, and group quarters.
3.1.12 Population by Rota Water Regions for Years 2015, 2020 and 2030 for High and Low Ranges
With the population projections by CDPs for all three horizon years, population can be allocated among Rota’s two Water Regions for the high and low ranges. Rota’s two Water Regions are Water Region 1, which comprises Sinapalo and Song Song, and Water Region 2, which comprise all other Rota villages.
See Table 3.1.12‐1 for allocations of projected population to Rota Water Regions for years 2015, 2020, and 2013.
3.1.13 Population by Rota Sewersheds for Years 2015, 2020 and 2030 As there is only one sewershed on Rota, the islandwide population projections for years 2015, 2020 and 2030 described earlier in this section present those data.
Draft
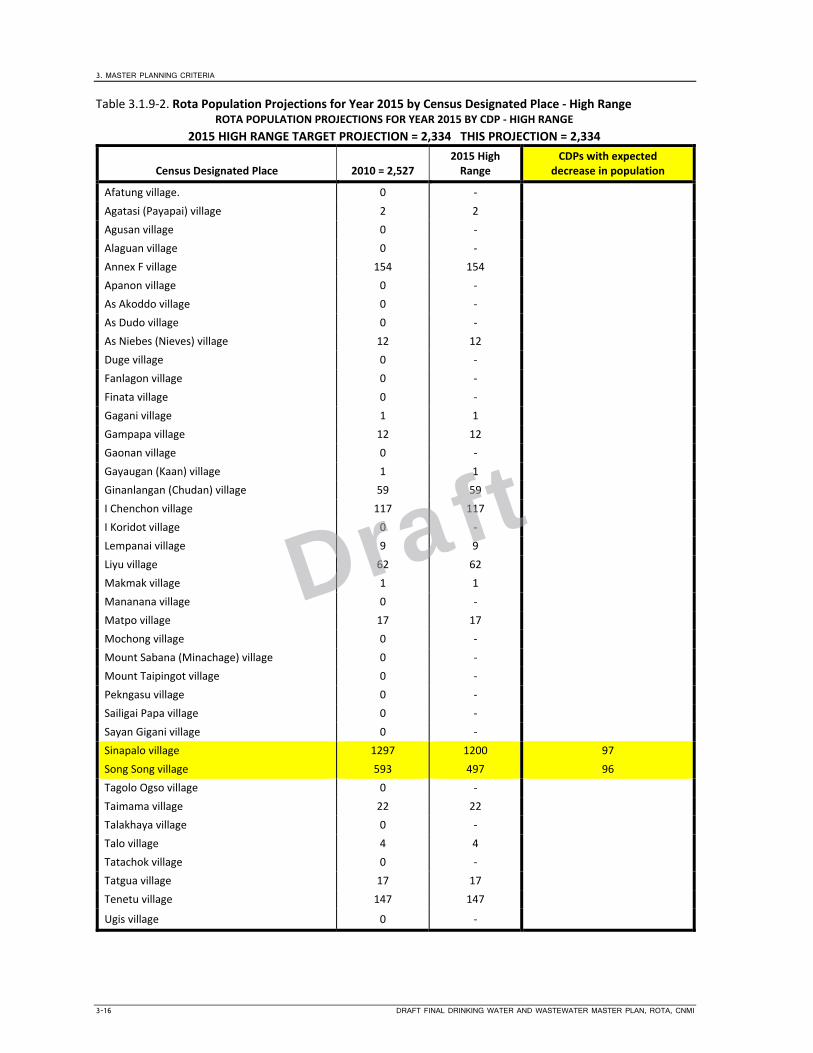
3. MASTER PLANNING CRITERIA
3-16 DRAFT FINAL DRINKING WATER AND WASTEWATER MASTER PLAN, ROTA, CNMI
Table 3.1.9‐2. Rota Population Projections for Year 2015 by Census Designated Place ‐ High Range ROTA POPULATION PROJECTIONS FOR YEAR 2015 BY CDP ‐ HIGH RANGE
2015 HIGH RANGE TARGET PROJECTION = 2,334 THIS PROJECTION = 2,334
Census Designated Place 2010 = 2,527 2015 High Range
CDPs with expected decrease in population
Afatung village. 0 ‐
Agatasi (Payapai) village 2 2
Agusan village 0 ‐
Alaguan village 0 ‐
Annex F village 154 154
Apanon village 0 ‐
As Akoddo village 0 ‐
As Dudo village 0 ‐
As Niebes (Nieves) village 12 12
Duge village 0 ‐
Fanlagon village 0 ‐
Finata village 0 ‐
Gagani village 1 1
Gampapa village 12 12
Gaonan village 0 ‐
Gayaugan (Kaan) village 1 1
Ginanlangan (Chudan) village 59 59
I Chenchon village 117 117
I Koridot village 0 ‐
Lempanai village 9 9
Liyu village 62 62
Makmak village 1 1
Mananana village 0 ‐
Matpo village 17 17
Mochong village 0 ‐
Mount Sabana (Minachage) village 0 ‐
Mount Taipingot village 0 ‐
Pekngasu village 0 ‐
Sailigai Papa village 0 ‐
Sayan Gigani village 0 ‐
Sinapalo village 1297 1200 97
Song Song village 593 497 96
Tagolo Ogso village 0 ‐
Taimama village 22 22
Talakhaya village 0 ‐
Talo village 4 4
Tatachok village 0 ‐
Tatgua village 17 17
Tenetu village 147 147
Ugis village 0 ‐
Draft
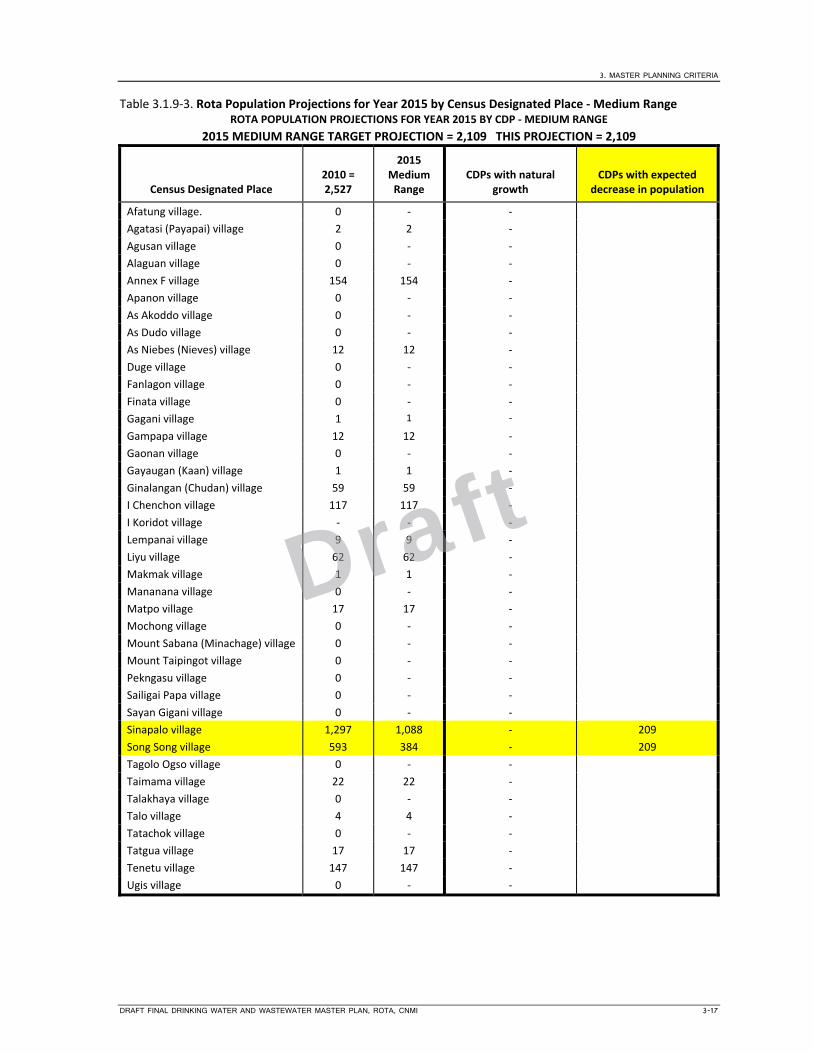
3. MASTER PLANNING CRITERIA
DRAFT FINAL DRINKING WATER AND WASTEWATER MASTER PLAN, ROTA, CNMI 3-17
Table 3.1.9‐3. Rota Population Projections for Year 2015 by Census Designated Place ‐ Medium Range ROTA POPULATION PROJECTIONS FOR YEAR 2015 BY CDP ‐ MEDIUM RANGE
2015 MEDIUM RANGE TARGET PROJECTION = 2,109 THIS PROJECTION = 2,109
Census Designated Place 2010 = 2,527
2015 Medium Range
CDPs with natural growth
CDPs with expected decrease in population
Afatung village. 0 ‐ ‐
Agatasi (Payapai) village 2 2 ‐
Agusan village 0 ‐ ‐
Alaguan village 0 ‐ ‐
Annex F village 154 154 ‐
Apanon village 0 ‐ ‐
As Akoddo village 0 ‐ ‐
As Dudo village 0 ‐ ‐
As Niebes (Nieves) village 12 12 ‐
Duge village 0 ‐ ‐
Fanlagon village 0 ‐ ‐
Finata village 0 ‐ ‐
Gagani village 1 1 ‐
Gampapa village 12 12 ‐
Gaonan village 0 ‐ ‐
Gayaugan (Kaan) village 1 1 ‐
Ginalangan (Chudan) village 59 59 ‐
I Chenchon village 117 117 ‐
I Koridot village ‐ ‐ ‐
Lempanai village 9 9 ‐
Liyu village 62 62 ‐
Makmak village 1 1 ‐
Mananana village 0 ‐ ‐
Matpo village 17 17 ‐
Mochong village 0 ‐ ‐
Mount Sabana (Minachage) village 0 ‐ ‐
Mount Taipingot village 0 ‐ ‐
Pekngasu village 0 ‐ ‐
Sailigai Papa village 0 ‐ ‐
Sayan Gigani village 0 ‐ ‐
Sinapalo village 1,297 1,088 ‐ 209
Song Song village 593 384 ‐ 209
Tagolo Ogso village 0 ‐ ‐
Taimama village 22 22 ‐
Talakhaya village 0 ‐ ‐
Talo village 4 4 ‐
Tatachok village 0 ‐ ‐
Tatgua village 17 17 ‐
Tenetu village 147 147 ‐
Ugis village 0 ‐ ‐
Draft

3. MASTER PLANNING CRITERIA
3-18 DRAFT FINAL DRINKING WATER AND WASTEWATER MASTER PLAN, ROTA, CNMI
Table 3.1.9‐4. Rota Population Projections for Year 2015 by Census Designated Place ‐ Low Range ROTA POPULATION PROJECTIONS FOR YEAR 2015 BY CDP ‐ LOW RANGE
2015 LOW RANGE TARGET PROJECTION = 1,997 THIS PROJECTION = 1,997
Census Designated Place 2010 = 2,527
2015 Low Range
CDPs with natural growth
CDPs with expected decrease in population
Afatung village. 0 ‐ ‐
Agatasi (Payapai) village 2 2 2
Agusan village 0 ‐ ‐
Alaguan village 0 ‐ ‐
Annex F village 154 154 154
Apanon village 0 ‐ ‐
As Akoddo village 0 ‐ ‐
As Dudo village 0 ‐ ‐
As Niebes (Nieves) village 12 12 12
Duge village 0 ‐ ‐
Fanlagon village 0 ‐ ‐
Finata village 0 ‐ ‐
Gagani village 1 1 1
Gampapa village 12 12 12
Gaonan village 0 ‐ ‐
Gayaugan (Kaan) village 1 1 1
Ginanlangan (Chudan) village 59 59 59
I Chenchon village 117 117 117
I Koridot village ‐ ‐ ‐
Lempanai village 9 9 9
Liyu village 62 62 62
Makmak village 1 1 1
Mananana village ‐ ‐ ‐
Matpo village 17 17 17
Mochong village 0 ‐ ‐
Mount Sabana (Minachage) village 0 ‐ ‐
Mount Taipingot village 0 ‐ ‐
Pekngasu village 0 ‐ ‐
Sailigai Papa village 0 ‐ ‐
Sayan Gigani village 0 ‐ ‐
Sinapalo village 1,297 997 ‐ 300
Song Song village 593 363 ‐ 230
Tagolo Ogso village 0 ‐ ‐
Taimama village 22 22 22
Talakhaya village 0 ‐ ‐
Talo village 4 4 4
Tatachok village 0 ‐ ‐
Tatgua village 17 17 17
Tenetu village 147 147 147
Ugis village 0 ‐ ‐
Draft
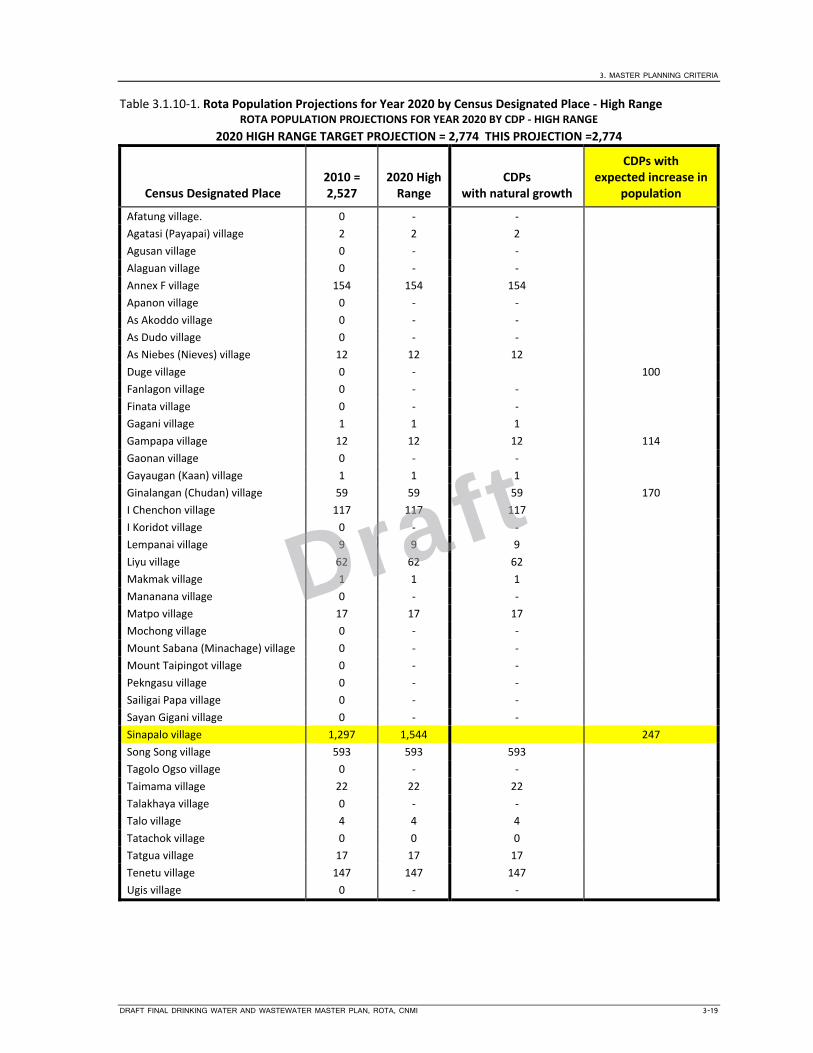
3. MASTER PLANNING CRITERIA
DRAFT FINAL DRINKING WATER AND WASTEWATER MASTER PLAN, ROTA, CNMI 3-19
Table 3.1.10‐1. Rota Population Projections for Year 2020 by Census Designated Place ‐ High Range ROTA POPULATION PROJECTIONS FOR YEAR 2020 BY CDP ‐ HIGH RANGE
2020 HIGH RANGE TARGET PROJECTION = 2,774 THIS PROJECTION =2,774
Census Designated Place 2010 = 2,527
2020 High Range
CDPs with natural growth
CDPs with expected increase in
population
Afatung village. 0 ‐ ‐
Agatasi (Payapai) village 2 2 2
Agusan village 0 ‐ ‐
Alaguan village 0 ‐ ‐
Annex F village 154 154 154
Apanon village 0 ‐ ‐
As Akoddo village 0 ‐ ‐
As Dudo village 0 ‐ ‐
As Niebes (Nieves) village 12 12 12
Duge village 0 ‐ 100
Fanlagon village 0 ‐ ‐
Finata village 0 ‐ ‐
Gagani village 1 1 1
Gampapa village 12 12 12 114
Gaonan village 0 ‐ ‐
Gayaugan (Kaan) village 1 1 1
Ginalangan (Chudan) village 59 59 59 170
I Chenchon village 117 117 117
I Koridot village 0 ‐ ‐
Lempanai village 9 9 9
Liyu village 62 62 62
Makmak village 1 1 1
Mananana village 0 ‐ ‐
Matpo village 17 17 17
Mochong village 0 ‐ ‐
Mount Sabana (Minachage) village 0 ‐ ‐
Mount Taipingot village 0 ‐ ‐
Pekngasu village 0 ‐ ‐
Sailigai Papa village 0 ‐ ‐
Sayan Gigani village 0 ‐ ‐
Sinapalo village 1,297 1,544 247
Song Song village 593 593 593
Tagolo Ogso village 0 ‐ ‐
Taimama village 22 22 22
Talakhaya village 0 ‐ ‐
Talo village 4 4 4
Tatachok village 0 0 0
Tatgua village 17 17 17
Tenetu village 147 147 147
Ugis village 0 ‐ ‐
Draft

3. MASTER PLANNING CRITERIA
3-20 DRAFT FINAL DRINKING WATER AND WASTEWATER MASTER PLAN, ROTA, CNMI
Table 3.1.10‐2. Rota Population Projections for Year 2020 by Census Designated Place ‐ Medium Range ROTA POPULATION PROJECTIONS FOR YEAR 2020 BY CDP ‐ MEDIUM RANGE
2020 MEDIUM RANGE TARGET PROJECTION = 2,549 THIS PROJECTION = 2,549
Census Designated Place 2010 = 2,527
2020 Medium Range
CDPs with natural growth
CDPs with expected increase in population
Afatung village. 0 ‐ ‐
Agatasi (Payapai) village 2 2 2
Agusan village 0 ‐ ‐
Alaguan village 0 ‐ ‐
Annex F village 154 154 154
Apanon village 0 ‐ ‐
As Akoddo village 0 ‐ ‐
As Dudo village 0 ‐ ‐
As Niebes (Nieves) village 12 12 12
Duge village 0 ‐
Fanlagon village 0 ‐ ‐
Finata village 0 ‐ ‐
Gagani village 1 1 1
Gampapa village 12 12 12
Gaonan village 0 ‐ ‐
Gayaugan (Kaan) village 1 1 1
Ginalangan (Chudan) village 59 59 59
I Chenchon village 117 117 117
I Koridot village 0 ‐ ‐
Lempanai village 9 9 9
Liyu village 62 62 62
Makmak village 1 1 1
Mananana village 0 ‐ ‐
Matpo village 17 17 17
Mochong village 0 ‐ ‐
Mount Sabana (Minachage) village 0 ‐ ‐
Mount Taipingot village 0 ‐ ‐
Pekngasu village 0 ‐ ‐
Sailigai Papa village 0 ‐ ‐
Sayan Gigani village 0 ‐ ‐
Sinapalo village 1,297 1,319 22
Song Song village 593 593 593
Tagolo Ogso village 0 ‐ ‐
Taimama village 22 22 22
Talakhaya village 0 ‐ ‐
Talo village 4 4 4
Tatachok village 0 0 0
Tatgua village 17 17 17
Tenetu village 147 147 147
Ugis village 0 ‐ ‐
Draft
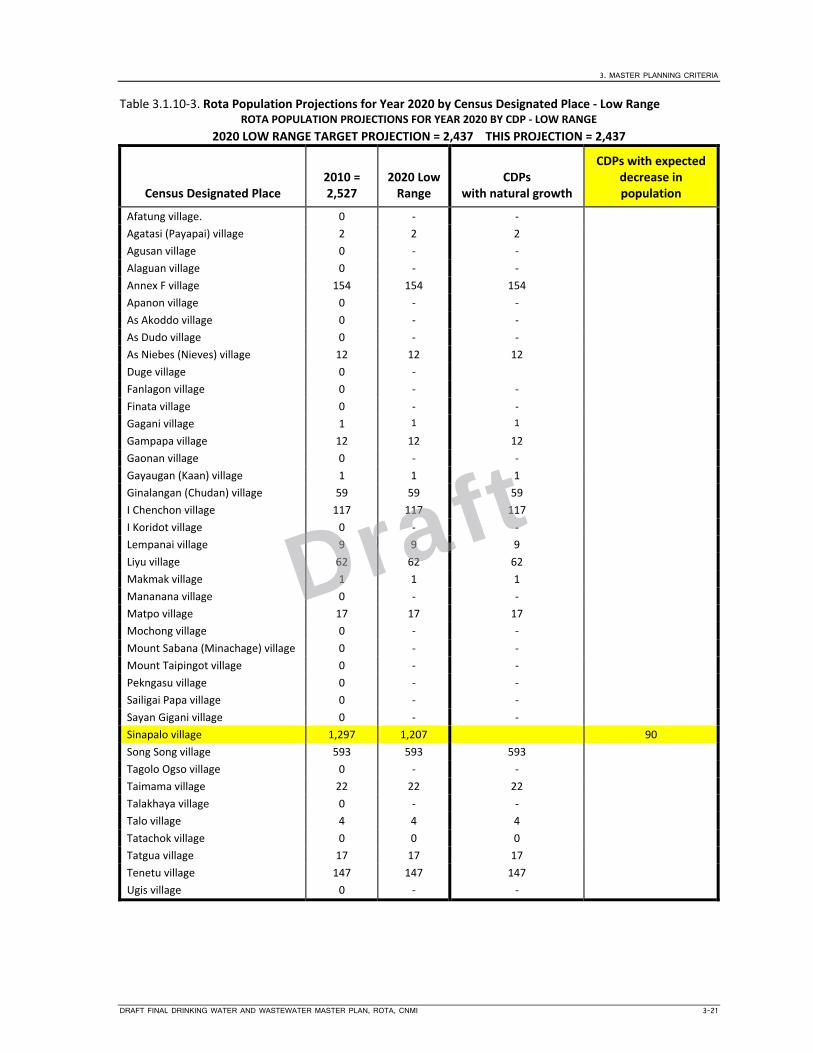
3. MASTER PLANNING CRITERIA
DRAFT FINAL DRINKING WATER AND WASTEWATER MASTER PLAN, ROTA, CNMI 3-21
Table 3.1.10‐3. Rota Population Projections for Year 2020 by Census Designated Place ‐ Low Range ROTA POPULATION PROJECTIONS FOR YEAR 2020 BY CDP ‐ LOW RANGE
2020 LOW RANGE TARGET PROJECTION = 2,437 THIS PROJECTION = 2,437
Census Designated Place 2010 = 2,527
2020 Low Range
CDPs with natural growth
CDPs with expected decrease in population
Afatung village. 0 ‐ ‐
Agatasi (Payapai) village 2 2 2
Agusan village 0 ‐ ‐
Alaguan village 0 ‐ ‐
Annex F village 154 154 154
Apanon village 0 ‐ ‐
As Akoddo village 0 ‐ ‐
As Dudo village 0 ‐ ‐
As Niebes (Nieves) village 12 12 12
Duge village 0 ‐
Fanlagon village 0 ‐ ‐
Finata village 0 ‐ ‐
Gagani village 1 1 1
Gampapa village 12 12 12
Gaonan village 0 ‐ ‐
Gayaugan (Kaan) village 1 1 1
Ginalangan (Chudan) village 59 59 59
I Chenchon village 117 117 117
I Koridot village 0 ‐ ‐
Lempanai village 9 9 9
Liyu village 62 62 62
Makmak village 1 1 1
Mananana village 0 ‐ ‐
Matpo village 17 17 17
Mochong village 0 ‐ ‐
Mount Sabana (Minachage) village 0 ‐ ‐
Mount Taipingot village 0 ‐ ‐
Pekngasu village 0 ‐ ‐
Sailigai Papa village 0 ‐ ‐
Sayan Gigani village 0 ‐ ‐
Sinapalo village 1,297 1,207 90
Song Song village 593 593 593
Tagolo Ogso village 0 ‐ ‐
Taimama village 22 22 22
Talakhaya village 0 ‐ ‐
Talo village 4 4 4
Tatachok village 0 0 0
Tatgua village 17 17 17
Tenetu village 147 147 147
Ugis village 0 ‐ ‐
Draft

3. MASTER PLANNING CRITERIA
3-22 DRAFT FINAL DRINKING WATER AND WASTEWATER MASTER PLAN, ROTA, CNMI
Table 3.1.11‐1. Rota Population Projections for Year 2030 by Census Designated Place ‐ High Range ROTA POPULATION PROJECTIONS FOR YEAR 2030 BY CDP ‐ HIGH RANGE
2030 HIGH RANGE TARGET PROJECTION = 3,107 THIS PROJECTION = 3,107
Census Designated Place 2010 = 2,527
2030 High Range
CDPs with natural growth
CDPs with expected increase in population
Afatung village. 0 ‐ ‐
Agatasi (Payapai) village 2 2 2
Agusan village 0 ‐ ‐
Alaguan village 0 ‐ ‐
Annex F village 154 154 154
Apanon village 0 ‐ ‐
As Akoddo village 0 ‐ ‐
As Dudo village 0 ‐ ‐
As Niebes (Nieves) village 12 12 12
Duge village 0 ‐ ‐
Fanlagon village 0 ‐ ‐
Finata village 0 ‐ ‐
Gagani village 1 1 1
Gampapa village 12 12 12
Gaonan village 0 ‐ ‐
Gayaugan (Kaan) village 1 1 1
Ginalangan (Chudan) village 59 59 59
I Chenchon village 117 117 117
I Koridot village 0 ‐ ‐
Lempanai village 9 9 9
Liyu village 62 62 62
Makmak village 1 1 1
Mananana village 0 ‐ ‐
Matpo village 17 17 17
Mochong village 0 ‐ ‐
Mount Sabana (Minachage) village 0 ‐ ‐
Mount Taipingot village 0 ‐ ‐
Pekngasu village 0 ‐ ‐
Sailigai Papa village 0 ‐ ‐
Sayan Gigani village 0 ‐ ‐
Sinapalo village 1,297 1,877 580
Song Song village 593 593 593
Tagolo Ogso village 0 ‐ ‐
Taimama village 22 22 22
Talakhaya village 0 ‐ ‐
Talo village 4 4 4
Tatachok village 0 ‐ 0
Tatgua village 17 17 17
Tenetu village 147 147 147
Ugis village 0 ‐ ‐
Draft

3. MASTER PLANNING CRITERIA
DRAFT FINAL DRINKING WATER AND WASTEWATER MASTER PLAN, ROTA, CNMI 3-23
Table 3.1.11‐2. Rota Population Projections for Year 2030 by Census Designated Place ‐ Medium Range ROTA POPULATION PROJECTIONS FOR YEAR 2030 BY CDP ‐ MEDIUM RANGE
2030 MEDIUM RANGE TARGET PROJECTION = 2,882 THIS PROJECTION = 2,882
Census Designated Place 2010 = 2,527
2030 Medium Range
CDPs with natural growth
CDPs with expected increase in population
Afatung village. 0 ‐ ‐
Agatasi (Payapai) village 2 2 2
Agusan village 0 ‐ ‐
Alaguan village 0 ‐ ‐
Annex F village 154 154 154
Apanon village 0 ‐ ‐
As Akoddo village 0 ‐ ‐
As Dudo village 0 ‐ ‐
As Niebes (Nieves) village 12 12 12
Duge village 0 ‐ ‐
Fanlagon village 0 ‐ ‐
Finata village 0 ‐ ‐
Gagani village 1 1 1
Gampapa village 12 12 12
Gaonan village 0 ‐ ‐
Gayaugan (Kaan) village 1 1 1
Ginalangan (Chudan) village 59 59 59
I Chenchon village 117 117 117
I Koridot village 0 ‐ ‐
Lempanai village 9 9 9
Liyu village 62 62 62
Makmak village 1 1 1
Mananana village 0 ‐ ‐
Matpo village 17 17 17
Mochong village 0 ‐ ‐
Mount Sabana (Minachage) village 0 ‐ ‐
Mount Taipingot village 0 ‐ ‐
Pekngasu village 0 ‐ ‐
Sailigai Papa village 0 ‐ ‐
Sayan Gigani village 0 ‐ ‐
Sinapalo village 1,297 1,652 355
Song Song village 593 593 593
Tagolo Ogso village 0 ‐ ‐
Taimama village 22 22 22
Talakhaya village 0 ‐ ‐
Talo village 4 4 4
Tatachok village 0 ‐ 0
Tatgua village 17 17 17
Tenetu village 147 147 147
Ugis village 0 ‐ ‐
Draft
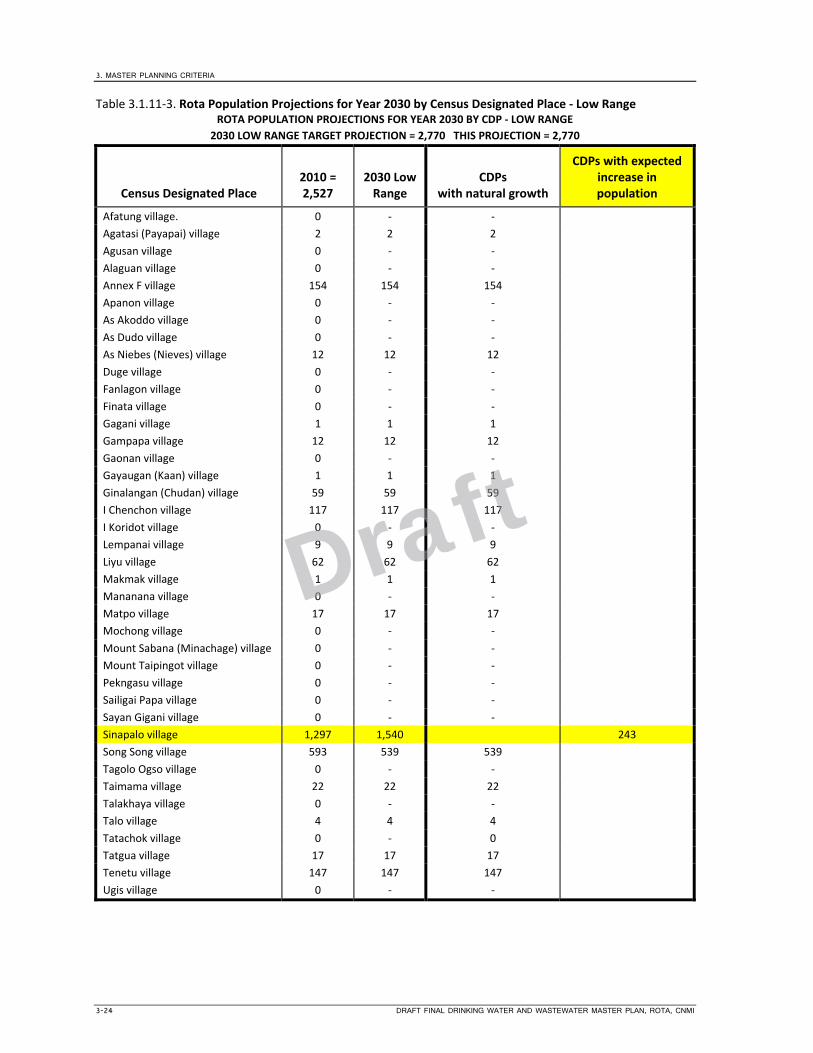
3. MASTER PLANNING CRITERIA
3-24 DRAFT FINAL DRINKING WATER AND WASTEWATER MASTER PLAN, ROTA, CNMI
Table 3.1.11‐3. Rota Population Projections for Year 2030 by Census Designated Place ‐ Low Range ROTA POPULATION PROJECTIONS FOR YEAR 2030 BY CDP ‐ LOW RANGE
2030 LOW RANGE TARGET PROJECTION = 2,770 THIS PROJECTION = 2,770
Census Designated Place 2010 = 2,527
2030 Low Range
CDPs with natural growth
CDPs with expected increase in population
Afatung village. 0 ‐ ‐
Agatasi (Payapai) village 2 2 2
Agusan village 0 ‐ ‐
Alaguan village 0 ‐ ‐
Annex F village 154 154 154
Apanon village 0 ‐ ‐
As Akoddo village 0 ‐ ‐
As Dudo village 0 ‐ ‐
As Niebes (Nieves) village 12 12 12
Duge village 0 ‐ ‐
Fanlagon village 0 ‐ ‐
Finata village 0 ‐ ‐
Gagani village 1 1 1
Gampapa village 12 12 12
Gaonan village 0 ‐ ‐
Gayaugan (Kaan) village 1 1 1
Ginalangan (Chudan) village 59 59 59
I Chenchon village 117 117 117
I Koridot village 0 ‐ ‐
Lempanai village 9 9 9
Liyu village 62 62 62
Makmak village 1 1 1
Mananana village 0 ‐ ‐
Matpo village 17 17 17
Mochong village 0 ‐ ‐
Mount Sabana (Minachage) village 0 ‐ ‐
Mount Taipingot village 0 ‐ ‐
Pekngasu village 0 ‐ ‐
Sailigai Papa village 0 ‐ ‐
Sayan Gigani village 0 ‐ ‐
Sinapalo village 1,297 1,540 243
Song Song village 593 539 539
Tagolo Ogso village 0 ‐ ‐
Taimama village 22 22 22
Talakhaya village 0 ‐ ‐
Talo village 4 4 4
Tatachok village 0 ‐ 0
Tatgua village 17 17 17
Tenetu village 147 147 147
Ugis village 0 ‐ ‐
Draft

3. MASTER PLANNING CRITERIA
DRAFT FINAL DRINKING WATER AND WASTEWATER MASTER PLAN, ROTA, CNMI 3-25
Table 3.1.12‐1. Rota Population Projections by CDP for 2015, 2020, and 2030 High and Low Ranges
Census Designated Place
2015 High Range
2015 Low Range
2020 High Range
2020 Low Range
2030 High Range
2030 Low Range Census Designated Place
Sinapalo village 1,200 997 1,544 1,207 1,544 1,207 Sinapalo village
Song Song village 497 363 593 593 593 593 Song Song village
Total Rota WR 1 1,697 1,360 2,137 1,800 2,137 1,800
Agusan village ‐ ‐ ‐ ‐ ‐ ‐ Agusan village
Alaguan village ‐ ‐ ‐ ‐ ‐ ‐ Alaguan village
Annex F village 154 154 154 154 154 154 Annex F village
Apanon village ‐ ‐ ‐ ‐ ‐ ‐ Apanon village
As Akoddo village ‐ ‐ ‐ ‐ ‐ ‐ As Akoddo village
As Dudo village ‐ ‐ ‐ ‐ ‐ ‐ As Dudo village
As Niebes (Nieves) village
12 12 12 12 12 12 As Niebes (Nieves) village
Duge village ‐ ‐ ‐ ‐ ‐ ‐ Duge village
Fanlagon village ‐ ‐ ‐ ‐ ‐ ‐ Fanlagon village
Finata village ‐ ‐ ‐ ‐ ‐ ‐ Finata village
Gagani village 1 1 1 1 1 1 Gagani village
Gampapa village 12 12 12 12 12 12 Gampapa village
Gaonan village ‐ ‐ ‐ ‐ ‐ ‐ Gaonan village
Gayaugan (Kaan) village 1 1 1 1 1 1 Gayaugan (Kaan) village
Ginalangan (Chudan) village
59 59 59 59 59 59 Ginalangan (Chudan) village
I Chenchon village
117 117 117 117 117 117 I Chenchon village
I Koridot village ‐ ‐ ‐ ‐ ‐ ‐ I Koridot village
Lempanai village 9 9 9 9 9 9 Lempanai village
Liyu village 62 62 62 62 62 62 Liyu village
Makmak village 1 1 1 1 1 1 Makmak village
Mananana village ‐ ‐ ‐ ‐ ‐ ‐ Mananana village
Matpo village 17 17 17 17 17 17 Matpo village
Mochong village ‐ ‐ ‐ ‐ ‐ ‐ Mochong village
Mount Sabana (Minachage) village
‐ ‐ ‐ ‐ ‐ ‐ Mount Sabana (Minachage) village
Mount Taipingot village ‐ ‐ ‐ ‐ ‐ ‐ Mount Taipingot village
Pekngasu village ‐ ‐ ‐ ‐ ‐ ‐ Pekngasu village
Sailigai Papa village ‐ ‐ ‐ ‐ ‐ ‐ Sailigai Papa village
Sayan Gigani village ‐ ‐ ‐ ‐ ‐ ‐ Sayan Gigani village
Tagolo Ogso village ‐ ‐ ‐ ‐ ‐ ‐ Tagolo Ogso village
Taimama village 22 22 22 22 22 22 Taimama village
Talakhaya village ‐ ‐ ‐ ‐ ‐ ‐ Talakhaya village
Talo village 4 4 4 4 4 4 Talo village
Tatachok village ‐ ‐ ‐ ‐ ‐ ‐ Tatachok village
Draft
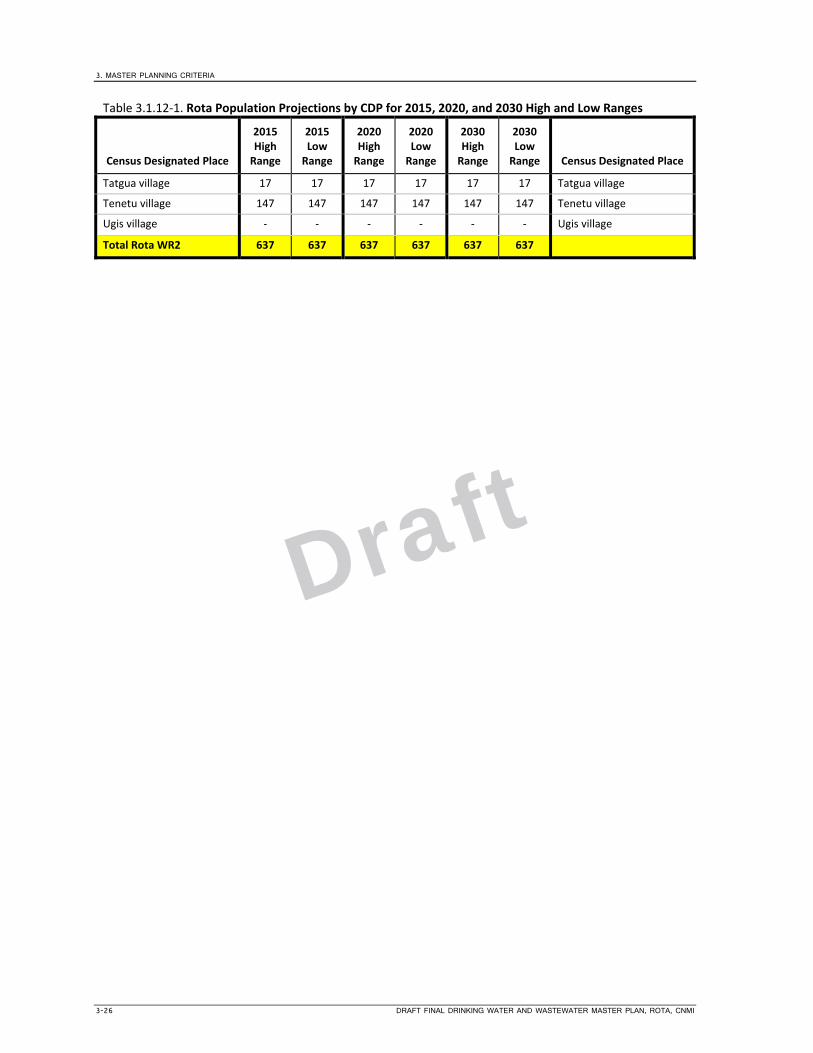
3. MASTER PLANNING CRITERIA
3-26 DRAFT FINAL DRINKING WATER AND WASTEWATER MASTER PLAN, ROTA, CNMI
Table 3.1.12‐1. Rota Population Projections by CDP for 2015, 2020, and 2030 High and Low Ranges
Census Designated Place
2015 High Range
2015 Low Range
2020 High Range
2020 Low Range
2030 High Range
2030 Low Range Census Designated Place
Tatgua village 17 17 17 17 17 17 Tatgua village
Tenetu village 147 147 147 147 147 147 Tenetu village
Ugis village ‐ ‐ ‐ ‐ ‐ ‐ Ugis village
Total Rota WR2 637 637 637 637 637 637
Draft
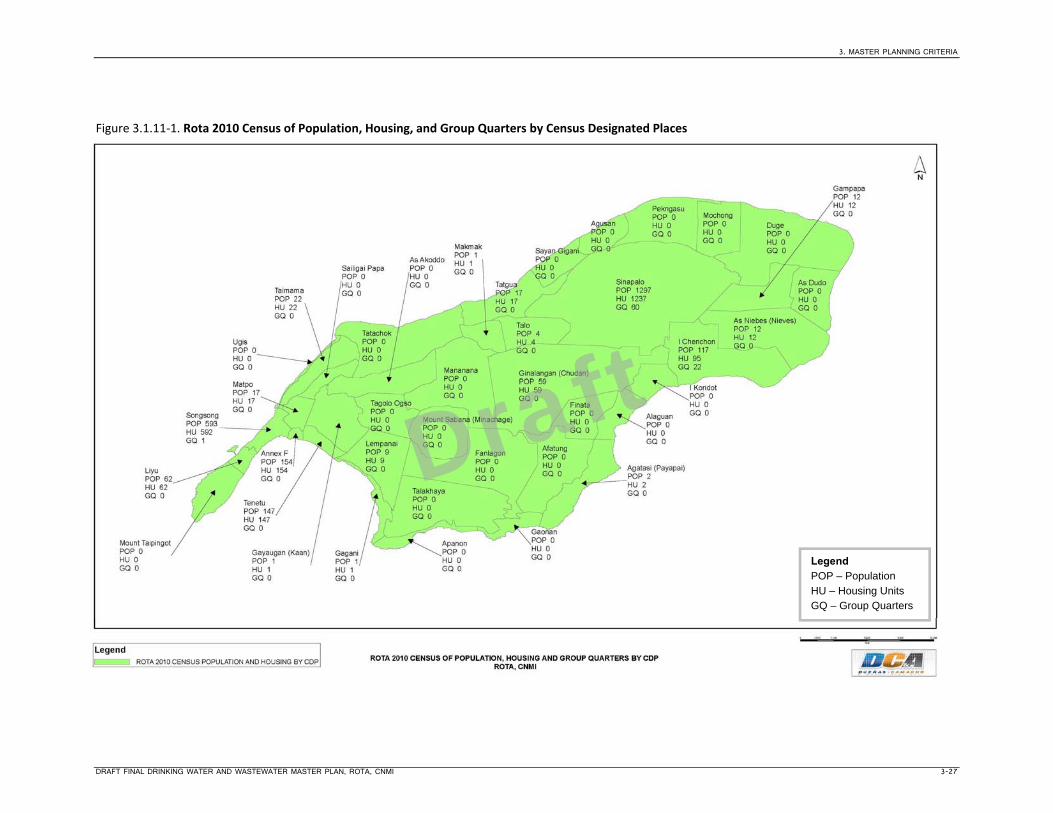
3. MASTER PLANNING CRITERIA
DRAFT FINAL DRINKING WATER AND WASTEWATER MASTER PLAN, ROTA, CNMI 3-27
Figure 3.1.11‐1. Rota 2010 Census of Population, Housing, and Group Quarters by Census Designated Places
Legend POP – Population
HU – Housing Units GQ – Group Quarters
Draft

Draft
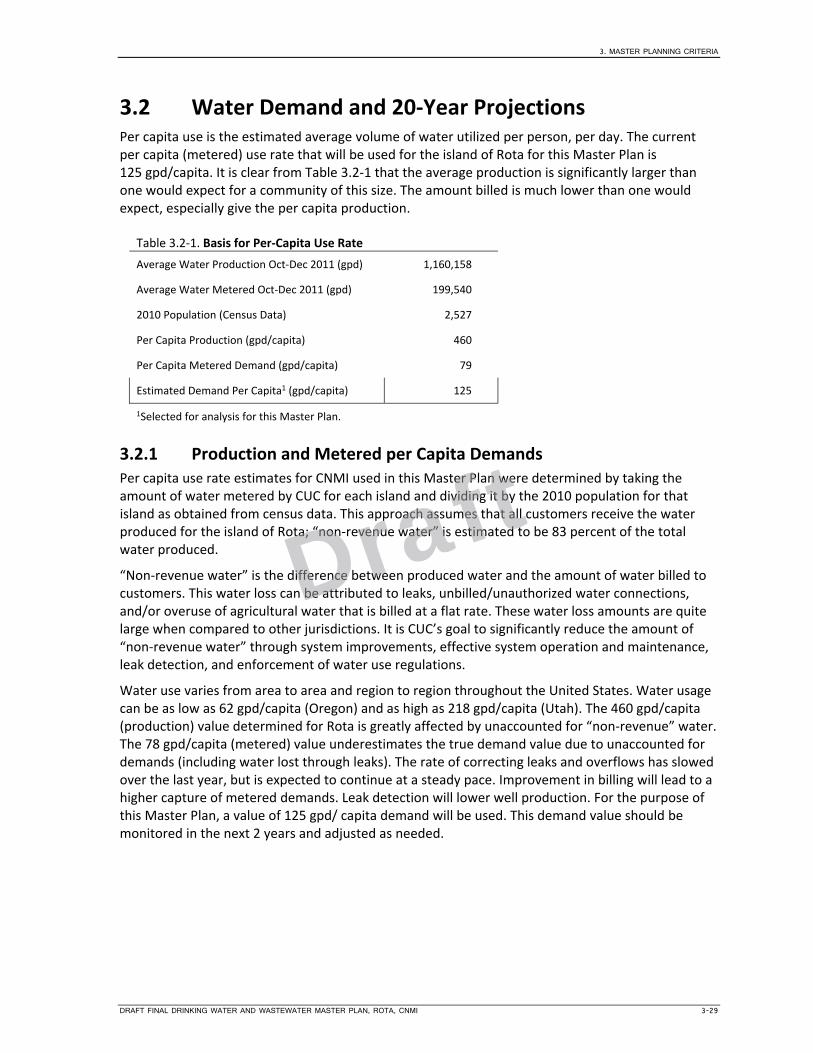
3. MASTER PLANNING CRITERIA
DRAFT FINAL DRINKING WATER AND WASTEWATER MASTER PLAN, ROTA, CNMI 3-29
3.2 Water Demand and 20‐Year Projections Per capita use is the estimated average volume of water utilized per person, per day. The current per capita (metered) use rate that will be used for the island of Rota for this Master Plan is 125 gpd/capita. It is clear from Table 3.2‐1 that the average production is significantly larger than one would expect for a community of this size. The amount billed is much lower than one would expect, especially give the per capita production.
Table 3.2‐1. Basis for Per‐Capita Use Rate
Average Water Production Oct‐Dec 2011 (gpd) 1,160,158
Average Water Metered Oct‐Dec 2011 (gpd) 199,540
2010 Population (Census Data) 2,527
Per Capita Production (gpd/capita) 460
Per Capita Metered Demand (gpd/capita) 79
Estimated Demand Per Capita1 (gpd/capita) 125
1Selected for analysis for this Master Plan.
3.2.1 Production and Metered per Capita Demands Per capita use rate estimates for CNMI used in this Master Plan were determined by taking the amount of water metered by CUC for each island and dividing it by the 2010 population for that island as obtained from census data. This approach assumes that all customers receive the water produced for the island of Rota; “non‐revenue water” is estimated to be 83 percent of the total water produced.
“Non‐revenue water” is the difference between produced water and the amount of water billed to customers. This water loss can be attributed to leaks, unbilled/unauthorized water connections, and/or overuse of agricultural water that is billed at a flat rate. These water loss amounts are quite large when compared to other jurisdictions. It is CUC’s goal to significantly reduce the amount of “non‐revenue water” through system improvements, effective system operation and maintenance, leak detection, and enforcement of water use regulations.
Water use varies from area to area and region to region throughout the United States. Water usage can be as low as 62 gpd/capita (Oregon) and as high as 218 gpd/capita (Utah). The 460 gpd/capita (production) value determined for Rota is greatly affected by unaccounted for “non‐revenue” water. The 78 gpd/capita (metered) value underestimates the true demand value due to unaccounted for demands (including water lost through leaks). The rate of correcting leaks and overflows has slowed over the last year, but is expected to continue at a steady pace. Improvement in billing will lead to a higher capture of metered demands. Leak detection will lower well production. For the purpose of this Master Plan, a value of 125 gpd/ capita demand will be used. This demand value should be monitored in the next 2 years and adjusted as needed.
Draft

3. MASTER PLANNING CRITERIA
3-30 DRAFT FINAL DRINKING WATER AND WASTEWATER MASTER PLAN, ROTA, CNMI
3.2.2 Tank Service Area Population Projections Tables 3.2.2‐2 and 3.2.2‐3 present the projected populations per village and per census designation area, respectively, using a high estimate for population growth. The high estimate has been used to present a conservative development approach and to reduce the possibility of undersizing the tank service area infrastructure, which could potentially result in the need for premature future capacity improvements.
Table 3.2.2‐2. Projected Population per Village for Rota
Population Projections
Village 2010 2015 2020 2030
Sinapalo 1297 1450 2380 2691
Song Song 593 646 600 600
Others 637 693 884 1437
Total 2527 2789 3864 4728
Table 3.2.2‐3. Projected Population per Tank Service Area for Rota
Population Projections
TSA 2010 2015 2020 2030
Sinapalo 1934 2143 3264 4128
Song Song 593 646 600 600
Total 2527 2789 3864 4728
Using unit demand and population projections, average projection demands for 2015, 2020, and 2030 can be calculated. Table 3.2.2‐4 presents the demands for the existing tank service areas.
Table 3.2.2‐4. Projected Population Water Demands per Tank Service Area for Rota
Production Projections (GPD)
TSA 2010 2015 2020 2030
Sinapalo 241,750 267,875 408,000 516,000
Song Song 74,125 80,750 75,000 75,000
Total 315,875 348,625 483,000 591,000
Note: Flows based on the per capita demand value of 125 gal/capita/day.
While no revision to the tank service areas have been recommended as part of this Master Plan, it is common that the Sinapalo TSA serves the entire island of Rota during the dry season. If a new tank is designed for Sinapalo TSA, it is recommended that it take into account the entire population.
Draft

3. MASTER PLANNING CRITERIA
DRAFT FINAL DRINKING WATER AND WASTEWATER MASTER PLAN, ROTA, CNMI 3-31
3.3 Wastewater Flow Projections Analysis of future wastewater flows is not discussed in this Master Plan. Rota currently relies entirely on private septic systems for disposal and treatment of wastewater. It is possible that in the future CUC may want to convert some or all residents from septic system usage to using CUC‐owned sewers and centralized treatment for disposal of wastewater. This would require construction of entirely new infrastructure, including a collection system, lift stations, and treatment facilities. A wastewater collection and treatment needs analysis study was identified and included in the CIP development section of this report (Section 5.3).
Draft

Draft

3. MASTER PLANNING CRITERIA
DRAFT FINAL DRINKING WATER AND WASTEWATER MASTER PLAN, ROTA, CNMI 3-33
3.4 Status of “Construction Works in Progress” Table 3.4.1 lists the construction projects that have been in progress or been completed since 2011.
Table 3.4‐1. Ongoing CUC Water and Wastewater Projects as of May 11, 2012
CUC Project Number Project Name Project Description
Funding Source Project Status
Water11‐010
Rota Water Supply Project
(Currently funded via EPA consolidated grant) This project includes system improvements such piping modifications at the existing water storage tanks, security fencing, booster pump station upgrade, PRV repair/replacement along the Main Cave to Kaan WST, and replacement of failed valves. A dedicated 8” transmission line exists between the wells and the Ginanlangan Water Storage Tank.
EPA Negotiating A&E Fees
Kaan WST Improvements: The existing Kaan WST tank is to be rehabilitated to extend the life of this facility. This includes exterior painting, new access ladder, hatches and cathodic protection and site fencing.
EPA Negotiating A&E Fees
Ginanlangan WST rehabilitation: This WST requires rehabilitation to extend the life of this WST. This includes exterior bolt replacement, cathodic protection, and rehabilitation of hatches, ladders and other appurtenances on this tank.
EPA Negotiating A&E Fees
Valve Replacement/Repair: There are a number of valves in Rota that are being by‐passed and need replacement or repair. This includes valves on the water transmission line and at both tank sites. Replacement valving along the existing water transmission lines to help prevent the current overflowing of the Kaan WST and chlorine wasting.
EPA Negotiating A&E Fees
Sinapalo Booster Station: A booster station with a means of providing back‐up generation will be provided for the Sinapalo area of Rota. The current booster station is exposed and does not have any back‐up generation building or capabilities in the case of a power outage. A new booster station is planned to be included within the existing Ginanlangan WST site and contained within a multipurpose "hardening" building that contains a back‐up generator, chlorination and electrical room.
EPA Negotiating A&E Fees
Draft
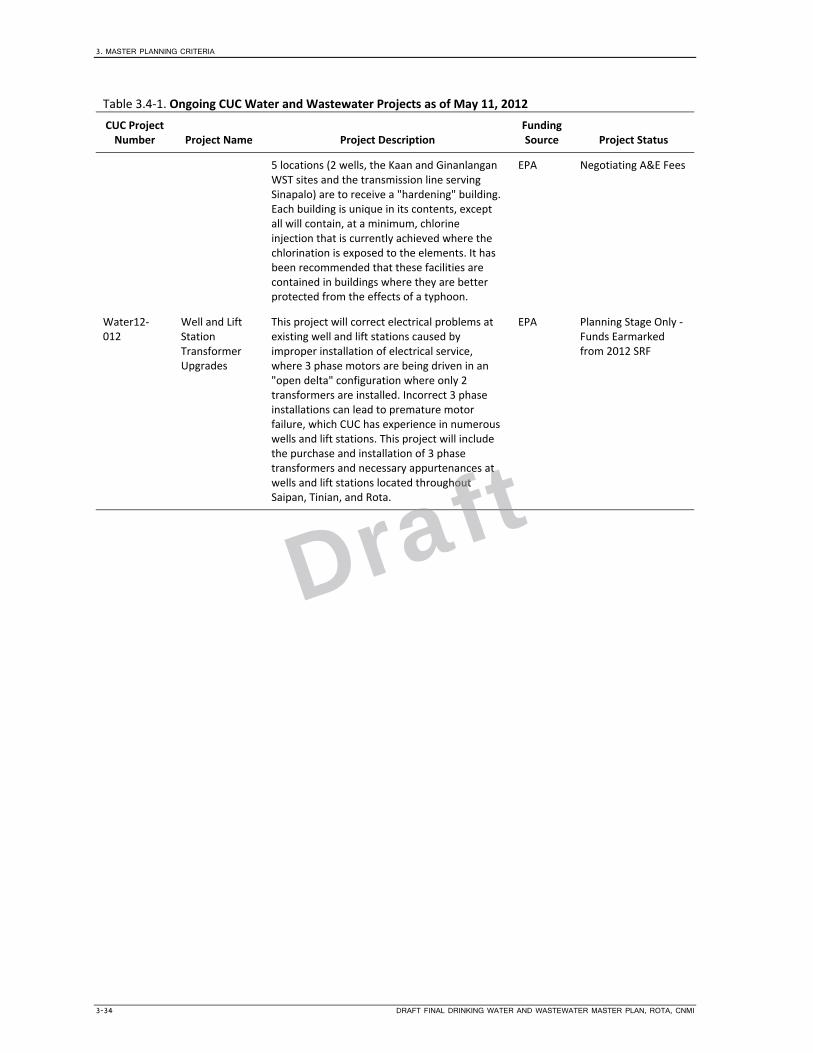
3. MASTER PLANNING CRITERIA
3-34 DRAFT FINAL DRINKING WATER AND WASTEWATER MASTER PLAN, ROTA, CNMI
Table 3.4‐1. Ongoing CUC Water and Wastewater Projects as of May 11, 2012
CUC Project Number Project Name Project Description
Funding Source Project Status
5 locations (2 wells, the Kaan and Ginanlangan WST sites and the transmission line serving Sinapalo) are to receive a "hardening" building. Each building is unique in its contents, except all will contain, at a minimum, chlorine injection that is currently achieved where the chlorination is exposed to the elements. It has been recommended that these facilities are contained in buildings where they are better protected from the effects of a typhoon.
EPA Negotiating A&E Fees
Water12‐012
Well and Lift Station Transformer Upgrades
This project will correct electrical problems at existing well and lift stations caused by improper installation of electrical service, where 3 phase motors are being driven in an "open delta" configuration where only 2 transformers are installed. Incorrect 3 phase installations can lead to premature motor failure, which CUC has experience in numerous wells and lift stations. This project will include the purchase and installation of 3 phase transformers and necessary appurtenances at wells and lift stations located throughout Saipan, Tinian, and Rota.
EPA Planning Stage Only ‐ Funds Earmarked from 2012 SRF
Draft
3. MASTER PLANNING CRITERIA
DRAFT FINAL DRINKING WATER AND WASTEWATER MASTER PLAN, ROTA, CNMI 3-35
3.5 Assessment of Current CUC Management Policies, Procedures, and Operating Rules and Regulations for Water and Wastewater Systems
This section summarizes the review of current CUC staffing, management policies, procedures, operating rules and regulations. The purpose of this review was to document the most prominent obstacles to CUC management in terms of its organizational structure, labor force issues, ability to comply with the Stipulated Order and, more importantly, to perform its mission to operate the CNMI water and WW infrastructure systems efficiently and in accord with governing laws and regulations. The information for this review was derived from four sources:
Observations during the 18‐month master planning period
Specific requests to CUC for relevant documentation
Workshop with CUC on December 13, 2012 to discuss management issues
Discussions with the Water Task Force
This section is organized as follows:
Management organization
Workforce issues
Automation and technology
Recommendations
3.5.1 Management Organization This subsection focuses on the overall CUC organization, the organization of the Engineering Department within CUC, and the Water Task Force.
CUC Organizational Structure The current upper management layer of CUC is shown in Figure 3.5.1‐1.
The current structure of the organization is designed to comply with the requirements of the Stipulated Order. The management positions listed in bold text are required by the Stipulated Order. Additional positions not shown in Figure 3.5.1‐1 include a Drinking Water and WW Division Manager and a Drinking Water and WW Associate Engineer. The positions dictated by the Stipulated Order have qualifications requirements that have been incorporated into the job description. These also serve as a safety mechanism to keep CUC from backsliding by preventing unqualified persons to become political appointments to critical positions, something that has been a problem in the past.
Though this organization structure meets current requirements, CUC expressed interest in evolving to a “flatter” organization, once Stipulated Order obligations have been satisfied, that reflects the current trend in the industry. This possible future restructuring would seek to reorient and streamline CUC engineering and operational functions. For example, the Stipulated Order requires a Deputy Executive Director, a Drinking Water and WW Division Manager, Chief Engineer, and a Drinking Water and WW Associate Engineer all possessing similar and redundant water and WW planning and engineering qualifications. A streamlined, but still effective CUC may eliminate a least one of these positions, if not more. At this point, however, there is no alternative organizational structure that is being requested for formal consideration by DEQ and EPA. Currently a number of these positons are vacant, including Deputy Director of Water and WW Operations and Deputy Executive Director, due to difficulty recruiting qualified staff.
Draft

3. MASTER PLANNING CRITERIA
3-36 DRAFT FINAL DRINKING WATER AND WASTEWATER MASTER PLAN, ROTA, CNMI
Figure 3.5.1‐1. Commonwealth Utilities Corporation Upper Management Organizational Structure
Engineering Organization within CUC Traditionally, the Engineering Department has the responsibility for executing design and construction management of new and replacement Capital Improvement Projects, providing support to Operations, and managing specialized technologies (i.e., models, GIS).
Prior to the Master Plan implementation, engineering personnel have been called upon to investigate and act upon a wide range of operational issues in an ad‐hoc manner, resulting in considerable time spent in the field designing water and WW system improvements to provide short‐term operational fixes. This situation, plus the transition of several senior staff in and out of CUC, had led to a fragmented approach to project prioritization.
CUC’s Engineering Department has made significant strides in reversing these past practices. Strong leadership from the Chief Engineer has helped to redefine and reorganize the department’s mission to focus primarily on project management, systems analyses, implementation of capital improvements, and assuring that water and WW system operations are in concert with design and systems optimization initiatives. This focus is critical to implementing the Drinking Water and WW Master Plans, each which requires the CUC Engineering Department to oversee a myriad of capital improvement projects developed and prioritized during the master planning process to meet Stipulated Order requirements. Operational evaluations should be made by the Engineering Department in close consultation with Operations initially when events occur. Engineering support will be assigned by the Chief Engineer. As is human nature, individual and external interests will tempt staff to focus on short‐term, or tactical, projects as opposed to taking a longer‐term, strategic view of the Master Plan goals and objectives. It must be emphasized that these Master Plans and the fulfillment of the Stipulated Order are one and the same; failure to comply will have significant legal implications for CUC. This is a strategic function that is currently being directed by the Chief Engineer.
CNMI Governor
CPUCExecutive Director
Water & Wastewater DED
Lab Manager
Chief Engineer
Water/Wastewater Operations Manager
Call Center Manager
HR Manager Legal Counsel Power DD
Oil Tech. Mgr. Power T&D Power Gen.
CFO
Water Task Force
Draft

3. MASTER PLANNING CRITERIA
DRAFT FINAL DRINKING WATER AND WASTEWATER MASTER PLAN, ROTA, CNMI 3-37
The Role of the Water Task Force The Water Task Force occupies a unique role in the CNMI Government. Organizationally, WTF is identified as part of CUC; however, functionally and operationally, WTF operates with near autonomy. Consisting of a small staff and having direct political support from the Governor’s Office, WTF has a single‐purpose mission: improve the Saipan water system infrastructure to provide drinking water to the island community on a 24‐hour basis. While 24‐hour water is also a formal CUC priority, WTF pursues this goal independently and with minimal CUC coordination. Often the projects that are being implemented do not reflect the current thinking or needs of CUC as WTF continues to use the 2002 Master Plan, which is extremely dated.
With the projected availability of financial resources to fund water and WW infrastructure improvements dwindling, formally integrating the WTF staff and functions back into CUC will reduce costs by consolidating resources while at the same time enhancing the agency’s ability to meet Stipulated Order requirements through implementation of the approved Master Plan. However, it will be important to keep intact the Water Task Force primary goal of achieving 24‐hour water and its grant‐writing expertise within CUC to maintain existing valuable relationships with funding agencies. The integration of WTF’s contract procurement, contract administration, management, and engineering resources will strengthen CUC’s ability to carry out its mandate to manage and operate the CNMI water and WW infrastructure systems efficiently and in accord with governing laws and regulations.
3.5.2 Workforce Issues CUC faces a number of challenging workforce‐related issues, including resident workforce development, training, absenteeism, and standard of care in performance of work.
Resident Professional and Technical Workforce Development Over the past decades, the professional and technical personnel at CUC were predominantly contract employees and, more recently, U.S. Public Health Service (USPHS) personnel on temporary assignment. The assumption of the control of immigration by the U.S. federal government a few years ago has resulted in the mass termination of the services of contractual employees of alien status, with additional terminations anticipated unless immigration requirements are relaxed. In addition, the departure of many USPHS personnel of late has seriously reduced the number of qualified engineering and operations personnel. These concerns, coupled with Stipulated Order‐mandated organizational requirements previously mentioned, have created at CUC a serious need to recruit and maintain a stable, qualified resident professional and technical workforce. Developing a qualified and efficient resident workforce will be an important goal for CUC. Until this is accomplished, CUC will need to continue to bring in recruits from the mainland for the key positions that are identified in the Stipulated Order.
Training The need for training in a variety of contexts came up repeatedly in meetings with CUC management. Technical training is not readily available on the island, and it is costly to send staff to off‐island training venues. As water and WW systems become more dependent on instrumentation, electronic controls, and equipment, providing technical training to CUC Engineering and Operations personnel must become an organizational objective. In addition, training will be a crucial component to developing a resident professional and technical workforce.
Draft
3. MASTER PLANNING CRITERIA
3-38 DRAFT FINAL DRINKING WATER AND WASTEWATER MASTER PLAN, ROTA, CNMI
Absenteeism Absenteeism, excused and unexcused, is substantially higher than that found at comparable utilities on the U.S. mainland. Several cultural elements play a part, including long‐standing practices regarding extended bereavement leaves and time‐off to attend to familial obligations. CUC management has attempted to control absenteeism in the past through policy enforcement communications, such as:
Directive to All Departments, dated February 3, 2010, directs appropriate enforcement staff to review Personnel Regulations regarding annual leave hours.
CUC Memorandum to All Employees, dated June 13, 2011, cites CUC Human Resources Rules, Section 12, specifically Section 12.12 – Unauthorized Absence.
These communications are provided in Appendix R. As evidenced in discussions with CUC senior management and in actual practice, HR policies, while in place, are not uniformly enforced, especially at the lower managerial levels.
Standard Level of Care at CUC Facilities The “standard level of care” exercised by field personnel at certain CUC facilities needs to be improved. Pump stations, reservoirs and maintenance yards are often littered with junk and equipment parts. The unkempt state of CUC facilities hurts CUC’s public image and lowers the public’s expectation of the quality of CUC water and WW services.
3.5.3 Automation and Technology The incorporation of automation and technology in CUC Operations and Engineering, if done effectively, will improve efficiency in managing and operating the water and WW systems, reduce costs, and increase productivity. Automation and technological initiatives are being applied to the SCADA system, the GIS, systems modeling, and a Computer Maintenance Management System (CMMS). The inclusion of the technologies discussed below will require that CUC identify champions who can be trained to properly maintain the functionalities. If this is not possible, CUC will need to have annual support contracts to provide this expertise.
SCADA System Presently, CUC operates all of the wells, reservoirs, treatment (chlorination) systems and booster pump stations for their drinking water system manually because no SCADA system is in place. The lack of a SCADA system results in a very labor‐intensive effort to check the operation of the drinking water system facilities daily to ensure proper operation. Installation and use of a robust SCADA system would decrease CUC Operations staff time required to inspect remote facilities on a daily basis, which would allow repurposing of staff for more pressing problems. In addition, SCADA alarms would provide an “early warning” if an operational issue was developing that would otherwise be unknown for hours or days. This benefit is of great value if the unattended operational issue could result in regulatory violations such as SSOs.
A pilot SCADA project is currently under final review for award to evaluate and test the performance of appropriate technologies. If the pilot program is successful, a detailed evaluation of the cost‐benefit will be assessed prior to moving forward with a system‐wide SCADA program. The SCADA Pilot project is further described and has been ranked in Section 4, but will be excluded from the CIP projects list as it is moving forward earlier than anticipated.
Draft

3. MASTER PLANNING CRITERIA
DRAFT FINAL DRINKING WATER AND WASTEWATER MASTER PLAN, ROTA, CNMI 3-39
Though CUC leadership is optimistic that SCADA, once instituted, will significantly reduce water and WW systems operational costs in the long run, the initial acquisition, installation and maintenance of a systems‐wide, integrated SCADA system will be costly. Furthermore, SCADA technology will require skilled, trained Instrument and Controls technicians to assure success. CUC must therefore develop a cost‐effective strategy for the introduction, development and eventual system‐wide use of SCADA in systems operations.
Geographic Information System The master planning effort will develop and deliver to CUC a linked database and graphic system of the public water and WW systems assets. It is imperative that the GIS be maintained and updated as water and WW system improvements are added or components removed. The productive uses of a GIS program are numerous and include:
Up‐to‐date inventory of all significant CUC water and WW assets
Quick retrieval of data on the type, make, capacity and condition of system components
Capability to create a graphic of water and WW infrastructure layouts on short notice
Assistance in the scheduling of system maintenance and component replacement
Interaction with computer‐based models of the water and WW systems
Extension of GIS capability to include other asset classes such as those associated with CUC power
CUC will need to dedicate an individual to champion the GIS to continue to receive value from the initial effort. Converting the desktop GIS to a web‐based GIS would provide a cost‐effective way for an outside contractor to perform system updates if internal resources are not available.
Water and Wastewater Systems Models The master planning effort will also develop and deliver to CUC computer‐based models of the water and WW systems. Updating these models is as important as the maintenance and updating of the GIS program. In fact, the GIS and systems‐modeling programs are interlinked and inter‐dependent in their function in that they operate using the same database of system components and conditions. The benefits of an accurate system model include:
Planning tool for new capital and replacement projects
Operational tool to assess the benefits and impacts of making large operational changes
The models developed for the Master Plan will need to be updated over time, and additional model calibrations conducted as the system evolves. This again can be done by a trained internal resource or by the same external group that would update the GIS.
Computer Maintenance Management System The design and implementation of a Computer Maintenance Management System (CMMS) would enhance the ability of engineering, operation, and finance staff to properly schedule and track routine and non‐routine maintenance activities, improve inventory control, track the financial cost of routine and non‐routine system maintenance. These activities are presently done manually using multiple databases making the information difficult to share efficiently. The result of implementing a CMMS in conjunction with GIS would include more efficient use of staff time, historical documentation of system maintenance activities, and improved financial tracking of maintenance costs.
Draft

3. MASTER PLANNING CRITERIA
3-40 DRAFT FINAL DRINKING WATER AND WASTEWATER MASTER PLAN, ROTA, CNMI
CUC is close to awarding a Task Order under the IDIQ to develop the first phase of a CMMS using VueWorks. The goal is to train CUC staff in the CMMS application and take them through a series of asset development tracks. After the initial training is conducted, the CUC team will continue to expand the CMMS capabilities for all of its water and WW assets.
3.5.4 Recommendations The following are recommendations on reducing or minimizing the impediments to CUC management in terms of its organizational structure, workforce issues, and ability to comply with the Stipulated Order as well as perform its mission to operate the CNMI water and WW infrastructure systems efficiently and in accord with governing laws and regulations.
Management Structure: Engineering and the Integration of the Water Task Force, GIS, and Systems Modeling Under the Engineering Function The Engineering branch of CUC should consider the proposed reorganization described below. The cost of the proposed reorganization would be relatively low since there would not be any additional staff required.
1. Continue to refine the Engineering function under the direction (and office) of the Chief Engineer. The current focus that the Chief Engineer has been implementing on project management, systems analyses, implementation of capital improvements, and assuring that water and WW systems operations are in concert with design and systems optimization initiatives is consistent with industry practices.
2. Integrate the Water Task Force into the water and WW engineering support groups under the Chief Engineer while maintaining as a key mission and goal of achieving 24‐hour water service for all customers. The integration of the WTF’s contract procurement, contract administration and grant writing expertise will strengthen CUC’s ability to carry out its mandate to manage and operate the CNMI water and WW infrastructure systems.
3. Place the GIS and modeling functions under the direct supervision of the Chief Engineer and managed by one staff member trained in GIS and systems modeling and equipped with a dedicated, specialized work station. In addition, establish a new job classification of GIS/Computer Modeling Specialist to aid in the recruitment of qualified personnel as needed. The budget of the GIS and Modeling functions must be forward‐looking to assure that software programs, licenses and attendant hardware are properly replaced or renewed.
Figure 3.5.4‐1 is a proposed organization chart that reflects the above recommendations.
Figure 3.5.4‐1. Proposed Commonwealth Utilities Corporation Engineering Organization Chart
CUC Engineering Chief Engineer
GIS & Systems Modeling Support
Water System Engineering and
Project Management
Wastewater System Engineering and
Project Management
Draft
3. MASTER PLANNING CRITERIA
DRAFT FINAL DRINKING WATER AND WASTEWATER MASTER PLAN, ROTA, CNMI 3-41
Workforce Issues The workforce issues described below will range from low‐cost, low‐hanging fruit (e.g., policy changes) to higher cost changes (e.g., training) that would need to be prioritized once the economic conditions for CUC improve and funds become available.
Resident Professional and Technical Workforce Development and Training The following are suggestions and recommendations on recruitment and development of a stable professional and technical resident workforce at CUC:
1. Identify current CUC employees who have demonstrated a high potential for advancement to professional, technical or high‐level operational positions required for the management and operation of CUC’s water and WW systems and develop and implement a program customized for each candidate to pursue a targeted, high‐level position. This program of in‐house advancement must be accompanied by a policy giving preference to employee promotions vis‐à‐vis open recruitment.
2. Identify and contact professionals and technicians who were former CNMI residents and recruit those who indicate a desire to relocate back to the CNMI.
3. Track local islanders who are pursuing higher education on the U.S. Mainland or elsewhere and target them for incentivized recruitment efforts. For example, returning residents with engineering degrees may be offered paid temporary housing and air travel to the CNMI. Recruitment efforts must target candidates during the early years of their off‐island education. This is already being done effectively by the CUC Engineering Department.
4. Offer internships to CNMI students seeking higher education abroad and who wish to spend summers in the CNMI in CUC Engineering and Operations.
5. Visit local high schools during “Career Day” to promote employment at CUC as a career opportunity under various professional, technical, and operations positions.
6. Approach NMC to develop a technical curriculum for current and prospective CUC employees.
7. Conduct periodic training workshops for all CUC engineers and engineering technicians on the capabilities and features of the GIS and System Modeling programs.
The following are several training‐related suggestions to aid in building a technologically savvy resident work force:
Budget to send key staff for off‐island training.
Reward “stars” with off‐island technical training opportunities.
Work with the local education entities (i.e., NMC) to develop apprenticeship programs. This has been done on Guam with modest success.
Create and fund an effective water and WW systems operator training in preparation for pursuing certification program. Provide project management training for CUC engineering personnel.
Draft
3. MASTER PLANNING CRITERIA
3-42 DRAFT FINAL DRINKING WATER AND WASTEWATER MASTER PLAN, ROTA, CNMI
Dealing with Absenteeism The following are suggestions and recommendations on minimizing absenteeism:
1. Educate and support middle and lower level supervisors regarding attendance policies and enforcement.
2. Discontinue “sick leave” accruals and adopt the more common Paid Time Off or Personal Leave concept.
3. Revise the Reduction in Force (RIF) approach to favor/give preference to retaining employees based on merit rather than seniority.
4. Conduct “all hands” meetings to address common issues.
Elevating the Standard of Level of Care of CUC Facilities We recommend that CUC develop and post written guidelines and performance standards defining the minimum level of care required at CUC facilities. These standards should typically describe house and grounds‐keeping tasks, many of which will not involve significant expenditure. They should include such topics as:
Yard maintenance
Removal and disposal of unusable equipment
Parts storage
Security
Maintenance of tools
Compliance with established Standard Level of Care of CUC facilities should be included in the duties and responsibilities of supervisory CUC personnel assigned to such facilities.
Automation SCADA System Conduct a pilot project to test the long‐term viability of SCADA. If successful, a second step can be the implementation of a project to install SCADA to control a selected water service area. Create a new job classification of Instrument and Control Technician to support the second step in the overall SCADA development strategy.
Computer Maintenance Management System Design and implement a CMMS for the water, WW, and power divisions under a single platform to reduce the cost of developing and maintaining multiple systems. As part of the CMMS implementation, develop process maps for different work activities being conducted and use the opportunity to brainstorm to identify ways to improve the efficiency for the workforce and remove redundancy where ever possible through the integration of activities. One example would be to integrate the WTF leak detection work with the CUC Operations Teams leak detection efforts.
Draft

DRAFT FINAL DRINKING WATER AND WASTEWATER MASTER PLAN, ROTA, CNMI 4-1
SECTION 4
Drinking Water System Master Plan
The contents of Section 3, “Drinking Water System Master Plan,” are as follows:
4.1 Stipulated Order Planning and Compliance Requirements for the Drinking Water Master Plan ....................................................................................... 4‐3
4.2 Water System Planning and Design Criteria ........................................................................... 4‐7 4.2.1 Design Period............................................................................................................. 4‐7 4.2.2 Phased Upgrades ....................................................................................................... 4‐7 4.2.3 System Pressures ....................................................................................................... 4‐8 4.2.4 System Control Elevations ......................................................................................... 4‐8 4.2.5 Distribution System Piping and Appurtenances ........................................................ 4‐9 4.2.6 Distribution Storage ................................................................................................ 4‐10 4.2.7 Water Tank Construction ........................................................................................ 4‐10 4.2.8 Supply 4‐10 4.2.9 Water Treatment (Disinfection) .............................................................................. 4‐11 4.2.10 Water Quality .......................................................................................................... 4‐11 4.2.11 Summary of Water System Key Design Criteria ...................................................... 4‐12
4.3 Drinking Water System Recommendations ......................................................................... 4‐15 4.3.1 Drinking Water System Project Identification and Prioritization ............................ 4‐15 4.3.2 Cost Development of Drinking Water System Prioritized Projects ......................... 4‐25 4.3.3 CIP Project Identification and Costs ........................................................................ 4‐29 4.3.4 Prioritized Water System Modifications/Improvements Program ......................... 4‐30
4.4 Drinking Water System Operations and Maintenance Improvement Recommendations .. 4‐35 4.4.1 Tanks ....................................................................................................................... 4‐35 4.4.2 Wells ........................................................................................................................ 4‐35 4.4.3 Chlorination Facilities .............................................................................................. 4‐35 4.4.4 Booster Pump Stations ............................................................................................ 4‐36 4.4.5 Water Distribution ................................................................................................... 4‐36 4.4.6 Pressure‐Reducing Valves ....................................................................................... 4‐36 4.4.7 Water Meters .......................................................................................................... 4‐36 4.4.8 Risk Assessments ..................................................................................................... 4‐36 4.4.9 Water Quality Monitoring Equipment .................................................................... 4‐37
Draft

Draft

4. DRINKING WATER SYSTEM MASTER PLAN
DRAFT FINAL DRINKING WATER AND WASTEWATER MASTER PLAN, ROTA, CNMI 4-3
4.1 Stipulated Order Planning and Compliance Requirements for the Drinking Water Master Plan
Table 4.1‐1 lists the requirements of the Stipulated Order and the corresponding sections in the project team’s scope of work and this Master Plan that comply with the requirements, for both water and wastewater systems.
Table 4.1‐1. Stipulated Order Requirements
Stipulated Order
Reference Task Description of End
Product Task Lead CH2M SOW Reference
Rota Water and Wastewater Master Plan
III.B.50 Develop a Comprehensive Drinking Water and Wastewater Master Plan
A Master Plan in accordance with the Stipulated Order
CUC, CH2M 3.4, 3.5 Rota Master Plan
III.B.B1.51 Wastewater Assessment
Wastewater Master Plan
N/A N/A N/A
III.B.B1.52 Condition Assessment for the Wastewater Systems
Wastewater Master Plan
N/A N/A N/A
III.B.B1.53 Drinking Water Assessment
Drinking Water Master Plan
CUC, CH2M 3.1.2, 3.1.3, 3.1.6
2.2
III.B.B1.54 Assessment of Drinking Water Technological Alternatives
A comprehensive review of available technologies, identify preferred alternatives, and technological alternatives to improve systems' pressures and delivery.
CUC, CH2M 3.4.3, 3.4.4 2.2.2, 2.2.3, 4.2
III.B.B1.55 Condition Assessment of Drinking Water Systems
Drinking Water Master Plan
CUC, CH2M 3.1.2, 3.1.3 2.2.2
III.B.B1.56 Assessment of Drinking Water Systems Improvement Alternatives
A comprehensive assessment of the drinking water systems' improvement needs and alternatives for meeting the appropriate standards in the next 20 years.
CUC, CH2M 3.4.2, 3.4.3, 3.4.4
2.2.2, 2.2.3, 4.3
III.B.B1.57a Hydraulic Capacity Assessments (Wastewater)
Wastewater Master Plan
N/A N/A N/A
Draft
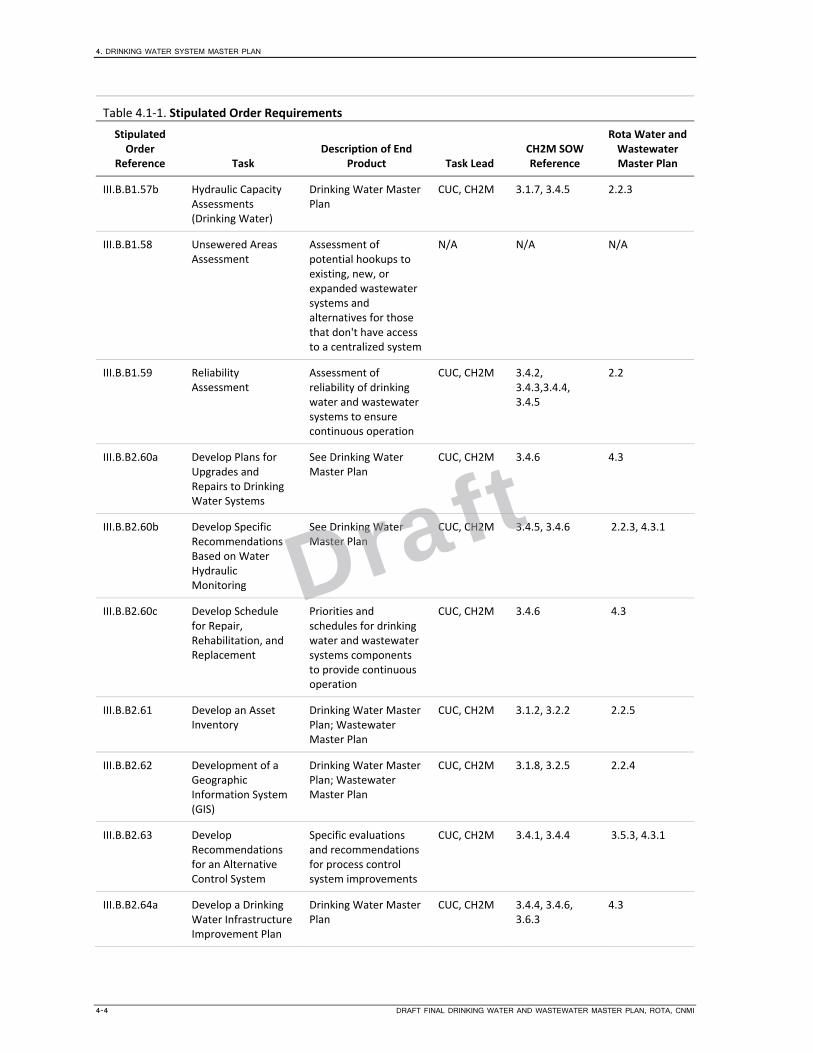
4. DRINKING WATER SYSTEM MASTER PLAN
4-4 DRAFT FINAL DRINKING WATER AND WASTEWATER MASTER PLAN, ROTA, CNMI
Table 4.1‐1. Stipulated Order Requirements
Stipulated Order
Reference Task Description of End
Product Task Lead CH2M SOW Reference
Rota Water and Wastewater Master Plan
III.B.B1.57b Hydraulic Capacity Assessments (Drinking Water)
Drinking Water Master Plan
CUC, CH2M 3.1.7, 3.4.5 2.2.3
III.B.B1.58 Unsewered Areas Assessment
Assessment of potential hookups to existing, new, or expanded wastewater systems and alternatives for those that don't have access to a centralized system
N/A N/A N/A
III.B.B1.59 Reliability Assessment
Assessment of reliability of drinking water and wastewater systems to ensure continuous operation
CUC, CH2M 3.4.2, 3.4.3,3.4.4, 3.4.5
2.2
III.B.B2.60a Develop Plans for Upgrades and Repairs to Drinking Water Systems
See Drinking Water Master Plan
CUC, CH2M 3.4.6 4.3
III.B.B2.60b Develop Specific Recommendations Based on Water Hydraulic Monitoring
See Drinking Water Master Plan
CUC, CH2M 3.4.5, 3.4.6 2.2.3, 4.3.1
III.B.B2.60c Develop Schedule for Repair, Rehabilitation, and Replacement
Priorities and schedules for drinking water and wastewater systems components to provide continuous operation
CUC, CH2M 3.4.6 4.3
III.B.B2.61 Develop an Asset Inventory
Drinking Water Master Plan; Wastewater Master Plan
CUC, CH2M 3.1.2, 3.2.2 2.2.5
III.B.B2.62 Development of a Geographic Information System (GIS)
Drinking Water Master Plan; Wastewater Master Plan
CUC, CH2M 3.1.8, 3.2.5 2.2.4
III.B.B2.63 Develop Recommendations for an Alternative Control System
Specific evaluations and recommendations for process control system improvements
CUC, CH2M 3.4.1, 3.4.4 3.5.3, 4.3.1
III.B.B2.64a Develop a Drinking Water Infrastructure Improvement Plan
Drinking Water Master Plan
CUC, CH2M 3.4.4, 3.4.6, 3.6.3
4.3
Draft

4. DRINKING WATER SYSTEM MASTER PLAN
DRAFT FINAL DRINKING WATER AND WASTEWATER MASTER PLAN, ROTA, CNMI 4-5
Table 4.1‐1. Stipulated Order Requirements
Stipulated Order
Reference Task Description of End
Product Task Lead CH2M SOW Reference
Rota Water and Wastewater Master Plan
III.B.B2.64b Develop a Wastewater Infrastructure Improvement Plan
Wastewater Master Plan
CUC, CH2M 3.5.6. 3.6.3 5.3
III.B.B2.65 Develop Final Financial Plan
Estimated Annual Budget for next 5‐years; Revenue Plan for All Compliance Activities
CUC, CH2M 3.6.1, 3.6.2, 3.6.3, 3.6.4, 3.6.5
See Financial Plan
III.B.B3.66a Develop Scope of Work and Request for Proposals
Scope of Work and Request for Proposals (RFPs)
CUC, CH2M This refers to the RFP for the development of this MP. Not relevant.
N/A
III.B.B3.66b Selection of Contractors
Selection and approval of contractors
CUC, CH2M This refers to the contractor for the development of this MP. Not relevant.
N/A
III.B.B3.66c Drafts of Master Plan
See Drinking Water and Wastewater Master Plans
CUC, CH2M Rota Master Plan
III.B.B3.66d Final Draft of the Master Plan and Financial Plan
Master Plans CUC, CH2M
III.B.B3.66e Public Comment on Master Plan
Press release and public notice in local newspaper
CUC, CH2M
III.B.B3.66f Completion of Master Plan
Completed Master Plan addressing Public Comments
CUC, CH2M
III.B.B4.67a Develop and Implement a Groundwater Management and Protection Program ‐ Interagency Coordination
Coordination of all CNMI resources agencies involved with groundwater resources
CUC Groundwater Management and Protection Plan (separate document)
III.B.B4.67b Develop and Implement a Groundwater Management and Protection Program ‐
Programs and Projects to restore contaminated wells and groundwater resources
CUC Groundwater Management and Protection Plan (separate document)
Draft

4. DRINKING WATER SYSTEM MASTER PLAN
4-6 DRAFT FINAL DRINKING WATER AND WASTEWATER MASTER PLAN, ROTA, CNMI
Table 4.1‐1. Stipulated Order Requirements
Stipulated Order
Reference Task Description of End
Product Task Lead CH2M SOW Reference
Rota Water and Wastewater Master Plan
Groundwater Restoration
III.B.B4.67c Develop and Implement a Groundwater Management and Protection Program ‐ Compliance with Applicable CNMI Statutes and Regulations
Demonstration of compliance with CNMI Regulations
CUC Groundwater Management and Protection Plan (separate document)
III.B.B4.67d Develop and Implement a Groundwater Management and Protection Program ‐ Sustainable Withdrawals of Groundwater
Programs to manage groundwater withdrawals
CUC Groundwater Management and Protection Plan (separate document)
III.B.B4.67e Develop and Implement a Groundwater Management and Protection Program ‐ Leakage Reduction
Projects that monitor and reduce leakage in water distribution lines
CUC Groundwater Management and Protection Plan (separate document)
III.B.B4.67f Develop and Implement a Groundwater Management and Protection Program ‐ Capacity Building
Recruitment of a qualified groundwater hydrologist
CUC Groundwater Management and Protection Plan (separate document)
Draft

4. DRINKING WATER SYSTEM MASTER PLAN
DRAFT FINAL DRINKING WATER AND WASTEWATER MASTER PLAN, ROTA, CNMI 4-7
4.2 Water System Planning and Design Criteria The intent of this section is to provide water system planners and designers with a guide for planning and designing water system infrastructure improvements. Information provided in this section was used as the basis for the recommended water capital improvements plan (CIP). Factors such as design period, pipe design pressures, system demands, pipe velocities, tank storage sizing, control elevations, and water treatment are discussed in this section. The information and guidance provided herein may be referenced in the scopes of work for water system design in CNMI. References to AWWA Standards and the Great Lakes – Upper Mississippi River Board’s 2012 Recommended Standards for Waterworks (10 States Standards) are made throughout this section. Site‐specific data and confirmation of the criteria listed in this section must be reviewed and confirmed to be appropriate by the planners and/or engineers of record.
Various factors were taken into consideration when developing basic design criteria for the recommended water system capital improvement projects, including current and projected future water demands, period of design, and financial capabilities of CUC. In general, the design criteria are based on conformance to current standards and waterworks practices. Section 4.2.11 summarizes the key design criteria used to identify recommended water distribution system improvements and to develop conceptual water supply and treatment alternatives.
4.2.1 Design Period The design period used for master planning of the water system improvements is 20 years. However, use of this design period for locating and sizing the water system components does not imply that any of the components will be obsolete or will physically deteriorate and require replacement after 20 years. The design period assumed for specific water system components is based on factors such as ease of expansion/upgrade, service life of the system, and the financial capabilities and resources of CUC.
Piping and structural components of treatment facilities, pumping stations, and distribution storage facilities are normally expected to remain functional for 50 years or more, provided the components are properly maintained. These components may also be constructed in staged increments, depending on factors such as site conditions, projected rate of increase in water demands, and financial capabilities of CUC.
Water distribution mains are components that have a relatively high construction cost. However, once in place, distribution mains cannot be expanded to meet increased demands. Secondary parallel pipelines must be installed, or pressure must be increased in the existing mains to meet increased demands, invariably resulting in an increase in energy costs. As such, pipe sizing during the design phases of the capital improvement projects must account for anticipated future increases in water demand. Installation of larger‐size pipes that exceed current demand requirements to account for future demand considerations can be accomplished at a minimal or modest increase in construction cost. The capital improvement projects recommended in this Master Plan call for the installation of water distribution mains that account for projected future demands.
4.2.2 Phased Upgrades The mechanical components, such as pumps and motors, of treatment facilities and pumping stations are normally expected to remain functional for 10 to 20 years. When considering future requirements during design, mechanical equipment can be replaced with larger units to accommodate future demands, or the installations can be phased so that increased capacity can be installed at the appropriate times.
Draft
4. DRINKING WATER SYSTEM MASTER PLAN
4-8 DRAFT FINAL DRINKING WATER AND WASTEWATER MASTER PLAN, ROTA, CNMI
Phasing may also be considered when undertaking large capital improvements. Such improvements should take into account the usefulness of phasing and whether the first phase can be placed online and then integrated with future phases. Construction of dormant improvements should be discouraged because of rapid deterioration associated with systems being out of service.
4.2.3 System Pressures System design pressures for ordinary service should be greater than 35 psi and preferably in the 60 to 80 psi range (10 States Standards). During extreme conditions, a minimum residual pressure of 20 psi should be maintained in the system (10 States Standards).
Site topography must be considered when designing water distribution systems. Hilly or mountainous areas require higher pressures to supply higher elevations, often resulting in excessive pressures in adjacent areas with lower elevations. To prevent this condition, pressure zones must be established to separate areas of higher elevation from areas of lower elevation. High‐pressure zones require the use of costly system components such as high pressure‐rated piping, fittings, and valves. In general, pressures in excess of 80 psi should be avoided. However, in those situations when high pressures cannot be avoided, installation of individual household pressure regulators is recommended.
4.2.4 System Control Elevations The topography throughout CNMI is rugged. As a result, the CUC water systems are best served by strategically establishing multiple water tank service areas with separate hydraulic grades. It is good engineering practice to have hydraulic grades set by the water level of tanks rather than by a pump or a closed (direct feed) system. The current CUC water system CIP has focused on the installation of dedicated water transmission and distribution lines, resulting in the hydraulic grades of about 90 percent of Saipan’s water service areas being controlled by storage tank elevations. The following are water system control‐related recommendations:
Wherever feasible, CUC water customers should be served by a distribution line connected to a storage tank. Pressure‐reducing valves (PRVs) are suggested to reduce high pressures to preferred service pressures (see Section 4.2.3 for a description of “high” pressures).
Some of the smaller and isolated areas within the CUC system cannot be included in a tank service area. These areas currently use a booster pump system to provide the needed pressure (head). For such systems, the following are recommended:
Pump systems and pneumatic tanks sized according to the 10 States Standards.
Air relief valves (ARVs) located at the upper portion of the areas served by the booster pump.
Careful attention paid by the designer to conditions on the suction side of the pump system. The pump should not cause a drop in system pressure below the recommended pressure.
A soft starter or variable frequency drive (VFD) is recommended to avoid upstream and downstream transient flows.
Draft

4. DRINKING WATER SYSTEM MASTER PLAN
DRAFT FINAL DRINKING WATER AND WASTEWATER MASTER PLAN, ROTA, CNMI 4-9
Table 4.2.4‐1 provides the existing and proposed hydraulic grades for the Rota tank service area. The (interim) hydraulic grades were established for the Master Plan CIP. The future hydraulic grade for Rota will be set by the new Ginanlangan tank.
Table 4.2.4‐1. Existing and Proposed Hydraulic Grades for Rota
Service Area Existing Tank
Finished Elevation (ft) Average Existing Hydraulic Grade
Proposed (Interim) Hydraulic Grade
Ginanlangan TSA (Rota) 604 637 630
4.2.5 Distribution System Piping and Appurtenances All potable water piping, fittings, and valves should comply with the latest standards issued by the American Society for Testing and Materials (ASTM) and/or AWWA as follows:
Minimum line size of water distribution mains: 6 inches in diameter.
All material in direct contact with potable water will be National Sanitation Foundation (NSF) certified for potable water use.
Water main velocities should range between from 2 to 5 feet per second (ft/s). However, in some cases, velocities up to 7 ft/s may be used. Such cases include peak flows along laterals serving four to five households. Velocities up to 10 feet/second can occur during extreme events, but this should not be the normal system condition. Planners and designers must avoid creating conditions where high velocities (more than 5 feet/second) pass by low‐flow laterals. Such a condition can and does result in a Venturi effect where the pressure in the lateral drops, resulting in a back‐siphoning effect and potential cross connection.
Water valves along new/upgraded distribution mains will be provided, at a maximum, every 750 feet for commercial use and every 1,000 feet for residential use. Dead ends should be avoided wherever possible. If a dead end must be installed, a means for flushing the dead‐end piping must be provided.
Disinfection of newly installed and/or upgraded water distribution systems or their components will follow the requirements set forth in the latest edition of AWWA C651 (2014a).
Pressure testing of newly installed and/or upgraded distribution system will follow AWWA C600 requirements (2010).
New and rehabilitated water mains must be kept at a safe distance from possible sources of contamination and cross connection. Water mains will be installed at least 10 feet from (edge to edge) existing or proposed sewer lines, reclaimed water lines, sewer forcemains and manholes, storm water collection lines, and sewage disposal systems such as septic tanks and leaching fields. In cases where it is not practical to meet such separation, CUC may consider a waiver on case‐by‐case basis. In such cases, additional protection measures such as concrete encasement or encasing in a segment of large pipe may be required.
Where crossings occur, the water line will be placed above the possible source of contamination. A minimum separation of 18 inches (edge to edge) will be provided. In addition, water line joints will be installed such that maximum separation is provided between the crossing and joints.
It is recommended that the AWWA Manual M22 Sizing Water Service Lines and Meters (2014b) be used as the basis for sizing laterals and meters.
Draft

4. DRINKING WATER SYSTEM MASTER PLAN
4-10 DRAFT FINAL DRINKING WATER AND WASTEWATER MASTER PLAN, ROTA, CNMI
4.2.6 Distribution Storage The sizing of all future storage tanks will follow guidelines provided in the latest edition of the Ten‐State Recommended Standards for Water Works. Applicable provisions are as follows:
The minimum size for the distribution storage tanks should be equal to the average daily consumption of a tank’s service zone rounded up to the next largest nominal tank size (i.e., 0.25, 0.5, 1.0 MG).
Disinfection and testing of newly installed potable water storage tanks will follow the requirements of AWWA 652 appropriate to the tank type.
4.2.7 Water Tank Construction There has been recent discussion among CUC officials with respect to the use of concrete as the material of choice for new and replacement water tanks. The lifespan of a properly constructed concrete tank is typically longer than that of a steel tank. Given the current poor condition of the majority of CUC steel tanks and the corrosive effects of the local environment, the use of concrete is recommended. However, cost and site constraints may preclude the use of concrete. Steel tanks generally have a lower capital cost than that for concrete, but have a shorter lifespan and require comparatively more maintenance. CUC should, on a project‐by‐project basis, compare the 20‐year lifecycle cost of steel and concrete in the context of available funding to determine the tank material of choice.
The hydraulics and inlet and outlet configuration of any new or rehabilitated tank must be carefully analyzed, taking into account factors such as mixing, system controls, and operations. The following are suggested for tank hydraulic configurations:
Use of separate inlet and outlet lines should be considered, having the inlet and outlet located at opposite ends of the tank.
Provisions for tank bypass should be installed to allow periodic cleaning and physical inspection of the tank.
Tank baffling or alternative mixing technology should be considered, particularly for tanks with storage capacity of 1 million gallons or greater.
Inlet controls such as pressure‐sustaining valves and/or altitude valves must be carefully designed with much care given to avoid overdesign. In addition, due consideration must be given to accommodate low‐flow bypasses.
4.2.8 Supply CUC utilizes the water caves and three water supply wells to meet the potable water demand for Rota. In 2011, the average daily CUC water production on Rota was 1.16 MGD. Of this amount, only 17 percent was metered. It is presumed that a significant amount of the 83 percent of unaccounted for water is lost though leakage, theft, and overflow, with the vast majority of the water loss overflow at the Ginanlangan tank.
Efforts to control leaks, theft, and overflow have not yet been initiated in Rota. These efforts, which include leak detection, metering, and improved system operations, should be initiated. The need for new water wells and or other supply sources may become unnecessary if efforts are made to reduce water loss. Additional discussion on this topic can be found in Section 2.3, “Assessment of Leak Detection and Drinking Water Conservation Programs.”
Draft

4. DRINKING WATER SYSTEM MASTER PLAN
DRAFT FINAL DRINKING WATER AND WASTEWATER MASTER PLAN, ROTA, CNMI 4-11
4.2.9 Water Treatment (Disinfection) Chlorine disinfection is currently the primary form of water treatment used by CUC. The typical disinfection system consists of an ejector, rotameter, chlorinator, scale, tubing, and booster pump. It has been common practice to eliminate the use of a booster pump and discharge the chlorinated solution to a free water surface (spring or infiltration gallery), a method that is not recommended and should be corrected. Good engineering practice should be used when sizing the chlorine booster pumps. This commonly requires the system back‐pressure and chlorine feed rate be thoroughly evaluated. Typical sizes within the CUC water system can range between ¾ and 2 hp. In addition, the chlorine booster pump must be elevated at least 2 inches above the chlorine station’s finished floor surface.
Chlorine cylinder scales and automatic switch‐over controls should be provided at every chlorination station. Furthermore, a chlorine detection alarm should be provided at each chlorination station as well as other locations where chlorine is stored. Chlorine sensors and data processors should be installed downstream of all chlorination stations.
4.2.10 Water Quality The CUC water system is permitted by EPA and must adhere to the local and federal regulations for potable water systems. At a minimum, the following must be applied:
A DEQ‐approved Sampling Plan that establishes a routine distribution sampling event representative of the entire distribution system.
A detectable disinfection residual, or Heterotrophic Plate Counts below 500 colony‐forming units, that is maintained at all times in all locations throughout the water distribution system. CUC will monitor and record disinfection residual as part of its sampling plan. CUC must establish clear operating procedures for sites that require a booster pump to activate the chlorination equipment. This operating procedure must have scenarios developed for point failure of these chlorination systems. In most cases, automatic switch‐over and system shutdown should be incorporated into each chlorination system. Chlorination facilities should have continuous chlorine monitoring in place to document the level of chlorine residual at all entry points into the distribution system.
An action plan to respond to internal corrosion and deposition problems within the distribution system. At a minimum, this plan should include:
Sampling and monitoring for pH, alkalinity, conductivity, phosphates, silicates, calcium, and metals
Procedure for iron and lead control
Guidelines for controlling corrosion‐related byproducts
A systematic flushing program that takes into account the current condition of the distribution system, hydraulic capacity, dead ends, low‐flow areas, aesthetic water quality problem areas, and other known problem areas.
Draft
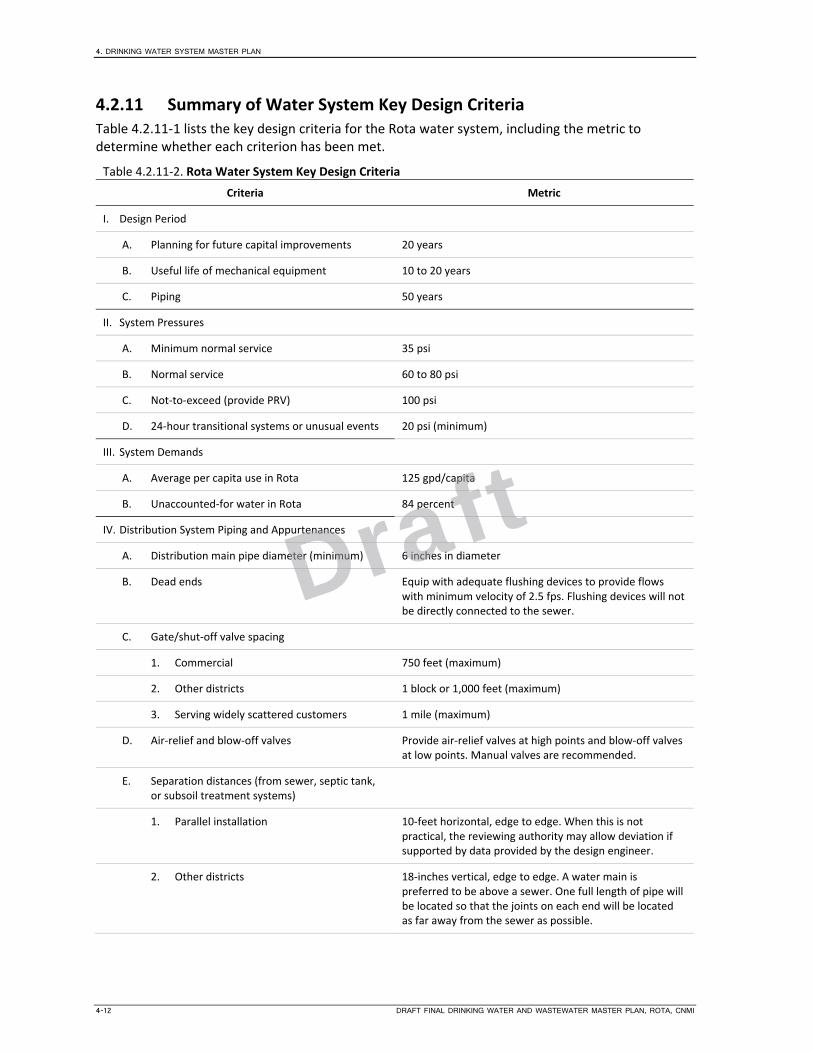
4. DRINKING WATER SYSTEM MASTER PLAN
4-12 DRAFT FINAL DRINKING WATER AND WASTEWATER MASTER PLAN, ROTA, CNMI
4.2.11 Summary of Water System Key Design Criteria Table 4.2.11‐1 lists the key design criteria for the Rota water system, including the metric to determine whether each criterion has been met.
Table 4.2.11‐2. Rota Water System Key Design Criteria
Criteria Metric
I. Design Period
A. Planning for future capital improvements 20 years
B. Useful life of mechanical equipment 10 to 20 years
C. Piping 50 years
II. System Pressures
A. Minimum normal service 35 psi
B. Normal service 60 to 80 psi
C. Not‐to‐exceed (provide PRV) 100 psi
D. 24‐hour transitional systems or unusual events 20 psi (minimum)
III. System Demands
A. Average per capita use in Rota 125 gpd/capita
B. Unaccounted‐for water in Rota 84 percent
IV. Distribution System Piping and Appurtenances
A. Distribution main pipe diameter (minimum) 6 inches in diameter
B. Dead ends Equip with adequate flushing devices to provide flows with minimum velocity of 2.5 fps. Flushing devices will not be directly connected to the sewer.
C. Gate/shut‐off valve spacing
1. Commercial 750 feet (maximum)
2. Other districts 1 block or 1,000 feet (maximum)
3. Serving widely scattered customers 1 mile (maximum)
D. Air‐relief and blow‐off valves Provide air‐relief valves at high points and blow‐off valves at low points. Manual valves are recommended.
E. Separation distances (from sewer, septic tank, or subsoil treatment systems)
1. Parallel installation 10‐feet horizontal, edge to edge. When this is not practical, the reviewing authority may allow deviation if supported by data provided by the design engineer.
2. Other districts 18‐inches vertical, edge to edge. A water main is preferred to be above a sewer. One full length of pipe will be located so that the joints on each end will be located as far away from the sewer as possible.
Draft

4. DRINKING WATER SYSTEM MASTER PLAN
DRAFT FINAL DRINKING WATER AND WASTEWATER MASTER PLAN, ROTA, CNMI 4-13
F. Surface water, drainage structure and bridge (above‐grade) crossings
1. Above‐grade crossings Provide adequate supports/anchors, protection from vandalism and damage while remaining accessible for repair/replacement.
2. Underwater, underwater course crossings Minimum 5 feet of cover; if crossing length exceeds 15 feet, requires flexible, restrained, or watertight joints, valves at both ends, and permanent taps for metering to determine leakage and to obtain water samples on each side of the valve closest to the supply source.
G. Interconnections Interconnections between potable water supplies must be approved by the reviewing authority with differences in water quality to be considered. Appropriate backflow prevention devices must be installed. CUC has drafted a cross‐connection manual that will establish requirements and guidelines for all interconnections.
H. Service meters Each service connection will be individually metered.
I. Pipe Friction (Hazen‐Williams) Coefficients (“C”)
1. Existing pipes 12 inches and smaller (for modeling)
100
2. Existing pipes 12 inches and smaller (for modeling)
100
3. New pipes 12 inches and smaller 120
4. New pipes 14 inches and larger 120
V. Distribution Storage
A. Capacity To meet project future demand requirements in each sub‐region with the total volume to meet the daily demand.
B. Disinfection and testing Disinfection and testing of newly installed potable water storage tanks will follow the requirements of AWWA 652 for the appropriate tank type.
VI. Supply
A. Wells Capacity (Primary Supply) Total developed groundwater source capacity will meet or exceed the design maximum day demand with the largest producing well offline.
B. Surface Water Capacity (Primary Supply) Meet maximum projected water demand of the service area based on calculations of a 1 in 50‐year drought or the extreme drought of record, with multiple year droughts considered.
1. Meet maximum projected water demand of the service area based on calculations of a 1 in 50‐year drought or the extreme drought of record, with multiple year droughts considered.
2. Surplus for projected growth.
Draft

4. DRINKING WATER SYSTEM MASTER PLAN
4-14 DRAFT FINAL DRINKING WATER AND WASTEWATER MASTER PLAN, ROTA, CNMI
3. Adequate to compensate for losses (seepage, silting, evaporation, etc.).
VII. Water Treatment
A. Groundwater Disinfection (as required)
B. Surface water Appropriate technology based on water quality followed by disinfection
Draft

4. DRINKING WATER SYSTEM MASTER PLAN
DRAFT FINAL DRINKING WATER AND WASTEWATER MASTER PLAN, ROTA, CNMI 4-15
4.3 Drinking Water System Recommendations This section of the Master Plan presents the methodology for identification of projects to be included in the capital improvement plans, as well as the development of cost estimates and implementation schedule for the water capital improvement projects.
4.3.1 Drinking Water System Project Identification and Prioritization This section presents the results of a series of project identification and prioritization workshops conducted in June 2012 and February 2015 for the Commonwealth Utilities Corporation (CUC). The objects of the workshops were the water and wastewater systems of the Commonwealth of the Northern Marianas Islands (CNMI), specifically the islands of Saipan, Tinian, and Rota. The workshop objectives were to develop a list of prioritized projects for all three islands, to aid in the development of the 2‐year, 5‐year, and 20‐year CIPs.
During the week of February 9 through 13, 2015, the project team, CUC, DEQ, and USEPA Region 9 met to conduct a complete reassessment of the water capital improvement projects for Saipan, Tinian, and Rota. These workshops were held due to the significant amount of capital improvement work performed over the prior 3 years since the original assessment, staffing changes, and the need to reexamine the original list of CIP projects and the addition of other projects.
Over the previous 4 years, the project team worked extensively in the field and in workshop settings with CUC staff to catalog water and wastewater assets, assess their condition and risk, and develop hydraulic models for the water and wastewater systems. These activities produced a large volume of information that has been organized and analyzed with the intent of identifying projects for inclusion in the Master Plans as part of the 2‐year, 5‐year, and 20‐year capital improvement plans.
This section describes the effort to identify all projects and rank them based on decision criteria developed specifically for CUC’s water system. This process is a completely separate ranking process from that documented in the Risk Assessment Section (2.2.5), which used likelihood of failure and consequence of failure scoring matrices to calculate the relative risk of failure for CUC’s assets.
This section is divided into the following subsections:
Project Identification: development of a list of projects designed to rehabilitate and improve the water system.
Project Ranking Criteria Development: creation and refinement of project ranking criteria.
Criteria Weighting: assignment of proportional values for each criterion.
Project Scoring: scoring process for projects in terms of regulatory and CUC criteria.
Results Analysis: presentation of project ranking results.
Project Ranking Confirmation: process for confirming project rankings.
Selecting Projects for Cost Estimation: methods or selecting projects to carry forward for cost estimation and potential inclusion in the CIPs.
Each of these steps is discussed in greater detail below.
Project Identification The project team developed a master list of potential water projects by aggregating projects from the following sources:
Project Team
Condition assessment field reports
Draft

4. DRINKING WATER SYSTEM MASTER PLAN
4-16 DRAFT FINAL DRINKING WATER AND WASTEWATER MASTER PLAN, ROTA, CNMI
Risk assessment‐generated projects
Hydraulic model‐generated projects
State Revolving Fund (SRF)
CNMI Drinking Water Infrastructure Needs Survey (DWINS) Project Prioritization List
Miscellaneous Grant Projects
CUC‐Identified Projects
Each source is discussed below.
Condition Assessment‐Generated Projects Early in the project, the project team performed condition assessments in the field of CUC’s drinking water infrastructure, including both “vertical” assets (e.g., above‐ground assets such as booster pump stations) and “linear” assets (e.g., below‐ground assets such as distribution system pipes). As the field condition assessment evaluations of CUC assets progressed, the project team began proposing projects to address both specific and general conditions regarding the water system. Many of these proposed projects are documented in the Condition Assessment Section (2.2.2) of this Master Plan.
Risk Assessment‐Generated Projects Risk assessment workshops were conducted in October 2011 with CUC staff where assets were organized into an asset hierarchy that facilitated scoring of similar assets in different locations as well as individual assets that formed a higher, “parent” asset. Each water asset was evaluated based on likelihood of failure and consequence of failure scoring matrices. An important outcome of this exercise was the identification of CUC assets as high, medium, or low risk based on the workshop scores. The results of the risk assessment workshops are documented in Section 2.2.5 of this Master Plan. The higher risk assets were reviewed to identify potential mitigation projects for inclusion in the master project list.
Hydraulic Model Generated Projects Similar to that above, the project team began identifying proposed project concepts based on software simulation model runs of the water transmission and distribution systems. These proposed projects were appended to the master project list after undergoing review.
State Revolving Fund Drinking Water Infrastructure Needs Survey Projects The Safe Drinking Water Act requires that every 4 years EPA conduct an assessment of the national public water system capital improvement needs, which is called the Drinking Water Infrastructure Needs Survey (DWINS). The purpose of the survey is to document the 20‐year capital investment needs of public water systems that are eligible to receive Drinking Water State Revolving Fund (DWSRF) monies. The survey reports infrastructure needs that are required to protect public health, such as projects to ensure compliance with the Safe Drinking Water Act (SDWA). As directed by the SDWA, EPA uses the results of the survey to allocate to the states and tribes hundreds of millions of annual DWSRF dollars to help build and improve the nation’s infrastructure for delivering safe drinking water. The SRF dollars cannot be used for operation‐, maintenance‐, or monitoring‐related projects.
CUC last completed DWINS in 2011 for Saipan, Rota, and Tinian. The proposed projects were identified by CUC and then scored in accordance with scoring criteria established by CNMI DEQ. The scoring of projects results in a prioritized list that is submitted for review and approval by EPA Region 9. Projects proposed by CUC in the 2011 DWINS and approved by DEQ and EPA—but not yet implemented—were added to the master project list for further consideration and scoring.
Draft

4. DRINKING WATER SYSTEM MASTER PLAN
DRAFT FINAL DRINKING WATER AND WASTEWATER MASTER PLAN, ROTA, CNMI 4-17
Miscellaneous Grant Projects CUC provided the project team with a list of additional projects that were submitted for grant funding consideration by the Department of Interior (DOI) and the Office of Insular Affairs (OIA). Appendix P provides the list of DOI and OIA grant‐funded projects. These projects were added to the master project list for ranking if they were not already implemented.
CUC Projects These projects were proposed by the CUC engineering group, but not previously identified in previous subsections.
Master Project List Development Prior to the June workshops, the project team prepared the master project list, aggregating projects from all the sources described above. The list was analyzed carefully to identify opportunities to remove redundant projects, combine related projects into a larger “program,” and refine project definitions. The preliminary consolidated list of recommended projects was reviewed by both senior consultant team members and CUC project management for feasibility and completeness. The resulting master project list was provided to CUC for final approval for use in the June 2012 workshops. During these workshops, projects were added, changed, and deleted as necessary. The final project list that was used during the project scoring workshops is provided in Appendix Q.
Scoring Criteria Development Using a similar process to that employed during the asset risk assessment workshops, the project team proposed two sets of criteria to help determine the relative merits of proposed water projects. These criteria were further refined to distinguish the varying needs of Saipan, Tinian, and Rota. Each major criterion is discussed separately.
Water System Criteria The primary consideration for potential water projects was the criteria DEQ employs under the DWINS framework. CUC project management elected to incorporate the DWINS criteria exactly as written by DEQ; this DEQ document is included as Appendix R. The DWINS criteria include public health and system improvement considerations:
Public Health
Mitigation of current public health issue(s)
System Improvements
Increases water conservation
Provides 24‐hour water
Improves water quality (with regard to secondary standards)
Provides water to another tank service area allowing for well abandonment
Improves infrastructure inadequacies
Increases safety to the public and/or operators
In addition to the DWINS criteria that CUC is mandated to use to receive SRF funding, CUC decided to include supplementary criteria that CUC has identified as important considerations for developing and approving projects in‐house. The CUC criteria was proposed and defined by CUC engineering and field staff. The CUC‐identified criteria are as follows:
Increases water quality (with regard to primary standards)
Removes potential or known cross‐connections or negative pressure issues
Draft
4. DRINKING WATER SYSTEM MASTER PLAN
4-18 DRAFT FINAL DRINKING WATER AND WASTEWATER MASTER PLAN, ROTA, CNMI
Supports the Emergency Response Plan (ERP)
Accounts for population served
Reduces energy consumption
Resolves right‐of‐way issues
Meets Stipulated Order requirements
Protects water resources
Considers environmental factors
Environmental permits/process required
Environmental impacts
The CUC‐specific criteria are defined in further detail in Appendix S. The environmental criteria included there originated from the DWINS criteria document (Appendix R), but were not considered mandatory by DEQ. For this reason, the environmental factors are considered CUC‐identified criteria. CUC‐identified criteria allow for additional differentiation between projects that would have equal scores using the SRF funding criteria and provide a methodology for additional prioritization.
Criteria Weighting Combining EPA and non‐EPA criteria into a single unified “scorecard” posed an issue to the project team: what relative “weight” should each of these criteria receive? CUC desired that the SRF/EPA funding criteria take precedence, yet CUC‐specific criteria were important to distinguish inter‐island differences and overall utility benefit. The points for DWINS criteria were assigned based on the DWINS criteria documents drafted by DEQ (Appendix R). CUC management and staff provided the final weightings for CUC‐identified criteria for the water system. Criteria weightings were calculated based on the input from the CUC staff involved with the workshops; up to eight staff individually provided written input on how they deemed the total allowable points should be distributed across the CUC‐identified criteria. The average scores per category of everyone’s collective input was calculated and verified by the group to be acceptable. This “secret ballot” process was completed separately for water and wastewater systems to ensure that staff with appropriate expertise and experience was included in the process.
Water System Criteria Weighting The maximum possible water project score was 320 points; the point contribution associated with each criterion is discussed below:
Public Health (EPA required) – 100 points: As dictated by DWINS requirements.
System Improvements (EPA required) – 60 points: As dictated by DWINS requirements; consists of six 10‐point sub‐criteria; however, it is important to note that when used by DEQ for SRF awards, only three may be considered for a maximum of 30 points. All six have been included in this project prioritization process to provide the fullest range of information about a project.
Environmental Impacts (EPA non‐mandatory) – 60 points: CUC elected to proportion 24 and 36 points respectively for the two environmental sub‐criteria.
CUC Identified (not required) – 100 points: The individual points allotted among these sub‐criteria were determined in workshops and reflect differing priorities among the islands. Right‐of‐way issues, for example, are far more important on Rota than either Saipan or Tinian.
Table 4.3.1‐1 summarizes the point distribution, or weighting, of the criteria and sub‐criteria for the water project scoring process.
Draft

4. DRINKING WATER SYSTEM MASTER PLAN
DRAFT FINAL DRINKING WATER AND WASTEWATER MASTER PLAN, ROTA, CNMI 4-19
Table 4.3.1‐1. Water Project Scoring Criteria and Weighting
Category Criteria Maximum Points Sub‐criteria
Maximum Points
Maximum Points
Maximum Points
EPA Required
Public Health 100 Mitigate Current Public Health Issues 100 System Improvements 60 Increases Water Conservation 10
Provides 24‐Hour Water 10
Improves Water Quality re: Secondary Standards 10 Provides Water to Another TSA Allowing for Well Abandonment 10 Improves Infrastructure Inadequacies 10 Increases Safety – Public & Operators 10
CUC Identified
Environmental Impacts 60 Saipan Rota Tinian Environmental Permits/Process Required 24 24 24 Environmental Impacts 36 36 36 CUC 100 Increases Water Quality re: Primary Standards 13 12 12
Removes Potential/Known Cross‐Connections or Negative Pressure Issues
18 13 13
Support of ERP 7 7 7 Population Served 10 8 9 Reduces Energy Consumption 15 14 16 Right‐of‐Way (Eliminates Trespassing) 10 19 16 Meets Stipulated Order Requirements 14 14 14 Protects Water Resources 14 14 14
TOTAL 320 100 100 100
Draft

4. DRINKING WATER SYSTEM MASTER PLAN
4-20 DRAFT FINAL DRINKING WATER AND WASTEWATER MASTER PLAN, ROTA, CNMI
Project Scoring With the master project list finalized and the criteria defined and weighted, the full project group and stakeholders met over several workshops to “score” the water projects. The process was identical for each project:
The project description was read out loud as well as projected onto a wall.
The project area was identified on a GIS map.
Additional information was projected, such as tank survey photos or model simulation.
The project was discussed by attendees.
The project team facilitated achieving group consensus for each score.
Each score was immediately entered into a decision science software application (Criterion Decision Plus™).
Results Analysis and Project Ranking Confirmation After the workshops, the project team compiled and analyzed the scoring results for the water projects. The final results were presented in the final workshop, where a few minor adjustments were made and group confirmation was achieved. The confirmed scoring results were processed and ranked based on the total score, as shown in Figures 4.3.1‐1, 4.3.1‐2, and 4.3.1‐3. Results for Saipan, Rota, and Tinian are presented here in this Master Plan together, so that the overall project scores can be compared against one another. The ranking of projects from all three islands, in conjunction with project cost estimates must be analyzed together for the development of the 2‐year, 5‐year, and 20‐year CIPs due to the funding sources being tied together. For this reason, results of project ranking from Saipan, Rota, and Tinian are presented together in this Master Plan.
Draft
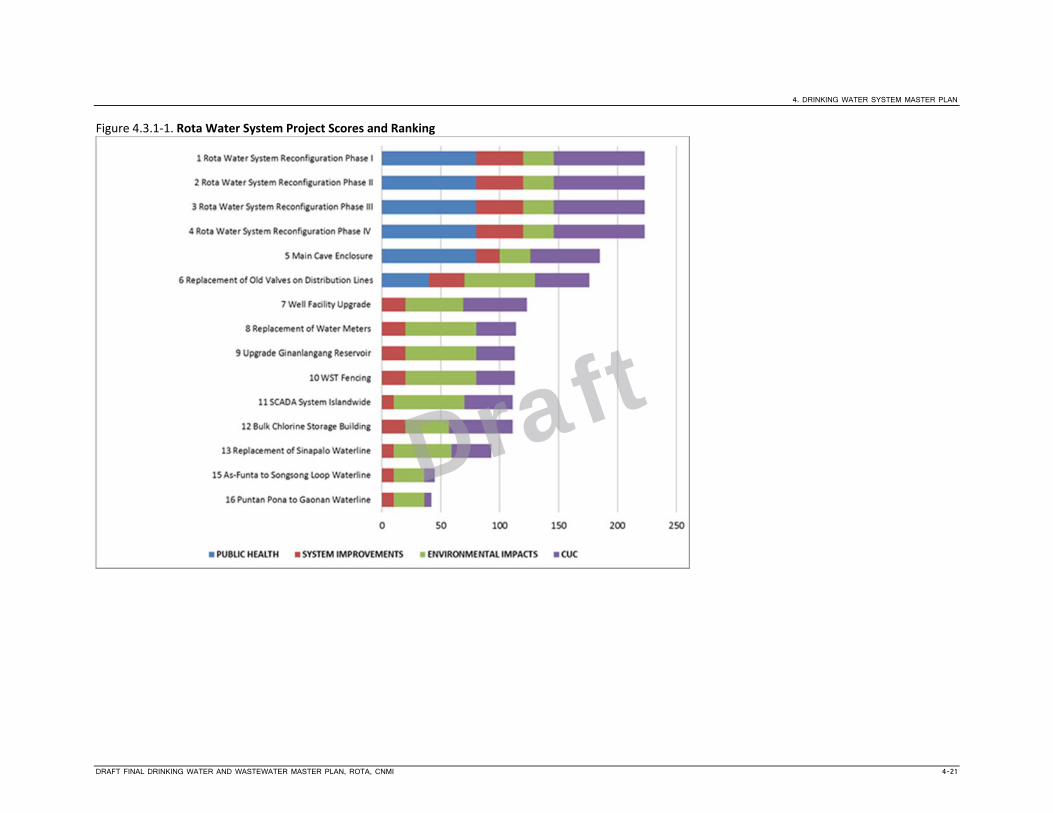
4. DRINKING WATER SYSTEM MASTER PLAN
DRAFT FINAL DRINKING WATER AND WASTEWATER MASTER PLAN, ROTA, CNMI 4-21
Figure 4.3.1‐1. Rota Water System Project Scores and Ranking
Draft

4. DRINKING WATER SYSTEM MASTER PLAN
4-22 DRAFT FINAL DRINKING WATER AND WASTEWATER MASTER PLAN, ROTA, CNMI
Figure 4.3.1‐2. Tinian Water System Project Scores and Ranking
Draft

4. DRINKING WATER SYSTEM MASTER PLAN
DRAFT FINAL DRINKING WATER AND WASTEWATER MASTER PLAN, ROTA, CNMI 4-23
Figure 4.3.1‐3. Saipan Water System Project Scores and Ranking
Draft

4. DRINKING WATER SYSTEM MASTER PLAN
4-24 DRAFT FINAL DRINKING WATER AND WASTEWATER MASTER PLAN, ROTA, CNMI
CUC Tank Risk and Project Prioritization To more accurately place tank projects into the CIP, which is an integral part of the Master Plan, it was decided that the individual tank risk scores would be evaluated in comparison to the CIP tank project rankings. Because the CIP project scoring criteria do not take into consideration the risk of failure of the assets affected by the proposed project, some tanks that are in severely poor condition did not make it to the top of the CIP project rankings. These tanks are critical to providing service to CUC customers. To ensure tanks in severe condition are prioritized in the CIP schedule, it is not possible to look at the CIP project rankings alone. As such, the risk scores for all tanks were assessed and those tanks that have a high risk of failure are prioritized in the CIP schedule to ensure that they are addressed in a timely fashion.
At the time of the final project ranking and prioritization workshop, it had been nearly 3 years since the asset risk scores were developed. During that 3 year period additional ACI inspections were performed on several tanks and additional knowledge was obtained; for this reason the observed condition of many tanks had changed since the initial risk assessments. To account for changing conditions, during the February 2015 project ranking workshops the tank risk scores were reassessed, specifically the likelihood of failure scores. Once the likelihood of failure scores, and thus the risk scores, for the tanks were updated, the risk scores were compared to the CIP project prioritization scores (Figures 4.3.1‐1, 4.3.1‐2, and 4.3.1‐3). Several tanks do not have a corresponding CIP project; these tanks are listed below along with the reason they have not been included in a CIP project:
Kumoi (0.05‐MG) ‐ currently being relocated.
Agag (0.1‐MG) ‐ will be abandoned as part of the East Project.
Gualo‐Rai (5,000 gal) ‐ tank is considered temporary.
Isley Tank New (0.5‐MG) ‐ recently refurbished by CUC.
Koblerville Sump Tank ‐ to be abandoned.
Isley Sump Tank/Booster 1 ‐ very low risk tank; no project has been identified that will provide upgrades to this tank.
Papago (0.5‐MG) ‐ new tank is under construction.
Puerto Rico (1.0‐MG) ‐ new tank is under construction.
Gualo‐Rai (0.2‐MG) ‐ currently under design for replacement.
Old NMC ‐ To be replaced as part of the new West Project.
Kannat Tabla (1.0‐MG) ‐ newly constructed.
Kaan (1.0‐MG) – this tank will be demolished as part of the Rota Water System Reconfiguration Phase II project.
Ginanlangan Reservoir (Sinapalo Tank, 0.5‐MG) ‐ this tank will be replaced and relocated under the Rota Water System Reconfiguration Phase I project.
Draft

4. DRINKING WATER SYSTEM MASTER PLAN
DRAFT FINAL DRINKING WATER AND WASTEWATER MASTER PLAN, ROTA, CNMI 4-25
The highest‐risk tanks for all three islands as listed below (in order of descending risk scores) are prioritized in the CIP and are scheduled during one of the next two 5‐year CIP cycles (see Figure 4.3.1‐4):
San Vicente (0.5‐MG)
Dan Dan (0.5‐MG)
Marpi (1.0‐MG)
Isley Tank Old (0.5‐MG)
Carolina/HMT (0.5‐MG)
Figure 4.3.1‐4. Tank CIP Project Scores versus Tank Risk Scores
4.3.2 Cost Development of Drinking Water System Prioritized Projects This section and Appendix T present the cost estimates and cost estimating approach for the projects identified in the Project Identification and Prioritization section of this Master Plan (Section 4.3.1). The cost estimates were used, in conjunction with the project prioritization results, to develop the 2‐year, 5‐year, and 20‐year capital improvement plans as required by the Stipulated Order. The ranking of projects from all three islands, in conjunction with project cost estimates must be analyzed together for the development of the 2‐year, 5‐year, and 20‐year CIPs due to the funding sources being tied together. For this reason, results of the costs and CIP development for Saipan, Rota, and Tinian are presented together in this Master Plan.
Draft

4. DRINKING WATER SYSTEM MASTER PLAN
4-26 DRAFT FINAL DRINKING WATER AND WASTEWATER MASTER PLAN, ROTA, CNMI
This section summarizes the results of the cost estimating effort for those projects chosen for inclusion in the Master Plan CIPs. This section is organized into the following sections:
Cost Estimating Classification and Terminology: Assignment of an American Association of Cost Engineers (AACE) Cost Classification
Cost Estimating Assumptions: Description of Cost Estimating Assumptions and Sources of Information
Project Cost Estimation: Assign a CIP‐level cost for the list of projects identified as needed to rehabilitate and improve the water and wastewater systems
Cost Estimating Classification and Terminology For the purposes of developing CIP cost estimates for this Master Plan, the following terms are defined and are specific to the cost estimating approach presented herein.
Construction Cost The cost to construct the CIP element is an estimate of the contractor’s price for construction of the infrastructure in 2012 dollars including project costs (i.e., materials, equipment, installation construction labor) and contractor markups. For the purposes of the cost estimates presented in this section, contractor markups are consistent for all infrastructure elements and are as follows:
Overhead: 10 percent
Profit: 5 percent
Mobilization/Bonds/Insurance: 5 percent
The percentages applied to the contractor markups are based on industry standards and CH2M’s experience with similar projects. Consistent with the cost estimating process, these contractor markups are added in a compounding manner following the order listed above to the project costs. After these markups are applied, a contingency of 30 percent as well as a location adjustment factor are applied. The contingency accounts for lack of detailed design definition, gross receipts tax (GRT), cost escalation, and costs associated with unknown or unforeseen conditions at the time of implementation. The location adjustment factor adjusts the construction cost for the area where the project is located. Based on the “Historical Air Force Construction Handbook” dated February 2007,
a location adjustment factor of 0.83 was used for Rota.
Capital Cost The Capital Cost equals the Construction Cost plus non‐construction costs (as a percentage of project costs plus contractor markups) for items that include the following:
Permitting: 1 percent (when applicable)
Engineering and Design Services: 10 percent (when applicable)
Services During Construction: 8.5 percent (when applicable)
Commissioning and Start‐up Services: 3 percent (when applicable)
Again, the percentages applied to each of the non‐construction costs are based on CH2M’s experience.
Annual Operations and Maintenance Cost The annual operations and maintenance (O&M) cost is the cost to operate and maintain the water infrastructure element or system in 2013 including power, chemicals, maintenance, materials, and labor. Similar to the capital cost, a 20‐percent contingency is included in the annual O&M Cost to account for undefined costs at this level of planning.
Draft

4. DRINKING WATER SYSTEM MASTER PLAN
DRAFT FINAL DRINKING WATER AND WASTEWATER MASTER PLAN, ROTA, CNMI 4-27
O&M costs are only estimated for projects that are considered to be new additions to the water infrastructure. For projects identified as replacement or upgrades to existing infrastructure, annual O&M cost estimates were not included as it was assumed that those costs are already included in CUC’s annual operating budget. Furthermore, the total O&M costs presented in this Master Plan do not take into account a potential reduction in current O&M costs. Many of the projects identified in the Master Plan could potentially result in a reduction of labor, material, and energy costs due to increased system reliability and operational efficiency. Quantification of these savings was not completed for this Master Plan because it is difficult to calculate the magnitude of the impact that these projects will have on the overall water or wastewater system.
O&M costs were developed for the purpose of assisting in the development of the financial plan and were not used in the development of the CIP. Therefore, no O&M costs are presented in this section but are included as part of Appendix T.
The Association for the Advancement of Cost Engineering (AACE International) defines the following cost estimate classifications:
Class 5. This estimate is prepared based on limited information, where little more than proposed infrastructure type, its location, and the capacity are known. Strategic planning purposes include, but are not limited to, market studies, assessment of viability, evaluation of alternate schemes, project screening, location and evaluation of resource needs and budgeting, and long‐range capital planning. Examples of estimating methods used include cost/capacity curves and factors, scale‐up factors, and parametric and modeling techniques. Little time is expended in the development of this estimate. The typical expected accuracy range for this class estimate is –20 to –50 percent on the low side and +30 to +100 percent on the high side.
Class 4. This estimate is prepared based on information where the preliminary engineering is from 1 to 5 percent complete. Detailed strategic planning, business development, project screening, alternative scheme analysis, confirmation of economic and/or technical feasibility, and preliminary budget approval are needed to proceed. Examples of estimating methods used include equipment and/or system process factors, scale‐up factors, and parametric and modeling techniques. This estimate requires more time expended in its development. The typical expected accuracy range for this class estimate is –15 to –30 percent on the low side and +20 to +50 percent on the high side.
Class 3. This estimate is prepared to form the basis for the project authorization and/or funding. Typically, engineering is from 10 to 40 percent complete and comprises process flow diagrams, preliminary piping runs for major processes, facility layout drawings, and complete process and facility equipment lists. This estimate becomes the project control or project budget estimate until more detailed estimates are completed. Examples of estimating methods used include a high degree of detailed unit cost and quantity takeoffs for major processes. Factoring and/or scale‐up factors can be used for less significant or support areas of the project. This estimate requires a great deal of time to prepare, where actual equipment and processes have been designed. The typical expected accuracy range for this class estimate is –10 to –20 percent on the low side and +10 to +30 percent on the high side.
Class 2. This estimate is prepared to form a detailed control baseline for the project. Typically, engineering is from 30 to 70 percent complete and comprises process flow diagrams, piping and instrument runs for all processes, final facility layout drawings, complete process and facility equipment lists, single‐line diagrams for electrical and major electrical components, and
Draft
4. DRINKING WATER SYSTEM MASTER PLAN
4-28 DRAFT FINAL DRINKING WATER AND WASTEWATER MASTER PLAN, ROTA, CNMI
schedules. This estimate becomes the detailed project control estimate. Examples of estimating methods used include a high degree of deterministic estimating and detailed quantity takeoffs for all of the facility processes and/or systems, with little factoring and/or scale‐up factors used, except for minor support areas of the project. This estimate usually becomes the final estimate and requires significant line‐item information, which takes time to prepare. The typical expected accuracy ranges for this class estimate are –5 to –15 percent on the low side and +5 to +20 percent on the high side.
Class 1. This estimate is prepared to confirm the control baseline for the project. Typically, engineering is from 80 to 100 percent complete, which comprises virtually all engineering and design documentation of the project, and complete project execution and commissioning plans. This estimate becomes the final control baseline of the project. Examples of methods used are the highest degree of deterministic estimating, with very detailed quantity takeoffs for all of the facility processes and/or systems of the project. This type of estimate usually becomes the bid‐check estimate and requires the most effort to create. The typical expected accuracy ranges for this class estimate are –3 to ‐10 percent on the low side and +3 to +15 percent on the high side.
The Class 5 estimate is the estimate type usually used to evaluate project alternatives at the planning‐level stage and is the class of estimate supported for the development of CUC’s CIP projects presented in this section of the Master Plan.
The Class 5 estimates presented in this section and any resulting conclusions on project financial or economic feasibility or funding requirements are prepared for guidance in project evaluation and implementation, and use the information available at the time of the estimate. The final costs of the project and resulting feasibility will depend on actual labor and material costs, competitive market conditions, actual site conditions, final project scope, implementation schedule, continuity of personnel and engineering, and other variable factors. Therefore, the final project costs will vary from the estimates developed using the information described in this section and presented in this Master Plan. Because of these factors, project feasibility, benefit/cost ratios, risks, and funding needs must be carefully reviewed, prior to making specific financial decisions or establishing project budgets, to help conduct proper project evaluation and allocate adequate funding.
Cost Estimating Assumptions
The following assumptions were made for the purposes of this cost analysis:
Land purchase was excluded from capital cost estimates for new facilities
No market adjustment factor was applied
When housing was required, it was assumed unit processes were housed in concrete masonry buildings
O&M costs were estimated based on a percentage of the capital cost. The percentage of O&M took into account the life expectancy of the infrastructure. Infrastructure life expectancy presented in this report ranges from 20 to 50 years depending on the infrastructure type; see Appendix T for specific details on individual projects. As a result, the O&M percentage ranges from 2 to 5 percent of the construction cost depending on the project.
The following O&M items were considered, but not explicitly estimated:
Equipment power
Building electrical (applicable to housed facilities only)
Draft

4. DRINKING WATER SYSTEM MASTER PLAN
DRAFT FINAL DRINKING WATER AND WASTEWATER MASTER PLAN, ROTA, CNMI 4-29
Chemicals
Cost estimates were developed using the CH2M Parametric Estimating System (CPES) and includes construction costs, non‐construction costs, and operations and maintenance costs. The construction cost assumptions are presented in Table 4.3.2‐1. The cost estimates developed for this Master Plan are classified as an AACE Class 5 Estimate (+100 percent/‐50 percent). Consequently, the actual construction costs could vary significantly from what is presented in Appendix T, which provides the cost estimate details for the water systems. Deviations from any of the above assumptions can significantly affect the costs.
Table 4.3.2‐1. Capital and O&M Cost Assumption Summary
Project Location Rota, CNMI
Local Adjustment Factor 0.83
Contractor Markups
Overhead Markup 10%
Profit 5%
Mob/Bond/Insurance 5%
Contingency 30%
Non‐Construction Additional Costs (when applicable
Permitting 1%
Engineering and Design 10%
Services During Construction 8.5%
Commissioning & Startup 3%
O&M Cost Assumption
O&M Costs 2%‐5% of capital cost
Contingency 20%
4.3.3 CIP Project Identification and Costs Projects were ranked (Section 4.3.1) based on a methodical scoring process after which the top ranking projects were selected for inclusion in the cost estimate exercises. The full project descriptions can be found in Appendix Q. Capital and O&M costs were estimated for each of these projects utilizing the methodology and assumptions discussed previously.
The project ranking results (Section 4.3.1) are crucial in creating a defensible and grant‐eligible CIP for CUC. With the projects being ranked in order of highest benefit to CUC for each island, the next step was to determine which projects would move forward in the process for cost estimation. Developing cost estimates for projects is a necessary step in developing an accurate and defensible CIP implementation plan.
Not all projects identified as part of the project identification process will be included in the CIP due to budget and scheduling restraints; it is not feasible to be able to complete all 73 projects that were identified and scored within the 20‐year CIP implementation period. The project team consulted with CUC management to identify those projects to be included in the cost estimation exercise
Draft

4. DRINKING WATER SYSTEM MASTER PLAN
4-30 DRAFT FINAL DRINKING WATER AND WASTEWATER MASTER PLAN, ROTA, CNMI
based on the project scoring results shown in Figures 4.4.1‐1 through 4.4.1‐3. The asset risk scores were also reviewed as part of this cost estimation project selection process to ensure projects associated with high risk assets were included in the cost estimation exercise, even if the project fell below the determined cut‐off points. As discussed in Section 4.3.1, the tanks with the highest risk scores were given special consideration for inclusion in the CIP and were included in the cost estimates.
The final projects selected for cost estimates were as follows:
Saipan water. Cost estimates were developed for projects 1 through 25 on the ranked project list, as well as three projects that will reduce the risk of three high‐risk tanks (As Matuis, Dan Dan, and Isley Tank old ‐ CCB).
Rota water. Cost estimates provided for projects 1 through 7 on the ranked project list.
Tinian water. Cost estimates provided for projects 1, 2, and 4 on the ranked project list.
4.3.4 Prioritized Water System Modifications/Improvements Program This section presents the methodology and results of the 2‐year, 5‐year, and 20‐year CIP development process, which meets the requirements set forth in the Stipulated Order. To assist with the development of a financial model and the CIP, a project sequencing plan was created based on project cost, priority, phasing, and available budget for capital projects. O&M costs were not a consideration when developing the CIP and therefore are not presented in this section.
The available budget was developed and is described in detail in the Financial Plan. A summary of the assumed funding for the first 5‐year period for water projects is presented in Table 4.3.3‐1.
Table 4.3.3‐1. Assumed Available Budget for Capital Improvement Projectsa
FY2016 FY2017 FY2018 FY2019 FY2020
Water Grant Funding $3,550,000 $3,180,000 $2,840,000 $2,540,000 $2,260,000
a Budgets were rounded to 3 significant figures. Actual budget estimates can be found in the Financial Plan.
2‐ and 5‐Year CIP Development Based on priority, projects for water were chosen for the 2‐ and 5‐year plans and each project was divided into two or three phases (permitting, design, and construction). Each phase was assigned an estimated time to completion and projects were then sequenced starting with the highest priority first, and more projects were added until the available budget for all 5 years was depleted. For the water projects, one of the top projects for Rota was included in the 5‐year CIP as presented in Figure 4.3.3‐1. For the water CIP project sequencing, a discretionary fund was included for each year to be used for emergency projects not included in the CIP project list. The discretionary amount varies each year for water 5‐year CIP. Any remaining funds not utilized by the CIP prioritized projects were added to the base discretionary fund. It should be noted that if the projects bid out for less than the conceptual placeholder costs presented herein, additional projects from the project identification list should be added to the project sequencing plan and should be done according to the projects’ relative prioritization. The complete project descriptions are provided in Appendix Q.
Draft
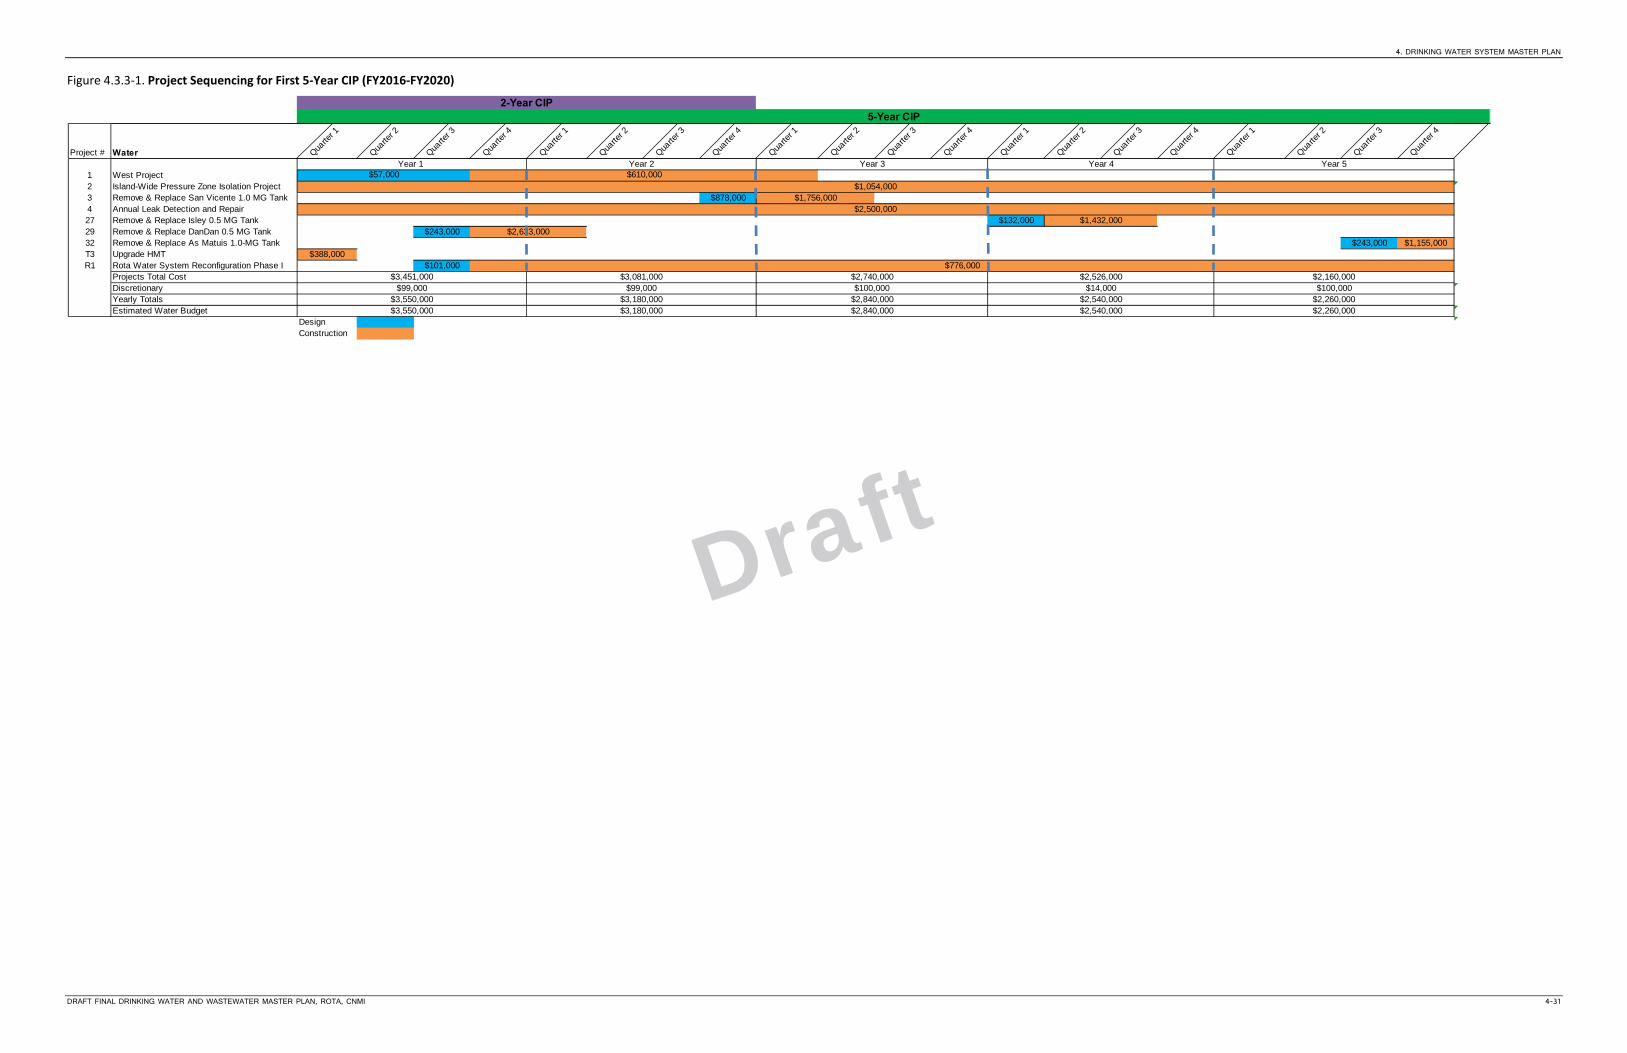
4. DRINKING WATER SYSTEM MASTER PLAN
DRAFT FINAL DRINKING WATER AND WASTEWATER MASTER PLAN, ROTA, CNMI 4-31
Figure 4.3.3‐1. Project Sequencing for First 5‐Year CIP (FY2016‐FY2020)
5-Year CIP2-Year CIP
Project # Water Quarte
r 1
Quarte
r 2
Quarte
r 3
Quarte
r 4
Quarte
r 1
Quarte
r 2
Quarte
r 3
Quarte
r 4
Quarte
r 1
Quarte
r 2
Quarte
r 3
Quarte
r 4
Quarte
r 1
Quarte
r 2
Quarte
r 3
Quarte
r 4
Quarte
r 1
Quarte
r 2
Quarte
r 3
Quarte
r 4
1 West Project #######2 Island-Wide Pressure Zone Isolation Project #REF!3 Remove & Replace San Vicente 1.0 MG Tank $878,000 #######4 Annual Leak Detection and Repair #######27 Remove & Replace Isley 0.5 MG Tank $132,000 #######29 Remove & Replace DanDan 0.5 MG Tank $243,000 #######32 Remove & Replace As Matuis 1.0-MG Tank $243,000 $1,155,000 #######T3 Upgrade HMT $388,000 #######R1 Rota Water System Reconfiguration Phase I $101,000 $0
Projects Total CostDiscretionary #REF!Yearly Totals #######Estimated Water Budget #REF!
Design #REF!Construction
Year 1 Year 2 Year 3 Year 4 Year 5$57,000 $610,000
$1,054,000$1,756,000
$2,500,000
$2,540,000 $2,260,000$3,550,000 $3,180,000 $2,840,000 $2,540,000 $2,260,000
$99,000 $99,000 $100,000 $14,000 $100,000
$3,550,000 $3,180,000 $2,840,000
$1,432,000
$776,000$3,451,000 $3,081,000 $2,740,000 $2,526,000 $2,160,000
$2,633,000
Draft

Draft

4. DRINKING WATER SYSTEM MASTER PLAN
DRAFT FINAL DRINKING WATER AND WASTEWATER MASTER PLAN, ROTA, CNMI 4-33
20‐Year CIP Development For the 20‐year CIP, it was assumed that the available funding estimate for fiscal year 2018 would remain constant through the 20‐year period for water projects. The 20‐year CIP projects for water are presented in Table 4.4.3‐2.
Table 4.3.3‐2. 20‐Year Water CIP Projects and Associated Costs
Project Location
Project #d Project Descriptiona
1st 5‐Year CIP (FY2016‐2020)
2nd 5‐Year CIP (FY2021‐
2025)
3rd 5‐Year CIP (FY2026‐2030)
4th 5‐Year CIP (FY2031‐2035)
Saipan 1 West Project $ 667,000
Saipan 2 Island‐wide Pressure Zone Isolation Project
$ 1,054,000
Saipan 3 Remove and Replace San Vicente 1.0‐MG Tank
$ 2,634,000
Saipan 4 Annual Leak Detection and Repair $ 2,500,000
Saipan 27 Upgrade Isley Tank – Old (CCB) $ 1,564,000
Saipan 29 Replace Dan Dan Tank 0.5‐MG Tank $ 2,876,000
Saipan 32 Upgrade As Matuis (Marpi) 1.0‐MG Tank
$ 1,398,000
Rota 1 Rota Water System Reconfiguration Phase I
$ 877,000
Tinian 4 Upgrade HMT (0.5‐MG) $ 388,000
5‐Year Total $ 13,958,000
Saipan 5 Fina‐Sisu Waterline Replacement $ 1,722,000
Saipan 6 New Meter Installation (24‐hr and non‐24‐hr zones)
$ 1,525,000
Saipan 7 Chinatown/Sugar King Waterline Replacement
$ 1,485,000
Saipan 8 Replace Talofofo Waterline $ 220,000
Saipan 9 Airport‐owned Tank Modification $ 8,000
Saipan 10 Isley II Booster System‐Upgrades $ 980,000
Saipan 14 Interim Agag Vacuum Controls $ 29,000
Saipan 18 Install Air Relief and Vacuum Valves $ 33,000
Saipan 20 Generator Upgrades $ 378,000
Saipan 32 Upgrade As Matuis (Marpi) 1.0‐MG Tank
$ 1,478,000
Rota 1 Rota Water System Reconfiguration Phase I
$ 309,000
Rota 2 Rota Water System Reconfiguration Phase II
$ 2,521,000
Tinian 1 Improvements to Maui II Well $ 60,000
Tinian 2 Upgrade QMT Tank (0.25‐MG) $ 163,000
5‐Year Total $ 10,911,000
Draft

4. DRINKING WATER SYSTEM MASTER PLAN
4-34 DRAFT FINAL DRINKING WATER AND WASTEWATER MASTER PLAN, ROTA, CNMI
Table 4.3.3‐2. 20‐Year Water CIP Projects and Associated Costs
Project Location
Project #d Project Descriptiona
1st 5‐Year CIP (FY2016‐2020)
2nd 5‐Year CIP (FY2021‐
2025)
3rd 5‐Year CIP (FY2026‐2030)
4th 5‐Year CIP (FY2031‐2035)
Saipan 7 Chinatown/Sugar King Waterline Replacement
$ 2,969,000
Saipan 8 Replace Talofofo Waterline $ 1,982,000
Saipan 11 Wireless Ridge Waterline Replacement
$ 1,755,000
Saipan 16 System Wide SCADA Project $ 800,000
Rota 2 Rota Water System Reconfiguration Phase II
$ 2,522,000
Rota 3 Rota Water System Reconfiguration Phase III
$ 572,000
Rota 4 Rota Water System Reconfiguration Phase IV
$ 141,000
Rota 5 Main Cave Enclosure $ 69,000
Rota 6 Replacement of Old Valves on Distribution Lines
$ 89,000
5‐Year Total $10,899,000
Saipan 12 Isley to As‐Perdido Transmission Line Replacement
$ 7,545,000
Saipan 13 As Lito Distribution Projectc $ 392,000
Saipan 15 Well Upgrades $ 2,208,000
Saipan 16 System Wide SCADA Project $ 578,000
Saipan 25 Emergency Backup Power for Water Supply Systems
$ 130,000
Rota 7 Well Facility Upgrade $43,000
5‐Year Total $10,896,000
Discretionary Project Funds $ 412,000 $ 389,000 $ 401,000 $ 404,000
Total Project Costs $ 14,370,000 $ 11,300,000 $ 11,300,000 $ 11,300,000
Available Budget $ 14,370,000 $ 11,300,000 $ 11,300,000 $ 11,300,000
aComplete project descriptions for the Rota drinking water system can be found in Appendix Q. bAll costs have been rounded to the nearest thousand. Actual cost estimates for Rota drinking water system projects can be found in Appendix T. cOnly engineering costs were included in the 20‐year CIP.
dThe project numbers correspond to the project prioritization rankings developed in Section 4.3.1. Projects were added to the 20‐year CIP in order of highest priority to lowest priority (1 being the highest priority) when possible. Some projects with high capital costs were excluded from the CIP to include more projects, some of which had a lower project priority ranking. The high risk tanks were incorporated into the 20 year CIP regardless of the tank project priority ranking to ensure that these tank projects are included in the first two 5‐year phases of the CIP.
Draft
4. DRINKING WATER SYSTEM MASTER PLAN
DRAFT FINAL DRINKING WATER AND WASTEWATER MASTER PLAN, ROTA, CNMI 4-35
4.4 Drinking Water System Operations and Maintenance Improvement Recommendations
4.4.1 Tanks
Schedule API tank inspections at 5‐year intervals and perform a hydraulic analysis to optimize placement of a tank should its replacement be warranted.
Repair the altitude valve at the Ginanlangan Tank as an interim recommendation until the
Rota Water System Reconfiguration Phase I project relocates the Ginanlangan Tank.
Repair the altitude valve at the Kaan Tank as an interim recommendation until Rota Water
System Reconfiguration Phase II project decommissions the Kaan Tank.
Compare the 20‐year lifecycle cost of steel and concrete in the context of available funding to determine the tank material of choice on a project‐by‐project basis. Given the current poor condition of the majority of CUC steel tanks and the corrosive effects of the local environment, the use of concrete is recommended.
The hydraulics and inlet and outlet configuration of any new or rehabilitated tank must be carefully analyzed, taking into account factors such as mixing, system controls, and operations. The following are suggested for tank hydraulic configurations:
Use of separate inlet and outlet lines should be considered, having the inlet and outlet
located at opposite ends of the tank.
Install provisions for tank bypass to allow periodic cleaning and physical inspection of the
tank.
Consider tank baffling or alternative mixing technology, particularly for tanks with storage
capacity of 1 million gallons or more.
Carefully design inlet controls, such as pressure‐sustaining valves and/or altitude valves,
with great care given to avoid overdesign. In addition, due consideration must be given to
accommodate low‐flow bypasses.
4.4.2 Wells
Do not apply tape to the outer cover of the motors (e.g., SQ‐5)
Evaluate well pump depth placement to ensure there is a 10‐foot clear zone between the bottom of the motor and bottom of the well.
Evaluate wells that have a high potential for sanding and select an appropriate pump and motor for that environment (e.g., KG‐4)
Evaluate the need to install a cooling sleeve over the motor and add a sacrificial anode. The sleeve will increase the flow across the motor and will reduce the calcium precipitation onto the outside of the motor. The sacrificial anode will help to protect against pitting due to aggressive water (chloride) (e.g., SQ‐5 and MQ‐8).
4.4.3 Chlorination Facilities
Install an automatic chlorine tank switchover.
Install amperometric chlorine analyzers at the entry point into the distribution.
Draft
4. DRINKING WATER SYSTEM MASTER PLAN
4-36 DRAFT FINAL DRINKING WATER AND WASTEWATER MASTER PLAN, ROTA, CNMI
4.4.4 Booster Pump Stations
Maintain pumping redundancy at the Sinapalo III booster pump station by keeping a spare pump and motor on island.
Upgrade the Sinapalo III booster pump station in the interim by equipping it with two pumps each sized to handle the full peak demand estimated at 200 gpm at 175 ft. The pump station should be equipped with a variable frequency drive (VFD) to maintain a constant pressure head to the customer, standby power, and a secure enclosure.
4.4.5 Water Distribution
Continue to conduct routine clearing around the concrete pedestals that support aboveground transmission pipelines to control the root intrusion.
Routine painting of the site piping is recommended.
Wherever feasible, serve CUC water customers by a distribution line connected to a storage tank. Pressure‐reducing valves (PRVs) are suggested to reduce high pressures to preferred service pressures.
Install individual household pressure regulators in those situations when high pressures cannot be avoided.
Some of the smaller and isolated areas within the CUC system cannot be included in a tank service area. These areas currently use a booster pump system to provide the needed pressure (head). For such systems, the following are recommended:
Size pump systems and pneumatic tanks according to the 10 States Standards.
Locate air relief valves (ARVs) at the upper portion of the areas served by the booster pump.
Pay careful attention to conditions on the suction side of the pump system. The pump should not cause a drop in system pressure below the recommended pressure.
Install a soft starter or variable frequency drive (VFD) to avoid upstream and downstream transient flows.
4.4.6 Pressure‐Reducing Valves
Specify aluminum or stainless steel pilot piping for reapers, upgrades, and replacements.
Install a pressure reducing/sustaining valve (PRSV) at the existing upper PRV as a short‐term correction to vacuum and pump cavitations between the Ginanlangan to Kaan Tanks.
Conduct additional training on the maintenance and operation of PRVs.
4.4.7 Water Meters
Purchase and evaluate both the Sensus accuSTREAM and the Badger Disc Meter while continuing to test the Sensus iPerl meter, then select a system‐wide meter based on actual performance.
4.4.8 Risk Assessments
Perform electrical system condition assessments for the booster station, similar to that accomplished for the wastewater lift station electrical equipment in Saipan. After condition data are collected in the field, update the asset hierarchy with revised Likelihood of Failure (LOF) scores.
It is recommended that as condition/material/age is determined for transmission pipes and distribution pipes, the asset hierarchy and COF and LOF scores be updated accordingly.
Draft

4. DRINKING WATER SYSTEM MASTER PLAN
DRAFT FINAL DRINKING WATER AND WASTEWATER MASTER PLAN, ROTA, CNMI 4-37
4.4.9 Water Quality Monitoring Equipment
At primary disinfection facilities (i.e., entry points into the distribution system), install amperometric chlorine meters with data recorders to provide a continuous measurement of chlorine residual entering the distribution system.
Draft

Draft

DRAFT FINAL DRINKING WATER AND WASTEWATER MASTER PLAN, ROTA, CNMI 5-1
SECTION 5
Wastewater System Master Plan
The contents of Section 3, “Wastewater System Master Plan,” are as follows:
5.1 Stipulated Order Planning and Compliance Requirements for the Wastewater Master Plan ............................................................................................ 5‐3
5.2 Wastewater System Planning and Design Criteria ................................................................. 5‐5 5.3 Wastewater Collection and Treatment System Recommendations ...................................... 5‐7
5.3.1 Wastewater System Project Identification and Prioritization ................................... 5‐7 5.3.2 Cost Development of Wastewater System Prioritized Projects .............................. 5‐12 5.3.3 Prioritized Water System Modifications/Improvements Program ......................... 5‐16
Draft

Draft

SECTION 5. WASTEWATER SYSTEM MASTER PLAN
DRAFT FINAL DRINKING WATER AND WASTEWATER MASTER PLAN, ROTA, CNMI 5-3
5.1 Stipulated Order Planning and Compliance Requirements for the Wastewater Master Plan
Table 4.1‐1 in the “Stipulated Order Planning and Compliance Requirements for the Drinking Water Master Plan” lists the requirements for both water and wastewater portions of the Stipulated Order and the corresponding sections in the project team’s scope of work and this Master Plan that comply with the requirements.
Draft

Draft
SECTION 5. WASTEWATER SYSTEM MASTER PLAN
DRAFT FINAL DRINKING WATER AND WASTEWATER MASTER PLAN, ROTA, CNMI 5-5
5.2 Wastewater System Planning and Design Criteria Currently on the island of Rota, there is no CUC‐owned wastewater infrastructure; wastewater disposal and treatment is achieved through use of private septic systems. CUC does not own or operate any wastewater infrastructure in Rota, although there is a possibility in the future that CUC could construct wastewater collection systems and treatment facilities. These are not prioritized CIPs for the 20‐year planning period, so development of wastewater system planning and design criteria is not required at this time. The Saipan Wastewater System Master Plan discusses wastewater system planning and design criteria; this information should be uses as a basis for developing criteria for Rota in the future, as needed.
Draft

Draft

SECTION 5. WASTEWATER SYSTEM MASTER PLAN
DRAFT FINAL DRINKING WATER AND WASTEWATER MASTER PLAN, ROTA, CNMI 5-7
5.3 Wastewater Collection and Treatment System Recommendations
Although Rota does not have any existing CUC‐owned wastewater infrastructure, projects were identified for the analysis and potential construction of future wastewater collection and treatment in Rota. This section of the Master Plan presents the methodology for identification of wastewater projects to be included in the CIP, as well as the development of cost estimates and implementation schedule for the wastewater capital improvement projects.
5.3.1 Wastewater System Project Identification and Prioritization In 2011 and 2012, the project team worked extensively in the field and in workshop settings with CUC staff to catalog water and wastewater assets, assess their condition and risk, and develop hydraulic models for the water and wastewater systems. These activities produced a large volume of information that was organized and analyzed with the intent of identifying projects for inclusion in the 2‐year, 5‐year, and 20‐year capital improvement plans.
This section describes the effort to identify all projects and rank them based on decision criteria that were developed specifically for CUC’s wastewater system. This process is a completely separate ranking process from that documented in the Asset Risk Assessment section, which used likelihood of failure and consequence of failure scoring matrices to calculate the relative risk of failure for CUC’s assets.
This section is organized into the following sections:
Project Identification: Development of a list of projects designed to rehabilitate and improve the wastewater system.
Project Ranking Criteria Development: Creation and refinement of project ranking criteria.
Criteria Weighting: Assignment of proportional values for each criterion.
Project Scoring: Scoring process for projects in terms of regulatory and CUC criteria.
Results Analysis: Presentation of project ranking results.
Project Ranking Confirmation: Process for confirming project rankings.
Selecting Projects for Cost Estimation: Methods or selecting projects to carry forward for cost estimation and potential inclusion in the CIPs.
Each of these steps is discussed in greater detail below.
Project Identification The project team developed a master list of potential wastewater projects by aggregating projects from the following sources:
State Revolving Fund (SRF): CNMI Clean Watersheds Needs Survey (CWNS) Project Prioritization List
CUC‐Identified Projects
State Revolving Fund Clean Watersheds Needs Survey Projects The EPA’s Office of Wastewater Management, in partnership with states, territories, and the District of Columbia, conducts the CWNS every 4 years. The CWNS is a comprehensive assessment of the capital needs to meet the water quality goals set in the Clean Water Act. DEQ developed scoring criteria that must be used for all projects listed in CWNS. The CWNS projects and scores are reviewed by DEQ and EPA for final approval before they can be funded through SRF monies. CUC
Draft
SECTION 5. WASTEWATER SYSTEM MASTER PLAN
5-8 DRAFT FINAL DRINKING WATER AND WASTEWATER MASTER PLAN, ROTA, CNMI
last completed CWNS in February 2012. Projects proposed by CUC and approved by DEQ and EPA—but not yet implemented—were added to the project list for further consideration and ranking.
CUC Projects These projects were proposed by the CUC engineering group but not previously identified in previously.
Master Project List Development Prior to the June workshops, the project team prepared the master project list, aggregating projects from all the sources described above. The list was analyzed carefully to identify opportunities to remove redundant projects, combine related projects into a larger “program,” and refine project definitions. The preliminary consolidated list of recommended projects was reviewed by both senior consultant team members and CUC project management for feasibility and completeness. The resulting master project list was provided to CUC for final approval for use in the June 2012 workshops. During these workshops, projects were added, changed, and deleted as necessary. The final project list that was used during the project scoring workshops is provided in Appendix U.
Scoring Criteria Development Using a similar process to that employed during the asset risk assessment workshops, the project team proposed a set of criteria to help determine the relative merits of proposed wastewater projects. These criteria were further refined to distinguish the varying needs of Saipan, Tinian, and Rota. Each major criterion is discussed separately.
Wastewater System Criteria The primary consideration for potential wastewater projects was driven by the criteria DEQ employs under the CWNS framework. CUC project management elected to incorporate the CWNS criteria exactly as written in Appendix V. The CWNS criteria are grouped as follows into four major categories of criteria:
Pollution abatement
NPDES permit requirements – meets treatment requirements
NPDS permit requirements – ability to obtain or maintain permit
Fulfills all or part of legal order
Existing pollution effects on area waters
Existing water quality standards violations
Improvements to existing wastewater system
Environmental health improvement
Ability to correct existing sewer‐related health problems
Population served
Miscellaneous
Completes currently incomplete in‐place system to provide service as intended
Qualifies for innovative or alternative system
Reduces complexity or reduces O&M
Project phasing requirements
In addition, CUC developed specific criteria to be used in conjunction with the EPA criteria:
Energy savings
Draft

SECTION 5. WASTEWATER SYSTEM MASTER PLAN
DRAFT FINAL DRINKING WATER AND WASTEWATER MASTER PLAN, ROTA, CNMI 5-9
Supports ERP
Revenue enhancing
The CUC criteria were proposed and defined by CUC engineering and field staff. The CUC‐identified criteria allow for additional differentiation between projects that would have equal scores using the SRF funding criteria and provide a methodology for additional prioritization. The CUC‐identified criteria for wastewater projects are defined in further detail in Appendix W.
Criteria Weighting Combining EPA and non‐EPA criteria into a single unified “scorecard” posed an issue to the project team: what relative “weight” should each of these criteria receive? CUC desired that the SRF/EPA funding criteria take precedence, yet CUC‐specific criteria were important to distinguish inter‐island differences and overall utility benefit. The points for CWNS criteria were assigned based on the CWNS criteria document drafted by DEQ (Appendix V). CUC management and staff provided the final weightings for CUC‐identified criteria for the wastewater system. Criteria weightings were calculated based on the input from the CUC staff involved with the workshops; up to eight staff individually provided written input on how they deemed the total allowable points should be distributed across the CUC‐identified criteria. The average scores per category of everyone’s collective input was calculated and verified by the group to be acceptable. This “secret ballot” process was completed separately for water and wastewater systems to ensure that staff with appropriate expertise and experience was included in the process.
Wastewater System Criteria Weighting The maximum possible wastewater project score was 532 points, the point contribution associated with each criterion is discussed below:
Pollution Abatement (EPA required) – 238 points: As dictated by CWNS requirements. Note the relatively high number of points, up to 150, available to the “Existing Pollution Effects on Area Waters” sub‐criteria.
Environmental Health Improvement (EPA required) – 104 points: As dictated by CWNS requirements.
Miscellaneous (EPA required) – 90 points: As dictated by CWNS requirements.
CUC Identified (not required) – 100 points: The individual points allotted among the three sub criteria were determined in workshops and reflect the importance of power conservation and revenue. There is no inter‐island scoring distinction due to the relatively modest wastewater infrastructure on Rota and Tinian as compared to Saipan.
Draft

SECTION 5. WASTEWATER SYSTEM MASTER PLAN
5-10 DRAFT FINAL DRINKING WATER AND WASTEWATER MASTER PLAN, ROTA, CNMI
Table 5.1.1‐1 summarizes the point distribution, or weighting, of the criteria and sub‐criteria for the wastewater project scoring process.
Table 5.1.1‐1. Wastewater Project Scoring Criteria and Weighting
Category Criteria Maximum Points Sub‐criteria
Maximum Points
EPA Required
Pollution Abatement
238
NPDES Permit Requirements ‐ meets treatment requirements
10
NPDES Permit Requirements ‐ ability to obtain or maintain permit
5
Fulfills All or Part of Legal Order 5
Existing Pollution Effects on Area Waters 150
Existing Water Quality Standards Violations 10
Improvements to Existing WW System 58
Environmental Health Improvement
104
Ability to Correct Existing Sewer‐Related Health Problems
25
Population Served 79
Miscellaneous 90
Completes Currently Incomplete In‐place System to Provide Service as Intended
20
Qualifies for Innovative or Alternative System 20
Reduces Complexity or Reduces O&M 20
Project Phasing Requirements 30
CUC Identified
CUC Identified 100
Energy Savings 43
Supports ERP 26
Revenue Enhancing 31
TOTAL 532 532
Project Scoring With the master project list finalized and the criteria defined and weighted, the full project group and stakeholders met over several workshops to “score” the wastewater projects. The process was identical for each project:
The project description was read out loud as well as projected onto a wall.
The project area was identified on a GIS map.
Additional information was projected, such as tank survey photos, or model simulation.
The project was discussed by attendees.
The project team facilitated achieving group consensus for each score.
Each score was immediately entered into a decision science software application (Criterion Decision Plus™).
Draft
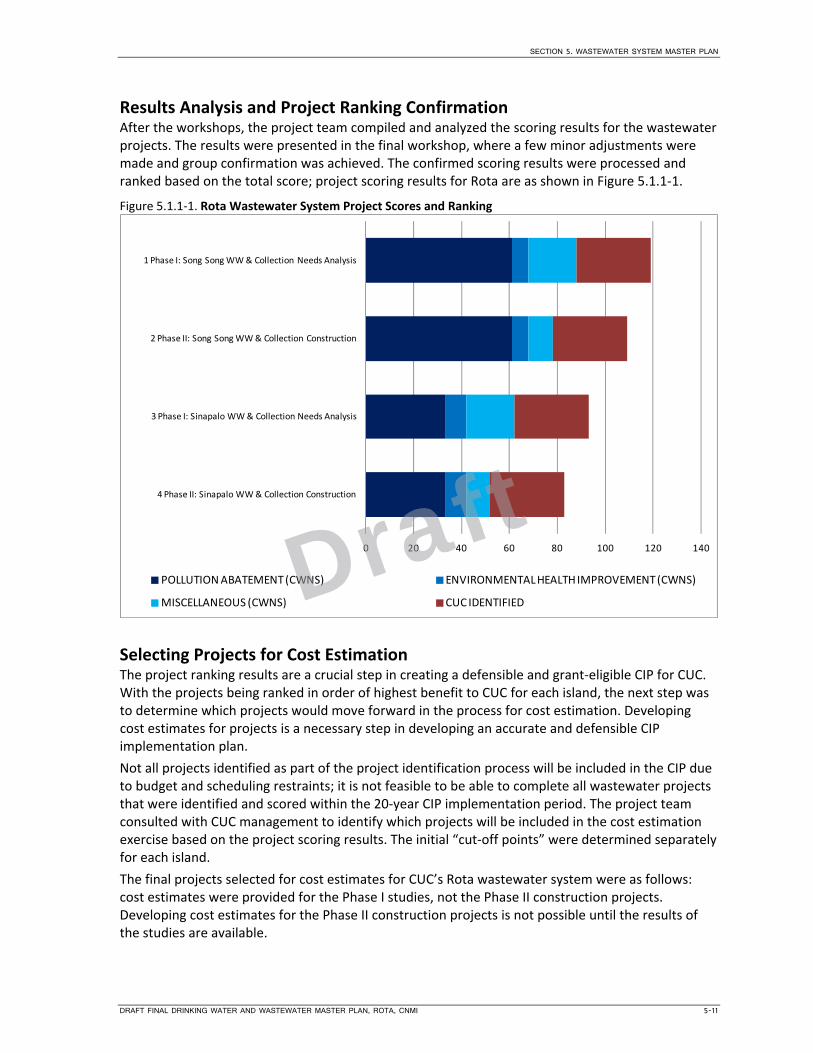
SECTION 5. WASTEWATER SYSTEM MASTER PLAN
DRAFT FINAL DRINKING WATER AND WASTEWATER MASTER PLAN, ROTA, CNMI 5-11
Results Analysis and Project Ranking Confirmation After the workshops, the project team compiled and analyzed the scoring results for the wastewater projects. The results were presented in the final workshop, where a few minor adjustments were made and group confirmation was achieved. The confirmed scoring results were processed and ranked based on the total score; project scoring results for Rota are as shown in Figure 5.1.1‐1.
Figure 5.1.1‐1. Rota Wastewater System Project Scores and Ranking
Selecting Projects for Cost Estimation The project ranking results are a crucial step in creating a defensible and grant‐eligible CIP for CUC. With the projects being ranked in order of highest benefit to CUC for each island, the next step was to determine which projects would move forward in the process for cost estimation. Developing cost estimates for projects is a necessary step in developing an accurate and defensible CIP implementation plan.
Not all projects identified as part of the project identification process will be included in the CIP due to budget and scheduling restraints; it is not feasible to be able to complete all wastewater projects that were identified and scored within the 20‐year CIP implementation period. The project team consulted with CUC management to identify which projects will be included in the cost estimation exercise based on the project scoring results. The initial “cut‐off points” were determined separately for each island.
The final projects selected for cost estimates for CUC’s Rota wastewater system were as follows: cost estimates were provided for the Phase I studies, not the Phase II construction projects. Developing cost estimates for the Phase II construction projects is not possible until the results of the studies are available.
0 20 40 60 80 100 120 140
4 Phase II: Sinapalo WW & Collection Construction
3 Phase I: Sinapalo WW & Collection Needs Analysis
2 Phase II: Song Song WW & Collection Construction
1 Phase I: Song Song WW & Collection Needs Analysis
POLLUTION ABATEMENT (CWNS) ENVIRONMENTAL HEALTH IMPROVEMENT (CWNS)
MISCELLANEOUS (CWNS) CUC IDENTIFIEDDraft
SECTION 5. WASTEWATER SYSTEM MASTER PLAN
5-12 DRAFT FINAL DRINKING WATER AND WASTEWATER MASTER PLAN, ROTA, CNMI
5.3.2 Cost Development of Wastewater System Prioritized Projects This section and the associated appendices present the cost estimates and cost estimating approach for the projects identified in the Project Identification and Prioritization section of this Master Plan. The cost estimates will be used, in conjunction with the project prioritizations, to develop the 2‐year, 5‐year, and 20‐year capital improvement plans as required by the Stipulated Order.
This section summarizes the results of the cost estimating effort for those projects chosen for inclusion in the Master Plan CIPs. This section is organized into the following sections:
Cost Estimating Classification and Terminology – Assignment of an American Association of Cost Engineers (AACE) Cost Classification
Cost Estimating Assumptions: Description of Cost Estimating Assumptions and Sources of Information
Project Cost Estimation: Assign a CIP‐level cost for the list of projects identified as needed to rehabilitate and improve the water and wastewater systems
Cost Estimating Classification and Terminology For the purposes of developing CIP cost estimates for the Master Plan, the following terms are defined and are specific to this cost estimating approach presented herein.
Construction Cost The cost to construct the CIP element is an estimate of the contractor’s price for construction of the infrastructure in 2012 dollars including project costs (i.e., materials, equipment, installation construction labor) and contractor markups. For the purposes of the cost estimates presented in this section, contractor markups are consistent for all infrastructure elements and are as follows:
Overhead: 10 percent
Profit: 5 percent
Mobilization/Bonds/Insurance: 5 percent
The percentages applied to the contractor markups are based on industry standards and CH2M’s experience with similar projects. Consistent with the cost estimating process, these contractor markups are added in a compounding manner following the order listed above to the project costs. After these markups are applied, a contingency of 30 percent as well as a location adjustment factor are applied. The contingency accounts for lack of detailed design definition, gross receipts tax (GRT), cost escalation, and costs associated with unknown or unforeseen conditions at the time of implementation. The location adjustment factor adjusts the construction cost for the area where the project is located. Based on the “Historical Air Force Construction Handbook” dated February 2007,
a location adjustment factor of 0.83 was used for Rota.
Capital Cost The Capital Cost equals the Construction Cost plus non‐construction costs (as a percentage of project costs plus contractor markups) for items that include the following:
Permitting: 1 percent (when applicable)
Engineering and Design Services: 10 percent (when applicable)
Services During Construction: 8.5 percent (when applicable)
Commissioning and Start‐Up Services: 3 percent (when applicable) Again, the percentages applied to each of the non‐construction are based on CH2M’s experience.
Draft

SECTION 5. WASTEWATER SYSTEM MASTER PLAN
DRAFT FINAL DRINKING WATER AND WASTEWATER MASTER PLAN, ROTA, CNMI 5-13
Annual Operations and Maintenance Cost The Annual Operations and Maintenance (O&M) Cost is the cost to operate and maintain the water or wastewater infrastructure element or system in 2013 including power, chemicals, maintenance, materials, and labor. Similar to the capital cost, a 20‐percent contingency is included in the annual O&M Cost to account for undefined costs at this level of planning.
O&M costs are only estimated for projects that are considered to be new additions to the water and wastewater infrastructure. For projects identified as replacement or upgrades to existing infrastructure, annual O&M cost estimates were not included, as it was assumed that those costs are already included in CUC’s annual operating budget. Furthermore, the total O&M costs presented in the Master Plan do not take into account a potential reduction in current O&M costs. Many of the projects identified in the Master Plan could potentially result in a reduction of labor, material, and energy costs due to increased system reliability and operation efficiency. Quantification of these savings was not completed for this Master Plan because it is difficult to calculate the magnitude of the impact that these projects will have on the overall water or wastewater system.
O&M costs were developed for the purpose of assisting in the development of the financial plan and were not used in the development of the CIP. Therefore, no O&M costs are presented in the section, but are included as part of Appendix X.
The Association for the Advancement of Cost Engineering (AACE International) defines the following cost estimate classifications:
Class 5. This estimate is prepared based on limited information, where little more than proposed infrastructure type, its location, and the capacity are known. Strategic planning purposes include, but are not limited to, market studies, assessment of viability, evaluation of alternate schemes, project screening, location and evaluation of resource needs and budgeting, and long‐range capital planning. Examples of estimating methods used include cost/capacity curves and factors, scale‐up factors, and parametric and modeling techniques. Little time is expended in the development of this estimate. The typical expected accuracy range for this class estimate is –20 to –50 percent on the low side and +30 to +100 percent on the high side.
Class 4. This estimate is prepared based on information where the preliminary engineering is from 1 to 5 percent complete. Detailed strategic planning, business development, project screening, alternative scheme analysis, confirmation of economic and/or technical feasibility, and preliminary budget approval are needed to proceed. Examples of estimating methods used include equipment and/or system process factors, scale‐up factors, and parametric and modeling techniques. This estimate requires more time expended in its development. The typical expected accuracy range for this class estimate is –15 to –30 percent on the low side and +20 to +50 percent on the high side.
Class 3. This estimate is prepared to form the basis for the project authorization and/or funding. Typically, engineering is from 10 to 40 percent complete and comprises process flow diagrams, preliminary piping runs for major processes, facility layout drawings, and complete process and facility equipment lists. This estimate becomes the project control or project budget estimate until more detailed estimates are completed. Examples of estimating methods used include a high degree of detailed unit cost and quantity takeoffs for major processes. Factoring and/or scale‐up factors can be used for less significant or support areas of the project. This estimate requires a great deal of time to prepare, where actual equipment and processes have been designed. The typical expected accuracy range for this class estimate is –10 to –20 percent on the low side and +10 to +30 percent on the high side.
Draft

SECTION 5. WASTEWATER SYSTEM MASTER PLAN
5-14 DRAFT FINAL DRINKING WATER AND WASTEWATER MASTER PLAN, ROTA, CNMI
Class 2. This estimate is prepared to form a detailed control baseline for the project. Typically, engineering is from 30 to 70 percent complete and comprises process flow diagrams, piping and instrument runs for all processes, final facility layout drawings, complete process and facility equipment lists, single‐line diagrams for electrical and major electrical components, and schedules. This estimate becomes the detailed project control estimate. Examples of estimating methods used include a high degree of deterministic estimating and detailed quantity takeoffs for all of the facility processes and/or systems, with little factoring and/or scale‐up factors used, except for minor support areas of the project. This estimate usually becomes the final estimate and requires significant line‐item information, which takes time to prepare. The typical expected accuracy ranges for this class estimate are –5 to –15 percent on the low side and +5 to +20 percent on the high side.
Class 1. This estimate is prepared to confirm the control baseline for the project. Typically, engineering is from 80 to 100 percent complete, which comprises virtually all engineering and design documentation of the project, and complete project execution and commissioning plans. This estimate becomes the final control baseline of the project. Examples of methods used are the highest degree of deterministic estimating, with very detailed quantity takeoffs for all of the facility processes and/or systems of the project. This type of estimate usually becomes the bid‐check estimate and requires the most effort to create. The typical expected accuracy ranges for this class estimate are –3 to ‐10 percent on the low side and +3 to +15 percent on the high side.
The Class 5 estimate is the estimate type usually used to evaluate project alternatives at the planning‐level stage and is the class of estimate supported for the development of CUC’s CIPs presented in this section of the Master Plan.
The Class 5 estimates presented in this section and any resulting conclusions on project financial or economic feasibility or funding requirements are prepared for guidance in project evaluation and implementation, and use the information available at the time of the estimate. The final costs of the project and resulting feasibility will depend on actual labor and material costs, competitive market conditions, actual site conditions, final project scope, implementation schedule, continuity of personnel and engineering, and other variable factors. Therefore, the final project costs will vary from the estimates developed using the information described in this section and presented in this Master Plan. Because of these factors, project feasibility, benefit/cost ratios, risks, and funding needs must be carefully reviewed, prior to making specific financial decisions or establishing project budgets, to help ensure proper project evaluation and adequate funding.
Cost Estimating Assumptions
The following assumptions were made for the purposes of this cost analysis:
Land purchase was excluded from capital cost estimates for new facilities
No market adjustment factor was applied
When housing was required, it was assumed unit processes were housed in concrete masonry buildings
O&M costs were estimated based on a percentage of the capital cost. The percentage of O&M took into account the life expectancy of the infrastructure. Infrastructure life expectancy presented in this report ranges from 20 to 50 years depending on the infrastructure type; see Appendix X for specific details on the individual projects. As a result, the O&M percentage ranges from 2 to 5 percent of the construction cost depending on the project.
The following O&M items were considered, but not explicitly estimated:
Draft
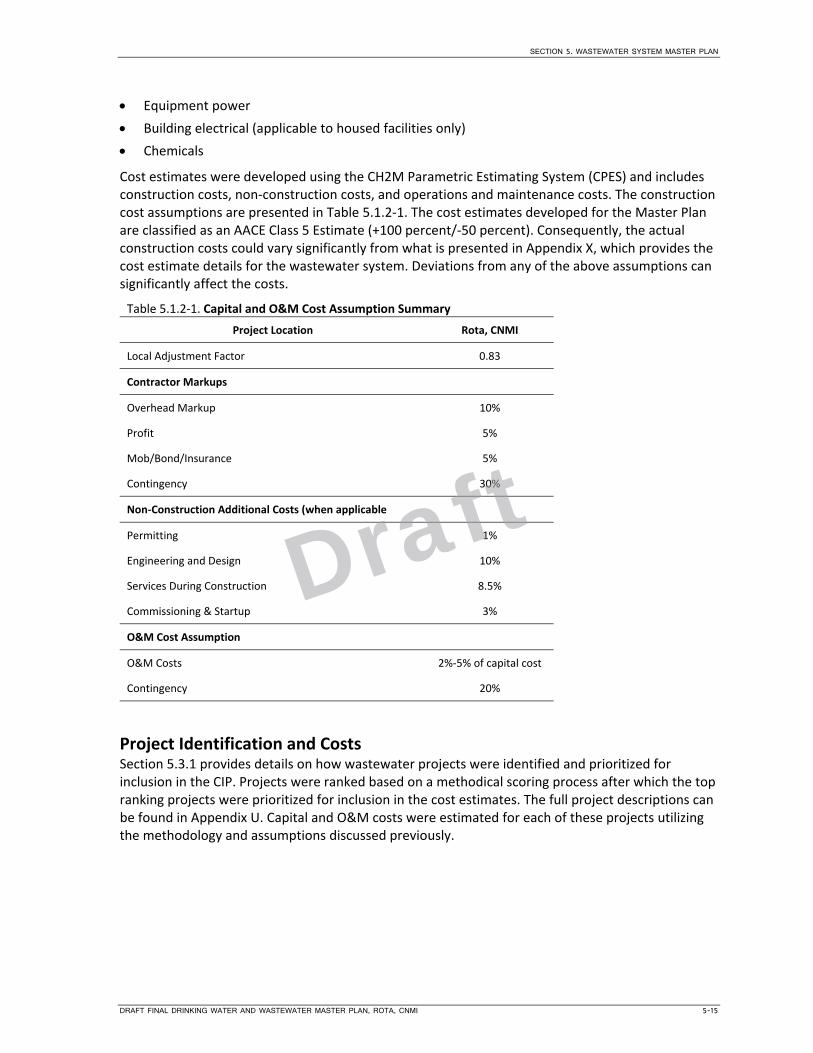
SECTION 5. WASTEWATER SYSTEM MASTER PLAN
DRAFT FINAL DRINKING WATER AND WASTEWATER MASTER PLAN, ROTA, CNMI 5-15
Equipment power
Building electrical (applicable to housed facilities only)
Chemicals
Cost estimates were developed using the CH2M Parametric Estimating System (CPES) and includes construction costs, non‐construction costs, and operations and maintenance costs. The construction cost assumptions are presented in Table 5.1.2‐1. The cost estimates developed for the Master Plan are classified as an AACE Class 5 Estimate (+100 percent/‐50 percent). Consequently, the actual construction costs could vary significantly from what is presented in Appendix X, which provides the cost estimate details for the wastewater system. Deviations from any of the above assumptions can significantly affect the costs.
Table 5.1.2‐1. Capital and O&M Cost Assumption Summary
Project Location Rota, CNMI
Local Adjustment Factor 0.83
Contractor Markups
Overhead Markup 10%
Profit 5%
Mob/Bond/Insurance 5%
Contingency 30%
Non‐Construction Additional Costs (when applicable
Permitting 1%
Engineering and Design 10%
Services During Construction 8.5%
Commissioning & Startup 3%
O&M Cost Assumption
O&M Costs 2%‐5% of capital cost
Contingency 20%
Project Identification and Costs Section 5.3.1 provides details on how wastewater projects were identified and prioritized for inclusion in the CIP. Projects were ranked based on a methodical scoring process after which the top ranking projects were prioritized for inclusion in the cost estimates. The full project descriptions can be found in Appendix U. Capital and O&M costs were estimated for each of these projects utilizing the methodology and assumptions discussed previously.
Draft

SECTION 5. WASTEWATER SYSTEM MASTER PLAN
5-16 DRAFT FINAL DRINKING WATER AND WASTEWATER MASTER PLAN, ROTA, CNMI
5.3.3 Prioritized Water System Modifications/Improvements Program This section presents the methodology and results of the 2‐year, 5‐year, and 20‐year CIP development process, which meets the requirements set forth in the Stipulated Order. To assist with the development of a financial model and the CIPs program, a project sequencing plan was created based on project cost, priority, phasing and available budget for capital projects. O&M costs were not a consideration when developing the CIP and therefore are not presented in this section.
The available budget was developed and is described in detail in the Financial Plan. A summary of the assumed funding for the first 5‐year period for wastewater is presented in Table 5.1.3‐1.
Table 5.1.3‐1. Assumed Available Budget for Capital Improvement Projects a
FY2016 FY2017 FY2018 FY2019 FY2020
Wastewater Grant Funding
$ 3,550,000 $ 3,180,000 $ 2,840,000 $ 2,540,000 $ 2,260,000
a Budgets were rounded to 3 significant figures. Actual budget estimates can be found in the Financial Plan.
2‐ and 5‐Year CIP Development Based on priority, projects for wastewater were chosen for the 2‐ and 5 year plans and each project was divided into two or three phases (permitting, design, and construction). Each phase was assigned an estimated time to completion and projects were then sequenced starting with the highest priority first and were added until the available budget for all 5 years was depleted. No Rota wastewater projects were included in the 5‐year plan due to budgeting constraints and relative prioritization.
20‐Year CIP Development For the 20‐year CIP, it was assumed that the available funding assumed for the fiscal year 2018 would remain constant through the 20‐year period for both water and wastewater. The 20 year CIP for wastewater is presented in Table 5.1.3‐2. The two priority wastewater projects for Rota (Wastewater System Needs Analysis) are included in the 20‐year wastewater CIP.
Draft

SECTION 5. WASTEWATER SYSTEM MASTER PLAN
DRAFT FINAL DRINKING WATER AND WASTEWATER MASTER PLAN, ROTA, CNMI 5-17
Table 5.1.3‐2. 20‐Year Wastewater CIP Capital Costs (costs presented in 2012 dollars; Rota projects in bold font)
Project Location
Project # Project Descriptiona
1st 5‐Year CIP (FY2016‐
2020)
2nd 5‐r CIP (FY2021‐2025)
3rd 5‐Year CIP (FY2026‐
2030)
4th 5‐Year CIP (FY2031‐
2035)
Saipan 1 Replacement of Existing Dilapidated Sewerlines
$ 3,630,000
Saipan 2 Island‐wide New Sewer Service Connections
$ 1,555,000
Saipan 3 SCADA Phase I: Pilot Study $ 521,000
Saipan 4 Upgrade Generators $ 432,000
Saipan 5 Upgrades of Various Lift Stations $ 4,366,000
Saipan 6 SCADA Phase II: Design $ 195,000
Saipan 7 I&I Reduction $ 1,859,000
Saipan 8 Garapan Lift Station Elimination $ 1,210,000
5‐Year Total $13,768,000
Saipan 9 FOG Phase II: FOG Disposal Facility Design & Construction
$ 3,260,000
Saipan 10 As Terlaje Sewerline Replacement & Lift Station Elimination
$ 3,461,000
Saipan 11 S‐3 Force Main Replacement $ 378,000
Saipan 12 Sadog Tasi Hygiene Facility $ 303,000
Saipan 13 Lower Sadog Tasi Sewer Collection System
$ 863,000
Saipan 14 Inventory Upgrades $ 550,000
Saipan 16 Lower Base Phase IIb: Southern Tanapag and Chalan Pale Arnold Sewer Collection System
$ 1,344,000
Rota R1 Phase I: Wastewater System Needs Analysis ‐ Song Song
$ 60,000
Rota R2 Phase I: Wastewater System Needs Analysis ‐ Sinapalo
$ 60,000
5‐Year Total $10,279,000
Draft

SECTION 5. WASTEWATER SYSTEM MASTER PLAN
5-18 DRAFT FINAL DRINKING WATER AND WASTEWATER MASTER PLAN, ROTA, CNMI
Table 5.1.3‐2. 20‐Year Wastewater CIP Capital Costs (costs presented in 2012 dollars; Rota projects in bold font)
Project Location
Project # Project Descriptiona
1st 5‐Year CIP (FY2016‐
2020)
2nd 5‐r CIP (FY2021‐2025)
3rd 5‐Year CIP (FY2026‐
2030)
4th 5‐Year CIP (FY2031‐
2035)
Saipan 15 Isa Drive Sewer Realignment $ 3,318,000
Saipan 17 Afetna Sewer Collection System Upgrades & Expansion
$ 2,102,000
Saipan 19 Wireless Road Phase I: Gravity Sewer System
$ 2,076,000
Saipan 20 As Perdido Road Sewer Collection System
$ 441,000
Saipan 21 Saipan Wastewater Equipment Maintenance Facility
$ 2,340,000
Tinian T1 Phase I: Wastewater System Needs Analysis
$ 60,000
5‐Year Total $10,337,000
Saipan 18 Sludge Composting $10,550,000
5‐Year Total $10,550,000
Discretionary Project Funds $ 602,000 $ 1,021,000 $ 963,000 $ 750,000
Total Project Costs $14,370,000 $11,300,000 $11,300,000 $11,300,000
Available Budget $14,370,000 $11,300,000 $11,300,000 $11,300,000
a Complete wastewater project descriptions can be found in Appendix U.
b All costs have been rounded to the nearest thousand. Actual cost estimates can be found in Appendix X.
Draft

DRAFT FINAL DRINKING WATER AND WASTEWATER MASTER PLAN, ROTA, CNMI xxix
References
American Water Works Association. 2010. C600‐10: Installation of Ductile‐Iron Mains and Their Appurtenances. Denver, Colo.
American Water Works Association. 2014a. C651‐14: Disinfecting Water Mains. Denver, Colo.
American Water Works Association. 2014b. M22: Sizing Water Service Lines and Meters (Third Edition). Denver, Colo.
Andrew, Justin (Central Statistics Division, Department of Commerce, GCNMI). 2013. Personal communication with Daniel D. Swavely. September 9.
CNMI Division of Environmental Quality (DEQ). 2011. Inspection and Sanitary Survey Report. Commonwealth Utilities Corporation. 2011. DRAFT Cross Connection Control and Backflow Prevention Program. May 30.
Commonwealth of the Northern Mariana Islands Law Revision Commission. n.d. Title 4: Economic Resources; Division 8: Utilities; Section 8194: Title to Property; Easement Rights. http://www.cnmilaw.org/pdf/cmc_section/T4/8194.pdf
Erediano, Emmanual T. 2011. "Fitial: No hope for jobless aliens.” Marianas Variety. October 17.
Eugenio, Haidee V. 2012. “U.S. Extends Parole For CNMI Guest Workers.” Saipan Tribune. January 13. http://pidp.eastwestcenter.org/pireport/2012/January/01‐13‐05.htm
Farrell, Don (Office of the Mayor of Tinian). 2012. Interview with Daniel D. Swavely. March 20.
Garrett, Thomas A. “Casino Gaming and Local Employment Trends.” Review. January/February 2004.
Great Lakes – Upper Mississippi River Board of State and Provincial Public Health and Environmental Managers. 2012. Recommended Standards for Waterworks (10 States Standards). Albany, NY: Health Research Inc. http://10statesstandards.com/waterrev2012.pdf
Gulick, David G. (District Director, USCIS District 26, Hawaii, Guam, & the Northern Mariana Islands). 2012. Correspondence with Dueñas, Camacho & Associates, Inc. January 28.
Liu, Tom (General Manager, Tinian Dynasty Hotel and Casino). 2012. Interview with Daniel D. Swavely. March 28.
Mendiola, Melchor A. (Mayor of Rota). 2012. Interview with Daniel D. Swavely. April 5.
Taitano, Perry. (Managing Director, Mariana Visitors Authority). 2012. Correspondence with Daniel D. Swavely. January 19.
U.S. Environmental Protection Agency. 1992. Consensus Method for Determining Groundwaters Under the Direct Influence of Surface Water Using Microscopic Particulate Analysis (MPA) (EPA 910/9‐92‐029). October. http://yosemite.epa.gov/water/owrccatalog.nsf/7322259e90d060c885256f0a0055db68/55e72db4e0b0321c85256b06007232f6!OpenDocument
Draft