Sulfamethoxazole Removal from Drinking Water by Activated ...
18
molecules Article Sulfamethoxazole Removal from Drinking Water by Activated Carbon: Kinetics and Diffusion Process Mohamed BIZI BRGM, Water, Environment, Processes Development & Analysis Division 3, Avenue C. Guillemin, 45060 Orleans, CEDEX 2, France; [email protected]; Tel.: +33-(0)2-38-64-36-62 Received: 18 September 2020; Accepted: 11 October 2020; Published: 13 October 2020 Abstract: Sulfamethoxazole (SMX), a pharmaceutical residue, which is persistent and mobile in soils, shows low biodegradability, and is frequently found in the different aquatic compartments, can be found at very low concentrations in water intended for human consumption. In conditions compatible with industrial practices, the kinetic reactivity and performance of tap water purification using activated carbon powder (ACP) are examined here using two extreme mass ratios of SMX to ACP: 2 μg/L and 2 mg/L of SMX for only 10 mg/L of ACP. In response to surface chemistry, ACP texture and the intrinsic properties of SMX in water at a pH of 8.1, four kinetic models, and two monosolute equilibrium models showed a total purification of the 2 μg/L of SMX, the presence of energetic heterogeneity of surface adsorption of ACP, rapid kinetics compatible with the residence times of industrial water treatment processes, and kinetics affected by intraparticle diffusion. The adsorption mechanisms proposed are physical mechanisms based mainly on π–π dispersion interactions and electrostatic interactions by SMX - /Divalent cation/ArO - and SMX - /Divalent cation/ArCOO - bridging. Adsorption in tap water, also an innovative element of this study, shows that ACP is very efficient for the purification of very slightly polluted water. Keywords: activated carbon; diffusion; kinetic; micropollutants; pharmaceuticals; sulfamethoxazole; water treatment; wastewater 1. Introduction Sulfamethoxazole (SMX), an antibiotic for human and veterinary use, figures among the most commonly found residues in different aquatic compartments [1,2]. After being consumed, this antibiotic is metabolized in proportions not exceeding 70% [3]. A non-negligible quantity of this active ingredient and its metabolites is therefore excreted, mainly in urine, and enters wastewater in urban areas, or is directly released into the environment in the case of livestock farms. Its concentration can range from 10 to 1500 ng/L in wastewater treatment plant (WWTP) effluents, from 0.2 to 1100 ng/L in groundwater, and from around 100 pg/L to a few ng/L in water intended for human consumption [4–8]. Heather E. Gall et al. [8] found 26 groundwater sites in the US (West Branch of the Susquehanna River basin) with SMX concentrations ranging between 0.1 and 32 μg/L, with an average of 17.1 μg/L. It was among the most prevalent antimicrobial contaminants detected in a nationwide groundwater survey conducted by the United States Geological Survey [9]. Wastewater treatment plants (WWTPs) have been identified as the main channel through which pharmaceutical residues are introduced into the natural environment. They were not designed to treat micropollutants. The reduction rate is highly variable within a single plant and from one plant to another. WWTPs are however capable of eliminating a large share of the substances present in the inputs. The reduction rate of SMX varies between 50 and 74% [2,10,11]. Although necessary for curative and preventive purposes, this molecule can have an unintended effect on non-target organisms present in the environment. The release of SMX, and more widely, Molecules 2020, 25, 4656; doi:10.3390/molecules25204656 www.mdpi.com/journal/molecules
-
Upload
khangminh22 -
Category
Documents
-
view
1 -
download
0
Transcript of Sulfamethoxazole Removal from Drinking Water by Activated ...
molecules
Article
Sulfamethoxazole Removal from Drinking Water byActivated Carbon: Kinetics and Diffusion Process
Mohamed BIZI
BRGM, Water, Environment, Processes Development & Analysis Division 3, Avenue C. Guillemin,45060 Orleans, CEDEX 2, France; [email protected]; Tel.: +33-(0)2-38-64-36-62
Received: 18 September 2020; Accepted: 11 October 2020; Published: 13 October 2020�����������������
Abstract: Sulfamethoxazole (SMX), a pharmaceutical residue, which is persistent and mobile insoils, shows low biodegradability, and is frequently found in the different aquatic compartments,can be found at very low concentrations in water intended for human consumption. In conditionscompatible with industrial practices, the kinetic reactivity and performance of tap water purificationusing activated carbon powder (ACP) are examined here using two extreme mass ratios of SMX toACP: 2 µg/L and 2 mg/L of SMX for only 10 mg/L of ACP. In response to surface chemistry, ACP textureand the intrinsic properties of SMX in water at a pH of 8.1, four kinetic models, and two monosoluteequilibrium models showed a total purification of the 2 µg/L of SMX, the presence of energeticheterogeneity of surface adsorption of ACP, rapid kinetics compatible with the residence times ofindustrial water treatment processes, and kinetics affected by intraparticle diffusion. The adsorptionmechanisms proposed are physical mechanisms based mainly on π–π dispersion interactions andelectrostatic interactions by SMX−/Divalent cation/ArO− and SMX−/Divalent cation/ArCOO− bridging.Adsorption in tap water, also an innovative element of this study, shows that ACP is very efficient forthe purification of very slightly polluted water.
Keywords: activated carbon; diffusion; kinetic; micropollutants; pharmaceuticals; sulfamethoxazole;water treatment; wastewater
1. Introduction
Sulfamethoxazole (SMX), an antibiotic for human and veterinary use, figures among the mostcommonly found residues in different aquatic compartments [1,2]. After being consumed, this antibioticis metabolized in proportions not exceeding 70% [3]. A non-negligible quantity of this active ingredientand its metabolites is therefore excreted, mainly in urine, and enters wastewater in urban areas, or isdirectly released into the environment in the case of livestock farms. Its concentration can range from10 to 1500 ng/L in wastewater treatment plant (WWTP) effluents, from 0.2 to 1100 ng/L in groundwater,and from around 100 pg/L to a few ng/L in water intended for human consumption [4–8]. Heather E.Gall et al. [8] found 26 groundwater sites in the US (West Branch of the Susquehanna River basin) withSMX concentrations ranging between 0.1 and 32 µg/L, with an average of 17.1 µg/L. It was among themost prevalent antimicrobial contaminants detected in a nationwide groundwater survey conductedby the United States Geological Survey [9].
Wastewater treatment plants (WWTPs) have been identified as the main channel through whichpharmaceutical residues are introduced into the natural environment. They were not designed to treatmicropollutants. The reduction rate is highly variable within a single plant and from one plant toanother. WWTPs are however capable of eliminating a large share of the substances present in theinputs. The reduction rate of SMX varies between 50 and 74% [2,10,11].
Although necessary for curative and preventive purposes, this molecule can have an unintendedeffect on non-target organisms present in the environment. The release of SMX, and more widely,
Molecules 2020, 25, 4656; doi:10.3390/molecules25204656 www.mdpi.com/journal/molecules
Molecules 2020, 25, 4656 2 of 18
antibiotics in general, into the environment can lead to the emergence of resistant bacterial strains [12].Antibiotics can also (i) disrupt the biological treatment process implemented in WWTPs by damagingthe microorganisms present in activated sludge (biological treatment), and (ii) lead to potentialtoxicity for aquatic organisms [2,13,14]. These toxic effects may be reinforced in the presence of otherantibiotics [15]. Furthermore, SMX can accumulate in certain plants (wheat, tomatoes, spinach) [16].The physicochemical properties of this molecule mean that it is difficult to reduce its presence in soils.SMX is an amphoteric, water soluble compound with a low pKa and carries a negative charge inalkaline water (WWTP and surface waters), with low biodegradability, making it persistent and mobilein soils. At alkaline pH, electrostatic repulsion occurs between this molecule and the main componentsof natural soil (minerals and organic matter).
Effective, economical, and sustainable measures suited to current industrial water treatmentprocesses and which do not require major investments should be designed and developed to removemicropollutants in order to facilitate the safe release and potential reuse of wastewater and toproduce good quality water for human consumption. Many technologies exist to treat pharmaceuticalresidues; however, their implementation in different types of treatment processes for wastewater andwater intended for human consumption is balanced against their cost and sometimes faces technicaldifficulties: poor compatibility with existing facilities, reliability of facilities, production of by-products,or degradation metabolites, etc. In terms of the removal of this pharmaceutical contaminant,numerous physical and chemical techniques and methods—such as adsorption, degradation by UVradiation, photochemical degradation, degradation by ozonation, Fenton oxidation, biodegradationand membrane filtration—have been assessed [17–23]. The adsorption technique was proven using agood adsorbent, the treatment method of choice due to its high efficiency, its low cost, and its simplefunctioning. Furthermore, adsorption is one of the treatment methods used for water intended forhuman consumption and is indirectly used for primary treatment in WWTPs (adsorption on sedimentstransported by wastewater). This technology is often suggested for the treatment of slightly pollutedwater. Different materials, such as clay, zeolite, carbon nanotubes, graphene oxide, nanocomposites,and TiO2 nanoparticles, have been examined for their removal efficiency of SMX from aqueoussolutions [24–26]. Typically, these studies are done in milli-Q water and at high concentrations of SMX.It is worth highlighting that the literature does not currently offer any data on the treatment of SMX atvery low concentration in drinking water. For health and environmental reasons, it is neither advisablenor conceivable to use nanoparticles (spheres, nanotubes, nanowires, or with another shape) to removeorganic or inorganic micropollutants. The release of such materials into the environment could bedetrimental to human health and to the ecological biosphere. Titanium oxide for instance, whethernanometric or micrometric, is classified as a possible carcinogen for humans and animals [27,28].Based on bibliographical and industrial data, activated carbon stands out as a suitable material forthe removal of pharmaceutical micropollutants [29,30]. Activated carbons can be distinguished bytheir rather specific texture and surface chemistry. They are generally highly microporous with highspecific surface areas. Irregularities in their microcrystalline structure and the presence of heteroatoms(oxygen, hydrogen, etc.) lead to the formation of functional groups at their surface, the nature of whichdepends mainly on the processes used for their activation [31–33]. These functional groups (adsorptionsites) give activated carbon acido-basic properties.
We therefore propose to examine the performance of an industrial activated carbon powder(ACP, Norit SA Super) for SMX removal as a final phase in drinking water treatment as well as forapplication in tertiary treatment in a WWTP. The aim of this study is (1) to examine the efficiency ofSMX removal from drinking water in conditions compatible with the analytical observations carried outin groundwater and in water intended for human consumption and also with industrial requirements(low-cost)—very low SMX concentrations (2 µg/L) and low concentration of solids; (2) to define ACPbehavior and kinetic adsorption mechanisms in the case of a very low concentration of this compound;and (3) to identify the functional groups involved in SMX/activated carbon interactions.
Molecules 2020, 25, 4656 3 of 18
2. Results and Discussion
2.1. SMX Characterization
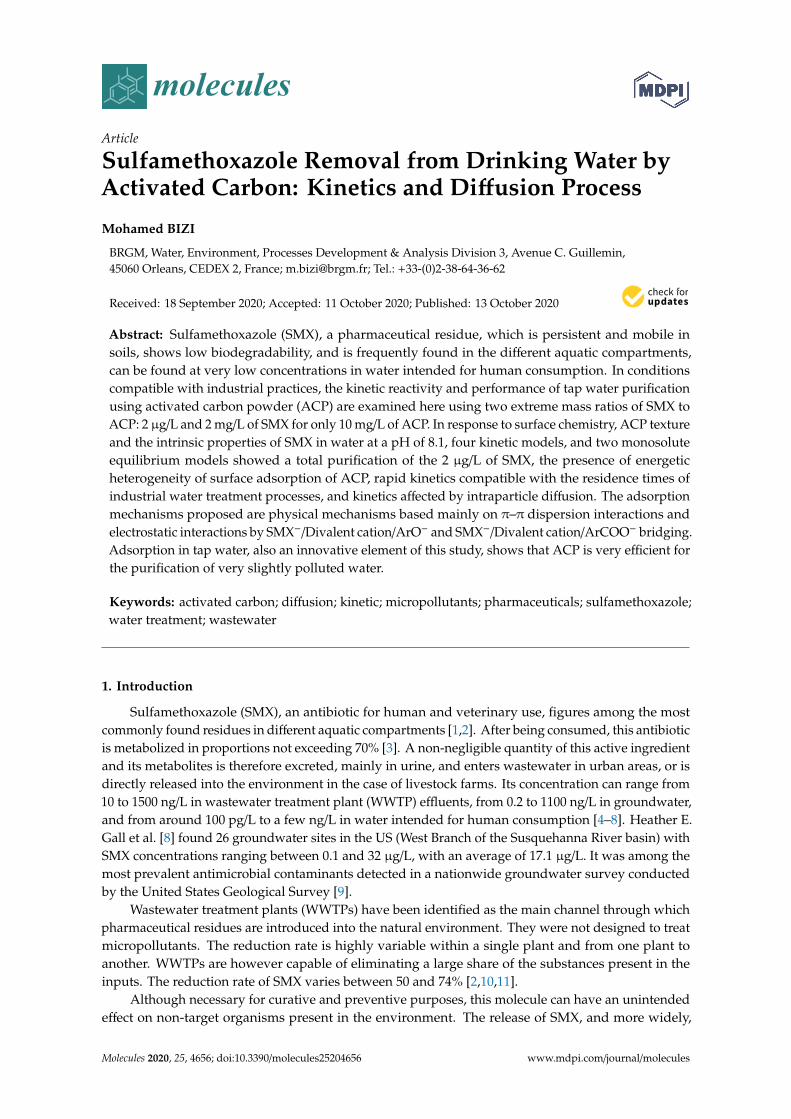
SMX is a polar, UV-sensitive molecule composed of a sulfonyl group located between an aminegroup and an aniline group. It has amphoteric properties with acido-basic characteristics. Morespecifically, it contains a basic amine group (-NH2) and an acidic amide group (-NH-). The aminegroup is able to accept a proton, while the amide group is able to donate a proton in specific pHconditions (Figure 1). Its speciation in pure water as a function of pH and of its dissociation constants,established based on the Henderson–Hasselbalch method and Equation (1), shows that this moleculeis zwitterionic between its two pKa values, practically cationic below pKa1 and anionic above pKa2. Itis completely anionic above pH 7.5 (Figure 1). Its solubility depends, among other factors, on the pH,temperature, and ionic strength of the carrier medium. It is minimal at its isoelectric point (IEP = 4) and,for a given pH, it increases with temperature. On the basis of the experimental data of Zhang et al. [34],the solubility of SMX in pure water below 60 ◦C can be expressed by the empirical function givenbelow Equation (2). The electronic absorption spectrum of this molecule is characterized by severalabsorption bands all located in the UV band with varying intensities and positions according to pH.The optical density of the most intense absorption band due to π→π* electronic transition was used,via a calibration, to determine the quantities of SMX adsorbed by the activated carbon based on theremainder method. In an alkaline medium, this transition is situated at 257 nm.
PI =100
1 + 10x(pH−pKa)(1)
where x = −1 and pKa = pKa1 if an acid drug is used or x = 1 and pKa = pKa2 if a basic drug is used.
S = aT + bTc (2)
where a = 14.80, b = 4.63 × 10⁻⁶, c = 4.43, T in ◦C (<60 ◦C), and the solubility S in mg/L.
Molecules 2020, 25, x FOR PEER REVIEW 3 of 18
2. Results and Discussion
2.1. SMX Characterization
SMX is a polar, UV-sensitive molecule composed of a sulfonyl group located between an amine
group and an aniline group. It has amphoteric properties with acido-basic characteristics. More
specifically, it contains a basic amine group (-NH2) and an acidic amide group (-NH-). The amine
group is able to accept a proton, while the amide group is able to donate a proton in specific pH
conditions (Figure 1). Its speciation in pure water as a function of pH and of its dissociation constants,
established based on the Henderson–Hasselbalch method and Equation (1), shows that this molecule
is zwitterionic between its two pKa values, practically cationic below pKa1 and anionic above pKa2. It
is completely anionic above pH 7.5 (Figure 1). Its solubility depends, among other factors, on the pH,
temperature, and ionic strength of the carrier medium. It is minimal at its isoelectric point (IEP = 4)
and, for a given pH, it increases with temperature. On the basis of the experimental data of Zhang et
al. [34], the solubility of SMX in pure water below 60 °C can be expressed by the empirical function
given below Equation (2). The electronic absorption spectrum of this molecule is characterized by
several absorption bands all located in the UV band with varying intensities and positions according
to pH. The optical density of the most intense absorption band due to * electronic transition was
used, via a calibration, to determine the quantities of SMX adsorbed by the activated carbon based
on the remainder method. In an alkaline medium, this transition is situated at 257 nm.
𝑃𝐼 =100
1 + 10𝑥(𝑝𝐻−𝑝𝐾𝑎) (1)
where x = −1 and pKa = pKa1 if an acid drug is used or x = 1 and pKa = pKa2 if a basic drug is used.
𝑆 = 𝑎𝑇 + 𝑏𝑇𝑐 (2)
where a = 14.80, b = 4.63 × 10⁻⁶, c = 4.43, T in °C (<60 °C), and the solubility S in mg/L.
Figure 1. Sulfamethoxazole (SMX) speciation as a function of pH in aqueous solution.
2.2. Activated Carbon Characteristics
The textural properties of an adsorbent affect the adsorption equilibria. Knowledge of these
properties is essential to more accurately interpret the adsorption mechanisms of all molecules,
whether organic or otherwise. The textural analysis of the ACP was therefore performed by N2
Figure 1. Sulfamethoxazole (SMX) speciation as a function of pH in aqueous solution.
Molecules 2020, 25, 4656 4 of 18
2.2. Activated Carbon Characteristics
The textural properties of an adsorbent affect the adsorption equilibria. Knowledge of theseproperties is essential to more accurately interpret the adsorption mechanisms of all molecules,whether organic or otherwise. The textural analysis of the ACP was therefore performed by N2
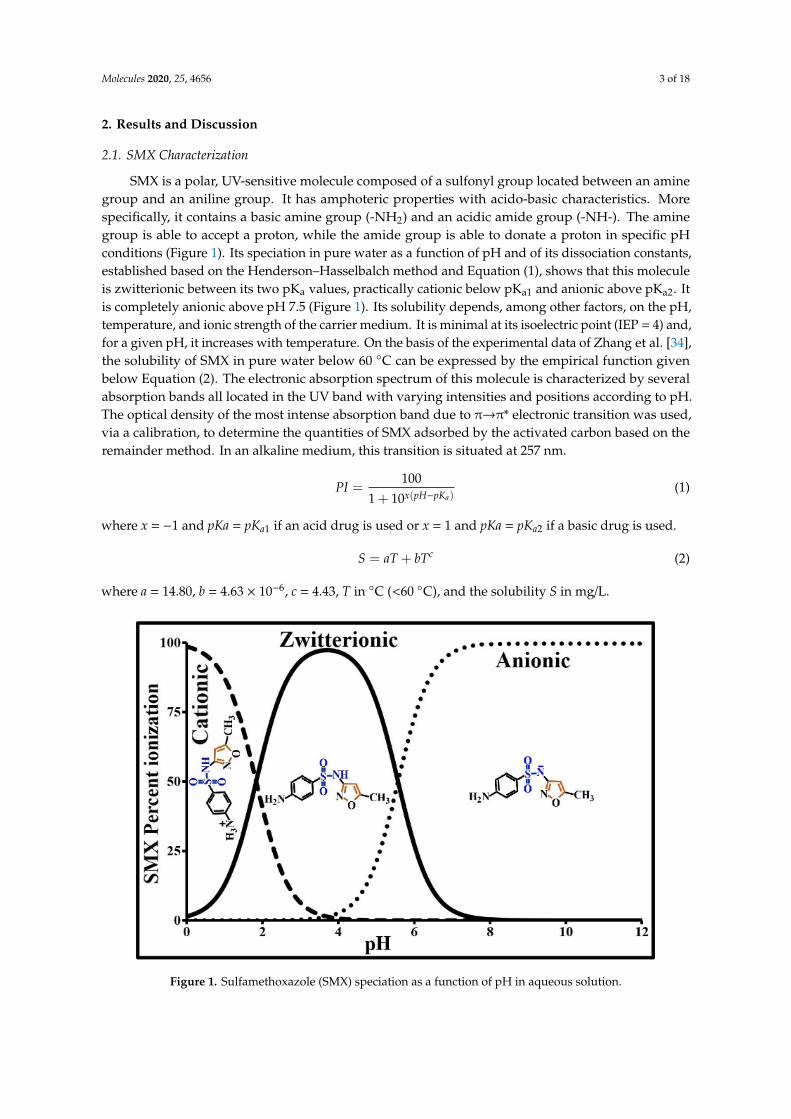
adsorption/desorption, CO2 adsorption, and by particle size measurement. Its main texture parametersare provided in Table 1. This activated carbon has a particle size of less than 120 µm and an averagediameter of around 24 ± 1 µm. 7.5% by mass of its particle size distribution is below 2 µm and 56% isbelow 20 µm. It is also characterized by a large specific surface area, as well as a polydisperse pore sizedistribution, with 95% below 3 nm and 64% below 2 nm (maximum micropore size). Virtually all ofits mesopores are between 2 and 6 nm. The macropore population (>50 nm) is negligible (Figure 2).These meso- and macropores contribute to SMX transport by diffusion of the liquid phase into eachparticle. The minimum micropore size for this activated carbon (0.95 nm) is accessible to SMX (widthand height <0.6 nm). The specific surface areas of its micropores, mesopores, and macropores representrespectively 73%, 21%, and 6% of the total specific surface area according to the t-plot model. N2 andCO2 give virtually the same micropore surface areas and volumes.
Table 1. Main characteristics of ACP Norit SA Super.
daµm PZC SSBET
m2/gSSµP-tm2/g
SSmP-tm2/g
SSMP-tm2/g
Lµ-tnm
VµP-tcm3/g
VmP-tcm3/g
VMP-tcm3/g
SSµP-DA *m2/g
VµP-DA *cm3/g
24 6.8 957 695 203 60 1.75 0.30 0.17 0.10 711 0.31
da—average diameter. PZC—Point of zero charge. t—t-plot method. DA—Dubinin–Astakhov method. * Analysisdone with CO2. SS—Specific area. SSBET—BET specific surface area. SSµP—Equivalent specific surface areaof micropores. SSmP—Equivalent specific surface area of mesopores. SSMP—Equivalent specific surface area ofmacropores. Lµ-t—Mean Equivalent pore width (t-Plot). VµP—Specific micropore volume. VmP—Specific mesoporevolume. VMP—Specific macropore volume.
Molecules 2020, 25, x FOR PEER REVIEW 4 of 18
adsorption/desorption, CO2 adsorption, and by particle size measurement. Its main texture
parameters are provided in Table 1. This activated carbon has a particle size of less than 120 µm and
an average diameter of around 24 1 µm. 7.5% by mass of its particle size distribution is below 2 µm
and 56% is below 20 µm. It is also characterized by a large specific surface area, as well as a
polydisperse pore size distribution, with 95% below 3 nm and 64% below 2 nm (maximum micropore
size). Virtually all of its mesopores are between 2 and 6 nm. The macropore population (>50 nm) is
negligible (Figure 2). These meso- and macropores contribute to SMX transport by diffusion of the
liquid phase into each particle. The minimum micropore size for this activated carbon (0.95 nm) is
accessible to SMX (width and height <0.6 nm). The specific surface areas of its micropores, mesopores,
and macropores represent respectively 73%, 21%, and 6% of the total specific surface area according
to the t-plot model. N2 and CO2 give virtually the same micropore surface areas and volumes.
Table 1. Main characteristics of ACP Norit SA Super.
da
µm PZC
SSBET
m2/g
SSµP-t
m2/g
SSmP-t
m2/g
SSMP-t
m2/g
Lµ-t
nm
VµP-t
cm3/g
VmP-t
cm3/g
VMP-t
cm3/g
SSµP-DA *
m2/g
VµP-DA *
cm3/g
24 6.8 957 695 203 60 1.7
5
0.30 0.17 0.10 711 0.31
da—average diameter. PZC—Point of zero charge. t—t-plot method. DA—Dubinin–Astakhov
method. * Analysis done with CO2. SS—Specific area. SSBET—BET specific surface area. SSµP—
Equivalent specific surface area of micropores. SSmP—Equivalent specific surface area of mesopores.
SSMP—Equivalent specific surface area of macropores. Lµ-t—Mean Equivalent pore width (t-Plot).
VµP—Specific micropore volume. VmP—Specific mesopore volume. VMP—Specific macropore
volume.
Figure 2. Pore size distribution obtained by N2 desorption at 77 K and CO2 adsorption at 273 K.
Activated carbons have surface functional groups, the nature of which is dependent on the origin
and chemical composition of their raw material as well as their preparation and activation method.
These functional groups can be considered acidic or basic sites promoting ion adsorption. The most
commonly found acidic sites at the surface of activated carbon are carboxyl (Ar-COOH), phenol (Ar-
OH), carbonyl (Ar-C=O), anhydride (Ar-(C=O-O-O=C), ether (Ar(-O-)Ar’), quinone (O=Ar=O), and
lactone groups (Ar-C=OO-Ar’). Basic sites can be associated with two types of structures: (i)
Figure 2. Pore size distribution obtained by N2 desorption at 77 K and CO2 adsorption at 273 K.
Activated carbons have surface functional groups, the nature of which is dependent on the originand chemical composition of their raw material as well as their preparation and activation method.These functional groups can be considered acidic or basic sites promoting ion adsorption. The mostcommonly found acidic sites at the surface of activated carbon are carboxyl (Ar-COOH), phenol
Molecules 2020, 25, 4656 5 of 18
(Ar-OH), carbonyl (Ar-C=O), anhydride (Ar-(C=O-O-O=C), ether (Ar(-O-)Ar’), quinone (O=Ar=O),and lactone groups (Ar-C=OO-Ar’). Basic sites can be associated with two types of structures: (i)chromene and pyrene; and (ii) Lewis structures associated with π electron-rich regions situated on basalplanes [31–33]. Furthermore, part of the basicity could also be attributed to the intrinsic properties ofthe ash [35]. The identification and quantities of these functional groups, determined using the Boehmmethod, are provided in Table 2.
Table 2. Functional groups on activated carbon Norit SA Super by Boehm analysis.
Functional Group Densityµmol/m2
Number of Sites/nm2
Carboxylic 0.28 0.17Carbonyl 0.46 0.28
Anhydride 0.17 0.10Lactone 0.06 0.03Phenol 0.53 0.32
Total electron donor 0.96Total electron acceptor 0.80
The sites revealed by this quantification method are present in very significant proportions, withthe exception of lactones. The phenol and carbonyl densities are almost 2 to 3 times higher than thoseof carboxyls and anhydrides. These functions make the carbon surface more polar and increase itsaffinity for water through the formation of hydrogen bonds. There are slightly more electron donorsthan acceptors. The concentrations of acidic and basic sites are 1.5 and 1.3 µmol/m2, respectively. Theratio of the concentrations tends towards neutral behavior, confirmed by the PZC value of 6.8 for thisactivated carbon. Above the PZC, the phenol and carboxyl groups dissociate by releasing their proton(H+) and obtaining a negative charge. Below this pH, the activated carbon’s overall surface chargebecomes positive and can be attributed to the basic functional groups. At tap water pH, the activatedcarbon Norit SA Super is negative and SMX is also negative. If we exclude the cations present in tapwater, the electrostatic interaction between the adsorbent and the adsorbate is completely repulsive.
2.3. Equilibrium Isotherm and Adsorption Mechanism
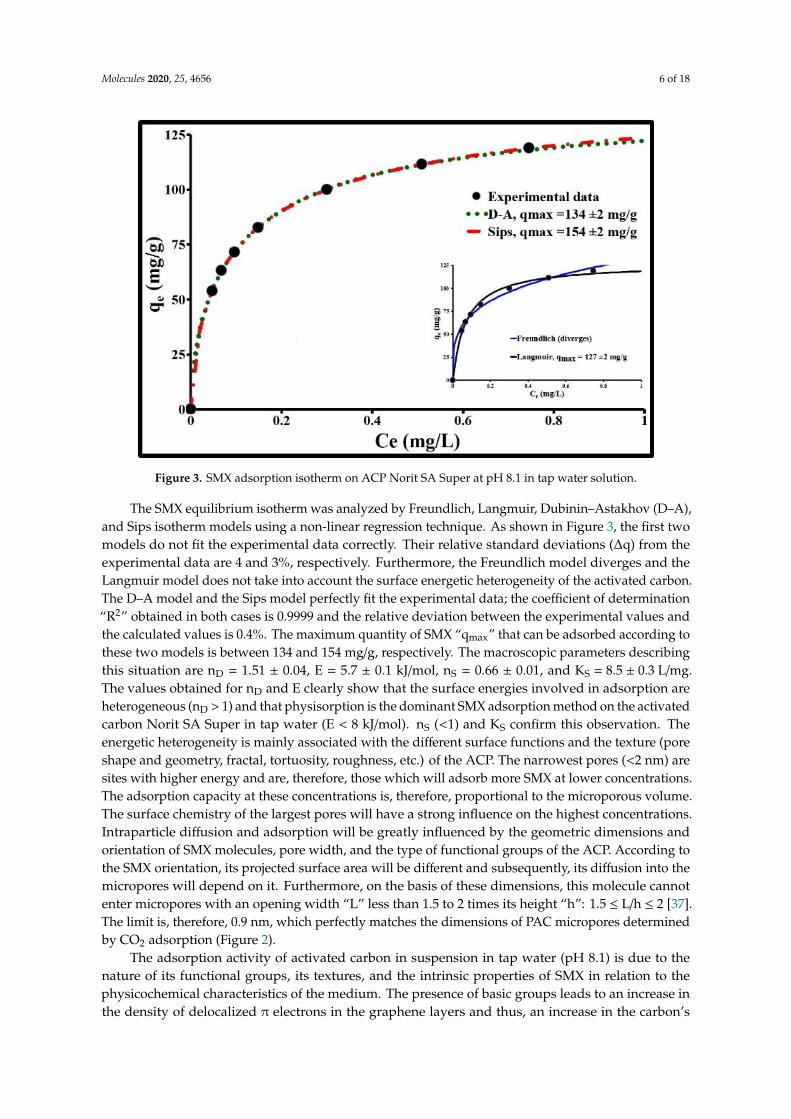
The ACP dose required for the total adsorption of 2 µg/L of SMX was found by evaluating theadsorption capacity of 5 doses of ACP: 3, 6, 8, 10, and 12 mg/L. Their respective adsorption rates are80, 97, 99, 100, and 100%. At 10 mg/l, the removal efficiency becomes almost constant. Therefore,this concentration corresponds to a very favorable optimum. In the applied experimental method(10 mg/L of ACP; 2µg/L to 2 mg/L of SMX), the isotherm for SMX adsorption by ACP (Figure 3) is H2according to Giles’ classification of adsorption isotherms [36]. Its shape indicates a very significantaffinity between the adsorbent and the adsorbate in tap water (pH 8.1). As an initial approximation,this isotherm can be described by three distinct regions: (1) a region with relatively high adsorptionenergy represented by a vertical slope of the isotherm representing the reaction of the most activeavailable sites when placing a low concentration of SMX in solution. The maximum amplitude of thisadsorption is approximately 0.2 mg/g. (2) An increasing adsorption region represented by a curvedisotherm. The isotherm shape in this location characterizes the presence of zones with heterogeneoussurface energies, where the most important rupture with the 3rd phase is located at a concentration,at equilibrium Ce, of 0.51 mg/L and adsorption of 111.6 mg/L. (3) A region of very slow adsorptionleading towards a plateau which finalizes the monolayer adsorption.
Molecules 2020, 25, 4656 6 of 18
Molecules 2020, 25, x FOR PEER REVIEW 6 of 18
Figure 3. SMX adsorption isotherm on ACP Norit SA Super at pH 8.1 in tap water solution.
The SMX equilibrium isotherm was analyzed by Freundlich, Langmuir, Dubinin–Astakhov (D–
A), and Sips isotherm models using a non-linear regression technique. As shown in Figure 3, the first
two models do not fit the experimental data correctly. Their relative standard deviations (∆q) from
the experimental data are 4 and 3%, respectively. Furthermore, the Freundlich model diverges and
the Langmuir model does not take into account the surface energetic heterogeneity of the activated
carbon. The D–A model and the Sips model perfectly fit the experimental data; the coefficient of
determination “R2” obtained in both cases is 0.9999 and the relative deviation between the
experimental values and the calculated values is 0.4%. The maximum quantity of SMX “qmax” that
can be adsorbed according to these two models is between 134 and 154 mg/g, respectively. The
macroscopic parameters describing this situation are nD = 1.51 0.04, E = 5.7 0.1 kJ/mol, nS = 0.66
0.01, and KS = 8.5 0.3 L/mg. The values obtained for nD and E clearly show that the surface energies
involved in adsorption are heterogeneous (nD > 1) and that physisorption is the dominant SMX
adsorption method on the activated carbon Norit SA Super in tap water (E < 8 kJ/mol). nS (< 1) and
KS confirm this observation. The energetic heterogeneity is mainly associated with the different
surface functions and the texture (pore shape and geometry, fractal, tortuosity, roughness, etc.) of the
ACP. The narrowest pores (<2 nm) are sites with higher energy and are, therefore, those which will
adsorb more SMX at lower concentrations. The adsorption capacity at these concentrations is,
therefore, proportional to the microporous volume. The surface chemistry of the largest pores will
have a strong influence on the highest concentrations. Intraparticle diffusion and adsorption will be
greatly influenced by the geometric dimensions and orientation of SMX molecules, pore width, and
the type of functional groups of the ACP. According to the SMX orientation, its projected surface area
will be different and subsequently, its diffusion into the micropores will depend on it. Furthermore,
on the basis of these dimensions, this molecule cannot enter micropores with an opening width “L”
less than 1.5 to 2 times its height “h”: 1.5 ≤ L/h ≤ 2 [37]. The limit is, therefore, 0.9 nm, which perfectly
matches the dimensions of PAC micropores determined by CO2 adsorption (Figure 2).
The adsorption activity of activated carbon in suspension in tap water (pH 8.1) is due to the
nature of its functional groups, its textures, and the intrinsic properties of SMX in relation to the
physicochemical characteristics of the medium. The presence of basic groups leads to an increase in
the density of delocalized π electrons in the graphene layers and thus, an increase in the carbon’s
adsorption potential, while the acidic groups accentuate the local density of π electrons in the
graphene layers [38,39].
Figure 3. SMX adsorption isotherm on ACP Norit SA Super at pH 8.1 in tap water solution.
The SMX equilibrium isotherm was analyzed by Freundlich, Langmuir, Dubinin–Astakhov (D–A),and Sips isotherm models using a non-linear regression technique. As shown in Figure 3, the first twomodels do not fit the experimental data correctly. Their relative standard deviations (∆q) from theexperimental data are 4 and 3%, respectively. Furthermore, the Freundlich model diverges and theLangmuir model does not take into account the surface energetic heterogeneity of the activated carbon.The D–A model and the Sips model perfectly fit the experimental data; the coefficient of determination“R2” obtained in both cases is 0.9999 and the relative deviation between the experimental values andthe calculated values is 0.4%. The maximum quantity of SMX “qmax” that can be adsorbed according tothese two models is between 134 and 154 mg/g, respectively. The macroscopic parameters describingthis situation are nD = 1.51 ± 0.04, E = 5.7 ± 0.1 kJ/mol, nS = 0.66 ± 0.01, and KS = 8.5 ± 0.3 L/mg.The values obtained for nD and E clearly show that the surface energies involved in adsorption areheterogeneous (nD > 1) and that physisorption is the dominant SMX adsorption method on the activatedcarbon Norit SA Super in tap water (E < 8 kJ/mol). nS (<1) and KS confirm this observation. Theenergetic heterogeneity is mainly associated with the different surface functions and the texture (poreshape and geometry, fractal, tortuosity, roughness, etc.) of the ACP. The narrowest pores (<2 nm) aresites with higher energy and are, therefore, those which will adsorb more SMX at lower concentrations.The adsorption capacity at these concentrations is, therefore, proportional to the microporous volume.The surface chemistry of the largest pores will have a strong influence on the highest concentrations.Intraparticle diffusion and adsorption will be greatly influenced by the geometric dimensions andorientation of SMX molecules, pore width, and the type of functional groups of the ACP. According tothe SMX orientation, its projected surface area will be different and subsequently, its diffusion into themicropores will depend on it. Furthermore, on the basis of these dimensions, this molecule cannotenter micropores with an opening width “L” less than 1.5 to 2 times its height “h”: 1.5 ≤ L/h ≤ 2 [37].The limit is, therefore, 0.9 nm, which perfectly matches the dimensions of PAC micropores determinedby CO2 adsorption (Figure 2).
The adsorption activity of activated carbon in suspension in tap water (pH 8.1) is due to thenature of its functional groups, its textures, and the intrinsic properties of SMX in relation to thephysicochemical characteristics of the medium. The presence of basic groups leads to an increase inthe density of delocalized π electrons in the graphene layers and thus, an increase in the carbon’s
Molecules 2020, 25, 4656 7 of 18
adsorption potential, while the acidic groups accentuate the local density of π electrons in the graphenelayers [38,39].
Given its composition and chemical structure, SMX− is able to initiate (i) π–π stacking interactionsbetween π electrons in its aromatic core and π electrons in the graphene [40–43], (ii) electrostaticinteractions by bridging, (iii) the amine group of SMX− can also react with the functional groups ofthe activated carbon containing oxygen such as carbonyl and phenol, and finally, (iv) the presence ofhydrogen bonds is not impossible. All these physical bonds can occur simultaneously. The presenceof Ca2+ and Mg2+ in low concentrations in tap water can be at the origin of electrostatic interactionsbetween the activated carbon and SMX− by producing bond bridges (-/+
Molecules 2020, 25, x FOR PEER REVIEW 7 of 18
Given its composition and chemical structure, SMX− is able to initiate (i) π–π stacking interactions between π electrons in its aromatic core and π electrons in the graphene [40–43], (ii) electrostatic interactions by bridging, (iii) the amine group of SMX− can also react with the functional groups of the activated carbon containing oxygen such as carbonyl and phenol, and finally, (iv) the presence of hydrogen bonds is not impossible. All these physical bonds can occur simultaneously. The presence of Ca2+ and Mg2+ in low concentrations in tap water can be at the origin of electrostatic interactions between the activated carbon and SMX− by producing bond bridges ↭ SMX−/Cation/ArO− and SMX-/Cation/ArCOO−. In the suspensions used, these two cations are found at respective concentrations of 2.06 and 0.47 meq/L and have electrostatic and thermodynamic characteristics which promote these interactions. Their hydration free energy (∆Gsolv) is, respectively, −380.8 and −455.5 kcal/mol, their polarizability is 3.161 and 0.481 a.u, and their ionic potential is 2 and2.78 [44]. Although the favored coordination for the Mg2+ ion is sixfold octahedral, Ca2+ shows agreater diversity of coordination numbers (5 to 8), with seven- and eightfold coordination the mostcommon [45].
Ca2+ and Mg2+ ions prefer to bind to hard ligands containing oxygen and/or nitrogen, with a preference for oxygen (strong electronegativity). In the case of interaction, they will mainly form electrostatic interactions [46]. However, since the Mg2+ ion interacts strongly with six molecules of water in [Mg(H2O)6]2+, it is unlikely that SMX−, a larger anion, will easily replace water to give an SMX−/Mg2+ complex. On the other hand, the larger Ca2+ ion will bind more easily and strongly to SMX−, a larger anion than water; the final dipole will in turn build an electrostatic bond with the activated carbon.
2.4. Sorption Dynamics
2.4.1. Initial Adsorption Rate
The initial SMX adsorption rate by 10 mg/L of ACP, determined from the slope of the initial straight line of the curve showing the evolution of the dimensionless ratio C/C0 in f(t), is dependent on the SMX concentration (Figure 4). It sharply decreases when the SMX concentration is increased from 2 µg/L to 2 mg/L. The adsorption rate constant is around 0.27 s−1 for 2 µg/L and 0.006 s−1 for 2 mg/L of SMX. The fact that the sorption rate increases when the initial SMX concentration is decreased suggests that the limiting mechanism in the kinetics involves transport phenomena in the ACP particles. At 2 µg/L, the C/C0 curve as a function of time has three inflection points which mark the transition between four transport mechanisms for SMX molecules. The sorption rate at 2 min reaches 54% for 2 µg/L and 1.5% for 2 mg/L. At 30 min, it reaches 100% and 21% for the two respective concentrations. Finally, for 2 mg/L, C/C0 stabilizes at 0.4 after 4 h of contact and at 0.39 ± 0.02 after 24 h. A high concentration acts as a driving force in the SMX diffusion and fixation processes.
+/-): SMX−/Cation/ArO−
and SMX-/Cation/ArCOO−. In the suspensions used, these two cations are found at respectiveconcentrations of 2.06 and 0.47 meq/L and have electrostatic and thermodynamic characteristicswhich promote these interactions. Their hydration free energy (∆Gsolv) is, respectively, −380.8 and−455.5 kcal/mol, their polarizability is 3.161 and 0.481 a.u, and their ionic potential is 2 and 2.78 [44].Although the favored coordination for the Mg2+ ion is sixfold octahedral, Ca2+ shows a greater diversityof coordination numbers (5 to 8), with seven- and eightfold coordination the most common [45].
Ca2+ and Mg2+ ions prefer to bind to hard ligands containing oxygen and/or nitrogen, with apreference for oxygen (strong electronegativity). In the case of interaction, they will mainly formelectrostatic interactions [46]. However, since the Mg2+ ion interacts strongly with six molecules ofwater in [Mg(H2O)6]2+, it is unlikely that SMX−, a larger anion, will easily replace water to give anSMX−/Mg2+ complex. On the other hand, the larger Ca2+ ion will bind more easily and strongly toSMX−, a larger anion than water; the final dipole will in turn build an electrostatic bond with theactivated carbon.
2.4. Sorption Dynamics
2.4.1. Initial Adsorption Rate
The initial SMX adsorption rate by 10 mg/L of ACP, determined from the slope of the initial straightline of the curve showing the evolution of the dimensionless ratio C/C0 in f(t), is dependent on the SMXconcentration (Figure 4). It sharply decreases when the SMX concentration is increased from 2 µg/L to2 mg/L. The adsorption rate constant is around 0.27 s−1 for 2 µg/L and 0.006 s−1 for 2 mg/L of SMX.The fact that the sorption rate increases when the initial SMX concentration is decreased suggests thatthe limiting mechanism in the kinetics involves transport phenomena in the ACP particles. At 2 µg/L,the C/C0 curve as a function of time has three inflection points which mark the transition betweenfour transport mechanisms for SMX molecules. The sorption rate at 2 min reaches 54% for 2 µg/L and1.5% for 2 mg/L. At 30 min, it reaches 100% and 21% for the two respective concentrations. Finally, for2 mg/L, C/C0 stabilizes at 0.4 after 4 h of contact and at 0.39 ± 0.02 after 24 h. A high concentration actsas a driving force in the SMX diffusion and fixation processes.

Molecules 2020, 25, 4656 8 of 18
Molecules 2020, 25, x FOR PEER REVIEW 8 of 18
Figure 4. Dimensionless concentration as a function of time for SMX adsorption by ACP in drinking
water at 293 K. (Values given at 2 ng/L for 2 µg SMX/10 mg ACP and at 0.03 mg/L for 10 mg
SMX/10 mg ACP).
2.4.2. Sorption Diffusion Mechanisms
Sorption at the liquid/solid interface, with adsorption occurring locally in the pores, includes, in
kinetic terms, three important stages:
‑ Diffusion through the film around the solid particles of adsorbate towards the outer surface,
known as external diffusion (external mass transfer);
‑ Diffusion into the pores of the adsorbate, known as “intraparticle diffusion”;
‑ The adsorption/desorption reaction, i.e., the “surface reaction”.
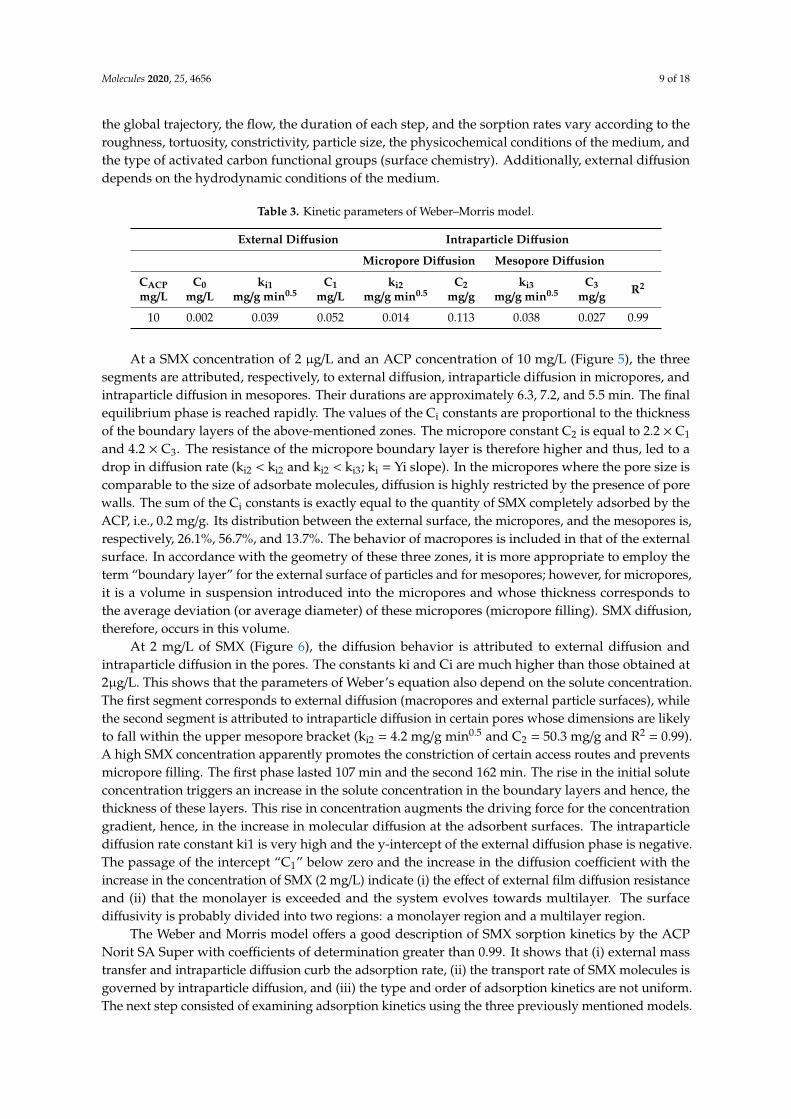
The study of these mechanisms in the case of SMX adsorption by ACP is based on the Weber
and Morris kinetic intraparticle diffusion model, the pseudo-first-order kinetic model, the pseudo-
second-order kinetic model, and the double exponential kinetic model. The Weber and Morris kinetic
intraparticle diffusion model is used to determine the phenomenon that limits the sorption
mechanism. According to this model, for the two SMX concentrations, sorption occurs in three
dynamic phases with a continuity between external mass transfer and internal diffusion. These
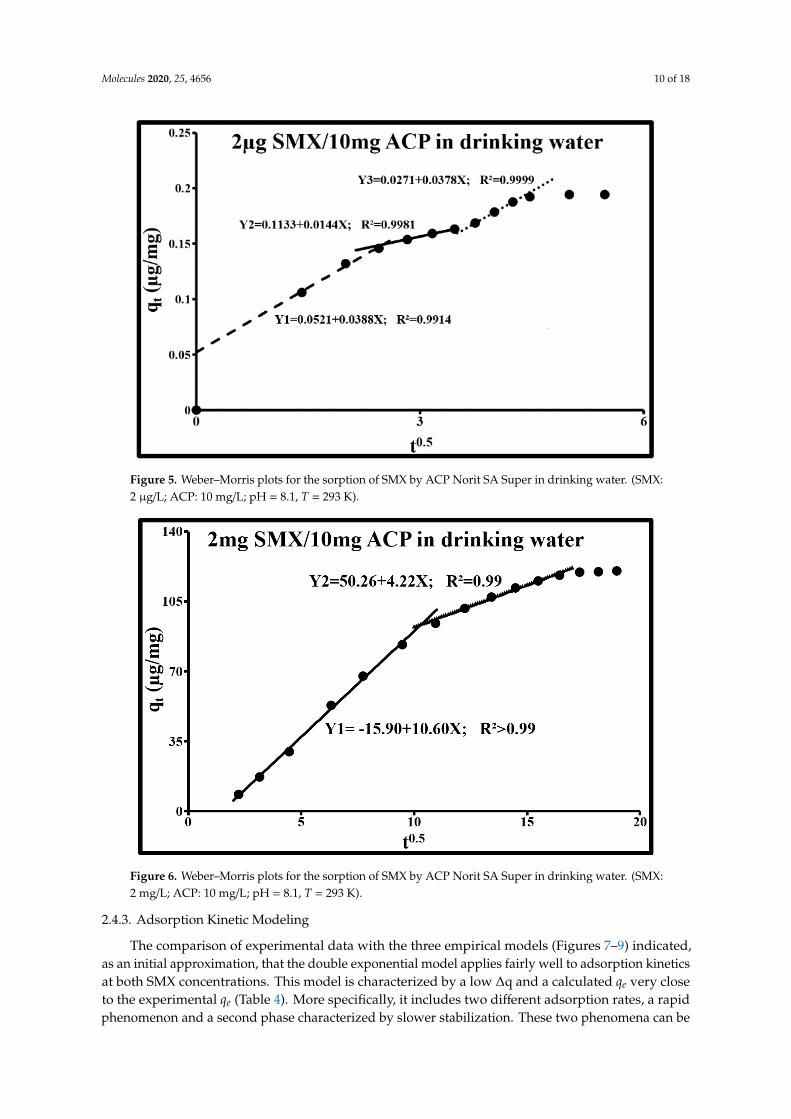
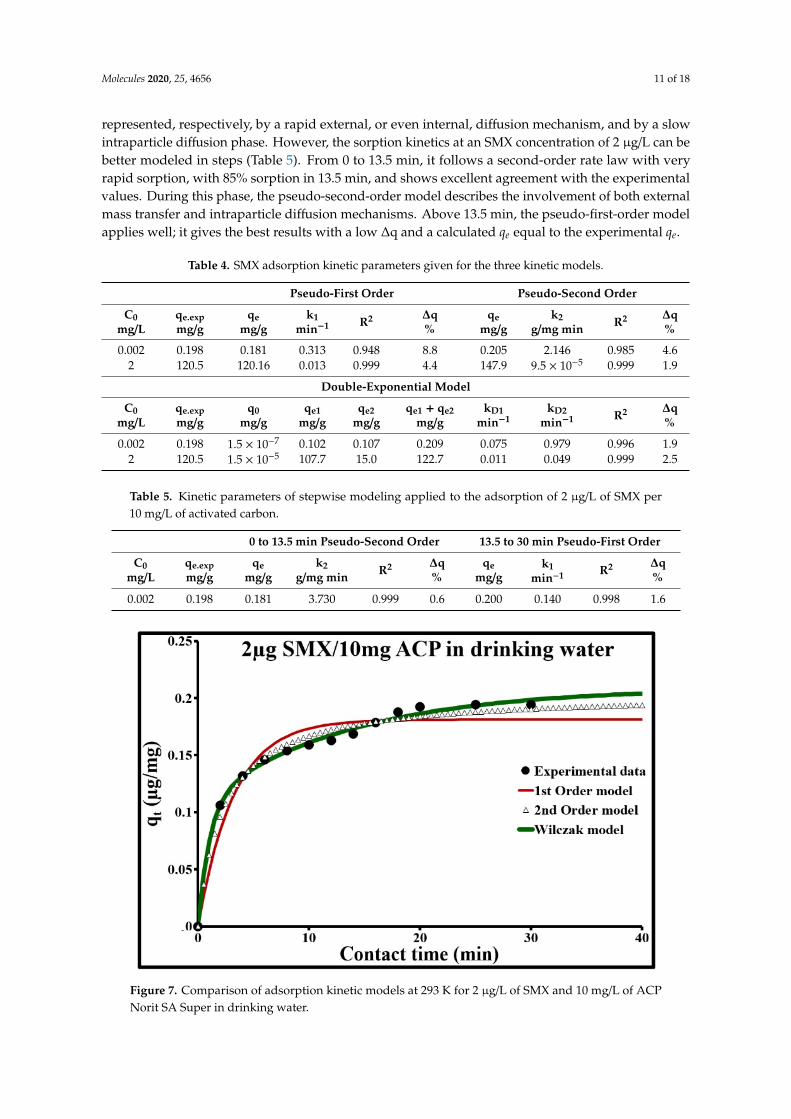
phases are revealed through a multilinear curve composed of several segments (Figures 5 and 6; Table
3). The first phase consists of the limitation of adsorption by external diffusion (1r segment: Y1). The
second consists of the gradual adsorption of the solute limited by intraparticle diffusion (2nd and 3rd
segment for SMX at 2 µg/L; 2nd segment for SMX at 2 mg/L). The third phase corresponds to a state
of equilibrium during which the adsorption capacity remains stable (plateau). Figures 5 and 6 clearly
show that the straight lines containing these segments do not pass through the origin. The slopes of
these straight lines are equal to the ki diffusion constants. The values of the non-zero y-intercepts
correspond to the “Ci” constants given in Table 3. The existence of these constants fully supports the
coexistence of external diffusion and intraparticle diffusion. A large deviation from the origin
indicates that the diffusion of the boundary layer affects adsorption. These constants are directly
related to the SMX concentration in the boundary layer and the thickness of this layer. The higher
these values, the greater the effect of the boundary layer. All these mechanisms can be assimilated
with a resistance in series of mass transfer of the adsorbate from the solution medium to active
adsorption sites. During the global trajectory, the flow, the duration of each step, and the sorption
rates vary according to the roughness, tortuosity, constrictivity, particle size, the physicochemical
Figure 4. Dimensionless concentration as a function of time for SMX adsorption by ACP in drinkingwater at 293 K. (Values given at ± 2 ng/L for 2 µg SMX/10 mg ACP and at ± 0.03 mg/L for 10 mgSMX/10 mg ACP).
2.4.2. Sorption Diffusion Mechanisms
Sorption at the liquid/solid interface, with adsorption occurring locally in the pores, includes,in kinetic terms, three important stages:
- Diffusion through the film around the solid particles of adsorbate towards the outer surface,known as external diffusion (external mass transfer);
- Diffusion into the pores of the adsorbate, known as “intraparticle diffusion”;- The adsorption/desorption reaction, i.e., the “surface reaction”.
The study of these mechanisms in the case of SMX adsorption by ACP is based on theWeber and Morris kinetic intraparticle diffusion model, the pseudo-first-order kinetic model, thepseudo-second-order kinetic model, and the double exponential kinetic model. The Weber and Morriskinetic intraparticle diffusion model is used to determine the phenomenon that limits the sorptionmechanism. According to this model, for the two SMX concentrations, sorption occurs in threedynamic phases with a continuity between external mass transfer and internal diffusion. These phasesare revealed through a multilinear curve composed of several segments (Figures 5 and 6; Table 3).The first phase consists of the limitation of adsorption by external diffusion (1r segment: Y1). Thesecond consists of the gradual adsorption of the solute limited by intraparticle diffusion (2nd and 3rdsegment for SMX at 2 µg/L; 2nd segment for SMX at 2 mg/L). The third phase corresponds to a state ofequilibrium during which the adsorption capacity remains stable (plateau). Figures 5 and 6 clearlyshow that the straight lines containing these segments do not pass through the origin. The slopes ofthese straight lines are equal to the ki diffusion constants. The values of the non-zero y-interceptscorrespond to the “Ci” constants given in Table 3. The existence of these constants fully supports thecoexistence of external diffusion and intraparticle diffusion. A large deviation from the origin indicatesthat the diffusion of the boundary layer affects adsorption. These constants are directly related to theSMX concentration in the boundary layer and the thickness of this layer. The higher these values, thegreater the effect of the boundary layer. All these mechanisms can be assimilated with a resistance inseries of mass transfer of the adsorbate from the solution medium to active adsorption sites. During
Molecules 2020, 25, 4656 9 of 18
the global trajectory, the flow, the duration of each step, and the sorption rates vary according to theroughness, tortuosity, constrictivity, particle size, the physicochemical conditions of the medium, andthe type of activated carbon functional groups (surface chemistry). Additionally, external diffusiondepends on the hydrodynamic conditions of the medium.
Table 3. Kinetic parameters of Weber–Morris model.
External Diffusion Intraparticle Diffusion
Micropore Diffusion Mesopore Diffusion
CACPmg/L
C0mg/L
ki1mg/g min0.5
C1mg/L
ki2mg/g min0.5
C2mg/g
ki3mg/g min0.5
C3mg/g R2
10 0.002 0.039 0.052 0.014 0.113 0.038 0.027 0.99
At a SMX concentration of 2 µg/L and an ACP concentration of 10 mg/L (Figure 5), the threesegments are attributed, respectively, to external diffusion, intraparticle diffusion in micropores, andintraparticle diffusion in mesopores. Their durations are approximately 6.3, 7.2, and 5.5 min. The finalequilibrium phase is reached rapidly. The values of the Ci constants are proportional to the thicknessof the boundary layers of the above-mentioned zones. The micropore constant C2 is equal to 2.2 × C1
and 4.2 × C3. The resistance of the micropore boundary layer is therefore higher and thus, led to adrop in diffusion rate (ki2 < ki2 and ki2 < ki3; ki = Yi slope). In the micropores where the pore size iscomparable to the size of adsorbate molecules, diffusion is highly restricted by the presence of porewalls. The sum of the Ci constants is exactly equal to the quantity of SMX completely adsorbed by theACP, i.e., 0.2 mg/g. Its distribution between the external surface, the micropores, and the mesopores is,respectively, 26.1%, 56.7%, and 13.7%. The behavior of macropores is included in that of the externalsurface. In accordance with the geometry of these three zones, it is more appropriate to employ theterm “boundary layer” for the external surface of particles and for mesopores; however, for micropores,it is a volume in suspension introduced into the micropores and whose thickness corresponds tothe average deviation (or average diameter) of these micropores (micropore filling). SMX diffusion,therefore, occurs in this volume.
At 2 mg/L of SMX (Figure 6), the diffusion behavior is attributed to external diffusion andintraparticle diffusion in the pores. The constants ki and Ci are much higher than those obtained at2µg/L. This shows that the parameters of Weber’s equation also depend on the solute concentration.The first segment corresponds to external diffusion (macropores and external particle surfaces), whilethe second segment is attributed to intraparticle diffusion in certain pores whose dimensions are likelyto fall within the upper mesopore bracket (ki2 = 4.2 mg/g min0.5 and C2 = 50.3 mg/g and R2 = 0.99).A high SMX concentration apparently promotes the constriction of certain access routes and preventsmicropore filling. The first phase lasted 107 min and the second 162 min. The rise in the initial soluteconcentration triggers an increase in the solute concentration in the boundary layers and hence, thethickness of these layers. This rise in concentration augments the driving force for the concentrationgradient, hence, in the increase in molecular diffusion at the adsorbent surfaces. The intraparticlediffusion rate constant ki1 is very high and the y-intercept of the external diffusion phase is negative.The passage of the intercept “C1” below zero and the increase in the diffusion coefficient with theincrease in the concentration of SMX (2 mg/L) indicate (i) the effect of external film diffusion resistanceand (ii) that the monolayer is exceeded and the system evolves towards multilayer. The surfacediffusivity is probably divided into two regions: a monolayer region and a multilayer region.
The Weber and Morris model offers a good description of SMX sorption kinetics by the ACPNorit SA Super with coefficients of determination greater than 0.99. It shows that (i) external masstransfer and intraparticle diffusion curb the adsorption rate, (ii) the transport rate of SMX molecules isgoverned by intraparticle diffusion, and (iii) the type and order of adsorption kinetics are not uniform.The next step consisted of examining adsorption kinetics using the three previously mentioned models.
Molecules 2020, 25, 4656 10 of 18
Molecules 2020, 25, x FOR PEER REVIEW 10 of 18
Figure 5. Weber–Morris plots for the sorption of SMX by ACP Norit SA Super in drinking water.
(SMX: 2µg/L; ACP: 10 mg/L; pH = 8.1, T = 293 K).
Figure 6. Weber–Morris plots for the sorption of SMX by ACP Norit SA Super in drinking water.
(SMX: 2mg/L; ACP: 10 mg/L; pH = 8.1, T = 293 K).
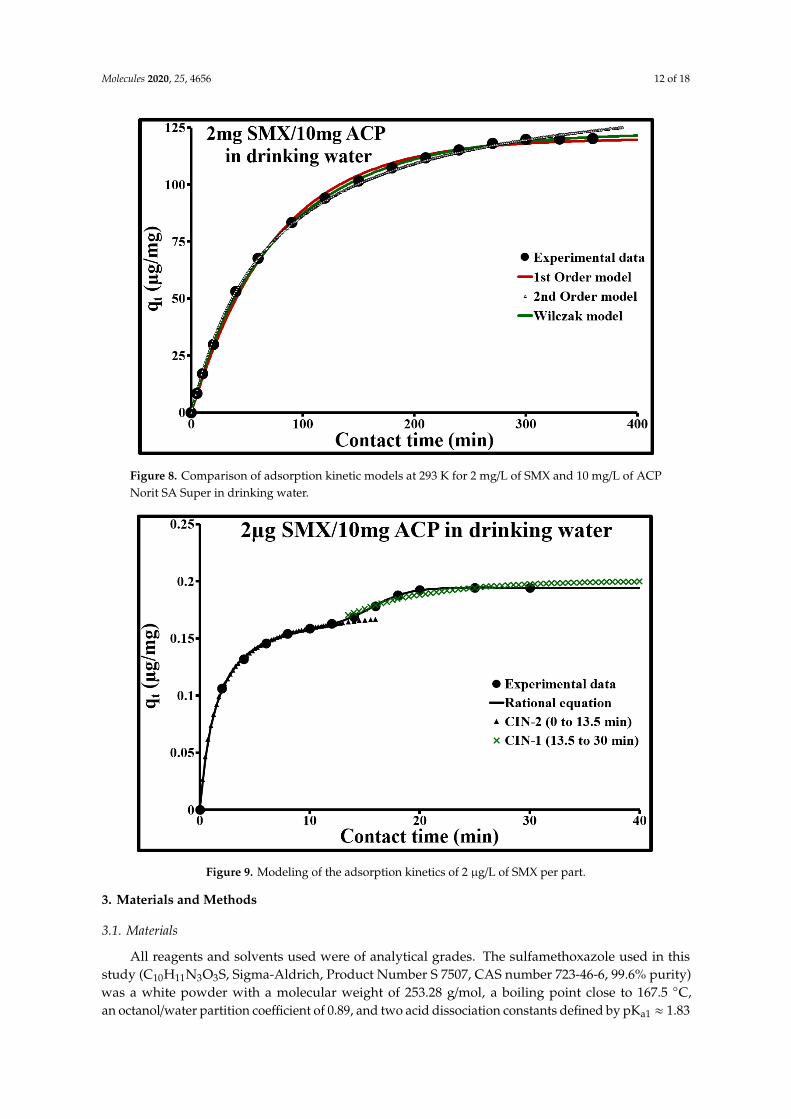
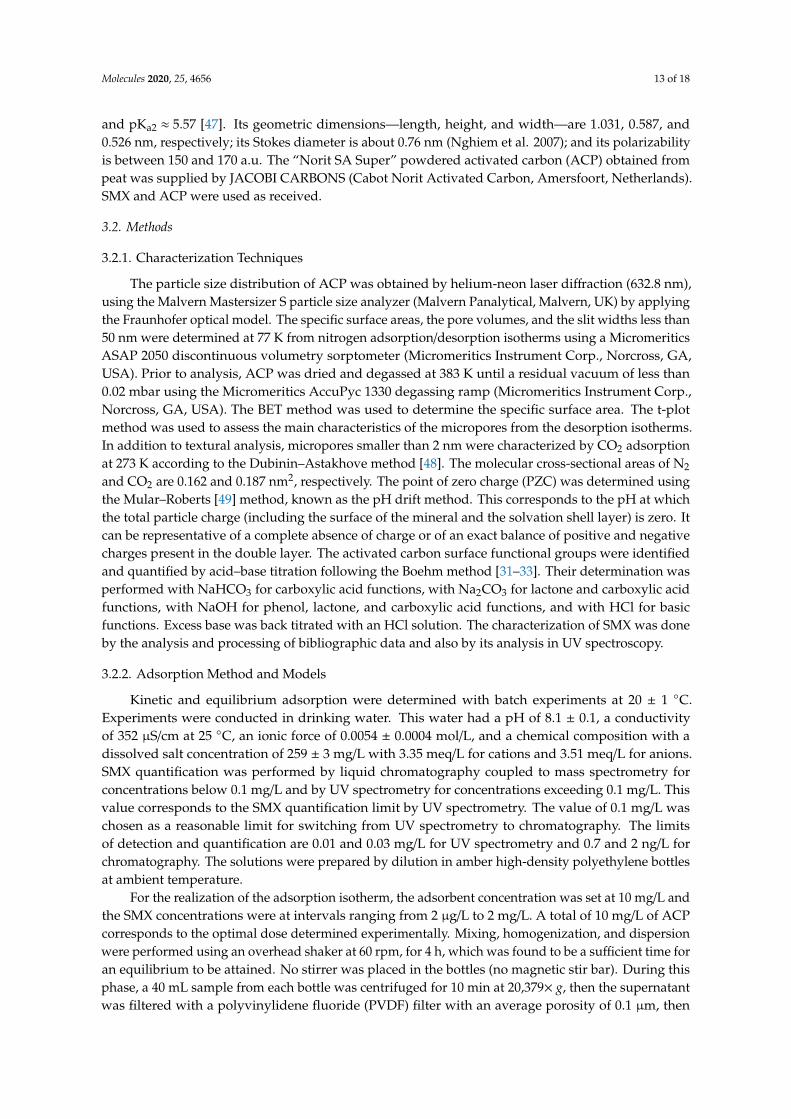
2.4.3. Adsorption Kinetic Modeling
The comparison of experimental data with the three empirical models (Figures 7–9) indicated,
as an initial approximation, that the double exponential model applies fairly well to adsorption
kinetics at both SMX concentrations. This model is characterized by a low ∆q and a calculated qe very
close to the experimental qe (Table 4). More specifically, it includes two different adsorption rates, a
rapid phenomenon and a second phase characterized by slower stabilization. These two phenomena
can be represented, respectively, by a rapid external, or even internal, diffusion mechanism, and by
a slow intraparticle diffusion phase. However, the sorption kinetics at an SMX concentration of 2
Figure 5. Weber–Morris plots for the sorption of SMX by ACP Norit SA Super in drinking water. (SMX:2 µg/L; ACP: 10 mg/L; pH = 8.1, T = 293 K).
Molecules 2020, 25, x FOR PEER REVIEW 10 of 18
Figure 5. Weber–Morris plots for the sorption of SMX by ACP Norit SA Super in drinking water.
(SMX: 2µg/L; ACP: 10 mg/L; pH = 8.1, T = 293 K).
Figure 6. Weber–Morris plots for the sorption of SMX by ACP Norit SA Super in drinking water.
(SMX: 2mg/L; ACP: 10 mg/L; pH = 8.1, T = 293 K).
2.4.3. Adsorption Kinetic Modeling
The comparison of experimental data with the three empirical models (Figures 7–9) indicated,
as an initial approximation, that the double exponential model applies fairly well to adsorption
kinetics at both SMX concentrations. This model is characterized by a low ∆q and a calculated qe very
close to the experimental qe (Table 4). More specifically, it includes two different adsorption rates, a
rapid phenomenon and a second phase characterized by slower stabilization. These two phenomena
can be represented, respectively, by a rapid external, or even internal, diffusion mechanism, and by
a slow intraparticle diffusion phase. However, the sorption kinetics at an SMX concentration of 2
Figure 6. Weber–Morris plots for the sorption of SMX by ACP Norit SA Super in drinking water. (SMX:2 mg/L; ACP: 10 mg/L; pH = 8.1, T = 293 K).
2.4.3. Adsorption Kinetic Modeling
The comparison of experimental data with the three empirical models (Figures 7–9) indicated,as an initial approximation, that the double exponential model applies fairly well to adsorption kineticsat both SMX concentrations. This model is characterized by a low ∆q and a calculated qe very closeto the experimental qe (Table 4). More specifically, it includes two different adsorption rates, a rapidphenomenon and a second phase characterized by slower stabilization. These two phenomena can be
Molecules 2020, 25, 4656 11 of 18
represented, respectively, by a rapid external, or even internal, diffusion mechanism, and by a slowintraparticle diffusion phase. However, the sorption kinetics at an SMX concentration of 2 µg/L can bebetter modeled in steps (Table 5). From 0 to 13.5 min, it follows a second-order rate law with veryrapid sorption, with 85% sorption in 13.5 min, and shows excellent agreement with the experimentalvalues. During this phase, the pseudo-second-order model describes the involvement of both externalmass transfer and intraparticle diffusion mechanisms. Above 13.5 min, the pseudo-first-order modelapplies well; it gives the best results with a low ∆q and a calculated qe equal to the experimental qe.
Table 4. SMX adsorption kinetic parameters given for the three kinetic models.
Pseudo-First Order Pseudo-Second Order
C0mg/L
qe.expmg/g
qemg/g
k1min−1 R2 ∆q
%qe
mg/gk2
g/mg min R2 ∆q%
0.002 0.198 0.181 0.313 0.948 8.8 0.205 2.146 0.985 4.62 120.5 120.16 0.013 0.999 4.4 147.9 9.5 × 10⁻⁵ 0.999 1.9
Double-Exponential Model
C0mg/L
qe.expmg/g
q0mg/g
qe1mg/g
qe2mg/g
qe1 + qe2mg/g
kD1min−1
kD2min−1 R2 ∆q
%
0.002 0.198 1.5 × 10⁻⁷ 0.102 0.107 0.209 0.075 0.979 0.996 1.92 120.5 1.5 × 10⁻⁵ 107.7 15.0 122.7 0.011 0.049 0.999 2.5
Table 5. Kinetic parameters of stepwise modeling applied to the adsorption of 2 µg/L of SMX per10 mg/L of activated carbon.
0 to 13.5 min Pseudo-Second Order 13.5 to 30 min Pseudo-First Order
C0mg/L
qe.expmg/g
qemg/g
k2g/mg min R2 ∆q
%qe
mg/gk1
min−1 R2 ∆q%
0.002 0.198 0.181 3.730 0.999 0.6 0.200 0.140 0.998 1.6
Molecules 2020, 25, x FOR PEER REVIEW 11 of 18
µg/L can be better modeled in steps (Table 5). From 0 to 13.5 min, it follows a second-order rate law
with very rapid sorption, with 85% sorption in 13.5 min, and shows excellent agreement with the
experimental values. During this phase, the pseudo-second-order model describes the involvement
of both external mass transfer and intraparticle diffusion mechanisms. Above 13.5 min, the pseudo-
first-order model applies well; it gives the best results with a low ∆q and a calculated qe equal to the
experimental qe.
Table 4. SMX adsorption kinetic parameters given for the three kinetic models.
Pseudo-First Order Pseudo-Second Order
C0
mg/L
qe.exp
mg/g
qe
mg/g
k1
min−1 R2
∆q
%
qe
mg/g
k2
g/mg min R2
∆q
%
0.002 0.198 0.181 0.313 0.948 8.8 0.205 2.146 0.985 4.6
2 120.5 120.16 0.013 0.999 4.4 147.9 9.5 × 10⁻⁵ 0.999 1.9
Double-Exponential Model
C0
mg/L
qe.exp
mg/g
q0
mg/g
qe1
mg/g
qe2
mg/g
qe1 + qe2
mg/g
kD1
min−1
kD2
min−1 R2
∆q
%
0.002 0.198 1.5× 10⁻⁷ 0.102 0.107 0.209 0.075 0.979 0.996 1.9
2 120.5 1.5× 10⁻⁵ 107.7 15.0 122.7 0.011 0.049 0.999 2.5
Table 5. Kinetic parameters of stepwise modeling applied to the adsorption of 2 µg/L of SMX per 10
mg/L of activated carbon.
0 to 13.5 min Pseudo-Second Order 13.5 to 30 min Pseudo-First Order
C0
mg/L
qe.exp
mg/g
qe
mg/g
k2
g/mg min R2
∆q
%
qe
mg/g
k1
min−1 R2
∆q
%
0.002 0.198 0.181 3.730 0.999 0.6 0.200 0.140 0.998 1.6
Figure 7. Comparison of adsorption kinetic models at 293 K for 2 µg/L of SMX and 10 mg/L of ACP
Norit SA Super in drinking water. Figure 7. Comparison of adsorption kinetic models at 293 K for 2 µg/L of SMX and 10 mg/L of ACPNorit SA Super in drinking water.
Molecules 2020, 25, 4656 12 of 18Molecules 2020, 25, x FOR PEER REVIEW 12 of 18
Figure 8. Comparison of adsorption kinetic models at 293 K for 2 mg/L of SMX and 10 mg/L of ACP
Norit SA Super in drinking water.
Figure 9. Modeling of the adsorption kinetics of 2 µg/L of SMX per part.
3. Materials and Methods
3.1. Materials
All reagents and solvents used were of analytical grades. The sulfamethoxazole used in this
study (C10H11N3O3S, Sigma-Aldrich, Product Number S 7507, CAS number 723-46-6, 99.6% purity)
was a white powder with a molecular weight of 253.28 g/mol, a boiling point close to 167.5 °C, an
octanol/water partition coefficient of 0.89, and two acid dissociation constants defined by pKa1 1.83
and pKa2 5.57 [47]. Its geometric dimensions—length, height, and width—are 1.031, 0.587, and 0.526
nm, respectively; its Stokes diameter is about 0.76 nm (Nghiem et al. 2007); and its polarizability is
Figure 8. Comparison of adsorption kinetic models at 293 K for 2 mg/L of SMX and 10 mg/L of ACPNorit SA Super in drinking water.
Molecules 2020, 25, x FOR PEER REVIEW 12 of 18
Figure 8. Comparison of adsorption kinetic models at 293 K for 2 mg/L of SMX and 10 mg/L of ACP
Norit SA Super in drinking water.
Figure 9. Modeling of the adsorption kinetics of 2 µg/L of SMX per part.
3. Materials and Methods
3.1. Materials
All reagents and solvents used were of analytical grades. The sulfamethoxazole used in this
study (C10H11N3O3S, Sigma-Aldrich, Product Number S 7507, CAS number 723-46-6, 99.6% purity)
was a white powder with a molecular weight of 253.28 g/mol, a boiling point close to 167.5 °C, an
octanol/water partition coefficient of 0.89, and two acid dissociation constants defined by pKa1 1.83
and pKa2 5.57 [47]. Its geometric dimensions—length, height, and width—are 1.031, 0.587, and 0.526
nm, respectively; its Stokes diameter is about 0.76 nm (Nghiem et al. 2007); and its polarizability is
Figure 9. Modeling of the adsorption kinetics of 2 µg/L of SMX per part.
3. Materials and Methods
3.1. Materials
All reagents and solvents used were of analytical grades. The sulfamethoxazole used in thisstudy (C10H11N3O3S, Sigma-Aldrich, Product Number S 7507, CAS number 723-46-6, 99.6% purity)was a white powder with a molecular weight of 253.28 g/mol, a boiling point close to 167.5 ◦C,an octanol/water partition coefficient of 0.89, and two acid dissociation constants defined by pKa1 ≈ 1.83
Molecules 2020, 25, 4656 13 of 18
and pKa2 ≈ 5.57 [47]. Its geometric dimensions—length, height, and width—are 1.031, 0.587, and0.526 nm, respectively; its Stokes diameter is about 0.76 nm (Nghiem et al. 2007); and its polarizabilityis between 150 and 170 a.u. The “Norit SA Super” powdered activated carbon (ACP) obtained frompeat was supplied by JACOBI CARBONS (Cabot Norit Activated Carbon, Amersfoort, Netherlands).SMX and ACP were used as received.
3.2. Methods
3.2.1. Characterization Techniques
The particle size distribution of ACP was obtained by helium-neon laser diffraction (632.8 nm),using the Malvern Mastersizer S particle size analyzer (Malvern Panalytical, Malvern, UK) by applyingthe Fraunhofer optical model. The specific surface areas, the pore volumes, and the slit widths less than50 nm were determined at 77 K from nitrogen adsorption/desorption isotherms using a MicromeriticsASAP 2050 discontinuous volumetry sorptometer (Micromeritics Instrument Corp., Norcross, GA,USA). Prior to analysis, ACP was dried and degassed at 383 K until a residual vacuum of less than0.02 mbar using the Micromeritics AccuPyc 1330 degassing ramp (Micromeritics Instrument Corp.,Norcross, GA, USA). The BET method was used to determine the specific surface area. The t-plotmethod was used to assess the main characteristics of the micropores from the desorption isotherms.In addition to textural analysis, micropores smaller than 2 nm were characterized by CO2 adsorptionat 273 K according to the Dubinin–Astakhove method [48]. The molecular cross-sectional areas of N2
and CO2 are 0.162 and 0.187 nm2, respectively. The point of zero charge (PZC) was determined usingthe Mular–Roberts [49] method, known as the pH drift method. This corresponds to the pH at whichthe total particle charge (including the surface of the mineral and the solvation shell layer) is zero. Itcan be representative of a complete absence of charge or of an exact balance of positive and negativecharges present in the double layer. The activated carbon surface functional groups were identifiedand quantified by acid–base titration following the Boehm method [31–33]. Their determination wasperformed with NaHCO3 for carboxylic acid functions, with Na2CO3 for lactone and carboxylic acidfunctions, with NaOH for phenol, lactone, and carboxylic acid functions, and with HCl for basicfunctions. Excess base was back titrated with an HCl solution. The characterization of SMX was doneby the analysis and processing of bibliographic data and also by its analysis in UV spectroscopy.
3.2.2. Adsorption Method and Models
Kinetic and equilibrium adsorption were determined with batch experiments at 20 ± 1 ◦C.Experiments were conducted in drinking water. This water had a pH of 8.1 ± 0.1, a conductivityof 352 µS/cm at 25 ◦C, an ionic force of 0.0054 ± 0.0004 mol/L, and a chemical composition with adissolved salt concentration of 259 ± 3 mg/L with 3.35 meq/L for cations and 3.51 meq/L for anions.SMX quantification was performed by liquid chromatography coupled to mass spectrometry forconcentrations below 0.1 mg/L and by UV spectrometry for concentrations exceeding 0.1 mg/L. Thisvalue corresponds to the SMX quantification limit by UV spectrometry. The value of 0.1 mg/L waschosen as a reasonable limit for switching from UV spectrometry to chromatography. The limitsof detection and quantification are 0.01 and 0.03 mg/L for UV spectrometry and 0.7 and 2 ng/L forchromatography. The solutions were prepared by dilution in amber high-density polyethylene bottlesat ambient temperature.
For the realization of the adsorption isotherm, the adsorbent concentration was set at 10 mg/L andthe SMX concentrations were at intervals ranging from 2 µg/L to 2 mg/L. A total of 10 mg/L of ACPcorresponds to the optimal dose determined experimentally. Mixing, homogenization, and dispersionwere performed using an overhead shaker at 60 rpm, for 4 h, which was found to be a sufficient time foran equilibrium to be attained. No stirrer was placed in the bottles (no magnetic stir bar). During thisphase, a 40 mL sample from each bottle was centrifuged for 10 min at 20,379× g, then the supernatantwas filtered with a polyvinylidene fluoride (PVDF) filter with an average porosity of 0.1 µm, then
Molecules 2020, 25, 4656 14 of 18
the SMX is determined. The adsorption isotherm was obtained by the graphic representation of thequantity of SMX adsorbed by the mineral “qe” according to the residual SMX concentration in theequilibrium solution “Ce” [qe = f(Ce)]. All experiments were carried out in a laboratory at a fixedtemperature of 20 ± 1 ◦C (air-conditioned laboratory).
Given the texture and the energetic heterogeneity of the adsorbent surface, the adsorption isothermmodels of Sips and Dubinin–Astakhov (D–A) were used to describe the adsorption equilibriumcharacteristics. The Sips model [50] is a combination of the Langmuir and Freundlich isotherm models,as shown in Equation (3).
qe = qmax(KsCe)
ns
1 + (KsCe)ns
(3)
where qe is the amount of pollutant adsorbed per gram of the adsorbent at equilibrium (mg/g), qmax isthe maximum monolayer saturation capacity (mg/g), Ce is the equilibrium concentration of adsorbate(mg/L), Ks is the affinity constant (L/mg), and ns is the surface heterogeneity index (dimensionless),which varies from 0 to 1. When ns equals unity, the Sips isotherm returns to the Langmuir isotherm andpredicts homogeneous adsorption. On the other hand, deviation of the ns value from the unity indicatesa heterogeneous surface. In addition, when the denominator equals unity, the model resembles theFreundlich model.
The Dubinin–Astakhov model in Equation (4) does not assume that the surface is homogeneousor that the adsorption potential is constant, as is the case for the Langmuir model. Its theory ofvolume filling of micropores is based on the fact that the adsorption potential is variable and theenthalpy of adsorption is related to the degree of pore-filling. This isotherm assumes that the surface isheterogeneous and is expressed as follows:
qe = qmax exp[−
(ε
E√
2
)nD]
(4)
ε = RT ln(1 +
1Ce
)= ∆G (5)
qe is the amount of pollutant adsorbed per gram of the adsorbent at equilibrium (mg/g), qmax is themaximum monolayer saturation capacity (mg/g), Ce is the equilibrium concentration of adsorbate (g/g),ε is the Polanyi potential, E is the average adsorption energy (kJ/mol), nD is the surface heterogeneityindex, R is the universal gas constant (8.314 J/mol K), and T is the absolute temperature (K).
The average adsorption energy E was used for estimating the type of adsorption mechanism.For a magnitude of E between 8 and 16 kJ/mol, the adsorption process followed the chemical ionexchange, and values of E below 8 kJ/mol were characteristic of a physical adsorption process. WhenE > 16 kJ/mol, the adsorption is dominated by intraparticle diffusion. The value nD characterizes thedistribution of the adsorption energy in the micropores and, indirectly, the distribution of microporesize. The heterogeneity of these two parameters increased as nD decreased from 2, and, conversely,their homogeneity increased for values above 2. The micropore size also decreased as nD increased [51].
Two adsorption kinetics were carried out. The first one was performed over 30 min with 2 µg/Lof SMX and 10 mg/L of ACP and the second one over 360 min with 2 mg/L of SMX and 10 mg/Lof ACP. The samples corresponding to the different time intervals were simply filtered and then,analyzed by HPLC. In order to study the sorption kinetics, two types of models were used. The first, adiffusion-controlled process, is the Weber and Morris intraparticle diffusion model Equation (6) [52].The second, which assumes that the process is controlled by the adsorption reaction at the liquid/solidinterface, combines the pseudo-first-order kinetic model Equation (7), the pseudo-second-order kineticmodel Equation (8), and the double exponential kinetic model Equation (9). The double exponentialkinetic model provides insight into the adsorption of a solute on two types of sites. This modelincludes two different adsorption rates, a rapid phenomenon and a second phase characterized by
Molecules 2020, 25, 4656 15 of 18
slower stabilization. These two phenomena can be represented, respectively, by a rapid external and/orinternal diffusion mechanism, and by a slow intraparticle diffusion phase.
These models are described by the following equations:
qt = ki√
t + C (6)
qt = qe[1− exp(−k1t)] (7)
qt =k2q2
e t1 + k2qet
(8)
qt = q0 + qr[1− exp(−kst)] + qs[1− exp(−krt)] (9)
with qt the amount of adsorbed solute at time t (mg/g), t the time (min), ki is intraparticle diffusionrate constant (mg/g min0.5), C (mg/g) is a constant related to the thickness of the boundary layer, qe itsvalue at equilibrium (mg/g), k1 the pseudo-first order rate constant (1/min), k2 the pseudo-secondorder kinetic rate constant (g/mg min), q0 is the amount of adsorbed solute at t = 0 min, qr and qs
are the amount of adsorbed solute of the rapid and the slow step, respectively, and ks and kr are rateparameters (1/min).
These non-linear forms have been used as such to interpret the experimental results. In order toquantitatively compare the applicability of different kinetic models in fitting the data, a normalizedstandard deviation, ∆q, was also calculated as follows [53]:
∆q(%) = 100
√1
n− 1
∑[qt,exp − qt,cal
qt,exp
]2
(10)
where n is the number of data points; and qt,exp and qt,cal are the experimental values and the valuescalculated by the model, respectively.
The appropriate model to describe the adsorption kinetics of each system was determined basedon the comparison of R2 and the normalized standard deviation ∆q (%). The determination of R2 aloneis insufficient to decide among the kinetic models.
4. Conclusions
Surface chemistry, specific surface area, pore size distribution, and electrokinetic properties areimportant parameters governing the sorption mechanism and the quantity of SMX adsorbed by theactivated carbon Norit SA Super. The quantities of SMX often found in polluted waters (≤2 µg/L) canbe completely adsorbed by very small quantities of activated carbon (≤10 g/m3 of water). At tap waterpH, SMX and ACP are both negative and their interaction is of a physical nature. The π–π dispersiveinteractions and electrostatic interactions produced by bridging using Ca2+ and/or Mg2+ are very likelyto be predominant and to control adsorption.
Given the heterogeneity of the activated carbon’s surface energy due to its internal and externalstructure, sorption kinetics can be perfectly modeled first by a second-order rate law for the microporesequence and then, by a first-order rate law for the mesopore and macropore sequence. The external andintraparticle diffusion phenomena are determining factors in the adsorption process. The intraparticlediffusion model clearly identifies all the phases involved. It also confirmed that the initial concentrationaffects the process kinetics. Modeling of the overall kinetics using a double exponential model is able tocover all these phases and gives a very significant mean with a very good coefficient of determinationand low deviation between experimental data and calculated values.
This investigation into adsorption kinetics and mechanisms of a very small quantity of apharmaceutical residue, which is persistent and mobile in soils, shows low biodegradability, and isfrequently found in the different aquatic compartments, constitutes progress in both theoretical andpractical aspects. From an industrial perspective, activated carbon offers rapid adsorption kinetics and
Molecules 2020, 25, 4656 16 of 18
is characterized by easy implementation and low sludge production (≤10 g/m3 of water). It can beused in different processes. The adsorption in tap water and examination of the adsorption kineticsof very reliable quantity of SMX with a very small quantity of ACP, the innovative element of thisstudy, show that the results obtained are very encouraging for the use of ACP on an industrial scalefor the removal of SMX. In terms of future prospects and prior to widespread application, the field ofapplication would need to be extended to other pharmaceutical pollutants and semi-pilot industrialstudies would have to be conducted.
Funding: This research received no external funding.
Acknowledgments: The author gratefully acknowledges the BRGM for financial support. He would like to thankFadoua EL Kili for her contribution to the realization of the adsorption experiments during her Master II internshipat BRGM and Anne Lagleyze for valuable scientific discussions about water pollution in general. He also wishesto thank all those who contributed indirectly to the realization of this work.
Conflicts of Interest: The author declare no conflict of interest.
References
1. aus der Beek, T.; Weber, F.A.; Bergmann, A.; Hickmann, S.; Ebert, I.; Hein, A.; Küster, A. Pharmaceuticals inthe Environment: Global Occurrence and Perspectives. Environ. Toxicol. Chem. 2016, 35, 823–835. [CrossRef][PubMed]
2. Kibuye, F.A.; Gall, H.E.; Elkin, K.R.; Ayers, B.; Veith, T.L.; Miller, M.; Jacob, S.; Hayden, K.R.; Watson, J.E.;Elliott, H.A. Fate of pharmaceuticals in a spray-irrigation system: From wastewater to groundwater.Sci. Total. Environ. 2019, 654, 197–208. [CrossRef] [PubMed]
3. Verlicchi, P.; Galletti, A.; Petrovic, M.; Barceló, D. Hospital effluents as a source of emerging pollutants:An overview of micropollutants and sustainable treatment options. J. Hydrol. 2010, 389, 416–428. [CrossRef]
4. Deblonde, T.; Cossu-Leguille, C.; Hartemann, P. Emerging pollutants in wastewater: A review of the literature.Int. J. Hyg. Environ. Health 2011, 214, 442–448. [CrossRef] [PubMed]
5. Furlong, E.T.; Batt, A.L.; Glassmeyer, S.T.; Noriega, M.C.; Kolpin, D.; Mash, H.; Schenck, K.M. Nationwidereconnaissance of contaminants of emerging concern in source and treated drinking waters of the UnitedStates: Pharmaceuticals. Sci. Total. Environ. 2017, 579, 1629–1642. [CrossRef]
6. Glassmeyer, S.T.; Furlong, E.T.; Kolpin, D.W.; Batt, A.L.; Bensond, R.; Boone, J.S.; Conerly, O.; Donohue, M.J.;King, D.N.; Kostich, M.S.; et al. Nationwide reconnaissance of contaminants of emerging concern in sourceand treated drinking waters of the United States. Sci. Total Environ. 2017, 909–922. [CrossRef]
7. Paíga, P.; Correia, M.; Fernandes, M.J.; Silva, A.; Carvalho, M.; Vieira, J.S.; Jorge, S.; Silva, J.G.; Freire, C.;Delerue-Matos, C. Assessment of 83 pharmaceuticals in WWTP influent and euent samples by UHPLC-MS/MS:Hourly variationSci. Sci. Total Environ. 2019, 648, 582–600. [CrossRef]
8. Kibuye, F.A.; Gall, H.E.; Elkin, K.R.; Swistock, B.; Veith, T.L.; Watson, J.E.; Elliott, H.A. Occurrence,Concentrations, and Risks of Pharmaceutical Compounds in Private Wells in Central Pennsylvania. J. Environ.Qual. 2019, 48, 1057–1066. [CrossRef]
9. Barnes, K.K.; Kolpin, D.W.; Furlong, E.T.; Zaugg, S.D.; Meyer, M.T.; Barber, L.B. A national reconnaissanceof pharmaceuticals and other organic wastewater contaminants in the United States—I) Groundwater.Sci. Total. Environ. 2008, 402, 192–200. [CrossRef]
10. Benotti, M.J.; Brownawell, B.J. Distributions of Pharmaceuticals in an Urban Estuary during both Dry- andWet-Weather Conditions. Environ. Sci. Technol. 2007, 41, 5795–5802. [CrossRef]
11. Chang, X.; Meyer, M.T.; Liu, X.; Zhao, Q.; Chen, H.; Chen, J.-A.; Qiu, Z.; Yang, L.; Cao, J.; Shu, W.Determination of antibiotics in sewage from hospitals, nursery and slaughter house, wastewater treatmentplant and source water in Chongqing region of Three Gorge Reservoir in China. Environ. Pollut. 2010, 158,1444–1450. [CrossRef] [PubMed]
12. Kümmerer, K. Resistance in the environment. J. Antimicrob. Chemother. 2004, 54, 311–320. [CrossRef][PubMed]
13. Costanzo, S.; Murby, J.; Bates, J. Ecosystem response to antibiotics entering the aquatic environment.Mar. Pollut. Bull. 2005, 51, 218–223. [CrossRef] [PubMed]
Molecules 2020, 25, 4656 17 of 18
14. Kim, Y.-H.; Cerniglia, C.E. Influence of erythromycin A on the microbial populations in aquaculture sedimentmicrocosms. Aquat. Toxicol. 2005, 73, 230–241. [CrossRef] [PubMed]
15. Yang, L.H.; Ying, G.G.; Su, H.C.; Stauber, J.L.; Adams, M.S.; Binet, M.T. Growth-inhibiting effects of 12antibacterial agents and their mixtures on the freshwater microalga Pseudokirchneriella subcapitata. Environ.Toxicol. Chem. 2008, 27, 1201–1208. [CrossRef] [PubMed]
16. Wu, X.; Ernst, F.; Conkle, J.L.; Gan, J. Comparative uptake and translocation of pharmaceutical and personalcare products (PPCPs) by common vegetables. Environ. Int. 2013, 60, 15–22. [CrossRef]
17. Nghiem, L.D.; Hawkes, S. Effects of membrane fouling on the nanofiltration of pharmaceutically activecompounds (PhACs): Mechanisms and role of membrane pore size. Sep. Purif. Technol. 2007, 57, 176–184.[CrossRef]
18. Trovó, A.G.; Nogueira, R.F.; Agüera, A.; Fernández-Alba, A.R.; Sirtori, C.; Malato, S. Degradation ofsulfamethoxazole in water by solar photo-Fenton. Chemical and toxicological evaluation. Water Res. 2009,43, 3922–3931. [CrossRef]
19. Garoma, T.; Umamaheshwar, S.K.; Mumper, A. Removal of sulfadiazine, sulfamethizole, sulfamethoxazole,and sulfathiazole from aqueous solution by ozonation. Chemosphere 2010, 79, 814–820. [CrossRef]
20. Mezghich, S.; Ayari, F.; Sarakha, M. Photochemical Degradation of the Antimicrobial Sulfamethoxazole uponSolar Light Excitation: Kinetics and Elucidation of Byproducts Using LC/ESI+/MS2 Technique. Mass Spectrom.Purif. Tech. 2017, 3, 1000118. [CrossRef]
21. Yang, Y.; Lu, X.; Jiang, J.; Ma, J.; Liu, G.; Cao, Y.; Liu, W.; Li, J.; Pang, S.; Kong, X.; et al. Degradation ofsulfamethoxazole by UV, UV/H2O2 and UV/persulfate (PDS): Formation of oxidation products and effect ofbicarbonate. Water Res. 2017, 118, 196–207. [CrossRef] [PubMed]
22. Zhao, W.; Sui, Q.; Mei, X.; Cheng, X. Efficient elimination of sulfonamides by an anaerobic/anoxic/
oxic-membrane bioreactor process: Performance and influence of redox condition. Sci. Total Environ.2018, 633, 668–676. [CrossRef] [PubMed]
23. Zhu, G.; Sun, Q.; Wang, C.; Yang, Z.; Xue, Q. Removal of Sulfamethoxazole, Sulfathiazole and Sulfamethazinein their Mixed Solution by UV/H2O2 Process. Int. J. Environ. Res. Public Health 2019, 16, 1797. [CrossRef][PubMed]
24. Hu, A.; Zhang, X.; Luong, D.; Oakes, K.D.; Servos, M.R.; Liang, R.; Kurdi, S.; Peng, P.; Zhou, Y. Adsorptionand Photocatalytic Degradation Kinetics of Pharmaceuticals by TiO2 Nanowires During Water Treatm.Waste Biomass Valorization 2012, 3, 443–449. [CrossRef]
25. Li, H.; He, J.; Chen, K.; Shi, Z.; Li, M.; Guo, P.; Wu, L. Dynamic Adsorption of Sulfamethoxazole fromAqueous Solution by Lignite Activated Coke. Materials 2020, 13, 1785. [CrossRef]
26. Prasannamedha, G.; Kumar, P.S. A review on contamination and removal of sulfamethoxazole from aqueoussolution using cleaner techniques: Present and future perspective. J. Clean. Prod. 2020, 250, 119553. [CrossRef]
27. Baan, R.A. Carcinogenic Hazards from Inhaled Carbon Black, Titanium Dioxide, and Talc not ContainingAsbestos or Asbestiform Fibers: Recent Evaluations by anIARC MonographsWorking Group. Inhal. Toxicol.2007, 19, 213–228. [CrossRef]
28. Ettrup, K.; Kounina, A.; Hansen, S.F.; Meesters, J.A.J.; Vea, E.B.; Laurent, A. Development of comparativetoxicity potentials of TiO2 nanoparticles for use in life cycle assessment. Environ. Sci. Technol. 2017, 51,4027–4037. [CrossRef]
29. Bizi, M. Activated Carbon and the Principal Mineral Constituents of a Natural Soil in the Presence ofCarbamazepine. Water 2019, 11, 2290. [CrossRef]
30. Bizi, M.; El Bachra, F. Evaluation of the ciprofloxacin adsorption capacity of common industrial minerals andapplication to tap water treatment. Powder Technol. 2020, 362, 323–333. [CrossRef]
31. Boehm, H.P.; Diehl, E.; Heck, W.; Sappok, R. Surface oxides de carbon. Angew. Chem. Int. Ed. Engl. 1964, 3,667–677. [CrossRef]
32. Boehm, H.P. Chemical Identification of Surface Groups, Advances in Catalysis; Eley, D.D., Pines, H., Weisz, P.B.,Eds.; Academic Press: New York, NY, USA, 1966; Volume 16, pp. 179–274.
33. Boehm, H.P. Some aspects of the surface chemistry of carbon blacks and other carbons. Carbon 1994, 32,759–769. [CrossRef]
34. Zhang, C.L.; Wang, F.A.; Wang, Y. Solubilities of Sulfadiazine, Sulfamethazine, Sulfadimethoxine,Sulfamethoxydiazine, Sulfamonomethoxine, Sulfamethoxazole, and Sulfachloropyrazine in Water from(298.15 to 333.15 K). J. Chem. Eng. Data 2007, 52, 1563–1566. [CrossRef]

Molecules 2020, 25, 4656 18 of 18
35. Finqueneisel, G.; Zimny, T.; Albiniak, A.; Siemieniewska, T.; Vogt, D.; Weber, J.V. Cheap adsorbent. Part 1:Active cokes from lignites and improvement of their adsorptive properties by mild oxidation. Fuel 1998, 77,549–556. [CrossRef]
36. Giles, C.H.; Smith, D.; Huitson, A. A general treatment and classification of thesolute adsorption isotherm. I.Theoretical. J. Colloid Interface Sci. 1974, 47, 755–765. [CrossRef]
37. Everett, D.H.; Powl, J.C. Adsorption in slit-like and cylindrical micropores in the henry’s law region. Amodel for the microporosity of carbons. J. Chem. Soc. Faraday Trans. Phys. Chem. Condens. Phases 1976, 72,619–636. [CrossRef]
38. Moreno-Castilla, C. Adsorption of organic molecules from aqueous solutions on carbon materials. Carbon2004, 42, 83–94. [CrossRef]
39. Derylo-Marczewska, A.; Swiatkowski, A.; Biniak, S.; Walczyk, M. Effect of properties of chemically modifiedactivated carbon and aromatic adsorbate molecule on adsorption from liquid phase. Colloids Surf. A Phys.Eng. Asp. 2008, 327, 1–8. [CrossRef]
40. Coughlin, R.W.; Ezra, F.S. Role of Surface Acidity in the Adsorption of Organic Pollutants on the Surface ofCarbon. Environ. Sci. Technol. 1968, 2, 291–293. [CrossRef]
41. Mattson, S.; Mark, H.B.; Malbin, M.D.; Weber, W.J.; Crittenden, J.C. Surface Chemistry of Active Carbon:Specific Adsorption of Phenols. J. Colloid Interface Sci. 1969, 31, 116–130. [CrossRef]
42. Hunter, C.A.; Singh, J.; Thornton, J.M. π-π interactions: The geometry and energetics ofphenylalanine-phenylalanine interactions in proteins. J. Mol. Biol. 1991, 218, 837–846. [CrossRef]
43. Haydar, S.; Ferro-García, M.A.; Rivera-Utrilla, J.; Joly, J.P. A dsorption of p-nitrophenol on an activatedcarbon with different oxidations. Carbon 2003, 41, 387–395. [CrossRef]
44. Friedman, H.L.; Krishnan, C.V. Thermodynamics of ionichydration. In Water: A Comprehensive Treatise;Franks, F., Ed.; PlenumPress: New York, NY, USA, 1973.
45. Ikeda, T.; Boero, M.; Terakura, K. Hydration properties of magnesium and calcium ions from constrainedfirst principles molecular dynamics. J. Chem. Phys. 2007, 127, 074503. [CrossRef]
46. de Courcy, B.; Pedersen, L.G.; Parisel, O.; Gresh, N.; Silvi, B.; Pilmé, J.; Piquemal, J.P. Understanding selectivityof hard and soft metal cations within biological systems using the subvalence concept. 1. Applicationto blood coagulation: Direct cation− protein electronic effects versus indirect interactions through waternetworks. J. Chem. Theory Comput. 2010, 6, 1048–1063. [CrossRef]
47. Lin, C.E.; Chang, C.C.; Lin, W.C. Migration behavior and separation of sulfonamides in capillary zoneelectrophoresis III. Citrate buffer as a background electrolyte. J. Chromatogr. A 1997, 768, 105–112.
48. Dubinin, M.M.; Stoeckli, H.F. Homogeneous and heterogeneous micropore structures in carbonaceousadsorbents. J. Colloid Interface Sci. 1980, 75, 34–42. [CrossRef]
49. Mular, A.L.; Roberts, R.B. A Simplified method to determine isoelectric points of oxides. Trans. Can. Inst.Min. Metall. 1966, 69, 438–439.
50. Sips, R. On the structure of a catalyst surface. J. Chem. Phys. 1948, 16, 490–495. [CrossRef]51. Moreno-Castilla, C. Micropore structure of activated carbons prepared from a Spanish subbituminous
coalstudied by CO2, benzene, and cyclohexane adsorption. Langmuir 1995, 11, 247–252. [CrossRef]52. Weber, W.J.; Morris, J.C. Kinetics of adsorption on carbon from solutions. J. Sanit. Eng. Div. 1963, 89, 31–60.53. Moussout, H.; Ahlafi, H.; Aazza, M.; Maghat, H. Critical of linear and nonlinear equations of pseudo-first
order and pseudo-second order kinetic models. Karbala Int. J. Mod. Sci. 2018, 4, 244–254. [CrossRef]
Sample Availability: Activated carbon is available from the author.
© 2020 by the author. Licensee MDPI, Basel, Switzerland. This article is an open accessarticle distributed under the terms and conditions of the Creative Commons Attribution(CC BY) license (http://creativecommons.org/licenses/by/4.0/).