Predicting the Transient Hydrodynamic Loads on Submarine ...

IntroductionThe sediment and pore waters at the interface between
salt water in coastal zones and fresh meteoric water in con-tinental aquifers has been defined by Moore (1999) as asubterranean estuary because of physicochemical similari-ties to surface water estuaries. Discharge from subterraneanestuaries (simply referred to herein as submarine groundwater discharge) may enhance fluxes of nutrients and con-taminants to surface water, thereby causing important envi-ronmental consequences for surface estuaries (Johannes1980; Emerson et al. 1984; Capone and Bautista 1985;
Zimmerman et al. 1985; Valiela et al. 1990; Simmons Jr.1992; Gallagher et al. 1996; Rutkowski et al. 1999; Corbettet al. 2000; Warnken et al. 2000). The nature of mixingbetween fresh water and sea water, and the magnitudes ofwater, nutrient, and contaminant fluxes associated withground water discharge, are difficult to evaluate because ofthe dispersed nature of the discharge, the slow rate of flow,the range of processes controlling the fluxes, and the diver-sity of techniques that have been used to evaluate thesefluxes (Burnett et al. 2002). Techniques include direct mea-surements of discharge using seepage meters (Lee 1977;Bokuniewicz 1980; Simmons Jr. 1992; Bugna et al. 1996;Gallagher et al. 1996; Cable et al. 1997a; Robinson et al.1998), measurements of concentrations in surface water ofnatural chemical and isotopic tracers that have no sourceother than within the sediments (Bugna et al. 1996; Cableet al. 1996a; Cable et al. 1996b; Moore 1996; Corbett et al.2000), models of pore water profiles (Aller 1980; Emersonet al. 1984; Boudreau and Marinelli 1994; Marinelli 1994;Mortimer et al. 1999; Schluter et al. 2000; Furukawa et al.2001), and ground water flow models (Pandit and El-Khazen 1990; Robinson and Gallagher 1999).
Estimates of submarine ground water dischargedepend strongly on the evaluation technique. For example,
AbstractSubmarine ground water discharge is suggested to be an important pathway for contaminants from continents to
coastal zones, but its significance depends on the volume of water and concentrations of contaminants that originatein continental aquifers. Ground water discharge to the Banana River Lagoon, Florida, was estimated by analyzing thetemporal and spatial variations of Cl– concentration profiles in the upper 230 cm of pore waters and was measureddirectly by seepage meters. Total submarine ground water discharge consists of slow discharge at depths > ~70 cmbelow seafloor (cmbsf) of largely marine water combined with rapid discharge of mixed pore water and estuarinewater above ~70 cmbsf. Cl– profiles indicate average linear velocities of ~0.014 cm/d at depths > ~70 cmbsf. In con-trast, seepage meters indicate water discharges across the sediment-water interface at rates between 3.6 and 6.9 cm/d.The discrepancy appears to be caused by mixing in the shallow sediment, which may result from a combination ofbioirrigation, wave and tidal pumping, and convection. Wave and tidal pumping and convection would be minorbecause the tidal range is small, the short fetch of the lagoon limits wave heights, and large density contacts are lack-ing between lagoon and pore water. Mixing occurs to ~70 cmbsf, which represents depths greater than previouslyreported. Mixing of oxygenated water to these depths could be important for remineralization of organic matter.
1000
Enhanced Submarine Ground Water Dischargefrom Mixing of Pore Water and Estuarine Waterby Jonathan B. Martin1, Jaye E. Cable2, Peter W. Swarzenski3, and Mary K. Lindenberg4
1Department of Geological Sciences, University of Florida,Gainesville, FL 32611; [email protected]
2Department of Oceanography and Coastal Sciences, CoastalEcology Institute, Louisiana State University, 208 Old Coastal Stud-ies Bldg., Baton Rouge, LA 70803
3U.S. Geological Survey, Center for Coastal Geology, 600Fourth St. South, St. Petersburg, FL 33701
4Department of Geological Sciences, University of Florida,Gainesville, FL 32611
Copyright © 2004 by the National Ground Water Association.
Vol. 42, No. 7—GROUND WATER—Oceans Issue 2004 (pages 1000–1010)
1000-1010 GW Ocean Issue 04 9/3/04 2:38 PM Page 1000
fluxes of water calculated from ground water flow modelstypically are one to several orders of magnitude smallerthan those measured using field instruments or chemicaltracers (Gallagher et al. 1996; Robinson and Gallagher1999; Moore 1996; Li et al. 1999; Belanger and Walker1990; Pandit and El-Khazen 1990). These differences indi-cate that meteoric water originating as recharge to onshoreaquifers represents only a fraction of total submarineground water discharge, with the remainder composed ofsea water that is mixed with the shallow pore water (Boku-niewicz 1992; Burnett et al. 2002). The addition of seawater could result from at least three major categories ofprocesses: density contrast between sea water and freshwater (Webster et al. 1996; Rasmussen 1998), wave andtidal pumping of water into the sediments (Li et al. 1999;Nielsen 1990; Shum 1992, 1993; Mu et al. 1999), and bio-logical pumping caused by burrowing organisms (bioirri-gation) (Aller 1980; Smethie et al. 1981; Emerson et al.1984; Aller and Aller 1992; Marinelli 1994; Boudreau andMarinelli 1994; Schulter et al. 2000; Warnken et al. 2000;Sandnes et al. 2000; Furukawa et al. 2000; Furukawa et al.2001; Meile et al. 2001; Timmermann et al. 2002). Conse-quently, the magnitude of submarine ground water dis-charge must be controlled to some extent by physical andbiological processes at the sediment-water interface, inaddition to hydraulic head-driven discharge from continen-tal aquifers. The relative importance of these processes willcontrol the chemical composition of discharging water, andis critical to determining the environmental effects of sub-marine ground water discharge.
This paper presents analyses of Cl– concentration datafrom pore waters in the Banana River Lagoon, Florida, thataddress the question of ground water discharge and themagnitude of mixing of shallow pore water and overlyingsea water. These data represent a subset of data from alarger study (Martin et al. 2002). The general results of thelarger study suggest that although hydraulic head drivessome deep flow in the system, the majority of ground waterdischarge represents water that has circulated through shal-low sediments (burial depths of < 1 m). As discussed in thispaper, mixing to nearly 1 m below the sediment-waterinterface in an estuary represents a greater depth than pre-viously reported for density-driven flow, physical pumpingby waves and tides, or by bioirrigation, and this mixing hasthe potential to provide a significant source of nutrients tothe estuary.
Field AreaThe data reported in this paper come from one site
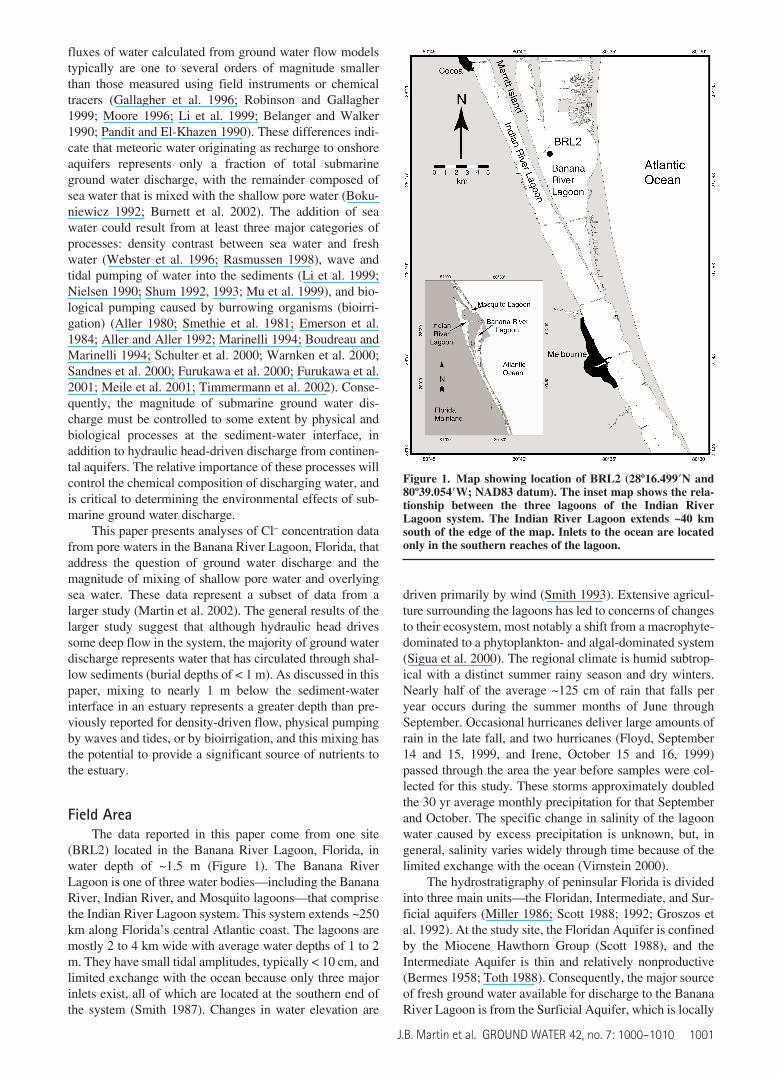
(BRL2) located in the Banana River Lagoon, Florida, inwater depth of ~1.5 m (Figure 1). The Banana RiverLagoon is one of three water bodies—including the BananaRiver, Indian River, and Mosquito lagoons—that comprisethe Indian River Lagoon system. This system extends ~250km along Florida’s central Atlantic coast. The lagoons aremostly 2 to 4 km wide with average water depths of 1 to 2m. They have small tidal amplitudes, typically < 10 cm, andlimited exchange with the ocean because only three majorinlets exist, all of which are located at the southern end ofthe system (Smith 1987). Changes in water elevation are
driven primarily by wind (Smith 1993). Extensive agricul-ture surrounding the lagoons has led to concerns of changesto their ecosystem, most notably a shift from a macrophyte-dominated to a phytoplankton- and algal-dominated system(Sigua et al. 2000). The regional climate is humid subtrop-ical with a distinct summer rainy season and dry winters.Nearly half of the average ~125 cm of rain that falls peryear occurs during the summer months of June throughSeptember. Occasional hurricanes deliver large amounts ofrain in the late fall, and two hurricanes (Floyd, September14 and 15, 1999, and Irene, October 15 and 16, 1999)passed through the area the year before samples were col-lected for this study. These storms approximately doubledthe 30 yr average monthly precipitation for that Septemberand October. The specific change in salinity of the lagoonwater caused by excess precipitation is unknown, but, ingeneral, salinity varies widely through time because of thelimited exchange with the ocean (Virnstein 2000).
The hydrostratigraphy of peninsular Florida is dividedinto three main units—the Floridan, Intermediate, and Sur-ficial aquifers (Miller 1986; Scott 1988; 1992; Groszos etal. 1992). At the study site, the Floridan Aquifer is confinedby the Miocene Hawthorn Group (Scott 1988), and theIntermediate Aquifer is thin and relatively nonproductive(Bermes 1958; Toth 1988). Consequently, the major sourceof fresh ground water available for discharge to the BananaRiver Lagoon is from the Surficial Aquifer, which is locally
1001J.B. Martin et al. GROUND WATER 42, no. 7: 1000–1010
Figure 1. Map showing location of BRL2 (28º16.499�N and80º39.054�W; NAD83 datum). The inset map shows the rela-tionship between the three lagoons of the Indian RiverLagoon system. The Indian River Lagoon extends ~40 kmsouth of the edge of the map. Inlets to the ocean are locatedonly in the southern reaches of the lagoon.
1000-1010 GW Ocean Issue 04 9/3/04 2:39 PM Page 1001

subdivided into informal units called the Shallow Rock,Terrace, Atlantic Coastal Ridge, Ten-Mile Ridge, andInter-Ridge aquifers (Toth 1988). These aquifers arePliocene in age, are recharged by local rainfall, and consistlargely of mixtures of sands and coquina, separated by thinconfining clay layers (Toth 1988).
A few previous attempts have been made to measureground water discharge to the Indian River Lagoon system,and these include both direct measurements and modeling(Belanger and Walker 1990; Pandit and El-Khazen 1990;Martin et al. 2002). Pandit and El-Khazen (1990) calculatedan annual ground water discharge of between 7.6 and 26 ×10–4 m3/m2/d using a finite element model of head differ-ence between the lagoon and the Surficial Aquifer in thearea of St. Lucie Inlet in the southern reaches of the IndianRiver Lagoon where the Floridan Aquifer is confined. Thisflux has since been substantiated through mass balance cal-culations considering the volume of potential recharge(Motz 2000). In the same region, Belanger and Walker(1990) used seepage meters to measure average fluxes of0.12 m3/m2/day, with maximum discharge rates of 0.48m3/m2/d, values which are 150 to 600 times greater than themodeled fluxes. Belanger and Walker (1990) suggested thelow model fluxes result from hydrologic assumptions madein the model. Alternatively, this discrepancy could occurbecause seepage meters measure all of the water crossingthe sediment-water interface while the modeling calcula-tions are restricted to discharge of water from the SurficialAquifer.
MethodsThe sampling location described here (BRL2) is one of
42 stations that were sampled as part of the larger study(Martin et al. 2002; Cable et al. this issue). Three separatesampling trips were made to the field area in May, August,and December 2000; these times roughly represent the endof the dry winter season, the latter portion of the summerrainy season, and the middle of the dry season, respec-tively. Station BRL2 is emphasized in this paper because itprovides the best resolution for pore water profiles of theseven stations where pore waters were collected, althoughother stations show Cl– concentration profiles similar toBRL2. At all 42 stations, ground water discharge rates weremeasured using Lee-type seepage meters (Lee 1977).Methodology of the seepage meter measurements followedprocedures described in Shaw and Prepas (1989) and Cableet al. (1997b). The values reported are the average of threesequential 1 to 2 h measurements of total discharge and theerrors are the standard deviation of the three measurements.
Samples of pore waters up to 230 cm below seafloor(cmbsf) were collected by a multilevel piezometer (referredto as a multisampler) (Martin et al. 2003). Briefly, the mul-tisampler consists of 2 in schedule 80 PVC pipe with eightscreened ports (210 µm polypropylene mesh) drilled intothe side and 3⁄8 in OD PVC flexible tubing up the interior ofthe pipe. The ports are separated by 10 to 40 cm with theclosest spacing in the upper section, and decreased spacingwith depth. The base of the multisampler is plugged with asolid point. The tool is driven into the sediment with a fencepost driver and the PVC tubing is led to the boat. Pore water
is pumped from depth using a peristaltic pump. Pumpingrates were not measured, but we estimate them to be ~2mL/s. The water was pumped until temperature stabilizedand oxygen concentrations were < ~0.3 mg/L (Martin et al.2003). These conditions usually occurred after ~5 min, atwhich time water samples were collected. In addition to thepore waters, samples of the lagoon water were collected.
A single 160 cm long core was collected from BRL2in November 2001 using vibracoring techniques. Porositywas calculated from density measurements made with aGeotek Multi-Sensor Core Logger (Geotek Inc., Stew-artsville, Minnesota), which measures bulk density bygamma attenuation from a 137Cs source. The core loggerwas calibrated for bulk density with several aluminumcylinders of increasing diameter and known density (Weberet al. 1997). The sediment at the location is largely quartzsands and, thus, bulk density (ρb) was converted to poros-ity, assuming mixing between pore water with a density of1.023 g/cm3 and solid with a density of 2.65 g/cm3 accord-ing to
(1)
where f is porosity.The water was measured for a variety of solutes, salin-
ity, conductivity, and temperature (Martin et al. 2002;Cable et al. this issue). The focus of this paper is on the dis-tributions of Cl– concentrations, which were measuredusing AgNO3 titration (Clesceri et al. 1989). Precision ofthe measurements is ~0.5% of the value as determinedthrough ~50 repeated measurements of two standards.
ResultsRates of ground water discharge that were measured
using seepage meters are reported as specific discharge inTable 1. These rates are similar to average rates found ateight additional stations distributed around the BananaRiver Lagoon, which in May, August, and December were4.4, 5.8, and 4.9 cm/d, respectively. Although the averagedischarge rates are similar, the values vary widely from 1.3to 8.0 cm/d for any individual location (Martin et al. 2002).
Distribution of porosity of the sediment is shown inFigure 2. Porosity is fairly uniform throughout most of thecore, with the exception of the upper 20 cm where theporosity decreases from ~66% to 38% and at 114 to 116cmbsf where the porosity increases to ~50%. High porosityin the upper portion of the core may be an end effect of the
rb 5 1.023f 1 2.65(1 2 f)
J.B. Martin et al. GROUND WATER 42, no. 7: 1000–10101002
Table 1Specific Discharge at BRL2
Rate ErrorDate (cm/d) (1 �)a
May 2000 6.4 1.7August 2000 6.9 0.5December 2000 3.6 2.2
a� = standard deviation
1000-1010 GW Ocean Issue 04 9/3/04 2:39 PM Page 1002
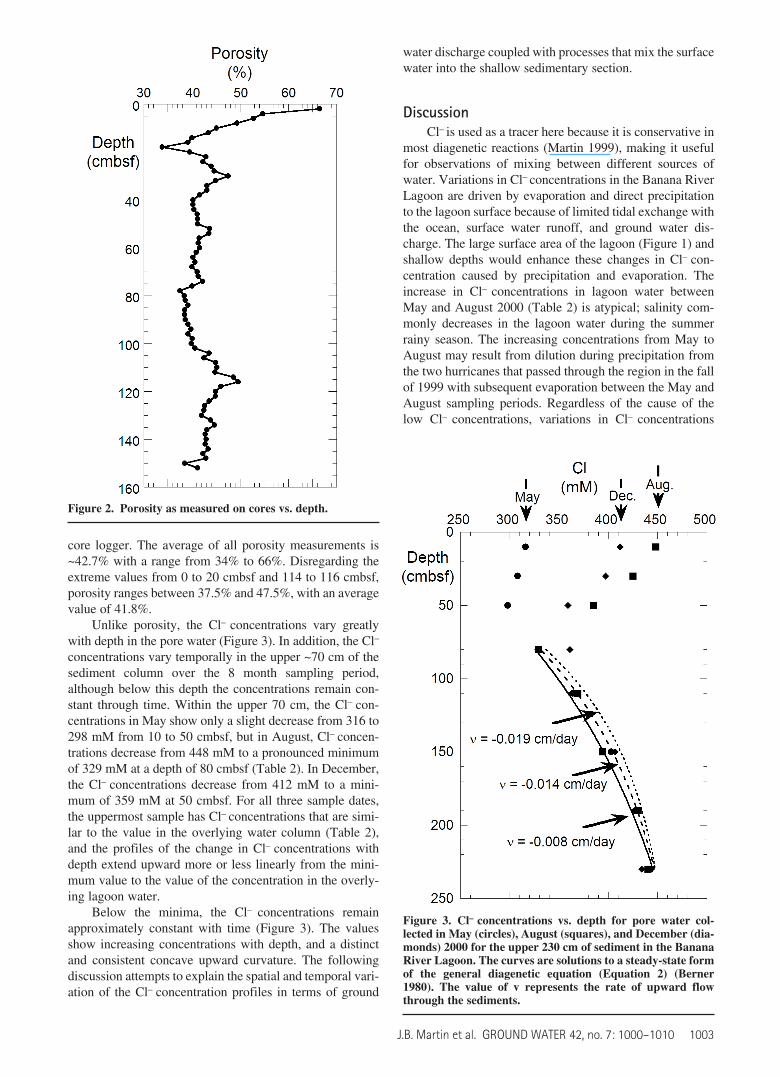
core logger. The average of all porosity measurements is~42.7% with a range from 34% to 66%. Disregarding theextreme values from 0 to 20 cmbsf and 114 to 116 cmbsf,porosity ranges between 37.5% and 47.5%, with an averagevalue of 41.8%.
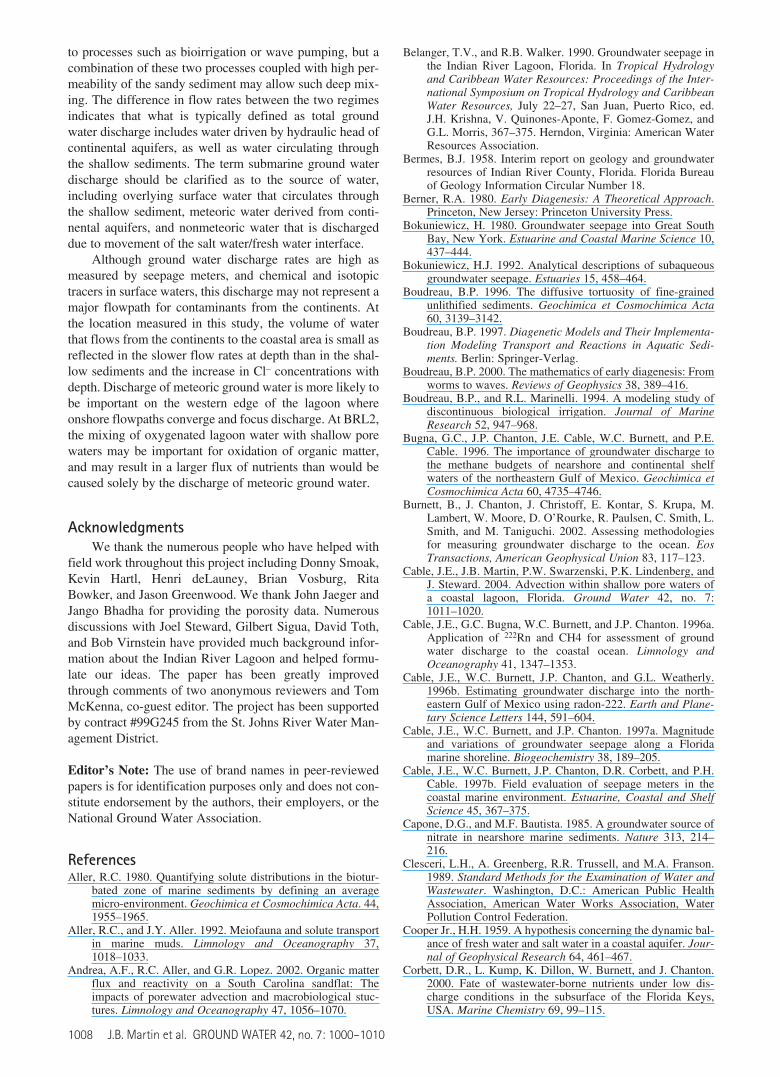
Unlike porosity, the Cl– concentrations vary greatlywith depth in the pore water (Figure 3). In addition, the Cl–
concentrations vary temporally in the upper ~70 cm of thesediment column over the 8 month sampling period,although below this depth the concentrations remain con-stant through time. Within the upper 70 cm, the Cl– con-centrations in May show only a slight decrease from 316 to298 mM from 10 to 50 cmbsf, but in August, Cl– concen-trations decrease from 448 mM to a pronounced minimumof 329 mM at a depth of 80 cmbsf (Table 2). In December,the Cl– concentrations decrease from 412 mM to a mini-mum of 359 mM at 50 cmbsf. For all three sample dates,the uppermost sample has Cl– concentrations that are simi-lar to the value in the overlying water column (Table 2),and the profiles of the change in Cl– concentrations withdepth extend upward more or less linearly from the mini-mum value to the value of the concentration in the overly-ing lagoon water.
Below the minima, the Cl– concentrations remainapproximately constant with time (Figure 3). The valuesshow increasing concentrations with depth, and a distinctand consistent concave upward curvature. The followingdiscussion attempts to explain the spatial and temporal vari-ation of the Cl– concentration profiles in terms of ground
water discharge coupled with processes that mix the surfacewater into the shallow sedimentary section.
DiscussionCl– is used as a tracer here because it is conservative in
most diagenetic reactions (Martin 1999), making it usefulfor observations of mixing between different sources ofwater. Variations in Cl– concentrations in the Banana RiverLagoon are driven by evaporation and direct precipitationto the lagoon surface because of limited tidal exchange withthe ocean, surface water runoff, and ground water dis-charge. The large surface area of the lagoon (Figure 1) andshallow depths would enhance these changes in Cl– con-centration caused by precipitation and evaporation. Theincrease in Cl– concentrations in lagoon water betweenMay and August 2000 (Table 2) is atypical; salinity com-monly decreases in the lagoon water during the summerrainy season. The increasing concentrations from May toAugust may result from dilution during precipitation fromthe two hurricanes that passed through the region in the fallof 1999 with subsequent evaporation between the May andAugust sampling periods. Regardless of the cause of thelow Cl– concentrations, variations in Cl– concentrations
1003J.B. Martin et al. GROUND WATER 42, no. 7: 1000–1010
Figure 2. Porosity as measured on cores vs. depth.
Figure 3. Cl– concentrations vs. depth for pore water col-lected in May (circles), August (squares), and December (dia-monds) 2000 for the upper 230 cm of sediment in the BananaRiver Lagoon. The curves are solutions to a steady-state formof the general diagenetic equation (Equation 2) (Berner1980). The value of v represents the rate of upward flowthrough the sediments.
1000-1010 GW Ocean Issue 04 9/3/04 2:39 PM Page 1003

through time provide a good tracer for mixing between theoverlying water column and pore waters.
The Cl– concentration profiles shown in Figure 3 indi-cate that two distinct flow regimes occur in the upper 230
cm of sediments of the Banana River Lagoon. The upperregime occurs between the sediment-water interface and adepth of ~70 cmbsf. The lower regime occurs from ~70cmbsf at least to the lowest portion of the profile at a depthof 230 cmbsf. These two regimes are discussed separately,and implications and origins of the two regimes aredescribed.
Changes in concentrations of dissolved solutes of porewaters that arise from diffusion, advection, and chemicalreactions can be modeled as functions of time and spaceusing the general diagenetic equation (Berner 1980;Boudreau 1997, 2000). The most general form of the equa-tion is
(2)
where f is the porosity, C is the concentration of solute inpore water, t is time, z is depth in the sediment (positivedownward with the origin at the sediment-water interface),Ds is the effective diffusion coefficient incorporating tortu-osity of flowpaths through the sediment, v is the verticalaverage linear velocity (positive downward), and ΣR is thesum of all reactions that alter the pore fluid concentrations.In the following discussion, various forms of the generaldiagenetic equation are used to explain potential controls ofthe Cl– profiles shown in Figure 3.
Advection Through the Lower Sediments at BRL2Equation 2 can be simplified in several ways to com-
pare with the data shown in Figure 3. The conservativebehavior of Cl– indicates that ΣR = 0, and the Cl– concen-trations between 230 and ~70 cmbsf appear to be steadystate over the timeframe of the study, indicating that ∂fC/∂t= 0. The value for Ds is related to the tortuosity, , by
(3)
(Berner 1980), where D (cm2/s) is the diffusion coefficientat infinite dilution. Tortuosity is a difficult parameter tomeasure directly and, thus, several empirical relationships
Ds 5
Du2
u
'fC't
5
'
'z Ds
'fC'dz
2 v
'fC'z
1 SR
J.B. Martin et al. GROUND WATER 42, no. 7: 1000–10101004
Table 2Pore Water Cl– Concentrations and Density of Lagoon and Pore Waters at BRL2
May August December
Depth Cl– σa Cl– σ Cl– σ(cmbsf) (mM) (kg/m3) (mM) (kg/m3) (mM) (kg/m3)
Lagoon water 313 9.55 452 15.92 412 21.3310 316 10.43 448 15.31 412 20.0530 308 9.91 425 14.26 397 18.6150 298 9.71 385 12.65 359 16.6780 329 10.47 361 17.17
110 364 13.06 369 11.69 369 17.48150 403 15.00 394 13.54 407 19.17190 429 15.79 430 15.24 426 19.89230 443 17.57 440 15.73 434 20.06
aσ = ρ–1000 (kg/m3), where ρ is density of water.
Figure 4. Cl– concentrations vs. depth for pore water col-lected in May (circles) and August (squares) 2000 in theupper 120 cm of sediment in the Banana River Lagoon. Thesolid curves are solutions to a nonsteady-state form of thediagenetic equation (Equation 6) that represents only diffu-sion (α = 0) or diffusion and a nonolocal source term (α ≠ 0).Below 40 cmbsf, the curves are straight vertical lines and thusare not shown on the figure.
1000-1010 GW Ocean Issue 04 9/3/04 2:39 PM Page 1004

between tortuosity and porosity have been developed. Thebest fit to available data takes the form
(4)
(Boudreau 1996). For the following calculations Ds isassumed to be constant with depth in the sediment.
With the simplifying assumptions of steady-state con-ditions, no reactions, and constant Ds with depth, Equa-tion 2 reduces to a second order ordinary differential equa-tion:
(5)
where C now represents the solute (i.e., Cl–) concentrationin the bulk sediment (Martin et al. 1996). Assuming aboundary at 70 cmbsf that has constant Cl– concentrationsof 300 mM (Figure 3), boundary conditions of Equation 5are
C(70) = C70 = 300 mMC(L) = CL
where CL is the concentration of the fluid at depth L for anassigned lower boundary. With these boundary conditions,the analytical solution to Equation 5 is
(6)
Equations 3 and 4 indicate that Ds = 4.17 × 10⁻⁶ cm2/s,given D = 7.78 × 10⁻⁶ cm2/s at 25ºC and infinite dilution (Liand Gregory 1974) and an average value of porosity of42.7%. For the observed range of porosity (34% to 66%),the value of Ds ranges from 3.74 × 10⁻⁶ cm2/s to 5.49 × 10⁻⁶
cm2/s, respectively. This variation in Ds values alters theshape of the modeled profiles by about the width of a data-point shown in Figure 3, suggesting the variations in poros-ity with depth do not cause the large observed changes inCl– concentrations. The value CL = 443 mM at 230 cmbsfcan be used to calculate the value v from Equation 6.Curves generated using Equation 6 and three values of v(–0.008, –0.014, and –0.019 cm/d) are shown in Figure 3.Although all values closely fit the observed data, visualobservation indicates that an average linear velocity of~–0.014 cm/d produces the best fit. Assuming averageeffective porosity of ~43% (Figure 2), this velocity con-verts to specific discharge of ~0.006 cm/d.
These flow rates are similar to values of specific dis-charge between 0.02 and 0.86 cm/d that have been esti-mated using finite element flow models for ground waterdischarge in other regions (Pandit and El-Khazen 1990;Robinson and Gallagher 1999; Li et al. 1999). The specificdischarge calculated by Pandit and El-Khazen (1990) forthe St. Lucie Inlet in the Indian River Lagoon considers
C70 cexpa v
Dszb 2 expa v
Dsb f
C(z) 51
1 2 expa v
Dsb
eCl c1 2 expa v
Dszb d 1
0 5 Ds
d2Cdz
2 v
dCdz
u2 5 1 2 ln(f2)
only a source from meteoric water driven by hydraulichead, and ranges from 0.08 to 0.26 cm/d. Although thesevalues are greater than those calculated from the Cl– con-centration profile, they are more similar to the model cal-culations than to the specific discharge measured usingseepage meters. Hydrologic variables are also likely to dif-fer between BRL2 and the St. Lucie Inlet, which are sepa-rated by ~95 km, and could influence differences in specificdischarge calculated by the two techniques.
If the calculated flow rate of –0.014 cm/d results fromupward flow of meteoric water from continental aquifers,Cl– concentrations should not increase with depth in thesediment as shown in Figure 3. The highest concentrationof 443 mM (Table 2) is ~80% of the Cl– concentration ofsea water (559 mM) and is greater than the Cl– concentra-tions in fresh water of the Floridan or Surficial aquifers.The elevated Cl– concentrations suggest that little, if any,fresh water from the aquifer extends to BRL2, and anyfresh water from the aquifer must mix with sea water priorto discharge at BRL2. The intersection of the salt water/fresh water interface with the mainland is likely to be nearthe western margin of the lagoon, which is located ~5 kmwest of BRL2 (Figure 1), and this interface should slopetoward the mainland (Cooper Jr. 1959; Johannes 1980;Simmons Jr. 1992). Although BRL2 is separated from themainland by Merritt Island, the island is only a few hundredmeters wide and a few meters above sea level and is thusunlikely to provide a large source of fresh water to thelagoon. Although the flow rates calculated from Cl– pro-files are similar to those calculated by Pandit and El-Khazen (1990) for the Surficial Aquifer, most waterdischarging from this source appears to have a sea waterorigin.
The flow rates calculated for the lower section of theCl– profiles shown in Figure 3 are 2.5 to 3 orders of magni-tude slower than the flow rates measured using seepagemeters (Table 1). The rates measured with seepage metersare not unusually high compared with previous measure-ments made using seepage meters in the Indian RiverLagoon (Belanger and Walker 1990) and elsewhere (Gal-lagher et al. 1996; Cable et al. 1997a; Rutkowski et al.1999; Burnett et al. 2002). These rates are also similar torates found using other direct measurements of groundwater discharge such as from chemical and isotopic tracers(Moore 1996; Cable et al. 1996a; Bugna et al. 1996; Bur-nett et al. 2002). The difference in flow rates suggests thathydraulic head and onshore recharge of aquifers is not thesole driving force for ground water discharge, but rather,the magnitude of ground water discharge is enhanced byprocesses in the shallow sediments.
Mixing in the Upper Sediments at BRL2
Diffusion and BioirrigationThe enhancement of discharge in the shallow sedi-
ments is reflected by variations in the Cl– concentrationprofiles at depths shallower than ~70 cmbsf. An importantprocess that can mix shallow pore water and water in theoverlying water column is pumping of water by burrowingorganisms, commonly referred to as bioirrigation (Aller1980; Emerson 1984; Aller and Aller 1992; Marinelli 1994;
1005J.B. Martin et al. GROUND WATER 42, no. 7: 1000–1010
1000-1010 GW Ocean Issue 04 9/3/04 2:39 PM Page 1005

Furukawa et al. 2000; Furukawa et al. 2001; Schulter et al.2000). A general approach to understanding bioirrigationuses models following various forms of Equation 2 withadditional terms that account for bioirrigation. For exam-ple, Emerson et al. (1984) and Sandnes et al. (2000) haveused introduced tritium and Br– as conservative tracers tomodel induced concentration profiles in natural sediments.Here we use a similar approach to examine the natural Cl–
profiles in the shallow sediments of the Banana RiverLagoon.
Considering bioirrigation and conservative solutes(i.e., ΣR = 0), and assuming Ds is constant with depth,Equation 2 takes the form
(7)
where C is the concentration of the conservative solute inthe bulk sediment (in this case Cl– concentrations), and αrepresents a nonlocal source term with units of t–1 (Emer-son et al. 1984; Sandnes et al. 2000). The nonlocal sourceterm includes any mode of transport of material into thesubsurface other than diffusion, including bioirrigation.Equation 7 neglects the advective term included in the gen-eral diagenetic Equation 1 because the timescale of theprocesses represented in the shallow pore water shown inFigure 3 are more rapid than the 0.014 cm/d rate calculatedusing Equation 6 (Emerson et al. 1984). Boundary and ini-tial conditions are given by
at z = 0 and t > 0, Cl = Clo (8)
at z > 0 and t = 0, Cl = 313 mM (9)
where Clo is the future value of Cl– concentration at thesediment-water interface. For the Cl– concentration profilesshown in Figure 3, the first boundary condition is set by theAugust Cl– concentration in the lagoon water and the sec-ond boundary condition is set by assuming that Cl– con-centrations in the May profile are constant with depth(Figure 3). We assume that at t > 0, the Cl– concentration inthe overlying water column immediately increases to thevalue observed in August (i.e., 452 mM). Although thisinstantaneous change is unlikely to have occurred, it allowsus to calculate the maximum possible depth of penetrationof Cl– resulting either from diffusion alone or from diffu-sion plus the nonlocal mixing term.
With the boundary conditions given in Equations 8 and9, the analytical solution to Equation 7 is
(10)
(Emerson et al. 1984). Four Cl– concentration profiles havebeen calculated using Equation 10 and are plotted to com-pare with the Cl– concentrations measured in May andAugust for the upper 120 cm of sediment at BRL2 (Figure4). These calculations are made using a value of Ds = 4.17× 10⁻⁶ cm2/s as derived earlier. The profile labeled α = 0represents simple molecular diffusion, i.e., without a non-local source term. The three other profiles represent calcu-
C(z) 5 Co 2 Coexp( 2 at)*erfa
z
2(Dst)1>2 b
'C't
5 Ds
'2C'z2 2 a(C 2 Co)
lations using various nonlocal source terms ranging from5 × 10–8 to 5 × 10⁻⁷/s, which are similar to those used byEmerson et al. (1984) to model bioirrigation in PugetSound. As shown by the calculated profiles in Figure 4, thenonlocal source term increases the rate of mixing into thesediments with the Cl– concentrations reaching a constantvalue at greater depths for greater values of α.
The maximum depth that Cl– would diffuse into thesediment solely by molecular diffusion is ~20 cmbsf duringthe 91 d separating measurements of the Cl– profiles (Fig-ure 4), and this depth is likely to be less if Cl– concentrationincreased gradually between May and August. The mea-sured Cl– concentrations in the August profile are 100 mMgreater than those modeled at depths between 20 and 70cmbsf, reflecting a flux of Cl– into the pore waters fromprocesses other than molecular diffusion. Cl– concentrationprofiles that are modeled using a nonlocal source term,however, also do not match the observed Cl– concentra-tions. As the value of α increases, the model profilesapproach Cl– concentrations at depths between 10 to 50cmbsf, but the calculated values are higher than the mea-sured Cl– concentrations below these depths. The primarydifference between these measured Cl– concentrations andpreviously measured concentration profiles (Emerson et al.1984, Sandnes et al. 2000; Schluter et al. 2000) is the depththat the Cl– penetrates into the sediment. In the previousstudies, the observed depths of penetration generally rangefrom ~5 to 20 cm below the sediment-water interface,which is similar to the model calculations. The relativelylarger depth of penetration at the Banana River Lagoonthan elsewhere suggests that there are differences in thecontrols on bioirrigation at Banana River Lagoon that arenot incorporated into the model calculations or that factorsin addition to bioirrigation control mixing in the shallowpore waters.
Nonbioirrigation MixingProcesses causing shallow mixing other than bioirriga-
tion could include tidal and wave pumping and density-driven convection. Tidal variations in water level have beenshown through numerical simulations to force water intopermeable sediments (Nielsen 1990; Shum 1992, 1993).Tidal range of the Banana River Lagoon is low, averaging~10 cm (Smith 1993), which suggests that tidal pumping isunlikely to be a major driving force for flow. Changes inwater elevation caused by winds could be important overlonger timescales than tides. Waves are smaller in theBanana River Lagoon than on open beaches such as mod-eled by Li et al. (1999) and Mu et al. (1999). The effects ofwaves over rippled beds, however, can provide significantpenetration of water into sediments (Shum 1992, 1993).The depth of penetration into rippled beds is controlled bya complex interplay of variables such as ripple length,amplitude, sediment permeability and the wavelength,height, and period of water waves, but penetration can beup to five times the ripple height (Shum 1993). No mea-surements exist of the ripple heights in the Banana RiverLagoon, but they are small (on the order of a few cm), sug-gesting that wave pumping also does not cause mixing todepths of 70 cmbsf in the sediments.
J.B. Martin et al. GROUND WATER 42, no. 7: 1000–10101006
1000-1010 GW Ocean Issue 04 9/3/04 2:39 PM Page 1006

Convection driven by density differences betweenfresh pore water and saline water of the overlying watercolumn has also been shown to mix water into estuarinesediments (Webster et al. 1996; Rasmussen 1998).Although densities of the sampled low Cl– pore waters arealways less than the overlying water column, the differ-ences in density are small (Table 2). Model calculations ofconvection-driven mixing typically use salinity contrast of20‰ to 30‰, which converts to Cl– concentrations of 320to 480 mM or a density difference of ~20 kg/m3 (Websteret al. 1996; Rasmussen 1998). The largest differences indensity for BRL2 is ~5 kg/m3 in August and December, butis < 1 kg/m3 in May. Furthermore, the pore water densityincreases with Cl– concentration at depths below ~70cmbsf, reflecting stable density stratification within thedeeper zone. Density-driven convection does not appear tobe an important driving force for mixing at this location.
SummaryMixing into the sediments to depths on the order of 70
cmbsf as shown by the Cl– concentrations is greater thanexpected either from bioirrigation or by wave pumping, anddoes not appear to be driven by density contrasts. Whymixing occurs to these depths is unknown, but may dependon sediment physical properties, particularly its permeabil-ity. The depth that mixing occurs has important implica-tions for mass transfer across the sediment-water interfacebecause mixing of lagoon water drives oxygenated waterinto the sediments, thereby enhancing oxidation of organicmatter (Simmons 1992; Shum and Sundby 1996; Mortimeret al. 1999).
Boundary Between the Upper and Lower Flow RegimesAn important unresolved question from the preceding
discussion is the origin of the minima in Cl– concentrationat ~70 cmbsf (Figure 3). There are a couple of possiblecauses for the low Cl– concentrations, but neither offers asatisfying explanation. One unlikely possibility is that lat-eral flow of meteoric water from onshore dilutes the porewater Cl– concentration in a restricted depth range. Thelocation of BRL2 far from the western edge of the BananaRiver Lagoon suggests that any meteoric water wouldlikely originate from Merritt Island. The low elevation andsmall aerial extent of the island indicate a relatively smallfresh water lens with low hydraulic gradients that would beinsufficient to maintain the observed concentration gradi-ents. In addition, it is unlikely water would flow theroughly 2 km to BRL2 at 70 cmbsf without mixing with theoverlying lagoon water. Alternatively, the low Cl– concen-tration could remain from an earlier low salinity period(perhaps following the two hurricanes in the fall) thatmixed into the sediment, and this low Cl– concentrationwater was not subsequently removed from the sedimentover the 8 months of the study. It is unclear why waterwould mix to 70 cmbsf following a precipitation event cre-ating low Cl– concentrations such as in the May profile(Figure 3), but would not completely mix with lagoonwater for the August and December profiles. Additionalprofiles taken at higher temporal and spatial resolutions, aswell as information on the rate of change in salinity of the
lagoon water, would be needed to provide information onthe timing of the mixing process.
The Cl– minimum apparently represents an importantboundary between water that is driven by hydrologic flowfrom aquifers and the physical and biological mixingprocesses in shallow sediments. Minima occur in other porewater profiles around the lagoon at a similar depth (Martinet al. 2002). The boundary is the location of the minimumin density of the pore water (Table 2), which may in partcontrol its location. Similar boundaries may occur in otherareas, but at variable depths, with the particular depthdepending on characteristics such as types of burrowingorganisms, wave and tidal amplitude, bedform shape andsize, and the permeability and grain size of the sediments.
Regardless of the controls of the depth, the zone in theshallow sediments where lagoon and pore waters mix islikely to be a critical source for mass fluxes into the over-lying water column across the sediment-water interfacebecause of oxidation of organic matter by sea water cyclingthrough the sediment (Andrea et al. 2002). Water pumpedinto the sediment from the lagoon water should be close tosaturation with oxygen, but the pore water contains littleoxygen (Martin et al. 2002; Martin et al. 2003). Oxygencarried into the sediment with the water could fuel redoxreactions such as remineralization of organic matter thatwould alter chemical composition of the pore water andresulting fluxes of mass associated with the total groundwater discharge.
The sea water cycling process also has importantimplications for what has been previously reported as totalground water discharge across the sediment-water inter-face. Considering continuity, the difference in specific dis-charge of ~0.006 cm/d below the boundary (Figure 3),modeled specific discharge of 0.08 to 0.26 cm/d (Panditand El-Khazen 1990) and specific discharge of 3.6 to 6.9cm/d measured with seepage meters (Table 1), suggeststhat < 1% of the water discharging across the sediment-water interface is meteoric water from the continentalaquifers. This value may increase at locations closer to thewestern edge of the lagoon where more of the water wouldprobably originate as onshore recharge from precipitation.
ConclusionsCl– concentration profiles from the Banana River
Lagoon, Florida, reflect two different flow regimes—onelocated at depths below ~70 cmbsf and one located atdepths between ~70 cmbsf and the sediment-water inter-face. The lower flow regime consists of upward averagelinear velocities of ~0.014 cm/d. These rates are similar tothose estimated from hydrologic models of discharge fromthe Surficial Aquifer, but considering increases in Cl– con-centrations with depth, the primary source of dischargingwater is sea water.
The flow rate in the lower regime is several orders ofmagnitude less than in the upper regime, which was mea-sured as water discharge across the sediment-water inter-face using seepage meters. The Cl– concentration profilesin the pore waters located above 70 cmbsf reflect mixinginto the sediment from the overlying water column. Thismixed depth is greater than has previously been attributed
1007J.B. Martin et al. GROUND WATER 42, no. 7: 1000–1010
1000-1010 GW Ocean Issue 04 9/3/04 2:39 PM Page 1007
to processes such as bioirrigation or wave pumping, but acombination of these two processes coupled with high per-meability of the sandy sediment may allow such deep mix-ing. The difference in flow rates between the two regimesindicates that what is typically defined as total groundwater discharge includes water driven by hydraulic head ofcontinental aquifers, as well as water circulating throughthe shallow sediments. The term submarine ground waterdischarge should be clarified as to the source of water,including overlying surface water that circulates throughthe shallow sediment, meteoric water derived from conti-nental aquifers, and nonmeteoric water that is dischargeddue to movement of the salt water/fresh water interface.
Although ground water discharge rates are high asmeasured by seepage meters, and chemical and isotopictracers in surface waters, this discharge may not represent amajor flowpath for contaminants from the continents. Atthe location measured in this study, the volume of waterthat flows from the continents to the coastal area is small asreflected in the slower flow rates at depth than in the shal-low sediments and the increase in Cl– concentrations withdepth. Discharge of meteoric ground water is more likely tobe important on the western edge of the lagoon whereonshore flowpaths converge and focus discharge. At BRL2,the mixing of oxygenated lagoon water with shallow porewaters may be important for oxidation of organic matter,and may result in a larger flux of nutrients than would becaused solely by the discharge of meteoric ground water.
AcknowledgmentsWe thank the numerous people who have helped with
field work throughout this project including Donny Smoak,Kevin Hartl, Henri deLauney, Brian Vosburg, RitaBowker, and Jason Greenwood. We thank John Jaeger andJango Bhadha for providing the porosity data. Numerousdiscussions with Joel Steward, Gilbert Sigua, David Toth,and Bob Virnstein have provided much background infor-mation about the Indian River Lagoon and helped formu-late our ideas. The paper has been greatly improvedthrough comments of two anonymous reviewers and TomMcKenna, co-guest editor. The project has been supportedby contract #99G245 from the St. Johns River Water Man-agement District.
Editor’s Note: The use of brand names in peer-reviewedpapers is for identification purposes only and does not con-stitute endorsement by the authors, their employers, or theNational Ground Water Association.
ReferencesAller, R.C. 1980. Quantifying solute distributions in the biotur-
bated zone of marine sediments by defining an averagemicro-environment. Geochimica et Cosmochimica Acta. 44,1955–1965.
Aller, R.C., and J.Y. Aller. 1992. Meiofauna and solute transportin marine muds. Limnology and Oceanography 37,1018–1033.
Andrea, A.F., R.C. Aller, and G.R. Lopez. 2002. Organic matterflux and reactivity on a South Carolina sandflat: Theimpacts of porewater advection and macrobiological stuc-tures. Limnology and Oceanography 47, 1056–1070.
Belanger, T.V., and R.B. Walker. 1990. Groundwater seepage inthe Indian River Lagoon, Florida. In Tropical Hydrologyand Caribbean Water Resources: Proceedings of the Inter-national Symposium on Tropical Hydrology and CaribbeanWater Resources, July 22–27, San Juan, Puerto Rico, ed.J.H. Krishna, V. Quinones-Aponte, F. Gomez-Gomez, andG.L. Morris, 367–375. Herndon, Virginia: American WaterResources Association.
Bermes, B.J. 1958. Interim report on geology and groundwaterresources of Indian River County, Florida. Florida Bureauof Geology Information Circular Number 18.
Berner, R.A. 1980. Early Diagenesis: A Theoretical Approach.Princeton, New Jersey: Princeton University Press.
Bokuniewicz, H. 1980. Groundwater seepage into Great SouthBay, New York. Estuarine and Coastal Marine Science 10,437–444.
Bokuniewicz, H.J. 1992. Analytical descriptions of subaqueousgroundwater seepage. Estuaries 15, 458–464.
Boudreau, B.P. 1996. The diffusive tortuosity of fine-grainedunlithified sediments. Geochimica et Cosmochimica Acta60, 3139–3142.
Boudreau, B.P. 1997. Diagenetic Models and Their Implementa-tion Modeling Transport and Reactions in Aquatic Sedi-ments. Berlin: Springer-Verlag.
Boudreau, B.P. 2000. The mathematics of early diagenesis: Fromworms to waves. Reviews of Geophysics 38, 389–416.
Boudreau, B.P., and R.L. Marinelli. 1994. A modeling study ofdiscontinuous biological irrigation. Journal of MarineResearch 52, 947–968.
Bugna, G.C., J.P. Chanton, J.E. Cable, W.C. Burnett, and P.E.Cable. 1996. The importance of groundwater discharge tothe methane budgets of nearshore and continental shelfwaters of the northeastern Gulf of Mexico. Geochimica etCosmochimica Acta 60, 4735–4746.
Burnett, B., J. Chanton, J. Christoff, E. Kontar, S. Krupa, M.Lambert, W. Moore, D. O’Rourke, R. Paulsen, C. Smith, L.Smith, and M. Taniguchi. 2002. Assessing methodologiesfor measuring groundwater discharge to the ocean. EosTransactions, American Geophysical Union 83, 117–123.
Cable, J.E., J.B. Martin, P.W. Swarzenski, P.K. Lindenberg, andJ. Steward. 2004. Advection within shallow pore waters ofa coastal lagoon, Florida. Ground Water 42, no. 7:1011–1020.
Cable, J.E., G.C. Bugna, W.C. Burnett, and J.P. Chanton. 1996a.Application of 222Rn and CH4 for assessment of groundwater discharge to the coastal ocean. Limnology andOceanography 41, 1347–1353.
Cable, J.E., W.C. Burnett, J.P. Chanton, and G.L. Weatherly.1996b. Estimating groundwater discharge into the north-eastern Gulf of Mexico using radon-222. Earth and Plane-tary Science Letters 144, 591–604.
Cable, J.E., W.C. Burnett, and J.P. Chanton. 1997a. Magnitudeand variations of groundwater seepage along a Floridamarine shoreline. Biogeochemistry 38, 189–205.
Cable, J.E., W.C. Burnett, J.P. Chanton, D.R. Corbett, and P.H.Cable. 1997b. Field evaluation of seepage meters in thecoastal marine environment. Estuarine, Coastal and ShelfScience 45, 367–375.
Capone, D.G., and M.F. Bautista. 1985. A groundwater source ofnitrate in nearshore marine sediments. Nature 313, 214–216.
Clesceri, L.H., A. Greenberg, R.R. Trussell, and M.A. Franson.1989. Standard Methods for the Examination of Water andWastewater. Washington, D.C.: American Public HealthAssociation, American Water Works Association, WaterPollution Control Federation.
Cooper Jr., H.H. 1959. A hypothesis concerning the dynamic bal-ance of fresh water and salt water in a coastal aquifer. Jour-nal of Geophysical Research 64, 461–467.
Corbett, D.R., L. Kump, K. Dillon, W. Burnett, and J. Chanton.2000. Fate of wastewater-borne nutrients under low dis-charge conditions in the subsurface of the Florida Keys,USA. Marine Chemistry 69, 99–115.
J.B. Martin et al. GROUND WATER 42, no. 7: 1000–10101008
1000-1010 GW Ocean Issue 04 9/3/04 2:39 PM Page 1008

Emerson, S., R. Jahnke, and D. Heggie. 1984. Sediment-waterexchange in shallow water estuarine sediments. Journal ofMarine Research 42, 709–730.
Furukawa, Y., S.J. Bentley, and D.L. Lavoie. 2001. Bioirrigationmodeling in experimental benthic mesocosms. Journal ofMarine Research 59, 417–452.
Furukawa, Y., S.J. Bentley, A.M. Shiller, D.L. Lavoie, and P.V.Cappellen. 2000. The role of biologically-enhanced porewater transport in early diagenesis: An example from car-bonate sediments in the vicinity of North Key Harbor, DryTortugas National Park, Florida. Journal of Marine Research58, 493–522.
Gallagher, D.L., A.M. Dietrich, W.G. Reay, M.C. Hayes, andG.M. Simmons. 1996. Ground water discharge of agriculturalpesticides and nutrients to estuarine surface water. GroundWater Monitoring & Remediation 16, no. 1: 118–129.
Groszos, M., R. Ceryak, D. Allison, R. Cooper, M. Weinberg, M.Macesich, M.M. Enright, and F. Rupert. 1992. Carbonateunits of the Intermediate aquifer system in the SuwanneeRiver Water Management District, Florida. Florida Geolog-ical Survey Open File Report #54.
Johannes, R.E. 1980. The ecological significance of the subma-rine discharge of groundwater. Marine Ecological ProgressSeries 3, 365–373.
Lee, D.R. 1977. A device for measuring seepage flux in lakes andestuaries. Limnology and Oceanography 22, 140–147.
Li, L., D.A. Barry, F. Stagnitti, and J.-Y. Parlange. 1999. Sub-marine groundwater discharge and associated chemicalinput to a coastal sea. Water Resources Research 35, 3253–3259.
Li, Y.-H., and S. Gregory. 1974. Diffusion of ions in seawaterand in deep-sea sediments. Geochimica et CosmochimicaActa 38, 703–714.
Marinelli, R.L. 1994. Effects of burrow ventilation on activitiesof a terebellid plychaete and silicate removal from sedimentpore waters. Limnology and Oceanography 39, 303–317.
Martin, J.B. 1999. Nonconservative bahavior of Br–/Cl– ratiosduring alteration of volcaniclastic sediments. Geochimica etCosmochimica Acta 63, 383–391.
Martin, J.B., J.E. Cable, and P.W. Swarzenski. 2002. Quantifica-tion of ground water discharge and nutrient loading to theIndian River Lagoon, Palatka, Florida. St. Johns RiverWater Management District Final Report.
Martin, J.B., M. Kastner, P. Henry, X. Le Pichon, and S. Lalle-mant. 1996. Chemical and isotopic evidence for sources offluids in mud volcano field seaward of the Barbados accre-tionary wedge. Journal of Geophysical Research 101,20,325–20,345.
Martin, J.B., K. Hartl, R. Corbett, P. Swarzenski, and J.E. Cable.2003. A multi-level pore water sampler for permeable sedi-ments. Journal of Sedimentary Research 73, 128–132.
Meile, C., C.M. Koretsky, and P.V. Cappellen. 2001. Quantify-ing bioirrigation in aquatic sediments: An inverse modelingapproach. Limnology and Oceanography 46, 164–177.
Miller, J.A. 1986. Hydrogeologic framework of the Floridanaquifer system in Florida and parts of Georgia, Alabama,and South Carolina. U.S. Geological Survey ProfessionalPaper Report P 1403-B.
Moore, W.S. 1996. Large groundwater inputs into coastal watersas revealed by 226Ra enrichment. Nature 380, 612.
Moore, W.S. 1999. The subterranean estuary: A reaction zone ofground water and sea water. Marine Chemistry 65, 111–125.
Mortimer, R.J.G., J.T. Davey, M.D. Krom, P.G. Watson, P.E.Frickers, and R.J. Clifton. 1999. The effect of macrofaunaon porewater profiles and nutrient fluxes in the intertidalzone of the Humber Estuary. Estuarine, Coastal and ShelfScience 48, 683–699.
Motz, L. 2000. Written communication with J.B. Martin.Mu, Y., A.H.-D. Cheng, M. Badiey, and R. Bennett. 1999. Water
wave driven seepage in sediment and parameter inversionbased on pore pressure data. International Journal forNumerical and Analytical Methods in Geomechanics 23,1655–1674.
Nielsen, P. 1990. Tidal dynamics of the water table in beaches.Water Resources Research 26, 2127–2134.
Pandit, A., and C.C. El-Khazen. 1990. Groundwater seepage intothe Indian River Lagoon at Port St. Lucie. Florida Scientist53, 169–179.
Rasmussen, L.L. 1998. Groundwater flow, tidal mixing andhaline convection in coastal sediments. M.S. thesis, Depart-ment of Oceanography, Florida State University.
Robinson, M.A., and D.L. Gallagher. 1999. A model of groundwater discharge from an unconfined coastal aquifer. GroundWater 37, 80–87.
Robinson, M.A., D.L. Gallagher, and W.G. Reay. 1998. Fieldobservations of tidal and seasonal variations in ground waterdischarge to estuarine surface waters. Ground Water Moni-toring & Remediation 18, 83–92.
Rutkowski, C.M., W.C. Burnett, R.L. Iverson, and J.P. Chanton.1999. The effect of groundwater seepage on nutrient deliv-ery and seagrass distribution in the northeastern Gulf ofMexico. Estuaries 22, 1033–1040.
Sandnes, J., T. Forbes, R. Hansen, B. Sandnes, and B. Rygg.2000. Bioturbation and irrigation in natural sediments,described by animal-community parameters. Marine Ecol-ogy Progress Series 197, 169–179.
Schluter, M., E. Sauter, H.-P. Hansen, and E. Suess. 2000. Sea-sonal variations of bioirrigation in coastal sediments: Mod-elling of field data. Geochimica et Cosmochimica Acta 64,821–834.
Scott, T.M. 1988. The lithostratigraphy of the Hawthorn Group(Miocene) of Florida. Florida Geological Survey BulletinReport #59.
Scott, T.M. 1992. A geological overview of Florida. Florida Geo-logical Survey Open File Report #50.
Shaw, R.D., and E.E. Prepas. 1989. Anomalous, short-term in-flux of water into seepage meters. Limnology and Oceanog-raphy 34, 1343–1351.
Shum, K.T. 1992. Wave-induced advective transport below a rip-pled water-sediment interface. Journal of GeophysicalResearch 97, 789–808.
Shum, K.T. 1993. The effects of wave-induced pore water circu-lation on the transport of reactive solutes below a rippledsediment bed. Journal of Geophysical Research 98,10,289–10,301.
Shum, K.T., and B. Sundby. 1996. Organic matter processing incontinental shelf sediments—The subtidal pump revisited.Marine Chemistry 53, 81–87.
Sigua, G.C., J.S. Steward, and W.A. Tweedale. 2000. Water-quality monitoring and biological integrity assessment in theIndian River Lagoon, Florida: Status, trends, and loadings(1988–1994). Environmental Management 25, 199–209.
Simmons Jr., G.M. 1992. Importance of submarine groundwaterdischarge (SGWD) and seawater cycling to material fluxacross sediment/water interfaces in marine environments.Marine Ecology Progress Series 84, 173–184.
Smethie, W.M., C.A. Nittrouer, and R.F.L. Self. 1981. The use ofradon-222 as a tracer of sediment irrigation and mixing onthe Washington continental shelf. Marine Geology 42,173–200.
Smith, N.P. 1987. An introduction to the tides of Florida’s IndianRiver Lagoon, 1. Water levels. Florida Scientist 50, 49–61.
Smith, N.P. 1993. Tidal and nontidal flushing of Florida’s IndianRiver Lagoon. Estuaries 16, 739–746.
Timmermann, K., J.H. Christensen, and G.T. Banta. 2002. Mod-eling of advective solute transport in sandy sediments inhab-ited by the lugworm Arenicola marina. Journal of MarineResearch 60, 151–169.
Toth, D.J. 1988. Salt water intrusion in coastal areas of Volusia,Brevard, and Indian River Counties. Palatka, Florida, St.Johns River Water Management District Technical Publica-tion SJ 88–1.
Valiela, I., J. Costa, K. Foreman, J.M. Teal, B. Howes, and D.Aubrey. 1990. Transport of groundwater-borne nutrientsfrom watersheds and their effects on coastal waters. Biogeo-chemistry 10, 177–197.
1009J.B. Martin et al. GROUND WATER 42, no. 7: 1000–1010
1000-1010 GW Ocean Issue 04 9/3/04 2:39 PM Page 1009

Virnstein, B. 2000. Personal communication with J.E. Cable andJ.B. Martin during a meeting.
Warnken, K.W., G.A. Gill, P.H. Santschi, and L.L. Griffen.2000. Benthic exchange of nutrients in Galveston Bay,Texas. Estuaries 23, 647–661.
Weber, M.E., F. Niessen, G. Kuhn, and M. Wiedicke. 1997. Cal-ibration and application of marine sedimentary physicalproperties using a multi-sensor core logger. Marine Geology136, 151–172.
Webster, I.T., S.J. Norquay, F.C. Ross, and R.A. Wooding. 1996.Solute exchange by convection within estuarine sediments.Estuarine, Coastal and Shelf Science 42, 171–183.
Zimmermann, C.F., J.R. Montgomery, and P.R. Carlson. 1985.Variability of dissolved reactive phosphate flux rates innearshore estuarine sediments: Effects of groundwater flow.Estuaries 8, 228–236.
J.B. Martin et al. GROUND WATER 42, no. 7: 1000–10101010
1000-1010 GW Ocean Issue 04 9/3/04 2:39 PM Page 1010
Copyright © 2022 FDOKUMEN