केरल क्षेत्र, त्रत्रवेंद्रम - Central Ground Water...
123
क ीय भ ू मि जल बोड जल संसाधन, नदी विकास और गंगा संरण विभाग, जल शति मंालय भारि सरकार Central Ground Water Board Department of Water Resources, River Development and Ganga Rejuvenation, Ministry of Jal Shakti Government of India AQUIFER MAPPING AND MANAGEMENT OF GROUND WATER RESOURCES WAYANAD DISTRICT, KERALA के रल े, वम Kerala Region, Trivendrum
-
Upload
khangminh22 -
Category
Documents
-
view
1 -
download
0
Transcript of केरल क्षेत्र, त्रत्रवेंद्रम - Central Ground Water...

कें द्रीय भूमि जल बोर्ड जल संसाधन, नदी विकास और गंगा संरक्षण
विभाग, जल शक्ति मंत्रालय
भारि सरकार Central Ground Water Board
Department of Water Resources, River Development and Ganga Rejuvenation,
Ministry of Jal Shakti Government of India
AQUIFER MAPPING AND
MANAGEMENT OF GROUND WATER
RESOURCES WAYANAD DISTRICT, KERALA
केरल के्षत्र, त्रत्रवेंद्रम
Kerala Region, Trivendrum
कें द्रीय भूजल बोर्ड, केरल के्षत्र जल शक्ति मंत्रालय
जल संसाधन, नदी विकास और गगंा संरक्षण विभाग
भारि सरकार
CENTRAL GROUND WATER BOARD MINISTRY OF JAL SHAKTI
DEPARTMENT OF WATER RESOURCES, RIVER DEVELOPMENT AND GANGA REJU-VENATION
GOVERNMENT OF INDIA KERALA REGION
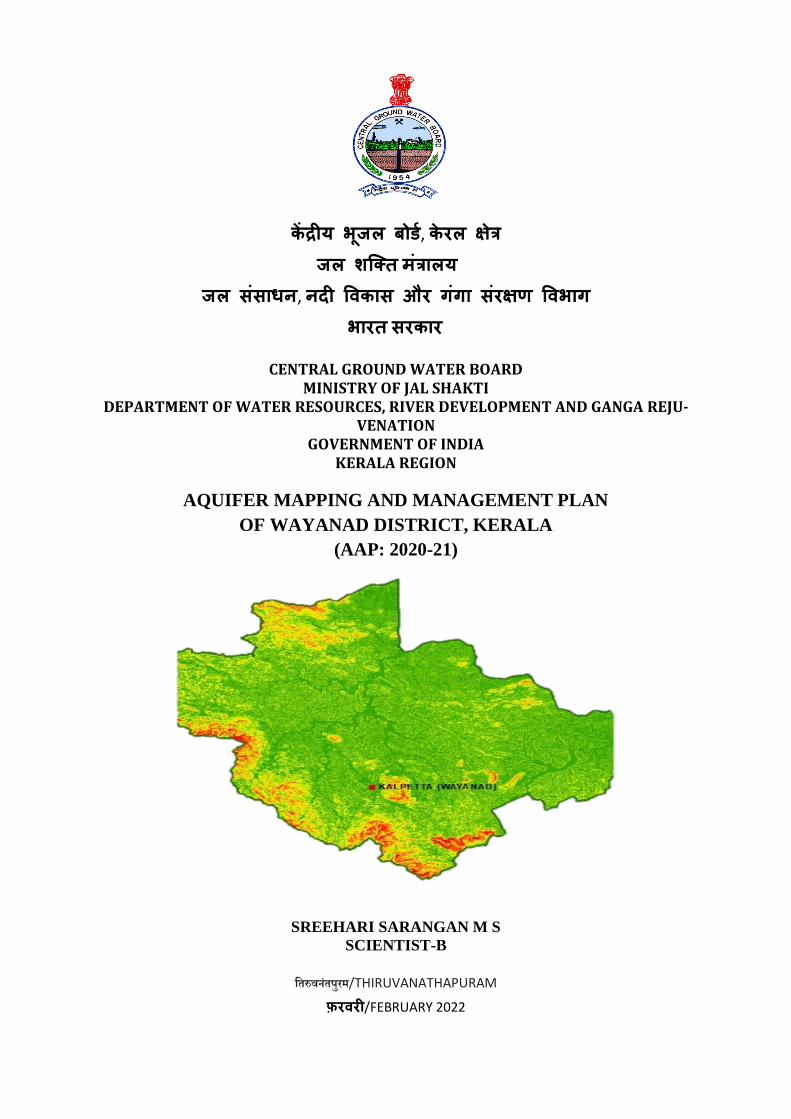
AQUIFER MAPPING AND MANAGEMENT PLAN
OF WAYANAD DISTRICT, KERALA
(AAP: 2020-21)
SREEHARI SARANGAN M S
SCIENTIST-B
तिरुवनिंपुरम/THIRUVANATHAPURAM
फ़रिरी/FEBRUARY 2022
AQUIFER MAPPING AND MANAGEMENT PLAN OF
WAYANAD DISTRICT, KERALA
(AAP- 2020-21)
CONTENTS
1.0 INTRODUCTION.............................................................................................................. 1 1.1 OBJECTIVES ............................................................................................................................... 1 1.2 SCOPE OF THE STUDY ............................................................................................................. 2 1.3 LOCATION AND ADMINISTRATION ..................................................................................... 2 1.4 DEMOGRAPHY .......................................................................................................................... 4 1.5 CLIMATE & RAINFALL ............................................................................................................ 4 1.6 SOIL .............................................................................................................................................. 4 1.7 PHYSIOGRAPHY & GEOMORPHOLOGY .............................................................................. 6 1.8 DRAINAGE .................................................................................................................................. 7 1.9 IRRIGATION ............................................................................................................................... 9 1.10 LAND USE ............................................................................................................................... 10 1.11 GEOLOGY ............................................................................................................................... 14 1.12 STRUCTURE ........................................................................................................................... 15 1.13 PREVIOUS WORK .................................................................................................................. 17 1.14 URBAN AREA, INDUSTRIES AND MINING ACTIVITIES ............................................... 18
2 DATA COLLECTION, GENERATION AND INTEGRATION .................................. 18 2.1 DATA COLLECTION AND DATA GAP ANALYSIS ............................................................ 18 2.2 DATA GENERATION AND INTEGRATION ......................................................................... 21
3.AQUIFER MAPPING ........................................................................................................ 26 3.1RAINFALL .................................................................................................................................. 26 3.2 GEOPHYSICAL INVESTIGATIONS ....................................................................................... 28 3.3 NATURE AND TYPE OF AQUIFERS ..................................................................................... 38 3.4 SOIL INFILTRATION STUDIES.............................................................................................. 54 3.5 CHEMICAL QUALITY OF GROUND WATER ...................................................................... 59 3.6 AQUIFER MAP .......................................................................................................................... 63
4 GROUND WATER RESOURCES ................................................................................... 66 4.1 DYNAMIC GROUNDWATER RESOURCES IN THE WEATHERED ZONE ...................... 66 4.2 TEMPORAL VARIATION OF GROUND WATER RESOURCES ....................................... 71 4.3 NUMBER OF GROUND WATER STRUCTURE FOR FUTURE DEVELOPMENT ............ 71 4.4 IN-STORAGE IN THE WEATHERED ZONE ......................................................................... 72 4.5 IN STORAGE IN THE FRACTURE ZONE ............................................................................. 72
5 GROUNDWATER RELATED PROBLEMS .................................................................. 72 6.MANAGEMENT STRATEGIES &AQUIFER MANAGEMENT PLAN. .................. 74
6.1 SUSTAINABLE PLAN .............................................................................................................. 75 6.2 AUGMENTATION PLAN ......................................................................................................... 75 6.3 SCOPE OF ARTIFICIAL RECHARGE STRUCTURES .......................................................... 75 6.4 AQUIFER MANAGEMENT PLAN .......................................................................................... 76 6.5 SUMMARY ................................................................................................................................ 85
7.0 REFERENCES: ............................................................................................................... 85
LIST OF FIGURES
Fig.1.1 Administrative set up of Wayanad District ................................................................... 3 Fig.1.2 Soil Map ....................................................................................................................... 5 Fig.1.3 Digital Elevation Model (DEM) Map ........................................................................... 6 Fig.1.4 Geomorphology map ..................................................................................................... 7

Fig1.5 Drainage map .................................................................................................................. 8
Fig. 1.6 Distribution of various land use pattern in Wayanad District .................................... 12 Fig.1.7 Land use map ............................................................................................................... 12 Fig.1.8 Source wise area irrigated in Wayanad district (Source: KSLUB, Govt of Kerala) .. 13
Fig.1.9 Geological map ............................................................................................................ 15 Fig.1.10 Structure map ............................................................................................................. 17 Fig.2.1 Location map of exploratory wells with TEM locations ............................................. 23 Fig.2.2 Location map of water level monitoring wells (GWMW & KW) .............................. 24 Fig.2.3 Location map of Water quality monitoring stations .................................................... 25
Fig.3.2 Isohyetal map. .............................................................................................................. 27 Fig.3.3 Conceptual diagram of working of TEM soundings .................................................. 28 Fig. 3.4: Location of TEM soundings conducted in Wayanad District, Kerala ....................... 29 Fig.3.5 Type curves of TEM with interpreted results of selected locations ............................ 37
Fig.3.6 Spatial distribution of weathering thickness ................................................................ 40 Fig.3.7 Depth to Water level map of Phreatic aquifer (Premonsoon) ..................................... 41 Fig.3.8 Depth to Water Level map of Phreatic aquifer (Postmonsoon)................................... 42
Fig.3.9 Water level fluctuation map of Phreatic aquifer .......................................................... 43 Fig.3.10 Hydrographs of selected wells tapping shallow aquifer ............................................ 45 Fig.3.11 Water table elevation contour map of Phreatic aquifer (Pre monsoon) .................... 46 Fig.3.12 Water table elevation contour map of Phreatic aquifer (Post monsoon) ................... 46
Fig.3.14: Fence diagram showing the disposition of Aquifer system...................................... 52 Fig.3.15 Rose diagram showing lineament trend................................................................... 53
Fig.3.16 Curves of infiltration and cumulative depth of infiltration of different locations ..... 59 Fig.3.17 Distribution of Electrical conductivity ...................................................................... 60 Fig.3.18 Hill-Piper diagram showing Geochemical Classification of phreatic aquifer ........... 62
Fig.3.19 Salinity diagram of Phreatic aquifer .......................................................................... 63
Fig.3.20 Aquifer map of Phreatic aquifer system .................................................................... 64
Fig 3.21 Aquifer map of Deeper Aquifer system .................................................................... 65 Fig. 4.1 Block wise groundwater resources in Wayanad District as on 31st March 2017 ... 69
Fig.4.2 Availability of resources and draft break up ............................................................... 70 Fig.4.3 Distribution of Ground water Draft and Availability ................................................. 70 Fig.6.1 Feasible water conservation structures in Wayanad District ...................................... 79 Fig.6.2 Panoramic view of two abandoned quarries near Ambalayaval .................................. 80
Fig.6.3 Springs at Thrissileri, Thirunelly area (left) and Pookode, Vythiri (right) (Source:
CGWB,2010) ........................................................................................................................... 81 Fig.6.4 Block wise break up of Micro irrigation methods ....................................................... 82 Fig.6.5 Autoflow well at (A) Irulam (CGWB,2018) and (B) Kappiset (CGWB,2010) ....... 83 Fig.6.6 Representative picture of Panam Keni in the field. ................................................... 84
LIST OF TABLES
Table 1.1: Aerial distribution of various soil texture in the district .......................................... 5 Table 1.2: Details of drainages in Wayanad District ................................................................. 8 Table 1.3: Salient features of Karapuzha irrigation project ....................................................... 9 Table 1.4: Salient features of Banasura Sagar Project ............................................................... 9 Table1.5 Land use pattern in Wayanad district (Source: KSLUB, Govt of Kerala 2019) ...... 10
Table 1.6 Source wise area irrigated in Wayanad district ....................................................... 13 Table 1.7: The geological succession in Wayanad District ..................................................... 16 Table.1.8 Details of industrial units in Wayanad District ....................................................... 18
Table 2.1: Data availability for data gap analysis .................................................................... 19
Table 2.2: Status of water level monitoring wells of CGWB .................................................. 19
Table 2.3: Data requirement and data generated for aquifer mapping .................................... 21 Table 3.1 Monthly rainfall data (mm) during 2015-2020. (Source : IMD) ............................ 26 Table-3.2 Interpreted parameters of TEM in Kalpetta Block .................................................. 30
Table.3.3 Interpreted parameters of TEM in Panamaram Block ............................................ 30 Table.3.4 Interpreted parameters of TEM in Sulthan Bathery Block ..................................... 32 Table.3.5 : Decadal Trend of water level (2010-19) ................................................................ 47 Table. 3.6 Frequency of bore wells in different yield ranges .................................................. 53 Table.3.7 Details of high yielding wells and lineament........................................................... 53
Table.3.8 Basic Infiltration rate of soil .................................................................................... 54 Table.3.9 Classification of Infiltration capacities .................................................................... 54 Table.3.10 Location wise summarised results of Soil Infiltration tests ................................... 55 Table.3.11 Ground Water quality of Phreatic Aquifers ......................................................... 61
Table 4.1 Specific Yield values of different hydrogeological units (GEC-2015) ................... 67 Table 4.2 Dynamic Ground Water Resources estimated of Wayanad District (Phreatic
aquifer) as on 31st March 2017 .............................................................................................. 68
Table 4.3 Groundwater Draft (MCM) and GW availability in Wayanad District during 2013
and 2017 ................................................................................................................................... 71 Table 4.4 Comparison of stage of development in Wayanad district during 2013 and 2017 . 71 Table.4.5 . Aquifer wise total groundwater resources in Wayanad District .......................... 72
Table.6.1 Breakup of various ongoing water harvesting structures........................................ 77 Table.6.2 Additional structures recommended for artificial recharge ..................................... 77
Table 6.3: Block wise details of abstraction structures proposed for Wayanad District ......... 78 Table.6.4 Area irrigated through Micro irrigation practices ................................................... 82
LIST OF ANNEXURES
ANNEXURE-I Details of GWMWs in the Study area .......................................................... 87 ANNEXURE-II Details of KOWs in the Study area .............................................................. 91 ANNEXURE-III Details of Exploratory wells drilled by CGWB in the study area .............. 95
ANNEXURE-IV Layer parameters of GTEM conducted in Wayanad District. ................. 97 ANNEXURE-V Details of Springs ..................................................................................... 104
ANNEXURE-VI Details of soil infiltration tests carried out in the study area .................... 107
1
AQUIFER MAPPING AND GROUND WATER MANAGEMENT PLAN
OF WAYANAD DISTRICT, KERALA
1.0 INTRODUCTION
During AAP 2020-21, under National Aquifer Mapping Programme (NAQUIM), CGWB
Kerala Region, has taken up Aquifer mapping studies of Wayanad district. The study aims to
formulate various ground water management interventions for the district after studying the
characteristics of different water bearing formations (aquifer) in the district. The existing and
additional data sets generated on geologic, geophysical, hydrologic and chemical quality
are integrated and used to characterise the quantity, quality and sustainability of ground water
in the aquifer systems. Various thematic maps on hydrogeological data are generated under a
GIS environment which can be customised based on the administrative requirements. Aquifer
mapping also envisages development of an Aquifer Management Plan to facilitate sustainable
management of groundwater resources in the district. Major objectives of the aquifer map-
ping programme are (i) delineation and characterization of aquifers in three dimensions (ii)
identification of issues on water quantity and quality (iii) Evaluation of groundwater water
resources in various aquifer systems and, (iv) to evolve a groundwater management plan to
ensure sustainable development of ground water resources. Various management plans for
each aquifer system are to be prepared for different interventions to optimize ground water
withdrawal/recharge. The management options also includes identification of feasible area
for artificial recharge to ground water and water conservation besides, demand side manage-
ment option including crop diversification, increasing water use efficiency etc. These man-
agement measures will help in the containment of declining water levels and overall im-
provement in the groundwater scenario. Lateral and vertical continuity of various aquifer sys-
tems need to be deciphered for evolving an efficient management.
1.1 OBJECTIVES
The objectives of mapping of aquifer systems in Wayanad are listed below.
(i) Define the aquifer geometry and depict the lateral and vertical variations through 2D and
3D maps.
(ii) Characterize the aquifer systems and its hydraulic properties
(iii) Study the influence of various components of the groundwater regime on the aquifer
systems.
(iv) Evaluate the hydro-chemical characteristics of groundwater and the extent of contami-
nation/pollution of groundwater, if any
(v) Identify the quantitative and qualitative issues of the aquifer systems
(vi)Evaluation of the groundwater resources in each aquifer system
(vii) Identify area suitable to Artificial Recharge structures to be implemented
(viii) Formulate a sustainable aquifer management plan
The objectives of the aquifer mapping are achieved through various steps/activities such as;
(i). Data gap analysis,
(ii). Data generation and integration and

2
(iii). Preparation of thematic maps and aquifer response models
Conceptualization of the sub surface disposition of aquifer system has been carried out by
integrating all data available on the groundwater regime and from the available technical re-
ports and publications within the department and line departments. The data gaps could be
identified from the analysis of historical data which facilitated generation of new data in gap
areas. The hydrogeological, hydrological, geophysical, hydro-chemical and meteorological
data were analysed for data gaps. Groundwater draft from the aquifer systems has been eval-
uated from well inventory data and integrated use of lithological and geophysical data could
refine the aquifer geometry of the area. Various thematic maps, cross sections, fence dia-
grams and three-dimensional view of aquifer systems are prepared in GIS platform showing
the subsurface disposition of aquifer systems which can be used for various interpretations to
formulate the sustainable management plans.
1.2 SCOPE OF THE STUDY
In Wayanad district, agriculture has always been climate dependent and even small changes
in soil temperature and moisture levels can adversely affect the yield. Wayanad had bestowed
with plenty of water earlier and the main agriculture was paddy and now the area is facing
drought due to change in rainfall pattern due to climate change, deforestation and large-scale
conversion of paddy fields into plantations. In 1980, there were 30,000 hectares of paddy
fields in Wayanad. It has been reduced by more than 63 percent to 11053.63 hectare at pre-
sent (CGWB, 2018). The climate and related environment are influenced by the geomorpho-
logical settings. The Wayanad district, famous for its agricultural traditions and bio diversity
is greatly endangered today. The present scenario needs to be improved by adopting prac-
tices like afforestation, protection of paddy fields, conservation of water resources and artifi-
cial recharge to groundwater. Moreover, the impact of climatic changes on agriculture af-
fects the livelihood of people in this district which has the highest percentage of tribal popu-
lation.
1.3 LOCATION AND ADMINISTRATION
The word “Wayanad” was derived from the word “Vayal Nadu”, (Vayal- Paddy , Nadu-
Land) which means the land of paddy fields and now known for its coffee plantation and
picturesque hill stations. There is no town or village named same as the district (i.e., there is
no "Wayanad town"). The district is located in the northern part of Kerala state bordering
Karnataka and Tamil Nadu, spread over an area of 2131 sq.km which is about 5.5 % of total
area of Kerala State. Earlier the district was part of Kannur district and present Wayanad dis-
trict was formed on November1 ,1980 with district headquarter at Kalpetta. About 485 sq.km
(23%) of area of the district is under forest. There are three Taluks viz.Vythiri, Sultan Bath-
ery and Mananthavady and divided into four blocks viz. Kalpetta, Mananthavady, Sultan
Bathery and Panamaram for administrative ease. (Fig.1.1). The district has 25 grama pancha-
yats and three municipalities. The district is bordered by Malappuram in the south and Ko-
zhikkod and Kannur districts on the west, Kannur district and Karnataka state are on the north
3
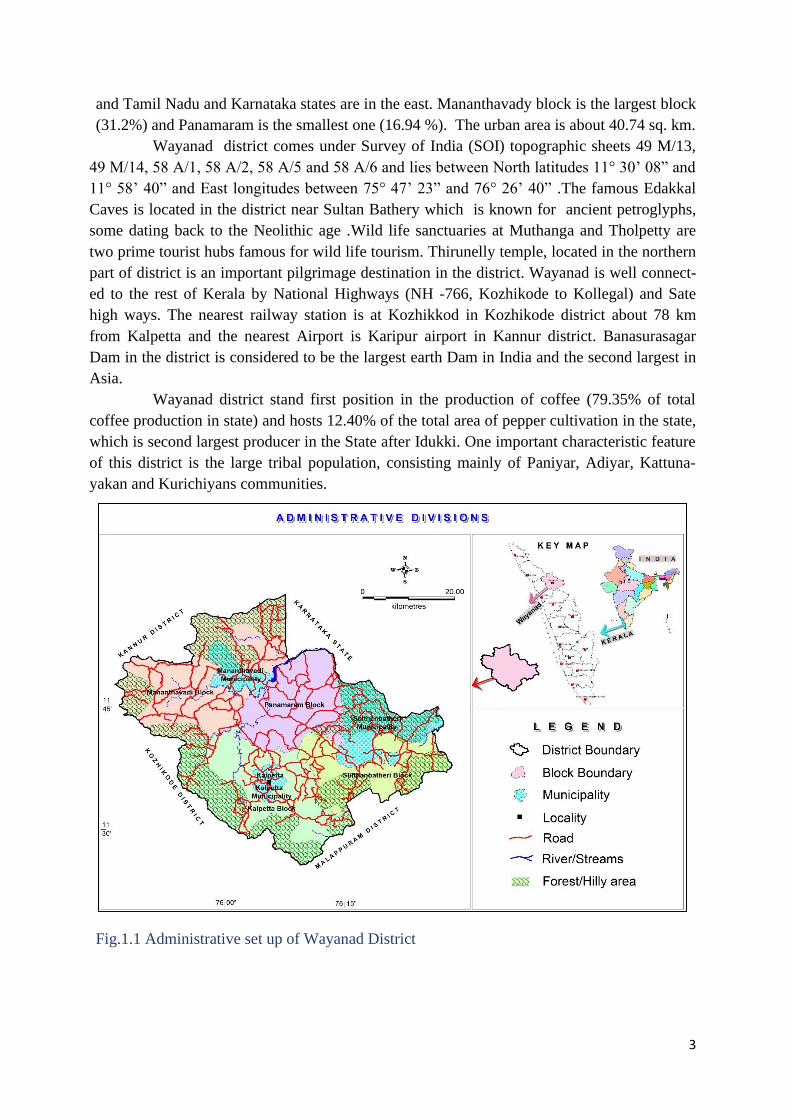
and Tamil Nadu and Karnataka states are in the east. Mananthavady block is the largest block
(31.2%) and Panamaram is the smallest one (16.94 %). The urban area is about 40.74 sq. km.
Wayanad district comes under Survey of India (SOI) topographic sheets 49 M/13,
49 M/14, 58 A/1, 58 A/2, 58 A/5 and 58 A/6 and lies between North latitudes 11° 30’ 08” and
11° 58’ 40” and East longitudes between 75° 47’ 23” and 76° 26’ 40” .The famous Edakkal
Caves is located in the district near Sultan Bathery which is known for ancient petroglyphs,
some dating back to the Neolithic age .Wild life sanctuaries at Muthanga and Tholpetty are
two prime tourist hubs famous for wild life tourism. Thirunelly temple, located in the northern
part of district is an important pilgrimage destination in the district. Wayanad is well connect-
ed to the rest of Kerala by National Highways (NH -766, Kozhikode to Kollegal) and Sate
high ways. The nearest railway station is at Kozhikkod in Kozhikode district about 78 km
from Kalpetta and the nearest Airport is Karipur airport in Kannur district. Banasurasagar
Dam in the district is considered to be the largest earth Dam in India and the second largest in
Asia.
Wayanad district stand first position in the production of coffee (79.35% of total
coffee production in state) and hosts 12.40% of the total area of pepper cultivation in the state,
which is second largest producer in the State after Idukki. One important characteristic feature
of this district is the large tribal population, consisting mainly of Paniyar, Adiyar, Kattuna-
yakan and Kurichiyans communities.
Fig.1.1 Administrative set up of Wayanad District

4
1.4 DEMOGRAPHY
As per Census data 2011, the total population of the district is 8,16,558 (M-4,01,314, F-
4,15,244). The sex ratio is 1035 and population density is 384. The literacy rate is 89.32.
Wayanad district has a large tribal population consisting mainly of Paniyas, Adiyas, Kattuna-
yakan and Kurichiyans. Wyanad district stands first in the case of Adivasi Population (about
36%) among other districts in the state. Scheduled caste population comes only 1% of the
state ST population.
1.5 CLIMATE & RAINFALL
Wayanad district is characterized by Tropical climate. Various elements of tropical
climate are rainfall, temperature, humidity, wind velocity, potential evapo-transpiration,
evaporation and insolation. The SW (80%) and NE (12%) monsoons mainly contribute rain-
fall in the area. Besides orographic precipitation and pre-monsoon “mango showers” play a
role in rainfall availability in the area. It is observed that June experiences maximum rainfall
and is the wettest month. Mean monthly rainfall is 2786 mm. The area experiences mild
weather throughout the year which attract tourists. Areas closer to Karnataka border such as
Pulpally, Mullankolly and Kappiset area there is lesser rainfall and lead to situation of rain
shadow effect in these areas.
The maximum average temperature is in the range of 28.9°C to 36.2°C and minimum
temperature is in the range of 17°C to 23.4 °C. December and January months experience
coolest period. Even though March is comparatively hotter, temperature is always lesser than
35 °C. The severe heat waves were never recorded in the area. The wind velocity is generally
low in the area and ranges between 1.91 and 5.69 km/hr in the area. The humidity in atmos-
phere is less during summer and it increases during rainy season. The monthly average rela-
tive humidity in the morning varies from 86.94 (morning at 8 .30 hr) to 96.16 %. On the other
hand, monthly average relative humidity in the evening at 14.30 hr increases from 55.62 % to
85.23 %. The evaporation in the area is very less during rainy reason .The monthly mean
evaporation ranges between 1.48 and 4.85 mm per day.
1.6 SOIL
There are four types soil encountered in Wayanad district viz. laterite soil, brown hy-
dromorphic soil, forest loam and riverine alluvium.
Laterite soil seen in some areas of Wayanad and is reddish brown in colour, formed
under tropical monsoonal climate with alternate wetting and drying condition. The organic
matter in the soil is very less with moderate nitrogen, phosphorous and potash. The pH of the
soil ranges between 5.5 and 6.5 and texture is clayey loam to silty loam with coarse frag-
ments between 5 to 20%. Laterites on high grounds are more compact when compared to the
low-lying areas.
Forest soil found in Mananthawady, Kalpetta and Sultan Bathery blocks. They are
rich in organic matter, nitrogen and humus. Forest loam is dark reddish brown formed by
weathering under forest cover with loamy to silty loam texture. The pH of the soil ranges be-
tween 5.3 and 6.3 and is slightly acidic in nature.
5
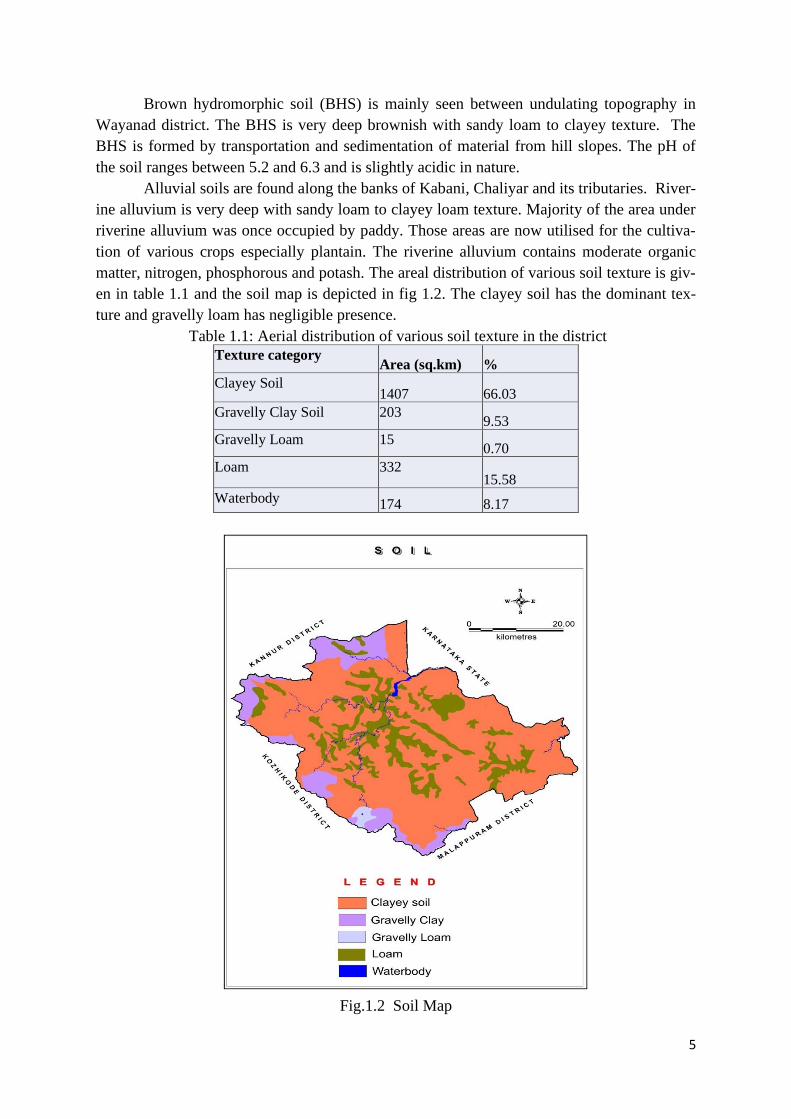
Brown hydromorphic soil (BHS) is mainly seen between undulating topography in
Wayanad district. The BHS is very deep brownish with sandy loam to clayey texture. The
BHS is formed by transportation and sedimentation of material from hill slopes. The pH of
the soil ranges between 5.2 and 6.3 and is slightly acidic in nature.
Alluvial soils are found along the banks of Kabani, Chaliyar and its tributaries. River-
ine alluvium is very deep with sandy loam to clayey loam texture. Majority of the area under
riverine alluvium was once occupied by paddy. Those areas are now utilised for the cultiva-
tion of various crops especially plantain. The riverine alluvium contains moderate organic
matter, nitrogen, phosphorous and potash. The areal distribution of various soil texture is giv-
en in table 1.1 and the soil map is depicted in fig 1.2. The clayey soil has the dominant tex-
ture and gravelly loam has negligible presence.
Table 1.1: Aerial distribution of various soil texture in the district
Texture category Area (sq.km) %
Clayey Soil 1407 66.03
Gravelly Clay Soil 203 9.53
Gravelly Loam 15 0.70
Loam 332 15.58
Waterbody 174 8.17
Fig.1.2 Soil Map

6
1.7 PHYSIOGRAPHY & GEOMORPHOLOGY
Wayanad district can be divided into three physiographic zones- Wayanad plateau (WP),
Central Sahyadri High Land (CH) and Mountainous Regions of Central Sahyadri (MR) as per
Soil Survey Organisation. On the basis of topographic features, the area can be divided into
different physiographic zones like high ranges with rugged topography, high ranges with
moderately rugged topography, intermontane valley and flood plains. There is absolutely no
low and mid lands in Wayanad district as in the case of other districts in Kerala. High ranges
with rugged topography include hill ranges in the west (Kalpetta and Mananthavady blocks)
northwest and southwestern part of Wayanad district and elevation ranges from 1400 to 2100
m amsl. This area is occupied by dense mixed jungles with steep slopes and narrow val-
leys.Hill ranges along the eastern part and isolated hills come under high ranges with moder-
ately rugged topography (Sulthan Bathery and Mananthavady blocks). The altitude of the
physiographic zone ranges between 1000 and 1400 m amsl having moderate slope. Intermon-
tane valleys are the valleys between high ranges. These areas are occupied by colluvium
formed by depositional processes. Erosional intermontane valleys are also seen.
Denudational landforms are unproductive zones. Digital Elevation Model (DEM) of
the study area with overlay of hilly area is given in Figure 1.3. This map indicates that the
general slope is towards east.
Fig.1.3 Digital Elevation Model (DEM) Map
The landform units identified in Wayanad are alluvial plain, flood plain, valley fill,
residual hill, piedmont zone, structural hill, residual hill, valley fill and upper plateau. Of all
these features piedmont zone (36.18% ) and denudational hill (23%) are the major land form
units in Wayanad district (Fig.1.4) The flood plain and valley fill are the major fluvial land-
forms whereas moderately sloping terrain . Flood plain is relatively smooth valley floors ad-
jacent to and formed by alluvial deposits by rivers, which are subject to overflow. The flood

7
plains have thickness more than 10 m are quite common and are productive aquifers. There
is no lithological control over land use in the area. Landform units with highest slope (90 )
identified in these area in scrap face.
In case of denudational hills there exist numerous peaks in various parts of Wayanad district.
The Vavumala (Camel Hill or Camel’s Hump) is the highest peak (2339 m) in the district.
Other highest peaks which deserve special mention are the Vellarimala (2245m), the Banas-
uramala (2061m), the Elambilerimala (1839 m), the Brahmagirimala (1608 m), the Kunelip-
pandimala (1607m), the Thariotemala (1553 m) and Muthumala (1374m). The Periya Ghat is
an important pass into the Wayanad plateau.
Fig.1.4 Geomorphology map
1.8 DRAINAGE
Kabani River is the major river in the district which is one of the three east flowing
rivers in Kerala and is an important tributary of Cauvery. The total drainage of the Kabani
river in the district is 1974 sq. km. Almost the entire Wayanad district is drained by Kabani
and its three main tributaries viz. Panamaram, Mananthawady and Tirunelli. Other tributaries
include Bavelipuzha and Noolpuzha. Kabani and its tributaries are mainly responsible for the
present landscape of Wayanad district. Kabani river has dendritic drainage pattern and struc-
turally controlled. Other drainages in Wayanad district are Chaliyar in the southwest and
Valapattanam (Mahe river) in the northwest side of the district. The Mahe river or Mayyazhi-
8
puzha originates from the Western slopes of the dense forests of Mananthavady Taluk. The
Chaliyar or Beypore river originates from the Elembileri Hills of Sulthan Batheri Taluk.
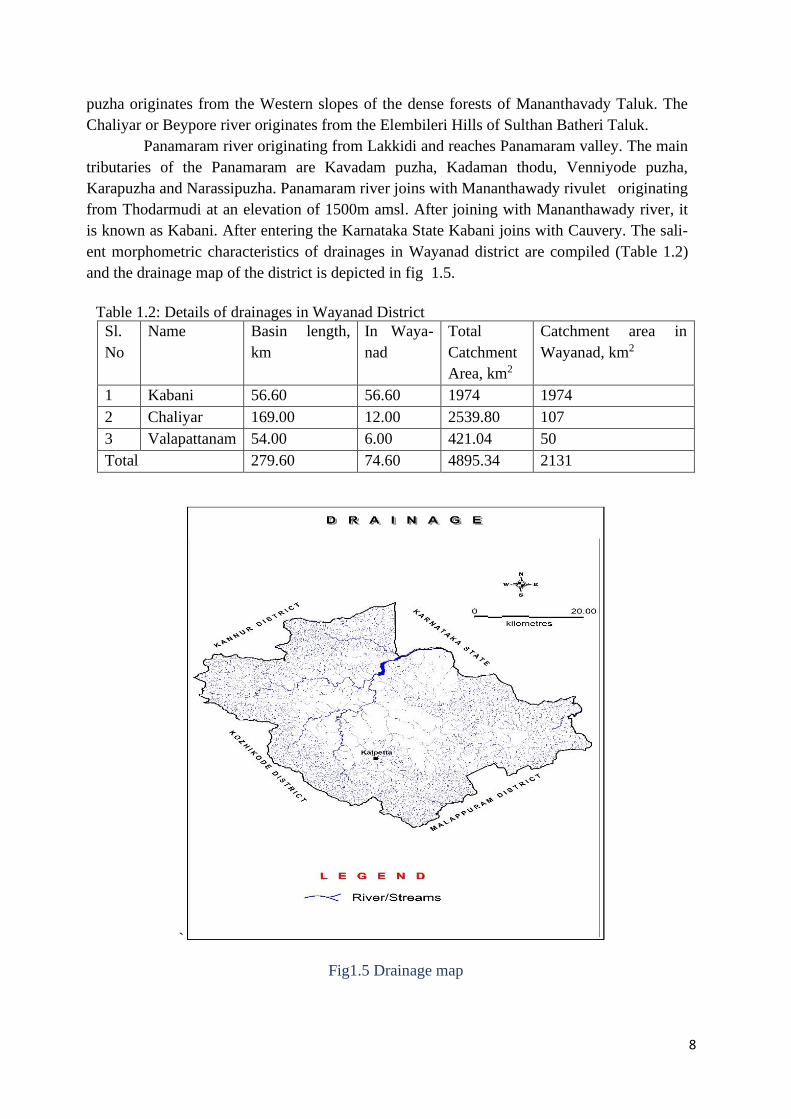
Panamaram river originating from Lakkidi and reaches Panamaram valley. The main
tributaries of the Panamaram are Kavadam puzha, Kadaman thodu, Venniyode puzha,
Karapuzha and Narassipuzha. Panamaram river joins with Mananthawady rivulet originating
from Thodarmudi at an elevation of 1500m amsl. After joining with Mananthawady river, it
is known as Kabani. After entering the Karnataka State Kabani joins with Cauvery. The sali-
ent morphometric characteristics of drainages in Wayanad district are compiled (Table 1.2)
and the drainage map of the district is depicted in fig 1.5.
Table 1.2: Details of drainages in Wayanad District
Sl.
No
Name Basin length,
km
In Waya-
nad
Total
Catchment
Area, km2
Catchment area in
Wayanad, km2
1 Kabani 56.60 56.60 1974 1974
2 Chaliyar 169.00 12.00 2539.80 107
3 Valapattanam 54.00 6.00 421.04 50
Total 279.60 74.60 4895.34 2131
`
Fig1.5 Drainage map

9
1.9 IRRIGATION
The area is having a number of irrigation projects. There are no major irrigation projects in
the area but only medium irrigation projects and minor irrigation schemes. Banasurasagar
multipurpose project and Karapuzha irrigation project are the two medium irrigation projects
in the Wayanad district.
The Karapuzha irrigation project (KIP) has been implemented in the Kabani sub basin of
Cauveri basin. An earth dam constructed across Karapuzha at Vazhavatta to create a reservoir
of 76.50 MCM storage capacity and to irrigate a proposed net ayacut of 5221 hectares of land
in Vythiri and Sultan Bathery taluks of Wayanad district through a network of canals. The
salient features of the projects are compiled and given in Table 1.3
Table 1.3: Salient features of Karapuzha irrigation project
Name Name of the project Karapuzha irrigation project
River basin Kabani
River Panamarampuzha
Tributary Karapuzha
District Wayanad
Command area Vythiri, Sultan’s Batheri, Manan-
thawady
Latitude and longitude 11 37 00 and 76 10 30
Gross command area 6800 Hectares
Cultivable command area 5600 Hectares
Gross area under irrigation 8721 Hectares
Net area under irrigation 5221 Hectares
Catchment area at headwork sight 6200 Hectares
Maximum water level 76.5 m
Dead storage level 4.5 m
Type of dam Homogeneous, earthen and saddle
dam
Capacity of reservoir 76.5 MCM
Length of main canal (LBC) 8.805 km
Length of main canal (RBC) 13.74 km
Year of starting 1977
Year of commissioning 2004
The Banasurasagar project (BSP) is a multipurpose scheme aims at harnessing Karamantho-
du, tributary of Panamaram comes under Kabani basin of Cauvery river. The project consists
of a reservoir of gross storage capacity of 246.78 MCM. The important features of BSP are
compiled and given inTable 1.4.
Table 1.4: Salient features of Banasura Sagar Project
Name of project Banasurasagar project
Year of starting 1971
Name of river Karamanthodu, tributary of
Kabani

10
Catchment area 6150 Hectors
Type of structure Homogeneous rolled earth fill
Main dam site Padinjarathara
District Wayanad
Latitude 11 40 10
Longitude 75 57 20
Capacity of reservoir 246.78 MCM
Net ayacut 2800 Hectares
Gross ayacut 4740
Main canal (LBC)
length
2.73 Km
1.10 LAND USE
The spatial information on land use/land cover and their pattern of change is essential for
planning, utilization and management of the country’s land resources. Land use/land cover
inventories are assuming increasing importance in various resource sectors like agriculture
planning, settlement and cadastral surveys, environmental studies and operational planning
based on agro-climatic zones. Information on land use/ land cover permits a better under-
standing of the land utilization aspects on cropping pattern, fallow land, forest and grazing
land, wasteland, surface water bodies etc., which is very vital for developmental planning.For
Kerala State the preparation of latest land use/land cover maps are entrusted with Kerala State
land Use Board and the data summarized from their report is given in table.1.4 (KSUUB re-
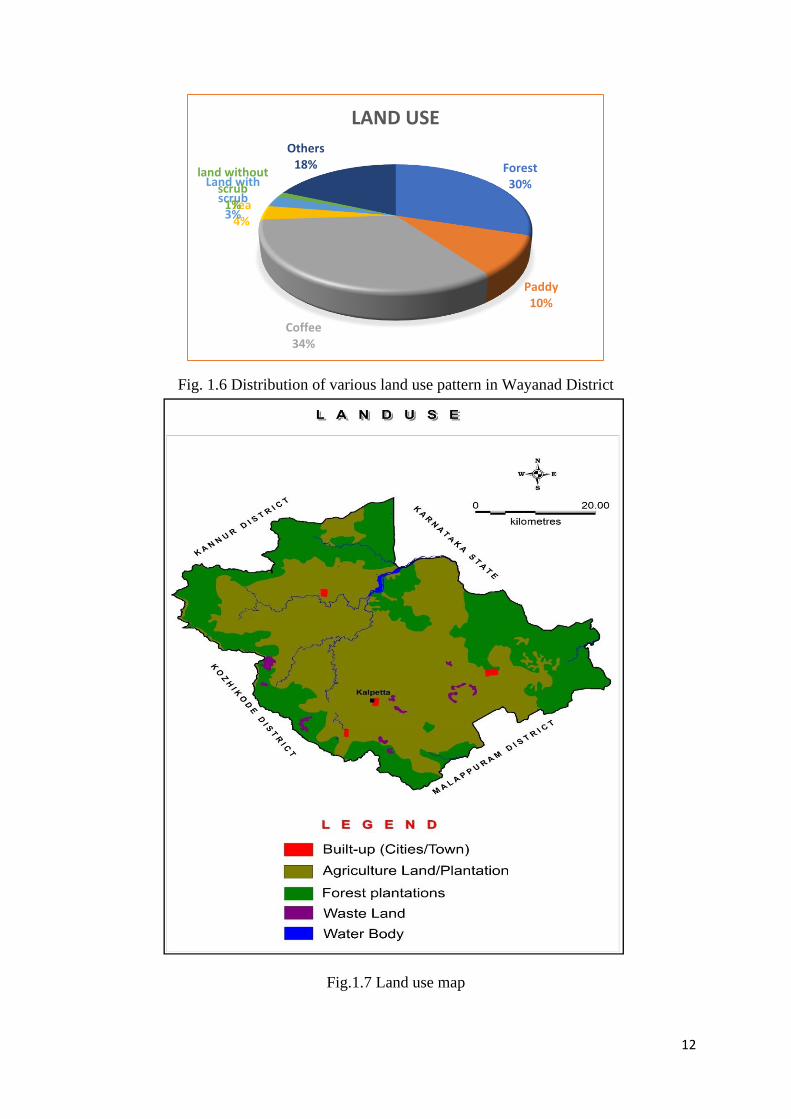
port-Wayanad,2019). Major portion of the area is used for coffee plantation (33%) followed
by different forest cover (30%). 6.26 % of area is used for Paddy cultivation (Virippu ) and
3.79 % is for Virippu and Mundakan ferming. Tea plantation is spreaded in 3.61 % of the ar-
ea. Land with scrub is 2.85 % and land without scrub is 1.28 %. Industrial wasteland is ab-
sent in the district (Fig.1.6 & 1.7).The Land use pattern in Wayanad District is described in
Table 1.5
Table1.5 Land use pattern in Wayanad district (Source: KSLUB, Govt of Kerala 2019)
Sl.
No. Category Area
(Sq.Km)
Percentage
1 Built up land (urban) - industrial 0.09 0
2 Built up land (urban) - commercial 2.46 0.12
3 Built up land (rural) - residential 14.63 0.69
4 Built up land (rural) - mixed builtup 2.7 0.13
5 Paddy - viruppu 133.25 6.26
6 Paddy - viruppu + mundakan 80.64 3.79
7 Paddy reclaimed arecanut 40.35 1.89
8 Paddy reclaimed mixed crop 1.86 0.09
9 Paddy reclaimed banana 25.96 1.22
10 Paddy reclaimed banana +tapioca 0.15 0.01

11
Sl.
No. Category Area
(Sq.Km)
Percentage
11 Paddy reclaimed residential 0.77 0.04
12 Paddy - fallow 0.58 0.03
13 Tea 76.96 3.61
14 Coffee 722.06 33.9
15 Rubber 13.32 0.63
16 Mixed crop 6.1 0.29
17 Pepper 0.05 0
18 Tapioca 0.64 0.03
19 Semi evergreen/Evergreen - Dense mixed forest 255.33 11.99
20 Semi evergreen/Evergreen - Dense mixed forest
(Reserve Forest) 268.72 12.62
21 Semi evergreen/Evergreen - Dense mixed forest
mainly bamboo 24.17 1.13
22 Semi evergreen/Evergreen - Dense mixed forest
mainly bamboo (Reserve Forest) 101.44 4.76
23 Semi evergreen/Evergreen - Open mixed forest 20.48 0.96
24 Semi evergreen/Evergreen - Scrub forest 20.13 0.95
25 Deciduous - Dense mixed forest mainly bamboo
+ teak 67.84 3.19
26 Deciduous - Dense mixed forest mainly teak 7.07 0.33
27 Deciduous - Dense mixed forest mainly teak
(Reserve Forest) 56.09 2.63
28 Deciduous - Scrub forest 0.54 0.03
29 Forest blank 0.48 0.02
30 Forest plantation - Teak 19.32 0.91
31 Forest plantation - Teak (Reserve Forest) 10.03 0.47
32 Forest plantation - Eucalyptus (Reserve Forest) 4.89 0.23
33 Forest plantation - Soft wood 3.75 0.18
34 Grassland 6.77 0.32
35 Grassland - degraded 1.28 0.06
36 Land with scrub 60.74 2.85
37 Land without scrub 27.34 1.28
38 Mining/Industrial wastelands 0.03 0
39 Barren rocky/sheet rock area 3.43 0.16
40 Degraded land under plantation crop (Coffee) 27.97 1.31
41 Degraded land under plantation crop (Tea) 1.98 0.09
42 Degraded land under plantation crop (Rubber) 0.52 0.02
43 Under utilised/degraded notified forest 4.61 0.22
44 Sands - riverine 0.34 0.02
45 Water bodies 11.88 0.56
Total 2129.74 100
12
Fig. 1.6 Distribution of various land use pattern in Wayanad District
Fig.1.7 Land use map
Forest30%
Paddy10%
Coffee34%
Tea4%
Land with scrub
3%
land without scrub
1%
Others18%
LAND USE
13
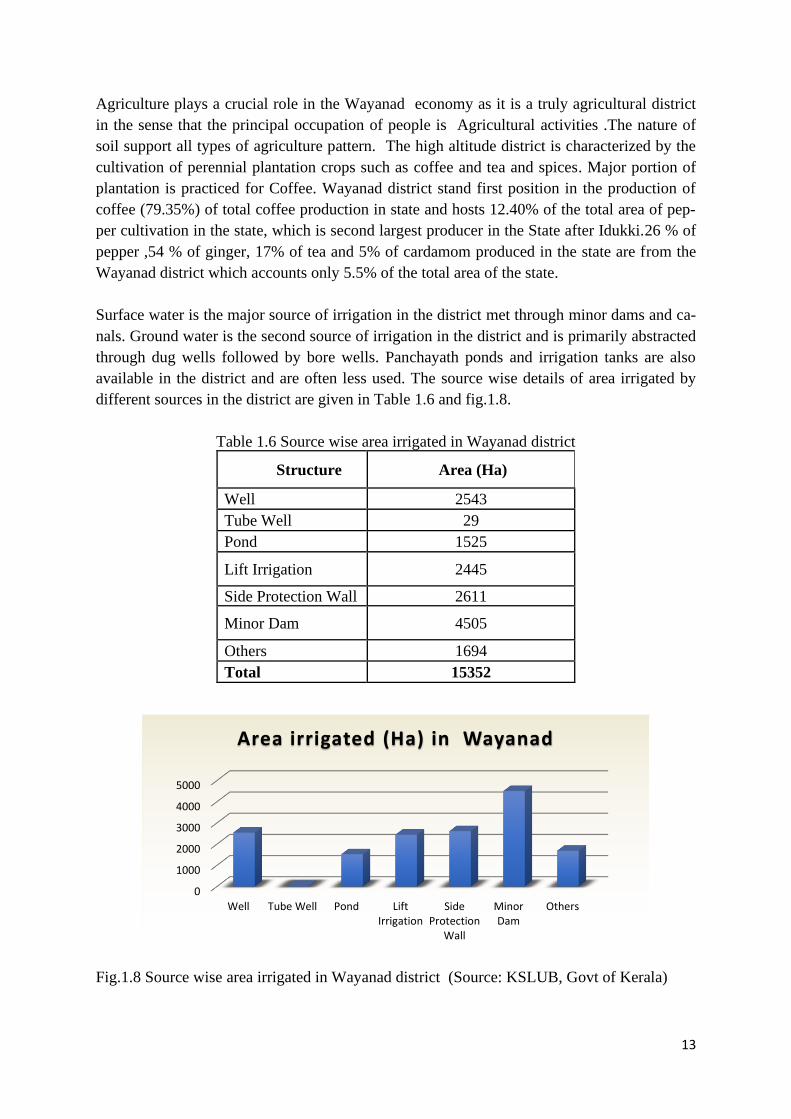
Agriculture plays a crucial role in the Wayanad economy as it is a truly agricultural district
in the sense that the principal occupation of people is Agricultural activities .The nature of
soil support all types of agriculture pattern. The high altitude district is characterized by the
cultivation of perennial plantation crops such as coffee and tea and spices. Major portion of
plantation is practiced for Coffee. Wayanad district stand first position in the production of
coffee (79.35%) of total coffee production in state and hosts 12.40% of the total area of pep-
per cultivation in the state, which is second largest producer in the State after Idukki.26 % of
pepper ,54 % of ginger, 17% of tea and 5% of cardamom produced in the state are from the
Wayanad district which accounts only 5.5% of the total area of the state.
Surface water is the major source of irrigation in the district met through minor dams and ca-
nals. Ground water is the second source of irrigation in the district and is primarily abstracted
through dug wells followed by bore wells. Panchayath ponds and irrigation tanks are also
available in the district and are often less used. The source wise details of area irrigated by
different sources in the district are given in Table 1.6 and fig.1.8.
Table 1.6 Source wise area irrigated in Wayanad district
Structure Area (Ha)
Well 2543
Tube Well 29
Pond 1525
Lift Irrigation 2445
Side Protection Wall 2611
Minor Dam 4505
Others 1694
Total 15352
Fig.1.8 Source wise area irrigated in Wayanad district (Source: KSLUB, Govt of Kerala)
0
1000
2000
3000
4000
5000
Well Tube Well Pond LiftIrrigation
SideProtection
Wall
MinorDam
Others
Area irrigated (Ha) in Wayanad

14
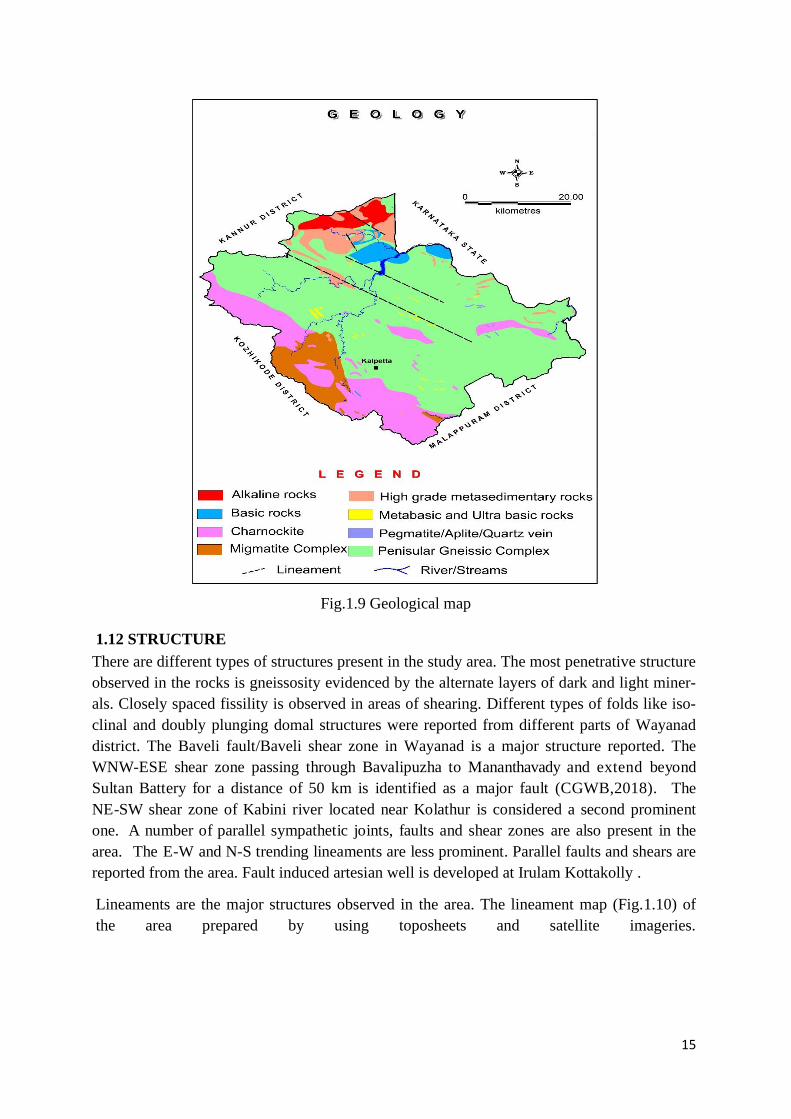
1.11 GEOLOGY
Geological succession has major role to play the ground water availability. Major part of the
study area is underlain by the crystalline rocks of Archaean age (Fig.1.9). Geological for-
mations occurred in the area are gneisses, charnockite, granite, intrusives viz. gabbro and dio-
rite, laterite and riverine alluvium. The hill district of Wayanad is covered mainly by Peninsu-
lar Shield of Western Ghats and forms the tri junction of Charnockites of Western Ghats,
Nilagiri Ranges and southward extension of Dharwars of Karnataka. Major rock groups of
the district are Wayanad Supracrustals, Gneisses, Charnockite, Basic and Acidic intrusives.
The rock types under wayanad supracrustals are Pyroxenite, Amphibolite, Pyroxene granu-
lite, Talc-tremolite-actinolite schists, Migmatitic quartz rock, fuchsite quartzite, garnet-
sillimanite - kyanite gneiss and quartz sericite schist and the various types of gneisses are Bi-
otite gneiss, Hornblende biotite gneiss, Augen gneiss and Mylonites. Among these, biotite
gneiss is extensively developed all over the district, followed by hornblende biotite gneiss.
Hornblende biotite gneiss is restricted only in the central and northern parts of Wayanad dis-
trict. Augen gneiss and mylonite occur in the vicinity of fault and shear zones with potash
feldspars as augens.
Charnockites suite of rocks are exposed in and around Chundale, Vythiri, Thariyode as linear
zones. Charnockites are trending in NW-SE with medium to coarse grained, mesocratic to
melanocratic and xenoblastic having mineral assemblages of pyroxene, feldspars, biotite and
garnet.
Basic intrusives noticed in Wayanad are Gabbro and Dolerite. Outcrops of gabbro are seen at
Kattikulam, Begur, Tholpetty and Karang. The NE of Mananthawady shows anorthositic dif-
ferentiates. The rocks are mesocratic to melanocratic, coarse grained, uneven texture consist-
ing essentially of plagioclase and pyroxenes. The diorites exposed in the northern parts of
Wayanad are mesocratic to melanocratic, coarse grained having mineral assemblages of grey
feldspars, hornblende and biotite. The geology of the area has been prepared (Fig.1.9) and the
geological succession compiled (Table 1.7).
Large bodies of intrusive pink granite occur near Kalpetta and Sulthan Bathery. Pegmatite
veins are also associated with granites. Dolerite and gabbro are intrusive with older rocks.
Large lenticular bodies of gabbro \ anorthosites occur north east of Mananthavady and a
large body of diorite occurs near the northern boundary of the district.
15
Fig.1.9 Geological map
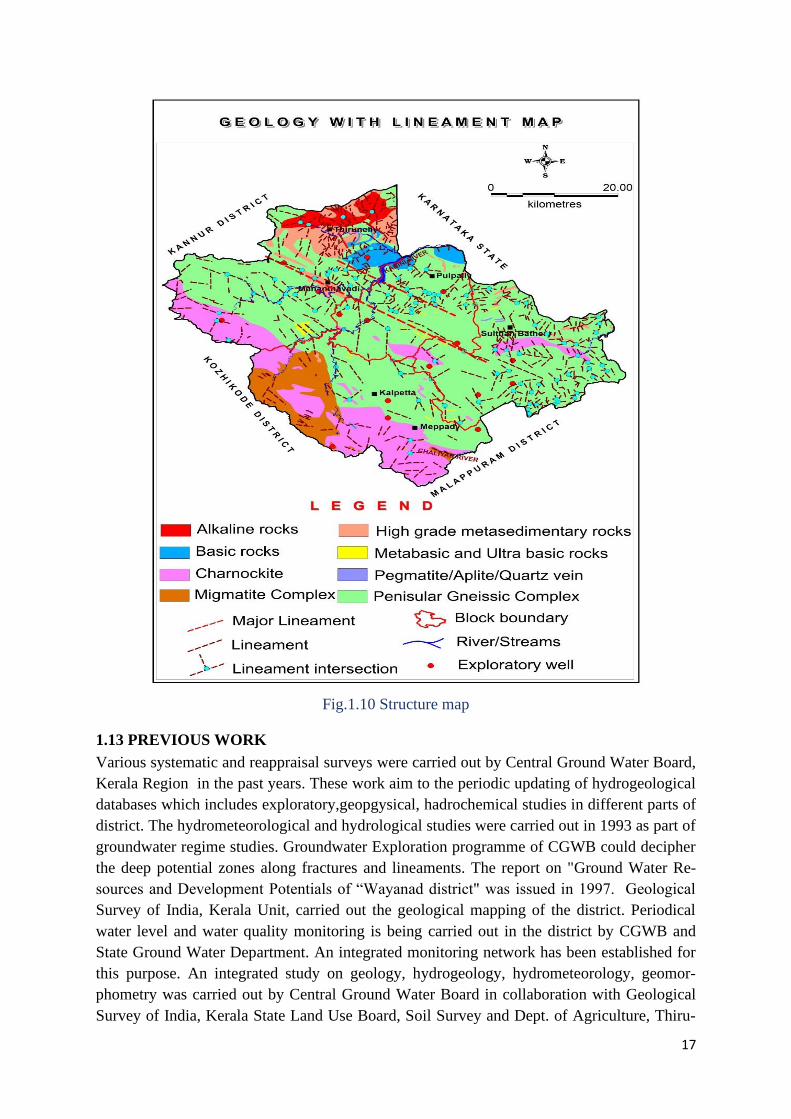
1.12 STRUCTURE
There are different types of structures present in the study area. The most penetrative structure
observed in the rocks is gneissosity evidenced by the alternate layers of dark and light miner-
als. Closely spaced fissility is observed in areas of shearing. Different types of folds like iso-
clinal and doubly plunging domal structures were reported from different parts of Wayanad
district. The Baveli fault/Baveli shear zone in Wayanad is a major structure reported. The
WNW-ESE shear zone passing through Bavalipuzha to Mananthavady and extend beyond
Sultan Battery for a distance of 50 km is identified as a major fault (CGWB,2018). The
NE-SW shear zone of Kabini river located near Kolathur is considered a second prominent
one. A number of parallel sympathetic joints, faults and shear zones are also present in the
area. The E-W and N-S trending lineaments are less prominent. Parallel faults and shears are
reported from the area. Fault induced artesian well is developed at Irulam Kottakolly .
Lineaments are the major structures observed in the area. The lineament map (Fig.1.10) of
the area prepared by using toposheets and satellite imageries.

16
Table 1.7: The geological succession in Wayanad District
Age
Formation Rock type
Recent Alluvium Sand and clays seen along flood
plains and valley fells
Sub-Recent Laterite Weathered crystalline rocks
Post Archaean
Dyke activity
Cataclasites
Dolerite and Meta gabbros
Myloblastic
Fissile mica gneiss
Proterozoic to Palaeozoic
Retrogression
Acid intrusives
Basic intrusives
Garnet-biotite gneiss
Pegmatite
Granite
Granite gneiss
Gabbro
Diorite
Archaean
Charnockitisation
Migmatisation
Wayanad
Supracrustals
Basement-gneiss
Charnockite
Migmatite gneiss (II)
Quartz-Seri cite schist
Garnet-sillimanite
Kyanite gneiss
Fuchsite quartzite
Magnetite-quartzite
Talc-tremolite-actinolite rock
Pyroxene / amphibolite granulite
Migmatitic gneiss (I) Fissile
17
Fig.1.10 Structure map
1.13 PREVIOUS WORK
Various systematic and reappraisal surveys were carried out by Central Ground Water Board,
Kerala Region in the past years. These work aim to the periodic updating of hydrogeological
databases which includes exploratory,geopgysical, hadrochemical studies in different parts of
district. The hydrometeorological and hydrological studies were carried out in 1993 as part of
groundwater regime studies. Groundwater Exploration programme of CGWB could decipher
the deep potential zones along fractures and lineaments. The report on "Ground Water Re-
sources and Development Potentials of “Wayanad district" was issued in 1997. Geological
Survey of India, Kerala Unit, carried out the geological mapping of the district. Periodical
water level and water quality monitoring is being carried out in the district by CGWB and
State Ground Water Department. An integrated monitoring network has been established for
this purpose. An integrated study on geology, hydrogeology, hydrometeorology, geomor-
phometry was carried out by Central Ground Water Board in collaboration with Geological
Survey of India, Kerala State Land Use Board, Soil Survey and Dept. of Agriculture, Thiru-

18
vananthapuram in 1992 under the title ‘Operation Wayanad’. Groundwater management
training was organized at Kalpetta in 2005 and pamphlets depicting groundwater scenario of
the district were distributed to the public during the function. The water samples collected
from the groundwater monitoring stations of the district during April every year is being ana-
lysed and studied for suitability of different uses. The hydro meteorological and hydrogeolog-
ical data collected from the district is also analysed and studied periodically.
1.14 URBAN AREA, INDUSTRIES AND MINING ACTIVITIES
Wayanad district is least urbanised district in Kerala. An urban ares as per census
norm can be defined as an area where more than 70% of the male working population is en-
gaged in non- agricultural and non-fisheries fields with high population density. There are
three municipalities in Wayanad district viz. Kalpetta,Mananthavady and Sulthan Bathery. In
all this municipalities, majority of the people are engaged in the agricultural practices and
selling various agricultural products especially spices viz. cardamom, pepper, clove, ginger
and others like rubber, tea, coffee and so on. Wayanad is backward in the case of industries.
There is no major industrial unit except factories like processing tea, timber mills and rice
mills. The details of industrial units in Wayanad district are compiled (Table 1.8).
Table.1.8 Details of industrial units in Wayanad District
Sl. No.
Blocks/Municipalities Mini industrial estates
Extend of
land, Acres
No. of industry
functioning
1 Kalpetta - -
2 Mananthawadi - -
3 Sultan’s Batherry 1200 3
4 Panamaram - -
The main mining activity in the study area is sand mining, clay mining and quarrying of the
hard rocks.
2 DATA COLLECTION, GENERATION AND INTEGRATION
2.1 DATA COLLECTION AND DATA GAP ANALYSIS
The database on Hydrometeorology, Geology, Geophysics, Hydrogeology and Hydrochemis-
try were compiled from previous studies carried out under various studies by CGWB such
as Systematic Hydrogeological studies, Reappraisal Hydrogeological studies, Groundwater
Management studies, Ground water Exploration, Micro level hydrogeological studies, short
term investigation and special studies have been utilized for data gap analysis in conjunction
with the data collected from various State (Land use board,GWD, MI Dept) and other Cen-
tral government departments (IMD,CWC). The thematic layers on drainage, geomorphology,
land use, soil and land cover were reproduced from the data obtained from concerned State
departments. The existing data on various themes analysed for finding the data gaps is given
in Table 2.1
19
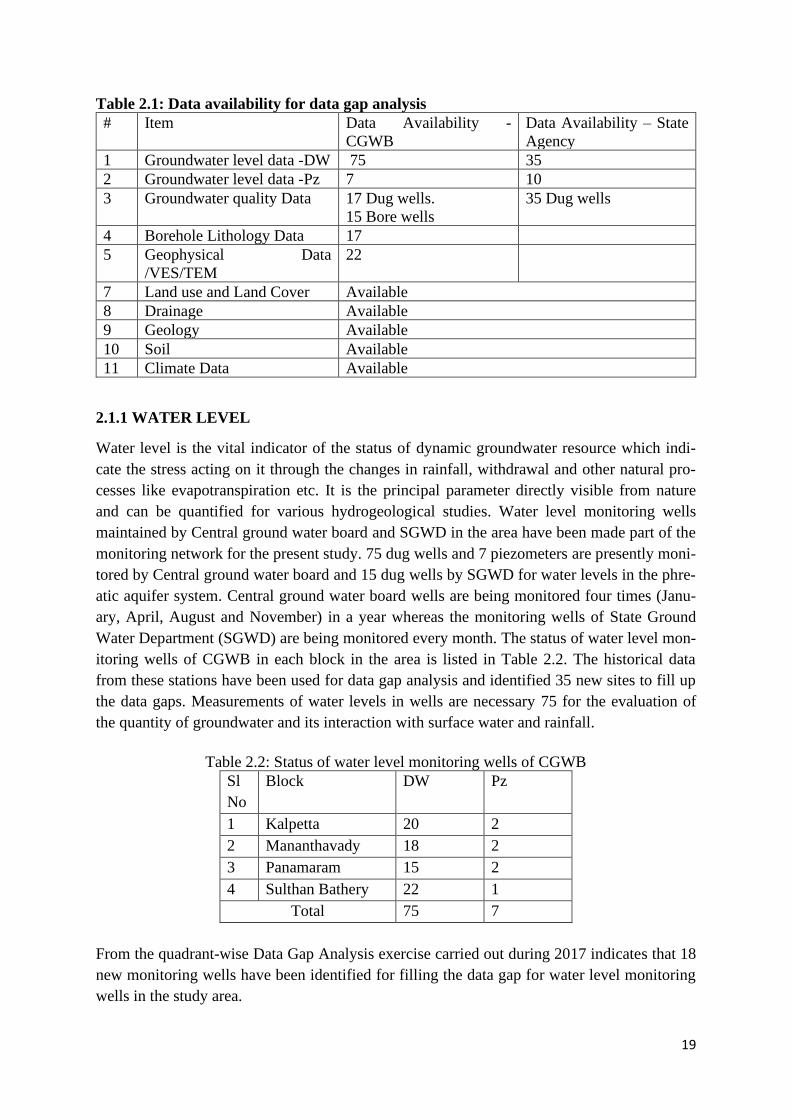
Table 2.1: Data availability for data gap analysis
# Item Data Availability -
CGWB
Data Availability – State
Agency
1 Groundwater level data -DW 75 35
2 Groundwater level data -Pz 7 10
3 Groundwater quality Data 17 Dug wells.
15 Bore wells
35 Dug wells
4 Borehole Lithology Data 17
5 Geophysical Data
/VES/TEM
22
7 Land use and Land Cover Available
8 Drainage Available
9 Geology Available
10 Soil Available
11 Climate Data Available
2.1.1 WATER LEVEL
Water level is the vital indicator of the status of dynamic groundwater resource which indi-
cate the stress acting on it through the changes in rainfall, withdrawal and other natural pro-
cesses like evapotranspiration etc. It is the principal parameter directly visible from nature
and can be quantified for various hydrogeological studies. Water level monitoring wells
maintained by Central ground water board and SGWD in the area have been made part of the
monitoring network for the present study. 75 dug wells and 7 piezometers are presently moni-
tored by Central ground water board and 15 dug wells by SGWD for water levels in the phre-
atic aquifer system. Central ground water board wells are being monitored four times (Janu-
ary, April, August and November) in a year whereas the monitoring wells of State Ground
Water Department (SGWD) are being monitored every month. The status of water level mon-
itoring wells of CGWB in each block in the area is listed in Table 2.2. The historical data
from these stations have been used for data gap analysis and identified 35 new sites to fill up
the data gaps. Measurements of water levels in wells are necessary 75 for the evaluation of
the quantity of groundwater and its interaction with surface water and rainfall.
Table 2.2: Status of water level monitoring wells of CGWB
Sl
No
Block DW Pz
1 Kalpetta 20 2
2 Mananthavady 18 2
3 Panamaram 15 2
4 Sulthan Bathery 22 1
Total 75 7
From the quadrant-wise Data Gap Analysis exercise carried out during 2017 indicates that 18
new monitoring wells have been identified for filling the data gap for water level monitoring
wells in the study area.

20
2.1.2 EXPLORATION
The subsurface disposition of aquifer systems can be deciphered by analysing exploratory
drilling details. Necessary information on aquifer geometry, hydraulic properties of aquifer
systems, groundwater potential of fracture systems and their characterization and quality of
deeper aquifer systems are primarily inferred from exploratory drilling data. The basic data
from 17 exploratory drillings in the area could be used for characterising aquifer disposition.
From the quadrant-wise Data Gap Analysis exercise carried out during 2017 indicate that
24 exploratory wells are to be drilled for filling the data gap of hydraulic properties in the
study area. The data gap will be accomplished in the future through in house drilling activi-
ties. Weathered thickness and depth of occurrence of fractures are also inferred from geo-
physical data such as Vertical Electrical Sounding (VES)/Transient Electro Magnetic (TEM)
and profiling and well inventory. Geophysical methods are normally employed as a recon-
naissance study before exploratory drilling. As the cost of geophysical investigation is much
less when compared to exploratory drilling it is effectively used to extract subsurface infor-
mation.
2.1.3 GEOPHYSICAL STUDIES
Geophysical data deciphered through VES or latest advancement like GTEM (Transi-
ent Electro Magnetic) sounding and profiling are used to extract information on the weath-
ered thickness, basement, fracture depth, thickness of fracture etc. The aquifer geometry
could be refined from the interpretation of geophysical data in conjunction with the available
groundwater exploration data. from quadrant-wise Data Gap Analysis exercise carried out
during 2017 indicate that 50 VES/TEM soundings have to be carried out for filling the data
gap subsurface profile of aquifer system including the weathered thickness.
2.1.4 WATER QUALITY MONITORING
The historical data on water quality in the area is available from the water level moni-
toring stations maintained by Central ground water board. Water sampling is being done eve-
ry year from these wells during pre-monsoon period (April). SGWD does the water sampling
twice a year during pre-monsoon and post-monsoon period. CGWB is maintaining 17
ground water quality monitoring stations in Wayanad district. The quadrant wise data gap
analysis has been carried out to find out the adequacy of information on water quality and it
is observed that 9 water quality locations are to be fixed for removing the data gap on qual-
ity
2.1.5 SOIL INFILTRATION TESTS
Infiltration rate of soil depends on the clay content and porosity which is essential in access-
ing the recharge rate specifically. To estimate the infiltration rate of soil in the study area 10
double ring infiltration tests were conducted in various parts of the district. A double ring in-
filtrometer requires two rings: an inner and outer ring. The purpose is to create a one-
dimensional flow of water from the inner ring so that the analysis of data is simplified. If wa-

21
ter is flowing in one dimension at steady state condition, and a unit gradient is present in the
underlying soil, the infiltration rate is approximately equal to the saturated hydraulic conduc-
tivity. An inner ring is driven into the ground, and a second bigger ring around that to help
control the flow of water through the first ring. Water is supplied either with a constant or
falling head condition, and the operator records how much water infiltrates from the inner
ring into the soil over a given time period. The ASTM standard method specifies inner and
outer rings of 30 and 60 cm diameters, respectively. Details of the tests are given in annex-
ure-VI. The infiltration rates are worked out to be 3.6 mm/hour at Padinjarathara and 0.12
mm/hour at Vythiri .
2.2 DATA GENERATION AND INTEGRATION
After determining various data gaps in the existing data set and additional data base is
essential to create additional data base in order to define the aquifer and its resources for bet-
ter management practices, The data generation activity after the data gap analysis include es-
tablishment of new key wells for water level monitoring, water quality monitoring, geophysi-
cal surveys and aquifer evaluation. Prior to data generation various data available with other
departments has been collected and finally integrated. The value addition made after data
generation and integration is discussed in the following sections. The activities include estab-
lishment of Key wells, water quality monitoring wells, geophysical survey. The data gap
identified and the new addition of data under various themes is given in Table 2.3. The value
addition made after data generation and integration of various components of the groundwa-
ter regime are described in the following sections.
Table 2.3: Data requirement and data generated for aquifer mapping
Themes Existing
data
Data
Gap
Total Data gener-
ated
Additional Data
requirement
Dug wells 75 18 93 40 nil
Exploratory
wells
17 50 67 nil 50
Piezometers 7 0 7 0 nil
VES/TEM 17 50 67 88 nil
Water quality 17 9 26 0 9
Soil Infiltra-
tion
0 10 10 10 nil
2.2.1 WATER LEVEL MONITORING
Data gap analysis carried out based on aquifer-wise as well as on quadrant-wise indicates the
requirement of 18 more monitoring wells in the area to represent the actual ground water lev-
el scenario. For this additional 40 new key wells have been established in the area and carried
out for postmonsoon and premonsoon water level monitoring. Few monitoring wells of GWD
were taken for fixing KOWs due to absence of dug wells in certain pockets. After integrat-
ing, the total number of ground water wells tapping unconfined aquifer becomes 93 The loca-
22
tions of these integrated GWMW’s are given in Figure 2.2. The details of groundwater level
monitoring wells are given in Annexure I (GWMWs) &II (KOWs).
2.2.2 EXPLORATION
Data gap analysis for exploration indicate an additional 24 no of EW are to be drilled which
will be taken up in the future through in house drilling .As such available data has been used
to interpret the aquifer geometry and its characteristics The locations of existing exploratory
as well as piezometers are given in Figure 2.1. Details of exploratory wells are given in An-
nexure-III
2.2.3 GTEM AND PROFILING
50 VES/ GTEM surveys were identified in data gap analysis for delineating the aquifer ge-
ometry in addition to the existing data. The geophysical investigation is required in the study
area to reveal weathered thickness, fracture depth, thickness of fracture and fracture pattern.
TEM has been carried out by employing the Schlumberger electrode configuration up to a
maximum spread length (AB/2) of 200 m. The obtained VES curves of H, QH, KH, HA, AA,
KHA and QHA type were interpreted by employing computer interpretational techniques.
The interpreted results have given rise to three layered geo electric sections. The locations of
these TEM locations are given in Figure 2.1 and details of G TEM are given in Annexure-IV.
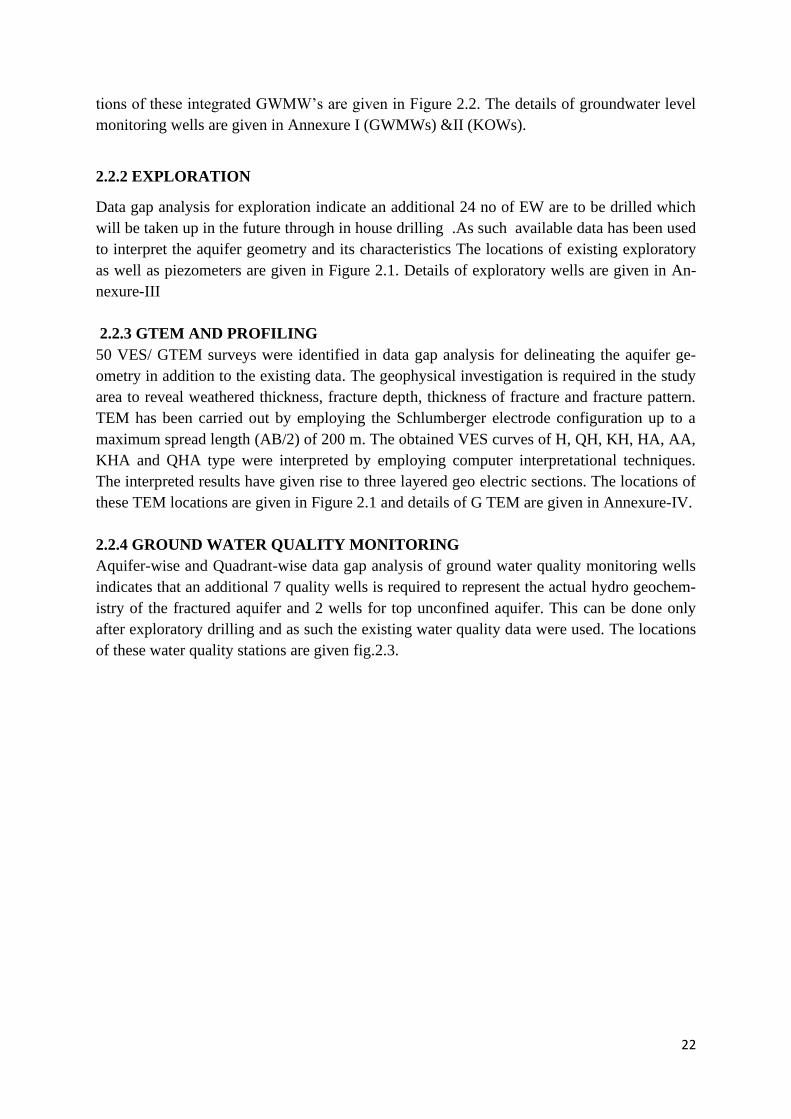
2.2.4 GROUND WATER QUALITY MONITORING
Aquifer-wise and Quadrant-wise data gap analysis of ground water quality monitoring wells
indicates that an additional 7 quality wells is required to represent the actual hydro geochem-
istry of the fractured aquifer and 2 wells for top unconfined aquifer. This can be done only
after exploratory drilling and as such the existing water quality data were used. The locations
of these water quality stations are given fig.2.3.

23
Fig.2.1 Location map of exploratory wells with TEM locations

24
Fig.2.2 Location map of water level monitoring wells (GWMW & KW)
25
Fig.2.3 Location map of Water quality monitoring stations

26
3.AQUIFER MAPPING
After analysing the existing data the next step is to interpret the data with the objectives of
generating a 2D and 3D disposition of the aquifer systems in the area, understand the ground
water regime and quantify the resources. Thus, various aquifer maps of the area have been
generated after integrating the hydrological, geological, geophysical, hydrogeological and
hydro chemical data. This summarised data is the basis for preparing various strategies to de-
velop the management of aquifer systems in the area.
3.1RAINFALL
Wayanad has a mean rainfall of 2786 mm. The district experiences heavy rainfall during
southwest monsoon season (80%) followed by the northeast monsoon season (12%) and win-
ter summer showers constitute 8 % .During January to May the rainfall is scanty with occa-
sional summer showers which constitute the non-monsoon rainfall. March and April are the
hottest months and December to February are the coldest. Besides orographic precipitation
and pre-monsoon “mango showers” play a role in rainfall availability in the area. Rain shad-
ow areas are existing in and around Pulpally, Kappiset, Mullankolly area adjoining Karnataka
border. 2019 witnessed record rainfall in the order of 2500.7 mm wheras low rainfall ob-
served during 2016.The monthly variations of rainfall pattern is provided in Table 3.1 and
Fig.3.1& 3.2 and it is found that august has recorded highest rainfall and January and Febru-
ary months are devoid of any rainfall.
Table 3.1 Monthly rainfall data (mm) during 2015-2020. (Source : IMD) Year Jan Feb Mar Apr May June Jul Aug Sept Oct Nov Dec Total
2015 0 0 33.42 125.86 198.3 444.77 179.1 147.78 166.07 126.42 138.32 17.05 1577.09
2016 3.72 1.47 8.44 17.13 115.9 263.03 232.91 150.6 61.79 37.73 9.65 24.35 926.72
2017 14.11 0 31.7 50.25 121.96 161.38 168.36 198.48 229.43 70.94 33.09 4.42 1084.12
2018 0 13.82 59.33 77.43 230.94 331.92 555.49 615.6 87.39 218.36 32.28 9.4 2231.96
2019 0.07 16.57 14.24 138.12 132.1 133.49 293.87 965.52 334.57 358.74 88.13 25.28 2500.7
2020 2.03 1.18 20.21 130.21 130.95 271.8 194.17 723.29 486.04 105.08 86.72 30.98 2182.66
Fig.3.1 Annual rainfall variations for the period of 2015-2020
27
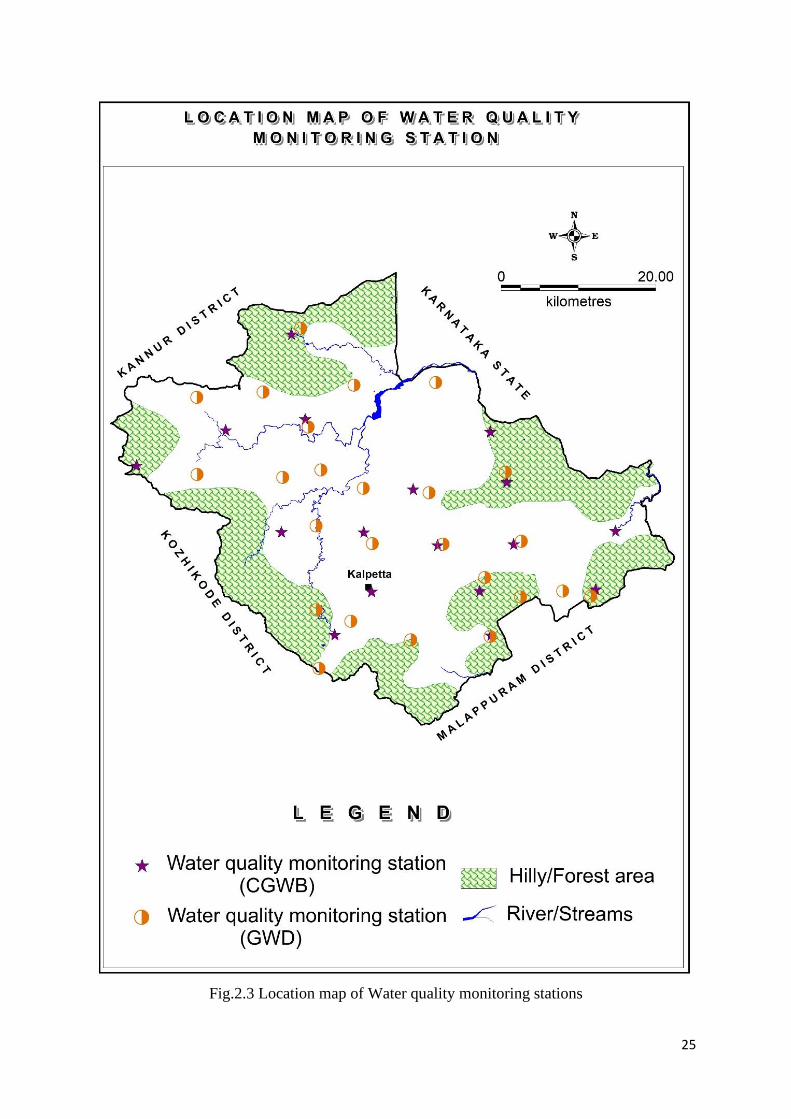
Analysis of isohyets (Fig. 3.2) revealed the actual rainfall distribution in the area. Different
rain gauge stations data were collected and is used for the preparation of isohyets / isohyetal
lines, which join all points that receive same amount of rainfall. It is seen that southern and
southwestern areas of the district such as areas Lakkidi, Padinjarathara (bordering Kozhikode
district) receive more than 2500 mm of annual normal rainfall. Eastern and northeastern areas
with lesser rainfall of less than 2000 mm of annual rainfall. Some areas surrounding eastern
and northeastern areas bordering Karnataka State experience drought and even some areas
come under rain shadow region. There is an increase in trend of rainfall towards south and,
southwestern areas.
Fig.3.2 Isohyetal map.

28
3.2 GEOPHYSICAL INVESTIGATIONS
Ground TEM (Transient Electromagnetic) or GTEM sounding is a geophysi-
cal technique used to obtain vertical resistivity soundings and a method which responds most
strongly to conductive materials. This method is non-destructive and uses a series of wire
loops for transmitting and receiving signals in the ground so no marks will be left in the sur-
vey area after measurements are finished.
The TEM procedure is remarkably efficient: with just a 40×40 meter square transmitter loop
and 1 or 2 smaller receiver coils, it is possible to reach depths of 200-250 meters and to get
from setting-up to a resistivity model only takes a few minutes. With a suitable sys-
tem configuration, it is possible to reach depths of more than 800 meters, without a huge in-
crease in survey times.
The advantages are (i) good depth of penetration (ii) stability to anisotropy (iii) lack of neces-
sity for galvanic grounding make the surveys independent of place, season, and weatherand
(iv) possibility of using loop sizes smaller than target depths.
TEM is an inductive method which means that it does not require a direct galvanaic (electric )
contact with the ground. The modus operandi is that a transmitter loop on the ground induces
a transient current within the subsurface and the receiver antennas then measure the rate of
change of magnetic field associated with that current as it propagates through the earth.
Transmitter loops and receiver coils are available in different sizes depending upon depth
penetration. Smaller transmitter and receiver loops are suited to shallow response, larger
loops are better for recording deeper depth responses.
Transient Electro Magnetic Met
Fig.3.3 Conceptual diagram of working of TEM soundings
TEM is sensitive to electromagnetic source and it may not appropriate for locations close to
buildings, utilities, infrastructure as these are potential noise source and therefore bad data.
TEM is adopted in defining the subsurface disposition of aquifers in the data gap area and to
recommend sites for exploratory drilling . Total 88 TEM were carried out in 22 locations by
employing the loop and antenna configuration. The obtained VES data was interpreted by
Current flowing through TX
Loop (red) create a magnetic
field (yellow)
The collapsing magnetic field
creates electrical currents in
the ground (orange)
Ground currents create a sec-
ondary magnetic field (yellow)
recorded by the RX coil (centre)

29
using the computer interpretational techniques. The interpreted results obtained are presented
in annexure -III.
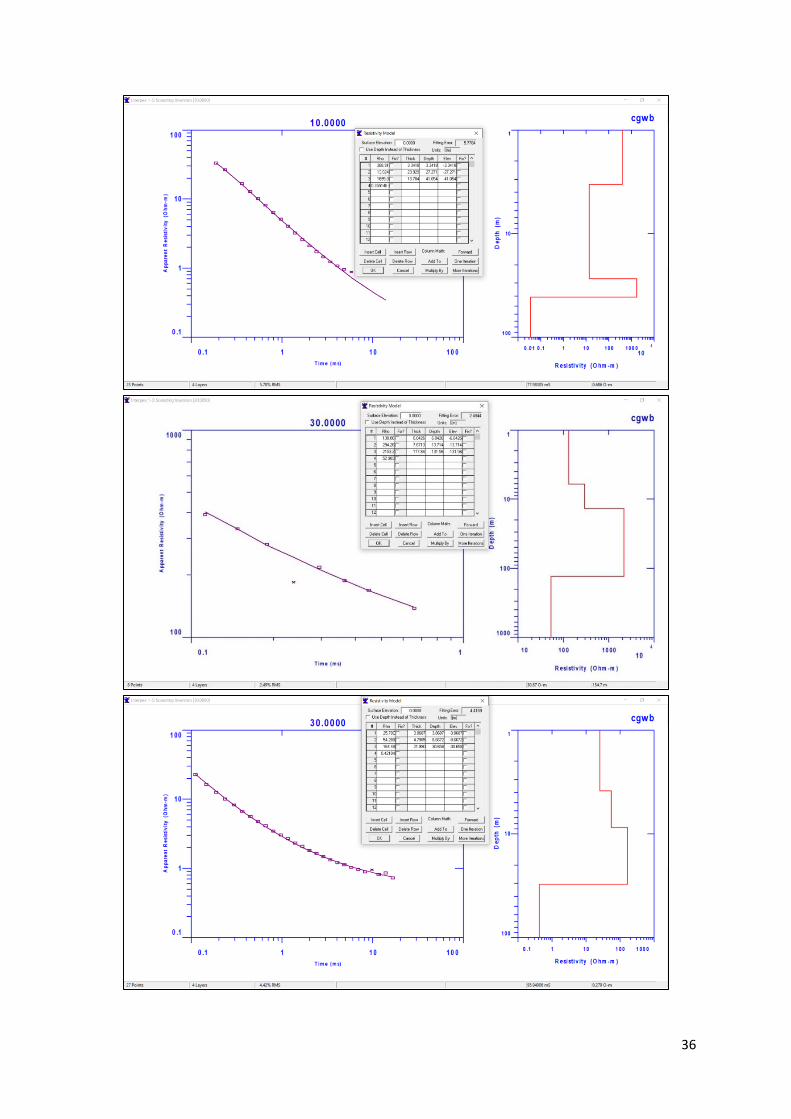
Totally 88 GTEM soundings/Profiles were carried out in 22 villages falling in 4
blocks. TEM locations conducted in Wayanad district is compiled (Fig-3.4) and interpreted
results of selected TEM soundings as layer parameters in the form of resistivity and thickness
are presented in Annexure-IV . Results are discussed block wise in the following paragraphs.
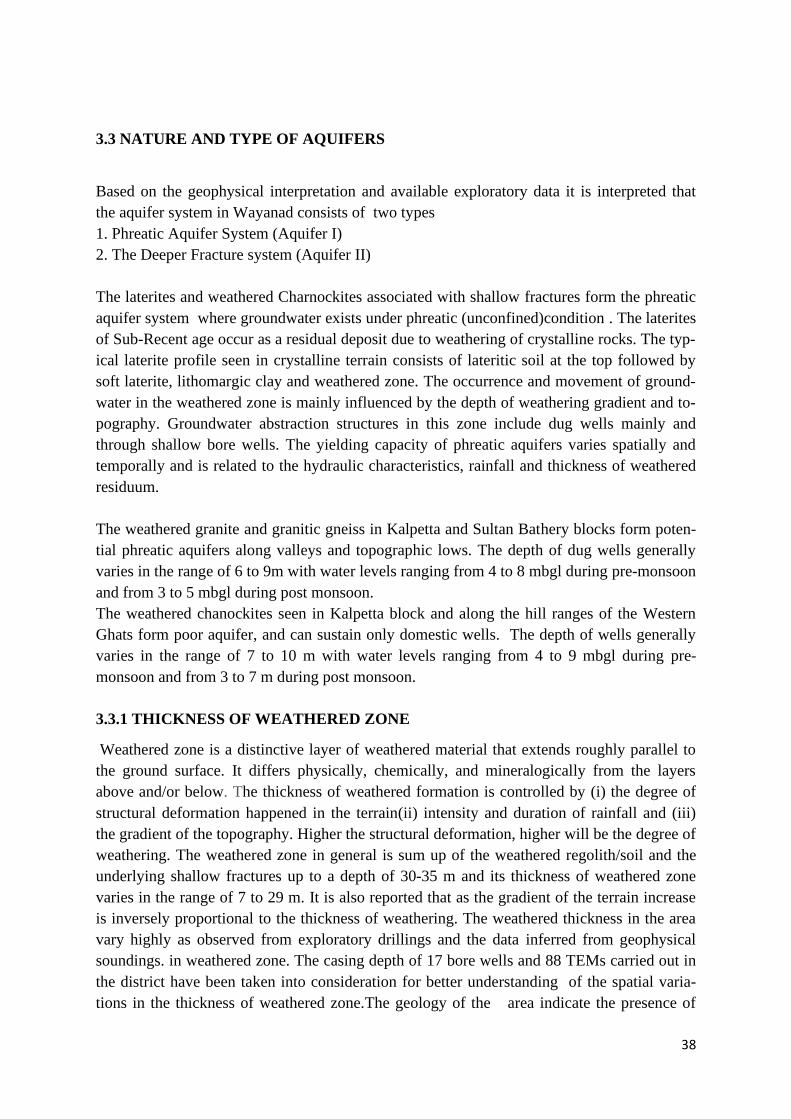
From the interpretation of TEM data in Wayanad district it is demarcated that the top
soil thickness is varying from 2.1 to 7.1 m, the weathered zone thickness is varying from 4.5
to 24 m and the depth to massive layer is varying from 6.5 to 27.5 m.
Fig. 3.4: Location of TEM soundings conducted in Wayanad District, Kerala
3.2.1 kalpetta block:
At Kalpetta block totally 14 GTEM soundings/Profiles were carried out in 4 villages.
Main rock formation in majority of study area is weathered granite, weathered charnockites
and granitic gneisses. Interpretation of TEM soundings indicated four layered behaviour
which can be correlated with Topsoil/and depth of weathering and compactness. Out of 14
Soundings 1 sounding could not be interpreted for layer parameters due to high noise level in
the data. General behaviour of these layers have been arrived at based on results of 13 TEM
soundings, and attributed to the following subsurface hydrogeological dispositions (Table.
3.2)

30
Table-3.2 Interpreted parameters of TEM in Kalpetta Block
S.N
o Location
TEM
No ρ1 ρ2 ρ3
Top Soil Weathered Depth to
Thickness Thickness Massive
1 Pookode 1 52 211 967 3.9 17.4 21.2
2 2 54 212 966 3.7 17.6 21.3
3 3 55 215 964 5.2 16.3 21.5
4 Kalpetta 1 136 129
0 82369 4.8 13.3
18.1
5 2 220 124
8 80325 5.6 12.6
18.2
6 3 330 181
5 80558 3.1 15.1
18.2
7 4 186 145
1 80530 2.9 15.5
18.3
8 Varambet-
ta 1 56 173 1923 2.3 11.9
14.2
9 2 37 143 1158 2.1 12.3 14.5
10 3 28 155 1386 3.0 10.9 13.9
11 Pinangode 1 297 44 4904 2.8 11.5 14.3
12 2 246 49 4977 3.2 11.2 14.4
13 3 227 46 4966 3.2 11.0 14.2
14 4 Not Interpretable
3.2.2 Panamaram Block:
At Panamaram block totally 25 GTEM soundings/Profiles were carried out in 6 vil-
lages. Main rock formation in majority of study area is weathered granite, weathered char-
nockites and granitic gneisses. Interpretation of TEM soundings indicated four layered behav-
iour which can be correlated with Topsoil/and depth of weathering and compactness. Out of
24 Soundings 1 sounding could not be interpreted for layer parameters due to high noise level
in the data. General behaviour of these layers have been arrived at based on results of 24
TEM soundings, and attributed to the following subsurface hydrogeological dispositions (Ta-
ble.3.3)
Table.3.3 Interpreted parameters of TEM in Panamaram Block
S.N
o Location
TEM
No ρ1 ρ2 ρ3
Top Soil Weathered Depth to
Thick-
ness Thickness Massive
1 Kaniyambet-
ta 1 358 101
204
1 3.5 12.4
15.9
2 2 454 92 203
5 3.2 12.4
15.5
3 3 Not Interpretable
4 4 358 99 204 3.8 12.1 15.9

31
S.N
o Location
TEM
No ρ1 ρ2 ρ3
Top Soil Weathered Depth to
Thick-
ness Thickness Massive
0
5 Valavayal 1 24 58 180 3.2 5.5 8.7
6 2 26 57 173 3.2 5.4 8.6
7 3 26 65 173 3.2 5.5 8.7
8 4 26 54 164 3.9 4.8 8.7
9 5 24 47 160 3.2 5.7 8.9
10 Perikalloor 1 311 17 169
5 3.3 23.8
27.2
11 2 389 14 169
5 3.3 23.9
27.3
12 3 287 20 170
0 3.1 24.2
27.3
13 4 287 24 169
6 3.2 24.4
27.6
14 Pulpally 1 141 426 185
0 5.7 8.2
13.9
15 2 151 449 224
1 7.1 6.7
13.8
16 3 140 352 191
3 6.1 7.8
13.9
17 4 131 294 215
3 6.0 7.7
13.7
18 Irulam 1 142 13 233
8 2.9 14.8
17.7
19 2 76 15 322 3.1 14.6 17.7
20 3 71 13 346 2.8 15.2 18.0
21 4 69 10 379 3.1 14.2 17.3
22 Nadavayal 1 345 60 243
7 4.5 9.9
14.4
23 2 379 60 223
0 4.6 10.0
14.5
24 3 363 55 233
2 4.9 9.2
14.1
25 4 350 57 250
0 4.7 9.6
14.2
3.2.3 Sulthan Bathery Block:
At Sulthan Bathery block totally 49 GTEM soundings/Profiles were carried out in 6
villages. Main rock formation in majority of study area is weathered granite, weathered
charnockites and granitic gneisses. Interpretation of TEM soundings indicated four layered

32
behaviour which can be correlated with Topsoil/and depth of weathering and compactness.
Out of 38 Soundings 11 sounding could not be interpreted for layer parameters due to high
noise level in the data. General behaviour of these layers have been arrived at based on re-
sults of 38 TEM soundings, and attributed to the following subsurface hydrogeological dispo-
sitions (Table.3.4)
Table.3.4 Interpreted parameters of TEM in Sulthan Bathery Block
S.N
o Location
TEM
No ρ1 ρ2 ρ3
Top Soil Weath-
ered Depth to
Thick-
ness Thickness Massive
1 Noolpuzha 1 381 129 3997 2.6 7.8 10.4
2 2 296 126 3990 2.4 7.6 10.0
3 3 443 129 4000 3.0 7.0 10.0
4 4 449 117 3960 3.5 7.2 10.7
5 CC Vakery 1 153 31 1515 2.7 6.5 9.2
6 2 143 32 1508 2.6 6.3 8.9
7 3 Not Interpretable 0.0
8 4 Not Interpretable 0.0
9 Thomat-
tuchal 1 191 29 1552 2.8 9.3
12.1
10 2 324 35 1506 2.5 10.0 12.5
11 3 199 19 1493 2.7 9.4 12.2
12 4 242 31 1737 2.5 9.8 12.3
13 Meenangadi 1 504 24 1431 4.1 10.9 15.0
14 2 450 24 1289 4.2 11.1 15.3
15 3 427 29 1282 4.4 11.0 15.4
16 4 418 34 1307 4.3 10.9 15.1
17 Sulthan
Bathery 1 586 16 3404 20.2 6.6
26.8
18 2 804 13 3734 20.2 5.7 25.8
19 3 597 35 3838 13.7 12.4 26.1
20 4 400 18 5122 19.1 7.2 26.3
21 Cheeral 1 43 491 5763 2.7 4.5 7.2
22 2 42 417 6412 2.3 5.0 7.3
23 3 40 383 6135 2.1 5.0 7.2
24 4 54 414 6742 2.2 5.1 7.2
25 5 55 306 5747 2.4 4.9 7.2
26 Kidangad 1 21 52 296 3.0 15.0 17.9
27 2 20 66 296 2.4 15.6 17.9
28 3 21 63 321 2.4 15.7 18.1
29 4 Not Interpretable
30 Odapallam 1 64 19288 1 13.5 0.0 13.5

33
S.N
o Location
TEM
No ρ1 ρ2 ρ3
Top Soil Weath-
ered Depth to
Thick-
ness Thickness Massive
31 2 65 19285 1 13.9 0.0 13.9
32 3 79 19316 13 13.9 0.0 13.9
33 4 69 19277 7 14.0 0.0 14.0
34 Muthanga 1 280 46 1530 3.9 10.2 14.1
35 2 315 45 1528 4.4 9.8 14.2
36 3 Not Interpretable
37 4 Not Interpretable
38 Ambalavayal 1 151 56 488 1.5 5.0 6.5
39 2 146 60 502 1.5 5.1 6.6
40 3 Not Interpretable
41 4 174 56 499 1.5 4.9 6.4
42 Nenmeni 1 Not Interpretable
43 2 22 99 881 4.7 6.7 11.3
44 3 30 84 226 1.9 9.5 11.3
45 4 27 90 729 4.8 6.5 11.4
46 Chulliyode 1 Not Interpretable
47 2 Not Interpretable
48 3 Not Interpretable
49 4 Not Interpretable
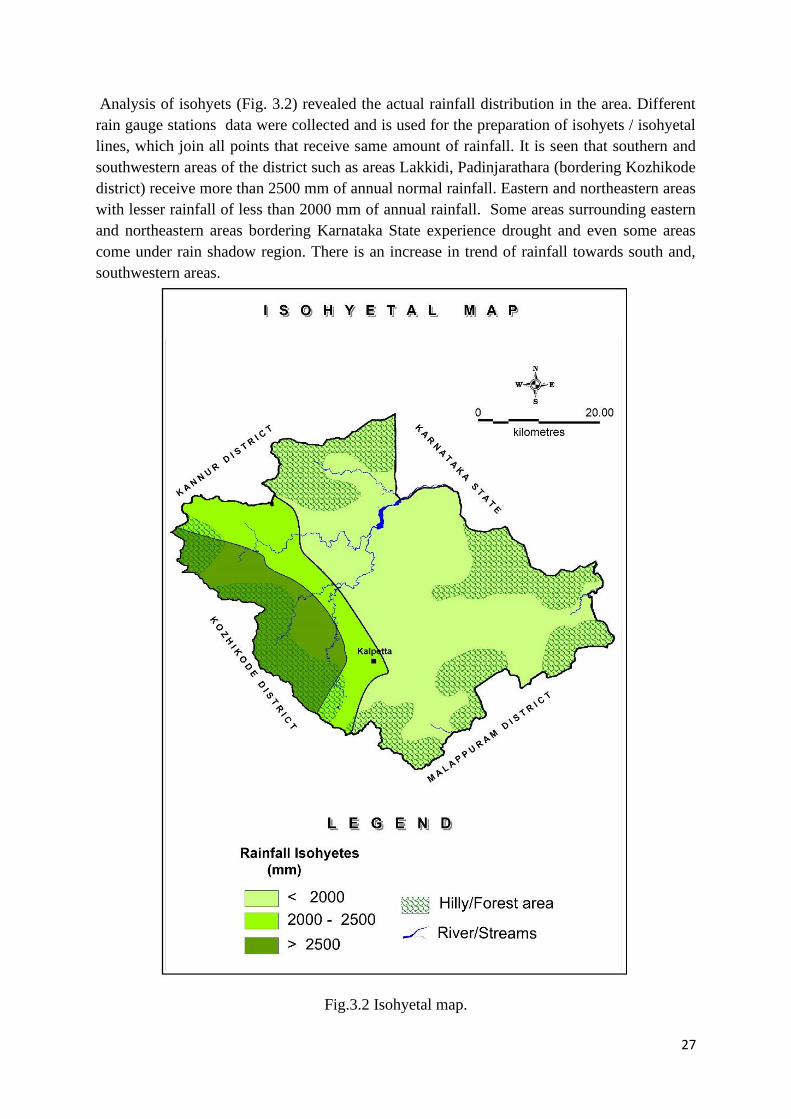
Some selected type curves of TEM with interpreted results are given in fig.3..5

34
Fig.
35
36

37
Fig.3.5 Type curves of TEM with interpreted results of selected locations
38
3.3 NATURE AND TYPE OF AQUIFERS
Based on the geophysical interpretation and available exploratory data it is interpreted that
the aquifer system in Wayanad consists of two types
1. Phreatic Aquifer System (Aquifer I)
2. The Deeper Fracture system (Aquifer II)
The laterites and weathered Charnockites associated with shallow fractures form the phreatic
aquifer system where groundwater exists under phreatic (unconfined)condition . The laterites
of Sub-Recent age occur as a residual deposit due to weathering of crystalline rocks. The typ-
ical laterite profile seen in crystalline terrain consists of lateritic soil at the top followed by
soft laterite, lithomargic clay and weathered zone. The occurrence and movement of ground-
water in the weathered zone is mainly influenced by the depth of weathering gradient and to-
pography. Groundwater abstraction structures in this zone include dug wells mainly and
through shallow bore wells. The yielding capacity of phreatic aquifers varies spatially and
temporally and is related to the hydraulic characteristics, rainfall and thickness of weathered
residuum.
The weathered granite and granitic gneiss in Kalpetta and Sultan Bathery blocks form poten-
tial phreatic aquifers along valleys and topographic lows. The depth of dug wells generally
varies in the range of 6 to 9m with water levels ranging from 4 to 8 mbgl during pre-monsoon
and from 3 to 5 mbgl during post monsoon.
The weathered chanockites seen in Kalpetta block and along the hill ranges of the Western
Ghats form poor aquifer, and can sustain only domestic wells. The depth of wells generally
varies in the range of 7 to 10 m with water levels ranging from 4 to 9 mbgl during pre-
monsoon and from 3 to 7 m during post monsoon.
3.3.1 THICKNESS OF WEATHERED ZONE
Weathered zone is a distinctive layer of weathered material that extends roughly parallel to
the ground surface. It differs physically, chemically, and mineralogically from the layers
above and/or below. The thickness of weathered formation is controlled by (i) the degree of
structural deformation happened in the terrain(ii) intensity and duration of rainfall and (iii)
the gradient of the topography. Higher the structural deformation, higher will be the degree of
weathering. The weathered zone in general is sum up of the weathered regolith/soil and the
underlying shallow fractures up to a depth of 30-35 m and its thickness of weathered zone
varies in the range of 7 to 29 m. It is also reported that as the gradient of the terrain increase
is inversely proportional to the thickness of weathering. The weathered thickness in the area
vary highly as observed from exploratory drillings and the data inferred from geophysical
soundings. in weathered zone. The casing depth of 17 bore wells and 88 TEMs carried out in
the district have been taken into consideration for better understanding of the spatial varia-
tions in the thickness of weathered zone.The geology of the area indicate the presence of

39
Charnockite rocks with migmatite and peninsular gneisses rcks in major parts of the dis-
trict.
Charnockite and migmatites are less prone to weathering and therefore shallow aquifer sys-
tem exist within a thickness of 15-20m.The weathering of Charnockite and migmatites create
less clay content due to mineralogical assemblages and are acting as good aquifers and of-
ten get saturated with onset of monsoon. Gneisses are known for more clayish content and
lead to clay rich weathered regolith and retard the recharging process due to low permeabil-
ity.
To understand the spatial variation, contour map depicting the weathered zone is prepared
and is shown in Figure 3.6. The thickness of the weathered zone generally decreases towards
the south central part towards Sulthan bathery side and , where it becomes less than 10m on
an average . In Mananthavadi and Muthunga side the weathered zone has developed into
maximum thickness of 29 m . The zone with 15-20 m range has been noticed as widely dis-
tributed one.
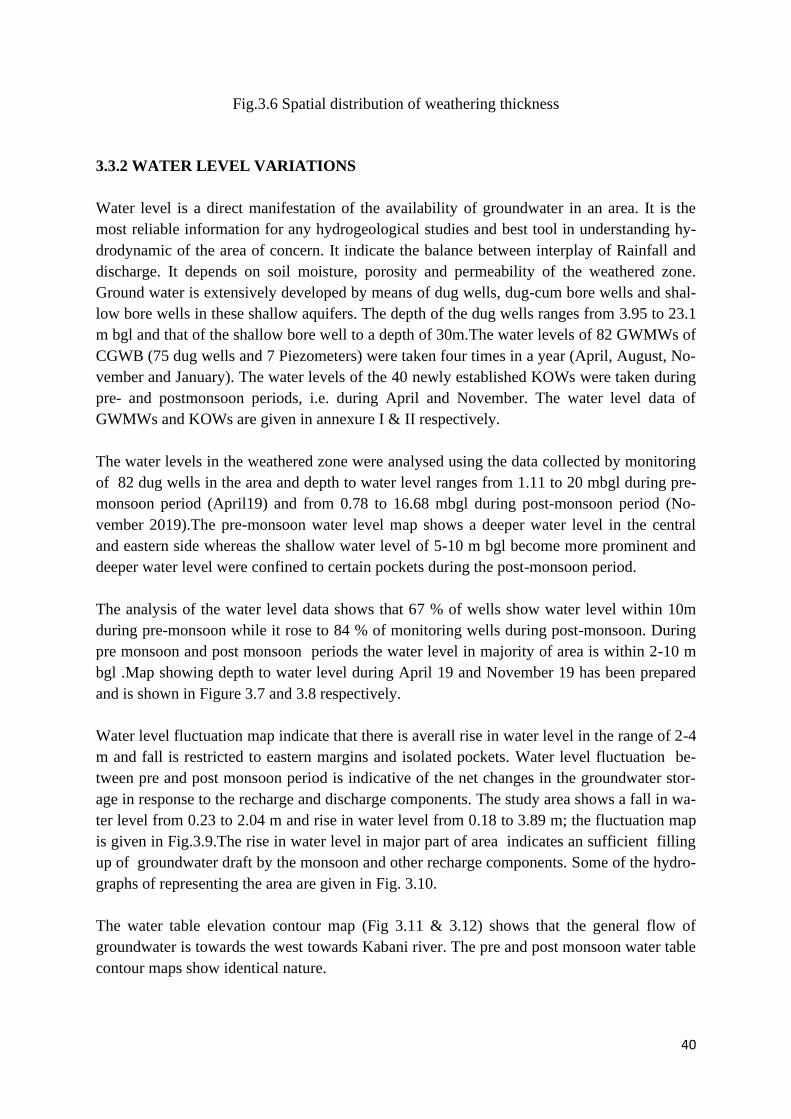
40
Fig.3.6 Spatial distribution of weathering thickness
3.3.2 WATER LEVEL VARIATIONS
Water level is a direct manifestation of the availability of groundwater in an area. It is the
most reliable information for any hydrogeological studies and best tool in understanding hy-
drodynamic of the area of concern. It indicate the balance between interplay of Rainfall and
discharge. It depends on soil moisture, porosity and permeability of the weathered zone.
Ground water is extensively developed by means of dug wells, dug-cum bore wells and shal-
low bore wells in these shallow aquifers. The depth of the dug wells ranges from 3.95 to 23.1
m bgl and that of the shallow bore well to a depth of 30m.The water levels of 82 GWMWs of
CGWB (75 dug wells and 7 Piezometers) were taken four times in a year (April, August, No-
vember and January). The water levels of the 40 newly established KOWs were taken during
pre- and postmonsoon periods, i.e. during April and November. The water level data of
GWMWs and KOWs are given in annexure I & II respectively.
The water levels in the weathered zone were analysed using the data collected by monitoring
of 82 dug wells in the area and depth to water level ranges from 1.11 to 20 mbgl during pre-
monsoon period (April19) and from 0.78 to 16.68 mbgl during post-monsoon period (No-
vember 2019).The pre-monsoon water level map shows a deeper water level in the central
and eastern side whereas the shallow water level of 5-10 m bgl become more prominent and
deeper water level were confined to certain pockets during the post-monsoon period.
The analysis of the water level data shows that 67 % of wells show water level within 10m
during pre-monsoon while it rose to 84 % of monitoring wells during post-monsoon. During
pre monsoon and post monsoon periods the water level in majority of area is within 2-10 m
bgl .Map showing depth to water level during April 19 and November 19 has been prepared
and is shown in Figure 3.7 and 3.8 respectively.
Water level fluctuation map indicate that there is averall rise in water level in the range of 2-4
m and fall is restricted to eastern margins and isolated pockets. Water level fluctuation be-
tween pre and post monsoon period is indicative of the net changes in the groundwater stor-
age in response to the recharge and discharge components. The study area shows a fall in wa-
ter level from 0.23 to 2.04 m and rise in water level from 0.18 to 3.89 m; the fluctuation map
is given in Fig.3.9.The rise in water level in major part of area indicates an sufficient filling
up of groundwater draft by the monsoon and other recharge components. Some of the hydro-
graphs of representing the area are given in Fig. 3.10.
The water table elevation contour map (Fig 3.11 & 3.12) shows that the general flow of
groundwater is towards the west towards Kabani river. The pre and post monsoon water table
contour maps show identical nature.
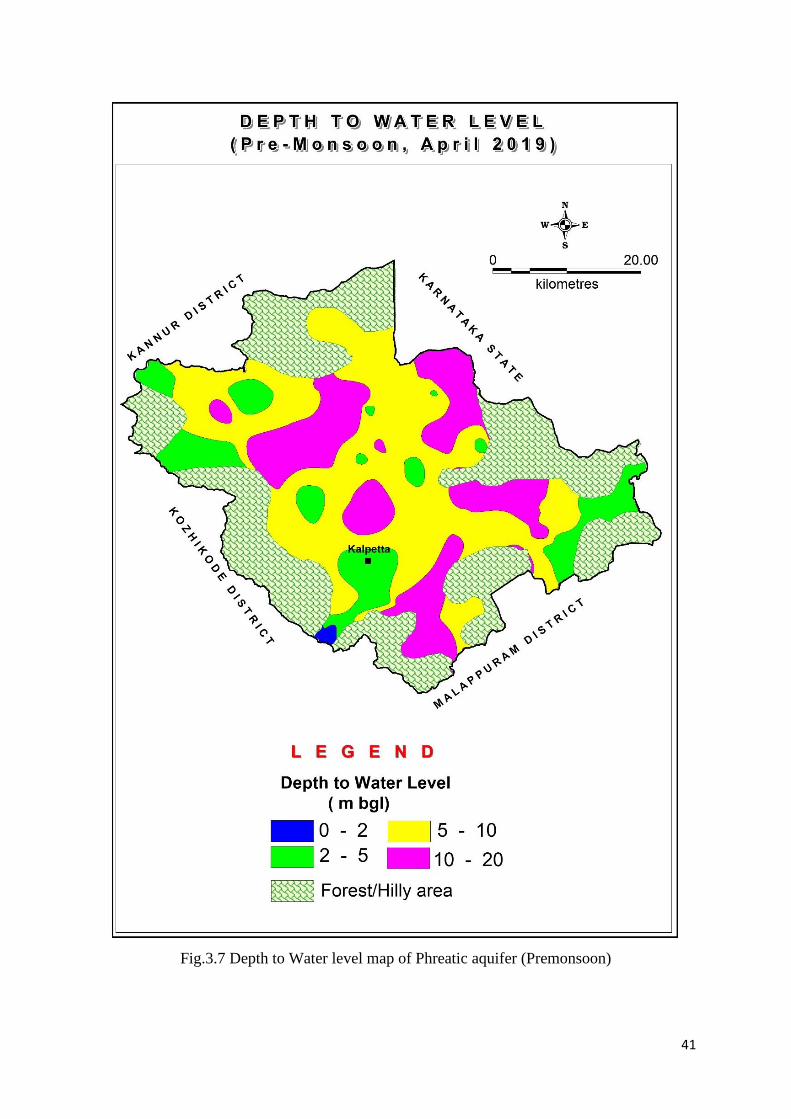
41
Fig.3.7 Depth to Water level map of Phreatic aquifer (Premonsoon)

42
Fig.3.8 Depth to Water Level map of Phreatic aquifer (Postmonsoon)
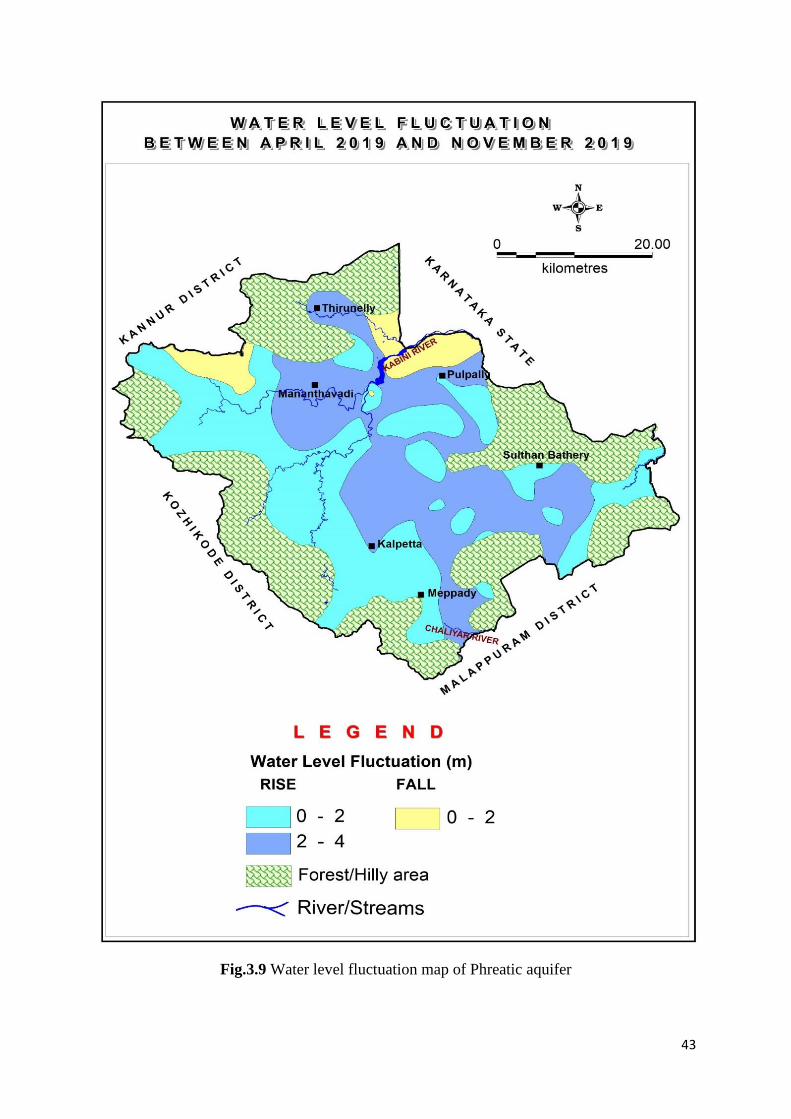
43
Fig.3.9 Water level fluctuation map of Phreatic aquifer
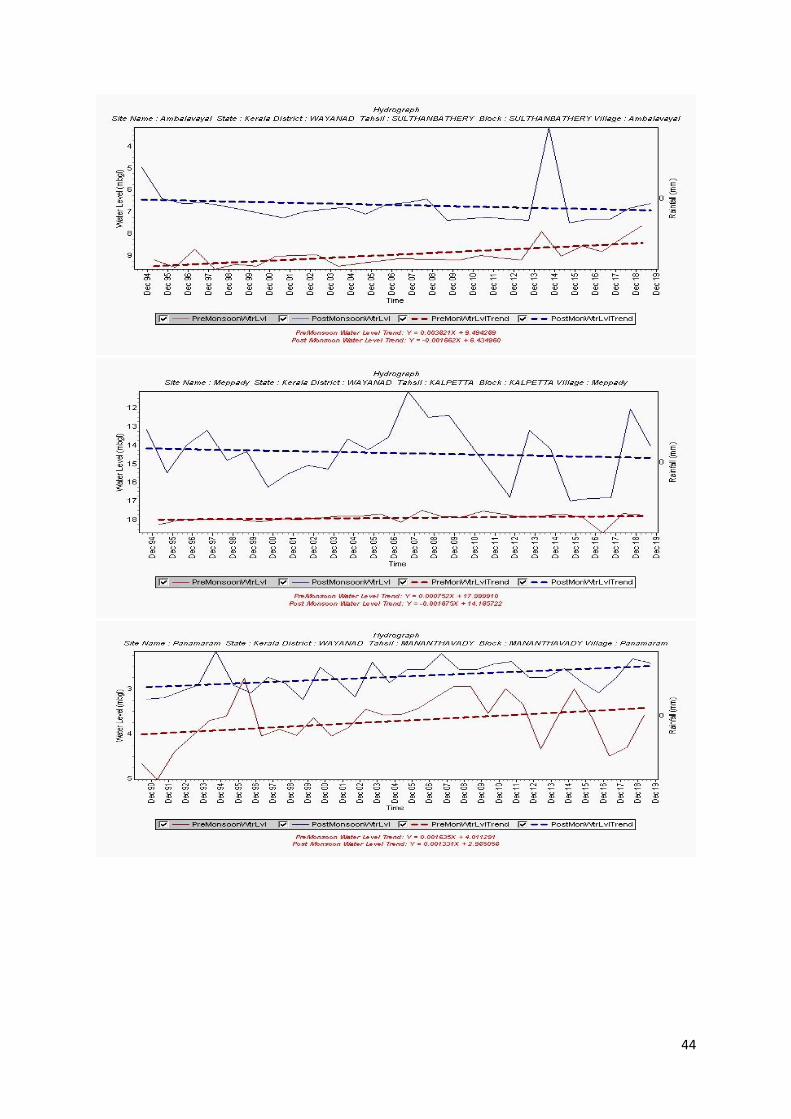
44
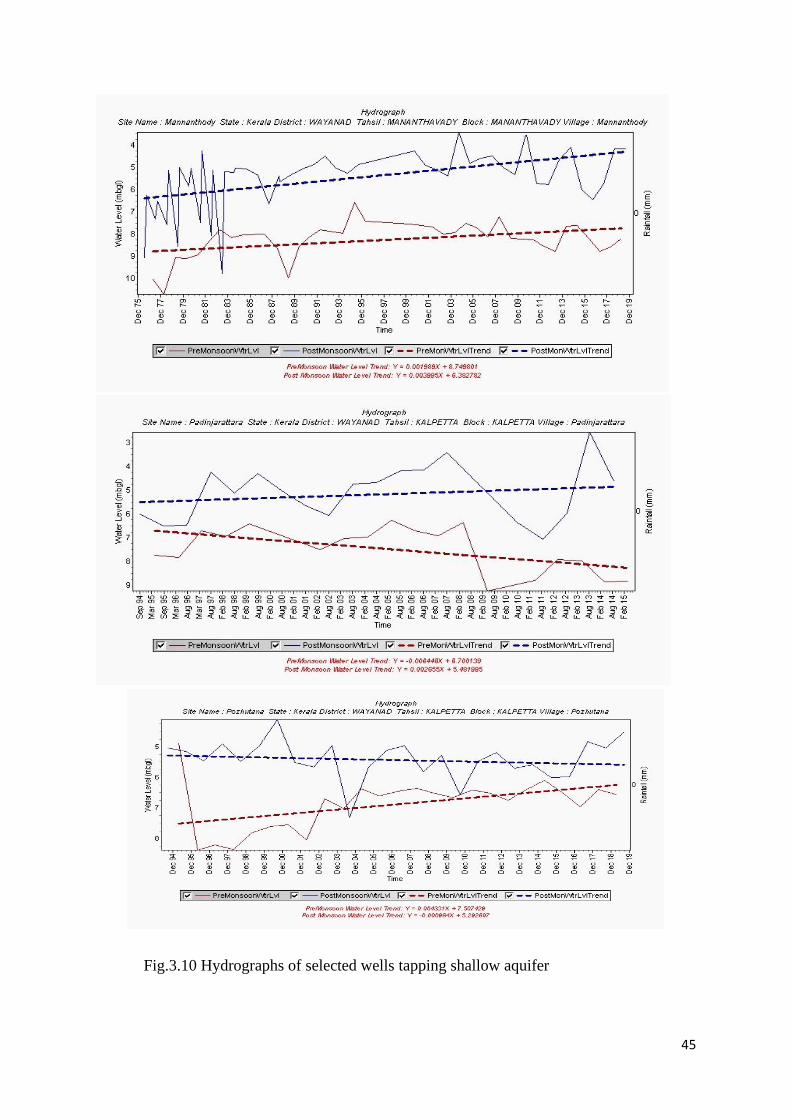
45
Fig.3.10 Hydrographs of selected wells tapping shallow aquifer
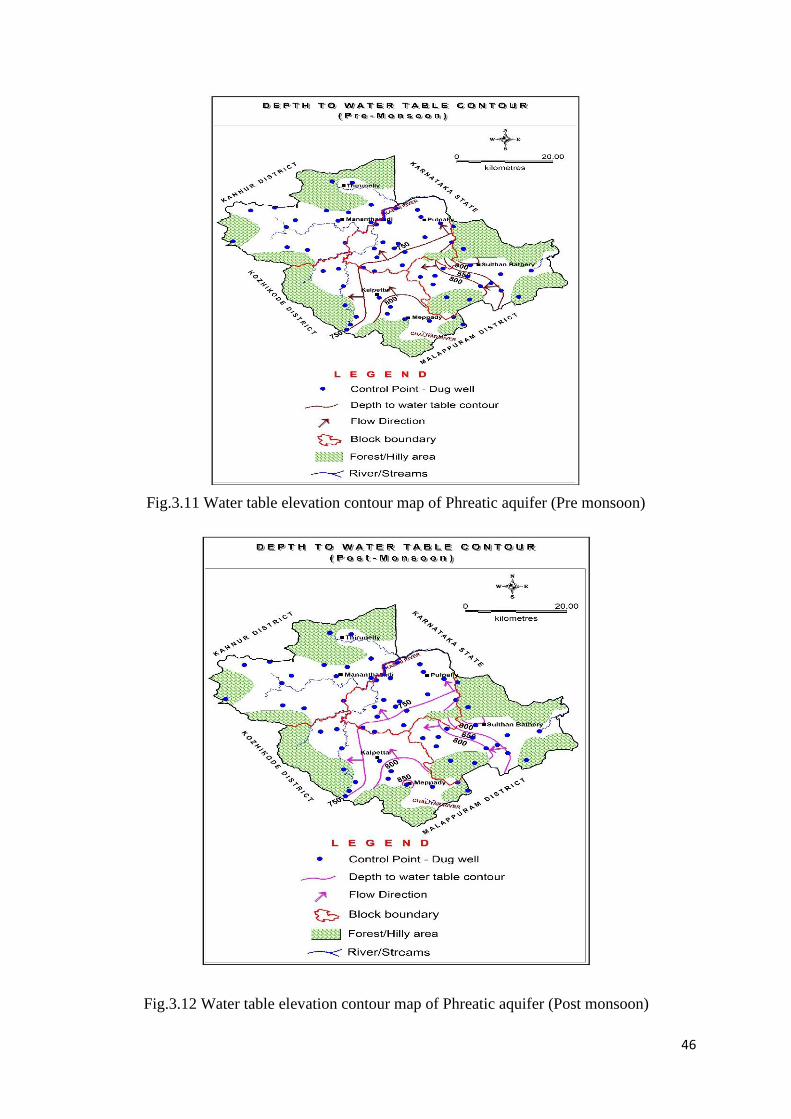
46
Fig.3.11 Water table elevation contour map of Phreatic aquifer (Pre monsoon)
Fig.3.12 Water table elevation contour map of Phreatic aquifer (Post monsoon)

47
3.3.3. WATER LEVEL TREND
The variation in water level with reference to time and space is the net result of groundwater
development and recharge. The long-term change in water level is apparent from the trend of
water levels over a period of time and is best reflected in a hydrograph. The decadal trend
(2010-2019) of groundwater levels, for pre-monsoon and post-monsoon periods is given be-
low in table 3.5. The analysis of pre-monsoon water level trend for the last decadal period
(i.e during indicates that only 34 % of GWMWs have recorded negligible change in water
level in the range of +0.05 to –0.05 m/year. The 32 % of monitoring wells have recorded de-
clining trend in the range of 0.05 to 0.2 m/year and 12% of monitoring wells have recorded
declining trend above 0.2 m/year.
16 % of monitoring wells have recorded rising trend in the range of 0.05 to 0.2 m/year and 6
% of monitoring wells have recorded rising trend above 0.2 m/year. Hence it is very clear that
long-term ground water level trend shows a falling trend in major portions of the state repre-
sented by about 44 % of the total wells excluding the wells showing negligible change in wa-
ter level
The analysis of post-monsoon water level trend for the last decadal period (i.e during 2010 -
2019) indicates that only 27% of GWMWs have recorded negligible change in water level in
the range of +0.05 to –0.05 m/year. The 26 % of monitoring wells have recorded declining
trend in the range of 0.05 to 0.2 m/year and 5 % of monitoring wells have recorded declining
trend above 0.2 m/year. 24 % of monitoring wells have recorded rising trend in the range of
0.05 to 0.2 m/year and 18 % of monitoring wells have recorded rising trend above 0.2 m/year.
Hence it is very clear that long-term ground water level trend shows a rising trend in major
portions of the state represented by about 42 % of the total wells excluding the wells showing
negligible change in water level.
Table.3.5 : Decadal Trend of water level (2010-19)
Premonsoon Postmonsoon
Location
Data
Point
s
Rise
(m/year
)
Fall
(m/year
) Location
Data
Point
s
Rise
(m/year
)
Fall
(m/year)
Ambalavayal 9 0.0946 Ambalavayal 9 0.0352
Appapara 10 0.1379 Appapara 11 0.0194
Begur 6 0.0970 Arimula 6 0.5571
Chenad 10 0.2431 Begur 6 0.0761
Cheyyambam 8 0.2323 Chenad 9 0.0916
Dasanakkara 6 0.1398 Cheyyambam 11 0.0225
Kalpetta-R1 6 0.1975 Dasanakkara 6 0.2737
Kamblakat 9 0.0260 Kamblakat 11 0.0644
Kattikulam 10 0.1541 Kattikulam 10 0.1083
Kavumandam 9 0.0942 Kavumandam 11 0.0922
Kellur -5th 8 0.5462 Kellur -5th 11 0.0416
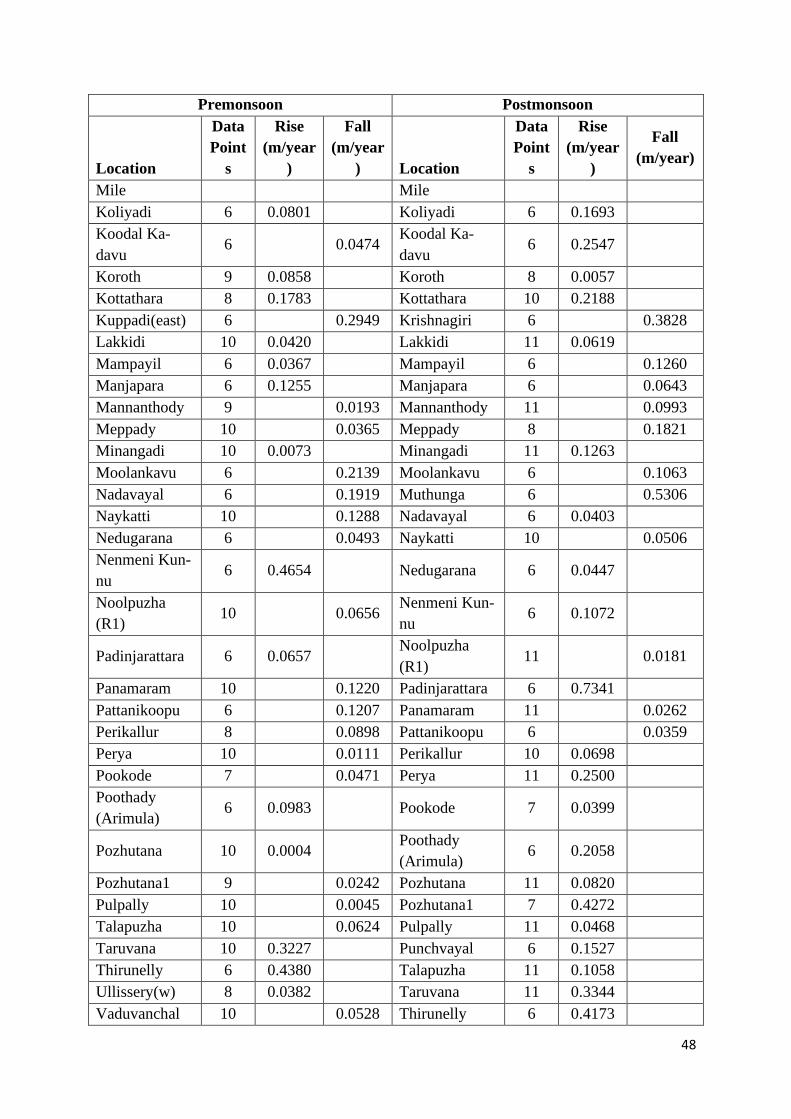
48
Premonsoon Postmonsoon
Location
Data
Point
s
Rise
(m/year
)
Fall
(m/year
) Location
Data
Point
s
Rise
(m/year
)
Fall
(m/year)
Mile Mile
Koliyadi 6 0.0801 Koliyadi 6 0.1693
Koodal Ka-
davu 6
0.0474
Koodal Ka-
davu 6 0.2547
Koroth 9 0.0858 Koroth 8 0.0057
Kottathara 8 0.1783 Kottathara 10 0.2188
Kuppadi(east) 6 0.2949 Krishnagiri 6 0.3828
Lakkidi 10 0.0420 Lakkidi 11 0.0619
Mampayil 6 0.0367 Mampayil 6 0.1260
Manjapara 6 0.1255 Manjapara 6 0.0643
Mannanthody 9 0.0193 Mannanthody 11 0.0993
Meppady 10 0.0365 Meppady 8 0.1821
Minangadi 10 0.0073 Minangadi 11 0.1263
Moolankavu 6 0.2139 Moolankavu 6 0.1063
Nadavayal 6 0.1919 Muthunga 6 0.5306
Naykatti 10 0.1288 Nadavayal 6 0.0403
Nedugarana 6 0.0493 Naykatti 10 0.0506
Nenmeni Kun-
nu 6 0.4654
Nedugarana 6 0.0447
Noolpuzha
(R1) 10
0.0656
Nenmeni Kun-
nu 6 0.1072
Padinjarattara 6 0.0657
Noolpuzha
(R1) 11
0.0181
Panamaram 10 0.1220 Padinjarattara 6 0.7341
Pattanikoopu 6 0.1207 Panamaram 11 0.0262
Perikallur 8 0.0898 Pattanikoopu 6 0.0359
Perya 10 0.0111 Perikallur 10 0.0698
Pookode 7 0.0471 Perya 11 0.2500
Poothady
(Arimula) 6 0.0983
Pookode 7 0.0399
Pozhutana 10 0.0004
Poothady
(Arimula) 6 0.2058
Pozhutana1 9 0.0242 Pozhutana 11 0.0820
Pulpally 10 0.0045 Pozhutana1 7 0.4272
Talapuzha 10 0.0624 Pulpally 11 0.0468
Taruvana 10 0.3227 Punchvayal 6 0.1527
Thirunelly 6 0.4380 Talapuzha 11 0.1058
Ullissery(w) 8 0.0382 Taruvana 11 0.3344
Vaduvanchal 10 0.0528 Thirunelly 6 0.4173

49
Premonsoon Postmonsoon
Location
Data
Point
s
Rise
(m/year
)
Fall
(m/year
) Location
Data
Point
s
Rise
(m/year
)
Fall
(m/year)
Valad 6 0.1435 Ullissery(w) 6 0.1682
Vallathur 6 0.1744 Vaduvanchal 11 0.0159
Valliyur-
kavu(e) 9 0.0269
Valad 7 0.3986
Valliyur-
kavu(w) 8 0.0267
Vallathur 6 0.1101
Varayal 6
0.0679 Valliyur-
kavu(e) 10
0.1204
Vellamunda 7
0.7452 Valliyur-
kavu(w) 10
0.1103
Vyittiri 10 0.0885 Varayal 6 0.1871
Vellamunda 11 0.1159
Vengapalli 6 0.1853
Vyittiri 11 0.0140
3.3.4 DEEPER FRACTURE AQUIFER SYSTEM (AQUIFER II)
In hard rock area the ground water is purely the interplay of fracture zones and lineaments
which is resultant of structural deformations.(see fig.1.1). The disposition of the deeper frac-
ture aquifer system can be inferred through integrated study using the geology and explora-
tion data in the form of various lithologs. A total of 17 bore wells have been drilled in the
hard rock area, tapping fractured crystallines. The exploratory data analysis indicate that deep
seated fractured rock occurs in the form of vertical to sub vertical narrow linear zones and
horizontal zones of varying thickness within the massive rocks. The depth of the wells ranges
from 60 to 200 m bgl. The depth of the fractures ranges from 16 to 199 m and the discharge
ranges from 0.33 to 11 lps and these bore wells were located along NW-SE, NNE-SSW, NS
and EW lineaments. It has been observed that wells falling along E-SW and E-W lineaments
have got relatively higher discharges when compared to others. In addition to exploratory
wells, 09 piezometers are drilled during Hydrology Project in the depth range of 30 to 40 m
with the purpose of monitoring.
Out of 17 wells drilled, 11 wells are tapping Granite gneisses where depth of occurrence of
fracture zones limited to 170 m. Maximum no of fractures (45%) are encountered in the depth
ranges of 0-50m which is followed by 50-100 (20%) and only limited fracture zones (15%)
are available in the depth range of 150-200 m. In case of remaining 11 wells tapping Char-
nockites, potential fracture zones are in 0-50m (45%) and 100-150m (30%), Deeper fracture
zones (199 m) are encountered in Charnokite rocks whereas maximum yield (11 lps) is rec-
orded in Granite Gneiss rocks.
50
The information on weathered thickness and fracture zones from exploratory wells have been
used for the preparation of various diagrams like fence, 3D model etc. to represent the sub-
surface aquifer disposition of the area. The cross sections of the sub surface aquifer disposi-
tion prepared from the lithologs of EWs drilled by CGWB is shown in fig. 3.13 and fence
diagram of the area is shown in fig. 3.14. Only 30 % of the wells drilled in the hard rock area
yielded discharge more than 3 lps (180 lpm). Groundwater in the deeper fractured aquifer
system exists under semi-confined to confined state and the depth to water level ranges from
0.3 to 10.95 mbgl.
3.3.5 GROUNDWATER POTENTIAL AND GEOLOGICAL STRUCTURES
It is well known fact that in hard rock area the structural features like fractures, joints and lin-
eaments are guiding the movement of ground water . These features can be observed in the
field (toposheets)or identify using satellite data by analysing the tonal differences with re-
spect to other terrain surfaces. Lineaments are linear or curvilinear surface manifestations of
structurally controlled features, such as joints, the straight course of streams/rivers and vege-
tation cover and being weak zones, it serve as conduits for movement or accumulation of
groundwater in the subsurface. Hence lineament analysis of an area when extracted from the
remotely sensed data give important information on subsurface features to assess the ground
water potential.
Baveli shear zone is the major lineament in Wayanad district having NW-SE trend Other lin-
eaments are parallel to this main one. Other minor lineaments are identified and are aligned to
NNE-SSW, NS and EW The rose diagram of the lineaments is shown in the Fig. 3.15. The
highest yield is encountered at Tholpetty area which rest on a lineament .
The yield of the boreholes had a direct bearing on the tectonic history and the rock types. The
yield from bore wells varies in the area. Within the same geological formation, the spatial
variation in yield is very common in hard rocks. The comparative study of the yield of the
wells
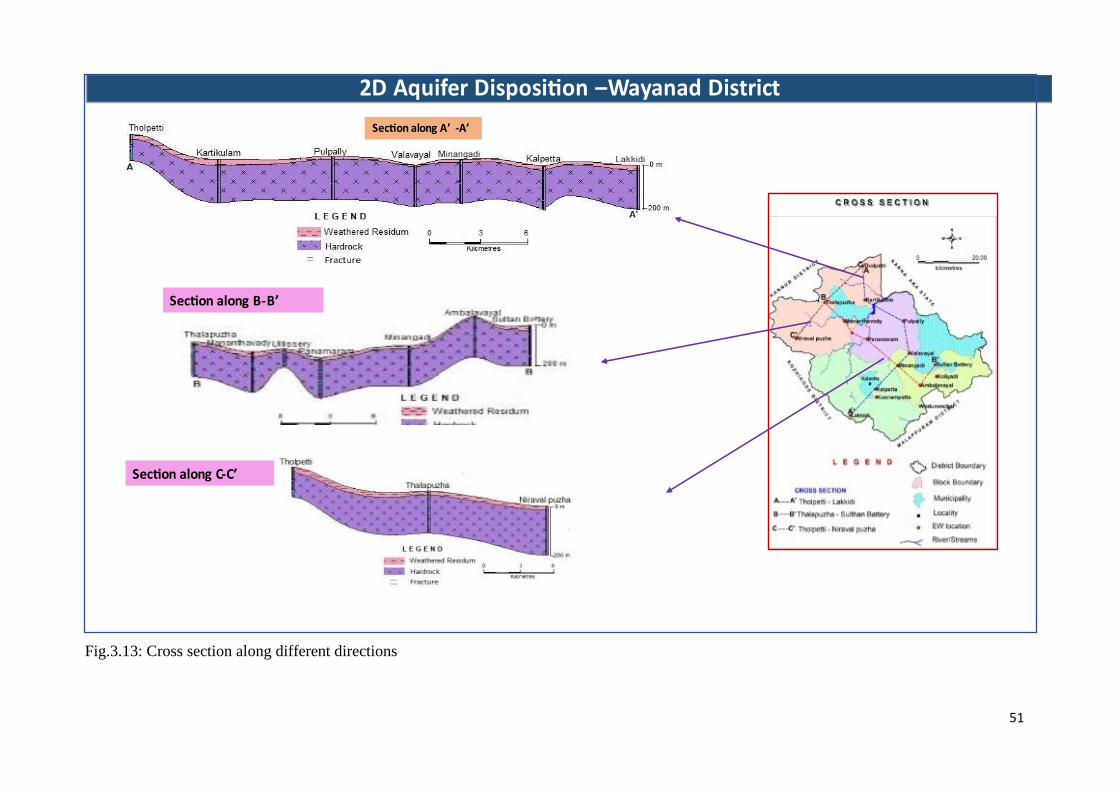
51
Fig.3.13: Cross section along different directions
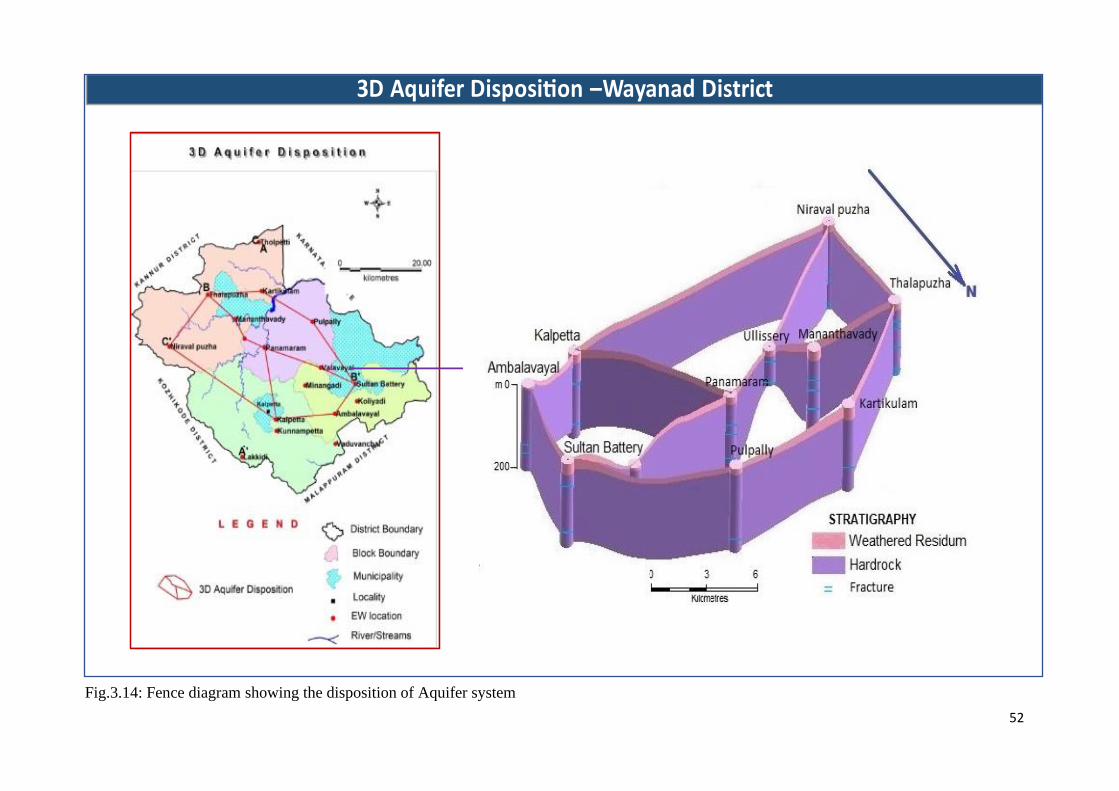
52
Fig.3.14: Fence diagram showing the disposition of Aquifer system

53
Fig.3.15 Rose diagram showing lineament trend
with lineaments indicates that the NNE-SSW and NNW-SSE lineaments are relatively more
potential. The number of wells having varying yield ranges and details of high yielding wells
and lineaments are given in Table.3.6. The relationship of the high yielding wells with linea-
ment direction in the study area is given in table 3.7.
Table. 3.6 Frequency of bore wells in different yield ranges
Yield of EW No of wells %
Up to 1 lps 7 41
Betwenn to 3 lps 4 24
>3 lpw 6 35
Total 17
Table.3.7 Details of high yielding wells and lineament
Sl No Location of
EW
Block Yield
(lps)
Geology Lineament
1 Tholpetty Mananthavady 11 Granite Gneiss E_W
2 Mananthavady Manananthavady 10.17 Hornblende
Gneiss
E-SW
3 Valavayal Sulthan Bathery 8 Granite Gneiss NE-SE
4 Kunnampetta Kalpetta 6 Hornblende Gneiss NNW-SSE
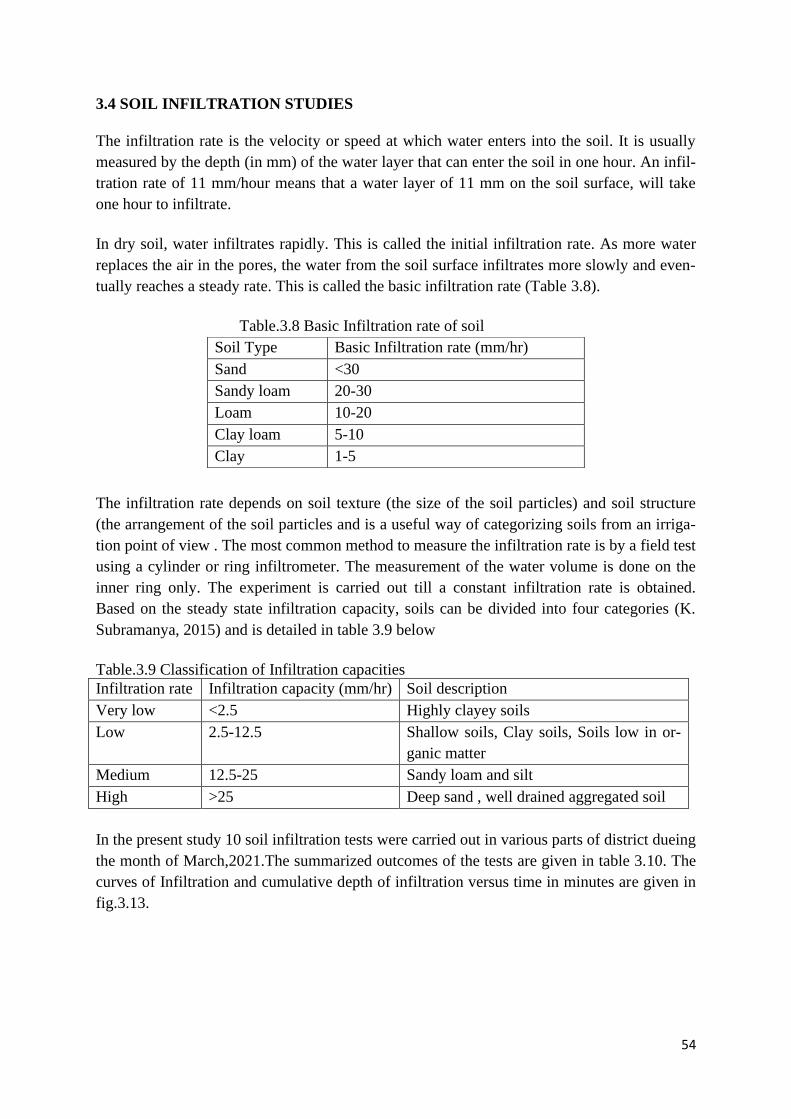
54
3.4 SOIL INFILTRATION STUDIES
The infiltration rate is the velocity or speed at which water enters into the soil. It is usually
measured by the depth (in mm) of the water layer that can enter the soil in one hour. An infil-
tration rate of 11 mm/hour means that a water layer of 11 mm on the soil surface, will take
one hour to infiltrate.
In dry soil, water infiltrates rapidly. This is called the initial infiltration rate. As more water
replaces the air in the pores, the water from the soil surface infiltrates more slowly and even-
tually reaches a steady rate. This is called the basic infiltration rate (Table 3.8).
Table.3.8 Basic Infiltration rate of soil
The infiltration rate depends on soil texture (the size of the soil particles) and soil structure
(the arrangement of the soil particles and is a useful way of categorizing soils from an irriga-
tion point of view . The most common method to measure the infiltration rate is by a field test
using a cylinder or ring infiltrometer. The measurement of the water volume is done on the
inner ring only. The experiment is carried out till a constant infiltration rate is obtained.
Based on the steady state infiltration capacity, soils can be divided into four categories (K.
Subramanya, 2015) and is detailed in table 3.9 below
Table.3.9 Classification of Infiltration capacities
Infiltration rate Infiltration capacity (mm/hr) Soil description
Very low <2.5 Highly clayey soils
Low 2.5-12.5 Shallow soils, Clay soils, Soils low in or-
ganic matter
Medium 12.5-25 Sandy loam and silt
High >25 Deep sand , well drained aggregated soil
In the present study 10 soil infiltration tests were carried out in various parts of district dueing
the month of March,2021.The summarized outcomes of the tests are given in table 3.10. The
curves of Infiltration and cumulative depth of infiltration versus time in minutes are given in
fig.3.13.
Soil Type Basic Infiltration rate (mm/hr)
Sand <30
Sandy loam 20-30
Loam 10-20
Clay loam 5-10
Clay 1-5

55
Table.3.10 Location wise summarised results of Soil Infiltration tests
Sl
No
Location Details Block Date Soil type Duration
(mts)
Cumulative
depth of infil-
tration (cm)
Final Infiltra-
tion rate
(mm/hr)
1 Sulthan Bathery Sarvajana High School Sulthan Bath-
ery
11/03/2021 Clay Sand 140 12.7 0.36
2 Chulliyod Parking area of Safas
Grand Party Hall
Sulthan Bath-
ery
11/03/2021 Sandy loam 140 24 0.3
3 Pulpally SNDP Yogam Br Panamaram 12/03/2021 Partially com-
pacted sand
170 12 0.3
4 Thetty Road Forest Quarters Mananthavady 12/03/2021 Clay loam 140 10 0.12
5 Meenangadi Muhammed Salim,
Edayakkaparambil house
Sulthan Bath-
ery
13/03/2021 Red Lateritic
soil
170 32.8 0.6
6 Kalpetta Saraladevi memorial LP
School
Kalpetta 13/03/2021 Clay loam 120 1.6 0.06
7 Padinjarathara Govt Higher Sec School Kalpetta 14/03/2021 Gravel sand
compacted
140 134.3 3.6
8 Thalapuzha CK Beeran,Chirayangad
House
Mananthavady 14/03/2021 Clay loam 160 4.8 0.12
9 Meppady Arrapetta Estate Staff club Sulthan Bath-
ery
15/03/2021 Clay loam 120 5.4 0.12
10 Vythiri (Lak-
kidi)
Govt LP School Kalpetta 15/03/2021 Clay loam 130 13.9 0.12
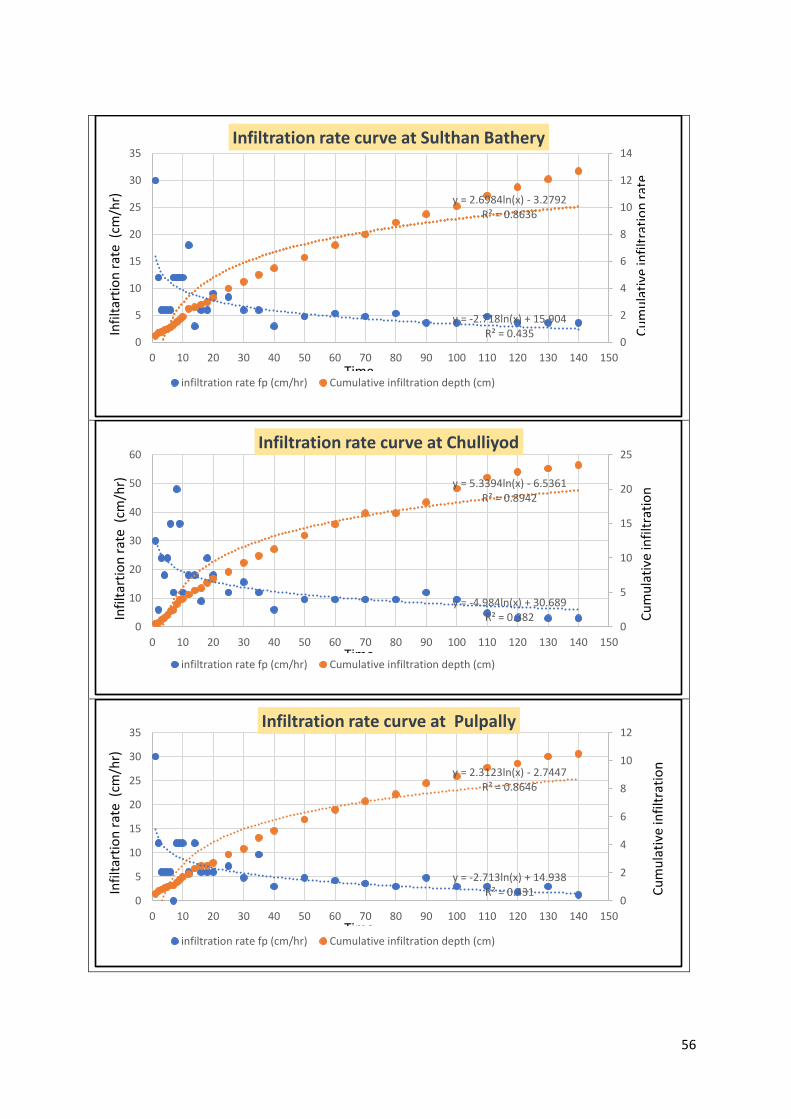
56
y = -2.718ln(x) + 15.904R² = 0.435
y = 2.6984ln(x) - 3.2792R² = 0.8636
0
2
4
6
8
10
12
14
0
5
10
15
20
25
30
35
0 10 20 30 40 50 60 70 80 90 100 110 120 130 140 150
Infiltration rate curve at Sulthan Bathery
infiltration rate fp (cm/hr) Cumulative infiltration depth (cm)
Infi
ltar
tio
n r
ate
(cm
/hr)
Cu
mu
lati
ve in
filt
rati
on
rat
e
Time
y = -4.984ln(x) + 30.689R² = 0.382
y = 5.3394ln(x) - 6.5361R² = 0.8942
0
5
10
15
20
25
0
10
20
30
40
50
60
0 10 20 30 40 50 60 70 80 90 100 110 120 130 140 150
Infiltration rate curve at Chulliyod
infiltration rate fp (cm/hr) Cumulative infiltration depth (cm)
Infi
ltar
tio
n r
ate
(cm
/hr)
Cu
mu
lati
ve in
filt
rati
on
Time
y = -2.713ln(x) + 14.938R² = 0.431
y = 2.3123ln(x) - 2.7447R² = 0.8646
0
2
4
6
8
10
12
0
5
10
15
20
25
30
35
0 10 20 30 40 50 60 70 80 90 100 110 120 130 140 150
Infiltration rate curve at Pulpally
infiltration rate fp (cm/hr) Cumulative infiltration depth (cm)
Infi
ltar
tio
n r
ate
(cm
/hr)
Cu
mu
lati
ve in
filt
rati
on
Time

57
y = -7.452ln(x) + 42.318R² = 0.6273
y = 6.7756ln(x) - 8.2839R² = 0.8777
0
5
10
15
20
25
30
35
0
10
20
30
40
50
60
70
0 10 20 30 40 50 60 70 80 90 100 110 120 130 140 150
Infiltration rate curve at Meenangadi
infiltration rate fp (cm/hr) Cumulative infiltration depth (cm)
Infi
ltar
tio
n r
ate
(cm
/hr)
Cu
mu
lati
ve in
filt
rati
on
Time
y = -6.089ln(x) + 27.993R² = 0.7465
y = 2.1287ln(x) - 1.2027R² = 0.9662
0
2
4
6
8
10
12
-5
0
5
10
15
20
25
30
35
0 10 20 30 40 50 60 70 80 90 100 110 120 130 140 150
Infiltration rate curve at Thetti Road
infiltration rate fp (cm/hr) Cumulative infiltration depth (cm)
Infi
ltar
tio
n r
ate
(cm
/hr)
Cu
mu
lati
ve in
filt
rati
on
Time
y = -2.308ln(x) + 8.3996R² = 0.2456
y = 0.1959ln(x) + 0.3045R² = 0.7382
0
0.2
0.4
0.6
0.8
1
1.2
1.4
1.6
-5
0
5
10
15
20
25
30
35
0 10 20 30 40 50 60 70 80 90 100 110 120 130
Infiltration rate curve at Kalpetta
infiltration rate fp (cm/hr) Cumulative infiltration depth (cm)
Infi
ltar
tio
n r
ate
(cm
/hr)
Cu
mu
lati
ve in
filt
rati
on
Time

58
y = -19.27ln(x) + 138.53R² = 0.3678
y = 27.098ln(x) - 35.524R² = 0.8455
0
20
40
60
80
100
120
140
0
20
40
60
80
100
120
140
160
180
200
0 10 20 30 40 50 60 70 80 90 100 110 120 130
Infiltration rate curve at Padinjarathara
infiltration rate fp (cm/hr) Cumulative infiltration depth (cm)
Infi
ltar
tio
n r
ate
(cm
/hr)
Cu
mu
lati
ve in
filt
rati
on
Time
y = -2.384ln(x) + 10.839R² = 0.3184
y = 0.983ln(x) - 0.7965R² = 0.8746
0
1
2
3
4
5
6
-5
0
5
10
15
20
25
30
35
0 10 20 30 40 50 60 70 80 90 100 110 120 130 140 150
Infiltration rate curve at Thalapuzha
infiltration rate fp (cm/hr) Cumulative infiltration depth (cm)
Infi
ltar
tio
n r
ate
(cm
/hr)
Cu
mu
lati
ve in
filt
rati
on
Time
y = -4.5ln(x) + 19.643R² = 0.5479
y = 1.3164ln(x) - 0.6357R² = 0.847
0
1
2
3
4
5
6
7
8
-5
0
5
10
15
20
25
30
35
0 10 20 30 40 50 60 70 80 90 100 110 120 130
Infiltration rate curve at Meppadi
infiltration rate fp (cm/hr) Cumulative infiltration depth (cm)
Infi
ltar
tio
n r
ate
(cm
/hr)
Cu
mu
lati
ve in
filt
rati
on
Time
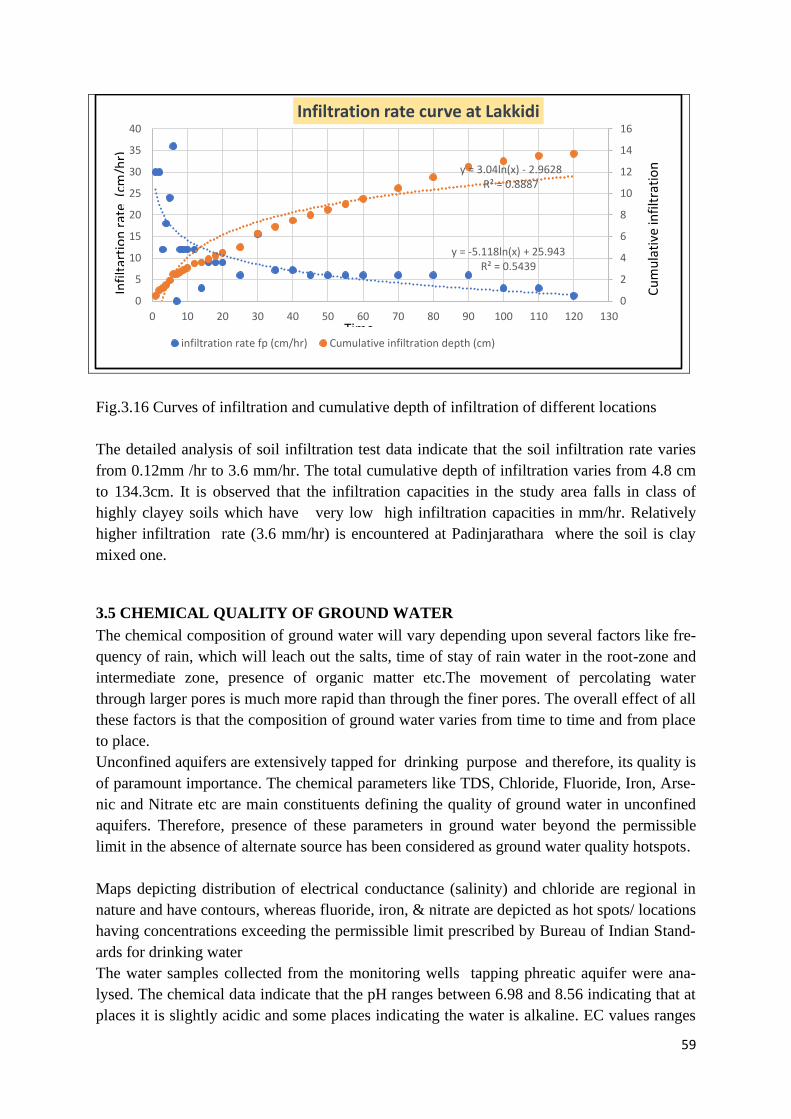
59
Fig.3.16 Curves of infiltration and cumulative depth of infiltration of different locations
The detailed analysis of soil infiltration test data indicate that the soil infiltration rate varies
from 0.12mm /hr to 3.6 mm/hr. The total cumulative depth of infiltration varies from 4.8 cm
to 134.3cm. It is observed that the infiltration capacities in the study area falls in class of
highly clayey soils which have very low high infiltration capacities in mm/hr. Relatively
higher infiltration rate (3.6 mm/hr) is encountered at Padinjarathara where the soil is clay
mixed one.
3.5 CHEMICAL QUALITY OF GROUND WATER
The chemical composition of ground water will vary depending upon several factors like fre-
quency of rain, which will leach out the salts, time of stay of rain water in the root-zone and
intermediate zone, presence of organic matter etc.The movement of percolating water
through larger pores is much more rapid than through the finer pores. The overall effect of all
these factors is that the composition of ground water varies from time to time and from place
to place.
Unconfined aquifers are extensively tapped for drinking purpose and therefore, its quality is
of paramount importance. The chemical parameters like TDS, Chloride, Fluoride, Iron, Arse-
nic and Nitrate etc are main constituents defining the quality of ground water in unconfined
aquifers. Therefore, presence of these parameters in ground water beyond the permissible
limit in the absence of alternate source has been considered as ground water quality hotspots.
Maps depicting distribution of electrical conductance (salinity) and chloride are regional in
nature and have contours, whereas fluoride, iron, & nitrate are depicted as hot spots/ locations
having concentrations exceeding the permissible limit prescribed by Bureau of Indian Stand-
ards for drinking water
The water samples collected from the monitoring wells tapping phreatic aquifer were ana-
lysed. The chemical data indicate that the pH ranges between 6.98 and 8.56 indicating that at
places it is slightly acidic and some places indicating the water is alkaline. EC values ranges
y = -5.118ln(x) + 25.943R² = 0.5439
y = 3.04ln(x) - 2.9628R² = 0.8887
0
2
4
6
8
10
12
14
16
0
5
10
15
20
25
30
35
40
0 10 20 30 40 50 60 70 80 90 100 110 120 130
Infiltration rate curve at Lakkidi
infiltration rate fp (cm/hr) Cumulative infiltration depth (cm)
Infi
ltar
tio
n r
ate
(cm
/hr)
Cu
mu
lati
ve in
filt
rati
on
Time

60
between 73 to 760 µs /cm at 250C. Highest EC value is observed in Pulpally area. All other
parameters fall under the permissible limit except Nitrate, Iron and Manganese which are
observed in specific locations. In General, the water from all the dug wells are suitable for
domestic and agricultural uses. The chemical quality of phreatic aquifers is presented in Fig.
3.17 and in table 3.11
Fig.3.17 Distribution of Electrical conductivity
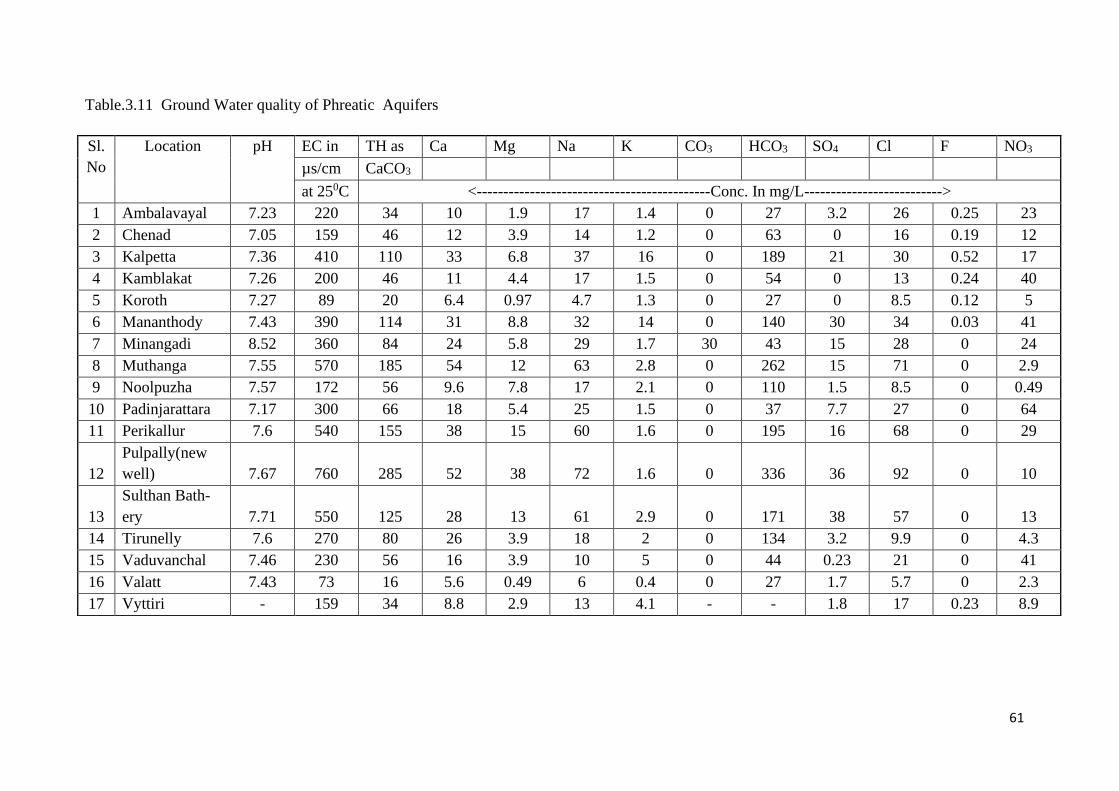
61
Table.3.11 Ground Water quality of Phreatic Aquifers
Sl.
No
Location pH EC in TH as Ca Mg Na K CO3 HCO3 SO4 Cl F NO3
µs/cm CaCO3
at 250C <--------------------------------------------Conc. In mg/L-------------------------->
1 Ambalavayal 7.23 220 34 10 1.9 17 1.4 0 27 3.2 26 0.25 23
2 Chenad 7.05 159 46 12 3.9 14 1.2 0 63 0 16 0.19 12
3 Kalpetta 7.36 410 110 33 6.8 37 16 0 189 21 30 0.52 17
4 Kamblakat 7.26 200 46 11 4.4 17 1.5 0 54 0 13 0.24 40
5 Koroth 7.27 89 20 6.4 0.97 4.7 1.3 0 27 0 8.5 0.12 5
6 Mananthody 7.43 390 114 31 8.8 32 14 0 140 30 34 0.03 41
7 Minangadi 8.52 360 84 24 5.8 29 1.7 30 43 15 28 0 24
8 Muthanga 7.55 570 185 54 12 63 2.8 0 262 15 71 0 2.9
9 Noolpuzha 7.57 172 56 9.6 7.8 17 2.1 0 110 1.5 8.5 0 0.49
10 Padinjarattara 7.17 300 66 18 5.4 25 1.5 0 37 7.7 27 0 64
11 Perikallur 7.6 540 155 38 15 60 1.6 0 195 16 68 0 29
12
Pulpally(new
well) 7.67 760 285 52 38 72 1.6 0 336 36 92 0 10
13
Sulthan Bath-
ery 7.71 550 125 28 13 61 2.9 0 171 38 57 0 13
14 Tirunelly 7.6 270 80 26 3.9 18 2 0 134 3.2 9.9 0 4.3
15 Vaduvanchal 7.46 230 56 16 3.9 10 5 0 44 0.23 21 0 41
16 Valatt 7.43 73 16 5.6 0.49 6 0.4 0 27 1.7 5.7 0 2.3
17 Vyttiri - 159 34 8.8 2.9 13 4.1 - - 1.8 17 0.23 8.9

62
3.5.1HYDROCHEMICAL FACIES
Piper plots (also known as Trilinear diagrams) are very powerful tool for visualizing the rela-
tive abundance of common ions in water samples. Although there are other plot types that can
show abundance of ions in groundwater, this plot type is especially useful because it allows
you to plot multiple samples on the same plot, thus allowing for grouping water samples by
groundwater facies and other criteria.
The Piper plot of the all 17 samples indicate that the most of water samples are falling in
Calcium Bicarbonate type of water in the phreatic zone as shown in Fig.3.18.The Alkaline
earth metals (ca+Mg) have dominance over Alkali metals (Na +K) in 80% samples. Sam-
ples collected from southern part of the district such as Chenad, Ambalavayal, Minangadi ,
Kalpetta and Sulthan Bathery falls in the Calcium rich and sodium +potassium less water
quality.
.
Fig.3.18 Hill-Piper diagram showing Geochemical Classification of phreatic aquifer
Two parameters commonly used for judging suitability for irrigation are salinity and sodi-
um. Salinity is reflected in EC and sodium hazard is reflected in Sodium Absorption Ratio
(SAR). The Sodium Absorption Ratio (SAR) of 17 representative samples have been worked
out using the equation
SAR =Na /√ (Ca+Mg)/2
The SAR values are plotted and shown in the Fig.13.19. It indicate that 41 % of all samples
are confined to low salinity hazard and sodium hazard whereas major fraction of samples
(53%) are showing medium salinity and sodium hazard indicating that the ground water of
phreatic aquifer is good for irrigation. Only one sample is of high salinity hazard.
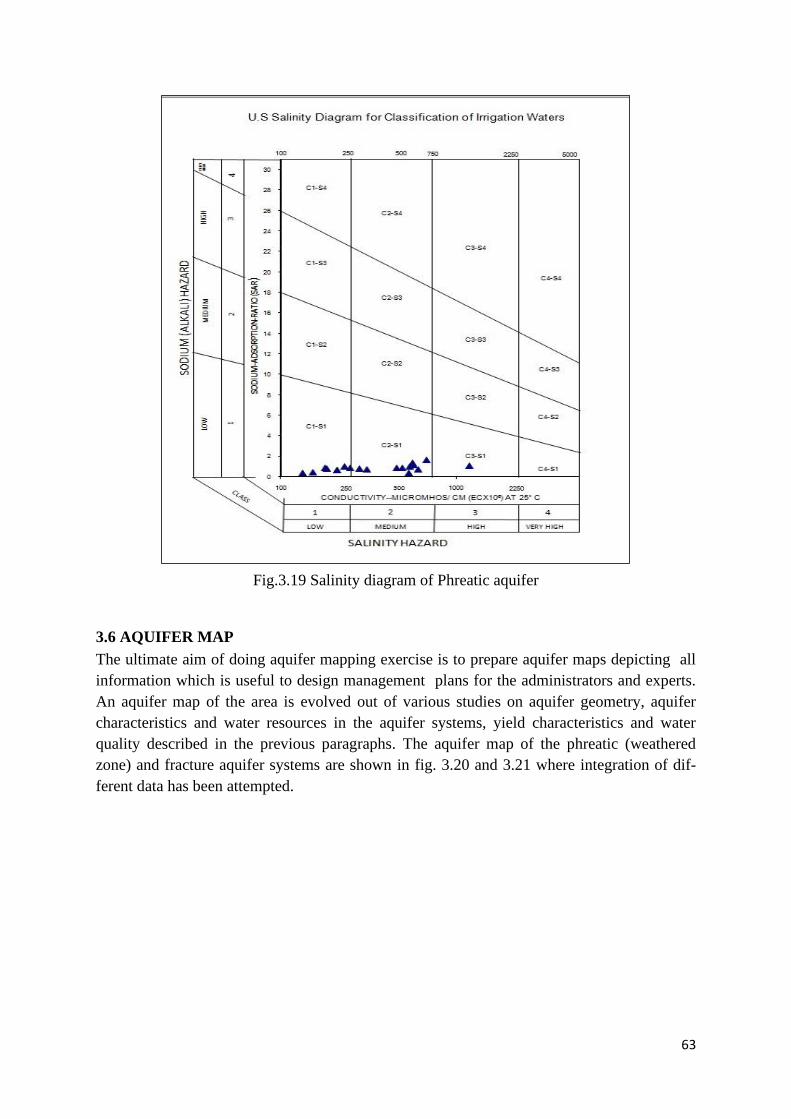
63
Fig.3.19 Salinity diagram of Phreatic aquifer
3.6 AQUIFER MAP
The ultimate aim of doing aquifer mapping exercise is to prepare aquifer maps depicting all
information which is useful to design management plans for the administrators and experts.
An aquifer map of the area is evolved out of various studies on aquifer geometry, aquifer
characteristics and water resources in the aquifer systems, yield characteristics and water
quality described in the previous paragraphs. The aquifer map of the phreatic (weathered
zone) and fracture aquifer systems are shown in fig. 3.20 and 3.21 where integration of dif-
ferent data has been attempted.

64
Fig.3.20 Aquifer map of Phreatic aquifer system

65
Fig 3.21 Aquifer map of Deeper Aquifer system
66
4 GROUND WATER RESOURCES
The quantification of ground water resources is important to assess the availability and trend
of utilization pattern existing in an area to design and implement ground water management
strategies. The availability of ground water is dependent on various factors like rainfall, to-
pography, geomorphological feature, geological set up and hydrogeological conditions re-
flected through water level etc. Rainfall is the major source of recharge for groundwater. In-
creasing population, rapid urbanization and changes in cropping pattern, conversion of agri-
culture land into cash crops etc has resulted in increasing use of ground water resources in the
district. Recharge, draft and the balance of resources left are to be kept in mind while con-
sidering the management plans .Judicious and planned development of ground water and its
scientific management have become necessary to ensure long-term sustainability of this pre-
cious natural resource.
4.1 DYNAMIC GROUNDWATER RESOURCES IN THE WEATHERED ZONE
Phreatic aquifers are the major source of groundwater in Wayanad district. The ground water
in the shallow weathered zone is mostly developed through dug wells for domestic and agri-
cultural purposes and to a limited extent for irrigation purposes. It is observed that some are-
as especially areas adjoining Karnataka State such as Mullankolly, Pulpally,Kappiset areas
experience shortage of ground water during summer months ,due to topographic characteris-
tics coupled with the unscientific development of ground water.
The groundwater resources in the area are estimated based on the Groundwater Estimation
Methodology (GEC) 2015. The administrative blocks are the basic unit for groundwater as-
sessment. The area under command and non-command could not be separated mainly due to
non-availability of data pertains to canal command areas exist in the district. The irrigation
projects such as Banasura Sagar and Karapuzha dam are mostly planned for irrigating paddy
cultivation along the topographic lows and as such the areas outside the influence of canal
system do not get benefits of surface water irrigation from these projects. Due to paucity of
the data pertaining to command and non-command area for the whole district, the entire area
is considered as non-command area for computations. The block wise groundwater resources
in the area is calculated for both phreatic (Aquifer-1) and deeper fractured aquifer system
(Aquifer-II). The storage parameter values used in the estimation for phreatic aquifer vary
from 0.003 to 0.08, whereas as for the deeper fractured aquifer, it varies from 0.0015 to
0.002. The recharge from canal segments and return seepage from irrigation due to surface
water in the command area have, however, been incorporated into the computations
The recharge to groundwater has been computed based on specific yield and water table fluc-
tuations of different geological units available in the district. The water level fluctuation data
was calculated from the ground water monitoring wells of CGWB. The specific yield values
used for the recharge calculation is as shown in table in 4.1.
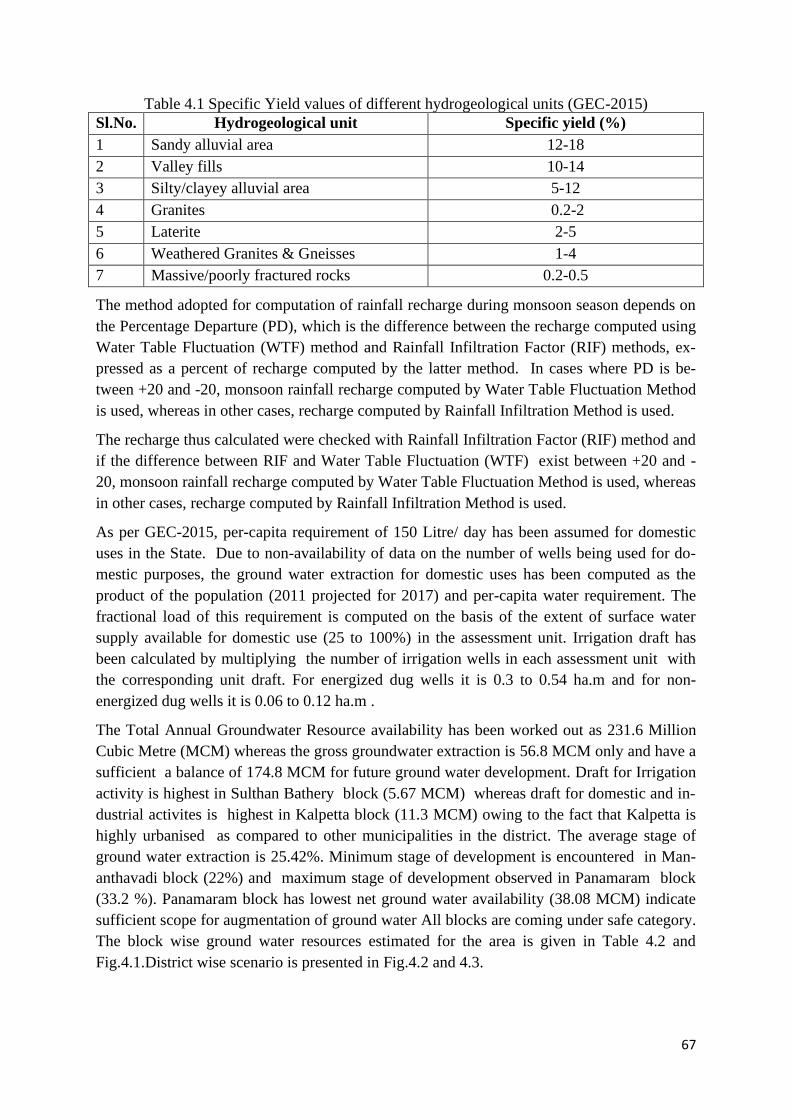
67
Table 4.1 Specific Yield values of different hydrogeological units (GEC-2015)
Sl.No. Hydrogeological unit Specific yield (%)
1 Sandy alluvial area 12-18
2 Valley fills 10-14
3 Silty/clayey alluvial area 5-12
4 Granites 0.2-2
5 Laterite 2-5
6 Weathered Granites & Gneisses 1-4
7 Massive/poorly fractured rocks 0.2-0.5
The method adopted for computation of rainfall recharge during monsoon season depends on
the Percentage Departure (PD), which is the difference between the recharge computed using
Water Table Fluctuation (WTF) method and Rainfall Infiltration Factor (RIF) methods, ex-
pressed as a percent of recharge computed by the latter method. In cases where PD is be-
tween +20 and -20, monsoon rainfall recharge computed by Water Table Fluctuation Method
is used, whereas in other cases, recharge computed by Rainfall Infiltration Method is used.
The recharge thus calculated were checked with Rainfall Infiltration Factor (RIF) method and
if the difference between RIF and Water Table Fluctuation (WTF) exist between +20 and -
20, monsoon rainfall recharge computed by Water Table Fluctuation Method is used, whereas
in other cases, recharge computed by Rainfall Infiltration Method is used.
As per GEC-2015, per-capita requirement of 150 Litre/ day has been assumed for domestic
uses in the State. Due to non-availability of data on the number of wells being used for do-
mestic purposes, the ground water extraction for domestic uses has been computed as the
product of the population (2011 projected for 2017) and per-capita water requirement. The
fractional load of this requirement is computed on the basis of the extent of surface water
supply available for domestic use (25 to 100%) in the assessment unit. Irrigation draft has
been calculated by multiplying the number of irrigation wells in each assessment unit with
the corresponding unit draft. For energized dug wells it is 0.3 to 0.54 ha.m and for non-
energized dug wells it is 0.06 to 0.12 ha.m .
The Total Annual Groundwater Resource availability has been worked out as 231.6 Million
Cubic Metre (MCM) whereas the gross groundwater extraction is 56.8 MCM only and have a
sufficient a balance of 174.8 MCM for future ground water development. Draft for Irrigation
activity is highest in Sulthan Bathery block (5.67 MCM) whereas draft for domestic and in-
dustrial activites is highest in Kalpetta block (11.3 MCM) owing to the fact that Kalpetta is
highly urbanised as compared to other municipalities in the district. The average stage of
ground water extraction is 25.42%. Minimum stage of development is encountered in Man-
anthavadi block (22%) and maximum stage of development observed in Panamaram block
(33.2 %). Panamaram block has lowest net ground water availability (38.08 MCM) indicate
sufficient scope for augmentation of ground water All blocks are coming under safe category.
The block wise ground water resources estimated for the area is given in Table 4.2 and
Fig.4.1.District wise scenario is presented in Fig.4.2 and 4.3.

68
Table 4.2 Dynamic Ground Water Resources estimated of Wayanad District (Phreatic aquifer) as on 31st March 2017
Sl.
No.
Assessment
Unit/ District
Area Net Annual
Ground Wa-
ter Availabil-
ity
(ha.m)
Existing
Gross
Ground Wa-
ter Extrac-
tion for ir-
rigation
(ha.m)
Existing Gross
Ground Water
Extraction for
domestic and
industrial wa-
ter supply
(ha.m)
Existing
Gross
Ground
Water Ex-
traction for
All uses
(ha.m)
(5+6)
Provision
for domes-
tic, and
industrial
use up to
2025
(ha.m)
Net Ground
Water
Availability
for future
irrigation
development
(4-5-8)
Stage of
Ground
Water
Extraction
{(7/4) *
100} (%)
Category
1 2 3 4 5 6 7 8 9 10 11
1 Kalpetta 58770 6653.8 342.3 1130.5 1472.9 1128.7 5182.8 22.1 Safe
2 Mananthavady 66660 6638.9 408.1 1052.3 1460.5 1045.3 5185.5 22.0 Safe
3 Panamaram 35130 3808.3 348.0 914.7 1262.7 883.1 2577.1 33.2 Safe
4 Sulthanbathery 52540 6062.1 567.0 914.7 1481.6 883.1 4612.0 24.4 Safe
TOTAL (ha.m) 213100 23163.1 1665.5 4012.1 5677.6 3940.2 17557.5 Avg:25.42 Safe
Total (mcm) 2131 231.6 16.7 40.1 56.8 39.4 175.6 Avg:25.42
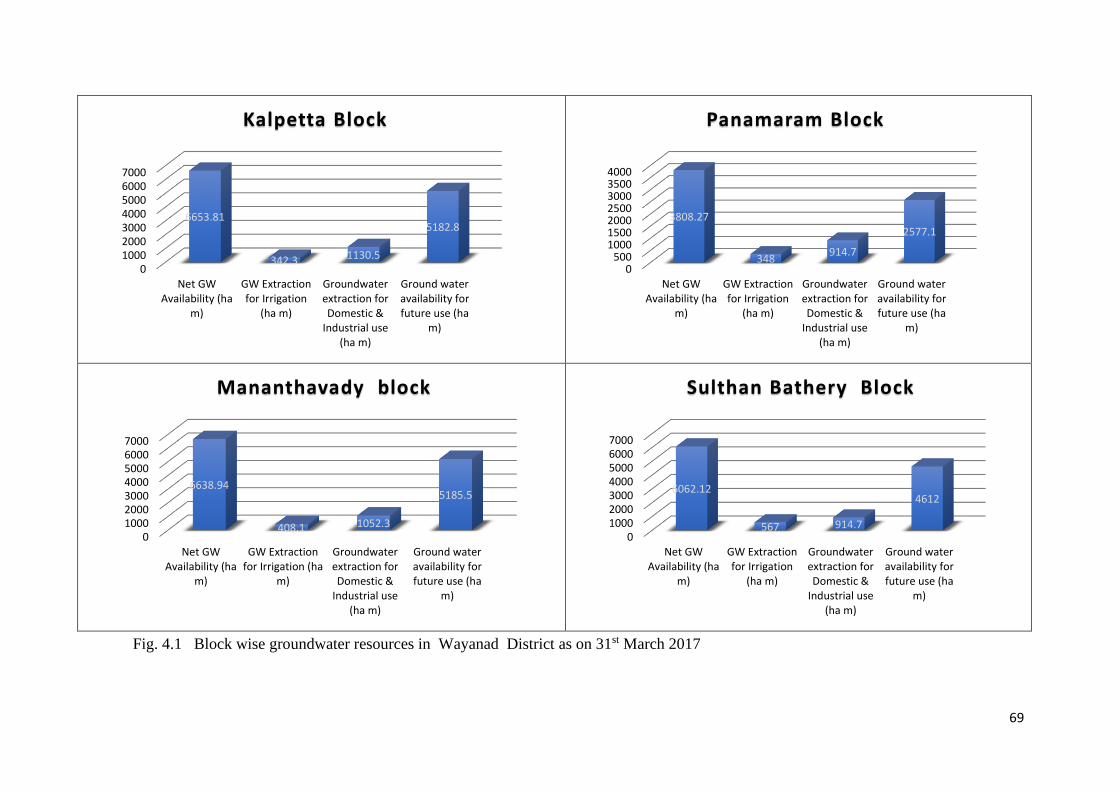
69
Fig. 4.1 Block wise groundwater resources in Wayanad District as on 31st March 2017
01000200030004000500060007000
Net GWAvailability (ha
m)
GW Extractionfor Irrigation
(ha m)
Groundwaterextraction forDomestic &
Industrial use(ha m)
Ground wateravailability forfuture use (ha
m)
6653.81
342.3 1130.5
5182.8
Kalpetta Block
0500
1000150020002500300035004000
Net GWAvailability (ha
m)
GW Extractionfor Irrigation
(ha m)
Groundwaterextraction forDomestic &
Industrial use(ha m)
Ground wateravailability forfuture use (ha
m)
3808.27
348914.7
2577.1
Panamaram Block
01000200030004000500060007000
Net GWAvailability (ha
m)
GW Extractionfor Irrigation (ha
m)
Groundwaterextraction forDomestic &
Industrial use(ha m)
Ground wateravailability forfuture use (ha
m)
6638.94
408.1 1052.3
5185.5
Mananthavady block
01000200030004000500060007000
Net GWAvailability (ha
m)
GW Extractionfor Irrigation
(ha m)
Groundwaterextraction forDomestic &
Industrial use(ha m)
Ground wateravailability forfuture use (ha
m)
6062.12
567 914.7
4612
Sulthan Bathery Block

70
Fig.4.2 Availability of resources and draft break up
Fig.4.3 Distribution of Ground water Draft and Availability
0
5000
10000
15000
20000
25000
Net GW Availability(ha m)
GW Extraction forIrrigation (ha m)
Groundwaterextraction forDomestic &
Industrial use (ham)
Ground wateravailability for
future use (ha m)
23163.14
1665.5
4012.1
17557.5
Gross draft for irrigation
7%Gross dfraft for domestic and
induatrial water supply
17%
Ground water availability for
future development
76%
DISTRIBUTION OF DRAFT AND BALANCE RESOURCE

71
4.2 TEMPORAL VARIATION OF GROUND WATER RESOURCES
(A) NET AVAILABILITY AND DRAFT
The ground water resources are dynamic in nature and variation in resources is subjected to
variations in recharge and changes in draft pattern. By analysing the resources with previous
years data it has been observed that there is drop in recharge component compared to 2013
data reflecting the changes in rainfall pattern. This is corroborated by the deficit in annual
average rainfall during 2013 as 1839 mm against 1200 mm during 2017. Total draft of the
district is marginally increased from 5477.53 ha.m during 2013 to 5677.6 ha.m during 2017
Details are shown in Table.4.3.
Table 4.3 Groundwater Draft (MCM) and GW availability in Wayanad District during 2013
and 2017
Sl
No
Block Net Groundwater
availability (ha.m)
Groundwater for
irrigation (ha.m)
Groundwater
draft for domes-
tic, industrial
(ha.m)
Groundwater
draft for all uses
(ha.m)
2013 2017 2013 2017 2013 2017 2013 2017
1 Kalpetta 8084.65 6653.8 321.40 342.3 1097.79 1130.5 1419.19 1472.9
2 Mananthavady 8059.16 6638.9 388.06 408.1 1022.00 1052.3 1410.06 1460.5
3 Panamaram 4607.39 3808.3 318.65 348.0 889.05 914.7 1207.70 1262.7
4 Sulthan Bath-
ery
7344.52 6062.1 547.53 567.0 889.05 914.7 1436.58 1481.6
Total 28095.73 23163.1 1575.64 1665.5 3897.89 4012.1 5473.53 5677.6
(B) STAGE OF DEVELOPMENT
The comparison of the stage of development with previous resource estimation (Table4.4)
indicate that on an average 5 % increase in the development of ground water in Wayanad
district and all the blocks are categorised as safe block. This shows that ground water de-
pendability among people is increasing day by day.
Table 4.4 Comparison of stage of development in Wayanad district during 2013 and 2017
Sl
No
Block Stage of Groundwater de-
velopment (%)
Categorization of block
2013 2017 2013 2017
1 Kalpetta 17.55 22.1 Safe Safe
2 Mananthavady 17.50 22.0 Safe Safe
3 Panamaram 26.21 33.2 Safe Safe
4 Sulthan Bathery 19.56 24.4 Safe Safe
Avg 20.20 25.42
4.3 NUMBER OF GROUND WATER STRUCTURE FOR FUTURE DEVELOPMENT
Considering the present stage of development and unit draft per structure, a total of 9219 no
of structures can be constructed by developing 70% of the balance resource available for
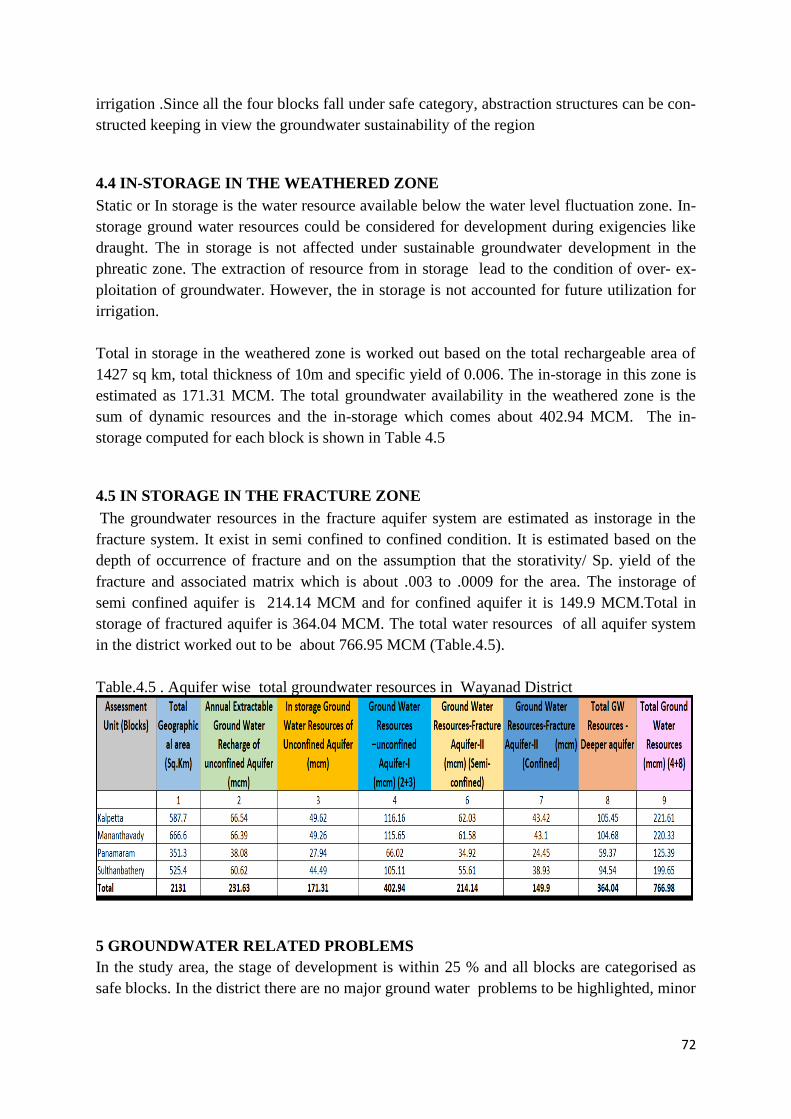
72
irrigation .Since all the four blocks fall under safe category, abstraction structures can be con-
structed keeping in view the groundwater sustainability of the region
4.4 IN-STORAGE IN THE WEATHERED ZONE
Static or In storage is the water resource available below the water level fluctuation zone. In-
storage ground water resources could be considered for development during exigencies like
draught. The in storage is not affected under sustainable groundwater development in the
phreatic zone. The extraction of resource from in storage lead to the condition of over- ex-
ploitation of groundwater. However, the in storage is not accounted for future utilization for
irrigation.
Total in storage in the weathered zone is worked out based on the total rechargeable area of
1427 sq km, total thickness of 10m and specific yield of 0.006. The in-storage in this zone is
estimated as 171.31 MCM. The total groundwater availability in the weathered zone is the
sum of dynamic resources and the in-storage which comes about 402.94 MCM. The in-
storage computed for each block is shown in Table 4.5
4.5 IN STORAGE IN THE FRACTURE ZONE
The groundwater resources in the fracture aquifer system are estimated as instorage in the
fracture system. It exist in semi confined to confined condition. It is estimated based on the
depth of occurrence of fracture and on the assumption that the storativity/ Sp. yield of the
fracture and associated matrix which is about .003 to .0009 for the area. The instorage of
semi confined aquifer is 214.14 MCM and for confined aquifer it is 149.9 MCM.Total in
storage of fractured aquifer is 364.04 MCM. The total water resources of all aquifer system
in the district worked out to be about 766.95 MCM (Table.4.5).
Table.4.5 . Aquifer wise total groundwater resources in Wayanad District
5 GROUNDWATER RELATED PROBLEMS
In the study area, the stage of development is within 25 % and all blocks are categorised as
safe blocks. In the district there are no major ground water problems to be highlighted, minor

73
issues are existing that can be rectified by adopting site specific management practices The
main groundwater related problems in the study area are as follows
(i) Ground water Scarcity: In the study area groundwater from phreatic aquifer is ex-
tracted mainly through dug wells and at some places bore wells are drilled as part of
government initiative. For the last few decades it was observed that dug wells are get-
ting drying up during summer season especially during rain deficient periods especially
in the high lands. In high land terrain also bore wells are common structures as the dug
wells in this area usually dries up. The physiography and geological settings of the area
as well as the anthropogenic activities further worsen the situation. The summer scarci-
ty is commonplace in Panamaram block especially in areas close to the Karnataka Bor-
der such as Mullankolly, Kappiset, Pulpally etc. Deeper water levels observed in these
areas are due to topographic characteristics. The low rainfall in these areas is the main
reason behind the ground water scarcity. More over there is limited surface water
schemes to supplement the water requirement of the area. People are depending on
tanker water from private players on payment basin. No mechanism is existing to assess
the quality of this tanker water. Topographic settings Inability to conserve the surplus
run-off available during the monsoons, due to topographic characteristics and destruc-
tion of traditional water storage structures such as ponds, tanks and wetlands.
(ii) Quality issues: Electrical conductivity is within the prescribed limit in all places of
Wayanad district.Concentration of Nitrate above permissible limit (more than 45 mg/l
)is observed in certain pockets viz. Vaduvanchal and Vythiri and concentration of
Manganese is observed more than permissible limit in certain pockets viz. Va-
duvanchal.
(iii) Anthropogenic activities: Rapid urbanization, tourist inflow and lack of facility for
waste disposal in municipalities, change in land-use and cropping pattern, indiscrimi-
nate dumping of biodegradable and non-biodegradable waste into abandoned wells and
surface water bodies, wet land filling, cultivable land encroachments, illegal sand min-
ing along river beds and conversion of paddy fields have adverse effects on the quantity
and quality of the water. The urban wastes include hospital wastes, market and slaugh-
ter house wastes and sewage and wastes generated from other commercial and residen-
tial areas. The people living near the water bodies in the rural stretches are depositing
the household wastes into the system that is mainly due to the absence of centralised
waste management system.
(iv) Quarrying: Charnockite group of rocks occupying the highland and midland region of
the study area are good sources of building materials.There are 106 granite quarries in
Sulthan Bathery, Kalpetta and Mananthavady blocks. Quarrying of these rocks creates
localized groundwater problems. In addition to granite building stone, mining of brick
or tile clay is common in Wayanad district. in localised areas especially low lying val-
ley fill areas.33 such clay mining centres are reported. These clay mining is catering
the local needs of construction
(v) Land Use Changes: Wayanad district is known for its plantation crops.Earlier pad-
dy cultivation was the prime agricultural activity which now converted into cash crops
for which land pattern is severely compromised. Deforestration, unauthorized en-
croachment , unscientific agricultural practices leads to soil erosion. Initially most of

74
the encroachments are for agriculture purposes; later these areas were reclaimed and
used for various other purposes which lead to the change in the ecosystem. Excessive
sand mining from the riverbeds especially Kallada and Ithikara river, downstream has
substantially lowered the local water table. The mushrooming of illegal resorts for at-
tracting tourists is making irreparable loss to the soil profile and water holding capaci-
ty of soil and finally result in heavy surface run off and landslide.This is common in
Kalpetta (vythiri area) and Mananthavady (Thirunelly area)and Sulthan Bathery
blocks9Meppady area).
(vi) Lack of awareness: Awareness among people and their participation for judicious use
of precious resources are inevitable for the effective management of ground water.
Creating awareness on water or building water literacy especially in a district where
good proportion of population are of Tribal communities who do not have basin in-
frastructure to maintain hygienic conditions around drinking water sources. It is the
collective efforts of the concerned government; non-government organisations and lo-
cal body institutions would lead to safer drinking water provisions. An ideal groundwa-
ter management approach will be one that will not only construct structures but also
make an effort to sensitize and involve the community to work on the issue. There is an
urgent need for a concerted effort to integrate science and community participation for
groundwater management.
6.MANAGEMENT STRATEGIES &AQUIFER MANAGEMENT PLAN.
Average stage of ground water development in the district is 25 % and remaining 75 % is yet
to be tapped for various developmental activities. Considering the fact that Wayanad is
known for coffee and tea plantation as major cropping pattern, use of ground water through
sustainable irrigation practices may yield more production and the per capita income of
people will go up. Therefore, effective utilization of ground water resource is the challeng-
ing part in management of groundwater resource in Wayanad district. Hence, it is pertinent
to formulate a practical and scientific management plan suitable to the area. In the present
study, sustainable management plan for groundwater resources is being proposed after a de-
tailed understanding of the aquifer disposition down to the target depth of 200 m bgl and es-
timation of available resources.
Even though the study area receives good annual rainfall and has best climatic conditions ,it
has been experiencing incidents of water scarcity in summer months for consummating do-
mestic and irrigation requirements. It is observed that even in the years of normal rainfall,
summer water scarcity problems are existing in areas close to Karnataka border. This per-
plexing condition is attributed due to natural reasons such as highly undulating topography
with steep slopes create some sort of rain shadow effect coupled with undulating topography
result in low recharge rate. In addition to this ,limited weathered residuum limits groundwa-
ter storage in the aquifer system. In situ conservation of rain water and conservation of sur-
plus run-off during monsoon and other artificial recharge measures to supplement the do-
mestic and irrigation needs are the possible solutions to overcome this problem.

75
6.1 SUSTAINABLE PLAN
The effective utilization of existing resources is kept under consideration while preparing sus-
tainable plans which can be done easily in case of blocks in Wayanad as all blocks are in safe
category and resources are under utilised. The average stage of development in all blocks is
about 25% which means that there is scope for further ground water development for irriga-
tion in all blocks where the stage of extraction is low. Considering the present stage of de-
velopment and unit draft per structure, there is potential for a total of 9219 no of groundwa-
ter extraction structures for optimal development of the available groundwater resources.
While formulating various ground water development and management plans, the role of ge-
ology and geomorphology of the area on the ground water regime should be given due im-
portance.
Even though the stage of development in the district is low there are specific areas where
groundwater is scarce due to reasons explained earlier. Water use efficient irrigation tech-
niques like drip and sprinkler irrigation methods can be adopted in those areas. Such irriga-
tion techniques have a major impact in boosting the production of coffee and other cash
crops. Since it supplies water directly to the crop, rather than the land around, water losses
occurring through evaporation and distribution are significantly reduced. There is water sav-
ing of 30-70 per cent for different crops like coffee, arecanut, nut meg, banana and plantains
under drip/sprinkler method of irrigation. Farmers may be encouraged to adopt these modern
irrigation techniques to have optimal use of the available resources in water scarce areas. An
area of 36104 Ha. can be brought under sprinkler irrigation and 1473 Ha under drip irriga-
tion crop specific distribution of water in identified water scarce areas.
6.2 AUGMENTATION PLAN
Topography of the area is suitable for implementing various artificial recharge structures such
as percolation ponds, check dams (CD), vented cross bars (VCB) contour bunding, trenching,
pitting, terrace cultivation and sub-surface dykes\ etc. Enough measures must be taken to
prevent building up of saturated soil condition especially along steep valley slops and hilly
area to avoid land slide. Periodic de-siltation as well as cleaning of existing check dams,
bunds and ponds are recommended for increasing the storage capacity as well as infiltration
rate. In order to reduce the surface, run off, gully plugs are suitable for along 1st order
streams , nallah bunds/cross bars for 2ndorder and check dams is recommended for 3rd and
higher order. This is to ensure that flow in rivers during summer months by limiting rainfall
run off.
6.3 SCOPE OF ARTIFICIAL RECHARGE STRUCTURES
Wayanad district is a plantation/agriculture-based district and there is ample scope for artifi-
cial recharge structures to maintain the availability of water throughout the year for farm-
ing/plantation activities even though it is getting high rainfall and low groundwater devel-
opment. The undulating topography and thin weathered aquifer systems resulted in limited
groundwater storage space. There are 375 check dams existing in the area and a sizeable
number of lift irrigation structures (43945) are functioning to boost the agriculture activities.
The surface water bodies are also augmenting the recharge. There are 804 farm ponds, 50
panchayat owned ponds, and 5 temple ponds.

76
In order to improve the groundwater scenario in the specified water scarce areas ground water
recharge through rainwater harvesting and artificial recharge are recommended. It is proposed
to have 25 check dams and 7 Vented Cross bars in the area as shown in fig 6.1. Apart from
this development of 23 springs is also recommended. These recommended structures are in
addition to various other structures proposed in the on-going PMKSY District Irrigation Plan
of Wayanad district. Full details including location wise and project wise details are given in
PMKSY report for reference (Pages: 105 to 314). This will create an irrigation potential of
43795.72 ha. Details of the on-going schemes, are given table 6.1and the recommended struc-
tures are given in table 6.2.
6.4 AQUIFER MANAGEMENT PLAN
6.4.1 SHORT-TERM LOCAL SOLUTIONS FOR GROUNDWATER MANAGE-
MENT
The distribution of water should be equitable across users particularly marginalised and poor-
er user groups in water scarce areas like Irulam tribal belt, Pulpally, Kappiset Mullankolli ar-
eas and adjoining Panchayats. Significant role is vested with local governing body and govt.
institutions to coordinate all stake holders to manage the issues at micro-level. This is done
by preparing comprehensive water management system and water allocation plans on a par-
ticipatory approach, involving users, planners and policy makers at all levels. All the existing
recharge/conservation structures must be cleaned on annual basis before onset of monsoon.
Identification of high yielding bore wells drilled by various government agencies help to
meet the drinking water needs of the populace especially during summer.
The domestic water needs of urban areas like Kalpetta, Mananthavady and Sulthan Bathery
are to be dealt separately and the water wastage component is increasing mainly because of
leakages through distributary system. Wastewater collection and disposal are equally im-
portant like supply of protected water in maintaining public health. Roof top rain water har-
vesting system must be part of all houses and larger concrete buildings which will reduce the
scarcity of water during lean periods. The effective implementation of roof top rainwater
harvesting system is essential for sustainability of water resources. In High land areas com-
munity based RTRWH (Storage) for drinking/domestic purpose is recommended.
Renovation of 50 Panchayat ponds will cater the additional requirement for domes-
tic/agricultural uses.

77
Table.6.1 Breakup of various ongoing water harvesting structures
Table.6.2 Additional structures recommended for artificial recharge
Sl. No Block Check Dam Vented Cross Bars Springs
1 Kalpetta 15 3 6
2 Mananthavady 5 2 9
3 Panamaram 5 2 5
4 Sultan Bathery 0 0 3
Total 25 7 23
Ongoing /completed structures-Block wise break up
Sl. No Block Check Dam Ponds Rain pits Community
water tanks
BW Water lifting
devices (Elec-
trical)
Water
lifting
devices
(So-
lar/wind)
Renovation of
small tanks
Insitu wa-
ter conser-
vation
1 Kalpetta 3 20 99000 5 36 525 8 29 100
2 Mananthavady 22 32 99000 4 36 525 8 29 100
3 Panamaram 125 331 99000 4 36 525 8 29 100
4 Sultan Bathery 4 31 99000 4 36 525 8 29 100
Total 154 414 396000 17 144 2100 32 116 400

78
6.4.2 LONG-TERM LOCAL SOLUTIONS FOR GROUND WATER MANAGEMENT
Based on ground water resource estimation it is found that groundwater extraction for irriga-
tion in Wayanad district is low (29.32 % of the total groundwater extraction) and extraction
for domestic and industrial use account for the major component (70.68 %). Net groundwater
available for future use is 175.58 MCM and stage of extraction is about 25 %. More than 70
% of the groundwater resources are unutilised which substantiate the scope for further devel-
opment of the ground water resources. Hence, it is proposed to construct ground water ab-
straction structures (144 bore wells) for creating additional irrigated agriculture in cultiva-
ble/Culturable waste land area of about 365.22 ha in the district and the block wise tentative
details in this regard is given in Table 6.3, in which suitable abstraction structures will be tak-
en up depending on the suitability of the area .
Roof top rainwater harvesting can be practiced by all including individuals with small land
holding especially in the block of Kalpetta. Gully plugs are suitable for all high land areas
with local break in slope such as the plateau terrains of Kalpetta, S. Bathery and Manan-
thavady blocks. Percolation Tanks are suitable for areas with thick alluvial patches like
Kainatty, Panamaram, Muttil and areas with valley fill, colluvium and highly weathered
rocks. Check dams can be constructed across small streams with gentle slope with permeable
beds and such sites are available in all blocks. Sub-surface dyke along gently sloping wide
valleys with narrow out let are effective ground water conservation structures for Amba-
lavayal and Thrikkaipatta areas. Dug well recharge can be practiced in and around Pulpally,
Perikallur, Kappiset, Mullankolli areas bordering Karnataka State.
Periodical maintenance of existing canal irrigation distributary system of Banasura Sagar
Project (BSP) and Karapuzha Irrigation Project (KIP) which are irrigating an area of
8021 ha of land is required. The canal system of Karapuzha project is still being developed
and this will further enhance the area irrigated to an additional area of 3500 Ha.
Table 6.3: Block wise details of abstraction structures proposed for Wayanad District
Block Total area
(sq.km)
Culturable
Waste Land, ha
Nos. of abstraction structures
proposed/ constructed (BW)
Kalpetta 587.7 158.31 36
Mananthavady 666.6 88.48 36
Panamaram 351.3 58.69 36
Sulthan Bathery 525.4 59.74 36
Total 2131 365.22 144
Identification of 116 number small tanks for the whole district is to be developed as
sources of water in water scarce situations. Such tanks identified must be de-silted, renovat-
ed and their feeding channels repaired to ensure that they receive enough water during the
monsoons. Steps shall also be taken to prevent contamination of water in such tanks. The
maintenance of these tanks shall be the responsibility of PRI/ water user associations at the
local level.

79
Fig.6.1 Feasible water conservation structures in Wayanad District
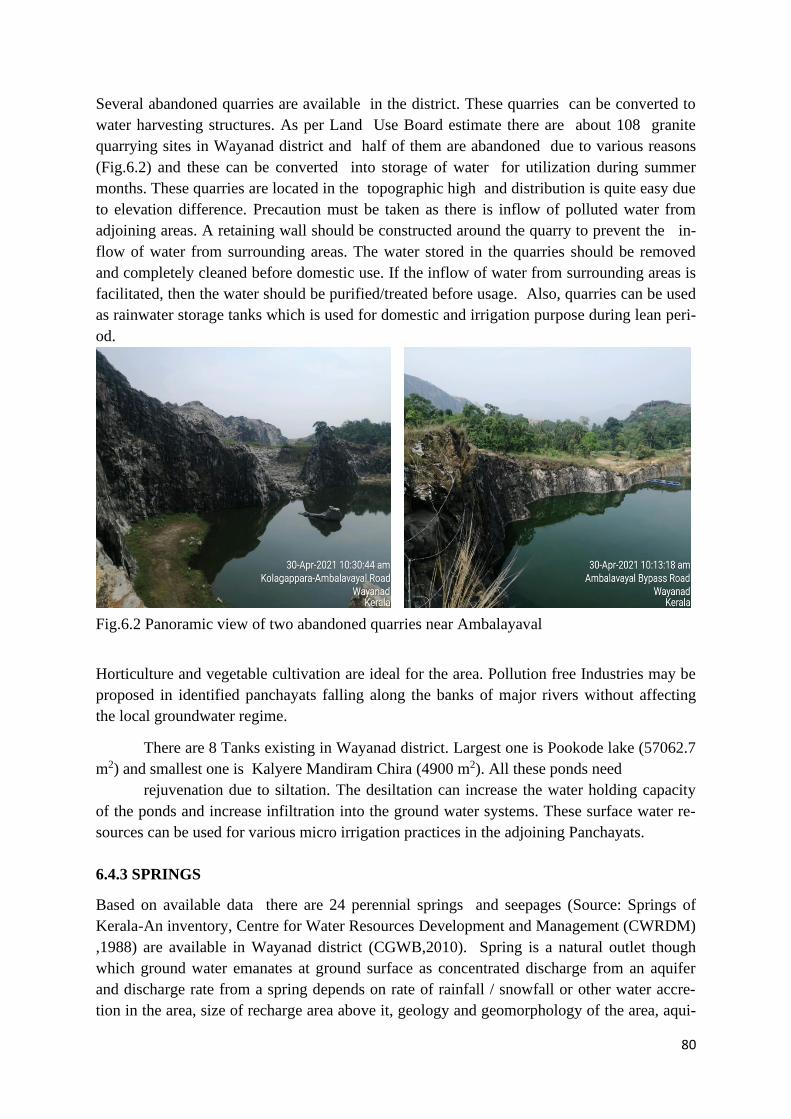
80
Several abandoned quarries are available in the district. These quarries can be converted to
water harvesting structures. As per Land Use Board estimate there are about 108 granite
quarrying sites in Wayanad district and half of them are abandoned due to various reasons
(Fig.6.2) and these can be converted into storage of water for utilization during summer
months. These quarries are located in the topographic high and distribution is quite easy due
to elevation difference. Precaution must be taken as there is inflow of polluted water from
adjoining areas. A retaining wall should be constructed around the quarry to prevent the in-
flow of water from surrounding areas. The water stored in the quarries should be removed
and completely cleaned before domestic use. If the inflow of water from surrounding areas is
facilitated, then the water should be purified/treated before usage. Also, quarries can be used
as rainwater storage tanks which is used for domestic and irrigation purpose during lean peri-
od.
Fig.6.2 Panoramic view of two abandoned quarries near Ambalayaval
Horticulture and vegetable cultivation are ideal for the area. Pollution free Industries may be
proposed in identified panchayats falling along the banks of major rivers without affecting
the local groundwater regime.
There are 8 Tanks existing in Wayanad district. Largest one is Pookode lake (57062.7
m2) and smallest one is Kalyere Mandiram Chira (4900 m2). All these ponds need
rejuvenation due to siltation. The desiltation can increase the water holding capacity
of the ponds and increase infiltration into the ground water systems. These surface water re-
sources can be used for various micro irrigation practices in the adjoining Panchayats.
6.4.3 SPRINGS
Based on available data there are 24 perennial springs and seepages (Source: Springs of
Kerala-An inventory, Centre for Water Resources Development and Management (CWRDM)
,1988) are available in Wayanad district (CGWB,2010). Spring is a natural outlet though
which ground water emanates at ground surface as concentrated discharge from an aquifer
and discharge rate from a spring depends on rate of rainfall / snowfall or other water accre-
tion in the area, size of recharge area above it, geology and geomorphology of the area, aqui-
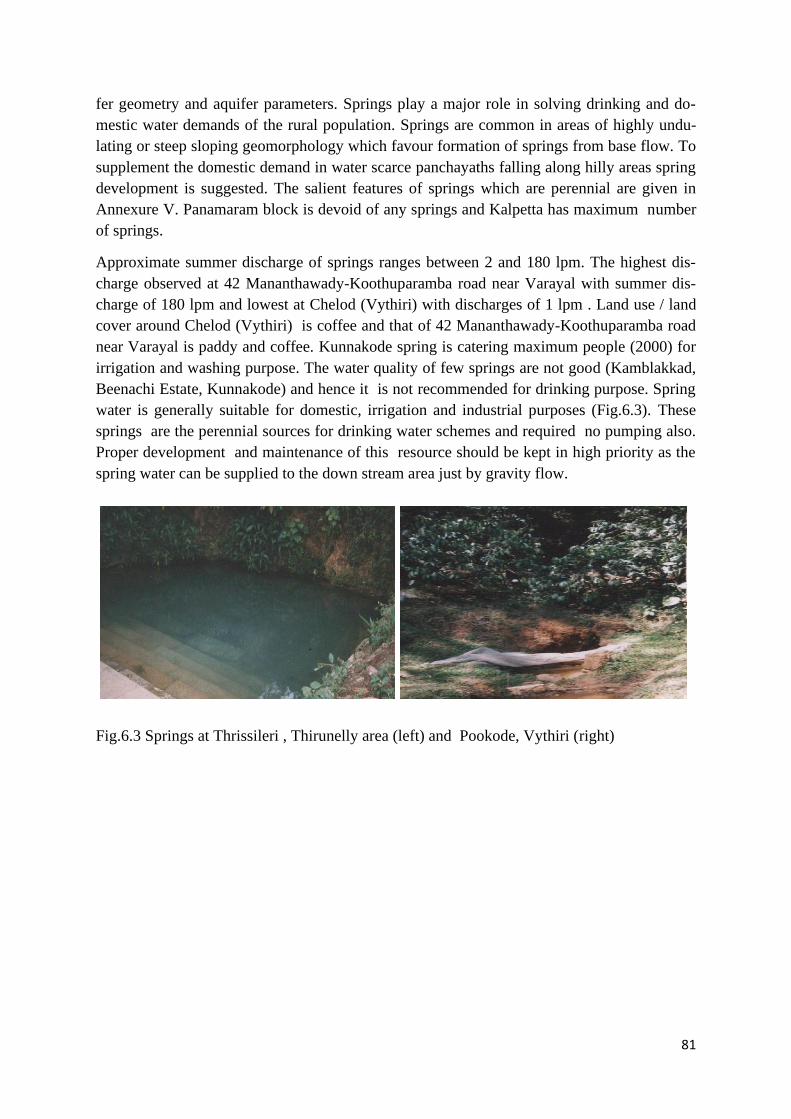
81
fer geometry and aquifer parameters. Springs play a major role in solving drinking and do-
mestic water demands of the rural population. Springs are common in areas of highly undu-
lating or steep sloping geomorphology which favour formation of springs from base flow. To
supplement the domestic demand in water scarce panchayaths falling along hilly areas spring
development is suggested. The salient features of springs which are perennial are given in
Annexure V. Panamaram block is devoid of any springs and Kalpetta has maximum number
of springs.
Approximate summer discharge of springs ranges between 2 and 180 lpm. The highest dis-
charge observed at 42 Mananthawady-Koothuparamba road near Varayal with summer dis-
charge of 180 lpm and lowest at Chelod (Vythiri) with discharges of 1 lpm . Land use / land
cover around Chelod (Vythiri) is coffee and that of 42 Mananthawady-Koothuparamba road
near Varayal is paddy and coffee. Kunnakode spring is catering maximum people (2000) for
irrigation and washing purpose. The water quality of few springs are not good (Kamblakkad,
Beenachi Estate, Kunnakode) and hence it is not recommended for drinking purpose. Spring
water is generally suitable for domestic, irrigation and industrial purposes (Fig.6.3). These
springs are the perennial sources for drinking water schemes and required no pumping also.
Proper development and maintenance of this resource should be kept in high priority as the
spring water can be supplied to the down stream area just by gravity flow.
Fig.6.3 Springs at Thrissileri , Thirunelly area (left) and Pookode, Vythiri (right)
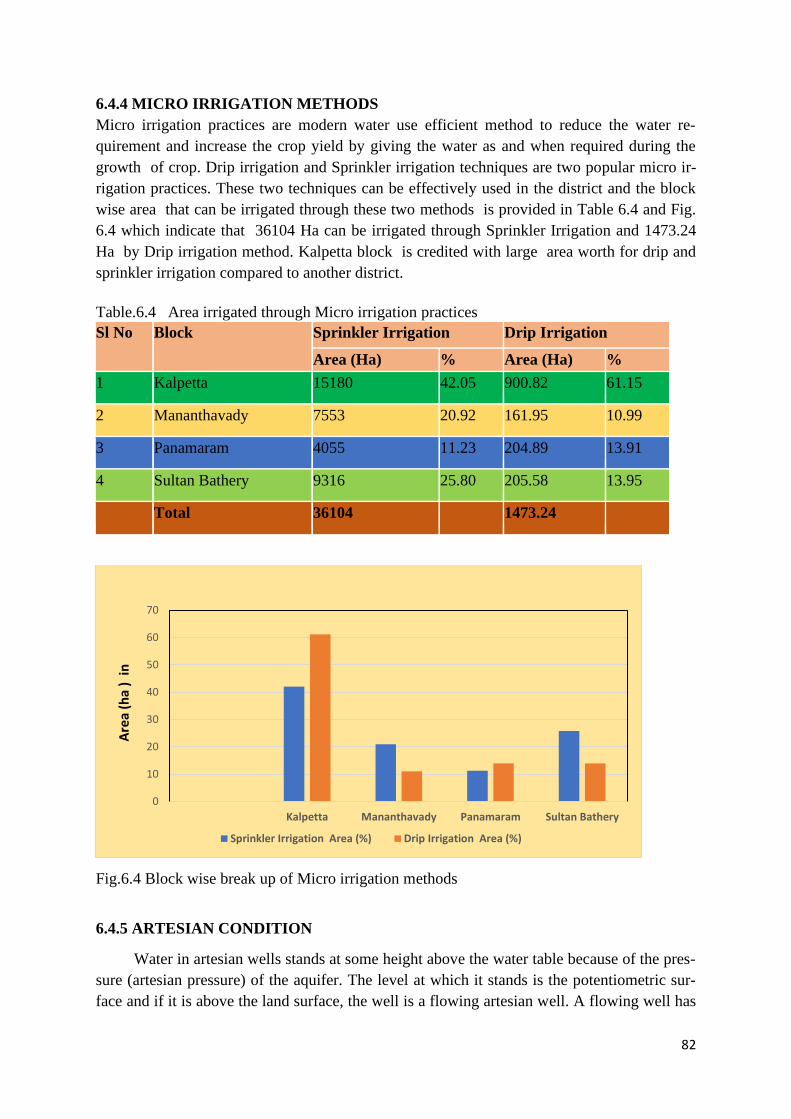
82
6.4.4 MICRO IRRIGATION METHODS
Micro irrigation practices are modern water use efficient method to reduce the water re-
quirement and increase the crop yield by giving the water as and when required during the
growth of crop. Drip irrigation and Sprinkler irrigation techniques are two popular micro ir-
rigation practices. These two techniques can be effectively used in the district and the block
wise area that can be irrigated through these two methods is provided in Table 6.4 and Fig.
6.4 which indicate that 36104 Ha can be irrigated through Sprinkler Irrigation and 1473.24
Ha by Drip irrigation method. Kalpetta block is credited with large area worth for drip and
sprinkler irrigation compared to another district.
Table.6.4 Area irrigated through Micro irrigation practices
Sl No Block Sprinkler Irrigation Drip Irrigation
Area (Ha) % Area (Ha) %
1 Kalpetta 15180 42.05 900.82 61.15
2 Mananthavady 7553 20.92 161.95 10.99
3 Panamaram 4055 11.23 204.89 13.91
4 Sultan Bathery 9316 25.80 205.58 13.95
Total 36104 1473.24
Fig.6.4 Block wise break up of Micro irrigation methods
6.4.5 ARTESIAN CONDITION
Water in artesian wells stands at some height above the water table because of the pres-
sure (artesian pressure) of the aquifer. The level at which it stands is the potentiometric sur-
face and if it is above the land surface, the well is a flowing artesian well. A flowing well has
0
10
20
30
40
50
60
70
Kalpetta Mananthavady Panamaram Sultan Bathery
Sprinkler Irrigation Area (%) Drip Irrigation Area (%)
Are
a(h
a )
in

83
water that comes up to the surface because of internal pressure in the underground aquifer
containing the water.
There are two-auto flow wells (free flow wells) in the district. These auto flow
wells are situated at Irulam-Kottakalli (Fig. 6.5) in between Sulthan Batheri-Pulpally and
Kappiset which is located 4.5 km east of Pulpally. In Irulam well now the flow is reduced
due to lowering of piezometric head. The discharge of Kappiset well is quite meagre and
measured as 0.48 lps (CGWB,2010). The water quality data indicate that water of the well is
suitable for domestic and non-domestic purposes(CGWB,2010)
Fig.6.5 Autoflow well at (A) Irulam (CGWB,2018) and (B) Kappiset (CGWB,2010)
6.4.6 OTHER TRADITIONAL WATER CONSERVATION METHODS
Wayanad is known for the presence of large number of tribal population. Kenis or sacred
wells reveal the ancient knowledge and wisdom of tribes of Wayanad in water conservation
and sustainable utilization of perennial water sources. “Panam Keni” (Toddy palm well) is
the special type of well used by Mullu kuruma hamlets (Fig.6.6). Mullu kurumas is concen-
trated and are mainly found in the panchayaths of Noolpuzha, Kidanganad, Muppainad,
Muttil, Parakkadi, Tirunelli and Mananthavadi. This type of wells are being used by kurumas
for hundreds of years. Kenis are located on the edge or middle of paddy fields and near for-
ests. Cylindrical in shape, they have a diameter and depth of around four feet only. The wall
is of Toddy palm (Caryota urens). Usually the bottom stem portion of large palms are used to
make wooden cylinders after retting them in water for a long time so that the inner core gets
rotten and degraded and the hard outer layer remains. The wooden cylinders are immersed in
the spots where there is good ground water spring and that is the secret of abundant water
even in hottest summer months. Now there may be around 200 kenis in Wayanad. These
wells reveal the ancient knowledge and wisdom of tribes of Wayanad in locating, preserving
and sustainable utilization of perennial water sources
Irulam-Kottakolli Kappiset
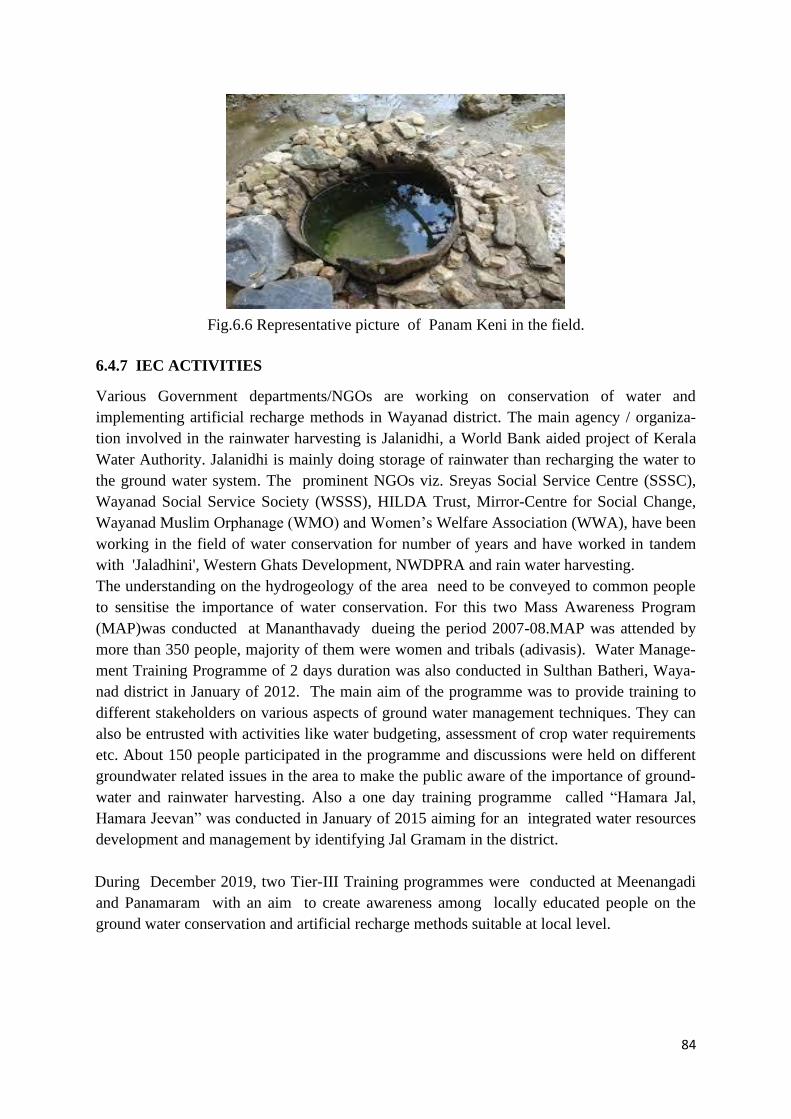
84
Fig.6.6 Representative picture of Panam Keni in the field.
6.4.7 IEC ACTIVITIES
Various Government departments/NGOs are working on conservation of water and
implementing artificial recharge methods in Wayanad district. The main agency / organiza-
tion involved in the rainwater harvesting is Jalanidhi, a World Bank aided project of Kerala
Water Authority. Jalanidhi is mainly doing storage of rainwater than recharging the water to
the ground water system. The prominent NGOs viz. Sreyas Social Service Centre (SSSC),
Wayanad Social Service Society (WSSS), HILDA Trust, Mirror-Centre for Social Change,
Wayanad Muslim Orphanage (WMO) and Women’s Welfare Association (WWA), have been
working in the field of water conservation for number of years and have worked in tandem
with 'Jaladhini', Western Ghats Development, NWDPRA and rain water harvesting.
The understanding on the hydrogeology of the area need to be conveyed to common people
to sensitise the importance of water conservation. For this two Mass Awareness Program
(MAP)was conducted at Mananthavady dueing the period 2007-08.MAP was attended by
more than 350 people, majority of them were women and tribals (adivasis). Water Manage-
ment Training Programme of 2 days duration was also conducted in Sulthan Batheri, Waya-
nad district in January of 2012. The main aim of the programme was to provide training to
different stakeholders on various aspects of ground water management techniques. They can
also be entrusted with activities like water budgeting, assessment of crop water requirements
etc. About 150 people participated in the programme and discussions were held on different
groundwater related issues in the area to make the public aware of the importance of ground-
water and rainwater harvesting. Also a one day training programme called “Hamara Jal,
Hamara Jeevan” was conducted in January of 2015 aiming for an integrated water resources
development and management by identifying Jal Gramam in the district.
During December 2019, two Tier-III Training programmes were conducted at Meenangadi
and Panamaram with an aim to create awareness among locally educated people on the
ground water conservation and artificial recharge methods suitable at local level.
85
6.5 SUMMARY
➢ Two aquifer systems were identified in the district viz; the phreatic aquifer system
(Aquifer-I) and the fracture aquifer system (Aquifer-II). The phreatic aquifer system
comprises weathered zone and underlying shallow fracture system extending up to 35
mbgl. The deeper fractured crystalline aquifers are under confined to semi confined
conditions and the potential fractures are encountered up to 199 m bgl. Baveli shear
zone is the major lineament in Wayanad district having NW-SE trend. The water level
in majority of area is within the range of 2-10 m bgl.
➢ The district is bestowed with abundant groundwater resources in the tune of about 767
MCM. Of which, the total resource in the phreatic aquifer is 403 MCM and Fractured
aquifer is 364 MCM). All the four blocks in the district are in Safe category. The av-
erage stage of development is about 25 % only. Therefore, sufficient scope exist for
further GW development.
➢ There are no major issues related to groundwater availability or water quality as per
the findings of aquifer mapping carried out in the district. However, shortage of drink-
ing water in highland areas is commonplace during lean periods due to limited aquifer
thickness and high rates of base flow. Of the four blocks, Panamaram block experi-
ences high water scarcity during lean periods due to low recharge.
➢ Water conservation practices are proposed under aquifer management plan for the
highland areas where shortage of water is being experienced during summer and its
implementation in convergence with ongoing MNREGS and PMKSY. Additionally,
water conservation structures like 3896 Check dams, 2301 Farm Ponds,15 Nallah
Bunds,140 Percolation Tanks,228 Fishery Ponds, and 51 in situ structures are recom-
mended at identified places which will create an additional irrigation potential of
103651.18 ha in the district.
➢ Extraction of ground water through renovation of 24 recommended for providing
sustainable drinking water supply to 9787 people living in various tribal hamlets
and for collection of water from springs 13 storage tanks are required.
➢ Encourage traditional knowledge like Panam Keni which has been used for conserv-
ing ground water by Tribal people.
7.0 REFERENCES:
1. CGWB,2010.Ground water resources and development potential of Wayanad Dis-
trict.Unpublished Report.
2. CGWB,2018.Dynamic Ground Water Resources of Kerala as on March,2017.
3. CGWB,2018.Ground water exploration in Kerala as on 31.03.2017.
4. CGWB,2018. Ground water information booklet of Wayanad District, Kerala State.
5. CGWB, 2020. Aquifer mapping and management of Ground Water resources of
Kottayam district.
6. Land Use Board, Govt of Kerala,2018, District Report-Wayanad.
7. Dept of Agriculture, Govt of Kerala.2019. District Irrigation Plan-Wayanad district under
PMKSY.

86
ANNEXURES

87
ANNEXURE-I : Details of GWMWs in the Study area
Sl
No Location Block Lat Long
MP
(m)
Dia
(m)
Total Depth
(m) Geology Use
Apr-
18
Non-
18
Aquifer
type
1 Ambalavayal
Sulthan Bath-
ery 11.61 76.21 2.90 10.70 2.15 Laterite Domestic 8.21 7.57
Unconfined
2 Appapara Mananthavady 11.91 76.03 0.75 9.26 3.30 Laterite Domestic 6.58 2.91 Unconfined
3 Arimula
Sulthan Bath-
ery 11.69 76.13 0.80 10.40 2.50 Laterite Domestic 9.20 6.17
Unconfined
4 Baveli Mananthavady 11.84 76.12 0.80 9.00 2.00 Laterite Domestic 9.04 3.27 Unconfined
5 Begur Mananthavady 11.76 76.17 0.90 13.10 3.00 Laterite Domestic 11.69 6.51 Unconfined
6 CC Junction
Sulthan Bath-
ery 11.68 76.21 0.80 14.00 2.00 Laterite Domestic 11.71 9.11
Unconfined
7 Cheenkeri
Sulthan Bath-
ery 11.64 76.19 1.00 11.83 2.30 Laterite Domestic 10.30 5.51
Unconfined
8 Chellakod
Sulthan Bath-
ery 11.54 76.24 0.90 10.50 1.35 Laterite Domestic 8.74 6.19
Unconfined
9 Chenad
Sulthan Bath-
ery 11.73 76.24 1.00 19.40 2.55 Laterite Domestic 16.84 11.15
Unconfined
10 Cheyyambam
Sulthan Bath-
ery 11.75 76.23 0.80 4.50 1.50 Laterite Domestic 3.98 2.88
Unconfined
11 Chulliyod
Sulthan Bath-
ery 11.60 76.26 0.98 16.00 2.40 Laterite Domestic 14.76 11.01
Unconfined
12 Dasanakkara Panamaram 11.80 76.08 0.60 7.00 2.00 Laterite Domestic 3.75 4.09 Unconfined
13 Kalpetta-R1 Kalpetta 11.61 76.08 0.85 9.98 1.40 Laterite Domestic 3.07 1.06 Unconfined
14 Kamblakat Kalpetta 11.68 76.08 1.50 21.00 1.80 Laterite Domestic 18.00 15.58 Unconfined
15 Kanjirangad Mananthavady 11.74 75.91 0.75 3.95 2.00 Laterite Domestic 2.29 1.64 Unconfined
16 Kappiset Panamaram 11.80 76.20 0.70 11.30 2.30 Laterite Domestic 14.00 5.37 Unconfined
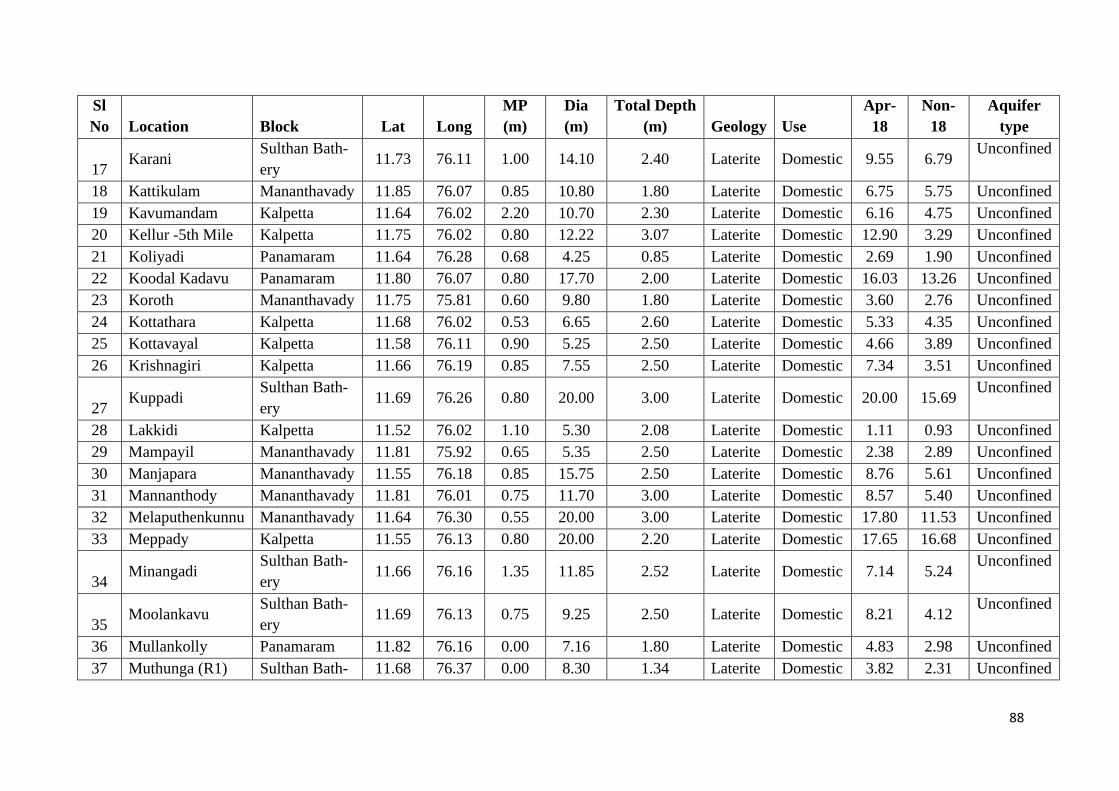
88
Sl
No Location Block Lat Long
MP
(m)
Dia
(m)
Total Depth
(m) Geology Use
Apr-
18
Non-
18
Aquifer
type
17 Karani
Sulthan Bath-
ery 11.73 76.11 1.00 14.10 2.40 Laterite Domestic 9.55 6.79
Unconfined
18 Kattikulam Mananthavady 11.85 76.07 0.85 10.80 1.80 Laterite Domestic 6.75 5.75 Unconfined
19 Kavumandam Kalpetta 11.64 76.02 2.20 10.70 2.30 Laterite Domestic 6.16 4.75 Unconfined
20 Kellur -5th Mile Kalpetta 11.75 76.02 0.80 12.22 3.07 Laterite Domestic 12.90 3.29 Unconfined
21 Koliyadi Panamaram 11.64 76.28 0.68 4.25 0.85 Laterite Domestic 2.69 1.90 Unconfined
22 Koodal Kadavu Panamaram 11.80 76.07 0.80 17.70 2.00 Laterite Domestic 16.03 13.26 Unconfined
23 Koroth Mananthavady 11.75 75.81 0.60 9.80 1.80 Laterite Domestic 3.60 2.76 Unconfined
24 Kottathara Kalpetta 11.68 76.02 0.53 6.65 2.60 Laterite Domestic 5.33 4.35 Unconfined
25 Kottavayal Kalpetta 11.58 76.11 0.90 5.25 2.50 Laterite Domestic 4.66 3.89 Unconfined
26 Krishnagiri Kalpetta 11.66 76.19 0.85 7.55 2.50 Laterite Domestic 7.34 3.51 Unconfined
27 Kuppadi
Sulthan Bath-
ery 11.69 76.26 0.80 20.00 3.00 Laterite Domestic 20.00 15.69
Unconfined
28 Lakkidi Kalpetta 11.52 76.02 1.10 5.30 2.08 Laterite Domestic 1.11 0.93 Unconfined
29 Mampayil Mananthavady 11.81 75.92 0.65 5.35 2.50 Laterite Domestic 2.38 2.89 Unconfined
30 Manjapara Mananthavady 11.55 76.18 0.85 15.75 2.50 Laterite Domestic 8.76 5.61 Unconfined
31 Mannanthody Mananthavady 11.81 76.01 0.75 11.70 3.00 Laterite Domestic 8.57 5.40 Unconfined
32 Melaputhenkunnu Mananthavady 11.64 76.30 0.55 20.00 3.00 Laterite Domestic 17.80 11.53 Unconfined
33 Meppady Kalpetta 11.55 76.13 0.80 20.00 2.20 Laterite Domestic 17.65 16.68 Unconfined
34 Minangadi
Sulthan Bath-
ery 11.66 76.16 1.35 11.85 2.52 Laterite Domestic 7.14 5.24
Unconfined
35 Moolankavu
Sulthan Bath-
ery 11.69 76.13 0.75 9.25 2.50 Laterite Domestic 8.21 4.12
Unconfined
36 Mullankolly Panamaram 11.82 76.16 0.00 7.16 1.80 Laterite Domestic 4.83 2.98 Unconfined
37 Muthunga (R1) Sulthan Bath- 11.68 76.37 0.00 8.30 1.34 Laterite Domestic 3.82 2.31 Unconfined

89
Sl
No Location Block Lat Long
MP
(m)
Dia
(m)
Total Depth
(m) Geology Use
Apr-
18
Non-
18
Aquifer
type
ery
38 Muttil Kalpetta 11.64 76.11 0.95 6.80 2.50 Laterite Domestic 3.49 2.03 Unconfined
39 Nadavayal
Sulthan Bath-
ery 11.75 76.12 0.90 10.10 2.50 Laterite Domestic 8.19 3.51
Unconfined
40 Naykatti
Sulthan Bath-
ery 11.67 76.32 0.75 9.05 2.77 Laterite Domestic 6.61 4.07
Unconfined
41 Nedugarana Kalpetta 11.55 76.18 0.75 9.55 2.25 Laterite Domestic 8.95 6.73 Unconfined
42 Neeravaram Panamaram 11.77 76.08 1.06 23.10 3.00 Laterite Domestic 16.82 11.38 Unconfined
43 Nenmeni Kunnu
Sulthan Bath-
ery 11.69 76.13 1.00 6.60 2.00 Laterite Domestic 3.11 1.28
Unconfined
44 Noolpuzha (R1)
Sulthan Bath-
ery 11.61 76.35 0.60 5.00 2.00 Laterite Domestic 3.48 2.19
Unconfined
45 Ondyangadi Mananthavady 11.83 76.03 0.70 17.45 2.25 Laterite Domestic 10.83 8.71 Unconfined
46 Pachilakkad Panamaram 11.71 76.08 0.80 11.88 2.00 Laterite Domestic 9.95 6.33 Unconfined
47
Padinjarattara
(R1) Kalpetta 11.68 75.98 0.65 10.24 2.25 Laterite Domestic 8.80 6.93
Unconfined
48 Pakkam Panamaram 11.80 76.10 0.90 7.74 2.75 Laterite Domestic 7.06 3.59 Unconfined
49 Pallikunnu Kalpetta 11.68 76.05 0.80 10.50 1.80 Laterite Domestic 9.55 7.43 Unconfined
50 Panamaram Panamaram 11.73 76.07 0.75 6.95 2.30 Laterite Domestic 4.31 2.65 Unconfined
51 Pattanikoopu Panamaram 11.84 76.16 0.70 11.50 1.75 Laterite Domestic 10.50 5.35 Unconfined
52 Perikallur Panamaram 11.79 76.23 0.70 14.25 0.00 Laterite Domestic 13.75 6.27 Unconfined
53 Perya Mananthavady 11.83 75.84 0.60 13.18 2.50 Laterite Domestic 5.56 5.21 Unconfined
54 Pookode Kalpetta 11.56 76.10 1.15 5.60 1.80 Laterite Domestic 2.41 1.65 Unconfined
55 Pozhutana Kalpetta 11.59 76.02 1.00 10.23 2.53 Laterite Domestic 6.40 6.16 Unconfined
56 Pulpally Panamaram 11.73 76.13 0.80 18.00 1.70 Laterite Domestic 3.40 2.94 Unconfined

90
Sl
No Location Block Lat Long
MP
(m)
Dia
(m)
Total Depth
(m) Geology Use
Apr-
18
Non-
18
Aquifer
type
57 Punchvayal Panamaram 11.75 76.09 0.60 11.00 2.50 Laterite Domestic 10.34 5.91 Unconfined
58 Sulthan Battery
Sulthan Bath-
ery 11.66 76.25 0.70 11.00 2.50 Laterite Domestic 6.91 3.02
Unconfined
59 Talapuzha Mananthavady 11.83 75.98 0.90 4.30 2.50 Laterite Domestic 2.40 1.33 Unconfined
60 Taruvana Mananthavady 11.83 75.98 0.90 12.85 2.22 Laterite Domestic 11.13 7.05 Unconfined
61 Thetti Road Mananthavady 11.90 76.07 1.00 15.90 1.50 Laterite Domestic 15.90 7.47 Unconfined
62 Thirunelly (R1) Mananthavady 11.91 75.99 0.90 7.80 1.50 Laterite Domestic 6.40 4.31 Unconfined
63 Theolpetty Mananthavady 11.94 76.07 0.70 12.00 2.00 Laterite Domestic 11.56 3.49 Unconfined
64 Thonichal Mananthavady 11.77 76.00 0.78 8.30 2.42 Laterite Domestic 6.55 3.68 Unconfined
65 Ullisseri Mananthavady 11.64 76.30 0.70 6.00 1.50 Laterite Domestic 4.77 0.98 Unconfined
66 Uppupara Kalpetta 11.59 76.14 0.83 10.80 1.70 Laterite Domestic 7.04 6.26 Unconfined
67 Vaduvanchal
Sulthan Bath-
ery 11.56 76.23 0.75 11.50 2.10 Laterite Domestic 9.37 7.70
Unconfined
68 Valad (R1) Mananthavady 11.79 75.91 0.70 12.90 1.65 Laterite Domestic 10.89 9.86 Unconfined
69 Vallathur
Sulthan Bath-
ery 11.62 76.32 0.75 4.70 2.50 Laterite Domestic 2.87 0.87
Unconfined
70
Vallithodu (Peri-
ye) Mananthavady 11.84 75.89 0.70 11.00 3.40 Laterite Domestic 7.72 9.75
Unconfined
71 Valliyur kavu Mananthavady 11.68 76.01 1.10 7.10 2.40 Laterite Domestic 2.51 1.08 Unconfined
74 Vengapalli Kalpetta 11.64 76.28 0.75 15.20 2.50 Laterite Domestic 15.23 12.01 Unconfined
72 Varayal Mananthavady 11.83 75.84 0.85 5.95 2.00 Laterite Domestic 4.35 4.13
73 Vellamunda Mananthavady 11.73 75.95 0.80 12.50 2.80 Laterite Domestic 12.68 4.41
75 Vyittiri Kalpetta 11.56 76.04 0.80 9.75 2.40 Laterite Domestic 7.56 7.11

91
ANNEXURE-II : Details of KOWs in the Study area
Sl
N
o
Location Block /
Mandal
Sub
Basin
Geolo-
gy
Latitude Longitude Well use Sur-
face
Water
Influ-
ence
MP Dia TD WL
(Jan
-
2020
)
Eleva-
tion of
Ground
Level
Land
Use
1 Chundale NH Kalpetta Kabani LTR 11°34' 12" 76°2' 60" Domestic Nil 0.6 2 7.2 3.68 780 Rural
2
Thinapuram
Ring Well
Panama-
ram Kabani ALV 11°31' 48" 76°9' 36" Domestic Nil 0.76 1.04 8 4.78 877 Rural
3 Mundakolli
Panama-
ram Kabani LTR 11°37' 12" 76°18' 36" Domestic Nil 0.8 1.74 21 13.7 750 Rural
4 Chethalayam
Sulthan-
bathery Kabani LTR 11°44' 24" 76°14' 24" Domestic Nil 0.75 2.4 11.5 1.65 903 Rural
5 Irulam
Sulthan-
bathery Kabani LTR 11°45' 0" 76°11' 24" Domestic Nil 1 2.6 12.5 8.78 900 Rural
6 Padichira
Panama-
ram Kabani ALV 11°49' 48" 76°10' 12" Domestic Nil 0.43 2.5 18 14 773 Rural
7 Karyambadi
Panama-
ram Kabani ALV 11°40' 12" 76°7' 48" Domestic Nil 0.68 2.4 15 10.1 763 Rural
8 Varadoor
Panama-
ram Kabani LTR 11°41' 60" 76°5' 60" Domestic Nil 0.8 2.6 16 9.53 720 Rural
9
Vilambukan-
dam
Panama-
ram Kabani LTR 11°41' 60" 76°1' 48" Domestic Nil 0.81 1.81 25
16.4
1 765 Rural
10 Anjukunnu
Sulthan-
bathery Kabani LTR 11°44' 24" 76°2' 24" Domestic Nil 0.5 2.6 18
11.8
5 750 Rural
11 Aruwal
Sulthan-
bathery Kabani LTR 11°42' 36" 75°58' 48" Domestic Nil 0 1.85 8 3.85 736 Rural
12 Beenachi Sulthan- Kabani LTR 11°35' 60" 76°13' 48" Domestic Nil 1.1 2.33 12 6.9 896 Rural
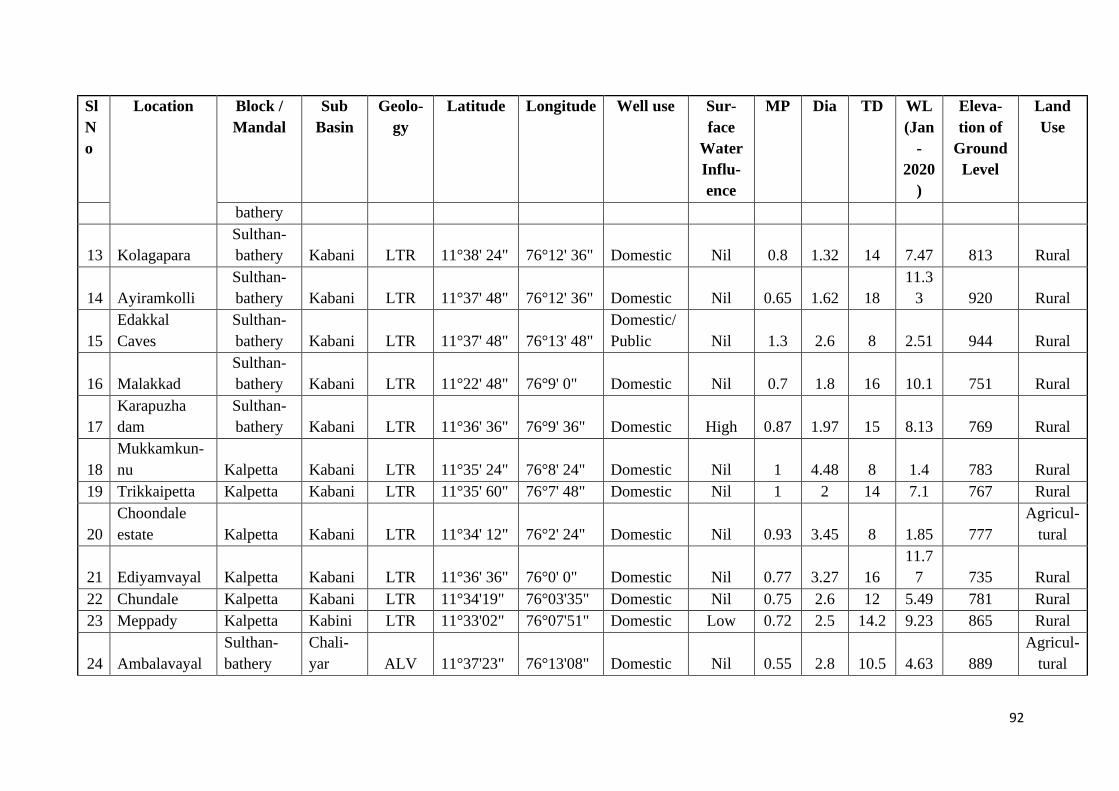
92
Sl
N
o
Location Block /
Mandal
Sub
Basin
Geolo-
gy
Latitude Longitude Well use Sur-
face
Water
Influ-
ence
MP Dia TD WL
(Jan
-
2020
)
Eleva-
tion of
Ground
Level
Land
Use
bathery
13 Kolagapara
Sulthan-
bathery Kabani LTR 11°38' 24" 76°12' 36" Domestic Nil 0.8 1.32 14 7.47 813 Rural
14 Ayiramkolli
Sulthan-
bathery Kabani LTR 11°37' 48" 76°12' 36" Domestic Nil 0.65 1.62 18
11.3
3 920 Rural
15
Edakkal
Caves
Sulthan-
bathery Kabani LTR 11°37' 48" 76°13' 48"
Domestic/
Public Nil 1.3 2.6 8 2.51 944 Rural
16 Malakkad
Sulthan-
bathery Kabani LTR 11°22' 48" 76°9' 0" Domestic Nil 0.7 1.8 16 10.1 751 Rural
17
Karapuzha
dam
Sulthan-
bathery Kabani LTR 11°36' 36" 76°9' 36" Domestic High 0.87 1.97 15 8.13 769 Rural
18
Mukkamkun-
nu Kalpetta Kabani LTR 11°35' 24" 76°8' 24" Domestic Nil 1 4.48 8 1.4 783 Rural
19 Trikkaipetta Kalpetta Kabani LTR 11°35' 60" 76°7' 48" Domestic Nil 1 2 14 7.1 767 Rural
20
Choondale
estate Kalpetta Kabani LTR 11°34' 12" 76°2' 24" Domestic Nil 0.93 3.45 8 1.85 777
Agricul-
tural
21 Ediyamvayal Kalpetta Kabani LTR 11°36' 36" 76°0' 0" Domestic Nil 0.77 3.27 16
11.7
7 735 Rural
22 Chundale Kalpetta Kabani LTR 11°34'19" 76°03'35" Domestic Nil 0.75 2.6 12 5.49 781 Rural
23 Meppady Kalpetta Kabini LTR 11°33'02" 76°07'51" Domestic Low 0.72 2.5 14.2 9.23 865 Rural
24 Ambalavayal
Sulthan-
bathery
Chali-
yar ALV 11°37'23" 76°13'08" Domestic Nil 0.55 2.8 10.5 4.63 889
Agricul-
tural
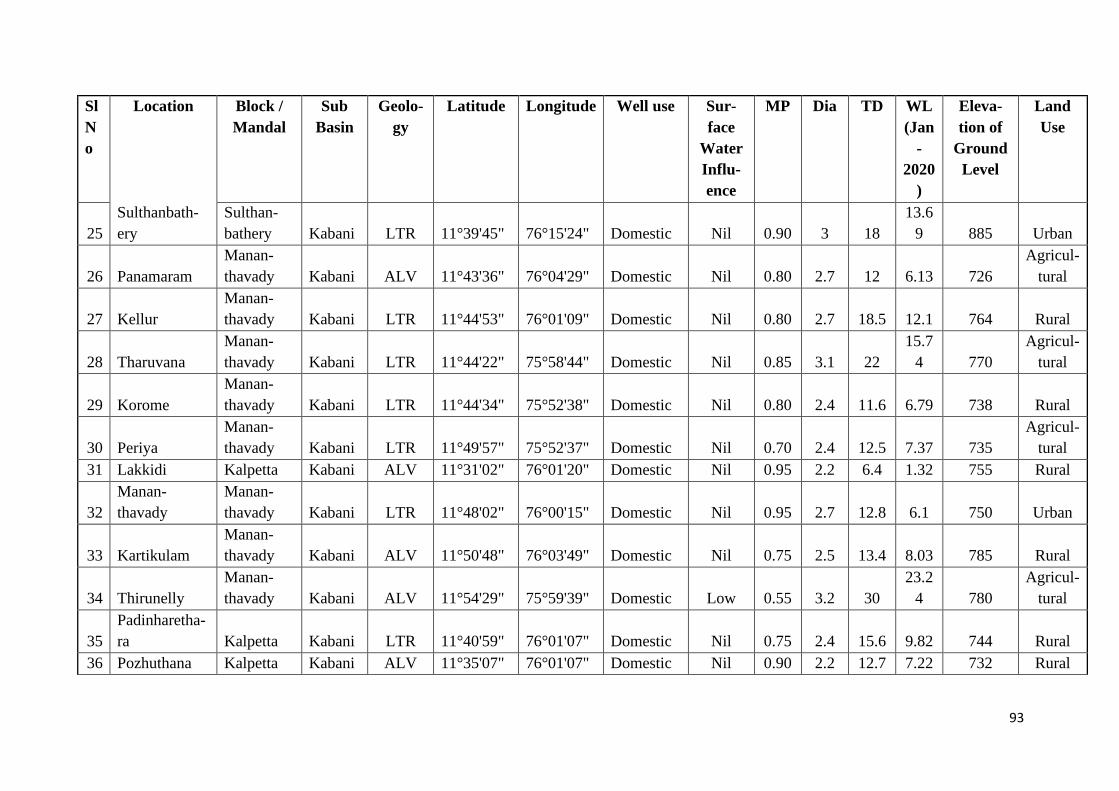
93
Sl
N
o
Location Block /
Mandal
Sub
Basin
Geolo-
gy
Latitude Longitude Well use Sur-
face
Water
Influ-
ence
MP Dia TD WL
(Jan
-
2020
)
Eleva-
tion of
Ground
Level
Land
Use
25
Sulthanbath-
ery
Sulthan-
bathery Kabani LTR 11°39'45" 76°15'24" Domestic Nil 0.90 3 18
13.6
9 885 Urban
26 Panamaram
Manan-
thavady Kabani ALV 11°43'36" 76°04'29" Domestic Nil 0.80 2.7 12 6.13 726
Agricul-
tural
27 Kellur
Manan-
thavady Kabani LTR 11°44'53" 76°01'09" Domestic Nil 0.80 2.7 18.5 12.1 764 Rural
28 Tharuvana
Manan-
thavady Kabani LTR 11°44'22" 75°58'44" Domestic Nil 0.85 3.1 22
15.7
4 770
Agricul-
tural
29 Korome
Manan-
thavady Kabani LTR 11°44'34" 75°52'38" Domestic Nil 0.80 2.4 11.6 6.79 738 Rural
30 Periya
Manan-
thavady Kabani LTR 11°49'57" 75°52'37" Domestic Nil 0.70 2.4 12.5 7.37 735
Agricul-
tural
31 Lakkidi Kalpetta Kabani ALV 11°31'02" 76°01'20" Domestic Nil 0.95 2.2 6.4 1.32 755 Rural
32
Manan-
thavady
Manan-
thavady Kabani LTR 11°48'02" 76°00'15" Domestic Nil 0.95 2.7 12.8 6.1 750 Urban
33 Kartikulam
Manan-
thavady Kabani ALV 11°50'48" 76°03'49" Domestic Nil 0.75 2.5 13.4 8.03 785 Rural
34 Thirunelly
Manan-
thavady Kabani ALV 11°54'29" 75°59'39" Domestic Low 0.55 3.2 30
23.2
4 780
Agricul-
tural
35
Padinharetha-
ra Kalpetta Kabani LTR 11°40'59" 76°01'07" Domestic Nil 0.75 2.4 15.6 9.82 744 Rural
36 Pozhuthana Kalpetta Kabani ALV 11°35'07" 76°01'07" Domestic Nil 0.90 2.2 12.7 7.22 732 Rural
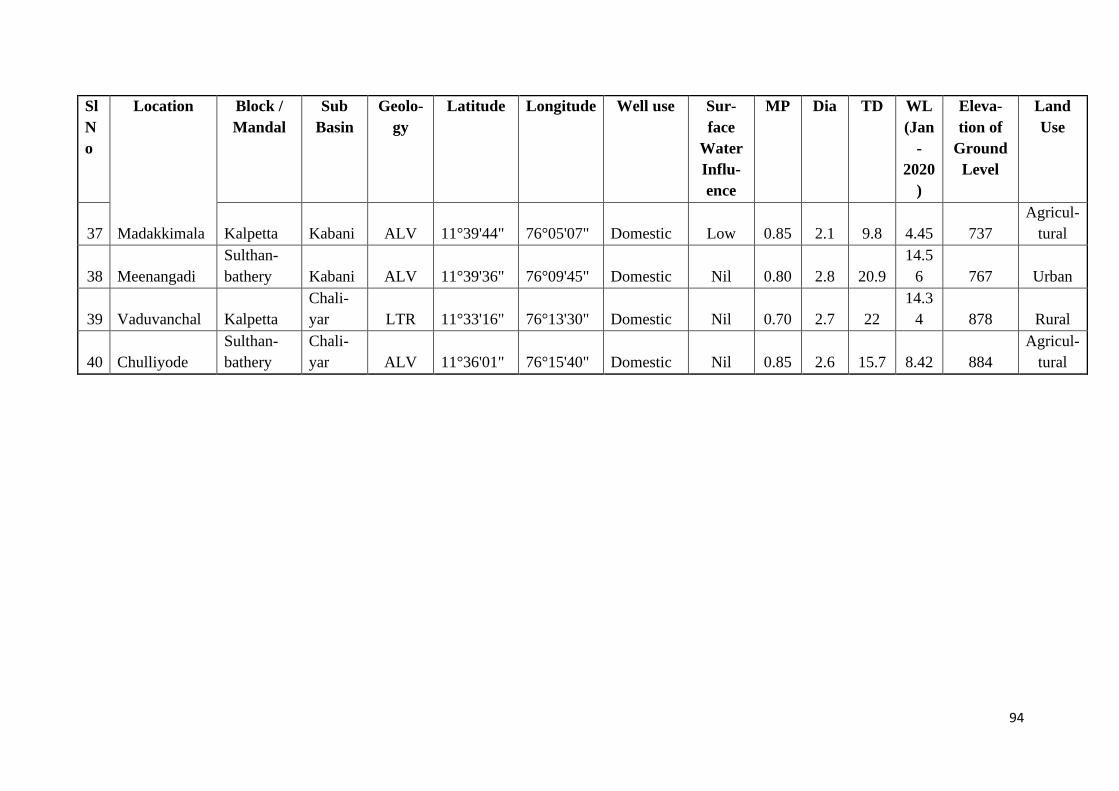
94
Sl
N
o
Location Block /
Mandal
Sub
Basin
Geolo-
gy
Latitude Longitude Well use Sur-
face
Water
Influ-
ence
MP Dia TD WL
(Jan
-
2020
)
Eleva-
tion of
Ground
Level
Land
Use
37 Madakkimala Kalpetta Kabani ALV 11°39'44" 76°05'07" Domestic Low 0.85 2.1 9.8 4.45 737
Agricul-
tural
38 Meenangadi
Sulthan-
bathery Kabani ALV 11°39'36" 76°09'45" Domestic Nil 0.80 2.8 20.9
14.5
6 767 Urban
39 Vaduvanchal Kalpetta
Chali-
yar LTR 11°33'16" 76°13'30" Domestic Nil 0.70 2.7 22
14.3
4 878 Rural
40 Chulliyode
Sulthan-
bathery
Chali-
yar ALV 11°36'01" 76°15'40" Domestic Nil 0.85 2.6 15.7 8.42 884
Agricul-
tural

95
ANNEXURE-III Details of Exploratory wells drilled by CGWB in the study area
Sl.
No
Location Latitude Longitude Year of con-
struction
Depth
drilled
(mbgl)
Major li-
thology en-
countered
Depth
to bed
rock
(casing
depth)
Fracture
zones with
yield lpm
SWL Discharge Draw
down
(m)
T S EC Cl
ppm
Lakkidi 11 31 20 76 1 20 1993-94 200 Granite
gneiss
21.7 177.3-179.3 1 NA 130 5.7
2 Vaduvanchal 11 32 53 76 13 49 60 Granite
gneiss
21.8 Nil 7.95 0.33 NA NA NA
3 Kunnampetta 11 34 25 76 5 55 124 Hornblende
gneiss
12.6 15.6-17.6,39-40,74.6-75.6,122.4-124.4
1.95 6
4 Kalpetta 11 35 45 76 5 50 1993-94 200.00, Granite
gneiss
21 30.9-31.9, 149.9-150.9
2.6 0.33 NA
5 Ambalavayal 11 36 25 76 13 45 200 Granite
gneiss
5.8 NA dry
6 Koliyadi 11 37 54 76 16 41 1993-94 200 Granite
gneiss
11.5 75.5-76.5 0.3 0.4 NA 240
7 Minangadi 11 39 45 76 9 45 200 Granite
gneiss
15 15.6-17.6,
100-101
8.1 1
8 Sultan Battery 11 39 55 76 16 30 200 Hornblende
gneiss
26.5 30.9-31.9,
149.9-150.9
8.39 2.17
9 Valavayal 11 41 50 76 11 50 190.5 Granite
gneiss
7.6 5.41 8

96
Sl.
No
Location Latitude Longitude Year of con-
struction
Depth
drilled
(mbgl)
Major li-
thology en-
countered
Depth
to bed
rock
(casing
depth)
Fracture
zones with
yield lpm
SWL Discharge Draw
down
(m)
T S EC Cl
ppm
10 Panamaram 11 44 10 76 4 20 200 Hornblende
gneiss
16.7 43-44, 54-56,
97-98, 113-
115
5.5 2.5
11 Niraval puzha 11 44 20 75 51 35 200 Charnockite 16 102-103,
107-108,
195-196,198-
199
5.56 1.5
12 Ullissery 11 45 15 76 1 40 83.8 Granite
gneiss
13.7 16-17, 66-67 1.02 5
13 Pulpally 11 47 15 76 10 46 1993-94 200 Granite
gneiss
13.6 Jul-14 14 0.5 NA 320 9.9
14 Mananthavady 11 47 15 76 0 15 200 Hornblende
gneiss
23.8 44-45, 49-
50,141-142
9.325 10.17
15 Thalapuzha 11 50 25 75 56 45 171.5 Granite
gneiss
15.4 16.6,27.80,
41,81.70,
126, 170
1.67 2.92
16 Kartikulam 11 50 50 76 3 56 200 Gabbro&
Diorite
29.1 Nil NA dry
17 Tholpetti 11 56 35 76 3 35 120 23.3 24, 33, 39,
71, 77,95,
101, 110
10.98 11 11
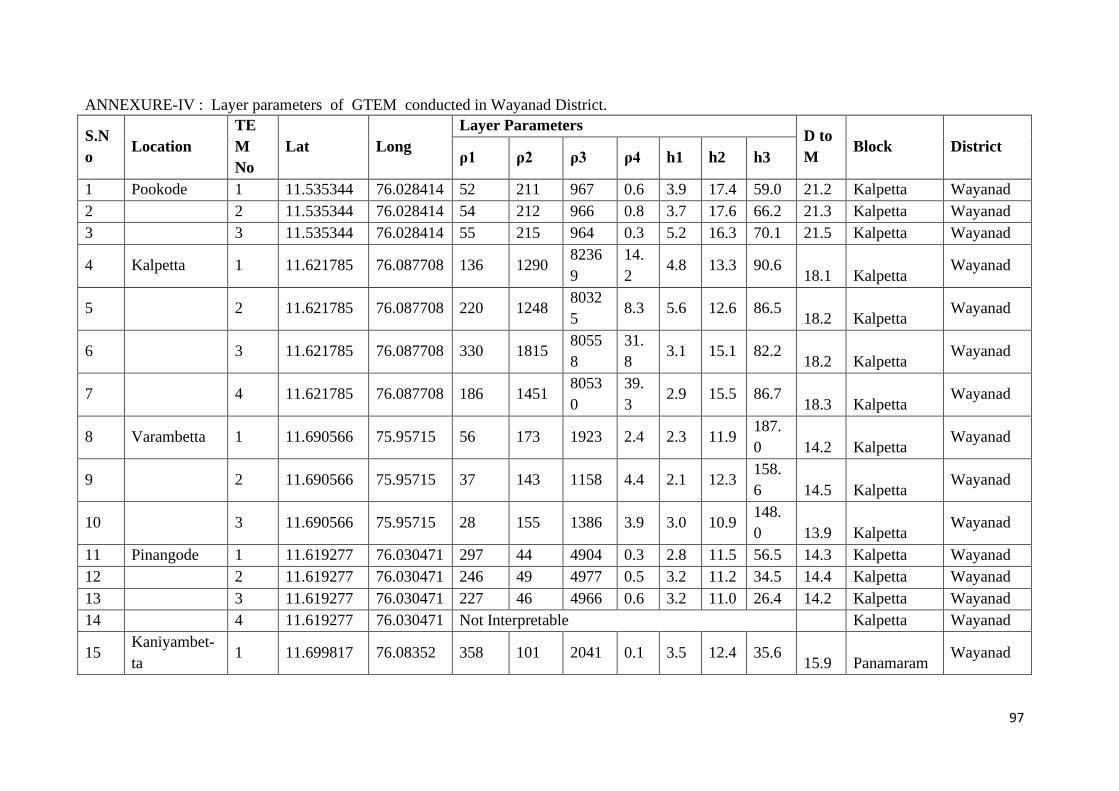
97
ANNEXURE-IV : Layer parameters of GTEM conducted in Wayanad District.
S.N
o Location
TE
M
No
Lat Long
Layer Parameters D to
M Block District
ρ1 ρ2 ρ3 ρ4 h1 h2 h3
1 Pookode 1 11.535344 76.028414 52 211 967 0.6 3.9 17.4 59.0 21.2 Kalpetta Wayanad
2 2 11.535344 76.028414 54 212 966 0.8 3.7 17.6 66.2 21.3 Kalpetta Wayanad
3 3 11.535344 76.028414 55 215 964 0.3 5.2 16.3 70.1 21.5 Kalpetta Wayanad
4 Kalpetta 1 11.621785 76.087708 136 1290 8236
9
14.
2 4.8 13.3 90.6
18.1 Kalpetta Wayanad
5 2 11.621785 76.087708 220 1248 8032
5 8.3 5.6 12.6 86.5
18.2 Kalpetta Wayanad
6 3 11.621785 76.087708 330 1815 8055
8
31.
8 3.1 15.1 82.2
18.2 Kalpetta Wayanad
7 4 11.621785 76.087708 186 1451 8053
0
39.
3 2.9 15.5 86.7
18.3 Kalpetta Wayanad
8 Varambetta 1 11.690566 75.95715 56 173 1923 2.4 2.3 11.9 187.
0 14.2 Kalpetta Wayanad
9 2 11.690566 75.95715 37 143 1158 4.4 2.1 12.3 158.
6 14.5 Kalpetta Wayanad
10 3 11.690566 75.95715 28 155 1386 3.9 3.0 10.9 148.
0 13.9 Kalpetta Wayanad
11 Pinangode 1 11.619277 76.030471 297 44 4904 0.3 2.8 11.5 56.5 14.3 Kalpetta Wayanad
12 2 11.619277 76.030471 246 49 4977 0.5 3.2 11.2 34.5 14.4 Kalpetta Wayanad
13 3 11.619277 76.030471 227 46 4966 0.6 3.2 11.0 26.4 14.2 Kalpetta Wayanad
14 4 11.619277 76.030471 Not Interpretable Kalpetta Wayanad
15 Kaniyambet-
ta 1 11.699817 76.08352 358 101 2041 0.1 3.5 12.4 35.6
15.9 Panamaram Wayanad
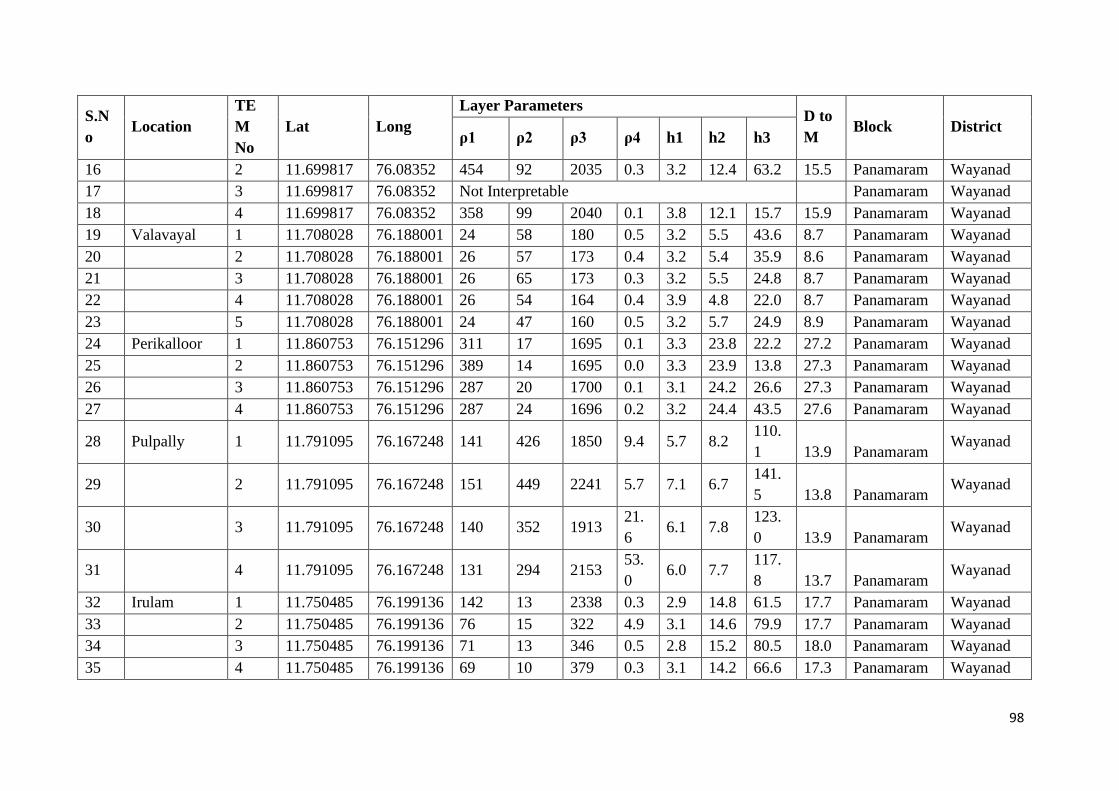
98
S.N
o Location
TE
M
No
Lat Long
Layer Parameters D to
M Block District
ρ1 ρ2 ρ3 ρ4 h1 h2 h3
16 2 11.699817 76.08352 454 92 2035 0.3 3.2 12.4 63.2 15.5 Panamaram Wayanad
17 3 11.699817 76.08352 Not Interpretable Panamaram Wayanad
18 4 11.699817 76.08352 358 99 2040 0.1 3.8 12.1 15.7 15.9 Panamaram Wayanad
19 Valavayal 1 11.708028 76.188001 24 58 180 0.5 3.2 5.5 43.6 8.7 Panamaram Wayanad
20 2 11.708028 76.188001 26 57 173 0.4 3.2 5.4 35.9 8.6 Panamaram Wayanad
21 3 11.708028 76.188001 26 65 173 0.3 3.2 5.5 24.8 8.7 Panamaram Wayanad
22 4 11.708028 76.188001 26 54 164 0.4 3.9 4.8 22.0 8.7 Panamaram Wayanad
23 5 11.708028 76.188001 24 47 160 0.5 3.2 5.7 24.9 8.9 Panamaram Wayanad
24 Perikalloor 1 11.860753 76.151296 311 17 1695 0.1 3.3 23.8 22.2 27.2 Panamaram Wayanad
25 2 11.860753 76.151296 389 14 1695 0.0 3.3 23.9 13.8 27.3 Panamaram Wayanad
26 3 11.860753 76.151296 287 20 1700 0.1 3.1 24.2 26.6 27.3 Panamaram Wayanad
27 4 11.860753 76.151296 287 24 1696 0.2 3.2 24.4 43.5 27.6 Panamaram Wayanad
28 Pulpally 1 11.791095 76.167248 141 426 1850 9.4 5.7 8.2 110.
1 13.9 Panamaram Wayanad
29 2 11.791095 76.167248 151 449 2241 5.7 7.1 6.7 141.
5 13.8 Panamaram Wayanad
30 3 11.791095 76.167248 140 352 1913 21.
6 6.1 7.8
123.
0 13.9 Panamaram Wayanad
31 4 11.791095 76.167248 131 294 2153 53.
0 6.0 7.7
117.
8 13.7 Panamaram Wayanad
32 Irulam 1 11.750485 76.199136 142 13 2338 0.3 2.9 14.8 61.5 17.7 Panamaram Wayanad
33 2 11.750485 76.199136 76 15 322 4.9 3.1 14.6 79.9 17.7 Panamaram Wayanad
34 3 11.750485 76.199136 71 13 346 0.5 2.8 15.2 80.5 18.0 Panamaram Wayanad
35 4 11.750485 76.199136 69 10 379 0.3 3.1 14.2 66.6 17.3 Panamaram Wayanad
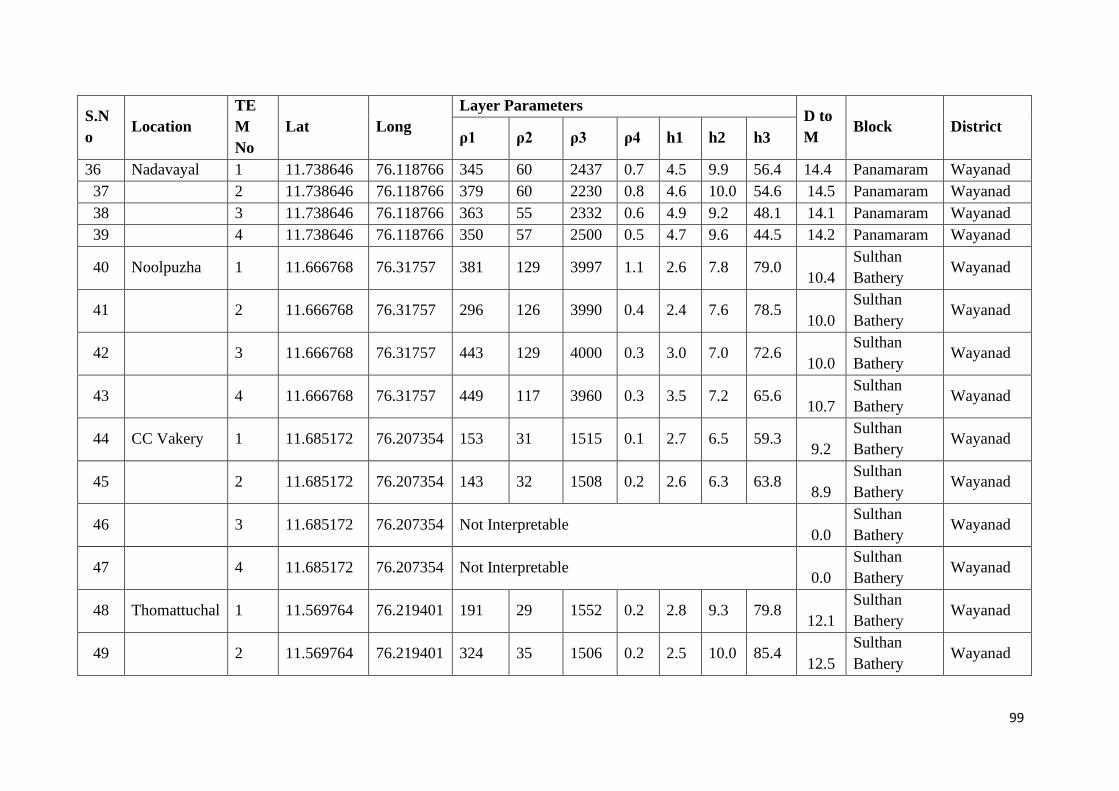
99
S.N
o Location
TE
M
No
Lat Long
Layer Parameters D to
M Block District
ρ1 ρ2 ρ3 ρ4 h1 h2 h3
36 Nadavayal 1 11.738646 76.118766 345 60 2437 0.7 4.5 9.9 56.4 14.4 Panamaram Wayanad
37 2 11.738646 76.118766 379 60 2230 0.8 4.6 10.0 54.6 14.5 Panamaram Wayanad
38 3 11.738646 76.118766 363 55 2332 0.6 4.9 9.2 48.1 14.1 Panamaram Wayanad
39 4 11.738646 76.118766 350 57 2500 0.5 4.7 9.6 44.5 14.2 Panamaram Wayanad
40 Noolpuzha 1 11.666768 76.31757 381 129 3997 1.1 2.6 7.8 79.0 10.4
Sulthan
Bathery Wayanad
41 2 11.666768 76.31757 296 126 3990 0.4 2.4 7.6 78.5 10.0
Sulthan
Bathery Wayanad
42 3 11.666768 76.31757 443 129 4000 0.3 3.0 7.0 72.6 10.0
Sulthan
Bathery Wayanad
43 4 11.666768 76.31757 449 117 3960 0.3 3.5 7.2 65.6 10.7
Sulthan
Bathery Wayanad
44 CC Vakery 1 11.685172 76.207354 153 31 1515 0.1 2.7 6.5 59.3 9.2
Sulthan
Bathery Wayanad
45 2 11.685172 76.207354 143 32 1508 0.2 2.6 6.3 63.8 8.9
Sulthan
Bathery Wayanad
46 3 11.685172 76.207354 Not Interpretable 0.0
Sulthan
Bathery Wayanad
47 4 11.685172 76.207354 Not Interpretable 0.0
Sulthan
Bathery Wayanad
48 Thomattuchal 1 11.569764 76.219401 191 29 1552 0.2 2.8 9.3 79.8 12.1
Sulthan
Bathery Wayanad
49 2 11.569764 76.219401 324 35 1506 0.2 2.5 10.0 85.4 12.5
Sulthan
Bathery Wayanad
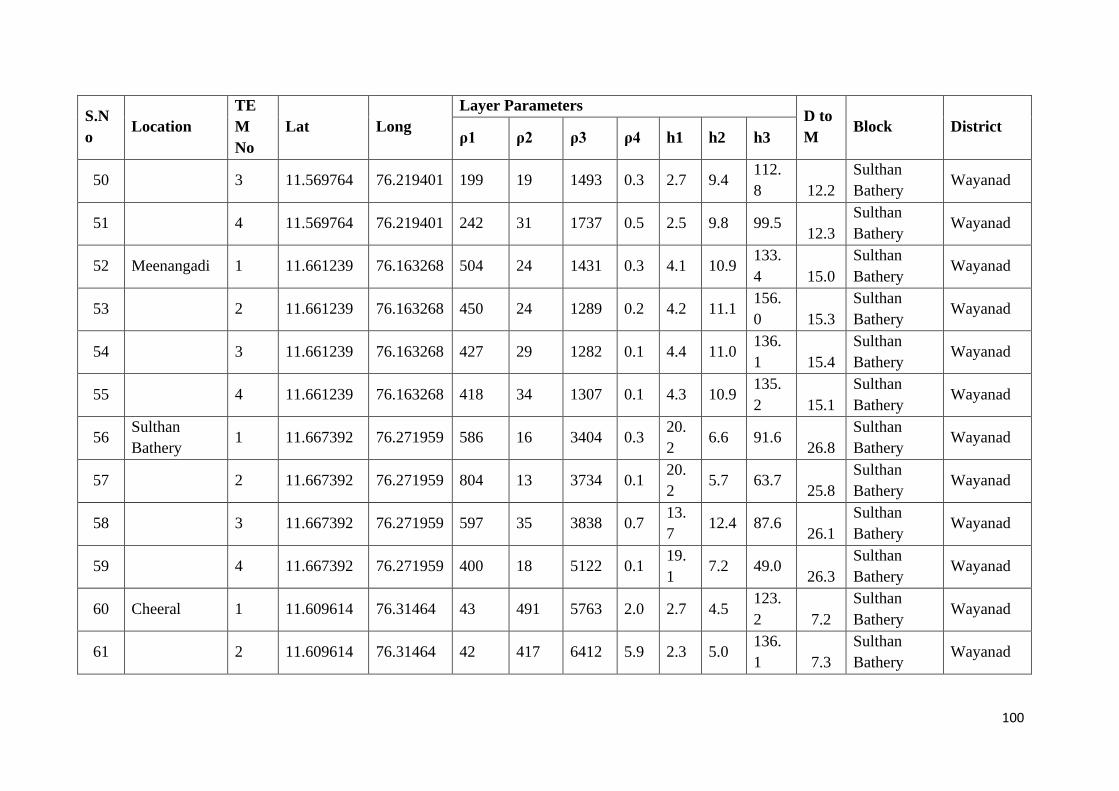
100
S.N
o Location
TE
M
No
Lat Long
Layer Parameters D to
M Block District
ρ1 ρ2 ρ3 ρ4 h1 h2 h3
50 3 11.569764 76.219401 199 19 1493 0.3 2.7 9.4 112.
8 12.2
Sulthan
Bathery Wayanad
51 4 11.569764 76.219401 242 31 1737 0.5 2.5 9.8 99.5 12.3
Sulthan
Bathery Wayanad
52 Meenangadi 1 11.661239 76.163268 504 24 1431 0.3 4.1 10.9 133.
4 15.0
Sulthan
Bathery Wayanad
53 2 11.661239 76.163268 450 24 1289 0.2 4.2 11.1 156.
0 15.3
Sulthan
Bathery Wayanad
54 3 11.661239 76.163268 427 29 1282 0.1 4.4 11.0 136.
1 15.4
Sulthan
Bathery Wayanad
55 4 11.661239 76.163268 418 34 1307 0.1 4.3 10.9 135.
2 15.1
Sulthan
Bathery Wayanad
56 Sulthan
Bathery 1 11.667392 76.271959 586 16 3404 0.3
20.
2 6.6 91.6
26.8
Sulthan
Bathery Wayanad
57 2 11.667392 76.271959 804 13 3734 0.1 20.
2 5.7 63.7
25.8
Sulthan
Bathery Wayanad
58 3 11.667392 76.271959 597 35 3838 0.7 13.
7 12.4 87.6
26.1
Sulthan
Bathery Wayanad
59 4 11.667392 76.271959 400 18 5122 0.1 19.
1 7.2 49.0
26.3
Sulthan
Bathery Wayanad
60 Cheeral 1 11.609614 76.31464 43 491 5763 2.0 2.7 4.5 123.
2 7.2
Sulthan
Bathery Wayanad
61 2 11.609614 76.31464 42 417 6412 5.9 2.3 5.0 136.
1 7.3
Sulthan
Bathery Wayanad

101
S.N
o Location
TE
M
No
Lat Long
Layer Parameters D to
M Block District
ρ1 ρ2 ρ3 ρ4 h1 h2 h3
62 3 11.609614 76.31464 40 383 6135 6.1 2.1 5.0 125.
6 7.2
Sulthan
Bathery Wayanad
63 4 11.609614 76.31464 54 414 6742 7.6 2.2 5.1 128.
8 7.2
Sulthan
Bathery Wayanad
64 5 11.609614 76.31464 55 306 5747 9.8 2.4 4.9 146.
8 7.2
Sulthan
Bathery Wayanad
65 Kidangad 1 11.733727 76.244499 21 52 296 0.3 3.0 15.0 67.0 17.9
Sulthan
Bathery Wayanad
66 2 11.733727 76.244499 20 66 296 0.5 2.4 15.6 71.9 17.9
Sulthan
Bathery Wayanad
67 3 11.733727 76.244499 21 63 321 0.2 2.4 15.7 74.9 18.1
Sulthan
Bathery Wayanad
68 4 11.733727 76.244499 Not Interpretable
Sulthan
Bathery Wayanad
69 Odapallam 1 11.696318 76.286839 64 1928
8 1 0.0
13.
5 10.1 7.9
13.5
Sulthan
Bathery Wayanad
70 2 11.696318 76.286839 65 1928
5 1 0.0
13.
9 10.2 7.7
13.9
Sulthan
Bathery Wayanad
71 3 11.696318 76.286839 79 1931
6 13 0.0
13.
9 7.8 28.2
13.9
Sulthan
Bathery Wayanad
72 4 11.696318 76.286839 69 1927
7 7 0.0
14.
0 9.5 18.4
14.0
Sulthan
Bathery Wayanad
73 Muthanga 1 11.677732 76.376785 280 46 1530 0.3 3.9 10.2 86.8 14.1
Sulthan
Bathery Wayanad

102
S.N
o Location
TE
M
No
Lat Long
Layer Parameters D to
M Block District
ρ1 ρ2 ρ3 ρ4 h1 h2 h3
74 2 11.677732 76.376785 315 45 1528 0.3 4.4 9.8 127.
0 14.2
Sulthan
Bathery Wayanad
75 3 11.677732 76.376785 Not Interpretable
Sulthan
Bathery Wayanad
76
4 11.677732 76.376785 Not Interpretable
Sulthan
Bathery Wayanad
77 Ambalavayal 1 11.621808 76.213971 151 56 488 7.4 1.5 5.0 85.8 6.5
Sulthan
Bathery Wayanad
78
2 11.621808 76.213971 146 60 502 8.5 1.5 5.1 90.0 6.6
Sulthan
Bathery Wayanad
79
3 11.621808 76.213971 Not Interpretable
Sulthan
Bathery Wayanad
80
4 11.621808 76.213971 174 56 499 4.4 1.5 4.9 99.3 6.4
Sulthan
Bathery Wayanad
81 Nenmeni 1 11.628861 76.276992 Not Interpretable
Sulthan
Bathery Wayanad
82 2 11.628861 76.276992 22 99 881 15.
8 4.7 6.7
155.
1 11.3
Sulthan
Bathery Wayanad
83 3 11.628861 76.276992 30 84 226 1.2 1.9 9.5 175.
2 11.3
Sulthan
Bathery Wayanad
84 4 11.628861 76.276992 27 90 729 6.5 4.8 6.5 282.
6 11.4
Sulthan
Bathery Wayanad
85 Chulliyode 1 11.595977 76.259603 Not Interpretable
Sulthan
Bathery Wayanad
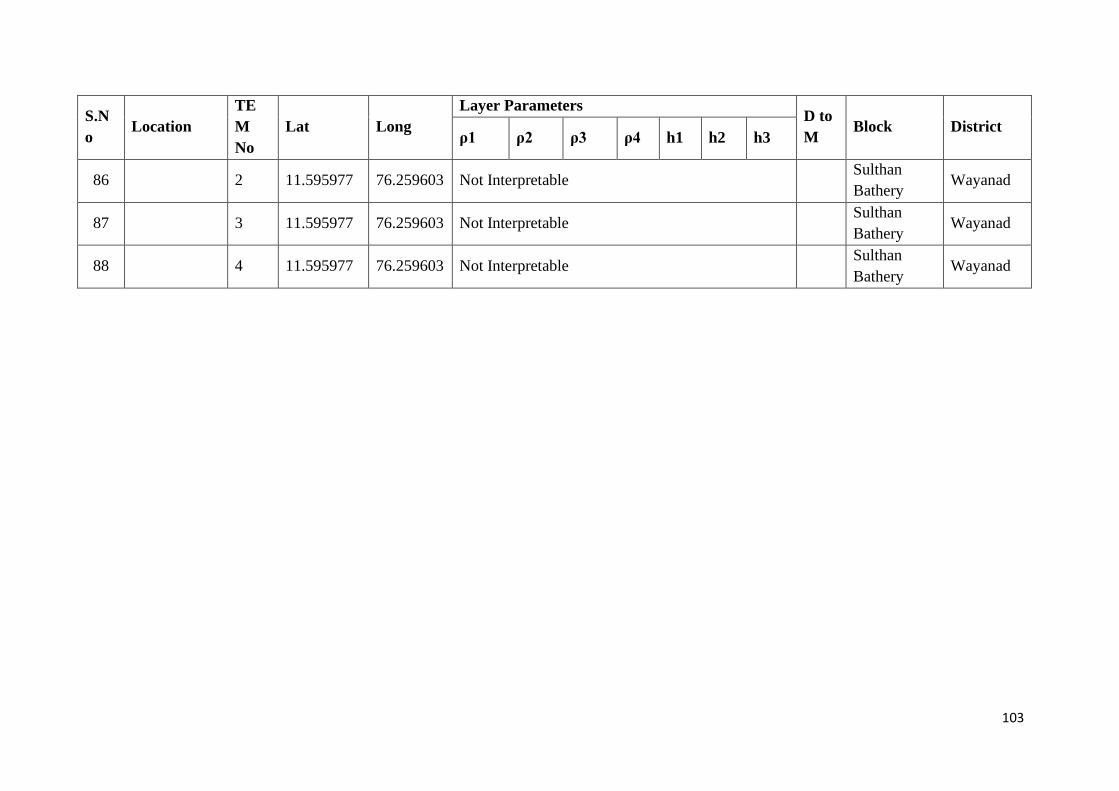
103
S.N
o Location
TE
M
No
Lat Long
Layer Parameters D to
M Block District
ρ1 ρ2 ρ3 ρ4 h1 h2 h3
86
2 11.595977 76.259603 Not Interpretable
Sulthan
Bathery Wayanad
87
3 11.595977 76.259603 Not Interpretable
Sulthan
Bathery Wayanad
88
4 11.595977 76.259603 Not Interpretable
Sulthan
Bathery Wayanad

104
ANNEXURE-V Details of Springs
Sl.
No
Location Block Land use
around the
spring
App.
RL,
mamsl
Perenniality Summer
discharge,
lpm
Water
quality
No of
persons
using
Type of
use
Storage
structure
Future
possibility
1 Kambalakkad Kalpetta Paddy/ Ba-
nana
700 Perennial 2 Not
good
100 Irrigation,
Washing
No To con-
tinue the
system
2 Amba (Chen-
naikavala)
Kalpetta Cardamom /
Pepper
700 Perennial 8 Potable 100 Drinking,
Washing
Storage
Tank
To con-
tinue the
system
3 42 Manantha-
wady- Koothu-
parambu Road
(Varayal)
Mananthavady Paddy/Coffee
Pepper
750 Perennial 180 Potable 200 Irrigation,
Drinking
No Can be
developed
4 Kaniyaram Mananthavady No 700 Perennial 2 Potable 100 Drinking No To con-
tinue the
system
5 Achur Plantation
IV group
Kalpetta Cardamom,
Pepper
700 Perennial 60 Potable 300 Irrigation,
Drinking
Storage
Tank
Can be
developed
6 50 Acre,
Pozhuthana
(Sugandhagiri
Cardamom Board)
Kalpetta Cardamom,
Pepper
700 Perennial 19 Potable 125 Irrigation,
Drinking
Storage
Tank
Can be
developed
7 Puthur Vayal
(Kottapadi)
Kalpetta Coffee 950 Perennial 5 Potable 10 Irrigation,
Washing
Storage
Tank
To con-
tinue the
system
8 Arunagiri-Vythiri Kalpetta Forest 800 Perennial 20 Potable 500 Irrigation,
Drinking
No Can be
developed

105
Sl.
No
Location Block Land use
around the
spring
App.
RL,
mamsl
Perenniality Summer
discharge,
lpm
Water
quality
No of
persons
using
Type of
use
Storage
structure
Future
possibility
9 Kuppumchal Mananthavady Paddy, Ba-
nana, Areca
nut
700 Perennial 3 Potable 300 Irrigation,
Drinking
No To con-
tinue the
system
10 Suritambath Trib-
al colony
Kalpetta Paddy 700 Perennial 3 Potable 500 Irrigation,
Drinking
No To con-
tinue the
system
11 Kalyanamandiram
Estate
Kalpetta Coffee, Es-
tate
700 Perennial 30 Potable 500 Irrigation,
Drinking
Storage
Tank
To con-
tinue the
system
12 Valiyambadichira-
Kalpetta
Kalpetta Coffee, Pad-
dy
750 Perennial 60 Potable 500 Irrigation,
Drinking
Storage
Tank
Can be
developed
13 Kunhakode-
Vythiri (Ravindra
Estate)
Kalpetta Paddy, Cof-
fee Pepper
700 Perennial 20 Not
good
2000 Irrigation,
washing
Storage
Tank
Can be
developed
14 Chelode-Vythiri Kalpetta Coffee 750 Perennial 1 Potable 150 Irrigation,
Drinking
No To con-
tinue the
system
15 Pathil Manantha-
wady
Mananthavady Paddy, Ba-
nana
700 Perennial 3 Potable 100 Irrigation,
Drinking
No To con-
tinue the
system
16 Tavinjal Bhaga-
vati Estate
Mananthavady Tea 750 Perennial 120 Potable 600 Irrigation,
Drinking
Storage
Tank
Can be
developed
17 Tavinjal Mananthavady Tea 700 Perennial 120 Potable 250 Irrigation,
Drinking
No Can be
developed
18 Chanthanthodu- Mananthavady Tea, Paddy, 750 Perennial 30 Potable 50 Irrigation, No Can be

106
Sl.
No
Location Block Land use
around the
spring
App.
RL,
mamsl
Perenniality Summer
discharge,
lpm
Water
quality
No of
persons
using
Type of
use
Storage
structure
Future
possibility
Periya Coconut Drinking developed
19 Periya 34 Mananthavady Paddy, Ba-
nana
700 Perennial 10 Potable 500 Irrigation,
Drinking
No Can be
developed
20 Thalapuzha Kutti
Plantation
Sultan Bath-
ery
Paddy, Ba-
nana
800 Perennial 20 Potable 2500 Irrigation,
Drinking
No Can be
developed
21 Beenachi Estate I Sultan Bath-
ery
Coffee 750 Perennial 4 Not
good
12 Washing Storage
Tank
To con-
tinue the
system
22 Beenachi Estate II
(Arivayal)
Sultan Bath-
ery
Coffee 750 Perennial 5 Potable 20 Drinking Storage
Tank
To con-
tinue the
system
23 Beenachi Estate
Block 24
Sultan Bath-
ery
Coffee 800 Perennial 2 Not
good
20 Irrigation,
Drinking
Storage
Tank
To con-
tinue the
system
24 Annimoola Mananthavady Pepper, Pad-
dy
750 Perennial 4 Potable 50 Irrigation,
Drinking
No To con-
tinue the
system
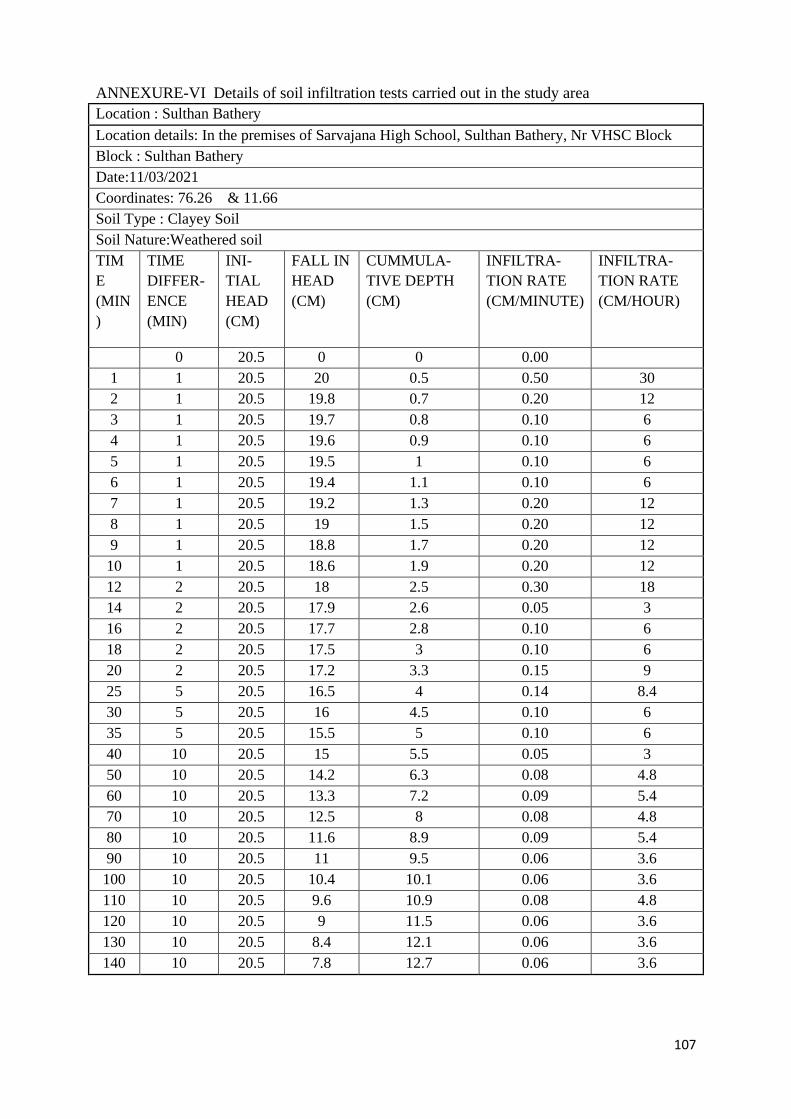
107
ANNEXURE-VI Details of soil infiltration tests carried out in the study area
Location : Sulthan Bathery
Location details: In the premises of Sarvajana High School, Sulthan Bathery, Nr VHSC Block
Block : Sulthan Bathery
Date:11/03/2021
Coordinates: 76.26 & 11.66
Soil Type : Clayey Soil
Soil Nature:Weathered soil
TIM
E
(MIN
)
TIME
DIFFER-
ENCE
(MIN)
INI-
TIAL
HEAD
(CM)
FALL IN
HEAD
(CM)
CUMMULA-
TIVE DEPTH
(CM)
INFILTRA-
TION RATE
(CM/MINUTE)
INFILTRA-
TION RATE
(CM/HOUR)
0 20.5 0 0 0.00
1 1 20.5 20 0.5 0.50 30
2 1 20.5 19.8 0.7 0.20 12
3 1 20.5 19.7 0.8 0.10 6
4 1 20.5 19.6 0.9 0.10 6
5 1 20.5 19.5 1 0.10 6
6 1 20.5 19.4 1.1 0.10 6
7 1 20.5 19.2 1.3 0.20 12
8 1 20.5 19 1.5 0.20 12
9 1 20.5 18.8 1.7 0.20 12
10 1 20.5 18.6 1.9 0.20 12
12 2 20.5 18 2.5 0.30 18
14 2 20.5 17.9 2.6 0.05 3
16 2 20.5 17.7 2.8 0.10 6
18 2 20.5 17.5 3 0.10 6
20 2 20.5 17.2 3.3 0.15 9
25 5 20.5 16.5 4 0.14 8.4
30 5 20.5 16 4.5 0.10 6
35 5 20.5 15.5 5 0.10 6
40 10 20.5 15 5.5 0.05 3
50 10 20.5 14.2 6.3 0.08 4.8
60 10 20.5 13.3 7.2 0.09 5.4
70 10 20.5 12.5 8 0.08 4.8
80 10 20.5 11.6 8.9 0.09 5.4
90 10 20.5 11 9.5 0.06 3.6
100 10 20.5 10.4 10.1 0.06 3.6
110 10 20.5 9.6 10.9 0.08 4.8
120 10 20.5 9 11.5 0.06 3.6
130 10 20.5 8.4 12.1 0.06 3.6
140 10 20.5 7.8 12.7 0.06 3.6
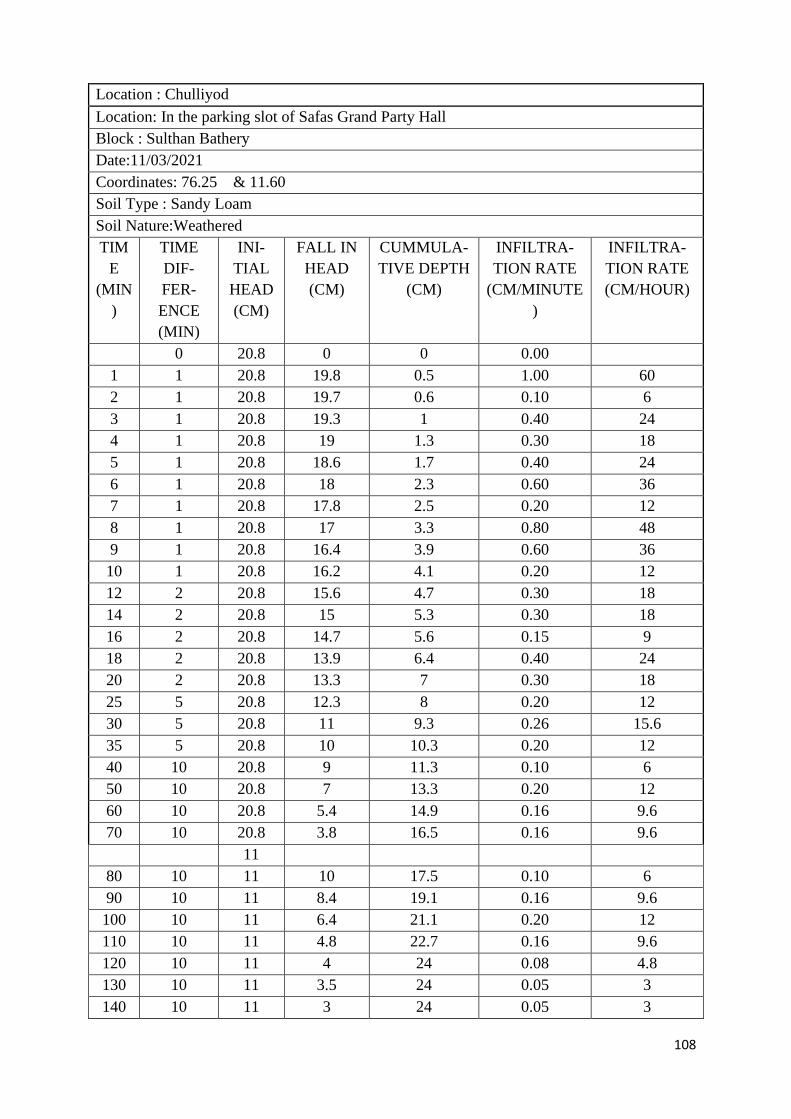
108
Location : Chulliyod
Location: In the parking slot of Safas Grand Party Hall
Block : Sulthan Bathery
Date:11/03/2021
Coordinates: 76.25 & 11.60
Soil Type : Sandy Loam
Soil Nature:Weathered
TIM
E
(MIN
)
TIME
DIF-
FER-
ENCE
(MIN)
INI-
TIAL
HEAD
(CM)
FALL IN
HEAD
(CM)
CUMMULA-
TIVE DEPTH
(CM)
INFILTRA-
TION RATE
(CM/MINUTE
)
INFILTRA-
TION RATE
(CM/HOUR)
0 20.8 0 0 0.00
1 1 20.8 19.8 0.5 1.00 60
2 1 20.8 19.7 0.6 0.10 6
3 1 20.8 19.3 1 0.40 24
4 1 20.8 19 1.3 0.30 18
5 1 20.8 18.6 1.7 0.40 24
6 1 20.8 18 2.3 0.60 36
7 1 20.8 17.8 2.5 0.20 12
8 1 20.8 17 3.3 0.80 48
9 1 20.8 16.4 3.9 0.60 36
10 1 20.8 16.2 4.1 0.20 12
12 2 20.8 15.6 4.7 0.30 18
14 2 20.8 15 5.3 0.30 18
16 2 20.8 14.7 5.6 0.15 9
18 2 20.8 13.9 6.4 0.40 24
20 2 20.8 13.3 7 0.30 18
25 5 20.8 12.3 8 0.20 12
30 5 20.8 11 9.3 0.26 15.6
35 5 20.8 10 10.3 0.20 12
40 10 20.8 9 11.3 0.10 6
50 10 20.8 7 13.3 0.20 12
60 10 20.8 5.4 14.9 0.16 9.6
70 10 20.8 3.8 16.5 0.16 9.6
11
80 10 11 10 17.5 0.10 6
90 10 11 8.4 19.1 0.16 9.6
100 10 11 6.4 21.1 0.20 12
110 10 11 4.8 22.7 0.16 9.6
120 10 11 4 24 0.08 4.8
130 10 11 3.5 24 0.05 3
140 10 11 3 24 0.05 3

109
Location: Pulpally
Location: In the premises of SNDP Yogam Pulpally Branch on Kappiset Road
Block : Panamaram
Date:12/03/2021
Coordinates: 76.17 & 11.79
Soil Type : Clayey Soil
Soil Nature:Weathered soil
TIME
(MIN)
TIME
DIFFER-
ENCE
(MIN)
INITIAL
HEAD
(CM)
FALL IN
HEAD
(CM)
CUM-
MULA-
TIVE
DEPTH
(CM)
INFILTRA-
TION RATE
(CM/MINUTE)
INFILTRA-
TION RATE
(CM/HOUR)
0 20.5 0 0 0.00
1 1 20.5 20 0.5 0.50 30
2 1 20.5 19.8 0.7 0.20 12
3 1 20.5 19.7 0.8 0.10 6
4 1 20.5 19.6 0.9 0.10 6
5 1 20.5 19.5 1 0.10 6
6 1 20.5 19.4 1.1 0.10 6
7 1 20.5 19.4 1.1 0.00 0
8 1 20.5 19.2 1.3 0.20 12
9 1 20.5 19 1.5 0.20 12
10 1 20.5 18.8 1.7 0.20 12
12 2 20.5 18.6 1.9 0.10 6
14 2 20.5 18.2 2.3 0.20 12
16 2 20.5 18 2.5 0.10 6
18 2 20.5 18 2.5 0.00 0
20 2 20.5 17.8 2.7 0.10 6
25 5 20.5 17.2 3.3 0.12 7.2
30 5 20.5 16.8 3.7 0.08 4.8
35 5 20.5 16 4.5 0.16 9.6
40 10 20.5 15.5 5 0.05 3
50 10 20.5 14.7 5.8 0.08 4.8
60 10 20.5 14 6.5 0.07 4.2
70 10 20.5 13.4 7.1 0.06 3.6
80 10 20.5 12.9 7.6 0.05 3
90 10 20.5 12.1 8.4 0.08 4.8
100 10 20.5 11.6 8.9 0.05 3
110 10 20.5 11 9.5 0.06 3.6
120 10 20.5 10.7 9.8 0.03 1.8
130 10 20.5 10.2 10.3 0.05 3

110
140 10 20.5 10 10.5 0.02 1.2
150 10 20.5 9.5 11 0.05 3
160 10 20.5 9 11.5 0.05 3
170 10 20.5 8.5 12 0.05 3
Location:Thetti Road (Thetrode)
Location: In front of Forest Staff Quarters at road diversion to Tholpetty
Block : Mananthavady
Date:12/03/2021
Coordinates: 76.06 & 11.96
Soil Type : Clayey Soil
TIM
E
(MIN
)
TIME
DIF-
FER-
ENCE
(MIN)
INI-
TIAL
HEAD
(CM)
FALL IN
HEAD
(CM)
CUMMULA-
TIVE DEPTH
(CM)
INFILTRA-
TION RATE
(CM/MINUTE
)
INFILTRA-
TION RATE
(CM/HOUR)
0 22.7 0 0 0.00
1 1 22.7 22.5 0.5 0.20 12
2 1 22.7 22 1 0.50 30
3 1 22.7 21.6 1.4 0.40 24
4 1 22.7 21.3 1.7 0.30 18
5 1 22.7 21 2 0.30 18
6 1 22.7 20.5 2.5 0.50 30
7 1 22.7 20.4 2.6 0.10 6
8 1 22.7 20.2 2.8 0.20 12
9 1 22.7 19.8 3.2 0.40 24
10 1 22.7 19.7 3.3 0.10 6
12 2 22.7 19.3 3.7 0.20 12
14 2 22.7 18.9 4.1 0.20 12
16 2 22.7 18.7 4.3 0.10 6
18 2 22.7 18.5 4.5 0.10 6
20 2 22.7 18.4 4.6 0.05 3
25 5 22.7 18 5 0.08 4.8
30 5 22.7 17.7 5.3 0.06 3.6
35 5 22.7 17.1 5.9 0.12 7.2
40 10 22.7 16.5 6.5 0.06 3.6
50 10 22.7 16 7 0.05 3
60 10 22.7 15.7 7.3 0.03 1.8
70 10 22.7 15 8 0.07 4.2
80 10 22.7 14.7 8.3 0.03 1.8
90 10 22.7 14.3 8.7 0.04 2.4
100 10 22.7 14 9 0.03 1.8
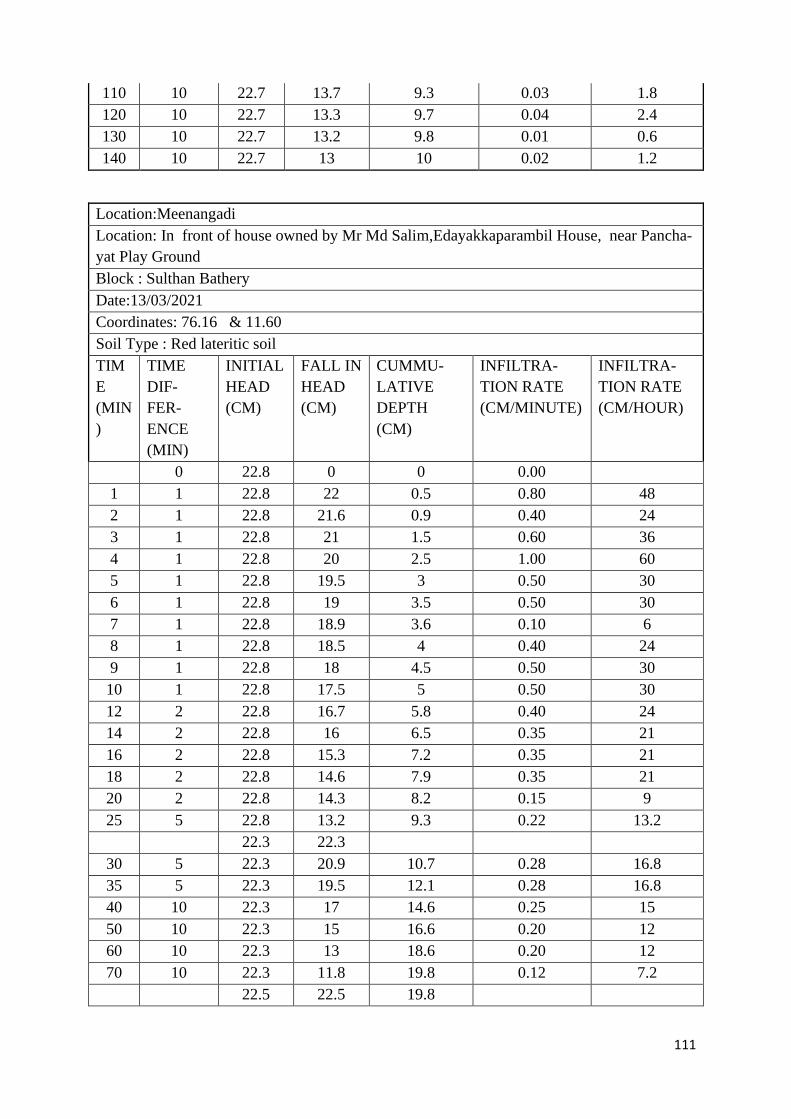
111
110 10 22.7 13.7 9.3 0.03 1.8
120 10 22.7 13.3 9.7 0.04 2.4
130 10 22.7 13.2 9.8 0.01 0.6
140 10 22.7 13 10 0.02 1.2
Location:Meenangadi
Location: In front of house owned by Mr Md Salim,Edayakkaparambil House, near Pancha-
yat Play Ground
Block : Sulthan Bathery
Date:13/03/2021
Coordinates: 76.16 & 11.60
Soil Type : Red lateritic soil
TIM
E
(MIN
)
TIME
DIF-
FER-
ENCE
(MIN)
INITIAL
HEAD
(CM)
FALL IN
HEAD
(CM)
CUMMU-
LATIVE
DEPTH
(CM)
INFILTRA-
TION RATE
(CM/MINUTE)
INFILTRA-
TION RATE
(CM/HOUR)
0 22.8 0 0 0.00
1 1 22.8 22 0.5 0.80 48
2 1 22.8 21.6 0.9 0.40 24
3 1 22.8 21 1.5 0.60 36
4 1 22.8 20 2.5 1.00 60
5 1 22.8 19.5 3 0.50 30
6 1 22.8 19 3.5 0.50 30
7 1 22.8 18.9 3.6 0.10 6
8 1 22.8 18.5 4 0.40 24
9 1 22.8 18 4.5 0.50 30
10 1 22.8 17.5 5 0.50 30
12 2 22.8 16.7 5.8 0.40 24
14 2 22.8 16 6.5 0.35 21
16 2 22.8 15.3 7.2 0.35 21
18 2 22.8 14.6 7.9 0.35 21
20 2 22.8 14.3 8.2 0.15 9
25 5 22.8 13.2 9.3 0.22 13.2
22.3 22.3
30 5 22.3 20.9 10.7 0.28 16.8
35 5 22.3 19.5 12.1 0.28 16.8
40 10 22.3 17 14.6 0.25 15
50 10 22.3 15 16.6 0.20 12
60 10 22.3 13 18.6 0.20 12
70 10 22.3 11.8 19.8 0.12 7.2
22.5 22.5 19.8
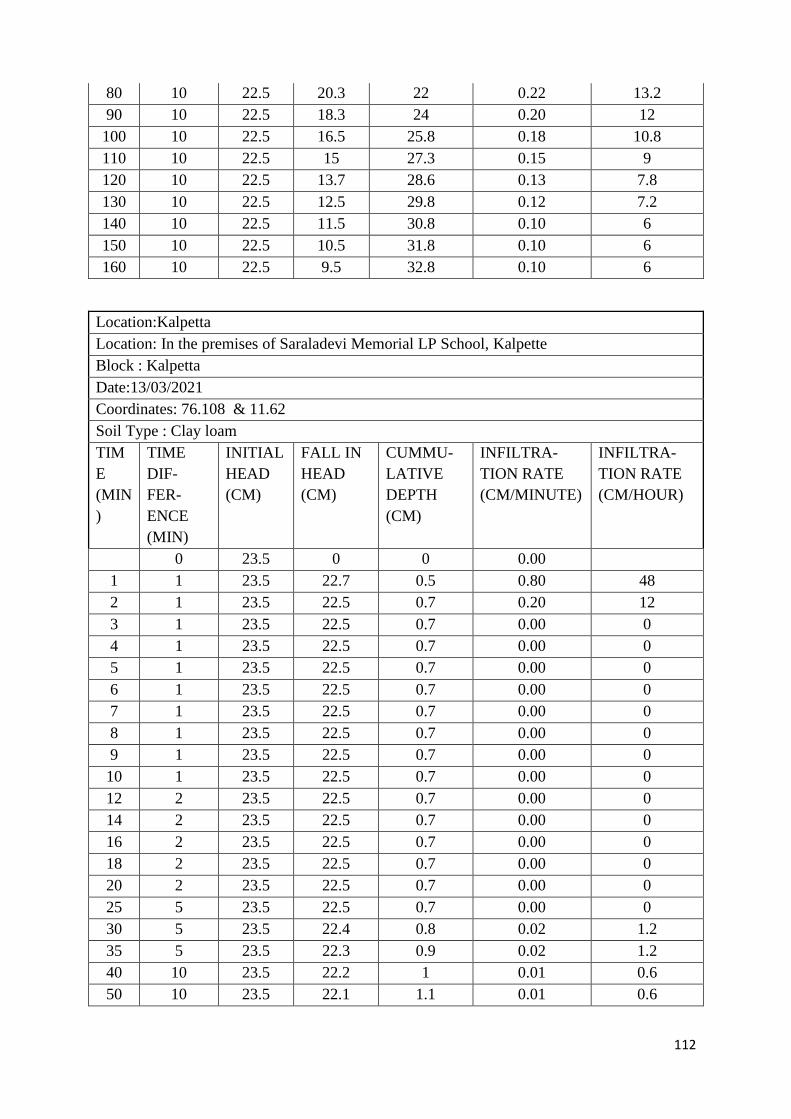
112
80 10 22.5 20.3 22 0.22 13.2
90 10 22.5 18.3 24 0.20 12
100 10 22.5 16.5 25.8 0.18 10.8
110 10 22.5 15 27.3 0.15 9
120 10 22.5 13.7 28.6 0.13 7.8
130 10 22.5 12.5 29.8 0.12 7.2
140 10 22.5 11.5 30.8 0.10 6
150 10 22.5 10.5 31.8 0.10 6
160 10 22.5 9.5 32.8 0.10 6
Location:Kalpetta
Location: In the premises of Saraladevi Memorial LP School, Kalpette
Block : Kalpetta
Date:13/03/2021
Coordinates: 76.108 & 11.62
Soil Type : Clay loam
TIM
E
(MIN
)
TIME
DIF-
FER-
ENCE
(MIN)
INITIAL
HEAD
(CM)
FALL IN
HEAD
(CM)
CUMMU-
LATIVE
DEPTH
(CM)
INFILTRA-
TION RATE
(CM/MINUTE)
INFILTRA-
TION RATE
(CM/HOUR)
0 23.5 0 0 0.00
1 1 23.5 22.7 0.5 0.80 48
2 1 23.5 22.5 0.7 0.20 12
3 1 23.5 22.5 0.7 0.00 0
4 1 23.5 22.5 0.7 0.00 0
5 1 23.5 22.5 0.7 0.00 0
6 1 23.5 22.5 0.7 0.00 0
7 1 23.5 22.5 0.7 0.00 0
8 1 23.5 22.5 0.7 0.00 0
9 1 23.5 22.5 0.7 0.00 0
10 1 23.5 22.5 0.7 0.00 0
12 2 23.5 22.5 0.7 0.00 0
14 2 23.5 22.5 0.7 0.00 0
16 2 23.5 22.5 0.7 0.00 0
18 2 23.5 22.5 0.7 0.00 0
20 2 23.5 22.5 0.7 0.00 0
25 5 23.5 22.5 0.7 0.00 0
30 5 23.5 22.4 0.8 0.02 1.2
35 5 23.5 22.3 0.9 0.02 1.2
40 10 23.5 22.2 1 0.01 0.6
50 10 23.5 22.1 1.1 0.01 0.6
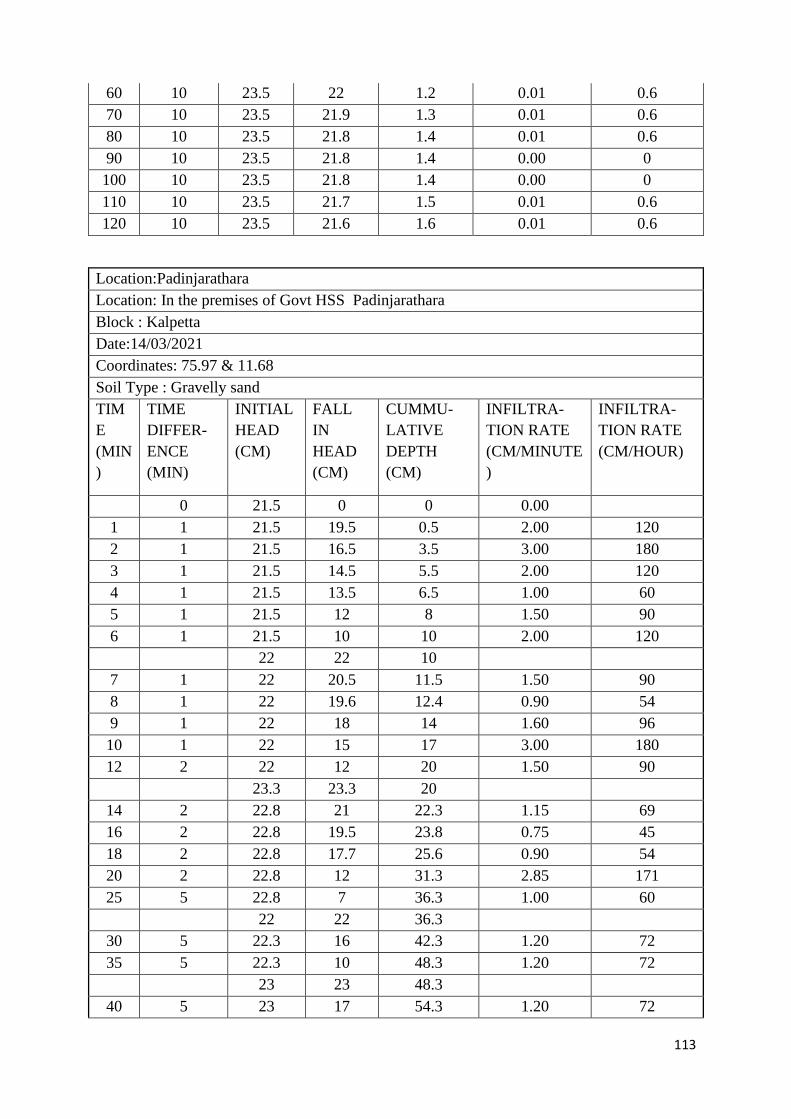
113
60 10 23.5 22 1.2 0.01 0.6
70 10 23.5 21.9 1.3 0.01 0.6
80 10 23.5 21.8 1.4 0.01 0.6
90 10 23.5 21.8 1.4 0.00 0
100 10 23.5 21.8 1.4 0.00 0
110 10 23.5 21.7 1.5 0.01 0.6
120 10 23.5 21.6 1.6 0.01 0.6
Location:Padinjarathara
Location: In the premises of Govt HSS Padinjarathara
Block : Kalpetta
Date:14/03/2021
Coordinates: 75.97 & 11.68
Soil Type : Gravelly sand
TIM
E
(MIN
)
TIME
DIFFER-
ENCE
(MIN)
INITIAL
HEAD
(CM)
FALL
IN
HEAD
(CM)
CUMMU-
LATIVE
DEPTH
(CM)
INFILTRA-
TION RATE
(CM/MINUTE
)
INFILTRA-
TION RATE
(CM/HOUR)
0 21.5 0 0 0.00
1 1 21.5 19.5 0.5 2.00 120
2 1 21.5 16.5 3.5 3.00 180
3 1 21.5 14.5 5.5 2.00 120
4 1 21.5 13.5 6.5 1.00 60
5 1 21.5 12 8 1.50 90
6 1 21.5 10 10 2.00 120
22 22 10
7 1 22 20.5 11.5 1.50 90
8 1 22 19.6 12.4 0.90 54
9 1 22 18 14 1.60 96
10 1 22 15 17 3.00 180
12 2 22 12 20 1.50 90
23.3 23.3 20
14 2 22.8 21 22.3 1.15 69
16 2 22.8 19.5 23.8 0.75 45
18 2 22.8 17.7 25.6 0.90 54
20 2 22.8 12 31.3 2.85 171
25 5 22.8 7 36.3 1.00 60
22 22 36.3
30 5 22.3 16 42.3 1.20 72
35 5 22.3 10 48.3 1.20 72
23 23 48.3
40 5 23 17 54.3 1.20 72

114
45 5 23 11.3 60 1.14 68.4
50 5 23 7 64.3 0.86 51.6
23 23 64.3
55 5 23 18.1 69.2 0.98 58.8
60 5 23 9.5 77.8 1.72 103.2
23 23 77.8
70 10 23 14 86.8 0.90 54
23 23 86.8
80 10 23 15 94.8 0.80 48
90 10 23 8.5 101.3 0.65 39
23 23 101.3
100 10 23 15.5 108.8 0.75 45
110 10 23 8 116.3 0.75 45
23 23 116.3
120 10 23 17 122.3 0.60 36
130 10 23 11 128.3 0.60 36
140 10 23 5 134.3 0.60 36
Location: Thalapuzha
Location: In the private plot of Mr CK Beeran, Chirayangad,Thalapuzha
Block : Mananthavady
Date:14/03/2021
Coordinates: 75.94 & 11.84
Soil Type : Clayey sand
TIM
E
(MIN
)
TIME
DIFFER-
ENCE
(MIN)
INI-
TIAL
HEA
D
(CM)
FALL
IN
HEAD
(CM)
CUMMULA-
TIVE DEPTH
(CM)
INFILTRA-
TION RATE
(CM/MINUTE
)
INFILTRA-
TION RATE
(CM/HOUR)
0 22 0 0 0.00
1 1 22 21.4 0.5 0.60 36
2 1 22 21.4 0.5 0.00 0
3 1 22 21.3 0.6 0.10 6
4 1 22 21.2 0.7 0.10 6
5 1 22 21 0.9 0.20 12
6 1 22 21 0.9 0.00 0
7 1 22 20.9 1 0.10 6
8 1 22 20.9 1 0.00 0
9 1 22 20.8 1.1 0.10 6
10 1 22 20.7 1.2 0.10 6
12 2 22 20.6 1.3 0.05 3
14 2 22 20.6 1.3 0.00 0

115
16 2 22 20.5 1.4 0.05 3
18 2 22 20.5 1.4 0.00 0
20 2 22 20.4 1.5 0.05 3
25 5 22 20 1.9 0.08 4.8
30 5 22 19.9 2 0.02 1.2
35 5 22 19.7 2.2 0.04 2.4
40 10 22 19.5 2.4 0.02 1.2
50 10 22 19.3 2.6 0.02 1.2
60 10 22 18.9 3 0.04 2.4
70 10 22 18.5 3.4 0.04 2.4
80 10 22 18.1 3.8 0.04 2.4
90 10 22 17.7 4.2 0.04 2.4
100 10 22 17.6 4.3 0.01 0.6
110 10 22 17.6 4.3 0.00 0
120 10 22 17.5 4.4 0.01 0.6
130 10 22 17.3 4.6 0.02 1.2
140 10 22 17.1 4.8 0.02 1.2
150 10 22 16.9 5 0.02 1.2
Location: Meppadi
Location: In the premises of Arrapetta Tea Estate Staff Club, Meppadi
Block : Kalpetta
Date:15/03/2021
Coordinates: 76.15 & 11.54
Soil Type : Clayey sand
TIM
E
(MIN
)
TIME
DIF-
FER-
ENCE
(MIN)
INI-
TIAL
HEAD
(CM)
FALL
IN
HEAD
(CM)
CUMMULA-
TIVE DEPTH
(CM)
INFILTRA-
TION RATE
(CM/MINUTE
)
INFILTRA-
TION RATE
(CM/HOUR)
0 22.5 0 0 0.00
1 1 22.5 22.3 0.5 0.20 12
2 1 22.5 22 0.8 0.30 18
3 1 22.5 21.8 1 0.20 12
4 1 22.5 21.4 1.4 0.40 24
5 1 22.5 21 1.8 0.40 24
6 1 22.5 20.9 1.9 0.10 6
7 1 22.5 20.8 2 0.10 6
8 1 22.5 20.8 2 0.00 0
9 1 22.5 20.7 2.1 0.10 6
10 1 22.5 20.6 2.2 0.10 6
12 2 22.5 20.5 2.3 0.05 3

116
14 2 22.5 20.4 2.4 0.05 3
16 2 22.5 20.2 2.6 0.10 6
18 2 22.5 20 2.8 0.10 6
20 2 22.5 20 2.8 0.00 0
25 5 22.5 19.8 3 0.04 2.4
30 5 22.5 19.8 3.1 0.02 1.2
35 5 22.5 19.7 3.2 0.02 1.2
40 5 22.5 19.6 3.4 0.04 2.4
45 5 22.5 19.4 3.5 0.02 1.2
50 5 22.5 19.3 3.7 0.04 2.4
55 5 22.5 19.1 3.8 0.02 1.2
60 5 22.5 19 4.2 0.08 4.8
70 10 22.5 18.6 5 0.08 4.8
80 10 22.5 19.4 6.2 0.12 7.2
90 10 22.5 18.2 6.4 0.02 1.2
100 10 22.5 18 6.6 0.02 1.2
110 10 22.5 17.8 6.8 0.02 1.2
120 10 22.5 17.6 7 0.02 1.2
Location: Lakkidi (Vythiri)
Location: In the premises of Govt LP School, Lakkidi, Vythiri
Block : Kalpetta
Date:15/03/2021
Coordinates: 76.02 & 11.52
Soil Type : Clayey sand
TIM
E
(MIN
)
TIME
DIFFER-
ENCE
(MIN)
INITIAL
HEAD
(CM)
FALL
IN
HEAD
(CM)
CUMMU-
LATIVE
DEPTH
(CM)
INFILTRA-
TION RATE
(CM/MINUTE
)
INFILTRA-
TION RATE
(CM/HOUR)
0 22.8 0 0 0.00
1 1 22.8 22 0.5 0.80 48
2 1 22.8 21.5 1 0.50 30
3 1 22.8 21.3 1.2 0.20 12
4 1 22.8 21 1.5 0.30 18
5 1 22.8 20.6 1.9 0.40 24
6 1 22.8 20 2.5 0.60 36
7 1 22.8 20 2.5 0.00 0
8 1 22.8 19.8 2.7 0.20 12
9 1 22.8 19.6 2.9 0.20 12
10 1 22.8 19.4 3.1 0.20 12
12 2 22.8 19 3.5 0.20 12
14 2 22.8 18.9 3.6 0.05 3
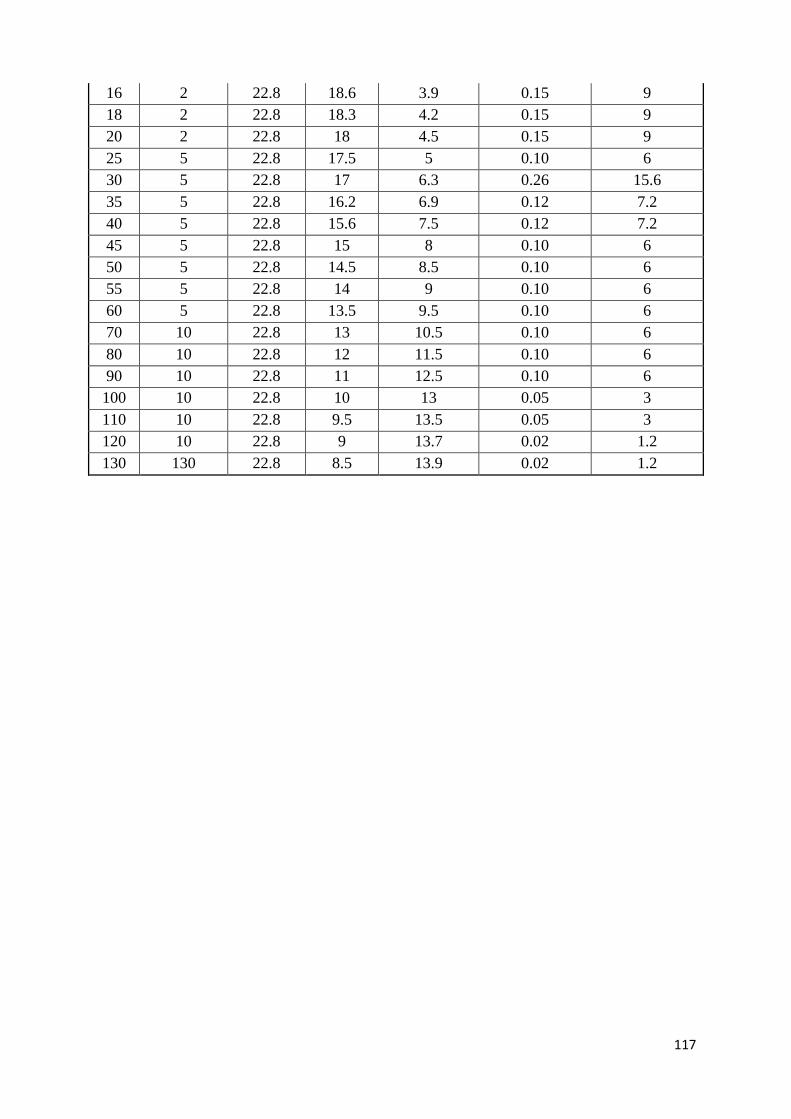
117
16 2 22.8 18.6 3.9 0.15 9
18 2 22.8 18.3 4.2 0.15 9
20 2 22.8 18 4.5 0.15 9
25 5 22.8 17.5 5 0.10 6
30 5 22.8 17 6.3 0.26 15.6
35 5 22.8 16.2 6.9 0.12 7.2
40 5 22.8 15.6 7.5 0.12 7.2
45 5 22.8 15 8 0.10 6
50 5 22.8 14.5 8.5 0.10 6
55 5 22.8 14 9 0.10 6
60 5 22.8 13.5 9.5 0.10 6
70 10 22.8 13 10.5 0.10 6
80 10 22.8 12 11.5 0.10 6
90 10 22.8 11 12.5 0.10 6
100 10 22.8 10 13 0.05 3
110 10 22.8 9.5 13.5 0.05 3
120 10 22.8 9 13.7 0.02 1.2
130 130 22.8 8.5 13.9 0.02 1.2