Ground Control - AusIMM
173
Ground Control A collection of technical papers from AusIMM conferences
-
Upload
khangminh22 -
Category
Documents
-
view
1 -
download
0
Transcript of Ground Control - AusIMM

Ground ControlA collection of technical papers from AusIMM conferences

ContentsAnalysis of premature failure of rock bolts and cable bolts failed in underground coal mines by H Chen, H Lamei Ramandi, P Craig, A Crosky, S Saydam
Originally published in Fourth Australasian Ground Control in Mining Conference (AusRock 2018)
A new tool for extensometer data analysis and improved understanding of geotechnical risk factors by P Corbett, P Sheffield and M Szwec
Originally published in AusRock 2014: Third Australasian Ground Control in Mining Conference
An investigation of the corrosive impact of groundwater on rock bolts in underground coalmines by P Craig, S Saydam, P C Hagan, B Hebblewhite, D Vandermaat, A Crosky and E Elias
Originally published in AusRock 2014: Third Australasian Ground Control in Mining Conference
The evolution of seismicity and ground control measures at Ernest Henry Mine by H EsterhuizenOriginally published in Fourth Australasian Ground Control in Mining Conference (AusRock 2018)
The significance of superincumbent strata stiffness and its impacts on coalmine design by J M GalvinOriginally published in AusRock 2014: Third Australasian Ground Control in Mining Conference
Investigating the tunnel closure using convergence confinement method and 2D plane strain finite difference analysis by E Kabwe, M Karakus, E Chanda and S Akdag
Originally published in Fourth Australasian Ground Control in Mining Conference (AusRock 2018)
Modelling multi-seam interactions for longwall mining by A LinesOriginally published in Fourth Australasian Ground Control in Mining Conference (AusRock 2018)
New risk assessment method for coal mine excavated slopes by A McQuillan, I Canbulat, D Payne and J OhOriginally published in Fourth Australasian Ground Control in Mining Conference (AusRock 2018)
Raise bore stability and risk assessment empirical database update by A Penney, R M Stephenson and M J PascoeOriginally published in Fourth Australasian Ground Control in Mining Conference (AusRock 2018)
Managing floor heave in an underground longwall coal mine by P Sheffield and P CorbettOriginally published in Fourth Australasian Ground Control in Mining Conference (AusRock 2018)
A personal review of South African rockburst research, experience and lessons learnt by T R StaceyOriginally published in Fourth Australasian Ground Control in Mining Conference (AusRock 2018)
Rock strength anisotropy and its importance in underground geotechnical design by A Vakili, J Albrecht and M SandyOriginally published in AusRock 2014: Third Australasian Ground Control in Mining Conference
Vibration control blasting for low stability final walls by G WyarttOriginally published in Fourth Australasian Ground Control in Mining Conference (AusRock 2018)

© The Australasian Institute of Mining and Metallurgy 2020
No part of this publication may be reproduced, stored in a retrieval system or transmitted in any form by any means without permission in writing from the publisher.
All papers in this collection were peer reviewed prior to publication.
The Institute is not responsible as a body for the facts and opinions advanced in any of its publications.
For access to more technical content please visit the AusIMM Library www.ausimm.com/library
Analysis of premature failure of rock bolts and cable bolts failed in underground coal mines
H Chen1, H Lamei Ramandi2, P Craig3, A Crosky4, S Saydam5
1.PhD student, UNSW Sydney, Sydney NSW 2052. Email: [email protected] Research Fellow, UNSW Sydney, Sydney NSW 2052. Email: [email protected] Manager – Coal, Jennmar Australia, Smeaton Grange NSW 2567. Email:
[email protected], UNSW Sydney, Sydney NSW 2052. Email: [email protected], UNSW Sydney, Sydney NSW 2052. Email: [email protected]
ABSTRACT Frequency of reports on premature failure of rock bolts and cable bolts have increased in past two decades. Such a failure threatens both the safety of underground mine workers and the economic viability of the operations. Herein, we report on analysis of rock bolts and cable bolts failed recently in three underground mines in Australia. Magnetic particle inspection (MPI) and scanning electron microscope (SEM) techniques were used to study the failed bolts. MPI showed a number of subcritical cracks on the surface of the bolts. The majority of the cracks in both cable bolts and rock bolts were initiated from the base of ribs (indentation) where the stress concentration was high. SEM examinations showed tearing topography surface (TTS) in all failed rock bolts and cable bolts. These indicated that the failure occurred through hydrogen assisted stress corrosion cracking (HISCC). The results of this study enhanced the understanding about the failure of rock bolts and cable bolts in underground mines.
INTRODUCTION Excavation of rocks in underground mines decreases the confining pressure applied on the surrounding rocks. This allows the strata to separate, fold and buckle into the void created (Aydan, 2018). This buckling action can result in fracturing of the strata and a roof failure. To stabilise the rockmass in the strata against collapse, rock bolts and cable bolts, as the dominant forms of reinforcement elements, are used in underground coal mines in Australia to pin large beams or blocks of rock in the mines (Chen et al., 2016a; Hadjigeorgiou and Potvin, 2011; Kılıc et al., 2002).
The rock bolts are generally manufactured from hot rolled rebars with a typical length of 1.5 to 2.4 m while cable bolts are made from cold-drawn wires wound together around a central king wire with a length of 4–12 m (Vandermaat, 2014; Vandermaat et al., 2016b; Wu et al., 2018b). The increased length and flexibility of cable bolts allow installation of long cable bolts anchoring into stable deep rockmass (Chen et al., 2016b). Although bolting suppliers have taken efforts to provide high quality cost-effective bolts to mining industry, several premature failures of rock and cable bolts have been reported from the underground mines. This type of failure in underground mines has been identified as a significant problem over the past two decades (Craig et al., 2016; Crosky et al., 2003; Vandermaat et al., 2016b; Wu et al., 2018c). UNSW Sydney has carried out intensive research into both rock bolts and cable bolts to (i) identify the cause of such a failure, (ii) simulate the failure in laboratory and in-situ environments, and (iii) prevent the failure (Chen et al., 2018; Craig et al., 2016; Crosky et al., 2003; Elias et al., 2013; Ramandi et al., 2018; Vandermaat et al., 2016a; Vandermaat et al., 2016b; Vandermaat et al., 2017; Wu et al., 2018a; Wu et al., 2018b; Wu et al., 2018c). Their research has determined that the cause of such a failure in underground mines is hydrogen induced stress corrosion cracking (HISCC). This type of failure is not limited to the bolts served for a long time, failure has seen to occur in less than 2 years after the bolt installation (Craig et al., 2016; Crosky et al., 2012).
Stress corrosion cracking (SCC) occurs when a material is under a load (applied and/or residual) in presence of a certain corrosive environment. Unlike general corrosion, this type of failure normally occurs in a brittle manner and below ultimate tensile strength (sometimes even below yield strength) of the material. Such a failure occurs due to the crack tip propagation trough the microstructure rather than weight loss of the material. This type of failure is difficult to detect and can cause catastrophic failure without any readily detectable sign or warning. HISCC is one of the common mechanisms of SCC during which atomic hydrogens from surrounding environment diffuse into the steel lattice and reduce the localised cohesive force between atoms. Such weakening of iron bonding can lead to initiation of microcracks and then

propagation due to external loading. The stress on the steel then can concentrate on those microcracks and accelerate the cracking process, and consequently results in catastrophic failure of the material below its ultimate tensile strength. The source of atomic hydrogen in the environment can be varied, e.g. from microbial activities, decomposition of water and other corrosion processes (Chawla and Meyers, 1999; King and Miller, 1971).
In this study, we report the results of analysis of rock bolts and cable bolts failed recently in three Australian underground mines. Collected failed bolts were first studied using magnetic particle inspection (MPI) to detect surface damage and subcritical cracks. Then, the subcritical cracks were examined using scanning electron microscope (SEM) technique to identify the mechanism of failure.
MATERIALS AND METHODS Two failed rock bolts (labelled as RB1 and RB2,) and two failed cable bolts (labelled as CB1 and CB2) were collected form three different Australian underground coal mines (Figure 1& Figure 2). Both rock bolts are HSAC 840 grade with a yield strength of 230kN and ultimate tensile strength of approximately 320kN. Both cable bolts are intended wire Superstrand cable bolts with a yield strength of about 345kN, and ultimate tensile strength is around 265kN, as provided by supplier.
Magnetic particle inspection (MPI) was carried out to detect subcritical cracks on both rock bolts and cable bolts surface. The surface of the bolts was firstly sprayed with Ardrox 8901W white background lacquer, and then magnetised in the longitudinal direction using an Ardrox electromagnetic yoke. Ardorx 800/3 black magnetic ink was sprayed on the surface of the bolts to highlight subcritical cracks.
After MPI, from each failed bolt, a 20 mm length section containing subcritical cracks was cut longitudinally across the crack to determine subcritical cracks path inside the bolts (Figure 3). The section was hot mounted in Bakelite at 180˚C using a Struers ProntoPress-20, then ground on 120, 320, 800 and 1200 SiC grinding papers using a Struers Labopol-5, subsequently polished on a 3-micron diamond pad and finished using a 1-micron diamond pad, using a Struers DAP-2. The crack path and microstructure were examined using Nikon Epiphot-200 optical microscope and Hitachi S3400 scanning electron microscope (SEM).
RB2
a
b
Figure 1: Failed rock bolts as received (a: RB1; b: RB2).
RB1
a
b
Figure 2: Failed cable bolts as received (a: CB1; b: CB2).
CB1
CB2

For fracture surface analysis, the bolts (or a wire of the cable bolt) were cut 20 mm below the fracture surface and cleaned in Ajax inhibited hydrochloric acid. Same SEM instrument was then used to obtain high-resolution images for fractographic analysis.
RESULTS AND DISCUSSIONS Both rock bolts and cable bolts displayed a number of subcritical cracks as shown in Figure 4. Subcritical cracks on both rock bolts were on the tension side of the bend and located near the base of ribs. Initiation of the cracks along the ribs of rock bolts (Crosky et al., 2002a) and cable bolts (Ramandi et al., 2018) were also observed by others. In the cable bolts, most of the cracks appeared at convex side of wires. The location and arrangement of the cracks indicated that the fracture initiated from the area with highest stress concentration. Moreover, while bending was observed on both failed rock bolts due to horizontal movement of rock strata, no evidence of necking was observed on both rock bolts and cable bolts. This suggested that all failures occurred in a brittle manner. The appearance of those cracks was similar to the subcritical SCC reported in previous studies (Crosky et al., 2002b; Ramandi et al., 2018; Wu et al., 2018a).
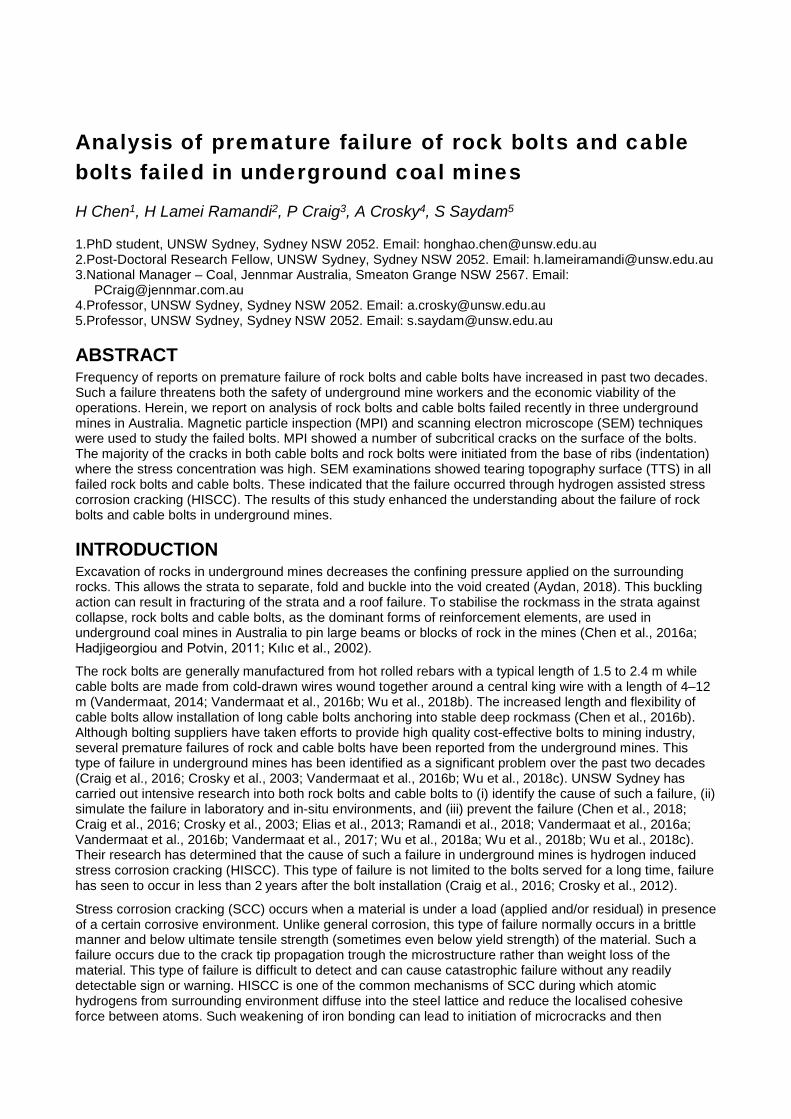
The path of subcritical cracks inside the bolts are shown in Figure 5. In the rock bolts, the cracks were perpendicular to the surface and not necessarily initiated from corrosion pits (Figure 5a & b). Some branching occurred during the crack propagation; however, the crack mostly displayed as one continuous line. The isotropic hot rolled microstructure of the rock bolts had a minor impact on crack propagation, therefore there was no significant crack path deflection and the fracture surface was almost perpendicular to the surface in all of the cracks.
In the cable bolts, the cracks were also not necessarily initiated from corrosion pits and were propagated perpendicular to the axis of the wire at the initiation region. Most of the cracks were then deflected in a large angle to the original direction during the propagation (Figure 5d). Such a crack deflection was likely due to hydrogen delamination and heavily elongated microstructure during cold drawing process. The crack deflection created a step-like fracture, which has also been observed by other researches and were
Figure 3: Cutting method for crack path. analysis
Figure 4: MPI images from failed bolts (a: RB1; b: RB2; c: CB1; d: CB2).
a
b
c
d
considered to be a characteristic of hydrogen induced stress corrosion cracking in cold-drawn high-carbon steel wires (Toribio, 2008; Wu et al., 2018a).
The fracture surface of rock bolts and cable bolts are shown in Figure 6, which visually show the fracture origin (pointed by an arrow) as a small discoloured region near the edge of surface (Figure 6a & b). This difference in colour was caused by two different mechanisms; (i) the SCC initiation region had been exposed to the corrosive environment during crack propagation and, in most of the time, this region had been covered by a layer of corrosion products, (ii) since SCC in rock bolts and cable bolts is a slow progressive failure, it has a completely different fractographic feature compare to fast overload section, and therefore, the colour of SCC initiation region is different from the fast overload region on the fracture surface. The fracture surface was generally flat and perpendicular to the axis of rock bolts due to its isotropic microstructure. For cable bolts, since the microstructure of wires were heavily elongated during cold drawing process, the fracture surface mainly appeared in a steep angle. The fracture, from the small fracture initiation region (pointed by an arrow in Figure 6b & c), which was almost perpendicular to the wire axis (stage 1), deflected and become stage 2 propagation, and finally reached the critical length and caused a fast overload failure at the other end of the wire. This is schematically shown in showed in Figure 7.
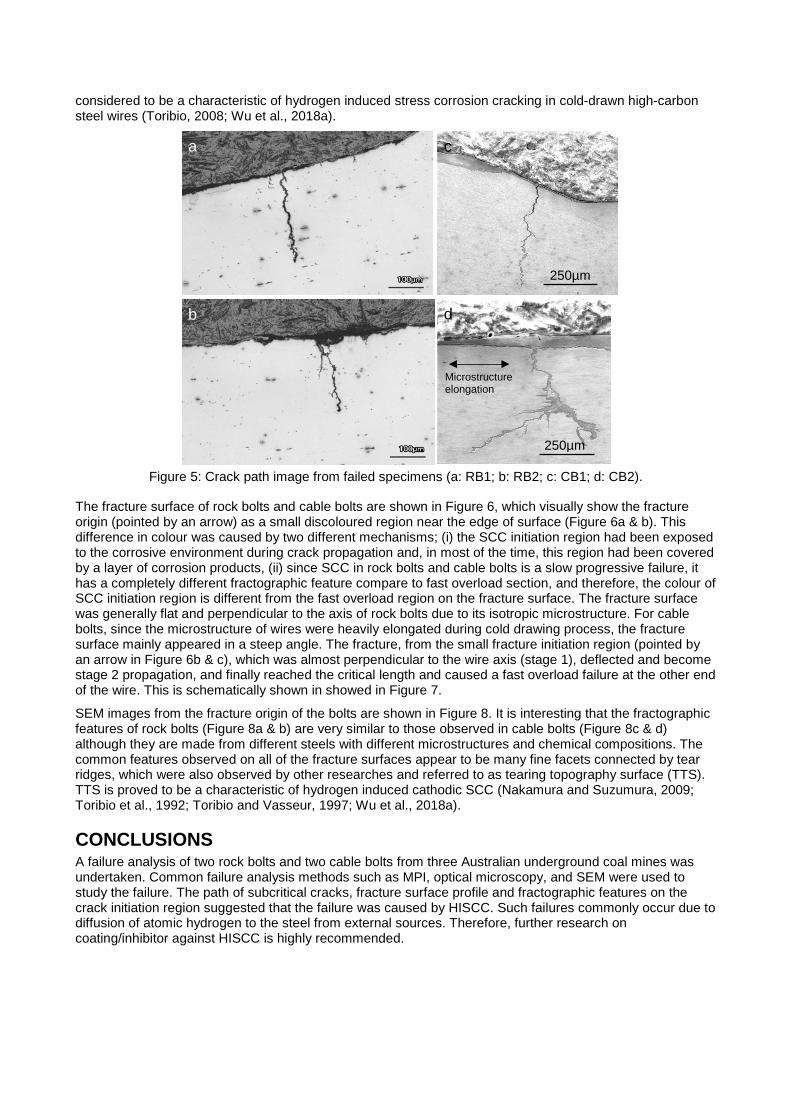
SEM images from the fracture origin of the bolts are shown in Figure 8. It is interesting that the fractographic features of rock bolts (Figure 8a & b) are very similar to those observed in cable bolts (Figure 8c & d) although they are made from different steels with different microstructures and chemical compositions. The common features observed on all of the fracture surfaces appear to be many fine facets connected by tear ridges, which were also observed by other researches and referred to as tearing topography surface (TTS). TTS is proved to be a characteristic of hydrogen induced cathodic SCC (Nakamura and Suzumura, 2009; Toribio et al., 1992; Toribio and Vasseur, 1997; Wu et al., 2018a).
CONCLUSIONS A failure analysis of two rock bolts and two cable bolts from three Australian underground coal mines was undertaken. Common failure analysis methods such as MPI, optical microscopy, and SEM were used to study the failure. The path of subcritical cracks, fracture surface profile and fractographic features on the crack initiation region suggested that the failure was caused by HISCC. Such failures commonly occur due to diffusion of atomic hydrogen to the steel from external sources. Therefore, further research on coating/inhibitor against HISCC is highly recommended.
250µm
250µm
Figure 5: Crack path image from failed specimens (a: RB1; b: RB2; c: CB1; d: CB2).
Microstructure elongation
a
b
c
d

ACKNOWLEDGEMENTS This research was funded by the Australian Government through the Australian Research Council (ARC) Linkage Projects 100200238 and 140100153, and also supported by Jennmar Australia Pty Ltd, Glencore Australia Holdings Pty Ltd, Illawarra Coal Holdings Pty Ltd, Springvale Coal Pty Ltd, Anglo Operations Pty Ltd, Anglo Coal Australia, and Narrabri Coal Operations Pty Ltd.
REFERENCESAydan, Ö., 2018. Rock Reinforcement and Rock Support. CRC Press.
Chawla, K.K., Meyers, M., 1999. Mechanical behavior of materials. Prentice Hall.
Chen, H., Lamei Ramandi, H., Walker, J., Crosky, A., Saydam, S., 2018. Failure of the threaded region of rockbolts in underground coal mines. Mining Technology: 1-9.
Chen, J., Hagan, P.C., Saydam, S., 2016a. Load Transfer Behavior of Fully Grouted Cable Bolts Reinforced in Weak Rocks Under Tensile Loading Conditions. Geotechnical Testing Journal, 39(2).
Chen, J., Hagan, P.C., Saydam, S., 2016b. Load Transfer Behavior of Fully Grouted Cable Bolts Reinforced in Weak Rocks Under Tensile Loading Conditions.
a
b
3mm
c
3mm
d
10mm
10mm
Figure 6: Fracture surface of failed bolt (a: RB1; b: RB2; c: CB1; d: CB2).
Crack initiation (stage 1)
Crack propagation (stage 2)
Fast overload (stage 3)
Figure 7: Different stage of SCC in cable bolts.
Craig, P., Saydam, S., Hagan, P., Hebblewhite, B., Vandermaat, D., Crosky, A., Elias, E., 2016. Investigations into the corrosive environments contributing to premature failure of Australian coal mine rock bolts. International Journal of Mining Science and Technology, 26(1): 59-64.
Crosky, A., Fabjanczyk, M., Gray, P., Hebbiewhite, B., Smith, B., 2002a. Final Report - Premature Rock Bolt Failure ACARP C8008. Australian Coal Association Research Program.
Crosky, A., Fabjanczyk, M., Gray, P., Hebblewhite, B., Smith, B., 2002b. Final report–premature rock bolt failure. ACARP C8008.
Crosky, A., Smith, B., Elias, E., Chen, H., Craig, P., Hagan, P., Vandermaat, D., Saydam, S., Hebblewhite, B., 2012. Stress corrosion cracking failure of rockbolts in underground mines in Australia, 7th international symposium on rockbolting and rock mechanics in mining, Aachen, Aachen, Germany.
Crosky, A., Smith, B., Hebblewhite, B., 2003. Failure of rockbolts in underground mines in Australia. Journal of Failure Analysis and Prevention, 3(2): 70-78.
Elias, E., Vandermaat, D., Crosky, A., Saydam, S., Hagan, P., Hebblewhite, B., Craig, P., 2013. Environmental characterization of the stress-corrosion cracking of rockbolts in underground coal mines using laboratory and in-situ testing. RapidMiner: Data Mining Use Cases and Business Analytics Applications: 261.
Hadjigeorgiou, J., Potvin, Y., 2011. A critical assessment of dynamic rock reinforcement and support testing facilities. Rock mechanics and rock engineering, 44(5): 565-578.
Kılıc, A., Yasar, E., Celik, A.G., 2002. Effect of grout properties on the pull-out load capacity of fully grouted rock bolt. Tunnelling and Underground Space Technology, 17(4): 355-362.
King, R., Miller, J., 1971. Corrosion by the sulphate-reducing bacteria. Nature, 233(5320): 491-492.
Nakamura, S.-i., Suzumura, K., 2009. Hydrogen embrittlement and corrosion fatigue of corroded bridge wires. Journal of Constructional Steel Research, 65(2): 269-277.
Ramandi, H.L., Chen, H., Crosky, A., Saydam, S., 2018. Interactions of stress corrosion cracks in cold drawn pearlitic steel wires: An X-ray micro-computed tomography study. Corrosion Science.
Toribio, J., 2008. Delamination fracture of prestressing steel: An engineering approach. Engineering Fracture Mechanics, 75(9): 2683-2694.
Toribio, J., Lancha, A.M., Elices, M., 1992. The tearing topography surface as the zone associated with hydrogen embrittlement processes in pearlitic steel. Metallurgical Transactions A, 23(5): 1573-1584.
Toribio, J., Vasseur, E., 1997. Hydrogen-assisted micro-damage evolution in pearlitic steel. Journal of materials science letters, 16(16): 1345-1348.
Vandermaat, D., 2014. Stress corrosion cracking of rockbolts: a laboratory based approach utilising a controlled mine environment, The University of New South Wales, Sydney, New South Wales, Australia, Australia.
30 µm 30 µm
30 µm 30 µm Figure 8: SEM images from fracture origin (a: RB1; b: RB2; c: CB1; d: CB2).
a c
b d

Vandermaat, D., Saydam, S., Hagan, P., Crosky, A., 2016a. Laboratory-based coupon testing for the understanding of SCC in rockbolts. Mining Technology, 125(3): 174-183.
Vandermaat, D., Saydam, S., Hagan, P.C., Crosky, A.G., 2016b. Examination of rockbolt stress corrosion cracking utilising full size rockbolts in a controlled mine environment. International Journal of Rock Mechanics and Mining Sciences, 81: 86-95.
Vandermaat, D., Saydam, S., Hagan, P.C., Crosky, A.G., 2017. Back-calculation of failure stress of rockbolts affected by Stress Corrosion Cracking in underground coal mines. International Journal of Rock Mechanics and Mining Sciences, 100: 310-317.
Wu, S., Chen, H., Craig, P., Ramandi, H.L., Timms, W., Hagan, P.C., Crosky, A., Hebblewhite, B., Saydam, S., 2018a. An experimental framework for simulating stress corrosion cracking in cable bolts. Tunnelling and Underground Space Technology, 76: 121-132.
Wu, S., Chen, H., Lamei Ramandi, H., Hagan, P.C., Hebblewhite, B., Crosky, A., Saydam, S., 2018b. Investigation of cable bolts for stress corrosion cracking failure. Construction and Building Materials, 187: 1224-1231.
Wu, S., Chen, H., Ramandi, H.L., Hagan, P.C., Crosky, A., Saydam, S., 2018c. Effects of environmental factors on stress corrosion cracking of cold-drawn high-carbon steel wires. Corrosion Science, 132: 234-243.
INTRODUCTION
GEOTECHNICAL AND GEOLOGICAL
INFLUENCES ON THE SPRINGVALE MINING
ENVIRONMENT
Geotechnical environment
A new tool for extensometer data
analysis and improved understanding
of geotechnical risk factorsP Corbett1, P Sheffield2 and M Szwec3
ABSTRACT
1. MAusIMM, Regional Technical Services Manager, Centennial Coal, 1384 Castlereagh Hwy, Lidsdale NSW 2780. Email: [email protected]
2. Technical Services Manager, Centennial Coal, 1384 Castlereagh Hwy, Lidsdale NSW 2780. Email: [email protected]
3. GAusIMM, Mining Engineer, Centennial Coal, 1384 Castlereagh Hwy, Lidsdale NSW 2780. Email: [email protected]
P CORBETT, P SHEFFIELD AND M SZWEC
in situ
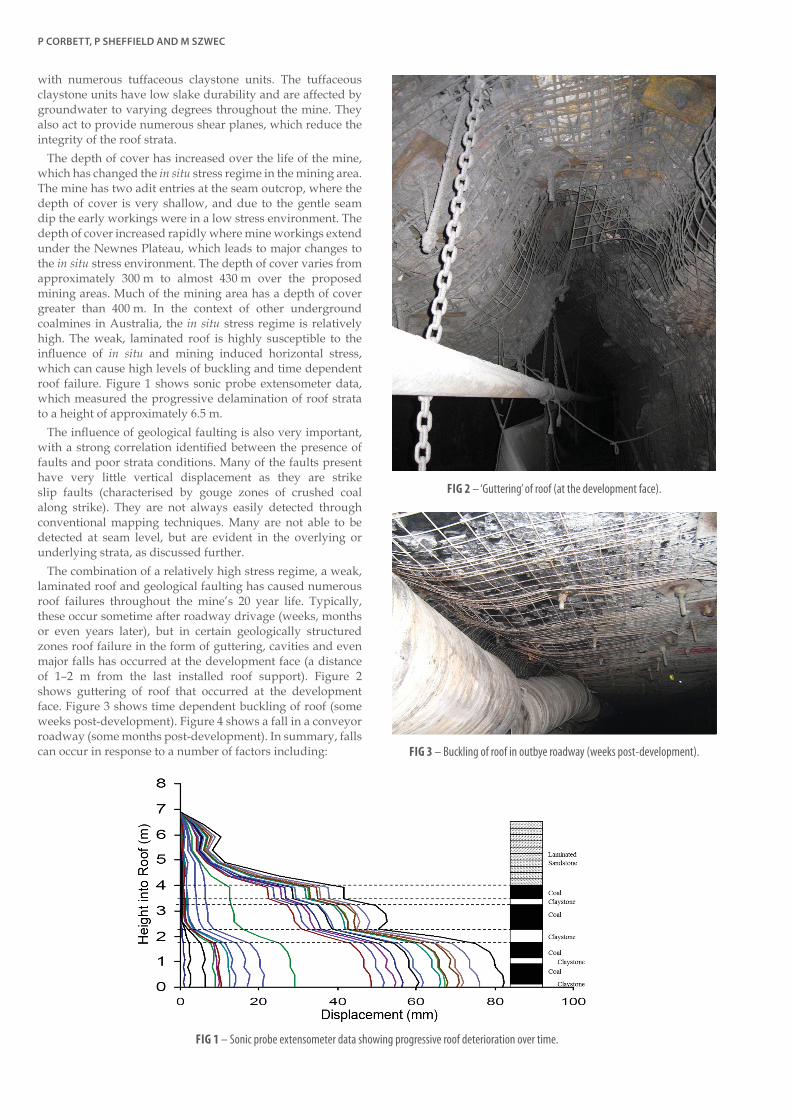
in situ
in situ
in situ
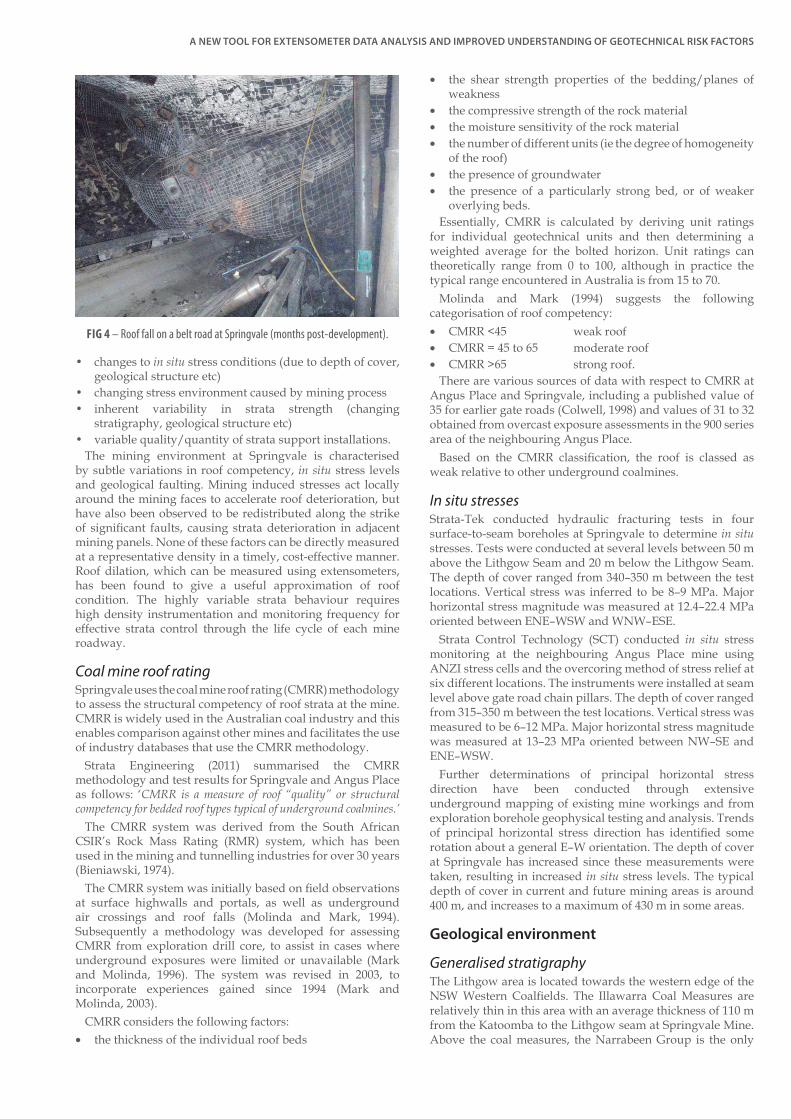
FIG 2 – ‘Guttering’ of roof (at the development face).
FIG 1 – Sonic probe extensometer data showing progressive roof deterioration over time.
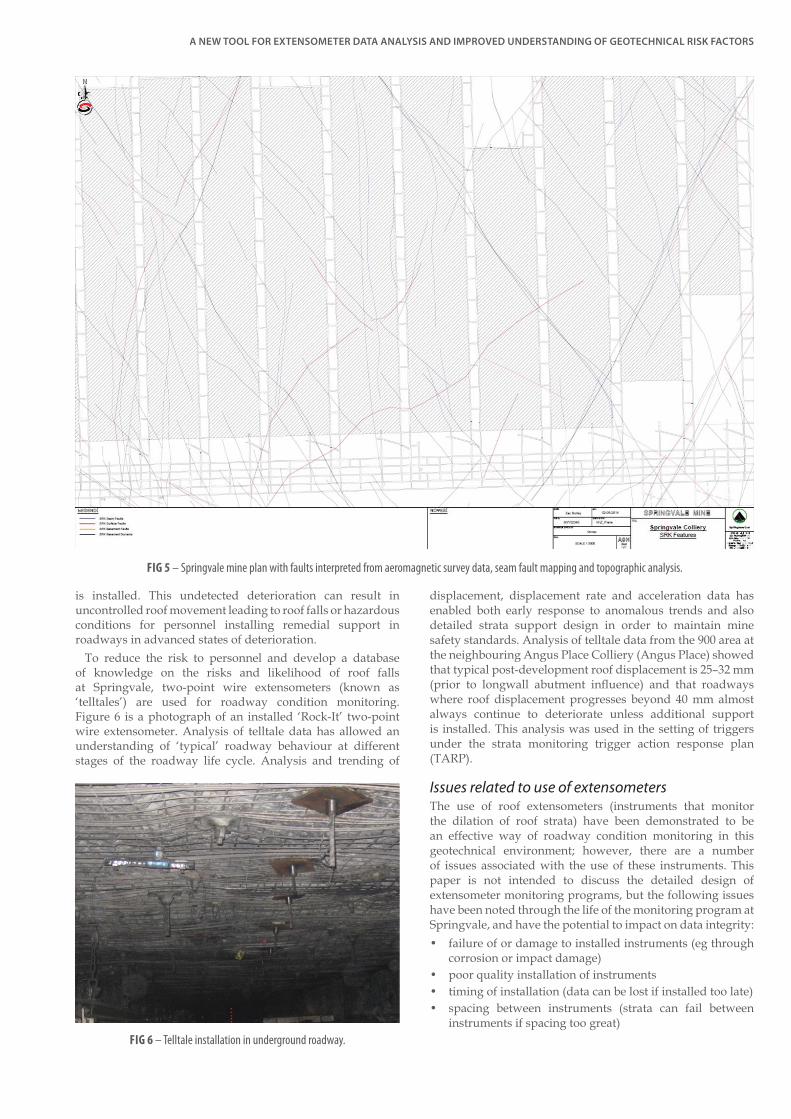
FIG 3 – Buckling of roof in outbye roadway (weeks post-development).
A NEW TOOL FOR EXTENSOMETER DATA ANALYSIS AND IMPROVED UNDERSTANDING OF GEOTECHNICAL RISK FACTORS
in situ
in situ
Coal mine roof rating
CMRR is a measure of roof “quality” or structural competency for bedded roof types typical of underground coalmines.’
•
•
• • •
• •
• • •
In situ stresses
in situ
in situ
in situ
Geological environment
Generalised stratigraphy
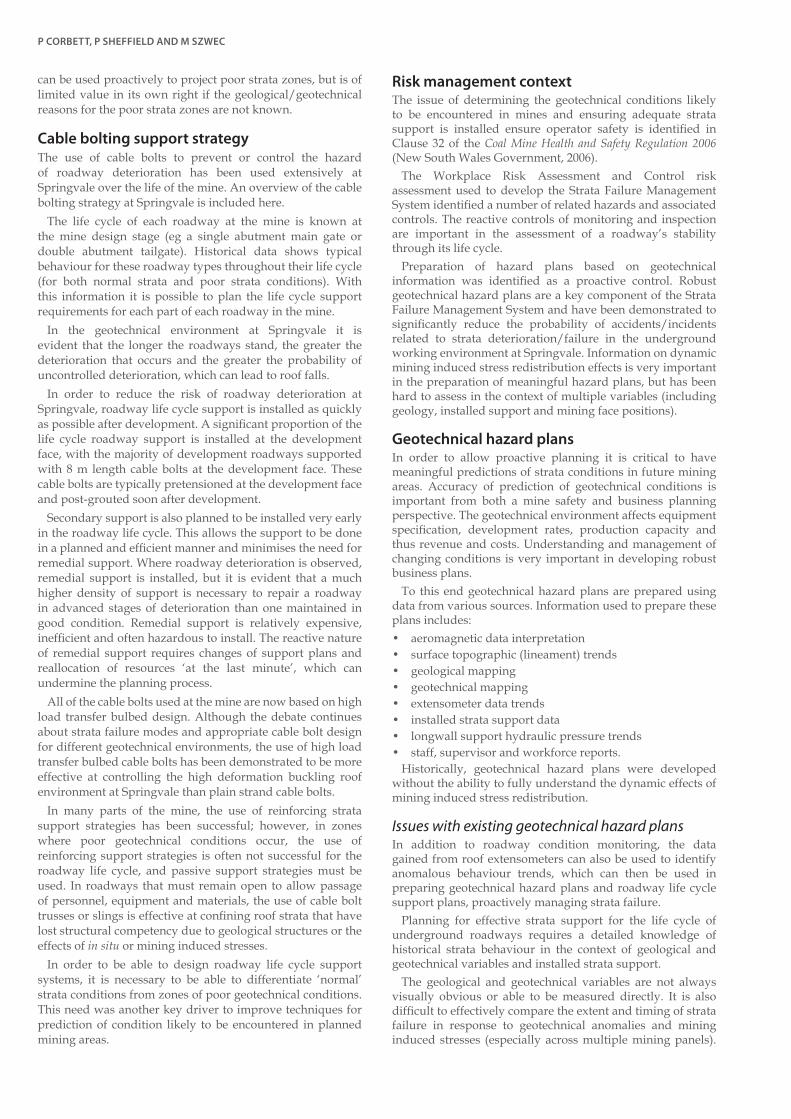
FIG 4 – Roof fall on a belt road at Springvale (months post-development).

P CORBETT, P SHEFFIELD AND M SZWEC
Geological structures
Faults in overlying strata
CSIRO work (1978). The major lineament pattern is a combination of two recurring directions: NNW and NNE. Geological development of this structural pattern
basement inherited zones, starting with extension and
shear zones.
Faults in underlying strata
Aeromagnetic data proved effective at Springvale because: The Lithgow seam was stratigraphically within 100 m above
the older basement rocks of the folded and deformed LachlanFoldbelt.
The structural grain of the older basement rocks appears tobe related to structures within the Lithgow Seam.
Aeromagnetics effectively picks up the basement structures.
Combined fault interpretation model
Use of extensometers for roadway condition
monitoring
A NEW TOOL FOR EXTENSOMETER DATA ANALYSIS AND IMPROVED UNDERSTANDING OF GEOTECHNICAL RISK FACTORS
Issues related to use of extensometers
FIG 5 – Springvale mine plan with faults interpreted from aeromagnetic survey data, seam fault mapping and topographic analysis.
FIG 6 – Telltale installation in underground roadway.

P CORBETT, P SHEFFIELD AND M SZWEC
Extensometer selection
Timing of extensometer installation
Spacing of extensometers
Contextual data requirements
ExtoChart database for processing extensometer data
Use of telltales for roadway condition monitoring
Use of data trends throughout roadway life cycle
Variability in monitored strata behaviour

A NEW TOOL FOR EXTENSOMETER DATA ANALYSIS AND IMPROVED UNDERSTANDING OF GEOTECHNICAL RISK FACTORS
FIG 7 – Trending of telltale data at roof movement monitoring sites showing major differences in strata behaviour over the life cycle of each instrumented roadway site.
A
B
C
P CORBETT, P SHEFFIELD AND M SZWEC
Cable bolting support strategy
in situ
Risk management context
Coal Mine Health and Safety Regulation 2006
Geotechnical hazard plans
Issues with existing geotechnical hazard plans

A NEW TOOL FOR EXTENSOMETER DATA ANALYSIS AND IMPROVED UNDERSTANDING OF GEOTECHNICAL RISK FACTORS
DEVELOPMENT OF EXTOCHART VISUAL
SOFTWARE
Geotechnical analysis using ExtoChart Visual
software
Case study of Longwall A
Geological structure model and mine workings
Extensometer data (instruments presented at common age)
— — —
in situ
Strata deterioration caused by in situ geological/geotechnical factors
FIG 8 – Springvale mine workings with fault interpretation model.

P CORBETT, P SHEFFIELD AND M SZWEC
in situ
in situ
It is notable that the
majority of the interpreted fault intersections with roadways in the vicinity of strata deterioration were not able to be detected in the mine roadways by conventional geological mapping techniques.
Distinguishing between in situ and mining induced stress effects
FIG 9 – Extensometer data (all instruments total displacement compared at six weeks post-installation).
FIG 10 – Springvale mine workings with fault interpretation model and extensometer data (all
instruments total displacement compared at six weeks post-installation).

A NEW TOOL FOR EXTENSOMETER DATA ANALYSIS AND IMPROVED UNDERSTANDING OF GEOTECHNICAL RISK FACTORS
or
in situ
FIG 11 – Springvale ,ine workings with fault interpretation model and extensometer data (at a date prior to Longwall A extraction) annotated
with significant geological fault zone. Note: seam-level geological mapping immediately post-development could not detect these faults.
FIG 12 – Springvale mine workings with fault interpretation model and extensometer data (at a date during Longwall A extraction)
annotated with longwall face position and significant geological fault zones in Longwall A and B gate roads.

P CORBETT, P SHEFFIELD AND M SZWEC
Strata deterioration triggered by mining induced stress redistribution (mined panel)
Strata deterioration triggered by mining induced stress redistribution (adjacent panel)
FIG 13 – Springvale mine workings with fault interpretation model and extensometer data annotated with longwall face position and showing high
level roof strata trigger action response plan (TARP) triggers occurring inbye the longwall face in response to mining induced stress redistribution.
FIG 14 – Photograph from the main gate corner of the longwall
face (looking outbye) in good strata conditions. Note the flat roof
and clearance above the main gate longwall equipment.

A NEW TOOL FOR EXTENSOMETER DATA ANALYSIS AND IMPROVED UNDERSTANDING OF GEOTECHNICAL RISK FACTORS
Mining induced strata deterioration truncated at interpreted fault intersection
Overview of findings of analysis of ExtoChart
Visual data (Longwall A)
FIG 15 – Springvale mine workings with fault interpretation model and extensometer data annotated with longwall face position and showing high-
level roof strata trigger action response plan (TARP) triggers occurring outbye the longwall face in response to mining induced stress redistribution.
FIG 16 – Photograph from the main gate corner of the longwall face
(looking outbye) in very poor strata conditions. Note the severely deformed
roof and lack of clearance above the main gate longwall equipment.

P CORBETT, P SHEFFIELD AND M SZWEC
Trending of other data types
FIG 17 – Springvale Mine workings with fault interpretation model and extensometer data annotated with longwall face position and showing high-level
roof strata trigger action response plan (TARP) triggers occurring in the adjacent Longwall B gate roads in response to mining induced stress redistribution.
FIG 18 – Springvale mine workings with fault interpretation model and extensometer data annotated with longwall
face position and interpreted fault intersection. Outbye of the interpreted fault intersection there were no high-level roof
strata trigger action response plan (TARP) triggers in response to mining induced stress redistribution.
A NEW TOOL FOR EXTENSOMETER DATA ANALYSIS AND IMPROVED UNDERSTANDING OF GEOTECHNICAL RISK FACTORS
CONCLUSIONS
ACKNOWLEDGEMENTS
REFERENCESNew South Wales Government, Coal Mine Health and Safety
Regulation 2006
Palaris,
Shepherd Mining Geotechnics Pty Ltd,
SRK Consulting,
Stone,Coal 2001: Coal Operators’ Geotechnology
Colloquium
Strata Control Technology (SCT), In situ
Strata Engineering,
Strata-Tek,
INTRODUCTIONThe problem of premature rock bolt failure in Australian coalmines was first identified by an Australian Coal Association Research Program (ACARP) funded project C8008 completed in 2002, with further findings from ACARP project C12014 reported in 2004. Many of the 50 broken bolts collected from five mine sites were determined to have failed from stress corrosion cracking (SCC). The majority of the broken bolts examined from 1999 to 2002 had steel Charpy impact toughness values of 4–7 J (Crosky et al, 2004). Fracture mechanics predicts that an increase in steel impact toughness will increase the length of the crack before sudden brittle failure. In the final report of 2004, anecdotal evidence from one coalmine indicated that the problem may be eliminated in some environments by a change to steel grades with higher Charpy impact values of ~16 (Crosky et al, 2004).
A 2003 laboratory study by Gamboa and Atrens on four Australian rock bolt steel grades in various electrolyte
solutions had found SCC failures only occur within pH <2.1, which was much lower than sampled groundwater from underground hard rock mines and one coalmine of pH 6.8–8.3 (Gamboa and Atrens, 2003). There was no correlation of steel grade performance between the laboratory studies and coalmine rock bolt service history (Crosky et al, 2004).
Between 2004 and 2010, many Australian coalmines had reported further SCC premature rock bolt failures and these now included the higher Charpy impact toughness steels of ~16 J. In 2010, the current UNSW Australian Research Council (ARC) and industry funded linkage project LP100200238 commenced with significantly more resources than previous projects.
The UNSW ARC linkage project has three main areas of investigation towards achieving its aims:
An investigation of the corrosive impact of groundwater on rock bolts in underground coalminesP Craig1, S Saydam2, P C Hagan3, B Hebblewhite4, D Vandermaat5, A Crosky6 and E Elias7
ABSTRACTPremature failure of rock bolts has been recorded at twelve underground coalmines over the past 15 years in Australia. Over the last four years, UNSW Australia has been conducting an Australian Research Council (ARC) and Industry funded linkage research project into premature failure of rock bolts. The extent of the problem was investigated by underground surveys of mines with known prematurely failed bolts using visual mapping, non-destructive load and ultrasound testing. A major component of this project was to define the environmental factors responsible for corrosion of rock bolts. The environment to which a rock bolt is exposed will include groundwater chemistry, the mineralogy of the strata, atmosphere within the drill hole and even microbial activity. This paper focuses on the groundwater survey and analysis findings to date along with in-hole bolt corrosion coupons installed into field sites. Corrosivity classification systems exist for general corrosion but do not apply to the rock bolt stress corrosion cracking (SCC) problem found in Australian underground coal. The method of in situ investigations is leading towards the building of a corrosivity classification model to assist mines in prediction of premature rock bolt failure. An ‘in-hole bolt corrosion coupon’ development by the project may have multiple benefits of: • helping quantify any corrosivity classification system • providing an in situ ground support corrosion monitoring tool • for testing possible corrosion protection solutions.
1. PhD Candidate, School of Mining Engineering, UNSW Australia, Sydney NSW 2052. Email: [email protected]
2. MAusIMM, Associate Professor, School of Mining Engineering, UNSW Australia, Sydney NSW 2052. Email: [email protected]
3. FAusIMM, Associate Professor, School of Mining Engineering, UNSW Australia, Sydney NSW 2052. Email: [email protected]
4. MAusIMM, Professor, School of Mining Engineering, UNSW Australia, Sydney NSW 2052. Email: [email protected]
5. SAusIMM, PhD Candidate, School of Mining Engineering, UNSW Australia, Sydney NSW 2052.
6. Professor, School of Materials Science and Engineering, UNSW Australia, Sydney NSW 2052.
7. PhD Candidate, School of Materials Science and Engineering, UNSW Australia, Sydney NSW 2052.
P CRAIG et al
1. laboratory bolt corrosion experiments aimed at re-producing SCC failures
2. metallurgical examinations aimed at defining the causesand mechanisms of coalmine SCC
3. coalmine data collection to identify the extent andenvironmental contributors to the problem.
This paper discussed the coalmine data collection and analysis to date.
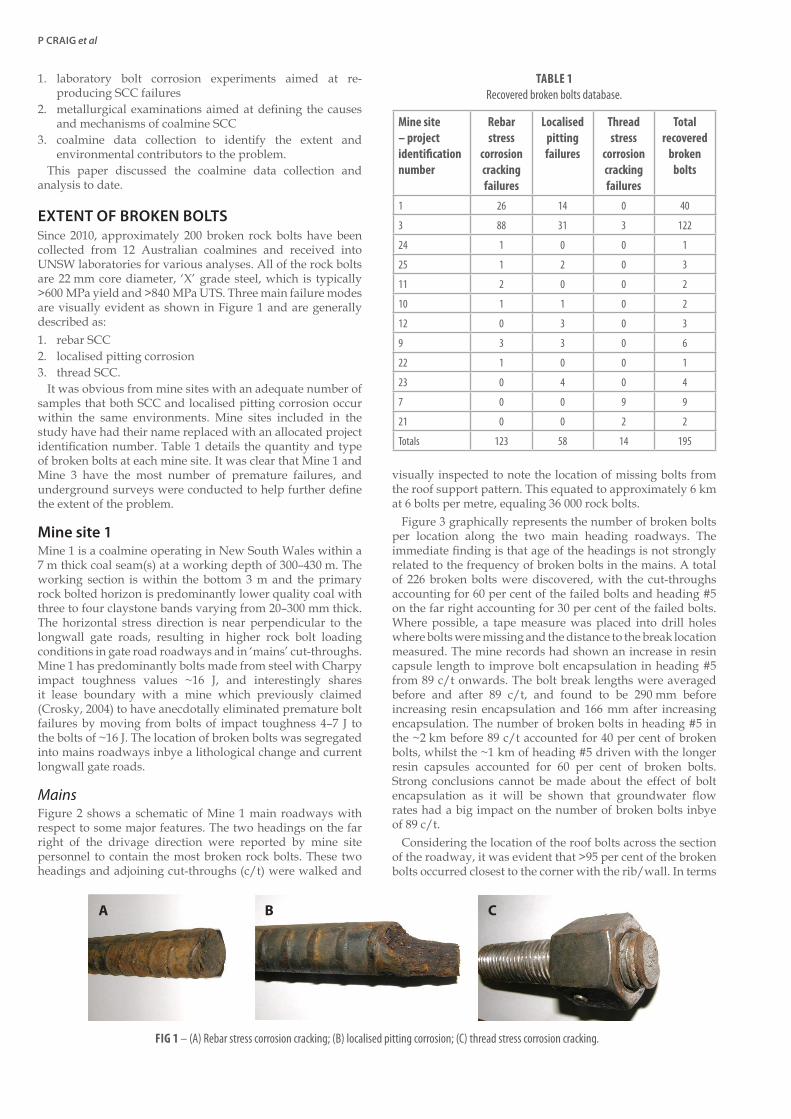
EXTENT OF BROKEN BOLTSSince 2010, approximately 200 broken rock bolts have been collected from 12 Australian coalmines and received into UNSW laboratories for various analyses. All of the rock bolts are 22 mm core diameter, ‘X’ grade steel, which is typically >600 MPa yield and >840 MPa UTS. Three main failure modesare visually evident as shown in Figure 1 and are generallydescribed as:1. rebar SCC2. localised pitting corrosion3. thread SCC.
It was obvious from mine sites with an adequate number ofsamples that both SCC and localised pitting corrosion occur within the same environments. Mine sites included in the study have had their name replaced with an allocated project identification number. Table 1 details the quantity and type of broken bolts at each mine site. It was clear that Mine 1 and Mine 3 have the most number of premature failures, and underground surveys were conducted to help further define the extent of the problem.
Mine site 1Mine 1 is a coalmine operating in New South Wales within a 7 m thick coal seam(s) at a working depth of 300–430 m. The working section is within the bottom 3 m and the primary rock bolted horizon is predominantly lower quality coal with three to four claystone bands varying from 20–300 mm thick. The horizontal stress direction is near perpendicular to the longwall gate roads, resulting in higher rock bolt loading conditions in gate road roadways and in ‘mains’ cut-throughs. Mine 1 has predominantly bolts made from steel with Charpy impact toughness values ~16 J, and interestingly shares it lease boundary with a mine which previously claimed (Crosky, 2004) to have anecdotally eliminated premature bolt failures by moving from bolts of impact toughness 4–7 J to the bolts of ~16 J. The location of broken bolts was segregated into mains roadways inbye a lithological change and current longwall gate roads.
MainsFigure 2 shows a schematic of Mine 1 main roadways with respect to some major features. The two headings on the far right of the drivage direction were reported by mine site personnel to contain the most broken rock bolts. These two headings and adjoining cut-throughs (c/t) were walked and
visually inspected to note the location of missing bolts from the roof support pattern. This equated to approximately 6 km at 6 bolts per metre, equaling 36 000 rock bolts.
Figure 3 graphically represents the number of broken bolts per location along the two main heading roadways. The immediate finding is that age of the headings is not strongly related to the frequency of broken bolts in the mains. A total of 226 broken bolts were discovered, with the cut-throughs accounting for 60 per cent of the failed bolts and heading #5 on the far right accounting for 30 per cent of the failed bolts. Where possible, a tape measure was placed into drill holes where bolts were missing and the distance to the break location measured. The mine records had shown an increase in resin capsule length to improve bolt encapsulation in heading #5 from 89 c/t onwards. The bolt break lengths were averaged before and after 89 c/t, and found to be 290 mm before increasing resin encapsulation and 166 mm after increasing encapsulation. The number of broken bolts in heading #5 in the ~2 km before 89 c/t accounted for 40 per cent of broken bolts, whilst the ~1 km of heading #5 driven with the longer resin capsules accounted for 60 per cent of broken bolts. Strong conclusions cannot be made about the effect of bolt encapsulation as it will be shown that groundwater flow rates had a big impact on the number of broken bolts inbye of 89 c/t.
Considering the location of the roof bolts across the section of the roadway, it was evident that >95 per cent of the broken bolts occurred closest to the corner with the rib/wall. In terms
Mine site – project identification number
Rebar stress
corrosion cracking failures
Localised pitting failures
Thread stress
corrosion cracking failures
Total recovered
broken bolts
1 26 14 0 40
3 88 31 3 122
24 1 0 0 1
25 1 2 0 3
11 2 0 0 2
10 1 1 0 2
12 0 3 0 3
9 3 3 0 6
22 1 0 0 1
23 0 4 0 4
7 0 0 9 9
21 0 0 2 2
Totals 123 58 14 195
TABLE 1Recovered broken bolts database.
FIG 1 – (A) Rebar stress corrosion cracking; (B) localised pitting corrosion; (C) thread stress corrosion cracking.
A B C

AN INVESTIGATION OF THE CORROSIVE IMPACT OF GROUNDWATER ON ROCK BOLTS IN UNDERGROUND COALMINES
of movement of laminated strata in a rectangular coalmine roadway, there is a concentration of horizontal stresses and lateral movement nearest the corners. It is postulated that the bending forces on the rock bolts nearest the roadway corners provide the increased ‘stress’ contributing to the stress corrosion cracking failure of bolts. There was also a higher instance of broken bolts in cut-throughs and nearest intersections in the roadways which matched the increased horizontal stress locations. The mine site had also completed geological structure and hazard mapping of the main roadways. It was found that many clusters of broken bolts coincided with areas of increased horizontal stress associated with geological structure locations and orientations.
The service age from installation of the broken bolts in the mains was greater than seven years. The older broken bolts near the start of the outbye lithological change had been in service for 13 years.
Gate roadsMine 1 gate roads comprise of around 28 pillars of 110 m long × 40 m wide, and as mentioned the headings are driven in the unfavourable direction to the regional horizontal stress. Reports of broken bolts in the active mining area of a recently completed gate road were investigated by visual inspection in August 2013. The bolts in the gate road were within two years of service life and there were 98 broken roof bolts, with all the broken bolts found within the headings and nil found in the cut-throughs. Broken bolts were particularly clustered
in the headings between 10–12 c/t, 14–15 c/t and 18–19 c/t, with these areas accounting for 78 per cent of the broken bolts in the gate road. These locations coincided with elevated horizontal stress, and all of the broken bolts had failed from the rebar SCC, as shown previously in Figure 1.
Across both mains and gate roads at Mine 1, a total of 324 broken bolts were discovered during underground inspection, whereas previously only 40 broken bolts had been recovered and taken into the UNSW laboratories representing only 12 per cent of the actual extent of the problem found underground.
Mine site 3Whereas Mine 1 had a fairly simple mine plan with one set of mains and all the gate roads off to the left in the same direction, Mine 3 is much more complex. Mine 3 has six different sets of main headings all in different directions to the regional horizontal stress, and the first development drivage commenced in 2003 making the majority of rock bolts less than ten years old.
Although in a completely different coalfield to Mine 1, Mine 3 had some similar overall characteristics. Mine 3 is operating in New South Wales within a 6–8 m thick coal seam(s) at a depth of 200–400 m. The working section is within the bottom 3 m of the seam and the primary rock bolted horizon is predominantly lower quality coal with three to four claystone bands varying from 10–100 mm thick. Mine 3 had older areas supported with bolts made from steel of impact toughness
FIG 2 – Sketch of Mine 1 main roadways and associated features.
FIG 3 – Mine 1 ‘mains’: underground survey of broken bolts.

P CRAIG et al
4–6 J, but the far majority of workings are supported with bolts made from steel with Charpy impact toughness values ~16 J. The underground investigations focused on four areas, including two main headings, a gate road in an active mining area and a very old tailgate that remains accessible. The mine site personnel have mapped the extensive areas and ranked by areas of concern. The four areas selected were some of the worst affected locations and resources were allocated to allow load testing of old bolts combined with ultrasonic non-destructive testing (NDT) within these areas. To prevent damage to the ground support, load applied when testing of in-pattern support bolt is limited to 75 per cent of steel yield, and if any higher the bolt is replaced. The ultrasonic NDT device was a crack detector with specifically selected probes to suit very long thin shafts as represented by the rock bolts. Signal reflections off surfaces such as cracks or the end of the bolt are represented by a peak in the signal at the specific location on the screen representing the distance along the bolt. The surveys were conducted in the first quarter of 2014, and results summary of the load testing and NDT inspection of these four areas are shown in Table 2.
MainsThe first set of main roadways consisted predominantly of the bolt type with impact toughness of ~16 J, these were between eight and ten years old. There were 65 recorded broken bolts from the first mains in the UNSW laboratory, but locations were scattered over 3 km. The second set of mains were 100 per cent of the bolt type with impact toughness of ~16 J, and these were seven to eight years old. There were 21 broken bolts from the second mains in the UNSW laboratory.
The selected worst case areas of the first mains resulted in five from 98 visually intact rock bolts (five per cent) failing the load tests. Three of the failures were between 14–17 t and when pulled completely from the roof a bolt was suffering loss cross-section due to localised pitting, this bolt is shown in Figure 4. Prior to load testing, these failed bolts did not produce signal reflection by the ultrasonic NDT as the sound waves would have been deflected at the reduced cross-section rather than reflected back to the probe. These findings raise the possibility of bolts passing the 18 t load test yet being seriously compromised by loss of cross-section.
The NDT used in the first mains gave small crack reflection signals on three bolts, and a very large crack reflection on the fourth bolt. The first three passed the 18 t load test, but the fourth bolt failed and pulled out at 6 t. The failure surface was a perpendicular SCC crack, which explained the strong reflection. The other three bolts with indicated cracks on the NDT passed the 18 t load test but were likely broken far enough into the intact resin column that the resin bond below the crack held the load. Both non-destructive load test and ultrasound methods have limitations. The area of the second mains tested all passed the NDT and load testing.
A limited number of overcores were performed, but outside the surveyed areas. The recovered bolts showed small amounts of localised pitting corrosion. There are plans in place to overcore bolts within the worst affected areas when the equipment is available for those locations.
Old tailgateMine 3 has ready access to an old tailgate roadway which is around eight years old and has been subject to longwall abutment stress. The old tailgate heading is within the same mining area as the first and second mains, and a total of 22 broken bolts from the old tailgate were logged at the UNSW laboratories. The number of bolts was high considering it was a single heading compared to the mains which were two and three headings. A 100 m length of the old tailgate selected for survey which visually was potentially the worst affected location in the mine. A total of 60 bolts (ten per cent) were visually broken from the 600 bolts visually inspected, and load testing to 18 t of 42 visually intact bolts resulted in ten failures (24 per cent). The ultrasound NDT indicated seven bolts were cracked from 27 bolts tested. Two of the seven bolts failed the load test at 2 t, whilst the other five passed the 18 t load test.
Active gate roadDuring June 2012, Mine 3 had reported several random broken bolts in a new mining area gate road during development where bolts were less than six months old. An underground visit was made and groundwater collected at the freshly exposed development heading at the continuous miner. It was noted at the time that water drippers were slow at 30 mL/min,
Location Load testing Non-destructive testing testing
Total tested Pass Fail Total tested Cracked bolts detected Load test result on cracked boltsFirst mains 98 93 5 93 4 1 failed
Second mains 35 35 0 35 0 -
Old tailgate 42 32 10 27 7 2 failed
Active gate road 17 15 2 nil - -
TABLE 2Mine 3 – results summary from load testing and non-destructive testing in the first and second set of main roadways.
FIG 4 – Mine 3: bolt broken at 15 t during load test.

AN INVESTIGATION OF THE CORROSIVE IMPACT OF GROUNDWATER ON ROCK BOLTS IN UNDERGROUND COALMINES
and that roof bolt drippers typically ceased flowing between 50 m and 100 m behind the advancing roadway.
A visual survey and load testing of bolts was conducted over 200 m of roadway at the same location in April 2014, after the roadway had been subjected to longwall retreat abutment stresses. There were 11 broken bolts during visual inspection and ten of these roof bolts had services pipes hanging from them which would have created vibration and small lateral loads. Load tests were conducted on 17 visually intact bolts and produced two failures (12 per cent).
GROUNDWATERThirty-eight groundwater specimens have been collected from 12 Australian coalmines, covering eight different coal seams across five coalfields. Each water collection was conducted by a member of the research team following a procedure of collection, storage and transport back to an accredited laboratory within 48 hours. All groundwater samples were taken from drippers coming out of rock bolts or cable bolts in the mines roof.
The groundwater analyses were compared for all mines, and also against other published corrosivity studies to build a relevant database which could be used for a future Australian coalmine corrosivity classification.
The variability of groundwater chemistry and flow rate across Mine 1 was investigated to check correlation against location of premature bolt failures.
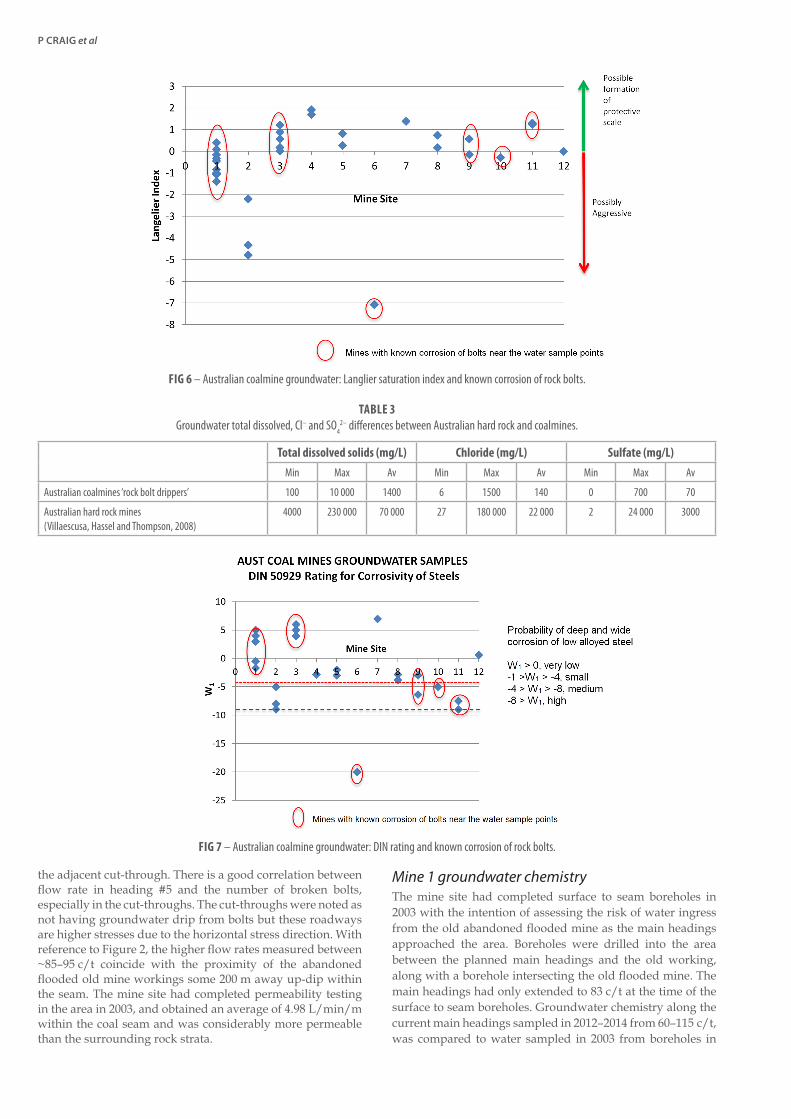
Groundwater databaseEarly literature on corrosivity of mine water from Indian coalfields (Rawat, 1976; Singh, 1988) and South African gold mines (Higginson and White, 1983) were mostly concerned with pump out water and the effect on mild steel pipes carrying the water. These studies both found that the Langlier saturation index (LSI) which predicts the deposition of protective scale on the steel surface as not applicable to mine waters due to the presence of aggressive ions such as chlorides and sulfates.
More recent literature has investigated corrosion of rebar and cable bolts. Satola and Aromaa (2003) and Hassal et al (2004) investigated the application of the German Standard DIN 50929 for corrosion of metals in soils to the corrosion of metals in hard rock mines groundwaters of Finland and Australia respectively. Both found that the DIN corrosivity classification did not correlate to corrosion in mining applications. Dorion, Hadjigeorgiou and Ghali (2009) completed steel coupon testing in mine groundwaters of Canadian and Villaescusa, Hassell and Thompson (2008) in Australian hard rock mines respectively, with the aim of correlating groundwater characteristics to the general corrosion rate in millimetres per year. The coupons were carefully prepared specimens to the AST M standard G4 as shown in Figure 5, with the surface mill scale removed. Australian coalmine rock bolts are rebar with mill scale attached, and are suffering from localised pitting corrosion and SCC which are different mechanism compared to general corrosion of coupons.
The UNSW coalmine groundwater data was also checked against the existing corrosivity classification systems and the known presence of premature rock bolt failures from particular mines.
Mine groundwater corrosivityCorrosivity studies typically focus on a limited number of groundwater features including pH, alkalinity, total
dissolved solids (TDS), aggressive anions (Cl– and SO42-),
dissolved oxygen (DO) and temperature. The 12 Australian coalmine rock bolt dripper waters analysed were in general near neutral pH and low concentrations of aggressive ions.
Figure 6 graphically represents the LSI rating for the Australian coalmine bolt dripper groundwater analysed by the project to date, on a mine by mine basis. It is clear that the LSI does not correlate as Mines 3, 9 and 11 are showing possible protective scale, but these mines have had numerous corroded bolts within the groundwater sampling locations. The LSI is not useful for Australian coalmine groundwater corrosivity due to the Cl– concentrations exceeding 25 ppm at nine of the 12 mines (Sastra et al, 1994), which was also the finding from the Western Australia School of Mines (WASM) study into Australian Hard rock mine water conducted by Villaescusa, Hassell and Thompson (2008). As shown in Table 3, the Australian coalmine groundwater had very small amounts of aggressive chloride and sulfate compared to the WASM Australian Hard rock groundwater study.
Figure 7 graphically represents the DIN corrosivity rating for the Australian coalmine bolt dripper groundwater sample analysed by the project to date, on a mine by mine basis. The DIN classification will not be discounted at this stage in the project due to good correlation with Mines 6, 9, 10 and 11. Mines 1 and 3 which do not correlate have significant clay bands in the bolted horizon, which may have a greater impact on corrosion than the groundwater alone.
Mine 1 groundwater field studyMine 1 heading #5 and adjacent cut-throughs were mapped for broken bolt locations. It was found that water was flowing and dripping from a large number of rock and cable bolts in heading #5. The adjacent cut-throughs and headings were damp but did not have water flowing or dripping from many bolts. The groundwater in heading #5 was sampled for chemical analysis every ~10 cut-throughs, and the flow rate was measured every intersection and mid-pillar for over 50 pillars. The support pattern included 2.1 m rock bolts and a mixture of 4 m and 8 m long cable bolts. To obtain a representative sample a 3 m length of the 5 m wide roadway was selected at each sampling point. The flow rate of each individual dripper was measured and then added together to obtain the total flow rate in millilitres per hour for that 3 m length of roadway.
Mine 1 groundwater flow rateThe flow rate from Mine 1 heading #5 is plotted in Figure 8 along with the frequency of broken bolt in heading #5 and
FIG 5 – ASTM Standard G4 coupons (Dorion, Hadjogeorgiou and Ghali, 2009).
P CRAIG et al
the adjacent cut-through. There is a good correlation between flow rate in heading #5 and the number of broken bolts, especially in the cut-throughs. The cut-throughs were noted as not having groundwater drip from bolts but these roadways are higher stresses due to the horizontal stress direction. With reference to Figure 2, the higher flow rates measured between ~85–95 c/t coincide with the proximity of the abandoned flooded old mine workings some 200 m away up-dip within the seam. The mine site had completed permeability testing in the area in 2003, and obtained an average of 4.98 L/min/m within the coal seam and was considerably more permeable than the surrounding rock strata.
Mine 1 groundwater chemistryThe mine site had completed surface to seam boreholes in 2003 with the intention of assessing the risk of water ingress from the old abandoned flooded mine as the main headings approached the area. Boreholes were drilled into the area between the planned main headings and the old working, along with a borehole intersecting the old flooded mine. The main headings had only extended to 83 c/t at the time of the surface to seam boreholes. Groundwater chemistry along the current main headings sampled in 2012–2014 from 60–115 c/t, was compared to water sampled in 2003 from boreholes in
Total dissolved solids (mg/L) Chloride (mg/L) Sulfate (mg/L)Min Max Av Min Max Av Min Max Av
Australian coalmines ‘rock bolt drippers’ 100 10 000 1400 6 1500 140 0 700 70
Australian hard rock mines (Villaescusa, Hassel and Thompson, 2008)
4000 230 000 70 000 27 180 000 22 000 2 24 000 3000
TABLE 3Groundwater total dissolved, Cl– and SO4
2– differences between Australian hard rock and coalmines.
FIG 6 – Australian coalmine groundwater: Langlier saturation index and known corrosion of rock bolts.
FIG 7 – Australian coalmine groundwater: DIN rating and known corrosion of rock bolts.

AN INVESTIGATION OF THE CORROSIVE IMPACT OF GROUNDWATER ON ROCK BOLTS IN UNDERGROUND COALMINES
close proximity to the now completed 94 c/t area of the mains and from the old flooded mine. Figure 9 shows generally that there is only minor variation of the groundwater coming from rock bolt drippers along the main headings. The groundwater analysis from the surface boreholes in 2003 gave similar results to rock bolt drippers after the mains headings were driven into that area many years later. The up-dip old abandoned flooded mine workings are the most likely source of the water as indicated by flow rate trends, but the chemical analysis of the assumed stagnant water sampled from the working in 2003 are very different to the flowing rock bolt drippers ~200 m down dip from the workings. In terms of corrosion, the pH 5.8 water from the old workings would have given a false indication of corrosion mechanism and severity compared to the surface borehole samples of pH 7.2–7.8, which proved to be closer to the actual groundwater coming into the roadways.
CORROSION COUPONSCarefully prepared steel coupons such as those shown in Figure 5 have been essential in building successful corrosivity classification systems based on uniform corrosion rates. The problem in ground support is not typically uniform corrosion and other types of coupon tests have been tried by different researchers. Satola and Aromaa (2003) and then Spearing, Mondal and Bylapudi (2010) immersed complete rebar and cable bolts in mine water with laboratories, neither methods produced SCC or gave grounds for a corrosivity classification. To date the current project laboratory tests conducted at UNSW laboratories as described by Vandermaat et al (2012b) have successfully produced SCC failures in complete rock bolts in acidic solution. The aforementioned laboratory experiments and the underground coupons described in
FIG 8 – Mine 1 ‘mains’: roof ‘dripper’ flow rate in heading #5 correlation to broken bolt location.
FIG 9 – Mine 1 comparison of groundwater properties.

P CRAIG et al
Vandermaat et al (2012a) have not produced SCC or localised pitting corrosion in actual mine water.
The importance of conducting quantitative controlled experiments on bolt coupons containing the surface deformation profiles and mill scale were highlighted by Elias et al (2013). Microstructure analysis of SCC failed Australian coal rebar rock bolts has shown that cracks most often initiate at the stress concentration geometry of the ribs/deformations. It was also found that cracks within the surface mill scale can act as an initiation point for SCC to propagate down into the main steel microstructure.
To develop a corrosivity classification system for Australia coalmines, a database would be required comparing rock bolt SCC and localised pitting corrosion to the environmental conditions those rock bolts are exposed. A limited amount of data is available comparing the number of broken bolt in service to the environments, as significant numbers of broken bolts (+100) have only been found in two coalmines. An ‘in-hole’ rock bolt coupon has been developed by the UNSW project team with promising results to date.
In-hole rock bolt corrosion couponIn-hole coupons constructed as shown in Figure 10 were installed in Mine 1 and Mine 3. Figure 10 shows the expanded stressed sections of rebar placed at ~200 mm centres and the entire coupon is inserted into an oversized drill hole. It is connected to an existing rock bolt to secure the coupon into the strata and to maintain connection to the existing steel mesh and adjacent bolts.
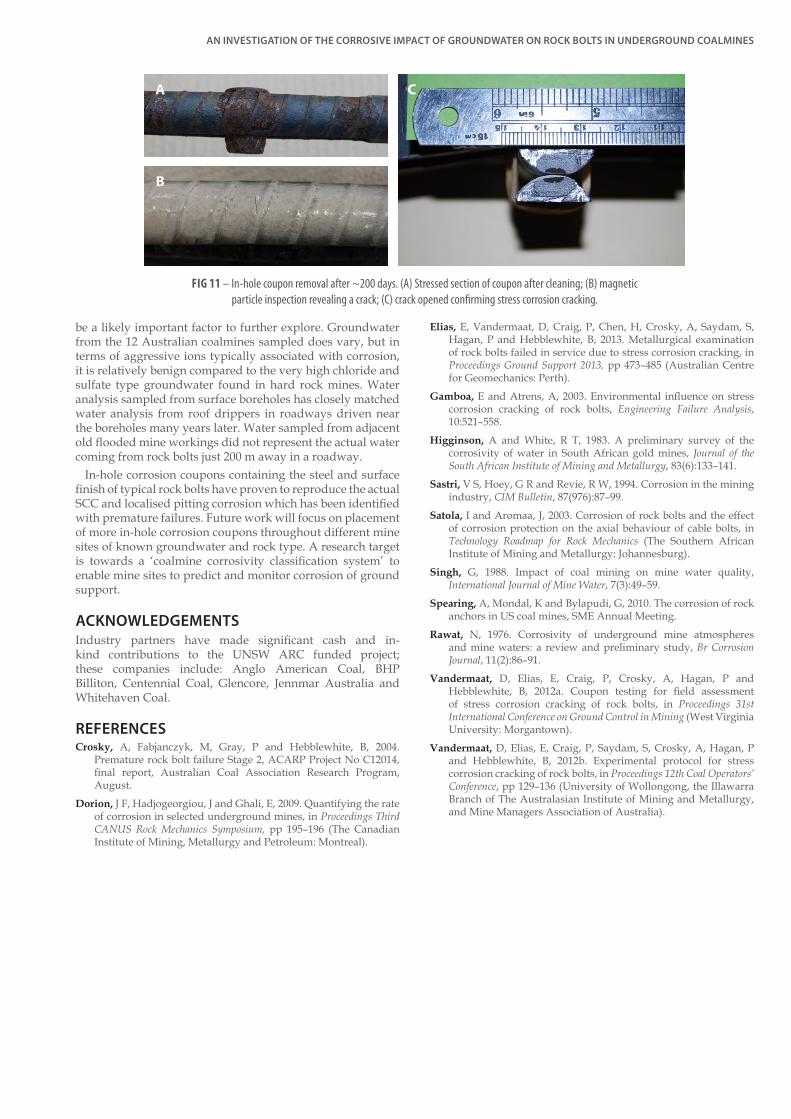
A set of five coupons made from different types of steel and surface finish were removed from Mine 1 gate road conditions after 203 days. Upon installation, a groundwater sample was taken for analysis and matched known areas of broken bolts for Mine 1. It was noted all coupon holes had groundwater dripping at installation, but at a 128 day interim inspection they were no longer dripping. Upon removal of the coupon from the drill holes, the top of the coupon contained puggy clay and approximately half a litre of groundwater above the clay plug which explains the drips ceasing over time. The coupon bolts were wrapped in plastic and transported to UNSW laboratories for cleaning and subsequent inspection for localised pitting and SCC. It was found that localised pitting corrosion was underway within the stressed section at the claystone, and in particular at points on the rebar where mill scale had been cracked from the expanded ‘stressed’ section. The most significant finding was a subcritical stress corrosion crack on one of the stressed sections below the claystone, this section is pictured in Figure 11 before and after inspection.
Three other sets of coupons will be removed from across Mines 1 and 3 during late 2014 to try and confirm the repeatability of the result. The relative simplicity and low cost of the in-hole coupon will also allow numerous other coupons to be installed into other coalmine sites across Australia. If successful, it is envisaged that the coupons will provide data towards building a quantitative corrosivity classification system. It also has potential to provide mines with a rock bolt corrosion monitoring system for different environments encountered across a mine.
CONCLUSIONSSince 2010, the current study into premature failure of coalmine rock bolts has received ~200 broken bolts into the UNSW laboratories. Underground surveys at the two mine sites where 82 per cent of these broken bolts originated, revealed that broken bolts taken to the surface by site
personnel may only represent 12 per cent of the extent of the problem underground. Non-destructive load testing in the very worst affected roadway containing ten per cent visually broken bolts has revealed up to 24 per cent premature failure rate of the remaining intact rock bolts. Non-destructive load testing is limited to 75 per cent of steel yield and will likely give many ‘pass’ results for bolts that could have small stress corrosion cracks or localised pitting. An ultrasonic non-destructive crack detector was used in conjunction with non-destructive load testing, and results to date indicate that ultrasound waves will reflect back of stress corrosion cracks but do not give signal reflections back off some large deep corrosion pits.
Increased presence of groundwater has been related to an increase in premature bolt failures. The existing groundwater corrosivity classifications typically aimed at general corrosion do not apply to the problem in Australian coalmines. The sometimes low probability of general corrosion from groundwater chemistry alone does not explain some increases in premature bolt failures. Interaction of groundwater with claystone bands was found with in-hole corrosion coupons to
FIG 10 – In-hole corrosion coupon construction.
AN INVESTIGATION OF THE CORROSIVE IMPACT OF GROUNDWATER ON ROCK BOLTS IN UNDERGROUND COALMINES
be a likely important factor to further explore. Groundwater from the 12 Australian coalmines sampled does vary, but in terms of aggressive ions typically associated with corrosion, it is relatively benign compared to the very high chloride and sulfate type groundwater found in hard rock mines. Water analysis sampled from surface boreholes has closely matched water analysis from roof drippers in roadways driven near the boreholes many years later. Water sampled from adjacent old flooded mine workings did not represent the actual water coming from rock bolts just 200 m away in a roadway.
In-hole corrosion coupons containing the steel and surface finish of typical rock bolts have proven to reproduce the actual SCC and localised pitting corrosion which has been identified with premature failures. Future work will focus on placement of more in-hole corrosion coupons throughout different mine sites of known groundwater and rock type. A research target is towards a ‘coalmine corrosivity classification system’ to enable mine sites to predict and monitor corrosion of ground support.
ACKNOWLEDGEMENTSIndustry partners have made significant cash and in-kind contributions to the UNSW ARC funded project; these companies include: Anglo American Coal, BHP Billiton, Centennial Coal, Glencore, Jennmar Australia and Whitehaven Coal.
REFERENCESCrosky, A, Fabjanczyk, M, Gray, P and Hebblewhite, B, 2004.
Premature rock bolt failure Stage 2, ACARP Project No C12014, final report, Australian Coal Association Research Program, August.
Dorion, J F, Hadjogeorgiou, J and Ghali, E, 2009. Quantifying the rate of corrosion in selected underground mines, in Proceedings Third CANUS Rock Mechanics Symposium, pp 195–196 (The Canadian Institute of Mining, Metallurgy and Petroleum: Montreal).
Elias, E, Vandermaat, D, Craig, P, Chen, H, Crosky, A, Saydam, S, Hagan, P and Hebblewhite, B, 2013. Metallurgical examination of rock bolts failed in service due to stress corrosion cracking, in Proceedings Ground Support 2013, pp 473–485 (Australian Centre for Geomechanics: Perth).
Gamboa, E and Atrens, A, 2003. Environmental influence on stress corrosion cracking of rock bolts, Engineering Failure Analysis, 10:521–558.
Higginson, A and White, R T, 1983. A preliminary survey of the corrosivity of water in South African gold mines, Journal of the South African Institute of Mining and Metallurgy, 83(6):133–141.
Sastri, V S, Hoey, G R and Revie, R W, 1994. Corrosion in the mining industry, CIM Bulletin, 87(976):87–99.
Satola, I and Aromaa, J, 2003. Corrosion of rock bolts and the effect of corrosion protection on the axial behaviour of cable bolts, in Technology Roadmap for Rock Mechanics (The Southern African Institute of Mining and Metallurgy: Johannesburg).
Singh, G, 1988. Impact of coal mining on mine water quality, International Journal of Mine Water, 7(3):49–59.
Spearing, A, Mondal, K and Bylapudi, G, 2010. The corrosion of rock anchors in US coal mines, SME Annual Meeting.
Rawat, N, 1976. Corrosivity of underground mine atmospheres and mine waters: a review and preliminary study, Br Corrosion Journal, 11(2):86–91.
Vandermaat, D, Elias, E, Craig, P, Crosky, A, Hagan, P and Hebblewhite, B, 2012a. Coupon testing for field assessment of stress corrosion cracking of rock bolts, in Proceedings 31st International Conference on Ground Control in Mining (West Virginia University: Morgantown).
Vandermaat, D, Elias, E, Craig, P, Saydam, S, Crosky, A, Hagan, P and Hebblewhite, B, 2012b. Experimental protocol for stress corrosion cracking of rock bolts, in Proceedings 12th Coal Operators’ Conference, pp 129–136 (University of Wollongong, the Illawarra Branch of The Australasian Institute of Mining and Metallurgy, and Mine Managers Association of Australia).
FIG 11 – In-hole coupon removal after ~200 days. (A) Stressed section of coupon after cleaning; (B) magnetic particle inspection revealing a crack; (C) crack opened confirming stress corrosion cracking.
A
B
C

The evolution of seismicity and ground control measures at Ernest Henry Mine
H C J Esterhuizen1
1. MAusIMM, Senior Geotechnical Engineer, Ernest Henry Mine, Cloncurry Queensland 4824. Email:[email protected]
ABSTRACT The Ernest Henry Mine (EHM) in Queensland, Australia is a Sub-level Caving operation that started production below the previously mined open pit at a depth of 535m. Current Production mining has progressed to a depth of 730m, with planned production mining to extend down to at least 1000m below surface. The inclined nature and geometry of the orebody combined with geological structures provides for challenging mining conditions. Over several years, Ernest Henry Mine has introduced measures to improve outcomes based on observations, monitoring and data analysis. As mining progresses deeper, EHM will continue to proactively take steps to ensure future outcomes are anticipated and mining can continue safely and uninterrupted. The focus of this paper is on the changes in seismic- and stress-driven behaviour of the rockmass experienced at EHM, the ground control measures implemented, and the anticipated future conditions and controls required.
INTRODUCTION The Ernest Henry Mine (EHM) is a 6.8Mt per annum Copper-Gold operation using Sub-Level Caving to extract ore via a dedicated hoisting shaft. The mine is situated in Northwest Queensland in Australia (Figure 1), featuring an inclined Iron Oxide Copper Gold (IOCG) deposit.
The EHM sub-level cave is situated underneath the previously mined EHM open pit. Development of the underground mine infrastructure and levels were undertaken concurrently with the last phases of open pit mining.
The EHM Sub-level cave crown pillar was removed during the early mining of the cave, and the cave daylights in the open pit south wall (Figure 2). The Underground Sub-level cave is now a steady state operation.
The orebody dips to the South at approximately 40 degrees, a significant influencing factor which manifests itself in the form of high stress step-outs into the solid abutment on each new level. The Sub-level cave footprint is currently 215m x 180m for the main cave, with a small satellite lens being mined adjacent to the main cave measuring approximately 120m x 45m. The orebody geometry and dip/dip direction changes with increasing depth, in general it become slightly narrower and longer. Several significant faults traverse the orebody, as well as the adjacent hangingwall and footwall of the orebody.
The increasing depth, relatively good quality rock mass conditions, the presence of significant fault structures and the localised high stress zones combined with the abovementioned factors, contribute to some interesting seismic and rockmass responses. The actions taken and controls put in place to manage them are described in this paper.
The time-history of seismicity at EHM illustrates that damaging seismic events do not necessarily always happens at depth, and it does not always get linearly worse with depth. What is also of significance is the presence of geological features, the mining geometries, and sequences followed. Although increasing depth is a significant factor, the mining strategy in terms of sequence and ground support is very important, at any depth.
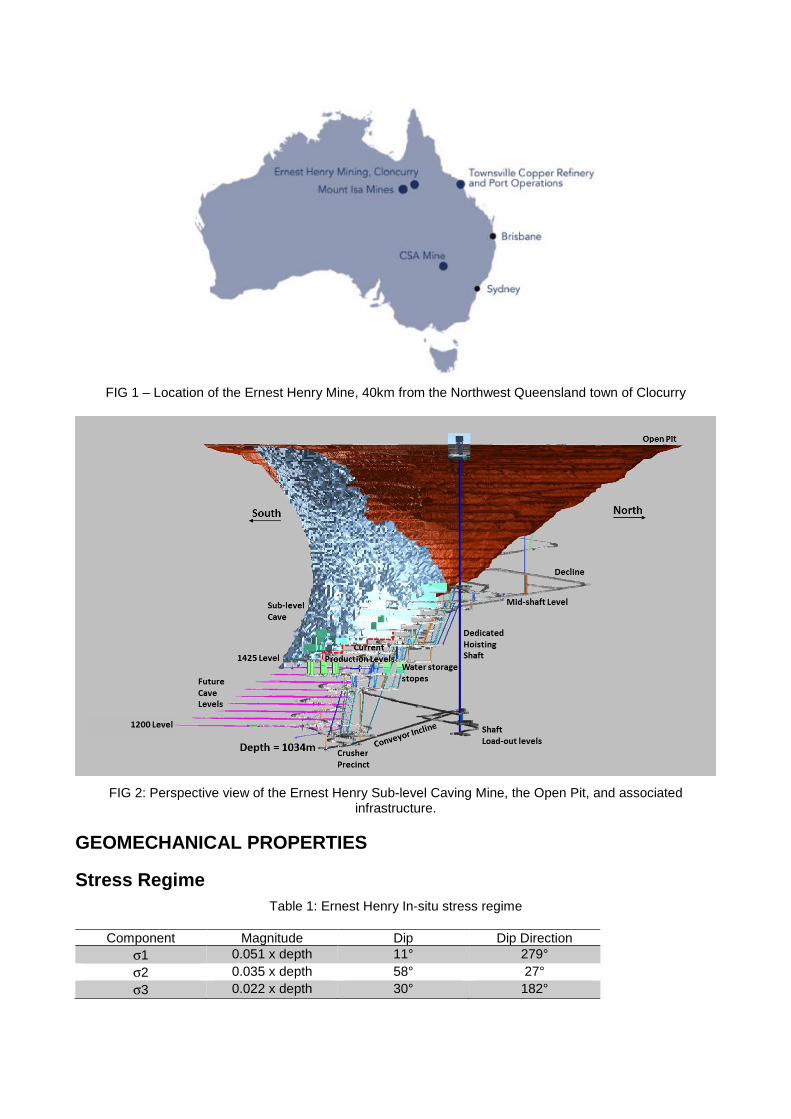
FIG 1 – Location of the Ernest Henry Mine, 40km from the Northwest Queensland town of Clocurry
FIG 2: Perspective view of the Ernest Henry Sub-level Caving Mine, the Open Pit, and associated infrastructure.
GEOMECHANICAL PROPERTIES
Stress Regime Table 1: Ernest Henry In-situ stress regime
Component Magnitude Dip Dip Direction σ1 0.051 x depth 11° 279° σ2 0.035 x depth 58° 27° σ3 0.022 x depth 30° 182°

Rockmass Strength Table 2: Ernest Henry Mine Rockmass properties
Rock Type Uniaxial Compressive Stress (MPa)
Young’s Modulus (GPa)
Indirect Tensile Strength
Poisson’s Ratio
Typical Rock Quality
Designation
Albitite (FGAB) 105 54 8 0.2 69
Diorite 103 42 10 - 78
Schist 101 42 - 0.3 75
Felsic Volcanics (FV1)
129 46 7.5 0.3 89
Felsic Volcanics (FV2)
144 45 - 0.3 89
Porphyritic Intermediate Volcanics (IV)
115 52 10 0.4 80
Hangingwall Shear Zone (HWSZ)
103 62 11 0.3 20-60
Footwall Shear Zone (FWSZ)
124.5 54 8.5 0.2 20-60
Geotechnical Domains Table 3: Ernest Henry Mine Geotechnical Domains
Domain Summary of behaviour/rockmass response
Hangingwall Step-outs Good quality rockmass conditions. Higher stress levels, increased seismic frequency and magnitude of moderate sized events, very little deformation damage
Main Cave Good quality rockmass conditions. Reduced stress levels, reduced significant seismic event frequency, seismic events focused on structures, damage at brows including wedge/layer separation, bagging of fractured material, and shear displacement on structures.
SE Lens orebody Moderate to weak quality rockmass. Higher stress levels, increased seismic frequency and magnitude of moderate to large sized events, high levels of structural deformation, high levels of ground support loading, bulking and shearing. Behaves ‘softer’. Higher water inflow.
West abutment Good quality rockmass. Higher stress levels, increased seismic frequency and magnitude of especially large sized events, very little deformation damage, behaves brittle, large events sometimes focused on intermediate sized faults
Orebody Hangingwall Good quality rockmass, weaker close to Fault 2. Cave seismogenic zone, multiple small seismic events associated with caving. Intermediate and large seismic events on Fault 2. Fault 2 is situated within the hangingwall,

and closer to the SE Lens step-out zones, influencing it with increased seismicity.
Orebody Footwall
Mostly good quality rockmass, weaker adjacent to regional structures. Footwall shear zone can be tens of metres wide. Low levels of rockmass deformation. Intermediate and large seismic events generated by cave abutment stress affecting localised and intermediate structures. Deep footwall infrastructure intersect regional faults, and can experience poor ground, high water inflows and associated corrosion. Development close to know seismically active structures can generate intermediate and large seismic events, otherwise structures are dormant.
Although in a relatively dry part of Queensland, Australia, EHM experienced significant ground water inflows with several aquifers and water zones present. The water also affects the ground support through corrosion.
SEISMICITY HISTORY – MAY 2012 TO MAY 2018
FIG 3: Seismic events with 8+ triggers, lustrating the migration of Seismicity at EHM
In Figure 3 above there are two areas indicated as period A. These were mined in the same early period when production mining on the top levels commenced whilst infrastructure development continued at the bottom of the mine. Volumes A and B in Figure 3 represents early stage mining, volume C represents the transition with increasing production mining depth up to the current mining. Area D in Figure 3 is below the current production levels, and represents future levels to be mined.
Figure 4 below show the large events per year recorded, reflecting the initial elevated response, including some large events on the upper levels. This was followed by an improvement and settlement period. More recently in 2017/2018, with EHM production mining progressively becoming deeper, the effect of increasing stress and associated seismic response is becoming more pronounced. Both the number of large events and the maximum magnitude recorded showed a significant increase. Figure 5 shows the b-value for the whole mine per annum (mMin set to -1.5ML), from the graph, it is clear that b-value has improved, despite the increase in the maximum magnitude in 2017/2018, indicated in Figure 4.
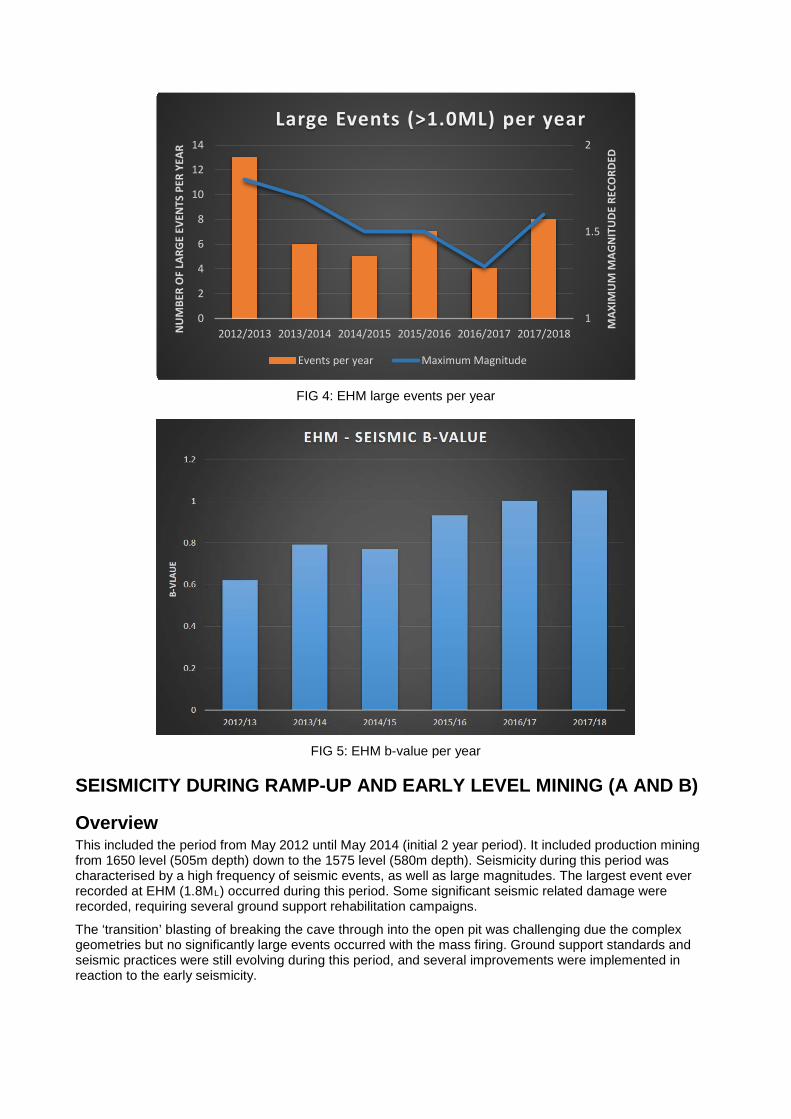
FIG 4: EHM large events per year
FIG 5: EHM b-value per year
SEISMICITY DURING RAMP-UP AND EARLY LEVEL MINING (A AND B)
Overview This included the period from May 2012 until May 2014 (initial 2 year period). It included production mining from 1650 level (505m depth) down to the 1575 level (580m depth). Seismicity during this period was characterised by a high frequency of seismic events, as well as large magnitudes. The largest event ever recorded at EHM (1.8ML) occurred during this period. Some significant seismic related damage were recorded, requiring several ground support rehabilitation campaigns.
The ‘transition’ blasting of breaking the cave through into the open pit was challenging due the complex geometries but no significantly large events occurred with the mass firing. Ground support standards and seismic practices were still evolving during this period, and several improvements were implemented in reaction to the early seismicity.
1
1.5
2
0
2
4
6
8
10
12
14
2012/2013 2013/2014 2014/2015 2015/2016 2016/2017 2017/2018
MAX
IMU
M M
AGN
ITU
DE R
ECO
RDED
NU
MBE
R O
F LA
RGE
EVEN
TS P
ER Y
EAR
Large Events (>1.0ML) per year
Events per year Maximum Magnitude
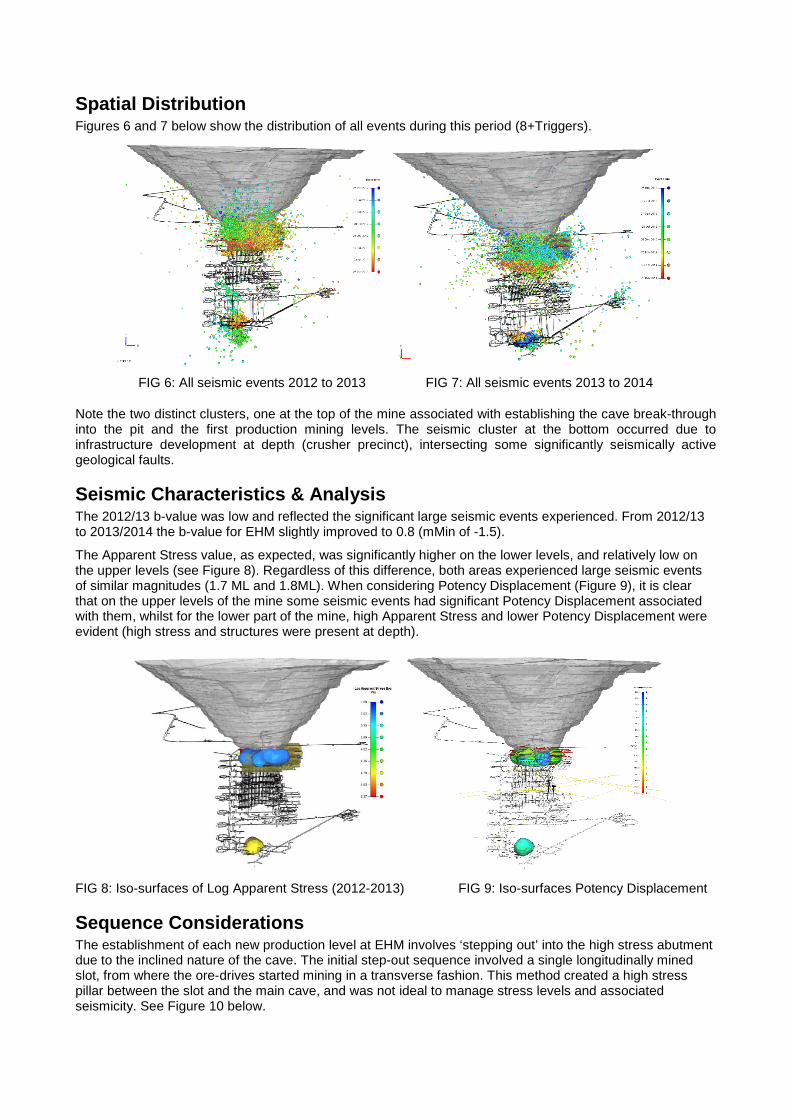
Spatial Distribution Figures 6 and 7 below show the distribution of all events during this period (8+Triggers).
FIG 6: All seismic events 2012 to 2013 FIG 7: All seismic events 2013 to 2014
Note the two distinct clusters, one at the top of the mine associated with establishing the cave break-through into the pit and the first production mining levels. The seismic cluster at the bottom occurred due to infrastructure development at depth (crusher precinct), intersecting some significantly seismically active geological faults.
Seismic Characteristics & Analysis The 2012/13 b-value was low and reflected the significant large seismic events experienced. From 2012/13 to 2013/2014 the b-value for EHM slightly improved to 0.8 (mMin of -1.5).
The Apparent Stress value, as expected, was significantly higher on the lower levels, and relatively low on the upper levels (see Figure 8). Regardless of this difference, both areas experienced large seismic events of similar magnitudes (1.7 ML and 1.8ML). When considering Potency Displacement (Figure 9), it is clear that on the upper levels of the mine some seismic events had significant Potency Displacement associated with them, whilst for the lower part of the mine, high Apparent Stress and lower Potency Displacement were evident (high stress and structures were present at depth).
FIG 8: Iso-surfaces of Log Apparent Stress (2012-2013) FIG 9: Iso-surfaces Potency Displacement
Sequence Considerations The establishment of each new production level at EHM involves ‘stepping out’ into the high stress abutment due to the inclined nature of the cave. The initial step-out sequence involved a single longitudinally mined slot, from where the ore-drives started mining in a transverse fashion. This method created a high stress pillar between the slot and the main cave, and was not ideal to manage stress levels and associated seismicity. See Figure 10 below.

FIG 10: Stepping out into abutment, then mining transverse back towards cave, creating high stress diminishing pillar.
Slip occurred on Fault 2 (F2) parallel structures resulting in seismic events and damage during the establishment of the first production levels. These structures traverse the orebody and cannot be avoided. Two dominant fault sets were present in the orebody, F2 parallel structures and F2 perpendicular structures. Mining through these structures without triggering large and damaging seismic events was identified as a key consideration in the design of level mining sequences.
Ground Support Types and Performance
Ground Support types The early ground support types during mining of production levels and infrastructure development varied over time. As mining progressed, key learnings resulted in improvements made. Some of the variations found in the early development phases at EHM:
• The decline and some other excavations supported with Fibrecrete and Posimix resin bolts. No mesh.See Figure 11 below.
• Fibrecrete, splitset friction bolts & mesh in some areas, no solid bar bolts
• ‘Black’ non-galvanised support used in some areas. EHM is a relatively high corrosion mine withsignificant water inflows (mainly in cave ore drive development).
• Fibrecrete, resin rockbolts & mesh
• Cablebolts were used to the minimum, mostly at intersections.
• Square development profiles used
o Initially no face meshing used, face burst conditions encountered at depth

FIG 11: Fibrecrete and resin bolting square profile drive from early stages of EHM development
Ground Support Performance Below some key points from this period:
• The ground support was ‘overwhelmed’ by the rockmass response to the conditions experiencedduring early mining of the cave and developing at depth through significant fault intersections. Wheresignificant seismic events occurred, the ground support installed was sometimes not suitable for theconditions.
• Several rockfalls occurred, none with any serious consequence
• Weak screen (surface) support was one of the main contributing factors; fibrecrete on its own was notadequate. See Figure 12 below.
• Lower walls were not supported and were therefore exposed to rockfalls
• Face bursting occurred during development, needed face ground support.
• Application quality of ground support contributed to how well it performed.
• Several improvements identified and implemented following rockmass response.
FIG 12: Failed fibrecrete support

Key Learnings It is important to acknowledge that there always will be learnings and improvements to be identified. It is critical that there is a willingness to back analyse, re-evaluate and improve. Sometimes the accepted “industry best practices” at the time may prove not to be best practice for the site conditions. Below some of the key learnings from the early phases of underground mining at EHM:
• Ground support systems need to be designed to operate as an integrated system, rather thanindividual units. During this phase of mining, there were still uncertainty to the extent to which dynamicsupport would be required throughout the mine.
• Adequate ground support capacity and performance around critical fault structures are very important.
• Initial ground support designs underestimated the rockmass response. Numerical modelling done priorto establishing the cave indicated that fibrecrete only drives could need rehabilitation.
• Fibrecrete on its own as a screen (surface) support to act as a containment measure during largeseismic events is not adequate. Large events (1.4ML to 1.8ML) at EHM during this period causedseveral rockfalls in areas with fibrecrete only surface support.
• Threaded rebar resin bolts without any additional yielding capacity is not adequate for significantlylarge seismic events.
• Sequence is very important in reducing the adverse response of the rockmass, and so is knowledgeabout key geological structures that may respond adversely to mining around or through them.
• There are numerous structures throughout the mine. In practice, as experienced at many mine sites, itis not easy to identify at an early stage of mining which of these structures will respond adversely, andto what extent. Where is ground support upgrades required?
• Although footwall drives were developed in relatively good rockmass conditions, they were exposed tosignificant stress change. A change away from the relatively light bolting and fibrecrete only supportwas required to adequately address long-term rockmass response, especially in terms of faultintersections, seismicity and pillars formed where ore drives intersect the footwall drive.
• Seismic events occurred very close to the cave production drives and development drives, resulting insignificant impact and damage.
• Guidelines developed for identifying burst-prone ground, and requirements to mine through it. Itincluded pre-conditioning ahead of development headings
• Improvements to the development profile resulted in the introduction of an arched profile.Implementation of perimeter blasting controls to limit damage and initial fracture zone around drives.
INCREASING DEPTH AND ASSOCIATED SEISMICITY KEY LEARNINGS WITH INCREASING DEPTH
Overview Following the establishment of the upper levels, and evaluating the rockmass response, some of the learnings described above were implemented. The period from May 2014 to May 2016 were include in this phase of the analysis. During this phase, production mining continued down to the 1525 Level (630m mining depth), and two more production levels were developed. The 1500 Level step-out mining commenced at the end of this period.
During this time, the inadequacy of using fibrecrete on its own as surface containment support for seismic conditions became very apparent. Significant work was done on improving the ground support standards. Relatively ‘small’ seismic events caused damage where fibrecrete was installed as the only surface support. The contribution of structures and lithology became more apparent, and non-linear modelling work was completed which included these structures. This enabled a better understanding of the influence of the faults and improved the accuracy of evaluating the rockmass response to the planned mining sequence.
Spatial Distribution Figures 13 and 14 below shows the seismic event special distribution during this period.

FIG 13: All events May 2014 to May 2015 FIG 14: All events May 2015 to May 2016
During 2014 to 2015, some significant cave propagation closer to surface was still occurring, whilst during the period 2015 and 2016 the migration of seismicity following the mining front is clear, so is the reduction in the overall number of seismic events.
Seismic Characteristics & Analysis The number of seismic events recorded per year decreased during this period, as mining progressed away from the upper levels. The maximum magnitude seismic event recorded reduced from 1.8ML in the previous period to 1.5ML during this period of mining. The b-value continued to increase to around 0.9. Compared to the early mining phase, the Apparent Stress values dropped significantly during the period May 2014 to May 2015, and the higher values were now situated on the upper levels, with reduced values recorded at depth around the crusher precinct (Figure 15). The lower values around the crusher precinct was because development around active fault structures present in this area was completed in the previous period of mining, hence reduced seismicity and large events around this area. Values on the upper levels around the cave remained similar compared to the early phase mining. There was a significant increase in Potency Displacement around the crusher precinct compared to the early phase mining, with some high values also recorded within the cave (Figure 16).
FIG 15: Iso-surface of Log Apparent Stress FIG 16: Iso-surface of Potency displacement
Sequence Considerations During the increasing depth phase of production mining, the cave front orientation on the 1525 level was still very flat and the change to an improved approach to Geological structures not yet implemented (Figure 17). On the 1550 and 1575 levels, the change to a westerly biased cave front with a 20° orientation was fully implemented (Figure 18). Lead/lags between individual ore drives were maintained within 1 to 3 rings, with the western ore drive leading the eastern.
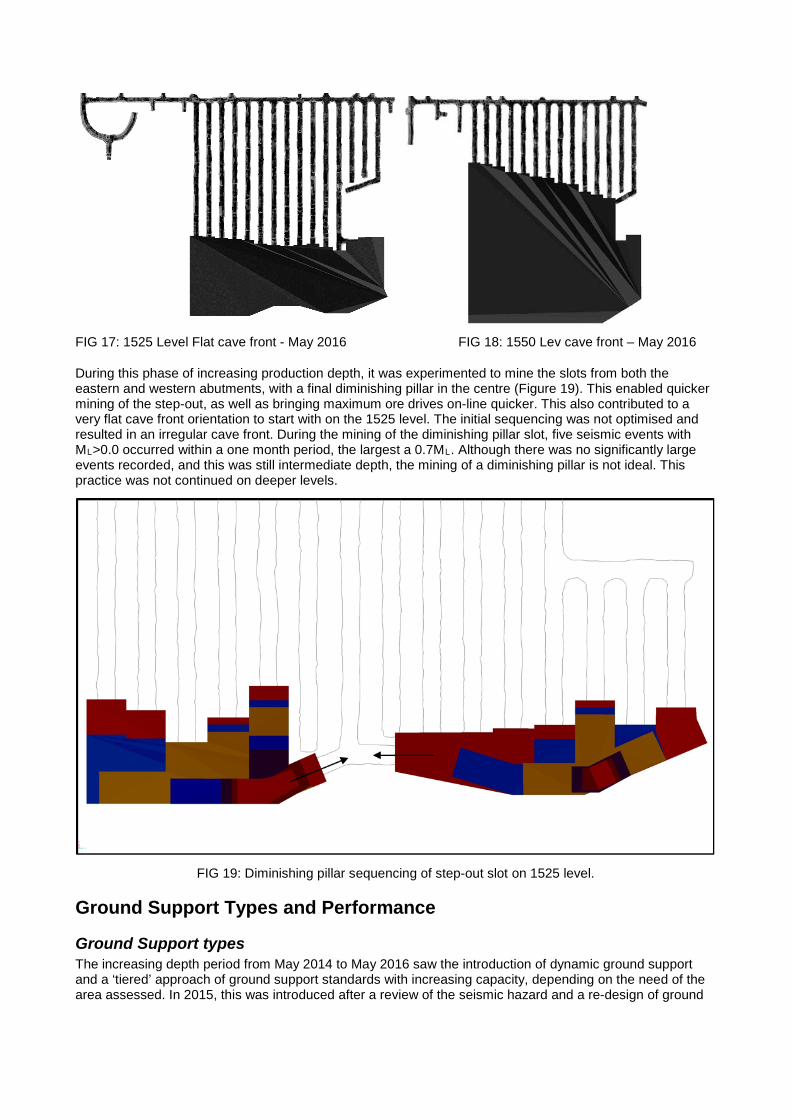
FIG 17: 1525 Level Flat cave front - May 2016 FIG 18: 1550 Lev cave front – May 2016
During this phase of increasing production depth, it was experimented to mine the slots from both the eastern and western abutments, with a final diminishing pillar in the centre (Figure 19). This enabled quicker mining of the step-out, as well as bringing maximum ore drives on-line quicker. This also contributed to a very flat cave front orientation to start with on the 1525 level. The initial sequencing was not optimised and resulted in an irregular cave front. During the mining of the diminishing pillar slot, five seismic events with ML>0.0 occurred within a one month period, the largest a 0.7ML. Although there was no significantly largeevents recorded, and this was still intermediate depth, the mining of a diminishing pillar is not ideal. Thispractice was not continued on deeper levels.
FIG 19: Diminishing pillar sequencing of step-out slot on 1525 level.
Ground Support Types and Performance
Ground Support types The increasing depth period from May 2014 to May 2016 saw the introduction of dynamic ground support and a ‘tiered’ approach of ground support standards with increasing capacity, depending on the need of the area assessed. In 2015, this was introduced after a review of the seismic hazard and a re-design of ground

support based on demand vs. capacity. The design methodology was based on the one described in the Canadian Rockburst Support Handbook, Kaiser, MgCreath, Tannant, 1996.
• The primary dynamic bolt was a debonded resin bolt (1.0m debonded length).
• Screen/surface support standards were changed to all have weld mesh integrated into the supportsystem (no fibrecrete only standards).
• Black (non-galvanised) support was still extensively used throughout the cave ore drives during thisperiod.
• Further additions available in the ‘Tiered’ ground support standards included debonded cablebolts andOsro straps, as well as extending the sidewall ground support lower down the walls.
• Factors of Safety for ground support (bursting) varied between 1.58 and 1.78, depending on the‘Tiered’ level of support used.
Ground Support performance During this phase, significant parts of the mine were still supported with the pre-2015 ground support standards, whilst new development was done with the new standards. Where assessed as required, rehabilitation was done to upgrade the support in select areas to the new ground support standards. Some of the performance observed:
• Fibrecrete fall-outs continued in areas where no mesh was used (old standards). This became asignificant issue, especially close to the mining front where personnel had to charge or connect blastholes. Several rockfalls occurred throughout the mine due to this issue. See Figures 20 and 21 below.
• The ground support standards did generally not include support for the lower sidewalls, and severalrockfalls occurred from the lower walls, especially in ore drives, which are subjected to continuedstress change from cave fronts above, below and on the level itself.
• During this period the effects of using black ground support, especially black mesh started to impactthe performance of the ground support system, with ground support units experiencing significantcorrosion in areas with conditions favourable for corrosion (which included most of the oredevelopment). Several rockfalls occurred due to corrosion, or rehabilitation was required to preventrockfalls. Due to the reduced capacity of corroded ground support, even relatively small seismicevents contributed to ground support failures and rockfalls.
FIG 20 and 21: Rockfalls ahead of cave front, fibrecrete as only surface containment support
• Some shear failures of rockbolts occurred, especially where favourable structures for sheardisplacement were present.
• Rockburst failures of ground support occurred in exceptional instances, especially where the surfacescreen support (mesh and/or fibrecrete) was compromised.
• Some ground support failures occurred in permanent or long-term infrastructure, especially electricalsubstations and switch rooms due to inadequate containment capacity, and support used not suitablefor long-term excavations.
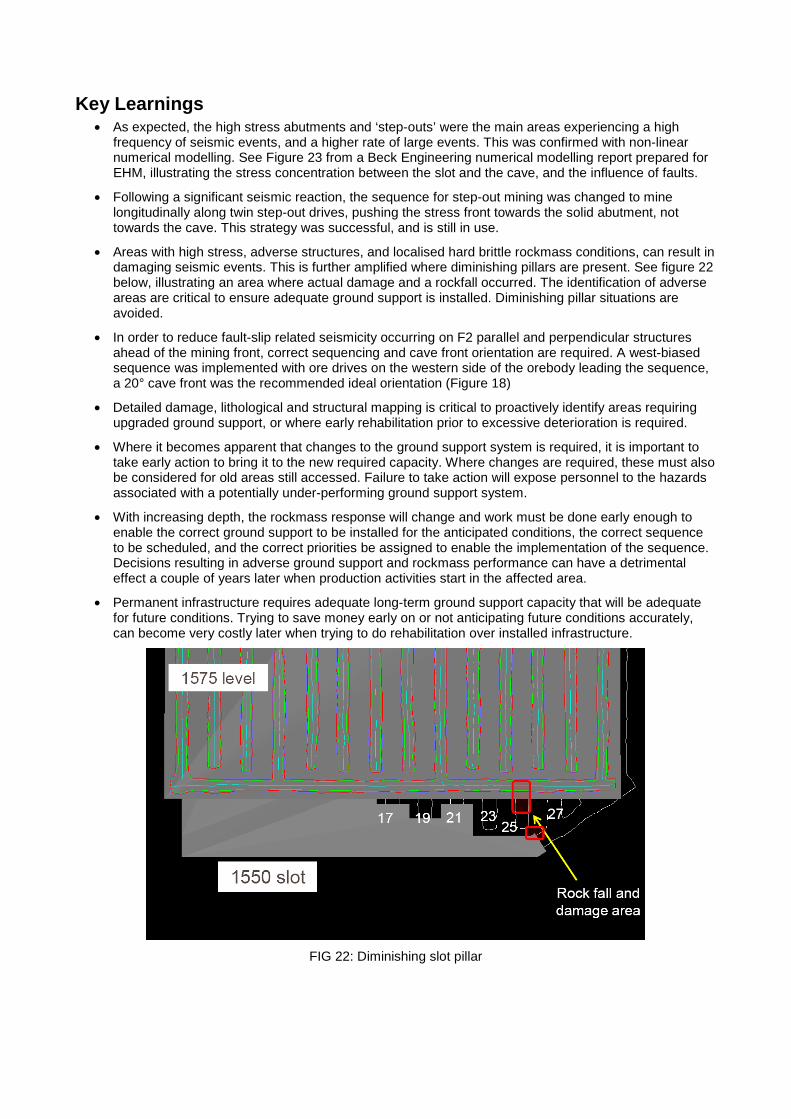
Key Learnings • As expected, the high stress abutments and ‘step-outs’ were the main areas experiencing a high
frequency of seismic events, and a higher rate of large events. This was confirmed with non-linearnumerical modelling. See Figure 23 from a Beck Engineering numerical modelling report prepared forEHM, illustrating the stress concentration between the slot and the cave, and the influence of faults.
• Following a significant seismic reaction, the sequence for step-out mining was changed to minelongitudinally along twin step-out drives, pushing the stress front towards the solid abutment, nottowards the cave. This strategy was successful, and is still in use.
• Areas with high stress, adverse structures, and localised hard brittle rockmass conditions, can result indamaging seismic events. This is further amplified where diminishing pillars are present. See figure 22below, illustrating an area where actual damage and a rockfall occurred. The identification of adverseareas are critical to ensure adequate ground support is installed. Diminishing pillar situations areavoided.
• In order to reduce fault-slip related seismicity occurring on F2 parallel and perpendicular structuresahead of the mining front, correct sequencing and cave front orientation are required. A west-biasedsequence was implemented with ore drives on the western side of the orebody leading the sequence,a 20° cave front was the recommended ideal orientation (Figure 18)
• Detailed damage, lithological and structural mapping is critical to proactively identify areas requiringupgraded ground support, or where early rehabilitation prior to excessive deterioration is required.
• Where it becomes apparent that changes to the ground support system is required, it is important totake early action to bring it to the new required capacity. Where changes are required, these must alsobe considered for old areas still accessed. Failure to take action will expose personnel to the hazardsassociated with a potentially under-performing ground support system.
• With increasing depth, the rockmass response will change and work must be done early enough toenable the correct ground support to be installed for the anticipated conditions, the correct sequenceto be scheduled, and the correct priorities be assigned to enable the implementation of the sequence.Decisions resulting in adverse ground support and rockmass performance can have a detrimentaleffect a couple of years later when production activities start in the affected area.
• Permanent infrastructure requires adequate long-term ground support capacity that will be adequatefor future conditions. Trying to save money early on or not anticipating future conditions accurately,can become very costly later when trying to do rehabilitation over installed infrastructure.
FIG 22: Diminishing slot pillar
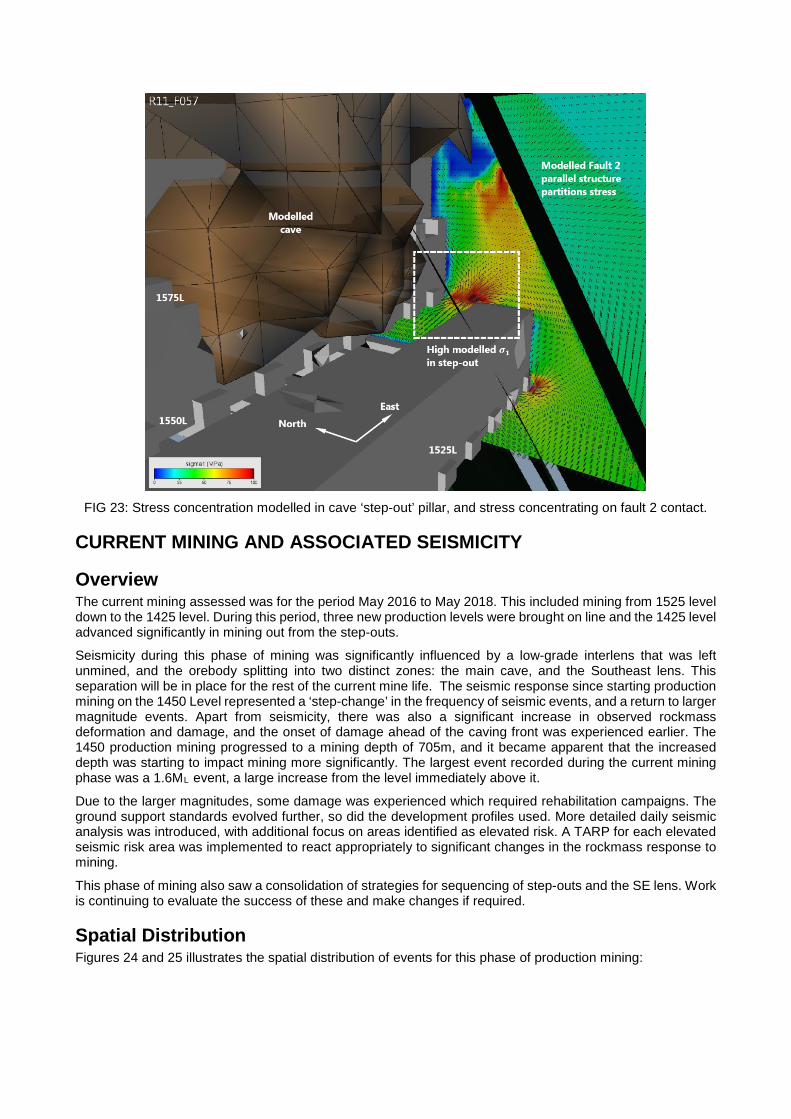
FIG 23: Stress concentration modelled in cave ‘step-out’ pillar, and stress concentrating on fault 2 contact.
CURRENT MINING AND ASSOCIATED SEISMICITY
Overview The current mining assessed was for the period May 2016 to May 2018. This included mining from 1525 level down to the 1425 level. During this period, three new production levels were brought on line and the 1425 level advanced significantly in mining out from the step-outs.
Seismicity during this phase of mining was significantly influenced by a low-grade interlens that was left unmined, and the orebody splitting into two distinct zones: the main cave, and the Southeast lens. This separation will be in place for the rest of the current mine life. The seismic response since starting production mining on the 1450 Level represented a ‘step-change’ in the frequency of seismic events, and a return to larger magnitude events. Apart from seismicity, there was also a significant increase in observed rockmass deformation and damage, and the onset of damage ahead of the caving front was experienced earlier. The 1450 production mining progressed to a mining depth of 705m, and it became apparent that the increased depth was starting to impact mining more significantly. The largest event recorded during the current mining phase was a 1.6ML event, a large increase from the level immediately above it.
Due to the larger magnitudes, some damage was experienced which required rehabilitation campaigns. The ground support standards evolved further, so did the development profiles used. More detailed daily seismic analysis was introduced, with additional focus on areas identified as elevated risk. A TARP for each elevated seismic risk area was implemented to react appropriately to significant changes in the rockmass response to mining.
This phase of mining also saw a consolidation of strategies for sequencing of step-outs and the SE lens. Work is continuing to evaluate the success of these and make changes if required.
Spatial Distribution Figures 24 and 25 illustrates the spatial distribution of events for this phase of production mining:
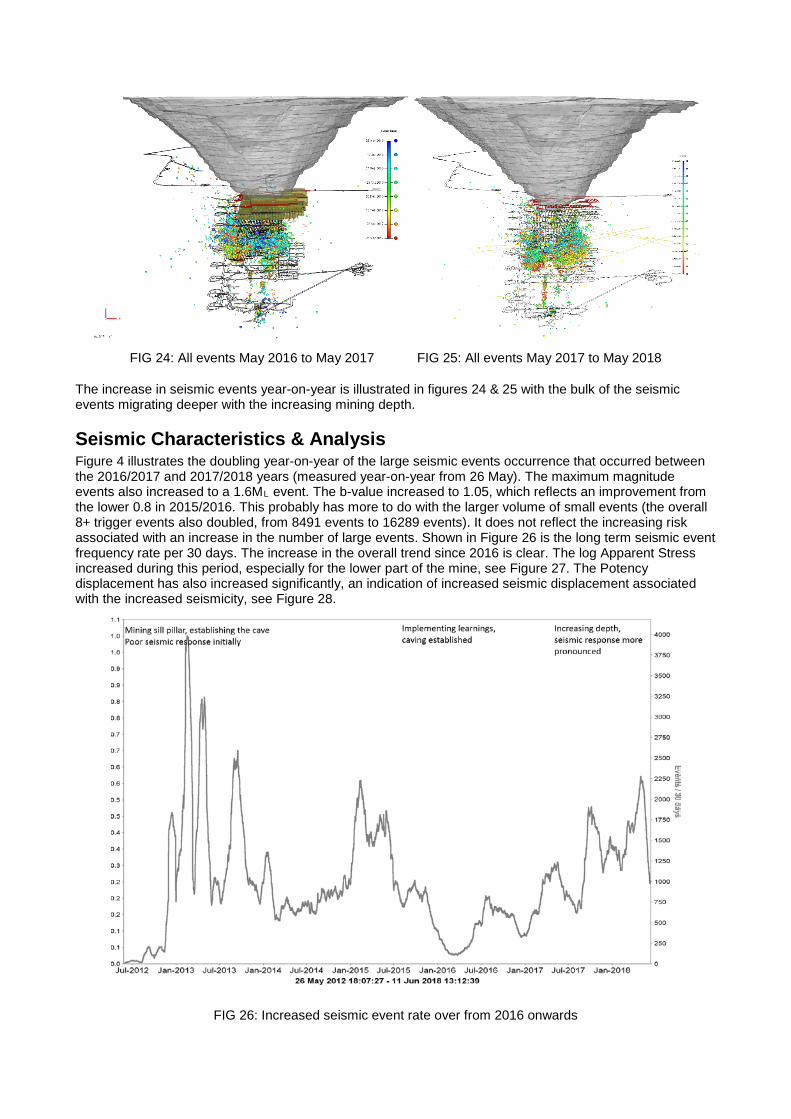
FIG 24: All events May 2016 to May 2017 FIG 25: All events May 2017 to May 2018
The increase in seismic events year-on-year is illustrated in figures 24 & 25 with the bulk of the seismic events migrating deeper with the increasing mining depth.
Seismic Characteristics & Analysis Figure 4 illustrates the doubling year-on-year of the large seismic events occurrence that occurred between the 2016/2017 and 2017/2018 years (measured year-on-year from 26 May). The maximum magnitude events also increased to a 1.6ML event. The b-value increased to 1.05, which reflects an improvement from the lower 0.8 in 2015/2016. This probably has more to do with the larger volume of small events (the overall 8+ trigger events also doubled, from 8491 events to 16289 events). It does not reflect the increasing risk associated with an increase in the number of large events. Shown in Figure 26 is the long term seismic event frequency rate per 30 days. The increase in the overall trend since 2016 is clear. The log Apparent Stress increased during this period, especially for the lower part of the mine, see Figure 27. The Potency displacement has also increased significantly, an indication of increased seismic displacement associated with the increased seismicity, see Figure 28.
FIG 26: Increased seismic event rate over from 2016 onwards
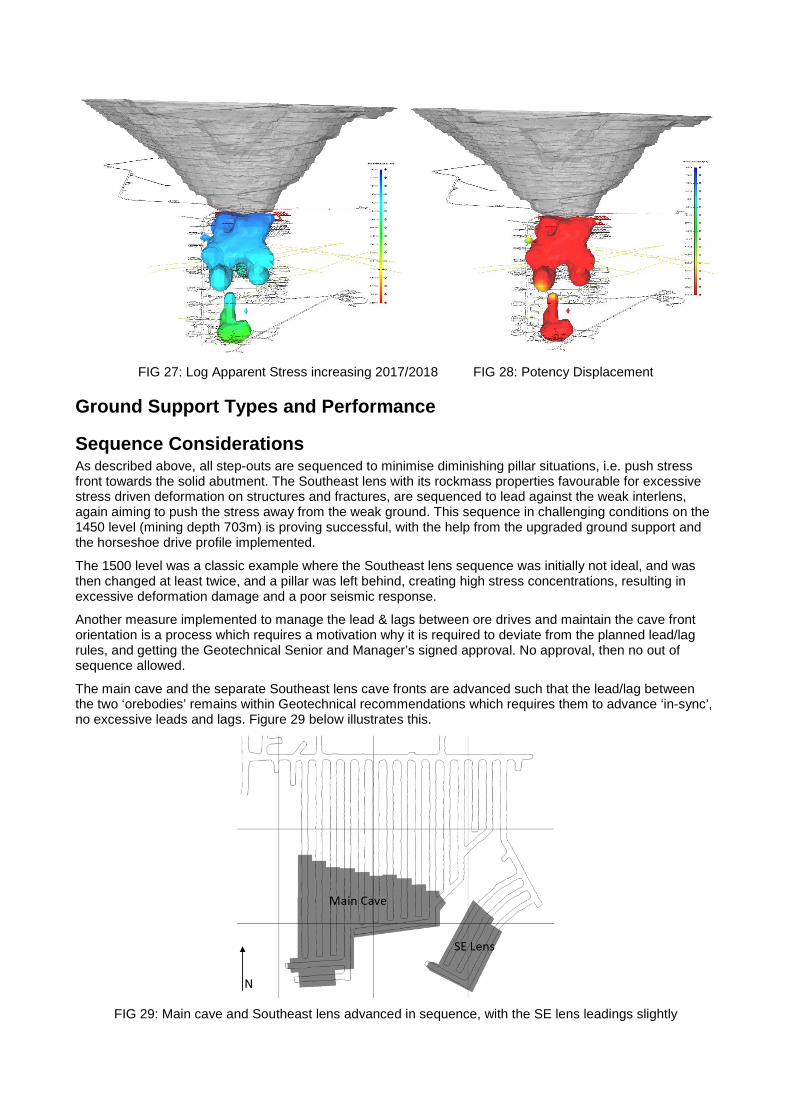
FIG 27: Log Apparent Stress increasing 2017/2018 FIG 28: Potency Displacement
Ground Support Types and Performance
Sequence Considerations As described above, all step-outs are sequenced to minimise diminishing pillar situations, i.e. push stress front towards the solid abutment. The Southeast lens with its rockmass properties favourable for excessive stress driven deformation on structures and fractures, are sequenced to lead against the weak interlens, again aiming to push the stress away from the weak ground. This sequence in challenging conditions on the 1450 level (mining depth 703m) is proving successful, with the help from the upgraded ground support and the horseshoe drive profile implemented.
The 1500 level was a classic example where the Southeast lens sequence was initially not ideal, and was then changed at least twice, and a pillar was left behind, creating high stress concentrations, resulting in excessive deformation damage and a poor seismic response.
Another measure implemented to manage the lead & lags between ore drives and maintain the cave front orientation is a process which requires a motivation why it is required to deviate from the planned lead/lag rules, and getting the Geotechnical Senior and Manager’s signed approval. No approval, then no out of sequence allowed.
The main cave and the separate Southeast lens cave fronts are advanced such that the lead/lag between the two ‘orebodies’ remains within Geotechnical recommendations which requires them to advance ‘in-sync’, no excessive leads and lags. Figure 29 below illustrates this.
FIG 29: Main cave and Southeast lens advanced in sequence, with the SE lens leadings slightly
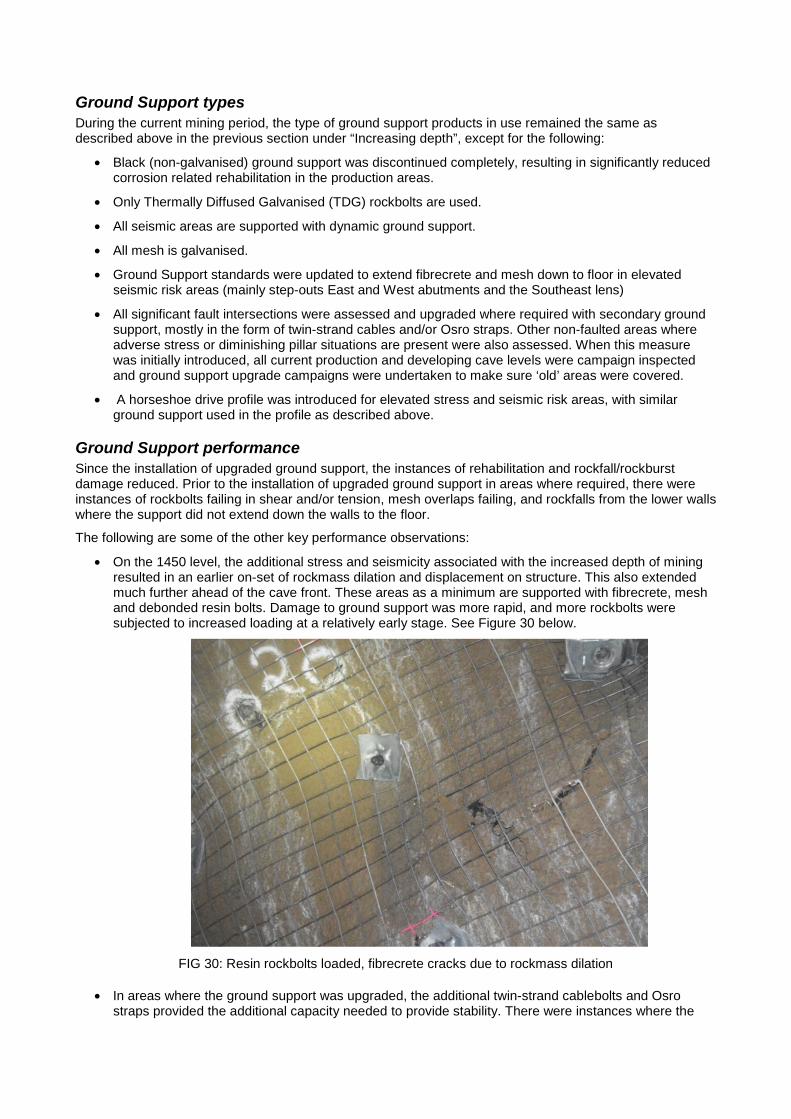
Ground Support types During the current mining period, the type of ground support products in use remained the same as described above in the previous section under “Increasing depth”, except for the following:
• Black (non-galvanised) ground support was discontinued completely, resulting in significantly reducedcorrosion related rehabilitation in the production areas.
• Only Thermally Diffused Galvanised (TDG) rockbolts are used.
• All seismic areas are supported with dynamic ground support.
• All mesh is galvanised.
• Ground Support standards were updated to extend fibrecrete and mesh down to floor in elevatedseismic risk areas (mainly step-outs East and West abutments and the Southeast lens)
• All significant fault intersections were assessed and upgraded where required with secondary groundsupport, mostly in the form of twin-strand cables and/or Osro straps. Other non-faulted areas whereadverse stress or diminishing pillar situations are present were also assessed. When this measurewas initially introduced, all current production and developing cave levels were campaign inspectedand ground support upgrade campaigns were undertaken to make sure ‘old’ areas were covered.
• A horseshoe drive profile was introduced for elevated stress and seismic risk areas, with similarground support used in the profile as described above.
Ground Support performance Since the installation of upgraded ground support, the instances of rehabilitation and rockfall/rockburst damage reduced. Prior to the installation of upgraded ground support in areas where required, there were instances of rockbolts failing in shear and/or tension, mesh overlaps failing, and rockfalls from the lower walls where the support did not extend down the walls to the floor.
The following are some of the other key performance observations:
• On the 1450 level, the additional stress and seismicity associated with the increased depth of miningresulted in an earlier on-set of rockmass dilation and displacement on structure. This also extendedmuch further ahead of the cave front. These areas as a minimum are supported with fibrecrete, meshand debonded resin bolts. Damage to ground support was more rapid, and more rockbolts weresubjected to increased loading at a relatively early stage. See Figure 30 below.
FIG 30: Resin rockbolts loaded, fibrecrete cracks due to rockmass dilation
• In areas where the ground support was upgraded, the additional twin-strand cablebolts and Osrostraps provided the additional capacity needed to provide stability. There were instances where the
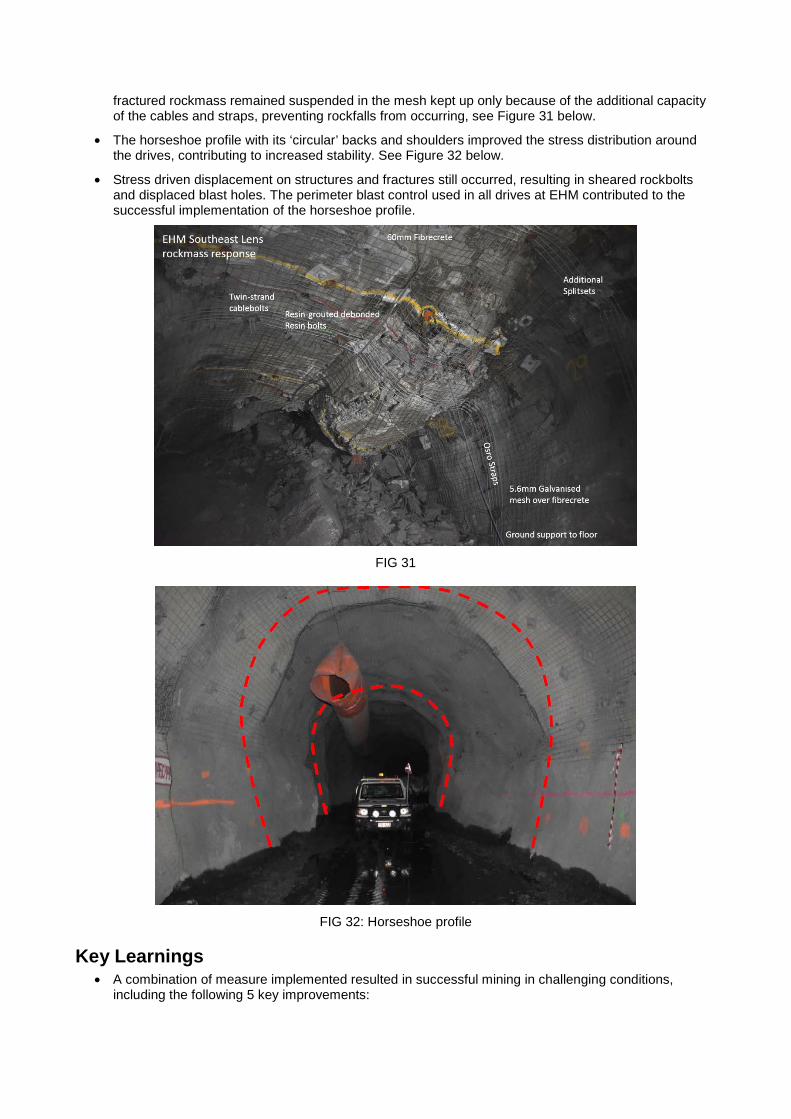
fractured rockmass remained suspended in the mesh kept up only because of the additional capacity of the cables and straps, preventing rockfalls from occurring, see Figure 31 below.
• The horseshoe profile with its ‘circular’ backs and shoulders improved the stress distribution aroundthe drives, contributing to increased stability. See Figure 32 below.
• Stress driven displacement on structures and fractures still occurred, resulting in sheared rockboltsand displaced blast holes. The perimeter blast control used in all drives at EHM contributed to thesuccessful implementation of the horseshoe profile.
FIG 31
FIG 32: Horseshoe profile
Key Learnings • A combination of measure implemented resulted in successful mining in challenging conditions,
including the following 5 key improvements:

o Horseshoe (HS) drive profile
o All ground support at EHM is now galvanised support, no black support. The instances ofrehabilitation due to corrosion and general damage to support have reduced significantly. 5.6mmGalvanised mesh is a better quality product than the 5.0mm black mesh previously used at EHM,and widely used throughout the mining industry.
o Adequate capacity of the ground support system to meet the increased demand through supportupgrades, both in the primary support standards used, and in additional secondary supportupgrades.
o Consistent sequencing aimed at reducing adverse stress and seismic impacts
o More detailed daily seismic analysis and improvements in the understanding of the seismicresponse by all of the on-site Geotechnical Engineers.
• Figure 33 below shows a combination of some of these improvements in a drive prior to productionmining. Once production starts, it is important to maintain a safe access, with no interruption to theproduction cycle. Without adequate ground support in challenging conditions, it is not possible toconsistently achieve this.
FIG 33: Improvements implemented: HS Profile, galvanised mesh, galvanised bolting and fibrecrete extended down to floor, twin-strand cablebolts, Osro straps (cables installed through the straps); mesh is
installed over the fibrecrete.
• FIG 33: Improvements implemented: HS Profile, galvanised mesh, galvanised bolting and fibrecreteextended down to floor, twin-strand cablebolts, Osro straps (cables installed through the straps); meshis installed over the fibrecrete.
• Although seismic demand on ground support systems must be met, it is also important to considerstress driven non-seismic displacement damage, and especially the shear failure of rockbolts.
• With increased seismicity and rockmass dilation/displacement, more areas in the mine whichhistorically did not had ground support installed on the lower walls, are exposed to shakedowndamage, or dislodgement of material through dilation and displacement. Although the lower sidewallsare sometimes interpreted as lower risk, the undercutting of the higher sidewall and its ground supportprovides a free face for material to slide out from higher up the wall, and a general unravelling of thehigher sidewall. This can result in large rockfalls extending up into shoulder. At EHM, part of thesupport upgrades assessments is to also to consider the lower walls historically not supported and toconsider support of these to prevent lower wall deterioration and damage.

• The frequency and severity of geological structures intersecting the orebody varies, and althoughhistorically it is well known where the worst areas are, with increasing depth and opening up newlevels, the intensity of structural intersections can change and shift. It is important to identify thesechanges early and upgrade/adjust the ground support installed.
• Due to known rockmass properties, detailed mapping of structures and the rockmass, and a rather’fixed’ sub-level cave mining method, the areas of elevated seismic risk at EHM is relatively welldefined and understood. See figure 34 below. Therefore, seismic analysis methods aimed at justhighlighting areas of high seismic risk is of little value as these are already well understood and thereare little change or shifts in these areas. Ground support and sequences are design to cater for therisk. There is a need to take it a step further, not just confirming what is known. A closer look atspecific seismic parameters, and using these to identify changes in the seismic response for the area,and the bigger mine as a whole. When this is not done, opportunities to take early action to mitigatethe impacts of a change in the response (if needed) will be lost.
FIG 34: Elevated seismic risk areas highlighted in blue. There are distinct differences in response for each of these areas.
• Daily analysis of seismicity by site Geotechnical Engineers, evaluating key seismic parameters suchas Energy Index (EI), Peak Ground Velocity (PGV),Cumulative Number of Events (CNE), CumulativeApparent Volume (CAV), and Seismic Displacement can give insight on a daily basis on how therockmass respond to blasting, approaching structures, or a slow-down or acceleration in the miningfront. At EHM, if significant changes are identified, action is taken which can include extendingexclusion zones and times, review of installed ground support quality and remaining capacity, andupgrading ground support if required. Without this analysis and action, it is a bit of “look at clusteringand hope for the best”. At EHM daily analysis are entered into a register, which also acts as a ratingsystem to rank the level of seismic response changes, and from that actions can be taken using aTrigger Action Response Plan (TARP) approach.
• Using the daily seismic analysis approach, a better understanding on the behaviour of specificgeological structures are developed. Where historically a structural response may have been definedfor example as ‘just the response to one of the Fault 2 parallel structures’, these structures are nowindividually named. With that, it becomes more apparent which of them specifically have a moreadverse response, i.e. the AA-fault and Y-fault on the western abutment are structures now known torespond significantly when mined through, and more careful planning of blasting through them can beundertaken, as well as support upgrades. At most mine sites there are many conflicting priorities andwhen this type of analysis become random and generalised, then it becomes difficult to shareinformation between engineers, track the response, and take appropriate action.

• Back analysis of past performance and actions to improve is very important, and change must beundertaken if needed. Fear of change and criticism of change when it happens hampers pro-activeactions, general improvement, learning, and growth. It ultimately leads to a reactive operation wherethings are left until something goes wrong, and then the fix is too late and sometimes difficult. At EHM,well-motivated and beneficial change are encouraged, learnings from past responses are considered,and changes are made to ensure there are continuous improvement.
• Adequate on-site Geotechnical / Rock Mechanics resources is required to develop and maintain anunderstanding of the rockmass and ground support response and to take early and pro-active actionswhen required.
CONCLUSIONS Over a period of several years, EHM has been monitoring the rockmass response to its mining activities, and adjusted or implemented a wide range of measures to manage the underground hazards associated with the rockmass and seismicity. The key is that it is not just one measure that is relied on, but a wide range of improvements and measures that are in place, ranging amongst others from drive profile, sequencing, to ground support. These have contributed to an improvement in the site’s rockfalls per year rate, See Figure 35 below.
FIG 35 – EHM Rockfalls per year
Ground support has evolved from an early support system that relied heavily on fibrecrete performance, to a fully integrated support system that contains all of the key components for an integrated ground support system:
• Reinforce - resin bolts
• Hold - debonded resin bolts and cablebolts
• Retain (or contain) – Mesh and to a lesser extent fibrecrete
• Connect – Bolt plates, Osro straps, mesh overlaps
The severity of the seismic response has shown not to be just a linear relationship with depth of mining; some of the largest events recorded on site was situated on the upper levels close to the pit. Large events and damage at depth during development of infrastructure were mainly driven by geological structures.

Knowledge about geological structures are critical to ensure adequate ground support is used in high seismic risk areas, and sequences and blasting are optimised through or around these structures. This is true for both production and development mining.
Production mining at EHM is now at a depth of just over 700m, and a step-change in the rockmass and seismic response are developing. Through close monitoring and analysis this was anticipated, and measures taken early enough to ensure continued and efficient mining in these more challenging conditions. This work is ongoing, with a focus on pro-active anticipation of future damage, and pre-supporting these areas with upgraded ground support capacity.
ACKNOWLEDGEMENTS Geotechnical Department personnel at Ernest Henry Mine for work done over several years. Information, data, and photos from Ernest Henry Mine internal reports were used in the preparation of this paper.
Beck Engineering Consultants for information provided in their March 2015 consultancy report prepared for EHM, titled “Review of 2013 model forecasts”
Management at Glencore and Ernest Henry Mine for allowing the publishing of this paper
REFERENCES Canadian Rockburst Support Handbook, Kaiser P.K., McCreath D.R., Tannant, D.D., 1990-1995

INTRODUCTIONThe traditional engineering approach to assessing stability is based on comparing resisting force (capacity) to driving force (demand), or strength to working stress. In underground coal mining, there has been a strong focus on developing strength formulations and failure criteria for rock structures, particularly pillar support systems. However, a similar level of effort has not been devoted to quantifying the load to which these structures are subjected.
The quantification of pillar working load is challenging because, firstly, it is an interactive function of both the stiffness of the pillar system and the stiffness of the surrounding strata and, secondly, most mine layouts are statically indeterminate. Except for a few special mine layouts, this interaction can only be assessed with the aid of numerical modelling, supported by surface subsidence observations, stress measurements and microseismic monitoring. This paper explores the significant role that the stiffness of the superincumbent strata stiffness has on local and regional coalmine stability, supported by a number of field examples.
THE CONCEPT OF STIFFNESSWhen a material is subjected to a compressive or tensile load, it undergoes displacement. Conversely, compressing
or stretching a material induces a change in load within the material. Figure 1 shows one of the simplest relationships between load, L, and displacement, Δd, where a material is loaded in only one direction and the load is linearly proportional to displacement up to the onset of permanent deformation, or yield, at point A. Stiffness, k, is the engineering term used to describe the relationship between load and displacement and is a measure of the ‘springiness’ of the material being loaded.
The significance of superincumbent strata stiffness and its impacts on coalmine designJ M Galvin1,2
ABSTRACTThe traditional engineering approach to assessing stability is based on comparing resisting force (capacity) to driving force (demand), or strength to working stress. In underground coal geomechanics, considerable effort has been expended on quantifying the strength of rock structures. However, this has not been matched by advances in determining the load acting on these structures, reflecting a reluctance by some to embrace numerical modelling to assess load magnitudes and distributions. Numerical modelling is a valuable aid as loading environments are a function of both the stiffness of the mine workings and the stiffness of the superincumbent strata and are statically indeterminate in most cases.
This paper defines stiffness, which is often confused with elastic modulus. It shows that, effectively, stiffness encapsulates geology, depth of mining, panel width, pillar width and mining height. Therefore, these factors are variables that need to be taken into account when determining stress magnitudes and distributions about mine workings. A range of examples are presented that illustrate the significance of the stiffness of the superincumbent strata on surface subsidence; the magnitude and distribution of pillar and abutment load; and aspects of bord and pillar mining, pillar extraction and longwall mining. These examples provide bases for identifying the limitations of some empirical approaches to mine design, identifying how to compensate for some of these in design processes; and emphasising the need to make greater use of numerical modelling in understanding and quantifying loading environments in underground coal mining.
1. FAusIMM(CP), Managing Director, Galvin & Associates, PO Box 1227, Manly NSW 2095. Email: [email protected]
2. Emeritus Professor, UNSW Australia, Sydney NSW 2052.
FIG 1 – An idealised load-displacement curve for a linearly stiff material.
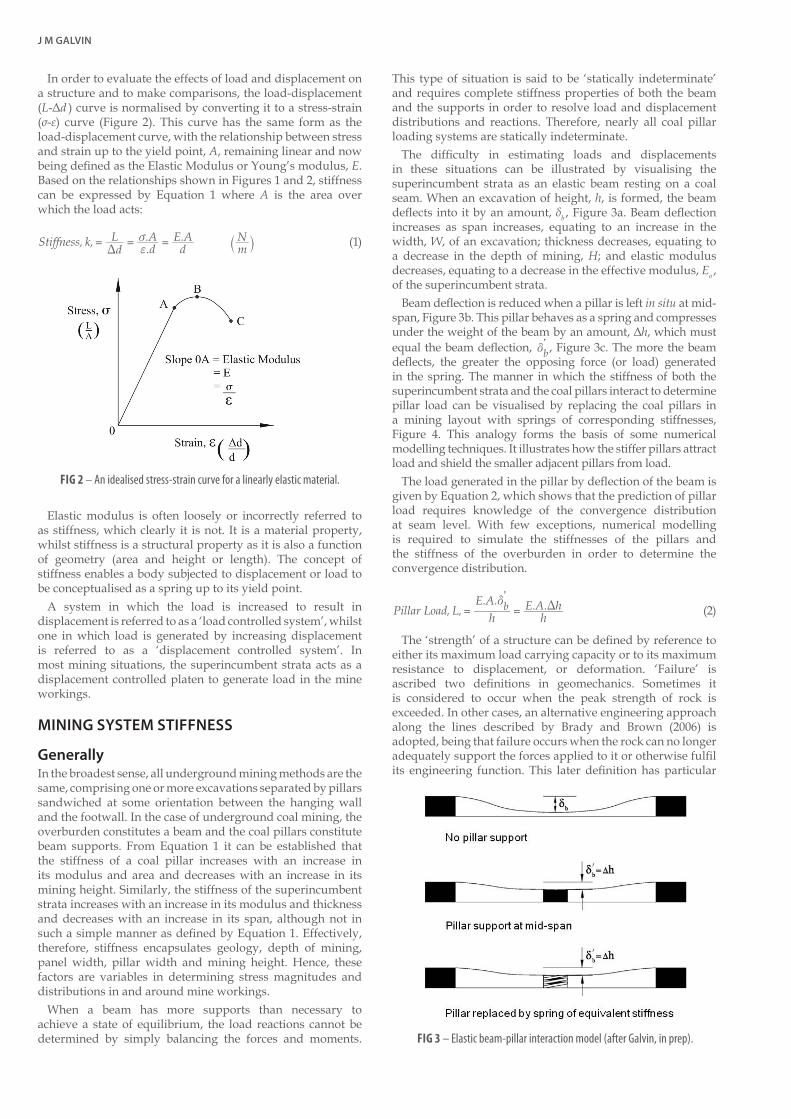
J M GALVIN
In order to evaluate the effects of load and displacement on a structure and to make comparisons, the load-displacement (L-Δd ) curve is normalised by converting it to a stress-strain (σ-ε) curve (Figure 2). This curve has the same form as the load-displacement curve, with the relationship between stress and strain up to the yield point, A, remaining linear and now being defined as the Elastic Modulus or Young’s modulus, E. Based on the relationships shown in Figures 1 and 2, stiffness can be expressed by Equation 1 where A is the area over which the load acts:
Stiffness, k, dL
.d
.AdE.A N
m= = =fv
D ` j (1)
Elastic modulus is often loosely or incorrectly referred to as stiffness, which clearly it is not. It is a material property, whilst stiffness is a structural property as it is also a function of geometry (area and height or length). The concept of stiffness enables a body subjected to displacement or load to be conceptualised as a spring up to its yield point.
A system in which the load is increased to result in displacement is referred to as a ‘load controlled system’, whilst one in which load is generated by increasing displacement is referred to as a ‘displacement controlled system’. In most mining situations, the superincumbent strata acts as a displacement controlled platen to generate load in the mine workings.
MINING SYSTEM STIFFNESS
GenerallyIn the broadest sense, all underground mining methods are the same, comprising one or more excavations separated by pillars sandwiched at some orientation between the hanging wall and the footwall. In the case of underground coal mining, the overburden constitutes a beam and the coal pillars constitute beam supports. From Equation 1 it can be established that the stiffness of a coal pillar increases with an increase in its modulus and area and decreases with an increase in its mining height. Similarly, the stiffness of the superincumbent strata increases with an increase in its modulus and thickness and decreases with an increase in its span, although not in such a simple manner as defined by Equation 1. Effectively, therefore, stiffness encapsulates geology, depth of mining, panel width, pillar width and mining height. Hence, these factors are variables in determining stress magnitudes and distributions in and around mine workings.
When a beam has more supports than necessary to achieve a state of equilibrium, the load reactions cannot be determined by simply balancing the forces and moments.
This type of situation is said to be ‘statically indeterminate’ and requires complete stiffness properties of both the beam and the supports in order to resolve load and displacement distributions and reactions. Therefore, nearly all coal pillar loading systems are statically indeterminate.
The difficulty in estimating loads and displacements in these situations can be illustrated by visualising the superincumbent strata as an elastic beam resting on a coal seam. When an excavation of height, h, is formed, the beam deflects into it by an amount, δb , Figure 3a. Beam deflection increases as span increases, equating to an increase in the width, W, of an excavation; thickness decreases, equating to a decrease in the depth of mining, H; and elastic modulus decreases, equating to a decrease in the effective modulus, Eo , of the superincumbent strata.
Beam deflection is reduced when a pillar is left in situ at mid-span, Figure 3b. This pillar behaves as a spring and compresses under the weight of the beam by an amount, Δh, which must equal the beam deflection, bd
\ , Figure 3c. The more the beamdeflects, the greater the opposing force (or load) generated in the spring. The manner in which the stiffness of both the superincumbent strata and the coal pillars interact to determine pillar load can be visualised by replacing the coal pillars in a mining layout with springs of corresponding stiffnesses, Figure 4. This analogy forms the basis of some numerical modelling techniques. It illustrates how the stiffer pillars attract load and shield the smaller adjacent pillars from load.
The load generated in the pillar by deflection of the beam is given by Equation 2, which shows that the prediction of pillar load requires knowledge of the convergence distribution at seam level. With few exceptions, numerical modelling is required to simulate the stiffnesses of the pillars and the stiffness of the overburden in order to determine the convergence distribution.
Pillar Load, L, hE.A.
hE.A. hb= =
d D\
(2)
The ‘strength’ of a structure can be defined by reference to either its maximum load carrying capacity or to its maximum resistance to displacement, or deformation. ‘Failure’ is ascribed two definitions in geomechanics. Sometimes it is considered to occur when the peak strength of rock is exceeded. In other cases, an alternative engineering approach along the lines described by Brady and Brown (2006) is adopted, being that failure occurs when the rock can no longer adequately support the forces applied to it or otherwise fulfil its engineering function. This later definition has particular
FIG 2 – An idealised stress-strain curve for a linearly elastic material.
FIG 3 – Elastic beam-pillar interaction model (after Galvin, in prep).
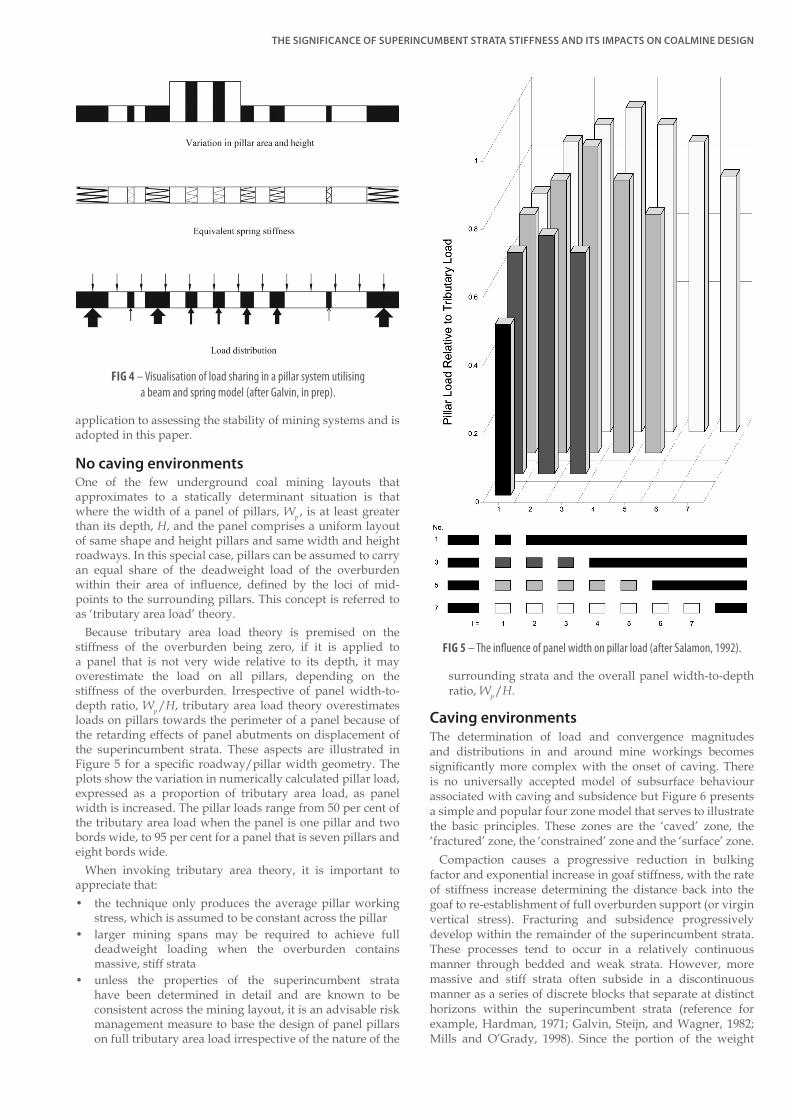
THE SIGNIFICANCE OF SUPERINCUMBENT STRATA STIFFNESS AND ITS IMPACTS ON COALMINE DESIGN
application to assessing the stability of mining systems and is adopted in this paper.
No caving environmentsOne of the few underground coal mining layouts that approximates to a statically determinant situation is that where the width of a panel of pillars, Wp , is at least greater than its depth, H, and the panel comprises a uniform layout of same shape and height pillars and same width and height roadways. In this special case, pillars can be assumed to carry an equal share of the deadweight load of the overburden within their area of influence, defined by the loci of mid-points to the surrounding pillars. This concept is referred to as ‘tributary area load’ theory.
Because tributary area load theory is premised on the stiffness of the overburden being zero, if it is applied to a panel that is not very wide relative to its depth, it may overestimate the load on all pillars, depending on the stiffness of the overburden. Irrespective of panel width-to-depth ratio, Wp /H, tributary area load theory overestimates loads on pillars towards the perimeter of a panel because of the retarding effects of panel abutments on displacement of the superincumbent strata. These aspects are illustrated in Figure 5 for a specific roadway/pillar width geometry. The plots show the variation in numerically calculated pillar load, expressed as a proportion of tributary area load, as panel width is increased. The pillar loads range from 50 per cent of the tributary area load when the panel is one pillar and two bords wide, to 95 per cent for a panel that is seven pillars and eight bords wide.
When invoking tributary area theory, it is important to appreciate that:
• the technique only produces the average pillar workingstress, which is assumed to be constant across the pillar
• larger mining spans may be required to achieve fulldeadweight loading when the overburden containsmassive, stiff strata
• unless the properties of the superincumbent stratahave been determined in detail and are known to beconsistent across the mining layout, it is an advisable riskmanagement measure to base the design of panel pillarson full tributary area load irrespective of the nature of the
surrounding strata and the overall panel width-to-depth ratio, Wp /H.
Caving environmentsThe determination of load and convergence magnitudes and distributions in and around mine workings becomes significantly more complex with the onset of caving. There is no universally accepted model of subsurface behaviour associated with caving and subsidence but Figure 6 presents a simple and popular four zone model that serves to illustrate the basic principles. These zones are the ‘caved’ zone, the ‘fractured’ zone, the ‘constrained’ zone and the ‘surface’ zone.
Compaction causes a progressive reduction in bulking factor and exponential increase in goaf stiffness, with the rate of stiffness increase determining the distance back into the goaf to re-establishment of full overburden support (or virgin vertical stress). Fracturing and subsidence progressively develop within the remainder of the superincumbent strata. These processes tend to occur in a relatively continuous manner through bedded and weak strata. However, more massive and stiff strata often subside in a discontinuous manner as a series of discrete blocks that separate at distinct horizons within the superincumbent strata (reference for example, Hardman, 1971; Galvin, Steijn, and Wagner, 1982; Mills and O’Grady, 1998). Since the portion of the weight
FIG 4 – Visualisation of load sharing in a pillar system utilising a beam and spring model (after Galvin, in prep).
FIG 5 – The influence of panel width on pillar load (after Salamon, 1992).

J M GALVIN
of undermined strata not carried by the goaf is transferred onto the abutments of the excavation, compaction, fracturing and subsidence behaviours have a significant influence on abutment stress magnitudes and distributions.
Against this background, quantifying the manner in which the relative stiffnesses of the goaf material, the overlying undermined strata and the surrounding strata determine the load distribution around an excavation is complex, even with the aid of sensible numerical modelling. A simplified two-dimensional caving model proposed by King and Whittaker (1971) provides a basis for conceptualising how abutment load is generated around an isolated panel, although as suspected by Mark and Bieniawski (1987), this model is not as straightforward as implied by its developers. The model
assumes that abutment load is generated by wedges of rock that project out over the goaf from the panel abutment at some ‘shear’ angle, θ, measured from the vertical (Figure 7). The weight of these wedges is apportioned to the panel abutments in accordance with tributary area load theory. This model forms the basis of others, one of which is the concept of abutment angle. This concept attempts to equate abutment stress to the mass of rock projecting out over the goaf at some so-called abutment angle, ϕ. In many cases, shear angle and abutment angle are taken to be one and the same.
There are a number of limitations with the abutment angle concept, the most significant being that it has no regard to the stiffness of the superincumbent strata, although there have been attempts to take this into account using different
FIG 7 – Simplified model of load transfer around an isolated excavation (after Salamon, 1991; adapted from King and Whittaker, 1971).
FIG 6 – A conceptual four zone model of caving and fracturing above an excavation (courtesy Dr Colin Mackie).

THE SIGNIFICANCE OF SUPERINCUMBENT STRATA STIFFNESS AND ITS IMPACTS ON COALMINE DESIGN
angles for different mining districts. Profiles of vertical displacement at the surface (often generically referred to as ‘surface subsidence’) are a reflection of the stiffness of the superincumbent strata and, therefore, give valuable insight into the distribution of superincumbent strata load. This is illustrated by the vertical surface displacement profiles shown in Figures 8 and 9, which are associated with two sets of 210 m wide longwall panels under not very dissimilar geological conditions, one at a depth of 80 m and the other at a depth of 500 m.
When the depth of cover is low (typically less than 150 m) and the excavation width-to-depth ratio, W/H, for an individual total extraction panel is high (typically, at least one and often higher), the stiffness of the superincumbent strata over the shallow excavation can reduce towards zero as it is being undermined, resulting in vertical surface displacement over that panel developing virtually independently of that over adjacent panels. The abutment load on the interpanel pillars is relatively low because the depth of cover is shallow and because the superincumbent strata over the flanking excavations does not dome and form a bridge. This results in near symmetrical profiles of vertical surface displacement, such as those shown in Figure 8, as soon as each panel is extracted. In these circumstances, compression of the interpanel pillars (chain pillars) and their immediate roof and floor strata makes only a minor contribution to vertical displacement and over 90 per cent of the final vertical displacement at a surface point is usually reached within weeks of it being undermined. The measured vertical surface displacement above interpanel pillars in these circumstances may largely reflect interaction of neighbouring subsidence troughs rather than compression of the pillar system and surrounding strata.
The situation is quite different at depth. Figure 9 shows that limited vertical surface displacement occurred over the first longwall panel extracted, being LW 401. Extraction of LW 402 resulted in a large step increase in vertical displacement over longwall LW 401. This additional displacement is referred to as ‘incremental displacement’ (or ‘incremental subsidence’).
The overall vertical surface displacement profile is found by summing the incremental profiles. The pattern of change in the incremental subsidence profiles as more longwall panels are extracted is evidence of a progressive reduction in superincumbent strata stiffness, resulting in increased compression of the pillar system and surrounding roof and floor strata. Vertical surface displacement over LW 401 continued to increase in increments during extraction of at least the next four longwall panels, albeit at a diminishing rate. Once the stiffness of the overburden had been reduced to zero, incremental vertical displacement reached a steady state.
The behaviour shown in Figures 8 and 9 is similar to that associated with the sites of microseismic research at Gordonstone Colliery and Appin Colliery as reported by Hatherly et al (1995), Kelly et al (1998) and Kelly and Gale (1999). In the shallow, high panel width-to-depth ratio case, microseismic events were located within the footprint of the panel, rising above the gate roads at an angle of about 16° to the vertical and sweeping ahead of the face on an arcuate shape (Figure 10). In contrast, microseismic activity associated with the deeper panel that had an individual panel width-to-depth ratio, W/H, of only 0.45–0.5 was strongly biased in the roof towards the tailgate (Figure 11). Similarly, microseismic activity in the floor was also biased towards the tailgate but also occurred beneath the tailgate of the previously extracted panel. The biased nature of the microseismic activity reflects that, for a given panel width-to-depth ratio, abutment load on interpanel pillars and surface subsidence develops incrementally at moderate to high depths of mining as the stiffness of the superincumbent strata is reduced towards zero during the course of extracting several panels.
The increase in stiffness of the superincumbent strata with depth and the impact that this has on interpanel pillar load is reflected, for example, in experience with the two chain pillar design procedures, analysis of longwall pillar stability (ALPS) and analysis of longwall tailgate serviceability (ALTS). Abutment angles for these two design procedures vary across
FIG 8 – Vertical surface displacement profiles over 210 m wide longwall panels at a depth of around 80 m (W/H = 2.6) showing maximum surface displacement developing virtually independently of subsequent panel extraction, indicative that interpanel pillar load approaches tributary area load as defined by the abutment angle concept as soon as each subsequent panel is extracted (Figure 8b courtesy of Mine Subsidence Engineering Consultants).
A
B
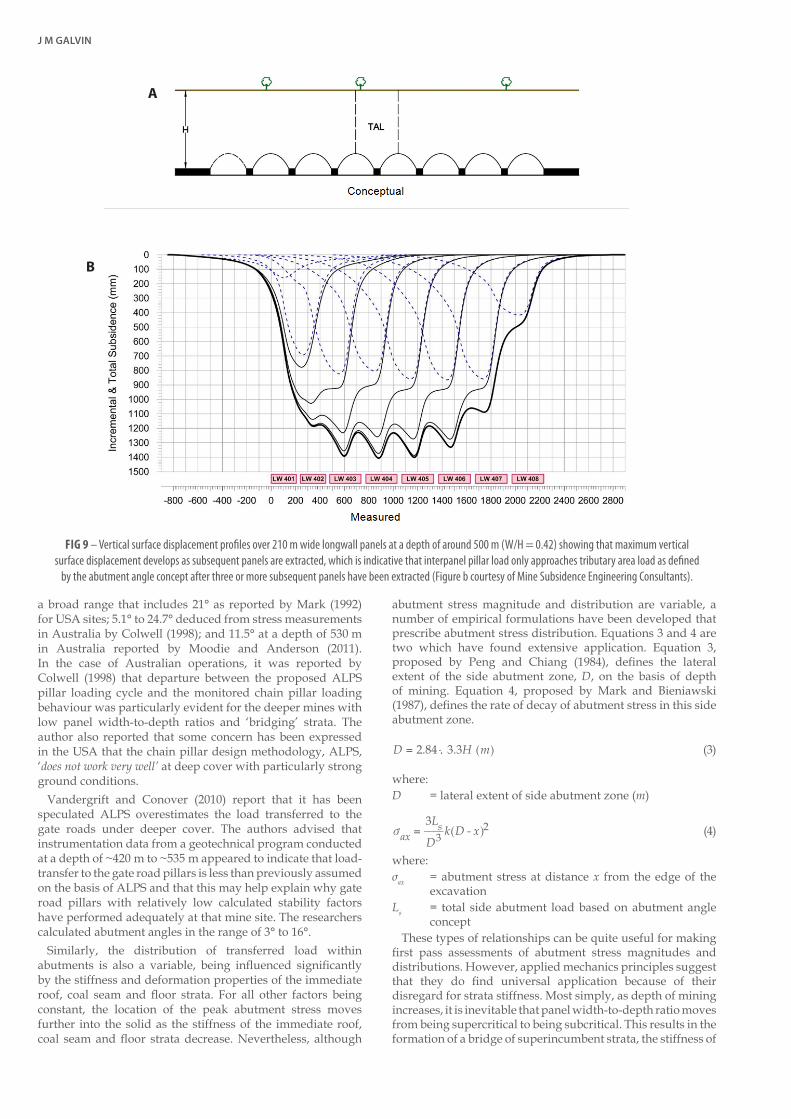
J M GALVIN
a broad range that includes 21° as reported by Mark (1992) for USA sites; 5.1° to 24.7° deduced from stress measurements in Australia by Colwell (1998); and 11.5° at a depth of 530 m in Australia reported by Moodie and Anderson (2011). In the case of Australian operations, it was reported by Colwell (1998) that departure between the proposed ALPS pillar loading cycle and the monitored chain pillar loading behaviour was particularly evident for the deeper mines with low panel width-to-depth ratios and ‘bridging’ strata. The author also reported that some concern has been expressed in the USA that the chain pillar design methodology, ALPS, ‘does not work very well’ at deep cover with particularly strong ground conditions.
Vandergrift and Conover (2010) report that it has been speculated ALPS overestimates the load transferred to the gate roads under deeper cover. The authors advised that instrumentation data from a geotechnical program conducted at a depth of ~420 m to ~535 m appeared to indicate that load-transfer to the gate road pillars is less than previously assumed on the basis of ALPS and that this may help explain why gate road pillars with relatively low calculated stability factors have performed adequately at that mine site. The researchers calculated abutment angles in the range of 3° to 16°.
Similarly, the distribution of transferred load within abutments is also a variable, being influenced significantly by the stiffness and deformation properties of the immediate roof, coal seam and floor strata. For all other factors being constant, the location of the peak abutment stress moves further into the solid as the stiffness of the immediate roof, coal seam and floor strata decrease. Nevertheless, although
abutment stress magnitude and distribution are variable, a number of empirical formulations have been developed that prescribe abutment stress distribution. Equations 3 and 4 are two which have found extensive application. Equation 3, proposed by Peng and Chiang (1984), defines the lateral extent of the side abutment zone, D, on the basis of depth of mining. Equation 4, proposed by Mark and Bieniawski (1987), defines the rate of decay of abutment stress in this side abutment zone.
2.84 3.3D H m= ^ h (3)
where:D = lateral extent of side abutment zone (m)
3
D
Lk D x3
2ax
s= -v ^ h (4)
where:σax = abutment stress at distance x from the edge of the
excavationLs = total side abutment load based on abutment angle
conceptThese types of relationships can be quite useful for making
first pass assessments of abutment stress magnitudes and distributions. However, applied mechanics principles suggest that they do find universal application because of their disregard for strata stiffness. Most simply, as depth of mining increases, it is inevitable that panel width-to-depth ratio moves from being supercritical to being subcritical. This results in the formation of a bridge of superincumbent strata, the stiffness of
FIG 9 – Vertical surface displacement profiles over 210 m wide longwall panels at a depth of around 500 m (W/H = 0.42) showing that maximum vertical surface displacement develops as subsequent panels are extracted, which is indicative that interpanel pillar load only approaches tributary area load as defined
by the abutment angle concept after three or more subsequent panels have been extracted (Figure b courtesy of Mine Subsidence Engineering Consultants).
A
B
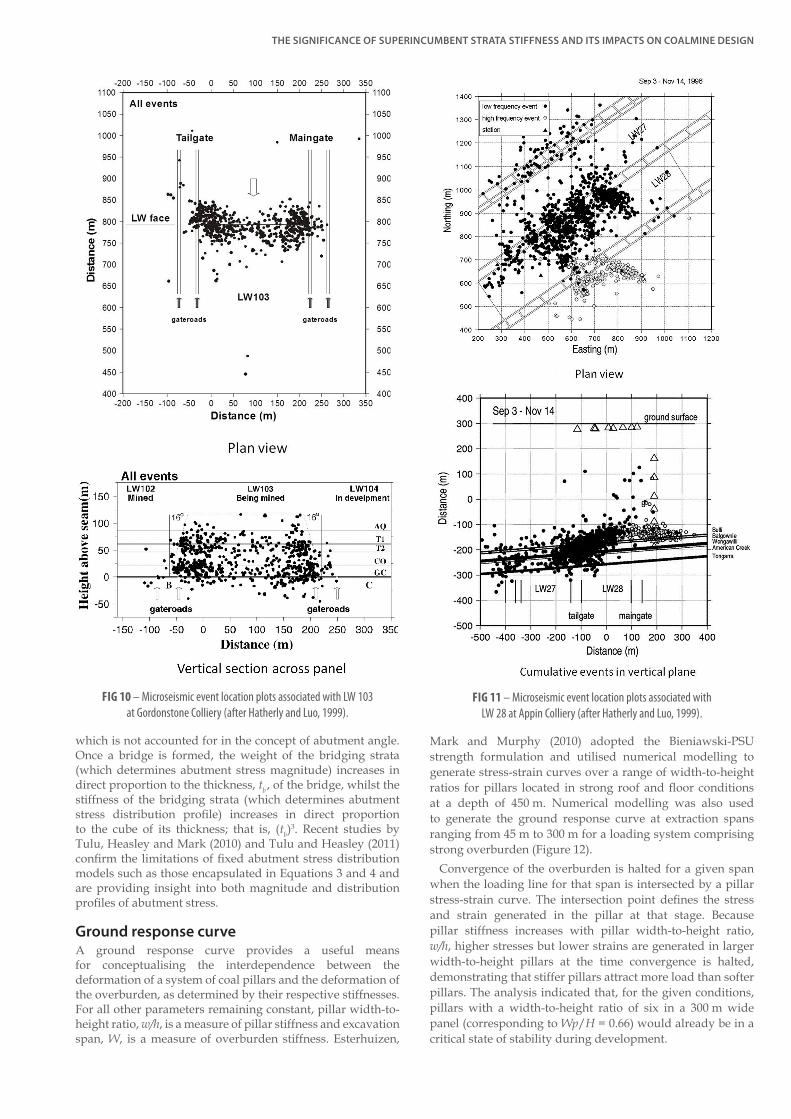
THE SIGNIFICANCE OF SUPERINCUMBENT STRATA STIFFNESS AND ITS IMPACTS ON COALMINE DESIGN
which is not accounted for in the concept of abutment angle. Once a bridge is formed, the weight of the bridging strata (which determines abutment stress magnitude) increases in direct proportion to the thickness, tb , of the bridge, whilst the stiffness of the bridging strata (which determines abutment stress distribution profile) increases in direct proportion to the cube of its thickness; that is, (tb )3. Recent studies by Tulu, Heasley and Mark (2010) and Tulu and Heasley (2011) confirm the limitations of fixed abutment stress distribution models such as those encapsulated in Equations 3 and 4 and are providing insight into both magnitude and distribution profiles of abutment stress.
Ground response curveA ground response curve provides a useful means for conceptualising the interdependence between the deformation of a system of coal pillars and the deformation of the overburden, as determined by their respective stiffnesses. For all other parameters remaining constant, pillar width-to-height ratio, w/h, is a measure of pillar stiffness and excavation span, W, is a measure of overburden stiffness. Esterhuizen,
Mark and Murphy (2010) adopted the Bieniawski-PSU strength formulation and utilised numerical modelling to generate stress-strain curves over a range of width-to-height ratios for pillars located in strong roof and floor conditions at a depth of 450 m. Numerical modelling was also used to generate the ground response curve at extraction spans ranging from 45 m to 300 m for a loading system comprising strong overburden (Figure 12).
Convergence of the overburden is halted for a given span when the loading line for that span is intersected by a pillar stress-strain curve. The intersection point defines the stress and strain generated in the pillar at that stage. Because pillar stiffness increases with pillar width-to-height ratio, w/h, higher stresses but lower strains are generated in larger width-to-height pillars at the time convergence is halted, demonstrating that stiffer pillars attract more load than softer pillars. The analysis indicated that, for the given conditions, pillars with a width-to-height ratio of six in a 300 m wide panel (corresponding to Wp/H = 0.66) would already be in a critical state of stability during development.
FIG 10 – Microseismic event location plots associated with LW 103 at Gordonstone Colliery (after Hatherly and Luo, 1999).
FIG 11 – Microseismic event location plots associated with LW 28 at Appin Colliery (after Hatherly and Luo, 1999).
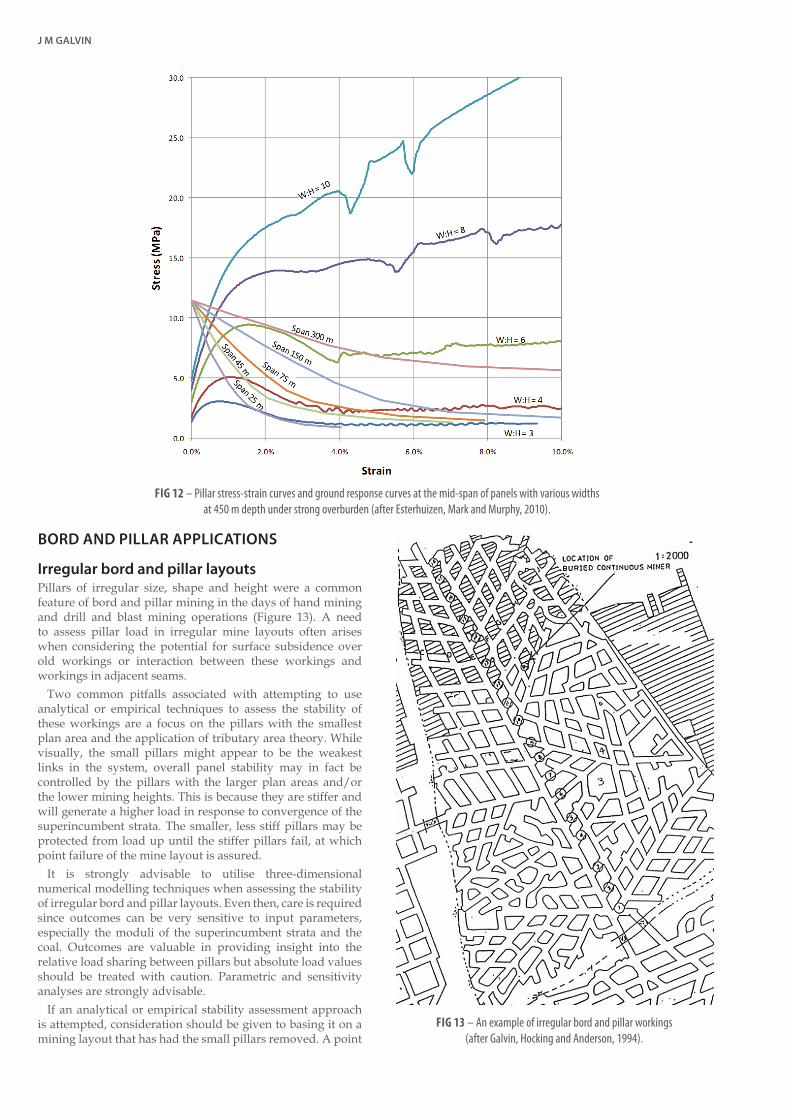
J M GALVIN
BORD AND PILLAR APPLICATIONS
Irregular bord and pillar layoutsPillars of irregular size, shape and height were a common feature of bord and pillar mining in the days of hand mining and drill and blast mining operations (Figure 13). A need to assess pillar load in irregular mine layouts often arises when considering the potential for surface subsidence over old workings or interaction between these workings and workings in adjacent seams.
Two common pitfalls associated with attempting to use analytical or empirical techniques to assess the stability of these workings are a focus on the pillars with the smallest plan area and the application of tributary area theory. While visually, the small pillars might appear to be the weakest links in the system, overall panel stability may in fact be controlled by the pillars with the larger plan areas and/or the lower mining heights. This is because they are stiffer and will generate a higher load in response to convergence of the superincumbent strata. The smaller, less stiff pillars may be protected from load up until the stiffer pillars fail, at which point failure of the mine layout is assured.
It is strongly advisable to utilise three-dimensional numerical modelling techniques when assessing the stability of irregular bord and pillar layouts. Even then, care is required since outcomes can be very sensitive to input parameters, especially the moduli of the superincumbent strata and the coal. Outcomes are valuable in providing insight into the relative load sharing between pillars but absolute load values should be treated with caution. Parametric and sensitivity analyses are strongly advisable.
If an analytical or empirical stability assessment approach is attempted, consideration should be given to basing it on a mining layout that has had the small pillars removed. A point
FIG 12 – Pillar stress-strain curves and ground response curves at the mid-span of panels with various widths at 450 m depth under strong overburden (after Esterhuizen, Mark and Murphy, 2010).
FIG 13 – An example of irregular bord and pillar workings (after Galvin, Hocking and Anderson, 1994).

THE SIGNIFICANCE OF SUPERINCUMBENT STRATA STIFFNESS AND ITS IMPACTS ON COALMINE DESIGN
which cannot be over-emphasised is that safety factor is not a valid criteria for assessing load transfer between pillars.
Sudden pillar collapseIn order for rock to deform, external energy has to be put into the system. Up to the point of maximum resistance to deformation, part of this energy is used to create fractures whilst most of the remainder is stored in the system in the form of strain energy. After peak strength is exceeded, resistance to deformation decreases and the stored strain energy is available to drive further deformation of the rock structure and to create additional fractures. If this energy is insufficient to cause further deformation and fracturing, then the system will stabilise.
If, however, the stored energy exceeds the energy required to drive further deformation and fracturing, the deformation process will become unstable and the rock structure will rupture violently. In order to assess the mode of structural failure of a rock structure, the energy required for rock deformation and fracturing and the energy stored in the system both need to be known. The energy stored in the system during loading to the point of maximum resistance to deformation depends on the stiffness of the system. The softer the system, the greater the amount of energy stored within it and, consequently, the greater the amount of energy available to drive post-peak strength deformation of the rock structure. The principles involved are analogous to testing a rock sample in a compression testing machine (see for example, Salamon and Oravecz (1976) and Brady and Brown (2006)).
Once the maximum strength of a coal pillar is exceeded, deformation can proceed in one of two manners. It may be gradual and be characterised by ample warning signs, such as rib or sidewall spall over an extended time period, in which case it is referred to as ‘controlled’. This deformation mode is sometimes described as a ‘creep’ or ‘squeeze’ and can often be arrested by reinforcing the pillars. On the other hand, failure may develop rapidly and violently, and not be preceded by any warning signs of pillar deterioration. Once initiated, it cannot be arrested and, therefore, is referred to as ‘uncontrolled’.
The manner of post-peak deformation is determined by the post-peak stiffness of the pillar system relative to the stiffness of the superincumbent strata (Figure 14). While ever the stiffness of the superincumbent strata is greater that the post-peak stiffness of the pillar system, further energy has to be put into the system to drive convergence of the superincumbent strata. However, the moment the two stiffnesses are matched (at point Q), the stored energy in the superincumbent strata can be released as kinetic energy and displacement of the pillar system will be overwhelmed by displacement of the superincumbent strata.
Since the stiffness of the superincumbent strata is a function of its modulus, thickness and span, and the post-peak stiffness of a coal pillar is a function of its width-to-height ratio, it follows that basic design controls against the onset of a sudden, uncontrolled failure of the mining system are:
• most fundamentally, panels pillars of sufficient size toavoid working load exceeding maximum load capacity
• panel pillars of sufficient width-to-height ratio to resultin their post failure stiffness being adequate to controlthe rate of roof convergence if their peak resistance todeformation is exceeded
• interpanel pillars to restrict panel span so that the residualstiffness of the overburden strata is sufficient to controlthe rate of roof convergence.
Sudden instability of stiff massive superincumbent strataDespite the fact that theoretical principles point to there being less likelihood of uncontrolled pillar failure when the overburden is stiff, some of the worst mining disasters have been associated with pillar collapse in these circumstances. Three reasons primarily account for these outcomes. Firstly, the stiffer the overburden, the larger the area that has to be extracted before the panel pillars experience deadweight loading, and so the greater the area of mine workings exposed to the consequences of collapse. Secondly, when the effective modulus of the overburden is high, the rate of increase in roof convergence with increase in mining panel span is decreased, thereby masking signs of impending collapse and/or causing them to be present in old workings that may not be accessible or regularly inspected. Thirdly, the larger the area mined, the higher the likelihood that mining will intersect a fault or dyke, thereby causing a step reduction in overburden stiffness as the bridging beam (plate) is turned into a cantilever.
A particular point to note is that at smaller mining spans, stiff superincumbent strata protects pillars from overburden load, thereby providing excellent pillar conditions and suggesting higher coal strength than normal. There is a legacy of this encouraging either overmining or under-designed pillars. Both approaches result in unsafe mining situations when panel dimensions increase. In theory, if panel width is strictly controlled and substantial interpanel pillars are left, stiff superincumbent strata can form the basis for increased extraction, possibly utilising yielding coal pillars. In practice, however, the use of yielding pillars in these types of circumstances is fraught with risk because the design of yielding pillar layouts is a very complex issue that requires detailed information of panel layout and stiffness and pillar post-failure characteristics and the consequences of getting it wrong can be extremely high (including multiple loss of life).
FIG 14 – Loading lines and stress-strain curves associated with controlled and uncontrolled rock failure (adapted from Salamon and Oravecz, 1976).
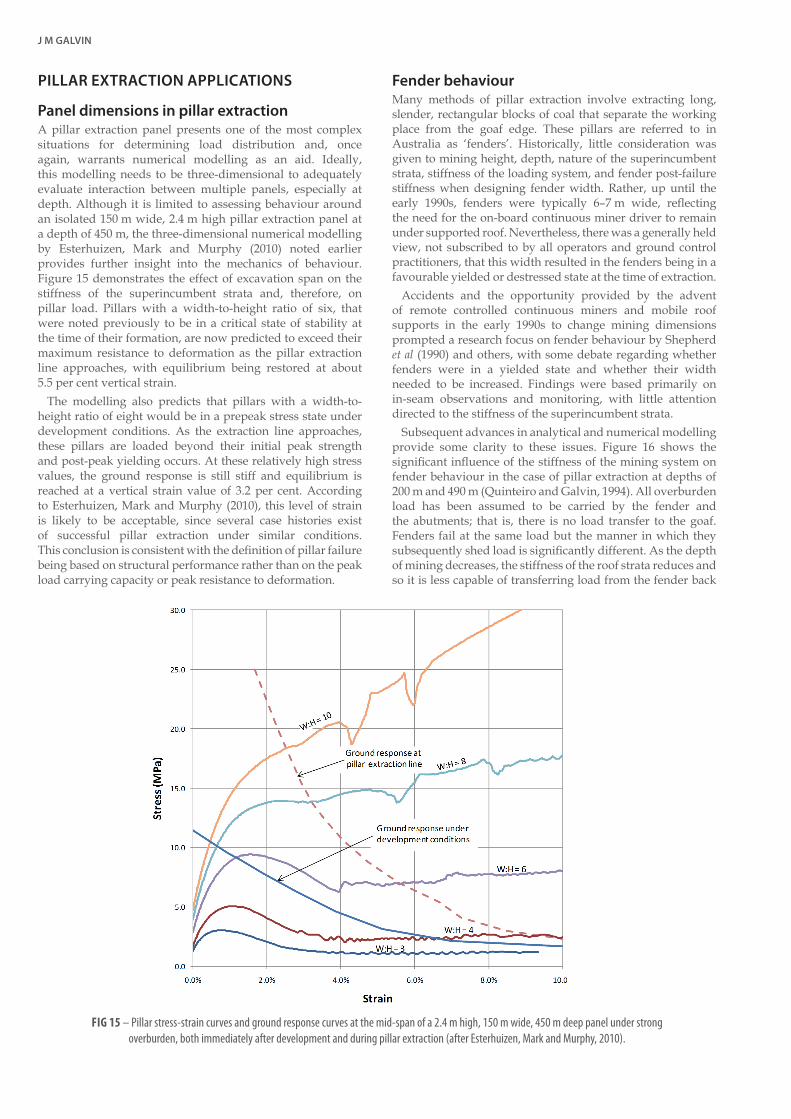
J M GALVIN
PILLAR EXTRACTION APPLICATIONS
Panel dimensions in pillar extractionA pillar extraction panel presents one of the most complex situations for determining load distribution and, once again, warrants numerical modelling as an aid. Ideally, this modelling needs to be three-dimensional to adequately evaluate interaction between multiple panels, especially at depth. Although it is limited to assessing behaviour around an isolated 150 m wide, 2.4 m high pillar extraction panel at a depth of 450 m, the three-dimensional numerical modelling by Esterhuizen, Mark and Murphy (2010) noted earlier provides further insight into the mechanics of behaviour. Figure 15 demonstrates the effect of excavation span on the stiffness of the superincumbent strata and, therefore, on pillar load. Pillars with a width-to-height ratio of six, that were noted previously to be in a critical state of stability at the time of their formation, are now predicted to exceed their maximum resistance to deformation as the pillar extraction line approaches, with equilibrium being restored at about 5.5 per cent vertical strain.
The modelling also predicts that pillars with a width-to-height ratio of eight would be in a prepeak stress state under development conditions. As the extraction line approaches, these pillars are loaded beyond their initial peak strength and post-peak yielding occurs. At these relatively high stress values, the ground response is still stiff and equilibrium is reached at a vertical strain value of 3.2 per cent. According to Esterhuizen, Mark and Murphy (2010), this level of strain is likely to be acceptable, since several case histories exist of successful pillar extraction under similar conditions. This conclusion is consistent with the definition of pillar failure being based on structural performance rather than on the peak load carrying capacity or peak resistance to deformation.
Fender behaviourMany methods of pillar extraction involve extracting long, slender, rectangular blocks of coal that separate the working place from the goaf edge. These pillars are referred to in Australia as ‘fenders’. Historically, little consideration was given to mining height, depth, nature of the superincumbent strata, stiffness of the loading system, and fender post-failure stiffness when designing fender width. Rather, up until the early 1990s, fenders were typically 6–7 m wide, reflecting the need for the on-board continuous miner driver to remain under supported roof. Nevertheless, there was a generally held view, not subscribed to by all operators and ground control practitioners, that this width resulted in the fenders being in a favourable yielded or destressed state at the time of extraction.
Accidents and the opportunity provided by the advent of remote controlled continuous miners and mobile roof supports in the early 1990s to change mining dimensions prompted a research focus on fender behaviour by Shepherd et al (1990) and others, with some debate regarding whether fenders were in a yielded state and whether their width needed to be increased. Findings were based primarily on in-seam observations and monitoring, with little attention directed to the stiffness of the superincumbent strata.
Subsequent advances in analytical and numerical modelling provide some clarity to these issues. Figure 16 shows the significant influence of the stiffness of the mining system on fender behaviour in the case of pillar extraction at depths of 200 m and 490 m (Quinteiro and Galvin, 1994). All overburden load has been assumed to be carried by the fender and the abutments; that is, there is no load transfer to the goaf. Fenders fail at the same load but the manner in which they subsequently shed load is significantly different. As the depth of mining decreases, the stiffness of the roof strata reduces and so it is less capable of transferring load from the fender back
FIG 15 – Pillar stress-strain curves and ground response curves at the mid-span of a 2.4 m high, 150 m wide, 450 m deep panel under strong overburden, both immediately after development and during pillar extraction (after Esterhuizen, Mark and Murphy, 2010).

THE SIGNIFICANCE OF SUPERINCUMBENT STRATA STIFFNESS AND ITS IMPACTS ON COALMINE DESIGN
onto the panel pillars. In this softer system, the roof ‘chases’ the fender as it deforms, causing it to yield more rapidly. The model shows that at a depth of around 200 m, fenders less than 7 m in width yield almost immediately upon drivage.
LONGWALL APPLICATIONS
Yield pillarsThe concept of a yielding coal pillar is based on the controlled deformation of a coal pillar once its peak resistance to deformation has been exceeded. It relies on utilising the post failure strength of a yielded pillar to provide local ground support, whilst transferring (shedding) the majority of the pillar load to adjacent, stiffer, non-yielding pillars. The terminology is sometimes confused, with yield pillars also referred to as ‘crush’ pillars. Furthermore, many so called yield pillars are, in fact, stable load-bearing pillars of very low height with quite benign roof strata conditions (Hebblewhite and Galvin, 1996). It is important to appreciate the distinction since the penalty for inappropriate design can be severe in the form of sudden and unpredictable collapse.
As the depth of mining increases, strength considerations result in an increase in chain pillar width-to-height ratio. This has implications for both the pillar width required to provide an adequate buffer from abutment stress and for the propensity for pressure bursts within the chain pillars. A situation is reached where, irrespective of the width of the pillar, induced stress levels at the pillar ribsides result in deformations sufficient to threaten safety and the serviceability of the gate roads. Longwall mining on the advance is uneconomic for mitigating these impacts. Hence, the concept of yielding coal pillars has found application to the design of chain pillars in deep longwall retreat operations in an attempt to ameliorate pressure bursts, severe rib spall and pillar punching of the roof and floor strata. It is also associated with initiatives to minimise coal sterilisation; to provide optimum geometries
for place changing in three heading developments and to reduce undulations in surface subsidence profiles, although many of these do not constitute yielding pillar layouts in a true engineering sense. A feature of most successful yield pillar and crush pillar outcomes to date has been the presence of massive, competent immediate roof strata.
Predriven roadwaysA range of circumstances give rise to longwall panels sometimes mining into and through predriven roadways. The stiffness of the superincumbent strata is an important consideration in many of these situations. Minney (1999) reported on the successful extraction of a dyke trending subparallel (~8°) to two longwall faces in a competent immediate and upper sandstone roof environment at New Denmark Colliery, South Africa. The longwall face width was reduced from 200 m to 120 m to modify the behaviour of the upper roof strata which contained a massive sandstone some 21 m thick. The dyke excavation was supported with fully encapsulated cables and the tailgate was kept 10 m in advance of the maingate so as to hole into the excavation progressively. Success was attributed in part to the presence of massive sandstone roof.
Figure 17 illustrates the stable ground conditions when longwall mining through bord and pillar workings at New Denmark Colliery (Galvin, Anderson and Stothard, 1991). The minimal support of the immediate roof of the headings and the upcoming longwall recovery roadway is noteworthy and reflects the stiff, displacement controlled, loading environment achieved by restricting the panel width-to-depth ratio, Wp /H, to 0.4 under competent sandstone roof. The successful utilisation of only 9 m wide chain pillars between longwall panels at the same mine (Galvin, 1997; Minney and Karparov, 1999), is attributable in part to the loading system being relatively stiff.
FIG 16 – The influence of surrounding strata stiffness on the behaviour of goaf edge fenders (after Quinteiro and Galvin, 1994).
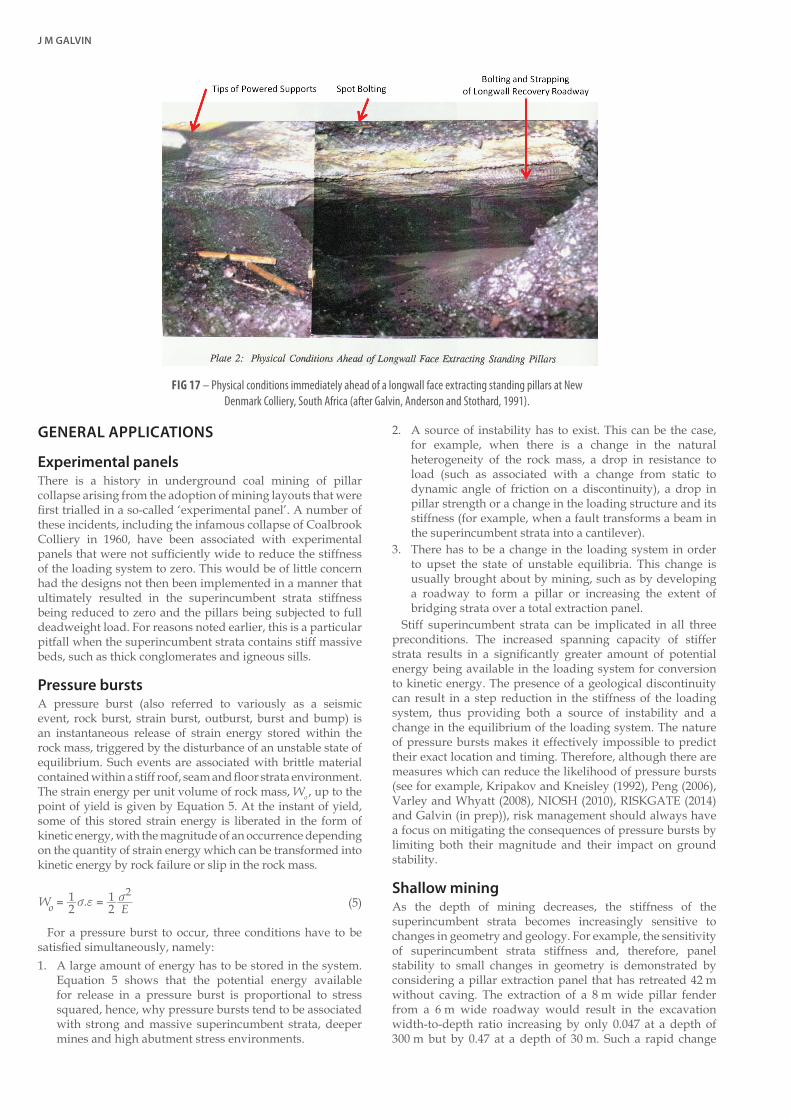
J M GALVIN
GENERAL APPLICATIONS
Experimental panelsThere is a history in underground coal mining of pillar collapse arising from the adoption of mining layouts that were fi rst trialled in a so-called ‘experimental panel’. A number of these incidents, including the infamous collapse of Coalbrook Colliery in 1960, have been associated with experimental panels that were not suffi ciently wide to reduce the stiffness of the loading system to zero. This would be of little concern had the designs not then been implemented in a manner that ultimately resulted in the superincumbent strata stiffness being reduced to zero and the pillars being subjected to full deadweight load. For reasons noted earlier, this is a particular pitfall when the superincumbent strata contains stiff massive beds, such as thick conglomerates and igneous sills.
Pressure burstsA pressure burst (also referred to variously as a seismic event, rock burst, strain burst, outburst, burst and bump) is an instantaneous release of strain energy stored within the rock mass, triggered by the disturbance of an unstable state of equilibrium. Such events are associated with brittle material contained within a stiff roof, seam and fl oor strata environment. The strain energy per unit volume of rock mass, Wo , up to the point of yield is given by Equation 5. At the instant of yield, some of this stored strain energy is liberated in the form of kinetic energy, with the magnitude of an occurrence depending on the quantity of strain energy which can be transformed into kinetic energy by rock failure or slip in the rock mass.
21
21W . E
2o = =v f v (5)
For a pressure burst to occur, three conditions have to be satisfi ed simultaneously, namely:1. A large amount of energy has to be stored in the system.
Equation 5 shows that the potential energy availablefor release in a pressure burst is proportional to stresssquared, hence, why pressure bursts tend to be associatedwith strong and massive superincumbent strata, deepermines and high abutment stress environments.
2. A source of instability has to exist. This can be the case,for example, when there is a change in the naturalheterogeneity of the rock mass, a drop in resistance toload (such as associated with a change from static todynamic angle of friction on a discontinuity), a drop inpillar strength or a change in the loading structure and itsstiffness (for example, when a fault transforms a beam inthe superincumbent strata into a cantilever).
3. There has to be a change in the loading system in orderto upset the state of unstable equilibria. This change isusually brought about by mining, such as by developinga roadway to form a pillar or increasing the extent ofbridging strata over a total extraction panel.
Stiff superincumbent strata can be implicated in all three preconditions. The increased spanning capacity of stiffer strata results in a signifi cantly greater amount of potential energy being available in the loading system for conversion to kinetic energy. The presence of a geological discontinuity can result in a step reduction in the stiffness of the loading system, thus providing both a source of instability and a change in the equilibrium of the loading system. The nature of pressure bursts makes it effectively impossible to predict their exact location and timing. Therefore, although there are measures which can reduce the likelihood of pressure bursts (see for example, Kripakov and Kneisley (1992), Peng (2006), Varley and Whyatt (2008), NIOSH (2010), RISKGATE (2014) and Galvin (in prep)), risk management should always have a focus on mitigating the consequences of pressure bursts by limiting both their magnitude and their impact on ground stability.
Shallow miningAs the depth of mining decreases, the stiffness of the superincumbent strata becomes increasingly sensitive to changes in geometry and geology. For example, the sensitivity of superincumbent strata stiffness and, therefore, panel stability to small changes in geometry is demonstrated by considering a pillar extraction panel that has retreated 42 m without caving. The extraction of a 8 m wide pillar fender from a 6 m wide roadway would result in the excavation width-to-depth ratio increasing by only 0.047 at a depth of 300 m but by 0.47 at a depth of 30 m. Such a rapid change
FIG 17 – Physical conditions immediately ahead of a longwall face extracting standing pillars at New Denmark Colliery, South Africa (after Galvin, Anderson and Stothard, 1991).

THE SIGNIFICANCE OF SUPERINCUMBENT STRATA STIFFNESS AND ITS IMPACTS ON COALMINE DESIGN
in excavation width-to-depth ratio translates to a rapid reduction in the stiffness of the superincumbent strata and thus, can have significant implications for ground control at the coalface. One of these is the rapid onset of goafing with an associated elevated risk of windblast.
THE ROLE OF NUMERICAL MODELLINGOn a number of occasions throughout this paper, numerical modelling has been recommended for evaluating the stiffness of a mining system and, hence, regional mine stability. This advice is offered in the same context as that provided by Starfield and Cundall (1988) and endorsed by Brown (2012); that is, numerical modelling is an aid to thought rather than a substitute for thinking. The reality, however, is that numerical modelling provides the only means of evaluating a statically indeterminate situation of the type presented by most mine layouts. Whilst linear regression and logistic regression analyses feature in a number of underground coal mining design approaches, these approaches are not always commensurate with the risk to be managed. In some cases, they might be viewed as an abdication of responsibility for undertaking sound engineering analysis to properly understand the mechanics of the behaviour that has to be managed safely and efficiently. Care is required not to misconstrue confidence levels associated with these approaches with a rigorous probabilistic approach to risk analysis.
Salamon (1989) reported that he came to the conclusion in the late 1950s that numerical modelling is essential in strata control because the number of variables is so great that it is entirely impractical to explore experimentally their full range of influences. At the same time, no mathematical model is sufficiently general or complete to incorporate all physical aspects of the rock mass, its behaviour and the geometry, support etc of the mine. Thus, field experiments are vital in the evaluation of the efficacy of the models. Salamon’s PhD thesis, submitted in 1962, appears to have contained the first proposal for numerical analyses on the basis of mathematical models, with Salamon lamenting in 1989 that it was frustrating to watch the reluctance on the part of operators and even specialists to accept and pursue modelling opportunities (Salamon, 1989). Unfortunately, this reluctance persists in some quarters.
The advent of computing technology has resulted in numerical analysis becoming a powerful and valuable tool in ground engineering. Elements of geotechnical systems that could only be evaluated previously as discrete units can now be analysed in the context of a composite and interactive system and outcomes can be subjected to a range of parametric, sensitivity and probabilistic analysis. Complex geological and/or geometric conditions can be simulated although, depending on model scale, it can be difficult to represent geological structures adequately. Numerical models enable the state of stress and strain to be evaluated at virtually any point in the rock mass and give insight into the mechanics of deformation. The more advanced models offer the benefit of being able to evaluate the effect of coupled fluid flow on rock mass behaviour.
These capabilities are all relevant to developing a sound understanding of mine stability and are not to be found in any alternative approach. They are particularly pertinent to evaluating the stiffnesses of pillar support systems and the surrounding strata and the interaction between these systems as a basis for safe and efficient mine design. For these reasons, it is these types of consideration that make it strongly advisable from a risk management perspective for design to
be based on a mechanistic approach supported by numerical modelling rather than only on a purely empirical approach.
CONCLUSIONSSafe and efficient mine design and mining methods require knowledge and understanding of the strength of rock structures and the working loads to which they are subjected. The determination of the working loads is a function of the stiffness of both the support system and the surrounding strata and, in most instances, is statically indeterminate. Analytical and empirical techniques are limited in their capacity to properly evaluate working load other than in situations where it is valid to apply tributary area load theory. Sensible numerical modelling calibrated to profiles of vertical surface displacement and informed by stress measurements and microseismic monitoring offers great scope for understanding and quantifying loading environments in underground coal mining.
REFERENCESBrady, B H G and Brown, E T, 2006. Rock Mechanics for Underground
Mining, third edition (Cordrecht: Springer).
Brown, E T, 2012. Progress and challenges in some areas of deep mining. Mining Technology, 121(4):177–191.
Colwell, M G, 1998. Chain pillar design – calibration of ALPS, ACARP report C6036.
Esterhuizen, G S, Mark, C and Murphy, M M, 2010. The ground response curve, pillar loading and pillar failure in coal mines, in Proceedings 29th International Conference on Ground Control in Mining, pp 19–27 (West Virginia University: Morgantown).
Galvin, J M, 1997. Task report: pillar design, volume I, International Committee for Coal Research and the Australian Coal Association Research Mission to South Africa.
Galvin, J M, in prep. Ground Engineering in Underground Coal Mining: Principles and Practices (Cordrecht: Springer).
Galvin, J M, Anderson, I and Stothard, R, 1991. Report of study tour investigation into pillar extraction at shallow cover, South Africa and United States of America, NSW Coal Association.
Galvin, J M, Hocking, G and Anderson, I, 1994. Pillar and roadway mechanics – stage 1 – introductory principles and practice, Department of Mining Engineering, University of New South Wales.
Galvin, J M, Steijn, J J and Wagner, H, 1982. Rock mechanics of total extraction, in Increased Underground Extraction of Coal (eds: C J Fauconnier and R W O Kirsten), Monograph Series 4, pp 69–110 (The South African Institute of Mining and Metallurgy: Johannesburg).
Hardman, D R, 1971. Longwall mining under dolerite: Sigma Colliery, panel no 4, Chamber of Mines of South Africa Research Organisation, research report no 9/71.
Hatherly, P and Luo, X, 1999. Microseismic monitoring – implications for longwall geomechanics and its role as an operational tool, in Proceedings Second International Underground Coal Conference, pp 65–73 (ACIRL and University of New South Wales: Sydney).
Hatherly, P J, Luo, X, Dixon, R, McKavanagh, B, Barry, M, Jecny, Z and Bugden, C, 1995. Roof and goaf monitoring for strata control in longwall mining, ACARP report no C3067.
Hebblewhite, B K and Galvin, J M, 1996. Issues affecting longwall chain pillar design, in Proceedings Symposium on Geology in Longwall Mining, pp 193–197 (Coalfield Geology Council of New South Wales).
Kelly, M and Gale, W, 1999. Ground behaviour about longwall faces and its effect on mining, ACARP report C5017.
J M GALVIN
Kelly, M, Gale, W, Luo, X, Hatherly, P, Balusu, R and Smith, G L, 1998. Longwall caving process in different geological environments – better understanding through combination of modern assessment methods, in Proceedings International Conferenceon Geomechanics/Ground Control in Mining and UndergroundConstruction, pp 573–589 (University of Wollongong Press: Wollongong).
King, H J and Whittaker, B N, 1971. A review of current knowledge on roadway behaviour, in Proceedings Symposium on Roadway Strata Control, pp 73–90 (Institution of Mining Engineers: London).
Kripakov, N P and Kneisley, R O, 1992. Pillar design in bump-prone deep western US coal mines, in Proceedings 11th International Conference Ground Control in Mining, pp 72–83 (The Australasian Institute of Mining and Metallurgy: Melbourne).
Mark, C, 1992. Analysis of longwall pillar stability (ALPS): an update, in Proceedings Workshop on Coal Pillar Mechanics and Design, pp 238–249 (US Bureau of Mines: Pittsburgh).
Mark, C and Bieniawski, Z T, 1987. A new method for sizing longwall pillars based on field measurements, in Proceedings Sixth International Conference on Ground Control in Mining, pp 151–171 (West Virginia University: Morgantown).
Mills, K W and O’Grady, P, 1998. Impact of longwall width on overburden behaviour, in Proceedings Coal 1998: Coal Operators’ Conference, pp 147–155 (The Australasian Institute of Mining and Metallurgy, Illawarra Branch: Wollongong).
Minney, D, 1999. Amcoal experience of longwalling through dykes, in Proceedings Second International Underground Coal Conference (University of New South Wales: Sydney).
Minney, D and Karparov, K, 1999. South African experience with mined chain pillars and remnant crush pillars, in Proceedings Second International Underground Coal Conference, pp 85–90 (University of New South Wales: Sydney).
Moodie, A and Anderson, J, 2011. Geotechnical considerations for longwall top coal caving at Austar coal mine, in Proceedings Coal 2011: Coal Operators’ Conference, pp 29–39 (The Australasian Institute of Mining and Metallurgy, Illawarra Branch: Wollongong).
National Institute for Occupational Safety and Health (NIOSH), 2010. Research report on the coal pillar recovery under deep cover, 82 p (NIOSH: Pittsburgh).
Peng, S S, 2006. Coal Mine Ground Control, third edition, 60 p (West Virginia University: Morgantown).
Peng, S S and Chiang, H S, 1984. Longwall Mining, first edition (John Wiley & Sons: New York).
Quinteiro, C and Galvin, J M, 1994. Yielding coal pillars /predeveloped longwall recovery roads, Strata Control for Coal Mine Design Newsletter, 4.
RISKGATE, 2014. Coal bumps and bursts [online] (University of Queensland: Brisbane). Available from: <http://www.riskgate.org>.
Salamon, M D G, 1989. Significance of strata control to the safety and efficiency of mining, in Proceedings Eighth International Strata Control Conference, pp 1–9.
Salamon, M D G, 1992. A review of coal pillar mechanics and design, volume 1, School of Mines, University of New South Wales research report no 2/92.
Salamon, M D G and Oravecz, K I, 1976. Rock Mechanics in Coal Mining, 37 p (Chamber of Mines of South Africa: Johannesburg).
Shepherd, J, Chaturvedula, V K, Brown, A G, Frith, R C and Shepherd, L, 1990. Investigation of pillar extraction goaf edge formation for improved safety, NERDDP end of grant report no 948.
Starfield, A M and Cundall, P A, 1988. Towards a methodology for rock mechanics modelling, International Journal of Rock Mechanics and Mining Sciences, 25(3):99–106.
Tulu, I B and Heasley, K A, 2011. Investigating the mechanics of pillar loading through the analysis of in-situ stress measurements, in Proceedings 45th US Rock Mechanics/Geomechanics Symposium (American Rock Mechanics Association: San Francisco).
Tulu, I B, Heasley, K A and Mark, C, 2010. A comparison of the overburden loading in ARMPS and LaModel, in Proceedings 29th International Conference on Ground Control in Mining, pp 28–37 (West Virginia University: Morgantown).
Vandergrift, T and Conover, D, 2010. Assessment of gate road loading under deep western US conditions, in Proceedings Third International Workshop on Coal Pillar Mechanics and Design, pp 38–46 (NIOSH: Morgantown).
Varley, F and Whyatt, J K, 2008. Work practices to manage bump control, in Proceedings 27th International Conference on Ground Control in Mining, pp 29–36 (West Virginia University: Morgantown).
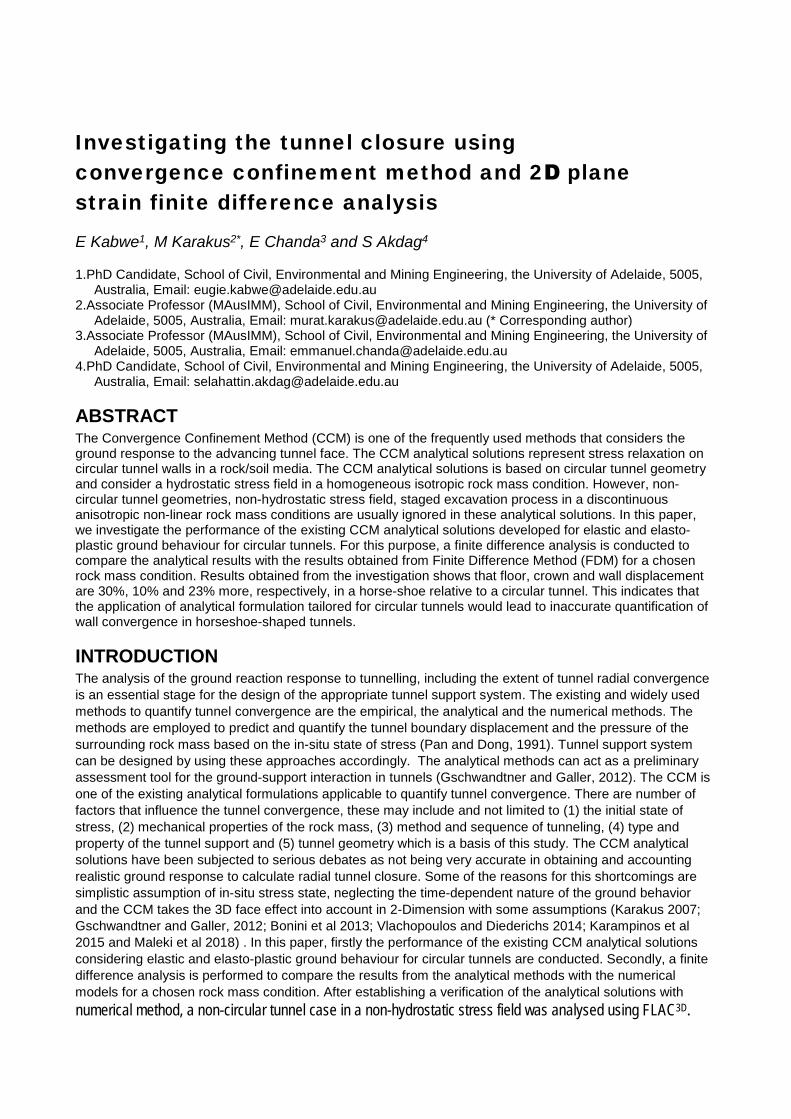
Investigating the tunnel closure using convergence confinement method and 2D plane strain finite difference analysis
E Kabwe1, M Karakus2*, E Chanda3 and S Akdag4
1.PhD Candidate, School of Civil, Environmental and Mining Engineering, the University of Adelaide, 5005,Australia, Email: [email protected]
2.Associate Professor (MAusIMM), School of Civil, Environmental and Mining Engineering, the University ofAdelaide, 5005, Australia, Email: [email protected] (* Corresponding author)
3.Associate Professor (MAusIMM), School of Civil, Environmental and Mining Engineering, the University ofAdelaide, 5005, Australia, Email: [email protected]
4.PhD Candidate, School of Civil, Environmental and Mining Engineering, the University of Adelaide, 5005,Australia, Email: [email protected]
ABSTRACT The Convergence Confinement Method (CCM) is one of the frequently used methods that considers the ground response to the advancing tunnel face. The CCM analytical solutions represent stress relaxation on circular tunnel walls in a rock/soil media. The CCM analytical solutions is based on circular tunnel geometry and consider a hydrostatic stress field in a homogeneous isotropic rock mass condition. However, non-circular tunnel geometries, non-hydrostatic stress field, staged excavation process in a discontinuous anisotropic non-linear rock mass conditions are usually ignored in these analytical solutions. In this paper, we investigate the performance of the existing CCM analytical solutions developed for elastic and elasto-plastic ground behaviour for circular tunnels. For this purpose, a finite difference analysis is conducted to compare the analytical results with the results obtained from Finite Difference Method (FDM) for a chosen rock mass condition. Results obtained from the investigation shows that floor, crown and wall displacement are 30%, 10% and 23% more, respectively, in a horse-shoe relative to a circular tunnel. This indicates that the application of analytical formulation tailored for circular tunnels would lead to inaccurate quantification of wall convergence in horseshoe-shaped tunnels.
INTRODUCTION The analysis of the ground reaction response to tunnelling, including the extent of tunnel radial convergence is an essential stage for the design of the appropriate tunnel support system. The existing and widely used methods to quantify tunnel convergence are the empirical, the analytical and the numerical methods. The methods are employed to predict and quantify the tunnel boundary displacement and the pressure of the surrounding rock mass based on the in-situ state of stress (Pan and Dong, 1991). Tunnel support system can be designed by using these approaches accordingly. The analytical methods can act as a preliminary assessment tool for the ground-support interaction in tunnels (Gschwandtner and Galler, 2012). The CCM is one of the existing analytical formulations applicable to quantify tunnel convergence. There are number of factors that influence the tunnel convergence, these may include and not limited to (1) the initial state of stress, (2) mechanical properties of the rock mass, (3) method and sequence of tunneling, (4) type and property of the tunnel support and (5) tunnel geometry which is a basis of this study. The CCM analytical solutions have been subjected to serious debates as not being very accurate in obtaining and accounting realistic ground response to calculate radial tunnel closure. Some of the reasons for this shortcomings are simplistic assumption of in-situ stress state, neglecting the time-dependent nature of the ground behavior and the CCM takes the 3D face effect into account in 2-Dimension with some assumptions (Karakus 2007; Gschwandtner and Galler, 2012; Bonini et al 2013; Vlachopoulos and Diederichs 2014; Karampinos et al 2015 and Maleki et al 2018) . In this paper, firstly the performance of the existing CCM analytical solutions considering elastic and elasto-plastic ground behaviour for circular tunnels are conducted. Secondly, a finite difference analysis is performed to compare the results from the analytical methods with the numerical models for a chosen rock mass condition. After establishing a verification of the analytical solutions withnumerical method, a non-circular tunnel case in a non-hydrostatic stress field was analysed using FLAC3D.
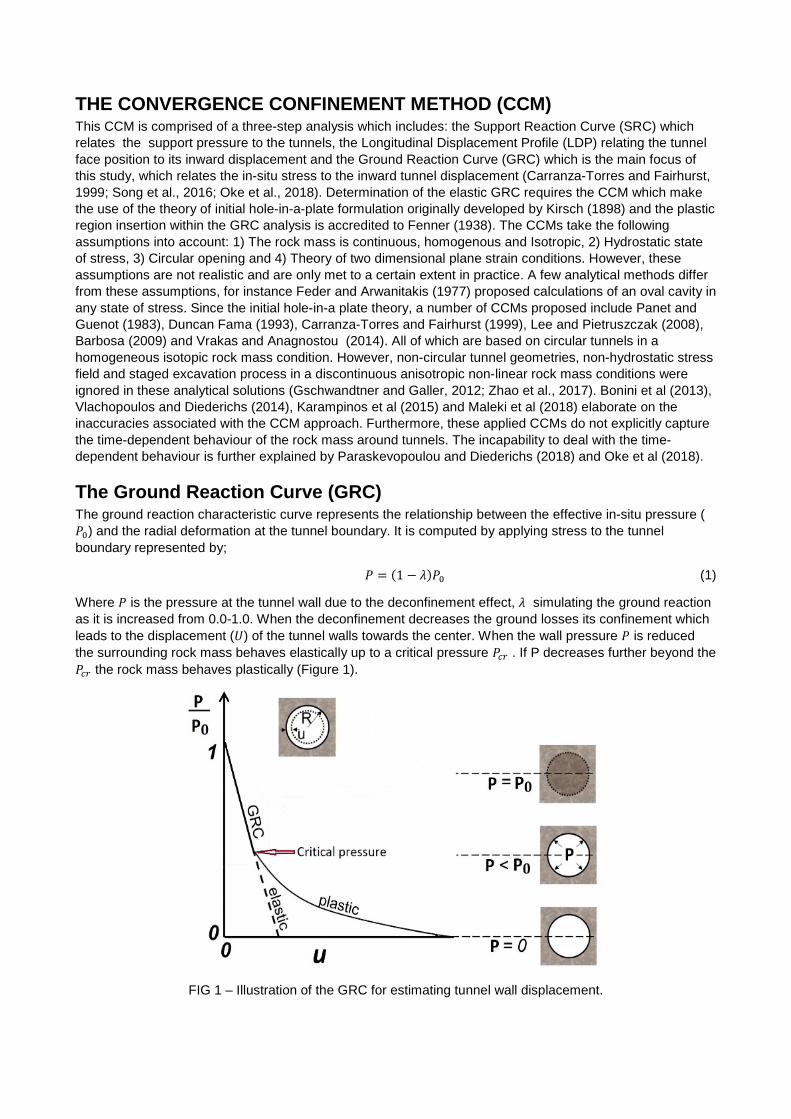
THE CONVERGENCE CONFINEMENT METHOD (CCM) This CCM is comprised of a three-step analysis which includes: the Support Reaction Curve (SRC) which relates the support pressure to the tunnels, the Longitudinal Displacement Profile (LDP) relating the tunnel face position to its inward displacement and the Ground Reaction Curve (GRC) which is the main focus of this study, which relates the in-situ stress to the inward tunnel displacement (Carranza-Torres and Fairhurst, 1999; Song et al., 2016; Oke et al., 2018). Determination of the elastic GRC requires the CCM which make the use of the theory of initial hole-in-a-plate formulation originally developed by Kirsch (1898) and the plastic region insertion within the GRC analysis is accredited to Fenner (1938). The CCMs take the following assumptions into account: 1) The rock mass is continuous, homogenous and Isotropic, 2) Hydrostatic state of stress, 3) Circular opening and 4) Theory of two dimensional plane strain conditions. However, these assumptions are not realistic and are only met to a certain extent in practice. A few analytical methods differ from these assumptions, for instance Feder and Arwanitakis (1977) proposed calculations of an oval cavity in any state of stress. Since the initial hole-in-a plate theory, a number of CCMs proposed include Panet and Guenot (1983), Duncan Fama (1993), Carranza-Torres and Fairhurst (1999), Lee and Pietruszczak (2008), Barbosa (2009) and Vrakas and Anagnostou (2014). All of which are based on circular tunnels in a homogeneous isotopic rock mass condition. However, non-circular tunnel geometries, non-hydrostatic stress field and staged excavation process in a discontinuous anisotropic non-linear rock mass conditions were ignored in these analytical solutions (Gschwandtner and Galler, 2012; Zhao et al., 2017). Bonini et al (2013), Vlachopoulos and Diederichs (2014), Karampinos et al (2015) and Maleki et al (2018) elaborate on the inaccuracies associated with the CCM approach. Furthermore, these applied CCMs do not explicitly capture the time-dependent behaviour of the rock mass around tunnels. The incapability to deal with the time-dependent behaviour is further explained by Paraskevopoulou and Diederichs (2018) and Oke et al (2018).
The Ground Reaction Curve (GRC) The ground reaction characteristic curve represents the relationship between the effective in-situ pressure ( 𝑃𝑃0) and the radial deformation at the tunnel boundary. It is computed by applying stress to the tunnel boundary represented by;
𝑃𝑃 = (1 − 𝜆𝜆)𝑃𝑃0 (1)
Where 𝑃𝑃 is the pressure at the tunnel wall due to the deconfinement effect, 𝜆𝜆 simulating the ground reaction as it is increased from 0.0-1.0. When the deconfinement decreases the ground losses its confinement which leads to the displacement (𝑈𝑈) of the tunnel walls towards the center. When the wall pressure 𝑃𝑃 is reduced the surrounding rock mass behaves elastically up to a critical pressure 𝑃𝑃𝑐𝑐𝑐𝑐 . If P decreases further beyond the 𝑃𝑃𝑐𝑐𝑐𝑐 the rock mass behaves plastically (Figure 1).
FIG 1 – Illustration of the GRC for estimating tunnel wall displacement.
Most researchers have used the 𝑈𝑈 with the maximum 𝑃𝑃 interacting with 𝑃𝑃0, in which the relations proposed are as follows: Duncan Fama (1993) solution considers an elastic-perfectly plastic material and employs the Mohr-Coulomb criterion. In the tunnel behaviour analysis, the tunnel of radius 𝑟𝑟0 is subjected to the 𝑃𝑃0 and the 𝑃𝑃. The surrounding rock mass undergoes plastic behaviour when the 𝑃𝑃 is less than the 𝑃𝑃𝑐𝑐𝑐𝑐 expressed as:
𝑃𝑃𝑐𝑐𝑐𝑐 = 𝑃𝑃0−𝜎𝜎𝑐𝑐𝑐𝑐(1+𝑘𝑘)
(2)
If the 𝑃𝑃 is greater than the 𝑃𝑃𝑐𝑐𝑐𝑐 the rock mass undergoes elastic behaviour and the inward radial elastic displacement 𝑈𝑈𝑒𝑒 of the tunnel wall is given by:
𝑈𝑈𝑒𝑒 = 𝑐𝑐0(1+𝑣𝑣) 𝐸𝐸𝑚𝑚
(𝑃𝑃0 − 𝑃𝑃) (3)
where; 𝑣𝑣 is the Poisson ratio and 𝐸𝐸𝑚𝑚 is the elastic modulus (MPa) and when the 𝑃𝑃 is less than the 𝑃𝑃𝑐𝑐𝑐𝑐 the plastic zone is formed around the tunnel with a radius 𝑟𝑟𝑝𝑝 and the plastic radial displacement 𝑈𝑈𝑝𝑝 is given by:
𝑟𝑟𝑝𝑝 = 𝑟𝑟0 �2(𝑃𝑃0(𝑘𝑘−1)+𝜎𝜎𝑐𝑐𝑐𝑐)
(𝑘𝑘+1)�(𝑘𝑘−1)𝑃𝑃+𝜎𝜎𝑐𝑐𝑐𝑐��
1(𝑘𝑘−1)
(4)
𝑈𝑈𝑝𝑝 = 𝑐𝑐0(1+𝑣𝑣) 𝐸𝐸𝑚𝑚
�2(1 − 𝑣𝑣)(𝑃𝑃0 + 𝑃𝑃𝑐𝑐𝑐𝑐) �𝑐𝑐𝑝𝑝𝑐𝑐0�2− (1 − 2𝑣𝑣)(𝑃𝑃0 − 𝑃𝑃)� (5)
Carranza-Torres and Fairhurst (1999) solution employs the general form of Hoek-Brown failure criterion on a tunnel of radius 𝑟𝑟0 exposed to the uniform far-field 𝑃𝑃0 and the 𝑝𝑝. It is applicable to the elastic-perfectly plastic case and the 𝑝𝑝 and 𝑃𝑃0 can be scaled to give the scaled 𝑃𝑃 and the far field stress 𝑆𝑆0
𝑃𝑃 = 𝑝𝑝𝑖𝑖𝑚𝑚𝑏𝑏𝜎𝜎𝑐𝑐𝑐𝑐
+ 𝑠𝑠𝑚𝑚𝑏𝑏2 (6)
𝑆𝑆0 = 𝑃𝑃0𝑚𝑚𝑏𝑏𝜎𝜎𝑐𝑐𝑐𝑐
+ 𝑠𝑠𝑚𝑚𝑏𝑏2 (7)
where: 𝑠𝑠 ,𝑚𝑚𝑏𝑏 are the rock mass parameters, the scaled critical pressure 𝑃𝑃𝑐𝑐𝑐𝑐 for which the elastic region is achieved and the actual 𝑝𝑝𝑐𝑐𝑐𝑐 are expressed by:
𝑃𝑃𝑖𝑖𝑐𝑐𝑐𝑐 = 116�1 −�1 + 16𝑆𝑆0�
2 (8)
𝑝𝑝𝑖𝑖𝑐𝑐𝑐𝑐 = �𝑃𝑃𝑖𝑖𝑐𝑐𝑐𝑐 −𝑠𝑠𝑚𝑚𝑏𝑏2�𝑚𝑚𝑏𝑏𝜎𝜎𝑐𝑐𝑐𝑐 (9)
Provided that 𝑝𝑝𝑖𝑖 ≥ 𝑝𝑝𝑖𝑖𝑐𝑐𝑐𝑐 the relationship between the radial closure 𝑈𝑈𝑒𝑒 and the 𝑃𝑃 is given by:
𝑈𝑈𝑒𝑒 = 𝑟𝑟01+𝑣𝑣𝐸𝐸𝑚𝑚
𝑃𝑃0 − 𝑃𝑃 (10)
When the 𝑝𝑝 < 𝑝𝑝𝑐𝑐𝑐𝑐 the extent of the plastic region 𝑟𝑟𝑝𝑝 and the inward radial displacement 𝑈𝑈𝑝𝑝 is given by;
𝑟𝑟𝑝𝑝 = 𝑒𝑒𝑒𝑒𝑝𝑝 �2 ��𝑃𝑃𝑐𝑐𝑐𝑐 − √𝑃𝑃�� 𝑟𝑟0 (11)
𝑈𝑈𝑝𝑝 = 𝑟𝑟01+𝑣𝑣𝐸𝐸𝑚𝑚
(𝑃𝑃0 − 𝑝𝑝𝑐𝑐𝑐𝑐) �1−2𝑣𝑣2
√𝑃𝑃𝑐𝑐𝑐𝑐
𝑆𝑆0−𝑃𝑃𝑐𝑐𝑐𝑐+ 1� �𝑐𝑐𝑝𝑝
𝑐𝑐0�2
+ 1−2𝑣𝑣4(𝑆𝑆0−𝑃𝑃𝑐𝑐𝑐𝑐)
�𝑙𝑙𝑙𝑙 �𝑐𝑐𝑝𝑝𝑐𝑐0��2− 1−2𝑣𝑣
2√𝑃𝑃𝑐𝑐𝑐𝑐
𝑆𝑆0−𝑃𝑃𝑐𝑐𝑐𝑐�2𝑙𝑙𝑙𝑙 �𝑐𝑐𝑝𝑝
𝑐𝑐0� + 1� (12)
Vrakas and Anagnostou (2014) is an explicit solution for the ground response that considers a linearly elastic-perfectly plastic behaviour obeying the Mohr-Coulomb yield criterion with a non-associated flow rule. The ground behaviour is elastic if the 𝑃𝑃 ≥ 𝑃𝑃𝑐𝑐𝑐𝑐 and elastoplastic if the 𝑃𝑃 <𝑃𝑃𝑐𝑐𝑐𝑐, the critical pressure at the onset of plastic behavior is given by.
𝑃𝑃𝑐𝑐𝑐𝑐 = 𝜁𝜁+1(1+𝜁𝜁𝜎𝜎𝑐𝑐𝑐𝑐)
𝑃𝑃0 (13)
where: 𝜁𝜁 is the variable that is assumed to be 1 for cylindrical openings, the expression for the elastic tunnel wall displacement is;
𝑈𝑈𝑒𝑒 = 𝑟𝑟0 �1 + 𝜁𝜁𝐸𝐸𝑚𝑚(1+𝑣𝑣)(𝑃𝑃0−𝑃𝑃)
�−1
(14)
The plastic radius 𝑟𝑟𝑝𝑝 is determined by considering the continuity of the radial stress at the elastoplastic boundary and the displacement is expressed by:
𝑟𝑟𝑝𝑝 = 𝑟𝑟0 �𝑃𝑃𝑐𝑐𝑐𝑐𝑃𝑃�� 1𝜁𝜁(𝜎𝜎𝑐𝑐𝑐𝑐−1)� (15)
𝑈𝑈𝑝𝑝 = �1+𝑣𝑣𝜁𝜁
(𝑃𝑃0 − 𝑃𝑃𝑐𝑐𝑐𝑐)� 𝑟𝑟𝑝𝑝 (16)
Lee and Pietruszczak (2008) method considers a strain-softening material that obeys either Mohr-Coulomb or the Generalized Hoek Brown failure criterion with a non-associated flow rule, only when the 𝑃𝑃 is less than the 𝑃𝑃𝑐𝑐𝑐𝑐 is the plastic zone formed. The plastic zone is composed of n concentric annuli, where the ith annulus is bounded by two circles of normalized radii 𝜌𝜌(𝑖𝑖−1) =
𝑐𝑐(𝑖𝑖−1)
𝑅𝑅𝑝𝑝 and 𝜌𝜌(𝑖𝑖) =
𝑐𝑐(𝑖𝑖)
𝑅𝑅𝑝𝑝. As long as the number of
annuli n is huge, the normalized radius is expressed as 𝜌𝜌 = 𝑐𝑐𝑅𝑅𝑝𝑝
and the normalized inner radius as 𝜌𝜌(𝑖𝑖) =𝑐𝑐(𝑖𝑖)
𝑅𝑅𝑝𝑝
the strain components relation to the radial displacement 𝑢𝑢 is expressed by
𝜀𝜀𝜃𝜃 = 𝑢𝑢𝑐𝑐 (17)
The plastic radius 𝑅𝑅𝑃𝑃is calculated from;
𝑈𝑈(𝑖𝑖) =𝑢𝑢(𝑖𝑖)
𝑅𝑅𝑃𝑃(19)
The radial deformation at each location is computed from the normalized radial deformation 𝑈𝑈(𝑖𝑖) using:
𝑢𝑢(𝑖𝑖) = 𝑈𝑈(𝑖𝑖)𝑅𝑅𝑃𝑃 (20)
In this paper, we investigate the performance of the existing CCM analytical solutions developed for elastic and elasto-plastic ground behaviour for circular tunnels. For this purpose, a finite difference analysis is conducted to compare the analytical results with the results obtained from FDM for a chosen rock mass condition.
NUMERICAL ANALYSIS The approach in this paper is demonstrated using a circular and non-circular tunnel excavated in the Upper Banded Shale (UBS) rock formation of the Nchanga underground mine in Zambia at a depth of 700 m with an in situ stress 𝜎𝜎 = 23 MPa. The rocks at the mine are mostly the Archean basement composite of granites, gneisses, schists and the late pre-cambrian Katanga system, which is a sedimentary series containing arenites, siltstones, dolomites, quartzites and limestones (Pearson 1981). Even though the method is demonstrated using hypothetical tunnels, the depth and dimensions are commonly employed at the Nchanga mine. Thus, the approach is applicable to the actual tunnel excavation at the mine. In this section the 2D plane strain FDM tunnel models are built using FLAC3D. The first model is used to analyze and compare the analytical methods with numerical methods in an elasto-plastic constitutive model using different choice of strength criteria. The strength criteria employed in this analysis are the Mohr-Coulomb (MC), the Hoek and Brown (HB), the Drucker Prager (DP) and a Mohr-Coulomb softening and hardening model (SHM) in a hydrostatic stress field. The second model comprises of the elasto-plastic material obeying the Mohr-Coulomb yield criterion to analyse a horseshoe-shaped tunnel in an in-situ state of stress. Rock mass is assumed to behave in elastic and perfectly plastic with no dilation. The models are composed of a circular tunnel in quarter symmetry and a horseshoe tunnel in half symmetry. The x and z boundaries are 12 m from the tunnel axes, the boundary conditions of the models are shown in Figure 2. The two different tunnel geometries are used to analyze the influence of tunnel geometry on wall convergence.
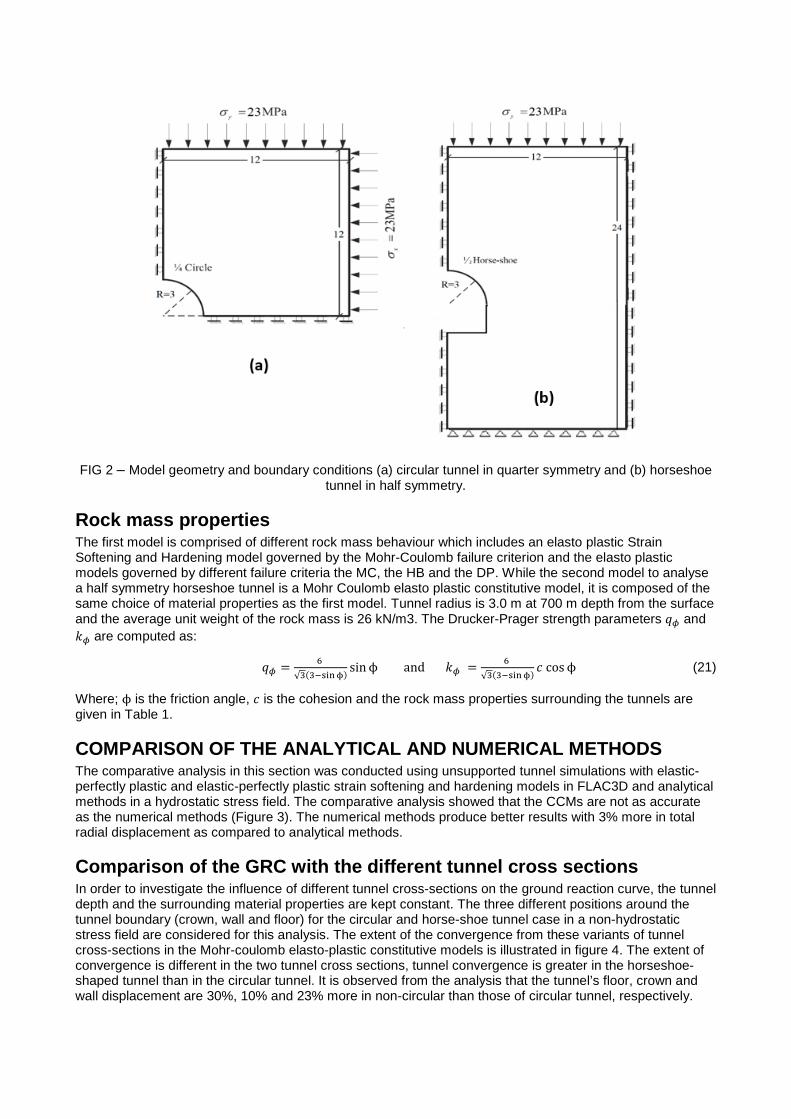
FIG 2 – Model geometry and boundary conditions (a) circular tunnel in quarter symmetry and (b) horseshoe tunnel in half symmetry.
Rock mass properties The first model is comprised of different rock mass behaviour which includes an elasto plastic Strain Softening and Hardening model governed by the Mohr-Coulomb failure criterion and the elasto plastic models governed by different failure criteria the MC, the HB and the DP. While the second model to analyse a half symmetry horseshoe tunnel is a Mohr Coulomb elasto plastic constitutive model, it is composed of the same choice of material properties as the first model. Tunnel radius is 3.0 m at 700 m depth from the surface and the average unit weight of the rock mass is 26 kN/m3. The Drucker-Prager strength parameters 𝑞𝑞𝜙𝜙 and 𝑘𝑘𝜙𝜙 are computed as:
𝑞𝑞𝜙𝜙 = 6 √3(3−sinϕ)
sinϕ and 𝑘𝑘𝜙𝜙 = 6 √3(3−sinϕ)
𝑐𝑐 cosϕ (21)
Where; ϕ is the friction angle, 𝑐𝑐 is the cohesion and the rock mass properties surrounding the tunnels are given in Table 1.
COMPARISON OF THE ANALYTICAL AND NUMERICAL METHODS The comparative analysis in this section was conducted using unsupported tunnel simulations with elastic-perfectly plastic and elastic-perfectly plastic strain softening and hardening models in FLAC3D and analytical methods in a hydrostatic stress field. The comparative analysis showed that the CCMs are not as accurate as the numerical methods (Figure 3). The numerical methods produce better results with 3% more in total radial displacement as compared to analytical methods.
Comparison of the GRC with the different tunnel cross sections In order to investigate the influence of different tunnel cross-sections on the ground reaction curve, the tunnel depth and the surrounding material properties are kept constant. The three different positions around the tunnel boundary (crown, wall and floor) for the circular and horse-shoe tunnel case in a non-hydrostatic stress field are considered for this analysis. The extent of the convergence from these variants of tunnel cross-sections in the Mohr-coulomb elasto-plastic constitutive models is illustrated in figure 4. The extent of convergence is different in the two tunnel cross sections, tunnel convergence is greater in the horseshoe-shaped tunnel than in the circular tunnel. It is observed from the analysis that the tunnel’s floor, crown and wall displacement are 30%, 10% and 23% more in non-circular than those of circular tunnel, respectively.

TABLE 1 The Upper Banded Shale rock formation parameters used for the ground reaction analysis.
Rock Mass Parameters Values
Tensile strength (MPa) 0.05
Young modulus (𝐸𝐸) (MPa) 3193
Poisson ratio (𝜈𝜈) 0.20
Cohesion (c) MPa 1.28
Friction angle (ϕ) degrees 26
Intact uniaxial compressive strength (MPa) 35
GSI 40
mi 8
mb 0.94
s 0.0013
a 0.5
FIG 3 – Ground reaction curves obtained by different methods.
The application of analytical formulation tailored for circular tunnel would lead to inaccurate quantification of wall convergence in horseshoe-shaped tunnel. The results from the above comparative analyses highlight the role of the tunnel cross-section on the extent of tunnel convergence. Furthermore, improvement on the analytical formulations is needed to address their applicability in underground mine’s horseshoe shaped tunnels. This can be accomplished by the inclusion of a cross section function in the existing analytical formulation which accounts for the tunnel’s hydraulic radius.
CONCLUSIONS A comparative analysis of analytical methods and numerical methods was conducted in this study to predict the wall deformations for two different tunnel geometries in an elasto plastic rock mass behaviour governed by the Mohr-Coulomb failure criterion. The two methods were compared based on equivalent boundary conditions, initial conditions and identical material properties. It is observed from the numerical analysis that
0 50 100 150 200 250 300 350
Radial Displacement (mm)
0
5
10
15
20
25
Con
finem
ent P
ress
ure
(MPa
)
GRC-Analytical (Vrakas and Anagnostou, 2014)
GRC-Analytical (Carranz-Torres, 2000)
GRC-Analytical (Lee and Pietruszczak, 2008)
GRC-Analytical (Duncan Fama, 1993)
GRC-Numerical (SHM model)
GRC-Numerical (MC model)
GRC-Numerical (DP model)
GRC-Numerical (HB model)
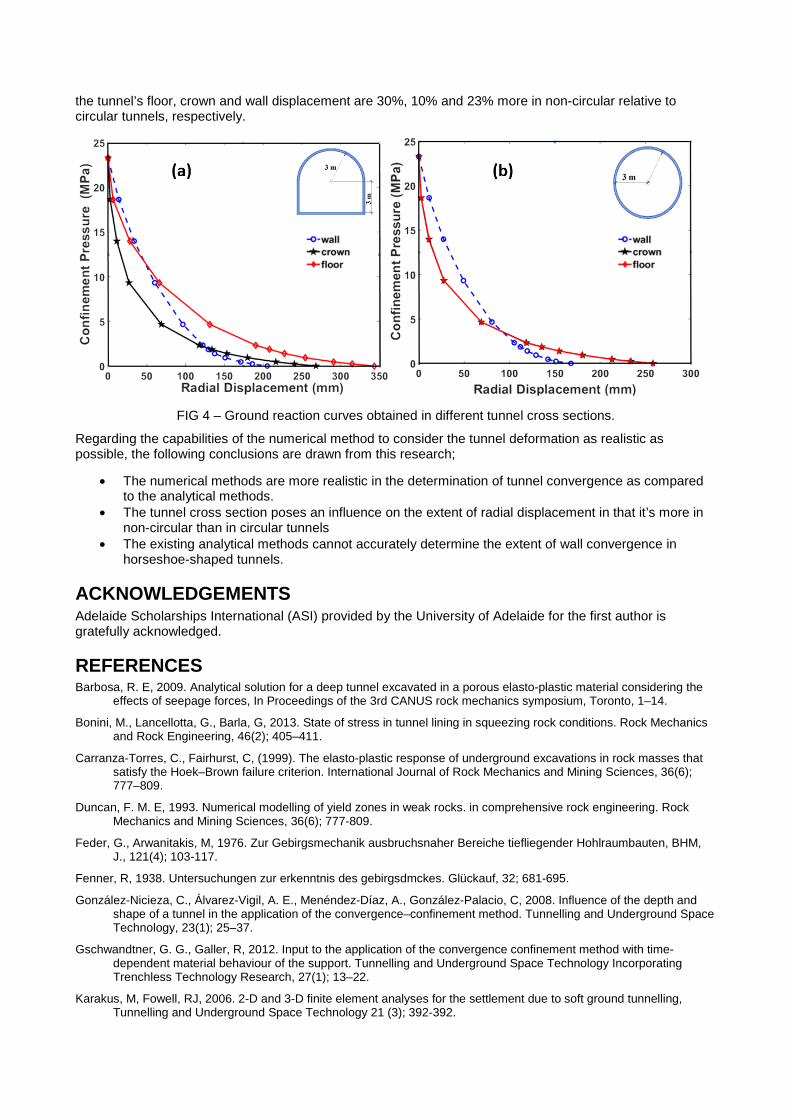
the tunnel’s floor, crown and wall displacement are 30%, 10% and 23% more in non-circular relative to circular tunnels, respectively.
FIG 4 – Ground reaction curves obtained in different tunnel cross sections.
Regarding the capabilities of the numerical method to consider the tunnel deformation as realistic as possible, the following conclusions are drawn from this research;
• The numerical methods are more realistic in the determination of tunnel convergence as comparedto the analytical methods.
• The tunnel cross section poses an influence on the extent of radial displacement in that it’s more innon-circular than in circular tunnels
• The existing analytical methods cannot accurately determine the extent of wall convergence inhorseshoe-shaped tunnels.
ACKNOWLEDGEMENTS Adelaide Scholarships International (ASI) provided by the University of Adelaide for the first author is gratefully acknowledged.
REFERENCES Barbosa, R. E, 2009. Analytical solution for a deep tunnel excavated in a porous elasto-plastic material considering the
effects of seepage forces, In Proceedings of the 3rd CANUS rock mechanics symposium, Toronto, 1–14.
Bonini, M., Lancellotta, G., Barla, G, 2013. State of stress in tunnel lining in squeezing rock conditions. Rock Mechanics and Rock Engineering, 46(2); 405–411.
Carranza-Torres, C., Fairhurst, C, (1999). The elasto-plastic response of underground excavations in rock masses that satisfy the Hoek–Brown failure criterion. International Journal of Rock Mechanics and Mining Sciences, 36(6); 777–809.
Duncan, F. M. E, 1993. Numerical modelling of yield zones in weak rocks. in comprehensive rock engineering. Rock Mechanics and Mining Sciences, 36(6); 777-809.
Feder, G., Arwanitakis, M, 1976. Zur Gebirgsmechanik ausbruchsnaher Bereiche tiefliegender Hohlraumbauten, BHM, J., 121(4); 103-117.
Fenner, R, 1938. Untersuchungen zur erkenntnis des gebirgsdmckes. Glückauf, 32; 681-695.
González-Nicieza, C., Álvarez-Vigil, A. E., Menéndez-Díaz, A., González-Palacio, C, 2008. Influence of the depth and shape of a tunnel in the application of the convergence–confinement method. Tunnelling and Underground Space Technology, 23(1); 25–37.
Gschwandtner, G. G., Galler, R, 2012. Input to the application of the convergence confinement method with time-dependent material behaviour of the support. Tunnelling and Underground Space Technology Incorporating Trenchless Technology Research, 27(1); 13–22.
Karakus, M, Fowell, RJ, 2006. 2-D and 3-D finite element analyses for the settlement due to soft ground tunnelling, Tunnelling and Underground Space Technology 21 (3); 392-392.

Karakus, M, 2007. Appraising the methods accounting for 3D tunnelling effects in 2D plane strain FE analysis. Tunnelling and Underground Space Technology, 22(1); 47-56.
Karakus M, 2012. Numerical modelling for NATM in soft ground, Lambert Academic Publishing
Karampinos, E., Hadjigeorgiou, J., Hazzard, J., Turcotte, P, 2015. Discrete element modelling of the buckling phenomenon in deep hard rock mines. International Journal of Rock Mechanics and Mining Sciences, 80; 346–356.
Kirsch, E. G, 1898. The theory if elasticity and the need of the strength of materials (trans.). Journal of the Association of German Engineers, 42; 797–807.
Lee, Y., & Pietruszczak, S, 2008. A new numerical procedure for elasto-plastic analysis of a circular opening excavated in a strain-softening rock mass, Tunnelling and Underground Space Technology, 23(5); 588-599.
Mason C. F, 1970. The geology of Nchanga. Report, NCCM (Chingola Division). Chingola: Geology Dept.
Oke, J, Vlachopoulos, N, Diederichs, M, 2018. Improvement to the Convergence ‑ Confinement Method : Inclusion of Support Installation Proximity and Stiffness. Rock Mechanics and Rock Engineering, 51(5); 1495-1519.
Pan, Y W, Dong, J J, 1991. Time-dependent tunnel convergence-I. Formulation of the model. International Journal of Rock Mechanics and Mining Sciences And, 28(6); 469–475.
Panet, M, Guenot, A, 1982. Analysis of convergence behind the face of a tunnel: Tunnelling 82, proceedings of the 3rd international symposium, Brighton, UK.
Paraskevopoulou, C., Diederichs, M, 2018. Analysis of time-dependent deformation in tunnels using the Convergence-Confinement Method. Tunnelling and Underground Space Technology, 71; 62–80.
Pearson B N, 1981. The development and control of block caving at the Chingola division of Nchanga consolidated copper mines limited, Zambia. In: Stewart DR. Design and operation of caving and sublevel stoping mines. New York (NY): Society of Mining Engineers, AlME; p. 211–223.
Rasouli Maleki, M, Narimani Dehnavi, R, 2018. Influence of Discontinuities on the Squeezing Intensity in High In Situ Stresses (a Tunnelling Case Study; Actual Evidences and TBM Release Techniques). Rock Mechanics and Rock Engineering, 1–23.
Song, L, Li, H Z, Chan, C L, Low, B K, 2016. Reliability analysis of underground excavation in elastic-strain-softening rock mass.Tunnelling and Underground Space Technology, 60; 66-79.
Stonley DCW,. 1975. A geological manual for the Upper Orebody. Report, NCCM. Chingola.
Vlachopoulos, N, Diederichs, M S, 2014. Appropriate Uses and Practical Limitations of 2D Numerical Analysis of Tunnels and Tunnel Support Response.Geotechnical and Geological Engineering, 32(2); 469-488.
Vrakas, A, Anagnostou, G, 2014. A finite strain closed-form solution for the elastoplastic ground response curve in tunnelling. International journal for numerical and analytical methods in geomechanics, 38(11); 1131-1148.
Zhao, C, Alimardani, A, Barciaga, T, Kämper, C, Mark, P, Schanz, T, 2017. Prediction of tunnel lining forces and deformations using analytical and numerical solutions. Tunnelling and Underground Space Technology Incorporating Trenchless Technology Research, 64; 164–176.

Modelling multi-seam interactions for longwall mining
A Lines1
1.Senior Geotechnical Engineer, Kestrel Mine, Emerald QLD 4720. Email: [email protected]: Kestrel Mine is currently undergoing a sale. I’m unsure the name/email of future company comeAugust.
ABSTRACT This paper addresses a gap in longwall multi-seam interactions and their predictions, providing a case study for future multi-seam operations for both anticipated conditions and a method for understanding the changes in stress regime.
Multiple panels were modelled with the results analysed and compared to panel experiences to validate the parameters and properties. The software chosen (LaModel) is a numerical modelling package designed to model stresses and displacements on thin deposits. It utilises a displacement-discontinuity variation of the boundary-element method and has been used extensively throughout both the United States and Australia in multi-seam operations.
Analysis of the results demonstrates a clear correlation with the above workings and regions of significant strata instability. This provides the opportunity going forward to analyse new models and incorporate into mine planning and geotechnical designs.
Continuous site-based assessment should be undertaken at multi-seam operations to better understand and quantify likely vertical stress levels within the workings. With a detailed analysis of models prior to extraction and a review of models post extraction.
Further research is required as LaModel is limited to vertical stress and it is likely that interactions impact both the horizontal and shear stress regime. 3-dimensional modelling could further assist in this understanding, combined with a thorough stress monitoring regime.
INTRODUCTION Multi-seam mining is an important form of mining that has increased in popularity overseas and is expected to increase in popularity in Australia as more readily available coal is mined. It is considered the future of a large portion of the underground coal mining industry in Australia (Howarth, 2009). Significant complications, however, can arise when mining is influenced by previous workings. A thorough understanding of the stress regime can assist in a productive and cost-effective mining environment.
In multi-seam mining interactions take numerous forms of which can cause disruptions in mining operations. Additional associated risks such as inrush of gases/water and increased localised stresses must be considered. Longwall operations are particularly vulnerable to multi-seam interactions due to the large abutments stresses involved and little flexibility in operations.
Underground mining disrupts the stress equilibrium that was in place prior to the influence of mining. By removing material from the ground the stress is required to be redistributed to another location as it’s prior medium no longer exists. This stress is displaced until a new equilibrium is reached. During traditional single seam mining this process is easily understood and the impacts managed well. In contrast, multi-seam mining contains other aspects that require closer consideration. This includes the interburden/overburden capacity to transmit stress, vertical stress profiles at each seam horizon, and the stress concentrations at the mining face. Due to the nature of multi-seam operations and the complex environment, it is commonly advised to utilise numerical modelling to evaluate displacement and load distributions (Morsy, 2006; Peng, 2008; Zhang, 2005).
The greatest hazard caused by multi-seam interactions is ground instability. The two key forms of interactions include overmining and undermining (Figure 1). Overmining occurs when the lower seam is extracted first, followed by the upper seam. Stress concentrations occur at goaf boundaries and around remnant pillars, full extraction of the lower seams results in subsidence of the overlying beds which can cause further complications. Undermining, the type of interaction at Cook Colliery, occurs when the upper seam is mined first followed by the lower seam. In this situation the stress concentrations occur at goaf

boundaries and remnant pillars. As the lower workings approach the upper workings the vertical stress is channelled through an ever-decreasing opening resulting in higher stress magnitudes (Figure 2).
Cook Colliery are developing and extracting the Argo seam. The mining environment is complicated by interactions with existing Castor seam workings above resulting in highly variable mining conditions (Lawrence, 2010). Mining underneath fully extracted workings may result in pristine conditions, while beneath remnant pillars and partially extracted workings conditions often deteriorate extensively and can become erratic. This erratic behaviour is the cause of potential safety concerns due to strata instability, and often resulted in substantial resource reallocation occurs outside of planned work.
This modelling was intended to address a gap in strata predictions for mining at Cook Colliery and provide a case study for future multi-seam operations for both expected conditions due to seam interactions and a possible method for understanding the changes in the stress regime. The correlation between poor strata conditions and the above workings are evident at Cook Colliery, and a thorough understanding of where these interactions could occur and how best to prepare is required for the success of future panels.
Vertical stress changes were modelled using the numerical modelling package LaModel and these results are compared to previous panels to validate the parameters and properties. This paper is not a guide on how to use LaModel, this is covered extensively by the programs creator Keith Heasley (Heasley, 2001).
FIG 1 – Overmining interaction (Mark, 2007).
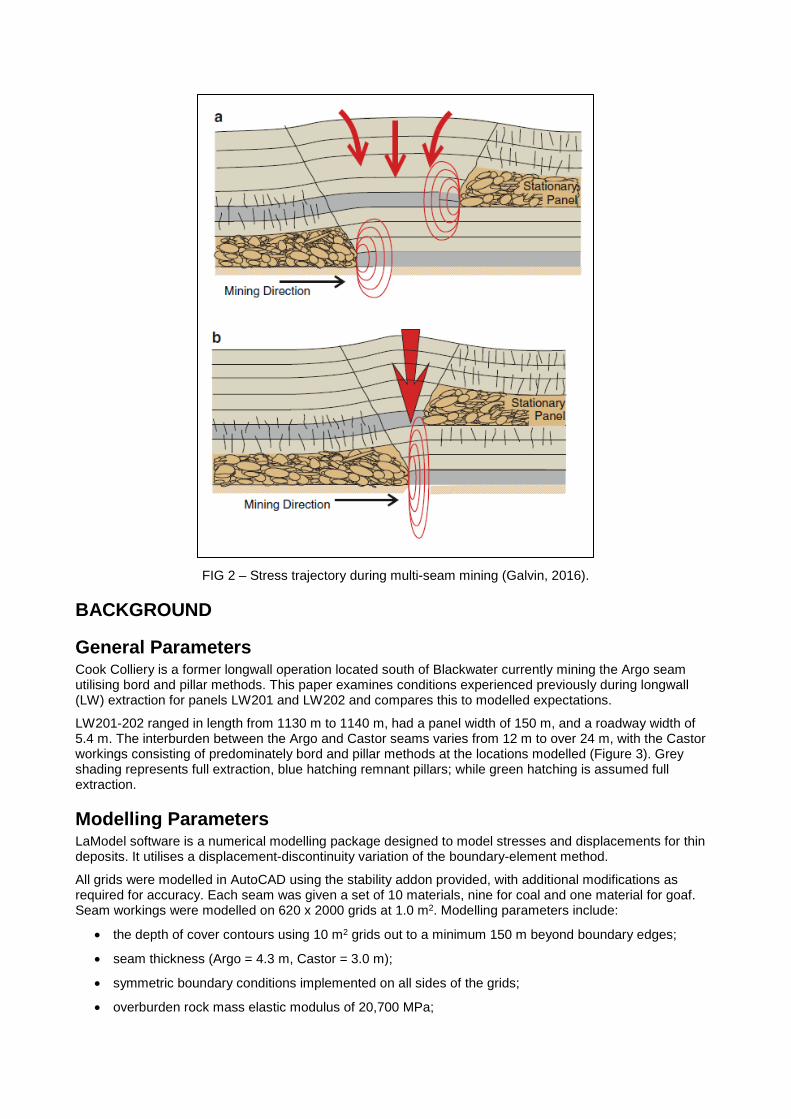
FIG 2 – Stress trajectory during multi-seam mining (Galvin, 2016).
BACKGROUND
General Parameters Cook Colliery is a former longwall operation located south of Blackwater currently mining the Argo seam utilising bord and pillar methods. This paper examines conditions experienced previously during longwall (LW) extraction for panels LW201 and LW202 and compares this to modelled expectations.
LW201-202 ranged in length from 1130 m to 1140 m, had a panel width of 150 m, and a roadway width of 5.4 m. The interburden between the Argo and Castor seams varies from 12 m to over 24 m, with the Castor workings consisting of predominately bord and pillar methods at the locations modelled (Figure 3). Grey shading represents full extraction, blue hatching remnant pillars; while green hatching is assumed full extraction.
Modelling Parameters LaModel software is a numerical modelling package designed to model stresses and displacements for thin deposits. It utilises a displacement-discontinuity variation of the boundary-element method.
All grids were modelled in AutoCAD using the stability addon provided, with additional modifications as required for accuracy. Each seam was given a set of 10 materials, nine for coal and one material for goaf. Seam workings were modelled on 620 x 2000 grids at 1.0 m2. Modelling parameters include:
• the depth of cover contours using 10 m2 grids out to a minimum 150 m beyond boundary edges;
• seam thickness (Argo = 4.3 m, Castor = 3.0 m);
• symmetric boundary conditions implemented on all sides of the grids;
• overburden rock mass elastic modulus of 20,700 MPa;
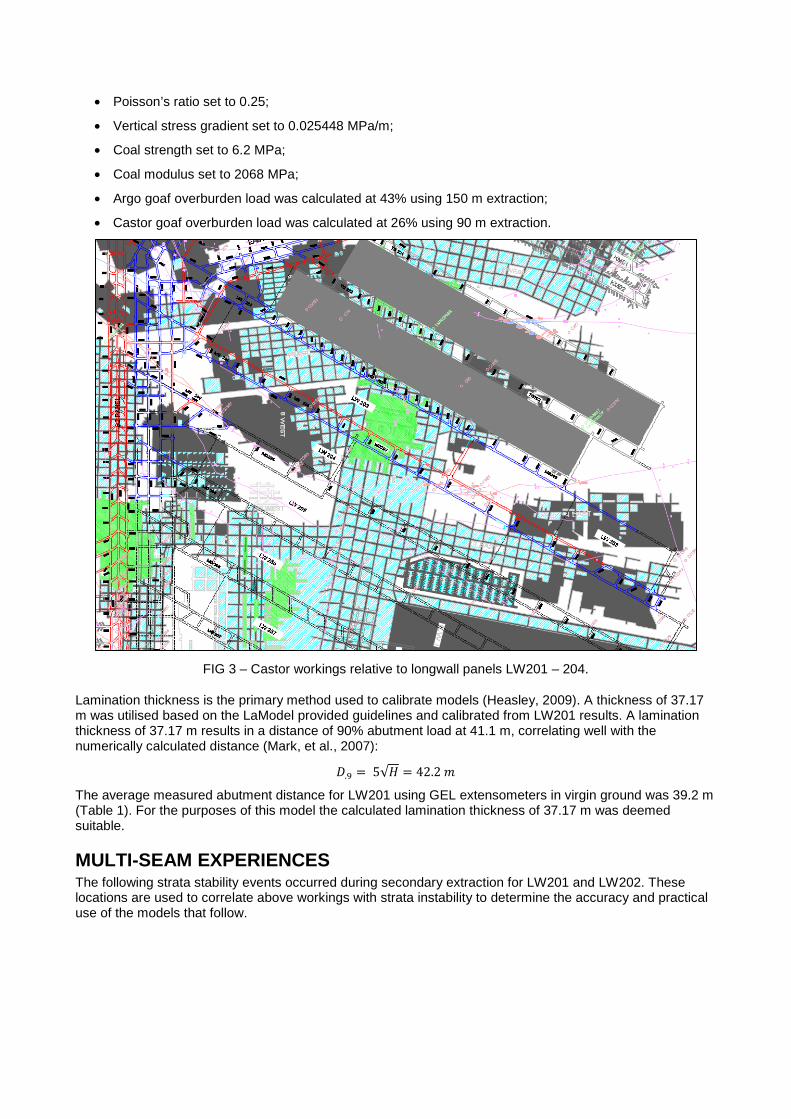
• Poisson’s ratio set to 0.25;
• Vertical stress gradient set to 0.025448 MPa/m;
• Coal strength set to 6.2 MPa;
• Coal modulus set to 2068 MPa;
• Argo goaf overburden load was calculated at 43% using 150 m extraction;
• Castor goaf overburden load was calculated at 26% using 90 m extraction.
FIG 3 – Castor workings relative to longwall panels LW201 – 204.
Lamination thickness is the primary method used to calibrate models (Heasley, 2009). A thickness of 37.17 m was utilised based on the LaModel provided guidelines and calibrated from LW201 results. A lamination thickness of 37.17 m results in a distance of 90% abutment load at 41.1 m, correlating well with the numerically calculated distance (Mark, et al., 2007):
𝐷𝐷.9 = 5√𝐻𝐻 = 42.2 𝑚𝑚
The average measured abutment distance for LW201 using GEL extensometers in virgin ground was 39.2 m (Table 1). For the purposes of this model the calculated lamination thickness of 37.17 m was deemed suitable.
MULTI-SEAM EXPERIENCES The following strata stability events occurred during secondary extraction for LW201 and LW202. These locations are used to correlate above workings with strata instability to determine the accuracy and practical use of the models that follow.
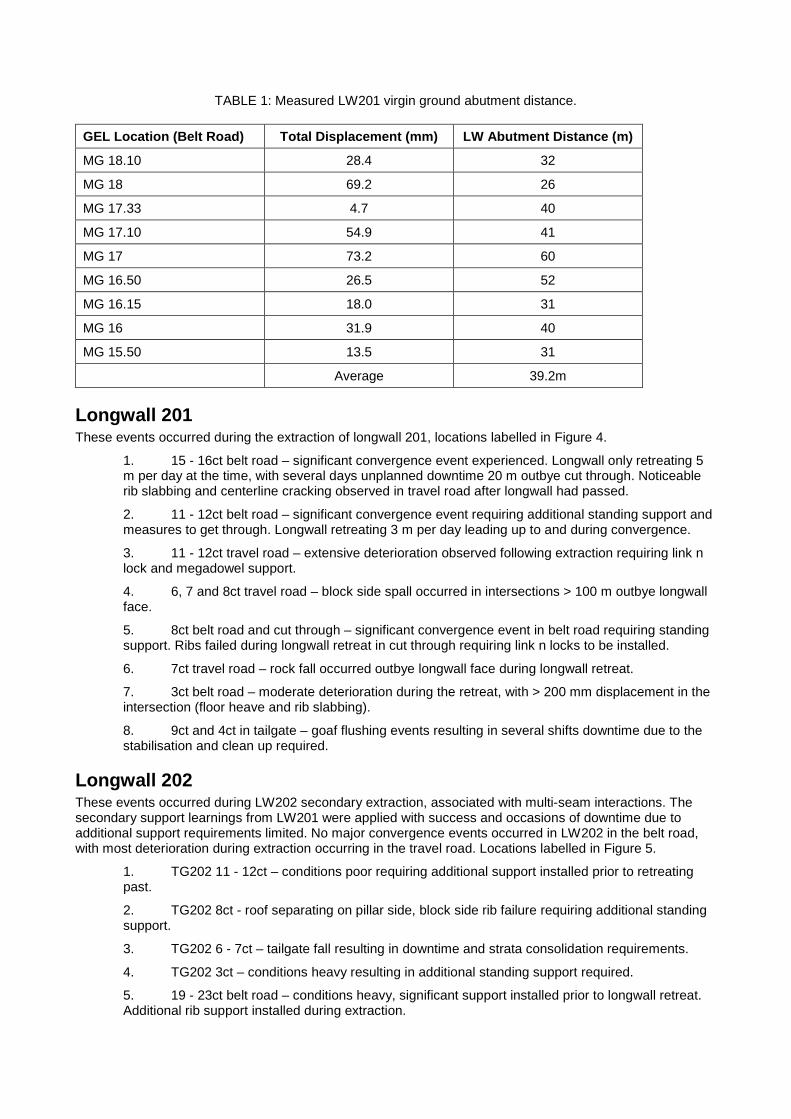
TABLE 1: Measured LW201 virgin ground abutment distance.
GEL Location (Belt Road) Total Displacement (mm) LW Abutment Distance (m)
MG 18.10 28.4 32
MG 18 69.2 26
MG 17.33 4.7 40
MG 17.10 54.9 41
MG 17 73.2 60
MG 16.50 26.5 52
MG 16.15 18.0 31
MG 16 31.9 40
MG 15.50 13.5 31
Average 39.2m
Longwall 201 These events occurred during the extraction of longwall 201, locations labelled in Figure 4.
1. 15 - 16ct belt road – significant convergence event experienced. Longwall only retreating 5m per day at the time, with several days unplanned downtime 20 m outbye cut through. Noticeablerib slabbing and centerline cracking observed in travel road after longwall had passed.
2. 11 - 12ct belt road – significant convergence event requiring additional standing support andmeasures to get through. Longwall retreating 3 m per day leading up to and during convergence.
3. 11 - 12ct travel road – extensive deterioration observed following extraction requiring link nlock and megadowel support.
4. 6, 7 and 8ct travel road – block side spall occurred in intersections > 100 m outbye longwallface.
5. 8ct belt road and cut through – significant convergence event in belt road requiring standingsupport. Ribs failed during longwall retreat in cut through requiring link n locks to be installed.
6. 7ct travel road – rock fall occurred outbye longwall face during longwall retreat.
7. 3ct belt road – moderate deterioration during the retreat, with > 200 mm displacement in theintersection (floor heave and rib slabbing).
8. 9ct and 4ct in tailgate – goaf flushing events resulting in several shifts downtime due to thestabilisation and clean up required.
Longwall 202 These events occurred during LW202 secondary extraction, associated with multi-seam interactions. The secondary support learnings from LW201 were applied with success and occasions of downtime due to additional support requirements limited. No major convergence events occurred in LW202 in the belt road, with most deterioration during extraction occurring in the travel road. Locations labelled in Figure 5.
1. TG202 11 - 12ct – conditions poor requiring additional support installed prior to retreatingpast.
2. TG202 8ct - roof separating on pillar side, block side rib failure requiring additional standingsupport.
3. TG202 6 - 7ct – tailgate fall resulting in downtime and strata consolidation requirements.
4. TG202 3ct – conditions heavy resulting in additional standing support required.
5. 19 - 23ct belt road – conditions heavy, significant support installed prior to longwall retreat.Additional rib support installed during extraction.

6. 19 - 23ct travel road – conditions extensively deteriorated resulting in substantial rib failure,roof delamination and floor heave. Required significant standing support installed post longwallextraction.
7. 15 - 17ct travel road – significant rib failure and floor heave post longwall retreat. Standingsupport required.
8. 11, 12 and 13ct – stoppings failed well outbye longwall face during extraction, requiringreplacement.
9. 11ct – roof deterioration resulting in secondary support to be installed well outbye longwallface.
FIG 4 – LW201 experiences.
FIG 5 – LW202 experiences.
RESULTS Several preliminary outputs were analysed initially as ‘sanity’ checks to ensure accuracy and confirm the model. Once modelled is confirmed the longwall extraction is included to analyse these impacts. All scales are in MPa.
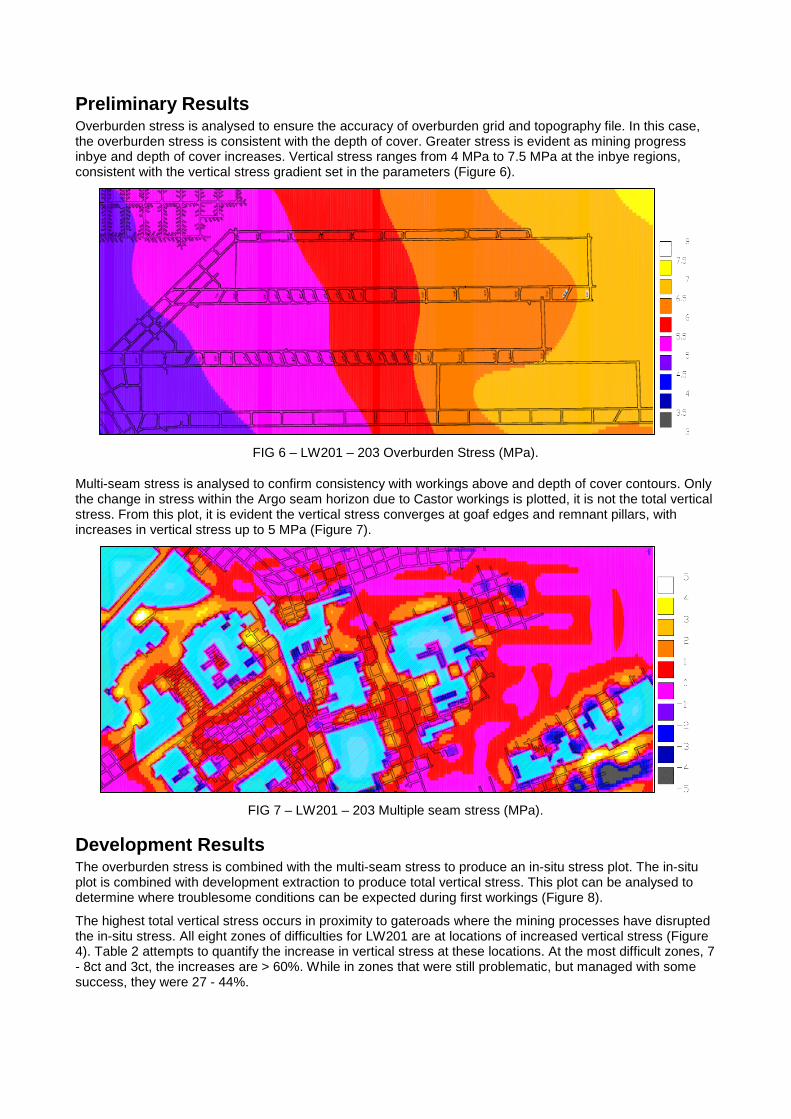
Preliminary Results Overburden stress is analysed to ensure the accuracy of overburden grid and topography file. In this case, the overburden stress is consistent with the depth of cover. Greater stress is evident as mining progress inbye and depth of cover increases. Vertical stress ranges from 4 MPa to 7.5 MPa at the inbye regions, consistent with the vertical stress gradient set in the parameters (Figure 6).
FIG 6 – LW201 – 203 Overburden Stress (MPa).
Multi-seam stress is analysed to confirm consistency with workings above and depth of cover contours. Only the change in stress within the Argo seam horizon due to Castor workings is plotted, it is not the total vertical stress. From this plot, it is evident the vertical stress converges at goaf edges and remnant pillars, with increases in vertical stress up to 5 MPa (Figure 7).
FIG 7 – LW201 – 203 Multiple seam stress (MPa).
Development Results The overburden stress is combined with the multi-seam stress to produce an in-situ stress plot. The in-situ plot is combined with development extraction to produce total vertical stress. This plot can be analysed to determine where troublesome conditions can be expected during first workings (Figure 8).
The highest total vertical stress occurs in proximity to gateroads where the mining processes have disrupted the in-situ stress. All eight zones of difficulties for LW201 are at locations of increased vertical stress (Figure 4). Table 2 attempts to quantify the increase in vertical stress at these locations. At the most difficult zones, 7 - 8ct and 3ct, the increases are > 60%. While in zones that were still problematic, but managed with somesuccess, they were 27 - 44%.

A cross-section of the belt road highlights the complex nature of the vertical stresses in this environment. The vertical stress drops to < 5 MPa before rising to > 9 MPa within a pillars length on multiple occasions. Of note is the comparison of the smaller pillars outbye to the larger pillars used inbye. The larger pillars offer a respite from increased vertical stress, while the smaller pillars do not allow the stress to dissipate between cut throughs (Figure 9).
FIG 8 – LW201 – 203 total vertical stress (MPa).
FIG 9 – Maingate 201 belt road total vertical stress cross section.
Longwall Results The impact of secondary extraction in multi-seam mines can be significant. The travel road inbye the longwall face suffered severe deterioration and under the zones of increased vertical stress often required significant standing support to remain serviceable, with vertical stress > 12 MPa at several locations along the new tailgate (Figure 10).

The castor working interactions create the potential for stress to redistribute great distances. Two notable events occurred during the extraction of LW201 that displayed this phenomenon. In maingate 202 the 20ct rib failed abruptly seven pillars outbye the development face, at this time LW201 was approaching the final pillars. A closer look at the modelling with LW201 extracted displays an increase in total vertical stresses at this location, despite a distance of > 250 m from the goaf (Figure 11). A similar event occurred at 11ct, with the stopping requiring replacement and resupporting during LW201 extraction.
FIG 10 – LW201 – 203 total vertical stress after LW201 extraction.
FIG 11a – Maingate 202 19-23ct prior to LW201 extraction.
FIG 11b – Maingate 202 19-23ct after LW201 extraction.

TABLE 2: Stress changes due to multiple seam influence.
Location Overburden (MPa) Total Vertical (MPa) Increase
MG201 15-16ct (belt r.) 6.2 8.8 +42%
MG201 11-12ct (belt r.) 5.7 8.0 +40%
MG201 11-12ct (travel r.) 5.7 8.2 +44%
MG201 6 – 8ct (travel r.) 5.2 - 5.5 8.0 – 9.2 +54%
MG201 8ct (cut through) 5.5 9.0 +63%
MG201 7ct (travel r.) 5.4 8.8 +63%
MG201 3ct (belt r.) 5.3 9.0 +69%
TG201 9ct 6.3 8.0 +27%
TG201 4ct 5.7 7.4 +30%
CONCLUSIONS Cook Colliery encountered numerous issues during the initial panel due to the multiple seam interactions and inexperience with longwall mining in close proximity to the workings above. The work undertaken addresses the gap in knowledge as to why these events occurred, encouraging a greater understanding of the stress regime in multi-seam operations.
Analysis of LW201 demonstrated a clear correlation with workings above and regions of significant deterioration during both development and longwall extraction. The dramatic swings in vertical stresses create a complex environment where erratic results can occur.
Incidents that have the potential to cause significant delays, as experienced in initial panels, would have the possibility of being mitigated with the systematic use of numerical modelling in the design process. This work emphasises the importance of numerical modelling in multi-seam operations while providing a unique case study to assist in understanding potential impacts.
Further research is required as LaModel is limited to vertical stress and it is likely that interactions impact both the horizontal and shear stress regime. 3-dimensional modelling could further assist in this understanding, combined with a thorough stress monitoring regime.
ACKNOWLEDGEMENTS The Author would like to thank Dr William Lawrence for the introduction to LaModel and his assistance throughout, and Professor Keith Heasley for providing guidance and assistance with working with LaModel
REFERENCES Galvin, J., 2016. Ground Engineering - Principles and Practices for Underground Coal Mining. s.l.:Springer International
Publishing.
Heasley, K. A., 2009. An Overview of Calibrating and Using the LaModel Program for Coal Mine Design. Pittsburgh, NIOSH, pp. 63-75.
Heasley, K. A. Z., 2001. LaModel - A Boundary Element Program for Coal Mine Design. Tucson, s.n., pp. 1679-1682.
Howarth, R. M. N., 2009. Multi-seam Working. Australian coal mining Practice - monograph 12, s.l.: AusIMM.
Lawrence, W. L. B. K. R., 2010. Recent Secondary Extraction Experience at Cook Colliery in a Multi-Seam Environment. Sydney, s.n., pp. 183-190.
Mark, C., 2007. Multiple-Seam Longwall Mining in the United States: Lessons for Ground Control. Pittsburgh, National Institute for Occupational Safety and Health (NIOSH), pp. 45-53.
Mark, C., Chase, F. E. & Pappas, D. M., 2007. Analysis of Multiple Seam Stability. Morgantown, West Virginia University, pp. 5-18.

Morsy, K. Y. A. P. S., 2006. Multiple Seam Mining Interactions - A Case Study. Morgantown, s.n., pp. 308-314.
Peng, S., 2008. Coal Mine Ground Control. 3rd ed. s.l.:Department of Mining Engineering.
Zhang, Y. L. Y. H. J. a. P. S., 2005. Impact of Lower Seam Caving on Upper Seam Mining. Salt Lake City, s.n.

New risk assessment method for coal mine excavated slopes*
A McQuillan1, I Canbulat2, D Payne3 and J Oh4
* This paper is a condensed version of a journal paper with the same title published in Internal Journal ofMining Sciences and Technology (McQuillan et al. 2018). Republished with permission.
1. Phd Candidate, UNSW Sydney, Sydney NSW 2052. Email: [email protected]. Professor, Kenneth Finlay Chair of Rock Mechanics, UNSW Sydney, Sydney NSW 2052.
Email: [email protected]. Geotechnical Services Manager, BHP, Brisbane QLD 4000. Email: [email protected]. Senior Lecturer, UNSW Sydney, Sydney NSW 2052. Email: [email protected]
ABSTRACT This paper presents a new risk assessment tool for coal mine excavated slopes. This new empirical-statistical Slope Stability Assessment Methodology (SSAM) is intended for use by geotechnical engineers at both the design review and operational stages of a mine’s life to categorise the risk of an excavated coal mine slope. A likelihood of failure is determined using a new slope stability classification system for excavated coal mine slopes developed using a database of 119 intact and failed case studies sourced from open cut coal mines in Australia. Consequence of failure is based on slope height and stand-off distance at the toe of the excavated slope. Results are presented in a new risk matrix, with slope risk being divided into low, medium and high categories.
The SSAM is put forward as a new risk assessment tool to assess the potential for, and consequence of, excavated coal mine slope failure. Unlike existing classification systems, assumptions about the likely failure mode or mechanism are not required. Instead, the SSAM applies an approach which compares the conditions present within the excavated slope face, with the known past performance of slopes with similar geotechnical and geometrical conditions, to estimate the slope’s propensity for failure.
The SSAM is novel in that it considers the depositional history of strata in an excavated slope and how this sequence affects slope stability. It is further novel in that it does not require explicit measurements of intact rock, rock mass and/or defect strength to rapidly calculate a slope’s likelihood of failure and overall risk.
Ratings can be determined entirely from visual observations of the excavated slope face.
The new SSAM is designed to be used in conjunction with existing slope stability assessment tools.
INTRODUCTION Strata failure is a principal hazard in open cut coal mining as it has the potential to cause multiple fatalities. Rigorous geotechnical design is critical to preventing and managing strata failure.
Several empirical classification methods are available to predict rock mass behaviour and/or slope performance (Bieniawski 1976, Selby 1980, Romana 1985, Abrahams and Parsons 1987, Robertson 1988, Laubscher 1990, Hoek et al. 1995, Chen 1995, Ünal 1996, Hack 1998, Jakubec and Laubscher 2000, Lindsay et al. 2001, Cai et al. 2004, Canbulat et al. 2004, Marinos et al. 2005, Taheri 2006, Tomás et al. 2007, Jhanwar 2012, Sullivan 2013, Ayden et al. 2014, Barton and Bar 2015). A review of the existing empirical classifications highlighted a gap in the industry for a classification system specific to excavated coal mine slopes.
Of the rock mass classification systems published to date, the OPCASSTA-COAL (Jhanwar 2012) and the GSPI (Sullivan 2013) are considered most applicable to predict the likely slope behaviour of excavated coal mine slopes. However, both classification systems provide a qualitative indication of slope behaviour only, in terms of Very Low to Very High Slope Hazard (Jhanwar 2012) or Stable to Collapse Slope Performance Classification (Sullivan 2013). The Q-Slope system (Barton and Bar 2015, Bar and Barton 2017) does provide a quantitative likelihood of failure but does not contain coal bearing rock formation case studies in its database (Bar 2018, personal comms.). No overall slope risk rating can be provided by any of these three classification systems.
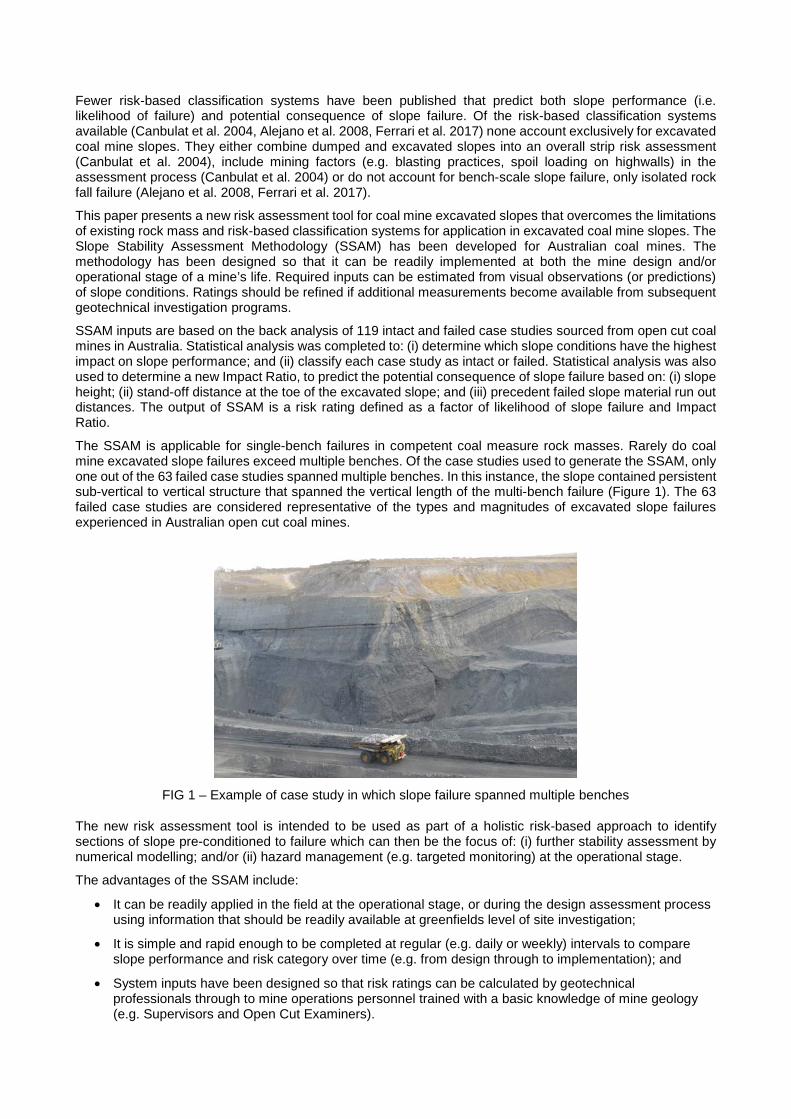
Fewer risk-based classification systems have been published that predict both slope performance (i.e. likelihood of failure) and potential consequence of slope failure. Of the risk-based classification systems available (Canbulat et al. 2004, Alejano et al. 2008, Ferrari et al. 2017) none account exclusively for excavated coal mine slopes. They either combine dumped and excavated slopes into an overall strip risk assessment (Canbulat et al. 2004), include mining factors (e.g. blasting practices, spoil loading on highwalls) in the assessment process (Canbulat et al. 2004) or do not account for bench-scale slope failure, only isolated rock fall failure (Alejano et al. 2008, Ferrari et al. 2017).
This paper presents a new risk assessment tool for coal mine excavated slopes that overcomes the limitations of existing rock mass and risk-based classification systems for application in excavated coal mine slopes. The Slope Stability Assessment Methodology (SSAM) has been developed for Australian coal mines. The methodology has been designed so that it can be readily implemented at both the mine design and/or operational stage of a mine’s life. Required inputs can be estimated from visual observations (or predictions) of slope conditions. Ratings should be refined if additional measurements become available from subsequent geotechnical investigation programs.
SSAM inputs are based on the back analysis of 119 intact and failed case studies sourced from open cut coal mines in Australia. Statistical analysis was completed to: (i) determine which slope conditions have the highest impact on slope performance; and (ii) classify each case study as intact or failed. Statistical analysis was also used to determine a new Impact Ratio, to predict the potential consequence of slope failure based on: (i) slope height; (ii) stand-off distance at the toe of the excavated slope; and (iii) precedent failed slope material run out distances. The output of SSAM is a risk rating defined as a factor of likelihood of slope failure and Impact Ratio.
The SSAM is applicable for single-bench failures in competent coal measure rock masses. Rarely do coal mine excavated slope failures exceed multiple benches. Of the case studies used to generate the SSAM, only one out of the 63 failed case studies spanned multiple benches. In this instance, the slope contained persistent sub-vertical to vertical structure that spanned the vertical length of the multi-bench failure (Figure 1). The 63 failed case studies are considered representative of the types and magnitudes of excavated slope failures experienced in Australian open cut coal mines.
FIG 1 – Example of case study in which slope failure spanned multiple benches
The new risk assessment tool is intended to be used as part of a holistic risk-based approach to identify sections of slope pre-conditioned to failure which can then be the focus of: (i) further stability assessment by numerical modelling; and/or (ii) hazard management (e.g. targeted monitoring) at the operational stage.
The advantages of the SSAM include:
• It can be readily applied in the field at the operational stage, or during the design assessment processusing information that should be readily available at greenfields level of site investigation;
• It is simple and rapid enough to be completed at regular (e.g. daily or weekly) intervals to compareslope performance and risk category over time (e.g. from design through to implementation); and
• System inputs have been designed so that risk ratings can be calculated by geotechnicalprofessionals through to mine operations personnel trained with a basic knowledge of mine geology(e.g. Supervisors and Open Cut Examiners).
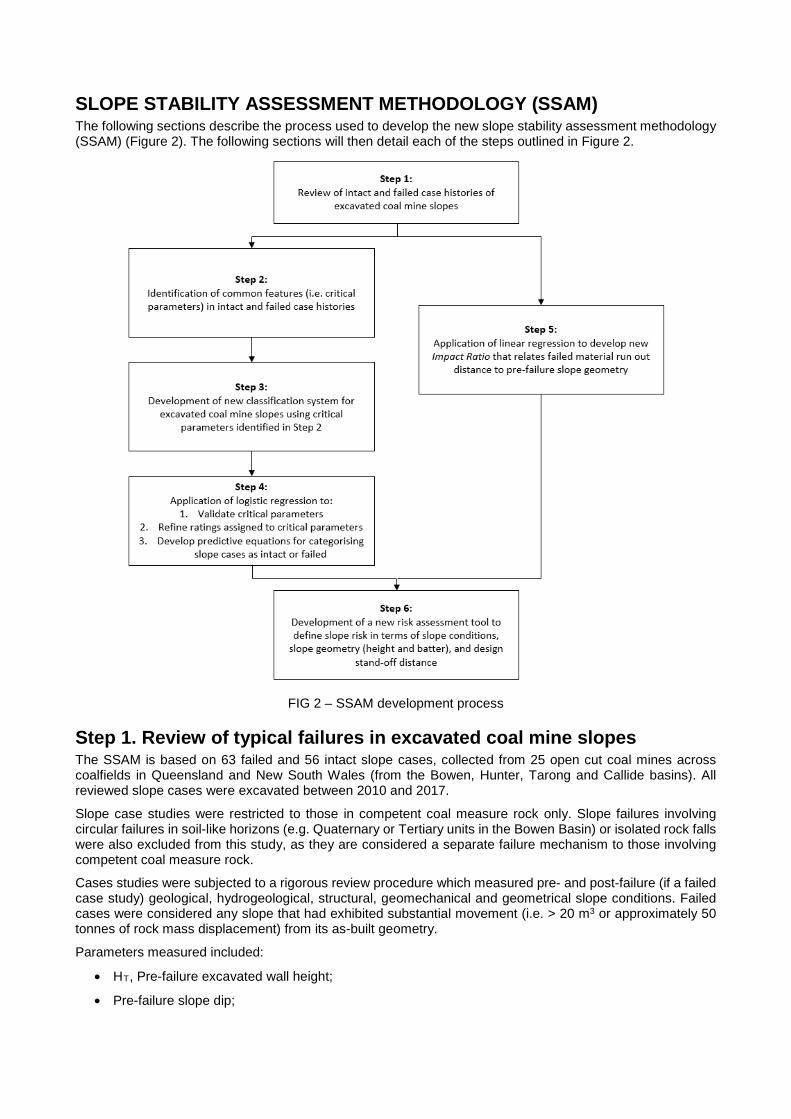
SLOPE STABILITY ASSESSMENT METHODOLOGY (SSAM) The following sections describe the process used to develop the new slope stability assessment methodology (SSAM) (Figure 2). The following sections will then detail each of the steps outlined in Figure 2.
FIG 2 – SSAM development process
Step 1. Review of typical failures in excavated coal mine slopes The SSAM is based on 63 failed and 56 intact slope cases, collected from 25 open cut coal mines across coalfields in Queensland and New South Wales (from the Bowen, Hunter, Tarong and Callide basins). All reviewed slope cases were excavated between 2010 and 2017.
Slope case studies were restricted to those in competent coal measure rock only. Slope failures involving circular failures in soil-like horizons (e.g. Quaternary or Tertiary units in the Bowen Basin) or isolated rock falls were also excluded from this study, as they are considered a separate failure mechanism to those involving competent coal measure rock.
Cases studies were subjected to a rigorous review procedure which measured pre- and post-failure (if a failed case study) geological, hydrogeological, structural, geomechanical and geometrical slope conditions. Failed cases were considered any slope that had exhibited substantial movement (i.e. > 20 m3 or approximately 50 tonnes of rock mass displacement) from its as-built geometry.
Parameters measured included:
• HT, Pre-failure excavated wall height;
• Pre-failure slope dip;

• Pre-failure slope dip direction;
• HF, failed height: vertical height from failure crest to failure toe, this may be less than HT;
• L: horizontal length from failed crest to distal toe of failed material;
• HT/L;
• V: volume of failed material;
• Runout distance: horizontal distance from pre-failure slope toe to distal toe of failed material, excludingisolated boulders, this may be less than L;
• W1: horizontal distance from pre-failure crest to failure back-scarp if failure daylighted at crest;
• W2: horizontal distance between pre-failure slope face to failure back-scarp if failure did not daylight atcrest;
• IWIDTH: width of in situ failed section of slope (i.e. horizontal distance between lateral extents of failedsection of slope), parallel to slope orientation;
• FWIDTH: width of failed material at immediate toe of slope, parallel to slope orientation;
• Defect (i.e. joint or fault) dip/s, contributing to slope failure;
• Defect (i.e. joint or fault) dip direction/s, contributing to slope failure; and
• Absolute difference slope orientation and defect orientations contributing to slope failure. The absolutedifference (∆) slope orientation and defect orientations contributing to slope failure were calculated bydetermining the absolute difference between pre-failure slope orientation and orientation of structurescontributing to slope failure (in terms of ∆ strike or ∆ dip direction).
Parameters qualitatively inferred included:
• Rock mass properties (i.e. fresh, weathered, interbedded, massive);
• Lithology at vertical extents of failure (i.e. change in rock type at crest and/or base of failed section ofslope);
• Water seepage and/or pressure (i.e. from ponding) at time of failure;
• Surface weathering condition of defects contributing to failure (i.e. fresh, moderately weathered,extremely weathered);
• Surface waviness (as per ISRM definition, 1978) condition of defects contributing to failure (i.e. severalundulations, moderate undulations, low or smooth undulations, or unknown conditions);
• Surface coating of defects contributing to failure (i.e. competent or crystalline vs soft or clayey);
• Strip orientation (i.e. straight, concave, convex);
• Primary mechanism of structural failure contributing to complex failure mechanism (i.e. planar: onedefect dipping into the excavation; wedge: two intersecting defects dipping into the excavation; ortoppling: one defect dipping into the slope face; and
• Slope class (e.g. 65°, 70°, 75°, etc.) based on slope design geometry, for determining trends in slopefailure vs slope design.
Measurements were acquired from surveyed point cloud data. Schematics of measured parameters are shown in Figure 3.

FIG 3 – Schematic of parameters measured in the back-analysis process (cross-section view)
Of note, the review of typical failures in excavated slopes showed that failure occurred at any slope height or batter angle (Figure 4). There was no cluster of failed cases at higher slopes and/or steeper batter angles that may intuitively be expected, or is eluded to in kinematic analysis.
FIG 4 – Relationship between slope performance (intact or failed), slope angle and slope height
Step 2. Critical Parameters The parameters measured and/or inferred from the review of intact and failed slope cases were used to define critical parameters (i.e. slope conditions present in the majority of failed cases). Critical parameters included:
1. Type and variation of rock mass units in the excavated slope face (e.g. massive rock mass units,interbedded rock mass units);
2. Presence of one persistent defect at absolute slope orientation differences of less than 30°, orpresence of two persistent intersecting defects with absolute slope orientation differences of less than50°;
3. Persistent defect dips of greater than 40° into the excavation, or persistent defect dips of 80-90° intothe slope;
0
20
40
60
80
100
120
45 55 65 75 85
Slop
e he
ight
(m)
Slope angle (°)
Slope angle vs Slope height
Failed
Intact

4. Strata bedding, rolling or dipping into the excavation;
5. Depositional history with respect to change in lithology (i.e. presence of a carbonaceous or coal band)at the crest or base of persistent defects. This is considered an indirect indicator of change in rockmass strength at the crest or base of persistent defects. The depositional history of strata in anexcavated slope was found to have a significant effect on slope stability. Back analysis of the 63 failedcase studies indicated that slope faces exhibiting persistent sub-vertical to vertical structure boundedby coal or carbonaceous bands were more likely to result in slope failure;
6. Presence of water ponding at the crest or toe of the excavated slope and/or change in water pressureconditions indicated by a change in seepage conditions observed in the excavated slope face;
7. Weathered surface condition of persistent defects bounding failure extents;
8. Waviness (i.e. roughness, ISRM 1978) and/or surface coating of persistent defects bounding failureextents, relating to strength of persistent defects, providing an indirect empirical estimate of defectstrength;
9. Slope geometry (i.e. height and batter angle); and
10. Presence of inflexions in strip orientation (i.e. concave bullnoses, convex inflections).
Schematics of each of these critical parameters are included in Appendix A.
Although intrusions (e.g. dykes and sills), burnt coal, crest loading and seismicity are frequently included in classification systems (Canbulat et al. 2004, Taheri 2006, Jhanwar 2012, Naghadehi et al. 2013), they were not considered critical parameters for Australian coal mine slopes. Such conditions were not present, or contributing factors, in any of the 63 failed case studies reviewed. If any of these conditions are predicted or observed their impact on slope stability should be analysed on a case by case basis, and are considered outside the limits of this new classification system.
Step 3 & Step 4. New rock mass classification system to determine an excavated coal mine slope’s likelihood of failure Critical parameters identified from the review of intact and failed slope cases were used as inputs to develop a new classification system for excavated coal mine slopes.
Numerical ratings were assigned to each critical parameter based on their influence on slope stability. Higher ratings (maximum rating of 30) were assigned where such conditions were present in failed slope cases, and lower ratings (minimum rating of 1) were assigned where such conditions were absent in failed slope cases. Intermediate ratings (e.g. 5, 10, 15) were assigned to conditions transitional between the extremes of failed and intact slope cases. Arbitrary values of 1 to 30 were selected based on the range of ratings applied in existing classification systems. For example, RMR applies ratings ranging from 0 to 30 (Bieniawski 1989), SRMR applies ratings from 0 to 30 (Robertson 1988) and RMQR applies ranges from 0 to 30 (Ayden et al. 2014). Negative ratings to indicate favourable slope conditions have not been included unlike existing classification systems (Ünal 1996, Taheri 2006, Jhanwar 2012). An overall rating is calculated by selecting the observed (or predicted) condition for each critical parameter and summing the assigned ratings. Possible overall ratings range from 10 to 175. Higher overall ratings indicate a higher likelihood of failure.
Multiple logistic regression (MLR) was used to refine critical parameters and their assigned ratings. Several iterations of MLR analysis were run (using SigmaPlot © 2014 and RStudio © 2016) to determine the combination of critical parameters and their assigned ratings that gave the best predictive model (e.g. highest accuracy) in terms of correctly defining the slope as intact or failed. See Appendix B for fundamentals of MLR analysis.
Model accuracy was tested by comparing statistical significance values and reviewing goodness-of-fit (GOF) measures, including the Wald Statistic, P-value, -2 log likelihood, Akaike Information Criteria (AIC) and Leave One Out Cross-Validation (LOOCV) Mean Square Error (MSE) for each combination of critical parameters and assigned values.
The final predictive model, equation 1, has an 82.4% success rate (i.e. 98 out of 119 case studies were correctly classified as intact or failed using the ratings assigned to critical parameters in the new classification system for excavated coal mine slopes) (Table 1).
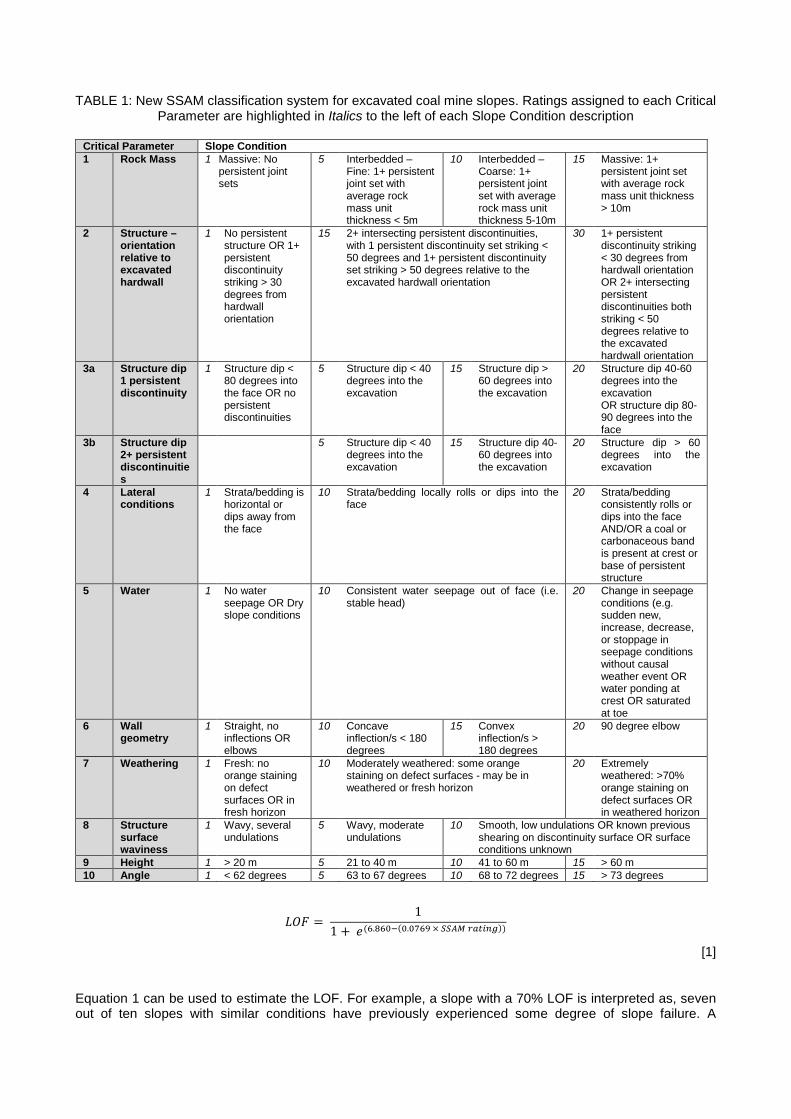
TABLE 1: New SSAM classification system for excavated coal mine slopes. Ratings assigned to each Critical Parameter are highlighted in Italics to the left of each Slope Condition description
Critical Parameter Slope Condition 1 Rock Mass 1 Massive: No
persistent joint sets
5 Interbedded – Fine: 1+ persistent joint set with average rock mass unit thickness < 5m
10 Interbedded – Coarse: 1+ persistent joint set with average rock mass unit thickness 5-10m
15 Massive: 1+ persistent joint set with average rock mass unit thickness > 10m
2 Structure – orientation relative to excavated hardwall
1 No persistent structure OR 1+ persistent discontinuity striking > 30 degrees from hardwall orientation
15 2+ intersecting persistent discontinuities, with 1 persistent discontinuity set striking < 50 degrees and 1+ persistent discontinuity set striking > 50 degrees relative to the excavated hardwall orientation
30 1+ persistent discontinuity striking < 30 degrees from hardwall orientation OR 2+ intersecting persistent discontinuities both striking < 50 degrees relative to the excavated hardwall orientation
3a Structure dip 1 persistent discontinuity
1 Structure dip < 80 degrees into the face OR no persistent discontinuities
5 Structure dip < 40 degrees into the excavation
15 Structure dip > 60 degrees into the excavation
20 Structure dip 40-60 degrees into the excavation OR structure dip 80-90 degrees into the face
3b Structure dip 2+ persistent discontinuities
5 Structure dip < 40 degrees into the excavation
15 Structure dip 40-60 degrees into the excavation
20 Structure dip > 60 degrees into the excavation
4 Lateral conditions
1 Strata/bedding is horizontal or dips away from the face
10 Strata/bedding locally rolls or dips into the face
20 Strata/bedding consistently rolls or dips into the face AND/OR a coal or carbonaceous band is present at crest or base of persistent structure
5 Water 1 No water seepage OR Dry slope conditions
10 Consistent water seepage out of face (i.e. stable head)
20 Change in seepage conditions (e.g. sudden new, increase, decrease, or stoppage in seepage conditions without causal weather event OR water ponding at crest OR saturated at toe
6 Wall geometry
1 Straight, no inflections OR elbows
10 Concave inflection/s < 180 degrees
15 Convex inflection/s > 180 degrees
20 90 degree elbow
7 Weathering 1 Fresh: no orange staining on defect surfaces OR in fresh horizon
10 Moderately weathered: some orange staining on defect surfaces - may be in weathered or fresh horizon
20 Extremely weathered: >70% orange staining on defect surfaces OR in weathered horizon
8 Structure surface waviness
1 Wavy, several undulations
5 Wavy, moderate undulations
10 Smooth, low undulations OR known previous shearing on discontinuity surface OR surface conditions unknown
9 Height 1 > 20 m 5 21 to 40 m 10 41 to 60 m 15 > 60 m 10 Angle 1 < 62 degrees 5 63 to 67 degrees 10 68 to 72 degrees 15 > 73 degrees
𝐿𝐿𝐿𝐿𝐿𝐿 = 1
1 + 𝑒𝑒(6.860−(0.0769 × 𝑆𝑆𝑆𝑆𝑆𝑆𝑆𝑆 𝑟𝑟𝑟𝑟𝑟𝑟𝑟𝑟𝑟𝑟𝑟𝑟))
[1]
Equation 1 can be used to estimate the LOF. For example, a slope with a 70% LOF is interpreted as, seven out of ten slopes with similar conditions have previously experienced some degree of slope failure. A
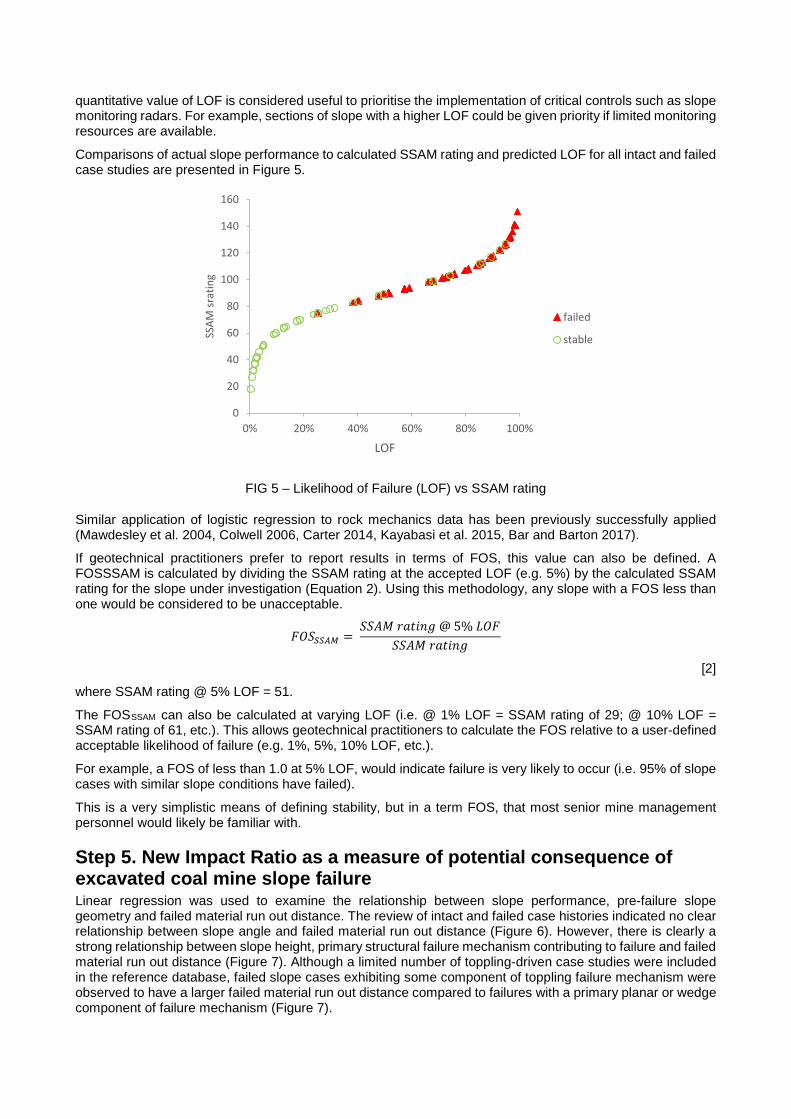
quantitative value of LOF is considered useful to prioritise the implementation of critical controls such as slope monitoring radars. For example, sections of slope with a higher LOF could be given priority if limited monitoring resources are available.
Comparisons of actual slope performance to calculated SSAM rating and predicted LOF for all intact and failed case studies are presented in Figure 5.
FIG 5 – Likelihood of Failure (LOF) vs SSAM rating
Similar application of logistic regression to rock mechanics data has been previously successfully applied (Mawdesley et al. 2004, Colwell 2006, Carter 2014, Kayabasi et al. 2015, Bar and Barton 2017).
If geotechnical practitioners prefer to report results in terms of FOS, this value can also be defined. A FOSSSAM is calculated by dividing the SSAM rating at the accepted LOF (e.g. 5%) by the calculated SSAM rating for the slope under investigation (Equation 2). Using this methodology, any slope with a FOS less than one would be considered to be unacceptable.
𝐿𝐿𝐿𝐿𝐹𝐹𝑆𝑆𝑆𝑆𝑆𝑆𝑆𝑆 = 𝐹𝐹𝐹𝐹𝑆𝑆𝑆𝑆 𝑟𝑟𝑟𝑟𝑟𝑟𝑟𝑟𝑟𝑟𝑟𝑟 @ 5% 𝐿𝐿𝐿𝐿𝐿𝐿
𝐹𝐹𝐹𝐹𝑆𝑆𝑆𝑆 𝑟𝑟𝑟𝑟𝑟𝑟𝑟𝑟𝑟𝑟𝑟𝑟
[2]
where SSAM rating @ 5% LOF = 51.
The FOSSSAM can also be calculated at varying LOF (i.e. @ 1% LOF = SSAM rating of 29; @ 10% LOF = SSAM rating of 61, etc.). This allows geotechnical practitioners to calculate the FOS relative to a user-defined acceptable likelihood of failure (e.g. 1%, 5%, 10% LOF, etc.).
For example, a FOS of less than 1.0 at 5% LOF, would indicate failure is very likely to occur (i.e. 95% of slope cases with similar slope conditions have failed).
This is a very simplistic means of defining stability, but in a term FOS, that most senior mine management personnel would likely be familiar with.
Step 5. New Impact Ratio as a measure of potential consequence of excavated coal mine slope failure Linear regression was used to examine the relationship between slope performance, pre-failure slope geometry and failed material run out distance. The review of intact and failed case histories indicated no clear relationship between slope angle and failed material run out distance (Figure 6). However, there is clearly a strong relationship between slope height, primary structural failure mechanism contributing to failure and failed material run out distance (Figure 7). Although a limited number of toppling-driven case studies were included in the reference database, failed slope cases exhibiting some component of toppling failure mechanism were observed to have a larger failed material run out distance compared to failures with a primary planar or wedge component of failure mechanism (Figure 7).
0
20
40
60
80
100
120
140
160
0% 20% 40% 60% 80% 100%
SSAM
srat
ing
LOF
failed
stable

FIG 6 – As-built slope angle vs Failed material run out distance. Points are indexed based on slope class (50 degrees = slope angles with range of 48-52°; 55 degrees = 53-57°; 60 degrees = 58-62°; 65 degrees = 63-
67°; 70 degrees = 68-72°; 75 degrees = > 73°)
FIG 7 – Pre-failure slope height vs Failed material run out distance. Points are indexed based on primary structural failure mechanism contributing to failure or slope geometry (e.g. if failure occurred at a bullnose
inflexion in strip orientation)
This relationship defined in Figure 7 was used to form the basis of the new Impact Ratio (IR) (Equation 3) which is designed to assess the potential consequence of slope failure in terms of slope height and design stand-off distance implemented at the toe of an excavated slope. The IR is designed to compliment the LOF calculated in the preceding section to allow an overall risk of slope failure to be estimated.
𝐼𝐼𝐼𝐼 = (𝑠𝑠𝑠𝑠𝑠𝑠𝑠𝑠𝑒𝑒 ℎ𝑒𝑒𝑟𝑟𝑟𝑟ℎ𝑟𝑟)
(𝑑𝑑𝑒𝑒𝑠𝑠𝑟𝑟𝑟𝑟𝑟𝑟 𝑠𝑠𝑟𝑟𝑟𝑟𝑟𝑟𝑑𝑑 𝑠𝑠𝑜𝑜𝑜𝑜)
[3]
The smaller the value of IR, the lower potential consequence of slope failure, implied in terms of failed material exceeding design stand-off’s.
0
10
20
30
40
50
60
55 60 65 70 75 80 85
Runo
ut d
istan
ce (m
)
Slope angle (°)
50 degrees
60 degrees
65 degrees
70 degrees
75 degrees
0
10
20
30
40
50
60
0 10 20 30 40 50 60 70
Runo
ut d
istan
ce (m
)
Slope height (m)
bullnose
planar
wedge
topple

The IR was designed to provide geotechnical practitioners a means to rapidly assess whether the designed or implemented stand-off should be adequate as a standalone control to manage risk. Or whether additional controls should be implemented to mitigate the risk of potential slope failure.
The database to generate the new Impact Ratio factor included 37 failed slope cases, collected from open cut coal mines across Australian coalfields in Queensland and New South Wales. All excavated slope cases excavated slopes were excavated between 2010 and 2017.
Step 6. SSAM risk assessment matrix Using the LOF and IR calculated in the preceding sections, a new risk assessment matrix is presented to risk rate excavated coal mine slopes as either low, medium or high risk categories.
An estimate of overall risk can be determined by graphing the LOF and IR in the new SSAM risk matrix (Figures 8 to 9).
FIG 8 – New SSAM risk matrix. Failures involving a toppling failure mechanism are represented by blue points. IR values displayed in Figure 8 were calculated by dividing pre-failure slope height by failed material
run out distance (not implemented stand-off, where this information was not readily available). Risk categories applying an arbitrary 15 m stand-off distance are displayed in Figure 9
FIG 9 – New SSAM risk matrix. Failures involving a toppling failure mechanism are represented by blue points. IR values displayed in Figure 9 were calculated by dividing slope height by a nominal 15 m stand-off
0.0
1.0
2.0
3.0
4.0
5.0
6.0
0% 20% 40% 60% 80% 100%
IR
LOF
LOF vs IRH
0.0
1.0
2.0
3.0
4.0
5.0
6.0
0% 20% 40% 60% 80% 100%
IR
LOF
LOF vs IR15m
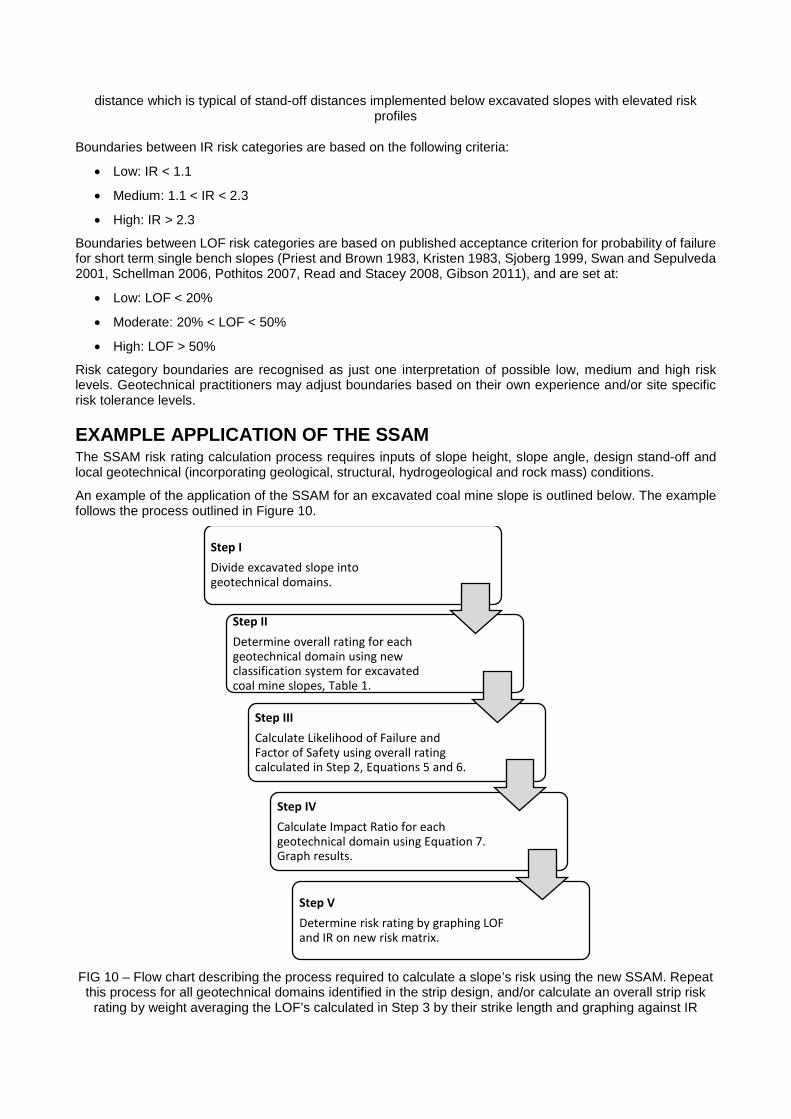
distance which is typical of stand-off distances implemented below excavated slopes with elevated risk profiles
Boundaries between IR risk categories are based on the following criteria:
• Low: IR < 1.1
• Medium: 1.1 < IR < 2.3
• High: IR > 2.3
Boundaries between LOF risk categories are based on published acceptance criterion for probability of failure for short term single bench slopes (Priest and Brown 1983, Kristen 1983, Sjoberg 1999, Swan and Sepulveda 2001, Schellman 2006, Pothitos 2007, Read and Stacey 2008, Gibson 2011), and are set at:
• Low: LOF < 20%
• Moderate: 20% < LOF < 50%
• High: LOF > 50%
Risk category boundaries are recognised as just one interpretation of possible low, medium and high risk levels. Geotechnical practitioners may adjust boundaries based on their own experience and/or site specific risk tolerance levels.
EXAMPLE APPLICATION OF THE SSAM The SSAM risk rating calculation process requires inputs of slope height, slope angle, design stand-off and local geotechnical (incorporating geological, structural, hydrogeological and rock mass) conditions.
An example of the application of the SSAM for an excavated coal mine slope is outlined below. The example follows the process outlined in Figure 10.
FIG 10 – Flow chart describing the process required to calculate a slope’s risk using the new SSAM. Repeat this process for all geotechnical domains identified in the strip design, and/or calculate an overall strip risk
rating by weight averaging the LOF’s calculated in Step 3 by their strike length and graphing against IR
Step IDivide excavated slope into geotechnical domains.
Step IIDetermine overall rating for each geotechnical domain using new classification system for excavated coal mine slopes, Table 1.
Step IIICalculate Likelihood of Failure and Factor of Safety using overall rating calculated in Step 2, Equations 5 and 6.
Step IVCalculate Impact Ratio for each geotechnical domain using Equation 7. Graph results.
Step VDetermine risk rating by graphing LOF and IR on new risk matrix.
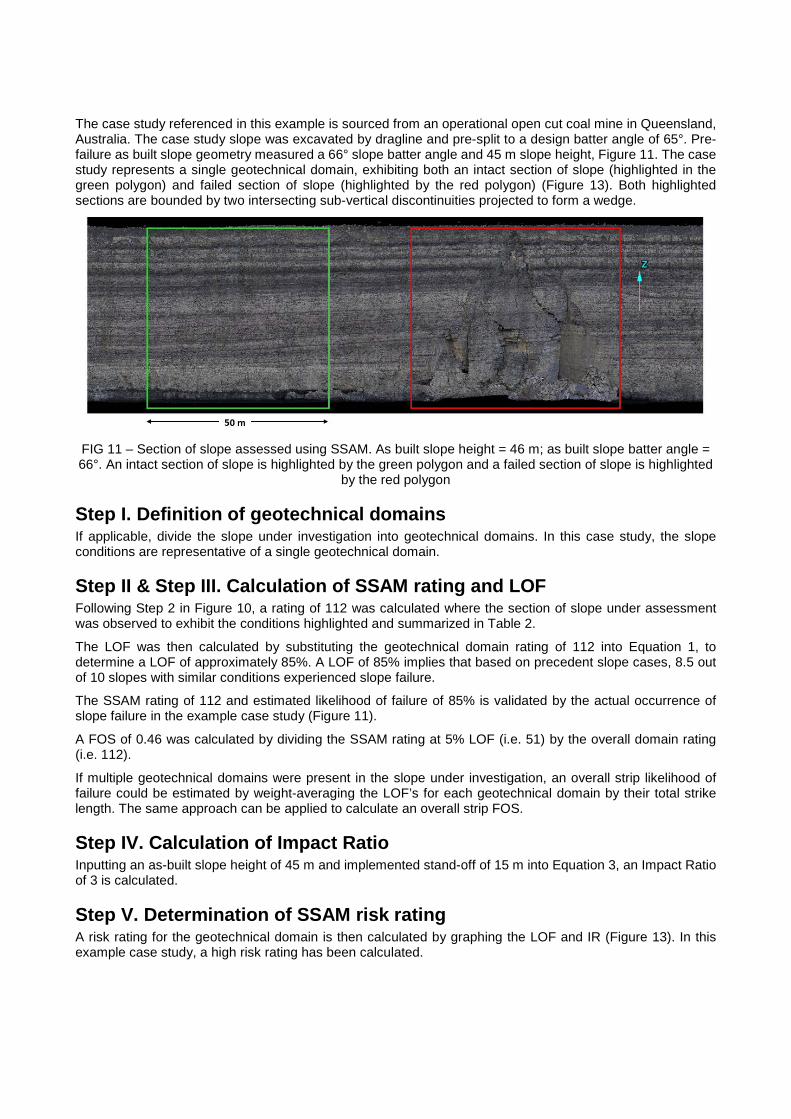
The case study referenced in this example is sourced from an operational open cut coal mine in Queensland, Australia. The case study slope was excavated by dragline and pre-split to a design batter angle of 65°. Pre-failure as built slope geometry measured a 66° slope batter angle and 45 m slope height, Figure 11. The case study represents a single geotechnical domain, exhibiting both an intact section of slope (highlighted in the green polygon) and failed section of slope (highlighted by the red polygon) (Figure 13). Both highlighted sections are bounded by two intersecting sub-vertical discontinuities projected to form a wedge.
FIG 11 – Section of slope assessed using SSAM. As built slope height = 46 m; as built slope batter angle = 66°. An intact section of slope is highlighted by the green polygon and a failed section of slope is highlighted
by the red polygon
Step I. Definition of geotechnical domains If applicable, divide the slope under investigation into geotechnical domains. In this case study, the slope conditions are representative of a single geotechnical domain.
Step II & Step III. Calculation of SSAM rating and LOF Following Step 2 in Figure 10, a rating of 112 was calculated where the section of slope under assessment was observed to exhibit the conditions highlighted and summarized in Table 2.
The LOF was then calculated by substituting the geotechnical domain rating of 112 into Equation 1, to determine a LOF of approximately 85%. A LOF of 85% implies that based on precedent slope cases, 8.5 out of 10 slopes with similar conditions experienced slope failure.
The SSAM rating of 112 and estimated likelihood of failure of 85% is validated by the actual occurrence of slope failure in the example case study (Figure 11).
A FOS of 0.46 was calculated by dividing the SSAM rating at 5% LOF (i.e. 51) by the overall domain rating (i.e. 112).
If multiple geotechnical domains were present in the slope under investigation, an overall strip likelihood of failure could be estimated by weight-averaging the LOF’s for each geotechnical domain by their total strike length. The same approach can be applied to calculate an overall strip FOS.
Step IV. Calculation of Impact Ratio Inputting an as-built slope height of 45 m and implemented stand-off of 15 m into Equation 3, an Impact Ratio of 3 is calculated.
Step V. Determination of SSAM risk rating A risk rating for the geotechnical domain is then calculated by graphing the LOF and IR (Figure 13). In this example case study, a high risk rating has been calculated.

TABLE 2: Observed conditions for example slope using SSAM classification system
Critical Parameter Slope Condition 1 Rock Mass 1 Massive: No
persistent joint sets
5 Interbedded – Fine: 1+ persistent joint set with average rock mass unit thickness < 5m
10 Interbedded – Coarse: 1+ persistent joint set with average rock mass unit thickness 5-10m
15 Massive: 1+ persistent joint set with average rock mass unit thickness > 10m
2 Structure – orientation relative to excavated hardwall
1 No persistent structure OR 1+ persistent discontinuity striking > 30 degrees from hardwall orientation
15 2+ intersecting persistent discontinuities, with 1 persistent discontinuity set striking < 50 degrees and 1+ persistent discontinuity set striking > 50 degrees relative to the excavated hardwall orientation
30 1+ persistent discontinuity striking < 30 degrees from hardwall orientation OR 2+ intersecting persistent discontinuities both striking < 50 degrees relative to the excavated hardwall orientation
3a Structure dip 1 persistent discontinuity
1 Structure dip < 80 degrees into the face OR no persistent discontinuities
5 Structure dip < 40 degrees into the excavation
15 Structure dip > 60 degrees into the excavation
20 Structure dip 40-60 degrees into the excavation OR structure dip 80-90 degrees into the face
3b Structure dip 2+ persistent discontinuities
5 Structure dip < 40 degrees into the excavation
15 Structure dip 40-60 degreesinto theexcavation
20 Structure dip > 60 degrees into the excavation
4 Lateral conditions
1 Strata/bedding is horizontal or dips away from the face
10 Strata/bedding locally rolls or dips into the face
20 Strata/bedding consistently rolls or dips into the face AND/OR a coal or carbonaceous band is present at crest or base of persistent structure
5 Water 1 No water seepage OR Dry slope conditions
10 Consistent water seepage out of face (i.e. stable head)
20 Change in seepage conditions (e.g. sudden new, increase, decrease, or stoppage in seepage conditions without causal weather event OR water ponding at crest OR saturated at toe
6 Wall geometry
1 Straight, no inflections OR elbows
10 Concave inflection/s < 180 degrees
15 Convex inflection/s > 180 degrees
20 90 degree elbow
7 Weathering 1 Fresh: no orange staining on defect surfaces OR in fresh horizon
10 Moderately weathered: some orange staining on defect surfaces - may be in weathered or fresh horizon
20 Extremely weathered: >70% orange staining on defect surfaces OR in weathered horizon
8 Structure surface waviness
1 Wavy, several undulations
5 Wavy, moderate undulations
10 Smooth, low undulations OR known previous shearing on discontinuity surface OR surface conditions unknown
9 Height 1 > 20 m 5 21 to 40 m 10 41 to 60 m 15 > 60 m 10 Angle 1 < 62 degrees 5 63 to 67 degrees 10 68 to 72 degrees 15 > 73 degrees SSAM Rating 112 (= 10 + 30 + 15 + 20 + 1 + 1 + 10 + 10 + 10 + 5) -z value -1.75Likelihood of Failure 85%
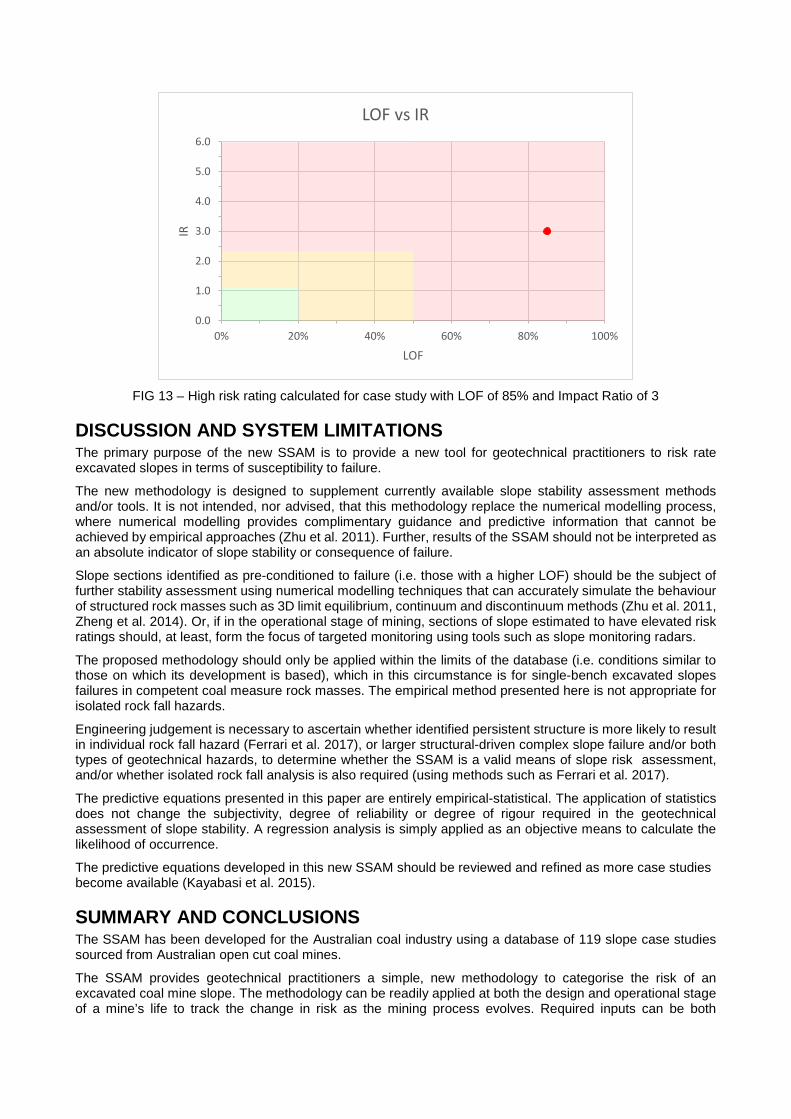
FIG 13 – High risk rating calculated for case study with LOF of 85% and Impact Ratio of 3
DISCUSSION AND SYSTEM LIMITATIONS The primary purpose of the new SSAM is to provide a new tool for geotechnical practitioners to risk rate excavated slopes in terms of susceptibility to failure.
The new methodology is designed to supplement currently available slope stability assessment methods and/or tools. It is not intended, nor advised, that this methodology replace the numerical modelling process, where numerical modelling provides complimentary guidance and predictive information that cannot be achieved by empirical approaches (Zhu et al. 2011). Further, results of the SSAM should not be interpreted as an absolute indicator of slope stability or consequence of failure.
Slope sections identified as pre-conditioned to failure (i.e. those with a higher LOF) should be the subject of further stability assessment using numerical modelling techniques that can accurately simulate the behaviour of structured rock masses such as 3D limit equilibrium, continuum and discontinuum methods (Zhu et al. 2011, Zheng et al. 2014). Or, if in the operational stage of mining, sections of slope estimated to have elevated risk ratings should, at least, form the focus of targeted monitoring using tools such as slope monitoring radars.
The proposed methodology should only be applied within the limits of the database (i.e. conditions similar to those on which its development is based), which in this circumstance is for single-bench excavated slopes failures in competent coal measure rock masses. The empirical method presented here is not appropriate for isolated rock fall hazards.
Engineering judgement is necessary to ascertain whether identified persistent structure is more likely to result in individual rock fall hazard (Ferrari et al. 2017), or larger structural-driven complex slope failure and/or both types of geotechnical hazards, to determine whether the SSAM is a valid means of slope risk assessment, and/or whether isolated rock fall analysis is also required (using methods such as Ferrari et al. 2017).
The predictive equations presented in this paper are entirely empirical-statistical. The application of statistics does not change the subjectivity, degree of reliability or degree of rigour required in the geotechnical assessment of slope stability. A regression analysis is simply applied as an objective means to calculate the likelihood of occurrence.
The predictive equations developed in this new SSAM should be reviewed and refined as more case studies become available (Kayabasi et al. 2015).
SUMMARY AND CONCLUSIONS The SSAM has been developed for the Australian coal industry using a database of 119 slope case studies sourced from Australian open cut coal mines.
The SSAM provides geotechnical practitioners a simple, new methodology to categorise the risk of an excavated coal mine slope. The methodology can be readily applied at both the design and operational stage of a mine’s life to track the change in risk as the mining process evolves. Required inputs can be both
0.0
1.0
2.0
3.0
4.0
5.0
6.0
0% 20% 40% 60% 80% 100%
IR
LOF
LOF vs IR

qualitatively estimated in the field, with ratings refined if additional quantitative measurements are available from subsequent geotechnical investigation programs.
The SSAM is unique in that: (i) unlike existing classification systems, no assumptions about the likely failure mechanism are required; (ii) the depositional history of strata in an excavated slope face is considered in the classification process; and (iii) explicit measurements of intact rock, rock mass and/or defect strength are not required to calculate an excavated slope’s likelihood of failure and subsequent risk rating.
Calculated risk ratings are based on comparisons between observed (or predicted) slope conditions of the slope under investigation with the known past performance of excavated slopes with similar geotechnical and geometrical conditions.
The SSAM is designed to be used in conjunction with existing slope stability assessment tools. For example: (i) slope sections identified to have a high LOF during the design review stage should then be the focus offurther stability assessment using numerical modelling techniques; and/or (ii) slope sections identified to havean elevated risk rating at the operational stage should form the focus of hazard management (e.g. targetingmonitoring) if the slope has already been excavated.
An example application of the SSAM has been presented validating the methodology’s results against the known performance of an excavated coal mine slope.
ACKNOWLEDGEMENTS This conference paper is a condensed version of a journal paper with the same title published in the Internal Journal of Mining Sciences and Technology (McQuillan et al. 2018).
The research presented in this paper is funded by the Australian Coal Association Research Program (ACARP).
The authors would also like to acknowledge and thank the following mining companies who have provided case studies for this research project: Anglo American, Peabody, BHP Billiton, Thiess, Downer Mining, Rio Tinto, Coal & Allied and New Hope Coal.
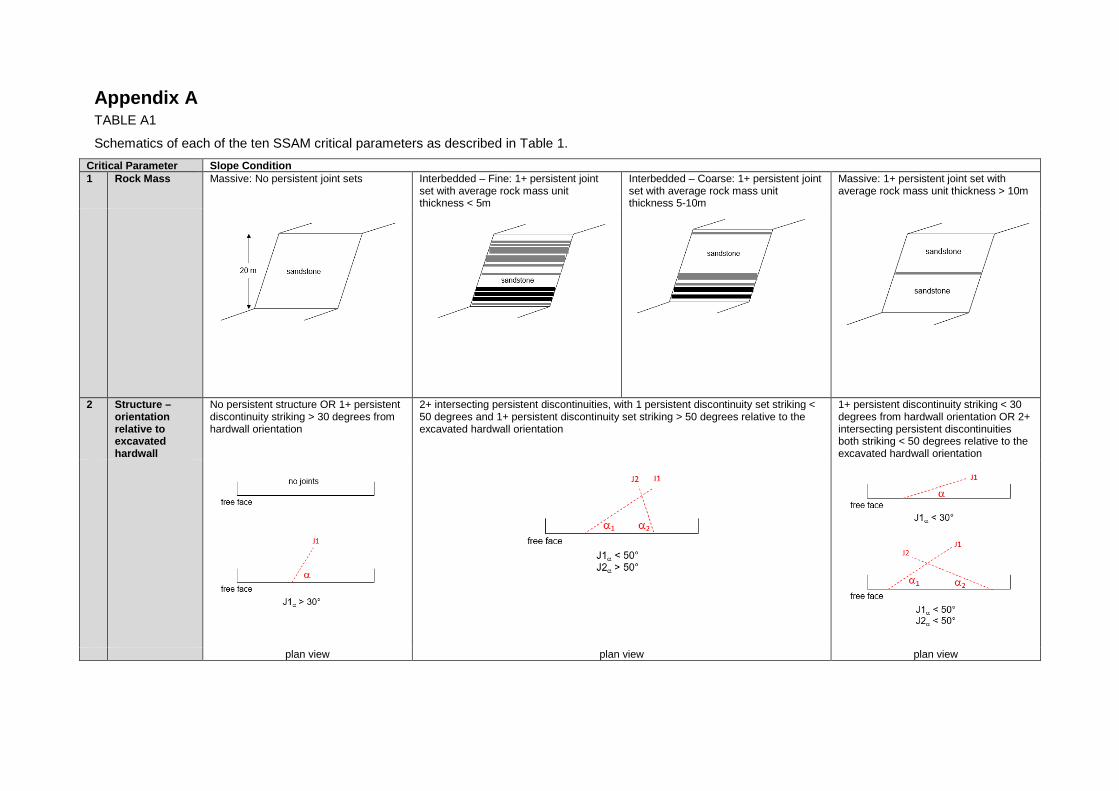
Appendix A TABLE A1
Schematics of each of the ten SSAM critical parameters as described in Table 1. Critical Parameter Slope Condition 1 Rock Mass Massive: No persistent joint sets Interbedded – Fine: 1+ persistent joint
set with average rock mass unit thickness < 5m
Interbedded – Coarse: 1+ persistent joint set with average rock mass unit thickness 5-10m
Massive: 1+ persistent joint set with average rock mass unit thickness > 10m
2 Structure – orientation relative to excavated hardwall
No persistent structure OR 1+ persistent discontinuity striking > 30 degrees from hardwall orientation
2+ intersecting persistent discontinuities, with 1 persistent discontinuity set striking < 50 degrees and 1+ persistent discontinuity set striking > 50 degrees relative to the excavated hardwall orientation
1+ persistent discontinuity striking < 30 degrees from hardwall orientation OR 2+ intersecting persistent discontinuities both striking < 50 degrees relative to the excavated hardwall orientation
plan view plan view plan view

Critical Parameter Slope Condition 3a Structure dip
1 persistent discontinuity
Structure dip < 80 degrees into the face OR no persistent discontinuities
Structure dip < 40 degrees into the excavation
Structure dip > 60 degrees into the excavation
Structure dip 40-60 degrees into the excavation OR structure dip 80-90 degrees into the face
3b Structure dip 2+ persistent discontinuities
Structure dip < 40 degrees into the excavation
Structure dip 40-60 degrees into the excavation
Structure dip > 60 degrees into the excavation
section view section view section view section view 4 Lateral
conditions Strata/bedding is horizontal or dips away from the face
Strata/bedding locally rolls or dips into the face Strata/bedding consistently rolls or dips into the face AND/OR a coal or carbonaceous band is present at crest or base of persistent structure
section view section view section view

Critical Parameter Slope Condition 5 Water No water seepage OR Dry slope
conditions Consistent water seepage out of face (i.e. stable head) Change in seepage conditions (e.g.
sudden new, increase, decrease, or stoppage in seepage conditions without causal weather event OR water ponding at crest OR saturated at toe
6 Wall geometry Straight, no inflections OR elbows Concave inflection/s < 180 degrees Convex inflection/s > 180 degrees 90 degree elbow
plan view plan view plan view plan view

Critical Parameter Slope Condition 7 Weathering Fresh: no orange staining on defect
surfaces OR in fresh horizon Moderately weathered: some orange staining on defect surfaces - may be in weathered or fresh horizon
Extremely weathered: >70% orange staining on defect surfaces OR in weathered horizon
8 Structure surface geometry
Wavy, several undulations Wavy, moderate undulations Smooth, low undulations OR known previous shearing on discontinuity surface OR surface conditions unknown
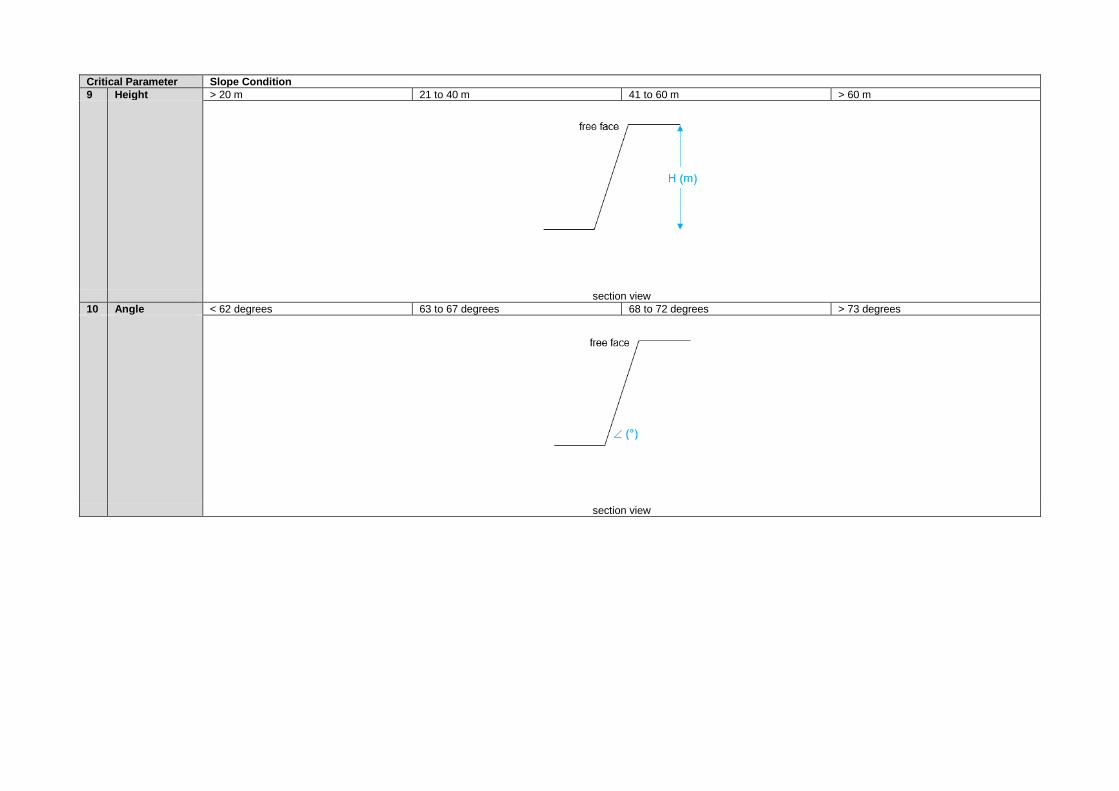
Critical Parameter Slope Condition 9 Height > 20 m 21 to 40 m 41 to 60 m > 60 m
section view 10 Angle < 62 degrees 63 to 67 degrees 68 to 72 degrees > 73 degrees
section view
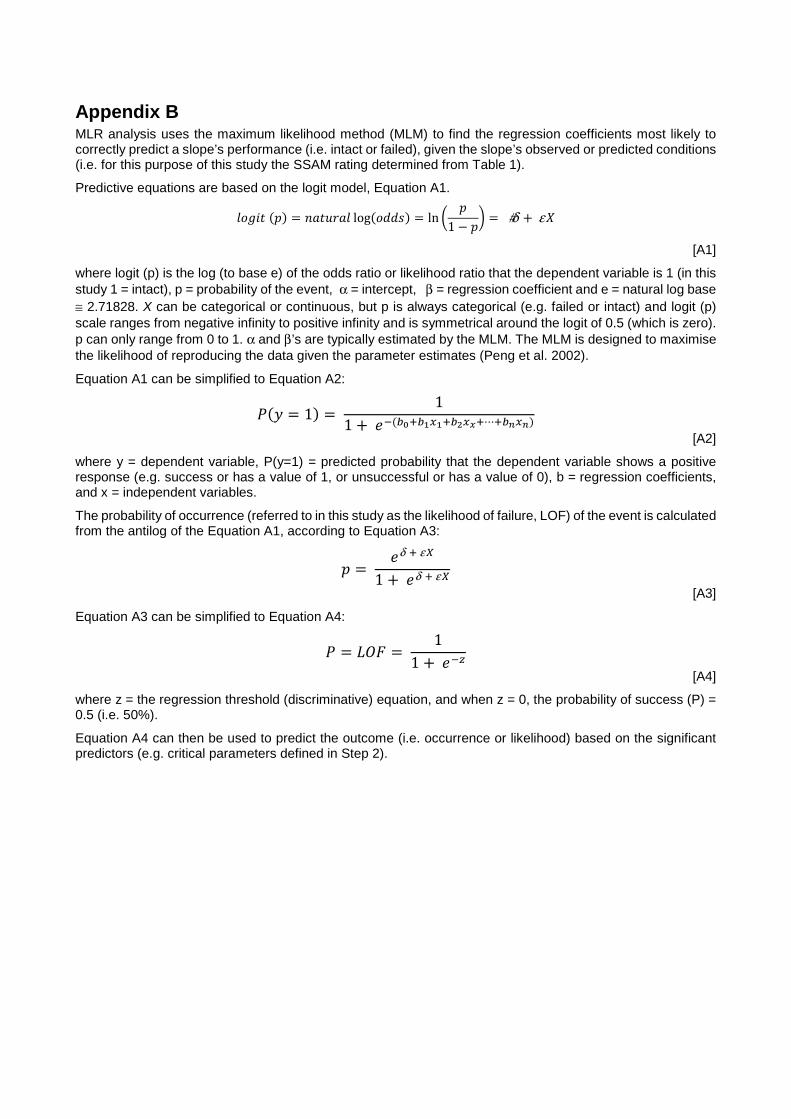
Appendix B MLR analysis uses the maximum likelihood method (MLM) to find the regression coefficients most likely to correctly predict a slope’s performance (i.e. intact or failed), given the slope’s observed or predicted conditions (i.e. for this purpose of this study the SSAM rating determined from Table 1).
Predictive equations are based on the logit model, Equation A1.
𝑠𝑠𝑠𝑠𝑟𝑟𝑟𝑟𝑟𝑟 (𝑠𝑠) = 𝑟𝑟𝑟𝑟𝑟𝑟𝑛𝑛𝑟𝑟𝑟𝑟𝑠𝑠 log(𝑠𝑠𝑑𝑑𝑑𝑑𝑠𝑠) = ln �𝑠𝑠
1 − 𝑠𝑠� = #δ + ε𝑋𝑋
[A1]
where logit (p) is the log (to base e) of the odds ratio or likelihood ratio that the dependent variable is 1 (in this study 1 = intact), p = probability of the event, α = intercept, β = regression coefficient and e = natural log base ≅ 2.71828. X can be categorical or continuous, but p is always categorical (e.g. failed or intact) and logit (p)scale ranges from negative infinity to positive infinity and is symmetrical around the logit of 0.5 (which is zero).p can only range from 0 to 1. α and β’s are typically estimated by the MLM. The MLM is designed to maximisethe likelihood of reproducing the data given the parameter estimates (Peng et al. 2002).
Equation A1 can be simplified to Equation A2:
𝑃𝑃(𝑦𝑦 = 1) = 1
1 + 𝑒𝑒−(𝑏𝑏0+𝑏𝑏1𝑥𝑥1+𝑏𝑏2𝑥𝑥𝑥𝑥+⋯+𝑏𝑏𝑛𝑛𝑥𝑥𝑛𝑛) [A2]
where y = dependent variable, P(y=1) = predicted probability that the dependent variable shows a positive response (e.g. success or has a value of 1, or unsuccessful or has a value of 0), b = regression coefficients, and x = independent variables.
The probability of occurrence (referred to in this study as the likelihood of failure, LOF) of the event is calculated from the antilog of the Equation A1, according to Equation A3:
𝑠𝑠 = 𝑒𝑒δ + ε𝑋𝑋
1 + 𝑒𝑒δ + ε𝑋𝑋 [A3]
Equation A3 can be simplified to Equation A4:
𝑃𝑃 = 𝐿𝐿𝐿𝐿𝐿𝐿 = 1
1 + 𝑒𝑒−𝑧𝑧 [A4]
where z = the regression threshold (discriminative) equation, and when z = 0, the probability of success (P) = 0.5 (i.e. 50%).
Equation A4 can then be used to predict the outcome (i.e. occurrence or likelihood) based on the significant predictors (e.g. critical parameters defined in Step 2).
REFERENCES Abrahams, A. Parsons, A. 1987. Identification of strength equilibrium rock slopes: Further statistical considerations. Earth
Surface Processes and Landforms. 12:631-635.
Alejano, L. Stockhausen, H. Alonso, E. Bastante, F. Oyanguren, P. 2008. ROFRAQ: a statistics-based empirical method for assessing accident risk from rockfalls in quarries. Int. J. Rock Mech & Mining Sciences. 45(8):1252-1272.
Aydan, Ö. Ulusay, R. Tokashiki, N. 2014. A new rock mass quality rating system: Rock Mass Quality Rating (RMQR) and its application to the estimation of geomechanical characteristics of rock masses. Rock Mech Rock Eng. 47:1255-1276.
Bar, N. Barton, N. 2017. The Q-slope method for rock slope engineering. Rock Mech. Rock Eng. 50:3307-3322.
Barton, N. Bar, N. 2015. Introducing the Q-slope method and its intended use within civil and mining engineering projects. In: Schubert W, Kluckner A (eds). Proceedings of the ISRM Regional Symposium Eurock 2015 and 64th Geomechanics Colloqium. Salzburg. 157-162.
Bieniawski, Z. 1976 Rock mass classification in rock engineering. In: Bieniawski, ZT (ed). Exploration for Rock Engineering. Balkema, Cape Town. 1:97-106.
Bieniawski, Z. 1989. Engineering rock mass classifications. John Wiley & Sons. New York.
Cai, M. Kaiser, P. Uno, H. Tasaka, Y. Minami, M. 2004. Estimation of rock mass deformation modulus and strength of jointed hard rock masses using the GSI system. Int. J. of Rock Mech. & Mining Sciences. 41:3-19.
Canbulat, I. Munsamy, L. Minney, D. 2004. A risk assessment tool for open cast mining in South Africa. In: Proceedings of the 23rd Int. Conference on Ground Control in Mining. Morgantown. 205-210.
Carter, T. 2014. Guidelines for use of the scaled span method for surface crown pillar stability assessment. In: Proceedings of the 1st Int. Conference on Applied Empirical Design Methods in Mining. Lima.
Chen, Z. 1995. Recent developments in slope stability analysis. In: Herausgeber, editor. Proceedings ISRM of the 8th Int. Congress Rock Mech. Tokyo. 3:1041-1048.
Colwell, M. 2006. A study of the mechanics of coal mine rib deformation and rib support as a basis for engineering design. Doctoral Thesis, School of Engineering – Mining Engineering Program, The University of Queensland. Brisbane.
Ferrari, F. Giacomini, A. Thoeni, K. Lambert, C. 2017. Qualitative evolving rockfall hazard assessment for highwalls. Int. J. Rock Mech. & Mining Sciences. 98:88-101.
Gibson, W. 2011. Probabilistic methods for slope analysis and design, Australian Geomechanics. 46(3):1-12.
Hack, R. 1998. Slope stability probability classification. ITC Delft Publication. Enschede, Netherlands. 43.
Hoek, E. Kaiser, P. Bawden, W. 1995. Support of underground excavations in hard rock. Balkema, Rotterdam.
International Society for Rock Mechanics (ISRM) Commission on Standardization of Laboratory and Field Tests. 1978. Suggested methods for the quantitative description of discontinuities in rock masses. Int. J. Rock Mech Min. Sci. & Geomech. 15:319-368.
Jakubec, J. Laubscher, D. 2000. The IRMR/MRMR rock mass classification system for jointed rock masses. SME. 475-481.
Jhanwar, J. 2012. A classification system for the slope stability assessment of opencast coal mines in Central India. Rock Mech. Rock Eng. 45:631-637.
Kayabasi, A. Yesiloglu-Gultekin, N. Gokceoglu, C. 2015. Use of non-linear prediction tools to assess rock mass permeability using various discontinuity parameters. Engineering Geology. 185:1-9.
Kristen, H. 1983. Significance of the probability of failure in slope engineering, The Civil Engineer in South Africa. 25(1):17-27.
Laubscher, D. 1990. A geomechanics classification system for the rating of rock mass in mine design. J. of South African Institute of Mining and Metallurgy. 90(10):279-293.
Lindsay, P. Campbell, R. Fergusson, D. Gillard, G. Moore, T. 2001. Slope stability probability classification, Waikato Coal Measures, New Zealand. Int. J. of Coal Geology. 45:127-145.
Marinos V, Marinos P, Hoek E. 2005. The geological strength index: applications and limitations. Bull. Eng. Geol. Environ. 64:55-65.
Mawdesley, C. Trueman, R. Whiten, W. 2001. Extending the Mathews stability graph for open-stope design. Mining Technology. 110(1):27-39.
McQuillan, A. Canbulat, I. Payne, D. Oh, J. 2018. New risk assessment methodology for coal mine excavated slopes. Int J Min Sci Technol. In press: https://doi.org/10.1016/j.ijmst.2018.07.001

Naghadehi, M. Jimenez, R. KhaloKakaie, R. Jalali, S. 2013. A new open-pit slope stability index defined using the improved rock engineering systems approach. Int. J. Rock Mech. & Mining Sciences. 61:1-14.
Peng, C. Lee, K. Ingersoll, G. 2002. An Introduction to Logistic Regression Analysis and Reporting. J. Educational Research. 96(1):3-14.
Pothitos, F. Li, T. 2007. Slope design criteria for large open pits: case study. In: Potvin Y (ed). Proceedings of the 2007 International Symposium on Rock Slope Stability in Open Pit Mining and Civil Engineering, Australian Centre for Geomechanics. Perth. 341-352.
Priest, S. Brown, E. 1983. Probabilistic stability analysis of variable rock slopes. Transactions of Institution of Mining and Metallurgy, Section A: Mining Industry. 92:A1-A12.
Read, J. Stacey, P. (eds). 2008. Guidelines for open pit slope design. CSIRO Publishing. Collingwood.
Robertson, A. 1988. Estimating weak rock strength. In: Proceedings of the SME annual meeting. Phoenix. 1-5.
Romana, M. 1985. New adjustment ratings for application of Bieniawski classification to slopes, In: Proceedings ISRM Int. Symposium on the Role of Rock Mech. Zacatecas. 49-53.
RStudio. 2016. RStudio ©. https://www.rstudio.com/products/rstudio/
Schellman, M. 2006. Slope design for the east wall of Mantoverde mine, Chanaral, Chile. In: Proceedings Int. Symposium on Stability of Rock Slopes in Open Pit Mining and Civil Engineering situations. Cape Town.
Selby, M. 1980. A rock mass strength classification for geomorphic purposes: with tests from Antarctica and New Zealand. Zeit Geomorph. 24(1):31-51.
Sjoberg, J. 1999. Analysis of large scale rock slopes. Doctoral Thesis, Lulea University of Technology Department of Civil and Mining Engineering Division of Rock Mechanics. Sweden.
Sullivan, T. 2013. Global slope performance index. In: Proceedings Slope Stability 2013. Brisbane. 55-80.
Swan, G. Sepulveda, R. 2000. Slope stability at Collahausi, In: Hustrulid W, McCarter K, van Zyl D (eds). Slope Stability in Surface Mining SME. Denver. 163-170.
Systat. 2014. SigmaPlot ©. https://systatsoftware.com/products/sigmaplot/
Taheri, A. Taheri, A. Tani, K. 2006. A modified rock mass classification system for preliminary design of rock slopes. In: Proceedings of the 4th Asian Rock Mechanics Symposium. Singapore. 280-288.
Tomás, R. Delgado, J. Serón, J. 2007. Modification of slope mass rating (SMR) by continuous functions. Int. J. Rock Mech. And Mining Sciences. 44:1062-1069.
Ünal, E. 1996. Modified rock mass classification: M-RMR system. Milestones in Engineering, The Bieniawski Jubilee Collection. Balkema. 203-223.
Zheng, W. Zhuang, X. Tannant, D. Cai, Y. Nunoo, S. 2014. Unified continuum/discontinuum modeling framework for slope stability assessment. Engineering Geology. 179:90-101.
Zhu, H. Zhuang, X. Cai, Y. 2011. High rock slope stability analysis using the enriched meshless shepard and least squares method. Int. J. Computational Methods. 8(2):209-228.
Raise bore stability and risk assessment empirical database update
A.R. Penney1, R.M. Stephenson2 and M.J. Pascoe3
1. Principal Geotechnical Engineer, AMC Consultants Pty Ltd, Melbourne, VIC, Australia. MAusIMM(CP)Email: [email protected]. Principal Geotechnical Engineer, AMC Consultants Pty Ltd, Perth, WA, Australia. MAusIMM(CP)Email: [email protected]. Chief Advisor Group Technical Assurance, Rio Tinto, Perth, WA, Australia. MAusIMM(CP)Email: [email protected]
ABSTRACT The empirical McCracken and Stacey stability and risk assessment method has been in use for more than 20 years to assess geotechnical stability issues for raise bored shafts. The methodology has been applied with various levels of success. Increasingly, trends in mining and civil tunnelling have been towards larger diameter, single pass, raise bored shafts to rapidly provide means of ventilation, material movement (ore passes), or emergency egress. Identifying and assessing potentially problematic zones before raise boring commences can allow for appropriate risk-based decisions on construction, or to investigate alternative solutions. The implementation of a proactive solution to raising through an identified weak zone is preferred to the application of an engineered solution to an area subjected to substantial instability or failure. Methods for investigating potentially problematic areas are discussed in this paper based on AMC’s benchmarking data. Proactive investigation programmes resulting from these investigations are also discussed.
Previous publications discussing the benchmarking data have concentrated on Australian case studies. Increased efforts and recent updates have been made to expand the database to include international case studies. This has provided further refinement of lower bound ‘raise bore rock quality index’ (QR) values, and various rock mass parameters for stability assessments.
INTRODUCTION Raise boring of shafts and ore passes offers an economic, safe, and rapid excavation method compared to other most other vertical excavation methods. However, the raise walls are unsupported during the excavation process, and there are limited options for dealing with any significant instability that develops during reaming. Appropriate geotechnical investigations remain critical to assessing the short-term and long-term stability of the excavation, and in determining the maximum stable unsupported spans. The investment in a raise can be substantial (several million dollars) and the consequences of a major failure can be highly disruptive to operations. Properly-conducted geotechnical risk assessments are essential for risk management of raiseboring.
The McCracken and Stacey (1989) assessment method (herein the M&S method) is used for determining the likely performance of raise bored excavations. This method is typically the technique used for the initial evaluation of stability and risk of these excavations. Peck et al (2011) presented a database of largely Australian case studies to update the empirical stability charts of the original work, and to present suggested limits for stability considerations.
Typically, the greatest area of uncertainty is the time dependant behaviour or performance of raise bore shafts, especially when access is restricted for ventilation or other purposes. The areas of greatest concern are generally near-surface weathered zones (including cover sequence materials), fault zones, unfavourable alteration zones, and highly anisotropic rock mass conditions. Challenges remain in improving the empirical charts in these areas, and the application of the charts should be considered with caution.
This paper presents an update to the results contained in the database of raisebore excavation performance and assessment methods, building on the work of Peck et al (2011). This update has more than doubled the total number of case studies included, and now contains numerous international raisebore case studies in both mining and civil tunnelling applications. Names and locations of all data points remain confidential, with the database targeted as providing an empirical estimate of stability.
The authors support, and strongly recommend, appropriate numerical assessments of vertical excavation stability, particularly where the service life is critical for on-going successful mining or civil requirements. While the M&S method is best applied to isotropic and blocky rock masses, it also remains a valuable tool for the initial stability considerations in strongly anisotropic rock masses. However, given the limitations of the method, numerical assessments should be applied for further stability considerations in these rock masses.
With a trend of increasing diameters of raise bored shafts being considered for many underground mines, having confidence in the empirical and analytical methods is crucial. Guidelines for standard processes to follow are provided in this paper, to assist the engineer to reliably design and assess the risks associated with this excavation technique. Of concern to the authors is the errors made from the incorrect collection of basic input parameters resulting in invalid stability assessments. The parameters are summarised below together with some notes to assist with the correct method of data collection for future assessments.
ASSESSMENT METHOD The underlying empirical assessment tool remains the M&S method. This method is based primarily on the Q-system (Barton et al, 1974), with minor modification factors applied. It is assumed that the reader is familiar with the Q-system, RMR (Bieniawski, 1989), and the M&S method, and as such they are not repeated in detail here.
For consistency with previous publications, the authors continue to use the following definitions for performance of the raisebore excavation:
• Stable – a raise bored shaft which performs its required function for at least two years without repair.
• Overbreak – limited fallout from the shaft walls without impairing its required function.
• Stable + support – situations where the ground was reinforced prior to, or immediately after, reamingto create a stable excavation.
• Collapsed – an excavation which was not able to achieve its designed purpose at any stage.
The raisebore database now contains 139 case studies. Over 50% of cases are from Australian mines and the remainder are from international locations.
The premace of the M&S method is to determine the appropriate QR value by evaluating the Q-value and applying various adjustment factors considered relevant for raisebore stability. The M&S method uses the following equation to determine the maximum stable span.
𝑆𝑆𝑆𝑆𝑆𝑆𝑆𝑆𝑚𝑚𝑚𝑚𝑚𝑚 = 2 𝑅𝑅𝑆𝑆𝑅𝑅 𝑄𝑄𝑅𝑅0.4
Where RSR is the raise bore stability ratio, a term for assigning an acceptable risk profile relating to the risk tolerance level of the company or project. This can also be considered in terms of the expected life of the excavation, or the criticality of the shaft.
To assess the worst-case conditions (the most likely areas of instability), the lower bound QR is selected from a plot of QR values, typically against hole depth (Figure 1). This lower bound QR value is then plotted with other parameters (described later) to estimate stability.
Using the maximum span equation above, the same method can also be used to conduct a basic quantitative risk assessment, from which project directors and management can make informed decisions on the proposed excavation. An example of this risk assessment is presented in Figure 2 where the maximum raise bore diameter is plotted with depth. In this example, the assessment indicates that a raise bored shaft with a planned diameter of 3.2 m would not be stable for about 18% of the planned shaft, with a QR value resulting in a span less than the planned raise diameter. A more informed decision can then be made, including whether to accept the risks and proceed with the planned excavation diameter and location, reduce the planned diameter/s, or relocate the shaft and complete a new investigation.
COMMON ERRORS IN RAISE BORE EVALUATIONS The addition of more than 75 case studies to the database continues to highlight many errors in the evaluation of key assessment parameters. Several parameters with errors consistently observed include the following.
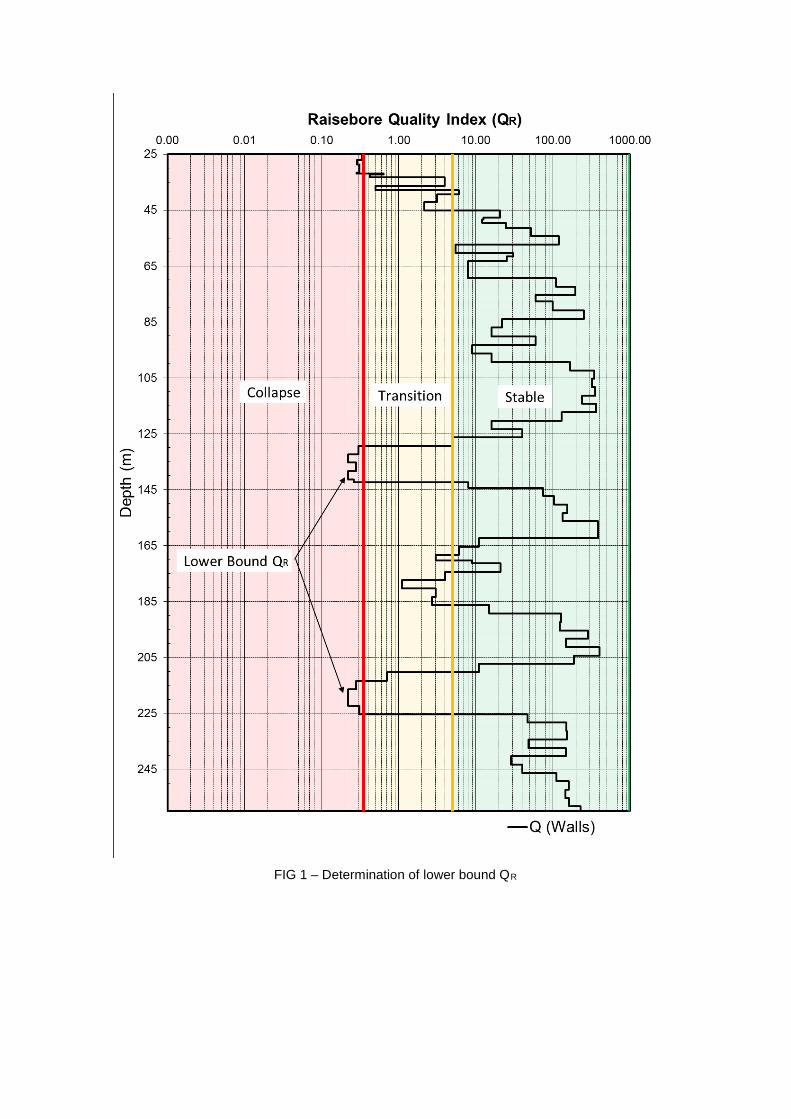
FIG 1 – Determination of lower bound QR

FIG 2 – Percentage of investigation hole with a lower bound QR <0.35
Stress Reduction Factor (SRF) This factor is strongly debated amongst engineers using the M&S method. SRF values from the Q-system have changed a number of times since its original publication in 1974. McCraken and Stacey (1989) identified this, and proposed that the SRF be determined based on the method proposed by Kirsten (1988). However, this method assumes the maximum principal stress is vertical, a situation rarely observed outside of South Africa, where it was originally proposed. Peck (2000) proposed an updated method to allow SRF to be determined where maximum principal stress conditions are sub-horizontal. The influence of stress-induced damage on raise bore stability is accounted for by applying an appropriate SRF value. It is critical to ensure that the SRF is determined and applied to suit the local stress environment, either by using methods described
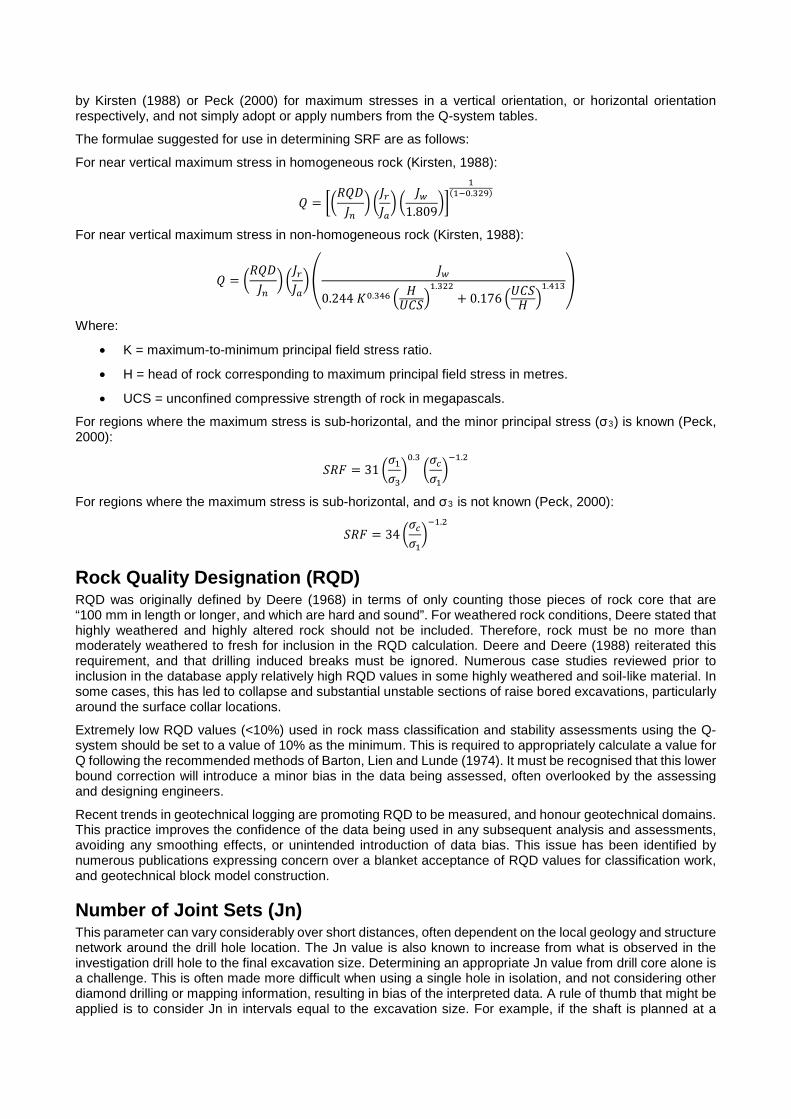
by Kirsten (1988) or Peck (2000) for maximum stresses in a vertical orientation, or horizontal orientation respectively, and not simply adopt or apply numbers from the Q-system tables.
The formulae suggested for use in determining SRF are as follows:
For near vertical maximum stress in homogeneous rock (Kirsten, 1988):
𝑄𝑄 = ��𝑅𝑅𝑄𝑄𝑅𝑅𝐽𝐽𝑛𝑛
� �𝐽𝐽𝑟𝑟𝐽𝐽𝑚𝑚� �
𝐽𝐽𝑤𝑤1.809
��1
(1−0.329)
For near vertical maximum stress in non-homogeneous rock (Kirsten, 1988):
𝑄𝑄 = �𝑅𝑅𝑄𝑄𝑅𝑅𝐽𝐽𝑛𝑛
� �𝐽𝐽𝑟𝑟𝐽𝐽𝑚𝑚��
𝐽𝐽𝑤𝑤
0.244 𝐾𝐾0.346 � 𝐻𝐻𝑈𝑈𝑈𝑈𝑆𝑆�
1.322+ 0.176 �𝑈𝑈𝑈𝑈𝑆𝑆𝐻𝐻 �
1.413�
Where:
• K = maximum-to-minimum principal field stress ratio.
• H = head of rock corresponding to maximum principal field stress in metres.
• UCS = unconfined compressive strength of rock in megapascals.
For regions where the maximum stress is sub-horizontal, and the minor principal stress (σ3) is known (Peck, 2000):
𝑆𝑆𝑅𝑅𝑆𝑆 = 31 �𝜎𝜎1𝜎𝜎3�0.3�𝜎𝜎𝑐𝑐𝜎𝜎1�−1.2
For regions where the maximum stress is sub-horizontal, and σ3 is not known (Peck, 2000):
𝑆𝑆𝑅𝑅𝑆𝑆 = 34 �𝜎𝜎𝑐𝑐𝜎𝜎1�−1.2
Rock Quality Designation (RQD) RQD was originally defined by Deere (1968) in terms of only counting those pieces of rock core that are “100 mm in length or longer, and which are hard and sound”. For weathered rock conditions, Deere stated that highly weathered and highly altered rock should not be included. Therefore, rock must be no more than moderately weathered to fresh for inclusion in the RQD calculation. Deere and Deere (1988) reiterated this requirement, and that drilling induced breaks must be ignored. Numerous case studies reviewed prior to inclusion in the database apply relatively high RQD values in some highly weathered and soil-like material. In some cases, this has led to collapse and substantial unstable sections of raise bored excavations, particularly around the surface collar locations.
Extremely low RQD values (<10%) used in rock mass classification and stability assessments using the Q-system should be set to a value of 10% as the minimum. This is required to appropriately calculate a value for Q following the recommended methods of Barton, Lien and Lunde (1974). It must be recognised that this lower bound correction will introduce a minor bias in the data being assessed, often overlooked by the assessing and designing engineers.
Recent trends in geotechnical logging are promoting RQD to be measured, and honour geotechnical domains. This practice improves the confidence of the data being used in any subsequent analysis and assessments, avoiding any smoothing effects, or unintended introduction of data bias. This issue has been identified by numerous publications expressing concern over a blanket acceptance of RQD values for classification work, and geotechnical block model construction.
Number of Joint Sets (Jn) This parameter can vary considerably over short distances, often dependent on the local geology and structure network around the drill hole location. The Jn value is also known to increase from what is observed in the investigation drill hole to the final excavation size. Determining an appropriate Jn value from drill core alone is a challenge. This is often made more difficult when using a single hole in isolation, and not considering other diamond drilling or mapping information, resulting in bias of the interpreted data. A rule of thumb that might be applied is to consider Jn in intervals equal to the excavation size. For example, if the shaft is planned at a

diameter of 5 m, Jn should be assessed at intervals of about 5 m because joints within that interval could intersect each other at the scale of the excavation. Hence, the same Jn value might be assigned across several logging intervals if they are less than 5 m.
Groundwater (Jw) Almost all of the recent case studies included in the database have applied dry conditions for the entire assessment of groundwater conditions for the raise bore excavation. Five of the new overbreak case studies indicated that fall-off occurred in areas where groundwater is present, reducing the local rock mass strength. Re-examination of the drilling logs identified notes from the drilling contractors suggesting the presence of groundwater (uncharacteristic water pressures). Investigation of core photos and drill core (when still available) also indicated that open fractures and stained/weathered defect surfaces were present, and in many cases, logged in the joint alteration parameter. Groundwater is also an important consideration for ventilation shafts, and should be assessed separately for these types of shafts. An example of an indication of potential groundwater in core is presented in Figure 3.
FIG 3 – Examples of potential water bearing zones in drill core
RAISE BORE DATABASE UPDATE The M&S method proposed a number of additional assessment parameters to evaluate raise bore stability. Updated charts and recommended design limits are provided.
Rock Mass Blockiness (RQD/Jn) The indicative blockiness of the rock mass is sometimes inferred by the RQD/Jn component of the Q-system, measured across the geotechnical domain as a maximum interval length, and sub-divided into core run lengths depending on the assessment accuracy and reliability required. The M&S method suggests this is assessed using the lower bound QR value, and best assessed with depth along the investigation hole. Figure 4 presents the raise bore assessment results contained in the database.
From the data presented, a reasonable correlation is observed between the blockiness parameter, the lower bound QR, and the stability of the excavation. A large percentage of raise bore excavations in the dataset with a blockiness parameter of < 6, and a lower bound QR of <0.35 had collapsed. Previous work had suggested a trend may exist, but the dataset was too small at that time. However, if the blockiness parameter plots below these limit lines, this does not necessarily predict collapse, as this region also contains 5% of stable cases, 50% of overbreak cases, and 37% of stable with support cases. This suggests that additional investigations and assessments will be required to appropriately evaluate stability.
Defect Shear Strength (Jr/Ja) Performance of raise bore excavations using the defect shear strength parameter and lower bound QR is presented in Figure 5. Low Jr/Ja values indicate material with low frictional resistance, and typically result in instability due to wedge or unravelling failure.
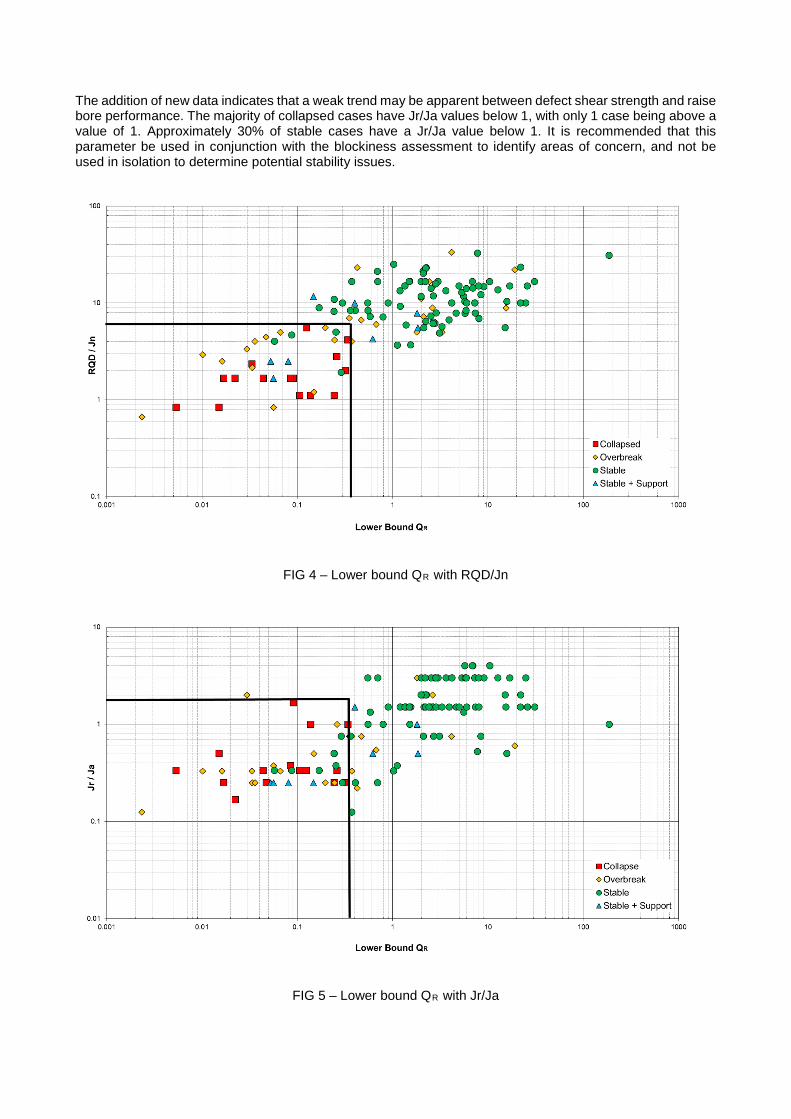
The addition of new data indicates that a weak trend may be apparent between defect shear strength and raise bore performance. The majority of collapsed cases have Jr/Ja values below 1, with only 1 case being above a value of 1. Approximately 30% of stable cases have a Jr/Ja value below 1. It is recommended that this parameter be used in conjunction with the blockiness assessment to identify areas of concern, and not be used in isolation to determine potential stability issues.
FIG 4 – Lower bound QR with RQD/Jn
FIG 5 – Lower bound QR with Jr/Ja
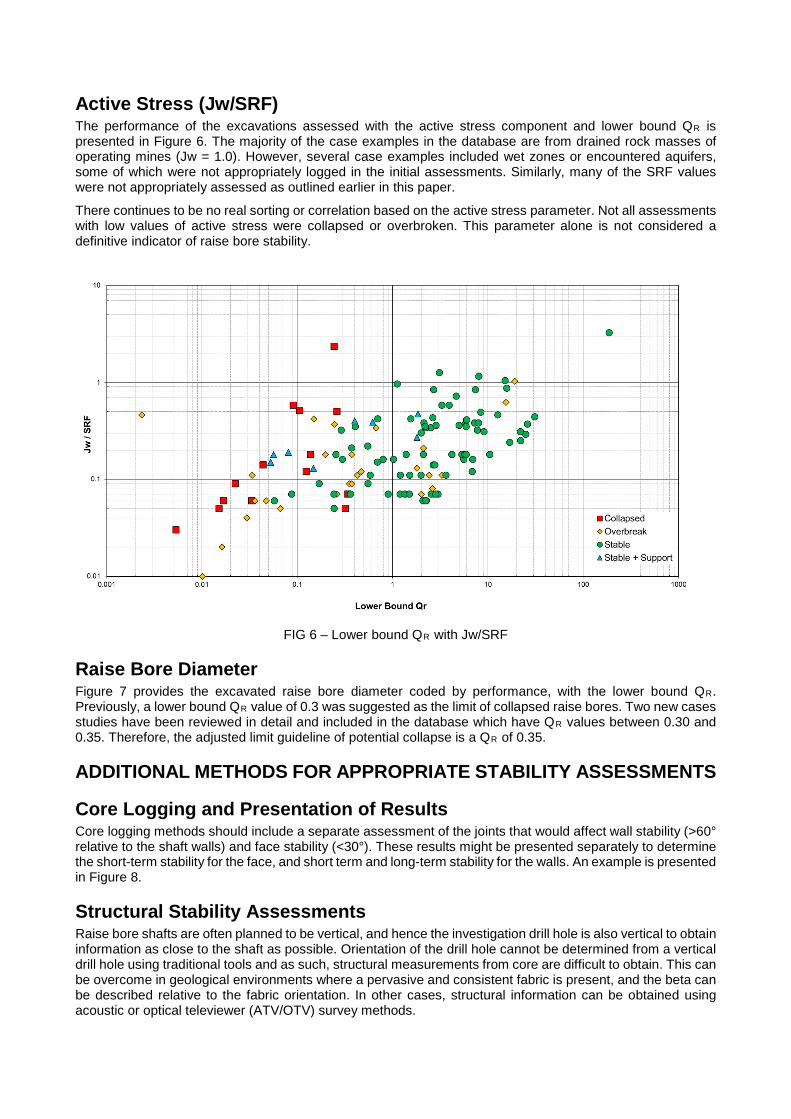
Active Stress (Jw/SRF) The performance of the excavations assessed with the active stress component and lower bound QR is presented in Figure 6. The majority of the case examples in the database are from drained rock masses of operating mines (Jw = 1.0). However, several case examples included wet zones or encountered aquifers, some of which were not appropriately logged in the initial assessments. Similarly, many of the SRF values were not appropriately assessed as outlined earlier in this paper.
There continues to be no real sorting or correlation based on the active stress parameter. Not all assessments with low values of active stress were collapsed or overbroken. This parameter alone is not considered a definitive indicator of raise bore stability.
FIG 6 – Lower bound QR with Jw/SRF
Raise Bore Diameter Figure 7 provides the excavated raise bore diameter coded by performance, with the lower bound QR. Previously, a lower bound QR value of 0.3 was suggested as the limit of collapsed raise bores. Two new cases studies have been reviewed in detail and included in the database which have QR values between 0.30 and 0.35. Therefore, the adjusted limit guideline of potential collapse is a QR of 0.35.
ADDITIONAL METHODS FOR APPROPRIATE STABILITY ASSESSMENTS
Core Logging and Presentation of Results Core logging methods should include a separate assessment of the joints that would affect wall stability (>60° relative to the shaft walls) and face stability (<30°). These results might be presented separately to determine the short-term stability for the face, and short term and long-term stability for the walls. An example is presented in Figure 8.
Structural Stability Assessments Raise bore shafts are often planned to be vertical, and hence the investigation drill hole is also vertical to obtain information as close to the shaft as possible. Orientation of the drill hole cannot be determined from a vertical drill hole using traditional tools and as such, structural measurements from core are difficult to obtain. This can be overcome in geological environments where a pervasive and consistent fabric is present, and the beta can be described relative to the fabric orientation. In other cases, structural information can be obtained using acoustic or optical televiewer (ATV/OTV) survey methods.

FIG 7 – Lower bound QR with raisebore diameter
The interpreted results of an ATV/OTV survey can be assessed for potential structural instability through the identification of structures that could intersect one another to form blocks. Blocky ground is often easy to determine from the results if a systematic approach is adopted in the assessment, for example highlighting structures of similar orientation by colour (Stephenson and Sandy, 2014).
Furthermore, ATV/OTV surveys can be used to investigate the raise bore pilot hole. This is particularly useful if the investigation drill hole was not drilled close to the site, or had deviated substantially from the planned location. The information obtained from the survey can be used to determine areas of poor ground or stress-induced failure where breakout of the pilot hole could have occurred. This type of information is particularly useful for back-reaming.
Great care is required in raise boring in ‘blocky’ rock masses, as unravelling from the face can lead to rough reaming conditions. These in turn can cause damage to the cutter head and lead to uneven loading and torque in the drill string. The authors are aware of a number of cases where drill string failure has occurred in these conditions. It is critical that the raise bore contractor has experience in reaming in similar conditions and understands the need to proceed cautiously. When encountered, blocky conditions may require deliberately slower reaming at reduced thrust.
For inclined raises, there is a requirement to complete more detailed wedge stability – fall off from the top of the raise can damage or lock up the head and fall off from the bottom edge of the raise can result in the reaming head becoming stuck if the head requires lowering for any reason.
Stress Assessments Although stress is accounted for in the M&S method, in the authors’ experience if the stresses are sufficiently high relative to rock strength, stress-related damage will occur in rock regardless of the hole diameter. The consequences of stress damage will vary with hole diameter, as the amount of damage in terms of volume of rock is directly proportional to the hole diameter squared. An empirical analysis to assess the potential for borehole breakout can be undertaken using the approach developed by Kaiser et al, 2000 (Figure 9). This approach is considered to be adequate for cylindrical shafts that will not be affected by mining-induced stresses. Numerical modelling methods should be considered to assess potential mining-induced stresses.

FIG 8 – Example of results presentation (face and wall stability)
Weathered Zone Assessments The M&S method was developed for deep, hard rock conditions. Its applicability to weathered rocks might be limited, and hence additional assessments may be employed to determine the stability throughout these zones. If the M&S method assessment indicates that raise boring is not suitable in a weathered zone, the options and associated references which might be considered are:
• Ground improvement using a combination of pressure grouting and the installation of grouted andreinforced piles around the circumference of the raise (Sexton et al, 2008, and Marlow et al, 2013).
• Adopt conventional pre-sink methods using a headframe or crane. Ground improvement might alsobe considered (Murrell and Graaf, 2017).
Additional considerations such as excavation during the ‘dry’ season, and appropriate preparation to line the shaft immediately after completion should be taken into account.

FIG 9 – Graph to determine depth of failure in massive rock (Kaiser et al, 2000)
RECOMMENDATIONS The addition of more than 75 case studies to the empirical M&S method continues to demonstrate that it is a reasonably robust method for determining raise bore stability when conducted correctly. However, as with any empirical system, it is only as good as the data available and used in outlining the trends, and the limitations need to be well understood. It must be recognised that 85% of cases in the current database are from homogeneous rock masses. Raise bored shafts through anisotropic rock masses can experience time dependent creep and squeezing, impacting on the performance of the excavation.
Based on the collective experience of the authors, and the numerous reviews completed on overbroken and collapsed raise bore excavations, the following steps are recommended to ensure that design assessments are completed to a robust standard. This process is considered the minimum requirement.
1. Complete an appropriate McCracken and Stacey assessment for all raise bore investigations. This iscritical for those excavations with a life-of-asset purpose, diameter greater than 3.0 m, or whereexpected problematic geological conditions may be present (high stress, major structure, soft rock,unknown geology). This assessment is to allow appropriate design considerations to be undertaken.If this basic assessment has not been completed, the risks of excavation instability, or potential failureof the raise cannot be determined with any reliability.
2. Plot the QR values, and associated blockiness, shear strength, and active stress components againstdepth.
3. Identify the lower bound QR value. Assess for potential instability (QR value <0.35), and review theselower bound QR depth zones against the blockiness, shear strength, and active stress plots.
4. Assess the maximum stable span with depth, and assess the percentage of the planned hole wherethe Maximum Unsupported Span is less than the planned raise diameter, or determine the raisediameter that meets the acceptance criteria set for the project. Zones of short length (i.e. less than theplanned diameter) that fall below the stable span might be considered suitable for raise boring if theimmediate overlying intervals can provide suitable competency to arrest failures.
5. Ensure structural assessments include wedge assessments, especially for inclined raise boreexcavations.
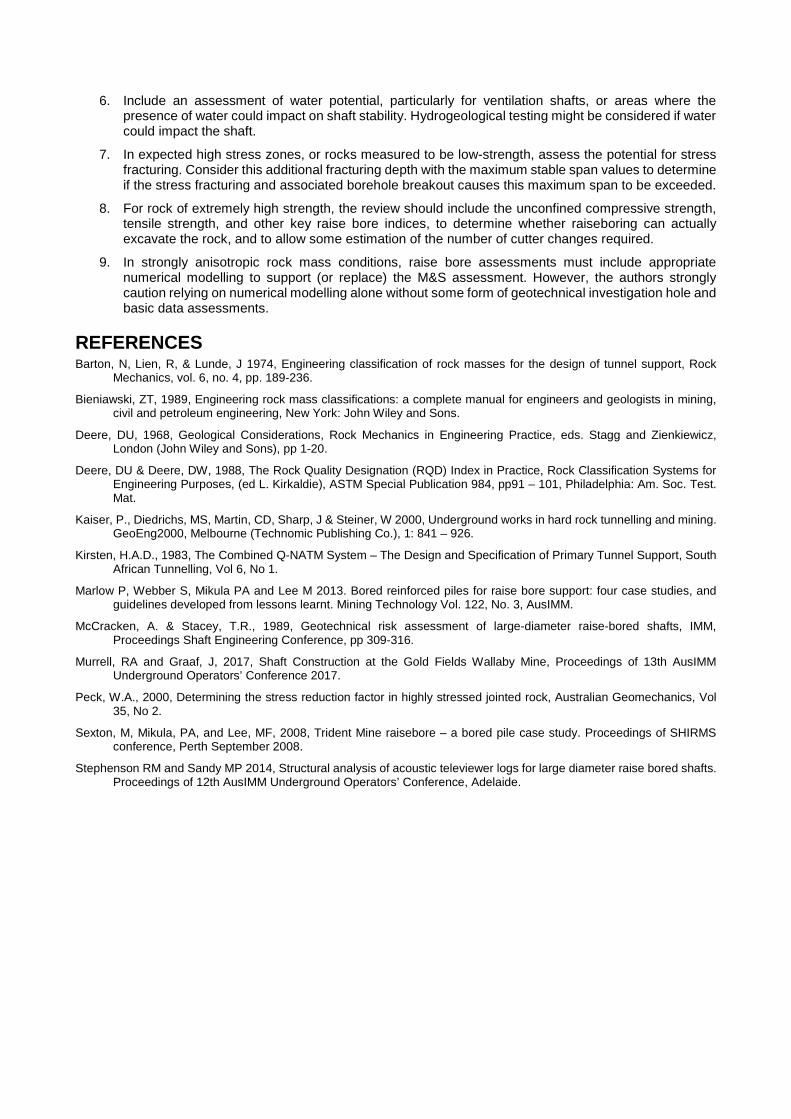
6. Include an assessment of water potential, particularly for ventilation shafts, or areas where thepresence of water could impact on shaft stability. Hydrogeological testing might be considered if watercould impact the shaft.
7. In expected high stress zones, or rocks measured to be low-strength, assess the potential for stressfracturing. Consider this additional fracturing depth with the maximum stable span values to determineif the stress fracturing and associated borehole breakout causes this maximum span to be exceeded.
8. For rock of extremely high strength, the review should include the unconfined compressive strength,tensile strength, and other key raise bore indices, to determine whether raiseboring can actuallyexcavate the rock, and to allow some estimation of the number of cutter changes required.
9. In strongly anisotropic rock mass conditions, raise bore assessments must include appropriatenumerical modelling to support (or replace) the M&S assessment. However, the authors stronglycaution relying on numerical modelling alone without some form of geotechnical investigation hole andbasic data assessments.
REFERENCES Barton, N, Lien, R, & Lunde, J 1974, Engineering classification of rock masses for the design of tunnel support, Rock
Mechanics, vol. 6, no. 4, pp. 189-236.
Bieniawski, ZT, 1989, Engineering rock mass classifications: a complete manual for engineers and geologists in mining, civil and petroleum engineering, New York: John Wiley and Sons.
Deere, DU, 1968, Geological Considerations, Rock Mechanics in Engineering Practice, eds. Stagg and Zienkiewicz, London (John Wiley and Sons), pp 1-20.
Deere, DU & Deere, DW, 1988, The Rock Quality Designation (RQD) Index in Practice, Rock Classification Systems for Engineering Purposes, (ed L. Kirkaldie), ASTM Special Publication 984, pp91 – 101, Philadelphia: Am. Soc. Test. Mat.
Kaiser, P., Diedrichs, MS, Martin, CD, Sharp, J & Steiner, W 2000, Underground works in hard rock tunnelling and mining. GeoEng2000, Melbourne (Technomic Publishing Co.), 1: 841 – 926.
Kirsten, H.A.D., 1983, The Combined Q-NATM System – The Design and Specification of Primary Tunnel Support, South African Tunnelling, Vol 6, No 1.
Marlow P, Webber S, Mikula PA and Lee M 2013. Bored reinforced piles for raise bore support: four case studies, and guidelines developed from lessons learnt. Mining Technology Vol. 122, No. 3, AusIMM.
McCracken, A. & Stacey, T.R., 1989, Geotechnical risk assessment of large-diameter raise-bored shafts, IMM, Proceedings Shaft Engineering Conference, pp 309-316.
Murrell, RA and Graaf, J, 2017, Shaft Construction at the Gold Fields Wallaby Mine, Proceedings of 13th AusIMM Underground Operators’ Conference 2017.
Peck, W.A., 2000, Determining the stress reduction factor in highly stressed jointed rock, Australian Geomechanics, Vol 35, No 2.
Sexton, M, Mikula, PA, and Lee, MF, 2008, Trident Mine raisebore – a bored pile case study. Proceedings of SHIRMS conference, Perth September 2008.
Stephenson RM and Sandy MP 2014, Structural analysis of acoustic televiewer logs for large diameter raise bored shafts. Proceedings of 12th AusIMM Underground Operators’ Conference, Adelaide.

Managing floor heave in an underground longwall coal mine
P Sheffield and P Corbett
ABSTRACT Springvale Mine is an underground coal mine in the western coalfield of New South Wales which utilises retreat longwall mining technique. The mine encountered significant gateroad floor heave issues during retreat of LW415. Floor heave has subsequently impeded longwall advance as well as longwall bolt up and recovery to some extent during the extraction of the next five longwalls. Floor heave at Springvale Mine develops throughout the lifecycle of the mine roadways, and is most prevalent in longwall gateroads. Floor heave has been measured as early as 2 weeks after roadway development and continues to develop through the post-development phase, with a rapid increase in close proximity to the longwall face.
This paper presents a case study of the evolution of understanding of floor heave behaviour at Springvale Mine based on geotechnical characterisation, an intensive convergence monitoring program (roof and floor movement) and spatial correlation of monitored locations with longwall face position. The analysis considers previously known factors contributing to floor heave including mining depth, geological and physical properties of the rock mass and mine design geometry. Investigation results indicate a strong correlation between floor heave magnitude and roof dilation magnitude, geophysically inferred faulting in underlying strata, areas of localised stress concentration and mine roadway dimensions. This paper also discusses the predictive model which was developed as a result of the study, which is now the basis of the floor heave removal program used to manage roadway convergence at the mine. Floor heave monitoring, prediction and management strategies (including floor reinforcement and removal) are also discussed.
INTRODUCTION Springvale Mine is an operating underground coal mine producing coal for both domestic and international markets. Springvale Mine is owned by Centennial Springvale Pty Limited (as to 50%) and Springvale SK Kores Pty Limited (as to 50%) as participants in the Springvale unincorporated joint venture. The Springvale pit top is located approximately 15km to the north-west of Lithgow city and 120km west of Sydney.
Springvale mine commenced its unground operations in 1995 and is currently approved to extract up to 5.5 Mt of run of mine (ROM) of coal per annum mined in Lithgow Seam (Illawarra Coal Measures). The Lithgow seam has a thickness of up to 7m, and the mine’s typical cutting height is 3-3.4m with and average 22% ROM ash. The mine roof consists of up to 4m of coal interbedded with numerous tuffaceous claystone plies (Lidsdale Coal Seam), overlain by a low to medium strength sandstone formation.
Springvale has had a long history of difficult geotechnical conditions including up to 26 roof falls during the production history leading to roof and rib strata management being a top priority for mine management. However, in the recent years (since 2012) large displacements of floor strata (referred to as floor heave) experienced both at the development faces as well as during longwall retreat caused numerous of safety hazards (roof shotfiring) as well as some significant production losses. Due to the ongoing and increasing floor heave management issues a number of tools were adopted to understand the complex nature of this phenomenon.
This paper presents results of a floor heave study based on a floor heave measurements obtained and analysed for Longwalls 419 and 420 at Springvale Mine.
FLOOR HEAVE AT SPRINGVALE MINE Since 2012, the number of roadways affected by floor heave as well as a magnitude of the floor heave at Springvale Mine has increased significantly. In some areas of the mine, up to 1m of floor heave was measured within a few months of roadway development, whilst other areas were affected by several hundred metres of floor heave ahead of the longwall face both in the maingate belt road and travelling road. Furthermore, between 1m to 2m of floor heave was often noted in tailgate roadways, however with planned limited tailgate serviceability the floor heave occurrence in the tailgate does not impact mine safety or operations.
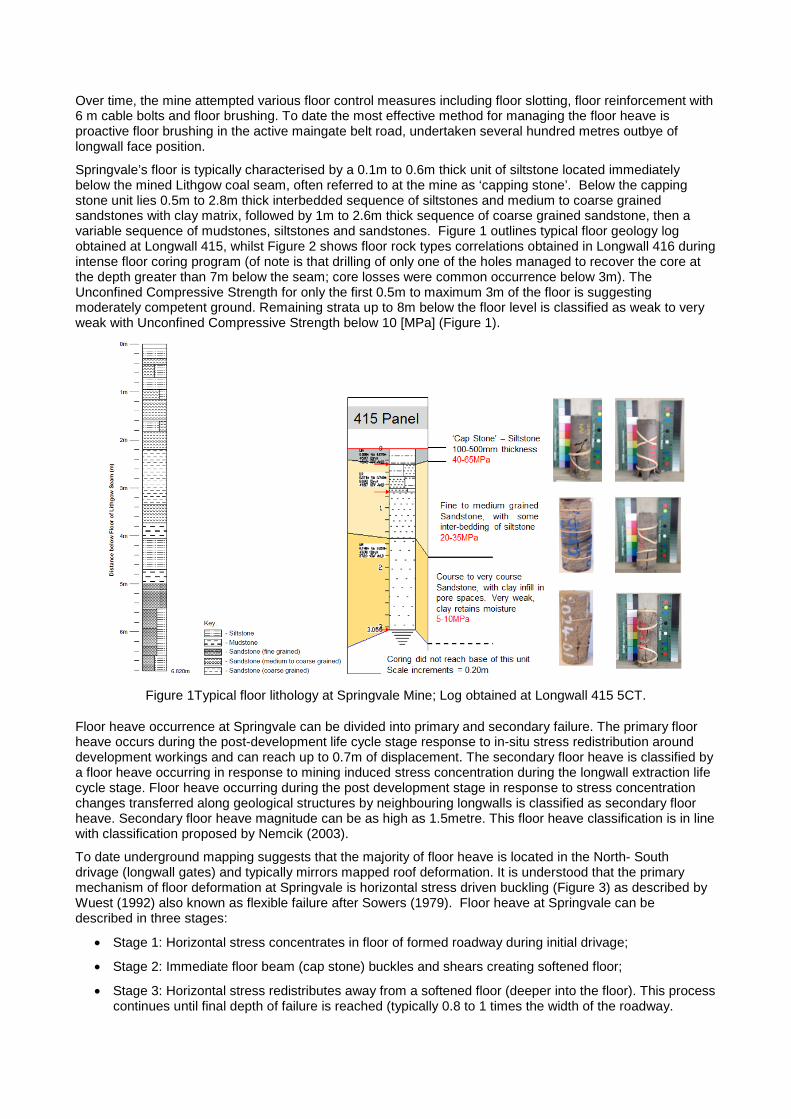
Over time, the mine attempted various floor control measures including floor slotting, floor reinforcement with 6 m cable bolts and floor brushing. To date the most effective method for managing the floor heave is proactive floor brushing in the active maingate belt road, undertaken several hundred metres outbye of longwall face position.
Springvale’s floor is typically characterised by a 0.1m to 0.6m thick unit of siltstone located immediately below the mined Lithgow coal seam, often referred to at the mine as ‘capping stone’. Below the capping stone unit lies 0.5m to 2.8m thick interbedded sequence of siltstones and medium to coarse grained sandstones with clay matrix, followed by 1m to 2.6m thick sequence of coarse grained sandstone, then a variable sequence of mudstones, siltstones and sandstones. Figure 1 outlines typical floor geology log obtained at Longwall 415, whilst Figure 2 shows floor rock types correlations obtained in Longwall 416 during intense floor coring program (of note is that drilling of only one of the holes managed to recover the core at the depth greater than 7m below the seam; core losses were common occurrence below 3m). The Unconfined Compressive Strength for only the first 0.5m to maximum 3m of the floor is suggesting moderately competent ground. Remaining strata up to 8m below the floor level is classified as weak to very weak with Unconfined Compressive Strength below 10 [MPa] (Figure 1).
Figure 1Typical floor lithology at Springvale Mine; Log obtained at Longwall 415 5CT.
Floor heave occurrence at Springvale can be divided into primary and secondary failure. The primary floor heave occurs during the post-development life cycle stage response to in-situ stress redistribution around development workings and can reach up to 0.7m of displacement. The secondary floor heave is classified by a floor heave occurring in response to mining induced stress concentration during the longwall extraction life cycle stage. Floor heave occurring during the post development stage in response to stress concentration changes transferred along geological structures by neighbouring longwalls is classified as secondary floor heave. Secondary floor heave magnitude can be as high as 1.5metre. This floor heave classification is in line with classification proposed by Nemcik (2003).
To date underground mapping suggests that the majority of floor heave is located in the North- South drivage (longwall gates) and typically mirrors mapped roof deformation. It is understood that the primary mechanism of floor deformation at Springvale is horizontal stress driven buckling (Figure 3) as described by Wuest (1992) also known as flexible failure after Sowers (1979). Floor heave at Springvale can be described in three stages:
• Stage 1: Horizontal stress concentrates in floor of formed roadway during initial drivage;
• Stage 2: Immediate floor beam (cap stone) buckles and shears creating softened floor;
• Stage 3: Horizontal stress redistributes away from a softened floor (deeper into the floor). This processcontinues until final depth of failure is reached (typically 0.8 to 1 times the width of the roadway.

The same floor heave behaviour was confirmed at Angus Place Colliery (Springvale’s neighbouring mine) where floor extensometer monitoring recorded greatest movement between 3m and 8m into the floor indicating that stress concentrates below the strong capping stone eventually causing it to buckle.
Figure 2 Example of Floor rock type correlation
Figure 3 Floor Buckling at Springvale Mine

FLOOR HEAVE MEASUREMENT Prior to 2015, floor heave and roadway convergence were measured only incidentally through infrequent conventional surveys. Whilst this information allowed some insight into the magnitude of floor heave at different locations at a moment in time, it did not help with understanding of floor heave mechanisms, key drivers or change over time.
A trial using photogrammetric surveys for detailed roadway convergence measurement (roof, floor, ribs) was conducted in 2015 (Figure 4). The trial included calculation of difference between successive surveys to assist with understanding of change in convergence over time. The short time (and low cost) for data acquisition was promising however at the time, data processing time and cost was too high for routine use. This may change with further technological improvements and it is considered that the use of photogrammetry may become viable in the future.
Springvale mine experiences significant groundwater inflows from overlying aquifers during the mining process, which creates numerous localised water pools (known locally as swillies) and muddy floor conditions. The presence of ponded water reduced the effectiveness of roadway clearance measurement using laser scanners and photogrammetry.
Figure 4 Longwall 419 photogrammetry survey
Since November 2015, Springvale Mine has been conducting routine roadway height measurements at tell-tale (roof extensometers) locations, nominally spaced at 25m intervals along the roadways. The measurements are conducted in the maingate belt road in retreating longwall panels (measuring secondary roadway convergence) and also in development panels (measuring primary roadway convergence). Gathering of the measurements allows for the determination of location, timing and magnitude of:
• Roadway clearance (for longwall passage)
• Roof movement (through extensometer measurements)
• Floor heave (difference between roadway height and roof movement)
• Floor brushing (used as a control to manage roadway height)
The measurements are taken at a minimum frequency of once per week in longwall gates using an electronic disto by Leica mounted on a fixed length pipe (to offset the disto from the floor for consistency of measurement in different floor conditions). The disto is positioned underneath each tell tale at a fixed location on a floor (typically marked with paint in the rib and floor). From an operational perspective, measuring of roadway height using the disto is cheap and reliable and can be obtained at the same time as tell-tale readings. It is also possible to subtract the measured roof displacement from measured roadway height to calculate floor displacement.

The extensometer and disto results are processed using the Springvale Strata Failure Management Database (Microsoft Access and Microsoft SQL Server), which allows rapid data analysis and presentation.
Figure 5 shows cumulative floor heave measured at a number of monitoring locations along Longwall 419 maingate. Figure 6 shows convergence over time at a single monitoring location. The red line shows floor heave, the grey line is roadway height and the yellow line is the minimum clearance required for longwall equipment to pass without becoming “iron bound”. In this case the total clearance is less than the minimum required height for longwall passage, and excavation of either floor or roof will be required to allow longwall extraction.
The calculated floor heave magnitude and rate, together with roof displacement magnitude and rate are then reviewed in the context of a database of other results for roadways in a similar lifecycle stage to allow characterisation and trending of typical and anomalous behaviour over time throughout the roadway lifecycle. This data can then be correlated with potentially influencing factors including:
• longwall face position
• depth of cover
• location of mapped or interpreted faults
• floor stratigraphy (e.g. cap stone thickness)
• mapped principal horizontal stress direction
Identification of factors which influence floor heave and understanding of typical and anomalous floor heave magnitudes and rates through different roadway lifecycle stages is a necessary predecessor to developing a meaningful predictive model, which in turn is a necessary predecessor to planning and implementing effective control measures.
The next section of this paper deals with data analysis and correlation.
hFigure 5 Maingate cumulative floor Heave monitoring results (Longwall 419)
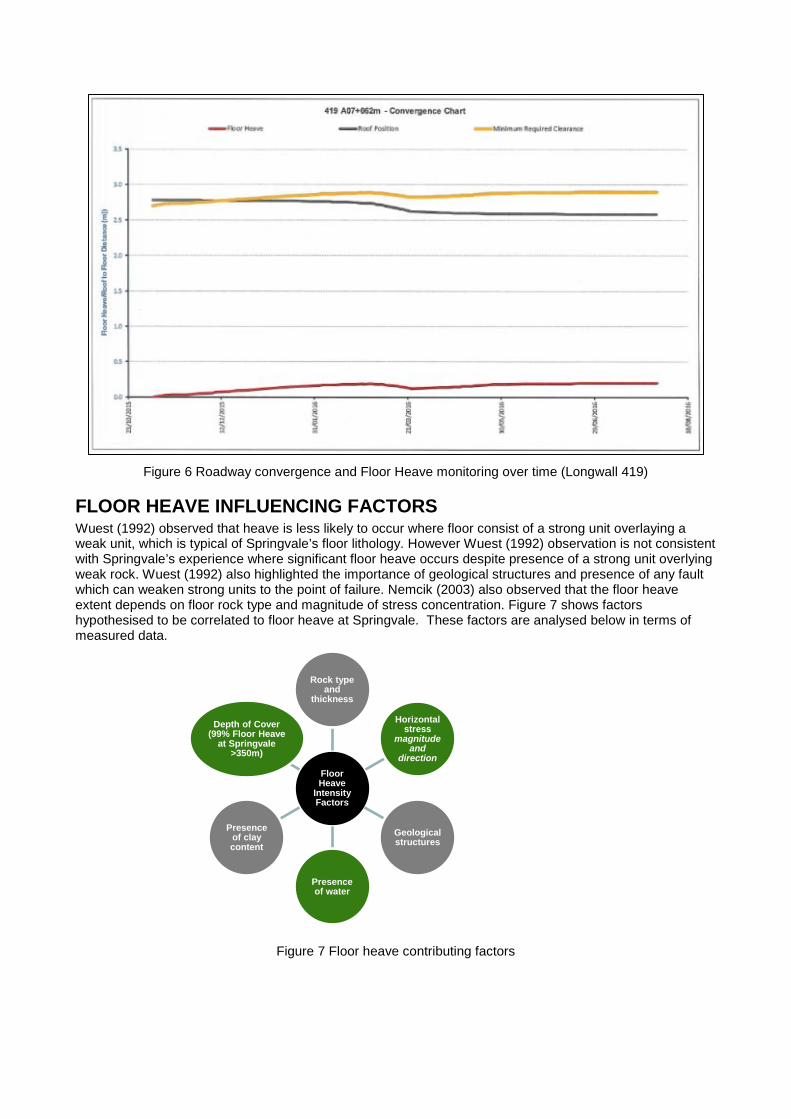
Figure 6 Roadway convergence and Floor Heave monitoring over time (Longwall 419)
FLOOR HEAVE INFLUENCING FACTORS Wuest (1992) observed that heave is less likely to occur where floor consist of a strong unit overlaying a weak unit, which is typical of Springvale’s floor lithology. However Wuest (1992) observation is not consistent with Springvale’s experience where significant floor heave occurs despite presence of a strong unit overlying weak rock. Wuest (1992) also highlighted the importance of geological structures and presence of any fault which can weaken strong units to the point of failure. Nemcik (2003) also observed that the floor heave extent depends on floor rock type and magnitude of stress concentration. Figure 7 shows factors hypothesised to be correlated to floor heave at Springvale. These factors are analysed below in terms of measured data.
Figure 7 Floor heave contributing factors
Floor Heave
Intensity Factors
Rock type and
thickness
Horizontal stress
magnitude and
direction
Geological structures
Presence of water
Presence of clay content
Depth of Cover (99% Floor Heave
at Springvale >350m)

Depth of cover The primary floor heave data recorded for Longwalls 419 and 420 were plotted against the depth of cover for those panels (Figure 8). The results are scattered with no obvious trend between depth of cover and floor heave magnitude in the depth of cover range 355m to 420m. Previous experience at Springvale suggests that floor heave was not a significant operational issue earlier in its life, and in the period since 2012, almost all areas where floor heave has been observed or measured have occurred where the depth of cover exceeds 350m. This infers that depth of cover and related increase in ground stress levels may be a significant influence on floor heave, with an implied “threshold value” beyond which floor failure and related floor heave transition from “anomalous” behaviour to “typical” behaviour. However since 2012, there has been no significant correlation between the measured floor heave and depth of cover, therefore it’s use as a predictor of floor heave in current mining areas is of limited value and there must be other more significant contributing factors.
Figure 8 Longwall 419 and 420 floor heave magnitude and frequency versus depth of cover.
Floor lithology – capping stone thickness In order to verify floor lithology influence on both primary and secondary floor heave occurrence and magnitude, capping stone thickness was recorded along Longwall 420 and plotted against primary and secondary floor heave (Figure 8). There were more occurrences of primary floor heave where the capping stone was thinner, however this may be a result of a lower frequency of thicker capping stone, as there was no compelling relationship between capping stone thickness and floor heave magnitude.
Based on the available data for Longwall 420 (Figure 9), there was no significant correlation between secondary floor heave and capping stone thickness (remaining after floor was brushed). Secondary floor heave occurred in locations where capping stone was totally removed as well as in areas where it was 0.9m thick.
These results suggest that there is no significant correlation between the measured floor heave and capping stone thickness, therefore its use as a predictor of floor heave in current mining areas is of limited value and there must be other more significant contributing factors.
Figure 9 Capping stone thickness versus recorded primary and secondary floor heave (Longwall 420)
Longwall retreat rate Nemcik (2003) observed relationship between increased floor heave movements relative to longwall position. Part of the scope of this study was to assess longwall retreat rate influence on secondary floor heave magnitude in the associated maingate belt road. Due to anecdotal evidence and measured roadway closure

in the vicinity of the longwall face, it is important to understand the relationship between longwall abutment stress and secondary floor heave.
The results (Figure 10) show a somewhat inverse trend where floor heave magnitude appears to increase during the slower longwall retreat rate. However, the correlation is relatively weak and the longwall retreat rate is not considered to be a major influencing factor with regards to secondary floor heave magnitude.
Figure 10 Longwall Retreat Rate versus Secondary Floor Heave
Geological structures For a number of years Springvale utilised SRK Consulting to develop a structural risk model for the life of mine. The SRK model brought considerable success in predicting poor roof conditions and identifying areas where increased levels of roof support were required. The model is validated on an annual basis with predicted ground conditions compared with an underground mapping and monitoring data. SRK Consulting uses geophysical data (from high resolution aeromagnetic surveys) to interpret the location of faults in the granite basement which underlie the Lithgow Seam (approximately 100m below the seam) as well as topographic features in conjunction with mapped seam level fault interpretation for indirect interpretation of structures at the Lithgow seam level.
Corbett and Sheffield (2015) described the influence of geological structures, especially basement lineaments, on roof behavior at Springvale (Figure 11). It was also considered that geological structures are a major influencing factor on floor heave magnitude (both primary and secondary). This theory was tested by comparing secondary floor heave magnitude and frequency encountered in Longwall 419 with location of lineaments (both basement and seam level structures). As shown on Figure 12, the majority of significant secondary floor heave locations were able to be correlated with mapped or interpreted fault locations. This suggest that there is direct relationship between significant secondary floor heave have and location of geological structures (basement and seam level). However there does not seem to be a correlation between the magnitude of primary floor heave and the location of geological faults. Figure 13 presents total primary floor heave recorded in Longwall 419 gateroads with marked locations of seam level (red circle) and basement level (brown circle) faults.
Figure 14 shows a further breakdown of fault types related to anomalous floor heave, which identifies the highest risk associated with the intersection of NW-SE and NNE-SSW trending faults. The analysis was undertaken for northern part of the mine (LW411 to LW418).

Figure 11 Springvale mine plan with faults interpreted from aeromagnetic survey data, seam fault mapping and topographic analysis. Interpreted faults are colour-coded: brown (interpreted basement faults), blue
(interpreted seam level), magenta (mapped seam level).
Figure 12 Secondary Floor heave occurrence and magnitude versus lineaments location, Longwall 419.
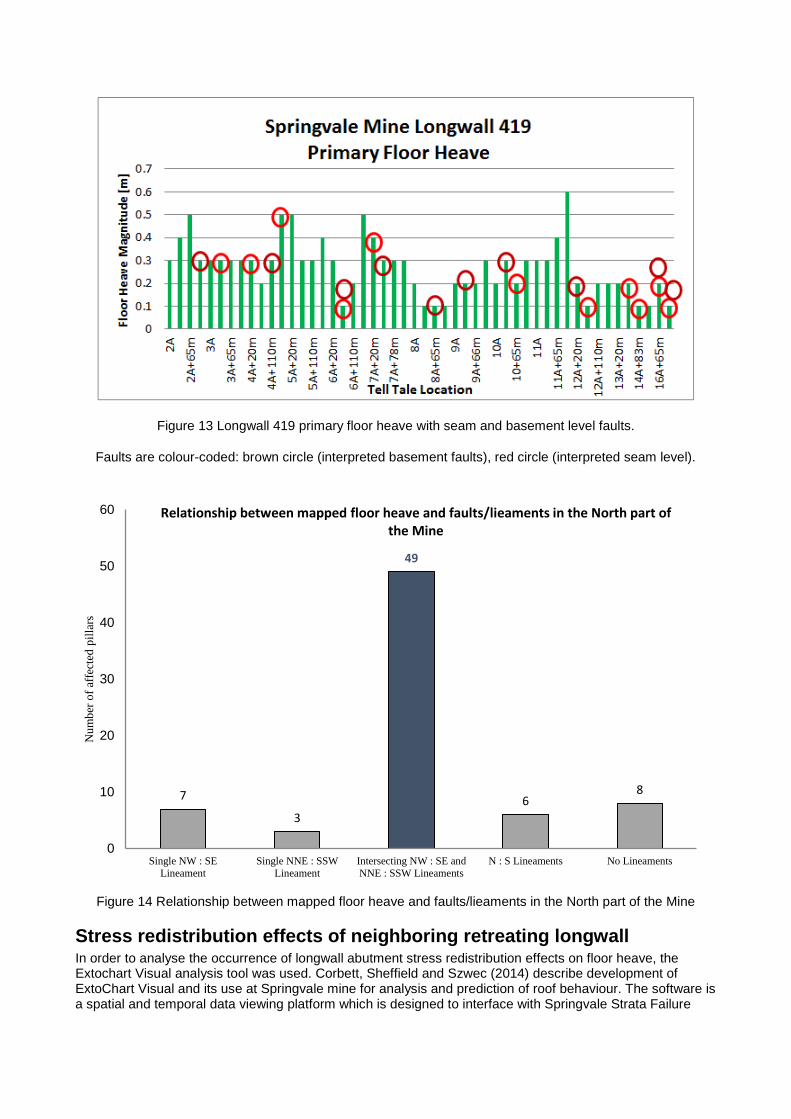
Figure 13 Longwall 419 primary floor heave with seam and basement level faults.
Faults are colour-coded: brown circle (interpreted basement faults), red circle (interpreted seam level).
Figure 14 Relationship between mapped floor heave and faults/lieaments in the North part of the Mine
Stress redistribution effects of neighboring retreating longwall In order to analyse the occurrence of longwall abutment stress redistribution effects on floor heave, the Extochart Visual analysis tool was used. Corbett, Sheffield and Szwec (2014) describe development of ExtoChart Visual and its use at Springvale mine for analysis and prediction of roof behaviour. The software is a spatial and temporal data viewing platform which is designed to interface with Springvale Strata Failure
7
3
49
68
0
10
20
30
40
50
60
Single NW : SELineament
Single NNE : SSWLineament
Intersecting NW : SE andNNE : SSW Lineaments
N : S Lineaments No Lineaments
Num
ber o
f affe
cted
pill
ars
Relationship between mapped floor heave and faults/lieaments in the North part of the Mine
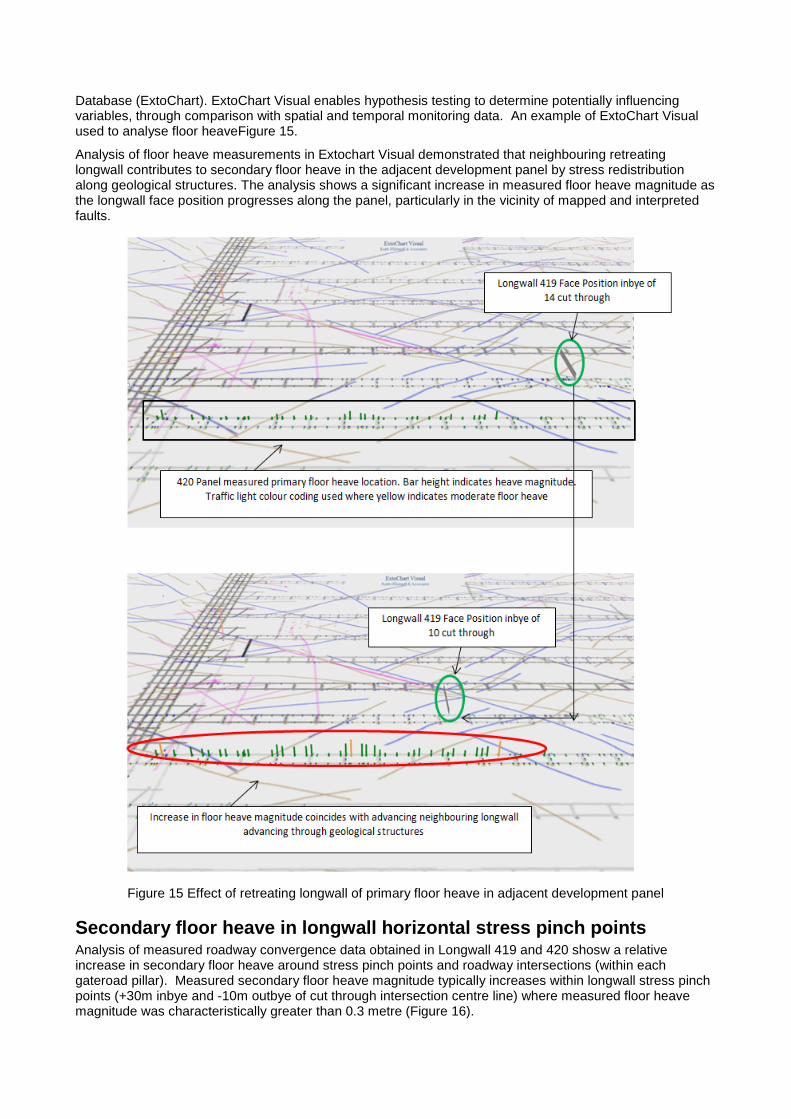
Database (ExtoChart). ExtoChart Visual enables hypothesis testing to determine potentially influencing variables, through comparison with spatial and temporal monitoring data. An example of ExtoChart Visual used to analyse floor heaveFigure 15.
Analysis of floor heave measurements in Extochart Visual demonstrated that neighbouring retreating longwall contributes to secondary floor heave in the adjacent development panel by stress redistribution along geological structures. The analysis shows a significant increase in measured floor heave magnitude as the longwall face position progresses along the panel, particularly in the vicinity of mapped and interpreted faults.
Figure 15 Effect of retreating longwall of primary floor heave in adjacent development panel
Secondary floor heave in longwall horizontal stress pinch points Analysis of measured roadway convergence data obtained in Longwall 419 and 420 shosw a relative increase in secondary floor heave around stress pinch points and roadway intersections (within each gateroad pillar). Measured secondary floor heave magnitude typically increases within longwall stress pinch points (+30m inbye and -10m outbye of cut through intersection centre line) where measured floor heave magnitude was characteristically greater than 0.3 metre (Figure 16).

Figure 16 Floor heave magnitude versus pinch points, LW 420.
Presence of clay content and presence of water Influence of ‘presence of water’ and ‘presence of clay content’ was not analysed during this study. Springvale mine experiences significant groundwater inflows (up to 20 ML/day) which causes muddy or ponded water floor conditions throughout the whole mine. Also, clay is continuously present within first 8m below the floor, this is consistent throughout the mine. The above indicates that neither presence of water within the roadway opening nor presence of clay within floor lithology are significant factors influencing either occurrence or magnitude of floor heave. Again it is of note that Springvale mine commenced its production in 1995 however floor heave issues were not ubiquitous until 2012.
FLOOR HEAVE MANAGEMENT Over time Springvale mine deployed a series of floor heave management strategies with various degrees of success, prior to development of routine floor heave measurement system the mine depend on a reactive floor heave management.
Reactive floor heave management
Longwall 415 The first significant floor heave reported at Springvale mine impacted longwall 415 Maingate belt road (also known as A heading) between 9 to 13CT in 2012. The experienced floor heave was of magnitude up to 1.5m and affected 530m of belt road (Figure 17). To enable continuation of production floor heave removal plan was developed and executed. In order to remove the heave the belt was hung on the roof bolts leaving sufficient clearance for belt management as well as access of machines underneath the belt. The heave was removed using an AM75 roadheader and it was undertaken 4 pillars outbye of retreating longwall face. In total approximately 2,454 cubic metres of material was removed with an average brushing depth of 1.2m. The method was deemed unsuccessful due to lack of control over brushing depth, issues with loading of brushed material which was either slipping off the loading stars or clogging the internal chain due to high clay content. Issues with material loading as well as cutting excessive floor caused slow progress rates. Overall the AM75 was not considered fit for purpose for floor heave removal.
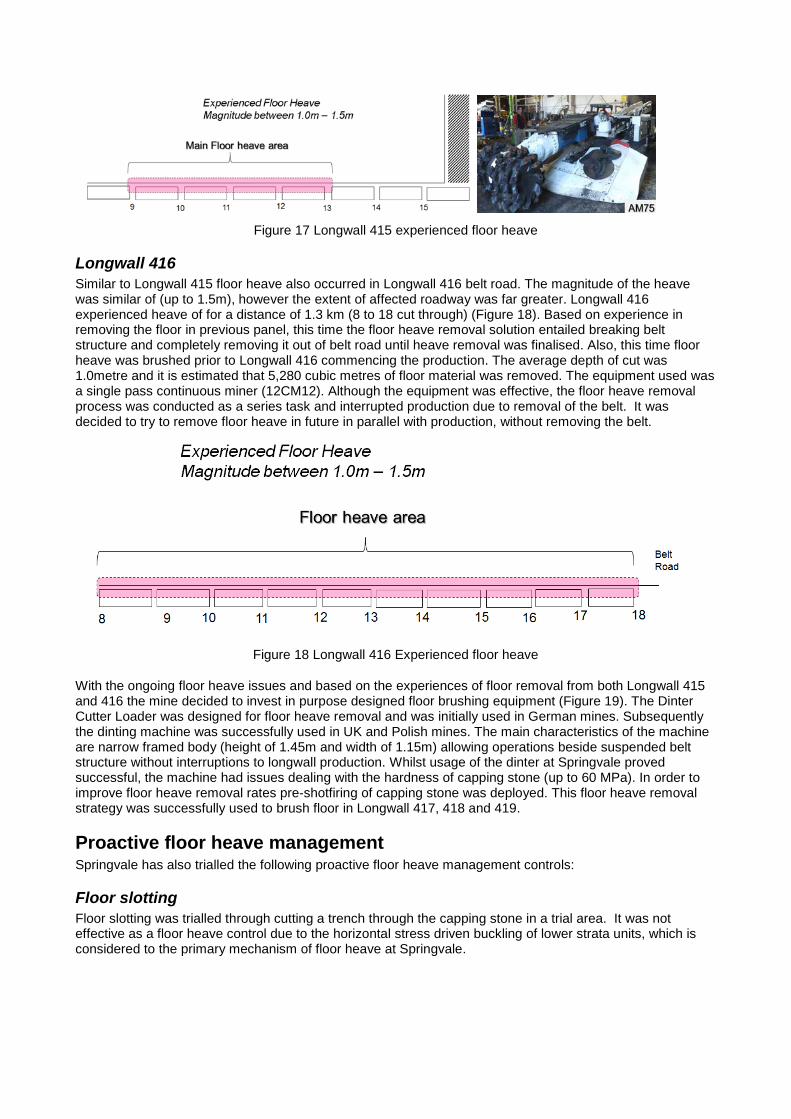
Figure 17 Longwall 415 experienced floor heave
Longwall 416 Similar to Longwall 415 floor heave also occurred in Longwall 416 belt road. The magnitude of the heave was similar of (up to 1.5m), however the extent of affected roadway was far greater. Longwall 416 experienced heave of for a distance of 1.3 km (8 to 18 cut through) (Figure 18). Based on experience in removing the floor in previous panel, this time the floor heave removal solution entailed breaking belt structure and completely removing it out of belt road until heave removal was finalised. Also, this time floor heave was brushed prior to Longwall 416 commencing the production. The average depth of cut was 1.0metre and it is estimated that 5,280 cubic metres of floor material was removed. The equipment used was a single pass continuous miner (12CM12). Although the equipment was effective, the floor heave removal process was conducted as a series task and interrupted production due to removal of the belt. It was decided to try to remove floor heave in future in parallel with production, without removing the belt.
Figure 18 Longwall 416 Experienced floor heave
With the ongoing floor heave issues and based on the experiences of floor removal from both Longwall 415 and 416 the mine decided to invest in purpose designed floor brushing equipment (Figure 19). The Dinter Cutter Loader was designed for floor heave removal and was initially used in German mines. Subsequently the dinting machine was successfully used in UK and Polish mines. The main characteristics of the machine are narrow framed body (height of 1.45m and width of 1.15m) allowing operations beside suspended belt structure without interruptions to longwall production. Whilst usage of the dinter at Springvale proved successful, the machine had issues dealing with the hardness of capping stone (up to 60 MPa). In order to improve floor heave removal rates pre-shotfiring of capping stone was deployed. This floor heave removal strategy was successfully used to brush floor in Longwall 417, 418 and 419.
Proactive floor heave management Springvale has also trialled the following proactive floor heave management controls:
Floor slotting Floor slotting was trialled through cutting a trench through the capping stone in a trial area. It was not effective as a floor heave control due to the horizontal stress driven buckling of lower strata units, which is considered to the primary mechanism of floor heave at Springvale.

Figure 19 Dinter Cutter Loader in use (Longwall 418)
Floor bolting 6m length twin strand mini-cage cable bolts were installed in the floor at a density of two per metre of roadway in the area of the Longwall 418 finish / recovery area. Although it is not able to be proven without more results, this was the only longwall recovery area not to experience very significant convergence out of the four longwalls between Longwall 417 and 420.
A further reference point was recently established at the Longwall 421 recovery are (Figure 20), where 7m length self-drilling coupled bolts were installed and grouted at a density of five per metre. Again, roadway convergence was significantly reduced compared to Longwalls 417, 419 and 420 which had no installed floor cables / bolts.
It is noted that the installation of cable bolts and extension bolts in the floor at Springvale is a very time consuming task, however it does seem to be effective. It is not seen as a viable control for all floor heave prone areas due to slow and inefficient floor support installation, however it is now seen as an effective control in targeted areas such as longwall recovery areas.
FLOOR HEAVE PREDICTIVE MODEL The first floor heave model was prepared for Longwall 416 and it was based on historical mapping information consisting of floor heave location and magnitude. The first model was also based on lineament theory where floor heave occurrence was predicted around lineament (fault) intersection with gateroad. This floor heave prediction methodology continued until Longwall 418.
A more advanced prediction model was developed for Longwall 419 floor where primary floor heave measurements and mapping were used to not only predict the areas of heave but also indicate the heave magnitude and required floor brushing (removal) strategy. Longwall 420 was the first benefiting from comprehensive floor heave prediction model. The comprehensive model was based on primary and secondary floor heave measurements obtained prior and during Longwall 419 retreat, and the identification and extrapolation of specific faults with a history of anomalous floor heave. The model was successful in predicting magnitude and location of primary and secondary floor heave. As shown on Figure 21 actual secondary floor heave was greater than predicted only in 7 locations out of 39, with only two cases where actual exceeded predicted floor heave by more than 100mm.
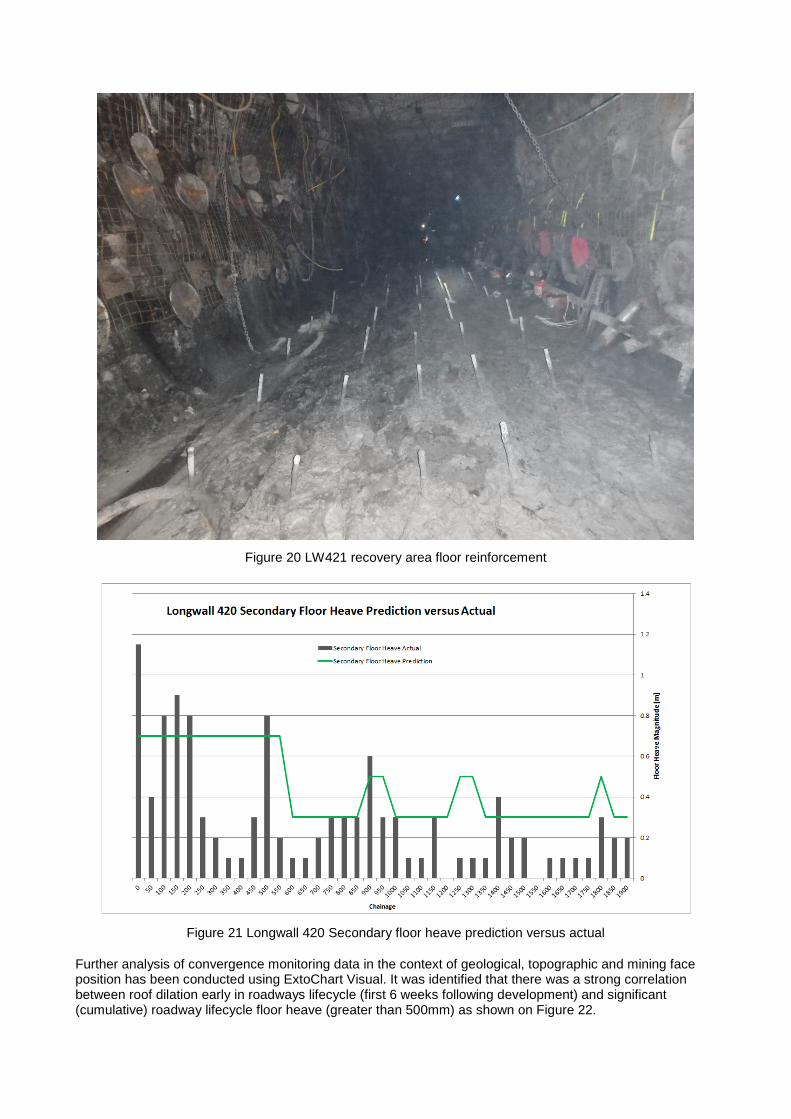
Figure 20 LW421 recovery area floor reinforcement
Figure 21 Longwall 420 Secondary floor heave prediction versus actual
Further analysis of convergence monitoring data in the context of geological, topographic and mining face position has been conducted using ExtoChart Visual. It was identified that there was a strong correlation between roof dilation early in roadways lifecycle (first 6 weeks following development) and significant (cumulative) roadway lifecycle floor heave (greater than 500mm) as shown on Figure 22.

Figure 22 Mapped significant floor heave correlations with interpreted faults
It was further identified that nearly all instances of mapped significant floor heave were correlated with either early roof dilation and/or interpreted faults, as shown on Figure 23.
Figure 23 Combined correlation between significant floor heave and early roof dilation and interpreted faults
These correlations indicate that there is a strong relationship between cumulative roadway lifecycle floor heave and areas where the coal seam, roof and floor is weakened by faulting and jointing.
Roadway convergence monitoring also indicated that significant floor heave occurred in areas where stress relief is not provided by an adjacent longwall goaf (including virgin stress fields and areas around margins of the workings where the principal horizontal stress can act on roadways).

From an operational perspective, it is useful to have a lead indicator of probability of significant floor heave, as this can facilitate targeted implementation of control measures including floor brushing to increase roadway clearance or floor reinforcement through installation of cable bolts or coupled bolts.
CONCLUSIONS Regular, high spatial density roadway clearance measurements, in parallel with roof extensometer movement allowed calculation of floor heave magnitude and rate of heave in time and space. The floor heave data was then able to be correlated to potential influencing factors to test hypotheses regarding causative factors.
The analysis of floor heave influencing factors based on data obtained from Springvale mine indicates that:
• Depth of cover and related increase in ground stress levels may be a significant influence on floorheave, with an implied “threshold value” beyond which floor failure and related floor heave transitionfrom “anomalous” behaviour to “typical” behaviour. However since 2012, there has been no significantcorrelation between the measured floor heave floor and depth of cover, therefore its use as a predictorof floor heave in current mining areas is of limited value;
• The majority of significant secondary floor heave locations were able to be correlated with mapped orinterpreted fault locations. Further, the highest risk is associated with the intersection of NW-SE andNNE-SSW trending faults.
• The retreating longwall contributes to secondary floor heave in the adjacent development panelthrough stress redistribution along geological structures. The analysis shows a significant increase inmeasured floor heave magnitude in the adjacent development panel as the longwall face progressesalong the panel, particularly in the vicinity of mapped and interpreted faults.
• Secondary floor heave magnitude is typically higher than 0.3m in longwall horizontal stress pinchpoints.
• Floor heave magnitude appears to increase during the slower longwall retreat rate.
• There is no significant correlation between the measured floor heave and capping stone thickness
• Presence of clay within floor lithology (up to 8m) is not considered to be a factor influencing floorbehaviour;
• Presence of water within roadway opening is not regarded as factor contributing to or influencing floorheave;
The Dinter Cutter Loader machine was effective at removing floor heave material from the maingate belt road in parallel with longwall production.
Floor bolting was found to be an effective control for targeted areas at Springvale Mine.
Floor slotting was found not to be an effective control for floor heave at Springvale Mine.
A successful predictive model for floor heave was developed following improved measurement, data analysis and identification of key influencing factors.
REFERENCES Corbett, P, Sheffield P and Szwec, M, 2014. A new tool for extensometer data analysis and improved understanding of
geotechnical risk factors, in Proceedings AusRock2014: third Australasian Ground Control in Mining Conference, pp217 -231 (The Australasian Institute of Mining and Metallurgy: Melbourne)
Nemcik, Jan Anton, Floor mechanisms at underground longwall face, Doctor of Philosophy thesis, Faculty of Engineering, University of Wollongong, 2003. http://ro.uow.edu.au/theses/1826
Sowers, G.F. (1979). Introductory Soil Mechanics and foundations, Geoetchnical Engineering, Fourth Edition. Macmillan Publishing Co., Inc. new York
Wuest, W, 1992. Controlling Coal Mine floor heave: An overview, United States Department of the Interior, Bureau of Mines
Corbett, P. and Sheffield, P., 2015. The Use of High-intensity Monitoring Data to Better Characterise Geotechnical Properties of a Non-homogeneous Rock Mass, in Proceedings Future Mining 2015: Third International Future Minnig Conference (The Australasian Institute of Mining and Metallurgy: Melbourne)

A personal review of South African rockburst research, experience and lessons learnt
T R Stacey1
1.Professor Emeritus, University of the Witwatersrand, Johannesburg, South Africa. Email:[email protected]
ABSTRACT South Africa has a long history of rockbursts, some 100 years. During this time much research and many developments have taken place in the country to limit the occurrence of rockbursts, and to mitigate their effects. In this paper I shall present a personal view of what I consider to be important achievements, and contributions made. Some of these are: planning of stope layouts, and the use of strike barrier pillars; recognition of energy as a key factor, the use of the energy release rate ERR as a layout planning criterion, and development of MINSIM for calculation of ERR and stope planning; sequential grid stope layouts; use of backfill for stope support; and, development yielding support elements, and dynamic testing of stope and tunnel supports. The record shows the establishment of a rock engineering research powerhouse over a 40 to 50 year period and, unfortunately, the complete breakdown of this capability in the subsequent 10 years.
INTRODUCTION South Africa, with its deep level gold mines, is well known as the “home” of rockbursting. Gold mining commenced in Johannesburg in 1886 and mining was soon taking place at significant depths. The history of the development of seismicity in South African mining is traced by Cook et al (1966) and Ortlepp (1983a). Earth tremors related to the mining were recorded within about 10 years after mining commenced. The Ophirton Earth Tremors Committee was appointed in 1908, and the Witwatersrand Earth Tremors Committee was appointed in 1915. Monitoring of seismicity showed that numbers of tremors recorded were increasing each year. In 1915, 305 such events were recorded. Accidents due to rockbursts became serious, and the Witwatersrand Rockburst Committee was appointed in 1924. Thus, rockbursting in South African mines has been a problem for a century.
Early research into rockbursts in the South African gold mines was initiated by Hill (1954) and Roux and Denkhaus (1954). The development of rock mechanics in South Africa during the period 1960-1982 has been described by Gay et al (1982), and South Africa became a world leader in rock engineering research. The paper by Gay et al (1982) identifies significant developments in South African rock mechanics activities that serve as a guide in the preparation of the current paper. In the 1950’s the Rock Mechanics Division of the National Mechanical Engineering Research Institute of the Council for Scientific and Industrial Research (CSIR) was established – E. Hoek, and subsequently Z.T. Bieniawski, were Heads of this Division. In the early 1960’s, individual mining companies carried out their own relevant research and then, in 1963, the mining industry established its own research facility, the Chamber of Mines Research Organisation (COMRO). This organisation focused substantially on rock mechanics research, but also carried out other mining research. By the 1980’s CSIR and COMRO had a total complement of more than 600 full time research personnel, mainly in the rock engineering field. Many very important, internationally recognised research outputs were produced. A number of the COMRO researchers subsequently became internationally recognised professors of rock engineering.
South Africa has provided a President of the International Society of Rock Mechanics (ISRM), and 10+ Vice-Presidents since the Society’s formation in 1966. Two from the CSIR/COMRO research environment have received the ISRM’s Leopold Muller Award, the ISRM’s most prestigious award (Evert Hoek and Neville Cook, the first two awards made). No fewer than five researchers from this environment have been awarded the ISRM’s Rocha Medal, which is for the best rock mechanics PhD in the world in a particular year (Richard Brummer, Arno Daehnke, Malcolm Hildyard, Francois Malan and Lindsay Linzer (nee Andersen), and also a runner-up, Bryan Watson). Five people who developed their rock engineering skills in South Africa, became international “giants” in the rock engineering field – Bieniawski, Cook, Hoek, Salamon and Wagner. Specific mention must also be made of Dave Ortlepp, who had a “passion” for rockbursts. His involvement with rockbursts began early (Cook et al, 1966) and continued throughout his life. He carried out unique research into rockburst ruptures and identified at an early stage the importance of yielding support in a rockburst

environment. He was responsible for significant research into rock support performance involving dynamic blast and drop-weight testing of rock support. Further information on Ortlepp’s research is provided later in this paper.
With this background to the many prestigious researchers in South Africa, it is not surprising that many rockburst research outputs have been produced over the years. It is first necessary to consider the question, “What is a rockburst?”
WHAT IS A ROCKBURST? Ortlepp (1997) noted, “… it is somewhat surprising to find that no widely-recognised definition of the term rockburst has yet been adopted.” He suggested, “… a seismic event which causes violent and significant damage to the tunnel or excavations of a mine.” This is similar to the description given by Roberts and Brummer (1988): “a seismic event that causes damage to an excavation”. A simplified classification of seismic event types that could lead to rockbursts was suggested by Ortlepp and Stacey (1994). However, from an engineering perspective, it is perhaps not so simple: influencing aspects include stress level (in situ and induced), rock and rock mass properties, excavation geometries and the support methods, quality of excavation methods and of support installation, and of course, seismicity. In contradiction of the above descriptions, seismicity may in some cases be the result of a rockburst rather than the cause, for example, in the case of a strainburst: owing to high stress levels, failure of intact rock may be induced, releasing seismic energy. However, such bursts may also be triggered by remotely located seismic events. In the conclusion to a review of factors influencing the severity of rockburst damage (Durrheim et al, 1988), the question is posed, with an answer, “Why does the severity of rockburst damage vary so much? There is no single, simple answer. Probably the most important reasons are variations in the condition of the rock mass and the failure of inadequate support systems. Neither is there an easy, instant solution to the rockburst hazard.” Hence, the statement by Ortlepp (1982), “Because rockbursts are capricious, it is very difficult to make objective measurements of their causes or effects”, remains relevant. For the purposes of this paper, two categories are relevant. The first is strainbursting, in which the source of the seismicity and the location of the damage are coincident. The second category involves rupture type rockbursts, in which the source of the seismicity and the location of the rockburst damage may be separated by substantial distances. Both types of rockbursts are violent events with associated seismicity, and are hazards to safety and to the stability of underground excavations.
It is important to distinguish rockburst research from seismic research. The latter is scientific research, whereas rockburst research must contribute to engineering understanding and solutions. Seismic monitoring may perhaps be described as “easy”, and produces huge amounts of data. Such monitoring is very important, but, from a rockbursting point of view, it is the interpretation of the data that is more important. This paper will therefore not deal significantly with seismic monitoring. It is appropriate, however, to acknowledge the huge contribution made in the field of seismic monitoring by Dr A. Mendecki (1996; and many keynote addresses at Rockburst and Seismicity in Mines Conferences), first within Anglo American, then Integrated Seismic Systems International (ISSI), and now the Institute for Mine Seismology (IMS). Additional significant seismological research contributions have been made in South Africa by van Aswegen (2008; 2013), Spottiswoode (1988; 1997), Durrheim et al (1998) and many others. Specific mention must be made of current research being carried out in the deep level gold mines by a team of researchers from Japan and South Africa (Durrheim et al, 2017; Ogasawara et al, 2017; Share et al, 2013; Yabe et al, 2013).
Since it is not possible to prevent rockbursts, the engineering requirements of rockburst research must be to minimise the occurrence of rockbursts, and reduce their consequences by limiting their occurrence and containing any damage that may result. Conventional rock engineering design requires knowledge of the location, the timing, the magnitude, and the direction of action of any dynamic loading. Despite some optimism regarding the prediction of rockbursts (Brink and O’Connor, 1983), none of these four parameters is known conclusively ahead of an event, and hence conventional engineering design is not possible. The conclusion to the review of factors influencing the severity of damage in South African gold mines (Durrheim et al, 1998), referred to above, is also relevant here. This is a challenge for future rockburst research.
SIGNIFICANT CONTRIBUTIONS MADE BY ROCKBURST RESEARCH IN SOUTH AFRICA In the following sections I shall highlight some of the areas in which, in my personal opinion, particularly significant contributions have been made as a result of rockburst research in South Africa.
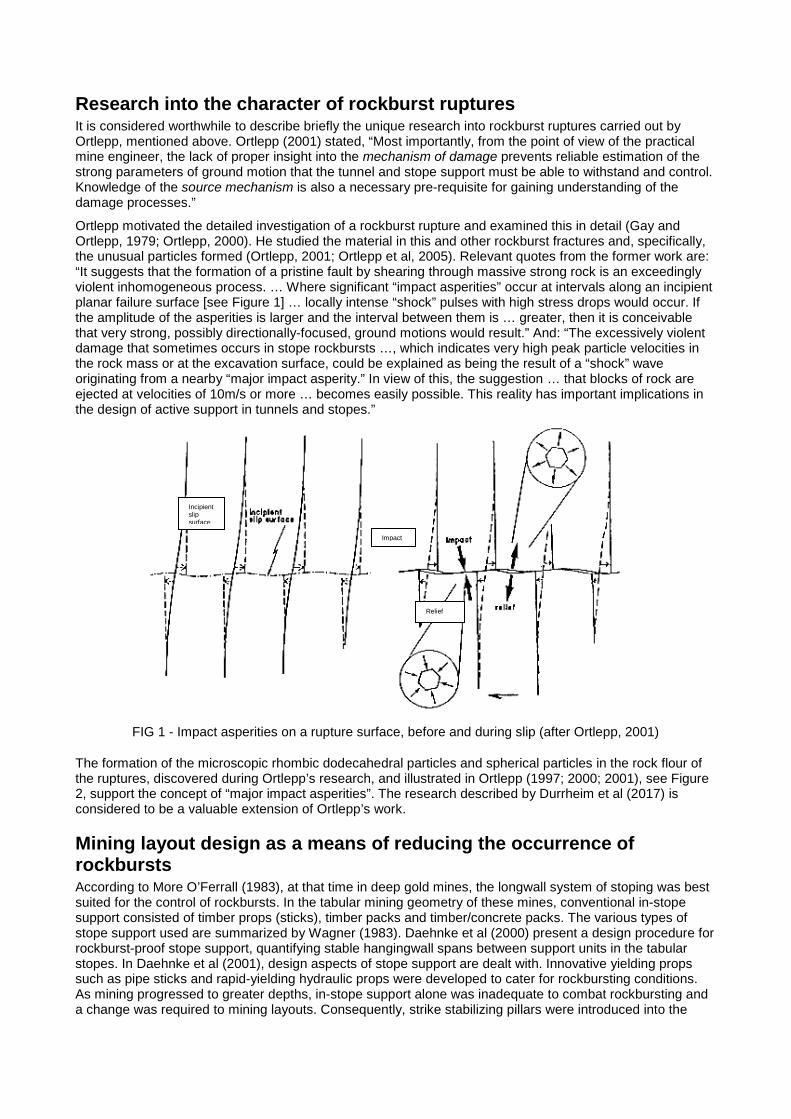
Research into the character of rockburst ruptures It is considered worthwhile to describe briefly the unique research into rockburst ruptures carried out by Ortlepp, mentioned above. Ortlepp (2001) stated, “Most importantly, from the point of view of the practical mine engineer, the lack of proper insight into the mechanism of damage prevents reliable estimation of the strong parameters of ground motion that the tunnel and stope support must be able to withstand and control. Knowledge of the source mechanism is also a necessary pre-requisite for gaining understanding of the damage processes.”
Ortlepp motivated the detailed investigation of a rockburst rupture and examined this in detail (Gay and Ortlepp, 1979; Ortlepp, 2000). He studied the material in this and other rockburst fractures and, specifically, the unusual particles formed (Ortlepp, 2001; Ortlepp et al, 2005). Relevant quotes from the former work are: “It suggests that the formation of a pristine fault by shearing through massive strong rock is an exceedingly violent inhomogeneous process. … Where significant “impact asperities” occur at intervals along an incipient planar failure surface [see Figure 1] … locally intense “shock” pulses with high stress drops would occur. If the amplitude of the asperities is larger and the interval between them is … greater, then it is conceivable that very strong, possibly directionally-focused, ground motions would result.” And: “The excessively violent damage that sometimes occurs in stope rockbursts …, which indicates very high peak particle velocities in the rock mass or at the excavation surface, could be explained as being the result of a “shock” wave originating from a nearby “major impact asperity.” In view of this, the suggestion … that blocks of rock are ejected at velocities of 10m/s or more … becomes easily possible. This reality has important implications in the design of active support in tunnels and stopes.”
FIG 1 - Impact asperities on a rupture surface, before and during slip (after Ortlepp, 2001)
The formation of the microscopic rhombic dodecahedral particles and spherical particles in the rock flour of the ruptures, discovered during Ortlepp’s research, and illustrated in Ortlepp (1997; 2000; 2001), see Figure 2, support the concept of “major impact asperities”. The research described by Durrheim et al (2017) is considered to be a valuable extension of Ortlepp’s work.
Mining layout design as a means of reducing the occurrence of rockbursts According to More O’Ferrall (1983), at that time in deep gold mines, the longwall system of stoping was best suited for the control of rockbursts. In the tabular mining geometry of these mines, conventional in-stope support consisted of timber props (sticks), timber packs and timber/concrete packs. The various types of stope support used are summarized by Wagner (1983). Daehnke et al (2000) present a design procedure for rockburst-proof stope support, quantifying stable hangingwall spans between support units in the tabular stopes. In Daehnke et al (2001), design aspects of stope support are dealt with. Innovative yielding props such as pipe sticks and rapid-yielding hydraulic props were developed to cater for rockbursting conditions. As mining progressed to greater depths, in-stope support alone was inadequate to combat rockbursting and a change was required to mining layouts. Consequently, strike stabilizing pillars were introduced into the
Incipient slip surface
Impact
Relief
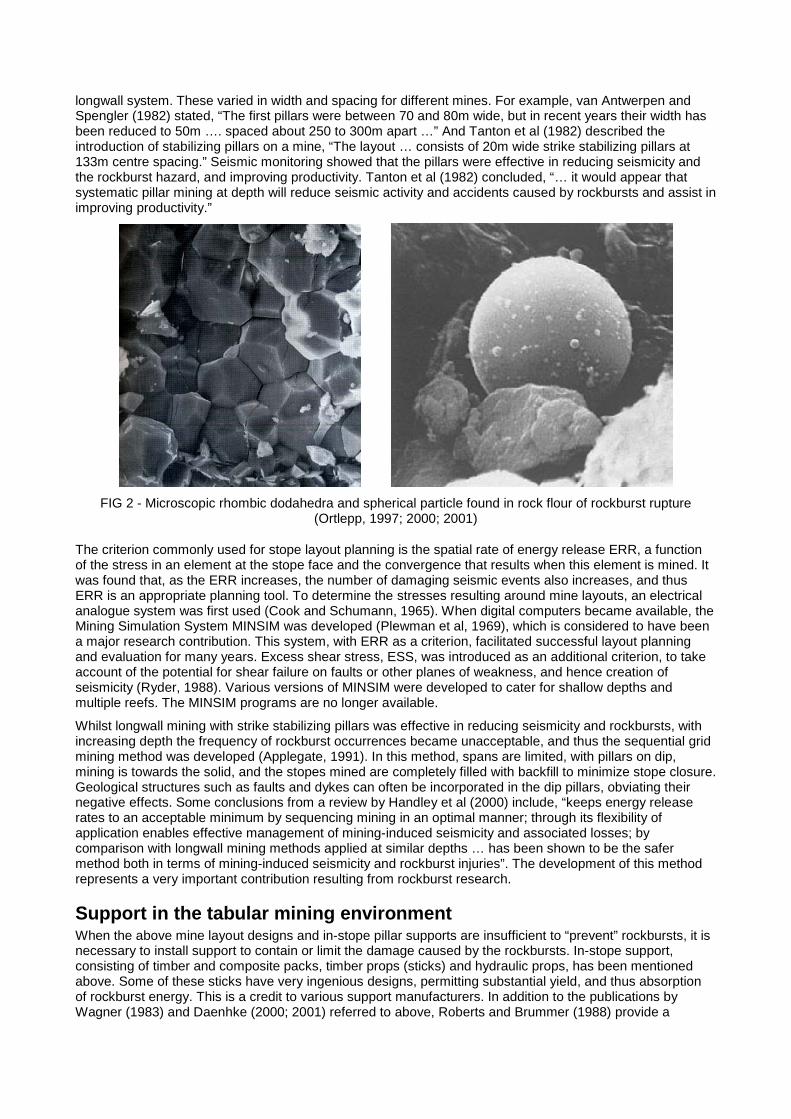
longwall system. These varied in width and spacing for different mines. For example, van Antwerpen and Spengler (1982) stated, “The first pillars were between 70 and 80m wide, but in recent years their width has been reduced to 50m …. spaced about 250 to 300m apart …” And Tanton et al (1982) described the introduction of stabilizing pillars on a mine, “The layout … consists of 20m wide strike stabilizing pillars at 133m centre spacing.” Seismic monitoring showed that the pillars were effective in reducing seismicity and the rockburst hazard, and improving productivity. Tanton et al (1982) concluded, “… it would appear that systematic pillar mining at depth will reduce seismic activity and accidents caused by rockbursts and assist in improving productivity.”
FIG 2 - Microscopic rhombic dodahedra and spherical particle found in rock flour of rockburst rupture (Ortlepp, 1997; 2000; 2001)
The criterion commonly used for stope layout planning is the spatial rate of energy release ERR, a function of the stress in an element at the stope face and the convergence that results when this element is mined. It was found that, as the ERR increases, the number of damaging seismic events also increases, and thus ERR is an appropriate planning tool. To determine the stresses resulting around mine layouts, an electrical analogue system was first used (Cook and Schumann, 1965). When digital computers became available, the Mining Simulation System MINSIM was developed (Plewman et al, 1969), which is considered to have been a major research contribution. This system, with ERR as a criterion, facilitated successful layout planning and evaluation for many years. Excess shear stress, ESS, was introduced as an additional criterion, to take account of the potential for shear failure on faults or other planes of weakness, and hence creation of seismicity (Ryder, 1988). Various versions of MINSIM were developed to cater for shallow depths and multiple reefs. The MINSIM programs are no longer available.
Whilst longwall mining with strike stabilizing pillars was effective in reducing seismicity and rockbursts, with increasing depth the frequency of rockburst occurrences became unacceptable, and thus the sequential grid mining method was developed (Applegate, 1991). In this method, spans are limited, with pillars on dip, mining is towards the solid, and the stopes mined are completely filled with backfill to minimize stope closure. Geological structures such as faults and dykes can often be incorporated in the dip pillars, obviating their negative effects. Some conclusions from a review by Handley et al (2000) include, “keeps energy release rates to an acceptable minimum by sequencing mining in an optimal manner; through its flexibility of application enables effective management of mining-induced seismicity and associated losses; by comparison with longwall mining methods applied at similar depths … has been shown to be the safer method both in terms of mining-induced seismicity and rockburst injuries”. The development of this method represents a very important contribution resulting from rockburst research.
Support in the tabular mining environment When the above mine layout designs and in-stope pillar supports are insufficient to “prevent” rockbursts, it is necessary to install support to contain or limit the damage caused by the rockbursts. In-stope support, consisting of timber and composite packs, timber props (sticks) and hydraulic props, has been mentioned above. Some of these sticks have very ingenious designs, permitting substantial yield, and thus absorption of rockburst energy. This is a credit to various support manufacturers. In addition to the publications by Wagner (1983) and Daenhke (2000; 2001) referred to above, Roberts and Brummer (1988) provide a

summary of support requirements in rockburst conditions, appropriate at the time. These support systems also became insufficient and it became necessary to install “volume” support in the form of backfill. It was established early (Cook et al, 1966) that “rockbursts …. occur when the rate at which energy must be released as a result of mining exceeds the rate at which it can be dissipated non-violently”; and “Since the total energy increases with the total volume of closure, its magnitude can be reduced by restricting the volume of closure.” With the increasing depth of mining, the increased stress levels, and hence the increased energy levels, backfill was seen as an important means of reducing volumetric closure, consequently reducing the rockburst hazard. Research into the properties of backfill and its potential to reduce the rockburst hazard was carried out in the 1980’s. Being able to place backfill hydraulically in stopes at depths greater than 3km and several kilometres distant from shaft bottom is no mean feat, and warranted mechanical engineering research, which is not dealt with in this paper.
Theoretical MINSIM type analyses showed that backfill was capable of reducing the energy release rate (ERR) and the excess shear stress (ESS) associated with mining (Ryder, 1988; Spottiswoode, 1988). The benefit shown was based on the type of backfill, alternatives considered being full plant tailings, cemented classified tailings (CCT) and CCT with various percentages of aggregate (Barrett et al, 1986; Jager and Ryder, 1999). The MINSIM evaluations carried out were elastic, and therefore the benefits determined were based on elastic magnitudes of stope closure. There was also concern at the time that backfill might not develop significant support resistance in stopes with small convergence. Research was consequently carried out regarding these concerns, taking into account non-linear behaviour due to weakness planes and fractures in the hangingwall (Kirsten and Stacey, 1986; 1988; 1989); Kirsten and Howell, 1993; Kirsten, 1994). These analyses were successful in confirming theoretically the value of backfill support under these non-linear conditions. Practical experience has shown that backfill has been beneficial in reducing the effects of rockbursts (Close and Klokow, 1986; Faure, 1986; Gay et al, 1986; Squelch and Gurtunca, 1991). In addition, backfill has been reported as being successful in reducing the frequency of rockbursts (Spottiswoode and Churcher, 1988; Hemp and Goldbach, 1993). Murphy (2001) reported very positive performance of backfill, indicating a reduction in large seismic events and cumulative seismic moment of more than 50% over a four year period.
Preconditioning Stope face bursts are hazardous occurrences, and in the 1950’s, in-mine trials (Roux et al, 1957) were carried out to evaluate the potential of preconditioning to reduce such bursts. According to Toper et al (2000), the 1950’s trials demonstrated that the number of severe rockbursts was reduced by 73%, with almost no occurrences of on-shift rockbursts. Despite the success of the trials, preconditioning was not implemented by mines at that time. It was only after further research (Toper, 2003), which commenced in the late 1980s, that preconditioning became a routine operation in the late 1990s. Toper’s research focused on face-perpendicular preconditioning in narrow tabular gold mine stopes, with preconditioning holes drilled into the stope face, and the blasting requirements for this preconditioning. Although safety benefits resulted, owing to the additional amount of drilling, and consequently, to the apparent higher direct and labour costs, there was initially resistance to the routine implementation of the technique. However, in addition to the substantial safety benefits, it was found that the drilling penetration rate for blast-holes was increased due to the preconditioning, as illustrated in Table 1.
TABLE 1. Comparison of drilling rates for production blast-holes in adjacent preconditioned and un-preconditioned stope panels (after Toper et al, 2000).
Stope scenario (blast-hole length and diameter)
Minimum drilling time
Average drilling time
Maximum drilling time
Average drilling rate
(m/min) Un-preconditioned 4’34” 5’08” 5’51” 0.21
Preconditioned (2.4 m, 36 mm)
3’56” 4’48” 5’50” 0.23
Preconditioned (3.2 m, 36 mm)
3’00” 3’57” 5’10” 0.28
Preconditioned (3.8 m, 36 mm)
2’30” 3’05” 3’55” 0.36
Preconditioned (3.2 m, 40 mm)
1’56” 3’14” 4’31” 0.34
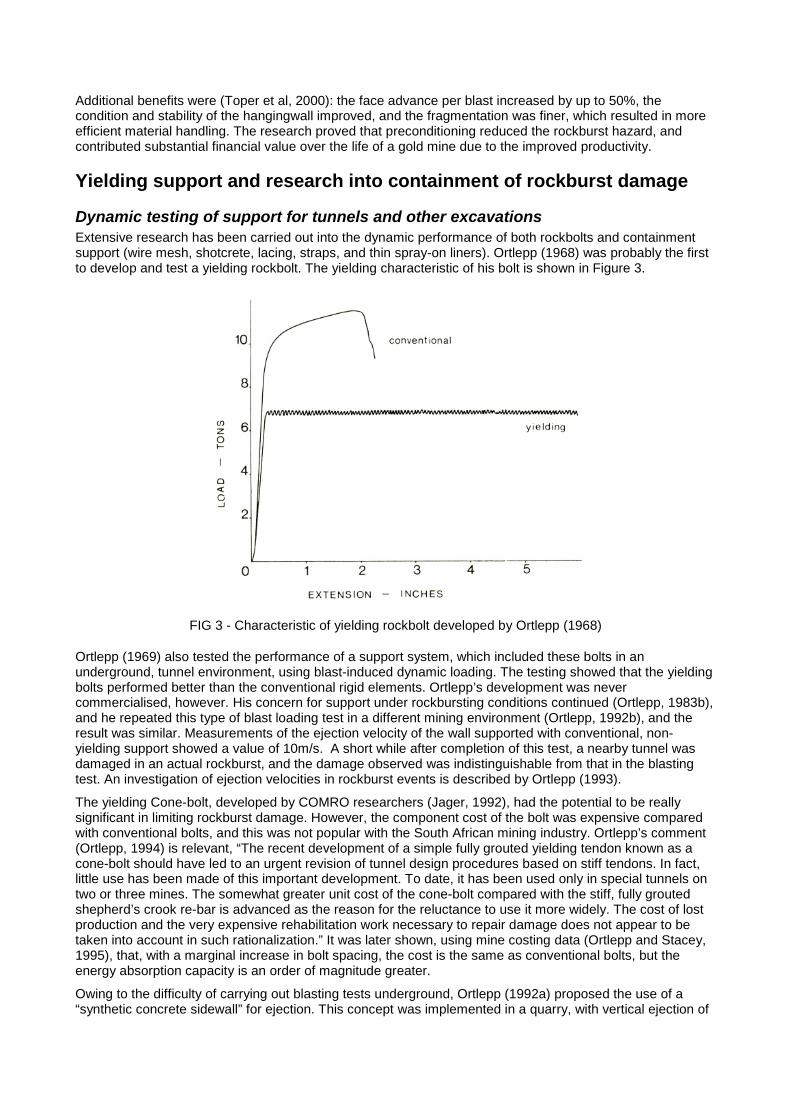
Additional benefits were (Toper et al, 2000): the face advance per blast increased by up to 50%, the condition and stability of the hangingwall improved, and the fragmentation was finer, which resulted in more efficient material handling. The research proved that preconditioning reduced the rockburst hazard, and contributed substantial financial value over the life of a gold mine due to the improved productivity.
Yielding support and research into containment of rockburst damage
Dynamic testing of support for tunnels and other excavations Extensive research has been carried out into the dynamic performance of both rockbolts and containment support (wire mesh, shotcrete, lacing, straps, and thin spray-on liners). Ortlepp (1968) was probably the first to develop and test a yielding rockbolt. The yielding characteristic of his bolt is shown in Figure 3.
FIG 3 - Characteristic of yielding rockbolt developed by Ortlepp (1968)
Ortlepp (1969) also tested the performance of a support system, which included these bolts in an underground, tunnel environment, using blast-induced dynamic loading. The testing showed that the yielding bolts performed better than the conventional rigid elements. Ortlepp’s development was never commercialised, however. His concern for support under rockbursting conditions continued (Ortlepp, 1983b), and he repeated this type of blast loading test in a different mining environment (Ortlepp, 1992b), and the result was similar. Measurements of the ejection velocity of the wall supported with conventional, non-yielding support showed a value of 10m/s. A short while after completion of this test, a nearby tunnel was damaged in an actual rockburst, and the damage observed was indistinguishable from that in the blasting test. An investigation of ejection velocities in rockburst events is described by Ortlepp (1993).
The yielding Cone-bolt, developed by COMRO researchers (Jager, 1992), had the potential to be really significant in limiting rockburst damage. However, the component cost of the bolt was expensive compared with conventional bolts, and this was not popular with the South African mining industry. Ortlepp’s comment (Ortlepp, 1994) is relevant, “The recent development of a simple fully grouted yielding tendon known as a cone-bolt should have led to an urgent revision of tunnel design procedures based on stiff tendons. In fact, little use has been made of this important development. To date, it has been used only in special tunnels on two or three mines. The somewhat greater unit cost of the cone-bolt compared with the stiff, fully grouted shepherd’s crook re-bar is advanced as the reason for the reluctance to use it more widely. The cost of lost production and the very expensive rehabilitation work necessary to repair damage does not appear to be taken into account in such rationalization.” It was later shown, using mine costing data (Ortlepp and Stacey, 1995), that, with a marginal increase in bolt spacing, the cost is the same as conventional bolts, but the energy absorption capacity is an order of magnitude greater.
Owing to the difficulty of carrying out blasting tests underground, Ortlepp (1992a) proposed the use of a “synthetic concrete sidewall” for ejection. This concept was implemented in a quarry, with vertical ejection of

the concrete mass (Ortlepp, 1994) by means of explosives. Ejection velocities of the order of 12m/s were measured in the tests. It was demonstrated that 16mm diameter yielding cone bolts performed satisfactorily at these velocities without breaking, displacements being of the order of 0.5m. In contrast, much stronger, fully grouted rebar bolts failed in the tests with low energy absorption. These tests were of groups of rockbolts only, not of support systems involving a combination of support elements. In addition, they involved tensile loading only, and bolts were not subjected to shear, or combinations of stresses.
One may question whether blast loading is a satisfactory representation of rockburst loading, since shock waves and subsequently (and substantially) gas pressure, provide the loads. In contrast, in a rockburst, a mass of rock is suddenly accelerated, with no gas pressure involved. More recent blasting “rockburst” research testing included the test carried out by the CSIR in South Africa, summarised by Hagan et al (2001). This minimised gas loading, and indicated ejection velocities were in the range of 0.7 to 2.5m/s. Ground velocities of 3.3m/s were recorded by an accelerometer. Rock support involved in the test consisted of fully cement-grouted rockbolts only. “Rockburst” damage occurred on the tunnel wall where the PPV exceeded 0.7m/s. High intensity damage occurred where the ground velocity of 3.3m/s was recorded.
Alternative methods have been developed for evaluation of rock support, usually involving some form of drop weight system. Such “laboratory rockburst” testing of rock support components and systems has been described by Ortlepp and Stacey (1994; 1997; 1998), Ortlepp et al (1999) and Stacey and Ortlepp (1999; 2001a; 2001b; 2002a; 2002b). These effectively tested the performance of the containment support such as wire mesh, straps and lacing. Results were published for different mesh types, shotcrete plus mesh, mesh and lacing, mesh and straps, etc. As shown in Figure 4, very significant levels of energy can be absorbed by appropriate support, provided that yield, or displacement, can take place. The value of wire rope lacing in absorbing energy was specifically identified by Stacey and Ortlepp (2002a), tests indicating that it could possibly enhance the capacity of mesh and shotcrete support by a factor of 7. The test facility used in this research is no longer available. Drop weight testing is now being carried out by support manufacturers.
FIG 4 - Results of drop weight tests on containment support
The blasting approach pioneered by Ortlepp (1969) more than 40 years ago, probably still provides the greatest validity as a severe test of rockburst support capabilities even though it does not simulate a rockburst (Stacey, 2012).
Recent rockburst support research has dealt with seismic wave interaction with excavations, and possibly appropriate “sacrificial” support (Stacey and Rojas, 2013; Mudau et al, 2016). The research described by Daehnke (1997) and Hildyard (2007) is directly relevant in this regard.

Dynamic stope support testing The development of yielding in-stope support to combat rockburst damage, mentioned above, is another outcome of rockburst research in South Africa. In the narrow tabular stoping environment practised in the gold and platinum mines, these support elements are very important contributors to safety in the near face area. Dynamic testing of such elements was carried out on a routine basis by COMRO in a special laboratory testing machine. However, this does not provide information on the performance of a support system. Consequently, based on the successful drop weight testing of tunnel support, a unique facility was developed for realistic testing of stope support systems (Ortlepp et al, 2001). In this facility, dynamic loading of an artificial, discontinuous stope roof surface occurred: the energy input was generated by dropping a mass of 10000kg from a height of 3 metres onto a pyramid of steel-clad concrete blocks. This transmitted the energy onto the collapsible discontinuous stope roof. Energy input was up to 300kJ at an impact velocity of up to 7.7m/s. This test facility is shown in Figure 5, and discontinuous displacement of the stope roof in a test is shown in Figure 6.
FIG 5 - Stope support test facility
FIG 6 - Discontinuous failure in the stope roof in a test

Tests were carried out using elongate support (props, sticks), pack supports, and linked support types. Human and Ortlepp (2004) describe testing carried out using the facility, and the results obtained. This test facility is no longer operative.
STRATEGIC CONSIDERATIONS IN ROCKBURST RESEARCH South Africa is a country endowed with an enviable supply of mineral resources, including more than 70% of the world’s known reserves of platinum group metals, and large reserves of gold (their extent unknown because of their depth). Although the mining industry has declined in recent years, it remains a major employer, and mineral sales represent a major source of income to the country. The mining of the precious metal resources in South Africa is currently taking place at deep levels, and is getting deeper. At these depths, whether gold or platinum, rock stresses and temperatures are high, and will increase further with increasing mining depths. Mining-induced seismicity and rockbursts may be expected to increase with depth. The difficulty in recovering the ore is perhaps reflected in the decline in gold production that has taken place over the last decade or more - South Africa is no longer the world’s major producer of gold. Without research into suitable mining methods, alternative methods, and appropriate mechanisation, it is likely that the resources will remain as valuable, but unmined, orebodies. As the owner or custodian of the minerals, the Government surely has a responsibility to ensure that the required fundamental, long term research is carried out, and to invest in that research. Similarly, mining companies have a responsibility regarding mining research, but their strategic requirements and policies will be driven by different factors. The important issue is that both short and longer term strategic approaches to rock engineering research are essential to develop appropriate designs, mining methods, technology and equipment to overcome hazardous rockbursting conditions, and to ensure the successful extraction of gold and platinum from deep resources. Unfortunately, the story of South African rock engineering research in recent times has been depressing and lacking any apparent strategy. In 1992, during a term that I served as Vice-President of the ISRM, I became concerned about the status of rock engineering research in South Africa. I authored a letter to the Senior General Manager Operations of the Chamber of Mines, ending with, “In your position within the Chamber of Mines, … I should like to appeal to you to bring my concerns to the attention of the mining industry …” Unfortunately my concern was not heeded, and, over a short period of 10 years, a world class COMRO and CSIR rock engineering research powerhouse, that had developed over a period of 50 years, was allowed to deteriorate and ultimately disappear. However, on a positive note, a new initiative started recently and it is hoped that this will develop and be able to provide some of the necessary research.
ACKNOWLEDGEMENTS In preparing this paper, reference has been made to the work of many researchers, and the many references cited may be regarded as examples. Many relevant references will have been overlooked, however, and I apologise to those authors for this omission.
REFERENCES Applegate, J D 1991. Rock mechanics aspects of Sequential Grid Mining, Project Report submitted to the University of
the Witwatersrand, Johannesburg, in partial fulfillment of the degree of Master of Science in Engineering.
Barrett, A J, Wrench, B P and Blair Hook, D 1986. An overview of materials testing relevant to backfilling at Vaal Reefs Gold Mine, in Backfill in South African Mines, S. Afr. Inst. Min. Metall.
Brink, A v Z and O’Connor, D M 1983. Research on the prediction of rockbursts at Western Deep Levels, Jl S. Afr. Inst. Min. Metall., 83: 1-10.
Close, A J and Klokow, J W 1986. The development of the West Driefontein Tailings Backfill Project, S. Afr. Mining World, 5(4): 49-67.
Cook, N G W, Hoek, E, Pretorius, J P G, Ortlepp, W D and Salamon, M D G 1966. Rock mechanics applied to the study of rockbursts – A synthesis of the results of rockbursts research in South Africa up to 1965, Jl S. Afr. Inst. Min. Metall., 66: 436-528.
Cook, N G W and Schumann, E H R 1965. An electrical resistance analogue for planning tabular mine excavations, Research Report 72/65, Chamber of Mines of South Africa, Johannesburg.
Daehnke, A 1997. Stress wave and fracture propagation in rock, PhD Thesis, Vienna University of Technology.
Durrheim, R J, Roberts, M K C, Haile, A T, Hagan, T O, Jager, A J, Handley, M F, Spottiswoode, S M and Ortlepp, W D 1998. Factors affecting the severity of rockburst damage in South African gold mines, Jl S. Afr. Inst. Min. Metall., 98: 53-57.

Faure, M 1986. Experimental backfilling at Harmony Gold Mine, Proc. Backfilling Symposium, Association of Mine Managers of S. Afr. and S. Afr. Inst. Min. Metall.
Gay, N, Jager, A J and Piper, P S 1986. Quantitative evaluation of fill performance in South African gold mines, Proc. Backfilling Symposium, Association of Mine Managers of S. Afr. and S. Afr. Inst. Min. Metall.
Gay, N C and Ortlepp, W D 1979. Anatomy of a mining-induced fault zone, Geol. Soc. America Bulletin, 90(1):47-58.
Gay, N C, Ortlepp, W D, Ryder, J A, Steffen, O and Wagner, H 1982. The development of rock mechanics in the South African mineral industry, Proc. 12th CMMI Congress, Johannesburg, ed H.W. Glen, S. Afr. Inst. Min. Metall. and Geol. Soc. S. Afr., 365-375.
Handley, M F, de Lange, J A J, Essrich, F and Banning, J A 2000. A review of the sequential grid mining method employed at Elandsrand Gold Mine, Jl S. Afr. Inst. Min. Metall., 100:157-168.
Hemp, D A and Goldbach, O D 1993. The effect of backfill on ground motion in a stope during seismic events, Proc. 3rd Int. Symp. on Rockbursts and Seismicity in Mines, Kingston, Canada.
Hildyard, M W 2007. Wave interaction with underground openings in fractured rock, Rock Mech. Rock Engng, 40:531-561.
Hill, F G 1954. An investigation into the problem of rockbursts. An operational research project. Part 1. The approach to the problem and analysis of the rock bursts that have occurred on the E.R.P.M. during the years of 1948-53, Jl Chemical, Metallurgical and Mining Society of South Africa, October, 63-72.
Human, J L and Ortlepp, W D 2004. Large scale testing of stope support systems under “realistic” rockburst conditions, Proc. 2nd Int. Seminar on Deep and High Stress Mining, S. Afr. Inst. Min. Metall., 107-121.
Jager, A J 1992. Two new support units for the control of rockburst damage, Proc. International Symposium on Rock Support, Sudbury, Laurentian University.
Jager, A J and Ryder, J A Eds 1999. A Handbook on Rock Engineering Practice for Tabular Hard Rock Mines, The Safety in Mines Research Advisory Committee (SIMRAC), Johannesburg, 371p.
Kirsten, H A D 1994. Effect of depth, span, stope support, and discontinuity strength on potential seismic activity in the fractured rock around a tabular mining excavation, Jl S. Afr. Inst. Min. Metall., 94:1-23.
Kirsten, H A D and Howell, G 1993. Effect of depth, span, stope support, and discontinuity strength on the stress and stiffness characteristics of the fractured rock around a tabular mining excavation, Jl S. Afr. Inst. Min. Metall., 93(10):253-266.
Kirsten, H A D and Stacey, T R 1986. Backfill support mechanisms in stopes with low convergence, in Backfill in South African Mines, S. Afr. Inst. Min. Metall., 1988, 137-151.
Kirsten, H A D and Stacey, T R 1988. Hangingwall behaviour in tabular stopes subjected to seismic events, Jl S. Afr. Inst. Min. Metall., 88(5):163-172.
Kirsten, H A D and Stacey, T R 1989. Stress displacement behaviour of the fractured rock around a deep level tabular stope of limited span, Jl S. Afr. Inst. Min. Metall., 89(2):47-58.
Kirsten, H A D, Ortlepp, W D and Stacey, T R 1997. Performance of fibre-reinforced shotcrete subjected to large deformations, Proc.1st Southern African Regional Rock Engineering Symposium, SARES 97, S. Afr. National Group of Int. Soc. Rock Mech., 301-307.
Mendecki, A J 1996. Seismic Monitoring in Mines, Springer Netherlands.
More O’Ferrall, R C 1983. Design considerations for the layout of stopes in tabular deposits, in Rock Mechanics in Mining Practice, ed S. Budavari, S. Afr. Inst. Min. Metall., Monograph Series M5, 133-149.
Mudau, A, Govender, R A and Stacey, T R 2016. A step towards combating rockburst damage by using sacrificial support, Jl S. Afr. Inst. Min. Metall., 116(11):1065-1074.
Murphy, S K 2001. An evaluation of the effect of extensive backfilling on the performance of stabilizing pillars, Rockbursts and Seismicity in Mines – RaSIM5, S. Afr. Inst. Min. Metall.
Ortlepp, W D 2001. Thoughts on the rockburst source mechanism based on observations of the mine-induced shear rupture, Rockbursts and Seismicity in Mines – RaSIM5, S. Afr. Inst. Min. Metall.
Ortlepp, W D 2000. Observation of mining-induced faults in an intact rock mass at depth, Int. J. Rock Mech. Min. Sci., 37:423-436.
Ortlepp, W D 1997. Rock Fracture and Rockbursts – an illustrative study, Monograph Series M9, S. Afr. Inst. Min. Metall., 255p.
Ortlepp, W D 1994. Grouted rock-studs as rockburst support: A simple design approach and an effective test procedure, Jl S. Afr. Inst. Min. Metall., 94:47-63.

Ortlepp, W D 1993. High ground displacement velocities associated with rockburst damage, Proc. 3rd Int. Symp. on Rockbursts and Seismicity in Mines RaSiM3, ed R.P. Young, Kingston, Ontario, Balkema, 101-106.
Ortlepp, W D 1992a. Invited lecture: The design of support for the containment of rockburst damage in tunnels, in Rock Support in Mining and Underground Construction, Kaiser and McCreath (eds), Balkema, Rotterdam, 593-609.
Ortlepp, W D 1992b. Implosive-load testing of tunnel support, in Rock Support in Mining and Underground Construction, Kaiser and McCreath (eds), Balkema, Rotterdam, 675-682.
Ortlepp, W D 1983a. The mechanism and control of rockbursts, in Rock Mechanics in Mining Practice, ed S. Budavari, S. Afr. Inst. Min. Metall., Monograph Series M5, 257-281.
Ortlepp, W D 1983b. Considerations in the design of support for deep hard-rock tunnels, Proc. 5th Int. Cong. Int. Soc. Rock Mech., Melbourne, D179-D187.
Ortlepp, W D 1982. Rockbursts in South African Gold Mines: A Phenomenological View, Proc. 1st Int. Cong. On Rockbursts and Seismicity in Mines, Johannesburg, S. Afr. Inst.Min. Metall., Symposium Series No. 6 (1984), 165-178.
Ortlepp, W D 1969. An empirical determination of the effectiveness of rockbolt support under impulse loading, Proc, Int. Symp. on Large Permanent Underground Openings, Oslo, September 1969, Brekke and Jorstad (eds), Universitatsforlaget, 197-205.
Ortlepp, W D 1968. A yielding rockbolt, Research Organisation Bulletin of the Chamber of Mines of South Africa, No 14, 6-8.
Ortlepp, W D, Armstrong, R, Ryder, J A and O’Connor, D 2005. Fundamental study of micro-fracturing on the slip surface of mine-induced dynamic brittle shear zones, Proc. Rockbursts and Seismicity in Mines RaSiM6, Australian Centre for Geomechanics, 229-238.
Ortlepp, W D, Bornmann, J J and Erasmus, N 2001. The Durabar – a yieldable support anchor – design rationale and laboratory results, Rockbursts and Seismicity in Mines – RaSim5, S. Afr. Inst. Min. Metall., 263-266.
Ortlepp, W D and Stacey, T R 1998. Performance of tunnel support under large deformation static and dynamic loading, Tunnelling and Underground Space Technology, 13(1):15-21.
Ortlepp, W D and Stacey, T R 1995. The spacing of support - safety and cost implications, Jl S. Afr. Inst. Min. Metall., 95:141-146.
Ortlepp, W D and Stacey, T R 1994. Rockburst mechanisms in tunnels and shafts, Tunnelling and Underground Space Technology, 9(1):59-65.
Ortlepp, W D, Stacey, T R and Kirsten, H A D 1999. Containment support for large static and dynamic deformations in mines, Proc. Int. Symp. Rock Support and Reinforcement Practice in Mining, Kalgoorlie, Australia, March 1999, Balkema, 359-364.
Ortlepp, W D, Wesseloo, J and Stacey, T R 2001. A facility for testing of stope support under realistic “rockburst” conditions, Proc. 5th Int. Symp. Rockbursts and Seismicity in Mines, Dynamic Rock Mass Response to Mining, S. Afr. Inst. Min. Metall., 197-204.
Plewman, R P, Deist, F H and Ortlepp, W D 1969. The development and application of a digital computer method for the solution of strata control problems, Jl S. Afr. Inst. Min. Metall., 70:33-44.
Roberts, M K C and Brummer, R K 1988. Support requirements in rockburst conditions, Jl S. Afr. Inst. Min. Metall., 88(3):97-104.
Roux, A J A and Denkhaus, H G 1954. An investigation into the problem of rockbursts. An operational research project. Part II. An analysis of the problem of rock bursts in deep level mining, Jl Chemical, Metallurgical and Mining Society of South Africa, November, 103-124.
Roux, A J A, Leeman, E R and Denkhaus, H G 1957. Destressing: a means of ameliorating rockburst conditions. Part I. The concept of destressing and the results obtained from its application, Jl S. Afr. Inst. Min. Metall., 57:101-119.
Ryder, J A 1988. Excess shear stress in the assessment of geologically hazardous situations, Jl S. Afr. Inst. Min. Metall., 88:27-39.
Ryder, J A and Jager, A J Eds 2002. A textbook on Rock Mechanics for Tabular Hard Rock Mines, The Safety in Mines Research Advisory Committee (SIMRAC), Johannesburg.
Share, P, Milev, A, Durrheim, R, Kuijpers, J and Ogasawara, H 2013. Relating high-resolution tilt measurements to the source displacement of an M2.2 event located at Mponeng gold mine, Jl S. Afr. Inst. Min. Metall., 113:787-793.
Spottiswoode, S M 1997. Energy release rate with limits to on-reef stress, Proc. 1st Southern African Rock Engineering Symposium, ed R.G. Gurtunca and T.O. Hagan, South African National Group on Rock Mechanics, 252-258.
Spottiswoode, S M 1988. Total seismicity, and the application of ESS to mining layouts, Jl S. Afr. Inst. Min. Metall., 88:109-116.

Spottiswoode, S M and Churcher, J M 1988. The effect of backfill on the transmission of seismic energy, Proc. Backfill in South African Mines, S. Afr. Inst. Min. Metall., 203-217.
Squelch, A P and Gurtunca, R G 1991. Reduction in rockfall accidents and rockburst damage in backfilled stopes, Proc. Mine Safety and Health Congress, Chamber of Mines of South Africa, Johannesburg.
Stacey, T R 2012. A philosophical view on the testing of rock support for rockburst conditions, Jl S. Afr. Inst. Min. Metall., 113(7):227-245.
Stacey, T R and Ortlepp, W D 2002a. The contribution of wire rope lacing in surface support, Proc. 2nd Int. Seminar on Surface Support Liners: Thin Sprayed Liners, Shotcrete, Mesh, Johannesburg, S. Afr. Inst. Min. Metall., Section 2, 1-8.
Stacey, T R and Ortlepp, W D 2002b. Yielding rock support – the capacities of different types of support, and matching of support type to seismic demand, Proc. Int. Seminar Deep and High Stress Mining, Perth, Australia, November 2002, Australian Centre for Geomechanics, Section 38, 10p.
Stacey, T R and Ortlepp, W D 2001a. Tunnel surface support - capacities of various types of wire mesh and shotcrete under dynamic loading, Jl S. Afr. Inst. Min. Metall., 101(7):337-342.
Stacey, T R and Ortlepp, W D 2001b. Large scale impact load testing of rock tunnel and stope support, Proc. 4th Asia-Pacific Conf. On Shock & Impact Loads on Structures, Singapore, November 2001, 85-96.
Stacey, T R and Ortlepp, W D 1999. Retainment support for dynamic events in mines, Proc. Int. Symp. Rock Support and Reinforcement Practice in Mining, Kalgoorlie, Australia, March 1999, Balkema, 329-333.
Stacey, T R, Ortlepp, W D and Kirsten, H A D 1995. Energy absorbing capacity of reinforced shotcrete, with reference to containment of rockburst damage, Jl S. Afr. Inst. Min. Metall., 95:137-140.
Stacey, T R and Rojas, E 2013. A potential method of containing rockburst damage and enhancing safety using a sacrificial layer, Jl S. Afr. Inst. Min. Metall., 113(7):565-573.
Tanton, J H, McCarthy, T F and Hagan, T O 1982. The introduction of stabilizing pillars to reduce rockbursts at Western Deep Levels, Limited, Proc. 1st Int. Cong. on Rockbursts and Seismicity in Mines, Johannesburg, S. Afr. Inst. Min. Metall., Symposium Series No. 6 (1984), 245-256.
Toper, A Z 2003. The effect of blasting on the rockmass for designing the most effective preconditioning blasts in deep-level gold mines. PhD thesis, University of the Witwatersrand, 359p.
Toper, A Z, Kabongo, K K, Stewart, R D, and Daehnke, A 2000. The mechanism, optimization and implementation of preconditioning, Jl S. Afr. Inst. Min. Metall., 100:7-16.
Van Antwerpen, H E F and Spengler, M G 1982. The effect of mining-related seismicity on excavations at East Rand Proprietary Mines, Limited, Proc. 1st Int. Cong. On Rockbursts and Seismicity in Mines, Johannesburg, S. Afr. Inst.Min. Metall., Symposium Series No. 6 (1984), 235-243.
Wagner, H 1983. Principles of the support of tabular excavations, in Rock Mechanics in Mining Practice, ed S. Budavari, S. Afr. Inst. Min. Metall., Monograph Series M5, 151-171.
Yabe, Y, Nakatani, M, Naoi, M, Iida, T, Satoh, T, Durrheim, R, Hofmann, G, Roberts, D, Yilmaz, H, Morema, G and Ogasawara, H 2013. Estimation of the stress state around the fault source of an Mw 2.2 earthquake in a deep gold mine in South Africa based on borehole breakout and core discing, Proc. 6th Int. Symp. on In-Situ Rock Stress, 20-22 August 2013, Sendai, Japan, 604-613.

INTRODUCTIONThe significance of rock strength anisotropy (anisotropy) in geotechnical design is often ignored or underestimated. This is partly because most geotechnical design methods (whether empirical, numerical or analytical) are largely developed for isotropic and not anisotropic rock mass conditions. Thus there is a tendency to ignore its impact to simplify the design process or apply conventional design methods.
However, anisotropy can play a key role in the stability of underground excavations and subsequent geotechnical design. Experience suggests that in many cases, anisotropy can even override other geotechnical factors such as stress in controlling the failure mechanism. In high-stress conditions, anisotropy can significantly change the time dependent failure mechanism and progression of damage into the rock mass.
Recent literature, such as that of Sandy et al (2010); Vakili, Sandy, and Albrecht (2012); Hadjigeorgiou et al (2013); and Vakili et al (2013) outlines the typical response of anisotropic rock masses to increasing stress levels and shows examples of geotechnical design in these conditions.
This paper first defines the concept of rock strength anisotropy. It then provides brief guidelines for data collection and selection of input parameters for geotechnical analysis considering this condition. A recently developed and
improved unified constitutive model (IUCM) is described. This is applied in sensitivity analyses and two case studies to better understand the typical responses of anisotropic rocks to underground mining. It also highlights how suitable geotechnical analysis can improve the reliability of design in anisotropic rock mass conditions.
DEFINITION OF STRENGTH ANISOTROPY IN ROCK MATERIALAnisotropy is a mechanical property of rock that makes the rock’s strength (or other material properties) directionally dependent. Unlike isotropic rocks, which have similar strength properties in all directions, anisotropic rocks can have significantly lower strength when loaded along their weak orientation.
Anisotropy is usually caused by some obvious ‘fabric’ in the rock material, such as schistosity, foliation or bedding. The intensity of anisotropic behaviour (in other words, the difference in directional strength) is often controlled by the amount and characteristics of flaky and elongated minerals present (such as mica, chlorite or amphiboles). This influence tends to be significant even at the scale of a laboratory test specimen (Palmström 1994; Brady and Brown, 2005). Two
Rock strength anisotropy and its importance in underground geotechnical designA Vakili1, J Albrecht2 and M Sandy3
ABSTRACTAlthough rock strength anisotropy is a well-known phenomenon in rock mechanics, its impact on geotechnical design is often ignored. No widely accepted guideline currently exists for its characterisation. Anisotropy can significantly control the failure mechanism and progression of damage into the rock mass, particularly in high-stress conditions. As such, it can play a key role in the stability of underground excavations and subsequent geotechnical design.
This paper introduces the concept of anisotropy at both intact and rock mass scales. It then presents guidelines for measuring anisotropy and assigning rock mass strength properties. An improved unified constitutive model (IUCM), which can account for more complex failure mechanisms, is then briefly described. This IUCM is used to better understand the typical responses of anisotropic rocks to underground mining and to develop an improved damage classification scheme for these conditions.
The application of conventional design methods in anisotropic conditions is shown to lead to significant errors. Two case histories are then presented, illustrating how the proposed methodology can improve the reliability and accuracy of the geotechnical analysis when compared with conventional design methods.
1. MAusIMM(CP), Senior Geotechnical Engineer, AMC Consultants Pty Ltd, Level 19, 114 William Street, Melbourne Vic 3000. Email: [email protected]
2. MAusIMM(CP), Mine Technical Services Superintendent, St Barbara Limited, Gwalia Mine Site, Kane Street Gwalia, Leonora WA 6438. Email: [email protected]
3. FAusIMM(CP), Director/Global Practice Leader – Geotechnical Engineering, AMC Consultants Pty Ltd, Level 19, 114 William Street, Melbourne Vic 3000. Email: [email protected]
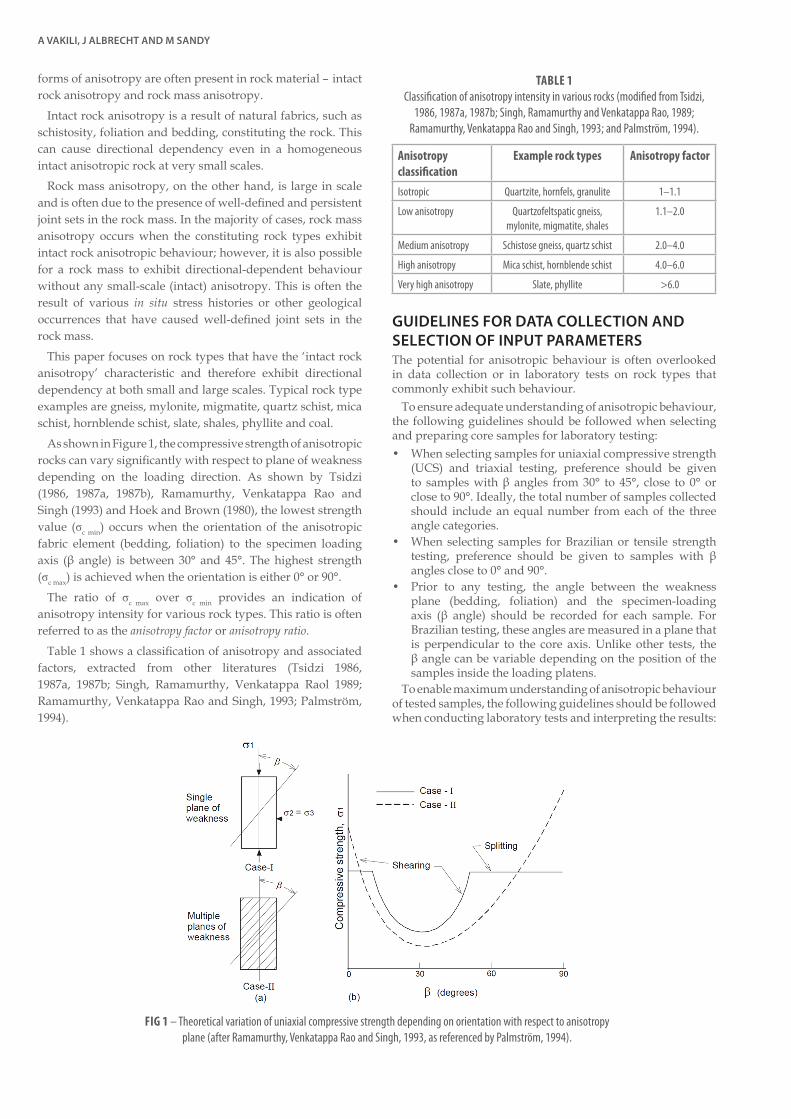
A VAKILI, J ALBRECHT AND M SANDY
forms of anisotropy are often present in rock material – intact rock anisotropy and rock mass anisotropy.
Intact rock anisotropy is a result of natural fabrics, such as schistosity, foliation and bedding, constituting the rock. This can cause directional dependency even in a homogeneous intact anisotropic rock at very small scales.
Rock mass anisotropy, on the other hand, is large in scale and is often due to the presence of well-defined and persistent joint sets in the rock mass. In the majority of cases, rock mass anisotropy occurs when the constituting rock types exhibit intact rock anisotropic behaviour; however, it is also possible for a rock mass to exhibit directional-dependent behaviour without any small-scale (intact) anisotropy. This is often the result of various in situ stress histories or other geological occurrences that have caused well-defined joint sets in the rock mass.
This paper focuses on rock types that have the ‘intact rock anisotropy’ characteristic and therefore exhibit directional dependency at both small and large scales. Typical rock type examples are gneiss, mylonite, migmatite, quartz schist, mica schist, hornblende schist, slate, shales, phyllite and coal.
As shown in Figure 1, the compressive strength of anisotropic rocks can vary significantly with respect to plane of weakness depending on the loading direction. As shown by Tsidzi (1986, 1987a, 1987b), Ramamurthy, Venkatappa Rao and Singh (1993) and Hoek and Brown (1980), the lowest strength value (σc min) occurs when the orientation of the anisotropic fabric element (bedding, foliation) to the specimen loading axis (β angle) is between 30° and 45°. The highest strength (σc max) is achieved when the orientation is either 0° or 90°.
The ratio of σc max over σc min provides an indication of anisotropy intensity for various rock types. This ratio is often referred to as the anisotropy factor or anisotropy ratio.
Table 1 shows a classification of anisotropy and associated factors, extracted from other literatures (Tsidzi 1986, 1987a, 1987b; Singh, Ramamurthy, Venkatappa Raol 1989; Ramamurthy, Venkatappa Rao and Singh, 1993; Palmström, 1994).
GUIDELINES FOR DATA COLLECTION AND SELECTION OF INPUT PARAMETERSThe potential for anisotropic behaviour is often overlooked in data collection or in laboratory tests on rock types that commonly exhibit such behaviour.
To ensure adequate understanding of anisotropic behaviour, the following guidelines should be followed when selecting and preparing core samples for laboratory testing:
• When selecting samples for uniaxial compressive strength(UCS) and triaxial testing, preference should be givento samples with β angles from 30° to 45°, close to 0° orclose to 90°. Ideally, the total number of samples collectedshould include an equal number from each of the threeangle categories.
• When selecting samples for Brazilian or tensile strengthtesting, preference should be given to samples with βangles close to 0° and 90°.
• Prior to any testing, the angle between the weaknessplane (bedding, foliation) and the specimen-loadingaxis (β angle) should be recorded for each sample. ForBrazilian testing, these angles are measured in a plane thatis perpendicular to the core axis. Unlike other tests, theβ angle can be variable depending on the position of thesamples inside the loading platens.
To enable maximum understanding of anisotropic behaviour of tested samples, the following guidelines should be followed when conducting laboratory tests and interpreting the results:
Anisotropy classification
Example rock types Anisotropy factor
Isotropic Quartzite, hornfels, granulite 1–1.1
Low anisotropy Quartzofeltspatic gneiss, mylonite, migmatite, shales
1.1–2.0
Medium anisotropy Schistose gneiss, quartz schist 2.0–4.0
High anisotropy Mica schist, hornblende schist 4.0–6.0
Very high anisotropy Slate, phyllite >6.0
TABLE 1Classification of anisotropy intensity in various rocks (modified from Tsidzi,
1986, 1987a, 1987b; Singh, Ramamurthy and Venkatappa Rao, 1989; Ramamurthy, Venkatappa Rao and Singh, 1993; and Palmström, 1994).
FIG 1 – Theoretical variation of uniaxial compressive strength depending on orientation with respect to anisotropy plane (after Ramamurthy, Venkatappa Rao and Singh, 1993, as referenced by Palmström, 1994).
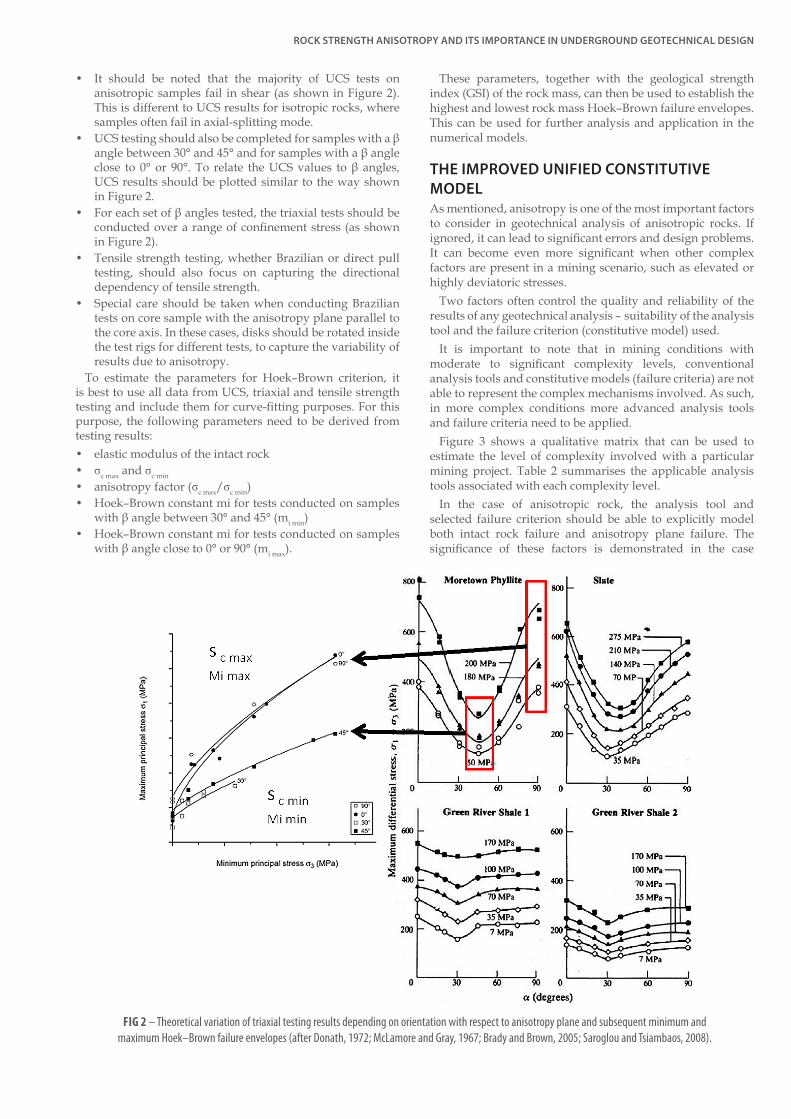
ROCK STRENGTH ANISOTROPY AND ITS IMPORTANCE IN UNDERGROUND GEOTECHNICAL DESIGN
• It should be noted that the majority of UCS tests onanisotropic samples fail in shear (as shown in Figure 2).This is different to UCS results for isotropic rocks, wheresamples often fail in axial-splitting mode.
• UCS testing should also be completed for samples with a βangle between 30° and 45° and for samples with a β angleclose to 0° or 90°. To relate the UCS values to β angles,UCS results should be plotted similar to the way shownin Figure 2.
• For each set of β angles tested, the triaxial tests should beconducted over a range of confinement stress (as shownin Figure 2).
• Tensile strength testing, whether Brazilian or direct pulltesting, should also focus on capturing the directionaldependency of tensile strength.
• Special care should be taken when conducting Braziliantests on core sample with the anisotropy plane parallel tothe core axis. In these cases, disks should be rotated insidethe test rigs for different tests, to capture the variability ofresults due to anisotropy.
To estimate the parameters for Hoek–Brown criterion, it is best to use all data from UCS, triaxial and tensile strength testing and include them for curve-fitting purposes. For this purpose, the following parameters need to be derived from testing results:
• elastic modulus of the intact rock • σc max and σc min
• anisotropy factor (σc max/σc min) • Hoek–Brown constant mi for tests conducted on samples
with β angle between 30° and 45° (mi min) • Hoek–Brown constant mi for tests conducted on samples
with β angle close to 0° or 90° (mi max).
These parameters, together with the geological strength index (GSI) of the rock mass, can then be used to establish the highest and lowest rock mass Hoek–Brown failure envelopes. This can be used for further analysis and application in the numerical models.
THE IMPROVED UNIFIED CONSTITUTIVE MODELAs mentioned, anisotropy is one of the most important factors to consider in geotechnical analysis of anisotropic rocks. If ignored, it can lead to significant errors and design problems. It can become even more significant when other complex factors are present in a mining scenario, such as elevated or highly deviatoric stresses.
Two factors often control the quality and reliability of the results of any geotechnical analysis – suitability of the analysis tool and the failure criterion (constitutive model) used.
It is important to note that in mining conditions with moderate to significant complexity levels, conventional analysis tools and constitutive models (failure criteria) are not able to represent the complex mechanisms involved. As such, in more complex conditions more advanced analysis tools and failure criteria need to be applied.
Figure 3 shows a qualitative matrix that can be used to estimate the level of complexity involved with a particular mining project. Table 2 summarises the applicable analysis tools associated with each complexity level.
In the case of anisotropic rock, the analysis tool and selected failure criterion should be able to explicitly model both intact rock failure and anisotropy plane failure. The significance of these factors is demonstrated in the case
FIG 2 – Theoretical variation of triaxial testing results depending on orientation with respect to anisotropy plane and subsequent minimum and maximum Hoek–Brown failure envelopes (after Donath, 1972; McLamore and Gray, 1967; Brady and Brown, 2005; Saroglou and Tsiambaos, 2008).
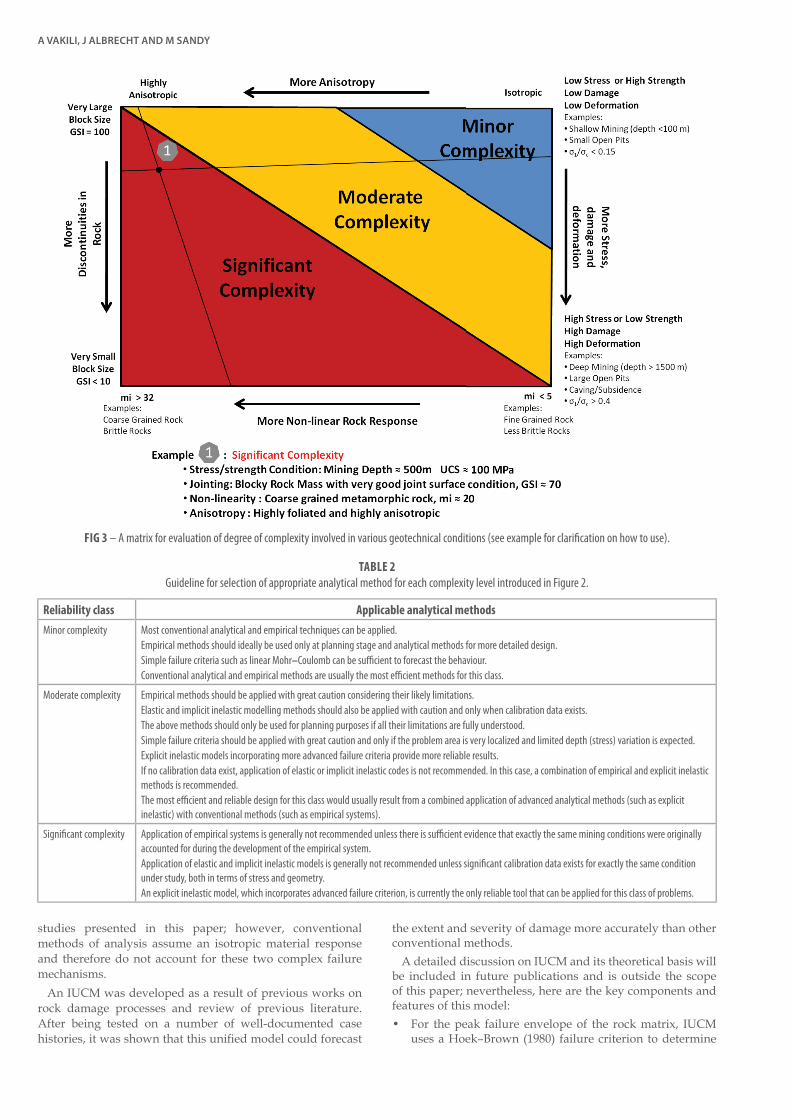
A VAKILI, J ALBRECHT AND M SANDY
studies presented in this paper; however, conventional methods of analysis assume an isotropic material response and therefore do not account for these two complex failure mechanisms.
An IUCM was developed as a result of previous works on rock damage processes and review of previous literature. After being tested on a number of well-documented case histories, it was shown that this unifi ed model could forecast
the extent and severity of damage more accurately than other conventional methods.
A detailed discussion on IUCM and its theoretical basis will be included in future publications and is outside the scope of this paper; nevertheless, here are the key components and features of this model:• For the peak failure envelope of the rock matrix, IUCM
uses a Hoek–Brown (1980) failure criterion to determine
FIG 3 – A matrix for evaluation of degree of complexity involved in various geotechnical conditions (see example for clarifi cation on how to use).
Reliability class Applicable analytical methods Minor complexity Most conventional analytical and empirical techniques can be applied.
Empirical methods should ideally be used only at planning stage and analytical methods for more detailed design. Simple failure criteria such as linear Mohr–Coulomb can be suffi cient to forecast the behaviour.Conventional analytical and empirical methods are usually the most effi cient methods for this class.
Moderate complexity Empirical methods should be applied with great caution considering their likely limitations.Elastic and implicit inelastic modelling methods should also be applied with caution and only when calibration data exists.The above methods should only be used for planning purposes if all their limitations are fully understood.Simple failure criteria should be applied with great caution and only if the problem area is very localized and limited depth (stress) variation is expected.Explicit inelastic models incorporating more advanced failure criteria provide more reliable results.If no calibration data exist, application of elastic or implicit inelastic codes is not recommended. In this case, a combination of empirical and explicit inelastic methods is recommended.The most effi cient and reliable design for this class would usually result from a combined application of advanced analytical methods (such as explicit inelastic) with conventional methods (such as empirical systems).
Signifi cant complexity Application of empirical systems is generally not recommended unless there is suffi cient evidence that exactly the same mining conditions were originally accounted for during the development of the empirical system.Application of elastic and implicit inelastic models is generally not recommended unless signifi cant calibration data exists for exactly the same condition under study, both in terms of stress and geometry.An explicit inelastic model, which incorporates advanced failure criterion, is currently the only reliable tool that can be applied for this class of problems.
TABLE 2Guideline for selection of appropriate analytical method for each complexity level introduced in Figure 2.
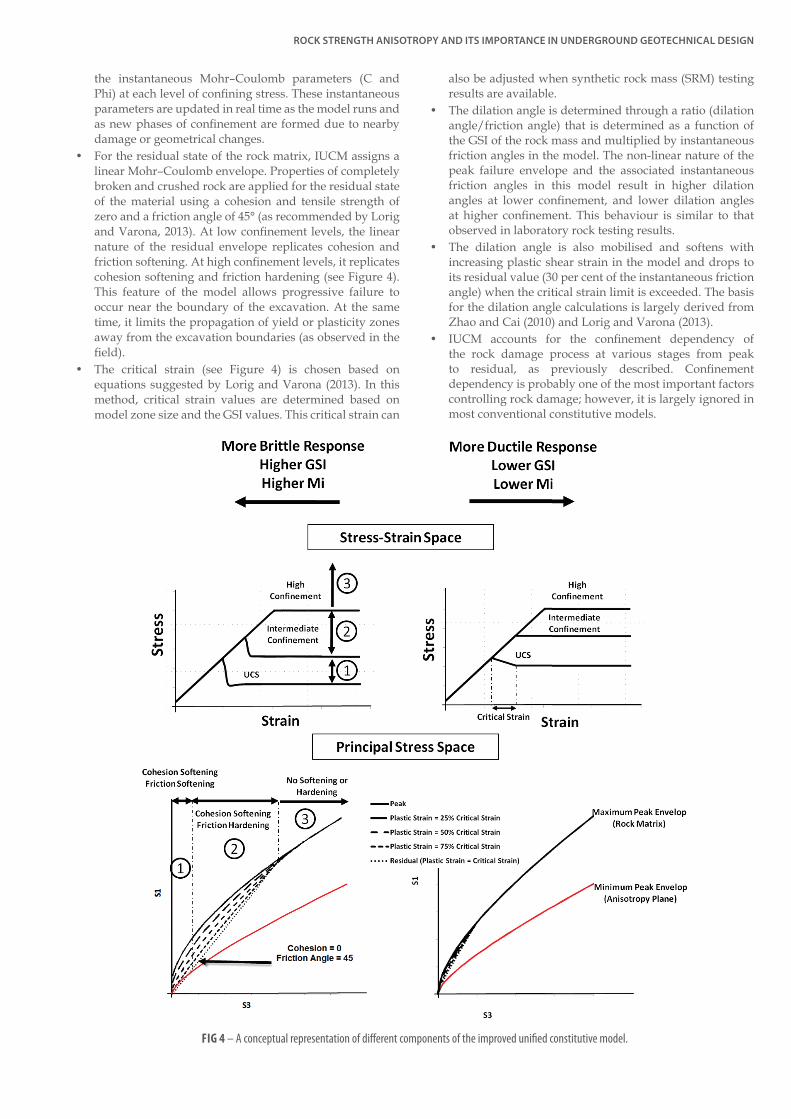
ROCK STRENGTH ANISOTROPY AND ITS IMPORTANCE IN UNDERGROUND GEOTECHNICAL DESIGN
the instantaneous Mohr–Coulomb parameters (C and Phi) at each level of confi ning stress. These instantaneous parameters are updated in real time as the model runs and as new phases of confi nement are formed due to nearby damage or geometrical changes.
• For the residual state of the rock matrix, IUCM assigns alinear Mohr–Coulomb envelope. Properties of completelybroken and crushed rock are applied for the residual stateof the material using a cohesion and tensile strength ofzero and a friction angle of 45° (as recommended by Lorigand Varona, 2013). At low confi nement levels, the linearnature of the residual envelope replicates cohesion andfriction softening. At high confi nement levels, it replicatescohesion softening and friction hardening (see Figure 4).This feature of the model allows progressive failure tooccur near the boundary of the excavation. At the sametime, it limits the propagation of yield or plasticity zonesaway from the excavation boundaries (as observed in thefi eld).
• The critical strain (see Figure 4) is chosen based onequations suggested by Lorig and Varona (2013). In thismethod, critical strain values are determined based onmodel zone size and the GSI values. This critical strain can
also be adjusted when synthetic rock mass (SRM) testing results are available.
• The dilation angle is determined through a ratio (dilationangle/friction angle) that is determined as a function ofthe GSI of the rock mass and multiplied by instantaneousfriction angles in the model. The non-linear nature of thepeak failure envelope and the associated instantaneousfriction angles in this model result in higher dilationangles at lower confi nement, and lower dilation anglesat higher confi nement. This behaviour is similar to thatobserved in laboratory rock testing results.
• The dilation angle is also mobilised and softens withincreasing plastic shear strain in the model and drops toits residual value (30 per cent of the instantaneous frictionangle) when the critical strain limit is exceeded. The basisfor the dilation angle calculations is largely derived fromZhao and Cai (2010) and Lorig and Varona (2013).
• IUCM accounts for the confi nement dependency ofthe rock damage process at various stages from peakto residual, as previously described. Confi nementdependency is probably one of the most important factorscontrolling rock damage; however, it is largely ignored inmost conventional constitutive models.
FIG 4 – A conceptual representation of diff erent components of the improved unifi ed constitutive model.

A VAKILI, J ALBRECHT AND M SANDY
• Most conventional constitutive models assume a constantmodulus of elasticity for the rock mass, irrespectiveof its damage state. In real-life situations, when rockundergoes failure and continuous loading, more voids aregenerated within the rock mass. The rock mass porosityis subsequently increased. The greater the porosity in therock mass, the smaller its elastic modulus. The drop in rockmass modulus can significantly affect the redistribution ofstresses around a failed area and the subsequent phasesof induced confinement. The impact of modulus softeningcan be more pronounced in situations where significantrock mass yield or deformation is expected, for examplein high-stress conditions, caving, or deep open pit mining.Reyes-Montes et al (2012) reviewed and collated theprevious literature in this area and presented an empiricalrelationship between modulus drop and the level ofporosity in a rock mass. IUCM uses this relationship toupdate the elastic modulus values according to newporosity levels. The porosity is calculated using the modelvolumetric strain outputs. The density in the model is alsoupdated as a result of new porosity levels.
• The strength anisotropy in IUCM is explicitly includedthrough a ubiquitous joint model, which accounts for bothrock matrix strength and the lower strength associatedwith the existence of an anisotropy plane. For anisotropicrocks, the model uses two non-linear Hoek–Brownfailure envelopes. One envelope defines the maximumstrength and is related to the rock matrix strength. Theother defines the minimum strength associated with theanisotropy plane.
• This constitutive model is implemented in the explicitfinite difference code FLAC3D (Itasca Consulting Group,2009) and therefore uses a time-stepping solution forcalculations. As a result, progressive and time-dependentfailure can be replicated in this model through updatingthe material properties as a function of new confinementand strain levels.
The key input parameters that are used in IUCM for anisotropic rock are:
• elastic modulus of intact rock • UCS of intact rock (σc max) • anisotropy factor (σc max/σc min)
• mi min
• mi max
• GSI.All of these parameters can be determined from laboratory
testing as described earlier in this paper and from core logging or structural mapping.
If, due to lack of sufficient and appropriate testing, the anisotropy factor and mi min cannot be determined, the information in Table 1 should be used to assign an indicative anisotropy factor. In addition, a mi min value equal to 50 per cent of mi max should be adopted.
The GSI value should ideally be estimated from field observations; however, if this is not possible, it should be estimated from joint condition and Rock Quality Designation values and according to relationships proposed by Hoek, Carter and Diederichs (2013). The formulae for conversion of Rock Mass Rating and Q’ values to GSI is not recommended.
APPLYING THE IMPROVED UNIFIED CONSTITUTIVE MODEL IN SENSITIVITY ANALYSESUsing the IUCM and the parameters of a calibrated base model, the authors conducted sensitivity analyses to better understand the relationship between the various properties of anisotropic rocks and the degree of resulting damage.
Closure strain, depth of cracking (dc), and volumetric strain were used to represent damage for each modelled case. As shown in Figure 5, volumetric strain can be used as an indicator of the degree of disintegration in continuum numerical models.
The results of these sensitivity analyses were used to derive the damage classification matrices shown in Figures 6 to 9 for vertical and horizontal development in anisotropic rock mass conditions. It should be noted that for the horizontal development scheme, medium anisotropy (anisotropy factor = 3) was assumed in all cases. Different responses are expected for conditions with a greater or lesser degree of anisotropy.
The following are the key conclusions of the sensitivity analysis:
FIG 5 – Visual representation of degree of rock disintegration at various levels of volumetric strain.

ROCK STRENGTH ANISOTROPY AND ITS IMPORTANCE IN UNDERGROUND GEOTECHNICAL DESIGN
FIG 6 – Response of anisotropic rock mass to vertical underground development and sensitivities to main inputs.
FIG 7 – Response of anisotropic rock mass to horizontal underground development (fl at dipping anisotropy plane).
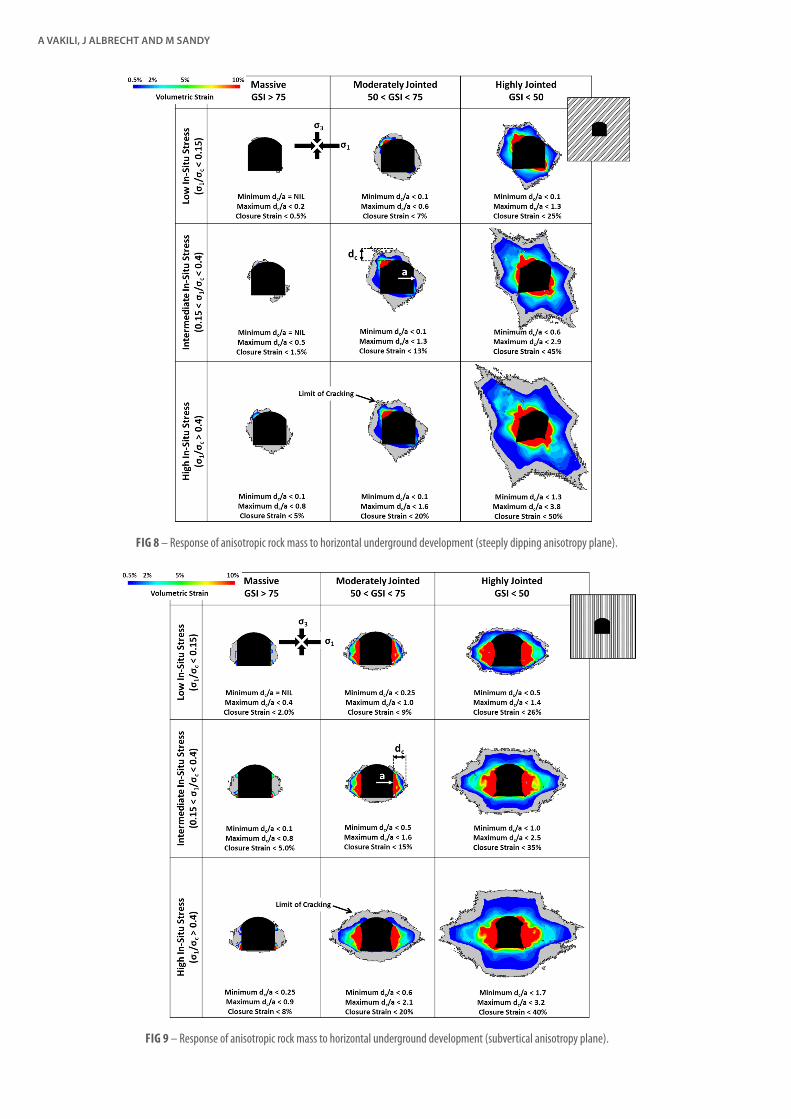
A VAKILI, J ALBRECHT AND M SANDY
FIG 8 – Response of anisotropic rock mass to horizontal underground development (steeply dipping anisotropy plane).
FIG 9 – Response of anisotropic rock mass to horizontal underground development (subvertical anisotropy plane).
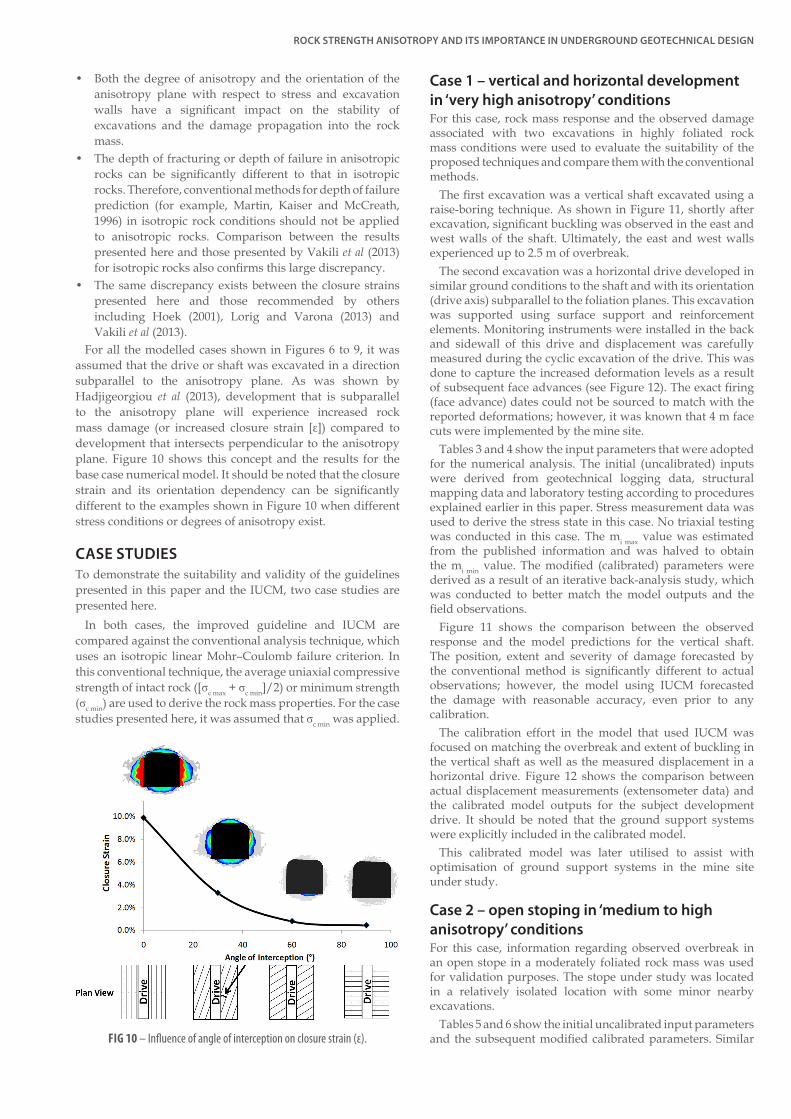
ROCK STRENGTH ANISOTROPY AND ITS IMPORTANCE IN UNDERGROUND GEOTECHNICAL DESIGN
• Both the degree of anisotropy and the orientation of theanisotropy plane with respect to stress and excavationwalls have a significant impact on the stability ofexcavations and the damage propagation into the rockmass.
• The depth of fracturing or depth of failure in anisotropicrocks can be significantly different to that in isotropicrocks. Therefore, conventional methods for depth of failureprediction (for example, Martin, Kaiser and McCreath,1996) in isotropic rock conditions should not be appliedto anisotropic rocks. Comparison between the resultspresented here and those presented by Vakili et al (2013)for isotropic rocks also confirms this large discrepancy.
• The same discrepancy exists between the closure strainspresented here and those recommended by othersincluding Hoek (2001), Lorig and Varona (2013) andVakili et al (2013).
For all the modelled cases shown in Figures 6 to 9, it was assumed that the drive or shaft was excavated in a direction subparallel to the anisotropy plane. As was shown by Hadjigeorgiou et al (2013), development that is subparallel to the anisotropy plane will experience increased rock mass damage (or increased closure strain [ε]) compared to development that intersects perpendicular to the anisotropy plane. Figure 10 shows this concept and the results for the base case numerical model. It should be noted that the closure strain and its orientation dependency can be significantly different to the examples shown in Figure 10 when different stress conditions or degrees of anisotropy exist.
CASE STUDIESTo demonstrate the suitability and validity of the guidelines presented in this paper and the IUCM, two case studies are presented here.
In both cases, the improved guideline and IUCM are compared against the conventional analysis technique, which uses an isotropic linear Mohr–Coulomb failure criterion. In this conventional technique, the average uniaxial compressive strength of intact rock ([σc max + σc min]/2) or minimum strength (σc min) are used to derive the rock mass properties. For the case studies presented here, it was assumed that σc min was applied.
Case 1 – vertical and horizontal development in ‘very high anisotropy’ conditionsFor this case, rock mass response and the observed damage associated with two excavations in highly foliated rock mass conditions were used to evaluate the suitability of the proposed techniques and compare them with the conventional methods.
The first excavation was a vertical shaft excavated using a raise-boring technique. As shown in Figure 11, shortly after excavation, significant buckling was observed in the east and west walls of the shaft. Ultimately, the east and west walls experienced up to 2.5 m of overbreak.
The second excavation was a horizontal drive developed in similar ground conditions to the shaft and with its orientation (drive axis) subparallel to the foliation planes. This excavation was supported using surface support and reinforcement elements. Monitoring instruments were installed in the back and sidewall of this drive and displacement was carefully measured during the cyclic excavation of the drive. This was done to capture the increased deformation levels as a result of subsequent face advances (see Figure 12). The exact firing (face advance) dates could not be sourced to match with the reported deformations; however, it was known that 4 m face cuts were implemented by the mine site.
Tables 3 and 4 show the input parameters that were adopted for the numerical analysis. The initial (uncalibrated) inputs were derived from geotechnical logging data, structural mapping data and laboratory testing according to procedures explained earlier in this paper. Stress measurement data was used to derive the stress state in this case. No triaxial testing was conducted in this case. The mi max value was estimated from the published information and was halved to obtain the mi min value. The modified (calibrated) parameters were derived as a result of an iterative back-analysis study, which was conducted to better match the model outputs and the field observations.
Figure 11 shows the comparison between the observed response and the model predictions for the vertical shaft. The position, extent and severity of damage forecasted by the conventional method is significantly different to actual observations; however, the model using IUCM forecasted the damage with reasonable accuracy, even prior to any calibration.
The calibration effort in the model that used IUCM was focused on matching the overbreak and extent of buckling in the vertical shaft as well as the measured displacement in a horizontal drive. Figure 12 shows the comparison between actual displacement measurements (extensometer data) and the calibrated model outputs for the subject development drive. It should be noted that the ground support systems were explicitly included in the calibrated model.
This calibrated model was later utilised to assist with optimisation of ground support systems in the mine site under study.
Case 2 – open stoping in ‘medium to high anisotropy’ conditionsFor this case, information regarding observed overbreak in an open stope in a moderately foliated rock mass was used for validation purposes. The stope under study was located in a relatively isolated location with some minor nearby excavations.
Tables 5 and 6 show the initial uncalibrated input parameters and the subsequent modified calibrated parameters. Similar FIG 10 – Influence of angle of interception on closure strain (ε).
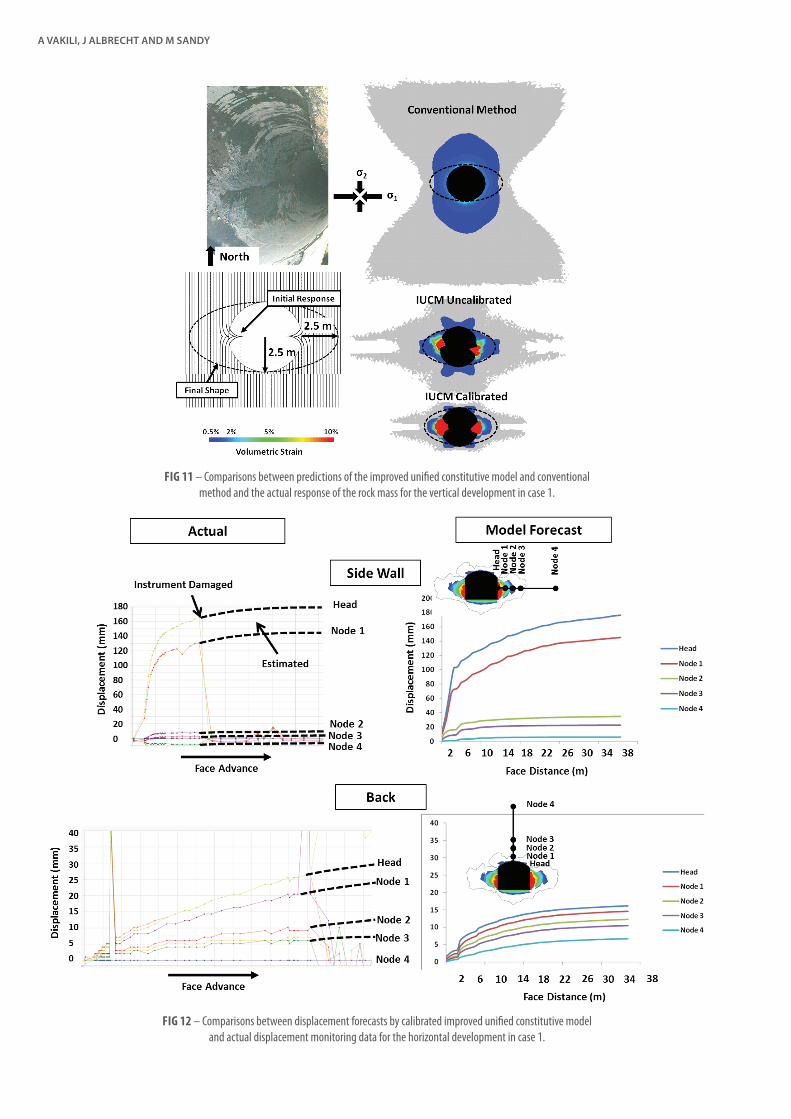
A VAKILI, J ALBRECHT AND M SANDY
FIG 12 – Comparisons between displacement forecasts by calibrated improved unifi ed constitutive model and actual displacement monitoring data for the horizontal development in case 1.
FIG 11 – Comparisons between predictions of the improved unifi ed constitutive model and conventional method and the actual response of the rock mass for the vertical development in case 1.
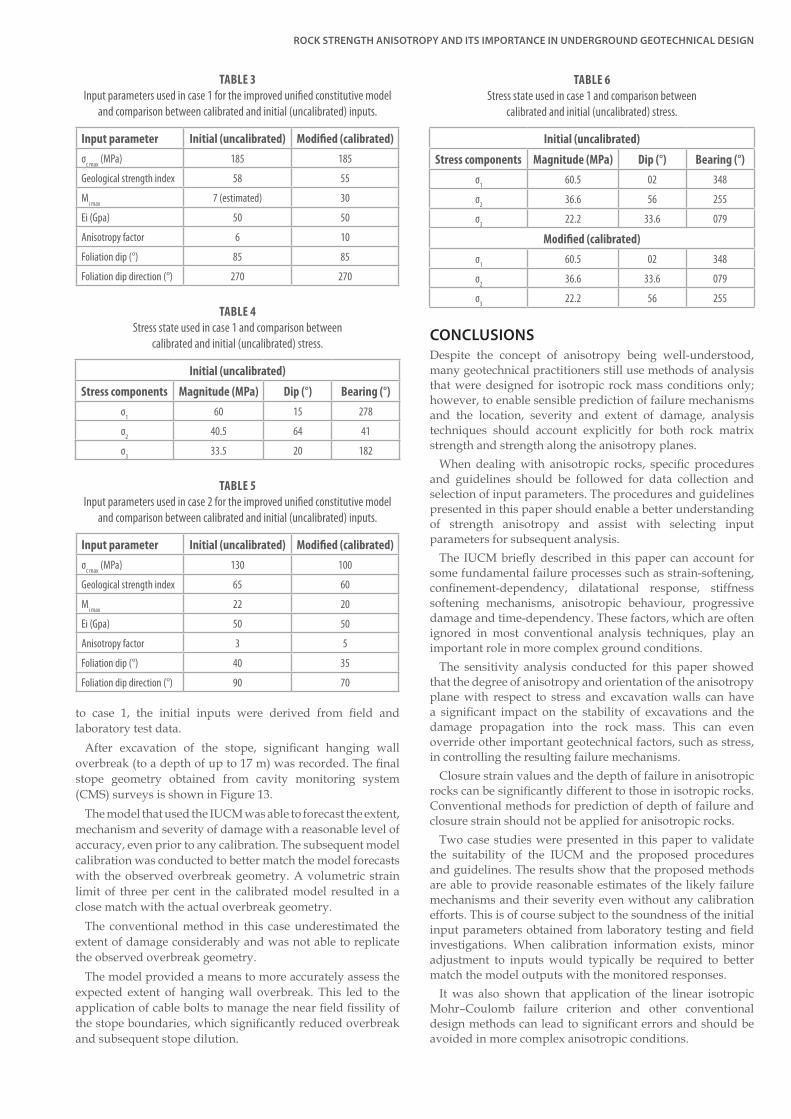
ROCK STRENGTH ANISOTROPY AND ITS IMPORTANCE IN UNDERGROUND GEOTECHNICAL DESIGN
to case 1, the initial inputs were derived from field and laboratory test data.
After excavation of the stope, significant hanging wall overbreak (to a depth of up to 17 m) was recorded. The final stope geometry obtained from cavity monitoring system (CMS) surveys is shown in Figure 13.
The model that used the IUCM was able to forecast the extent, mechanism and severity of damage with a reasonable level of accuracy, even prior to any calibration. The subsequent model calibration was conducted to better match the model forecasts with the observed overbreak geometry. A volumetric strain limit of three per cent in the calibrated model resulted in a close match with the actual overbreak geometry.
The conventional method in this case underestimated the extent of damage considerably and was not able to replicate the observed overbreak geometry.
The model provided a means to more accurately assess the expected extent of hanging wall overbreak. This led to the application of cable bolts to manage the near field fissility of the stope boundaries, which significantly reduced overbreak and subsequent stope dilution.
CONCLUSIONSDespite the concept of anisotropy being well-understood, many geotechnical practitioners still use methods of analysis that were designed for isotropic rock mass conditions only; however, to enable sensible prediction of failure mechanisms and the location, severity and extent of damage, analysis techniques should account explicitly for both rock matrix strength and strength along the anisotropy planes.
When dealing with anisotropic rocks, specific procedures and guidelines should be followed for data collection and selection of input parameters. The procedures and guidelines presented in this paper should enable a better understanding of strength anisotropy and assist with selecting input parameters for subsequent analysis.
The IUCM briefly described in this paper can account for some fundamental failure processes such as strain-softening, confinement-dependency, dilatational response, stiffness softening mechanisms, anisotropic behaviour, progressive damage and time-dependency. These factors, which are often ignored in most conventional analysis techniques, play an important role in more complex ground conditions.
The sensitivity analysis conducted for this paper showed that the degree of anisotropy and orientation of the anisotropy plane with respect to stress and excavation walls can have a significant impact on the stability of excavations and the damage propagation into the rock mass. This can even override other important geotechnical factors, such as stress, in controlling the resulting failure mechanisms.
Closure strain values and the depth of failure in anisotropic rocks can be significantly different to those in isotropic rocks. Conventional methods for prediction of depth of failure and closure strain should not be applied for anisotropic rocks.
Two case studies were presented in this paper to validate the suitability of the IUCM and the proposed procedures and guidelines. The results show that the proposed methods are able to provide reasonable estimates of the likely failure mechanisms and their severity even without any calibration efforts. This is of course subject to the soundness of the initial input parameters obtained from laboratory testing and field investigations. When calibration information exists, minor adjustment to inputs would typically be required to better match the model outputs with the monitored responses.
It was also shown that application of the linear isotropic Mohr–Coulomb failure criterion and other conventional design methods can lead to significant errors and should be avoided in more complex anisotropic conditions.
Initial (uncalibrated)
Stress components Magnitude (MPa) Dip (°) Bearing (°)σ1 60 15 278
σ2 40.5 64 41
σ3 33.5 20 182
TABLE 4Stress state used in case 1 and comparison between
calibrated and initial (uncalibrated) stress.
Input parameter Initial (uncalibrated) Modified (calibrated)σc max (MPa) 130 100
Geological strength index 65 60
Mi max 22 20
Ei (Gpa) 50 50
Anisotropy factor 3 5
Foliation dip (°) 40 35
Foliation dip direction (°) 90 70
TABLE 5Input parameters used in case 2 for the improved unified constitutive model
and comparison between calibrated and initial (uncalibrated) inputs.
Input parameter Initial (uncalibrated) Modified (calibrated)σc max (MPa) 185 185
Geological strength index 58 55
Mi max 7 (estimated) 30
Ei (Gpa) 50 50
Anisotropy factor 6 10
Foliation dip (°) 85 85
Foliation dip direction (°) 270 270
TABLE 3Input parameters used in case 1 for the improved unified constitutive model
and comparison between calibrated and initial (uncalibrated) inputs.
Initial (uncalibrated)
Stress components Magnitude (MPa) Dip (°) Bearing (°)σ1 60.5 02 348
σ2 36.6 56 255
σ3 22.2 33.6 079
Modified (calibrated)σ1 60.5 02 348
σ2 36.6 33.6 079
σ3 22.2 56 255
TABLE 6Stress state used in case 1 and comparison between
calibrated and initial (uncalibrated) stress.

A VAKILI, J ALBRECHT AND M SANDY
ACKNOWLEDGEMENTSThe authors would like to acknowledge Louise Correcha, AMC Consultants Pty Ltd, for proofreading the paper, and AMC Consultants Pty Ltd for company approval to publish this paper.
REFERENCESBrady, B H G and Brown, E T, 2005. Rock Mechanics for Underground
Mining, third edition, pp 117–119 (Springer Science+Business Media: Dordrecht).
Donath, F A, 1972. Effects of cohesion and granularity on deformational behavior of anisotropic rock, in Studies in Mineralogy and Precambrian Geology (Mem 135) (eds: R Doe and D K Smith), pp 95–128 (Geological Society of America: Colorado).
Hadjigeorgiou, J, Karampinos, E, Turcote, P and Mercier-Langevin, F, 2013. Assessment of the infl uence of drift orientation on observed levels of squeezing in hard rock mines, in Proceedings Ground Support, pp 109–117 (Australian Centre for Geomechanics: Perth).
Hoek, E and Brown, E T, 1980. Empirical strength criterion for rock masses, Journal of the Geotechnical Engineering Division, 106(9):1013–1035.
Hoek, E, Carter T G and Diederichs, M S, 2013. Quantifi cation of the geological strength index chart, in Proceedings 47th US Rock Mechanics/Geomechanics Symposium (American Rock Mechanics Association: Alexandria).
Itasca Consulting Group, 2009. Fast Lagrangian analysis of continua in 3 dimensions, version 5.0, Minneapolis.
Lorig, L J and Varona, P, 2013. Guidelines for numerical modelling of rock support for mines, in Proceedings Seventh International Symposium on Ground Support in Mining and Underground Construction, pp 81–105 (Australian Centre for Geomechanics: Perth).
Martin, C D, Kaiser, P K and McCreath, D R, 1996. Hoek–Brown parameters for predicting the depth of brittle failure around tunnels, Canadian Geotechnical Journal, 36(1):136–151.
McLamore, R and Gray, K E, 1967. The mechanical behavior of anisotropic sedimentary rocks, ASME J Eng Ind, 89:62–73.
Palmström, A, 1994. RMi – a rock mass characterization system for rock engineering purposes, PhD thesis, 409 p, University of Oslo, Norway.
Ramamurthy, T, Venkatappa Rao, G and Singh, J, 1993. Engineering behaviour of phyllites, Engineering Geology, 33:209–225.
Reyes-Montes, J M, Sainsbury, B, Andrew, J R and Young, R P, 2012. Application of cave-scale rock degradation models in the imaging of the seismogenic zone, in Proceedings Massmin 2012 (The Canadian Institute of Mining, Metallurgy and Petroleum: Sudbury).
Sandy, M, Sharrock, G, Albrecht, J and Vakili, A, 2010. Managing the transition from low-stress to high-stress conditions, in Proceedings Second Australasian Ground Control in Mining Conference, pp 247–254 (The Australasian Institute of Mining and Metallurgy: Melbourne).
Saroglou, H and Tsiambaos, G, 2008. A modifi ed Hoek–Brown failure criterion for anisotropic intact rock, International Journal of Rock Mechanics and Mining Sciences, 45(2):223–234.
Singh, J, Ramamurthy, T and Venkatappa Rao, G, 1989. Strength anisotropies in rocks, Ind Geotech Journal, 19(2):1477–166.
Tsidzi, K E N, 1986. A quantitative petrofabric characterization of metamorphic rocks, Bull Int Assoc Engineering Geology, 33:37–12.
Tsidzi, K E N, 1987a. Foliation index determination for fi ne-grained metamorphic rocks, Bull Int Assoc Engineering Geology, 36:277–33.
Tsidzi, K E N, 1987b. Compressive strength anisotropy of foliated rocks, in Proceedings Symposium on Mechanics of Jointed and Faulted Rock, pp 421–428 (Rotterdam).
FIG 13 – Comparisons between predictions of the improved unifi ed constitutive model and conventional method and the actual response of the rock mass for the open stope in case 2.

ROCK STRENGTH ANISOTROPY AND ITS IMPORTANCE IN UNDERGROUND GEOTECHNICAL DESIGN
Vakili, A, Sandy, M and Albrecht, J, 2012. Interpretation of non-linear numerical models in geomechanics – a case study in the application of numerical modelling for raise bored shaft design in a highly stressed and foliated rock mass, in Proceedings Massmin 2012 (The Canadian Institute of Mining, Metallurgy and Petroleum: Sudbury).
Vakili, A, Sandy, M, Mathews, M and Rodda, B, 2013. Ground support under highly stressed conditions, in Proceedings Ground Support 2013, pp 551–564 (Australian Centre for Geomechanics: Perth).
Zhao, X G and Cai, M, 2010. A mobilized dilation angle model for rocks, International Journal of Rock Mechanics and Mining Sciences, 47(3):368–384.
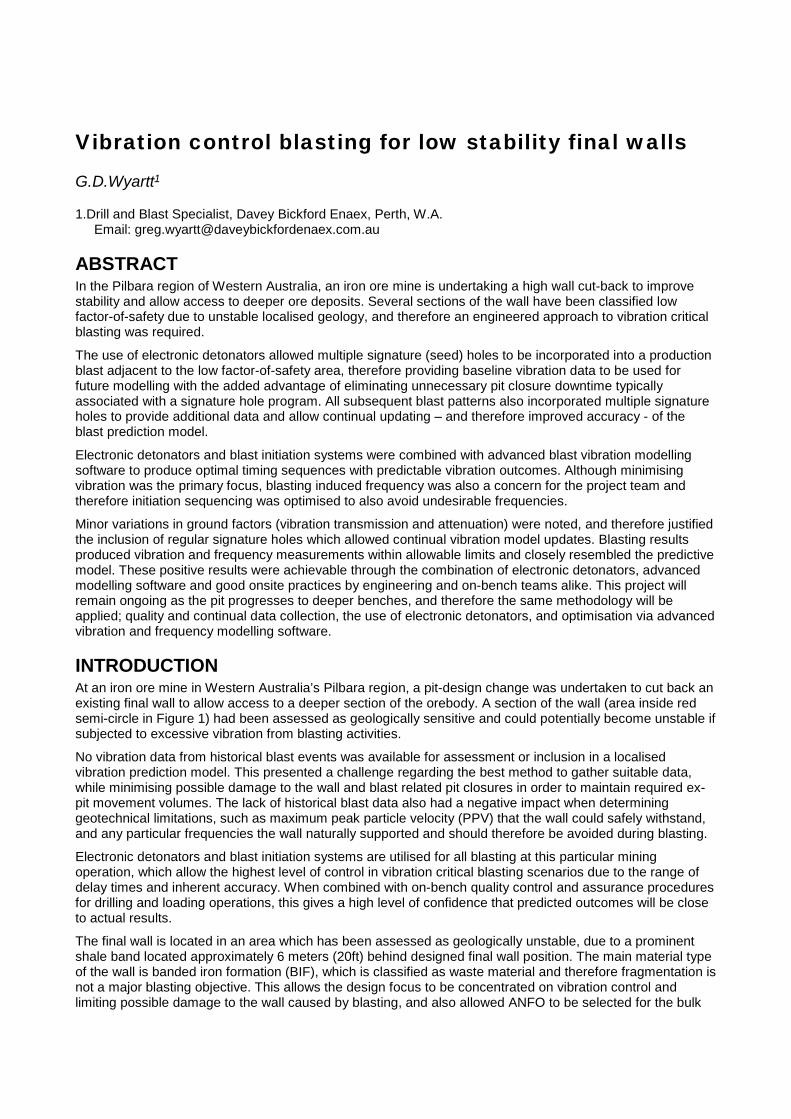
Vibration control blasting for low stability final walls
G.D.Wyartt1
1.Drill and Blast Specialist, Davey Bickford Enaex, Perth, W.A.Email: [email protected]
ABSTRACT In the Pilbara region of Western Australia, an iron ore mine is undertaking a high wall cut-back to improve stability and allow access to deeper ore deposits. Several sections of the wall have been classified low factor-of-safety due to unstable localised geology, and therefore an engineered approach to vibration critical blasting was required.
The use of electronic detonators allowed multiple signature (seed) holes to be incorporated into a production blast adjacent to the low factor-of-safety area, therefore providing baseline vibration data to be used for future modelling with the added advantage of eliminating unnecessary pit closure downtime typically associated with a signature hole program. All subsequent blast patterns also incorporated multiple signature holes to provide additional data and allow continual updating – and therefore improved accuracy - of the blast prediction model.
Electronic detonators and blast initiation systems were combined with advanced blast vibration modelling software to produce optimal timing sequences with predictable vibration outcomes. Although minimising vibration was the primary focus, blasting induced frequency was also a concern for the project team and therefore initiation sequencing was optimised to also avoid undesirable frequencies.
Minor variations in ground factors (vibration transmission and attenuation) were noted, and therefore justified the inclusion of regular signature holes which allowed continual vibration model updates. Blasting results produced vibration and frequency measurements within allowable limits and closely resembled the predictive model. These positive results were achievable through the combination of electronic detonators, advanced modelling software and good onsite practices by engineering and on-bench teams alike. This project will remain ongoing as the pit progresses to deeper benches, and therefore the same methodology will be applied; quality and continual data collection, the use of electronic detonators, and optimisation via advanced vibration and frequency modelling software.
INTRODUCTION At an iron ore mine in Western Australia’s Pilbara region, a pit-design change was undertaken to cut back an existing final wall to allow access to a deeper section of the orebody. A section of the wall (area inside red semi-circle in Figure 1) had been assessed as geologically sensitive and could potentially become unstable if subjected to excessive vibration from blasting activities.
No vibration data from historical blast events was available for assessment or inclusion in a localised vibration prediction model. This presented a challenge regarding the best method to gather suitable data, while minimising possible damage to the wall and blast related pit closures in order to maintain required ex-pit movement volumes. The lack of historical blast data also had a negative impact when determining geotechnical limitations, such as maximum peak particle velocity (PPV) that the wall could safely withstand, and any particular frequencies the wall naturally supported and should therefore be avoided during blasting.
Electronic detonators and blast initiation systems are utilised for all blasting at this particular mining operation, which allow the highest level of control in vibration critical blasting scenarios due to the range of delay times and inherent accuracy. When combined with on-bench quality control and assurance procedures for drilling and loading operations, this gives a high level of confidence that predicted outcomes will be close to actual results.
The final wall is located in an area which has been assessed as geologically unstable, due to a prominent shale band located approximately 6 meters (20ft) behind designed final wall position. The main material type of the wall is banded iron formation (BIF), which is classified as waste material and therefore fragmentation is not a major blasting objective. This allows the design focus to be concentrated on vibration control and limiting possible damage to the wall caused by blasting, and also allowed ANFO to be selected for the bulk
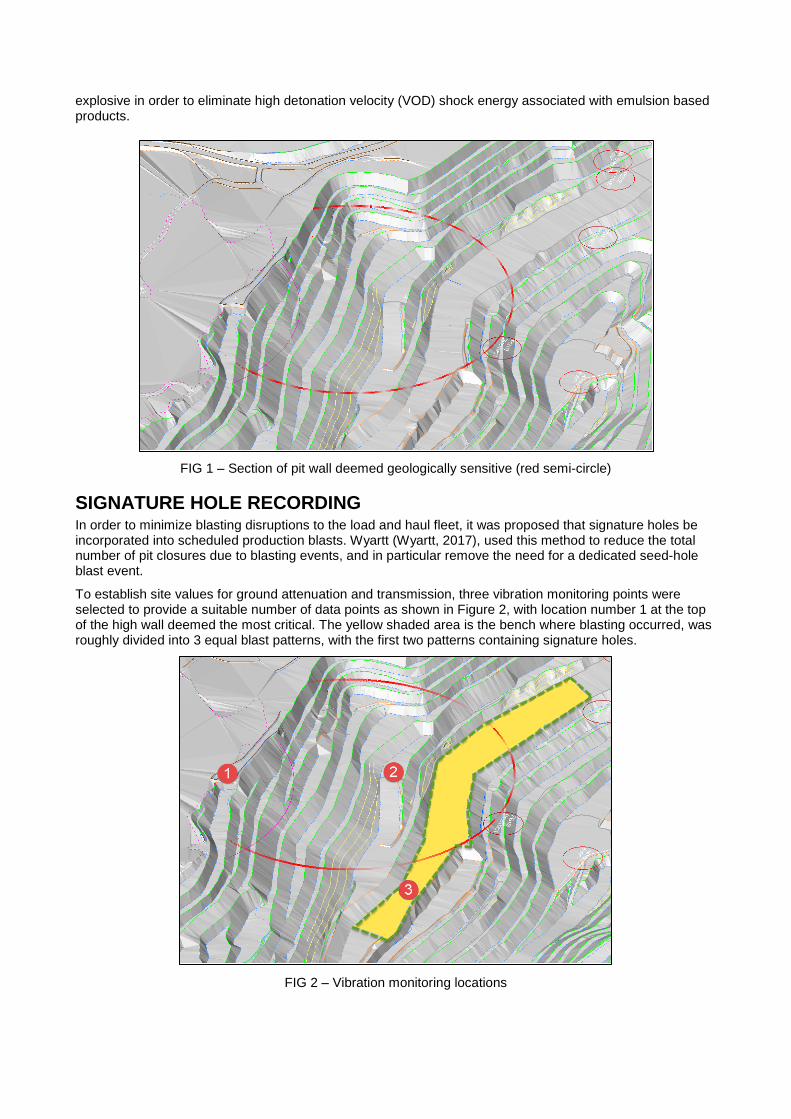
explosive in order to eliminate high detonation velocity (VOD) shock energy associated with emulsion based products.
FIG 1 – Section of pit wall deemed geologically sensitive (red semi-circle)
SIGNATURE HOLE RECORDING In order to minimize blasting disruptions to the load and haul fleet, it was proposed that signature holes be incorporated into scheduled production blasts. Wyartt (Wyartt, 2017), used this method to reduce the total number of pit closures due to blasting events, and in particular remove the need for a dedicated seed-hole blast event.
To establish site values for ground attenuation and transmission, three vibration monitoring points were selected to provide a suitable number of data points as shown in Figure 2, with location number 1 at the top of the high wall deemed the most critical. The yellow shaded area is the bench where blasting occurred, was roughly divided into 3 equal blast patterns, with the first two patterns containing signature holes.
FIG 2 – Vibration monitoring locations
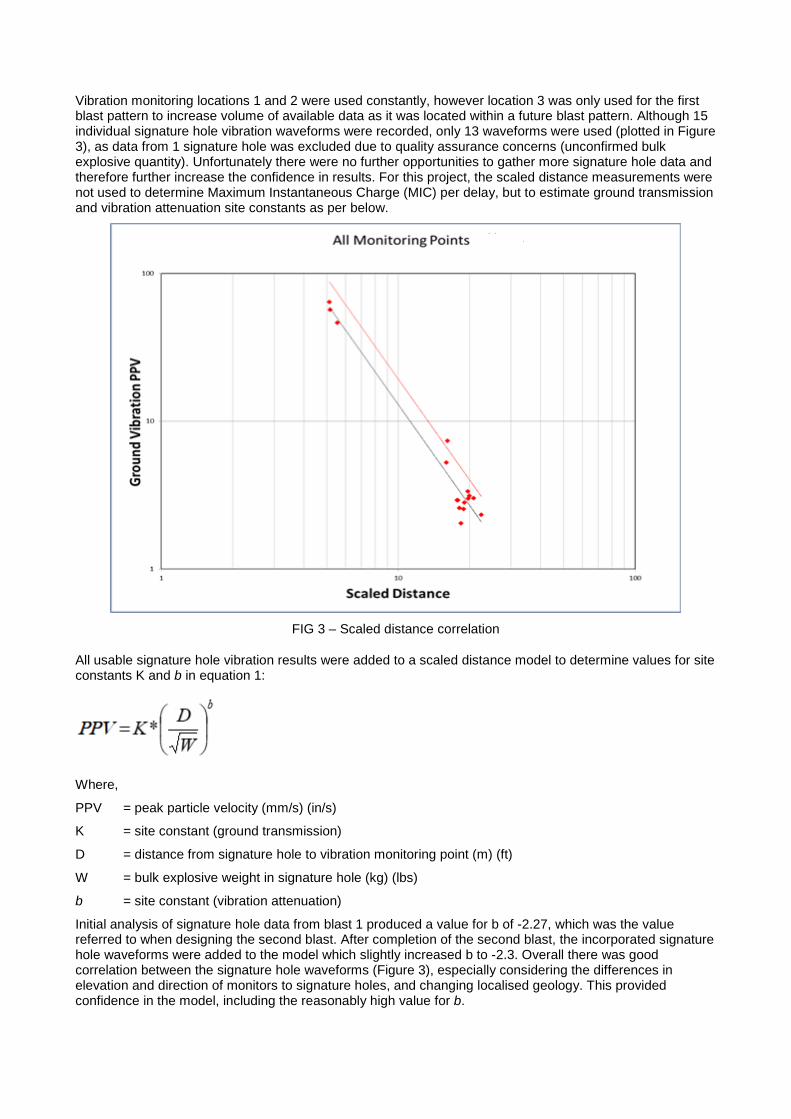
Vibration monitoring locations 1 and 2 were used constantly, however location 3 was only used for the first blast pattern to increase volume of available data as it was located within a future blast pattern. Although 15 individual signature hole vibration waveforms were recorded, only 13 waveforms were used (plotted in Figure 3), as data from 1 signature hole was excluded due to quality assurance concerns (unconfirmed bulk explosive quantity). Unfortunately there were no further opportunities to gather more signature hole data and therefore further increase the confidence in results. For this project, the scaled distance measurements were not used to determine Maximum Instantaneous Charge (MIC) per delay, but to estimate ground transmission and vibration attenuation site constants as per below.
FIG 3 – Scaled distance correlation
All usable signature hole vibration results were added to a scaled distance model to determine values for site constants K and b in equation 1:
Where,
PPV = peak particle velocity (mm/s) (in/s)
K = site constant (ground transmission)
D = distance from signature hole to vibration monitoring point (m) (ft)
W = bulk explosive weight in signature hole (kg) (lbs)
b = site constant (vibration attenuation)
Initial analysis of signature hole data from blast 1 produced a value for b of -2.27, which was the value referred to when designing the second blast. After completion of the second blast, the incorporated signature hole waveforms were added to the model which slightly increased b to -2.3. Overall there was good correlation between the signature hole waveforms (Figure 3), especially considering the differences in elevation and direction of monitors to signature holes, and changing localised geology. This provided confidence in the model, including the reasonably high value for b.

Although blast-induced vibration was the primary concern for the final wall, frequency resulting from the blasts were also to be considered for the initiation designs. Fast Fourier Transform (FFT) of the signature hole waveforms showed the dominant frequency at monitoring location 1 was approximately 7Hz in both vertical and radial axes. Therefore, initiation sequences need to be designed to avoid this low frequency.
VIBRATION MODELLING Accurate modelling when blasting in geologically sensitive or potentially unstable areas is critical to reliably predict results. Electronic detonators and blast initiation systems substantially increase vibration prediction confidence due to improved delay time accuracy, and also allow improved flexibility for optimal initiation sequence design due to millisecond delay increments. For the blast modelling phase of this project, the blast optimisation and vibration prediction program Paradigm Advanced (Recursive Theory Pty. Ltd.) was employed, resulting in accurate modelling based on previously recorded signature hole blast waveforms.
As previously mentioned, there was no historical data available regarding signature hole waveforms or maximum vibration which the wall could safely withstand. This posed an initial issue as the project team had no vibration target with which to work towards, therefore a conservative maximum limit of 10mm/s (0.39in/s) peak vector sum (PVS) at monitoring location 1 was recommended in order to allow blasting to continue but also keep vibrations as low as possible.
All blast pattern design parameters were imported into the vibration modelling software to produce a 3D model, where they are combined with multiple vibration monitoring locations – each with a corresponding signature hole blast waveform. The process for determining the optimal initiation sequence is quite simple when using electronic detonators: ‘tie-in’ the blast holes in the desired direction and sequence (e.g. echelon, row, centre lift); select a range of delay times for the detonators (e.g. 1ms to 150ms); run simulations for any or all of the vibration monitoring points (the number of simulations can easily reach into the tens of thousands); analyse predicted results and apply the chosen sequence to the initiation design.
Multiple initiation sequences were modelled to determine the optimal firing direction and delay times (one example in Figure 4). The aim was to produce low peak vector sum (PVS) values whilst also maintaining a higher frequency value than what was determined as dominant during signature hole analysis (7Hz) in order to reduce the risk of damage to the wall structures. During the design phase, when there were multiple initiation sequences that each produced acceptable PVS predictions, the design with the highest predicted frequency was selected. In Figure 4 below, the initiation sequence design is shown on the left, while this same sequence is displayed as a heat map in the image on the right, with short delay times in blue moving towards long delays in red.
BLAST RESULTS AND MODEL COMPARISON As monitoring location 1 (top of the high wall) was considered to be the most critical, only the modelling and blasting results for that location shall be discussed in this report. Monitoring location 1 is situated approximately 107 meters (351 feet) above and approximately 300 meters (984 feet) to the south of the nearest blast pattern.
Table 1 shows vibration modelling predictions from the software compared with blast results from the vibration monitor at location 1. As discussed above, there was no historical signature hole data available for the area, and therefore blast 1 could not be modelled for accurate vibration predictions. However, blast 1 did incorporate multiple signature holes for future modelling use in blasts 2 and 3.
As can be seen in Table 1 the predicted vibration ranges align well with results. Blast 2 recorded a difference of less than 1mm/s (0.04in/s) compared to predicted range, and results from Blast 3 were within the predicted range. Frequency results were also promising, with almost all results indicating above the dominant frequency of 7Hz in both vertical and radial axes.
APPLYING MODELLING TO OTHER VIBRATION SENSITIVE AREAS At the same mining operation there are several other pits which include structures considered to be geologically sensitive, or susceptible to blasting vibration damage. Several active mining areas are in close proximity to Aboriginal cultural and heritage sites which have stringent management policies applied, and great care is taken to avoid blast-induced damage due to vibration. One particular pit has a semi-circular ring of heritage sites around the pit boundary with an imposed vibration limit of 50mm/s (1.96in/s) at each location, and therefore correct blasting in this area is critical to reduce risk. However, the pit also has a hard layer of cap rock on the surface which results in difficult – or impossible - excavation if blast fragmentation is poor.
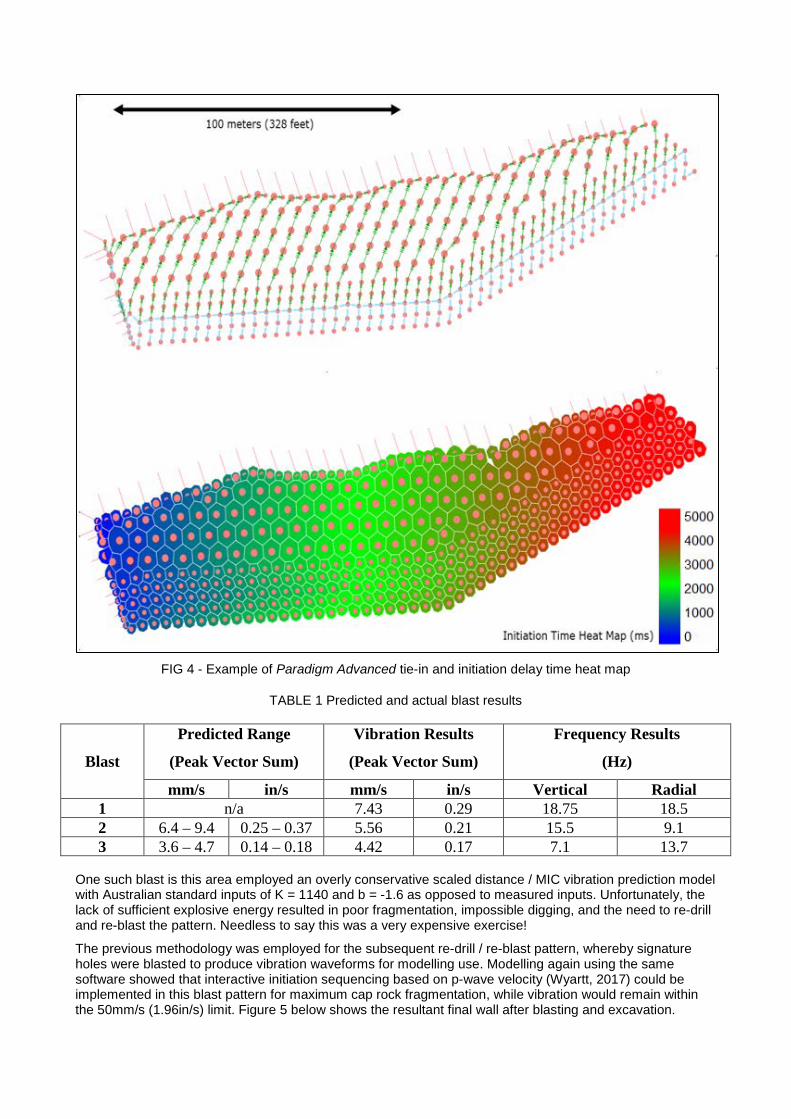
FIG 4 - Example of Paradigm Advanced tie-in and initiation delay time heat map
TABLE 1 Predicted and actual blast results
Blast
Predicted Range
(Peak Vector Sum)
Vibration Results
(Peak Vector Sum)
Frequency Results
(Hz)
mm/s in/s mm/s in/s Vertical Radial 1 n/a 7.43 0.29 18.75 18.5 2 6.4 – 9.4 0.25 – 0.37 5.56 0.21 15.5 9.1 3 3.6 – 4.7 0.14 – 0.18 4.42 0.17 7.1 13.7
One such blast is this area employed an overly conservative scaled distance / MIC vibration prediction model with Australian standard inputs of K = 1140 and b = -1.6 as opposed to measured inputs. Unfortunately, the lack of sufficient explosive energy resulted in poor fragmentation, impossible digging, and the need to re-drill and re-blast the pattern. Needless to say this was a very expensive exercise!
The previous methodology was employed for the subsequent re-drill / re-blast pattern, whereby signature holes were blasted to produce vibration waveforms for modelling use. Modelling again using the same software showed that interactive initiation sequencing based on p-wave velocity (Wyartt, 2017) could be implemented in this blast pattern for maximum cap rock fragmentation, while vibration would remain within the 50mm/s (1.96in/s) limit. Figure 5 below shows the resultant final wall after blasting and excavation.

FIG 5 - Pit wall result using p-wave based timing and vibration modelling
Table 2 below shows the predicted vibration range compared with blast results at the closest heritage site monitoring vibration location. As can be seen, there is some difference in the predicted and actual vibration results, however, the mine was pleased to note that recorded vibration results were less than predicted. There are believed to two main factors which contribute to the disparity between predicted and actual vibration results:
• Blast pattern was previously blasted ground, therefore reducing vibration transmission (shielding);
• Large size of the blast pattern (1468 holes), increasing chances for loading discrepancies.
TABLE 2 Predicted and actual blast results
Blast Predicted Range
(Peak Vector Sum)
Vibration Results
(Peak Vector Sum)
mm/s in/s mm/s in/s 1 33 - 38 0.25 – 0.37 24 0.94
CONCLUSIONS AND FUTURE WORK According to the ISEE (ISEE, 2011) “production blasts can be designed for optimum timing by conducting signature blasts, monitoring the vibrations and determining the ideal delay intervals for vibration control.” As presented this has been the process used for this project, whereby vibration waveforms were recorded from signature blast holes and used in conjunction with blast modelling software to determine optimal delay intervals, and implemented with electronic detonators to maintain blast control to produce both satisfactory blast and vibration results.
This project has demonstrated two distinct points; Firstly, the value of modelling and the accuracy of predicted compared to actual results when utilising electronic detonators and blast initiation systems. The increased flexibility of delay time selection allows tailored optimal initiation sequences for each blast, while the accuracy of the electronic detonators increases confidence that the initiation sequence will fire as designed.
The second point (as demonstrated when applying modelling to other vibration sensitive areas) is that interactive initiation timing based on p-wave velocity can be modelled and employed in areas considered to be vibration sensitive. This also shows that the method of calculating MIC in an 8ms window to control vibrations has been superseded by the use of advanced software modelling packages and electronic blasting systems.
Future work relating to this project consists of progressively cutting back the existing high wall to allow extraction of the deeper orebody. The same methodology will be followed, whereby further signature holes

will be recorded and incorporated into the localised vibration model. Each future blast design will also be modelled with the vibration prediction software, which will provide tailored initiation designs and therefore high confidence of predicted and actual blast result correlation.
Blasting work using these principles will also continue in other vibration sensitive areas at this mine site, particularly where Aboriginal heritage sites exist. It is anticipated that the separate models in use at various active mining areas at this site will progressively evolve as the geology changes.
ACKNOWLEDGEMENTS The author wishes to thank several parties who have had a positive influence on this project, including David Scutt (GTS Manager, Davey Bickford Australia), Recursive Theory Pty. Ltd, and also the drill and blast engineering team from the mine site – even though names cannot be mentioned.
REFERENCES ISEE, (2011), Chapter 26: Vibration, The International Society of Explosive Engineers Blasters’ Handbook (p-575).
Cleveland: ISEE
Wyartt, G, (2017), Electronic Blast Initiation Sequencing – Designing for Productivity, Proceedings of the Forty-third annual conference on Explosives and blasting technique, Cleveland: ISEE.
Recursive Theory PTY LTD, Paradigm Advanced Software, available from http://paradigm.recursivetheory.com/