L2 Translation at the Periphery: A Meta-Analysis of Current Views on Translation Directionality
Upload
khangminh22Category
view
4download
0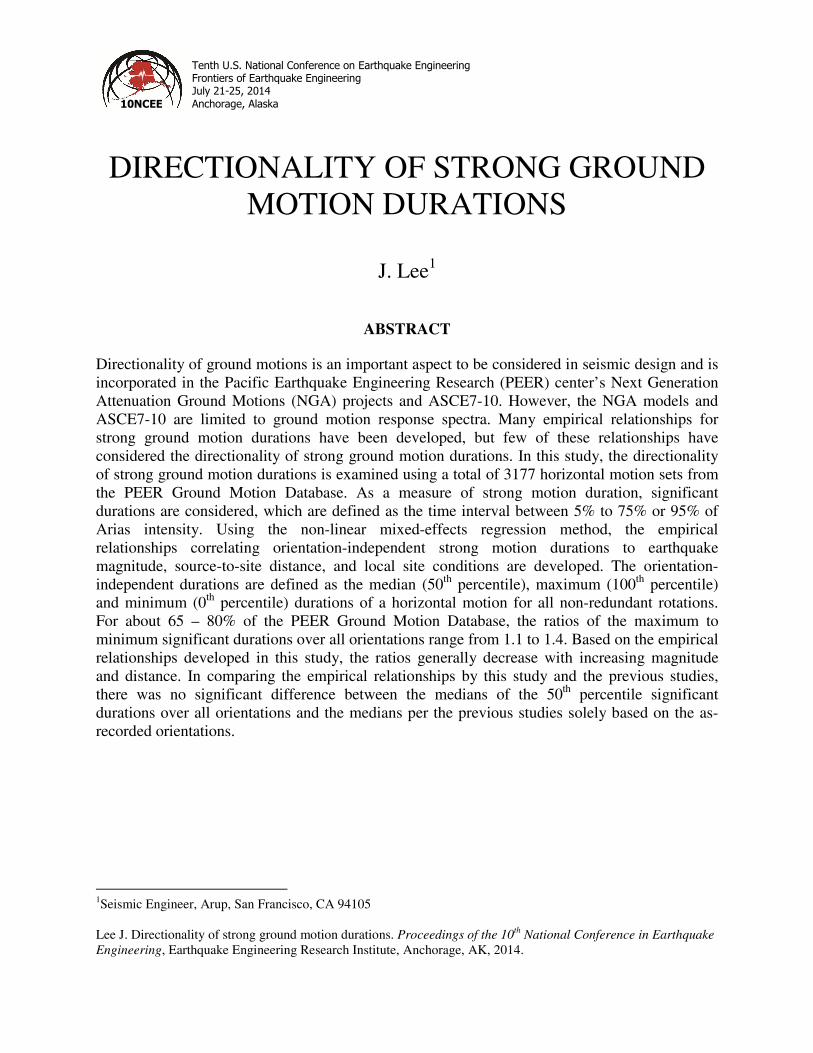
Tenth U.S. National Conference on Earthquake EngineeringFrontiers of Earthquake Engineering July 21-25, 2014 Anchorage, Alaska 10NCEE
DIRECTIONALITY OF STRONG GROUND MOTION DURATIONS
J. Lee1
ABSTRACT Directionality of ground motions is an important aspect to be considered in seismic design and is incorporated in the Pacific Earthquake Engineering Research (PEER) center’s Next Generation Attenuation Ground Motions (NGA) projects and ASCE7-10. However, the NGA models and ASCE7-10 are limited to ground motion response spectra. Many empirical relationships for strong ground motion durations have been developed, but few of these relationships have considered the directionality of strong ground motion durations. In this study, the directionality of strong ground motion durations is examined using a total of 3177 horizontal motion sets from the PEER Ground Motion Database. As a measure of strong motion duration, significant durations are considered, which are defined as the time interval between 5% to 75% or 95% of Arias intensity. Using the non-linear mixed-effects regression method, the empirical relationships correlating orientation-independent strong motion durations to earthquake magnitude, source-to-site distance, and local site conditions are developed. The orientation-independent durations are defined as the median (50th percentile), maximum (100th percentile) and minimum (0th percentile) durations of a horizontal motion for all non-redundant rotations. For about 65 – 80% of the PEER Ground Motion Database, the ratios of the maximum to minimum significant durations over all orientations range from 1.1 to 1.4. Based on the empirical relationships developed in this study, the ratios generally decrease with increasing magnitude and distance. In comparing the empirical relationships by this study and the previous studies, there was no significant difference between the medians of the 50th percentile significant durations over all orientations and the medians per the previous studies solely based on the as-recorded orientations.
1Seismic Engineer, Arup, San Francisco, CA 94105 Lee J. Directionality of strong ground motion durations. Proceedings of the 10th National Conference in Earthquake Engineering, Earthquake Engineering Research Institute, Anchorage, AK, 2014.
Tenth U.S. National Conference on Earthquake EngineeringFrontiers of Earthquake Engineering July 21-25, 2014 Anchorage, Alaska 10NCEE
Directionality of Strong Ground Motion Durations
J. Lee1
ABSTRACT Directionality of ground motions is an important aspect to be considered in seismic design and is
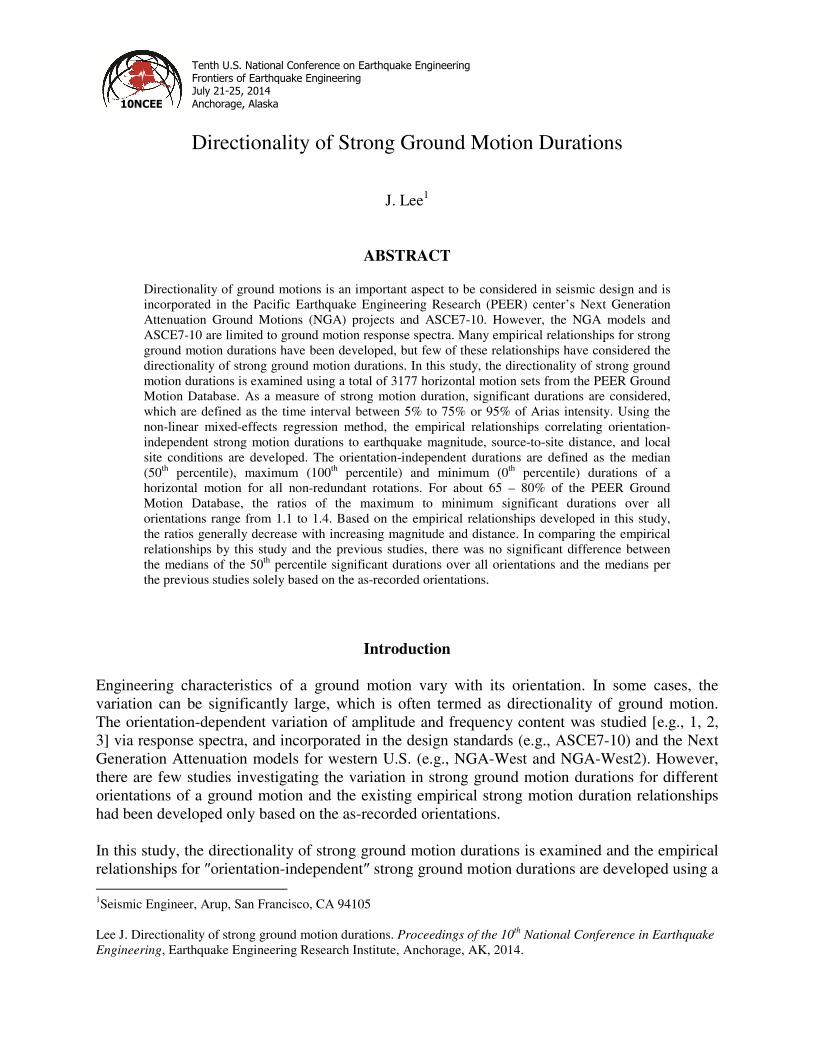
incorporated in the Pacific Earthquake Engineering Research (PEER) center’s Next Generation Attenuation Ground Motions (NGA) projects and ASCE7-10. However, the NGA models and ASCE7-10 are limited to ground motion response spectra. Many empirical relationships for strong ground motion durations have been developed, but few of these relationships have considered the directionality of strong ground motion durations. In this study, the directionality of strong ground motion durations is examined using a total of 3177 horizontal motion sets from the PEER Ground Motion Database. As a measure of strong motion duration, significant durations are considered, which are defined as the time interval between 5% to 75% or 95% of Arias intensity. Using the non-linear mixed-effects regression method, the empirical relationships correlating orientation-independent strong motion durations to earthquake magnitude, source-to-site distance, and local site conditions are developed. The orientation-independent durations are defined as the median (50th percentile), maximum (100th percentile) and minimum (0th percentile) durations of a horizontal motion for all non-redundant rotations. For about 65 – 80% of the PEER Ground Motion Database, the ratios of the maximum to minimum significant durations over all orientations range from 1.1 to 1.4. Based on the empirical relationships developed in this study, the ratios generally decrease with increasing magnitude and distance. In comparing the empirical relationships by this study and the previous studies, there was no significant difference between the medians of the 50th percentile significant durations over all orientations and the medians per the previous studies solely based on the as-recorded orientations.
Introduction Engineering characteristics of a ground motion vary with its orientation. In some cases, the variation can be significantly large, which is often termed as directionality of ground motion. The orientation-dependent variation of amplitude and frequency content was studied [e.g., 1, 2, 3] via response spectra, and incorporated in the design standards (e.g., ASCE7-10) and the Next Generation Attenuation models for western U.S. (e.g., NGA-West and NGA-West2). However, there are few studies investigating the variation in strong ground motion durations for different orientations of a ground motion and the existing empirical strong motion duration relationships had been developed only based on the as-recorded orientations. In this study, the directionality of strong ground motion durations is examined and the empirical relationships for ″orientation-independent″ strong ground motion durations are developed using a 1Seismic Engineer, Arup, San Francisco, CA 94105 Lee J. Directionality of strong ground motion durations. Proceedings of the 10th National Conference in Earthquake Engineering, Earthquake Engineering Research Institute, Anchorage, AK, 2014.

total of 3177 sets of two orthogonal horizontal motions from 104 earthquakes available from the PEER Ground Motion Database (PGMD). The empirical models are expressed as a function of earthquake magnitude (MW), the closest distance to rupture plane (R) and the average shear wave velocity of the upper 30-m (VS30). As a measure of duration of strong phases, the significant durations are employed herein. Regarding the organization of this paper, the definition of significant durations is reviewed first. The directionality of strong ground motion durations is presented along with the ground motion records used in this study. Then, the proposed empirical orientation-independent strong motion duration models are presented with the comparisons with the existing empirical relations: Abrahamson and Silva (1996); Kempton and Stewart (2006); and Bommer et al. (2009) [4, 5, 6, respectively].
Significant Durations Significant duration is one of the most commonly used definitions by engineering seismologists and earthquake engineers. For example, U.S. Nuclear Regulatory Commission (NRC) requires ground motion time histories developed for seismic site response or structural analyses shall be checked to ensure their significant durations are consistent with the characteristics of the controlling earthquake scenarios [7]. The normalized cumulative squared acceleration, H(t), is used in its definition:
( )( )
( )∫∫
=dt
t
dtta
dttatH
0
2
0
2
(1)
where a(t) is the ground motion acceleration time history, and td is the total duration of the acceleration time history. As may be surmised from this equation, the normalized cumulative squared acceleration varies from 0 to 1 (or 0% to 100%). Significant duration is most often defined as the time interval between H(t) = 5% and 75% [8] or H(t) = 5% and 95% [9], denoted as D5-75 and D5-95, respectively. As an example, Fig. 1 illustrates the determination of the D5-75 for an acceleration time history using the H(t) plot, referred to as a Husid plot [10].
Directionality of Significant Duration For a given set of two as-recorded horizontal ground motion components, the acceleration time history, of one horizontal component rotated by is determined by Eq. 2. ( , ) = ( ) cos( ) − ( )sin( ) (2) where is the rotation angle; ( ) and ( ) are the as-recorded mutually-orthogonal horizontal accelerations at time, . Then, the significant durations (D5-75 and D5-95) of the rotated horizontal component are computed for the non-redundant rotations. The periodicity of rotation angle is 180° because of the orthogonality of the two horizontal components. This procedure is repeated for range of 0° to 179° with an increment of 1°, and the significant durations are
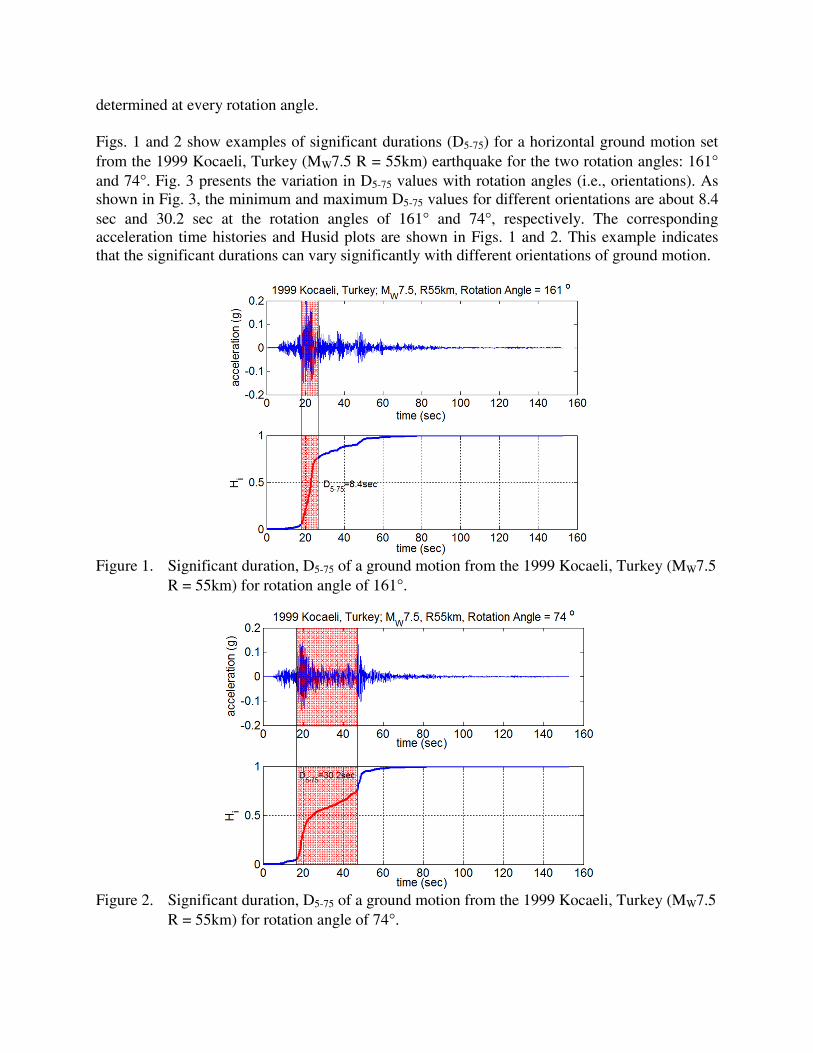
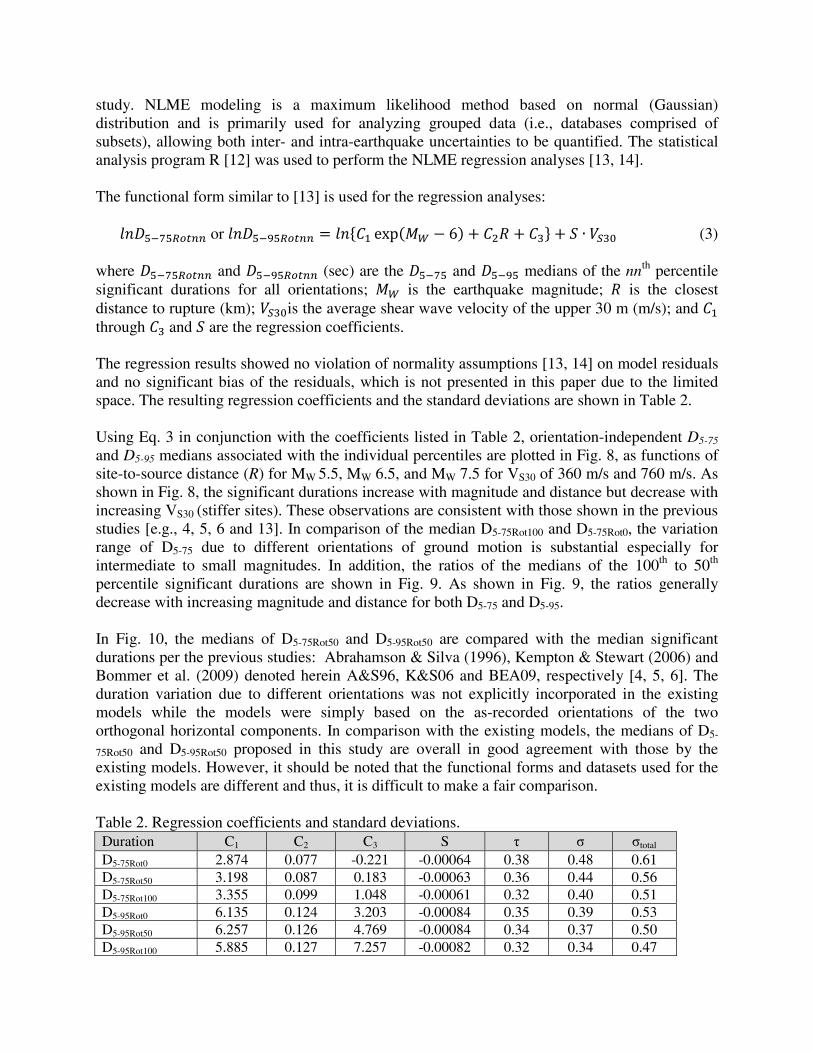
determined at every rotation angle. Figs. 1 and 2 show examples of significant durations (D5-75) for a horizontal ground motion set from the 1999 Kocaeli, Turkey (MW7.5 R = 55km) earthquake for the two rotation angles: 161° and 74°. Fig. 3 presents the variation in D5-75 values with rotation angles (i.e., orientations). As shown in Fig. 3, the minimum and maximum D5-75 values for different orientations are about 8.4 sec and 30.2 sec at the rotation angles of 161° and 74°, respectively. The corresponding acceleration time histories and Husid plots are shown in Figs. 1 and 2. This example indicates that the significant durations can vary significantly with different orientations of ground motion.
Figure 1. Significant duration, D5-75 of a ground motion from the 1999 Kocaeli, Turkey (MW7.5
R = 55km) for rotation angle of 161°.
Figure 2. Significant duration, D5-75 of a ground motion from the 1999 Kocaeli, Turkey (MW7.5
R = 55km) for rotation angle of 74°.

Figure 3. Variation in D5-75 for non-redundant rotation angle; 1999 Kocaeli, Turkey (MW7.5 R
= 55km). Strong Motion Data A total of 3177 sets from 104 earthquakes are used in this study. 3182 sets were available from the PGMD [11] but 5 sets were discarded due to their VS30 unavailable. Fig. 4 shows the magnitude and distance distribution of the ground motions used herein. As shown in Fig. 4, the magnitude ranges from 4.3 to 7.9 and the distance ranges from 0.07 km to 316 km. Also Fig. 5 shows the VS30 values of the ground motion records used herein, ranging from 116 m/s to 2016 m/s. It should be noted that motions with near-fault and/or basin effects are included in the strong motion dataset used in this study. A separate study to consider the near-fault directivity and basin effects on directionality of strong ground motion durations is in progress and thus, not presented in this paper.
Figure 4. Magnitude and distance distribution of ground motions used in this study.

Figure 5. Magnitude and VS30 distribution of ground motions used in this study.
Orientation-independent Significant Durations Orientation-independent significant durations are determined using the individual horizontal ground motion sets presented above. For each set of horizontal components, the 0th (minimum), 50th (median) and 100th (maximum) percentiles of significant durations over all non-redundant rotations are determined by the following steps.
1. Determine the significant duration of a horizontal component in the as-recorded orientation set as 0 degree.
2. Rotate the horizontal component by 1 degree using Eq. 2 and determine the significant duration.
3. Repeat Steps 1 and 2 until the rotation angle reaches 180 degrees. 4. Sort the significant durations for all the rotation angles in an ascending order. 5. Determine the 0th, 50th and 100th percentiles of the significant duration.
In a similar way used in [2], the orientation-independent significant durations are designated by D5-75Rotnn or D5-95Rotnn, where nn represents the nnth percentile of the significant duration over all orientations. The ratios of the 100th to the 50th and the 100th to the 0th percentile durations are calculated and the ratio ranges are summarized in Table 1. As shown in Table 1, the variation in significant durations for different orientations is considerably large. The histograms of the 100th to the 0th and the 100th to the 50th percentile ratios are shown in Figs. 6 and 7, respectively. As shown in Fig. 6, the ratios of the 100th to the 0th percentile D5-75 and D5-95 over all orientations are less than 1.4 for the majority of the ground motion database (about 65% and 80%, respectively). Also the 100th to the 50th percentile ratios are mostly less than 1.2 for both D5-75 and D5-95 as shown in Fig. 7.

Table 1. Range of the 100th to the 50th and the 100th to the 0th percentile ratios for the used
strong ground motion dataset. D5-75 D5-95
D5-75Rot100 / D5-75Rot50 D5-75Rot100 / D5-75Rot0 D5-95Rot100 / D5-95Rot50 D5-95Rot100 / D5-95Rot0
Min. Max. Min. Max. Min. Max. Min. Max. 1.004 6.4 1.02 12.2 1.002 6.6 1.01 24.5
Figure 6. Histogram of the ratios of the 100th to the 0th percentile significant durations over all
non-redundant rotations.
Figure 7. Histogram of the ratios of the 100th to the 50th percentile significant durations over all
non-redundant rotations.
Orientation-Independent Empirical Significant Duration Model Empirical relationships for the 0th, 50th and 100th percentile significant durations are developed herein, correlating the respective percentile orientation-independent significant durations to earthquake magnitude (MW), the closest distance to rupture (R) and VS30. The non-linear mixed-effects (NLME) regression technique was used to develop the empirical relationships in this
study. NLME modeling is a maximum likelihood method based on normal (Gaussian) distribution and is primarily used for analyzing grouped data (i.e., databases comprised of subsets), allowing both inter- and intra-earthquake uncertainties to be quantified. The statistical analysis program R [12] was used to perform the NLME regression analyses [13, 14]. The functional form similar to [13] is used for the regression analyses:
or = exp( − 6) + + + ∙ (3) where and (sec) are the and medians of the nnth percentile significant durations for all orientations; is the earthquake magnitude; is the closest distance to rupture (km); is the average shear wave velocity of the upper 30 m (m/s); and through and are the regression coefficients. The regression results showed no violation of normality assumptions [13, 14] on model residuals and no significant bias of the residuals, which is not presented in this paper due to the limited space. The resulting regression coefficients and the standard deviations are shown in Table 2. Using Eq. 3 in conjunction with the coefficients listed in Table 2, orientation-independent D5-75 and D5-95 medians associated with the individual percentiles are plotted in Fig. 8, as functions of site-to-source distance (R) for MW 5.5, MW 6.5, and MW 7.5 for VS30 of 360 m/s and 760 m/s. As shown in Fig. 8, the significant durations increase with magnitude and distance but decrease with increasing VS30 (stiffer sites). These observations are consistent with those shown in the previous studies [e.g., 4, 5, 6 and 13]. In comparison of the median D5-75Rot100 and D5-75Rot0, the variation range of D5-75 due to different orientations of ground motion is substantial especially for intermediate to small magnitudes. In addition, the ratios of the medians of the 100th to 50th percentile significant durations are shown in Fig. 9. As shown in Fig. 9, the ratios generally decrease with increasing magnitude and distance for both D5-75 and D5-95. In Fig. 10, the medians of D5-75Rot50 and D5-95Rot50 are compared with the median significant durations per the previous studies: Abrahamson & Silva (1996), Kempton & Stewart (2006) and Bommer et al. (2009) denoted herein A&S96, K&S06 and BEA09, respectively [4, 5, 6]. The duration variation due to different orientations was not explicitly incorporated in the existing models while the models were simply based on the as-recorded orientations of the two orthogonal horizontal components. In comparison with the existing models, the medians of D5-
75Rot50 and D5-95Rot50 proposed in this study are overall in good agreement with those by the existing models. However, it should be noted that the functional forms and datasets used for the existing models are different and thus, it is difficult to make a fair comparison. Table 2. Regression coefficients and standard deviations. Duration C1 C2 C3 S τ σ σtotal D5-75Rot0 2.874 0.077 -0.221 -0.00064 0.38 0.48 0.61 D5-75Rot50 3.198 0.087 0.183 -0.00063 0.36 0.44 0.56 D5-75Rot100 3.355 0.099 1.048 -0.00061 0.32 0.40 0.51 D5-95Rot0 6.135 0.124 3.203 -0.00084 0.35 0.39 0.53 D5-95Rot50 6.257 0.126 4.769 -0.00084 0.34 0.37 0.50 D5-95Rot100 5.885 0.127 7.257 -0.00082 0.32 0.34 0.47
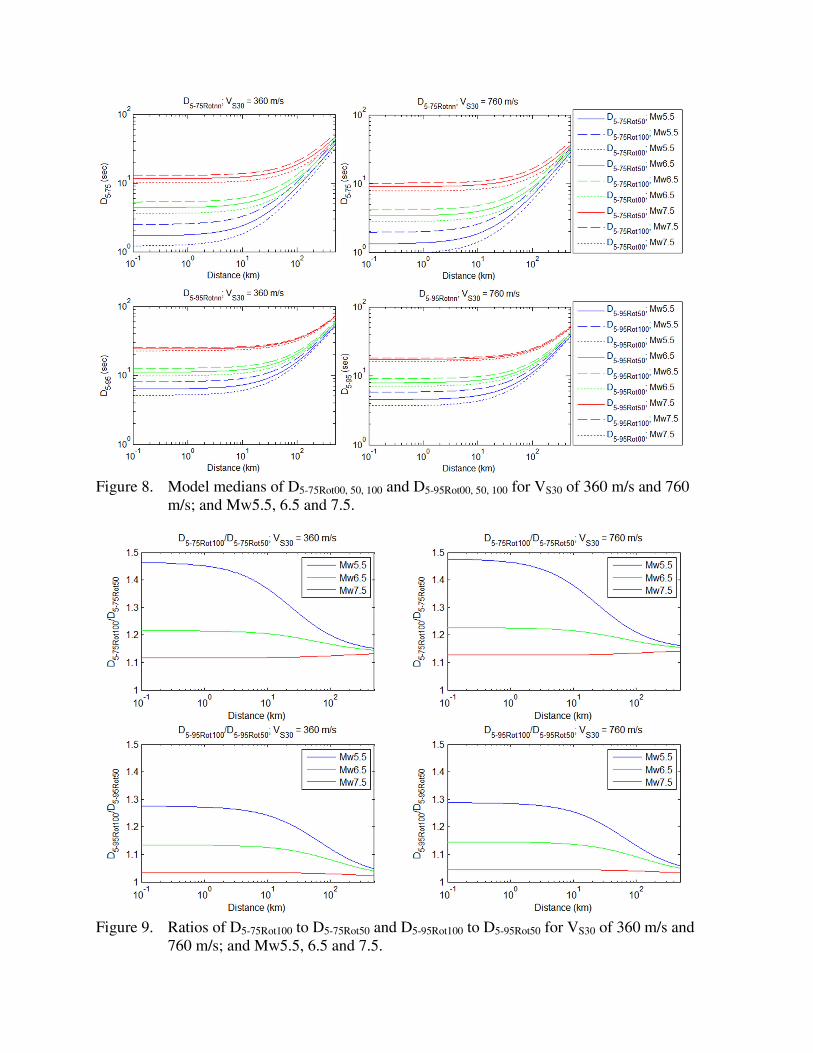
Figure 8. Model medians of D5-75Rot00, 50, 100 and D5-95Rot00, 50, 100 for VS30 of 360 m/s and 760
m/s; and Mw5.5, 6.5 and 7.5.
Figure 9. Ratios of D5-75Rot100 to D5-75Rot50 and D5-95Rot100 to D5-95Rot50 for VS30 of 360 m/s and
760 m/s; and Mw5.5, 6.5 and 7.5.
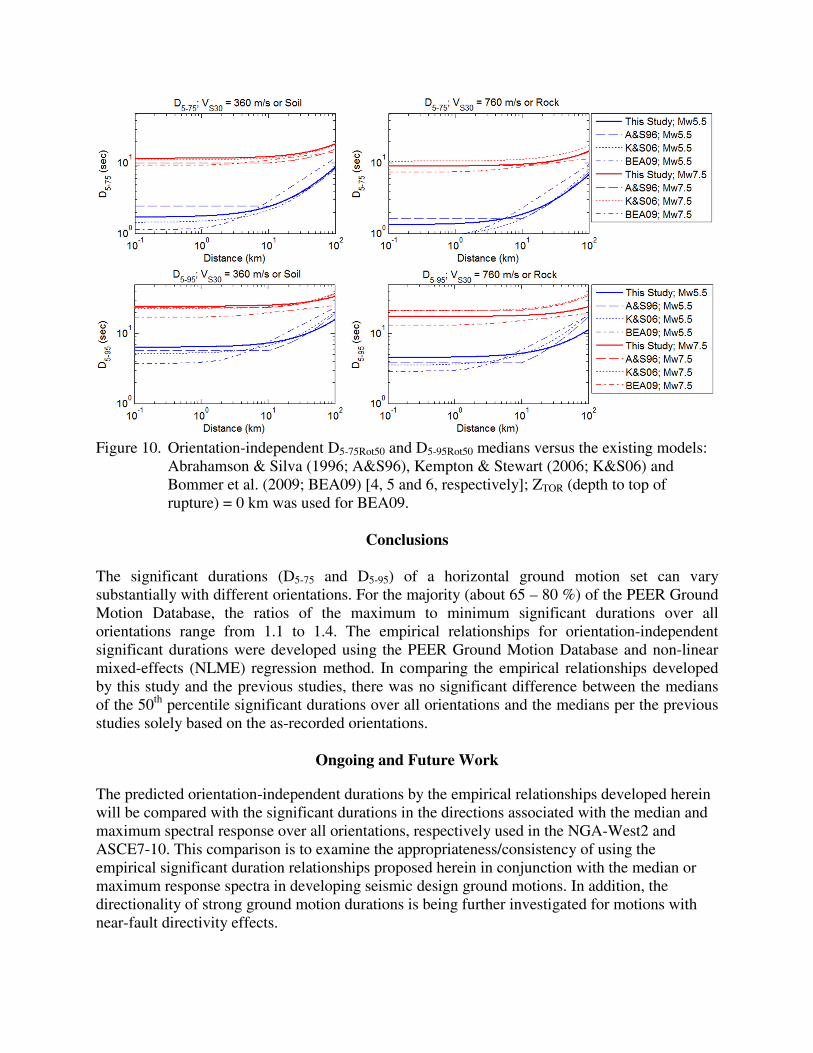
Figure 10. Orientation-independent D5-75Rot50 and D5-95Rot50 medians versus the existing models:
Abrahamson & Silva (1996; A&S96), Kempton & Stewart (2006; K&S06) and Bommer et al. (2009; BEA09) [4, 5 and 6, respectively]; ZTOR (depth to top of rupture) = 0 km was used for BEA09.
Conclusions
The significant durations (D5-75 and D5-95) of a horizontal ground motion set can vary substantially with different orientations. For the majority (about 65 – 80 %) of the PEER Ground Motion Database, the ratios of the maximum to minimum significant durations over all orientations range from 1.1 to 1.4. The empirical relationships for orientation-independent significant durations were developed using the PEER Ground Motion Database and non-linear mixed-effects (NLME) regression method. In comparing the empirical relationships developed by this study and the previous studies, there was no significant difference between the medians of the 50th percentile significant durations over all orientations and the medians per the previous studies solely based on the as-recorded orientations.
Ongoing and Future Work The predicted orientation-independent durations by the empirical relationships developed herein will be compared with the significant durations in the directions associated with the median and maximum spectral response over all orientations, respectively used in the NGA-West2 and ASCE7-10. This comparison is to examine the appropriateness/consistency of using the empirical significant duration relationships proposed herein in conjunction with the median or maximum response spectra in developing seismic design ground motions. In addition, the directionality of strong ground motion durations is being further investigated for motions with near-fault directivity effects.
References
1. Boore DM, Watson-Lamprey J, Abrahamson NA. Orientation-independent measures of ground motion. Bulletin
of the Seismological Society of America 2006; 96(4A): 1502–1511.
2. Boore DM. Orientation-independent, nongeometric-mean measures of seismic intensity from two horizontal components of motion. Bulletin of the Seismological Society of America 2010; 100(4): 1830-1835.
3. Shahi SK, Baker JW. Preliminary NGA-West 2 models for ground-motion directionality. Proceedings of 15th World Conference of Earthquake Engineering 2012; Lisbon, Portugal.
4. Abrahamson NA, Silva WJ. Empirical ground motion models. Report, Brookhaven National Laboratory 1996.
5. Kempton JJ. Stewart JP. Prediction equations for significant duration of earthquake ground motions considering site and near-source effects. Earthquake Spectra 2006; 22(4), 985–1013.
6. Bommer JJ, Stafford PJ, Alarcon JE. Empirical equations for the prediction of the significant, bracketed and uniform duration of earthquake ground motion. Bulletin of the Seismological Society of America 2009; 99(6): 3217-3233.
7. U.S. Nuclear Regulatory Commission (2007). A performance-based approach to define the site-specific earthquake ground motion, Regulatory Guide 1.208, March, 2007.
8. Somerville PG, Smith NF, Graves RW, Abrahamson NA. Modification of empirical strong ground motion attenuation relations to include the amplitude and duration effects of rupture directivity. Seismological Research Letters 1997; 68(1), 199–222.
9. Trifunac MD. Brady AG. Study on duration of strong earthquake ground motion. Bulletin of the Seismological Society of America 1975; 65(3), 581–626.
10. Husid LR. Características de terremotos. Análisis general. Revista del IDIEM 8 1969; Santiago de Chile, 21–42.
11. PEER. Technical report for the PEER ground motion database web application, October 1st, 2010.
12. Program-R. (version 3.0.2). A language and environment for statistical computing and graphics: http://www.r-project.org/.
13. Lee J. Engineering characterization of earthquake ground motions. Ph.D. Dissertation 2009; University of Michigan, Ann Arbor.
14. Pinheiro, JC, Bates DM. Mixed-effects models in S and S-PLUS, Springer, New York, 2000.
Copyright © 2022 FDOKUMEN