Evaluation of the Relationship Between Age and Trabecular ...
Upload
johnshopkinsCategory
view
3download
0
2415
Physiological Measurement
On estimating the directionality distribution in pedicle trabecular bone from micro-CT images
Catherine M Gdyczynski1,3,4, Amir Manbachi1,3,4, SayedMasoud Hashemi1, Bahman Lashkari2 and Richard S C Cobbold1
1 Institute of Biomaterials and Biomedical Engineering (IBBME), University of Toronto, M5S 3G9, Toronto, Canada2 Center for Advanced Diffusion-Wave Technologies (CADIFT), Department of Mechanical and Industrial Engineering, University of Toronto, M5S 3G9, Toronto, Canada3 Spinesonics Medical Inc, 411-112 College St, M5G 1L6, Toronto, Ontario, Canada
E-mail: [email protected]
Received 7 May 2014, revised 18 August 2014Accepted for publication 12 September 2014Published 12 November 2014
AbstractOur interest in the trabecular alignment within bone stems from the need to better understand the manner in which it can affect ultrasound propagation, particularly in pedicles. Within long bones it is well established that trabecular structures are aligned in an organized manner associated with the direction of load distribution; however, for smaller bones there are limited alignment studies. To investigate the directionality distribution in a quantitative manner we used a micro-CT to obtain three-dimensional (3D) structural data and developed analytical methods based on the special properties of Gabor filters. Implementation of these techniques has been developed and tested on a variety of simulated images as well as on 3D structures whose geometry is well-defined. To test the use of this technique we compared the results obtained on vertebral body trabecular bone with visual directionality and previous measurements by others. The method has been applied to six human pedicle samples in two orthogonal planes with results that provide reasonable proof-of-principle evidence that the method is well suited for estimating the directionality distribution within pedicle bones.
Keywords: bone directionality, trabecular bone, pedicle bone, micro-CT, Gabor filter
(Some figures may appear in colour only in the online journal)
C M Gdyczynski et al
Printed in the UK
2415
PMEA
© 2014 Institute of Physics and Engineering in Medicine
2014
35
Physiol. Meas.
PMEA
0967-3334
10.1088/0967-3334/35/12/2415
Papers
2415
2428
Physiological Measurement
Institute of Physics and Engineering in Medicine
IOP
4 These authors contributed equally to this manuscript.
0967-3334/14/122415+14$33.00 © 2014 Institute of Physics and Engineering in Medicine Printed in the UK
Physiol. Meas. 35 (2014) 2415–2428 doi:10.1088/0967-3334/35/12/2415

C M Gdyczynski et al
2416
Physiol. Meas. 35 (2014) 2415
1. Introduction
1.1. Background
Bone is comprised of two types of hard tissue: trabecular and cortical bone. Cortical bone forms the hard outer shell and trabecular bone forms the inner spongy bone found most commonly at the ends of long bones, such as the femur and tibia, as well as in flat and irreg-ular bones such as vertebrae. Trabecular bone has a complex geometry consisting of tra-beculae, rod and plate-like structures with thicknesses in the order of 100–300 µm (Launey et al 2010) forming a porous structure filled with bone marrow. According to Wolff’s Law (Wolff 1986, Frost 1994), the presence of a load can cause changes to the internal trabecular structures. It has been demonstrated that in many long bones such as the femur, these inner structures vary their orientation depending on the mechanical load on the bone, aligning in the direction requiring the most strength. As trabecular bone volume fraction, elastic and strength properties, dimensions of trabeculae, and their arrangement vary greatly between each region of the body (Keaveny et al 2001, Parkinson and Fazzalari 2013), studies per-taining to one location in bone do not directly translate to another. In regions where the trabecular bone volume is small, such as the pedicles of the spine, the microstructure of the trabeculae is largely unstudied. Some studies have been reported for these regions (Pal et al 1988, Inceoglu et al 2005, Inceoglu et al 2007); however, such approaches are mainly qualitative in nature and do not specify particular angles at which trabeculae align. The degree of anisotropy is a measure of how highly oriented substructures are within a volume (Mitton et al 2011) and a number of studies describe approaches towards characterizing the degree of anisotropy in bone (Harrigan and Mann 1984, Odgaard 1997, Hildebrand et al 1999); however, the degree of anisotropy does not provide information as to the trabeculae spatial angle distribution.
It appears that the use of two-dimensional (2D) Gabor filters to characterize trabecu-lae was first described by Jarvi et al (1997). They obtained digitized transmission x-ray images of bones from various anatomical sites, and used 2D Gabor wavelets to analyse the pattern. Subsequently, Xiang et al (2007) performed a quantitative study with 2D Gabor filters to assess bone anisotropy and quality in trabecular bone from the distal metacarpals of dogs. They made 10 µm microtome slices that were subsequently digitized and converted into two-bit images. Following removal of the artifacts created by the corti-cal bone, the slices were then analysed using a Gabor filter at orientations of 0°, 45°, 90° and 135°. In contrast, our method uses a micro-CT to obtain the basic three-dimensional (3D) data, from which the directionality was estimated by using 1° increments for test images and 5° increments for pedicle bones in both the original plane of the data and in an orthogonal plane.
Our work was primarily motivated by the need to gain a better understanding of ultra-sound propagation in trabecular bone, for the purpose of developing an image guidance system for pedicle screw insertion during spinal fusion surgery (Aly et al 2011, Manbachi et al 2014). There is evidence that within trabecular bone, the orientation of structures may influence the propagation characteristics of ultrasound waves (Lashkari et al 2012, Yamashita et al 2012, Liu et al 2014), and as a result the imaging properties could be ori-entation dependent.
The purpose of this paper is to estimate the orientation distribution of pedicle trabecular microstructures from micro-CT images. The method is based on the special properties of the Gabor filter that have been exploited for this purpose. Testing of this proposed method was accomplished using 2D simulated structures and 3D bone models fabricated

C M Gdyczynski et al
2417
Physiol. Meas. 35 (2014) 2415
using 3D printing and subsequently imaged using a micro-CT. To further test the use of this method on trabecular bone we performed an analysis on the trabecular bone from a human vertebral body. These results, whose alignment has been estimated by others, pro-vided additional support for our methodology. The results from six human pedicle samples (University of Toronto Ethics Approval Protocol #29007) in both the coronal and sagittal planes are also presented.
1.2. Gabor filters
In 1946 Dennis Gabor described an important new method for filtering communication sig-nals (Gabor 1946), now known as the Gabor filter. This one-dimensional (1D) time domain application has been greatly expanded and is currently used for texture discrimination, facial recognition, and object detection (Jiang et al 2008). Frequency and orientation representa-tions of Gabor filters have been reported to represent those of human visual cortical cells and are therefore used for texture representation and discrimination (Mehrotra et al 1992). Due to the similarity between the perception in the human visual system and the image analysis by the Gabor transform, the method is well established in the image-processing field, particularly for extracting useful features from an image. Edges can be represented as a discontinuity in the intensities within an image and it is this property which is used by a Gabor filter to detect edges.
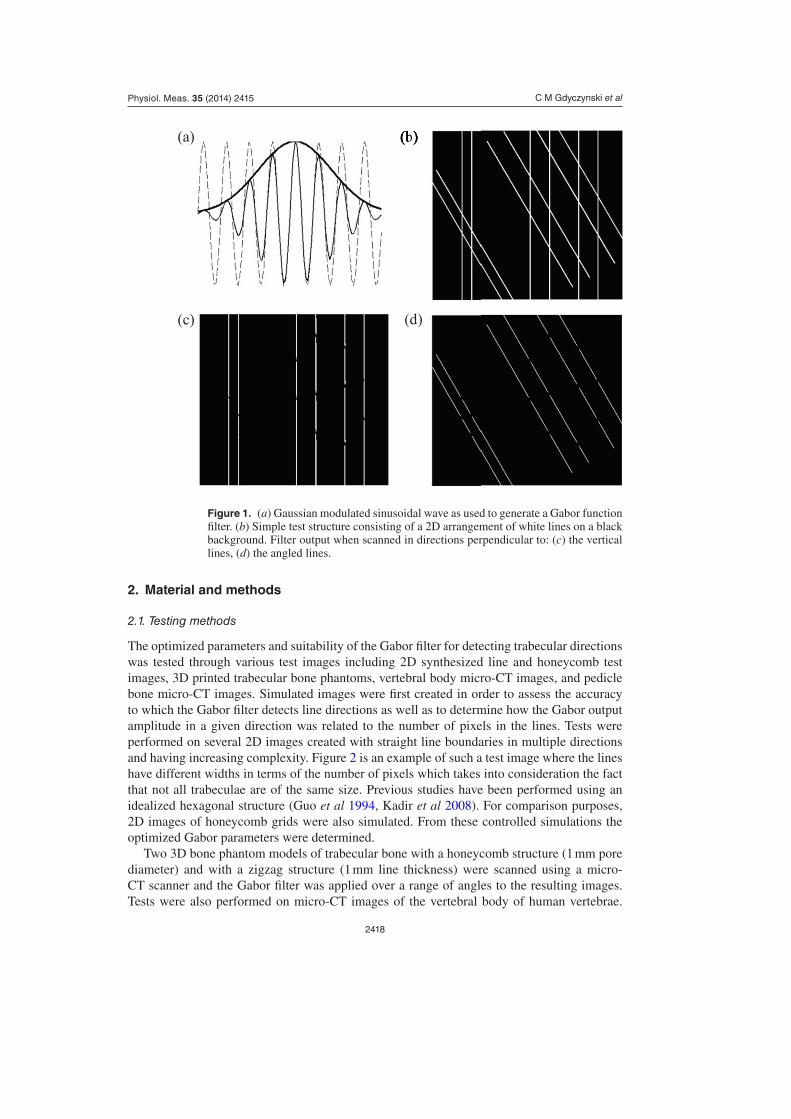
By modulating a sinusoidal wave with a Gaussian function, as illustrated in figure 1(a), a time domain signal is created, called a Gabor function. Such a waveform, when convolved with an input signal, forms a 1D Gabor filter. Similarly, in the 2D spatial domain, a Gabor function can be formed by modulating a 2D sinusoidal wave by a 2D Gaussian kernel function. In (x, y) coordinate space a simplified form of the Gabor function can be written as:
θ γσ
πλ
= − ′ + ′ ′⎜ ⎟⎛⎝⎜
⎞⎠⎟
⎛⎝
⎞⎠G x y
x yx( , : ) exp
2cos
2,
2 2 2
2 (1)
where
θ θ
θ θ
′ = +
′ = − +
x x y
y x y
cos sin
sin cos ,
θ represents the orientation with respect to the normal, γ is an aspect ratio, σ is the standard deviation of the Gaussian function and λ specifies a wavelength. All quantities except γ are measured in pixels. A 2D Gabor filter capable of detecting boundaries within a 2D image I(x, y) can be formed by convolving (1) with the image on a pixel by pixel basis, so that the filter output at an orientation θ can be represented by:
θ θ= ⊗v x y G x y I x y( , : ) ( , : ) ( , ),where ⊗ represents a 2D convolution. For a given angle, the convolution provides a measure of the number of edges that are perpendicular to the filter direction (Mehrotra et al 1992, Jiang et al 2008). When such a function, with appropriately chosen parameters, is convolved at vari-ous orientations to an image function, the strongest response is obtained when the edges are perpendicular to the angle of the filter. Thus by scanning the structure over a range of filter angles, it is possible to determine the angles at which edges occur. Figure 1(b) shows a test structure consisting of grey-scale 2D rectangles. The results of scanning this structure at two orthogonal filter angles are shown in figures 1(c) and (d).
C M Gdyczynski et al
2418
Physiol. Meas. 35 (2014) 2415
2. Material and methods
2.1. Testing methods
The optimized parameters and suitability of the Gabor filter for detecting trabecular directions was tested through various test images including 2D synthesized line and honeycomb test images, 3D printed trabecular bone phantoms, vertebral body micro-CT images, and pedicle bone micro-CT images. Simulated images were first created in order to assess the accuracy to which the Gabor filter detects line directions as well as to determine how the Gabor output amplitude in a given direction was related to the number of pixels in the lines. Tests were performed on several 2D images created with straight line boundaries in multiple directions and having increasing complexity. Figure 2 is an example of such a test image where the lines have different widths in terms of the number of pixels which takes into consideration the fact that not all trabeculae are of the same size. Previous studies have been performed using an idealized hexagonal structure (Guo et al 1994, Kadir et al 2008). For comparison purposes, 2D images of honeycomb grids were also simulated. From these controlled simulations the optimized Gabor parameters were determined.
Two 3D bone phantom models of trabecular bone with a honeycomb structure (1 mm pore diameter) and with a zigzag structure (1 mm line thickness) were scanned using a micro-CT scanner and the Gabor filter was applied over a range of angles to the resulting images. Tests were also performed on micro-CT images of the vertebral body of human vertebrae.
Figure 1. (a) Gaussian modulated sinusoidal wave as used to generate a Gabor function filter. (b) Simple test structure consisting of a 2D arrangement of white lines on a black background. Filter output when scanned in directions perpendicular to: (c) the vertical lines, (d) the angled lines.

C M Gdyczynski et al
2419
Physiol. Meas. 35 (2014) 2415
Since prior work has reported the trabecular directionality in this region of the vertebrae (Hallgrimsson 1998, Buck et al 2002, Bogduk 2005), comparisons could be made using our new methodology. Our implemented Gabor filter was then applied to the micro-CT slices of six human pedicle bones in two orthogonal planes.
2.2. Bones samples and image acquisition
Three vertebral bone specimens (male, age 83) were used in the study, one from each of the following vertebral levels: C6 (cervical), T10 (thoracic), and L4 (lumbar). The pedicles were separated from the vertebral body using a bone saw and divided along the medial plane to yield six pedicle bones. The spinous and transverse processes were then trimmed in order to decrease the size of the samples for the scanner sample holder. The pedicles were scanned using a micro-CT system (μCT 40, Scanco Medical AG, Brüttisellen, Switzerland) which was operated at 55 kVp at 145 µA. Due to differing sizes of the samples, the cur-rent-scan time product varied on the range of 184–345 mAs. The acquired images all have a voxel resolution of 36 µm. This high resolution image quality was sufficient to ensure that the small trabecular structures would be properly captured. The 36 µm slice thickness meant that for each specimen several hundred adjacent slices were obtained. All pedicles were placed in the sample holder in the same orientation such that the images acquired would be perpendicular to the anterior-posterior direction, corresponding anatomically to the coronal plane as well as the plane of relevance to the ultrasound application mentioned above (Mujagic et al 2008, Manbachi et al 2014). The scanner generated 2D 16-bit DICOM (digital imaging and communications in medicine) images which were used to reconstruct a 3D image of the pedicle so that the trabeculae could be readily visualized. Because suf-ficient exposure time and current were used to acquire the micro-CT images, the data was found to have minimal noise. Grey-scale images are converted to binary using a threshold (mean + 2 × standard deviation). This simplification enabled artifacts to be removed such as those originating from the sample holder and bone marrow so that only trabecular bone was visible: it also reduced the computational load. The images obtained from the micro-CT were also re-sliced in an orthogonal direction corresponding to the sagittal plane in order to detect trabecular orientations in a plane perpendicular to the one of interest for comparison.
Figure 2. Simulated 2D image of straight lines at 0° and 30° with resulting directions detected by the Gabor filter (λ = 20, σ = 18). Plots are mirrored about the vertical axis.
C M Gdyczynski et al
2420
Physiol. Meas. 35 (2014) 2415
2.3. Software and Gabor script
The analysis software was written in MATLAB (MathWorks, Massachusetts, USA) and was based on the Gabor filter source code function available from Petkov and Wieling (2004). The optimal parameter choices of the Gabor filter are specimen specific and chosen separately for each image set. Results based on 2D simulated image tests were used to determine best choices for variables. For all tests, γ was set to the default value of 0.5 corresponding to an elliptical filter, and θ was varied from 0–180° (plots are symmetric about the 180° axis), in increments of 1° for test images and 5° for bone images, in order to cover the entirety of the image. By varying the values for λ and σ, the necessary edges of the trabeculae were tested for detectability in the micro-CT images. From the results of experimenting with test images, λ was chosen to be twice the expected width of the structure to be detected and σ was chosen to be equal to (λ − 2). The filter was applied to every micro-CT slice where the results from each angle were combined and averaged, resulting in a single compass plot representing the distribution of trabeculae angles that were detected.
2.4. Data representation
Since the directionality results are completely symmetrical, measurements were made over 180° and mirrored with respect to the plot origin to produce a full 360° representation. For each angle, the number of pixels corresponding to the detected structures is represented as a ratio with respect to the total number of pixels in the whole image. Since this ratio is typically quite small, the data is presented in a normalized manner along the radial axis. The dominant direction for each pedicle bone was compared against all other angles using Student’s t-test where p < 0.05 was considered statistically significant.
For all test structures, the Gabor analysis was applied in 1° increments resulting in a Gaussian-type amplitude response about the dominant direction. While the method with the current settings did not have sufficient sensitivity to resolve such small increments, averaging the response over larger increments provided a clear indication of each dominant edge direc-tion. Increments of 5° were considered sufficient for measuring the distribution within the pedicle bones whose large data size made it desirable to reduce the computation time.
3. Results
In this section the major results obtained with optimized parameters for the 2D and 3D test structures are presented along with the results from the bone specimens.
3.1. Test images
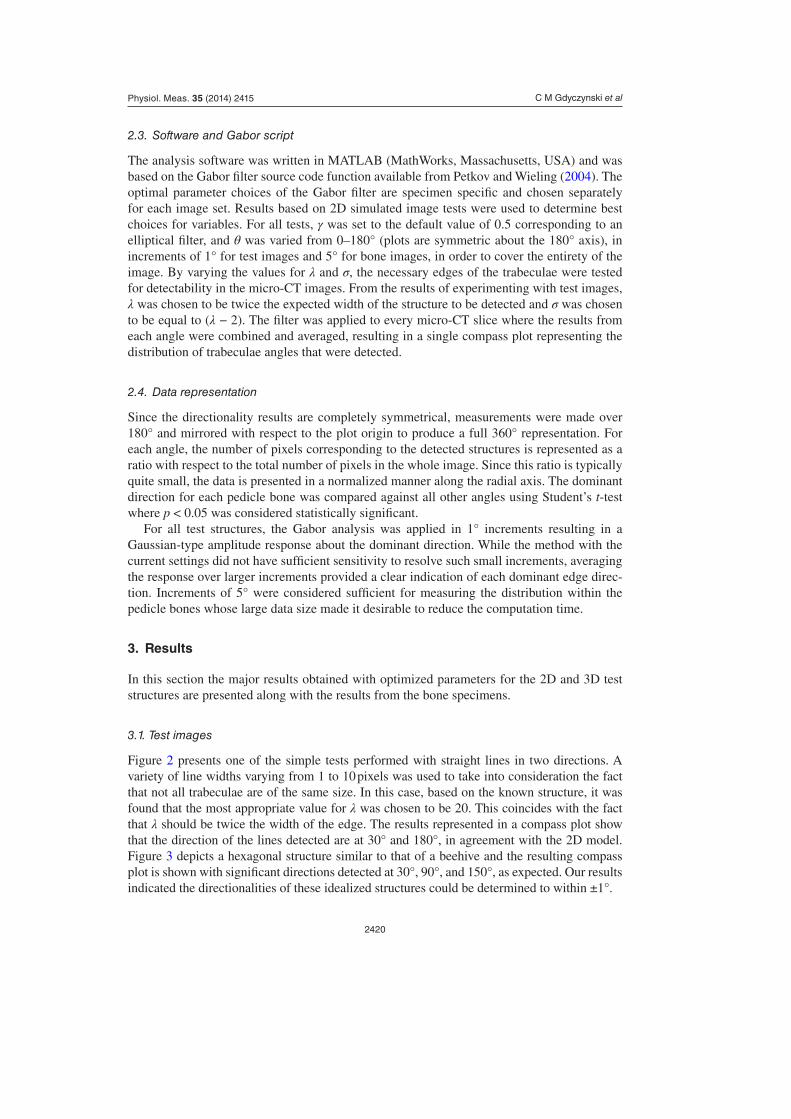
Figure 2 presents one of the simple tests performed with straight lines in two directions. A variety of line widths varying from 1 to 10 pixels was used to take into consideration the fact that not all trabeculae are of the same size. In this case, based on the known structure, it was found that the most appropriate value for λ was chosen to be 20. This coincides with the fact that λ should be twice the width of the edge. The results represented in a compass plot show that the direction of the lines detected are at 30° and 180°, in agreement with the 2D model. Figure 3 depicts a hexagonal structure similar to that of a beehive and the resulting compass plot is shown with significant directions detected at 30°, 90°, and 150°, as expected. Our results indicated the directionalities of these idealized structures could be determined to within ±1°.
C M Gdyczynski et al
2421
Physiol. Meas. 35 (2014) 2415
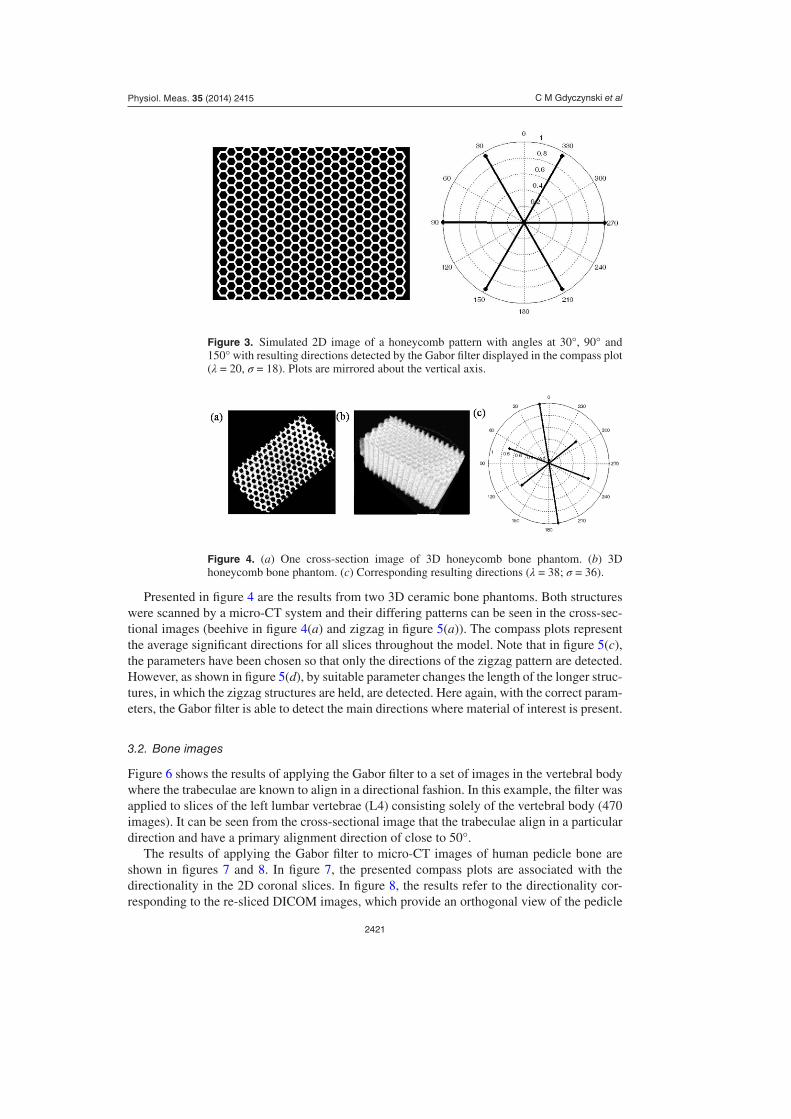
Presented in figure 4 are the results from two 3D ceramic bone phantoms. Both structures were scanned by a micro-CT system and their differing patterns can be seen in the cross-sec-tional images (beehive in figure 4(a) and zigzag in figure 5(a)). The compass plots represent the average significant directions for all slices throughout the model. Note that in figure 5(c), the parameters have been chosen so that only the directions of the zigzag pattern are detected. However, as shown in figure 5(d), by suitable parameter changes the length of the longer struc-tures, in which the zigzag structures are held, are detected. Here again, with the correct param-eters, the Gabor filter is able to detect the main directions where material of interest is present.
3.2. Bone images
Figure 6 shows the results of applying the Gabor filter to a set of images in the vertebral body where the trabeculae are known to align in a directional fashion. In this example, the filter was applied to slices of the left lumbar vertebrae (L4) consisting solely of the vertebral body (470 images). It can be seen from the cross-sectional image that the trabeculae align in a particular direction and have a primary alignment direction of close to 50°.
The results of applying the Gabor filter to micro-CT images of human pedicle bone are shown in figures 7 and 8. In figure 7, the presented compass plots are associated with the directionality in the 2D coronal slices. In figure 8, the results refer to the directionality cor-responding to the re-sliced DICOM images, which provide an orthogonal view of the pedicle
Figure 3. Simulated 2D image of a honeycomb pattern with angles at 30°, 90° and 150° with resulting directions detected by the Gabor filter displayed in the compass plot (λ = 20, σ = 18). Plots are mirrored about the vertical axis.
Figure 4. (a) One cross-section image of 3D honeycomb bone phantom. (b) 3D honeycomb bone phantom. (c) Corresponding resulting directions (λ = 38; σ = 36).

C M Gdyczynski et al
2422
Physiol. Meas. 35 (2014) 2415
in the sagittal plane (where the anatomical directions present are superior and anterior). One compass plot is present for each pedicle, representing the average directionality of each image set which varies in size between 410 to 1400 image slices, depending on the size of the bone. In both experiments, the filter was applied to each micro-CT slice at 5° increments.
Figure 5. (a) One cross-section of 3D zigzag bone phantom. (b) 3D zigzag bone phantom. (c) Corresponding resulting directions (λ = 40, σ = 38). (d) Corresponding resulting directions (λ = 60, σ = 58). Plots are mirrored about the vertical axis.
Figure 6. One cross-sectional slice of a vertebral body section with visible directionality and the 3D vertebral section with corresponding detected directions (λ = 14, σ = 12). Plots are mirrored about the vertical axis.

C M Gdyczynski et al
2423
Physiol. Meas. 35 (2014) 2415
4. Discussion
The goal of this study was to examine the directionality of the trabeculae within the pedicle bone and to provide a scientific platform for understanding how ultrasound may propagate in pedicle bones. Through testing of control images with a known number of lines and direc-tionality, the Gabor filter was optimized and appropriate parameter values were determined. The value of λ was chosen through experimental testing in which the value was varied for known structures with clearly defined edge directions. The chosen value of λ, equal to twice the characteristic structure width, was found to be optimal and agrees with Jarvi et al (1997)
Figure 7. Compass plots for human pedicles in the coronal plane (λ = 14, σ = 12) (a) Left C6, (b) Left T10, (c) Left L4, (d) Right C6, (e) Right T10 and (f) Right L4. The red circle represents the value at which p = 0.05.

C M Gdyczynski et al
2424
Physiol. Meas. 35 (2014) 2415
and Petkov and Wieling (2004). The value for σ was chosen similarly; however, it differs from some previously chosen values such as those from Petkov (1995) or Jiang et al (2008). This pair of values was selected for each image set separately and gave rise to the most accurate detection of known directions in the test images. The simple line test shown in figure 2 is an example where the Gabor filter accurately detects the lines in the 0° and 30° directions. The lines had varying widths in order to provide a simplified example of the varying widths of trabeculae. This test shows that by taking the upper limit for λ (in this case it was twice
Figure 8. Compass plots for human pedicles in the sagittal plane (λ = 14, σ = 12) (a) Left C6, (b) Left T10, (c) Left L4, (d) Right C6, (e) Right T10 and (f) Right L4. The red circle represents the value at which p = 0.05.

C M Gdyczynski et al
2425
Physiol. Meas. 35 (2014) 2415
the width of the largest line, 10 pixels), the method is able to accurately detect all structures present in the test structure. The magnitudes of the lines in each direction correspond to the number of pixels detected in those respective directions. In this example, the 30° line has a slightly lower magnitude (13% decrease) when compared to the 0° direction. This can be attributed to the fact that there are in fact fewer pixels in the angled lines as some are truncated by the edges of the image (78 100 pixels in the 0° direction and 70 278 pixels in the 30° direc-tion). Figure 3 demonstrates a 2D image of a honeycomb structure consisting of hexagons following the assumption that trabecular bone forms in a hexagonal pattern (Hildebrand et al 1999). By adjusting the Gabor parameters to correspond with the line widths of 10 pixels, the three angles of 30°, 90° and 150° are correctly detected. The filter is able to both accurately detect specific angles at which structures are present and determine the approximate number of structures at those particular directions. Moreover, the method is able to detect the main alignments of directionality, though the optimal directionality values may be difficult to inter-pret with this method.
The results from the 3D bone phantom models (figures 4 and 5), represent a more complex case and one closer to real trabecular bone. In these cases, the filter was applied to several micro-CT images and the results were averaged. The method was able to detect major direc-tions where material was present in both cases. From these controlled tests, we can conclude that, with the correct choices for the Gabor parameters, this method is able to detect structures in particular directions with accuracy sufficient for its application to trabecular bone. It is worth noting that with the optimal parameters, the filter will only detect specific edges. This can be seen in figure 5(c), where only directions of 36° and 118° are detected which corre-spond to the zigzag pattern and is due to the fact that the choice for lambda was optimized for the width of these structures. Figure 5(d) shows that by changing the value for lambda, only the structures in the 75° direction are detected. In order to detect all directions at which struc-tures exist, a bank of software filters with different frequencies would be required. However, because our interest lies in detecting trabecular structures whose dimensions fall within a relatively narrow range of widths, this is not an issue when determining the principal direc-tions in a micro-CT image. Before applying the Gabor filter to pedicle bone micro-CT images, it was applied to vertebral bodies. This was performed in order to test the method on a set of micro-CT images from a real trabecular bone whose directionality had been previously stud-ied (Hallgrimsson 1998, Buck et al 2002, Bogduk 2005). From the compass image of figure 6, it can be seen that the trabeculae align in a particular direction and that this corresponds to the cross-sectional slice image, which is typical of that within this region. The results from this test quantitatively determine the directions at which most trabeculae align. This also coincides with the superior direction anatomically.
For the analysis of all six human pedicles (figures 7(a)–(f)), the average thickness of the trabeculae was 7 pixels, which corresponds to trabecular thicknesses of about 252 µm (resolu-tion of 36 µm) which is in agreement with Launey et al (2010). The solid bold circle in each compass plot represents p < 0.05, indicating all directions inside the circle are significantly different compared to the main direction. In these plots, the vertical direction corresponds to superior-inferior (0°) and the horizontal direction corresponds to medial–lateral (90°). Structures were detected at almost all angles, which is to be expected, since the trabeculae form a complex matrix within the bone. However, main directions were found within each pedicle using this technique and when compared to the anatomy of the spine, they generally align approximately in the superior-inferior direction; however, there are outliers such as right L4. These results provide information with respect to the coronal plane which is the main interest relating to the application of ultrasound. By reconstructing the original images into an orthogonal plane, we were able to detect how the trabeculae are aligned within the sagittal

C M Gdyczynski et al
2426
Physiol. Meas. 35 (2014) 2415
plane of the same sample. In these plots, the vertical direction corresponds to superior-infe-rior (0°) and the horizontal direction corresponds to anterior-posterior (90°). These show that within this orthogonal plane, there are directions in which more trabeculae align. It appears that the superior direction is most dominant, especially in the lumbar pedicles; however, it is difficult to draw a general conclusion as there are many irregularities. Variations in results could be due to the selection of the superior direction. Although anatomically the superior direction is vertical, this direction had to be chosen to the best of our ability from the micro-CT images, using known landmarks and positioning. In addition, when slicing the images for the sagittal plane, the superior direction was once again chosen from landmarks in the micro-CT images. For this reason, there is some variation in the choice for the superior direction and its exact angle at which it is located is variable.
3D Gabor filters, as primarily used for facial recognition and motion analysis (Cook et al 2005, Yeom et al 2005, Yun and Guan 2010), are computationally intensive. To use such fil-ters for analysing trabecular bone micro-CT data was not a practical option. By applying 2D Gabor filters to several 2D slices of a 3D object in orthogonal planes, we have demonstrated important information regarding the trabecular structures of interest within the pedicle bone. A possible future study might include using 3D filters to determine trabecular structure in all directions.
Due to the fact that only six pedicles were analysed, all of which are from the same verte-bral column, it is not reasonable to draw conclusions as to whether the trabecular bone pedi-cles align in a particular manner. Therefore this work should be regarded as a feasibility study, the technique of which could be used for other conclusive studies.
The Gabor filter technique is simple to use and optimal parameters for the filter are not difficult to find. As these parameters are chosen based on the width of the structures of inter-est, the current implementation of the technique is heavily dependent on the resolution of the imaging machine. Noise is always present in micro-CT systems, particularly when lower doses are used. In order to test whether this could have a significant influence on the detection method, we added varying amounts of Gaussian noise to our DICOM image files (obtained at 55 kVp at 145 µA) both before and after thresholding. We found that for the doses used (184–345 mAs) the structure detection remained consistent with those measured without added noise.
There are several limitations associated with this study that need to be noted. The first con-cerns the inability to provide quantitative information as to the number of structures that lie in a particular direction. Rather, it provides information as to which direction has the most struc-tures and also represents proportionality between main directions. A possible improvement will be to optimize the parameters further to increase the accuracy or to automate the search for the best parameter values. The second limitation concerns reproducibility. The position of the specimen in the micro-CT scanner is of major importance and can affect the outcome. In a repeat measurement, if a pedicle specimen is not placed exactly as the original, a slightly different plane would be imaged. In the tests performed, the pedicle specimens were specifi-cally placed within the scanner such that the images would correspond to slices in the coronal plane. If the specimen is rotated within that plane, the results would not change. Due to the restrictions imposed by the sample holder on the specimen as well as the specimen size, we estimate that the maximum difference in placement would be ±10°. However, if the specimen is placed differently within the scanner, the micro-CT image will probably change, resulting in the detection of different structures.
We expect that this technique will be useful to determine which direction within the bone the trabeculae have aligned for further studies relating to bone physiology and morphology. This quantitative method will be particularly useful for analysing the trabecular structures

C M Gdyczynski et al
2427
Physiol. Meas. 35 (2014) 2415
during ultrasound guided spinal surgeries (Mujagic et al 2008, Aly et al 2011, Manbachi et al 2014) and could also prove to be useful to study the effects of trabecular formations in bone with tumours or osteoporosis.
5. Conclusions
In this study, we have estimated the direction distribution of pedicle trabecular bone from micro-CT images using Gabor filters. The Gabor filter has been a valuable tool used for edge detection in the past, but its application for detecting directionality within bone is not widespread and has not been used to determine particular angles at which trabeculae align. The Gabor filter was tested for suitability and accuracy in detecting trabecular structures first through simulated 2D line tests then through 3D bone models. When applied to micro-CT images of six human pedicle bones, the final results are an estimation of the main directions of trabecular structures in both the coronal and sagittal planes. However, since the pedicles tested were from just one cadaver, more general conclusions cannot be drawn concerning the directionality distribution.
Acknowledgments
The authors thank Dr J E Davies (IBBME) for support obtaining the micro-CT images and Dr James Drake (Hospital for Sick Children, Toronto) for making available the 3D printing facility necessary for generating the bone phantoms. CG has received financial support from the Graduate Enterprise Internship program. AM acknowledges academic scholarship support from the Ontario Graduate Scholarship for Science and Technology, as well as an external fel-lowship from Ontario Brain Institute. RSCC is grateful to Ontario Centres of Excellence for financial support under grant #494299 and to the Natural Sciences and Engineering Research Council (NSERC) for support under grant #3247-2012.
References
Aly A-H, Ginsberg H J and Cobbold R S C 2011 On ultrasound imaging for guided screw insertion in spinal fusion surgery Ultrasound Med. Biol. 37 651–64
Bogduk N 2005 Clinical Anatomy of the Lumbar Spine and Sacrum 4th edn (Philedelpha: Elsevier) pp 8–9
Buck A M, Price R I, Sweetman I M and Oxnard C E 2002 An investigation of thoracic and lumbar cancellous vertebral architecture using power-spectral analysis of plain radiographs J. Anat. 200 445–56
Cook J A, Chandran V, Sridharan S and Fookes C 2005 Gabor filter bank representation for 3D face recognition IEEE Proc. Digital Imaging Computing: Techniques and Applications DICTA (Queensland, Australia, 2005) pp 16–23
Frost H M 1994 Wolff’s law and bone’s structual adaptations to mechanical usage: an overview for clinicians Angle Orthod. 64 175–88
Gabor D 1946 Theory of communication J. lnst. Electr. Eng. 93 429–57Guo X-D E, McMahon TA, Keaveny T M, Hayes W C and Gibson L J 1994 Finite element modeling of
damage accumulation in trabecular bone under cyclic loading J. Biomech. 27 145–55Hallgrimsson B 1998 Fluctuating Skeletal Asymmetry: General Evolutionary Implications Evolutionary
Biology ed M K Hecht et al (New York: Springer) p 231Harrigan T P and Mann R W 1984 Characterization of microstructural anisotripy in orthotripoc materials
using a second rank tensor J. Mater. Sci. 19 761–7Hildebrand T, Laib A, Muller R, Dequeker J and Ruegsegger P 1999 Direct 3D morphometric analyisis
of human cancellous bone: microstructural data from spine, femur, iliac crest, and calcaneus J. Bone Miner. Res. 14 1167–74

C M Gdyczynski et al
2428
Physiol. Meas. 35 (2014) 2415
Inceoglu S, Burghardt A and Akbay A 2005 Trabecular architecture of lumbar vertebral pedicle Spine 30 1485–90
Inceoglu S, Kilincer C, Tami A and McLain R F 2007 Cortex of the pedicle of the vertebral arch: II. Microstructure J. Neurosurg.-Spine 7 347–51
Jarvi A, Tammisalo E and Nevalainen O 1997 Characterization of radiographic trabecular bone structures with Gabor wavelets Proc. SPIE 3034 Medical Imaging 1997: Image Processing pp 671–80
Jiang W, Lam K-M and Shen T-Z 2008 Edge detection using simplified Gabor wavelets IEEE Int. Conf. Neural Networks and Signal Processing (Zhenjiang, China, 8–10 June 2008) pp 586–91
Keaveny T M, Morgan E F and Niebur G L 2001 Biomechanics of trabecular bone Ann. Rev. Biomed. Eng. 3 307–33
Kadir M R A, Syahrom A, Yusof M A R and Kamsah N 2008 Micro-modelling and analysis of actual and idealised cancellous structure IFMBE Proc. BIOMED 2008 4th Kuala Lumpur Int. Conf. on Biomedical Engineering vol 21 (Kuala Lumpur, Malaysia, 25–28 June 2008) pp 433–7
Lashkari B, Manbachi A, Mandelis A and Cobbold R S C 2012 Slow and fast ultrasonic wave detection improvement in human trabecular bones using Golay code modulation JASA-EL 132 222–8
Mitton D, Roux C and Laugier P 2011 Bone overview Bone Quantitative Ultrasound ed P Laugier and G Haiat (Dordrecht: Springer) pp 1–28 chapter 1
Launey M E, Buehler M J and Ritchie R O 2010 On the mechanistic origins of toughness in bone Annu. Rev. Mater. Res. 40 25–53
Liu C, Ta D, Fujita F, Hachiken T, Matsukawa M, Mizuno K and Wang W 2014 The relationship between ultrasonic backscatter and trabecular anisotropic microstructure in cancellous bone J. Appl. Phys. 115 064906
Manbachi A, Cobbold R S C and Ginsberg H J 2014 Guided pedicle screw insertion: techniques and training The Spine J. 14 165–79
Mehrotra R, Namuduri K and Ranganathan N 1992 Gabor filter-based edge detection Pattern Recognit. 25 1479–94
Mujagic M, Ginsberg H J and Cobbold R S C 2008 Development of a method for ultrasound-guided placement of pedicle screws IEEE Trans. Ultrason. Ferroelectr. Freq. Control 55 1267–76
Odgaard A 1997 3D methods for quantification of cancellous bone architecture Bone 20 315–28Pal G P, Cosio L and Routal R V 1988 Trajectory architecture of the trabecular bone between the body
and the neural arch in human vertebrae Anat. Rec. 222 418–25Parkinson I H and Fazzalari N L 2013 Characterisation of trabecular bone structure Stud. Mechanobiol.
Tissue Eng. Biomater. 5 31–51Petkov N 1995 Biologically motivated computationally intensive approaches to image pattern recognition
Future Gener. Comput. Syst. 11 451–65Petkov N and Wieling M B 2004 Gabor filter for image processing and computer vision [online] http://
matlabserver.cs.rug.nl/, accessed May 2013Wolff J 1986 The Law of Bone Remodelling (English Edition) (Berlin: Springer) pp 81–3Xiang Y, Yingling V R, Malique R, Li C Y, Schaffler M B and Raphan T 2007 Comparative assessment
of bone mass and structure using texture-based and histomorphometric analyses Bone 40 544–52Yamashita K, Fujita F, Mizuno K, Mano I and Matsukawa M 2012 Two-wave propagation imaging
to evaluate the structure of cancellous bone IEEE Trans. Ultrason. Ferroelectr. Freq. Control 59 1160–6
Yeom S, Javidi B, Roh Y J and Cho H S 2005 3D object recognition using x-ray imaging Opt. Eng. 44 027201
Yun T and Guan L 2010 Human emotion recognition using real 3D visual features from Gabor library IEEE MMSP (Saint-Malo, France, 4–6 October 2010) pp 505–10
Copyright © 2022 FDOKUMEN