Field testing of a rover guidance, navigation, and control architecture to support a ground-ice...
8
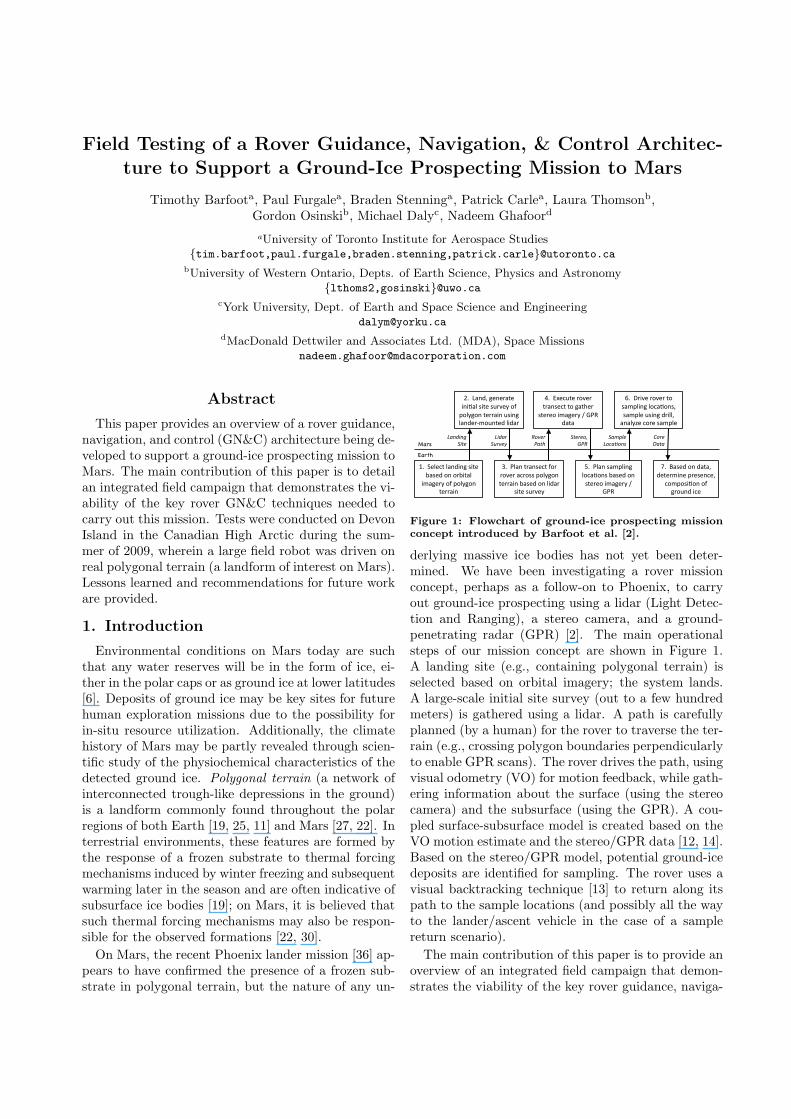
Field Testing of a Rover Guidance, Navigation, & Control Architec- ture to Support a Ground-Ice Prospecting Mission to Mars Timothy Barfoot a , Paul Furgale a , Braden Stenning a , Patrick Carle a , Laura Thomson b , Gordon Osinski b , Michael Daly c , Nadeem Ghafoor d a University of Toronto Institute for Aerospace Studies {tim.barfoot,paul.furgale,braden.stenning,patrick.carle}@utoronto.ca b University of Western Ontario, Depts. of Earth Science, Physics and Astronomy {lthoms2,gosinski}@uwo.ca c York University, Dept. of Earth and Space Science and Engineering [email protected] d MacDonald Dettwiler and Associates Ltd. (MDA), Space Missions [email protected] Abstract This paper provides an overview of a rover guidance, navigation, and control (GN&C) architecture being de- veloped to support a ground-ice prospecting mission to Mars. The main contribution of this paper is to detail an integrated field campaign that demonstrates the vi- ability of the key rover GN&C techniques needed to carry out this mission. Tests were conducted on Devon Island in the Canadian High Arctic during the sum- mer of 2009, wherein a large field robot was driven on real polygonal terrain (a landform of interest on Mars). Lessons learned and recommendations for future work are provided. 1. Introduction Environmental conditions on Mars today are such that any water reserves will be in the form of ice, ei- ther in the polar caps or as ground ice at lower latitudes [6]. Deposits of ground ice may be key sites for future human exploration missions due to the possibility for in-situ resource utilization. Additionally, the climate history of Mars may be partly revealed through scien- tific study of the physiochemical characteristics of the detected ground ice. Polygonal terrain (a network of interconnected trough-like depressions in the ground) is a landform commonly found throughout the polar regions of both Earth [19, 25, 11] and Mars [27, 22]. In terrestrial environments, these features are formed by the response of a frozen substrate to thermal forcing mechanisms induced by winter freezing and subsequent warming later in the season and are often indicative of subsurface ice bodies [19]; on Mars, it is believed that such thermal forcing mechanisms may also be respon- sible for the observed formations [22, 30]. On Mars, the recent Phoenix lander mission [36] ap- pears to have confirmed the presence of a frozen sub- strate in polygonal terrain, but the nature of any un- Mars Earth !" $%&%’( &)*+,*- .,(% /).%+ 0* 01/,()& ,2)-%13 04 50&3-0* (%11),* 6" 7)*+8 -%*%1)(% ,*,9)& .,(% .:1;%3 04 50&3-0* (%11),* :.,*- &)*+%1<20:*(%+ &,+)1 =" >&)* (1)*.%’( 401 10;%1 )’10.. 50&3-0* (%11),* /).%+ 0* &,+)1 .,(% .:1;%3 ?" @A%’:(% 10;%1 (1)*.%’( (0 -)(B%1 .(%1%0 ,2)-%13 C D>E +)() F" >&)* .)25&,*- &0’)90*. /).%+ 0* .(%1%0 ,2)-%13 C D>E G" H1,;% 10;%1 (0 .)25&,*- &0’)90*.8 .)25&% :.,*- +1,&&8 )*)&3I% ’01% .)25&% J" K).%+ 0* +)()8 +%(%12,*% 51%.%*’%8 ’0250.,90* 04 -10:*+ ,’% !"#$%#& (%)* !%$"+ (,+-*. /0-*+ 1")2 ()*+*03 41/ ("567* !08"90#: ;0+* <")" Figure 1: Flowchart of ground-ice prospecting mission concept introduced by Barfoot et al. [2]. derlying massive ice bodies has not yet been deter- mined. We have been investigating a rover mission concept, perhaps as a follow-on to Phoenix, to carry out ground-ice prospecting using a lidar (Light Detec- tion and Ranging), a stereo camera, and a ground- penetrating radar (GPR) [2]. The main operational steps of our mission concept are shown in Figure 1. A landing site (e.g., containing polygonal terrain) is selected based on orbital imagery; the system lands. A large-scale initial site survey (out to a few hundred meters) is gathered using a lidar. A path is carefully planned (by a human) for the rover to traverse the ter- rain (e.g., crossing polygon boundaries perpendicularly to enable GPR scans). The rover drives the path, using visual odometry (VO) for motion feedback, while gath- ering information about the surface (using the stereo camera) and the subsurface (using the GPR). A cou- pled surface-subsurface model is created based on the VO motion estimate and the stereo/GPR data [12, 14]. Based on the stereo/GPR model, potential ground-ice deposits are identified for sampling. The rover uses a visual backtracking technique [13] to return along its path to the sample locations (and possibly all the way to the lander/ascent vehicle in the case of a sample return scenario). The main contribution of this paper is to provide an overview of an integrated field campaign that demon- strates the viability of the key rover guidance, naviga-
-
Upload
independent -
Category
Documents
-
view
0 -
download
0
Transcript of Field testing of a rover guidance, navigation, and control architecture to support a ground-ice...
Field Testing of a Rover Guidance, Navigation, & Control Architec-ture to Support a Ground-Ice Prospecting Mission to Mars
Timothy Barfoota, Paul Furgalea, Braden Stenninga, Patrick Carlea, Laura Thomsonb,Gordon Osinskib, Michael Dalyc, Nadeem Ghafoord
aUniversity of Toronto Institute for Aerospace Studies{tim.barfoot,paul.furgale,braden.stenning,patrick.carle}@utoronto.ca
bUniversity of Western Ontario, Depts. of Earth Science, Physics and Astronomy{lthoms2,gosinski}@uwo.ca
cYork University, Dept. of Earth and Space Science and [email protected]
dMacDonald Dettwiler and Associates Ltd. (MDA), Space [email protected]
Abstract
This paper provides an overview of a rover guidance,navigation, and control (GN&C) architecture being de-veloped to support a ground-ice prospecting mission toMars. The main contribution of this paper is to detailan integrated field campaign that demonstrates the vi-ability of the key rover GN&C techniques needed tocarry out this mission. Tests were conducted on DevonIsland in the Canadian High Arctic during the sum-mer of 2009, wherein a large field robot was driven onreal polygonal terrain (a landform of interest on Mars).Lessons learned and recommendations for future workare provided.
1. Introduction
Environmental conditions on Mars today are suchthat any water reserves will be in the form of ice, ei-ther in the polar caps or as ground ice at lower latitudes[6]. Deposits of ground ice may be key sites for futurehuman exploration missions due to the possibility forin-situ resource utilization. Additionally, the climatehistory of Mars may be partly revealed through scien-tific study of the physiochemical characteristics of thedetected ground ice. Polygonal terrain (a network ofinterconnected trough-like depressions in the ground)is a landform commonly found throughout the polarregions of both Earth [19, 25, 11] and Mars [27, 22]. Interrestrial environments, these features are formed bythe response of a frozen substrate to thermal forcingmechanisms induced by winter freezing and subsequentwarming later in the season and are often indicative ofsubsurface ice bodies [19]; on Mars, it is believed thatsuch thermal forcing mechanisms may also be respon-sible for the observed formations [22, 30].
On Mars, the recent Phoenix lander mission [36] ap-pears to have confirmed the presence of a frozen sub-strate in polygonal terrain, but the nature of any un-
Mars!
Earth!
!"##$%&%'(#&)*+,*-#.,(%#
/).%+#0*#01/,()&#
,2)-%13#04#50&3-0*#
(%11),*#
6"##7)*+8#-%*%1)(%#
,*,9)&#.,(%#.:1;%3#04#
50&3-0*#(%11),*#:.,*-#
&)*+%1<20:*(%+#&,+)1#
="##>&)*#(1)*.%'(#401#
10;%1#)'10..#50&3-0*#
(%11),*#/).%+#0*#&,+)1#
.,(%#.:1;%3#
?"##@A%':(%#10;%1#
(1)*.%'(#(0#-)(B%1#
.(%1%0#,2)-%13#C#D>E#
+)()#
F"##>&)*#.)25&,*-#
&0')90*.#/).%+#0*#
.(%1%0#,2)-%13#C#
D>E###
G"##H1,;%#10;%1#(0#
.)25&,*-#&0')90*.8#
.)25&%#:.,*-#+1,&&8#
)*)&3I%#'01%#.)25&%#
J"##K).%+#0*#+)()8#
+%(%12,*%#51%.%*'%8#
'0250.,90*#04#
-10:*+#,'%#
!"#$%#&'
(%)*'
!%$"+'
(,+-*.'
/0-*+'
1")2'
()*+*03'
41/'
("567*'
!08"90#:'
;0+*'
<")"'
Figure 1: Flowchart of ground-ice prospecting missionconcept introduced by Barfoot et al. [2].
derlying massive ice bodies has not yet been deter-mined. We have been investigating a rover missionconcept, perhaps as a follow-on to Phoenix, to carryout ground-ice prospecting using a lidar (Light Detec-tion and Ranging), a stereo camera, and a ground-penetrating radar (GPR) [2]. The main operationalsteps of our mission concept are shown in Figure 1.A landing site (e.g., containing polygonal terrain) isselected based on orbital imagery; the system lands.A large-scale initial site survey (out to a few hundredmeters) is gathered using a lidar. A path is carefullyplanned (by a human) for the rover to traverse the ter-rain (e.g., crossing polygon boundaries perpendicularlyto enable GPR scans). The rover drives the path, usingvisual odometry (VO) for motion feedback, while gath-ering information about the surface (using the stereocamera) and the subsurface (using the GPR). A cou-pled surface-subsurface model is created based on theVO motion estimate and the stereo/GPR data [12, 14].Based on the stereo/GPR model, potential ground-icedeposits are identified for sampling. The rover uses avisual backtracking technique [13] to return along itspath to the sample locations (and possibly all the wayto the lander/ascent vehicle in the case of a samplereturn scenario).
The main contribution of this paper is to provide anoverview of an integrated field campaign that demon-strates the viability of the key rover guidance, naviga-

tion, and control (GN&C) techniques required to carryout this ground-ice prospecting mission to Mars. Testswere conducted on Devon Island in the Canadian HighArctic during the summer of 2009. This paper extendsthe work of Barfoot et al. [2] in that a real field robotwas used to test the engineering aspects of the mis-sion concept (i.e., rover GN&C techniques), whereasthe earlier paper focussed on showing the science in-struments could produce the required data products tosupport the concept. The paper is organized as follows.Related work on rover GN&C for planetary explorationis discussed, followed by our specific GN&C architec-ture. Next, our experimental setup is presented, fol-lowed by our field test results. A discussion of theresults ensues including an elaboration of our lessonslearned and recommendations for future work, followedby a conclusion.
2. Related Work
Our mission concept employs lidar, stereo vision,and GPR as the main scientific instruments used forground-ice prospecting. In this section we briefly in-troduce these instruments to motivate the required ca-pabilities of our rover GN&C. We then summarize thestate of the art in the areas of (i) traversing away froma lander, and (ii) backtracking to places along the out-bound path.
2.1. Lidar, stereo camera, and GPR
Measuring surface properties and morphologies areof critical importance to understanding geological pro-cesses. This information can help to predict the pres-ence of ground ice in, for example, ice-wedge poly-gons. Surface properties can also help in the inter-pretation of coupled subsurface geophysical data (e.g.,GPR data). Two candidate instruments capable ofmeasuring three-dimensional (3D) surface propertieson future planetary missions are lidar and stereo cam-era. These instruments are complementary in that li-dar actively illuminates a scene using laser light andworks well from short to long range, while a stereocamera is passive, works only to short ranges, but canprovide valuable colour information. Osinski et al.[31] shows the benefits of using a combination of lidarand stereo camera to build detailed 3D models of vari-ous geological features including polygonal terrain, ter-raced crater walls, impact breccias, and gullies in theHaughton impact structure. The Phoenix Lander hadboth a lidar, as part of its Meteorological Station [36],and a stereo camera as part of its Surface Stereo Im-ager [21]. The lidar was pointing upward and thus didnot image the terrain around the lander. The stereocamera did produce 3D images of the terrain, but onlyout to a short range. The ability to move these instru-ments across the surface would be highly beneficial on
future missions.To prospect for ground ice, subsurface measurements
are also required. One candidate instrument is ground-penetrating radar (GPR), which is widely used to de-termine subsurface structures and the distribution ofground ice based on di!erences in the dielectric prop-erties of subsurface materials [1]. When a GPR sur-vey is conducted along a surface traverse, individualtraces can be combined to produce a two-dimensionalprofile showing continuous subsurface reflective layers,which allows for enhanced stratigraphic interpretation.Rover-based GPR has thus been proposed for a va-riety of planetary missions and will be included onthe European Space Agency’s ExoMars mission [37].Fong et al. [9] investigated the use of lidar, stereo cam-era, and GPR to carry out site surveys on Devon Is-land; it is noteworthy that GPR traverses were pre-cisely planned in advance based on orbital imagery andthen driven using GPS for rover positioning. Furgaleet al. [14] also detail a technique to build a coupledsurface/subsurface model using a stereo camera andGPR, without the need for GPS.
2.2. Outbound traverse
There are typically several GN&C techniques re-quired to drive a rover away from the lander towardssome goal including (i) long-range (strategic) pathplanning, (ii) relative localization, (iii) path tracking,and (iv) short-range (tactical) path-planning to avoidlocal obstacles. For reasons related to the acquisitionof our science data, we carry out long-range path plan-ning manually and currently have not implementedshort-range path planning, although the need for thelatter is one of our lessons learned. Since path trackingis quite vehicle-specific and fairly well understood, welimit our discussion of the outbound traverse to the is-sue of relative localization (a.k.a., dead-reckoning), aswe feel this is the main bottleneck in the process at themoment.
The MERs serve as a benchmark for comparison.On nominal terrain, they utilize wheel odometry mea-surements to estimate position changes. However, theMERs have frequently encountered steep slopes andsandy terrain, resulting in large amounts of wheel slip,thereby rendering the odometry measurements unreli-able [26]. For these high-slip situations, they employ atechnique called visual odometry (VO) over short dis-tances. VO is based on earlier work by Matthies et al.[28], where updated vehicle poses are determined bytracking features between stereo camera image pairs.VO has proven to be a crucial tool in high-tilt terrains,and was used frequently in the Eagle and Endurancecraters, as well as during climbing operations in theColumbia Hills [26]. With some improvements [17],the upcoming Mars Science Laboratory rover will also

make use of visual odometry. Note that VO is still adead-reckoning technique and therefore estimation er-rors grow as a function of distance travelled. The MERimplementations typically have errors of a few percentof distance travelled.
Over longer distances (e.g., a few hundred me-ters), the MERs periodically employ a techniquecalled local bundle adjustment (BA) to improve theirVO/odometric/inertial estimate [23]. Common tiepoints are found manually in a network of images alongthe rover’s traverse and are then used in an optimiza-tion procedure to estimate all the associated roverposes. Typically, rocks are identified in a forward-looking PanCam image and then re-identified in abackwards-looking image at a new rover pose. Follow-on work has investigated the automation of the rock-matching step [24], but this has not yet been tested onMars. The MER BA framework claims to have errorgrowth as low as 0.1% of distance travelled over a 5km traverse [23].
The other noteworthy method of improvingVO/odometric/inertial estimates is matching of 3D li-dar scans from di!erent robot poses. This idea hasbeen investigated by several research groups. Specifi-cally for rover applications, the works of Se et al. [35],Rekleitis et al. [33], Dupuis et al. [8], and Wettergreenet al. [40] are representative examples of this concept.Variants of the popular Iterative Closest Point (ICP)algorithm [5] are typically used to align the lidar scansbefore and after a few hundred meters of travel. Theframework of Se et al. [35] is most similar to our cur-rent work, as we employ VO to estimate position for afew hundred meters, then correct our pose by aligningbefore-and-after lidar scans.
Both local BA and lidar scan-to-scan match-ing still accumulate error growth as a functionof distance travelled, albeit at a slower rate thanVO/odometric/inertial estimates.
2.3. Inbound traverse
Traversing back to the lander/ascent vehicle is a lessmature topic than the other aspects of rover GN&C.Both NASA and the European Space Agency are devel-oping Mars-sample-return missions [34]. Landing withpinpoint accuracy at a site of scientific interest is eitherunlikely [7] or not possible (such as in our ice prospect-ing mission concept wherein in-situ data is needed toidentify sampling locations). For sample-return mis-sions, it would be extremely beneficial if the rover couldperform an autonomous return to the lander/ascent ve-hicle in a single command cycle; this could allow therobot to spend most of the mission on the outboundtraverse and then quickly return.
NASA has tested two GN&C technologies to al-low a rover to return to a lander/ascent vehicle: a
!"#$%&'()%)*"+,%-.
/+&+".
012'34))5)&.6",7$5+*)&.
/#8)".94+::1:.
;!(0.<#".!"#$%&*"$*4..
=#7+51>+,#%.
0$%.0)%:#".
0*)")#.9+?)"+.
@%751%#?)*)".
=#%-'/+%-).=1&+".
#%.(+%'A15*.B%1*.
04#"*'/+%-).=1&+".
#%.(+%'A15*.B%1*.
CD9E.
=#%-'/+%-).
9#??$%17+,#%:.
31")5)::.
F?)"-)%7G.
0*#H.
CD9I.
!"#$%&''(%)*+,-%
#./012345./%
(a) Driving configuration. (b) Middle pod lifted.
Figure 2: ROC6 field robot at Lake Orbiter Site.
radio-frequency beacon and visual tracking. The vi-sual tracking system identified the lander using therover’s mast camera from up to 125 m away. Therover tracked the lander in subsequent images as itapproached [16, 3, 38]. This technique only works ifthe rover can see the lander, limiting its range of ap-plication.
One concept that can work over the horizon is vi-sual homing, which enables a return by ‘memorizing’a route on the outgoing drive and then repeating it inreverse. Baumgartner and Skaar [4] develop a naviga-tion system that uses visual cues (in this case artificialring shaped markers), wheel odometry, and Kalmanfilter localization against a known map. The Kalmanfilter estimates are recorded and later used to retracethe path. While the map of the path is not globallyconsistent, it is locally consistent and allows the robotto navigate tight spaces and repeat its path.
The concept of a manifold of maps [15] was extendedto the problem of visual homing for a mobile robotdriving over rough outdoor terrain using a stereo cam-era for feedback by Furgale and Barfoot [13]. Here asequence of locally-consistent overlapping maps of dis-tinctive visual features is built up on the outbound passand then used to reverse the path very accurately backto the start location. This was demonstrated over 32km of driving on Devon Island during the summer of2009. The rover drove without intervention for 99.6%of the distance. This serves as the visual homing im-plementation used in the current work.
3. Experimental Setup
3.1. Field robot
The ROC6 field robot, used as a proxy for a realplanetary rover in this study, is a ruggedized mobilerobot platform that may be used to carry out a varietyof mission scenarios (see Figure 2(a)).
The chassis has six wheels on three main pods joinedby active/passive hydraulic articulation joints. In pas-sive mode, the base is able to keep all six wheels ingood contact with the terrain ensuring excellent trac-tion. In active mode, the center pod may be lifted
!"#$%&'$()&
*+,$&-%./)$%&!"#$%&0+)1&
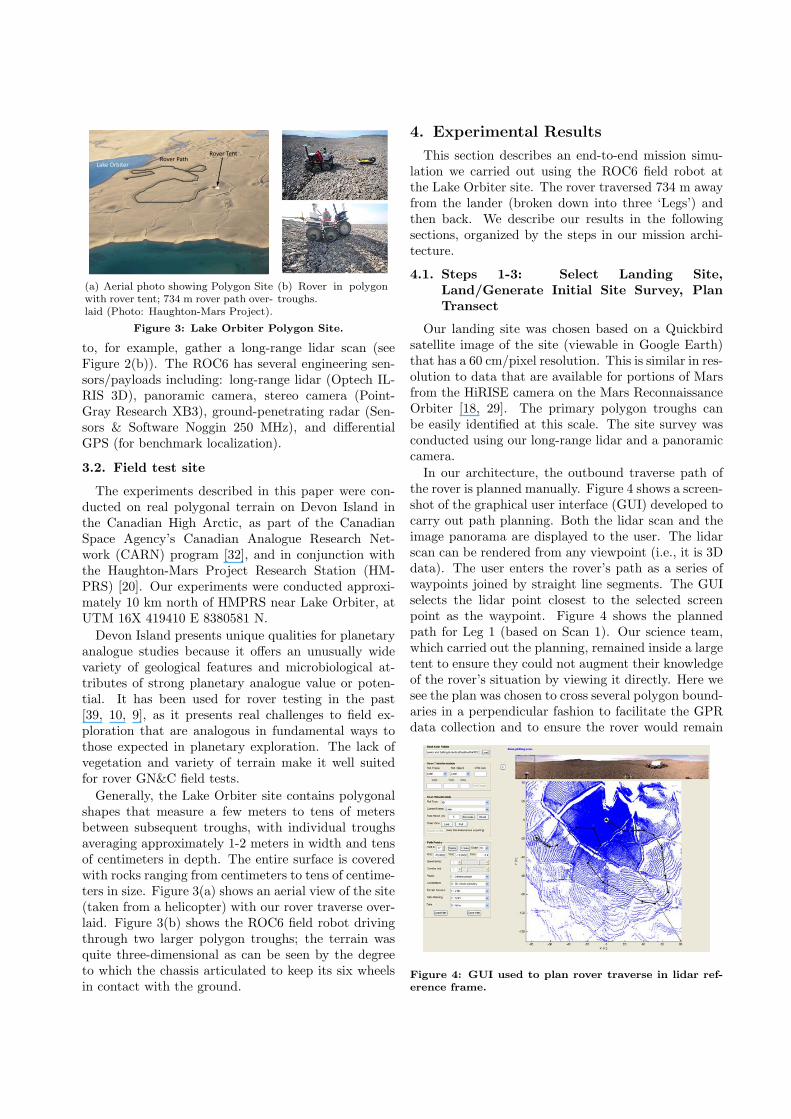
(a) Aerial photo showing Polygon Sitewith rover tent; 734 m rover path over-laid (Photo: Haughton-Mars Project).
(b) Rover in polygontroughs.
Figure 3: Lake Orbiter Polygon Site.
to, for example, gather a long-range lidar scan (seeFigure 2(b)). The ROC6 has several engineering sen-sors/payloads including: long-range lidar (Optech IL-RIS 3D), panoramic camera, stereo camera (Point-Gray Research XB3), ground-penetrating radar (Sen-sors & Software Noggin 250 MHz), and di!erentialGPS (for benchmark localization).
3.2. Field test site
The experiments described in this paper were con-ducted on real polygonal terrain on Devon Island inthe Canadian High Arctic, as part of the CanadianSpace Agency’s Canadian Analogue Research Net-work (CARN) program [32], and in conjunction withthe Haughton-Mars Project Research Station (HM-PRS) [20]. Our experiments were conducted approxi-mately 10 km north of HMPRS near Lake Orbiter, atUTM 16X 419410 E 8380581 N.
Devon Island presents unique qualities for planetaryanalogue studies because it o!ers an unusually widevariety of geological features and microbiological at-tributes of strong planetary analogue value or poten-tial. It has been used for rover testing in the past[39, 10, 9], as it presents real challenges to field ex-ploration that are analogous in fundamental ways tothose expected in planetary exploration. The lack ofvegetation and variety of terrain make it well suitedfor rover GN&C field tests.
Generally, the Lake Orbiter site contains polygonalshapes that measure a few meters to tens of metersbetween subsequent troughs, with individual troughsaveraging approximately 1-2 meters in width and tensof centimeters in depth. The entire surface is coveredwith rocks ranging from centimeters to tens of centime-ters in size. Figure 3(a) shows an aerial view of the site(taken from a helicopter) with our rover traverse over-laid. Figure 3(b) shows the ROC6 field robot drivingthrough two larger polygon troughs; the terrain wasquite three-dimensional as can be seen by the degreeto which the chassis articulated to keep its six wheelsin contact with the ground.
4. Experimental Results
This section describes an end-to-end mission simu-lation we carried out using the ROC6 field robot atthe Lake Orbiter site. The rover traversed 734 m awayfrom the lander (broken down into three ‘Legs’) andthen back. We describe our results in the followingsections, organized by the steps in our mission archi-tecture.
4.1. Steps 1-3: Select Landing Site,Land/Generate Initial Site Survey, PlanTransect
Our landing site was chosen based on a Quickbirdsatellite image of the site (viewable in Google Earth)that has a 60 cm/pixel resolution. This is similar in res-olution to data that are available for portions of Marsfrom the HiRISE camera on the Mars ReconnaissanceOrbiter [18, 29]. The primary polygon troughs canbe easily identified at this scale. The site survey wasconducted using our long-range lidar and a panoramiccamera.
In our architecture, the outbound traverse path ofthe rover is planned manually. Figure 4 shows a screen-shot of the graphical user interface (GUI) developed tocarry out path planning. Both the lidar scan and theimage panorama are displayed to the user. The lidarscan can be rendered from any viewpoint (i.e., it is 3Ddata). The user enters the rover’s path as a series ofwaypoints joined by straight line segments. The GUIselects the lidar point closest to the selected screenpoint as the waypoint. Figure 4 shows the plannedpath for Leg 1 (based on Scan 1). Our science team,which carried out the planning, remained inside a largetent to ensure they could not augment their knowledgeof the rover’s situation by viewing it directly. Here wesee the plan was chosen to cross several polygon bound-aries in a perpendicular fashion to facilitate the GPRdata collection and to ensure the rover would remain
Figure 4: GUI used to plan rover traverse in lidar ref-erence frame.
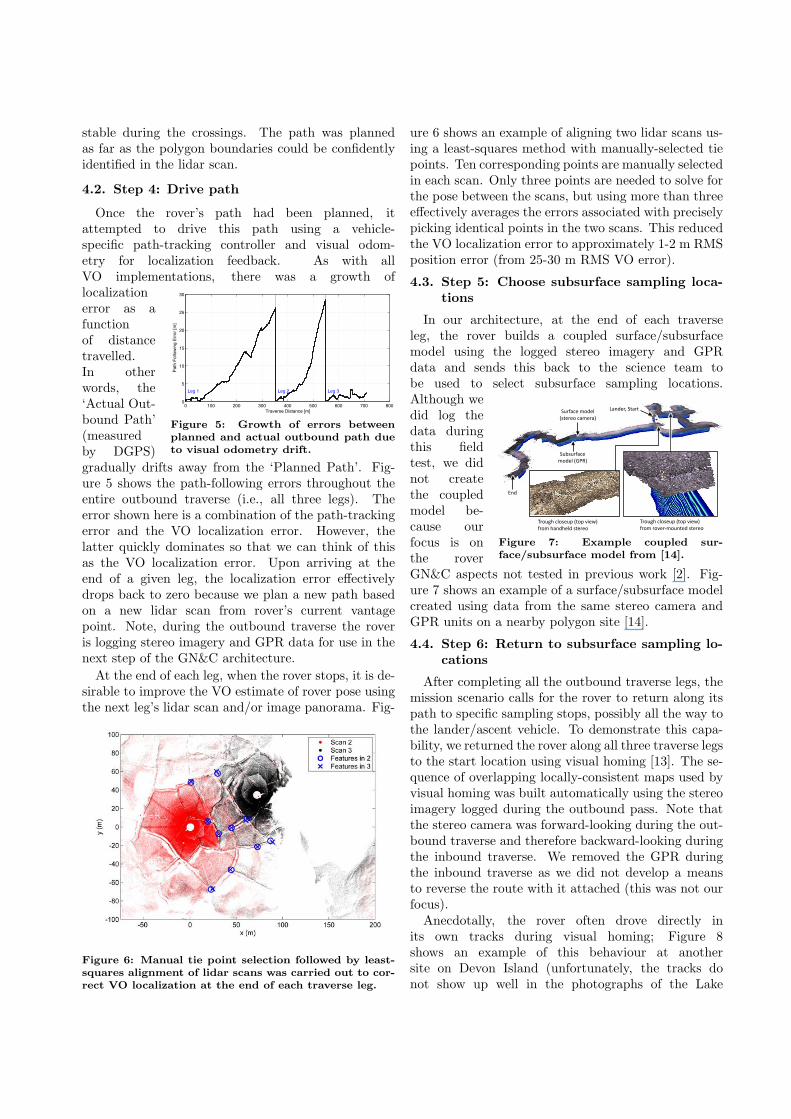
stable during the crossings. The path was plannedas far as the polygon boundaries could be confidentlyidentified in the lidar scan.
4.2. Step 4: Drive path
Once the rover’s path had been planned, itattempted to drive this path using a vehicle-specific path-tracking controller and visual odom-etry for localization feedback. As with allVO implementations, there was a growth of
0 100 200 300 400 500 600 700 8000
5
10
15
20
25
30
Traverse Distance [m]
Path
Fol
lowi
ng E
rror [
m]
Leg 1 Leg 2 Leg 3
Figure 5: Growth of errors betweenplanned and actual outbound path dueto visual odometry drift.
localizationerror as afunctionof distancetravelled.In otherwords, the‘Actual Out-bound Path’(measuredby DGPS)gradually drifts away from the ‘Planned Path’. Fig-ure 5 shows the path-following errors throughout theentire outbound traverse (i.e., all three legs). Theerror shown here is a combination of the path-trackingerror and the VO localization error. However, thelatter quickly dominates so that we can think of thisas the VO localization error. Upon arriving at theend of a given leg, the localization error e!ectivelydrops back to zero because we plan a new path basedon a new lidar scan from rover’s current vantagepoint. Note, during the outbound traverse the roveris logging stereo imagery and GPR data for use in thenext step of the GN&C architecture.
At the end of each leg, when the rover stops, it is de-sirable to improve the VO estimate of rover pose usingthe next leg’s lidar scan and/or image panorama. Fig-
Figure 6: Manual tie point selection followed by least-squares alignment of lidar scans was carried out to cor-rect VO localization at the end of each traverse leg.
ure 6 shows an example of aligning two lidar scans us-ing a least-squares method with manually-selected tiepoints. Ten corresponding points are manually selectedin each scan. Only three points are needed to solve forthe pose between the scans, but using more than threee!ectively averages the errors associated with preciselypicking identical points in the two scans. This reducedthe VO localization error to approximately 1-2 m RMSposition error (from 25-30 m RMS VO error).
4.3. Step 5: Choose subsurface sampling loca-tions
In our architecture, at the end of each traverseleg, the rover builds a coupled surface/subsurfacemodel using the logged stereo imagery and GPRdata and sends this back to the science team tobe used to select subsurface sampling locations.
!"#$%&'()*"&*(
+&,-./(01,2%-3(4*,3(56%78(
9&,:(&,5%&;:,-#*%$(2*%&%,(
<#$(
)-&9"0%(:,$%1((
42*%&%,(0":%&"8(
)-=2-&9"0%((
:,$%1(4>?@8(
+&,-./(01,2%-3(4*,3(56%78(
9&,:(/"#$/%1$(2*%&%,(
Figure 7: Example coupled sur-face/subsurface model from [14].
Although wedid log thedata duringthis fieldtest, we didnot createthe coupledmodel be-cause ourfocus is onthe roverGN&C aspects not tested in previous work [2]. Fig-ure 7 shows an example of a surface/subsurface modelcreated using data from the same stereo camera andGPR units on a nearby polygon site [14].
4.4. Step 6: Return to subsurface sampling lo-cations
After completing all the outbound traverse legs, themission scenario calls for the rover to return along itspath to specific sampling stops, possibly all the way tothe lander/ascent vehicle. To demonstrate this capa-bility, we returned the rover along all three traverse legsto the start location using visual homing [13]. The se-quence of overlapping locally-consistent maps used byvisual homing was built automatically using the stereoimagery logged during the outbound pass. Note thatthe stereo camera was forward-looking during the out-bound traverse and therefore backward-looking duringthe inbound traverse. We removed the GPR duringthe inbound traverse as we did not develop a meansto reverse the route with it attached (this was not ourfocus).
Anecdotally, the rover often drove directly inits own tracks during visual homing; Figure 8shows an example of this behaviour at anothersite on Devon Island (unfortunately, the tracks donot show up well in the photographs of the Lake

Figure 8: Rover driving in its owntracks during visual homing.
Orbiter site dueto the nature ofthe terrain). Fig-ure 9 shows thepath-following er-rors for the in-bound traverses ofLegs 1, 2, and 3.The errors plot-ted here are be-tween the actual
outbound path (measured using DGPS) and the actualinbound path (measured using DGPS). During the in-bound traverse of Leg 2, the GPS system dropped outof di!erential mode and thus only regular GPS infor-mation is available for this leg (i.e., the groundtruthsystem was not adequate to measure the performanceof visual homing). For Legs 1 and 3, we see that thepath-following error is generally less than 1 m, mean-ing the rover was able to very accurately drive alongthe same route back to the start without human in-tervention. Figure 10 also plots both the outboundand inbound traverses, although it is hard to tell themapart at this scale.
0 100 200 300 400 500 600 700 8000
0.5
1
1.5
2
2.5
3
3.5
4
4.5
Traverse Distance [m]
Pa
th F
ollo
win
g E
rro
r [m
]
Leg 1 Leg 2 Leg 3
RTK GPS dropout
during Leg 2
Figure 9: Bounded error between actualinbound and outbound paths due to vi-sual backtracking.
Pausingat any des-ignatedlocationalong theinboundtraversein orderto gathersubsurfacesampleswould be straightforward, although we did not demon-strate this. Actually gathering the samples from thesubsurface is a more di"cult task that we have notyet attempted to address in this research.
5. Discussion
We have learned several lessons during our field testthat may inform future research in this area. Most im-portantly, we learned that there is merit to conductingintegrated field tests such as the one reported here. Bybringing together all the requisite GN&C elements intoa single test, we were able to identify the deficienciesin their ability to enable the overall mission concept.See Figure 10 for a summary of our results. Clearly,it would be nice to be able to report on a much largernumber of tests, but running large-scale robotics exper-iments in this remote venue was logistically challeng-ing. Still, we believe there are some specific findingsworth detailing from our campaign.
Figure 10: Rover GN&C performance summary includ-ing: (i) groundtruth scan positions and aligned lidarscans of polygon terrain, (ii) planned paths based onlidar scans, (iii) actual outbound path using VO for lo-calization, (iv) improved localization (using VO as theinitial guess) at the end of Legs 1 and 2, and (v) actualinbound path using visual homing.
The users of the graphical user interface during ourtest were planetary scientists, who were not involved inthe GUI’s development. They planned the rover’s pathwith advice from a rover specialist. The main lessonlearned in this step is that human users are very com-fortable with image panoramas and less comfortablewith lidar data. The GUI allowed both data sourcesto be viewed simultaneously and visually correlated us-ing annotations on the screen. Although the GUI couldcertainly be refined, the capability to view images andlidar data together was found to be very successful.Generally, the idea of planning the rover’s path manu-ally based on the raw geometry of the polygon terrain(as measured by the lidar scan) did prove to be suc-cessful as it provided adequate situational awarenessof the polygonal terrain’s specific structure around therover.
In terms of driving the outbound path, our mainconclusion here is that we either need to improve theaccuracy of visual odometry, or reduce the length ofeach traverse leg. A combination of these two changesis also possible. From Figure 5 we see that the posi-tion errors on our traverse legs grew as high as tens ofmeters. This is not acceptable for two reasons. First,the rover may not cross the polygon troughs perpen-dicularly, thereby compromising the science data col-lection; we can see the manifestation of this e!ect inFigure 10. Second, the rover may drive into unsafeterrain when it deviates from the planned path by alarge amount. Knowing the limitations of VO, we canpartially account for the second issue by ensuring there

is a safety corridor on either side of the planned path.However, as Figure 5 indicates, the VO localization er-rors grow super-linearly with distance travelled, mean-ing the safety corridor would need to grow impracti-cally large. A quick solution is to reduce the traverselegs to less than 150 m each, whereby the localizationerrors would shrink to about 2-3% of distance trav-elled. A more permanent solution would be to switchto a VO implementation that maintains good accuracyover longer distances.
Another lesson learned is that a simple hazard-detection system should be implemented as there willinevitably be some deviation between the planned anddriven paths. As the stereo camera is forward-lookingduring the outbound pass, a basic stereo reconstruc-tion could serve in this regard. We did not includesuch a monitoring system due to lack of developmenttime, but will do so in future work.
We found that visual homing was able to very accu-rately return the rover along its outbound path backto the start location. It is worth stressing that the per-formance of visual homing is una!ected by any path-following errors accumulated during the outbound tra-verse; visual homing simply drives the robot back alongthe actual outbound path. The biggest concern with
(a) Image from the outboundpass.
(b) Image from the failed in-bound traverse 4 hours later.
Figure 11: Images from the start of Leg 2 visual homing(all taken at Scan 3 location) showing that lighting cancause drastic changes to a scene’s appearance.
visual homing is lighting sensitivity. Because the tech-nique is appearance-based, drastic changes in light-ing can cause the algorithm to be unable to recognizeplaces it has visited before. During the summer in theArctic, the sun moves rapidly around the horizon andthereby quickly changes the shadow directions. TheLake Orbiter site is also littered with many similar-sized rocks. The combination of these e!ects causedvisual homing to be unable to report the rover’s po-sition at the start of Leg 2 (see Figure 11). A periodof a several hours had elapsed between the outboundand inbound traverses, changing the appearance of thescene. Visual homing failed to recognize the location.With no changes to the algorithm, a second attemptthe next morning allowed the inbound traverse to becompleted successfully.
6. Conclusion
We have presented the results of an integrated fieldtest of a rover GN&C architecture designed to sup-port a ground-ice prospecting mission to Mars. Theexperiments were conducted at a Mars analogue siteon Devon Island in the Canadian High Arctic on realpolygonal terrain using a real field robot. The novelcontribution of this paper is the combination and cri-tique of several rover GN&C techniques in a single test.We believe that the mission architecture presented inthis paper is viable; however, we identified a numberof improvements that need to be made to the individ-ual rover GN&C components and their interactions toreach adequate performance levels for a real mission.
Acknowledgements
We would like to thank the Canadian Space Agencyfor funding this field campaign under its CanadianAnalogue Research Network Grant Program. Addi-tional funding was provided by the Northern Scien-tific Training Program, Natural Sciences and Engineer-ing Research Council of Canada, and Canada Founda-tion for Innovation. We would also like to thank theHaughton-Mars Project, the Polar Continental ShelfProject, and Technical Field Support Services for lo-gistics and field support. Optech Inc. and MarwanHussein generously provided support of the lidar sys-tem during our test. Matt Izawa of the Universityof Western Ontario also provided invaluable field sup-port at the Lake Orbiter site. Sensors & Software Inc.generously provided equipment loans/donations in theform of the GPR.
References
[1] Arcone, S., Prentice, M., Delaney, A., 2002. Stratigraphicprofiling with ground-penetrating radar in permafrost: Areview of possible analogs for mars. Journal of GeophysicalResearch 107 (E11), 5108.
[2] Barfoot, T. D., Furgale, P. T., Osinski, G. R., Ghafoor, N.,Williams, K., March 2010. Field testing of robotic technolo-gies to support ground-ice prospecting in martian polygonalterrain. Planetary and Space Science, 58 (4), 671–681.
[3] Baumgartner, E. T., Leger, P. C., Schenker, P. S., Hunts-berger, T. L., 1998. Sensor-fused navigation and manipula-tion for a planetary rover. In: Proc. of SPIE Vol 3523.
[4] Baumgartner, E. T., Skaar, S. B., 1994. An autonomousvision-based mobile robot. Automatic Control, IEEE Trans-actions on 39 (3), 493–502.
[5] Besl, P., McKay, H., 1992. A method for registration of 3-Dshapes. IEEE Transactions on pattern analysis and machineintelligence 14 (2), 239–256.
[6] Carr, M. H., 1996. Water on Mars. Oxford University Press,New York.
[7] Clark, B. C., 2007. Mars sample return: The critical nextstep. Acta Astronautica 61 (1-6), 95–100.
[8] Dupuis, E., Rekleitis, I., Bedwani, J. L., Lamarche, T., Al-lard, P., Zhu, W. H., 2008. Over-the-horizon autonomousrover navigation: Experimental results. In: Proc. of the 9th

Int. Symp. on Artificial Intelligence, Robotics and Automa-tion in Space (iSAIRAS). Los Angeles, CA.
[9] Fong, T., Allan, M., Bouyssounouse, X., Bualat, M., Deans,M., Edwards, L., Fluckiger, L., Keely, L., Lee, S., Lees, D.,To, V., Utz, H., February 26-29 2008. Robotics site sur-vey at haughton crater. In: Proceedings of the 9th Interna-tional Symposium on Artificial Intelligence, Robotics andAutomation in Space (iSAIRAS). Los Angeles, CA.
[10] Fong, T., Deans, M., Lee, P., Bualat, M., March 12-16 2007.Simulated lunar robotic survey at terrestrial analog sites.In: Proceedings of the 38th Lunar and Planetary ScienceConference. League City, Texas.
[11] Fortier, D., Allard, M., 2004. Late holocene syngenetic icewedge polygons development, bylot island, canadian arcticarchipelago. Canadian J. of Earth Sciences 41, 997–1012.
[12] Furgale, P., Barfoot, T. D., Ghafoor, N., 14-16 July 2009.Rover-based surface and subsurface modeling for planetaryexploration. In: Proceedings of Field and Service Robotics(FSR). Cambridge, MA.
[13] Furgale, P. T., Barfoot, T. D., 2010. Visual teach and repeatfor long-range rover autonomy. Journal of Field Robotics,special issue on “Visual mapping and navigation outdoors”.Manuscript # ROB-09-0081, accepted on March 31, 2010.
[14] Furgale, P. T., Barfoot, T. D., Osinski, G. R., Williams,K., Ghafoor, N., 2010. Field testing of an integrated sur-face/subsurface modeling technique for planetary explo-ration. International Journal of Robotics Research, specialissue on “Field and Service Robotics”. Manuscript # IJR-09-0636, accepted on March 23, 2010.
[15] Howard, A., Sukhatme, G. S., Mataric, M. J., 2006. Mul-tirobot simultaneous localization and mapping using man-ifold representations. In: Proc. of the IEEE. Vol. 94. pp.1360–1369.
[16] Huntsberger, T. L., Baumgartner, E. T., Aghazarian, H.,Cheng, Y., Schenker, P. S., Leger, P. C., Iagnemma, K. D.,Dubowsky, S., September 1999. Sensor fused autonomousguidance of a mobile robot and applications to mars samplereturn operations. In: Proc. SPIE Symp. on Sensor Fusionand Decentralized Control in Robotic Systems II, Vol. 3839.
[17] Johnson, A. E., Goldberg, S. B., Cheng, Y., Matthies, L. H.,2008. Robust and e!cient stereo feature tracking for visualodometry. In: IEEE Int. Conf. on Robotics and Automa-tion. pp. 39–46.
[18] Johnston, M., Graf, J., Zurek, R., Eisen, H., 2005. TheMars Reconnaissance Orbiter mission. In: IEEE Conferenceon Aerospace. pp. 1–18.
[19] Lachenbruch, A., 1962. Mechanics of thermal contractioncracks and ice-wedge polygons in permafrost. Special paperto the Geological Society of America 70, 69.
[20] Lee, P., et al., 2007. Haughton-mars project: 10 years ofscience operations and exploration systems development ata moon/mars analog site on devon island, high arctic. In:Proceedings of the 38th Lunar and Planetary Science Con-ference. League City, Texas, pp. 2426–2427.
[21] Lemmon, M. T., et al., 2008. The phoenix surface stereo im-ager (ssi) investigation. In: Proceedings of the 39th Lunarand Planetary Science Conference. No. 2156.
[22] Levy, J., Head, J., Marchant, D., 2009. Thermal contrac-tion crack polygons on mars: Classification, distribution,and climate implications from hirise observations. Journalof Geophysical Research 114 (E01007).
[23] Li, R., Arvidson, R. E., Di, K., et al., February 2007. Op-portunity rover localization and topographic mapping atthe landing site of Meridiani Planum, Mars. Journal of Geo-physical Research 112 (E2).
[24] Li, R., Di, K., Howard, A. B., March 2007. Rock model-ing and matching for autonomous long-range Mars roverlocalization. Journal of Field Robotics 24 (3), 187–203.
[25] Mackay, J. R., Burn, C. R., 2002. The first 20 years (1978-1979 to 1998-1999) of ice wedge growth at the illisarvikexperimental drained lake site, western arctic coast, canada.Canadian Journal of Earth Sciences 39 (1), 95–111.
[26] Maimone, M., Cheng, Y., Matthies, L., 2007. Two years ofvisual odometry on the mars exploration rovers. Journal ofField Robotics 24 (3), 169–186.
[27] Mangold, N. A., 2005. High latitude patterned groundson mars: Classification, distribution, and climatic control.Icarus 174, 336–359.
[28] Matthies, L., Maimone, M., Johnson, A., Cheng, Y., Will-son, R., Villalpando, C., Goldberg, S., Huertas, A., Stein,A., Angelova, A., 2007. Computer vision on mars. Interna-tional Journal of Computer Vision 75 (1), 67–92.
[29] McEwen, A., Delamere, W., Eliason, E., et al., March 2002.HiRISE - The High Resolution Imaging Science Experimentfor Mars Reconnaissance Orbiter. In: Lunar and PlanetaryScience XXXIII, Houston, TX.
[30] Mellon, M. T., Arvidson, R. E., Marlow, J. J., Phillips,R. J., Asphaug, E., 2008. Periglacial landforms at thephoenix landing site and the northern plains of mars. Jour-nal of Geophysical Research 113 (E00A23).
[31] Osinski, G. R., Barfoot, T. D., Ghafoor, N., Izawa, M.,Bangerjee, N., Jasiobedzki, P., Tripp, J., Richards, R., Au-clair, S., Sapers, H., Thomson, L., Flemming, R., March2010. Lidar and the mobile scene modeler (mSM) as scien-tific tools for planetary exploration. Planetary and SpaceScience, 58 (4), 691–700.
[32] Osinski, G. R., Leveille, R., Berinstain, A., Lebeuf, M.,Bamsey, M., 2007. Terrestrial analogues to mars and themoon: Canada’s role. Geoscience Canada 33 (4), 175–188.
[33] Rekleitis, I., Bedwani, J.-L., Dupuis, E., 2007. Over-the-horizon, autonomous navigation for planetary exploration.In: Bedwani, J.-L. (Ed.), Proc. IEEE/RSJ Int. Conf. onIntelligent Robots and Systems 2007. pp. 2248–2255.
[34] Schenker, P. S., Huntsberger, T. L., Pirjanian, P., Baum-gartner, E. T., Tunstel, E., 2003. Planetary rover devel-opments supporting mars exploration, sample return andfuture human-robotic colonization. Autonomous Robots14 (2), 103–126.
[35] Se, S., Ng, H.-K., Jasiobedzki, P., Moyung, T.-J., 2004.Vision based modeling and localization for planetary ex-ploration rovers. In: Proceedings of the 55th InternationalAstronautical Congress. Vancouver, Canada.
[36] Smith, P. H. et al., 2008. Introduction to special section onthe phoenix mission: landing site characterization experi-ments, mission overviews, and expected science. Journal ofGeophysical Research 113 (E00A18).
[37] Vago, J., Gardini, B., Kminek, G., Baglioni, P., Gianfiglio,G., Santovincenzo, A., Bayon, S., van Winnendael, M., May2006. ExoMars - searching for life on the Red Planet. ESABulletin 126, 16–23.
[38] Volpe, R., Baumgartner, E., Scheaker, P., Hayati, S., 2000.Technology development and testing for enhanced marsrover sample return operations. In: Aerospace ConferenceProceedings, 2000 IEEE. Vol. 7. pp. 247–257 vol.7.
[39] Wettergreen, D., Dias, M., Shamah, B., Teza, J., Tompkins,P., Urmson, C., Wagner, M., Whittaker, W., May 2002.First experiment in sun-synchronous exploration. In: Pro-ceedings of the IEEE International Conference on Roboticsand Automation (ICRA). Washington, DC, pp. 3501–3507.
[40] Wettergreen, D., Jonak, D., Kohanbash, D., Moreland, S.,Spiker, S., Teza, J., 14-16 July 2009. Field experiments inmobility and navigation with a lunar rover prototype. In:Proceedings of the 7th International Conference on Fieldand Service Robotics. Cambridge, Massachusetts, USA.