Naida District (9 Blocks) - Central Ground Water Board (CGWB)
165
कीय भूमि जल बोड जल संसाधन, नदी विकास और गंगा संरण विभाग, जल शि मंालय भारत सरकार Central Ground Water Board Department of Water Resources, River Development and Ganga Rejuvenation, Ministry of Jal Shakti Government of India AQUIFER MAPPING AND MANAGEMENT OF GROUND WATER RESOURCES Parts Of Nadia District (9 Blocks), West Bengal (Karimpur - I, Karimpur - II, Tehatta - I, Tehatta - II, Kaliganj, Nakashipara, Chapra, Krishnaganj & Hanskhali Blocks) (Phase - II) पूिी े, कोलकाता Eastern Region, Kolkata
-
Upload
khangminh22 -
Category
Documents
-
view
1 -
download
0
Transcript of Naida District (9 Blocks) - Central Ground Water Board (CGWB)
कें द्रीय भूमि जल बोर्ड
जल संसाधन, नदी विकास और गंगा संरक्षण
विभाग, जल शक्ति मंत्रालय
भारत सरकार
Central Ground Water Board Department of Water Resources, River Development and Ganga Rejuvenation,
Ministry of Jal Shakti Government of India
AQUIFER MAPPING AND MANAGEMENT
OF GROUND WATER RESOURCES Parts Of Nadia District (9 Blocks), West Bengal
(Karimpur - I, Karimpur - II, Tehatta - I, Tehatta -
II, Kaliganj, Nakashipara, Chapra, Krishnaganj &
Hanskhali Blocks) (Phase - II)
पूिी के्षत्र, कोलकाता
Eastern Region, Kolkata
GOVERNMENT OF INDIA
MINISTRY OF JAL SHAKTI
REPORT ON
AQUIFER MAPPING STUDIES IN PARTS OF
NADIA DISTRICT (9 Blocks), WEST BENGAL
(Karimpur - I, Karimpur - II, Tehatta - I, Tehatta - II, Kaliganj, Nakashipara,
Chapra, Krishnaganj & Hanskhali Blocks)
(PHASE - II)
(AAP 2016 - 2017)
By
D. Biswas, Scientist ‘D’
Supervision
S. Brahma, Scientist ‘D’
Central Ground Water Board Eastern Region, Kolkata
SEPTEMBER 2019
REPORT ON
AQUIFER MAPPING STUDIES IN PARTS OF
NADIA DISTRICT (9 Blocks), WEST BENGAL
(Karimpur - I, Karimpur - II, Tehatta - I, Tehatta - II, Kaliganj, Nakashipara,
Chapra, Krishnaganj & Hanskhali Blocks)
(PHASE - II)
(AAP 2016 - 2017)
CONTENTS
Part I
Aquifer Mapping Studies in parts of Nadia district (9 Blocks)
CHAPTER Page No (s).
Chapter - 1: INTRODUCTION
1.1 Objective 01
1.2 Scope of Study 01
1.3 Approach and Methodology 01 to 02
1.4 Location, Extent and Accessibility of the study area 02
1.5 Administrative divisions and Population 02 to 04
1.6 Land use and cropping pattern 04 to 05
1.7 Urban areas 05
Chapter - 2: HYDROMETEOROLOGY
2.1 Rainfall 05 to 06
2.2 Temperature 06
Chapter - 3: PHYSIOGRAPHY
3.1 Geomorphology 07
3.2 Drainage 07
3.3 Soil Types 07
Chapter - 4: GEOLOGY & HYDROGEOLOGY
4.1 General geology 07 to 08
4.2: Hydrogeology 08 to 26
4.2.1: Sub-surface Hydrogeology 08 to 15
4.2.2: Aquifer characteristics 16
4.2.3: Ground water regime of aquifers 16 to 21
4.2.4: Seasonal long term water level trend analysis 21 to 23
4.2.5: Ground Water Resources, Draft, SOD & Category 23 to 26
Chapter - 5: HYDROCHEMISTRY
5.1: Quality of Shallow and Deeper Aquifer Water 27
5.2: General range of chemical parameter 27 to 31
5.3: Ground water pollution 31 to 32
Chapter - 6: AQUIFER MANAGEMENT PLAN
6.1: Ground Water Management Plan for Drinking Purposes 33 to 36
6.2: Ground Water Management Plan for Irrigation Purposes 36 to 38
Chapter - 7: SCOPE OF ARTIFICIAL RECHARGE 39
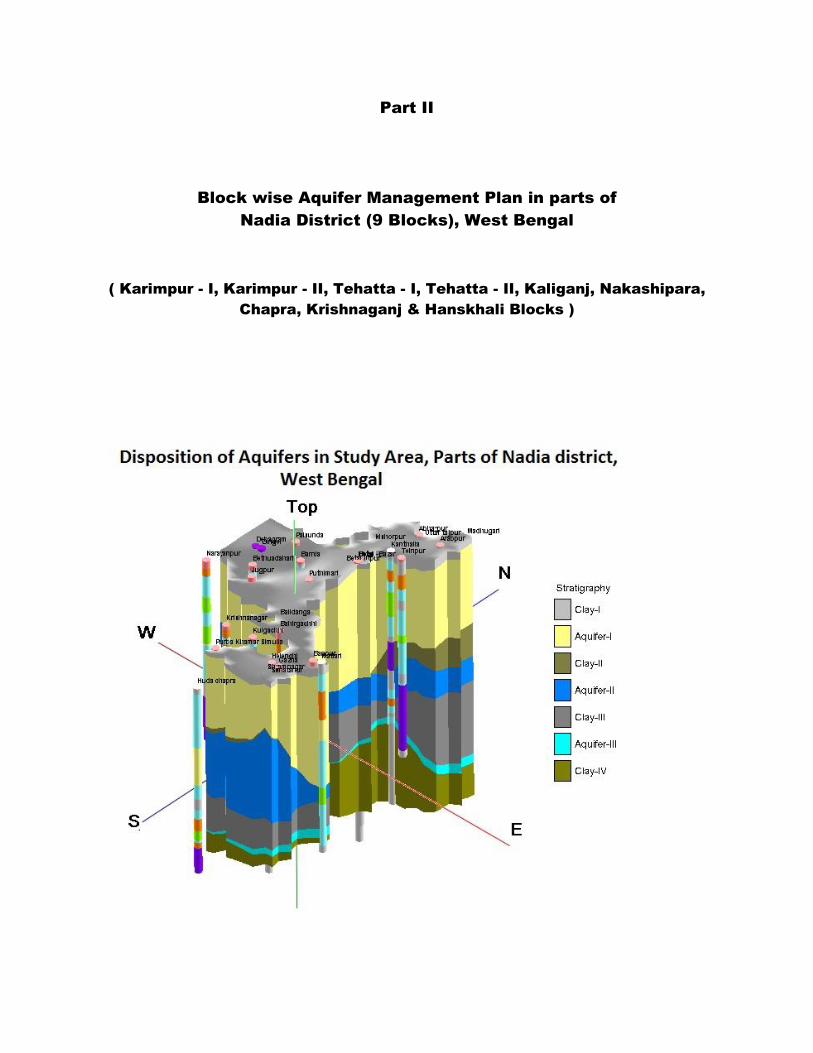
Part II
Block wise Aquifer Management Plan in parts of Nadia District (9 Blocks)
1. Karimpur I Block. 40 to 49
2. Karimpur II Block. 50 to 60
3. Tehatta I Block. 61 to 71
4. Tehatta II Block. 72 to 82
5. Kaliganj Block. 83 to 93
6. Nakashipara Block. 94 to 102
7. Chapra Block. 103 to 113
8. Krishnaganj Block. 114 to 124
9. Hanskhali Block. 125 to 138
Part III
Data Gap Analysis in parts of Nadia District (9 Blocks), West Bengal
139 to 153
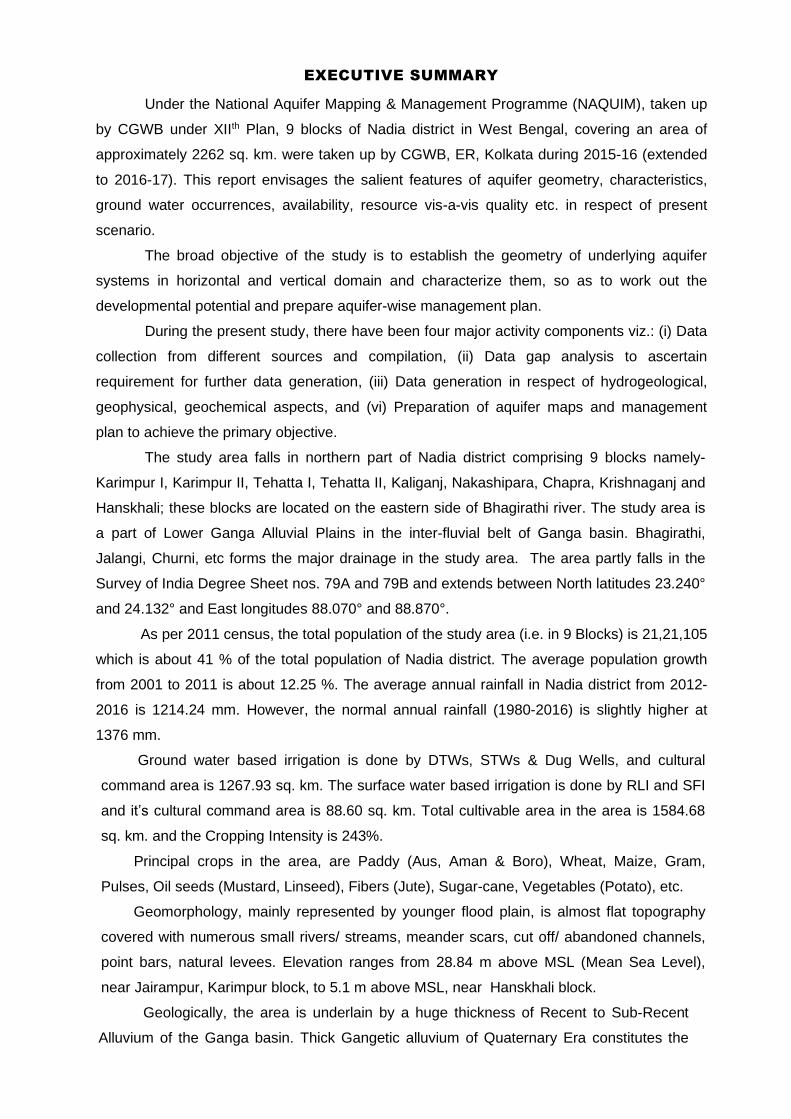
EXECUTIVE SUMMARY
Under the National Aquifer Mapping & Management Programme (NAQUIM), taken up
by CGWB under XIIth Plan, 9 blocks of Nadia district in West Bengal, covering an area of
approximately 2262 sq. km. were taken up by CGWB, ER, Kolkata during 2015-16 (extended
to 2016-17). This report envisages the salient features of aquifer geometry, characteristics,
ground water occurrences, availability, resource vis-a-vis quality etc. in respect of present
scenario.
The broad objective of the study is to establish the geometry of underlying aquifer
systems in horizontal and vertical domain and characterize them, so as to work out the
developmental potential and prepare aquifer-wise management plan.
During the present study, there have been four major activity components viz.: (i) Data
collection from different sources and compilation, (ii) Data gap analysis to ascertain
requirement for further data generation, (iii) Data generation in respect of hydrogeological,
geophysical, geochemical aspects, and (vi) Preparation of aquifer maps and management
plan to achieve the primary objective.
The study area falls in northern part of Nadia district comprising 9 blocks namely-
Karimpur I, Karimpur II, Tehatta I, Tehatta II, Kaliganj, Nakashipara, Chapra, Krishnaganj and
Hanskhali; these blocks are located on the eastern side of Bhagirathi river. The study area is
a part of Lower Ganga Alluvial Plains in the inter-fluvial belt of Ganga basin. Bhagirathi,
Jalangi, Churni, etc forms the major drainage in the study area. The area partly falls in the
Survey of India Degree Sheet nos. 79A and 79B and extends between North latitudes 23.240°
and 24.132° and East longitudes 88.070° and 88.870°.
As per 2011 census, the total population of the study area (i.e. in 9 Blocks) is 21,21,105
which is about 41 % of the total population of Nadia district. The average population growth
from 2001 to 2011 is about 12.25 %. The average annual rainfall in Nadia district from 2012-
2016 is 1214.24 mm. However, the normal annual rainfall (1980-2016) is slightly higher at
1376 mm.
Ground water based irrigation is done by DTWs, STWs & Dug Wells, and cultural
command area is 1267.93 sq. km. The surface water based irrigation is done by RLI and SFI
and it’s cultural command area is 88.60 sq. km. Total cultivable area in the area is 1584.68
sq. km. and the Cropping Intensity is 243%.
Principal crops in the area, are Paddy (Aus, Aman & Boro), Wheat, Maize, Gram,
Pulses, Oil seeds (Mustard, Linseed), Fibers (Jute), Sugar-cane, Vegetables (Potato), etc.
Geomorphology, mainly represented by younger flood plain, is almost flat topography
covered with numerous small rivers/ streams, meander scars, cut off/ abandoned channels,
point bars, natural levees. Elevation ranges from 28.84 m above MSL (Mean Sea Level),
near Jairampur, Karimpur block, to 5.1 m above MSL, near Hanskhali block.
Geologically, the area is underlain by a huge thickness of Recent to Sub-Recent
Alluvium of the Ganga basin. Thick Gangetic alluvium of Quaternary Era constitutes the
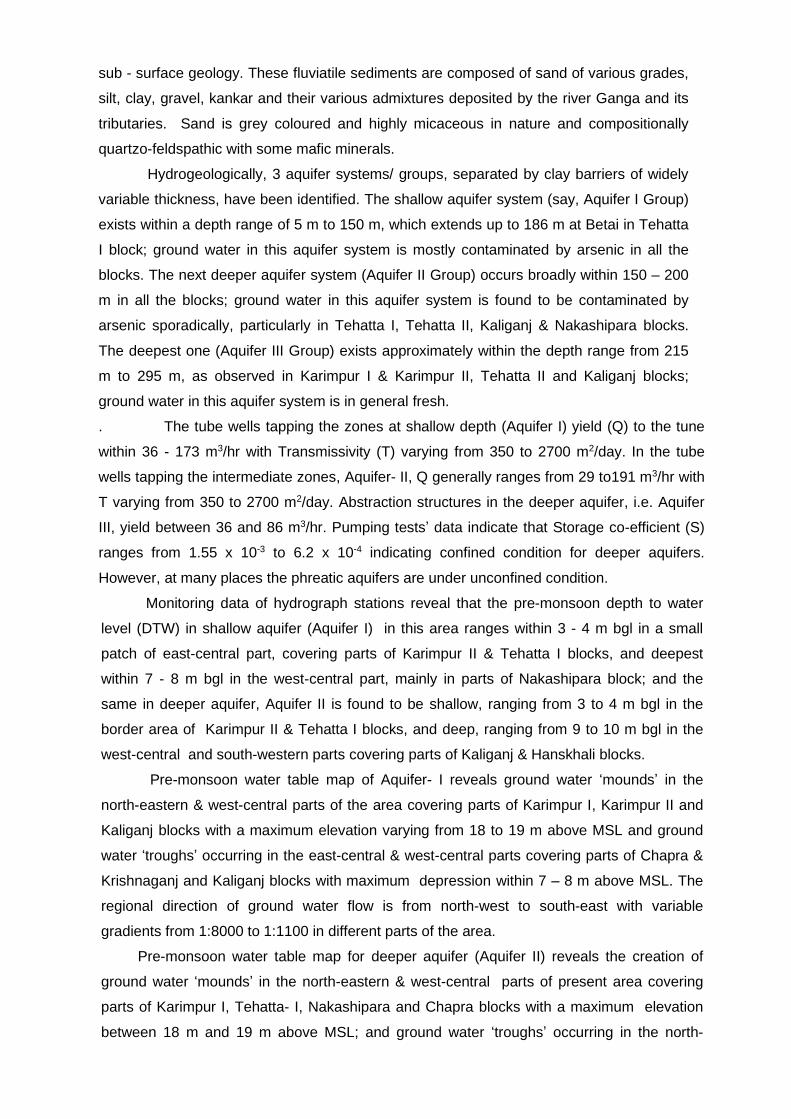
sub - surface geology. These fluviatile sediments are composed of sand of various grades,
silt, clay, gravel, kankar and their various admixtures deposited by the river Ganga and its
tributaries. Sand is grey coloured and highly micaceous in nature and compositionally
quartzo-feldspathic with some mafic minerals.
Hydrogeologically, 3 aquifer systems/ groups, separated by clay barriers of widely
variable thickness, have been identified. The shallow aquifer system (say, Aquifer I Group)
exists within a depth range of 5 m to 150 m, which extends up to 186 m at Betai in Tehatta
I block; ground water in this aquifer system is mostly contaminated by arsenic in all the
blocks. The next deeper aquifer system (Aquifer II Group) occurs broadly within 150 – 200
m in all the blocks; ground water in this aquifer system is found to be contaminated by
arsenic sporadically, particularly in Tehatta I, Tehatta II, Kaliganj & Nakashipara blocks.
The deepest one (Aquifer III Group) exists approximately within the depth range from 215
m to 295 m, as observed in Karimpur I & Karimpur II, Tehatta II and Kaliganj blocks;
ground water in this aquifer system is in general fresh.
. The tube wells tapping the zones at shallow depth (Aquifer I) yield (Q) to the tune
within 36 - 173 m3/hr with Transmissivity (T) varying from 350 to 2700 m2/day. In the tube
wells tapping the intermediate zones, Aquifer- II, Q generally ranges from 29 to191 m3/hr with
T varying from 350 to 2700 m2/day. Abstraction structures in the deeper aquifer, i.e. Aquifer
III, yield between 36 and 86 m3/hr. Pumping tests’ data indicate that Storage co-efficient (S)
ranges from 1.55 x 10⁻³ to 6.2 x 10⁻⁴ indicating confined condition for deeper aquifers.
However, at many places the phreatic aquifers are under unconfined condition.
Monitoring data of hydrograph stations reveal that the pre-monsoon depth to water
level (DTW) in shallow aquifer (Aquifer I) in this area ranges within 3 - 4 m bgl in a small
patch of east-central part, covering parts of Karimpur II & Tehatta I blocks, and deepest
within 7 - 8 m bgl in the west-central part, mainly in parts of Nakashipara block; and the
same in deeper aquifer, Aquifer II is found to be shallow, ranging from 3 to 4 m bgl in the
border area of Karimpur II & Tehatta I blocks, and deep, ranging from 9 to 10 m bgl in the
west-central and south-western parts covering parts of Kaliganj & Hanskhali blocks.
Pre-monsoon water table map of Aquifer- I reveals ground water ‘mounds’ in the
north-eastern & west-central parts of the area covering parts of Karimpur I, Karimpur II and
Kaliganj blocks with a maximum elevation varying from 18 to 19 m above MSL and ground
water ‘troughs’ occurring in the east-central & west-central parts covering parts of Chapra &
Krishnaganj and Kaliganj blocks with maximum depression within 7 – 8 m above MSL. The
regional direction of ground water flow is from north-west to south-east with variable
gradients from 1:8000 to 1:1100 in different parts of the area.
Pre-monsoon water table map for deeper aquifer (Aquifer II) reveals the creation of
ground water ‘mounds’ in the north-eastern & west-central parts of present area covering
parts of Karimpur I, Tehatta- I, Nakashipara and Chapra blocks with a maximum elevation
between 18 m and 19 m above MSL; and ground water ‘troughs’ occurring in the north-
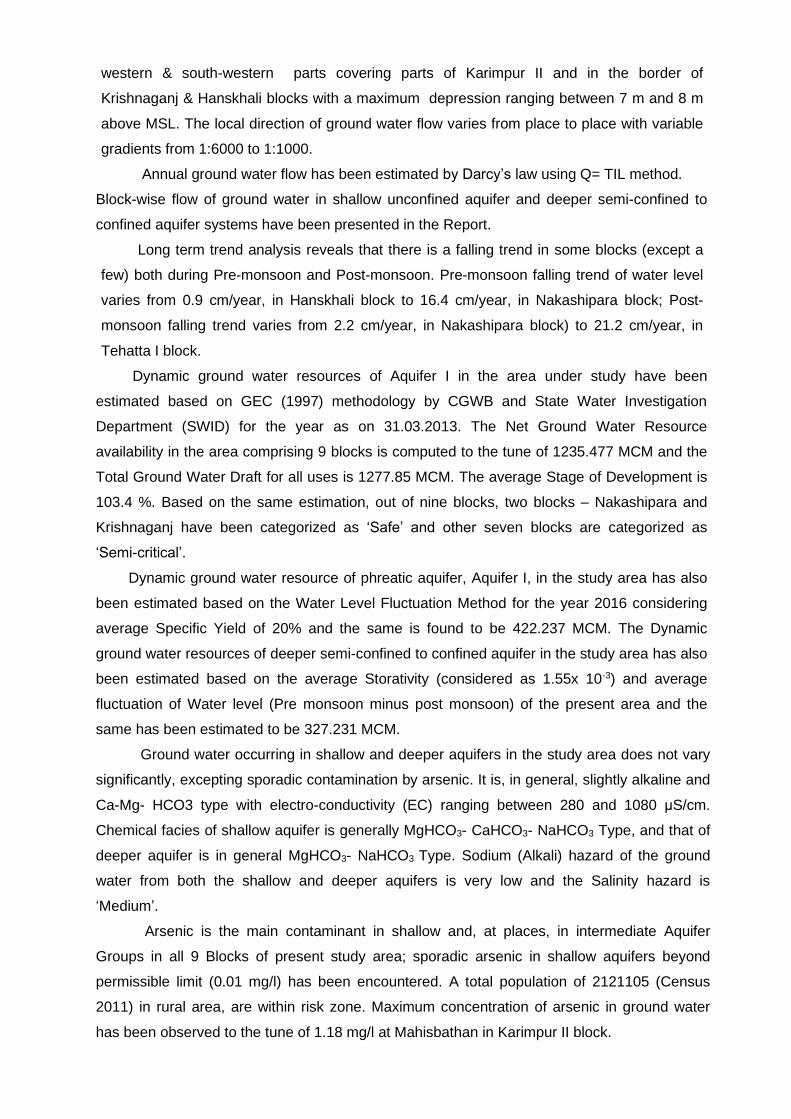
western & south-western parts covering parts of Karimpur II and in the border of
Krishnaganj & Hanskhali blocks with a maximum depression ranging between 7 m and 8 m
above MSL. The local direction of ground water flow varies from place to place with variable
gradients from 1:6000 to 1:1000.
Annual ground water flow has been estimated by Darcy’s law using Q= TIL method.
Block-wise flow of ground water in shallow unconfined aquifer and deeper semi-confined to
confined aquifer systems have been presented in the Report.
Long term trend analysis reveals that there is a falling trend in some blocks (except a
few) both during Pre-monsoon and Post-monsoon. Pre-monsoon falling trend of water level
varies from 0.9 cm/year, in Hanskhali block to 16.4 cm/year, in Nakashipara block; Post-
monsoon falling trend varies from 2.2 cm/year, in Nakashipara block) to 21.2 cm/year, in
Tehatta I block.
Dynamic ground water resources of Aquifer I in the area under study have been
estimated based on GEC (1997) methodology by CGWB and State Water Investigation
Department (SWID) for the year as on 31.03.2013. The Net Ground Water Resource
availability in the area comprising 9 blocks is computed to the tune of 1235.477 MCM and the
Total Ground Water Draft for all uses is 1277.85 MCM. The average Stage of Development is
103.4 %. Based on the same estimation, out of nine blocks, two blocks – Nakashipara and
Krishnaganj have been categorized as ‘Safe’ and other seven blocks are categorized as
‘Semi-critical’.
Dynamic ground water resource of phreatic aquifer, Aquifer I, in the study area has also
been estimated based on the Water Level Fluctuation Method for the year 2016 considering
average Specific Yield of 20% and the same is found to be 422.237 MCM. The Dynamic
ground water resources of deeper semi-confined to confined aquifer in the study area has also
been estimated based on the average Storativity (considered as 1.55x 10⁻³) and average
fluctuation of Water level (Pre monsoon minus post monsoon) of the present area and the
same has been estimated to be 327.231 MCM.
Ground water occurring in shallow and deeper aquifers in the study area does not vary
significantly, excepting sporadic contamination by arsenic. It is, in general, slightly alkaline and
Ca-Mg- HCO3 type with electro-conductivity (EC) ranging between 280 and 1080 μS/cm.
Chemical facies of shallow aquifer is generally MgHCO3- CaHCO3- NaHCO3 Type, and that of
deeper aquifer is in general MgHCO3- NaHCO3 Type. Sodium (Alkali) hazard of the ground
water from both the shallow and deeper aquifers is very low and the Salinity hazard is
‘Medium’.
Arsenic is the main contaminant in shallow and, at places, in intermediate Aquifer
Groups in all 9 Blocks of present study area; sporadic arsenic in shallow aquifers beyond
permissible limit (0.01 mg/l) has been encountered. A total population of 2121105 (Census
2011) in rural area, are within risk zone. Maximum concentration of arsenic in ground water
has been observed to the tune of 1.18 mg/l at Mahisbathan in Karimpur II block.
In Part II, Aquifer Management Plan for Drinking and Irrigation has been dealt. Arsenic
contamination in shallow aquifer is an important issue in present area. Arsenic free deeper
aquifers, ranging from 200 to 300 m bgl, are potential with yield to the tune of 12.5 litre per
second with drawdown of 6 m (approx), can cater to the need of rural water supply. Nos. of
tube wells needed for supply of potable water in uncovered area have been estimated based
on detail rational approach and cost estimate has been drawn for construction of those wells
for implementation of PWSS in those parts.Tube wells should be constructed by tapping
aquifers, separated from top arsenic contaminated aquifers by a persistent clay blanket above
it and putting cement seal against clay layer in order to prevent the vertical percolation of
arsenic contaminated water from the top contaminated aquifer. However, PHED, Government
of West Bengal has been implementing different Short Term, Medium Term and Long Term
measures to tackle the menace of ground water contamination by arsenic.
Paddy and Rabi vegetables are the important corps that are cultivated mainly by
irrigation by ground water. There is regionally extensive unconfined upper aquifer system
within depth of 150 m bgl in the area. This aquifer is highly potential and holds fresh water and
can cater to the need of irrigation, agriculture and industries. There is urgent need for efficient
management of the aquifer systems for sustenance of the tube wells due to huge declining of
water level due to irrigation and also heavy withdrawal for drinking purpose in urban areas.
Based on the availability of ground water resources & its present status of
development, block-wise availability of ground water for future Irrigation has been estimated; it
reveals that only 4 blocks, eg. Hanskhali, Kaliganj, Nakashipara and Krishnaganj have
nominal ground water available for future irrigation, whereas, no ground water is available in
remaining 5 blocks.
Area suitable for artificial recharge is worked out based on post-monsoon depth to
water level of more than 3m and showing long term falling trend of water level more than 0.20
m/year. Block-wise net surface water availability for recharge has been estimated after
Dhruvanarayana, 1993, followed by source water allocation for suitable types of conservation
& artificial recharge structures with feasible numbers and structure-wise cost estimate, have
also been worked out for the study area. Considering the higher level of ground water
development, categorization of block, suitable area for recharge, proposal for implementation
of conservation and artificial recharge projects in the study area have been proposed.
Percolation Tanks, Re-Excavation of Existing Tanks (REET) with Recharge Shafts, Injection
Wells, Conservation Ponds in the rural area, and Roof-Top Rain Water Harvesting structures
in urban areas are proposed structures in the present area.
To improve the ground water scenario in shallow aquifer, implementation of modern
irrigation practices like drip water irrigation system, sprinklers can be implemented. Water
columns suggested in consultation with BCKV are as follows: rice - 0.8m, wheat - 0.2 - 0.35m,
mustard - 0.2m, pulse - 0.08 - 0.12m, vegetable 0.12 - 0.16m, following micro-irrigation
system. By decreasing area of Boro cultivation in summer and implementing micro-irrigation
techniques, huge draft of ground water could be avoided.
In Part II of the Report, block wise management plan of 9 blocks of Nadia district have
been dealt separately by giving salient information of the block concerned, tabulating facts and
figures of the aquifer(s), their disposition by 2D and 3D images, tabulating seasonal depth to
water levels, analyzing long term water level trends, individual aquifer characteristics, viz.
Discharge, Transmissivity, Storativity etc., aquifer-wise availability of ground water resources,
eg. (dynamic and static), annual flow of ground water through the aquifer, chemical quality of
ground water especially arsenic contamination & risk population. Under resource
enhancement & management plan, suitable interventions for tapping proper aquifer have been
proposed. Judicious use of irrigation water, eg. phase wise lessening of area of cultivation of
‘Boro’ rice, change in cropping pattern, use of low water requiring crops and use of micro-
irrigation techniques have been strongly suggested. Finally, artificial recharge and rain water
harvesting is suggested for specific structures; for this quantum of rain water for harvesting,
has been estimated for individual blocks by applying ‘Dhruvaarayana (1993)’ method. The
proposed conservation and / or recharge structures along with cost estimates have also been
tabulated for all the blocks separately.
Part I
Aquifer Mapping Studies in parts of Nadia District (9 Blocks),
West Bengal
( Karimpur - I, Karimpur - II, Tehatta - I, Tehatta - II, Kaliganj, Nakashipara,
Chapra, Krishnaganj & Hanskhali Blocks )
1
1. INTRODUCTION
Groundwater is one of the prime sources of fresh water contributing significantly for the
survival of mankind. However, overexploitation, surface runoff, subsurface groundwater
discharge have depleted the fresh groundwater availability considerably. Assessing the
groundwater potential zone is extremely important for the protection of water quantity & quality,
and the management of groundwater system. In this context, the National Aquifer Mapping &
Management Programme (NAQUIM) has been taken up by CGWB under XIIth
Plan. As per the
Action Plan under NAQUIM, ground water management studies in 9 blocks of Nadia district in
West Bengal, covering an area of approximately 2262 sq. km. was taken up by CGWB, ER,
Kolkata during 2015-16-17. This report envisages the salient features of aquifer geometry,
characteristics; ground water occurrences, availability, resource vis-a-vis quality etc. in present
scenario.
1.1 Objective
The broad objective of the study is to establish the geometry of the underlying
aquifer systems in horizontal and vertical domain and characterize them, so as to work out
the development potential and prepare aquifer-wise management plan using ground water
simulation model.
1.2 Scope of Study
The scope of the present study is broadly within the framework of National
Aquifer Mapping & Management Programme (NAQUIM) being implemented by CGWB.
There are four major activity components viz.: (i) Data collection / compilation (ii) Data
gap analysis (iii) Data generation and (vi) Preparation of aquifer maps and management
plan to achieve the primary objective. Data compilation included collection, and wherever
required procurement, of all maps from concerned Agencies, such as the Survey of India,
Geological Survey of India, State Governments etc., computerization and analyses of all
acquired data, and preparation of a knowledge base. Identification of Data Gap included
ascertaining requirement for further data generation in respect of hydrogeological,
geophysical, chemical, hydrological, hydro-meteorological studies, etc. Data generation
included those of hydrometeorology, chemical quality of ground water, litho-logs and
aquifer parameters. Generation of ground water chemical quality data was accomplished
by collection of water samples and their laboratory analyses for all major parameters, and
some of the heavy metals. Additional data pertaining to sub-surface lithology and aquifer
parameters were obtained through drilling of additional exploratory wells and slim holes,
pumping tests at the drilling sites.
1.3 Approach and Methodology
2
An approach and methodology adopted to achieve the major objective have been shown
below step-wise.
i) Compilation of existing data
ii) Identification of data gaps
iii) Data generation based on data gaps
iv) Preparation of thematic maps on GIS platform
v) Preparation of Rock-Works based 2D/3D maps
vi) Compilation of Block-wise Aquifer Maps and Management Plan
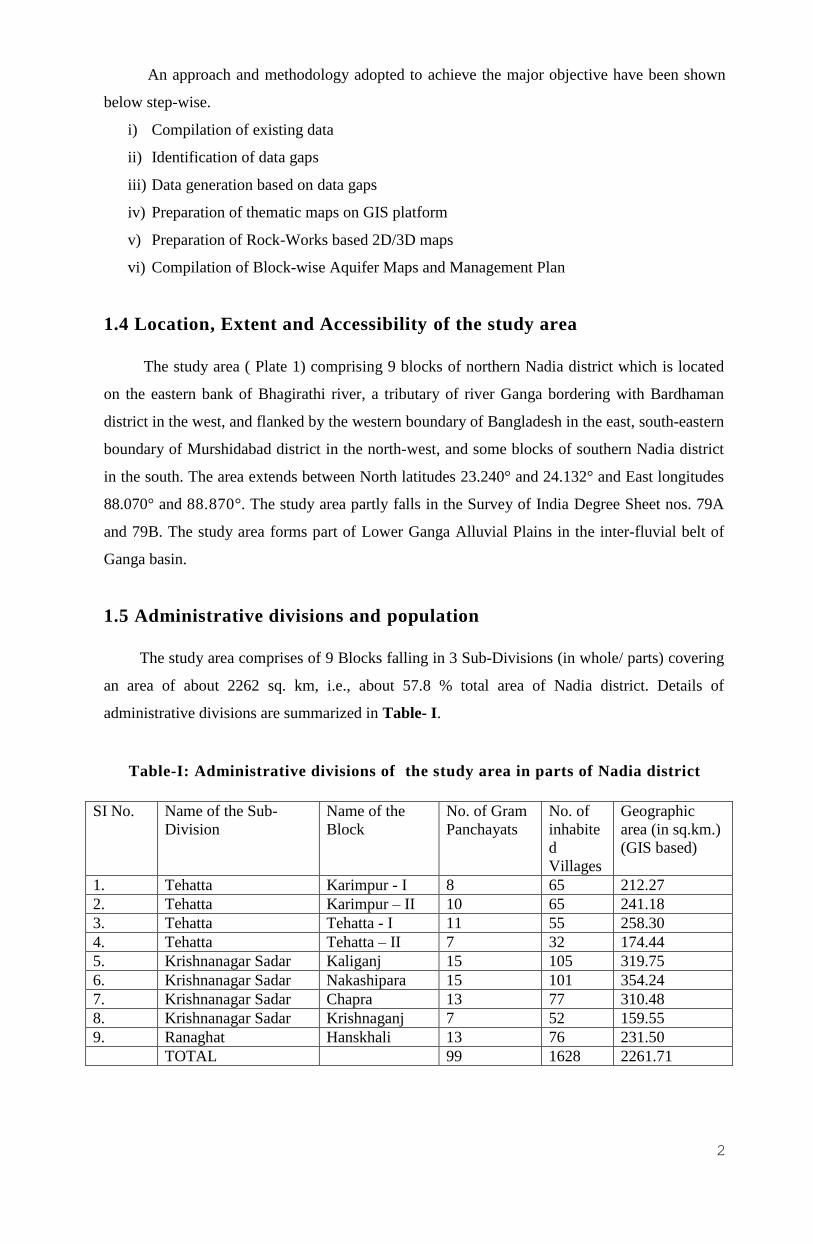
1.4 Location, Extent and Accessibility of the study area
The study area ( Plate 1) comprising 9 blocks of northern Nadia district which is located
on the eastern bank of Bhagirathi river, a tributary of river Ganga bordering with Bardhaman
district in the west, and flanked by the western boundary of Bangladesh in the east, south-eastern
boundary of Murshidabad district in the north-west, and some blocks of southern Nadia district
in the south. The area extends between North latitudes 23.240° and 24.132° and East longitudes
88.070° and 88.870°. The study area partly falls in the Survey of India Degree Sheet nos. 79A
and 79B. The study area forms part of Lower Ganga Alluvial Plains in the inter-fluvial belt of
Ganga basin.
1.5 Administrative divisions and population
The study area comprises of 9 Blocks falling in 3 Sub-Divisions (in whole/ parts) covering
an area of about 2262 sq. km, i.e., about 57.8 % total area of Nadia district. Details of
administrative divisions are summarized in Table- I.
Table-I: Administrative divisions of the study area in parts of Nadia district
SI No. Name of the Sub-
Division
Name of the
Block
No. of Gram
Panchayats
No. of
inhabite
d
Villages
Geographic
area (in sq.km.)
(GIS based)
1. Tehatta Karimpur - I 8 65 212.27
2. Tehatta Karimpur – II 10 65 241.18
3. Tehatta Tehatta - I 11 55 258.30
4. Tehatta Tehatta – II 7 32 174.44
5. Krishnanagar Sadar Kaliganj 15 105 319.75
6. Krishnanagar Sadar Nakashipara 15 101 354.24
7. Krishnanagar Sadar Chapra 13 77 310.48
8. Krishnanagar Sadar Krishnaganj 7 52 159.55
9. Ranaghat Hanskhali 13 76 231.50
TOTAL 99 1628 2261.71
3
Plate-1
As per 2011 census, the total population of the study area (i.e. 9 Blocks) is 21,21,105
which is about 41 % of the total population of Nadia district. The average population growth
from 2001 to 2011 is about 12.25 %. Block-wise male and female population in the study area
is shown in Table-II.
Table-II: Block-wise Male and Female population
Block Population (2011)
Male Female Total
Karimpur - I 83014 77881 160895
Karimpur – II 111488 105648 217136
Tehatta - I 125875 118447 244322
Tehatta – II 77299 73932 151231
Kaliganj 157234 148963 306197
4
Source: District Statistical Handbook, 2013
The Administrative Map of the study area is shown in Plate-1.
1.6 Land-use and Cropping pattern
Irrigation plays an important role for crop production and intensity of crops. The area is
having cultivable area of about 61% of the total geographical area. The cultivable land in the
study area, about 35% is rain fed, and in the rest area crop production is solely dependent of
surface water and ground water irrigation systems. Ground water irrigation is created by deep
tube well and shallow tube wells. Irrigation by surface water is done through River lift
irrigation, whereas irrigation by water conservation structures (tanks etc.) is covering an area of
about 12% of the total irrigated area.
The details of land use pattern in each blocks is shown in the following Table- III.
Table-III: Block-wise details of Land-use pattern
Sl.
N
o.
Name of
the Block
Geograp
hical
Area
(ha)
(Agricul
ture-
based)
Cultiv
able
Area
(ha)
Area
Under
Pasture
and
Orchar
d(ha)
Cultivab
le Waste
Land
(ha)
Fores
t
Land
(ha)
Hom
e
State
Land
(ha)
Remarks
1. Karimpur-I 21580 12516 209 ------ ---- 4631 Some
Vested Land
2. Karimpur-
II
22440 13015 217 ------ ---- 4712 Some
Vested Land
3. Tehatta-I 24960 15224 241 ------ ----- 5241 Some
Vested Land
4. Tehatta-II 17250 10212 167 ------- ----- 3622 Some
Vested Land
5. Kaliganj 32000 20480 357 ------ ----- 6720 Some
Vested Land
6. Nakashipar
a
36090 23052 312 Nil 309 7525 Some
Vested Land
7. Chapra 30600 20002 287 ----- ---- 6426 Some
Vested Land
8. Krishnagan
j
15160 9612 146 ----- 215 3183 Some
Vested Land
9. Hanskhali 24630 13745 176 ---- 181 5085 Some
Vested Land
Nakashipara 180990 171201 352191
Chapra 152575 143954 296529
Krishnganj 75573 71132 146705
Hanskhali 127576 118323 145899
Total 10,91,624 10,29,481 21,21,105
5
The principal crops which are cultivated In this area, are :-
a) Paddy- Aus, Aman & Boro; Wheat, Maize etc.
b) Cereals- Gram and other Pulses
c) Oil seeds- Mustard, Linseed etc.
d) Fibers- Jute etc.
e) Miscellaneous- Sugar-cane, Potato etc.
The ground water based irrigation is done by DTWs, STWs and Dug Wells and the
cultural command area is 1267.93 sq. km. The surface water based irrigation is done by RLI
and SFI and the cultural command area is 88.60 sq. km. Total cultivable area in the area is
1584.68 sq. km. and the Cropping Intensity is 243%.
1.7 Urban areas
Urban areas in the study area include some of the Census Towns, viz., Karimpur,
Chapra, Bagula, Majdia etc.
2. HYROMETEOROLOGY
The climate of the area is characterized by hot and humid climate with adequate rainfall
mainly derived from south-west monsoon, which starts from mid-June and continue up to
September. Generally, 85 percent of the rainfall is received during the monsoon period. Pre-
monsoon showers are occasionally received in the month of March, April and May.
2.1 Rainfall
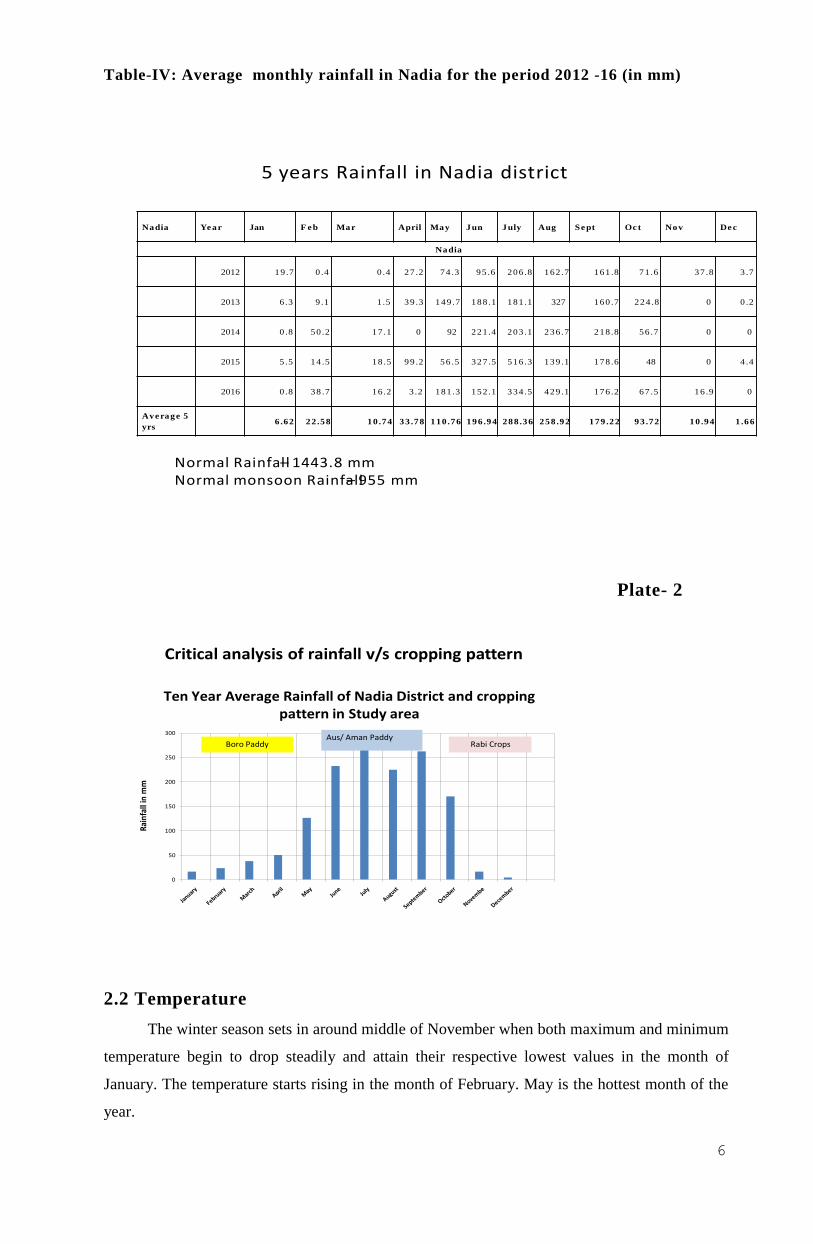
The average annual rainfall in Nadia district from 2012-2016 is 1214.24 mm. Rainfall
amount is measured from 10 Rain gauge stations in different blocks. Rainfall data for a period of
5 years (2012-2016) have been recorded month-wise (Table- IV).
However, the normal annual rainfall (1980-2016) is slightly higher at 1376 mm. It is obvious
that there is slight decrease in rainfall during the last 5 years.
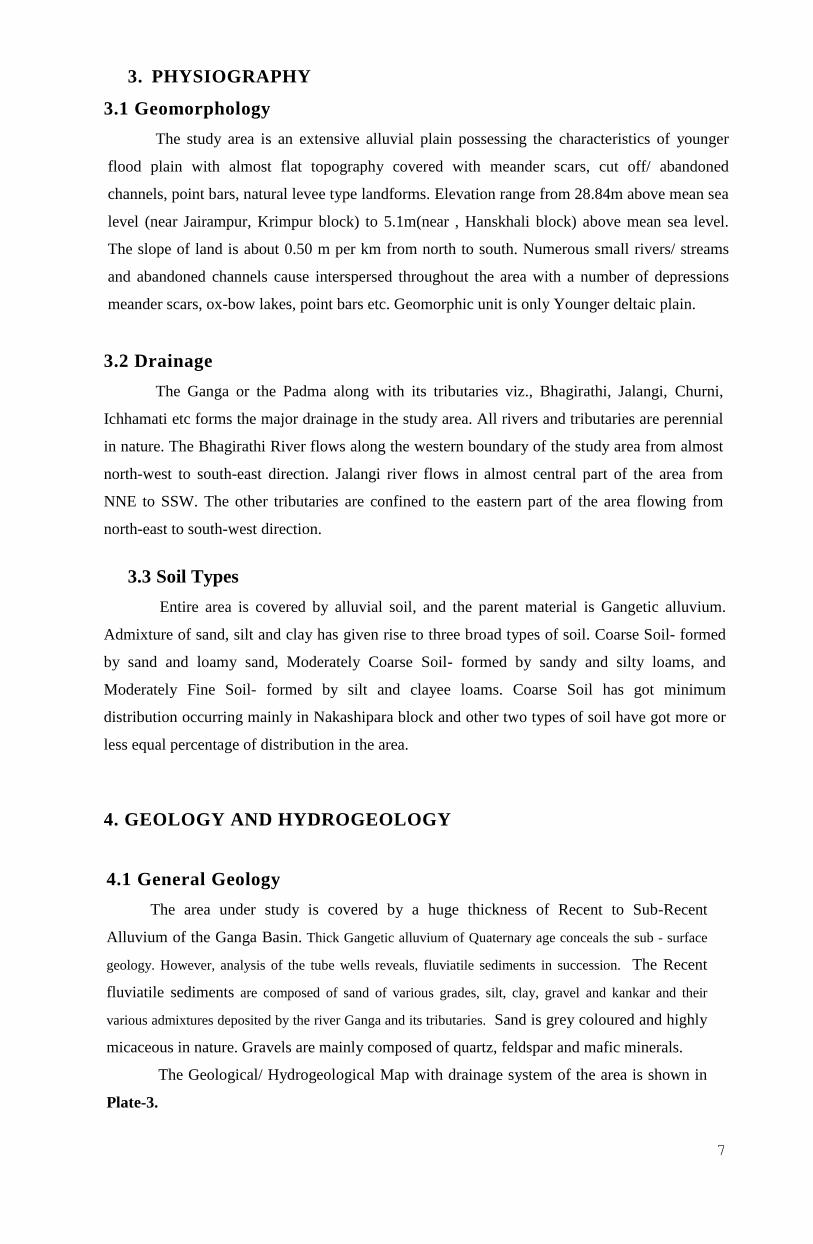
A critical analysis of Rainfall v/s cropping pattern is shown in Plate-2.
6
Table-IV: Average monthly rainfall in Nadia for the period 2012 -16 (in mm)
Nadia Ye ar Jan F e b Mar April May Jun July Aug Se pt Oc t Nov De c
Nadia
2012 19 .7 0 .4 0 .4 27 .2 74 .3 95 .6 206 .8 162 .7 161 .8 71 .6 37 .8 3 .7
2013 6 .3 9 .1 1 .5 39 .3 149 .7 188 .1 181 .1 327 160 .7 224 .8 0 0 .2
2014 0 .8 50 .2 17 .1 0 92 221 .4 203 .1 236 .7 218 .8 56 .7 0 0
2015 5 .5 14 .5 18 .5 99 .2 56 .5 327 .5 516 .3 139 .1 178 .6 48 0 4 .4
2016 0 .8 38 .7 16 .2 3 .2 181 .3 152 .1 334 .5 429 .1 176 .2 67 .5 16 .9 0
Ave rage 5
yrs6 .62 22 .58 10 .74 33 .78 110 .76 196 .94 288 .36 258 .92 179 .22 93 .72 10 .94 1 .66
5 years Rainfall in Nadia district
Normal Rainfall – 1443.8 mmNormal monsoon Rainfall – 955 mm
Plate- 2
0
50
100
150
200
250
300
Rai
nfa
ll in
mm
Ten Year Average Rainfall of Nadia District and cropping pattern in Study area
Boro PaddyAus/ Aman Paddy
Rabi Crops
Critical analysis of rainfall v/s cropping pattern
2.2 Temperature
The winter season sets in around middle of November when both maximum and minimum
temperature begin to drop steadily and attain their respective lowest values in the month of
January. The temperature starts rising in the month of February. May is the hottest month of the
year.
7
3. PHYSIOGRAPHY
3.1 Geomorphology
The study area is an extensive alluvial plain possessing the characteristics of younger
flood plain with almost flat topography covered with meander scars, cut off/ abandoned
channels, point bars, natural levee type landforms. Elevation range from 28.84m above mean sea
level (near Jairampur, Krimpur block) to 5.1m(near , Hanskhali block) above mean sea level.
The slope of land is about 0.50 m per km from north to south. Numerous small rivers/ streams
and abandoned channels cause interspersed throughout the area with a number of depressions
meander scars, ox-bow lakes, point bars etc. Geomorphic unit is only Younger deltaic plain.
3.2 Drainage
The Ganga or the Padma along with its tributaries viz., Bhagirathi, Jalangi, Churni,
Ichhamati etc forms the major drainage in the study area. All rivers and tributaries are perennial
in nature. The Bhagirathi River flows along the western boundary of the study area from almost
north-west to south-east direction. Jalangi river flows in almost central part of the area from
NNE to SSW. The other tributaries are confined to the eastern part of the area flowing from
north-east to south-west direction.
3.3 Soil Types
Entire area is covered by alluvial soil, and the parent material is Gangetic alluvium.
Admixture of sand, silt and clay has given rise to three broad types of soil. Coarse Soil- formed
by sand and loamy sand, Moderately Coarse Soil- formed by sandy and silty loams, and
Moderately Fine Soil- formed by silt and clayee loams. Coarse Soil has got minimum
distribution occurring mainly in Nakashipara block and other two types of soil have got more or
less equal percentage of distribution in the area.
4. GEOLOGY AND HYDROGEOLOGY
4.1 General Geology
The area under study is covered by a huge thickness of Recent to Sub-Recent
Alluvium of the Ganga Basin. Thick Gangetic alluvium of Quaternary age conceals the sub - surface
geology. However, analysis of the tube wells reveals, fluviatile sediments in succession. The Recent
fluviatile sediments are composed of sand of various grades, silt, clay, gravel and kankar and their
various admixtures deposited by the river Ganga and its tributaries. Sand is grey coloured and highly
micaceous in nature. Gravels are mainly composed of quartz, feldspar and mafic minerals.
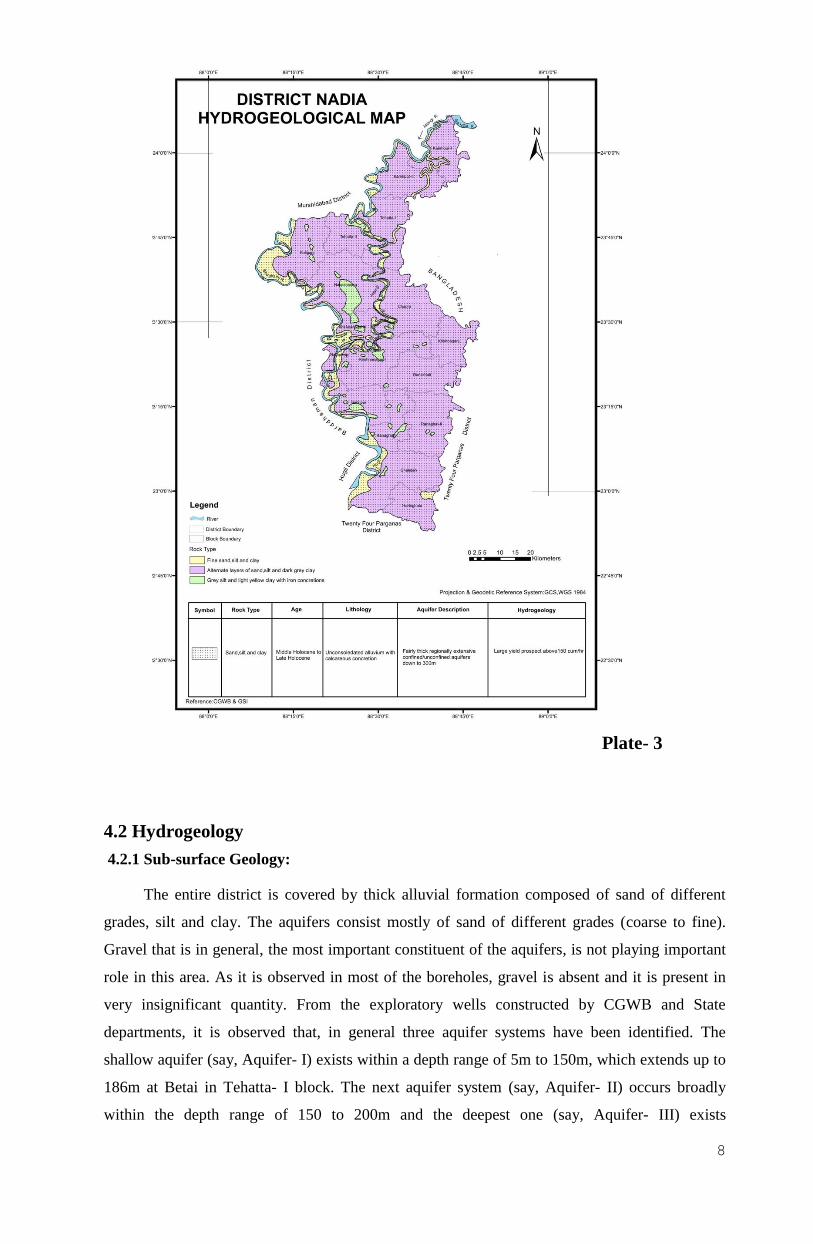
The Geological/ Hydrogeological Map with drainage system of the area is shown in
Plate-3.
8
Plate- 3
4.2 Hydrogeology
4.2.1 Sub-surface Geology:
The entire district is covered by thick alluvial formation composed of sand of different
grades, silt and clay. The aquifers consist mostly of sand of different grades (coarse to fine).
Gravel that is in general, the most important constituent of the aquifers, is not playing important
role in this area. As it is observed in most of the boreholes, gravel is absent and it is present in
very insignificant quantity. From the exploratory wells constructed by CGWB and State
departments, it is observed that, in general three aquifer systems have been identified. The
shallow aquifer (say, Aquifer- I) exists within a depth range of 5m to 150m, which extends up to
186m at Betai in Tehatta- I block. The next aquifer system (say, Aquifer- II) occurs broadly
within the depth range of 150 to 200m and the deepest one (say, Aquifer- III) exists
9
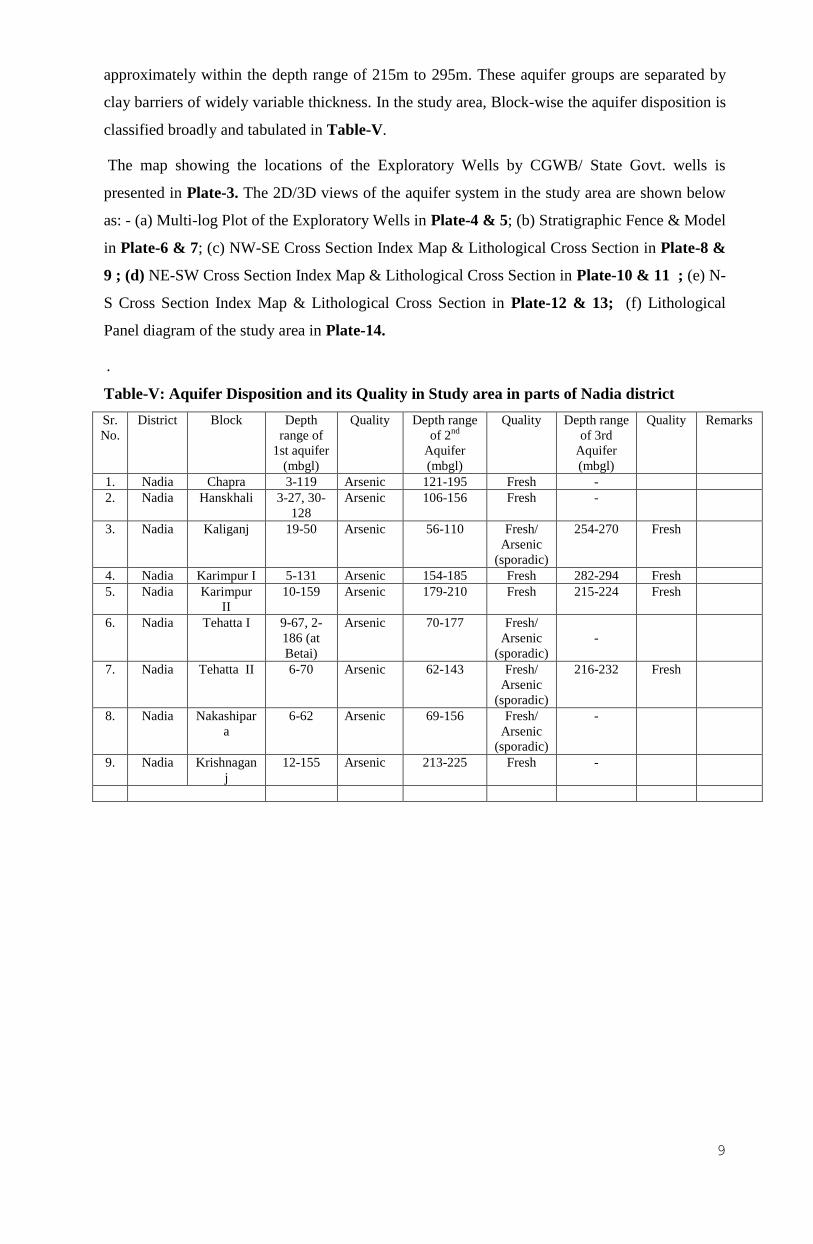
approximately within the depth range of 215m to 295m. These aquifer groups are separated by
clay barriers of widely variable thickness. In the study area, Block-wise the aquifer disposition is
classified broadly and tabulated in Table-V.
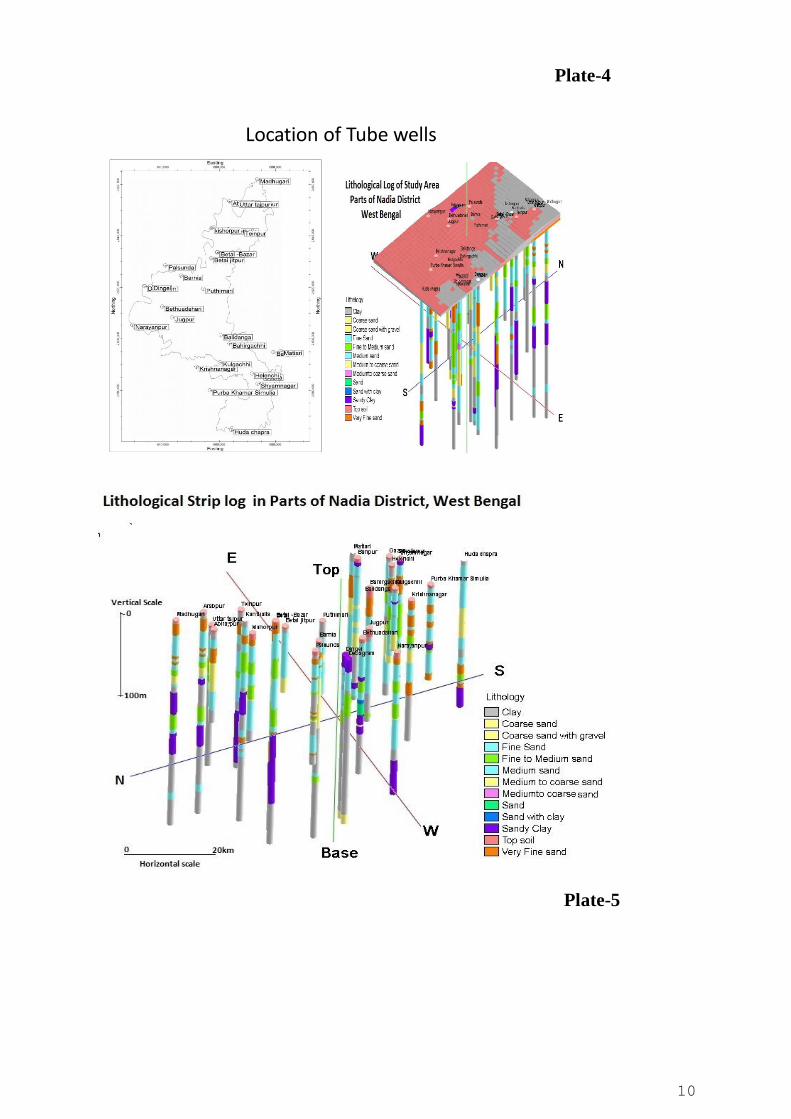
The map showing the locations of the Exploratory Wells by CGWB/ State Govt. wells is
presented in Plate-3. The 2D/3D views of the aquifer system in the study area are shown below
as: - (a) Multi-log Plot of the Exploratory Wells in Plate-4 & 5; (b) Stratigraphic Fence & Model
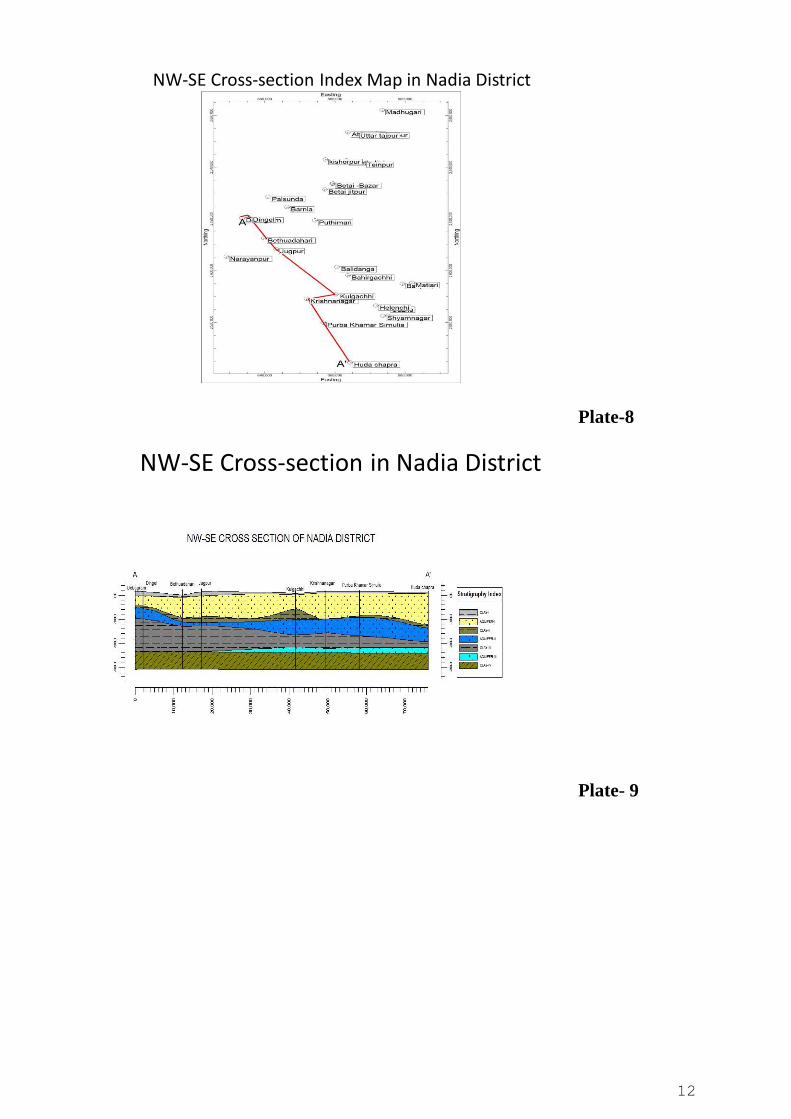
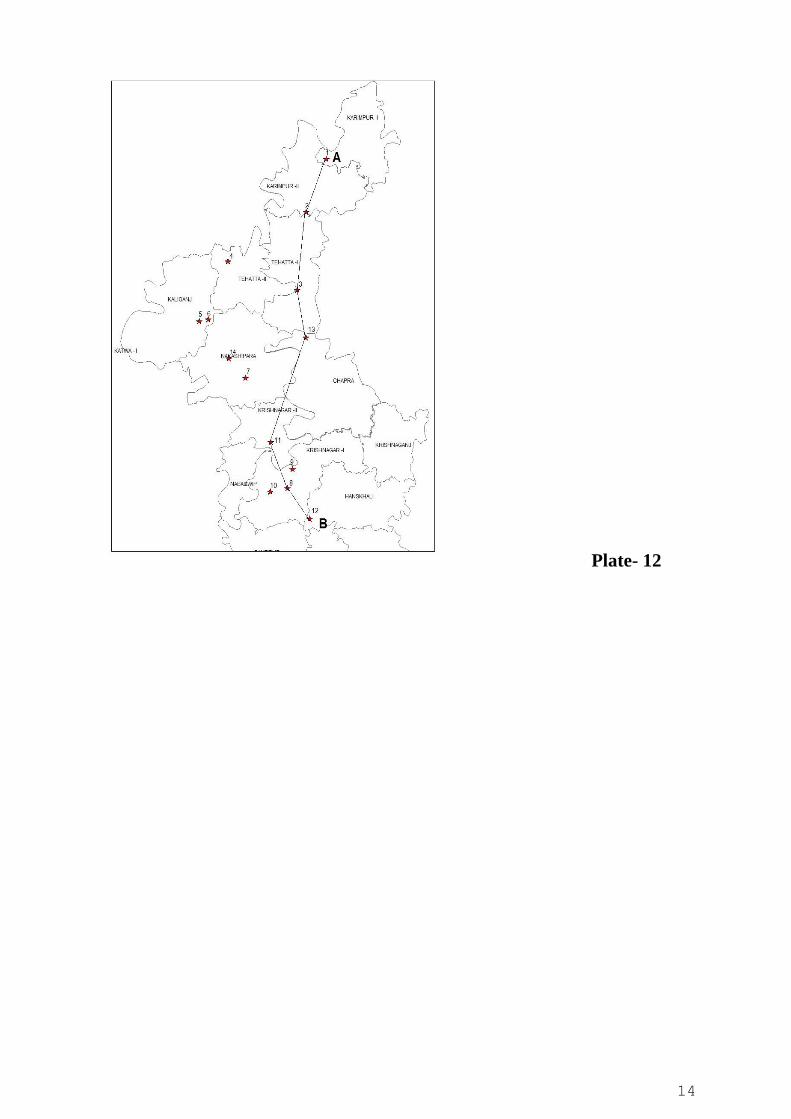
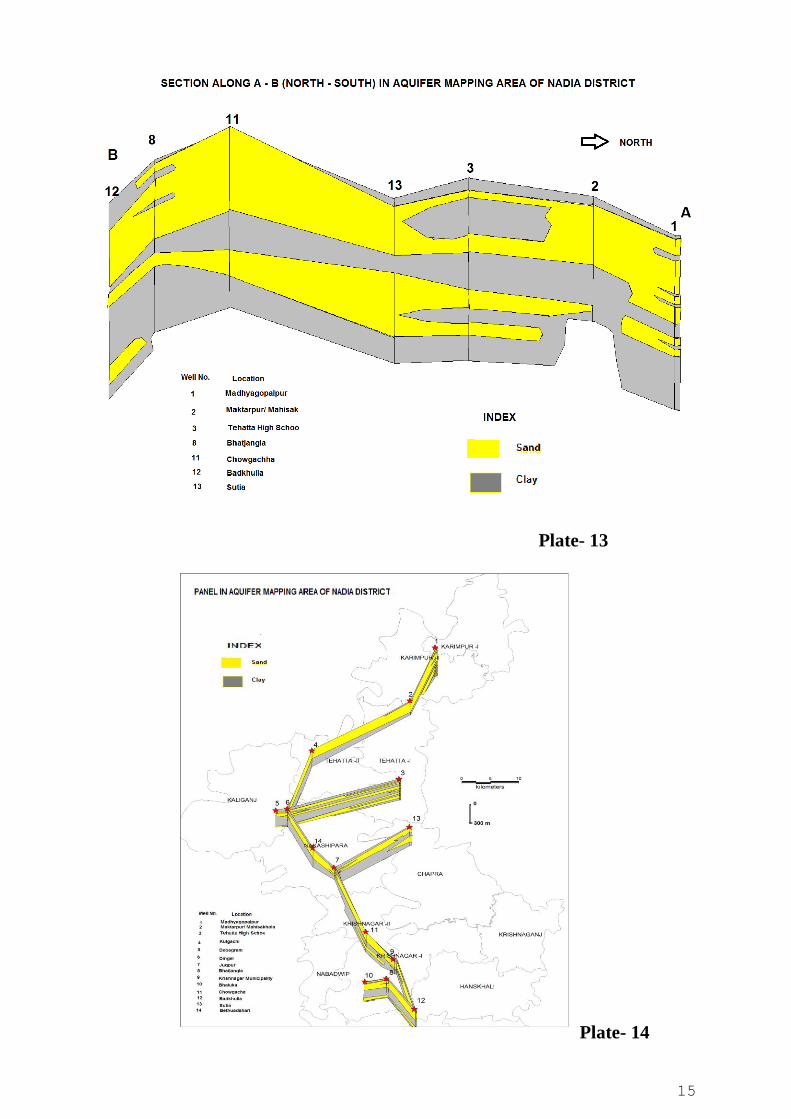
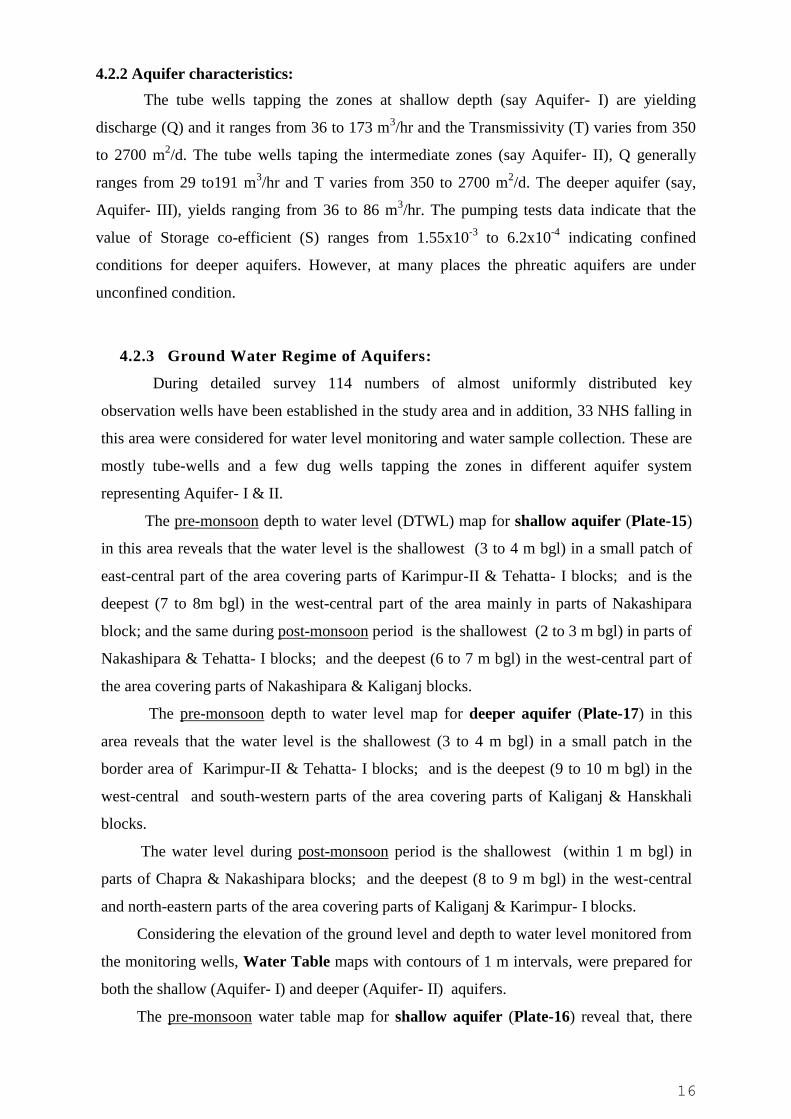
in Plate-6 & 7; (c) NW-SE Cross Section Index Map & Lithological Cross Section in Plate-8 &
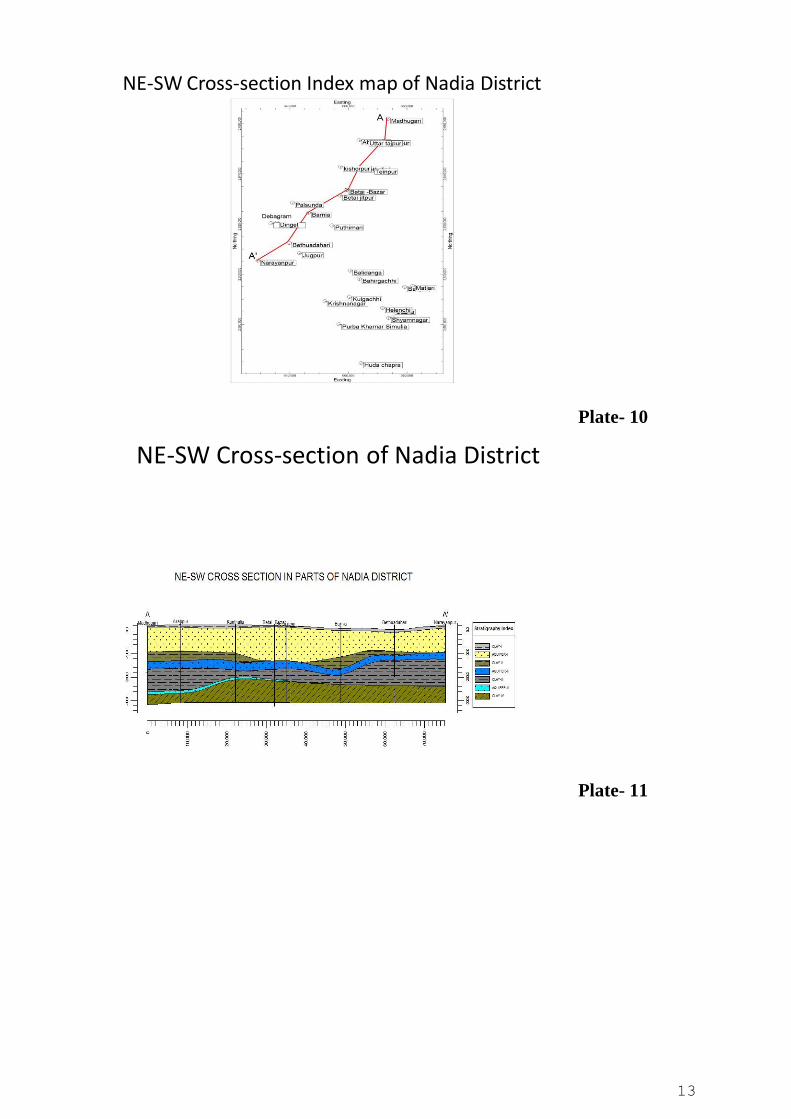
9 ; (d) NE-SW Cross Section Index Map & Lithological Cross Section in Plate-10 & 11 ; (e) N-
S Cross Section Index Map & Lithological Cross Section in Plate-12 & 13; (f) Lithological
Panel diagram of the study area in Plate-14.
.
Table-V: Aquifer Disposition and its Quality in Study area in parts of Nadia district
Sr.
No.
District Block Depth
range of
1st aquifer
(mbgl)
Quality Depth range
of 2nd
Aquifer
(mbgl)
Quality Depth range
of 3rd
Aquifer
(mbgl)
Quality Remarks
1. Nadia Chapra 3-119 Arsenic 121-195 Fresh -
2. Nadia Hanskhali 3-27, 30-
128
Arsenic 106-156 Fresh -
3. Nadia Kaliganj 19-50 Arsenic 56-110 Fresh/
Arsenic
(sporadic)
254-270 Fresh
4. Nadia Karimpur I 5-131 Arsenic 154-185 Fresh 282-294 Fresh
5. Nadia Karimpur
II
10-159 Arsenic 179-210 Fresh 215-224 Fresh
6. Nadia Tehatta I 9-67, 2-
186 (at
Betai)
Arsenic 70-177 Fresh/
Arsenic
(sporadic)
-
7. Nadia Tehatta II 6-70 Arsenic 62-143 Fresh/
Arsenic
(sporadic)
216-232 Fresh
8. Nadia Nakashipar
a
6-62 Arsenic 69-156 Fresh/
Arsenic
(sporadic)
-
9. Nadia Krishnagan
j
12-155 Arsenic 213-225 Fresh -
10
Plate-4
Location of Tube wells
Plate-5
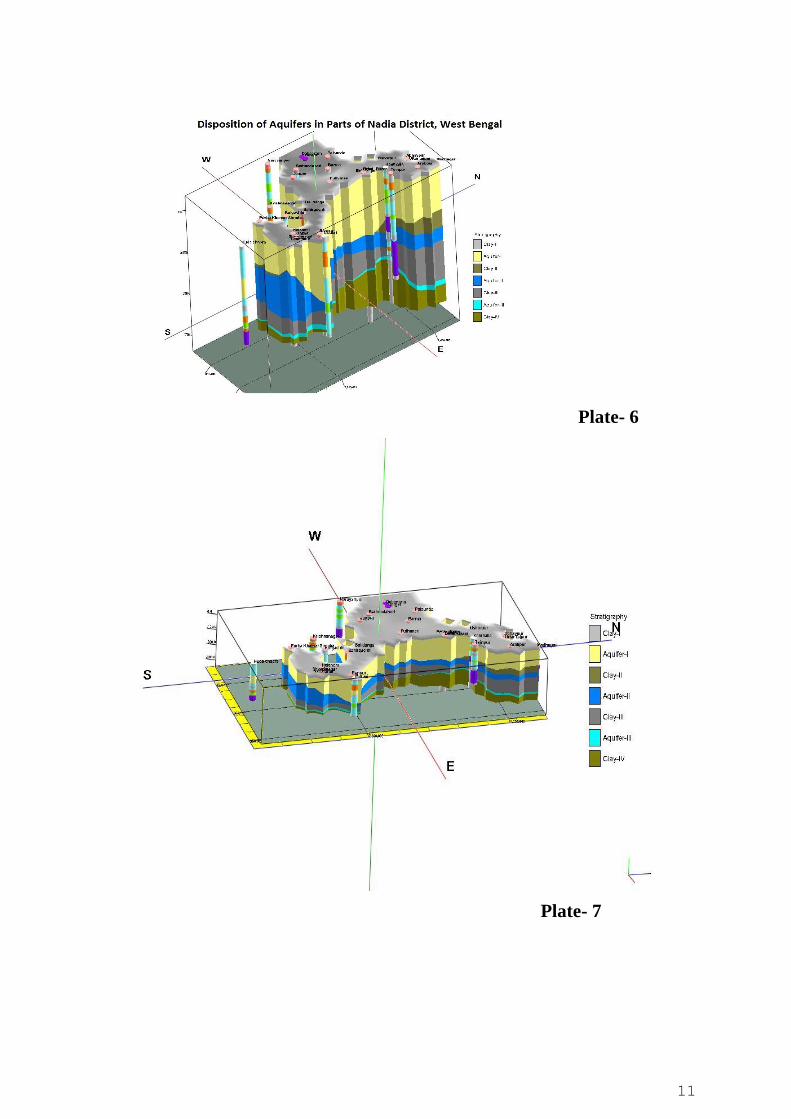
11
Plate- 6
Plate- 7
12
NW-SE Cross-section Index Map in Nadia District
Plate-8
NW-SE Cross-section in Nadia District
Plate- 9
13
NE-SW Cross-section Index map of Nadia District
Plate- 10
NE-SW Cross-section of Nadia District
Plate- 11
14
Plate- 12
15
Plate- 13
Plate- 14
16
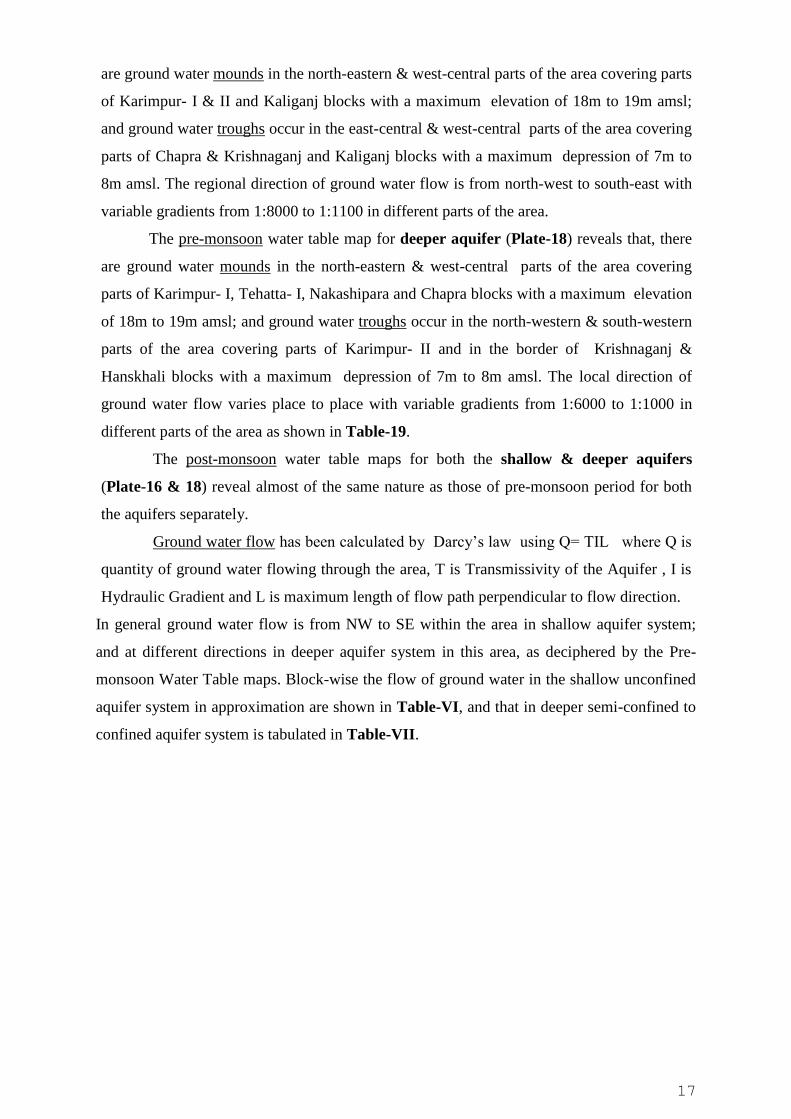
4.2.2 Aquifer characteristics:
The tube wells tapping the zones at shallow depth (say Aquifer- I) are yielding
discharge (Q) and it ranges from 36 to 173 m3/hr and the Transmissivity (T) varies from 350
to 2700 m2/d. The tube wells taping the intermediate zones (say Aquifer- II), Q generally
ranges from 29 to191 m3/hr and T varies from 350 to 2700 m
2/d. The deeper aquifer (say,
Aquifer- III), yields ranging from 36 to 86 m3/hr. The pumping tests data indicate that the
value of Storage co-efficient (S) ranges from 1.55x10⁻³
to 6.2x10⁻⁴
indicating confined
conditions for deeper aquifers. However, at many places the phreatic aquifers are under
unconfined condition.
4.2.3 Ground Water Regime of Aquifers:
During detailed survey 114 numbers of almost uniformly distributed key
observation wells have been established in the study area and in addition, 33 NHS falling in
this area were considered for water level monitoring and water sample collection. These are
mostly tube-wells and a few dug wells tapping the zones in different aquifer system
representing Aquifer- I & II.
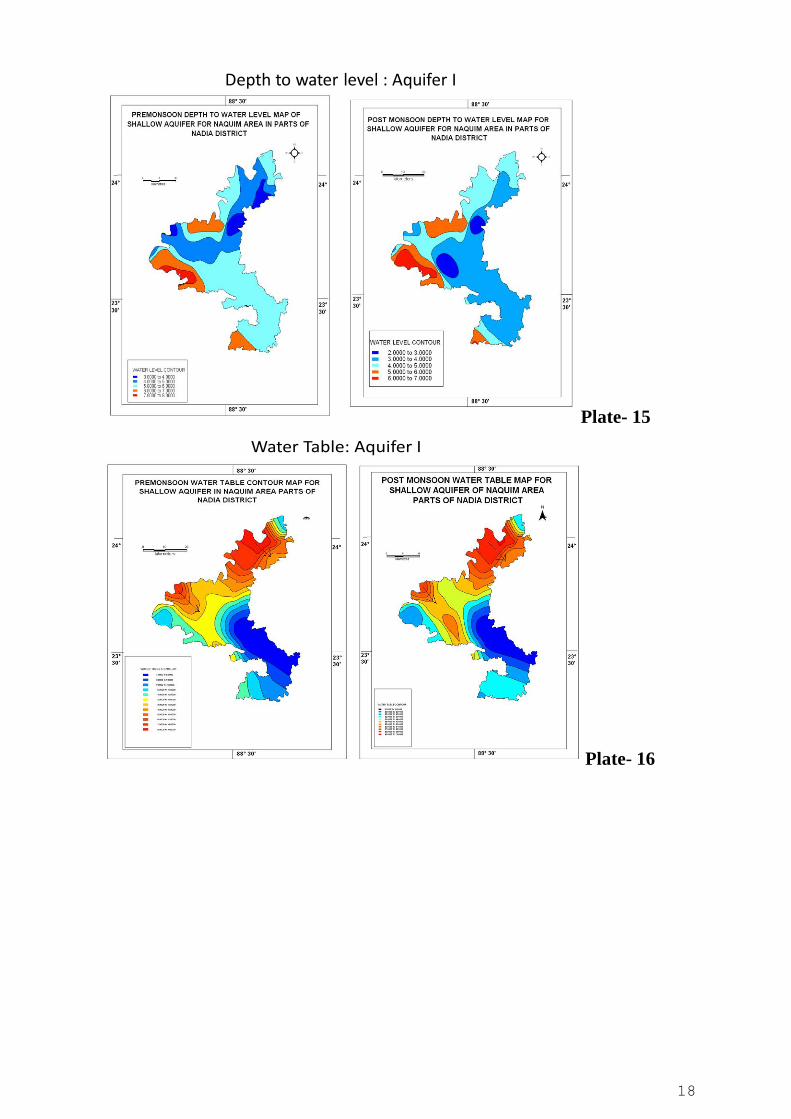
The pre-monsoon depth to water level (DTWL) map for shallow aquifer (Plate-15)
in this area reveals that the water level is the shallowest (3 to 4 m bgl) in a small patch of
east-central part of the area covering parts of Karimpur-II & Tehatta- I blocks; and is the
deepest (7 to 8m bgl) in the west-central part of the area mainly in parts of Nakashipara
block; and the same during post-monsoon period is the shallowest (2 to 3 m bgl) in parts of
Nakashipara & Tehatta- I blocks; and the deepest (6 to 7 m bgl) in the west-central part of
the area covering parts of Nakashipara & Kaliganj blocks.
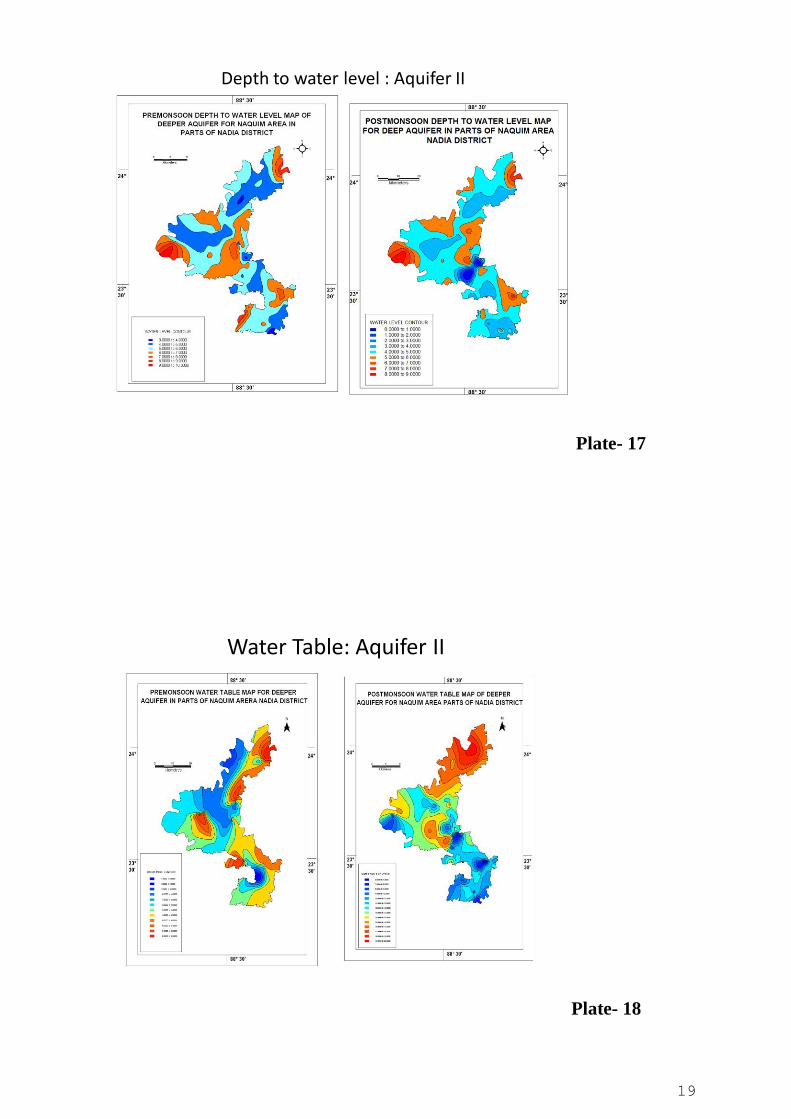
The pre-monsoon depth to water level map for deeper aquifer (Plate-17) in this
area reveals that the water level is the shallowest (3 to 4 m bgl) in a small patch in the
border area of Karimpur-II & Tehatta- I blocks; and is the deepest (9 to 10 m bgl) in the
west-central and south-western parts of the area covering parts of Kaliganj & Hanskhali
blocks.
The water level during post-monsoon period is the shallowest (within 1 m bgl) in
parts of Chapra & Nakashipara blocks; and the deepest (8 to 9 m bgl) in the west-central
and north-eastern parts of the area covering parts of Kaliganj & Karimpur- I blocks.
Considering the elevation of the ground level and depth to water level monitored from
the monitoring wells, Water Table maps with contours of 1 m intervals, were prepared for
both the shallow (Aquifer- I) and deeper (Aquifer- II) aquifers.
The pre-monsoon water table map for shallow aquifer (Plate-16) reveal that, there
17
are ground water mounds in the north-eastern & west-central parts of the area covering parts
of Karimpur- I & II and Kaliganj blocks with a maximum elevation of 18m to 19m amsl;
and ground water troughs occur in the east-central & west-central parts of the area covering
parts of Chapra & Krishnaganj and Kaliganj blocks with a maximum depression of 7m to
8m amsl. The regional direction of ground water flow is from north-west to south-east with
variable gradients from 1:8000 to 1:1100 in different parts of the area.
The pre-monsoon water table map for deeper aquifer (Plate-18) reveals that, there
are ground water mounds in the north-eastern & west-central parts of the area covering
parts of Karimpur- I, Tehatta- I, Nakashipara and Chapra blocks with a maximum elevation
of 18m to 19m amsl; and ground water troughs occur in the north-western & south-western
parts of the area covering parts of Karimpur- II and in the border of Krishnaganj &
Hanskhali blocks with a maximum depression of 7m to 8m amsl. The local direction of
ground water flow varies place to place with variable gradients from 1:6000 to 1:1000 in
different parts of the area as shown in Table-19.
The post-monsoon water table maps for both the shallow & deeper aquifers
(Plate-16 & 18) reveal almost of the same nature as those of pre-monsoon period for both
the aquifers separately.
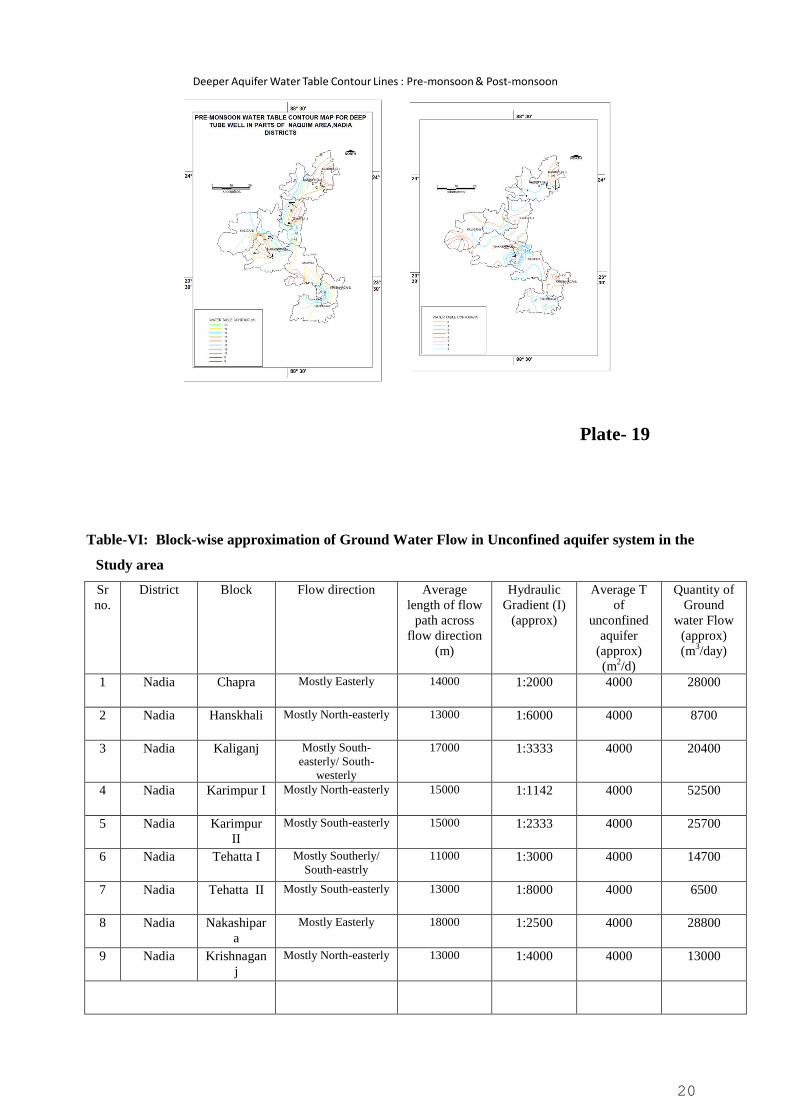
Ground water flow has been calculated by Darcy‟s law using Q= TIL where Q is
quantity of ground water flowing through the area, T is Transmissivity of the Aquifer , I is
Hydraulic Gradient and L is maximum length of flow path perpendicular to flow direction.
In general ground water flow is from NW to SE within the area in shallow aquifer system;
and at different directions in deeper aquifer system in this area, as deciphered by the Pre-
monsoon Water Table maps. Block-wise the flow of ground water in the shallow unconfined
aquifer system in approximation are shown in Table-VI, and that in deeper semi-confined to
confined aquifer system is tabulated in Table-VII.
18
Depth to water level : Aquifer I
Plate- 15
SUB AREA BSUB AREA B
Water Table: Aquifer I
Plate- 16
19
Depth to water level : Aquifer II
Plate- 17
Water Table: Aquifer II
Plate- 18
20
SUB AREA B
SUB AREA B
Deeper Aquifer Water Table Contour Lines : Pre-monsoon & Post-monsoon
Plate- 19
Table-VI: Block-wise approximation of Ground Water Flow in Unconfined aquifer system in the
Study area
Sr
no.
District Block Flow direction Average
length of flow
path across
flow direction
(m)
Hydraulic
Gradient (I)
(approx)
Average T
of
unconfined
aquifer
(approx)
(m2/d)
Quantity of
Ground
water Flow
(approx)
(m3/day)
1 Nadia Chapra Mostly Easterly 14000 1:2000 4000 28000
2 Nadia Hanskhali Mostly North-easterly 13000 1:6000 4000 8700
3 Nadia Kaliganj Mostly South-
easterly/ South-
westerly
17000 1:3333 4000 20400
4 Nadia Karimpur I Mostly North-easterly 15000 1:1142 4000 52500
5 Nadia Karimpur
II
Mostly South-easterly 15000 1:2333 4000 25700
6 Nadia Tehatta I Mostly Southerly/
South-eastrly
11000
1:3000
4000
14700
7 Nadia Tehatta II Mostly South-easterly 13000 1:8000 4000 6500
8 Nadia Nakashipar
a
Mostly Easterly 18000 1:2500 4000 28800
9 Nadia Krishnagan
j
Mostly North-easterly 13000 1:4000 4000 13000
21
Table-VII: Block-wise approximation of Ground Water Flow in Semi-confined to Confined
aquifer system in the study area
Sr
no.
District Block Flow direction Average
length of flow
path across
flow direction
(m)
Hydraulic
Gradient (I)
(approx)
Average T
of confined
aquifer
(m2/d)
Quantity of
Ground
water Flow
(approx)
(m3/day)
1 Nadia Chapra Mostly North/ North-
easterly
18000 1:1500 3100 37200
2 Nadia Hanskhali Mostly North/ North-
westerly
23000 1:1250 3300 60720
3 Nadia Kaliganj Mostly Westerly 20000 1:1750 2800 32000
4 Nadia Karimpur I Radial- outward (as
centrally Gr. W.
mound) Mostly
Westerly/ South-
westerly
18000 1:1666 2700 29160
5 Nadia Karimpur II Mostly Westerly 15000 1:2000 2800 21000
6 Nadia Tehatta I Radial- outward (as
centrally Gr. W.
mound) Mostly
Westerly
13000 1:1166 2800 31200
7 Nadia Tehatta II Radial- inward (as
centrally Gr. W. trough)
22000 1:6000 2950 10800
8 Nadia Nakashipara Radial- outward (as
centrally Gr. W.
mound) Mostly
Southerly
17000 1:2500 2900 19720
9 Nadia Krishnaganj Radial- inward (as
centrally Gr. W. trough)
Mostly Westerly
15000 1:1000 3200 48000
4.2.4 Pre-monsoon & Post-monsoon long term trend analysis:
The long term trend analysis reveals that there is a falling trend in almost all the
Blocks both during Pre-monsoon and Post-monsoon periods. The Pre-monsoon falling trend
of water level varies from 0.9 cm/year (in Hanskhali block) to 16.4 cm/year (in Nakashipara
block). The same during Post-monsoon varies from 2.2 cm/year (in Nakashipara block) to
21.2 cm/year (in Tehatta- I block). However, a few monitoring wells show slight rising
trends during pre-monsoon period in Tehatta- I, Nakashipara and Krishnaganj blocks and
during post-monsoon period in Krishnaganj block. Details of pre-monsoon and post-
monsoon water level trend (from 1995 to 2011) in cm/year for individual Block is given in
Table-VIII.
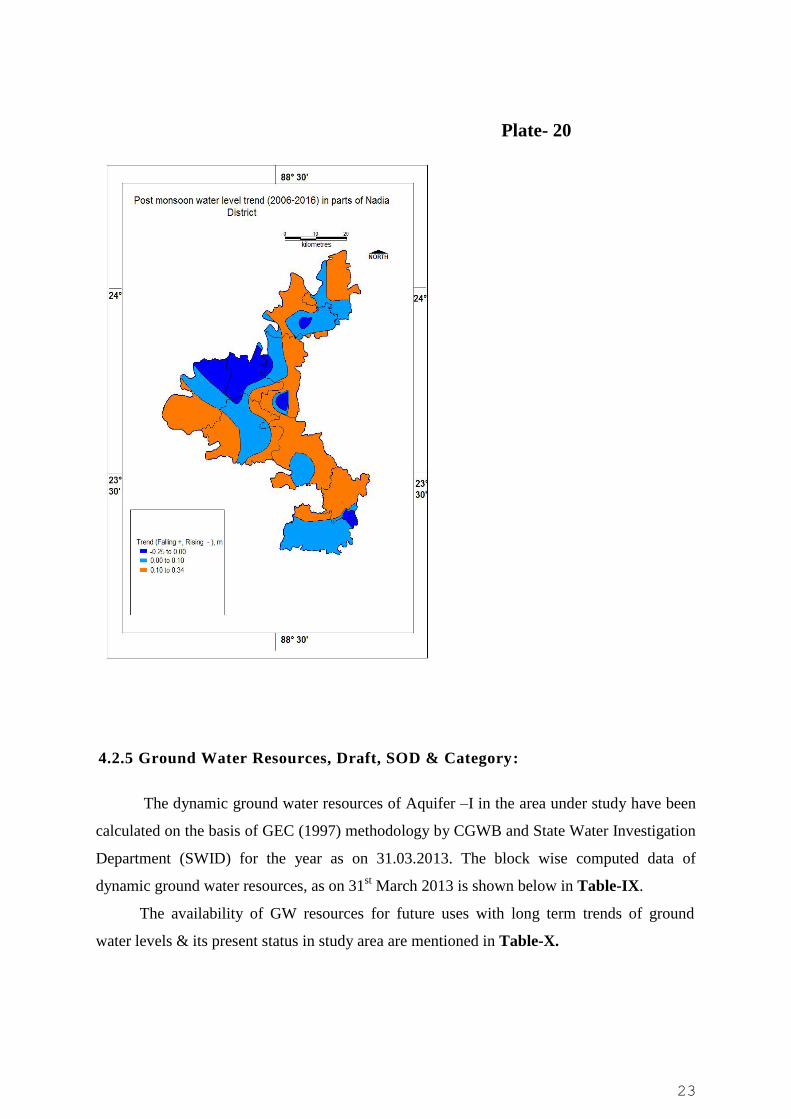
The map showing the Post-monsoon Water Level Trends (2006-2016) of the
Aquifer-I in the study area (Plate-20) indicates slight rising trend of water level in the west-
central part of the area.
22
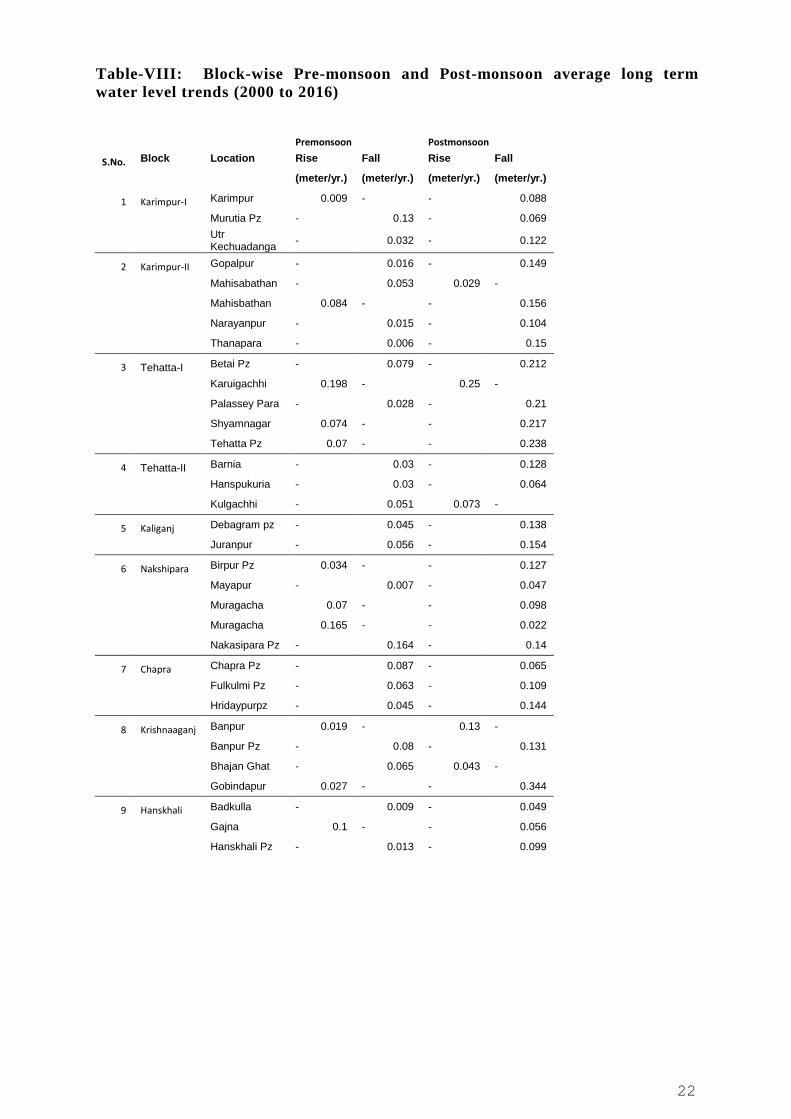
Table-VIII: Block-wise Pre-monsoon and Post-monsoon average long term
water level trends (2000 to 2016)
Premonsoon Postmonsoon
S.No. Block Location Rise Fall Rise Fall
(meter/yr.) (meter/yr.) (meter/yr.) (meter/yr.)
1 Karimpur-I Karimpur 0.009 - - 0.088
Murutia Pz - 0.13 - 0.069
Utr Kechuadanga
- 0.032 - 0.122
2 Karimpur-II Gopalpur - 0.016 - 0.149
Mahisabathan - 0.053 0.029 -
Mahisbathan 0.084 - - 0.156
Narayanpur - 0.015 - 0.104
Thanapara - 0.006 - 0.15
3 Tehatta-I Betai Pz - 0.079 - 0.212
Karuigachhi 0.198 - 0.25 -
Palassey Para - 0.028 - 0.21
Shyamnagar 0.074 - - 0.217
Tehatta Pz 0.07 - - 0.238
4 Tehatta-II Barnia - 0.03 - 0.128
Hanspukuria - 0.03 - 0.064
Kulgachhi - 0.051 0.073 -
5 Kaliganj Debagram pz - 0.045 - 0.138
Juranpur - 0.056 - 0.154
6 Nakshipara Birpur Pz 0.034 - - 0.127
Mayapur - 0.007 - 0.047
Muragacha 0.07 - - 0.098
Muragacha 0.165 - - 0.022
Nakasipara Pz - 0.164 - 0.14
7 Chapra Chapra Pz - 0.087 - 0.065
Fulkulmi Pz - 0.063 - 0.109
Hridaypurpz - 0.045 - 0.144
8 Krishnaaganj Banpur 0.019 - 0.13 -
Banpur Pz - 0.08 - 0.131
Bhajan Ghat - 0.065 0.043 -
Gobindapur 0.027 - - 0.344
9 Hanskhali Badkulla - 0.009 - 0.049
Gajna 0.1 - - 0.056
Hanskhali Pz - 0.013 - 0.099
23
Plate- 20
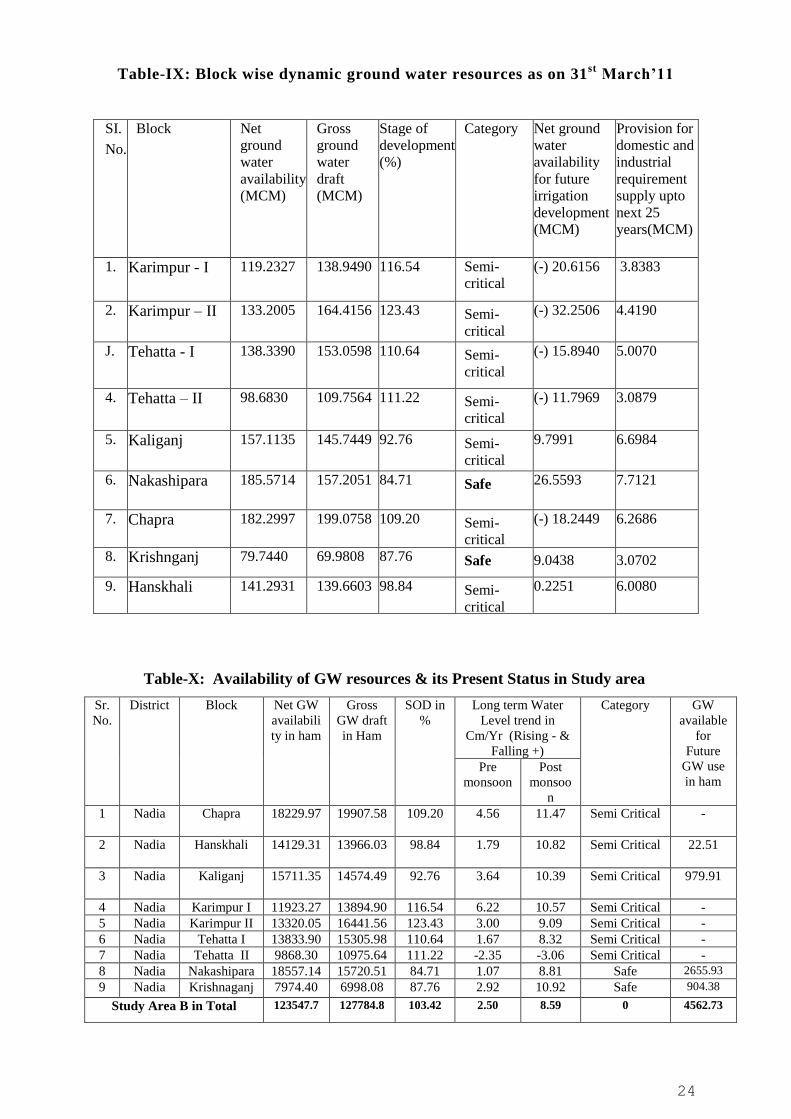
4.2.5 Ground Water Resources, Draft, SOD & Category:
The dynamic ground water resources of Aquifer –I in the area under study have been
calculated on the basis of GEC (1997) methodology by CGWB and State Water Investigation
Department (SWID) for the year as on 31.03.2013. The block wise computed data of
dynamic ground water resources, as on 31st March 2013 is shown below in Table-IX.
The availability of GW resources for future uses with long term trends of ground
water levels & its present status in study area are mentioned in Table-X.
24
Table-IX: Block wise dynamic ground water resources as on 31st
March’11
SI.
No.
Block Net
ground
water
availability
(MCM)
Gross
ground
water
draft
(MCM)
Stage of
development
(%)
Category Net ground
water
availability
for future
irrigation
development
(MCM)
Provision for
domestic and
industrial
requirement
supply upto
next 25
years(MCM)
1. Karimpur - I 119.2327 138.9490 116.54 Semi-
critical
(-) 20.6156 3.8383
2. Karimpur – II 133.2005 164.4156 123.43 Semi-
critical
(-) 32.2506 4.4190
J. Tehatta - I 138.3390 153.0598 110.64 Semi-
critical
(-) 15.8940 5.0070
4. Tehatta – II 98.6830 109.7564 111.22 Semi-
critical
Semi-
critical
(-) 11.7969 3.0879
5. Kaliganj 157.1135 145.7449 92.76 Semi-
critical
9.7991 6.6984
6. Nakashipara 185.5714 157.2051 84.71 Safe 26.5593 7.7121
7. Chapra 182.2997 199.0758 109.20 Semi-
critical
(-) 18.2449 6.2686
8. Krishnganj 79.7440 69.9808 87.76 Safe 9.0438 3.0702
9. Hanskhali 141.2931 139.6603 98.84 Semi-
critical
0.2251 6.0080
Table-X: Availability of GW resources & its Present Status in Study area
Sr.
No.
District Block Net GW
availabili
ty in ham
Gross
GW draft
in Ham
SOD in
%
Long term Water
Level trend in
Cm/Yr (Rising - &
Falling +)
Category GW
available
for
Future
GW use
in ham Pre
monsoon
Post
monsoo
n
1 Nadia Chapra 18229.97
19907.58
109.20 4.56 11.47 Semi Critical -
2 Nadia Hanskhali 14129.31 13966.03 98.84 1.79 10.82 Semi Critical 22.51
3 Nadia Kaliganj 15711.35 14574.49 92.76 3.64 10.39 Semi Critical 979.91
4 Nadia Karimpur I 11923.27 13894.90 116.54 6.22 10.57 Semi Critical -
5 Nadia Karimpur II 13320.05 16441.56 123.43 3.00 9.09 Semi Critical -
6 Nadia Tehatta I 13833.90 15305.98 110.64 1.67 8.32 Semi Critical -
7 Nadia Tehatta II 9868.30 10975.64 111.22 -2.35 -3.06 Semi Critical -
8 Nadia Nakashipara 18557.14 15720.51 84.71 1.07 8.81 Safe 2655.93
9 Nadia Krishnaganj 7974.40 6998.08 87.76 2.92 10.92 Safe 904.38
Study Area B in Total 123547.7 127784.8 103.42 2.50 8.59 0 4562.73
25
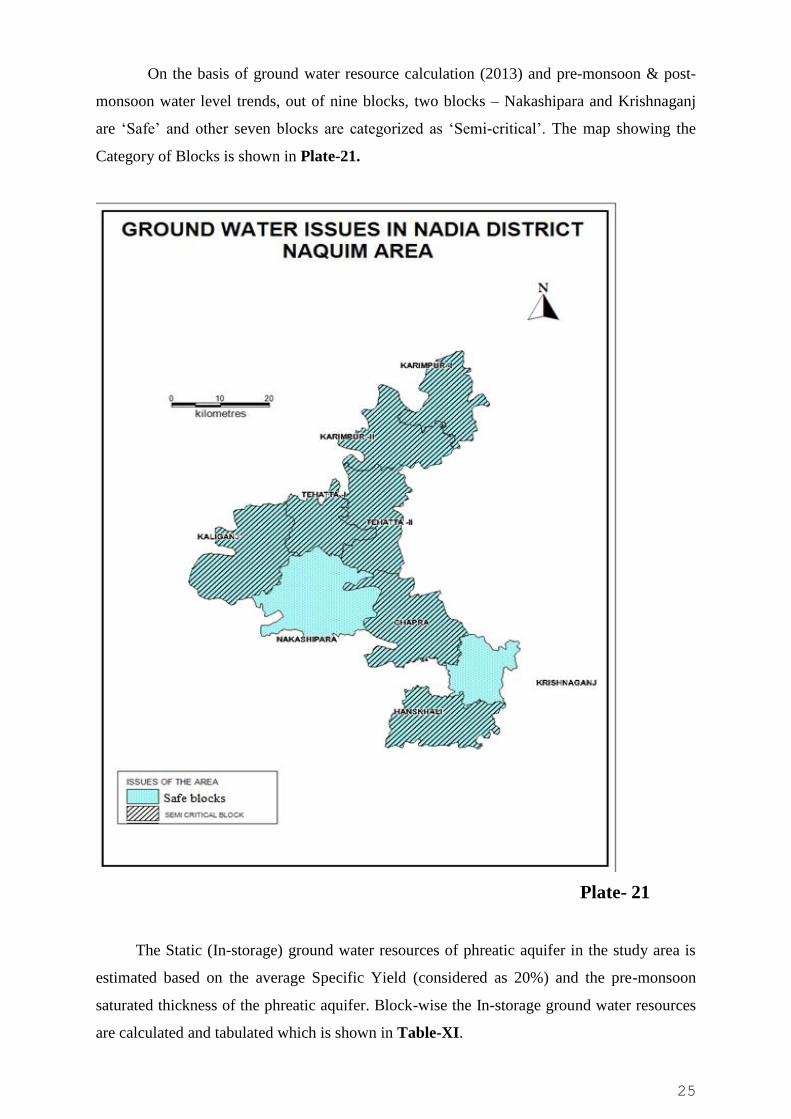
On the basis of ground water resource calculation (2013) and pre-monsoon & post-
monsoon water level trends, out of nine blocks, two blocks – Nakashipara and Krishnaganj
are „Safe‟ and other seven blocks are categorized as „Semi-critical‟. The map showing the
Category of Blocks is shown in Plate-21.
Plate- 21
The Static (In-storage) ground water resources of phreatic aquifer in the study area is
estimated based on the average Specific Yield (considered as 20%) and the pre-monsoon
saturated thickness of the phreatic aquifer. Block-wise the In-storage ground water resources
are calculated and tabulated which is shown in Table-XI.
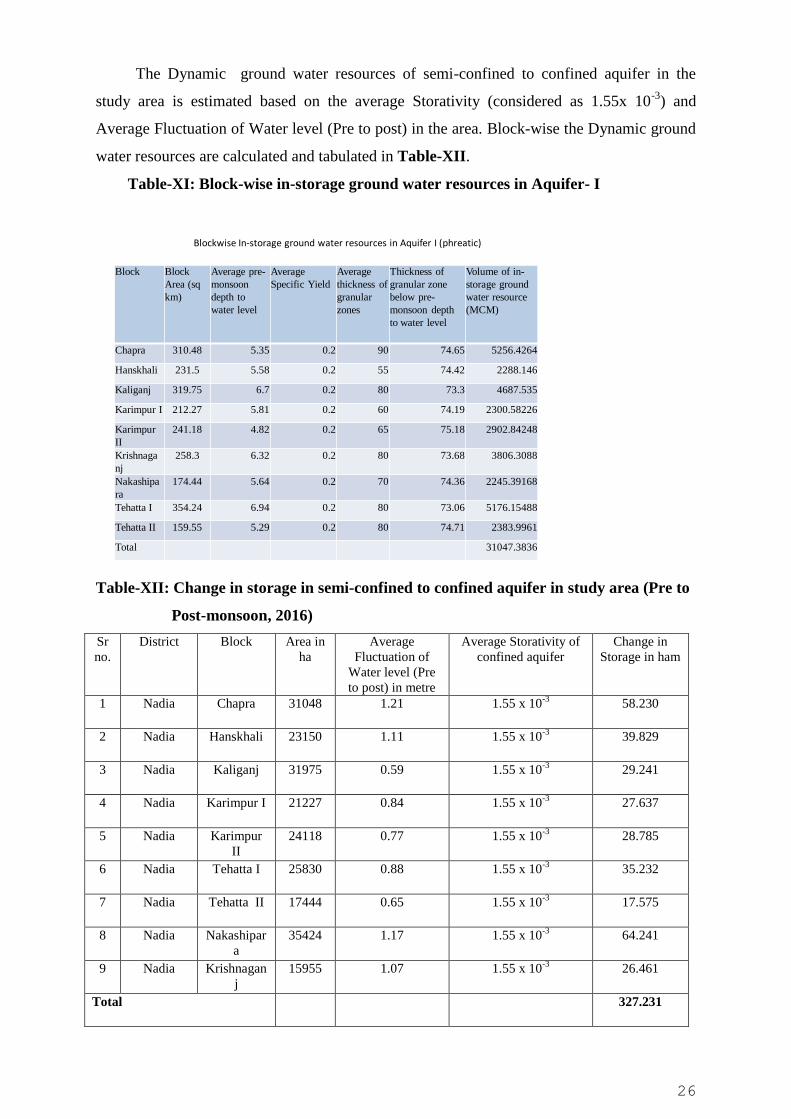
26
The Dynamic ground water resources of semi-confined to confined aquifer in the
study area is estimated based on the average Storativity (considered as 1.55x 10⁻³
) and
Average Fluctuation of Water level (Pre to post) in the area. Block-wise the Dynamic ground
water resources are calculated and tabulated in Table-XII.
Table-XI: Block-wise in-storage ground water resources in Aquifer- I
Blockwise In-storage ground water resources in Aquifer I (phreatic)
Block Block
Area (sq
km)
Average pre-
monsoon
depth to
water level
Average
Specific Yield
Average
thickness of
granular
zones
Thickness of
granular zone
below pre-
monsoon depth
to water level
Volume of in-
storage ground
water resource
(MCM)
Chapra 310.48 5.35 0.2 90 74.65 5256.4264
Hanskhali 231.5 5.58 0.2 55 74.42 2288.146
Kaliganj 319.75 6.7 0.2 80 73.3 4687.535
Karimpur I 212.27 5.81 0.2 60 74.19 2300.58226
Karimpur
II
241.18 4.82 0.2 65 75.18 2902.84248
Krishnaga
nj
258.3 6.32 0.2 80 73.68 3806.3088
Nakashipa
ra
174.44 5.64 0.2 70 74.36 2245.39168
Tehatta I 354.24 6.94 0.2 80 73.06 5176.15488
Tehatta II 159.55 5.29 0.2 80 74.71 2383.9961
Total 31047.3836
Table-XII: Change in storage in semi-confined to confined aquifer in study area (Pre to
Post-monsoon, 2016)
Sr
no.
District Block Area in
ha
Average
Fluctuation of
Water level (Pre
to post) in metre
Average Storativity of
confined aquifer
Change in
Storage in ham
1 Nadia Chapra 31048 1.21 1.55 x 10⁻³
58.230
2 Nadia Hanskhali 23150 1.11 1.55 x 10⁻³
39.829
3 Nadia Kaliganj 31975 0.59 1.55 x 10⁻³
29.241
4 Nadia Karimpur I 21227 0.84 1.55 x 10⁻³
27.637
5 Nadia Karimpur
II
24118 0.77 1.55 x 10⁻³
28.785
6 Nadia Tehatta I 25830 0.88 1.55 x 10⁻³
35.232
7 Nadia Tehatta II 17444 0.65 1.55 x 10⁻³
17.575
8 Nadia Nakashipar
a
35424 1.17 1.55 x 10⁻³
64.241
9 Nadia Krishnagan
j
15955 1.07 1.55 x 10⁻³
26.461
Total
327.231
27
5. HYDROCHEMISTRY
5.1 Quality of Shallow and Deeper Aquifer Water
Ground water samples were collected during pre-monsoon period from the National
Hydrograph Stations falling in the study area and those have been analysed in the
departmental Chemical Laboratory. Chemical quality of ground water occurring in shallow
and deeper aquifers does not vary significantly, except arsenic concentration. The water, in
general, is slightly alkaline. Water is Ca-Mg- HCO3 type.
5.2 General range of chemical parameter
The samples from the monitoring wells in the study area, were analysed in the CGWB
Laboratory. From the analytical results, it is found that, pH of water, in general, varies
between 8.31 and 8.50 indicating slightly Basic in nature, and EC ranges between 282.9 and
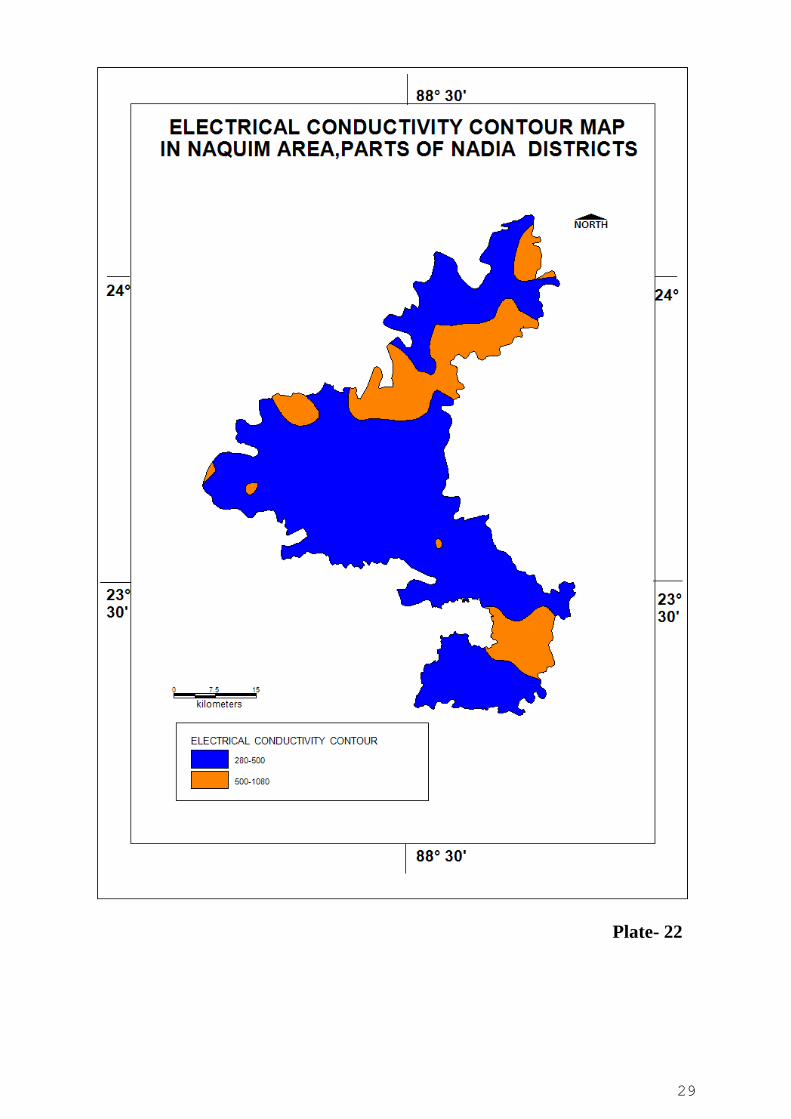
1077 µS/cm. The EC contour map (Plate-22) shows that, the ground water is mainly having
less than 500 µS/cm in most of the part including the central portion. EC is higher than 500
µS/cm in parts of Karimpur- II, Tehatta- I & II, Krishnaganj and Hanskhali blocks.
Concentrations of Na ranges from 10.8 to 100.4 mg/1. Cl is mostly in the range of 7.5 - 110
mg/1. Fluoride ranges from BDL – 1.08 mg/1, whereas Nitrate concentration ranges from 0.1
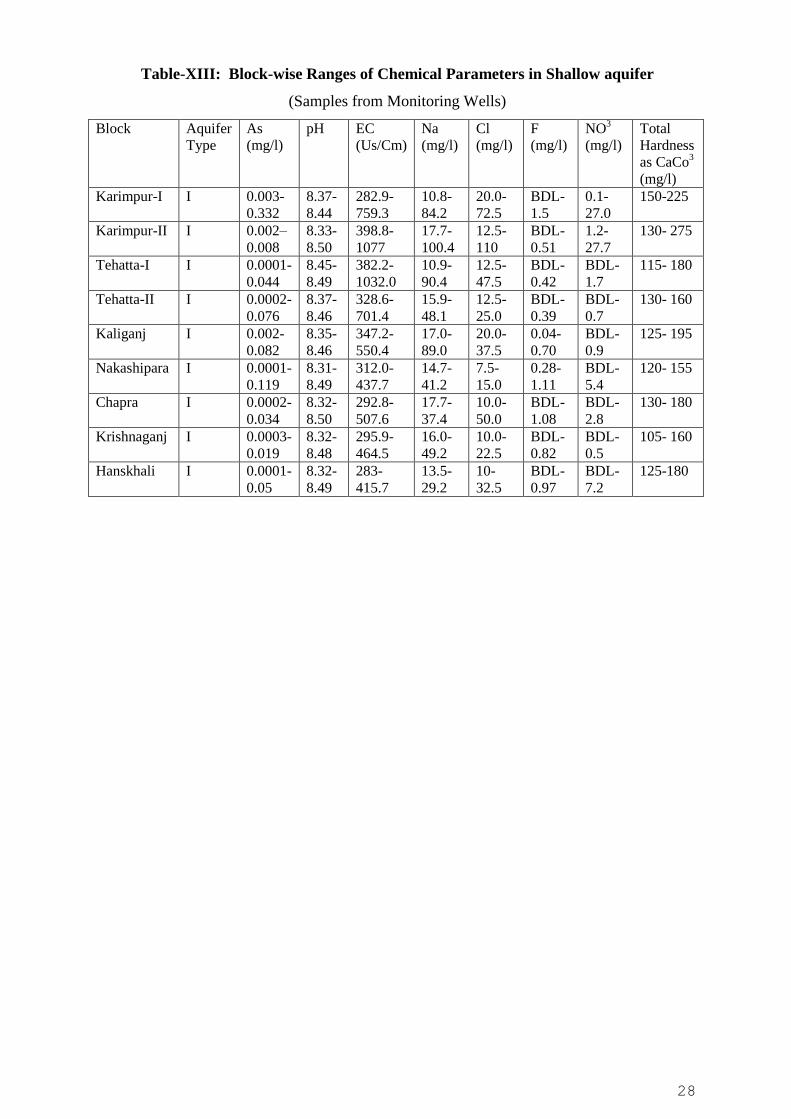
– 27.7 mg/1. Total hardness as CaC03 ranges from 105 - 275 mg/1. Block-wise Ranges of
Chemical Parameters in Shallow aquifer is shown in Table-XIII.
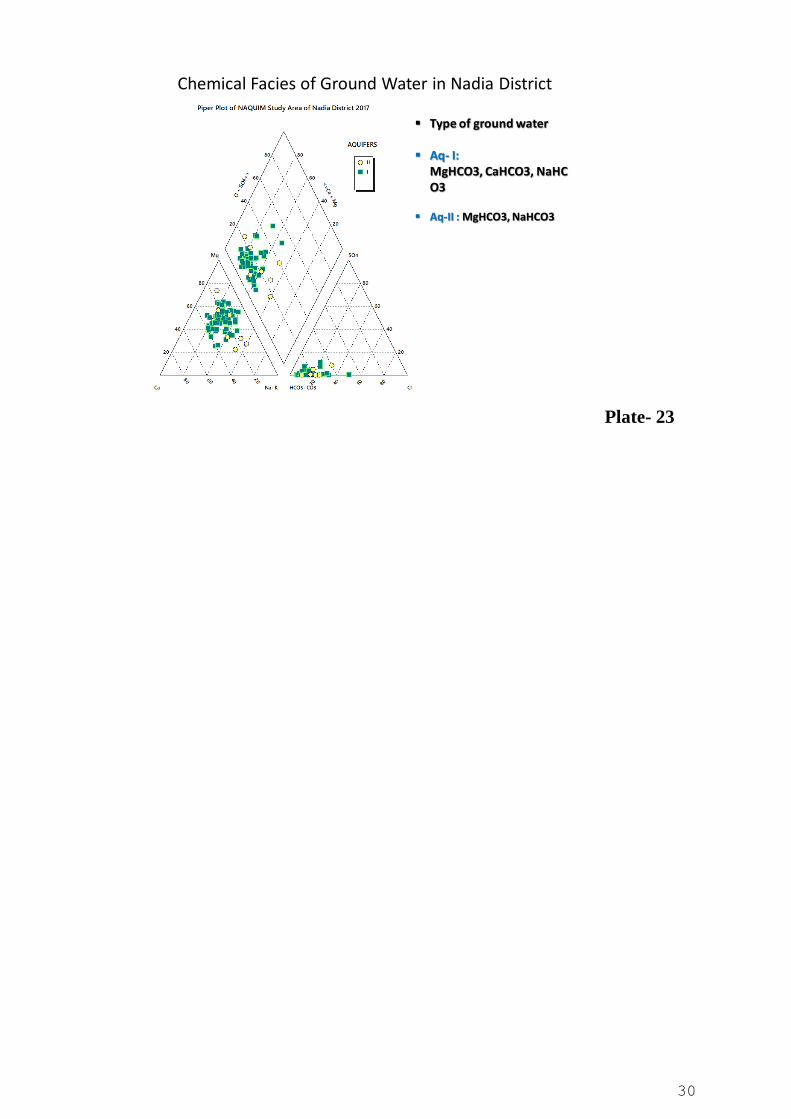
The Chemical Facies in the Piper-Trilinear Diagram (Plate-23) shows that the ground
water in shallow aquifers is in general MgHCO3- CaHCO
3- NaHCO
3 Type, and that of deeper
aquifer is in general MgHCO3- NaHCO
3 Type.
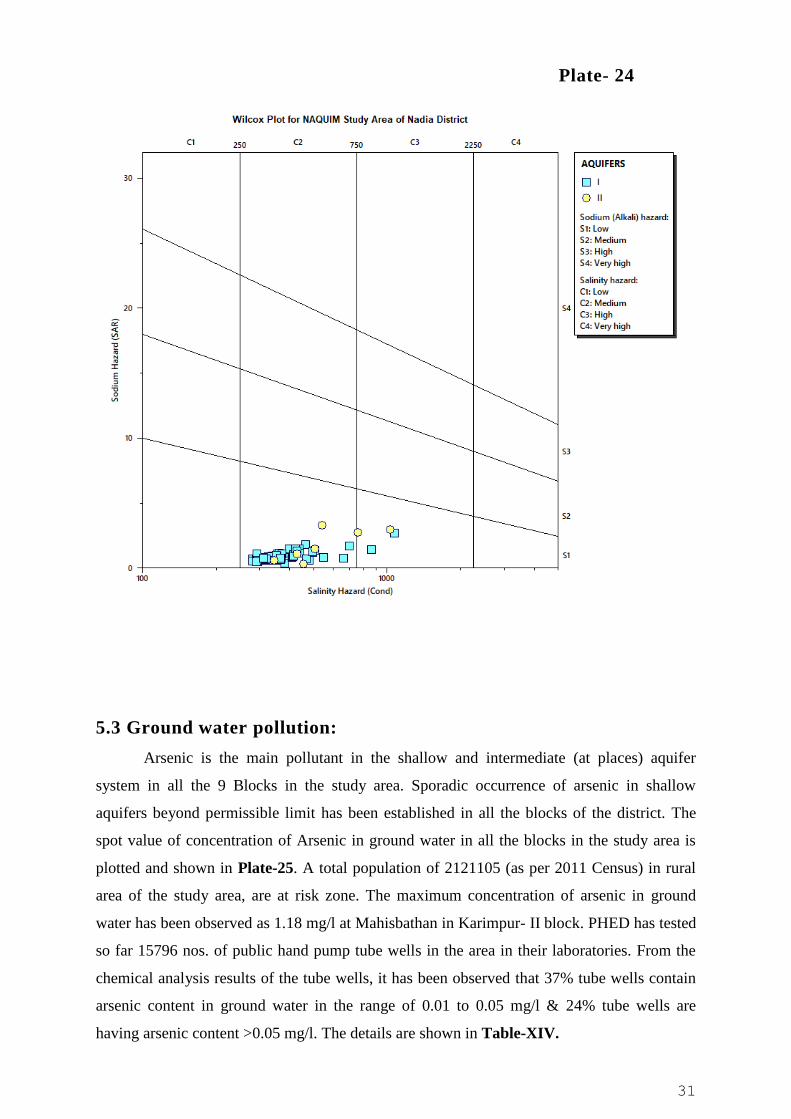
The Wilcox Plot (Plate-24) indicates that the Sodium (Alkali) hazard of the ground
water from both the shallow and deeper aquifers is very low and the Salinity hazard is in the
„Medium‟ category.
28
Table-XIII: Block-wise Ranges of Chemical Parameters in Shallow aquifer
(Samples from Monitoring Wells)
Block Aquifer
Type
As
(mg/l)
pH EC
(Us/Cm)
Na
(mg/l)
Cl
(mg/l)
F
(mg/l)
NO3
(mg/l)
Total
Hardness
as CaCo3
(mg/l)
Karimpur-I I 0.003-
0.332
8.37-
8.44
282.9-
759.3
10.8-
84.2
20.0-
72.5
BDL-
1.5
0.1-
27.0
150-225
Karimpur-II I 0.002–
0.008
8.33-
8.50
398.8-
1077
17.7-
100.4
12.5-
110
BDL-
0.51
1.2-
27.7
130- 275
Tehatta-I I 0.0001-
0.044
8.45-
8.49
382.2-
1032.0
10.9-
90.4
12.5-
47.5
BDL-
0.42
BDL-
1.7
115- 180
Tehatta-II I 0.0002-
0.076
8.37-
8.46
328.6-
701.4
15.9-
48.1
12.5-
25.0
BDL-
0.39
BDL-
0.7
130- 160
Kaliganj I 0.002-
0.082
8.35-
8.46
347.2-
550.4
17.0-
89.0
20.0-
37.5
0.04-
0.70
BDL-
0.9
125- 195
Nakashipara I 0.0001-
0.119
8.31-
8.49
312.0-
437.7
14.7-
41.2
7.5-
15.0
0.28-
1.11
BDL-
5.4
120- 155
Chapra I 0.0002-
0.034
8.32-
8.50
292.8-
507.6
17.7-
37.4
10.0-
50.0
BDL-
1.08
BDL-
2.8
130- 180
Krishnaganj I 0.0003-
0.019
8.32-
8.48
295.9-
464.5
16.0-
49.2
10.0-
22.5
BDL-
0.82
BDL-
0.5
105- 160
Hanskhali I 0.0001-
0.05
8.32-
8.49
283-
415.7
13.5-
29.2
10-
32.5
BDL-
0.97
BDL-
7.2
125-180
29
Plate- 22
30
Chemical Facies of Ground Water in Nadia District
Type of ground water
Aq- I:MgHCO3, CaHCO3, NaHCO3
Aq-II : MgHCO3, NaHCO3
Plate- 23
31
Plate- 24
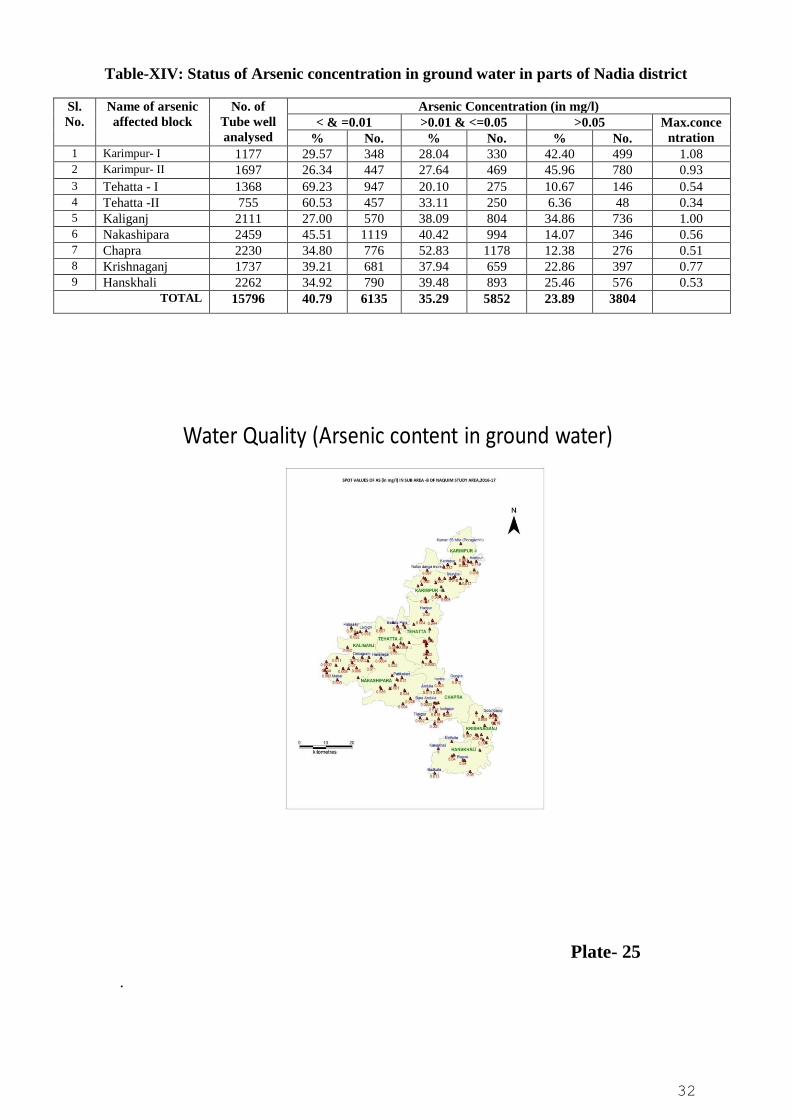
5.3 Ground water pollution:
Arsenic is the main pollutant in the shallow and intermediate (at places) aquifer
system in all the 9 Blocks in the study area. Sporadic occurrence of arsenic in shallow
aquifers beyond permissible limit has been established in all the blocks of the district. The
spot value of concentration of Arsenic in ground water in all the blocks in the study area is
plotted and shown in Plate-25. A total population of 2121105 (as per 2011 Census) in rural
area of the study area, are at risk zone. The maximum concentration of arsenic in ground
water has been observed as 1.18 mg/l at Mahisbathan in Karimpur- II block. PHED has tested
so far 15796 nos. of public hand pump tube wells in the area in their laboratories. From the
chemical analysis results of the tube wells, it has been observed that 37% tube wells contain
arsenic content in ground water in the range of 0.01 to 0.05 mg/l & 24% tube wells are
having arsenic content >0.05 mg/l. The details are shown in Table-XIV.
32
Table-XIV: Status of Arsenic concentration in ground water in parts of Nadia district
Sl.
No.
Name of arsenic
affected block
No. of
Tube well
analysed
Arsenic Concentration (in mg/l)
< & =0.01 >0.01 & <=0.05 >0.05 Max.conce
ntration % No. % No. % No. 1 Karimpur- I 1177 29.57 348 28.04 330 42.40 499 1.08 2 Karimpur- II 1697 26.34 447 27.64 469 45.96 780 0.93
3 Tehatta - I 1368 69.23 947 20.10 275 10.67 146 0.54 4 Tehatta -II 755 60.53 457 33.11 250 6.36 48 0.34 5 Kaliganj 2111 27.00 570 38.09 804 34.86 736 1.00 6 Nakashipara 2459 45.51 1119 40.42 994 14.07 346 0.56 7 Chapra 2230 34.80 776 52.83 1178 12.38 276 0.51 8 Krishnaganj 1737 39.21 681 37.94 659 22.86 397 0.77 9 Hanskhali 2262 34.92 790 39.48 893 25.46 576 0.53
TOTAL 15796 40.79 6135 35.29 5852 23.89 3804
Water Quality (Arsenic content in ground water)
Plate- 25
.
33
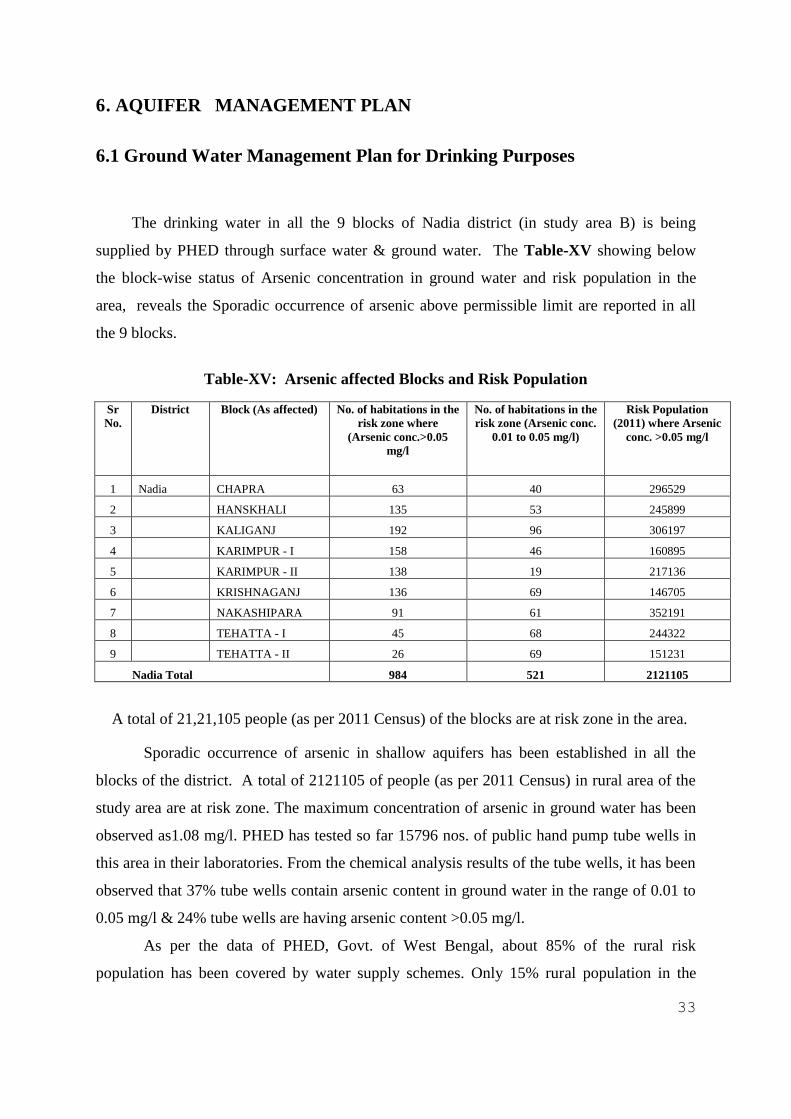
6. AQUIFER MANAGEMENT PLAN
6.1 Ground Water Management Plan for Drinking Purposes
The drinking water in all the 9 blocks of Nadia district (in study area B) is being
supplied by PHED through surface water & ground water. The Table-XV showing below
the block-wise status of Arsenic concentration in ground water and risk population in the
area, reveals the Sporadic occurrence of arsenic above permissible limit are reported in all
the 9 blocks.
Table-XV: Arsenic affected Blocks and Risk Population
Sr
No.
District Block (As affected) No. of habitations in the
risk zone where
(Arsenic conc.>0.05
mg/l
No. of habitations in the
risk zone (Arsenic conc.
0.01 to 0.05 mg/l)
Risk Population
(2011) where Arsenic
conc. >0.05 mg/l
1 Nadia CHAPRA 63 40 296529
2 HANSKHALI 135 53 245899
3 KALIGANJ 192 96 306197
4 KARIMPUR - I 158 46 160895
5 KARIMPUR - II 138 19 217136
6 KRISHNAGANJ 136 69 146705
7 NAKASHIPARA 91 61 352191
8 TEHATTA - I 45 68 244322
9 TEHATTA - II 26 69 151231
Nadia Total 984 521 2121105
A total of 21,21,105 people (as per 2011 Census) of the blocks are at risk zone in the area.
Sporadic occurrence of arsenic in shallow aquifers has been established in all the
blocks of the district. A total of 2121105 of people (as per 2011 Census) in rural area of the
study area are at risk zone. The maximum concentration of arsenic in ground water has been
observed as1.08 mg/l. PHED has tested so far 15796 nos. of public hand pump tube wells in
this area in their laboratories. From the chemical analysis results of the tube wells, it has been
observed that 37% tube wells contain arsenic content in ground water in the range of 0.01 to
0.05 mg/l & 24% tube wells are having arsenic content >0.05 mg/l.
As per the data of PHED, Govt. of West Bengal, about 85% of the rural risk
population has been covered by water supply schemes. Only 15% rural population in the

34
study area in Karimpur I & II, Tehatta I & II, Hanskhali, Krishnaganj, Chapra blocks are to
be covered by arsenic free water supply. Kaliganj and Nakashipara blocks are fully covered
by State Authority.
6.1.1 Requirement of Wells:
As evidenced from the exploration arsenic free deeper aquifers ranging from 200 to
300 mbgl) are potential with a capacity to yield to the tune of 12.5 litre per second with
drawdown of 6 m (approx) and can cater to the need of rural water supply. Considering
human drinking and domestic demand of water @70 lpcd & projected population upto 2021
(considering decadal growth rate @ 21.09% following PHED guidelines and District Census
2011), the demand of water for human population as on 2021 has been calculated. Cattle
population as on 2021 is estimated considering 0.19 per capita human population (district
cattle population/ district human population), village population & 0.36 annual growth rate.
Considering the cattle consumption @20 lpcd, water requirement for cattle has been
calculated.
As per the ground Water Act, 2005 for arsenic affected areas, the extraction has been
restricted to 45 m3/hr (+/- 5%). Considering above guideline number of tube wells sizing of
250 mm X 150 mm with depth 300 mbgl has been calculated. Four observation wells, one for
each block, are suggested for the blocks to monitor the impact of withdrawal of water from
the tube wells on the water level. The tube wells should be constructed by tapping the
aquifers which is separated from top arsenic contaminated aquifers by a persistent clay
blanket. Provision for sealing the top arsenic contaminated aquifers with proper cement
sealing against clay layer should be kept in order to prevent the vertical percolation of arsenic
contaminated water from the top contaminated aquifer.
6.1.2 Mitigation Measures:
To supply safe Drinking Water to the affected blocks of the State a comprehensive
Arsenic Master Plan was taken for implementation through various Short, Medium and
Long Term measures by the State Government with assistance of Government of India.
To combat the arsenic contamination in ground water, mitigation measures have been
taken up by State Govt. by involving different NGOs, institutions etc., to provide arsenic
free drinking water in the arsenic affected areas. Over the years, State Government has
35
undertaken number of steps to tackle the problem of arsenic contamination for ensuring
safe drinking water to local habitants. Surface water supply scheme along with ground
water based supply schemes are implemented in West Bengal by PHED, Govt. of West
Bengal. A number of arsenic removal plants are also installed in the arsenic infested areas
to remove arsenic from arsenic rich ground water as a short term measures. Sludge
disposal from arsenic removal equipment is another problem for arsenic infested areas.
But due to number of reasons, regarding operation, maintenance, social adaptability, lack
of awareness among local people these efforts were not that much successful.
The technologies which are relevant to the ground water of West Bengal only have
been classified as short, medium or long term remedial measures based on their nature.
Since 1995 onwards PHED of Government of West Bengal has been implementing all
possible mitigation measures by Engineering interventions .
Short Term : New Hand Pump Tube well tapping deeper Aquifer, Ring Well etc.
Medium Term : ATU with existing Hand Tube Well, ARP for existing PWSS , New
large bore Tube Wells tapping deeper Aquifer, New Ground Water
based PWSS.
Long Term : Surface Water based PWSS
Groundwater with arsenic contamination has been found mainly in the shallow
aquifers. Deep aquifers, separated by thick clay layer of appropriate composition (which acts
as an impervious layer between aquifer groups) may yield arsenic free fresh ground water. It
was inferred from the isotopic studies carried out in West Bengal that in alluvial formations,
there is no hydraulic connection between shallow and deep aquifers, when separated by an
appropriate impervious layer. Central Ground Water Board, while carrying out extensive
work on this aspect, has deciphered and delineated deep arsenic free aquifers in some parts of
arsenic infested areas of West Bengal.
Exploration in the areas also reveals that the wells, constructed by tapping multiple
aquifer system (tapping shallow and deep both aquifers), allows contamination from adjacent
contaminated aquifers through annular space packed with gravel. At places the confining
clays layers, silty in nature, act as semi-pervious, but under stressed condition (over pumping)
arsenic contaminated water gets passage through these semi-confining layers and may
contaminate safe aquifer water. In order to prevent such vertical percolation of contaminated
36
water, CGWB has adopted cement sealing technique to separate deeper arsenic free
aquifer from shallow arsenic rich aquifer. Central Ground Water Board has already
constructed tube wells in arsenic infested areas of West Bengal adopting cement sealing
techniques and handed over to PHED, Govt. of West Bengal for supply of arsenic free water.
Therefore construction of suitably designed tube well tapping arsenic free deeper aquifer in
arsenic infested area is most suitable structure for supplying arsenic free water.
Based on the exploration data and need for water supply schemes, district wise
feasibility of arsenic free abstraction structures is discussed below.
6.2 Ground Water Management Plan for Irrigation Purposes
The study area is basically under intensive irrigated agriculture by groundwater and
also partly by surface water. Paddy and Rabi vegetables are the important corps cultivated by
farmers in the region. In major part of the area farmers depend only on groundwater for
cultivation of these crops during all seasons. Any reduction in the yield of the tube wells due
to decline in groundwater shall adversely impact the production of the food grain. The study
area has multilayer aquifer system where ground water occurs as regionally extensive
unconfined conditions in upper aquifer system (say Aquifer- I & II) within depth of 150 mbgl
(with local variation). This aquifer system is highly potential in nature, holds fresh water and
caters to the need of irrigation, agriculture and industries. But in most of the places arsenic
contamination in ground water occurs (>0.01mg/l) in a sporadic manner in Aquifer -I and
Aquifer –II (at places), therefore it is not suitable for drinking purposes. The Aquifer System-
III within depth of 280 mbgl (with slight variation in regional/ local level) occurs below the
Aquifer System-I & II separated by clay bed with variable thickness. The ground water
occurs under semi-confined to confined conditions and is in general arsenic free. As revealed
by the Exploration, the Aquifer System-III within depth of 300 mbgl occurs below the
Aquifer System-II separated by thick clay bed with variable thickness in northern Blocks
(except Tehatta-I, where further exploration is required) of the study area, and is arsenic free.
The ground water occurs under confined conditions in this aquifer system. The CGWB has
constructed number of arsenic free wells tapping the Aquifer II & III groups using cement
sealing techniques and handed over to PHED/ State Government departments for supply of
arsenic free water. It is observed that ground water level is declining slowly in most of the
area under irrigation and also in some of the wells in the urban areas. Therefore there is need
for efficient management of these aquifer systems for sustenance of the tube wells tapping
37
Aquifer Systems– I, II as well as III.
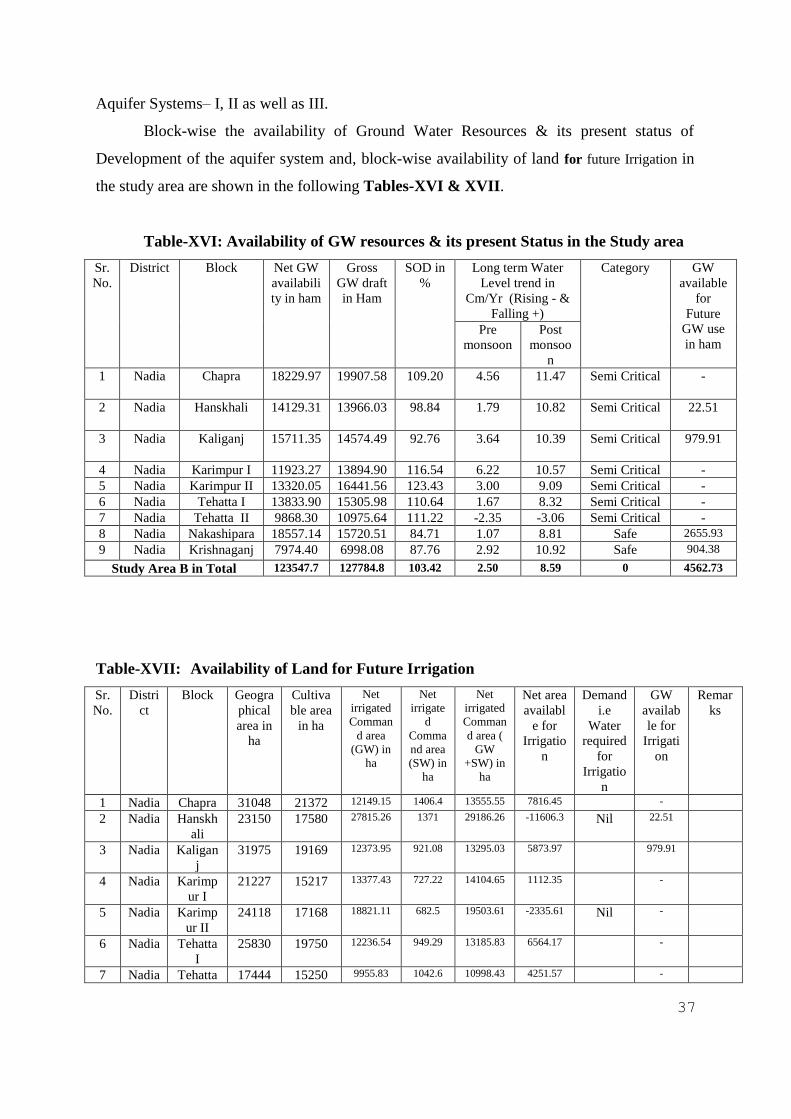
Block-wise the availability of Ground Water Resources & its present status of
Development of the aquifer system and, block-wise availability of land for future Irrigation in
the study area are shown in the following Tables-XVI & XVII.
Table-XVI: Availability of GW resources & its present Status in the Study area
Sr.
No.
District Block Net GW
availabili
ty in ham
Gross
GW draft
in Ham
SOD in
%
Long term Water
Level trend in
Cm/Yr (Rising - &
Falling +)
Category GW
available
for
Future
GW use
in ham Pre
monsoon
Post
monsoo
n
1 Nadia Chapra 18229.97
19907.58
109.20 4.56 11.47 Semi Critical -
2 Nadia Hanskhali 14129.31 13966.03 98.84 1.79 10.82 Semi Critical 22.51
3 Nadia Kaliganj 15711.35 14574.49 92.76 3.64 10.39 Semi Critical 979.91
4 Nadia Karimpur I 11923.27 13894.90 116.54 6.22 10.57 Semi Critical -
5 Nadia Karimpur II 13320.05 16441.56 123.43 3.00 9.09 Semi Critical -
6 Nadia Tehatta I 13833.90 15305.98 110.64 1.67 8.32 Semi Critical -
7 Nadia Tehatta II 9868.30 10975.64 111.22 -2.35 -3.06 Semi Critical -
8 Nadia Nakashipara 18557.14 15720.51 84.71 1.07 8.81 Safe 2655.93
9 Nadia Krishnaganj 7974.40 6998.08 87.76 2.92 10.92 Safe 904.38
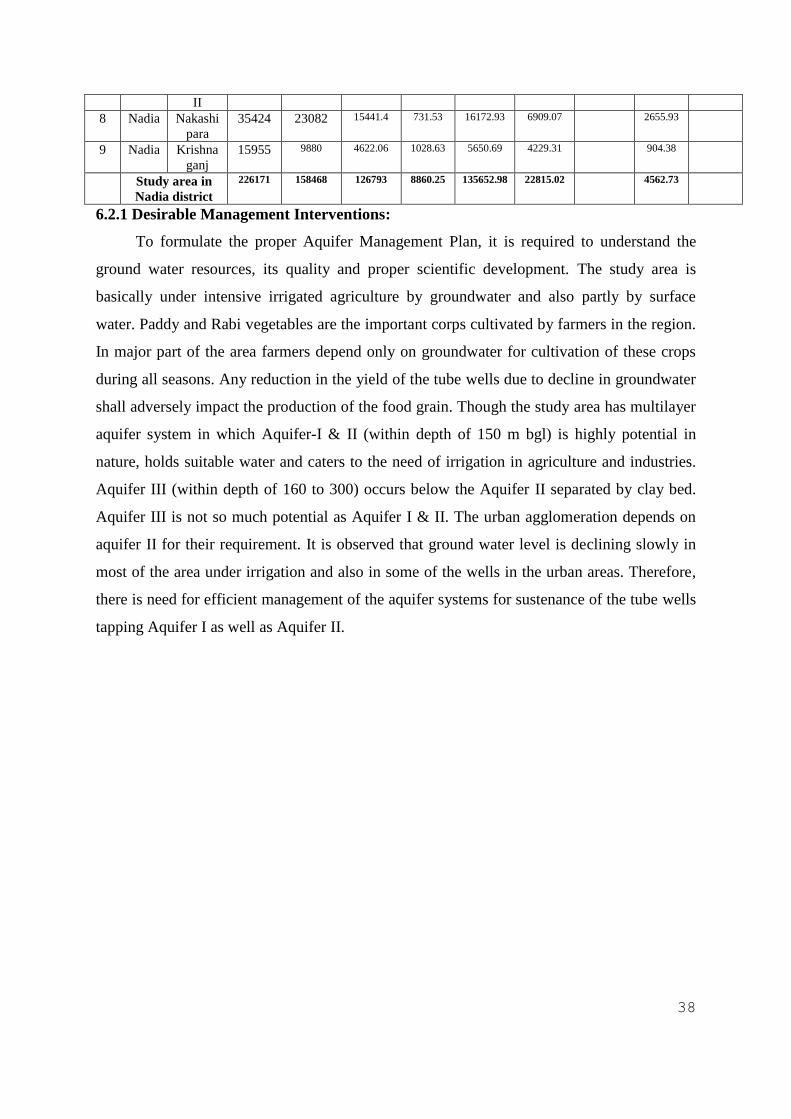
Study Area B in Total 123547.7 127784.8 103.42 2.50 8.59 0 4562.73
Table-XVII: Availability of Land for Future Irrigation
Sr.
No.
Distri
ct
Block Geogra
phical
area in
ha
Cultiva
ble area
in ha
Net
irrigated
Comman
d area
(GW) in
ha
Net
irrigate
d
Comma
nd area
(SW) in
ha
Net
irrigated
Comman
d area (
GW
+SW) in
ha
Net area
availabl
e for
Irrigatio
n
Demand
i.e
Water
required
for
Irrigatio
n
GW
availab
le for
Irrigati
on
Remar
ks
1 Nadia Chapra 31048 21372 12149.15 1406.4 13555.55 7816.45 -
2 Nadia Hanskh
ali
23150 17580 27815.26 1371 29186.26 -11606.3 Nil 22.51
3 Nadia Kaligan
j
31975 19169 12373.95 921.08 13295.03 5873.97 979.91
4 Nadia Karimp
ur I
21227 15217 13377.43 727.22 14104.65 1112.35 -
5 Nadia Karimp
ur II
24118 17168 18821.11 682.5 19503.61 -2335.61 Nil -
6 Nadia Tehatta
I
25830 19750 12236.54 949.29 13185.83 6564.17 -
7 Nadia Tehatta 17444 15250 9955.83 1042.6 10998.43 4251.57 -
38
II
8 Nadia Nakashi
para
35424 23082 15441.4 731.53 16172.93 6909.07 2655.93
9 Nadia Krishna
ganj
15955 9880 4622.06 1028.63 5650.69 4229.31 904.38
Study area in
Nadia district
226171 158468 126793 8860.25 135652.98 22815.02
4562.73
6.2.1 Desirable Management Interventions:
To formulate the proper Aquifer Management Plan, it is required to understand the
ground water resources, its quality and proper scientific development. The study area is
basically under intensive irrigated agriculture by groundwater and also partly by surface
water. Paddy and Rabi vegetables are the important corps cultivated by farmers in the region.
In major part of the area farmers depend only on groundwater for cultivation of these crops
during all seasons. Any reduction in the yield of the tube wells due to decline in groundwater
shall adversely impact the production of the food grain. Though the study area has multilayer
aquifer system in which Aquifer-I & II (within depth of 150 m bgl) is highly potential in
nature, holds suitable water and caters to the need of irrigation in agriculture and industries.
Aquifer III (within depth of 160 to 300) occurs below the Aquifer II separated by clay bed.
Aquifer III is not so much potential as Aquifer I & II. The urban agglomeration depends on
aquifer II for their requirement. It is observed that ground water level is declining slowly in
most of the area under irrigation and also in some of the wells in the urban areas. Therefore,
there is need for efficient management of the aquifer systems for sustenance of the tube wells
tapping Aquifer I as well as Aquifer II.
39
7. SCOPE OF ARTIFICIAL RECHARGE
Considering the administrative units (blocks or municipalities), average post monsoon
water level and long term trend of ground water level, the area suitable for artificial recharge
has been identified. The area suitable for recharge is arrived considering area having the post-
monsoon depth to water level more than 3m and showing long term falling trend of water
level more than 2cm/year.
a) Water levels more than 9m bgl with or without the falling trend with first
priority.
b) Water levels between 6m and 9m bgl and with declining trend with second
priority.
c) Area showing water levels between 6m and 9m bgl with no declining trend with
third priority.
d) Areas showing water levels between 3m and 6m bgl and with declining trend with
fourth priority.
However, area with 3m to 6m bgl post monsoon water level with no long term
falling trend and area with 0 to 3m bgl of post monsoon water level has not been
considered as feasible area for recharge.
Block-wise net surface water availability for recharge; source-water allocation for
suitable types of artificial recharge structures; feasible numbers of various structures and
structure-wise cost estimates were worked out for the study area, based on soil characteristic,
land-slope, Runoff co efficient, rainfall data and long term trend, recommended by Dhruvanarayana,
1993.
Considering the higher ground water development, categorization of the block as per
the Ground Water Resource Assessment, 2013 and block/municipal level suitable area for
recharge, priority may be assessed for implementation of artificial recharge projects in the
study area. Percolation Tanks, Re-Excavation of Existing Tanks (REET) with Recharge Shafts,
Injection Wells, Conservation Ponds in the rural area, and Roof-Top Rain Water Harvesting
structures in the urban areas may be constructed as per the feasibility study.
N. B. - The Reports on “Data Gap Analysis”, “Geophysical Studies” and “Block-wise Ground
Water Management Plan” of the concerned area are presented separately.
Part II
Block wise Aquifer Management Plan in parts of
Nadia District (9 Blocks), West Bengal
( Karimpur - I, Karimpur - II, Tehatta - I, Tehatta - II, Kaliganj, Nakashipara,
Chapra, Krishnaganj & Hanskhali Blocks )
40
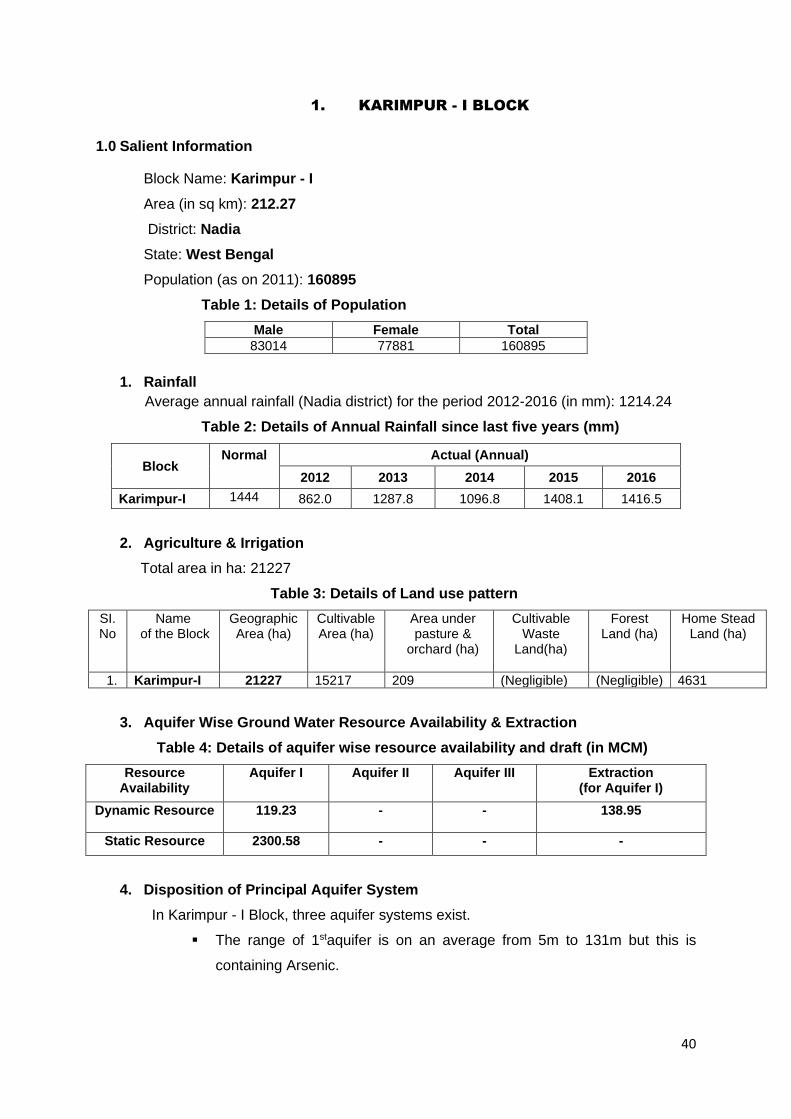
1. KARIMPUR - I BLOCK
1.0 Salient Information
Block Name: Karimpur - I
Area (in sq km): 212.27
District: Nadia
State: West Bengal
Population (as on 2011): 160895
Table 1: Details of Population
Male Female Total
83014 77881 160895
1. Rainfall
Average annual rainfall (Nadia district) for the period 2012-2016 (in mm): 1214.24
Table 2: Details of Annual Rainfall since last five years (mm)
Block Normal Actual (Annual)
2012 2013 2014 2015 2016
Karimpur-I 1444 862.0 1287.8 1096.8 1408.1 1416.5
2. Agriculture & Irrigation
Total area in ha: 21227
Table 3: Details of Land use pattern
SI. No
Name of the Block
Geographic Area (ha)
Cultivable Area (ha)
Area under pasture &
orchard (ha)
Cultivable Waste
Land(ha)
Forest Land (ha)
Home Stead Land (ha)
1. Karimpur-I 21227 15217 209 (Negligible) (Negligible) 4631
3. Aquifer Wise Ground Water Resource Availability & Extraction
Table 4: Details of aquifer wise resource availability and draft (in MCM)
Resource Availability
Aquifer I Aquifer II Aquifer III Extraction (for Aquifer I)
Dynamic Resource 119.23 - - 138.95
Static Resource 2300.58 - - -
4. Disposition of Principal Aquifer System
In Karimpur - I Block, three aquifer systems exist.
▪ The range of 1staquifer is on an average from 5m to 131m but this is
containing Arsenic.

41
▪ The range of 2ndaquifer is on an average from 154m to 185m, which is
fresh and Arsenic free.
▪ The range of 3rdaquifer is 282 m to 294 m, which is also fresh and Arsenic
free.
Table 5: Details of aquifer disposition depth range
Karimpur- I
1st Aquifer 2nd aquifer 3rd aquifer
5-131 m 154-185 m 282-294 m
Fig.1: Aquifer disposition in Karimpur - I Block
42
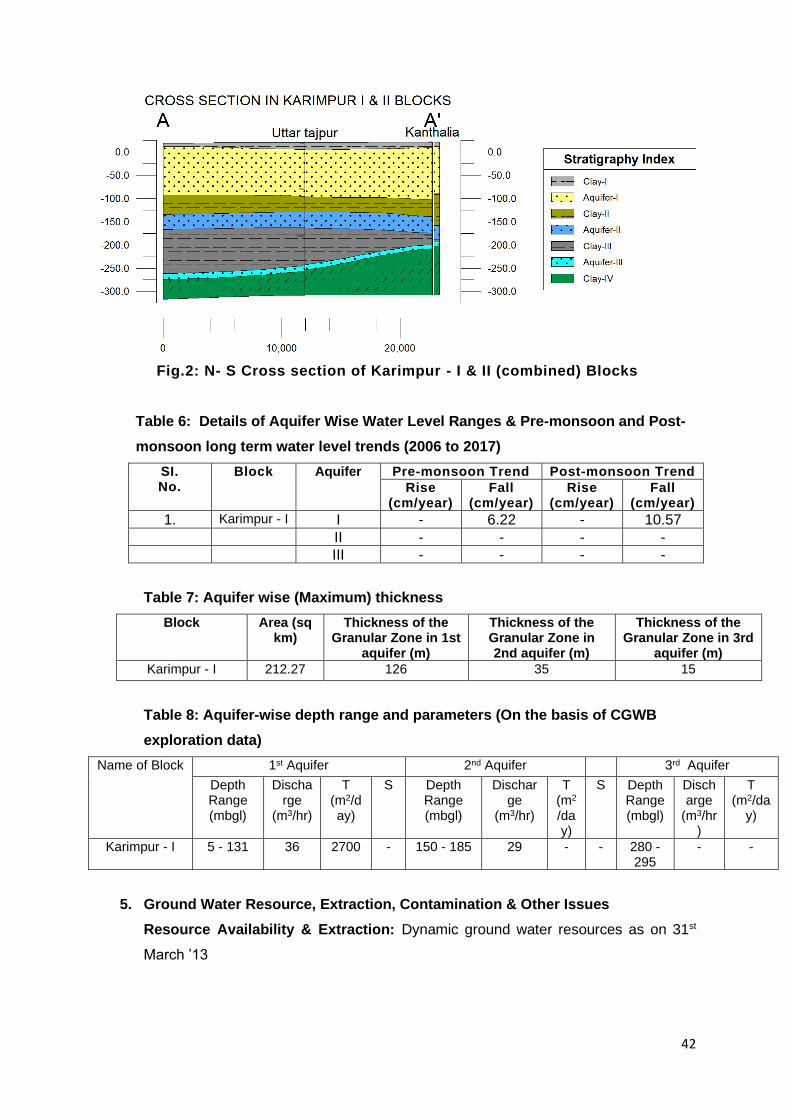
Fig.2: N- S Cross section of Karimpur - I & II (combined) Blocks
Table 6: Details of Aquifer Wise Water Level Ranges & Pre-monsoon and Post-
monsoon long term water level trends (2006 to 2017)
SI. No.
Block Aquifer Pre-monsoon Trend Post-monsoon Trend
Rise (cm/year)
Fall (cm/year)
Rise (cm/year)
Fall (cm/year)
1. Karimpur - I I - 6.22 - 10.57
II - - - -
III - - - -
Table 7: Aquifer wise (Maximum) thickness
Block Area (sq km)
Thickness of the Granular Zone in 1st
aquifer (m)
Thickness of the Granular Zone in 2nd aquifer (m)
Thickness of the Granular Zone in 3rd
aquifer (m)
Karimpur - I 212.27 126 35 15
Table 8: Aquifer-wise depth range and parameters (On the basis of CGWB
exploration data)
Name of Block 1st Aquifer 2nd Aquifer 3rd Aquifer
Depth Range (mbgl)
Discharge
(m3/hr)
T (m2/day)
S Depth Range (mbgl)
Discharge
(m3/hr)
T (m2
/day)
S Depth Range (mbgl)
Discharge
(m3/hr)
T (m2/da
y)
Karimpur - I 5 - 131 36 2700 - 150 - 185 29 - - 280 -295
- -
5. Ground Water Resource, Extraction, Contamination & Other Issues
Resource Availability & Extraction: Dynamic ground water resources as on 31st
March ’13
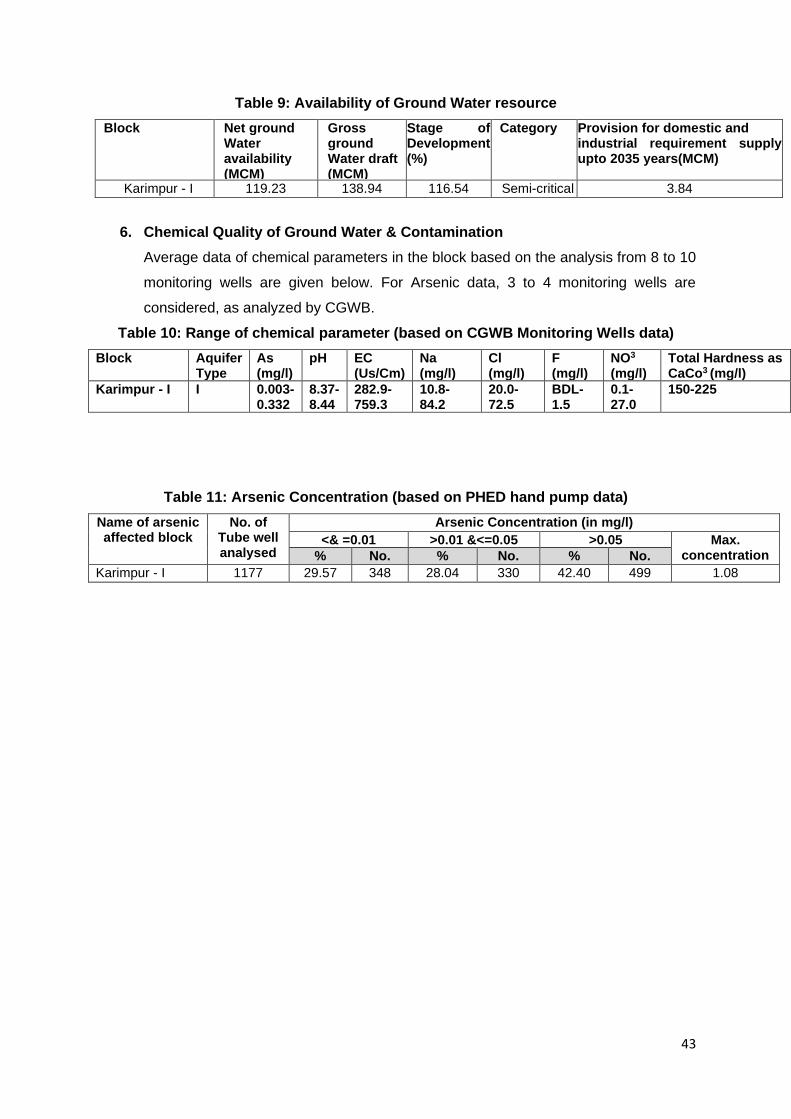
43
Table 9: Availability of Ground Water resource
Block Net ground Water availability (MCM)
Gross ground Water draft (MCM)
Stage of Development (%)
Category Provision for domestic and industrial requirement supply upto 2035 years(MCM)
Karimpur - I 119.23
138.94 116.54 Semi-critical 3.84
6. Chemical Quality of Ground Water & Contamination
Average data of chemical parameters in the block based on the analysis from 8 to 10
monitoring wells are given below. For Arsenic data, 3 to 4 monitoring wells are
considered, as analyzed by CGWB.
Table 10: Range of chemical parameter (based on CGWB Monitoring Wells data)
Block Aquifer Type
As (mg/l)
pH EC (Us/Cm)
Na (mg/l)
Cl (mg/l)
F (mg/l)
NO3 (mg/l)
Total Hardness as CaCo3 (mg/l)
Karimpur - I I 0.003-0.332
8.37-8.44
282.9-759.3
10.8-84.2
20.0-72.5
BDL-1.5
0.1-27.0
150-225
Table 11: Arsenic Concentration (based on PHED hand pump data)
Name of arsenic affected block
No. of Tube well analysed
Arsenic Concentration (in mg/l)
<& =0.01 >0.01 &<=0.05 >0.05 Max. concentration % No. % No. % No.
Karimpur - I 1177 29.57 348 28.04 330 42.40 499 1.08
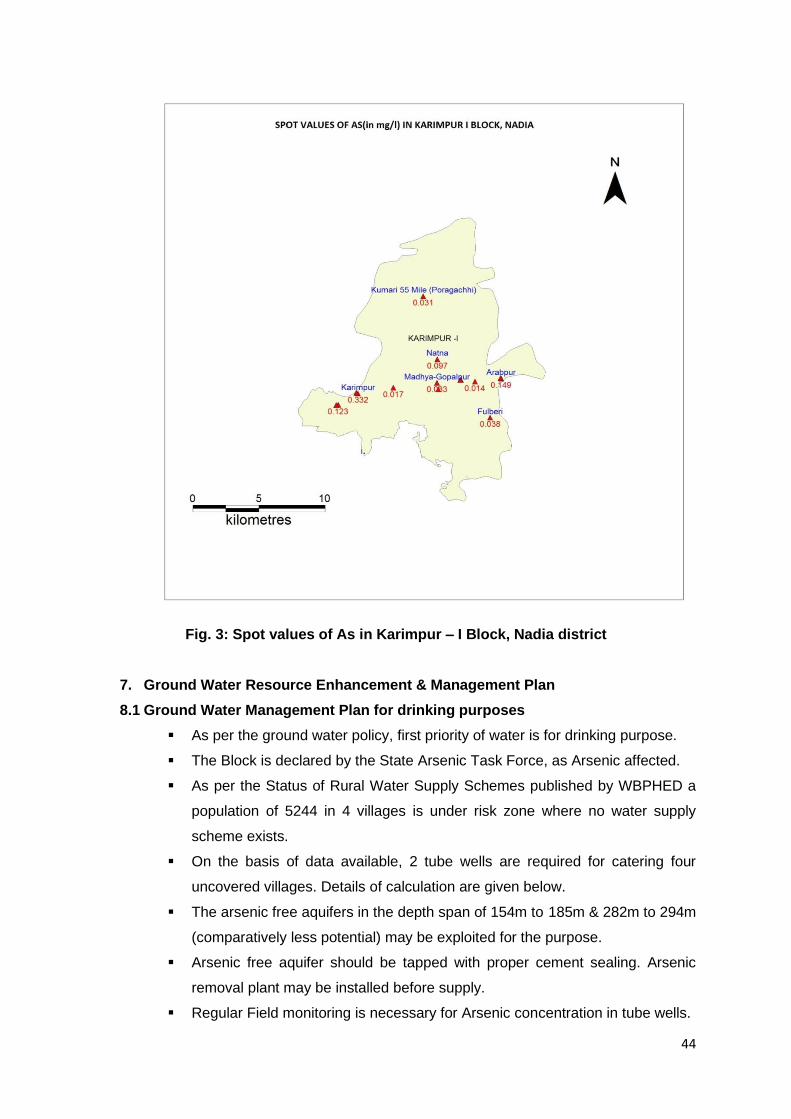
44
Fig. 3: Spot values of As in Karimpur – I Block, Nadia district
7. Ground Water Resource Enhancement & Management Plan
8.1 Ground Water Management Plan for drinking purposes
▪ As per the ground water policy, first priority of water is for drinking purpose.
▪ The Block is declared by the State Arsenic Task Force, as Arsenic affected.
▪ As per the Status of Rural Water Supply Schemes published by WBPHED a
population of 5244 in 4 villages is under risk zone where no water supply
scheme exists.
▪ On the basis of data available, 2 tube wells are required for catering four
uncovered villages. Details of calculation are given below.
▪ The arsenic free aquifers in the depth span of 154m to 185m & 282m to 294m
(comparatively less potential) may be exploited for the purpose.
▪ Arsenic free aquifer should be tapped with proper cement sealing. Arsenic
removal plant may be installed before supply.
▪ Regular Field monitoring is necessary for Arsenic concentration in tube wells.
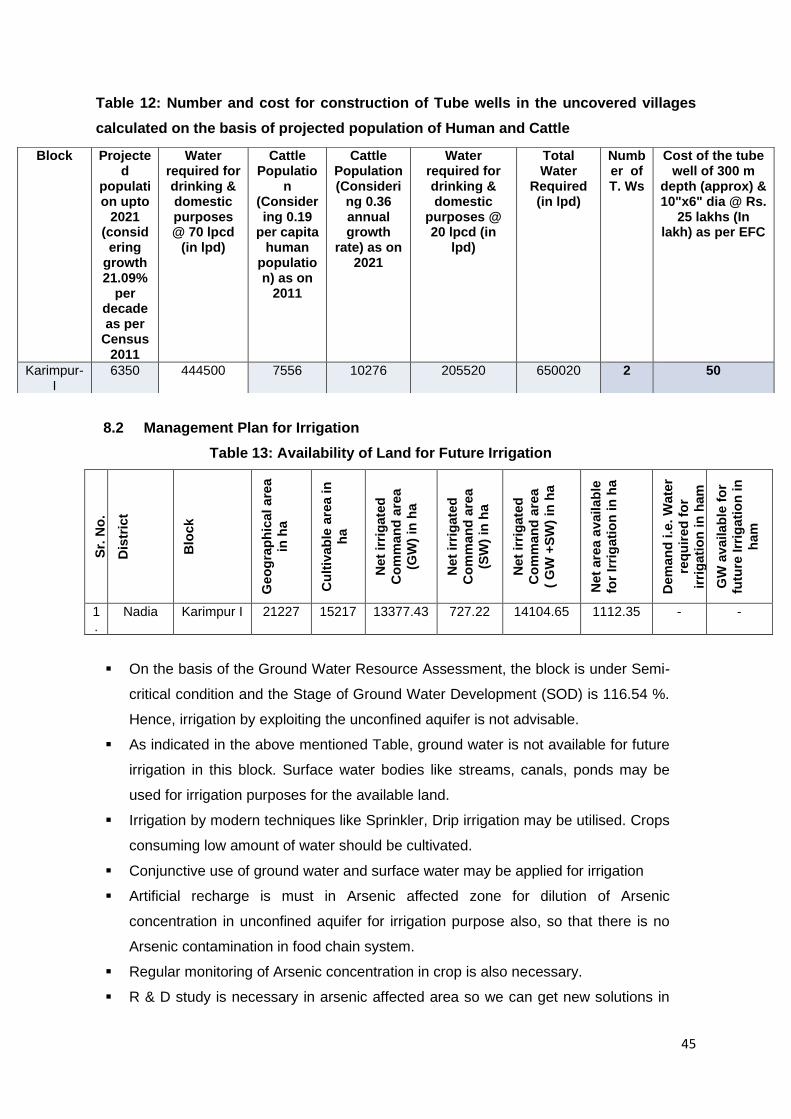
45
Table 12: Number and cost for construction of Tube wells in the uncovered villages
calculated on the basis of projected population of Human and Cattle
8.2 Management Plan for Irrigation
Table 13: Availability of Land for Future Irrigation
Sr.
No
.
Dis
tric
t
Blo
ck
Geo
gra
ph
ica
l a
rea
in h
a
Cu
ltiv
ab
le a
rea in
ha
Net
irri
gate
d
Co
mm
an
d a
rea
(GW
) in
ha
Net
irri
gate
d
Co
mm
an
d a
rea
(SW
) in
ha
Net
irri
gate
d
Co
mm
an
d a
rea
( G
W +
SW
) in
ha
Net
are
a a
vail
ab
le
for
Irri
gati
on
in
ha
Dem
an
d i.e
. W
ate
r
req
uir
ed
fo
r
irri
gati
on
in
ham
GW
av
ailab
le f
or
futu
re Irr
igati
on
in
ham
1.
Nadia Karimpur I 21227 15217 13377.43 727.22 14104.65 1112.35 - -
▪ On the basis of the Ground Water Resource Assessment, the block is under Semi-
critical condition and the Stage of Ground Water Development (SOD) is 116.54 %.
Hence, irrigation by exploiting the unconfined aquifer is not advisable.
▪ As indicated in the above mentioned Table, ground water is not available for future
irrigation in this block. Surface water bodies like streams, canals, ponds may be
used for irrigation purposes for the available land.
▪ Irrigation by modern techniques like Sprinkler, Drip irrigation may be utilised. Crops
consuming low amount of water should be cultivated.
▪ Conjunctive use of ground water and surface water may be applied for irrigation
▪ Artificial recharge is must in Arsenic affected zone for dilution of Arsenic
concentration in unconfined aquifer for irrigation purpose also, so that there is no
Arsenic contamination in food chain system.
▪ Regular monitoring of Arsenic concentration in crop is also necessary.
▪ R & D study is necessary in arsenic affected area so we can get new solutions in
Block Projected
population upto
2021 (considering
growth 21.09%
per decade as per
Census 2011
Water required for drinking & domestic purposes @ 70 lpcd
(in lpd)
Cattle Populatio
n (Considering 0.19
per capita human
population) as on
2011
Cattle Population (Consideri
ng 0.36 annual growth
rate) as on 2021
Water required for drinking & domestic
purposes @ 20 lpcd (in
lpd)
Total Water
Required (in lpd)
Number of T. Ws
Cost of the tube well of 300 m
depth (approx) & 10"x6" dia @ Rs.
25 lakhs (In lakh) as per EFC
Karimpur- I
6350 444500 7556 10276 205520 650020 2 50
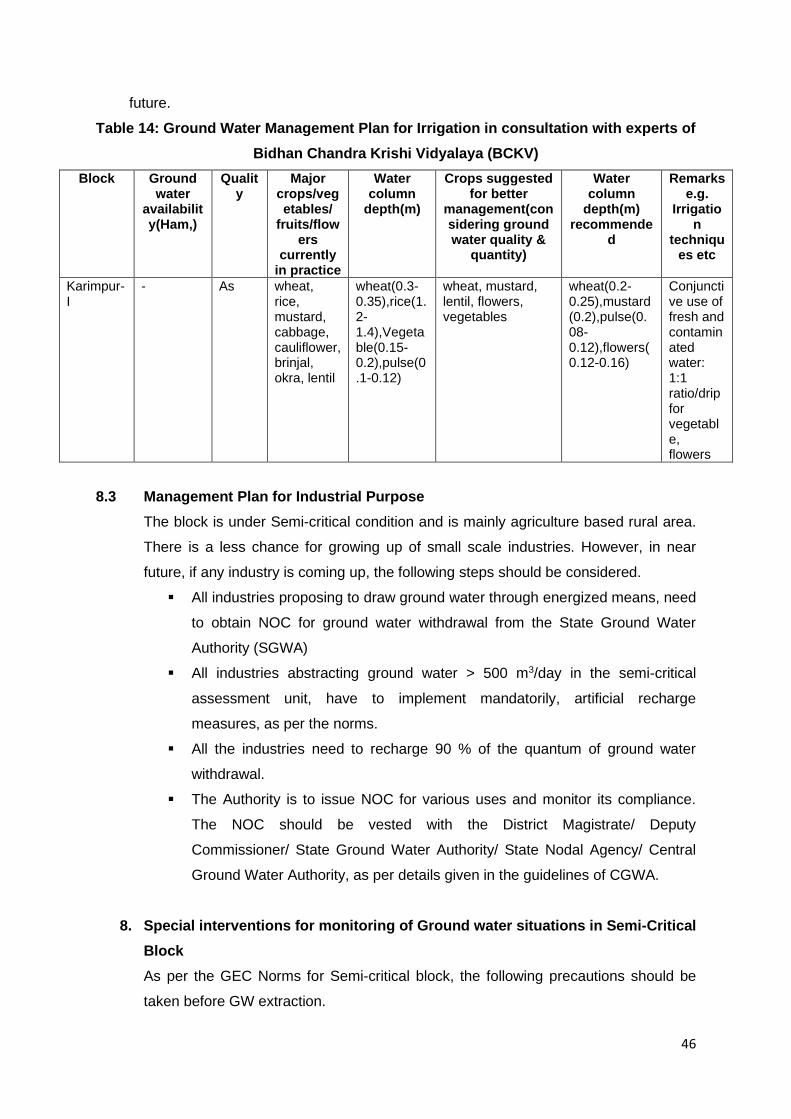
46
future.
Table 14: Ground Water Management Plan for Irrigation in consultation with experts of
Bidhan Chandra Krishi Vidyalaya (BCKV)
Block Ground water
availability(Ham,)
Quality
Major crops/vegetables/
fruits/flowers
currently in practice
Water column
depth(m)
Crops suggested for better
management(considering ground water quality &
quantity)
Water column
depth(m) recommende
d
Remarks e.g.
Irrigation
techniques etc
Karimpur-I
- As wheat, rice, mustard, cabbage, cauliflower, brinjal, okra, lentil
wheat(0.3-0.35),rice(1.2-1.4),Vegetable(0.15-0.2),pulse(0.1-0.12)
wheat, mustard, lentil, flowers, vegetables
wheat(0.2-0.25),mustard(0.2),pulse(0.08-0.12),flowers(0.12-0.16)
Conjunctive use of fresh and contaminated water: 1:1 ratio/drip for vegetable, flowers
8.3 Management Plan for Industrial Purpose
The block is under Semi-critical condition and is mainly agriculture based rural area.
There is a less chance for growing up of small scale industries. However, in near
future, if any industry is coming up, the following steps should be considered.
▪ All industries proposing to draw ground water through energized means, need
to obtain NOC for ground water withdrawal from the State Ground Water
Authority (SGWA)
▪ All industries abstracting ground water > 500 m3/day in the semi-critical
assessment unit, have to implement mandatorily, artificial recharge
measures, as per the norms.
▪ All the industries need to recharge 90 % of the quantum of ground water
withdrawal.
▪ The Authority is to issue NOC for various uses and monitor its compliance.
The NOC should be vested with the District Magistrate/ Deputy
Commissioner/ State Ground Water Authority/ State Nodal Agency/ Central
Ground Water Authority, as per details given in the guidelines of CGWA.
8. Special interventions for monitoring of Ground water situations in Semi-Critical
Block
As per the GEC Norms for Semi-critical block, the following precautions should be
taken before GW extraction.
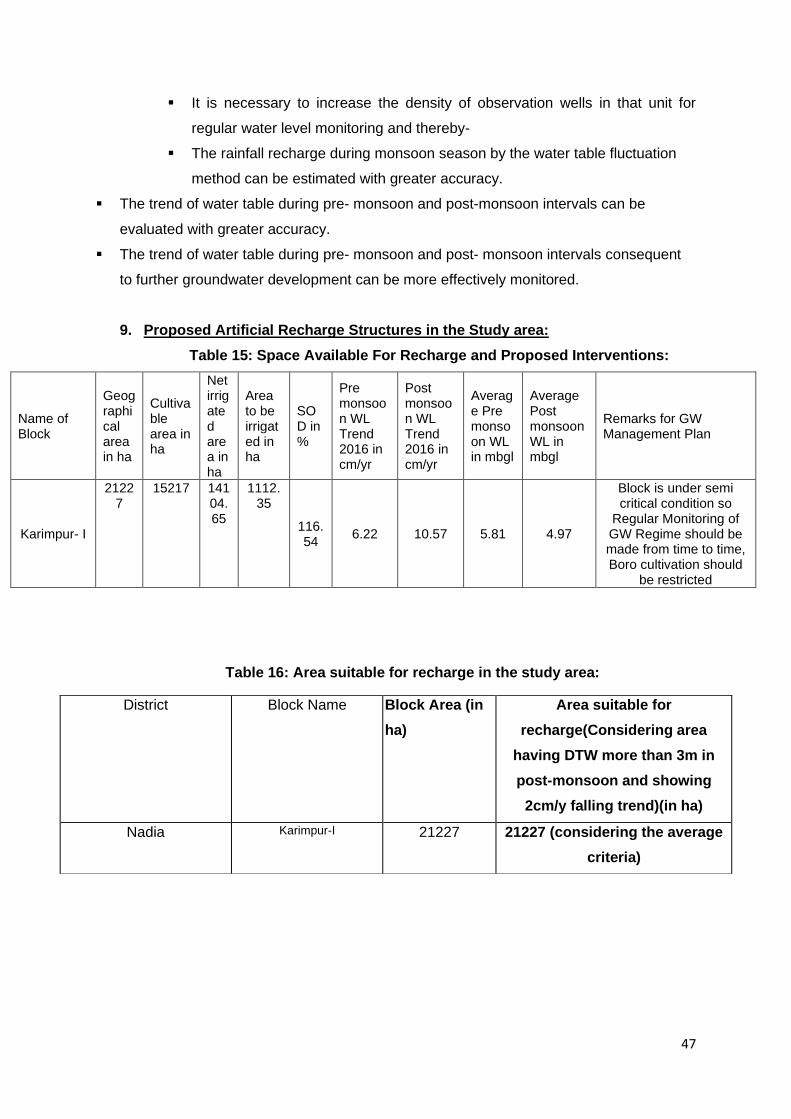
47
▪ It is necessary to increase the density of observation wells in that unit for
regular water level monitoring and thereby-
▪ The rainfall recharge during monsoon season by the water table fluctuation
method can be estimated with greater accuracy.
▪ The trend of water table during pre- monsoon and post-monsoon intervals can be
evaluated with greater accuracy.
▪ The trend of water table during pre- monsoon and post- monsoon intervals consequent
to further groundwater development can be more effectively monitored.
9. Proposed Artificial Recharge Structures in the Study area:
Table 15: Space Available For Recharge and Proposed Interventions:
Name of Block
Geographical area in ha
Cultivable area in ha
Net irrigated area in ha
Area to be irrigated in ha
SOD in %
Pre monsoon WL Trend 2016 in cm/yr
Post monsoon WL Trend 2016 in cm/yr
Average Pre monsoon WL in mbgl
Average Post monsoon WL in mbgl
Remarks for GW Management Plan
Karimpur- I
21227
15217 14104.65
1112.35
116.54
6.22 10.57 5.81 4.97
Block is under semi critical condition so
Regular Monitoring of GW Regime should be made from time to time, Boro cultivation should
be restricted
Table 16: Area suitable for recharge in the study area:
District Block Name Block Area (in
ha)
Area suitable for
recharge(Considering area
having DTW more than 3m in
post-monsoon and showing
2cm/y falling trend)(in ha)
Nadia Karimpur-I 21227 21227 (considering the average
criteria)
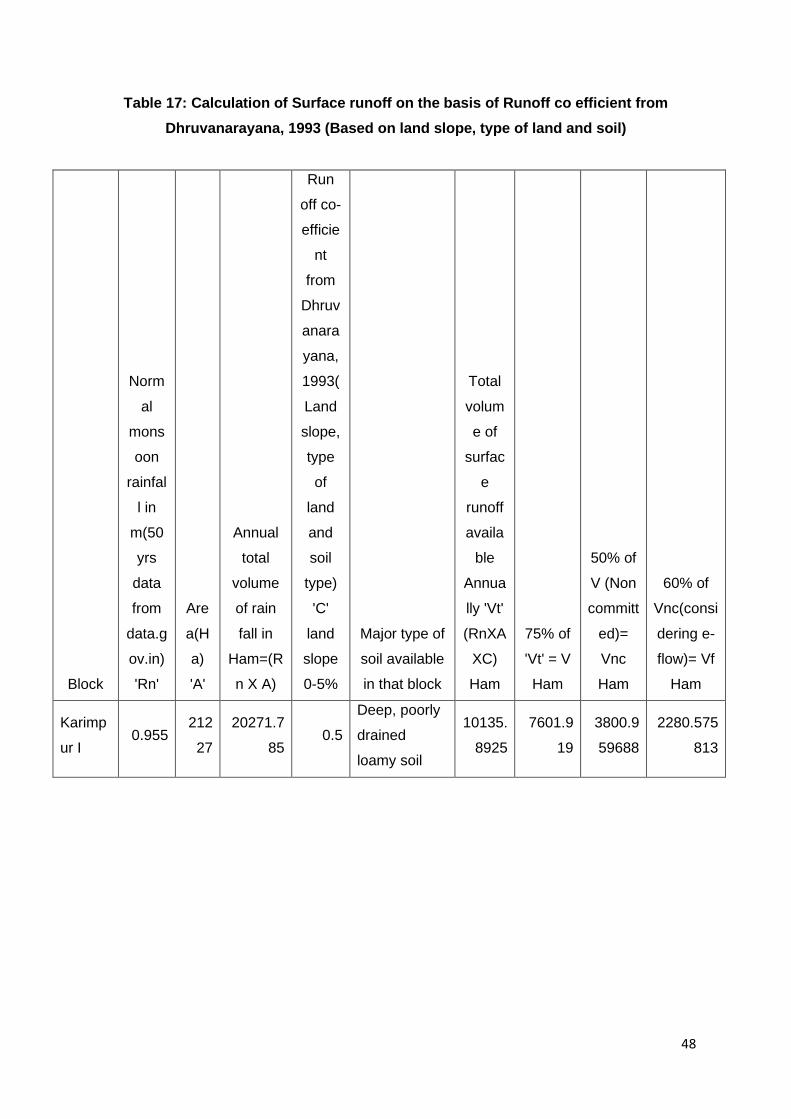
48
Table 17: Calculation of Surface runoff on the basis of Runoff co efficient from
Dhruvanarayana, 1993 (Based on land slope, type of land and soil)
Block
Norm
al
mons
oon
rainfal
l in
m(50
yrs
data
from
data.g
ov.in)
'Rn'
Are
a(H
a)
'A'
Annual
total
volume
of rain
fall in
Ham=(R
n X A)
Run
off co-
efficie
nt
from
Dhruv
anara
yana,
1993(
Land
slope,
type
of
land
and
soil
type)
'C'
land
slope
0-5%
Major type of
soil available
in that block
Total
volum
e of
surfac
e
runoff
availa
ble
Annua
lly 'Vt'
(RnXA
XC)
Ham
75% of
'Vt' = V
Ham
50% of
V (Non
committ
ed)=
Vnc
Ham
60% of
Vnc(consi
dering e-
flow)= Vf
Ham
Karimp
ur I 0.955
212
27
20271.7
85 0.5
Deep, poorly
drained
loamy soil
10135.
8925
7601.9
19
3800.9
59688
2280.575
813
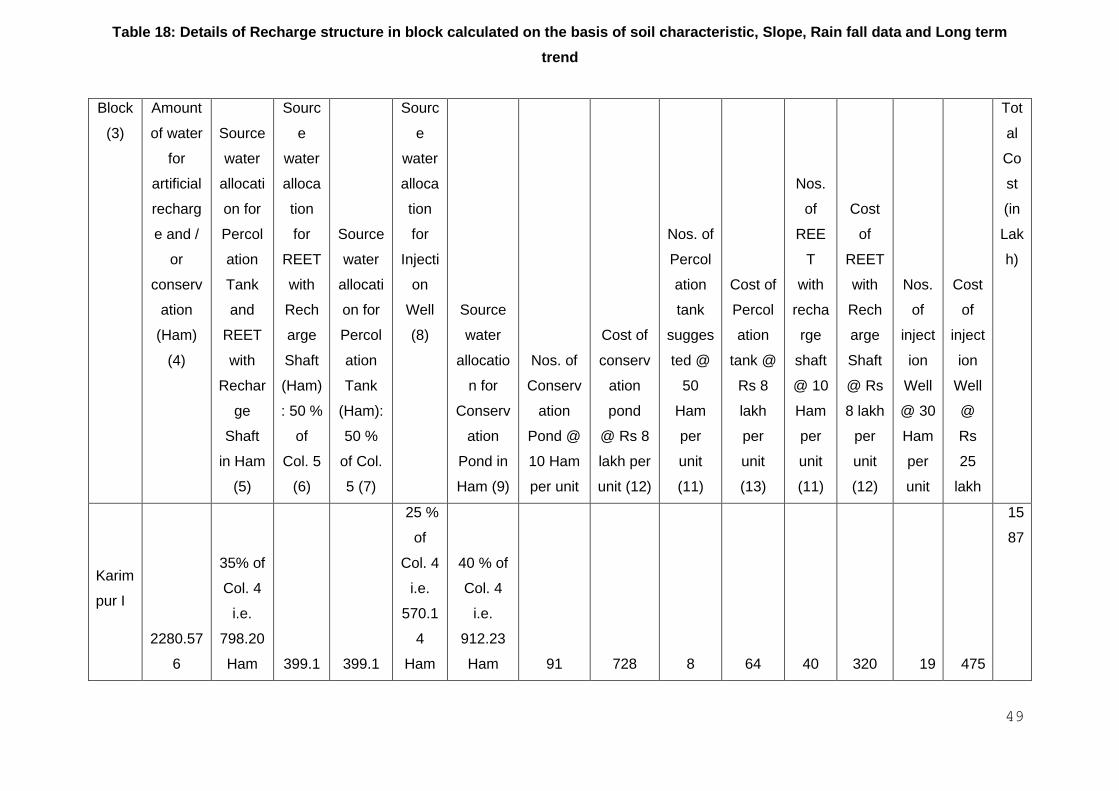
49
Table 18: Details of Recharge structure in block calculated on the basis of soil characteristic, Slope, Rain fall data and Long term
trend
Block
(3)
Amount
of water
for
artificial
recharg
e and /
or
conserv
ation
(Ham)
(4)
Source
water
allocati
on for
Percol
ation
Tank
and
REET
with
Rechar
ge
Shaft
in Ham
(5)
Sourc
e
water
alloca
tion
for
REET
with
Rech
arge
Shaft
(Ham)
: 50 %
of
Col. 5
(6)
Source
water
allocati
on for
Percol
ation
Tank
(Ham):
50 %
of Col.
5 (7)
Sourc
e
water
alloca
tion
for
Injecti
on
Well
(8)
Source
water
allocatio
n for
Conserv
ation
Pond in
Ham (9)
Nos. of
Conserv
ation
Pond @
10 Ham
per unit
Cost of
conserv
ation
pond
@ Rs 8
lakh per
unit (12)
Nos. of
Percol
ation
tank
sugges
ted @
50
Ham
per
unit
(11)
Cost of
Percol
ation
tank @
Rs 8
lakh
per
unit
(13)
Nos.
of
REE
T
with
recha
rge
shaft
@ 10
Ham
per
unit
(11)
Cost
of
REET
with
Rech
arge
Shaft
@ Rs
8 lakh
per
unit
(12)
Nos.
of
inject
ion
Well
@ 30
Ham
per
unit
Cost
of
inject
ion
Well
@
Rs
25
lakh
Tot
al
Co
st
(in
Lak
h)
Karim
pur I
2280.57
6
35% of
Col. 4
i.e.
798.20
Ham 399.1 399.1
25 %
of
Col. 4
i.e.
570.1
4
Ham
40 % of
Col. 4
i.e.
912.23
Ham 91 728 8 64 40 320 19 475
15
87
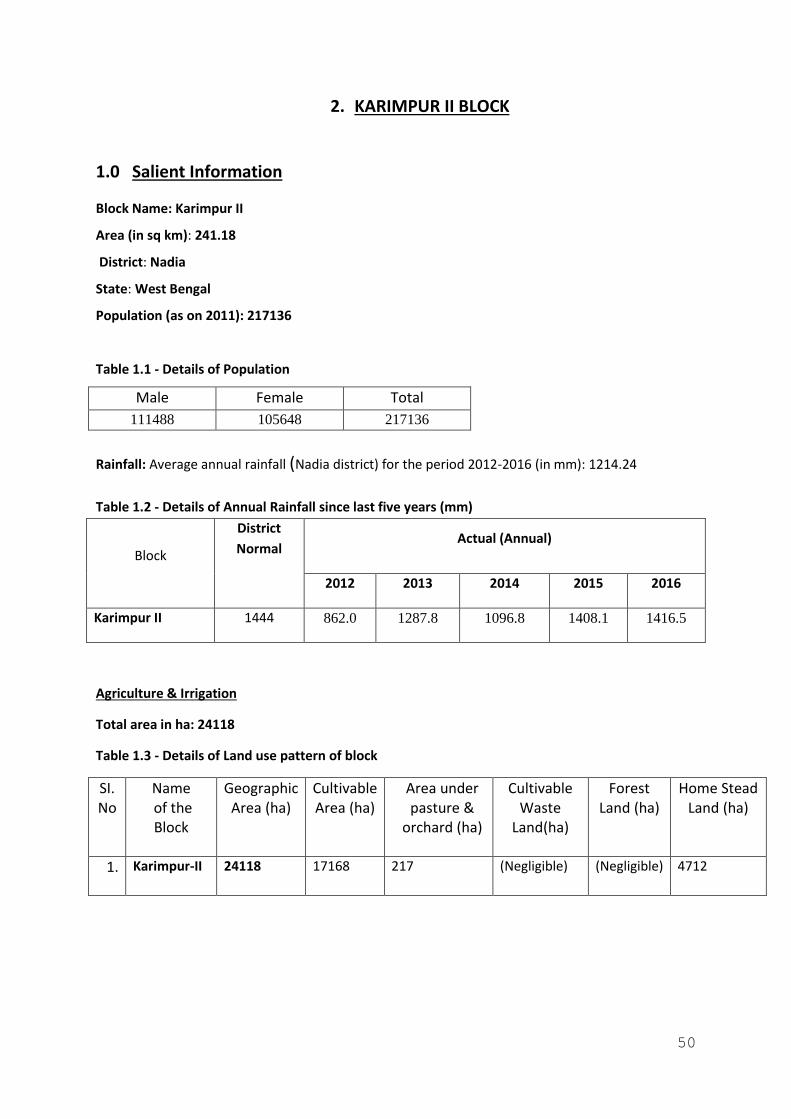
50
2. KARIMPUR II BLOCK
1.0 Salient Information
Block Name: Karimpur II
Area (in sq km): 241.18
District: Nadia
State: West Bengal
Population (as on 2011): 217136
Table 1.1 - Details of Population
Male Female Total
111488 105648 217136
Rainfall: Average annual rainfall (Nadia district) for the period 2012-2016 (in mm): 1214.24
Table 1.2 - Details of Annual Rainfall since last five years (mm)
Block
District
Normal Actual (Annual)
2012 2013 2014 2015 2016
Karimpur II 1444 862.0 1287.8 1096.8 1408.1 1416.5
Agriculture & Irrigation
Total area in ha: 24118
Table 1.3 - Details of Land use pattern of block
SI. No
Name of the Block
Geographic Area (ha)
Cultivable Area (ha)
Area under pasture &
orchard (ha)
Cultivable Waste
Land(ha)
Forest Land (ha)
Home Stead Land (ha)
1. Karimpur-II 24118
17168 217 (Negligible) (Negligible) 4712
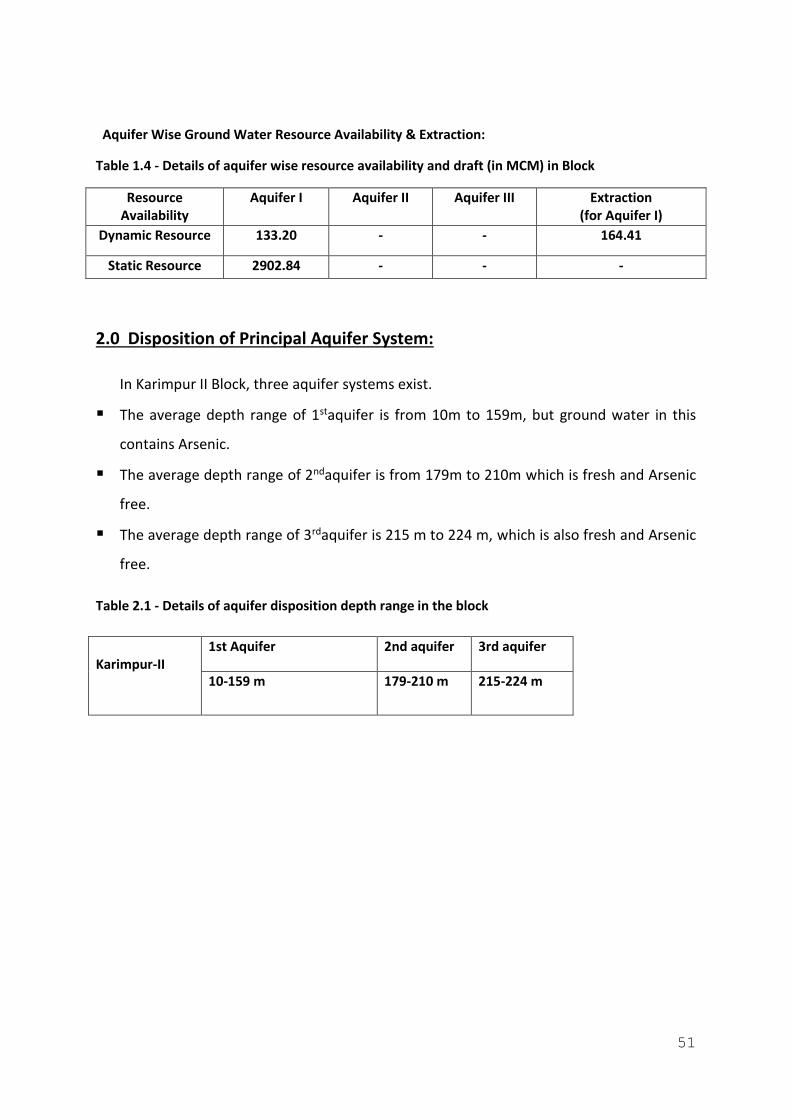
51
Aquifer Wise Ground Water Resource Availability & Extraction:
Table 1.4 - Details of aquifer wise resource availability and draft (in MCM) in Block
Resource Availability
Aquifer I Aquifer II Aquifer III Extraction (for Aquifer I)
Dynamic Resource 133.20 - - 164.41
Static Resource 2902.84 - - -
2.0 Disposition of Principal Aquifer System:
In Karimpur II Block, three aquifer systems exist.
▪ The average depth range of 1staquifer is from 10m to 159m, but ground water in this
contains Arsenic.
▪ The average depth range of 2ndaquifer is from 179m to 210m which is fresh and Arsenic
free.
▪ The average depth range of 3rdaquifer is 215 m to 224 m, which is also fresh and Arsenic
free.
Table 2.1 - Details of aquifer disposition depth range in the block
Karimpur-II
1st Aquifer 2nd aquifer 3rd aquifer
10-159 m 179-210 m 215-224 m

52
Fig 2.1 - Aquifer disposition in Karimpur II Block
Fig 2.2 – Cross section index line in Karimpur II Block
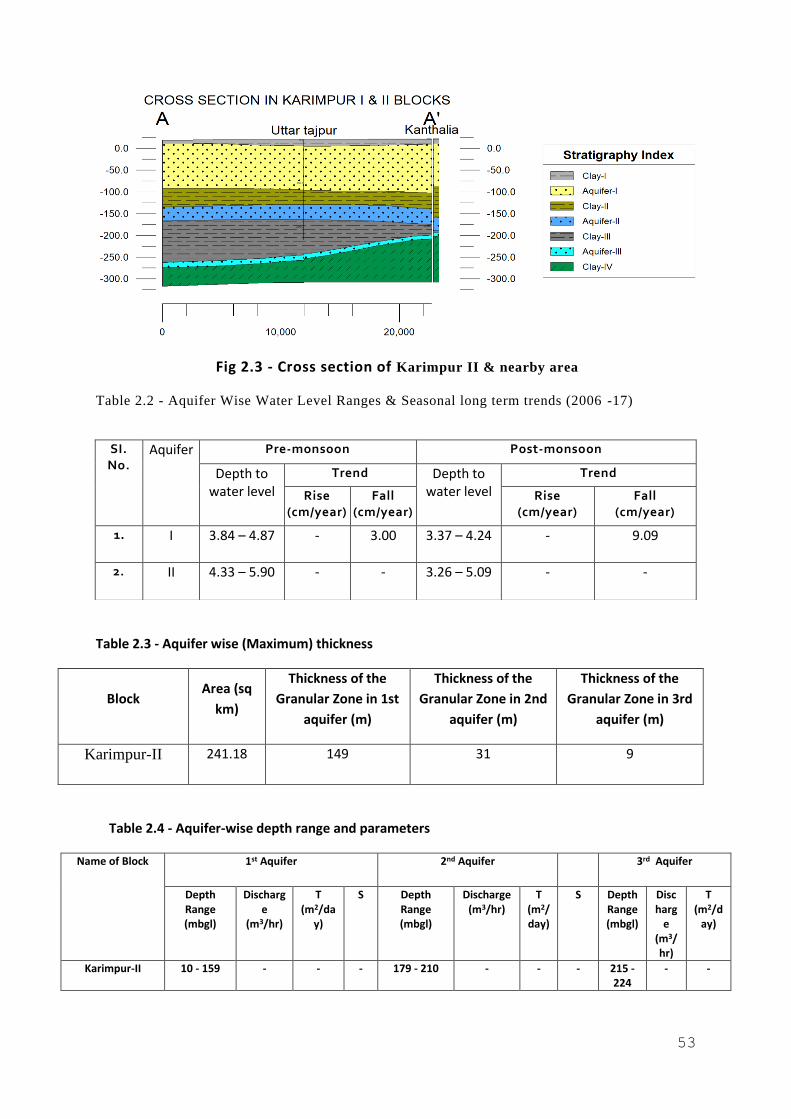
53
Fig 2.3 - Cross section of Karimpur II & nearby area
Table 2.2 - Aquifer Wise Water Level Ranges & Seasonal long term trends (2006 -17)
Table 2.3 - Aquifer wise (Maximum) thickness
Block Area (sq
km)
Thickness of the
Granular Zone in 1st
aquifer (m)
Thickness of the
Granular Zone in 2nd
aquifer (m)
Thickness of the
Granular Zone in 3rd
aquifer (m)
Karimpur-II 241.18 149 31 9
Table 2.4 - Aquifer-wise depth range and parameters
Name of Block 1st Aquifer 2nd Aquifer 3rd Aquifer
Depth Range (mbgl)
Discharge
(m3/hr)
T (m2/da
y)
S Depth Range (mbgl)
Discharge (m3/hr)
T (m2/day)
S Depth Range (mbgl)
Discharg
e (m3/hr)
T (m2/d
ay)
Karimpur-II 10 - 159 - - - 179 - 210 - - - 215 - 224
- -
SI. No.
Aquifer Pre-monsoon Post-monsoon
Depth to water level
Trend Depth to water level
Trend
Rise (cm/year)
Fall (cm/year)
Rise (cm/year)
Fall (cm/year)
1. I 3.84 – 4.87 - 3.00 3.37 – 4.24 - 9.09
2. II 4.33 – 5.90 - - 3.26 – 5.09 - -
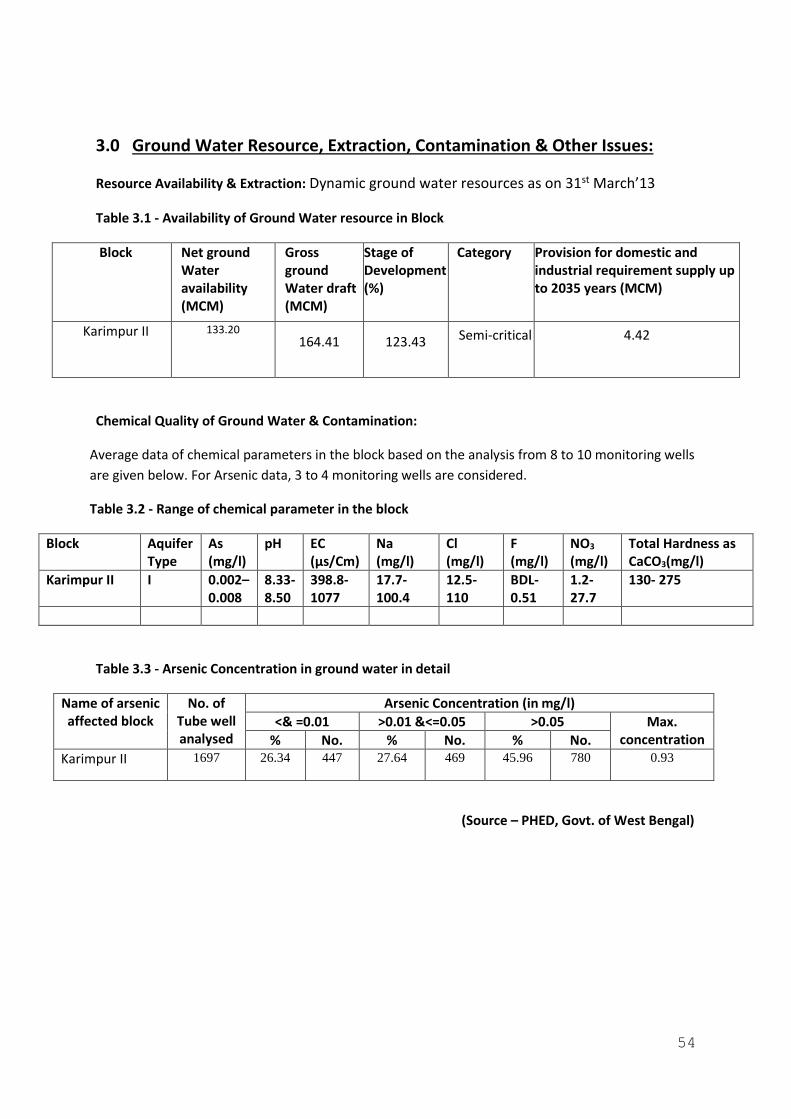
54
3.0 Ground Water Resource, Extraction, Contamination & Other Issues:
Resource Availability & Extraction: Dynamic ground water resources as on 31st March’13
Table 3.1 - Availability of Ground Water resource in Block
Block Net ground Water availability (MCM)
Gross ground Water draft (MCM)
Stage of Development (%)
Category Provision for domestic and industrial requirement supply up to 2035 years (MCM)
Karimpur II 133.20
164.41 123.43 Semi-critical 4.42
Chemical Quality of Ground Water & Contamination:
Average data of chemical parameters in the block based on the analysis from 8 to 10 monitoring wells
are given below. For Arsenic data, 3 to 4 monitoring wells are considered.
Table 3.2 - Range of chemical parameter in the block
Block Aquifer Type
As (mg/l)
pH EC (µs/Cm)
Na (mg/l)
Cl (mg/l)
F (mg/l)
NO3 (mg/l)
Total Hardness as CaCO3(mg/l)
Karimpur II I 0.002– 0.008
8.33- 8.50
398.8- 1077
17.7- 100.4
12.5- 110
BDL- 0.51
1.2- 27.7
130- 275
Table 3.3 - Arsenic Concentration in ground water in detail
Name of arsenic affected block
No. of Tube well analysed
Arsenic Concentration (in mg/l)
<& =0.01 >0.01 &<=0.05 >0.05 Max. concentration % No. % No. % No.
Karimpur II 1697 26.34 447 27.64 469 45.96 780 0.93
(Source – PHED, Govt. of West Bengal)
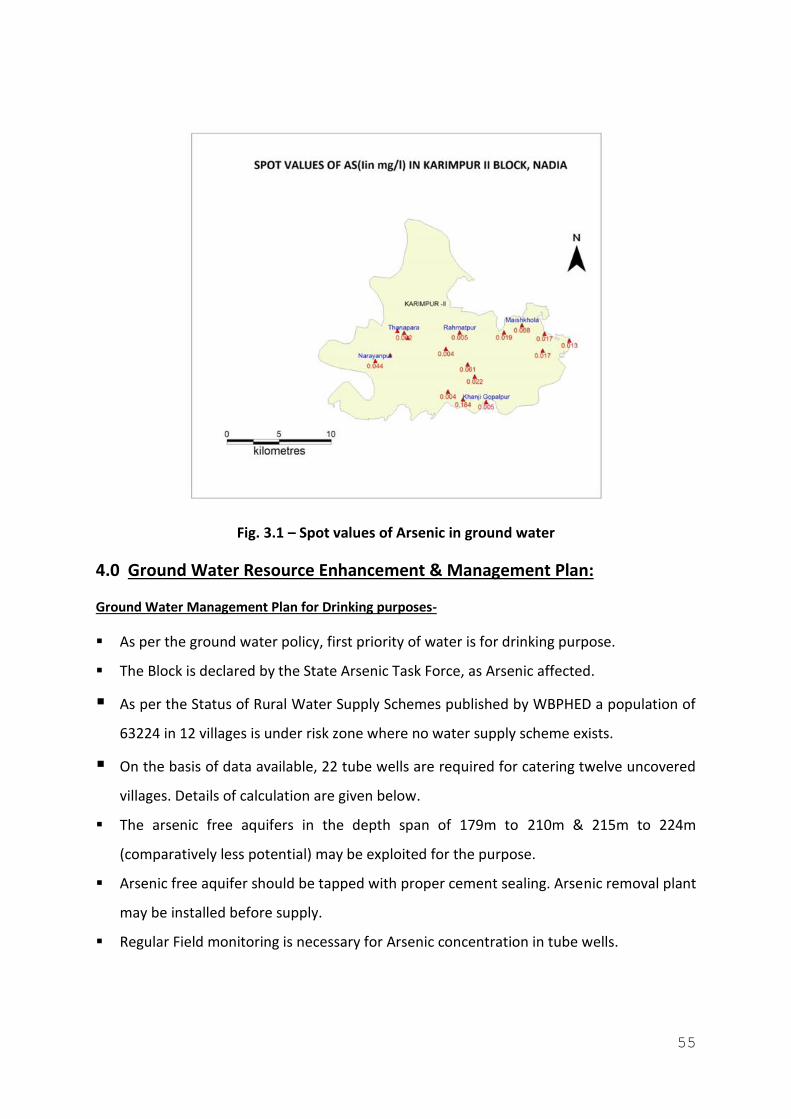
55
Fig. 3.1 – Spot values of Arsenic in ground water
4.0 Ground Water Resource Enhancement & Management Plan:
Ground Water Management Plan for Drinking purposes-
▪ As per the ground water policy, first priority of water is for drinking purpose.
▪ The Block is declared by the State Arsenic Task Force, as Arsenic affected.
▪ As per the Status of Rural Water Supply Schemes published by WBPHED a population of
63224 in 12 villages is under risk zone where no water supply scheme exists.
▪ On the basis of data available, 22 tube wells are required for catering twelve uncovered
villages. Details of calculation are given below.
▪ The arsenic free aquifers in the depth span of 179m to 210m & 215m to 224m
(comparatively less potential) may be exploited for the purpose.
▪ Arsenic free aquifer should be tapped with proper cement sealing. Arsenic removal plant
may be installed before supply.
▪ Regular Field monitoring is necessary for Arsenic concentration in tube wells.
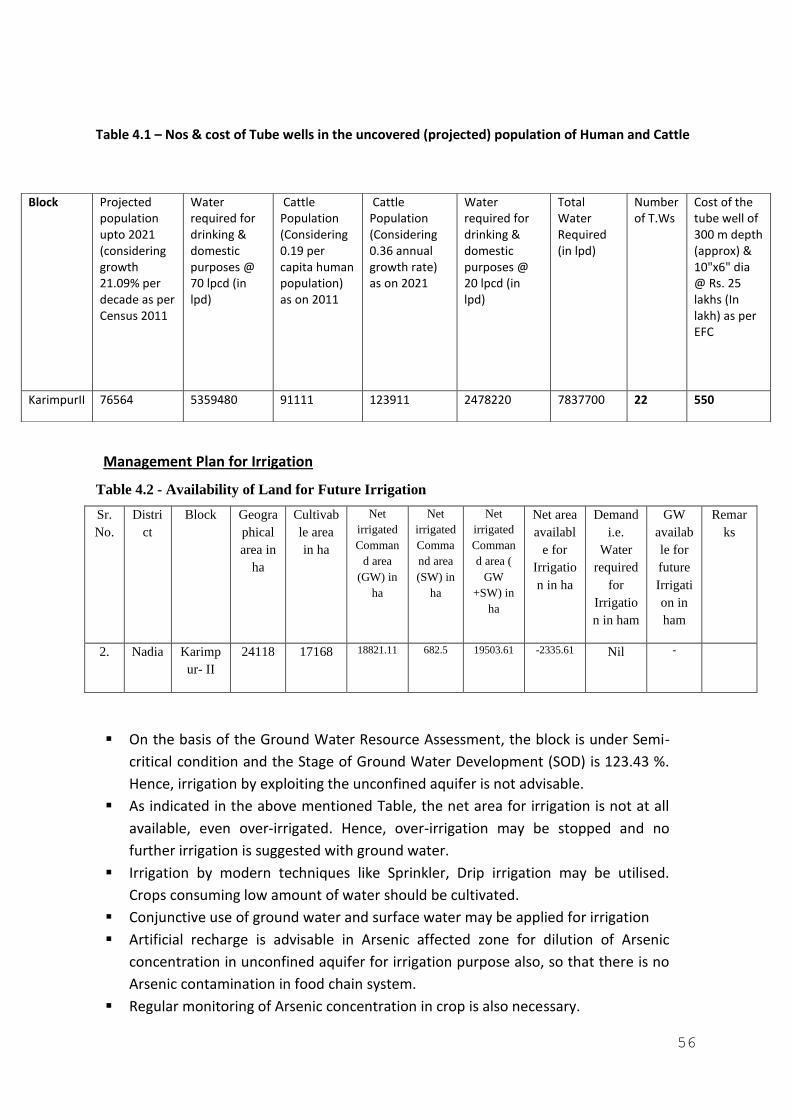
56
Table 4.1 – Nos & cost of Tube wells in the uncovered (projected) population of Human and Cattle
Management Plan for Irrigation
Table 4.2 - Availability of Land for Future Irrigation
Sr.
No.
Distri
ct
Block Geogra
phical
area in
ha
Cultivab
le area
in ha
Net
irrigated
Comman
d area
(GW) in
ha
Net
irrigated
Comma
nd area
(SW) in
ha
Net
irrigated
Comman
d area (
GW
+SW) in
ha
Net area
availabl
e for
Irrigatio
n in ha
Demand
i.e.
Water
required
for
Irrigatio
n in ham
GW
availab
le for
future
Irrigati
on in
ham
Remar
ks
2. Nadia Karimp
ur- II
24118 17168 18821.11 682.5 19503.61 -2335.61 Nil -
▪ On the basis of the Ground Water Resource Assessment, the block is under Semi-
critical condition and the Stage of Ground Water Development (SOD) is 123.43 %.
Hence, irrigation by exploiting the unconfined aquifer is not advisable.
▪ As indicated in the above mentioned Table, the net area for irrigation is not at all
available, even over-irrigated. Hence, over-irrigation may be stopped and no
further irrigation is suggested with ground water.
▪ Irrigation by modern techniques like Sprinkler, Drip irrigation may be utilised.
Crops consuming low amount of water should be cultivated.
▪ Conjunctive use of ground water and surface water may be applied for irrigation
▪ Artificial recharge is advisable in Arsenic affected zone for dilution of Arsenic
concentration in unconfined aquifer for irrigation purpose also, so that there is no
Arsenic contamination in food chain system.
▪ Regular monitoring of Arsenic concentration in crop is also necessary.
Block Projected population upto 2021 (considering growth 21.09% per decade as per Census 2011
Water required for drinking & domestic purposes @ 70 lpcd (in lpd)
Cattle Population (Considering 0.19 per capita human population) as on 2011
Cattle Population (Considering 0.36 annual growth rate) as on 2021
Water required for drinking & domestic purposes @ 20 lpcd (in lpd)
Total Water Required (in lpd)
Number of T.Ws
Cost of the tube well of 300 m depth (approx) & 10"x6" dia @ Rs. 25 lakhs (In lakh) as per EFC
KarimpurII 76564 5359480 91111 123911 2478220 7837700 22 550
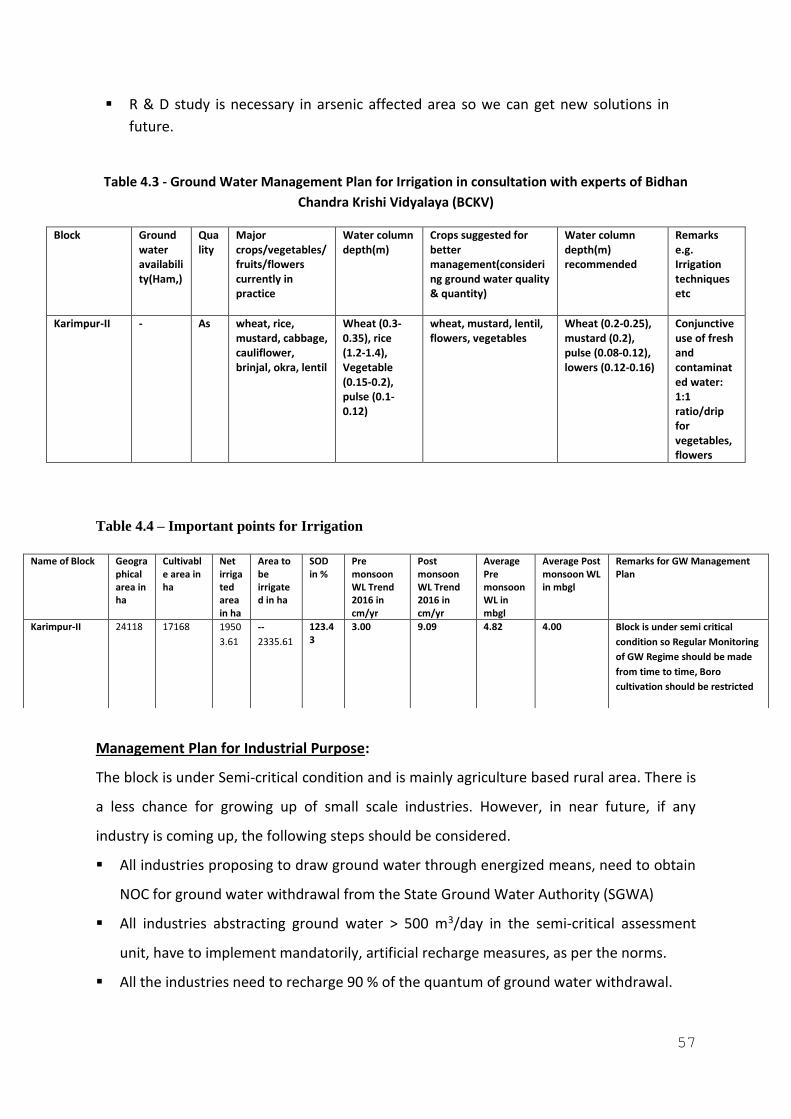
57
▪ R & D study is necessary in arsenic affected area so we can get new solutions in
future.
Table 4.3 - Ground Water Management Plan for Irrigation in consultation with experts of Bidhan
Chandra Krishi Vidyalaya (BCKV)
Block Ground water availability(Ham,)
Quality
Major crops/vegetables/ fruits/flowers currently in practice
Water column depth(m)
Crops suggested for better management(considering ground water quality & quantity)
Water column depth(m) recommended
Remarks e.g. Irrigation techniques etc
Karimpur-II - As wheat, rice, mustard, cabbage, cauliflower, brinjal, okra, lentil
Wheat (0.3-0.35), rice (1.2-1.4), Vegetable (0.15-0.2), pulse (0.1-0.12)
wheat, mustard, lentil, flowers, vegetables
Wheat (0.2-0.25), mustard (0.2), pulse (0.08-0.12), lowers (0.12-0.16)
Conjunctive use of fresh and contaminated water: 1:1 ratio/drip for vegetables, flowers
Table 4.4 – Important points for Irrigation
Management Plan for Industrial Purpose:
The block is under Semi-critical condition and is mainly agriculture based rural area. There is
a less chance for growing up of small scale industries. However, in near future, if any
industry is coming up, the following steps should be considered.
▪ All industries proposing to draw ground water through energized means, need to obtain
NOC for ground water withdrawal from the State Ground Water Authority (SGWA)
▪ All industries abstracting ground water > 500 m3/day in the semi-critical assessment
unit, have to implement mandatorily, artificial recharge measures, as per the norms.
▪ All the industries need to recharge 90 % of the quantum of ground water withdrawal.
Name of Block Geographical area in ha
Cultivable area in ha
Net irrigated area in ha
Area to be irrigated in ha
SOD in %
Pre monsoon WL Trend 2016 in cm/yr
Post monsoon WL Trend 2016 in cm/yr
Average Pre monsoon WL in mbgl
Average Post monsoon WL in mbgl
Remarks for GW Management Plan
Karimpur-II 24118 17168 1950
3.61
--
2335.61
123.43
3.00 9.09 4.82 4.00 Block is under semi critical
condition so Regular Monitoring
of GW Regime should be made
from time to time, Boro
cultivation should be restricted
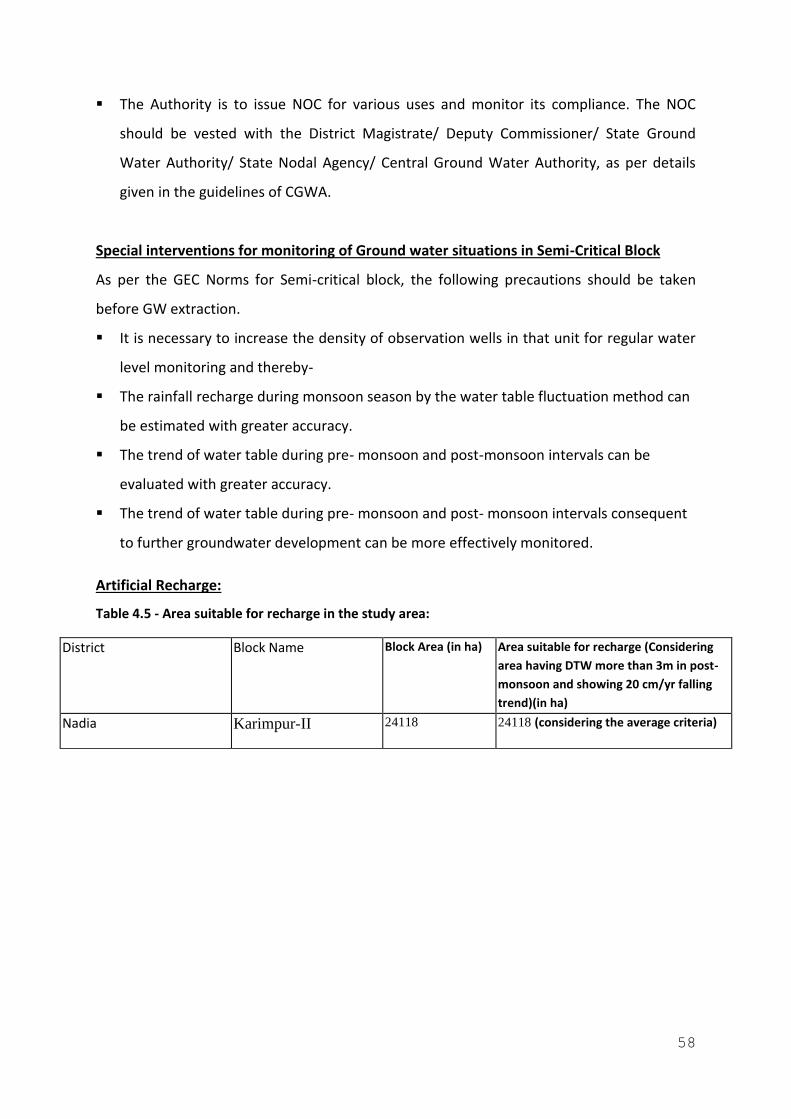
58
▪ The Authority is to issue NOC for various uses and monitor its compliance. The NOC
should be vested with the District Magistrate/ Deputy Commissioner/ State Ground
Water Authority/ State Nodal Agency/ Central Ground Water Authority, as per details
given in the guidelines of CGWA.
Special interventions for monitoring of Ground water situations in Semi-Critical Block
As per the GEC Norms for Semi-critical block, the following precautions should be taken
before GW extraction.
▪ It is necessary to increase the density of observation wells in that unit for regular water
level monitoring and thereby-
▪ The rainfall recharge during monsoon season by the water table fluctuation method can
be estimated with greater accuracy.
▪ The trend of water table during pre- monsoon and post-monsoon intervals can be
evaluated with greater accuracy.
▪ The trend of water table during pre- monsoon and post- monsoon intervals consequent
to further groundwater development can be more effectively monitored.
Artificial Recharge:
Table 4.5 - Area suitable for recharge in the study area:
District Block Name Block Area (in ha) Area suitable for recharge (Considering
area having DTW more than 3m in post-
monsoon and showing 20 cm/yr falling
trend)(in ha)
Nadia Karimpur-II 24118 24118 (considering the average criteria)
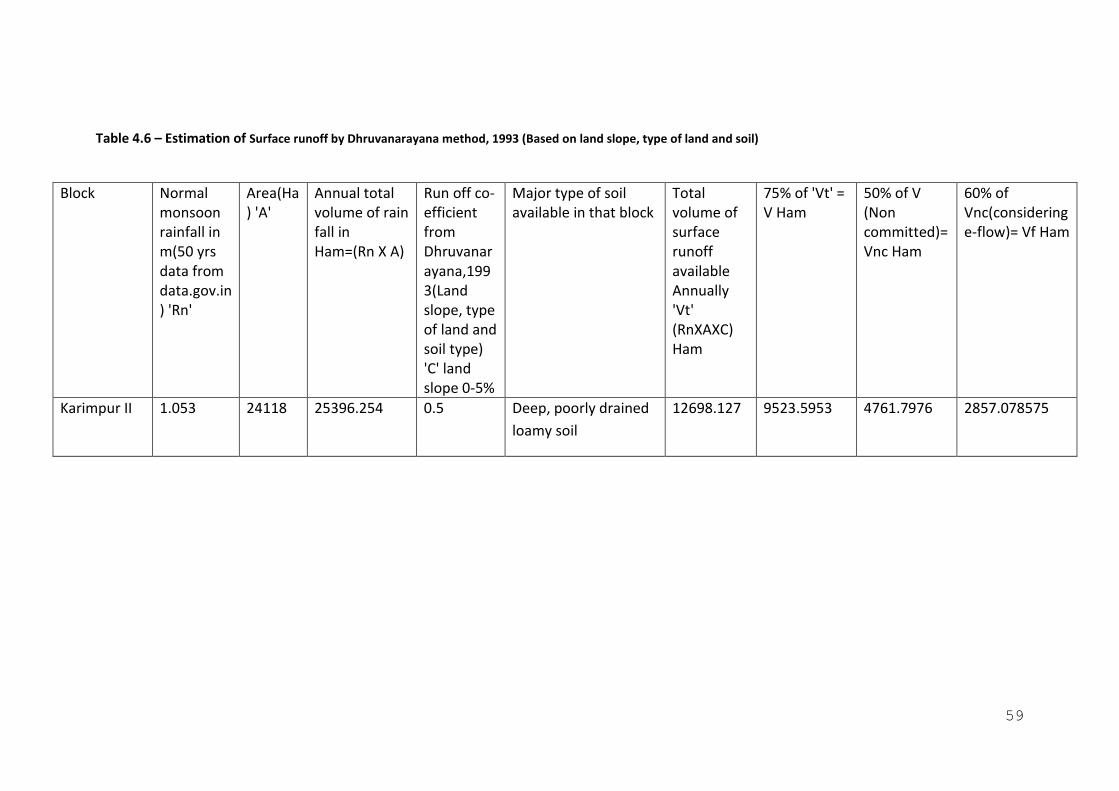
59
Table 4.6 – Estimation of Surface runoff by Dhruvanarayana method, 1993 (Based on land slope, type of land and soil)
Block Normal monsoon rainfall in m(50 yrs data from data.gov.in) 'Rn'
Area(Ha) 'A'
Annual total volume of rain fall in Ham=(Rn X A)
Run off co-efficient from Dhruvanarayana,1993(Land slope, type of land and soil type) 'C' land slope 0-5%
Major type of soil available in that block
Total volume of surface runoff available Annually 'Vt' (RnXAXC) Ham
75% of 'Vt' = V Ham
50% of V (Non committed)= Vnc Ham
60% of Vnc(considering e-flow)= Vf Ham
Karimpur II 1.053 24118 25396.254 0.5 Deep, poorly drained
loamy soil
12698.127 9523.5953 4761.7976 2857.078575
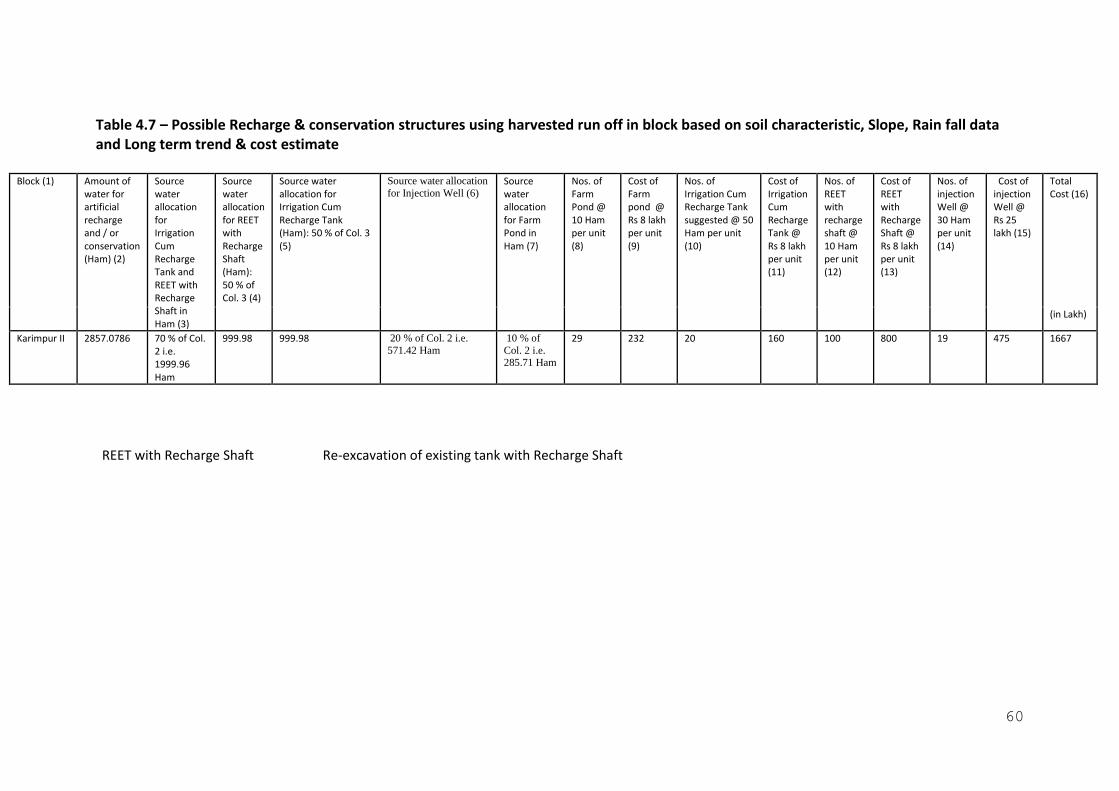
60
Table 4.7 – Possible Recharge & conservation structures using harvested run off in block based on soil characteristic, Slope, Rain fall data and Long term trend & cost estimate
Block (1) Amount of water for artificial recharge and / or conservation (Ham) (2)
Source water allocation for Irrigation Cum Recharge Tank and REET with Recharge Shaft in Ham (3)
Source water allocation for REET with Recharge Shaft (Ham): 50 % of Col. 3 (4)
Source water allocation for Irrigation Cum Recharge Tank (Ham): 50 % of Col. 3 (5)
Source water allocation
for Injection Well (6) Source water allocation for Farm Pond in Ham (7)
Nos. of Farm Pond @ 10 Ham per unit (8)
Cost of Farm pond @ Rs 8 lakh per unit (9)
Nos. of Irrigation Cum Recharge Tank suggested @ 50 Ham per unit (10)
Cost of Irrigation Cum Recharge Tank @ Rs 8 lakh per unit (11)
Nos. of REET with recharge shaft @ 10 Ham per unit (12)
Cost of REET with Recharge Shaft @ Rs 8 lakh per unit (13)
Nos. of injection Well @ 30 Ham per unit (14)
Cost of injection Well @ Rs 25 lakh (15)
Total Cost (16)
(in Lakh)
Karimpur II 2857.0786 70 % of Col. 2 i.e. 1999.96 Ham
999.98 999.98 20 % of Col. 2 i.e.
571.42 Ham
10 % of
Col. 2 i.e. 285.71 Ham
29 232 20 160 100 800 19 475 1667
REET with Recharge Shaft Re-excavation of existing tank with Recharge Shaft
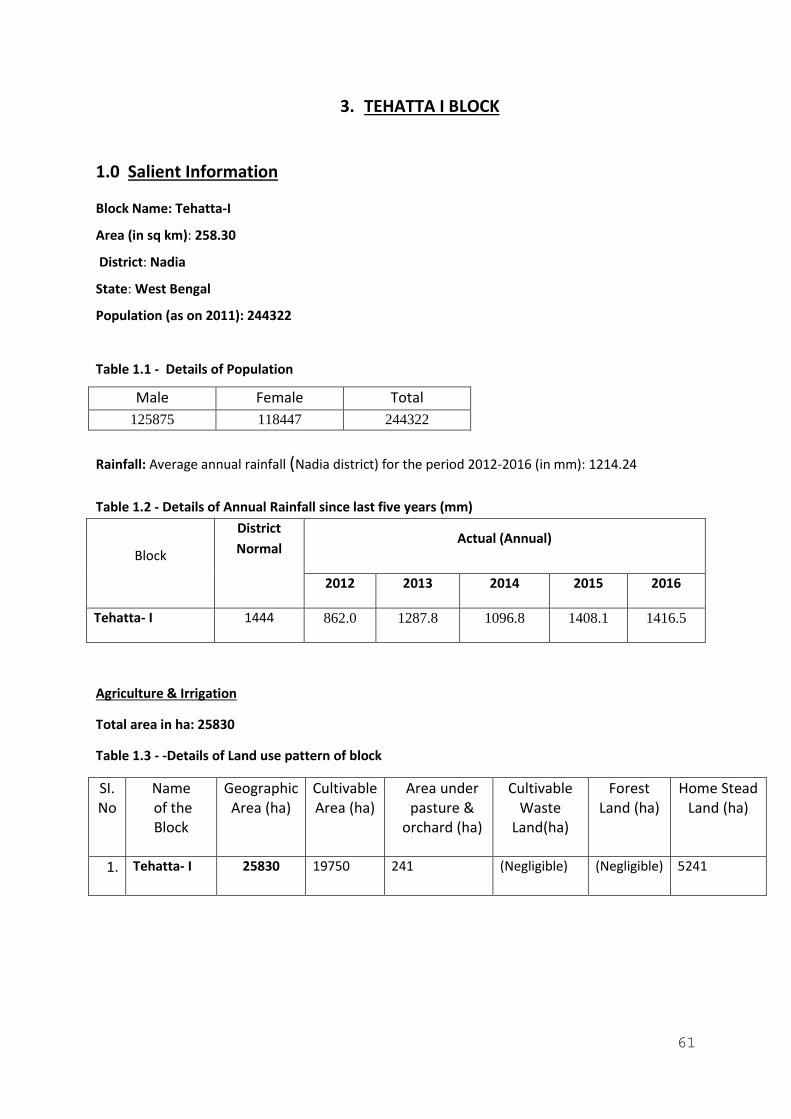
61
3. TEHATTA I BLOCK
1.0 Salient Information
Block Name: Tehatta-I
Area (in sq km): 258.30
District: Nadia
State: West Bengal
Population (as on 2011): 244322
Table 1.1 - Details of Population
Male Female Total
125875 118447 244322
Rainfall: Average annual rainfall (Nadia district) for the period 2012-2016 (in mm): 1214.24
Table 1.2 - Details of Annual Rainfall since last five years (mm)
Block
District
Normal Actual (Annual)
2012 2013 2014 2015 2016
Tehatta- I 1444 862.0 1287.8 1096.8 1408.1 1416.5
Agriculture & Irrigation
Total area in ha: 25830
Table 1.3 - -Details of Land use pattern of block
SI. No
Name of the Block
Geographic Area (ha)
Cultivable Area (ha)
Area under pasture &
orchard (ha)
Cultivable Waste
Land(ha)
Forest Land (ha)
Home Stead Land (ha)
1. Tehatta- I 25830 19750 241 (Negligible) (Negligible) 5241
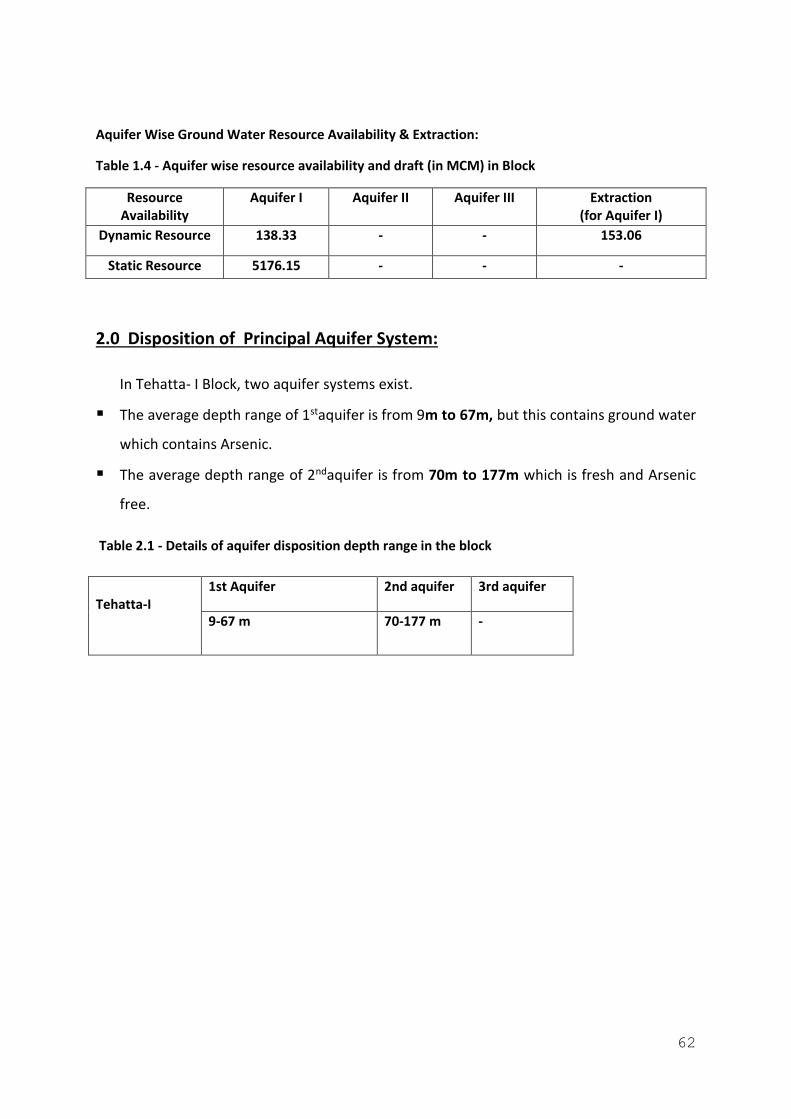
62
Aquifer Wise Ground Water Resource Availability & Extraction:
Table 1.4 - Aquifer wise resource availability and draft (in MCM) in Block
Resource Availability
Aquifer I Aquifer II Aquifer III Extraction (for Aquifer I)
Dynamic Resource 138.33 - - 153.06
Static Resource 5176.15 - - -
2.0 Disposition of Principal Aquifer System:
In Tehatta- I Block, two aquifer systems exist.
▪ The average depth range of 1staquifer is from 9m to 67m, but this contains ground water
which contains Arsenic.
▪ The average depth range of 2ndaquifer is from 70m to 177m which is fresh and Arsenic
free.
Table 2.1 - Details of aquifer disposition depth range in the block
Tehatta-I
1st Aquifer 2nd aquifer 3rd aquifer
9-67 m 70-177 m -
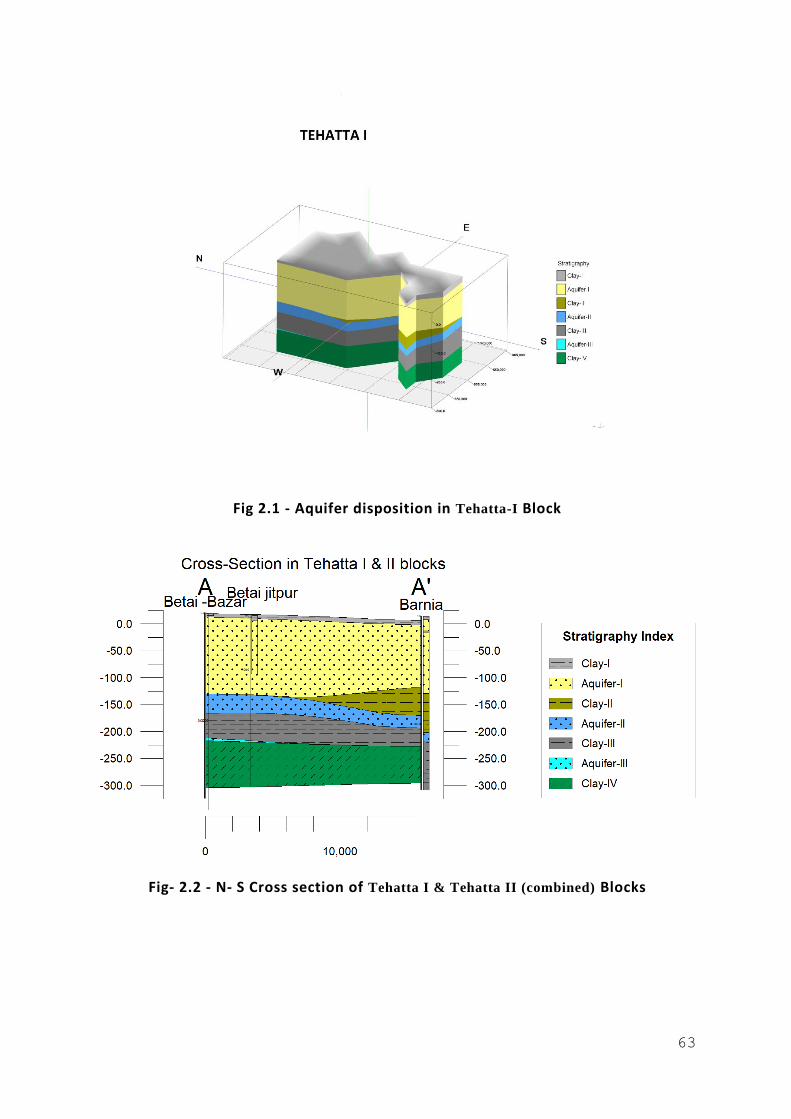
63
Fig 2.1 - Aquifer disposition in Tehatta-I Block
Fig- 2.2 - N- S Cross section of Tehatta I & Tehatta II (combined) Blocks
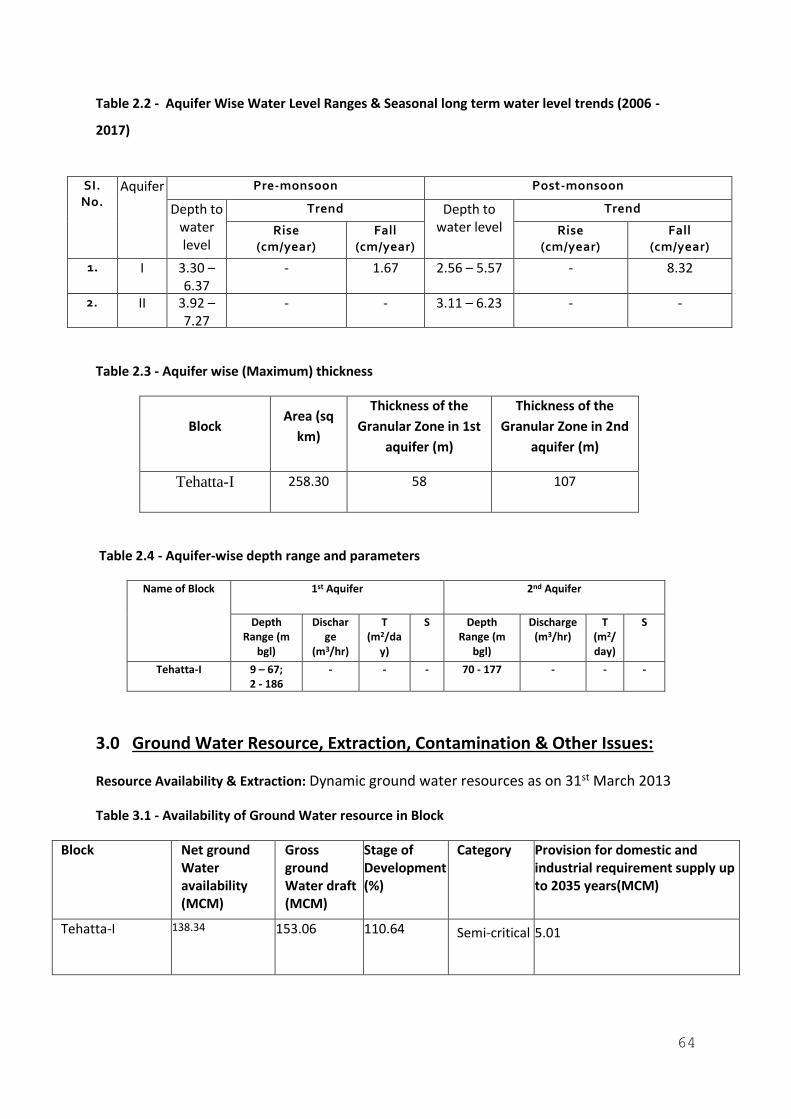
64
Table 2.2 - Aquifer Wise Water Level Ranges & Seasonal long term water level trends (2006 -
2017)
Table 2.3 - Aquifer wise (Maximum) thickness
Block Area (sq
km)
Thickness of the
Granular Zone in 1st
aquifer (m)
Thickness of the
Granular Zone in 2nd
aquifer (m)
Tehatta-I 258.30 58 107
Table 2.4 - Aquifer-wise depth range and parameters
Name of Block 1st Aquifer 2nd Aquifer
Depth Range (m
bgl)
Discharge
(m3/hr)
T (m2/da
y)
S Depth Range (m
bgl)
Discharge (m3/hr)
T (m2/day)
S
Tehatta-I 9 – 67; 2 - 186
- - - 70 - 177 - - -
3.0 Ground Water Resource, Extraction, Contamination & Other Issues:
Resource Availability & Extraction: Dynamic ground water resources as on 31st March 2013
Table 3.1 - Availability of Ground Water resource in Block
Block Net ground Water availability (MCM)
Gross ground Water draft (MCM)
Stage of Development (%)
Category Provision for domestic and industrial requirement supply up to 2035 years(MCM)
Tehatta-I 138.34
153.06 110.64 Semi-critical 5.01
SI. No.
Aquifer Pre-monsoon Post-monsoon
Depth to water level
Trend Depth to water level
Trend
Rise (cm/year)
Fall (cm/year)
Rise (cm/year)
Fall (cm/year)
1. I 3.30 – 6.37
- 1.67 2.56 – 5.57 - 8.32
2. II 3.92 – 7.27
- - 3.11 – 6.23 - -
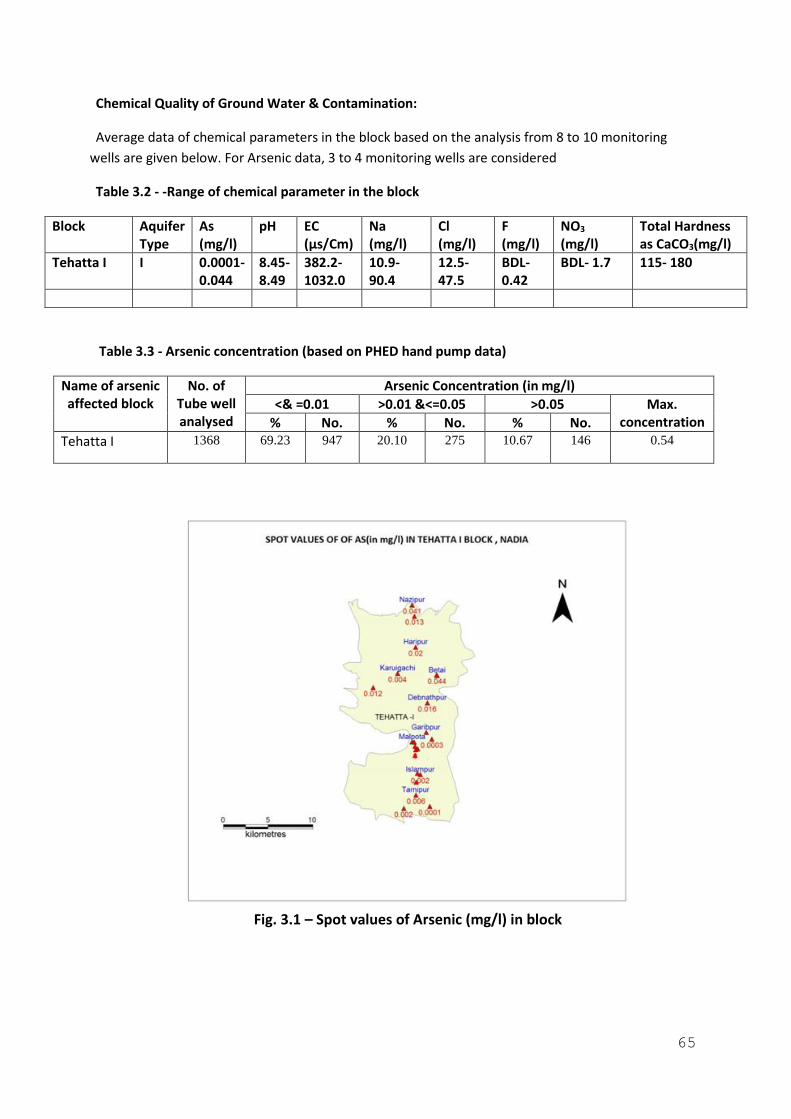
65
Chemical Quality of Ground Water & Contamination:
Average data of chemical parameters in the block based on the analysis from 8 to 10 monitoring
wells are given below. For Arsenic data, 3 to 4 monitoring wells are considered
Table 3.2 - -Range of chemical parameter in the block
Block Aquifer Type
As (mg/l)
pH EC (µs/Cm)
Na (mg/l)
Cl (mg/l)
F (mg/l)
NO3 (mg/l)
Total Hardness as CaCO3(mg/l)
Tehatta I I 0.0001- 0.044
8.45- 8.49
382.2- 1032.0
10.9- 90.4
12.5- 47.5
BDL- 0.42
BDL- 1.7 115- 180
Table 3.3 - Arsenic concentration (based on PHED hand pump data)
Name of arsenic affected block
No. of Tube well analysed
Arsenic Concentration (in mg/l)
<& =0.01 >0.01 &<=0.05 >0.05 Max. concentration % No. % No. % No.
Tehatta I 1368 69.23 947 20.10 275 10.67 146 0.54
Fig. 3.1 – Spot values of Arsenic (mg/l) in block

66
4.0 Ground Water Resource Enhancement& Management Plan:
Ground Water Management Plan for Drinking purposes-
▪ As per the ground water policy, first priority of water is for drinking purpose.
▪ The Block is declared by the State Arsenic Task Force, as Arsenic affected.
▪ As per the Status of Rural Water Supply Schemes published by WBPHED a population of
95511 in 23 villages is under risk zone where no water supply scheme exists.
▪ On the basis of data available, 24 tube wells are required for catering twenty-three
uncovered villages. Details of calculation are given below.
▪ The arsenic free aquifers in the depth span of 70m to 177m (comparatively less
potential) may be exploited for the purpose.
▪ Arsenic free aquifer should be tapped with proper cement sealing. Arsenic removal plant
may be installed before supply.
▪ Regular Field monitoring is necessary for Arsenic concentration in tube wells.
Table 4.1 – Nos. & cost of Tube wells in the uncovered (projected) population of Human and Cattle
Block Projected population upto 2021 (considering growth 21.09% per decade as per Census 2011
Water required for drinking & domestic purposes @ 70 lpcd (in lpd)
Cattle Population (Considering 0.19 per capita human population) as on 2011
Cattle Population (Considering 0.36 annual growth rate) as on 2021
Water required for drinking & domestic purposes @ 20 lpcd (in lpd)
Total Water Required (in lpd)
Number of T. Ws
Cost of the tube well of 300 m depth (approx) & 10"x6" dia @ Rs. 25 lakhs (In lakh) as per EFC
Tehatta I 115664 8096480 19583 20300 406001 8502481 24 600
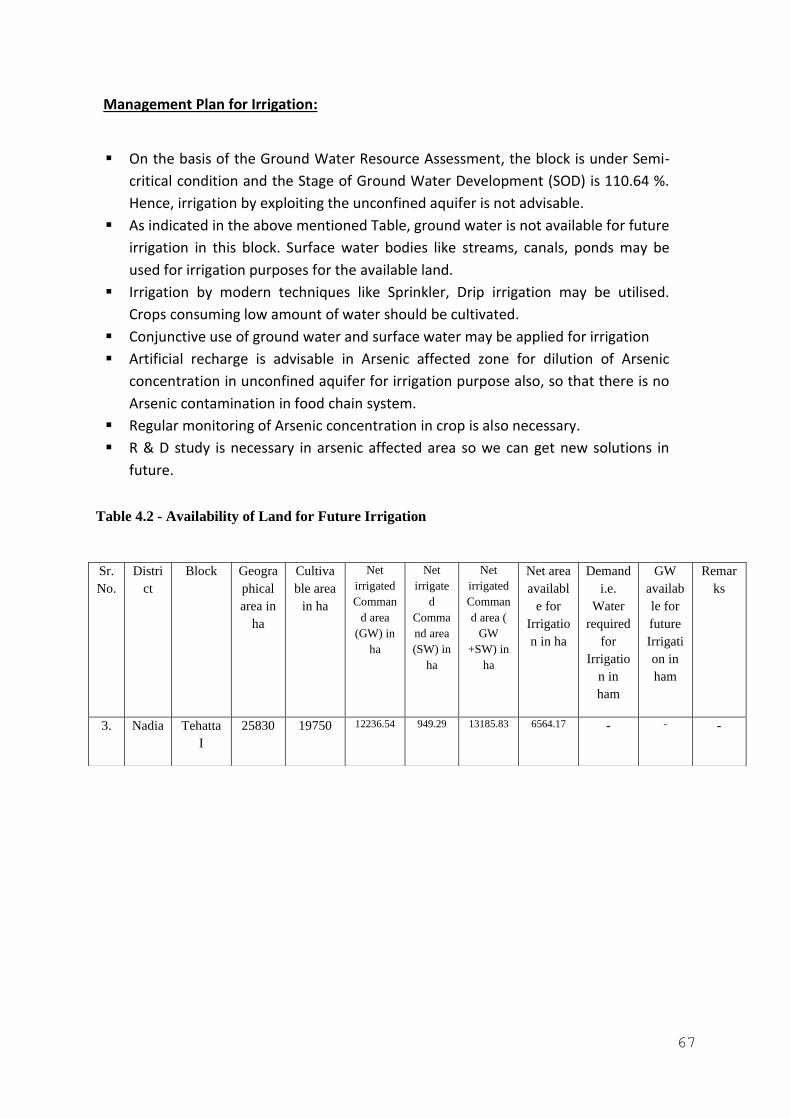
67
Management Plan for Irrigation:
▪ On the basis of the Ground Water Resource Assessment, the block is under Semi-
critical condition and the Stage of Ground Water Development (SOD) is 110.64 %.
Hence, irrigation by exploiting the unconfined aquifer is not advisable.
▪ As indicated in the above mentioned Table, ground water is not available for future
irrigation in this block. Surface water bodies like streams, canals, ponds may be
used for irrigation purposes for the available land.
▪ Irrigation by modern techniques like Sprinkler, Drip irrigation may be utilised.
Crops consuming low amount of water should be cultivated.
▪ Conjunctive use of ground water and surface water may be applied for irrigation
▪ Artificial recharge is advisable in Arsenic affected zone for dilution of Arsenic
concentration in unconfined aquifer for irrigation purpose also, so that there is no
Arsenic contamination in food chain system.
▪ Regular monitoring of Arsenic concentration in crop is also necessary.
▪ R & D study is necessary in arsenic affected area so we can get new solutions in
future.
Table 4.2 - Availability of Land for Future Irrigation
Sr.
No.
Distri
ct
Block Geogra
phical
area in
ha
Cultiva
ble area
in ha
Net
irrigated
Comman
d area
(GW) in
ha
Net
irrigate
d
Comma
nd area
(SW) in
ha
Net
irrigated
Comman
d area (
GW
+SW) in
ha
Net area
availabl
e for
Irrigatio
n in ha
Demand
i.e.
Water
required
for
Irrigatio
n in
ham
GW
availab
le for
future
Irrigati
on in
ham
Remar
ks
3. Nadia Tehatta
I
25830 19750 12236.54 949.29 13185.83 6564.17 - - -
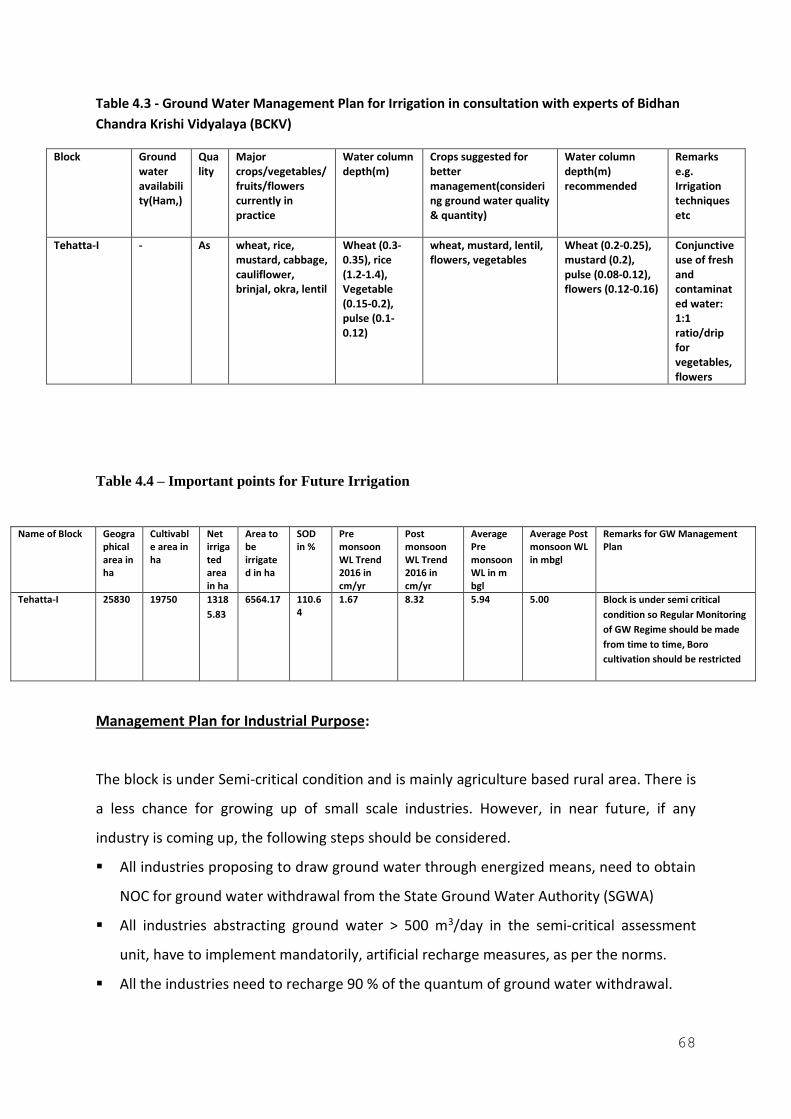
68
Table 4.3 - Ground Water Management Plan for Irrigation in consultation with experts of Bidhan
Chandra Krishi Vidyalaya (BCKV)
Block Ground water availability(Ham,)
Quality
Major crops/vegetables/ fruits/flowers currently in practice
Water column depth(m)
Crops suggested for better management(considering ground water quality & quantity)
Water column depth(m) recommended
Remarks e.g. Irrigation techniques etc
Tehatta-I - As wheat, rice, mustard, cabbage, cauliflower, brinjal, okra, lentil
Wheat (0.3-0.35), rice (1.2-1.4), Vegetable (0.15-0.2), pulse (0.1-0.12)
wheat, mustard, lentil, flowers, vegetables
Wheat (0.2-0.25), mustard (0.2), pulse (0.08-0.12), flowers (0.12-0.16)
Conjunctive use of fresh and contaminated water: 1:1 ratio/drip for vegetables, flowers
Table 4.4 – Important points for Future Irrigation
Name of Block Geographical area in ha
Cultivable area in ha
Net irrigated area in ha
Area to be irrigated in ha
SOD in %
Pre monsoon WL Trend 2016 in cm/yr
Post monsoon WL Trend 2016 in cm/yr
Average Pre monsoon WL in m bgl
Average Post monsoon WL in mbgl
Remarks for GW Management Plan
Tehatta-I 25830 19750 1318
5.83
6564.17 110.64
1.67 8.32 5.94 5.00 Block is under semi critical
condition so Regular Monitoring
of GW Regime should be made
from time to time, Boro
cultivation should be restricted
Management Plan for Industrial Purpose:
The block is under Semi-critical condition and is mainly agriculture based rural area. There is
a less chance for growing up of small scale industries. However, in near future, if any
industry is coming up, the following steps should be considered.
▪ All industries proposing to draw ground water through energized means, need to obtain
NOC for ground water withdrawal from the State Ground Water Authority (SGWA)
▪ All industries abstracting ground water > 500 m3/day in the semi-critical assessment
unit, have to implement mandatorily, artificial recharge measures, as per the norms.
▪ All the industries need to recharge 90 % of the quantum of ground water withdrawal.
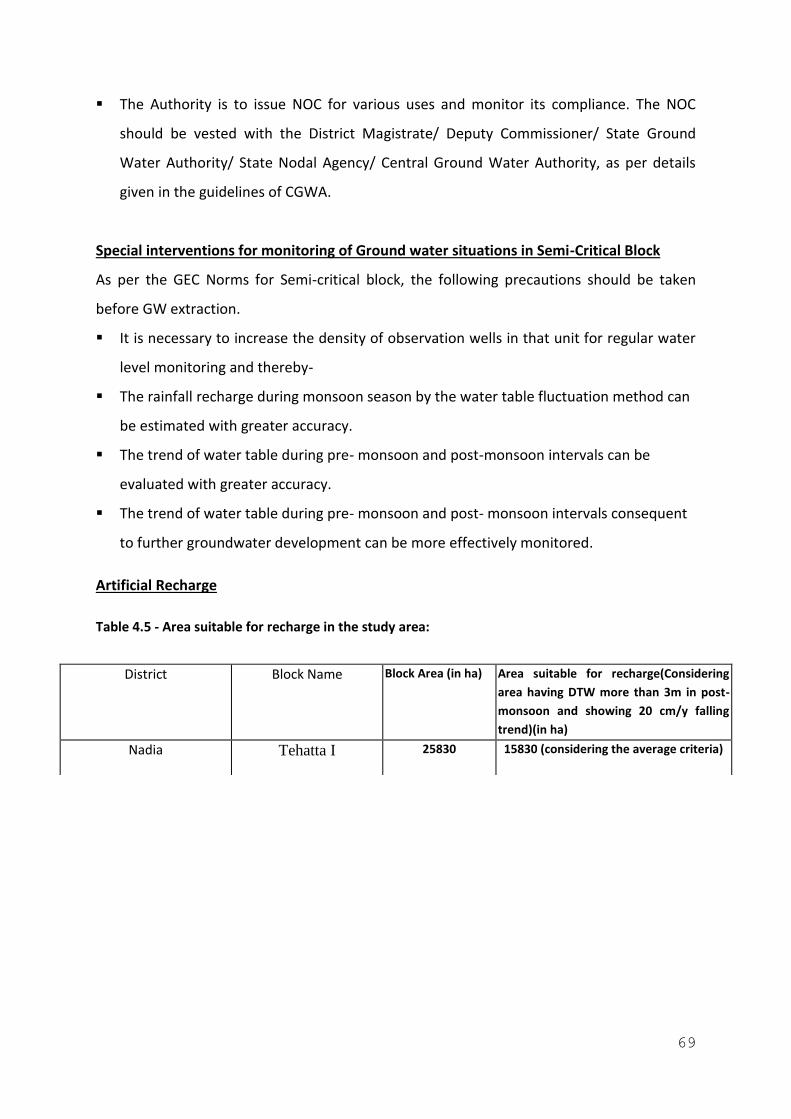
69
▪ The Authority is to issue NOC for various uses and monitor its compliance. The NOC
should be vested with the District Magistrate/ Deputy Commissioner/ State Ground
Water Authority/ State Nodal Agency/ Central Ground Water Authority, as per details
given in the guidelines of CGWA.
Special interventions for monitoring of Ground water situations in Semi-Critical Block
As per the GEC Norms for Semi-critical block, the following precautions should be taken
before GW extraction.
▪ It is necessary to increase the density of observation wells in that unit for regular water
level monitoring and thereby-
▪ The rainfall recharge during monsoon season by the water table fluctuation method can
be estimated with greater accuracy.
▪ The trend of water table during pre- monsoon and post-monsoon intervals can be
evaluated with greater accuracy.
▪ The trend of water table during pre- monsoon and post- monsoon intervals consequent
to further groundwater development can be more effectively monitored.
Artificial Recharge
Table 4.5 - Area suitable for recharge in the study area:
District Block Name Block Area (in ha) Area suitable for recharge(Considering
area having DTW more than 3m in post-
monsoon and showing 20 cm/y falling
trend)(in ha)
Nadia Tehatta I 25830 15830 (considering the average criteria)
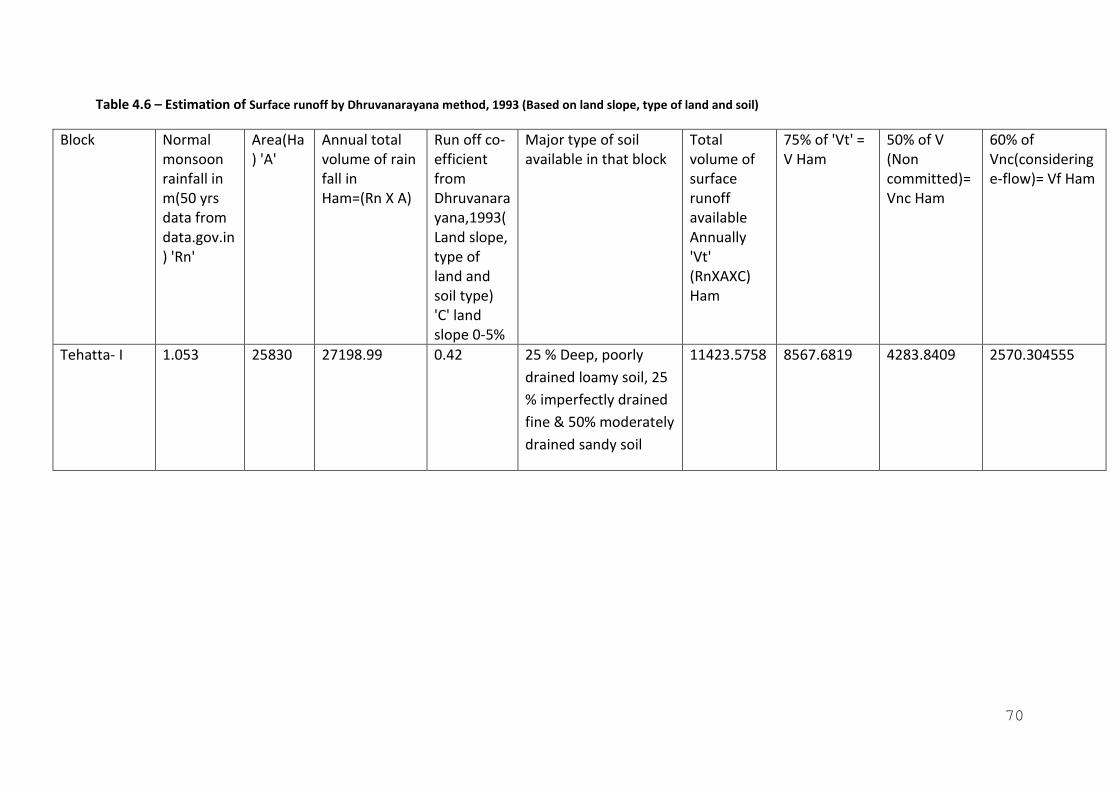
70
Table 4.6 – Estimation of Surface runoff by Dhruvanarayana method, 1993 (Based on land slope, type of land and soil)
Block Normal monsoon rainfall in m(50 yrs data from data.gov.in) 'Rn'
Area(Ha) 'A'
Annual total volume of rain fall in Ham=(Rn X A)
Run off co-efficient from Dhruvanarayana,1993(Land slope, type of land and soil type) 'C' land slope 0-5%
Major type of soil available in that block
Total volume of surface runoff available Annually 'Vt' (RnXAXC) Ham
75% of 'Vt' = V Ham
50% of V (Non committed)= Vnc Ham
60% of Vnc(considering e-flow)= Vf Ham
Tehatta- I 1.053 25830 27198.99 0.42 25 % Deep, poorly
drained loamy soil, 25
% imperfectly drained
fine & 50% moderately
drained sandy soil
11423.5758 8567.6819 4283.8409 2570.304555
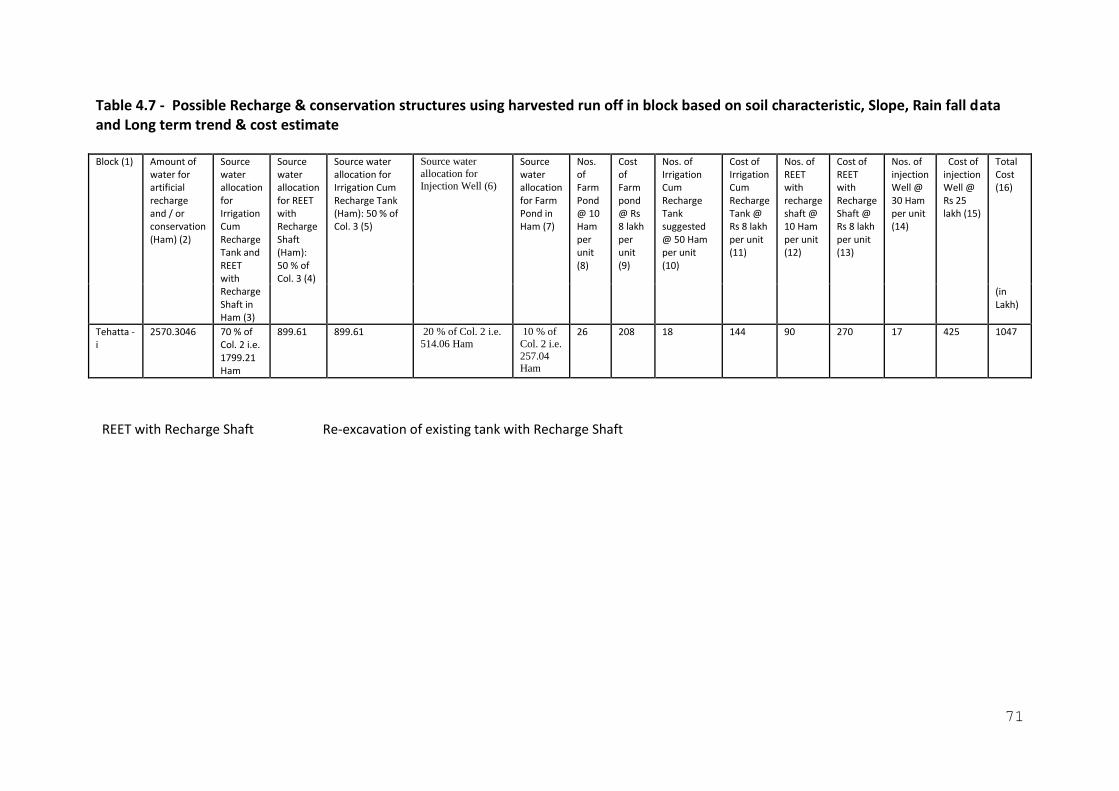
71
Table 4.7 - Possible Recharge & conservation structures using harvested run off in block based on soil characteristic, Slope, Rain fall data and Long term trend & cost estimate Block (1) Amount of
water for artificial recharge and / or conservation (Ham) (2)
Source water allocation for Irrigation Cum Recharge Tank and REET with Recharge Shaft in Ham (3)
Source water allocation for REET with Recharge Shaft (Ham): 50 % of Col. 3 (4)
Source water allocation for Irrigation Cum Recharge Tank (Ham): 50 % of Col. 3 (5)
Source water
allocation for
Injection Well (6)
Source water allocation for Farm Pond in Ham (7)
Nos. of Farm Pond @ 10 Ham per unit (8)
Cost of Farm pond @ Rs 8 lakh per unit (9)
Nos. of Irrigation Cum Recharge Tank suggested @ 50 Ham per unit (10)
Cost of Irrigation Cum Recharge Tank @ Rs 8 lakh per unit (11)
Nos. of REET with recharge shaft @ 10 Ham per unit (12)
Cost of REET with Recharge Shaft @ Rs 8 lakh per unit (13)
Nos. of injection Well @ 30 Ham per unit (14)
Cost of injection Well @ Rs 25 lakh (15)
Total Cost (16)
(in Lakh)
Tehatta -i
2570.3046 70 % of Col. 2 i.e. 1799.21 Ham
899.61 899.61 20 % of Col. 2 i.e.
514.06 Ham
10 % of
Col. 2 i.e.
257.04 Ham
26 208 18 144 90 270 17 425 1047
REET with Recharge Shaft Re-excavation of existing tank with Recharge Shaft
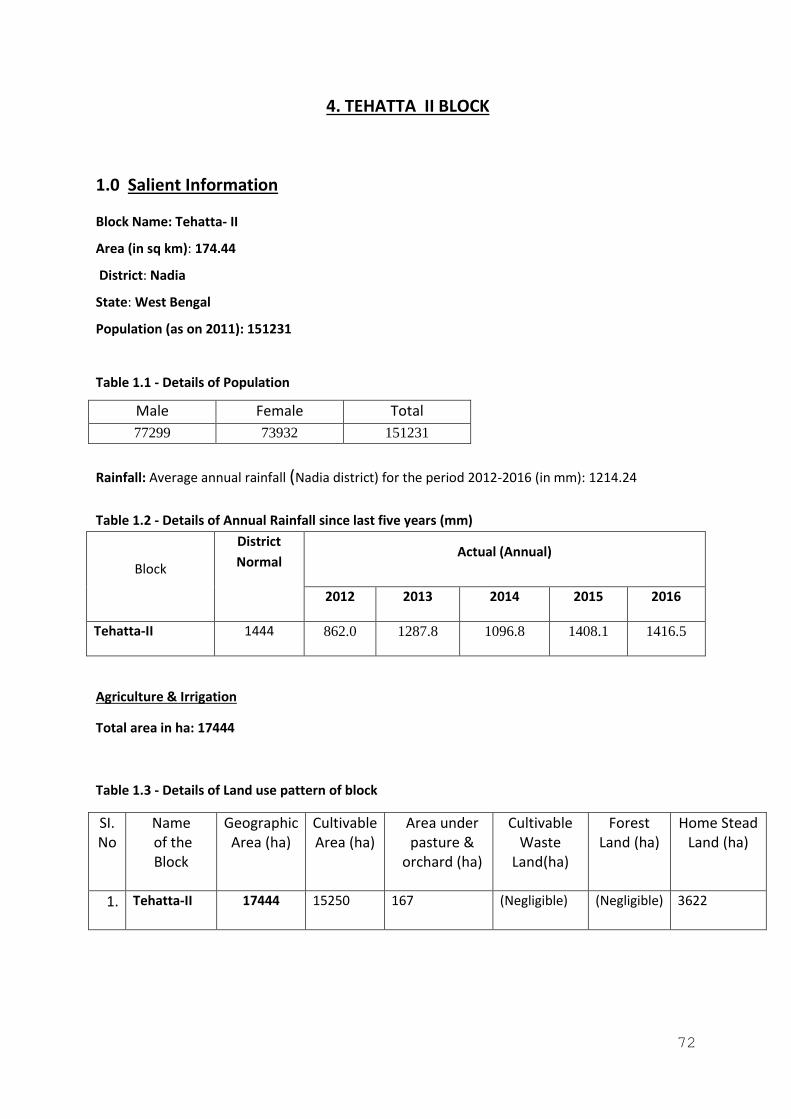
72
4. TEHATTA II BLOCK
1.0 Salient Information
Block Name: Tehatta- II
Area (in sq km): 174.44
District: Nadia
State: West Bengal
Population (as on 2011): 151231
Table 1.1 - Details of Population
Male Female Total
77299 73932 151231
Rainfall: Average annual rainfall (Nadia district) for the period 2012-2016 (in mm): 1214.24
Table 1.2 - Details of Annual Rainfall since last five years (mm)
Block
District
Normal Actual (Annual)
2012 2013 2014 2015 2016
Tehatta-II 1444 862.0 1287.8 1096.8 1408.1 1416.5
Agriculture & Irrigation
Total area in ha: 17444
Table 1.3 - Details of Land use pattern of block
SI. No
Name of the Block
Geographic Area (ha)
Cultivable Area (ha)
Area under pasture &
orchard (ha)
Cultivable Waste
Land(ha)
Forest Land (ha)
Home Stead Land (ha)
1. Tehatta-II 17444 15250 167 (Negligible) (Negligible) 3622
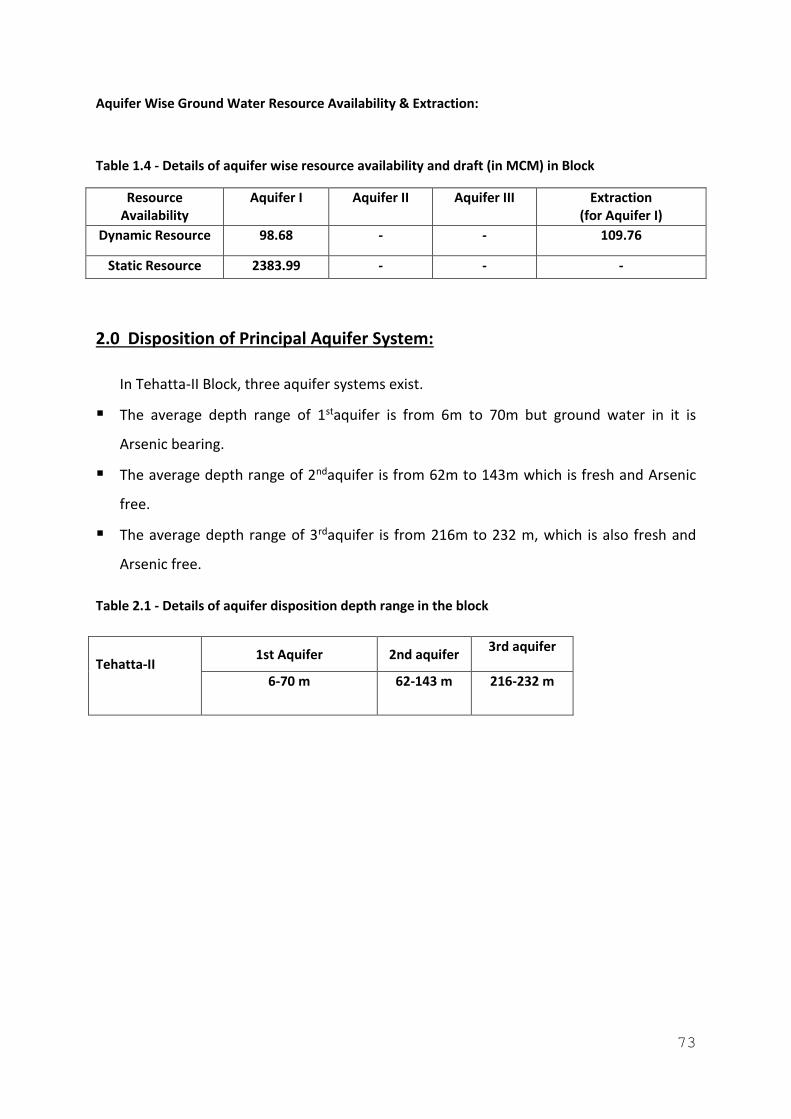
73
Aquifer Wise Ground Water Resource Availability & Extraction:
Table 1.4 - Details of aquifer wise resource availability and draft (in MCM) in Block
Resource Availability
Aquifer I Aquifer II Aquifer III Extraction (for Aquifer I)
Dynamic Resource 98.68 - - 109.76
Static Resource 2383.99 - - -
2.0 Disposition of Principal Aquifer System:
In Tehatta-II Block, three aquifer systems exist.
▪ The average depth range of 1staquifer is from 6m to 70m but ground water in it is
Arsenic bearing.
▪ The average depth range of 2ndaquifer is from 62m to 143m which is fresh and Arsenic
free.
▪ The average depth range of 3rdaquifer is from 216m to 232 m, which is also fresh and
Arsenic free.
Table 2.1 - Details of aquifer disposition depth range in the block
Tehatta-II
1st Aquifer 2nd aquifer 3rd aquifer
6-70 m 62-143 m 216-232 m
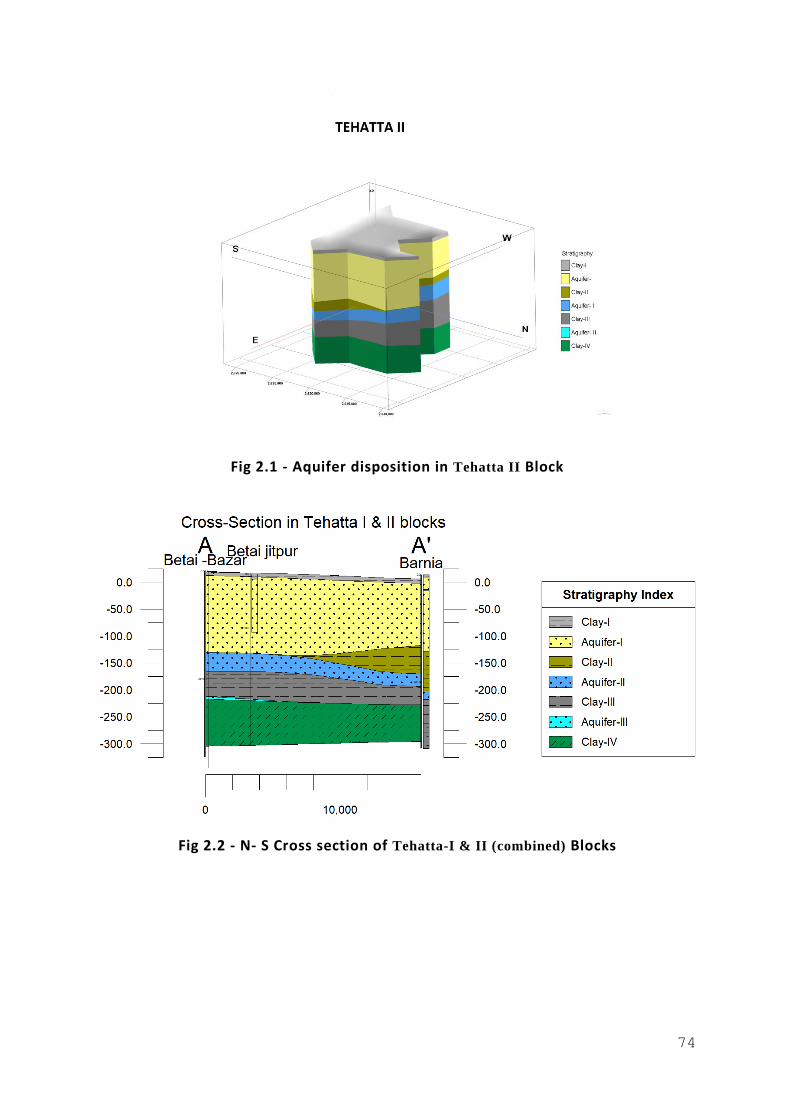
74
Fig 2.1 - Aquifer disposition in Tehatta II Block
Fig 2.2 - N- S Cross section of Tehatta-I & II (combined) Blocks
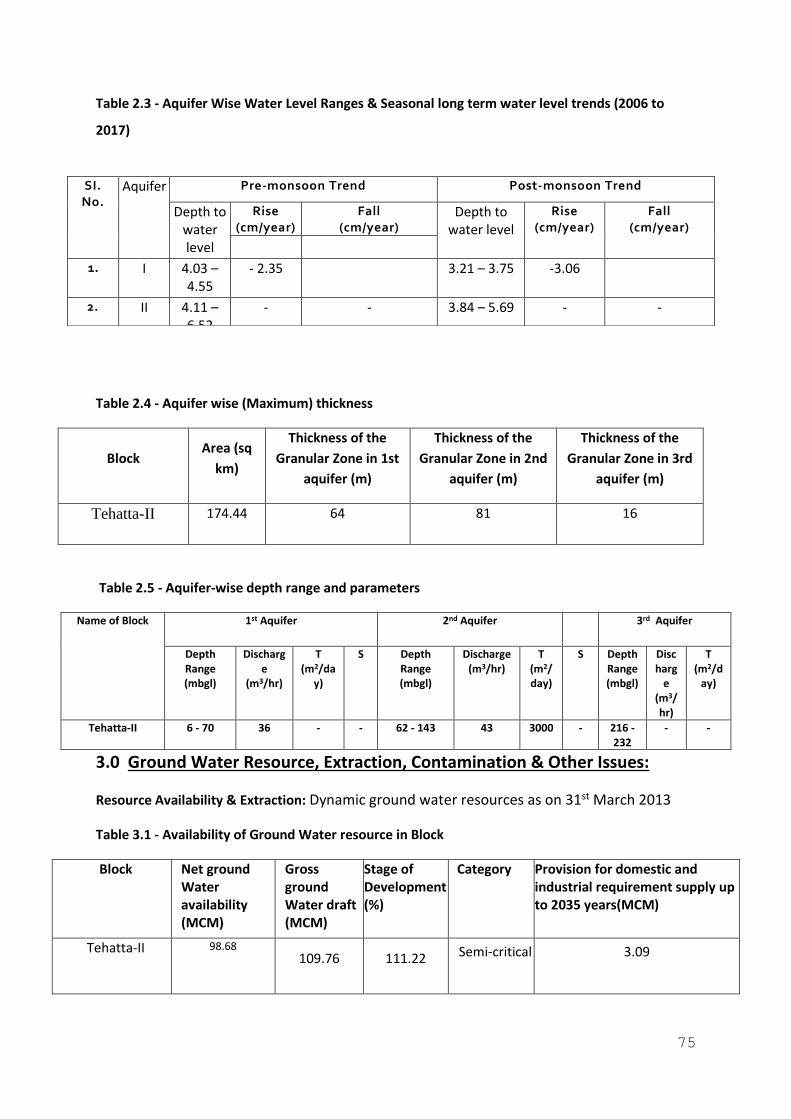
75
Table 2.3 - Aquifer Wise Water Level Ranges & Seasonal long term water level trends (2006 to
2017)
Table 2.4 - Aquifer wise (Maximum) thickness
Block Area (sq
km)
Thickness of the
Granular Zone in 1st
aquifer (m)
Thickness of the
Granular Zone in 2nd
aquifer (m)
Thickness of the
Granular Zone in 3rd
aquifer (m)
Tehatta-II 174.44 64 81 16
Table 2.5 - Aquifer-wise depth range and parameters
Name of Block 1st Aquifer 2nd Aquifer 3rd Aquifer
Depth Range (mbgl)
Discharge
(m3/hr)
T (m2/da
y)
S Depth Range (mbgl)
Discharge (m3/hr)
T (m2/day)
S Depth Range (mbgl)
Discharg
e (m3/hr)
T (m2/d
ay)
Tehatta-II 6 - 70 36 - - 62 - 143 43 3000 - 216 - 232
- -
3.0 Ground Water Resource, Extraction, Contamination & Other Issues:
Resource Availability & Extraction: Dynamic ground water resources as on 31st March 2013
Table 3.1 - Availability of Ground Water resource in Block
Block Net ground Water availability (MCM)
Gross ground Water draft (MCM)
Stage of Development (%)
Category Provision for domestic and industrial requirement supply up to 2035 years(MCM)
Tehatta-II 98.68
109.76 111.22 Semi-critical 3.09
SI. No.
Aquifer Pre-monsoon Trend Post-monsoon Trend
Depth to water level
Rise (cm/year)
Fall (cm/year)
Depth to water level
Rise (cm/year)
Fall (cm/year)
1. I 4.03 – 4.55
- 2.35 3.21 – 3.75 -3.06
2. II 4.11 – 6.52
- - 3.84 – 5.69 - -
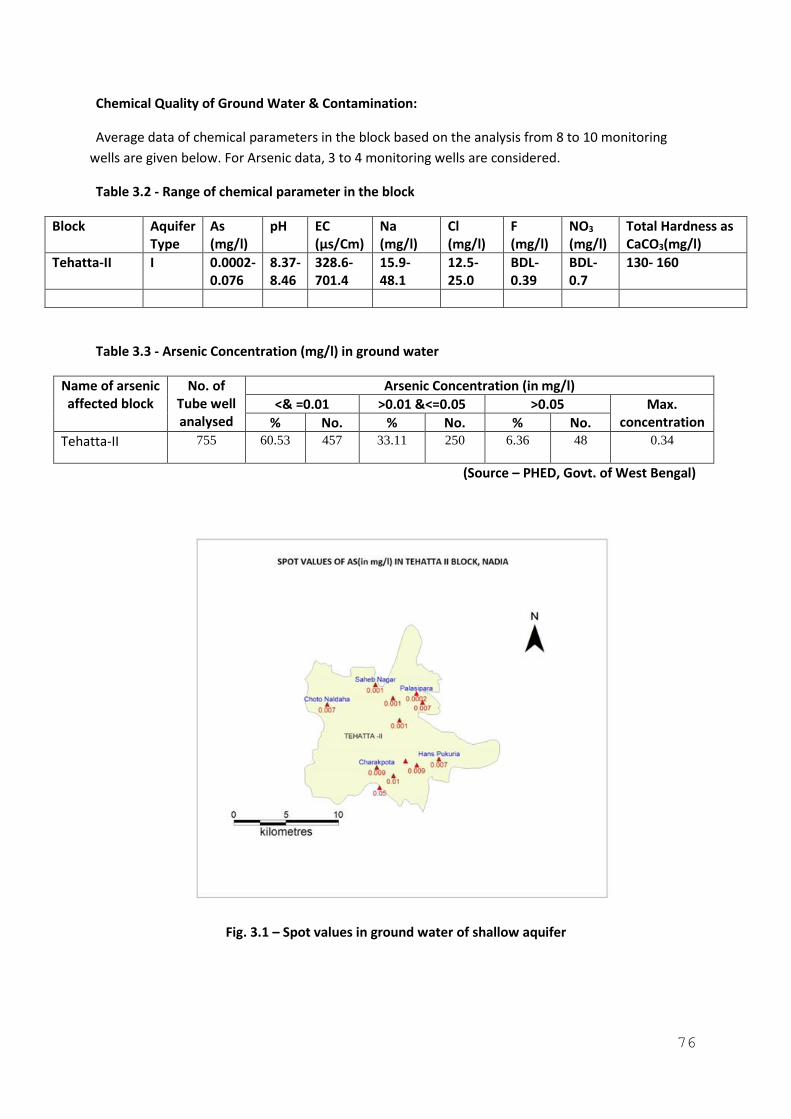
76
Chemical Quality of Ground Water & Contamination:
Average data of chemical parameters in the block based on the analysis from 8 to 10 monitoring
wells are given below. For Arsenic data, 3 to 4 monitoring wells are considered.
Table 3.2 - Range of chemical parameter in the block
Block Aquifer Type
As (mg/l)
pH EC (µs/Cm)
Na (mg/l)
Cl (mg/l)
F (mg/l)
NO3
(mg/l) Total Hardness as CaCO3(mg/l)
Tehatta-II I 0.0002- 0.076
8.37- 8.46
328.6- 701.4
15.9- 48.1
12.5- 25.0
BDL- 0.39
BDL- 0.7
130- 160
Table 3.3 - Arsenic Concentration (mg/l) in ground water
Name of arsenic affected block
No. of Tube well analysed
Arsenic Concentration (in mg/l)
<& =0.01 >0.01 &<=0.05 >0.05 Max. concentration % No. % No. % No.
Tehatta-II 755 60.53 457 33.11 250 6.36 48 0.34
(Source – PHED, Govt. of West Bengal)
Fig. 3.1 – Spot values in ground water of shallow aquifer
77
4. Ground Water Resource Enhancement & Management Plan:
Ground Water Management Plan for Drinking purposes-
▪ As per the ground water policy, first priority of water is for drinking purposes.
▪ The Block is declared by the State Arsenic Task Force, as Arsenic affected.
▪ As per the Status of Rural Water Supply Schemes published by WBPHED a population of
25415 in 9 villages is under risk zone where no water supply scheme exists.
▪ On the basis of data available, 7 tube wells are required for catering nine uncovered
villages. Details of calculation are given below.
▪ The arsenic free aquifers in the depth span of 62m to 143m (at places) & 216m to 232m
(comparatively less potential) may be exploited for the purpose.
▪ Arsenic free aquifer should be tapped with proper cement sealing. Arsenic removal plant
may be installed before supply.
▪ Regular Field monitoring is necessary for Arsenic concentration in tube wells.
Management Plan for Irrigation:
▪ On the basis of the Ground Water Resource Assessment, the block is under Semi-
critical condition and the Stage of Ground Water Development (SOD) is 111.22 %.
Hence, irrigation by exploiting the unconfined aquifer is not advisable.
▪ As indicated in the above mentioned Table, ground water is not available for future
irrigation in this block. Surface water bodies like streams, canals, ponds may be
used for irrigation purposes for the available land.
▪ Irrigation by modern techniques like Sprinkler, Drip irrigation may be utilised.
Crops consuming low amount of water should be cultivated.
▪ Conjunctive use of ground water and surface water may be applied for irrigation
▪ Artificial recharge is advisable in Arsenic affected zone for dilution of Arsenic
concentration in unconfined aquifer for irrigation purpose also, so that there is no
Arsenic contamination in food chain system.
▪ .Regular monitoring of Arsenic concentration in crop is also necessary.
▪ R & D study is necessary in arsenic affected area so we can get new solutions in
future.
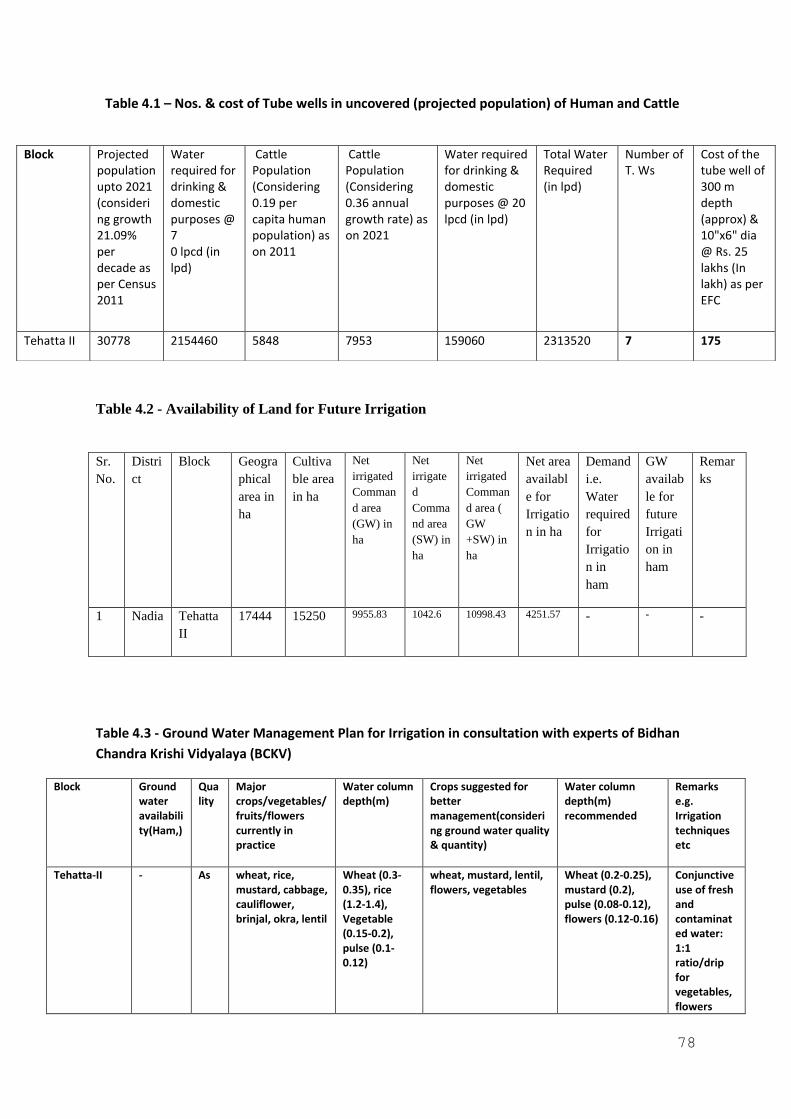
78
Table 4.1 – Nos. & cost of Tube wells in uncovered (projected population) of Human and Cattle
Table 4.2 - Availability of Land for Future Irrigation
Table 4.3 - Ground Water Management Plan for Irrigation in consultation with experts of Bidhan
Chandra Krishi Vidyalaya (BCKV)
Block Ground water availability(Ham,)
Quality
Major crops/vegetables/ fruits/flowers currently in practice
Water column depth(m)
Crops suggested for better management(considering ground water quality & quantity)
Water column depth(m) recommended
Remarks e.g. Irrigation techniques etc
Tehatta-II - As wheat, rice, mustard, cabbage, cauliflower, brinjal, okra, lentil
Wheat (0.3-0.35), rice (1.2-1.4), Vegetable (0.15-0.2), pulse (0.1-0.12)
wheat, mustard, lentil, flowers, vegetables
Wheat (0.2-0.25), mustard (0.2), pulse (0.08-0.12), flowers (0.12-0.16)
Conjunctive use of fresh and contaminated water: 1:1 ratio/drip for vegetables, flowers
Block Projected population upto 2021 (considering growth 21.09% per decade as per Census 2011
Water required for drinking & domestic purposes @ 7 0 lpcd (in lpd)
Cattle Population (Considering 0.19 per capita human population) as on 2011
Cattle Population (Considering 0.36 annual growth rate) as on 2021
Water required for drinking & domestic purposes @ 20 lpcd (in lpd)
Total Water Required (in lpd)
Number of T. Ws
Cost of the tube well of 300 m depth (approx) & 10"x6" dia @ Rs. 25 lakhs (In lakh) as per EFC
Tehatta II 30778 2154460 5848 7953 159060 2313520 7 175
Sr.
No.
Distri
ct
Block Geogra
phical
area in
ha
Cultiva
ble area
in ha
Net
irrigated
Comman
d area
(GW) in
ha
Net
irrigate
d
Comma
nd area
(SW) in
ha
Net
irrigated
Comman
d area (
GW
+SW) in
ha
Net area
availabl
e for
Irrigatio
n in ha
Demand
i.e.
Water
required
for
Irrigatio
n in
ham
GW
availab
le for
future
Irrigati
on in
ham
Remar
ks
1 Nadia Tehatta
II
17444 15250 9955.83 1042.6 10998.43 4251.57 - - -
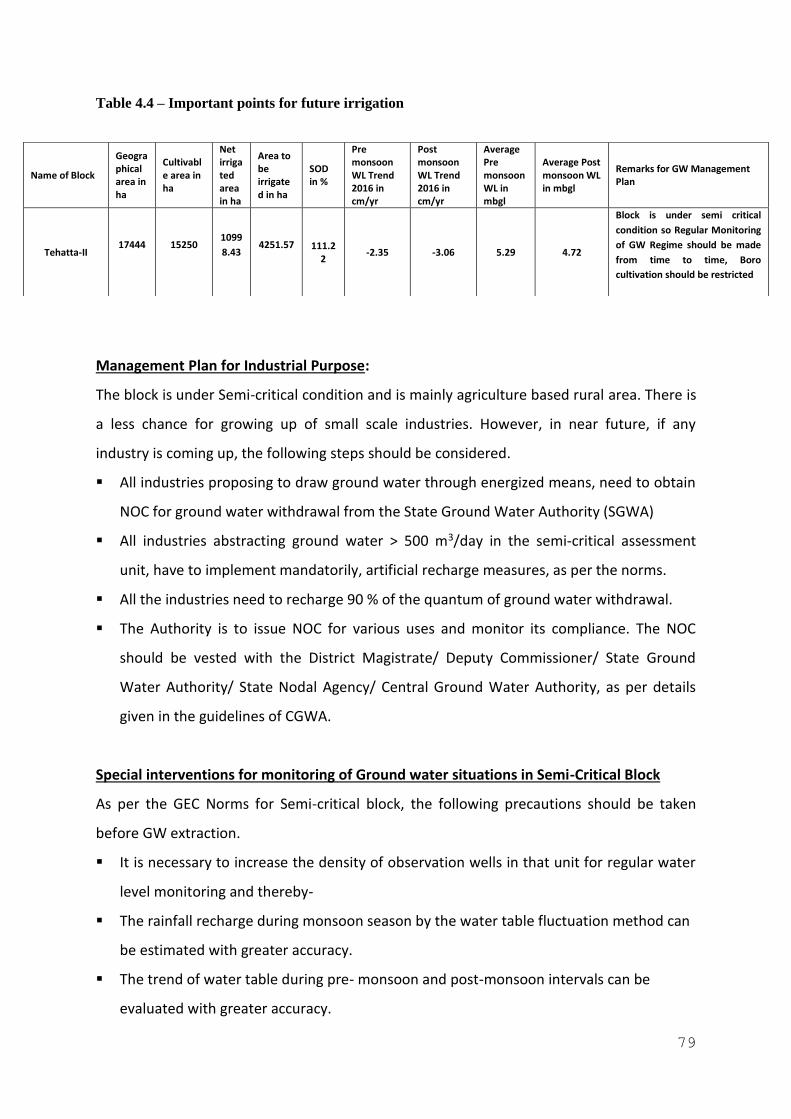
79
Table 4.4 – Important points for future irrigation
Management Plan for Industrial Purpose:
The block is under Semi-critical condition and is mainly agriculture based rural area. There is
a less chance for growing up of small scale industries. However, in near future, if any
industry is coming up, the following steps should be considered.
▪ All industries proposing to draw ground water through energized means, need to obtain
NOC for ground water withdrawal from the State Ground Water Authority (SGWA)
▪ All industries abstracting ground water > 500 m3/day in the semi-critical assessment
unit, have to implement mandatorily, artificial recharge measures, as per the norms.
▪ All the industries need to recharge 90 % of the quantum of ground water withdrawal.
▪ The Authority is to issue NOC for various uses and monitor its compliance. The NOC
should be vested with the District Magistrate/ Deputy Commissioner/ State Ground
Water Authority/ State Nodal Agency/ Central Ground Water Authority, as per details
given in the guidelines of CGWA.
Special interventions for monitoring of Ground water situations in Semi-Critical Block
As per the GEC Norms for Semi-critical block, the following precautions should be taken
before GW extraction.
▪ It is necessary to increase the density of observation wells in that unit for regular water
level monitoring and thereby-
▪ The rainfall recharge during monsoon season by the water table fluctuation method can
be estimated with greater accuracy.
▪ The trend of water table during pre- monsoon and post-monsoon intervals can be
evaluated with greater accuracy.
Name of Block
Geographical area in ha
Cultivable area in ha
Net irrigated area in ha
Area to be irrigated in ha
SOD in %
Pre monsoon WL Trend 2016 in cm/yr
Post monsoon WL Trend 2016 in cm/yr
Average Pre monsoon WL in mbgl
Average Post monsoon WL in mbgl
Remarks for GW Management Plan
Tehatta-II 17444 15250
1099
8.43 4251.57 111.2
2 -2.35 -3.06 5.29 4.72
Block is under semi critical
condition so Regular Monitoring
of GW Regime should be made
from time to time, Boro
cultivation should be restricted
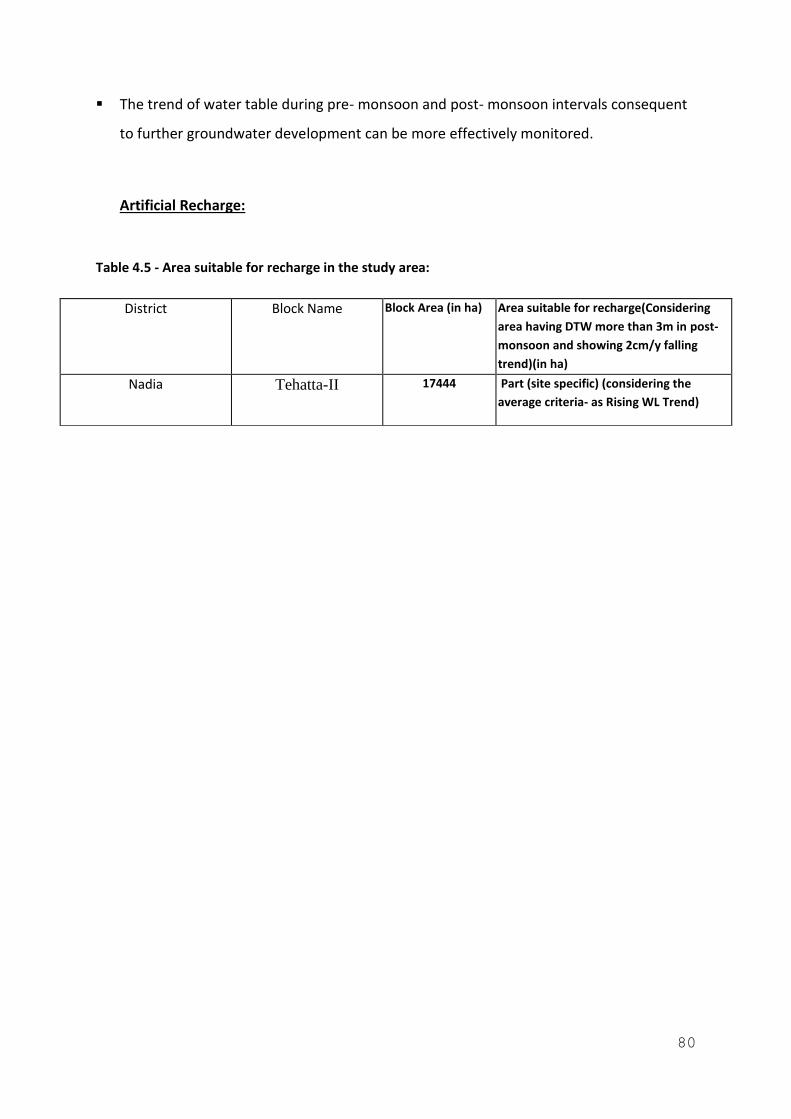
80
▪ The trend of water table during pre- monsoon and post- monsoon intervals consequent
to further groundwater development can be more effectively monitored.
Artificial Recharge:
Table 4.5 - Area suitable for recharge in the study area:
District Block Name Block Area (in ha) Area suitable for recharge(Considering
area having DTW more than 3m in post-
monsoon and showing 2cm/y falling
trend)(in ha)
Nadia Tehatta-II 17444 Part (site specific) (considering the
average criteria- as Rising WL Trend)
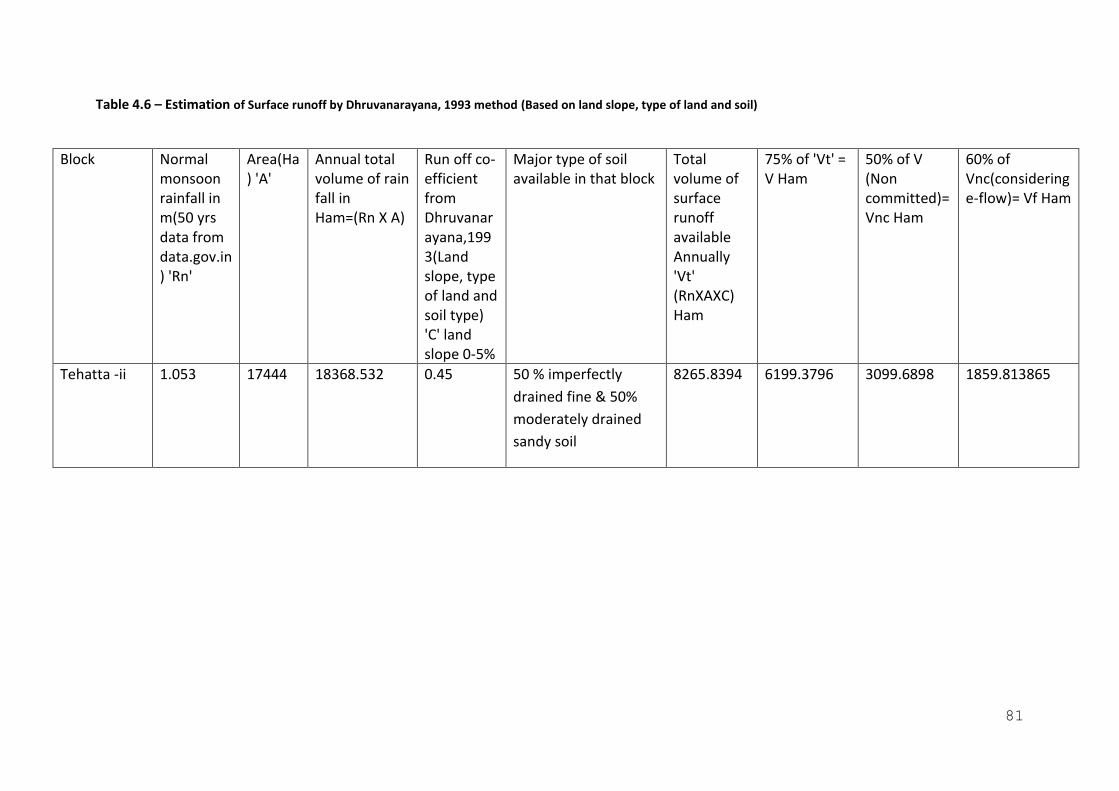
81
Table 4.6 – Estimation of Surface runoff by Dhruvanarayana, 1993 method (Based on land slope, type of land and soil)
Block Normal monsoon rainfall in m(50 yrs data from data.gov.in) 'Rn'
Area(Ha) 'A'
Annual total volume of rain fall in Ham=(Rn X A)
Run off co-efficient from Dhruvanarayana,1993(Land slope, type of land and soil type) 'C' land slope 0-5%
Major type of soil available in that block
Total volume of surface runoff available Annually 'Vt' (RnXAXC) Ham
75% of 'Vt' = V Ham
50% of V (Non committed)= Vnc Ham
60% of Vnc(considering e-flow)= Vf Ham
Tehatta -ii 1.053 17444 18368.532 0.45 50 % imperfectly
drained fine & 50%
moderately drained
sandy soil
8265.8394 6199.3796 3099.6898 1859.813865
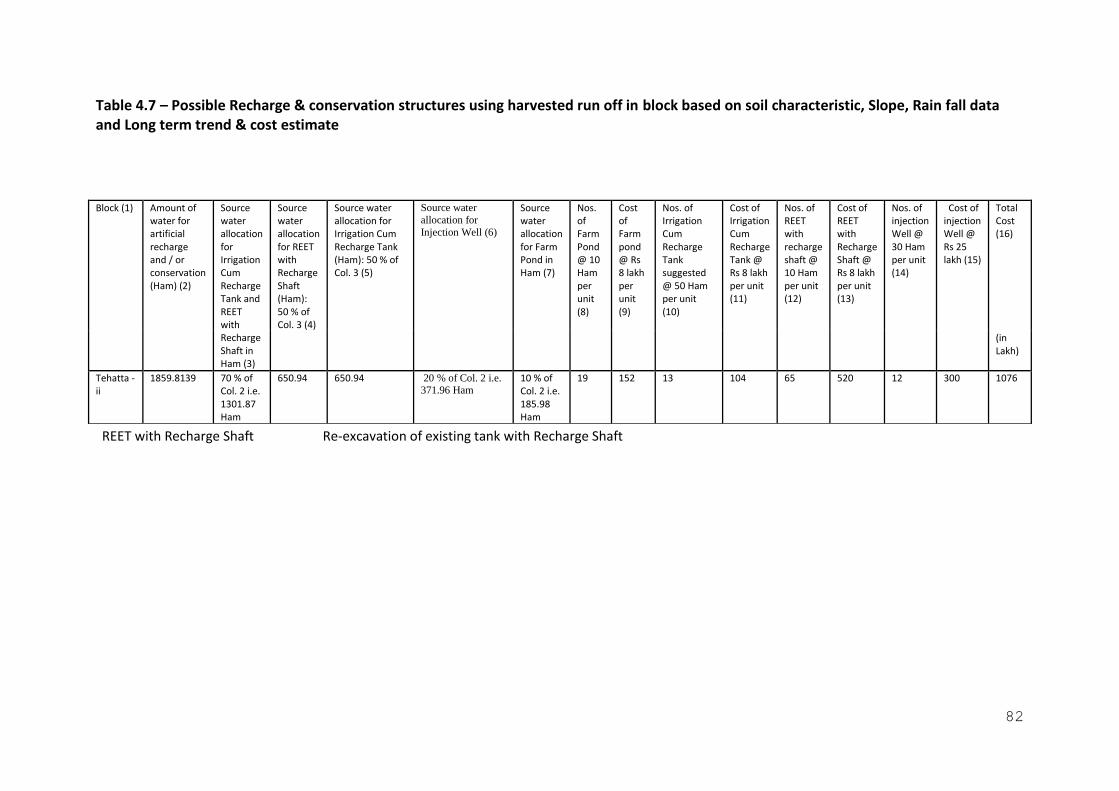
82
Table 4.7 – Possible Recharge & conservation structures using harvested run off in block based on soil characteristic, Slope, Rain fall data and Long term trend & cost estimate
REET with Recharge Shaft Re-excavation of existing tank with Recharge Shaft
Block (1) Amount of water for artificial recharge and / or conservation (Ham) (2)
Source water allocation for Irrigation Cum Recharge Tank and REET with Recharge Shaft in Ham (3)
Source water allocation for REET with Recharge Shaft (Ham): 50 % of Col. 3 (4)
Source water allocation for Irrigation Cum Recharge Tank (Ham): 50 % of Col. 3 (5)
Source water
allocation for
Injection Well (6)
Source water allocation for Farm Pond in Ham (7)
Nos. of Farm Pond @ 10 Ham per unit (8)
Cost of Farm pond @ Rs 8 lakh per unit (9)
Nos. of Irrigation Cum Recharge Tank suggested @ 50 Ham per unit (10)
Cost of Irrigation Cum Recharge Tank @ Rs 8 lakh per unit (11)
Nos. of REET with recharge shaft @ 10 Ham per unit (12)
Cost of REET with Recharge Shaft @ Rs 8 lakh per unit (13)
Nos. of injection Well @ 30 Ham per unit (14)
Cost of injection Well @ Rs 25 lakh (15)
Total Cost (16)
(in Lakh)
Tehatta -ii
1859.8139 70 % of Col. 2 i.e. 1301.87 Ham
650.94 650.94 20 % of Col. 2 i.e. 371.96 Ham
10 % of Col. 2 i.e. 185.98 Ham
19 152 13 104 65 520 12 300 1076
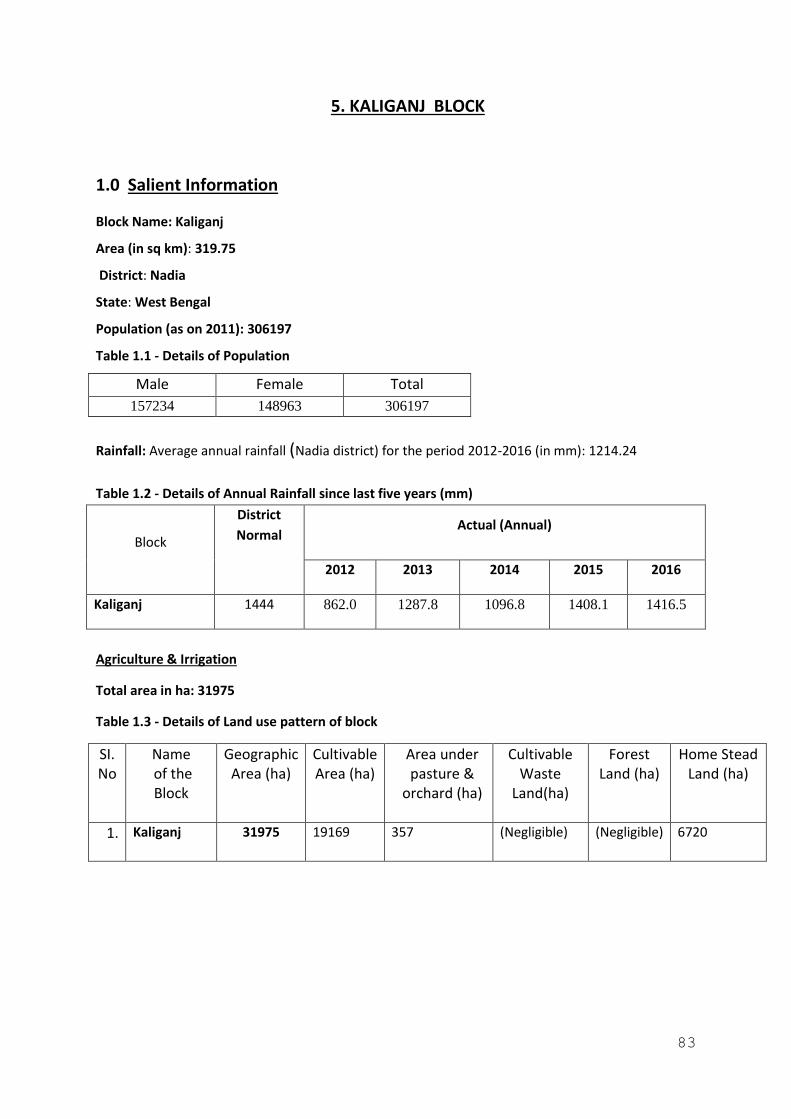
83
5. KALIGANJ BLOCK
1.0 Salient Information
Block Name: Kaliganj
Area (in sq km): 319.75
District: Nadia
State: West Bengal
Population (as on 2011): 306197
Table 1.1 - Details of Population
Male Female Total
157234 148963 306197
Rainfall: Average annual rainfall (Nadia district) for the period 2012-2016 (in mm): 1214.24
Table 1.2 - Details of Annual Rainfall since last five years (mm)
Block
District
Normal Actual (Annual)
2012 2013 2014 2015 2016
Kaliganj 1444 862.0 1287.8 1096.8 1408.1 1416.5
Agriculture & Irrigation
Total area in ha: 31975
Table 1.3 - Details of Land use pattern of block
SI. No
Name of the Block
Geographic Area (ha)
Cultivable Area (ha)
Area under pasture &
orchard (ha)
Cultivable Waste
Land(ha)
Forest Land (ha)
Home Stead Land (ha)
1. Kaliganj 31975 19169 357 (Negligible) (Negligible) 6720
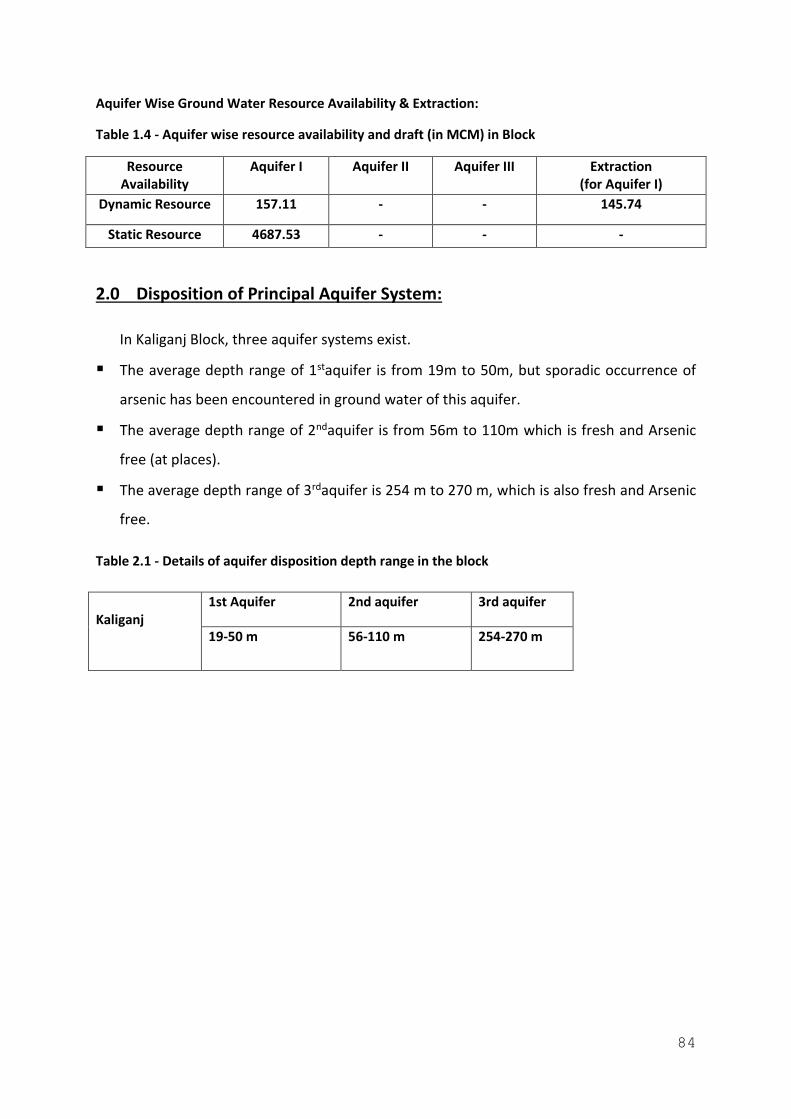
84
Aquifer Wise Ground Water Resource Availability & Extraction:
Table 1.4 - Aquifer wise resource availability and draft (in MCM) in Block
Resource Availability
Aquifer I Aquifer II Aquifer III Extraction (for Aquifer I)
Dynamic Resource 157.11 - - 145.74
Static Resource 4687.53 - - -
2.0 Disposition of Principal Aquifer System:
In Kaliganj Block, three aquifer systems exist.
▪ The average depth range of 1staquifer is from 19m to 50m, but sporadic occurrence of
arsenic has been encountered in ground water of this aquifer.
▪ The average depth range of 2ndaquifer is from 56m to 110m which is fresh and Arsenic
free (at places).
▪ The average depth range of 3rdaquifer is 254 m to 270 m, which is also fresh and Arsenic
free.
Table 2.1 - Details of aquifer disposition depth range in the block
Kaliganj
1st Aquifer 2nd aquifer 3rd aquifer
19-50 m 56-110 m 254-270 m
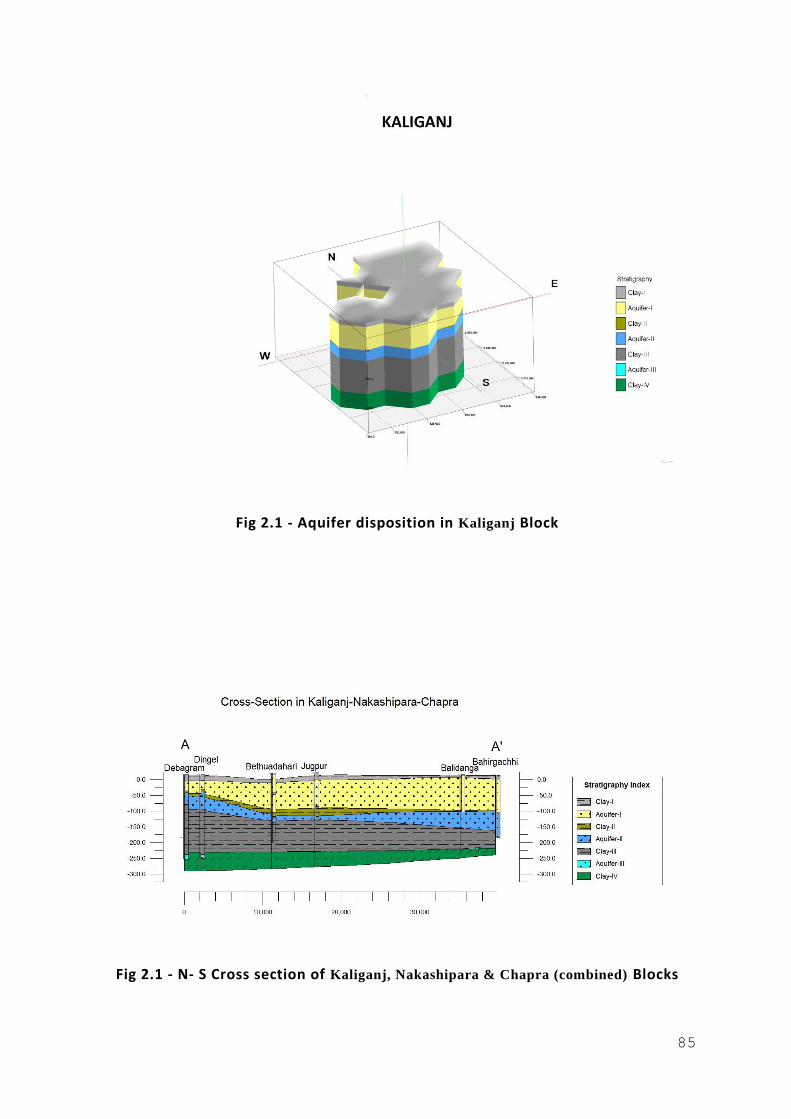
85
Fig 2.1 - Aquifer disposition in Kaliganj Block
Fig 2.1 - N- S Cross section of Kaliganj, Nakashipara & Chapra (combined) Blocks
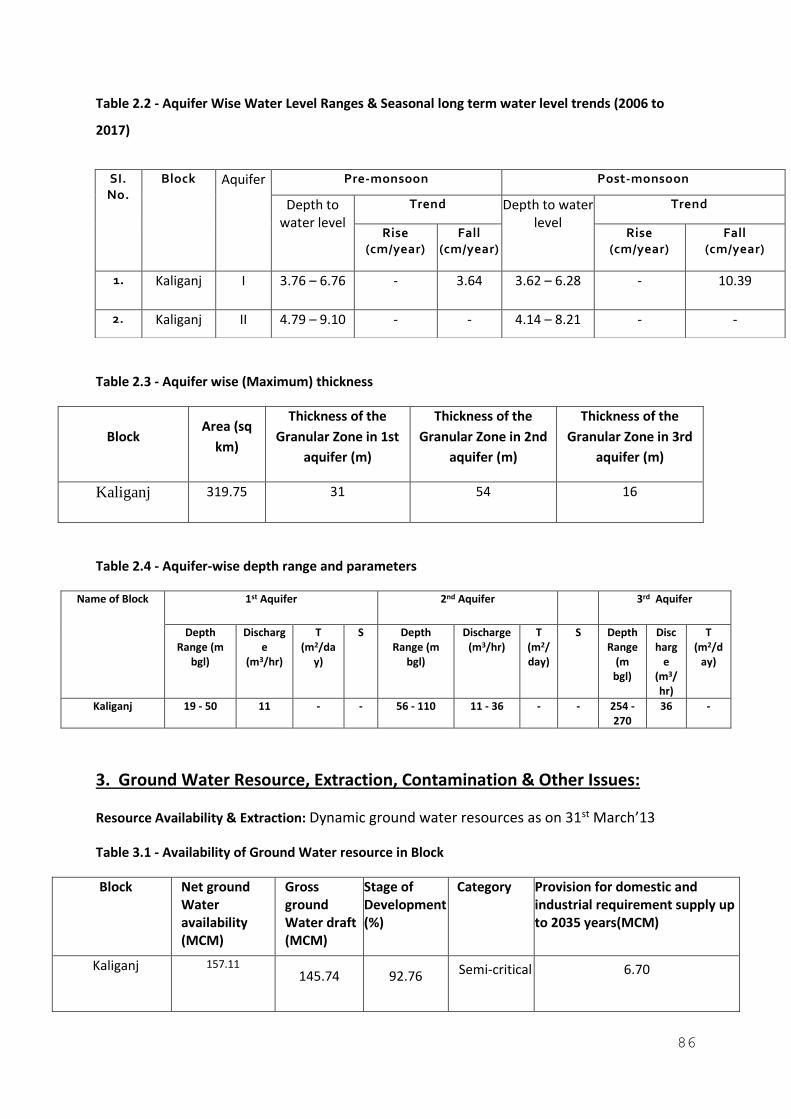
86
Table 2.2 - Aquifer Wise Water Level Ranges & Seasonal long term water level trends (2006 to
2017)
Table 2.3 - Aquifer wise (Maximum) thickness
Block Area (sq
km)
Thickness of the
Granular Zone in 1st
aquifer (m)
Thickness of the
Granular Zone in 2nd
aquifer (m)
Thickness of the
Granular Zone in 3rd
aquifer (m)
Kaliganj 319.75 31 54 16
Table 2.4 - Aquifer-wise depth range and parameters
Name of Block 1st Aquifer 2nd Aquifer 3rd Aquifer
Depth Range (m
bgl)
Discharge
(m3/hr)
T (m2/da
y)
S Depth Range (m
bgl)
Discharge (m3/hr)
T (m2/day)
S Depth Range
(m bgl)
Discharg
e (m3/hr)
T (m2/d
ay)
Kaliganj 19 - 50 11 - - 56 - 110 11 - 36 - - 254 - 270
36 -
3. Ground Water Resource, Extraction, Contamination & Other Issues:
Resource Availability & Extraction: Dynamic ground water resources as on 31st March’13
Table 3.1 - Availability of Ground Water resource in Block
Block Net ground Water availability (MCM)
Gross ground Water draft (MCM)
Stage of Development (%)
Category Provision for domestic and industrial requirement supply up to 2035 years(MCM)
Kaliganj 157.11
145.74 92.76 Semi-critical 6.70
SI. No.
Block Aquifer Pre-monsoon Post-monsoon
Depth to water level
Trend Depth to water level
Trend
Rise (cm/year)
Fall (cm/year)
Rise (cm/year)
Fall (cm/year)
1. Kaliganj I 3.76 – 6.76 - 3.64 3.62 – 6.28 - 10.39
2. Kaliganj II 4.79 – 9.10 - - 4.14 – 8.21 - -
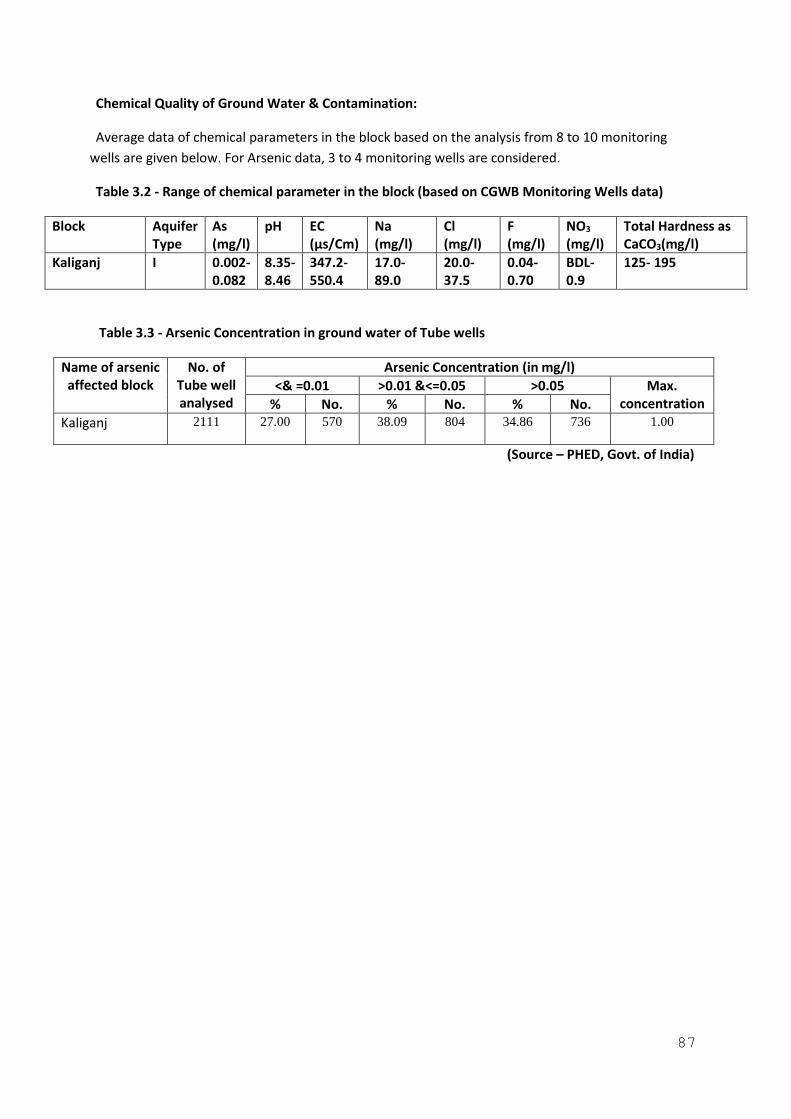
87
Chemical Quality of Ground Water & Contamination:
Average data of chemical parameters in the block based on the analysis from 8 to 10 monitoring
wells are given below. For Arsenic data, 3 to 4 monitoring wells are considered.
Table 3.2 - Range of chemical parameter in the block (based on CGWB Monitoring Wells data)
Block Aquifer Type
As (mg/l)
pH EC (µs/Cm)
Na (mg/l)
Cl (mg/l)
F (mg/l)
NO3
(mg/l) Total Hardness as CaCO3(mg/l)
Kaliganj I 0.002- 0.082
8.35- 8.46
347.2- 550.4
17.0- 89.0
20.0- 37.5
0.04- 0.70
BDL- 0.9
125- 195
Table 3.3 - Arsenic Concentration in ground water of Tube wells
Name of arsenic affected block
No. of Tube well analysed
Arsenic Concentration (in mg/l)
<& =0.01 >0.01 &<=0.05 >0.05 Max. concentration % No. % No. % No.
Kaliganj 2111 27.00 570 38.09 804 34.86 736 1.00
(Source – PHED, Govt. of India)
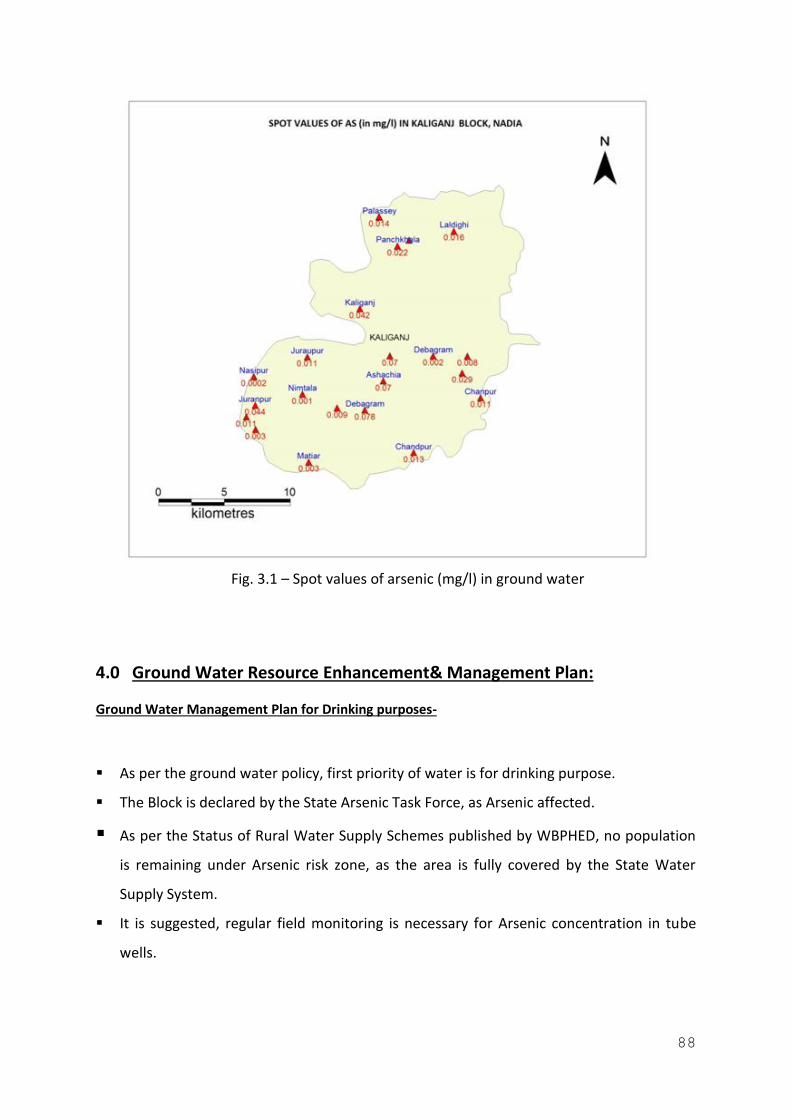
88
Fig. 3.1 – Spot values of arsenic (mg/l) in ground water
4.0 Ground Water Resource Enhancement& Management Plan:
Ground Water Management Plan for Drinking purposes-
▪ As per the ground water policy, first priority of water is for drinking purpose.
▪ The Block is declared by the State Arsenic Task Force, as Arsenic affected.
▪ As per the Status of Rural Water Supply Schemes published by WBPHED, no population
is remaining under Arsenic risk zone, as the area is fully covered by the State Water
Supply System.
▪ It is suggested, regular field monitoring is necessary for Arsenic concentration in tube
wells.
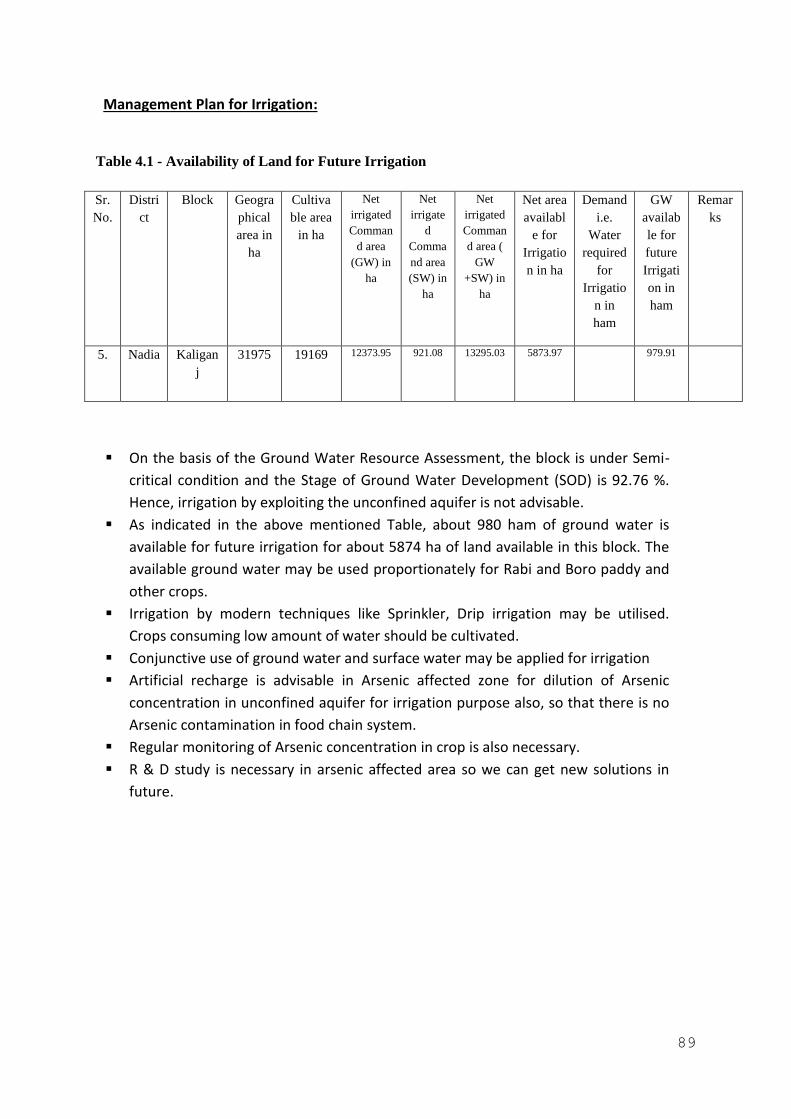
89
Management Plan for Irrigation:
Table 4.1 - Availability of Land for Future Irrigation
Sr.
No.
Distri
ct
Block Geogra
phical
area in
ha
Cultiva
ble area
in ha
Net
irrigated
Comman
d area
(GW) in
ha
Net
irrigate
d
Comma
nd area
(SW) in
ha
Net
irrigated
Comman
d area (
GW
+SW) in
ha
Net area
availabl
e for
Irrigatio
n in ha
Demand
i.e.
Water
required
for
Irrigatio
n in
ham
GW
availab
le for
future
Irrigati
on in
ham
Remar
ks
5. Nadia Kaligan
j
31975 19169 12373.95 921.08 13295.03 5873.97 979.91
▪ On the basis of the Ground Water Resource Assessment, the block is under Semi-
critical condition and the Stage of Ground Water Development (SOD) is 92.76 %.
Hence, irrigation by exploiting the unconfined aquifer is not advisable.
▪ As indicated in the above mentioned Table, about 980 ham of ground water is
available for future irrigation for about 5874 ha of land available in this block. The
available ground water may be used proportionately for Rabi and Boro paddy and
other crops.
▪ Irrigation by modern techniques like Sprinkler, Drip irrigation may be utilised.
Crops consuming low amount of water should be cultivated.
▪ Conjunctive use of ground water and surface water may be applied for irrigation
▪ Artificial recharge is advisable in Arsenic affected zone for dilution of Arsenic
concentration in unconfined aquifer for irrigation purpose also, so that there is no
Arsenic contamination in food chain system.
▪ Regular monitoring of Arsenic concentration in crop is also necessary.
▪ R & D study is necessary in arsenic affected area so we can get new solutions in
future.
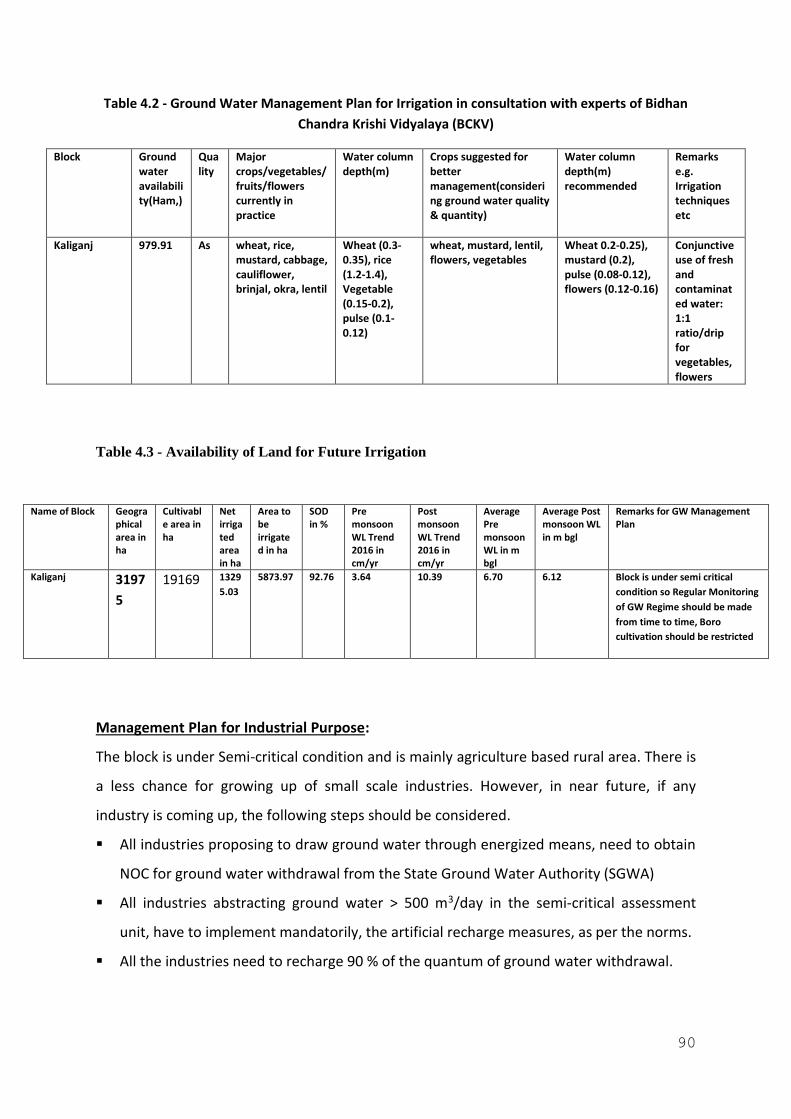
90
Table 4.2 - Ground Water Management Plan for Irrigation in consultation with experts of Bidhan
Chandra Krishi Vidyalaya (BCKV)
Block Ground water availability(Ham,)
Quality
Major crops/vegetables/ fruits/flowers currently in practice
Water column depth(m)
Crops suggested for better management(considering ground water quality & quantity)
Water column depth(m) recommended
Remarks e.g. Irrigation techniques etc
Kaliganj 979.91 As wheat, rice, mustard, cabbage, cauliflower, brinjal, okra, lentil
Wheat (0.3-0.35), rice (1.2-1.4), Vegetable (0.15-0.2), pulse (0.1-0.12)
wheat, mustard, lentil, flowers, vegetables
Wheat 0.2-0.25), mustard (0.2), pulse (0.08-0.12), flowers (0.12-0.16)
Conjunctive use of fresh and contaminated water: 1:1 ratio/drip for vegetables, flowers
Table 4.3 - Availability of Land for Future Irrigation
Management Plan for Industrial Purpose:
The block is under Semi-critical condition and is mainly agriculture based rural area. There is
a less chance for growing up of small scale industries. However, in near future, if any
industry is coming up, the following steps should be considered.
▪ All industries proposing to draw ground water through energized means, need to obtain
NOC for ground water withdrawal from the State Ground Water Authority (SGWA)
▪ All industries abstracting ground water > 500 m3/day in the semi-critical assessment
unit, have to implement mandatorily, the artificial recharge measures, as per the norms.
▪ All the industries need to recharge 90 % of the quantum of ground water withdrawal.
Name of Block Geographical area in ha
Cultivable area in ha
Net irrigated area in ha
Area to be irrigated in ha
SOD in %
Pre monsoon WL Trend 2016 in cm/yr
Post monsoon WL Trend 2016 in cm/yr
Average Pre monsoon WL in m bgl
Average Post monsoon WL in m bgl
Remarks for GW Management Plan
Kaliganj 3197
5
19169 1329
5.03
5873.97 92.76 3.64 10.39 6.70 6.12 Block is under semi critical
condition so Regular Monitoring
of GW Regime should be made
from time to time, Boro
cultivation should be restricted
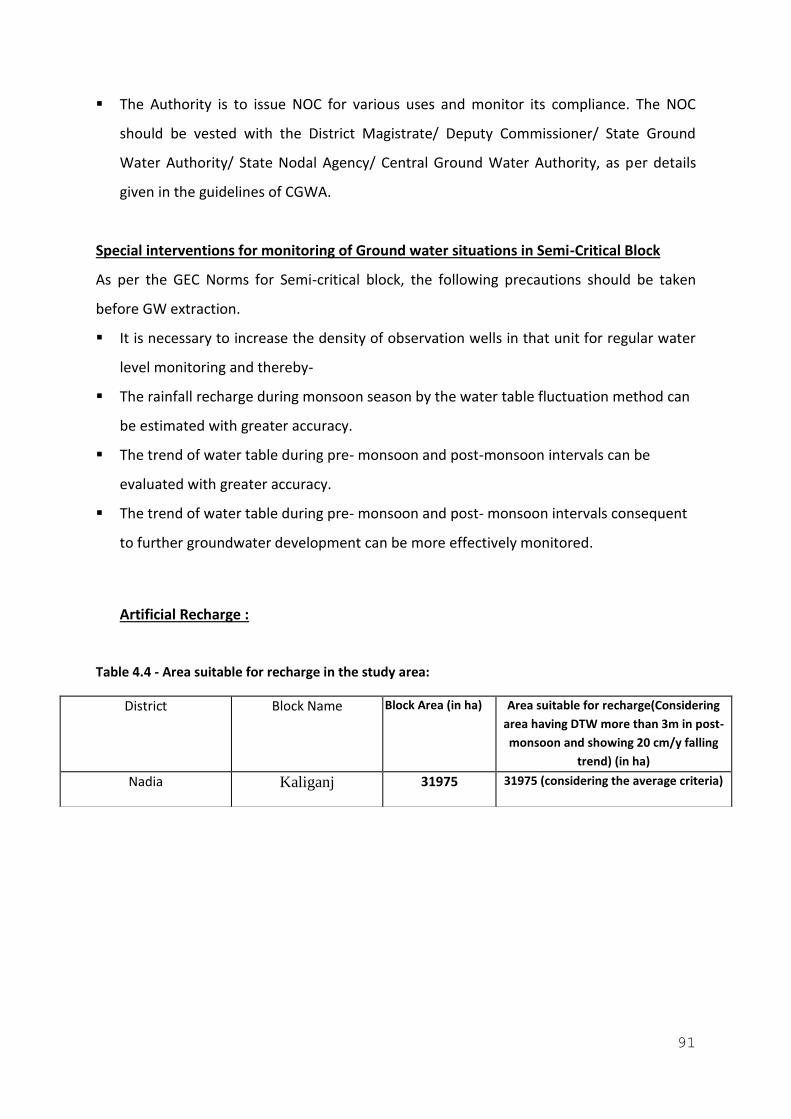
91
▪ The Authority is to issue NOC for various uses and monitor its compliance. The NOC
should be vested with the District Magistrate/ Deputy Commissioner/ State Ground
Water Authority/ State Nodal Agency/ Central Ground Water Authority, as per details
given in the guidelines of CGWA.
Special interventions for monitoring of Ground water situations in Semi-Critical Block
As per the GEC Norms for Semi-critical block, the following precautions should be taken
before GW extraction.
▪ It is necessary to increase the density of observation wells in that unit for regular water
level monitoring and thereby-
▪ The rainfall recharge during monsoon season by the water table fluctuation method can
be estimated with greater accuracy.
▪ The trend of water table during pre- monsoon and post-monsoon intervals can be
evaluated with greater accuracy.
▪ The trend of water table during pre- monsoon and post- monsoon intervals consequent
to further groundwater development can be more effectively monitored.
Artificial Recharge :
Table 4.4 - Area suitable for recharge in the study area:
District Block Name Block Area (in ha) Area suitable for recharge(Considering
area having DTW more than 3m in post-
monsoon and showing 20 cm/y falling
trend) (in ha)
Nadia Kaliganj 31975 31975 (considering the average criteria)
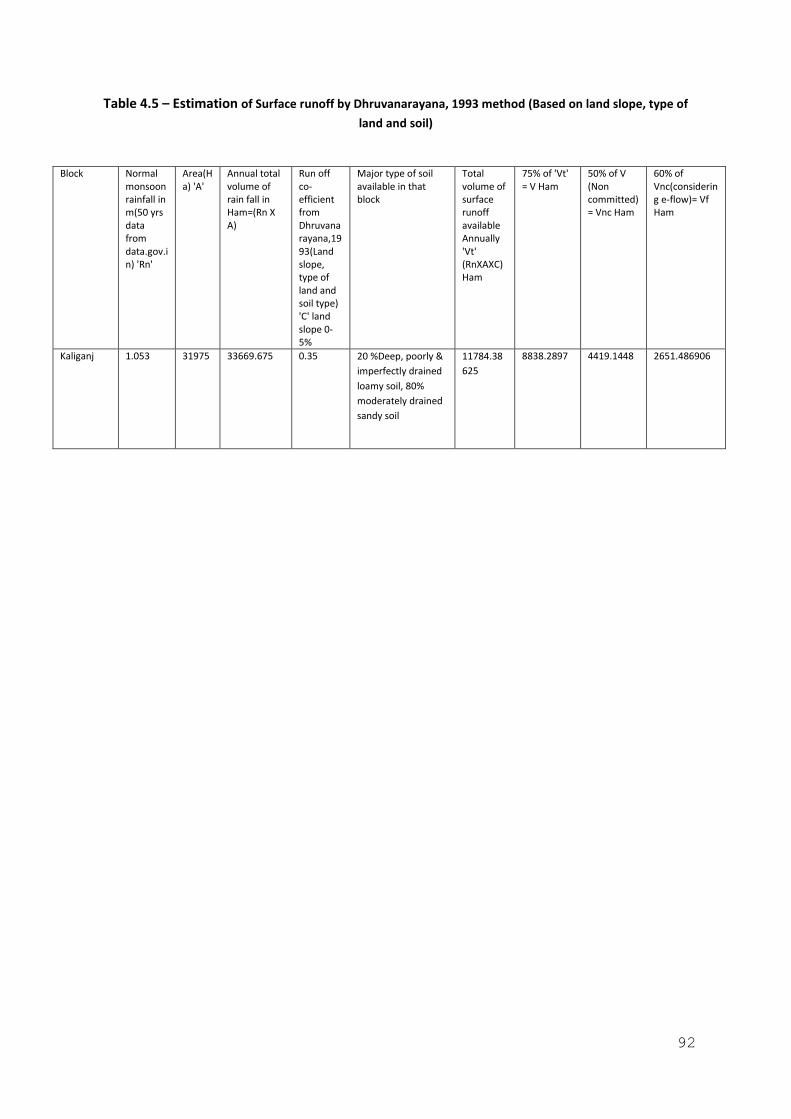
92
Table 4.5 – Estimation of Surface runoff by Dhruvanarayana, 1993 method (Based on land slope, type of
land and soil)
Block Normal
monsoon rainfall in m(50 yrs data from data.gov.in) 'Rn'
Area(Ha) 'A'
Annual total volume of rain fall in Ham=(Rn X A)
Run off co-efficient from Dhruvanarayana,1993(Land slope, type of land and soil type) 'C' land slope 0-5%
Major type of soil available in that block
Total volume of surface runoff available Annually 'Vt' (RnXAXC) Ham
75% of 'Vt' = V Ham
50% of V (Non committed)= Vnc Ham
60% of Vnc(considering e-flow)= Vf Ham
Kaliganj 1.053 31975 33669.675 0.35 20 %Deep, poorly &
imperfectly drained
loamy soil, 80%
moderately drained
sandy soil
11784.38
625
8838.2897 4419.1448 2651.486906

93
Table 4.6 – Possible Recharge & conservation structures using harvested run off in block based on soil characteristic, Slope, Rain fall data and Long term trend & cost estimate
Block (1) Amount of water for artificial recharge and / or conservation (Ham) (2)
Source water allocation for Irrigation Cum Recharge Tank and REET with Recharge Shaft in Ham (3)
Source water allocation for REET with Recharge Shaft (Ham): 50 % of Col. 3 (4)
Source water allocation for Irrigation Cum Recharge Tank (Ham): 50 % of Col. 3 (5)
Source water
allocation for
Injection Well (6)
Source water allocation for Farm Pond in Ham (7)
Nos. of Farm Pond @ 10 Ham per unit (8)
Cost of Farm pond @ Rs 8 lakh per unit (9)
Nos. of Irrigation Cum Recharge Tank suggested @ 50 Ham per unit (10)
Cost of Irrigation Cum Recharge Tank @ Rs 8 lakh per unit (11)
Nos. of REET with recharge shaft @ 10 Ham per unit (12)
Cost of REET with Recharge Shaft @ Rs 8 lakh per unit (13)
Nos. of injection Well @ 30 Ham per unit (14)
Cost of injection Well @ Rs 25 lakh (15)
Total Cost (16)
(in Lakh)
Kaliganj 2651.4869 70 % of Col. 2 i.e. 1856.04 Ham
928.02 928.02 20 % of Col. 2 i.e. 530.30 Ham
10 % of Col.2 i.e. 265.15 Ham
27 216 19 152 93 474 18 450 1292
REET with Recharge Shaft Re-excavation of existing tank with Recharge Shaft
94
6. NAKASHIPARA BLOCK
1.0 Salient Information
Block Name: Nakashipara
Area (in sq km): 354.24
District: Nadia
State: West Bengal
Population (as on 2011): 352191
Table 1.1 - Details of Population
Male Female Total
180990 171201 352191
Rainfall: Average annual rainfall (Nadia district) for the period 2012-2016 (in mm): 1214.24
Table 1.2 - Details of Annual Rainfall since last five years (mm)
Block District Normal
Actual (Annual)
2012 2013 2014 2015 2016
Nakashipara 1444 862.0 1287.8 1096.8 1408.1 1416.5
Agriculture & Irrigation
Total area in ha: 35424
Table 1.3 - Land use pattern of block
SI. No
Name of the Block
Geographic Area (ha)
Cultivable Area (ha)
Area under pasture &
orchard (ha)
Cultivable Waste
Land(ha)
Forest Land (ha)
Home Stead Land (ha)
1. Nakashipara 35424 23082 312 Nil 309 7525
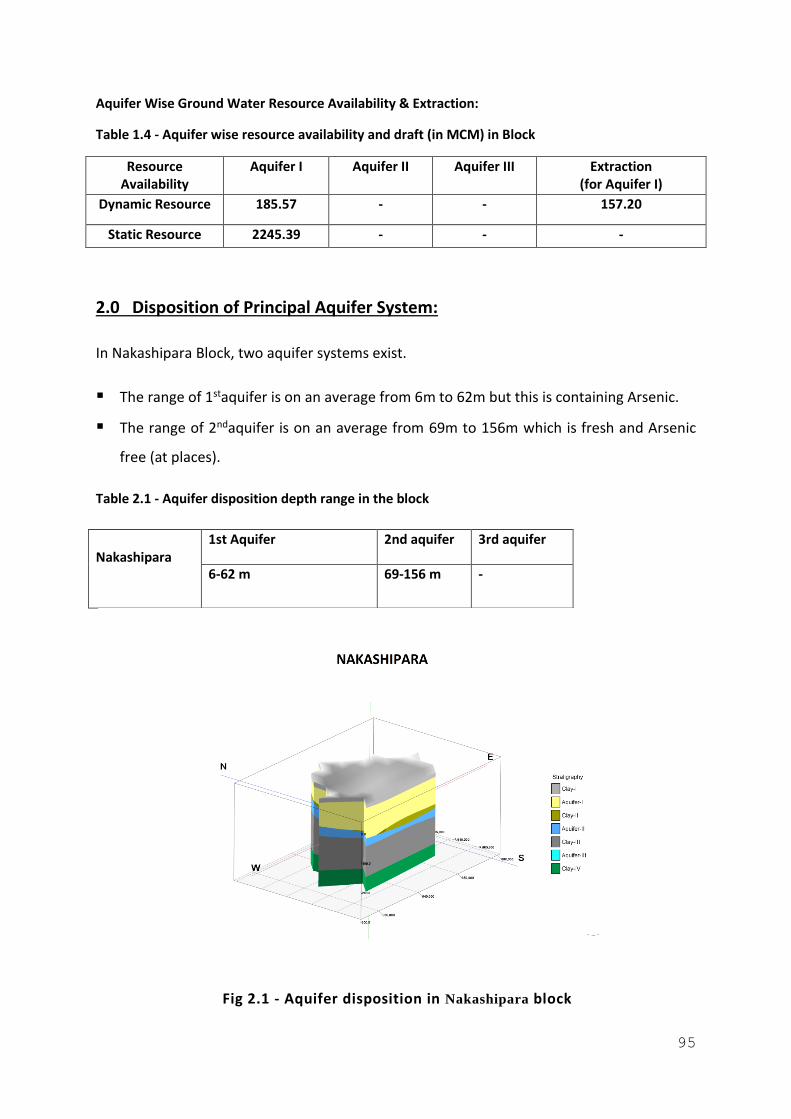
95
Aquifer Wise Ground Water Resource Availability & Extraction:
Table 1.4 - Aquifer wise resource availability and draft (in MCM) in Block
Resource Availability
Aquifer I Aquifer II Aquifer III Extraction (for Aquifer I)
Dynamic Resource 185.57 - - 157.20
Static Resource 2245.39 - - -
2.0 Disposition of Principal Aquifer System:
In Nakashipara Block, two aquifer systems exist.
▪ The range of 1staquifer is on an average from 6m to 62m but this is containing Arsenic.
▪ The range of 2ndaquifer is on an average from 69m to 156m which is fresh and Arsenic
free (at places).
Table 2.1 - Aquifer disposition depth range in the block
Nakashipara
1st Aquifer 2nd aquifer 3rd aquifer
6-62 m 69-156 m -
Fig 2.1 - Aquifer disposition in Nakashipara block
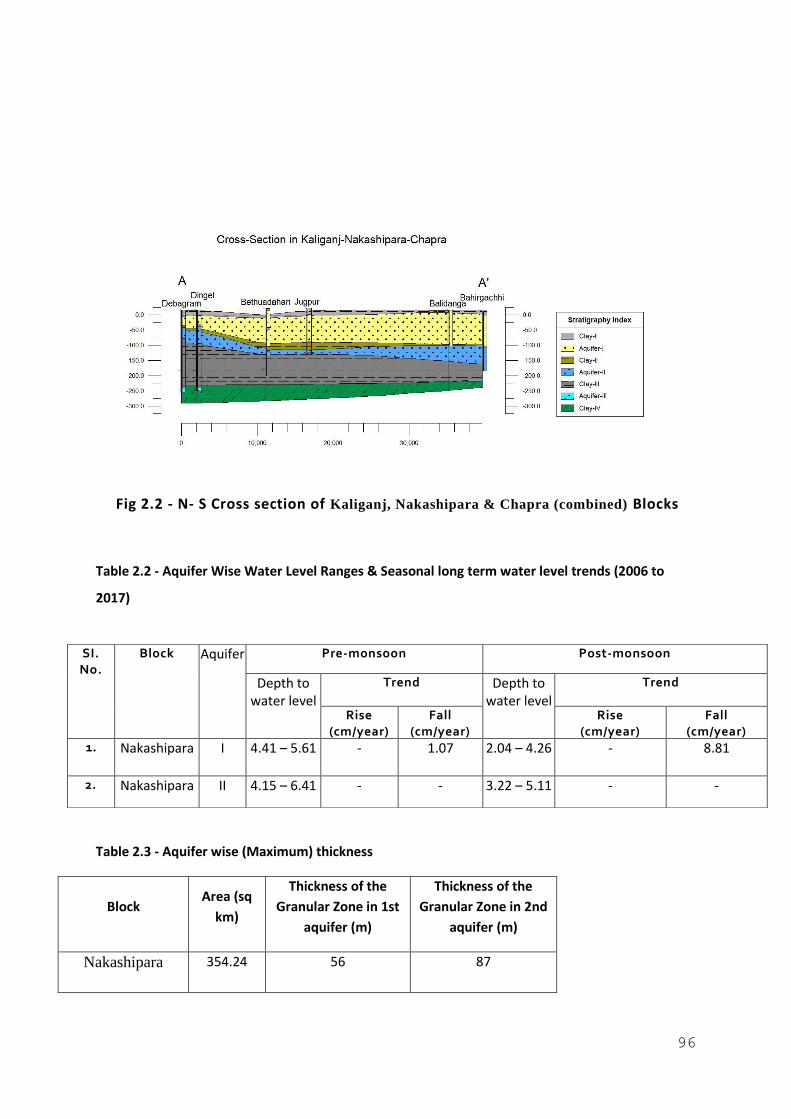
96
Fig 2.2 - N- S Cross section of Kaliganj, Nakashipara & Chapra (combined) Blocks
Table 2.2 - Aquifer Wise Water Level Ranges & Seasonal long term water level trends (2006 to
2017)
Table 2.3 - Aquifer wise (Maximum) thickness
Block Area (sq
km)
Thickness of the
Granular Zone in 1st
aquifer (m)
Thickness of the
Granular Zone in 2nd
aquifer (m)
Nakashipara 354.24 56 87
SI. No.
Block Aquifer Pre-monsoon Post-monsoon
Depth to water level
Trend Depth to water level
Trend
Rise (cm/year)
Fall (cm/year)
Rise (cm/year)
Fall (cm/year)
1. Nakashipara I 4.41 – 5.61 - 1.07 2.04 – 4.26 - 8.81
2. Nakashipara II 4.15 – 6.41 - - 3.22 – 5.11 - -
97
Table 2.4 - Aquifer-wise depth range and parameters
Name of Block 1st Aquifer 2nd Aquifer
Depth Range (mbgl)
Discharge
(m3/hr)
T (m2/da
y)
S Depth Range (mbgl)
Discharge (m3/hr)
T (m2/d
ay)
S
Nakashipara 6 - 62 173 350 - 69 - 156 191 1400 -
3.0 Ground Water Resource, Extraction, Contamination & Other Issues:
Resource Availability & Extraction: Dynamic ground water resources as on 31st March’13
Table 3.1 - Ground Water resource in Block
Block Net ground Water availability (MCM)
Gross ground Water draft (MCM)
Stage of Development (%)
Category Provision for domestic and industrial requirement supply up to 2035 years(MCM)
Nakashipara 185.57
157.20 84.71 Safe
7.71
Chemical Quality of Ground Water & Contamination:
Average data of chemical parameters in the block based on the analysis from 8 to 10 monitoring
wells are given below. For Arsenic data, 3 to 4 monitoring wells are considered
Table 3.2 - Range of chemical parameter in the block
Block Aquifer Type
As (mg/l)
pH EC (µs/Cm)
Na (mg/l)
Cl (mg/l)
F (mg/l)
NO3 (mg/l)
Total Hardness as CaCO3(mg/l)
Nakashipara I 0.0001- 0.119
8.31- 8.49
312.0- 437.7
14.7- 41.2
7.5- 15.0
0.28- 1.11
BDL- 5.4
120- 155
Table 3.3 - Arsenic Concentration in ground water of Tube wells
Name of arsenic affected block
No. of Tube well analysed
Arsenic Concentration (in mg/l)
<& =0.01 >0.01 &<=0.05 >0.05 Max. concentration % No. % No. % No.
Nakashipara 2459 45.51 1119 40.42 994 14.07 346 0.56
(Source – PHED, Govt. of West Bengal)

98
Fig. 3.1 – Spot values in ground water
4.0 Ground Water Resource Enhancement & Management Plan:
Ground Water Management Plan for Drinking purposes-
▪ As per the ground water policy, first priority of water is for drinking purpose.
▪ The Block is declared by the State Arsenic Task Force, as Arsenic affected.
▪ As per the Status of Rural Water Supply Schemes published by WBPHED, no population
is remaining under Arsenic risk zone, as the area is fully covered by the State Water
Supply System.
▪ It is suggested, regular field monitoring is necessary for Arsenic concentration in tube
wells.
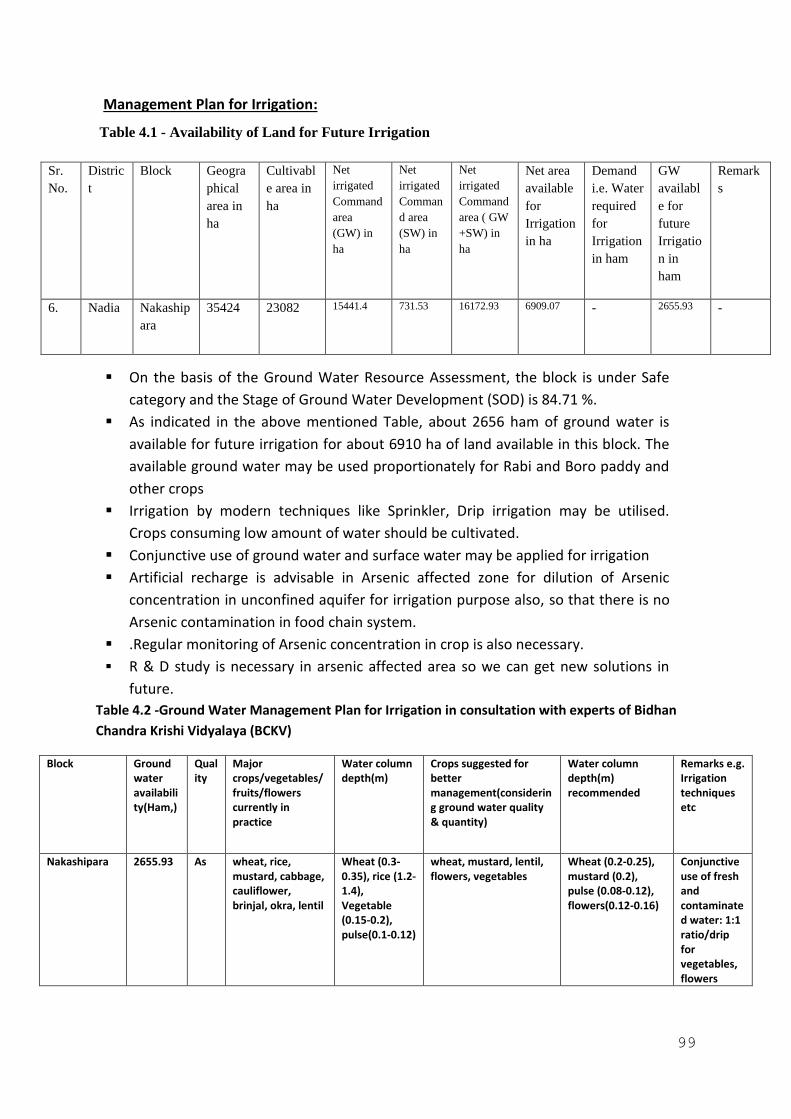
99
Management Plan for Irrigation:
Table 4.1 - Availability of Land for Future Irrigation
Sr.
No.
Distric
t
Block Geogra
phical
area in
ha
Cultivabl
e area in
ha
Net
irrigated
Command
area
(GW) in
ha
Net
irrigated
Comman
d area
(SW) in
ha
Net
irrigated
Command
area ( GW
+SW) in
ha
Net area
available
for
Irrigation
in ha
Demand
i.e. Water
required
for
Irrigation
in ham
GW
availabl
e for
future
Irrigatio
n in
ham
Remark
s
6. Nadia Nakaship
ara
35424 23082 15441.4 731.53 16172.93 6909.07 - 2655.93
-
▪ On the basis of the Ground Water Resource Assessment, the block is under Safe
category and the Stage of Ground Water Development (SOD) is 84.71 %.
▪ As indicated in the above mentioned Table, about 2656 ham of ground water is
available for future irrigation for about 6910 ha of land available in this block. The
available ground water may be used proportionately for Rabi and Boro paddy and
other crops
▪ Irrigation by modern techniques like Sprinkler, Drip irrigation may be utilised.
Crops consuming low amount of water should be cultivated.
▪ Conjunctive use of ground water and surface water may be applied for irrigation
▪ Artificial recharge is advisable in Arsenic affected zone for dilution of Arsenic
concentration in unconfined aquifer for irrigation purpose also, so that there is no
Arsenic contamination in food chain system.
▪ .Regular monitoring of Arsenic concentration in crop is also necessary.
▪ R & D study is necessary in arsenic affected area so we can get new solutions in
future.
Table 4.2 -Ground Water Management Plan for Irrigation in consultation with experts of Bidhan
Chandra Krishi Vidyalaya (BCKV)
Block Ground water availability(Ham,)
Quality
Major crops/vegetables/ fruits/flowers currently in practice
Water column depth(m)
Crops suggested for better management(considering ground water quality & quantity)
Water column depth(m) recommended
Remarks e.g. Irrigation techniques etc
Nakashipara 2655.93 As wheat, rice, mustard, cabbage, cauliflower, brinjal, okra, lentil
Wheat (0.3-0.35), rice (1.2-1.4), Vegetable (0.15-0.2), pulse(0.1-0.12)
wheat, mustard, lentil, flowers, vegetables
Wheat (0.2-0.25), mustard (0.2), pulse (0.08-0.12), flowers(0.12-0.16)
Conjunctive use of fresh and contaminated water: 1:1 ratio/drip for vegetables, flowers
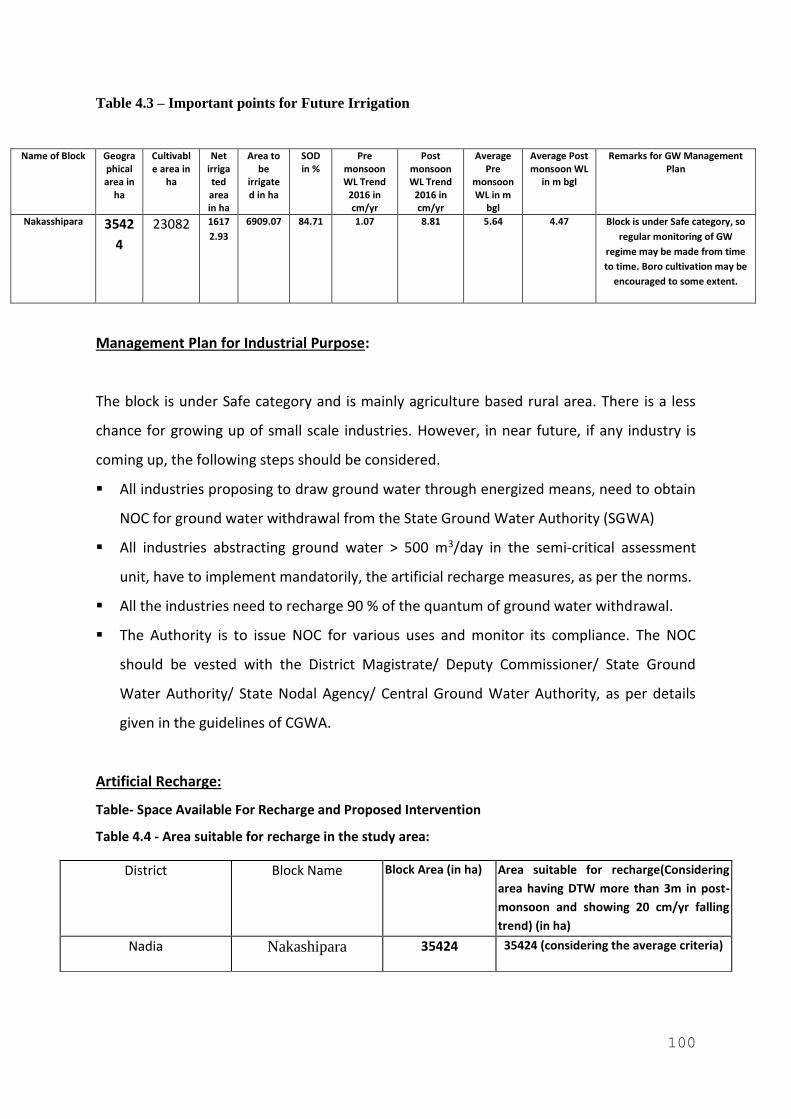
100
Table 4.3 – Important points for Future Irrigation
Name of Block Geographical area in
ha
Cultivable area in
ha
Net irrigated area in ha
Area to be
irrigated in ha
SOD in %
Pre monsoon WL Trend
2016 in cm/yr
Post monsoon WL Trend
2016 in cm/yr
Average Pre
monsoon WL in m
bgl
Average Post monsoon WL
in m bgl
Remarks for GW Management Plan
Nakasshipara 3542
4
23082 1617
2.93
6909.07 84.71 1.07 8.81 5.64 4.47 Block is under Safe category, so
regular monitoring of GW
regime may be made from time
to time. Boro cultivation may be
encouraged to some extent.
Management Plan for Industrial Purpose:
The block is under Safe category and is mainly agriculture based rural area. There is a less
chance for growing up of small scale industries. However, in near future, if any industry is
coming up, the following steps should be considered.
▪ All industries proposing to draw ground water through energized means, need to obtain
NOC for ground water withdrawal from the State Ground Water Authority (SGWA)
▪ All industries abstracting ground water > 500 m3/day in the semi-critical assessment
unit, have to implement mandatorily, the artificial recharge measures, as per the norms.
▪ All the industries need to recharge 90 % of the quantum of ground water withdrawal.
▪ The Authority is to issue NOC for various uses and monitor its compliance. The NOC
should be vested with the District Magistrate/ Deputy Commissioner/ State Ground
Water Authority/ State Nodal Agency/ Central Ground Water Authority, as per details
given in the guidelines of CGWA.
Artificial Recharge:
Table- Space Available For Recharge and Proposed Intervention
Table 4.4 - Area suitable for recharge in the study area:
District Block Name Block Area (in ha) Area suitable for recharge(Considering
area having DTW more than 3m in post-
monsoon and showing 20 cm/yr falling
trend) (in ha)
Nadia Nakashipara 35424 35424 (considering the average criteria)
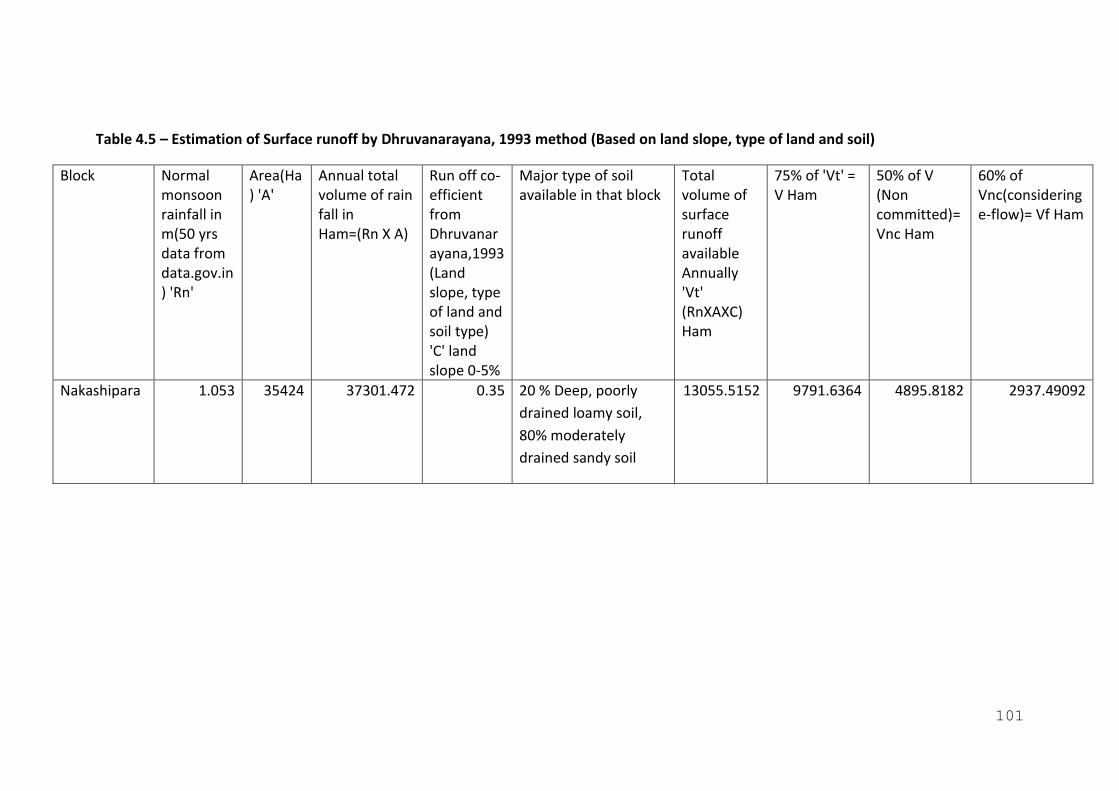
101
Table 4.5 – Estimation of Surface runoff by Dhruvanarayana, 1993 method (Based on land slope, type of land and soil)
Block Normal monsoon rainfall in m(50 yrs data from data.gov.in) 'Rn'
Area(Ha) 'A'
Annual total volume of rain fall in Ham=(Rn X A)
Run off co-efficient from Dhruvanarayana,1993(Land slope, type of land and soil type) 'C' land slope 0-5%
Major type of soil available in that block
Total volume of surface runoff available Annually 'Vt' (RnXAXC) Ham
75% of 'Vt' = V Ham
50% of V (Non committed)= Vnc Ham
60% of Vnc(considering e-flow)= Vf Ham
Nakashipara 1.053 35424 37301.472 0.35 20 % Deep, poorly
drained loamy soil,
80% moderately
drained sandy soil
13055.5152 9791.6364 4895.8182 2937.49092
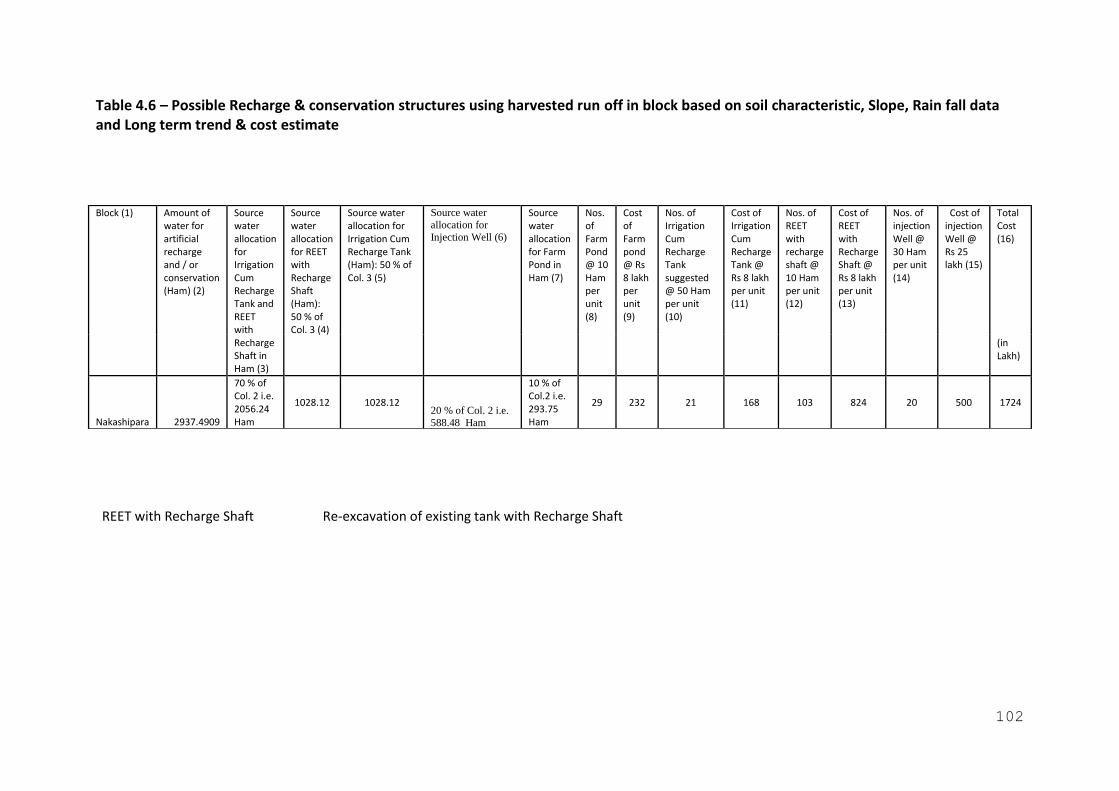
102
Table 4.6 – Possible Recharge & conservation structures using harvested run off in block based on soil characteristic, Slope, Rain fall data and Long term trend & cost estimate
REET with Recharge Shaft Re-excavation of existing tank with Recharge Shaft
Block (1) Amount of water for artificial recharge and / or conservation (Ham) (2)
Source water allocation for Irrigation Cum Recharge Tank and REET with Recharge Shaft in Ham (3)
Source water allocation for REET with Recharge Shaft (Ham): 50 % of Col. 3 (4)
Source water allocation for Irrigation Cum Recharge Tank (Ham): 50 % of Col. 3 (5)
Source water
allocation for
Injection Well (6)
Source water allocation for Farm Pond in Ham (7)
Nos. of Farm Pond @ 10 Ham per unit (8)
Cost of Farm pond @ Rs 8 lakh per unit (9)
Nos. of Irrigation Cum Recharge Tank suggested @ 50 Ham per unit (10)
Cost of Irrigation Cum Recharge Tank @ Rs 8 lakh per unit (11)
Nos. of REET with recharge shaft @ 10 Ham per unit (12)
Cost of REET with Recharge Shaft @ Rs 8 lakh per unit (13)
Nos. of injection Well @ 30 Ham per unit (14)
Cost of injection Well @ Rs 25 lakh (15)
Total Cost (16)
(in Lakh)
Nakashipara 2937.4909
70 % of Col. 2 i.e. 2056.24 Ham
1028.12 1028.12 20 % of Col. 2 i.e.
588.48 Ham
10 % of Col.2 i.e. 293.75 Ham
29 232 21 168 103 824 20 500 1724
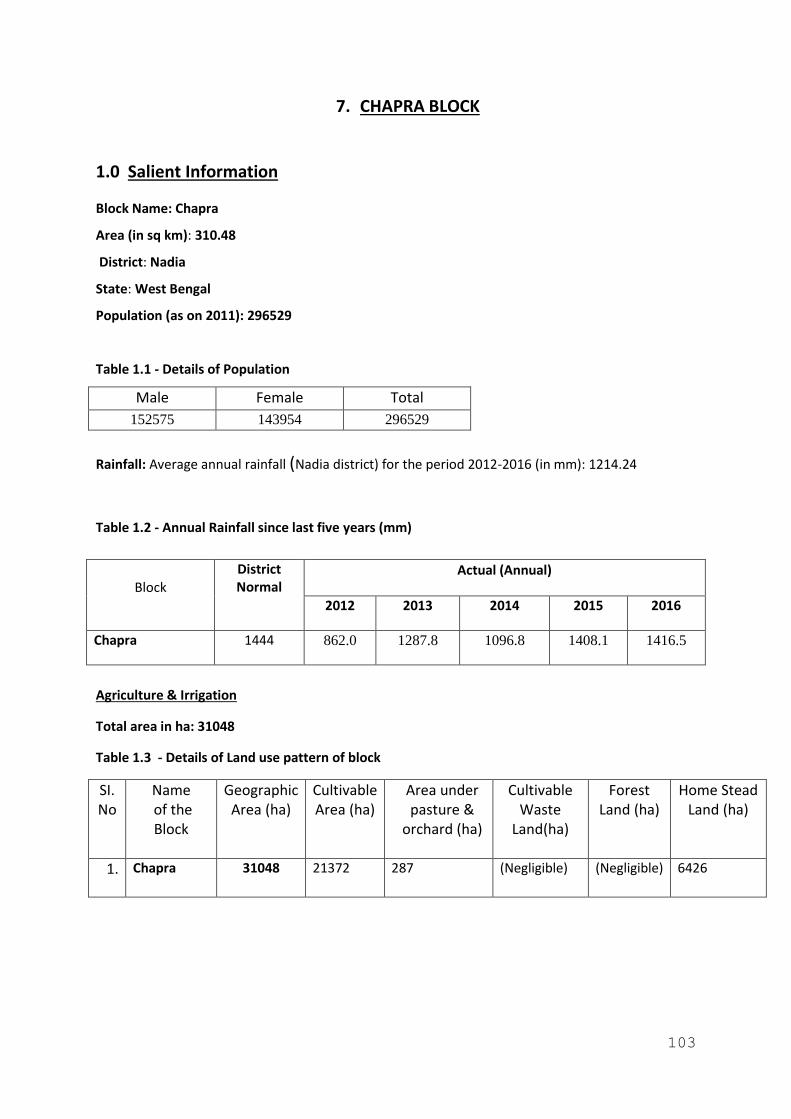
103
7. CHAPRA BLOCK
1.0 Salient Information
Block Name: Chapra
Area (in sq km): 310.48
District: Nadia
State: West Bengal
Population (as on 2011): 296529
Table 1.1 - Details of Population
Male Female Total
152575 143954 296529
Rainfall: Average annual rainfall (Nadia district) for the period 2012-2016 (in mm): 1214.24
Table 1.2 - Annual Rainfall since last five years (mm)
Block District Normal
Actual (Annual)
2012 2013 2014 2015 2016
Chapra 1444 862.0 1287.8 1096.8 1408.1 1416.5
Agriculture & Irrigation
Total area in ha: 31048
Table 1.3 - Details of Land use pattern of block
SI. No
Name of the Block
Geographic Area (ha)
Cultivable Area (ha)
Area under pasture &
orchard (ha)
Cultivable Waste
Land(ha)
Forest Land (ha)
Home Stead Land (ha)
1. Chapra 31048 21372 287 (Negligible) (Negligible) 6426
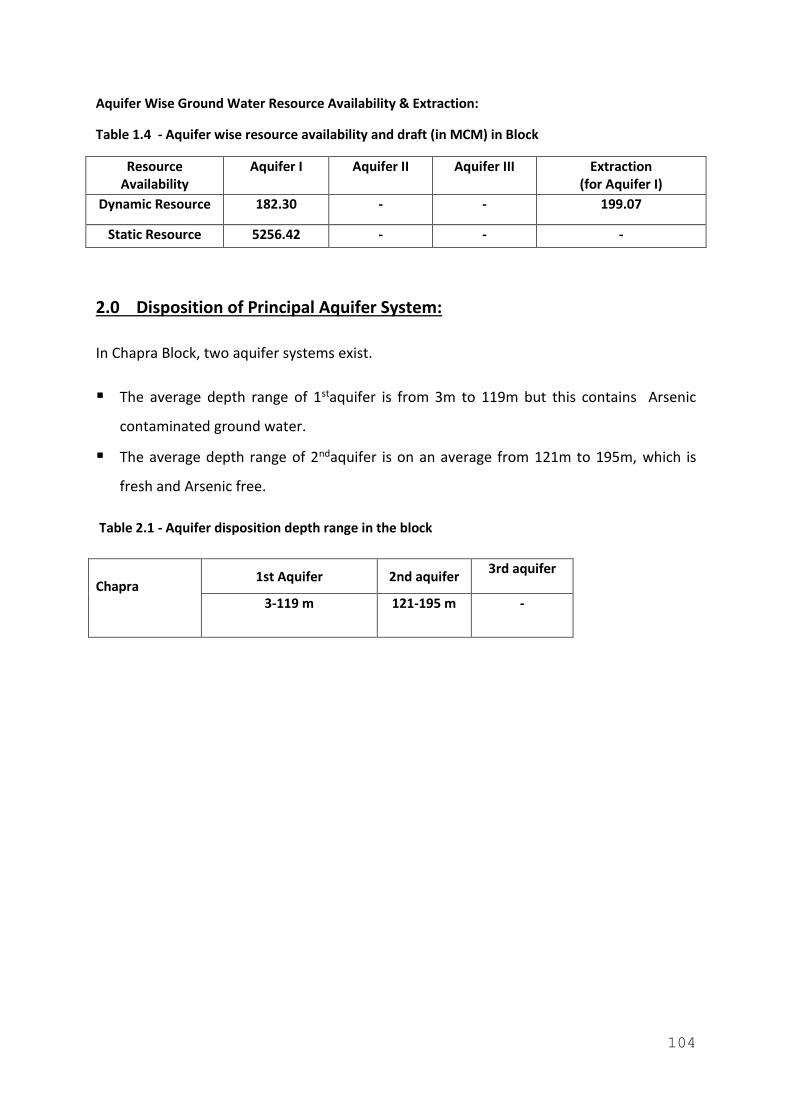
104
Aquifer Wise Ground Water Resource Availability & Extraction:
Table 1.4 - Aquifer wise resource availability and draft (in MCM) in Block
Resource Availability
Aquifer I Aquifer II Aquifer III Extraction (for Aquifer I)
Dynamic Resource 182.30 - - 199.07
Static Resource 5256.42 - - -
2.0 Disposition of Principal Aquifer System:
In Chapra Block, two aquifer systems exist.
▪ The average depth range of 1staquifer is from 3m to 119m but this contains Arsenic
contaminated ground water.
▪ The average depth range of 2ndaquifer is on an average from 121m to 195m, which is
fresh and Arsenic free.
Table 2.1 - Aquifer disposition depth range in the block
Chapra
1st Aquifer 2nd aquifer 3rd aquifer
3-119 m 121-195 m -

105
Fig 2.1 - Aquifer disposition in Chapra Block
Fig 2.2 - N- S Cross section of Kaliganj, Nakashipara & Chapra Blocks (combined)
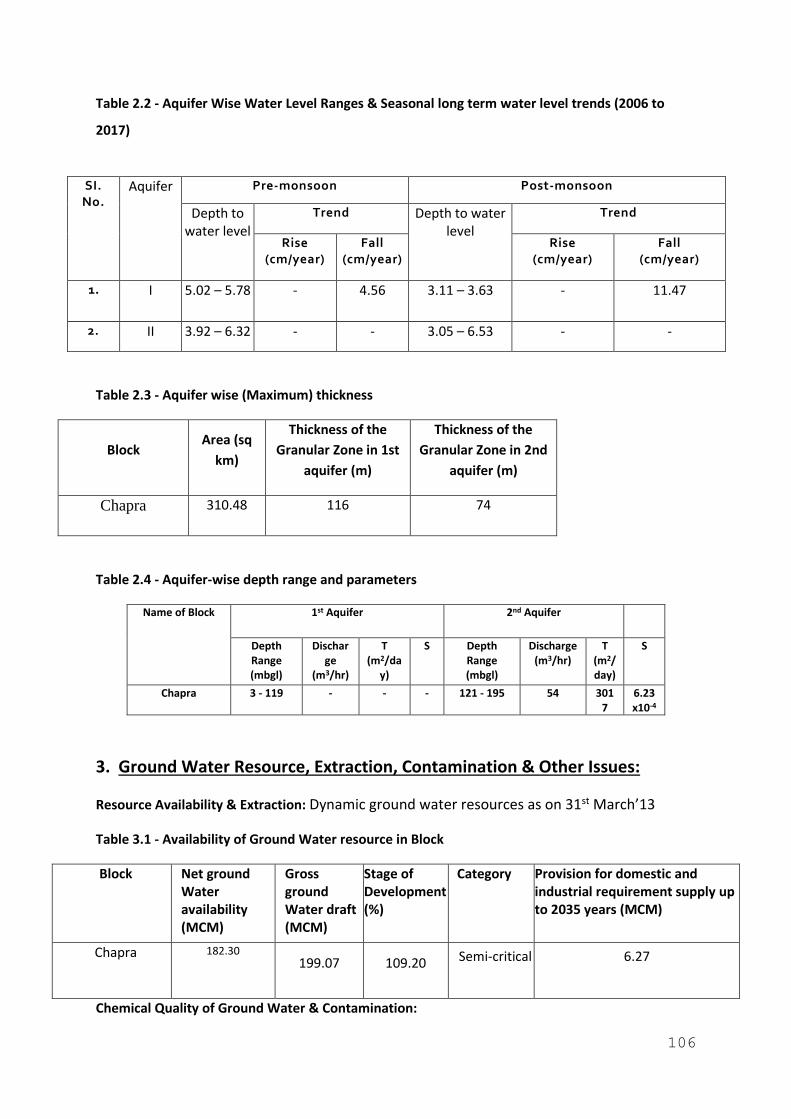
106
Table 2.2 - Aquifer Wise Water Level Ranges & Seasonal long term water level trends (2006 to
2017)
Table 2.3 - Aquifer wise (Maximum) thickness
Block Area (sq
km)
Thickness of the
Granular Zone in 1st
aquifer (m)
Thickness of the
Granular Zone in 2nd
aquifer (m)
Chapra 310.48 116 74
Table 2.4 - Aquifer-wise depth range and parameters
Name of Block 1st Aquifer 2nd Aquifer
Depth Range (mbgl)
Discharge
(m3/hr)
T (m2/da
y)
S Depth Range (mbgl)
Discharge (m3/hr)
T (m2/day)
S
Chapra 3 - 119 - - - 121 - 195 54 3017
6.23x10⁻⁴
3. Ground Water Resource, Extraction, Contamination & Other Issues:
Resource Availability & Extraction: Dynamic ground water resources as on 31st March’13
Table 3.1 - Availability of Ground Water resource in Block
Block Net ground Water availability (MCM)
Gross ground Water draft (MCM)
Stage of Development (%)
Category Provision for domestic and industrial requirement supply up to 2035 years (MCM)
Chapra 182.30
199.07 109.20 Semi-critical 6.27
Chemical Quality of Ground Water & Contamination:
SI. No.
Aquifer Pre-monsoon Post-monsoon
Depth to water level
Trend Depth to water level
Trend
Rise (cm/year)
Fall (cm/year)
Rise (cm/year)
Fall (cm/year)
1. I 5.02 – 5.78 - 4.56 3.11 – 3.63 - 11.47
2. II 3.92 – 6.32 - - 3.05 – 6.53 - -
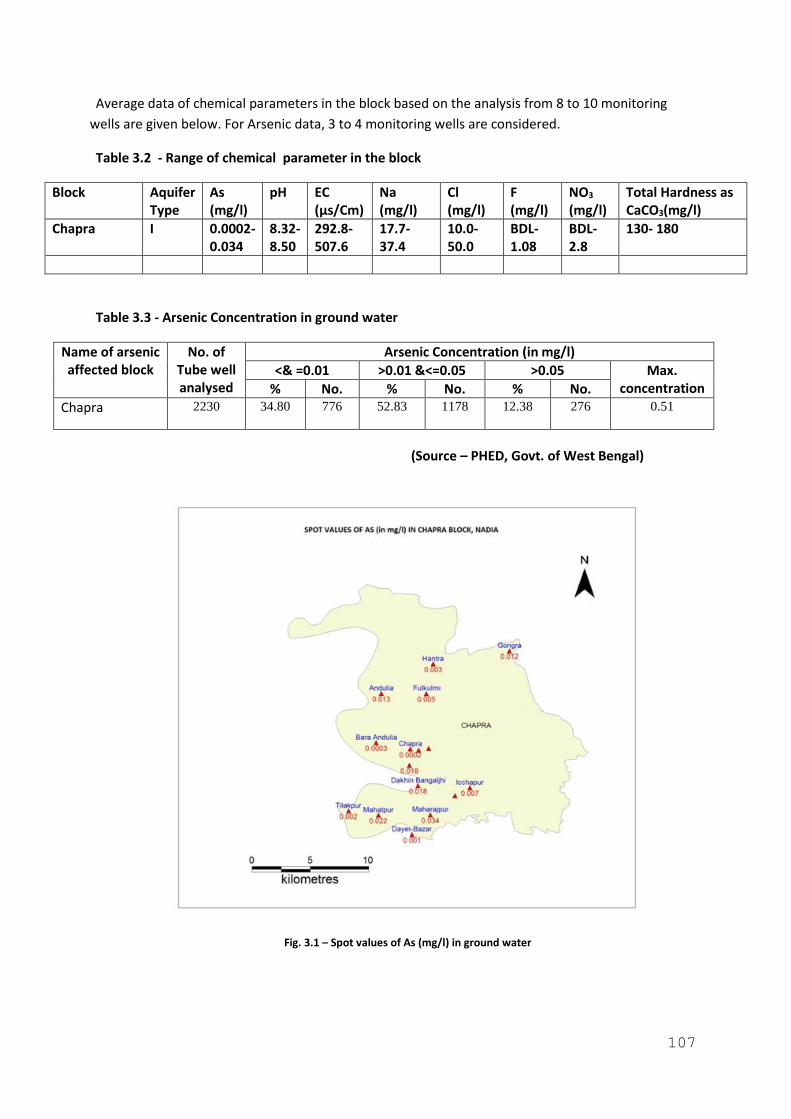
107
Average data of chemical parameters in the block based on the analysis from 8 to 10 monitoring
wells are given below. For Arsenic data, 3 to 4 monitoring wells are considered.
Table 3.2 - Range of chemical parameter in the block
Block Aquifer Type
As (mg/l)
pH EC (µs/Cm)
Na (mg/l)
Cl (mg/l)
F (mg/l)
NO3 (mg/l)
Total Hardness as CaCO3(mg/l)
Chapra I 0.0002- 0.034
8.32- 8.50
292.8- 507.6
17.7- 37.4
10.0- 50.0
BDL- 1.08
BDL- 2.8
130- 180
Table 3.3 - Arsenic Concentration in ground water
Name of arsenic affected block
No. of Tube well analysed
Arsenic Concentration (in mg/l)
<& =0.01 >0.01 &<=0.05 >0.05 Max. concentration % No. % No. % No.
Chapra 2230 34.80 776 52.83 1178 12.38 276 0.51
(Source – PHED, Govt. of West Bengal)
Fig. 3.1 – Spot values of As (mg/l) in ground water
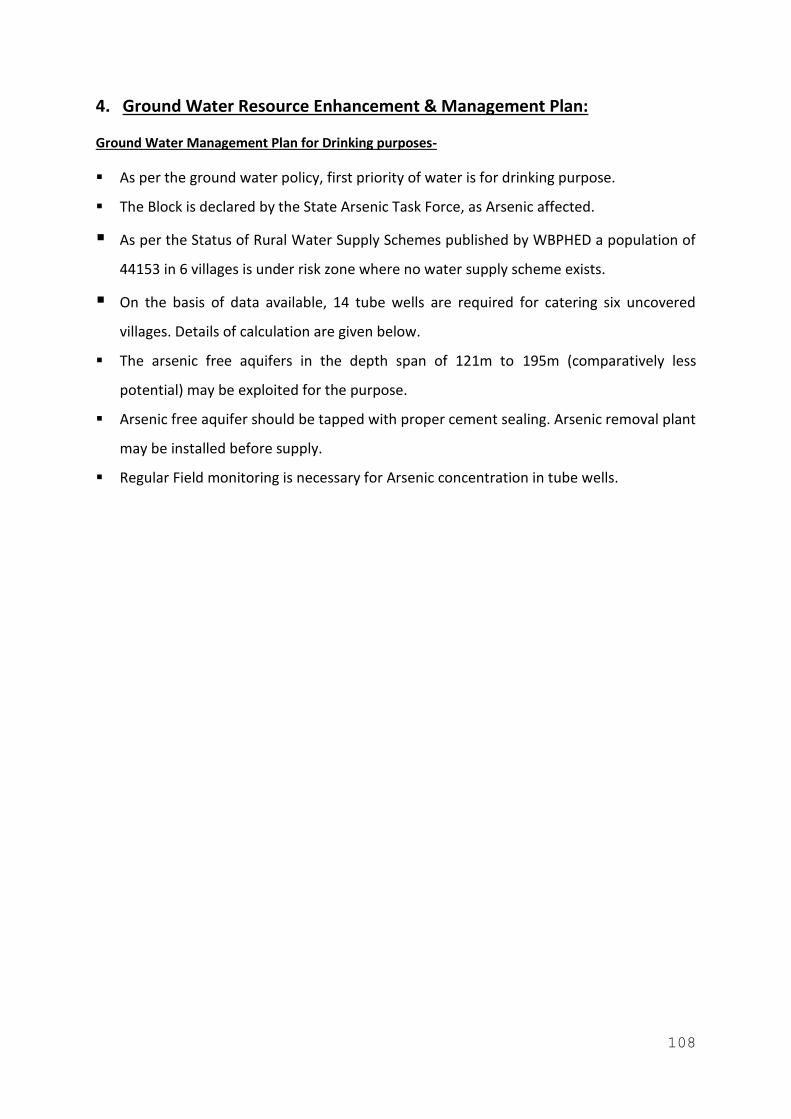
108
4. Ground Water Resource Enhancement & Management Plan:
Ground Water Management Plan for Drinking purposes-
▪ As per the ground water policy, first priority of water is for drinking purpose.
▪ The Block is declared by the State Arsenic Task Force, as Arsenic affected.
▪ As per the Status of Rural Water Supply Schemes published by WBPHED a population of
44153 in 6 villages is under risk zone where no water supply scheme exists.
▪ On the basis of data available, 14 tube wells are required for catering six uncovered
villages. Details of calculation are given below.
▪ The arsenic free aquifers in the depth span of 121m to 195m (comparatively less
potential) may be exploited for the purpose.
▪ Arsenic free aquifer should be tapped with proper cement sealing. Arsenic removal plant
may be installed before supply.
▪ Regular Field monitoring is necessary for Arsenic concentration in tube wells.
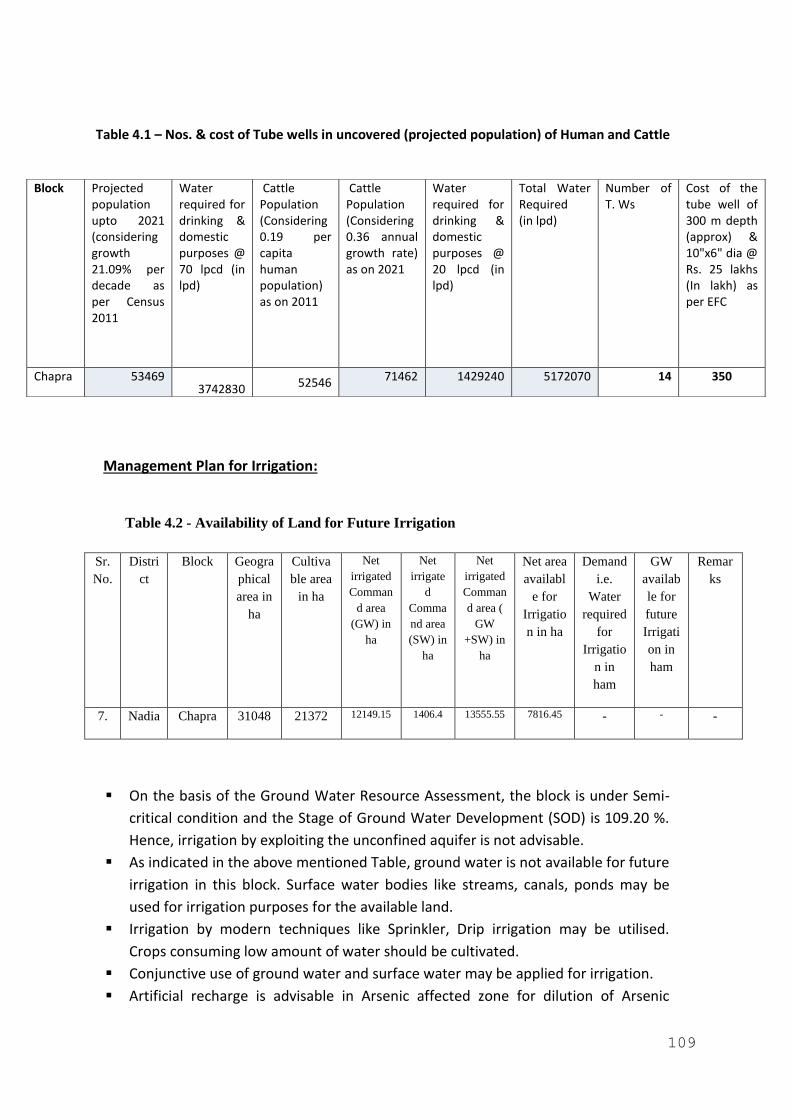
109
Table 4.1 – Nos. & cost of Tube wells in uncovered (projected population) of Human and Cattle
Management Plan for Irrigation:
Table 4.2 - Availability of Land for Future Irrigation
Sr.
No.
Distri
ct
Block Geogra
phical
area in
ha
Cultiva
ble area
in ha
Net
irrigated
Comman
d area
(GW) in
ha
Net
irrigate
d
Comma
nd area
(SW) in
ha
Net
irrigated
Comman
d area (
GW
+SW) in
ha
Net area
availabl
e for
Irrigatio
n in ha
Demand
i.e.
Water
required
for
Irrigatio
n in
ham
GW
availab
le for
future
Irrigati
on in
ham
Remar
ks
7. Nadia Chapra 31048 21372 12149.15 1406.4 13555.55 7816.45 - - -
▪ On the basis of the Ground Water Resource Assessment, the block is under Semi-
critical condition and the Stage of Ground Water Development (SOD) is 109.20 %.
Hence, irrigation by exploiting the unconfined aquifer is not advisable.
▪ As indicated in the above mentioned Table, ground water is not available for future
irrigation in this block. Surface water bodies like streams, canals, ponds may be
used for irrigation purposes for the available land.
▪ Irrigation by modern techniques like Sprinkler, Drip irrigation may be utilised.
Crops consuming low amount of water should be cultivated.
▪ Conjunctive use of ground water and surface water may be applied for irrigation.
▪ Artificial recharge is advisable in Arsenic affected zone for dilution of Arsenic
Block Projected population upto 2021 (considering growth 21.09% per decade as per Census 2011
Water required for drinking & domestic purposes @ 70 lpcd (in lpd)
Cattle Population (Considering 0.19 per capita human population) as on 2011
Cattle Population (Considering 0.36 annual growth rate) as on 2021
Water required for drinking & domestic purposes @ 20 lpcd (in lpd)
Total Water Required (in lpd)
Number of T. Ws
Cost of the tube well of 300 m depth (approx) & 10"x6" dia @ Rs. 25 lakhs (In lakh) as per EFC
Chapra 53469 3742830 52546 71462 1429240 5172070 14 350
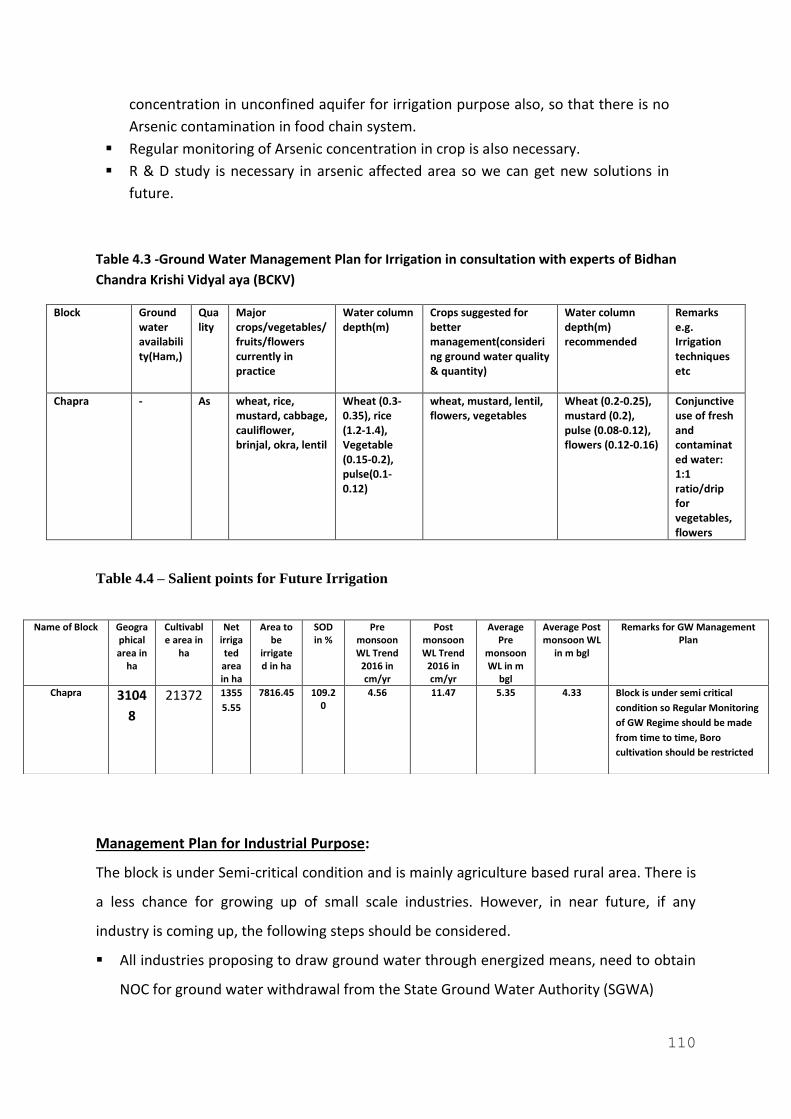
110
concentration in unconfined aquifer for irrigation purpose also, so that there is no
Arsenic contamination in food chain system.
▪ Regular monitoring of Arsenic concentration in crop is also necessary.
▪ R & D study is necessary in arsenic affected area so we can get new solutions in
future.
Table 4.3 -Ground Water Management Plan for Irrigation in consultation with experts of Bidhan
Chandra Krishi Vidyal aya (BCKV)
Block Ground water availability(Ham,)
Quality
Major crops/vegetables/ fruits/flowers currently in practice
Water column depth(m)
Crops suggested for better management(considering ground water quality & quantity)
Water column depth(m) recommended
Remarks e.g. Irrigation techniques etc
Chapra - As wheat, rice, mustard, cabbage, cauliflower, brinjal, okra, lentil
Wheat (0.3-0.35), rice (1.2-1.4), Vegetable (0.15-0.2), pulse(0.1-0.12)
wheat, mustard, lentil, flowers, vegetables
Wheat (0.2-0.25), mustard (0.2), pulse (0.08-0.12), flowers (0.12-0.16)
Conjunctive use of fresh and contaminated water: 1:1 ratio/drip for vegetables, flowers
Table 4.4 – Salient points for Future Irrigation
Management Plan for Industrial Purpose:
The block is under Semi-critical condition and is mainly agriculture based rural area. There is
a less chance for growing up of small scale industries. However, in near future, if any
industry is coming up, the following steps should be considered.
▪ All industries proposing to draw ground water through energized means, need to obtain
NOC for ground water withdrawal from the State Ground Water Authority (SGWA)
Name of Block Geographical area in
ha
Cultivable area in
ha
Net irrigated area in ha
Area to be
irrigated in ha
SOD in %
Pre monsoon WL Trend
2016 in cm/yr
Post monsoon WL Trend
2016 in cm/yr
Average Pre
monsoon WL in m
bgl
Average Post monsoon WL
in m bgl
Remarks for GW Management Plan
Chapra 3104
8
21372 1355
5.55
7816.45 109.20
4.56 11.47 5.35 4.33 Block is under semi critical
condition so Regular Monitoring
of GW Regime should be made
from time to time, Boro
cultivation should be restricted
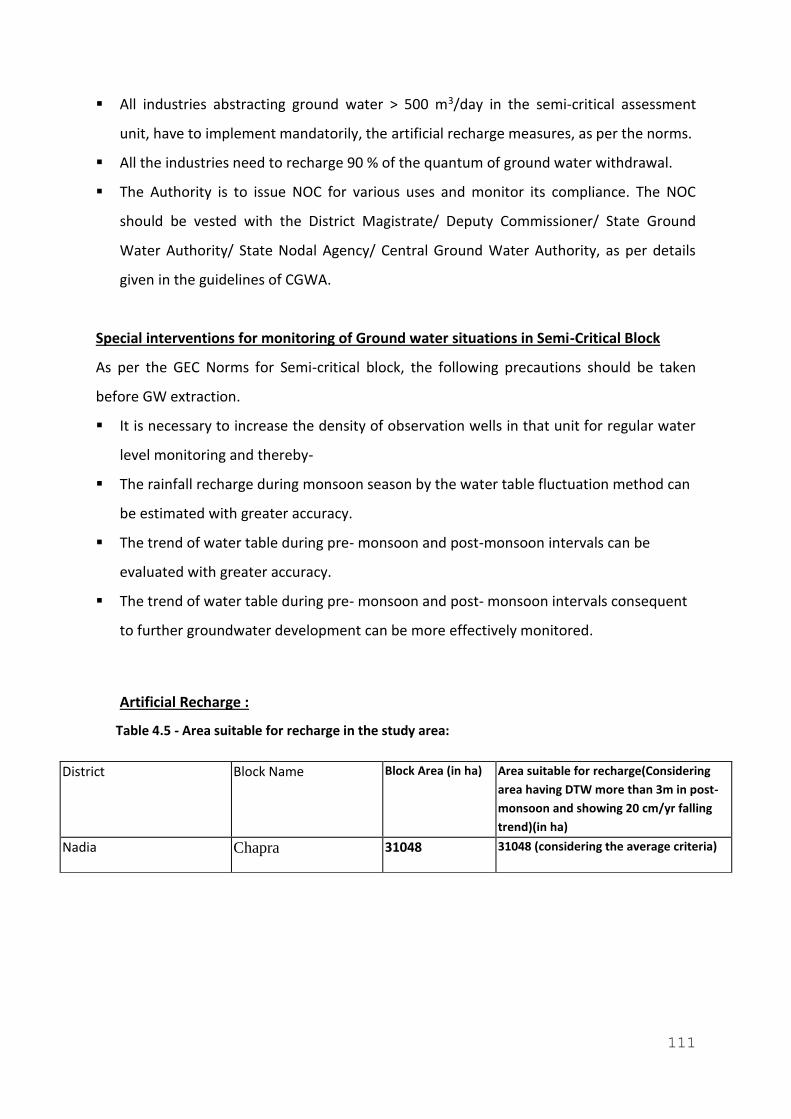
111
▪ All industries abstracting ground water > 500 m3/day in the semi-critical assessment
unit, have to implement mandatorily, the artificial recharge measures, as per the norms.
▪ All the industries need to recharge 90 % of the quantum of ground water withdrawal.
▪ The Authority is to issue NOC for various uses and monitor its compliance. The NOC
should be vested with the District Magistrate/ Deputy Commissioner/ State Ground
Water Authority/ State Nodal Agency/ Central Ground Water Authority, as per details
given in the guidelines of CGWA.
Special interventions for monitoring of Ground water situations in Semi-Critical Block
As per the GEC Norms for Semi-critical block, the following precautions should be taken
before GW extraction.
▪ It is necessary to increase the density of observation wells in that unit for regular water
level monitoring and thereby-
▪ The rainfall recharge during monsoon season by the water table fluctuation method can
be estimated with greater accuracy.
▪ The trend of water table during pre- monsoon and post-monsoon intervals can be
evaluated with greater accuracy.
▪ The trend of water table during pre- monsoon and post- monsoon intervals consequent
to further groundwater development can be more effectively monitored.
Artificial Recharge :
Table 4.5 - Area suitable for recharge in the study area:
District Block Name Block Area (in ha) Area suitable for recharge(Considering
area having DTW more than 3m in post-
monsoon and showing 20 cm/yr falling
trend)(in ha)
Nadia Chapra 31048 31048 (considering the average criteria)
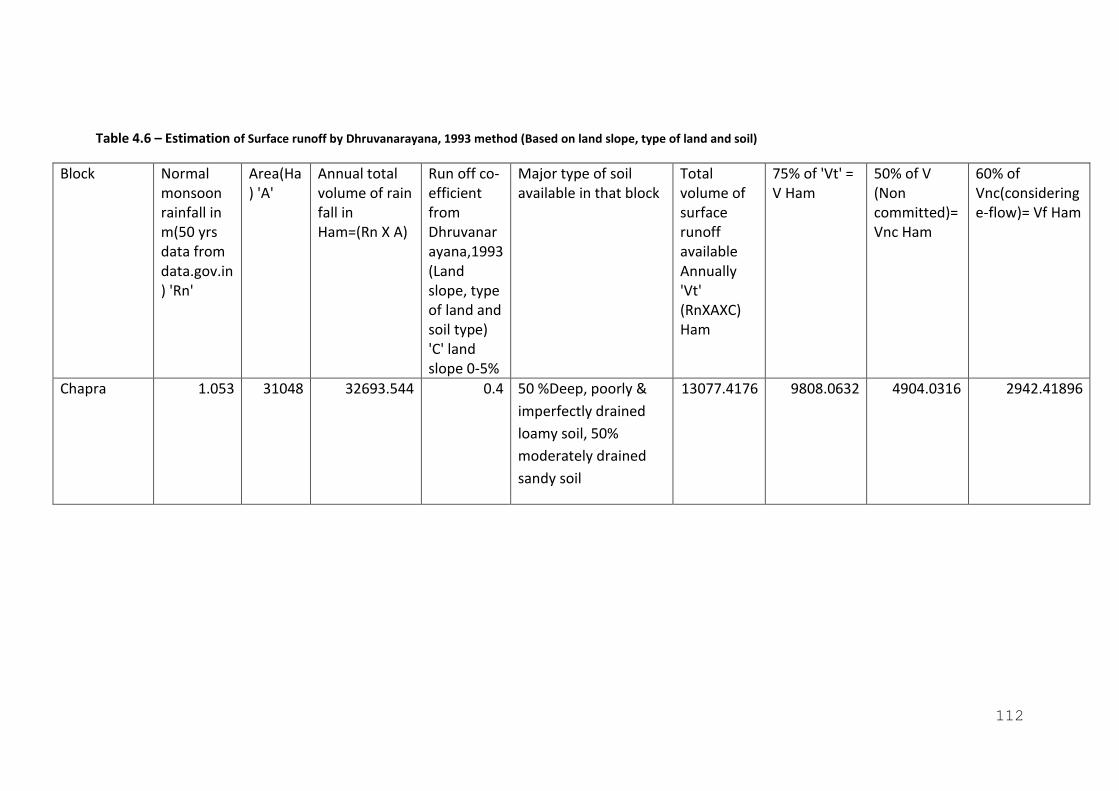
112
Table 4.6 – Estimation of Surface runoff by Dhruvanarayana, 1993 method (Based on land slope, type of land and soil)
Block Normal monsoon rainfall in m(50 yrs data from data.gov.in) 'Rn'
Area(Ha) 'A'
Annual total volume of rain fall in Ham=(Rn X A)
Run off co-efficient from Dhruvanarayana,1993(Land slope, type of land and soil type) 'C' land slope 0-5%
Major type of soil available in that block
Total volume of surface runoff available Annually 'Vt' (RnXAXC) Ham
75% of 'Vt' = V Ham
50% of V (Non committed)= Vnc Ham
60% of Vnc(considering e-flow)= Vf Ham
Chapra 1.053 31048 32693.544 0.4 50 %Deep, poorly &
imperfectly drained
loamy soil, 50%
moderately drained
sandy soil
13077.4176 9808.0632 4904.0316 2942.41896
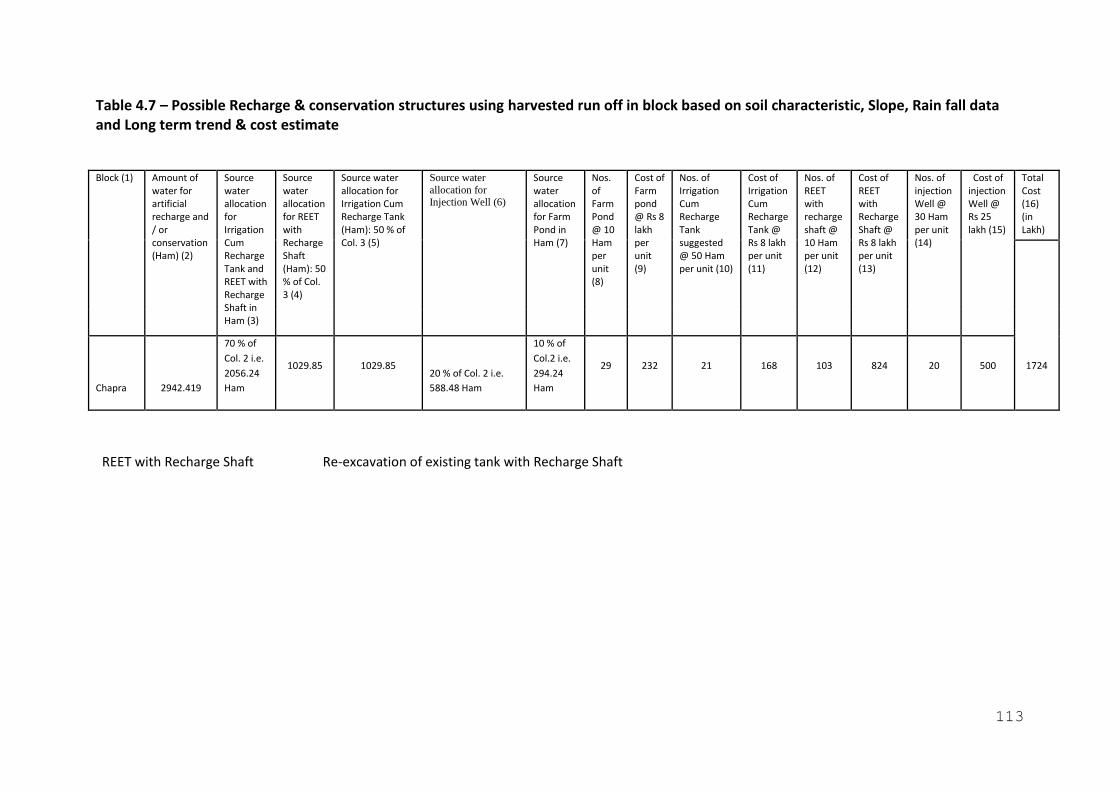
113
Table 4.7 – Possible Recharge & conservation structures using harvested run off in block based on soil characteristic, Slope, Rain fall data and Long term trend & cost estimate
Block (1) Amount of water for artificial recharge and / or conservation (Ham) (2)
Source water allocation for Irrigation Cum Recharge Tank and REET with Recharge Shaft in Ham (3)
Source water allocation for REET with Recharge Shaft (Ham): 50 % of Col. 3 (4)
Source water allocation for Irrigation Cum Recharge Tank (Ham): 50 % of Col. 3 (5)
Source water
allocation for Injection Well (6)
Source water allocation for Farm Pond in Ham (7)
Nos. of Farm Pond @ 10 Ham per unit (8)
Cost of Farm pond @ Rs 8 lakh per unit (9)
Nos. of Irrigation Cum Recharge Tank suggested @ 50 Ham per unit (10)
Cost of Irrigation Cum Recharge Tank @ Rs 8 lakh per unit (11)
Nos. of REET with recharge shaft @ 10 Ham per unit (12)
Cost of REET with Recharge Shaft @ Rs 8 lakh per unit (13)
Nos. of injection Well @ 30 Ham per unit (14)
Cost of injection Well @ Rs 25 lakh (15)
Total Cost (16) (in Lakh)
Chapra 2942.419
70 % of
Col. 2 i.e.
2056.24
Ham
1029.85 1029.85 20 % of Col. 2 i.e.
588.48 Ham
10 % of
Col.2 i.e.
294.24
Ham
29 232 21 168 103 824 20 500 1724
REET with Recharge Shaft Re-excavation of existing tank with Recharge Shaft
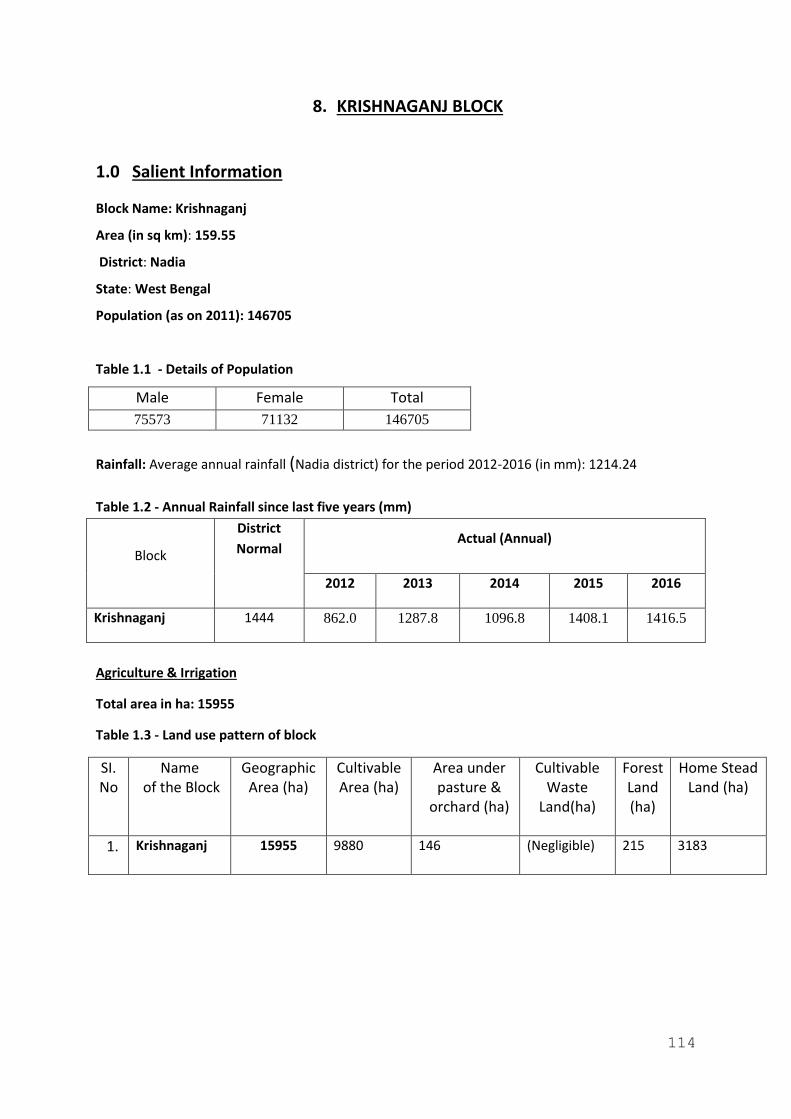
114
8. KRISHNAGANJ BLOCK
1.0 Salient Information
Block Name: Krishnaganj
Area (in sq km): 159.55
District: Nadia
State: West Bengal
Population (as on 2011): 146705
Table 1.1 - Details of Population
Male Female Total
75573 71132 146705
Rainfall: Average annual rainfall (Nadia district) for the period 2012-2016 (in mm): 1214.24
Table 1.2 - Annual Rainfall since last five years (mm)
Block
District
Normal Actual (Annual)
2012 2013 2014 2015 2016
Krishnaganj 1444 862.0 1287.8 1096.8 1408.1 1416.5
Agriculture & Irrigation
Total area in ha: 15955
Table 1.3 - Land use pattern of block
SI. No
Name of the Block
Geographic Area (ha)
Cultivable Area (ha)
Area under pasture &
orchard (ha)
Cultivable Waste
Land(ha)
Forest Land (ha)
Home Stead Land (ha)
1. Krishnaganj 15955 9880 146 (Negligible) 215 3183
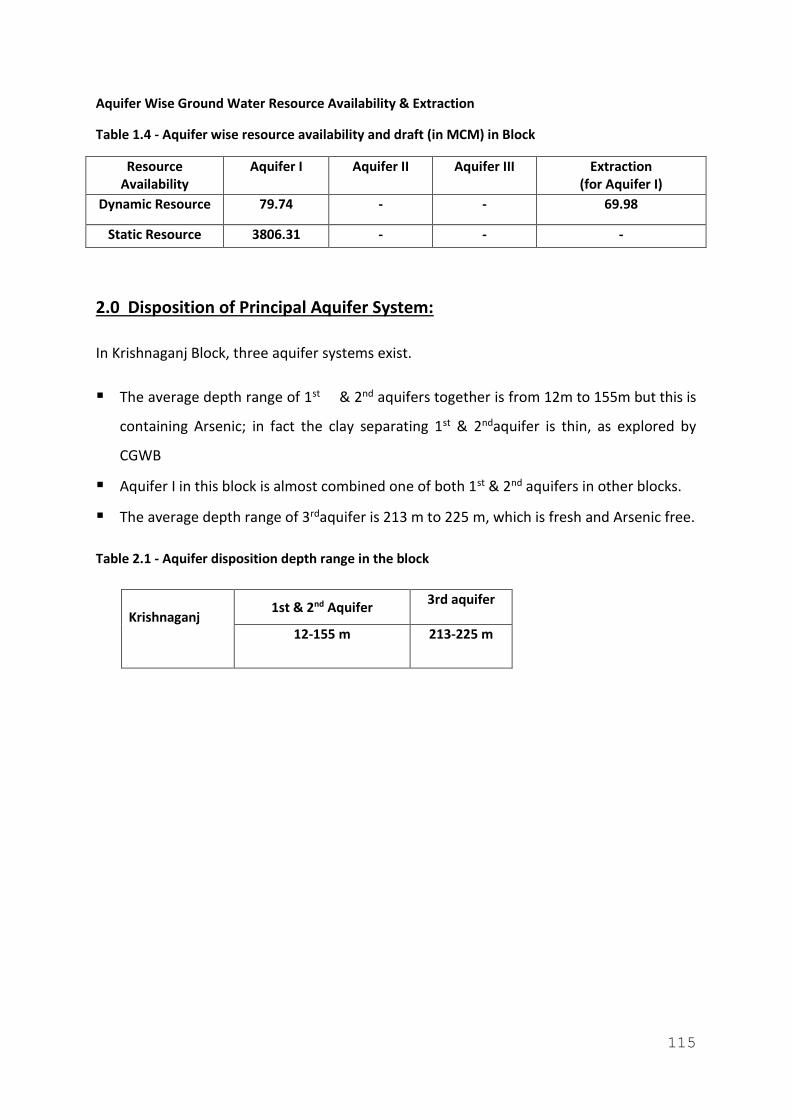
115
Aquifer Wise Ground Water Resource Availability & Extraction
Table 1.4 - Aquifer wise resource availability and draft (in MCM) in Block
Resource Availability
Aquifer I Aquifer II Aquifer III Extraction (for Aquifer I)
Dynamic Resource 79.74 - - 69.98
Static Resource 3806.31 - - -
2.0 Disposition of Principal Aquifer System:
In Krishnaganj Block, three aquifer systems exist.
▪ The average depth range of 1st & 2nd aquifers together is from 12m to 155m but this is
containing Arsenic; in fact the clay separating 1st & 2ndaquifer is thin, as explored by
CGWB
▪ Aquifer I in this block is almost combined one of both 1st & 2nd aquifers in other blocks.
▪ The average depth range of 3rdaquifer is 213 m to 225 m, which is fresh and Arsenic free.
Table 2.1 - Aquifer disposition depth range in the block
Krishnaganj
1st & 2nd Aquifer 3rd aquifer
12-155 m 213-225 m
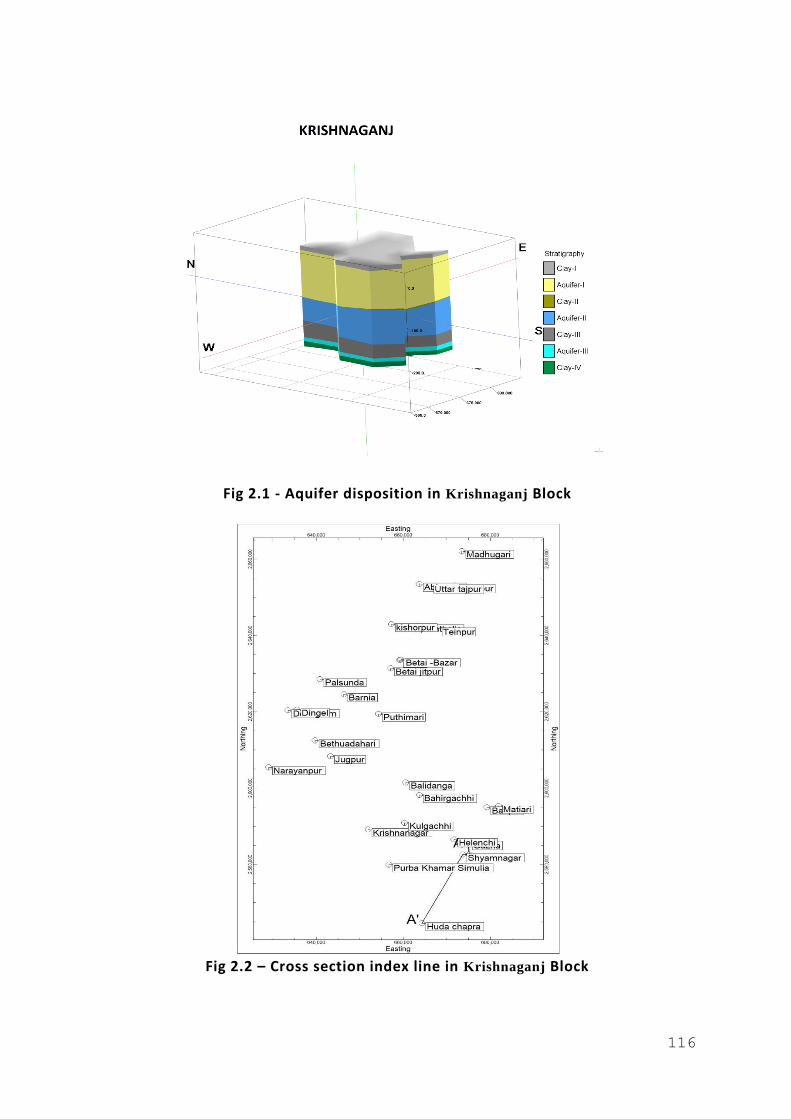
116
Fig 2.1 - Aquifer disposition in Krishnaganj Block
Fig 2.2 – Cross section index line in Krishnaganj Block
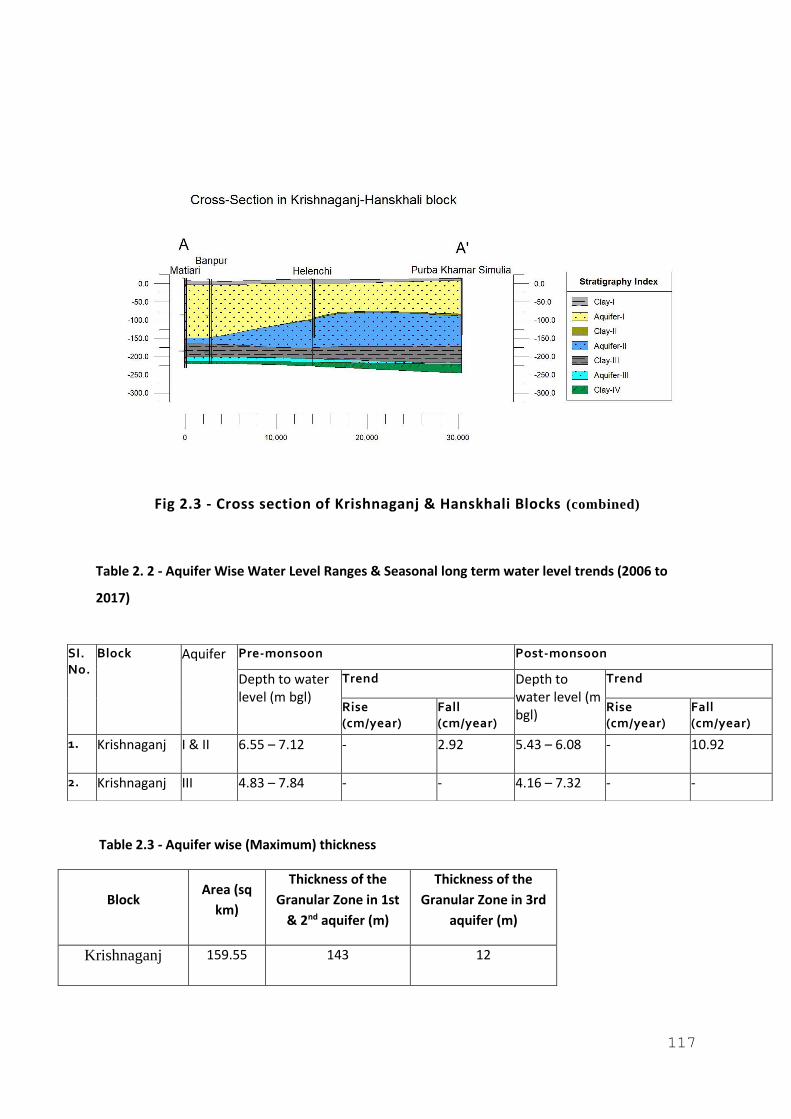
117
Fig 2.3 - Cross section of Krishnaganj & Hanskhali Blocks (combined)
Table 2. 2 - Aquifer Wise Water Level Ranges & Seasonal long term water level trends (2006 to
2017)
Table 2.3 - Aquifer wise (Maximum) thickness
Block Area (sq
km)
Thickness of the
Granular Zone in 1st
& 2nd aquifer (m)
Thickness of the
Granular Zone in 3rd
aquifer (m)
Krishnaganj 159.55 143 12
SI. No.
Block Aquifer Pre-monsoon Post-monsoon
Depth to water level (m bgl)
Trend Depth to water level (m bgl)
Trend
Rise (cm/year)
Fall (cm/year)
Rise (cm/year)
Fall (cm/year)
1. Krishnaganj I & II 6.55 – 7.12 - 2.92 5.43 – 6.08 - 10.92
2. Krishnaganj III 4.83 – 7.84 - - 4.16 – 7.32 - -
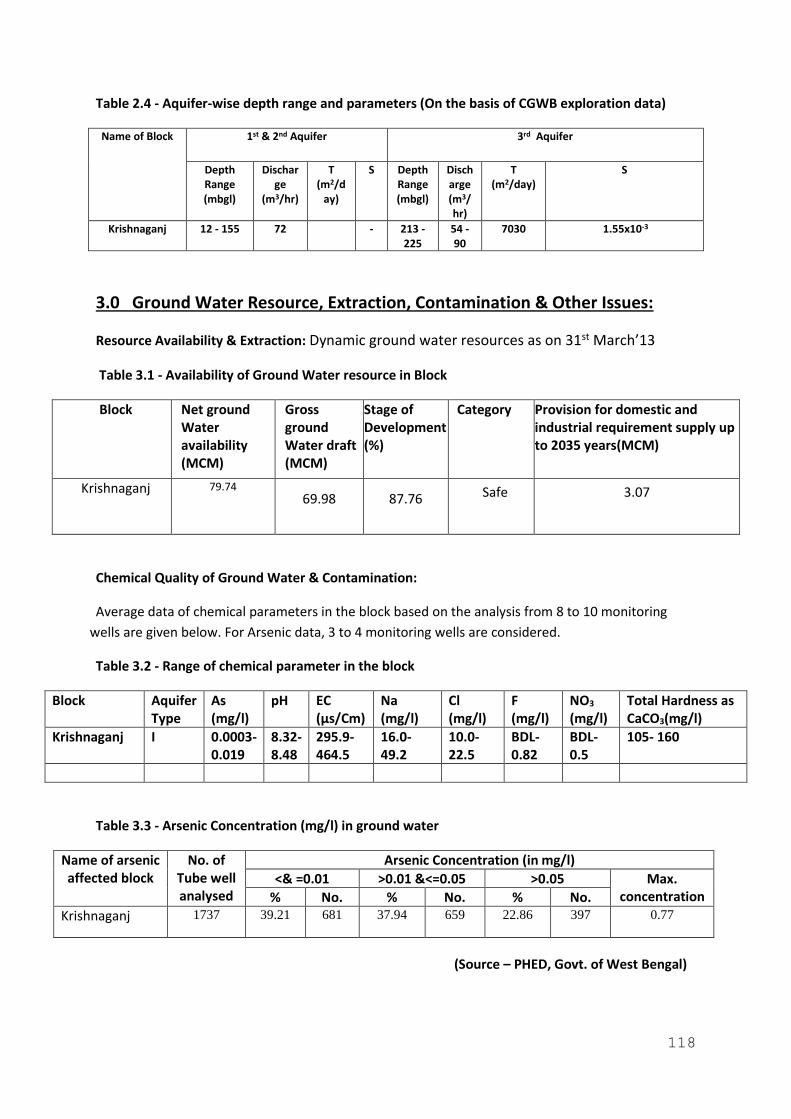
118
Table 2.4 - Aquifer-wise depth range and parameters (On the basis of CGWB exploration data)
Name of Block 1st & 2nd Aquifer 3rd Aquifer
Depth Range (mbgl)
Discharge
(m3/hr)
T (m2/d
ay)
S Depth Range (mbgl)
Discharge (m3/hr)
T (m2/day)
S
Krishnaganj 12 - 155 72 - 213 - 225
54 - 90
7030
1.55x10⁻³
3.0 Ground Water Resource, Extraction, Contamination & Other Issues:
Resource Availability & Extraction: Dynamic ground water resources as on 31st March’13
Table 3.1 - Availability of Ground Water resource in Block
Block Net ground Water availability (MCM)
Gross ground Water draft (MCM)
Stage of Development (%)
Category Provision for domestic and industrial requirement supply up to 2035 years(MCM)
Krishnaganj 79.74
69.98 87.76 Safe 3.07
Chemical Quality of Ground Water & Contamination:
Average data of chemical parameters in the block based on the analysis from 8 to 10 monitoring
wells are given below. For Arsenic data, 3 to 4 monitoring wells are considered.
Table 3.2 - Range of chemical parameter in the block
Block Aquifer Type
As (mg/l)
pH EC (µs/Cm)
Na (mg/l)
Cl (mg/l)
F (mg/l)
NO3
(mg/l) Total Hardness as CaCO3(mg/l)
Krishnaganj I 0.0003- 0.019
8.32- 8.48
295.9- 464.5
16.0- 49.2
10.0- 22.5
BDL- 0.82
BDL- 0.5
105- 160
Table 3.3 - Arsenic Concentration (mg/l) in ground water
Name of arsenic affected block
No. of Tube well analysed
Arsenic Concentration (in mg/l)
<& =0.01 >0.01 &<=0.05 >0.05 Max. concentration % No. % No. % No.
Krishnaganj 1737 39.21 681 37.94 659 22.86 397 0.77
(Source – PHED, Govt. of West Bengal)
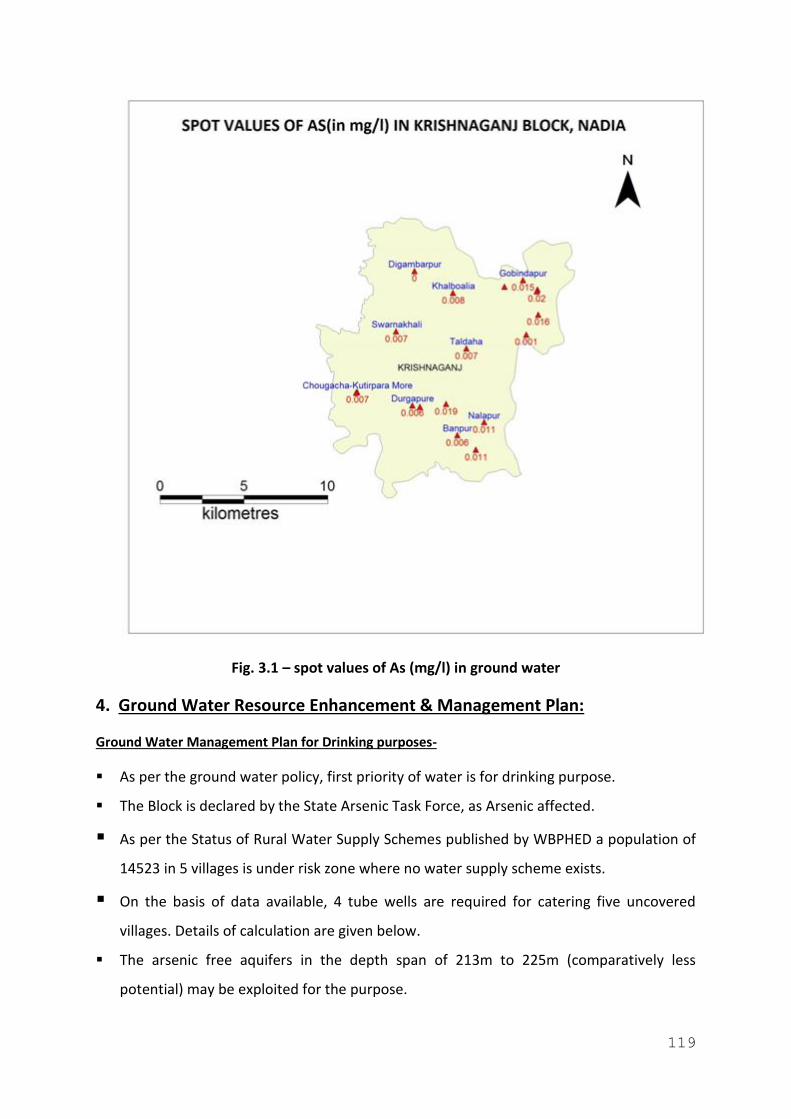
119
Fig. 3.1 – spot values of As (mg/l) in ground water
4. Ground Water Resource Enhancement & Management Plan:
Ground Water Management Plan for Drinking purposes-
▪ As per the ground water policy, first priority of water is for drinking purpose.
▪ The Block is declared by the State Arsenic Task Force, as Arsenic affected.
▪ As per the Status of Rural Water Supply Schemes published by WBPHED a population of
14523 in 5 villages is under risk zone where no water supply scheme exists.
▪ On the basis of data available, 4 tube wells are required for catering five uncovered
villages. Details of calculation are given below.
▪ The arsenic free aquifers in the depth span of 213m to 225m (comparatively less
potential) may be exploited for the purpose.
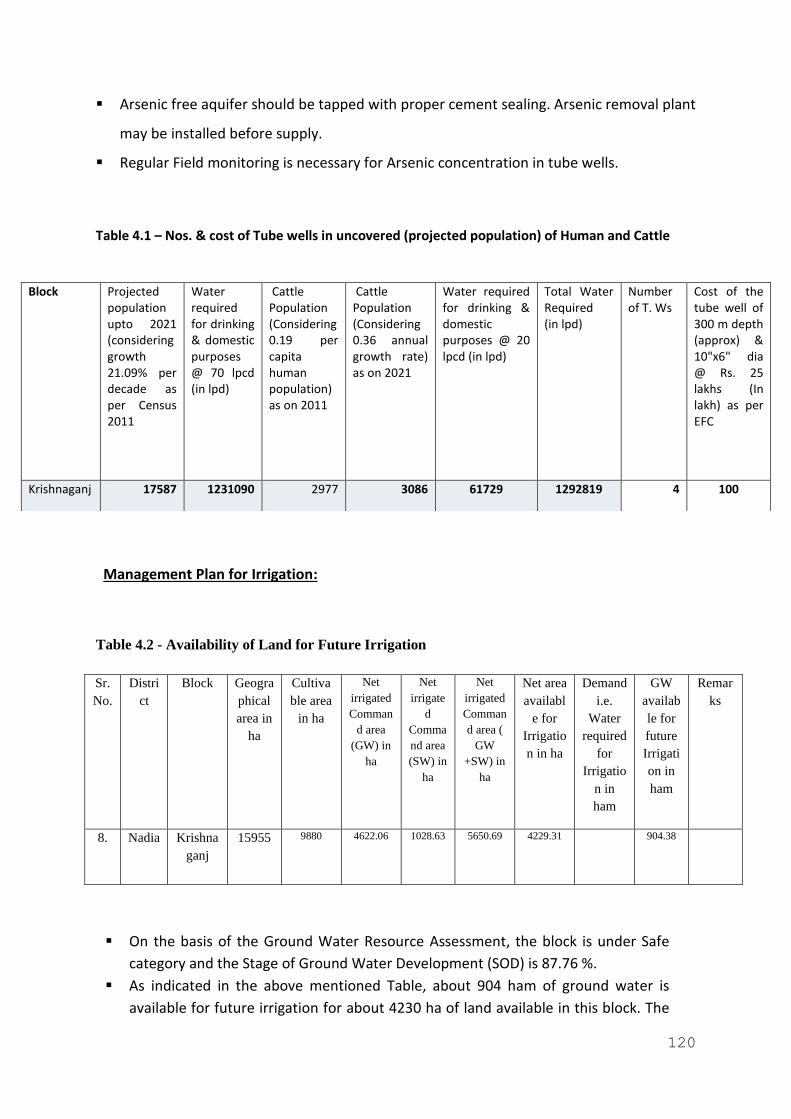
120
▪ Arsenic free aquifer should be tapped with proper cement sealing. Arsenic removal plant
may be installed before supply.
▪ Regular Field monitoring is necessary for Arsenic concentration in tube wells.
Table 4.1 – Nos. & cost of Tube wells in uncovered (projected population) of Human and Cattle
Management Plan for Irrigation:
Table 4.2 - Availability of Land for Future Irrigation
Sr.
No.
Distri
ct
Block Geogra
phical
area in
ha
Cultiva
ble area
in ha
Net
irrigated
Comman
d area
(GW) in
ha
Net
irrigate
d
Comma
nd area
(SW) in
ha
Net
irrigated
Comman
d area (
GW
+SW) in
ha
Net area
availabl
e for
Irrigatio
n in ha
Demand
i.e.
Water
required
for
Irrigatio
n in
ham
GW
availab
le for
future
Irrigati
on in
ham
Remar
ks
8. Nadia Krishna
ganj
15955 9880 4622.06 1028.63 5650.69 4229.31 904.38
▪ On the basis of the Ground Water Resource Assessment, the block is under Safe
category and the Stage of Ground Water Development (SOD) is 87.76 %.
▪ As indicated in the above mentioned Table, about 904 ham of ground water is
available for future irrigation for about 4230 ha of land available in this block. The
Block Projected population upto 2021 (considering growth 21.09% per decade as per Census 2011
Water required for drinking & domestic purposes @ 70 lpcd (in lpd)
Cattle Population (Considering 0.19 per capita human population) as on 2011
Cattle Population (Considering 0.36 annual growth rate) as on 2021
Water required for drinking & domestic purposes @ 20 lpcd (in lpd)
Total Water Required (in lpd)
Number of T. Ws
Cost of the tube well of 300 m depth (approx) & 10"x6" dia @ Rs. 25 lakhs (In lakh) as per EFC
Krishnaganj 17587 1231090 2977 3086 61729 1292819 4 100
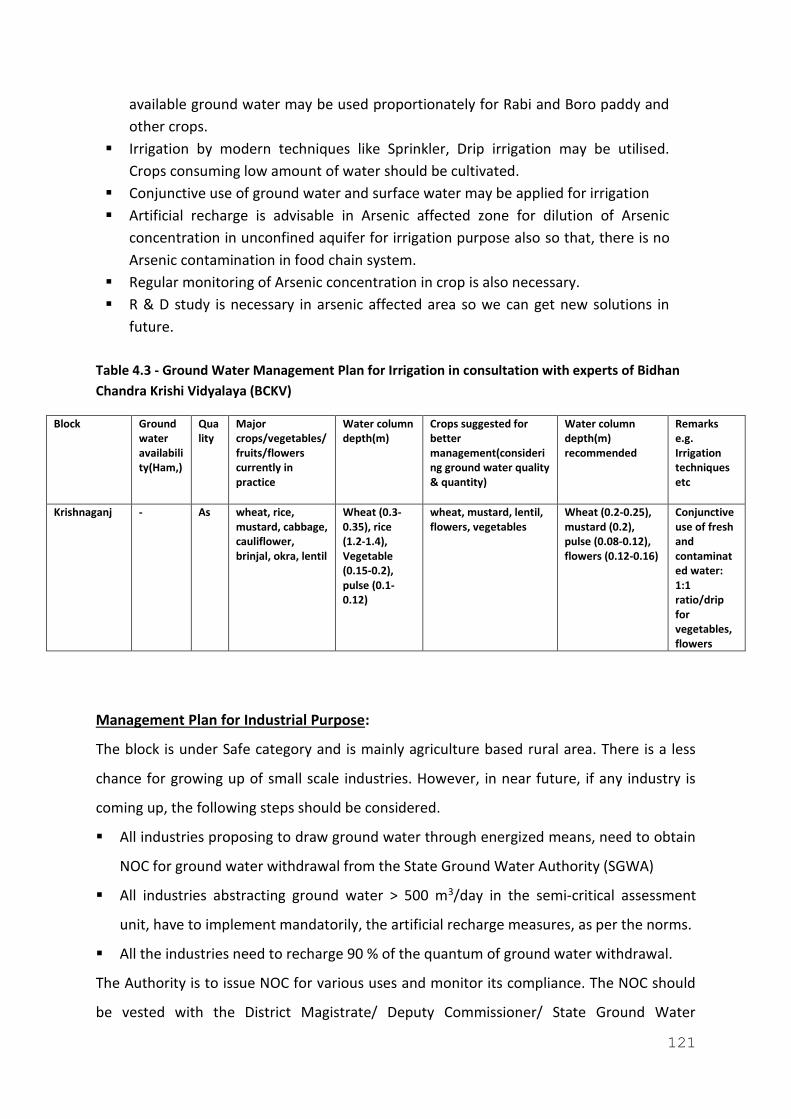
121
available ground water may be used proportionately for Rabi and Boro paddy and
other crops.
▪ Irrigation by modern techniques like Sprinkler, Drip irrigation may be utilised.
Crops consuming low amount of water should be cultivated.
▪ Conjunctive use of ground water and surface water may be applied for irrigation
▪ Artificial recharge is advisable in Arsenic affected zone for dilution of Arsenic
concentration in unconfined aquifer for irrigation purpose also so that, there is no
Arsenic contamination in food chain system.
▪ Regular monitoring of Arsenic concentration in crop is also necessary.
▪ R & D study is necessary in arsenic affected area so we can get new solutions in
future.
Table 4.3 - Ground Water Management Plan for Irrigation in consultation with experts of Bidhan
Chandra Krishi Vidyalaya (BCKV)
Block Ground water availability(Ham,)
Quality
Major crops/vegetables/ fruits/flowers currently in practice
Water column depth(m)
Crops suggested for better management(considering ground water quality & quantity)
Water column depth(m) recommended
Remarks e.g. Irrigation techniques etc
Krishnaganj - As wheat, rice, mustard, cabbage, cauliflower, brinjal, okra, lentil
Wheat (0.3-0.35), rice (1.2-1.4), Vegetable (0.15-0.2), pulse (0.1-0.12)
wheat, mustard, lentil, flowers, vegetables
Wheat (0.2-0.25), mustard (0.2), pulse (0.08-0.12), flowers (0.12-0.16)
Conjunctive use of fresh and contaminated water: 1:1 ratio/drip for vegetables, flowers
Management Plan for Industrial Purpose:
The block is under Safe category and is mainly agriculture based rural area. There is a less
chance for growing up of small scale industries. However, in near future, if any industry is
coming up, the following steps should be considered.
▪ All industries proposing to draw ground water through energized means, need to obtain
NOC for ground water withdrawal from the State Ground Water Authority (SGWA)
▪ All industries abstracting ground water > 500 m3/day in the semi-critical assessment
unit, have to implement mandatorily, the artificial recharge measures, as per the norms.
▪ All the industries need to recharge 90 % of the quantum of ground water withdrawal.
The Authority is to issue NOC for various uses and monitor its compliance. The NOC should
be vested with the District Magistrate/ Deputy Commissioner/ State Ground Water
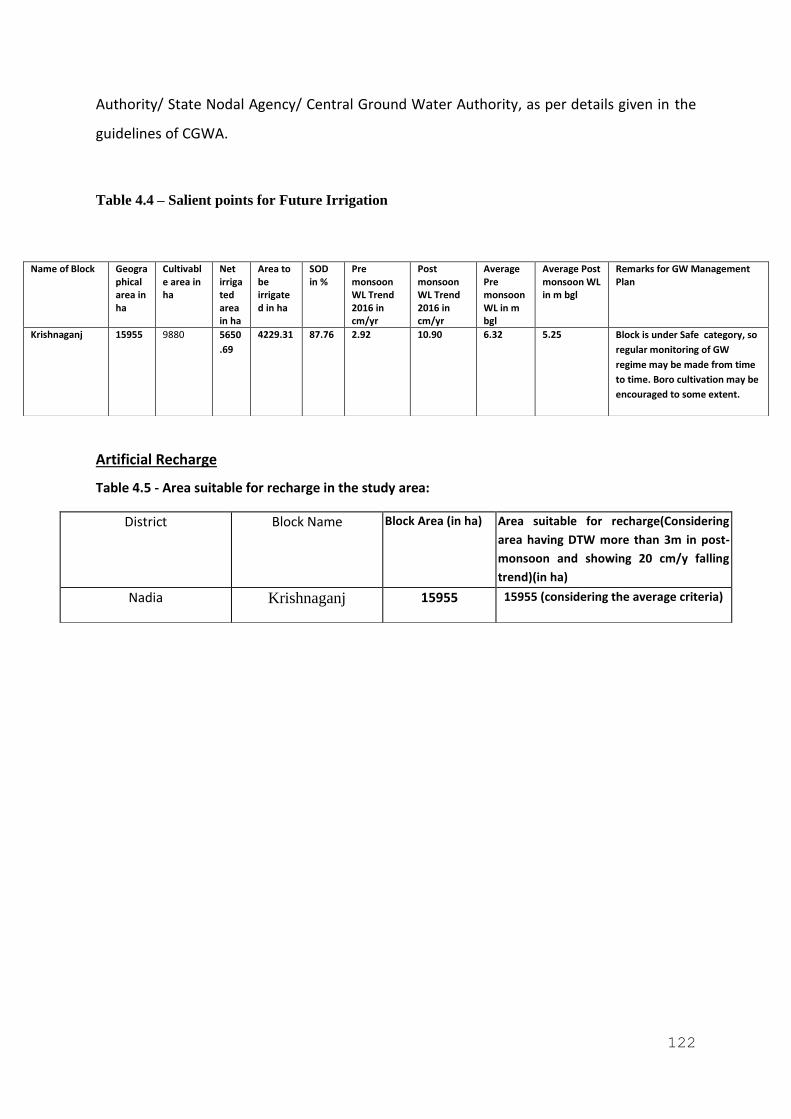
122
Authority/ State Nodal Agency/ Central Ground Water Authority, as per details given in the
guidelines of CGWA.
Table 4.4 – Salient points for Future Irrigation
Artificial Recharge
Table 4.5 - Area suitable for recharge in the study area:
Name of Block Geographical area in ha
Cultivable area in ha
Net irrigated area in ha
Area to be irrigated in ha
SOD in %
Pre monsoon WL Trend 2016 in cm/yr
Post monsoon WL Trend 2016 in cm/yr
Average Pre monsoon WL in m bgl
Average Post monsoon WL in m bgl
Remarks for GW Management Plan
Krishnaganj 15955 9880 5650
.69
4229.31 87.76 2.92 10.90 6.32 5.25 Block is under Safe category, so
regular monitoring of GW
regime may be made from time
to time. Boro cultivation may be
encouraged to some extent.
District Block Name Block Area (in ha) Area suitable for recharge(Considering
area having DTW more than 3m in post-
monsoon and showing 20 cm/y falling
trend)(in ha)
Nadia Krishnaganj 15955 15955 (considering the average criteria)
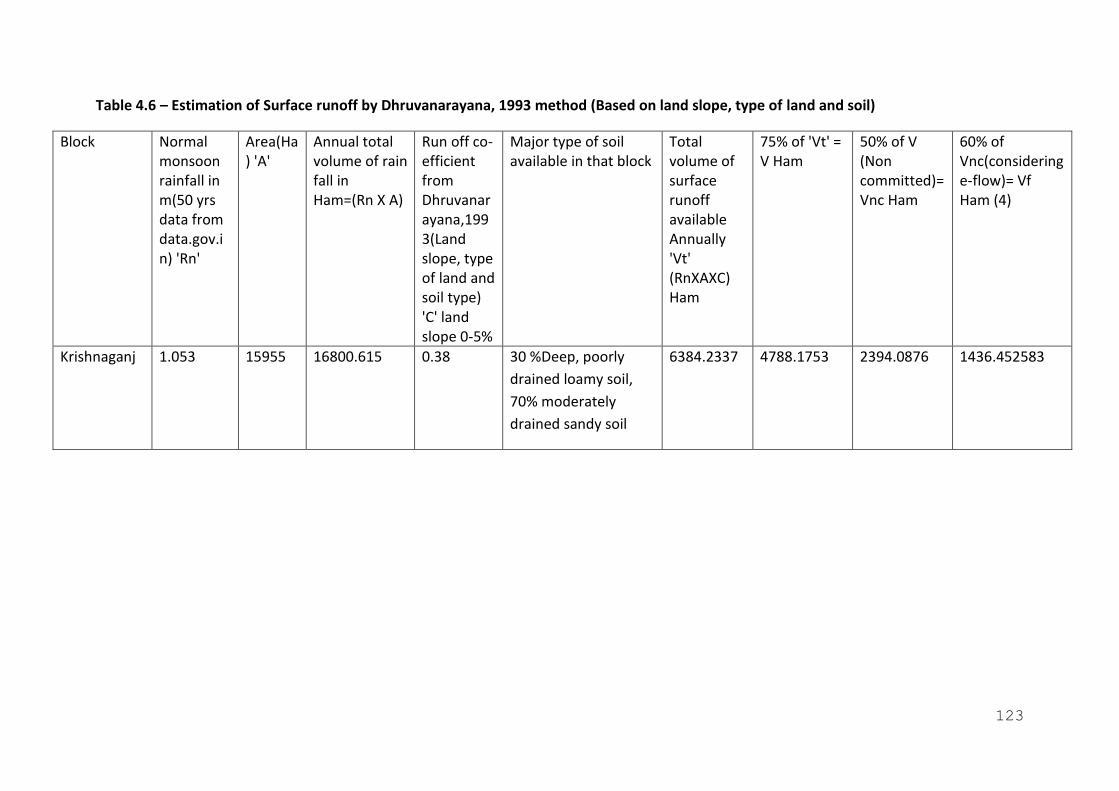
123
Table 4.6 – Estimation of Surface runoff by Dhruvanarayana, 1993 method (Based on land slope, type of land and soil)
Block Normal monsoon rainfall in m(50 yrs data from data.gov.in) 'Rn'
Area(Ha) 'A'
Annual total volume of rain fall in Ham=(Rn X A)
Run off co-efficient from Dhruvanarayana,1993(Land slope, type of land and soil type) 'C' land slope 0-5%
Major type of soil available in that block
Total volume of surface runoff available Annually 'Vt' (RnXAXC) Ham
75% of 'Vt' = V Ham
50% of V (Non committed)= Vnc Ham
60% of Vnc(considering e-flow)= Vf Ham (4)
Krishnaganj 1.053 15955 16800.615 0.38 30 %Deep, poorly
drained loamy soil,
70% moderately
drained sandy soil
6384.2337 4788.1753 2394.0876 1436.452583
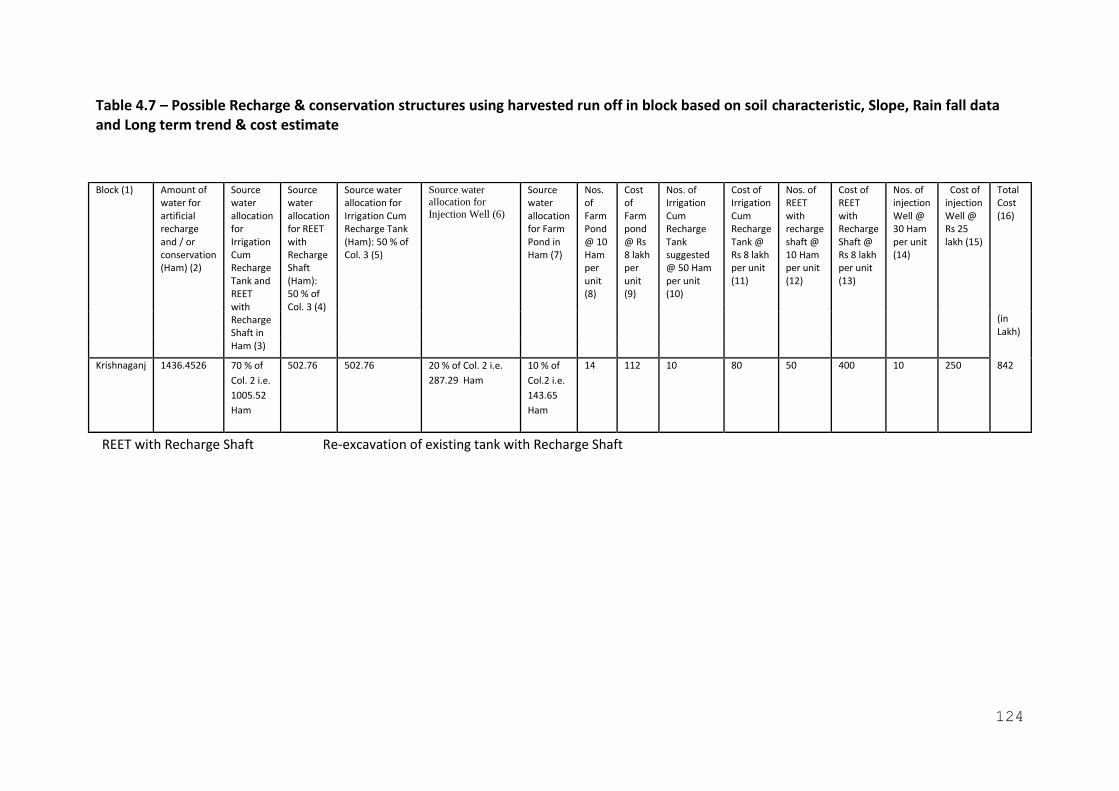
124
Table 4.7 – Possible Recharge & conservation structures using harvested run off in block based on soil characteristic, Slope, Rain fall data and Long term trend & cost estimate
REET with Recharge Shaft Re-excavation of existing tank with Recharge Shaft
Block (1) Amount of water for artificial recharge and / or conservation (Ham) (2)
Source water allocation for Irrigation Cum Recharge Tank and REET with Recharge Shaft in Ham (3)
Source water allocation for REET with Recharge Shaft (Ham): 50 % of Col. 3 (4)
Source water allocation for Irrigation Cum Recharge Tank (Ham): 50 % of Col. 3 (5)
Source water allocation for
Injection Well (6)
Source water allocation for Farm Pond in Ham (7)
Nos. of Farm Pond @ 10 Ham per unit (8)
Cost of Farm pond @ Rs 8 lakh per unit (9)
Nos. of Irrigation Cum Recharge Tank suggested @ 50 Ham per unit (10)
Cost of Irrigation Cum Recharge Tank @ Rs 8 lakh per unit (11)
Nos. of REET with recharge shaft @ 10 Ham per unit (12)
Cost of REET with Recharge Shaft @ Rs 8 lakh per unit (13)
Nos. of injection Well @ 30 Ham per unit (14)
Cost of injection Well @ Rs 25 lakh (15)
Total Cost (16)
(in Lakh)
Krishnaganj 1436.4526 70 % of
Col. 2 i.e.
1005.52
Ham
502.76 502.76 20 % of Col. 2 i.e.
287.29 Ham
10 % of
Col.2 i.e.
143.65
Ham
14 112 10 80 50 400 10 250 842
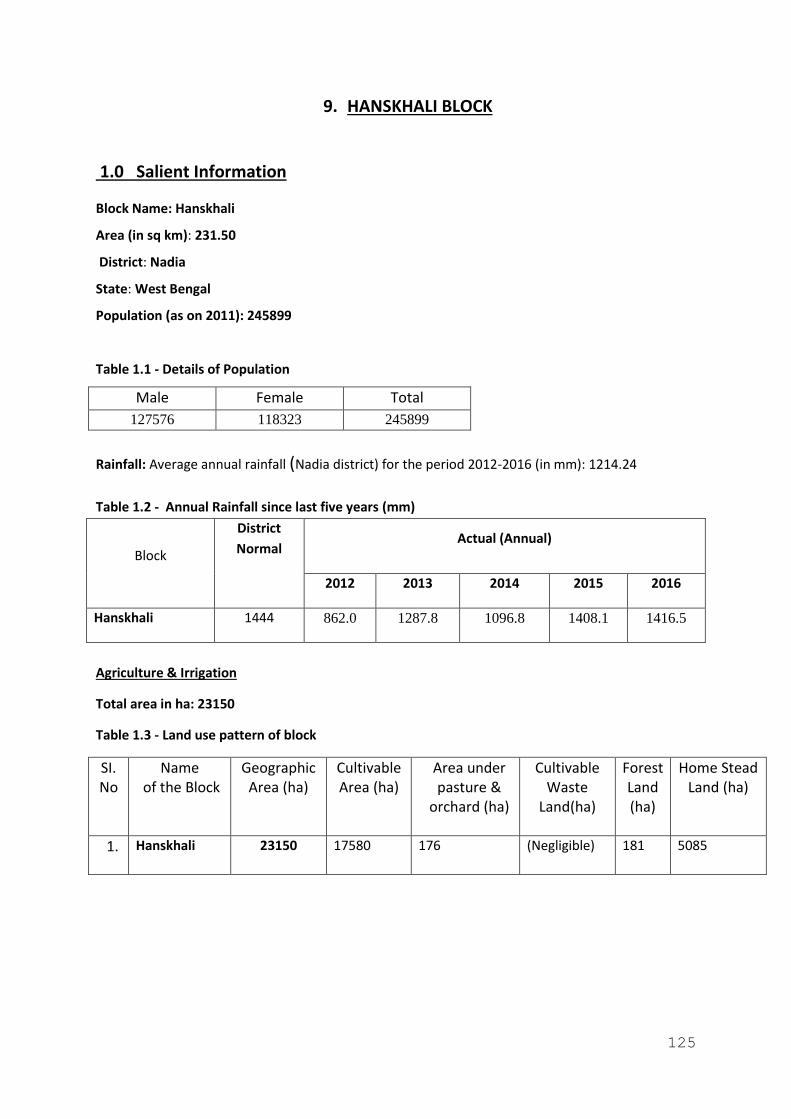
125
9. HANSKHALI BLOCK
1.0 Salient Information
Block Name: Hanskhali
Area (in sq km): 231.50
District: Nadia
State: West Bengal
Population (as on 2011): 245899
Table 1.1 - Details of Population
Male Female Total
127576 118323 245899
Rainfall: Average annual rainfall (Nadia district) for the period 2012-2016 (in mm): 1214.24
Table 1.2 - Annual Rainfall since last five years (mm)
Block
District
Normal Actual (Annual)
2012 2013 2014 2015 2016
Hanskhali 1444 862.0 1287.8 1096.8 1408.1 1416.5
Agriculture & Irrigation
Total area in ha: 23150
Table 1.3 - Land use pattern of block
SI. No
Name of the Block
Geographic Area (ha)
Cultivable Area (ha)
Area under pasture &
orchard (ha)
Cultivable Waste
Land(ha)
Forest Land (ha)
Home Stead Land (ha)
1. Hanskhali 23150 17580 176 (Negligible) 181 5085
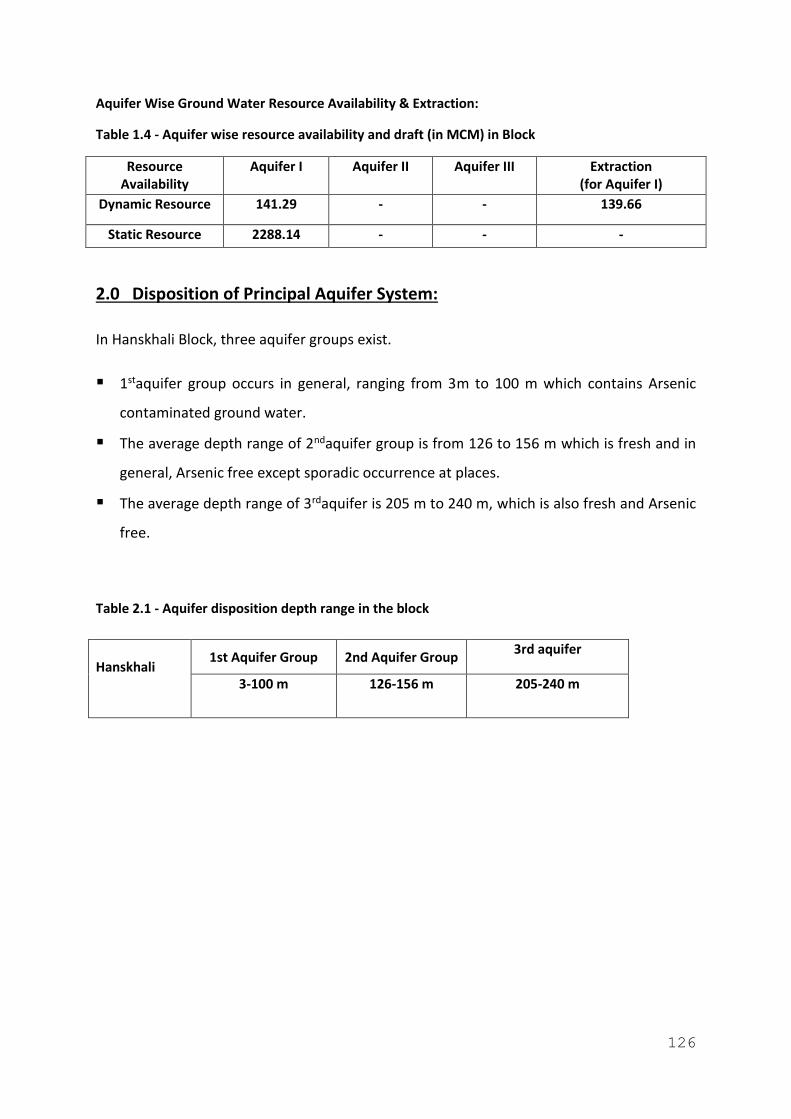
126
Aquifer Wise Ground Water Resource Availability & Extraction:
Table 1.4 - Aquifer wise resource availability and draft (in MCM) in Block
Resource Availability
Aquifer I Aquifer II Aquifer III Extraction (for Aquifer I)
Dynamic Resource 141.29 - - 139.66
Static Resource 2288.14 - - -
2.0 Disposition of Principal Aquifer System:
In Hanskhali Block, three aquifer groups exist.
▪ 1staquifer group occurs in general, ranging from 3m to 100 m which contains Arsenic
contaminated ground water.
▪ The average depth range of 2ndaquifer group is from 126 to 156 m which is fresh and in
general, Arsenic free except sporadic occurrence at places.
▪ The average depth range of 3rdaquifer is 205 m to 240 m, which is also fresh and Arsenic
free.
Table 2.1 - Aquifer disposition depth range in the block
Hanskhali
1st Aquifer Group 2nd Aquifer Group 3rd aquifer
3-100 m 126-156 m 205-240 m
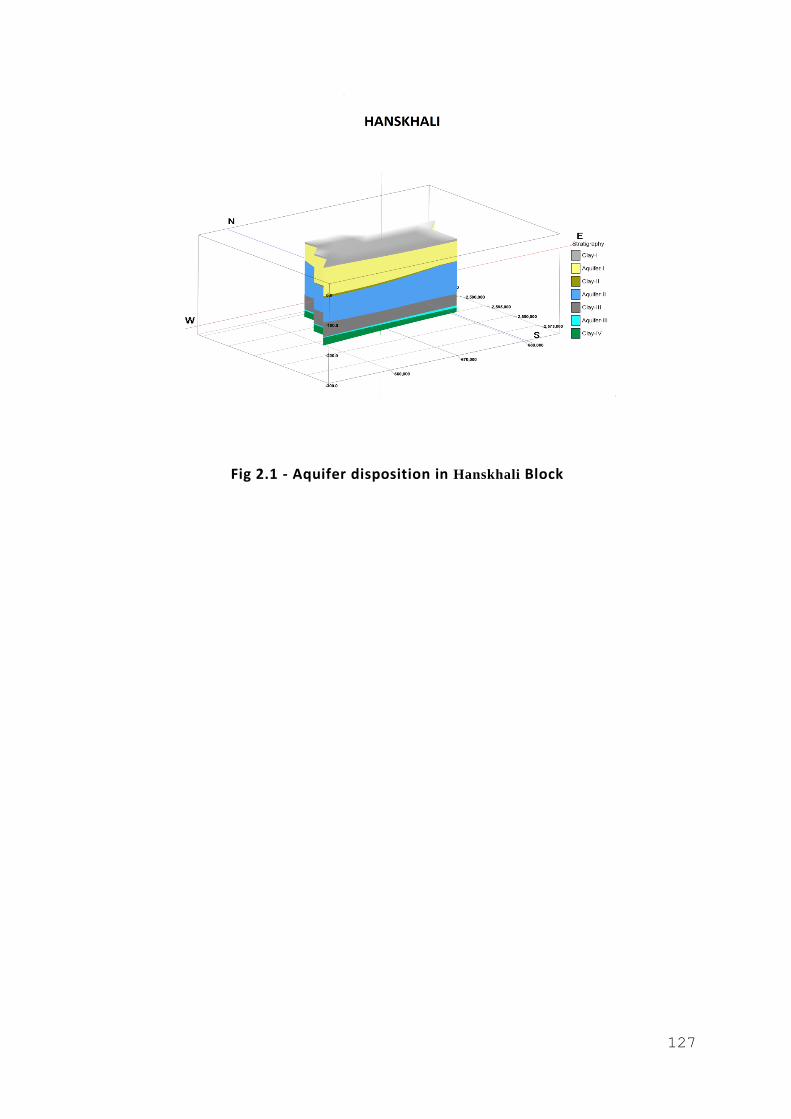
127
Fig 2.1 - Aquifer disposition in Hanskhali Block
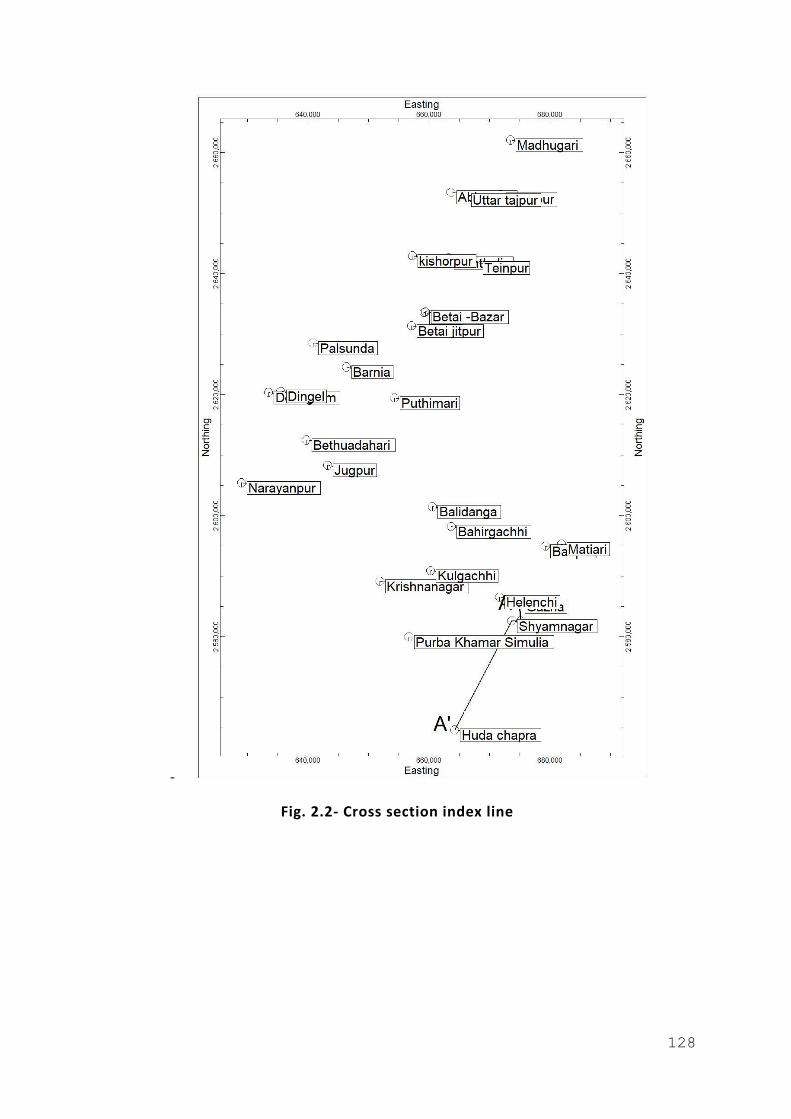
128
-
Fig. 2.2- Cross section index line
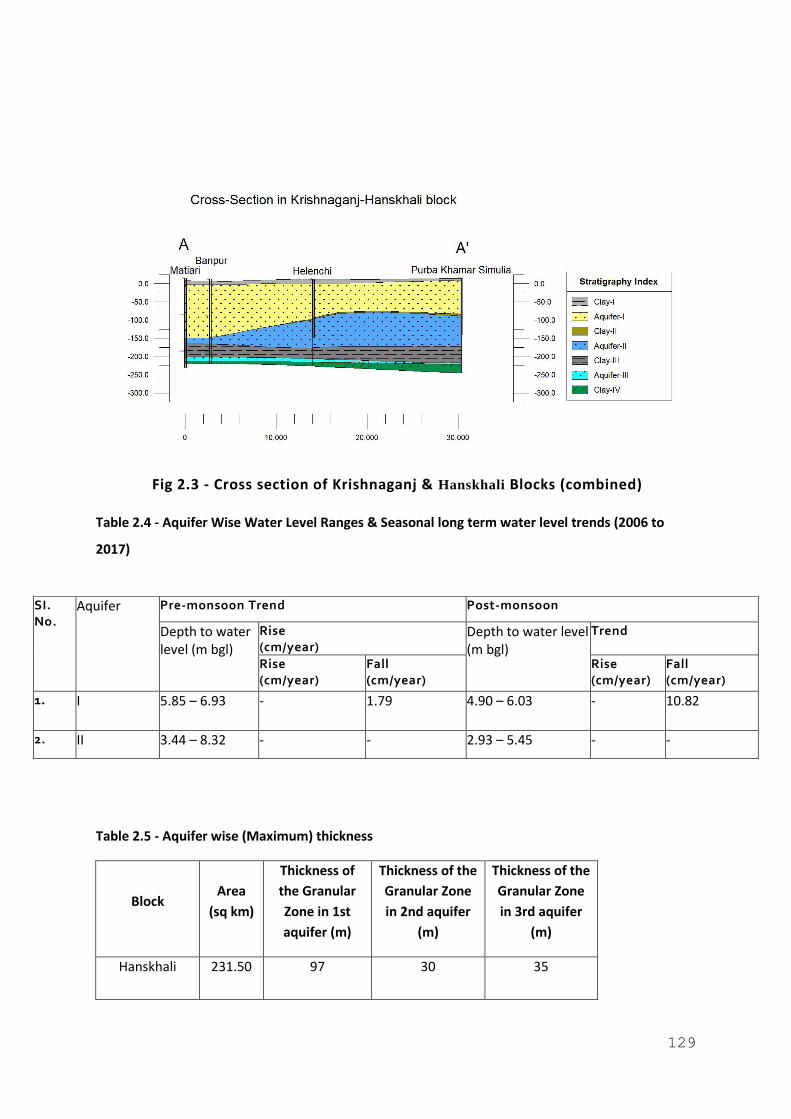
129
Fig 2.3 - Cross section of Krishnaganj & Hanskhali Blocks (combined)
Table 2.4 - Aquifer Wise Water Level Ranges & Seasonal long term water level trends (2006 to
2017)
Table 2.5 - Aquifer wise (Maximum) thickness
Block Area
(sq km)
Thickness of
the Granular
Zone in 1st
aquifer (m)
Thickness of the
Granular Zone
in 2nd aquifer
(m)
Thickness of the
Granular Zone
in 3rd aquifer
(m)
Hanskhali 231.50 97 30 35
SI. No.
Aquifer Pre-monsoon Trend Post-monsoon
Depth to water level (m bgl)
Rise (cm/year)
Depth to water level (m bgl)
Trend
Rise (cm/year)
Fall (cm/year)
Rise (cm/year)
Fall (cm/year)
1. I 5.85 – 6.93 - 1.79 4.90 – 6.03 - 10.82
2. II 3.44 – 8.32 - - 2.93 – 5.45 - -
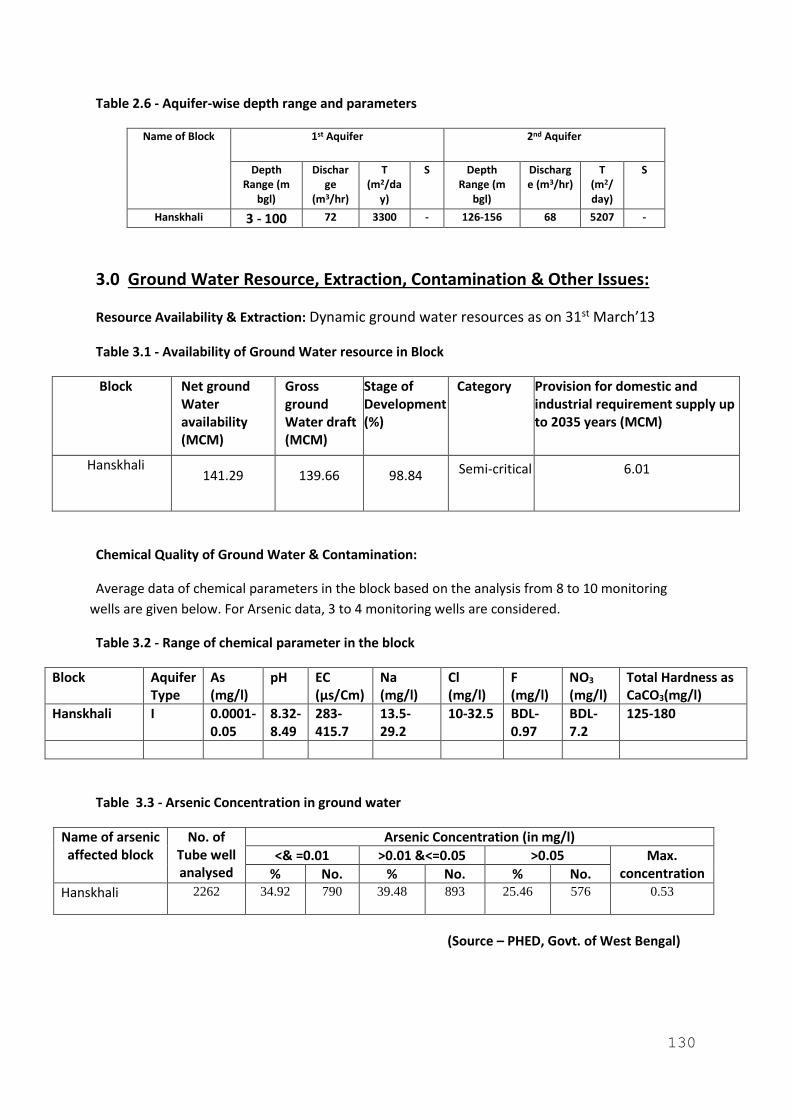
130
Table 2.6 - Aquifer-wise depth range and parameters
Name of Block 1st Aquifer 2nd Aquifer
Depth Range (m
bgl)
Discharge
(m3/hr)
T (m2/da
y)
S Depth Range (m
bgl)
Discharge (m3/hr)
T (m2/day)
S
Hanskhali 3 - 100 72 3300 - 126-156 68 5207 -
3.0 Ground Water Resource, Extraction, Contamination & Other Issues:
Resource Availability & Extraction: Dynamic ground water resources as on 31st March’13
Table 3.1 - Availability of Ground Water resource in Block
Block Net ground Water availability (MCM)
Gross ground Water draft (MCM)
Stage of Development (%)
Category Provision for domestic and industrial requirement supply up to 2035 years (MCM)
Hanskhali 141.29 139.66 98.84 Semi-critical 6.01
Chemical Quality of Ground Water & Contamination:
Average data of chemical parameters in the block based on the analysis from 8 to 10 monitoring
wells are given below. For Arsenic data, 3 to 4 monitoring wells are considered.
Table 3.2 - Range of chemical parameter in the block
Block Aquifer Type
As (mg/l)
pH EC (µs/Cm)
Na (mg/l)
Cl (mg/l)
F (mg/l)
NO3 (mg/l)
Total Hardness as CaCO3(mg/l)
Hanskhali I 0.0001-0.05
8.32-8.49
283-415.7
13.5-29.2
10-32.5 BDL-0.97
BDL-7.2
125-180
Table 3.3 - Arsenic Concentration in ground water
Name of arsenic affected block
No. of Tube well analysed
Arsenic Concentration (in mg/l)
<& =0.01 >0.01 &<=0.05 >0.05 Max. concentration % No. % No. % No.
Hanskhali 2262 34.92 790 39.48 893 25.46 576 0.53
(Source – PHED, Govt. of West Bengal)
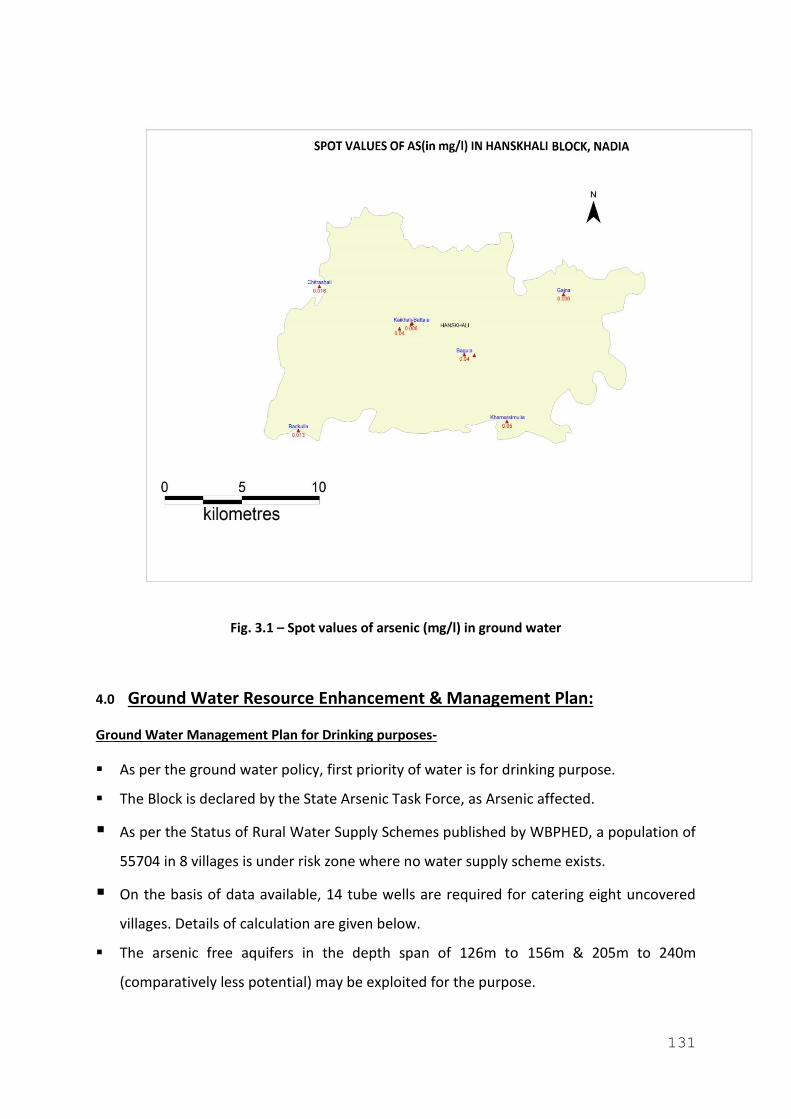
131
Fig. 3.1 – Spot values of arsenic (mg/l) in ground water
4.0 Ground Water Resource Enhancement & Management Plan:
Ground Water Management Plan for Drinking purposes-
▪ As per the ground water policy, first priority of water is for drinking purpose.
▪ The Block is declared by the State Arsenic Task Force, as Arsenic affected.
▪ As per the Status of Rural Water Supply Schemes published by WBPHED, a population of
55704 in 8 villages is under risk zone where no water supply scheme exists.
▪ On the basis of data available, 14 tube wells are required for catering eight uncovered
villages. Details of calculation are given below.
▪ The arsenic free aquifers in the depth span of 126m to 156m & 205m to 240m
(comparatively less potential) may be exploited for the purpose.

132
▪ Arsenic free aquifer should be tapped with proper cement sealing. Arsenic removal plant
may be installed before supply.
▪ Regular Field monitoring is necessary for Arsenic concentration in tube wells.

133
Table 4.1 – Nos. & cost for construction of Tube wells in uncovered (projected) population of Human and Cattle
Management Plan for Irrigation:
▪ On the basis of the Ground Water Resource Assessment, the block is under Semi-
critical condition and the Stage of Ground Water Development (SOD) is 98.84 %.
Hence, irrigation by exploiting the unconfined aquifer is not advisable.
▪ As indicated in the above mentioned Table, the net area for irrigation is not at all
available, even over-irrigated. Hence, over-irrigation may be stopped and no
further irrigation is suggested in this block. However, a quantum of about 22.5 ham
of ground water which is available for future irrigation in this block, may be utilised
for irrigation in adjacent water demanding block like Krishnaganj.
▪ Irrigation by modern techniques like Sprinkler, Drip irrigation may be utilised.
Crops consuming low amount of water should be cultivated.
▪ Conjunctive use of ground water and surface water may be applied for irrigation
▪ Artificial recharge is advisable in Arsenic affected zone for dilution of Arsenic
concentration in unconfined aquifer for irrigation purpose also, so that there is no
Arsenic contamination in food chain system.
▪ .Regular monitoring of Arsenic concentration in crops is also necessary.
▪ R & D study is necessary in arsenic affected area so we can get new solutions in
future.
Block Projected population upto 2021 (considering growth 21.09% per decade as per Census 2011
Water required for drinking & domestic purposes @ 70 lpcd (in lpd)
Cattle Population (Considering 0.19 per capita human population) as on 2011
Cattle Population (Considering 0.36 annual growth rate) as on 2021
Water required for drinking & domestic purposes @ 20 lpcd (in lpd)
Total Water Required (in lpd)
Number of T. Ws
Cost of the tube well of 300 m depth (approx) & 10"x6" dia @ Rs. 25 lakhs (In lakh) as per EFC
Hanskhali 67458 4722060 11421 11839 236783 4958843 14 350
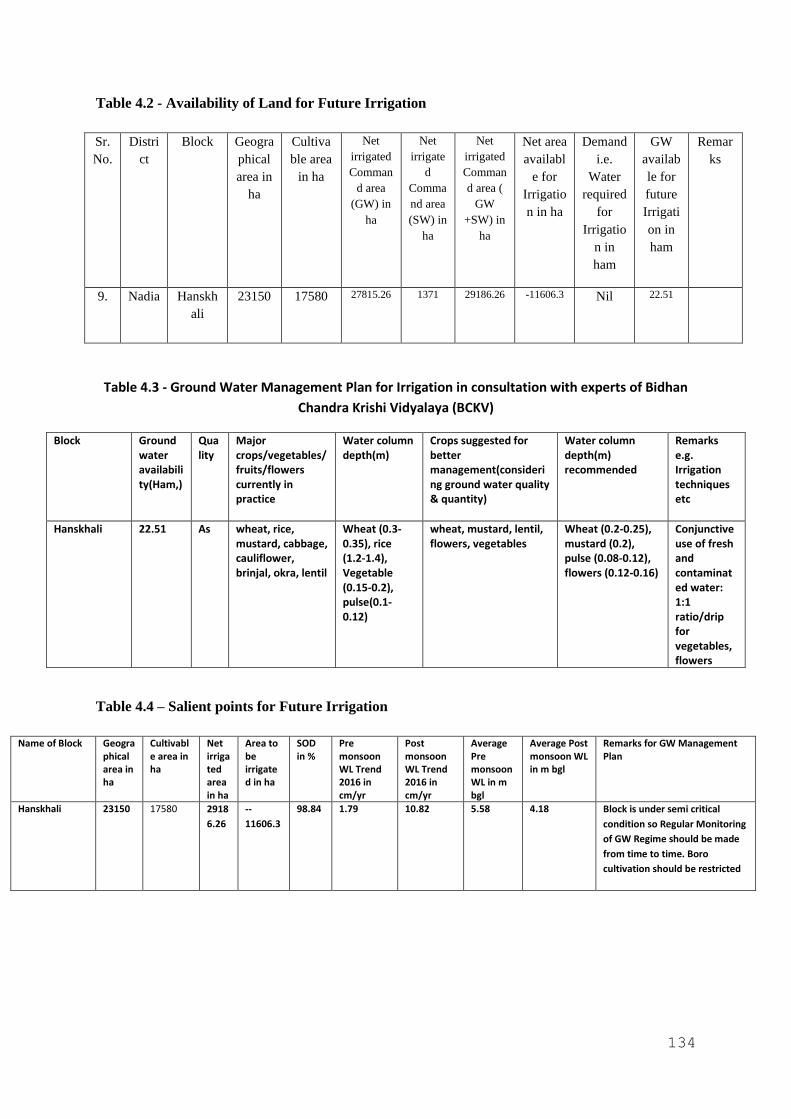
134
Table 4.2 - Availability of Land for Future Irrigation
Sr.
No.
Distri
ct
Block Geogra
phical
area in
ha
Cultiva
ble area
in ha
Net
irrigated
Comman
d area
(GW) in
ha
Net
irrigate
d
Comma
nd area
(SW) in
ha
Net
irrigated
Comman
d area (
GW
+SW) in
ha
Net area
availabl
e for
Irrigatio
n in ha
Demand
i.e.
Water
required
for
Irrigatio
n in
ham
GW
availab
le for
future
Irrigati
on in
ham
Remar
ks
9. Nadia Hanskh
ali
23150 17580 27815.26 1371 29186.26 -11606.3 Nil 22.51
Table 4.3 - Ground Water Management Plan for Irrigation in consultation with experts of Bidhan
Chandra Krishi Vidyalaya (BCKV)
Block Ground water availability(Ham,)
Quality
Major crops/vegetables/ fruits/flowers currently in practice
Water column depth(m)
Crops suggested for better management(considering ground water quality & quantity)
Water column depth(m) recommended
Remarks e.g. Irrigation techniques etc
Hanskhali 22.51 As wheat, rice, mustard, cabbage, cauliflower, brinjal, okra, lentil
Wheat (0.3-0.35), rice (1.2-1.4), Vegetable (0.15-0.2), pulse(0.1-0.12)
wheat, mustard, lentil, flowers, vegetables
Wheat (0.2-0.25), mustard (0.2), pulse (0.08-0.12), flowers (0.12-0.16)
Conjunctive use of fresh and contaminated water: 1:1 ratio/drip for vegetables, flowers
Table 4.4 – Salient points for Future Irrigation
Name of Block Geographical area in ha
Cultivable area in ha
Net irrigated area in ha
Area to be irrigated in ha
SOD in %
Pre monsoon WL Trend 2016 in cm/yr
Post monsoon WL Trend 2016 in cm/yr
Average Pre monsoon WL in m bgl
Average Post monsoon WL in m bgl
Remarks for GW Management Plan
Hanskhali 23150 17580 2918
6.26
--
11606.3
98.84 1.79 10.82 5.58 4.18 Block is under semi critical
condition so Regular Monitoring
of GW Regime should be made
from time to time. Boro
cultivation should be restricted
135
Management Plan for Industrial Purpose:
The block is under Semi-critical condition and is mainly agriculture based rural area. There is
a less chance for growing up of small scale industries. However, in near future, if any
industry is coming up, the following steps should be considered.
▪ All industries proposing to draw ground water through energized means, need to obtain
NOC for ground water withdrawal from the State Ground Water Authority (SGWA)
▪ All industries abstracting ground water > 500 m3/day in the semi-critical assessment
unit, have to implement mandatorily, the artificial recharge measures, as per the norms.
▪ All the industries need to recharge 90 % of the quantum of ground water withdrawal.
▪ The Authority is to issue NOC for various uses and monitor its compliance. The NOC
should be vested with the District Magistrate/ Deputy Commissioner/ State Ground
Water Authority/ State Nodal Agency/ Central Ground Water Authority, as per details
given in the guidelines of CGWA.
Special interventions for monitoring of Ground water situations in Semi-Critical Block
As per the GEC Norms for Semi-critical block, the following precautions should be taken
before GW extraction.
▪ It is necessary to increase the density of observation wells in that unit for regular water
level monitoring and thereby-
▪ The rainfall recharge during monsoon season by the water table fluctuation method can
be estimated with greater accuracy.
▪ The trend of water table during pre- monsoon and post-monsoon intervals can be
evaluated with greater accuracy.
▪ The trend of water table during pre- monsoon and post- monsoon intervals consequent
to further groundwater development can be more effectively monitored.

136
Artificial Recharge:
Table 4.5 - Area suitable for recharge in the study area:
District Block Name Block Area (in ha) Area suitable for recharge (Considering
area having DTW more than 3m in post-
monsoon and showing 20 cm/y falling
trend) (in ha)
Nadia Hanskhali 23150 23150 (considering the average criteria)
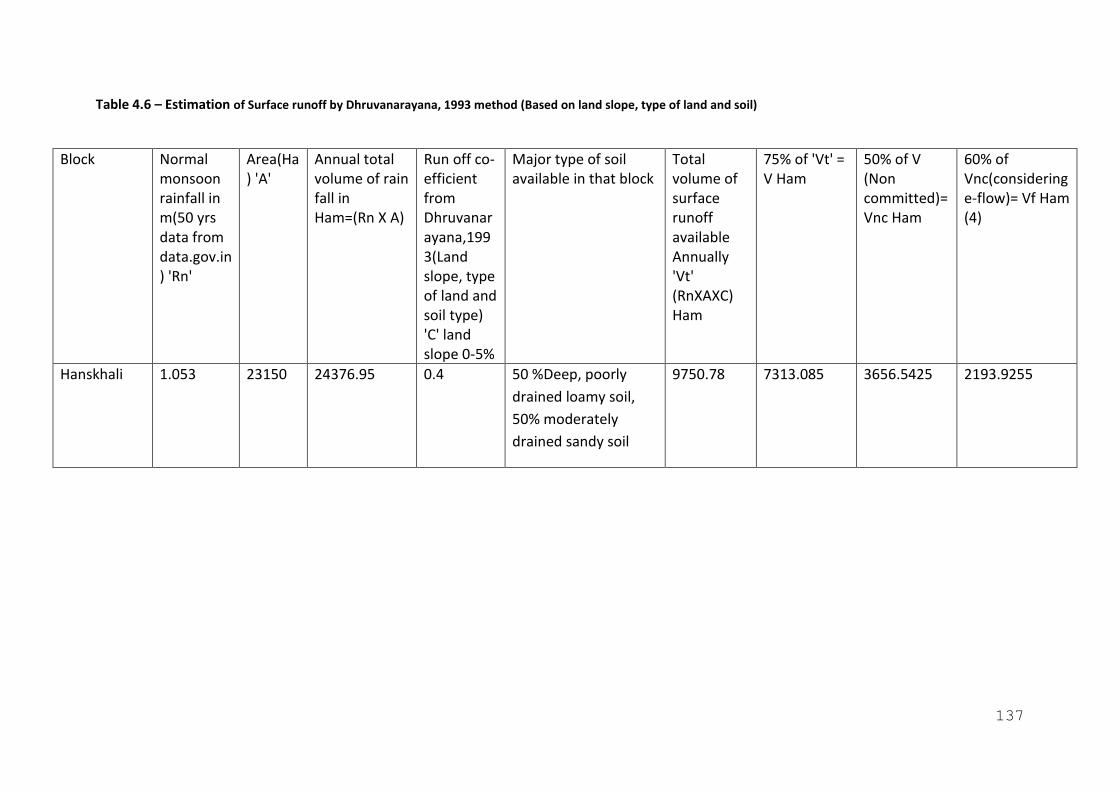
137
Table 4.6 – Estimation of Surface runoff by Dhruvanarayana, 1993 method (Based on land slope, type of land and soil)
Block Normal monsoon rainfall in m(50 yrs data from data.gov.in) 'Rn'
Area(Ha) 'A'
Annual total volume of rain fall in Ham=(Rn X A)
Run off co-efficient from Dhruvanarayana,1993(Land slope, type of land and soil type) 'C' land slope 0-5%
Major type of soil available in that block
Total volume of surface runoff available Annually 'Vt' (RnXAXC) Ham
75% of 'Vt' = V Ham
50% of V (Non committed)= Vnc Ham
60% of Vnc(considering e-flow)= Vf Ham (4)
Hanskhali 1.053 23150 24376.95 0.4 50 %Deep, poorly
drained loamy soil,
50% moderately
drained sandy soil
9750.78 7313.085 3656.5425 2193.9255

138
Table 4.7 – Possible Recharge & conservation structures using harvested run off in block based on soil characteristic, Slope, Rain fall data and Long term trend & cost estimate
Block (1) Amount of water for artificial recharge and / or conservation (Ham) (2)
Source water allocation for Irrigation Cum Recharge Tank and REET with Recharge Shaft in Ham (3)
Source water allocation for REET with Recharge Shaft (Ham): 50 % of Col. 3 (4)
Source water allocation for Irrigation Cum Recharge Tank (Ham): 50 % of Col. 3 (5)
Source water
allocation for
Injection Well (6)
Source water allocation for Farm Pond in Ham (7)
Nos. of Farm Pond @ 10 Ham per unit (8)
Cost of Farm pond @ Rs 8 lakh per unit (9)
Nos. of Irrigation Cum Recharge Tank suggested @ 50 Ham per unit (10)
Cost of Irrigation Cum Recharge Tank @ Rs 8 lakh per unit (11)
Nos. of REET with recharge shaft @ 10 Ham per unit (12)
Cost of REET with Recharge Shaft @ Rs 8 lakh per unit (13)
Nos. of injection Well @ 30 Ham per unit (14)
Cost of injection Well @ Rs 25 lakh (15)
Total Cost (16)
(in Lakh)
Hanskhali 2193.9255 70 % of
Col. 2 i.e.
1535.75
Ham
767.88 767.88 20 % of Col. 2 i.e.
438.79 Ham
10 % of
Col.2 i.e.
219.40
Ham
22 176 15 120 77 616 15 120 1032
REET with Recharge Shaft Re-excavation of existing tank with Recharge Shaft
Part III
Data Gap Analysis in parts of Nadia District
(9 Blocks), West Bengal
(Karimpur - I, Karimpur - II, Tehatta - I, Tehatta - II, Kaliganj, Nakashipara,
Chapra, Krishnaganj & Hanskhali Blocks)
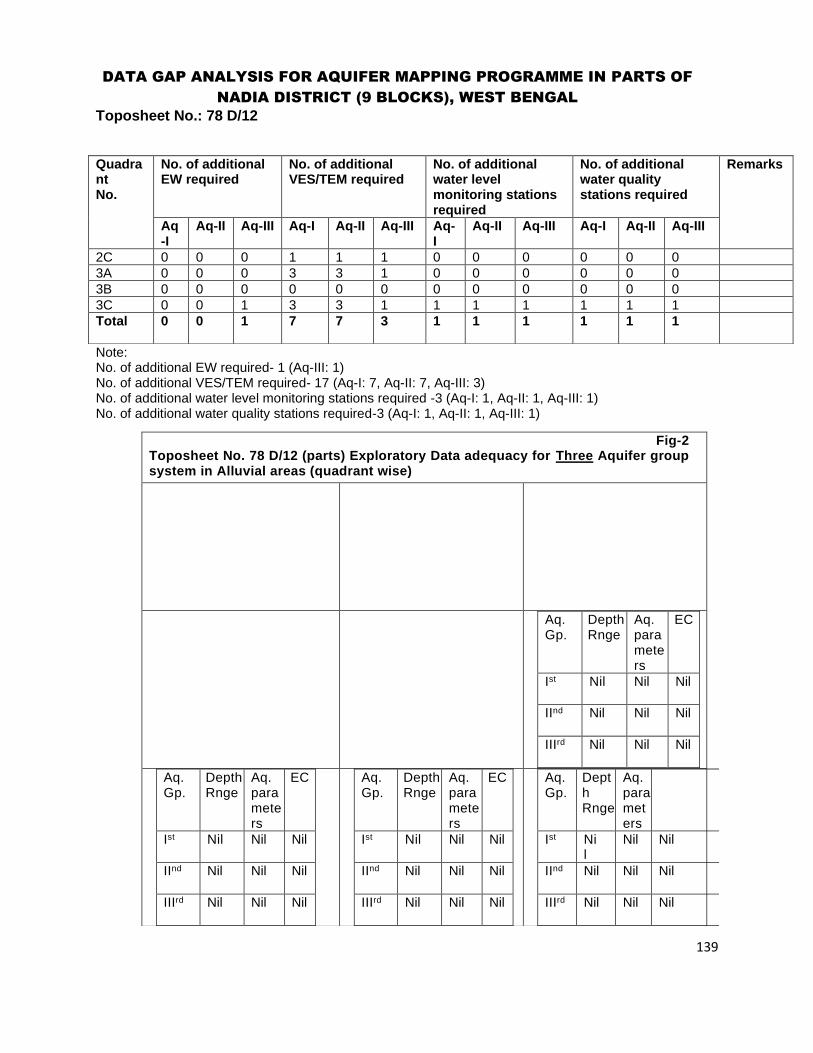
139
DATA GAP ANALYSIS FOR AQUIFER MAPPING PROGRAMME IN PARTS OF
NADIA DISTRICT (9 BLOCKS), WEST BENGAL
Toposheet No.: 78 D/12
Note: No. of additional EW required- 1 (Aq-III: 1) No. of additional VES/TEM required- 17 (Aq-I: 7, Aq-II: 7, Aq-III: 3) No. of additional water level monitoring stations required -3 (Aq-I: 1, Aq-II: 1, Aq-III: 1) No. of additional water quality stations required-3 (Aq-I: 1, Aq-II: 1, Aq-III: 1)
Quadrant No.
No. of additional EW required
No. of additional VES/TEM required
No. of additional water level monitoring stations required
No. of additional water quality stations required
Remarks
Aq-I
Aq-II Aq-III Aq-I Aq-II Aq-III Aq-I
Aq-II Aq-III Aq-I Aq-II Aq-III
2C 0 0 0 1 1 1 0 0 0 0 0 0
3A 0 0 0 3 3 1 0 0 0 0 0 0
3B 0 0 0 0 0 0 0 0 0 0 0 0
3C 0 0 1 3 3 1 1 1 1 1 1 1
Total 0
0
1 7 7 3 1 1 1 1 1 1
Fig-2 Toposheet No. 78 D/12 (parts) Exploratory Data adequacy for Three Aquifer group system in Alluvial areas (quadrant wise)
Aq. Gp.
Depth Rnge
Aq. parameters
EC
Ist Nil Nil Nil
IInd Nil Nil Nil
IIIrd Nil Nil Nil
Aq. Gp.
Depth Rnge
Aq. parameters
EC
Ist Nil Nil Nil
IInd Nil Nil Nil
IIIrd Nil Nil Nil
Aq. Gp.
Depth Rnge
Aq. parameters
EC
Ist Nil Nil Nil
IInd Nil Nil Nil
IIIrd Nil Nil Nil
Aq. Gp.
Depth Rnge
Aq. parameters
EC
Ist Nil
Nil Nil
IInd Nil Nil Nil
IIIrd Nil Nil Nil
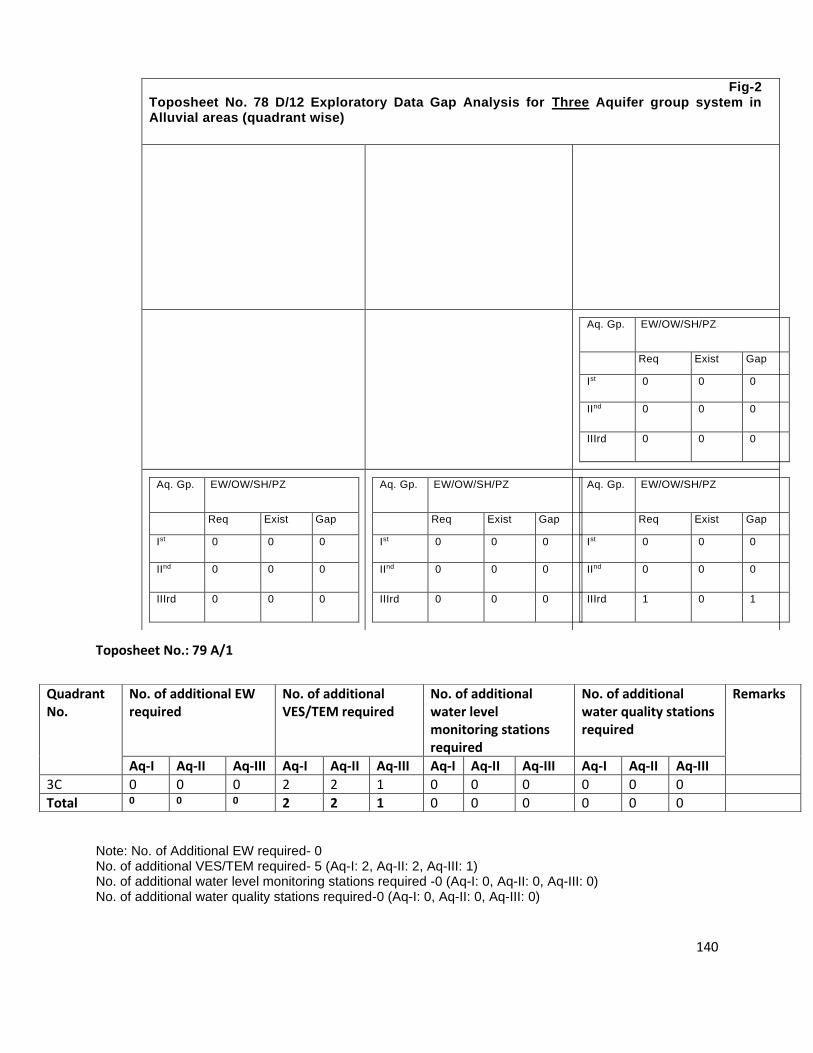
140
Toposheet No.: 79 A/1
Note: No. of Additional EW required- 0 No. of additional VES/TEM required- 5 (Aq-I: 2, Aq-II: 2, Aq-III: 1) No. of additional water level monitoring stations required -0 (Aq-I: 0, Aq-II: 0, Aq-III: 0) No. of additional water quality stations required-0 (Aq-I: 0, Aq-II: 0, Aq-III: 0)
Fig-2 Toposheet No. 78 D/12 Exploratory Data Gap Analysis for Three Aquifer group system in Alluvial areas (quadrant wise)
Aq. Gp. EW/OW/SH/PZ
Req Exist Gap
Ist 0 0 0
IInd 0 0 0
IIIrd 0 0 0
Aq. Gp. EW/OW/SH/PZ
Req Exist Gap
Ist 0 0 0
IInd 0 0 0
IIIrd 0 0 0
Aq. Gp. EW/OW/SH/PZ
Req Exist Gap
Ist 0 0 0
IInd 0 0 0
IIIrd 0 0 0
Aq. Gp. EW/OW/SH/PZ
Req Exist Gap
Ist 0 0 0
IInd 0 0 0
IIIrd 1 0 1
Quadrant No.
No. of additional EW required
No. of additional VES/TEM required
No. of additional water level monitoring stations required
No. of additional water quality stations required
Remarks
Aq-I Aq-II Aq-III Aq-I Aq-II Aq-III Aq-I Aq-II Aq-III Aq-I Aq-II Aq-III
3C 0 0 0 2 2 1 0 0 0 0 0 0
Total 0 0 0 2 2 1 0 0 0 0 0 0
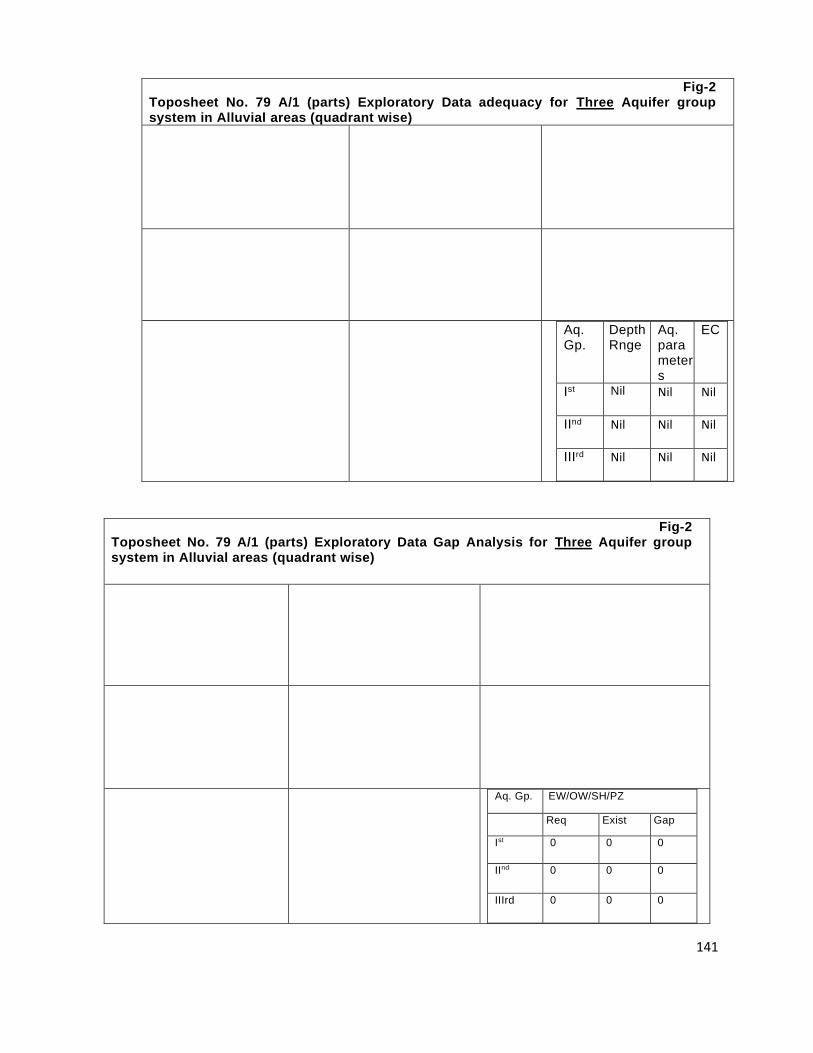
141
Fig-2 Toposheet No. 79 A/1 (parts) Exploratory Data adequacy for Three Aquifer group system in Alluvial areas (quadrant wise)
Aq. Gp.
Depth Rnge
Aq. parameters
EC
Ist Nil Nil Nil
IInd Nil Nil Nil
IIIrd Nil Nil Nil
Fig-2 Toposheet No. 79 A/1 (parts) Exploratory Data Gap Analysis for Three Aquifer group system in Alluvial areas (quadrant wise)
Aq. Gp. EW/OW/SH/PZ
Req Exist Gap
Ist 0 0 0
IInd 0 0 0
IIIrd 0 0 0

142
Toposheet No.: 79A/5
Note: No. of Additional EW required- 1 (Aq-III: 1) No. of additional VES/TEM required- 27 (Aq-I: 11, Aq-II: 11, Aq-III: 5) No. of additional water level monitoring stations required -5 (Aq-I: 0, Aq-II: 2, Aq-III: 3) No. of additional water quality stations required-5 (Aq-I: 0, Aq-II: 2, Aq-III: 3)
Quadrant No.
No. of additional EW required
No. of additional VES/TEM required
No. of additional water level monitoring stations required
No. of additional water quality stations required
Remarks
Aq-I Aq-II Aq-III Aq-I Aq-II Aq-III Aq-I Aq-II Aq-III Aq-I Aq-II Aq-III
1C 0 0 0 1 1 1 0 0 0 0 0 0
2C 0 0 0 2 2 1 0 0 0 0 0 0
3A 0 0 1 2 2 1 0 1 1 0 1 1
3B 0 0 0 3 3 1 0 1 1 0 1 1
3C 0 0 0 3 3 1 0 0 1 0 0 1
Total 0 0 1 11 11 5 0 2 3 0 2 3
Fig-2 Toposheet No. 79 A/5 (parts) Exploratory Data adequacy for Three Aquifer group system in Alluvial areas (quadrant wise)
Aq. Gp.
Depth Rnge
Aq. parameters
EC
Ist Nil Nil Nil
IInd Nil Nil Nil
IIIrd Nil Nil Nil
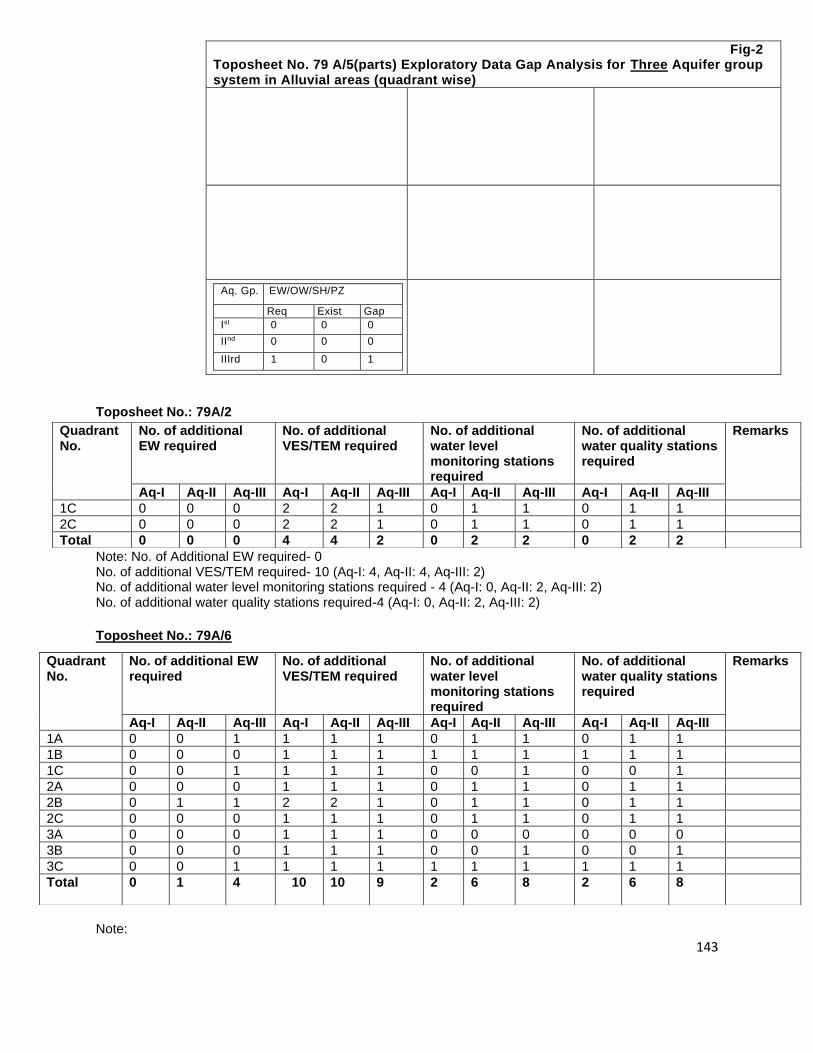
143
Toposheet No.: 79A/2
Note: No. of Additional EW required- 0 No. of additional VES/TEM required- 10 (Aq-I: 4, Aq-II: 4, Aq-III: 2) No. of additional water level monitoring stations required - 4 (Aq-I: 0, Aq-II: 2, Aq-III: 2) No. of additional water quality stations required-4 (Aq-I: 0, Aq-II: 2, Aq-III: 2)
Toposheet No.: 79A/6
Note:
Fig-2 Toposheet No. 79 A/5(parts) Exploratory Data Gap Analysis for Three Aquifer group system in Alluvial areas (quadrant wise)
Aq. Gp. EW/OW/SH/PZ
Req Exist Gap
Ist 0 0 0
IInd 0 0 0
IIIrd 1 0 1
Quadrant No.
No. of additional EW required
No. of additional VES/TEM required
No. of additional water level monitoring stations required
No. of additional water quality stations required
Remarks
Aq-I Aq-II Aq-III Aq-I Aq-II Aq-III Aq-I Aq-II Aq-III Aq-I Aq-II Aq-III
1C 0 0 0 2 2 1 0 1 1 0 1 1
2C 0 0 0 2 2 1 0 1 1 0 1 1
Total 0 0 0 4 4 2 0 2 2 0 2 2
Quadrant No.
No. of additional EW required
No. of additional VES/TEM required
No. of additional water level monitoring stations required
No. of additional water quality stations required
Remarks
Aq-I Aq-II Aq-III Aq-I Aq-II Aq-III Aq-I Aq-II Aq-III Aq-I Aq-II Aq-III
1A 0 0 1 1 1 1 0 1 1 0 1 1
1B 0 0 0 1 1 1 1 1 1 1 1 1
1C 0 0 1 1 1 1 0 0 1 0 0 1
2A 0 0 0 1 1 1 0 1 1 0 1 1
2B 0 1 1 2 2 1 0 1 1 0 1 1
2C 0 0 0 1 1 1 0 1 1 0 1 1
3A 0 0 0 1 1 1 0 0 0 0 0 0
3B 0 0 0 1 1 1 0 0 1 0 0 1
3C 0 0 1 1 1 1 1 1 1 1 1 1
Total 0 1 4 10 10
9
2 6 8 2 6 8

144
No. of Additional EW required- 5 (AQ-II: 1, AQ-III: 4) 2 OW for 2B No. of additional VES/TEM required- 29 (Aq-I: 10, Aq-II: 10, Aq-III: 9) No. of additional water level monitoring stations required -16 (Aq-I: 2, Aq-II: 6, Aq-III: 8) No. of additional water quality stations required-16 (Aq-I: 2, Aq-II: 6, Aq-III: 8)
Fig-2 Toposheet No. 79 A/6 Exploratory Data adequacy for Three Aquifer group system in Alluvial areas (quadrant wise)
Aq. Gp.
Depth Rnge
Aq. parameters
EC
Ist Nil Nil Nil
IInd Nil Nil Nil
IIIrd Nil Nil Nil
Aq. Gp.
Depth Rnge
Aq. parameters
EC
Ist Nil Nil Nil
IInd Nil Nil Nil
IIIrd Nil Nil Nil
Aq. Gp.
Depth Rnge
Aq. parameters
EC
Ist Nil Nil Nil
IInd 183-
195
Nil Nil
IIIrd Nil Nil Nil
Aq. Gp.
Depth Rnge
Aq. parameters
EC
Ist Nil Nil Nil
IInd Nil Nil Nil
IIIrd Nil Nil Nil
Aq. Gp.
Depth Rnge
Aq. parameters
EC
Ist Nil Nil Nil
IInd Nil Nil Nil
IIIrd Nil Nil Nil
Aq. Gp.
Depth Rnge
Aq. parameters
EC
Ist Nil Nil Nil
IInd Nil Nil Nil
IIIrd Nil Nil Nil
Aq. Gp.
Depth Rnge
Aq. parameters
EC
Ist Nil Nil Nil
IInd Nil Nil Nil
IIIrd Nil Nil Nil
Aq. Gp.
Depth Rnge
Aq. parameters
EC
Ist Nil Nil Nil
IInd Nil Nil Nil
IIIrd Nil Nil Nil
Aq. Gp.
Depth Rnge
Aq. parameters
EC
Ist Nil Nil Nil
IInd Nil Nil Nil
IIIrd Nil Nil Nil
Fig-2 Toposheet No. 79 A/6 Exploratory Data Gap Analysis for Three Aquifer group system in Alluvial areas (quadrant wise)

145
Toposheet No.: 79A/9
Note: No. of Additional EW required-5 (Aq-I: 1, AQ-II: 1, AQ-III: 3) 3 OW for 2B No. of additional VES/TEM required- 30 (Aq-I: 12, Aq-II: 12, Aq-III: 6) No. of additional water level monitoring stations required -12 (Aq-I: 1, Aq-II:6, Aq-III: 5) No. of additional water quality stations required-12 (Aq-I: 1, Aq-II:6, Aq-III: 5)
Aq. Gp. EW/OW/SH/PZ
Req Exist Gap
Ist 0 0 0
IInd 0 0 0
IIIrd 1 0 1
Aq. Gp. EW/OW/SH/PZ
Req Exist Gap
Ist 0 0 0
IInd 0 0 0
IIIrd 0 0 0
Aq. Gp. EW/OW/SH/PZ
Req Exist Gap
Ist 0 0 0
IInd 0 0 0
IIIrd 1 0 1
Aq. Gp. EW/OW/SH/PZ
Req Exist Gap
Ist 0 0 0
IInd 0 0 0
IIIrd 0 0 0
Aq. Gp. EW/OW/SH/PZ
Req Exist Gap
Ist 0 0 0
IInd 1 0 1
IIIrd 1 0 1
Aq. Gp. EW/OW/SH/PZ
Req Exist Gap
Ist 0 0 0
IInd 0 0 0
IIIrd 0 0 0
Aq. Gp. EW/OW/SH/PZ
Req Exist Gap
Ist 0 0 0
IInd 0 0 0
IIIrd 0 0 0
Aq. Gp. EW/OW/SH/PZ
Req Exist Gap
Ist 0 0 0
IInd 0 0 0
IIIrd 0 0 0
Aq. Gp. EW/OW/SH/PZ
Req Exist Gap
Ist 0 0 0
IInd 0 0 0
IIIrd 1 0 1
Quadrant No.
No. of additional EW required
No. of additional VES/TEM required
No. of additional water level monitoring stations required
No. of additional water quality stations required
Remark
Aq-I Aq-II Aq-III Aq-I Aq-II Aq-III Aq-I Aq-II Aq-III Aq-I Aq-II Aq-III
1A 0 0 1 2 2 1 0 1 1 0 1 1
1B 0 0 0 2 2 1 0 1 0 0 1 0
1C 0 0 0 2 2 1 0 1 1 0 1 1
2A 0 0 0 2 2 1 1 1 1 1 1 1
2B 1 1 1 2 2 1 0 1 1 0 1 1
3A 0 0 1 2 2 1 0 1 1 0 1 1
Total 1 1 3 12 12 6 1 6 5 1 6 5
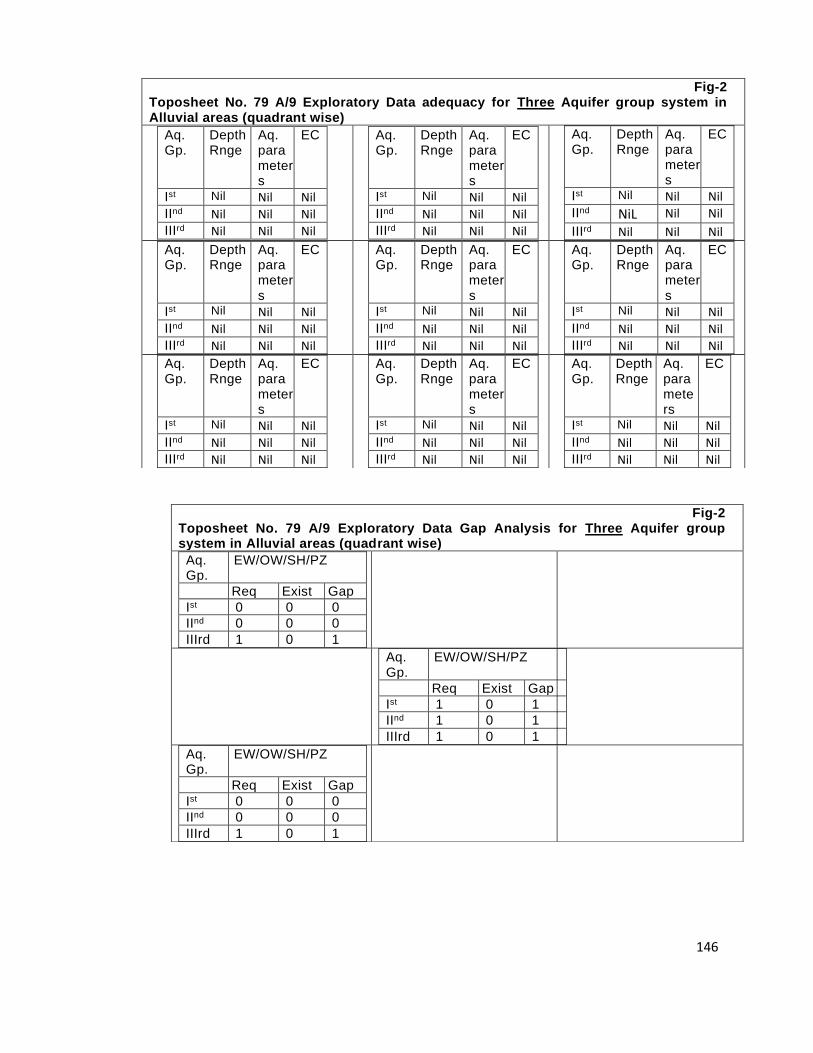
146
Fig-2 Toposheet No. 79 A/9 Exploratory Data adequacy for Three Aquifer group system in Alluvial areas (quadrant wise)
Aq. Gp.
Depth Rnge
Aq. parameters
EC
Ist Nil Nil Nil IInd Nil Nil Nil IIIrd Nil Nil Nil
Aq. Gp.
Depth Rnge
Aq. parameters
EC
Ist Nil Nil Nil IInd Nil Nil Nil IIIrd Nil Nil Nil
Aq. Gp.
Depth Rnge
Aq. parameters
EC
Ist Nil Nil Nil IInd NiL Nil Nil IIIrd Nil Nil Nil
Aq. Gp.
Depth Rnge
Aq. parameters
EC
Ist Nil Nil Nil IInd Nil Nil Nil IIIrd Nil Nil Nil
Aq. Gp.
Depth Rnge
Aq. parameters
EC
Ist Nil Nil Nil IInd Nil Nil Nil IIIrd Nil Nil Nil
Aq. Gp.
Depth Rnge
Aq. parameters
EC
Ist Nil Nil Nil IInd Nil Nil Nil IIIrd Nil Nil Nil
Aq. Gp.
Depth Rnge
Aq. parameters
EC
Ist Nil Nil Nil IInd Nil Nil Nil IIIrd Nil Nil Nil
Aq. Gp.
Depth Rnge
Aq. parameters
EC
Ist Nil Nil Nil IInd Nil Nil Nil IIIrd Nil Nil Nil
Aq. Gp.
Depth Rnge
Aq. parameters
EC
Ist Nil Nil Nil IInd Nil Nil Nil IIIrd Nil Nil Nil
Fig-2 Toposheet No. 79 A/9 Exploratory Data Gap Analysis for Three Aquifer group system in Alluvial areas (quadrant wise)
Aq. Gp.
EW/OW/SH/PZ
Req Exist Gap
Ist 0 0 0
IInd 0 0 0
IIIrd 1 0 1
Aq. Gp.
EW/OW/SH/PZ
Req Exist Gap
Ist 1 0 1
IInd 1 0 1
IIIrd 1 0 1
Aq. Gp.
EW/OW/SH/PZ
Req Exist Gap
Ist 0 0 0
IInd 0 0 0
IIIrd 1 0 1
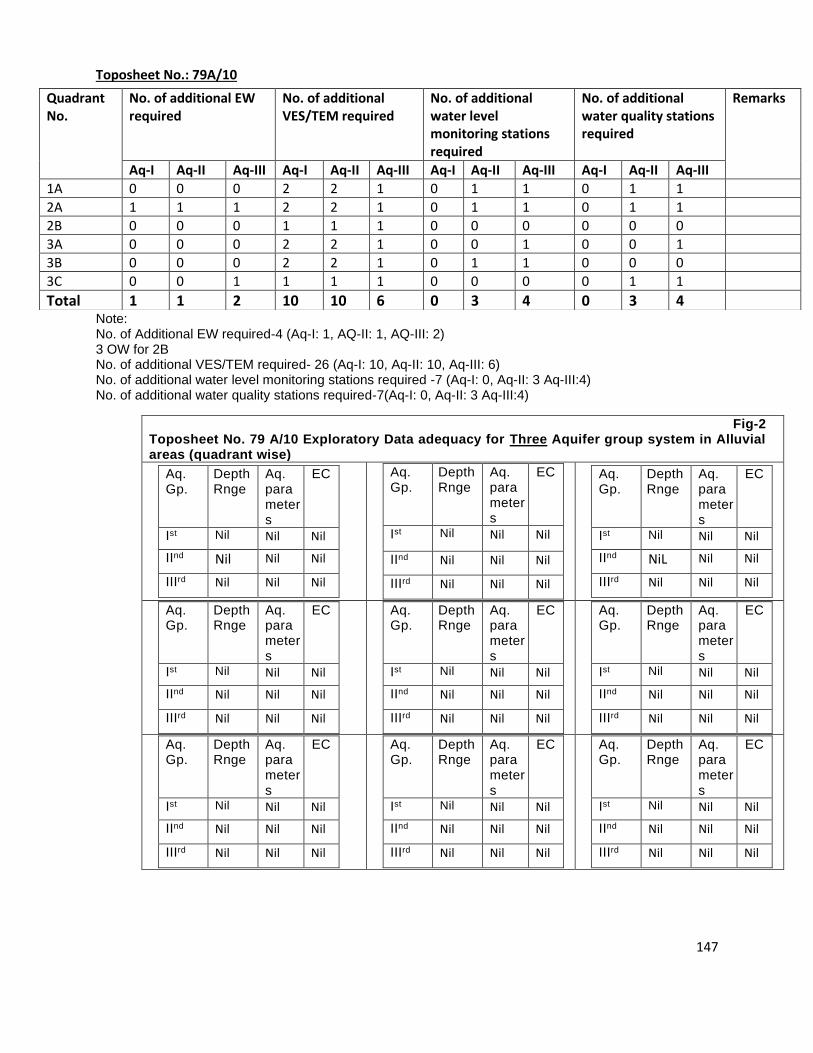
147
Toposheet No.: 79A/10
Note: No. of Additional EW required-4 (Aq-I: 1, AQ-II: 1, AQ-III: 2) 3 OW for 2B No. of additional VES/TEM required- 26 (Aq-I: 10, Aq-II: 10, Aq-III: 6) No. of additional water level monitoring stations required -7 (Aq-I: 0, Aq-II: 3 Aq-III:4) No. of additional water quality stations required-7(Aq-I: 0, Aq-II: 3 Aq-III:4)
Quadrant No.
No. of additional EW required
No. of additional VES/TEM required
No. of additional water level monitoring stations required
No. of additional water quality stations required
Remarks
Aq-I Aq-II Aq-III Aq-I Aq-II Aq-III Aq-I Aq-II Aq-III Aq-I Aq-II Aq-III
1A 0 0 0 2 2 1 0 1 1 0 1 1
2A 1 1 1 2 2 1 0 1 1 0 1 1
2B 0 0 0 1 1 1 0 0 0 0 0 0
3A 0 0 0 2 2 1 0 0 1 0 0 1
3B 0 0 0 2 2 1 0 1 1 0 0 0
3C 0 0 1 1 1 1 0 0 0 0 1 1
Total 1 1 2 10 10 6 0 3 4 0 3 4
Fig-2 Toposheet No. 79 A/10 Exploratory Data adequacy for Three Aquifer group system in Alluvial areas (quadrant wise)
Aq. Gp.
Depth Rnge
Aq. parameters
EC
Ist Nil Nil Nil
IInd Nil Nil Nil
IIIrd Nil Nil Nil
Aq. Gp.
Depth Rnge
Aq. parameters
EC
Ist Nil Nil Nil
IInd Nil Nil Nil
IIIrd Nil Nil Nil
Aq. Gp.
Depth Rnge
Aq. parameters
EC
Ist Nil Nil Nil
IInd NiL Nil Nil
IIIrd Nil Nil Nil
Aq. Gp.
Depth Rnge
Aq. parameters
EC
Ist Nil Nil Nil
IInd Nil Nil Nil
IIIrd Nil Nil Nil
Aq. Gp.
Depth Rnge
Aq. parameters
EC
Ist Nil Nil Nil
IInd Nil Nil Nil
IIIrd Nil Nil Nil
Aq. Gp.
Depth Rnge
Aq. parameters
EC
Ist Nil Nil Nil
IInd Nil Nil Nil
IIIrd Nil Nil Nil
Aq. Gp.
Depth Rnge
Aq. parameters
EC
Ist Nil Nil Nil
IInd Nil Nil Nil
IIIrd Nil Nil Nil
Aq. Gp.
Depth Rnge
Aq. parameters
EC
Ist Nil Nil Nil
IInd Nil Nil Nil
IIIrd Nil Nil Nil
Aq. Gp.
Depth Rnge
Aq. parameters
EC
Ist Nil Nil Nil
IInd Nil Nil Nil
IIIrd Nil Nil Nil
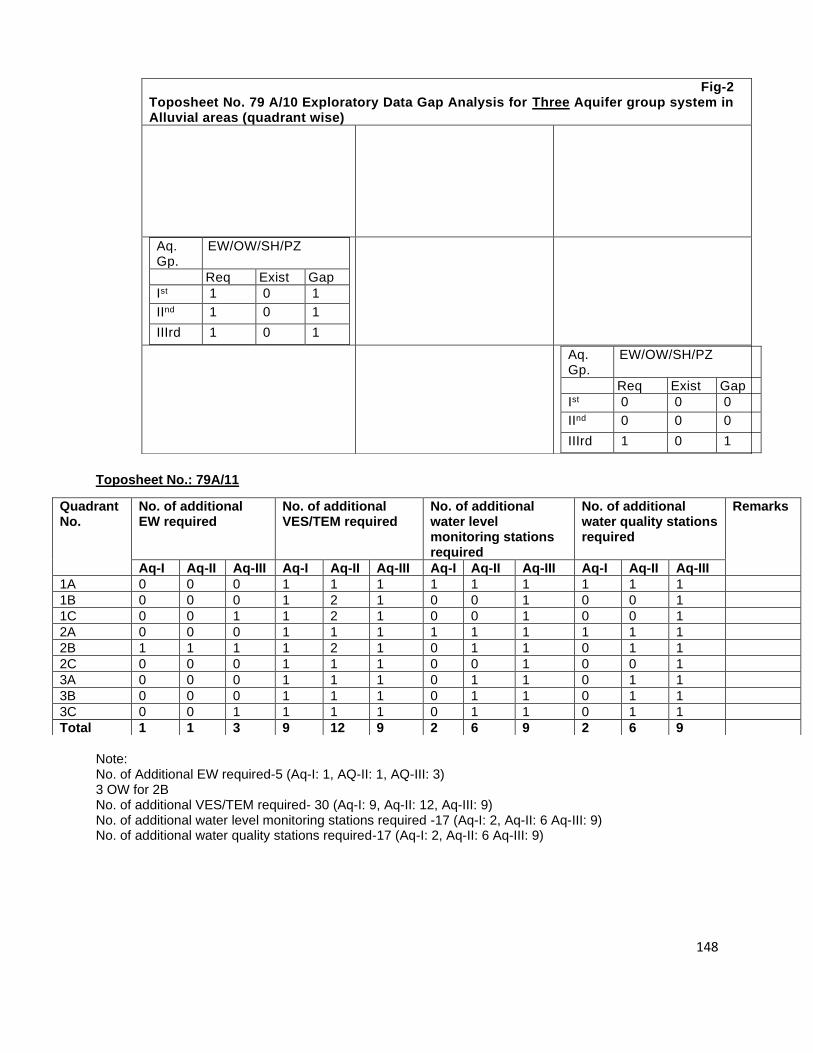
148
Toposheet No.: 79A/11
Note: No. of Additional EW required-5 (Aq-I: 1, AQ-II: 1, AQ-III: 3) 3 OW for 2B No. of additional VES/TEM required- 30 (Aq-I: 9, Aq-II: 12, Aq-III: 9) No. of additional water level monitoring stations required -17 (Aq-I: 2, Aq-II: 6 Aq-III: 9) No. of additional water quality stations required-17 (Aq-I: 2, Aq-II: 6 Aq-III: 9)
Fig-2 Toposheet No. 79 A/10 Exploratory Data Gap Analysis for Three Aquifer group system in Alluvial areas (quadrant wise)
Aq. Gp.
EW/OW/SH/PZ
Req Exist Gap
Ist 1 0 1
IInd 1 0 1
IIIrd 1 0 1
Aq. Gp.
EW/OW/SH/PZ
Req Exist Gap
Ist 0 0 0
IInd 0 0 0
IIIrd 1 0 1
Quadrant No.
No. of additional EW required
No. of additional VES/TEM required
No. of additional water level monitoring stations required
No. of additional water quality stations required
Remarks
Aq-I Aq-II Aq-III Aq-I Aq-II Aq-III Aq-I Aq-II Aq-III Aq-I Aq-II Aq-III
1A 0 0 0 1 1 1 1 1 1 1 1 1
1B 0 0 0 1 2 1 0 0 1 0 0 1
1C 0 0 1 1 2 1 0 0 1 0 0 1
2A 0 0 0 1 1 1 1 1 1 1 1 1
2B 1 1 1 1 2 1 0 1 1 0 1 1
2C 0 0 0 1 1 1 0 0 1 0 0 1
3A 0 0 0 1 1 1 0 1 1 0 1 1
3B 0 0 0 1 1 1 0 1 1 0 1 1
3C 0 0 1 1 1 1 0 1 1 0 1 1
Total 1 1 3 9 12 9 2 6 9 2 6 9
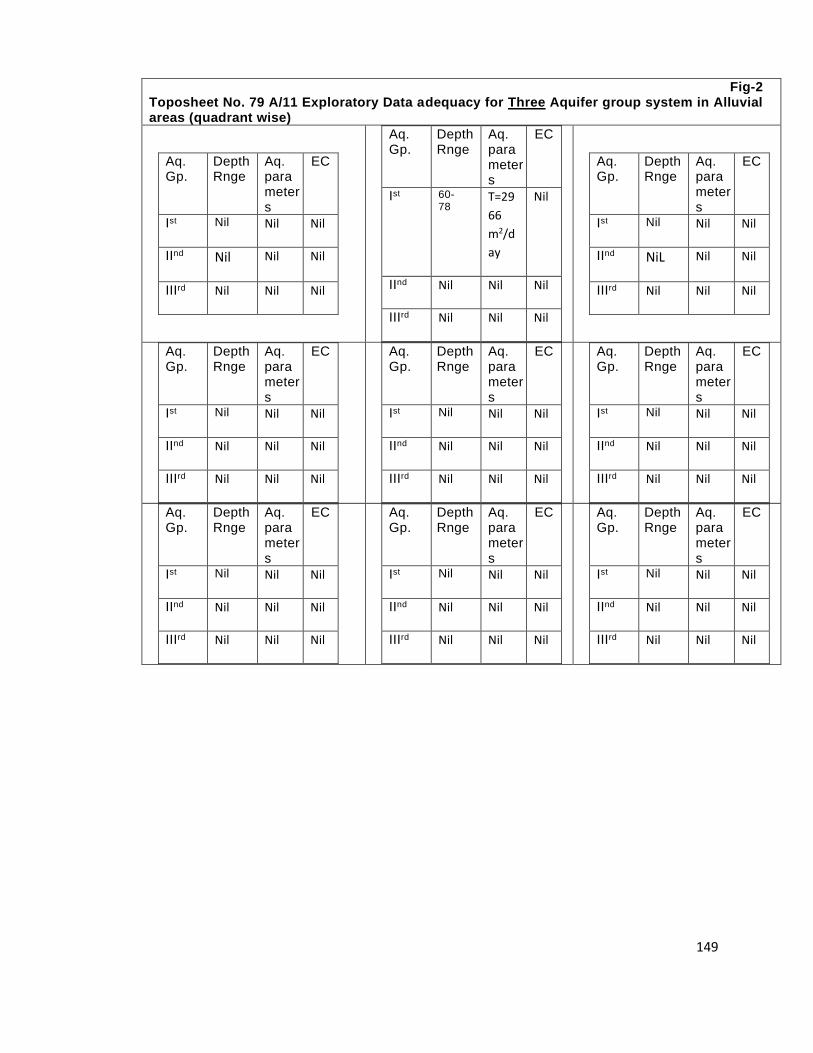
149
Fig-2 Toposheet No. 79 A/11 Exploratory Data adequacy for Three Aquifer group system in Alluvial areas (quadrant wise)
Aq. Gp.
Depth Rnge
Aq. parameters
EC
Ist Nil Nil Nil
IInd Nil Nil Nil
IIIrd Nil Nil Nil
Aq. Gp.
Depth Rnge
Aq. parameters
EC
Ist 60-78
T=29
66
m2/d
ay
Nil
IInd Nil Nil Nil
IIIrd Nil Nil Nil
Aq. Gp.
Depth Rnge
Aq. parameters
EC
Ist Nil Nil Nil
IInd NiL Nil Nil
IIIrd Nil Nil Nil
Aq. Gp.
Depth Rnge
Aq. parameters
EC
Ist Nil Nil Nil
IInd Nil Nil Nil
IIIrd Nil Nil Nil
Aq. Gp.
Depth Rnge
Aq. parameters
EC
Ist Nil Nil Nil
IInd Nil Nil Nil
IIIrd Nil Nil Nil
Aq. Gp.
Depth Rnge
Aq. parameters
EC
Ist Nil Nil Nil
IInd Nil Nil Nil
IIIrd Nil Nil Nil
Aq. Gp.
Depth Rnge
Aq. parameters
EC
Ist Nil Nil Nil
IInd Nil Nil Nil
IIIrd Nil Nil Nil
Aq. Gp.
Depth Rnge
Aq. parameters
EC
Ist Nil Nil Nil
IInd Nil Nil Nil
IIIrd Nil Nil Nil
Aq. Gp.
Depth Rnge
Aq. parameters
EC
Ist Nil Nil Nil
IInd Nil Nil Nil
IIIrd Nil Nil Nil
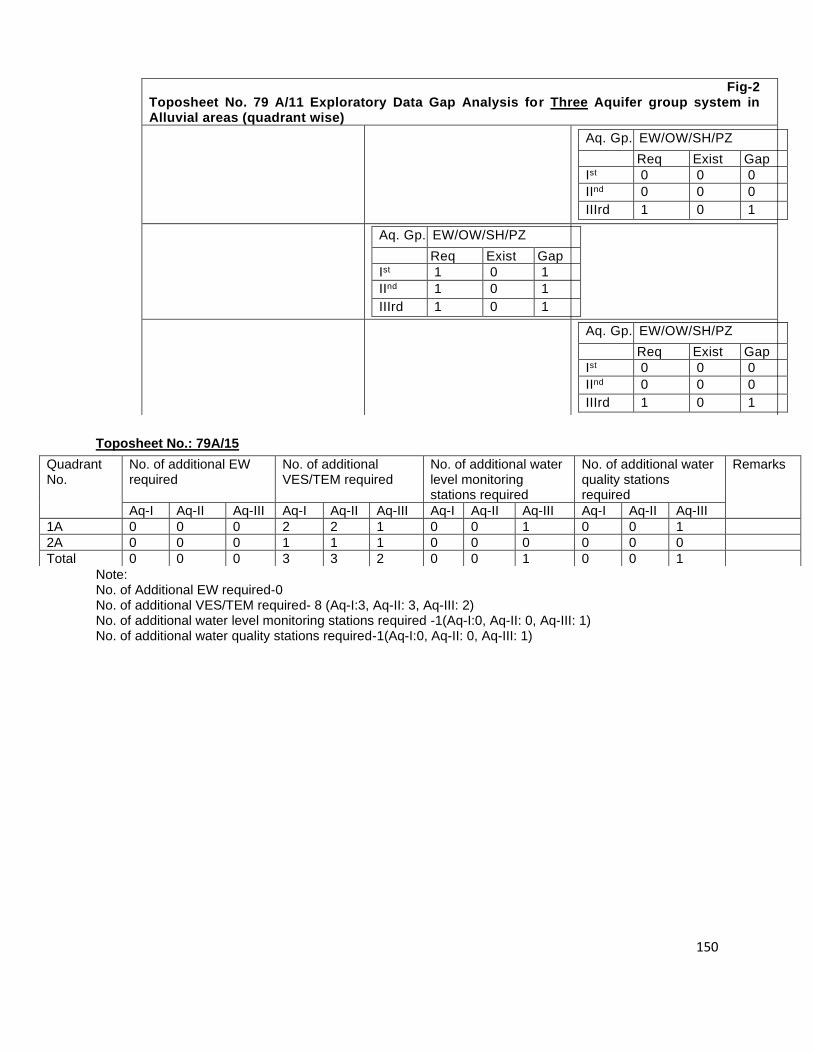
150
Toposheet No.: 79A/15
Note: No. of Additional EW required-0 No. of additional VES/TEM required- 8 (Aq-I:3, Aq-II: 3, Aq-III: 2) No. of additional water level monitoring stations required -1(Aq-I:0, Aq-II: 0, Aq-III: 1) No. of additional water quality stations required-1(Aq-I:0, Aq-II: 0, Aq-III: 1)
Fig-2 Toposheet No. 79 A/11 Exploratory Data Gap Analysis for Three Aquifer group system in Alluvial areas (quadrant wise)
Aq. Gp. EW/OW/SH/PZ
Req Exist Gap
Ist 0 0 0
IInd 0 0 0
IIIrd 1 0 1
Aq. Gp. EW/OW/SH/PZ
Req Exist Gap
Ist 1 0 1
IInd 1 0 1
IIIrd 1 0 1
Aq. Gp. EW/OW/SH/PZ
Req Exist Gap
Ist 0 0 0
IInd 0 0 0
IIIrd 1 0 1
Quadrant No.
No. of additional EW required
No. of additional VES/TEM required
No. of additional water level monitoring stations required
No. of additional water quality stations required
Remarks
Aq-I Aq-II Aq-III Aq-I Aq-II Aq-III Aq-I Aq-II Aq-III Aq-I Aq-II Aq-III
1A 0 0 0 2 2 1 0 0 1 0 0 1
2A 0 0 0 1 1 1 0 0 0 0 0 0
Total 0 0 0 3 3 2 0 0 1 0 0 1
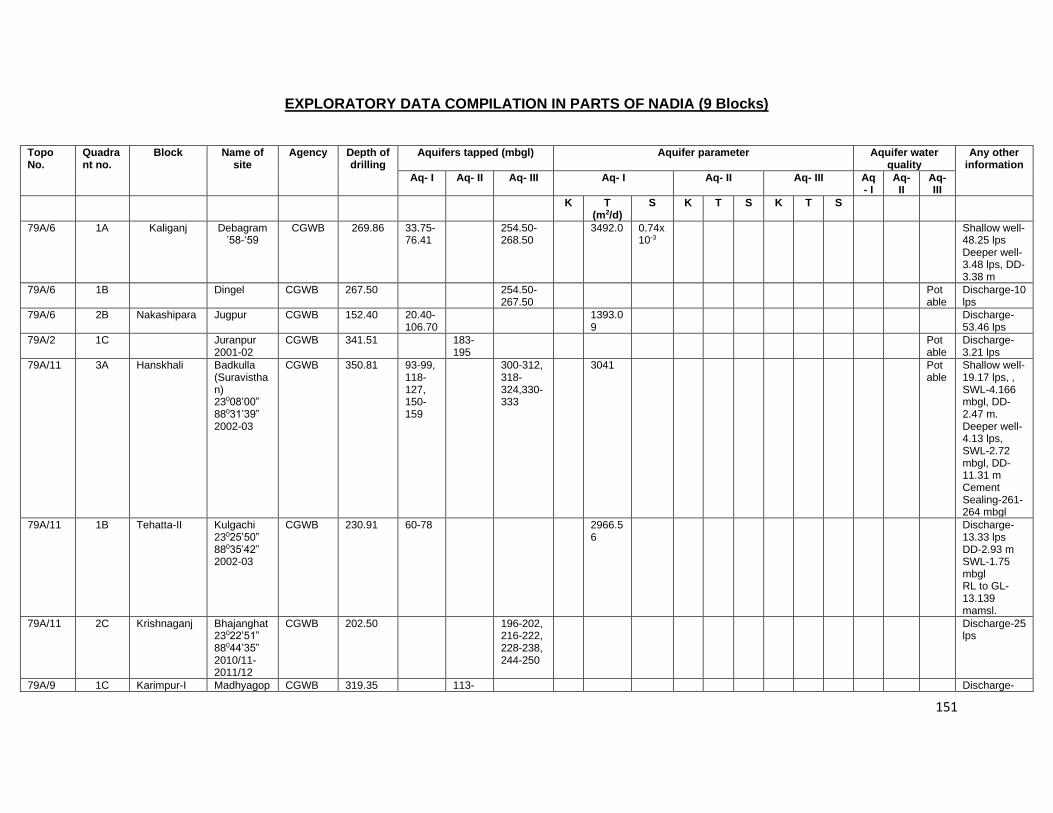
151
EXPLORATORY DATA COMPILATION IN PARTS OF NADIA (9 Blocks)
Topo No.
Quadrant no.
Block Name of site
Agency Depth of drilling
Aquifers tapped (mbgl) Aquifer parameter Aquifer water quality
Any other information
Aq- I Aq- II Aq- III Aq- I Aq- II Aq- III Aq- I
Aq- II
Aq- III
K T (m2/d)
S K T S K T S
79A/6 1A Kaliganj Debagram ’58-‘59
CGWB 269.86 33.75-76.41
254.50-268.50
3492.0 0.74x 10⁻³
Shallow well- 48.25 lps Deeper well- 3.48 lps, DD-3.38 m
79A/6 1B Dingel CGWB 267.50 254.50-267.50
Potable
Discharge-10 lps
79A/6 2B Nakashipara Jugpur CGWB 152.40 20.40-106.70
1393.09
Discharge-53.46 lps
79A/2 1C Juranpur 2001-02
CGWB 341.51 183-195
Potable
Discharge-3.21 lps
79A/11 3A Hanskhali Badkulla (Suravisthan) 23008’00” 88031’39” 2002-03
CGWB 350.81 93-99, 118-127, 150-159
300-312, 318-324,330-333
3041 Potable
Shallow well- 19.17 lps, , SWL-4.166 mbgl, DD-2.47 m. Deeper well- 4.13 lps, SWL-2.72 mbgl, DD-11.31 m Cement Sealing-261-264 mbgl
79A/11 1B Tehatta-II Kulgachi 23025’50” 88035’42” 2002-03
CGWB 230.91 60-78 2966.56
Discharge-13.33 lps DD-2.93 m SWL-1.75 mbgl RL to GL-13.139 mamsl.
79A/11 2C Krishnaganj Bhajanghat 23022’51” 88044’35” 2010/11-2011/12
CGWB 202.50 196-202, 216-222, 228-238, 244-250
Discharge-25 lps
79A/9 1C Karimpur-I Madhyagop CGWB 319.35 113- Discharge-
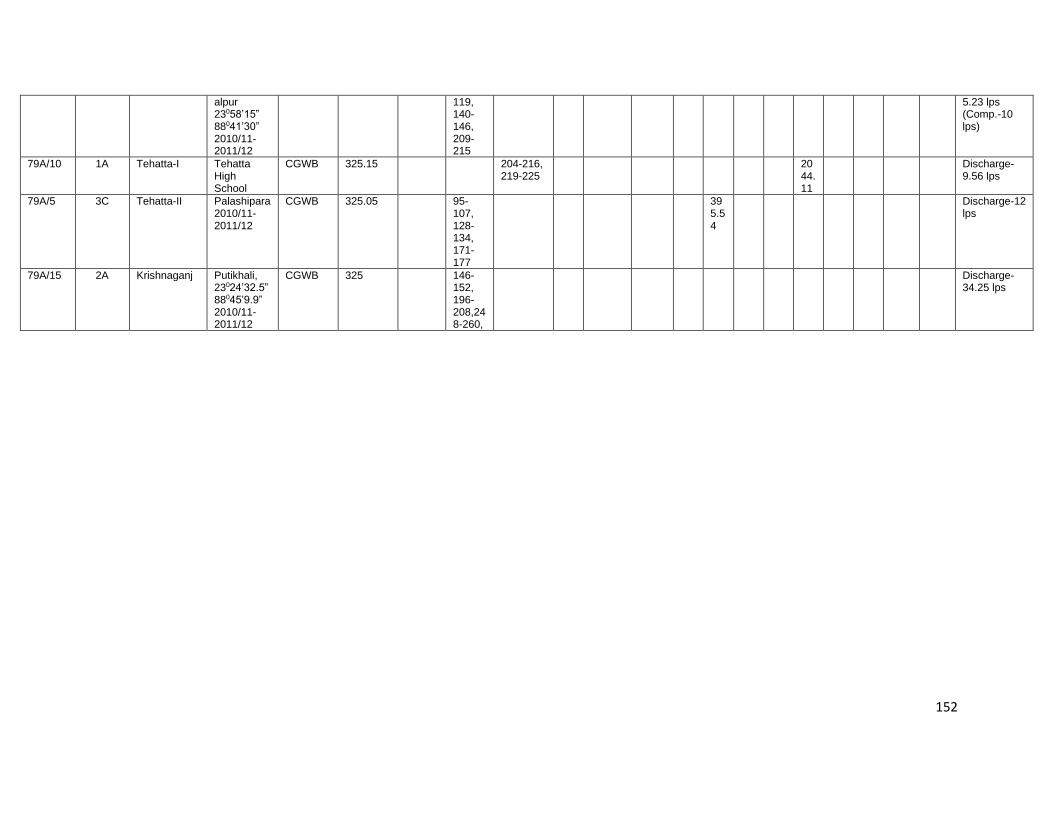
152
alpur 23058’15” 88041’30” 2010/11-2011/12
119, 140-146, 209-215
5.23 lps (Comp.-10 lps)
79A/10 1A Tehatta-I Tehatta High School
CGWB 325.15 204-216, 219-225
2044.11
Discharge-9.56 lps
79A/5 3C Tehatta-II Palashipara 2010/11-2011/12
CGWB 325.05 95-107, 128-134, 171-177
395.54
Discharge-12 lps
79A/15 2A Krishnaganj Putikhali, 23024’32.5” 88045’9.9” 2010/11-2011/12
CGWB 325 146-152, 196-208,248-260,
Discharge-34.25 lps
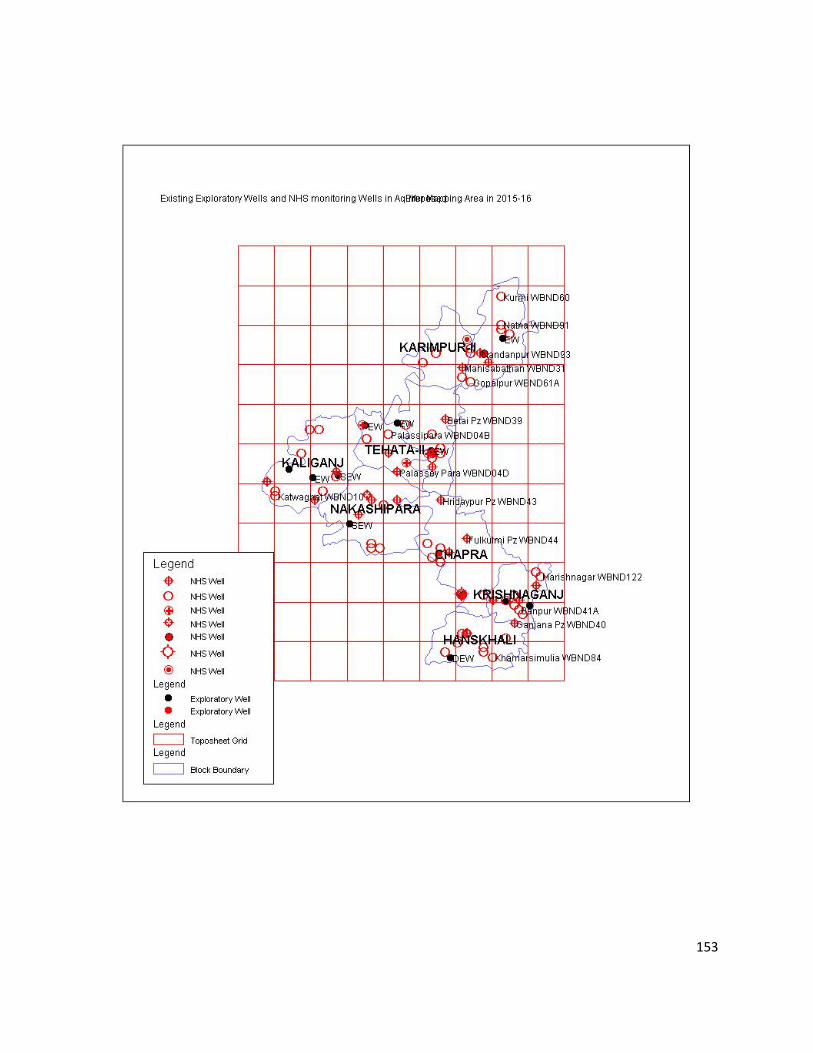
153