The ground checkout system
11
Proc. Indian Acad. Sci., Vol. C 1, No. 3, November 1978, pp. 279-289. Printed in India. The ground checkout system TARSEM SINGH, A D DHARMA, O P SAPRA, V R PRATAP, K A NARAYANAN, S SUBBIAH, J V INGLE, Miss A S BHAMAVATI and B K SHAMAPRAKASH ISRO Satellite Centre, Peenya,Bangalore 560 058 MS received 16 April 1977; revised 9 November 1977 Abstract. This paper describes the ground checkout system used for testing the Aryabhata from integration stage to launch from Cosmodrome in USSR. Intro- duction and design details are followed by brief descriptions of the system elements and test philosophy. Keywords. Ground checkoutsystem;Cablesystem. 1. Introduction To establish and evaluate the operational effectiveness and reliability of the integrated satellite system, it is necessary to confirm that every subsystem is functioning accord- ing to the technical specifications laid down. The ground checkout equipment provides a means for assessing the overall performance of the integrated satellite through checks carried out during various stages of the satellite assembly and after every mechanical operation, such as transportation to the technological position (TP), interfacing the satellite with the rocket and also during pre-launch operations at the launch pad (LP). It is imperative that the checkout system should be able to test all the subsystems extensively in as short a time as possible. The ground checkout system for Aryabhata shown in figure 1 (plate 1) essentially processes telemetry data through a radio frequency (r.f.) link, power and various necessary stimuli being provided through a cable link. The checkout system consisted of control panel, cable checkout system, tape recorder test console and spin test console which were connected to the satellite through cables and the telemetry data processor, PDP-11 computer with associated input/output devices and telecom- mand encoder with transmitter to simulate up and down r.f. link of the satellite. 2. Design philosophy The extensive functional testing of the various onboard subsystems of the satellite was done by monitoring maximum number of possible vital points and parameters. In addition to the large number of points available on the spacecraft telemetry system, additional points on the spacecraft were also monitored through the checkout system using the cable link to assist in isolating problems. The selection of signals appear- ing on the cables was done very carefully to keep the number of cables to a bare 279
-
Upload
independent -
Category
Documents
-
view
1 -
download
0
Transcript of The ground checkout system

Proc. Indian Acad. Sci., Vol. C 1, No. 3, November 1978, pp. 279-289. �9 Printed in India.
The ground checkout system
TARSEM SINGH, A D DHARMA, O P SAPRA, V R PRATAP, K A NARAYANAN, S SUBBIAH, J V INGLE, Miss A S BHAMAVATI and B K SHAMAPRAKASH ISRO Satellite Centre, Peenya, Bangalore 560 058
MS received 16 April 1977; revised 9 November 1977
Abstract. This paper describes the ground checkout system used for testing the Aryabhata from integration stage to launch from Cosmodrome in USSR. Intro- duction and design details are followed by brief descriptions of the system elements and test philosophy.
Keywords. Ground checkout system; Cable system.
1. Introduction
To establish and evaluate the operational effectiveness and reliability of the integrated satellite system, it is necessary to confirm that every subsystem is functioning accord- ing to the technical specifications laid down. The ground checkout equipment provides a means for assessing the overall performance of the integrated satellite through checks carried out during various stages of the satellite assembly and after every mechanical operation, such as transportation to the technological position (TP), interfacing the satellite with the rocket and also during pre-launch operations at the launch pad (LP). It is imperative that the checkout system should be able to test all the subsystems extensively in as short a time as possible.
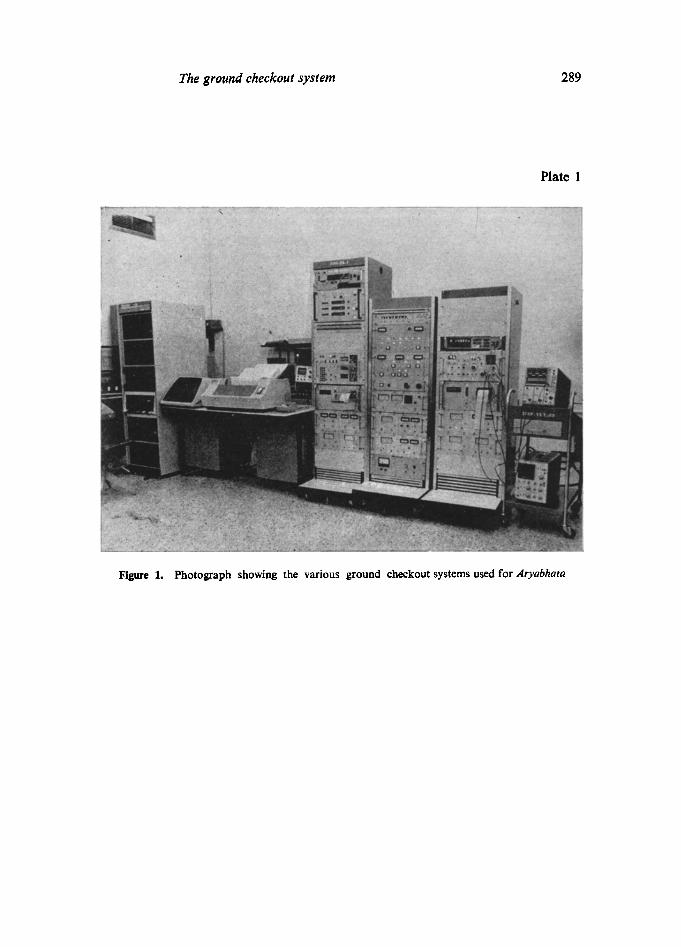
The ground checkout system for Aryabhata shown in figure 1 (plate 1) essentially processes telemetry data through a radio frequency (r.f.) link, power and various necessary stimuli being provided through a cable link. The checkout system consisted of control panel, cable checkout system, tape recorder test console and spin test console which were connected to the satellite through cables and the telemetry data processor, PDP-11 computer with associated input/output devices and telecom- mand encoder with transmitter to simulate up and down r.f. link of the satellite.
2. Design philosophy
The extensive functional testing of the various onboard subsystems of the satellite was done by monitoring maximum number of possible vital points and parameters. In addition to the large number of points available on the spacecraft telemetry system, additional points on the spacecraft were also monitored through the checkout system using the cable link to assist in isolating problems. The selection of signals appear- ing on the cables was done very carefully to keep the number of cables to a bare
279

280 Tarsem $ingh et al
minimum as they do not serve any useful purpose once the satellite is launched. Signals brought on to the connectors on the satellite surface were protected against any possible external shorts to ground. Duplication of monitoring through r.f. link and cables was also kept to a minimum. Reliability of the checkout system monitor- ing is itself ensured by having alternative methods to check and verify the functioning of the spacecraft and also by incorporating self tests of the checkout equipment.
3. System description
3.1. Cable system
3.1a. Control panel
The control panel was used for the measurement of various parameters and it controls the satellite both at TP and LP. The block schematic is shown in figure 2. At these positions it simulated chemical and solar batteries thereby providing d.c. power to the satellite subsystems during testing. Power control network provided control for feeding power to the satellite in the required sequence, initialising onboard relays to establish initial conditions of the satellite, and helping to test the onboard power control logic under various simulated conditions of solar and chemical batteries. The control panel consisted of the following modules:
(i) Control Board: This is the heart of the system and fully controls the satellite at the time of testing at TP and LP. Satellite load power is turned ' off ' at the time of launching, and is turned ' on ' by the ' rocket-signal' at the time of injection into orbit. For increased reliability a complete redundancy was provided for the rocket
sotellite Isolell i le Jmulolor
chemicol soo orroy i [J sotellile power , ~ syslem II sy~,em Ibo,,ery l i ~ r ' ;o' , foe' workJl oe, work
l leme ge cy I..L i If reloy conlocls Iu I [TIR regulofor I I ; i ,
' t. i I II t .... [power co,',lro, I I'omp driver circuits I
solor orroy' C)C TR experimenls he ,co, II.. o0u,olorII e0o,o,oJl llpowe. ,p,o eo, l
vo,oge:o,e,,,le.im!,o.on DE : direct current ~ T R " tope recorder �9 spin sofellife lood l
Lconlrol power conlrol~
Figure 2. Block-schematic of the control panel
The ground checkout system 281
signal by opening of the snap on the umbilical connector, connected between the rocket and the satellite at the time of separation. The simulation and testing of these two power' on ' methods can be done b y ' satellite power control ' network provided in the control panel. These two power ' o n ' methods also generate signals for firing the first two spin bottles, and thereby spin the satellite for stabilisation at the time of separation from the rocket. Therefore, it is essential that for testing at the launch pad, satellite load power should be made" on ' in such a way that spin firing signals are not generated. This was achieved by ' direct power on ' circuit which was also a part of the satellite power control network. ' Satellite power on' circuits operate only when a particular sequence of operations is done to avoid any accidental ' power on ' of the satellite. ' Spin control' network monitors the circuitry for spin firing arrangement and was used to put off power to these circuits at LP. Onboard regulator voltages were monitored through high impedance lamp driver circuits. The lamp display provides a quick means of ascertaining the status of onboard regu- lator conditions.
(ii) Satellite simulator: It was used for the self test of the control panel, and of the cables which connect the satellite to the control panel. This can simulate the initial conditions of the satellite, snap enable/disable operation, initial power ' on ' through all methods, d.c. regulator voltages, and emergency condition of the power logic system. The umbilicals were used to carry out these tests and in the process these cables also get tested.
(iii) Solar array and chemical battery simulator: Custom-made power supplies were used for this purpose.
(iv) Battery charger: This was used for charging the onboard chemical battery to ensure that the chemical battery is fully charged, at the time of launch.
(v) Real time clock: This is a 100 kHz crystal oscillator and displays the time in seconds, minutes, hours and days. Its function is to find the test time and to syn- chronise different testing operations.
3.lb. Cable checkout system
This system was used for cable monitoring and supplying stimuli to the satellite subsystems. It consisted of power supply unit, cable checkout unit, digital printer and a multifunction meter mounted in a standard 19 in. rack. The system should: (i) scan the various d.c. voltages from vital points available through the cables and display these measurements; (ii) be able to provide different stimuli needed for testing the sensors and scientific experiments; (iii) allow individual manual selection of a cable as desired; (iv) provide a high degree of isolation between different cables; (v) have provision for observing wave-shapes at some of the vital points on a cathode-ray oscilloscope (CRO); (iv) have sufficient flexibility for modification to meet varied requirements of the onboard systems.
Block schematic of the system used for this purpose is given in figure 3. The system consists of three main parts described below.
(i) DC measurement unit: This consists of a scanner system with a provision for both auto and manual selection modes and is capable of measuring voltages appear- ing on different cables upto a maximum of 100. A multifunction meter is used as the measuring unit and a digital printer enables printing of the data. To avoid a momen-
282 Tarsem Singh et al
r
o
I . ~ X-roy stimuli & control
- [ stimuli ]
magnetic I sensor stlmuliJ
experimenf transfer command J test signals ~ ~ ~ , ' ,
Ineutron-gomm.o I i pr~ " ' "
test commands & = ~r , ~, signals j channel seector ~ s e q u e n c e r ~
J ' , j decoder matrix]
] relay drivers l ~ - - - ~ from
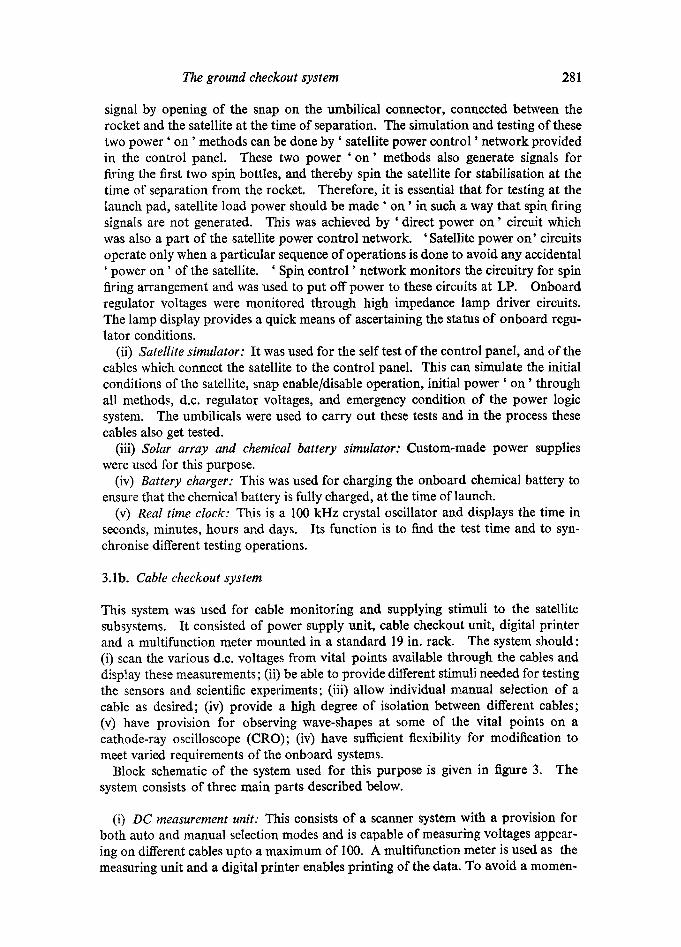
Figure 3. Block diagram of the cable checkout system
tary short between these two cables, the selected cable was initially disconnected and another cable was switched on only after some lapse of time, when transients died down.
In the manual mode, the desired channel was selected by a 'channel selector switch' and its reading was entered in the sequencer by pressing the 'manual data transfer' switch. Data can be printed by pressing ' print ' switch.
(ii) Stimulus generators: The electronics for sensors and the three onboard scientific experiments were tested in dynamic state through feeding appropriate stimuli and control signals for different states of operation. These stimuli were specifically designed for Aryabhata subsystems. Stimuli and control signals were fed in a predetermined sequence and data were analysed through the r.f. link. For each subsystem separate printed circuit cards were used so that changes and additional requirements for testing one subsystem did not necessitate changes in the other cards.
(iii) Signal observation unit: A provision was made for observing some of the signal wave forms on CRO. A simple method of terminating the cables on a 10• 10 patch board was used. Besides being simple it was reliable, and as signals are normally viewed on oscilloscope for a long period it was not necessary to have an elaborate sequencer as in the d.c. measurement unit.
Interactions in the above mentioned sub-units were kept to a minimum except where required to increase the reliability and flexibility of the system.
(iv) Tape recorder and spin test consoles: These two test consoles were also connected to the satellite through cables and were used for monitoring and display- ing the status of the onboard tape recorders and the spin-up systems.
3.2. RF checkout system
The block schematic of this system is shown in figure 4. Various objectives for this system are:
(i) to make an arrangement for identifying the frame synchronisation code;

The ground checkout system 283
..d
Q
~d
Q
284 Tarsem Singh et al
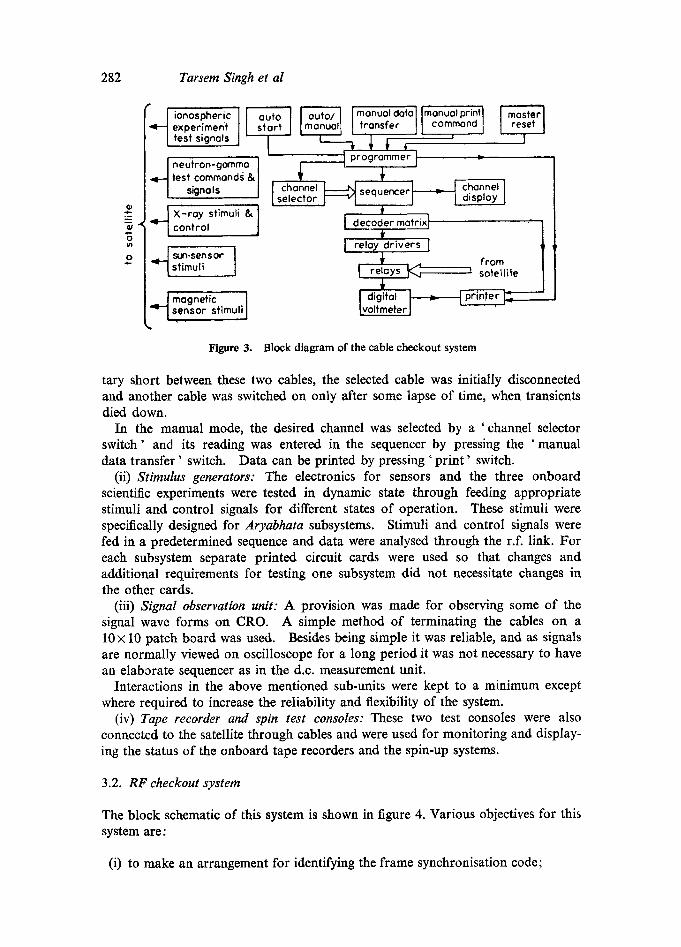
(ii) to monitor all incoming words of the telemetry format and print; (iii) to compare the input information with reference data and then process and
analyse the data according to subsystem requirements; (iv) to monitor the command status.
As shown in the block diagram, two units, namely the telemetry data processor and a computer, were used for data processing. Normally the computer system was employed and the other unit acted as a standby in case of computer failure or of computer non-availability due to other reasons. Both these systems are described in the following pages.
3.2a Telemetry data processor
(i) Receiver and discriminator: Telemetry receiver (TMR-74 Defence Electronics) receives the transmitted signal from the satellite at 137.25 MHz and produces a subcarrier frequency of 22 kHz from which pulse code modulated (PCM) signal is extracted by a discriminator.
(ii) Bit synchroniser: The next step was to generate the clock from non-return to zero PCM data using a bit synchroniser which could generate buffered clock, buffered clock complement and PCM data as the output for further processing. The bit synchroniser consists of a zero crossing detector to determine transitions, voltage controlled oscillator (VCO), phase comparator and a second order active loop filter. It can be operated at 256 Hz (real time mode) and 2560 Hz (stored mode) and has locking range of approximately 1 70.
(iii) Frame synchroniser: This device achieves its task by continuously shifting the serial data input into a 32-bit serial to parallel register and comparing its contents by a digital comparator at every clock pulse, with reference code stored in another storage register. The result of comparison was stored in a flip-flop and the output was ANDed with clock which enables the clock to pass through only after frame synchronisation is achieved. There was a provision to allow an error of upto 2 bits.
(iv) Deeommutator: This device consists of a 10-stage counter, 4-1ine to 16-line decoders, and uses synchronised clock for generating the pulses at different channel points for selecting different telemetry words. It also generates the neces- sary pulses for transferring the data to the word comparator, to the buffer register for printing and any other decoded pulse needed for the system. All the decommutated pulses were brought to the front panel on a patch board for selecting different reference words. The frame identification (ID-frame) information was transferred to a separate 8-bit register where it was decoded and proper frame number information was obtained.
(v) Word generator: This generates two reference words for each channel, one for lower limit (LL) value, and the other for higher limit (HL) value. It consists of a 128 to 8-bit encoder and all the 128 combinations of 7 information bits are brought on the front panel (separately for HL and LL). Any one of them can be selected for comparison by inserting patch cords between proper word decommutator pulse and limit value.
(vi) Word eomparator: The synchronised clock was divided by 8 and was used to convert the serial incoming data into parallel form by an 8-bit serial-to-parallel shift
The ground checkout system 285
register. Parallel words were simultaneously transferred to LL word and HL word comparator where they were compared against their LL value and HL value. The outputs were ORed together to get the final GO/NOGO signal.
(vii) Digital printer and interface: An 18-column, 20-1ines/s digital printer was selected to print the telemetry data. Word number, frame number, word contents in decimal and GO/NOGO signal were printed. Each row contained two such items of information. Word number and its contents were converted to binary coded decimal (BCD) form by a binary to BCD converter and stored in a buffer register, the contents of which were printed by a command signal generated by the decommutator.
(viii) Display: There was a provision for displaying the command status on the front panel for confirming the execution of every command while testing. Refereneo frame synchronisation code, incoming binary word value, reference word value (both lower limit and higher limit), GO/NOGO indication, channel number, frame number and bit synchroniser functional status were also displayed.
(ix) Self-test: This consists of frame syncbxoniser simulator, clock, word generator and parallel-to-serial converter. The clock gives square wave pulses with a repetition rate of 256 Hz or 2560 Hz selectable by a front panel switch. Frame synchroniser simulator generates a 32-bit code needed for frame synchronisation. This code is followed by the words programmed in the word generator and converted to serial form by parallel-to-serial converter. This signal acts as input PCM data in self test mode.
Bit synehroniser, frame synehroniser, word eomparator, decommutator, word generator, printer interface and displays can be tested by this arrangement.
3.21). Computer system
This system incorporates a real time digital computer (PDP-II/40 or TDC-12) in place of telemetry data processor for processing, analysing and printing the results. Reception of data, bit synchronisation and frame synchronisation remains the same as described in w 3-2a. Data and clock after frame synchronisation, were converted to proper logic levels compatible with the computer. A 16-bit code was generated for synchronisation of the telemetry interface. The serial data were converted into g-bit parallel form by the Telemetry Interface Unit.
These g-bit words were transferred to memory in the program interrupt mode after checking the parity. After receiving 4 master frames and storing them in memory, the data were deeommutated, processed, analysed as per the subsystem requirements and results were printed on a line printer. The results can also be displayed on a CRT display in the PDP-11/40 system. For the input/output of the computer a high speed paper tape reader and punch was used.
The software required for this purpose was developed in assembly language for the following reasons: (i) programme storage requires minimum memory; (ii) type of processing consists mainly of logical operations; (iii) on-line debugging is easier in paper tape system with assembly language.
The software developed for testing Aryab~ta can be divided into the following parts.
O) Reception of telemetry data: Three different programs were used for this purpose. The first one achieves bit and frame syuchronisation outside the
Pror C---4
286 Tarsem Singh et al
computer, and then clock and data were given to the computer interface for the rest of the processing. The second method involves doing bit synehronisation extern- ally and frame synchronisation internally. In the last method both bit and frame synchronisation were done internally by software.
(ii) Data processing for housekeeping and sensors data: Housekeeping and sensors data words were decommutated, compared against given limits, if any, or processed as required and printed in a convenient format.
Time reference unit onboard the satellite gives satellite time in binary code which was converted into days, hours, minutes and seconds and printed.
Sensors data were converted to decimal values and all data in one master frame were printed separately for X, Y, and Z magnetic sensors, elevation sun-sensor and azimuth sun-sensor.
Power, tape recorder, temperature sensors and receiver health monitoring data were compared against their limits and printed separately for each subsystem with result- ing GO/NOGO.
Telecommand status was displayed on CRT display unit and printed simultaneously in an easily understandable format.
(iii) Experimental data processing: The three onboard scientific experiments were tested for their electrical performance, background data and source induced data. For improved statistics, data from the experiments were accumulated for 4 to 5 rain according to the requirements, processed and then printed.
In the case of the x-ray experiment one cycle of x-ray data takes 24 s. Every cycle has a 24-bit code, and then there are 4 channels of unshielded detectors with 64 sectors of 3 bits each, 4 channels of shielded detector of 8 bits each and a charged particle detector of 16 bits. For data processing, the code was identified prior to printing the data from each channel.
Neutron gamma ray data were printed in an energy-cross-over-time (E-T) matrix of 64 • 64. Any entry in the matrix indicated the number of times a particular event (E,T) had occurred in the data collection interval of approximately 256 s.
The ionospheric experiment recognises three events which are time-multiplexed in a 192 s frame. The four most significant bits of each word give the awplitude infor- mation, and the three least significant bits give gain information. An internal two-word code was first identified and then amplitude and gain values for each word were plotted on the printer.
Teleeommand encoder and transmitter are capable of generating and sending all the 35 commands required for the satellite. These were used to test the command link and to put the satellite in various operational modes in orbit, for testing.
4. Test philosophy
To qualify the spacecraft for launch worthiness and to enhance the acceptance level of its performance, it has to be tested again and again, after every mechanical operation or transportation or after each stage of integration. The entire testing sequence was well documented and followed rigidly prior to launch. Essentially the test was carried out in two phases: (a) in the disassembled mode and Co) in the assembled mode.
The ground checkout system 287
4.1. Uplink test procedure
Uplink test procedure is taken as an example to illustrate the extent of tests conducted on subsystems at integrated level. Satellite uplink consists of receiver, decoder and command control unit and was capable of executing 35 commands. Telecommand transmitter was connected through variable attenuators of 100 dB (10 db steps), and 10 db (1 db steps) to a small transmitting whip antenna kept at a distance of 8 m from the satellite. The attenuation was adjusted to produce a high signal level, say --50 dBm, at the receiver input and was verified by decoding AGC level from telemetry data. For testipg the command operation, initial command status was processed through received telemetry data and stored in the memory. Then test command was sent through ground telecommand transmitter and the resulting telecommand status was again stored and compared with the initial telecommand status. The comparison result confirms the execution of test command and non-operation of all other commands. The process was repeated for all 35 commands. The whole operation was repeated in 10 db steps upto a signal level of --90 dBm and then in one db steps upto --96 dbm, the specified threshold of the receiver. This test procedure ensures uplink performance and proper operation of all commands.
4.2. Disassembled satellite test
This test was carried out just after the electrical integration was completed, but before the top shell, deck plate and bottom shell were put together. The electrical inter- connections among these three structural parts were made with patch cords. The testing and processing required in this position was maximum. One complete test took three to four days. 200 cables were used to provide various stimuli and to measure corresponding outputs in this position.
I' ,p,..up i I p~
Jtape recorder y S telemetry
data processor
digifol' '"
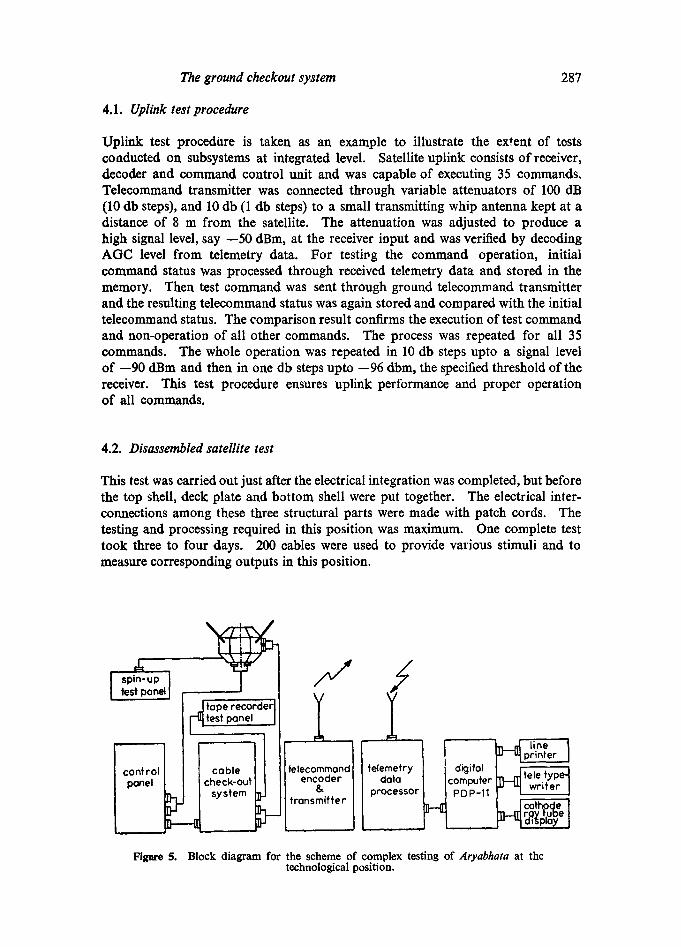
Figure 5. Block diagram for the scheme of complex testing of Aryabhata at the technological position.
288 Tarsem Singh et al
4.3. Assembled satellite test
The assembled satellite test set-up is shown in Figure 5. This test followed the same sequenee as above but with the satellite in the fully assembled condition. At the launch pad the satellite was mated with the rocket and the amount of testing was reduced to a minimum because of the presence of other radio signals from rocket telemetry and other ground systems. Cables carrying stimuli or other high frequency signals were avoided in this case as the length of the cables was approximately 250 m. The number of cables was reduced to 100. The amount of telemetry data processing was also reduced to a great extent in this position.
Just prior to launch all the onboard relays were put in the initial conditions as specified in the subsystem designs. The resistance of the cables through which power was fed must not be more than one or two ohms. Finally, the onboard chemical battery voltage was checked and connected in the circuit.
5. Conclusion
The checkout equipment performed well during all phases of the testing of the satellite, both during integration and during the pre-launch checkout phase at the Soviet Cosmodrome.
The ground checkout system 289
Plate 1
Figure 1. Photograph showing the various ground checkout systems used for Aryabhata