Development of a Soft Ground Arrestor System - ROSA P
115
vi The contents of this report reflect the views of the author, who is responsible for the facts and accuracy of the information presented herein. This document is disseminated under the sponsorship of the Department of Transportation, University Transportation Centers Program, in the interest of information exchange. The U.S. Government assumes no liability for the contents or use thereof. Development of a Soft Ground Arrestor System MBTC-2089 By Sreeram C. Marisetty Eric D. Bailey W. Micah Hale Ernest P. Heymsfield
-
Upload
khangminh22 -
Category
Documents
-
view
3 -
download
0
Transcript of Development of a Soft Ground Arrestor System - ROSA P

vi
The contents of this report reflect the views of the author, who is responsible for the facts and accuracy of the information presented herein. This document is disseminated under the sponsorship of the Department of Transportation, University Transportation Centers Program, in the interest of information exchange. The U.S. Government assumes no liability for the contents or use thereof.
Development of a Soft Ground Arrestor System
MBTC-2089
By
Sreeram C. Marisetty
Eric D. Bailey W. Micah Hale
Ernest P. Heymsfield

vii
TABLE OF CONTENTS LIST OF TABLES........................................................................................................... viii
REPORT DOCUMENTATION PAGE Form Approved OMB No. 0704-0188
Public reporting burden for this collection of information is estimated to average 1 hour per response, including the time for reviewing instructions, searching existing data sources, gathering and maintaining the data needed, and completing and reviewing the collection of information. Send comments regarding this burden estimate or any other aspect of this collection of information, including suggestions for reducing this burden, to Washington Headquarters Services, Directorate for information Operations and Reports, 1215 Jefferson Davis Highway, Suite 1204, Arlington, VA 22202-4302, and to the Office of Management and Budget, Paperwork Reduction Project (0704-0188), Washington, DC 20503.
2. REPORT DATE August 15, 2008
3. REPORT TYPE AND DATES COVERED Final Report – July 2005 – July 2008
4. TITLE AND SUBTITLE Development of a Soft Ground Arrestor System
6. AUTHOR(S)
Sreeram C. Marisetty, Eric D. Bailey, W. Micah Hale, and Ernest P. Heymsfield
5. FUNDING NUMBERS (leave blank)
7. PERFORMING ORGANIZATION NAME(S) AND ADDRESS(ES) Mack-Blackwell Transportation Center 4190 Bell Engineering Center University of Arkansas Fayetteville, AR 72701
8. PERFORMING ORGANIZATION REPORT NUMBER
MBTC 2089
9. SPONSORING/MONITORING AGENCY NAME(S) AND ADDRESS(ES) US Department of Transportation Research and Special Programs Administration 400 7th Street, S.W. Washington, DC 20590-0001
10. SPONSORING/ MONITORING AGENCY REPORT NUMBER
(office use – leave blank)
11. SUPPLEMENTARY NOTES Supported by a grant from the U.S. Department of Transportation University Transportation Centers program 12a. DISTRIBUTION/AVAILABILITY STATEMENT (to be completed by reporting agency – leave blank)
12b. DISTRIBUTION CODE N/A
13. ABSTRACT (MAXIMUM 200 WORDS) Increase in the demand for air travel safety has promoted the development of Ground Arrestor Systems (GAS). Currently, GAS has been deployed in many of the airports throughout America and is called as Engineered Material Arrestor System (EMAS). The present EMAS is designed to decelerate the speed of the aircraft in order to bring it to complete rest without any causalities and not causing much damage to the aircraft. But the present GAS that’s in use is considered expensive as well as labor intensive. Efforts are being made to develop a mixture that can be used as a replacement for the present material that is being used in GAS construction. The research program described in this thesis examined the behavior of ultra-lightweight concrete with variation of chemical admixtures. Different concrete mixtures were batched and tested for fresh and hardened properties to develop the ultra-lightweight concrete that can meet the requirements provided by FAA in advisory circular AC 150/5220-22A.
14. SUBJECT TERMS Soft ground arrestor systems, lightweight concrete, airport runways
15. NUMBER OF PAGES 106 16. PRICE CODE N/A
17. SECURITY CLASSIFICATION OF REPORT none
18. SECURITY CLASSIFICATION OF THIS PAGE none
19. SECURITY CLASSIFICATION OF ABSTRACT
none
20. LIMITATION OF ABSTRACT
N/A
1. AGENCY USE ONLY (Leave Blank)

viii
1. Report Number
3. Recipient’s Catalog No. (leave blank)
2. Government Access No. (leave blank)
5. Report Date August 15, 2008
6. Performance Organization Code
10. Work Unit No. (TRAIS) (leave blank)
8. Performing Organization Report No.
11. Contract or Grant No. (leave blank) 13. Type of Report and Period Covered
14. Sponsoring Agency Code (leave blank)
4. Title and Subtitle Development of a Soft Ground Arrestor System
7. Author(s) Sreeram C. Marisetty, Eric D. Bailey, W. Micah Hale, and Ernest P. Heymsfield 9. Performing Organization Name and Address
Mack-Blackwell Transportation Center 4190 Bell Engineering Center University of Arkansas Fayetteville, AR 72701 12. Sponsoring Agency Name and Address US Department of Transportation Research and Special Programs Administration 400 7th Street, S.W. Washington, DC 20590-0001 15. Supplementary Notes Supported by a grant from the U.S. Department of Transportation University Transportation Centers program 16. Abstract Increase in the demand for air travel safety has promoted the development of Ground Arrestor Systems (GAS). Currently, GAS has been deployed in many of the airports throughout America and is called as Engineered Material Arrestor System (EMAS). The present EMAS is designed to decelerate the speed of the aircraft in order to bring it to complete rest without any causalities and not causing much damage to the aircraft. But the present GAS that’s in use is considered expensive as well as labor intensive. Efforts are being made to develop a mixture that can be used as a replacement for the present material that is being used in GAS construction. The research program described in this thesis examined the behavior of ultra-lightweight concrete with variation of chemical admixtures. Different concrete mixtures were batched and tested for fresh and hardened properties to develop the ultra-lightweight concrete that can meet the requirements provided by FAA in advisory circular AC 150/5220-22A
17. Key Words Soft ground arrestor systems, lightweight concrete, airport runways
18. Distribution Statement
No restrictions. This document is available from the National Technical Information Service, Springfield, VA 22161
19. Security Classif. (of this report) unclassified
20. Security Cassif. (of this page) unclassified
22. Price N/A
21. No. of Pages 106
Technical Report Documentation

ix
TABLE OF CONTENTS LIST OF TABLES............................................................................................................. xi
LIST OF FIGURES ......................................................................................................... xiii
CHAPTER
I. INTRODUCTION ...................................................................................................1 1.1 Introduction.....................................................................................................1 1.2 Background.....................................................................................................1 1.3 Research Objectives........................................................................................4 1.4 Testing Programs ............................................................................................4
II. LITERATURE REVIEW ........................................................................................5 2.1 Introduction to Ground Arrestor Systems.......................................................5 2.2 Classifications of Concrete .............................................................................7
2.2.1 Conventional Concrete ……………………………………………7 2.2.2 Air-Entrained Concrete...................................................................9 2.2.3 Introduction to Lightweight Concrete............................................10 2.2.4 Lightweight Aggregate ..................................................................11
2.2.4.1 Perlite .................................................................................13 2.2.4.2 Exfoliated Vermiculite.......................................................13
2.2.5 Chemical Admixtures ....................................................................14 2.2.5.1 Air-Entraining Agents .......................................................14 2.2.5.2 High Range Water Reducers (Superplasticizers) ..............15 2.2.5.3 Air-Stabilizing Agents .......................................................15
2.3 Classifications of Lightweight concrete .......................................................15 2.3.1 Lightweight Aggregate Concrete...................................................16 2.3.2 No-Fines Concrete .........................................................................19 2.3.3 Cellular Concrete ...........................................................................20 2.3.4 Mechanical Properties of Lightweight Aggregate Cellular Concrete .........................................................................................23
2.4 Summary.......................................................................................................27
III. RESEARCH PROGRAM AND EXPERIMENTAL PROCEDURE....................29 3.1 Introduction...................................................................................................29 3.2 Materials .......................................................................................................30
3.2.1 Binders ...........................................................................................30 3.2.2 Lightweight Aggregate ..................................................................30 3.2.3 Chemical Admixture......................................................................31
3.2.3.1 Stepanol Medry..................................................................31 3.2.3.2 Rheocell 30 ........................................................................32 3.2.3.3 Melflux 2651F ...................................................................32 3.2.3.4 Methocel K 100 LV Hydroxypropyl Methylcellulose

x
(Methocel)..........................................................................32 3.2.3.5 Aluminum Sulfate..............................................................33
3.3 Experimental Procedures .............................................................................33 3.3.1 Mixtures and Batching...................................................................33
3.3.1.1 Aggregate Blending ...........................................................33 3.3.1.2 Concrete Mixing Techniques.............................................36
3.3.2 Curing ............................................................................................38 3.3.3 Concrete Properties........................................................................39
3.3.3.1 Fresh Concrete Tests..........................................................39 3.3.3.2 Hardened Concrete Tests ...................................................41
3.3.3.2.1 Test Specimen..................................................41 IV. TEST DATA AND DISCUSSIONS .....................................................................44
4.1 Introduction...................................................................................................44 4.2 Reference Mixtures.......................................................................................45 4.3 Mixture Proportions with a Combination of CAC and PC-I ........................48 4.4 Increased Batch Quantities ...........................................................................54 4.5 Variation in Medry and Melflux ...................................................................57 4.6 Consistency Check Using M16 as Reference Mixture .................................64 4.7 Effect of Batch Size on Mixture Performance..............................................67 4.8 Unit Weight Optimization.............................................................................69 4.9 Introduction of Rheocell ...............................................................................81 4.10 Effect of Batch Size on Mixture Performance using Rheocell .....................84 4.11 Bubble Stabilization Using Aluminum Sulfate.............................................91 4.12 Check for Repeatability of Drum Mixtures M 30 through M 33..................93
V. CONCLUSIONS AND RECOMMENDATIONS ……………………………97 5.1 Introduction...................................................................................................97 5.2 Conclusions...................................................................................................97
5.2.1 Mixing Procedures .........................................................................97 5.2.2 Chemical Admixtures ....................................................................98 5.2.3 Material ..........................................................................................99
5.3 Research Team Difficulties ........................................................................100 5.4 Batching Recommendations ......................................................................100 5.5 Research Recommendations .......................................................................101
REFERENCE...................................................................................................................102
xi
LIST OF TABLES AND FIGURES
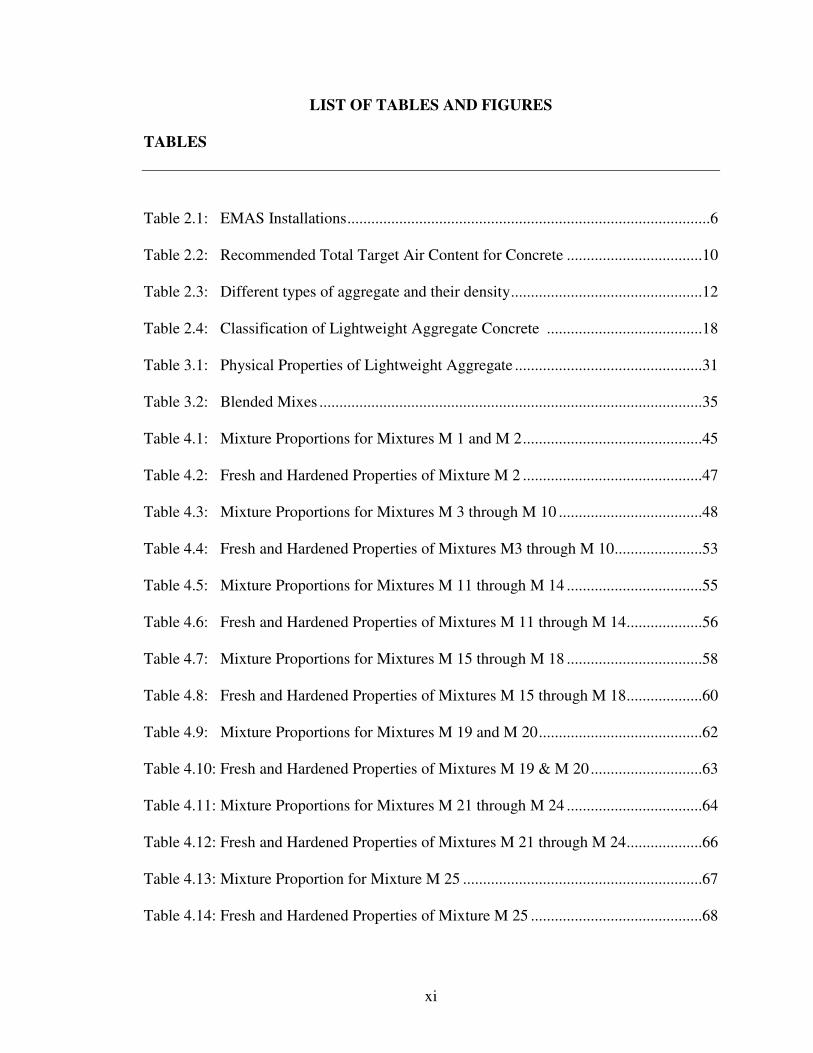
TABLES
Table 2.1: EMAS Installations...........................................................................................6
Table 2.2: Recommended Total Target Air Content for Concrete ..................................10
Table 2.3: Different types of aggregate and their density................................................12
Table 2.4: Classification of Lightweight Aggregate Concrete .......................................18
Table 3.1: Physical Properties of Lightweight Aggregate ...............................................31
Table 3.2: Blended Mixes ................................................................................................35
Table 4.1: Mixture Proportions for Mixtures M 1 and M 2.............................................45
Table 4.2: Fresh and Hardened Properties of Mixture M 2 .............................................47
Table 4.3: Mixture Proportions for Mixtures M 3 through M 10 ....................................48
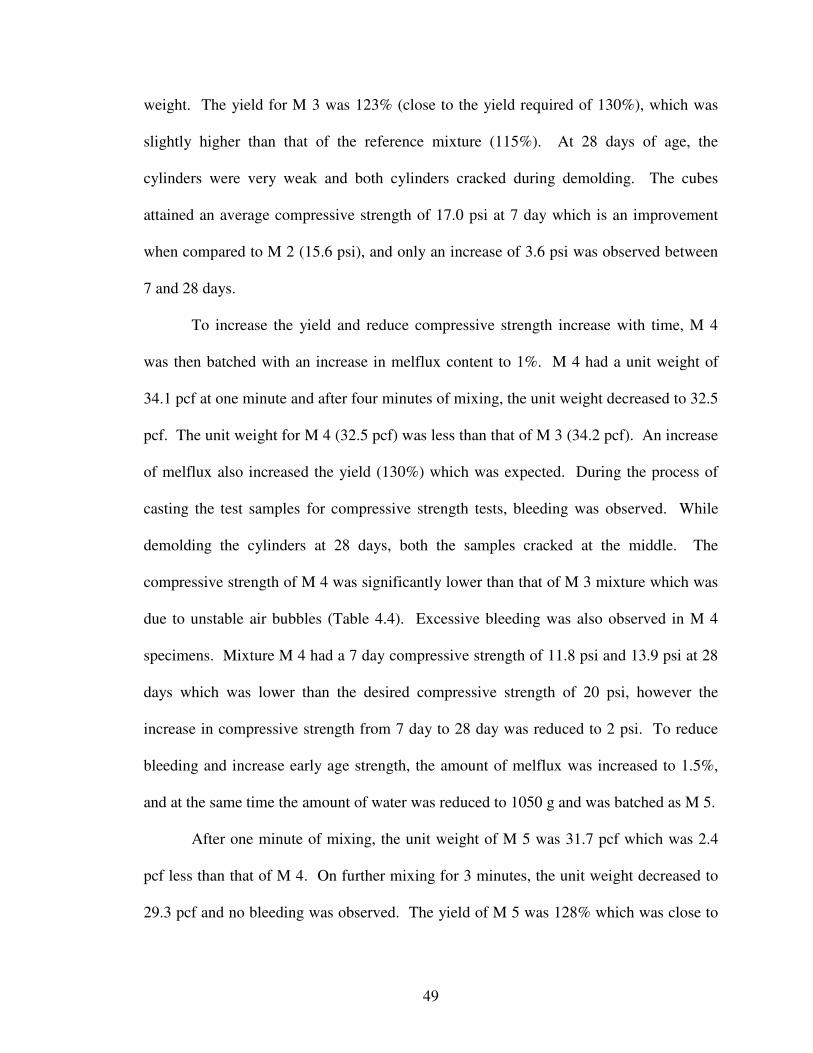
Table 4.4: Fresh and Hardened Properties of Mixtures M3 through M 10......................53
Table 4.5: Mixture Proportions for Mixtures M 11 through M 14 ..................................55
Table 4.6: Fresh and Hardened Properties of Mixtures M 11 through M 14...................56
Table 4.7: Mixture Proportions for Mixtures M 15 through M 18 ..................................58
Table 4.8: Fresh and Hardened Properties of Mixtures M 15 through M 18...................60
Table 4.9: Mixture Proportions for Mixtures M 19 and M 20.........................................62
Table 4.10: Fresh and Hardened Properties of Mixtures M 19 & M 20............................63
Table 4.11: Mixture Proportions for Mixtures M 21 through M 24 ..................................64
Table 4.12: Fresh and Hardened Properties of Mixtures M 21 through M 24...................66
Table 4.13: Mixture Proportion for Mixture M 25 ............................................................67
Table 4.14: Fresh and Hardened Properties of Mixture M 25 ...........................................68

xii
Table 4.15: Mixture Proportions for Mixtures UW 1 through UW 7................................70
Table 4.16: Mixture Proportions for Mixtures UW 8 through UW 14..............................70
Table 4.17: Mixture Proportions for Mixtures UW 15 through UW 18............................71
Table 4.18: Mixture Proportions for Mixtures UW 19 through UW 22............................71
Table 4.19: Fresh Properties of Mixtures UW 1 through UW 9........................................78
Table 4.20: Fresh Properties of Mixtures UW 10 through UW 16....................................79
Table 4.21: Fresh Properties of Mixtures UW 17 through UW 22....................................80
Table 4.22: Mixture Proportions for Mixtures M 26 through M 28 ..................................81
Table 4.23: Fresh and Hardened Properties of Mixtures M 26, M 27, & M 28 ................83
Table 4.24: Mixture Proportions for Mixtures M 29 through M 31 ..................................84
Table 4.25: Fresh and Hardened Properties of Mixtures M 29 through M 31...................86
Table 4.26: Mixture Proportions for Mixtures M 32 through M 33 ..................................88
Table 4.27: Fresh and Hardened Properties of Mixtures M 32 & M 33............................89
Table 4.28: Mixture Proportions for Mixtures M 34 through M 38 ..................................91
Table 4.29: Fresh Properties of Mixtures M 34 through M 38..........................................93
Table 4.30: Mixture Proportions for Mixtures M 39 through M 41 ..................................94
Table 4.31: Fresh and Hardened Properties of Mixtures M 39 through M 41...................96
xiii
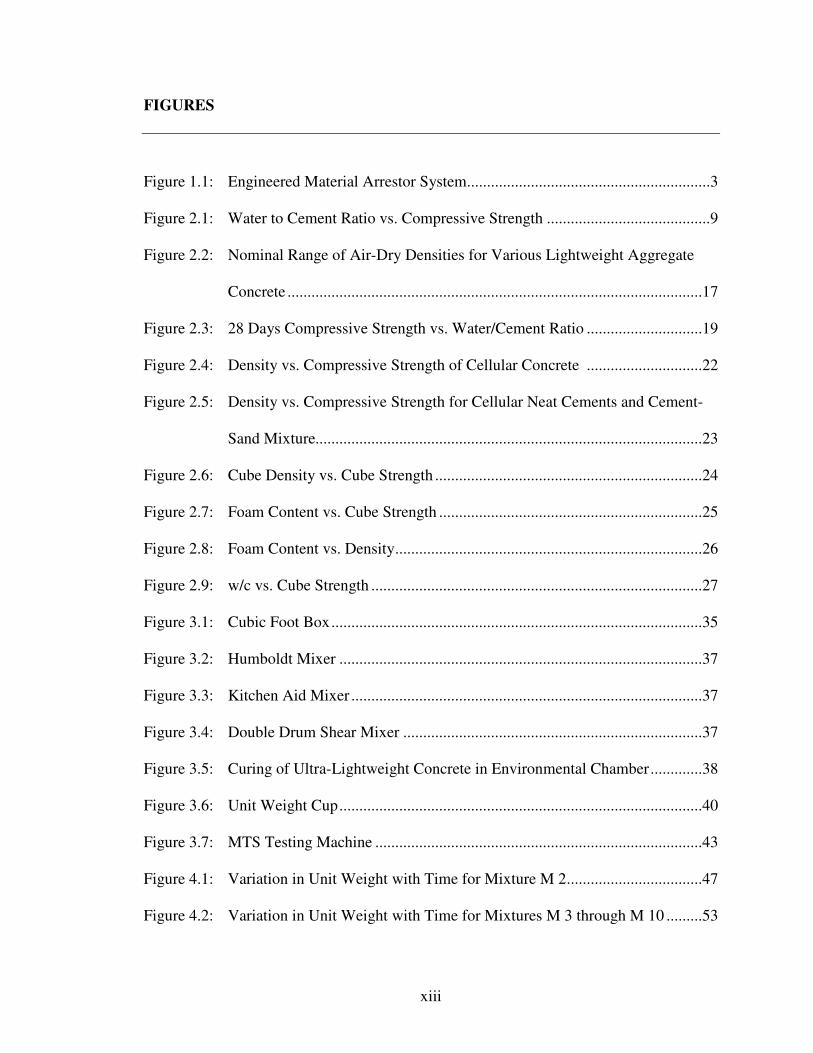
FIGURES
Figure 1.1: Engineered Material Arrestor System.............................................................3
Figure 2.1: Water to Cement Ratio vs. Compressive Strength .........................................9
Figure 2.2: Nominal Range of Air-Dry Densities for Various Lightweight Aggregate
Concrete ........................................................................................................17
Figure 2.3: 28 Days Compressive Strength vs. Water/Cement Ratio .............................19
Figure 2.4: Density vs. Compressive Strength of Cellular Concrete .............................22
Figure 2.5: Density vs. Compressive Strength for Cellular Neat Cements and Cement-
Sand Mixture.................................................................................................23
Figure 2.6: Cube Density vs. Cube Strength ...................................................................24
Figure 2.7: Foam Content vs. Cube Strength ..................................................................25
Figure 2.8: Foam Content vs. Density.............................................................................26
Figure 2.9: w/c vs. Cube Strength ...................................................................................27
Figure 3.1: Cubic Foot Box.............................................................................................35
Figure 3.2: Humboldt Mixer ...........................................................................................37
Figure 3.3: Kitchen Aid Mixer ........................................................................................37
Figure 3.4: Double Drum Shear Mixer ...........................................................................37
Figure 3.5: Curing of Ultra-Lightweight Concrete in Environmental Chamber.............38
Figure 3.6: Unit Weight Cup...........................................................................................40
Figure 3.7: MTS Testing Machine ..................................................................................43
Figure 4.1: Variation in Unit Weight with Time for Mixture M 2..................................47
Figure 4.2: Variation in Unit Weight with Time for Mixtures M 3 through M 10 .........53
xiv
Figure 4.3: Variation in Unit Weight with Time for Mixtures M 11 through M 14 .......57
Figure 4.4: Variation in Unit Weight with Time for Mixtures M 15 through M 18 .......61
Figure 4.5: Variation in Unit Weight with Time for Mixture M 19 through M 20.........63
Figure 4.6: Variation in Unit Weight with Time for Mixtures M 21 through M 24 .......66
Figure 4.7: Variation in Unit Weight with Time for Mixture M 25................................69
Figure 4.8: Variation in Unit Weight with Time for Mixtures UW1 through UW 9......79
Figure 4.9: Variation in Unit Weight with Time for Mixtures UW10 through UW 22..80
Figure 4.10: Variation in Unit Weight with Time for Mixtures M 26 through M 28 .......83
Figure 4.11: Variation in Unit Weight with Time for Mixtures M 29 through M 31 .......87
Figure 4.12 Failure of Air Bubble ......………………………………………………….90
Figure 4.13 Variation in Unit Weight with Time for Mixtures M 32 & M 33 ................90
Figure 4.14 Variation in Unit Weight with Time for Mixtures M 34 through M 38 .......93
Figure 4.15 Variation in Unit Weight with Time for Mixtures M 39 through M 41 .......96

1
CHAPTER 1
INTRODUCTION 1.1 Introduction
Air travel is considered one of the fastest and safest ways of transportation
available. However, due to lack of safety area available at the end of runways,
approximately 10 overruns (passing beyond the end of the runway) occur every year
(Edwards 2007). An overrun generally occurs during landing and some times during take
off, however most overruns occur during landing in bad weather. Because of this, the
Federal Aviation Administration (FAA) recommends a safety area extending 1000 feet
beyond each end of the runway (FAA 2002). Practically, it is difficult to provide this
runway extension at many airports. In such cases, installing a Soft Ground Arrestor
System (SGAS) can be a solution. The present SGAS available is known as an
Engineered Material Arresting System (EMAS).
1.2 Background
The primary role of EMAS is to stop an overrun aircraft without causing any
injuries to the passengers and causing little or no damage to the aircraft. When an aircraft
enters the arrestor bed or EMAS, it crushes the material as it tries to pass through it. This
develops a drag force between the tires of the aircraft and the bed material leading to the
deceleration of the aircraft.
The typical cross-section suggested by FAA for an EMAS is 1000 feet long and
having the same width of the runway (FAA 2002). This is not possible in many of the
airports, in such cases the length of the bed is generally determined based on the length of

2
the safety area. The depth is generally varied based on the type of aircraft to be arrested
at that particular airport. Figure 1.1 shows the general plan view, section view and
elevation of an EMAS.
The arrestor bed can be composed of crushable pre-cast cellular concrete blocks.
Blocks are generally four foot in length with varying heights and are shipped to the site
for their placement (Zodiac 2007). The front end of the arrestor system is ramped and
then the depth of the bed is increased toward the far end as shown in Figure 1.1. This
increase in depth is generally provided for maximum deceleration. Side steps are
constructed at the sides of the arrestor system which facilitates the access of rescue and
firefighting vehicles.

3
Figure 1.1 Engineered Material Arrestor System

4
1.3 Research Objectives
The objective of this research program is to develop an ultra-lightweight concrete
mixture that is reliable and economical and that can be used as a SGAS. The project
involves a detailed study of various types of concrete admixtures and their use in ultra-
lightweight concrete. Since the behavior of ultra-lightweight concrete is dependent on its
density, a relationship between density and concrete properties will also be examined.
1.4 Testing Programs
Density, compressive strength, and durability are the concrete properties which
are the main concern of this project. These properties can be affected by the mixture
proportions, aggregate type, entrained air content, admixtures type and dosage, mixing
time, mixing speed, and water to cement ratio (w/c). In the case of arrestor beds, density,
yield, and compressive strength play a major role. So, proper research will be conducted
on these properties.

5
CHAPTER 2
LITERATURE REVIEW
2.1 Introduction to Ground Arrestor Systems
Since 1982 there have been 23 fatalities, over 300 injuries, and uncounted
millions of dollars in aircraft damage at United States airports (United States of America
2005). The National Transportation Safety Board (NTSB) and the International Civil
Aviation Organization (ICAO) performed a detailed study on the overruns and it was
concluded that overruns can be prevented by providing a 1000 feet long safety area at the
end of the runways. After this study, Federal Aviation Administration (FAA) then
recommended a 1000 feet long safety area at the end of all runways (FAA 2002).
For many airports, it was impractical to build the 1000 feet long safety area due to
man made and natural boundaries such as highways, water ways, natural terrain,
residential areas, commercial or industrial uses or sensitive environmental areas. FAA
was then asked by NTSB to develop a solution for cases where this safety area cannot be
provided.
FAA then partnered with the Port Authority of New York and New Jersey,
Academic Community, and ESCO (Engineered Arresting Systems Corporation) to
conduct research on arrestor systems (Zodiac 2007). EMAS was then introduced as a
solution. The first EMAS was installed in 1996 at John F. Kennedy International Airport
(JFK) on runway 04R and was tested in 1999 when a SAAB 320 overran the runway at a
speed of more than 70 knots. The aircraft came to a stop with no injuries to the
passengers and no damage to the aircraft. Again in 2003, a cargo jet carrying 3 members

6
overran into the same arrestor bed and again there were no injuries to the passengers and
no damage to the aircraft (PANYNJ 2004). Currently there are approximately 20 EMAS
beds installed in the United States (Edwards 2006). Table 2.1 lists the EMAS
installations in the United States.
Table 2.1 EMAS Installations
#EMAS Airport Location Runways Installation date
1 JFK International Jamaica, NY 4R 1996
1 Minneapolis/St. Paul Minneapolis, MN 12R 1999
2 Little Rock Little Rock, AR 4R/22R 2000/2003
1 Rochester International Rochester, NY 28 2001
1 Burbank Burbank, CA 8 2002
1 Baton Rouge Metro Baton Rouge, LA 31 2002
2 Greater Binghamton Binghamton, NY 16/34 2002
1 Greenville Downtown Greenville, SC 19 2003
1 Barnstable Municipal Hyannis, MA 6 2003
1 Roanoke Regional Roanoke, VA 15 2004
2 Fort Lauderdale International
Fort Lauderdale, FL 27R/9L 2004
1 Dutchess County Poughkeepsie, NY 6 2004
2 LaGuardia Flushing, NY 22/13 2005
1 Boston Logan Boston, MA 4L 2005
1 Laredo International Laredo, TX 17R 2006
1 Jiuzhai-Huanglong (JZH) Sichuan, PRC 20 2006

7
Of the 13 overruns that occurred between Oct. 7, 2004 and March 8, 2006, only
one occurred on a runway where an EMAS was installed. For this overrun, there were no
casualties and also no damage to the aircraft (Edwards 2006). For the other 12 overruns
where there was no EMAS, there were 34 deaths, 185 injuries and 10 damaged aircrafts
(Edwards 2006). This clearly indicates the importance of the EMAS.
2.2 Classifications of Concrete
Concrete can be the material of choice for many EMAS. A concrete mixture can
be proportioned to have the density, strength, and durability necessary for an EMAS.
The following sections provide a brief overview of various types of concrete and discuss
the differences in the concretes.
2.2.1Conventional Concrete
ASTM C 125 - 95a (1996) defines concrete as a composite material that consists
essentially of a binding medium within which are embedded particles or fragments of
aggregate; in hydraulic cement concrete, the binder is formed from a mixture of hydraulic
cement and water. Concrete is basically a mixture of two components: aggregates and
paste. The quality of concrete depends on the quality of the paste and aggregate, and the
bond between the two (Kosmatka et al. 2002).
The paste is comprised of binder, water and air (entrapped and/or entrained). The
paste portion makes up about 25-40% of total volume of concrete. Different types of
binders are used for specific purposes. The most commonly used binder is portland
cement.

8
Aggregates generally account for 70-80% of the concrete volume. Aggregates
can be classified into two groups. These two groups are coarse aggregate (greater than ¼
in.) and fine aggregate (aggregate size smaller than ¼ in.). Generally gravel or crushed
stone are used as coarse aggregate and natural sand, crushed natural rock smaller than 0.2
in. or a combination of both, are used as fine aggregate (La Londe and Janes 1961).
Some of the aggregate properties that are to be considered while selecting an aggregate
for a particular project are shape, size, texture, porosity, water absorption capacity,
strength, and impact resistance (Murdock et al. 1991). These properties play a
substantial role in the workability, strength, stability, and durability of the concrete.
Alternative aggregate material includes granulated plastics, granulated coal ash, blast
furnace slag, paper and wood products. The density of conventional concrete normally
ranges between 137 to 150 pcf (Kosmatka et al. 2002).
Compressive strength of conventional concrete is approximately 3000 to 6000 psi
at 28 days of age and that of high-strength concrete is more than 6000 psi (Kumar 1986).
Generally compressive strength is measured at ages of 7, 14, 28, 56, and 90 days.
Among which the 28 day strength is considered most important. It is estimated that the
compressive strength of concrete at 7 days is 75% of the 28 day strength and there is an
increase of about 10 to 15% in compressive strength from 28 days to 56 days and another
10 to 15% increase by 90 days (Kosmatka et al. 2002).
The compressive strength of concrete is dependent upon the water to cement ratio
(w/c), constituent materials, mixing procedure, placement and compaction methods, and
type of curing. High-strength concrete may have w/c of 0.30 or less (Kumar 1986). A
lower w/c significantly helps in reducing permeability, segregation and bleeding.

9
During the period of 1985 and 1999, studies have been conducted on a variety of
mixtures with different compressive strengths and w/c. It was clearly seen that the
compressive strength increased with decreases in w/c. Figure 2.1 shows 28 day
compressive strength of different portland cement concrete mixtures developed with
varying w/c.
Figure 2.1 Water to Cement Ratio vs. Compressive Strength (Kosmatka et al. 2002)
2.2.2 Air-Entrained Concrete
Air-entrained concrete is produced using either air entraining agents (chemical
admixture is added) or by using air-entraining cement. Generally, the amount of air in
air-entrained concrete ranges between 4 to 8% of the total volume. The entrained air is in
the form of minute bubbles (McMillan and Lewis 1987). The amount of entrained air
affects the compressive strength of concrete. Generally, with an increase of entrained air
of 1% the compressive strength decreases approximately 5% (Murdock et al. 1991). But

10
in spite of this, there are many benefits of using air-entraining concrete, such as;
increased workability, resistance to alkali-silica reactivity, sulfate resistance, scaling
resistance, and freeze-thaw resistance. Air-entrainment also improves the water
tightness. Shown in Table 2.2 is the recommended air content for concrete based on
exposure conditions (Kosmatka et al. 2002).
Table 2.2 Recommended Total Target Air Content for Concrete (Kosmatka et al. 2002)
Air content,% Nominal maximum size aggregate,
mm (in.) Severe exposure
Moderate exposure
Mild exposure
<9.5 (3/8) 9 7 5
9.5 (3/8) 71/2 6 41/2
12.5 (1/2) 7 51/2 4
19 (3/4) 6 5 31/2
25 (1) 6 41/2 3
37.5 (11/2) 51/2 41/2 21/2
50 (2) 5 4 2
75 (3) 41/2 31/2 11/2
2.2.3 Introduction to Lightweight Concrete
Lightweight concrete is very similar to conventional concrete. Both concretes
contain the same basic constituent materials. However the differences lie in the type of
coarse aggregate (which are further discussed in section 2.5.1).
Lightweight concrete has been a solution for many construction problems.
Lightweight concrete can be designed to have compressive strengths equal to that
produced by normal weight concrete but with lower densities (Dolby 1996). The lower

11
densities of lightweight concrete can decrease the dead load of the structure (Anon 1929)
and decrease shipping costs. The density of light weight concrete generally ranges
between 19-116 pcf (Anon 1989).
There are many benefits of using lightweight concrete, some of which are as
follows (Bobrowski 1977):
1. Lightweight concrete can reduce the dead load of the structure. Since the dead
load of the structure is a major part in the design, there are economic advantages
in using lower-density concrete.
2. Lightweight concrete is widely used as an insulating material as it possesses
excellent thermal properties. The thermal insulation property of cellular concrete
(detailed description on cellular concrete is discussed in section 2.6.3) depends
on its density. Lower densities have better insulation properties (Anon 1963).
3. The segregation resistance of lightweight concrete is greater than that of
conventional concrete.
4. Lightweight concrete is much easier to pump when compared to conventional
concrete.
5. Large volumes of lightweight concrete are easier to transport and accommodate.
2.2.4 Lightweight Aggregate
The behavior of the lightweight aggregate in concrete is difficult to understand as
it varies with minimum variations in the mixture design. Environmental conditions may
also change the fresh and hardened properties of concrete. Therefore, a proper

12
understanding of the aggregate is required to develop a uniform mixture for meeting the
requirements of an arrestor bed.
Lightweight aggregate can be either natural or artificial. Table 2.3 shows various
types of aggregate (both normal weight and light weight) and their densities (Spratt et al,
1980). Lightweight aggregate can vary in bulk density based on its absorption capacity.
The absorption capacity of lightweight aggregate is much higher than that of the
normal weight aggregate. This is one of the main concerns in the production of
lightweight concrete as it might affect the consistency of the concrete mixture (Larrard
1999). The absorption capacity mainly depends on the structure of the aggregate.
Lightweight aggregate exhibits a higher porosity when compared to normal weight
aggregate resulting in higher absorption capacity (Mindess et al. 2003).
Table 2.3 Different types of aggregate and their density (Spratt et al. 1980)
Aggregate type Density (lb/ft³) Normal weight aggregate 85-100
Sintered PFA 48-65 Brick rubble 47-70
Scoria 45-81 Volcanic slag 44-75
Furnace clinker and breeze 45-65 Expanded slag 44-61 Foamed slag 30-960
Pumice 30-55 Expanded slate 29-50
Sintered diatomite 28-50 Expanded shale and clay 20-60
Wood shavings and sawdust 20-30 Exfoliated vermiculite 04-10
Expanded perlite 03-15

13
2.2.4.1 Perlite Perlite is the most commonly used lightweight aggregate.
It is known as the world’s most versatile mineral (Perlite Institute 2005). Perlite is found
in acidic volcanic glass rock. Perlite expands almost 20 times its volume when heated,
resulting in the production of a very fine powder that is generally white to light gray in
color. The expanded perlite has a bulk density ranging between 2 to 15 pcf (Neville
1987). The water absorption capacity of perlite is about 10-50% by weight (Mindess et
al. 2003). Lightweight concrete containing perlite has low strength and is mainly used
for insulation
Concrete containing perlite has good workability. However perlite decreases
concrete strength when compared to concrete made using other light weight aggregates
such as pumice, expanded slag, or shale (Perlite Institute 2005). Hence, for concrete
where higher strengths are required and perlite is used, the cement content in the mixture
is increased. Generally compressive strength of perlite concrete ranges from 100 to 1,500
psi and based on the strength requirements of the project, concrete strengths are varied by
changing the amount of cement in the mixture or by introducing an air entraining
admixture. High strength concrete made from perlite generally have good resistance to
freezing and thawing.
2.2.4.2 Exfoliated Vermiculite Exfoliated vermiculite is a very light weight
aggregate formed by heating raw vermiculite (micaceous mineral) to 1382-2012ºF
(Murdock et al. 1991). It is generally grey to light brown in color, and its density ranges
between 4 to 10 pcf. Exfoliated vermiculite has a thermal conductivity that is similar to
perlite and is also used in insulating concrete.
14
The structural strength of concrete containing exfoliated vermiculite is quite low.
Exfoliated vermiculite is very soft which makes it very weak in compression. So weak,
that during mixing, the material can collapse (Murdock et al. 1991). The water
absorption capacity of exfoliated vermiculite ranges between 25-35% by weight (Mindess
et al. 2003). Hence it is important to properly understand its resistance to freezing and
thawing, as it can cause great damage to the concrete (Murdock et al. 1991).
2.2.5 Chemical Admixtures
To achieve the desired fresh and hardened properties needed for concrete used in
an EMAS, several types of admixtures may be used. Each of these admixtures is
discussed in greater detail in the following sections.
2.2.5.1 Air–Entraining Agents According to ASTM C 260 - 94 (1994) an air-
entraining agent is defined as a material that is used as an ingredient in concrete, added to
the batch immediately before or during mixing, for the purpose of entraining air. The
function of air-entraining agents is to stabilize the smaller bubbles and to assure that they
remain in the concrete and provide a space where water pressure can be relieved during
freezing. Air-entraining agents were first used by early Romans and Greeks to increase
the workability of the pozzolanic mixes. Blood or animal fat was used as the air-
entraining admixture (Dhir 2005). When used at the proper dosage, these exhibit great
benefits, such as: increasing workability, increasing concrete uniformity, increasing frost
resistance, and reducing bleeding (Kosmatka et al. 2002). In general, all concrete
structures exposed to severe climatic conditions should contain air-entraining agents.

15
2.2.5.2 High Range Water Reducers (Superplasticizers) High Range Water
Reducers (HRWR) also known as super plasticizers are admixtures that reduce the
amount of water required for the production of concrete. Superplasticizers are well
known for their capabilities of improving the workability, long-term durability, and
strength of concrete mixtures. Superplasticizers free the water by dispersing the cement
particles. They generally reduce the amount of water by 10 to 15% (Ramachandran
1984) which reduces the w/c and therefore improves the concrete’s properties. The
percentage of water reduction can be increased by increasing the amount of
superplasticizer which might lead to some undesirable effects in the concrete such as loss
in workability and low compressive strength. The cohesive effect of superplasticizer
helps prevent segregation in concrete, but this is dependent upon the HRWR dosage
(Ramachandran 1984).
2.2.5.3 Air-Stabilizing Agents Shrinkage is the most common problem found in
the lightweight air-entrained concrete (Regan 1990). The stability of the foam (the
entrained air in cellular concrete is generally in the form of foam) or the air bubbles can
be increased by adding an air-stabilizing agent. Resinate foams may be stabilized by
adding aluminum sulfate to the mixing water (Taylor 1974). Sometimes foaming agents
with moderate foaming properties work better than the other agents.
2.3 Classifications of Lightweight Concrete
Of the different types of concrete previously mentioned, light weight concrete is
most promising for use in an EMAS. According to Anon (1989), lightweight concrete

16
can be classified into three types; lightweight aggregate concrete, lightweight concrete
with no-fines, cellular concrete. Each of these three types of lightweight concrete are
discussed in greater detail in the following sections.
2.3.1 Lightweight Aggregate Concrete
Lightweight aggregate concrete is similar to conventional concrete except the
normal weight aggregate is replaced by lightweight aggregate. The density of
lightweight aggregate concrete ranges between 75-125 pcf. BS 3797 (British Standard)
gives a detailed specification for lightweight aggregates for concrete. BS 3797 sets limits
of 24-75 pcf (400-1200 kg/m³) for fine lightweight aggregate and 16-62 pcf for coarse
aggregate.
Factors that affect the density of lightweight concrete are: mixture proportions,
aggregate size, entrained air, admixtures, and water content (ISE and CS 1987). Typical
ranges of nominal air-dry densities for the aggregates are shown in the Figure 2.2. While
using light weight aggregate such as perlite and exfoliated vermiculite water absorption is
one of the main concerns as it may affect the workability and density of concrete (ISE
and CS 1987).

17
Figure 2.2 Nominal Range of Air-Dry Densities for Various Light Weight Aggregate Concrete (ISE and CS 1987)
Lightweight aggregate concrete can then be divided into three classes based on
their function: Class � (for structural use), Class �� (for both structural and insulation
purpose), Class ��� (for insulation use). Table 2.4 shows different types of lightweight
aggregate concrete and their corresponding densities, compressive strength, and
coefficient of thermal conductivity values.

18
Table 2.4 Classification of Lightweight Aggregate Concrete (ISE and CS 1987).
Class
� �� ���
Type of light weight concrete Structural Structural and
Insulating Insulating
Oven-dry density (kg/m³) <2000 Not specified Not specified
Compressive strength (N/mm²) >15.0 >3.5 >0.5
Coefficient of thermal
conductivity (W m.k)
- <0.75 <0.30
Recognizing the importance of lightweight aggregate, the Bureau of Reclamation,
the United States Department of the Interior, and the National Bureau of Standard
Investigation (NBSI) examined the properties of lightweight aggregate concrete in 1950
(HHFA 1949). Their research showed that concrete made of perlite also showed good
resistance to freezing and thawing but had higher shrinkage which is of interest for an
EMAS.
The mixture design of lightweight aggregate concrete mainly depends on the dry
density of the aggregate that is used. At the same time it is important to maintain proper
wet density during the project which can only be done by maintaining mixing time,
proper mixing speed, and proper proportioning of mixture (Clarke 1993).

19
2.3.2 No-Fines Concrete
No-fines concrete is produced by eliminating fine aggregate from the concrete
mix. In this type of concrete, the cement paste bonds the coarse aggregate together
(Neville 1987). Coarse aggregate of ordinary weight are generally used in no-fines
concrete, and they have a size of less 20 mm (Shetty 2004). Due to the absence of fines,
the requirement of cement paste reduces as the surface area to be coated is decreased.
This in turn makes no-fines concrete economical (Neville 1987).
No-fines concrete has low density, low strength and exhibits good resistance to
frost action which is due to high volume of voids. No-fines concrete has a density of 100
to 120 pcf when conventional aggregates are used and about 22.5 pcf when lightweight
aggregates are used (Shetty 2004). The strength of no-fines concrete is dependent on
w/c, aggregate to cement ratio (a/c), and unit weight of concrete (Shetty 2004). It can be
clearly seen from Figure 2.3 that high strength no-fines concrete can be attained by
maintaining lower w/c and lower a/c.
Figure 2.3 28-Days Compressive Strength vs. Water/Cement Ratio (Shetty 2004)

20
The drying shrinkage of no-fines concrete is relatively low and has no segregation
(The Concrete Center 2007). No-fines concrete is used in various types of construction,
some of which are: exterior and interior building walls (Paul 2005), free drainage
pavements, playing surfaces such as tennis courts, drainage layers, and leveling courses
(CCAA 1999).
2.3.3 Cellular Concrete
Cellular concrete is a type of lightweight concrete formed by entraining air into
the cement slurry. A cellular concrete mixture is composed of binder and slurry
(Legatski 1987). While batching, air is entrained into the concrete in the form of stable
bubbles (foam) which disintegrate upon hardening of the concrete. This results in the
formation of numerous air voids. There are a number of physical properties that affect
the behavior of cellular concrete among which unit weight is the most important property
to be considered.
For cellular concrete, the w/c and aggregate are chosen based on the required
density (Kearsley and Mostert 2005). The density of cellular concrete generally ranges
between 20-120 pcf and is generally controlled by changing the amount of entrained air
(Legatski 1987). In some cases light weight aggregates are introduced into the cellular
concrete in order to attain certain properties such as strength, durability, and economy.
Figure 2.4 provides the relationship between density and 28 day compressive strength of
different cellular concrete mixtures (Fouad 2006).
Cellular concrete is commonly batched by two methods. The first method
involves mixing foam or mixing foaming agents in the cement and water slurry (Fouad
21
2006). The second method involves the mixing of lime, sand, cement, water, and an
expansion agent such as aluminum powder or hydrogen peroxide. During mixing, a
chemical reaction occurs which produces gases such as hydrogen and oxygen which form
a gas bubble structure in the concrete. This process of gas production results in a
significant expansion of the concrete. The concrete is then cured under high-pressured-
steam ranging from 356°-410°F to form the final structure (Fouad 2006).
It is important to maintain a proper w/c in cellular concrete. If the water added is
less than the amount of water required, then the cement absorbs the water from the foam
resulting in deterioration of the foam. If the amount water added is more than that
required, then segregation will occur (Kearsley and Mostert 2005).
There are many benefits of cellular concrete. Some of which are: reduced dead
load, increased durability, ease of production, workability, pumpability, economy, good
freeze-thaw resistance, good insulating properties, reduced permeability, seismic
resistance, fire resistance, and shock absorption (Fouad 2006).
Cellular concrete is used in many types of concrete construction. Cellular concrete
is best known for its thermal property which makes it one of the best insulating material.
The thermal conductivity of cellular concrete is directly proportional to density (Anon
1963). One of the most common uses of cellular concrete as insulating material is in roof
decks (Legatski 1987). Cellular concrete is also used as backfill.
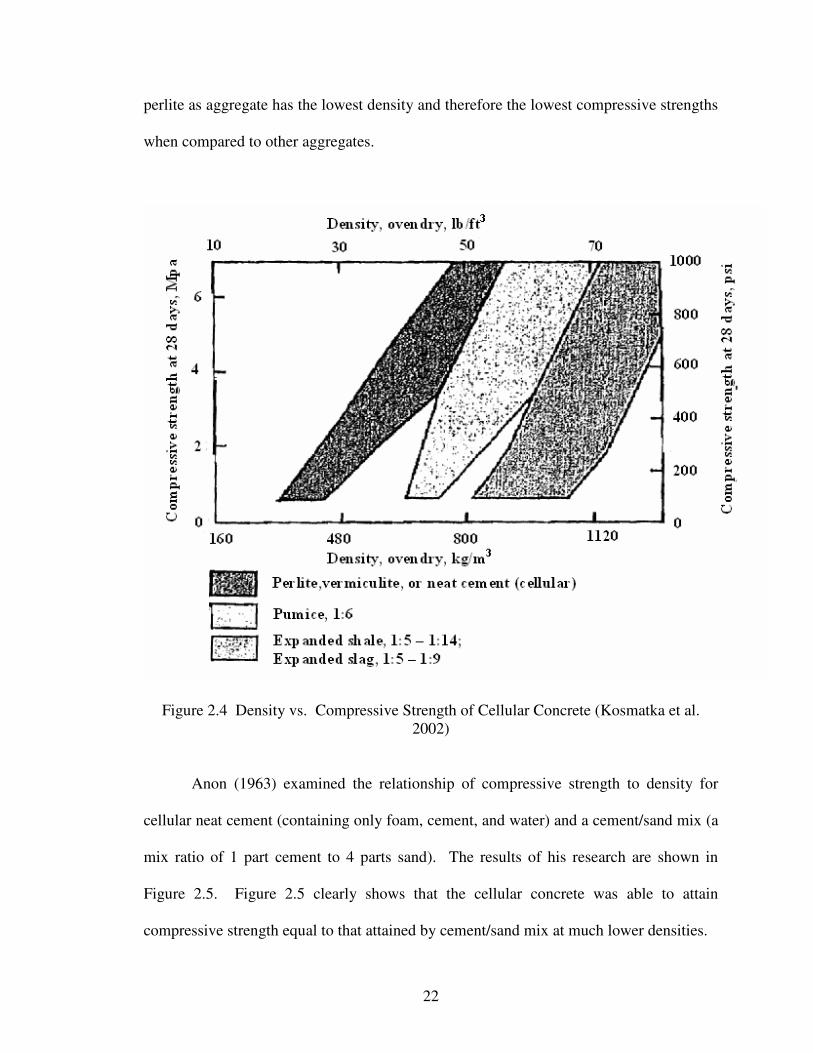
Figure 2.4 shows the relationship between the oven dry density and compressive
strength of cellular concrete made of different aggregates. The figure clearly shows that
the compressive strength increases with increase in density. Cellular concrete made with
22
perlite as aggregate has the lowest density and therefore the lowest compressive strengths
when compared to other aggregates.
Figure 2.4 Density vs. Compressive Strength of Cellular Concrete (Kosmatka et al. 2002)
Anon (1963) examined the relationship of compressive strength to density for
cellular neat cement (containing only foam, cement, and water) and a cement/sand mix (a
mix ratio of 1 part cement to 4 parts sand). The results of his research are shown in
Figure 2.5. Figure 2.5 clearly shows that the cellular concrete was able to attain
compressive strength equal to that attained by cement/sand mix at much lower densities.

23
Figure 2.5 Density vs. Compressive Strength for Cellular Neat Cements and Cement-Sand Mixture (Anon 1963)
2.3.4 Mechanical Properties of Lightweight Aggregate Cellular Concrete
Regan and Arasteh (1990) conducted research on the material and structural
properties of lightweight aggregate cellular concrete. A foaming agent (DeeCell) was
used to produce foam with a density of 5 pcf. Rapid hardening portland cement was also
used as the binder. The density and compressive strength were measured for all mixtures.

24
Shown below in Figure 2.6 is the cube strength versus concrete density. The plot
clearly indicates that there is a steep increase in cube strength with small variations in
cured density which shows a clear indication of the influence of cured densities on the
strength of concrete. According to Regan and Arasteh, there was approximately a 25%
increase in strength of concrete from 14 day to 90 day and there was approximately a
10% increase in strength from 7 day to 14 day. Some of the samples were oven dried
which had lower strengths than samples that were normally cured concrete (cured at
70ºF).
Figure 2.6 Cube Density vs. Cube Strength (Regan and Arasteh 1988)

25
The second graph (Figure 2.7) shows the relationship between the cellular
concrete and the cube strength. Regan and Arasteh varied the amount of foam in the
concrete and measured compressive strength at the various foam contents. The plot
clearly shows that there was a gradual decrease in the strength with increase in foam
content.
Figure 2.7 Foam Content vs. Cube Strength (Regan and Arasteh 1988)
Density is one of the most important factors affecting the behavior of lightweight
concrete, Regan and Arasteh examined the relationship between foam content and density
of concrete. The values obtained from the experiments were then compared with the
theoretical calculations. Figure 2.8 shows this relationship. This clearly shows that there
is a gradual decrease in density with increase in foam content which is expected.

26
Figure 2.8 Foam Content vs. Density (Regan and Arasteh 1988)
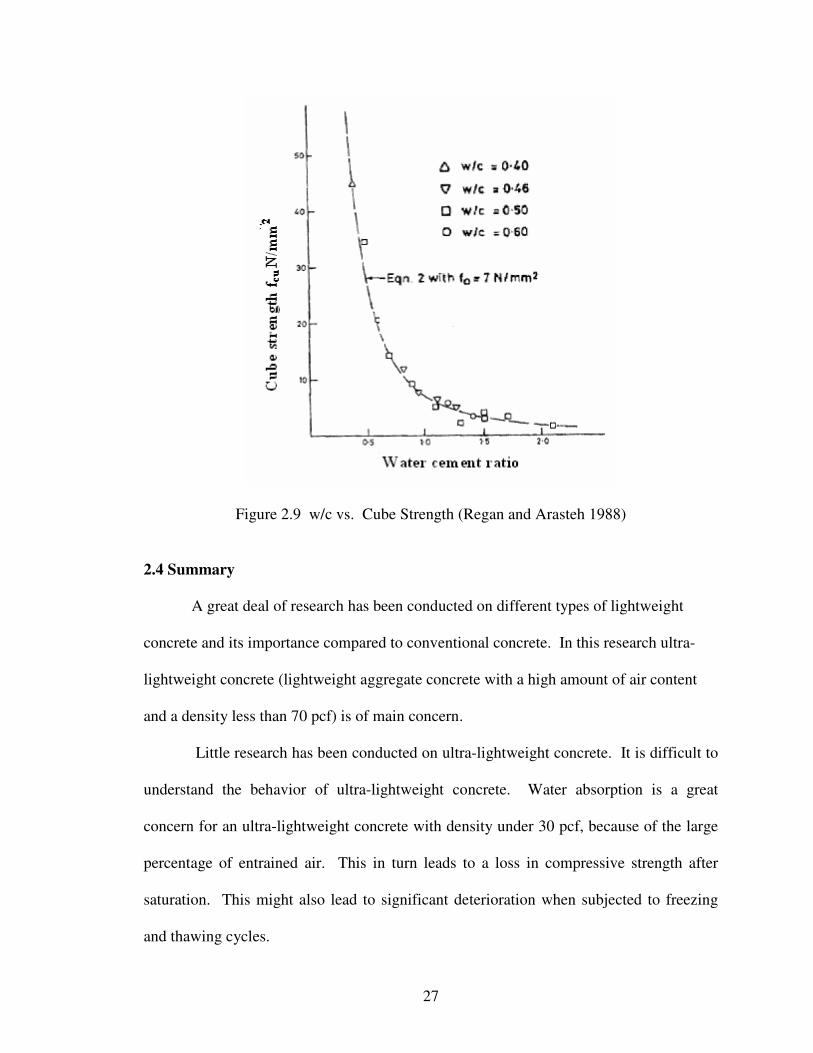
Figure 2.9 displays the variation in cube strength with respect to w/c, which
showed that with increases in w/c there was a decrease in the strength. Initially when the
w/c ratio was varied from 0.5 to 1.5 there was a reduction of nearly 6400 psi and with
further increases in w/c there was little change in the strength.
27
Figure 2.9 w/c vs. Cube Strength (Regan and Arasteh 1988) 2.4 Summary
A great deal of research has been conducted on different types of lightweight
concrete and its importance compared to conventional concrete. In this research ultra-
lightweight concrete (lightweight aggregate concrete with a high amount of air content
and a density less than 70 pcf) is of main concern.
Little research has been conducted on ultra-lightweight concrete. It is difficult to
understand the behavior of ultra-lightweight concrete. Water absorption is a great
concern for an ultra-lightweight concrete with density under 30 pcf, because of the large
percentage of entrained air. This in turn leads to a loss in compressive strength after
saturation. This might also lead to significant deterioration when subjected to freezing
and thawing cycles.

28
Another concern is the density of ultra-lightweight concrete. Efforts to establish a
relationship between the density and compressive strength of concrete using under
various admixtures and mixing temperatures should be determined. This research
program will examine a complete range of ultra-lightweight concrete mixtures to develop
a mix suitable for construction of a soft ground arrestor system.

29
CHAPTER 3
RESEARCH PROGRAM AND EXPERIMENTAL PROCEDURE
3.1 Introduction
The project involves development of ultra-lightweight concrete mixtures that will
meet the requirements of an arrestor system (EMAS). According to FAA advisory
circular AC 150/5220-22A the material used for EMAS should possess following
characteristics:
1. Water resistant.
2. Not attract wildlife.
2. Non-sparking.
3. Non-flammable.
4. Non-combustible.
5. Not emit toxic or malodorous fumes during a fire.
6. Not support plant growth.
7. Have constant strength and density characteristics throughout life.
8. Be resistant to deterioration that might result from contact with soil, aircraft
fluids, water, paint, sunlight, etc.
This project focuses on the strength and density characteristics of the EMAS and
the role that chemical admixtures play in attaining the fresh and hardened concrete
properties. Any improper use of chemical admixtures can reduce performance.
Therefore this study will focus on developing ultra-lightweight concrete using a variety
of chemical admixtures.

30
3.2 Materials
The following sections list and describe the materials used in the experimental
research program. The materials used in the study include the binders, aggregates, and
chemical admixtures. Each material is discussed in greater detail below.
3.2.1 Binders
Strong Company Inc, being one of the official project sponsors, supplied the two
binders used in this project. Type I portland cement (PC-I) manufactured by Ash Grove
Cement Company and calcium aluminate cement (CAC) manufactured by Heidelberger
Calcium Aluminates Inc were the binders used in the project. The specific gravity of PC-
I and CAC was 3.15.
3.2.2 Lightweight Aggregate
Two types of lightweight aggregates were used in the project, perlite and
exfoliated vermiculite. Grefco Minerals Inc of Torrance, California manufactured the
perlite and American Vermiculite Corporation of Kennesaw, Georgia manufactured the
exfoliated vermiculite used in the project.
ASTM C 332-87 classifies lightweight aggregate into two groups. Perlite and
exfoliated vermiculite are placed in Group I (aggregate prepared by expanding products).
These aggregates are generally used in manufacturing lightweight insulating concrete.
These two aggregates are non flammable and meet the EMAS requirements listed in
Section 3.1. Proper protective gear such as goggles, gloves, and dust masks were used
when handling these aggregate because they are considered hazardous. These aggregates

31
were stored dry in closed containers at all times. The physical properties of the
lightweight aggregates are shown in Table 3.1.
Table 3.1 Physical Properties of Lightweight Aggregate
Perlite Exfoliated Vermiculite Melting Point NA 2426º F
Specific Gravity 2.35 0.66-0.96 Water Absorption 10-50% 25-35%
3.2.3 Chemical Admixture
Chemical admixtures are the ingredients in concrete other than binder, aggregate,
fibers, and water. There are various types of admixtures and these admixtures are added
before or during mixing to modify specific fresh and hardened concrete properties. The
chemical admixtures used in the project are discussed in greater detail below.
3.2.3.1 Stepanol Medry Stepanol medry, commonly known as medry is an air-entraining
agent manufactured by Stepan Company in Northfield, Illinois. It is white in color and is
manufactured in a dry powdered form. It is also known as Sodium Lauryl Sulfate. It has
excellent foaming properties and is generally used in preparation of detergents. Medry
tends to agglomerate and is biodegradable. Hence, medry should be sealed properly and
should be kept in a cool place. Medry is considered to be toxic and it has a pH of 8.5-11.
Hence proper precautions such as using a dust mask, safety glasses and gloves should be
taken while handling it.

32
3.2.3.2 Rheocell 30 Rheocell 30 is the second type of air entraining agent used in the
project. It is manufactured by BASF Corporation. It is a dark brown colored liquid with
a pH ranging from 7-9 and specific gravity 1.015. It is water soluble, and it is very
suitable for developing ultra-lightweight concrete. It tends to flocculate at a temperate
lower than 34ºF and hence should be stored in a safe place.
3.2.3.3 Melflux 2651F Melflux 2651F, also known as melflux is a pastel colored powder
used as a high range water reducer (HRWR). HRWR’s increase the workability of
concrete without adding additional water. Therefore, HRWR’S allow for a reduction in
mixing water which will increase strength without sacrificing workability. Melflux can
also be used as viscosity modifying agent to increase the workability of concrete. The
melflux used in this project is manufactured by the Degussa Corporation. It has a pH of
6.5-8.5. Melflux can be mixed directly either to the dry mixture (dosage rate of 0.05% to
1.5% by weight of cementitious material) or added to the water. Melflux is a stable
compound unless exposed to temperature more than 105ºF (stable until 105ºF, but
flocculation’s occurs above this temperature). Proper dosage of melflux improves the
hardened concrete properties such as early age compressive strength. However, if used in
excess, it can cause bleeding and segregation. Melflux is considered a hazardous
material and proper protective measures should be taken while handling it.
3.2.3.4 Methocel K 100 LV Hydroxypropyl Methylcellulose (Methocel) The methocel
used in this project is a water soluble cellulose ether manufactured by The Dow Chemical
Company. It was used as a viscosity modifying agent (VMA) to reduce bleeding.

33
Methocel increases the workability and also increases the working time of the mix. It is
easily dissolved in the mixing water. Methocel is also a hazardous material and care
should be taken when handling the material. The product is flammable and should be
stored in safe environment where the temperature is less than 90ºF.
3.2.3.5 Aluminum Sulfate The aluminum sulfate used in this project was manufactured
by Alfa Aesar, A Johnson Matthey Company. The white colored powder was used to
stabilize entrained air bubbles in the fresh concrete. It has a density 100 pcf, and is
considered as toxic. Hence, care should be taken while handling. It is soluble in water
and can be added directly to the dry mixture or to the mixing water.
3.3 Experimental Procedures
The experimental procedures section contains a discussion of the mixing
techniques, batching, and curing method. Also, discussed in detail is the preparation of
the pre-blend mixture (section 3.3.1.1) for batching. Finally, the fresh and hardened
concrete property tests are listed along with the ages at which the mixtures were tested.
3.3.1 Mixtures and Batching
The following sections provide detailed discussions on material blending, mixing,
and curing.
3.3.1.1 Aggregate Blending Prior to batching, the dry ingredients for the concrete
mixtures required blending. For some mixtures, the Strong Company provided the

34
blended mixtures to the University of Arkansas. For others, the mixtures were blended
by the research team. The lists of pre-blends used in this project are listed in Table 3.2.
The pre-blend mixture contained lightweight aggregate (perlite and exfoliated
vermiculite), binder (PC-I, CAC, or both), and chemical admixtures (medry and
methocel). The quantity of lightweight aggregate was measured in terms of volume not
weight. This is because the absorption capacity of lightweight aggregate is much higher
when compared to normal weight aggregate. Hence it is better to check the bulk density
of lightweight concrete and adjust the weights accordingly. A cubic foot box made of
wood shown in Figure 3.1 was used in the project to measure the light weight aggregate.
Aggregate blending was accomplished using a revolving drum mixer with a 6
ft3 capacity. The aggregate blend was dry mixed until uniform. Since perlite is light
weight, precautions were taken to ensure that perlite did not accumulate at the top of the
mix. To ensure homogeneity, a particular order of mixing was maintained in the
blending process (perlite followed by vermiculite and then binder and finally chemical
admixtures). Careful attention to mixing time is necessary, because excessive mixing can
cause the mixture to lose homogeneity. This is due to the variation in density of the
different ingredients (binder being the heaviest tends to settle to the bottom). A mixing
time of 4-5 minutes was maintained for all the pre-blend mixture batches. While
blending aggregate, the mixer was covered to prevent the loss of material.

35
Table 3.2 Blended Mixes
Pre-Blend Pre-Blend
1 Master Blend 1
Master Blend 2 2
Pre-blend (PB 1) (MB 1) (MB 2) (PB 2)
PC-I (lb/ft³ aggregate) 10.4 5.2 7.8 10.4 CAC (lb/ft³ aggregate) 0 5.2 2.6 0
Vermiculite (ft³) 0.5 0.5 0.5 0.5 Perlite (ft³) 0.5 0.5 0.5 0.5
Medry (g/ft³ aggregate) 6 6 6 0 Methocel (g/ft³ aggregate) 12 12 12 12
Figure 3.1 Cubic Foot Box

36
3.3.1.2 Concrete Mixing Techniques
In this project three types of concrete mixers were used to batch the ultra-
lightweight concrete. For smaller batches of approximately 0.2 ft3 or less, a kitchen aid
mixer (Figure 3.3) or a hobart mixer (Figure 3.2) was used. For larger batches of
approximately 2.5 ft3, a double drum shear mixer as shown in Figure 3.4 was used.
For mixing in the double drum shear mixer, the following procedure was followed
throughout the project. First, one third of the water was poured in the mixer, followed by
the dry ingredients being certain to evenly distribute the dry ingredients equally
throughout the mixer. Once these ingredients were added, the mixer was turned on and
the remaining mixing water was added and mixing continued for 15 seconds. Once all
the ingredients were added, the dry mixture accumulated at the opening gate of the mixer.
The dry mixture was collected in a bowl and reintroduced back into the mixer. This is
repeated every 10 seconds for 2 to 3 times. The wet unit weight of concrete was
measured (section 3.4.1.1) at one minute and then at intervals of 30 seconds until the
targeted unit weight was attained.
For batching trial batches, a kitchen aid mixer (Figure 3.3), and hobart mixer
(Figure 3.2) were used. The kitchen aid mixer has five control speeds. For this project
“Speed 2” which mixed the concrete at 54 revolutions per minute, was used throughout
the project. The hobart mixer has two control speeds. For this project, “Speed 1” was
used throughout the project. At this speed, the mixer turned at a speed of 47 revolutions
per minute. The maximum amount of sample that could be batched using the kitchen aid
mixer was approximately 1100 g and that by the hobart mixer was approximately 2000 g.

37
Figure 3.2 Hobart Mixer Figure 3.3 Kitchen Aid Mixer
(A) Front View (B) Rare View
Figure 3.4 Double Drum Shear Mixer
38
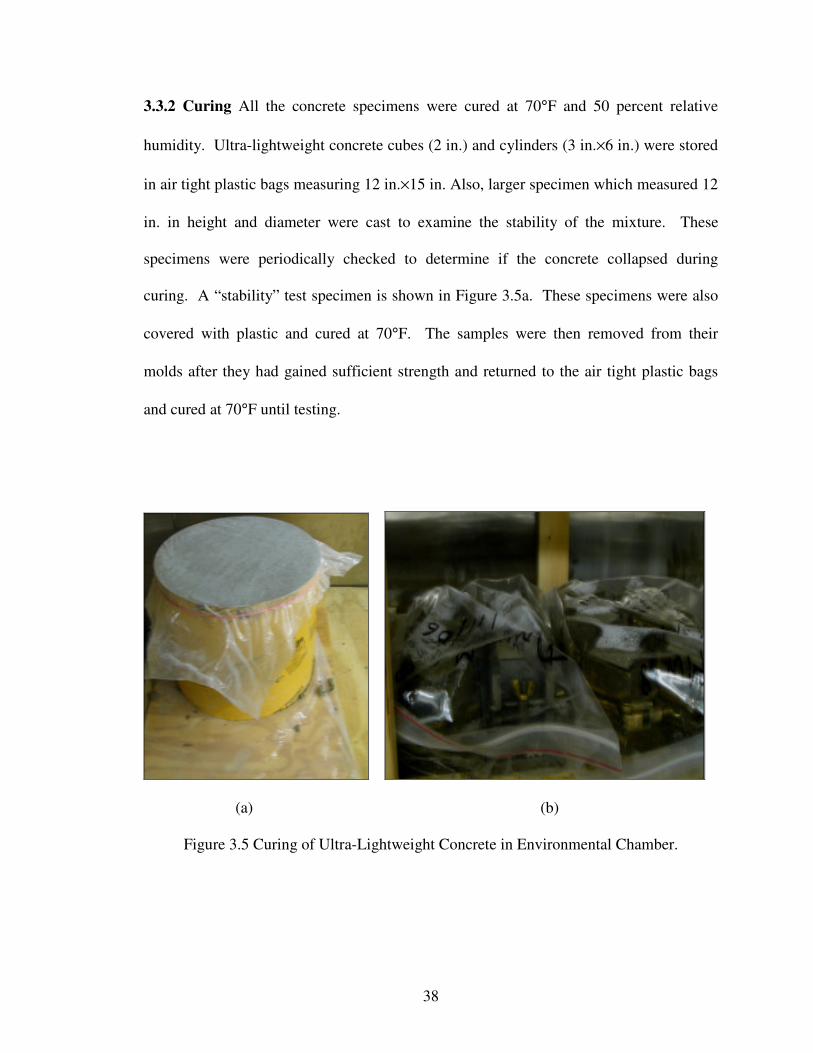
3.3.2 Curing All the concrete specimens were cured at 70°F and 50 percent relative
humidity. Ultra-lightweight concrete cubes (2 in.) and cylinders (3 in.×6 in.) were stored
in air tight plastic bags measuring 12 in.×15 in. Also, larger specimen which measured 12
in. in height and diameter were cast to examine the stability of the mixture. These
specimens were periodically checked to determine if the concrete collapsed during
curing. A “stability” test specimen is shown in Figure 3.5a. These specimens were also
covered with plastic and cured at 70°F. The samples were then removed from their
molds after they had gained sufficient strength and returned to the air tight plastic bags
and cured at 70°F until testing.
(a) (b)
Figure 3.5 Curing of Ultra-Lightweight Concrete in Environmental Chamber.

39
3.3.3 Concrete Properties
The concrete mixtures were subjected to fresh and hardened concrete tests. The
only fresh concrete property that was tested in the project was wet unit weight. The
compressive strength of the mixtures were tested on 2 in. cubes as well as 3 in.×6 in.
cylinders at 1, 7, 28, 56, and 90 days.
It is also important to determine the accurate dry unit weight of the per blend
mixture (because the varying absorption capacities of the lightweight aggregate can affect
the unit weight of the concrete). The dry unit weight was measured using a 6×12 in.
single-use cylinder mold made of plastic. While measuring the dry unit weight of per-
blend mixture, the cylinder was not compacted or vibrated, because the material can
settle and result in an inaccurate prediction of density. The weights were then adjusted
based on the dry density of the mixture.
3.3.3.1 Fresh Concrete Tests
In general terms unit weight is also known as specific weight or relative density and
is defined as weight per unit volume of material. In the case of ultra-lightweight
concrete, wet unit weight test (also known as fresh concrete density) acts as a control test
and can be used in predicting later age concrete behavior. For this project, the unit
weight was determined using a brass 3 in. in diameter (internal) and 3.5 in. tall (Shown in
Figure 3.6). To accurately measure the wet unit weight of the concrete, it is vital that the
proper test procedures be followed. The following steps were used to measure the wet
unit weight of the ultra-lightweight concrete:
• Weigh unit weight cup.

40
• Fill the cup in three equal layers. Instead of tamping or rodding after each layer,
the unit weight cup was tamped three times against the table.
• The third layer was filled in excess and then a trowel was applied to the top
surface.
• Excess concrete was then removed from the exterior of the cup.
The unit weight can also be used to determine the yield of concrete batch. Yield is the
measure of volume of concrete batched. Yield of concrete batch can be determined using
the following equation (Mindess et al. 2003):
Y = [C+W/(WUW)]/[C/(DUW)] * 100
Where, C = weight of cement content in the concrete mixture
W = weight of water in the concrete mixture
WUW = wet unit weight
DUW = dry unit weight
Figure 3.6 Unit Weight Cup
3.3.3.2 Hardened
Concrete Tests
41
The compressive strength was tested at 1, 7, 28, 56, and 90 days of age. Three 2
in. cubes and three 3 in. × 6 in. cylinders were tested at each of these days. The samples
were tested using a MTS testing machine (Figure 3.7). Prior to testing, the dimensions of
the samples were measured using calipers. Early testing showed that the cylinders were
not able to be demolded due to lack of concrete strength, and therefore limited test results
were obtained from the cylinders.
3.3.3.2.1 Test Specimen Three different types of specimens were cast to measure the
compressive strength and crushing strength of ultra-lightweight concrete. Two inch
cubes and 3 in. × 6 in. cylinders were cast to measure the compressive strength.
Prior to casting, a particular procedure was followed to cast the cube specimens.
WD-40 was applied to the faces of the mold for ease of stripping and preventing damage
to the concrete specimen. Concrete was placed in 1 in. layers in the mold. Instead of
tamping or rodding, the concrete was consolidated by lifting the ends of the molds off the
table approximately 1 in. and then allowing them to drop. This procedure was repeated
for 3 to four times. This was repeated for the second and final layer of concrete. The
excess concrete was then struck off using a scraper and finished. The samples were then
cured in the environment chamber at 70ºF. A similar procedure was followed for the
cylinders, except the cylinders were cast in two equal layers of 3 inches.
Concrete stability was tested by casting concrete specimens 12 in. diameter and
12 in. height using sona tubes. In casting the samples, the concrete was placed in the
molds in two layers of equal height and for each layer the outer surface of the sona tube

42
was slightly tapped. The excess concrete was struck off using a trowel. The samples
were then cured according to the test.

43
Figure 3.7 MTS Testing Machine

44
CHAPTER 4
TEST DATA AND DISCUSSIONS
4.1 Introduction
This chapter presents the results of the trial batches made to develop ultra-
lightweight concrete for use in a Soft Ground Arrestor System (SGAS). In addition, this
chapter shows problems that were faced and the efforts made to address them.
Mixture proportions were first chosen based on some reference mixtures
developed by the Strong Company. These trial mixtures were cast to determine a mixture
that is durable with a compressive strength close to 20 psi, with little to no increase in
compressive strength with age. Preliminary tests conducted by the Strong Company on
ultra-lightweight concrete showed that the unit weights and compressive strengths
corresponding to a yield of 130% produced the best results. Therefore, in addition to 20
psi, and 26 to 28 pcf goals, a yield of 130% was also targeted.
Mixture designs provided by Strong Company were the reference mixtures from
which the research began and new mixtures developed at the University of Arkansas
were based on the reference mixtures and designed to meet the requirements of SGAS.
In the present chapter there are recommendations for different chemical admixtures and
dosage rates which were selected considering the desired properties, such as unit weight
and compressive strength. W/cm of 0.99 was initially chosen to attain low compressive
strength.

45
The present project examines the effects of various chemical admixtures and their
dosage rates on ultra-lightweight concrete with the goal of developing a concrete mixture
that can be used in a SGAS.
4.2 Reference Mixtures
The proportions of the first mixture, M 1, were developed by the Strong
Company. In mixture M 1, the general pre-blend 1 (shown in Table 3.2) was used. The
pre-blend 1 mixture contained PC-I, perlite, vermiculite, medry, and methocel. All pre-
blend mixtures used in the project were batched in accordance to Section 3.3.2.1.
Mixture proportions of M 1 and M 2 are listed below in Table 4.1. The unit weight
results obtained were plotted with respect to time (Figure 4.1).
Table 4.1 Mixture Proportions for Mixtures M 1 and M 2
Mixture Number Material
M 1 M 2
Pre-Blend Mixture PB 1 PB 1
Sample Weight (g) 1006 1100
Dry unit weight (lb/ft³) 18.0 18.0
Water (g) 996 996
w/cm 0.99 0.99
Melflux 2651 (% Cement) 0 0
With reference to mixture M 1, M 2 was batched to get acquainted with ultra-
lightweight concrete. The dry unit weight of M 2 was 18.0 pcf. The concrete mixture
was mixed for four minutes and the wet unit weight was measured at one, one and a half,

46
two, three, and four minutes. After one minute of mixing the wet unit weight was 30 pcf
and was increased to 31.2 pcf after four minutes of mixing. The yield of the mixture was
115% which was less than the desired yield of 130%. Eighteen cubes and one cylinder
were cast for testing purposes. At seven days of age, the cylinder could not be demolded
because of low strengths. Three cubes also broke during demolding at day one. Also, the
cubes that did not break during demolding contained many surface defects. The cubes
attained an average compressive strength of 21.3 psi at 28 days. The fresh and hardened
properties of mixture M 2 are listed in Table 4.2. Unit weight was plotted with respect to
time and is shown in Figure 4.1. From the results, it was observed that the increase in
compressive strength from 7 days to 28 days was 6 psi. The early age strength was too
low and the increase in the compressive strength was high from 7 days to 28 days (15.6
psi to 21.6 psi respectively). Hence in order to increase the early age strength and also
maintain minimal increase in compressive strength with time, calcium aluminate cement
(CAC) was introduced as a partial replacement for type-I portland cement (PC-I).

47
Table 4.2 Fresh and Hardened Properties of Mixture M 2
Mixture Designation
M 2
Mixing Time (minutes) Unit Weight (pcf)
1 30.0 1.5 31.6 2 31.2 3 31.4 4 31.2
Yield (%) 115%
Age (day) Compressive Strength (psi)
7 15.6 28 21.6
27
28
29
30
31
32
0 1 2 3 4 5
Time (minutes)
Uni
t Wei
ght (
pcf)
M 2
Figure 4.1 Variation in Unit Weight with Time for Mixture M 2
48
4.3 Mixture Proportions with a Combination of CAC and PC-I
In order to minimize the later age strength gain but increase in early age strength,
several mixtures were cast that contained a combination of CAC and PC-I. Previous
research has shown that concrete mixtures cast with CAC gain strength rapidly, but the
strength gain after 7 days of age is minimal (Shetty 2004). M 3 through M 8 were the
first set of mixtures batched with 50% of the PC-I replaced with CAC. For these
mixtures master-blend (MB) 1 was used. MB 1 was contained different proportions of
binders (PC-I and CAC). The contents of MB 1 are listed in Table 3.2. M 4, M 6, and M
7 mixture proportions were similar to that of mixture M 3 except the percentage of
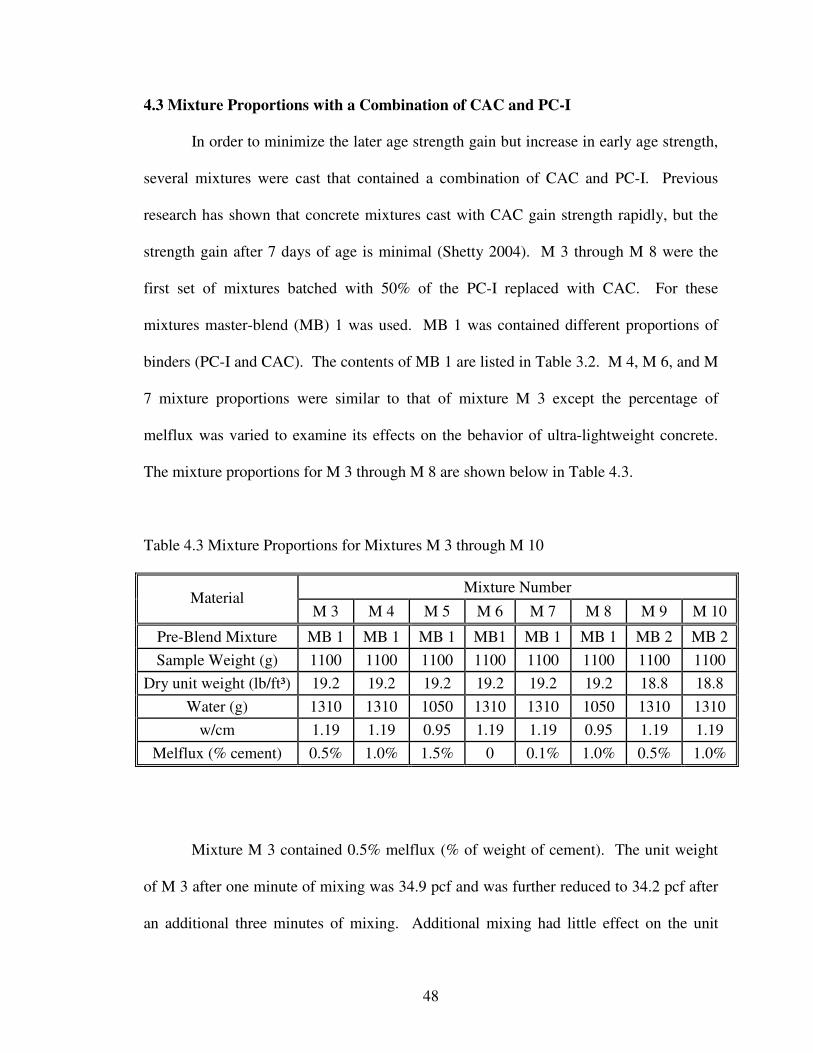
melflux was varied to examine its effects on the behavior of ultra-lightweight concrete.
The mixture proportions for M 3 through M 8 are shown below in Table 4.3.
Table 4.3 Mixture Proportions for Mixtures M 3 through M 10
Mixture Number Material
M 3 M 4 M 5 M 6 M 7 M 8 M 9 M 10
Pre-Blend Mixture MB 1 MB 1 MB 1 MB1 MB 1 MB 1 MB 2 MB 2 Sample Weight (g) 1100 1100 1100 1100 1100 1100 1100 1100
Dry unit weight (lb/ft³) 19.2 19.2 19.2 19.2 19.2 19.2 18.8 18.8 Water (g) 1310 1310 1050 1310 1310 1050 1310 1310
w/cm 1.19 1.19 0.95 1.19 1.19 0.95 1.19 1.19 Melflux (% cement) 0.5% 1.0% 1.5% 0 0.1% 1.0% 0.5% 1.0%
Mixture M 3 contained 0.5% melflux (% of weight of cement). The unit weight
of M 3 after one minute of mixing was 34.9 pcf and was further reduced to 34.2 pcf after
an additional three minutes of mixing. Additional mixing had little effect on the unit
49
weight. The yield for M 3 was 123% (close to the yield required of 130%), which was
slightly higher than that of the reference mixture (115%). At 28 days of age, the
cylinders were very weak and both cylinders cracked during demolding. The cubes
attained an average compressive strength of 17.0 psi at 7 day which is an improvement
when compared to M 2 (15.6 psi), and only an increase of 3.6 psi was observed between
7 and 28 days.
To increase the yield and reduce compressive strength increase with time, M 4
was then batched with an increase in melflux content to 1%. M 4 had a unit weight of
34.1 pcf at one minute and after four minutes of mixing, the unit weight decreased to 32.5
pcf. The unit weight for M 4 (32.5 pcf) was less than that of M 3 (34.2 pcf). An increase
of melflux also increased the yield (130%) which was expected. During the process of
casting the test samples for compressive strength tests, bleeding was observed. While
demolding the cylinders at 28 days, both the samples cracked at the middle. The
compressive strength of M 4 was significantly lower than that of M 3 mixture which was
due to unstable air bubbles (Table 4.4). Excessive bleeding was also observed in M 4
specimens. Mixture M 4 had a 7 day compressive strength of 11.8 psi and 13.9 psi at 28
days which was lower than the desired compressive strength of 20 psi, however the
increase in compressive strength from 7 day to 28 day was reduced to 2 psi. To reduce
bleeding and increase early age strength, the amount of melflux was increased to 1.5%,
and at the same time the amount of water was reduced to 1050 g and was batched as M 5.
After one minute of mixing, the unit weight of M 5 was 31.7 pcf which was 2.4
pcf less than that of M 4. On further mixing for 3 minutes, the unit weight decreased to
29.3 pcf and no bleeding was observed. The yield of M 5 was 128% which was close to

50
the targeted yield of 130%. The increase in yield and decrease in unit weight was the
result of the reduction in water content and increase in melflux dosage. The compressive
strength was 18.7 psi at 28 days which was slightly less that the targeted strength of 20
psi, but the increase in compressive strength from 7 days to 28 days was 8.6 psi.
Increase in melflux improved unit weight and yield, and because of this mixtures
were batched to properly understand the behavior of melflux in ultra-lightweight
concrete. Mixture M 6 was then batched with no melflux to understand the behavior of
ultra-lightweight concrete with no melflux. The unit weight was 1 pcf higher after one
minute of mixing when compared to that attained by mixture M 3 which contained 0.5%
of melflux. The mixture was mixed for two additional minutes but the decrease in the
unit weight was only 0.1 pcf. The yield of M 6 was 118%, which showed that there was
an increase in yield with the presence of melflux. The average compressive strength was
10.2 psi at seven days and 18.3 psi at 28 days. The compressive strength values were
close in comparison with M 5. Since the melflux was omitted from mixture M 6, the
amount of water available for bubble formation was reduced which resulted in higher unit
weights compared to M 3 (shown in Figure 4.2). The demolding problem was also
observed in case of M 6, and 6 out of 18 cubes broke during the process of demolding at
7 days of age.
Melflux was then introduced and batched as M 7 (0.1% of melflux). This was
done to see if there would be any variation in fresh and hardened properties of ultra-
lightweight concrete with a small amount of melflux. The mixture was initially mixed
for 10 seconds before the melflux was added. The mixture reached its peak (lowest) unit
weight of 31.5 pcf after one and a half minutes of mixing. The mixture was mixed for a

51
total of three minutes and an increase in unit weight (4.1 pcf) was observed. With the
addition of 0.1% of melflux, there was no difference in the yield between M 6 and M 7
(in both the cases yield was 118%). The increase in compressive strength from 7 days to
28 days was also high (4.3 psi). For this particular mixture, a melflux dosage rate of
0.1% was not effective in increasing yield and reducing unit weight.
For mixture M 8, the w/cm was reduced to 0.95 and the melflux content was
increased to 1%. Mixture M 8 was similar to mixture M 4 but with a reduction of water
content. Melflux was added after mixing for ten seconds. M 8 had a 31.5 pcf unit weight
after one minute of mixing, which was 3.4 pcf less than the unit weight of M 4 (34.1 pcf).
Since water was the second heaviest ingredient in the mixture and M8 contained less
water than M 7, the lower unit weight was expected. The unit weight was 29.8 pcf after 3
additional minutes of mixing. The yield increased to 126% as expected due to the
increase in melflux. This mixture had good 7 day and 28 day compressive strengths of
17.3 psi and 23.4 psi which was higher than that of mixture M 4 (11.8 psi and 13.9 psi).
So, the increase in melflux clearly increased the yield and decreased unit weight. But in
mixtures M 3 through M 8 an increase in compressive strength from 7 day to 28 day was
observed.
For mixtures M 9 and M 10, 25% of PC-I was replaced with CAC. This was done
to increase compressive strength at early ages (7 days or earlier). For these mixtures, MB
2 was used. MB 2 contained PC-I, CAC, perlite, vermiculite, medry, and methocel (see
Table 3.2 for the proportions). The melflux dosage rate was 0.5% for M 9 and 1% for M
10. The unit weight of M 10 was 1.4 pcf less than that of M 9 at one minute but both unit
weights were greater than the targeted value of 26-28 pcf. For both mixtures, little

52
change in unit weight was observed after mixing for three minutes. A yield of 120% for
M 9 and 125% for M 10 was measured. The one day compressive strengths of both
mixtures were much less when compared to that of mixtures developed with a 50%
replacement of PC-I with CAC, which was expected because of the reduction of
percentage of CAC. The increase in compressive strengths after 28 days was much
higher in the case of M 9 and M 10 when compared to mixtures with 50% replacement of
PC-I with CAC, which was due to greater percentages of PC-I in M 9 and M 10.
The unit weights and compressive strengths for the mixtures containing both
percentage replacement of PC-I with CAC are shown in Table 4.4 and the unit weight
plotted against mixing time is shown as Figure 4.2. From the above test results it was
clearly shown that the replacement of PC-I with CAC for these ultra-lightweight concrete
mixtures was ineffective for reducing the strength gain from 7 days to 28 days. Hence
future mixture proportions were designed containing only portland cement.
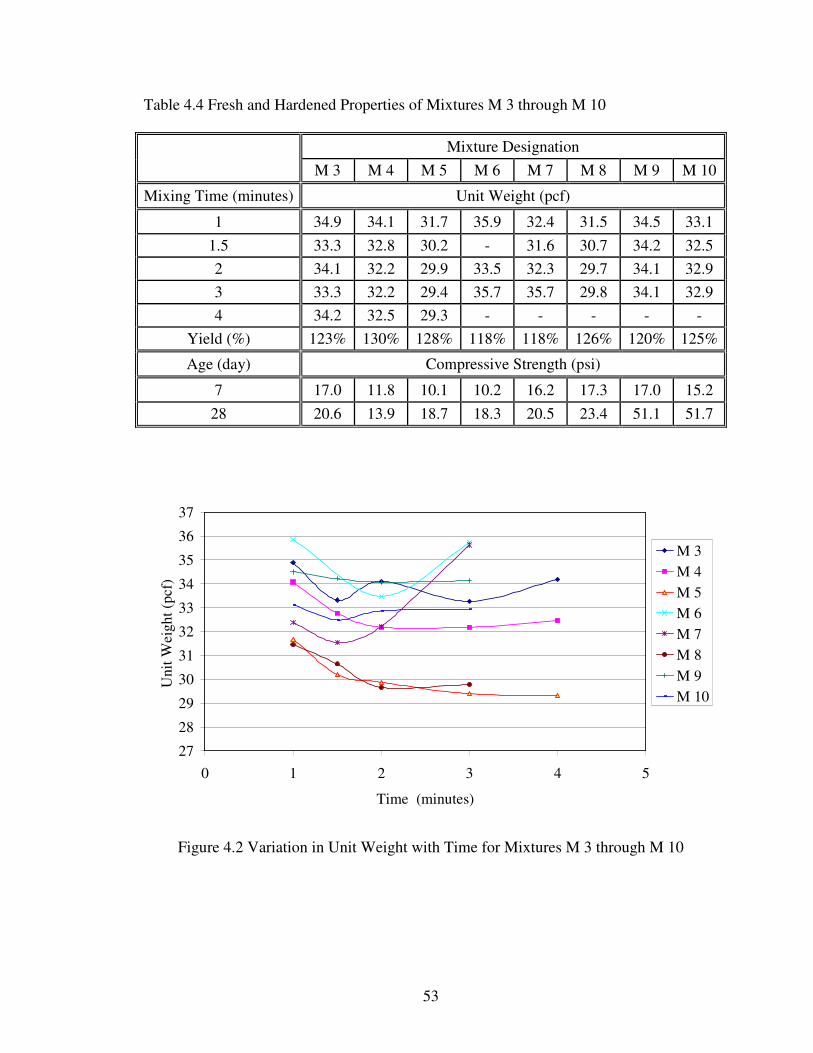
53
Table 4.4 Fresh and Hardened Properties of Mixtures M 3 through M 10
Mixture Designation
M 3 M 4 M 5 M 6 M 7 M 8 M 9 M 10
Mixing Time (minutes) Unit Weight (pcf)
1 34.9 34.1 31.7 35.9 32.4 31.5 34.5 33.1 1.5 33.3 32.8 30.2 - 31.6 30.7 34.2 32.5 2 34.1 32.2 29.9 33.5 32.3 29.7 34.1 32.9 3 33.3 32.2 29.4 35.7 35.7 29.8 34.1 32.9 4 34.2 32.5 29.3 - - - - -
Yield (%) 123% 130% 128% 118% 118% 126% 120% 125%
Age (day) Compressive Strength (psi)
7 17.0 11.8 10.1 10.2 16.2 17.3 17.0 15.2 28 20.6 13.9 18.7 18.3 20.5 23.4 51.1 51.7
27
28
29
30
31
32
33
34
35
36
37
0 1 2 3 4 5
Time (minutes)
Uni
t Wei
ght (
pcf)
M 3M 4M 5M 6M 7M 8M 9M 10
Figure 4.2 Variation in Unit Weight with Time for Mixtures M 3 through M 10

54
4.4 Increased Batch Quantities
Previously mixtures M 1 though M 10 were batched using the kitchen aid mixer
described in Chapter 3. For most of these mixtures, the total quantity of concrete batched
was approximately less then 0.2 ft3. The behavior and performance of the concrete
mixtures can change as batch size increases. To examine these potential changes, the
double drum shear mixer, which was described in Chapter 3, was used to batch mixtures
M 12 through M 14.
Mixture M 11 was developed by the Strong Company, which served as the
reference mixture M 12 was developed and tested to check the behavior of ultra-
lightweight concrete when batched using double drum shear mixer. M 13 and M 14 were
then batched with the same mixture proportions as that of M 12 to examine the
repeatability of the mixture. PB 1 was used in these four mixtures. The mixture
proportions for M 11 through M 14 are shown in Table 4.5. In all these mixtures, a
sample weight of approximately 36 pounds was maintained. Mixture M 11, which was
developed by the Strong Company, contained no melflux and had a w/cm of 0.99. As
from the previous results, it was observed that the addition of melflux resulted in a
decrease in unit weight, in mixtures M 12 through M 14, 0.1% melflux and w/cm of
1.008 was maintained.
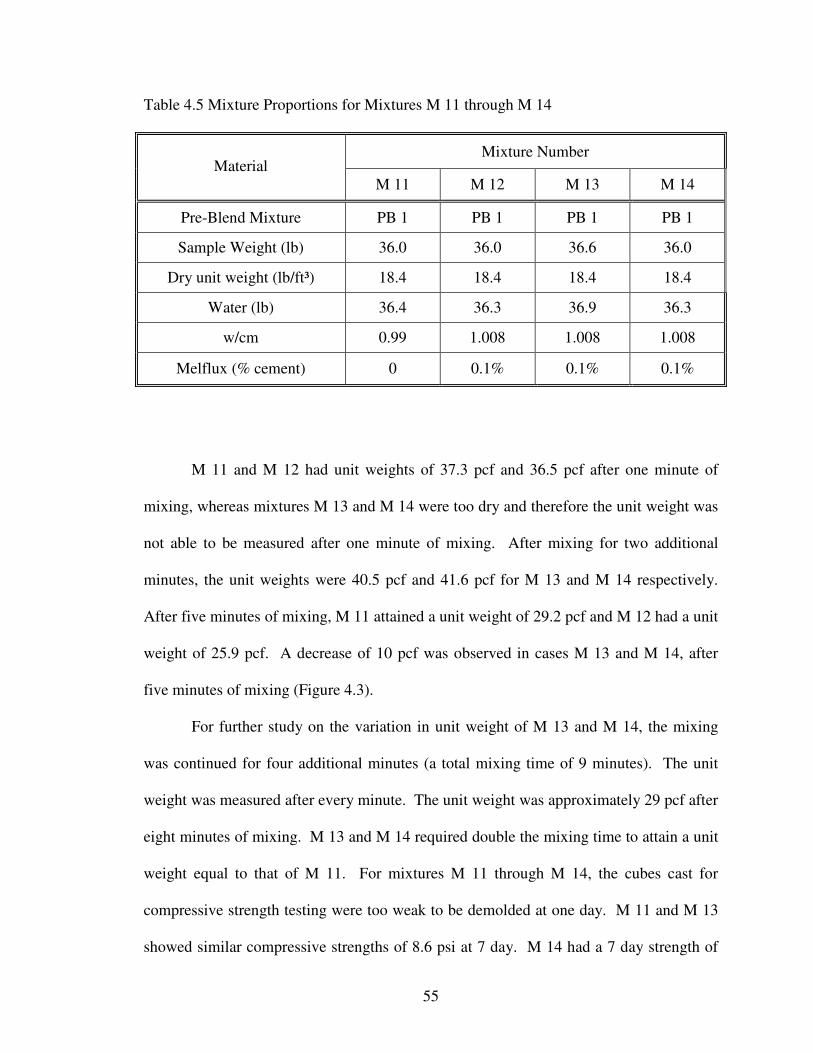
55
Table 4.5 Mixture Proportions for Mixtures M 11 through M 14
Mixture Number Material
M 11 M 12 M 13 M 14
Pre-Blend Mixture PB 1 PB 1 PB 1 PB 1
Sample Weight (lb) 36.0 36.0 36.6 36.0
Dry unit weight (lb/ft³) 18.4 18.4 18.4 18.4
Water (lb) 36.4 36.3 36.9 36.3
w/cm 0.99 1.008 1.008 1.008
Melflux (% cement) 0 0.1% 0.1% 0.1%
M 11 and M 12 had unit weights of 37.3 pcf and 36.5 pcf after one minute of
mixing, whereas mixtures M 13 and M 14 were too dry and therefore the unit weight was
not able to be measured after one minute of mixing. After mixing for two additional
minutes, the unit weights were 40.5 pcf and 41.6 pcf for M 13 and M 14 respectively.
After five minutes of mixing, M 11 attained a unit weight of 29.2 pcf and M 12 had a unit
weight of 25.9 pcf. A decrease of 10 pcf was observed in cases M 13 and M 14, after
five minutes of mixing (Figure 4.3).
For further study on the variation in unit weight of M 13 and M 14, the mixing
was continued for four additional minutes (a total mixing time of 9 minutes). The unit
weight was measured after every minute. The unit weight was approximately 29 pcf after
eight minutes of mixing. M 13 and M 14 required double the mixing time to attain a unit
weight equal to that of M 11. For mixtures M 11 through M 14, the cubes cast for
compressive strength testing were too weak to be demolded at one day. M 11 and M 13
showed similar compressive strengths of 8.6 psi at 7 day. M 14 had a 7 day strength of

56
12.6 psi. Not enough samples were left for testing compressive strength at 28 days.
From the test results it was clearly seen that M 13 and M 14 (batched with same mixture
proportion) showed similar results. From the results shown in Table 4.6, it was clear that
concrete batched in larger quantities had better unit weights, yield and compressive
strength.
Table 4.6 Fresh and Hardened Properties for mixtures M 11 through M 14
Mixture Designation
M 11 M 12 M 13 M 14
Mixing Time (minutes) Unit Weight (pcf)
1 37.3 36.5 Dry Dry 1.5 - - - - 2 35.3 32.7 40.5 41.6 3 32.5 29.9 36.9 36.2 4 30.3 27.9 34.2 33.4
Yield (%) 149% 145%
Age (day) Compressive Strength (psi)
7 8.8 - 8.6 12.6 28 12.2 - 15.4 21.4

57
25
27
29
31
33
35
37
39
41
43
0 1 2 3 4 5
Time (minutes)
Uni
t Wei
ght (
pcf) M 11
M 12M 13M 14
Figure 4.3 Variation in Unit Weight with Time for Mixtures M 11 through M 14 4.5 Variation in Medry and Melflux
As the unit weights observed in the previous tests were higher than the desired
unit weight of 26-28 pcf at 3 minutes of mixing, mixtures were developed to reduce the
unit weight within 3 minutes of mixing. In the case of mixtures M 15, M 16, M 17, and
M 18, the amount of medry was increased by 0.3% in order to increase air content earlier
during the mixing. These four mixtures were mixed using the kitchen aid mixer. These
mixtures had a targeted unit weight of 28 pcf after 3 minutes of mixing.
M 15 was developed using PB 1. Melflux content was very much effective in
reducing the unit weight and increasing the yield of concrete, 0.5% melflux was used.
An additional amount of 0.3% of medry was added to the dry mixture to increase the

58
amount of air bubble. The mixture proportions for M 15 and all other mixtures
developed in this section of the research program are shown in Table 4.7. After one
minute of mixing the unit weight was 32.0 pcf. The mixture was then mixed for an
additional 3 minutes and the unit weight was 30.8 pcf. The decrease in the unit weight
was minimal after two minutes of mixing. The mixture had a yield of 106%, which was
very low. Melflux reduced the mixing water which in turn increased strength (1 day
strength and 28 day strengths were 44.7 psi and 59.4 psi).
Table 4.7 Mixture Proportions for Mixtures M 15 through M 18
Mixture Designation Material
M 15 M 16 M 17 M 18
Pre-Blend Mixture PB 1 PB 1 PB 1 PB 1 Sample Weight (g) 1100 1100 1100 1100
Dry unit weight (lb/ft³) 18.0 18.0 18.0 18.0 Water (g) 900 875 875 875
w/cm 0.82 0.80 0.80 0.80 Medry (% cement) 0.3% 0.3% 0.3% 0.3%
Melflux (% cement) 0.5% 0.5% 1.0% 1.25%
M 16 was very similar to M 15, except the w/cm was reduced to 0.80 from 0.82.
This was done to reduce the unit weight because water is the second heaviest ingredient
in ultra-lightweight concrete. After one minute of mixing, the unit weight was 38.1 pcf
which was due to the lack of air bubble formation. The mixture was dry after one minute
of mixing. After additional 30 seconds of mixing, the unit weight dropped to 30.1 pcf.
The mixture was further mixed for two and a half minutes, but the drop in the unit weight
was not as significant as the first. After a total of four minutes of mixing, the unit weight

59
was 29.6 pcf. This showed that the concrete produced lower unit weights when the w/cm
was reduced from 0.82 to 0.80. M 16 had a yield of 109% which was better than that of
M 15 (106%) but was still much less than the targeted yield (130%). The samples for
mixture M 16 were cast at 29.6 pcf and that of M 15 were cast at 30.8 pcf. This small
variation in unit weight resulted in lower compressive strengths of M 16 when compared
to that of M 15. The average compressive strength at 28 days was 43.1 psi. The
compressive strength results also showed that there was an increase of 10.7 psi
compressive strength from 28 days to 90 days (the 90 day compressive strength was 69.1
psi). As it was clearly seen that a w/cm of 0.80 was effective in reducing the unit weight
and hence was maintained the same for the remaining batches.
To further reduce unit weight and increase yield, the melflux dosage was
increased to 1% and batched as M 17. A w/cm of 0.80 was used. It was observed that
after one minute of mixing the mixture had a unit weight of 29.3 pcf which was less than
that of M 15 and M 16 (32.0 pcf and 38.1 pcf). It was then further mixed for 30 seconds
and the unit weight decreased to 28.4 pcf. Further mixing resulted in little difference in
unit weight and, after three minutes of mixing, the unit weight was 28.0 pcf. The
additional melflux resulted in a yield of 115% which was higher than that of M 15
(106%) and M 16 (109%) but still less than the targeted. Even though the test samples
were cast with unit weight 27.9 pcf (after 3 minutes of mixing), the compressive strength
was measured high after 28 days (50.1 psi), which was not expected.
For M 18 the amount of melflux was further increased to 1.25% while
maintaining the same medry dosage rate as M 17, this was done to increase the yield and
decrease the unit weight. The w/cm was 0.80. After one minute of mixing, the unit

60
weight was 35.0 pcf and the mixture appeared dry. At one and a half minutes, the unit
weight of the mixture decreased 5 pcf (Figure 4.4). On further mixing, the unit weight at
2, 3, and 4 minutes was 29.1, 28.9, and 28.7 pcf respectively (Table 4.8). The unit weight
with respect to time is shown in Figure 4.4. M 18 produced a yield of 112% (lower than
the desired yield of 130%). M 18 had an average compressive strength of 71.9 psi after
28 days this was due to the high amount of melflux. The high amount of melflux reduced
the amount of mixing water which in turn increased the compressive strength. This
showed that the increase in melflux to 1.25% was not helpful in reducing the unit weight
and maintaining proper compressive strength. Among the four mixtures, those
containing 0.3% medry and 0.5% melflux had better unit weights as well as compressive
strengths.
Table 4.8 Fresh and Hardened Properties of Mixtures M 15 through M 18
Mixture Number
M 15 M 16 M 17 M 18
Mixing Time (minutes) Unit Weight (pcf)
1 32.0 38.1 29.3 35.0 1.5 31.1 30.7 28.4 29.9 2 30.9 29.7 28.2 29.1 3 30.9 29.6 28.0 28.9 4 30.8 29.6 - 28.7
Yield (%) 106% 109% 115% 112%
Age (day) Compressive Strength (psi)
7 44.7 35.1 38.1 45.7 28 59.4 43.1 50.1 71.9

61
27
29
31
33
35
37
39
0 1 2 3 4 5
Time (minutes)
Uni
t Wei
ght (
pcf)
M 15M 16M 17M 18
Figure 4.4 Variations in Unit Weight with Time for Mixtures M 15 through M 18
The medry and melflux content of 0.3% and 0.5% was contained for M 19 and M
20, and these mixtures were batched using a double drum shear mixer to examine the
concrete behavior when mixed in larger quantities. A sample weight of 36.5 pounds with
a 0.8 w/cm was used to batch M 19 and at the same time, M 20 was batched with a
sample weight of 38.6 pounds and a w/cm of 0.79. Both mixtures had the same dry unit
weight of 18.0 pcf. The mixture proportions for both these batches are listed in Table
4.9.

62
Table 4.9 Mixture Proportions for Mixtures M 19 and M 20.
Mixture Number Material
M 19 M 20
Pre-Blend Mixture PB 1 PB 1 Sample Weight (lb) 36.5 38.6
Dry unit weight (lb/ft³) 18.0 18.0 Water (lb) 29.1 30.7
w/cm 0.80 0.80 Medry (g/ft³ aggregate) 0.3% 0.3%
Melflux (% cement) 0.5% 0.5%
It was observed that the mixtures were dry after one minute of mixing and hence
the unit weight was not measured. M 19 had a high unit weight of 38.4 pcf after one and
a half minutes, and M 20 had a unit weight of 34.9 pcf after one and a half minutes,
which was expected, since the water content was reduced. Both mixtures were mixed for
five minutes and a unit weight of approximately 27 pcf was measured in both the cases.
These low unit weights showed the combination of 0.3% medry and 1% melflux was
effective in decreasing unit weight. M 19 had 7 day and 28 day compressive strengths of
18.5 psi and 24.6 psi, respectively. Whereas M 20 had similar average compressive
strengths of 32.2 psi at 7 days and 32.2 psi at 28 days. Mixture M 20 had a higher yield
than M 19 and both are listed in Table 4.10. In spite of casting both batches at the same
unit weight (27.5 pcf), a difference in the compressive strength was observed. The unit
weights are plotted against time and are shown in Figure 4.5.
Since the research team observed inconsistencies in compressive strength, the
next set of mixtures were batched using the kitchen aid mixer to examine the consistency
of the mixtures.

63
Table 4.10 Fresh and Hardened Properties of Mixtures M 19 & M 20
Mixture Designation
M 19 M 20
Mixing Time (minutes) Unit Weight (pcf)
1 Dry Dry 1.5 38.4 34.9 2 38.5 33.0 3 34.6 30.7 4 29.5 28.8
Yield (%) 139% 150%
Age (day) Compressive Strength (psi)
7 18.5 32.2 28 24.6 32.2
27
29
31
33
35
37
39
41
0 1 2 3 4 5
Time (minutes)
Uni
t Wei
ght (
pcf)
M 19M 20
Figure 4.5 Variation in Unit Weight with Time for Mixture M 19 through M 20

64
4.6 Consistency Check Using M 16 as Reference Mixture
From the previous mixtures M 15 and M 16, it was clearly seen that there was no
consistency in the results of unit weight and compressive strengths. Hence four mixtures,
M 21 through M 24, were batched with mixture proportion M 16 to check the
repeatability of the mixture. The mixture proportions are shown in Table 4.13. For these
mixtures PB 1 was used. The mixtures were batched on the same day and the water
temperature, mixing technique, and mixing speeds were kept constant. As shown in
Table 4.11 the w/cm for all four mixtures was maintained at 0.8, and the targeted unit
weight was 28 pcf. The dry unit weight of the mixture was 18.0 pcf. Unit weights
obtained from the following tests were plotted with respect to time and are shown as
Figure 4.6.
Table 4.11 Mixture Proportions for Mixtures M 21 through M 24.
Mixture Number Material
M 21 M 22 M 23 M 24
Pre-Blend Mixture PB 1 Sample Weight (g) 1100
Dry unit weight (lb/ft³) 18.0 Water (g) 875
w/cm 0.80 Medry (% cement) 0.3%
Melflux (% cement) 0.5%
After one minute of mixing, the unit weight of M 21 was 33.4 pcf and an
additional two minutes of mixing was required to attain a unit weight of 28.0 pcf. The
mixture was too dry at one minute. The yield was very low (115%) when compared to

65
the required yield of 130%. The 28 day compressive strength was 42.8 psi, which was
higher than required compressive strength (20 psi).
M 22 had an initial unit weight of 31.5 pcf after one minute of mixing and the unit
weight decreased to 28.5 pcf after an additional two minutes of mixing. This mixture had
the lowest yield of 113% among the four batches. The average 28 day compressive
strength was 49.4 psi (an approximately 15% increase in strength when compared to M
21).
M 23 weighed 32.0 pcf after one minute of mixing and decreased to 28.1 pcf
after two additional minutes of mixing. M 23 showed results similar to M 21 and are
listed in Table 4.14. The yields were also similar for mixtures M 21 and M 23. The
average 28-day compressive strength was 44 psi. This showed that a consistency in the
results was observed between M 21 and M 23.
M 24 had a unit weight of 28.7 pcf after one minute of mixing and reached 27.8
pcf after an additional one and a half minutes of mixing. The samples were difficult to
demold at one day and this difficulty resulted in uneven surfaces at the bottom of the
specimens. This mixture had a yield of 116% and the lowest 28 day average compressive
strength among the four batches (36.7 psi). The reduction in the compressive strength
was most likely due to the lower unit weight (27.8 pcf) at which the cubes were cast.
Hence, the consistency of the mixtures was checked and found sufficient. So, the
M 25 batch was batched with same proportions, except the mixture was batched in the
hobart mixer to examine the behavior of the mixture when batched in greater quantities.

66
Table 4.12 Fresh and Hardened Properties of Mixtures M 21 through M 24
Mixture Designation
M 21 M 22 M 23 M 24
Mixing Time (minutes) Unit Weight
1 33.4 31.5 32.0 28.7 1.5 29.5 29.3 28.7 27.8 2 28.0 28.5 28.1 - 3 - - - - 4 - - - -
Yield (%) 115% 113% 115% 116%
Age (day) Compressive Strength (psi)
7 33.3 44.2 31.4 28.7 28 42.8 49.4 44.0 36.7
27
28
29
30
31
32
33
34
0.5 0.7 0.9 1.1 1.3 1.5 1.7 1.9 2.1
Time (minutes)
Uni
t Wei
ght (
pcf)
M 21M 22M 23M 24
Figure 4.6 Variation in Unit Weight with Time for Mixtures M 21 through M 24

67
4.7 Effect of Batch Size on Mixture Performance
To determine the effect of batch size on mixture proportion M 16, mixture M 25
was mixed in a larger quantity using a hobart mixer. Water temperature, mixture
temperature, and air temperature were all monitored for these mixtures. The mixture
proportions for M 25 are shown below in Table 4.13. The dry unit weight of M 25 was
20.8 pcf, which was much higher than the normal dry unit weight (18.0 pcf). The
increase in the dry unit weight was most likely due to an increase in moisture content due
to improper storage of the dry material.
Table 4.13 Mixture Proportion for Mixture M 25
Mixture Number Material
M 25
Pre-Blend Mixture PB 1 Sample Weight (g) 1888.9
Dry unit weight (lb/ft³) 20.8 Water (g) 1501.7
w/cm 0.80 Medry (% cement) 0.3%
Melflux (% cement) 0.5%
M 25 was initially mixed for one minute and unit weight was 33.9 pcf. After
mixing for another 30 seconds, the unit weight dropped down by 4.8 pcf and on further
mixing for 1.5 minutes, unit weight dropped to 26.2 pcf in two minutes. M 25 had a yield
of 143% which exceeded the targeted value of 130%. The samples in case of M 25 were
cast at lower unit weight compared to M 21 through M 24, which in turn resulted in lower
compressive strength. The mixture had a 28 day compressive strength of 27 psi, which is

68
less than mixtures M 21 through M 24. At 3 days of age, the specimens were so weak
that it was difficult to demold the cubes. The fresh and hardened properties of M 25 are
listed in Table 4.14, and unit weights were plotted against time and are shown in Figure
4.7.
It was noted that the mixture properties also vary with the amount of mixture
batched. From the results, it appears that the hobart mixer more effectively mixed the
concrete, meaning more air and therefore lower unit weights. From the above test results
it was also clear that lower unit weights result in lower compressive strengths. Hence
unit weight optimization tests were conducted to obtain the desired unit weight of 26-28
pcf.
Table 4.14 Fresh and Hardened Properties of Mixture M 25
Mixture Number
M 25
Mixing Time (minutes) Unit Weight (pcf)
1 33.9 1.5 29.1 2 26.2 3 - 4 -
Yield (%) 143%
Age (day) Compressive Strength (psi)
7 23.5 28 27.7

69
0
5
10
15
20
25
30
35
40
0 0.5 1 1.5 2 2.5
Time (minutes)
Uni
t Wei
ght (
pcf)
M 25
Figure 4.7 Variation in Unit Weight with Time for Mixture M 25
4.8 Unit Weight Optimization
One of the main objectives of this research was to develop a mixture with unit
weights between 26 to 28 pcf within a mixing time of three minutes. Hence, 22 mixture
proportions were developed during the process of optimizing the unit weight. The pre-
blend material PB 1 (Table 3.2) was used in all these mixtures. All the mixtures in this
section of the study were batched using the kitchen aid mixer. Since the goal for this
series is obtaining a unit weight of 26 to 28 pcf in less than 3 minutes of mixing, the
compressive strength of the mixtures was not measured. The mixture proportions of
different batches developed in this series are listed in Table 4.15 through Table 4.18. All
mixtures were batched for four minutes using the kitchen aid mixer maintained at speed 4

70
(unless noted elsewhere). The unit weight was measured after 1, 1.5, 2, 3, and 4 minutes
of mixing. The unit weight results for all mixtures are listed in Table 4.19 through Table
4.21.
Table 4.15 Mixture Proportions for Mixtures UW 1 through UW 7
Mixture Number Material
UW 1 UW 2 UW 3 UW 4 UW 5 UW 6 UW 7
Pre-Blend Mixture PB 1 PB 1 PB 1 PB 1 PB 1 PB 1 PB 1
Sample Weight (g) 1100 1100 1100 1100 1100 1100 1100
Water (g) 1089 1089 1089 1310 1210 950 1050
w/cm 0.99 0.99 0.99 1.19 1.10 0.86 0.95
Medry (g) 0.6 0.6 1.8 0.6 1.8 1.8 1.8
Melflux (g) 0 0 0 0 0 0 0
Table 4.16 Mixture Proportions for Mixtures UW 8 through UW 14
Mixture Number Material
UW 8 UW 9 UW 10 UW 11 UW 12 UW 13 UW 14
Pre-Blend Mixture PB 1 PB 1 PB 1 PB 1 PB 1 PB 1 PB 1
Sample Weight (g) 1100 1100 1100 1100 1100 1100 1100
Water (g) 1050 1089 1089 1089 1050 1050 1050
w/cm 0.95 0.99 0.99 0.99 0.95 0.95 0.95
Medry (g) 3.6 0.6 0.6 0.6 0.6 0.6 1.8
Melflux (g) 0 0 0.6 3.0 0.6 3.0 3.0

71
Table 4.17 Mixture Proportions for Mixtures UW 15 through UW 18
Mixture Number Material
UW 15 UW 16 UW 17 UW 18
Pre-Blend Mixture PB 1 PB 1 PB 1 PB 1 Sample Weight (g) 1100 1100 1100 1100
Water (g) 950 950 900 900 w/cm 0.86 0.86 0.81 0.81
Medry (g) 1.8 1.8 3.0 1.8 Melflux (g) 0.6 3.0 1.8 3.0
Table 4.18 Mixture Proportions for Mixtures UW 19 through UW 22
Mixture Number Material
UW 19 UW 20 UW 21 UW 22
Pre-Blend Mixture PB 1 PB 1 PB 1 PB 1 Sample Weight (g) 1100 1100 1100 1100
Water (g) 875 875 900 875 w/cm 0.79 0.79 0.81 0.79
Medry (g) 1.8 1.8 1.8 1.8 Melflux (g) 3.0 6.0 0.5 7.5
The first set of mixtures was batched with varying medry and water content. UW
1 was batched using 1100 g of PB 1 mixture and 0.6 g of medry and 1089 g of water
(w/cm of 0.99). After one minute of mixing, the unit weight was 34.3 pcf and there was
little decrease in unit weight after two minutes of mixing, which can be clearly seen in
Figure 4.8. The mixing speed was then increased to 4 and the unit weight decreased to
29.4 pcf and 29.2 pcf after three and four minutes of mixing, respectively. The unit
weight was greater than the targeted value of 26 to 28 pcf. To determine if the increase
72
in unit weight was due to excessive moisture content in the pre-blend, a second mixture
UW 2 was batched with the same mixture proportion as that of UW 1 except an unopened
bag of PB 1 was used. UW 2 had a similar unit weight (34.7 pcf) as UW 1 (34.3 pcf) at
one minute and upon further mixing, the unit weight of UW 2 decreased (Figure 4.8) to
31.3 pcf after four minutes. The speed of the mixer was increased to 4 from 2 in case of
mixture UW 1 at 3 and 4 minutes, where as the speed of the mixer was maintained at 2
for the complete 4 minute mixing in case of UW 2. Hence the unit weight results
obtained at 3 and 4 minutes for these mixtures were not compared. Figure 4.8 clearly
showed that UW 2 had lower unit weights within 3 minutes of mixing when compared to
that of UW 1. Based on the results of UW 2 when compared to UW 1, a new bag of PB 1
was used for remaining mixtures and care was taken to properly seal the bag once it was
opened.
Since the unit weights of UW 1 and UW 2 were too high, the amount of medry
was increased by 0.6 g for UW 3. The unit weight at one minute was 36.6 pcf which was
higher than that of UW 1 (34.3 pcf) and UW 2 (34.7 pcf). Upon further mixing for one
minute, the unit weight was reduced by 4.5 pcf. The mixing continued for four minutes,
but there was little decrease in unit weight. This drop in the unit weight can be clearly
seen in Figure 4.8. With a unit weight of 32.5 pcf after four minutes of mixing, the
mixing speed was increased from 2 to 4, and the concrete was mixed for an additional
two minutes. The unit weight was 30.5 pcf and 29.9 pcf after 5 minutes and 6 minutes of
mixing which is still greater than the targeted values. The increase in medry had no
effect on unit weight, and therefore the amount of medry was reduced to 0.6 g and the
water content was increased to 1.19. These changes were done to determine if there was

73
sufficient water available in the concrete mixture for air bubbles to form, which would in
turn reduce the unit weight.
Based on the results of UW 3, the amount of water in UW 4 was increased to
1310 g. Since water is the second heaviest ingredient in the mixture (next to cement), the
unit weights were higher than those of UW 1 and UW 2 (Table 4.19) which was
expected. A unit weight of 37.2 pcf was measured after one minute of mixing and it
decreased 0.2 pcf after an additional two minutes of mixing. The mixer speed was
increased to speed 4 for the next two minutes to determine if increasing mixer speed
would reduce unit weight. After one minute of mixing at speed 4, the unit weight
decreased by 5.3 pcf and on further mixing for one minute, the unit weight decreased by
1.7 pcf. This showed that the higher mixing speed reduced unit weight at a faster rate.
To decrease unit weight, UW 5 contained more medry (1.8 g) and less water to
1210 g (w/cm of 1.10). In this batch the unit weight was initially 35.2 pcf after one
minute of mixing and after two minutes, the unit weight was 34.3 pcf. On further mixing
the unit weight remained at 34.5 pcf. For this mixture, the increase in medry was
ineffective.
Since water is the second heaviest ingredient in the concrete, the water content
was further reduced to 950 g (UW 6). The resulting mixture, UW 6 was very dry, and the
unit weight could not be measured after 1.5 minutes of mixing. However, after two
minutes, the unit weight was 31.6 pcf. UW 6 was then mixed for an additional 2 minutes
(a total of 4 minutes), but there was little reduction in unit weight. The speed of the
mixer was increased from 2 to 4 and mixed for one minute which resulted in a unit

74
weight of 29.8 pcf. Reducing the water content was not an effective means of reducing
unit weight, and the mixture was too dry after 1.5 minutes of minutes of mixing.
Therefore the amount of water was increased to 1050 g for mixture UW 7. This
change in water content resulted in a unit weight of 31.3 pcf after one minute of mixing.
UW 7 was further mixed for three additional minutes, but the unit weight remained
constant at approximately 30.2 pcf which was 2.7 pcf greater than the targeted unit
weight of 26-28 pcf. Since the increase in water appeared to have decreased the unit
weight for the mixture UW 7 when compared to UW 6, mixture UW 8 was batched with
the same water content (as UW 7) but twice the dosage of medry (3.6 g). It was hoped
that the observed increase in workability for UW 7 along with the increase in medry
would decrease the unit weight. However, little difference in unit weight was observed
between UW 8 and UW 7.
Since the unit weight of UW 2 was the lowest measured in this series, UW 2 was
batched again as mixture UW 9. UW 9 had higher unit weight of 35.5 pcf when mixed
for one minute when compared to that of UW 2 (34.7 pcf). After 4 minutes, UW 9 had a
unit weight 2.4 pcf higher than UW 2. In both the batches the unit weight was much
higher than the targeted unit weight of 26-28 pcf, hence to reduce the unit weight melflux
was introduced.
UW 10 through UW 22 was then batched using melflux (high range water
reducer) with the hopes of reducing water content but maintaining workability. Since 0.6
g medry was effective for mixtures UW 1, UW 2, & UW 3 with mixtures unit weights of
29.2 pcf, 31.3 pcf, & 30.0 pcf respectively, the same dosage of medry was used in UW
10. The melflux content was 0.6 g for the mixture. With the additional melflux, a

75
decrease in unit weight was expected. Whereas, UW 10 had a high unit weight of 37.2
pcf after one minute of mixing, and the unit weight decreased to 35.0 pcf after mixing for
4 minutes. For UW 11, the melflux dosage was increased to 3 g with the intent that the
workability would increase, which would then allow the air-entraining agent to work
better and therefore reduce the unit weight.
UW 11 had a unit weight of 35.8 pcf after one minute of mixing, which was
similar to UW 9 (35.5 pcf). UW 11 was then mixed for 4 minutes, but the resulting
decrease in unit weight was only 1 pcf. Hence, the increase in melflux showed a small
variation in unit weight, the amount of melflux was reduced to 0.6 g and at the same time,
the w/cm was reduced to 0.95 (1050 g) and batched as UW 12.
UW 12 was then batched with 0.6 g melflux, 0.6 g medry, and 1050 g of water
(Table 4.16). UW 12 had unit weights similar to those of UW 9, which were too high
(33.7 pcf). To reduce the unit weight, the amount of melflux was then increased to 3 g
for UW 13. The unit weight after one minute of mixing was 33.9 pcf (nearly 2 pcf less
than that of UW 12). However, upon further mixing the unit weight remained at
approximately 33.3 pcf.
Since the unit weights for UW 13 were too high, the medry content was increased
for mixture UW 14 to 1.8 g the and melflux content remained same (3 g). The increase in
medry, the air-entraining agent, resulted in an increase in air bubbles which in turn,
decreased the unit weight by 0.5 pcf when compared to that of UW 13.
Both mixtures, UW 13 and UW 14, had higher unit weights (33.65 pcf and 32.64
pcf) than the desired unit weight of 26-28 pcf. For both batches, 3.0 g of melflux was
used. Since the high amount of melflux had no effect on unit weight, the amount of
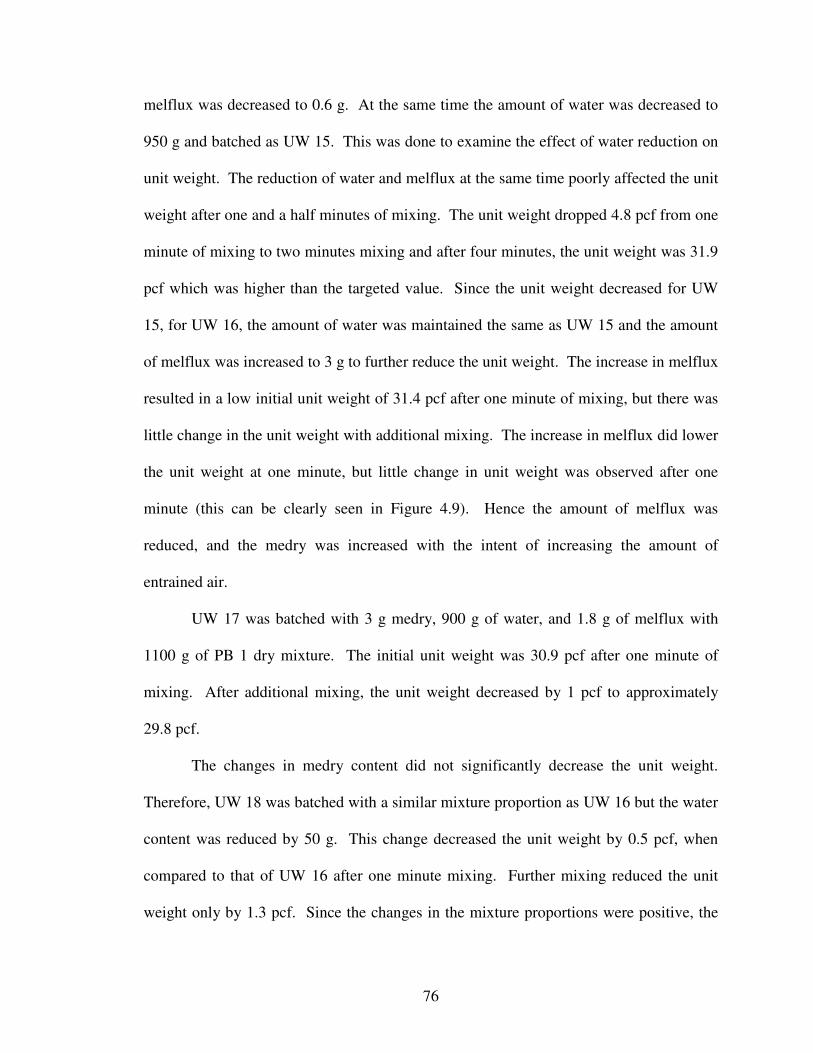
76
melflux was decreased to 0.6 g. At the same time the amount of water was decreased to
950 g and batched as UW 15. This was done to examine the effect of water reduction on
unit weight. The reduction of water and melflux at the same time poorly affected the unit
weight after one and a half minutes of mixing. The unit weight dropped 4.8 pcf from one
minute of mixing to two minutes mixing and after four minutes, the unit weight was 31.9
pcf which was higher than the targeted value. Since the unit weight decreased for UW
15, for UW 16, the amount of water was maintained the same as UW 15 and the amount
of melflux was increased to 3 g to further reduce the unit weight. The increase in melflux
resulted in a low initial unit weight of 31.4 pcf after one minute of mixing, but there was
little change in the unit weight with additional mixing. The increase in melflux did lower
the unit weight at one minute, but little change in unit weight was observed after one
minute (this can be clearly seen in Figure 4.9). Hence the amount of melflux was
reduced, and the medry was increased with the intent of increasing the amount of
entrained air.
UW 17 was batched with 3 g medry, 900 g of water, and 1.8 g of melflux with
1100 g of PB 1 dry mixture. The initial unit weight was 30.9 pcf after one minute of
mixing. After additional mixing, the unit weight decreased by 1 pcf to approximately
29.8 pcf.
The changes in medry content did not significantly decrease the unit weight.
Therefore, UW 18 was batched with a similar mixture proportion as UW 16 but the water
content was reduced by 50 g. This change decreased the unit weight by 0.5 pcf, when
compared to that of UW 16 after one minute mixing. Further mixing reduced the unit
weight only by 1.3 pcf. Since the changes in the mixture proportions were positive, the

77
water content was further reduced by 25 g, while maintaining the other ingredients at the
same amount. This mixture was UW 9. After one minute of mixing, the mixture was
dry, and the unit weight was 38.1 pcf. The mixture was then mixed for another 30
seconds, and the unit weight dropped 8 pcf, upon further mixing, the unit weight
remained constant at 29.6 pcf.
UW 20 was the next mixture batched, and it contained twice the melflux (6 g)
content than UW 19. The amount of medry was increased to improve the air content
which would reduce the unit weight. This mixture had lower unit weights than all
previous mixtures. The unit weight after one minute of mixing was 29.3 pcf, and upon
further mixing, for two and a half minutes, the unit weight decreased to 28.0 pcf. The
change in UW 20 appeared to indicate that the increase in melflux was decreasing the
unit weight. To understand better the effect of melflux, UW 21 was batched with 0.5 g of
melflux which was 1/12th the dosage of UW 20. UW 21 had a unit weight of 32.0 pcf after
one minute of mixing and after mixing for 3 additional minutes, it decreased by 1.2 pcf.
The results of UW 20 and UW 21 showed that the melflux content did affect the
unit weight. Since UW 20 achieved the target unit weight with 6 g of melflux, mixture
UW 22 was batched with 7.5 g of melflux with the hope of further reducing the unit
weight. However, the increase in melflux was not effective. The mixture was dry after
one minute of mixing and the unit weight was 35.0 pcf. On further mixing, the unit
weight decreased nearly 5 pcf after one and a half minutes of mixing. The mixture was
then mixed for another two and a half minutes, but the change in unit weight was
minimal.

78
The results from mixtures UW 1 through UW 22 showed that medry was not very
effective at entraining air for these mixtures, since the unit weights of the mixtures were
higher than the targeted unit weight of 26-28 pcf. Hence, rheocell, a liquid air-entraining
agent was introduced and used in the remaining mixtures.
Table 4.19 Fresh Properties of Mixtures UW 1 through UW 9
Mixture Designation UW 1 UW 2 UW 3 UW 4 UW 5 UW 6 UW 7 UW 8 UW 9
Time (minutes) Unit weight (pcf)
1 34.3 34.7 36.6 37.2 35.2 36.3 32.2 32.4 35.5 1.5 33.3 32.6 33.2 36.3 34.3 - 31.3 31.7 34.0 2 33.2 31.9 33.2 37.0 34.7 31.6 30.7 31.3 33.9 3 29.4* 31.7 32.7 31.6* 34.6 31.4 30.9 31.0 33.6 4 29.2* 31.3 32.5 30.0* - 31.2 30.6 30.8 33.6 5 - - 30.5* - - 29.8* - 30.3 - 6 - - 29.9* - - - - - -
• Represents the unit weight of the mixture noted after the speed of the mixer is increased from 2 to 4
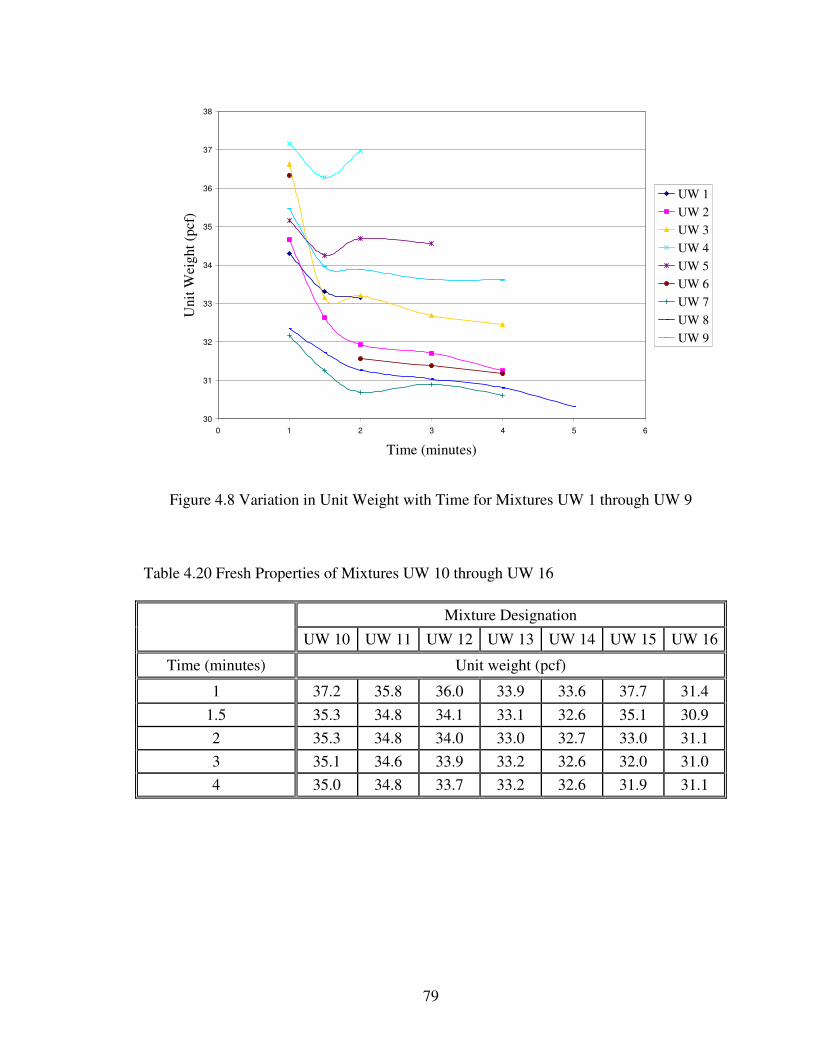
79
30
31
32
33
34
35
36
37
38
0 1 2 3 4 5 6
Time (minutes)
Uni
t Wei
ght (
pcf)
UW 1UW 2UW 3UW 4UW 5UW 6UW 7UW 8UW 9
Figure 4.8 Variation in Unit Weight with Time for Mixtures UW 1 through UW 9 Table 4.20 Fresh Properties of Mixtures UW 10 through UW 16
Mixture Designation
UW 10 UW 11 UW 12 UW 13 UW 14 UW 15 UW 16
Time (minutes) Unit weight (pcf)
1 37.2 35.8 36.0 33.9 33.6 37.7 31.4 1.5 35.3 34.8 34.1 33.1 32.6 35.1 30.9 2 35.3 34.8 34.0 33.0 32.7 33.0 31.1 3 35.1 34.6 33.9 33.2 32.6 32.0 31.0 4 35.0 34.8 33.7 33.2 32.6 31.9 31.1

80
Table 4.21 Fresh Properties of Mixtures UW 17 through UW 22
Mixture Designation
UW 17 UW 18 UW 19 UW 20 UW 21 UW 22
Time (minutes) Unit weight (pcf)
1 30.9 30.9 38.1 29.3 32.0 35.0 1.5 30.6 30.0 30.7 28.4 31.1 29.9 2 30.3 30.0 29.7 28.2 30.9 29.1 3 29.8 29.9 29.6 28.0 30.9 28.9 4 29.8 29.6 29.6 - 30.8 28.7
26
27
28
29
30
31
32
33
34
35
36
37
38
0 1 2 3 4 5
Time (minutes)
Uni
t Wei
ght (
pcf)
UW 10UW 11UW 12UW 13UW 14UW 15UW 16UW 17UW 18UW 19UW 20UW 21UW 22
Figure 4.9 Variation in Unit Weight with Time for Mixtures UW 10 through UW 22

81
4.9 Introduction of Rheocell
A different type of air-entraining agent, rheocell, was introduced in this series of
mixtures. As described in chapter 3, rheocell is a liquid admixture that is added to the
mixing water. M 26 was the first mixture batched with rheocell. The mixture proportion
was provided by the Strong Company and shown below in Table 4.22. The rheocell
dosage was dependent on the amount of water in the mixture. The rheocell dosage shown
in Table 4.22 is represented as the ratio of rheocell to the amount of water. Medry from
PB 1 was removed and the new pre-blend material was named as PB 2 (Table 3.2), which
was used in all the mixtures developed using rheocell as air-entraining agent. For these
mixtures, the temperature of the ingredients and the mixture were recorded to determine
the effects of temperature on unit weight.
Table 4.22 Mixture Proportions for Mixtures M 26 through M 28
Mixture Number Material
M 26 M 27 M 28
Pre-Blend Mixture PB 2 PB 2 PB 2
Sample Weight (g) 2013.7 2067.5 1997.6
Dry unit weight (lb/ft³) 22.2 22.8 22.0
Water (g) 2028.2 2015.8 1897.7
w/cm 1.008 0.97 0.95
Rheocell (Rheocell/Water) 1:136 1:102 1:102
Mixture M 26 contained a ratio of rheocell to water of 1:136. After one minute of
mixing, the unit weight was 35.1 pcf, and the mixture was too dry. However, after an

82
additional minute of mixing, the unit weight dropped to 27.4 pcf, and compressive
strength samples were cast. The remaining concrete was left in the mixer for fifteen
minutes. The mixer remained off, and after the 15 minutes, the unit weight was 32.6 pcf.
This was done to examine the stability of the air bubbles. The yield of the concrete was
163% which was higher than the desired yield of 130%. The average 28 day compressive
strength was 42.1 psi which was also too high.
M 27 and M 28 were then batched with a r/w (ratio of rheocell to water) of 1:102.
Both mixtures had a unit weight as high as 35 pcf after one minute of mixing. After two
minutes of mixing, the unit weight of the mixtures was approximately 27 pcf. This
increase in the amount of rheocell increased the yield of the concrete to approximately
165%. For M 27, 18 cubes were cast for compressive strength testing, and out of which,
6 samples broke during demolding at 7 days. The 28 day compressive strength of the
cubes was 18.3 psi. For M 28, the 28 day compressive strength was 15.1 psi. The
compressive strengths for all these mixtures are shown in Table 4.23.
The results from this series of mixtures clearly showed that rheocell was more
effective in entraining air than medry. When used at a dosage rate of 1:102, rheocell was
very effective, and further batches were conducted to refine the mixtures. Unit weights
were plotted against time and are shown in Figure 4.10. All these mixtures attained the
targeted unit weight (26-28 pcf) within two minutes. Hence, no further unit weight
readings were recorded.

83
Table 4.23 Fresh and Hardened Properties of Mixtures M 26, M 27, & M 28
Mixture Designation
M 26 M 27 M 28
Mixing Time (minutes) Unit Weight (pcf)
1 35.1 35.0 35.8 1.5 29.8 29.7 29.7 2 27.4 27.1 26.5 3 - - - 4 - - -
Yield (%) 163% 167% 163%
Age (day) Compressive Strength (psi)
7 24.9 12.5 8.5 28 31.4 18.3 15.1
25
27
29
31
33
35
37
0.5 1 1.5 2 2.5
Time (minutes)
Uni
t Wei
ght (
pcf)
M 26M 27M 28
Figure 4.10 Variation in Unit Weight with Time for Mixtures M 26 through M 28

84
4.10 Effect of Batch Size on Mixture Performance using Rheocell
The preliminary unit weights measured in the previous section using rheocell at a
dosage of 1:102 were successful. The next mixtures were cast to determine if rheocell
was as effective in larger batch sizes. The mixtures (M 26-M 28) in section 4.9 had a
batch size of approximately 4.4 lb. Whereas these mixtures had a batch size of
approximately 42 pounds. Due to the larger batch size, these mixtures, M 29 through M
31, were batched in the double drum shear mixer. The mixture proportions and concrete
properties for M 29 through M 31 are shown in Table 4.24.
Table 4.24 Mixture Proportions for Mixtures M 29 through M 31
Mixture Number Material
M 29 M 30 M 31
Pre-Blend Mixture PB 2 PB 2 PB 2
Sample Weight (lb) 44.3 39.9 41.6
Dry unit weight (lb/ft³) 22.2 20.0 20.8
Water (lb) 44.7 40.2 41.9
w/cm 1.008 1.008 1.008
Rheocell (Rheocell/Water) 1:102 1:102 1:102
M 29 was batched with same mixture proportions as M 26 but at a lower dosage
rheocell (1:102). M 29 was mixed for one minute and the unit weight was 33.5 pcf. The
mixture was further mixed for two minutes, and the unit weight dropped to 29.1 pcf.
Since the targeted unit weight was 26 to 28 pcf, the mixture was mixed for one additional
minute, and the resulting unit weight was 25.4 pcf. The unit weight was slightly lower

85
than the desired unit weight which in turn produced a yield of 175%. At 28 days, a
concave shape was observed on the specimens cast from the concrete with a unit weight
of 25.4 pcf concrete.
The concave shape was not present on the specimens cast from the concrete with
unit weights more than 27 pcf. This shape possibly showed that the air voids became
unstable and collapsed. Additionally, the remaining concrete was left in the mixer for
twenty five minutes and the unit weight increased to 38.7 pcf. The gain in the unit
weight was attributed to the instability of the air bubbles. The average 28 day
compressive strength was 47.2 psi, which was higher than the desired compressive
strength of 20 psi (Table 4.25).
To check the repeatability of mixture M 29, M 30 and M 31 were cast with the
identical mixture proportions. These mixtures contained PB 2, and the dry unit weight
was 20.0 pcf (M 30) and 20.8 pcf (M 31). Both mixtures had unit weights that were
similar to that of M 29 (Figure 4.11), which was approximately 27.5 pcf. M 30 was
mixed for a total of three minutes, and the resulting yield was 155%. M 31 was mixed
for two minutes, and the resulting yield was 151%. For M 30 and M 31, 18 cubes, 3
cylinders (3 in. × 6 in.), and 3 blocks (12 in. × 12 in.) were cast. Among the three blocks,
one was cast and stored in the environmental chamber. The second was cast outside in
ambient conditions and then cured in the environmental chamber. The third was cast and
cured in ambient conditions. The goal of using the three different curing environments
was to examine the stability of the air bubbles in different environmental conditions. The
results showed that the different curing environments had little to no effect on specimen
shrinkage. All the blocks had a smooth surface (non-concave), but the surface of the

86
cubes was concave. Since the cubes experienced some shrinkage (concave shape),
further research on bubble stability with respect to temperature was conducted.
Table 4.25 Fresh and Hardened Properties of Mixtures M 29 through M 31
Mixture Designation
M 29 M 30 M 31
Mixing Time (minutes) Unit Weight (pcf)
1 33.5 32.0 33.5 1.5 30.7 29.8 30.0 2 29.1 27.5 27.7 3 25.4 26.1 - 4 - - -
Yield (%) 176% 155% 151%
Age (day) Compressive Strength (psi)
7 - 19.7 15.9 28 47.2 29.9 15.0

87
25
26
27
28
29
30
31
32
33
34
0 0.5 1 1.5 2 2.5 3 3.5 4
Time (minutes)
Uni
t Wei
ght (
pcf)
M 29M 30M 31
Figure 4.11 Variation in Unit Weight with Time for Mixtures M 29 through M 31
Since M 29 had a high yield and low unit weight, the same mixture proportion
was used to batch two mixtures, M 32 and M 33, to examine the effects of temperature on
the unit weight and volume change of the mixtures. M 32 was batched with a fresh
concrete temperature of 65ºF, and M 33 had a fresh concrete temperature of 80ºF. To
obtain these fresh concrete temperatures, M 32 was batched in the morning and M 33 was
batched in the afternoon of the same day. Additionally the mixing water temperature was
62ºF and 71ºF for M 32 and M 33, respectively. The mixture proportions for both
mixtures are shown in Table 4.26.

88
Table 4.26 Mixture Proportions for Mixtures M 32 through M 33
Mixture Number Material
M 32 M 33
Pre-Blend Mixture PB 2 PB 2
Sample Weight (lb) 42.4 45.2
Dry unit weight (lb/ft³) 21.2 22.6
Water (lb) 42.4 45.2
w/cm 1.008 1.008
Rheocell (Rheocell/Water) 1:102 1:102
After 2.5 minutes of mixing, M 32 had attained a unit weight of 27.6 pcf. As with
M 31, three blocks (12 in. diameter and 12 in. height) were cast for M 32. The first block
was cast and cured in the environmental chamber, the second block was cast outside the
environmental chamber and was immediately moved to the environmental chamber, and
the third block was cast and cured outside the environmental chamber and was left
outside in the lab. For all blocks, there was no shrinkage or volume change observed.
For M 33, the mixture was initially dry after one minute of mixing and had a unit
weight of 32.4 pcf. Upon further mixing, the unit weight dropped to 27.7 pcf after two
minutes. The concrete was very fluid with a yield of 165%. Once again, blocks were
cast from M 33. The blocks were subjected to the same curing regimens as M 31 and M
32. Among the three blocks, the block that was cast and stored in the environmental
chamber was the only block that did not experience any volume changes. However, the
concrete collapsed and had a concave surface on the top for the other two blocks. This

89
collapse was due to the failure of the air void system (Figure 4.12). The concave surface
was also noted on cubes and cylinders. The fresh and hardened properties of M 32 and M
33 are shown in Table 4.27. The unit weights vs. time for the mixtures are shown in
Figure 4.13.
From the results, it was observed that the air void system produced by rheocell
was more unstable at high temperatures. Maintaining an appropriate batching
temperature is not only difficult but also expensive, for future mixtures, aluminum sulfate
was added to stabilize the air bubbles.
Table 4.27 Fresh and Hardened Properties of Mixtures M 32 & M 33
Mixture Designation M 32 M 33
Mixing Time (minutes) Unit Weight (pcf) 1 34.4 32.4
1.5 31.7 29.6 2 28.9 27.7
2.5 27.6 - Yield (%) 155% 165% Age (day) Compressive Strength (psi)
1 6.5 14.1 28 14.1 23.0

90
Figure 4.12 Failure of Air Bubble
0
5
10
15
20
25
30
35
40
0 0.5 1 1.5 2 2.5 3
Time (minutes)
Uni
t Wei
ght (
pcf)
M 32M 33
Figure 4.13 Variation in Unit Weight with Time for Mixtures M 32 & M 33

91
4.11 Bubble Stabilization Using Aluminum Sulfate
To increase the stability of the air voids, aluminum sulfate was introduced.
Aluminum sulfate acts as an air-stabilizing agent when added to fresh concrete (Taylor
1974). For this series of mixtures, a kitchen aid mixer was used to mix the concrete. M
34 was the control mixture for this series and did not contain aluminum sulfate. The
mixture proportions for M 34 through M 38 are shown in Table 4.28. For all mixtures,
the unit weight was measured at 1, 1.5, 6.5, 11.5, and out to 16.5 minutes to check the
bubble stability. The unit weight results are listed in Table 4.29.
Table 4.28 Mixture Proportions for Mixtures M 34 through M 38
Mixture Number Material
M 34 M 35 M 36 M 37 M 38
Pre-Blend Mixture PB 2 PB 2 PB 2 PB 2 PB 2 Sample weight (g) 811 811 811 811 811
Dry unit weight (lb/ft³) 21.3 21.3 22.3 22.3 22.3 Water (g) 817.5 817.5 817.5 817.5 817.5
w/cm 1.008 1.008 1.008 1.008 1.008 Aluminum Sulfate (% of cement) 0 0.25% 0.50% 0 0
Rheocell 1:102 1:102 1:102 1:102 1:102
M 34 was batched with the same mixture proportions as M 33 and was considered
as control mixture. It attained a unit weight of 30.01 pcf after one minute of mixing.
Upon further mixing for 30 seconds, the unit weight dropped to 27.59 pcf. M 34 was
further mixed for six minutes, but there was little change in unit weight. However, after
11.5 minutes of mixing, the unit weight increased 0.7 pcf, and after 16.5 minutes, the
final unit weight was 28.4 pcf.

92
M 35 was the first mixture containing aluminum sulfate, and it contained 0.25%
aluminum sulfate per weight of cement. This mixture performed similar to the reference
mixture. There was little change in unit weight with the addition of aluminum sulfate.
For M 36, the aluminum sulfate dosage was increased to 0.5%. The dry unit weight was
22.3 pcf which was slightly higher than the normal range of 18 to 20 pcf. This resulted in
a higher unit weight compared to that of the reference mixture. As shown in Figure 4.14,
the unit weights of these two mixtures (M 35 & M 36) showed the addition of aluminum
sulfate was not able to stabilize bubbles. M 37 and M 38 were then batched to determine
mixing water temperatures, which would in turn help in increasing the stability of the
bubbles.
The dry unit weight of the material used in both these mixtures (M 37 and M 38)
was 22.3 pcf. Mixture proportions are shown in Table 4.28. Both mixtures were batched
on the same day at an air temperature of 84ºF. M 37 was batched with hot water (85ºF),
and M 38 was batched with cold water (57ºF). The unit weights obtained from the tests
is shown in Table 4.29. For M 37, the initial unit weight was 2 pcf greater than M38.
Figure 4.14 shows clearly that after seven minutes of mixing the rate of increase in unit
weight was higher in the case of the hot water mixture (M 37). Based on the results from
M 37 and M 38, it appears that concrete at lower temperatures has a more stable air void
system than at higher temperatures.

93
Table 4.29 Fresh Properties of Mixtures M 34 through M 38
Mixture Designation
M 34 M 35 M 36 M 37 M 38
Mixing Time (minutes) Unit Weight (pcf)
1 30.0 30.0 30.8 32.0 30.7 1.5 27.4 27.6 27.4 29.1 27.5 6.5 27.6 28.0 27.7 28.5 27.4
11.5 28.2 28.3 28.3 29.7 27.9 16.5 28.4 28.2 28.6 30.5 28.0
27
28
29
30
31
32
33
0 5 10 15 20Time (minutes)
Uni
t Wei
ght (
pcf) M 34
M 35M 36M 37M 38
Figure 4.14 Variation in Unit Weight with Time for Mixtures M 34 through M 38.
4.12 Check for Repeatability of Drum Mixtures M 30 through M 33
From the previous batches conducted in the research, M 30 through M 33 had the
properties that were suitable for use in SGAS. Hence a test with three batches was
conducted to check the repeatability of these mixtures. In reference to mixtures M 30

94
through M 33, three batches, M 39, M 40, and M 41 were batched to examine the
repeatability of the mixture when batched in larger quantities. These mixtures were
batched with the same mixture proportions. A w/cm of 1.008 was maintained for the
three mixtures. The mixture proportions are listed in Table 4.30. Also, fresh concrete
and ambient temperatures were measured for these mixtures.
Table 4.30 Mixture Proportions for Mixtures M 39 through M 41
Mixture Number Material
M 39 M 40 M 41
Pre-Blend Mixture PB 2 PB 2 PB 2
Sample Weight (lb) 43.3 40.3 35.1
Dry unit weight (lb/ft³) 21.7 20.2 17.5
Water (lb) 43.7 40.7 35.3
w/cm 1.008 1.008 1.008
Rheocell (Rheocell/Water) 1:102 1:102 1:102
For these mixtures, the portland cement used for the pre-blends contained small
pebbles of cement which in turn affected the dry unit weight. The dry unit weight of the
three mixtures ranged from a low of 17.5 pcf for mixture M 41 to a high of 21.7 pcf for
M 64. Due to time constraints, the batches were conducted with the same mixtures. For
the mixtures, the mixing water temperature was maintained between 56 to 60ºF. The unit
weight for M 39 and M 40 was measured at 1, 1.5, 2, 3 and 4 minutes. The unit weights
of M 39 and M 40 were initially at 33.4 pcf and 31.4 pcf after one minute of mixing, and
after 3 minutes of mixing their unit weights reached a low of 27.0 pcf and 26.1 pcf.

95
Since the targeted unit weights were attained, further mixing was not continued. Both
mixtures had an average 7 day compressive strength of 4.8 psi (M 39) and 3.4 psi (M 40),
which was due to low unit weights at which the concrete was cast (less than 28 pcf).
Most of the specimens failed during demolding, and there were not enough specimens
left for testing the compressive strength at 28 days. Both these mixtures had high yields
of 162% (M 39) and 156% (M 40).
For M 41, the mixing continued until four minutes, because M 41 required a
longer mixing to attain a unit weight of approximately 29 pcf. As the mixture was mixed
for a longer time, no cubes were cast to test the compressive strength. The test results are
listed in Table 4.31, and the relationship between unit weight and time are shown in
Figure 4.15. As shown in Figure 4.15, the unit weights for M 39 and M 40 were very
similar as was the final mixture temperature (59ºF). For all mixtures, three blocks were
cast to assess the stability of the mixtures. All blocks were cast and cured in the
environmental chamber, and shrinkage was not observed in any of the blocks.

96
Table 4.31 Fresh and Hardened Properties of Mixtures M 39 through M 41
Mixture Designation
M 39 M 40 M 41
Mixing Time (minutes) Unit Weight (pcf)
1 33.4 31.4 33.8 1.5 30.1 29.2 32.8 2 27.8 27.7 31.4 3 27.0 26.1 - 4 - - 28.8
Yield (%) 162% 156% 130%
Age (day) Compressive Strength (psi)
7 4.8 3.4 - 28 - - -
25
26
27
28
29
30
31
32
33
34
35
0 1 2 3 4 5
Time (minutes)
Uni
t Wei
ght (
pcf)
M 39M 40M 41
Figure 4.15 Variation in Unit Weight with Time for Mixtures M 39 through M 41

97
CHAPTER 5
CONCLUSIONS AND RECOMMENDATIONS
5.1 Introduction
This project examined different types of admixtures that can be used to develop
ultra-lightweight concrete for use in a Soft Ground Arrestor System (SGAS). The fresh
and hardened properties of the concrete were analyzed while varying the type and dosage
of chemical admixtures. For these mixtures the wet unit weight of the concrete and the
compressive strength were the only concrete properties measured. The targeted unit
weight was 26 pcf to 28 pcf after 3 minutes of mixing. The targeted 28 day compressive
strength was 20 psi with minimal to no increase in compressive strength beyond 28 days
of age.
5.2 Conclusions
The research project showed that the appropriate use of chemical admixtures can
result in the targeted fresh and hardened properties. The following is a summary of the
conclusions and observations from the research project. The following section is divided
into conclusions regarding the mixing procedures, chemical admixtures, and materials.
5.2.1 Mixing Procedures
• The speed of the mixer is an important factor that must be considered when
batching ultra-lightweight concrete. For the double drum shear mixer used in the
study, a mixer speed of 58 revolutions per minute produced the best results. Any
98
decrease in speed requires more time to attain the targeted unit weights. For
speeds greater than 58 revolutions/minute, the targeted unit weights can be
attained within 3 minutes, but the stability of air bubble is reduced which may
result in the collapse of the concrete.
• For the mixtures examined in this study, the ideal concrete temperature during
mixing was 60ºF.
• The concrete properties are dependent on the quantity batched. The higher the
quantity, the better the homogeneity of the concrete.
• Proper curing is considerably important. Proper curing consisted of maintaining a
ambient temperature of 70ºF and curing the specimens in a sealed container.
5.2.2 Chemical Admixtures
• An increase in melflux dosage increased the concrete’s yield, but overdosing can
cause bleeding and segregation.
• Combinations of medry and melflux were more effective than concrete mixtures
containing only medry in reducing unit weight. Medry when used at a dosage rate
of 1.8 g for every 1100 g of PB-1 produced the best results and any further
increase in medry was ineffective. It was also observed that mixtures without
melflux had higher unit weights.
• For the mixtures developed in this program, the suggested dosage rate for melflux
is 0.5% (percent of cement by weight) to 1%. Any further decrease in melflux
increases unit weights and compressive strengths. Also, increasing the melflux
above 1% has no effect on unit weight and compressive strength.

99
• Rheocell produced concrete with lower unit weights, higher yields, and lower
compressive strengths than mixtures containing medry. For the mixtures tested, a
rheocell dosage of 1:102 (rheocell to water ratio) was effective in producing
ultra-lightweight concrete.
• For mixtures containing rheocell, the optimum mixing time is 5 minutes. Mixing
longer than 7 minutes can diminish bubble stability and cause settlement.
• For mixtures containing rheocell, concrete with unit weights less than 27 pcf were
prone to collapse.
• Aluminum sulfate was ineffective in increasing the stability of bubbles.
5.2.3 Material
• Improper storage of the dry material can cause variations in the unit weight. This
is due to high absorption capacity of the lightweight aggregate. Therefore, the
pre-blend mixtures and materials should be stored in a dry place at all times.
• To limit the strength gain of the concrete, several mixtures were cast using
calcium aluminate cement (CAC). Since the amount of cement used in ultra-
lightweight concrete is very small, CAC was not helpful in reducing the
compressive strength gain.
• For mixtures containing medry, a w/cm of 0.80 was effective in producing
concrete with the targeted unit weights and compressive strengths. For mixtures
containing rheocell, the most effective w/cm was 1.008. Any further reduction in
water content results in a mixture that was too dry with higher unit weights and

100
compressive strengths. Increasing the water content caused segregation and
bleeding.
5.3 Research Team Difficulties
• The research team experienced difficulty in maintaining the water temperature
and mixture temperature, which was required for bubble stability.
• Problems in demolding the concrete specimens at one day were observed. This
was due to slow setting times and low early age strengths of ultra-lightweight
concrete. Hence the ultra-lightweight concrete was demolded at 3 days and cured
in the environmental chamber at 70ºF.
5.4 Batching Recommendations
• While preparing and weighing the materials prior to testing, it is important not to
subject the material to any type of compaction. This is mainly to avoid settlement
of particles which would increase the unit weight and compressive strength.
• While casting ultra-lightweight concrete specimens, make sure that they are not
subjected to excessive compaction. Excessive compaction can lead to the failure
of the air void system in the concrete.
• Dry admixtures worked well when added to the dry ingredients rather than when
added to the mixing water. For admixtures such as medry, melflux, and methocel,
better results were achieved when the admixture was added to the dry mixture
prior to batching. For mixtures containing rheocell, adding directly to the mixing
water prior to batching produced better results.

101
• For the mixtures developed and tested in this study, a uniform batching and
mixing procedure was employed. For the mixtures, one third of mixing water was
added along with all the dry ingredients including the admixtures to the mixer.
The mixer was then started, and the remaining water was slowly added.
• Multiple trial batches should be conducted on the same mixture in order to
properly understand the behavior of the concrete with respect to batch quantity,
mixer, concrete temperature, and ambient temperature.
5.5 Research Recommendations
Recommendations for future research work are listed below.
• Because of the difficulties in maintaining a constant mixing temperature and its
effect on air void stability, further research is needed in the area of air bubble
stabilization (specifically admixtures to improve bubble stability).
• Another area of potential research is to examine the effects of pumping ultra-
lightweight concrete. Pumping the concrete will reduce labor costs and reduce
the time required for casting SGAS.

102
REFERENCES
1. Anon, (1929). "Widening the concrete field by use of light weight aggregate." Pit
& quarry. 18(6), pp. 55-56.
2. Anon, (1963). "Cellular concrete." Concrete construction. 8(1), pp. 5-8.
3. Anon, (1989). "Foamed concrete becomes popular." The Indian concrete journal.
63(4), pp. 169-171.
4. American Society for Testing and Materials (ASTM). (1994). “ASTM C 33 - 93:
Standard specification for concrete aggregates.” Annual Book of ASTM
Standards: Concrete and aggregate. American Society for Testing and Materials,
West Conshohocken, PA.
5. American Society for Testing and Materials (ASTM). (1996). “ASTM C 125 -
95a: Standard terminology relating to concrete and concrete aggregates.” Annual
Book of ASTM Standards: Concrete and aggregate. American Society for
Testing and Materials, West Conshohocken, PA.
6. American Society for Testing and Materials (ASTM). (1994). “ASTM C 150 -
04A: Standard specification for portland cement.” Annual Book of ASTM
Standards: Concrete and aggregate. American Society for Testing and Materials,
West Conshohocken, PA.
7. American Society for Testing and Materials (ASTM). (1994). “ASTM C260:
Standard specification for air-entraining admixtures for concrete.” Annual Book of
ASTM Standards: Concrete and aggregate. American Society for Testing and
Materials, West Conshohocken, PA.

103
8. American Society for Testing and Materials (ASTM). (1994). “ASTM C 332 -
87: Standard specification for lightweight aggregates for insulating concrete.”
Annual Book of ASTM Standards: Concrete and aggregate. American Society for
Testing and Materials, West Conshohocken, PA.
9. Bobrowski, Jan. (1977). "Why Not Lightweight Concrete?" Civil engineering.
pp. 32-33.
10. Cement and Concrete Association of Australia (CCAA) (1999). “No-fines
concrete.” <http://www.concrete.net.au/search.php?category=Strength&menu=3>
(July 10, 2007).
11. Clarke, J. L. (1993). Structural lightweight aggregate concrete 1st Ed., Blackie
Academic & Professional, London; Glasgow; New York; Tokyo; Melbourne;
Madras. pp. 19-41.
12. Dhir, Ravindra K., Newlands Moray D., and McCarthy, Aikaterini. (2005). Use
of foamed concrete in construction. Thomas Telford Publishing, Thomas Telford
Ltd, London. pp. 2.
13. Dolby, Peter. (1996). “Is lightweight concrete weighed down by convention?”
Concrete. 30(6), pp. 11-13.
14. Edwards, Dan. [2006]. “ Engineered Material Arresting Systems.”, Airline Pilots
Association, Int’l.
<http://www.alpa.org/DesktopModules/ALPA_Documents/ALPA_DocumentsVi
ew.aspx?itemid=4255&ModuleId=2156&Tabid=256> (Aug. 10, 2007).
15. Federal Aviation Administration (FAA) (2002). “FAA Advisory Circular
150/5300-13; Airport Design.” U.S. Department of Transportation,

104
<http://www.faa.gov/airports_airtraffic/airports/resources/advisory_circulars/medi
a/150-5300-13/150_5300_13_chg7.pdf> (July 5, 2007).
16. Fouad, Fouad H. (2006). "Cellular concrete.” Significance of tests and properties
of concrete and concrete-making material. 169, pp. 561-569.
17. Housing and Home Finance Agency (HHFA) (1949). Lightweight Aggregate
Concretes. Housing and Home Finance Agency, Office of the Administrator,
Division of Standardized Building Codes and Materials, Washington 25, D.C.
18. Institution of Structural Engineers (ISE) [and] the Concrete Society (CS) (1987).
Guide to the structural use of lightweight aggregate concrete. Institution of
Structural Engineers, London.
19. Kearsley, E. P. and Mostert, M. F. (2005). "Designing Mix Composition of
Foamed Concrete with High Fly Ash Conctents." Proc. International conference
held at the University of Dundee, Scotland, UK. pp. 29-36.
20. Kosmatka, Steven H., Kerkhoff, Beatrix., and Panarese, William C. (2002).
Design and control of concrete mixtures 14th Ed., Portland Cement Association,
Skokie, Ill. pp. 1-10, 107.
21. Kumar, P. M. (1986). Concrete: Structure, properties, and materials. Prentice-
Hall, Englewood Cliffs, N.J. pp. 46-47, 353.
22. La Londe, William S., and Janes, Milo F. (1961). Concrete Hand book 1st Ed.,
McGraw-Hill, New York. pp. 11-22.
23. Larrard, F. de. (1999). Concrete mixture proportioning: A scientific approach, E
& FN Spon, London; New York. pp. 373-374.

105
24. Legatski Leo A. (1987). "Structural considerations of cellular concrete."
Material and member behavior; Proceedings of the sessions at structures
congress ’87 related to materials and member behavior, pp. 435-441.
25. McMillan, F.R., Lewis, Tuthill H. (1987). Concrete primer 4th Ed., American
Concrete Institute, Detroit, Mich. Pp. 35-38.
26. Neville, Adam M., Brooks, J. J. (1987). Concrete technology, Longman
Scientific & Technical, Harlow, Essex, UK :; Copublished: J. Wiley, New York,
pp. 345-361.
27. Mindess, Sidney., Young, J. Francis. and Darwin, David. (2002). Concrete 2nd
Ed. Pearson Education, Inc., Upper Saddle River, NJ. pp. 158.
28. Murdock, L. J., Brook, K. M., and Dewar, J. D. (1991). Concrete materials
and practice 6th Ed., Edward Arnold, London, pp. 83, 382-391.
29. Perlite Institute, Inc. (2005). “Basic Facts About Perlite.”
<http://www.perlite.org/perlite_info/guides/general_info/basic_facts.pdf> (May
16, 2007).
30. Ramachandran, V.S., (1984). Concrete admixtures handbook: Properties,
science, and technology. Noyes Publications, Park Ridge, N.J. pp. 211-264.
31. Regan, P. E., and Arasteh, A. R. (1990). “Lightweight aggregate foamed
concrete.” Journal of the institution of structural engineers. 68(9). pp. 167-173.
32. Shetty, M. S. (2004). Concrete technology, S. Chand & Company Ltd., Ram
Nagar, India. pp. 456-458.
33. The Port Authority of NY & NJ (2004). “Port Authority Prepares John F.
Kennedy International Airport for Next Generation of Quieter, More-Efficient

106
Aircraft.” Press release number: 34-2004.
<http://www.panynj.gov/AboutthePortAuthority/PressCenter/PressReleases/Press
Release/index.php?id=497> (July 5, 2007).
34. Taylor, W. H. (1974). "Production, properties and uses of foamed concrete."
Precast concrete. 5(2), pp. 83-84.
35. The Concrete Center (©2007). “No-fines concrete.”
<http://www.concretecentre.com/main.asp?page=136> (July 10, 2007).
36. The Port Authority of NY & NJ (2004). “Port Authority Prepares John F.
Kennedy International Airport for Next Generation of Quieter, More-Efficient
Aircraft.” Press release number: 34-2004.
<http://www.panynj.gov/AboutthePortAuthority/PressCenter/PressReleases/Press
Release/index.php?id=497> (July 5, 2007).
37. United States of America (2005). “Runway safety areas/Engineered Materials
Arresting Systems. ICAO, Second Meeting of North American, Central
American and Caribbean Directors of Civil Aviation (NACC/DCA/2),
Tegucigalpa, Honduras.”
<http://www.icao.int/icao/en/ro/nacc/meetings/2005/NACC_DCA2/nacc02ip18.p
df> (June 13, 2007).
38. White, George R. (1977). Concrete technology 3rd Ed., Van Nostrand Reinhold
Co., New York. pp. 33-37.
39. Zodiac (©2007). “ESCO’s EMAS Video.”
<http://www.esco.zodiac.com/index.cfm?navid=73&cid=116> (July 5, 2007).