IMPROVEMENT OF SOFT GROUND USING STONE ...
415
Tanta University Faculty of Engineering Structural Engineering Department IMPROVEMENT OF SOFT GROUND USING STONE COLUMNS TECHNIQUE A THESIS Submitted for the Degree of Doctor of Philosophy In Civil Engineering (Structural Engineering) By Eng. Khaled Abdel Moneim Abdel Hay Under the Supervision of Tanta - 2017 Prof. Dr. Mohamed A. Sakr Professor of Geotechnical Engineering, Structural Engineering Department, Faculty of Engineering Tanta University Assoc. Prof. Dr. Ahmed F. Abdel kader Associate Professor of Geotechnical Engineering, Structural Engineering Department, Faculty of Engineering, Tanta University Prof. Dr. Marawan M. Shahien Professor of Geotechnical Engineering, Structural Engineering Department, Faculty of Engineering Tanta University
-
Upload
khangminh22 -
Category
Documents
-
view
0 -
download
0
Transcript of IMPROVEMENT OF SOFT GROUND USING STONE ...

Tanta University
Faculty of Engineering
Structural Engineering Department
IMPROVEMENT OF SOFT GROUND USING
STONE COLUMNS TECHNIQUE
A THESIS
Submitted for the Degree of Doctor of Philosophy
In Civil Engineering (Structural Engineering)
By Eng. Khaled Abdel Moneim Abdel Hay
Under the Supervision of
Tanta - 2017
Prof. Dr. Mohamed A. Sakr
Professor of Geotechnical Engineering,
Structural Engineering Department,
Faculty of Engineering
Tanta University
Assoc. Prof. Dr. Ahmed F. Abdel kader
Associate Professor of Geotechnical Engineering,
Structural Engineering Department,
Faculty of Engineering,
Tanta University
Prof. Dr. Marawan M. Shahien
Professor of Geotechnical Engineering,
Structural Engineering Department,
Faculty of Engineering
Tanta University

Tanta University
Faculty of Engineering Structural Engineering Department
The Examining Committee
Candidate Name:
KHALED ABD EL-MONEIM ABD EL-HAY
Title of Thesis:
“Improvement of soft ground using stone columns technique”
The Examining Committee:
No. NAME POSITION
1 Prof. Dr. Moustafa Kamel El Ghamrawy Professor of Geotechnical Eng.
Faculty of Engineering
Al Azhar University
2 Prof. Dr. Mohamed A. Sakr Professor of Geotechnical Eng.
Faculty of Engineering
Tanta University
3 Prof. Dr. Ashraf Kamal Nazir
Professor of Geotechnical Eng.
Faculty of Engineering
Tanta University
4 Prof. Dr. Marawan M. Shahien Professor of Geotechnical Eng.
Faculty of Engineering
Tanta University
Examining Date: 26 / 4 / 2017
Signatures:
No. NAME SIGNATURE
1 Prof. Dr. Moustafa Kamel El Ghamrawy
2 Prof. Dr. Mohamed A. Sakr
3 Prof. Dr. Ashraf Kamal Nazir
4 Prof. Dr. Marawan M. Shahien

سورة ]طه[
(111اآلية )

To
My Parents, Wife and Sons

SUMMARY

i
Summary
This thesis aims to study the application of using stone columns to
strengthen, consolidate the soft clay soil and increase the footing load
capacity. In addition to reduce the expected collapse of the
foundations when constructed on soft soils.
In this research a practical program contains various types of soft clay
soil were prepared in the laboratory. The subgrade soils has been
strengthened by stone columns with different diameters and lengths
and loaded until the failure. The main control parameter of ultimate
load capacity at different cases with corresponding settlement were
recorded and plotted to show the most benefit of such technique in
improving the soft clay below the foundation.
Results demonstrated that the maximum capacity of the load of the
soil reinforced by stone columns depends on the diameter and length
of the stone column. The improvement in the ratio of the carrying
capacity based on a stone column base to about 3.2 times the carrying
capacity of the foundation without stone columns. The study also
included numerical modeling by Geotechnical specialist theoretical
program (Plaxis 2d) for an analysis of the effect of allowing the
drainage of water during loading (Drained conditions) because of the
difficulty of making this technique in the laboratory. The study also
confirmed the theory that the presence of the stone column works to
increase the clay stiffness and significantly improved the coefficient
subgrade modulus which reached to 7.7 times the value of subgrade
soil without soil stone columns.
Keywords:
Stone column, Settlement, Bearing capacity, Soft clay, Undrained shear
strength.

ACKNOWLEDGEMENT

I
ACKNOWLEDGEMENT
First of all, I would like to thank Allah owner of many graces for
enabling me to execute this research and complete this work.
I wish to express his gratitude to Prof. Dr. Mohamed A. Sakr,
professor of Geotechnical Engineering, Faculty of Engineering, Tanta
University, for his constant encouragement, his valuable views and
views and opinions at all step of this study.
I would like to extend special thanks to Prof. Dr. Marawan M.
Shahien, professor of Geotechnical Engineering, Faculty of
Engineering, Tanta University, for his direct supervision, support,
provide me with extremely valuable comments and rational guidance
throughout the research work.
Also, I would like to extend special thanks to A. /Professor Ahmed
Farouk A.E.K Assoc. professor of Geotechnical Engineering,
Faculty of Engineering, Tanta University, for all the effort he paid
during the preparation of this work and encouragement me during all
stages of this research.
I am also grateful to Geotechnical Engineering Laboratory staff
members, Faculty of Engineering, Tanta University for their support
and encouragement during carrying out the numerical work and tests.
This work would not have been possible without the support and love
of my parents nothing to be said is sufficient to reveal my sincere
gratitude.
I owe an expression of special gratitude for my great wife for her
patience and her support at various stages of this work.
ENG. Khaled Abdel Moneim Abdel Hay

ABSTRACT

II
ABSTRACT
Stone columns have been used as an effective technique for improving
the engineering behavior of soft clayey grounds. The soil improvement
via stone columns are achieved from accelerating the consolidation of
weak soil due to shortened drainage path, increasing the load carrying
capacity and settlement reduction due to inclusion of stronger granular
material.
A detailed experimental study on behavior of floating and fully
penetrating single stone column is carried out by varying parameters
like L/D ratio (slenderness ratio) and undrained shear strength of soft
clay. Laboratory tests are carried out on a column of 50 mm, 100 mm,
150 mm and 300 mm in diameter with different length of 100 mm, 200
mm, 300 mm and 400 mm surrounded by soft to medium clay with
different undrained shear strength in the range of 10 to 30 kPa. The
tests are carried out on the entire equivalent area loaded to estimate the
stiffness of the improved ground by the technique.
Finite-element analyses have also been performed using PLAXIS
software aimed at investigating the small scale model that carried out
in the laboratory testing program. The effect of stone column
geometry, undrained shear strength and the effect of drained condition
are also investigated. The load – settlement behaviour responses of the
columns was evaluated of both drained and undrained conditions.
A drained and undrained analysis was carried out using Mohr-
Coulomb’s criterion for soft clay. The modeling of stone columns was
designed by axisymmetric pattern in PLAXIS. The numerical results
from the finite element modeling are compared with the experimental
results which showed good agreement between the results.

III
While the second part of study is related to discuss and develop the
numerical modeling of full scale analysis using most common case
study as stated by Tan et al., 2008.
An Axisymmetric configuration and a Plane strain configuration for
the column are adopted for comparison. The results show that the
axisymmetric configuration shows the best agreement with the case
study results.
Comparison all results from finite element model by examination (Han
and Ye 2001) and (Han and Ye 2002) simplified analytical solution for
the rate of consolidation of stone-column reinforced ground are also
submitted.
Parametric analyses are carried out to study the effect of various
parameters such as the column spacing to diameter ratio and
embankment height. The ratio of modulus of elasticity of the column
to modulus of elasticity of the soft soil on the stress concentration
factor, settlement reduction factors and time reduction factors are also
presented. It helps in increasing efficiency of the stone column
technique. The results of this parametric study are compared with
analytical approaches.
The analysis captured the undrained nature of loading domain in the
loading test. In order to pair the results obtained for undrained
laboratory cases to drained behaviour, a series of finite element
analysis were carried out using drained model for all undrained cases
carried out in the laboratory. The results were performed in the form of
vertical stress versus settlement relationship.

CONTENTS

IV
CONTENTS
Page
ACKNOWLEDGMENT………………...……………………….. I
ABSTRACT ………………………………………………………. III
CONTENTS …………………………………….………………... IV
LIST OF FIGURE ………………….……………………………. X
LIST OF TABLES ……………………..……………………… XXVI
CHAPTER(1) INTRODUCTION
1.1 General…………………………………………………………. 1
1.2 Objectives of the Study…...……………………………............. 2
1.3 Scope of Work…………………………………………………. 3
1.4 Thesis Organization……………………………………………. 3
CHAPTER (2) LITERATURE REVIEW
2.1 Introduction ……………………………………………………. 6
2.1.1 General …………………….………………………………… 6
2.1.2 Definition…………………………………………………….. 7
2.1.3 Historical Review of the Use of Stone Column……………… 7
2.1.4 Characteristics of Ground Improvement Systems …………... 8
2.1.5 Improvement of Soil Characteristics Using Stone Column
Technique ……………………………………………………...…..
9
2.2 Methods of Granular Pile Construction………………………... 10
2.2.1 Vibro – Compaction Method………………………………… 10
2.2.2 Vibro – Replacement Method………………………………... 11
2.2.2.1 Wet Method………………………………………………... 13
2.2.2.2 Dry Method……………........................................................ 14
2.2.2.3 The Dry bottom Feed ……...…………………..…………... 14

V
2.2.4 Vibro – Compozer Method …………………...………….…. 16
2.2.5 Cased– Borehole Method or Rammed Method ………...…… 17
2.3 Engineering Behavior of Composite Ground …………………. 18
2.3.1 Basic Design Parameters..................................…………...…. 18
2.3.1.1 Stone Column Diameter, D ………………….……………. 18
2.3.1.2 Stone Column Pattern………...…......................................... 18
2.3.1.3 Stone Column Spacing…………………………………….. 20
2.3.1.4 Replacement Ratio (as).......................................................... 21
2.3.1.5 Stress Concentration Factor (n)……………………………. 23
2.3.1.6 Back Fill for Stone Columns ………………………...……. 24
2.3.2 Failure Mechanisms................................................................. 24
2.4 Mechanism and Performance of Stone Columns……………… 29
2.5 Experimental Studies ………………………………………….. 29
2.5.1 Field Tests................................................................................ 29
2.5.2 Laboratory Tests....................................................................... 39
2.5.3 Theoretical Studies................................................................... 55
2.5.3.1 Numerical Methods………………………………………... 56
2.6 Ultimate Bearing Capacity of Stone Columns…………………. 58
2.6.1 Isolated, Single Stone Column………………………………. 58
2.6.2 Stone Column Groups………………………………………... 63
2.7 Settlement Analyses……………………………………………. 70
2.7.1 Greenwood Method………………………………………….. 70
2.7.2 Priebe Method…………………………………...…………… 71
2.7.3 Equilibrium Method…………………………………..……… 76
2.7.4 Incremental Method…………………………………………. 78
2.7.5 The Granular Wall Method 80
2.8 Estimation of Rate of Consolidation 81

VI
2.8.1 Consolidation Rate of Improved Ground by Stone Column 81
2.8.2 Stone Columns-Soft Soil Reinforcement System under
Embankment……………………………………………………….. 93
2.9 Smear Zone: Effect on Permeability…………………………… 96
2.10 Scale Effect 101
2.11 Data Base of Stone Column Studies 107
CHAPTER (3) EXPERIMENTAL WORK
3.1 Introduction................................................................................. 113
3.2 Soft Clay preparing…………………………………………. 113
3.2.1 Commercial Kaolinite Clay Type……………………………. 113
3.2.3 Determination of Soil Properties…………………………….. 115
3.2.3.1 Shear strength of Tested Samples …………………………. 116
3.2.3.2 Consistency Limits………………………………………… 117
3.2.3.3 Consolidation tests ………………………………………... 120
3.3 Sand ………………………………………..……………….…. 121
3.4 Columns Materials Properties………………………………….. 124
3.4.1 Stone/ Aggregate ………………..…..………………………. 124
3.5 Test Setup……………………………………………………… 126
3.5.1 Loading Frame………………………………………….......... 126
3.5.1.1 Loading Jack…………………………………………..…… 127
3.5.1.2 Measuring device……………………………………..…… 127
3.5.2 Test Tank…………………………………………………….. 127
3.5.3 Loading plate………………………………………..……….. 127
3.6 Soft clay preparation ……………………………………….….. 127
3.7 Test Procedures…………………………………………………
3.7.1 Column Installation…………………………………………..
3.8 The Experimental Program……………………………………..
128
128
131

VII
CHAPTER (4) EXPERIMENTAL TEST RESULTS
4.1 Introduction……………………………………………………. 133
4.2 Definition of the Failure Load…………………………………. 134
4.3 Effect of Stone Column Diameter ………………...................... 135
4.4 Effect of Stone Column Length…………………………….….. 135
4.5 Improvement Factor, If (%)……………………………….…. 136
4.6 Stone Column Treated Soft Clay Soil in the Case of Undrained
Shear Strength (cu) = 10 kPa……………………………………….
137
4.6.1 Improvement in the Ultimate Load Capacity of the Stone
Column Treated Soft Clay………………………………………….
142
4.7 Stone Column Treated Soft Clay Soil in the Case of Undrained
Shear Strength (cu) = 20 kPa……………………………………….
146
4.7.1 Improvement in the Ultimate Load Capacity of the Stone
Column Treated Soft Clay…………………………………………. 151`
4.8 Stone Column Treated Soft Clay Soil in the Case of Undrained
Shear Strength (cu) = 30 kPa……………………………………….
155
4.8.1 Improvement in the Ultimate Load Capacity of the Stone
Column Treated Soft Clay………………………………………….
160
4.9 Behavior of End Bearing Stone Column …………………….... 163
4.9.1 Bulging Responses of End Bearing Stone Columns…...……. 165
CHAPTER (5) NUMERICAL MODELING
5.1 Introduction …………………………………...……………….. 171
5.2 Finite Element Modeling Program Used in This Research……. 172
5.2.1 Input Program………………………………………………... 172
5.2.1.1 Soil Elements………………………………………………. 172
5.2.1.2 Types of Soil Behavior…………………………………….. 174
5.2.1.3 Boundary Conditions……………………….……………… 175

VIII
5.2.1.4 Mesh Generation …………..……………………………….
5.2.1.5 Initial Conditions…………………………………………...
176
176
5.2.2 Calculation ……………………………….….………………. 177
5.2.2.1 Types of Calculations……………………..……………….. 177
5.2.3 Output …………………………………………..………...…. 178
5.3 The Mohr Coulomb Model……………………………….……. 178
5.3.1 Young’s Modulus……………………………………………. 179
5.3.2 Poisson’s Ratio (υ)…………………………………………… 181
5.3.3 Cohesion (c)…………………………………………….……. 181
5.3.4 Friction Angle
(ϕ )…………...……………………………….. 182
5.3.5 Dilatancy Angle (ψ)……………...…………………..………. 182
5.4 The Hardening Soil Model………………...…………………... 183
5.5 Numerical Model Verification…………………………….…… 183
5.5.1 Validation Using (Ambily and Gandhi, 2007) Results…...….. 183
5.5.2 Validation Using the Results Obtained by (Narasimha Rao et
al., 1992):…………………………………………………………...
189
5.5.3 Verification for Experimental Work of Present Study………. 192
CHAPTER (6) NUMERICAL ANALYSIS
6.1 Introduction …………………………………...…………….…. 200
6.2 Numerical Analysis of Model Testing……………………...….. 200
6.3 Numerical Analysis of Drained Condition ………………….… 215
6.4 Stress – Settlement Curves for End Bearing Stone Column in
drained condition…………………………………………………...
230
6.5 Analysis of Failure Mechanism of Stone Column in Drained
Condition …………………………………………………......……
232
6.6 Comparison Between Drained and Undrained Condition……... 234

IX
6.7 Stress Concentration Ratio at Various Shear Strengths and
Various L/H Ratios for Drained Condition………………………...
263
6.8 Statistical Analysis…………………………………………… 267
CHAPTER (7) COMPARATIVE STUDY
7.1 Scope…………………………………………………………… 270
7.2 Case Study Description ……………..………………………... 270
7.3 Numerical Modeling 2D Finite Element Analyses………...…... 274
7.3.1 Axisymmetric Model………………………………………....
7.3.2 Plane Strain Model Using Equivalent Parameters……………
7.4 Comparison Between the 2D FE Analyses and Field
Measurements………………………………………………………
7.4.1 Settlement………………………………………………….
7.4.2 Excess pore water pressure……………………………….....
276
279
283
283
285
7.5 Examination Method of (Han and Ye 2001 & 2002) ………... 288
7.6 Parametric Study …………..………………………….……… 297
7.6.1 Stress Concentration Factor ………..…………………….… 298
7.6.2 Modular Ratio …..………………………………………..… 298
7.6.3 Settlement Reduction Factor ..……………………………… 298
7.6.4 Time Reduction Factor………………………………………. 298
7.7 Effect of Spacing to the Diameter of Stone Column (S/D)...… 300
7.8 Effect of Stress Level …..…………………………...………... 302
7.9 The Effect of Modular Ratio ……………..………..…………. 305
7.10 Comparative Study…………………………………………… 309
7.10.1 The Stress Concentration Factor …………………...………. 309
7.10.2 The Settlement Reduction Factor …………………...……... 313
6.16.3 The Time Reduction ………………………………….....…. 316
7.11 Comparative study with different investigators on stone 319

X
columns…………………………………………………………......
CHAPTER (8) CONCLUSIONS AND RECOMMENDATIONS
8.1 Introduction…………….……………………..……..…………. 322
8.2 Conclusions Regarding experimental results ………..………… 322
8.3 Conclusions Regarding Numerical Analysis of Laboratory
Model Tests………………………………………………………...
323
8.3.1 Numerical Analysis of Drained Condition (cu = 10 kPa) …… 325
8.4 Conclusions Regarding Comparison Between Drained and
Undrained Condition………………………………………..…...…
327
8.5 Conclusions Regarding Effect of stone column on Subgrade
modulus……………………………………………………………..
328
8.6 Conclusions Regarding Case study and parametric study…….. 329
8.7 Recommendations for Future Studies………………….....……. 330
REFERENCE …………………………………………….…...… 331
PUBLISHED PAPER……………………………………………… 354
ARABIC SUMMARY

LIST OF FIGURES

X Figure Page No.
CHAPTER (2)
2.1 Vibroflot used for vibro-compaction and vibro –replacement
methods (Slocombe et al., 2000)…………………................ 11
2.2 The vibro – compaction process (Bergado et al., 1994)…...… 12
2.3 The vibro – replacement method (Bergado et al., 1994)……. 12
2.4 Range of soils suitable for vibro – compaction and vibro-
replacement (Bergado et al., 1994)…………………………... 13
2.5 Bottom feed of stone column (Slocombe et al., 2000)………. 15
2.6 The vibro composer method (Bergado et al., 1994)…….…… 16
2.7 The cased – borehole method (Bergado et al., 1994)……...… 17
2.8 Equivalent diameter of the tributary soil treated by stone
column (Balaam and Booker, 1981)……………….….….….. 19
2.9 Unit cell idealizations (Barksdale and Bachus 1983)…….….. 21
2.10 Diagram of composite ground (Bergado et al., 1994)...…....... 22
2.11 Area ratios for (i) square grids, (ii) triangular grids and (iii)
pad footing (Bergado et al., 1994) …………………………... 22
2.12 Failure mechanisms of single stone column in homogeneous
soft layer (Barksdale and Bachus. 1983) ……………..…...… 25
2.13 Failure modes of stone column groups (Barksdale and
Bachus. 1983) …………………………………………..…… 26
2.14 Stone column failure mechanisms in nonhomogeneous
cohesive soil (Barksdale and Bachus. 1983) ……...………… 26
2.15
Failure of stone column, (pivarc, 2011)……………...……… 28

XI Figure Page No.
2.16 Comparison of large scale filed loading test results on
untreated soft clay, soft clay reinforced with stone column
and with sand column at Bremerhaven, Germany,
(Greenwood, 1970)……….……………..……………………
31
2.17 Field deformation behaviour of a single column under a
(rigid) plate load test, (Hughes et al., 1976) ………………… 33
2.18 Field load test arrangement (Goughnour and Bayuk, 1979)… 34
2.19 Settlement versus log time at the centre and corners of load
area in field trial (Goughnour and Bayuk, 1979)…..………... 35
2.20 Comparison of load settlement performance of granular
column constructed with different numbers of blows per
compacted layer (Bergado & lam, 1987) …….………..……. 38
2.21 Failure modes of stone columns (Wood et al., 2000)…….….. 42
2.22 Normalized load-settlement results for model footings;
variation of area ratio (short columns) (Wood et al., 2000)..... 43
2.23 Normalized load-settlement results for model footings;
variation of area ratio (long columns) (Wood et al., 2000)...... 44
2.24 Normalized load-settlement results for model footings;
variation of column length (short columns) (Wood et al.,
2000)…………………………………………………………. 44
2.25 Normalized load-settlement results for model footings;
variation of column length (long columns) (Wood et al.,
2000)…………………………………………………………. 45
2.26 Photos of sand column beneath circular footing at
beginning, middle and end of foundation loading process: (a)
150 mm length; (b) 250 mm length (Mckelvey et al.,
2004)………………………………………….……………… 47
2.27 Single column test arrangement (a) column area loading (b)
entire area loading (Ambily and Gandhi., 2007) ……….…… 49

XII Figure Page No.
2.28 Effect of s/d and ϕ on axial capacity of stone
column..……… 50
2.29 Stress settlement behavior under entire area loading (Ambily
and Gandhi, 2007) ……………………………………...….... 51
2.30 Comparison of group column test and single column test
(Ambily and Gandhi, 2007) …………………….........……… 51
2.31 The test setup for single and group column test (Isaac and
Grirish, 2009) ……………………………………..………… 53
2.32 Load –Settlement curve for clay with single column (Isaac
and Grirish, 2009) …………………………………………… 53
2.33 Comparison of stress settlement relation for clay with group
of seven columns (S=2.5D)…………...……………..………. 54
2.34 Comparison of stress settlement relation for clay with with
group of seven columns (S=3D)…………………...………… 54
2.35 Greenwood curves (Greenwood and Kirsch, 1983).….……... 55
2.36 Priebe design curves (Priebe, 1995)…………………………. 56
2.37 Typical test setup examined by (Rao et al., 1992)………….... 62
2.38 Stone column group analysis – firm to stiff cohesive soil
(Barksdale and Bachus, 1983)……………………………….. 64
2.39 Proportional loads on stone columns (Priebe, 1995) …….….. 67
2.40 Settlement for stone column in clay (Greenwood, 1970).…… 71
2.41 Priebe’s settlement improvement factor curves (Priebe,
1995)………………………………………………................. 73
2.42 Additional area ratio curves (Priebe, 1995) …….…………… 75
2.43 Settlement of single footings (Priebe, 1995) ……...………… 75
2.44 Settlement of strip footings (Priebe, 1995)….…………...…... 76

XIII Figure Page No.
2.45 Settlement reduction factor using equilibrium method
(Aboshi et al., 1979)……………………………………….... 78
2.46 Total settlement-time relationship of reinforced soft clay by
Granular piles (Bergado and Long, 1994)…………………... 82
2.47 Total settlement-time relationship of reinforced soft clay by
Vertical drain (Bergado and Long, 1994)…………………… 83
2.48 Definition of terms for modeling (Han and Ye, 2001) …....… 85
2.49 Vertical stress on soil and columns with time, N = 3 and
ns = 5 (Han and Ye, 2001)…………………………………... 87
2.50 Stress concentration ration with time (Han and Ye, 2001)….. 88
2.51 Dissipation of excess pore water pressure, N = 3 and ns = 5
(Han and Ye, 2001)……………….…………………………. 89
2.52 Rate of consolidation of stone column reinforced foundations
(Han and Ye, 2001)…………………………..……………… 90
2.53 Rate of consolidation of stone column reinforced foundations
(Han and Ye, 2001)………………………………………….. 91
2.54 Stress concentration factor. Influence of radial deformation
and plastic strains (Castro and Sagaseta, 2009…………..…... 93
2.55 Suggested variation of horizontal permeability with radius
according to (Onoue et al.,1991)…………………………….. 97
2.56 Section of the test setup showing the smear zone (Indraratna
and Redana, 1998)…………………………………………... 98
2.57 Ratio of horizontal to vertical coefficient of permeability
against the radial distance from the axis of the sand
compaction pile (denoted as drain) (Indraratna and Redana,
1998)………………………………………………………… 99
2.58 Excess pore water pressures during the insertion of the
installation mandrel (Sharma and Xiao, 2000) ………..……. 100

XIV Figure Page No.
2.59 Single column test arrangement dimension (Ambily and
Gandhi, 2007)……………………………………………… 101
2.60
The test setup for single column model test (Isaac and
Grirish, 2009)………………………………………………. 102
2.61
Test arrangement and dimension (Shivashankar et al.,
2011)………………………………………………………… 102
2.62
Schematic view of stone column foundation of (Ali et al.,
2011)…………………………………………………………. 103
2.63
The Schematic diagram of sand column test arrangement
(Tandel et al., 2012)…………………………………………. 104
2.64 Test arrangement (Prasad and Satyanarayana, 2016)………... 104
CHAPTER (3)
3.1 Grain size distribution curve from hydrometer test for the
tested sample………………………………………………… 116
3.2 Classification of soft clay using plasticity chart…………...… 118
3.3 Relation between normal stress and shear strength
(cu =10 kPa)……………………………...…………………... 118
3.4 Relation between normal stress and shear strength
(cu =20 kPa)……………………………...…………………... 119
3.5 Relation between normal stress and shear strength
(cu =30 kPa)……………………………...…………………... 119
3.6 e-log p curve for tested soft clay in odometer……………….. 120
3.7 Sieve analysis curve for used sand…………………………... 122
3.8 Compaction curve for tested sand…………………………... 123

XV Figure Page No.
3.9 Relation between normal stress and shear strength (for tested
sand at maximum dray density)……………………………… 123
3.10 Sieve analysis curve for used stone………………………….. 125
3.11 Relation between normal stress and shear strength for used
stone…………………………………………………………..
125
3.12 Experimental setup.……………..…………………………… 126
3.13 Column Installation………………………………………….. 128
3.14 Lay out of installation steps for the case of floating stone
column………………………………………………………..
129
3.15 Lay out of installation steps for the case of fully penetrate
stone column………………………………………………….
130
3.16 General lay out of the studied parameters. 131
CHAPTER (4)
4.1 Typical load-displacement curves (Hirany and Kulhawy
1989)………………………………………………………… 134
4.2 Variation of the diameter D within the unit cell…………….. 135
4.3 Geometry configurations for model tested stone column ….... 136
4.4 Stress settlement curves for different stone columns L/H
ratios (D = 50 mm, cu = 10 kPa)…… ……………….……… 138
4.5 Stress settlement curves for different stone columns L/H
ratios (D = 100 mm, cu = 10 kPa)………………………….… 139
4.6 Stress settlement curves for different stone columns L/H
ratios (D = 150 mm, cu = 10 kPa)………………...……….…. 140
4.7 Stress settlement curves for different stone columns L/H
ratios (D = 300 mm, cu = 10 kPa)………………..………..… 141

XVI Figure Page No.
4.8 The effect of column length on the improvement factor,
If (%) at different diameters for 25 mm settlement (cu = 10
kPa)…………………………………………………………... 142
4.9 The effect of column diameters on the improvement factor, If
(%) for different lengths at 25 mm settlement (cu = 10 kPa)... 144
4.10
The effect of L/D ratio on the improvement factor,If (%) at
25 mm settlement (cu = 10 kPa)……………………………... 144
4.11
The effect of L/D ratio on the improvement factor, If (%) for
different L/H ratio at 25 mm settlement (cu = 10 kPa)………
145
4.12 The effect of L/H ratio on the improvement factor, If (%)
for different diameters at 25 mm settlement (cu = 10 kPa)…... 145
4. 13 Stress settlement curves for different stone columns L/H
ratios (D = 50 mm, cu = 20 kPa)…………………………..…. 147
4.14 Stress settlement curves for different stone columns L/H
ratios (D = 100 mm, cu = 20 kPa)……………………....……. 148
4.15 Stress settlement curves for different stone columns L/H
ratios (D = 150 mm, cu = 20 kPa)…………………...………. 149
4.16 Stress settlement curves for different stone columns L/H
ratios (D = 300 mm, cu = 20 kPa)……………………….…… 150
4.17 The effect of total column lengths on the percentage of load
increase for different diameters at 25 mm settlement (cu = 20
kPa)…………...……………………………………………… 152
4. 18 The effect of column diameters on the improvement factor, If
(%) for different lengths at 25 mm settlement (cu= 20
kPa)…………………………………………………………...
153
4.19
The effect of L/D ratio on the improvement factor, If (%) at
25 mm settlement (cu = 20 kPa)…………………................... 153

XVII Figure Page No.
4.20 The effect of L/D ratio on the improvement factor, If (%)
for different L/H ratio at 25 mm settlement (cu = 20 kPa)….. 154
4.21 The effect of L/H ratio on the improvement factor, If (%)
for different diameters at 25 mm settlement (cu = 20 kPa)…... 154
4.22 Stress settlement curves for different stone columns L/H
ratios (D = 50 mm, cu = 30 kPa)……………….…………….. 156
4.23 Stress settlement curves for different stone columns L/H
ratios (D = 100 mm, cu = 30 kPa)…………….………..…….. 157
4.24 Stress settlement curves for different stone columns L/H
ratios (D = 150 mm, cu = 30 kPa)……………………………. 158
4.25 Stress settlement curves for different stone columns L/H
ratios (D = 300 mm, cu = 30 kPa)……...…………………….. 159
4.26 The effect of column length on the improvement factor, for
different diameters at 25 mm settlement ………. 160
4.27 The effect of column diameter on improvement factor, If (%)
for different lengths at 25 mm settlement..……………...…… 161
4.28
The effect of L/D ratio on the improvement factor, If (%) at
25 mm settlement (cu = 30 kPa)……………………………… 161
4.29
The effect of L/D ratio on the improvement factor, If (%)
for different L/H ratio at 25 mm settlement (cu = 30 kPa) .…. 157
4.30
The effect of L/H ratio on the improvement factor, If (%)
for different diameters at 25 mm settlement (cu = 30 kPa)…... 157
4.31 Stress settlement curves for end bearing stone columns at
different diameters and cu = 10 kPa……………...……...…… 163
4.32 Stress settlement curves for end bearing stone column at
different diameters of and cu = 20 kPa………….....………… 164

XVIII Figure Page No.
4.33 Stress settlement curves for end bearing stone column at
different diameters of and cu = 30 kPa………….…………… 164
4.34 Pouring cement slurry into the stone column to maintain the
shape of the resulting deformation…...……………………… 165
4.35 Separation of stone column from surrounding soil after 24
hours ………………………………………………………… 166
4.36 Shape of stone column after removing it from the
surrounding soil……………………………………………… 166
4. 37 Deformed shape of stone column ……………...……………. 167
4. 38 Stone column shape before and after testing (cu = 10 kPa)..… 167
4.39 Variation of the horizontal displacement for end bearing
loading condition for different undrained shear strength
values, cu (D = 50 mm)………………………...…………….. 168
4.40 Variation of the horizontal displacement for end bearing
loading condition for different undrained shear strength
values, cu (D = 100 mm)……………..….…………………… 169
4.41 Variation of the horizontal displacement for end bearing
loading condition for different undrained shear strength
values, cu (D = 150 mm)………………...…………………… 169
4.42 Variation of the horizontal displacement for end bearing
loading condition for different undrained shear strength
values, cu (D = 300 mm)……………………..…….………… 170
CHAPTER (5)
5.1 Example distribution of nodes and stress points in PlAXIS
finite elements (PlAXIS version 8 manuals)………………… 173
5.2 Mohr’s circle of stress used to drive relation between
undrained shear strength and drained shear parameters
Brinkgreve, 2002)……………………….…………………… 175

XIX Figure Page No.
5.3 Mesh refine in for the proposed model in stability analysis in
2D PLAXIS program………………………………………… 176
5.4 Mohr-Coulomb yield criterion ………………………………. 179
5.5 Definition of E0 and E50 for standard drained triaxial test
results (Brinkgreve, 2002)……..……………………...…....... 180
5.6 Mohr-Coulomb failure envelope with one Mohr failure circle
(Brinkgreve, 2002)…………………………………………... 182
5.7 Finite-element discretization for both cases (Ambily and
Gandhi, 2007) …………………………………..…...……….
185
5.8 Deformed mesh for both cases (Ambily and Gandhi, 2007)… 186
5.9 Verification of are current plaxis results with the load
settlement behavior of loaded stone column alone (Ambily
and Gandhi, 2007)…………………………………………… 187
5.10 Verification of are current plaxis results with the load
settlement behavior of entire loaded area (Ambily and
Gandhi, 2007)………………………………………………... 188
5.11 Finite-element discretization of model test (Narasimha Rao et
al., 1992)……………………………………………………... 190
5.12 Verification of are current plaxis results with the load
settlement behavior (Narasimha Rao et al., 1992)…………... 186
5.13 The model and the soil mesh for the case of untreated soil….. 192
5.14 Unit cell stone column and unit cell stone column mesh for
the case of treated soil……………………………………….. 193
5.15 Stress settlement response for the two cases of Mohr
Coulomb and hardening soil criteria model, (L = 300 mm &
D = 150 mm)………………………………………………… 194
5.16 Stress settlement behavior of both model test and finite
element at cu = 10 kPa, D = 50 mm and L = 100 mm………. 197

XX Figure Page No.
5.17 Stress settlement behavior of both model test and finite
element at cu = 10 kPa, D = 150 mm and L = 300 mm…….... 197
5.18 Stress settlement behavior of both model test and finite
element at cu = 20 kPa, D = 150 mm and L = 300 mm…….... 198
5.19 Stress settlement behavior of both model test and finite
element at cu = 20 kPa, D = 300 mm and L = 200 mm….…... 198
5.20 Stress settlement behavior of both model test and finite
element at cu = 30 kPa, D = 50 mm and L = 300 mm……….
199
5. 21 Stress settlement behavior of both model test and finite
element at cu = 30 kPa, D = 300 mm and L = 300 mm……... 199
CHAPTER (6)
6.1 Stress – settlement curves for different L/H ratios (D = 50
mm and cu = 10 kPa)………………………………………… 203
6.2 Stress – settlement curves for different L/H ratios (D = 100
mm and cu = 10 kPa)………………………………………… 203
6.3 Stress – settlement curves for different L/H ratios (D = 150
mm and cu = 10 kPa)……………………………………….... 204
6.4 Stress – settlement curves for different L/H ratios (D = 300
mm and cu = 10 kPa)……………………………………….... 204
6.5 Stress – settlement curves for different L/H ratios (D = 50
mm and cu = 20 kPa)………………………………………… 208
6.6 Stress – settlement curves for different L/H ratios (D = 100
mm and cu = 20 kPa)………………………………………… 208
6.7 Stress – settlement curves for different L/H ratios (D = 150
mm and cu = 20 kPa)……………………………………….... 209
6.8 Stress – settlement curves for different L/H ratios (D = 300
mm and cu = 20 kPa)……………………………………….... 209
6.9 Stress – settlement curves for different L/H ratios (D = 100
mm and cu = 30 kPa)………………………………………… 213
6.10 Stress – settlement curves for different L/H ratios (D = 100
mm and cu = 30 kPa)………………………………………… 213

XXI Figure Page No.
6.11 Stress – settlement curves for different L/H ratios (D = 150
mm and cu = 30 kPa)……………………………………….... 214
6.12 Stress – settlement curves for different L/H ratios (D = 300
mm and cu = 30 kPa)………………………………………… 214
6.13 Stress – settlement curves for different L/H ratios (D = 50
mm and cu = 10 kPa)……………………………………........ 218
6.14 Stress – settlement curves for different L/H ratios (D = 100
mm and cu = 10 kPa)………………………………………… 218
6.15 Stress – settlement curves for different L/H ratios (D = 150
mm and cu = 10 kPa)………………………………………… 219
6.16 Stress – settlement curves for different L/H ratios (D = 300
mm and cu = 10 kPa)………………………………………… 219
6.17 Stress – settlement curves for different L/H ratios (D = 50
mm and cu = 20 kPa)…………………………………........... 223
6.18 Stress – settlement curves for different L/H ratios (D = 100
mm and cu = 20 kPa)……………………………………….... 223
6.19 Stress – settlement curves for different L/H ratios (D = 150
mm and cu = 20 kPa)……………………………………….... 224
6.20 Stress – settlement curves for different L/H ratios (D = 300
mm and cu = 20 kPa)……………………………………….... 224
6.21 Stress – settlement curves for different L/H ratios (D = 50
mm and cu = 30 kPa)………………………………………... 228
6.22 Stress – settlement curves for different L/H ratios (D = 100
mm and cu = 30 kPa)………………………………………… 228
6.23 Stress – settlement curves for different L/H ratios (D = 150
mm and cu = 30 kPa)………………………………………… 229
6.24 Stress – settlement curves for different L/H ratios (D = 300
mm and cu = 30 kPa)……………………………………….... 229
6.25 Stress – settlement curves for end bearing stone column,
D = 50 mm at different undrained shear strength …………… 230
6.26 Stress – settlement curves for end bearing stone column,
D = 100 mm at different undrained shear strength…….….… 231
6.27 Stress – settlement curves for end bearing stone column,
D = 150 mm at different undrained shear strength….……..… 231
6.28 Stress – settlement curves for end bearing stone column,
D = 300 mm at different undrained shear strength…………... 232
6.29 Stress – settlement behaviour of floating type stone column
divided into three stages (D= 50 mm, L/H= 0.5)..…………... 233
6.30 Stress - settlement behaviour for the two cases of drained and
undrained conditions (cu = 10 kPa, D = 50 mm)….………… 236

XXII Figure Page No.
6.31 Stress - settlement behaviour for the two cases of drained and
undrained conditions (cu = 10 kPa, D = 100 mm)….……… 232
6.32 Stress - settlement behaviour for the two cases of drained and
undrained conditions (cu = 10 kPa, D = 150 mm)….……… 233
6.33 Stress - settlement behaviour for the two cases of drained and
undrained conditions (cu = 10 kPa, D = 300 mm)….……… 234
6.34 Stress - settlement behaviour for the two cases of drained and
undrained conditions (cu = 20 kPa, D = 50 mm)….………… 235
6.35 Stress - settlement behaviour for the two cases of drained and
undrained conditions (cu = 20 kPa, D = 100 mm)….……… 236
6.36 Stress - settlement behaviour for the two cases of drained and
undrained conditions (cu =20 kPa, D = 150 mm)….……… 237
6.37 Stress - settlement behaviour for the two cases of drained and
undrained conditions (cu = 20 kPa, D = 300 mm)….……… 238
6.38 Stress - settlement behaviour for the two cases of drained and
undrained conditions (cu = 30 kPa, D = 50 mm)….………… 239
6.39 Stress - settlement behaviour for the two cases of drained and
undrained conditions (cu = 30 kPa, D = 100 mm)….……… 240
6.40 Stress - settlement behaviour for the two cases of drained and
undrained conditions (cu = 30 kPa, D = 150 mm)….……… 241
6. 41 Stress - settlement behaviour for the two cases of drained and
undrained conditions (cu = 30 kPa, D = 300 mm)………… 242
6. 42 Stress - settlement behaviour for the two cases of drained and
undrained conditions (cu = 10 kPa, D = 50 mm)……………. 252
6. 43 Stress - settlement behaviour for the two cases of drained and
undrained conditions (cu = 10 kPa, D = 100 mm). 252
6. 44 Stress - settlement behaviour for the two cases of drained and
undrained conditions (cu = 10 kPa, D = 150 mm). 253
6. 45 Stress - settlement behaviour for the two cases of drained and
undrained conditions (cu = 10 kPa, D = 300 mm). 253
6. 46 Stress - settlement behaviour for the two cases of drained and
undrained conditions (cu = 20 kPa, D = 50 mm). 254
6. 47 Stress - settlement behaviour for the two cases of drained and
undrained conditions (cu = 20 kPa, D = 100 mm). 254
6. 48 Stress - settlement behaviour for the two cases of drained and
undrained conditions (cu = 20 kPa, D = 150 mm). 255
6. 49 Stress - settlement behaviour for the two cases of drained and
undrained conditions (cu = 20 kPa, D = 300 mm). 255
6. 50 Stress - settlement behaviour for the two cases of drained and
undrained conditions (cu = 30 kPa, D = 50 mm). 256

XXIII Figure Page No.
6. 51 Stress - settlement behaviour for the two cases of drained and
undrained conditions (cu = 30 kPa, D = 100 mm). 256
6. 52 Stress - settlement behaviour for the two cases of drained and
undrained conditions (cu = 30 kPa, D = 150 mm). 257
6. 53 Stress - settlement behaviour for the two cases of drained and
undrained conditions (cu = 30 kPa, D = 300 mm). 257
6.54 The relationship between L/H ratio and increase in the
subgrade modulus for cu = 10 kPa ……..……………………. 259
6.55 The relationship between L/H ratio and increase in the
subgrade modulus for cu = 20 kPa…………………………… 260
6.56 The relationship between L/H ratio and increase in the
subgrade modulus for cu = 30 kPa…………………………… 260
6.57 The relationship between the undrained shear strength cu
(kPa) and the relative subgrade modulus (D = 50 mm)…….. 261
6.58 The relationship between the undrained shear strength cu
(kPa) and the relative subgrade modulus (D = 100 mm)…... 261
6.59 The relationship between the undrained shear strength cu
(kPa) and the relative subgrade modulus (D = 150 mm)….. 262
6.60 The relationship between the undrained shear strength cu
(kPa) and the relative subgrade modulus (D = 300 mm)….. 262
6.61 The relationship between L/H and stress concentration factor
at different shear strength (D = 50 mm).……………….……. 264
6.62 The relationship between L/H and stress concentration factor
at different shear strength (D = 100 mm).……………...……. 265
6.63 The relationship between L/H and stress concentration factor
at different shear strength (D = 150 mm).……………...……. 265
6.64 The relationship between L/H and stress concentration factor
at different shear strength (D = 300 mm).……………...……. 266
CHAPTER (7)
7.1 Layout plan of stone column works at New Pantai
expressway………………………………………...………… 272
7.2 Cross section of embankment case history through centerline
of stone columns……………………………..………………
273

XXIV Figure Page No.
7.3 (a) Geometry and boundary conditions for the axisymmetric
model (b) Generated finite element mesh for the
axisymmetric model…………………………………………. 277
7.4 Settlement at SP1 using axisymmetric model………….….… 278
7.5 Excess pore water pressures at point (A) using axisymmetric
model………………………………………………….……... 278
7.6 Geometry and boundary conditions for plane strain with
equivalent parameters finite element model...………...…...... 280
7.7 Generated finite element mesh for plane strain with
equivalent parameters finite element model………………… 280
7.8 Settlements at (SP1) for Plane strain with equivalent
Parameters Finite element model……………………………. 281
7.9 Settlements at (SP2) for Plane strain with equivalent
Parameters Finite element model…………….……………… 281
7.10 Excess pore water pressure at points (A) and (B) for plane
strain with equivalent parameters finite element model…….. 282
7.11 Comparison of settlements at (SP1)…………………………. 284
7.12 Comparison of settlements at (SP2)…………………………. 284
7.13 Comparison of Excess pore water pressure at point (A)…….. 286
7.14 Comparison of Excess pore water pressure at point (B)......… 286
7.15 Variation of stress concentration factor with modular ratio –
linear elastic analysis………………………………………… 290
7.16 Measured and calculated settlement – time curve…………… 296
7.17 Effect of columns spacing on the stress concentration factor.. 300
7.18 Effect of columns spacing on the settlement reduction factor. 301
7.19 Effect of columns spacing on the time reduction factor……... 302
7.20 Effect of stress level on the stress concentration factor …….. 303
7.21 Effect of stress level on the settlement reduction factor……...
304

XXV Figure Page No.
7.22
Effect of stress level on the time reduction factor……………
305
7.23
Effect of Modular ratios on the stress concentration factor….
306
7.24 Effect of Modular ratios on the settlement reduction factor…. 307
7.25 Effect of Modular ratio on the time reduction……………….. 308
7.26 The effect of column spacing on the stress concentration
factor using numerical modeling and theoretical approaches..
310
7.27 The effect of embankment height on the stress concentration
factor using numerical modeling and theoretical ……………
311
7.28 The effect of Modular ratio on the stress concentration factor
using numerical modeling and theoretical approaches……….
313
7.29 The effect of column spacing on the settlement reduction
factor using numerical modeling and theoretical approaches..
314
7.30 The effect of embankment height on the settlement reduction
factor using numerical modeling and theoretical approaches..
315
7.31 The effect of modular ratio on the settlement reduction factor
using numerical modeling and theoretical approaches……….
316
7.32 The effect of column spacing on the time reduction factor
using numerical modeling and theoretical approaches……….
317
7.33 The effect of embankment height on the time reduction
factor using numerical modeling and theoretical approaches..
318
7.34 The effect of modular ratio on the time reduction factor using
numerical modeling and theoretical approaches……………..
319
7.35
Settlement improvement factor against area replacement
ratio for sites with widespread loading ………………...…….
320

LIST OF TABLES

XXVI LIST OF TABLES Page No.
CHAPTER (2)
2.1 Properties of granular columns (Bergado and Lam, 1987)….. 37
2.2 Database of numerical studies on stone columns……………. 108
2.3 Database of laboratory tests on stone columns………………. 110
2.4 Database of field tests on stone columns…………………….. 112
CHAPTER (3)
3.1 Mineralogical composition of the kaolinite used in model
tests (Given by the manufacturer from the Data sheet)…….... 114
3.2 Chemical composition of the kaolinite used in model test
(Given by the manufacturer from the Data sheet)…………… 115
3.3 Properties of used soil………………………………………... 117
3.4 Consolidation properties of tested soft clay………………… 121
3.5 Physical and mechanical properties of tested sand…………. 122
3.6 Experimental program and studied parameters……………… 132
CHAPTER (4)
4.1 The percentage of load increase due to the increase of
columns diameter 50 mm and cu = 10 kpa………………….. 138
4.2 The percentage of load increase due to the increase of
columns diameter 100 mm and cu =10 kPa…………………. 139
4.3 The percentage of load increase due to the increase of
columns diameter 150 mm and cu =10 kPa…………………. 140
4.4 The percentage of load increase due to the increase of
columns diameter 300 mm and cu =10 kPa………………….. 141
4.5 The percentage of load increase due to the increase of
columns diameter 50 mm and cu = 20 kPa…………….......... 147

XXVII LIST OF TABLES Page No.
4.6 The percentage of load increase due to the increase of
columns diameter 100 mm and cu =20 kPa………………….. 148
4.7 The percentage of load increase due to the increase of
columns diameter 150 mm and cu =20 kpa………………….. 149
4.8 The percentage of load increase due to the increase of
columns diameter 300 mm and cu =20 kPa ………………… 150
4.9 The percentage of load increase due to the increase of
columns diameter 50 mm and cu = 30 kpa………………… 156
4.10 The percentage of load increase due to the increase of
columns diameter 100 mm and cu =30 kPa…………………. 157
4. 11 The percentage of load increase due to the increase of
columns diameter 150 mm and cu =30 kpa…………………. 158
4.12 The percentage of load increase due to the increase of
columns diameter 300 mm and cu =30 kpa………………….
159
CHAPTER (5)
5.1 Details of material properties (Ambily and Gandhi, 2007)….. 184
5.2 Properties of Materials Used for Validation of PLAXIS……. 191
5.3 Mohr Coulomb Parameters for all Materials for the case of
cu = 10,20 and 30 kPa ……...………………………………... 195
5.4 Hardening Soil Parameters for Soft Clay Materials at shear
strength cu = 20 kPa………………………………………… 196
CHAPTER (6)
6. 1 Ratio between stress in undrained condition and drained
condition at 25 mm settlement, (cu =10 kPa)………………... 248
6. 2 Ratio between stress in undrained condition and drained
condition at 25 mm settlement, (cu =20 kPa)……………… 249

XXVIII LIST OF TABLES Page No.
6. 3 Ratio between load in undrained condition and drained
condition at 25 mm settlement, (cu =20 kPa).……..………… 250
6. 4 The values of C1 and C2 for stone column under drained
condition……………………………………………………..
266
CHAPTER (7)
7.1 Material Parameters for Case study……………………….... 274
7.2 Stone columns parameters (equivalent parameters plane
strain model)……………………………………………….… 279
7.3 Comparison between results of settlement at SP1 and SP2…... 285
7.4 Comparison of excess pore water pressure at point (A) and at
point (B)……………………………………………………… 287
7.5 Parametric study……………………………...……………… 299

Chapter (1):
INTRODUCTION

- 1 -
CHAPTER (1)
INTRODUCTION
1.1 General
Soft soil deposits usually exhibit excessive settlement characteristics
and have a low bearing capacity. In order to prevent these problems, it is
necessary to improve the existing soft soil before any construction
activities can be preceded. Many measures have been proposed which
include dewatering, compaction, dynamic compaction, deep mixing,
deep densification, jet grouting, compaction grouting and soil
reinforcement. These methods are regarded as ground improvement
techniques. Among them, stone column (also termed granular pile) has
been generally recognized as a useful technique to improve the weak
ground. This technique requires large size columns of granular material
to be inserted into the ground by means of special vibrators (or other
construction methods) to form a stiffer composite structure with
surrounding soils.
The increases in load bearing capacity, shear resistance, and the
reduction in total settlement together with fast consolidation time are
beneficial effects of stone column in soft soils .Stone columns have been
applied successfully on numerous sites around the world. It gains
reputation by the ability to improve soft ground which allows for safe
and economic construction of road embankment, airfield, residential and
light commercial and industrial structures.

- 2 -
In the present investigation, the technique of stone column is applied to
improve the soft clay deposits. The thesis aims to study the effect of
using such stone columns with different configuration on the ultimate
load capacity of supporting subgrade. The effect of soil stiffness is also
investigated. The thesis contain two part of study, the first one is using
experimental tests to study the problem under investigation. While the
second part aims to study numerically the behaviour of improved soft
ground reinforced with such stone columns.
1.2 Objectives of the study:
The goals of the proposed thesis can be summarized as follows:
- To figure out the previous experimental studies on the performance of
stone column.
- To investigate experimentally the effect of different parameters such
as stone column diameter, length of column and effect undrained shear
strength of soil on the bearing capacity and settlement behavior.
- To study the effect of both drained and undrained condition on the
behavior of composite soil column system.
- To conduct numerical investigation by finite element method to study
the behavior of the stone column distribution inside the soft clay soil in
both drained and undrained conditions.
- To examination (Han and Ye 2001) and (Han and Ye 2002) as a
simplified analytical solution for the rate of consolidation of stone
column reinforced ground.

- 3 -
- To show the effect spacing, stress level and modular ratio on the stress
concentration factor, the reduction of settlement and the reduction in
consolidation time.
1.3 Scope of work
The thesis will study the following subjects:
1- An intensive literature review of the previous studies in the
subjects of behavior of stone column in soft clay.
2- Experimental investigation by means of an intensive
experimental program which contains a number of samples
loaded up to failure and monitors the general behavior.
3- Analytical investigation by using finite element program.
4- To find out the results and the notes for this study.
1.4 Thesis Organization:
This thesis organized in eight chapters, as follows:
Chapter (1):
This chapter presents an introduction to identify the problem, the aim of
Proposed work and dissertation outlines.
Chapter (2):
This chapter includes a literature review about problems associated with
construction on soft clay by using stone columns technique. In addition
to show studies under taken for the problem under investigation.

- 4 -
Chapter (3):
This chapter describes in details the experimental work. Description of
the materials used, preparation of soil specimens, test preparation,
method of installing columns and testing methodology, loading setup
and measuring devices used in the experimental are also presented.
Chapter (4):
The chapter contains analysis and discussion of the experimental results
and the influence of different tests parameters on bearing capacity and
settlement behavior.
Chapter (5):
This chapter presents a brief discussion about finite element method
including analysis sequence and different types of elements that may be
used in the analysis. Also, the finite element analysis program which is
used during this research is briefly discussed. The verification examples
are also presented.
Chapter (6):
This chapter presents the results of numerical models of the problem
under investigation at different studied parameters. It divided into two
parts; the first one is aimed at investigating the numerical analysis of
small scale model that mentioned in laboratory testing program. The
effect of stone column geometry, undrained shear strength and the effect
of drained condition are also investigated. While the second part of
study is related to discuss the numerical modeling of full scale analysis
using most common case study. In this part, the deformation
characteristic of the application of numerical modeling is applied for
large scale embankment of the stone column. In this part, the adopted

- 5 -
case study is used as mentioned by Tan et al., 2008. The settlement
values monitored during and after the construction of the embankment
are introduced. The application of consolidation behavior is also
analyzed. Finally comparison all results from finite element model by
examination (Han and Ye 2001) and (Han and Ye 2002) as a simplified
analytical solution for the rate of consolidation of stone-column
reinforced ground. A parametric study performed to investigate the
effect of different parameters on the performance of stone columns.
Finally, comparison between the results of the numerically performed
parametric study with analytical methods used to estimate the behavior
of the soft soil reinforced by stone columns.
Chapter (7):
This chapter presents a discussion of the numerical modeling of full
scale analysis using most common case study. Also a comparative study
with different researchers is presented with details.
Chapter (8):
This chapter presents the summary and the conclusions of the current
research and recommendations for future studies are presented.
Finally, list of references is given at the end of the thesis.

Chapter (2):
LITERATURE REVIEW

- 6 -
CHAPTER (2)
LITERATURE REVIEW
2.1 Introduction:
2.1.1 General
Because of the ever – increasing value of land, the development of
marginal sites is now often economically feasible. The increased cost
of conventional foundations like concrete piles, and the other several
environmental constraints greatly encouraged the improvement of
weak soils (cohesionless or cohesive soils) by any of these numerous
developed improvement techniques, blasting, soil mixing, tamping,
grouting, nailing, stone and sand piles,…etc.
Stone columns are considered as a versatile, proven and effective
soil improvement and strengthening technique. It has been an
environmentally acceptable and economically viable alternative to
other conventional forms of foundations that can be used for
improving the soft weak cohesive or loose cohesionless soils. The
advantages gained from using this method are the increase in bearing
capacity of foundation soil, reducing total and differential settlement,
and accelerating the consolidation process. It achieved a success in
supporting the structures that tolerates moderate or high differential
settlements, like storage tanks, embankments, and small structures of
moderate to low importance.

- 7 -
2.1.2 Definition
Stone columns are compacted columns of gravel or crushed rock
installed into soft soil. The ground improved by the compacted columns
is sometimes referred to as composite ground. Diameters of these
columns are usually in the range of 0.6 to 1.0 m (Mitchell, 1981).Larger
diameters can be formed by coupling more than one vibrator together.
Column lengths up to 21 m have been installed, and the typical column
spacing is approximately 1.8-2.7 m although smaller spacing is possible,
(Barksdale and Bachus, 1983). Stone column technique is one of the
most commonly used soil reinforcement methods. It is utilized
worldwide to increase the soil‟s bearing capacity, speed up its
consolidation process, and decrease structure settlement.
2.1.3 Historical Review of the Use of Stone Column
In the early nineteenth century, stone columns were first used by
military engineers in France. The columns were 2 m in length and 0.2 m
in diameter. They were constructed in soft estuarine deposits to support
heavy foundations of the artillery bases and to reduce the expected
foundation settlement by a factor of four. Although the method proved
its success, it was almost a century before the technique was used again
(Hughes and Withers, 1974, and Mckelvey and Sivakumar, 2000).
In the 1930‟s, the deep vibrator was developed by the Keller Company
to improve and densify loose cohesionless soils to depths exceeding 30
m. This improvement technique is known as vibro- compaction. Two
decades later, in the 1950‟s, this method was extended to cohesive soils
by introducing granular material through the hole formed by the

- 8 -
vibrator, thus forming a composite ground with higher strength and
lower compressibility. This process is known as vibro-replacement.
Since then, this technique has been widely used in Europe, Asia and the
United States (Mckelvey and Sivakumar, 2000). It has also been
estimated that a total of 50,000,000 meters of columns had been installed
at more than 2000 sites of about 20,000,000m² total area in the period
from 1955 to 1979 (Aboshi et al., 1979).
2.1.4 Characteristics of Ground Improvement Systems
Ground improvement or ground modification engineering is the
collective term for any mechanical, hydrological, physicochemical,
biological methods or any combination of such methods employed to
improve certain properties of natural or man-made soil deposits. The
purposes of the improvement are:-
1-Strengthen ground soil before failure occurs: This type of ground
improvement generally happens where the soil is weak with low bearing
capacity, and groundwater table is high.
2-Strengthen ground soil during soil's useful life period: This type of
ground improvement is generally necessary for proper maintenance or to
repair certain potential failure areas to prolong soil's useful life.
3-Strengthen ground soil after premature or unexpected failure: In many
cases, ground failure is unexpected. However, it is required to examine
the causes of failure before the ground improvement start.
4-Temporary ground improvement systems: This type of ground
improvement system is used in certain conditions and certain locations,

- 9 -
such as underwater repair, or where the permanent structure is under
construction.
2.1.5 Improvement of Soil Characteristics Using Stone
Column Technique
Demand and restrictions on land suitable for construction has in recent
times led to an increasing trend for the construction industry to exploit
sites that were previously considered uneconomical to develop. The use
of these sites for construction requires a coherent and economical
construction technique to be applied. One of these sites is soft clay site
particularly with great depth, which causes troubles during and after
construction due to its low shear strength and high compressibility.
The stone column technique of ground treatment has proven successful
in the following:
(1) Improving slope stability of both embankments and natural slopes.
(2) Increasing bearing capacity.
(3) Reducing total and differential settlements.
(4) Reducing the liquefaction potential of land.
(5) Increasing the time rate of settlement.
(6) Control the deformation and accelerate consolidation.
When loads are applied on soils reinforced with stone columns, a large
portion of the total load is initially resisted by the relatively strong stone
columns which are far more rigid compared to the surrounding cohesive
soil. The remainder of the load is carried by the surrounding soils. As the
consolidation process continues, variations in the sharing of the total
applied load between the stone columns and the soils takes place and the

- 10 -
potion of load transferred from soils to the stone columns, (Mitchell and
Huber (1985); Greenwood (1991))
2.2 Methods of Granular Pile Construction
Various methods have been adopted over the years for the installation of
granular piles. Stone columns being a type of granular piles depending
on their proven applicability and availability of equipment in the
locality. Some of the most common methods are discussed hereinafter:
2.2.1 Vibro – Compaction Method
The vibro – compaction method is used in cohesionless soil to improve
the soil‟s density. The equipment used in this process is called the
vibroflot and is shown in Fig. (2-1).The vibroflot sinks in the ground
under its own weight and with the assistance of water and vibration
(Bergado et al., 1994), until it reaches the required depth. Then, the
vibroflot is withdrawn gradually with subsequent addition of granular
backfill, therefore causing compaction. Fig. (2-2) illustrates the steps of
this process. The range of particle size suitable for vibro – compaction is
shown in Fig. (2-4).

- 11 -
2.2.2 Vibro – Replacement Method
The vibro – replacement method is used to improve cohesive soils with
more than 18% passing No. 200 U.S. standard sieve is shown in Fig. (2-
4).The grain size range of the suitable soils for this treatment is also
shown in Fig. (2-4).The equipment used in drilling a hole in the cohesive
soil is similar to that for vibro – compaction. The methods by which the
granular material is filled into the hole are the wet process (non –
displacement method), dry process (displacement method), and dry
bottom – feed process. A typical vibrator is used in the wet and dry
process. The typical vibrator ranges from 30 to 45 cm in diameter, 2.5m
in length, and is torpedo – shaped as shown in Fig. (2-1) while special
vibrator is used in the dry bottom – feed process.
Fig. (2-1): Vibroflot used for vibro-compaction and vibro -
replacement methods (Slocombe et al., 2000).

- 12 -
Fig. (2-2): The vibro – compaction process (Bergado et al., 1994).
Fig. (2-3): The vibro – replacement method (Bergado et al., 1994).

- 13 -
Fig. (2-4): Range of soils suitable for vibro - compaction and vibro -
replacement (Bergado et al., 1994).
2.2.2.1 Wet Method
In the wet process, a hole is formed in the ground by jetting a vibroflot
down to the desired depth with water. When the vibroflot is withdrawn,
it leaves a borehole of greater diameter than the vibrator. This
cylindrical hole is filled in stages with well – graded 12 to 75 mm size
imported gravel (Bergado et al., 1994) and each stage thoroughly
compacted by reinsertion of the vibrator, pushing the gravel laterally
against the surrounding soil. The wet process is generally suited for
unstable boreholes in case of very soft saturated clay of undrained shear
strength not less than 7 kN/m² and a high ground – water table
(Barksdale and Bachus., 1983). However, in recent years, this method
became restrained to sites with very weak soils only due the
unacceptable environmental effects from the effluent arising from the
water jetting.

- 14 -
2.2.2.2 Dry Method
In the dry process, the vibrator enters the ground under the combined
effect of self-weight, compressed air and vibration. The borehole must
be able to stand open upon the extraction of the vibroflot. Therefore, it
should be applied to stable, insensitive cohesive soils having undrained
shear strength of more than 40 kN/m² and a relatively low ground water
level.
2.2.2.3 The Dry Bottom Feed
In this system the stone is fed to the nose of the vibrator through pipes
attached to the vibrator and extension tubes. This process has the
advantage that it ensures stone reach to the tip point of the vibrator
leading to well compacting and assists in the construction of a high
integrity stone column, Fig. (2-5 a & b) illustrates the bottom feed vibro
replacement process and the equipment used in this method respectively.
(a) The bottom feed vibro replacement process.

- 15 -
(b) Cross section through bottom feed vibratos
Fig. (2-5): Bottom feed of stone columns (Slocombe et al., 2000).
- 16 -
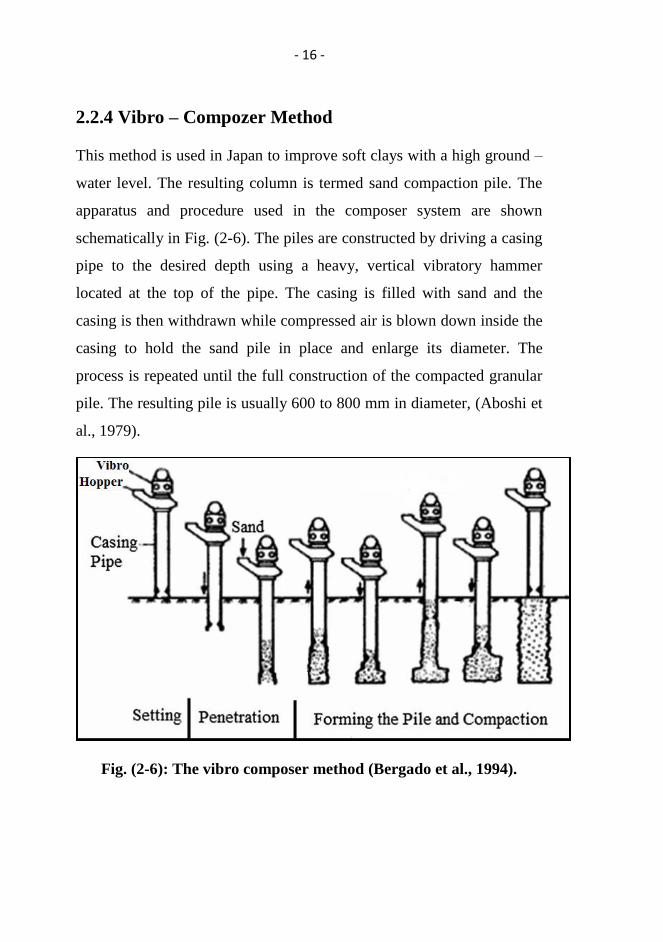
2.2.4 Vibro – Compozer Method
This method is used in Japan to improve soft clays with a high ground –
water level. The resulting column is termed sand compaction pile. The
apparatus and procedure used in the composer system are shown
schematically in Fig. (2-6). The piles are constructed by driving a casing
pipe to the desired depth using a heavy, vertical vibratory hammer
located at the top of the pipe. The casing is filled with sand and the
casing is then withdrawn while compressed air is blown down inside the
casing to hold the sand pile in place and enlarge its diameter. The
process is repeated until the full construction of the compacted granular
pile. The resulting pile is usually 600 to 800 mm in diameter, (Aboshi et
al., 1979).
Fig. (2-6): The vibro composer method (Bergado et al., 1994).

- 17 -
2.2.5 Cased– Borehole Method or Rammed Method
In this method, the piles are constructed by ramming granular materials
into the pre- bored holes in stages using heavy falling weight (usually of
15 to 20 kN) from a height of 1.0 to 1.5m, as shown in Fig. (2-7). It is
distinguished with its low cost, but on the other hand, the disturbance
and subsequent remolding by the ramming operation may limit its
applicability to sensitive soils
Fig. (2-7): The cased – borehole method (Bergado et al., 1994).

- 18 -
2.3 Engineering Behaviour of Composite Ground
2.3.1 Basic Design Parameters
2.3.1.1 Stone Column Diameter, D
Installation of stone columns in soft cohesive soils is basically a
self-compensating process, i.e. the softer the soil, the bigger is the
diameter of the stone column formed. Due to lateral displacement
of stones during vibrations/ramming, the completed diameter of
the hole is always greater than the initial diameter of the probe or
the casing. The column diameter installed by vibroflot (diameter
300-500 mm) varies between 0.6 m in case of stiff clays to 1.1 m
in very soft cohesive soils (Ranjan 1989). The diameter of the
stone column constructed by dry method is less than that of a wet
method (Greenwood and Kirsch 1983).
2.3.1.2 Stone Column Pattern
Stone columns should be installed preferably in an equilateral
triangular pattern which gives the most dense packing although a
square pattern and hexagonal pattern may also be used .A typical
layout in an equilateral triangular pattern, square pattern and
Hexagonal are shown in Fig. (2-8).

- 19 -
Fig. (2-8): Equivalent diameter of the tributary soil treated by
stone column (Balaam and Booker, 1981).

- 20 -
2.3.1.3 Stone Column Spacing
The design of stone columns should be site specific and no precise
guidelines can be given on the maximum and the minimum column
spacing. The spacing of stone columns is generally determined by
settlement tolerances for the loads to be applied and to provide
overlapping zones to cover a wide area of ground (Greenwood, 1970).
Column spacing is also dependent on the degree of improvement
required for providing a satisfactory foundation under the applied design
load. It has been recognized in practice that closer spacing are preferred
under isolated footings than beneath large rafts (Greenwood, 1970).
However, the column spacing may broadly range from 2 to 3 times the
diameter of the column depending upon the site conditions, loading
pattern, column factors, the installation technique, settlement tolerances,
etc... For large projects, it is desirable to carry out field trials to
determine the most optimum spacing of stone columns taking into
consideration the required bearing capacity of the soil and permissible
settlement of the foundation. For purposes of settlement and stability
analysis, it is convenient to associate the tributary area of soil
surrounding each stone column as illustrated in Figs. (2-8 and 2-9). The
tributary area can be closely approximated as an equivalent circle having
the same total area. For an equilateral triangular pattern of stone
columns the equivalent circle has an effective diameter (De) of 1.05S
and for a square grid it is equal to 1.13S and for a hexagonal pattern is
equal to 1.29S where „S‟ is the spacing of stone columns. The resulting
equivalent cylinder of material having a diameter De enclosing the
tributary soil and one stone column is known as the Unit cell.

- 21 -
Fig. (2-9): Unit cell idealizations (Barksdale and Bachus, 1983).
2.3.1.4 Replacement Ratio (as)
The volume of soil replaced by stone columns has an important
effect upon the performance of the improved ground. To quantify
the amount of soil replacement, define the area replacement ratio,
as the ratio of the area of the stone column after compaction (As)
to the total area within the unit cell (A) as illustrate in Fig.( 2-10 )
and (2-11) and expressed as:
as = Ac / (As+Ac) (2.1)
Where:

- 22 -
Ac = Horizontal area of the stone column; and,
As = Horizontal area of the soil surrounding the stone column.
Fig. (2-11): area ratios for (i) square grids, (ii) triangular grids
and (iii) pad footing (Bergado et al., 1994).
Fig. (2-10): Diagram of composite ground (Bergado et al., 1994).

- 23 -
2.3.1.5 Stress Concentration Factor (n)
When the stone column reinforced ground is loaded, concentration of
stress occurs in the stone column, and an accompanying reduction in
stress occurs in the surrounding less stiff soil Fig. (2-9c). The
distribution of vertical stress within a unit cell can be expressed by a
stress concentration factor „n‟ defined as the ratio of the stress in the
stone column (σc) to the stress in the surrounding cohesive soil (σs).
The unit cell can be expresses by a stress concentration factor, n as:
n = σc /σs (2.2)
Where:
σc = Stress in the stone column
σs = Stress in the surrounding soil
The average stress over the unit cell area corresponding to a given area
replacement ratio, as, is expressed as:
σ = σs as+ σc (1- as) (2.3)
The magnitude of stress concentration depends on the relative stiffness
of the stone column and the surrounding soil. The value of n generally
lies between 2 and 6 (Goughnour and Bayuk 1979; Aboshi et al., 1979)
with values of 3-4 usual, at the ground surface. The stress concentration
factor (n) increases with time of consolidation (Han and Ye 1991) and
decreases along the length of the stone column. Higher n value at ground

- 24 -
surface may result if load is applied to the composite ground through a
rigid foundation as compared to the flexible foundation (Barksdale and
Bachus 1983). The stress concentration factor was found to decrease
with the increasing in the applied load (Bergado et al., 1988).
2.3.1.6 Back Fill for Stone Columns
Crushed stone or gravel for the column backfill shall be clean, hard,
unweathered stone free of organics, trash or other deleterious materials
(Barksdale and Bachus, 1983). The criteria for selecting a suitable
backfill material are availability, suitability and economy. Well graded
stones of 75-2 mm size shall be used.
2.3.2 Failure Mechanisms
Stone columns maybe constructed as either end bearing on affirm
stratum underlying soft soil, or as floating columns with its tip
embedded within the soft layer. Consider a single stone column loaded
over just the area of the column as shown in Fig. (2-12). Either end
bearing or floating column greater than about three diameters in length
fail in bulging, Fig. (2-12a). A very short column rested on a firm
stratum will undergo either local or general shear failure, Fig. (2-12b).
Finally, a floating stone column with length less than 2 to 3 diameters
may fail in end bearing in the weak underlying layer, Fig. (2-12c).

- 25 -
In case of stone column groups, the failure may be due to spreading such
as an embankment constructed over stone column improved ground, as
shown in Figs. (2-13a and 2-13b). Also, a group of stone columns
supported on a firm layer may fail in bulging and local shear failure, Fig.
(2-13c). Finally, stone column groups having short stone column can fail
in end bearing as shown in Fig. (2-13d), or perhaps undergo a bearing
capacity failure of individual stone column similar to the failure mode of
short, single stone column.
Fig. (2-12): Failure mechanisms of single stone column in homogeneous
soft layer (Barksdale and Bachus, 1983).

- 26 -
Fig. (2-13): Failure modes of stone column groups (Barksdale and
Bachus, 1983).
Also, the presence of a very weak layer (such as peat) greater than about
one column diameter in thickness can also seriously affect stone column
performance, as depicted in Fig. (2-14).
Fig. (2-14): Stone column failure mechanisms in nonhomogeneous
cohesive soil (Barksdale and Bachus, 1983).

- 27 -
Also, Pivarc (2011) presented the bulging behavior of stone column
results from laboratory tests and comparing the results with Plaxis
model. The laboratory experiments were carried out using stone columns
with diameters of about 60 mm and lengths of 300 mm, 420 mm and 540
mm surrounded by clayey sand, in cylindrical test boxes with a height of
600 mm and with variable inner diameters varying from 125 mm to 253
mm. The cylindrical boxes represent the required area of a unit cell
around a stone column. The stone columns were modeled as a floating
unit in the soil space. The ratios of the length of the stone columns to the
diameter of the stone columns L/d are modeled as 5, 7 and 9. The
bulging of stone column after loading the stone column only and after
loading both the stone column and the surrounding soil are shown in
Figs. (2-15a and 2-15b) respectively. The finite element results and
those obtained from the laboratory experiments appear satisfactory.
Different techniques were used by various researches to examine the
deformation and failure mode of stone column treated ground. X-ray
technique has been used successfully to monitor the deformation of an
isolated granular column and surrounding clay (Hughes and Withers
1974).

- 28 -
(a) Shape of the failed
stone column after the
area of stone column
was loaded
(b) The whole area of
the stone column and
surrounding soil was
loaded
Fig. (2-15): Failure of stone columns, (Pivarc, 2011).

- 29 -
2.4 Mechanism and performance of Stone Columns
The presence of a stone column creates a composite material of lower
overall compressibility and higher shear strength than in-situ soil.
Confinement, and thus stiffness of the stone, is provided by the lateral
stress within the weak soil. When an axial load is applied at the top of a
single stone column, an extension of the column diameter is produced
beneath the surface. This extension in turn, increases the lateral stress
within the clay, which provides an additional confinement for the stone
column. An equilibrium state is eventually reached, resulting in a
reduction in the vertical displacement, when compared with the
untreated ground.
2.5 Experimental Studies
2.5.1 Field Tests
Greenwood, (1970) described the results of trials at Bremerhaven
(Germany) for motorway slip road embankment(s) application. Both
vibro stone columns and sand columns were constructed for comparison
purposes. The stone and sand columns were installed to an average
depth of 6.0 m by the wet top-feed technique through a layer of soft clay
and peat into a fine uniform sand layer).
The stone columns were constructed using gravel of size 30-70 mm with
the sand backfill having a grain size of 0-3 mm. The combined total
thickness of the clay and peat layers was about 3.0 m, with geotechnical
properties summarized in Fig. (2-16).
He reported that the average stone column diameters were 1.2 m, with
columns installed on a 2.3 m triangular grid spacing (Ar = 25%). For the

- 30 -
stone column, sand column and untreated areas, average settlements and
range of settlements after 15 months following. Reduction of settlements
was around 15% where sand columns were installed and 40% where
stone columns where installed, representing settlement improvement
ratios of 1.18 and 1.6 respectively. In addition, closer column spacing
resulted in less settlement.
The field trials demonstrate the importance of using a coarse aggregate
backfill rather than sand in the column construction to lend better
rigidity (stiffness) to the column.

- 31 -
Fig.(2-16): Comparison of large scale field loading test results on
untreated soft clay, soft clay reinforced with stone columns and with
sand columns at Bremerhaven, Germany, (Greenwood, 1970).

- 32 -
Hughes et al. (1975) undertook field scale trials to verify the theory
proposed by Hughes and Withers, 1974 in their laboratory modeling.
A single 730 mm diameter column was installed by the wet top-feed
technique through soft clay strata to the level of a firm stratum at a depth
of 10 m. A rigid 660 mm diameter circular steel plate was used to apply
vertical load to the column as shown in Fig. (2-17).The test was
considered to be undrained since it only took around 30 minutes to
complete. Good agreement was obtained between predicted and
measured load-settlement curves and demonstrated the occurrence of
shear transfer between the column and surrounding clay.
Considering the column as a 'pile', Hughes et al., 1975 defined a critical
length for an isolated column, at which end bearing and friction are
equated. Beyond this length the column was considered not to contribute
extra benefit in terms of enhanced ultimate load, but contributed to
reducing settlements by penetrating to a firm stratum. Based upon the
site specific soil and column parameters the critical depth (zone of
anticipated bulging) translated to about four column diameters, similar
to observations by Hughes and Withers, 1974.
It was observed that the deformed shape was similar to that described by
Hughes and Withers, 1974.

- 33 -
Fig. (2-17): Field deformation behaviour of a single column under a
(rigid) plate load test, (Hughes et al., 1975).
Goughnour and Bayuk (1979) reported the results of a field trial on a
group of columns installed using the wet top-feed technique, through
very soft sensitive silts and clays in Hampton, Virginia (U.S.). As shown

- 34 -
in Fig. (2-18), the columns were installed to an average depth of 6.4 m
and on an approximate 1.8 m grid pattern with a recorded average
diameter of 1.1 m (representing an Ar of 33%).
A vertical load test was undertaken to simulate embankment loading
conditions. Load cells placed on top of stone columns and intervening
clay soil prior to application of load recorded stress concentration ratios
of between 2.6 and 3.0.
Pore pressure measurements indicated that a large stress increase at the
completion of load application occurred at a depth equal to half the
width of the loaded area.
Fig. (2-18): Field load test arrangement (Goughnour and Bayuk, 1979).

- 35 -
Fig. (2-19): Settlement versus log time at the centre and corners of
load area in field trial (Goughnour and Bayuk, 1979).

- 36 -
Munfakh et al, (1984) reported a field study (for a project named
Jordan Road Terminal) on the effectiveness of stone columns in
stabilizing a deep deposit of very soft cohesive soil under a 3.4m height
of embankment load. In situ shear tests showed that a peak internal
frictional angle of 45° is achieved at the surface of an insitu column.
Approximately 40% of settlement reduction was achieved at the end of
the embankment construction period. Significant lateral movements
(maximum value of 60 mm) beneath the embankment were measured
mostly occurring at mid height of the column depth. It was reported that
no significant lateral bulging was observed at the top of the stone
columns. The failure of this testing embankment was accomplished by
adding surcharge and excavation on the supporting side so that the
ultimate failure mode was a combination of general shearing and local
bulging.
Mitchell and Huber, (1985) performed 28 field load tests on individual
stone columns constructed in soft estuarine deposits during the
installation of 6500 stone columns. The stone columns reinforced soft
soil is used to support a large waste water treatment plant. All stone
columns extended completely through the soft soil layer which ranged
from 9 m to 15 m. the diameter of the stone columns ranged from 0.5 m
to 0.75 m. the column spacing ranged from a 1.2 m x 1.5 m pattern to a
2.1 m x 2.1 m pattern.
The results of the load test showed that the existence of the stone column
led to a reduction in settlements to about 30% - 40% compared to the
settlement of the untreated ground.

- 37 -
Bergado and Lam, (1987) reported the results of field trials to
investigate the behavior of granular 'piles' (columns) with different
densities and containing different proportions of sand and gravel,
installed in soft Bangkok clay by the compozer method. Table (2.1)
shows that for the same granular (stone column) materials the ultimate
bearing capacity increases with number of blows per layer during
installation attributed to an increase in density and angle of internal
friction.
Table 2.1 Properties of granular columns (Bergado and Lam, 1987).
The resulting load-settlement curves for the different proportions of
gravel and sand are compared and indicate a higher ultimate capacity for
pure gravel and which equates to the higher reported friction angles in
the literature for compacted gravels compared to those for compacted
sands. The average deformed shape of the granular columns was
described as typically bulging type and it was observed that the
maximum bulge occurred near the top of the column.

- 38 -
The authors indicate that with an initial diameter of 300 mm, the
measurements of bulging recorded were in close agreement with the
field observations of Hughes et al. (1976).
Fig. (2-20) Comparison of load-settlement performance of granular
columns constructed with different numbers of blows per
compacted layer (Bergado and Lam, 1987).
Han and Ye, (1991) presented the results of full scale load tests on
stone columns reinforced soft soil in coastal areas. A total of 16 stone
columns were used in soft soil having a length of 14 m and an average
diameter of 0.85 m arranged in triangular pattern. The treated and
untreated grounds were loaded. It was found that the stone columns

- 39 -
increase the bearing capacity of the treated ground to two times the
untreated ground. Also, it was established that using stone columns to
reinforce soft soil is very effective in decreasing the initial excess pore
water pressure and to keep the foundation stable.
Christoulas et al., (2000) described the results of two instrumented
axial loading tests on large scale model stone columns. Kaolin clay was
used to simulate natural soil conditions. Two columns were constructed
with average diameter of 0.17 m in a cubic pit with 1.5 m edge. The
results of the experimental tests provided support of that the upper part
of the column bulged along a length of about 2.5-3.0 column diameter.
The experimental data of this study suggested that the ultimate load
corresponds to settlements approximately equal to 35 % of the stone
column diameter.
2.5.2 Laboratory Tests
The first laboratory test performed to model stone column reinforced
ground was conducted by Hughes and Withers, (1974). Model columns
were constructed using Leighton Buzzard sand, 150 mm in length, with
diameters ranging from 12.5 to 38 mm; the columns were "floated" in
the surrounding soil.
The soil used in the laboratory scale models was kaolinite consolidated
to unspecified shear strengths. Displacements within the cohesive soil
were cleverly monitored using lead shot placed a priori within the
columns and the surrounding soil; radiographs of the experimental
model revealed the incremental soil movements. Load deformation

- 40 -
results, obtained from stress-controlled tests, were presented in terms of
the ratio of applied stress to undrained shear strength against the percent
of vertical displacement as function of column diameter. Regardless of
the unfortunate omission of the in-situ soil parameters, the test results
plainly show that the ultimate strength of the reinforced ground is a
strong function of the lateral restraint provided by the in-situ soil. These
tests were the first experimental evidence to support the previously
assumed load transfer mechanism.
Narasimha Rao et al., (1992) conducted experimental studies on single
column and continued the work (Rao et al. 1997) on group of columns
comprising 2, 3 and 4 columns in soft clay to study the influence of
moisture content of the soft clay and the effect of slenderness ratio (L/d)
of the stone column. The results showed that the presence of stone
columns increases the support capacity of the soft clay by 2 to 3 times.
The other conclusions drawn were as follows:
- Consistency index plays an important role in load carrying capacity of
the stone column, since the load carrying capacity of stone column
depends on the extent of bulging of column. It was found that the
increase in consistency index increases the capacity under the imposed
load, and the stone column bulges satisfactorily in a soil with
consistency index of 0.5.
- The L/d ratio is an important parameter for the mobilization of skin
friction. The overall length of the column, diameter of the column and
bulging control the skin friction. The ideal L/d ratio of stone columns for
the consistencies tested is in the range between 5 and 10.

- 41 -
- The end bearing values are more in short columns particularly in
column with L/d = 2.5; however the contribution due to end bearing is
less with L/d and is negligible for longer columns (i.e. higher
slenderness ratio). The optimum L/d is 5 to 7, beyond this critical length
there is no significant increase in the load carrying capacity.
- The size of the bearing area has significant effect on the load carrying
capacity of stone columns with lower L/d ratios. At higher values of L/d
of 7 to 9 the increase in bearing area has no influence on capacity.
Also the contribution from the end bearing on limiting axial stress is
very little compared to that due to skin friction.
Wood et al., (2000) performed model tests to determine the mechanisms
of response for beds of clay reinforced with stone columns subjected to
surface footing loads. An exhumation technique was used to discover the
deformed shapes of the stone columns. The laboratory model tests
showed that there was significant interaction between the footing and the
individual stone columns within a group. As a consequence, the load-
settlement relationship for neighboring columns in different locations
was different. Wood et al. reported that it will be more accurate in
design of the stone column reinforced foundation to consider increasing
stiffness towards center of the group. The kinematic constrains that the
rough base of the footings imposes, push the load to greater depths
toward the center of the footing. Based on the study of wood et al.
(2000), the following failure modes of stone columns were proposed as
shown in Fig. (2-28).

- 42 -
(a) The bulging failure of a stone column takes place when it is not
prevented from expanding radially by adjacent columns
(b) The bearing capacity failure plan occurs in the head of the column.
(c) Failing by a diagonal shear plane if the stone column has a little
lateral restrains and is subjected to high loads.
(d) Failing by penetration through an underlying soft clay layer if the
stone column is short column.
(e) The compression failure happens when the stone column is long.
(f) A slender stone column can fail by bending if it is laterally loaded.
Fig. (2-21): Failure modes of stone columns (Wood et al., 2000).
Results of the experimental model conducted by Wood et al., (2000) are
illustrated in Figs. (2-22 through 2-25), which give the normalized
footing load versus normalized footing settlement behavior by variable
area ratio values, AS for short and long columns, and column length.
Wood et al., (2000) stated that as the area ratio increases, the stiffness
and thus the strength also increases. Moreover, Wood et al., (2000)

- 43 -
states that there exists a certain point up to which the column length is
relevant and no further advantage is obtained by increasing the column
length beyond that point.
Fig. (2-22): Normalized load-settlement results for model footings;
variation of area ratio (short columns) (Wood et al., 2000).

- 44 -
Fig. (2-23): Normalized load-settlement results for model footings;
variation of area ratio (long columns) (Wood et al., 2000).
Fig. (2-24): Normalized load-settlement results for model footings;
variation of column length (short columns) (Wood et al., 2000).
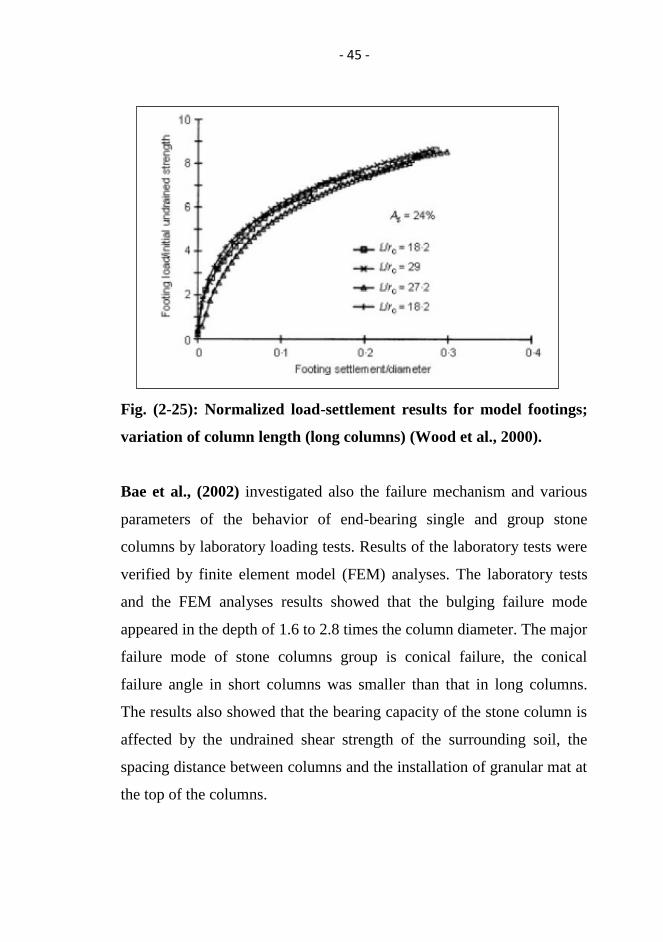
- 45 -
Fig. (2-25): Normalized load-settlement results for model footings;
variation of column length (long columns) (Wood et al., 2000).
Bae et al., (2002) investigated also the failure mechanism and various
parameters of the behavior of end-bearing single and group stone
columns by laboratory loading tests. Results of the laboratory tests were
verified by finite element model (FEM) analyses. The laboratory tests
and the FEM analyses results showed that the bulging failure mode
appeared in the depth of 1.6 to 2.8 times the column diameter. The major
failure mode of stone columns group is conical failure, the conical
failure angle in short columns was smaller than that in long columns.
The results also showed that the bearing capacity of the stone column is
affected by the undrained shear strength of the surrounding soil, the
spacing distance between columns and the installation of granular mat at
the top of the columns.

- 46 -
Mckelvey et al., (2004) carried out a series of laboratory model tests on
a consolidated clay bed using two different materials:
1. Transparent material with clay like properties prepared by
mixing fumed silica in an oil blend of mineral spirits and crystal
light liquid paraffin.
2. Speswhite Kaolin clay.
The tests on the transparent material permitted visual examination for
the deforming of the stone column during loading. For the Foundation
loading on transparent material samples, three sand columns, 25 mm in
diameter, were installed in a triangular pattern beneath a circular footing,
100 mm in diameter, and also in a row arrangement beneath a strip
footing to depths of 150 mm and 250 mm. For the foundation loading of
Kaolin clay tests, four sand columns, 25 mm in diameter, were installed
in a square pattern beneath a model pad footing, 90 mm x 90 mm, to
depths of 150 mm and 250 mm.
The presence of the granular columns significantly improved the load-
carrying capacity of the soft clay. However, columns with length to
diameter ratio (L/d) more than 6 seem to show further increase in the
load capacity. The results of the tests showed that columns can fail in 3
different ways: bulging, punching and pending. Punching is more
prevalent in short columns whilst bending failure is predominant in
perimeter columns located beyond the center of the footing. Bulging was
more generally common in long columns, as shown in Fig. (2-26).
Beneath the rigid footing, the central column in the stone columns group

- 47 -
deformed or bulged uniformly, while the edge columns bulged away
from the neighboring columns.
(a) 150 mm length (b) 250 mm length
Fig. (2-26): Photos of sand column beneath circular footing at
beginning, middle and end of foundation loading process: (Mckelvey
et al., 2004).

- 48 -
Ambily and Gandhi, (2007) used experimental study to predicate the
behavior of single column and group of seven columns. The test was
carried out by varying parameters like spacing between the columns,
shear strength of soft clay, and loading condition surrounded by soft clay
in cylindrical tanks of 500 mm high and a diameter varying from 210 to
835 mm to represent the required unit cell area of soft clay around each
column assuming triangular pattern of installation of columns. For single
column tests the diameter of the tank was varied from 210 to 420 mm
and for group tests on 7 columns, 835 mm diameter be used. Tests had
been carried out with shear strength of 30, 14, and 7 kPa. The tests are
carried out either with an entire equivalent area loaded to estimate the
stiffness of improved ground or only a column loaded to estimate the
limiting axial capacity, as shown in Fig. (2-27).
During the group experiments, the actual stress on column and clay were
measured by fixing pressure cells in the loading plate. Finite-element
analyses have also been performed using 15-noded triangular elements
with the software package Plaxis. A drained analysis was carried out
using Mohr-Coulomb‟s criterion for soft clay, stones, and sand. The
numerical results from the FEM are compared with the experimental
results which showed good agreement between the results.

- 49 -
Fig. (2-27): Single column test arrangement (Ambily and Gandhi,
2007) (a) column area loading (b) entire area loading.
The following conclusions were drawn based on that study:
1. As spacing increased, axial capacity of the column decreases and
settlement increased up to an s/d of 3, beyond which the change is
negligible.
2. The ratio of limiting axial stress on column to corresponding shear
strength of surrounding clay is found to be constant for any given s /d
and angle of internal friction of stones and it is independent of the shear
strength of the surrounding clay, Fig. (2-28).

- 50 -
Fig. (2-28): Effect of s/d and ϕ on axial capacity of stone column.
(Ambily and Gandhi, 2007).
3. The load settlement behavior of a unit cell with an entire area loaded
is almost linear and it is possible to find the stiffness of improved
ground, Fig. (2-29).
4. Single column tests with an entire unit cell area loaded compare well
with the group test results. Hence the single column behavior with unit
cell concept can simulate the field behavior for an interior column when
large number of columns is simultaneously loaded, Fig. (2-30).

- 51 -
Fig. (2-29): stress settlement behavior under entire area loading
(Ambily and Gandhi, 2007).
Fig. (2-30): Comparison of group column test and single column
test (Ambily and Gandhi, 2007).

- 52 -
Isaac and Grirish, (2009) studied the influence of column material in
the performance of stone column through laboratory experiments on
model stone columns installed in clay. Load tests were carried out on
Kuttanad clay and load deformation curves were plotted for untreated
clay and clay treated with stone column made of five column materials
i.e. quarry dust sea sand, river sand, gravel and stones designated as m1,
m2, m3, m4 and m5 respectively. All experiments were carried out on a
50 mm diameter stone column surrounded by the required soil in a
cylindrical tank of 270mm height and 210mm diameter to represent the
required unit cell area of clay around each column, as shown in Fig. (2-
31). For group of columns, a tank of 270mm height and 520mm
diameter was used.
A finite element analysis using 15-noded triangular elements with the
software package Plaxis was also carried out to compare the load
settlement behavior with the model test, as shown in Fig. (2-32). Load
versus settlement response was determined. Along the periphery of the
tank (interface between the soft clay and the cylindrical surface of the
unit cell), radial deformation was restricted but settlement was allowed.
Along the bottom of the tank both radial deformation and settlement
were restricted. Analysis for a group of seven columns was also carried.
Isaac and Grirish stated that the presence of stone columns considerably
improved the load deformation characteristics of Kuttanad clay. Among
the different stone column materials used, stones were found to be more
effective from single column test and group column test. Also, spacing
of the column played an important role in affecting the load deformation
characteristics, as shown in Figs. (2-33 and 2-34).

- 53 -
Fig. (2-31): The test setup for single and group column test
(Isaac and Grirish, 2009).
Fig. (2-32): Load - Settlement curve for clay with single
Column (Isaac and Grirish, 2009).

- 54 -
Fig. (2-33): Comparison of stress settlement relation for clay
with group of seven columns(S = 2.5D).
Fig. (2-34): Comparison of stress settlement relation for clay
with group of seven columns (S = 3D).

- 55 -
2.5.3 Theoretical Studies
Laboratory research, testing and field studies undertaken over the last
years have led to the development of empirical, analytical and numerical
techniques used to assess column capacity and load-settlement behavior.
In the following sections, a brief description of the design methods used
for assessment of settlement reduction is introduced.
Greenwood, (1970) Introduced design curves to asses settlement
reduction associated with the use of conventional stone columns. The
empirical curves were derived from column groups placed under
widespread loads on uniform soft soil. They represent settlement
reduction as a function of column spacing and the undrained shear
strength of the natural soil (For cu = 20 kPa and 40 kPa). Later,
Greenwood and Kirsch (1983) presented updated curves as a function of
area ratio, as illustrated in Fig. (2-35).
Fig. (2-35) Greenwood curves (Greenwood and Kirsch, 1983).

- 56 -
Priebe, (1976) Proposed a method for assessing settlement reduction
based on the unit cell, elastic theory and Rankine earth pressure theory.
In this model, the stone column was assumed to be incompressible and
surrounded by an elastic material. Soil settlement occurred when lateral
pressure in the column exceeded the confining pressure in the
surrounding soil. Priebe generated a series of design curves where the
basic settlement improvement factor was plotted against the area ratio
for a range of granular materials. The improvement factor is the ratio
between the settlement of the untreated and treated soil. Later Priebe,
1995 presented a revised version which included compressibility,
modular ratio of column and soil, confinement from overburden pressure
and solutions for single and strip footings. An example of these modified
design curves is presented in Fig. (2-36).
Fig. (2-36): Priebe design curves (Priebe, 1995).
2.5.3.1 Numerical Methods
Numerical methods are probably the most theoretically suitable to
modeling stone column treated ground.
Gniel and Bouazza, (2007) reported that Balaam et al., 1977 used finite
element and finite difference methods to explore stone column behavior,

- 57 -
resulting in publication of design curves used to assess settlement
reduction. That work was continued by Balaam and Booker (1981 and
1985) and Balaam and Poulos, 1983.
Recently, sophisticated models have been used to better model soft soil
behavior and its interaction with loaded columns such as the study of
Lee and Pande, 1998 and Tan et al., 2008.
Balaam and Booker, (1985) studied the settlement of a rigid foundation
supported by a layer of clay stabilized with stone columns. The results of
an analytic solution for the settlement, assuming no yield occurs in the
clay or the columns, were presented. Later, this solution was used to
develop an interaction analysis, which considered yielding within the
stone columns. The solutions were obtained from the analysis of a unit
cell. In order to check the validity of these assumptions elastoplastic
FEM analyses were performed and the agreement between the two
methods was very good. The results were plotted as a settlement
correction factor, which is the ratio between actual settlement and elastic
settlement of the foundation. The results showed that the most
significant reduction in settlement occur when the columns are closely
spaced and the column-soil modular ratio is high.
Poorooshasb and Meyerhof, (1997) introduced elastic analyses to
study the settlement reduction of a raft foundation resting on reinforced
soft soil with end bearing stone columns. The results of the analyses
showed that the factors that most severely affect the performance of a
stone column foundation scheme are the spacing and degree of

- 58 -
compaction of the material in the columns which, in turns, control their
strength and stiffness.
Pulko and Majes, (2006) introduced a simple analytical method for the
analysis of stone-column reinforced foundations. The stone-column and
the surrounding soil were modeled as a unit cell, consisting of elastic
soil and rigid plastic column material according to the Mohr-Coulomb
failure law. The dilation of the column material according to the Rowe
stress - dilatancy theory was directly incorporated into the method. The
closed-form solution method was used for the prediction of the effects of
stone-columns on settlement reduction and stresses in the soil and
column. A parametric study was also presented to study the influence of
area replacement ratio and material properties of the granular material
on settlement reduction factor. The study showed the significant effect
of the dilatancy of granular material on the settlement reduction and
stress concentration.
2.6 Ultimate Bearing Capacity of Stone Columns
2.6.1 Isolated, Single Stone Column
The ultimate bearing capacity of stone column in clay depends upon the
internal angle of friction of the column material and the shear strength of
the surrounding clay. For single isolated granular piles, the most
probable failure mechanism is bulging failure. This mechanism develops
whether the tip of the column is floating in the soft soil or resting on a
firm bearing on a firm layer (Barksdale and Bachus 1983). A number of
approaches have been presented by the researchers for predicting the

- 59 -
ultimate capacity of an isolated single stone column surrounded by a soft
soil, which are reviewed in this part.
Greenwood (1970) was one of the first who came up with mechanisms
and explained the load transfer phenomenon in stone columns. He
suggested a method to predict the ultimate bearing capacity of stone
column in c-ϕ soils based on passive pressure approach. The failure of a
single column was assumed to be by bulging of the column up to critical
depth. The ultimate bearing capacity was assumed to be equal to the
ultimate lateral strength of the surrounding soil. Prakash et al. (2000)
reported that, this approach did not take into consideration both of the
passive earth pressure coefficient of stone column material and the
effects of the intervening soil.
Hughes and Withers (1974) indicated that the ultimate column load
depended on the friction angle of the stone used to form the column, the
size of the column, and the restraint of the clay on the uncemented stone.
They considered the bulging type failure of a single stone column to be
similar to a cylindrical cavity expands till reaching the ultimate passive
resistance of the surrounding soil.
Using the elasto-plastic theory, they developed an analytical expression
for the total limiting radial stress as:
(2.7)
Where:
= initial radial effective stress
= initial excess pore water pressure
= undrained cohesion of surrounding soil

- 60 -
If the stone column approached shear failure with an effective angle of
internal friction of ϕ `, then the limiting axial stress in the column was
given by
(
) (2.8)
(
) ) (2.9)
If = 0, drainage into the stone column makes this possible. The value
of σrl or c should be the minimum that would be expected over the
critical length of the column (Lc). If the vertical shear stress developed
along the side of the column was equal to the average shear strength of
the soil when end bearing failure was about to occur, the critical length
can be evaluated by equating the boundary forces on the column;
column load equals the sum of the shaft friction and end bearing force:
(2.10)
Where:
P = ultimate column load
Nc = bearing capacity factor (taken normally as 9 for long
columns).
As1 = surface area of column side.
c and c` = average shaft cohesion and cohesion at the bottom of the
critical length, respectively.
The critical length is the minimum lengths at which both bulging and
end bearing failure occur simultaneously. Hughes et al (1975) carried

- 61 -
out a series of plate loading tests in order to verify the theory proposed
by Hughes and Withers (1974). Excellent agreement was achieved
between the predicted and the measured results.
Narasimha Rao et al., (1992) were conducted Small scale laboratory
tests in (1992) to examine the ultimate bearing capacity of single stone
columns. The influence of the column diameter, length and footing
diameter was investigated by varying the L/d ratio from 3 to 9 and
examining a range of footing diameters, D = 1d–2d, Fig. (2-37). The
tests indicated that the ultimate capacity of stone columns increased with
the L/d ratio, which the authors suggest is the governing factor of
column capacity. A critical L/d ratio appeared to exist between 5 and 7,
beyond which no further increase in ultimate capacity is gained. The
ultimate capacity of stone columns was also observed to increase with
footing size; however, this increase was only noticeable for columns
shorter than 7d.
Fig. (2-37): Typical test setup examined by (Rao et al., 1992).

- 62 -
Bouassida and Hadhri, (1995) determined the extreme load for soils
reinforced by stone columns for the case of isolated column, using the
yield design theory. The plane strain and axisymmetric cases were
studied for the composite ground in order to estimate the value of the
upper and lower bounds of loads. The undrained and drained behaviors
were established for plane strain case, and the undrained condition only
was considered for the axisymmetric case. The influence of gravity was
also studied. It was obvious that the increase in this parameter caused a
considerable increase in the extreme load value in the plane strain
analysis for columns material of high frictional values. But in
axisymmetric case, the influence of gravity was negligible for all values
of the friction angle. Finally, they recommended the use of the upper
bounds determined based on the plane strain assumption for estimating
the bearing capacity of reinforced soil by group of trenches.
2.6.2 Stone Column Groups
Goughnour and Bayuk, (1979) proposed an approach dealing with the
stone column and the surrounding soil as a unit cell to simulate large
group of columns. Stone column material was assumed to be rigid
plastic, surrounding soil to be in the elastic range and the soil at the
boundary of the unit cell to be completely plastic. The assumption of
complete plasticity of soil between unit cells may lead to over
simplification as in case of large groups of columns supporting flexible
footings or in case of embankments where the columns and surrounding

- 63 -
soil are subjected to spreading. The approach is more applicable for
stone columns in soft clays only.
Aboshi et al., (1979) mentioned that the induced stress concentration on
sand piles with increasing settlement was because different deformations
occurred between column and soil. He proposed two equations for
estimating the value of stress concentration factor, n, at yielding of
column material and surrounding soil for undrained and drained
conditions. Then, the relation between the bearing capacity and stress
concentration was postulated in an equation calculating the shear
strength of composite ground based on the circular sliding surface
method.

- 64 -
Barksdale and Bachus, (1983) they proposed a method to estimate the
ultimate bearing capacity of stone column groups of either a square or
infinitely rigid concrete footing resting on the surface of cohesive soil as
depicted in Fig. (2-38). Assuming that foundation was loaded quickly so
that the undrained shear strength is developed in cohesive soil, with the
angle of internal friction bearing negligible, neglecting cohesion in stone
column, and assuming the full mobilization of shear strength of both
stone column and cohesive soil.
Fig. (2-38) Stone column group analysis - firm to stiff cohesive
soil (Barksdale and Bachus, 1983).

- 65 -
For the firm to stiff cohesive soil with undrained strength greater than 30
to 40 kN/m2, the authors approximated the failure surface with two
straight rupture lines as shown in Fig. (2-39).
Assuming the ultimate vertical stress, qult, and the ultimate lateral stress
σ3 to be the principal stresses, then the equilibrium of the wedge
requires:
= σ3 tan2β
` +
tan β
` (2.12)
σ3 = (γcB tan β`/2) +2c (2.13)
Where: (2.14)
tan -1
(µsas tan ) (2.15)
= (1-as) c (2.16)
Where:
γc = saturated or wet unit weight of the cohesive soil
B = foundation width
β` = failure surface inclination
c = undrained shear strength within the undrained
cohesive soil
= angle of internal friction of stone
= composite angle of internal friction on shear
surface
= composite cohesion on the shear surface

- 66 -
For the case of the soft and very soft cohesive soils, the stone column
group capacity was predicated using the capacity of a single, isolated
stone column located within a group, and to be multiplied by the number
of columns. The ultimate bearing capacity for a single, isolated stone
column can be expressed:
qult = C Nc (2.17)
Where:
C = undrained shear strength of cohesive soil
Nc = composite bearing capacity factor for the stone column
Nc ranges from 18 to 20 (Barksdale and Bachus, 1983). For the soft
Bangkok clay, it ranges from 15 to 18, using an initial pile diameter of
25.4 cm with the gravel compacted by a 0.16 ton hammer dropping 0.7m
(Bergado et al., 1994).
Priebe, (1995) presented design chart for determining the portion of the
total load received by the stone column as depicted in Fig. (2-39).The
factor m postulates the increased proportion of the total load carried by
the column. There are two groups of curves, the solid lines present the
value of m based on the value of area replacement ratio, as, and the value
of settlement improvement factor (ratio of settlement of untreated group
to that of treated ground , as determined
(2.18)

- 67 -
Fig. (2-39): proportional loads on stone columns (Priebe, 1995).
The dashed lines give the value of m averaging on the basis of the load
distribution on columns and soil. So, this reduced value of m was
calculated from the following equation:
(2.19)
According to the proportional loads on columns and soil, the shear
resistance from the friction characteristics of the composite ground was
averaged as:
tan ϕ avg = m.tan ϕ c + (1-m`).tan ϕ s (2.20)
The cohesion of the composite ground depends on the area ratio:
cavg = (1-as) .c (2.21)
Due to the damage caused in soil during the process of installation, it
seemed advisable to consider the cohesion proportional to the loads:
cavg = (1- m`) .c (2.22)

- 68 -
The ultimate bearing capacity of a rigid single isolated and strip footings
on the composite ground was estimated by priebe (1991,1995) on the
basis determining a fictitious width b of the footing, which is larger than
the actual width b. In case of ground failure, the failure line of sliding
extending outside the improved area is the same as in case of actual
footing at the actual conditions, but under the footing the rupture surface
would be increased as b' > b.
The value of b' was calculated from:
.
b'=b.e (arc(45 -
avg/2).tan
avg - arc(45-
s/2).tan
s )
(2.23)
Then, this fictitious width is used in determining the bearing capacity by
using the normal bearing capacity factors, the friction angle of the
untreated ground, and the average cohesion according to the proportion
of fictitious width and failure width outside the footing.
Another method was developed by preibe, (1991) for estimating the
bearing value by drawing an approximate failure line for the treated
ground under the footing and the untreated area. The average friction
angle and cohesion values were adopted for the zone of treated ground.
Outside of this zone, parameters of weak soil were used. Then, these
parameters, in addition to the bearing capacity factors, were substituted
the equation of bearing capacity to calculate its value. The
aforementioned two approaches gave results agreed well with that
obtained by Barksdale and Bachus, (1983).
Boussida et al., (1995) studied the improvement of the bearing capacity
of the foundation soil reinforced by columnar inclusions in two stages;

- 69 -
the trixial loading test was simulated on the composite cylindrical cell of
central column surrounded with the weak soil, using the yield design
theory. The second stage, was concerned with estimating the bearing
capacity of a smooth rigid footing resting on the reinforced soil, using
the predetermined solution from the first stage. A quantitative analysis
of the grain of strength due to reinforcement was developed. The bearing
capacity was estimated regardless of the foundation shape or columns
distribution and neglecting the gravitational forces in the analysis.
Bae et al., (2002) studied the failure mechanism and various parameters
influencing the behavior of end bearing stone column groups by
conducting loading tests and unit cell consolidation tests and the results
of model tests are verified through FEM analysis. They found that the
bearing capacity of stone column.
Black et al., (2007) conducted tests on isolated stone column and on a
group of three columns with same area replacement ratio with different
lengths under drained triaxial conditions. They concluded that grouping
of columns can lead to a possible reduction in the stiffness when
compared with a single column at similar area replacement ratio.

- 70 -
2.7 Settlement Analyses
2.7.1Greenwood Method
Greenwood, (1970) presented charts for predicting consolidation
settlements of stone column reinforced clay based on entirely empirical
approach. The total settlement of the composite ground was assumed to
be uniform and was equal to the vertical strain at the top of stone column
plus the compression of soil layer below tip.
Settlement reduction, under widespread loads, is presented as a function
of column spacing and the undrained strength of the clay. The clay
strength considered in the analysis ranged from 20 to 40 kN/ m2 as
shown in Fig. (2-40). Greenwood suggested that these curves be used
with caution within the indicated range (Balaam and Poulos, 1983).
Immediate settlements and shear displacements were neglected,
Greenwood‟s approach compares well with many of the more recent
numerical and theoretical methods of settlement prediction (Mckelevey
and Sivakumar, 2000).

- 71 -
Fig. (2-40): Settlement for stone column in clay (Greenwood, 1970).
2.7.2 Priebe Method
Priebe, (1995) proposed a method for estimating the reduction in
settlement of infinitely loaded foundation supported on ground improved
with stone columns. Depending on his earlier work in 1991. The unit
cell model method was used with area A and a concentric single column
with cross section As. This method was based on some idealized
conditions and assumptions as follows:
The stone column is assumed to be in the plastic equilibrium
state the surrounding soil to behave elastically
The column is resting on a rigid layer.
The column material is incompressible, and the change in
volume within the surrounding soil is directly related to vertical
shortening of the cylindrical column which forms the basis of the
derivation. The radial deformation of the elastic soil was

- 72 -
determined using an infinitely long, elastic hollow cylinder
solution. The elastic cylinder of soil, which had a rigid exterior
boundary coinciding with the boundary of the unit cell, was
subjected to a uniform internal pressure (Barksdale and Bachus,
1983).
Equal vertical settlements of column and soil.
Uniform stresses in the two materials.
Settlement occurred due to bulging of stone column into
surrounding soil. Assuming a constant bulging along the column
length.
The bulk density of column and soil was neglected.
The coefficient of lateral earth pressure was taken equal to Kac
and 1.0 for stone column and surrounding soil, respectively.
According to the aforementioned assumption, Priebe derived the
following equation to calculate the settlement improvement factor,
which equal to the ratio of settlement of original untreated ground
(soil), Sunt, to the settlement of soil treated with stone columns, St, using
poisson‟ s ratio, ν , equal 0.3 .
1 + .
(2.24)
Where:
Kac = coefficient of the active lateral earth pressure of stone column The
relation between the improvement factor, the reciprocal of area
replacement ratio, A/AS , and the angle of internal friction of backfill
A
As
1
)/1.(.4
/5
AAK
AAs
sac

- 73 -
material, ϕ , was illustrated in Fig.(2-41)
Fig. (2-41): Priebe’s settlement improvement factor curves
(Priebe, 1995).
Balaam and poulos (1983) and Barksdale and Bachus (1983) found
that using Fig. (2-42) would over – predict the beneficial effect of stone
columns in reducing settlements when compared with actual field data
and data from other design methods like equilibrium method. As this
method is depending on the elastic theory, it would give a good
agreement with the other non – linear methods at very close column
spacing, but the discrepancy increases as the column spacing increases,
(Balaam and poulos, 1983). Based on the fact that the backfill material is still compressible and also
in the case of A/Ac= 1.0 dose not achieve an infinite value of settlement
improvement factor as determined theoretically for incompressible
material, Priebe had introduced an additional area ratio ∆ (A/Ac) to be
added to the actual value of area ratio. The modified value of area ratio

- 74 -
was used in Fig. (2-42) to get the improvement factor. The additional
area ratio was determined from Fig. (2-42) relating it with the ratio of
column constrained modulus, Ds, to soil constrained modulus, Dc, and
the angle of internal friction of backfill material. The modifications were
extended to introduce the effect of overburden pressure of soil in
increasing the coefficient of the stone column.
As an advanced for his approach, Priebe, (1995) provided design charts
to estimate the settlement of foundation of limited size supported on a
limited number of stone columns as a function of the settlement of
infinite foundation on infinite grid of stone columns, as shown in Fig.
(2-43) and (2-44) for isolated and strip footings, respectively. These
design charts show the relation between the required settlement ratio,
depth of treatment to diameter of stone column ratio d/D, and the
numbers of stone columns under the footing area attributable to a stone
column as well as the foundation pressure were identical in both cases of
foundation of finite size foundation. Also, the load distribution as well as
the lower bearing capacity of the outer columns of the column group
below the footing was taken into consideration.

- 75 -
Fig. (2-42): Additional area ratio curves (Priebe, 1995).
Fig. (2-43): Settlement of single footings (Priebe, 1995).

- 76 -
Fig. (2-44): Settlement of strip footings (Priebe, 1995).
2.7.3 Equilibrium Method
Aboshi et al., (1979) developed the equilibrium method for estimating
the settlement of sand compaction piles in Japan. He assumed an
infinitely loaded area, reinforced with sand piles having a constant
diameter and spacing. The stress concentration factor needed for
calculating the settlement was estimated from the past experience. For
this condition of loading, the assumptions used in this method were:
The unit cell concept assumed to be valid.
The total vertical load applied to the unit cell equals the sum of
the force carried by stone and soil.
The vertical strains at any horizontal level are uniform.
A uniform vertical stress due to external load exists thought the
length of stone column or the compressible layer is divided into
increments.

- 77 -
The settlement Sunt of the untreated soft clayey subsoil under an
average applied stress σ is calculated by the following equation:
Sunt= mv.σ.H (2.25)
Where:
mv = modulus of volume compressibility
H = thickness of clay layer
The settlement St of the treated soil was estimated by the following
equation, taken into account the effect of stress reduction on the soil
surrounding the pile.
St= mv. (µcσ).H (2.26)
Comparing Equation (2.24) with (2.25), settlement reduction ratio β is
the ratio of the settlement of the treated to untreated soil, equals:
β = St / Sunt = µc = 1/ [1+ (n-1) as] (2.27)
A design chart according to Equation (2.27) is shown in Fig. (2-45). it
was reported by Barksdale and Bachus (1983) that this method slightly
overestimated the expected ground improvement and was only useful for
preliminary studies.

- 78 -
Fig. (2-45): Settlement reduction factor using equilibrium method
(Aboshi et al., 1979).
2.7.4 Incremental Method
The method developed by Goughnour and Bayuk, (1979) was an
extension to the work presented by Huges et al. (1975). The unit cell
concept was used considering successive vertical increments, i.e. disc
shaped elements to take into account the increase of the confining
pressure, applied to the stone column by in – situ soil, with depth.
Hence, bulging due to yielding in the column was a function of depth
and occurred initially in the top portion of the column
The stone column material was assumed to be incompressible and all of
the volumetric strain must be accommodated by the surrounding soil, as
it consolidates. Shear stresses were disregarded between stone column
and soil by assuming equal vertical strain in the composite system.

- 79 -
Equations were derived to solve the vertical stain and the average
vertical stress in the in-situ soil surrounding the column for both the
elastic and plastic behavior of the stone. In the plastic analysis, bulging
occurred and column considered in plastic equilibrium state yielding
according to Mohr-coulomb criterion in terms of the angle of internal
friction on effective stress basis. The effect of column installation was
taken into account in the equations by estimating a value for the
coefficient was taken into consideration due to the vertical and lateral
strains. The surrounding soil was assumed behave according to
Terzaghi‟s one dimensional consolidation theory modified to
accommodate both of the vertical and radial consolidation.
For the elastic analysis, the stone and clay were both assumed to behave
as linearly elastic material. In this range, the column would not bulge.
The use of modulus of elasticity in this analysis probably gave higher
values of vertical settlement, as there was some degree of constraint
provided by the boundaries of the unit cell. The actual long – term
settlement was taken from the larger of those computed for the stone
considered as elastic and as plastic material.
Design charts were provided by Goughnour, 1983 to facilitate settlement
calculation instead of using the equations that need iterative procedures
for solution.

- 80 -
2.7.5 The Granular Wall Method
This is a simple way of estimating the improvement of settlement of a
soft cohesive soil reinforced with stone columns reaching a more
resistant stratum. Van Impe and De Beer, (1983) considered two cases
for estimating the improvement of settlement:
1) Under the foundation load, the columns are at the limit equilibrium
and deform at constant volume.
2) Under foundation load, the stone column are deforming elastically.
The stone columns were replaced in the calculation by stone walls with
equivalent area, which is the condition of plane strain. The shear stresses
between column and surrounding soft soil and the own weight of both
the columns and soil were neglected. In addition, the resisting layer
underneath the soft soil was considered undeformable.
The first case of computation was more appropriate than the second one
in calculating the improvement of the settlement. For the first case,
design charts were provided depending on number of parameters, the
pattern of stone columns, their diameter, the angle of shearing strength
of stone material, the odometer modulus of the soft soil and its poisons
ratio. The second case of computation was only valid as long as the
stone column did not reach the plastic condition and the area
replacement ratio was more than 0.7.
This computation method was used in some foundation problems of
large storage tanks on soft soil improved with stone columns, and the

- 81 -
measurements indicated the reliability of this method. However, there
were some shortcomings in this method, as neglecting the shear stresses
transmitted from column to the surrounding soil, which might alter the
column capacity as reported by Huges et al., (1975).
The assumption of uniform bulging along the column was not consistent
with the actual behavior since the bulging was large at smaller depth
than deeper ones due to the effect of confinement of the surrounding soil
to the column.
2.8 Estimation of Rate of Consolidation
2.8.1 Consolidation Rate of Improved Ground by Stone
Column
Field observations showed that stone columns accelerate the
consolidation rate in the soft soil. Field pore water pressure
measurement under an embankment indicated that a homogenous clay
stratum without stone columns area only completed 25% primary
consolidation when that clay with stone columns area completed 100%
primary consolidation, (Munfakh et al., 1984).
Han and Ye, (1992) reported that the rates of settlement of two similar
buildings, one on an unreinforced foundation and the other on stone
columns reinforced foundation in the same site, ached 66 % and 95 %,
respectively in the same time of 480 days. The acceleration of
consolidation rate is accredited to the stone column for providing a
drainage path and relieving excess pore water pressures by transferring
load from the surrounding soft soil to the stone column.

- 82 -
Bergado and Long, (1994) presented the use of the FEM for
embankment simulations. Based on revised Cam clay model for 2-D
consolidation analysis, two test embankments where constructed on soft
Bangkok clay improved by granular piles and vertical drains. The
embankments had 4m height. The soft clay which had 8 m depth is over-
lained by a medium stiff clay layer. In 2-D plane strain model, the
vertical drains and granular piles were converted into continuous walls.
The analysis results showed the granular piles imply more acceleration
of consolidation and more reductions in the total settlement of the soft
clay than vertical drains, as shown in Fig.(2-46) and (2-47).
Fig. (2-46): total settlement-time relationship of reinforced soft clay
by Granular piles (Bergado and Long, 1994).

- 83 -
Fig. (2-47): total settlement-time relationship of reinforced soft clay
by Vertical drain (Bergado and Long, 1994).
Barron, (1947) proposed a known solution which dealt with
consolidation of fine grained soil by vertical drain. The average rate (or
degree) of consolidation in the radial direction is
(2.28)
Where
*
+
(2.29)

- 84 -
( ) Is defined as the diameter ratio which is the ratio between the
diameter of a drain well ( ) and the diameter of its influence zone ( );
( ) is the consolidation time factor for radial flow
The solution of Barron (1947) dealt with the consolidation of fine-
grained soils by vertical drain. Stone columns and vertical drain have
two major differences. First, stone columns have the larger drainage
ability. Barron‟s solution ignored the effect of stiffness difference
between the vertical drain and the surrounding soil on the consolidation
rate. However, the stone columns are much stiffer than vertical drains
and carry a substantial part of the applied load. Second, the stone
columns have a smaller diameter ratio (influence diameter/column
diameter) than drain wells. Typical diameter ratios for stone columns
range from 1.5 to 5. However, the values for well diameter ratios used
by Barron (1947) ranged from 5 to 100.
Han and Ye, (2001) presented a simplified method for computing rate
of the consolidation of the soft soil around stone columns considering
stiffness ratio. Although stone columns and surrounding soil were
assumed linearly elastic in their study, in reality, they have a nonlinear
behavior. Stone columns act as drain wells where vertical and radial
flows are similar to those of Terzaghi 1D solution and the Barron
solution for drain wells in fine grained soils, respectively. The following
relationship is still applicable to calculate time rate and settlement of the
stone column improved ground:
(2.30)

- 85 -
Where,
= degree of consolidation (both radial and vertical direction)
= degree of consolidation (radial direction only)
= degree of consolidation (vertical direction only)
Fig. (2-48): Definition of terms for modeling (Han and Ye, 2001).

- 86 -
An approximate solution can be obtained as follows:
[ ] [ ] (2.31)
Where
, a modified time factor in the radial flow
, a modified time factor in vertical the flow; and H = is the
vertical drainage path.
The modified coefficients of consolidation are as follows:
(
) (2.32)
(
) (2.33)
Where ( ) is the diameter ratio; steady stress concentration ratio ( ) is
the ratio between steady stress in column ( ) and steady stress in soil
( ) at the end of consolidation.
The new solution demonstrates stress transfer from the soil to the stone
columns and dissipation of excess pore water pressure due to the
drainage and vertical stress reduction during consolidation. Ignoring
consolidation due to vertical flow, the calculated average total stress on
the soil and columns for case and are plotted in Fig. (2-
49). This figure, demonstrates that the stress on columns increase with
time, while the stress in soil decreases. This stress transfer from the soil
to the columns is called “stress concentration”.

- 87 -
Fig. (2-49): Vertical stress on soil and columns with time, N = 3 and
ns = 5 (Han and Ye, 2001).
The stress concentration can also be presented in terms of the stress
concentration ratio, as shown in Fig. (2-50). The stress concentration
ratio increases with time and approaches the steady-stress concentration
ratio (ns = 5 in this case). This proposed method indicated the general
trend that the steady-stress concentration ratio increased with the applied
loads .at larger loads than the yield load of the stone columns, the
steady-stress concentration started to decrease.

- 88 -
In the study of Han and Ye (2001), however, no lateral displacement
was assumed in the theoretical development. Therefore, the dissipation
of the excess pore water pressure depends mainly on two factors,
drainage and reduction of vertical stresses. The dissipation of excess
pore water pressure, due to the vertical stress reduction, was about 40%
of the total dissipation for this special case, as shown in Fig. (2-51). The
contribution of vertical stress reduction to the dissipation of excess pore
water pressure explains why stone columns are more effective than drain
wells in accelerating consolidation rate of the soft clays.
Fig. (2-50): Stress concentration ratio with time (Han and Ye, 2001).

- 89 -
Fig. (2-51): Dissipation of excess pore water pressure, N = 3 and
ns = 5 (Han and Ye, 2001).
The comparison between the results of the simplified method and the
numerical study of Balaam and Booker (1981) for all cases indicated
that the computed rate of consolidation by numerical method was greater
than that by the simplified method at the beginning of the consolidation.
However, it is reversed when the rate of consolidation was greater than
approximately 40%. These discrepancies can result from the different
assumptions used in the numerical and simplified methods.
In the numerical study, the lateral displacement was permitted.
However, the lateral displacement was not allowed in the development
of the simplified method. The lateral displacement in the numerical
study tended to reduce the excess pore water pressures at the beginning
ate of consolidation. When more stress is transferred onto the stone

- 90 -
column with time, however, the lateral displacement from the stone
towards the soft soil in the numerical study tends to increase the excess
pore water pressures, so that it slows down the process of consolidation.
The difference between the rate of consolidation from the numerical
analysis and the simplified method is diminished with an increase of the
diameter ratio, N, as shown in Fig. (2-52) and (2-53).
Fig. (2-52): Rate of consolidation of stone column reinforced
foundations (Han and Ye, 2001).

- 91 -
Han and Ye, (2002) developed the following equation to calculate the
rate of consolidation of the stone column reinforced foundation
considering smear zone and well resistance effects:
[ ] (2.34)
(
)
(
) (
)
(
)
(
) (
)
(2.35)
Where:
N , the diameter ratio of the smeared zone to the stone
column
Fig. (2-53): Rate of consolidation of stone column reinforced
foundations (Han and Ye, 2001).

- 92 -
the stone column
Permeability of the smeared soil in the radial direction
= permeability of the undisturbed surrounding soil in the
radial direction
Castro and Sagaseta, (2009) developed equivalent coefficients of
consolidation which account for the lateral movement of the stone
column during the consolidation process. The behaviour of the column
was modeled as an elastic material or as an elasto-plastic dilatant
material with a Mohr-Coulomb failure criterion. Vertical stress increased
in columns with consolidation and column yielding occurred. The
stiffness of columns reduces once yielding occurs, which results in
increased radial deformability of the column. Therefore columns in a
plastic state expand and increase the excess pore water pressure in the
soil. The solution developed by Castro and Sagaseta, (2009) allows the
depth and time of column yielding to be determined. Therefore it is
possible to accurately determine the stresses and strains occurring in
columns at any stage in the loading history. A comparison with Han and
Ye, 2001 of the development of stress concentration ratio with time is
shown in Fig. (2-54).

- 93 -
2.8.2 Stone Columns-Soft Soil Reinforcement System
under Embankment
Terzaghi and Peck (1967) stated that the instability of embankment
constructed on soft soil foundations is mainly of two types: a) where the
embankment sinks into the foundation soils and b) failure by spreading.
Hence, stone columns reinforced soils as embankment foundation have
been used as a more effective method to prevent sinking and spreading
failure. Therefore, that technique improves the performance of the
embankment over it by increasing shear strength and bearing capacity as
well as decreasing consolidation settlement and lateral displacement of
the soft foundation soil.
Fig. (2-54): Stress concentration factor. Influence of radial
deformation and plastic strains (Castro and Sagaseta, 2009).

- 94 -
Weber (2006) investigated the behavior of a base reinforced
embankment constructed on a soft clay layer, which was improved with
stone columns. Centrifuge tests were performed in order to gain a deeper
understanding of the interaction problem within the structure. The
centrifuge tests were performed at 50–times gravity. The model
represented a prototype structure of a 7 m clay layer depth with a
compaction pile grid spacing of 1.7 m x 1.7 m and an average pile length
of 5 m with a 0.6 m pile diameter.
The model embankment produced an overburden pressure of about 90
kPa, representing a prototype embankment constructed of sand of about
5 m in height. The test was conducted in a modeling container, which
was divided into 2 sections to permit comparison to be made on the soil
with the same provenance and stress history. In one section, the soft clay
was improved with sand compaction piles, while in the other section, the
clay was not improved.
Due to the ground improvement in this centrifuge test, a factor of
settlement reduction of 2.0 was measured. The acceleration of
consolidation time t90was measured with a factor of 5.0 for the
described test. This showed that the factor of ground improvement a.
Vertical displacement profile b. Horizontal displacement profile at mid
of slope for settlement reduction does not coincide with the factor of
accelerated consolidation time. The reason for that was probably the
floating pile construction and ongoing consolidation in the lowest third
of the clay layer, which was not improved.

- 95 -
Saroglou et al., (2008) presented the ground improvement using stone
columns for the construction of a new high way road from Keratea to
Lavrio, in Attika peninsula, Greece. An embankment of maximum
height of 3 m was constructed on subsoil comprises of soft clays of low
plasticity with intercalations of silty to clayey sands of medium density
with gravel. Using stone columns with a depth of 14 m reduced the total
settlement from 14 cm to 7 cm and accelerated consolidation time from
16 months to a period of 4 months.
Borges et al., (2009) conducted a parametric study to investigate the
influence of several factors on the behavior of soft soils reinforced with
stone columns under embankment loads. Parameters such as
replacement ratio, deformability of the column, thickness of the soft soil,
deformability of the fill and friction angle of the column material were
examined. The confined axisymmetric cylindrical unit cell was used.
The analysis was performed by a finite element program that
incorporates the Biot consolidation theory. The results confirmed that
increasing replacement area ratio or stiffness of the column material
significantly reduces settlements and horizontal displacement and
accelerates the consolidation.

- 96 -
2.9 Smear Zone: Effect on Permeability
The installation of stone columns, or vertical drains, not only influences
the stress level but causes a thin disturbed zone around the inclusion,
which is dependent on the host soil characteristics, and is usually
described as smear zone (e.g. Onoue et al.,(1991); Indraratna and
Redana, (1998); Sharma and Xiao, (2000); Bergado et al., (1991) and
Shin et al., (2009). This zone exhibits a reduced permeability and thus
reduces the drainage performance of the inclusion.
Onoue et al. (1991) conducted small-scale loading tests on sand drains
installed in Boston Blue Clay, while recording the pore water pressures
10 mm under the surface of the clay specimen. Based on their
observations, they suggested dividing the soil surrounding the drains
into three zones:
- Zone I or undisturbed zone, beginning at a distance of 6.5 times the
radius of the drain (rw) from the drain axis;
- Zone II where the installation of the inclusion causes a decrease of the
void ratio and, as a consequence, a decrease of the permeability;
- Zone III or remolded zone where an additional decrease of the
horizontal coefficient of permeability kh is anticipated.
Fig. (2-55) shows the evolution of the normalized horizontal coefficient
of permeability (kho denotes the undisturbed permeability) with the radial
distance from the drain axis.

- 97 -
Fig. (2-55): Suggested variation of horizontal permeability with
radius according to (Onoue et al., 1991).
Indraratna and Redana, (1998) and Indraratna et al., (2001) present
the results of small-scale tests modeling the installation of sand
compaction pile in remolded clay. Indraratna and Redana, 1998
evaluated the extent of the smear zone by determining the
compressibility and permeability parameters at different distances from
the axis of the sand compaction pile. The main conclusions drawn from
these investigations are that the installation effect of the sand
compaction pile on the soil structure is greatest near the boundary of the
sand compaction pile, while the radius of the smear zone rs can be taken
to be equal to 100 mm or 4 to 5 times the radius of the column
(respectively equal in this case to 25 mm and denoted as rw in Fig. (2-
56).

- 98 -
Fig. (2-56): Section of the test setup showing the smear zone
(Indraratna and Redana, 1998).
It could also be observed that the horizontal coefficient of permeability
kh in the smear zone decreased in vicinity of the sand compaction pile,
but that the vertical permeability kv remained almost identical to the
original values in the host soil, even at the column interface. However,
this approach assumes that the smear zone remains homogeneous, which
may lead to some less accurate results than if a difference was made
between smear zone (or remolded zone) and compaction zone (or
disturbed zone), Fig. (2-57).

- 99 -
Fig. (2-57): Ratio of horizontal to vertical coefficient of permeability
against the radial distance from the axis of the sand compaction pile
(denoted as drain) (Indraratna and Redana, 1998).
Sharma and Xiao, 2000 used a large-scale laboratory apparatus to
install vertical sand drains in kaolin samples with different pre-
consolidation pressures. They measured the pore water pressures at
different distances from the drain axis during installation, using 6.4 mm
diameter miniature pore pressure transducers. The experimental setup
allowed for an installation with, and without, smear zone to be
conducted. The mandrel consisted of an open-ended 54 mm diameter
outer tube with a thickness of 2 mm and of a 50 mm diameter inner tube
with a closed bottom end. In the first case, both tubes were fixed
together and pushed into the clay, thus reproducing the common
installation process and causing a smear zone. In the second case, only
the outer tube was pushed into the host soil and subsequently the clay

- 100 -
stuck in the tube was removed carefully with an auger, so that the
installation effects are limited in such a way that they can be neglected
in the analysis.
A comparative study of the response of the soil with and without smear
zone is illustrated in Fig. (2-58), t0 corresponds to the start of the
insertion of the installation mandrel, t1 to the time when the tip of the
mandrel reaches the depth of the transducers and t2 denotes the time
when the mandrel reaches the full penetration depth. The generated
excess pore water pressures are significantly higher in the case with
smear, which is consistent with the expected reduction of horizontal
permeability in the smear zone.
Fig. (2-58) Excess pore water pressures during the insertion of the
installation mandrel (Sharma and Xiao, 2000).

- 101 -
2.10 Scale Effect
There are a variety of researcher has been investigate the model test of
stone column embedded in soft clay soil with studied stone column
dimension relative to tank dimension.
Ambily and Gandhi, (2007) has been investigated the model of stone
column embedded in soft clay with adopted tank diameter in range of
(210mm and 350mm). While the adopted stone column diameter in this
study is constant and equal to 100 mm. This clarify that thickness of the
clay layer a long each side of stone column in rang (x = 0.55D to 1.6D) .
Isaac and Grirish, (2009) used reinforcing columns 50 mm diameter
surrounded by the soil in a cylindrical tank 210mm diameter.This refers
to the width of clay layer along each side of stone column is around (x =
1.6D) of column diameter as shown in Fig. (2-60).
Fig. (2-59): Single column test arrangement dimension (Ambily and Gandhi,

- 102 -
In addition to, Shivashankar, et al., (2011) studied the model of stone
column in soft clay with stone column diameter of 90mm relative to tank
size diameter of 237mm. This indicts that the width of clay layer along
each side of stone column is around ( x = 0.82D) of pile diameter
Fig. (2-60): The test setup for single column model test (Isaac and Grirish, 2009).
Fig. (2-61): Test arrangement and dimension after (Shivashankar, et al., 2011)

- 103 -
Ali, et al., (2011) studied the model of stone column in soft clay with
stone column diameter of 50mm relative to tank size diameter of
300mm, this again shows that the width of clay layer along each side of
stone column is around ( x = 2.5D) of column diameter as shown in Fig.
(2-62).
Tandel, et al., (2012) studied the model of stone column in sand with
stone column diameter of 100mm relative to tank size diameter of
260mm. It can be concluded that the width of clay layer along each side
of stone column is around ( x = 1.6D ) of pile diameter.
Fig. (2-62): Schematic view of stone column foundation of (Ali, et al., 2011).

- 104 -
While Prasad and Satyanarayana, (2016) studied the improvement of
Soft Soil Performance using Stone Columns Improved with Circular
Geogrid Discs. The studied maximum diameter of stone column model
is around 50mm and the diameter of tank is 200mm. Therefore the
thickness of clay layer in each side of stone column in range of 1.5D.
Fig. (2-64): Test arrangement (Prasad and Satyanarayana, 2016)
Fig. (2-63): The Schematic diagram of sand column test arrangement
(Tandel, et al., 2012)

- 105 -
Based on the paper in literature in this thesis about tank size effect, the
adopted minimum and maximum stone column diameter are in rang of
(50, 100, 150, and 300mm) with constant tank diameter of 600mm. This
can be attributed to the width of clay layer along each side of stone
column are found to be (x = 5.5D, 5D, 4.5D and 0.5D). This can
attributed that the adopted stone column and tank size for clay bed are in
rang presented above by the different investigators.
The main essence has been found that the axisymmetric modeling can be
used to study the behavior of foundation. In order to overcome the errors
associated with this modeling, the tank side walls should be built as a
rigid as possible to eliminate the out of plane side movements. The
effect of sidewalls friction can be reduced significantly by using low
friction materials such as glass, polished steel, PVC or greased
membrane.
The small scale model tests can be used to describe a certain
phenomenon. The use of small scale models to investigate the behavior
of full scale foundation is a widely used technique, due to the nature of
soils that has been reported that there are differences between field
behavior and small scale model tests. For interpretation that in case of
shallow foundations, the averages shear strength mobilized along the
slip line under the foundation decreases with the foundation size. It is
clearly shown that the relative compressibility of soils, both with respect
to gravity forces and with respect to the soil strength, increases with the
foundation size ( De Beer, 1963 and Vesic, 1974 )

- 106 -
In summary model footing may be considered as prototype in their
own right. However, and departure from similarity must be identified so
that the applicability of results can be assessed. The general conclusion
drawn from the literature is that there is no scale effect due to the ratio of
the footing size to the particle size provided particle size is small
compared to the footing dimension and stone column. However, scaling
effects due to variations in stress level will occur in 1 g (earth gravity)
modeling. Therefore, it is of limit use in predicting the behavior of a
particular prototype, the use of 1g models can be useful in predicting
general trends of behavior.

- 107 -
2.11 Data Base of Stone Column Studies
The objective of the section is to assemble published results from field,
laboratory, and numerical investigations of stone columns in soft clay in
present research to provide future researchers and designers with easy
access to information and data. The majority of the reviewed papers
include an experimental component that are based on field or laboratory
scale tests conducted on clay specimens reinforced with partially or fully
penetrating that were installed as columns or as groups of stone
columns.
This section aims at summarizing published work on the analysis,
testing, and modeling of soft soils that are reinforced with single stone
columns and stone column groups.
Three subsections are included to demonstrate:
(1) A summary of numerical studies
(2) A summary of laboratory model tests
(3) A summary of field model tests
This can be found in tables (2.2 through 2.4) which show the collected
and investigated approaches by different investigators.
It should be noted that the review incorporates studies that are limited to
applications where stone columns are used to reinforce soft soils (reduce
settlement and increase bearing capacity).
Additional information regarding the test setup, soil and column types
and properties are also included in the table. Detailed information on the
scope and main findings of each paper is presented in the literature
review section and a summary of major findings from the physical,
numerical and analytical models is presented at the end of the Thesis.

- 801 -
Table (2.2) Database of numerical studies on stone columns
Reference Numerical method
(Code) Type of analysis
Constitutive behavior/model
Mesh type External Load
Soil Stone column
Ambiy and Gandhi
(2007) FEM (PLAXIS 2D) Axisymmetric Mohr–Coulomb Mohr–Coulomb 15-noded
triangular Plate Load
Guetif et al. (2007) FEM (PLAXIS 2D) Axisymmetric Mohr–Coulomb Mohr–Coulomb
15-noded
triangular Uniform Pressure
Tan et al. (2008) FEM (PLAXIS 2D)
Axisymmetric &
Equivalent Plane
Strain
Mohr–Coulomb Mohr–Coulomb 15-noded
triangular Embankment
Chen et al. (2009) FDM (FLAC 3D) 3D
Modified Cam-
Clay Mohr–Coulomb Brick and shell Uniform Pressure
Choobbasti et al.
(2011) FEM (PLAXIS 2D) Axisymmetric Mohr–Coulomb Mohr–Coulomb 15-noded
triangular
Footing
Ng and Tan (2012) FEM (PLAXIS 2D) Axisymmetric Mohr–Coulomb Mohr–Coulomb 15-noded
triangular Plate Load

- 801 -
Reference Numerical method
(Code) Type of analysis
Constitutive behavior/model
Mesh type External Load
Soil Stone column
Castro et al. (2013) FEM (PLAXIS 2D) Axisymmetric
Modified Cam-
Clay Hardening Soil
15-noded
triangular Uniform Pressure
Castro et al. (2014) FEM (PLAXIS 2D) Axisymmetric
Modified Cam-
Clay Mohr–Coulomb
15-noded
triangular Embankment
Shahu and Reddy
(2014) FEM (ABAQUS) 3D Modified Cam-
Clay Mohr–Coulomb
20-noded
hexahedral
Footing
Indraratna et al
(2014) Coupled
FDM+DEM
Axisymmetric
Mohr–Coulomb DEM model DEM-FDM grid Column Load
Mohr – Coulomb (MC)
Modified Cam Clay (MCC)
Hardening Soil (HS)
Soft Soil (SS)
Soft Soil Creep (SSC)
The finite element method (FEM)
Finite difference method (FDM)
Discrete element method (DEM)

- 880 -
Table (2.3) Database of laboratory tests on stone columns
Reference
Type of
Experiment
S=single
G=group
Type of
Loading
Foundation
size (cm)
Test
Sample
Size
(cm×cm×
cm)
Column
dimension
(mm)
Area
replacement
ratio %
Soil type Column type Clay cu
(Kpa)
Column
ϕ °
Hughes and
Withers(1974) 1-g (S) C --
22.5×16
×15 D= 12.5-38 -- Kaolin
Lighton
buzzard sand 19 35
Bachus and
Barksdale (1984) 1-g (S/G)
A -- D=10.8,
H=30.5
D=29.3,53.3
L=305 7 and 25
Kaolin Quartz 14.4-19.1 --
F -- 17.3×50.5
×30.5
D=29
L=305 20
Narasimha Rao et
al. (1992) 1-g (S) F 1.5 D
100×80
×100
D=25,50,75
L/D=5,8,12 44.4
Marine
Clay Granite chips
Soft/M.Sti
ff 38
wood et al.
(2000) 1-g (G) F 10 D=30
D=11,17.5
L=300 10-30 Kaolin Quartz 12 --
Mckelvey et
al.(2004) 1-g(G) F 9×9
D=41.3
H=50
D=25
L/D=6,10 24 Kaolin Sand 32 --
Black et al.
(2006) Triaxial (S) F 6
D=30
H=40
D=25
L/D=6and1
0
17 Kaolin Crushed
basalt 35 --
Ambily and
Gandhi (2007) 1-g (S/G) A+C --
D=21,42,8
3 H=45
D=100
L/D=4.5
5.7,10.1,
22.7 CH Stones 7,14,30 43
Isaac and Grirish
(2009) (S/G) C --
single
D=210,
H=270
Group
D=520,H
=270
D=50
L=250 --
Kutt and
Clay
quarry
dust,sea
sand,river
sand,gravel,st
ones
3.1 38,39.5,39
.5,42,43

- 888 -
Type of the study: l-g, triaxial
The column configuration (Single, S or Group, G)
The loading configuration (column loading C, foundation loading F, or area loading A)
Reference
Type of
Experiment
S=single
G=group
Type of
Loading
Foundation
size (cm)
Test
Sample
Size
(cm×cm×
cm)
Column
dimension
(mm)
Area
replacement
ratio %
Soil type Column type Clay cu
(Kpa)
Column
ϕ °
Shivashankar
et al. (2010) 1-g (single) C + A --
D = 19–28
H = 72
D = 60–90
mm,
L/D= 6–9,
10–23% ML Silt Aggregate 38
Black et al.
(2011)
Triaxial
(S/G) F 6
D=30
H=40
D=25,32,38
L=125,250,
400
17,28,40 Kaolin Crushed
basalt 35 --
Sivakumar et al.
(2011) Triaxial (S) F 6
D=30
H=40
D=40,50,60
L=400
44.4,69.4,10
0 Kaolin
Crushed
basalt 35 --
Shahu and Reddy
(2011) 1-g (G) F 10
D=30
H=30
D=13,25
L=100,150 10,20,30 Kaolin Barbadur sand 7-9 43.4

- 881 -
Table (2. 4) Database of field tests on stone columns
Reference
Type of
Experiment
S=single
G=group
Type of
Loading
Foundation
size (cm)
Test Sample
Size
(cm×cm×c
m)
Column
dimension
(mm)
Area
replacement
ratio %
Soil type Column type Clay cu
(Kpa) Column ϕ °
Hughes et al.
(1975) Field (S) C 66 --
D=0.73m
L=7m -- Grey Silty River Gravel 22 38
Greenwood (1975) Field (S) F 91 -- D=0.58m
L=2.9m 40.6 Boulder Gravel 4.4 --
Bergado and Lam
(1987) Field (S) C -- --
D=0.3m
L=8m -- Bangkok Sand/gravel 20-45 35.6-43.3
Han and Ye (1991) Field (S) C+F 125 -- D=0.85m
L=12m 36and100 Silty Clay Crushed gravel 15 --
White et al. (2007) Field (S/G) C+F 229 -- D=0.76m
L=2.79-5.1m 35 CL Clay
Crushed
Limestone 30 43

Chapter (3):
EXPERIMENTAL WORK

- 113 -
CHAPTER (3)
EXPERIMENTAL WORK
3.1 Introduction
This chapter describes the materials used, mixing procedures and
preparation of the tested soil .The method of installing the stone columns
and testing methodology were illustrated briefly. Loading setup and the
measuring devices that used in the experimental work were also
described. The detailed experimental program was presented in this
chapter. The experimental works were carried out at the Geotechnical
laboratory of Faculty of Engineering, Tanta University.
3.2 Soft Clay Preparing
Obtaining undisturbed soft clay samples from the site is too difficult; so,
the soft clay has been prepared in the laboratory using kaolin according
to Ali, K. et al., (2011). The procedures of preparing of soft clay in the
laboratory were described as following subsections.
3.2.1 Commercial Kaolin Clay Type
Commercially available kaolinite clay type has been used in both
fundamental studies of soil behavior and physical model tests. The
properties of kaolin are somewhat a typical of natural clay soils.
The mineralogical and chemical properties of the kaolinite published by
the manufacturer were presented in Tables (3.1) and (3.2).
White kaolin was used to prepare clay deposits with three different
bearing capacities. In order to reach full saturation and homogeneity, the

- 114 -
clay slurry was mixed at different water content to obtain the desired
density and cohesion. A series of trial mix were done to check the
density by preparing cylinder samples having a diameter of 3.5cm and
height 7cm. The test was carried out at three different samples having
shear strength of 10 kPa, 20 kPa and 30kPa. The corresponding water
contents were found to be 33, 25 and 19% respectively. The clay sultry
mix was prepared using a mechanical mixer operated for 15 minutes
mixing to obtain the final tested form at given water content. The final
mix cohesion was checked by vane shear test which provide a
reasonable fit with direct shear box test results.
Table (3.1): Mineralogical composition of the kaolinite used in the
model tests (After the Data sheet of the manufacturer).
Type of Mineral
Volumetric content
Clay Mineral
90.97
Sodium Feldspar
2.27
Potassium Feldspar
2.31
Free Quartz
4.45

- 115 -
Table (3.2) Chemical composition of the kaolinite used in model tests
(After the Data sheet of the manufacturer).
Element Percentage
SiO2 50 - 56 %
Al2O3 30 - 33 %
Fe2O3 1.0 - 1.3 %
TiO2 1.3 - 1.8 %
MgO 0.05 - 0.10 %
CaO 0.10 - 0.25 %
Na2O 0.07 - 0.15 %
K2O 0.03 - 0.06 %
LOi 11 - 12 %
3.2.3 Determination of Soil Properties
The following tests were performed at three different samples to
determine the properties of the prepared soft clay and to ensure
compliance of the soft clay prepared in the laboratory with properties of
the natural soft clay.
The following tests were conducted on the soft clay such as, water
content, grains, Atterberg limits tests and direct shear box, in addition to
consolidation test.
These tests were performed at the Geotechnical laboratory of Faculty of
Engineering, Tanta University.

- 116 -
In order to obtain the grain size distribution of the kaolinite, first the soil
was wet sieved and then hydrometer test was performed. Grain size
distribution curve of kaolinite is plotted as shown in Figure (3.1).
Fig. (3-1): Grain size distribution curve from hydrometer test for the
tested sample.
It is found that kaolinite is clayey silt which consists of 95% clay and
5% silt size particles.
3.2.3.1 Shear strength of Tested Samples
The shear strength parameters of the tested clay soils were determined
using direct shear box tests and confirmed by laboratory vane shear test.
Soft clay sample in direct shear was collected from the mixed soft. A
normal load is applied to the specimen and the specimen is sheared
across the pre-determined horizontal plane between the two halves of the
0
10
20
30
40
50
60
70
80
90
100
0.00010.0010.010.1
Diameter, mm
Per
cen
tage
of
Pass
ing b
y w
eigh
t %
Fig.1: Grain size distribution curve from hydrometer test for the tested
sample.

- 117 -
shear box with dimensions 6×6×6 cm. Measurements of shear load and
normal displacement are recorded. From the results, the shear strength
parameters of soft clay can be determined as show in Figs. (3-3 through
3-5). The modulus of elasticity (Es) of tested clay soils at different water
content were also calculated from the direct shear box test results as
initial tangent in order to be used in finite element analysis (Table 3.3).
3.2.3.2 Consistency Limits
Consistency limits tests were performed on the soft clay to determine
Liquid limit, Plastic limit, Plasticity index and consistency index of the
soft clay. The results of these tests were presented in Table (3.3). Figure
(3-2) indicated the classification of the soft clay according to united soil
classification system (USCS) as clay with low plasticity (CL).
Table (3.3): Properties of used soil.
Property Soil A Soil B Soil C
Water content 19% 25% 33%
Bulk Density kN/m3 17.8 17.3 16.5
Liquid limit (LL) 41%
Plastic limit (PL) 17%
Plasticity index (Ip) 24%
Consistency index (Ic) 6%
Cohesion (cu) kN/m2 30 20 10
Angle of internal friction (ϕ ) 0 0 0
Modulus of elasticity (Es) kN/m2 6000 4000 2000

- 118 -
Fig. (3-2): Classification of soft clay using plasticity chart.
Fig. (3-3): Relation between normal stress and shear strength
(cu =10 kPa).
0
5
10
15
20
0 20 40 60 80 100 120
Normal stress, kN/m2
Sh
ea
r s
tren
gth
, k
N/m
2

- 119 -
Fig. (3-4): Relation between normal stress and shear strength
(cu =20 kPa).
0
10
20
30
40
0 20 40 60 80 100 120
Normal stress, kN/m2
Sh
ea
r s
tren
gth
, k
N/m
2
0
20
40
60
0 20 40 60 80 100 120
Normal stress, kN/m2
Sh
ea
r s
tren
gth
, k
N/m
2
Fig. (3-5): Relation between normal stress and shear strength
(cu =30 kPa).

- 120 -
3.2.3.3 Consolidation tests
After the mixing process, the tested soils ( A, B and C) were prepared to
the desired density and placed in consolidation rings, (75 mm) in
diameter and (19 mm) in height, to be tested by odometer cell. All the
performed tests were done according to (ASTM) specifications, at
different three clay water content and density. The test results of the
odometer tests carried out on the three samples were shown in the Fig.
(3-6). The obtained compressibility parameters were also given in Table
(3.4)
0.1
0.6
1.1
1.6
2.1
2.6
3.1
10 100 1000
Pressure, kPa
Cu = 10 kPa
Cu = 20 kPa
Cu = 30 kPa
Fig. (3-6): e-log p curve for tested soft clay in odometer.

- 121 -
Table (3.4) Consolidation properties of tested soft clay
Property Soil A Soil B Soil C
Saturated density (γsat) kN/ m3 17.8 17.3 16.5
Compression index Cc 0.78 0.65 0.57
Re-Compression index Cr 0.09 0.072 0.064
pc, kN/ m2 70 100 85
3.3 Sand
The sand bed layer was underline the soft clay deposit and consists of
300 mm thickness. Sieve analysis test was performed on a sample of
sand soil; the result is presented in Fig. (3-5). Sand was classified as
poorly graded sand (PS) according to Unified soil classification system
(USCS).
Direct shear test was also performed on samples of sand to get the shear
strength parameters of tested sand at maximum dry density that obtained
from modified proctor test as shown in Fig.(3-6) (dmax = 1.83kN/m3)
and the OMC = 6.7%. While Fig. (3-7) indicates the relation between
normal stress and shear strength for sand samples. From figure cohesion
c = 0.0 and angle of internal friction ϕ =38°. The module of elasticity of
the tested sand (initial tangent modulus for stress strain curve) is found
to be 80000 kN/m2. The main properties of the tested sand are presented
in Table (3.5)

- 122 -
Table (3.5) Physical and mechanical properties of tested sand
Property Value
Specific gravity 2.65
Maximum dry density d max (kN/m3) 18.3
Min dry density - loose case d min (kN/m3) 15.6
Relative density Dr for Max. density 80%
Uniformity coefficient Uc 26
Coefficient of curvature Cc 4.20
Middle size D50% 0.313
Max. shear angle dir 38o
Min. shear angle dir 27o
Modulus of elasticity (kN/m2) 80000
Coefficient of permeability K (cm/sec) 3.2 x 10⁻²
0
10
20
30
40
50
60
70
80
90
100
0.001 0.01 0.1 1 10 100
Diameter, mm
Percen
t o
f p
ass
ing
%
Silt fraction Sand fraction
Fine Mdium Coarse
Gravel fraction
Fine Medium CoarseClassification
Fig. (3-7): Sieve analysis curve for used sand
sand.

- 123 -
17
17.5
18
18.5
19
19.5
5 5.5 6 6.5 7 7.5 8 8.5 9
(Dry
de
nsi
ty a
s kN
/m3
)
water content as weight percent Wc%
Chart Title
0
20
40
60
80
100
0 20 40 60 80 100 120
Normal stress, kN/m2
Sh
ea
r s
tren
gth
, k
N /
m2
Fig. (3-9): Relation between normal stress and shear strength (for
tested sand at maximum dray density).
Fig. (3-8): Compaction curve for tested sand.

- 124 -
3.4 Columns materials Properties
The materials of column used in the experimental program to improve
the soft clay were stone. The main properties of the adopted aggregate
materials were described in the following sections:
3.4.1 Stone /Aggregate
Sieve analysis test was performed on a sample of adopted stone. The
results were presented in Fig. (3-10). The classification of stone was
poorly graded stone (PS) according to Unified soil classification system
(USCS). The size of grains in range of 2 to 10mm. the uniformity
coefficient and coefficient of curvature are found to be 2.61 and 1.5
respectively.
Direct shear test was also performed on samples of stone to get the shear
strength parameter of the stone at maximum dry density. Where the
obtained maximum dry density from proctor test is (dmax = 1.73kN/m3)
and the OMC = 4.1%.
Fig. (3-11) shows the relation between normal stress and shear strength
for stone samples. It can be concluded that the angle of internal friction
of such tone is 42°.
In general, the main characteristics of the adopted aggregate were agree
with those obtained by Ambily and Gandhi., (2007).

- 125 -
Fig. (3-10): Sieve analysis curve for used stone.
0
10
20
30
40
50
60
70
80
90
100
0.001 0.01 0.1 1 10 100
Diameter, mm
Perc
en
t o
f p
ass
ing
%
Silt fraction Sand fraction
Fine Mdium Coarse
Gravel fraction
Fine Medium CoarseClassification
Chart Title
0
20
40
60
80
100
0 20 40 60 80 100 120
Normal stress, kN/m2
Sh
ea
r s
tren
gth
, k
N /
m2
Fig. (3-11): Relation between normal stress and shear strength for used
stone.

- 126 -
3.5 Test Setup
3.5.1 Loading Frame
Fig. (3-12) shows the experimental set up
Fig. (3-12) Experimental setup.

- 127 -
3.5.1.1 Loading Jack
A hydraulic jack with maximum load capacity of 10 ton was used in all
test
3.5.1.2 Measuring Devices
The following devices were used in testing:
• Calibrated proving ring of 50 kN
• Dial gauge of 0.01mm accuracy and total capacity of 50 mm are used
for settlement measurements
3.5.2 Test Tank
The model tests were carried out in a cylindrical tank manufactured of
steel with dimensions of 600 mm in diameter and 800 mm in height,
made of steel (6 mm in thickness). The test tank is sufficiently rigid and
exhibited no lateral deformation during the tests. The thickness of soil
bed inside the container was 300 mm sand and 400 mm soft clay.
3.5.3 Loading plate
A rigid steel plate with a diameter of 600 mm and a thickness of 12 mm
was used as a loading plate on the entire area including stone column
and the surrounding soil.
3.6 Soft Clay Preparation
Oil is applied to the tank wall to minimize the friction between clay and
tank wall with out figure. The Required quantity of clay is mixed with
the required moisture content. Then the mixture is poured in the tank up
to predetermine depth at studied water content and density. Care was
taken to ensure that no significant air voids are formed in the test bed. At

- 128 -
the center of the prepared clay bed, vane Shear test is carried out to
measure the shear strength of the clay bed.
3.7 Test Procedures
3.7.1 Column Installation
In this part of study the methods of installation and preparation of stone
column model in the laboratory is adopted as follows.
Figures (3-14) and (3-15) show the lay out of installation steps for the
two cases of floating and end bearing stone column respectively.
Same installation procedures are shown in Fig. (3-13)
Fig. (3-13): Column Installation.
(b) Hammer was used to
compact the stone.
(c) The pipe is completely
removed.
(a) The soft clay layer is
placed around the
tube.

- 129 -
(a) (b) (c)
(d) (e) (f)
Fig. (3-14): Lay out of installation steps for the case of floating stone column
(a) Installation of sand bed and soft clay layer below the floating stone column at predetermined
depth.
(b) Installation of a PVC pipe as a floating at the predetermined depth.
(c) Then placing the soft clay layer around the pipe in layers each 50 mm for full depth.
(d) Installation of aggregate in layers each 50 mm to achieve the maximum density using manual
hammer.
(e) After installation of column aggregate, the tube was carefully removed.
(f) Finally, the loading plate was placed and the test load was applied.

- 130 -
(a) (b) (c)
(d) (e)
Fig. (3-15): Lay out of installation steps for the case of fully penetrate stone
column (a) Installation of sand bed and placing the PVC tube at predetermined depth.
(b) Then placing the soft clay layer around the pipe in layers each 50 mm for full depth.
(c) Installation of aggregate in layers each 50 mm to achieve the maximum density using manual
hammer.
(d) After installation of column aggregate, the tube was carefully removed.
(e) Finally, the loading plate was placed and the test load was applied.

- 131 -
3.8 The Experimental Program
The experimental program consists of 51 tests as shown in Table (3.6)
• All the tests were performed using constant circular plate diameter of
600 mm. Fig. (3-16) shows the general lay out of the investigated
parameters.
Diameter of the tank is taken as the diameter of the area of zone of
influence around single stone column. Stone column diameter used for
the test is varied from 50 mm to 300 mm. In the tank, clay is placed for a
height of 400 mm in which the stone column is installed at the center. A
sand layer of 30 mm thick is placed under soft clay layer. Vertical load
is applied either over the entire tank area.
Fig. (3-16): General lay out of the studied parameters.

- 132 -
Table (3.6): Experimental program and studied parameters.
series Studied parameters
1 Without stone column cu = 10, 20 and 30kPa
2
c u =
10 k
Pa
D = 50 mm L/D = 2 ,4 , 6 , 8
L/H = 0.25,0.5,0.75,1.0
D = 100 mm L/D = 1 , 2 , 3 , 4
L/H = 0.25,0.5,0.75,1.0
D = 150 mm L/D = 0.67, 1.33 , 2.0 ,2.67
L/H = 0.25,0.5,0.75,1.0
D = 300 mm L/D = 0.33, 0.67, 1 , 1.33
L/H = 0.25,0.5,0.75,1.0
3
c u =
20 k
Pa
D = 50 mm L/D = 2 ,4 , 6 , 8
L/H = 0.25,0.5,0.75,1.0
D = 100 mm L/D = 1 , 2 , 3 , 4
L/H = 0.25,0.5,0.75,1.0
D = 150 mm L/D = 0.67, 1.33 , 2.0 ,2.67
L/H = 0.25,0.5,0.75,1.0
D = 300 mm L/D = 0.33, 0.67, 1 , 1.33
L/H = 0.25,0.5,0.75,1.0
4
c u =
30 k
Pa
D = 50 mm L/D = 2 ,4 , 6 , 8
L/H = 0.25,0.5,0.75,1.0
D = 100 mm L/D = 1 , 2 , 3 , 4
L/H = 0.25,0.5,0.75,1.0
D = 150 mm L/D = 0.67, 1.33 , 2.0 ,2.67
L/H = 0.25,0.5,0.75,1.0
D = 300 mm L/D = 0.33, 0.67, 1 , 1.33
L/H = 0.25,0.5,0.75,1.0
D is the stone column diameter and L the stone column length.
H is the clay thickness (constant during all tests and equal to 400mm).

Chapter (4):
EXPERIMENTAL TEST RESULTS

- 133 -
CHAPTER (4)
EXPERIMENTAL TEST RESULTS
4.1 Introduction
This chapter concerned with the analysis and discussion of the test
results of the problem under investigation. In this study, experiments
were carried out in the laboratory on scaled down models of single stone
columns formed in soft clay beds. The effects of different factors on the
behaviour of the column were investigated. These factors include the
diameter, length of the column and undrained shear strength of tested
soft clay. Around 12% of the tests in each series were repeated for
verification of results and reproducibility.
The main focus in this chapter is a comparison between behaviour of the
soft clay soil with and without stone column. In order to bring out their
relative performances, single stone columns were formed at the centre of
soft clay beds independently and load tested using circular steel plate as
model footing which resting on total area of column and surrounding
soil. Tests were conducted by varying all these parameters. Tests thus
conducted have shown very consistent results. Results of the tests are
presented and discussed in this chapter. This chapter brings out the
influences of the above mentioned parameters on the improvement of
load carrying capacity of stone columns. The improvement in strength of
columns is correlated with the shear strength of the soil, which is one of
the basic factors for designing the stone column. In addition to the
percentage reduction on settlement for investigated stone columns at
different parameters are discussed in details

- 134 -
4.2 Definition of the Failure Load
In general, load–displacement curves of shallow foundations can exhibit
any one of the three shapes shown in Fig. (4-1) (Hirany and Kulhawy
1989). The peak of curve A and the asymptote of curve C give the
maximum resistance of the foundations for dense sand and stiff clay.
However, load– displacement curves for soft clay and loose sand often
resemble curve B. In this research the load–displacement curves take the
form of curve B in Fig. (4-1) and the ultimate load (Pu) is defined as the
load at 25.0 mm settlement as recommended by Bowels (1996).
Fig. (4-1): Typical load–displacement curves (Hirany and Kulhawy, 1989).

- 135 -
4.3 Effect of Stone Column Diameter
Figure (4-2) shows the horizontal and vertical cross-sectional areas of
the loading configuration with the varying column diameters considered
in this study. The column diameter varied between 50 and 300 mm
within the unit cell, and the column length was varyied from 100 mm to
400 mm.
Fig. (4-2): Variation of the diameter D within the unit cell.
4.4 Effect of Stone Column Length
To study the influence of the variation of column length, floating and
end bearing stone columns were constructed and loaded individually
within the unit cell. All constructed columns had the same diameter.

- 136 -
However, the lengths of columns varied from 100 mm to 400 mm as
shown in Fig. (4-3). All columns were installed in soft clay bed with
undrained shear strength of 10 kPa, 20 kPa and 30 kPa and the
settlements were recorded.
Fig. (4-3): Geometry configurations for model tested stone column.
4.5 Improvement Factor, If (%)
• The percentage of load increase due to the increase of L/D ratio is
expressed as improvement factor, If (%) which can be calculated from
the following Equation:
.
..%
untr
untrtr
P
PPIf
Where:
Ptr. = Stress of treated soil at 25mm
Puntr. = Stress of untreated soil at 25 mm
(4.1)

- 137 -
4.6 Stone Column Treated Soft Clay Soil in the Case of
Undrained Shear Strength (cu) = 10 kPa
Figures (4-4 through 4-7) show the relationships between load (kN) and
settlement (mm), for different diameters of stone column (i.e., 50, 100,
150 and 300 mm), for different length of stone column (i.e., 100, 200,
300 and 400 mm), respectively.
Referring to Figs. (4-4 through 4-7), the following observations may be
drawn:
• At 10 mm settlement and at 25 mm settlement, the stress increases as
the diameter of stone columns increases.
• At 10 mm settlement and at 25 mm settlement, the stress increases as
the length of stone columns increases.
The improvement factor, (If) increases due to the increase of column's
diameters as calculated by Eq. (4.1) and tabulated in tables (4.1 through
4.4)
For all stone columns, the settlement increased gradually with the
increase in the applied stress. However, the rate of increase in settlement
decreased with the increase of the column diameter. This shows that
larger columns with larger diameters can withstand higher loads.

- 138 -
Table (4.1): The percentage of load increase due to the increase of
columns diameter 50 mm and cu = 10 kPa.
Column
Diameter
(mm)
Type of
Column
L/H
L/D
At 10 mm settlement At 25 mm settlement
Load
(kN)
Improvement
factor, If (%)
Load
(kN)
Improvement
factor, If (%)
No column (untreated ) 2.86 - - 5.13 - -
50
Floating 0.25 2.0 4.24 48.15 8.84 72.41
Floating 0.50 4.0 4.77 66.67 9.76 90.34
Floating 0.75 6.0 6.01 89.77 10.9 113.79
End Bearing 1.00 8.0 7.42 109.88 13.4 162.07
0
5
10
15
20
25
30
35
40
0 7 14 21 28 35Stress, kPa
Sett
lem
en
t, m
m
No Column
L/H = 0.25
L/H = 0.50
L/H = 0.75
L/H = 1.00
Fig. (4-4): Stress settlement curves for different stone columns L/H
ratios (D = 50 mm, cu = 10 kPa).

- 139 -
Table (4.2): The percentage of load increase due to the increase of
columns diameter 100 mm and cu =10 kPa.
Column
Diameter
(mm)
Type of
Column
L/H
L/D
At 10 mm settlement At 25 mm settlement
Load
(kN)
Improvement
factor, If (%)
Load
(kN)
Improvement
factor, If (%)
No column (untreated ) 2.86 - - 5.13 - -
100
Floating 0.25 1.0 5.41 88.89 9.90 93.10
Floating 0.50 2.0 5.90 106.17 12.0 134.84
Floating 0.75 3.0 6.89 140.74 12.8 148.97
End Bearing 1.00 4.0 9.40 228.40 16.3 217.24
0
5
10
15
20
25
30
35
40
0 7 14 21 28 35Stress, kPa
Sett
lem
en
t, m
m
No Column
L/H = 0.25
L/H = 0.50
L/H = 0.75
L/H = 1.00
Fig. (4-5): Stress settlement curves for different stone columns L/H
ratios (D = 100 mm, cu = 10 kPa).

- 140 -
Fig. (4-6): Stress settlement curves for different stone columns L/H
ratios (D = 150 mm, cu = 10 kPa).
Table (4.3): The percentage of load increase due to the increase of
columns diameter 150 mm and cu =10 kPa.
Column
Diameter
(mm)
Type of
Column
L/H
L/D
At 10 mm settlement At 25 mm settlement
Load
(kN)
Improvement
factor, If (%)
Load
(kN)
Improvement
factor, If (%)
No column (untreated ) 2.86 - - 5.13 - -
150
Floating 0.25 0.15 5.90 106.17 11.2 118.63
Floating 0.50 1.33 6.47 125.93 13.1 155.86
Floating 0.75 2.0 8.02 180.25 14.8 189.66
End Bearing 1.0 2.67 9.72 239.51 17.9 248.28
0
5
10
15
20
25
30
35
40
0 7 14 21 28 35
Stress, kPa
Sett
lem
en
t, m
m
No Column
L/H = 0.25
L/H = 0.50
L/H = 0.75
L/H = 1.00

- 141 -
Table (4.4): The percentage of load increase due to the increase of
columns diameter 300 mm and cu =10 kPa.
Column
Diameter
(mm)
Type of
Column
L/H
L/D
At 10 mm settlement At 25 mm settlement
Load
(kN)
Improvement
factor, If (%)
Load
(kN)
Improvement
factor, If (%)
No column (untreated ) 2.86 - - 5.13 - -
300
Floating 0.25 0.33 7.50 161.73 13.9 171.72
Floating 0.50 0.67 9.72 239.51 5.35 268.97
Floating 0.75 1.0 12.4 332.10 18.9 334.48
End Bearing 1.0 1.33 17.5 511.11 31.6 517.24
0
5
10
15
20
25
30
35
40
0 7 14 21 28 35Stress, kPa
Sett
lem
en
t, m
m
No Column
L/H = 0.25
L/H = 0.50
L/H = 0.75
L/H = 1.00
Fig. (4-7): Stress settlement curves for different stone columns L/H
ratios (D = 300 mm, cu = 10 kPa).

- 142 -
4.6.1 Improvement in the Ultimate Load Capacity of the
Stone Column Treated Soft Clay
For all stone columns, the settlement increased gradually with the
increase in the applied stress as shown in Figs. (4-4 through 4-7).
However, the rate of increase in settlement decreased with the increase
of the column diameter. This shows that larger columns can withstand
higher compressive loads. The improvement factor for column diameters
of 100 mm, 150 mm and 300 mm to that of the 50 mm column diameter
respectively is graphically shown in Fig. (4-8) It can be inferred that
when the diameter of the stone column in the base soil increases by 2, 3
and 6 times of its initial diameter, its load carrying capacity are
approximately 1.34, 1.53 and 3.2 times higher than the initial strength
respectively.
0
100
200
300
400
500
600
0 100 200 300 400 500
Stone column Length, L(mm)
Im
pro
vem
en
t F
acto
r,
I f (
%)
D = 50 mm
D = 100 mm
D = 150 mm
D = 300 mm
Fig. (4-8): The effect of column length on the improvement factor,
If (%) at different diameters for 25 mm settlement (cu = 10 kPa).

- 143 -
It has been found that the increase of stone column diameter leads to
significant increase on the ultimate capacity of stone column. It is also
found that, at (L = 400 mm), the increase of stone column diameter from
50 to 100 mm increased the ultimate capacity of stone column by
(34.04 %). While for stone column diameter of 300 mm, the ultimate
load capacity is increase by 2.20 times of stone column with diameter 50
mm.
On the other hand, Figs. (4-9 through 4-12) shows the effect of column
diameters on the percentage of load increase, the effect of L/D ratio on
the percentage load increase, the effect of L/D ratio on the improvement
factor, If (%) for different L/H ratio and the effect of L/H ratio on the
improvement factor, If (%) for different diameters at 25 mm settlement
respectively.

- 144 -
Fig. (4-10): The effect of L/D ratio on the improvement factor,If (%)
at 25 mm settlement (cu = 10 kPa).
0
100
200
300
400
500
600
0 100 200 300 400
Stone Column Diameter, D(mm)
Im
pro
vem
ent
Fa
cto
r, I
f (%
)
L = 100 mm
L = 200 mm
L = 300 mm
L = 400 mm
0
100
200
300
400
500
600
0 2 4 6 8 10 L/D
Im
prov
emen
t F
acto
r, I
f (%
)
D=50 mm
D=100 mm
D=150 mm
D=300 mm
Fig. (4-9): The effect of column diameters on the improvement
factor, If (%) for different lengths at 25 mm settlement (cu = 10 kPa).

- 145 -
0
100
200
300
400
500
600
0 2 4 6 8 10 L/D
Im
pro
vem
ent
Fa
cto
r, I
f (%
)
L/H = 0.25
L/H = 0.50
L/H = 0.75
L/H = 1.0
0
100
200
300
400
500
600
0 0.25 0.5 0.75 1 1.25 L/H
Im
prov
emen
t F
acto
r, I
f (%
)
D=50 mm
D=100 mm
D=150 mm
D=300 mm
Fig. (4-11): The effect of L/D ratio on the improvement factor, If (%)
for different L/H ratio at 25 mm settlement (cu = 10 kPa).
Fig. (4-12): The effect of L/H ratio on the improvement factor, If (%)
for different diameters at 25 mm settlement (cu = 10 kPa).

- 146 -
4.7 Stone Column Treated Soft Clay Soil in the Case of
Undrained Shear Strength (cu) = 20 kPa
Figures (4-13 through 4-16) show the relationships between load (kN)
and settlement (mm), for different diameters of stone column (i.e., 50,
100, 150 and 300 mm), for different lengths of stone column (i.e., 100,
200, 300 and 400 mm), respectively.
The percentage of load increase due to the increase of columns
diameters are calculated by Eq. (4.1) and tabulated in table (4.5 through
4.8)
For all stone columns, the settlement increased gradually with the
increase in the applied load. However, the rate of increase in settlement
decreased with enlargement of the column size. This shows that columns
with larger diameters can withstand higher loads.

- 147 -
Table (4.5): The percentage of load increase due to the increase of
columns diameter 50 mm and cu = 20 kPa.
Column
Diameter
(mm)
Type of
Column
L/H
L/D
At 10 mm settlement At 25 mm settlement
Load
(kN)
Improvement
factor, If (%)
Load
(kN)
Improvement
factor, If (%)
No column (untreated ) 6.01 - - 11.1 - -
50
Floating 0.25 2.0 9.19 52.94 18.2 63.17
Floating 0.50 4.0 10.6 76.47 19.8 77.78
Floating 0.75 6.0 11.7 94.12 22.1 98.41
End Bearing 1.00 8.0 15.7 161.76 27.4 146.03
0
5
10
15
20
25
30
35
40
0 14 28 42 56 70Stress, kPa
Sett
lem
en
t, m
m
No column
L/H = 0.25
L/H = 0.50
L/H = 0.75
L/H = 1.00
Fig. (4-13): Stress settlement curves for different stone columns L/H
ratios (D = 50 mm, cu = 20 kPa).

- 148 -
Fig. (4-14): Stress settlement curves for different stone columns L/H
ratios (D = 100 mm, cu = 20 kPa).
Table (4.6): The percentage of load increase due to the increase of
columns diameter 100 mm and cu =20 kPa.
Column
Diameter
(mm)
Type of
Column
L/H
L/D
At 10 mm settlement At 25 mm settlement
Load
(kN)
Improvement
factor, If (%)
Load
(kN)
Improvement
factor, If (%)
No column (untreated ) 6.01 - - 11.1 - -
100
Floating 0.25 1.0 9.83 63.53 19.6 76.19
Floating 0.50 2.0 12.0 100.0 23.4 110.16
Floating 0.75 3.0 14.3 138.24 25.9 133.33
End Bearing 1.00 4.0 18.0 200.0 32 187.30
0
5
10
15
20
25
30
35
40
0 14 28 42 56 70
Stress, kPa
Sett
lem
en
t, m
m
No Column
L/H = 0.25
L/H = 0.50
L/H = 0.75
L/H = 1.00

- 149 -
Fig. (4-15): Stress settlement curves for different stone columns L/H
ratios (D = 150 mm, cu = 20 kPa).
Table (4.7): The percentage of load increase due to the increase of
columns diameter 150 mm and cu =20 kPa.
Column
Diameter
(mm)
Type of
Column
L/H
L/D
At 10 mm settlement At 25 mm settlement
Load
(kN)
Improvemen
t factor, If
(%)
Load
(kN)
Improvement
factor, If (%)
No column (untreated ) 6.01 - - 11.1 - -
150
Floating 0.25 0.15 11.8 97.06 22.6 103.17
Floating 0.50 1.33 13.3 120.59 26.5 138.10
Floating 0.75 2.0 16.4 173.53 30.2 171.42
End Bearing 1.00 2.67 21.9 264.70 37.65 238.10
0
5
10
15
20
25
30
35
40
0 14 28 42 56 70Stress, kPa
Sett
lem
en
t, m
m
No Column
L/H = 0.25
L/H = 0.50
L/H = 0.75
L/H = 1.00

- 150 -
Fig. (4-16): Stress settlement curves for different stone columns L/H
ratios (D = 300 mm, cu = 20 kPa).
Table (4.8): The percentage of load increase due to the increase of
columns diameter 300 mm and cu =20 kPa.
Column
Diameter
(mm)
Type of
Column
L/H
L/D
At 10 mm settlement At 25 mm settlement
Load
(kN)
Improvement
factor, If (%)
Load
(kN)
Improvement
factor, If (%)
No column (untreated ) 6.01 - - 11.1 - -
300
Floating 0.25 0.33 15.0 150.0 28.1 152.38
Floating 0.50 0.67 19.1 217.65 37.5 236.50
Floating 0.75 1.0 24.4 305.88 45.3 306.35
End Bearing 1.00 1.33 34.7 477.65 63.1 466.67
0
5
10
15
20
25
30
35
40
0 14 28 42 56 70
Stress, kPa
Sett
lem
en
t, m
m
No Column
L/H = 0.25
L/H = 0.50
L/H = 0.75
L/H = 1.00

- 151 -
4.7.1 Improvement in the Ultimate Load Capacity of the
Stone Column Treated Soft Clay
The ratio of the load carrying capacities for column diameters of 100
mm, 150 mm and 300 mm to that of the 50 mm column diameter
respectively is graphically shown in Fig. (4-17) It can be inferred that
when the diameter of the stone column in the base soil increases by 2, 3
and 6 times of its initial diameter, its load carrying capacity are
approximately 1.28, 1.63 and 3.19 times higher than the initial strength
respectively.
It has been found that the increase of stone column diameter leads to
significant increase on the ultimate capacity of stone column. It is also
found that, at (L = 400 mm), the increase of stone column diameter from
50 to 100 mm increased the ultimate capacity of stone column by
(28.08 %). While for stone column diameter of 300 mm, the ultimate
load capacity is increase by 3.19 times of stone column with diameter 50
mm.

- 152 -
On the other hand, Figs. (4-18 through 4-21) shows the effect of column
diameters on the percentage of load increase, the effect of L/D ratio on
the percentage load increase, the effect of L/D ratio on the improvement
factor, If (%) for different L/H ratio and the effect of L/H ratio on the
improvement factor, If (%) for different diameters at 25 mm settlement
respectively.
0
100
200
300
400
500
600
0 100 200 300 400 500
Stone Column Length, L(mm)
I
mp
ro
vem
en
t F
acto
r,
I f (
%)
D = 50 mm
D = 100 mm
D = 150 mm
D = 300 mm
Fig. (4-17): The effect of total column lengths on the improvement
factor, If (%) for different diameters at 25 mm settlement (cu = 20 kPa).

- 153 -
]
0
100
200
300
400
500
600
0 100 200 300 400
Stone Column Diameter, D(mm)
Im
pro
vem
en
t F
acto
r,
I f (
%)
L = 100 mm
L = 200 mm
L = 300 mm
L = 400 mm
0
100
200
300
400
500
600
0 2 4 6 8 10L/D
Im
pro
vem
en
t F
acto
r,
I f (
%)
D = 50 mm
D = 100 mm
D = 150 mm
D = 300 mm
Fig. (4-18): The effect of column diameters on the improvement factor,
If (%) for different lengths at 25 mm settlement (cu = 20 kPa).
Fig. (4-19): The effect of L/D ratio on the improvement factor, If (%)
at 25 mm settlement (cu = 20 kPa).

- 154 -
0
100
200
300
400
500
600
0 2 4 6 8 10L/D
Im
pro
vem
en
t F
acto
r,
I f (
%)
L/H = 0.25
L/H = 0.50
L/H = 0.75
L/H = 1.0
0
100
200
300
400
500
600
0 0.25 0.5 0.75 1 1.25
L/H
Im
pro
vem
en
t F
acto
r,
I f (
%)
D = 50 mm
D = 100 mm
D = 150 mm
D = 300 mm
Fig. (4-20): The effect of L/D ratio on the improvement factor, If (%)
for different L/H ratio at 25 mm settlement (cu = 20 kPa).
Fig. (4-21): The effect of L/H ratio on the improvement factor, If (%)
for different diameters at 25 mm settlement (cu = 20 kPa).

- 155 -
4.8 Stone Column Treated Soft Clay Soil in the Case of
Undrained Shear Strength (cu) = 30 kPa
Figures (4-22 through 4-25) show the relationships between load (kN)
and settlement (mm), for different diameters of stone column (i.e., 50,
100, 150 and 300 mm), at different lengths of stone column (i.e., 100,
200, 300 and 400 mm), respectively.
The percentage of load increase due to the increase of columns
diameters are calculated by Eq. (4.1) and tabulated in table (4.18 through
4.21)

- 156 -
Fig. (4-22): Stress settlement curves for different stone columns L/H
ratios (D = 50 mm, cu = 30 kPa).
Table (4-9): The percentage of load increase due to the increase of
columns diameter 50 mm and cu = 30 kPa.
Column
Diameter
(mm)
Type of
Column
L/H
L/D
At 10 mm settlement At 25 mm settlement
Load
(kN)
Improvement
factor, If (%)
Load
(kN)
Improvement
factor, If (%)
No column (untreated ) 8.31 - - 16.0 - -
50
Floating 0.25 2.0 13.6 63.83 24.1 50.55
Floating 0.50 4.0 16.1 93.62 30.2 88.74
Floating 0.75 6.0 18.0 117.02 33.6 109.71
End Bearing 1.00 8.0 23.7 185.53 41.7 160.50
0
5
10
15
20
25
30
35
40
0 21 42 63 84 105
Stress, kPa
Sett
lem
en
t, m
m
No Column
L/H = 0.25
L/H = 0.50
L/H = 0.75
L/H = 1.00

- 157 -
Fig. (4-23): Stress settlement curves for different stone columns L/H
ratios (D = 100 mm, cu = 30 kPa).
Table (4.10): The percentage of load increase due to the increase of
columns diameter 100 mm and cu =30 kPa.
Column
Diameter
(mm)
Type of
Column
L/H
L/D
At 10 mm settlement At 25 mm settlement
Load
(kN)
Improvement
factor, If (%)
Load
(kN)
Improvement
factor, If (%)
No column (untreated ) 8.31 - - 16.0 - -
100
Floating 0.25 1.0 14.8 78.72 29.3 83.22
Floating 0.50 2.0 18.0 117.02 35.2 120.09
Floating 0.75 3.0 20.9 152.34 39.2 145.03
End Bearing 1.00 4.0 27.9 236.60 48.8 204.63
0
5
10
15
20
25
30
35
40
0 21 42 63 84 105Stress, kPa
Sett
lem
en
t, m
m
No Column
L/H = 0.25
L/H = 0.50
L/H = 0.75
L/H = 1.00

- 158 -
Fig. (4-24): Stress settlement curves for different stone columns L/H
ratios (D = 150 mm, cu = 30 kPa).
Table (4.11): The percentage of load increase due to the increase of
columns diameter 150 mm and cu =30 kPa.
Column
Diameter
(mm)
Type of
Column
L/H
L/D
At 10 mm settlement At 25 mm settlement
Load
(kN)
Improvement
factor, If (%)
Load
(kN)
Improvement
factor, If (%)
No column (untreated ) 8.31 - - 16.0 - -
150
Floating 0.25 0.15 18.0 117.02 34.0 112.36
Floating 0.50 1.33 19.8 138.30 39.6 147.24
Floating 0.75 2.0 24.0 189.36 45.3 182.56
End Bearing 1.00 2.67 32.4 289.79 55.9 248.79
0
5
10
15
20
25
30
35
40
0 21 42 63 84 105
Stress, kPa
Sett
lem
en
t, m
m
No Column
L/H = 0.25
L/H = 0.50
L/H = 0.75
L/H = 1.00

- 159 -
Table (4.12): The percentage of load increase due to the increase of
columns diameter 300 mm and cu =30 kPa.
Column
Diameter
(mm)
Type of
Column
L/H
L/D
At 10 mm settlement At 25 mm settlement
Load
(kN)
Improvement
factor, If (%)
Load
(kN)
Improvement
factor, If (%)
No column (untreated ) 8.31 - - 16.0 - -
300
Floating 0.25 0.33 22.45 170.21 41.47 158.94
Floating 0.50 0.67 28.99 248.40 56.35 251.88
Floating 0.75 1.0 36.77 342.55 68.76 329.36
End Bearing 1.00 1.33 51.79 523.40 93.33 482.78
0
5
10
15
20
25
30
35
40
0 21 42 63 84 105Stress, kPa
Sett
lem
en
t, m
m
No Column
L/H = 0.25
L/H = 0.50
L/H = 0.75
L/H = 1.00
Fig. (4-25): Stress settlement curves for different stone columns
L/D ratios (D = 300 mm, cu = 30 kPa).

- 160 -
4.8.1 Improvement in the Ultimate Load Capacity of the
Stone Column Treated Soft Clay
On the other hand, Figs. (4-26 through 4-30) shows the effect of column
diameters on the percentage of load increase, the effect of L/D ratio on
the improvement factor, the effect of L/D ratio on the improvement
factor, If (%) for different L/H ratio and the effect of L/H ratio on the
improvement factor, If (%) for different diameters at 25 mm settlement
respectively.
Fig. (4-26): The effect of column length on the improvement factor,
If (%) for different diameters at 25 mm settlement.
0
100
200
300
400
500
600
0 100 200 300 400 500
Stone Column Length, L(mm)
Imp
rov
emen
t F
act
or,
If
(%)
D = 50 mm
D = 100 mm
D = 150 mm
D = 300 mm

- 161 -
0
100
200
300
400
500
600
0 100 200 300 400
Stone Column Diameter, D(mm)
Im
pro
vem
ent
Fa
cto
r, I
f (%
) L = 100 mm
L = 200 mm
L = 300 mm
L = 400 mm
0
100
200
300
400
500
600
0 2 4 6 8 10
L/D
Im
prov
emen
t F
acto
r, I
f (%
)
D = 50 mm
D = 100 mm
D = 150 mm
D = 300 mm
Fig. (4-28): The effect of L/D ratio on the improvement factor, If
(%) at 25 mm settlement (cu = 30 kPa).
Fig. (4-27): The effect of column diameter on the improvement factor,
If (%) for different lengths at 25 mm settlement.

- 162 -
0
100
200
300
400
500
600
0 2 4 6 8 10L/D
Im
pro
vem
ent
Fa
cto
r, I
f (%
)
L/H = 0.25
L/H = 0.50
L/H = 0.75
L/H = 1.0
0
100
200
300
400
500
600
0 0.25 0.5 0.75 1 1.25
L/H
Im
pro
vem
ent
Fa
cto
r, I
f (%
)
D = 50 mm
D = 100 mm
D = 150 mm
D = 300 mm
Fig. (4-29): The effect of L/D ratio on the improvement factor, If (%)
for different L/H ratio at 25 mm settlement (cu = 30 kPa).
Fig. (4-30): The effect of L/H ratio on the improvement factor, If (%)
for different diameters at 25 mm settlement (cu = 30 kPa).

- 163 -
4.9 Behavior of end bearing stone column
Figs. (4-31 through 4-33) shows the variations of load settlement curve
for stone column fully penetrate as end bearing case.
It is observed that the increase of undrained shear strength provided a
higher confinement for stone columns as a result the ultimate load
capacity is increased with remarkable reduction in settlement.
Fig. (4-31): Stress settlement curves for end bearing stone columns
at different diameters and cu = 10 kPa.
0
5
10
15
20
25
30
35
40
0 21 42 63 84 105Stress, kPa
Sett
lem
en
t, m
m
No column
D = 50 mm
D = 100 mm
D = 150 mm
D = 300 mm

- 164 -
Fig. (4-32): Stress settlement curves for end bearing stone column at
different diameters of and cu = 20 kPa.
0
5
10
15
20
25
30
35
40
0 21 42 63 84 105Stress, kPa
Sett
lem
en
t, m
m
No column
D = 50 mm
D = 100 mm
D = 150 mm
D = 300 mm
0
5
10
15
20
25
30
35
40
0 21 42 63 84 105Stress, kPa
Sett
lem
en
t, m
m
No Column
D = 50 mm
D = 100 mm
D = 150 mm
D = 300 mm
Fig. (4-33): Stress settlement curves for end bearing stone column at
different diameters of and cu = 30 kPa.

- 165 -
4.9.1 Bulging responses of end bearing stone columns
At the end of each experimental test, the failed stone column was
carefully examined to study the deformed shape by pouring a cement
slurry into the failed stone column, Fig (4-34) and allowing to set for
about 24 hours, Fig (4-35) and the deformed shape was examimed by
scooping the surrounding soil carefully. The resulted shape of the
deformed stone column was observed as shown in Fig. (4-36 & 4-37).
As can be seen in Fig. (4-38) the deformation was more prominent in the
upper part of the column over a length of about 2.5D. The maximum
radial expansion of the column diameter was observed at (1.25-1.5D)
approximately below the top surface of the failed column.
Fig. (4-34): Pouring cement slurry into the stone column to maintain
the shape of the resulting deformation.

- 166 -
Fig. (4-35): Separation of stone column from surrounding soil
after 24 hours
Fig. (4-36): Shape of stone column after removing it from the
surrounding soil.

- 167 -
Fig. (4-37): Deformed shape of stone column.
0
1
2
3
4
0 100 200 300 400 500 600
Diameter, mm
L/D
Before testing
After testing
Fig. (4-38): Stone column shape before and after testing (cu = 10 kPa).

- 168 -
The variations of radial expansion of the four end bearing stone columns
which diameter 50mm, 100mm,150mm and 300mm are shown in Fig.
(4-39 through 4-42). In general, the radial deformation of the columns
increased with depth, reaching its maximum value at a depth of
approximately 1.25D for diameter 50 mm ,100 mm and 150 mm
respectively, while it is found to be 1.5D in case of diameter of 300 mm
. The bulging effect was mainly observed up to an approximate depth of
2.5D. It was evident that the horizontal displacement increased with
applied pressure for all cases since the greater the applied pressure, the
bigger the column bulging. All these findings confirm the observations
made in earlier studies reporting that end bearing fail by bulging.
Fig. (4-39): Variation of the horizontal deformation for end bearing loading
condition for different undrained shear strength values, cu (D = 50 mm).

- 169 -
Fig. (4-41): Variation of the horizontal deformation for end bearing loading
condition for different undrained shear strength values, cu (D = 150 mm).
Fig. (4-40): Variation of the horizontal deformation for end bearing loading
condition for different undrained shear strength values, cu (D = 100 mm).

- 170 -
Fig. (4-42): Variation of the horizontal deformation for end bearing loading
condition for different undrained shear strength values, cu (D = 300 mm).

Chapter (5):
NUMERICAL MODELING

- 171 -
CHAPTER (5)
NUMERICAL MODELING
5.1 Introduction
The Finite Element Method has been applied to Geotechnical
Engineering problems since 1960. It has developed a decade earlier for
applications in Structural Engineering and continuum mechanics. The
name finite element was, however, first coined in a paper by Clough
(1960), in which the technique was presented for plane stress analysis.
Since then, a large amount of research has been devoted to this
technique and a number of research papers and text books have been
published on this subject. The method is now firmly established as an
engineering tool of wide applicability. The main advantage of the
method is that it can be applied to the materials exhibiting non-linear
stress-strain behavior. In the current research the finite element program
of PLAXIS has been used.
Implementation of various constitutive relationships into finite element
method facilitated the study of numerous problems in geotechnical
Engineering. Finite element procedure is a powerful tool that can
analyze problems incorporating non uniform geometry and complicated
boundary conditions. In this chapter, PLAXIS 2D, version 8.2
axisymmetric finite element models were used to compare between
results of experimental work and contain a brief description of the finite
element method for the problem under investigation. The different
constitutive laws in Geomechanics and the utilized material models
formulations are illustrated. Also, the numerical models used in these

- 172 -
studies are discussed in detail. In addition to the experimental analysis
and case studies were verified using the numerical program PLAXIS V
8.2. The parameters that cannot be investigated in the laboratory were
studied by the program.
5.2 Finite Element Modeling Program Used in This
Research
5.2.1 Input Program
In the Input program of the PLAXIS the geometry of the problem is
given by entering different soil layers, structural parts, external loads,
etc. a choice between various available material models, such as Mohr-
Coulomb, Hardening soil, etc., is made at the input for each material.
The material is given relative material properties, such as stiffness and
density, which differs according to the used material model. Appropriate
boundary conditions are then assigned to the whole model. When the
model is complete, a mesh is automatically generated and initial stress
and pore water pressure are initiated before moving to the Calculation
program.
5.2.1.1 Soil Element
During generation of the mesh, soil clusters are divided into triangular
elements. Plaxis provides two types of triangular elements, 6-nodes
elements and 15-nodes elements, as shown in Figure (5-1). During the
finite element calculations, displacements are calculated at those nodes.
On other hand, stress is calculated at individual points called stress

- 173 -
points rather than at the nodes. A 15-nodes triangular element contains
12 stress points while a 6-nodes triangular element contains 3 stress
points. In this research a 15-nodes triangular element was used.
Fig. (5-1): Example distribution of nodes and stress points in
PLAXIS finite elements (PLAXIS version 8 manuals).

- 174 -
5.2.1.2 Types of Soil Behavior
An important feature of the soil is the presence of pore water. Pore water
pressure significantly influences the soil response. To enable
incorporation of the pore water influence in the soil response Plaxis
offers for each model a choice of three types of behavior:
1. Drained behavior where no excess pore water pressure is generated.
This behavior is used for dry soils and also for soil types providing full
drainage due to high permeability, as in sand, or due to low rate of
loading. This option can also be used to model the long-term behavior of
soil without the need to model the precise history of the undrained
loading and consolidation.
2. Undrained behavior in which a full development of excess pore water
pressure is present. This occurs when a soil has low permeability, as in
clay, or under a high rate of loading. The undrained behavior is usually
followed by consolidation in loading phases.
During this research the drained and undrained soil behavior was used in
simulating the soft clay layer. In all models the drained soil behavior
was used in simulating the stone columns and the sand layer as they
have high permeability.

- 175 -
The undrained shear strength of soil is calculated in according to
equation deduced from Fig. (5-2).
( +
(5.1)
5.2.1.3 Boundary Conditions
Boundary conditions are used to describe the fixities for the boundaries
of the problem geometry. In this research the boundary conditions were
set by fixing the vertical boundaries in the horizontal direction only (Ux
= 0) while allowing displacement to take place in the vertical direction;
while a fixation of both vertical and horizontal displacement (Ux = Uy =
0) for the lower horizontal boundary of the problem.
Fig. (5-2): Mohr’s circle of stress used to drive relation between undrained
shear strength and drained shear parameters (Brinkgreve, 2002).

- 176 -
5.2.1.4 Mesh Generation
Plaxis uses unstructured mesh, which is generated automatically with
options for global and local mesh refinement. Plaxis provides several
options of mesh density ranged from very coarse to very fine mesh. In
this research fine mesh size was chosen to model the soil deposit. Mesh
was then refined in zones which stresses and strains are expected to be
high i.e. the soil area surrounding the stone columns, the crust layer and
the embankment body. Fig. (5-3) showed the mesh generation and
geometry of the studied in the (PLAXIS 2D, version 8.2)
Fig. (5-3): Mesh refine in for the proposed model in stability analysis
in 2D PLAXIS program.
5.2.1.5 Initial Conditions
The initial stresses in a soil body are influenced by the weight of the
material and the history of its formation. This stress state is usually

- 177 -
characterized by an initial vertical effective stress (ơ'v). The initial
horizontal effective stress (ơ'h) is related to the initial vertical effective
stress by the coefficient of lateral earth pressure K0.
K0 procedure is a special calculation method available in PLAXIS to
define the initial stresses for the model, taking into account the loading
history of the soil.
In practice, the value of K0 for a normally consolidated soil is often
assumed to be related to the friction angle by Jacky‘s empirical
expression:
(5.3)
When the K0 procedure is adopted, PLAXIS will generate vertical
stresses that are in equilibrium with the self-weight of the soil.
Horizontal stresses are calculated from the specified value of K0
5.2.2 Calculation
After generation of finite element models, calculation can be executed.
Both calculation type and loading type has to be specified in this step.
5.2.2.1 Types of Calculations
Choose between different ways of analysis of the actual problem are
mode in the calculation program. Distinctions of the two types of
calculations were mentioned as follows:

- 178 -
1. Plastic calculation should be selected to carry out an elastic-plastic
deformation analysis in which it is not necessary to take excess pore
water pressure with time into account.
2. Consolidation analysis should be selected when it is necessary to
analyze the development or the dissipation of excess pore water pressure
in water-saturated clay-type soils as a function in time. Plaxis allows for
true elastic-plastic consolidation analyses.
In the current research consolidation analysis was used to be able to
detect the behavior of the stone column-soft soil settlement with time.
5.2.3 Output
When the calculations are completed the results can be viewed in the
output program. A large amount of data can be obtained from finite
element calculation such as stresses, pore water pressure and
displacements.
5.3 The Mohr Coulomb Model
The Mohr Coulomb model is an elastic perfectly plastic model. As
explained before in this chapter, the yield surface of the elastoplastic
model with perfect plasticity is a fixed surface. The yield surface of the
Mohr Coulomb model, as shown in Fig. (5-4), is fully defined by model
parameters and not affected by plastic straining. The Mohr Coulomb
model requires a total of five parameters, which are generally familiar to
most geotechnical engineers and which can be obtained from basic tests
on soil samples. These parameters are Young‘s modulus, E, Poisson‘s

- 179 -
ratio, ν, Friction angle, ϕ , Cohesion, c, and Dilatancy angle, ψ. These
parameters are briefly explained in the following part.
Fig. (5-4): Mohr-Coulomb yield criterion.
5.3.1 Young’s Modulus
Plaxis uses the young‘s modulus (E) as the basic stiffness in the elastic
model and the Mohr Coulomb model. A stiffness modulus has the
dimension of stress. The values of the stiffness parameter adopted in a
calculation require a special attention as many materials show nonlinear

- 180 -
behavior from the beginning of loading. For soils, the initial slope is
usually indicated as ( ), and secant modulus at 50 % strength is
donated ( ), as shown in Fig. (5-5). For materials with a large linear
elastic range it is realistic to use , but for loading of soils is
generally used.
Fig. (5-5): Definition of and for standard drained triaxial test
results (Brinkgreve, 2002).
The studied soft clay soils consist of a homogeneous soil underlain by a
dense sand layer. There are three samples of undrained and drained soft
clay soil types, which were considered in this research.
Bowles, 1996 introduced empirical formulae to calculate stiffness
parameters of clay soil.

- 181 -
A nonlinear analysis was assumed, so that (Es) represent a secant
modulus for low load level.
The Mohr-Coulomb model was considered to model elastic- plastic
behavior of sand soils. These parameters in this model are soil cohesion
(c), angle of internal friction (ϕ ) and soil dilatancy (ψ). Since we
considered sand soils in this study in the drained case, soil cohesion was
set to 1*10-3
kPa to avoid errors.
5.3.2 Poisson’s Ratio (υ)
The selection of a Poisson‘s ratio (υ) is particularly simple when the
elastic model or the Mohr Coulomb model is used for gravity loading.
For this type of loading Plaxis should give realistic ratios of
as both models will give the well-known ratio = υ/(1- υ) . For
one-dimensional compression it is easy to select Poisson‘s ratio that
gives a realistic value of ; hence, υ is evaluated by matching . In
many cases the value of Poisson‘s ratio is ranged between 0.3 and 0.4,
however, it is in the range of 0.5 in the case of undrained behavior.
5.3.3 Cohesion (c)
The cohesive strength has the dimension of stress. Plaxis can handle
cohesion-less soils (c = 0), but some options will not perform well.
Plaxis offers a special option of layers in which the cohesion increases
with depth.

- 182 -
5.3.4 Friction Angle (ϕ) The friction angle, ϕ is entered in degrees. The friction angle largely
determines the shear strength by means of Mohr‘s stress circle, as shown
in Fig. (5-6). The Mohr- Coulomb failure criterion proves to be better
for describing soil behavior than the Druker-Prager approximation, as
the latter failure surface tends to be highly inaccurate for axisymmetric
configurations.
Fig. (5-6): Mohr-Coulomb failure envelope with one Mohr failure
circle (Brinkgreve, 2002).
5.3.5 Dilatancy angle (ψ)
The dilatancy angle, ψ is specified in degrees. Apart from heavily over-
consolidated layers, clay soils tend to show little dilatancy (ψ = 0). The
dilatancy of sand depends on both the density and the friction angle. A
small negative value of ψ is only realistic for extremely loose sands.

- 183 -
5.4 The Hardening Soil Model
The Hardening Soil model is an advanced model used for the simulation
of soil behavior. In this study, the Hardening model was considered to
model elastic- plastic behavior of soft clay soil.
As for the Mohr-Coulomb model, limiting states of stress are described
by means of the friction angle (ϕ ), the cohesion (c) and the dilatancy
angle (ψ). However, soil stiffness is described much more accurately by
using three different input stiffness, such as: Plastic straining due to
primary loading in the standard drained triaxial test,
, the triaxial
unloading stiffness,
and Plastic straining due to primary
compression,
.
5.5 Numerical Model Verification
Two case studies were used for verification of the Finite Element
Models of the (2D PLAXIS, version (8.2) program as presented by
Ambily and Gandhi, (2007) and Narasimha Rao et al., (1992) in order to
confirm the program validity.
5.5.1 Validation Using (Ambily and Gandhi, 2007) Results
The numerical modeling has been validated using results reported by,
Ambily and Gandhi, (2007). In this analysis, soft clay and stone column
is modeled using Mohr-Coulomb criterion (linear elastic). To start with,
the model developed in PLAXIS 2D considering elastic-plastic response
is compared with this similar study.

- 184 -
Model developed by Ambily and Gandhi, 2007studies the behavior of
interior columns among a large group of columns. Here, interior column
was idealized as unit cell as shown in Fig. (5-7). They considered the
following cases.
1) Stone column loaded alone
2) Stone column and surrounding soil loaded together (sand pad is
provided on the top)
The input parameters used in PLAXIS analyses are given in Table (5.1).
The drained behaviour is considered for clay, stone column, and sand.
The simulation of unit cell model is initialized by applying initial
stresses in all materials using K0 procedure. To get equal vertical strain
condition, load is applied as prescribed displacement. Fine meshes
which are generated using 15-noded triangular elements and boundary
conditions for both the cases are shown in Fig. (5-8). Along the lateral
boundaries, radial deformation is restricted but vertical deformation is
allowed. Along the bottom boundary, radial and vertical deformations
are restricted. In this analysis, no interface element is used.
Bulk
density
(kN/m3)
Dry
density
(kN/m3)
Friction
Angle
ϕ
(Degree)
Dilatancy
Ψ
(Degree)
Cohesion
cu
(kN/m2)
Poisson's
ratio
υ
Deformation
Modulus
E
(kN/m2)
Materials
19.45 15.56 _ _ 30
0.42
5500 Soft
Clay
17 16.62 43 10
_
0.3 55000
Stone
16 15.50 30 4 _ 0.3 20000 Sand
Table (5.1): Details of material properties (Ambily and Gandhi, 2007).

- 185 -
Sand layer
Stone
Column
30 mm
450 mm
Soft Clay
100 mm
(a) Case of entire area loaded (b) Case of loaded column alone
Fig. (5-7): Finite-element discretization for both cases (Ambily and Gandhi, 2007).

- 186 -
Figure (5-8) shows deformed mesh at failure for both cases. In the case
of loaded column alone, bulging failure occurs with maximum bulging
at a depth of 0.5 times diameter of granular pile as was noticed in
Ambily and Gandhi‘s study. For the case of entire area loaded, no
bulging is observed and similar behavior reported in their analysis.
(a) Case of loaded column alone (b) Case of entire area loaded
Fig. (5-8): Deformed mesh for both cases (Ambily and Gandhi, 2007).

- 187 -
Based on the axial stress developed at the pile top and settlement
behaviour, for the case of stone column loaded alone, it can be observed
that stone column reaches a failure stage. Settlement behavior of stone
column with respect to axial stress is shown in Fig. (5-8). But for second
case, failure did not take place even for a large settlement of 35 mm and
it is in linear elastic range of loading. Figs. (5-9) and (5-10) show axial
loaded versus settlement behavior from numerical analysis reported by
Ambily and Gandhi, (2007) and PLAXIS analysis. The results from the
present analysis match well with the results obtained by Ambily and
Gandhi, (2007).
Fig. (5-9): Verification of are current plaxis results with the load
settlement behavior of loaded stone column alone (Ambily and
Gandhi, 2007).
0
4
8
12
16
20
24
0 125 250 375 500 625 750
Load, kN
Sett
lem
en
t, m
m
Plaxis result (current study)
Ambily and Gandhi, 2007

- 188 -
Fig. (5-10): Verification of are current plaxis results with the load
settlement behavior of entire loaded area (Ambily and Gandhi,
2007).
0
1
2
3
4
5
6
0 30 60 90 120 150 180
Load, kN
Sett
lem
en
t, m
m
Plaxis result (current study)
Ambily and Gandhi, 2007

- 189 -
5.5.2 Validation Using the Results Obtained by (Narasimha
Rao et al., 1992):
For more confirmation, the model used in this study was validated by
analyzing the load settlement behavior of a single stone column as
discussed by Narasimha Rao et al. (1992).
The test tank used in their experiment is 650 mm diameter and height of
clay bed is 350 mm. A stone column of diameter 25 mm and height 225
mm was made at the center of the clay bed and loaded with a plate of
diameter equal to two times the diameter of the stone column. Properties
of clay and stones are shown in Table 3. An axisymmetric analysis was
carried out using Mohr-Coulomb‘s criterion for clay and stones. The
finite-element discretization using 15-noded triangular elements with
boundary conditions is shown in Fig. (5-11).
Comparing the results obtained from the experimental model test
(Narasimha Rao et al., 1992) and those obtained from PLAXIS analysis,
it was found that both results are matching well and the load
displacement curve has the same trend for the two cases as can be seen
from Fig. (5-12).

- 190 -
(a) Model
(b) Mesh (c) Deformed mesh
Fig. (5-11): Finite-element discretization of model test (Narasimha
Rao et al., 1992).

- 191 -
Table (5.2): Details of material properties (Narasimha Rao et al.,
1992).
Bulk
density
(kN/m3)
Dry
density
(kN/m3)
Friction Angle
ϕ
(Degree)
Dilatancy
Ψ (Degree)
Cohesion
cu (kN/m
2)
Poisson's
ratio
µ
Deformation
Modulus
E
(kN/m2)
Materials
17
16.2
_
_
20
0.45
4000
Soft
Clay
18.9
18.2
38
8
_
0.3
45000
Stones
0
5
10
15
20
25
30
35
0 80 160 240 320 400 480
Load, kN
Sett
lem
en
t, m
m
Plaxis results (current study)
Narasimha Roa et al., 1992
Fig. (5-12): Verification of are current plaxis results with the load
settlement behavior (Narasimha Rao et al., 1992).

- 192 -
5.5.3 Verification for Experimental Work of Present Study
Input parameters that used in the FEM for problem under investigation
were obtained from basic laboratory tests as show in chapter 3.
Plaxis 2D, finite element analysis was carried out for natural clay and for
the same clay modified by single stone column (unit cell) under loading.
The modeling of single stone column is designed by axisymmetric
pattern in Plaxis. The different diameters and length of stone column
were applied for the analysis and the results were compared. The
axisymmetric unit cell was carried out using Mohr–Coulomb‘s and
hardening soil criterion. The studied model dimension was adopted as
shown in the labrtory model test. Figs. (5-13 and 5-14) show the finite
element model for the studied problem.
(a) Untreated soil model (b) Untreated soil mesh
Fig. (5-13): The model and the soil mesh for the case of untreated soil.

- 193 -
The results of finite element analysis for treated clay by single stone
column and untreated clay were compared the load–deformation results
with the laboratory model test results. The input parameters for clay and
stone column material and sand layer (unit weight, cohesion, elastic
modulus, angle of internal friction, Poisson ratio and dilatancy angle) are
given in table (5.3) and Hardening Soil Parameters for Soft Clay table
(5.4).
The numerical analysis were done using both Mohr Coulomb and
hardening soil criteria model. Where Fig. (5-15) shows the load
settlement curve for refer soft clay with stone column for case cu = 20
(a) Treated Soil Model (b) Treated Soil Mesh
Fig. (5-14): Unit cell stone column and unit cell stone column
mesh for the case of treated soil.

- 194 -
kPa , D = 150 mm and L = 300 mm . It has been found that there is
insignificant difference in the numerical result as shown in the relavent
figure for both Mohr Coulomb and Hardening models. It is also found
that the difference is around 5% for both adopted models.
For both Mohr Coulomb and hardening soil it has been found that the
numerical results of both model has the same trend. Therefore the
Mohr Coulomb model was used in the present research due to its
availability for their parameters.
The load settlement behavior of both model test and finite element
analysis at different studied parameters are shown in Figs. (5-16 through
5-21).
0
5
10
15
20
25
30
35
40
0 14 28 42 56 70
Stress, kPa
Sett
lem
en
t, m
m
Mohar-Coulomb
Hardening Soil
Cu = 20 kPa
L/H = 0.75
Fig. (5-15): Stress settlement response for the two cases of Mohr Coulomb
and hardening soil criteria model, (L=300 mm & D = 150 mm).

- 195 -
Table (5.3): Mohr Coulomb parameters for all materials in the cases
of cu = 10, 20 and 30 kPa.
Soil classification Dense sand Stone Soft clay Soft clay Soft clay
Model Used MC MC MC MC MC
Soil behavior Drained Drained Undrained Undrained Undrained
Unit weight
d (kN/m3) 18 18 16 16 16
sat(kN/m3) 19 19 17 17 17
Mohr- Coloumb
failure parameters
Cu, (kPa) - - 10 20 30
38 42 0 0 0
ψ o 8 12 0 0 0
Soil stiffness
Parameters
Mohr column
E (kPa) 80000 100000 2000 4000 6000
υ 0.30 0.35 0.45 0.45 0.45
Rf 0.8 0.8 0.7 0.7 0.7
Permeability
Ky (m/day) 1 10 1e-8 1e
-8 1e-
8
Kx (m/day) 1 10 1e-8 1e-
8 1e-
8

- 196 -
Table (5.4): Hardening soil model parameters for soft clay materials
at shear strength cu = 20 kPa.
Soil classification Soft clay
Model Used Hardening Model
Soil behavior Undrained
Unit weight d (kN/m
3) 16
sat(kN/m3) 17
Hardening soil
failure parameters
Cu, kPa 20
0
ψ, o 0
Soil stiffness
Parameters
Hardening model
4000
6000
8000
ν 0.45
m 0.5
Pref 100
Rf 0.7
Permeability
Ky (m/day) 1e-8
Kx (m/day) 1e-8

- 197 -
Fig. (5-16): Stress settlement behavior of both model test and finite
element at cu = 10 kPa, D = 50 mm and L = 100 mm.
0
5
10
15
20
25
30
35
40
0 7 14 21 28 35Stress, kPa
Sett
lem
en
t, m
m
Experimental
Numerical
0
5
10
15
20
25
30
35
40
0 7 14 21 28 35
Stress, kPa
Sett
lem
en
t, m
m
Experimental
Numerical
Fig. (5-17): Stress settlement behavior of both model test and
finite element at cu = 10 kPa, D = 150 mm and L = 300 mm.

- 198 -
Fig. (5-18): Stress settlement behavior of both model test and finite
element at cu = 20 kPa, D = 150 mm and L = 300 mm.
0
5
10
15
20
25
30
35
40
0 14 28 42 56 70Stress, kPa
Sett
lem
en
t, m
m
Experimental
Numerical
0
5
10
15
20
25
30
35
40
0 14 28 42 56 70
Stress, kPa
Sett
lem
en
t, m
m
Experimental
Numerical
Fig. (5-19): Stress settlement behavior of both model test and
finite element at cu = 20 kPa, D = 300 mm and L = 200 mm.

- 199 -
Fig. (5-20): Stress settlement behavior of both model test and finite
element at cu = 30 kPa, D = 50 mm and L = 300 mm.
0
5
10
15
20
25
30
35
40
0 21 42 63 84 105
Stress, kPa
Sett
lem
en
t, m
m
Experimental
Numerical
0
5
10
15
20
25
30
35
40
0 21 42 63 84 105Stress, kPa
Sett
lem
en
t, m
m
Experimental
Numerical
Fig. (5-21): Stress settlement behavior of both model test and
finite element at cu = 30 kPa, D = 300 mm and L = 300 mm.

CHAPTER (6):
NUMERICAL ANALYSIS

- 200 -
CHAPTER (6)
NUMERICAL ANALYSIS AND RESULTS
6.1 Introduction
This chapter presents the results of numerical models of the problem
under investigation at different studied parameters. It is aimed at
investigating the numerical analysis of small scale model that mentioned
in laboratory testing program. The effect of stone column geometry,
untrained shear strength and the effect of drained condition are also
investigated. The main control parameters are stress displacement
response of both drained and untrained conditions. The effect of stone
column on the subgrade stiffness is also submitted.
6.2 Numerical Analysis of Model Testing
Figures (6-1 through 6-4) illustrate the load settlement curves from the
finite element analysis of small scale model for different L/H ratio and
the same shear strength of 10 kPa for different stone column diameters.
The load deformation of numerical results of reinforced subgrade are
compared with untreated soil. Figure (6-1) shows the load carrying
capacity of 50mm diameter stone column. The capacity of 50mm
diameter stone column at 25 mm settlement with L/H ratio of 0.25, 0.50,
0.75 and 1.0 is found to be, 2.42, 2.68, 3.0 and 3.9 kN respectively. The
improvement in the load carrying capacity of stone column is reached to
1.74, 1.92, 2.16 and 2.81 times compared to untreated soil with different
L/H ratio of 0.25, 0.50, 0.75 and 1.0 respectively. The trends obtained

- 201 -
from results show that, by increasing the length of stone column, the
load carrying capacity of stone column increased.
It is noticed that for floating stone column (L/H = 0.25, 0.50, 0.75) the
load settlement response is partially different from the curve of end
bearing case (L/H= 1.0). It can be seen that the same pattern for floating
stone columns with length 100 mm, 200 mm and 300 mm respectively
disagree with the last curve for end bearing stone column with length
400 mm that differentiate from the other curves . One can be concluded
that the failure of stone column for end bearing case is took place due to
bulging failure. While the floating type, the failure is backed to
excessive settlement in the form of punching shear failure as confirmed
by Fig. (6-1). For floating type it can be also indicated that the failure is
obtained due to slippage at interface of stone column.
The capacity of 100mm diameter stone column at 25 mm settlement
with L/H ratio of 0.25, 0.50, 0.75 and 1.0 are 2.56, 3.22, 3.55 and 4.9 kN
respectively as shown in Fig. (6-2). The load carrying capacity of stone
column compared to untreated soft clay with different L/H ratio of 0.25,
0.50, 0.75 and 1.0 are increased by 1.84, 2.32, 2.55 and 3.53 times
respectively. This confirmed again that, increasing the length of stone
column leads to significant increase in the load carrying capacity of
stone column.
It has been found that the stress settlement response for floating stone
column (L/H = 0.25, 0.50, 0.75) is partially different from the curve of
end bearing case (L/H= 1.0). It can be seen that the same pattern for

- 202 -
floating stone columns with length 100 mm, 200 mm and 300 mm
respectively that disagree with the last curve for end bearing stone
column with length 400 mm. This also backed to the bulging failure of
end bearing one. While the large settlement is observed for floating case
due to punching failure.
The capacity of 150mm diameter stone column at 25 mm settlement
with L/H ratio of 0.25, 0.50, 0.75 and 1.0 are 3.1, 3.62, 4.05 and 5.35 kN
respectively as shown in Fig. (6-3). The load carrying capacity of stone
column compared to untreated soft clay with different L/H ratio 0.25,
0.50, 0.75 and 1.0 is increases up to 2.23, 2.60, 2.91 and 3.85 times
respectively. The trends obtained from results show that, by increasing
the length of stone column, the load carrying capacity of stone column
increases.
While for floating stone column (L/H = 0.25, 0.50, 0.75) it has been
found that the load settlement response is partially different from the
curve of end bearing case (L/H=1.0). It can be seen that the same pattern
for floating stone columns with length 100 mm, 200 mm and 300 mm
respectively are distinctly disagree with the last curve for end bearing
stone column with length 400 mm as shown in Fig. (6-3).
The capacity of 300 mm diameter stone column at 25 mm settlement
with L/H ratio of 0.25, 0.50, 0.75 and 1.0 are 4.05, 5.70, 7.25 and 9.19
kN respectively as shown in Fig. (6-4). The increase in the load carrying
capacity of stone column compared to untreated soft clay with different
L/H ratio 0.25, 0.50, 0.75 and 1.0 are found to be 2.91, 4.10, 5.22 and
6.61 times respectively.

- 203 -
Fig. (6-1): Stress – settlement curves for different L/H ratios
(D = 50 mm and cu = 10 kPa).
0
5
10
15
20
25
30
35
40
0 7 14 21 28 35Stress, kPa
Sett
lem
en
t, m
m
No Column
L/H = 0.25
L/H = 0.50
L/H = 0.75
L/H = 1.00
0
5
10
15
20
25
30
35
40
0 7 14 21 28 35Stress, kPa
Sett
lem
en
t, m
m
No Column
L/H = 0.25
L/H = 0.50
L/H = 0.75
L/H = 1.00
Fig. (6-2): Stress – settlement curves for different L/H ratios
(D = 100 mm and cu = 10 kPa).

- 204 -
Fig. (6-3): Stress – settlement curves for different L/H ratios
(D = 150 mm and cu = 10 kPa).
0
5
10
15
20
25
30
35
40
0 7 14 21 28 35Stress, kPa
Sett
lem
en
t, m
m
No Column
L/H = 0.25
L/H = 0.50
L/H = 0.75
L/H = 1.00
0
5
10
15
20
25
30
35
40
0 7 14 21 28 35
Stress, kPa
Sett
lem
en
t, m
m
No Column
L/H = 0.25
L/H = 0.50
L/H = 0.75
L/H = 1.00
Fig. (6-4): Stress – settlement curves for different L/H ratios
(D = 300 mm and cu = 10 kPa).

- 205 -
Figures (6-5 through 6-8) illustrate the load settlement curves from finite
element analysis of small scale model for different L/H ratio and the
same shear strength of 20 kPa for different stone column diameter. The
load deformations of numerical results are compared with untreated soil.
Figure (6-5) shows the load carrying capacity of 50mm diameter stone
column. The capacity of 50mm diameter stone column at 25 mm
settlement with L/H ratio 0.25, 0.50, 0.75 and 1.0 are , 4.95, 5.49, 5.97
and 7.55 kN respectively. The load carrying capacity of stone column
compared to untreated soil with different L/H ratio 0.25, 0.50, 0.75 and
1.0 are found to be 1.76, 1.96, 2.13 and 2.97 times respectively. The
trends obtained from results show that by increasing the length of stone
column, the load carrying capacity of stone column is increased.
It can be seen that for floating stone column (L/H = 0.25, 0.50, 0.75), it
has been found that the load settlement response is partially different
from the curve of end bearing case (L/H=1.0). It is found that the same
pattern for floating stone columns with length 100 mm, 200 mm and 300
mm respectively is disagree with the last curve for end bearing stone
column with length 400 mm that differentiate from the other curves. One
can be concluded that the failure of stone column for end bearing case
due to bulging failure. While for the floating type, the failure is backed
to excessive settlement in the form of punching shear failure as
confirmed by Fig. (6-5).
The capacity of 100mm diameter stone column at 25 mm settlement
with L/H ratio 0.25, 0.50, 0.75 and 1.0 are 5.35, 6.45, 7.1 and 9.5 kN
respectively as shown in Fig. (6-6). The load carrying capacity of stone

- 206 -
column compared to untreated soft clay with different L/H ratio of 0.25,
0.50, 0.75 and 1.0 are found to be 1.91, 2.31, 2.54 and 3.39 times
respectively. The trends obtained from results show that, by increasing
the length of stone column, the load carrying capacity of stone column is
increased.
On the other hand, it is noticed that, for floating stone column (L/H =
0.25, 0.50, 0.75), the load settlement response is partially different from
the case of end bearing (L/H=1.0). It can be seen that the same pattern
for floating stone columns with length 100 mm, 200 mm and 300 mm
respectively are disagree with the curve for end bearing stone column of
length 400 mm that different from the other curves . One can conclude
that the failure of stone column for end bearing case due to bulging
failure. While the floating type, the failure is backed to excessive
settlement in the form of punching shear failure as confirmed by load
settlement response of Fig. (6-6).
The capacity of 150mm diameter stone column at 25 mm settlement
with L/H ratio 0.25, 0.50, 0.75 and 1.0 are 6.31, 7.50, 8.22 and 10.50 kN
respectively as shown in Fig. (6-7). The load carrying capacity of stone
column compared to untreated soft clay with different L/H ratio 0.25,
0.50, 0.75 and 1.0 are found to be 2.25, 2.68, 2.94 and 3.75 times
respectively. The trends obtained from the results show that, by
increasing the length of stone column, the load carrying capacity of
stone column is increased.

- 207 -
It is noticed that for floating stone column of (L/H = 0.25, 0.50, 0.75), it
has been found that the load settlement response is partially different
from the curve of end bearing case (L/H=1.0). It can be seen that the
same pattern for floating stone columns with length 100 mm, 200 mm
and 300 mm respectively are disagree with the last curve for end bearing
stone column with length 400 mm that different from the other curves .
One can be concluded that the failure of stone column for end bearing
case is obtained due to bulging failure. While for the floating type, the
failure is backed to excessive settlement in the form of punching shear
failure as illustrated in Fig. (6-7).
The capacity of 300mm diameter stone column at 25 mm settlement
with L/H ratio 0.25, 0.50, 0.75 and 1.0 are 7.9, 11.1, 13.6 and 18.3 kN
respectively as shown in Fig. (6-8). The load carrying capacity of stone
column compared to untreated soft clay with different L/H ratio of (0.25,
0.50, 0.75 and 1.0) are found to be 2.82, 3.97, 4.86 and 6.54 times
respectively.

- 208 -
0
5
10
15
20
25
30
35
40
0 14 28 42 56 70Stress, kPa
Sett
lem
en
t, m
m
No Column
L/H = 0.25
L/H = 0.50
L/H = 0.75
L/H = 1.00
0
5
10
15
20
25
30
35
40
0 14 28 42 56 70
Stress, kPa
Sett
lem
en
t, m
m
No Column
L/H = 0.25
L/H = 0.50
L/H = 0.75
L/H = 1.00
Fig. (6-6): Stress – settlement curves for different L/H ratios
(D = 100 mm and cu = 20 kPa).
Fig. (6-5): Stress – settlement curves for different L/H ratios
(D = 50 mm and cu = 20 kPa).

- 209 -
Fig. (6-7): Stress – settlement curves for different L/H ratios
(D = 150 mm and cu = 20 kPa).
0
5
10
15
20
25
30
35
40
0 14 28 42 56 70
Stress, kPa S
ett
lem
en
t, m
m
No Column
L/H = 0.25
L/H = 0.50
L/H = 0.75
L/H =1.00
0
5
10
15
20
25
30
35
40
0 14 28 42 56 70Stress, kPa
Sett
lem
en
t, m
m
No Column
L/H = 0.25
L/H = 0.50
L/H = 0.75
L/H =1.00
Fig. (6-8): Stress – settlement curves for different L/H ratios
(D = 300 mm and cu = 20 kPa).

- 210 -
Figures (6-9 through 6-12) illustrate the load settlement curves from
finite element analysis of small scale model for different L/H ratio and
the same shear strength of 30 kPa. The load deformations of numerical
results are compared with untreated soil. Fig. (6-9) shows the load
carrying capacity of 50mm diameter stone column. The capacity of
50mm diameter stone column at 25 mm settlement with L/H ratio of
0.25, 0.50, 0.75 and 1.0 is found to be, 7.7, 8.35, 9.15 and 12.1 kN
respectively. The load carrying capacity of stone column compared to
untreated soil with different L/H ratio 0.25, 0.50, 0.75 and 1.0 are found
to be 1.85, 2.0, 2.20 and 2.91 times respectively. The trends obtained
from the results show that by increasing the length of stone column, the
load carrying capacity of stone column is increased.
It is noticed that for floating stone column (L/H = 0.25, 0.50, 0.75), it
has been found that the load settlement response is partially different
from the curve of end bearing case (L/H=1.0). It can be seen that the
same pattern for floating stone columns with length 100 mm, 200 mm
and 300 mm respectively disagree with the last curve for end bearing
stone column with length 400 mm that different from the other curves .
One can be concluded that the failure of stone column for end bearing
case is due to bulging failure. While the floating type, the failure is
backed to excessive settlement in the form of punching shear failure as
confirmed by Fig. (6-9).
The capacity of 100mm diameter stone column at 25 mm settlement
with L/H ratio 0.25, 0.50, 0.75 and 1.0 is 7.9, 10.25, 11.5 and 13.8 kN
respectively as shown in Fig. (6-10). The load carrying capacity of stone

- 211 -
column compared to untreated soft clay with different L/H ratio 0.25,
0.50, 0.75 and 1.0 is increases 1.90, 2.46, 2.76 and 3.32 times
respectively. The trends obtained from results show that by increasing
the length of stone column, the load carrying capacity of stone column
increases.
It can be seen that for floating stone column (L/H = 0.25, 0.50, 0.75) it
has been found that the load settlement response is partially different
from the curve of end bearing case (L/H=1.0). It can be seen that the
same pattern for floating stone columns with length 100 mm, 200 mm
and 300 mm respectively disagree with the last curve for end bearing
stone column with length 400 mm that differentiate from the other
curves . One can be concluded that the failure of stone column for end
bearing case due to bulging failure. While the floating type, the failure is
backed to excessive settlement in the form of punching shear failure as
confirmed by Fig. (6-10).
The capacity of 150mm diameter stone column at 25 mm settlement
with L/H ratio 0.25, 0.50, 0.75 and 1.0 is 9.45, 10.75, 12.2 and 16 kN
respectively as shown in Fig. (6-11). The load carrying capacity of stone
column compared to untreated soft clay with different L/H ratio 0.25,
0.50, 0.75 and 1.0 is increases 2.27, 2.58, 2.93 and 3.85 times
respectively. The trends obtained from results show that by increasing
the length of stone column, the load carrying capacity of stone column
increases.

- 212 -
It is noticed that for floating stone column (L/H = 0.25, 0.50, 0.75) it has
been found that the load settlement response is partially different from
the curve of end bearing case (L/H=1.0). It can be seen that the same
pattern for floating stone columns with length 100 mm, 200 mm and 300
mm respectively disagree with the last curve for end bearing stone
column with length 400 mm that differentiate from the other curves .
One can be concluded that the failure of stone column for end bearing
case due to bulging failure. While the floating type, the failure is backed
to excessive settlement in the form of punching shear failure as
confirmed by Fig. (6-11).
The capacity of 300mm diameter stone column at 25 mm settlement
with L/H ratio 0.25, 0.50, 0.75 and 1.0 is 12.5, 17, 20.3 and 27.1 kN
respectively as shown in Fig. (6-12). The load carrying capacity of stone
column compared to untreated soft clay with different L/H ratio 0.25,
0.50, 0.75 and 1.0 is increases 3.0, 4.01, 4.88 and 6.50 times
respectively.

- 213 -
Fig. (6-9): Stress – settlement curves for different L/H ratios
(D = 50 mm and cu = 30 kPa).
0
5
10
15
20
25
30
35
40
0 21 42 63 84 105
Stress, kPa
Sett
lem
en
t, m
m
No Column
L/H = 0.25
L/H = 0.50
L/H = 0.75
L/H = 1.00
0
5
10
15
20
25
30
35
40
0 21 42 63 84 105
Stress, kPa
Sett
lem
en
t, m
m
No Columnl
L/H =0.25
L/H = 0.50
L/H = 0.75
L/H = 1.00
Fig. (6-10): Stress – settlement curves for different L/H ratios
(D = 100 mm and cu = 30 kPa).

- 214 -
0
5
10
15
20
25
30
35
40
0 21 42 63 84 105
Stress, kPa
Sett
lem
en
t, m
m
No Column
L/H =0.25
L/H = 0.50
L/H = 0.75
L/H = 1.00
0
5
10
15
20
25
30
35
40
0 21 42 63 84 105Stress, kPa
Sett
lem
en
t, m
m
No Column
L/H = 0.25
L/H = 0.50
L/H = 0.75
L/H = 1.00
Fig. (6-12): Stress – settlement curves for different L/H ratios
(D = 300 mm and cu = 30 kPa).
Fig. (6-11): Stress – settlement curves for different L/H ratios
(D = 150 mm and cu = 30 kPa).

- 215 -
6.3 Numerical Analysis of Drained Condition
This part of study presents the numerical analysis of load displacement
curves of stone column in drained condition for the same proposed
investigated model listed in chapter (3).
Figures (6-13 through 6-16) show the settlement response of stone
column at different L/H ratio and undrained shear strength of (10 kPa).
In case of (D = 50mm) as shown in Fig. (6-13), it has been found that
increasing the L/H ratio significantly improved the load capacity of
stone column until reaching to higher value in end bearing column ( L/H
= 1.0 ).
It is found that the ultimate load capacity of reinforced subgrade by
stone column with (L/H = 0.25 to 0.75) as floating type increased by
around (73 % to 110 %). While at (L/H = 1.0) for end bearing case the
load is increased by 152.5% whereas gradual reduction in settlement can
be achieved by the increase of L/H ratio.
It can be seen that at (L/H = 0.25) the settlement of stone column system
is reduced by 14% of its initial value of system without stone column.
While this reduction is found to be (24%, 30% and 35%) in case of
(L/H = 0.50, 0.75 and 1.0) respectively.
It can be concluded that when the stone column installed in soft clay
under drained condition the settlement is remarkably achieved with
lower improvement in ultimate load capacity.
In case of ( D = 100 mm ) as shown in Fig.(6-14), it has been found that
increasing the L/H ratio significantly improved the load capacity of

- 216 -
stone column until reaching to higher value in end bearing column ( L/H
= 1.0 ).
It is found that the ultimate load capacity of reinforced subgrade by
stone column with (L/H = 0.25 to 0.75) as floating type increased by
around (94.3 % to 162.5 %). While at (L/H = 1.0) for end bearing case
the load is increased by 190%, whereas gradual reduction in settlement
can be attained by the increase of L/H ratio.
It can be seen at (L/H = 0.25) the settlement of stone column system is
reduced by 24% of its initial value of system without stone column.
While this reduction is found to be (27%, 31% and 36%) in case of
(L/H = 0.50, 0.75 and 1.0) respectively.
It can be concluded that when the stone column installed in soft clay
under drained condition the settlement is remarkably achived with lower
improvement in ultimate load capacity.
On the other hand Fig. (6-15) shows the load displacement curve for
stone column with diameter of (D = 150 mm), it can be noticed that the
increasing of the L/H ratio significantly improved the load capacity of
stone column until reaching to higher value in end bearing column
(L/H = 1.0).
It is found that the ultimate load capacity of reinforced subgrade by
stone column with (L/H = 0.25 to 0.75) as floating type increased by
around (121.25 % to 199.38 %). While at (L/H = 1.0) for end bearing
case the load is increased by 231.25% whereas gradual reduction in
settlement can be achieved by the increase of L/H ratio.

- 217 -
It can be seen at (L/H = 0.25) the settlement of stone column system is
reduced by 26% of its initial value of system without stone column.
While this reduction is found to be (29.4%, 32.5%, 38%) in case of
(L/H = 0.50, 0.75 and 1.0) respectively.
It can be concluded that when the stone column installed in soft clay
under drained condition the settlement is remarkably achieved with
lower improvement in ultimate load capacity.
On the other hand, for maximum stone column diameter, D = 300 mm. It
is observed that the increase of L/H ratio produced a considerable
increase in the ultimate load capacity (Fig. 5-16). It is also found that the
increase of stone column stiffness provides a linear variation in load
displacement curve at L/H = 0.25, 0.50, 0.75 and 1.0. That is backed to
volume of replaced soft clay by stone is remarkably increased by as such
as (50%) case of (L/H =1.0). The improvement in ultimate load capacity
are found to be 173.75, 290, 375, 452.5 % for L/H = 0.25, 0.50, 0.75, 1.0
respectively, while these settlement is reduced by as much as 41% for
end bearing case (L/H = 1.0).

- 218 -
Fig. (6-13): Stress – settlement curves for different L/H ratios
(D = 50 mm and cu = 10 kPa).
0
10
20
30
40
50
60
70
0 7 14 21 28 35Stress, kPa
Sett
lem
en
t, m
m
No Column
L/H = 0.25
L/H = 0.50
L/H = 0.75
L/H = 1.00
0
10
20
30
40
50
60
70
0 7 14 21 28 35
Stress, kPa
Sett
lem
en
t, m
m
No Column
L/H = 0.25
L/H = 0.50
L/H = 0.75
L/H = 1.00
Fig. (6-14): Stress – settlement curves for different L/H ratios
(D = 100 mm and cu = 10 kPa).

- 219 -
Fig. (6-15): Stress – settlement curves for different L/H ratios
(D = 150 mm and cu = 10 kPa).
0
10
20
30
40
50
60
70
0 7 14 21 28 35Stress, kPa
Sett
lem
en
t, m
m
No Column
L/H = 0.25
L/H = 0.50
L/H = 0.75
L/H = 1.00
0
10
20
30
40
50
60
70
0 7 14 21 28 35
Stress, kpa
Sett
lem
en
t, m
m
No Column
L/H = 0.25
L/H = 0.50
L/H = 0.75
L/H = 1.00
Fig. (6-16): Stress – settlement curves for different L/H ratios
(D = 300 mm and cu = 10 kPa).

- 220 -
Figures (6-17 through 6-20) show the settlement response of stone
column at different L/H ratio and undrained shear strength of (20 kPa).
In case of (D = 50 mm) as shown in Fig. (6-17), it has been found that
increasing the L/H ratio significantly improved the load capacity of
stone column until reaching to higher value in end bearing column ( L/H
= 1.0 ).
It is found that the ultimate load capacity of reinforced subgrade by
stone column with (L/H = 0.25 to 0.75) as floating type increased by
around (73.93 % to 110.89 %), while at (L/H = 1.0) for end bearing case
the load is increased by 125.5% whereas gradual reduction in settlement
can be achived by the increase of L/H ratio.
It can be seen at (L/H = 0.25) the settlement of stone column system is
reduced by 15% of its initial value of system without stone column.
While this reduction is found to be (25%, 31% and 36%) in the cases of
(L/H = 0.50, 0.75 and 1.0) respectively.
It can be concluded that when the stone column installed in soft clay
under drained condition the settlement is remarkably achieved with
lower improvement in ultimate load capacity.
In case of ( D = 100 mm ) as shown in Fig.(6-18), it has been found that
increasing the L/H ratio significantly improved the load capacity of
stone column until reaching to higher value in end bearing column ( L/H
= 1.0 ).
It is found that the ultimate load capacity of reinforced subgrade by
stone column with (L/H = 0.25 to 0.75) as floating type increased by
around (86.25 % to 146.42 %). While at (L/H = 1.0) for end bearing case

- 221 -
the load is increased by 176.76% whereas gradual reduction in
settlement can be achived by the increase of L/H ratio.
It can be seen at (L/H = 0.25) the settlement of stone column system is
reduced by 26% of its initial value of system without stone column.
While this reduction is found to be (28%, 32%, 38%) in case of (L/H =
0.50, 0.75 and 1.0) respectively.
It can be concluded that when the stone column installed in soft clay
under drained condition the settlement is remarkably achieved with
lower improvement in ultimate load capacity.
Moreover, Fig. (6-19) shows the load displacement curve for stone
column with diameter of (D = 150 mm), it can be noticed that the
increasing of the L/H ratio significantly improved the load capacity of
stone column until reaching to higher value in end bearing column ( L/H
= 1.0 ).
It is found that the ultimate load capacity of reinforced subgrade by
stone column with (L/D = 0.25 to 0.75) as floating type increased by
around (109.74 % to 180.52 %). While at (L/H = 1.0) for end bearing
case the load is increased by 209.46% whereas gradual reduction in
settlement can be achived by the increase of L/H ratio.
It can be seen at (L/H = 0.25) the settlement of stone column system is
reduced by 26% of its initial value of system without stone column.
While this reduction is found to be (29.4%, 33.5%, 39.5%) in case of
(L/H = 0.50, 0.75 and 1.0) respectively.

- 222 -
It is worth mentioned that when the stone column installed in soft clay
under drained condition the settlement is remarkably achived with lower
improvement in ultimate load capacity.
While for maximum stone column diameter, D = 300 mm. It is observed
that the increase of L/H ratio produced a considerable increase in the
ultimate load capacity (Fig. 5-20). It is also found that the increase of
stone column stiffness provides a linear variation in load displacement
curve at L/H = 0.25 , 0.50 ,0.75 and 1.0 that is backed to volume of
replaced soft clay by stone is remarkably increased by as such as (50%)
in case of (L/H =1.0). The improvement in ultimate load capacity are
found to be 152.44, 261.03, 326.93, 410.03 % for L/H =0.25, 0.50, 0.75,
1.0 respectively, while these settlement is reduced by as much as 43%
for stiff stone column end bearing case (L/H = 1.0).

- 223 -
Fig. (6-17): Stress – settlement curves for different L/H ratios
(D = 50 mm and cu = 20 kPa).
0
10
20
30
40
50
60
70
0 14 28 42 56 70
Stress, kPa
Sett
lem
en
t, m
m
No Column
L/H = 0.25
L/H = 0.50
L/H = 0.75
L/H = 1.00
0
10
20
30
40
50
60
70
0 4 8 12 16 20
Load, kN
Sett
lem
en
t, m
m
No Column
L/H = 0.25
L/H = 0.50
L/H = 0.75
L/H = 1.00
Fig. (6-18): Stress – settlement curves for different L/H ratios
(D = 100 mm and cu = 20 kPa).

- 224 -
0
10
20
30
40
50
60
70
0 14 28 42 56 70Stress, kPa
Sett
lem
en
t, m
m
No Column
L/H = 0.25
L/H = 0.50
L/H = 0.75
L/H = 1.00
0
10
20
30
40
50
60
70
0 14 28 42 56 70Stress, kPa
Sett
lem
en
t, m
m
No Column
L/H = 0.25
L/H = 0.50
L/H = 0.75
L/H = 1.00
Fig. (6-20): Stress – settlement curves for different L/H ratios
(D = 300 mm and cu = 20 kPa).
Fig. (6-19): Stress – settlement curves for different L/H ratios
(D = 150 mm and cu = 20 kPa).

- 225 -
Figures (6-21 through 6-24) show the settlement response of stone
column at different L/D ratio and undrained shear strength of (30 kPa).
In case of (D = 50 mm) as shown in Fig. (6-21), it has been found that
increasing the L/D ratio significantly improved the load capacity of
stone column until reaching to higher value in end bearing column ( L/H
= 1.0 ).
It is found that the ultimate load capacity of reinforced subgrade by
stone column with (L/H = 0.25 to 0.75) as floating type increased by
around (72.66 % to 112.24 %), while at (L/H = 1.0) for end bearing case
the load is increased by 121.80% whereas gradual reduction in
settlement can be achived by the increase of L/H ratio.
It can be seen at (L/H = 0.25) the settlement of stone column system is
reduced by 16% of its initial value of system without stone column.
While this reduction is found to be (26%, 33%, 37%) in case of (L/H =
0.50, 0.75 and 1.0) respectively.
It can be concluded that when the stone column installed in soft clay
under drained condition the settlement is remarkably achived with lower
improvement in ultimate load capacity.
In case of ( D = 100 mm ) as shown in Fig.(6-22), it has been found that
increasing the L/H ratio significantly improved the load capacity of
stone column until reaching to higher value in end bearing column ( L/H
= 1.0 ).
It is found that the ultimate load capacity of reinforced subgrade by
stone column with (L/H = 0.25 to 0.75) as floating type increased by
around (89.5 % to 146.65 %). While at (L/H = 1.0) for end bearing case

- 226 -
the load is increased by 167.69% whereas gradual reduction in
settlement can be achieved by the increase of L/H ratio.
It can be seen at (L/H = 0.25) the settlement of stone column system is
reduced by 27% of its initial value of system without stone column.
While this reduction is found to be (28%, 34%, 39%) in case of (L/H =
0.50, 0.75 and 1.0) respectively.
It can be concluded that when the stone column installed in soft clay
under drained condition the settlement is remarkably achieved with
lower improvement in ultimate load capacity.
On the other hand Fig.(6-23) shows the load displacement curve for
stone column with diameter of (D = 150 mm), it can be noticed that the
increasing of the L/H ratio significantly improved the load capacity of
stone column until reaching to higher value in end bearing column ( L/H
= 1.0 ).
It is found that the ultimate load capacity of reinforced subgrade by
stone column with (L/D = 0.25 to 0.75) as floating type increased by
around (114.15 % to 184.9 %). While at (L/D = 1.0) for end bearing case
the load is increased by 213.58% whereas gradual reduction in
settlement can be achieved by the increase of L/H ratio.
It can be seen at (L/H = 0.25) the settlement of stone column system is
reduced by 28% of its initial value of system without stone column.
While this reduction is found to be (29.4%, 35%, 40%) in case of (L/H =
0.50, 0.75 and 1.0) respectively.

- 227 -
It can be concluded that when the stone column installed in soft clay
under drained condition the settlement is remarkably achieved with
lower improvement in ultimate load capacity.
While for maximum stone column diameter, D = 300 mm. It is observed
that the increase of L/H ratio produced a considerable increase in the
ultimate load capacity as shown in Fig. (6-24). It is also found that the
increase of stone column stiffness provides a linear variation in load
displacement curve at L/H = 0.25 , 0.50 ,0.75 and 1.0 that is backed to
volume of replaced soft clay by stone is remarkably increased by as such
as (50%) case of (L/H =1.0). The improvement in ultimate load capacity
are found to be 156.21, 263.29, 324.50, 410.52 % for L/H =0.25, 0.50,
0.75, 1.0 respectively, while these settlement is reduced by as much as
45% for stone column of end bearing case (L/D = 1.0).

- 228 -
Fig. (6-21): Stress – settlement curves for different L/H ratios
(D = 50 mm and cu = 30 kPa).
0
10
20
30
40
50
60
70
0 21 42 63 84 105Stress, kPa
Sett
lem
en
t, m
m
No Column
L/H = 0.25
L/H = 0.50
L/H = 0.75
L/H = 1.00
0
10
20
30
40
50
60
70
0 21 42 63 84 105Stress, kPa
Sett
lem
en
t, m
m
No Column
L/H = 0.25
L/H = 0.50
L/H = 0.75
L/H = 1.00
Fig. (6-22): Stress – settlement curves for different L/H ratios
(D = 100 mm and cu = 30 kPa).

- 229 -
0
10
20
30
40
50
60
70
0 21 42 63 84 105
Stress, kPa
Sett
lem
en
t, m
m
No Column
L/H = 0.25
L/H = 0.50
L/H = 0.75
L/H = 1.00
0
10
20
30
40
50
60
70
0 21 42 63 84 105Stress, kPa
Sett
lem
en
t,m
m
No Column
L/H = 0.25
L/H = 0.50
L/H = 0.75
L/H = 1.00
Fig. (6-24): Stress – settlement curves for different L/H ratios
(D = 300 mm and cu = 30 kPa).
Fig. (6-23): Stress – settlement curves for different L/H ratios
(D = 150 mm and cu = 30 kPa).

- 230 -
6.4 Stress - Settlement Curves for End Bearing Stone
Column in Drained Condition
Figures (6-25 through 6-28) show the stress - settlement response for
end bearing stone column at different undrained shear strength of 10
kPa, 20 kPa and 30 kPa.
Fig. (6-25): Stress – settlement curves for end bearing stone column,
D = 50 mm at different undrained shear strength.
0
5
10
15
20
25
30
35
40
0 21 42 63 84 105Stress, kPa
Sett
lem
en
t, m
m
Cu = 10 kPa
Cu = 20 kPa
Cu = 30 kPa

- 231 -
Fig. (6-26): Stress – settlement curves for end bearing stone column,
D = 100 mm at different undrained shear strength.
0
5
10
15
20
25
30
35
40
0 21 42 63 84 105Stress, kPa
Sett
lem
en
t, m
m
Cu = 10 kPa
Cu = 20 kPa
Cu = 30 kPa
0
5
10
15
20
25
30
35
40
0 21 42 63 84 105
Stress, kPa
Sett
lem
en
t, m
m
Cu = 10 kPa
Cu = 20 kPa
Cu = 30 kPa
Fig. (6-27): Stress – settlement curves for end bearing stone column,
D = 150 mm at different undrained shear strength.

- 232 -
Fig. (6-28): Stress – settlement curves for end bearing stone column,
D = 300 mm at different undrained shear strength.
6.5 Analysis of Failure Mechanism of Stone Column in
Drained Condition
It can be seen that for end bearing stone column, the stone column is
gradually compressed until reaching to bulging failure (general shear
failure) as a result the failure of stone column is a achieved. It can be
noticed that linear relationship is exhibited during all stages of loading
until reaching to failure.
While for partially penetrated stone column or floating types the load
displacement behaviour of stone column divided into three stages.
0
5
10
15
20
25
30
35
40
0 21 42 63 84 105
Stress, kPa
Sett
lem
en
t, m
m
Cu = 10 kPa
Cu = 20 kPa
Cu = 30 kPa

- 233 -
Stage I, at early stage of loading, refers to linear or elastic behaviour.
Stage II, shows plastic behaviour with the increase of loading due to
frictional resistance a long column diameter.
Finally at failure stage III is obtained in the term of punching shear
failure, where at failure the floating stone column is totally moved
downward producing obvious punching shear failure as stated by
(Barksdale and Bachus, 1983).
Fig. (6-29): Stress settlement behaviour of floating type stone
column divided into three stages (D= 50 mm, L/H= 0.5).

- 234 -
6.6 Comparison Between Drained and Undrained
Conditions
This part presents a numerical analysis of the behaviour of the stone
column under both drained and undrained condition. The numerical
results of scaled laboratory model test for drained and undrained
condition are analyzed through the load displacement curves using
axisymmetric model that verified as presented before.
Figures (6-30 through 6-41) shows the load displacement curves of
studied stone column under drained and undrained condition at different
clay shear strength and stone column geometry.
It has been found that the load displacement responses of vertically
loaded stone column under drained condition are totally different from
case of undrained condition. It can be seen that the ultimate load
capacity of stone column in case of no permeation for drainage is higher
than of drained case. Also it was found that the settlement of stone
column soil system is lower than of stone column in drained condition as
confirmed by relevant figures.
It can be concluded that the drained case provided a minor capacity with
high settlement. That is due to the dissipation of pore water pressure,
which can be effectively resisted the additional loads within the stone
column when no permeation allowed for water. Therefore the undrained
case is significantly produced additional resistance for loads.
On the other hand, for floating stone column under undrained case,
linear behavior is achieved for different (L/H) and clay cohesion. While

- 235 -
for end bearing case the nonlinear relationship is achieved at failure.
Because the end bearing stone columns are subjected to vertical
confining pressure that significantly provided additional load resistance.
As a result yielding behavior is observed at failure compared with
floating cases.
The increases of stone column ultimate resistance due to undrained
condition are related to subgrade cohesion and stone column stiffness.
It is observed that the increase in the ultimate load résistance of end
bearing stone columns at (cu = 10 kPa, D = 50 mm) is found to be 12%
as shown in Fig. (6-29d). While at stone columns diameters of (D = 100,
150, 300 mm) for cohesion of cu = 10 kPa, the increase of ultimate
capacity are expected in range of (14%, 17%, 18% and 20%)
respectively. Whereas, the increases of undrained shear strength has also
a great effect on increasing the load capacity under undrained
conditions. It has been found that for stone column diameter of 50 mm,
the increase of load capacity of stone columns were found to be around
24% and 29% at (cu = 20 , 30 kPa) respectively.
In general, it can be concluded that the pore water pressure within the
stone columns can sustain around (12-25%) of ultimate load in drained
case according to stone column geometry and clay cohesion.

- 236 -
0
10
20
30
40
50
60
70
0 7 14 21 28 35Stress, kPa
Sett
lem
en
t, m
m
Drained
Undrained
0
10
20
30
40
50
60
70
0 7 14 21 28 35Stress, kPa
Sett
lem
en
t, m
m
Drained
Undrained
0
10
20
30
40
50
60
70
0 7 14 21 28 35Stress, kPa
Sett
lem
en
t, m
m
Drained
Undrained
0
10
20
30
40
50
60
70
0 7 14 21 28 35Stress, kPa
Sett
lem
en
t, m
m
Drained
Undrained
(a) L/H = 0.25 (b) L/H = 0.50
(c) L/H = 0.75 (d) L/H = 1.00
Fig. (6-30): Stress - settlement behaviour for the two cases of
drained and undrained conditions (cu = 10 kPa, D = 50 mm).

- 237 -
0
10
20
30
40
50
60
70
0 7 14 21 28 35
Stress, kPa
Sett
lem
en
t, m
m
Drained
Undrained
0
10
20
30
40
50
60
70
0 7 14 21 28 35
Stress, kPa
Sett
lem
en
t, m
m
Drained
Undrained
0
10
20
30
40
50
60
70
0 7 14 21 28 35
Stress, kPa
Sett
lem
en
t, m
m
Drained
Undrained
0
10
20
30
40
50
60
70
0 7 14 21 28 35
Stress, kPa S
ett
lem
en
t, m
m
Drained
Undrained
(a) L/H = 0.25 (b) L/H = 0.50
(c) L/H = 0.75 (d) L/H = 1.00
Fig. (6-31): Stress - settlement behaviour for the two cases of
drained and undrained conditions (cu = 10 kPa, D = 100 mm).

- 238 -
0
10
20
30
40
50
60
70
0 7 14 21 28 35
Stress, kPa
Sett
lem
en
t, m
m
Drained
Undrained
0
10
20
30
40
50
60
70
0 7 14 21 28 35
Stress, kPa
Sett
lem
en
t, m
m
Drained
Undrained
0
10
20
30
40
50
60
70
0 7 14 21 28 35
Stress, kPa
Sett
lem
en
t, m
m
Drained
Undrained
0
10
20
30
40
50
60
70
0 7 14 21 28 35Stress, kPa
Sett
lem
en
t, m
m
Drained
Undrained
(a) L/H = 0.25 (b) L/H = 0.50
(c) L/H = 0.75 (d) L/H = 1.00
Fig. (6-32): Stress - settlement behaviour for the two cases of
drained and undrained conditions (cu = 10 kPa, D = 150 mm).

- 239 -
0
10
20
30
40
50
60
70
0 7 14 21 28 35
Stress, kPa
Sett
lem
en
t, m
m
Drained
Undrained
0
10
20
30
40
50
60
70
0 7 14 21 28 35
Stress, kPa
Sett
lem
en
t, m
m
Drained
Undrained
0
10
20
30
40
50
60
70
0 7 14 21 28 35Stress, kPa
Sett
lem
en
t, m
m
Drained
Undrained
0
10
20
30
40
50
60
70
0 7 14 21 28 35Stress, kPa
Sett
lem
en
t, m
m
Drained
Undrained
(a) L/H = 0.25 (b) L/H = 0.50
(c) L/H = 0.75 (d) L/H = 1.00
Fig. (6-33): Stress - settlement behaviour for the two cases of
drained and undrained conditions (cu = 10 kPa, D = 300 mm).

- 240 -
0
10
20
30
40
50
60
70
0 14 28 42 56 70
Stress, kPa
Sett
lem
en
t, m
m
Drained
Undrained
0
10
20
30
40
50
60
70
0 14 28 42 56 70
Stress, kPa
Sett
lem
en
t, m
m
Drained
Undrained
0
10
20
30
40
50
60
70
0 14 28 42 56 70
Stress, kPa
Sett
lem
en
t, m
m
Drained
Undrained
0
10
20
30
40
50
60
70
0 14 28 42 56 70
Stress, kPa S
ett
lem
en
t, m
m
Drained
Undrained
(c) L/H = 0.75 (d) L/H = 1.00
Fig. (6-34): Stress - settlement behaviour for the two cases of
drained and undrained conditions (cu = 20 kPa, D = 50 mm).
(a) L/H = 0.25 (b) L/H = 0.50

- 241 -
0
10
20
30
40
50
60
70
0 14 28 42 56 70
Stress, kPa
Sett
lem
ent,
mm
Drained
Undrained
0
10
20
30
40
50
60
70
0 14 28 42 56 70
Stress, kPa
Sett
lem
en
t, m
m
Drained
Undrained
0
10
20
30
40
50
60
70
0 14 28 42 56 70
Stress, kPa
Sett
lem
en
t, m
m
Drained
Undrained
0
10
20
30
40
50
60
70
0 14 28 42 56 70
Stress, kPa
Sett
lem
en
t, m
m
Drained
Undrained
(a) L/H = 0.25 (b) L/H = 0.50
(c) L/H = 0.75 (d) L/H = 1.00
Fig. (6-35): Stress - settlement behaviour for the two cases of
drained and undrained conditions (cu = 20 kPa, D = 100 mm).

- 242 -
0
10
20
30
40
50
60
70
0 14 28 42 56 70Stress, kPa
Sett
lem
en
t, m
m
Drained
Undrained
0
10
20
30
40
50
60
70
0 14 28 42 56 70Stress, kPa
Sett
lem
en
t, m
m
Drained
Undrained
0
10
20
30
40
50
60
70
0 14 28 42 56 70Stress, kPa
Sett
lem
en
t, m
m
Drained
Undrained
0
10
20
30
40
50
60
70
0 14 28 42 56 70Stress, kPa
Sett
lem
en
t, m
m
Drained
Undrained
(a) L/H = 0.25 (b) L/H = 0.50
(c) L/H = 0.75 (d) L/H = 1.00
Fig. (6-36): Stress - settlement behaviour for the two cases of
drained and undrained conditions (cu = 20 kPa, D = 150 mm).

- 243 -
0
10
20
30
40
50
60
70
0 14 28 42 56 70Stress, kPa
Sett
lem
en
t, m
m
Drained
Undrained
0
10
20
30
40
50
60
70
0 14 28 42 56 70
Stress, kPa
Sett
lem
en
t, m
m
Drained
Undrained
0
10
20
30
40
50
60
70
0 14 28 42 56 70Stress, kPa
Sett
lem
en
t, m
m
Drained
Undrained
0
10
20
30
40
50
60
70
0 14 28 42 56 70Stress, kPa
Sett
lem
en
t, m
m
Drained
Undrained
(a) L/H = 0.25 (b) L/H = 0.50
(c) L/H = 0.75 (d) L/H = 1.00
Fig. (6-37): Stress - settlement behaviour for the two cases of
drained and undrained conditions (cu = 20 kPa, D = 300 mm).

- 244 -
0
10
20
30
40
50
60
70
0 21 42 63 84 105Stress, kPa
Sett
lem
en
t, m
m
Drained
Undrained
0
10
20
30
40
50
60
70
0 21 42 63 84 105Stress, kPa
Sett
lem
en
t, m
m
Drained
Undrained
0
10
20
30
40
50
60
70
0 21 42 63 84 105Stress, kPa
Sett
lem
en
t, m
m
Drained
Undrained
0
10
20
30
40
50
60
70
0 21 42 63 84 105Stress, kPa
Sett
lem
en
t, m
m
Drained
Undrained
(a) L/H = 0.25 (b) L/H = 0.50
(c) L/H = 0.75 (d) L/H = 1.00
Fig. (6-38): Stress - settlement behaviour for the two cases of
drained and undrained conditions (cu = 30 kPa, D = 50 mm).

- 245 -
0
10
20
30
40
50
60
70
0 21 42 63 84 105
Stress, kPa
Sett
lem
en
t, m
m
Drained
Undrained
0
10
20
30
40
50
60
70
0 21 42 63 84 105
Stress, kPa
Sett
lem
en
t, m
m
Drained
Undrained
0
10
20
30
40
50
60
70
0 21 42 63 84 105
Stress, kPa
Sett
lem
en
t, m
m
Drained
Undrained
0
10
20
30
40
50
60
70
0 21 42 63 84 105
Stress, kPa
Sett
lem
en
t, m
m
Drained
Undrained
(a) L/H = 0.25 (b) L/H = 0.50
(c)L/H = 0.75 (d) L/H = 1.00
Fig. (6-39): Stress - settlement behaviour for the two cases of
drained and undrained conditions (cu = 30 kPa, D = 100 mm).

- 246 -
0
10
20
30
40
50
60
70
0 21 42 63 84 105
Stress, kPa
Sett
lem
en
t, m
m
Drained
Undrained
0
10
20
30
40
50
60
70
0 21 42 63 84 105
Stress, kPa
Sett
lem
en
t, m
m
Drained
Undrained
0
10
20
30
40
50
60
70
0 21 42 63 84 105
Stress, kPa
Sett
lem
en
t, m
m
Drained
Undrained
0
10
20
30
40
50
60
70
0 21 42 63 84 105
Stress, kPa
Sett
lem
en
t, m
m
Drained
Undrained
(a) L/H = 0.25 (b) L/H = 0.50
(c) L/H = 0.75 (d) L/H = 1.00
Fig. (6-40): Stress - settlement behaviour for the two cases of
drained and undrained conditions (cu = 30 kPa, D = 150 mm).

- 247 -
0
10
20
30
40
50
60
70
0 21 42 63 84 105Stress, kPa
Sett
lem
en
t, m
m
Drained
Undrained
0
10
20
30
40
50
60
70
0 21 42 63 84 105
Stress, kPa
Sett
lem
en
t, m
m
Drained
Undrained
0
10
20
30
40
50
60
70
0 21 42 63 84 105Stress, kPa
Sett
lem
en
t, m
m
Drained
Undrained
0
10
20
30
40
50
60
70
0 21 42 63 84 105Stress, kPa
Sett
lem
en
t, m
m Drained
Undrained
(a) L/H = 0.25 (b) L/H = 0.50
(c) L/H = 0.75 (d) L/H = 1.00
Fig. (6-41): Stress - settlement behaviour for the two cases of
drained and undrained conditions (cu = 30 kPa, D = 300 mm).

- 248 -
Table (6.1): Ratio between stress in undrained condition and
drained condition at 25 mm settlement, (cu =10 kPa).
Column
diameter
(mm)
Type of
column
Stress in
undrained
condition at
25 mm
settlement
Sund.
Stress in
drained
condition at
25 mm
settlement
Sdr.
Ratio
between
stresses in
two cases
50
Floating 8.60 6.19 0.72
Floating 8.42 6.72 0.80
Floating 10.01 7.96 0.80
End bearing 13.77 11.32 0.82
100
Floating 9.06 6.79 0.75
Floating 11.39 9.13 0.80
Floating 12.67 10.26 0.81
End bearing 17.34 13.31 0.77
150
Floating 11.11 8.42 0.76
Floating 12.95 10.30 0.80
Floating 14.33 11.92 0.83
End bearing 19.00 15.00 0.79
300
Floating 14.61 9.70 0.66
Floating 20.24 14.97 0.74
Floating 25.58 19.07 0.75
End bearing 32.13 25.76 0.80

- 249 -
Table (6.2): Ratio between stress in undrained condition and
drained condition at 25 mm settlement, (cu =20 kPa).
Column
diameter
(mm)
Type of
column
Stress in
undrained
condition at
25 mm
settlement
Sund.
Stress in
drained
condition at
25 mm
settlement
Sdr.
Ratio
between
stresses in
two cases
50
Floating 17.52 12.10 0.69
Floating 19.50 15.36 0.79
Floating 21.55 18.54 0.86
End bearing 26.72 18.75 0.70
100
Floating 18.83 14.51 0.77
Floating 22.36 17.69 0.79
Floating 25.55 20.95 0.82
End bearing 33.51 28.67 0.83
50
Floating 22.47 16.458 0.73
Floating 26.57 20.88 0.79
Floating 29.62 25.519 0.86
End bearing 38.57 30.79 0.80
300
Floating 28.13 19.75 0.70
Floating 39.99 29.69 0.74
Floating 47.77 36.80 0.77
End bearing 64.57 52.37 0.81

- 250 -
Table (6.3): Ratio between stress in undrained condition and
drained condition at 25 mm settlement, (cu =30 kPa).
Column
diameter
(mm)
Type of
column
Stress in
undrained
condition at
25 mm
settlement
Sund.
Stress in
drained
condition at
25 mm
settlement
Sdr.
Ratio
between
stresses in
two cases
50
Floating 26.68 21.94 0.82
Floating 29.55 24.49 0.83
Floating 32.55 28.49 0.88
End bearing 42.82 33.79 0.88
100
Floating 28.66 25.12 0.88
Floating 35.92 31.67 0.88
Floating 40.34 36.10 0.89
End bearing 48.83 41.76 0.86
150
Floating 33.79 29.19 0.86
Floating 39.99 33.79 0.85
Floating 44.23 39.99 0.90
End bearing 56.97 45.47 0.80
300
Floating 44.41 30.61 0.69
Floating 60.51 45.47 0.75
Floating 71.13 56.62 0.80
End bearing 96.25 79.79 0.83

- 251 -
In order to show the significant effect of undrained condition in case of
using such stone column within the soft clay layer, Figures (6-42
through 6-53) are illustrated. It is also given for confirmation and
justified the stress behavior of drained cases are lesser than undrained
condition as stated before
It can be seen that the curves of undrained conditions are showed that
the pore water pressure provided a significant additional resistance with
stone columns.
As a results the stress – settlement of undrained cases highly depended
on the pore water pressure and the pore water pressure and stone column
geometry.

- 252 -
0
10
20
30
40
50
60
70
0 7 14 21 28 35Stress, kPa
Sett
lem
en
t, m
m
N
o
C
o
l
u
m
n
L
/
H
=
0
.
2
L
/
H
=
0
.
5
L
/
H
=
0
.
7
L
/
H
=
1
.
0N
o
C
o
l
u
m
n
L
/
H
=
0
.
2
L
/
H
=
0
.
5
L
/
H
=
0
.
7
L
/
H
=
1
.
0
0
10
20
30
40
50
60
70
0 7 14 21 28 35Stress, kPa
Sett
lem
en
t, m
m
Fig. (6-42): Stress - settlement behaviour for the two cases of drained and
undrained conditions (cu = 10 kPa, D = 50 mm).
Fig. (6-43): Stress - settlement behaviour for the two cases of drained and
undrained conditions (cu = 10 kPa, D = 100 mm).

- 253 -
0
10
20
30
40
50
60
70
0 7 14 21 28 35Stress, kPa
Sett
lem
en
t, m
m
0
10
20
30
40
50
60
70
0 7 14 21 28 35
Stress, kPa
Sett
lem
en
t, m
m
Fig. (6-44): Stress - settlement behaviour for the two cases of drained and
undrained conditions (cu = 10 kPa, D = 150 mm).
Fig. (6-45): Stress - settlement behaviour for the two cases of drained and
undrained conditions (cu = 10 kPa, D = 300 mm).

- 254 -
0
10
20
30
40
50
60
70
0 14 28 42 56 70Stress, kPa
Sett
lem
en
t, m
m
0
10
20
30
40
50
60
70
0 14 28 42 56 70
Stress, kPa
Sett
lem
en
t, m
m
Fig. (6-47): Stress - settlement behaviour for the two cases of drained and
undrained conditions (cu = 20 kPa, D = 100 mm).
Fig. (6-46): Stress - settlement behaviour for the two cases of drained and
undrained conditions (cu = 20 kPa, D = 50 mm).

- 255 -
0
10
20
30
40
50
60
70
0 14 28 42 56 70
Stress, kPa
Sett
lem
en
t, m
m
0
10
20
30
40
50
60
70
0 14 28 42 56 70Stress, kPa
Sett
lem
en
t, m
m
Fig. (6-49): Stress - settlement behaviour for the two cases of drained and
undrained conditions (cu = 20 kPa, D = 300 mm).
Fig. (6-48): Stress - settlement behaviour for the two cases of drained and
undrained conditions (cu = 20 kPa, D = 150 mm).

- 256 -
0
10
20
30
40
50
60
70
0 21 42 63 84 105
Stress, kPa S
ett
lem
en
t, m
m
0
10
20
30
40
50
60
70
0 21 42 63 84 105
Stress, kPa
Sett
lem
en
t, m
m
Fig. (6-51): Stress - settlement behaviour for the two cases of drained and
undrained conditions (cu = 30 kPa, D = 100 mm).
Fig. (6-50): Stress - settlement behaviour for the two cases of drained and
undrained conditions (cu = 30 kPa, D = 50 mm).

- 257 -
0
10
20
30
40
50
60
70
0 21 42 63 84 105
Stress, kPa
Sett
lem
en
t, m
m
0
10
20
30
40
50
60
70
0 21 42 63 84 105Stress, kPa
Sett
lem
en
t, m
m
Fig. (6-52): Stress - settlement behaviour for the two cases of drained and
undrained conditions (cu = 30 kPa, D = 150 mm).
Fig. (6-53): Stress - settlement behaviour for the two cases of drained and
undrained conditions (cu = 30 kPa, D = 300 mm).

- 258 -
Figure (6-54) shows the relationship between L/H ratio and increase in
the subgrade modulus where subgrade modulus is defined as the ratio
between subgrade modulus of system with stone column to subgrade
modulus without stone column =
It can be seen that the existence of stone column can increase the
subgrade modulus by the increase of stone column diameter.
For drained condition cu = 10 kPa, the improvement on the subgrade
modulus are found to be 1.2, 2.5, 3 and 5.7 time of system without stone
column for column diameter (50,100,150 and 300 mm) respectively.
While in undrained condition these improvements in the subgrade
modulus are found to be 1.9, 2.8, 3.7 and 7.7 time in the same order of
the diameter.
It can concluded that the undrained condition has a great effect on
increasing the subgrade modulus. That is due to the resistance of the
pore water pressure. The induced pore water pressure within the stone
column can increase the resistance of stone against acting loads.
As result the ultimate load capacity is increased by considerable value
compared with drained condition

- 259 -
Fig. (6-54): The relationship between L/H ratio and increase in the
subgrade modulus for cu = 10 kPa.
Figures (6-55 and 6-56) shows the relationship between L/H ratio and
increase in the subgrade modulus for cu = 20 kPa and 30 kPa. Also
Figures (6-57 through 6-60) shows the relationship between cu and
increase in the subgrade modulus for different diameters of stone
column.
0
1
2
3
4
5
6
7
8
0 0.25 0.5 0.75 1 1.25
L/H
Sm
= (
Mw
ith
colu
mn
/ M
wit
hou
t co
lum
n)
D = 50 mm drained
D = 100 mm drained
D = 150 mm drained
D = 300 mm drained
D = 50 mm undrained
D = 100 mm undrained
D = 150 mm undrained
D = 300 mm undrained

- 260 -
Fig. (6-55): The relationship between L/H ratio and increase in the
subgrade modulus for cu = 20 kPa.
0
1
2
3
4
5
6
7
8
9
0 0.25 0.5 0.75 1 1.25
L/H
Sm
= (
Mw
ith
colu
mn
/ M
wit
hou
t co
lum
n)
D = 50 mm drained
D = 100 mm drained
D = 150 mm drained
D = 300 mm drained
D = 50 mm undrained
D = 100 mm undrained
D = 150 mm undrained
D = 300 mm undrained
0
1
2
3
4
5
6
7
8
9
0 0.25 0.5 0.75 1 1.25
L/H
Sm
= (
Mw
ith
co
lum
n / M
wit
ho
ut
colu
mn)
D = 50 mm drained
D = 100 mm drained
D = 150 mm drained
D = 300 mm drained
D = 50 mm undrained
D = 100 mm undrained
D = 150 mm undrained
D = 300 mm undrained
Fig. (6-56): The relationship between L/H ratio and increase in
the subgrade modulus for cu = 30 kPa.

- 261 -
Fig. (6-57): The relationship between the undrained shear strength
cu (kPa) and the relative subgrade modulus (D = 50 mm).
0
1
2
3
4
5
6
7
0 5 10 15 20 25 30 35 40 45
cu, kPa
Sm
= (
Mw
ith
colu
mn
/ M
wit
hou
t co
lum
n)
L/H = 0.25
L/H = 0.50
L/H = 0.75
L/H = 1.00
0
1
2
3
4
5
6
7
0 5 10 15 20 25 30 35 40 45
cu, kPa
Sm
= (
Mw
ith
co
lum
n / M
wit
ho
ut
colu
mn)
L/H = 0.25
L/H = 0.50
L/H = 0.75
L/H = 1.00
Fig. (6-58): The relationship between the undrained shear strength
cu (kPa) and the relative subgrade modulus (D = 100 mm).

- 262 -
0
1
2
3
4
5
6
7
0 5 10 15 20 25 30 35 40 45cu, kPa
Sm
= (
Mw
ith
colu
mn
/ M
wit
hou
t co
lum
n)
L/H = 0.25
L/H = 0.50
L/H = 0.75
L/H = 1.00
0
1
2
3
4
5
6
7
0 5 10 15 20 25 30 35 40 45
cu, kPa
Sm
= (
Mw
ith
co
lum
n /
Mw
ith
ou
t co
lum
n)
L/H = 0.25
L/H = 0.50
L/H = 0.75
L/H = 1.00
Fig. (6-60): The relationship between the undrained shear strength
cu (kPa) and the relative subgrade modulus (D = 300 mm).
Fig. (6-59): The relationship between the undrained shear strength
cu (kPa) and the relative subgrade modulus (D = 150 mm).

- 263 -
6.7 Stress Concentration Ratio at Various Shear Strengths
and Various L/H Ratios for Drained Condition
Figures (6-61 through 6.64) show the effect of clay cohesion on
relationship between the stress concentration ratio and L/H ratios at
various diameters for soil treated with single stone column at drained
condition. As mentioned previously the stone columns are constructed in
very soft clays having three shear strengths (cu=10, 20, and 30 kPa) and
four values of L/H ratio. It has been found that the increase of cohesion
leads to significant reduction on stress concentration factor.
At minimum value of stone column diameter (50 mm), it can be seen
that the increase of L/H ratio gradually increase the stress concentration
factor in linear relationship with lower increase in clay cohesion. For
fully penetrated stone column (L/H=1), the stress concentration factor is
found to be increased by 20, 15 and 13% of its initial value of floating
stone column (L/H=0.25) for clay cohesion of (10, 20 and 30kPa)
respectively.
While for maximum stone diameter of 300 mm, these values is found to
be (15.5, 11.5 ad 10.3%) for the same order.
It can be concluded that the lower variation on stress concentration
factor is achived with the increase of (L/H) ratios. The value of stress
concentration factor is found to be within the range of ( 2.3 to 4.3) these
values are agree with the value obtained by (Goughnour and Bayuk
1979; Aboshi et al., 1979).

- 264 -
On the other had the stress concentration factor "n" can be expressed by
the following linear relationship:
n = C1 (L/H) + C2 (6.1)
Where:
C1 and C2 are constants related to (L/H, undrained shear strength and
stone column diameter).
The enclosed proposed equation can be valid for stone column with
diameter equal or less than 300mm
This equation can be used for crude estimation of "n" values for stone
column with different clay cohesion and stone diameter. Table (6.4)
shows the values of C1 and C2.
0
1
2
3
4
5
6
0 0.25 0.5 0.75 1 1.25
L/H
Str
ess
Co
ncen
tra
tio
n F
acto
r,
n
Cu = 10 kPa
Cu = 20 kPa
Cu = 30 kPa
Fig. (6-61): The relationship between L/H and stress concentration
factor at different shear strength (D = 50 mm).

- 265 -
0
1
2
3
4
5
6
0 0.25 0.5 0.75 1 1.25L/H
Str
ess
Co
ncen
tra
tio
n F
acto
r,
n Cu = 10 kPa
Cu = 20 kPa
Cu = 30 kPa
0
1
2
3
4
5
6
0 0.25 0.5 0.75 1 1.25L/H
Str
ess
Co
ncen
tra
tio
n F
acto
r,
n
Cu = 10 kPa
Cu = 20 kPa
Cu = 30 kPa
Fig. (6-62): The relationship between L/H and stress concentration
factor at different shear strength (D = 100 mm).
Fig. (6-63): The relationship between L/H and stress concentration
factor at different shear strength (D = 150 mm).

- 266 -
Table (6.4): The values of C1 and C2 for stone column under drained
condition
Undraied shear
strength (kPa)
Diameter 50 mm
Diameter
100 mm
Diameter
150 mm
Diameter
300 mm
C1 C2 C1 C2 C1 C2 C1 C2
10 0.59 2.86 0.62 2.96 0.6 3.12 0.57 3.71
20 0.52 2.57 0.54 2.67 0.57 2.78 0.52 3.32
30 0.45 2.18 0.46 2.27 0.48 2.37 0.44 2.82
0
1
2
3
4
5
6
0 0.25 0.5 0.75 1 1.25L/H
Str
ess
Co
ncen
tra
tio
n F
acto
r,
n
Cu = 10 kPa
Cu = 20 kPa
Cu = 30 kPa
Fig. (6-64): The relationship between L/H and stress concentration
factor at different shear strength (D = 300 mm).

- 267 -
6.8 Statistical Analysis
The following investigation introduces the verification of the model test
results by the finite element analysis using statistical analysis
procedures. Also, the main nation of this study is to correlate the
relationships of the different experimental variable in the form of
ultimate bearing capacity equations for stone column under
investigation. It also aimed to provide a simple form to crude estimation
of the ultimate bearing capacity of stone column inserted in soft clay at
different analyzed parameters as clay cohesion, stone column geometry
and clay layer thickness.
The obtained results were organized, tabulated and statistically analyzed
using SPSS (statistical program for scientific studies) software statistical
computer package. The 5% level of significance was adopted for
interpretation of test results (P < 5%). The meaning of the (P) value: the
level of in the judgment of significance and the liability of occurrence
the change by chance. T test and Chi square were used in this
investigation and other SPSS application to correlate the tested
parameters or variables.
Statistical enhancements. Perform more in-depth analysis with
additional statistics, including:
New ANOVA procedure with custom models and post-hoc tests. Robust Levene test to compare variance between groups
in the Explore procedure. Harmonic and geometric means in the Means procedure. Interclass correlation in the Reliability procedure
(Professional Statistics option).

- 268 -
One-minus-survival functions in Survival procedures
(Advanced Statistics option). Improved correspondence analysis and multiple
regressions for categorical data (Categories option). The experimental and theoretical results of using different reinforced
techniques were verified by applying unpaired t test and ANOVA testing
difference (comparing differences between two groups or more than two
groups). It has been found that the p value (p < 5%) it was referred that
there was no difference between both experimental and theoretical
results. On the other way, the program was mainly used to provide the
bearing capacity equation or the relationships between studied
parameters in the form of linear equation that correlated the main control
independent parameter qult with other tested parameters. Where the
relationship between ultimate bearing capacity and the tested parameters
(soft clay cohesion cu, stone column stiffness L/D and soft clay
thickness to stone column depth L/H) for stone column on soft clay can
be written respectively by the following equations:
qult = 10.172(L/H) + 0.469Cu – 1.036(L/D) – 4.254 for drained
conditions
qult = 11.558(L/H) + 0.434Cu – 1.0209(L/D) – 4.386 for undrained
conditions
The enclosed proposed expressions are valid for stone column installed
in soft clay layer under the following limits: (or limitation)
i) Compacted dry density of sand under stone column as a
bearing layer (18.3kN /m3) and relative density (80%).

- 269 -
ii) Maximum and minimum grain range of stone column ( 2 to
10 mm)
iii) Stress concentration factor in rage of (n = 2.3 to 4.3)
iv) The stone column depth to clay thickness in range (0.25 to 1)
v) The size effect of test setup adopted in this study are in rage
of (x = 5.5D, 5D, 4.5D and 0.5D). Where x is the spacig from
stone column face to side wall of the adopted tank.

CHAPTER (7):
COMPARATIVE STUDY

- 270 -
CHAPTER (7)
COMPARATIVE STUDY
7.1 Scope
In this chapter a discussion of the numerical modeling of full scale
analysis using most common case study. In this part, the deformation
characteristic of the application of numerical modeling is applied for
large scale embankment of the stone column. In this part, the adopted
case study is used as mentioned by Tan et al., 2008. The soil profile for
the relevant case study and parameters for the different soil layers and
the used stone columns are also explained. The settlement values
monitored during and after the construction of the embankment are
introduced. The application of consolidation behavior is also analyzed.
Finally comparison all results from finite element model 2D by
examination (Han and Ye 2001) and (Han and Ye 2002) as a simplified
analytical solution for the rate of consolidation of stone-column
reinforced ground. Also a comparative study with different researchers
is presented with details.
7.2 Case Study Description The finite element simulation has been applied for the modeling of an
embankment construction for Penchala Toll Plaza project at New Pantai
Expressway, Malaysia, in 2003. A brief description of the project was
given by Tan et al. (2008). The Layout Plan of Stone Column Works
shown in Fig. (7-1). The embankment geometry and the stone column

- 271 -
reinforced soil profile are shown in Fig. (7-2) having a line of symmetry
on the left boundary. The 40 m wide and 1.8 m high embankment is
filled by sandy material. The embankment lies over a 6 m layer of soft
clay underlain by an extended layer of stiff clay. The stone columns,
arranged in a square grid 2.4 m x 2.4 m, extends through the entire soft
clay layer. The upper crust layer is a 1 m thick fill of hard soil, which
was provided as a replacement of soft clay surface to improve ground
for a stable construction platform and to distribute the load on the treated
soil uniformly. The groundwater level is 1 m below the ground surface.
Table (7.1) presents the different parameters for all soil layers, as well
as, the embankment and the used stone columns. The embankment was
constructed over 3 stages, each stage involved a 3 days construction of a
0.6 m height layer of the embankment, and thus the embankment was
built over entire construction duration of 9 days. As the stone columns
extends through the entire soft clay layer and ends at the top of the stiff
clay layer which has a very high elasticity modulus, the stone columns in
this case can be considered as end bearing columns. Also, the columns
can be considered as short columns as there entire length is 6 m only.

- 272 -
Fig. (7-1): Layout plan of stone column works at New Pantai
expressway.

- 273 -
Fig. (7-2): Cross section of embankment case history through
centerline of stone columns.

- 274 -
Table (7.1): Material parameters for case study.
7.3 Numerical Modeling 2D Finite Element Analyses
Because the two dimensional finite element analyses programs are more
commonly used in practice and easily than the three dimensional finite
element analyses program in solving different geotechnical engineering
problems.
An axisymmetric problem involves circular loading where deformations
and stresses are assumed to be identical in any radial direction and a
plane strain problem involves a long body with uniform geometry and
loading in the longitudinal direction. The behavior of stone columns can be examined using the Unit cell
concept (i.e., a cylindrical cell with the stone column at the center and
surrounded by the soft soil within its effective diameter) which can be
Material
Sat.
(kN/m3)
Unsat.
(kN/m3) υ´
E
(kPa)
Kh
(m/s)
Kv
(m/s)
c´
(kPa) ϕ ´
(deg)
Embankment
Fill
20
18
0.3
15000
1.16 x 10⁻⁵
1.16 x 10⁻⁵
3
33
Crust
18
17
0.3
15000
3.47 x 10⁻⁷
1.16 x 10⁻⁷
3
28
Soft Clay
15
15
0.3
1100
3.47 x 10⁻⁹
1.16 x 10⁻⁹
1
20
Stiff Clay
20
18
0.3
40000
3.47 x 10⁻⁹
1.16 x 10⁻⁹
3
30
Stone Column
20
19
0.3
30000
1.16 x 10⁻⁴
1.16 x 10⁻⁴
5
40

- 275 -
perfectly simulated using the axisymmetric configuration. However, the
unit cell concept is not suitable to investigate the behavior of the
embankment itself, especially when studying the stability of the
embankment slope; thus, the plan strain configuration is more suitable in
such cases. In the plane strain configuration, the stone columns are
modeled as continuous walls instead of discreet columns, thus, affecting
the results of the entire problem.
Mohr-Coulomb constitutive laws are used to model all different soil
layers as well as the embankment and the stone columns for all the two
dimensional finite element analyses used during this research. The soft
clay and stiff clay layers are modeled in the undrained conditions while
using their effective strength parameters, while, the stone columns,
embankment and the crust layer are modeled in a drained condition.
The horizontal movement is prevented while allowing the vertical
movement for all the vertical boundaries. For the bottom horizontal
boundary both the vertical and horizontal displacements are prevented.
The water flow is prevented through all the vertical and horizontal
boundaries of the models. The stiff clay layer was presented as a layer
with 4 m depth only. The model extends to a distance of 20 m beyond
the embankment width for both configurations of the plane strain
models.

- 276 -
7.3.1 Axisymmetric Model
The axisymmetric model is used to simulate the unit cell concept of the
stone column. Cross section of the model is shown in Fig. (7-3 a).The
radius of the model is determined according to the influence diameter of
the stone column. The influence diameter depends on the columns
arrangement pattern and the distance between the columns. The
influence diameter for a square pattern is 1.13 times the spacing between
the columns. For this case the columns are arranged with spacing of 2.4
m, thus, the radius of the model is 1.36 m. Fig. (7-3 b), shows the
generated finite element mesh of the model. The settlement at (SP1) and
the excess pore water pressure dissipation at point (A) are shown in Figs.
(7-4 and 7-5), respectively.

- 277 -
(a) (b)
Fig. (7-3): (a) Geometry and boundary conditions for the
axisymmetric model (b) Generated finite element mesh for the
axisymmetric model.
Embankment
Stone Column Crust
Soft Clay
Stiff clay
1.36 m

- 278 -
Fig. (7-4): Settlement at SP1 using axisymmetric model.
0
10
20
30
40
50
60
70
80
90
0 10 20 30 40 50 60 70 80 90
Time, day S
ett
lem
en
t, m
m
SP1 Field
SP1 FEM
0
2
4
6
8
10
12
14
16
18
20
0 10 20 30 40 50 60 70 80 90
Time, day
Ex
cess
po
re w
ate
r p
ress
ure ,
kP
a
Fig. (7-5): Excess pore water pressures at point (A) using
axisymmetric model.

- 279 -
7.3.2 Plane Strain Model Using Equivalent Parameters
In this model, the columns are simulated as continuous walls having a
width of 0.8 m which is the same as original diameter of the stone
columns. The parameters of the wall used to simulate the stone column
are replaced by a set of equivalent parameters as shown in table (7.2).
The equivalent parameters are calculated according to equation 6.1
which in cooperates the parameters of the stone column and the soil
according to their areas relative to the area of the wall.
(7.1)
Where:
Xeq. is the equivalent parameter.
Xc is the column parameter.
Xs is the soil parameter.
Ac and As are the column and the in between soil areas respectively.
dc is the stone column diameter.
S is the spacing between columns.
Table (7.2): Stone columns parameters (equivalent parameters
plane strain model).
Material Sat. (kN/m3)
Unsat. (kN/m3)
υ E
(kPa)
Kh
(m/s)
Kv
(m/s)
c
(kPa)
φ
(deg)
Stone
column
16.3
16
0.3
8671
3.04 x 10⁻⁵
3.04 x 10⁻⁵
2
25

- 280 -
Fig. (7-6): Geometry and boundary conditions for plane strain with
equivalent parameters finite element model.
Fig. (7-7): Generated finite element mesh for plane strain with
equivalent parameters finite element model.
Figures (7-6 and 7-7) show the geometry and boundary conditions of the
used model and the generated finite element mesh, respectively. The
settlement at (SP1) and (SP2), also, the pore water pressure dissipation at
points (A) and (B) are shown in Figs. (7-8 through 7-10), respectively.
Stiff clay
Stiff clay
Soft Clay
Soft Clay
Embankment
Embankment
Stone
Column
Stone
Column
Crust
Crust

- 281 -
Fig. (7-8): Settlements at (SP1) for plane strain with equivalent
Parameters finite element model.
Fig. (7-9): Settlements at (SP2) for plane strain with equivalent
parameters finite element model.
0
10
20
30
40
50
60
70
80
90
100
0 10 20 30 40 50 60 70 80 90
Time, day
Sett
lem
en
t, m
m
SP1 Field
SP1 FEM
0
10
20
30
40
50
60
70
80
90
100
0 10 20 30 40 50 60 70 80 90
Time, day
Sett
lem
en
t, m
m
SP2 Field
SP2 FEM

- 282 -
Fig. (7-10): Excess pore water pressure at points (A) and (B) for
plane strain with equivalent parameters finite element model.

- 283 -
7.4 Comparison Between the 2D FE Analyses and Field
Measurements
A comparison between the behaviors of the two dimensional analyses of
the case study is introduced. The settlement, the excess pore water
pressure, the development of shear strength with time.
7.4.1 Settlement
Figure (7-11) shows the settlement at (SP1). The plain strain using
equivalent parameters analysis predicts higher values for settlement,
during the construction and early stages after, than all the other
numerical simulations; the settlement value reaches 40 mm at the end of
the construction period of 9 days compared to values of 29 mm, 28 mm
for the three dimensional and Axisymmetric respectively. However, the
plane strain with equivalent parameters analysis gives lower value for
the final settlement (67 mm) when compared to the Axisymmetric 79
The settlement behavior at (SP2) is similar to that at (SP1) as shown in
Fig. (7-12).The equivalent parameters configuration reaches higher
settlement values during the earlier stages (43.5 mm at the end of
construction). However, the settlement values at later stages are lower
for the equivalent parameters configuration (73.5 mm for the final
settlement).

- 284 -
Fig. (7-11): Comparison of settlements at (SP1).
Fig. (7-12): Comparison of settlements at (SP2).
0
10
20
30
40
50
60
70
80
90
100
0 10 20 30 40 50 60 70 80 90
Time, day
Sett
lem
en
t, m
m
Field Measurments
Axisymmetric
Plain Strain
0
10
20
30
40
50
60
70
80
90
100
0 10 20 30 40 50 60 70 80 90
Time, day
Sett
lem
en
t, m
m
Field Measurments
Axisymmetric
plain strain

- 285 -
Generally, as seen in table (7.3), the axisymmetric analysis gives a very
good agreement with both the 3D analysis and the field measurements
throughout the entire consolidation process.
Case
Settlement at SP1 (mm) Settlement at SP2 (mm)
At time = 9
days (end of
construction)
At time = 90
days (After end
of consolidation)
At time = 9
days (end of
construction)
At time = 90
days (After end
of consolidation)
Field
measurements 27 77 36 79
Axisymmetric 28 79 - -
Plain strain 40 67 43.5 73.5
7.4.2 Excess pore water pressure
The excess pore water pressure readings at points (A) and (B) through a
total period of 90 days are shown in Figs. (7-13) and (7-14) respectively.
The axisymmetric finite element analysis could not be used to
investigate point (B) which is a downside for this configuration type as it
cannot be used to study the behavior of the soft clay layer beyond the
embankment.
Table (7.3): Comparison between results of settlement at SP1 and SP2.

- 286 -
0
2
4
6
8
10
12
14
16
18
20
0 20 40 60 80 100
Time, day
Ex
cess
po
re w
ate
r p
ress
ure,
kP
a Plain Strain
Axisymmetric
0
2
4
6
8
10
12
14
16
18
20
0 15 30 45 60 75 90
Time, day
Ex
cess
po
re w
ate
r p
ress
ure,
kP
a
Point (B)
Fig. (7-13): Comparison of Excess pore water pressure at point (A).
Fig. (7-14): Comparison of Excess pore water pressure at point (B).

- 287 -
At point (A), the axisymmetric gives a higher value of excess pore water
pressure during the construction process and early stages after
construction reaching values of 17 KPa (at the end of construction). The
plane strain with equivalent parameters analysis predicts lower values
for the excess pore water pressure throughout the entire period reaching
a maximum value of 12.7 KPa at the end of construction.
Similarly, At point (B), plane strain with equivalent parameters analysis
simulations gives a value of excess pore water pressure during the
construction process and early stages after construction reaching a
maximum value of 2.9 KPa .
Generally, the axisymmetric shows a relatively good agreement with
field measurements at point (A). However, the plane strain with
equivalent parameters analysis predicts lower values for the excess pore
water pressure at point (A). Another comment is that the plane strain
with equivalent parameters analysis shows a much higher rate for the
consolidation process, as mentioned before, this can be associated to the
fact that the radial flow paths is smaller in this configuration which in
turn speeds up the consolidation process. A summary for the values of
excess pore water pressure for different models is show in table (7.4).
Table (7.4): Comparison of excess pore water pressure at point (A)
and at point (B).
case Maximum Excess pore
water at point (A) (kPa)
Maximum Excess pore
water at point (B) (kPa)
Axisymmetric 17 -
Plain strain 12.7 2.9

- 288 -
7.5 Examination Method of (Han and Ye 2001& 2002)
Area of stone column
effective diameter de = 1.13 S for square pattern
Area of unit cell
The settlement of the natural ground is
(7.2)
Where,
= coefficient of volume compressibility natural soil
= additional vertical stress
= thickness of soil layer
=
= 0.00068 kPa
-1
The settlement of the natural ground is

- 289 -
The settlement of the composite foundation considering the stress
reduction factor
The modular ratio of the columns to the soil
Han and Ye reported The typical elastic modulus ratios of stone column
to soft clay range from 10 to 20
(should be taken in design equal 20)
From Barksdale and Bachus (1983) design chart
The stress concentration ratio

- 290 -
Fig. (7-15): Variation of stress concentration factor with modular
ratio – linear elastic analysis.
Calculation the settlement of natural foundation
The stress reduction factor

- 291 -
where
Formula for the permeability of granular drain with fine contents in
FHWA Highway sub drainage design manual (Moulton, 1980) to
estimate the permeability of granular columns as follows:
Where
Assume = 5 for (20 – 25 % ) clay particles when stone column are installed in clay

- 292 -
Modified coefficients of consolidation of soft soil :
The coefficients of consolidation of soft soil in the vertical and radial
direction are
Modified coefficients of consolidation of soft soil in the vertical and
radial direction are
(
)
(
)
(
)
(
)

- 293 -
The equivalent diameter of the unit cell is
The diameter ratio
Time factors
The time factors in the vertical and radial direction are :
Assume time after one month
Where
Where

- 294 -
Degree of consolidation:
The degree of consolidation due to the vertical flow according to one –
dimensional Terzaghi consolidation theory is :
√
√
(
)
(
) (
)
(
)
( ) (
)
Where , the diameter ratio of the smeared zone to the stone
column
the stone column
Permeability of the smeared soil in the radial direction
If we take according Hansbo, 1987 and Bergado, 1992

- 295 -
(
)
(
)(
)
(
)
(
)(
)
The degree of consolidation due to radial flow is
(
)
The degree of consolidation due to combined vertical and radial flow is
(7.16)
Consolidation settlement at one month after construction:
The consolidation settlement of the composite foundation at one month
after construction

- 296 -
Fig. (7-16): Measured and calculated settlement – time curve
0
10
20
30
40
50
60
70
80
90
0 20 40 60 80 100
Time, day S
ett
lem
en
t, m
m
SP1 Field
Han and Ye, 2002 ( well resistance ), Mr = 27.27
Han and Ye, 2002 ( well resistance ), Mr = 20.0
Han and Ye, 2001( no well resistance)

- 297 -
7.6 Parametric Study
A parametric study has been made to show the effect of various
parameters on different aspects of the behavior of the soft soil clay
reinforced by stone columns.
Parametric studies using the finite-element analysis were performed for
the configuration of stone columns of the case study reported by Tan et
al. (2008).
The axisymmetric model is used to represent this parametric study
because of the axisymmetric model gives the best agreement with the
behavior of the field results.
The most three important factors that control the performance of soil -
stone column system can be identified as different parameters are
studied during this parametric study. These parameters are:
1- Effect spacing to the diameter of stone column ⁄
2- Effect the stress level
3- Effect the modular ratio ⁄
The effect of the last mentioned parameters on the behavior of the
reinforced soft soil is monitored through three following aspects:
1- The stress concentration factor
2- The reduction of settlement
4- The reduction in consolidation time.
Table (7.5) presents all cases which have been analyzed in this study

- 298 -
7.6.1 Stress Concentration Factor
The stress concentration factor ( ) is the ratio of the stress in the stone
column and the stresses to the stress surrounding soil. Equation 6.1
shows the Stress concentration factor definition.
7.6.2 Modular Ratio
The modular ratio ( ) is the ratio between modulus of elasticity of the
stone columns and modulus of elasticity of the surrounding soil.
7.6.3 Settlement Reduction Factor
Settlement reductions factor ( ) is the ratio between the settlement of
the treated soil by stone columns and the settlement of the untreated soil.
7.6.4 Time Reduction Factor
Time reduction factor ( ) is the ratio between the time required to reach
90% of the consolidation process for the soil deposits reinforced using
stone columns and the untreated soil deposits.

- 299 -
Table (7.5): parametric study
Column
diameter,
D
(m)
Column
spacing,
S
(m)
Column
spacing to
diameter
ratio, S/D
Embank-
ment
height, H
(m)
Stress
level
× H
(kN/m2)
Modulus
of
elasticity
of
soft clay,
Ec (kPa)
Modulus of
elasticity of
stone column,
Es (kPa)
Modular
ratio
Es /Ec
0.8
1.6 2
6
32.4
1100
30000
27.27
2.4 3
3.2 4
4.0 5
4.8 6
5.6 7
0.8
2.4
3
1.5 27.00
1100
30000
27.27
2.5 45.00
3.5 63.00
4.5 81.00
5.5 99.00
6.5 117.0
0.8
2.4
3
6
32.4
1100
15000 13.64
25000 22.73
35000 31.82
45000 40.91
55000 50.00
65000 59.10

- 300 -
7.7 Effect of Spacing to the Diameter of Stone
Column ⁄
To study the simultaneous effect of centre to centre spacing (S) and
diameter of stone column (D), six different values; 2, 3, 4, 5, 6 and 7 for
⁄ is investigated. In the case study stone columns is established
with diameter of 0.8 m and spacing of 2.4 m. The effect of changing
value of ⁄ ratio on the stress concentration factor is shown in Fig.
(7-17).
It is found that the stress concentration factor increases from a value of
4.0 to 4.63at spacing to diameter ratio of 2 and 5 respectively. After this
value the stress concentration factor seems be constant until
3.8
4
4.2
4.4
4.6
4.8
5
0 1 2 3 4 5 6 7 8
S /D
Str
ess
co
ncen
tra
tio
n
facto
r (
n)
Fig. (7-17): Effect of columns spacing on the stress concentration factor.

- 301 -
value ⁄ . This can be observed due to load shearing between
columns and surrounding soil as confirmed by arch effect. It has been
found that the optimum spacing is found to be five time of column
diameter (5D) because of the stress concentration factor is remaining
constant. Over this range of spacing inapproachable effect on the stress
concentration factor.
The effect of increasing the column spacing on the reduction in
settlement is shown in Fig. (7-18). The settlement is reduced by as much
as 89% for spacing of 7D, while this reduction is dropped to 36% at S
equal 2D.
20
30
40
50
60
70
80
90
100
0 1 2 3 4 5 6 7 8
S / D
S
ett
lmen
t red
ucti
on
fa
cto
r
(%)
Fig. (7-18): Effect of columns spacing on the settlement reduction factor.

- 302 -
The effect of increasing the column spacing on the reduction of
consolidation time is shown in Fig. (7-19). The reduction in time of the
consolidation process is gradually increased up to reach the higher value
of 8.4% at (S = 7D) while this value is found to be 2.0% at (S = 2D). It
can be seen that at minimum spacing with the range of S/D < 4, the time
reduction factor is very low.
This shows that the variation of the ⁄ ratio has a much greater
effect on the reduction of settlement when compared to the reduction of
the consolidation time.
7.8 Effect of Stress Level
In this study the height of embankment is varied to evaluate its effects
on the stress level that transferred to stone column system. The
embankment height during this study is taken with the values of 1.5 m,
0
2
4
6
8
10
12
0 1 2 3 4 5 6 7 8
S / D
T
ime r
ed
ucti
on
fa
cto
r
(%)
Fig. (7-19): Effect of columns spacing on the time reduction factor.

- 303 -
2.5 m, 3.5 m, 4.5 m, 5.5 m and 6.5 m, these values agree with stress
levels of 27 kPa, 45 kPa, 63 kPa, 81 kPa, 99 kPa and 117.0 kPa
respectively.
Fig. (7-20) shows that the increases of embankment height lead to
distinctly reduction on the stress concentration factor. It can be observed
that the stress concentration factor is reduced as 3.9 at minimum
embankment height (H =1.5m), while this value is dropped to minimum
level 3.2 at maximum height of the (H = 6.5 m) that is due to, the
considerable increase on the overburden pressure that increased by the
increase of height of the embankment. This can be observed due to the
increase of the stress level affecting on the reinforced soft soil increases
the confinement provided to the stone columns that correspond increases
the columns capacity and the stresses diverting to the columns.
3
3.2
3.4
3.6
3.8
4
0 1 2 3 4 5 6 7 8
Embankment height (m)
S
tress
co
ncen
tra
tio
n f
acto
r
Fig. (7-20): Effect of stress level on the stress concentration factor.

- 304 -
On the other hand, the effect of changing the embankment height on the
reduction in the settlement is shown in Fig. (7-21).The reduction in the
settlement of the reinforced soft soil deposits increases from a value of
55% to 78% when the embankment height varied from 1.5 m to 6.5 m.
This is due to the fact that the stress levels diverting to the soft soil.
Thus, increasing the resulting settlement and in turn decreasing the
reduction in settlement ratio.
The effect of variation the embankment height on the time reduction
factor is shown in Fig. (7-22). It is obvious that the increase in the
embankment height has a relatively minor effect on the time reduction
factor. It is noticed that the time reduction factor is found to be in range
of 2.0 to 2.8% at embankment height of 1.5, 6.5m respectively.
40
50
60
70
80
90
100
0 1 2 3 4 5 6 7 8
Embankment hight (m)
Sett
lem
en
t red
ucti
on
fa
cto
r
(%)
Fig. (7-21): Effect of stress level on the settlement reduction.

- 305 -
Fig. (7-22): Effect of stress level on the time reduction factor.
7.9 The Effect of Modular Ratio
The difference in the modular ratio through this study is done by
increasing the value of the elasticity modulus of the stone columns but
the value of the elasticity modulus for the soft clay is kept at a value
1100 kPa. The modulus of elasticity for the stone columns is taken
15000 kPa, 25000 kPa, 35000 kPa, 45000 kPa, 55000 kPa and 65000
kPa through this parametric study. The effect of the modular ratio on the
stress concentration factor is shown in Fig. (7-23). The stress
concentration factor increase from value of 2.2 to value of 4.0 when
increasing the modular ratio from 13.64 to 59.10. This increase is
explained by the fact that increasing the modular ratio leads to an
1
2
3
4
5
6
7
8
0 1 2 3 4 5 6 7 8
Embankment hight (m)
Tim
e r
ed
ucti
on
fa
cto
r
(%)

- 306 -
increase in the stone columns stiffness when compared to that of the soft
soil. And therefore higher stresses and more loads are transferred to the
column instead of the soft soil.
The effect of the modular ratio on the settlement reduction factor is
shown in Fig. (7-24). The increase in the modular ratio increases the
relative stiffness of the stone columns which leads to less stresses on the
soft soil. This can explain the decrease in the settlement reduction factor
from 69.5% to 68% as the modular ratio increased from 13.64 to 59.10.
1.8
2.2
2.6
3
3.4
3.8
4.2
4.6
0 10 20 30 40 50 60 70
Modular ratio
S
tress
co
ncen
tra
tio
n f
acto
r
Fig. (7-23): Effect of Modular ratios on the stress concentration.

- 307 -
The effect of the modular ratio on the time reduction factor is shown in
Figures (7-25). A small increase in the value of time reduction factor
from value 1.82% to1.85% as the modular ratio increased from 13.64 to
59.10.
60
65
70
75
80
85
90
0 10 20 30 40 50 60 70
Modular ratio
S
ett
lem
en
t red
ucti
on
fa
cto
r (
%)
Fig. (7-24): Effect of Modular ratios on the settlement reduction factor.

- 308 -
1.2
1.4
1.6
1.8
2
2.2
2.4
2.6
0 10 20 30 40 50 60 70
Modular ratio
Tim
e r
ed
ucti
on
fa
cto
r (
%)
Fig. (7-25): Effect of Modular ratio on the time reduction factor.
factor

- 309 -
7.10 Comparative Study
In this section, the results of the parametric study previously performed
using the finite element model are compared to the behavior of the stone
column in soft soil estimated by some of the theoretical approaches as
stated by variety of investigators .
7.10.1 The Stress Concentration Factor
The value of the stress concentration factor generally lies between 2.0
and 6.0 (Goughnour and Bayuk 1979, Aboshi etal. 1979) with values of
3.0 - 4.0 usual, at the ground surface.
A comparison between the stress concentration factor given by the
numerical modeling and that calculated using different theoretical
approaches such as the analytical methods of Pulko and Majes (2006) is
performed.
The effect of the variation of spacing between columns on the stress
concentration factor is illustrated in Fig. (7-26). It is found that the curve
of the behavior predicted by Pulko and Majes (2006) is agreed and has
the same trend to the curve of the present study. It is also found that the
maximum difference between the two cases is found to be around 20%
as clearly shown in the relevant figure. Moreover, at S/D =5, the stress
concentration factor remain constant for both present study and Pulko
and Majs (2006).

- 310 -
Fig. (7-26): The effect of column spacing on the stress concentration
factor using numerical modeling and theoretical approaches.
It can be seen that the concentration factor higher than that estimated
through the numerical modeling. This can be observed due to due to the
assumption that no lateral bulging occurs in the column which in turn
increases the capacity of the column.
When studying the effect of the variation of the embankment height
from 1.5 m to 6.5 this approach gives decrease in the stress
concentration factor from a value of 3.9 to a value of 3.2 for
embankment heights of 1.5m and 6.5m respectively as shown in Fig. (7-
27). .
The analytical approach of Pulko and Majes (2006) gives higher values
for the stress concentration factor than the values estimated by the
1
2
3
4
5
6
7
8
9
10
0 1 2 3 4 5 6 7 8
S/D
Str
ess
co
ncen
tra
tio
n f
acto
r
Numerical analyses (Present study)
Pulko and Majes (2006)

- 311 -
numerical analyses as the values of the stress concentration factor lies in
the range between 5 to 6.The difference between the two approaches is
in the 30%. Moreover, the approach by Pulko and Majes (2006) ignore
the effect of the embankment height (i.e. stress level) on the stress
concentration factor as it gives a value of 5.5 for the stress concentration
factor regardless to the stresses applied to the reinforced soil system
which is not accurate according to the numerical study.
On the other hand, the results of variation of the modular ratio in the
numerical study show, the stress concentration factor increase from a
value of 2.2 to a value of 4.0 for modular ratios 13.64 and 59.1
respectively.
1
2
3
4
5
6
7
8
9
10
0 1 2 3 4 5 6 7 8
Embankment hight
Str
ess
co
ncen
tra
tio
n f
acto
r
Numerical analyses (Present study)
Pulko and Majes (2006)
Fig. (7-27): The effect of embankment height on the stress
concentration factor using numerical modeling and theoretical.
approaches

- 312 -
The relation between the modular ratio and the stress concentration
factor calculated using the analytical approach of Pulko and Majes
(2006) gives higher values for the stress concentration factor than the
values estimated by the numerical analyses as the values of the stress
concentration factor lies in the range between 5 to 6 as shown in Fig. (7-
28). The difference between the two approaches is in the range of 30%
to 65%. Moreover, the approach by Pulko and Majes, (2006) ignores the
effect of the modular ratio on the stress concentration factor as it gives a
value of 5.5 for the stress concentration factor regardless to the modular
ratio to the reinforced soil system which is not accurate according to the
numerical study.
The results of numerical analyses also correspond with the experimental
study conducted by Ambily and Gandhi, (2007) where he showed that
the stress concentration factor (n) increases with the increase in modular
ratio.

- 313 -
Fig. (7-28): The effect of Modular ratio on the stress concentration
factor using numerical modeling and theoretical approaches.
7.10.2 The Settlement Reduction Factor
The effect of the column spacing to diameter ratio ⁄ on the
settlement reduction factor show in Fig. (7-29). The settlement reduction
is estimated using numerical analyses as well as theoretical approaches
of Pulko and Majes (2006). It is noticed that the behavior of the
settlement reduction variation with the column spacing by Pulko and
Majes (2006) is similar to that of the parametric study as it increases
from 45% to 92% with the increase of the spacing to diameter ratio from
2 to 6 which corresponds to an increase from 36% to 89% estimated for
the same increase in spacing to diameter ratio using the numerical
analyses.
0
2
4
6
8
10
12
14
16
0 10 20 30 40 50 60 70
Modular ratio
Str
ess
co
ncen
tra
tio
n f
acto
rNumerical analyses (Present study)
Pulko and Majes (2006)

- 314 -
The theoretical approach of Pulko and Majes (2006) shows a very good
agreement with the results of the numerical analyses when used to
estimate the settlement reduction factor. The settlement reduction factors
given by both the Pulko and Majes (2006) approach and the numerical
modeling almost coincide with the variation of column spacing.
Fig. (7-29): The effect of column spacing on the settlement reduction
factor using numerical modeling and theoretical approaches.
The effect of the embankment height on the settlement reduction factor
show in Fig. (7-30). Pulko and Majes, (2006) approach does not depend
on the applied stress in its calculations and gives a constant value for the
settlement reduction factor with the variation of the embankment height,
the value given by this approach (70%) is almost the average value of
the settlement reduction factor given by the parametric study which
gives a value of 55% at an embankment height of 1.5m and increases to
0
20
40
60
80
100
120
0 1 2 3 4 5 6 7 8
S/D
Sett
lmen
t red
ucti
on
fa
cto
r (
%)
Numerical analyses ( present study )
Pulko and Majes (2006)

- 315 -
78% at an embankment height of 6.5m. This can return to the fact that
this approach considers the column lateral bulging as well as its
plasticity.
The effect of the modular ratio on the settlement reduction factor show
in Fig. (7-31). The theoretical approach of Pulko and Majes (2006)
shows a very good agreement with the results of the numerical analyses
when used to estimate the settlement reduction factor. The settlement
reduction factors given by both the Pulko and Majes (2006) approach
0
10
20
30
40
50
60
70
80
90
100
0 1 2 3 4 5 6 7 8
Embankment hight (m)
Sett
lmen
t red
ucti
on
fa
cto
r (
%)
Numerical analyses (present study)
Pulko and Majes (2006)
Fig. (7-30): The effect of embankment height on the settlement
reduction factor using numerical modeling and theoretical approaches.

- 316 -
and the numerical modeling almost coincide with the variation of the
modular ratio.
Fig. (7-31): The effect of modular ratio on the settlement reduction
factor using numerical modeling and theoretical approaches.
7.10.3 The Time Reduction Factor
The analytical method of Han and Ye, (2001) is used comparison
between the time reduction factor given by the parametric study and that
calculated using theoretical approaches. Fig. (7-32) show the variation of
the time reduction factor with spacing between columns.
Spacing between columns as it estimates an increase of the time
reduction factor from 0.15% to 3.2% when increasing the column to
diameter ratio from 2 to 7. This agrees with the findings of the
0
10
20
30
40
50
60
70
80
0 10 20 30 40 50 60 70 80
Modular ratio
Sett
lmen
t red
ucti
on
fa
cto
r (
%)
Numerical analyses ( present study)
Pulko and Majes (2006)

- 317 -
numerically performed parametric study, however, the numerical
analyses estimates a higher rate of increase from 0.5% to 4.9% for the
same range of column diameter to spacing ratios.
Fig. (7-33) show the variation of the time reduction factor with
embankment height of the theoretical approach with Han and Ye (2001)
and the parametric study. This approach agreed with the numerical
analyses in the fact that the embankment heights (applied stress level) do
not have a significant effect on the time reduction factor as it gives a
constant value of 0.5% for the time reduction factor for embankment
heights ranging from 1.5m to 6.5m. However, the numerical analysis
0
1
2
3
4
5
6
7
0 1 2 3 4 5 6 7 8
S/D
Tim
e r
ed
ucti
on
fa
cto
r (
%)
Numerical analyses ( present study )
Han and Ye (2001)
Fig. (7-32): The effect of column spacing on the time reduction
factor using numerical modeling and theoretical approaches.

- 318 -
estimates a value of 2% to 2.88% for the embankment heights from
1.5m to 6.5m respectively.
Fig. (7-33): The effect of embankment height on the time reduction
factor using numerical modeling and theoretical approaches.
Fig. (7-34) show the variation of the time reduction factor with modular
ratio of the theoretical approach with Han and Ye (2001) and the
parametric study. This approach agreed with the numerical analyses in
the fact that the modular ratio does not have a significant effect on the
time reduction factor as it gives a constant value of 0.4% for the time
reduction factor for modular ratios ranging from 13.64 to 59.1.
However, the numerical analysis estimates an almost constant value of
1.82% for a value of 1.85% for modular ratios from 13.64 to 59.1.
0
1
2
3
4
5
6
7
8
1 2 3 4 5 6 7
Embankment height (m)
Tim
e r
ed
ucti
on
fa
cto
r (
%)
Numerical analyses ( present study)
Han and Ye (2001)

- 319 -
Fig. (7-34): The effect of modular ratio on the time reduction factor
using numerical modeling and theoretical approaches.
7.11 Comparative study with different investigators on
stone columns
In order to show the beneficial effect of stone columns on soft clay as an
improvement tools, a comparative study with different studied stone
columns techniques were carried out.
The values of (n) as presented by (McCabe et.al, 2009), which refers to
settlement performance. It captured in the form of a settlement
improvement factor (n), which defined as:
n = Suntreated /Streated
0
1
2
3
4
5
6
7
8
0 10 20 30 40 50 60 70
Modular ratio
Tim
e r
ed
ucti
on
fa
cto
r (
%)
Numerical analysis ( present study)
Han and Ye (2001)

- 320 -
Where Suntreated is the settlement (of the loaded zone) in the absence of
stone column treatment, and Streated is the corresponding settlement with
stone column treatment.
Fig. (7-35) shows the relationships between (n) versus (A/Ac) area
replacement ratios for different investigated stone column of field study.
The mean curve of (Priebe, 1995) used as a basic improvement factor as
illustrated in the relevant figure. The quantity used by Priebe, 1995
captured the concentration of column array in an infinite grid is referred
to the area replacement ratio, A/Ac where A is the plan area of the ‗unit
cell‘ attributed to a single column, and Ac is the cross-sectional area of
one column.
Also, it can be seen that there is a spread data around the mean curve by
different field tests of mentioned investigators. While for the present
study of small scale test, the value of A/Ac ratio plotted against (n) at
Fig. (7-35): Settlement improvement factor against area replacement
ratio for sites with widespread loading

- 321 -
the same curve for both drained and undrained condition of end bearing
stone columns of (D = 150 mm , 300 mm , cu = 20 kPa)
It has been found that the settlement improved factor n is decreased with
the increase of stone column diameter.
It also has a lower value compared with mean curve of (Priebe, 1995)
and different field data. That is backed to the variation of scale effect
and stress level between the field and small scale test. But the present
data has the same trend. As a result the adopted stone column technique
considered as advanced effective method to increase the soft clay
resistance and control the settlement compared with other investigators.

CHAPTER (8):
CONCLUSIONS AND
RECOMMENDATIONS

- 322 -
CHAPTER (8)
CONCLUSIONS AND RECOMMENDATIONS
8.1 Introduction
A series of small scale laboratory model tests and numerical analysis has
been carried out to investigate the bearing capacity of a circular plate
resting on entire area loading of stone column within soft clay. The
study primary focused on studying the effect of stone column diameter,
length and soft clay shear strength. The drained condition is also
investigated using numerical modeling to compare between drained and
untrained conditions.
8.2 Conclusions Regarding experimental results
The following conclusions can be drawn:
1- The existence of such stone column within the soft clay can
significantly modify the load displacement behaviors.
2- When the stone column in the base soil increased by 2, 3 and 6
times of its initial diameter, the load carrying capacity are
approximately 1.34, 1.53 and 3.2 times of its initial value in case
of (cu = 10 kPa ).
3- In case of stone column installed in soft clay with cohesion 10
kPa with full penetration depth, the increase of stone column
diameter from 50 to 100 mm increased the ultimate capacity by
128%. This increase is found to be 319% for stone column
diameter of 300 mm.

- 323 -
4- The load settlement behaviour of drained condition when entire
area is loaded is almost linear and it is possible to arrive at the
stiffness of the improved ground.
5- The measurements made before and after testing showed that the
ultimate bearing capacity of stone columns increased by about
(1.8 and 5.2) % at L/D = 2, 8 respectively for cu = 10 kPa.
6- The increase of clay cohesion has a relatively minor variation on
the ultimate load capacity of stone columns
7- Stiffness improvement factor is found to be independent on shear
strength of surrounding clay and depends mainly on column
diameter and length.
8- The deformation of end bearing stone column was more
prominent in the upper region over the length of 2.5D. The
maximum lateral deformation (bulging) was found to be at depth
of (1.25-1.5) D below the top surface of the failed column.
9- The failure pattern of floating stone column was observed as a
punching shear failure.
8.3 Conclusions Regarding Numerical Analysis of
Laboratory Model Tests
1- The numerical analysis is helped to understand the failure pattern
of stone column and confirm the model test results.
2- The numerical results using both Mohar column and Hardening
models has the same trend with model test with difference
around 5%.

- 324 -
1- The improvement in the load carrying capacity of stone column
is reached to 1.74, 1.92, 2.16 and 2.81 times compared to
untreated soil with different L/D ratio of 2, 4, 6, and 8
respectively.
2- For floating stone column (L/D = 2, 4, 6) the load settlement
response is partially different from the curve of end bearing case
of (L/D= 8).
3- The capacity of 100mm diameter stone column at 25 mm
settlement with L/D ratio of 1, 2, 3 and 4 are 2.56, 3.22, 3.55 and
4.9 kN respectively. The load carrying capacity of stone column
compared to untreated soft clay with different L/D ratio of 1, 2,
3, and 4 are increased by 1.84, 2.32, 2.55 and 3.53 times
respectively.
4- The capacity of 150mm diameter stone column at 25 mm
settlement with L/D ratio of 1, 2, 3 and 4 are 3.1, 3.62, 4.05 and
5.35 kN respectively. The load carrying capacity of stone column
compared to untreated soft clay with different L/D ratio 1, 2, 3,
and 4 is increases up to 2.23, 2.60, 2.91 and 3.85 times of its
initial value.
5- The capacity of 300mm diameter stone column at 25 mm
settlement with L/D ratio of 1, 2, 3 and 4 are 4.05, 5.70, 7.25 and
9.19 kN respectively. The increase in the load carrying capacity
of stone column compared to untreated soft clay with different
L/D ratio 1, 2, 3, and 4 are found to be 2.91, 4.10, 5.22 and 6.61
times of its initial value.

- 325 -
8.3.1 Numerical Analysis of Drained Condition (cu = 10 kPa)
a) In case of (D = 50 mm),
1- Increasing the L/D ratio significantly improved the load capacity
of stone column until reaching to higher value in end bearing
column (L/D = 4).
2- The ultimate load capacity of reinforced subgrade by stone
column with (L/D = 1 to 3) as floating type increased by around
(73 % to 110 %), while at (L/D = 4) for end bearing case the load
is increased by 152.5%.
3- At (L/D = 1) the settlement of stone column system is reduced by
14% of its initial value of soil without stone column. While this
reduction is found to be (24%, 30% and 35%) in case of (L/D =
2, 3 and 4) respectively.
4- When the stone column installed in soft clay under drained
condition the settlement is remarkably achieved with lower
improvement in ultimate load capacity.
b) In case of (D = 100 mm),
1- The increase of the L/D ratio significantly improved the load
capacity of stone column until reaching to higher value in end
bearing column (L/D = 4).
2- The ultimate load capacity of reinforced subgrade by stone
column with (L/D = 1 to 3) as floating type increased by around
(94.3 % to 162.5 %), while at (L/D = 4) for end bearing case the
load is increased by 190%.
3- At (L/D = 1) the settlement of stone column system is reduced by
24% of its initial value of system without stone column. While

- 326 -
this reduction is found to be (27%, 31% and 36%) in case of
(L/D = 2, 3 and 4) respectively.
c) In case of (D = 150 mm),
1. The ultimate load capacity of reinforced subgrade by stone
column with (L/D = 1 to 3) as floating type increased by around
(121.25 % to 199.38 %), while at (L/D = 4) for end bearing case
the load is increased by 231.25%.
2. At (L/D = 1) the settlement of stone column system is reduced by
26% of its initial value of system without stone column. While
this reduction is found to be (29.4%, 32.5%, 38%) in case of
(L/D = 2, 3 and 4) respectively.
d) In case of (D = 300 mm),
1. The increase of L/D ratio produced a considerable increase in the
ultimate load capacity. It is also found that the increase of stone
column stiffness provides a linear variation in load displacement
curve at L/D = 0.33, 0.67, 1 and 1.33. The improvement in
ultimate load capacity are found to be 173.75, 290, 375, 452.5 %
for L/D =0.33, 0.67, 1, 1.33 respectively, while the settlement is
reduced by as much as 41% for end bearing case (L/D = 1.33).

- 327 -
8.4 Conclusions Regarding Comparison Between Drained
and Undrained Condition
2. The load displacement responses of vertically loaded stone
column under drained condition are totally different from case of
undrained condition.
3. The ultimate load capacity of stone column in case of no
permeation for drained is higher than of drained case. Also it was
found that the settlement of stone column soil system is lower
than of stone column in drained condition.
4. The drained case provided a minor capacity with high settlement.
That is due to the dissipation of pore water pressure, which can
be effectively resisted the additional loads within the stone
column when no permeation allowed for water. Therefore the
undrained case is significantly produced additional resistance for
loads.
5. For floating stone column under undrained case, linear behavior
is achieved for different (L/D) and clay cohesion. While for end
bearing case the nonlinear relationship is achieved at failure.
6. The end bearing stone columns are subjected to vertical
confining pressure that significantly provided additional load
resistance. As a result yielding behavior is observed at failure
compared with floating cases.
7. The increases of stone column ultimate resistance due to
undrained condition are related to subgrade cohesion and stone
column stiffness (L/D).

- 328 -
8. At stone columns diameters of (D = 100, 150, 300 mm) for
cohesion of cu = 10 kPa, the increase of ultimate capacity are
expected in range of (14%, 17%, 18% and 20%) respectively.
Whereas, the increases of undrained shear strength has also a
great effect on increasing the load capacity under undrained
conditions. It has been found that for stone column diameter of
50 mm, the increase of load capacity of stone columns were
found to be around 24% and 29% at (cu = 20 , 30 kPa)
respectively.
9. In general, it can be concluded that the pore water pressure
within the stone columns can sustain around (12-25%) of
ultimate load in drained case according to stone column
geometry and clay cohesion.
8.5 Conclusions Regarding Effect of stone column on
Subgrade modulus
1. The existence of stone column can increase the subgrade
modulus by the increase of stone column diameter.
2. For drained condition cu = 10 kPa, the improvement on the
subgrade modulus are found to be 1.2, 2.5, 3 and 5.7 time of soil
without stone column for column diameter of (50,100,150 and
300 mm) respectively. While in the undrained condition these
improvements in the subgrade modulus are found to be 1.9, 2.8,
3.7 and 7.7 time in the same order of the diameter.
3. The undrained condition has a great effect on increasing the
subgrade modulus. That is due to the resistance of the pore water

- 329 -
pressure. The induced pore water pressure within the stone
column can increase the resistance of stone column against
acting loads. As result the ultimate load capacity is increased by
considerable value compared with drained condition.
8.6 Conclusions Regarding Case study and parametric
study
The following conclusions can be drawn:
1. Two dimensional finite element analyses is the most suitable method
for predicting the behavior of stone columns used to improve soft soil
deposits.
2. Increasing the spacing between the stone columns leads to:
- Increase in the stresses transferring to the stone columns to a certain
extent then it becomes insignificant.
- Decrease in the reduction of settlement.
- Decrease in the reduction of consolidation duration.
3. Increasing the stress level on the reinforced soil system leads to:
- Decrease in the stress concentration factor.
- Decrease in the reduction of settlement.
- Almost in significant in the reduction of consolidation duration.
4. Increasing the Modular ratio leads to:
- Increase in the stress concentration factor.
- Slight increase in the settlement reduction.
- Almost in significant in the reduction of consolidation duration.

- 330 -
8.7 Recommendations for Future Studies
1. The application of geogrids or Geosynthetics as an encasement
to increase the confinement and thus the capacity of the
columns.
2. The effect of the cementation of the upper part of the column on
its capacity.
3. The adequacy of different theoretical approaches for different
cases especially long or floating columns needs further study.
4. Study using centrifugal model or large scale tests to provide
more information of loaded stone columns under both drained
and undrained conditions.

REFERENCES

- 331 -
REFERENCES
Abd Elrahman, G. E. and Elragi, A. F. (2006): ―Behavior
improvement of footings on soft clay utilizing geofoam,‖ The 10th
Arab Structural Engineering Conference, 13 -15 November, Kuwait.
Aboshi, H., Ichimoto, E., Enoki, M. and Harada, K. (1979): ―The
composer - a method to improve characteristics of soft clays by
inclusion of large diameter sand columns‖, Proceedings International
Conference on Soil-Reinforcement, Paris, pp. 211-216.
Afshar, J. N. and Ghazavi, M. (2014): ―A simple analytical method
for calculation of bearing capacity of stone column‖, International
Journal of Civil Engineering, Vol. 12, No. 1, Transaction B:
Geotechnical Engineering.
Alamgir, M., Miura, N., Poorooshasb, H.B., and Madhav, M.R.
(1996): ―Deformation analysis of soft ground reinforced by
columnar inclusions‖, Computers and Geotechnics, Vol.18, No.4,
PP. 267-290.
Ali, K., Shahu, J.T. and Sharma, K.G. (2011): ―An experimental
study of stone columns in soft soils‖, Proceedings of Indian
Geotechnical Conference, Kochi, India.
Ali, Z. and Abolfazle, E. (2005): ―Determining the geotechnical
parameters of stabilized soils by stone column based on SPT
results‖, Electronic Journal of Geotechnical Engineering, 10A.

- 332 -
Al-Joulani, N. A. (1995): ―Laboratory and analytical investigation of
sleeve reinforced stone columns‖, Ph.D. Thesis of Carleton
University, Ottawa, Canada.
Al-Waily, M.J. and Al-Dabbas M.S. (2012): ―Laboratory
investigation on efficiency of models stone and lime column
groups‖, Journal of Karbala University, Vol. 10 No.4.
Ambily, A.P. and Gandhi, S.R. (2004): ―Experimental and
theoretical evaluation of stone column in soft clay‖ ICGGE, pp. 201-
206.
Ambily, A.P. and Gandhi S.R. (2006): ―Effect of sand pad thickness
on load sharing in stone column‖, In: Proceedings Indian
geotechnical conference, Chennai, pp. 555–556.
Ambily, A.P. and Gandhi, S.R. (2007): ―Behavior of stone columns
based on experimental and FEM‖ Journal of Geotechnical and
Geoenvironmental Engineering, Vol. 133, No.4, pp. 405-415.
Andreou, P., Frikha, W., Frank, R., Canou, J., Papadopoulos, V. and
Dupla, J.C. (2008): ―Experimental study on sand and gravel columns
in clay‖, Journal of Ground Improvement 161, No. 4, pp.189-198.
Bae, W.S., Shin, B.W. and An, B.C. (2002): ―Behavior of foundation
system improved with stone columns‖, In: Proceedings 12th
international offshore and polar engineering. Conference,
Kitakyushu, Japan, pp. 675–678
Bahandari, R.K., Ghosh, A. and Pandey, Y. (1985): ―Field
monitoring of an oil tank founded on soft clay deposit treated with

- 333 -
stone column‖ proceedings of the Eleventh International conference
on soil Mechanics and Foundation Engineering, Vol.2, pp.1123-1126
San Francisco.
Balaam, N.P., (1978): ―Load-settlement behavior of granular piles‖,
Thesis presented to the University of Sydney in partial fulfillment of
the requirements for the degree of Doctor of Philosophy.
Balaam, N.P., and Booker, J.R. (1981): ―Analysis of rigid rafts
supported by granular piles‖ International Journal for Numerical and
Analytical Methods in Geomechanics, Vol. 5, pp. 379-403
Balaam, N.P. and Booker, J.R. (1985): ―Effect of stone column yield
on settlement of rigid foundations in stabilized clay‖, International
Journal for Numerical and Analytical Methods in Geomechanics,
Vol.9, pp. 331-351.
Balaam N.P. and Poulos, H.G. (1983): ―The behavior of foundation
supported by clay stabilized by stone columns‖, Proceedings of the
Eights European Conference on soil Mechanics and Foundation
Engineering, Vol.1, pp.199-204, Helsinki
Balaam, N.P., Poulos, H.G. and Brown, P.T. (1977): ―Settlement
analysis of soft clays reinforced with granular piles‖, Proceedings,
Fifth Asian Conference on Soil Engineering, Bangkok, pp. 81–92.
Barksdale, R.D. and Bachus, R.C. (1983): ―Design and construction
of stone columns‖ .Vol. I, Fedral Highway Administration, Rd-
83/026

- 334 -
Barksdale, R.D., and Bachus, R.C. (1983): ―Design and construction
of stone columns. Technical Report, Vol. II, Final report FHWA/RD
83–06, US Federal Highway Administration, Washington
Barron, R.A. (1947): ―Consolidation of fine-grained soils by drain
wells‖, Journal of Soil Mechanics and Foundation Division, ASCE,
Vol. 73, No.SM6, Reston, Virginia,pp. 811-835.
Basack, S., Indraratna, B. and Rujikiatkamjorn, C. (2011): ―Design
recommendation for stone column reinforced soft clay deposit‖, Pan
- Am, CGS, Geotechnical conference
Baumann, V. and Bauer, G. E. A. (1974): ―The performance of
foundations on various soils stabilized by the vibrocompaction
method. Canadian Geotechnical Journal, Vol.11, No. 4, pp. 509-530.
Bell, A. L. (1993): ―Report on Performance of Vibro Replacement
Ground Improvement Beneath Embankment at Stockton‖, Keller
Internal Report, Vol. 21.
Bergado, D.T., Asakami, H., Alfaro, M.C. and Balasubramaniam,
A.S. (1991): ―Smear effects of vertical drains on soft Bangkok clay‖,
Journal of Geotechnical Engineering (ASCE), Vol.117, No.10,
pp.1509-1530.
Bergado, D.T., Chai, J.C., Alfaro, M.C. and Balasubramanium, A.S.
(1994): ―Improvement techniques of soft ground in subsiding and
lowland environment‖, Balkema, Rotterdam.
Bergado, D.T., Enriquez, A.S., Sampaco, C.L., Alfaro, M.C. and
Balasubramaniam, A.S. (1992): ―Inverse analysis of geotechnic

- 335 -
parameters on improved soft Bangkok clay‖, Journal of Geotechnical
Engineering, Vol. 118, No.7, pp. 1012-1030
Bergado D.T, Lam, F.L. (1987): ―Full-scale load test of granular
piles with different densities and different proportions of gravel and
sand on soft Bangkok clay‖, Soils and Foundations, Vol. 27, No.1,
pp. 86–93.
Bergado, D.T., Panichayatum and Sampaco, C.L. (1988):
―Reinforcement of soft bangkok clay using granular piles‖,
International symposium on theory and practice of earth
reinforcement, Kyushu, Japan, pp. 179–184
Bhandari, R.K. (1983): ―Behaviour of a Tank Founded on soil
reinforced with stone columns‖, proceeding of the Eighth European
conference on soil Mechanics and Foundation Engineering, Vol.2,
Helsinki.
Biot, M. A. (1956): ―General solutions of the equations of elasticity
and consolidation for a porous material‘ Journal of Applied
Mechanics, pp. 91- 96.
Black, J.A., Sivakumar, V. and McKinley, J.D. (2007):
―Performance of clay samples reinforced with vertical granular
columns‖, Canadian Geotechnical Journal, Vol. 44, No. 1, pp. 89-95.
Black, J.A., Sivakumar, V., Madhav, M.R. and McCabe, B. (2006):
―An Improved Experimental test set up to study the performance of
granular columns‖, Geotechnical Testing Journal, Vol. 29, No.3.

- 336 -
Borges, J.L., Domingues, T.S. and Cardoso, A.S. (2009):
―Embankments on soft soil reinforced with stone columns numerical
analysis and proposal of a new design method‖,
Geotechnical and Geological Engineering, Vol 27 pp.667–679.
Bouassida, M. and Hadhri T (1995): ―Extreme load of soils
reinforced by columns: The case of an isolated column‖, Soils and
Foundations, Vol. 35, No. 1, pp. 21-36.
Bouassida, M. and Porbaha, A. (2004): ―Ultimate Bearing capacity
of soft clays reinforced by a group of columns - Application to a
deep mixing technique‖, Soils and Foundations, Vol., 44 No. 3,
pp.91-101.
Bouassida, M., de Buhan, P. and Dormieux, L. (1995): ―Bearing
capacity of a foundation resting on a soil reinforced by a group of
columns‖, Geotechnique, Vol. 45, No. 1, pp. 25-34.
Bouassida, M., Ellouze, S. and Hazzar, L. (2008): ―Investigating
Priebe‘s method for settlement estimation of foundation resting on
soil reinforced by stone columns‖, Proceedings of the Second
International Workshop on Geotechnics of Soft Soils, Scotland, pp.
321-325.
Brinkgreve R.B.J. (2002): ―Plaxis 2D version 8‖, Balkema
Publishers, Lisse.
Bowles, J. E., (1996): ―Foundation analysis and design‖, 5th end,
McGraw-Hill, New York, USA.

- 337 -
Castro, J. (2007): ―Pore pressure during stone column installation‖,
Proceedings of the 18th European Young Geotechnical Engineers
Conference, Ancona, Italy.
Castro J. and Karstunen, M. (2010): ―Numerical simulations of stone
Column installations‖. Canadian Geotechnical Journal, Vol. 47
No.10, pp.1127–1138.
Castro, J. and Sagaseta, C. (2008): ―Influence of stone column
deformation on surrounding soil consolidation‖, Proceedings of the
Second International Workshop on Geotechnics of Soft Soils,
Scotland, pp.333-338.
Castro, J. and Sagaseta, C. (2009): ―Field instrumentation of an
embankment on stone columns‖, Proceeding of the 17th ICSMGE,
Alexandrina, Egypt.
Castro J and Sagaseta, C. (2011): ―Consolidation and deformation
around stone columns: Numerical evaluation of analytical solutions‖,
Computers and Geotechnics, Vol.38 No. 3, pp. 354-62.
Castro, J. Cimentada, A. Costa, A. d. CanizaL, J. and Sagaseta, C.
(2013): ―Consolidation and deformation around stone columns:
Comparison of theoretical and laboratory results‖, Computers and
Geotechnics, Vol. 49, pp. 326–337.
Charles, J. A. and Watts, K. S. (1983): ―Compressibility of soft clay
reinforced with granular columns‖, Proc. 8th European Conference
on Soil Mechanics and Foundation Engineering, Vol. 1, pp. 347-352
Helsinki.

- 338 -
Chai, J., Igaya, Y. Hino, T. Carter, J. (2013): ―Finite element
simulation of an embankment on soft clay - Case study‖, Computers
and Geotechnics, Vol.48, pp.117–126.
Christoulas, S.T., Bouckovalas, G. and Giannaros, C.H. (2000): ―An
Experimental Study on Model Stone Columns‖, Soils and
Foundations Journal –Tokyo, Vol.40, No.6, pp.11-22.
Christoulas, S.T., Giannaros, Ch. and Tsiambaos, G., (1997):
―Stabilization of embankment foundations by using stone columns‖,
Geotechnical and Geological Engineering, Vol.15, pp.247-258.
Cimentada A., Costa, A.D., Canizal, J. and Sagaseta, C. (2011):
―Laboratory study on radial consolidation and deformation in clay
reinforced with stone columns‖, Canadian Geotechnical Journal,
Vol.48, No.1, pp.36–52.
Clough, R.W. (1980): ―The finite element in plane stress analysis‖,
proceeding 2nd A.S.C.E. Conference on Electronic Computations,
Pittsburg, Paris.
Cooper, M. R. and Rose, A. N. (1999): ―Stone column support for
an embankment on deep alluvial soils‖, Proceedings of the
Institution of Civil Engineers-Geotechnical Engineering, Vol.137,
No.1, pp. 15-25.
Das, A. K. and Deb, K. (2013): ―Rate of consolidation of stone
column - improved ground under axi-symmetric condition‖,
Proceedings of Indian Geotechnical Conference, Roorkee.

- 339 -
Datye, K.R. and Madhav, M.R. (1988): ―Case Histories of
Foundations with Stone Columns‖, Second International Conference
on Case Histories in Geotechnical Engineering, St. Louis.
Daya, D. and Niranjana, K. (2017): ―A study on conventional
aggregate and gravel as columnar inclusions in clay‖, International
Conference on Geotechniques for Infrastructure Projects 27th & 28th
February, Thiruvananthapuram.
De Beer, E.E. (1963): ―The scale effect in the transposition of the
results of deep sounding tests on the ultimate bearing capacity of
piles and caisson foundation‖, Geotechnique, Vol.8, No.1, pp. 39-95.
Deb, K. (2007): ―Modeling of granular bed-stone column-improved
soft soil‖, International Journal for Geotechnical and Analytical
Methods in Geomechanics, Vol.32, No. 10, pp.1267-1288.
De Cock, F. and d‘Hoore, S. (1994): ―Deep soil improvement by
rammed stone columns: two case histories for large diameter storage
tanks‖, Proceedings of the 5th International Conference on Piling
and Deep Foundations, Bruges, Vol. 5, No.21, pp.1-5
Ellouze, S., Bouassida, M., Hazzar, L., & Mroueh, H. (2010): ―On
settlement of stone column foundation by Priebe‘s method‖, Ground
Improvement, Vol. 163(GI2), pp. 101-107.
Fattah, M. Y., Al-Jamaily, N.M.S. and Salman, F. A. (2012):
―Improvement of the behavior of embankment on soft soil by stone
columns‖, Proceedings of the International Conference on Ground
Improvement and Ground Control.

- 340 -
Gautray, J., Laue, J. and Springman, S.M. (2013): ―Development of
pore water pressure around a stone column‖, Proceedings of the 18th
International Conference on Soil Mechanics and Geotechnical
Engineering, Paris.
Gniel, J. and Bouazza, A. (2007): ―Methods used for the design of
conventional and geosynthetic reinforced stone columns‖,
Proceedings of the 10th Australia New Zealand Conference on
Geomechanics - Common Ground, Brisbane Australia, Vol. 2, pp.
72-77.
Goughnour, R.R. and Bayuk, A.A. (1979): ―A field study of long-
term settlements of loads supported by stone columns in soft
ground‖, Proceedings of the International Conference on Soil
Reinforcement, Paris, pp. 279-285
Goughnour, R.R. (1983): ―Settlement of vertical loaded stone
column in soft ground‖, proceedings of the Eights European
Conference on soil Mechanics and Foundation Engineering, Vol.1,
pp.235-240, Helsiniki.
Gowri Prasad, S. S. and Satyanarayana, P. V. V. (2016):
―Improvement of Soft Soil Performance using Stone Columns
Improved with Circular Geogrid Discs‖, Indian Journal of Science
and Technology, Vol.9, No.30, pp.1- 6.
Greenwood, D. A. (1970): ―Mechanical improvement of soils below
ground surfaces‖, In: Proceedings, Ground Engineering Conference,
Institution of Civil Engineers, London, pp.11-22.

- 341 -
Greenwood, D. A. (1974): ―Differential settlement tolerances of
cylindrical steel tanks for bulk liquid storage‖, Proceedings of the
Conference on Settlement of Structures, Cambridge, pp. 361-367.
Greenwood, D. A. (1991): ―Load tests on stone columns‖, In Deep
Foundation Improvements: Design, Construction and Testing,
American Society for Testing and Materials, Philadelphia, ASTM
STP 1089,pp.141-171
Greenwood, D.A. and Kirsch, K. (1983): ―Specialist ground
treatment by vibratory and dynamics methods‖, Proceeding of the
International Conference on Advances in Piling and Ground
Treatment for Foundation, Thomas Telford, London, pp.17-45
Guelif, Z., Bouassida, M. and Debats, J.M. (2007):
―Improved soft clay characteristics due to stone column installation‖
Computers and Geotechnics Vol. 34, pp.104 – 111.
Guo, W.D. and Qian, H.J. (1991): ―Behaviour of stone column
foundation‖, Proceedings of the Ninth Asian Regional Conference
on Soil Mechanics and Foundation Engineering, Vol. I, Bangkok,
Thailand.
Han, J. and Ye, S.L. (1991): ―Field tests on clays stabilized by stone
columns at coastal areas in China‖, Proceedings of 4th International
Conference on Piling and Deep Foundations, Stresa, Italy.
Han, J. and Ye, S.L. (1992): ―Settlement analysis of buildings on the
soft clays stabilized by stone columns‖, In Proceedings, international
conference on soil improvement and pile found, Vol.118, pp.446-
451.

- 342 -
Han, J., and Ye, S. L. (2001): ―Simplified method for consolidation
rate of stone column reinforced foundations‖, Journal of
Geotechnical and Geoenviromental Engineering, Vol. 127, No. 7,pp.
597-603.
Han, J., and Ye, S. L. (2002): ―A theoretical solution for
consolidation rates of stone column-reinforced foundations
accounting for smear and well resistance effects‖, International
Journal Geomechanics, Vol.2, No.2, pp. 135-151.
Hansbo, S. (1987): ―Design aspects of vertical drains and lime
column installation‖, In IX Southeast Asian Geotechnical
Conference, Bangkok, Thailand.
Hindi, A.O., Bondok, A.R. and Anwar, M.B. (2003): ―Bearing
Capacity of Reinforced Soft Soil‖, Tenth International colloquium
on Structural and Geotechnical Engineering, April 22-24, Ain shams
University, Cairo, Egypt.
Hirany, A. & Kulhawy, F. H. (1989): ―Interpretation of load tests on
drilled shafts‖. Part 3: lateral and moment. In Foundation.
Engineering: Current principles and practices (GSP 22), pp.1160-
1172. New York: ASCE.
Hughes J.M.O. and Withers N.J. (1974): ―Reinforcing of soft
cohesive soils with stone columns‖, Ground Engineering, Vol. 7 No.
3, pp.42–49.
Hughes, J.M.O., Withers, N.J. and Greenwood, D.A. (1975): ―A
field trial of the reinforcing effect of a stone column in soil‖,
Geotechnique, Vol. 25, No.1, pp.31-44.

- 343 -
Indraratna, B., and Redana, I. W. (1997): ―Plane strain modeling of
smear effects associated with vertical drains.‖ J. Geotech. Eng., Vol.
123, No.5, pp. 474–478.
Indraratna, B. and Redana, I.W. (1998): ―Laboratory determination
of smear zone due to vertical drain installation‖, Journal of
Geotechnical and Geoenvironmental Engineering (ASCE), Vol. 124,
No.2, pp.180-184.
Indraratna, B., Bamunawita, C., Redana, I.W. and Balasubramaniam,
A.S. (2001): ―Modeling of vertical drains in soft clay‖, International
Conference on Soft Soil Engineering, Hong Kong, Swets and
Zeitlinger, pp.329-338.
Indraratna, B., Basack, S. and Rujikiatkamjorn, C. (2013):
―Numerical solution of stone column-improved soft soil considering
arching, clogging, and smear effects‖, Journal of Geotechnical and
Geoenvironmental Engineering, Vol. 139, No. 3, pp.377-394.
Indraratna, B., Ngo, N. Trung., Rujikiatkamjorn, C. and Sloan, S. W.
(2015): ―Coupled discrete element-finite difference method for
analysing the load-deformation behaviour of a single stone column
in soft soil‖, Computers and Geotechnics, Vol. 63, pp.267-278.
Isaac, D. S. and Girish, M. S. (2009): ―Suitability of different
material for stone column construction‖, Electronic Journal of
Geotechnical Engineering, Vol. 14, pp.1-12.
Jellali, B., Bouassida, M. and de Buhan, P. (2007): ―A
homogenization approach to estimate the ultimate bearing capacity

- 344 -
of a stone column reinforced foundation‖, International Journal of
Geotechnical Engineering Vol.1, No.1, pp.31-69.
Juran I, Guermazi A (1988): ―Settlement response of soft soils
reinforced by compacted sand columns‖, Journal of Geotechnical
and Geoenvironmental Engineering (ASCE), Vol.114, No.8 ,
pp.903-943.
Kempfert, H.G. (2003): ―Ground improvement methods with special
emphasis on column – type techniques‖, International workshop on
Geotechnics of soft soils - Theory and practice Vermeer, Schwiger,
Karstunen & cudny.
Kirsch, F. (2006): ―Vibro stone column installation and its effect on
the ground improvement‖, International Conference on Numerical
Simulation of Construction Processes in Geotechnical Engineering
for Urban Environment, Bochum, pp.115–124.
Kirsch, F. and Sondermann, W. (2003): ―Field measurements and
numerical analysis of the stress distribution below stone column
supported embankments and their stability‖, International Workshop
on Geotechnics of soft soils – Theory and practice, Vermeer,
Schwinger, Karstunen & Cudny.
Kishida, H. and Nakai, S. (1977): ―Large deflection of a single pile
under horizontal load‖, In Proceedings 9th International Conference
on Soil Mechanics and Foundation Engineering, Specialty session
10, Tokyo.

- 345 -
Lee, J.S. and Pande, G.N. (1998): ―Analysis of stone-column
reinforced foundations‖, International Journal for Numerical
Analytical Method in Geomechanics, Vol. 22, pp.1001-1020.
Lu M. M, Xie K. H. and Guo, B. (2010): ―Consolidation theory for a
composite foundation considering radial and vertical flows within
the column and the variation of soil permeability within the
disturbed soil zone‖, Canadian Geotechnical Journal, Vol. 47, pp.
207–217.
Lu M. M, Xie K. H, Wang S. Y. and Li C. X. (2013): ―Analytical
Solution for the Consolidation of a Composite Foundation
Reinforced by an Impervious Column with an Arbitrary Stress
Increment‖, International Journal of Geomechanics, Vol. 13, No. 1,
pp. 33-40.
Madhav, M. (2007): ― Granular Piles – Construction, Design and
Behaviour ‖, Sri Lankan geotechnical Society with International
Society of Soil Mechanics and geotechnical Engineering under the
ISSMGE Touring Lecture Programme 17th &18th December,
pp.146 – 161.
Madhav, M.R., Sharma, J. K. and Sivakumar, K. (2009): ―Settlement
of and load distribution in a granular piled raft‖, Geomechanics and
Engineering, Vol. 1, No. 1, pp. 97-112.
Malarvizhi, S. N. and Ilamparuthi, K. (2004): ―Load versus
settlement of clay bed stabilized with stone and reinforced stone
columns‖, In Proceedings of the 3rd Asian Regional Conference on
Geosynthetics, Seoul, South Korea, pp.322–329.

- 346 -
Marto, A., Moradi, R., Helmi, F., Latifi, N., Oghabi, M., (2013):
―Performance analysis of reinforced stone columns using finite
element method‖, Electronic Journal of Geotechnical Engineering,
Vol. 18, pp.315-323.
McCabe, B., Kamrat-Pietraszewska, D., and Egan, D. (2013):
―Ground heave induced by installing stone columns in clay soils‖,
Proceedings of the Institution of Civil Engineers Geotechnical
Engineering, Volume 166 December Issue GE6, pp.589-593.
McCabe, B.A., McNeill, J.A. and Black J.A. (2007): ―Ground
Improvement using the vibro - stone column technique‖, Presented
to a joint meeting of Engineers Ireland west Region and the
Geotechnical Society of Ireland, NUI Galway.
McCabe, B. A., Nimmons, G. J. and Egan, D. (2009): ―A review of
field performance of stone columns in soft soils‖, Proc. Institution of
Civil Engineers - Geotechnical Engineering, Vol. 162, No. 6, pp.
323–334.
McKelvey, D., and Sivekumar, V. (2000): ―A review of the
Performance of Vibro Stone Column Foundations‖, Proceedings, 3rd
International Conference on Ground Improvement Techniques,
Singapore, pp.245-254.
McKelvey, D., Sivakumar, V., Bell, A. and Graham, J. (2004):
―Modeling vibrated stone columns in soft clay‖, Journal of
Geotechnical Engineering, Vol. 157, No.3, pp.137-149.

- 347 -
Mitchell, J.K. (1981): ―Soil improvement - state of the art report‖,
Proceedings of the 10th international conference on soil mech. and
found. eng., Stockholm, pp. 509-565
Mitchell, J.K. and Huber, T. R. (1985): ―Performance of a stone
column foundation‖, Journal of Geotechnical Engineering, ASCE,
Vol. 11, No. 2, pp.205–223.
Mohamed zein, Y.E.A. and Al-Shibani, I.H. (2011): ―Performance of
an embankment supported on soft soil reinforced by stone columns‖,
Proceedings of the Institution of Civil Engineers Ground
Improvement, Vol.164 (GI4), pp.213–224.
Moulton, L. (1980): ―Highway subdrainage design‖, Report No.FHWA-
TS-80-224. Washington, D.C.: Federal Highway Administration.
Munfakh, G. A., Sarkar, S. K., & Castelli, R. J. (1984):
―Performance of a test embankment founded on stone columns‖,
Proceedings of the International Conference on Advances in Piling
and Ground Treatment for Foundations, London, pp.259–265
Narasimharao, S., Madhiyan, M. and Prasad, Y. V. S. N. (1992):
―Influence of Bearing Area on the Behaviour of Stone Columns‖,
Proc. of Indian Geotechnical Conference held at Calcutta, pp. 235-
237.
Ng, K.S. & Tan, S.A. (2012): ―Equivalent column method for stone
column design‖, International Conference on Ground Improvement
and Ground Control, Wollongong, pp.665-670.

- 348 -
Onoue, A., Ting, N., Germaine, J.T., Whitman, R.V. and Mori, N.
(1991): ―Smear zone around a drain pile and well resistance of
drains‖, Proc., Geo-Coast‘ 91, Yokohama-Japan.
Pivarc, J. (2011): ―stone columns – determination of the soil
improvement factor‖, Slovak journal of civil engineering Vol. XIX,
No. 3, pp.17 – 21.
Plaxis Manual (2008): ―Finite Element Code for Soil and Rock
Analysis Program‖, Version 8.
Poorooshasb, H.B and Madhav, M.R. (1985): ―Application of rigid
plastic diltancy model for predicting of granular pile settlement‖,
Fifth International Conference on Numerical Methods in
Geomechanics, Nagoya
Poorooshasb, H.B. and Meyerhof, G.G. (1997): ―Analysis of
behaviour of stone columns and lime columns‖, Journal of
Computers and Geotechnics, Vol. 20, No.1, pp. 47–70.
Prakash, C., Ramakrishna, W.G.S.T., Rastogi, P.C., and Sharma, A.
K. (2000): ―Rammed stone columns - design and construction
fallacies‖, Proceedings of the Third International Conference on
ground Improvement Techniques, Singapore
Priebe, H.J. (1976): ―Evaluation of the settlement reduction of a
foundation improved by Vibro-Replacement‖, Bautechnik, Vol. 5,
pp.160–162 (in German).

- 349 -
Priebe, H. J. (1991): ―Vibro Replacement—Design Criteria and
Quality Control‖, ASTM STP 1089—Deep foundation
improvements-Design. Construction and Testing.
Priebe, H. J. (1995): ―The design of vibro replacement. Ground
Engineering‖, Vol. 28, No. 10, pp. 31–37.
Pulko B, Majes B (2006): ―Analytical method for the analysis of
stone-columns according to the Rowe dilatancy theory‖, Acta
Geotechnical Slovenica, Vol. 3, No. 1, pp. 37–45.
Raju, V. R. (1997): ―The behaviour of very soft soils improved by
vibro-replacement‖, In Ground Improvement Geosystems:
Densification and Reinforcement, Thomas Telford, London, 1997,
pp. 253–259.
Raju, V.R. (2003): ―Ground improvement techniques for railway
embankments‖, Technical paper Keller.
Raju, V.R., Hari Krishna, R. y Wegner, R. (2004): ―Ground
Improvement using Vibro Replacement in Asia 1994 to 2004 – A 10
Years Review‖,5th International Conference on Ground
Improvement Techniques, Kuala Lumpur.
Ranjan, G. (1989): ―Ground treated with granular piles and its
response under load‖, Indian Geotechnical Journal, Vol.19, No.1,
pp.1-86.
Saroglou, H., Antoniou, A. A. and Pateras, S. K. (2008): ―Ground
improvement of clayey soil formations using stone columns: A case

- 350 -
study from Greece‖, International Journal of Geotechnical
Engineering, Vol. 3, No. 4, PP. 493-498.
Shahu, J.T (2006): ―Non – uniform granular pile – mat foundations
analysis and model tests‖, Geological engineering, vol. 24, pp.1065-
1087.
Shahu J.T, Madhav M.R and Hayashi, S. (2000): ―Analysis of soft
ground - Granular pile-granular mat system‖, Journal Computer and
Geotechnics, Vol. 27, No. 1, pp.45-62.
Shahu J.T. and Reddy, Y.R. (2008): ―Granular pile-mat foundation:
long duration model tests and numerical simulation‖, The 12th
International Conference of International Association for Computer
Methods and Advances in Geomechanics (IACMAG) 1-6 October,
Goa, India, pp. 3658 – 3663
Sharma, J.S. and Xiao, D. (2000): ―Characterization of a smear zone
around vertical drains by large-scale laboratory tests‖, Canadian
Geotechnical Journal, Vol. 37, pp.1265-1271.
Shin, D.H., Lee, C., Lee, J.S. and Lee, W. (2009): ―Detection of
smear zone using micro-cone and electrical resistance probe‖,
Canadian Geotechnical Journal, Vol. 46, No.6, pp. 719-726.
Shivashankar R., Babu M.R.D., Nayak S. amd Kumar V.R. (2011):
―Experimental studies on behavior of stone columns in layered
soils‖, Geotechnical and Geological Engineering, Vol.29, No.5, pp.
749-757

- 351 -
Sivakumar, V., Glynn, D., Black, J.A. and McNeill (2007): ―A
laboratory model study of the performance of vibrated stone columns
in soft clay‖, Proceedings 14th European Conferences on Soil
Mechanics and Geotechnical Engineering, Madrid.
Slocombe, B.C., Bell, A.L. and Baez, J.I. (2000): ―The densification
of granular soil using Vibro methods‖, Geotechnique, Vol. L, No. 6,
PP.715-726.
Tan, S. A., Tjahyono, S. and Oo, K. K. (2008): ―Simplified plane-
strain modeling of stone-column reinforced ground‖, Journal of
Geotechnical and Geoenvironmental Engineering, Vol. 134, No. 2,
PP.185- 194.
Tandel, Y.K., Solanki, C.H. and Desai, A.K. (2012): ―Reinforced
granular column for deep soil stabilization: A review‖, International
Journal of Civil and Structural Engineering, Vol.2, pp.720-730.
Terzaghi, K. and Peck, R. B. (1967): ―Soil mechanics in engineering
practice (12th ed.). New York, USA: John Wiley and Sons.
Van Impe, W.F. and de Beer, E. (1983): ―Improvement of Settlement
Behaviour of Soft Layers by Means of Stone Columns‖, Proc. 8th.
European Conf. SMFE, Helsinki, pp.309-312.
Van Impe, W.F., Madhav, M.R, and Vander cruyssen, J.P., (1997):
―Considerations in stone column Design‖, Proceedings of the third
International Conference on Ground Improvement Geosystems,
London, pp.190-196

- 352 -
Venmans, A. A. J. (1998): ―Design, construction and lifetime
behaviour on a highway widening on stone column improved
ground‖, Proceedings of the International Symposium on
Problematic Soils, Tohoku, pp.105–108.
Vesic, A.S. (1972): ―Expansion of cavities in infinite soil mass‖, J
Soil Mech. Found. Div. ASCE 98, pp. 265–290.
Weber, T.M. (2006): ―Centrifuge modeling of ground improvement
under embankments‖, Pollack Periodica Journal, Vol. 1, No. 2, pp. 3-15.
Weber T.M, Laue J.P.M., Peschke, G. and Springman, S.M. (2010):
―Smear zone identification around stone columns constructed in-
flight in centrifuge model tests‖, Geotechnique, Vol. 60 No. 3,
pp.197-206.
Weber T.M., Springman, S.M., Gab, M., Racansky V. and
Schweiger, H.F. (2008): ―Numerical modeling of stone columns in
soft clay under an embankment", In: Karstunen M, Leoni M
Geotechnics of soft soils-focus on ground improvement. Taylor &
Francis, London, pp.305–311.
Wood, D.M., Hu W. and Nash, D.F.T. (2000): Group effects in stone
column foundations: model tests. Geotechnique, Vol. 50 No. 6, PP.
689-698
Wu, C.S. and Hong, Y.S. (2008): ―The behavior of a laminated
reinforced granular column‖, Geotextiles and Geomembranes, Vol.
26, pp. 302 – 316.

- 353 -
Xie, K.H. Lu, M.M. and Liu, G.B. (2009): ―Equal strain
consolidation for stone columns reinforced foundation‖,
International Journal for Numerical and Analytical Methods in
Geomechanics; Vol. 33, pp.1721–1735.

PUBLISHED PAPER

- 354 -
PUBLISHED PAPER Abdel Moneim, K., Farouk, A., Shahein, M. and Sakr, M., (2016):
―Model Study of Stone Columns in Soft Clay‖, the Ninth Alexanria
International Conference on Structural and Geotechnical Engineering
2016, 19 to 21 December.
MODEL STUDY OF STONE COLUMNS IN SOFT CLAY Abdel Moneim, K.
1, Farouk, A.
2, Shahein, M.
3 and Sakr, M.
4
1 Researcher at Structural Engineering Department, Faculty of Engineering, Tanta
University
[email protected] 2Associate Prof., Structural Engineering Department, Faculty of Engineering, Tanta
University
[email protected] 3Prof. of Geotechnical Engineering, Faculty of Engineering, Tanta University, Egypt
[email protected] 4Prof. of Geotechnical Engineering, Faculty of Engineering, Tanta University, Egypt
ABSTRACT Stone columns have been used as an effective technique for improving the engineering
behavior of soft clayey grounds. The soil improvements using stone columns are
achieved via increasing the load carrying capacity and reduction of settlement due to
inclusion of stronger granular material. In this research a detailed experimental study
on the behavior of floating and fully penetrating single stone column model is carried
out. The tested parameters include the stone columns geometry and undrained shear
strength of soft clay. Laboratory tests are carried out on columns of 50 mm, 100 mm,
150 mm and 300 mm in diameter with different lengths of 100 mm, 200 mm, 300 mm
and 400 mm surrounded by a soft to medium clay with different undrained shear
strength in the range of 10 to 30 kPa. The tests are carried out on the entire equivalent
loaded area to estimate the stiffness of the improved ground. The results showed that
the tested stone columns can significantly increase the bearing capacity with a
remarkable reduction of the foundation settlement. It was found also that the ultimate
bearing capacity of a soft clay having a cohesion of 10 kPa increased by about 1.8 (for
partially penetrated stone columns) and keeps increasing as a result of increasing the
column length until reaching a value of 5.2 (for fully penetrated stone column) times
the bearing capacity of the same clay but without the inclusion of a stone column. It
was concluded that, the improvement factor is found to be independent of the shear
strength of the surrounding clay, while it depends mainly on both the column diameter
and length.
Keywords: stone column, Settlement, Bearing capacity, Soft clay, undrained shear
strength.

- 355 -
PUBLISHED PAPER Sakr, M., Shahein, M., Farouk, A. and Abdel Moneim, K., (2017):
―Numerical Modeling of Stone Columns in Soft Clay for Drained and
Undrained Conditions‖, Electronic Journal of Geotechnical Engineering,
Vol.22, PP. 1907-1924.
NUMERICAL MODELING OF STONE COLUMNS IN SOFT
CLAY FOR DRAINED AND UNDRAINED CONDITIONS
SAKR, M.1, SHAHEIN, M.
2, FAROUK, A.
3 and ABDEL MONEIM, K.
4
1 Prof. of Geotechnical Engineering, Faculty of Engineering, Tanta University,
[email protected] 2 Prof. of Geotechnical Engineering, Faculty of Engineering, Tanta University,
[email protected] 3 Assistant Prof. of Structural Engineering Department, Faculty of Engineering, Tanta
University, Egypt,
[email protected] 4 A Researcher at Structural Engineering Department, Faculty of Engineering, Tanta
University, Egypt,
ABSTRACT
During the last three decades, stone columns have been increasingly used worldwide to
improve soft soils by increasing the soil carrying capacity and reducing the settlement.
Stone columns has been successfully applied below foundations of different types of
structures (e.g., oil storage tanks, earthen embankments, raft foundations of high rise
buildings, etc…) where large settlement is highly expected. In this paper, analyses of
stone columns embedded in soft clay soil have been performed using the finite element
numerical program PLAXIS 2D software. Drained and undrained analyses were carried
out using the Mohr-Coulomb‘s model for the soft clay at different shear strength values
(cu). Series of modeled stone columns were simulated at different length to diameter
(L/D) ratios. The results showed that reinforcing soft clay by stone columns having
(L/D) ratios between 2 to 8 increase the load carrying capacity of the clay by nearly
1.74 to 2.81 times the load carrying capacity of the untreated soft clay. In addition, a
comparison between the results of drained and undrained analysis showed that the pore
water pressure within the stone columns in case of undrained condition can sustain
about 12 to 25% of the ultimate load in drained condition depending on dimensions of
the stone column and shear strength of the clay.
Keywords: Stone Columns, PLAXIS 2D, Bearing Capacity, Soft Clay.

ARABIC SUMMARY

ملخص الرسالت
ركاميتاألعمذة التقنيت ستخذامإاللينت بتحسين التربت
١- المقذمت :
ازشثخ ١غذ ثبشئ اغذ٠ذ فمذ ػشفب اإلغب ف اؼظس امذ٠خ اغبثمخ رم٠خا فىشح
زشبسا امذ شذ زا اغبي رمذب عش٠ؼب , ازـج١مبد اخزفخ اؼذ٠ذ عزخذب فا
اعؼب ف وض١ش ازـج١مبد اخزفخ ذعخ اذ١خ خبطخ ف اشآد اغبذح اغذد
. أوزبف اىجبس اغغس اـشق أعبعبد اجب
رؾذ٠ب ػظ١ب شبو از رضثب أ ازشثخ اـ١١خ ا١خ رؼزجش اؽذح ازشثخ راد ا
ا ؼؼف مبخ امض ب از رغؼ لذسح رؾب ػؼ١فظش هذط اذ ر
عزخذا ز ا ب, ف ؽ ابرغ از رؾذس ػمت اجبء ازؾ١ ػ١باج ل١خ ض٠بدح ا٠ؼب
بن اؼذ٠ذ ز ازشثخ وزشثخ رؤع١ظ ؼذ٠ذ اشآد اذ١خ ٠زـت رم١بد خبطخ
عزخذذ زغت ػ شبو زا اع أعزؾذصذ ز فزشاد عبثمخ أازم١بد از لذ
اشأع١خ اظبػ١خ , األػذح ظبسف, ا اغجكازشثخ رؾغ١ خاطب ض ازؾ١
١ عزخذا رم١خ األػذح اؾغش٠خ زؾغاؽذ٠ضب ٠ؼزجش . ....اخاش١خ األػذح اؾغش٠خ
خاص ازشثخ اـ١١خ ا١خ ازم١بد ابخ از رغزعت ػ١ب ازعغ ف دساعزب
وزه ا١زب ف ابرظ جؽا رم١ اإلسرىبص مبخره ذسب اىج١ش ف ص٠بدح
ؾ ظشا غخ رف١زب وب الزظبد٠خ ف ازؼبغ ػ١خ إلرب االص اض ازم١
.رىب١ف اشبئب ثبمبسخ ثبـشق األخش
٢- أهذاف البحث :
ا اغشع زا اجؾش دساعخ أعة رذػ١ ازشث اـ١١ ا١ ثبعزخذا رم١خ
ر رمغ١ اذساع ا عضئ١ : األػذ اؾغش٠ طي ا أذاف اجؾش

خ ؽبالد خزفخ ازشث اـ١١ ٠ؾز ػثاعـخ ثشبظ ػ ػ١ اػذاد دساعخ ر
خزف از ر رذػ١ب ثؤلـبس أؿاي ا١ اغض ؼ١ب ثمببد لض خزف
.ز ازشث١بس الؽظخ عن إلرؾ١ب ؽز اؼد اؾغش ر ا
أصجزذ ازبئظ أ اغؼخ امظ زؾ١ زشث اما ثاعـخ األػذح اؾغش٠خ ٠ؼزذ ػ
لـش اؼد اؾغش ؿ ؽ١ش رظ غجخ ازؾغ ف لذسح رؾ األعبط اشرىض ػ
ثذ أػذح ؽغش٠خ. شح لذسح رؾ األعبط ,٣2ػد ؽغش ا ؽا
أ اإل١بس اؾبدس ؼد اؾغش ف طسح خالي اذساعخ اؼ١خ رالؽق
bulging . ف غبفخ شح ظف لـش اؼد مبعخ عـؼ األسع
ثبـشق اظش٠خ ػ ؿش٠ك اػذاد رط ثاعـخ ثشبظ ظش اشزذ اذساعخ أ٠ؼب
( ؼ رؾ١ زؤص١ش اغبػ ثزظشف ا١ب أصبء ازؾ١ Plaxis 2d) ع١رم زخظض
ا ظؼثخ اعشاء ز ازم١خ ف اؼ دساعخ عن اؼد اؾغش افز ف ازشثخ ظش
اـ١١خ ا١خ ف ز اؾبخ .
أ ؾ اؾ اجؽ ف ؽبخ اغبػ ثزظش٠ف ا١ب ٠م ػ ظ١ش أشبسد اذساعخ
عد ػغؾ ا١ب ف ف اؾبخ اؼبد٠خ ثذ اغبػ زظش٠ف ا١ب , ٠شعغ ره ا رؤص١ش
افشاغبد از رؼ ػ ص٠بدح عؼخ ازؾ١ ؼد اؾغش ػ ػذ اغبػ ١ب
ثبخشط .
رالؽق أ ؾ اؾ اجؽ ٠ؾذس مض ؾف ػ اغبػ ثظشف ا١ب ٠ظ
ثبمبسخ ثبؾبخ اغ١ش زظشفخ. جؽ %٥,% ؾ وزه ٢,ا ؽا
ثبألػذح اؾغش٠خ اغؾخ اـ١١خ ا١ف خاص ازشثخ اؾبدس دساعخ ازـس روزه
ره ػ ؿش٠ك اػذاد رط ثاعـخ زا اجشبظ ازؤوذ دلخ زا غ شس اض
مبسخ زبئغ ثزبئظ ؽم١خ ششع عبثك وب ؼشف ذع١ ارط ره ث
عزخذا اجشاظ اضالص١خ اأ شى ثذلخ ػب١ فب ٠غزعت ػ١ب اغ١رم١١ أ زض١
فزذ امبس ث١األثؼبد ى غذ أ اجشاظ اضبئ١خ األثؼبد األع األوضش ازشبسا
األػبع اضبئ١خ األثؼبد ػغ ازبص اؾس ػغ ازبص اـ زبئظ
رج١ أ ؽ١ش ازبئظ اؾم١خ جشبظاث١ زبئظ مبسخ ؼثبعزخذا خاص ىبفئ
زبئظ اؾم١خ. ػغ ازبص اؾس األلشة

وب أوذد اذساعخ اظش٠خ أ عد اؼد اؾغش ٠ؼ ػ ص٠بدح عغبءح ازشثخ اـ١١خ
ا ٠ؾذس رؾغ ؾف ؼب شخ ازشثخ اذػخ ثبألػذح اؾغش٠خ ثم١خ رظ
شح ل١خ ؼب ازشثخ ثذ أػذح ؽغش٠خ ٧2٧
٣- محتوياث الرسالت :
فظي ٠ى رخ١ظ وب ٠ : صب١خػ اشعبخرؾز
الفصل االول :
ذافب غبي اذساعخ وزه أرشز ػ خض شعبخ ٠ؾز زا افظ ػ مذخ
اغك اؼب ألعضاء اشعبخ رظ١ب . عزؼشاعارؾز ػ
الفصل الثانى :
از عجك ششب ف غبي اجؾش األثؾبس ثؾبسألا٠ؾز ػ شاعؼخ اعزؼشاع
ىبي رغـ١خ اذساعخ اـث اإلعزفبدح ازؼمخ ثبجؾش از ٠ى اإلعزفبدح ب إلعز
. اغبثم١جبؽض١ ب إلعشاء امبسبد اـث ثب
الفصل الثالث :
بر اعشاء اذساع ػ١ اززا افظ ػ طف رفظ١ ذساع اؼ١خ ٠ؾز
ؽ١ش ٠ششػ ثبزفظ١ ازغبسة از ر اعشاءب زؾذ٠ذ اخظبئض اخزفخ اد از ر
ز وزه طف غبص ازؾ١ اغزخذ ششػ ألعضاء اخزف وزه ٠ؾ اعزخذب
خاص ازشثخ از ر اعزخذاب ف اجؾش أ٠ؼب ٠شز ػ ػشع زغبسة ػ
خالي اجشبظ اؼ از ر اعشاإب ػذ ازغ١شاد از ر دساعزباخزف از ر
ػؼ ذساعخ اشىخ.
الفصل الرابع :
ر اعشاء اذساعخ ػ١زا افظ ػ طف رفظ١ جشبظ اظش از ٠ؾز
ؽ١ش ٠ششػ و١ف١خ ػ اجشبظ اغزخذ )ثشبظ اؼبطش اؾذدح( ؼشفخ ل١

اذخالد ف اؾبالد اخزفخ وزه ؿش٠مخ ازؤوذ زبئظ اجشبظ ذ اضمخ ف
اعزخذاخ ػ ؿش٠ك مبسخ زبئظ اجشبظ غ ػذد ازبئظ اشسح اشرجـخ ثزا
ألوضش (Verification) أ (Validation)وب اشز زا افظ ػ ػ اجؾش
شىخ عدح ػ١ب زؾمك ذ دلخ ازبئظ خشعبد اجشبظ ؽز ٠زغ اعزخذا
. اجشبظ ف اشعبخ
الفصل الخامس :
ؼشفخ اؼ١ اذساعخ اغزخشعخ زبئظ ارؾ١ ٠خزض زا افظ ثذساعخ
لذسح رؾ ازشثخ اـ١١خ ا١خ ره ثؼذ ص٠بدح از رئصش ػ اخزف ازغ١شادرؤص١ش
دساعخ ازغ١شاد اخزفخ ث١ب رؤص١شب ػ عن رذػ١ب ثبؼد اؾغش افشد
. اؼد اؾغش خالي سع ػاللبد ث١ب١خ ج١ب ؿج١ؼخ ره اؼاللبد
الفصل السادس :
اذساعخ اظش٠خ ثؤعزخذا اغزخشعخ رؾ١ ازبئظ ٠خزض زا افظ ثذساعخ
ا١ب رظش٠فـبثم جشبظ اؼ ػذ عد ف اؾبخ ا (Plaxis 2d) ثشبظ
رظش٠ف ١ب زشثخ اـ١١خ ا١خ . زشثخ اـ١١خ ا١خ وزه ف ؽبخ عد
الفصل السابع :
ششع عبثك ثبجشبظثبػذاد رط ره ٠خزض زا افظ ثؼ دساعخ مبسخ
ام١بعبد اؾم١خا أللشة ثالوغ١ظ صبئ األثؼبد ل١بعبد ؽم١خ ره ؼشفخ اػغ ا
ظش٠خ وزه ر دساعخ رؤص١ش غبثبد اجؽ فظ اششع ثـشق وزه اعشاء ؽ
از ٠ز اعشاإب زشثخ اـ١١خ ا١خ اذػخ ثبألػذح اؾغش٠خاؼبالد ازظ١١خ
اـجمخ ٠ؼب غز اإلعبدادأاغبفخ ث١ األػذح اؾغش٠خ رؤص١ش ض ف اؼ
اغغش افز وزه اغجخ ث١ ؼب اشخ ؼد اؾغش ا ابرغخ رغ١ش اسرفبع
اـ١١خ ا١خ ػ خظبئظب رؤص١شب ػ ؼب رشو١ض اإلعبداد ؼب اشخ زشثخ
ػ ؼب رخف١غ اجؽ ا٠ؼب ػ ؼب رخف١غ اض االص ؾذس اجؽ
ر از اذساعخ ز زبئظ ث١ مبسخػ رالش ػغؾ ١ب اغب اضائذ, ص ثؼذ ره ر
ازشثخ خاص ف ازؾغ ؾغبة رغزخذ زا األخش اظش٠خ اـشقاؽذ غ ػب

ػ دساعخ مبسخ زبئظ ر , وزهاؾغش٠خ األػذح ثبعزخذا ذػ١بر ب ٠زػذ
اغززغخ اذساعخ اؾب١خ غ اذساعبد اغبثمخ.
الفصل الثامن :
ازط١بد اغززغخ ره ٠ؾز زا افظ ػ ازبئظ اغزخظخ ره اجؾش
:از ٠ى رخ١ظب وبزب اجؾش ألثؾبس اغزمج١خ
المراجع
اخ١شا رز اشعبخ ثمبئخ اشاعغ االثؾبس اغزخذخ ف زا اجؾش.

الملخص العربي

المستخلص
ركاميةاألعمدة التقنية ستخدامإاللينة بالتربة تحسين
ذف زا انبحذ ي دساست اسخخذاو االعذة انحجشت نخقت حذعى انخشبت انطت انهت
انخحكى ف انبط ححس ي قذسة ححها نقايت االحال انحذ ي االاساث
باسطت بشايج عه حخ عه إعذاد دساست حى خقعت نالساساث. ف زا انبحذان
ااع يخخهفت ي انخشب انطت انه انجض يعها بقاياث قص يخخهف انخ حى عه
اس يالحظت إلححها حخ احذعا بأقطاس أطال يخخهف ي انعد انحجش حى
نهخحم نهخشب انقا باسطت األعذة أربخج انخائج أ انسعت انقص .ز انخشبسهك
انحجشت عخذ عه قطش انعد انحجش طن حذ حصم سبت انخحس ف قذسة ححم
يشة قذسة ححم األساط بذ أعذة ,٣2األساط انشحكض عه عد حجش ان حان
عه إعذاد رج باسطت بشايج ظش جحق إشخهج انذساست أضا حجشت.
( نعم ححهم نخأرش انساح بخصشف انا أراء Plaxis 2d) يخخصص
نصعبت إجشاء ز انخقت ف انعم ي اجم ظشا (Drained conditions)انخحم
كا أكذث دساست سهك انعد انحجش انفز ف انخشبت انطت انهت ف ز انحانت .
انذساست انظشت أ جد انعد انحجش عم عه صادة جساءة انخشبت انطت حذد
يشة ٧2٧ححس يهحظ نعايم يشت انخشبت انذعت باألعذة انحجشت بقت حصم ان
.قت يعايم انخشبت بذ أعذة حجشت

ـــاطــعة طنــــــــجـام كــليــــــة الهـــــندسـة
جامعة طنطا - كلية اهلندسة-رسالة علمية مقدمة إىل قسم اهلندسة اإلنشائية
من متطلبات احلصول علىكجزء
الهندسة المدنيه فى درجة دكتور الفلسفة (هندسة االنشاءات)
بعنوان
ركاميةاألعمدة ال تقنية ستخدامبإ تحسين التربة اللينة
إعداد
خالد عبد المنعم عبد الحيم.
جـنة الحكـم والمناقشـةل
الوظيفــــــــــــــة االســــــــــم م
األستاذ بقسم الهندسة اإلنشائية مصطفى كامل الغمراويأ.د. / 1 األزهرجامعة –كلية الهندسة
األستاذ بقسم الهندسة اإلنشائية أ.د. / محمد الغريب صقر 2 جامعة طنطا –كلية الهندسة
األستاذ بقسم الهندسة اإلنشائية أشرف كمال نظيرأ.د. / 3 جامعة طنطا –كلية الهندسة
األستاذ بقسم الهندسة اإلنشائية مروان مغاوري شاهينأ.د. / 4 جامعة طنطا –كلية الهندسة
م 2١1٢/ 4 / ٦٢ تاريخ المناقشة :
توقيعات لجـــنـة الحكــــم والمناقشـــة :
التوقيـــــــــــــع ــماالســــــــ م
مصطفى كامل الغمراويأ.د. / 1
أ.د. / محمد الغريب صقر 2
أشرف كمال نظيرأ.د. / 3
مروان مغاوري شاهينأ.د. / 4

جامعة طنطا كلية اهلندسة
قسم اهلندسة اإلنشائية
رسالة علمية مقدمة إلى جامعة طنطا -كلية الهندسة -قسم الهندسة اإلنشائية
كجزء من متطلبات الحصول على
)هندسة االنشاءات( فى الهندسة المدنيه درجة دكتور الفلسفة
إعداد
خالد عبد المنعم عبد الحيم.
حتت إشراف
٧١٠٢ –طنطا
أ.د محمد الغريب صقراهلندسة اجليوتقنية أستاذ ءاتهندسة اإلنشاقسم
طنطاجامعة -كلية اهلندسة
أ.د مروان مغاوري شاهيهاهلندسة اجليوتقنية أستاذ ءاتهندسة اإلنشاقسم
طنطاجامعة -كلية اهلندسة
أ.م.د أحمد فاروق عبد القادر
مساعد اهلندسة اجليوتقنية أستاذ ءاتهندسة اإلنشاقسم
جامعة طنطا-كلية اهلندسة