
Final Report - ROSA P
103
Darren Begg Reference: 5637C.FR Date: April 24, 2009 Alternate Welding Processes for In-Service Welding Final Report
-
Upload
khangminh22 -
Category
Documents
-
view
0 -
download
0
Transcript of Final Report - ROSA P

Darren Begg Reference: 5637C.FR Date: April 24, 2009
Alternate Welding Processes for In-Service Welding
Final Report
The information contained herein is the copyright of and proprietary to BMT Fleet Technology Limited and must not be disclosed by the receiving party to any other party nor duplicated or used in whole or in part for any purpose other than for the evaluation of the proposal for which the information has been prepared; provided that, if a contract is awarded to BMT Fleet Technology Limited as a result of or in connection with the submission of this information, the receiving party shall have the right to duplicate, use or disclose the information to the extent provided in the contract. This restriction does not limit the recipient's right to use portions of this information if it is obtained from another source without restriction.
5637C.FR
ALTERNATE WELDING PROCESSES FOR IN-SERVICE WELDING
FINAL REPORT
April 24, 2009
Submitted to:
US Department of Transportation Pipeline and Hazardous Materials Safety Administration (PHMSA)
400-7th Street S.W. Washington, D.C. 20590-0001
Submitted by:
BMT FLEET TECHNOLOGY LIMITED 311 Legget Drive Kanata, Ontario
Canada K2K 1Z8
BMT Contact: Darren Begg Ph.: (613) 592-2830, Ext. 229
Fax: (613) 592-4950 Email: [email protected]

BMT Fleet Technology Limited 5637C.FR
Alternate Welding Processes for In-Service Welding i
BMT FTL DOCUMENT QUALITY CONTROL DATA SHEET
PROPOSAL/REPORT: Alternate Welding Processes for In-Service Welding”
DATE: April 24, 2009
PREPARED BY: Darren Begg Program Manager, Welding and Inspection
REVIEWED : Nick Pussegoda, Phd, P. Eng. Program Manager, Materials and Metallurgy
REVIEWED AND APPROVED BY:
Aaron Dinovitzer, P. Eng.
President

BMT Fleet Technology Limited 5637C.FR
Alternate Welding Processes for In-Service Welding ii
EXECUTIVE SUMMARY
Conducting weld repairs and attaching hot tap tees onto pressurized pipes has the advantage of avoiding loss of service and revenue. However, the risks involved with in-service welding need to be managed by ensuring that welding is performed in a reproducible and consistent manner within an optimal heat input window. The optimal heat input window avoids burn-through (upper limit of heat input) and weld faults or hydrogen induced cold cracking (lower limit of heat input). Welding on live pipelines has been successfully performed for years, using mainly the shielded metal arc welding (SMAW) process. Over the past 25 years, failures have occurred in welds deposited on in-service pipelines, and these failures have been attributed to weldment hydrogen cracking, and inconsistent bead size or penetration profile. Numerous investigations have been completed to address the most significant in-service welding hazards, namely burn-through and hydrogen-induced cracking. Weld procedures designed to avoid burn-through and hydrogen cracking consider primarily the thermal cycle, while pipe chemistry and internal pressure are additional influencing parameters for delayed cracking and burn-through, respectively. The thermal cycle itself depends on the welding heat energy input, heat sink capacity of the pipeline (pipe wall thickness, fluid type and flow rate), and any preheat or post heat applied. A significant, process dependant, in-service welding concern that can be addressed by modern power sources is the reliable control of heat input and weld size that are often difficult to maintain in all position welding. To increase in-service welding productivity, improve welder safety and assure weld integrity, alternative arc welding processes and other recent technological developments were evaluated with the objective of defining parameters and conditions associated that can preclude hydrogen cracking and burn-through in a reproducible manner. The five alternative welding processes that were identified and evaluated in comparison to the benchmark (i.e., SMAW with low hydrogen electrodes) were:
Self-shielded flux cored arc welding (SS-FCAW): Gas metal arc welding with Controlled Dip Transfer Technology, (Miller Electric's Regulated
Metal Discharge (RMD)): Pulsed Gas Metal Arc Welding (PGMAW) using state-of-the-art power sources with closed
loop feedback control: Gas Shielded Flux Cored Arc Welding (GS-FCAW): Pulsed Metal Cored Arc Welding (PMCAW):
Each of the advanced welding processes has the benefit of:
allowing higher deposition rate without burn-through. This can be achieved by virtue of a soft arc and reduced penetration, or by running a cold arc, i.e., by allowing a lower heat input for a given deposition rate;
allowing lower heat input without causing hydrogen induced delayed cracking. This can be achieved through the use of processes/consumables with lower weld metal hydrogen potential. The arc efficiency of each process is another factor which can influence cooling rate, and hence the susceptibility of the weld zone microstructures to delayed cracking at a given energy input;
having a reduced susceptibility to weld flaws; providing better and consistent control of the weld metal puddle; rugged and portable equipment for field use; and requiring reduced operator skill.

BMT Fleet Technology Limited 5637C.FR
Alternate Welding Processes for In-Service Welding iii
Each of these semi-automatic processes can be used with mechanical tracking devices, and thus remove the variability in weld deposition and thus improve the safety and integrity of in-service welding. To assess if the alternative processes/variations do indeed offer some or all of the expected advantages, the alternative processes were subjected to mutual head to head experimental comparisons, as well as with the current practice, viz., shielded metal arc welding using low hydrogen electrodes. The comparison or performance trials focused on the prevention of hydrogen cracking, burn-through, and weld flaws. The results of the trials can be used to demonstrate the range of welding parameters that could be expected to produce sound welds for each process and develop comments on ease of welding, preparation requirements, and productivity. The evaluations were performed on instrumented pipe of both low and high strength pipe with a range of heat sink conditions, including static air and water backing, thus representing the extremes of expected in-service heat sink conditions that could be encountered during welding on thin wall live pipelines. Based on the results of the alternative welding processes evaluated (a) Each have the potential to provide slower cooling rates over a range of heat inputs, compared to the
SMAW process. Slower cooling resulted in lower CGHAZ hardness and thus lower susceptibility to hydrogen
cracking PMCAW and PGMAW demonstrated lower CGHAZ hardness compared to SMAW at the same
calculated heat input level. (b) Each alternative process exhibited a higher susceptibility to burn-though compared to SMAW, likely
due to their higher process arc efficiencies and resulting higher peak inside surface temperature for a given calculated heat input level. The SSFCAW process had demonstrated the highest susceptibility to burn-through, however SMAW with 2.4mm electrodes had demonstrated the lowest. Possible that adjusting pulse waveform parameters could reduce their susceptibility
(c) Alternative processes offer the advantage of mechanization to enhance consistency of the welding procedure in all positions of welding as well as enhanced productivity with continuous wire feed and less interruptions.
PMCAW and PMCAW processes demonstrated enhanced tempering of HAZ’s in previously weld deposits at heat inputs 50% lower than the FCAW process, as demonstrated in Task 8.
(d) Alternate welding processes passed the requirements for bend and nick break testing as per API 1104 specifications.
(e) Each process demonstrated longer hydrogen delay times in the simulated hydrogen model when welding on water filled pipe compared to the static air conditions.

BMT Fleet Technology Limited 5637C.FR
Alternate Welding Processes for In-Service Welding iv
ACKNOWLEDGEMENTS The author would like to thank the following organizations for their participation and support in this project:
US Department of Transportation TransCanada Pipelines TDW/Williamson Industries RMS Welding Systems ESAB Hobart Brothers Miller Electric Bohler Thyssen Enbridge Pipelines

BMT Fleet Technology Limited 5637C.FR
Alternate Welding Processes for In-Service Welding v
TABLE OF CONTENTS
1 BACKGROUND ............................................................................................................................... 1
2 PROJECT OBJECTIVES ................................................................................................................. 5
3 WORK SCOPE ................................................................................................................................ 7 3.1 Task 1: Literature and Industry Practice Review: Establish the Current State-of-the-Art In
Welding Process and Procedure Application for Hot Tapping and Repairs for the Linepipe Materials of Interest. ............................................................................................................... 7
3.2 Task 2: Establish Practical Welding Parameter Ranges for Out-of-Position Welding ........... 7 3.3 Task 3: Examination the Potential for Burn-Through for the Selected Processes ................. 7 3.4 Task 4: Examine Cooling Rates as a Function of Welding Process Arc Efficiency ............... 8 3.5 Task 5: Establish Diffusible Hydrogen Characteristics .......................................................... 8 3.6 Task 6: Prediction of Delay Times for Hydrogen Cracking .................................................... 8 3.7 Task 7: Weld Zone Characterization for a Variety of Simulated Pipeline In-service Welding
Conditions .............................................................................................................................. 8 3.8 Task 8: Hot-tap Joint Simulation ............................................................................................ 9
4 RESULTS ....................................................................................................................................... 10 4.1 Task 1.1: Literature and Industry Practice Review ............................................................... 10 4.2 Task 1.2: Pipe Selection ....................................................................................................... 10 4.3 Task 1.3: Welding Consumable Selection ........................................................................... 12 4.4 Task 2: Establish Practical Welding Parameter Ranges for Out-of-Position Welding ......... 15 4.5 Task 3: Examination the Potential for Burn-Through for the Selected Processes ............... 20
4.5.1 Weld Burn-through – Static Air (No Flow) .................................................................... 22 4.5.2 Water Backed Burn-through Predictions ...................................................................... 31
4.6 Task 4: Examine Cooling Rates as a Function of Welding Process Arc Efficiency ............. 37 4.7 Task 5: Establish Diffusible Hydrogen Characteristics ......................................................... 43 4.8 Task 6: Establish Delay Time Predictions ............................................................................ 44 4.9 Task 7: Weld Zone Characterization for Various Repair Scenarios ..................................... 56
4.9.1 Flowing Air – Bead on Pipe Welds ............................................................................... 56 4.9.2 Water Mist Spray – Bead on Pipe Welds ..................................................................... 59 4.9.3 Air and Water Backed Results for Bead on Pipe and Sleeve Fillet Welds ................... 64
4.10 Task 8: Hot-tap Joint Simulation .......................................................................................... 76
5 CONCLUSIONS ............................................................................................................................. 92 APPENDICES APPENDIX A: LITERATURE REVIEW RESULTS APPENDIX B: EXPERIMENTAL WELDING PARAMETERS – SMAW, PGMAW, SSFCAW, AND RMD APPENDIX C: TASK 3 – WELD DATA – STATIC AIR APPENDIX D: TASK 3 - WELD DATA – STATIC AIR - MACROS APPENDIX E: TASK 3 – WELD DATA – WATER BACKING APPENDIX F: TASK 3 – WELD DATA – WATER BACKING - MACROS APPENDIX G: TASK 7 – WELDING DATA – FLOWING AIR APPENDIX H: TASK 7 – WELDING DATA – FLOWING AIR - MACROS APPENDIX I: TASK 7 – WELDING DATA – WATER MIST SPRAY APPENDIX J: TASK 7 – WELDING DATA – WATER MIST SPRAY - MACROS APPENDIX K: TASK 7 – SLEEVE FILLET WELDING DATA – STATIC AIR APPENDIX L: TASK 7 – SLEEVE FILLET WELDING DATA – WATER BACKING APPENDIX M: TASK 7 – SLEEVE FILLET WELDING DATA – STATIC AIR - MACROS APPENDIX N: TASK 7 – SLEEVE FILLET WELDING DATA – WATER BACKING - MACROS
BMT Fleet Technology Limited 5637C.FR
Alternate Welding Processes for In-Service Welding vi
LIST OF FIGURES
Figure 1.1(a): Cooling Time 800 to 500°C against Thickness for T-Joint (Equal Thickness) ...................... 1 Figure 1.1(b): Cooling Time 1500 to 100°C against Thickness for T-Joint (Equal Thickness) .................... 1 Figure 1.2: BMT Hydrogen Diffusion and Delayed Cracking Model ............................................................ 2 Figure 1.3: Wall Thickness vs. Weld Cooling Time for 40 kJ/in Weld.......................................................... 3 Figure 4.1: Welding Positions .................................................................................................................... 15 Figure 4.2: Sleeve Simulation Joint Configuration ..................................................................................... 16 Figure 4.3: Weld Cross-sections for 6.4mm Pipe Wall X52 Simulations ................................................... 18 Figure 4.4: Cross-sections for 19mm Pipe Wall X80 Simulations ............................................................. 18 Figure 4.5: Weld Cross-sections for 6.4mm Pipe Wall X52 Simulations ................................................... 20 Figure 4.6: Cross-sections for 19mm Pipe Wall X80 Simulations ............................................................. 20 Figure 4.7: Slotted Pipe to Achieve 3.2mm Thickness .............................................................................. 21 Figure 4.8: Thermocouple Set-up .............................................................................................................. 21 Figure 4.9: Set-up for Controlled Welding with Semi-Automatic Processes .............................................. 22 Figure 4.10: Set-up for Controlled Welding with SMAW Process .............................................................. 23 Figure 4.11: Thermal History of Weld and Back Surface ........................................................................... 23 Figure 4.12: Thermal History of Weld and Back Surface ........................................................................... 24 Figure 4.13: Peak Back Surface Temperatures vs Heat Input and Process ............................................. 24 Figure 4.14: Weld A62 Macro, 0.53 kJ/mm, 2.5X Mag .............................................................................. 25 Figure 4.15: Weld A63 Macro, 1.29 kJ/mm, 2.5X Mag. ............................................................................. 25 Figure 4.16: Methodology and Calculations for Determining Burn-through ............................................... 26 Figure 4.17: Burst Pressure / MOP (%) vs. Thickness and Weld Process – 0.53kJ/mm .......................... 30 Figure 4.18: Burst Pressure / MOP (%) vs. Thickness and Weld Process - 1.29kJ/mm ........................... 30 Figure 4.19: Burst Pressure / MOP (%) vs. Thickness and Weld Process, Combined Heat Inputs .......... 31 Figure 4.20: Water Backed Set-up ............................................................................................................. 32 Figure 4.21: Weld FW62 Macro, 0.53 kJ/mm, 2.5X Mag ........................................................................... 32 Figure 4.22: Weld FW63 Macro, 1.29 kJ/mm, 2.5X Mag. .......................................................................... 33 Figure 4.23: Burst Pressure / MOP (%) vs. Thickness and Weld Process - 0.53kJ/mm ........................... 36 Figure 4.24: Burst Pressure / MOP (%) vs. Thickness and Weld Process - 1.29kJ/mm ........................... 36 Figure 4.25: Burst Pressure / MOP (%) vs. Thickness and Weld Process – 0.53 and 1.29kJ/mm ........... 37 Figure 4.26: Cooling Rate vs. Heat Input, P-MCAW Process .................................................................... 39 Figure 4.27: Cooling Rate vs, Welding Process, Heat Input 1.29 kJ/mm .................................................. 39 Figure 4.28: Heat Input vs. Hardness, 6.4mm ........................................................................................... 40 Figure 4.29: Heat Input vs. Hardness, 7.9mm ........................................................................................... 41 Figure 4.30: Heat Input vs. Hardness, 11mm ............................................................................................ 41 Figure 4.31: Heat Input vs. Hardness, 16.1mm ......................................................................................... 42 Figure 4.32: Heat Input vs. Hardness, 19.1mm ......................................................................................... 42 Figure 4.33: Diffusible Hydrogen Comparisons of Each Electrode Evaluated .......................................... 44 Figure 4.34: BMT Fleet Technology Limited Hydrogen Cracking Susceptibility and Delay Time Prediction
Model ....................................................................................................................................... 45 Figure 4.35: Cells Monitored in Model ....................................................................................................... 46 Figure 4.36: Hydrogen Concentration vs. Time (Specimen A68, Welded in Static Air) ............................ 46 Figure 4.37: Specimen W4 – Static Water – Hydrogen vs. Time History .................................................. 49 Figure 4.38: Specimen A4 & W4 – Comparison of Hydrogen Time Histories – Static Air and Static Water
– Cell 2 ..................................................................................................................................... 50 Figure 4.39: Specimen W5 – Static Water – Hydrogen vs. Time History .................................................. 51 Figure 4.40: Specimen A5 & W5 – Comparison of Hydrogen Time Histories – Static Air and Static Water
– Cell 2 ..................................................................................................................................... 52 Figure 4.41: Specimen W12 – Static Water – Hydrogen vs. Time History ................................................ 53 Figure 4.42: Specimen A12 & W12 – Comparison of Hydrogen Time Histories – Static Air and Static
Water – Cell 2 .......................................................................................................................... 54 Figure 4.43: Specimen W64 – Static Water – Hydrogen vs. Time History ................................................ 55 Figure 4.44: Specimen A64 & W64 – Comparison of Hydrogen Time Histories – Static Air and Static
Water – Cell 2 .......................................................................................................................... 56 Figure 4.45: Weld and Back Surface Cooling Rate, Flowing Air Heat Sink Conditions ............................ 58
BMT Fleet Technology Limited 5637C.FR
Alternate Welding Processes for In-Service Welding vii
Figure 4.46: Heat Input vs. HAZ Hardness, Flowing Air Conditions .......................................................... 59 Figure 4.47: Weld and Back Surface Cooling Rate, Flowing Water Mist Spray ........................................ 61 Figure 4.48: Heat Input vs. HAZ Hardness, Flowing Water Mist Spray ..................................................... 62 Figure 4.49: Cooling Time vs. Welding Process, 0.53kJ/mm Heat Input .................................................. 63 Figure 4.50: Cooling Time vs. Thickness, 1.29kJ/mm Heat Input ............................................................. 63 Figure 4.51: Coarse Grain Heat Affected Zone (CG-HAZ) Hardness (Hv) vs Cooling Rate and Carbon
Equivalent (CE), Regardless of Heat Sink Condition .............................................................. 64 Figure 4.52: Thermocouple Locations ....................................................................................................... 65 Figure 4.53: Typical Thermocouple Output ................................................................................................ 65 Figure 4.54: Welding Process vs Cooling Rate, Fillet Weld vs. Bead on Pipe, 0.53 kJ/mm ..................... 70 Figure 4.55: Welding Process vs. Cooling Rate, Fillet Weld vs. Bead on Pipe, 1.29 kJ/mm .................... 70 Figure 4.56: Heat Input vs. Hardness, PMCAW ........................................................................................ 71 Figure 4.57: Heat Input vs. Hardness, GSFCAW ...................................................................................... 71 Figure 4.58: Heat Input vs. Hardness, PGCAW......................................................................................... 72 Figure 4.59: Heat Input vs. Hardness, SMAW, 2.4mm Diameter Electrode .............................................. 72 Figure 4.60: Heat Input vs. Hardness, SMAW, 3.2mm Diameter Electrode .............................................. 73 Figure 4.61: Heat Input vs Hardness vs Cooling Rate, Bead on Pipe, Air Backing................................... 74 Figure 4.62: Heat Input vs. Hardness vs. Cooling Rate, Sleeve Fillet Welding, Air Backing .................... 74 Figure 4.63: Heat Input vs. Hardness vs. Cooling Rate, Sleeve Fillet Welding, Water Backing ............... 75 Figure 4.64: Sleeve Assembly ................................................................................................................... 77 Figure 4.65: Sleeve Fit-up .......................................................................................................................... 77 Figure 4.66: Mechanized Welding Head and Travel Band Set-up ............................................................ 78 Figure 4.67: FCAW First Pass ................................................................................................................... 80 Figure 4.68: FCAW Second Pass .............................................................................................................. 80 Figure 4.69: FCAW Third Pass .................................................................................................................. 81 Figure 4.70: PMCAW First Pass ................................................................................................................ 81 Figure 4.71: PMCAW Second Pass ........................................................................................................... 82 Figure 4.72: PMCAW Third Pass ............................................................................................................... 83 Figure 4.73: PGMAW First Pass ................................................................................................................ 84 Figure 4.74: PGMAW Second Pass ........................................................................................................... 85 Figure 4.75: PGMAW Third Pass ............................................................................................................... 85 Figure 4.76: Mechanized Fillet Welding ..................................................................................................... 86 Figure 4.77: Weld Pass Staggering ........................................................................................................... 87 Figure 4.78: PMCAW Weld Passes and Average CGHAZ Hardness per Pass ........................................ 88 Figure 4.79: PGMAW Weld Passes and Average CGHAZ Hardness per Pass ........................................ 88 Figure 4.80: FCAW Weld Passes and Average CGHAZ Hardness per Pass ........................................... 88 Figure 4.81: FCAW Face Bend Test Results ............................................................................................. 89 Figure 4.82: PGMAW Face Bend Results ................................................................................................. 89 Figure 4.83: PMCAW Face Bend Results .................................................................................................. 90 Figure 4.84: FCAW Nick Break Results ..................................................................................................... 90 Figure 4.85: PGMAW Nick Break Results ................................................................................................. 91 Figure 4.86: PMCAW Nick Break Results .................................................................................................. 91

BMT Fleet Technology Limited 5637C.FR
Alternate Welding Processes for In-Service Welding viii
LIST OF TABLES
Table 4.1: Base Metal Properties for Pipes Evaluated .............................................................................. 11 Table 4.2: Welding Electrode Properties ................................................................................................... 13 Table 4.3: Dual Shield II 70T-12 Typical Properties and E7018-1 Requirements ..................................... 14 Table 4.4: Dual Shield II 80Ni1H4 Typical Properties and E8018C3 Requirements ................................. 15 Table 4.5: Hobart MC70 and MC100 Parameters ..................................................................................... 17 Table 4.6: ESAB Dual Shield II 70T-12 Parameters .................................................................................. 19 Table 4.7: ESAB Dual Shield II 80 NiMH4 Parameters ............................................................................. 19 Table 4.8: Burst Pressure Calculations ...................................................................................................... 28 Table 4.9: Weld Data and Burst Pressure Results .................................................................................... 29 Table 4.10: Burst Pressure Calculations .................................................................................................... 34 Table 4.11: Weld Data and Burst Pressure Results ................................................................................... 35 Table 4.12: Cooling Data and Hardness Results – Static Air .................................................................... 38 Table 4.13: Diffusible Hydrogen Comparison between As-received and Conditioned Low Hydrogen
Electrodes ................................................................................................................................ 43 Table 4.14: Delay Time Prediction Results ................................................................................................ 48 Table 4.15: Cooling Rate and Hardness Results – Flowing Air Conditions ............................................... 57 Table 4.16: Cooling Rate and Hardness Data vs. Process – Water Mist Spray Conditions ..................... 60 Table 4.17: Cooling Data and Hardness Results – Bead on Pipe – Water Backing ................................. 66 Table 4.18: Cooling Data and Hardness Results – Sleeve Fillet Welds – Static Air (No Flow) ................. 67 Table 4.19: Cooling Data and Hardness Results – Sleeve Fillet Welds – Water Backing ........................ 68 Table 4.20: Mechanized Fillet Welding Procedures .................................................................................. 79

BMT Fleet Technology Limited 5637C.FR
Alternate Welding Processes for In-Service Welding ix
LIST OF ACRONYMS
BMT FTL BMT Fleet Technology Limited CGHAZ Coarse Grain Heat Affected Zone ESO Electrical Stick-out EWI Edison Welding Institute FCAW Flux Cored Arc Welding IPM Inches per Minute PGMAW Pulse Gas Metal Arc Welding PHMSA Pipeline and Hazardous Materials Safety Administration PMCAW Pulse Metal Cored PRCI Pipeline Research Council International RMD Regulated Metal Deposition SMAW Shielded Metal Arc Welding TCPL TransCanada Pipeline Limited TS Travel Speed USDOT US Department of Transportation WFS Wire Feed Speed

BMT Fleet Technology Limited 5637C.FR
Alternate Welding Processes for In-Service Welding
1
1 BACKGROUND
Conducting weld repairs and attaching hot tap tees onto pressurized pipes has the advantage of avoiding loss of service and revenue. However, the risks involved with in-service welding need to be managed by ensuring that welding is performed in a reproducible and consistent manner within an optimal heat input window. The optimal heat input window avoids burn-through (upper limit of heat input) and weld faults or hydrogen induced cold cracking (lower limit of heat input). Numerous investigations have been undertaken in the past to study welding on pressurized pipelines. Some of these are numerical in nature and aim to model heat flow to determine:
(a) the heat input to cause burn-through in pipes of various thickness, carrying fluids at various pressures and flow rates; and
(b) 800°C to 500°C cooling time as an indicator of the weld zone microstructure and hardness, and therefore of the susceptibility to delayed cracking.
For example, Figures 1.1(a) and 1.1(b)1 display, in a quantitative manner, the general understanding that the effect of the water backing on cooling rate increases as the energy input increases or thickness decreases. From such data, one can estimate a critical thickness above which the water backing has no affect on the cooling rate. Welding on live pipelines has been successfully performed for years, using mainly the shielded metal arc welding (SMAW) process. Over the past 25 years, failures have occurred in welds deposited on in-service pipelines, and these failures have been attributed to weldment hydrogen cracking, and inconsistent bead size or penetration profile. Numerous investigations have been completed to address the most significant in-service welding hazards, namely burn-through and hydrogen-induced cracking. Weld procedures designed to avoid burn-through and hydrogen cracking consider primarily the thermal cycle, while pipe chemistry and internal pressure are additional influencing parameters for delayed cracking and burn-through, respectively. The thermal cycle itself depends on the welding heat energy input, heat sink capacity of the pipeline (pipe wall thickness, fluid type and flow rate), and any preheat or post heat applied.
Figure 1.1(a): Cooling Time 800 to 500°C against Thickness for T-Joint (Equal
Thickness)
Figure 1.1(b): Cooling Time 1500 to 100°C against Thickness for T-Joint (Equal Thickness)
1 Morrison, K.G.; “Repair Welding of Stiffeners to Hull Plating in Low Temperature Marine Environments without Preheat”; Fleet Technology Limited Report E83366C; November 1990

BMT Fleet Technology Limited 5637C.FR
Alternate Welding Processes for In-Service Welding
2
BMT and Graville Associates2,3,4 developed and continue to refine an engineering tool for multi-pass weld hydrogen management which addresses many of the concerns related to hydrogen cracking. The current model considers a wide range of welding, environmental and material parameters influencing the risk of hydrogen cracking, and can also be applied to welding of the newer microalloyed, high strength steels used for major pipeline projects. This delayed cracking risk assessment approach is based upon a two-dimensional weld representation, assuming that hydrogen diffusion and heat flow are primarily normal to the weld axis. The inputs include a user-defined welding procedure, material description and weld cross-section, as shown in Figure 1.2 for a six pass fillet welded sleeve welding procedure. Weld cracking susceptibility is based upon local hydrogen concentration, microstructure susceptibility (quantified in terms of hardness) and stress effects, thus developing a time history of cracking risk for all locations within the weldment. This model has been validated against lab trial results and continues to be improved.
Figure 1.2: BMT Hydrogen Diffusion and Delayed Cracking Model
Other investigations have been experimental in nature and focused on weld zone cooling time and/or heat-affected zone hardness5 as an indicator of the potential of hydrogen induced cold cracking (for example, see Figure 1.36). Variables considered include heat input, pipe thickness and fluid flow characteristics. Analytic tools and graphical outputs are developed from these studies to help define ideal heat inputs for in-service welding.
2 Dinovitzer, A., (1998), “Modelling Weld Hydrogen Diffusion and Predicting Delayed Cracking in Multi-Pass Welds”, Fleet Technology Limited internal development report 3 Dinovitzer, A., Graville, B., Glover, A., Pussegoda, N., “Multi-Pass Weld Hydrogen Management to Prevent Delayed Cracking”, International Pipeline Conference, Calgary ,2000 4 Graville, B.A., (1997), “The risk of delayed hydrogen cracking in pipeline welds”, report P398/1 for Nova Gas Transmission Ltd., November 5 Coe, F.R., “Welding Steels without Hydrogen Cracking”, The Welding Institute, UK, 1973. 6 Bruce, W.A.; “Hydrogen Cracking of Water-backed Welds”; International Conference on Advances in Welding Technology: Joining of High Performance Steels, Columbus, Ohio, November 1996

BMT Fleet Technology Limited 5637C.FR
Alternate Welding Processes for In-Service Welding
3
Figure 1.3: Wall Thickness vs. Weld Cooling Time for 40 kJ/in Weld
BMT has focused its numerical and experimental in-service welding investigations on three primary issues: the prevention of hydrogen cracking, the effectiveness of tempering on multi-pass weld hardness control and the development of welding procedures that ensure fault free high toughness welds. The prevention of delayed cracking involves the control of hydrogen, microstructure susceptibility, and tensile stresses. To understand the interaction of these factors, BMT has developed several tests to characterize the susceptibility of a base metal or weld metal to hydrogen cracking. These tests have been used along with other industry data to calibrate the BMT numerical model predicting the susceptibility of multi-pass weld procedures to hydrogen cracking. The constant deflection and slow bend tests, being standardized in a PRCI funded project are used to quantify susceptibility of materials and welding procedures to hydrogen cracking by identifying the relationship between applied stress and hydrogen concentration required for cracking7. This data has been used to develop a preliminary quantitative relationship between HAZ critical hardness, weld metal hydrogen content, local stress (Figure 1.4) that compares well with current industry standard hardness limits.
Figure 1.4: BMT Hydrogen Cracking Susceptibility Relationship
7 Malik, Pussegoda, Graville, Glover, "Prediction of Maximum Time for Delayed Cracking in a Simulated Girth Weld Repair", International Pipeline Conference 1998.

BMT Fleet Technology Limited 5637C.FR
Alternate Welding Processes for In-Service Welding
4
This data is used in the BMT hydrogen cracking numerical model to identify hydrogen cracking risk, maximum cracking delay time and allows the user to investigate the effect of environmental, applied loading and welding procedure parameters on these results. Experimentally, BMT has made extensive use of its welding expertise to evaluate welding equipment, consumables and procedures to produce sound welds with desired mechanical properties (e.g., fracture toughness). This work has been completed for a range of steels on plate and pipe in air and in the BMT in-service welding simulation flow loop facility.

BMT Fleet Technology Limited 5637C.FR
Alternate Welding Processes for In-Service Welding
5
2 PROJECT OBJECTIVES
The primary objective of this project is to define parameters and conditions associated with each advanced welding process that can preclude hydrogen cracking and burn-through in a reproducible manner. A significant, process dependant, in-service welding concern that can be addressed by modern power sources is the reliable control of heat input and weld size that are often difficult to maintain in all position welding. To increase in-service welding productivity, improve welder safety and assure weld integrity, alternative arc welding processes and other recent technological developments were evaluated. Welding process and procedure characteristics that aid in achieving these goals include:
(a) allowing higher deposition rate without burn-through. This can be achieved by virtue of a soft arc and reduced penetration, or by running a cold arc, i.e., by allowing a lower heat input for a given deposition rate;
(b) allowing lower heat input without causing hydrogen induced delayed cracking. This can be achieved through the use of processes/consumables with lower weld metal hydrogen potential. The arc efficiency of each process is another factor which can influence cooling rate, and hence the susceptibility of the weld zone microstructures to delayed cracking at a given energy input;
(c) having a reduced susceptibility to weld flaws; (d) providing better and consistent control of the weld metal puddle; (e) rugged and portable equipment for field use; and (f) requiring reduced operator skill.
Five alternative welding processes were identified and evaluated that possessed one or more of the above desirable characteristics, compared to the SMAW process, and these were:
(a) Self-shielded flux cored arc welding (SS-FCAW): higher productivity compared to SMAW; controlled hydrogen, generally between that for low hydrogen SMAW electrodes and the
GMAW process; no shielding gas required and amenable to use in an outdoor environment without inducing
weld flaws; minimal skill requirement above and beyond that for the SMAW process; and rugged equipment suitable for field use.
(b) Gas metal arc welding with Controlled Dip Transfer Technology, (Miller Electric's Regulated Metal Discharge (RMD)): higher productivity compared to SMAW; ability to achieve a higher deposition rate at a given energy input due to some flexibility in
controlling the wire feed speed independent of the energy input; lower weld metal hydrogen content; better and consistent control of the weld puddle and root
bead profile; out of position welding capability; may require higher operator skill level; and equipment designed for field use, pipeline girth welds being a prime application.
(c) Pulsed Gas Metal Arc Welding (PGMAW) using state-of-the-art power sources with closed loop feedback control: higher productivity compared to SMAW; lower weld metal hydrogen content; better and consistent control of the weld puddle, reduced susceptibility to flaws in all position
welding;

BMT Fleet Technology Limited 5637C.FR
Alternate Welding Processes for In-Service Welding
6
equipment suitable for use in field environment; and requires greater skill than that for the SMAW process.
(d) Gas Shielded Flux Cored Arc Welding (GS-FCAW): higher productivity compared to GMAW; low weld metal hydrogen content; consistent control of the weld puddle, reduced susceptibility to flaws in all position welding;
equipment suitable for use in field environment; requires greater skill than the SMAW process, but less skill than GMAW;
more tolerable of wind and drafts compared to GMAW (due to the protective slag covering).
(e) Pulsed Metal Cored Arc Welding (PMCAW): productivity between GS-FCAW and PGMAW, less susceptible to lack of fusion flaws
compared to PGMAW, low weld metal hydrogen content; requires greater skill than the SMAW process but less than P-GMAW; electrodes can easily be manufactured to a specific composition.
Each of these semi-automatic processes has the potential to be used with mechanical tracking devices, and thus remove the variability in weld deposition and thus improve the safety and integrity of in-service welding. Mechanized welding also requires less welder skill to operate and apply welding procedures. The improved weld bead profiles that can be realized with mechanized welding also make these potential variants excellent candidates for temper bead welding procedures. Temper beads are used for high carbon equivalent pipe where weld parameters cannot on their own reduce heat-affected zone hardness to levels that would avoid hydrogen cracking.

BMT Fleet Technology Limited 5637C.FR
Alternate Welding Processes for In-Service Welding
7
3 WORK SCOPE
To assess if the alternative processes/variations do indeed offer some or all of the expected advantages, the alternative processes were subjected to mutual head to head experimental comparisons, as well as with the current practice, viz., shielded metal arc welding using low hydrogen electrodes. The comparison or performance trials focused on the prevention of hydrogen cracking, burn-through, and weld flaws. The results of the trials can be used to demonstrate the range of welding parameters that could be expected to produce sound welds for each process and develop comments on ease of welding, preparation requirements, and productivity. The evaluations were performed on instrumented pipe of both low and high strength pipe with a range of heat sink conditions, including static air and water backing, thus representing the extremes of expected in-service heat sink conditions that could be encountered during welding on thin wall live pipelines. A description of each task is provided below.
3.1 Task 1: Literature and Industry Practice Review: Establish the Current State-of-the-Art In Welding Process and Procedure Application for Hot Tapping and Repairs for the Linepipe Materials of Interest.
Work Scope: Pertinent documents were procured along with other pipeline research reports on this subject. A significant source of this information was from PRCI reports outlining the results of previous initiatives. All the gathered information was reviewed and a state-of-the-art summary was prepared that include:
(a) burn-through tendency and weld zone cooling rate as a function of the welding process, energy input, thickness and the backing medium; and
(b) practices for hot tapping and build-up repair in the field.. It was suggested from the onset that X52 and X80 be chosen for the evaluations, as these would demonstrate higher CE and strength, respectively, each having very different susceptibilities to cracking.
3.2 Task 2: Establish Practical Welding Parameter Ranges for Out-of-Position Welding
Work Scope: The intention of this task was to define the range of parameters that would be practical for in-service welding applications and not induce lack of fusion type of flaws. The consumables of interest for all evaluations were slightly over-matching and matching strength with respect to the X52 and X80 base materials, respectively. Practical welding parameter ranges were established for buttering and for fillet welds of various sizes. The variables involved position of welding and the main pipe wall thickness. The highest and lowest ranges of heat inputs were established based on the following weld trial characteristics: weld bead visual appearances, weld pool fluidity and base metal wetting, weld depth of penetration and shape, and, susceptibility to interpass and lack of side wall fusion flaws.
3.3 Task 3: Examination the Potential for Burn-Through for the Selected Processes
Work Scope: Using the range of heat input limits established in Task 2, the critical material thicknesses and pressures for burn-through to occur were established with each welding processes of interest. This task was conducted with "still air" backing to simulate worst-case conditions. Thermocouples were placed on the opposite side of the pipe along the weld axis to measure the temperature of the base metal ligament between the root of the weld bead and the backside of the plate surface. These temperature measurements, along with macro sectioning and empirical correlations were used to numerically estimate the yield strength reduction (vs. increasing temperature) of the remaining base metal ligament and the susceptibility to significant bulging or blow out at various pipeline pressures.

BMT Fleet Technology Limited 5637C.FR
Alternate Welding Processes for In-Service Welding
8
3.4 Task 4: Examine Cooling Rates as a Function of Welding Process Arc Efficiency
Work Scope: The arc efficiency of each welding process type is known to have an effect on the cooling rate for a given heat input, therefore different results can be obtained when measuring the HAZ hardness and the susceptibility to cracking from one process to another. For example, the submerged arc welding is rated at approximately 95% arc efficiency and will have a slower cooling rate at a given heat input in comparison to the GMAW process, which is rated at approximately 75% arc efficiency. Although the arc efficiency differences for the SMAW, GMAW, and FCAW processes are small, they can still have a pronounced effect on the cooling rates and the resulting HAZ hardness, especially when welding on a live pipeline. A series of bead on plate welds were conducted with each process over the range of heat inputs established in Task 2. Each plate was instrumented with a series of thermocouples attached to a multi-channel high-speed temperature data acquisition system, to examine the 1000 to 100°C and 800 to 500°C cooling times for each process. Samples were extracted from each weld to examine bead profiles, depth of penetration, and weld zone hardness. The results were compared to those obtained in Task 7 that simulated various operating and environmental in-service welding conditions (i.e., static air, flowing air, air-mist, and water backing) for each material of interest.
3.5 Task 5: Establish Diffusible Hydrogen Characteristics
Work Scope: The hydrogen potential of each process/consumable combination was characterized using AWS 4.3 standard of testing under mercury. Since welding parameters are known to influence the hydrogen entrapment, the diffusible hydrogen of each process was characterized at several welding parameter settings within the heat input range established in Task 2. The results from this task were used in correlation with Task 6 for determining delay times (i.e., time to peak hydrogen concentration and thus maximum time to cracking) with each process/consumable and base metal combination evaluated.
3.6 Task 6: Prediction of Delay Times for Hydrogen Cracking
Work Scope: BMT Fleet Technology Limited's hydrogen diffusion model was used to estimate the delay times for sample welds that are considered cracking susceptible (i.e., have a hardness of 300 HVN or more).
3.7 Task 7: Weld Zone Characterization for a Variety of Simulated Pipeline In-service Welding Conditions
Work Scope: Deposit a series of bead on pipe and fillet welds on pipe with flowing air, water-mist spray, and water backing using each welding process (at the predetermined highest and lowest heat inputs) and base materials of interest. Samples were extracted from each weld to examine the weld penetration depths and profiles, measure weld zone hardness, and to compare the results compared back those in Tasks 3 and 4. The intention of this task was to determine if susceptibility to burn-through could reduce with increasing heat sink capacity, at a given heat input level, and, if one or more processes could extend the safety envelope of in-service welding compared back to the SMAW process.
BMT Fleet Technology Limited 5637C.FR
Alternate Welding Processes for In-Service Welding
9
3.8 Task 8: Hot-tap Joint Simulation
Work Scope: Hot-tapping sleeve joints were simulated using pressure retaining sleeves provided by Williamson Industries. Modified mechanized welding equipment (by RMS Welding Systems) designed specifically for circumferential girth welding was used to complete the in-service hot tap sleeve welding simulations. Macros were removed from each position of welding for examination and hardness measurements as well for nick break tests in accordance with API 1104. The simulations were conducted in still air (rather than flowing water) to keep costs down of transporting either the BMT flow loop or mechanized welding equipment “to and from” the equipment manufacture’s locations. Note that the primary objective of this task was to evaluate the equipment’s ability to reproduce the procedures developed in the lab in each clock position of welding.

BMT Fleet Technology Limited 5637C.FR
Alternate Welding Processes for In-Service Welding
10
4 RESULTS
4.1 Task 1.1: Literature and Industry Practice Review
Research reports related to welding on in-service pipelines were gathered from project team members. Each report was reviewed and a state-of-the-art summary was produced from each, and is included in Appendix A. Most of the information discussed in these reports focuses on the use of the shielded metal arc welding (SMAW) process.
Although one of objectives in Task 1 was to review the application of state-of-the-art mechanized welding of sleeves to in-service pipelines, insufficient information was available from publicly published reports. The research reports reviewed included a series of experimental procedures for depositing welds on thin walled pipe and preventing the incidence of burn-through, using the SMAW process. The main variables used to establish burn-through limitations in these reports were the pipe wall thickness, electrode diameter, heat input, and flow rate and medium. A number of these procedures were duplicated in the lab to confirm their effectiveness to control burn-through on thin walled pipe, and are discussed in more detail in Tasks 3, 4, and 7 herein.
In developing a framework to establish optimal procedures for welding on “live” pipelines, three goals need to be achieved, that being:
(1) prevention of hydrogen cracking; (2) prevention of burn-through; and (3) prevention of weld flaws.
Of these, prevention of burn-through and of weld flaws depend on physical properties of the pipeline steel and welding parameters, and so any recommendations developed in this regard would be valid irrespective of the pipeline steel grade, since physical properties such as thermal conductivity are not altered by steel composition, at least within the range applicable to pipeline steels.
The incidence of hydrogen cracking, on the other hand, is strongly influenced by the composition and strength, and hence the grade of the steel. Older pipelines (e.g., 1950-60’s vintage), were typically X52 grade, and steel composition used to be C-Mn type, with carbon in the range of 0.15 to 0.30%. Under fast cooling conditions of welding on live pipelines, the Heat Affected Zone (HAZ) in these steels can be quite hard (>350 VPN) thus increasing the potential for hydrogen cracking in the HAZ.
More recent pipelines have utilized X80 grade pipeline steels since they have lower carbon content (typically 0.05%) and thus represent better HAZ weldability in spite of their higher strength. However, research in recent years has suggested that critical hardness to prevent HAZ hydrogen cracking is lower in lower carbon steels and therefore any reliance on models predicting HAZ hardness as a function of composition and cooling rate must take this into account. Secondly, even if the potential for HAZ hydrogen cracking might be acceptably small, the necessary use of higher strength and therefore more highly alloyed weld metal increase the potential for weld metal cracking.
In the experimental program being undertaken here, including both these grades of pipeline steels (i.e., X52 and X80) will thus ensure that the hydrogen cracking resistant procedures recommended would have taken into account HAZ and weld metal susceptibilities as well as the effects of base metal and weld metal strengths.
4.2 Task 1.2: Pipe Selection
The grades, sizes, and thicknesses of X52 and X80 pipes obtained from industry for this study, including their composition and mechanical properties, are shown in Table 4.1. Although some of the pipes obtained are X70 grade, each of their yield strengths and carbon equivalents are within the range typical of X80, and should provide similar characteristics with respect to weldability.

BMT Fleet Technology Limited 5637C.FR
Alternate Welding Processes for In-Service Welding
11
Table 4.1: Base Metal Properties for Pipes Evaluated
Base Metal Chemical Composition (%) Mechanical Properties
Grade Manufacture Diameter Thickness Heat Number
C Mn Si S P Cr Mo Nb V Ni Cu Ti Al N B CE (Z245.2:1974)
UTS (ksi)
YS (ksi)
Elongation(%)
Charpy V-notch J ºC
X52 LTV NPS 10 6.4 293201 .05 1.04 .22 .04 .02 .044 .001 .03 .05 .16 75.7 69.7 35 61 (1/2 size) -5 X52 NA NPS 20 6.4 NA
(era 1972) .24 1.09 .033 .029 .025 .033 .43 78.3 58.5 32.5 12 (1/2 size) -5
X52 LTV NPS12 8 133062 .066 .72 .023 .021 .014 .042 .005 .037 .026 .01 .028 .14 70.2 62.4 37 NA X70 STELCO NPS36 11 565879 .031 1.54 .021 .0042 .0024 .066 .19 .07 .034 .15 .34 .22 88 74.2 32 NA X80 STELCO NPS 48 16.1 561831 .04 1.74 .37 .002 .014 .04 .31 .076 .004 .32 .28 .012 .029 .008 .27 106.8 86.2 40 168 -5 X70 SUMITOMO NPS 40 19 2822519 .06 1.57 .14 .002 .011 .03 .17 .042 .04 .13 .14 .017 .029 .0034 .0001 .24 98 89 22.1 324 -5

BMT Fleet Technology Limited 5637C.FR
Alternate Welding Processes for In-Service Welding
12
4.3 Task 1.3: Welding Consumable Selection
Based on input from the project team and the consumable suppliers, welding consumables were selected for each grade of pipe. The electrodes selected were to provide suitable matching strength with the parent base metals, exhibit low diffusible hydrogen characteristics, and be able to operate and produce sound welds in each position of welding.
The project sponsors were consulted to determine if candidate off-the-shelf electrodes were available for the SMAW benchmark procedures, as well as the PGMAW, Self Shielded FCAW, and Controlled Dip Transfer Welding Process (i.e., RMD) that were examined. Based on their input, the electrodes shown in Table 4.2 were utilized. Each electrode was selected based on its ability to provide matching strengths to the pipe grade as well as exhibit low diffusible hydrogen characteristics .

BMT Fleet Technology Limited 5637C.FR
Alternate Welding Processes for In-Service Welding
13
Table 4.2: Welding Electrode Properties
Electrode Chemical Composition (%) Mechanical Properties Manufacture AWS
Classification Trade Name
Size Lot Number
Pipe Grade
Application
C Mn Si S P Cu Cr Ni Mo V Ti Al Co Nb UTS (ksi)
YS (ksi)
Elongation (%)
Charpy V-notch ft-lbs (2)
ºF
Hobart E71T8-K6 Fabshield 71K6 (1)
5/64 H01629 X52 .04 .91 .06 .005 .012 <.01 .04 .74 .02 <.01 .72 .25 74 62 30 120 -40
Hobart E81T8-Ni2 J Fabshield 81N2 (1)
5/64 H02453 X80 .02 1.02 .05 .004 .011 <.01 .08 2.28 .02 <.01 .69 .35 88 76 26 96 -40
Hobart E7018-1 H4R 718MC 3/32 X52 Not reported Hobart E7018-1 H4R 718MC (1) 1/8 X52 .05 1.07 .61 .012 .009 .02 .06 <.01 .01 79 66 30 81 -50 ESAB E10018-G Filarc
108MP (1) 1/8 1136191 X80 .07 1.98 .008 .006 .96 .02 .01
Not reported ESAB MIL-10018-M1 Atomarc
10018-M1 (1)
1/8 4A321M02 X80 .035 1.18 .29 .010 .009 .02 1.95 .31 .01
ESAB ER70S-G Spoolarc XTi (3)
.035 X80 .08 1.62 .64 .006 .012 .01 .045
Bohler Thyssen ER70S-6 Thyssen K-Nova (3)
.035 X52 .081 1.33 .61 .012 .008 .12 .04 .03 .005 .002 .021 88 81 24.5 87 -40
Bohler Thyssen ER70S-6 Thyssen K-Nova (3)
.047 X52 .069 1.10 .50 .014 .007 .08 .05 .02 .009 .001 .021 82 69 26.2 53 -20
Notes: (1) Chemical Composition from Weld Pad Analysis (2) Average Absorbed Energy (3) Chemical Composition from Wire Analysis

BMT Fleet Technology Limited 5637C.FR
Alternate Welding Processes for In-Service Welding
14
The project sponsors were consulted to determine if candidate off-the-shelf electrodes were also available for the PMCAW and gas shielded FCAW processes. Hobart Brothers recently had developed two metal cored electrode products for this application and the trade names are MC70 and MC100. Trans Canada Pipelines Limited (TCPL) had been concurrently evaluating the MC100 electrode for X80 grade pipe and their findings were sufficiently appealing to warrant further investigation in this test program. Previous testing by Hobart on their MC70 product demonstrated all weld metal mechanical properties of 78 ksi Yield Strength (YS), 91 ksi Ultimate Tensile Strength (UTS), and an average of 18 ft-lbs at -40°F, which are sufficient properties for X52 grade pipe. The MC100 product had demonstrated 95 ksi YS, 106 ksi UTS, and 41 ft-lbs at -40°F, which are sufficient properties for X80 grade pipe.
TCPL had also been examining gas shielded flux cored products from ESAB for various applications and these are the Dual Shield II 70T-12MJ H4 and Dual Shield II 80Ni1H4 electrodes. The Dual Shield II 70T-12MJH4 is an all position flux cored wire intended for applications with weld metal impact toughness requirements of more than 50 ft-lbs at -60°F, as well as Cracking Tip Opening Displacement (CTOD = industry accepted measurement of fracture toughness characterising a material’s resistance to rapid crack extension) requirements of more than 20 mils at -40°F. The weld metal composition, strength, and diffusible hydrogen characteristics are reportedly similar to an E7018-1 shield metal arc welding (SMAW) electrode, and the typical properties as well as the AWS A5.1 requirements for an E7018-1 electrode are shown in Table 4.3. As shown in Table 3, both electrodes can produce welds with ultimate strength and elongation of the same order of magnitude. The apparent differences in toughness and yield strength are due to the different manner in which they are specified for each material.
Table 4.3: Dual Shield II 70T-12 Typical Properties and E7018-1 Requirements
Temperature (°C)
Avg. Energy (J)
Dual Shield II 70T-12
0.05 1.16 0.31 0.008 0.012 580 531 28 -40 122
E7018-1 Requirements per AWS A5.1
Standard
NS 1.6 max.
0.75 max.
NS NS 0.3 482 min. 399 min. 22 min. -46 27 min.
NS = Not Specified
Charpy V- Notch ImpactTensile Strength
(Mpa)
Yield Strength
(Mpa)
Electrode
Composition (%)* Mechanical Properties
C Mn Si P S Ni%
Elongation
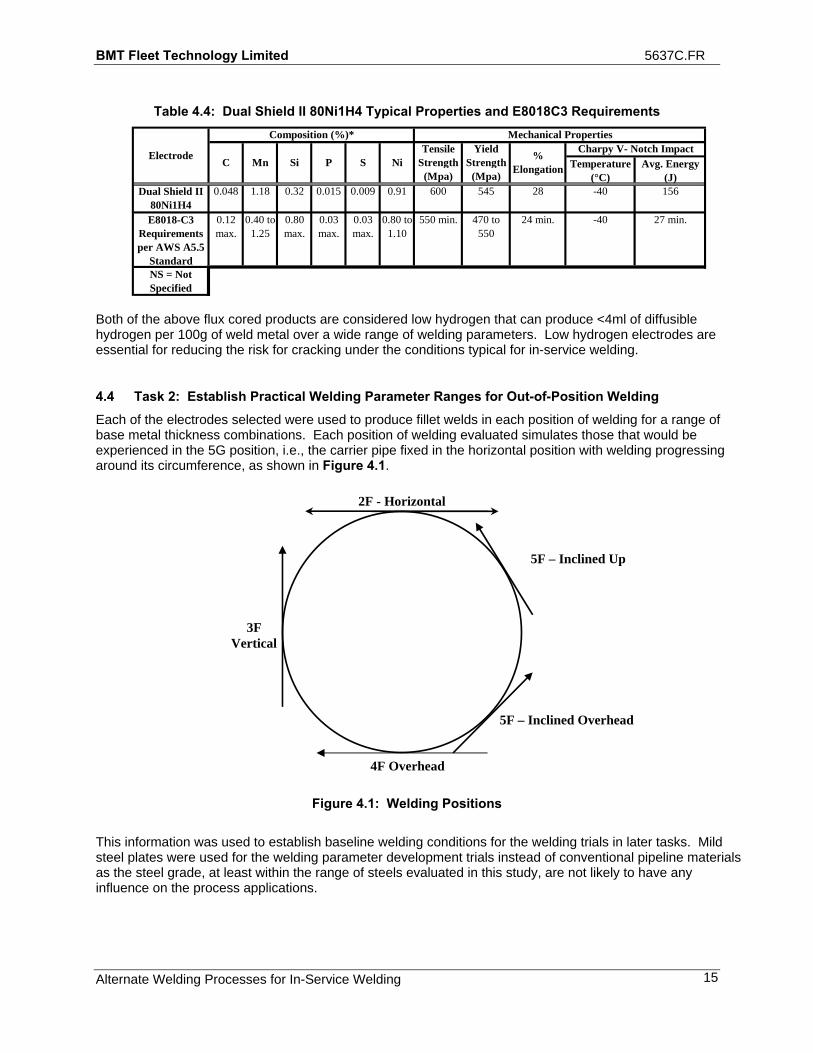
The weld metal analysis of the Dual Shield II 80Ni1H4 is reportedly similar to an E8018-C3 low hydrogen SMAW electrode and produces excellent weld metal toughness in both the as-welded and stress relieved condition, and the typical properties as well as the AWS A5.5 requirements for E8018-C3 electrodes are shown in Table 4.4. As shown in Table 4.4, both electrodes can produce welds with ultimate strength, yield strength and elongation of the same order of magnitude. The apparent differences in toughness are due to the different manner in which it is specified for each material.
BMT Fleet Technology Limited 5637C.FR
Alternate Welding Processes for In-Service Welding
15
Table 4.4: Dual Shield II 80Ni1H4 Typical Properties and E8018C3 Requirements
Temperature (°C)
Avg. Energy (J)
Dual Shield II 80Ni1H4
0.048 1.18 0.32 0.015 0.009 0.91 600 545 28 -40 156
E8018-C3 Requirements per AWS A5.5
Standard
0.12 max.
0.40 to 1.25
0.80 max.
0.03 max.
0.03 max.
0.80 to 1.10
550 min. 470 to 550
24 min. -40 27 min.
NS = Not Specified
Charpy V- Notch ImpactTensile Strength
(Mpa)
Yield Strength
(Mpa)
Electrode
Composition (%)* Mechanical Properties
C Mn Si P S Ni%
Elongation
Both of the above flux cored products are considered low hydrogen that can produce <4ml of diffusible hydrogen per 100g of weld metal over a wide range of welding parameters. Low hydrogen electrodes are essential for reducing the risk for cracking under the conditions typical for in-service welding.
4.4 Task 2: Establish Practical Welding Parameter Ranges for Out-of-Position Welding
Each of the electrodes selected were used to produce fillet welds in each position of welding for a range of base metal thickness combinations. Each position of welding evaluated simulates those that would be experienced in the 5G position, i.e., the carrier pipe fixed in the horizontal position with welding progressing around its circumference, as shown in Figure 4.1.
Figure 4.1: Welding Positions
This information was used to establish baseline welding conditions for the welding trials in later tasks. Mild steel plates were used for the welding parameter development trials instead of conventional pipeline materials as the steel grade, at least within the range of steels evaluated in this study, are not likely to have any influence on the process applications.
2F - Horizontal
3F Vertical
5F – Inclined Up
5F – Inclined Overhead
4F Overhead

BMT Fleet Technology Limited 5637C.FR
Alternate Welding Processes for In-Service Welding
16
The simulated sleeve joint utilized a plate of “T” thickness (representing the parent pipe thickness) and a plate of at least “1.5T” (representing the sleeve thickness) which was selected based on input from TCPL, as shown in Figure 4.2. Parameters were developed for the 2F, 3F, 5F - 45º over-head, and 5F - 45º inclined positions.
Figure 4.2: Sleeve Simulation Joint Configuration
The range of all parameters tested with the SMAW, PGMAW, self shielded FCAW, and RMD processes are tabulated in Appendix B. Note that BOP welds were rated as safe, marginal, and burn-thorough in the table in Appendix B, where:
(a) safe = heat input to avoid burn-through; (b) marginal = HAZ extends to back side of plate however no melting on the backside of
plate occurs; and (c) burn-through = weld has penetrated the plate thickness or melting occurred on the back
side of the plate. These safe and marginal limits were verified in the burn-through susceptibility task based on back surface temperature measurements and weld penetration depths during welding.
The welding parameters that were developed in each position of welding with the PMCAW products and with C15 gas (15%CO2 – bal. Argon) are shown in Table 4.5, using the Miller Axcess 450 power source with their Accu-Pulse technology. Several trials were conducted with various combinations of wire feed speed and pulse parameters to fine tune the arc and the final procedures are considered suitable for depositing single fillet welds (5 and 6mm leg size) in each position as well as for multi-pass welding to achieve larger fillet weld sizes. Cross-sections were extracted from each mock-up to evaluate the depth of penetration and soundness, and a sample weld cross section for MC70 and MC100 are shown in Figure 4.3 and 4.4, respectively, illustrating each position of welding for the smallest X52 and largest X80 pipe wall thicknesses being evaluated. Each cross-section exhibited acceptable bead profiles with equal leg lengths and suitable penetration to the root region. Note that the simulated sleeve thickness was at least 1.5 times the thickness of the thinner base plate.
T
2T

BMT Fleet Technology Limited 5637C.FR
Alternate Welding Processes for In-Service Welding
17
Table 4.5: Hobart MC70 and MC100 Parameters
Base Plate Thickness
(mm)
Single Fillet Weld Leg
Size (mm)
Position Wire Feed Speed
(in/min)
Amperage(A)
Voltage (V)
Travel Speed
(in/min)
Heat Input
(kJ/mm)
X52 – MC70
2F
6.4 5 200 140 20.5 13 0.52 8 6 240 165 20 10.5 0.74
X80 - MC100 11 6 240 165 20 10.5 0.74
16.1 6 240 165 20 10.5 0.74 19.1 6 240 165 20 10.5 0.74
X52 – MC70
3F - up
6.4 5 180 115 19.5 6 0.88 8 6 180 130 18.5 8 0.71
X80 – MC100 11 6 180 130 18.5 8 0.71
16.1 6 180 130 18.5 8 0.71 19.1 6 180 130 18.5 8 0.71
X52 – MC70
4F
6.4 5 180 135 20.5 10 0.65 8 6 180 135 19.5 8.5 0.73
X80 – MC100 11 6 180 135 19.5 8.5 0.73
16.1 6 180 135 19.5 8.5 0.73 19.1 6 180 135 19.5 8.5 0.73
X52 – MC70
5F
6.4 5 180 135 20.5 8 0.82 8 6 180 130 20 7.5 0.82
X80 – MC100 11 6 180 130 20 7.5 0.82
16.1 6 180 130 20 7.5 0.82 19.1 6 180 130 20 7.5 0.82

BMT Fleet Technology Limited 5637C.FR
Alternate Welding Processes for In-Service Welding
18
Figure 4.3: Weld Cross-sections for 6.4mm Pipe Wall X52 Simulations
Figure 4.4: Cross-sections for 19mm Pipe Wall X80 Simulations
The welding parameters that were developed in each position of welding with the gas shielded FCAW products and C25 gas (25% CO2 – bal. Argon) are shown in Table 4.6 and 4.7, using a conventional constant voltage (CV) power source. The final welding procedures are considered suitable for depositing single fillet welds (5 and 6mm leg size) in each position as well as for multi-pass welding to achieve larger fillet weld sizes. Cross-sections were extracted from each mock-up to evaluate the depth of penetration and soundness, and sample weld cross sections are shown in Figure 4.5 and 4.6 illustrating each position of welding for the smallest X52 and largest X80 pipe wall thicknesses being evaluated. Each cross section exhibited acceptable bead profiles with equal leg lengths and suitable penetration to the root region.
MC100
MC70

BMT Fleet Technology Limited 5637C.FR
Alternate Welding Processes for In-Service Welding
19
Table 4.6: ESAB Dual Shield II 70T-12 Parameters
Base Plate Thickness
(mm)
Single Fillet Weld Leg
Size (mm)
Position Wire Feed Speed
(in/min)
Amperage(A)
Voltage (V)
Travel Speed
(in/min)
Heat Input
(kJ/mm)
6.4 5 2F
325 200 25.5 12 1.00 8 6 360 220 26.5 12 1.15
6.4 5
3F - up 325 205 25.5 9.5 1.30
8 6 330 210 26.5 8 1.64
6.4 5 4F
320 200 25 12 0.98 8 6 345 215 25.5 11 1.18
6.4 5
5F 320 200 24.5 10 1.16
8 6 345 215 25.5 8.5 1.52
Table 4.7: ESAB Dual Shield II 80 NiMH4 Parameters
Base Plate Thickness
(mm)
Single Fillet Weld Leg
Size (mm)
Position Wire Feed Speed
(in/min)
Amperage(A)
Voltage (V)
Travel Speed
(in/min)
Heat Input
(kJ/mm)
11 6 2F
360 215 26.5 11 1.22 16.1 6 360 215 26.5 11 1.22 19.1 6 360 215 26.5 11 1.22
11 6
3F-up 325 190 26 8 1.46
16.1 6 325 190 26 8 1.46 19.1 6 325 190 26 8 1.46
11 6
4F 345 210 25.5 9.5 1.33
16.1 6 345 210 25.5 9.5 1.33 19.1 6 345 210 25.5 9.5 1.33
11 6
5F 345 215 25.5 9.5 1.36
16.1 6 345 215 25.5 9.5 1.36 19.1 6 345 215 25.5 9.5 1.36

BMT Fleet Technology Limited 5637C.FR
Alternate Welding Processes for In-Service Welding
20
Figure 4.5: Weld Cross-sections for 6.4mm Pipe Wall X52 Simulations
Figure 4.6: Cross-sections for 19mm Pipe Wall X80 Simulations
4.5 Task 3: Examination the Potential for Burn-Through for the Selected Processes
The objective of this task was to numerically predict the susceptibility of each welding process and procedure to burn-through over the entire range of practical heat inputs developed in Task 2. The primary factors determining the susceptibility to burn-through include the peak back surface temperature, depth of weld penetration and wall thickness, and pipeline operating pressure. Calculations based upon the “ASME B31G” formulation were used to determine the required operating pressure to cause a burn-through / bulging event with each of the welds deposited. The “ASME B31G” type calculations considered material with a peak temperature above 1000oC as a corrosion feature and applied a temperature based material strength reduction to the remaining ligament.

BMT Fleet Technology Limited 5637C.FR
Alternate Welding Processes for In-Service Welding
21
Bead on pipe welds were deposited over the range of pipe thicknesses evaluated (i.e. 3.2, 6.4, 7.9, 11, 16.1, and 19mm) for the X52 and X80 materials. The 3.2mm wall thickness was achieved by slotting a 6.4mm wall X52 pipe, using a 20mm wide square bottom machining mill cutter, as shown in Figure 4.7, for simulating welds on thin walled pipe. The 3.2mm thicknesses were verified in each region using an ultrasonic thickness gauge. Each intended weld zone was instrumented with K-type thermocouples along the centreline axis of the welds, on both the back surface of the pipe and in the weld. This method is effective in acquiring the actual thermal history at both the back surface and at the weld fusion line (as shown in Figure 4.8), compared to thermocouple plunging. The thermocouples were attached to a high speed temperature acquisition system at a collection frequency of 25Hz.
Figure 4.7: Slotted Pipe to Achieve 3.2mm Thickness
Figure 4.8: Thermocouple Set-up
Weld Thermocouple
Location
Back Surface Thermocouple Location along
Weld Centerline
BEFORE
AFTER
Thermocouple Drilled Hole
Pipe Wall Thickness
Weld

BMT Fleet Technology Limited 5637C.FR
Alternate Welding Processes for In-Service Welding
22
All welding was initially performed in still air (no flow conditions) to simulate the worst case scenario for burn-through to occur, however the same welds were repeated at a later stage with water backing to determine if a higher heat sink capacity could extend the safety envelope for in-service welding with the alternative welding processes.
4.5.1 Weld Burn-through – Static Air (No Flow)
After fine tuning the welding procedures developed in Task 2, a series of bead on pipe welds were deposited using mechanized travel to achieve the predetermined heat input level, examples of welding with both wire fed and SMAW processes are shown in Figures 4.9 and 4.10, respectively.
Figure 4.9: Set-up for Controlled Welding with Semi-Automatic Processes

BMT Fleet Technology Limited 5637C.FR
Alternate Welding Processes for In-Service Welding
23
Figure 4.10: Set-up for Controlled Welding with SMAW Process
All welding data for bead on pipe welds for static air (no flow) conditions is shown in Appendix C. The thermocouple data was acquired at a scanning frequency of 25Hz. The thermocouple ID number is the same as the weld number. An example of the typical thermal history plots showing both weld and back surface temperature histories are shown in Figure 4.11 and 4.12, for welds A62 and A63, respectively. Note the increase in peak back surface temperature and as well as the longer weld cooling rate with increasing the heat input from 0.53kJ/mm to 1.29kJ/mm.
Weld A62X52, 7.9mm Thickness Pulsed MCAW
0.53kJ/mm Heat Input
0.00E+00
2.00E+02
4.00E+02
6.00E+02
8.00E+02
1.00E+03
1.20E+03
1.40E+03
+000
:00:
00
+000
:00:
10
+000
:00:
21
+000
:00:
32
+000
:00:
43
+000
:00:
54
+000
:01:
05
+000
:01:
16
+000
:01:
27
+000
:01:
37
+000
:01:
48
+000
:01:
59
+000
:02:
10
+000
:02:
21
+000
:02:
32
+000
:02:
43
+000
:02:
54
+000
:03:
04
Time (hh:mm:ss)
Tem
per
atu
re (
C)
Weld
Back Surface
Figure 4.11: Thermal History of Weld and Back Surface

BMT Fleet Technology Limited 5637C.FR
Alternate Welding Processes for In-Service Welding
24
Weld A63X52, 7.9mm Thickness, Pulsed MCAW
1.29 kJ/mm Heat Input
0.00E+00
2.00E+02
4.00E+02
6.00E+02
8.00E+02
1.00E+03
1.20E+03
1.40E+03
+000
:00:
00
+000
:00:
26
+000
:00:
53
+000
:01:
20
+000
:01:
47
+000
:02:
14
+000
:02:
41
+000
:03:
07
+000
:03:
34
+000
:04:
01
+000
:04:
28
+000
:04:
55
+000
:05:
22
+000
:05:
48
+000
:06:
15
+000
:06:
42
+000
:07:
09
+000
:07:
36
Time (hh:mm:ss)
Tem
per
atu
re (
C)
Weld
Back Surface
Figure 4.12: Thermal History of Weld and Back Surface
Each of peak back surface temperature measurements was plotted vs. welding process for heat inputs of .53 and 1.29 kJ/mm, and are shown in Figure 4.13. This data shows that for a given heat input, the PMCAW provides the greatest peak back surface temperature, followed by the GSFCAW, PGMAW, and SMAW process. The self shielded FCAW process demonstrates the highest peak back surface temperatures at the 1.29 kJ/mm level.
Figure 4.13: Peak Back Surface Temperatures vs. Heat Input and Process

BMT Fleet Technology Limited 5637C.FR
Alternate Welding Processes for In-Service Welding
25
Welds were cross-sectioned to measure the depths of penetration and to determine the remaining base metal ligament thickness between the root of the weld and the back surface of the pipe. Sample weld cross-sections for welds A62 and A63 using the P-MCAW process on 7.9mm X52 pipe at heat inputs of 0.53 kJ/mm and 1.29 kJ/mm, are shown in Figures 4.14 and 4.15, respectively. All remaining bead on pipe weld cross-sections for static air conditions are shown in Appendix D.
Figure 4.14: Weld A62 Macro, 0.53 kJ/mm, 2.5X Mag
Figure 4.15: Weld A63 Macro, 1.29 kJ/mm, 2.5X Mag.
Since the weld temperature history of the weld fusion line and back surface were obtained, the thermal transients between these two regions could therefore be interpolated. This thermal history, along with the weld travel speed, was used to estimate a flaw size based on a zero strength at 1000ºC temperature limit correlation, as calculated in Figure 4.16.

BMT Fleet Technology Limited 5637C.FR
Alternate Welding Processes for In-Service Welding
26
Welding Conditions T1000 = Isotherm (1000oC) g = plate thickness (mm) Tbs = Back surface temperature (oC) L = “flaw” length = v x T1000-1000 T1-5 = Interpolated temperature in layers 1 through 5 v = weld travel speed (mm/s) T1000-1000 = Time between 1000oC for heating and cooling cycles d = “flaw” depth = depth to 1000oC isotherm Calculations
Pint = Burst Pressure (MPa) m
f
D
g
2
f = hoop stress @ burst
11
1
To
oflow
MAA
AA
Dm = mean pipe diameter (mm) A = area of “flaw” dL
Ao = area of plate gL
flow = average flow stress for remaining ligament 5
54321flowflowflowflowflow
MT = Folias Factor 2
1
224
2
003375.06275.01
gD
L
Dg
L for
Dg
L2
50
3.3032.02
Dg
L for
Dg
L2
> 50
iflow = flow stress at layer i = i
fiYS C
iYS = Yield Stress at layer i = 0.11085.11051.21038.1 42639 TxTxTx iiYS
YS = Room Temperature Yield Stress (MPa) Ti = Temperature at layer i
ifC = flow stress correction = 0.11085.11051.21038.195.68 42639 TxTxTx ii
Figure 4.16: Methodology and Calculations for Determining Burn-through
L
g
Tbs
T1000 d
1 2 3 4 5
Weld Travel Speed v (mm/s)

BMT Fleet Technology Limited 5637C.FR
Alternate Welding Processes for In-Service Welding
27
The results of the burn-through calculations are presented in Tables 4.8 and 4.9 where the information can be plotted as Burst Pressure over Maximum Operating Pressure (MOP = 72% pipe yield pressure). Note that the values in red are for welds where the back surface temperature (ID of pipe) during welding reached at least 1000°C and that the effective flow stresses to cause a burst event is essentially any pressure over 0 Mpa. This data can be used to estimate the susceptibility to burn-through with each welding process over a range of heat inputs and material thicknesses, at a given percentage of MOP, as shown in Figures 4.17 and 4.18, where any value below each curve for a given welding process is considered a safe region. In the examples shown, these curves illustrate that as heat input increases from 0.53 to 1.29 kJ/mm, the arc efficiency of the process has a greater influence on heat transfer, depth of penetration, and the susceptibility to burn-through. For example, the FCAW and P-GMAW processes have theoretically higher arc efficiencies (i.e., transfer heat from the arc to the base metal more efficiently) when compared to the SMAW process, and are therefore more susceptible to burn-through at a given heat input. As heat input increases from 0.53 kJ/mm to 1.29 kJ/mm, the arc efficiency characteristics become more apparent as demonstrated by the increasing separation of their curves with increasing heat input. This is consistent with what was illustrated previously in the peak back surface temperature plot in Figure 4.13. Figure 4.19 illustrates the results of both the combined 0.53 and 1.29 kJ/mm heat inputs.
Because these burst pressure values are presented in non-dimensional form, ratio of burst pressure to maximum operating pressure (MOP), the results may be used to consider a range of pipe material grades and geometries.

BMT Fleet Technology Limited 5637C.FR
Alternate Welding Processes for In-Service Welding
28
Table 4.8: Burst Pressure Calculations
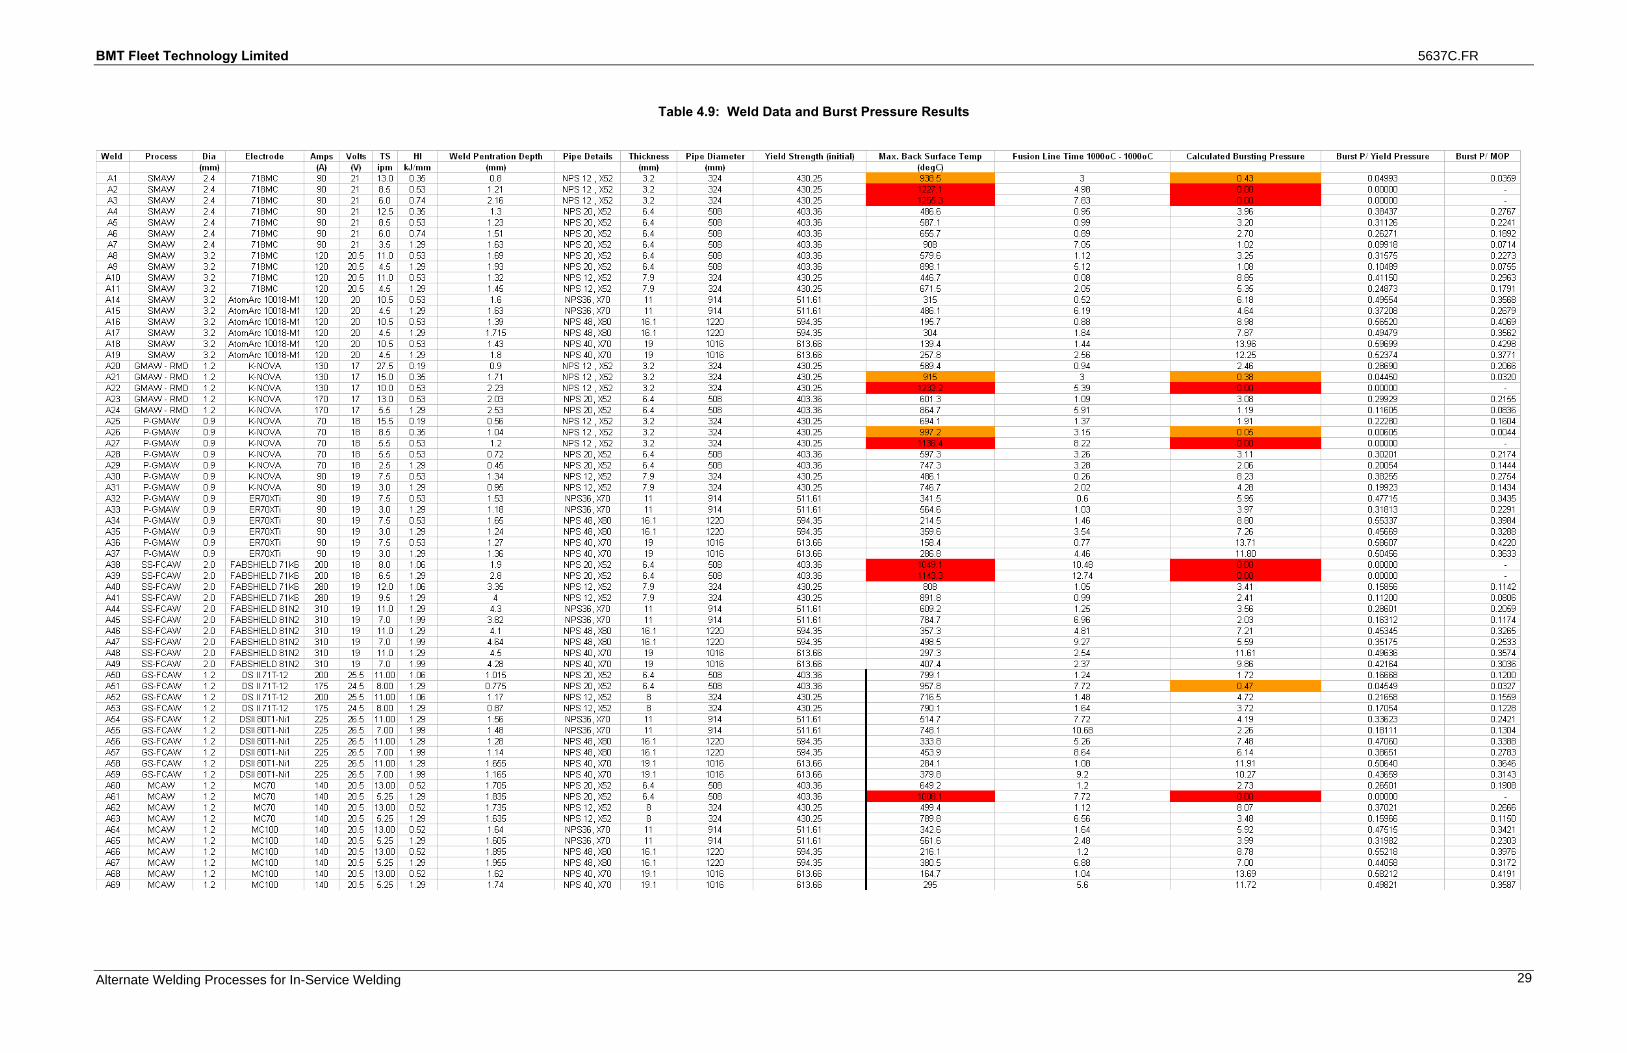
BMT Fleet Technology Limited 5637C.FR
Alternate Welding Processes for In-Service Welding
29
Table 4.9: Weld Data and Burst Pressure Results

BMT Fleet Technology Limited 5637C.FR
Alternate Welding Processes for In-Service Welding
30
0.53 kJ/mm
0.000
0.050
0.100
0.150
0.200
0.250
0.300
0.350
0.400
0.450
0.500
0 5 10 15 20 25
Thickness (mm)
Bu
rst
Pre
ss
ure
/ M
AO
P
SMAW
GMAW
P-GMAW
MCAW
Figure 4.17: Burst Pressure/MOP (%) vs. Thickness and Weld Process – 0.53kJ/mm
1.29 kJ/mm
0.000
0.050
0.100
0.150
0.200
0.250
0.300
0.350
0.400
0.450
0.500
0 5 10 15 20 25
Thickness (mm)
Bu
rst
Pre
ss
ure
/ M
AO
P
SMAW
P-GMAW
SS-FCAW
GS-FCAW
MCAW
Figure 4.18: Burst Pressure/MOP (%) vs. Thickness and Weld Process - 1.29kJ/mm

BMT Fleet Technology Limited 5637C.FR
Alternate Welding Processes for In-Service Welding
31
Combined
0.000
0.050
0.100
0.150
0.200
0.250
0.300
0.350
0.400
0.450
0.500
0 5 10 15 20 25
Thickness (mm)
Bu
rst
Pre
ssu
re /
MA
OP
3.2mm SMAW - 1.29kJ/mm
PGMAW - 1.29kJ/mm
SS-FCAW - 1.29kJ/mm
GS-FCAW - 1.29kJ/mm
MCAW - 1.29kJ/mm
3.2mm SMAW - 0.53kJ/mm
GMAW - RMD - 0.53kJ/mm
PGMAW - 0.53kJ/mm
MCAW - 0.53kJ/mm
2.4mm SMAW - 0.53kJ/mm
Figure 4.19: Burst Pressure/MOP (%) vs. Thickness and Weld Process, Combined Heat Inputs
4.5.2 Water Backed Burn-through Predictions
Although outside the scope of the original work plan, welds for static air deposited in the 6.4, 8, and 11mm thicknesses were reproduced with water backed conditions. This task was investigated to determine if the water backing would provide sufficient heat sink capacity to extend the limits of in-service welding. The set-up for welding with water backing for both bead on pipe and for fillet welding of sleeves is illustrated in Figure 4.20. It should be noted that the burn-through calculations are only based on the bead on pipe data and not for fillet welds. All welding data for bead on pipe welds deposited with water backing is shown in Appendix E. The thermocouple data was acquired at a scanning frequency of 25Hz. The thermocouple ID number is the same as the weld number. An example of the typical thermal history plots showing both weld and back surface temperature histories are shown in Figure 4.21 and 4.22, for welds FW62 and FW63, respectively. All remaining bead on pipe weld cross-sections for water backed conditions are shown in Appendix F.

BMT Fleet Technology Limited 5637C.FR
Alternate Welding Processes for In-Service Welding
32
Figure 4.20: Water Backed Set-up
Figure 4.21: Weld FW62 Macro, 0.53 kJ/mm, 2.5X Mag

BMT Fleet Technology Limited 5637C.FR
Alternate Welding Processes for In-Service Welding
33
Figure 4.22: Weld FW63 Macro, 1.29 kJ/mm, 2.5X Mag.
The results of the burn-through calculations for water backed conditions are presented in Tables 4.10 and 4.11 where the information can be plotted as Burst Pressure over Maximum Operating Pressure (MOP = 72% pipe yield pressure). Note that the values in red are for welds where the back surface temperature (ID of pipe) during welding reached at least 1000°C and that the effective flow stresses to cause a burst event is essentially any pressure over 0 Mpa. This data can be used to estimate the susceptibility to burn-through with each welding process over a range of heat inputs and material thicknesses, at a given percentage of MOP, as shown in Figures 4.23 and 4.24, where any value below each curve for a given welding process is considered a safe region. It should be noted that none of the welding procedures evaluated with water backing reached a peak back surface temperature of 1000°C, and therefore shows that the higher heat sink capacity of forced cooling provides a greater heat input window for safe in-service welding practice. Figure 4.25 illustrates the results of both 0.53 and 1.29 kJ/mm heat inputs combined.

BMT Fleet Technology Limited 5637C.FR
Alternate Welding Processes for In-Service Welding
34
Table 4.10: Burst Pressure Calculations

BMT Fleet Technology Limited 5637C.FR
Alternate Welding Processes for In-Service Welding
35
Table 4.11: Weld Data and Burst Pressure Results

BMT Fleet Technology Limited 5637C.FR
Alternate Welding Processes for In-Service Welding
36
0.53 kJ/mm
-
0.05
0.10
0.15
0.20
0.25
0.30
0.35
0.40
0.45
0.50
0 2 4 6 8 10 12
Thickness (mm)
Bu
rst
Pre
ss
ure
/ M
OP
MCAW
P-GMAW
SMAW
Figure 4.23: Burst Pressure/MOP (%) vs. Thickness and Weld Process - 0.53kJ/mm
1.29 kJ/mm
-
0.05
0.10
0.15
0.20
0.25
0.30
0.35
0.40
0.45
0.50
0 2 4 6 8 10 12
Thickness (mm)
Bu
rst
Pre
ss
ure
/ M
OP
GS-FCAW
P-GMAW
SMAW
MCAW
Figure 4.24: Burst Pressure/MOP (%) vs. Thickness and Weld Process - 1.29kJ/mm

BMT Fleet Technology Limited 5637C.FR
Alternate Welding Processes for In-Service Welding
37
Combined
-
0.05
0.10
0.15
0.20
0.25
0.30
0.35
0.40
0.45
0.50
0 2 4 6 8 10 12
Thickness (mm)
Bu
rst
Pre
ss
ure
/ M
OP
MCAW - 0.53kJ/mm
SMAW - 0.53kJ/mm
P-GMAW - 0.53kJ/mm
MCAW - 1.29kJ/mm
SMAW - 1.29kJ/mm
P-GMAW - 1.29kJ/mm
GS-FCAW - 1.29kJ/mm
Figure 4.25: Burst Pressure / MOP (%) vs. Thickness and Weld Process – 0.53 and 1.29kJ/mm
4.6 Task 4: Examine Cooling Rates as a Function of Welding Process Arc Efficiency
The weld temperature history, calculated cooling rates, HAZ and weld metal hardness measurements, and maximum back surface temperatures from each of the welds under static air (no flow conditions) are shown in Table 4.12. Only the alloyed weld metals were measured for hardness as mild steel “weld metals” are typically not as sensitive to delayed cracking compared to those highly alloyed weld metals typically used in low CE high strength pipeline materials. To acquire the required data, each test weld deposited on pipe measured a length of six (6) inches and the travel speed was maintained at a predetermined rate with mechanized travel. Using the methods outlined previously, thermocouples were used to acquire the thermal data from both the weld and back surface temperature for each weld deposited. The collected weld thermal data can be used to plot the cooling rate of each process over a range of thickness, as shown in Figures 4.26 and 4.27.

BMT Fleet Technology Limited 5637C.FR
Alternate Welding Processes for In-Service Welding
38
Table 4.12: Cooling Data and Hardness Results – Static Air
∆T 800-500C Slope at 540C(mm) (kJ/mm) (s) (degC / sec)
A1 3.2 X52 0.16 SMAW 0.35 6.06 -38 218 217 215 216 214 195 197 201 199 202 202 199A2 3.2 X52 0.16 SMAW 0.53 9.2 -20 221 218 213 217 220 190 195 204 197 192 204 196A3 3.2 X52 0.16 SMAW 0.74 14.59 -18 215 217 210 213 214 201 197 210 204 202 210 203A4 6.4 X52 0.43 SMAW 0.35 2.56 -59.5 155 164 175 172 166 386 345 303 313 336 386 337A5 6.4 X52 0.43 SMAW 0.53 6.56 -29.5 188 176 199 182 182 262 299 234 280 280 299 271A6 6.4 X52 0.43 SMAW 0.74 12.3 -22.5 199 200 201 200 202 234 232 229 232 227 234 231A7 6.4 X52 0.43 SMAW 1.29 22.36 -19.5 209 205 207 205 204 212 221 216 221 223 223 219A8 6.4 X52 0.43 SMAW 0.53 6.57 -17.5 214 227 226 231 232 202 180 182 174 172 202 182A9 6.4 X52 0.43 SMAW 1.29 25.54 -12 223 226 224 224 223 186 182 185 185 186 186 185A10 8 X52 0.14 SMAW 0.53 5.02 -52.5 215 215 213 216 215 201 201 204 199 201 204 201A11 8 X52 0.14 SMAW 1.29 23.29 -14.5 221 223 223 223 211 190 186 186 186 208 208 191A12 6.4 X52 0.43 P-GMAW 0.35 4.63 -46 157 180 181 167 172 376 286 283 332 313 376 318A14 11 X70 0.22 SMAW 0.53 3.34 -63 182 182 181 180 180 177 182 180 184 280 280 283 286 286 296 280 286 274 286 296 283 284A15 11 X70 0.22 SMAW 1.29 10.88 -6 194 193 199 194 194 187 196 195 192 246 249 234 246 246 265 241 244 252 249 265 244 250A16 16.1 X80 0.27 SMAW 0.53 2.66 -92 172 171 174 171 171 175 180 180 179 313 317 306 317 317 303 286 286 289 317 303 314 291A17 16.1 X80 0.27 SMAW 1.29 10.04 -23 173 179 178 180 179 184 191 190 190 310 289 293 286 289 274 254 257 257 310 274 293 260A18 19.1 X70 0.24 SMAW 0.53 2.5 -88.5 175 175 180 178 176 176 183 176 181 303 303 286 293 299 299 277 299 283 303 299 297 290A19 19.1 X70 0.24 SMAW 1.29 9.35 -29.5 190 190 193 199 198 184 186 188 191 257 257 249 234 237 274 268 262 254 257 274 247 265A20 3.2 X52 0.16 GMAW - RMD 0.19 2.55 -80.5 211 211 213 209 206 208 208 204 212 218 218 210A21 3.2 X52 0.16 GMAW - RMD 0.35 5.96 -43 212 211 212 212 213 206 208 206 206 204 208 206A22 3.2 X52 0.16 GMAW - RMD 0.53 8.49 -20 212 213 213 214 211 206 204 204 202 208 208 205A23 6.4 X52 0.43 GMAW - RMD 0.53 5.89 -28.5 180 181 187 192 193 286 283 265 252 249 286 267A24 6.4 X52 0.43 GMAW - RMD 1.29 30.59 -0.5 209 209 211 214 211 212 212 208 202 208 212 209A25 3.2 X52 0.16 P-GMAW 0.19 2.9 -68 211 213 214 211 212 208 204 202 208 206 208 206A26 3.2 X52 0.16 P-GMAW 0.35 7.14 -36.5 211 212 217 213 217 208 206 197 204 197 208 203A27 3.2 X52 0.16 P-GMAW 0.53 14.13 -20 217 212 215 215 215 197 206 201 201 201 206 201A28 6.4 X52 0.43 P-GMAW 0.53 8.01 -23.5 222 181 195 192 193 188 283 244 252 249 283 243A29 6.4 X52 0.43 P-GMAW 1.29 24.46 -8.89 209 212 208 215 216 212 206 214 201 199 214 206A30 8 X52 0.14 P-GMAW 0.53 7.63 -37 213 216 219 217 217 204 199 193 197 197 204 198A31 8 X52 0.14 P-GMAW 1.29 27.49 -8 229 224 227 225 222 177 185 180 183 188 188 183A32 11 X70 0.22 P-GMAW 0.53 2.83 -37 186 182 181 180 182 186 186 189 188 268 280 283 286 280 268 268 260 262 286 268 279 264A33 11 X70 0.22 P-GMAW 1.29 23.02 -8.34 198 198 197 197 198 203 204 204 207 237 237 239 239 237 225 223 223 216 239 225 237 222A34 16.1 X80 0.27 P-GMAW 0.53 4.14 -66.5 173 169 172 173 173 179 184 185 181 310 325 313 310 310 289 274 271 283 325 289 313 279A35 16.1 X80 0.27 P-GMAW 1.29 12.62 -25 182 182 183 182 185 198 199 185 198 280 280 277 280 271 237 234 271 237 280 271 278 245A36 19.1 X70 0.24 P-GMAW 0.53 3.11 -86 181 184 179 178 176 175 175 180 178 283 274 289 293 299 303 303 286 293 299 303 288 296A37 19.1 X70 0.24 P-GMAW 1.29 7.22 -32 193 197 194 188 189 196 194 198 198 249 239 246 262 260 241 246 237 237 262 246 251 240A38 6.4 X52 0.43 SS-FCAW 1.06 31.44 -8.5 215 214 216 217 217 201 202 199 197 197 202 199A39 6.4 X52 0.43 SS-FCAW 1.29 37.09 -8.5 212 219 217 217 219 206 193 197 197 193 206 197A40 8 X52 0.14 SS-FCAW 1.06 18.9 -13.5 225 225 229 225 221 183 183 177 183 190 190 183A41 8 X52 0.14 SS-FCAW 1.29 27.73 -6 223 228 228 226 230 186 178 178 182 175 186 180A44 11 X70 0.22 SS-FCAW 1.29 22.71 -14.5 197 196 199 200 200 204 203 203 204 239 241 234 232 232 223 225 225 223 241 225 236 224A45 11 X70 0.22 SS-FCAW 1.99 39.91 -2.5 202 202 204 202 204 206 211 205 208 227 227 223 227 223 218 208 221 214 227 221 225 215A46 16.1 X80 0.27 SS-FCAW 1.29 7.68 -23 180 179 180 184 180 191 190 192 196 286 289 286 274 286 254 257 252 241 289 257 284 251A47 16.1 X80 0.27 SS-FCAW 1.99 17.51 -8 192 190 192 191 196 202 203 199 200 252 257 252 254 241 227 225 234 232 257 234 251 230A48 19.1 X70 0.24 SS-FCAW 1.29 4.99 -24.4 192 196 196 196 195 191 197 193 198 252 241 241 241 244 254 239 249 237 252 254 244 245A49 19.1 X70 0.24 SS-FCAW 1.99 16.2 -15 201 201 201 204 205 203 203 206 206 229 229 229 223 221 225 225 218 218 229 225 226 222A50 6.4 X52 0.43 GS-FCAW 1.06 21.12 -7.2 208 209 217 209 210 214 212 197 212 210 214 209A51 6.4 X52 0.43 GS-FCAW 1.29 35.24 -6.375 210 208 210 208 213 210 214 210 214 204 214 211A52 8 X52 0.14 GS-FCAW 1.06 16.16 -10.625 222 223 226 224 221 188 186 182 185 190 190 186A53 8 X52 0.14 GS-FCAW 1.29 24.04 -9.875 226 225 226 225 225 182 183 182 183 183 183 183A54 11 X70 0.22 GS-FCAW 1.29 7.56 -77.25 199 201 198 198 198 200 202 201 200 234 229 237 237 237 232 227 229 232 237 232 235 230A55 11 X70 0.22 GS-FCAW 1.99 37.88 -3.75 211 212 209 210 210 209 211 212 212 208 206 212 210 210 212 208 206 206 212 212 209 208A56 16.1 X80 0.27 GS-FCAW 1.29 6.01 -37.5 183 182 181 182 185 194 197 197 201 277 280 283 280 271 246 239 239 229 283 246 278 238A57 16.1 X80 0.27 GS-FCAW 1.99 15.62 -6 195 188 192 187 191 202 202 203 203 244 262 252 265 254 227 227 225 225 265 227 255 226A58 19.1 X70 0.24 GS-FCAW 1.29 6.38 -34.5 190 197 197 194 191 194 194 202 202 257 239 239 246 254 246 246 227 227 257 246 247 237A59 19.1 X70 0.24 GS-FCAW 1.99 13.42 -25.5 202 204 203 204 206 211 210 209 211 227 223 225 223 218 208 210 212 208 227 212 223 210A60 6.4 X52 0.43 MCAW 0.53 7.28 -25.75 198 191 203 190 195 237 254 225 257 244 257 243A61 6.4 X52 0.43 MCAW 1.29 41.4 -6.5 215 214 222 219 220 201 202 188 193 192 202 195A62 8 X52 0.14 MCAW 0.53 4.6 -13.32 218 219 223 220 218 195 193 186 192 195 195 192A63 8 X52 0.14 MCAW 1.29 28.52 -9.375 228 227 231 231 228 178 180 174 174 178 180 177A64 11 X70 0.22 MCAW 0.53 3 -73.125 189 187 188 186 187 175 176 177 178 260 265 262 268 265 303 299 296 293 268 303 264 298A65 11 X70 0.22 MCAW 1.29 16.08 -12.875 207 205 206 205 209 191 194 195 194 216 221 218 221 212 254 246 244 246 221 254 218 248A66 16.1 X80 0.27 MCAW 0.53 2.92 -95 175 175 175 176 174 175 173 178 186 303 303 303 299 306 303 310 293 268 306 310 303 293A67 16.1 X80 0.27 MCAW 1.29 6.93 -66 187 194 185 188 189 188 188 190 191 265 246 271 262 260 262 262 257 254 271 262 261 259A68 19.1 X70 0.24 MCAW 0.53 2.76 -88.875 182 181 185 177 194 179 178 176 177 280 283 271 296 246 289 293 299 296 296 299 275 294A69 19.1 X70 0.24 MCAW 1.29 6.64 -36.625 197 195 196 198 196 196 190 190 189 239 244 241 237 241 241 257 257 260 244 260 240 254
Ocular Reading Hardness (Hv5)
Grade C.E1 2 3 45 1 2 31 2 3 41 2 3 4 CGHAZ Sleeve Weld1 2 3 4 5 1 2 3 CGHAZ Pipe CGHAZ Sleeve Weld CGHAZ Pipe
Pipe Thickness Heat InputWeld ID Process
Peak Hardness (Hv5) Average Hardness (Hv5)
Location
Cooling Rate CGHAZ - Pipe Side CG-HAZ Sleeve WeldCGHAZ - Pipe Side CG-HAZ Sleeve Weld

BMT Fleet Technology Limited 5637C.FR
Alternate Welding Processes for In-Service Welding
39
Heat Input vs. Cooling Rate P-MCAW
0
5
10
15
20
25
30
35
40
45
6.4 8 11 16.1 19.1
Thickness (mm)
Co
oli
ng
Rat
e (8
/5)
-(s)
0.53 kJ/mm
1.29 kJ/mm
Figure 4.26: Cooling Rate vs. Heat Input, P-MCAW Process
Welding Process vs Cooling RateHeat Input 1.29kJ/mm
0
5
10
15
20
25
30
35
40
45
6.4 8 11 16.1 19.1
Thickness (mm)
Co
oli
ng
Rat
e (8
/5)
- (s
)
GS-FCAW
P-MCAW
Figure 4.27: Cooling Rate vs. Welding Process, Heat Input 1.29 kJ/mm
Figure 4.27 shows that at a constant heat input of 1.29 kJ/mm, the P-MCAW process produces a slower cooling rate for a given thickness compared to the GS-FCAW process. This again is an effect of arc efficiency and could be advantageous in terms of using a specific process to produce softer weld zone microstructures that are less susceptible to delayed hydrogen cracking.

BMT Fleet Technology Limited 5637C.FR
Alternate Welding Processes for In-Service Welding
40
The hardness results when plotted vs. heat input and process (shown in Figures 4.28 to 4.32), show a general trend of decreasing hardness with increasing heat input as expected, however there is an even more interesting trend that shows the SMAW process results in the highest hardness at a given heat input level, with a downward trend in hardness vs. process at a given heat input level proceeding from the PGMAW to FCAW to PMCAW processes. This indicates that the processes with the higher arc efficiencies (i.e., transfer more heat from the arc to the base material) result in lower CGHAZ hardnesses regardless of material type and thickness. Based on these results, the SMAW process has the lowest arc efficiency (as demonstrated by the highest hardness) and the PMCAW has the highest arc efficiency (as demonstrated by the lowest hardness). As demonstrated in Figure 4.27, the MCAW process produced slower cooling rates vs. the FCAW process for a given heat input which in theory should provide a softer HAZ hardness. The plots in Figures 4.29 to 4.32 prove this theory is correct.
Heat Input vs. Hardness - BOPNPS20, API X52, 6.4mm, 0.43CE
170
190
210
230
250
270
290
310
330
0.5 1 1.5 2
Heat Input (kJ/mm)
CG
HA
Z H
ard
ne
ss
(H
v)
SMAW 2.4
SMAW 3.2
PGMAW
PMCAW
Figure 4.28: Heat Input vs. Hardness, 6.4mm

BMT Fleet Technology Limited 5637C.FR
Alternate Welding Processes for In-Service Welding
41
Welding Process vs Heat and HardnessNPS12, API X52, 7.9mm, 0.14CE
170
190
210
230
250
270
290
310
330
0.5 1 1.5 2
Heat Input (kJ/mm)
CG
HA
Z H
ard
nes
s (H
v)
SMAW 3.2
PGMAW
PMCAW
GSFCAW
Figure 4.29: Heat Input vs. Hardness, 7.9mm
Welding Process vs Heat and HardnessNPS36, API X70, 11mm, 0.22CE
170
190
210
230
250
270
290
310
330
0.5 1 1.5 2
Heat Input (kJ/mm)
CG
HA
Z H
ard
nes
s (H
v)
SMAW 3.2
PGMAW
PMCAW
GSFCAW
Figure 4.30: Heat Input vs. Hardness, 11mm

BMT Fleet Technology Limited 5637C.FR
Alternate Welding Processes for In-Service Welding
42
Welding Process vs Heat and HardnessNPS48, API X80, 16.1mm, 0.27CE
170
190
210
230
250
270
290
310
330
0.5 1 1.5 2
Heat Input (kJ/mm)
CG
HA
Z H
ard
nes
s (H
v)
SMAW 3.2
PGMAW
PMCAW
GSFCAW
Figure 4.31: Heat Input vs. Hardness, 16.1mm
Welding Process vs Heat and HardnessNPS40, API X80, 19.1mm, 0.24CE
170
190
210
230
250
270
290
310
330
0.5 1 1.5 2
Heat Input (kJ/mm)
CG
HA
Z H
ard
nes
s (H
v)
SMAW 3.2
PGMAW
PMCAW
GSFCAW
Figure 4.32: Heat Input vs. Hardness, 19.1mm

BMT Fleet Technology Limited 5637C.FR
Alternate Welding Processes for In-Service Welding
43
4.7 Task 5: Establish Diffusible Hydrogen Characteristics
This task was used to determine the diffusible hydrogen characteristics of each of the electrodes received for this study. The data was then used to investigate the times to peak hydrogen concentration in Task 6, that involves predicting delay times for welds that are considered susceptible to hydrogen cracking (i.e., those welds that have a hardness of 300 VHN or higher). All low hydrogen mild steel SMAW electrodes received were baked at 400ºC for one (1) hour at a maximum layer depth of 25mm. The electrodes were immediately transferred into an electrode storage oven set at 120ºC. Each of the mild steel SMAW electrodes, except the 2.4mm diameter, were tested for diffusible hydrogen as per AWS A4.3 Standard using the under mercury method, in the as-received and baked condition. The results are shown in Table 4.13. No real trend was visible between the electrodes that were tested in the as-received and baked conditions, however a significant trend was apparent between increase of welding amperage and hydrogen. One possible reason for this hydrogen increase is that as amperage increases with the SMAW process using a constant current power source, the voltage across the arc and the arc length will increase. It is possible that this arc length increase allows for more moisture to be picked up and transferred across the arc in the form of hydrogen into the weld pool. All other electrode/process combinations were subjected to diffusible hydrogen testing in the as-received condition to estimate the hydrogen potential and susceptibility to delayed cracking in Task 6, and the results are shown in Figure 4.33. The 10% C02 – 90% Argon shielding gas used for the GMAW processes was analyzed for moisture and the results indicated a 1ppm moisture concentration. Gas moisture and other factors have a direct correlation with available hydrogen, and 1ppm is considered to be on the low side of the range of most industrial gases which typically contain 5 to 10ppm concentrations.
Table 4.13: Diffusible Hydrogen Comparison between As-received and Conditioned Low Hydrogen Electrodes
Electrode Condition Amperage
(A) Average Diffusible Hydrogen
(ml/100g) 2.4mm Hobart 718MC (E7018-1) as received 90 2.93
3.2mm Hobart 718MC (E7018-1)
as-received 90 4.27 baked 90 4.12
as-received 160 6.03 baked 160 6.73
4.0mm Hobart 718MC (E7018-1)
as-received 130 4.03 baked 130 3.93
as-received 220 5.28 baked 220 6.2

BMT Fleet Technology Limited 5637C.FR
Alternate Welding Processes for In-Service Welding
44
0 1 2 3 4 5 6 7 8 9
Average Hydrogen (ml/100g)
2.4mm Hobart 718MC
3.2mm Hobart 718MC
3.2mm ESAB AtomArc 10018-M1
3.2mm ESAB Filarc 108MP
0.9mm ESAB ER70XTi - AccuPulse - C10 Gas
0.9mm Thyssen K-Nova - AccuPulse - C10 Gas
1.2mm Thyssen K-Nova - RMD - C10 Gas
2.0mm Hobart Fabshield 71K6
2.0mm Hobart Fabshield 81N2
1.2mm Hobart MC70
1.2mm Hobart MC100
1.2mm ESAB DSII 70T-12
1.2mm ESAB DSII 80Ni1H4
Diffusible Hydrogen (AWS A4.3 )
Figure 4.33: Diffusible Hydrogen Comparisons of Each Electrode Evaluated
4.8 Task 6: Establish Delay Time Predictions
It is well publicized that welds with a HAZ hardness of 350 VHN and higher, and with sufficient available hydrogen, are susceptible to hydrogen induced cold cracking, also known as delayed hydrogen cracking. Delay time is the amount of time that passes from the end of weld completion to the time that available (local) hydrogen reaches its highest concentration in the most susceptible cracking region (i.e., highest stress concentration zone in the hard HAZ). For the purpose of this project, select welds that exhibit a hardness of 300VHN and higher, were modelled to determine their time to peak hydrogen. The 300VHN boundary is selected to include the uncertainty of the 350HVN when applying this criterion to modern low carbon steels, noting that the 350VHN is based on C-Mn steels. The delay time to peak hydrogen was determined using the BMT Fleet Technology Limited Hydrogen Cracking Susceptibility and Delay Time Prediction software. A typical example of a weld model used in the modeling software is shown in Figure 4.34. The weld profile (taken from an actual weld cross section) in this case is identified by green cells marked 1 and the dimensions were measured from the cross section of the bead-on-pipe weld A68 (P-MCAW weld using MC100 filler metal on 19.1mm thick X80 pipe, heat input of 0.53 kJ/mm)). The grey cells represent parent/base metal. The cells identified by 0 (yellow) are open space. A cell is 0.5mm x 0.5mm.

BMT Fleet Technology Limited 5637C.FR
Alternate Welding Processes for In-Service Welding
45
Figure 4.34: BMT Fleet Technology Limited Hydrogen Cracking Susceptibility and Delay Time Prediction Model
The hydrogen diffusion through the weld model is calculated using a finite difference technique, based on the thermal history and the apparent hydrogen diffusivity. The thermal history is calculated based on an analytical solution to the moving point heat source equation, and the apparent hydrogen diffusivity is calculated based on the trap density input for each weld model. A diffusion analysis was conducted in this case for static air (no flow conditions). The analyses were carried out for a total hydrogen level equal to unity (Htotal = 1.0). Two trap densities were considered for each model, vd = 0.05 and vd = 0.10. These trap densities span those that have been experimentally determined from apparent diffusivity for single pass welds encompassing SMAW and GMAW welds.[8,9] The hydrogen levels for four cells located in the HAZ (orange cells 1 and 2 (root location), and, 3 and 4 (weld toe location) in Figure 4.35) were monitored for a time period of 48 hours. A typical result, in terms of the hydrogen level versus time, is presented in Figure 4.36 (for Specimen A68 in a static air environment). The time to peak hydrogen in Figure 4.36 represents a 1mm wide HAZ band where delayed cracking is most likely as it covers the hard HAZ. The important output from these plots is the maximum delay to peak hydrogen in the 1mm HAZ band and not the level of hydrogen, as the focus of this task is guidance for determination of optimal inspection times after welding. Thus, in this example for weld A68 the time to peak hydrogen concentration at the cell 2 location takes approximately 10.25 hours, and therefore the likelihood for hydrogen cracking is minimal after that time period has lapsed assuming a Vd = 0.1. To assess the likelihood of delayed cracking before this delay time, knowledge of the susceptibility of the microstructure (hardness level is one of the parameters), and tensile stress (applied and residual) is required in addition to the actual peak hydrogen level, therefore the actual susceptibility of this weld to delayed cracking is uncertain.
8 L. N. Pussegoda et al: “Delayed Cracking in Simulated Naval Platform Repair Welds”, Trends in Welding Research-Proc. 6th Int. Conf.”, ASM International, (2002), pp. 581-585. 9 L. N. Pussegoda et al: “Determination of critical hydrogen curves from loe bend tests”, Proc. IPC 2004 (IPC 04-0414).

BMT Fleet Technology Limited 5637C.FR
Alternate Welding Processes for In-Service Welding
46
Figure 4.35: Cells Monitored in Model
0
0.05
0.1
0.15
0.2
0.25
0.3
0 5000 10000 15000 20000 25000 30000 35000 40000
Time (seconds)
Cell 1 Vd=0.05 Cell 1 Vd=0.10Cell 2 Vd=0.05 Cell 2 Vd=0.10Cell 3 Vd=0.05 Cell 3 Vd=0.10Cell 4 Vd=0.05 Cell 4 Vd=0.10
Figure 4.36: Hydrogen Concentration vs. Time (Specimen A68, Welded in Static Air)

BMT Fleet Technology Limited 5637C.FR
Alternate Welding Processes for In-Service Welding
47
The complete modeling results of the delay times in the welds that were considered highest susceptible to hydrogen cracking (CGHAZ above 300VHN), are shown in Table 4.14. These welds were produced in the NPS20 X52 pipe that had the highest carbon equivalent of 0.43 CE. Also note that the flowing air and water mist spray delay time results are based on the thermal history and hardness results achieved in Task 7. The columns identified as time to peak hydrogen are the delay times for Vd = 0.05 and 0.1, respectively. Several of the welds deposited with static air and with water backing were plotted against each other as a comparison, and these are shown in Figures 4.37 to 4.44. These illustrate that the addition of the heat sink from the water containment results in a significance difference in delay time. The primary reason for this is the rapid cooling of the weld to the pipe temperature while in-service. One of the main controlling factors for the diffusion of hydrogen is temperature, therefore if the weld cools quicker to the pipeline operating temperature, then it will take longer for the hydrogen to migrate to a specific point within the weld zone, and thus a require a longer delay time.

BMT Fleet Technology Limited 5637C.FR
Alternate Welding Processes for In-Service Welding
48
Table 4.14: Delay Time Prediction Results

BMT Fleet Technology Limited 5637C.FR
Alternate Welding Processes for In-Service Welding
49
0
0.05
0.1
0.15
0.2
0.25
0.3
0.35
0.4
0 2 4 6 8 10
Time (Hours)
Hyd
rog
en C
once
ntra
tion
.
Cell 1Cell 2Cell 3Cell 4
Figure 4.37: Specimen W4 – Static Water – Hydrogen vs. Time History

BMT Fleet Technology Limited 5637C.FR
Alternate Welding Processes for In-Service Welding
50
0
0.05
0.1
0.15
0.2
0.25
0 2 4 6 8 10
Time (Hours)
Hyd
roge
n C
once
ntra
tion.
Water Backing
Air Backing
Figure 4.38: Specimen A4 & W4 – Comparison of Hydrogen Time Histories – Static Air and Static Water – Cell 2

BMT Fleet Technology Limited 5637C.FR
Alternate Welding Processes for In-Service Welding
51
0
0.05
0.1
0.15
0.2
0.25
0.3
0.35
0 2 4 6 8 10
Time (Hours)
Hyd
roge
n C
once
ntra
tion.
Cell 1
Cell 2
Cell 3
Cell 4
Figure 4.39: Specimen W5 – Static Water – Hydrogen vs. Time History

BMT Fleet Technology Limited 5637C.FR
Alternate Welding Processes for In-Service Welding
52
0
0.05
0.1
0.15
0.2
0.25
0 2 4 6 8 10
Time (Hours)
Hyd
roge
n C
once
ntra
tion.
Air Backing
Water Backing
Figure 4.40: Specimen A5 & W5 – Comparison of Hydrogen Time Histories – Static Air and Static Water – Cell 2

BMT Fleet Technology Limited 5637C.FR
Alternate Welding Processes for In-Service Welding
53
0
0.05
0.1
0.15
0.2
0.25
0.3
0 2 4 6 8 10
Time (Hours)
Hyd
roge
n C
once
ntra
tion.
Cell 1Cell 2Cell 3Cell 4
Figure 4.41: Specimen W12 – Static Water – Hydrogen vs. Time History

BMT Fleet Technology Limited 5637C.FR
Alternate Welding Processes for In-Service Welding
54
0
0.02
0.04
0.06
0.08
0.1
0.12
0.14
0.16
0.18
0.2
0 2 4 6 8 10
Time (Hours)
Hyd
roge
n C
once
ntra
tion.
Air BackingWater Backing
Figure 4.42: Specimen A12 & W12 – Comparison of Hydrogen Time Histories – Static Air and Static Water – Cell 2

BMT Fleet Technology Limited 5637C.FR
Alternate Welding Processes for In-Service Welding
55
0
0.05
0.1
0.15
0.2
0.25
0.3
0 5 10 15 20
Time (Hours)
Hyd
roge
n C
once
ntra
tion.
Cell 1Cell 2Cell 3Cell 4
Figure 4.43: Specimen W64 – Static Water – Hydrogen vs. Time History
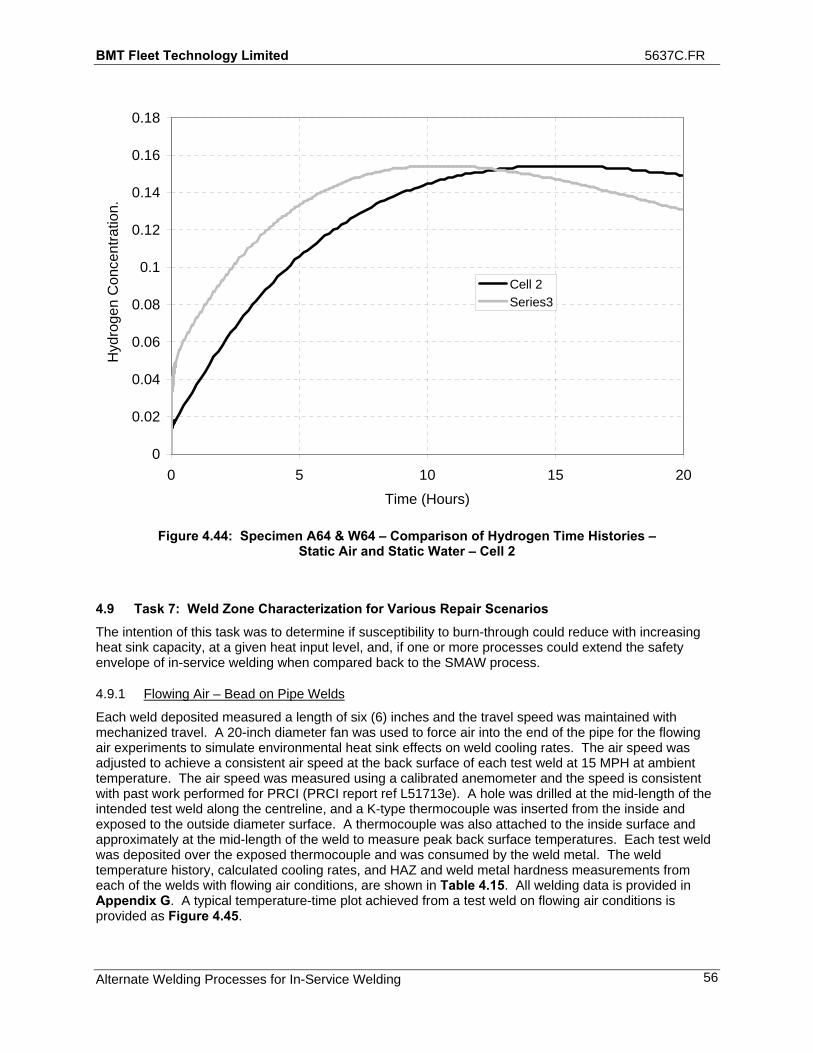
BMT Fleet Technology Limited 5637C.FR
Alternate Welding Processes for In-Service Welding
56
0
0.02
0.04
0.06
0.08
0.1
0.12
0.14
0.16
0.18
0 5 10 15 20
Time (Hours)
Hyd
roge
n C
once
ntra
tion.
Cell 2Series3
Figure 4.44: Specimen A64 & W64 – Comparison of Hydrogen Time Histories – Static Air and Static Water – Cell 2
4.9 Task 7: Weld Zone Characterization for Various Repair Scenarios
The intention of this task was to determine if susceptibility to burn-through could reduce with increasing heat sink capacity, at a given heat input level, and, if one or more processes could extend the safety envelope of in-service welding when compared back to the SMAW process.
4.9.1 Flowing Air – Bead on Pipe Welds
Each weld deposited measured a length of six (6) inches and the travel speed was maintained with mechanized travel. A 20-inch diameter fan was used to force air into the end of the pipe for the flowing air experiments to simulate environmental heat sink effects on weld cooling rates. The air speed was adjusted to achieve a consistent air speed at the back surface of each test weld at 15 MPH at ambient temperature. The air speed was measured using a calibrated anemometer and the speed is consistent with past work performed for PRCI (PRCI report ref L51713e). A hole was drilled at the mid-length of the intended test weld along the centreline, and a K-type thermocouple was inserted from the inside and exposed to the outside diameter surface. A thermocouple was also attached to the inside surface and approximately at the mid-length of the weld to measure peak back surface temperatures. Each test weld was deposited over the exposed thermocouple and was consumed by the weld metal. The weld temperature history, calculated cooling rates, and HAZ and weld metal hardness measurements from each of the welds with flowing air conditions, are shown in Table 4.15. All welding data is provided in Appendix G. A typical temperature-time plot achieved from a test weld on flowing air conditions is provided as Figure 4.45.
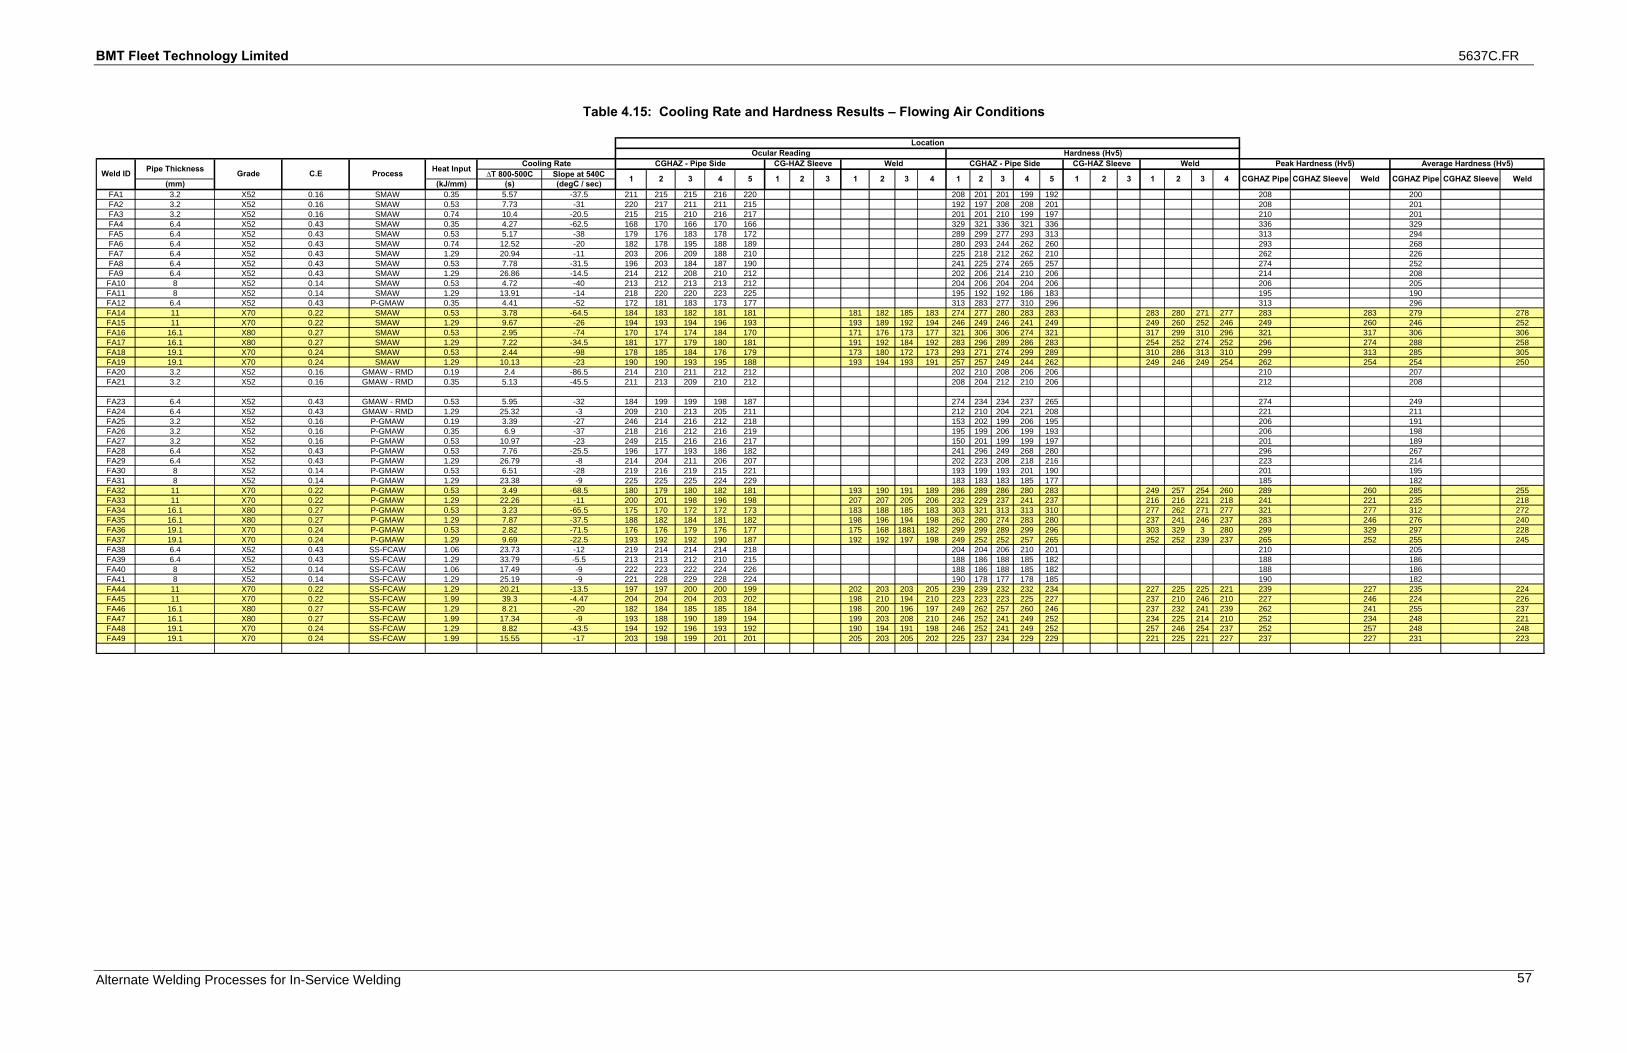
BMT Fleet Technology Limited 5637C.FR
Alternate Welding Processes for In-Service Welding
57
Table 4.15: Cooling Rate and Hardness Results – Flowing Air Conditions
∆T 800-500C Slope at 540C(mm) (kJ/mm) (s) (degC / sec)
FA1 3.2 X52 0.16 SMAW 0.35 5.57 -37.5 211 215 215 216 220 208 201 201 199 192 208 200FA2 3.2 X52 0.16 SMAW 0.53 7.73 -31 220 217 211 211 215 192 197 208 208 201 208 201FA3 3.2 X52 0.16 SMAW 0.74 10.4 -20.5 215 215 210 216 217 201 201 210 199 197 210 201FA4 6.4 X52 0.43 SMAW 0.35 4.27 -62.5 168 170 166 170 166 329 321 336 321 336 336 329FA5 6.4 X52 0.43 SMAW 0.53 5.17 -38 179 176 183 178 172 289 299 277 293 313 313 294FA6 6.4 X52 0.43 SMAW 0.74 12.52 -20 182 178 195 188 189 280 293 244 262 260 293 268FA7 6.4 X52 0.43 SMAW 1.29 20.94 -11 203 206 209 188 210 225 218 212 262 210 262 226FA8 6.4 X52 0.43 SMAW 0.53 7.78 -31.5 196 203 184 187 190 241 225 274 265 257 274 252FA9 6.4 X52 0.43 SMAW 1.29 26.86 -14.5 214 212 208 210 212 202 206 214 210 206 214 208
FA10 8 X52 0.14 SMAW 0.53 4.72 -40 213 212 213 213 212 204 206 204 204 206 206 205FA11 8 X52 0.14 SMAW 1.29 13.91 -14 218 220 220 223 225 195 192 192 186 183 195 190FA12 6.4 X52 0.43 P-GMAW 0.35 4.41 -52 172 181 183 173 177 313 283 277 310 296 313 296FA14 11 X70 0.22 SMAW 0.53 3.78 -64.5 184 183 182 181 181 181 182 185 183 274 277 280 283 283 283 280 271 277 283 283 279 278FA15 11 X70 0.22 SMAW 1.29 9.67 -26 194 193 194 196 193 193 189 192 194 246 249 246 241 249 249 260 252 246 249 260 246 252FA16 16.1 X80 0.27 SMAW 0.53 2.95 -74 170 174 174 184 170 171 176 173 177 321 306 306 274 321 317 299 310 296 321 317 306 306FA17 16.1 X80 0.27 SMAW 1.29 7.22 -34.5 181 177 179 180 181 191 192 184 192 283 296 289 286 283 254 252 274 252 296 274 288 258FA18 19.1 X70 0.24 SMAW 0.53 2.44 -98 178 185 184 176 179 173 180 172 173 293 271 274 299 289 310 286 313 310 299 313 285 305FA19 19.1 X70 0.24 SMAW 1.29 10.13 -23 190 190 193 195 188 193 194 193 191 257 257 249 244 262 249 246 249 254 262 254 254 250FA20 3.2 X52 0.16 GMAW - RMD 0.19 2.4 -86.5 214 210 211 212 212 202 210 208 206 206 210 207FA21 3.2 X52 0.16 GMAW - RMD 0.35 5.13 -45.5 211 213 209 210 212 208 204 212 210 206 212 208
FA23 6.4 X52 0.43 GMAW - RMD 0.53 5.95 -32 184 199 199 198 187 274 234 234 237 265 274 249FA24 6.4 X52 0.43 GMAW - RMD 1.29 25.32 -3 209 210 213 205 211 212 210 204 221 208 221 211FA25 3.2 X52 0.16 P-GMAW 0.19 3.39 -27 246 214 216 212 218 153 202 199 206 195 206 191FA26 3.2 X52 0.16 P-GMAW 0.35 6.9 -37 218 216 212 216 219 195 199 206 199 193 206 198FA27 3.2 X52 0.16 P-GMAW 0.53 10.97 -23 249 215 216 216 217 150 201 199 199 197 201 189FA28 6.4 X52 0.43 P-GMAW 0.53 7.76 -25.5 196 177 193 186 182 241 296 249 268 280 296 267FA29 6.4 X52 0.43 P-GMAW 1.29 26.79 -8 214 204 211 206 207 202 223 208 218 216 223 214FA30 8 X52 0.14 P-GMAW 0.53 6.51 -28 219 216 219 215 221 193 199 193 201 190 201 195FA31 8 X52 0.14 P-GMAW 1.29 23.38 -9 225 225 225 224 229 183 183 183 185 177 185 182FA32 11 X70 0.22 P-GMAW 0.53 3.49 -68.5 180 179 180 182 181 193 190 191 189 286 289 286 280 283 249 257 254 260 289 260 285 255FA33 11 X70 0.22 P-GMAW 1.29 22.26 -11 200 201 198 196 198 207 207 205 206 232 229 237 241 237 216 216 221 218 241 221 235 218FA34 16.1 X80 0.27 P-GMAW 0.53 3.23 -65.5 175 170 172 172 173 183 188 185 183 303 321 313 313 310 277 262 271 277 321 277 312 272FA35 16.1 X80 0.27 P-GMAW 1.29 7.87 -37.5 188 182 184 181 182 198 196 194 198 262 280 274 283 280 237 241 246 237 283 246 276 240FA36 19.1 X70 0.24 P-GMAW 0.53 2.82 -71.5 176 176 179 176 177 175 168 1881 182 299 299 289 299 296 303 329 3 280 299 329 297 228FA37 19.1 X70 0.24 P-GMAW 1.29 9.69 -22.5 193 192 192 190 187 192 192 197 198 249 252 252 257 265 252 252 239 237 265 252 255 245FA38 6.4 X52 0.43 SS-FCAW 1.06 23.73 -12 219 214 214 214 218 204 204 206 210 201 210 205FA39 6.4 X52 0.43 SS-FCAW 1.29 33.79 -5.5 213 213 212 210 215 188 186 188 185 182 188 186FA40 8 X52 0.14 SS-FCAW 1.06 17.49 -9 222 223 222 224 226 188 186 188 185 182 188 186FA41 8 X52 0.14 SS-FCAW 1.29 25.19 -9 221 228 229 228 224 190 178 177 178 185 190 182FA44 11 X70 0.22 SS-FCAW 1.29 20.21 -13.5 197 197 200 200 199 202 203 203 205 239 239 232 232 234 227 225 225 221 239 227 235 224FA45 11 X70 0.22 SS-FCAW 1.99 39.3 -4.47 204 204 204 203 202 198 210 194 210 223 223 223 225 227 237 210 246 210 227 246 224 226FA46 16.1 X80 0.27 SS-FCAW 1.29 8.21 -20 182 184 185 185 184 198 200 196 197 249 262 257 260 246 237 232 241 239 262 241 255 237FA47 16.1 X80 0.27 SS-FCAW 1.99 17.34 -9 193 188 190 189 194 199 203 208 210 246 252 241 249 252 234 225 214 210 252 234 248 221FA48 19.1 X70 0.24 SS-FCAW 1.29 8.82 -43.5 194 192 196 193 192 190 194 191 198 246 252 241 249 252 257 246 254 237 252 257 248 248FA49 19.1 X70 0.24 SS-FCAW 1.99 15.55 -17 203 198 199 201 201 205 203 205 202 225 237 234 229 229 221 225 221 227 237 227 231 223
Weld Peak Hardness (Hv5) Average Hardness (Hv5)
Location
Cooling Rate CGHAZ - Pipe Side CG-HAZ Sleeve WeldCGHAZ - Pipe Side CG-HAZ Sleeve Pipe Thickness Heat Input
Weld ID ProcessCGHAZ Pipe CGHAZ Sleeve Weld CGHAZ Pipe CGHAZ Sleeve Weld1 2 3 4 5 1 2 3 1 2 3 4 2 31 2 3 4
Ocular Reading Hardness (Hv5)
Grade C.E1 2 3 45 1
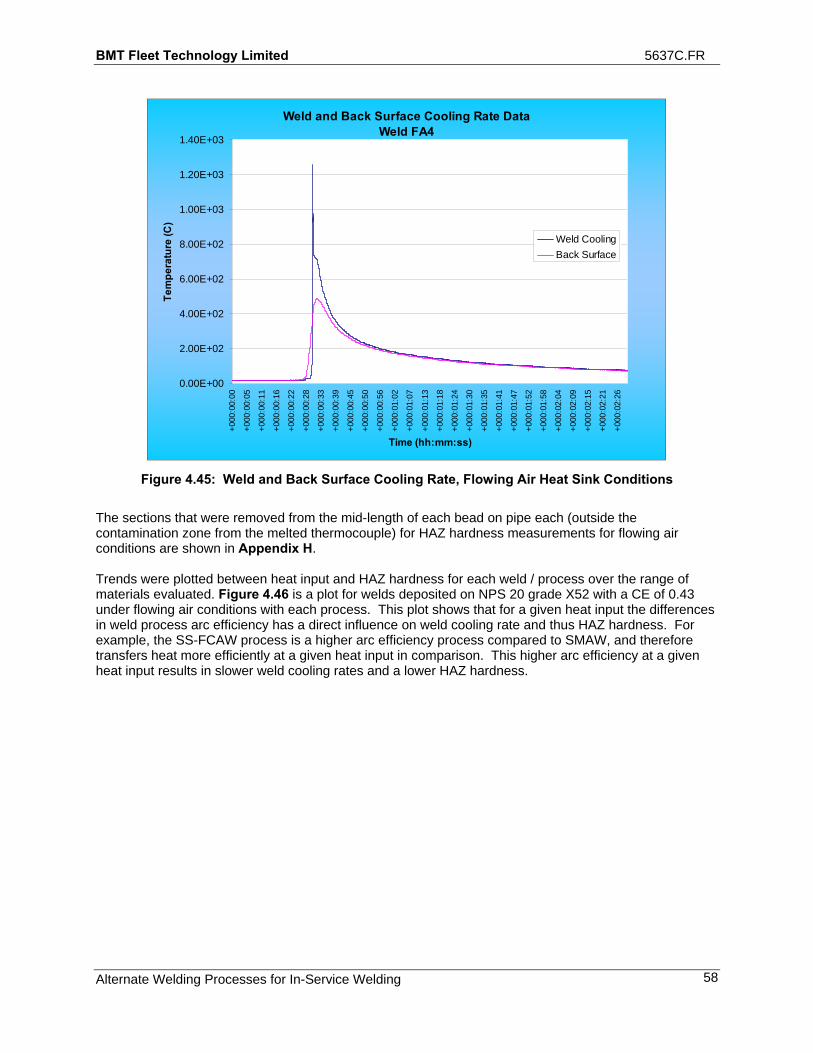
BMT Fleet Technology Limited 5637C.FR
Alternate Welding Processes for In-Service Welding
58
Weld and Back Surface Cooling Rate DataWeld FA4
0.00E+00
2.00E+02
4.00E+02
6.00E+02
8.00E+02
1.00E+03
1.20E+03
1.40E+03
+00
0:00
:00
+00
0:00
:05
+00
0:00
:11
+00
0:00
:16
+00
0:00
:22
+00
0:00
:28
+00
0:00
:33
+00
0:00
:39
+00
0:00
:45
+00
0:00
:50
+00
0:00
:56
+00
0:01
:02
+00
0:01
:07
+00
0:01
:13
+00
0:01
:18
+00
0:01
:24
+00
0:01
:30
+00
0:01
:35
+00
0:01
:41
+00
0:01
:47
+00
0:01
:52
+00
0:01
:58
+00
0:02
:04
+00
0:02
:09
+00
0:02
:15
+00
0:02
:21
+00
0:02
:26
Time (hh:mm:ss)
Te
mp
erat
ure
(C)
Weld Cooling
Back Surface
Figure 4.45: Weld and Back Surface Cooling Rate, Flowing Air Heat Sink Conditions
The sections that were removed from the mid-length of each bead on pipe each (outside the contamination zone from the melted thermocouple) for HAZ hardness measurements for flowing air conditions are shown in Appendix H.
Trends were plotted between heat input and HAZ hardness for each weld / process over the range of materials evaluated. Figure 4.46 is a plot for welds deposited on NPS 20 grade X52 with a CE of 0.43 under flowing air conditions with each process. This plot shows that for a given heat input the differences in weld process arc efficiency has a direct influence on weld cooling rate and thus HAZ hardness. For example, the SS-FCAW process is a higher arc efficiency process compared to SMAW, and therefore transfers heat more efficiently at a given heat input in comparison. This higher arc efficiency at a given heat input results in slower weld cooling rates and a lower HAZ hardness.

BMT Fleet Technology Limited 5637C.FR
Alternate Welding Processes for In-Service Welding
59
6.4 mm Thick X52 - 0.43 CEFLOWING AIR COOLING @ 15mph
175
195
215
235
255
275
295
315
335
0 0.2 0.4 0.6 0.8 1 1.2 1.4
Heat Input (kJ/mm)
Ha
rdn
es
s (
Hv
5k
g)
SMAW - 2.4mm
SMAW - 3.2mm
GMAW- RMD
PGMAW
SS-FCAW
Figure 4.46: Heat Input vs. HAZ Hardness, Flowing Air Conditions
4.9.2 Water Mist Spray – Bead on Pipe Welds
Each weld deposited measured a length of six (6) inches and the travel speed was maintained with mechanized travel. A water mist nozzle system (consisting of spray nozzle, feed water, and compressed air), was used to simulate natural gas heat sink conditions and its affect on weld cooling rates over a range of material thicknesses, types, and welding procedures. To ensure consistency from one test to another, the air pressure and water feed rate to the spray nozzle was controlled by calibrated metering valves. The air pressure was adjusted to achieve an average flow rate of 5.5 meters per second (m/sec) at the back surface of each test weld, and the air speed was measured using an anemometer. The water pressure was adjusted to achieve a fine mist and wide spray pattern from the spray nozzle for maximum pipe wall coverage. To ensure the same spray pattern was used for all test welds, the indexed metering valves were locked to achieve a consistent air pressure and water flow rate. To determine if the flowing water mist spray would provide sufficient heat sink to achieve the cooling conditions of a in-service flowing natural gas pipelines, heat sink capacity spot heating tests were conducted to determine the 250°C to 100°C cooling times (procedure as specified in PRCI report L51713e) on the NPS 20 x 6.4mm wall X52 pipe. The results of spot heating tests provided an average cooling time of 23 sec from 250°C to 100°C. The linear flow rate and resulting heat sink cooling capacity measurements are within the range of tests from past research for PRCI (PRCI report ref. L51713e), conducted on the High Pressure Loop at the GRI Metering Research Facility, on a simulated 6.4mm wall natural gas pipeline flowing at a volumetric flow rate of 16.9 mmscfd. A hole was drilled at the mid-length of the intended test weld location and along its centreline, and a K-type thermocouple was inserted from the inside diameter and exposed to the outside diameter surface. The temperature of the flowing water mist spray was measured with a thermocouple attached to the back surface of the test weld before welding commenced, and the temperature ranged from 10 to 12°C for all welds deposited. The test weld was deposited over the exposed thermocouple and was consumed by the weld metal. The weld temperature history, calculated cooling rates, and HAZ and weld metal hardness measurements from each of the welds deposited with flowing water mist spray, are shown in Table 4.16. All welding data is provided in Appendix I. A typical temperature-time plot achieved from a test weld, and the back surface, with flowing water mist spray conditions is provided as Figure 4.47.

BMT Fleet Technology Limited 5637C.FR
Alternate Welding Processes for In-Service Welding
60
Table 4.16: Cooling Rate and Hardness Data vs. Process – Water Mist Spray Conditions
∆T 800-500C Slope at 540C(mm) (kJ/mm) (s) (degC / sec)
WMS1 3.2 X52 0.16 SMAW 0.35 4.72 -51 214 216 218 218 216 202 199 195 195 199 202 198WMS2 3.2 X52 0.16 SMAW 0.53 7.05 -31 211 212 214 214 216 208 206 202 202 199 208 204WMS3 3.2 X52 0.16 SMAW 0.74 11.98 -23 212 213 213 212 217 206 204 204 206 197 206 204WMS4 6.4 X52 0.43 SMAW 0.35 2.53 -80 155 152 159 150 156 386 401 367 412 381 412 389WMS5 6.4 X52 0.43 SMAW 0.53 5.5 -37.5 186 180 182 176 184 268 286 280 299 274 299 281WMS6 6.4 X52 0.43 SMAW 0.74 11.04 -23.5 194 197 178 175 196 246 239 293 303 241 303 264WMS7 6.4 X52 0.43 SMAW 1.29 20.17 -17 205 212 209 202 203 221 206 212 227 225 227 218WMS8 6.4 X52 0.43 SMAW 0.53 5.16 -31 167 174 182 182 185 332 306 280 280 271 332 294WMS9 6.4 X52 0.43 SMAW 1.29 16.75 -2.5 204 208 212 214 212 223 214 206 202 206 223 210WMS10 8 X52 0.14 SMAW 0.53 3.59 -57 211 216 215 214 212 208 199 201 202 206 208 203WMS11 8 X52 0.14 SMAW 1.29 15.74 -17.5 227 226 222 221 221 180 182 188 190 190 190 186WMS12 6.4 X52 0.43 P-GMAW 0.35 4.07 -55 175 177 200 178 183 303 296 232 293 277 303 280WMS14 11 X70 0.22 SMAW 0.53 3.21 -66.5 182 186 184 182 182 183 187 187 184 280 268 274 280 280 277 265 265 274 280 277 276 270WMS15 11 X70 0.22 SMAW 1.29 12.56 -11.5 202 195 196 197 200 197 199 200 194 227 244 241 239 232 239 234 232 246 244 246 237 238WMS16 16.1 X80 0.27 SMAW 0.53 3.19 -66.5 172 173 171 172 174 180 181 179 183 313 310 317 313 306 286 283 289 277 317 289 312 284WMS17 16.1 X80 0.27 SMAW 1.29 5.36 -57 184 184 185 183 183 190 192 192 192 274 274 271 277 277 257 252 252 252 277 257 274 253WMS18 19.1 X70 0.24 SMAW 0.53 2.72 -60.5 174 181 181 181 180 179 181 186 183 306 283 283 283 286 289 283 268 277 306 289 288 279WMS19 19.1 X70 0.24 SMAW 1.29 6.62 -34 188 191 193 193 190 193 193 191 191 262 254 249 249 257 249 249 254 254 262 254 254 252WMS20 3.2 X52 0.16 GMAW - RMD 0.19 1.91 -91.5 212 208 210 206 207 206 214 210 218 216 218 213WMS21 3.2 X52 0.16 GMAW - RMD 0.35 4.41 -17.5 212 207 210 210 210 206 216 210 210 210 216 211WMS22 3.2 X52 0.16 GMAW - RMD 0.53 6.84 -31.5 211 215 210 216 210 208 201 210 199 210 210 206WMS23 6.4 X52 0.43 GMAW - RMD 0.53 6.25 -32 191 184 196 181 196 254 274 241 283 241 283 259WMS24 6.4 X52 0.43 GMAW - RMD 1.29 27.81 -8.5 209 211 205 208 207 212 208 221 214 216 221 214WMS25 3.2 X52 0.16 P-GMAW 0.19 3 -71.5 217 211 211 212 213 197 208 208 206 204 208 205WMS26 3.2 X52 0.16 P-GMAW 0.35 6.31 -46 208 205 211 206 208 214 221 208 218 214 221 215WMS27 3.2 X52 0.16 P-GMAW 0.53 10.15 -48 215 213 217 213 215 201 204 197 204 201 204 201WMS28 6.4 X52 0.43 P-GMAW 0.53 7.85 -26 176 178 190 192 190 299 293 257 252 257 299 271WMS29 6.4 X52 0.43 P-GMAW 1.29 25.58 -11 222 212 179 176 177 188 206 289 299 296 299 256WMS30 8 X52 0.14 P-GMAW 0.53 5.46 -39.5 220 215 217 213 217 192 201 197 204 197 204 198WMS31 8 X52 0.14 P-GMAW 1.29 26.72 -6 222 232 227 224 223 188 172 180 185 186 188 182WMS32 11 X70 0.22 P-GMAW 0.53 3.48 -77.5 183 181 184 184 186 185 190 185 191 277 283 274 274 268 271 257 271 254 283 271 275 263WMS33 11 X70 0.22 P-GMAW 1.29 12.84 -17 195 194 196 196 198 203 206 206 204 244 246 241 241 237 225 218 218 223 246 225 242 221WMS34 16.1 X80 0.27 P-GMAW 0.53 2.75 -97 173 172 173 173 175 183 180 181 180 310 313 310 310 303 277 286 283 286 313 286 309 283WMS35 16.1 X80 0.27 P-GMAW 1.29 9.09 -20 186 177 187 179 186 195 201 197 199 268 296 265 289 268 244 229 239 234 296 244 277 237WMS36 19.1 X70 0.24 P-GMAW 0.53 1.71 -106 177 178 177 173 175 176 168 181 174 296 293 296 310 303 299 329 283 306 310 329 299 304WMS37 19.1 X70 0.24 P-GMAW 1.29 7.41 -40.5 188 188 189 186 190 193 191 192 190 262 262 260 268 257 249 254 252 257 268 257 262 253WMS38 6.4 X52 0.43 SS-FCAW 1.06 26.44 -8 211 208 211 207 209 208 214 208 216 212 216 212WMS39 6.4 X52 0.43 SS-FCAW 1.29 33.07 -3 209 206 212 208 213 212 218 206 214 204 218 211WMS40 8 X52 0.14 SS-FCAW 1.06 19.51 -12.5 220 223 229 224 226 192 186 177 185 182 192 184WMS41 8 X52 0.14 SS-FCAW 1.29 26.7 -6 228 221 227 222 224 178 190 180 188 185 190 184WMS44 11 X70 0.22 SS-FCAW 1.29 12.57 -22 195 199 203 198 199 205 205 206 204 244 234 225 237 234 221 221 218 223 244 223 235 221WMS45 11 X70 0.22 SS-FCAW 1.99 29.54 -9 203 205 206 201 199 211 212 209 212 225 221 218 229 234 208 206 212 206 234 212 226 208WMS46 16.1 X80 0.27 SS-FCAW 1.29 8.01 -20 183 185 186 184 183 194 196 197 197 277 271 268 274 277 246 241 239 239 277 246 273 241WMS47 16.1 X80 0.27 SS-FCAW 1.99 15.59 -11.5 194 192 191 190 186 204 205 208 208 246 252 254 257 268 223 221 214 214 268 223 255 218WMS48 19.1 X70 0.24 SS-FCAW 1.29 6.46 -36.5 196 190 202 194 192 195 197 190 192 241 257 227 246 252 244 239 257 252 257 257 245 248WMS49 19.1 X70 0.24 SS-FCAW 1.99 11.68 -26.5 193 198 202 197 199 205 205 201 207 249 237 227 239 234 221 221 229 216 249 229 237 222
Weld Peak Hardness (Hv5) Average Hardness (Hv5)
Location
Cooling Rate CGHAZ - Pipe Side CG-HAZ Sleeve WeldCGHAZ - Pipe Side CG-HAZ Sleeve Pipe Thickness Heat Input
Weld ID ProcessCGHAZ Pipe CGHAZ Sleeve Weld CGHAZ Pipe CGHAZ Sleeve Weld1 2 3 4 5 1 2 3 1 2 3 4 2 31 2 3 4
Ocular Reading Hardness (Hv5)
Grade C.E1 2 3 45 1

BMT Fleet Technology Limited 5637C.FR
Alternate Welding Processes for In-Service Welding
61
Weld and Back Surface Cooling Rate, Flowing Water Mist Spray WMS4
0.00E+00
2.00E+02
4.00E+02
6.00E+02
8.00E+02
1.00E+03
1.20E+03
1.40E+03
+00
0:00
:00
+00
0:00
:05
+00
0:00
:11
+00
0:00
:16
+00
0:00
:22
+00
0:00
:27
+00
0:00
:33
+00
0:00
:39
+00
0:00
:44
+00
0:00
:50
+00
0:00
:55
+00
0:01
:01
+00
0:01
:07
+00
0:01
:12
+00
0:01
:18
+00
0:01
:23
+00
0:01
:29
+00
0:01
:35
+00
0:01
:40
+00
0:01
:46
+00
0:01
:51
Time (hh:mm:ss)
Te
mp
era
ture
(C
)
Weld Cooling Data
Back Surface
Figure 4.47: Weld and Back Surface Cooling Rate, Flowing Water Mist Spray
The sections that were removed from the mid-length of each bead on pipe weld (outside the contamination zone from the melted thermocouple) for HAZ hardness measurements for flowing air conditions are shown in Appendix J. Trends were plotted between heat input and HAZ hardness for each weld / process over the range of materials evaluated. Figure 4.48 is a plot for welds deposited on 0.43 CE X52 under flowing water mist spray conditions with each process. This plot shows that for a given heat input the differences in weld process arc efficiency has a direct influence on weld cooling rate and thus HAZ hardness. For example, the SS-FCAW process is a higher arc efficiency process compared to SMAW, and therefore transfers heat more efficiently at a given heat input in comparison. This higher arc efficiency at a given heat input results in slower weld cooling rates and a lower HAZ hardness.

BMT Fleet Technology Limited 5637C.FR
Alternate Welding Processes for In-Service Welding
62
6.4 mm Thick X52 - 0.43 CEWATER MIST SPRAY
175
225
275
325
375
425
0 0.2 0.4 0.6 0.8 1 1.2 1.4
Heat Input (kJ/mm)
Ha
rdn
es
s (
Hv
5k
g)
SMAW - 2.4
SMAW - 3.2
GMAW RMD
P-GMAW
FCAW
Figure 4.48: Heat Input vs. HAZ Hardness, Flowing Water Mist Spray
To examine the differences in arc efficiency between each of the welding processes and its influence on cooling rate, a trend is plotted for 0.53 kJ/mm and 1.29 kJ/mm heat inputs in Figures 4.49 and 4.50, respectively, for each process and conditions between static air, flowing air, and water mist spray. These plots demonstrate that cooing time from 1000°C to 100°C rate is less affected by the “external” cooling conditions or the process as thickness increases at the lower heat input setting, compared to at the higher heat input. As heat input increases the differences between arc efficiency of each process and cooling rate become more apparent. These plots also demonstrate that the heat sink has less of an influence on cooling rates as the pipe wall thickness approaches 20mm, in other words it is likely that the cooling rate of welds deposited on 20mm and higher thickness will not be influenced by the flowing fluid/gas. In addition, these plots demonstrate that for a given heat input, welding process, and heat sink condition, the SMAW process has the fastest cooling rate compared to the other welding processes. The SS-FCAW and P-GMAW processes provide the slowest cooling times and could be beneficial in terms of allowing more time for hydrogen to escape from the weld pool before returning to ambient or service temperature, and reduce the risk of hydrogen cracking. Furthermore, these plots demonstrate the effect of accelerated cooling as thickness decreases, as the flowing conditions draw more heat from the weld pool. For the low heat input welds, the effect of heat sink becomes most noticeable at a thickness of 6.4mm, as opposed to the higher heat input welds at 11mm, regardless of the welding process used. In addition, each of the welds evaluated under static air, flowing air, and water mist spray were plotted for cooling rate (slope @ 540°C) vs. CGHAZ hardness, irrespective of the welding process or simulated in-service welding condition. The results are shown in Figure 4.51, and demonstrate how each material behaves with respect to cooling rate and hardness. As the pipeline materials carbon equivalent increases the slope of the hardening curves increases rapidly with increasing (higher) cooling rates. This type of plot could be useful for identifying lower heat input and cooling rate boundaries for specific material chemistries in order to produce a weld CGHAZ hardness below a desirable level to avoid cracking.

BMT Fleet Technology Limited 5637C.FR
Alternate Welding Processes for In-Service Welding
63
Cooling Time vs ThicknessSMAW vs GMAW - 0.53kJ/mm
0
50
100
150
200
250
300
350
400
0 5 10 15 20
Thickness (mm)
Tim
e fr
om
100
0 to
100
C (
sec)
SMAW - Air
SMAW - FlowingAir
SMAW - WaterMist Spray
P-GMAW - Air
P-GMAW - FlowingAir
P-GMAW - WaterMist Spray
Figure 4.49: Cooling Time vs. Welding Process, 0.53kJ/mm Heat Input
Cooling Time vs Thickness - 1.29 kJ/mm
0
50
100
150
200
250
300
350
400
0 5 10 15 20
Thickness (mm)
1000
to
100
Co
olin
g T
ime
(sec
)
Air - SMAW
Air - FCAW
Air - PGMAW
Flowing Air -SMAW
Flowing Air -FCAW
Flowing Air -PGMAW
Water MistSpray - SMAW
Water MistSpray - FCAW
Water MistSpray -PGMAW
Figure 4.50: Cooling Time vs. Thickness, 1.29kJ/mm Heat Input

BMT Fleet Technology Limited 5637C.FR
Alternate Welding Processes for In-Service Welding
64
Figure 4.51: Coarse Grain Heat Affected Zone (CG-HAZ) Hardness (Hv) vs. Cooling Rate and Carbon Equivalent (CE), Regardless of Heat Sink Condition
4.9.3 Air and Water Backed Results for Bead on Pipe and Sleeve Fillet Welds
Sleeve fillet and bead on pipe welds were manufactured with both air and water backing to demonstrate how the cooling rates of the sleeve fillet welds compare back to the welds deposited on pipe with air backing. The plots of heat input vs. CGHAZ hardness for bead on pipe welds with air backing and each process in Figures 4.28 to 4.32 can be referenced. To re-summarize, these plots shown a general trend of decreasing hardness with increasing heat input as expected, however there is an even more interesting trend that shows the SMAW process results in the highest hardness at a given heat input level, with a downward trend in hardness vs. process at a given heat input level from the PGMAW to FCAW to PMCAW processes. This indicates that the processes with the higher arc efficiencies (i.e., transfer more heat from the arc to the base material) result in lower CGHAZ hardnesses regardless of material type and thickness. Based on these results, the SMAW process has the lowest arc efficiency (as demonstrated by the highest hardness) and the PMCAW has the highest arc efficiency (as demonstrated by the lowest hardness). The set-up for fillet welding the sleeves and bead on pipe welds with water backing was illustrated previously in Figure 4.20. In the case of the sleeves, thermocouples were positioned along the weld axis on the back surface, at the weld fusion line, and 10mm away from the edge of the sleeve, as shown in Figure 4.52.
Cooling Rate vs Hardness
150
200
250
300
350
400
450
1101001000
Cooling Rate at 540degC(degC per sec)
Av
g.
CG
-HA
Z H
ard
ne
ss
(Hv
5k
g)
X52 - Carbon Equivalent 0.16 - 3.2mm
X52 - Carbon Equivalent 0.43 - 6.4mm
X52 - Carbon Equivalent 0.14 - 7.9mm
X80 - Carbon Equivalent 0.22 - 11mm
X80 - CarbonEquivalent 0.27 - 16.1mm
X80 - Carbon Equivalent 0.24 - 19mm
Increasing CE
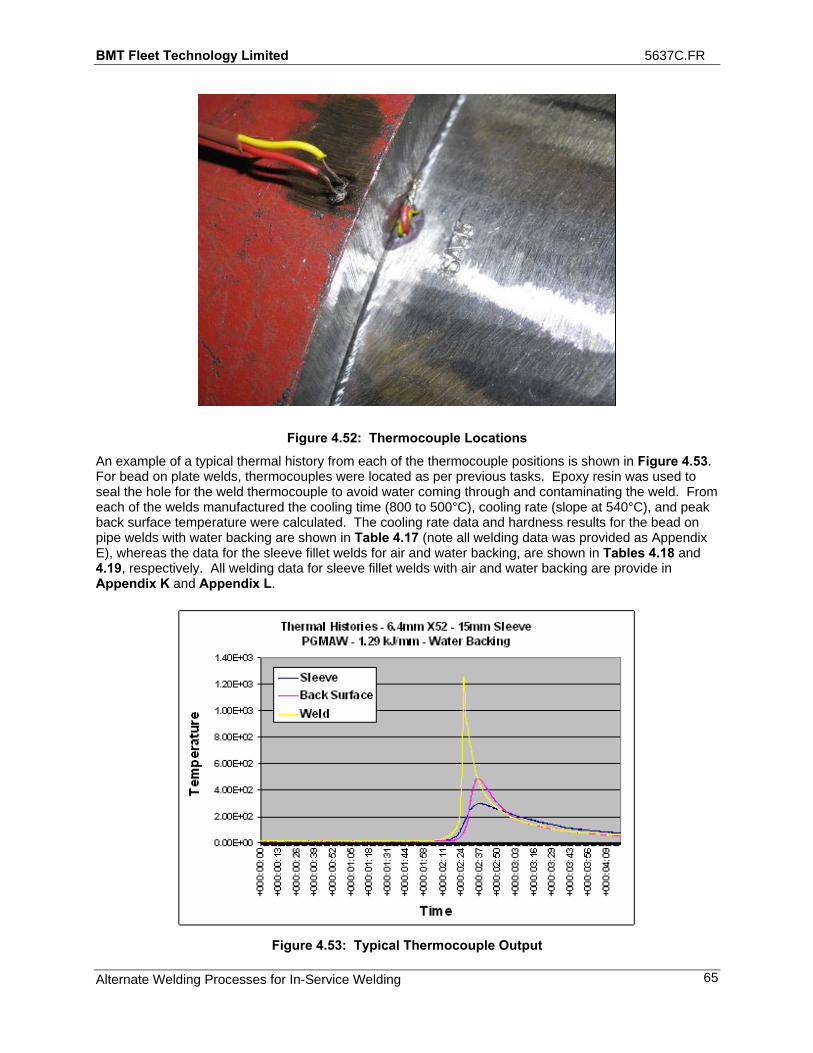
BMT Fleet Technology Limited 5637C.FR
Alternate Welding Processes for In-Service Welding
65
Figure 4.52: Thermocouple Locations
An example of a typical thermal history from each of the thermocouple positions is shown in Figure 4.53. For bead on plate welds, thermocouples were located as per previous tasks. Epoxy resin was used to seal the hole for the weld thermocouple to avoid water coming through and contaminating the weld. From each of the welds manufactured the cooling time (800 to 500°C), cooling rate (slope at 540°C), and peak back surface temperature were calculated. The cooling rate data and hardness results for the bead on pipe welds with water backing are shown in Table 4.17 (note all welding data was provided as Appendix E), whereas the data for the sleeve fillet welds for air and water backing, are shown in Tables 4.18 and 4.19, respectively. All welding data for sleeve fillet welds with air and water backing are provide in Appendix K and Appendix L.
Figure 4.53: Typical Thermocouple Output

BMT Fleet Technology Limited 5637C.FR
Alternate Welding Processes for In-Service Welding
66
Table 4.17: Cooling Data and Hardness Results – Bead on Pipe – Water Backing
∆T 800-500C Slope at 540C(mm) (kJ/mm) (s) (degC / sec)
FW4 6.4 X52 0.43 SMAW 0.35 3.16 -63.25 162 165 175 183 161 198 196 195 196 353 341 303 277 358 237 241 244 241 358 244 326 241FW5 6.4 X52 0.43 SMAW 0.53 4.12 -50.75 160 167 189 174 158 195 195 189 197 362 332 260 306 371 244 244 260 239 371 260 326 247FW6 6.4 X52 0.43 SMAW 0.74 6.16 -33 182 183 195 168 179 204 205 205 206 280 277 244 329 289 223 221 221 218 329 223 284 221FW7 6.4 X52 0.43 SMAW 1.29 10.92 -17.25 194 195 182 208 194 205 209 206 206 246 244 280 214 246 221 212 218 218 280 221 246 217FW8 6.4 X52 0.43 SMAW 0.53 6.6 -27.25 196 195 196 165 173 202 203 202 203 241 244 241 341 310 227 225 227 225 341 227 275 226FW9 6.4 X52 0.43 SMAW 1.29 16.04 -13.625 195 203 213 204 199 212 210 208 214 244 225 204 223 234 206 210 214 202 244 214 226 208FW10 8 X52 0.14 SMAW 0.53 6.1 -44.4 213 216 224 218 217 199 200 199 199 204 199 185 195 197 234 232 234 234 204 234 196 234FW11 8 X52 0.14 SMAW 1.29 5.75 -40.7 209 213 217 209 210 199 197 200 197 212 204 197 212 210 234 239 232 239 212 239 207 236FW12 6.4 X52 0.43 P-GMAW 0.35 3.12 -64.75 155 155 180 150 150 190 189 189 189 386 386 286 412 412 257 260 260 260 412 260 376 259FW14 11 X70 0.22 SMAW 0.53 3.55 -59.2 179 179 179 179 179 180 184 178 183 289 289 289 289 289 286 274 293 277 289 293 289 282FW15 11 X70 0.22 SMAW 1.29 6.25 -57.4 190 189 189 190 190 191 193 192 191 257 260 260 257 257 254 249 252 254 260 254 258 252FW23 6.4 X52 0.43 GMAW - RMD 0.53 6.8 -27.875 177 175 201 169 177 200 199 197 197 296 303 229 325 296 232 234 239 239 325 239 290 236FW24 6.4 X52 0.43 GMAW - RMD 1.29 15.28 -13 197 195 210 189 200 211 205 206 204 239 244 210 260 232 208 221 218 223 260 223 237 218FW28 6.4 X52 0.43 P-GMAW 0.53 5.56 -36.25 167 171 194 181 177 201 200 200 201 332 317 246 283 296 229 232 232 229 332 232 295 231FW29 6.4 X52 0.43 P-GMAW 1.29 24.64 -9.25 204 194 214 183 207 213 213 216 214 223 246 202 277 216 204 204 199 202 277 204 233 202FW30 8 X52 0.14 P-GMAW 0.53 3.9 -48.7 215 217 220 213 217 201 201 196 197 201 197 192 204 197 229 229 241 239 204 241 198 235FW31 8 X52 0.14 P-GMAW 1.29 24.3 -7.9 220 226 223 226 225 218 214 214 214 192 182 186 182 183 195 202 202 202 192 202 185 201FW32 11 X70 0.22 P-GMAW 0.53 3.05 -75.1 178 179 179 177 176 181 181 186 183 293 289 289 296 299 283 283 268 277 299 283 293 278FW33 11 X70 0.22 P-GMAW 1.29 7.35 -33.2 178 177 177 178 178 185 189 187 192 293 296 296 293 293 271 260 265 252 296 271 294 262FW50 6.4 X52 0.43 GS-FCAW 1.06 14.44 -19.875 198 210 212 186 205 204 202 199 207 237 210 206 268 221 223 227 234 216 268 234 228 225FW51 6.4 X52 0.43 GS-FCAW 1.29 16.2 -11.5 205 202 192 179 202 211 203 209 214 221 227 252 289 227 208 225 212 202 289 225 243 212FW52 8 X52 0.14 GS-FCAW 1.06 6.15 -22.2 209 209 216 212 208 194 200 196 199 212 212 199 206 214 246 232 241 234 214 246 209 238FW53 8 X52 0.14 GS-FCAW 1.29 23.4 -10.3 224 224 222 222 222 216 216 216 217 185 185 188 188 188 199 199 199 197 188 199 187 198FW54 11 X70 0.22 GS-FCAW 1.29 7.7 -28.57 190 191 191 190 189 194 193 198 193 257 254 254 257 260 246 249 237 249 260 249 256 245FW55 11 X70 0.22 GS-FCAW 1.99 27.9 -6.3 200 194 196 196 200 200 202 203 205 232 246 241 241 232 232 227 225 221 246 232 239 226FW60 6.4 X52 0.43 MCAW 0.53 7.48 -22.375 170 175 196 181 183 200 203 201 199 321 303 241 283 277 232 225 229 234 321 234 285 230FW61 6.4 X52 0.43 MCAW 1.29 20.92 -11.375 200 194 219 196 205 211 214 215 214 232 246 193 241 221 208 202 201 202 246 208 227 203FW62 8 X52 0.14 MCAW 0.53 3.55 -66.6 220 219 225 220 218 205 203 203 203 192 193 183 192 195 221 225 225 225 195 225 191 224FW63 8 X52 0.14 MCAW 1.29 9.65 -25.8 213 212 211 213 213 192 195 192 193 204 206 208 204 204 252 244 252 249 208 252 206 249FW64 11 X70 0.22 MCAW 0.53 2 -81.11 174 174 174 173 171 171 170 166 168 306 306 306 310 317 317 321 336 329 317 336 309 326FW65 11 X70 0.22 MCAW 1.29 10.6 -18.18 192 193 193 190 195 186 189 188 193 252 249 249 257 244 268 260 262 249 257 268 250 260
Weld Peak Hardness (Hv5) Average Hardness (Hv5)
Location
Cooling Rate CGHAZ - Pipe Side CG-HAZ Sleeve WeldCGHAZ - Pipe Side CG-HAZ Sleeve Pipe Thickness Heat Input
Weld ID ProcessCGHAZ Pipe CGHAZ Sleeve Weld CGHAZ Pipe CGHAZ Sleeve Weld1 2 3 4 5 1 2 3 1 2 3 4 2 31 2 3 4
Ocular Reading Hardness (Hv5)
Grade C.E1 2 3 45 1

BMT Fleet Technology Limited 5637C.FR
Alternate Welding Processes for In-Service Welding
67
Table 4.18: Cooling Data and Hardness Results – Sleeve Fillet Welds – Static Air (No Flow)
∆T 800-500C Slope at 540C(mm) (kJ/mm) (s) (degC / sec)
SA1 6.4 X52 0.43 SMAW 2F 0.53 5.55 -36.6 163 167 160 154 160 158 187 196 349 332 362 391 362 371 265 241 362 391 265 348 375 253SA2 6.4 X52 0.43 SMAW 3F-UP 1.29 13.25 -17.3 198 185 186 185 170 169 196 196 237 271 268 271 321 325 241 241 271 325 241 258 305 241SA3 6.4 X52 0.43 SMAW 2F 0.90 9.35 -19.5 177 180 180 173 174 173 196 195 296 286 286 310 306 310 241 244 296 310 244 289 309 243SA4 6.4 X52 0.43 SMAW 3F-UP 1.29 13.85 -17.6 194 176 185 181 174 177 199 198 246 299 271 283 306 296 234 237 299 306 237 272 295 235SA5 8 X52 0.14 SMAW 2F 0.90 5.05 -44.3 210 211 213 136 139 140 185 187 210 208 204 501 480 473 271 265 210 501 271 208 485 268SA6 8 X52 0.14 SMAW 3F-UP 1.56 12.6 -15.7 220 213 214 164 161 160 192 195 192 204 202 345 358 362 252 244 204 362 252 199 355 248SA7 11 X70 0.22 SMAW 3F-DWN 0.90 4 -88.3 179 179 180 148 150 156 160 165 289 289 286 423 412 381 362 341 289 423 362 288 405 351SA8 11 X70 0.22 SMAW 2F 1.29 4.65 -45.2 184 183 183 160 157 153 165 169 274 277 277 362 376 396 341 325 277 396 341 276 378 333SA9 16.1 X80 0.27 SMAW 3F-DWN 0.90 2 -71.42
SA10 16.1 X80 0.27 SMAW 2F 1.29 3.95 -67.1 170 168 167 140 144 142 159 163 321 329 332 473 447 460 367 349 332 473 367 327 460 358SA11 19.1 X70 0.24 SMAW 3F-DWN 0.90 2.35 -99 174 173 175 137 137 139 147 147 306 310 303 494 494 480 429 429 310 494 429 306 489 429SA12 19.1 X70 0.24 SMAW 2F 1.29 3.9 -60.8 177 178 179 139 141 140 160 160 296 293 289 480 466 473 362 362 296 480 362 293 473 362SA13 6.4 X70 0.43 P-GMAW 3F-UP 0.53 8.2 -30.9 173 168 170 166 174 170 200 196 310 329 321 336 306 321 232 241 329 336 241 320 321 237SA14 6.4 X70 0.43 P-GMAW 2F 1.29 10.65 -18.9 188 189 181 187 183 195 201 201 262 260 283 265 277 244 229 229 283 277 229 268 262 229SA15 8 X80 0.14 P-GMAW 3F-UP 0.53 3.4 -65.2 217 216 216 148 150 149 192 191 197 199 199 423 412 418 252 254 199 423 254 198 418 253SA16 8 X80 0.14 P-GMAW 2F 1.29 3.35 -60.8 218 218 218 159 150 155 192 193 195 195 195 367 412 386 252 249 195 412 252 195 388 250SA17 11 X70 0.22 P-GMAW 3F-UP 0.53 2.9 -72.8 173 170 175 146 152 152 173 171 310 321 303 435 401 401 310 317 321 435 317 311 413 313SA18 11 X70 0.22 P-GMAW 2F 1.29 5.25 -46.4 182 176 176 162 160 164 177 182 280 299 299 353 362 345 296 280 299 362 296 293 353 288SA19 16.1 X80 0.27 P-GMAW 3F-UP 0.53 1.75 -80.64 166 167 167 140 142 140 166 160 336 332 332 473 460 473 336 362 336 473 362 334 469 349SA20 16.1 X80 0.27 P-GMAW 2F 1.29 4.85 -47.5 173 174 173 141 147 147 182 182 310 306 310 466 429 429 280 280 310 466 280 309 442 280SA21 19.1 X70 0.24 P-GMAW 3F-UP 0.53 2.05 -118.7 178 173 177 143 142 153 161 169 293 310 296 453 460 396 358 325 310 460 358 299 436 341SA22 19.1 X70 0.24 P-GMAW 2F 1.29 3.8 -73.3 179 174 174 143 145 142 170 163 289 306 306 453 441 460 321 349 306 460 349 301 451 335SA23 6.4 X52 0.43 SS-FCAW 3F-DWN 1.29 12.8 -18.4 203 186 202 185 182 193 204 209 225 268 227 271 280 249 223 212 268 280 223 240 267 218SA24 6.4 X52 0.43 SS-FCAW 2F 1.99 21.8 -9.7 204 211 205 200 206 206 214 211 223 208 221 232 218 218 202 208 223 232 208 217 223 205SA25 8 X52 0.14 SS-FCAW 3F-DWN 1.29 14.1 -17.7 214 213 211 152 150 150 204 202 202 204 208 401 412 412 223 227 208 412 227 205 408 225SA26 8 X52 0.14 SS-FCAW 2F 1.99 30.4 -30.6 226 220 225 178 173 178 216 215 182 192 183 293 310 293 199 201 192 310 201 185 298 200SA27 11 X70 0.22 SS-FCAW 3F-DWN 1.29 5 -38.8 185 185 184 160 160 171 182 188 271 271 274 362 362 317 280 262 274 362 280 272 347 271SA28 11 X70 0.22 SS-FCAW 2F 1.99 11.7 -17.2 194 192 190 177 173 183 188 183 246 252 257 296 310 277 262 277 257 310 277 252 294 270SA29 16.1 X80 0.27 SS-FCAW 3F-DWN 1.29 5 -47.6 170 172 168 148 146 150 180 180 321 313 329 423 435 412 286 286 329 435 286 321 423 286SA30 16.1 X80 0.27 SS-FCAW 2F 1.99 5.45 -21.9 177 175 175 149 150 152 183 183 296 303 303 418 412 401 277 277 303 418 277 300 410 277SA31 19.1 X70 0.24 SS-FCAW 3F-DWN 1.29 4.05 -56.7 182 180 184 148 145 155 181 179 280 286 274 423 441 386 283 289 286 441 289 280 417 286SA32 19.1 X70 0.24 SS-FCAW 2F 1.99 6.35 -40.7 183 185 185 146 149 157 175 175 277 271 271 435 418 376 303 303 277 435 303 273 410 303SA33 6.4 X80 0.43 GS-FCAW 3F-UP 1.99 21.4 -9.6 198 205 204 188 189 193 204 206 237 221 223 262 260 249 223 218 237 262 223 227 257 221SA34 6.4 X80 0.43 GS-FCAW 2F 1.29 8.3 -22.3 183 178 182 172 161 168 192 192 277 293 280 313 358 329 252 252 293 358 252 283 333 252SA35 8 X70 0.14 GS-FCAW 3F-UP 1.99 18.44 -18.54 211 217 216 184 182 174 204 208 208 197 199 274 280 306 223 214 208 306 223 201 287 219SA36 8 X70 0.14 GS-FCAW 2F 1.29 8.16 -24 214 214 216 139 144 147 195 195 202 202 199 480 447 429 244 244 202 480 244 201 452 244SA37 11 X70 0.22 GS-FCAW 3F-UP 1.99 2.05 -50 191 184 187 167 164 154 189 188 254 274 265 332 345 391 260 262 274 391 262 264 356 261SA38 11 X70 0.22 GS-FCAW 2F 1.29 3.25 -63.7 187 187 186 160 163 171 182 186 265 265 268 362 349 317 280 268 268 362 280 266 343 274SA39 16.1 X80 0.27 GS-FCAW 3F-UP 1.99 6.6 -24.4 176 174 175 151 146 149 178 179 299 306 303 407 435 418 293 289 306 435 293 303 420 291SA40 16.1 X80 0.27 GS-FCAW 2F 1.29 5.1 -50 171 170 171 137 145 145 175 180 317 321 317 494 441 441 303 286 321 494 303 318 459 294SA41 19.1 X70 0.24 GS-FCAW 3F-UP 1.99 5.05 -52.85 180 179 178 148 145 149 172 168 286 289 293 423 441 418 313 329 293 441 329 289 427 321SA42 19.1 X70 0.24 GS-FCAW 2F 1.29 3.25 -68.7 175 175 180 147 143 143 184 180 303 303 286 429 453 453 274 286 303 453 286 297 445 280SA43 6.4 X80 0.43 MCAW 3F-UP 0.53 6.6 -33.7 175 172 172 165 167 180 194 194 303 313 313 341 332 286 246 246 313 341 246 310 320 246SA44 6.4 X80 0.43 MCAW 2F 1.29 7 -31.2 167 164 183 164 170 182 199 198 332 345 277 345 321 280 234 237 345 345 237 318 315 235SA45 8 X70 0.14 MCAW 3F-UP 0.53 5.48 -39.375 213 212 214 144 141 143 193 193 204 206 202 447 466 453 249 249 206 466 249 204 456 249SA46 8 X70 0.14 MCAW 2F 1.29 4.52 -35.97 210 215 215 140 139 139 191 191 210 201 201 473 480 480 254 254 210 480 254 204 478 254SA47 11 X70 0.22 MCAW 3F-UP 0.53 3.7 -59.7 177 175 176 148 154 153 153 151 296 303 299 423 391 396 396 407 303 423 407 299 403 401SA48 11 X70 0.22 MCAW 2F 1.29 3.5 -57.33 185 182 182 152 161 158 174 173 271 280 280 401 358 371 306 310 280 401 310 277 377 308SA49 16.1 X80 0.27 MCAW 3F-UP 0.53 3.4 -80.8 168 167 168 138 143 145 158 156 329 332 329 487 453 441 371 381 332 487 381 330 460 376SA50 16.1 X80 0.27 MCAW 2F 1.29 3.45 -68.2 168 169 168 137 141 148 160 159 329 325 329 494 466 423 362 367 329 494 367 327 461 364SA51 19.1 X70 0.24 MCAW 3F-UP 0.53 2.7 -95.3 173 173 174 140 143 141 154 159 310 310 306 473 453 466 391 367 310 473 391 309 464 379SA52 19.1 X70 0.24 MCAW 2F 1.29 4.85 -52.7 176 179 180 142 145 154 156 160 299 289 286 460 441 391 381 362 299 460 381 292 431 372
Average Hardness (Hv5)Welding Position WeldCGHAZ - Pipe Side CGHAZ - Pipe Side
Location
Cooling RateCG-HAZ Sleeve
Side
Ocular Reading
Pipe Thickness Heat InputWeld ID Process
CGHAZ PipeCGHAZ Sleeve
Weld CGHAZ PipeCGHAZ Sleeve
Weld1 2 3 1 2 3 1 2
Hardness (Hv5)
CG-HAZ Sleeve Side Weld Peak Hardness (Hv5)
2 31 2 3
Grade C.E
1 21

BMT Fleet Technology Limited 5637C.FR
Alternate Welding Processes for In-Service Welding
68
Table 4.19: Cooling Data and Hardness Results – Sleeve Fillet Welds – Water Backing
∆T 800-500C Slope at 540C(mm) (kJ/mm) (s) (degC / sec)
SW1 6.4 X52 0.43 SMAW 2F 0.53 3.56 -63.25 143 153 145 146 149 147 177 177 453 396 441 435 418 429 296 296 453 435 296 430 427 296SW2 6.4 X52 0.43 SMAW 3F-UP 1.29 6.28 -37.25 180 151 158 164 162 160 186 193 286 407 371 345 353 362 268 249 407 362 268 355 353 258SW3 6.4 X52 0.43 SMAW 2F 0.90 3.48 -92.5 149 144 142 150 151 150 167 171 418 447 460 412 407 412 332 317 460 412 332 442 410 325SW4 6.4 X52 0.43 SMAW 3F-UP 1.29 4 -64.5 147 145 152 153 152 153 184 189 429 441 401 396 401 396 274 260 441 401 274 424 398 267SW5 8 X52 0.14 SMAW 2F 0.90 4.25 -42.6 210 209 216 139 139 140 174 185 210 212 199 480 480 473 306 271 212 480 306 207 478 289SW6 8 X52 0.14 SMAW 3F-UP 1.56 7 -32.8 211 211 217 137 142 139 191 189 208 208 197 494 460 480 254 260 208 494 260 204 478 257SW7 11 X70 0.22 SMAW 3F-DWN 0.90 4.25 -53.3SW8 11 X70 0.22 SMAW 2F 1.29 7 -30.2SW13 6.4 X70 0.43 P-GMAW 3F-UP 0.53 6.24 -43.47 139 143 143 146 154 148 182 180 480 453 453 435 391 423 280 286 480 435 286 462 416 283SW14 6.4 X70 0.43 P-GMAW 2F 1.29 5.8 -40.25 151 141 152 159 159 158 190 187 407 466 401 367 367 371 257 265 466 371 265 425 368 261SW15 8 X80 0.14 P-GMAW 3F-UP 0.53 3.35 -68.9 208 210 215 144 138 138 182 181 214 210 201 447 487 487 280 283 214 487 283 208 474 281SW16 8 X80 0.14 P-GMAW 2F 1.29 4.15 -50.8 216 218 217 139 140 140 190 193 199 195 197 480 473 473 257 249 199 480 257 197 475 253SW17 11 X70 0.22 P-GMAW 3F-UP 0.53 2 -115.1 174 172 173 148 149 148 162 169 306 313 310 423 418 423 353 325 313 423 353 310 421 339SW18 11 X70 0.22 P-GMAW 2F 1.29 3.85 -68.3 182 176 179 165 162 154 179 178 280 299 289 341 353 391 289 293 299 391 293 290 362 291SW33 6.4 X80 0.43 GS-FCAW 3F-UP 1.99 10.08 -23.125 163 167 151 167 164 173 191 193 349 332 407 332 345 310 254 249 407 345 254 363 329 252SW34 6.4 X80 0.43 GS-FCAW 2F 1.29 3.84 -50 153 148 157 164 156 165 194 182 396 423 376 345 381 341 246 280 423 381 280 399 355 263SW35 8 X70 0.14 GS-FCAW 3F-UP 1.99 10.6 -25.7 210 210 210 138 140 141 191 191 210 210 210 487 473 466 254 254 210 487 254 210 475 254SW36 8 X70 0.14 GS-FCAW 2F 1.29 5.85 -32.6 216 214 215 141 146 151 198 190 199 202 201 466 435 407 237 257 202 466 257 201 436 247SW37 11 X70 0.22 GS-FCAW 3F-UP 1.99 4.35 -22.7 178 179 178 166 162 161 178 177 293 289 293 336 353 358 293 296 293 358 296 292 349 294SW38 11 X70 0.22 GS-FCAW 2F 1.29 7.8 -33.34 184 184 182 158 157 159 170 173 274 274 280 371 376 367 321 310 280 376 321 276 371 315SW43 6.4 X80 0.43 MCAW 3F-UP 0.53 3.04 -90.9 140 144 143 150 149 150 186 187 473 447 453 412 418 412 268 265 473 418 268 458 414 267SW44 6.4 X80 0.43 MCAW 2F 1.29 5.8 -28.57 143 156 146 163 152 157 187 184 453 381 435 349 401 376 265 274 453 401 274 423 375 270SW45 8 X70 0.14 MCAW 3F-UP 0.53 3.2 -76.3 206 211 210 136 139 139 184 184 218 208 210 501 480 480 274 274 218 501 274 212 487 274SW46 8 X70 0.14 MCAW 2F 1.29 5.7 -40 215 212 216 140 149 157 195 192 201 206 199 473 418 376 244 252 206 473 252 202 422 248SW47 11 X70 0.22 MCAW 3F-UP 0.53 4 -62.5 179 178 177 158 157 160 169 169 289 293 296 371 376 362 325 325 296 376 325 293 370 325SW48 11 X70 0.22 MCAW 2F 1.29 4.5 -50.4 184 184 183 163 162 166 170 169 274 274 277 349 353 336 321 325 277 353 325 275 346 323
Grade C.E
1 21 2 31 2 3
Hardness (Hv5)
CG-HAZ Sleeve Side Weld Peak Hardness (Hv5)
2 3 1 21 2 3 1
Location
Cooling RateCG-HAZ Sleeve
Side
Ocular Reading
Pipe Thickness Heat InputWeld ID Process
CGHAZ Pipe
Average Hardness (Hv5)Welding Position WeldCGHAZ - Pipe Side CGHAZ - Pipe SideCGHAZ Sleeve
Weld CGHAZ PipeCGHAZ Sleeve
Weld

BMT Fleet Technology Limited 5637C.FR
Alternate Welding Processes for In-Service Welding
69
Cooling rate comparisons between bead on pipe and fillet welds for 0.53 and 1.29kJ/mm heat inputs and each process are shown in Figures 4.54 and 4.55. These comparisons show that the weld cooling rate for the fillet welded sleeves increase considerably over the bead on pipe welds for the same heat inputs. This is due to the additional mass and heat sink capacity when the sleeve is attached. Cross-sections were extracted from each weld and hardness measurements were made to develop a relationship between heat input, cooling rate, and CGHAZ hardness in the base metal (i.e., carrier pipe). Cross-sections for air and water backed sleeve fillet welds are provided as Appendix M and Appendix N (note that air and water backed bead on pipe cross-sections are included as Appendix D and Appendix F, as previously discussed in Task 3). Figures 4.56 to 4.60 show the general trend of increasing hardness with increasing heat sink capacity going from bead on pipe with air backing, to sleeve fillet welds with air backing, to sleeve fillet welds with water backing. These examples are shown for the 6.4mm thick X52 pipe with the highest carbon equivalent (C.E.) of all materials evaluated. Figures 4.61 to 4.63 shows the result of the CGHAZ hardness of the carrier pipe for each repair scenario (i.e., direct bead on pipe with air backing, sleeve fillet welding with air backing, and sleeve fillet welding with water backing) as a comparison with each welding process. To the right of each plot are the cooling times (800 to 500°C in seconds) vs. heat input to show the relationship between the resulting hardnesses and “actual” cooling times for each weld deposited. The trend of increasing hardness with shorter cooling times (i.e., faster cooling rates) is apparent, however there does not appear to be a trend of any process resulting in softer CGHAZ’s at a given cooling rate compared to the others. The water backed sleeve fillet welds demonstrate overall higher hardnesses and the air backed bead on pipe welds have the lowest hardnesses over the same heat input range.

BMT Fleet Technology Limited 5637C.FR
Alternate Welding Processes for In-Service Welding
70
Figure 4.54: Welding Process vs. Cooling Rate, Fillet Weld vs. Bead on Pipe, 0.53 kJ/mm
Figure 4.55: Welding Process vs. Cooling Rate, Fillet Weld vs. Bead on Pipe, 1.29 kJ/mm
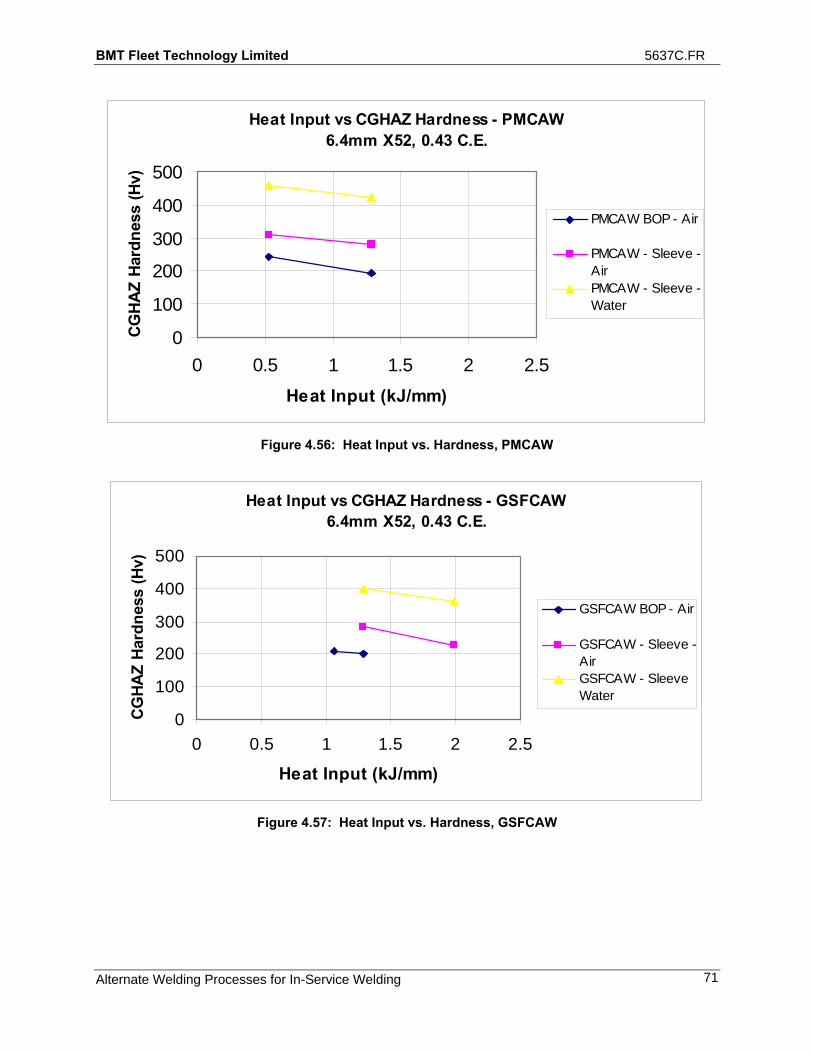
BMT Fleet Technology Limited 5637C.FR
Alternate Welding Processes for In-Service Welding
71
Heat Input vs CGHAZ Hardness - PMCAW6.4mm X52, 0.43 C.E.
0
100
200
300
400
500
0 0.5 1 1.5 2 2.5
Heat Input (kJ/mm)
CG
HA
Z H
ard
nes
s (H
v)
PMCAW BOP - Air
PMCAW - Sleeve -AirPMCAW - Sleeve -Water
Figure 4.56: Heat Input vs. Hardness, PMCAW
Heat Input vs CGHAZ Hardness - GSFCAW6.4mm X52, 0.43 C.E.
0
100
200
300
400
500
0 0.5 1 1.5 2 2.5
Heat Input (kJ/mm)
CG
HA
Z H
ard
nes
s (H
v)
GSFCAW BOP - Air
GSFCAW - Sleeve -AirGSFCAW - SleeveWater
Figure 4.57: Heat Input vs. Hardness, GSFCAW

BMT Fleet Technology Limited 5637C.FR
Alternate Welding Processes for In-Service Welding
72
Heat Input vs CGHAZ Hardness - PGMAW6.4mm X52, 0.43 C.E.
0
100
200
300
400
500
0 0.5 1 1.5 2 2.5
Heat Input (kJ/mm)
CG
HA
Z H
ard
nes
s (H
v)
PGMAW- BOP -Air
PGMAW -Sleeve - Air
PGMAW -Sleeve - Water
Figure 4.58: Heat Input vs. Hardness, PGCAW
Heat Input vs CGHAZ Hardness - SMAW 2.4mm Electrode6.4mm X52, 0.43 C.E.
0
100
200
300
400
500
0 0.5 1 1.5 2 2.5
Heat Input (kJ/mm)
CG
HA
Z H
ard
nes
s (H
v)
SMAW 2.4 - BOP -Air
SMAW 2.4 -Sleeve - Air
SMAW 2.4 -Sleeve - Water
Figure 4.59: Heat Input vs. Hardness, SMAW, 2.4mm Diameter Electrode

BMT Fleet Technology Limited 5637C.FR
Alternate Welding Processes for In-Service Welding
73
Heat Input vs CGHAZ Hardness - SMAW 3.2mm Electrode6.4mm X52, 0.43 C.E.
0
100
200
300
400
500
0 0.5 1 1.5 2 2.5
Heat Input (kJ/mm)
CG
HA
Z H
ard
nes
s (H
v)
SMAW 3.2 - BOP -Air
SMAW 3.2 -Sleeve - Air
SMAW 3.2 -Sleeve - Water
Figure 4.60: Heat Input vs. Hardness, SMAW, 3.2mm Diameter Electrode

BMT Fleet Technology Limited 5637C.FR
Alternate Welding Processes for In-Service Welding
74
Heat Input vs CGHAZ Hardness6.4mm X52, 0.43 C.E., BOP Welds, Air Backing
150
200
250
300
350
400
450
500
0 0.5 1 1.5
Heat Input (kJ/mm)
CG
HA
Z H
ard
ne
ss
(H
v)
SMAW 3.2
SMAW 2.4
PGMAW
PMCAW
GSFCAW
Heat Input vs Cooling Rate vs Process6.4mm X52, 0.43 C.E., BOP Welds, Air Backing
1
10
100
0 0.5 1 1.5
Heat Input (kJ/mm)
Co
olin
g T
ime
(800
to
500
C)
- (s
)
SMAW 3.2
SMAW 2.4
PGMAW
PMCAW
GSFCAW
Figure 4.61: Heat Input vs. Hardness vs. Cooling Rate, Bead on Pipe, Air Backing
Heat Input vs CGHAZ Hardness vs Process6.4mm X52, 0.43C.E., Sleeve Fillet Welds, Air Backing
150
200
250
300
350
400
450
500
0 0.5 1 1.5 2 2.5
Heat Inut (kJ/mm)
CG
HA
Z H
ard
ne
ss
(H
v
SMAW 3.2
SMAW 2.4
PGMAW
PMCAW
GSFCAW
Heat Input vs Cooling Rate vs Process6.4mm X52, 0.43 C.E., Sleeve Fillet Welds, Air Backing
1
10
100
0 0.5 1 1.5 2 2.5
Heat Input (kJ/mm)
Co
olin
g T
ime
(800
to
500
C)
- (s
)
SMAW 3.2
SMAW 2.4
PGMAW
PMCAW
GSFCAW
Figure 4.62: Heat Input vs. Hardness vs. Cooling Rate, Sleeve Fillet Welding, Air Backing
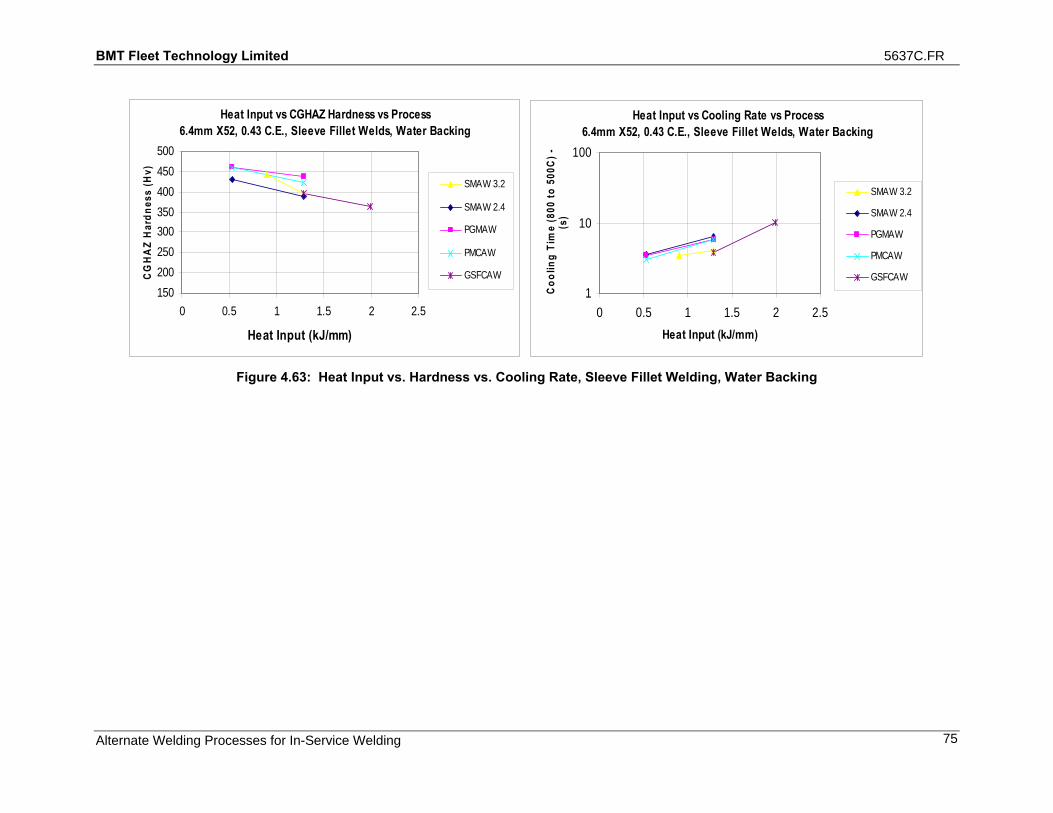
BMT Fleet Technology Limited 5637C.FR
Alternate Welding Processes for In-Service Welding
75
Heat Input vs CGHAZ Hardness vs Process6.4mm X52, 0.43 C.E., Sleeve Fillet Welds, Water Backing
150
200
250
300
350
400
450
500
0 0.5 1 1.5 2 2.5
Heat Input (kJ/mm)
CG
HA
Z H
ard
nes
s (H
v)
SMAW 3.2
SMAW 2.4
PGMAW
PMCAW
GSFCAW
Heat Input vs Cooling Rate vs Process6.4mm X52, 0.43 C.E., Sleeve Fillet Welds, Water Backing
1
10
100
0 0.5 1 1.5 2 2.5
Heat Input (kJ/mm)
Co
olin
g T
ime
(800
to
500
C)
-(s
)
SMAW 3.2
SMAW 2.4
PGMAW
PMCAW
GSFCAW
Figure 4.63: Heat Input vs. Hardness vs. Cooling Rate, Sleeve Fillet Welding, Water Backing

BMT Fleet Technology Limited 5637C.FR
Alternate Welding Processes for In-Service Welding
76
4.10 Task 8: Hot-tap Joint Simulation
An NPS36 X70 pipe (19mm thickness) and a 25mm thick sleeve (ASTM A516 Gr70, C.E .46) was used for the test assembly as supplied by Williamson Industries. The long seams of the sleeves were positioned at the 12 o’clock and 6 o’clock positions (see Figure 4.64) to allow a continuous non-interrupted fillet weld to be deposited with vertical up progression from the bottom of the pipe to the top. This method allowed for procedures to be developed for all positions of welding with each process for a three pass fillet weld. The target final fillet weld size had a leg length of 13mm. The good fit-up between the Williamson Industries provided sleeve and the NPS36 pipe is shown in Figure 4.65. The processes that were successfully evaluated included pulsed gas metal arc welding (PGMAW), pulsed metal cored arc welding (PMCAW) and gas shielded flux cored arc welding (FCAW). An attempt was made to implement self shielded FCAW however the welding control system and power source could not accurately control the parameters required to deposit a sound weld with a 2mm diameter electrode. However, a fillet weld will be made semi-automatically at a later date to compare the results of the weld zone hardnesses between all of the processes investigated. The welding equipment used included Miller’s Pipe Pro Axcess 450 power source (serial number LF310619) and Pipe Pro feeder. The welding head used for this evaluation was from RMS Welding Systems, which is a modified “bug and band” circumferential welding system with torch fixturing that was designed specifically to perform fillet welding. The welding head is shown in Figure 4.66. The welding procedures that were developed for each of the welding processes are shown in Table 4.20. It should be noted that the welding parameters for each individual weld pass for each process application did not change as the weld head progressed around the sleeve. This is an obvious advantage in that complex welding procedures do not have to be implemented for this application. The first, second, and third pass of the FCAW process are shown in Figure 4.67, 4.68, and 4.69, respectively. The first, second, and third pass of the PMCAW process are shown in Figures 4.70, 4.71, and 4.72, respectively. The first, second, and third pass of the PGMAW process are shown in Figures 4.73, 4.74, and 4.75, respectively. An example of the mechanized welding system in operation is shown in Figure 4.76.

BMT Fleet Technology Limited 5637C.FR
Alternate Welding Processes for In-Service Welding
77
Long Seams
Figure 4.64: Sleeve Assembly
Figure 4.65: Sleeve Fit-up

BMT Fleet Technology Limited 5637C.FR
Alternate Welding Processes for In-Service Welding
78
Figure 4.66: Mechanized Welding Head and Travel Band Set-up

BMT Fleet Technology Limited 5637C.FR
Alternate Welding Processes for In-Service Welding
79
Table 4.20: Mechanized Fillet Welding Procedures

BMT Fleet Technology Limited 5637C.FR
Alternate Welding Processes for In-Service Welding
80
Figure 4.67: FCAW First Pass
Figure 4.68: FCAW Second Pass

BMT Fleet Technology Limited 5637C.FR
Alternate Welding Processes for In-Service Welding
81
Figure 4.69: FCAW Third Pass
Figure 4.70: PMCAW First Pass

BMT Fleet Technology Limited 5637C.FR
Alternate Welding Processes for In-Service Welding
82
Figure 4.71: PMCAW Second Pass

BMT Fleet Technology Limited 5637C.FR
Alternate Welding Processes for In-Service Welding
83
Figure 4.72: PMCAW Third Pass
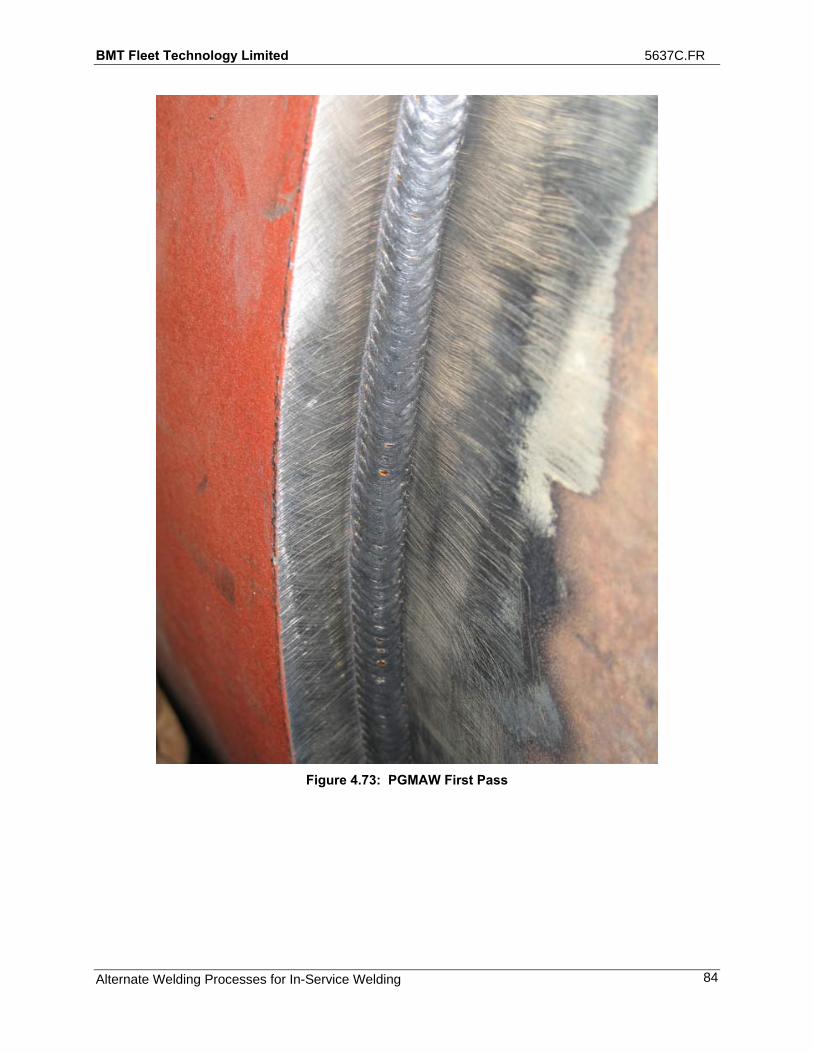
BMT Fleet Technology Limited 5637C.FR
Alternate Welding Processes for In-Service Welding
84
Figure 4.73: PGMAW First Pass

BMT Fleet Technology Limited 5637C.FR
Alternate Welding Processes for In-Service Welding
85
Figure 4.74: PGMAW Second Pass
Figure 4.75: PGMAW Third Pass

BMT Fleet Technology Limited 5637C.FR
Alternate Welding Processes for In-Service Welding
86
Figure 4.76: Mechanized Fillet Welding
The ends of the welds for each pass for each process were staggered by approximately four (4) inches (see Figure 4.77), to demonstrate the effectiveness of weld and HAZ tempering from subsequent passes by each process evaluated.

BMT Fleet Technology Limited 5637C.FR
Alternate Welding Processes for In-Service Welding
87
First Pass Second Pass
Third Pass
Figure 4.77: Weld Pass Staggering
Macro and micro sections were extracted from each of the mechanized welds and then prepared for weld bead penetration profile examination and hardness evaluations, as well as nick break and face bend tests. The macro cross-section of each completed fillet weld and each weld pass for each process are shown in Figures 4.78 to 4.80. Shown on each of the cross-sections are the heat inputs and average HAZ hardness measurements for each weld pass that demonstrate the degree of tempering of the previous weld deposits by the subsequent weld passes. It is interesting to note that each weld with each process demonstrated similar hardness results and degree of hardness reductions (i.e., tempering), however the PGMAW and PMCAW processes achieved the same degree of tempering at heat inputs 50% less than those of the FCAW process. This infers that the FCAW process is not as effective at tempering compared to the other two processes. The PMCAW and PGMAW processes therefore have the potential to provide weld zones that are less susceptible to hydrogen induced cracking compared to the FCAW process, since increasing hardness and susceptibility to cracking are directly related. Face bend specimens were extracted from each completed mechanized fillet weld and tested in accordance with API 1104. The results are shown in Figures 4.81 to 4.83. Each weld was acceptable in that they demonstrated no signs of discontinuity exceeding 1/8” in size. Nick break specimens were also extracted from each weld and tested in accordance with API 1104. The results are shown in Figures 4.84 to 4.86. Each weld was acceptable in that they demonstrated good fusion with no signs of cracks, lack of fusion, slag inclusions, or porosity exceeding the acceptance criteria.

BMT Fleet Technology Limited 5637C.FR
Alternate Welding Processes for In-Service Welding
88
Figure 4.78: PMCAW Weld Passes and Average CGHAZ Hardness per Pass
335
343
316 344
353
311 332
277
342
PGMAW
Heat Input 1st pass – 0.90 kJ/mm 2nd pass – 0.54 kJ/mm 3rd pass – 0.79 kJ/mm
Figure 4.79: PGMAW Weld Passes and Average CGHAZ Hardness per Pass
340
372
345 301
346
339 298
259
354
FCAW
Heat Input 1st pass - 1.42 kJ/mm 2nd pass – 1.13 kJ/mm 3rd pass – 1.42 kJ/mm
Figure 4.80: FCAW Weld Passes and Average CGHAZ Hardness per Pass
336
366
315 346
363
308 343
288
366
PMCAW
Heat Input1st pass - 1.01 kJ/mm 2nd pass – 0.52 kJ/mm 3rd pass – 0.83 kJ/mm

BMT Fleet Technology Limited 5637C.FR
Alternate Welding Processes for In-Service Welding
89
Figure 4.81: FCAW Face Bend Test Results
Figure 4.82: PGMAW Face Bend Results

BMT Fleet Technology Limited 5637C.FR
Alternate Welding Processes for In-Service Welding
90
Figure 4.83: PMCAW Face Bend Results
Figure 4.84: FCAW Nick Break Results

BMT Fleet Technology Limited 5637C.FR
Alternate Welding Processes for In-Service Welding
91
Figure 4.85: PGMAW Nick Break Results
Figure 4.86: PMCAW Nick Break Results

BMT Fleet Technology Limited 5637C.FR
Alternate Welding Processes for In-Service Welding
92
5 CONCLUSIONS
Based on the results of the alternative welding processes evaluated (a) Each have the potential to provide slower cooling rates over a range of heat inputs, compared to the
SMAW process. Slower cooling resulted in lower CGHAZ hardness and thus lower susceptibility to hydrogen
cracking PMCAW and PGMAW demonstrated lower CGHAZ hardness compared to SMAW at the same
calculated heat input level. (b) Each alternative process exhibited a higher susceptibility to burn-though compared to SMAW, likely
due to their higher process arc efficiencies and resulting higher peak inside surface temperature for a given calculated heat input level. The SSFCAW process had demonstrated the highest susceptibility to burn-through, however SMAW with 2.4mm electrodes had demonstrated the lowest.
(c) Possible that adjusting pulse waveform parameters could reduce their susceptibility (d) Alternative processes offer the advantage of mechanization to enhance consistency of the welding
procedure in all positions of welding as well as enhanced productivity with continuous wire feed and less interruptions.
(e) PMCAW and PMCAW processes demonstrated enhanced tempering of HAZ’s in previously weld deposits at heat inputs 50% lower than the FCAW process, as demonstrated in Task 8.
(f) Alternate welding processes passed the requirements for bend and nick break testing as per API 1104 specifications.
(g) Each process demonstrated longer hydrogen delay times in the simulated hydrogen model when welding on water filled pipe compared to the static air conditions.