2003 Florida Transportation Almanac - ROSA P
332
2003 Florida Transportation Almanac Center for Urban Transportation Research College of Engineering • University of South Florida ©CUTR, December 2003
-
Upload
khangminh22 -
Category
Documents
-
view
0 -
download
0
Transcript of 2003 Florida Transportation Almanac - ROSA P

2003 FloridaTransportation
Almanac
Center for Urban Transportation ResearchCollege of Engineering • University of South Florida
©CUTR, December 2003
Florida Transportation Almanac
ii

Florida Transportation Almanac
iii
PREFACE
This publication is the third edition of the Florida Transportation Almanac, developed and produced by theCenter for Urban Transportation Research (CUTR) at the University of South Florida (USF) in Tampa. Itfollows the original publication produced in 1995 and the Florida Transportation Almanac and Atlas on CD-ROM produced in 1998.
The Almanac contains data from existing data sources throughout Florida and the United States. A rangeof transportation topics is covered, and, to the extent possible, statistical data are for the most recent yearavailable. Although most of the information provided in the Almanac is available directly from the respectiveagencies that compiled or collected the information, the ability to access this information from a single source offers significant advantages to the transportation community.
The Almanac comprises nine chapters, as follows:
# Chapter 1, DEMOGRAPHICS, presents information for the U.S., Florida, and the 67 counties in the state.All data are taken from the 2000 Census and previous.
# Chapter 2, TRAVEL BEHAVIOR CHARACTERISTICS, summarizes travel behavior characteristics and trendsin Florida and the U.S. Summary statistics are provided for all personal travel in the U.S. and Florida, aswell as for the aggregated metropolitan regions in Florida. In addition, characteristics of the journey-to-work are provided for the U.S., Florida, and its counties.
# Chapter 3, MODAL STATISTICS, includes information on highways, aviation, public transportation, rail,seaports, transportation demand management (TDM), freight, and intelligent transportation systems (ITS).
# Chapter 4, SAFETY, includes information about traffic crashes for the state.
# Chapter 5, TOURISM, focuses on tourism statistics for the state.
# Chapter 6, TRANSPORTATION FINANCING, presents information on Florida's transportation tax and feesources and transportation costs associated with the construction and operation of various modes,including highways, bridges, airports, public transportation, and bicycle and pedestrian facilities.
# Chapter 7, TRANSPORTATION EDUCATION AND RESEARCH, presents an overview of the transportationeducation programs available at the state’s universities and colleges and a summary of the activities ofthe state’s transportation research organizations.
# Chapter 8, DIRECTORY, includes contact information for various transportation-related organizations inFlorida, including planning agencies, operating agencies, commissions, councils, committees, andprofessional associations, among others.
# Chapter 9, MISCELLANEOUS, contains a list of frequently-used transportation acronyms as well as a metricconversion chart.
The editors wish to acknowledge the assistance of all the individuals at the numerous agencies andorganizations who provided information and review of this publication. A fourth edition of the Almanac willbe published, and we welcome your comments and suggestions for improvements and additions.
–The Editors

Florida Transportation Almanac
iv
Florida Transportation Almanac
v
CONTENTS
1. DEMOGRAPHICS . . . . . . . . . . . . . . . . . . . . . . . . . . . . . . . . . . . . . . . . . . . . . . . . . . . . . . . . . 1
2. TRAVEL BEHAVIOR CHARACTERISTICS . . . . . . . . . . . . . . . . . . . . . . . . . . . . . . . . . . . . . 31
Personal Travel . . . . . . . . . . . . . . . . . . . . . . . . . . . . . . . . . . . . . . . . . . . . . . . . . . . . . . 33
Census Journey-to-Work Travel . . . . . . . . . . . . . . . . . . . . . . . . . . . . . . . . . . . . . . . . . 43
3. MODAL STATISTICS . . . . . . . . . . . . . . . . . . . . . . . . . . . . . . . . . . . . . . . . . . . . . . . . . . . . . 63
Highways . . . . . . . . . . . . . . . . . . . . . . . . . . . . . . . . . . . . . . . . . . . . . . . . . . . . . . . . . . . 69
Toll Facilities . . . . . . . . . . . . . . . . . . . . . . . . . . . . . . . . . . . . . . . . . . . . . . . . . . . . . . . 107
Aviation . . . . . . . . . . . . . . . . . . . . . . . . . . . . . . . . . . . . . . . . . . . . . . . . . . . . . . . . . . . 115
Public Transportation . . . . . . . . . . . . . . . . . . . . . . . . . . . . . . . . . . . . . . . . . . . . . . . . 127
Rail . . . . . . . . . . . . . . . . . . . . . . . . . . . . . . . . . . . . . . . . . . . . . . . . . . . . . . . . . . . . . . 141
Seaports . . . . . . . . . . . . . . . . . . . . . . . . . . . . . . . . . . . . . . . . . . . . . . . . . . . . . . . . . . 151
Transportation Demand Management . . . . . . . . . . . . . . . . . . . . . . . . . . . . . . . . . . . 167
Freight . . . . . . . . . . . . . . . . . . . . . . . . . . . . . . . . . . . . . . . . . . . . . . . . . . . . . . . . . . . . 171
Intelligent Transportation Systems . . . . . . . . . . . . . . . . . . . . . . . . . . . . . . . . . . . . . 185
4. SAFETY . . . . . . . . . . . . . . . . . . . . . . . . . . . . . . . . . . . . . . . . . . . . . . . . . . . . . . . . . . . . . . 203
5. TOURISM . . . . . . . . . . . . . . . . . . . . . . . . . . . . . . . . . . . . . . . . . . . . . . . . . . . . . . . . . . . . . 215
6. TRANSPORTATION FINANCING . . . . . . . . . . . . . . . . . . . . . . . . . . . . . . . . . . . . . . . . . . . 247
7. TRANSPORTATION EDUCATION AND RESEARCH . . . . . . . . . . . . . . . . . . . . . . . . . . . . . 279
8. DIRECTORY . . . . . . . . . . . . . . . . . . . . . . . . . . . . . . . . . . . . . . . . . . . . . . . . . . . . . . . . . . . 289
9. MISCELLANEOUS . . . . . . . . . . . . . . . . . . . . . . . . . . . . . . . . . . . . . . . . . . . . . . . . . . . . . . 317
Acronyms . . . . . . . . . . . . . . . . . . . . . . . . . . . . . . . . . . . . . . . . . . . . . . . . . . . . . . . . . 319
Metric Conversion Chart . . . . . . . . . . . . . . . . . . . . . . . . . . . . . . . . . . . . . . . . . . . . . . 321
INDEX . . . . . . . . . . . . . . . . . . . . . . . . . . . . . . . . . . . . . . . . . . . . . . . . . . . . . . . . . . . . . . . 323

Florida Transportation Almanac
vi
Florida Transportation Almanac
1
Chapter 1:DEMOGRAPHICS

Florida Transportation Almanac
2

Florida Transportation Almanac
3
SECTION HIGHLIGHTS
Florida
# According to the Bureau of the Census, Florida’s population has increased more than 24 percent from 1990(12.9 million) to 2000 (15.98 million).
# During this time, licensed drivers increased about 39 percent (9.2 million in 1990; 12.85 million in 2000).
# The number of licensed drivers per household increased from 1.8 drivers in 1990 to 2.0 drivers in 2000.
# The gender distribution in Florida has remained relatively stable from 1990 to 2000 with approximately48.8 percent of the population being male and 51.2 percent being female.
# The percent of households in Florida above the poverty level has increased by about 24 percent between1990 and 2000.
United States
# Total U.S. population increased 13.2 percent from 248.7 million in 1990 to 281.4 million in 2000.
# During this time, licensed drivers increased 14.1 percent (167.0 million in 1990; 190.6 million in 2000).
# The number of licensed drivers per household decreased slightly from 1.82 drivers in 1990 to 1.81 driversin 2000.
# The gender distribution in the U.S. has remained relatively stable from 1990 to 2000 with approximately49 percent of the population being male and 51 percent being female.
# The percent of households in the U.S. above the poverty level increased by about 14 percent between1990 and 2000.
For more information, direct e-mail comments, and questions about the 2000 US Census, contact [email protected] or the PublicInformation Office at (301) 763-3030.

Florida Transportation Almanac
4
Figure 1-1POPULATION GROWTH RATES, FLORIDA AND UNITED STATES (1970-2000)
Figure 1-2WORKER GROWTH RATES, FLORIDA AND UNITED STATES (1970-2000)
0%
20%
40%
60%
80%
100%
120%
140%
160%
1970-1980 1980-1990 1990-2000 1970-2000
44%33%
24%
135%
12% 10% 13%
39%
Florida United States
0%
20%
40%
60%
80%
100%
120%
140%
160%
180%
200%
1970-1980 1980-1990 1990-2000 1970-2000
61%45%
19%
179%
26%19%
12%
67%
Florida United States
Florida Transportation Almanac
5
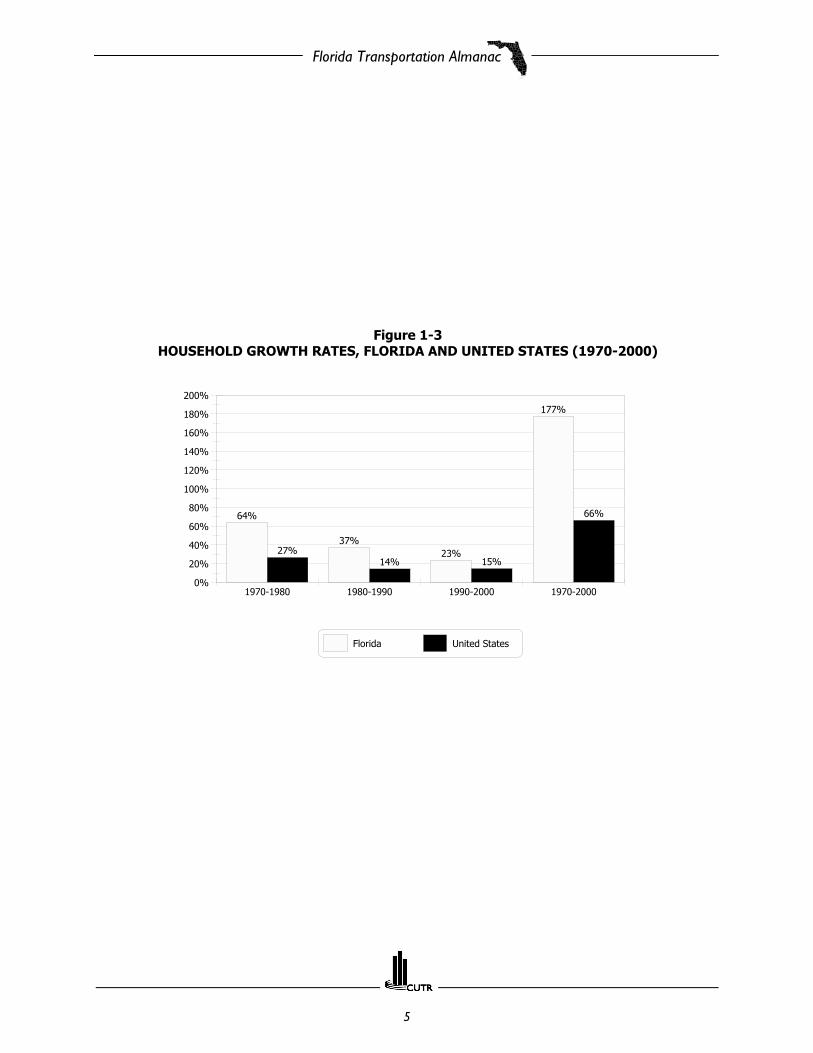
Figure 1-3HOUSEHOLD GROWTH RATES, FLORIDA AND UNITED STATES (1970-2000)
0%
20%
40%
60%
80%
100%
120%
140%
160%
180%
200%
1970-1980 1980-1990 1990-2000 1970-2000
64%
37%23%
177%
27%14% 15%
66%
Florida United States
Florida Transportation Almanac
6
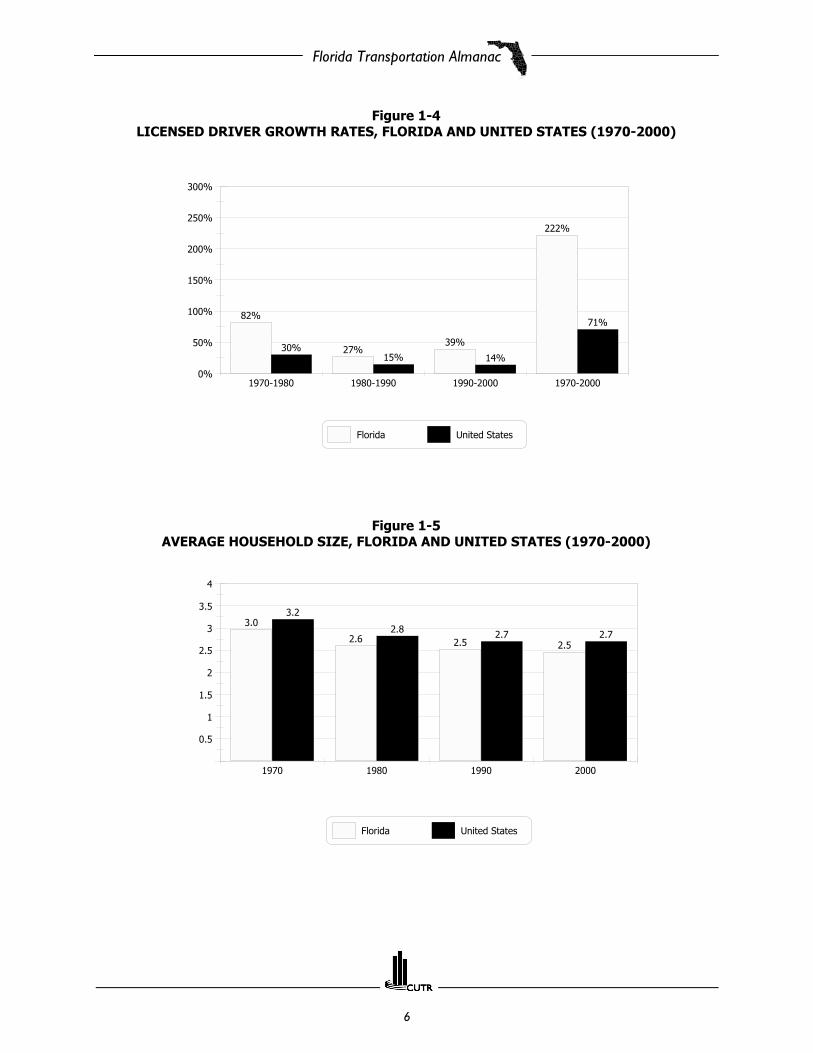
Figure 1-4LICENSED DRIVER GROWTH RATES, FLORIDA AND UNITED STATES (1970-2000)
Figure 1-5AVERAGE HOUSEHOLD SIZE, FLORIDA AND UNITED STATES (1970-2000)
0%
50%
100%
150%
200%
250%
300%
1970-1980 1980-1990 1990-2000 1970-2000
82%
27%39%
222%
30%15% 14%
71%
Florida United States
0.5
1
1.5
2
2.5
3
3.5
4
1970 1980 1990 2000
3.0
2.6 2.5 2.5
3.2
2.8 2.7 2.7
Florida United States
Florida Transportation Almanac
7
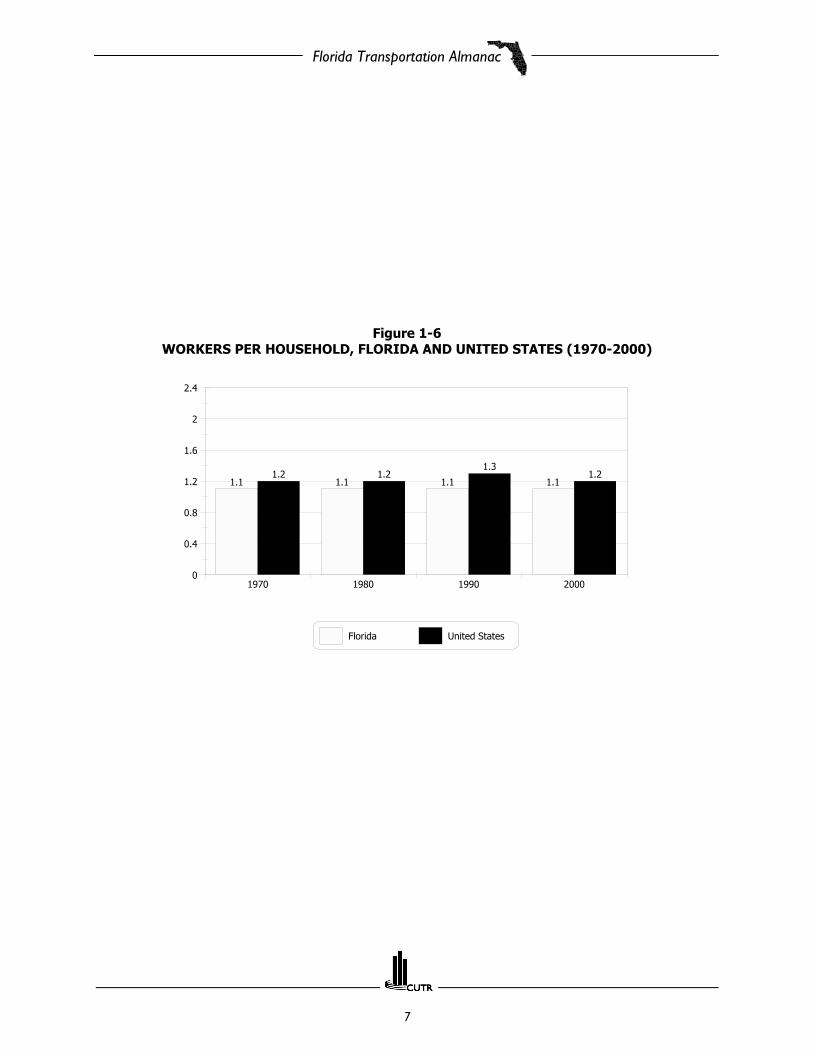
Figure 1-6WORKERS PER HOUSEHOLD, FLORIDA AND UNITED STATES (1970-2000)
0
0.4
0.8
1.2
1.6
2
2.4
1970 1980 1990 2000
1.1 1.1 1.1 1.11.2 1.2
1.31.2
Florida United States

Florida Transportation Almanac
8
Figure 1-7LICENSED DRIVERS PER HOUSEHOLD, FLORIDA AND UNITED STATES (1970-2000)
0
0.4
0.8
1.2
1.6
2
2.4
1970 1980 1990 2000
1.6
2.0
1.8
2.0
1.7 1.8 1.8 1.8
Florida United States

Florida Transportation Almanac
9
Figure 1-8LABOR FORCE PARTICIPATION RATES, FLORIDA AND UNITED STATES (1970-2000)
0%
20%
40%
60%
80%
1970 1980 1990 2000
53%56%
60% 59%58%62%
65% 64%
Florida United States
Florida Transportation Almanac
10
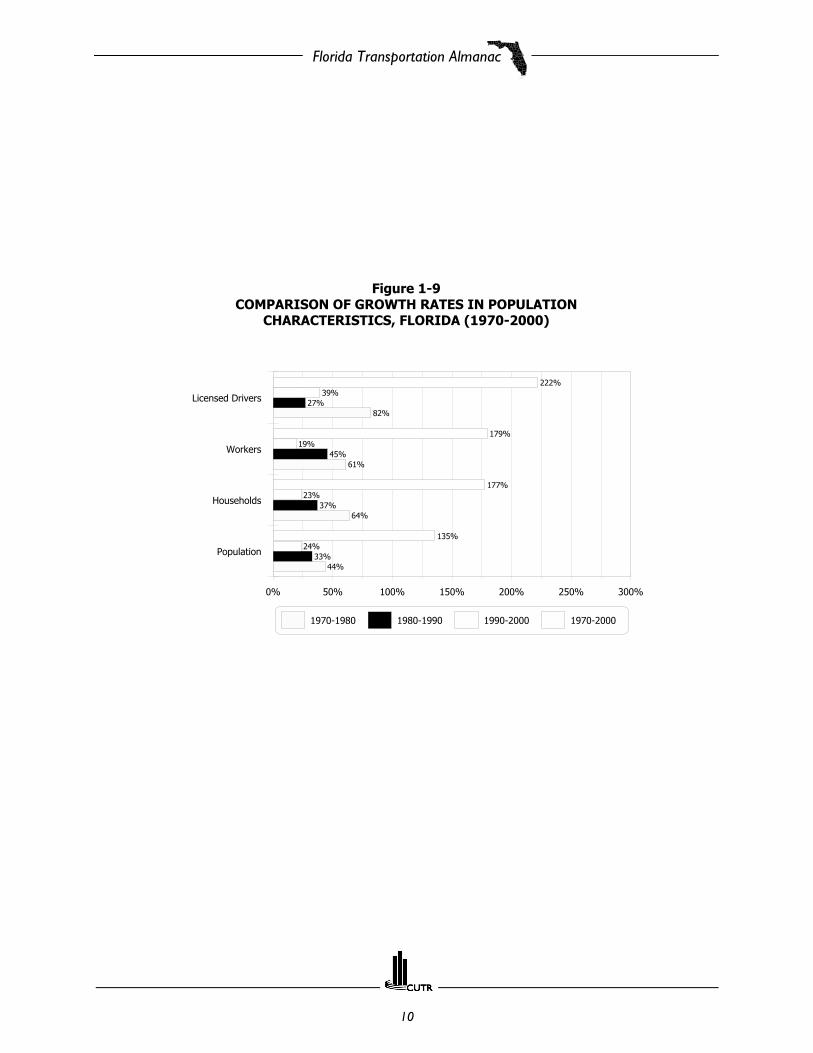
Figure 1-9COMPARISON OF GROWTH RATES IN POPULATION
CHARACTERISTICS, FLORIDA (1970-2000)
0% 50% 100% 150% 200% 250% 300%
Population
Households
Workers
Licensed Drivers
44%
64%
61%
82%
33%
37%
45%
27%
24%
23%
19%
39%
135%
177%
179%
222%
1970-1980 1980-1990 1990-2000 1970-2000

Florida Transportation Almanac
11
Figure 1-10ETHNIC ORIGIN, FLORIDA AND UNITED STATES (1970-2000)
FLORIDA
UNITED STATES
0%
20%
40%
60%
80%
100%
1970 1980 1990 2000
84% 84% 83% 80%
15% 14% 14% 15%
0% 2% 3% 5%
White African-American Other
20%
40%
60%
80%
100%
1970 1980 1990 2000
88%83% 80% 77%
11% 12% 12% 13%
1% 5% 8% 10%
White African-American Other
Florida Transportation Almanac
12
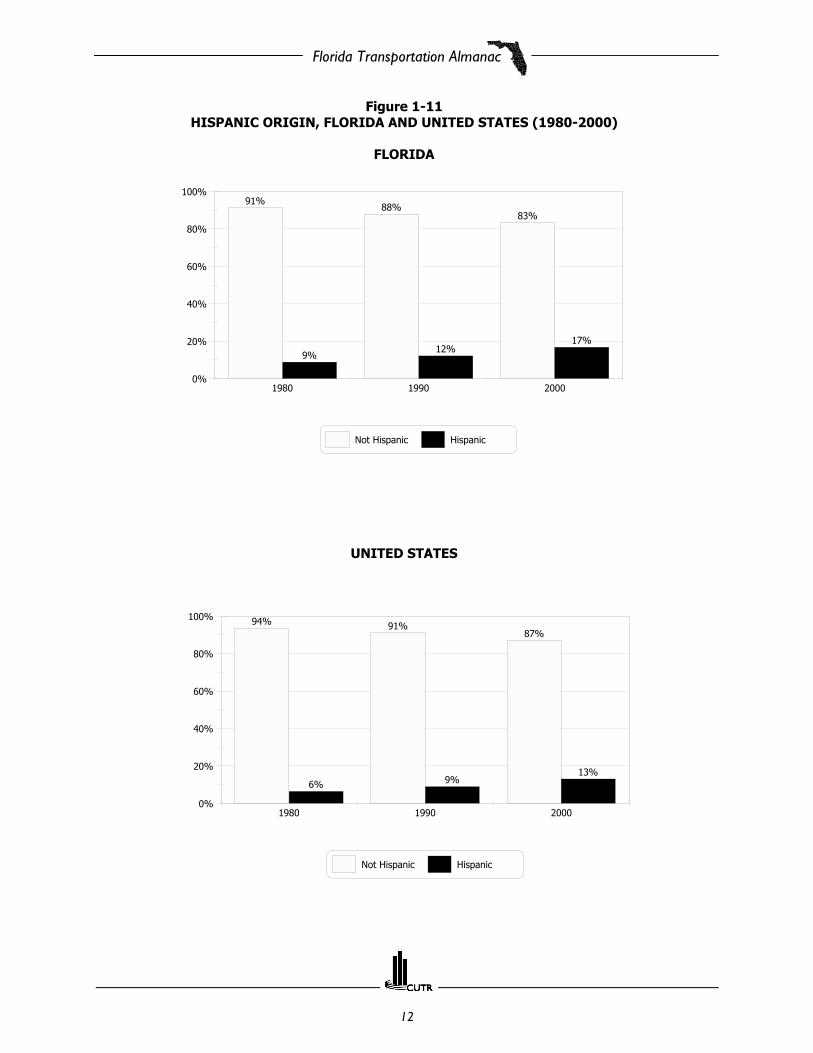
Figure 1-11HISPANIC ORIGIN, FLORIDA AND UNITED STATES (1980-2000)
FLORIDA
UNITED STATES
0%
20%
40%
60%
80%
100%
1980 1990 2000
91%88%
83%
9%12%
17%
Not Hispanic Hispanic
0%
20%
40%
60%
80%
100%
1980 1990 2000
94% 91%87%
6% 9%13%
Not Hispanic Hispanic
Florida Transportation Almanac
13
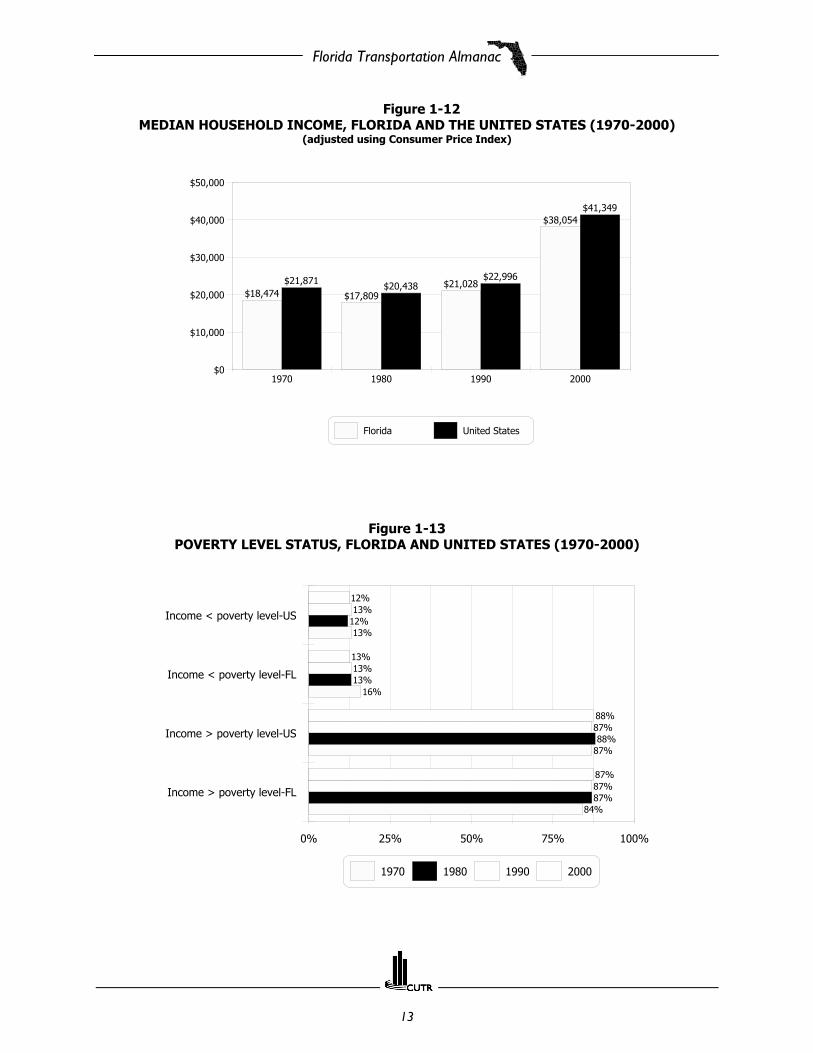
Figure 1-12MEDIAN HOUSEHOLD INCOME, FLORIDA AND THE UNITED STATES (1970-2000)
(adjusted using Consumer Price Index)
Figure 1-13POVERTY LEVEL STATUS, FLORIDA AND UNITED STATES (1970-2000)
$0
$10,000
$20,000
$30,000
$40,000
$50,000
1970 1980 1990 2000
$18,474 $17,809$21,028
$38,054
$21,871 $20,438$22,996
$41,349
Florida United States
0% 25% 50% 75% 100%
Income > poverty level-FL
Income > poverty level-US
Income < poverty level-FL
Income < poverty level-US
84%
87%
16%
13%
87%
88%
13%
12%
87%
87%
13%
13%
87%
88%
13%
12%
1970 1980 1990 2000

Florida Transportation Almanac
14
Figure 1-14AGE DISTRIBUTION, FLORIDA AND UNITED STATES (1970-2000)
FLORIDA
UNITED STATES
0%
10%
20%
30%
40%
1970 1980 1990 2000
28%
21%20% 20%
7% 7%
5% 5%
13%
16%15%
12%11%
13%
16%15%
22%21% 21%
26%
5% 6% 5% 5%
15%
17%18%
18%
<16 16 To 19 20 To 29 30 To 39 40 To 59 60 to 64 65+
0%
10%
20%
30%
40%
1970 1980 1990 2000
31%
24%
23% 23%
7% 8%
6% 6%
15%
18%
16%
14%
11%
14%
17%
15%
22%
20%
22%
26%
4%5%
4% 4%
10%11%
13% 12%
<16 16 To 19 20 To 29 30 To 39 40 To 59 60 to 64 65+

Florida Transportation Almanac
15
Figure 1-15EDUCATION LEVEL, FLORIDA AND UNITED STATES (1970-2000)
FLORIDA
UNITED STATES
10%
20%
30%
40%
50%
1970 1980 1990 2000
28%
18%
10%
7%
20%
16% 16%14%
31%
35%
30% 31%
12%
17%
26%23%
6%9%
12%15%
4%6% 6%
9%
Less than 9th grade 9th grade to 12th grade High school graduate
Some college Bachelor's degree Graduate or prof. degree
0%
10%
20%
30%
40%
50%
1970 1980 1990 2000
28%
18%
10%8%
20%
15% 14% 13%
31%
35%
30% 31%
11%
16%
25%
22%
6%
9%
13%
17%
5%
8% 7%9%
Less than 9th grade 9th grade to 12th grade High school graduate
Some college Bachelor's degree Graduate or prof. degree

Florida Transportation Almanac
16
Tabl
e 1
-1FL
OR
IDA
PO
PU
LATI
ON
CH
AR
AC
TER
ISTI
CS
(20
00
)
Pop
ula
tion
Ch
arac
teri
stic
s
FLO
RID
A
Cal
enda
r Y
ear
Ch
ange
(%
)
19
70
19
80
1
99
02
00
07
0-8
08
0-9
09
0-0
07
0-0
0
Popu
latio
n6,
789,
443
9,74
6,32
412
,937
,926
15,9
82,3
7843
.632
.723
.513
5.4
Hou
seho
lds
2,28
4,78
63,
744,
254
5,13
4,86
96,
337,
929
63.9
37.1
23.4
177.
4
Num
ber
of W
orke
rs2,
473,
256
3,98
4,83
65,
794,
452
6,91
0,16
861
.145
.419
.317
9.4
Lice
nsed
Driv
ers
3,99
4,02
47,
267,
962
9,23
1,40
512
,853
,000
82.0
27.0
39.2
221.
8
Pers
ons
per
Hou
seho
ld
3.0
2.6
2.5
2.5
-13.
3 -3
.8
0.0
-16.
7
Wor
kers
per
Hou
seho
ld
1.1
1.1
1.1
1.1
0.0
0.0
0.
0
0.0
Lice
nsed
Driv
ers
per
Hou
seho
ld
1.6
2.0
1.8
2.0
25.0
-1
0.0
11.1
25.
0
Labo
r Fo
rce
Part
icip
atio
n Rat
e (%
) 53
56
60
59
5.
7 7.
1 -1
.7
11.
3
Sour
ce:
2000
U.S
. Cen
sus:
htt
p://
ww
w.c
ensu
s.go
v/m
ain/
ww
w/c
en20
00.h
tml a
nd U
.S. F
eder
al H
ighw
ay A
dmin
istr
atio
n H
ighw
ay S
tatis
tics
for
num
ber
of li
cens
ed d
river
s.
Florida Transportation Almanac
17
Tabl
e 1
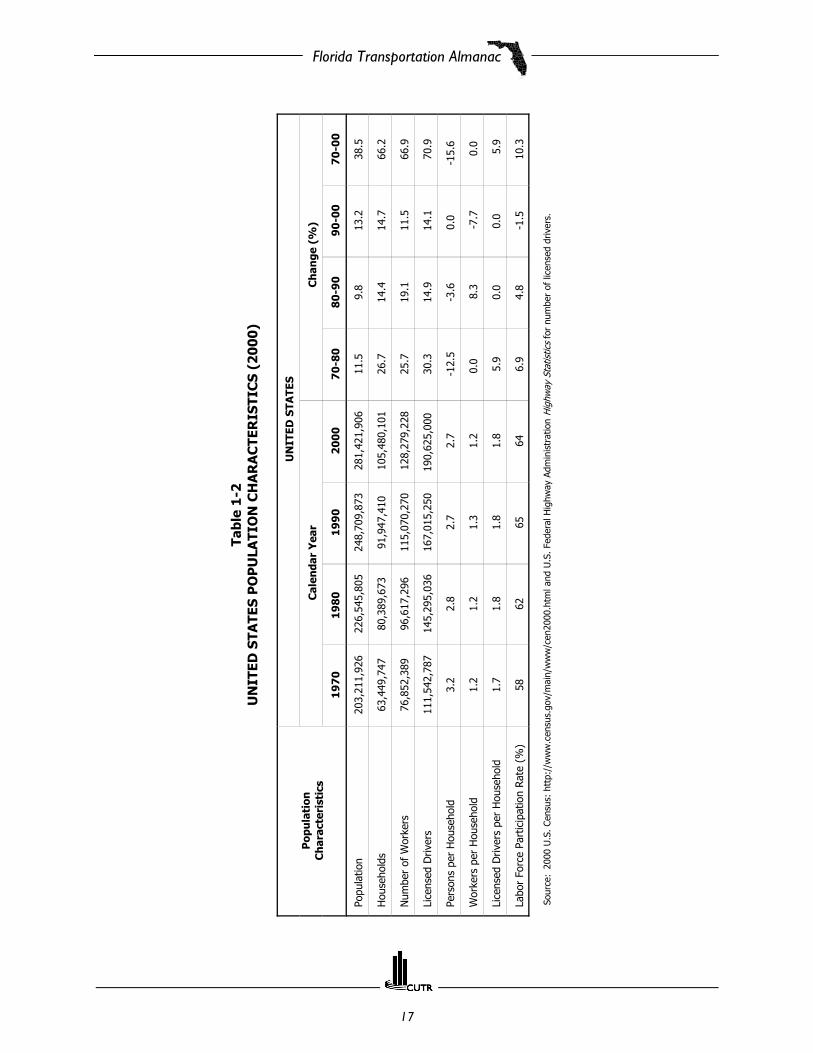
-2U
NIT
ED S
TATE
S P
OP
ULA
TIO
N C
HA
RA
CTE
RIS
TIC
S (2
00
0)
Pop
ula
tion
Ch
arac
teri
stic
s
UN
ITED
STA
TES
Cal
enda
r Y
ear
Ch
ange
(%
)
19
70
19
80
1
99
02
00
07
0-8
08
0-9
09
0-0
07
0-0
0
Popu
latio
n20
3,21
1,92
622
6,54
5,80
524
8,70
9,87
328
1,42
1,90
611
.59.
813
.238
.5
Hou
seho
lds
63,4
49,7
4780
,389
,673
91,9
47,4
1010
5,48
0,10
126
.714
.414
.766
.2
Num
ber
of W
orke
rs76
,852
,389
96,6
17,2
9611
5,07
0,27
012
8,27
9,22
825
.719
.111
.566
.9
Lice
nsed
Driv
ers
111,
542,
787
145,
295,
036
167,
015,
250
190,
625,
000
30.3
14
.9
14.1
70
.9
Pers
ons
per
Hou
seho
ld
3.2
2.8
2.7
2.7
-12.
5 -3
.6
0.0
-15.
6
Wor
kers
per
Hou
seho
ld
1.2
1.2
1.3
1.2
0.0
8
.3
-7.7
0.
0
Lice
nsed
Driv
ers
per
Hou
seho
ld
1.7
1.8
1.8
1.8
5.9
0.0
0.
0 5
.9
Labo
r Fo
rce
Part
icip
atio
n Rat
e (%
) 58
62
65
64
6.
9 4.
8 -1
.5
10.3
Sour
ce:
2000
U.S
. Cen
sus:
htt
p://
ww
w.c
ensu
s.go
v/m
ain/
ww
w/c
en20
00.h
tml a
nd U
.S. F
eder
al H
ighw
ay A
dmin
istr
atio
n H
ighw
ay S
tatis
tics
for
num
ber
of li
cens
ed d
river
s.
Florida Transportation Almanac
18
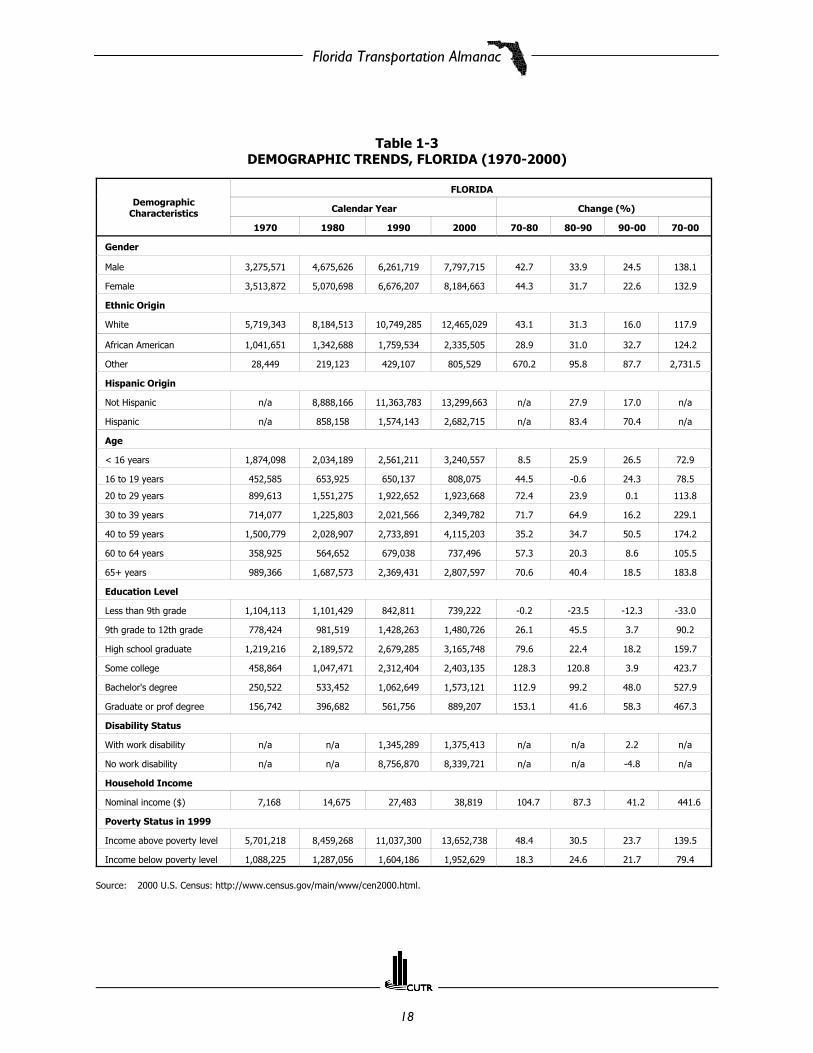
Table 1-3DEMOGRAPHIC TRENDS, FLORIDA (1970-2000)
DemographicCharacteristics
FLORIDA
Calendar Year Change (%)
1970 1980 1990 2000 70-80 80-90 90-00 70-00
Gender
Male 3,275,571 4,675,626 6,261,719 7,797,715 42.7 33.9 24.5 138.1
Female 3,513,872 5,070,698 6,676,207 8,184,663 44.3 31.7 22.6 132.9
Ethnic Origin
White 5,719,343 8,184,513 10,749,285 12,465,029 43.1 31.3 16.0 117.9
African American 1,041,651 1,342,688 1,759,534 2,335,505 28.9 31.0 32.7 124.2
Other 28,449 219,123 429,107 805,529 670.2 95.8 87.7 2,731.5
Hispanic Origin
Not Hispanic n/a 8,888,166 11,363,783 13,299,663 n/a 27.9 17.0 n/a
Hispanic n/a 858,158 1,574,143 2,682,715 n/a 83.4 70.4 n/a
Age
< 16 years 1,874,098 2,034,189 2,561,211 3,240,557 8.5 25.9 26.5 72.9
16 to 19 years 452,585 653,925 650,137 808,075 44.5 -0.6 24.3 78.5
20 to 29 years 899,613 1,551,275 1,922,652 1,923,668 72.4 23.9 0.1 113.8
30 to 39 years 714,077 1,225,803 2,021,566 2,349,782 71.7 64.9 16.2 229.1
40 to 59 years 1,500,779 2,028,907 2,733,891 4,115,203 35.2 34.7 50.5 174.2
60 to 64 years 358,925 564,652 679,038 737,496 57.3 20.3 8.6 105.5
65+ years 989,366 1,687,573 2,369,431 2,807,597 70.6 40.4 18.5 183.8
Education Level
Less than 9th grade 1,104,113 1,101,429 842,811 739,222 -0.2 -23.5 -12.3 -33.0
9th grade to 12th grade 778,424 981,519 1,428,263 1,480,726 26.1 45.5 3.7 90.2
High school graduate 1,219,216 2,189,572 2,679,285 3,165,748 79.6 22.4 18.2 159.7
Some college 458,864 1,047,471 2,312,404 2,403,135 128.3 120.8 3.9 423.7
Bachelor's degree 250,522 533,452 1,062,649 1,573,121 112.9 99.2 48.0 527.9
Graduate or prof degree 156,742 396,682 561,756 889,207 153.1 41.6 58.3 467.3
Disability Status
With work disability n/a n/a 1,345,289 1,375,413 n/a n/a 2.2 n/a
No work disability n/a n/a 8,756,870 8,339,721 n/a n/a -4.8 n/a
Household Income
Nominal income ($) 7,168 14,675 27,483 38,819 104.7 87.3 41.2 441.6
Poverty Status in 1999
Income above poverty level 5,701,218 8,459,268 11,037,300 13,652,738 48.4 30.5 23.7 139.5
Income below poverty level 1,088,225 1,287,056 1,604,186 1,952,629 18.3 24.6 21.7 79.4
Source: 2000 U.S. Census: http://www.census.gov/main/www/cen2000.html.

Florida Transportation Almanac
19
Table 1-4DEMOGRAPHIC TRENDS, UNITED STATES (1970-2000)
DemographicCharacteristics
UNITED STATES
Calendar Year Change (%)
1970 1980 1990 2000 70-80 80-90 90-00 70-00
Gender
Male 98,912,192 110,053,161 121,239,418 138,053,563 11.3 10.2 13.9 39.6
Female 104,299,734 116,492,644 127,470,455 143,368,343 11.7 9.4 12.5 37.5
Ethnic Origin
White 177,748,975 188,371,622 199,686,070 211,460,626 6.0 6.0 5.9 19.0
African American 22,580,289 26,495,025 29,986,060 34,658,190 17.3 13.2 15.6 53.5
Other 2,882,662 11,679,158 19,037,743 28,476,862 305.2 63.0 49.6 887.9
Hispanic Origin
Not Hispanic n/a 211,937,132 226,355,814 246,116,088 n/a 6.8 8.7 n/a
Hispanic n/a 14,608,673 22,354,059 35,305,818 n/a 53.0 57.9 n/a
Age
< 16 years 61,929,086 55,350,237 56,889,480 64,272,779 -10.6 2.8 13.0 3.8
16 to 19 years 15,041,314 17,108,226 14,432,406 16,200,486 13.7 -15.6 12.3 7.7
20 to 29 years 29,848,014 40,839,623 40,333,357 38,345,337 36.8 -1.2 -4.9 28.5
30 to 39 years 22,537,287 31,526,222 41,826,004 43,217,052 39.9 32.7 3.3 91.8
40 to 59 years 45,173,939 46,084,449 53,370,628 73,589,052 2.0 15.8 37.9 62.9
60 to 64 years 8,616,784 10,087,621 10,616,167 10,805,447 17.1 5.2 1.8 25.4
65+ years 20,065,502 25,549,427 31,241,831 34,991,753 27.3 22.3 12.0 74.4
Education Level
Less than 9th grade 31,087,390 24,257,683 16,502,211 13,755,477 -22.0 -32.0 -16.6 -55.8
9th grade to 12th grade 21,285,922 20,277,514 22,841,507 21,960,148 -4.7 12.6 -3.9 3.2
High school graduate 34,158,051 45,947,035 47,642,763 52,168,981 34.5 3.7 9.5 52.7
Some college 11,650,730 20,794,975 39,571,702 38,351,595 78.5 90.3 -3.1 229.2
Bachelor's degree 6,657,604 11,420,499 20,832,567 28,317,792 71.5 82.4 35.9 325.3
Graduate or prof degree 5,059,662 10,137,981 11,477,686 16,144,813 100.4 13.2 40.7 219.1
Disability Status
With work disability n/a n/a 22,537,613 21,287,570 n/a n/a -5.5 n/a
No work disability n/a n/a 164,349,820 157,399,664 n/a n/a -4.2 n/a
Household Income
Nominal income ($) 8,486 16,841 30,056 41,994 98.5 78.5 39.7 394.9
Poverty Status in 1999
Income above poverty 176,003,343 199,153,225 210,234,995 239,982,420 13.2 5.6 14.1 36.4
Income below poverty level 27,208,583 27,392,580 31,742,855 33,899,812 0.7 15.9 6.8 24.6
Source: 2000 U.S. Census: http://www.census.gov/main/www/cen2000.html.

Florida Transportation Almanac
20
Table 1-5DISTRIBUTION OF DEMOGRAPHIC CHARACTERISTICS, FLORIDA AND U.S. (1970-2000)
DemographicCharacteristics
Florida (%) United States (%)
1970 1980 1990 2000 1970 1980 1990 2000
Gender
Male 48.2 48.0 48.4 48.8 48.7 48.6 48.7 49.1
Female 51.8 52.0 51.6 51.2 51.3 51.4 51.3 50.9
Ethnic Origin
White 84.2 84.0 83.1 78.0 87.5 83.1 80.3 77.0
African-American 15.3 13.8 13.6 14.6 11.1 11.7 12.1 12.6
Other 0.4 2.2 3.3 5.0 1.4 5.2 7.7 10.4
Hispanic Origin
Not Hispanic n/a 91.2 87.8 83.2 n/a 93.6 91.0 87.5
Hispanic n/a 8.8 12.2 16.8 n/a 6.4 9.0 12.5
Age
< 16 years 27.6 20.9 19.8 20.3 30.5 24.4 22.9 22.8
16 to 19 years 6.7 6.7 5.0 5.1 7.4 7.6 5.8 5.8
20 to 29 years 13.3 15.9 14.9 12.0 14.7 18.0 16.2 13.6
30 to 39 years 10.5 12.6 15.6 14.7 11.1 13.9 16.8 15.4
40 to 59 years 22.1 20.8 21.1 25.7 22.2 20.3 21.5 26.1
60 to 64 years 5.3 5.8 5.2 4.6 4.2 4.5 4.3 3.8
65+ years 14.6 17.3 18.3 17.6 9.9 11.3 12.6 12.4
Education Level
Less than 9th grade 27.8 17.6 9.5 6.7 28.3 18.3 10.4 8.1
9th grade to 12th grade 19.6 15.7 16.1 13.4 19.4 15.3 14.4 12.9
High school graduate 30.7 35.0 30.1 28.7 31.1 34.6 30.0 30.6
Some college 11.6 16.8 26.0 21.8 10.6 15.7 24.9 22.5
Bachelor's degree 6.3 8.5 12.0 14.3 6.1 8.6 13.1 16.6
Graduate or prof degree 4.0 6.3 6.3 8.1 4.6 7.6 7.2 9.5
Disability Status
With work disability n/a n/a 13.3 7.4 n/a n/a 12.1 11.9
No work disability n/a n/a 86.7 92.5 n/a n/a 87.9 88.2
Poverty Status in 1999
Income above poverty level 84.0 86.8 87.3 87.5 86.6 87.9 86.9 87.6
Income below poverty level 16.0 13.2 12.7 12.5 13.4 12.1 13.1 12.4
Source: 2000 U.S. Census: http://www.census.gov/main/www/cen2000.html.
Florida Transportation Almanac
21
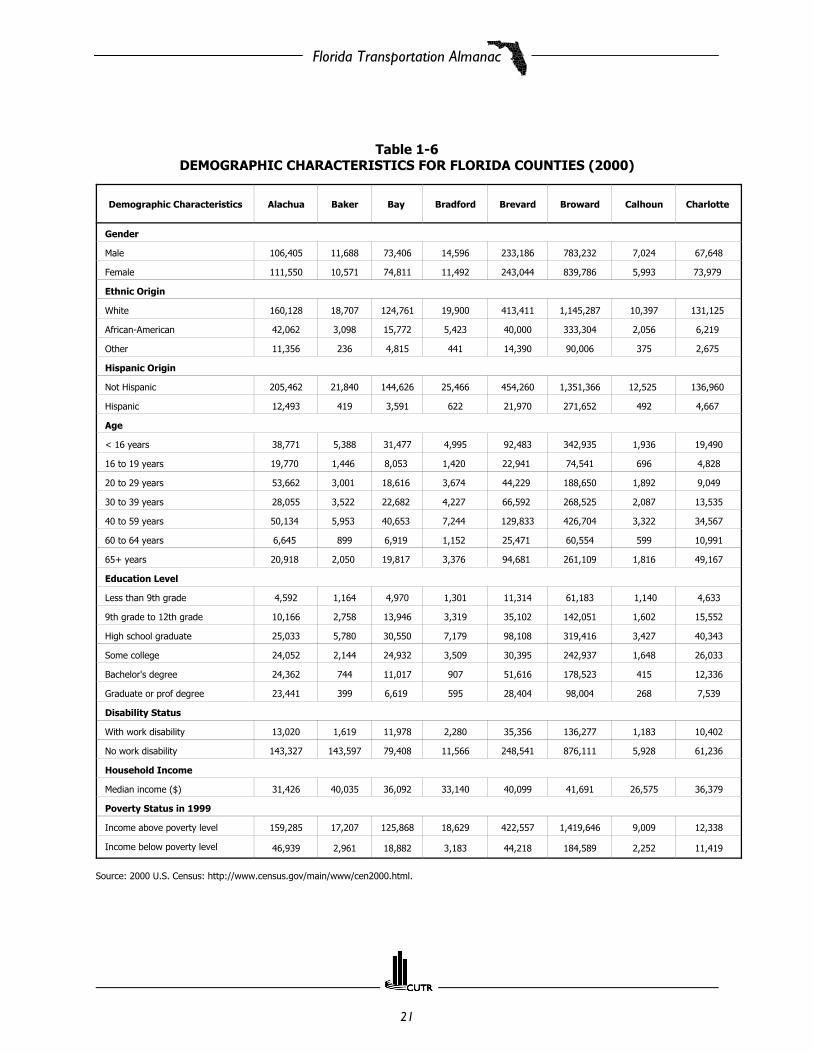
Table 1-6DEMOGRAPHIC CHARACTERISTICS FOR FLORIDA COUNTIES (2000)
Demographic Characteristics Alachua Baker Bay Bradford Brevard Broward Calhoun Charlotte
Gender
Male 106,405 11,688 73,406 14,596 233,186 783,232 7,024 67,648
Female 111,550 10,571 74,811 11,492 243,044 839,786 5,993 73,979
Ethnic Origin
White 160,128 18,707 124,761 19,900 413,411 1,145,287 10,397 131,125
African-American 42,062 3,098 15,772 5,423 40,000 333,304 2,056 6,219
Other 11,356 236 4,815 441 14,390 90,006 375 2,675
Hispanic Origin
Not Hispanic 205,462 21,840 144,626 25,466 454,260 1,351,366 12,525 136,960
Hispanic 12,493 419 3,591 622 21,970 271,652 492 4,667
Age
< 16 years 38,771 5,388 31,477 4,995 92,483 342,935 1,936 19,490
16 to 19 years 19,770 1,446 8,053 1,420 22,941 74,541 696 4,828
20 to 29 years 53,662 3,001 18,616 3,674 44,229 188,650 1,892 9,049
30 to 39 years 28,055 3,522 22,682 4,227 66,592 268,525 2,087 13,535
40 to 59 years 50,134 5,953 40,653 7,244 129,833 426,704 3,322 34,567
60 to 64 years 6,645 899 6,919 1,152 25,471 60,554 599 10,991
65+ years 20,918 2,050 19,817 3,376 94,681 261,109 1,816 49,167
Education Level
Less than 9th grade 4,592 1,164 4,970 1,301 11,314 61,183 1,140 4,633
9th grade to 12th grade 10,166 2,758 13,946 3,319 35,102 142,051 1,602 15,552
High school graduate 25,033 5,780 30,550 7,179 98,108 319,416 3,427 40,343
Some college 24,052 2,144 24,932 3,509 30,395 242,937 1,648 26,033
Bachelor's degree 24,362 744 11,017 907 51,616 178,523 415 12,336
Graduate or prof degree 23,441 399 6,619 595 28,404 98,004 268 7,539
Disability Status
With work disability 13,020 1,619 11,978 2,280 35,356 136,277 1,183 10,402
No work disability 143,327 143,597 79,408 11,566 248,541 876,111 5,928 61,236
Household Income
Median income ($) 31,426 40,035 36,092 33,140 40,099 41,691 26,575 36,379
Poverty Status in 1999
Income above poverty level 159,285 17,207 125,868 18,629 422,557 1,419,646 9,009 12,338
Income below poverty level 46,939 2,961 18,882 3,183 44,218 184,589 2,252 11,419
Source: 2000 U.S. Census: http://www.census.gov/main/www/cen2000.html.
Florida Transportation Almanac
22
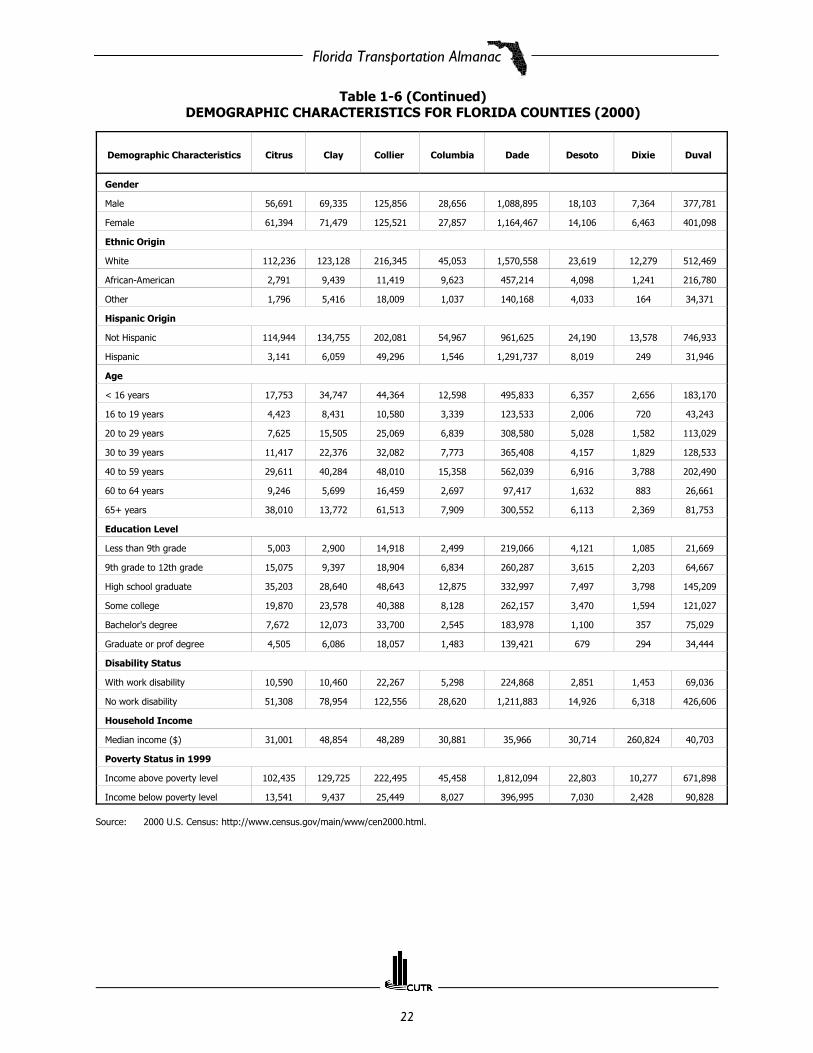
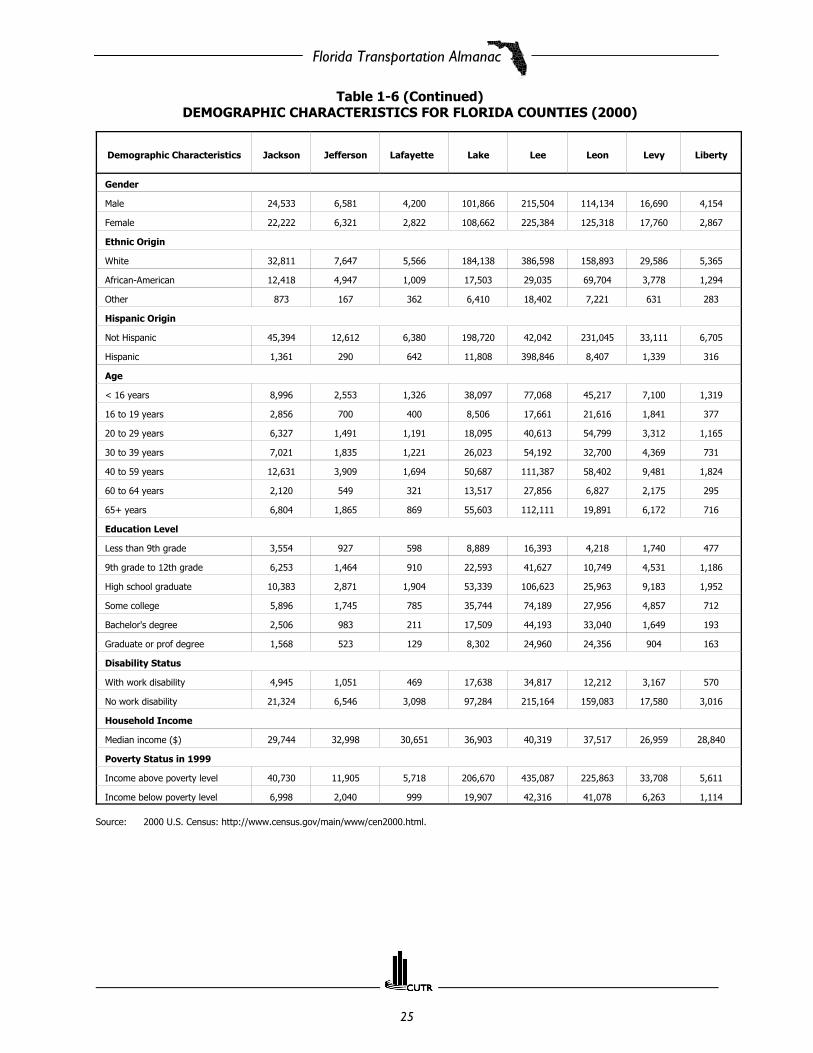
Table 1-6 (Continued)DEMOGRAPHIC CHARACTERISTICS FOR FLORIDA COUNTIES (2000)
Demographic Characteristics Citrus Clay Collier Columbia Dade Desoto Dixie Duval
Gender
Male 56,691 69,335 125,856 28,656 1,088,895 18,103 7,364 377,781
Female 61,394 71,479 125,521 27,857 1,164,467 14,106 6,463 401,098
Ethnic Origin
White 112,236 123,128 216,345 45,053 1,570,558 23,619 12,279 512,469
African-American 2,791 9,439 11,419 9,623 457,214 4,098 1,241 216,780
Other 1,796 5,416 18,009 1,037 140,168 4,033 164 34,371
Hispanic Origin
Not Hispanic 114,944 134,755 202,081 54,967 961,625 24,190 13,578 746,933
Hispanic 3,141 6,059 49,296 1,546 1,291,737 8,019 249 31,946
Age
< 16 years 17,753 34,747 44,364 12,598 495,833 6,357 2,656 183,170
16 to 19 years 4,423 8,431 10,580 3,339 123,533 2,006 720 43,243
20 to 29 years 7,625 15,505 25,069 6,839 308,580 5,028 1,582 113,029
30 to 39 years 11,417 22,376 32,082 7,773 365,408 4,157 1,829 128,533
40 to 59 years 29,611 40,284 48,010 15,358 562,039 6,916 3,788 202,490
60 to 64 years 9,246 5,699 16,459 2,697 97,417 1,632 883 26,661
65+ years 38,010 13,772 61,513 7,909 300,552 6,113 2,369 81,753
Education Level
Less than 9th grade 5,003 2,900 14,918 2,499 219,066 4,121 1,085 21,669
9th grade to 12th grade 15,075 9,397 18,904 6,834 260,287 3,615 2,203 64,667
High school graduate 35,203 28,640 48,643 12,875 332,997 7,497 3,798 145,209
Some college 19,870 23,578 40,388 8,128 262,157 3,470 1,594 121,027
Bachelor's degree 7,672 12,073 33,700 2,545 183,978 1,100 357 75,029
Graduate or prof degree 4,505 6,086 18,057 1,483 139,421 679 294 34,444
Disability Status
With work disability 10,590 10,460 22,267 5,298 224,868 2,851 1,453 69,036
No work disability 51,308 78,954 122,556 28,620 1,211,883 14,926 6,318 426,606
Household Income
Median income ($) 31,001 48,854 48,289 30,881 35,966 30,714 260,824 40,703
Poverty Status in 1999
Income above poverty level 102,435 129,725 222,495 45,458 1,812,094 22,803 10,277 671,898
Income below poverty level 13,541 9,437 25,449 8,027 396,995 7,030 2,428 90,828
Source: 2000 U.S. Census: http://www.census.gov/main/www/cen2000.html.

Florida Transportation Almanac
23
Table 1-6 (Continued)DEMOGRAPHIC CHARACTERISTICS FOR FLORIDA COUNTIES (2000)
Demographic Characteristics Escambia Flagler Franklin Gadsen Gilchrist Glades Gulf Hamilton
Gender
Male 146,183 23,887 6,242 21,448 7,643 5,801 7,119 7,657
Female 148,227 25,945 4,815 23,639 6,794 4,775 6,213 5,670
Ethnic Origin
White 213,008 43,490 8,983 17,448 13,068 8,142 10,651 7,835
African-American 63,010 4,401 1,804 25,763 1,010 1,114 2,259 5,027
Other 12,024 1,208 122 1,474 177 1,153 215 309
Hispanic Origin
Not Hispanic 286,475 47,295 10,789 42,305 14,033 8,982 270 12,480
Hispanic 2,679 2,537 268 2,782 404 1,594 13,062 847
Age
< 16 years 61,480 7,848 1,776 10,477 3,094 2,066 2,529 2,747
16 to 19 years 20,163 1,915 442 2,861 939 501 640 722
20 to 29 years 43,889 3,319 1,385 5,824 2,306 1,264 1,454 2,103
30 to 39 years 42,387 5,141 1,742 6,496 1,778 1,424 1,981 2,176
40 to 59 years 74,860 13,341 3,262 12,064 3,651 2,639 3,809 3,541
60 to 64 years 12,462 3,999 709 1,878 701 692 761 548
65+ years 39,169 14,269 1,741 5,487 1,968 1,990 2,158 1,490
Education Level
Less than 9th grade 9,567 1,222 664 3,242 695 715 818 921
9th grade to 12th grade 24,475 4,231 1,939 5,238 1,752 1,518 1,794 2,330
High school graduate 53,751 12,330 2,983 10,384 3,197 2,727 3,539 3,073
Some college 46,468 9,881 1,326 5,153 1,892 1,380 1,910 1,405
Bachelor's degree 25,870 5,170 513 2,314 560 412 628 452
Graduate or prof degree 13,919 3,021 505 1,430 276 316 338 184
Disability Status
With work disability 21,406 3,614 859 4,490 1,210 906 1,117 1,199
No work disability 153,037 23,900 5,111 22,470 7,032 4,833 6,167 5,681
Household Income
Median income ($) 35,234 40,214 26,756 31,248 30,328 30,774 30,276 25,638
Poverty Status in 1999
Income above poverty level 209,669 25,878 6,428 28,246 7,191 6,424 9,162 7,067
Income below poverty level 43,010 2,658 2,332 10,962 1,527 1,047 1,895 2,725
Source: 2000 U.S. Census: http://www.census.gov/main/www/cen2000.html.
Florida Transportation Almanac
24
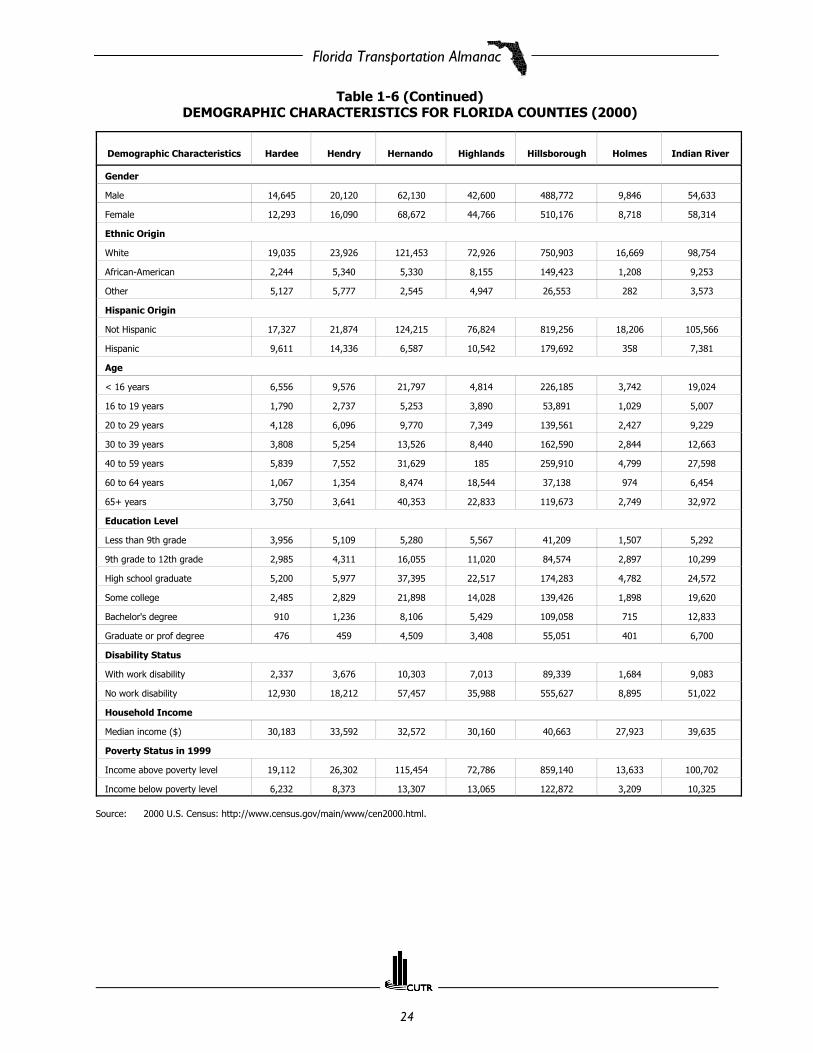
Table 1-6 (Continued)DEMOGRAPHIC CHARACTERISTICS FOR FLORIDA COUNTIES (2000)
Demographic Characteristics Hardee Hendry Hernando Highlands Hillsborough Holmes Indian River
Gender
Male 14,645 20,120 62,130 42,600 488,772 9,846 54,633
Female 12,293 16,090 68,672 44,766 510,176 8,718 58,314
Ethnic Origin
White 19,035 23,926 121,453 72,926 750,903 16,669 98,754
African-American 2,244 5,340 5,330 8,155 149,423 1,208 9,253
Other 5,127 5,777 2,545 4,947 26,553 282 3,573
Hispanic Origin
Not Hispanic 17,327 21,874 124,215 76,824 819,256 18,206 105,566
Hispanic 9,611 14,336 6,587 10,542 179,692 358 7,381
Age
< 16 years 6,556 9,576 21,797 4,814 226,185 3,742 19,024
16 to 19 years 1,790 2,737 5,253 3,890 53,891 1,029 5,007
20 to 29 years 4,128 6,096 9,770 7,349 139,561 2,427 9,229
30 to 39 years 3,808 5,254 13,526 8,440 162,590 2,844 12,663
40 to 59 years 5,839 7,552 31,629 185 259,910 4,799 27,598
60 to 64 years 1,067 1,354 8,474 18,544 37,138 974 6,454
65+ years 3,750 3,641 40,353 22,833 119,673 2,749 32,972
Education Level
Less than 9th grade 3,956 5,109 5,280 5,567 41,209 1,507 5,292
9th grade to 12th grade 2,985 4,311 16,055 11,020 84,574 2,897 10,299
High school graduate 5,200 5,977 37,395 22,517 174,283 4,782 24,572
Some college 2,485 2,829 21,898 14,028 139,426 1,898 19,620
Bachelor's degree 910 1,236 8,106 5,429 109,058 715 12,833
Graduate or prof degree 476 459 4,509 3,408 55,051 401 6,700
Disability Status
With work disability 2,337 3,676 10,303 7,013 89,339 1,684 9,083
No work disability 12,930 18,212 57,457 35,988 555,627 8,895 51,022
Household Income
Median income ($) 30,183 33,592 32,572 30,160 40,663 27,923 39,635
Poverty Status in 1999
Income above poverty level 19,112 26,302 115,454 72,786 859,140 13,633 100,702
Income below poverty level 6,232 8,373 13,307 13,065 122,872 3,209 10,325
Source: 2000 U.S. Census: http://www.census.gov/main/www/cen2000.html.
Florida Transportation Almanac
25
Table 1-6 (Continued)DEMOGRAPHIC CHARACTERISTICS FOR FLORIDA COUNTIES (2000)
Demographic Characteristics Jackson Jefferson Lafayette Lake Lee Leon Levy Liberty
Gender
Male 24,533 6,581 4,200 101,866 215,504 114,134 16,690 4,154
Female 22,222 6,321 2,822 108,662 225,384 125,318 17,760 2,867
Ethnic Origin
White 32,811 7,647 5,566 184,138 386,598 158,893 29,586 5,365
African-American 12,418 4,947 1,009 17,503 29,035 69,704 3,778 1,294
Other 873 167 362 6,410 18,402 7,221 631 283
Hispanic Origin
Not Hispanic 45,394 12,612 6,380 198,720 42,042 231,045 33,111 6,705
Hispanic 1,361 290 642 11,808 398,846 8,407 1,339 316
Age
< 16 years 8,996 2,553 1,326 38,097 77,068 45,217 7,100 1,319
16 to 19 years 2,856 700 400 8,506 17,661 21,616 1,841 377
20 to 29 years 6,327 1,491 1,191 18,095 40,613 54,799 3,312 1,165
30 to 39 years 7,021 1,835 1,221 26,023 54,192 32,700 4,369 731
40 to 59 years 12,631 3,909 1,694 50,687 111,387 58,402 9,481 1,824
60 to 64 years 2,120 549 321 13,517 27,856 6,827 2,175 295
65+ years 6,804 1,865 869 55,603 112,111 19,891 6,172 716
Education Level
Less than 9th grade 3,554 927 598 8,889 16,393 4,218 1,740 477
9th grade to 12th grade 6,253 1,464 910 22,593 41,627 10,749 4,531 1,186
High school graduate 10,383 2,871 1,904 53,339 106,623 25,963 9,183 1,952
Some college 5,896 1,745 785 35,744 74,189 27,956 4,857 712
Bachelor's degree 2,506 983 211 17,509 44,193 33,040 1,649 193
Graduate or prof degree 1,568 523 129 8,302 24,960 24,356 904 163
Disability Status
With work disability 4,945 1,051 469 17,638 34,817 12,212 3,167 570
No work disability 21,324 6,546 3,098 97,284 215,164 159,083 17,580 3,016
Household Income
Median income ($) 29,744 32,998 30,651 36,903 40,319 37,517 26,959 28,840
Poverty Status in 1999
Income above poverty level 40,730 11,905 5,718 206,670 435,087 225,863 33,708 5,611
Income below poverty level 6,998 2,040 999 19,907 42,316 41,078 6,263 1,114
Source: 2000 U.S. Census: http://www.census.gov/main/www/cen2000.html.

Florida Transportation Almanac
26
Table 1-6 (Continued)DEMOGRAPHIC CHARACTERISTICS FOR FLORIDA COUNTIES (2000)
Demographic Characteristics Madison Manatee Marion Martin Monroe Nassau Okaloosa Okeechobee
Gender
Male 9,710 127,549 124,945 62,192 42,379 28,443 86,160 19,245
Female 9,023 136,453 133,971 64,539 37,210 29,220 84,338 16,665
Ethnic Origin
White 10,769 227,981 217,909 113,912 72,151 51,909 142,218 28,468
African-American 7,549 21,611 29,900 6,673 3,795 4,465 15,508 2,844
Other 220 10,733 7,384 4,704 2,225 712 7,731 3,883
Hispanic Origin
Not Hispanic 18,133 239,462 243,300 117,225 67,036 873 163,196 29,226
Hispanic 600 24,540 15,616 9,506 12,553 56,790 7,302 6,684
Age
< 16 years 20,990 48,896 48,893 20,990 12,073 12,801 37,132 7,837
16 to 19 years 4,731 8,558 12,083 4,731 2,892 2,924 9,599 2,284
20 to 29 years 9,614 25,503 23,290 9,614 8,294 6,131 23,548 4,618
30 to 39 years 2,643 33,266 31,384 14,847 8,561 26,992 26,992 4,911
40 to 59 years 4,686 65,238 64,124 33,288 17,041 44,992 44,992 8,508
60 to 64 years 905 14,394 15,654 7,475 2,938 7,579 7,579 1,888
65+ years 2,726 65,647 63,488 35,786 7,267 20,656 20,656 5,864
Education Level
Less than 9th grade 1,239 10,847 11,414 4,281 2,827 2,196 4,176 3,439
9th grade to 12th grade 2,746 24,930 29,399 9,902 6,405 5,202 9,295 4,722
High school graduate 4,190 61,485 67,271 27,263 17,664 13,415 30,515 7,925
Some college 2,146 43,775 41,545 23,338 13,738 8,319 31,123 4,243
Bachelor's degree 796 26,077 16,126 16,857 10,256 4,809 16,826 1,423
Graduate or prof degree 456 13,982 9,500 8,556 5,327 2,555 10,424 665
Disability Status
With work disability 2,035 21,645 22,710 9,678 9,471 4,507 12,491 3,528
No work disability 8,238 125,033 119,516 58,457 44,636 32,727 86,452 16,893
Household Income
Median income ($) 26,533 38,673 31,944 43,083 42,283 46,022 41,474 30,456
Poverty Status in 1999
Income above poverty level 13,075 232,924 218,818 112,760 70,394 51,580 150,147 28,248
Income below poverty level 3,919 26,104 32,918 10,844 7,977 5,192 14,562 5,391
Source: 2000 U.S. Census: http://www.census.gov/main/www/cen2000.html.

Florida Transportation Almanac
27
Table 1-6 (Continued)DEMOGRAPHIC CHARACTERISTICS FOR FLORIDA COUNTIES (2000)
Demographic Characteristics Orange Osceola Palm Beach Pasco Pinellas Polk Putnam St.Johns
Gender
Male 443,716 85,022 546,739 165,417 438,959 237,366 34,791 59,814
Female 452,628 87,471 584,445 179,348 482,523 246,558 35,632 63,321
Ethnic Origin
White 614,830 133,169 894,207 323,036 791,111 385,099 54,868 111,955
African-American 162,899 12,702 156,055 7,148 82,556 65,545 12,003 7,744
Other 87,844 20,365 53,994 9,822 32,669 25,027 2,708 2,240
Hispanic Origin
Not Hispanic 727,983 121,766 990,509 325,162 878,722 437,991 66,255 119,891
Hispanic 168,361 50,727 140,675 19,603 42,760 45,933 4,168 3,244
Age
< 16 years 202,571 41,029 214,908 62,135 112,546 104,818 15,362 25,175
16 to 19 years 51,059 9,838 48,545 14,023 37,352 26,009 3,782 6,220
20 to 29 years 144,681 23,513 111,882 29,530 92,036 56,117 7,076 11,636
30 to 39 years 155,412 27,553 158,969 43,782 128,708 65,085 8,439 17,207
40 to 59 years 223,272 44,170 283,412 83,993 252,946 118,988 18,755 37,517
60 to 64 years 29,390 6,681 51,392 18,899 45,031 24,169 4,000 5,801
65+ years 89,959 19,709 262,076 92,403 207,563 88,738 13,009 19,579
Education Level
Less than 9th grade 31,431 6,810 44,985 15,195 26,921 26,554 4,308 2,865
9th grade to 12th grade 73,160 16,285 89,361 42,102 82,777 55,786 9,852 8,172
High school graduate 148,006 37,536 219,805 93,918 203,495 109,920 17,833 21,117
Some college 125,076 24,896 182,836 54,260 163,849 66,317 9,083 19,245
Bachelor's degree 104,818 12,052 143,872 22,581 103,324 32,646 2,750 18,834
Graduate or prof degree 45,191 5,364 82,743 10,967 53,911 16,023 1,757 9,726
Disability Status
With work disability 81,766 16,892 88,686 31,876 82,949 46,337 8,455 9,595
No work disability 513,749 93,631 560,450 157,409 466,222 238,691 32,850 67,958
Household Income
Median income ($) 41,311 38,214 45,062 32,969 37,111 36,036 28,180 50,099
Poverty Status in 1999
Income above poverty level 770,858 149,963 1,002,446 303,213 813,157 410,239 54,776 111,222
Income below poverty level 106,233 19,532 110,430 36,201 90,059 60,953 14,449 9,698
Source: 2000 U.S. Census: http://www.census.gov/main/www/cen2000.html.

Florida Transportation Almanac
28
Table 1-6 (Continued)DEMOGRAPHIC CHARACTERISTICS FOR FLORIDA COUNTIES (2000)
Demographic Characteristics St. Lucie Santa Rosa Sarasota Seminole Sumter Suwannee Taylor
Gender
Male 94,119 59,059 154,418 178,776 28,312 17,012 9,833
Female 98,576 58,684 171,539 186,420 25,033 17,832 9,423
Ethnic Origin
White 152,504 106,822 301,985 300,948 44,061 29,455 14,988
African-American 29,714 5,000 13,621 34,764 7,351 4,221 3,666
Other 6,969 3,595 7,039 21,540 1,139 720 337
Hispanic Origin
Not Hispanic 176,962 114,775 311,815 324,465 3,356 33,141 18,961
Hispanic 15,733 2,968 14,142 40,731 49,989 1,703 295
Age
< 16 years 38,736 27,614 46,733 184,668 7,512 7,266 4,163
16 to 19 years 9,063 6,497 11,295 19,558 1,949 2,128 1,080
20 to 29 years 17,799 12,547 24,372 45,816 5,072 3,842 2,357
30 to 39 years 25,001 19,191 35,864 60,126 6,376 4,328 2,697
40 to 59 years 36,604 36,518 83,983 105,530 12,938 9,350 5,349
60 to 64 years 10,416 5,404 21,127 13,228 4,880 2,025 902
65+ years 4,753 12,972 102,583 38,853 14,618 5,905 2,708
Education Level
Less than 9th grade 9,190 3,120 8,674 8,186 2,539 2,019 1,156
9th grade to 12th grade 21,273 8,265 24,490 19,337 6,897 4,267 2,717
High school graduate 44,627 22,829 77,323 59,280 16,113 9,118 5,282
Some college 31,216 19,290 59,708 58,908 8,869 4,432 2,047
Bachelor's degree 13,432 11,695 43,886 51,235 3,194 1,692 690
Graduate or prof degree 7,130 6,186 26,560 24,256 1,886 770 457
Disability Status
With work disability 1,886 25,926 23,718 25,926 4,297 3,535 1,815
No work disability 90,582 217,168 151,372 217,168 20,899 17,993 9,516
Household Income
Median income ($) 36,363 41,881 41,957 49,326 32,073 29,963 30,032
Poverty Status in 1999
Income above poverty level 164,600 103,502 294,453 334,846 40,528 27,935 14,694
Income below poverty level 25,464 11,282 24,817 26,804 6,448 6,325 3,229
Source: 2000 U.S. Census: http://www.census.gov/main/www/cen2000.html.

Florida Transportation Almanac
29
Table 1-6 (Continued)DEMOGRAPHIC CHARACTERISTICS FOR FLORIDA COUNTIES (2000)
Demographic Characteristics Union Volusia Wakulla Walton Washington Florida
Gender
Male 8,693 215,361 11,836 20,812 10,783 7,797,715
Female 4,749 227,982 11,027 19,789 10,190 8,184,663
Ethnic Origin
White 9,896 381,760 19,684 35,896 17,140 12,465,029
African-American 3,070 41,198 2,631 2,832 2,872 2,335,505
Other 274 14,038 266 1,035 532 805,529
Hispanic Origin
Not Hispanic 12,965 414,232 22,420 39,721 20,490 13,299,663
Hispanic 477 29,111 443 880 483 2,682,715
Age
< 16 years 2,560 79,254 5,148 7,771 4,282 3,240,557
16 to 19 years 723 22,149 1,324 1,931 1,105 808,075
20 to 29 years 1,930 47,484 2,517 4,420 2,396 1,923,668
30 to 39 years 2,872 56,680 3,732 5,819 3,091 2,349,782
40 to 59 years 3,931 116,341 6,782 11,832 5,733 4,115,203
60 to 64 years 423 23,624 1,010 2,397 1,073 737,496
65+ years 1,003 71,201 2,350 6,431 3,293 2,807,597
Education Level
Less than 9th grade 699 15,226 962 2,121 1,724 739,222
9th grade to 12th grade 1,879 41,756 2,324 4,813 2,403 1,480,726
High school graduate 3,638 102,353 5,316 9,323 5,562 3,165,748
Some college 1,984 76,948 3,319 6,117 2,759 2,403,135
Bachelor's degree 453 36,646 1,539 2,930 818 1,573,121
Graduate or prof degree 252 19,315 854 1,752 506 889,207
Disability Status
With work disability 810 35,769 1,696 4,549 1,791 1,375,413
No work disability 5,080 226,914 12,630 20,330 10,494 8,339,721
Household Income
Median income ($) 34,563 35,219 37,149 32,407 27,922 38,819
Poverty Status in 1999
Income above poverty level 7,991 379,552 19,173 33,199 15,834 13,652,738
Income below poverty level 1,298 49,907 2,437 5,577 3,757 1,952,629
Source: 2000 U.S. Census: http://www.census.gov/main/www/cen2000.html.

Florida Transportation Almanac
30
Florida Transportation Almanac
31
Chapter 2:TRAVEL BEHAVIOR CHARACTERISTICS

Florida Transportation Almanac
32

Florida Transportation Almanac
33
Personal Travel

Florida Transportation Almanac
34
Florida Transportation Almanac
35
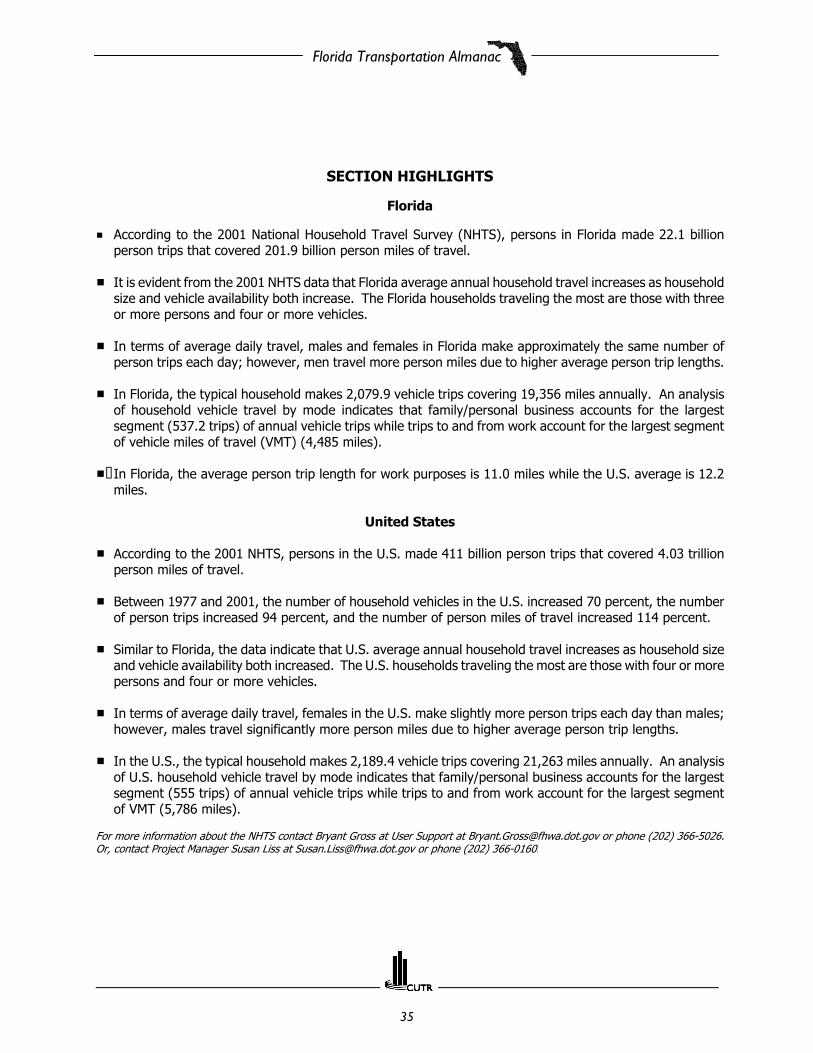
SECTION HIGHLIGHTS
Florida
# According to the 2001 National Household Travel Survey (NHTS), persons in Florida made 22.1 billionperson trips that covered 201.9 billion person miles of travel.
# It is evident from the 2001 NHTS data that Florida average annual household travel increases as householdsize and vehicle availability both increase. The Florida households traveling the most are those with threeor more persons and four or more vehicles.
# In terms of average daily travel, males and females in Florida make approximately the same number ofperson trips each day; however, men travel more person miles due to higher average person trip lengths.
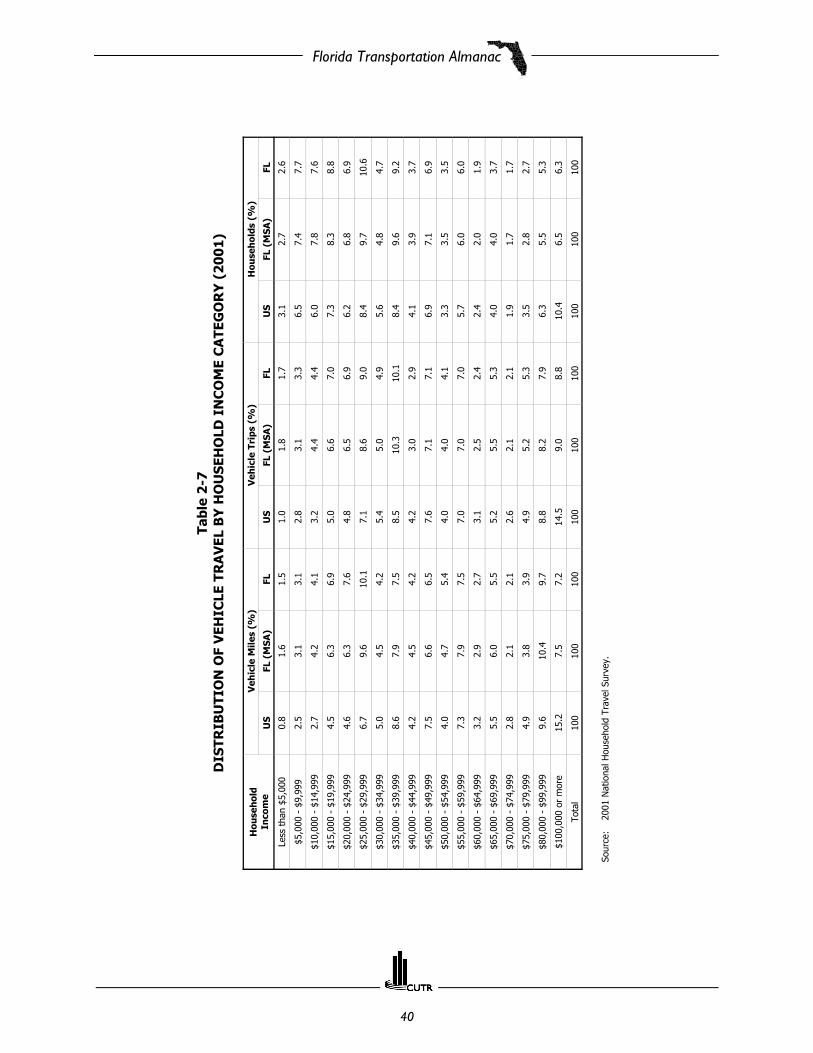
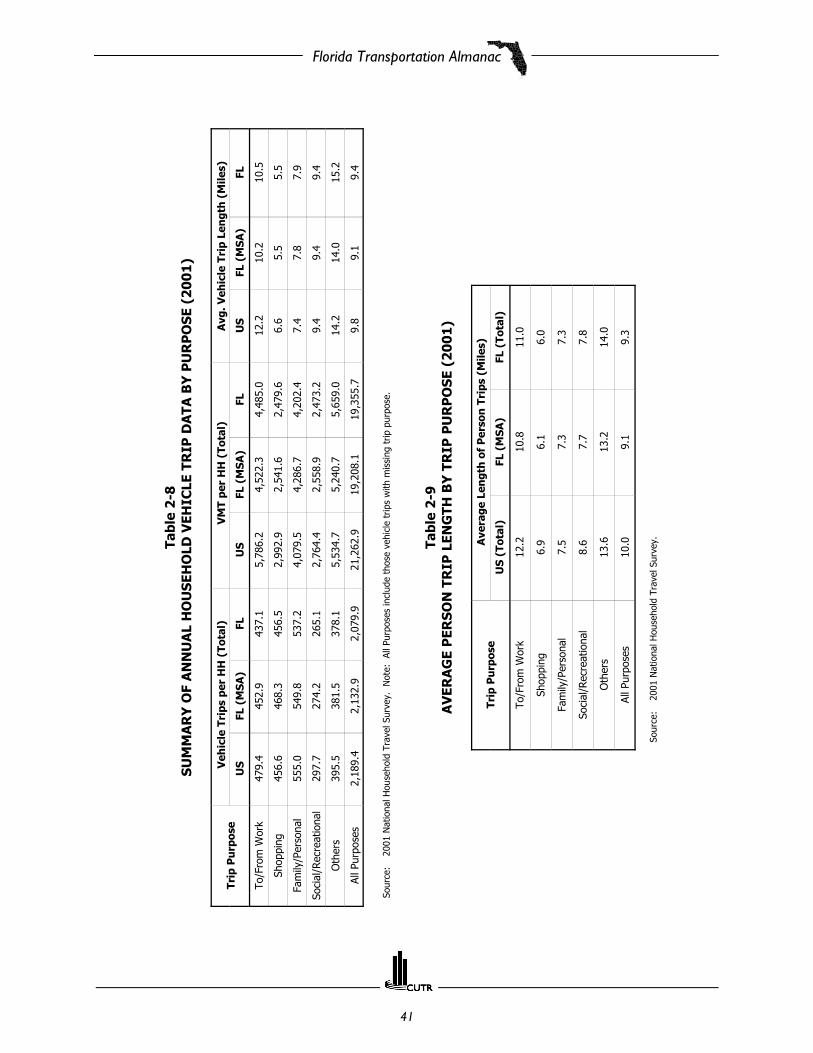
# In Florida, the typical household makes 2,079.9 vehicle trips covering 19,356 miles annually. An analysisof household vehicle travel by mode indicates that family/personal business accounts for the largestsegment (537.2 trips) of annual vehicle trips while trips to and from work account for the largest segmentof vehicle miles of travel (VMT) (4,485 miles).
# In Florida, the average person trip length for work purposes is 11.0 miles while the U.S. average is 12.2miles.
United States
# According to the 2001 NHTS, persons in the U.S. made 411 billion person trips that covered 4.03 trillionperson miles of travel.
# Between 1977 and 2001, the number of household vehicles in the U.S. increased 70 percent, the numberof person trips increased 94 percent, and the number of person miles of travel increased 114 percent.
# Similar to Florida, the data indicate that U.S. average annual household travel increases as household sizeand vehicle availability both increased. The U.S. households traveling the most are those with four or morepersons and four or more vehicles.
# In terms of average daily travel, females in the U.S. make slightly more person trips each day than males;however, males travel significantly more person miles due to higher average person trip lengths.
# In the U.S., the typical household makes 2,189.4 vehicle trips covering 21,263 miles annually. An analysisof U.S. household vehicle travel by mode indicates that family/personal business accounts for the largestsegment (555 trips) of annual vehicle trips while trips to and from work account for the largest segmentof VMT (5,786 miles).
For more information about the NHTS contact Bryant Gross at User Support at [email protected] or phone (202) 366-5026.Or, contact Project Manager Susan Liss at [email protected] or phone (202) 366-0160.
Florida Transportation Almanac
36
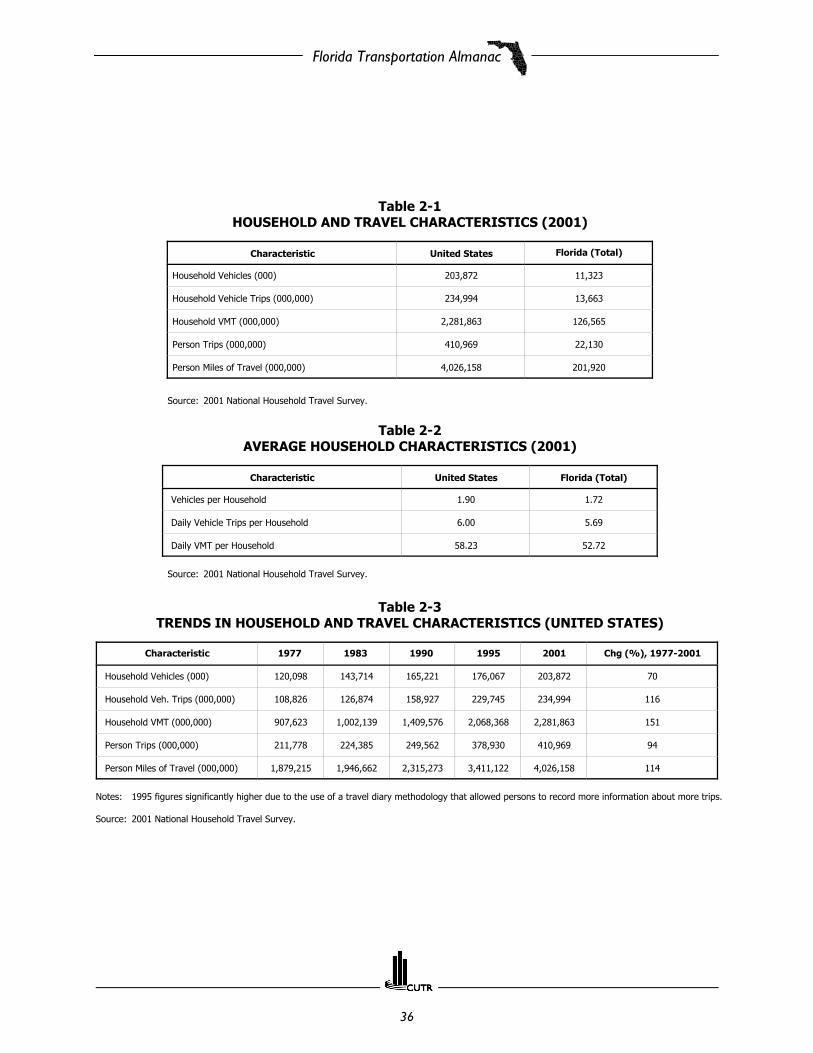
Table 2-1HOUSEHOLD AND TRAVEL CHARACTERISTICS (2001)
Characteristic United States Florida (Total)
Household Vehicles (000) 203,872 11,323
Household Vehicle Trips (000,000) 234,994 13,663
Household VMT (000,000) 2,281,863 126,565
Person Trips (000,000) 410,969 22,130
Person Miles of Travel (000,000) 4,026,158 201,920
Source: 2001 National Household Travel Survey.
Table 2-2AVERAGE HOUSEHOLD CHARACTERISTICS (2001)
Characteristic United States Florida (Total)
Vehicles per Household 1.90 1.72
Daily Vehicle Trips per Household 6.00 5.69
Daily VMT per Household 58.23 52.72
Source: 2001 National Household Travel Survey.
Table 2-3TRENDS IN HOUSEHOLD AND TRAVEL CHARACTERISTICS (UNITED STATES)
Characteristic 1977 1983 1990 1995 2001 Chg (%), 1977-2001
Household Vehicles (000) 120,098 143,714 165,221 176,067 203,872 70
Household Veh. Trips (000,000) 108,826 126,874 158,927 229,745 234,994 116
Household VMT (000,000) 907,623 1,002,139 1,409,576 2,068,368 2,281,863 151
Person Trips (000,000) 211,778 224,385 249,562 378,930 410,969 94
Person Miles of Travel (000,000) 1,879,215 1,946,662 2,315,273 3,411,122 4,026,158 114
Notes: 1995 figures significantly higher due to the use of a travel diary methodology that allowed persons to record more information about more trips.
Source: 2001 National Household Travel Survey.

Florida Transportation Almanac
37
Tabl
e 2
-4A
VER
AG
E A
NN
UA
L H
OU
SEH
OLD
TR
AV
EL B
Y A
VA
ILA
BLE
VEH
ICLE
S (2
00
1)
Hou
seh
old
Veh
icle
sP
erso
n T
rips
Per
son
Mile
s
US
(Tot
al)
FL (
MSA
)FL
(To
tal)
US
(Tot
al)
FL (
MSA
)FL
(To
tal)
01,
657.
71,
193.
01,
277.
111
,332
.75,
386.
55,
650.
8
12,
432.
22,
241.
62,
197.
319
,916
.218
,827
.118
,794
.6
24,
478.
94,
359.
84,
207.
344
,731
.639
,118
.638
,648
.6
35,
134.
74,
616.
24,
586.
554
,319
.540
,035
.940
,884
.0
4+5,
831.
16,
259.
76,
041.
065
,215
.868
,788
.070
,238
.3
Tota
l3,
827.
63,
440.
73,
364.
837
,494
.530
,592
.530
,698
.0
Sour
ce:
2001
Nat
iona
l Hou
seho
ld T
rave
l Sur
vey.

Florida Transportation Almanac
38
Tabl
e 2
-5A
VER
AG
E A
NN
UA
L V
EHIC
LE T
RIP
S, V
EHIC
LE M
ILES
, AN
D T
RIP
LEN
GTH
BY
GEN
DER
(2
00
1)
Gen
der
Ave
rage
Veh
icle
Tri
p Le
ngt
hV
ehic
le M
iles
Veh
icle
Tri
ps
US
(Tot
al)
FL (
MSA
)FL
(To
tal)
US
(Tot
al)
FL (
MSA
)FL
(To
tal)
US
(Tot
al)
FL (
MSA
)FL
(To
tal)
Mal
e11
.610
.611
.110
,474
.810
,107
.710
,343
.491
1.7
959.
294
0.6
Fem
ale
7.9
7.6
7.7
6,10
0.9
6,32
1.2
6,33
1.8
787.
384
9.4
836.
0
Tota
l9.
89.
19.
48,
235.
68,
118.
78,
243.
684
8.0
901.
588
5.8
Sour
ce:
2001
Nat
iona
l Hou
seho
ld T
rave
l Sur
vey.

Florida Transportation Almanac
39
Tabl
e 2
-6A
VER
AG
E A
NN
UA
L P
ERSO
N T
RIP
S, P
ERSO
N M
ILES
, AN
D T
RIP
LEN
GTH
BY
GEN
DER
(2
00
1)
Gen
der
Per
son
Tri
psP
erso
n M
iles
Per
son
Tri
p Le
ngt
h
US
(Tot
al)
FL (
MSA
)FL
(To
tal)
US
(Tot
al)
FL (
MSA
)FL
(To
tal)
US
(Tot
al)
FL (
MSA
)FL
(To
tal)
Mal
e1,
475.
01,
439.
51,
416.
115
,988
.914
,732
.514
,910
.211
.010
.310
.6
Fem
ale
1,48
9.7
1,46
7.6
1,44
8.4
13,1
24.4
11,3
02.0
11,4
02.6
9.0
7.9
8.1
Tota
l1,
482.
51,
454.
31,
433.
114
,522
.412
,930
.513
,074
.210
.09.
19.
3
Sour
ce:
2001
Nat
iona
l Hou
seho
ld T
rave
l Sur
vey.
Florida Transportation Almanac
40
Tabl
e 2
-7D
ISTR
IBU
TIO
N O
F V
EHIC
LE T
RA
VEL
BY
HO
USE
HO
LD I
NC
OM
E C
ATE
GO
RY
(2
00
1)
Hou
seh
old
Inco
me
Veh
icle
Mile
s (%
)V
ehic
le T
rips
(%
)H
ouse
hol
ds (
%)
US
FL (
MSA
)FL
US
FL (
MSA
)FL
US
FL (
MSA
)FL
Less
tha
n $5
,000
0.8
1.6
1.5
1.0
1.8
1.7
3.1
2.7
2.6
$5,0
00 -
$9,
999
2.5
3.1
3.1
2.8
3.1
3.3
6.5
7.4
7.7
$10,
000
- $1
4,99
92.
74.
24.
13.
24.
44.
46.
07.
87.
6
$15,
000
- $1
9,99
94.
56.
36.
95.
06.
67.
07.
38.
38.
8
$20,
000
- $2
4,99
94.
66.
37.
64.
86.
56.
96.
26.
86.
9
$25,
000
- $2
9,99
96.
79.
610
.17.
18.
69.
08.
49.
710
.6
$30,
000
- $3
4,99
95.
04.
54.
25.
45.
04.
95.
64.
84.
7
$35,
000
- $3
9,99
98.
67.
97.
58.
510
.310
.18.
49.
69.
2
$40,
000
- $4
4,99
94.
24.
54.
24.
23.
02.
94.
13.
93.
7
$45,
000
- $4
9,99
97.
56.
66.
57.
67.
17.
16.
97.
16.
9
$50,
000
- $5
4,99
94.
04.
75.
44.
04.
04.
13.
33.
53.
5
$55,
000
- $5
9,99
97.
37.
97.
57.
07.
07.
05.
76.
06.
0
$60,
000
- $6
4,99
93.
22.
92.
73.
12.
52.
42.
42.
01.
9
$65,
000
- $6
9,99
95.
56.
05.
55.
25.
55.
34.
04.
03.
7
$70,
000
- $7
4,99
92.
82.
12.
12.
62.
12.
11.
91.
71.
7
$75,
000
- $7
9,99
94.
93.
83.
94.
95.
25.
33.
52.
82.
7
$80,
000
- $9
9,99
99.
610
.49.
78.
88.
27.
96.
35.
55.
3
$100
,000
or
mor
e15
.27.
57.
214
.59.
08.
810
.46.
56.
3
Tota
l10
010
010
010
010
010
010
010
010
0
Sour
ce:
2001
Nat
iona
l Hou
seho
ld T
rave
l Sur
vey.
Florida Transportation Almanac
41
Tabl
e 2
-8SU
MM
AR
Y O
F A
NN
UA
L H
OU
SEH
OLD
VEH
ICLE
TR
IP D
ATA
BY
PU
RP
OSE
(2
00
1)
Trip
Pu
rpos
e V
ehic
le T
rips
per
HH
(To
tal)
VM
T pe
r H
H (
Tota
l)A
vg. V
ehic
le T
rip
Len
gth
(M
iles)
US
FL (
MSA
)FL
US
FL (
MSA
)FL
US
FL (
MSA
)FL
To/F
rom
Wor
k47
9.4
452.
943
7.1
5,78
6.2
4,52
2.3
4,48
5.0
12.2
10.2
10.5
Shop
ping
456.
646
8.3
456.
52,
992.
92,
541.
62,
479.
66.
65.
55.
5
Fam
ily/P
erso
nal
555.
054
9.8
537.
24,
079.
54,
286.
74,
202.
47.
47.
87.
9
Soci
al/R
ecre
atio
nal
297.
727
4.2
265.
12,
764.
42,
558.
92,
473.
29.
49.
49.
4
Oth
ers
395.
538
1.5
378.
15,
534.
75,
240.
75,
659.
014
.214
.015
.2
All P
urpo
ses
2,18
9.4
2,13
2.9
2,07
9.9
21,2
62.9
19,2
08.1
19,3
55.7
9.8
9.1
9.4
Sour
ce:
2001
Nat
iona
l Hou
seho
ld T
rave
l Sur
vey.
N
ote:
Al
l Pur
pose
s in
clud
e th
ose
vehi
cle
trip
s w
ith m
issi
ng t
rip p
urpo
se.
Tabl
e 2
-9A
VER
AG
E P
ERSO
N T
RIP
LEN
GTH
BY
TR
IP P
UR
PO
SE (
20
01
)
Trip
Pu
rpos
eA
vera
ge L
engt
h o
f P
erso
n T
rips
(M
iles)
US
(Tot
al)
FL (
MSA
)FL
(To
tal)
To/F
rom
Wor
k12
.210
.811
.0
Shop
ping
6.9
6.1
6.0
Fam
ily/P
erso
nal
7.5
7.3
7.3
Soci
al/R
ecre
atio
nal
8.6
7.7
7.8
Oth
ers
13.6
13.2
14.0
All P
urpo
ses
10.0
9.1
9.3
Sour
ce:
2001
Nat
iona
l Hou
seho
ld T
rave
l Sur
vey.

Florida Transportation Almanac
42
Tabl
e 2
-10
AV
ERA
GE
PER
SON
TR
IP T
RA
VEL
TIM
E B
YTR
IP P
UR
PO
SE (
20
01
)
Trip
Pu
rpos
eA
vera
ge D
ura
tion
of
Per
son
Tri
ps (
Min
ute
s)
US
(Tot
al)
FL (
Tota
l)
To/F
rom
Wor
k23
.524
.5
Shop
ping
15.5
14.8
Fam
ily/P
erso
nal
16.1
16.8
Soci
al/R
ecre
atio
nal
20.6
20.3
Oth
ers
23.6
27.9
All P
urpo
ses
19.8
20.7
Sour
ce:
2001
Nat
iona
l Hou
seho
ld T
rave
l Sur
vey.

Florida Transportation Almanac
43
CensusJourney-to-WorkTravel
Florida Transportation Almanac
44

Florida Transportation Almanac
45
SECTION HIGHLIGHTS
Florida
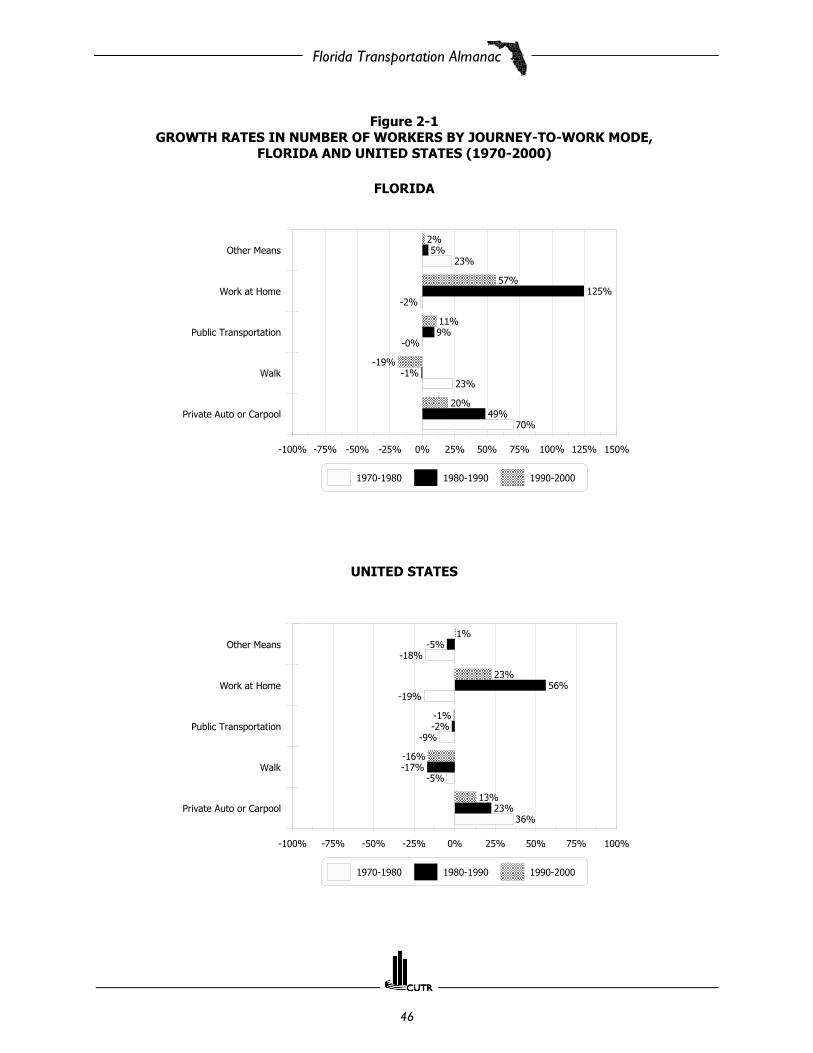
# According to the Bureau of the Census, the number of persons in Florida working at home increased 56.8percent from 132,084 in 1990 to 207,089 in 2000.
# The Census Journey-to-Work data for Florida indicate that the number of persons utilizing publictransportation as a mode to work increased 10.9 percent between 1990 and 2000.
# The majority (66.6%) of persons in Florida depart for work between 6:00 a.m. and 8:59 a.m.
# In terms of private vehicle occupancy, the percentage of persons in Florida who drive alone to workincreased from 77.1 percent in 1990 to 78.8 percent in 2000.
United States
# According to the Bureau of the Census, the number of persons in the U.S. working at home increased 22.8percent from 3.4 million in 1990 to 4.2 million in 2000.
# The Census Journey-to-Work data for the U.S. indicate that the number of persons utilizing publictransportation as a mode to work declined by less than 1 percent from 1990 to 2000.
# The majority (64.3%) of persons in the U.S. depart for work between 6:00 a.m. and 8:59 a.m.
# In terms of private vehicle occupancy, the percentage of persons in the U.S. who drive alone to workincreased from 73.2 percent in 1990 to 75.7 percent in 2000.
Florida Transportation Almanac
46
Figure 2-1GROWTH RATES IN NUMBER OF WORKERS BY JOURNEY-TO-WORK MODE,
FLORIDA AND UNITED STATES (1970-2000)
FLORIDA
UNITED STATES
-100% -75% -50% -25% 0% 25% 50% 75% 100% 125% 150%
Private Auto or Carpool
Walk
Public Transportation
Work at Home
Other Means
70%
23%
-0%
-2%
23%
49%
-1%
9%
125%
5%
20%
-19%
11%
57%
2%
1970-1980 1980-1990 1990-2000
-100% -75% -50% -25% 0% 25% 50% 75% 100%
Private Auto or Carpool
Walk
Public Transportation
Work at Home
Other Means
36%
-5%
-9%
-19%
-18%
23%
-17%
-2%
56%
-5%
13%
-16%
-1%
23%
1%
1970-1980 1980-1990 1990-2000

Florida Transportation Almanac
47
Figure 2-2DISTRIBUTION OF JOURNEY-TO-WORK MODE,
FLORIDA AND UNITED STATES (1970-2000)
FLORIDA
UNITED STATES
0% 20% 40% 60% 80% 100%
Private Auto or Carpool
Drive Alone
Carpool
Walk
Public Transportation
Work at Home
Other Means
85%
5%
4%
2%
4%
89%
69%
20%
4%
3%
2%
3%
91%
77%
14%
3%
2%
2%
2%
92%
79%
13%
2%
2%
3%
2%
1970 1980 1990 2000
0% 20% 40% 60% 80% 100%
Private Auto or Carpool
Drive Alone
Carpool
Walk
Public Transportation
Work at Home
Other Means
78%
7%
9%
4%
3%
84%
64%
20%
6%
6%
2%
2%
87%
73%
13%
4%
5%
3%
1%
88%
76%
12%
3%
5%
3%
1%
1970 1980 1990 2000

Florida Transportation Almanac
48
Figure 2-3TRAVEL TIME TO WORK IN MINUTES,
FLORIDA AND THE UNITED STATES (1980-2000)
0
10
20
30
1980 1990 2000
20.9 21.7
26.2
21.422.4
25.5
Florida United States
Figure 2-4 DEPARTURE TIME TO WORK,
FLORIDA AND UNITED STATES (2000)
0% 10% 20% 30% 40%
12:00 to 4:59 a.m.
5:00 to 5:59 a.m.
6:00 to 6:59 a.m.
7:00 to 7:59 a.m.
8:00 to 8:59 a.m.
9:00 to 9:59 a.m.
10:00 to 10:59 a.m.
11:00 to 11:59 a.m.
12:00 to 3:59 p.m.
4:00 to 11:59 p.m.
Worked at home
3%
6%
19%
31%
17%
6%
2%
1%
6%
6%
3%
3%
7%
19%
30%
16%
5%
2%
1%
7%
7%
3%
Florida United States

Florida Transportation Almanac
49
Figure 2-5PRIVATE VEHICLE OCCUPANCY, FLORIDA AND UNITED STATES (1990-2000)
FLORIDA
UNITED STATES
0%
20%
40%
60%
80%
100%
Drive alone 2-person 3-person 4-person+ Other means
77%
11%
2% 1%
9%
79%
10%
2% 1%8%
1990 2000
0%
20%
40%
60%
80%
100%
Drive alone 2-person 3-person 4-person+ Other means
73%
11%
2% 1%
14%
76%
9%2% 1%
12%
1990 2000

Florida Transportation Almanac
50
Tabl
e 2
-11
JOU
RN
EY-T
O-W
OR
K T
REN
DS,
U.S
. (1
97
0-2
00
0)
Jou
rney
-to-
Wor
kC
har
acte
rist
ics
Yea
rC
han
ge (
%)
Dis
trib
uti
on o
f Tr
ends
(%
)
19
70
19
80
1
99
02
00
07
0-8
08
0-9
09
0-0
07
0-0
01
97
01
98
0
19
90
20
00
Pla
ce o
f W
ork
Wor
ked
in h
ome
coun
ty
57,4
64,6
06n/
a 87
,587
,677
94,0
42,8
63n/
a n/
a 7.
463
.774
.8n/
a76
.176
.1
Wor
ked
outs
ide
hom
e co
unty
13
,688
,172
n/a
27,4
82,5
9729
,600
,841
n/a
n/a
7.7
116.
317
.8n/
a23
.923
.9
Plac
e of
wor
k no
t re
port
ed
5,69
9,61
1 n/
a n/
a n/
a n/
a n/
a n/
a n/
a 7.
4 n/
a n/
a n/
a
Mod
e to
Wor
k
Priv
ate
auto
or
carp
ool
59,7
22,5
5081
,258
,496
99,5
92,9
32
112,
736,
101
36.1
22
.6
13.2
88.8
77.7
84.1
86.5
87.9
Driv
e al
one
n/a
62,1
93,4
49
84,2
15,2
98
97,1
02,0
50
n/a
35.4
15
.3
n/a
n/a
64.4
73
.2
75.7
Carp
ool
n/a
19,0
65,0
4715
,377
,634
15
,634
,051
n/a
-19.
3 1.
7n/
an/
a19
.713
.412
.2
Wal
k5,
689,
819
5,41
3,24
84,
488,
886
3,75
8,98
2-4
.9
-17.
1 -1
6.3
-33.
97.
45.
63.
92.
9
Publ
ic t
rans
port
atio
n 6,
810,
458
6,17
5,06
1 6,
069,
589
6,06
7,70
3 -9
.3
-1.7
-0
.03
-10.
9 8.
9 6.
4 5.
3 4.
7
Wor
k at
hom
e 2,
685,
144
2,17
9,86
3 3,
406,
025
4,18
4,22
3 -1
8.8
56.2
22
.8
55.8
3.
5 2.
3 3.
0 3.
3
Oth
er m
eans
1,
944,
418
1,59
0,62
8 1,
512,
842
1,53
2,21
9 -1
8.2
-4.9
1.
3 -2
1.2
2.5
1.6
1.3
1.2
Trav
el T
ime
to W
ork
Less
tha
n 10
min
utes
n/a
16,8
71,5
7218
,257
,921
17,8
68,0
11n/
a8.
2 -2
.1n/
an/
a17
.515
.913
.9
10 t
o 19
min
utes
n/a
31,8
46,6
0236
,980
,181
38,2
52,6
33n/
a16
.1
3.4
n/a
n/a
32.9
32.1
29.8
20 t
o 29
min
utes
n/a
18,8
49,2
6022
,436
,930
25,1
72,2
96n/
a19
.0
12.2
n/a
n/a
19.5
19.5
19.6
30 t
o 44
min
utes
n/a
15,9
96,0
0920
,053
,109
23,7
03,9
03n/
a25
.4
18.2
n/a
n/a
16.5
17.4
18.5
45 o
r m
ore
min
utes
n/a
10,9
23,6
5213
,936
,108
19,0
98,1
62n/
a27
.6
37.0
n/a
n/a
11.3
12.1
14.9
Wor
ked
at h
ome
n/a
2,17
9,86
3 3,
406,
025
4,18
4,22
3 n/
a 56
.2
22.8
n/
a n/
a 2.
3 3.
0 3.
3
Sour
ce:
2000
U.S
. Cen
sus:
ht
tp:/
/ww
w.c
ensu
s.go
v/m
ain/
ww
w/c
en20
00.h
tml.

Florida Transportation Almanac
51
Tabl
e 2
-11
(C
onti
nu
ed)
JOU
RN
EY-T
O-W
OR
K T
REN
DS,
U.S
. (1
97
0-2
00
0)
Jou
rney
-to-
Wor
kC
har
acte
rist
ics
Yea
rC
han
ge (
%)
Dis
trib
uti
on o
f Tr
ends
(%
)
19
70
19
80
1
99
02
00
07
0-8
08
0-9
09
0-0
07
0-0
01
97
01
98
0
19
90
20
00
Dep
artu
re T
ime
to W
ork
12:0
0 to
4:5
9 a.
m.
n/a
n/a
2,74
7,48
8 4,
237,
970
n/a
n/a
54.2
n/a
n/a
n/a
2.4
3.3
5:00
to
5:59
a.m
.n/
an/
a7,
145,
946
9,44
0,32
1n/
an/
a32
.1n/
an/
an/
a6.
27.
4
6:00
to
6:59
a.m
.n/
an/
a22
,820
,464
24
,196
,129
n/a
n/a
6.0
n/a
n/a
n/a
19.8
18.9
7:00
to
7:59
a.m
.n/
an/
a35
,346
,620
38
,305
,923
n/a
n/a
8.4
n/a
n/a
n/a
30.7
29.9
8:00
to
8:59
a.m
.n/
an/
a18
,867
,326
19
,937
,875
n/a
n/a
5.7
n/a
n/a
n/a
16.4
15.5
9:00
to
9:59
a.m
.n/
an/
a5,
792,
355
6,83
5,54
9n/
an/
a18
.0n/
an/
an/
a5.
05.
3
10:0
0 to
10:
59 a
.m.
n/a
n/a
2,24
9,96
0 2,
839,
779
n/a
n/a
26.2
n/a
n/a
n/a
2.0
2.2
11:0
0 to
11:
59 a
.m.
n/a
n/a
1,16
7,63
3 1,
360,
775
n/a
n/a
16.5
n/a
n/a
n/a
1.0
1.1
12:0
0 to
3:5
9 p.
m.
n/a
n/a
7,96
5,16
0 8,
522,
829
n/a
n/a
7.0
n/a
n/a
n/a
6.9
6.6
4:00
to
11:5
9 p.
m.
n/a
n/a
7,56
1,29
7 8,
417,
855
n/a
n/a
11.3
n/a
n/a
n/a
6.6
6.6
Wor
ked
at h
ome
n/a
n/a
3,40
6,02
5 4,
184,
223
n/a
n/a
22.8
n/a
n/a
n/a
3.0
3.3
Pri
vate
Veh
icle
Occ
upa
ncy
Driv
e al
one
n/a
62,1
93,4
49
84,2
15,2
98
97,1
02,0
50
n/a
35.4
15
.3
n/a
n/a
64.4
73
.2
75.7
2 pe
rson
car
pool
n/a
13,3
03,7
0112
,078
,175
12,0
97,3
46n/
a-9
.2
0.2
n/a
n/a
13.8
10.5
9.4
3 pe
rson
car
pool
n/a
3,36
0,78
12,
001,
378
2,15
9,15
1n/
a-4
0.5
7.9
n/a
n/a
3.5
1.7
1.7
4 pe
rson
+ c
arpo
oln/
a2,
400,
565
1,29
8,08
11,
377,
554
n/a
-45.
9 6.
1n/
an/
a2.
51.
11.
1
Oth
er m
eans
n/a
15,3
58,8
0015
,477
,342
15,5
43,1
27n/
a0.
8 0.
4n/
an/
a15
.913
.512
.1
Sour
ce:
2000
U.S
. Cen
sus:
ht
tp:/
/ww
w.c
ensu
s.go
v/m
ain/
ww
w/c
en20
00.h
tml.

Florida Transportation Almanac
52
Tabl
e 2
-12
JOU
RN
EY-T
O-W
OR
K T
REN
DS,
FLO
RID
A (
19
70
-20
00
)
Jou
rney
-to-
Wor
kC
har
acte
rist
ics
Yea
rC
han
ge (
%)
Dis
trib
uti
on o
f Tr
ends
(%
)
19
70
19
80
1
99
02
00
07
0-8
08
0-9
09
0-0
07
0-0
01
97
01
98
0
19
90
20
00
Pla
ce o
f W
ork
Wor
ked
in h
ome
coun
ty
2,05
3,79
3 3,
157,
989
4,95
6,24
0 5,
662,
640
53.8
56
.9
14.3
175.
783
.088
.885
.582
.9
Wor
ked
outs
ide
hom
e co
unty
19
8,35
1 35
7,98
7 83
8,21
2 1,
167,
904
80.5
13
4.1
39.3
48
8.8
8.0
10.1
14
.5
17.1
Plac
e of
wor
k no
t re
port
ed
221,
112
41,5
64
n/a
n/a
-81.
2 n/
a n/
a n/
a 8.
9 1.
2 n/
a n/
a
Mod
e to
Wor
k
Priv
ate
auto
or
carp
ool
2,09
9,43
6 3,
557,
675
5,28
6,56
7 6,
339,
293
69.5
48
.6
19.9
202.
084
.989
.491
.291
.7
D
rive
alon
en/
a2,
751,
259
4,46
8,02
1 5,
445,
527
n/a
62.4
21
.9n/
an/
a69
.277
.178
.8
C
arpo
oln/
a80
6,41
6 81
8,54
6 89
3,76
6n/
a1.
5 9.
2n/
an/
a20
.314
.112
.9
Wal
k11
8,60
1 14
6,42
1 14
5,26
9 11
8,38
623
.5
-0.8
-1
8.5
-0.2
4.8
3.7
2.5
1.7
Publ
ic t
rans
port
atio
n10
6,73
0 10
6,54
6 11
6,35
2 12
9,07
5-0
.2
9.2
10.9
20.9
4.3
2.7
2.0
1.9
Wor
k at
hom
e59
,676
58
,778
13
2,08
4 20
7,08
9-1
.5
124.
7 56
.824
7.0
2.4
1.5
2.3
3.0
Oth
er m
eans
88,8
13
108,
987
114,
180
116,
325
22.7
4.
8 1.
931
.03.
62.
72.
01.
7
Trav
el T
ime
to W
ork
Less
tha
n 10
min
utes
n/a
611,
036
768,
607
751,
256
n/a
25.8
-2
.3n/
an/
a15
.313
.310
.9
10 t
o 19
min
utes
n/a
1,38
0,67
3 1,
908,
310
2,00
7,97
9n/
a38
.2
5.2
n/a
n/a
34.6
32.9
29.1
20 t
o 29
min
utes
n/a
866,
785
1,23
6,77
8 1,
444,
986
n/a
42.7
16
.8n/
an/
a21
.821
.320
.9
30 t
o 44
min
utes
n/a
722,
745
1,17
2,06
0 1,
497,
880
n/a
62.2
27
.8n/
an/
a18
.120
.221
.7
45 o
r m
ore
min
utes
n/a
345,
155
576,
613
1,00
0,97
8n/
a67
.1
73.6
n/a
n/a
8.7
10.0
14.5
Wor
ked
at h
ome
n/a
58,7
78
132,
084
207,
089
n/a
124.
7 56
.8n/
an/
a1.
52.
33.
0
Sour
ce:
2000
U.S
. Cen
sus:
ht
tp:/
/ww
w.c
ensu
s.go
v/m
ain/
ww
w/c
en20
00.h
tml.

Florida Transportation Almanac
53
Tabl
e 2
-12
(C
onti
nu
ed)
JOU
RN
EY-T
O-W
OR
K T
REN
DS,
FLO
RID
A (
19
70
-20
00
)
Jou
rney
-to-
Wor
kC
har
acte
rist
ics
Yea
rC
han
ge (
%)
Dis
trib
uti
on o
f Tr
ends
(%
)
19
70
19
80
1
99
02
00
07
0-8
08
0-9
09
0-0
07
0-0
01
97
01
98
0
19
90
20
00
Dep
artu
re T
ime
to W
ork
12:0
0 to
4:5
9 a.
m.
n/a
n/a
126,
901
195,
491
n/a
n/a
54.1
n/a
n/a
n/a
2.2
2.8
5:00
to
5:59
a.m
.n/
an/
a28
3,70
2 41
0,55
1n/
an/
a44
.7n/
an/
an/
a4.
95.
9
6:00
to
6:59
a.m
.n/
an/
a1,
120,
718
1,29
0,19
9n/
an/
a15
.1n/
an/
an/
a19
.318
.7
7:00
to
7:59
a.m
.n/
an/
a1,
843,
369
2,11
0,08
7n/
an/
a14
.5n/
an/
an/
a31
.830
.5
8:00
to
8:59
a.m
.n/
an/
a1,
066,
549
1,20
0,75
7n/
an/
a12
.6n/
an/
an/
a18
.417
.4
9:00
to
9:59
a.m
.n/
an/
a34
1,73
7 41
9,45
0n/
an/
a22
.7n/
an/
an/
a5.
96.
1
10:0
0 to
10:
59 a
.m.
n/a
n/a
123,
249
167,
860
n/a
n/a
36.2
n/a
n/a
n/a
2.1
2.4
11:0
0 to
11:
59 a
.m.
n/a
n/a
60,9
48
77,0
65n/
an/
a26
.4n/
an/
an/
a1.
11.
1
12:0
0 to
3:5
9 p.
m.
n/a
n/a
343,
816
413,
569
n/a
n/a
20.3
n/a
n/a
n/a
5.9
6.0
4:00
to
11:5
9 p.
m.
n/a
n/a
351,
379
418,
050
n/a
n/a
19.0
n/
a n/
a n/
a 6.
1 6.
0
Wor
ked
at h
ome
n/a
n/a
132,
084
207,
089
n/a
n/a
56.8
n/a
n/a
n/a
2.3
3.0
Pri
vate
Veh
icle
Occ
upa
ncy
Driv
e al
one
n/a
2,75
1,25
9 4,
468,
021
5,44
5,52
7n/
a62
.4
21.9
n/a
n/a
69.2
77.1
78.8
2 pe
rson
car
pool
n/a
579,
825
660,
172
698,
577
n/a
13.9
5.
8n/
an/
a14
.611
.410
.1
3 pe
rson
car
pool
n/a
132,
525
99,5
18
117,
465
n/a
-24.
9 18
.0n/
an/
a3.
31.
71.
7
4 pe
rson
+ c
arpo
oln/
a94
,066
58
,856
77
,724
n/a
-37.
4 32
.1n/
an/
a2.
41.
01.
1
Oth
er m
eans
n/a
420,
732
507,
885
570,
875
n/a
20.7
12
.4n/
an/
a10
.68.
88.
3
Sour
ce:
2000
U.S
. Cen
sus:
ht
tp:/
/ww
w.c
ensu
s.go
v/m
ain/
ww
w/c
en20
00.h
tml.

Florida Transportation Almanac
54
Table 2-13JOURNEY-TO-WORK CHARACTERISTICS FOR FLORIDA COUNTIES (2000)
Journey-to-WorkCharacteristics Alachua Baker Bay Bradford Brevard Broward Calhoun Charlotte
Place of Work
Worked in home county 95,670 4,415 64,159 4,503 189,056 565,812 3,438 36,750
Worked outside home county 6,379 4,600 2,147 4,718 13,600 171,561 1,782 12,350
Worked outside home state 664 132 1,242 93 2,423 6,170 166 531
Mode to Work
Private auto or carpool 89,842 8,785 63,535 8,502 192,896 684,540 4,182 46,680
Drive alone 76,760 7,296 54,694 7,308 171,034 595,165 3,438 40,548
Carpool 13,082 1,489 8,841 1,194 21,862 89,375 744 6,132
Walk 3,326 62 1,111 250 2,653 9,680 89 370
Public Transportation 2,511 19 212 39 591 17,048 20 121
Work at home 3,294 185 1,561 270 5,506 21,509 92 1,610
Other means 545 85 639 196 1,390 6,155 33 475
Travel Time to Work
Less than 10 minutes 14,489 1,259 10,208 1,381 25,318 65,903 694 7,432
10 to 19 minutes 39,878 1,894 25,499 2,790 65,595 190,786 1,310 18,816
20 to 29 minutes 23,218 1,144 15,047 1,041 48,130 158,050 586 8,580
30 to 39 minutes 12,518 1,583 8,923 1,321 32,467 155,232 714 5,286
40 or more minutes 9,316 3,082 6,310 2,511 28,063 152,063 1,048 7,907
Worked at home 3,294 185 1,561 270 5,506 21,509 92 1,610
Departure Time to Work
12:00 to 4:59 a.m. 1,895 489 1,770 566 5,874 15,820 306 1,411
5:00 to 5:59 a.m. 3,448 1,132 5,153 782 12,710 32,303 674 2,811
6:00 to 6:59 a.m. 14,438 2,116 15,617 2,039 43,688 118,828 1,142 9,198
7:00 to 7:59 a.m. 33,136 2,405 21,857 2,853 61,719 232,378 1,240 15,550
8:00 to 8:59 a.m. 18,304 814 7,618 859 31,810 155,631 254 8,244
9:00 to 9:59 a.m. 7,288 281 2,719 311 11,448 52,456 83 3,075
10:00 to 10:59 a.m. 2,969 95 1,342 130 4,853 20,878 35 1,315
11:00 to 11:59 a.m. 1,756 71 635 61 2,005 9,023 9 635
12:00 to 3:59 p.m. 8,399 688 4,770 754 13,197 39,905 353 2,758
4:00 to 11:59 p.m. 7,786 871 4,506 689 12,269 44,812 256 3,024
Worked at home 3,294 185 1,561 270 5,506 21,509 92 1,610
Private Vehicle Occupancy
Drive alone 76,760 7,296 54,694 7,308 171,034 595,165 3,438 40,548
2 person carpool 13,082 1,091 7,109 946 17,827 71,726 582 4,903
3 person carpool 10,841 281 1,308 165 2,684 11,194 120 796
4 person+ carpool 2,241 117 424 83 1,351 6,455 42 433
Other means 12,871 362 4,013 812 12,183 59,003 262 2,951
Source: 2000 U.S. Census: http://www.census.gov/main/www/cen2000.html.

Florida Transportation Almanac
55
Table 2-13 (Continued)JOURNEY-TO-WORK CHARACTERISTICS FOR FLORIDA COUNTIES (2000)
Journey-to-WorkCharacteristics Citrus Clay Collier Columbia Dade Desoto Dixie Duval
Place of Work
Worked in home county 29,461 26,798 95,028 16,940 823,481 9,191 2,823 349,553
Worked outside home county 7,779 40,064 6,418 5,347 70,125 3,320 1,623 19,806
Worked outside home state 672 891 1,630 420 5,717 56 60 4,933
Mode to Work
Private auto or carpool 35,604 64,416 92,081 21,359 795,204 10,722 4,117 346,401
Drive alone 30,691 56,961 76,730 18,281 663,902 6,567 3,463 297,404
Carpool 4,913 7,455 15,351 3,078 131,302 4,155 654 48,997
Walk 528 664 1,858 305 19,367 200 27 6,665
Public Transportation 106 138 1,964 27 47,087 1,040 14 7,521
Work at home 1,175 1,549 4,869 524 24,149 334 233 7,437
Other means 288 741 1,432 409 8,547 176 100 3,646
Travel Time to Work
Less than 10 minutes 5,290 5,458 13,061 3,190 61,452 1,745 940 35,114
10 to 19 minutes 12,634 12,325 32,426 8,294 214,277 3,447 1,255 107,883
20 to 29 minutes 7,374 11,024 22,067 3,917 175,662 1,669 474 93,429
30 to 39 minutes 4,847 13,818 16,558 2,874 198,793 2,421 550 77,768
40 or more minutes 6,592 23,579 14,087 3,327 224,990 2,951 1,287 52,711
Worked at home 1,175 1,549 4,869 524 24,149 334 233 7,437
Departure Time to Work
12:00 to 4:59 a.m. 1,347 2,648 2,448 1,214 23,078 441 309 10,959
5:00 to 5:59 a.m. 3,191 6,809 6,142 1,713 46,678 1,761 401 23,765
6:00 to 6:59 a.m. 7,162 17,949 19,371 3,963 158,970 3,855 1,013 80,575
7:00 to 7:59 a.m. 11,738 17,325 30,223 8,221 254,550 3,306 1,199 114,952
8:00 to 8:59 a.m. 6,024 8,513 19,540 2,749 179,260 1,039 470 57,989
9:00 to 9:59 a.m. 1,731 2,741 7,171 954 68,497 312 153 20,441
10:00 to 10:59 a.m. 847 1,157 2,570 376 27,324 147 67 7,812
11:00 to 11:59 a.m. 470 588 1,131 121 10,859 41 44 3,966
12:00 to 3:59 p.m. 2,132 4,255 5,181 1,598 54,664 518 255 22,017
4:00 to 11:59 p.m. 2,095 4,219 4,422 1,274 51,294 813 362 24,379
Worked at home 1,175 1,549 4,869 524 24,149 334 233 7,437
Private Vehicle Occupancy
Drive alone 30,691 56,961 76,730 21,359 663,902 6,567 3,463 297,404
2 person carpool 4,022 6,176 10,708 2,275 100,773 1,831 480 38,944
3 person carpool 658 926 1,944 515 18,747 516 92 6,476
4 person+ carpool 233 353 2,699 288 25,411 1,808 82 3,577
Other means 2,308 3,337 10,987 1,348 104,119 1,845 389 27,891
Source: 2000 U.S. Census: http://www.census.gov/main/www/cen2000.html.

Florida Transportation Almanac
56
Table 2-13 (Continued)JOURNEY-TO-WORK CHARACTERISTICS FOR FLORIDA COUNTIES (2000)
Journey-to-WorkCharacteristics Escambia Flagler Franklin Gadsen Gilchrist Glades Gulf Hamilton
Place of Work
Worked in home county 114,990 11,451 3,411 8,686 2,288 1,642 3,145 2,370
Worked outside home county 6,809 6,810 388 8,701 3,330 1,919 1,344 988
Worked outside home state 6,524 188 70 356 67 22 132 718
Mode to Work
Private auto or carpool 113,493 17,168 3,585 16,877 5,191 3,243 4,311 3,758
Drive alone 98,681 15,018 2,847 13,161 4,305 2,434 3,572 3,129
Carpool 14,812 2,150 738 3,716 886 809 739 629
Walk 7,704 221 98 322 84 46 68 88
Public Transportation 1,739 130 15 109 42 94 6 34
Work at home 3,096 625 108 322 248 104 175 70
Other means 1,379 151 34 86 88 63 61 121
Travel Time to Work
Less than 10 minutes 18,115 2,643 1,474 1,849 580 735 1,202 704
10 to 19 minutes 46,588 6,078 962 3,842 1,292 793 1,222 1,063
20 to 29 minutes 28,466 2,837 396 2,754 785 715 458 848
30 to 39 minutes 18,248 3,002 487 4,221 734 450 467 780
40 or more minutes 13,810 3,264 442 4,755 2,046 786 1,097 611
Worked at home 3,096 625 108 322 248 104 175 70
Departure Time to Work
12:00 to 4:59 a.m. 4,580 580 75 514 241 226 211 227
5:00 to 5:59 a.m. 11,177 1,202 228 1,011 488 449 423 281
6:00 to 6:59 a.m. 29,530 3,361 612 4,606 1,482 930 776 926
7:00 to 7:59 a.m. 39,864 5,194 1,404 6,796 1,703 1,112 1,526 1,358
8:00 to 8:59 a.m. 13,948 3,202 670 1,786 563 319 592 346
9:00 to 9:59 a.m. 5,593 1,194 219 462 169 131 282 129
10:00 to 10:59 a.m. 2,603 465 98 257 40 30 53 48
11:00 to 11:59 a.m. 1,355 179 20 62 27 47 36 47
12:00 to 3:59 p.m. 8,036 1,330 240 1,011 399 133 380 381
4:00 to 11:59 p.m. 8,541 1,117 195 916 325 102 167 263
Worked at home 3,096 625 108 322 248 104 175 70
Private Vehicle Occupancy
Drive alone 98,681 15,018 2,847 13,161 4,305 2,434 3,572 3,129
2 person carpool 11,980 1,734 637 2,586 673 541 568 472
3 person carpool 1,907 302 73 520 140 175 145 83
4 person+ carpool 925 114 28 610 73 93 26 74
Other means 14,830 1,281 482 866 494 340 310 318
Source: 2000 U.S. Census: http://www.census.gov/main/www/cen2000.html.

Florida Transportation Almanac
57
Table 2-13 (Continued)JOURNEY-TO-WORK CHARACTERISTICS FOR FLORIDA COUNTIES (2000)
Journey-to-WorkCharacteristics Hardee Hendry Hernando Highlands Hillsborough Holmes Indian River
Place of Work
Worked in home county 6,798 9,901 2,805 26,245 419,780 3,115 39,072
Worked outside home county 2,936 4,325 13,915 2,905 47,617 2,475 5,152
Worked outside home state 56 81 469 192 3,356 1,151 652
Mode to Work
Private auto or carpool 8,947 12,340 41,002 27,383 435,652 6,229 41,594
Drive alone 6,311 9,113 35,198 21,731 374,120 5,395 36,099
Carpool 2,636 3,227 5,804 5,652 61,532 834 5,495
Walk 226 264 350 499 7,702 148 579
Public Transportation 124 1,139 77 345 6,368 0 166
Work at home 266 271 1,232 762 13,624 324 1,686
Other means 190 194 338 256 3,974 40 407
Travel Time to Work
Less than 10 minutes 2,002 3,683 4,591 4,488 49,254 758 6,867
10 to 19 minutes 2,554 3,413 13,517 11,653 131,778 1,737 19,171
20 to 29 minutes 1,193 1,451 8,547 5,431 103,710 1,087 8,762
30 to 39 minutes 1,477 2,156 5,576 3,591 90,556 1,195 4,989
40 or more minutes 2,298 3,333 9,726 3,417 81,831 1,640 3,401
Worked at home 266 271 1,232 762 13,624 324 1,686
Departure Time to Work
12:00 to 4:59 a.m. 336 281 1,943 996 14,341 435 772
5:00 to 5:59 a.m. 818 867 3,952 2,314 24,946 771 2,046
6:00 to 6:59 a.m. 2,754 3,426 8,169 6,289 92,408 1,889 7,286
7:00 to 7:59 a.m. 3,325 3,221 11,710 9,550 149,724 1,760 15,095
8:00 to 8:59 a.m. 1,020 1,396 6,998 3,921 75,691 389 8,529
9:00 to 9:59 a.m. 189 283 2,377 1,347 27,239 193 2,863
10:00 to 10:59 a.m. 204 162 880 585 10,542 74 1,089
11:00 to 11:59 a.m. 42 30 502 294 4,912 38 424
12:00 to 3:59 p.m. 455 380 2,909 1,491 28,060 480 2,862
4:00 to 11:59 p.m. 381 312 2,517 1,793 29,266 388 2,224
Worked at home 266 136 1,232 762 13,624 324 1,686
Private Vehicle Occupancy
Drive alone 8,947 7,190 35,198 21,731 374,120 5,395 36,099
2 person carpool 1,346 1,265 4,717 3,914 48,401 571 4,306
3 person carpool 351 431 891 643 8,180 163 806
4 person+ carpool 939 911 196 1,095 4,951 100 483
Other means 843 1,967 2,187 1,959 35,101 512 3,282
Source: 2000 U.S. Census: http://www.census.gov/main/www/cen2000.html.

Florida Transportation Almanac
58
Table 2-13 (Continued)JOURNEY-TO-WORK CHARACTERISTICS FOR FLORIDA COUNTIES (2000)
Journey-to-WorkCharacteristics Jackson Jefferson Lafayette Lake Lee Leon Levy Liberty
Place of Work
Worked in home county 12,625 2,351 1,567 51,842 161,939 114,007 6,804 1,135
Worked outside home county 3,334 2,946 873 28,962 18,656 4,479 5,767 1,203
Worked outside home state 1,006 148 35 659 1,986 1,533 128 18
Mode to Work
Private auto or carpool 15,920 5,162 2,264 76,050 168,719 111,497 11,714 2,232
Drive alone 13,850 4,101 1,812 65,662 143,636 95,293 9,482 1,666
Carpool 2,070 1,061 452 10,388 25,083 16,204 2,232 566
Walk 265 52 94 1,129 2,695 2,245 260 37
Public Transportation 36 43 0 348 1,401 1,928 26 0
Work at home 537 127 68 2,633 6,332 3,020 502 48
Other means 179 43 47 838 1,640 602 154 39
Travel Time to Work
Less than 10 minutes 2,927 689 538 10,861 21,767 14,699 2,018 411
10 to 19 minutes 5,008 997 782 22,290 54,316 43,318 2,619 506
20 to 29 minutes 3,110 683 326 13,472 58,669 29,074 1,752 226
30 to 39 minutes 2,804 1,446 349 13,174 32,437 19,323 2,367 322
40 or more minutes 2,579 1,503 412 19,033 26,991 10,585 3,441 843
Worked at home 537 127 68 2,633 6,332 502 502 48
Departure Time to Work
12:00 to 4:59 a.m. 825 113 113 3,174 5,008 2,178 457 73
5:00 to 5:59 a.m. 1,484 255 255 6,316 11,742 3,032 1,158 331
6:00 to 6:59 a.m. 4,292 1,395 585 16,539 36,486 16,343 2,964 782
7:00 to 7:59 a.m. 5,128 2,113 875 24,862 55,760 43,123 3,990 730
8:00 to 8:59 a.m. 1,255 729 257 13,185 30,631 24,111 1,320 187
9:00 to 9:59 a.m. 450 188 37 3,873 10,854 7,469 544 30
10:00 to 10:59 a.m. 172 48 0 1,671 4,043 3,336 229 8
11:00 to 11:59 a.m. 158 58 23 787 1,833 1,410 55 0
12:00 to 3:59 p.m. 1,511 214 146 4,620 9,777 8,123 694 93
4:00 to 11:59 p.m. 1,153 229 176 3,803 10,115 7,874 786 74
Worked at home 537 127 68 2,633 6,332 3,020 502 48
Private Vehicle Occupancy
Drive alone 13,850 4,101 1,812 65,662 143,636 95,293 9,482 1,666
2 person carpool 1,627 810 291 8,130 19,284 12,752 1,709 378
3 person carpool 252 171 50 1,365 3,564 2,188 367 68
4 person+ carpool 191 80 111 893 1,363 875 156 120
Other means 1,045 283 211 5,413 13,862 8,522 985 124
Source: 2000 U.S. Census: http://www.census.gov/main/www/cen2000.html.

Florida Transportation Almanac
59
Table 2-13 (Continued)JOURNEY-TO-WORK CHARACTERISTICS FOR FLORIDA COUNTIES (2000)
Journey-to-WorkCharacteristics Madison Manatee Marion Martin Monroe Nassau Okaloosa Okeechobee
Place of Work
Worked in home county 4,724 82,098 83,034 34,150 39,721 14,472 74,920 10,345
Worked outside home county 1,246 27,823 12,173 15,297 1,441 10,471 5,449 3,220
Worked outside home state 766 1,081 1,097 794 455 1,852 1,779 136
Mode to Work
Private auto or carpool 6,194 103,148 90,409 45,872 32,609 25,084 77,642 12,429
Drive alone 5,152 88,443 77,664 39,783 27,976 21,463 68,046 9,291
Carpool 1,042 14,705 12,745 6,089 4,633 3,621 9,596 3,138
Walk 179 1,633 1,369 683 2,223 292 1,225 217
Public Transportation 6 546 217 186 436 56 252 472
Work at home 195 3,774 3,019 2,474 2,092 924 1,690 309
Other means 132 1,017 818 437 850 295 652 236
Travel Time to Work
Less than 10 minutes 1,263 13,694 10,645 6,839 11,814 3,979 13,537 2,508
10 to 19 minutes 1,854 36,790 30,602 16,311 15,856 6,361 29,898 4,425
20 to 29 minutes 1,317 25,470 20,893 8,616 4,249 3,878 15,467 1,691
30 to 39 minutes 1,056 17,703 16,953 7,469 3,269 4,445 11,349 1,456
40 or more minutes 1,051 13,571 14,192 8,532 4,337 7,208 10,207 3,312
Worked at home 195 3,774 3,019 2,474 2,092 924 1,690 309
Departure Time to Work
12:00 to 4:59 a.m. 288 3,046 4,242 1,017 922 908 2,153 628
5:00 to 5:59 a.m. 560 6,601 8,017 2,808 1,916 2,358 6,332 2,152
6:00 to 6:59 a.m. 1,678 21,131 19,595 9,382 5,863 5,584 21,124 3,311
7:00 to 7:59 a.m. 2,000 36,470 29,369 15,968 11,863 8,036 23,654 3,521
8:00 to 8:59 a.m. 605 17,758 13,299 9,477 8,653 3,704 10,130 1,588
9:00 to 9:59 a.m. 188 5,433 4,923 2,885 3,334 1,152 3,681 268
10:00 to 10:59 a.m. 82 2,055 1,837 1,204 1,107 501 1,722 187
11:00 to 11:59 a.m. 79 917 919 476 599 252 959 76
12:00 to 3:59 p.m. 632 6,786 5,621 2,290 2,169 1,598 5,865 828
4:00 to 11:59 p.m. 429 7,040 5,463 2,260 3,099 1,778 4,838 833
Worked at home 195 3,774 3,019 2,474 2,092 924 1,690 309
Private Vehicle Occupancy
Drive alone 5,152 88,443 77,664 39,783 27,976 21,463 68,046 9,291
2 person carpool 734 11,293 10,511 4,494 3,950 2,930 7,396 1,609
3 person carpool 111 1,976 1,298 664 443 534 1,378 307
4 person+ carpool 197 1,436 936 931 240 157 822 1,222
Other means 542 7,854 5,895 4,369 9,008 1,711 4,506 1,272
Source: 2000 U.S. Census: http://www.census.gov/main/www/cen2000.html.

Florida Transportation Almanac
60
Table 2-13 (Continued)JOURNEY-TO-WORK CHARACTERISTICS FOR FLORIDA COUNTIES (2000)
Journey-to-WorkCharacteristics Orange Osceola Palm Beach Pasco Pinellas Polk Putnam St. Johns
Place of Work
Worked in home county 376,709 38,416 421,811 71,367 360,285 170,637 17,322 35,438
Worked outside home county 59,411 38,653 48,556 59,040 54,751 30,378 8,183 22,617
Worked outside home state 3,203 794 5,205 983 3,589 1,326 253 823
Mode to Work
Private auto or carpool 404,604 73,183 435,506 123,365 379,865 190,595 24,440 54,160
Drive alone 351,068 60,899 378,759 105,107 333,832 161,641 20,094 47,811
Carpool 53,536 12,284 56,747 18,258 46,033 28,954 4,346 6,349
Walk 6,085 1,054 6,485 1,771 8,392 2,850 251 1,203
Public Transportation 10,923 825 6,671 378 8,117 1,504 170 327
Work at home 11,178 1,510 19,454 3,840 14,649 4,206 512 2,157
Other means 3,642 624 4,319 1,290 3,126 2,001 345 500
Travel Time to Work
Less than 10 minutes 35,699 6,441 49,078 15,193 52,267 25,139 3,424 8,115
10 to 19 minutes 116,488 17,594 142,889 34,505 140,081 64,306 7,247 16,550
20 to 29 minutes 105,324 17,951 102,521 20,479 87,503 42,936 4,380 10,559
30 to 39 minutes 96,164 17,875 84,228 20,948 66,339 31,992 3,702 10,182
40 or more minutes 74,470 16,492 77,402 36,425 57,786 33,762 6,493 11,315
Worked at home 11,178 1,510 19,454 3,840 14,649 4,206 512 2,157
Departure Time to Work
12:00 to 4:59 a.m. 14,523 3,234 9,734 4,625 9,455 8,635 1,127 1,554
5:00 to 5:59 a.m. 26,915 6,260 20,651 11,108 20,608 17,474 2,685 2,984
6:00 to 6:59 a.m. 77,130 14,505 76,515 27,887 70,073 44,279 6,790 9,890
7:00 to 7:59 a.m. 130,577 22,171 150,368 35,870 126,867 63,819 7,321 18,567
8:00 to 8:59 a.m. 1,588 10,621 98,982 20,232 81,763 25,097 3,133 10,440
9:00 to 9:59 a.m. 25,625 3,714 33,495 7,813 27,159 8,248 772 3,854
10:00 to 10:59 a.m. 11,417 1,874 12,139 2,489 10,921 3,523 390 1,735
11:00 to 11:59 a.m. 5,782 720 5,644 1,713 4,728 1,873 277 644
12:00 to 3:59 p.m. 30,727 6,870 23,339 7,569 26,884 12,142 1,415 3,451
4:00 to 11:59 p.m. 30,554 6,384 25,251 8,244 25,518 13,045 1,336 3,602
Worked at home 11,178 1,510 19,454 3,840 14,649 4,206 512 2,157
Private Vehicle Occupancy
Drive alone 351,068 60,899 378,759 105,107 333,832 132,883 20,094 47,811
2 person carpool 42,350 9,917 43,313 14,746 38,257 19,166 3,032 5,450
3 person carpool 7,007 1,613 7,654 2,440 5,446 3,195 700 629
4 person+ carpool 4,179 754 5,780 1,072 2,330 1,751 614 270
Other means 34,719 4,680 40,066 8,025 38,760 11,746 1,318 4,718
Source: 2000 U.S. Census: http://www.census.gov/main/www/cen2000.html.

Florida Transportation Almanac
61
Table 2-13 (Continued)JOURNEY-TO-WORK CHARACTERISTICS FOR FLORIDA COUNTIES (2000)
Journey-to-WorkCharacteristics St. Lucie Santa Rosa Sarasota Seminole Sumter Suwannee Taylor
Place of Work
Worked in home county 49,979 23,087 113,691 96,293 7,960 8,818 6,311
Worked outside home county 25,595 26,587 17,344 89,569 6,591 4,465 806
Worked outside home state 687 2,127 1,730 1,732 147 213 101
Mode to Work
Private auto or carpool 71,634 48,877 120,672 174,772 13,818 12,436 6,697
Drive alone 60,997 42,983 107,208 155,868 11,942 10,046 5,547
Carpool 10,637 5,894 13,464 18,904 1,876 2,390 1,150
Walk 776 480 2,156 1,898 169 283 212
Public Transportation 790 149 1,070 1,227 25 25 13
Work at home 1,937 1,571 6,179 7,186 449 460 140
Other means 564 585 996 1,317 196 190 134
Travel Time to Work
Less than 10 minutes 7,047 5,565 18,664 15,854 2,276 1,923 1,879
10 to 19 minutes 22,667 12,097 48,541 42,055 3,975 3,398 2,803
20 to 29 minutes 17,617 11,110 28,344 32,679 2,411 2,520 967
30 to 39 minutes 14,760 10,595 17,863 29,994 2,401 2,623 603
40 or more minutes 12,233 10,863 13,174 25,546 3,186 2,572 826
Worked at home 1,937 1,571 6,179 3,805 449 460 140
Departure Time to Work
12:00 to 4:59 a.m. 2,356 1,576 2,956 4,645 711 839 246
5:00 to 5:59 a.m. 5,036 4,947 5,815 9,478 1,235 1,180 597
6:00 to 6:59 a.m. 15,917 13,140 19,630 31,710 2,855 2,676 1,770
7:00 to 7:59 a.m. 24,609 16,063 40,420 59,224 4,888 4,641 2,359
8:00 to 8:59 a.m. 11,576 5,548 28,303 36,522 1,917 1,340 557
9:00 to 9:59 a.m. 4,030 1,830 9,777 12,406 439 497 288
10:00 to 10:59 a.m. 1,528 1,111 3,903 4,304 210 202 140
11:00 to 11:59 a.m. 697 395 1,547 2,132 183 54 91
12:00 to 3:59 p.m. 4,052 2,838 7,188 9,650 1,025 821 501
4:00 to 11:59 p.m. 4,523 2,782 7,047 10,337 786 786 529
Worked at home 1,937 2,571 6,179 7,186 449 460 140
Private Vehicle Occupancy
Drive alone 60,997 42,983 89,650 155,868 11,942 10,046 5,547
2 person carpool 8,118 4,690 11,375 15,434 1,462 1,598 787
3 person carpool 1,139 903 1,453 2,225 186 393 219
4 person+ carpool 1,380 301 421 1,245 228 399 144
Other means 4,627 2,924 12,093 12,822 880 1,060 521
Source: 2000 U.S. Census: http://www.census.gov/main/www/cen2000.html.
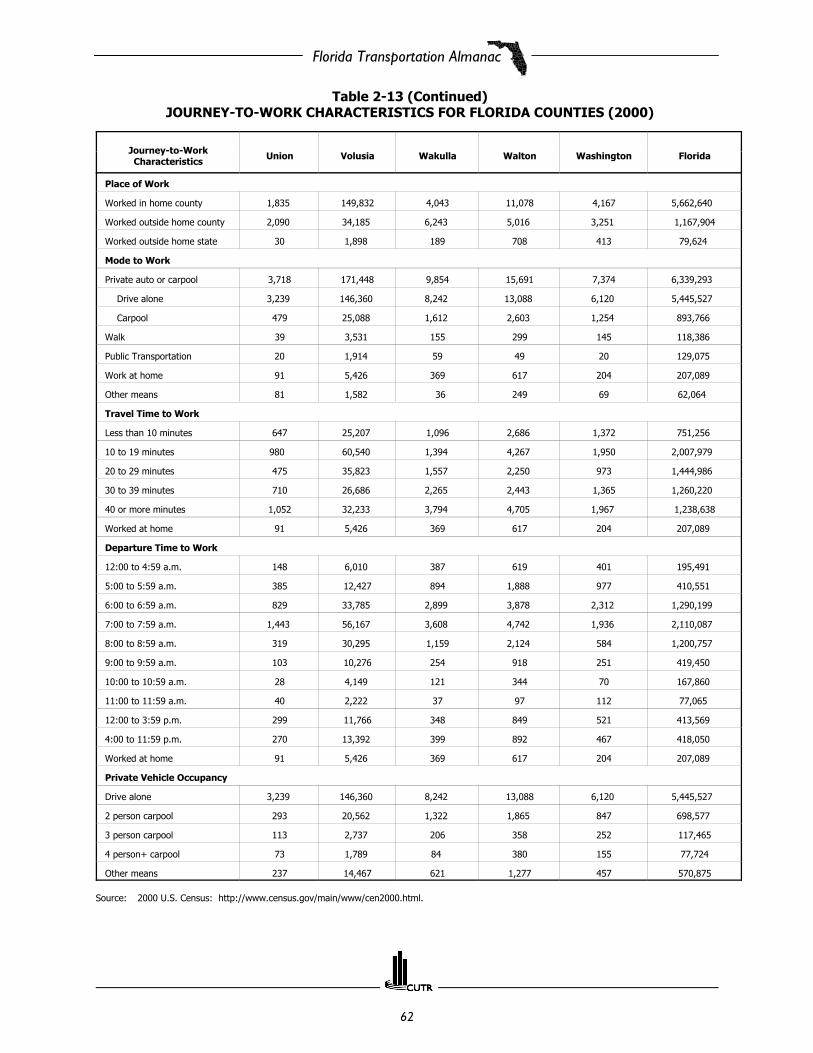
Florida Transportation Almanac
62
Table 2-13 (Continued)JOURNEY-TO-WORK CHARACTERISTICS FOR FLORIDA COUNTIES (2000)
Journey-to-WorkCharacteristics Union Volusia Wakulla Walton Washington Florida
Place of Work
Worked in home county 1,835 149,832 4,043 11,078 4,167 5,662,640
Worked outside home county 2,090 34,185 6,243 5,016 3,251 1,167,904
Worked outside home state 30 1,898 189 708 413 79,624
Mode to Work
Private auto or carpool 3,718 171,448 9,854 15,691 7,374 6,339,293
Drive alone 3,239 146,360 8,242 13,088 6,120 5,445,527
Carpool 479 25,088 1,612 2,603 1,254 893,766
Walk 39 3,531 155 299 145 118,386
Public Transportation 20 1,914 59 49 20 129,075
Work at home 91 5,426 369 617 204 207,089
Other means 81 1,582 36 249 69 62,064
Travel Time to Work
Less than 10 minutes 647 25,207 1,096 2,686 1,372 751,256
10 to 19 minutes 980 60,540 1,394 4,267 1,950 2,007,979
20 to 29 minutes 475 35,823 1,557 2,250 973 1,444,986
30 to 39 minutes 710 26,686 2,265 2,443 1,365 1,260,220
40 or more minutes 1,052 32,233 3,794 4,705 1,967 1,238,638
Worked at home 91 5,426 369 617 204 207,089
Departure Time to Work
12:00 to 4:59 a.m. 148 6,010 387 619 401 195,491
5:00 to 5:59 a.m. 385 12,427 894 1,888 977 410,551
6:00 to 6:59 a.m. 829 33,785 2,899 3,878 2,312 1,290,199
7:00 to 7:59 a.m. 1,443 56,167 3,608 4,742 1,936 2,110,087
8:00 to 8:59 a.m. 319 30,295 1,159 2,124 584 1,200,757
9:00 to 9:59 a.m. 103 10,276 254 918 251 419,450
10:00 to 10:59 a.m. 28 4,149 121 344 70 167,860
11:00 to 11:59 a.m. 40 2,222 37 97 112 77,065
12:00 to 3:59 p.m. 299 11,766 348 849 521 413,569
4:00 to 11:59 p.m. 270 13,392 399 892 467 418,050
Worked at home 91 5,426 369 617 204 207,089
Private Vehicle Occupancy
Drive alone 3,239 146,360 8,242 13,088 6,120 5,445,527
2 person carpool 293 20,562 1,322 1,865 847 698,577
3 person carpool 113 2,737 206 358 252 117,465
4 person+ carpool 73 1,789 84 380 155 77,724
Other means 237 14,467 621 1,277 457 570,875
Source: 2000 U.S. Census: http://www.census.gov/main/www/cen2000.html.

Florida Transportation Almanac
63
Chapter 3:MODALSTATISTICS

Florida Transportation Almanac
64

Florida Transportation Almanac
65

Florida Transportation Almanac
66

Florida Transportation Almanac
67

Florida Transportation Almanac
68

Florida Transportation Almanac
69
Highways

Florida Transportation Almanac
70
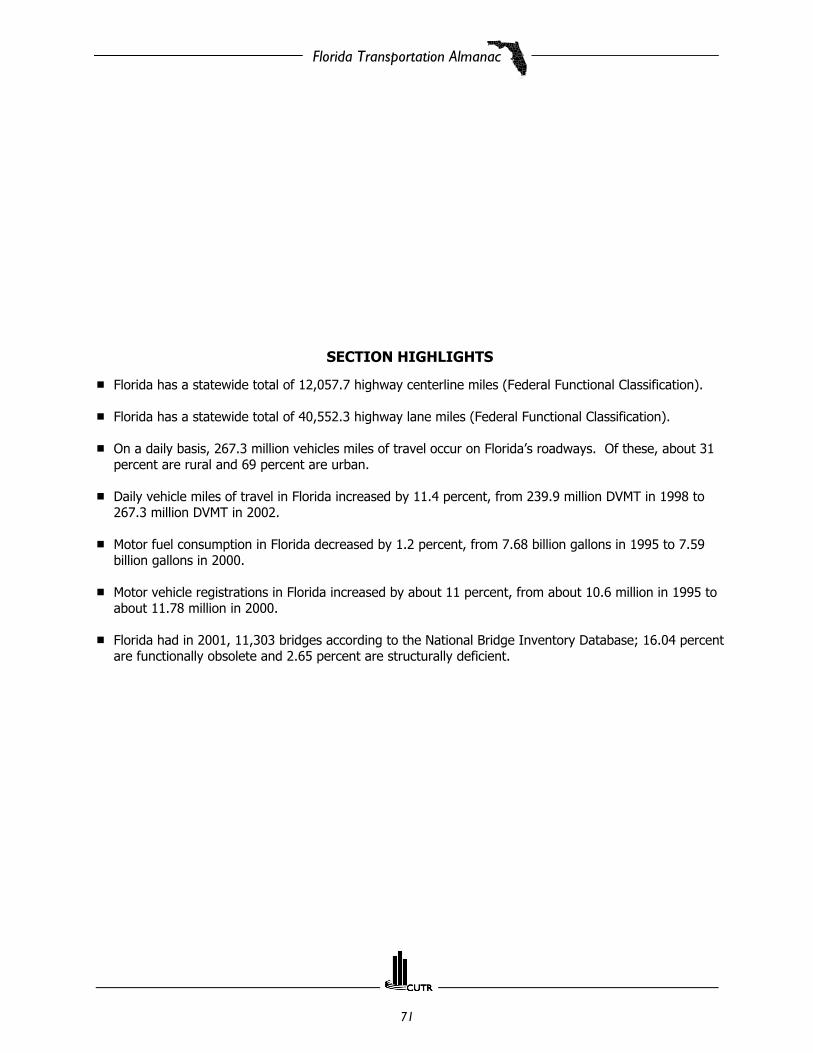
Florida Transportation Almanac
71
SECTION HIGHLIGHTS
# Florida has a statewide total of 12,057.7 highway centerline miles (Federal Functional Classification).
# Florida has a statewide total of 40,552.3 highway lane miles (Federal Functional Classification).
# On a daily basis, 267.3 million vehicles miles of travel occur on Florida’s roadways. Of these, about 31percent are rural and 69 percent are urban.
# Daily vehicle miles of travel in Florida increased by 11.4 percent, from 239.9 million DVMT in 1998 to267.3 million DVMT in 2002.
# Motor fuel consumption in Florida decreased by 1.2 percent, from 7.68 billion gallons in 1995 to 7.59billion gallons in 2000.
# Motor vehicle registrations in Florida increased by about 11 percent, from about 10.6 million in 1995 toabout 11.78 million in 2000.
# Florida had in 2001, 11,303 bridges according to the National Bridge Inventory Database; 16.04 percentare functionally obsolete and 2.65 percent are structurally deficient.
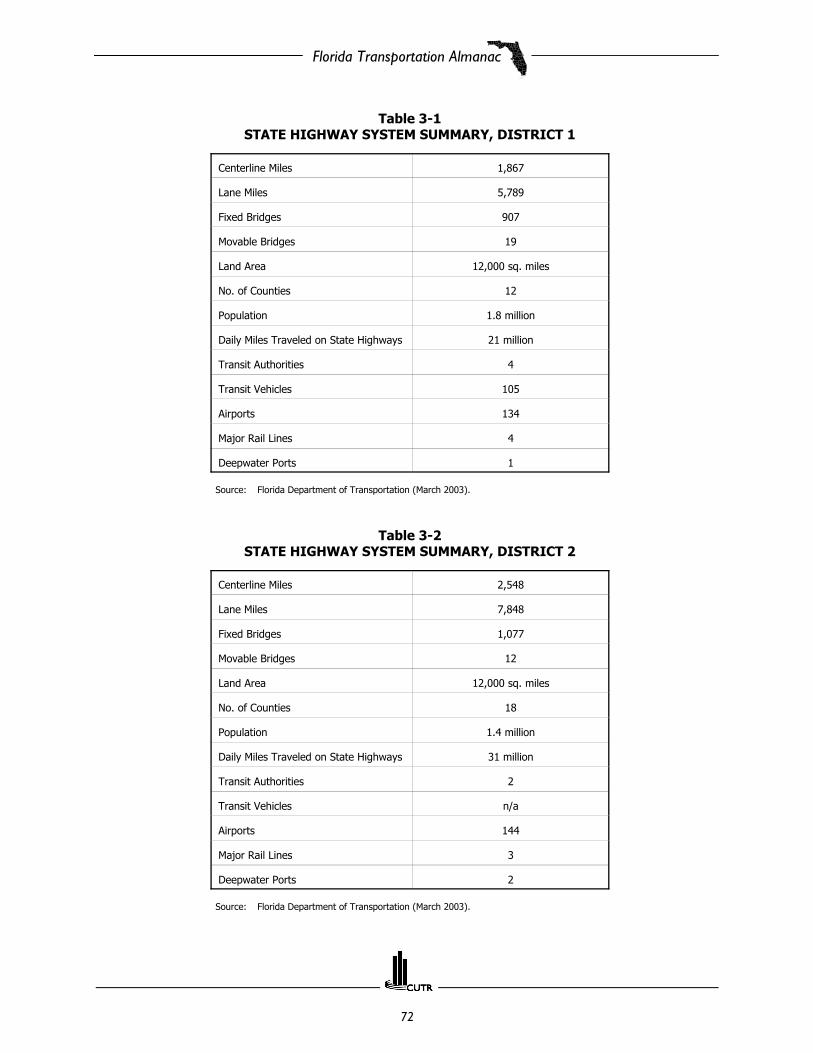
Florida Transportation Almanac
72
Table 3-1STATE HIGHWAY SYSTEM SUMMARY, DISTRICT 1
Centerline Miles 1,867
Lane Miles 5,789
Fixed Bridges 907
Movable Bridges 19
Land Area 12,000 sq. miles
No. of Counties 12
Population 1.8 million
Daily Miles Traveled on State Highways 21 million
Transit Authorities 4
Transit Vehicles 105
Airports 134
Major Rail Lines 4
Deepwater Ports 1
Source: Florida Department of Transportation (March 2003).
Table 3-2STATE HIGHWAY SYSTEM SUMMARY, DISTRICT 2
Centerline Miles 2,548
Lane Miles 7,848
Fixed Bridges 1,077
Movable Bridges 12
Land Area 12,000 sq. miles
No. of Counties 18
Population 1.4 million
Daily Miles Traveled on State Highways 31 million
Transit Authorities 2
Transit Vehicles n/a
Airports 144
Major Rail Lines 3
Deepwater Ports 2
Source: Florida Department of Transportation (March 2003).
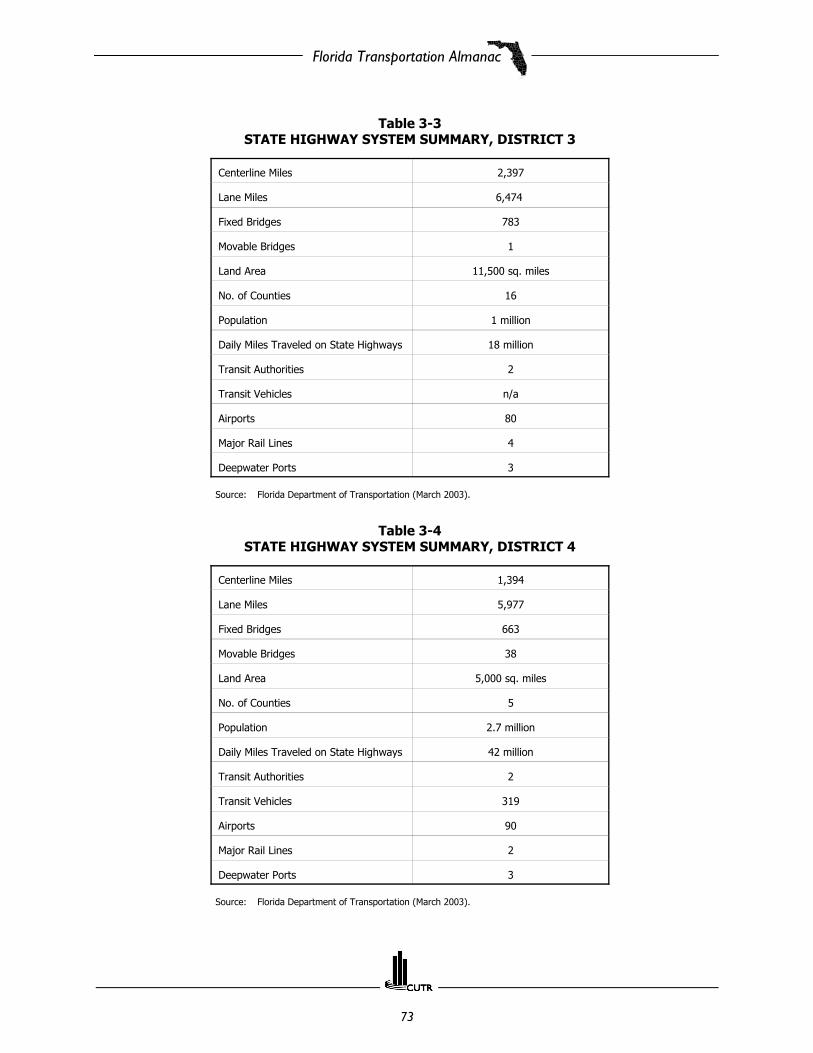
Florida Transportation Almanac
73
Table 3-3STATE HIGHWAY SYSTEM SUMMARY, DISTRICT 3
Centerline Miles 2,397
Lane Miles 6,474
Fixed Bridges 783
Movable Bridges 1
Land Area 11,500 sq. miles
No. of Counties 16
Population 1 million
Daily Miles Traveled on State Highways 18 million
Transit Authorities 2
Transit Vehicles n/a
Airports 80
Major Rail Lines 4
Deepwater Ports 3
Source: Florida Department of Transportation (March 2003).
Table 3-4STATE HIGHWAY SYSTEM SUMMARY, DISTRICT 4
Centerline Miles 1,394
Lane Miles 5,977
Fixed Bridges 663
Movable Bridges 38
Land Area 5,000 sq. miles
No. of Counties 5
Population 2.7 million
Daily Miles Traveled on State Highways 42 million
Transit Authorities 2
Transit Vehicles 319
Airports 90
Major Rail Lines 2
Deepwater Ports 3
Source: Florida Department of Transportation (March 2003).

Florida Transportation Almanac
74
Table 3-5STATE HIGHWAY SYSTEM SUMMARY, DISTRICT 5
Centerline Miles 2,100
Lane Miles 7,379
Fixed Bridges 605
Movable Bridges 9
Land Area 9,000 sq. miles
No. of Counties 9
Population 2.3 million
Daily Miles Traveled on State Highways 40 million
Transit Authorities 5
Transit Vehicles n/a
Airports 160
Major Rail Lines 5
Deepwater Ports 1
Source: Florida Department of Transportation (March 2003).
Table 3-6STATE HIGHWAY SYSTEM SUMMARY, DISTRICT 6
Centerline Miles 691
Lane Miles 2,864
Fixed Bridges 904
Movable Bridges 13
Land Area n/a
No. of Counties 2
Population 2.0 million
Daily Miles Traveled on State Highways 23 million
Transit Authorities 2
Transit Vehicles 650
Airports 85
Major Rail Lines 2
Deepwater Ports 1
Source: Florida Department of Transportation (March 2003).

Florida Transportation Almanac
75
Table 3-7STATE HIGHWAY SYSTEM SUMMARY, DISTRICT 7
Centerline Miles 1,061
Lane Miles 4,221
Fixed Bridges 626
Movable Bridges 13
Land Area 3,332 sq. miles
No. of Counties 5
Population 2 million
Daily Miles Traveled on State Highways 25 million
Transit Authorities 3
Transit Vehicles n/a
Airports 42
Major Rail Lines 1
Deepwater Ports 2
Source: Florida Department of Transportation (March 2003).
Table 3-82001 BRIDGES BY JURISDICTION
Jurisdiction Number of Bridges
State Owned 7,197
Locally Owned 4,106
Total 11,303
Source: 2001 National Bridge Inventory Database, Federal Highway Administration.
Table 3-92001 BRIDGE DEFICIENCIES
Deficiencies % of Bridges
Structurally Deficient 2.65
Functionally Obsolete 16.04
Functionally Adequate 81.31
Source: 2001 National Bridge Inventory Database, Federal Highway Administration.

Florida Transportation Almanac
76
Tabl
e 3
-10
CEN
TER
LIN
E M
ILES
FO
R F
LOR
IDA
CO
UN
TIES
AN
D D
ISTR
ICTS
(2
00
2),
BY
FU
NC
TIO
NA
L C
LASS
IFIC
ATI
ON
Cou
nty
Ru
ral
Urb
anTo
tal
Tota
lC
olle
ctor
Tota
lP
rin
cipa
lA
rter
ial
Min
orA
rter
ial
Maj
orC
olle
ctor
Min
orC
olle
ctor
Pri
nci
pal
Art
eria
lM
inor
Art
eria
lTo
tal
Col
lect
orP
rin
cipa
lA
rter
ial
Min
orA
rter
ial
Char
lott
e37
.624
.20.
00.
025
.010
.60.
062
.634
.80.
097
.4
Colli
er13
7.5
31.3
0.0
0.0
30.5
9.4
0.0
167.
940
.80.
020
8.7
Des
oto
45.9
22.5
0.0
0.0
12.9
1.7
0.0
58.8
24.2
0.0
83.0
Gla
des
41.4
44.3
0.0
0.0
0.0
0.0
0.0
41.4
44.3
0.0
85.8
Har
dee
70.2
21.2
0.0
0.0
0.0
0.0
0.0
70.2
21.2
0.0
91.4
Hen
dry
61.0
1.3
0.0
0.0
2.5
0.0
0.0
63.5
1.3
0.0
64.8
Hig
hlan
ds10
6.1
0.0
5.5
0.0
14.2
0.0
6.7
120.
30.
012
.213
2.5
Lee
43.2
29.9
0.0
0.0
64.1
32.0
0.0
107.
361
.90.
016
9.2
Man
atee
94.6
28.7
0.0
0.0
56.1
25.3
3.1
150.
754
.03.
120
7.9
Oke
echo
bee
98.5
4.8
0.0
0.0
0.0
0.0
0.0
98.5
4.8
0.0
103.
3
Polk
149.
847
.933
.70.
013
8.2
75.6
18.2
287.
912
3.5
51.8
463.
3
Sara
sota
35.6
22.6
0.0
0.0
64.0
37.3
0.0
99.6
59.9
0.0
159.
5
Dis
tric
t 1
9
21
.52
78
.83
9.1
0.0
40
7.3
19
1.9
28
.01
,32
8.8
47
0.7
67
.11
,86
6.6
Alac
hua
145.
647
.713
.50.
057
.327
.34.
920
2.8
75.1
18.4
296.
3
Bake
r25
.543
.814
.70.
00.
00.
00.
025
.543
.814
.783
.9
Brad
ford
19.8
30.1
8.9
0.0
4.1
4.8
1.3
23.9
34.9
10.2
69.0
Clay
50.3
26.9
3.5
0.0
26.4
2.8
0.0
76.7
29.6
3.5
109.
9
Colu
mbi
a10
6.6
64.4
2.3
0.0
18.3
12.3
0.0
125.
076
.72.
320
4.0
Dix
ie29
.217
.00.
00.
00.
00.
00.
029
.217
.00.
046
.3
Duv
al26
.811
.70.
00.
027
5.4
151.
91.
830
2.2
163.
61.
846
7.7
Gilc
hris
t18
.441
.90.
00.
00.
00.
00.
018
.441
.90.
060
.2
Ham
ilton
28.7
61.9
0.0
0.0
0.0
0.0
0.0
28.7
61.9
0.0
90.6
Lafa
yett
e31
.031
.20.
00.
00.
00.
00.
031
.031
.20.
062
.2
Levy
82.1
86.8
14.5
0.0
0.0
0.0
0.0
82.1
86.8
14.5
183.
5
Mad
ison
38.8
99.9
0.0
0.0
0.0
0.0
0.0
38.8
99.9
0.0
138.
6
Nas
sau
62.8
21.8
0.0
0.0
4.4
22.3
0.0
67.2
44.2
0.0
111.
4
Putn
am75
.351
.30.
00.
07.
76.
60.
083
.057
.90.
014
0.8
Not
e:Th
e Fu
nctio
nal C
lass
ifica
tion
mile
age
does
not
incl
ude
0.5
mile
s of
Sta
te r
oads
fun
ctio
nally
cla
ssifi
ed a
s “l
ocal
.”So
urce
:Fl
orid
a D
epar
tmen
t of
Tra
nspo
rtat
ion,
Sta
te H
ighw
ay S
yste
m M
ileag
e Re
port
for
Dec
embe
r 31
, 200
2.
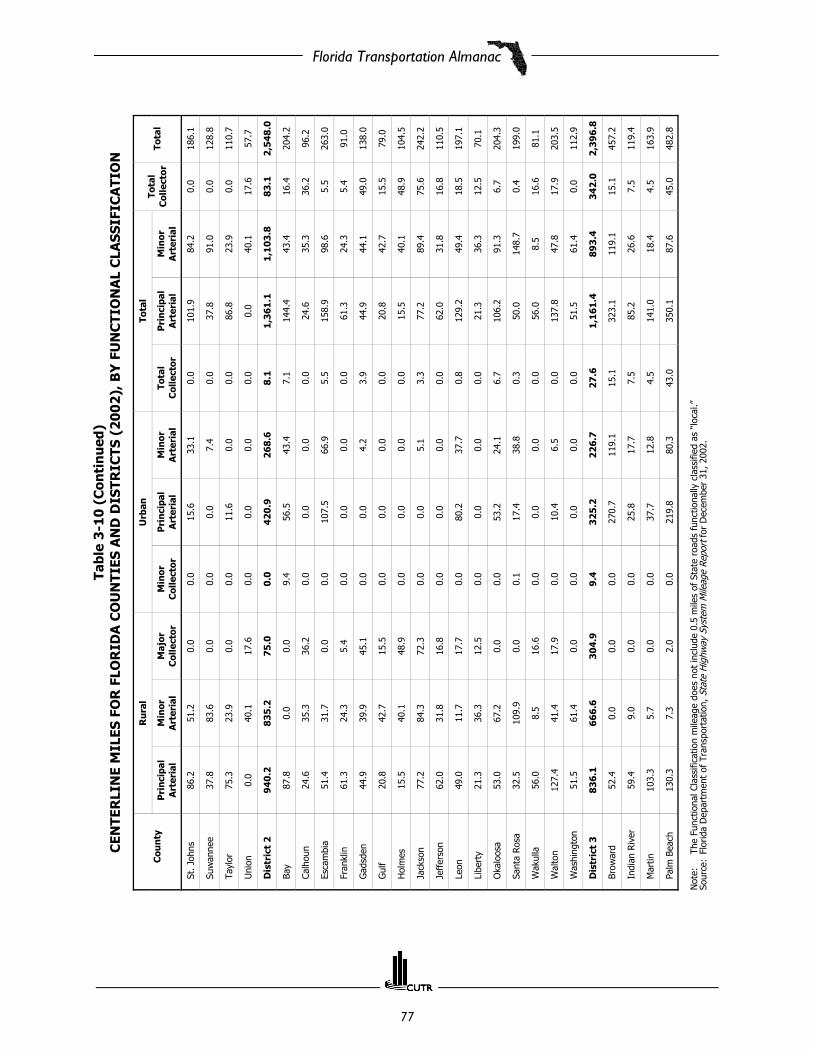
Florida Transportation Almanac
77
Tabl
e 3
-10
(C
onti
nu
ed)
CEN
TER
LIN
E M
ILES
FO
R F
LOR
IDA
CO
UN
TIES
AN
D D
ISTR
ICTS
(2
00
2),
BY
FU
NC
TIO
NA
L C
LASS
IFIC
ATI
ON
Cou
nty
Ru
ral
Urb
anTo
tal
Tota
lC
olle
ctor
Tota
lP
rin
cipa
lA
rter
ial
Min
orA
rter
ial
Maj
orC
olle
ctor
Min
orC
olle
ctor
Pri
nci
pal
Art
eria
lM
inor
Art
eria
lTo
tal
Col
lect
orP
rin
cipa
lA
rter
ial
Min
orA
rter
ial
St. J
ohns
86.2
51.2
0.0
0.0
15.6
33.1
0.0
101.
984
.20.
018
6.1
Suw
anne
e37
.883
.60.
00.
00.
07.
40.
037
.891
.00.
012
8.8
Tayl
or75
.323
.90.
00.
011
.60.
00.
086
.823
.90.
011
0.7
Uni
on0.
040
.117
.60.
00.
00.
00.
00.
040
.117
.657
.7
Dis
tric
t 2
94
0.2
83
5.2
75
.00
.04
20
.92
68
.68
.11
,36
1.1
1,1
03
.88
3.1
2,5
48
.0
Bay
87.8
0.0
0.0
9.4
56.5
43.4
7.1
144.
443
.416
.420
4.2
Calh
oun
24.6
35.3
36.2
0.0
0.0
0.0
0.0
24.6
35.3
36.2
96.2
Esca
mbi
a51
.431
.70.
00.
010
7.5
66.9
5.5
158.
998
.65.
526
3.0
Fran
klin
61.3
24.3
5.4
0.0
0.0
0.0
0.0
61.3
24.3
5.4
91.0
Gad
sden
44.9
39.9
45.1
0.0
0.0
4.2
3.9
44.9
44.1
49.0
138.
0
Gul
f20
.842
.715
.50.
00.
00.
00.
020
.842
.715
.579
.0
Hol
mes
15.5
40.1
48.9
0.0
0.0
0.0
0.0
15.5
40.1
48.9
104.
5
Jack
son
77.2
84.3
72.3
0.0
0.0
5.1
3.3
77.2
89.4
75.6
242.
2
Jeff
erso
n62
.031
.816
.80.
00.
00.
00.
062
.031
.816
.811
0.5
Leon
49.0
11.7
17.7
0.0
80.2
37.7
0.8
129.
249
.418
.519
7.1
Libe
rty
21.3
36.3
12.5
0.0
0.0
0.0
0.0
21.3
36.3
12.5
70.1
Oka
loos
a53
.067
.20.
00.
053
.224
.16.
710
6.2
91.3
6.7
204.
3
Sant
a Ro
sa32
.510
9.9
0.0
0.1
17.4
38.8
0.3
50.0
148.
70.
419
9.0
Wak
ulla
56.0
8.5
16.6
0.0
0.0
0.0
0.0
56.0
8.5
16.6
81.1
Wal
ton
127.
441
.417
.90.
010
.46.
50.
013
7.8
47.8
17.9
203.
5
Was
hing
ton
51.5
61.4
0.0
0.0
0.0
0.0
0.0
51.5
61.4
0.0
112.
9
Dis
tric
t 3
83
6.1
66
6.6
30
4.9
9.4
32
5.2
22
6.7
27
.61
,16
1.4
89
3.4
34
2.0
2,3
96
.8
Brow
ard
52.4
0.0
0.0
0.0
270.
711
9.1
15.1
323.
111
9.1
15.1
457.
2
Indi
an R
iver
59.4
9.0
0.0
0.0
25.8
17.7
7.5
85.2
26.6
7.5
119.
4
Mar
tin10
3.3
5.7
0.0
0.0
37.7
12.8
4.5
141.
018
.44.
516
3.9
Palm
Bea
ch13
0.3
7.3
2.0
0.0
219.
880
.343
.035
0.1
87.6
45.0
482.
8
Not
e:Th
e Fu
nctio
nal C
lass
ifica
tion
mile
age
does
not
incl
ude
0.5
mile
s of
Sta
te r
oads
fun
ctio
nally
cla
ssifi
ed a
s “l
ocal
.”So
urce
:Fl
orid
a D
epar
tmen
t of
Tra
nspo
rtat
ion,
Sta
te H
ighw
ay S
yste
m M
ileag
e Re
port
for
Dec
embe
r 31
, 200
2.

Florida Transportation Almanac
78
Tabl
e 3
-10
(C
onti
nu
ed)
CEN
TER
LIN
E M
ILES
FO
R F
LOR
IDA
CO
UN
TIES
AN
D D
ISTR
ICTS
(2
00
2),
BY
FU
NC
TIO
NA
L C
LASS
IFIC
ATI
ON
Cou
nty
Ru
ral
Urb
anTo
tal
Tota
lC
olle
ctor
Tota
lP
rin
cipa
lA
rter
ial
Min
orA
rter
ial
Maj
orC
olle
ctor
Min
orC
olle
ctor
Pri
nci
pal
Art
eria
lM
inor
Art
eria
lTo
tal
Col
lect
orP
rin
cipa
lA
rter
ial
Min
orA
rter
ial
St. L
ucie
49.3
17.0
0.0
0.0
77.2
23.1
3.9
126.
640
.23.
917
0.7
Dis
tric
t 4
39
4.7
39
.02
.00
.06
31
.22
53
.07
4.1
1,0
26
.02
91
.97
6.0
1,3
93
.9
Brev
ard
96.0
25.1
0.0
0.0
181.
429
.11.
427
7.4
54.2
1.4
333.
1
Flag
ler
56.3
29.1
0.0
0.0
12.0
5.0
0.0
68.3
34.2
0.0
102.
4
Lake
88.4
72.7
0.0
0.0
44.2
18.9
0.3
132.
791
.60.
322
4.6
Mar
ion
137.
554
.10.
40.
032
.924
.40.
017
0.4
78.5
0.4
249.
3
Ora
nge
73.5
8.8
0.0
0.0
220.
076
.90.
129
3.5
85.7
0.1
379.
4
Osc
eola
144.
60.
00.
00.
053
.70.
00.
019
8.3
0.0
0.0
198.
3
Sem
inol
e4.
913
.80.
00.
094
.07.
30.
098
.921
.10.
012
0.0
Sum
ter
93.5
38.6
0.0
0.0
0.0
0.0
0.0
93.5
38.6
0.0
132.
2
Volu
sia
147.
541
.40.
00.
014
6.0
25.3
0.8
293.
566
.80.
836
1.0
Dis
tric
t 5
84
2.3
28
3.8
0.4
0.0
78
4.3
18
6.9
2.7
1,6
26
.64
70
.73
.02
,10
0.3
Dad
e86
.511
.80.
00.
031
5.1
158.
30.
040
1.5
170.
10.
057
1.6
Mon
roe
82.0
0.0
0.0
0.0
35.6
1.7
0.0
117.
61.
70.
011
9.3
Dis
tric
t 6
16
8.4
11
.80
.00
.03
50
.71
60
.00
.05
19
.21
71
.70
.06
90
.9
Citr
us75
.30.
00.
00.
013
.40.
00.
088
.60.
00.
088
.6
Her
nand
o84
.211
.00.
00.
027
.41.
90.
011
1.6
12.9
0.0
124.
5
Hill
sbor
ough
106.
05.
50.
00.
027
3.9
42.6
0.9
379.
948
.20.
942
9.0
Pasc
o11
7.8
8.2
2.2
0.0
60.1
6.6
0.0
177.
914
.82.
219
4.9
Pine
llas
0.0
0.0
0.0
0.0
138.
183
.52.
613
8.1
83.5
2.6
224.
2
Dis
tric
t 7
38
3.3
24
.72
.20
.05
12
.81
34
.73
.58
96
.11
59
.45
.71
,06
1.3
Stat
ewid
e4
,48
6.6
2,1
39
.84
23
.79
.43
,43
2.5
1,4
21
.81
43
.97
,91
9.2
3,5
61
.65
77
.01
2,0
57
.7
Not
e:Th
e Fu
nctio
nal C
lass
ifica
tion
mile
age
does
not
incl
ude
0.5
mile
s of
Sta
te r
oads
fun
ctio
nally
cla
ssifi
ed a
s “l
ocal
.”So
urce
:Fl
orid
a D
epar
tmen
t of
Tra
nspo
rtat
ion,
Sta
te H
ighw
ay S
yste
m M
ileag
e Re
port
for
Dec
embe
r 31
, 200
2.

Florida Transportation Almanac
79
Tabl
e 3
-11
LAN
E M
ILES
FO
R F
LOR
IDA
CO
UN
TIES
AN
D D
ISTR
ICTS
(2
00
2),
BY
FU
NC
TIO
NA
L C
LASS
IFIC
ATI
ON
Cou
nty
Ru
ral
Urb
anTo
tal
Tota
lC
olle
ctor
Tota
lP
rin
cipa
lA
rter
ial
Min
orA
rter
ial
Maj
orC
olle
ctor
Min
orC
olle
ctor
Pri
nci
pal
Art
eria
lM
inor
Art
eria
lTo
tal
Col
lect
orP
rin
cipa
lA
rter
ial
Min
orA
rter
ial
Char
lott
e14
1.6
54.2
0.0
0.0
104.
434
.00.
024
6.0
88.2
0.0
334.
2
Colli
er39
6.9
73.6
0.0
0.0
130.
838
.00.
052
7.7
111.
60.
063
9.3
Des
oto
92.0
45.1
0.0
0.0
30.6
3.4
0.0
122.
648
.40.
017
1.0
Gla
des
140.
988
.60.
00.
00.
00.
00.
014
0.9
88.6
0.0
229.
5
Har
dee
158.
142
.30.
00.
00.
00.
00.
015
8.1
42.3
0.0
200.
4
Hen
dry
152.
12.
60.
00.
010
.00.
00.
016
2.1
2.6
0.0
164.
6
Hig
hlan
ds28
8.6
0.0
11.7
0.0
68.9
0.0
16.3
357.
40.
028
.038
5.4
Lee
161.
873
.90.
00.
026
9.0
107.
30.
043
0.8
181.
20.
061
2.0
Man
atee
294.
557
.50.
00.
025
4.4
73.8
6.1
548.
913
1.3
6.1
686.
3
Oke
echo
bee
224.
79.
60.
00.
00.
00.
00.
022
4.7
9.6
0.0
234.
3
Polk
510.
198
.367
.30.
054
0.4
247.
540
.61,
050.
534
5.8
107.
91,
504.
2
Sara
sota
158.
745
.20.
00.
028
7.4
136.
70.
044
6.2
181.
90.
062
8.1
Dis
tric
t 1
2,7
20
.05
90
.87
9.0
0.0
1,6
95
.96
40
.76
3.0
4,4
15
.91
,23
1.5
14
2.0
5,7
89
.4
Alac
hua
543.
095
.927
.00.
024
9.0
93.1
16.1
792.
218
9.0
43.1
1,02
4.0
Bake
r10
1.8
92.8
29.4
0.0
0.0
0.0
0.0
101.
892
.829
.422
4.0
Brad
ford
74.1
60.2
17.7
0.0
14.2
9.6
2.7
88.3
69.8
20.4
178.
6
Clay
160.
453
.87.
10.
012
7.6
11.3
0.0
288.
065
.17.
136
0.2
Colu
mbi
a36
4.8
130.
64.
60.
070
.846
.00.
043
5.6
176.
64.
661
6.8
Dix
ie11
6.9
34.1
0.0
0.0
0.0
0.0
0.0
116.
934
.10.
015
1.0
Duv
al95
.523
.40.
00.
01,
250.
352
1.6
4.2
1,34
5.8
545.
04.
21,
894.
9
Gilc
hris
t38
.083
.70.
00.
00.
00.
00.
038
.083
.70.
012
1.7
Ham
ilton
172.
512
4.8
0.0
0.0
0.0
0.0
0.0
172.
512
4.8
0.0
297.
3
Lafa
yett
e62
.162
.40.
00.
00.
00.
00.
062
.162
.40.
012
4.4
Levy
282.
817
3.6
29.0
0.0
0.0
0.0
0.0
282.
817
3.6
29.0
485.
4
Mad
ison
155.
020
5.5
0.0
0.0
0.0
0.0
0.0
155.
020
5.5
0.0
360.
6
Nas
sau
200.
754
.10.
00.
09.
862
.20.
021
0.6
116.
30.
032
6.9
Putn
am20
1.1
102.
60.
00.
023
.025
.00.
022
4.1
127.
60.
035
1.7
Not
e:Th
e Fu
nctio
nal C
lass
ifica
tion
mile
age
does
not
incl
ude
0.5
mile
s of
Sta
te r
oads
fun
ctio
nally
cla
ssifi
ed a
s “l
ocal
.”So
urce
:Fl
orid
a D
epar
tmen
t of
Tra
nspo
rtat
ion,
Sta
te H
ighw
ay S
yste
m M
ileag
e Re
port
for
Dec
embe
r 31
, 200
2.

Florida Transportation Almanac
80
Tabl
e 3
-11
(C
onti
nu
ed)
LAN
E M
ILES
FO
R F
LOR
IDA
CO
UN
TIES
AN
D D
ISTR
ICTS
(2
00
2),
BY
FU
NC
TIO
NA
L C
LASS
IFIC
ATI
ON
Cou
nty
Ru
ral
Urb
anTo
tal
Tota
lC
olle
ctor
Tota
lP
rin
cipa
lA
rter
ial
Min
orA
rter
ial
Maj
orC
olle
ctor
Min
orC
olle
ctor
Pri
nci
pal
Art
eria
lM
inor
Art
eria
lTo
tal
Col
lect
orP
rin
cipa
lA
rter
ial
Min
orA
rter
ial
St. J
ohns
293.
811
1.0
0.0
0.0
64.3
94.4
0.0
358.
020
5.4
0.0
563.
4
Suw
anne
e14
1.3
172.
60.
00.
00.
018
.30.
014
1.3
190.
90.
033
2.1
Tayl
or23
2.1
47.8
0.0
0.0
39.6
0.0
0.0
271.
847
.80.
031
9.5
Uni
on0.
080
.135
.20.
00.
00.
00.
00.
080
.135
.211
5.4
Dis
tric
t 2
3,2
35
.81
,70
9.0
15
0.0
0.0
1,8
48
.68
81
.52
2.9
5,0
84
.52
,59
0.5
17
2.9
7,8
47
.9
Bay
224.
50.
00.
018
.821
8.9
116.
914
.144
3.4
116.
932
.959
3.2
Calh
oun
52.6
71.2
72.4
0.0
0.0
0.0
0.0
52.6
71.2
72.4
196.
3
Esca
mbi
a16
9.4
66.1
0.0
0.0
371.
520
6.3
11.0
540.
927
2.4
11.0
824.
3
Fran
klin
122.
648
.610
.90.
00.
00.
00.
012
2.6
48.6
10.9
182.
0
Gad
sden
179.
510
9.5
117.
20.
00.
016
.910
.317
9.5
126.
412
7.5
433.
3
Gul
f43
.587
.630
.90.
00.
00.
00.
043
.587
.630
.916
2.0
Hol
mes
61.8
85.8
97.8
0.0
0.0
0.0
0.0
61.8
85.8
97.8
245.
4
Jack
son
283.
518
4.8
145.
30.
00.
016
.16.
628
3.5
200.
915
1.9
636.
3
Jeff
erso
n23
2.5
65.0
33.5
0.0
0.0
0.0
0.0
232.
065
.033
.533
0.5
Leon
151.
126
.935
.30.
028
4.9
116.
82.
043
6.0
143.
737
.361
7.0
Libe
rty
45.6
72.6
25.1
0.0
0.0
0.0
0.0
45.6
72.6
25.1
143.
2
Oka
loos
a17
6.1
141.
00.
00.
021
8.4
89.9
28.9
394.
923
0.9
28.9
654.
4
Sant
a Ro
sa13
0.1
225.
70.
00.
172
.510
9.4
1.2
202.
633
5.1
1.3
539.
0
Wak
ulla
112.
217
.033
.30.
00.
00.
00.
011
2.2
17.0
33.3
162.
5
Wal
ton
309.
784
.135
.80.
039
.519
.40.
034
9.1
103.
535
.848
8.4
Was
hing
ton
138.
212
8.2
0.0
0.0
0.0
0.0
0.0
138.
212
8.2
0.0
266.
4
Dis
tric
t 3
2,4
32
.41
,41
3.9
63
7.5
18
.91
,20
5.7
69
1.7
74
.13
,63
8.1
2,1
05
.77
30
.46
,47
4.2
Brow
ard
214.
10.
00.
00.
01,
649.
450
0.6
44.3
1,86
3.5
500.
644
.32,
408.
4
Indi
an R
iver
194.
117
.90.
00.
010
7.2
38.4
19.0
301.
256
.419
.037
6.6
Mar
tin34
3.5
13.4
0.0
0.0
182.
433
.49.
052
5.9
46.8
9.0
581.
6
Palm
Bea
ch45
0.3
15.3
5.2
0.0
1,11
7.6
305.
110
4.4
1,56
7.9
320.
410
9.6
1,99
7.9
Not
e:Th
e Fu
nctio
nal C
lass
ifica
tion
mile
age
does
not
incl
ude
0.5
mile
s of
Sta
te r
oads
fun
ctio
nally
cla
ssifi
ed a
s “l
ocal
.”So
urce
:Fl
orid
a D
epar
tmen
t of
Tra
nspo
rtat
ion,
Sta
te H
ighw
ay S
yste
m M
ileag
e Re
port
for
Dec
embe
r 31
, 200
2.

Florida Transportation Almanac
81
Tabl
e 3
-11
(C
onti
nu
ed)
LAN
E M
ILES
FO
R F
LOR
IDA
CO
UN
TIES
AN
D D
ISTR
ICTS
(2
00
2),
BY
FU
NC
TIO
NA
L C
LASS
IFIC
ATI
ON
Cou
nty
Ru
ral
Urb
anTo
tal
Tota
lC
olle
ctor
Tota
lP
rin
cipa
lA
rter
ial
Min
orA
rter
ial
Maj
orC
olle
ctor
Min
orC
olle
ctor
Pri
nci
pal
Art
eria
lM
inor
Art
eria
lTo
tal
Col
lect
orP
rin
cipa
lA
rter
ial
Min
orA
rter
ial
St. L
ucie
162.
935
.40.
00.
035
5.5
48.5
10.6
518.
483
.910
.661
2.9
Dis
tric
t 4
1,3
64
.98
2.1
5.2
0.0
3,4
12
.09
26
.21
87
.24
,77
6.9
1,0
08
.11
92
.45
,97
7.4
Brev
ard
345.
862
.90.
00.
071
0.8
82.8
2.9
1,05
6.6
145.
72.
91,
205.
3
Flag
ler
184.
859
.90.
00.
043
.410
.00.
022
8.2
70.0
0.0
298.
1
Lake
304.
015
4.5
0.0
0.0
179.
861
.10.
648
3.8
215.
60.
670
0.0
Mar
ion
537.
811
3.0
0.7
0.0
151.
473
.50.
068
9.2
186.
50.
787
6.5
Ora
nge
279.
521
.40.
00.
01,
035.
026
9.5
0.2
1,31
4.5
291.
00.
21,
605.
7
Osc
eola
408.
40.
00.
00.
024
4.1
0.0
0.0
652.
50.
00.
065
2.5
Sem
inol
e12
.827
.70.
00.
040
8.3
20.1
0.0
421.
047
.80.
046
8.8
Sum
ter
297.
979
.30.
00.
00.
00.
00.
029
7.9
79.3
0.0
377.
2
Volu
sia
477.
982
.70.
00.
057
1.1
61.2
1.5
1,04
9.0
143.
91.
51,
194.
4
Dis
tric
t 5
2,8
49.0
601.
40
.70.
03
,34
3.9
57
8.3
5.2
6,1
92
.91
,17
9.7
5.9
7,3
78
.6
Dad
e22
1.7
25.8
0.0
0.0
1,67
9.5
633.
80.
01,
901.
165
9.6
0.0
2,56
0.7
Mon
roe
176.
30.
00.
00.
012
2.6
3.9
0.0
298.
83.
90.
030
2.8
Dis
tric
t 6
397.
925
.80
.00.
01
,80
2.1
63
7.7
0.0
2,2
00
.06
63
.50
.02
,86
3.5
Citr
us22
3.0
0.0
0.0
0.0
42.6
0.0
0.0
265.
60.
00.
026
5.6
Her
nand
o29
1.5
25.2
0.0
0.0
106.
34.
40.
039
7.8
29.6
0.0
427.
4
Hill
sbor
ough
355.
211
.10.
00.
01,
288.
616
5.5
3.2
1,64
3.8
176.
63.
21,
823.
6
Pasc
o34
1.4
25.2
4.5
0.0
263.
420
.40.
060
4.8
45.6
4.5
654.
9
Pin
ella
s0.
00.
00.
00.
073
5.6
309.
05.
273
5.6
309.
05.
21,
049.
8
Dis
tric
t 7
1,2
11.0
61.5
4.5
0.0
2,4
36
.54
99
.48
.43
,64
7.6
56
0.9
12
.94
,22
1.3
Stat
ewid
e1
4,2
11
.04
,48
4.5
87
6.9
18
.91
5,7
44
.84,
85
5.4
36
0.7
29
,95
5.8
9,3
39
.91
,25
6.5
40
,55
2.3
Not
e:Th
e Fu
nctio
nal C
lass
ifica
tion
mile
age
does
not
incl
ude
0.5
mile
s of
Sta
te r
oads
fun
ctio
nally
cla
ssifi
ed a
s “l
ocal
.”So
urce
:Fl
orid
a D
epar
tmen
t of
Tra
nspo
rtat
ion,
Sta
te H
ighw
ay S
yste
m M
ileag
e Re
port
for
Dec
embe
r 31
, 200
2.
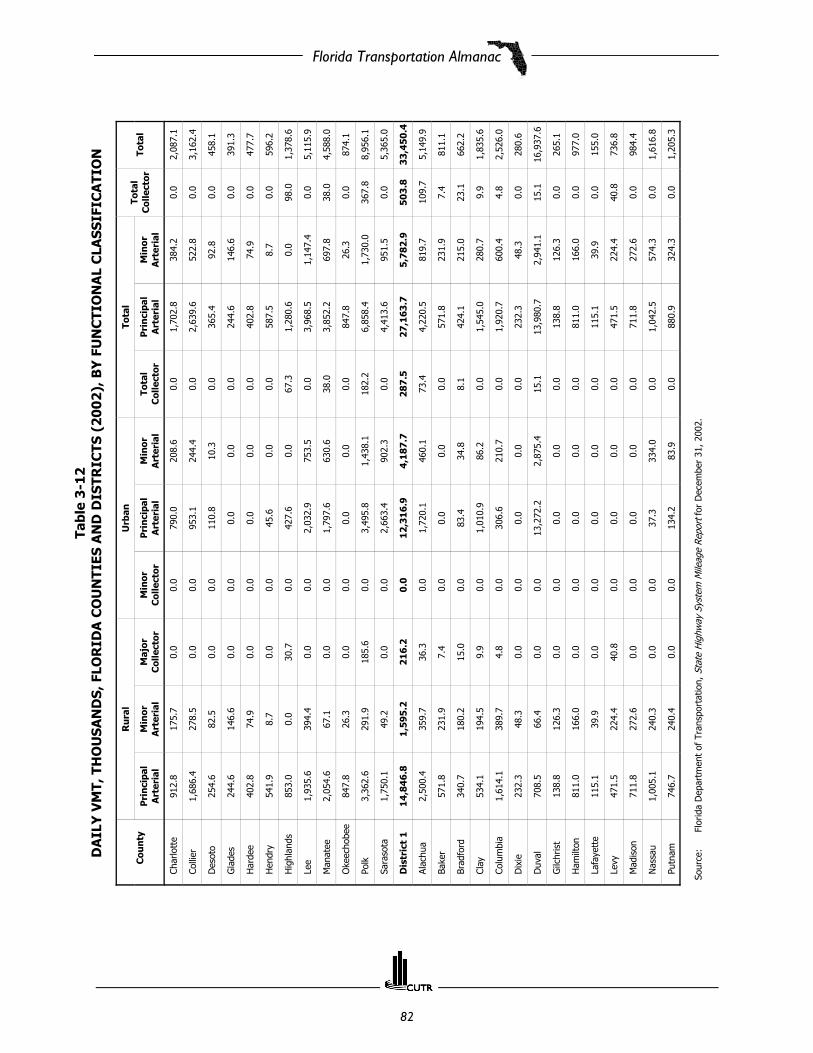
Florida Transportation Almanac
82
Tabl
e 3
-12
DA
ILY
VM
T, T
HO
USA
ND
S, F
LOR
IDA
CO
UN
TIES
AN
D D
ISTR
ICTS
(2
00
2),
BY
FU
NC
TIO
NA
L C
LASS
IFIC
ATI
ON
Cou
nty
Ru
ral
Urb
anTo
tal
Tota
lC
olle
ctor
Tota
lP
rin
cipa
lA
rter
ial
Min
orA
rter
ial
Maj
orC
olle
ctor
Min
orC
olle
ctor
Pri
nci
pal
Art
eria
lM
inor
Art
eria
lTo
tal
Col
lect
orP
rin
cipa
lA
rter
ial
Min
orA
rter
ial
Char
lott
e91
2.8
175.
70.
00.
079
0.0
208.
60.
01,
702.
838
4.2
0.0
2,08
7.1
Colli
er1,
686.
427
8.5
0.0
0.0
953.
124
4.4
0.0
2,63
9.6
522.
80.
03,
162.
4
Des
oto
254.
682
.50.
00.
011
0.8
10.3
0.0
365.
492
.80.
045
8.1
Gla
des
244.
614
6.6
0.0
0.0
0.0
0.0
0.0
244.
614
6.6
0.0
391.
3
Har
dee
402.
874
.90.
00.
00.
00.
00.
040
2.8
74.9
0.0
477.
7
Hen
dry
541.
98.
70.
00.
045
.60.
00.
058
7.5
8.7
0.0
596.
2
Hig
hlan
ds85
3.0
0.0
30.7
0.0
427.
60.
067
.31,
280.
60.
098
.01,
378.
6
Lee
1,93
5.6
394.
40.
00.
02,
032.
975
3.5
0.0
3,96
8.5
1,14
7.4
0.0
5,11
5.9
Man
atee
2,05
4.6
67.1
0.0
0.0
1,79
7.6
630.
638
.03,
852.
269
7.8
38.0
4,58
8.0
Oke
echo
bee
847.
826
.30.
00.
00.
00.
00.
084
7.8
26.3
0.0
874.
1
Polk
3,36
2.6
291.
918
5.6
0.0
3,49
5.8
1,43
8.1
182.
26,
858.
41,
730.
036
7.8
8,95
6.1
Sara
sota
1,75
0.1
49.2
0.0
0.0
2,66
3.4
902.
30.
04,
413.
695
1.5
0.0
5,36
5.0
Dis
tric
t 1
14
,84
6.8
1,5
95
.22
16
.20
.01
2,3
16
.94
,18
7.7
28
7.5
27
,16
3.7
5,7
82
.95
03
.83
3,4
50
.4
Alac
hua
2,50
0.4
359.
736
.30.
01,
720.
146
0.1
73.4
4,22
0.5
819.
710
9.7
5,14
9.9
Bake
r57
1.8
231.
97.
40.
00.
00.
00.
057
1.8
231.
97.
481
1.1
Brad
ford
340.
718
0.2
15.0
0.0
83.4
34.8
8.1
424.
121
5.0
23.1
662.
2
Clay
534.
119
4.5
9.9
0.0
1,01
0.9
86.2
0.0
1,54
5.0
280.
79.
91,
835.
6
Colu
mbi
a1,
614.
138
9.7
4.8
0.0
306.
621
0.7
0.0
1,92
0.7
600.
44.
82,
526.
0
Dix
ie23
2.3
48.3
0.0
0.0
0.0
0.0
0.0
232.
348
.30.
028
0.6
Duv
al70
8.5
66.4
0.0
0.0
13,2
72.2
2,87
5.4
15.1
13,9
80.7
2,94
1.1
15.1
16,9
37.6
Gilc
hris
t13
8.8
126.
30.
00.
00.
00.
00.
013
8.8
126.
30.
026
5.1
Ham
ilton
811.
016
6.0
0.0
0.0
0.0
0.0
0.0
811.
016
6.0
0.0
977.
0
Lafa
yett
e11
5.1
39.9
0.0
0.0
0.0
0.0
0.0
115.
139
.90.
015
5.0
Levy
471.
522
4.4
40.8
0.0
0.0
0.0
0.0
471.
522
4.4
40.8
736.
8
Mad
ison
711.
827
2.6
0.0
0.0
0.0
0.0
0.0
711.
827
2.6
0.0
984.
4
Nas
sau
1,00
5.1
240.
30.
00.
037
.333
4.0
0.0
1,04
2.5
574.
30.
01,
616.
8
Putn
am74
6.7
240.
40.
00.
013
4.2
83.9
0.0
880.
932
4.3
0.0
1,20
5.3
Sour
ce:
Flor
ida
Dep
artm
ent
of T
rans
port
atio
n, S
tate
Hig
hway
Sys
tem
Mile
age
Repo
rt f
or D
ecem
ber
31, 2
002.

Florida Transportation Almanac
83
Tabl
e 3
-12
(C
onti
nu
ed)
DA
ILY
VM
T, T
HO
USA
ND
S, F
LOR
IDA
CO
UN
TIES
AN
D D
ISTR
ICTS
(2
00
2),
BY
FU
NC
TIO
NA
L C
LASS
IFIC
ATI
ON
Cou
nty
Ru
ral
Urb
anTo
tal
Tota
lC
olle
ctor
Tota
lP
rin
cipa
lA
rter
ial
Min
orA
rter
ial
Maj
orC
olle
ctor
Min
orC
olle
ctor
Pri
nci
pal
Art
eria
lM
inor
Art
eria
lTo
tal
Col
lect
orP
rin
cipa
lA
rter
ial
Min
orA
rter
ial
St. J
ohns
2,02
7.1
386.
70.
00.
046
9.2
649.
80.
02,
496.
31,
036.
50.
03,
532.
7
Suw
anne
e67
3.9
394.
60.
00.
00.
068
.30.
067
3.9
462.
90.
01,
136.
8
Tayl
or33
8.8
42.2
0.0
0.0
104.
60.
00.
044
3.4
42.2
0.0
485.
6
Uni
on0.
017
1.2
41.6
0.0
0.0
0.0
0.0
0.0
171.
241
.621
2.9
Dis
tric
t 2
13
,54
1.8
3,7
75
.21
55
.80
.01
7,1
38
.54
,80
3.2
96
.63
0,6
80
.38,
57
8.4
25
2.5
39
,51
1.1
Bay
582.
80.
00.
042
.21,
302.
162
5.4
62.8
1,88
4.9
625.
410
5.0
2,61
5.3
Calh
oun
121.
711
3.6
52.3
0.0
0.0
0.0
0.0
121.
711
3.6
52.3
287.
6
Esca
mbi
a60
9.1
136.
70.
00.
02,
810.
21,
301.
180
.83,
419.
31,
437.
980
.84,
938.
0
Fran
klin
240.
922
.616
.30.
00.
00.
00.
024
0.9
22.6
16.3
279.
8
Gad
sden
843.
731
2.9
148.
90.
00.
068
.927
.284
3.7
381.
717
6.1
1,40
1.6
Gul
f11
2.4
136.
916
.80.
00.
00.
00.
011
2.4
136.
916
.826
6.1
Hol
mes
245.
115
1.1
74.6
0.0
0.0
0.0
0.0
245.
115
1.1
74.6
470.
9
Jack
son
982.
044
7.4
158.
50.
00.
071
.623
.698
2.0
519.
018
2.0
1,68
3.1
Jeff
erso
n63
3.4
73.9
17.0
0.0
0.0
0.0
0.0
633.
473
.917
.072
4.3
Leon
585.
991
.239
.40.
02,
199.
374
2.8
5.7
2,78
5.2
834.
045
.13,
664.
3
Libe
rty
90.8
29.3
27.3
0.0
0.0
0.0
0.0
90.8
29.3
27.3
147.
4
Oka
loos
a79
1.5
369.
80.
00.
01,
713.
650
5.1
250.
42,
505.
287
4.9
250.
43,
630.
5
Sant
a Ro
sa85
7.6
354.
80.
00.
468
3.6
618.
46.
81,
541.
297
3.1
7.2
2,52
1.5
Wak
ulla
345.
334
.539
.50.
00.
00.
00.
034
5.3
34.5
39.5
419.
3
Wal
ton
1,22
8.4
174.
437
.70.
023
2.2
55.8
0.0
1,46
0.6
230.
337
.71,
728.
7
Was
hing
ton
459.
720
4.0
0.0
0.0
0.0
0.0
0.0
459.
720
4.0
0.0
663.
7
Dis
tric
t 3
8,7
30
.22
,65
3.2
62
8.4
42
.68
,94
1.1
3,9
89
.14
57
.21
7,6
71
.36,
64
2.4
1,1
28
.22
5,4
41
.9
Brow
ard
847.
20.
00.
00.
020
,888
.03,
208.
924
2.2
21,7
35.3
3,20
8.9
242.
225
,186
.3
Indi
an R
iver
1,20
6.0
43.3
0.0
0.0
605.
922
7.2
97.3
1,81
1.9
270.
697
.32,
179.
8
Mar
tin1,
996.
851
.40.
00.
01,
237.
121
1.8
48.5
3,23
3.8
263.
248
.53,
545.
6
Palm
Bea
ch1,
297.
259
.220
.90.
012
,766
.61,
728.
347
5.1
14,0
63.8
1,78
7.6
495.
916
,347
.3
Sour
ce:
Flor
ida
Dep
artm
ent
of T
rans
port
atio
n, S
tate
Hig
hway
Sys
tem
Mile
age
Repo
rt f
or D
ecem
ber
31, 2
002.

Florida Transportation Almanac
84
Tabl
e 3
-12
(C
onti
nu
ed)
DA
ILY
VM
T, T
HO
USA
ND
S, F
LOR
IDA
CO
UN
TIES
AN
D D
ISTR
ICTS
(2
00
2),
BY
FU
NC
TIO
NA
L C
LASS
IFIC
ATI
ON
Cou
nty
Ru
ral
Urb
anTo
tal
Tota
lC
olle
ctor
Tota
lP
rin
cipa
lA
rter
ial
Min
orA
rter
ial
Maj
orC
olle
ctor
Min
orC
olle
ctor
Pri
nci
pal
Art
eria
lM
inor
Art
eria
lTo
tal
Col
lect
orP
rin
cipa
lA
rter
ial
Min
orA
rter
ial
St. L
ucie
904.
372
.20.
00.
02,
397.
725
5.7
29.8
3,30
2.0
327.
929
.83,
659.
7
Dis
tric
t 4
6,2
51
.62
26
.22
0.9
0.0
37
,89
5.3
5,6
31
.98
92
.94
4,1
46
.85,
85
8.1
91
3.8
50
,91
8.8
Brev
ard
2,90
7.6
225.
90.
00.
05,
071.
255
5.2
18.8
7,97
8.8
781.
218
.88,
778.
8
Flag
ler
781.
010
5.5
0.0
0.0
521.
825
.40.
01,
302.
813
0.9
0.0
1,43
3.7
Lake
2,12
8.1
523.
30.
00.
01,
475.
831
0.6
5.4
3,60
3.9
833.
95.
44,
443.
1
Mar
ion
3,28
6.0
453.
75.
20.
01,
157.
545
5.1
0.0
4,44
3.4
908.
85.
25,
357.
4
Ora
nge
1,85
6.7
103.
70.
00.
012
,106
.42,
024.
61.
513
,963
.12,
128.
31.
516
,093
.0
Osc
eola
1,69
7.4
0.0
0.0
0.0
2,24
8.5
0.0
0.0
3,94
5.9
0.0
0.0
3,94
5.9
Sem
inol
e89
.212
4.4
0.0
0.0
4,32
4.7
164.
90.
04,
414.
028
9.3
0.0
4,70
3.2
Sum
ter
1,93
9.0
211.
60.
00.
00.
00.
00.
01,
939.
021
1.6
0.0
2,15
0.6
Volu
sia
3,07
1.0
300.
70.
00.
04,
348.
334
7.2
0.8
7,41
9.3
647.
90.
88,
068.
0
Dis
tric
t 5
17
,75
6.0
2,0
48
.95
.20
.03
1,2
54
.23
,88
3.0
26
.54
9,0
10
.35,
93
1.9
31
.75
4,9
73
.8
Dad
e1,
585.
387
.40.
00.
021
,812
.24,
395.
30.
023
,397
.54,
482.
70.
027
,880
.2
Mon
roe
1,37
6.1
0.0
0.0
0.0
893.
424
.10.
02,
269.
524
.10.
02,
293.
7
Dis
tric
t 6
2,9
61
.48
7.4
0.0
0.0
22
,70
5.6
4,4
19
.50
.02
5,6
67
.04
,50
6.8
0.0
30
,17
3.8
Citr
us98
7.5
0.0
0.0
0.0
255.
30.
00.
01,
242.
80.
00.
01,
242.
8
Her
nand
o1,
147.
569
.50.
00.
056
2.3
23.0
0.0
1,70
9.8
92.5
0.0
1,80
2.3
Hill
sbor
ough
2,44
9.8
9.1
0.0
0.0
12,7
87.7
960.
018
.615
,237
.596
9.1
18.6
16,2
25.2
Pasc
o2,
340.
392
.31.
90.
01,
915.
411
3.4
0.0
4,25
5.7
205.
71.
94,
463.
4
Pine
llas
0.0
0.0
0.0
0.0
7,06
6.2
2,00
0.0
25.1
7,06
6.2
2,00
0.0
25.1
9,09
1.3
Dis
tric
t 7
6,9
25
.01
71
.01
.90
.02
2,5
87
.03,
09
6.4
43
.72
9,5
12
.03,
26
7.4
45
.63
2,8
25
.0
Stat
ewid
e7
1,0
12
.81
0,5
57
.01
,02
8.4
42
.61
52
,83
8.5
30
,01
0.8
1,8
04
.52
23
,85
1.3
40
,56
7.8
2,8
75
.52
67
,29
4.7
Sour
ce:
Flor
ida
Dep
artm
ent
of T
rans
port
atio
n, S
tate
Hig
hway
Sys
tem
Mile
age
Repo
rt f
or D
ecem
ber
31, 2
002.

Florida Transportation Almanac
85
Table 3-13FLORIDA SYSTEM SUMMARY CENTERLINE MILES (1998-2002)
County 1998 1999 2000 2001 2002
Charlotte 97.4 97.3 97.3 97.4 97.4
Collier 208.7 208.7 208.7 208.7 208.7
Desoto 81.3 82.7 82.7 82.7 83.0
Glades 85.8 85.8 85.8 85.8 85.8
Hardee 91.4 91.4 91.4 91.4 91.4
Hendry 64.8 64.8 64.8 64.8 64.8
Highlands 132.5 132.5 132.5 132.5 132.5
Lee 172.5 69.1 169.1 169.2 169.2
Manatee 207.9 207.9 207.9 207.9 207.9
Okeechobee 103.3 103.3 103.3 103.3 103.3
Polk 447.3 445.4 461.4 463.0 463.3
Sarasota 159.9 159.5 159.5 159.5 159.5
District 1 1,852.5 1,848.3 1,864.3 1,866.6 1,866.6
Alachua 296.3 296.3 296.3 296.3 296.3
Baker 83.9 83.9 83.9 83.9 83.9
Bradford 69.0 69.0 69.0 69.0 69.0
Clay 107.9 107.9 107.9 109.9 109.9
Columbia 204.0 204.0 204.0 204.0 204.0
Dixie 46.3 46.3 46.3 46.3 46.3
Duval 456.8 457.6 462.1 466.5 467.7
Gilchrist 60.2 60.2 60.2 60.2 60.2
Hamilton 90.6 90.6 90.6 90.6 90.6
Lafayette 62.2 62.2 62.2 62.2 62.2
Levy 183.6 183.6 183.6 183.6 183.5
Madison 138.6 138.6 138.6 138.6 138.6
Nassau 111.2 111.5 111.4 111.4 111.4
Putnam 140.8 140.8 140.8 140.8 140.8
St. Johns 186.2 186.1 186.1 186.1 186.1
Suwannee 128.8 128.8 128.8 128.8 128.8
Taylor 110.7 110.7 110.7 110.7 110.7
Union 57.7 57.7 57.7 57.7 57.7
District 2 2,535.1 2,536.1 2,540.4 2,546.9 2,548.0
Source: Florida Department of Transportation, State Highway System Mileage Report for December 31, 2002.

Florida Transportation Almanac
86
Table 3-13 (Continued)FLORIDA SYSTEM SUMMARY CENTERLINE MILES (1998-2002)
County 1998 1999 2000 2001 2002
Bay 204.4 204.4 204.4 204.5 204.2
Calhoun 96.2 96.2 96.2 96.2 96.2
Escambia 262.5 259.3 262.3 262.2 263.0
Franklin 91.1 91.1 91.1 91.2 91.0
Gadsden 138.1 138.1 138.1 138.1 138.0
Gulf 64.5 79.0 79.0 79.0 79.0
Holmes 104.4 104.4 104.4 104.4 104.5
Jackson 242.3 242.3 242.3 242.2 242.2
Jefferson 110.5 110.5 110.5 110.5 110.5
Leon 195.7 196.3 197.2 197.2 197.1
Liberty 70.1 70.1 70.1 70.1 70.1
Okaloosa 204.4 204.4 204.4 204.4 204.3
Santa Rosa 188.4 188.4 188.4 199.0 199.0
Wakulla 81.2 81.2 81.2 81.2 81.1
Walton 203.6 203.6 203.6 203.6 203.5
Washington 113.0 113.0 113.0 112.9 112.9
District 3 2,370.4 2,382.3 2,386.2 2,396.7 2,396.8
Broward 456.5 456.6 457.4 457.3 457.2
Indian River 119.5 119.4 119.4 119.4 119.4
Martin 163.9 163.9 163.9 163.9 163.9
Palm Beach 480.5 483.3 483.3 482.8 482.8
St. Lucie 166.4 166.2 166.2 166.4 170.7
District 4 1,386.9 1,389.5 1,390.2 1,389.7 1,393.9
Brevard 332.7 332.7 333.1 333.1 333.1
Flagler 102.4 102.4 102.4 102.4 102.4
Lake 224.5 224.8 224.8 224.9 224.6
Marion 240.2 240.0 249.3 249.3 249.3
Orange 371.5 371.5 381.3 382.1 379.4
Osceola 198.8 198.2 198.2 198.5 198.3
Seminole 113.2 113.2 113.1 114.7 120.0
Sumter 132.2 132.2 132.2 132.2 132.2
Volusia 361.4 360.5 360.5 359.7 361.0
District 5 2,076.9 2,075.7 2,094.9 2,096.9 2,100.3
Source: Florida Department of Transportation, State Highway System Mileage Report for December 31, 2002.
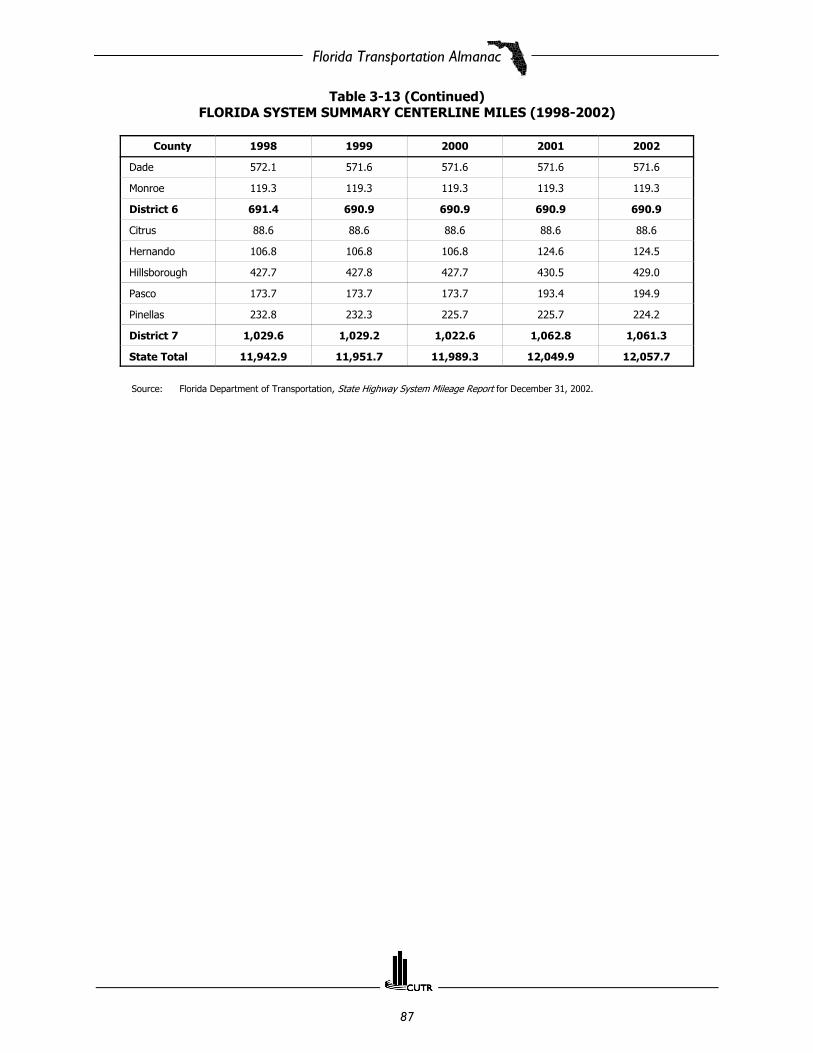
Florida Transportation Almanac
87
Table 3-13 (Continued)FLORIDA SYSTEM SUMMARY CENTERLINE MILES (1998-2002)
County 1998 1999 2000 2001 2002
Dade 572.1 571.6 571.6 571.6 571.6
Monroe 119.3 119.3 119.3 119.3 119.3
District 6 691.4 690.9 690.9 690.9 690.9
Citrus 88.6 88.6 88.6 88.6 88.6
Hernando 106.8 106.8 106.8 124.6 124.5
Hillsborough 427.7 427.8 427.7 430.5 429.0
Pasco 173.7 173.7 173.7 193.4 194.9
Pinellas 232.8 232.3 225.7 225.7 224.2
District 7 1,029.6 1,029.2 1,022.6 1,062.8 1,061.3
State Total 11,942.9 11,951.7 11,989.3 12,049.9 12,057.7
Source: Florida Department of Transportation, State Highway System Mileage Report for December 31, 2002.

Florida Transportation Almanac
88
Table 3-14FLORIDA SYSTEM SUMMARY LANE MILES (1998-2002)
County 1998 1999 2000 2001 2002
Charlotte 312.2 312.1 318.5 329.3 334.2
Collier 620.7 620.7 624.5 639.3 639.3
Desoto 164.6 168.3 168.5 168.3 171.0
Glades 227.8 227.8 227.8 229.5 229.5
Hardee 199.3 199.3 199.3 198.7 200.4
Hendry 156.1 156.1 157.9 164.6 164.6
Highlands 362.0 362.0 378.9 385.4 385.4
Lee 578.4 582.5 611.5 611.3 612.0
Manatee 669.7 674.0 683.4 686.3 686.3
Okeechobee 233.7 234.0 233.8 233.8 234.3
Polk 1,404.5 1,422.9 1,482.7 1,500.6 1,504.2
Sarasota 588.0 590.9 628.1 628.1 628.1
District 1 5,516.9 5,550.6 5,715.0 5,775.2 5,789.4
Alachua 1,010.1 1,013.9 1,025.0 1,020.8 1,024.0
Baker 220.4 224.0 224.0 223.4 224.0
Bradford 178.6 178.6 178.6 178.6 178.6
Clay 347.3 347.3 347.2 360.3 360.2
Columbia 608.4 618.1 618.0 616.4 616.8
Dixie 151.0 151.0 151.0 151.0 151.0
Duval 1,828.6 1,841.5 1,868.2 1,881.4 1,894.9
Gilchrist 121.7 121.7 121.7 121.7 121.7
Hamilton 239.7 297.1 297.1 297.3 297.3
Lafayette 124.4 124.4 124.4 124.4 124.4
Levy 468.3 468.3 468.3 477.8 485.4
Madison 363.9 363.5 363.5 364.8 360.6
Nassau 323.2 323.8 324.9 326.0 326.9
Putnam 338.8 338.8 337.8 338.0 351.7
St. Johns 547.7 561.2 561.6 561.5 563.4
Suwannee 324.5 331.9 331.8 331.8 332.1
Taylor 320.5 320.2 319.5 319.5 319.5
Union 115.4 115.4 115.4 115.4 115.4
District 2 7,632.3 7,740.5 7,777.9 7,810.1 7,847.9
Source: Florida Department of Transportation, State Highway System Mileage Report for December 31, 2002.
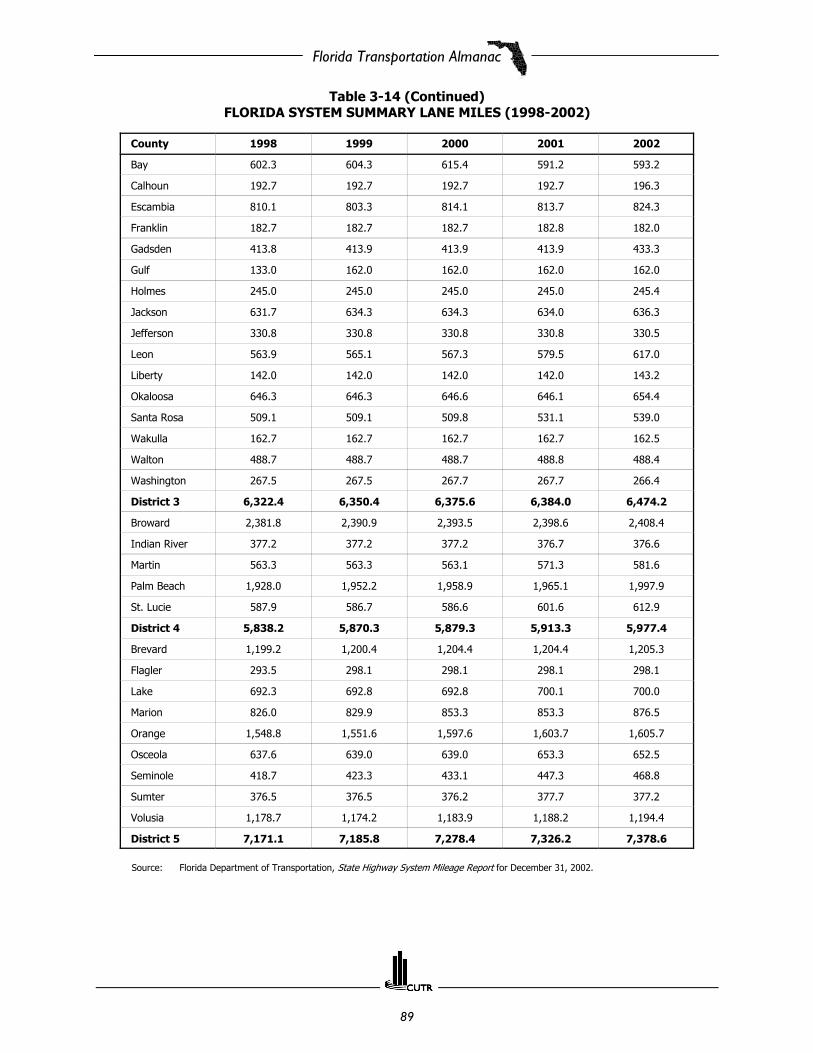
Florida Transportation Almanac
89
Table 3-14 (Continued)FLORIDA SYSTEM SUMMARY LANE MILES (1998-2002)
County 1998 1999 2000 2001 2002
Bay 602.3 604.3 615.4 591.2 593.2
Calhoun 192.7 192.7 192.7 192.7 196.3
Escambia 810.1 803.3 814.1 813.7 824.3
Franklin 182.7 182.7 182.7 182.8 182.0
Gadsden 413.8 413.9 413.9 413.9 433.3
Gulf 133.0 162.0 162.0 162.0 162.0
Holmes 245.0 245.0 245.0 245.0 245.4
Jackson 631.7 634.3 634.3 634.0 636.3
Jefferson 330.8 330.8 330.8 330.8 330.5
Leon 563.9 565.1 567.3 579.5 617.0
Liberty 142.0 142.0 142.0 142.0 143.2
Okaloosa 646.3 646.3 646.6 646.1 654.4
Santa Rosa 509.1 509.1 509.8 531.1 539.0
Wakulla 162.7 162.7 162.7 162.7 162.5
Walton 488.7 488.7 488.7 488.8 488.4
Washington 267.5 267.5 267.7 267.7 266.4
District 3 6,322.4 6,350.4 6,375.6 6,384.0 6,474.2
Broward 2,381.8 2,390.9 2,393.5 2,398.6 2,408.4
Indian River 377.2 377.2 377.2 376.7 376.6
Martin 563.3 563.3 563.1 571.3 581.6
Palm Beach 1,928.0 1,952.2 1,958.9 1,965.1 1,997.9
St. Lucie 587.9 586.7 586.6 601.6 612.9
District 4 5,838.2 5,870.3 5,879.3 5,913.3 5,977.4
Brevard 1,199.2 1,200.4 1,204.4 1,204.4 1,205.3
Flagler 293.5 298.1 298.1 298.1 298.1
Lake 692.3 692.8 692.8 700.1 700.0
Marion 826.0 829.9 853.3 853.3 876.5
Orange 1,548.8 1,551.6 1,597.6 1,603.7 1,605.7
Osceola 637.6 639.0 639.0 653.3 652.5
Seminole 418.7 423.3 433.1 447.3 468.8
Sumter 376.5 376.5 376.2 377.7 377.2
Volusia 1,178.7 1,174.2 1,183.9 1,188.2 1,194.4
District 5 7,171.1 7,185.8 7,278.4 7,326.2 7,378.6
Source: Florida Department of Transportation, State Highway System Mileage Report for December 31, 2002.

Florida Transportation Almanac
90
Table 3-14 (Continued)FLORIDA SYSTEM SUMMARY LANE MILES (1998-2002)
County 1998 1999 2000 2001 2002
Dade 2,561.2 2,559.0 2,532.0 2,535.5 2,560.7
Monroe 302.6 302.6 302.6 302.8 302.8
District 6 2,863.8 2,861.6 2,834.6 2,838.3 2,863.5
Citrus 266.4 266.5 266.5 265.6 265.6
Hernando 304.6 325.9 331.7 409.3 427.7
Hillsborough 1,772.6 1,779.3 1,774.7 1,790.7 1,823.6
Pasco 523.1 543.7 556.1 634.6 654.9
Pinellas 1,042.5 1,053.1 1,048.8 1,055.0 1,049.8
District 7 3,909.2 3,968.5 3,977.7 4,155.2 4,221.3
State Total 39,254.0 39,527.6 39,838.6 40,203.8 40,552.3
Source: Florida Department of Transportation, State Highway System Mileage Report for December 31, 2002.
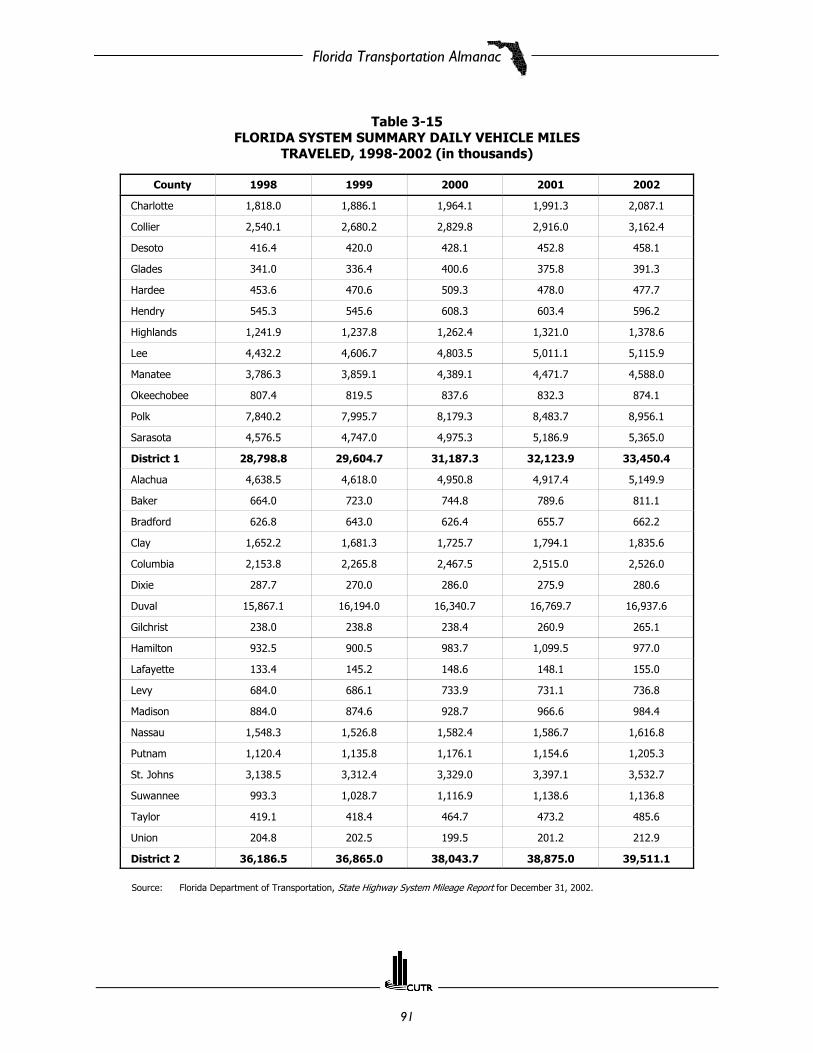
Florida Transportation Almanac
91
Table 3-15FLORIDA SYSTEM SUMMARY DAILY VEHICLE MILES
TRAVELED, 1998-2002 (in thousands)
County 1998 1999 2000 2001 2002
Charlotte 1,818.0 1,886.1 1,964.1 1,991.3 2,087.1
Collier 2,540.1 2,680.2 2,829.8 2,916.0 3,162.4
Desoto 416.4 420.0 428.1 452.8 458.1
Glades 341.0 336.4 400.6 375.8 391.3
Hardee 453.6 470.6 509.3 478.0 477.7
Hendry 545.3 545.6 608.3 603.4 596.2
Highlands 1,241.9 1,237.8 1,262.4 1,321.0 1,378.6
Lee 4,432.2 4,606.7 4,803.5 5,011.1 5,115.9
Manatee 3,786.3 3,859.1 4,389.1 4,471.7 4,588.0
Okeechobee 807.4 819.5 837.6 832.3 874.1
Polk 7,840.2 7,995.7 8,179.3 8,483.7 8,956.1
Sarasota 4,576.5 4,747.0 4,975.3 5,186.9 5,365.0
District 1 28,798.8 29,604.7 31,187.3 32,123.9 33,450.4
Alachua 4,638.5 4,618.0 4,950.8 4,917.4 5,149.9
Baker 664.0 723.0 744.8 789.6 811.1
Bradford 626.8 643.0 626.4 655.7 662.2
Clay 1,652.2 1,681.3 1,725.7 1,794.1 1,835.6
Columbia 2,153.8 2,265.8 2,467.5 2,515.0 2,526.0
Dixie 287.7 270.0 286.0 275.9 280.6
Duval 15,867.1 16,194.0 16,340.7 16,769.7 16,937.6
Gilchrist 238.0 238.8 238.4 260.9 265.1
Hamilton 932.5 900.5 983.7 1,099.5 977.0
Lafayette 133.4 145.2 148.6 148.1 155.0
Levy 684.0 686.1 733.9 731.1 736.8
Madison 884.0 874.6 928.7 966.6 984.4
Nassau 1,548.3 1,526.8 1,582.4 1,586.7 1,616.8
Putnam 1,120.4 1,135.8 1,176.1 1,154.6 1,205.3
St. Johns 3,138.5 3,312.4 3,329.0 3,397.1 3,532.7
Suwannee 993.3 1,028.7 1,116.9 1,138.6 1,136.8
Taylor 419.1 418.4 464.7 473.2 485.6
Union 204.8 202.5 199.5 201.2 212.9
District 2 36,186.5 36,865.0 38,043.7 38,875.0 39,511.1
Source: Florida Department of Transportation, State Highway System Mileage Report for December 31, 2002.

Florida Transportation Almanac
92
Table 3-15 (Continued)FLORIDA SYSTEM SUMMARY DAILY VEHICLE MILES
TRAVELED, 1998-2002 (in thousands)
County 1998 1999 2000 2001 2002
Bay 2,484.8 2,546.9 2,593.1 2,672.2 2,615.3
Calhoun 291.1 283.0 284.8 297.9 287.6
Escambia 4,658.3 4,640.5 4,888.7 4,874.3 4,938.0
Franklin 248.6 250.7 258.1 257.7 279.8
Gadsden 1,338.0 1,404.4 1,409.3 1,462.6 1,401.6
Gulf 256.3 258.3 239.3 259.6 266.1
Holmes 445.3 446.1 471.8 469.0 470.9
Jackson 1,540.2 1,599.0 1,630.0 1,637.0 1,683.1
Jefferson 628.0 683.4 715.9 717.2 724.3
Leon 3,153.5 3,221.3 3,414.6 3,483.4 3,664.3
Liberty 133.8 139.0 143.5 143.9 147.4
Okaloosa 3,351.0 3,388.3 3,507.9 3,578.1 3,630.5
Santa Rosa 2,180.4 2,268.5 2,324.9 2,448.5 2,521.5
Wakulla 373.5 381.1 391.9 378.1 419.3
Walton 1,525.7 1,572.2 1,713.6 1,640.9 1,728.6
Washington 621.0 635.7 675.1 649.3 663.7
District 3 23,229.7 23,718.5 24,662.4 24,969.8 25,441.9
Broward 22,388.8 22,450.1 23,472.5 24,579.4 25,186.3
Indian River 2,042.2 2,096.6 2,166.9 2,079.0 2,179.8
Martin 3,037.7 3,013.8 3,395.3 3,325.5 3,545.6
Palm Beach 14,781.7 15,181.5 15,907.9 16,151.5 16,347.3
St. Lucie 3,200.5 3,275.1 3,284.8 3,368.2 3,659.7
District 4 45,450.9 46,017.1 48,227.3 49,503.7 50,918.8
Brevard 8,132.1 8,198.6 8,331.1 8,300.7 8,778.8
Flagler 1,191.0 1,208.8 1,261.5 1,342.7 1,433.7
Lake 3,735.8 3,739.4 3,983.9 4,135.1 4,443.1
Marion 4,631.5 4,935.0 5,010.7 5,033.6 5,357.4
Orange 14,159.6 14,527.5 14,661.0 15,250.5 16,093.0
Osceola 3,578.9 3,615.4 3,643.5 3,704.8 3,945.9
Seminole 4,094.0 4,208.5 4,286.7 4,486.4 4,703.2
Sumter 1,747.5 1,930.7 2,029.5 1,985.3 2,150.6
Volusia 7,634.7 7,935.1 7,941.8 7,886.9 8,068.0
District 5 48,905.0 50,299.0 51,149.7 52,126.1 54,973.8
Source: Florida Department of Transportation, State Highway System Mileage Report for December 31, 2002.

Florida Transportation Almanac
93
Table 3-15 (Continued)FLORIDA SYSTEM SUMMARY DAILY VEHICLE MILES
TRAVELED, 1998-2002 (in thousands)
County 1998 1999 2000 2001 2002
Dade 25,397.0 26,414.4 26,976.1 27,961.1 27,880.2
Monroe 2,106.4 2,344.9 2,462.6 2,317.9 2,293.7
District 6 27,503.4 28,759.3 29,438.7 30,279.0 30,173.8
Citrus 1,215.2 1,217.4 1,211.8 1,171.6 1,242.8
Hernando 1,674.0 1,701.4 1,640.7 1,656.9 1,802.2
Hillsborough 14,634.3 14,883.0 15,914.2 15,215.2 16,225.2
Pasco 3,805.0 4,046.9 4,124.1 3,987.5 4,463.4
Pinellas 8,523.6 8,578.0 8,577.9 8,593.5 9,091.3
District 7 29,852.0 30,426.7 31,468.7 30,624.7 32,825.0
State Total 239,926.2 245,690.3 254,177.8 258,502.1 267,294.7
Source: Florida Department of Transportation, State Highway System Mileage Report for December 31, 2002.
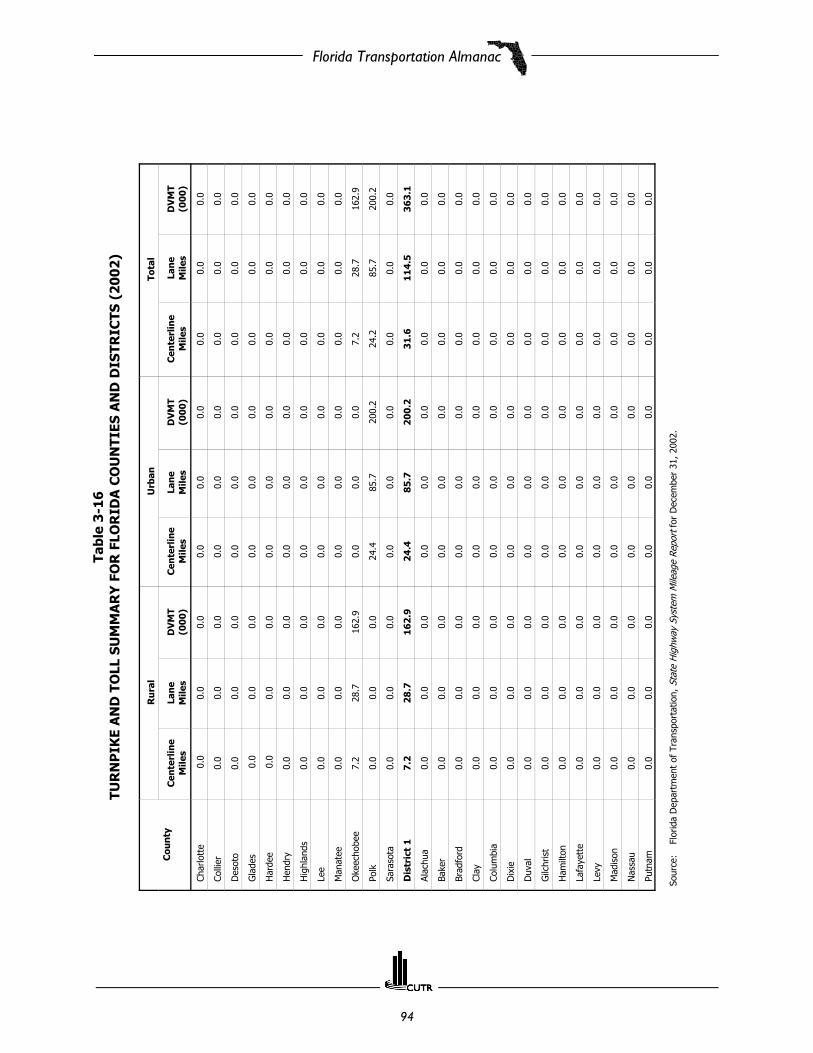
Florida Transportation Almanac
94
Tabl
e 3
-16
TUR
NP
IKE
AN
D T
OLL
SU
MM
AR
Y F
OR
FLO
RID
A C
OU
NTI
ES A
ND
DIS
TRIC
TS (
20
02
)
Cou
nty
Ru
ral
Urb
anTo
tal
Cen
terl
ine
Mile
sLa
ne
Mile
sD
VM
T(0
00
)C
ente
rlin
eM
iles
Lan
eM
iles
DV
MT
(00
0)
Cen
terl
ine
Mile
sLa
ne
Mile
sD
VM
T(0
00
)
Char
lott
e 0
.00.
00.
00.
00.
00.
00.
00.
00.
0
Colli
er0.
00.
00.
00.
00.
00.
00.
00.
00.
0
Des
oto
0.0
0.0
0.0
0.0
0.0
0.0
0.0
0.0
0.0
Gla
des
0.0
0.0
0.0
0.0
0.0
0.0
0.0
0.0
0.0
Har
dee
0.0
0.0
0.0
0.0
0.0
0.0
0.0
0.0
0.0
Hen
dry
0.0
0.0
0.0
0.0
0.0
0.0
0.0
0.0
0.0
Hig
hlan
ds0.
00.
00.
00.
00.
00.
00.
00.
00.
0
Lee
0.0
0.0
0.0
0.0
0.0
0.0
0.0
0.0
0.0
Man
atee
0.0
0.0
0.0
0.0
0.0
0.0
0.0
0.0
0.0
Oke
echo
bee
7.2
28.7
162.
90.
00.
00.
07.
228
.716
2.9
Polk
0.0
0.0
0.0
24.4
85.7
200.
224
.285
.720
0.2
Sara
sota
0.0
0.0
0.0
0.0
0.0
0.0
0.0
0.0
0.0
Dis
tric
t 1
7.2
28
.71
62
.92
4.4
85
.72
00
.23
1.6
11
4.5
36
3.1
Alac
hua
0.0
0.0
0.0
0.0
0.0
0.0
0.0
0.0
0.0
Bake
r0.
00.
00.
00.
00.
00.
00.
00.
00.
0
Brad
ford
0.0
0.0
0.0
0.0
0.0
0.0
0.0
0.0
0.0
Clay
0.0
0.0
0.0
0.0
0.0
0.0
0.0
0.0
0.0
Colu
mbi
a0.
00.
00.
00.
00.
00.
00.
00.
00.
0
Dix
ie0.
00.
00.
00.
00.
00.
00.
00.
00.
0
Duv
al0.
00.
00.
00.
00.
00.
00.
00.
00.
0
Gilc
hris
t0.
00.
00.
00.
00.
00.
00.
00.
00.
0
Ham
ilton
0.0
0.0
0.0
0.0
0.0
0.0
0.0
0.0
0.0
Lafa
yett
e0.
00.
00.
00.
00.
00.
00.
00.
00.
0
Levy
0.0
0.0
0.0
0.0
0.0
0.0
0.0
0.0
0.0
Mad
ison
0.0
0.0
0.0
0.0
0.0
0.0
0.0
0.0
0.0
Nas
sau
0.0
0.0
0.0
0.0
0.0
0.0
0.0
0.0
0.0
Putn
am0.
00.
00.
00.
00.
00.
00.
00.
00.
0
Sour
ce:
Flor
ida
Dep
artm
ent
of T
rans
port
atio
n, S
tate
Hig
hway
Sys
tem
Mile
age
Repo
rt f
or D
ecem
ber
31, 2
002.

Florida Transportation Almanac
95
Tabl
e 3
-16
(C
onti
nu
ed)
TUR
NP
IKE
AN
D T
OLL
SU
MM
AR
Y F
OR
FLO
RID
A C
OU
NTI
ES A
ND
DIS
TRIC
TS (
20
02
)
Cou
nty
Ru
ral
Urb
anTo
tal
Cen
terl
ine
Mile
sLa
ne
Mile
sD
VM
T(0
00
)C
ente
rlin
eM
iles
Lan
eM
iles
DV
MT
(00
0)
Cen
terl
ine
Mile
sLa
ne
Mile
sD
VM
T(0
00
)
St. J
ohns
0.0
0.0
0.0
0.0
0.0
0.0
0.0
0.0
0.0
Suw
anne
e0.
00.
00.
00.
00.
00.
00.
00.
00.
0
Tayl
or0.
00.
00.
00.
00.
00.
00.
00.
00.
0
Uni
on0.
00.
00.
00.
00.
00.
00.
00.
00.
0
Dis
tric
t 2
0.0
0.0
0.0
0.0
0.0
0.0
0.0
0.0
0.0
Bay
0.0
0.0
0.0
0.0
0.0
0.0
0.0
0.0
0.0
Calh
oun
0.0
0.0
0.0
0.0
0.0
0.0
0.0
0.0
0.0
Esca
mbi
a0.
00.
00.
00.
00.
00.
00.
00.
00.
0
Fran
klin
0.0
0.0
0.0
0.0
0.0
0.0
0.0
0.0
0.0
Gad
sden
0.0
0.0
0.0
0.0
0.0
0.0
0.0
0.0
0.0
Gul
f0.
00.
00.
00.
00.
00.
00.
00.
00.
0
Hol
mes
0.0
0.0
0.0
0.0
0.0
0.0
0.0
0.0
0.0
Jack
son
0.0
0.0
0.0
0.0
0.0
0.0
0.0
0.0
0.0
Jeff
erso
n0.
00.
00.
00.
00.
00.
00.
00.
00.
0
Leon
0.0
0.0
0.0
0.0
0.0
0.0
0.0
0.0
0.0
Libe
rty
0.0
0.0
0.0
0.0
0.0
0.0
0.0
0.0
0.0
Oka
loos
a4.
29.
464
.62.
46.
135
.46.
615
.610
0.0
Sant
a Ro
sa0.
00.
00.
05.
210
.520
.45.
210
.520
.4
Wak
ulla
0.0
0.0
0.0
0.0
0.0
0.0
0.0
0.0
0.0
Wal
ton
0.0
0.0
0.0
0.0
0.0
0.0
0.0
0.0
0.0
Was
hing
ton
0.0
0.0
0.0
0.0
0.0
0.0
0.0
0.0
0.0
Dis
tric
t 3
4.2
9.4
64
.67
.61
6.6
55
.91
1.8
26
.01
20
.5
Brow
ard
0.0
0.0
0.0
55.5
281.
83,
498.
555
.528
1.8
3,49
8.5
Indi
an R
iver
10.3
41.1
233.
30.
00.
00.
010
.341
.123
3.3
Mar
tin12
.650
.429
5.8
7.7
30.8
199.
720
.381
.149
5.6
Palm
Bea
ch3.
514
.115
8.7
41.1
175.
81,
769.
544
.618
9.9
1,92
8.2
Sour
ce:
Flor
ida
Dep
artm
ent
of T
rans
port
atio
n, S
tate
Hig
hway
Sys
tem
Mile
age
Repo
rt f
or D
ecem
ber
31, 2
002.
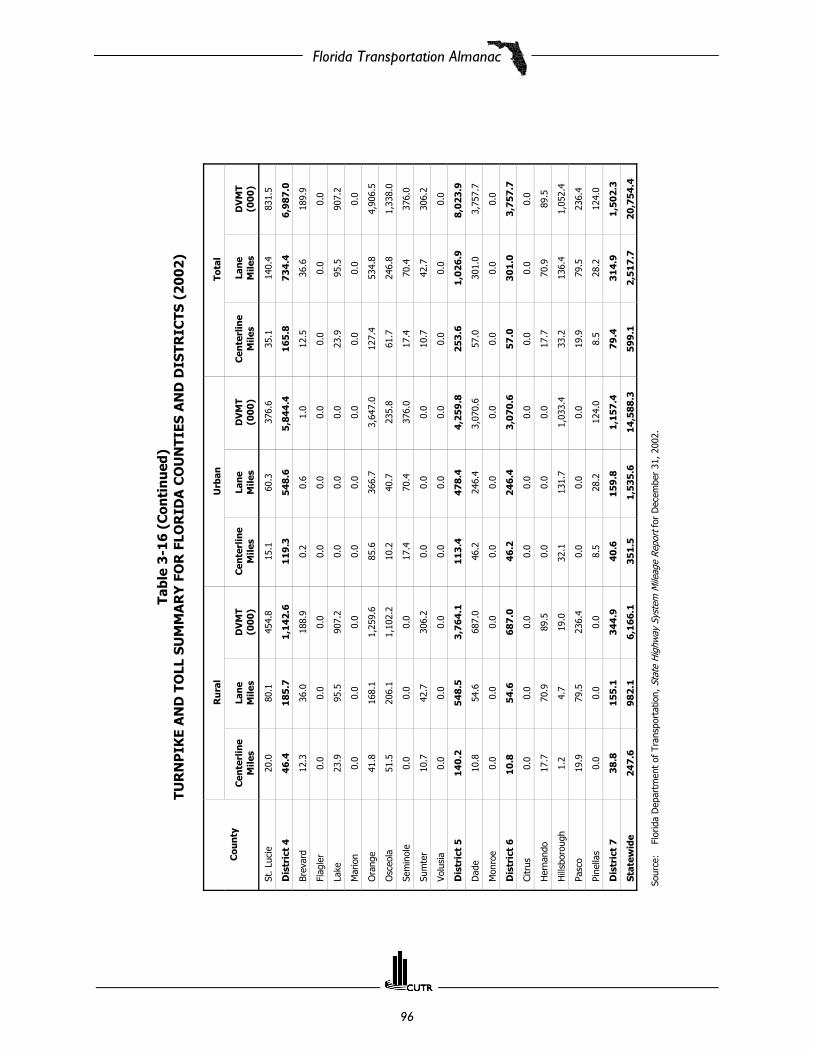
Florida Transportation Almanac
96
Tabl
e 3
-16
(C
onti
nu
ed)
TUR
NP
IKE
AN
D T
OLL
SU
MM
AR
Y F
OR
FLO
RID
A C
OU
NTI
ES A
ND
DIS
TRIC
TS (
20
02
)
Cou
nty
Ru
ral
Urb
anTo
tal
Cen
terl
ine
Mile
sLa
ne
Mile
sD
VM
T(0
00
)C
ente
rlin
eM
iles
Lan
eM
iles
DV
MT
(00
0)
Cen
terl
ine
Mile
sLa
ne
Mile
sD
VM
T(0
00
)
St. L
ucie
20.0
80.1
454.
815
.160
.337
6.6
35.1
140.
483
1.5
Dis
tric
t 4
46
.41
85
.71
,14
2.6
11
9.3
54
8.6
5,8
44
.4
16
5.8
73
4.4
6,9
87
.0
Brev
ard
12.3
36.0
188.
90.
20.
61.
012
.536
.618
9.9
Flag
ler
0.0
0.0
0.0
0.0
0.0
0.0
0.0
0.0
0.0
Lake
23.9
95.5
907.
20.
00.
00.
023
.995
.590
7.2
Mar
ion
0.0
0.0
0.0
0.0
0.0
0.0
0.0
0.0
0.0
Ora
nge
41.8
168.
11,
259.
685
.636
6.7
3,64
7.0
127.
453
4.8
4,90
6.5
Osc
eola
51.5
206.
11,
102.
210
.240
.723
5.8
61.7
246.
81,
338.
0
Sem
inol
e0.
00.
00.
017
.470
.437
6.0
17.4
70.4
376.
0
Sum
ter
10.7
42.7
306.
20.
00.
00.
010
.742
.730
6.2
Volu
sia
0.0
0.0
0.0
0.0
0.0
0.0
0.0
0.0
0.0
Dis
tric
t 5
14
0.2
54
8.5
3,7
64
.11
13
.44
78
.44
,25
9.8
25
3.6
1,0
26
.98
,02
3.9
Dad
e10
.854
.668
7.0
46.2
246.
43,
070.
6 57
.030
1.0
3,75
7.7
Mon
roe
0.0
0.0
0.0
0.0
0.0
0.0
0.0
0.0
0.0
Dis
tric
t 6
10
.8
54
.66
87
.04
6.2
24
6.4
3,0
70
.65
7.0
30
1.0
3,7
57
.7
Citr
us0.
00.
00.
00.
00.
00.
00.
00.
00.
0
Her
nand
o17
.770
.989
.50.
00.
00.
017
.770
.989
.5
Hill
sbor
ough
1.2
4.7
19.0
32.1
13
1.7
1,03
3.4
33.2
136.
41,
052.
4
Pasc
o19
.979
.523
6.4
0.0
0.0
0.0
19.9
79.5
236.
4
Pine
llas
0.0
0.0
0.0
8.5
28.2
124.
08.
528
.212
4.0
Dis
tric
t 7
38
.81
55
.13
44
.94
0.6
15
9.8
1
,15
7.4
79
.43
14
.91
,50
2.3
Stat
ewid
e2
47
.69
82
.16
,16
6.1
35
1.5
1,5
35
.61
4,5
88
.35
99
.12
,51
7.7
20
,75
4.4
Sour
ce:
Flor
ida
Dep
artm
ent
of T
rans
port
atio
n, S
tate
Hig
hway
Sys
tem
Mile
age
Repo
rt f
or D
ecem
ber
31, 2
002.

Florida Transportation Almanac
97
Table 3-17MOTOR FUELS: CONSUMPTION
BY USE IN FLORIDA, 1965-2000 (thousands of gallons)
Year Total Quantity Consumed 1 Non-Highway Use 2 Highway Use
1965 2,409,617 104,646 2,291,031
1966 2,562,586 120,505 2,428,962
1967 2,711,163 135,851 2,561,698
1968 2,959,259 138,496 2,803,754
1969 3,215,457 129,949 3,069,173
1970 3,484,439 153,969 3,312,830
1971 3,771,337 146,210 3,585,727
1972 4,215,995 124,098 4,045,322
1973 4,695,983 126,054 4,494,951
1974 4,510,456 123,058 4,342,185
1975 4,639,217 135,547 4,456,610
1976 4,827,840 136,774 4,650,302
1977 5,023,007 131,635 4,846,201
1978 5,337,604 139,114 5,152,263
1979 5,374,535 142,358 5,171,693
1980 5,293,548 164,430 5,116,312
1981 5,390,545 137,165 5,240,229
1982 5,469,775 139,779 5,317,892
1983 5,723,316 163,810 5,548,590
1984 5,934,391 181,767 5,740,587
1985 6,110,435 254,402 5,843,396
1986 6,394,295 263,337 6,116,961
1987 6,700,629 275,337 6,387,472
1988 6,863,376 281,739 6,530,151
1989 7,034,489 292,036 6,680,708
1990 7,043,054 306,520 6,674,542
1991 6,930,325 319,863 6,549,254
1992 7,163,374 264,516 6,827,210
1993 7,431,207 169,860 7,187,669
1994 7,487,188 178,304 7,308,884
1995 7,680,638 206,176 7,474,462
1996 7,800,062 201,216 7,598,846
1997 8,019,637 206,247 7,813,390
1998 8,371,333 241,386 8,129,947
1999 8,675,760 218,669 8,457,091
2000 7,593,619 225,147 7,368,472
1 Includes losses allowed for evaporation and handling.2 Gasoline including gasohol.Note: Includes gasoline and all other fuels (except under non-highway use) under state motor fuel laws.Source: Florida Statistical Abstract 2002 (Bureau of Economic and Business Research, College of Business Administration,
University of Florida, 2002), Table 15.60.
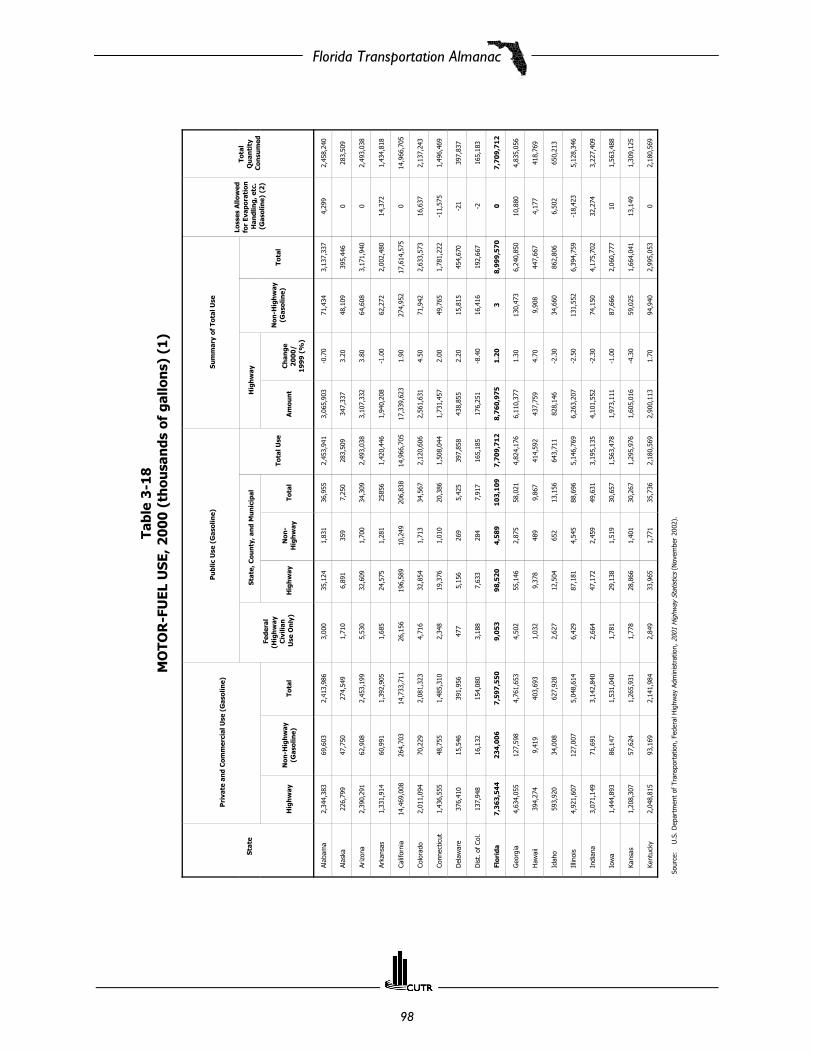
Florida Transportation Almanac
98
Tabl
e 3
-18
MO
TOR
-FU
EL U
SE, 2
00
0 (
thou
san
ds o
f ga
llon
s) (
1)
Sta
te
Pri
vate
an
d C
omm
erci
al U
se (
Gas
olin
e)P
ubl
ic U
se (
Gas
olin
e)S
um
mar
y of
Tot
al U
se
Loss
es A
llow
ed
for
Evap
orat
ion
H
andl
ing,
etc
.(G
asol
ine)
(2
)
Tota
l Q
uan
tity
C
onsu
med
Fede
ral
(Hig
hw
ay
Civ
ilian
Use
On
ly)
Sta
te, C
oun
ty, a
nd
Mu
nic
ipal
Tota
l Use
Hig
hw
ay
Non
-Hig
hw
ay(G
asol
ine)
Tota
l
Hig
hw
ayN
on-H
igh
way
(Gas
olin
e)To
tal
Hig
hw
ayN
on-
Hig
hw
ayTo
tal
Am
oun
tC
han
ge2
00
0/
19
99
(%
)
Alab
ama
2,34
4,38
369
,603
2,41
3,98
63,
000
35,1
241,
831
36,9
552,
453,
941
3,06
5,90
3-0
.70
71,4
343,
137,
337
4,29
92,
458,
240
Alas
ka22
6,79
947
,750
274,
549
1,71
06,
891
359
7,25
028
3,50
934
7,33
73.
2048
,109
395,
446
028
3,50
9
Ariz
ona
2,39
0,29
162
,908
2,45
3,19
95,
530
32,6
091,
700
34,3
092,
493,
038
3,10
7,33
23.
8064
,608
3,17
1,94
00
2,49
3,03
8
Arka
nsas
1,33
1,91
460
,991
1,39
2,90
51,
685
24,5
751,
281
2585
61,
420,
446
1,94
0,20
8-1
.00
62,2
722,
002,
480
14,3
721,
434,
818
Calif
orni
a14
,469
,008
264,
703
14,7
33,7
1126
,156
196,
589
10,2
4920
6,83
814
,966
,705
17,3
39,6
231.
9027
4,95
217
,614
,575
014
,966
,705
Colo
rado
2,01
1,09
470
,229
2,08
1,32
34,
716
32,8
541,
713
34,5
672,
120,
606
2,56
1,63
14.
5071
,942
2,63
3,57
316
,637
2,13
7,24
3
Conn
ectic
ut1,
436,
555
48,7
551,
485,
310
2,34
819
,376
1,01
020
,386
1,50
8,04
41,
731,
457
2.00
49,7
651,
781,
222
-11,
575
1,49
6,46
9
Del
awar
e37
6,41
015
,546
391,
956
477
5,15
626
95,
425
397,
858
438,
855
2.20
15,8
1545
4,67
0-2
139
7,83
7
Dis
t. o
f Co
l.13
7,94
816
,132
154,
080
3,18
87,
633
284
7,91
716
5,18
517
6,25
1-8
.40
16,4
1619
2,66
7-2
165,
183
Flor
ida
7,3
63
,54
42
34
,00
67
,59
7,5
50
9,0
53
98
,52
04
,58
91
03
,10
97
,70
9,7
12
8,7
60
,97
51
.20
38
,99
9,5
70
07
,70
9,7
12
Geo
rgia
4,63
4,05
512
7,59
84,
761,
653
4,50
255
,146
2,87
558
,021
4,82
4,17
66,
110,
377
1.30
130,
473
6,24
0,85
010
,880
4,83
5,05
6
Haw
aii
394,
274
9,41
940
3,69
31,
032
9,37
848
99,
867
414,
592
437,
759
4.70
9,90
844
7,66
74,
177
418,
769
Idah
o59
3,92
034
,008
627,
928
2,62
712
,504
652
13,1
5664
3,71
182
8,14
6-2
.30
34,6
6086
2,80
66,
502
650,
213
Illin
ois
4,92
1,60
712
7,00
75,
048,
614
6,42
987
,181
4,54
588
,696
5,14
6,76
96,
263,
207
-2.5
013
1,55
26,
394,
759
-18,
423
5,12
8,34
6
Indi
ana
3,07
1,14
971
,691
3,14
2,84
02,
664
47,1
722,
459
49,6
313,
195,
135
4,10
1,55
2-2
.30
74,1
504,
175,
702
32,2
743,
227,
409
Iow
a1,
444,
893
86,1
471,
531,
040
1,78
129
,138
1,51
930
,657
1,56
3,47
81,
973,
111
-1.0
087
,666
2,06
0,77
710
1,56
3,48
8
Kans
as1,
208,
307
57,6
241,
265,
931
1,77
828
,866
1,40
130
,267
1,29
5,97
61,
605,
016
-4.3
059
,025
1,66
4,04
113
,149
1,30
9,12
5
Kent
ucky
2,04
8,81
593
,169
2,14
1,98
42,
849
33,9
651,
771
35,7
362,
180,
569
2,90
0,11
31.
7094
,940
2,99
5,05
30
2,18
0,56
9
Sour
ce:
U.S
. Dep
artm
ent
of T
rans
port
atio
n, F
eder
al H
ighw
ay A
dmin
istr
atio
n, 2
001
Hig
hway
Sta
tistic
s (N
ovem
ber
2002
).
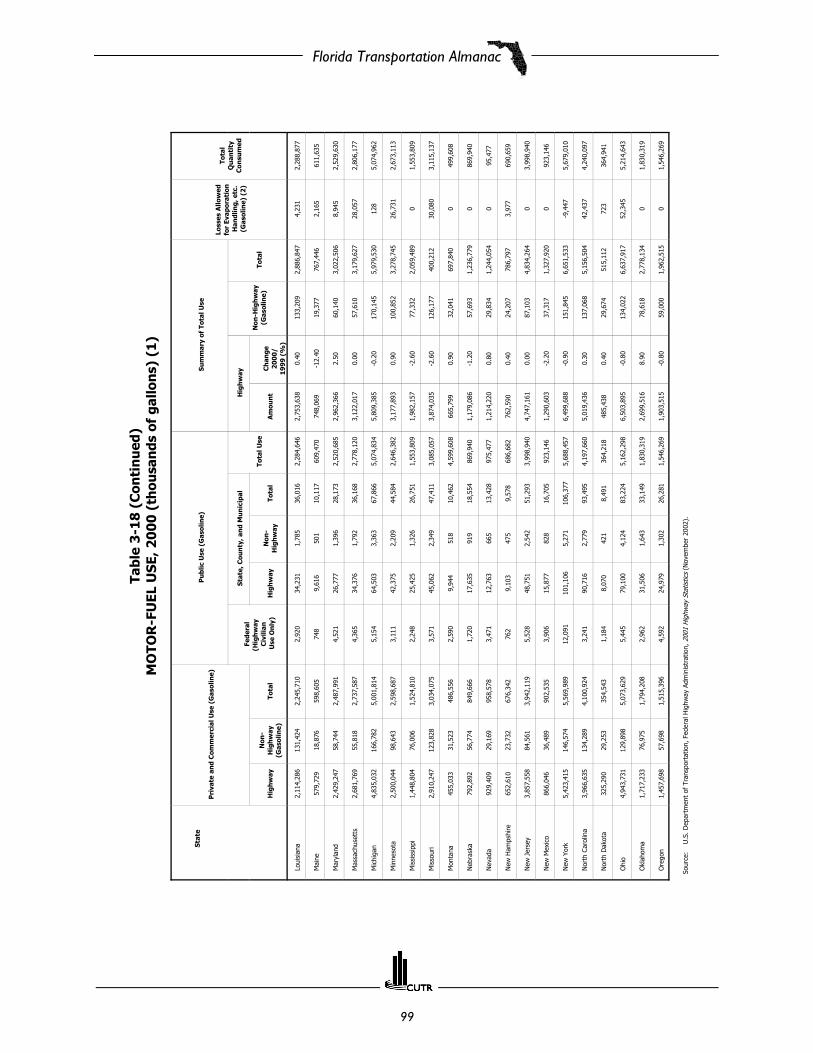
Florida Transportation Almanac
99
Tabl
e 3
-18
(C
onti
nu
ed)
MO
TOR
-FU
EL U
SE, 2
00
0 (
thou
san
ds o
f ga
llon
s) (
1)
Sta
te
Pri
vate
an
d C
omm
erci
al U
se (
Gas
olin
e)P
ubl
ic U
se (
Gas
olin
e)S
um
mar
y of
Tot
al U
se
Loss
es A
llow
ed
for
Evap
orat
ion
H
andl
ing,
etc
.(G
asol
ine)
(2
)
Tota
lQ
uan
tity
Con
sum
edFe
dera
l(H
igh
way
C
ivili
an U
se O
nly
)
Sta
te, C
oun
ty, a
nd
Mu
nic
ipal
Tota
l Use
Hig
hw
ay
Non
-Hig
hw
ay(G
asol
ine)
Tota
l
Hig
hw
ayN
on-
Hig
hw
ay(G
asol
ine)
Tota
lH
igh
way
Non
-H
igh
way
Tota
lA
mou
nt
Ch
ange
20
00
/1
99
9 (
%)
Loui
sian
a
2,11
4,28
613
1,42
42,
245,
710
2,92
034
,231
1,78
536
,016
2,28
4,64
62,
753,
638
0.40
133,
209
2,88
6,84
74,
231
2,28
8,87
7
Mai
ne57
9,72
918
,876
598,
605
748
9,61
650
110
,117
609,
470
748,
069
-12.
4019
,377
767,
446
2,16
561
1,63
5
Mar
ylan
d2,
429,
247
58,7
442,
487,
991
4,52
126
,777
1,39
628
,173
2,52
0,68
52,
962,
366
2.50
60,1
403,
022,
506
8,94
52,
529,
630
Mas
sach
uset
ts2,
681,
769
55,8
182,
737,
587
4,36
534
,376
1,79
236
,168
2,77
8,12
03,
122,
017
0.00
57,6
103,
179,
627
28,0
572,
806,
177
Mic
higa
n4,
835,
032
166,
782
5,00
1,81
45,
154
64,5
033,
363
67,8
665,
074,
834
5,80
9,38
5-0
.20
170,
145
5,97
9,53
012
85,
074,
962
Min
neso
ta2,
500,
044
98,6
432,
598,
687
3,11
142
,375
2,20
944
,584
2,64
6,38
23,
177,
893
0.90
100,
852
3,27
8,74
526
,731
2,67
3,11
3
Mis
siss
ippi
1,44
8,80
476
,006
1,52
4,81
02,
248
25,4
251,
326
26,7
511,
553,
809
1,98
2,15
7-2
.60
77,3
322,
059,
489
01,
553,
809
Mis
sour
i2,
910,
247
123,
828
3,03
4,07
53,
571
45,0
622,
349
47,4
113,
085,
057
3,87
4,03
5-2
.60
126,
177
400,
212
30,0
803,
115,
137
Mon
tana
455,
033
31,5
2348
6,55
62,
590
9,94
451
810
,462
4,59
9,60
866
5,79
90.
9032
,041
697,
840
049
9,60
8
Neb
rask
a79
2,89
256
,774
849,
666
1,72
017
,635
919
18,5
5486
9,94
01,
179,
086
-1.2
057
,693
1,23
6,77
90
869,
940
Nev
ada
929,
409
29,1
6995
8,57
83,
471
12,7
6366
513
,428
975,
477
1,21
4,22
00.
8029
,834
1,24
4,05
40
95,4
77
New
Ham
pshi
re65
2,61
023
,732
676,
342
762
9,10
347
59,
578
686,
682
762,
590
0.40
24,2
0778
6,79
73,
977
690,
659
New
Jer
sey
3,85
7,55
884
,561
3,94
2,11
95,
528
48,7
512,
542
51,2
933,
998,
940
4,74
7,16
10.
0087
,103
4,83
4,26
40
3,99
8,94
0
New
Mex
ico
866,
046
36,4
8990
2,53
53,
906
15,8
7782
816
,705
923,
146
1,29
0,60
3-2
.20
37,3
171,
327,
920
092
3,14
6
New
Yor
k5,
423,
415
146,
574
5,56
9,98
912
,091
101,
106
5,27
110
6,37
75,
688,
457
6,49
9,68
8-0
.90
151,
845
6,65
1,53
3-9
,447
5,67
9,01
0
Nor
th C
arol
ina
3,96
6,63
513
4,28
94,
100,
924
3,24
190
,716
2,77
993
,495
4,19
7,66
05,
019,
436
0.30
137,
068
5,15
6,50
442
,437
4,24
0,09
7
Nor
th D
akot
a32
5,29
029
,253
354,
543
1,18
48,
070
421
8,49
136
4,21
848
5,43
80.
4029
,674
515,
112
723
364,
941
Ohi
o4,
943,
731
129,
898
5,07
3,62
95,
445
79,1
004,
124
83,2
245,
162,
298
6,50
3,89
5-0
.80
134,
022
6,63
7,91
752
,345
5,21
4,64
3
Okl
ahom
a1,
717,
233
76,9
751,
794,
208
2,96
231
,506
1,64
333
,149
1,83
0,31
92,
699,
516
8.90
78,6
182,
778,
134
01,
830,
319
Ore
gon
1,45
7,69
857
,698
1,51
5,39
64,
592
24,9
791,
302
26,2
811,
546,
269
1,90
3,51
5-0
.80
59,0
001,
962,
515
01,
546,
269
Sour
ce:
U.S
. Dep
artm
ent
of T
rans
port
atio
n, F
eder
al H
ighw
ay A
dmin
istr
atio
n, 2
001
Hig
hway
Sta
tistic
s (N
ovem
ber
2002
).

Florida Transportation Almanac
100
Tabl
e 3
-18
(C
onti
nu
ed)
MO
TOR
-FU
EL U
SE, 2
00
0 (
thou
san
ds o
f ga
llon
s) (
1)
Sta
te
Pri
vate
an
d C
omm
erci
al U
se (
Gas
olin
e)P
ubl
ic U
se (
Gas
olin
e)S
um
mar
y of
Tot
al U
seLo
sses
Allo
wed
fo
rEv
apor
atio
n
Han
dlin
g,et
c.(G
asol
ine)
(2)
Tota
l Q
uan
tity
C
onsu
med
Fede
ral
(Hig
hw
ay
Civ
ilian
Use
On
ly)
Sta
te, C
oun
ty, a
nd
Mu
nic
ipal
Tota
l Use
Hig
hw
ay
Non
-Hig
hw
ay(G
asol
ine)
Tota
l
Hig
hw
ayN
on-
Hig
hw
ay(G
asol
ine)
Tota
lH
igh
way
Non
-H
igh
way
Tota
lA
mou
nt
Ch
ange
20
00
/1
99
9 (
%)
Penn
sylv
ania
49,4
4890
,479
5,03
5,34
98,
007
71,7
943,
743
75,5
3751
,189
6,41
1,43
71.
4094
,222
6,50
5,65
925
,613
5,14
4,50
6
Rho
de I
slan
d39
,050
9,38
239
9,88
959
58,
011
418
8,42
940
8,91
345
4,20
41.
209,
800
464,
004
597
409,
510
Sout
h Ca
rolin
a2,
187,
073
69,4
802,
256,
553
2,89
227
,176
1,41
728
,593
2,28
8,03
82,
837,
893
0.20
70,8
9729
0,79
00
2,28
8,03
8
Sout
h D
akot
a39
1,59
832
,419
424,
017
1,53
79,
337
487
9,82
443
5,37
855
2,14
3-1
.90
32,9
0658
5,04
94,
397
439,
775
Tenn
esse
e2,
789,
013
66,0
262,
855,
039
5,78
542
,769
2,23
044
,999
2,90
5,82
33,
706,
107
-1.4
068
,256
3,77
4,36
329
,532
2,93
5,17
5
Texa
s10
,480
,741
267,
950
10,7
48,6
9113
,202
143,
545
7,48
415
1,02
910
,912
,922
13,5
27,7
51-0
.60
275,
434
13,9
03,1
8568
10,9
12,9
90
Uta
h92
4,33
433
,262
957,
596
2,38
318
,814
981
19,7
9597
9,77
41,
283,
429
-1.0
034
,243
1,31
7,67
29,
933
989,
707
Verm
ont
325,
312
11,2
0133
6,51
337
05,
501
287
5,78
834
2,67
140
1,55
8-0
.50
11,4
8841
3,04
621
342,
692
Virg
inia
3,71
1,08
193
,728
3,80
4,80
95,
269
49,3
682,
574
51,9
423,
862,
020
4,70
5,22
64.
6096
,302
4,80
1,52
836
3,68
2,05
6
Was
hing
ton
2,57
9,88
777
,920
2,65
7,80
76,
923
35,8
231,
868
37,6
912,
702,
421
3,16
7,76
6-0
.50
79,7
883,
247,
554
8,18
52,
710,
606
Wes
t Vi
rgin
ia80
1,20
019
,274
820,
474
1,32
815
,988
834
16,8
2283
8,62
41,
090,
138
0.80
20,1
081,
110,
246
1,61
084
0,23
4
Wis
cons
in2,
372,
637
90,1
162,
462,
753
2,58
943
,063
2,24
545
,308
2,51
0,65
03,
089,
479
0.90
92,3
613,
181,
840
25,3
602,
536,
010
Wyo
min
g31
4,12
132
,458
346,
579
1,43
56,
291
328
6,61
935
4,63
363
0,40
0-3
.90
32,7
8666
3,18
62,
214
356,
847
Tota
l12
7,50
4,04
83,
958,
037
131,
462,
085
207,
970
1,97
0,07
210
0,10
02,
070,
172
133,
740,
227
163,
046,
891
0.30
4,05
8,13
716
7,10
5,02
837
0,03
713
4,11
0,26
4
Sour
ce:
U.S
. Dep
artm
ent
of T
rans
port
atio
n, F
eder
al H
ighw
ay A
dmin
istr
atio
n, 2
001
Hig
hway
Sta
tistic
s (N
ovem
ber
2002
).
(1)
This
tab
le is
one
of
a se
ries
givi
ng a
n an
alys
is o
f m
otor
-fue
l con
sum
ptio
n, b
ased
on
repo
rts
from
Sta
te m
otor
-fue
l tax
age
ncie
s.
Gas
ohol
is in
clud
ed w
ith g
asol
ine.
In
orde
r to
mak
e th
e da
ta u
nifo
rm a
nd c
ompl
ete,
pub
lic u
se a
nd n
on-h
ighw
ay u
se w
ere
estim
ated
by t
he F
eder
al H
ighw
ay A
dmin
istr
atio
n.
Thes
e es
timat
es m
ay n
ot b
e co
mpa
rabl
e to
dat
a fo
r pr
ior
year
s du
e to
rev
ised
est
imat
ion
proc
edur
es. T
he r
esul
ting
volu
mes
diff
er in
man
y ca
ses
from
the
una
djus
ted
data
rep
orte
d in
tab
le M
F-2.
Fo
r so
me
Stat
es, d
ata
are
not
com
para
ble
to p
rior
year
s du
e to
cha
nges
in d
ata
anal
ysis
and
/or
impr
ovem
ents
in r
epor
ting
proc
edur
es.
All d
ata
are
subj
ect
to r
evie
w a
nd r
evis
ion.
(2)
Som
e St
ates
mak
e a
flat
perc
enta
ge a
llow
ance
for
loss
es in
sto
rage
and
han
dlin
g, a
nd o
ther
s al
low
for
act
ual l
osse
s no
t to
exc
eed
a sp
ecifi
ed p
erce
ntag
e.
Still
oth
ers
perm
it di
strib
utor
s to
cla
im s
tock
loss
es in
rec
onci
liatio
ns o
f in
vent
orie
s, t
hus
exem
ptin
g th
e lo
stvo
lum
e fr
om t
axat
ion.
Lo
sses
by
dest
ruct
ion,
whe
re r
epor
ted
sepa
rate
ly, a
re a
lso
incl
uded
in t
his
colu
mn.
Th
e m
axim
um a
llow
ance
use
d in
the
ana
lysi
s to
cov
er lo
sses
in s
tora
ge a
nd h
andl
ing
was
one
per
cent
. Be
caus
e of
acc
ount
ing
met
hods
, los
ses
can
be r
epor
ted
as a
net
gai
n.
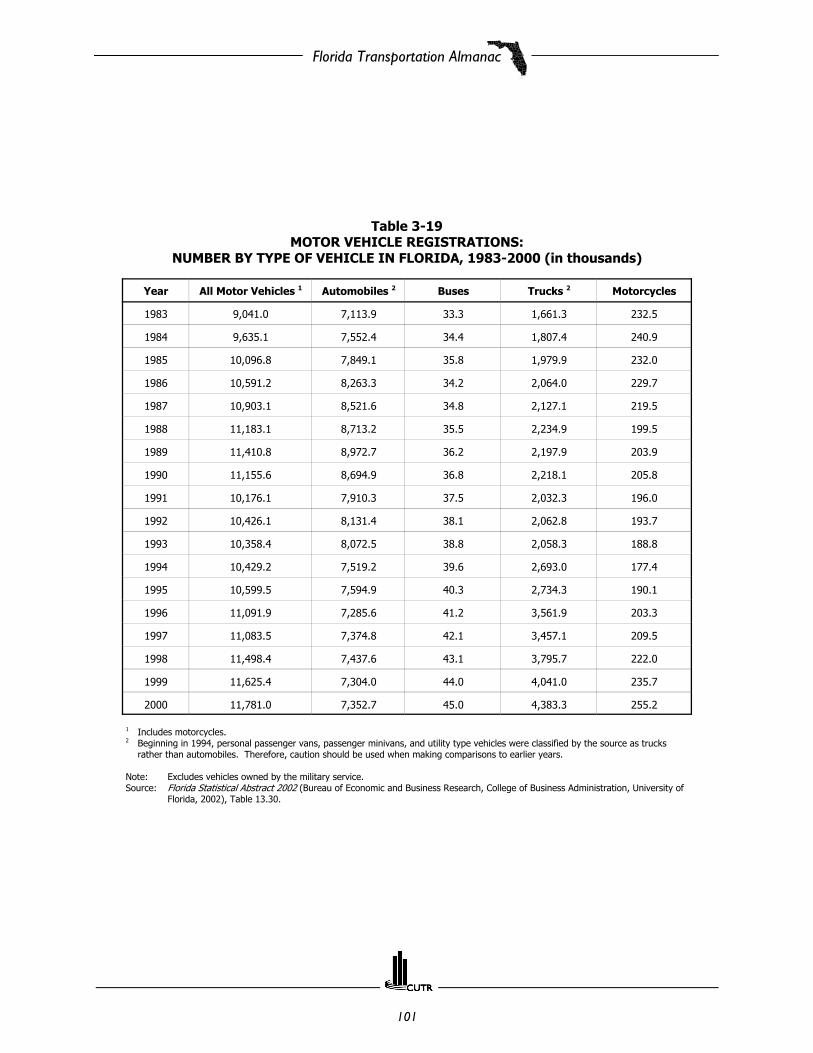
Florida Transportation Almanac
101
Table 3-19MOTOR VEHICLE REGISTRATIONS:
NUMBER BY TYPE OF VEHICLE IN FLORIDA, 1983-2000 (in thousands)
Year All Motor Vehicles 1 Automobiles 2 Buses Trucks 2 Motorcycles
1983 9,041.0 7,113.9 33.3 1,661.3 232.5
1984 9,635.1 7,552.4 34.4 1,807.4 240.9
1985 10,096.8 7,849.1 35.8 1,979.9 232.0
1986 10,591.2 8,263.3 34.2 2,064.0 229.7
1987 10,903.1 8,521.6 34.8 2,127.1 219.5
1988 11,183.1 8,713.2 35.5 2,234.9 199.5
1989 11,410.8 8,972.7 36.2 2,197.9 203.9
1990 11,155.6 8,694.9 36.8 2,218.1 205.8
1991 10,176.1 7,910.3 37.5 2,032.3 196.0
1992 10,426.1 8,131.4 38.1 2,062.8 193.7
1993 10,358.4 8,072.5 38.8 2,058.3 188.8
1994 10,429.2 7,519.2 39.6 2,693.0 177.4
1995 10,599.5 7,594.9 40.3 2,734.3 190.1
1996 11,091.9 7,285.6 41.2 3,561.9 203.3
1997 11,083.5 7,374.8 42.1 3,457.1 209.5
1998 11,498.4 7,437.6 43.1 3,795.7 222.0
1999 11,625.4 7,304.0 44.0 4,041.0 235.7
2000 11,781.0 7,352.7 45.0 4,383.3 255.2
1 Includes motorcycles.2 Beginning in 1994, personal passenger vans, passenger minivans, and utility type vehicles were classified by the source as trucks
rather than automobiles. Therefore, caution should be used when making comparisons to earlier years.
Note: Excludes vehicles owned by the military service.Source: Florida Statistical Abstract 2002 (Bureau of Economic and Business Research, College of Business Administration, University of
Florida, 2002), Table 13.30.

Florida Transportation Almanac
102
Tabl
e 3
-20
STA
TE M
OTO
R-V
EHIC
LE R
EGIS
TRA
TIO
NS
(1)
Mot
or V
ehic
les
Sta
te
Au
tom
obile
sB
use
sTr
uck
sA
ll M
otor
Veh
icle
sC
ompa
riso
n o
f To
tal M
otor
-Veh
icle
Reg
istr
atio
ns
Pri
vate
an
dC
omm
erci
al(i
ncl
udi
ng
taxi
cabs
)
Pu
blic
lyO
wn
ed(2
)To
tal
Pri
vate
an
dC
omm
erci
al(3
)
Pu
blic
lyO
wn
ed (
2)
Tota
lP
riva
te
and
Com
mer
cial
Pu
blic
lyO
wn
ed(2
)To
tal
Pri
vate
an
dC
omm
erci
al
Pu
blic
lyO
wn
ed(2
)To
tal
Tota
lR
egs.
Incr
ease
or
Dec
reas
e2
00
0C
han
ge (
%)
Alab
ama
1,74
9,26
715
,821
1,76
5,08
82,
465
6,36
18,
826
2,43
4,28
226
,893
2,46
1,17
54,
186,
014
49,0
754,
235,
089
3,96
0,14
927
4,94
07
Alas
ka23
9,78
02,
513
242,
293
2,13
243
62,
568
342,
937
9,93
635
2,87
358
4,84
912
,885
597,
734
594
,399
3,33
51
Ariz
ona
2,24
7,07
316
,897
2,26
3,97
01,
399
3,32
64,
725
1,67
9,26
319
,159
1,69
8,42
23,
927,
735
39,3
823,
967,
117
3,79
4,53
817
2,57
95
Arka
nsas
963,
912
9,61
997
3,53
11,
470
5,46
66,
936
871,
859
11,4
7288
3,33
11,
837,
241
26,5
571,
863,
798
1,84
0,19
323
,605
1
Calif
orni
a17
,726
,983
191,
777
17,9
18,7
6032
,314
16,7
2749
,041
10,5
31,8
5328
0,40
210
,812
,255
28,2
91,1
5048
8,90
628
,780
,056
27,7
69,7
921,
010,
264
4
Colo
rado
2,35
7,40
910
,156
2,36
7,56
51,
807
4,06
85,
875
2,24
8,78
226
,598
2,27
5,38
04,
607,
998
40,8
224,
648,
820
3,62
6,01
21,
022,
808
28
Conn
ectic
ut2,
039,
677
11,4
632,
051,
140
9,34
984
810
,197
828,
221
27,3
1085
5,53
12,
877,
247
39,6
212,
916,
868
2,85
3,44
963
,419
2
Del
awar
e40
2,18
88,
276
410,
464
1,47
159
12,
062
237,
653
2,90
624
0,55
964
1,31
211
,773
653,
085
630,
446
22,6
394
Dis
t. o
f Co
l.19
9,36
34,
330
203,
693
2,26
540
42,
669
35,7
346,
766
42,5
0023
7,36
211
,500
248,
862
242,
081
6,78
13
Flor
ida
8,8
35
,13
41
02
,42
98
,93
7,5
63
5,8
52
39
,76
94
5,6
21
5,2
06
,27
11
50
,64
75
,35
6,9
18
14
,04
7,2
57
29
2,8
45
14
,34
0,1
02
11,7
81,0
102
,55
9,0
92
22
Geo
rgia
4,05
8,87
325
,873
4,08
4,74
64,
197
14,3
4118
,538
3,13
5,79
165
,710
3,20
1,50
17,
198,
861
105,
924
7,30
4,78
57,
155,
006
149,
779
3
Haw
aii
521,
396
7,22
652
8,62
23,
473
1,16
74,
640
326,
897
7,91
433
4,81
185
1,76
616
,307
868,
073
737,
551
130,
522
18
Idah
o57
2,04
85,
714
577,
762
1,28
32,
427
3,71
072
5,41
816
,958
742,
376
1,29
8,74
925
,099
1,32
3,84
81,
177,
700
146,
148
12
Illin
ois
6,35
5,65
068
,951
6,42
4,60
117
,252
735
17,9
873,
403,
474
15,4
283,
418,
902
9,77
6,37
685
,114
9,86
1,49
08,
972,
584
888,
906
10
Indi
ana
3,20
5,96
623
,393
3,22
9,35
98,
690
19,4
3028
,120
2,32
5,32
642
,226
2,36
7,55
25,
539,
982
85,0
495,
625,
031
5,57
0,94
254
,089
1
Iow
a1,
859,
770
10,6
871,
870,
457
1,51
26,
804
8,31
61,
408,
356
31,1
801,
439,
536
3,26
9,63
848
,671
3,31
8,30
93,
106,
223
212,
086
7
Kans
as83
4,42
77,
885
842,
312
1,41
12,
469
3,88
01,
465,
223
19,2
861,
484,
509
2,30
1,06
129
,640
2,33
0,70
12,
296,
135
34,5
662
Kent
ucky
2,09
8,69
024
,185
2,12
2,87
51,
631
11,7
1613
,347
1,48
0,98
98,
489
1,48
9,47
83,
581,
310
44,3
903,
625,
700
2,82
6,40
379
9,29
728
Loui
sian
a1,
953,
186
41,2
171,
994,
403
14,9
325,
883
20,8
151,
569,
722
23,6
191,
593,
341
3,53
7,84
070
,719
3,60
8,55
93,
556,
982
51,5
771
Mai
ne61
3,01
24,
769
617,
781
592
2,24
42,
836
385,
872
11,0
5039
6,92
299
9,47
618
,063
1,01
7,53
91,
024,
096
-6,5
57-1
Mar
ylan
d2,
582,
361
13,5
312,
595,
892
6,97
04,
953
11,9
231,
307,
622
23,4
111,
331,
033
3,89
6,95
341
,895
3,93
8,84
83,
847,
538
91,3
102
Mas
sach
uset
ts3,
513,
020
17,9
353,
530,
955
11,1
1156
211
,673
1,61
6,40
139
,192
1,65
5,59
35,
140,
532
57,6
895,
198,
221
5,26
5,39
9-6
7,17
8-1
Mic
higa
n4,
855,
591
47,6
044,
903,
195
10,5
7115
,489
26,0
603,
446,
848
77,5
483,
524,
396
8,31
3,01
014
0,64
18,
453,
651
8,43
5,72
117
,930
0
Min
neso
ta2,
554,
530
10,4
102,
564,
940
7,29
48,
103
15,3
971,
949,
541
24,3
081,
973,
849
4,51
1,36
542
,821
4,55
4,18
64,
629,
940
-75,
754
-2
Mis
siss
ippi
1,13
6,94
910
,291
1,14
7,24
03,
506
5,72
89,
234
780,
334
16,9
6579
7,29
91,
920,
789
32,9
841,
953,
773
2,28
9,41
1-3
35,6
38-1
5
Mis
sour
i2,
483,
413
7,30
82,
490,
721
4,34
68,
078
12,4
241,
687,
809
16,8
841,
704,
693
4,17
5,56
832
,270
4,20
7,83
84,
579,
629
-371
,791
-8
Mon
tana
454,
459
5,56
546
0,02
41,
112
1,70
22,
814
552,
478
17,7
6857
0,24
61,
008,
049
25,0
351,
033,
084
1,02
6,22
66,
858
1
Neb
rask
a82
1,06
612
,913
833,
979
1,21
24,
997
6,20
977
3,33
819
,924
793,
262
1,59
5,61
637
,834
1,63
3,45
01,
618,
933
14,5
171
(1)
For
addi
tiona
l det
ails
of
publ
icly
ow
ned
vehi
cles
and
of
truc
ks, b
uses
, and
tra
ilers
reg
iste
red,
see
Tab
les
MV-
7, 9
, 10,
11,
res
pect
ivel
y.
Excl
udes
8,0
01 D
iplo
mat
ic C
orps
veh
icle
s is
sued
lice
nse
plat
es b
y th
e U
nite
d St
ates
Dep
artm
ent
of S
tate
.(2
)W
here
the
reg
istr
atio
n ye
ar is
not
mor
e th
an o
ne m
onth
rem
oved
fro
m t
he c
alen
dar
year
, reg
istr
atio
n-ye
ar d
ata
are
give
n.
Whe
re t
he r
egis
trat
ion
year
is m
ore
than
one
mon
th r
emov
ed, r
egis
trat
ions
are
giv
en f
or t
he c
alen
dar
year
.(3
)In
clud
es F
eder
al, S
tate
, cou
nty,
and
mun
icip
al v
ehic
les.
Veh
icle
s ow
ned
by t
he m
ilita
ry s
ervi
ces
are
not
incl
uded
.(4
)Th
e nu
mbe
rs o
f pr
ivat
e an
d co
mm
erci
al b
uses
giv
en h
ere
are
estim
ates
by
the
Fede
ral H
ighw
ay A
dmin
istr
atio
n of
the
num
bers
in o
pera
tion,
rat
her
than
the
reg
istr
atio
n co
unts
of
the
Stat
es.
(5)
The
follo
win
g fa
rm t
ruck
s, r
egis
tere
d at
a n
omin
al f
ee a
nd r
estr
icte
d to
use
in t
he v
icin
ity o
f th
e ow
ner's
far
m, a
re n
ot in
clud
ed in
thi
s ta
ble:
Con
nect
icut
, 7,8
63;
New
Ham
pshi
re, 3
,497
; N
ew J
erse
y, 6
,186
; N
ew Y
ork,
26,
005;
Pen
nsyl
vani
a, 2
2,08
8; a
nd R
hode
Isl
and,
994
. (6
)Th
e St
ate
repo
rted
mot
or-v
ehic
le r
egis
trat
ion
data
for
199
3 do
not
incl
ude
tran
sfer
tag
s or
reg
istr
atio
ns.
Sour
ce:
U.S
. Dep
artm
ent
of T
rans
port
atio
n, F
eder
al H
ighw
ay A
dmin
istr
atio
n, 2
001
Hig
hway
Sta
tistic
s (2
002)
.

Florida Transportation Almanac
103
Tabl
e 3
-20
(C
onti
nu
ed)
STA
TE M
OTO
R-V
EHIC
LE R
EGIS
TRA
TIO
NS
(1)
Mot
or V
ehic
les
Sta
te
Au
tom
obile
sB
use
sTr
uck
sA
ll M
otor
Veh
icle
sC
ompa
riso
n o
f To
tal M
otor
-Veh
icle
Reg
istr
atio
ns
Pri
vate
an
dC
omm
erci
al(i
ncl
udi
ng
taxi
cabs
)
Pu
blic
lyO
wn
ed(2
)To
tal
Pri
vate
an
dC
omm
erci
al(3
)
Pu
blic
lyO
wn
ed (
2)
Tota
lP
riva
te
and
Com
mer
cial
Pu
blic
lyO
wn
ed(2
)To
tal
Pri
vate
an
dC
omm
erci
al
Pu
blic
lyO
wn
ed(2
)To
tal
Tota
lR
egs.
Incr
ease
or
Dec
reas
e2
00
0C
han
ge (
%)
Nev
ada
669,
257
9,88
067
9,13
71,
628
276
1,90
458
3,97
914
,808
598,
787
1,25
4,86
424
,964
1,27
9,82
81,
219,
725
60,1
035
New
Ham
pshi
re68
0,30
34,
075
684,
378
1,46
834
21,
810
401,
814
11,5
3841
3,35
21,
083,
585
15,9
551,
099,
540
1,05
1,75
147
,789
5
New
Jer
sey
4,47
2,36
445
,542
4,51
7,90
619
,076
3,33
122
,407
1,93
8,23
310
1,47
92,
039,
712
642,
973
150,
352
6,58
0,02
56,
390,
031
189,
994
3
New
Mex
ico
656,
908
14,2
2467
1,13
72,
347
1,05
53,
402
731,
230
22,6
9675
3,92
61,
390,
485
37,9
751,
428,
460
1,52
8,51
0-1
00,0
50-7
New
Yor
k7,
517,
062
80,3
097,
597,
371
23,1
8932
,509
55,6
982,
449,
908
93,4
912,
543,
399
9,99
0,15
920
6,30
910
,196
,468
10,2
34,5
31-3
8,06
30
Nor
th C
arol
ina
3,68
4,44
729
,220
3,71
3,66
79,
765
21,4
6131
,226
2,38
6,97
647
,882
2,43
4,85
86,
081,
188
98,5
636,
179,
751
6,22
2,50
3-4
2,75
2-1
Nor
th D
akot
a34
3,66
23,
958
347,
620
628
1,66
32,
291
348,
878
8,79
635
7,67
469
3,16
814
,417
707,
585
693,
860
13,7
252
Ohi
o6,
616,
322
49,7
116,
666,
033
15,6
3122
,699
38,3
303,
774,
506
76,0
333,
850,
539
10,4
06,4
5914
8,44
310
,554
,902
10,4
67,4
7687
,426
1
Okl
ahom
a1,
737,
011
11,8
781,
748,
889
2,44
814
,591
17,0
391,
467,
462
47,6
901,
515,
152
3,20
6,92
174
,159
3,28
1,08
03,
014,
491
266,
589
9
Ore
gon
1,53
2,69
026
,538
1,55
9,22
84,
253
9,31
913
,572
1,43
5,25
731
,338
1,46
6,59
52,
972,
200
67,1
953,
039,
395
3,02
1,57
417
,821
1
Penn
sylv
ania
6,18
4,24
247
,049
6,23
1,29
128
,343
8,13
536
,478
3,29
6,58
266
,404
3,36
2,98
69,
509,
167
121,
588
9,63
0,75
59,
259,
967
370,
788
4
Rho
de I
slan
d53
1,52
84,
718
536,
246
1,84
911
1,86
022
1,17
55,
197
226,
372
754,
552
9,92
676
4,47
875
9,57
04,
908
1
Sout
h Ca
rolin
a1,
908,
834
10,5
711,
919,
405
4,88
411
,746
16,6
301,
180,
417
26,2
871,
206,
704
3,09
4,13
548
,604
3,14
2,73
93,
094,
729
48,0
102
Sout
h D
akot
a38
4,74
64,
286
389,
032
773
1,82
52,
598
398,
262
13,6
0441
1,86
678
3,78
119
,715
803,
496
792,
509
10,9
871
Tenn
esse
e2,
990,
575
21,2
123,
011,
787
3,79
113
,289
17,0
802,
055,
918
54,0
582,
109,
976
5,05
0,28
488
,559
5,13
8,84
34,
819,
799
319,
044
7
Texa
s7,
618,
374
105,
935
7,72
4,30
917
,434
62,0
9779
,531
6,34
7,20
420
7,71
36,
554,
917
139,
830,
122
375,
745
14,3
58,7
5714
,070
,096
288,
661
2
Uta
h91
3,48
010
,541
924,
021
452
810
1,26
281
0,92
415
,627
826,
451
1,72
4,75
626
,978
1,75
1,73
41,
627,
606
124,
128
8
Verm
ont
298,
693
3,07
230
1,76
563
91,
434
2,07
322
3,59
16,
356
229,
947
522,
923
10,8
6253
3,78
551
4,88
318
,902
4
Virg
inia
3,94
0,96
535
,399
3,97
6,36
42,
726
15,5
3418
,260
2,14
0,15
036
,607
2,17
6,75
76,
083,
841
87,5
406,
171,
381
6,04
6,12
712
5,25
42
Was
hing
ton
2,88
3,58
119
,620
2,90
3,20
13,
445
6,27
49,
719
2,22
4,25
841
,919
2,26
6,17
75,
111,
284
67,8
135,
179,
097
5,11
5,86
663
,231
1
Wes
t Vi
rgin
ia77
1,21
515
,324
786,
539
861
2,25
93,
120
632,
314
30,0
7966
2,39
31,
404,
390
47,6
621,
452,
052
1,44
1,73
510
,317
1
Wis
cons
in2,
563,
421
15,6
402,
579,
061
9,36
54,
639
14,0
041,
834,
326
45,5
441,
879,
870
4,40
7,11
265
,823
4,47
2,93
54,
365,
525
107,
410
2
Wyo
min
g20
6,07
25,
082
211,
154
979
1,83
22,
811
345,
983
12,6
7535
8,65
855
3,03
419
,589
572,
623
585,
690
-13,
067
-2
Tota
l13
6,34
0,94
51,
292,
522
137,
633,
467
317,
593
431,
955
749,
548
89,9
87,5
412,
057,
770
92,0
45,3
1122
6,64
6,07
93,
782,
247
230,
428,
326
221,
475,
173
8,95
3,15
34
(1)
For
addi
tiona
l det
ails
of
publ
icly
ow
ned
vehi
cles
and
of
truc
ks, b
uses
, and
tra
ilers
reg
iste
red,
see
Tab
les
MV-
7, 9
, 10,
11,
res
pect
ivel
y.
Excl
udes
8,0
01 D
iplo
mat
ic C
orps
veh
icle
s is
sued
lice
nse
plat
es b
y th
e U
nite
d St
ates
Dep
artm
ent
of S
tate
.(2
)W
here
the
reg
istr
atio
n ye
ar is
not
mor
e th
an o
ne m
onth
rem
oved
fro
m t
he c
alen
dar
year
, reg
istr
atio
n-ye
ar d
ata
are
give
n.
Whe
re t
he r
egis
trat
ion
year
is m
ore
than
one
mon
th r
emov
ed, r
egis
trat
ions
are
giv
en f
or t
he c
alen
dar
year
.(3
)In
clud
es F
eder
al, S
tate
, cou
nty,
and
mun
icip
al v
ehic
les.
Veh
icle
s ow
ned
by t
he m
ilita
ry s
ervi
ces
are
not
incl
uded
.(4
)Th
e nu
mbe
rs o
f pr
ivat
e an
d co
mm
erci
al b
uses
giv
en h
ere
are
estim
ates
by
the
Fede
ral H
ighw
ay A
dmin
istr
atio
n of
the
num
bers
in o
pera
tion,
rat
her
than
the
reg
istr
atio
n co
unts
of
the
Stat
es.
(5)
The
follo
win
g fa
rm t
ruck
s, r
egis
tere
d at
a n
omin
al f
ee a
nd r
estr
icte
d to
use
in t
he v
icin
ity o
f th
e ow
ner's
far
m, a
re n
ot in
clud
ed in
thi
s ta
ble:
Con
nect
icut
, 7,8
63;
New
Ham
pshi
re, 3
,497
; N
ew J
erse
y, 6
,186
; N
ew Y
ork,
26,
005;
Pen
nsyl
vani
a,22
,088
; an
d R
hode
Isl
and,
994
. (6
)Th
e St
ate
repo
rted
mot
or-v
ehic
le r
egis
trat
ion
data
for
199
3 do
not
incl
ude
tran
sfer
tag
s or
reg
istr
atio
ns.
Sour
ce:
U.S
. Dep
artm
ent
of T
rans
port
atio
n, F
eder
al H
ighw
ay A
dmin
istr
atio
n, 2
001
Hig
hway
Sta
tistic
s (2
002)
.

Florida Transportation Almanac
104
Table 3-21CENTERLINE MILES BY FUNCTIONAL SYSTEM AND
MEASURED PAVEMENT ROUGHNESS (International Roughness Index, IRI)
Functional System ISR:
Miles
n/a < 60 60-94 95-119 120-144 145-170 171-194 195-220 > 220 Total
Rural
Interstate 30 767 66 16 49 19 5 n/a n/a 922
Other Principal Arterial 112 1,680 1,450 275 122 44 24 2 3 3,600
Minor Arterial n/a 753 1,298 387 61 58 25 n/a 7 2,584
Major Collector n/a n/a n/a n/a n/a n/a n/a n/a n/a n/a
Urban
Interstate 38 270 146 26 21 12 6 n/a n/a 481
Other Freeways andExpressways 59 155 199 24 17 6 2 n/a 1 404
Other Principal Arterial 288 517 1,116 366 212 95 36 31 34 2,407
Minor Arterial n/a n/a n/a n/a n/a n/a n/a n/a n/a n/a
Collector n/a n/a n/a n/a n/a n/a n/a n/a n/a n/a
Source: U.S. Department of Transportation, Federal Highway Administration, Highway Statistics 2001 (November 2002), Table HM-64.
Table 3-22CENTERLINE MILES BY FUNCTIONAL SYSTEM AND
VOLUME-SERVICE FLOW RATIO (VSFR)
Functional SystemVSFR:
Miles %
0.80 - 0.95 > 0.95 Total 0.80 - 0.95 > 0.95 0.80 and Greater
Rural
Interstate 59.0 6.0 952.0 6.2 0.6 6.8
Other Principal Arterial 21.0 n/a 3,712.0 0.6 0.0 0.6
Minor Arterial 1.0 n/a 2,584.0 0.0 0.0 0.0
Major Collector 0.0 0.0 0.0 0.0 0.0 0.0
Urban
Interstate 68.0 144.0 517.0 13.2 27.9 41.0
Other Freeways and Expressways 24.0 31.0 458.0 5.2 6.8 12.0
Other Principal Arterial 252.0 182.0 2,651.0 9.5 6.9 16.4
Minor Arterial 346.0 329.0 3,111.0 11.1 10.6 21.7
Collector 240.0 440.0 5,806.0 4.1 7.6 11.7
Source: U.S. Department of Transportation, Federal Highway Administration, Highway Statistics 2001 (November 2002), Table HM-61.

Florida Transportation Almanac
105
Tabl
e 3
-23
CEN
TER
LIN
E M
ILES
BY
FU
NC
TIO
NA
L SY
STEM
AN
D
PR
ESEN
T SE
RV
ICEA
BIL
ITY
RA
TIN
G (
PSR
)
Fun
ctio
nal
Sys
tem
PSR
:
Mile
s%
0.0
-2.0
2.1
-2.5
2.6
-3.4
3.5
-5.0
Tota
l0
.0-2
.02
.1-2
.52
.6-3
.43
.5-5
.0
Rur
al
Inte
rsta
ten/
an/
an/
an/
an/
an/
an/
an/
an/
a
Oth
er P
rinci
pal A
rter
ial
n/a
n/a
n/a
n/a
n/a
n/a
n/a
n/a
n/a
Min
or A
rter
ial
n/a
n/a
n/a
n/a
n/a
n/a
n/a
n/a
n/a
Maj
or C
olle
ctor
n/a
241
1,35
62,
041
3,63
8n/
a6.
6237
.27
56.1
Urb
an
Inte
rsta
ten/
an/
an/
an/
an/
an/
an/
an/
an/
a
Oth
er F
reew
ays
and
Expr
essw
ays
n/a
n/a
n/a
n/a
n/a
n/a
n/a
n/a
n/a
Oth
er P
rinci
pal A
rter
ial
n/a
n/a
n/a
n/a
n/a
n/a
n/a
n/a
n/a
Min
or A
rter
ial
94
326
1,21
51,
554
.58
.26
2178
.18
Colle
ctor
7424
61,
811
3,51
25,
643
1.3
4.3
32.0
962
.23
Sour
ce:
U.S
. Dep
artm
ent
of T
rans
port
atio
n, F
eder
al H
ighw
ay A
dmin
istr
atio
n, H
ighw
ay S
tatis
tics
2001
(N
ovem
ber
2002
), T
able
HM
-63.

Florida Transportation Almanac
106
Table 3-24STATEWIDE MINIMUM LEVEL OF SERVICE STANDARDS FOR
THE FLORIDA STATE HIGHWAY SYSTEM 1
RuralAreas 2
TransitioningUrbanized
Areas 3, UrbanAreas 4, or
Communities 5
UrbanizedAreas 6
Under500,000
UrbanizedAreas
Over 500,000
RoadwaysParallel toExclusiveTransit
Facilities 7
InsideTransportationConcurrencyManagement
Areas 8
Constrained 9
andBacklogged 10
Roadways
INTRASTATE
Limited AccessHighway
(Freeway) 12B C C(D) D(E) D(E) D(E) Maintain 15
Controlled AccessHighway 13 B C C D E E Maintain
OTHER STATE ROADS 14
Other Multilane B C D D E * 16 Maintain
Two-Lane C C D D E * Maintain
Level of service standards inside parentheses apply to general use lanes only whenexclusive through lanes exist.
1. The indicated levels of service designate lowest quality operating conditions for the 100thhighest volume hour of the year in the predominant traffic flow direction from the presentthrough a 20-year planning horizon. The 100th highest hour approximates the typical peakhour during the peak season. Definitions and measurement criteria used for minimum level ofservice standards are based on the most recent updates of the Transportation Research BoardHighway Capacity Manual "Special Report 209." All level of service evaluations are to be basedon "Special Report 209," or a methodology which has been accepted by FDOT as havingcomparable reliability.
2. Rural areas are areas not included in a transportation concurrency management area, anurbanized area, a transitioning urbanized area, an urban area or a community.
3. Transitioning urbanized areas are the areas outside urbanized areas that are planned to beincluded within the urbanized areas within the next 20 years based primarily on the U.S. Bureauof Census urbanized criteria of a population density of at least 1,000 people per square mile.
4. Urban Areas are places with a population of at least 5,000 and are not included in urbanizedareas. The applicable boundary encompasses the 1990 urban area as well as the surroundinggeographical area as agreed upon by FDOT, local government, and Federal HighwayAdministration (FHWA). The boundaries are commonly called FHWA Urban Area Boundariesand include areas expected to have medium density development before the next decennialcensus.
5. Communities are incorporated places outside urban or urbanized areas, or unincorporateddeveloped areas having 500 population or more identified by local governments in their localgovernment comprehensive plans and located outside of urban or urbanized areas.
6. Urbanized areas are the 1990 urbanized areas designated by the U.S. Bureau of Census aswell as the surrounding geographical areas as agreed upon by the FDOT, Metropolitan PlanningOrganization (MPO), and Federal Highway Administration (FHWA), commonly called FHWAUrbanized Area Boundaries. The over or under 500,000 classifications distinguish urbanizedareas with a population over or under 500,000 based on the 1990 U.S. Census.
7. Roadways parallel to exclusive transit facilities are roads generally parallel to and withinone-half mile of a physically separated rail or roadway lane reserved for multi-passenger useby rail cars or buses serving large volumes of home/work trips during peak travel hours.Exclusive transit facilities do not include downtown people movers or high occupancy vehiclelanes unless physically separated from other travel lanes.
8. Transportation Concurrency Management Areas are geographically compact areasdesignated in local government comprehensive plans where intensive development exists or isplanned in a manner that will ensure an adequate level of mobility and further the achievementof identified important state planning goals and policies, including discouraging the proliferationof urban sprawl, encouraging the revitalization of existing downtowns and designatedredevelopment areas, protecting natural resources, protecting historic resources, maximizingthe efficient use of existing public facilities, and promoting public transit, bicycling, walking andother alternatives to the single occupant automobile. Transportation concurrency managementareas may be established in a comprehensive plan in accordance with Rule 9J-5.0057, FloridaAdministrative Code.
9. Constrained roadways are roads on the State Highway System which FDOT has determinedwill not be expanded by the addition of two or more through lanes because of physical,environmental or policy constraints. Physical constraints primarily occur when intensive landuse development is immediately adjacent to roads, thus making expansion costs prohibitive.Environmental and policy constraints primarily occur when decisions are made not to expanda road based on environmental, historical, archaeological, aesthetic, or social impactconsiderations.
10. Backlogged roadways are roads on the State Highway System operating at a level of servicebelow the minimum level of service standards, not programmed for construction in the firstthree years of FDOT's adopted work program or the five year schedule of improvementscontained in a local government's capital improvements element, and not constrained.
11. Intrastate means the Florida Intrastate Highway System (FIHS), which comprises a statewidenetwork of limited and controlled access highways. The primary function of the system is forhigh speed and high volume traffic movements within the state. Access to abutting land issubordinate to this function and such access must be prohibited or highly regulated. Highwaysincluded as part of this system are designated in the Florida Transportation Plan. General uselanes are intrastate roadway lanes not exclusively designated for long distance high speedtravel. In urbanized areas general use lanes include high occupancy vehicle lanes not physicallyseparated from other travel lanes. Exclusive through lanes are roadway lanes exclusivelydesignated for intrastate travel, which are physically separated from general use lanes and towhich access is highly regulated. These lanes may be used for high occupancy vehicles andexpress buses during peak hours if the level of service standards can be maintained.
12. Limited access highways (freeways) are multilane divided highways having a minimum oftwo lanes for exclusive use of traffic in each direction and full control of ingress and egress; thisincludes freeways and all fully controlled access roadways.
13. Controlled access highways are non-limited access arterial facilities where accessconnections, median openings and traffic signals are highly regulated. The standards shownare the ultimate standards to be achieved for controlled access facilities on the Florida IntrastateHighway System (FIHS) within a 20-year period. For rural two-lane FIHS facilities, the standardis “C” until such time as the facility is improved to four or more lanes when the “B” standardwould apply. Signalized intersections are to be minimized on these facilities within 20 yearsmaking an uninterrupted flow standard generally applicable. Controlled access facilities on theFIHS currently not meeting the ultimate standards shall be allowed to remain on the FIHS witha "maintain" status.
14. Other state roads are roads on the State Highway System that are not part of the FloridaIntrastate Highway System.
15. Maintain means continuing operating conditions at a level such that significant degradationdoes not occur based on conditions existing at the time of local government comprehensive planadoption. For roadways in rural areas, transitioning urbanized areas, urban areas orcommunities, significant degradation means (1) an increase in average annual daily traffic intwo-way traffic volume of 5 percent above the maximum service volume, or (2) a reductionin operating speed for the peak direction in the 100th highest hour of 5 percent below thespeed, of the adopted LOS standard at the time the comprehensive plan was adopted. Forroadways in urbanized areas, for roadways parallel to exclusive transit facilities or for intrastateroadways in transportation concurrency management areas significant degradation means (1)an increase in average annual daily traffic in two-way traffic volume of 10 percent above themaximum service volume, or (2) a reduction in operating speed for the peak direction in the100th highest hour of 10 percent below the speed, of the adopted LOS standard at the time thecomprehensive plan was adopted. For other state roads in transportation concurrencymanagement areas significant degradation means that amount defined in the transportationmobility element. For constrained roadways meeting or exceeding the level of servicestandards, "maintain" does not apply until the roadway is operating below the applicableminimum level of service standard.
16. * means the level of service standard will be set in a transportation mobility element that meetsthe requirements of Rule 9J-5.0057.
Source: Florida Department of Transportation, FDOT Quality/Level of Service Handbook (November 2002).
Florida Transportation Almanac
107
Toll Facilities

Florida Transportation Almanac
108

Florida Transportation Almanac
109
SECTION HIGHLIGHTS
# The state operates 671 tolled traffic lanes throughout Florida. These lanes include controlling access tothree bridges, one ferry service, Florida's Turnpike, and other toll facilities.
# Florida has a total of 599.1 centerline miles and 2,517.7 lane miles on its statewide turnpike system andother toll roads.
# Daily vehicle miles of travel (DVMT) on the statewide turnpike system totaled 20.7 million miles in 2002.

Florida Transportation Almanac
110
Table 3-25FLORIDA TOLL ROADS
Department Owned and Operated SystemsYear TollCollection
Started
CenterlineMiles
Sunshine Skyway Bridge 1954 17
Florida’s Turnpike 1957 449
Navarre Bridge 1960 1
Pinellas Bayway 1962 15
Everglades Parkway (Alligator Alley) 1966 78
Bee Line East 1974 14
Department Operated Systems
Lee Roy Selmon Crosstown Expressway 1975 14
Mid-Bay Bridge 1993 3
Garcon Point Bridge 1999 3
Other Major Toll Systems
Miami-Dade Expressway System 1961 30
Lee County 1964 5
Orlando-Orange County Expressway System (OOCEA) 1966 90
Source: Florida Department of Transportation, Office of Toll Operations (March 2003).

Florida Transportation Almanac
111
Tabl
e 3
-26
TUR
NP
IKE
AN
D T
OLL
SU
MM
AR
Y F
OR
FLO
RID
A C
OU
NTI
ES A
ND
DIS
TRIC
TS (
20
02
)
Cou
nty
Ru
ral
Urb
anTo
tal
Cen
terl
ine
Mile
sLa
ne
Mile
sD
VM
T(0
00
)C
ente
rlin
eM
iles
Lan
eM
iles
DV
MT
(00
0)
Cen
terl
ine
Mile
sLa
ne
Mile
sD
VM
T(0
00
)
Char
lott
e 0
.00.
00.
00.
00.
00.
00.
00.
00.
0
Colli
er0.
00.
00.
00.
00.
00.
00.
00.
00.
0
Des
oto
0.0
0.0
0.0
0.0
0.0
0.0
0.0
0.0
0.0
Gla
des
0.0
0.0
0.0
0.0
0.0
0.0
0.0
0.0
0.0
Har
dee
0.0
0.0
0.0
0.0
0.0
0.0
0.0
0.0
0.0
Hen
dry
0.0
0.0
0.0
0.0
0.0
0.0
0.0
0.0
0.0
Hig
hlan
ds0.
00.
00.
00.
00.
00.
00.
00.
00.
0
Lee
0.0
0.0
0.0
0.0
0.0
0.0
0.0
0.0
0.0
Man
atee
0.0
0.0
0.0
0.0
0.0
0.0
0.0
0.0
0.0
Oke
echo
bee
7.2
28.7
162.
90.
00.
00.
07.
228
.716
2.9
Polk
0.0
0.0
0.0
24.4
85.7
200.
224
.285
.720
0.2
Sara
sota
0.0
0.0
0.0
0.0
0.0
0.0
0.0
0.0
0.0
Dis
tric
t 1
7.2
28
.71
62
.92
4.4
85
.72
00
.23
1.6
11
4.5
36
3.1
Alac
hua
0.0
0.0
0.0
0.0
0.0
0.0
0.0
0.0
0.0
Bake
r0.
00.
00.
00.
00.
00.
00.
00.
00.
0
Brad
ford
0.0
0.0
0.0
0.0
0.0
0.0
0.0
0.0
0.0
Clay
0.0
0.0
0.0
0.0
0.0
0.0
0.0
0.0
0.0
Colu
mbi
a0.
00.
00.
00.
00.
00.
00.
00.
00.
0
Dix
ie0.
00.
00.
00.
00.
00.
00.
00.
00.
0
Duv
al0.
00.
00.
00.
00.
00.
00.
00.
00.
0
Gilc
hris
t0.
00.
00.
00.
00.
00.
00.
00.
00.
0
Ham
ilton
0.0
0.0
0.0
0.0
0.0
0.0
0.0
0.0
0.0
Lafa
yett
e0.
00.
00.
00.
00.
00.
00.
00.
00.
0
Levy
0.0
0.0
0.0
0.0
0.0
0.0
0.0
0.0
0.0
Mad
ison
0.0
0.0
0.0
0.0
0.0
0.0
0.0
0.0
0.0
Nas
sau
0.0
0.0
0.0
0.0
0.0
0.0
0.0
0.0
0.0
Putn
am0.
00.
00.
00.
00.
00.
00.
00.
00.
0
Sour
ce:
Flor
ida
Dep
artm
ent
of T
rans
port
atio
n, S
tate
Hig
hway
Sys
tem
Mile
age
Repo
rt f
or D
ecem
ber
31, 2
002.
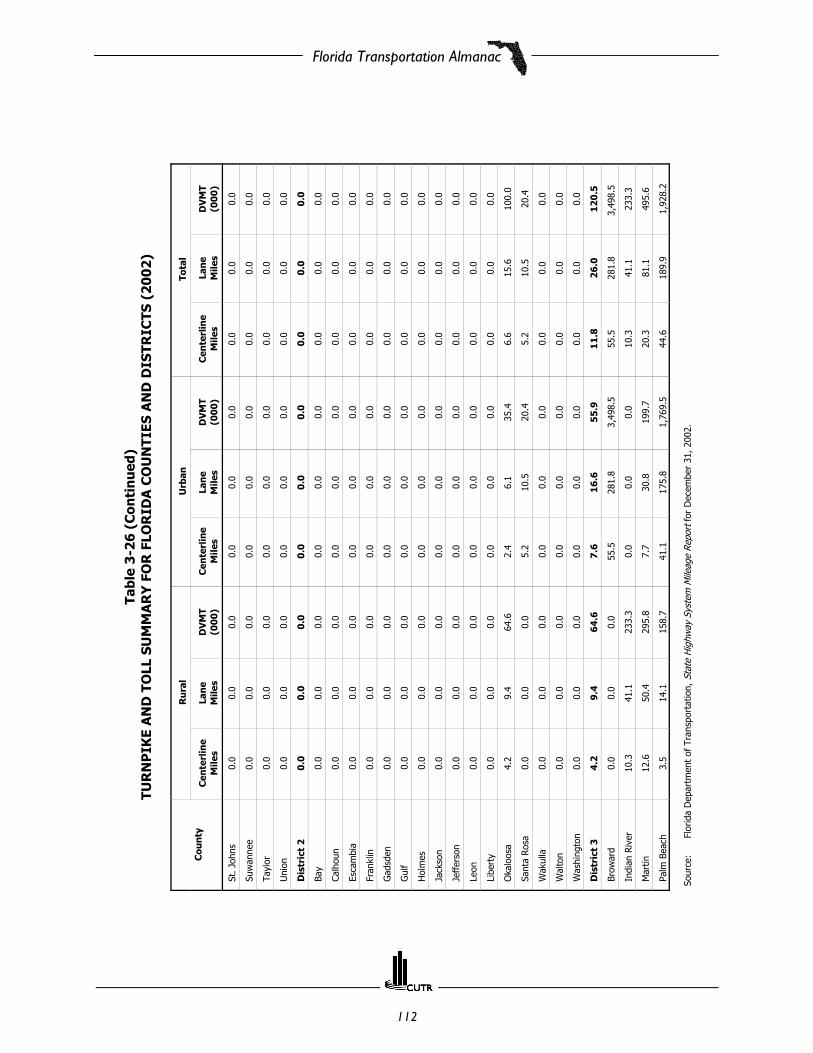
Florida Transportation Almanac
112
Tabl
e 3
-26
(C
onti
nu
ed)
TUR
NP
IKE
AN
D T
OLL
SU
MM
AR
Y F
OR
FLO
RID
A C
OU
NTI
ES A
ND
DIS
TRIC
TS (
20
02
)
Cou
nty
Ru
ral
Urb
anTo
tal
Cen
terl
ine
Mile
sLa
ne
Mile
sD
VM
T(0
00
)C
ente
rlin
eM
iles
Lan
eM
iles
DV
MT
(00
0)
Cen
terl
ine
Mile
sLa
ne
Mile
sD
VM
T(0
00
)
St. J
ohns
0.0
0.0
0.0
0.0
0.0
0.0
0.0
0.0
0.0
Suw
anne
e0.
00.
00.
00.
00.
00.
00.
00.
00.
0
Tayl
or0.
00.
00.
00.
00.
00.
00.
00.
00.
0
Uni
on0.
00.
00.
00.
00.
00.
00.
00.
00.
0
Dis
tric
t 2
0.0
0.0
0.0
0.0
0.0
0.0
0.0
0.0
0.0
Bay
0.0
0.0
0.0
0.0
0.0
0.0
0.0
0.0
0.0
Calh
oun
0.0
0.0
0.0
0.0
0.0
0.0
0.0
0.0
0.0
Esca
mbi
a0.
00.
00.
00.
00.
00.
00.
00.
00.
0
Fran
klin
0.0
0.0
0.0
0.0
0.0
0.0
0.0
0.0
0.0
Gad
sden
0.0
0.0
0.0
0.0
0.0
0.0
0.0
0.0
0.0
Gul
f0.
00.
00.
00.
00.
00.
00.
00.
00.
0
Hol
mes
0.0
0.0
0.0
0.0
0.0
0.0
0.0
0.0
0.0
Jack
son
0.0
0.0
0.0
0.0
0.0
0.0
0.0
0.0
0.0
Jeff
erso
n0.
00.
00.
00.
00.
00.
00.
00.
00.
0
Leon
0.0
0.0
0.0
0.0
0.0
0.0
0.0
0.0
0.0
Libe
rty
0.0
0.0
0.0
0.0
0.0
0.0
0.0
0.0
0.0
Oka
loos
a4.
29.
464
.62.
46.
135
.46.
615
.610
0.0
Sant
a Ro
sa0.
00.
00.
05.
210
.520
.45.
210
.520
.4
Wak
ulla
0.0
0.0
0.0
0.0
0.0
0.0
0.0
0.0
0.0
Wal
ton
0.0
0.0
0.0
0.0
0.0
0.0
0.0
0.0
0.0
Was
hing
ton
0.0
0.0
0.0
0.0
0.0
0.0
0.0
0.0
0.0
Dis
tric
t 3
4.2
9.4
64
.67
.61
6.6
55
.91
1.8
26
.01
20
.5
Brow
ard
0.0
0.0
0.0
55.5
281.
83,
498.
555
.528
1.8
3,49
8.5
Indi
an R
iver
10.3
41.1
233.
30.
00.
00.
010
.341
.123
3.3
Mar
tin12
.650
.429
5.8
7.7
30.8
199.
720
.381
.149
5.6
Palm
Bea
ch3.
514
.115
8.7
41.1
175.
81,
769.
544
.618
9.9
1,92
8.2
Sour
ce:
Flor
ida
Dep
artm
ent
of T
rans
port
atio
n, S
tate
Hig
hway
Sys
tem
Mile
age
Repo
rt f
or D
ecem
ber
31, 2
002.

Florida Transportation Almanac
113
Tabl
e 3
-26
(C
onti
nu
ed)
TUR
NP
IKE
AN
D T
OLL
SU
MM
AR
Y F
OR
FLO
RID
A C
OU
NTI
ES A
ND
DIS
TRIC
TS (
20
02
)
Cou
nty
Ru
ral
Urb
anTo
tal
Cen
terl
ine
Mile
sLa
ne
Mile
sD
VM
T(0
00
)C
ente
rlin
eM
iles
Lan
eM
iles
DV
MT
(00
0)
Cen
terl
ine
Mile
sLa
ne
Mile
sD
VM
T(0
00
)
St. L
ucie
20.0
80.1
454.
815
.160
.337
6.6
35.1
140.
483
1.5
Dis
tric
t 4
46
.41
85
.71
,14
2.6
11
9.3
54
8.6
5,8
44
.4
16
5.8
73
4.4
6,9
87
.0
Brev
ard
12.3
36.0
188.
90.
20.
61.
012
.536
.618
9.9
Flag
ler
0.0
0.0
0.0
0.0
0.0
0.0
0.0
0.0
0.0
Lake
23.9
95.5
907.
20.
00.
00.
023
.995
.590
7.2
Mar
ion
0.0
0.0
0.0
0.0
0.0
0.0
0.0
0.0
0.0
Ora
nge
41.8
168.
11,
259.
685
.636
6.7
3,64
7.0
127.
453
4.8
4,90
6.5
Osc
eola
51.5
206.
11,
102.
210
.240
.723
5.8
61.7
246.
81,
338.
0
Sem
inol
e0.
00.
00.
017
.470
.437
6.0
17.4
70.4
376.
0
Sum
ter
10.7
42.7
306.
20.
00.
00.
010
.742
.730
6.2
Volu
sia
0.0
0.0
0.0
0.0
0.0
0.0
0.0
0.0
0.0
Dis
tric
t 5
14
0.2
54
8.5
3,7
64
.11
13
.44
78
.44
,25
9.8
25
3.6
1,0
26
.98
,02
3.9
Dad
e10
.854
.668
7.0
46.2
246.
43,
070.
6 57
.030
1.0
3,75
7.7
Mon
roe
0.0
0.0
0.0
0.0
0.0
0.0
0.0
0.0
0.0
Dis
tric
t 6
10
.8
54
.66
87
.04
6.2
24
6.4
3,0
70
.65
7.0
30
1.0
3,7
57
.7
Citr
us0.
00.
00.
00.
00.
00.
00.
00.
00.
0
Her
nand
o17
.770
.989
.50.
00.
00.
017
.770
.989
.5
Hill
sbor
ough
1.2
4.7
19.0
32.1
13
1.7
1,03
3.4
33.2
136.
41,
052.
4
Pasc
o19
.979
.523
6.4
0.0
0.0
0.0
19.9
79.5
236.
4
Pine
llas
0.0
0.0
0.0
8.5
28.2
124.
08.
528
.212
4.0
Dis
tric
t 7
38
.81
55
.13
44
.94
0.6
15
9.8
1
,15
7.4
79
.43
14
.91
,50
2.3
Stat
ewid
e2
47
.69
82
.16
,16
6.1
35
1.5
1,5
35
.61
4,5
88
.35
99
.12
,51
7.7
20
,75
4.4
Sour
ce:
Flor
ida
Dep
artm
ent
of T
rans
port
atio
n, S
tate
Hig
hway
Sys
tem
Mile
age
Repo
rt f
or D
ecem
ber
31, 2
002.

Florida Transportation Almanac
114

Florida Transportation Almanac
115
Aviation

Florida Transportation Almanac
116

Florida Transportation Almanac
117
SECTION HIGHLIGHTS
# Florida’s airports were scheduled to have 377,505 aircraft departures in 2000. The actual total performedwas 375,723.
# In 2000, enplaned revenue passengers for all Florida airports totaled 51,492,425. Approximately 40percent of the enplaned revenue passengers occurred at two of the three Miami/Ft. Lauderdale regionalairports.
# All Florida airports carried a total of 896,008 enplaned revenue tons. Of this, 796,009 were freight innature and 99,999 were mail in nature.

Florida Transportation Almanac
118
Source: Florida Department of Transportation, Office of Policy Planning, Policy Analysis, and Program Evaluation,2002 Transportation Costs (March 2003).
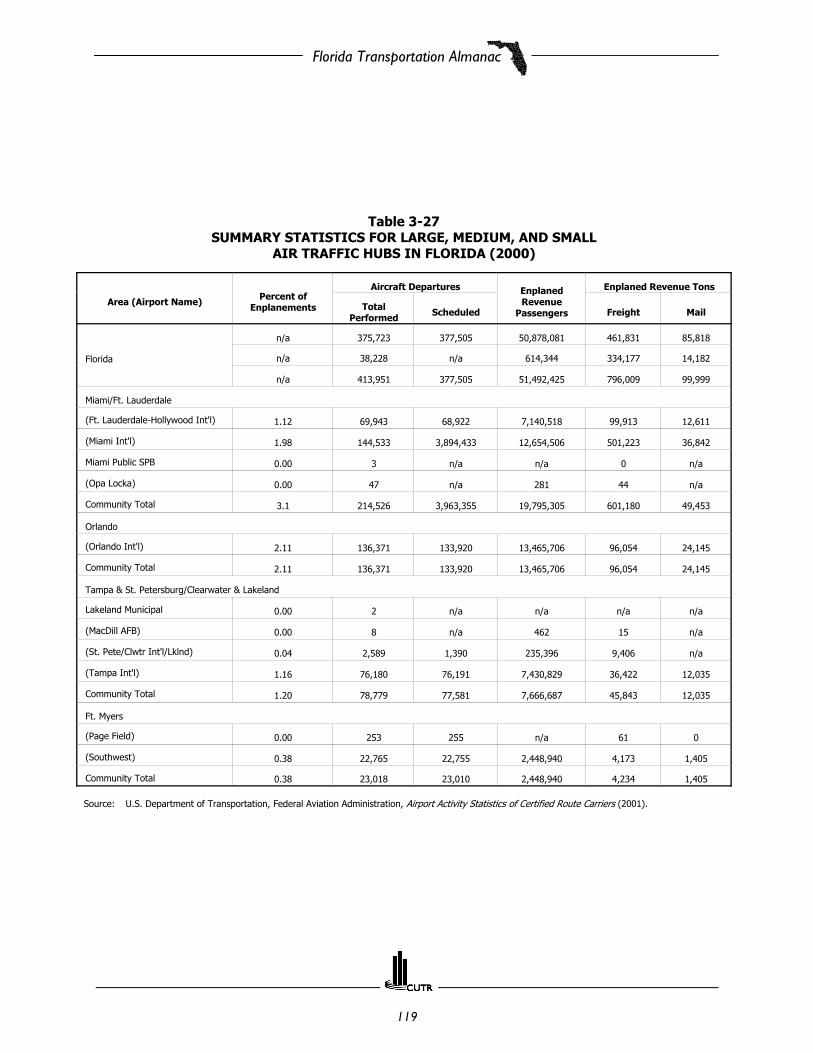
Florida Transportation Almanac
119
Table 3-27SUMMARY STATISTICS FOR LARGE, MEDIUM, AND SMALL
AIR TRAFFIC HUBS IN FLORIDA (2000)
Area (Airport Name) Percent ofEnplanements
Aircraft Departures EnplanedRevenue
Passengers
Enplaned Revenue Tons
TotalPerformed Scheduled Freight Mail
Florida
n/a 375,723 377,505 50,878,081 461,831 85,818
n/a 38,228 n/a 614,344 334,177 14,182
n/a 413,951 377,505 51,492,425 796,009 99,999
Miami/Ft. Lauderdale
(Ft. Lauderdale-Hollywood Int'l) 1.12 69,943 68,922 7,140,518 99,913 12,611
(Miami Int'l) 1.98 144,533 3,894,433 12,654,506 501,223 36,842
Miami Public SPB 0.00 3 n/a n/a 0 n/a
(Opa Locka) 0.00 47 n/a 281 44 n/a
Community Total 3.1 214,526 3,963,355 19,795,305 601,180 49,453
Orlando
(Orlando Int'l) 2.11 136,371 133,920 13,465,706 96,054 24,145
Community Total 2.11 136,371 133,920 13,465,706 96,054 24,145
Tampa & St. Petersburg/Clearwater & Lakeland
Lakeland Municipal 0.00 2 n/a n/a n/a n/a
(MacDill AFB) 0.00 8 n/a 462 15 n/a
(St. Pete/Clwtr Int'l/Lklnd) 0.04 2,589 1,390 235,396 9,406 n/a
(Tampa Int'l) 1.16 76,180 76,191 7,430,829 36,422 12,035
Community Total 1.20 78,779 77,581 7,666,687 45,843 12,035
Ft. Myers
(Page Field) 0.00 253 255 n/a 61 0
(Southwest) 0.38 22,765 22,755 2,448,940 4,173 1,405
Community Total 0.38 23,018 23,010 2,448,940 4,234 1,405
Source: U.S. Department of Transportation, Federal Aviation Administration, Airport Activity Statistics of Certified Route Carriers (2001).

Florida Transportation Almanac
120
Table 3-27 (Continued)SUMMARY STATISTICS FOR LARGE, MEDIUM, AND SMALL
AIR TRAFFIC HUBS IN FLORIDA (2000)
Area (Airport Name)
Percent ofEnplanements
Aircraft Departures EnplanedRevenue
Passengers
EnplanedRevenue Tons
TotalPerformed
Scheduled Freight Mail
Jacksonville
(Jacksonville Int'l) 0.39 33,265 31,852 2,498,702 24,503 7,820
(Jacksonville NAS) 0.00 165 n/a 6,070 128 n/a
(Craig Municipal) 0.00 499 510 n/a 135 n/a
Community Total 0.39 33,929 32,362 2,504,772 24,766 7,820
West Palm Beach/Palm Beach
(Palm Beach Int'l) 0.44 27,570 26,956 2,787,443 15,198 3,457
Daytona Beach
(Daytona Beach Regional) n/a n/a n/a n/a n/a n/a
Melbourne
(Cape Kennedy Regional) n/a n/a n/a n/a n/a n/a
Pensacola
(Pensacola Regional) 0.07 7,577 7,806 435,498 585 1,031
Sarasota/Bradenton
(Sarasota-Bradenton) 0.11 8,301 8,203 719,483 577 2
Tallahassee
(Tallahassee MUNI) n/a n/a n/a n/a n/a n/a
Valparaiso
Eglin AFB 0.06 6,320 6,469 382,824 61 2
Source: U.S. Department of Transportation, Federal Aviation Administration, Airport Activity Statistics of Certified Route Carriers (2001).

Florida Transportation Almanac
121
Table 3-28FLORIDA'S AVIATION SYSTEM (2001)
Public Airports Region Size (acres) Based AircraftAnnual Operations
(take offs andlandings)
Commercial Service Airports
Okaloosa County Air Terminal
Northwest Florida
108 n/a 16,414
Panama City-Bay County 745 121 92,146
Pensacola Regional 1,211 94 126,006
Tallahassee Regional 2,490 128 120,051
Gainesville Regional North Central Florida 1,650 112 78,367
Jacksonville International Northeast Florida 7,911 37 150,424
Daytona Beach International
East Central Florida Metropolitan Area
2,007 281 236,252
Melbourne International 2,800 166 192,153
Orlando International 16,000 1 369,100
Orlando Sanford 2,010 232 365,805
St. Petersburg-ClearwaterWest Central Florida Metropolitan Area
1,900 309 233,654
Tampa International 3,300 78 274,920
Naples Municipal
Southwest Florida
732 348 120,311
Sarasota/Bradenton 1,102 295 184,822
Southwest Florida International 3,431 9 78,952
Vero Beach Municipal Treasure Coast 1,707 266 216,722
Ft Lauderdale
South Florida Metropolitan Area
1,380 165 302,153
Key West International 174 35 99,891
Marathon n/a n/a n/a
Miami International 3,300 345 511,867
Palm Beach International 2,120 n/a 214,327
Source: Florida Department of Transportation, Florida-Aviation-Database.

Florida Transportation Almanac
122
Table 3-28 (Continued)FLORIDA'S AVIATION SYSTEM (2001)
Public Airports Region Size (acres) Based AircraftAnnual Operations
(take offs andlandings)
Reliever Airports
Craig Municipal
Northeast Florida Metropolitan Area
1,342 303 138,307
Coastal 42 31 7,520
Costin 21 8 12,500
Ferguson 120 50 67,500
Fernandina Beach Municipal 1,116 78 47,000
Herlong 1,484 130 72,200
St. Augustine 668 320 143,800
Ames Field
Northwest Florida
80 1 1,200
Ft. Walton Beach 15 7 8,030
Rudy's Airport 0 3 400
Tallahassee Commercial 283 8 2,625
Bob Lee Flight Strip
East Central Florida Metropolitan Area
25 30 6,000
Central Florida Regional n/a n/a n/a
Kissimmee Gateway 892 270 142,887
Massey Ranch Airparl 12 58 4,750
Merrit Island 140 225 113,500
New Hibiscus Airpark 90 20 22,000
Orlando Executive 1,055 372 237,053
Space Center Executive n/a n/a n/a
Airport Manatee
Central Florida
20 90 7,100
Albert Whitted Municipal 119 184 98,828
Clearwater Airpark 74 139 50,560
Peter O. Knight 0 102 66,000
Pilot Country 27 60 30,000
South Lakeland 32 37 12,000
Space Coast Regional Airport 810 229 149,110
Tampa North Aero Park 30 29 11,000
Vandenburg 0 130 94,590
Bob White Field 20 74 20,000
Chalet Suzanne Air Strip 20 5 2,472
Flying Ten 55 22 30,000
Jack Brown's SPB 8 6 10,000
Lakeland Linder Regional 1,360 212 201,443
Mid-Florida Air Service 167 55 21,024
Source: Florida Department of Transportation, Florida-Aviation-Database.

Florida Transportation Almanac
123
Table 3-28 (Continued)FLORIDA'S AVIATION SYSTEM (2001)
Public Airports Region Size (acres) Based AircraftAnnual Operations
(take offs andlandings)
Reliever Airports
Orlando Country
Central Florida
0 43 21,900
River Ranch Resort 89 n/a n/a
Utamilla Municipal Airport 65 15 5,000
Page FieldSouthwest Florida
670 220 87,244
Shell Creek 60 8 2,190
Boca Raton
South Florida Metropolitan Area
204 281 132,300
Dade-Collier Training and Transition 24,960 0 23,796
Ft. Lauderdal Executive 1,050 708 259,294
Homestead General Aviation 960 48 62,314
Indiantown 600 38 5,000
Kendall-Tamiami Executive 1,380 410 194,300
North Perry 536 325 200,292
Opa Locka 1,880 310 127,443
Palm Beach County Park 14 380 140,325
Source: Florida Department of Transportation, Florida-Aviation-Database.

Florida Transportation Almanac
124
Table 3-28 (Continued)FLORIDA'S AVIATION SYSTEM (2001)
Public Airports Region Size (acres) Based AircraftAnnual Operations
(take offs andlandings)
General Aviation Airports
Apalachicola Municipal
Northwest Florida
800 30 24,375
Bob Sikes 1,080 52 17,000
Calhoun County 49 5 1,020
Carabelle-Thompson 202 n/a 524
De Funiak Springs 159 10 16,200
Destin-Fort Walton Beach 395 74 50,732
Marianna 2,400 38 28,016
Peter Prince 0 90 93,900
Quincy Municipal 212 52 13,500
Tri-County 300 6 28,376
Wakulla 15 9 5,475
Cross City
North Central Florida
591 5 18,000
Crystal River 100 51 36,600
Dunnellon/Marion Park of Commerce 1,706 47 15,000
George T. Lewis 40 3 5,200
Inverness 302 29 12,000
Lake City Municipal 1,250 26 29,941
Ocala International-Jim Taylor Field 1,532 204 49,600
Perry-Foley 927 10 18,400
Suwannee County 183 24 16,300
Williston Municipal 1,600 36 16,250
Cecil Field
Northeast Florida Metropolitan Area
6,000 32 57,242
Flagler County 1,145 61 190,010
Hilliard Airpark 30 24 n/a
Kay Larkin Municipal 703 77 40,596
Keystone Airpark 2,505 39 32,400
Arthur Dunn Airpark
East Central Florida Metropolitan Area
138 80 40,450
Deland Municipal-Sidney H. Taylor 1,289 196 109,839
Leesburg Regional 818 175 114,061
New Smyrna Beach Municipal 769 159 140,000
Ormond Beach Municipal 1,128 169 200,000
Pierson Municipal 147 5 14,000
Valkaria 0 38 14,400
Source: Florida Department of Transportation, Florida-Aviation-Database.
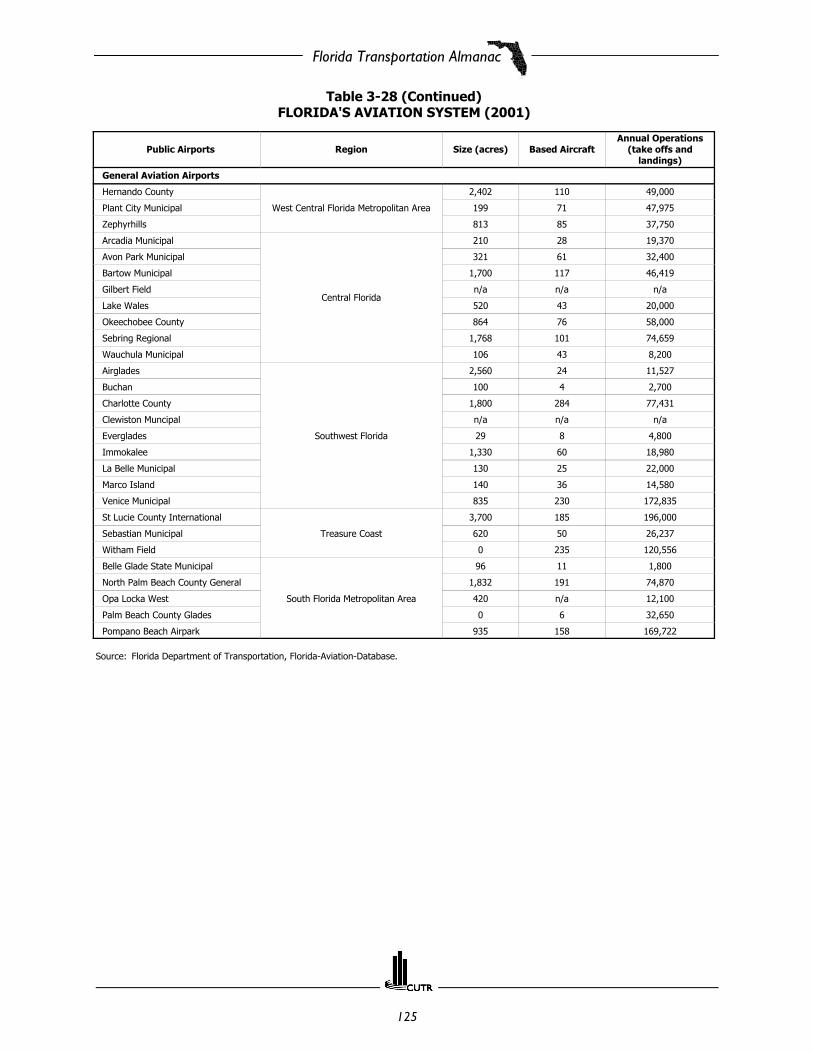
Florida Transportation Almanac
125
Table 3-28 (Continued)FLORIDA'S AVIATION SYSTEM (2001)
Public Airports Region Size (acres) Based AircraftAnnual Operations
(take offs andlandings)
General Aviation Airports
Hernando County
West Central Florida Metropolitan Area
2,402 110 49,000
Plant City Municipal 199 71 47,975
Zephyrhills 813 85 37,750
Arcadia Municipal
Central Florida
210 28 19,370
Avon Park Municipal 321 61 32,400
Bartow Municipal 1,700 117 46,419
Gilbert Field n/a n/a n/a
Lake Wales 520 43 20,000
Okeechobee County 864 76 58,000
Sebring Regional 1,768 101 74,659
Wauchula Municipal 106 43 8,200
Airglades
Southwest Florida
2,560 24 11,527
Buchan 100 4 2,700
Charlotte County 1,800 284 77,431
Clewiston Muncipal n/a n/a n/a
Everglades 29 8 4,800
Immokalee 1,330 60 18,980
La Belle Municipal 130 25 22,000
Marco Island 140 36 14,580
Venice Municipal 835 230 172,835
St Lucie County International
Treasure Coast
3,700 185 196,000
Sebastian Municipal 620 50 26,237
Witham Field 0 235 120,556
Belle Glade State Municipal
South Florida Metropolitan Area
96 11 1,800
North Palm Beach County General 1,832 191 74,870
Opa Locka West 420 n/a 12,100
Palm Beach County Glades 0 6 32,650
Pompano Beach Airpark 935 158 169,722
Source: Florida Department of Transportation, Florida-Aviation-Database.

Florida Transportation Almanac
126

Florida Transportation Almanac
127
PublicTransportation

Florida Transportation Almanac
128
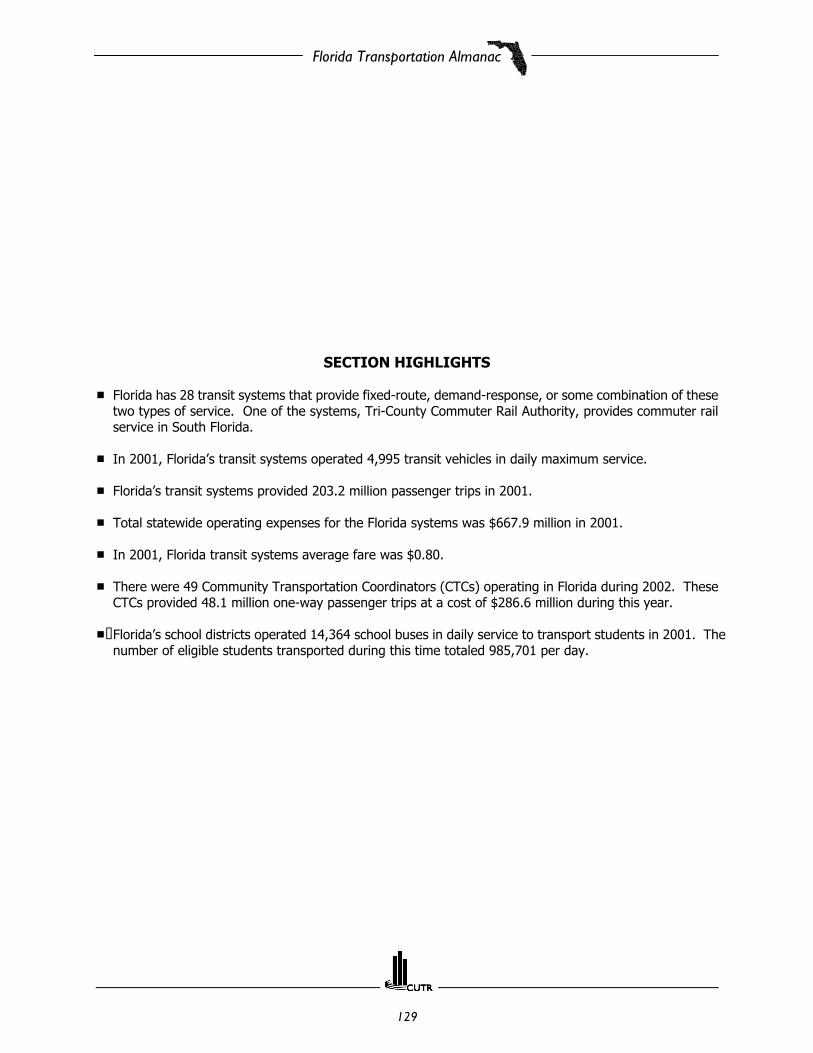
Florida Transportation Almanac
129
SECTION HIGHLIGHTS
# Florida has 28 transit systems that provide fixed-route, demand-response, or some combination of thesetwo types of service. One of the systems, Tri-County Commuter Rail Authority, provides commuter railservice in South Florida.
# In 2001, Florida’s transit systems operated 4,995 transit vehicles in daily maximum service.
# Florida’s transit systems provided 203.2 million passenger trips in 2001.
# Total statewide operating expenses for the Florida systems was $667.9 million in 2001.
# In 2001, Florida transit systems average fare was $0.80.
# There were 49 Community Transportation Coordinators (CTCs) operating in Florida during 2002. TheseCTCs provided 48.1 million one-way passenger trips at a cost of $286.6 million during this year.
# Florida’s school districts operated 14,364 school buses in daily service to transport students in 2001. Thenumber of eligible students transported during this time totaled 985,701 per day.

Florida Transportation Almanac
130
Table 3-29FLORIDA’S MAJOR TRANSIT OPERATORS,
SYSTEM NAMES AND ABBREVIATIONS
Bay Bay County COA-Coord. Transportation
BCT Broward County Mass Transit Division
CAT Collier Area Transit
ECAT Escambia County Area Transit
HART Hillsborough Area Regional Transit
Indian River Indian River County COA/Community Coach
JTA Jacksonville Transportation Authority
KWDOT Key West Dept. of Transportation
LAMTD Lakeland Area Mass Transit District
LeeTran Lee County Transit
LYNX Lynx Transit (Orlando)
MCAT Manatee County Area Transit
- Martin County Council on Aging
MDT Miami-Dade Transit Agency
OCT Okaloosa County Council on Aging
Palm Tran Palm Beach County Transportation Authority
PCPT Pasco County Public Transit
PSTA Pinellas Suncoast Transit Authority
- Polk County Transportation Services Division
RTS Regional Transit System (Gainesville)
SCAT (Sarasota) Sarasota County Area Transit
SCAT (Brevard) Space Coast Area Transit
- St. Lucie Council on Aging
SunTran Ocala/Marion County Public Transit System
TALTRAN Tallahassee Transit
Tri-Rail Tri-County Commuter Rail Authority
VOTRAN County of Volusia (VOTRAN)
WHAT Winter Haven Area Transit

Florida Transportation Almanac
131

Florida Transportation Almanac
132
Tabl
e 3
-30
STA
TEW
IDE
FLO
RID
A T
RA
NSI
T SY
STEM
TO
TALS
Per
form
ance
In
dica
tors
19
97
19
98
19
99
20
00
20
01
Serv
ice
Area
Pop
ulat
ion
10,9
16,2
5711
,326
,383
11,6
40,0
4511
,685
,752
12,1
19,2
93
Pass
enge
r Tr
ips
169,
782,
749
175,
776,
980
189,
542,
389
195,
701,
285
203,
215,
335
Rev
enue
Mile
s11
8,40
4,04
712
9,54
0,95
813
7,68
7,65
713
8,79
9,06
515
8,22
6,37
9
Rev
enue
Hou
rs7,
949,
488
8,57
1,99
29,
287,
679
9,50
2,28
410
,804
,286
Tota
l Pas
seng
er F
are
Rev
enue
$135
,035
,219
$139
,407
,403
$140
,758
,336
$147
,625
,962
$163
,003
,819
Tota
l Ope
ratin
g Ex
pens
e$4
80,7
73,0
44$5
06,6
82,8
62$5
50,5
75,9
06$5
84,9
93,7
43$6
67,9
23,7
82
Tota
l Mai
nten
ance
Exp
ense
$109
,509
,890
$131
,391
,572
$142
,918
,287
$148
,293
,217
$166
,962
,223
Tota
l Cap
ital E
xpen
se$1
58,8
82,3
58$1
74,7
56,7
62$1
39,3
49,9
84$1
87,7
48,2
14$1
92,9
77,0
24
Tota
l Loc
al R
even
ue$3
90,6
69,3
07$4
06,7
10,8
54$4
13,5
55,8
48$4
51,9
19,8
16$5
00,3
58,5
67
Tota
l Em
ploy
ee F
TEs
6,60
36,
461
6,89
77,
187
7,67
7
Vehi
cles
Ava
ilabl
e fo
r M
axim
um S
ervi
ce4,
046
4,45
94,
136
4,24
84,
995
Vehi
cles
Ope
rate
d in
Max
imum
Ser
vice
2,79
03,
118
3,21
83,
340
3,95
5
Num
ber
of I
ncid
ents
1,96
41,
955
2,26
92,
303
2,31
0
Num
ber
of V
ehic
le S
yste
m F
ailu
res
31,9
1128
,967
31,1
9835
,563
24,8
91
Pass
enge
r Tr
ips
Per
Rev
enue
Mile
1.4
1.4
1.4
1.4
1.3
Ope
ratin
g Ex
pens
e Pe
r Pa
ssen
ger
Trip
2.8
2.9
2.9
3.0
3.3
Ope
ratin
g Ex
pens
e Pe
r Rev
enue
Hou
r60
.559
.159
.361
.661
.8
Fare
box
Rec
over
y (%
)28
2826
2524
Aver
age
Fare
($)
0.80
0.79
0.74
0.75
0.80
Not
e:Sy
stem
wid
e ag
greg
ate
incl
udes
all
tran
sit
syst
ems
(fix
ed-r
oute
and
dem
and-
resp
onse
) an
d al
l mod
es li
sted
in t
he F
lorid
a Tr
ansi
t In
form
atio
n Sy
stem
for
Flo
rida
for
2001
(th
em
ost
rece
nt y
ear
of d
ata
avai
labi
lity)
.So
urce
:Fl
orid
a Tr
ansi
t In
form
atio
n Sy
stem
, Ver
sion
200
3.

Florida Transportation Almanac
133
Table 3-31STATEWIDE SUMMARY OF OPERATING STATISTICS
FOR COMMUNITY TRANSPORTATION COORDINATORS
Operating Statistics 2000 2001 2002 Change (%)2000 - 2002
Number of CTCs 50 49 49 -2.0
Number of Counties Covered 67 67 67 0.0
Number of Transportation Operators 464 468 468 0.9
Total Passengers (unduplicated passengerhead count) 667,914 654,432 615,091 -7.9
Total One-Way Passenger Trips 43,388,385 51,477,893 48,176,142 11.0
Fixed-Route Passenger Trips 26,059,816 32,581,161 27,630,351 6.0
Stretcher Passenger Trips 69,816 77,711 83,714 19.9
School Bus Passenger Trips 556,119 603,566 519,383 -6.6
Vehicle Miles 119,731,545 144,181,390 138,789,715 15.9
Revenue Miles 90,357,273 84,630,102 116,667,988 29.1
Operating Revenue ($) $224.9 million $271.0 $292.8 30.2
Operating Expense ($) $235.4 million $246.6 $286.6 21.7
Vehicles 5,378 5,609 5,859 8.9
Roadcalls 9,003 4,100 3,533 -60.8
Accidents 1,164 1,100 1,018 -12.5
Employees (Number) 8,621 8,162 9,049 5.0
Source: Florida Commission for the Transportation Disadvantaged, 2002 Annual Performance Report.

Florida Transportation Almanac
134
Table 3-32BREAKDOWN OF ONE-WAY PASSENGER TRIPS BY TRIP PURPOSE
Trip Purpose 2001 2002 Change (%)
Medical 14,681,180 18,359,937 25.1
Employment 8,257,662 4,876,886 -40.9
Education/Training 11,975,791 11,029,587 -7.9
Nutritional 2,420,633 7,342,518 203.3
Life-Sustaining/Other 14,142,626 6,567,214 -53.6
Total Trips 51,477,892 48,176,142 -6.4
Source: Florida Commission for the Transportation Disadvantaged, 2002 Annual Performance Report.
Table 3-33PASSENGER TRIP INFORMATION BY
PASSENGER TYPE
Passenger Type Number of One-Way Passenger Trips
Elderly 1,402,463
Elderly Disabled 7,968,349
Elderly Low Income 8,131,374
Elderly Disabled 3,413,872
Children 803,790
Children Disabled 3,166,051
Children Low Income 4,306,627
Children Disabled 2,048,169
Adult 1,507,716
Adult Disabled 6,526,852
Adult Low Income 4,295,802
Adult Disabled 4,605,077
Total Trips by Passenger Type 48,176,142
Source: Florida Commission for the Transportation Disadvantaged, 2002 Annual Performance Report.

Florida Transportation Almanac
135
Table 3-34FLORIDA SCHOOL DISTRICT TRANSPORTATION PROFILES (2001)
District # Buses inDaily Service
EnrollmentPreK - 12
# of EligibleStudents
Transported
Average BusOccupancy
# ofStudentsCenter-
to-Center
Non-EligibleStudents
Transported
# ofStudents
HazardousWalking
# of Studentsw/Disabilities
Alachua 180 29,673 15,120 84 19 1,733 103 422
Baker 37 4,566 2,467 67 0 399 0 25
Bay 142 25,752 10,498 74 17 3,053 0 727
Bradford 38 4,161 1,987 52 46 418 0 246
Brevard 354 70,590 26,277 74 139 1,055 899 1,098
Broward 1,127 251,080 69,752 62 56 2,788 1,332 10,580
Calhoun 20 2,232 1,104 55 0 180 0 91
Charlotte 122 17,170 8,271 68 0 598 558 286
Citrus 155 15,197 9,818 63 18 820 0 610
Clay 180 28,115 13,464 75 0 1,320 187 561
Collier 233 34,199 16,161 69 89 1,029 701 2,570
Columbia 87 9,590 4,773 55 4 163 0 480
Dade 1,471 368,123 62,992 43 118 2,820 0 8,776
DeSoto 32 4,595 1,936 61 7 342 81 61
Dixie 25 2,305 1,388 56 1 207 0 161
Duval 928 125,832 52,768 57 840 160 1,623 2,971
Escambia 382 45,007 30,347 80 110 1,670 5,293 1,230
Flagler 58 6,758 4,972 86 0 460 0 128
Franklin 10 1,472 416 42 0 215 0 0
Gadsden 74 7,582 5,102 69 14 511 0 930
Gilchrist 26 2,606 1,505 58 2 80 0 13
Glades 8 1,106 402 50 0 296 0 1
Gulf 24 2,262 1,227 51 0 0 0 144
Hamilton 23 2,171 986 44 0 290 0 11
Hardee 28 4,703 2,518 90 0 345 0 167
Hendry 60 7,571 4,258 72 10 623 0 55
Hernando 168 17,216 11,210 67 57 1,147 0 277
Highlands 104 11,201 5,696 55 2 593 0 217
Hillsborough 1,018 164,224 80,207 79 24 5,289 8,238 6,775
Holmes 41 3,588 2,239 55 0 252 0 277
Indian River 71 14,975 6,299 89 19 770 401 804
Jackson 84 7,424 4,383 52 36 578 0 487
Jefferson 30 1,842 1,137 39 0 287 0 221
Source: Florida School District Transportation Profiles, Volume 11 (July 2002).
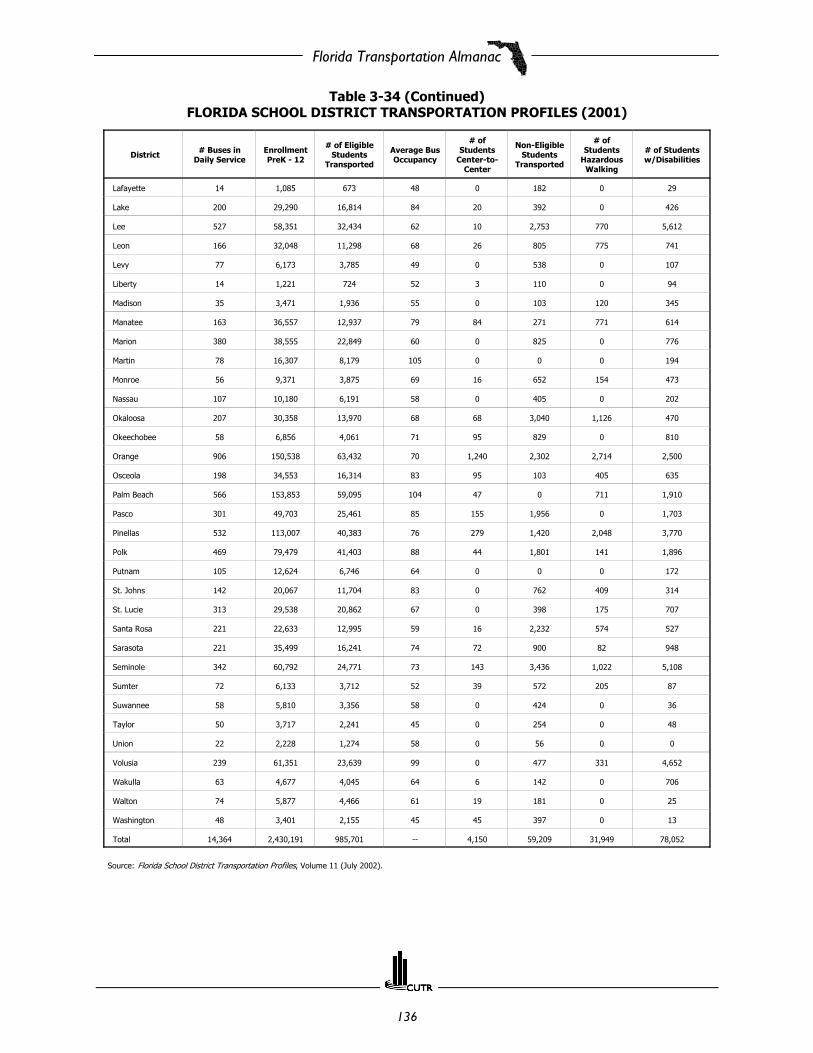
Florida Transportation Almanac
136
Table 3-34 (Continued)FLORIDA SCHOOL DISTRICT TRANSPORTATION PROFILES (2001)
District # Buses inDaily Service
EnrollmentPreK - 12
# of EligibleStudents
Transported
Average BusOccupancy
# ofStudents
Center-to-Center
Non-EligibleStudents
Transported
# ofStudents
HazardousWalking
# of Studentsw/Disabilities
Lafayette 14 1,085 673 48 0 182 0 29
Lake 200 29,290 16,814 84 20 392 0 426
Lee 527 58,351 32,434 62 10 2,753 770 5,612
Leon 166 32,048 11,298 68 26 805 775 741
Levy 77 6,173 3,785 49 0 538 0 107
Liberty 14 1,221 724 52 3 110 0 94
Madison 35 3,471 1,936 55 0 103 120 345
Manatee 163 36,557 12,937 79 84 271 771 614
Marion 380 38,555 22,849 60 0 825 0 776
Martin 78 16,307 8,179 105 0 0 0 194
Monroe 56 9,371 3,875 69 16 652 154 473
Nassau 107 10,180 6,191 58 0 405 0 202
Okaloosa 207 30,358 13,970 68 68 3,040 1,126 470
Okeechobee 58 6,856 4,061 71 95 829 0 810
Orange 906 150,538 63,432 70 1,240 2,302 2,714 2,500
Osceola 198 34,553 16,314 83 95 103 405 635
Palm Beach 566 153,853 59,095 104 47 0 711 1,910
Pasco 301 49,703 25,461 85 155 1,956 0 1,703
Pinellas 532 113,007 40,383 76 279 1,420 2,048 3,770
Polk 469 79,479 41,403 88 44 1,801 141 1,896
Putnam 105 12,624 6,746 64 0 0 0 172
St. Johns 142 20,067 11,704 83 0 762 409 314
St. Lucie 313 29,538 20,862 67 0 398 175 707
Santa Rosa 221 22,633 12,995 59 16 2,232 574 527
Sarasota 221 35,499 16,241 74 72 900 82 948
Seminole 342 60,792 24,771 73 143 3,436 1,022 5,108
Sumter 72 6,133 3,712 52 39 572 205 87
Suwannee 58 5,810 3,356 58 0 424 0 36
Taylor 50 3,717 2,241 45 0 254 0 48
Union 22 2,228 1,274 58 0 56 0 0
Volusia 239 61,351 23,639 99 0 477 331 4,652
Wakulla 63 4,677 4,045 64 6 142 0 706
Walton 74 5,877 4,466 61 19 181 0 25
Washington 48 3,401 2,155 45 45 397 0 13
Total 14,364 2,430,191 985,701 -- 4,150 59,209 31,949 78,052
Source: Florida School District Transportation Profiles, Volume 11 (July 2002).

Florida Transportation Almanac
137
Table 3-34 (Continued)FLORIDA SCHOOL DISTRICT TRANSPORTATION PROFILES (2001)
District Purchase of Buses ($) Total Salaries andBenefits ($)
Total TransportationExpenditure Per Student
($)
Total TransportationOperating Expenditure
($)
Total Annual Miles (includes field and activity trips)
Alachua 2,509,296 6,400,507 677 7,970,595 291,921
Baker 278,443 1,048,118 656 1,345,936 51,937
Bay 420,923 3,938,666 610 6,043,769 25,000
Bradford 242,763 920,770 661 1,104,636 90,377
Brevard 2,074,145 10,664,061 566 12,960,001 146,281
Broward 5,968,413 58,936,837 1,007 66,672,922 393,716
Calhoun 118,586 420,380 655 606,411 33,213
Charlotte 881 3,612,033 566 4,732,531 130,135
Citrus 613,366 3,527,358 551 4,833,721 106,745
Clay 1,170,702 6,364,661 654 7,670,586 158,994
Collier 1,734,779 9,545,279 829 12,086,254 281,901
Columbia 370,904 2,619,243 745 3,205,208 96,393
Dade 9,274,851 64,134,680 1,282 79,234,204 436,572
DeSoto 145,960 1,042,066 777 1,379,347 32,832
Dixie 98,000 614,869 663 824,215 22,982
Duval 0 1,476,764 695 39,127,921 891,712
Escambia 65,383 13,022,743 602 16,270,543 65,383
Flagler 583,584 1,708,978 585 2,349,483 194,574
Franklin 242,432 244,994 1,433 380,509 33,397
Gadsden 674,182 1,958,680 632 2,579,007 71,434
Gilchrist 0 604,458 517 783,628 329,557
Glades 197,986 231,180 1,282 318,693 175,276
Gulf 120,626 608,547 718 764,781 62,855
Hamilton 107,029 454,188 706 595,801 30,220
Hardee 142,230 1,088,409 590 1,344,707 83,471
Hendry 205,286 1,660,349 549 2,154,601 98,500
Hernando 527,829 4,674,971 589 6,129,643 260,903
Highlands 802,229 2,922,114 781 3,668,353 68,513
Hillsborough 1,653,936 37,790,013 585 46,236,025 613,264
Holmes 265,338 693,833 540 943,725 31,488
Indian River 261,492 2,325,151 525 3,084,376 165,094
Jackson 143,388 1,653,509 523 2,160,557 122,670
Jefferson 113,771 678,993 899 915,093 67,784
Source: Florida School District Transportation Profiles, Volume 11 (June 2002).

Florida Transportation Almanac
138
Table 3-34 (Continued)FLORIDA SCHOOL DISTRICT TRANSPORTATION PROFILES (2001)
District Purchase of Buses ($) Total Salaries andBenefits ($)
Total TransportationExpenditure Per
Student ($)
Total TransportationOperating Expenditure
($)
Total Annual Miles (includesfield and activity trips)
Lafayette 128,856 317,729 776 397,018 22,988
Lake 1,216,355 5,554,547 540 7,883,782 167,009
Lee 3,064,799 18,455,829 772 22,080,888 175,987
Leon 829,141 6,013,670 735 7,729,442 93,058
Levy 414,443 2,091,052 803 2,630,589 70,460
Liberty 0 290,045 549 403,063 28,717
Madison 214,924 807,766 700 1,161,828 70,321
Manatee 1,289,328 7,618,078 793 9,312,019 101,476
Marion 1,699,692 11,997,849 718 14,969,616 181,040
Martin 223,692 1,474,993 563 4,535,993 600,000
Monroe 297,829 2,413,174 882 3,190,453 159,662
Nassau 250,238 2,446,729 528 3,035,173 88,499
Okaloosa 978,318 5,799,483 536 6,585,633 187,525
Okeechobee 282,264 1,320,047 509 1,839,443 43,021
Orange 8,513,546 36,198,325 751 40,736,303 929,675
Osceola 835,321 6,708,045 533 7,950,655 39,527
Palm Beach 4,710,873 24,808,722 555 29,552,802 730,250
Pasco 1,879,107 10,952,441 581 13,356,634 155,518
Pinellas 6,538,391 21,880,192 754 24,696,977 307,398
Polk 2,713,575 13,471,979 497 18,001,323 266,963
Putnam 478,136 2,570,758 596 3,563,650 119,484
Santa Rosa 0 3,944,082 697 9,074,022 173,651
Sarasota 1,677,975 9,173,876 769 10,886,424 96,000
Seminole 1,148,579 13,434,546 674 15,784,094 300,175
St. Johns 844,739 4,351,978 537 5,467,060 198,283
St. Lucie 935,137 9,546,730 615 11,905,371 262,689
Sumter 191,976 1,301,441 496 1,680,756 56,896
Suwannee 0 1,538,607 586 1,969,012 75,401
Taylor 672,196 1,177,558 929 1,459,319 80,796
Union 0 419,855 503 644,186 83,165
Volusia 1,499,792 9,227,905 548 11,477,529 461,065
Wakulla 304,736 1,374,566 535 1,899,374 100,978
Walton 381,114 1,502,353 508 1,901,071 113,770
Washington 532,714 1,036,209 884 1,418,462 56,500
Total 75,876,519 488,808,561 45,602 639,657,746 12,263,041
Source: Florida School District Transportation Profiles, Volume 11 (July 2002).
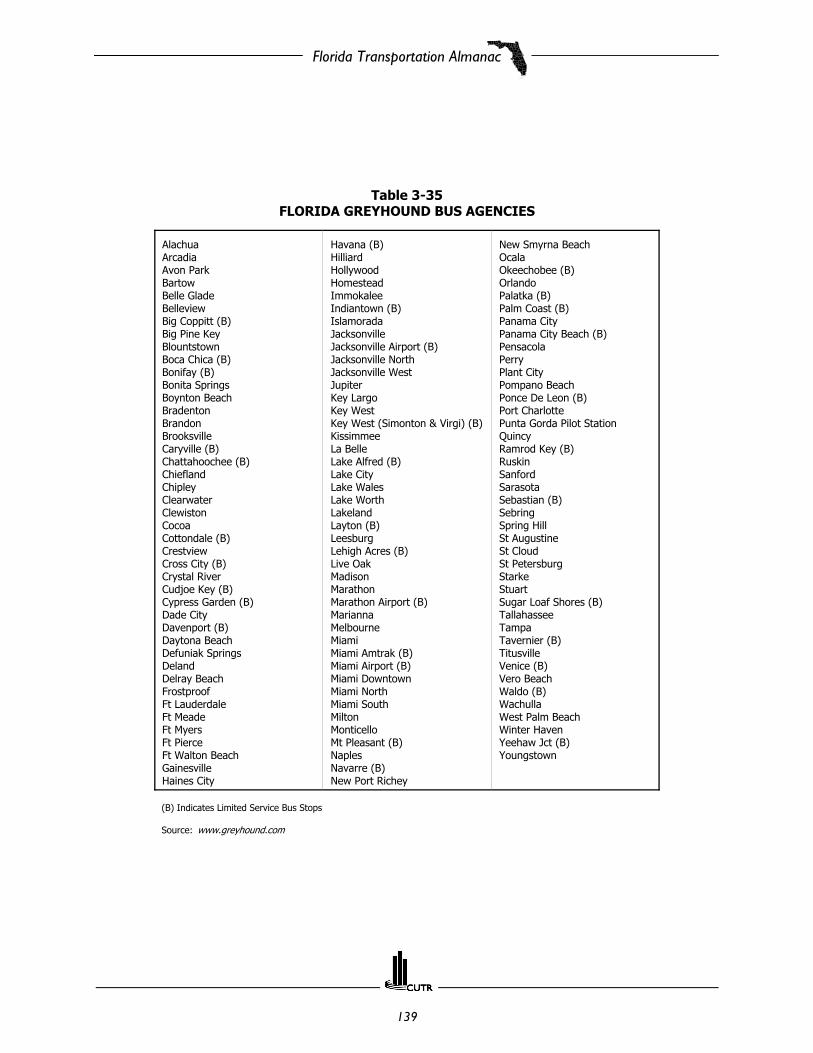
Florida Transportation Almanac
139
Table 3-35FLORIDA GREYHOUND BUS AGENCIES
Alachua Arcadia Avon Park Bartow Belle Glade Belleview Big Coppitt (B) Big Pine Key Blountstown Boca Chica (B) Bonifay (B) Bonita Springs Boynton Beach Bradenton Brandon Brooksville Caryville (B) Chattahoochee (B) Chiefland Chipley Clearwater Clewiston Cocoa Cottondale (B) Crestview Cross City (B) Crystal River Cudjoe Key (B) Cypress Garden (B) Dade City Davenport (B) Daytona Beach Defuniak Springs Deland Delray Beach Frostproof Ft LauderdaleFt Meade Ft Myers Ft Pierce Ft Walton Beach Gainesville Haines City
Havana (B)Hilliard Hollywood Homestead Immokalee Indiantown (B) Islamorada Jacksonville Jacksonville Airport (B) Jacksonville North Jacksonville West Jupiter Key Largo Key West Key West (Simonton & Virgi) (B) Kissimmee La Belle Lake Alfred (B) Lake City Lake Wales Lake Worth Lakeland Layton (B) Leesburg Lehigh Acres (B) Live Oak Madison Marathon Marathon Airport (B) Marianna Melbourne Miami Miami Amtrak (B) Miami Airport (B) Miami Downtown Miami North Miami South Milton Monticello Mt Pleasant (B) Naples Navarre (B) New Port Richey
New Smyrna Beach Ocala Okeechobee (B) Orlando Palatka (B) Palm Coast (B) Panama City Panama City Beach (B) Pensacola Perry Plant City Pompano Beach Ponce De Leon (B) Port Charlotte Punta Gorda Pilot StationQuincy Ramrod Key (B) Ruskin Sanford Sarasota Sebastian (B) Sebring Spring Hill St Augustine St Cloud St Petersburg Starke Stuart Sugar Loaf Shores (B) Tallahassee Tampa Tavernier (B) Titusville Venice (B) Vero Beach Waldo (B) Wachulla West Palm Beach Winter Haven Yeehaw Jct (B) Youngstown
(B) Indicates Limited Service Bus Stops
Source: www.greyhound.com

Florida Transportation Almanac
140

Florida Transportation Almanac
141
Rail

Florida Transportation Almanac
142
Florida Transportation Almanac
143
SECTION HIGHLIGHTS
# The Florida rail system is comprised of 13 line-haul railroads and 4 terminal or switching companies. Theline haul carries range in size from fairly small intrastate railroads to members of large rail systemsextending from Florida to the Pacific Coast and into Canada.
# In 2001, the Florida rail system operated 2,871 miles of railroad.
# There were 44 derailments in 2001. Of these, 20 were due to track problems, 13 were due to improperoperating practices, 5 were due to equipment failures, and 6 were due to other reasons.
# Florida rail carriers transported 119.9 million tons of freight in 1972. In 2001, the amount of freighttransported increased to 157.8 million tons.
# More than 50 percent of the total freight transported in Florida in 2001 was nonmetallic minerals(excluding fuels).
# According to Amtrak’s 2003 Timetable, the passenger rail service serves 41 destinations.
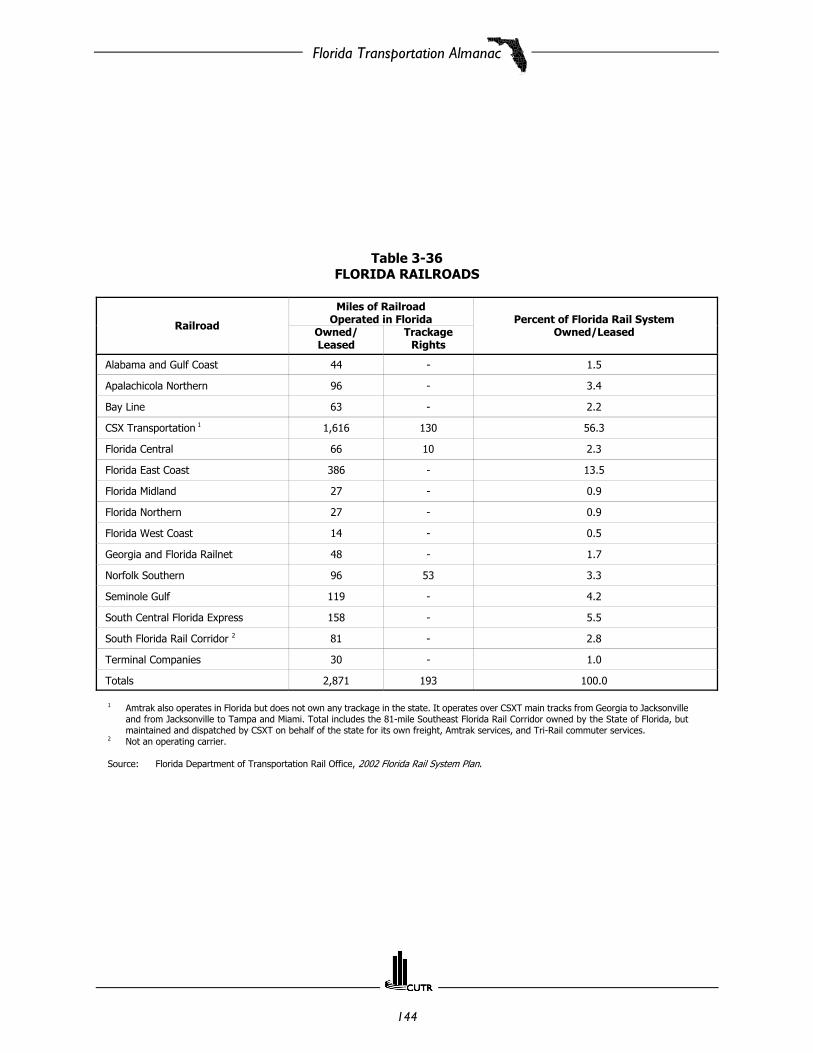
Florida Transportation Almanac
144
Table 3-36FLORIDA RAILROADS
Railroad
Miles of RailroadOperated in Florida Percent of Florida Rail System
Owned/LeasedOwned/Leased
TrackageRights
Alabama and Gulf Coast 44 - 1.5
Apalachicola Northern 96 - 3.4
Bay Line 63 - 2.2
CSX Transportation 1 1,616 130 56.3
Florida Central 66 10 2.3
Florida East Coast 386 - 13.5
Florida Midland 27 - 0.9
Florida Northern 27 - 0.9
Florida West Coast 14 - 0.5
Georgia and Florida Railnet 48 - 1.7
Norfolk Southern 96 53 3.3
Seminole Gulf 119 - 4.2
South Central Florida Express 158 - 5.5
South Florida Rail Corridor 2 81 - 2.8
Terminal Companies 30 - 1.0
Totals 2,871 193 100.0
1 Amtrak also operates in Florida but does not own any trackage in the state. It operates over CSXT main tracks from Georgia to Jacksonvilleand from Jacksonville to Tampa and Miami. Total includes the 81-mile Southeast Florida Rail Corridor owned by the State of Florida, butmaintained and dispatched by CSXT on behalf of the state for its own freight, Amtrak services, and Tri-Rail commuter services.
2 Not an operating carrier.
Source: Florida Department of Transportation Rail Office, 2002 Florida Rail System Plan.
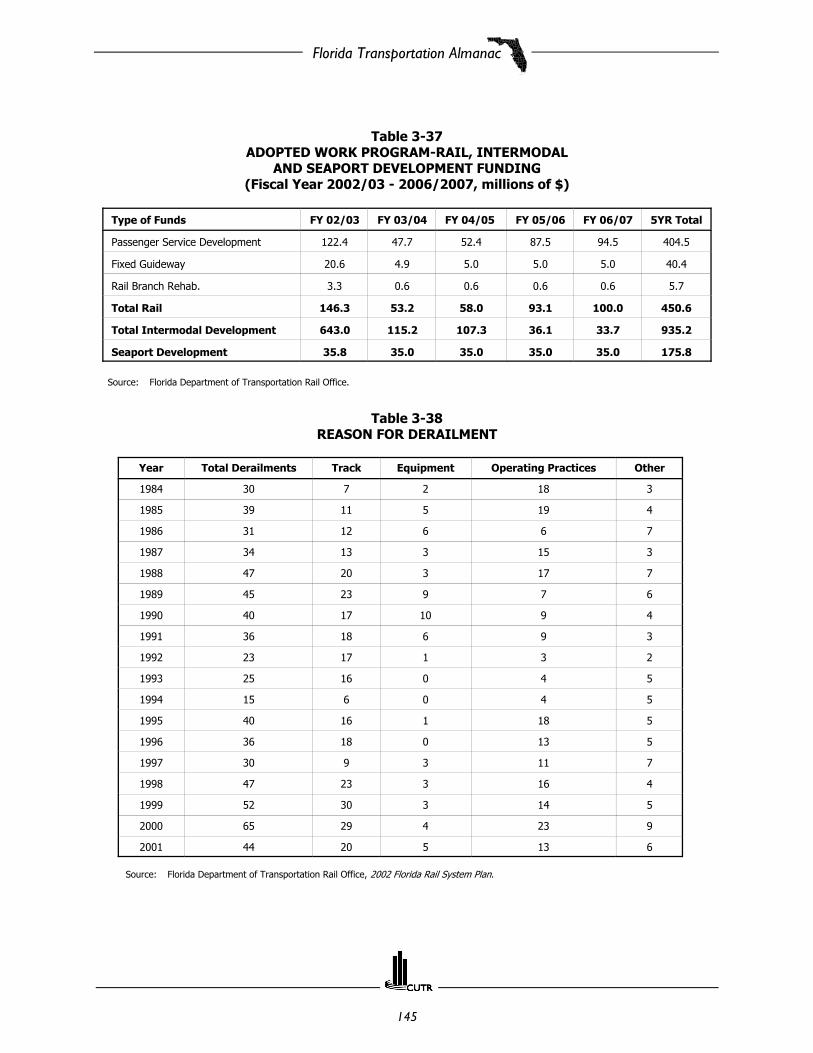
Florida Transportation Almanac
145
Table 3-37ADOPTED WORK PROGRAM-RAIL, INTERMODAL
AND SEAPORT DEVELOPMENT FUNDING(Fiscal Year 2002/03 - 2006/2007, millions of $)
Type of Funds FY 02/03 FY 03/04 FY 04/05 FY 05/06 FY 06/07 5YR Total
Passenger Service Development 122.4 47.7 52.4 87.5 94.5 404.5
Fixed Guideway 20.6 4.9 5.0 5.0 5.0 40.4
Rail Branch Rehab. 3.3 0.6 0.6 0.6 0.6 5.7
Total Rail 146.3 53.2 58.0 93.1 100.0 450.6
Total Intermodal Development 643.0 115.2 107.3 36.1 33.7 935.2
Seaport Development 35.8 35.0 35.0 35.0 35.0 175.8
Source: Florida Department of Transportation Rail Office.
Table 3-38REASON FOR DERAILMENT
Year Total Derailments Track Equipment Operating Practices Other
1984 30 7 2 18 3
1985 39 11 5 19 4
1986 31 12 6 6 7
1987 34 13 3 15 3
1988 47 20 3 17 7
1989 45 23 9 7 6
1990 40 17 10 9 4
1991 36 18 6 9 3
1992 23 17 1 3 2
1993 25 16 0 4 5
1994 15 6 0 4 5
1995 40 16 1 18 5
1996 36 18 0 13 5
1997 30 9 3 11 7
1998 47 23 3 16 4
1999 52 30 3 14 5
2000 65 29 4 23 9
2001 44 20 5 13 6
Source: Florida Department of Transportation Rail Office, 2002 Florida Rail System Plan.

Florida Transportation Almanac
146
Table 3-39FLORIDA RAIL FREIGHT TRAFFIC
HISTORY TONNAGE (000 tons)
Year Originating Terminating Total
1972 57,038 62,830 119,868
1975 57,581 63,227 120,808
1979 75,032 87,101 162,133
1982 55,912 68,717 124,629
1986 60,196 78,305 138,501
1990 65,933 89,573 155,506
1991 59,915 83,587 143,502
1992 59,116 83,454 142,570
1993 58,859 82,616 141,475
1994 64,478 91,750 156,228
1995 68,514 97,228 165,742
1996 71,707 102,243 173,950
1997 71,337 101,608 172,945
1998 75,634 106,640 182,274
1999 68,979 99,790 168,769
2000 68,741 98,041 166,782
2001 64,417 93,408 157,825
Source: Florida Department of Transportation Rail Office, 2002 Florida RailSystem Plan.

Florida Transportation Almanac
147
Table 3-40FLORIDA RAIL FREIGHT TRAFFIC TONNAGE BY COMMODITY (000 tons)
StandardTransport
CommodityCommodity Description Originated Terminated Totals Percent of
Total
11 Coal 0 15,992 15,992 10.1
14 Nonmetallic Minerals (except Fuels) 38,952 42,453 81,405 51.6
20 Food or Kindred Products 2,695 4,205 6,900 4.4
24 Lumber or Wood Products; Except Furniture 585 2,495 3,080 2
26 Pulp, Paper, or Allied products 1,768 1,515 3,283 2.1
28 Chemicals or Allied Products 10,805 8,020 18,825 11.9
32 Clay, Concrete, Glass, or Stone Products 1,200 2,219 3,419 2.2
46 Miscellaneous Mixed Shipments 2,776 5,018 7,794 4.9
49 Hazardous Materials 1,806 3,795 5,601 3.5
All Others 1 3,830 7,696 11,526 7.3
Totals 64,417 93,408 157,825 100
1 Includes all commodities comprising less than 2 percent of total.
Source: Florida Department of Transportation Rail Office, 2002 Florida Rail System Plan.

Florida Transportation Almanac
148
Source: Florida Department of Transportation Rail Office, 2002 Florida Rail System Plan.

Florida Transportation Almanac
149
Table 3-41FLORIDA CITIES SERVED BY AMTRAK
PASSENGER RAIL (2003)
Bradenton, FL BDT Chipley, FL CIP Crestview, FL CSV Dade City, FL DDE Daytona Beach, FL DYA Deerfield Beach, FL DFB Deland, FL DLD Delray Beach, FL DLB Fort Lauderdale, FL FTL Fort Myers, FL FTM Hollywood, FL HOL Homestead, FL HMF Islamorada, FL ISL Jacksonville, FL JAX Key Largo, FL KYL Key West-Airport, FL KWA Kissimmee, FL KIS Lake City, FL LEC Lakeland, FL LAK Madison, FL MDO Marathon, FL MTH
Miami, FL MIA Miami International Airport, FL MII Ocala, FL OCA Okeechobee, FL OKE Orlando, FL ORL Palatka, FL PAK Pensacola, FL PNS Port Charlotte, FL PCH Sanford (Auto Train Only), FL SFA Sanford (Regular Trains), FL SFD Sarasota, FL SRA Sebring, FL SBG St. Petersburg, FL STP Tallahassee, FL TLH Tampa, FL TPA Waldo, FL WDO West Palm Beach, FL WPB Wildwood, FL WWD Winter Haven, FL WTH Winter Park, FL WPK
Source: http://www.amtrak.com.

Florida Transportation Almanac
150

Florida Transportation Almanac
151
Seaports

Florida Transportation Almanac
152
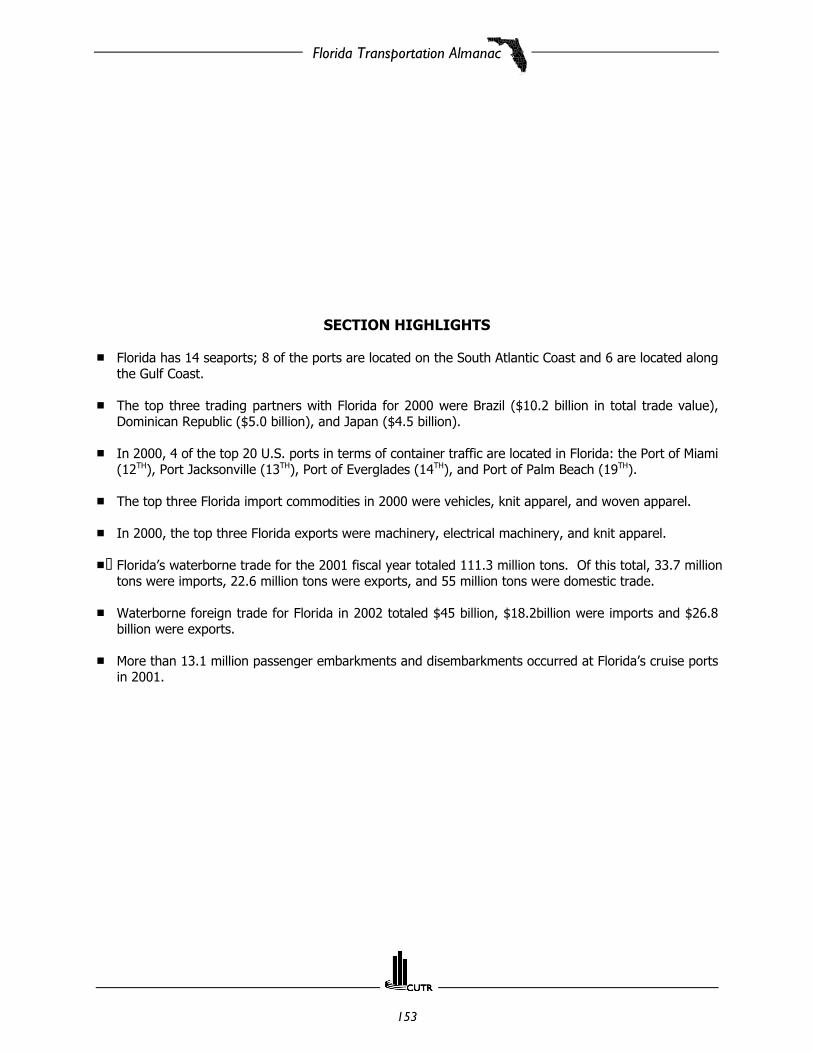
Florida Transportation Almanac
153
SECTION HIGHLIGHTS
# Florida has 14 seaports; 8 of the ports are located on the South Atlantic Coast and 6 are located alongthe Gulf Coast.
# The top three trading partners with Florida for 2000 were Brazil ($10.2 billion in total trade value),Dominican Republic ($5.0 billion), and Japan ($4.5 billion).
# In 2000, 4 of the top 20 U.S. ports in terms of container traffic are located in Florida: the Port of Miami(12TH), Port Jacksonville (13TH), Port of Everglades (14TH), and Port of Palm Beach (19TH).
# The top three Florida import commodities in 2000 were vehicles, knit apparel, and woven apparel.
# In 2000, the top three Florida exports were machinery, electrical machinery, and knit apparel.
# Florida’s waterborne trade for the 2001 fiscal year totaled 111.3 million tons. Of this total, 33.7 milliontons were imports, 22.6 million tons were exports, and 55 million tons were domestic trade.
# Waterborne foreign trade for Florida in 2002 totaled $45 billion, $18.2billion were imports and $26.8billion were exports.
# More than 13.1 million passenger embarkments and disembarkments occurred at Florida’s cruise portsin 2001.

Florida Transportation Almanac
154
Florida Transportation Almanac
155
The South Atlantic Coast Ports
Port of FernandinaThe Port of Fernandina provides terminal service to over 15 pulp and paper mills located throughout Florida and the southeast.Fernandina also supports a number of independent container liners serving Venezuela, Colombia, Brazil, Ecuador, the DominicanRepublic, Haiti, Jamaica, and Bermuda. Its sphere of influence spans all over the southeastern United States including Atlanta, NewOrleans, and Houston. The Port’s principal cargos include exports of forest products including kraft linerboard wood pulp and treatedlumber. Other main cargos include containerized goods such as wood pulp, automobile parts, beer, frozen foods, machinery, andconsumer goods. The mission statement for the port states, “The Ocean and Highway and Port Authority was created in 1941 andauthorized to carry out public purposes of benefit to the citizens of the County of Nassau and the State of Florida. (Ch. 21418, Sp. Acts1941).” The port lists promoting economic development, creating employment opportunities in Nassau County, revitalizing andmaintaining deepwater seaport activities, and supporting local industries by providing port facilities as its major goals and objectives.Capital improvements needed to achieve the port’s mission include expanding warehouse space, expanding rail siding to serviceintermodal traffic, and developing bulk import facilities. Its environmental initiatives are a two-year manatee monitoring study,participating with the New England Aquarium in a right whale monitoring program, near-shore disposal for beach renourishment, andthe creation of five acres of saltwater marsh. The port has recently instituted a new monthly service of imported lumber from Europe,increased warehouse capacity by approximately 30 percent, and made notable progress on Dade Street access improvements and newgate configuration.
Port of JacksonvilleThe Port of Jacksonville includes many private terminals along the St. Johns River plus the three public terminals controlled by theJacksonville Port Authority, otherwise known as JAXPORT. The private facilities include multiple dry and liquid bulk terminals, shipyards,and U.S. Navy and Marine Corps installations. JAXPORT facilities serve as a southeastern hub for the intermodal movement ofcommodities on the world market. Well known as a leading importer of automobiles and other vehicles, the Port also ranks among thetop container ports in the nation and dominates trade with Puerto Rico. JAXPORT is also developing a new marine terminal on a 460-acre “greenfield” site on Dames Point, currently preparing over 45 acres to handle expanded bulk and breakbulk cargo opportunities.Jacksonville continues to be an important military outload port for the rapid deployment of supplies for U.S. military operationsthroughout the world. The Ports sphere of influence reaches throughout the state of Florida and the Southeastern United States as wellas major portions of the Midwest. The vision of the Port “is to be the major diversified international transportation center of theSoutheastern United States.” The major goals and objectives for the Port of Jacksonville are to continue to expand Port facilities andimprove existing infrastructure through major capital initiatives. This is to be accomplished by further developing JAXPORT’s newestterminal for intermodal, bulk, and breakbulk business; intensifying international marketing efforts and diversifying trade lanes and cargos;establishing a common-use terminal and Freeport connection as a means of market diversification; working with FDOT to improve amodern transportation connector system linking Jacksonville to an interstate road network; and attracting a major cruise line to homeporta cruise ship in Jacksonville. To achieve these goals, the Port lists needs to make the following capital improvements: intermodalhighway connections, channel dredging to 40 plus 1 feet, and funding assistance for capital projects. Environmental initiatives includeparticipation on the Northern Right Whale Monitoring Team and a continuing role in public acquisition and enhancement of anenvironmentally sensitive nature island in the Intercostal Waterway (part of the wetland mitigation effort). The Port has experiencedover a 50 percent increase in marine cargo volume since 1990, is the second busiest vehicle-handling port in the country, hasimplemented a $190 million port development and expansion plan, and is in the progress of deepening 14.7 miles of St. Johns River’smain shipping channel from 38 to 41 feet. On October 1, 2001, JAXPORT was restructured into two agencies, the Jacksonville AviationAuthority and the Jacksonville Seaport Authority.
Port CanaveralLocated on mid-Florida’s Atlantic coast, adjacent to the Kennedy Space Center and Orlando attractions, Port Canaveral serves both cargoand cruise markets. In FY 2000, Port Canaveral handled 3.8 million revenue cruise passengers on one-, three-, four-, and seven-daycruises to the Bahamas and the Carribean. To date, the Port has invested $100 million in its six major cruise terminals, designed andcustom-built to accommodate the world’s fleet of megacruise ships. The Port has room for three more terminals, including a facility tohomeport the America World City, if it is built. Port Canaveral and its Foreign Trade Zone 136 serve as a unique quadramodaltransportation hub, linking sea, land, air and space transportation modes. Primary cargoes served by 10 berths and a new 6-acrecontainer yard include citrus, meat products, limber, scrap steel, petroleum products, newsprint, gypsum, salt, cement, and rock. Inaddition to its maritime operations, Port Canaveral has created a state-of-the-art maritime fire training facility for the ships’ crews anddeveloped award-winning environmental programs. Port property also is utilized for public/private commercial and recreational facilitiesfor access by the local community and tourists to the area. Port Canaveral’s sphere of influence includes all of Central Florida andbecause of its involvement in the cruise industry Europe, the Bahamas, the Carribean, and both Central and South America. The missionof the Port is “serving the economic and social needs of the District and the region by providing low-cost transportation benefits; creatinga stable, meaningful and permanent employment base; promoting and accommodating major marine-associated industries, facilitiesand services for the military and space organizations; promoting the District’s and region’s economic growth; and enhancing local andregional recreational facilities and opportunities.” The major goals and objectives of the Port are to construct and expand port facilitiesand infrastructure in an orderly manner to meet the growth needs of the District, the cruise/tourist industry, the cargo transport industry,the Foreign Trade Zone and supporting marine commercial/industrial groups, the fishing industry, the military establishment, and thespace industry as well as the recreational demands of the community. To achieve these objectives, the Port needs to construct a cruiseterminal, expand and deepen the Cargo berth, restore land, expand warehouse and cold storage, improve roads, and expand thecontainer yard. The Port is involved in sand bypass and beach restoration, educational programs about threatened/endangered species,and right whale protection. Recently, it has seen 10 percent increase in cargo tonnage and a record number of cruise ship calls and

Florida Transportation Almanac
156
cruise passenger trips, and has received the American Association of Port Authorities annual Award of Excellence for the Port’s advertisingcampaign.
Port of Fort PierceSt. Lucie County and the City of Fort Pierce are exploring their strategic options for the Port by implementing a planning process todetermine how best to use land designated for Port operations while satisfying the local community’s expressed preferences. The Countyis working with the FAU/FIU Center for Environmental & Urban Problems to update the Port Master Plan, while the City is preparing abusiness plan and comprehensive plan update. The land designated for Port development is now owned by an entity planning to importfruit and vegetables from the Bahamas, using the southern 20 acres of Port property for their maritime operations. Private users of thePort continue to move bulk products at their facilities. The Port of Fort Pierce’s sphere of influence reaches St. Lucie, Indian River,Okeechobee, Highlands, Hendry, Glades, and Martin Counties. The Port’s mission is to “broaden and strengthen the economic base ofthe regional community by providing adequate infrastructure and development processes for mixed-use Port development.” The majorgoals and objectives of the Port are to acquire land for port use; provide infrastructure for land to be developed for mixed marinerecreation, marine commercial, and marine industrial use; and to update the Port Master Plan. To achieve these goals, the followingcapital improvements are necessary: land acquisition, road improvements, and infrastructure construction. Recently, the Port completeda feasibility study for the north entrance to the Port; designed the Taylor Creek restoration project; and formed and implemented a PortSecurity Committee.
Port of Palm BeachThe Port of Palm Beach is a full service, landlord, public port that provides services through its private sector partners in South Floridaand is responsible for facilitating economic development within Palm Beach County and the region. It is estimated that between 3,000and 4,000 jobs are directly associated with Port of Palm Beach activities. Port services include container, dry bulk, liquid bulk, breakbulk, and roll-on/roll-off cargo-handling capabilities. Additionally, the Port provides Foreign Trade Zone and intermodal opportunitiesto its customers and users. Single-day cruises complement other Port operations. Currently, the Port handles about 4 million tons ofcargo annually. The major goals and objectives are to develop adequate, modern and efficient port facilities, cost effective portoperations, and effective trade promotion activities. The Port of Palm Beach has a sphere of influence that reaches not only throughoutthe state but also to three continents. Recently, the Port completed a Skypass and preparation of an intermodal plan.
Port EvergladesPort Everglades ranks as one of the nation’s leading container and cruise ports. Its diversified cargo includes bulk, breakbulk, container,rolling stock, vehicles, and equipment. Port Everglades is a designated point of entry for coffees and is the second largest East Coastnon-refinery center for petroleum products. Among the Port's primary goals and objectives are to consistently maintain, develop, expandand modify the Port to meet service area needs, strengthen Broward County's economy, and enhance the region's multi-modaltransportation network. The Port aims to assure the development of an integrated and balanced regional transportation system. Inaddition, the Port would like to provide new container, bulk and breakbulk facilities, including an intermodal container facility; expandcruise operations and construct new facilities for a greater market share; expand Foreign Trade Zone operations; expand role as atransshipment center for the Southeastern U.S., Caribbean and Latin American markets; improve intermodal connections to guaranteecompetitive road and rail service; pursue new trading opportunities and strengthen existing ties; and maximize the advantage of theCoffee Exchange Destination.
Port of MiamiKnown as the Cruise Capital of the World, Miami is the world's busiest cruise port, with a fleet of more than 17 homeporting ships,including 6 of the world’s largest megaships. Miami is the largest container port in Florida, and is among the largest in the U.S. Inaddition to providing frequent liner service to markets in the Carribean and Central and South America, it serves markets in Europe andthe Far East. This diversity accounts for the wide range of commodities it handles including breakbulk and general cargo, automobilesand heavy equipment. The Port of Miami's mission is to be an economic generator for both Miami-Dade County and South Florida,projecting a positive world-class image for our local community and to ensure that the port has the capabilities to provide both cruisepassenger and cargo industries with the necessary infrastructure. Among the Port's primary goals and objectives are expanding cruisemarket share by restoring existing facilities and constructing new terminals and berths required for new generation ships; expandingcontainer market by providing cargo-handling and railroad facilities required for efficient intermodal container operations; enhancingposition as transshipment hub of the Caribbean and Central and South America; and pursuing new trade opportunities and strengtheningexisting ties.
Port of Key WestThe primary port-related activities in Key West are cruise-ship oriented, as the Port has become a popular port-of-call for the evergrowing cruise fleet homeporting at Florida's ports. Over the years, it has also played an important role in hosting the nation's military,particularly the U.S. Navy. The Port’s mission is "to provide mutual benefits for visitors to Key West who arrive by ship and residentswho depend upon a healthy local economy."

Florida Transportation Almanac
157
The Gulf Coast Ports
Port of PensacolaThis Northwest Florida port has capitalized on its easy Gulf of Mexico access, service from two national railroads, and dominance inhandling bagged agricultural goods and liquid bulk products. The Port of Pensacola has been successfully diversifying its cargo mix toprovide new business opportunities. The Port’s cargo mix has increased from three primary commodities to more than 13 over the pastthree years, adding frozen cargoes and dry bulk product to the port’s product inventory. The westernmost deepwater port in Florida,it is well situated for Caribbean as well as Central and South American trade. The Port of Pensacola's mission is to manage and operatecost-effective facilities for marine commerce to foster regional and international trade, to stimulate private investment, and to promoteeconomic development and employment. Its major goals and objectives are to maintain aggressive marketing initiatives, targetingspecific cargoes, including additional project cargo; rehabilitate Port facilities; attract and retain waterborne commerce and new industry;and solidify and enhance Port-tenant relationships.
Port of Panama CityLocated on the Gulf Coast in Florida's panhandle, this port specializes in breakbulk cargo plus some dry bulk products. The Port hasbecome a catalyst for industrial development in Northwest Florida. In addition, the Port, which is located adjacent to the IntracoastalWaterway, is equipped with modern cargo-handling facilities for truck, rail, barge, container, and roll-on/roll-off traffic. Future goalsand objectives for the port include provision of additional deepwater berthing areas, warehouse space and cargo-handling capabilities;provision of additional port property to accommodate water-dependent/related industrial activities through property acquisition anddredging spoil disposal; and the maintenance of in-water and on-land facilities.
Port St. JoeThis small northwestern Florida port’s location allows the intermodal interchange of cargo from ocean vessels to rail, highway orcontinued water movement, via barge by the Intracoastal Waterway. The Port handles inbound liquid bulk products, chemicals, fish,and coal while handling outbound movements of forest products, liquid bulk products, and processed fish.
Port ManateeLocated near the entrance to Tampa Bay, Port Manatee is a full-service deepwater port with both cargo and cruise operations. The Porthas successfully diversified its cargo matrix to include a wide variety of general cargoes, containerized breakbulk, and bulk commodities.Port Manatee ranks first among the Sunshine State’s west coast port in container movement, and ranks number one nationally forimporting frozen concentrated orange juice and is the nation’s leading export location for citrus juices and beverages. The major goalsand objectives of Port Manatee are to develop and operate as a competitive and viable deepwater shipping port, to stimulate localdevelopment and serve local, state, national, and international shipping needs generated by that economic development.
Port of St. PetersburgThis Port of St. Petersburg, located on Tampa Bay, is exploring opportunities to create a multi-use facility that capitalizes on its uniqueassets with the City of St. Petersburg. It is now pursuing partnering opportunities with its neighbors: the Albert Whitted Airport, theUniversity of South Florida, and the U.S. Coast Guard. The port aims to expand its cruise facilities, including new terminal, berths,parking, and public access; attract selected types of roll-on/roll-off cargo; provide required facilities to expand potential maritimeoperations; maintain existing facilities; and attract a diversity of revenue-producing amenities in conjunction with cruise operations.
Port of TampaThe Port of Tampa is one of Florida’s largest ports, as measured by tonnage. It is a major port of entry for the fuel and buildingmaterials used in the region and a force in the shipbuilding and repair industry. The Port is also a popular cruise port, serving theexpanding Western Caribbean market. The predominant bulk products handled include phosphate rock, fertilizer products, petroleum,coal, and general cargo. In addition to the traditional liquid and dry bulk cargo, the Port handles many other commodities, exportingautomobiles, citrus, frozen poultry, and scrap steel and importing produce, gypsum, ammonia, sulphur, cement, steel, rock, fruit,construction materials, and refrigerated good. The Port Authority's major goals and objectives are to contribute to state and localeconomic development by promoting trade, developing port properties, and improving the efficiency of port operations; develop generalcargo and passenger facilities and terminals to meet the needs of existing and new port customers; improve public terminal efficiencies;strengthen and diversify the Port's economic base by promoting mixed-use development of certain waterfront Port properties; andmaximizing revenue-generating potential of non-waterfront property; and develop efficient and economically viable transportationlinkages by improving access roads and other surface transportation access.
Source: Florida Seaport Transportation and Economic Development Council, A Five-Year Plan To Accomplish The Mission of Florida's Seaports 2001/2002-2004/2005.

Florida Transportation Almanac
158
Tabl
e 3
-42
FLO
RID
A'S
PO
RTS
(2
00
0)
Por
tG
over
nin
g B
ody
Hin
terl
and
Serv
edTr
adin
g P
artn
ers
Pri
nci
pal A
ctiv
itie
s &
Pro
duct
sC
urr
ent
& P
roje
cted
Thro
ugh
puts
Val
ue
of W
ater
born
eIm
port
s an
dEx
port
s ($
)
Ton
nag
e of
Wat
erbo
rne
Trad
e (i
n T
ons)
Cru
ise
Act
ivit
ies
(Em
bark
atio
ns
&D
isem
bark
atio
ns)
Cana
vera
lCa
nave
ral P
ort
Auth
ority
(Can
aver
al P
ort
Dis
tric
t)
Cent
ral c
ount
ies
ofBr
evar
d, F
lagl
er,
Hig
hlan
ds, I
ndia
n Ri
ver,
Lake
, Oke
echo
bee,
Ora
nge,
Osc
eola
,Se
min
ole,
St.
Luc
ie, a
ndVo
lusi
a
Euro
pe, S
outh
Amer
ica,
Car
ibbe
anBa
sin,
Can
ada,
Far
East
, Cen
tral
Amer
ica,
For
mer
Russ
ian
Stat
es
Bulk
, neo
-bul
k an
dbr
eakb
ulk
carg
o; c
ruis
eop
erat
ions
;Fo
reig
n Tr
ade
Zone
136
;co
ntai
ner
serv
ice;
publ
ic/p
rivat
ere
crea
tiona
l fac
ilitie
s
Carg
o (t
ons)
: C
urre
nt -
4.5
mill
ion
Pro
ject
ed -
5
.5 m
illio
n
Crui
se (
reve
nue
pass
enge
rs):
Cur
rent
-
3
.8 m
illio
n P
roje
cted
-
5.7
mill
ion
Impo
rts:
512
mill
ion
Expo
rts:
140
mill
ion
Impo
rts:
2,18
1,82
9
Expo
rts:
282
,444
Dom
estic
:
2,08
9,51
8
One
-day
:
1,7
93,0
02
(
indi
v.
pass
enge
rs)
Mul
ti-da
y:
1,9
95,6
18
(
indi
v.
pass
enge
rs)
Ever
glad
esBr
owar
d Co
unty
Boar
d of
Cou
nty
Com
mis
sion
ers
Prim
arily
Bro
war
d, D
ade,
and
Palm
Bea
ch c
ount
ies
as p
art
of a
24-
coun
tyar
ea e
xten
ding
nort
hwar
d to
Pas
co, P
olk,
Osc
eola
, and
Bre
vard
,so
uthw
ard
to M
onro
ean
d w
estw
ard
to t
he G
ulf
of M
exic
o
Carib
bean
Bas
in;
Nor
th, C
entr
al, a
ndSo
uth
Amer
ica;
Euro
pe;
Med
iterr
anea
n; t
heM
iddl
e Ea
st;
Sout
hwes
t As
ia;
Afric
a; a
nd t
hePa
cific
Rim
Bulk
(ga
solin
e an
dav
iatio
n fu
el, c
emen
t an
dcl
inke
rs, p
etro
leum
/cru
dean
d fu
el o
ils, g
ypsu
m);
brea
kbul
k (b
uild
ing
mat
eria
ls, s
teel
, lum
ber)
;co
ntai
ner
carg
o(til
e,le
athe
r go
ods,
cof
fee,
pape
r pr
oduc
ts, a
uto
part
s, f
urni
ture
, app
arel
,be
vera
ges,
dai
rypr
oduc
ts, a
gric
ultu
ral
prod
ucts
, fro
zen
mea
ts,
citr
us c
once
ntra
te);
and
rolli
ng s
tock
suc
h as
yach
ts a
nd o
ther
boa
ts,
vehi
cles
and
equ
ipm
ent.
Carg
o (t
ons)
: C
urre
nt -
23.9
mill
ion
Pro
ject
ed -
2
7.0
mill
ion
Crui
se (
reve
nue
pass
enge
rs):
Cur
rent
-
2
.7 m
illio
n P
roje
cted
-
4.0
mill
ion
Impo
rts:
7.0
bill
ion
Expo
rts:
5.0
bill
ion
Impo
rts:
4,98
5,53
9
Expo
rts:
6,09
3,43
7
Dom
estic
: 1
2,77
6,37
4
One
-day
:
1,1
41,2
24
(
indi
v.
pass
enge
rs)
Mul
ti-da
y:
1,5
96,1
65
(in
div.
pa
ssen
gers
)
Fern
andi
naO
cean
Hig
hway
and
Port
Aut
horit
y,N
assa
u Co
unty
Sout
heas
tern
Uni
ted
Stat
esan
d G
ulf
Stat
es;
maj
orm
etro
polit
an a
reas
suc
has
Tam
pa, O
rland
o,Ja
ckso
nvill
e, A
tlant
a,N
ew O
rlean
s, a
ndH
oust
on
Nor
ther
n Eu
rope
,M
edite
rran
ean,
Berm
uda,
Ve
nezu
ela,
Ecua
dor,
Bra
zil,
Arge
ntin
a,Co
lom
bia,
Chi
le,
Colu
mbi
a Tr
inid
ad,
Jam
aica
, the
Baha
mas
, and
Puer
to R
ico
Expo
rts
of f
ores
tpr
oduc
tsin
clud
ing
kraf
t lin
erbo
ard,
woo
d pu
lp, a
nd t
reat
edlu
mbe
r,an
d co
ntai
neriz
ed g
oods
(woo
d pu
lp, a
utom
obile
part
s, b
eer,
fro
zen
food
s,m
achi
nery
, con
sum
ergo
ods)
.
Carg
o (t
ons)
: C
urre
nt -
0.6
mill
ion
Pro
ject
ed -
1
.3 m
illio
n
Crui
se (
reve
nue
pass
enge
rs):
Cur
rent
-
0
Pro
ject
ed -
0
Impo
rts:
120
mill
ion
Expo
rts:
292
mill
ion
Impo
rts:
98,
000
Expo
rts:
455
,000
Dom
estic
:
0
One
-day
:
0
Mul
ti-da
y:
0
Fort
Pie
rce
St. L
ucie
Cou
nty
St. L
ucie
, Ind
ian
Riv
er,
Oke
echo
bee,
Hig
hlan
ds,
Hen
dry,
Gla
des,
and
Mar
tin c
ount
ies
Carib
bean
Bas
in,
Baha
mas
, the
Far
East
, Eur
ope
impo
rts
of a
rago
nite
and
cem
ent,
exp
orts
of
grap
efru
it
Carg
o (t
ons)
: C
urre
nt -
0
.021
mill
ion
Pro
ject
ed -
0
.30
mill
ion
Crui
se (
reve
nue
pass
enge
rs):
Cur
rent
-
0 P
roje
cted
-
0.01
5 m
illio
n
Impo
rts:
22
mill
ion
Expo
rts:
8
mill
ion
Impo
rts:
21,
087
Expo
rts:
0
Dom
estic
:
0
One
-day
:
0
Mul
ti-da
y:
0
Sour
ce:
Flor
ida
Seap
ort
Tran
spor
tatio
n an
d Ec
onom
ic D
evel
opm
ent
Coun
cil,
A Fi
ve-Y
ear
Plan
To
Acco
mpl
ish
The
Mis
sion
of F
lorid
a's
Seap
orts
200
1/20
02-2
004/
2005
.

Florida Transportation Almanac
159
Tabl
e 3
-42
(C
onti
nu
ed)
FLO
RID
A'S
PO
RTS
(2
00
0)
Por
tG
over
nin
g B
ody
Hin
terl
and
Serv
edTr
adin
g P
artn
ers
Pri
nci
pal A
ctiv
itie
s &
Pro
duct
sC
urr
ent
& P
roje
cted
Thro
ugh
puts
Val
ue
of W
ater
born
eIm
port
s an
dEx
port
s ($
)
Ton
nag
e of
Wat
erbo
rne
Trad
e (i
n T
ons)
Cru
ise
Act
ivit
ies
(Em
bark
atio
ns
&D
isem
bark
atio
ns)
Jack
sonv
ille
Jack
sonv
ille
Port
Auth
ority
Cent
ral a
nd N
orth
ern
Flor
ida,
Sout
heas
tern
Uni
ted
Stat
es, a
ndm
ajor
por
tions
of
the
Mid
wes
t
Far
East
, Can
ada,
Cent
ral a
nd S
outh
Amer
ica,
Car
ibbe
anBa
sin,
incl
udin
gPu
erto
Ric
o,N
orth
ern
and
Wes
tern
Eur
ope,
the
Mid
dle
East
,an
d Af
rica
Mar
ine-
rela
ted
faci
litie
sth
at s
erve
as
aco
mm
oditi
es lo
ad c
ente
rfo
r th
e So
uthe
aste
rn U
.S.
and
the
Mid
wes
t, li
ner
and
roll-
on/r
oll-o
ffse
rvic
e, a
nd m
ilita
ryou
tload
Carg
o (t
ons)
: C
urre
nt:
19.3
mill
ion
Pro
ject
ed:
27.0
mill
ion
Crui
se (
reve
nue
pass
enge
rs):
Cur
rent
:0
Pro
ject
ed:
0.18
7
Impo
rts
8.28
bill
ion
Expo
rts:
1.93
bill
ion
Impo
rts:
8,28
0,00
0
Expo
rts:
911,
000
Dom
estic
:10
,067
,000
One
-day
:0
Mul
ti-da
y:0
Key
Wes
tCi
ty o
f Ke
y W
est
City
of
Key
Wes
t, lo
wer
Keys
Not
App
licab
lePr
inci
pal p
ort-
rela
ted
activ
ities
are
cru
ise-
ship
orie
nted
;ot
her
activ
ities
incl
ude
host
ing
a la
rge
mili
tary
cont
inge
nt;
Pass
enge
rfe
rry
inte
rmod
al c
ente
r.
Carg
o (t
ons)
: C
urre
nt:
0 P
roje
cted
:0
Crui
se (
reve
nue
pass
enge
rs):
Cur
rent
:0.
6 m
illio
n P
roje
cted
:1.
6 m
illio
n
Impo
rts:
0.91
mill
ion
Expo
rts:
12 m
illio
n
Impo
rts:
0
Expo
rts:
0
Dom
estic
:0
One
-day
:0
Mul
ti-da
y:67
0,53
1
(
indi
v.
pass
enge
rs)
Man
atee
Man
atee
Cou
nty
Port
Aut
horit
yFl
orid
a co
untie
s w
ithin
a10
0-m
ile r
adiu
s in
clud
ing
Lee,
Cha
rlott
e, D
eSot
o,Sa
raso
ta, H
arde
e, P
olk,
Hill
sbor
ough
, Pas
co,
Her
nand
o, P
inel
las
asw
ell a
s M
anat
ee
Paci
fic R
im, C
entr
alan
d So
uth
Amer
ica,
Carib
bean
Bas
in,
Euro
pe, a
nd A
fric
a
Gen
eral
car
goes
incl
udin
g pe
risha
ble,
com
mod
ities
, citr
us ju
ices
fore
st p
rodu
cts,
auto
mob
iles,
ste
el a
ndno
n-fe
rrou
s m
etal
s; B
ulk
com
mod
ities
incl
ude
finis
hed
phos
phat
epr
oduc
ts, r
efin
edpe
trol
eum
, cem
ent,
cem
ent
clin
kers
, and
ava
riety
of
cons
truc
tion
grad
e ag
greg
ates
.
Carg
o (t
ons)
: C
urre
nt:
4.4
mill
ion
Pro
ject
ed:
7.8
mill
ion
Crui
se (
reve
nue
pass
enge
rs):
Cur
rent
:0.
06 m
illio
n P
roje
cted
:0.
29 m
illio
n
Impo
rts:
242
mill
ion
Expo
rts:
64
mill
ion
Impo
rts:
3,68
5,43
4
Expo
rts:
711,
152
Dom
estic
: 0
One
Day
:0
Mul
ti-da
y:55
,196
(indi
v. p
asse
nger
s)
Mia
mi
Mia
mi-D
ade
Boar
dof
Cou
nty
Com
mis
sion
ers
From
the
Sou
th F
lorid
aco
untie
s of
Mia
mi-D
ade,
Brow
ard,
Mon
roe,
and
Palm
Bea
ch t
hrou
ghou
tth
e st
ate
into
the
Sout
heas
tern
and
Mid
wes
tern
Uni
ted
Stat
es
Paci
fic R
im, E
urop
e,Ce
ntra
l and
Sou
thAm
eric
a,Ca
ribbe
an, F
ar E
ast
Crui
se o
pera
tions
,El
ectr
onic
s, c
loth
ing,
avia
tion
and
auto
mot
ive
part
s, m
achi
nery
, pap
er,
text
iles
and
appa
rel,
seaf
ood,
cof
fee,
flo
wer
s,el
ectr
onic
s an
d ce
ram
ics.
Carg
o (t
ons)
: C
urre
nt:
7.8
mill
ion
Pro
ject
ed:
10.5
mill
ion
Crui
se (
reve
nue
pass
enge
rs):
Cur
rent
:3.
4 m
illio
n P
roje
cted
:4.
5 m
illio
n
Impo
rts:
8.9
billi
on
Expo
rts:
8.5
billi
on
Impo
rts:
4,46
3,18
7
Expo
rts:
3,34
1,75
9
Dom
estic
:0
One
-day
:47
,888
(in
div.
pa
ssen
gers
)
Mul
ti-da
y3,
316,
755
(in
div.
pa
ssen
gers
)
Sour
ce:
Flor
ida
Seap
ort
Tran
spor
tatio
n an
d Ec
onom
ic D
evel
opm
ent
Coun
cil,
A Fi
ve-Y
ear
Plan
To
Acco
mpl
ish
The
Mis
sion
of F
lorid
a's
Seap
orts
200
0/20
01 -
200
4/20
05.

Florida Transportation Almanac
160
Tabl
e 3
-42
(C
onti
nu
ed)
FLO
RID
A'S
PO
RTS
(2
00
0)
Por
tG
over
nin
g B
ody
Hin
terl
and
Serv
edTr
adin
g P
artn
ers
Pri
nci
pal A
ctiv
itie
s &
Pro
duct
sC
urr
ent
& P
roje
cted
Thro
ugh
puts
Val
ue
of W
ater
born
eIm
port
s an
dEx
port
s ($
)
Ton
nag
e of
Wat
erbo
rne
Trad
e (i
n T
ons)
Cru
ise
Act
ivit
ies
(Em
bark
atio
ns
&D
isem
bark
atio
ns)
Palm
Bea
chBo
ard
of P
ort
Com
mis
sion
ers
(Por
t of
Pal
mBe
ach
Dis
tric
t)
Palm
Bea
ch, M
artin
, St.
Luci
e, O
keec
hobe
e,H
ighl
ands
, Gla
des,
Hen
dry,
Bre
vard
, Ind
ian
Rive
r, M
onro
e, D
ade,
and
Brow
ard
Coun
ties
Cent
ral a
nd S
outh
Amer
ica,
Mex
ico,
Carib
bean
Bas
in,
Cana
da, a
ndN
orth
ern
Euro
pe
Crui
se s
hip
oper
atio
ns;
cont
aine
r, b
ulk
(cem
ent,
suga
r, f
uel o
il, m
olas
ses)
,dr
y bu
lk, l
iqui
d bu
lk, r
oll-
on/r
oll-o
ff a
nd b
reak
bulk
carg
o; in
dust
rial p
ark
and
Fore
ign
Trad
e Zo
ne 1
35
Carg
o (t
ons)
Cur
rent
:4.
0 m
illio
n P
roje
cted
:4.
7 m
illio
n
Crui
se (
reve
nue
pass
enge
rs)
Cur
rent
:0.
69 m
illio
n P
roje
cted
0.85
mill
ion
Impo
rts:
818
mill
ion
Expo
rts:
981
mill
ion
Impo
rts:
511,
630
Expo
rts:
1,71
2,44
7
Dom
estic
:1,
774,
235
One
-day
:68
8,60
9
(
indi
v.
pass
enge
rs)
Mul
ti-da
y:0
Pana
ma
City
Pana
ma
City
Por
tAu
thor
ityFl
orid
a, A
laba
ma,
G
eorg
ia, M
issi
ssip
pi,
Tenn
esse
e, K
entu
cky,
Nor
th C
arol
ina,
and
Virg
inia
Cent
ral A
mer
ica,
the
Far
East
,M
exic
o, E
urop
e,an
d th
eM
edite
rran
ean
Expo
rts:
Ste
el a
nd s
teel
pipe
, fle
xibl
e st
eel p
ipe,
mac
hine
ry, l
iner
boar
d,cl
ay a
nd r
esin
s,ag
ricul
tura
l pro
duct
s,m
isce
llane
ous
gene
ral
carg
oIm
port
s: S
teel
pla
te,
stee
l coi
ls, l
umbe
r, li
quid
bulk
, mol
asse
s, w
ood
chip
s, c
hem
ical
s,ag
greg
ates
, ani
mal
feed
s, a
nd f
ertil
izer
Carg
o (t
ons)
Cur
rent
:0.
4 m
illio
n P
roje
cted
:1.
1 m
illio
n
Crui
se (
reve
nue
pass
enge
rs)
Cur
rent
:0
Pro
ject
ed:
0
Impo
rts:
91 m
illio
n
Expo
rts:
232
mill
ion
Impo
rts:
141,
871
Expo
rts:
220,
696
Dom
estic
:47
,479
One
-day
:0
Mul
ti-da
y:0
Pens
acol
aCi
ty o
f Pe
nsac
ola
Nor
thw
est
Flor
ida,
Geo
rgia
, Ala
bam
a,M
issi
ssip
pi, T
enn.
,Ar
kans
as, I
llino
is,
Neb
rask
a, I
owa,
Ind
iana
,Co
lora
do, M
isso
uri,
and
Wis
cons
in
Cent
ral a
nd S
outh
Amer
ica,
Car
ibbe
anBa
sin,
Med
iterr
anea
n,Af
rica,
Ind
ia,
Phili
ppin
es, R
ussi
a,an
d So
uth
Kore
a
Expo
rts:
Fro
zen
food
,ba
gged
foo
d pr
oduc
ts,
fore
st p
rodu
cts,
rai
l car
s,liq
uid
bulk
pro
duct
s,su
lphu
r, a
nd p
ipe;
impo
rts:
For
est
prod
ucts
,ag
greg
ate,
bau
xite
,as
phal
t, s
teel
, pap
er,
cott
on, l
iqui
d bu
lkpr
oduc
ts
Carg
o (t
ons)
: C
urre
nt:
0.7
mill
ion
Pro
ject
ed:
1.1
mill
ion
Crui
se (
reve
nue
pass
enge
rs):
Cur
rent
:0
Pro
ject
ed:
30,0
00
Impo
rts:
4.1
mill
ion
Expo
rts:
95 m
illio
n
Impo
rts:
162,
027
Expo
rts:
246,
587
Dom
estic
:28
8,67
7
One
-day
:0
Mul
ti-da
y:0
Port
St.
Joe
Port
St.
Joe
Por
tAu
thor
ityTo
be
dete
rmin
edTo
be
dete
rmin
edEx
port
s in
clud
e fo
rest
prod
ucts
, liq
uid
bulk
prod
ucts
, and
pro
cess
edfis
h; im
port
s in
clud
eliq
uid
bulk
pro
duct
s an
dch
emic
als,
coa
l, an
d fis
h
Carg
o (t
ons)
: C
urre
nt:
0 P
roje
cted
:0.
4
Crui
se (
reve
nue
pass
enge
rs):
Cur
rent
/Pro
ject
ed:
0
Impo
rts:
n/a
Expo
rts:
n/a
Impo
rts:
0
Expo
rts:
0
Dom
estic
:0
One
-day
:0
Mul
ti-da
y:0
Sour
ce:
Flor
ida
Seap
ort
Tran
spor
tatio
n an
d Ec
onom
ic D
evel
opm
ent
Coun
cil,
A Fi
ve-Y
ear
Plan
To
Acco
mpl
ish
The
Mis
sion
of F
lorid
a's
Seap
orts
200
0/20
01 -
200
4/20
05.

Florida Transportation Almanac
161
Tabl
e 3
-42
(C
onti
nu
ed)
FLO
RID
A'S
PO
RTS
(2
00
0)
Por
tG
over
nin
g B
ody
Hin
terl
and
Serv
edTr
adin
g P
artn
ers
Pri
nci
pal A
ctiv
itie
s &
Pro
duct
sC
urr
ent
& P
roje
cted
Thro
ugh
puts
Val
ue
of W
ater
born
eIm
port
s an
dEx
port
s ($
)
Ton
nag
e of
Wat
erbo
rne
Trad
e (i
n T
ons)
Cru
ise
Act
ivit
ies
(Em
bark
atio
ns
&D
isem
bark
atio
ns)
St. P
eter
sbur
gCi
ty o
f St
.Pe
ters
burg
Crui
se p
asse
nger
s co
me
prim
arily
fro
m t
heTa
mpa
Bay
reg
ion,
but
also
fro
m o
ut o
f st
ate
Not
App
licab
leN
/ACa
rgo
(ton
s):
Cur
rent
:0
Pro
ject
ed:
0
Crui
se (
reve
nue
pass
enge
rs):
Cur
rent
:0
Pro
ject
ed:
0.13
mill
ion
Impo
rts:
0.52
mill
ion
Expo
rts:
0.35
mill
ion
Impo
rts:
0
Expo
rts:
0
Dom
estic
0
One
-day
:0
Mul
ti-da
y:0
Tam
paTa
mpa
Por
tAu
thor
ityH
illsb
orou
gh, H
erna
ndo,
Pasc
o, P
inel
las,
and
Pol
kco
untie
s
Chin
a, I
ndia
,Ca
nada
, Car
ibbe
anBa
sin,
Mex
ico,
Cent
ral a
nd S
outh
Amer
ica,
Eur
ope,
Far
East
, Coa
stw
ide
trad
e
Maj
or p
ort
of e
ntry
for
fuel
and
bui
ldin
gm
ater
ials
; po
pula
r cr
uise
port
; pr
edom
inan
t bu
lkca
rgoe
s in
clud
eph
osph
ate
rock
, fer
tiliz
erpr
oduc
ts, p
etro
leum
,co
al, a
nd g
ener
al c
argo
.In
add
ition
to
the
trad
ition
al li
quid
and
dry
bulk
car
go t
he p
ort
expo
rts:
aut
omob
iles,
citr
us, f
roze
n po
ultr
y,an
d sc
arp
stee
l. Im
port
s: p
rodu
ce,
gyps
um, a
mm
onia
,su
lphu
r, c
emen
t, s
teel
,ro
ck, f
ruit,
con
stru
ctio
nm
ater
ials
, and
refr
iger
ated
pro
duct
s.
Carg
o (t
ons)
: C
urre
nt:
50 m
illio
n P
roje
cted
:52
mill
ion
Crui
se (
reve
nue
pass
enge
rs):
Cur
rent
:0.
4 m
illio
n P
roje
cted
:0.
8 m
illio
n
Impo
rts:
2.7
billi
on
Expo
rts:
1.4
billi
on
Impo
rts:
6,96
7,00
0
Expo
rts:
9,36
9,00
0
Dom
estic
:32
,907
,000
One
-day
zz:
0
Mul
ti-da
y: 4
59,8
03
Sour
ce:
Flor
ida
Seap
ort
Tran
spor
tatio
n an
d Ec
onom
ic D
evel
opm
ent
Coun
cil,
A Fi
ve-Y
ear
Plan
To
Acco
mpl
ish
The
Mis
sion
of F
lorid
a's
Seap
orts
200
0/20
01 -
200
4/20
05.

Florida Transportation Almanac
162
Table 3-43TOP TEN TRADING PARTNERS WITH FLORIDA FOR 2000
(in billions of current U.S. $)
Country Total Trade Value ($ billions)
(1) Brazil 10.2
(2) Dominican Republic 5.0
(3) Japan 4.5
(4) Costa Rica 4.0
(5) Germany 4.0
(6) Honduras 3.8
(7) Venezuela 3.7
(8) Colombia 3.3
(9) Argentina 2.6
(10) Guatemala 2.5
Source: Florida Seaport Transportation and Economic Development Council, A Five-Year Plan To Accomplish The Mission of Florida's Seaports 2000/2001 -2004/2005.
Table 3-44FLORIDA'S INTERNATIONAL TRADE (2000)
(in billions of current U.S. $)
Exports Imports Airborne Waterborne Total
Foreign Tradebillions of $ 35.9 37.9 - - 73.8
percent 48.64 51.35 - - 100.0
Airborne Tradebillions of $ - - 26.2 - 26.2
percent - - 35.5 - 35.5
Waterborne Tradebillions of $ - - - 47.6 47.6
percent - - - 64.5 64.5
Waterborne ForeignTrade
billions of $ 18.8 28.8 - - 47.6
percent 39.5 60.5 - - 100
Source: Florida Seaport Transportation and Economic Development Council, A Five-Year Plan To Accomplish The Mission of Florida's Seaports2000/2001 - 2004/2005.
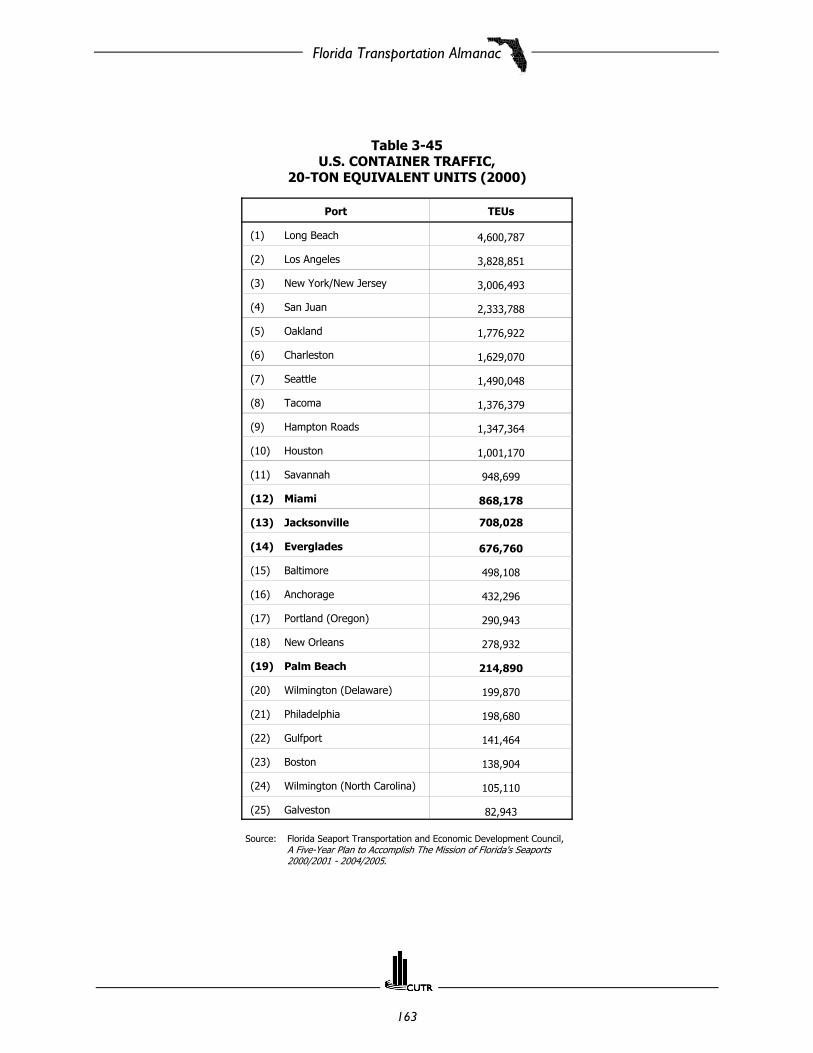
Florida Transportation Almanac
163
Table 3-45U.S. CONTAINER TRAFFIC,
20-TON EQUIVALENT UNITS (2000)
Port TEUs
(1) Long Beach 4,600,787
(2) Los Angeles 3,828,851
(3) New York/New Jersey 3,006,493
(4) San Juan 2,333,788
(5) Oakland 1,776,922
(6) Charleston 1,629,070
(7) Seattle 1,490,048
(8) Tacoma 1,376,379
(9) Hampton Roads 1,347,364
(10) Houston 1,001,170
(11) Savannah 948,699
(12) Miami 868,178
(13) Jacksonville 708,028
(14) Everglades 676,760
(15) Baltimore 498,108
(16) Anchorage 432,296
(17) Portland (Oregon) 290,943
(18) New Orleans 278,932
(19) Palm Beach 214,890
(20) Wilmington (Delaware) 199,870
(21) Philadelphia 198,680
(22) Gulfport 141,464
(23) Boston 138,904
(24) Wilmington (North Carolina) 105,110
(25) Galveston 82,943
Source: Florida Seaport Transportation and Economic Development Council,A Five-Year Plan to Accomplish The Mission of Florida's Seaports2000/2001 - 2004/2005.

Florida Transportation Almanac
164
Table 3-46FLORIDA'S TOP TEN IMPORT COMMODITIES (2000)
Commodity Percent Share of FLImports
(1) Vehicles 19.3
(2) Knit apparel 12
(3) Woven apparel 10.3
(4) Aircraft and spacecraft 9.5
(5) Machinery 6.3
(6) Electrical machinery 4.6
(7) Mineral fuel, oil, etc. 4.1
(8) Fish and seafood 3.3
(9) “special other” 2.8
(10) Optical and medical instruments 2.1
Source: Florida Seaport Transportation and Economic DevelopmentCouncil, A Five-Year Plan To Accomplish The Mission ofFlorida's Seaports 2000/2001 - 2004/2005.
Table 3-47FLORIDA'S TOP TEN EXPORT COMMODITIES (2000)
Commodity Percent Share ofFlorida’s Exports
(1) Machinery 25.3
(2) Electrical machinery 18.3
(3) Knit apparel 5.7
(4) Optical and medical instruments 5.1
(5) Vehicles, not railway 5.1
(6) Aircraft and spacecraft 4.4
(7) Woven apparel 4.2
(8) Fertilizers 3.1
(9) Pharmaceutical products 2.6
(10) Plastic 1.9
Source: Florida Seaport Transportation and Economic DevelopmentCouncil, A Five-Year Plan To Accomplish The Mission of Florida'sSeaports 2000/2001 - 2004/2005.
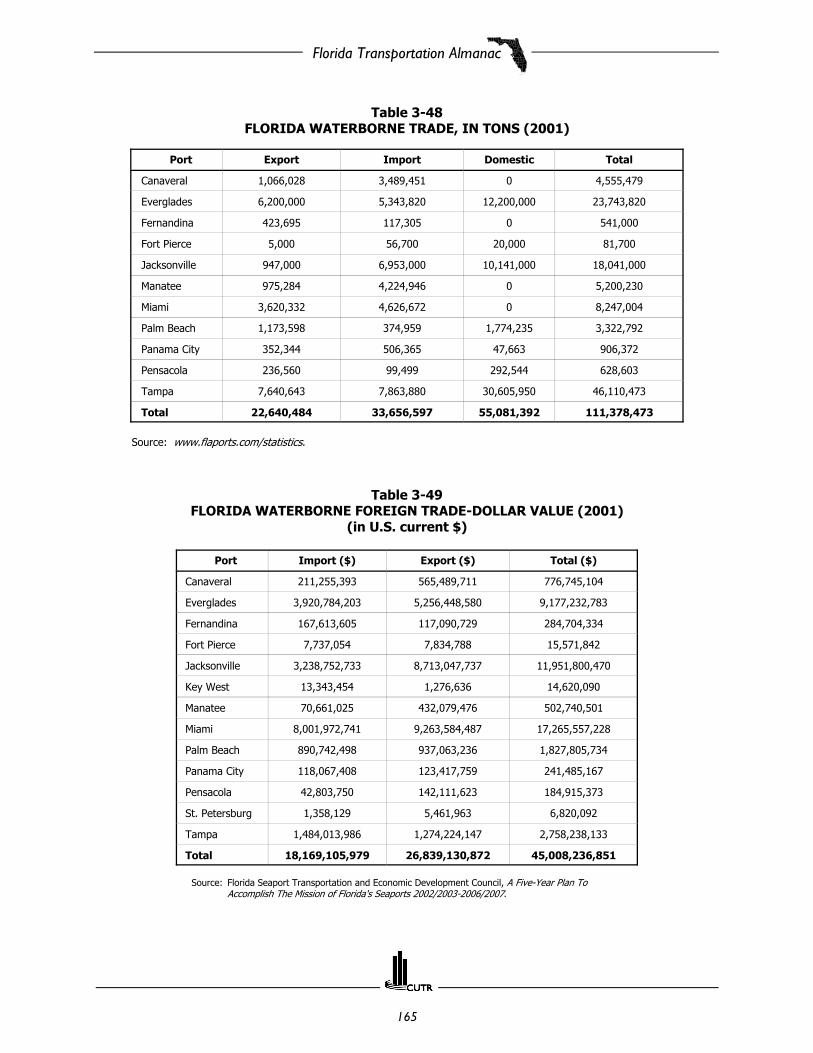
Florida Transportation Almanac
165
Table 3-48FLORIDA WATERBORNE TRADE, IN TONS (2001)
Port Export Import Domestic Total
Canaveral 1,066,028 3,489,451 0 4,555,479
Everglades 6,200,000 5,343,820 12,200,000 23,743,820
Fernandina 423,695 117,305 0 541,000
Fort Pierce 5,000 56,700 20,000 81,700
Jacksonville 947,000 6,953,000 10,141,000 18,041,000
Manatee 975,284 4,224,946 0 5,200,230
Miami 3,620,332 4,626,672 0 8,247,004
Palm Beach 1,173,598 374,959 1,774,235 3,322,792
Panama City 352,344 506,365 47,663 906,372
Pensacola 236,560 99,499 292,544 628,603
Tampa 7,640,643 7,863,880 30,605,950 46,110,473
Total 22,640,484 33,656,597 55,081,392 111,378,473
Source: www.flaports.com/statistics.
Table 3-49FLORIDA WATERBORNE FOREIGN TRADE-DOLLAR VALUE (2001)
(in U.S. current $)
Port Import ($) Export ($) Total ($)
Canaveral 211,255,393 565,489,711 776,745,104
Everglades 3,920,784,203 5,256,448,580 9,177,232,783
Fernandina 167,613,605 117,090,729 284,704,334
Fort Pierce 7,737,054 7,834,788 15,571,842
Jacksonville 3,238,752,733 8,713,047,737 11,951,800,470
Key West 13,343,454 1,276,636 14,620,090
Manatee 70,661,025 432,079,476 502,740,501
Miami 8,001,972,741 9,263,584,487 17,265,557,228
Palm Beach 890,742,498 937,063,236 1,827,805,734
Panama City 118,067,408 123,417,759 241,485,167
Pensacola 42,803,750 142,111,623 184,915,373
St. Petersburg 1,358,129 5,461,963 6,820,092
Tampa 1,484,013,986 1,274,224,147 2,758,238,133
Total 18,169,105,979 26,839,130,872 45,008,236,851
Source: Florida Seaport Transportation and Economic Development Council, A Five-Year Plan ToAccomplish The Mission of Florida's Seaports 2002/2003-2006/2007.

Florida Transportation Almanac
166
Table 3-50FLORIDA CRUISE EMBARKMENTS AND DISEMBARKMENTS (FY 01/02)
Port One-Day Cruise Multi-Day Cruise Total Revenue Passengers
Canaveral 1,873,044 1,951,196 3,824,240
Everglades 1,030,665 2,455,192 3,485,857
Fernandina 0 454 454
Key West 0 927,746 927,746
Manatee 0 63,042 63,042
Miami 0 3,642,990 3,642,990
Palm Beach 591,338 141 591,479
Tampa 0 583,130 583,130
Total 3,495,047 9,623,891 13,118,938
Source: www.flaports.org/statistics.

Florida Transportation Almanac
167
TransportationDemandManagement

Florida Transportation Almanac
168

Florida Transportation Almanac
169

Florida Transportation Almanac
170
Florida's Commuter Assistance Program
Coordinated use of existing transportation resources can provide a responsive, low-cost alternative for alleviating urban highwaycongestion, improving air quality, and reducing the need for costly highway improvements. The Florida Commuter Assistance Program(CAP) focuses on reducing the single occupant commuter trip that is a major cause of peak-hour highway congestion. A coordinatedeffort to provide alternatives to these commuters, using existing or low-cost resources, can be beneficial to the development of publictransit statewide and Florida Department of Transportation's (FDOT) priority efforts to relieve traffic congestion, improve air quality, andto assure energy conservation.
To achieve its goals, the CAP encourages the use of Transportation Demand Management (TDM) strategies at the regional, local, activitycenter, and employer level. TDM is defined as a set of measures designed to reduce the number of trips made by single occupantvehicles and enhance the regional mobility of all citizens. These strategies can include but are not limited to: ridesharing (carpooling& vanpooling); public transportation, alternative work hours (flextime, compressed work week, etc.), bicycle and pedestrian modes;development and implementation of shuttle services; priority/preferential parking for ridesharers; promotion and distribution ofdiscounted transit passes; and fostering telecommuting programs.
Florida's CAP exists to identify and support effective TDM strategies and foster development of public/private partnerships to addressthe State's mobility, congestion, and environmental goals. Depending on the needs of the community, CAP service takes one of fourforms: regional commuter services, local commuter services, transportation management associations/organizations, and transportationmanagement initiatives.
Regional Commuter Services are multi-county programs designed to carry out CAP goals. When feasible, these programs are housedat an existing regional entity (i.e., regional planning council, metropolitan planning organization, or transit agency, or other privateagency). When appropriate, a Regional Commuter Services program may be created as a private-not-for-profit corporation. RegionalCommuter Services provide ridematching, vanpooling, guaranteed ride home programs, and other TDM strategies as determined byFDOT Districts. Regional Commuter Services also provide these basic TDM programs in support of Transportation ManagementAssociations (TMA), Transportation Management Organizations (TMO), and Transportation Management Initiatives (TMI) within itsservice area. The FDOT may fund up to 100 percent of the eligible costs of commuter services determined by the District to be regionalin scope and application or statewide in nature.
Local commuter services provide similar services as a regional commuter services program but to a defined local area, usually servingone municipality or county. State funding for a local commuter services project cannot exceed the amount of local participation.
TMAs are public/private partnerships formed so that employers, developers, building owners, central business districts, downtownmerchant associations, and government entities can work collectively to establish policies, programs and services to address trafficcongestion, air quality, and occasionally, employment issues through TDM strategies. TMAs are established within a limited geographicalarea to address the transportation management needs of their members. TMAs are expected to obtain private sector financing in additionto public funding. TMOs are synonymous with TMAs. TMAs are eligible for continued funding by FDOT at the lesser of $75,000 or 50percent of their total budget, provided they are meeting the performance criteria outlined in their existing Joint Participation Agreement.Grants supporting TMAs may be made directly to the incorporated organization or to the appropriate local governmental agency forpass-through to the TMA. TMAs receiving these grants include FDOT as an ex officio member of its Board of Directors during the grantperiod.
Transportation Management Initiatives (TMIs) are hybrid entities that are the first step in a process in which employers and otherinterested parties consider collective actions for improving the means to carry people and/or goods. TMIs are usually not legallyconstituted and may be projects or field offices of larger organizations with broader missions. TMIs are frequently led by an advisorycommittee of the private sector in partnership with the public sector to solve transportation problems.
Florida Transportation Almanac
171
Freight

Florida Transportation Almanac
172

Florida Transportation Almanac
173
SECTION HIGHLIGHTS
# In 2000, Florida’s intrastate freight movement totaled 5.6 billion tons, interstate to Florida freightmovement totaled 1.3 billion tons, and interstate from Florida freight movement totaled 473 million tons.
# For all interstate freight transport modes (rail, for-hire truck, private truck, air, water), the top three importcommodities in 2000 were petroleum products (370.5 million tons), coal (230.9 million tons), and chemicals(116.3 million tons). The top three export commodities were chemicals (69 million tons), minerals (68.5million tons), and food (63.4 million tons).
# The top three intrastate freight commodities for all modes in 2000 were coal (3.2 billion tons); warehousing(658.8 million tons); and clay, glass, concrete, and stone (530.2 million tons).
# In 2000, the top three regions/states that transport interstate freight to Florida were West South Central(501.1 million tons), East South Central (237.4 million tons), and Georgia (138.7 million tons).
# The top three regions/states that receive interstate from Florida in 2000 were West South Central (119.2million tons), Georgia (102.8 million tons), and East North Central (43.8 million tons).

Florida Transportation Almanac
174
Table 3-51FLORIDA FREIGHT MOVEMENT (2000)
Freight Movement DescriptionFlorida Intrastate Interstate to Florida Interstate from Florida
Tons (000) % Tons (000) % Tons (000) %
Rail Carload 3,755,002.4 67.2 384,355.4 30.2 103,662.0 21.9
Rail Intermodal 20,046.4 0.4 56,789.6 4.5 27,093.6 5.7
For-Hire Truck (truckload) 793,127.5 14.2 210,754.2 16.6 142,413.2 30.1
For-Hire Truck (less-than-truckload) 27,463.6 0.5 32,340.1 2.5 11,611.1 2.5
Private Truck 944,159.7 16.9 43,587.7 3.4 70,654.9 14.9
Air Freight 4,257.8 0.1 3,669.2 0.3 268.3 0.1
Water Freight 39,767.7 0.7 540,075.6 42.5 117,380.0 24.8
All Modes 5,583,825.1 100.0 1,271,571.8 100.0 473,083.1 100.0
Source: TRANSEARCH by Reebie and Associates via Florida Department of Transportation (2000).
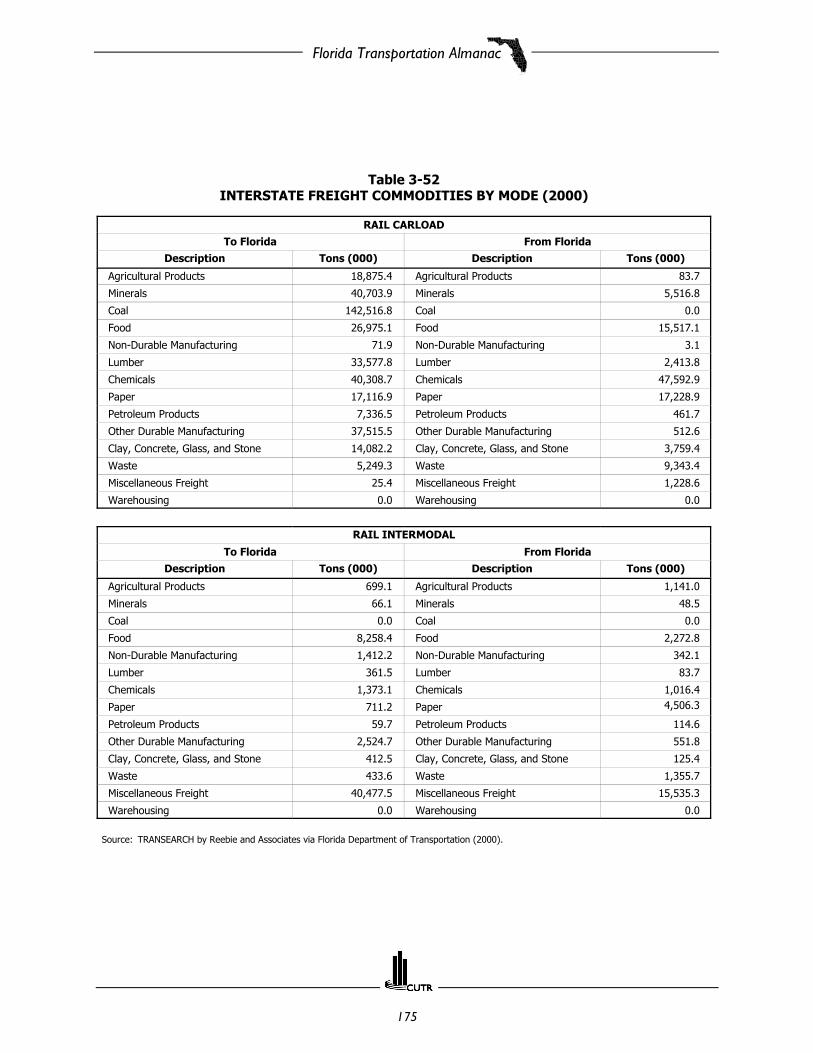
Florida Transportation Almanac
175
Table 3-52INTERSTATE FREIGHT COMMODITIES BY MODE (2000)
RAIL CARLOADTo Florida From Florida
Description Tons (000) Description Tons (000)
Agricultural Products 18,875.4 Agricultural Products 83.7
Minerals 40,703.9 Minerals 5,516.8
Coal 142,516.8 Coal 0.0
Food 26,975.1 Food 15,517.1
Non-Durable Manufacturing 71.9 Non-Durable Manufacturing 3.1
Lumber 33,577.8 Lumber 2,413.8
Chemicals 40,308.7 Chemicals 47,592.9
Paper 17,116.9 Paper 17,228.9
Petroleum Products 7,336.5 Petroleum Products 461.7
Other Durable Manufacturing 37,515.5 Other Durable Manufacturing 512.6
Clay, Concrete, Glass, and Stone 14,082.2 Clay, Concrete, Glass, and Stone 3,759.4
Waste 5,249.3 Waste 9,343.4
Miscellaneous Freight 25.4 Miscellaneous Freight 1,228.6
Warehousing 0.0 Warehousing 0.0
RAIL INTERMODAL
To Florida From FloridaDescription Tons (000) Description Tons (000)
Agricultural Products 699.1 Agricultural Products 1,141.0
Minerals 66.1 Minerals 48.5
Coal 0.0 Coal 0.0
Food 8,258.4 Food 2,272.8
Non-Durable Manufacturing 1,412.2 Non-Durable Manufacturing 342.1
Lumber 361.5 Lumber 83.7
Chemicals 1,373.1 Chemicals 1,016.4
Paper 711.2 Paper 4,506.3
Petroleum Products 59.7 Petroleum Products 114.6
Other Durable Manufacturing 2,524.7 Other Durable Manufacturing 551.8
Clay, Concrete, Glass, and Stone 412.5 Clay, Concrete, Glass, and Stone 125.4
Waste 433.6 Waste 1,355.7
Miscellaneous Freight 40,477.5 Miscellaneous Freight 15,535.3
Warehousing 0.0 Warehousing 0.0
Source: TRANSEARCH by Reebie and Associates via Florida Department of Transportation (2000).

Florida Transportation Almanac
176
Table 3-52 (Continued)INTERSTATE FREIGHT COMMODITIES BY MODE (2000)
FOR-HIRE TRUCK (truckload)To Florida From Florida
Description Tons (000) Description Tons (000)
Agricultural Products 7,115.6 Agricultural Products 33,133.8
Minerals 324.4 Minerals 108.8
Coal 3,053.4 Coal 0.0
Food 36,288.3 Food 25,844.7
Non-Durable Manufacturing 4,867.3 Non-Durable Manufacturing 3,242.0
Lumber 22,811.9 Lumber 13,535.8
Chemicals 18,054.1 Chemicals 14,648.1
Paper 6,435.0 Paper 7,819.4
Petroleum Products 13,501.0 Petroleum Products 146.7
Other Durable Manufacturing 26,564.7 Other Durable Manufacturing 16,811.2
Clay, Concrete, Glass, and Stone 18,647.7 Clay, Concrete, Glass, and Stone 1,903.4
Waste 8.1 Waste 229.2
Miscellaneous Freight 22,430.0 Miscellaneous Freight 8,620.5
Warehousing 30,652.7 Warehousing 16,369.6
FOR-HIRE TRUCK (less-than-truckload)
To Florida From FloridaDescription Tons (000) Description Tons (000)
Agricultural Products 0.0 Agricultural Products 0.0
Minerals 0.0 Minerals 0.0
Coal 0.0 Coal 0.0
Food 2,254.3 Food 1,017.0
Non-Durable Manufacturing 4,668.5 Non-Durable Manufacturing 1,811.6
Lumber 291.8 Lumber 75.8
Chemicals 4,664.3 Chemicals 1,742.6
Paper 1,879.5 Paper 824.1
Petroleum Products 554.9 Petroleum Products 14.6
Other Durable Manufacturing 15,174.8 Other Durable Manufacturing 4,972.4
Clay, Concrete, Glass, and Stone 899.7 Clay, Concrete, Glass, and Stone 111.7
Waste 0.0 Waste 0.0
Miscellaneous Freight 0.0 Miscellaneous Freight 0.0
Warehousing 1,952.3 Warehousing 1,041.3
Source: TRANSEARCH by Reebie and Associates via Florida Department of Transportation (2000).
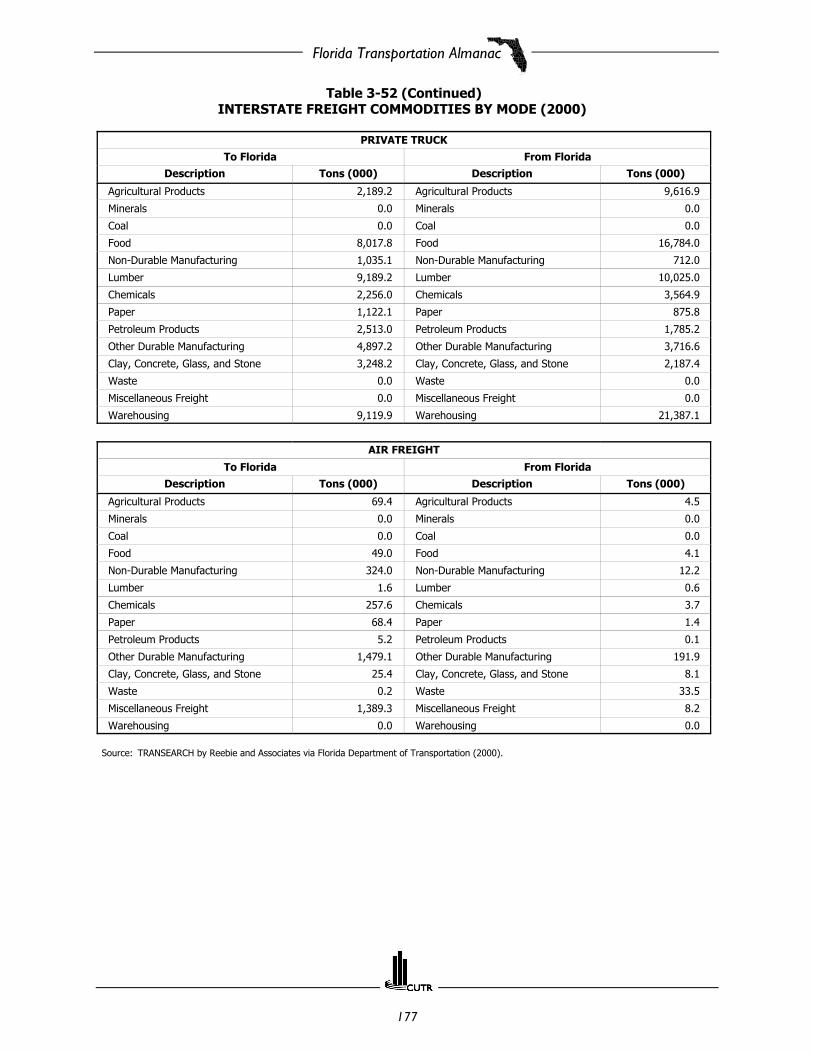
Florida Transportation Almanac
177
Table 3-52 (Continued)INTERSTATE FREIGHT COMMODITIES BY MODE (2000)
PRIVATE TRUCKTo Florida From Florida
Description Tons (000) Description Tons (000)
Agricultural Products 2,189.2 Agricultural Products 9,616.9
Minerals 0.0 Minerals 0.0
Coal 0.0 Coal 0.0
Food 8,017.8 Food 16,784.0
Non-Durable Manufacturing 1,035.1 Non-Durable Manufacturing 712.0
Lumber 9,189.2 Lumber 10,025.0
Chemicals 2,256.0 Chemicals 3,564.9
Paper 1,122.1 Paper 875.8
Petroleum Products 2,513.0 Petroleum Products 1,785.2
Other Durable Manufacturing 4,897.2 Other Durable Manufacturing 3,716.6
Clay, Concrete, Glass, and Stone 3,248.2 Clay, Concrete, Glass, and Stone 2,187.4
Waste 0.0 Waste 0.0
Miscellaneous Freight 0.0 Miscellaneous Freight 0.0
Warehousing 9,119.9 Warehousing 21,387.1
AIR FREIGHT
To Florida From FloridaDescription Tons (000) Description Tons (000)
Agricultural Products 69.4 Agricultural Products 4.5
Minerals 0.0 Minerals 0.0
Coal 0.0 Coal 0.0
Food 49.0 Food 4.1
Non-Durable Manufacturing 324.0 Non-Durable Manufacturing 12.2
Lumber 1.6 Lumber 0.6
Chemicals 257.6 Chemicals 3.7
Paper 68.4 Paper 1.4
Petroleum Products 5.2 Petroleum Products 0.1
Other Durable Manufacturing 1,479.1 Other Durable Manufacturing 191.9
Clay, Concrete, Glass, and Stone 25.4 Clay, Concrete, Glass, and Stone 8.1
Waste 0.2 Waste 33.5
Miscellaneous Freight 1,389.3 Miscellaneous Freight 8.2
Warehousing 0.0 Warehousing 0.0
Source: TRANSEARCH by Reebie and Associates via Florida Department of Transportation (2000).

Florida Transportation Almanac
178
Table 3-52 (Continued)INTERSTATE FREIGHT COMMODITIES BY MODE (2000)
WATER FREIGHTTo Florida From Florida
Description Tons (000) Description Tons (000)
Agricultural Products 1,224.9 Agricultural Products 7,537.9
Minerals 17,730.6 Minerals 62,801.4
Coal 85,400.8 Coal 0.0
Food 214.4 Food 2,007.6
Non-Durable Manufacturing 531.8 Non-Durable Manufacturing 9.2
Lumber 0.0 Lumber 0.0
Chemicals 49,396.6 Chemicals 467.7
Paper 0.0 Paper 0.0
Petroleum Products 346,526.1 Petroleum Products 3,392.8
Other Durable Manufacturing 1,226.5 Other Durable Manufacturing 324.5
Clay, Concrete, Glass, and Stone 217.4 Clay, Concrete, Glass, and Stone 1.4
Waste 37,210.7 Waste 40,681.3
Miscellaneous Freight 395.8 Miscellaneous Freight 156.2
Warehousing 0.0 Warehousing 0.0
ALL MODES
To Florida From FloridaDescription Tons (000) Description Tons (000)
Agricultural Products 30,173.6 Agricultural Products 51,517.8
Minerals 58,825.0 Minerals 68,475.5
Coal 230,971.0 Coal 0.0
Food 82,057.3 Food 63,447.3
Non-Durable Manufacturing 12,910.8 Non-Durable Manufacturing 6,132.2
Lumber 66,233.8 Lumber 26,134.7
Chemicals 116,310.4 Chemicals 69,036.3
Paper 27,333.1 Paper 31,255.9
Petroleum Products 370,496.4 Petroleum Products 5,915.7
Other Durable Manufacturing 89,382.5 Other Durable Manufacturing 27,081.0
Clay, Concrete, Glass, and Stone 37,533.1 Clay, Concrete, Glass, and Stone 8,096.8
Waste 42,901.9 Waste 51,643.1
Miscellaneous Freight 64,718.0 Miscellaneous Freight 25,548.8
Warehousing 41,724.9 Warehousing 38,798.0
Source: TRANSEARCH by Reebie and Associates via Florida Department of Transportation (2000).
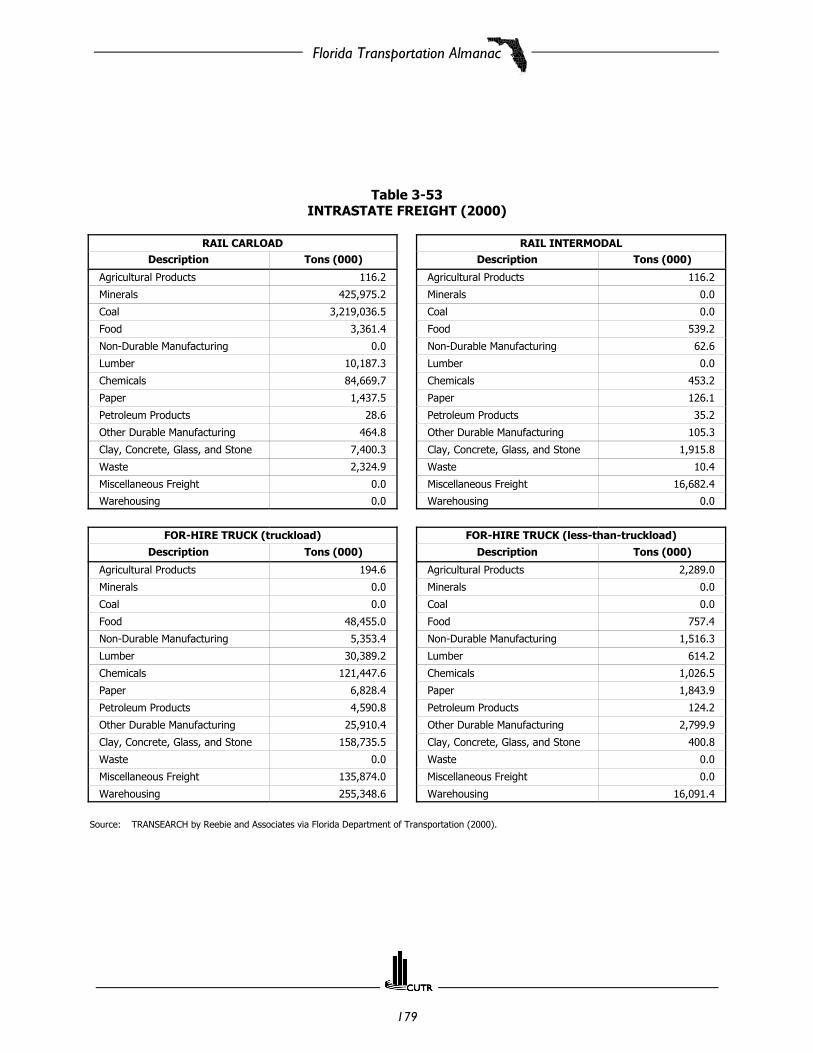
Florida Transportation Almanac
179
Table 3-53INTRASTATE FREIGHT (2000)
RAIL CARLOAD RAIL INTERMODALDescription Tons (000) Description Tons (000)
Agricultural Products 116.2 Agricultural Products 116.2
Minerals 425,975.2 Minerals 0.0
Coal 3,219,036.5 Coal 0.0
Food 3,361.4 Food 539.2
Non-Durable Manufacturing 0.0 Non-Durable Manufacturing 62.6
Lumber 10,187.3 Lumber 0.0
Chemicals 84,669.7 Chemicals 453.2
Paper 1,437.5 Paper 126.1
Petroleum Products 28.6 Petroleum Products 35.2
Other Durable Manufacturing 464.8 Other Durable Manufacturing 105.3
Clay, Concrete, Glass, and Stone 7,400.3 Clay, Concrete, Glass, and Stone 1,915.8
Waste 2,324.9 Waste 10.4
Miscellaneous Freight 0.0 Miscellaneous Freight 16,682.4
Warehousing 0.0 Warehousing 0.0
FOR-HIRE TRUCK (truckload) FOR-HIRE TRUCK (less-than-truckload)Description Tons (000) Description Tons (000)
Agricultural Products 194.6 Agricultural Products 2,289.0
Minerals 0.0 Minerals 0.0
Coal 0.0 Coal 0.0
Food 48,455.0 Food 757.4
Non-Durable Manufacturing 5,353.4 Non-Durable Manufacturing 1,516.3
Lumber 30,389.2 Lumber 614.2
Chemicals 121,447.6 Chemicals 1,026.5
Paper 6,828.4 Paper 1,843.9
Petroleum Products 4,590.8 Petroleum Products 124.2
Other Durable Manufacturing 25,910.4 Other Durable Manufacturing 2,799.9
Clay, Concrete, Glass, and Stone 158,735.5 Clay, Concrete, Glass, and Stone 400.8
Waste 0.0 Waste 0.0
Miscellaneous Freight 135,874.0 Miscellaneous Freight 0.0
Warehousing 255,348.6 Warehousing 16,091.4
Source: TRANSEARCH by Reebie and Associates via Florida Department of Transportation (2000).
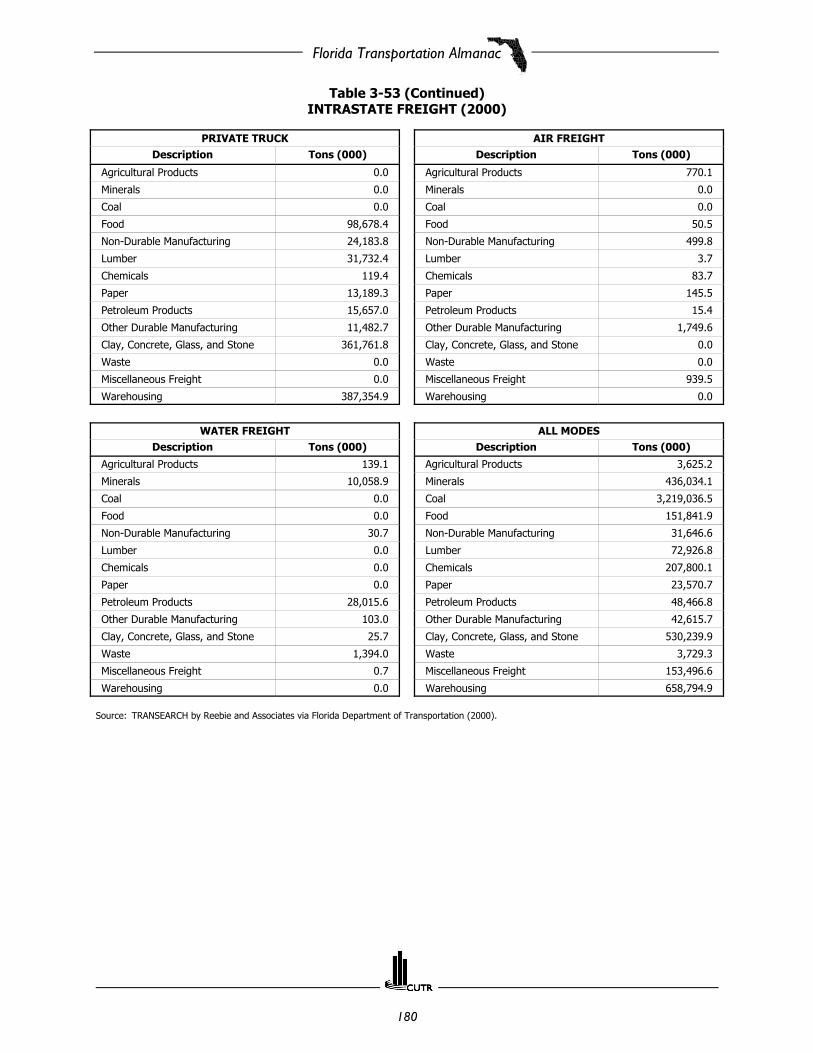
Florida Transportation Almanac
180
Table 3-53 (Continued)INTRASTATE FREIGHT (2000)
PRIVATE TRUCK AIR FREIGHTDescription Tons (000) Description Tons (000)
Agricultural Products 0.0 Agricultural Products 770.1
Minerals 0.0 Minerals 0.0
Coal 0.0 Coal 0.0
Food 98,678.4 Food 50.5
Non-Durable Manufacturing 24,183.8 Non-Durable Manufacturing 499.8
Lumber 31,732.4 Lumber 3.7
Chemicals 119.4 Chemicals 83.7
Paper 13,189.3 Paper 145.5
Petroleum Products 15,657.0 Petroleum Products 15.4
Other Durable Manufacturing 11,482.7 Other Durable Manufacturing 1,749.6
Clay, Concrete, Glass, and Stone 361,761.8 Clay, Concrete, Glass, and Stone 0.0
Waste 0.0 Waste 0.0
Miscellaneous Freight 0.0 Miscellaneous Freight 939.5
Warehousing 387,354.9 Warehousing 0.0
WATER FREIGHT ALL MODESDescription Tons (000) Description Tons (000)
Agricultural Products 139.1 Agricultural Products 3,625.2
Minerals 10,058.9 Minerals 436,034.1
Coal 0.0 Coal 3,219,036.5
Food 0.0 Food 151,841.9
Non-Durable Manufacturing 30.7 Non-Durable Manufacturing 31,646.6
Lumber 0.0 Lumber 72,926.8
Chemicals 0.0 Chemicals 207,800.1
Paper 0.0 Paper 23,570.7
Petroleum Products 28,015.6 Petroleum Products 48,466.8
Other Durable Manufacturing 103.0 Other Durable Manufacturing 42,615.7
Clay, Concrete, Glass, and Stone 25.7 Clay, Concrete, Glass, and Stone 530,239.9
Waste 1,394.0 Waste 3,729.3
Miscellaneous Freight 0.7 Miscellaneous Freight 153,496.6
Warehousing 0.0 Warehousing 658,794.9
Source: TRANSEARCH by Reebie and Associates via Florida Department of Transportation (2000).

Florida Transportation Almanac
181
Table 3-54FLORIDA INTERSTATE FREIGHT BY STATE (2000)
RAIL CARLOADTo Florida From Florida
State / Region Tons (000) State / Region Tons (000)
Georgia 38,235.1 Georgia 15,258.2
Alabama 34,773.0 Alabama 7,072.6
New England 1,041.3 New England 661.9
Mid Atlantic 3,116.1 Mid Atlantic 13,781.2
East North Central 50,351.9 East North Central 16,105.9
West North Central 5,879.0 West North Central 12,380.8
East South Central 151,401.2 East South Central 13,312.4
West South Central 32,460.9 West South Central 7,404.7
Mountain 7,461.9 Mountain 177.1
Pacific 4,942.3 Pacific 1,852.4
Eastern Canada 6,519.1 Eastern Canada 896.2
Western Canada 13,634.2 Western Canada 1,545.9
Mexico 278.2 Mexico 794.3
South Atlantic 34,261.3 South Atlantic 12,493.1
RAIL INTERMODAL
To Florida From Florida
State / Region Tons (000) State / Region Tons (000)
Georgia 7,726.4 Georgia 2,686.1
Alabama 674.4 Alabama 468.8
New England 206.0 New England 91.2
Mid Atlantic 4,698.0 Mid Atlantic 3,224.3
East North Central 15,862.1 East North Central 8,182.4
West North Central 2,217.3 West North Central 1,706.2
East South Central 4,849.6 East South Central 2,630.7
West South Central 11,161.9 West South Central 4,288.0
Mountain 227.4 Mountain 6.4
Pacific 3,370.8 Pacific 574.4
Eastern Canada 0.0 Eastern Canada 0.0
Western Canada 0.0 Western Canada 0.0
Mexico 0.0 Mexico 0.0
South Atlantic 5,795.5 South Atlantic 3,235.2
Source: TRANSEARCH by Reebie and Associates via Florida Department of Transportation (2000).

Florida Transportation Almanac
182
Table 3-54 (Continued)FLORIDA INTERSTATE FREIGHT BY STATE (2000)
FOR-HIRE TRUCK (truckload)To Florida From Florida
State / Region Tons (000) State / Region Tons (000)
Georgia 69,567.9 Georgia 35,619.6
Alabama 4,935.2 Alabama 5,050.8
New England 4,992.9 New England 4,855.6
Mid Atlantic 24,112.4 Mid Atlantic 14,828.5
East North Central 25,679.5 East North Central 14,685.5
West North Central 9,034.5 West North Central 6,233.3
East South Central 10,633.6 East South Central 9,661.3
West South Central 29,006.6 West South Central 17,961.3
Mountain 3,289.4 Mountain 3,715.6
Pacific 6,417.3 Pacific 4,797.0
Eastern Canada 5,248.7 Eastern Canada 5,700.7
Western Canada 1,186.7 Western Canada 1,128.5
Mexico 2,406.8 Mexico 2,546.8
South Atlantic 14,242.5 South Atlantic 15,628.6
FOR-HIRE TRUCK (less-than-truckload)
To Florida From Florida
State / Region Tons (000) State / Region Tons (000)
Georgia 4,092.8 Georgia 2,003.6
Alabama 1,088.6 Alabama 400.8
New England 1,134.3 New England 398.1
Mid Atlantic 4,165.1 Mid Atlantic 1,531.4
East North Central 6,745.9 East North Central 1,619.3
West North Central 1,944.9 West North Central 583.5
East South Central 4,103.8 East South Central 773.5
West South Central 3,653.6 West South Central 1,362.6
Mountain 305.7 Mountain 223.2
Pacific 996.8 Pacific 477.8
Eastern Canada 0.0 Eastern Canada 0.0
Western Canada 0.0 Western Canada 0.0
Mexico 0.0 Mexico 0.0
South Atlantic 4,108.6 South Atlantic 2,237.1
Source: TRANSEARCH by Reebie and Associates via Florida Department of Transportation (2000).

Florida Transportation Almanac
183
Table 3-54 (Continued)FLORIDA INTERSTATE FREIGHT BY STATE (2000)
PRIVATE TRUCKTo Florida From Florida
State / Region Tons (000) State / Region Tons (000)Georgia 18,073.0 Georgia 41,335.7
Alabama 2,045.4 Alabama 5,962.2
New England 1,339.8 New England 1,151.7
Mid Atlantic 2,620.2 Mid Atlantic 3,231.9
East North Central 4,362.9 East North Central 3,168.7
West North Central 981.8 West North Central 1,152.8
East South Central 3,631.4 East South Central 1,938.9
West South Central 4,177.7 West South Central 2,430.6
Mountain 613.3 Mountain 276.7
Pacific 956.8 Pacific 2,082.5
Eastern Canada 0.0 Eastern Canada 0.0
Western Canada 0.0 Western Canada 0.0
Mexico 0.0 Mexico 0.0
South Atlantic 4,785.2 South Atlantic 7,923.0
AIR FREIGHT
To Florida From Florida
State / Region Tons (000) State / Region Tons (000)
Georgia 423.6 Georgia 8.6
Alabama 0.2 Alabama 0.0
New England 177.0 New England 0.1
Mid Atlantic 713.1 Mid Atlantic 0.5
East North Central 561.2 East North Central 0.2
West North Central 182.7 West North Central 0.0
East South Central 513.2 East South Central 0.0
West South Central 304.6 West South Central 0.2
Mountain 43.0 Mountain 0.0
Pacific 487.2 Pacific 0.2
Eastern Canada 65.7 Eastern Canada 192.1
Western Canada 10.1 Western Canada 66.3
Mexico 0.0 Mexico 0.0
South Atlantic 187.8 South Atlantic 0.2
Source: TRANSEARCH by Reebie and Associates via Florida Department of Transportation (2000).

Florida Transportation Almanac
184
Table 3-54 (Continued)FLORIDA INTERSTATE FREIGHT BY STATE (2000)
WATER FREIGHTTo Florida From Florida
State / Region Tons (000) State / Region Tons (000)
Georgia 568.1 Georgia 5,902.4
Alabama 29,548.2 Alabama 19,779.7
New England 206.7 New England 0.0
Mid Atlantic 619.5 Mid Atlantic 4,160.7
East North Central 8,796.7 East North Central 31.7
West North Central 996.9 West North Central 0.0
East South Central 62,270.1 East South Central 847.2
West South Central 420,294.3 West South Central 85,737.0
Mountain 0.0 Mountain 0.0
Pacific 0.0 Pacific 14.7
Eastern Canada 16,775.3 Eastern Canada 489.0
Western Canada 0.0 Western Canada 0.3
Mexico 0.0 Mexico 0.0
South Atlantic 0.0 South Atlantic 417.5
ALL MODES
To Florida From Florida
State / Region Tons (000) State / Region Tons (000)
Georgia 138,686.9 Georgia 102,814.2
Alabama 73,065.0 Alabama 38,734.9
New England 9,098.0 New England 7,158.6
Mid Atlantic 40,044.4 Mid Atlantic 40,758.5
East North Central 112,360.2 East North Central 43,793.7
West North Central 21,237.1 West North Central 22,056.6
East South Central 237,402.9 East South Central 29,164.0
West South Central 501,059.6 West South Central 119,184.4
Mountain 11,940.7 Mountain 4,399.0
Pacific 17,171.2 Pacific 9,799.0
Eastern Canada 28,608.8 Eastern Canada 7,278.0
Western Canada 14,831.0 Western Canada 2,741.0
Mexico 2,685.0 Mexico 3,341.1
South Atlantic 63,380.9 South Atlantic 41,934.7
Source: TRANSEARCH by Reebie and Associates via Florida Department of Transportation (2000).

Florida Transportation Almanac
185
IntelligentTransportation
Systems

Florida Transportation Almanac
186

Florida Transportation Almanac
187
SECTION HIGHLIGHTS
# There are currently several components to the Intelligent Transportation System (ITS) program in Florida:Advanced Traffic Management Systems, Incident Management Systems, Advanced Traveler InformationSystems, Transportation Management Systems, and Freeway Management Systems.
# The Florida Turnpike’s Dynamic Message Sign (DMS) System Project installed 19 shuttered, fiber-optic DMSon full-span structures along the Turnpike mainline. Communication is accomplished via dedicatedlow-speed leased lines from the Pompano Traffic Management Center (TMC).
# The US 19 Advance Traffic Management System in Pasco County is the most southerly of three constructionprojects to be built on the full length of US 19 in Pasco County. It runs from the Pinellas/Pasco county lineto Main Street. The adaptive signal system SCATS controls traffic on an areawide basis. SCATS selectscombinations of cycle time, splits, and offsets from predetermined sets of parameters and on-linecalculations. SCATS then directly optimizes traffic parameters for each subsystem based on measuredactivity and then applies offsets to achieve coordination as appropriate across the network in the corridorto optimize traffic flow.

Florida Transportation Almanac
188
FLORIDA DEPARTMENT OF TRANSPORTATION INTELLIGENTTRANSPORTATION SYSTEMS REPORT
Advanced Traffic Management Systems (ATMS)
Florida's Turnpike Enterprise Dynamic Message Sign (DMS) System Project
This project installed 19 shuttered, fiber-optic DMS on full-span structures along the Turnpike mainline.Communication is accomplished via dedicated low-speed leased lines from the Pompano Traffic ManagementCenter (TMC). Construction is complete. All of the DMS are installed and fully operational. System acceptancetesting is complete. The 90-day observation period commenced October 3, 2002. A supplemental agreementhas been executed with the contract to install two additional DMS in Miami-Dade County.Project contact: Gummada Murthy at (954) 975-4855.
SunNavSM Phase I Fiber Project
This project will install 68 miles of fiber optic cable and 8 Pan-tilt-zoom CCTV cameras from milepost (MP) 7to MP 75 along the Turnpike mainline. The fiber optic cable will integrate 5 Turnpike DMS and 2 District 4 DMSwithin the project limits, with the Pompano TMC. The project will also provide a fiber optic drop for possiblefuture connection to the Boca Tolls Data Center and allow for future interfaces to FDOT Districts 4 and 6. Inaddition, the project will install eight CCTV cameras. The project is designed to accommodate future VehicleDetector Stations (VDS) and cameras every mile within the project limits. The Low-bid Design-Buildprocurement method was utilized and a Contractor has been selected. A Construction, Engineering, &Inspection (CEI) Consultant has been selected. Notice to Proceed was given to the Contractor in August 2002.Construction was started in January 2003 and completion is scheduled for April 2003.Project contact: Ingrid Birenbaum at (954) 975-4855.
Ocoee Traffic Monitoring System Project
This project will install 8 traffic-monitoring cameras and 4 Radar Traffic Monitoring System (RTMS) VehicleDetectors from MP 263 to MP 267 along the Turnpike mainline beginning at the Turkey Lake Service Plaza andending at the Ocoee/SR 50 Exit. The project will integrate the cameras and vehicle detectors to the TurkeyLake TMC via the existing fiber optic communications infrastructure. The project will utilize IP video transportover Ethernet. The video transport equipment has been procured, delivered, and accepted; the centralequipment has been installed at the TMC. One hundred percent Plans and Technical Special Provisions (TSPs)for the field construction have been reviewed and comments are being incorporated into the Final Plans andTSPs. One of the 8 cameras is currently operational on the Orlando West Microwave Tower and can be viewedand controlled from the Turkey Lake and Pompano TMC facilities. The project has been awarded with ananticipated Notice to Proceed to the contractor in February 2003.Project contact: Craig Carnes at (407) 532-3999.
Traffic Management Centers
The Pompano TMC facility is operational 24-hours a day, 7-days a week. The Turkey Lake TMC facility isoperational seven days per week from 6 AM to 11 PM. A gradual transition to 24-7 is underway at the TurkeyLake facility. Incident management is accomplished utilizing nine HARs and 19 DMSs along the Turnpikemainline. TMC operators work closely with FHP Troop K to detect, verify, and mitigate incidents. AdvancedTraveler Information System operators at each facility work in close coordination with Turnpike Road Rangersthrough an Automatic Vehicle Locator (AVL) system. The Florida's Turnpike Enterprise is also part of theSunGuideSM 511 Advanced Traveler Information System (ATIS) partnership in Miami-Dade, Broward, and Palm
Florida Transportation Almanac
189
Beach Counties. Renovations at the TMC facilities are complete. Installation of the video walls, equipmentracks, and operator consoles has been accomplished. Completion is noted as “ongoing.”Project contact: Gummada Murthy at (954) 975-4855.
SunNavSM Software Development and Integration
Software development on SunNavSM Release 1.1 began in July 2002. ITS Operations and Design staff werepresented a Prototype design to provide feedback to the Software Team. Development of a DMS controlwindow and system integration continues. Release 1.01 is scheduled for installation in late February 2003.Release 1.02 and 1.03 will add drivers for CCTV and video wall. Completion is scheduled for July 2003.Project contact: Ranzy Whiticker at (407) 532-3999.
Automated Vehicle Location (AVL) System
This project will integrate the existing Turnpike Road Rangers' AVL system with the TMC facilities. The projecthas two primary objectives. First, the AVL system will provide location information to the TMC enabling moreefficient response to incidents on the Turnpike by dispatching the closest available mobile asset(s). Second,the AVL system will provide the TMC with accurate vehicle speed of Turnpike monitored vehicles to helpdetermine traffic flow. The AVL system will collect vital information and deliver this information to the TMC in"real time." AVL has been installed at the Pompano facility.Project contact: Gummada Murthy at (954) 975-4855.
Portable Roadside Readers
The Turnpike's Portable Roadside Reader (PRR) is a self-contained, trailer-mounted SunPassTM transponderreader. This equipment was designed to be used for SunPassTM transponder data collection and extractionat specified geographical locations. In September 2001, four PRRs were provided to the Turnpike. Two of thePRRs are based at the Pompano Beach Maintenance yard, and two are based at the Orlando South Maintenanceyard. Turnpike Traffic Operations has made the PRRs available to other agencies that require traffic data. Theunits have been actively deployed since January 2002. Completion is noted as “on-going.”Project contact: Derole Duncan at (954) 975-4855.
SunNavSM Phase II Fiber Project
This project will install 70 miles of fiber optic communications infrastructure and a camera approximately everymile from MP 75 to MP 145 along the Turnpike mainline. The project will integrate 5 DMS within the projectlimits with the Pompano TMC. The project will also provide communications to the Florida Highway Patrol LakeWorth Regional Dispatch Center. The project is designed to accommodate future Vehicle Detector Stations(VDS) within the project limits. Development of the Project Concept Report will begin in February 2003.Completion is scheduled for December 2004.Project contact: Ingrid Birenbaum at (954) 975-4855.
Vehicle Detector Station (VDS) System
This project will provide incident detection capability integrated with the Pompano and Turkey Lake TMCs alongthe Turnpike mainline. Completion is scheduled for an unspecified date in 2007.Project contact: Ingrid Birenbaum at (954) 975-4855.
Video System
This project will provide video-monitoring capability integrated with the Pompano and Turkey Lake TMCs alongthe Turnpike mainline. Completion is scheduled for an unspecified date in 2007.Project contact: Ingrid Birenbaum at (954) 975-4855.
Florida Transportation Almanac
190
District 1
Advanced Traffic Management Systems (ATMS)
City of Winter Haven Signal Retiming Project
This project is retiming 26 signalized intersections that are currently part of the City of Winter Haven's existingclosed loop system. The notice to proceed was issued in January 2002. The analysis work is complete andtiming implementation and signalization fine-tuning is underway. Completed in April 2003.Project contact: Chris Birosak at (863) 519-2507.
Sarasota-Manatee Signal Computer System Update
This project is a two-part study/design that will prepare an ATMS Master Plan, develop a Concept of Operations,and prepare a Design-Build Requirements Package for the Sarasota/Manatee Urban Area. The ATMS upgradewill include phased construction of a new Traffic Management Center, new central hardware and software, newcontrollers and cabinets, an updated communications plant, and video monitoring at selected locations. Thenotice to proceed was issued in June 2002 and the project is proceeding on schedule.Completion is scheduled for October 2003.Project contact: Chris Birosak at (863) 519-2507.
City of Naples/Collier County Advanced Transportation Management System (ATMS), Design Group I,Construction
This project involves constructing a hybrid traffic control system utilizing fiber optic cable for communicationsto 77 intersections. This is the first of two projects that are scheduled to construct the ATMS. This project willbuild the control centers for the city and county and communicate with 77 intersections. Completion isscheduled for June 2003.Project contact: Chris Birosak at (863) 519-2507.
City of Punta Gorda/Charlotte County Advanced Transportation Management System, Design Group I,Construction
This project is the construction of a hybrid traffic control system utilizing fiber optic cable for communicationsto 53 intersections. This is the first of two projects that are scheduled to construct the ATMS. This project willbuild the control center for the county and communicate with 53 intersections. Completion is scheduled forJune 2003.Project contact: Chris Birosak at (863) 519-2507.
City of Naples/Collier County Advanced Transportation Management System, Design Group II, Design
This project will expand the computerized signal system to an additional 77 intersections and install video at50 locations for monitoring traffic. This is the second of two projects that were scheduled to construct theATMS. Design began in July 2001 and is continuing on-schedule. Phase III (90%) Plans are complete.Completion is scheduled for July 2003.Project contact: Chris Birosak at (863) 519-2507.
Florida Transportation Almanac
191
City of Punta Gorda/Charlotte County Advanced Transportation Management System, Design Group II,Design
This project will expand the computerized signal system to an additional 44 intersections and install video at40 locations for monitoring traffic. This is the second of two projects that were scheduled to construct theATMS. Design began in December 2001 and is continuing on-schedule. Phase II (60%) Plans are complete.Completion is scheduled for June 2003.Project contact: Chris Birosak at (863) 519-2507.
Lakeland Signal Computer System Update
This project will prepare an ATMS Master Plan for the Lakeland Urban Area and develop a Design-BuildRequirements Package to be used by the Department to secure a Design-Build Team, which will complete thedesign and construct an upgrade to the existing signal system. The ATMS upgrade will include new centralhardware and software, new controllers and cabinets, an updated communications plant, and video monitoringat selected locations. The notice to proceed was issued in June 2002 and the project is proceeding on schedule. Completion is scheduled for July 2003.Project contact: Chris Birosak at (863) 519-2507.
District 2
Jacksonville Surveillance and Control System
The Jacksonville Urban Area has begun to install the infrastructure necessary to establish its Advanced TrafficManagement System. Initially focusing on highly congested corridors, the foundation of this system will providefor the future expansion of the system and will integrate operations with the city signal system, and theJacksonville Transportation Authority.
I-10 (Phase III)
Work has been completed on this roadway system as of June 2002. CCTV cameras and video detection havebeen deployed to complement existing DMS along the roadway. An all-inclusive TMC software package(SunGuide) was developed to control field elements (CCTV, DMS and VIDS), monitor alarms and trackcompleted maintenance tasks.
I-95 South (Phase III)
This project began construction in May 2003. It involves the deployment of ITS devices along I-95 in DuvalCounty between the Fuller Warren Bridge and Greenland Road. Cameras, non-invasive traffic detectors andcantilevered dynamic message signs will be installed along this roadway system. Modifications to the internalcomponents of the TMC will be made to incorporate these new devices (i.e. database modification, softwarerevision, and hardware changes).
I-95 North (Phase IV)
This project will be advertised in July 2003. It involves the deployment of ITS devices along I-95 in DuvalCounty between the Fuller Warren Bridge and Airport Road. Cameras, non-invasive traffic detectors andcantilevered dynamic message signs will be installed along this roadway system. Modifications to the internalcomponents of the TMC will be made to incorporate these new devices (i.e. database modification, softwarerevision and hardware changes). Work should be completed by Spring 2005.

Florida Transportation Almanac
192
District 3
Tallahassee ATMS
Features of this Advanced Transportation Management System include 170-type field equipment, videomonitoring, traveler advisory radio, and fiber optic communications. Renovation of the Traffic ManagementCenter and CCTV integration has been completed.
Okaloosa County/Fort Walton Area
Construction is underway for an area-wide Advanced Traffic Management System. Features are to include aserver-based distributed traffic signal system with, 2070 series controllers, fiber optic backbone, DMS and CCTVcapability.
Bay Area County Regional ITS
This project includes a $1 million earmark in FY2000 and a $1.5 million earmark in FY2001 that proposes tofund design and construction of a fiber optic communications backbone within Florida's Bay County.Construction services will include the implementation of an ATMS and integration of that ATMS with, what willthen be, the existing IMS system at the Hathaway Bridge Replacement Project. Major partners in the projectwill be the Florida Department of Transportation District III Traffic Operations, Bay County Traffic EngineeringDepartment and the Bay District Schools. The Bay District Schools are a unique partner in that they are nottraditionally considered in transportation issues. However, they are interested in the formulation of acommunication network that will assist in connecting the area 34 schools together to maximize theirdistance-learning program. This would also allow for integration of the Bay District Schools with emergencyservices for improved and real-time emergency management communication during emergency shelteroperation. A regional architecture has been completed with design-build packages to be let by the end of theyear.
District 4
Broward County Advanced Traffic Management System (ATMS)
This multi-years project replaces the existing old Urban Traffic Control System used at about 1,300 intersectionswith a new Traffic Signal System using Type 2070 controller that complies the National TransportationCommunications for ITS Protocol (NTCIP) standard. A countywide fiber optical network with eight GigabitEthernet Switches forms a backbone fully redundant communication network with a mesh topology. Along withover one thousand edge routers, this communication network brings images from about 300 Close CircuitTelevision (CCTV) back to the ITS Operation Facility. The network also connects all those intersection signalcontrollers, about one hundred Dynamic Message Signs (DMS), and other traffic detectors to the trafficmanagement center. All these subsystems are fully integrated into a single software control platform that iscapable of configuring, controlling, and monitoring these subsystems as well as alarm generation, logging, andincident managing. This project is implemented in six phases in terms of time and location.
Palm Beach County Advanced Traffic Management System (ATMS)
Palm Beach County is replacing the existing old Urban Traffic Control System used at intersections with a newTraffic Signal System using NEMA TS2 controller that complies the National Transportation Communications forITS Protocol (NTCIP) standard. A countywide fiber optical network with eight Gigabit Ethernet Switches formsa backbone fully redundant communication network with a mesh topology. Along with over one thousand edgerouters, this communication network brings images from Close Circuit Television (CCTV) back to the ITSOperation Facility. The network also connects all those intersection signal controllers, Dynamic Message Signs(DMS), and other traffic detectors to the traffic management center. All these subsystems are fully integrated
Florida Transportation Almanac
193
into a single software control platform that is capable of configuring, controlling, and monitoring thesesubsystems as well as alarm generation, logging, and incident managing.
Palm Beach County New Traffic Management Center (TMC)
Palm Beach County is building a new Traffic Management Center along with the contribution from FloridaDepartment Of Transportation. The center will house operators from different agencies working together topromptly response public needs under Palm Beach's management. This Traffic Management Center will be ableto control all Close Circuit Televisions (CCTV), Dynamic Message Signs (DMS), and traffic detectors through acountywide fiber optical network with Gigabit Ethernet routers.
City of Boca Raton Advanced Traffic Management System (ATMS)
The City of Boca Raton is in the process of building a citywide ring shaped fiber optical communication networkthat enable the city traffic engineers control all intersection signal controllers, Close Circuit Televisions (CCTV),Dynamic Message Signs (DMS), and detectors from a central office. All the old signaling systems will also bereplaced by the new NEMA TS2 controllers that comply the National Transportation Communications for ITSProtocol (NTCIP) standard.
District 5
I-4 SMIS - US 192 to Lake Mary Boulevard A complete system of cameras, detection, and changeable message signs has been deployed from World Drivein Osceola County to Lake Mary Boulevard in Seminole County. The total length of this system in 39 miles andwas built in two phases. Capital investment totaled approximately $8.7 million (design/construction/CEI).
4 SMIS Phase 3 - St. Johns River Bridge Replacement
Phase 3 of the I-4 SMIS system is part of the St. Johns River Bridge reconstruction project. This project willextend the existing system from Lake Mary Boulevard in Seminole County to SR 472 in Volusia County. A totalof nineteen (19) CCTV cameras, thirty (30) detector stations and six (6) Dynamic Message Signs will be addedalong with the expansion of the fiber optic network to the new ITS devices. This project also includes a fiberoptic communication link to the District Office to create an Emergency Operations Center and the integrationof an operator interface computer at the District 5 Offices in Deland. The EOC in the District Office will beaccomplished under another contract and will include a video screen, a projector, and a workstation for theSMIS Operator Interface.
I-4 SMIS Phase 4 - I-4 Widening from US 192 to US 27
Phase 4 of this system is part of a 6-lane reconstruction project in Osceola County. The ITS elements willextend from the existing system at World Drive to US 27 in Polk County. A total of eight (8) CCTV cameras,sixteen (16) detector stations and five (5) Dynamic Message Signs will be added. This project is funded forconstruction in fiscal year 2003. I-4 Auxiliary Lanes from SR 536 to SR 528
This Design/Build Project included relocating and/or replacing all existing components of the existing I-4 SMISthat are located within the construction limits and impacted by the widening of I-4 from SR 536 to SR 528Beeline Expressway. The existing fiber optic cable located on the eastbound side of I-4 will be maintained andused for system operation during the construction phase and the new 72-strand cable will be placed on thewestbound side of I-4. This will create a redundancy in the system along this section.
Florida Transportation Almanac
194
I-4 Auxiliary Lanes from SR 528 to SR 482
This Design/Build Project will include relocating and/or replacing all existing components of the existing I-4SMIS that are located within the construction limits and impacted by the widening of I-4 from SR 528 BeelineExpressway to SR 482 Sand Lake Road. The existing fiber optic network within the project limits shall bemaintained and the new 72-strand fiber optic network shall be placed on the westbound side of I-4.
I-4 Auxiliary Lanes from SR 423 to SR 436
This Design/Build Project will include relocating and/or replacing all existing components of the existing I-4SMIS that are located within the construction limits and impacted by the widening of I-4 from John YoungParkway to SR 436.
I-4 Auxiliary Lanes from SR 435/Kirkman Road to Florida's Turnpike
This construction project will include relocating and/or replacing all existing components of the existing I-4 SMISthat are located with the construction limits and impacted by the widening of I-4 from SR 435/Kirkman Roadto Florida's Turnpike.
I-4 Widening from Lake Mary Boulevard to US 17/92
This construction project will include relocating and/or replacing all existing components of the existing I-4 SMISthat are located with the construction limits and impacted by the widening of I-4 from Lake Mary Boulevard toUS 17/92.
I-4 SMIS Upgrade from SR 436 to Lake Mary Boulevard
This project will upgrade all of the existing ITS elements on I-4 from SR 436 to Lake Mary Boulevard.
I-95 Daytona Area Smart Highway (DASH) System
A complete system of cameras, detection, and changeable message signs has been deployed along a 10-milesection including the interchanges along I-95 and I-4 in the Daytona Beach area. This system is known asDaytona Area Smart Highway (DASH) surveillance and control system and is co-monitored and co-controlledby the City of Daytona Beach and Florida Department of Transportation. The system has a total of ten (10)CCTV cameras, ten (10) detector stations and four (4) Dynamic Message Signs. Capital investment totaledapproximately $1.8 million.
I-95 Phase 2 - I-95 / SR 528 Hurricane Evacuation System
Phase 2 of the I-95 system is proposed at SR 528 in Brevard County. The primary purpose of this system isto aid in the evacuation of east and south Florida. The system will be monitored from the RTMC and includesa total of twelve (12) CCTV cameras, thirteen (13) detector stations and six (6) Dynamic Message Signs.
I-95 Widening North of US 92 to South of I-4
This construction project will include relocating and/or replacing all existing components of the existing DASHthat are located with the construction limits and impacted by the widening of I-95 from North of US 92 to Southof Interstate 4.
Florida Transportation Almanac
195
I-95 DASH Expansion
This project will expand the existing DASH system and add new ITS devices to the DASH system, includingconnecting ITS to some arterial roads. The new ITS devices will be added on I-4 from SR 44 to US 92 and onI-95 from US 92 to SR 40.
I-95 Northern DASH Expansion
This project will expand the existing DASH system North on Interstate 95, including connecting ITS to somearterial roads. This project will expand DASH from SR 40 North to US 1.
I-95 Southern DASH Expansion
This project will expand the existing DASH system south on Interstate 95, including connecting ITS to somearterial roads. This project will expand DASH from Interstate 4 south to SR 44.
I-95 Expansion HES and DASH
This project will expand the existing DASH and HES on Interstate 95, including connecting ITS to some arterialroads. This project will expand these systems from SR 520 to SR 519.
I-75 Phase 1
Phase 1 of the I-75 system is proposed to cover all of Sumter County, including the I-75/Turnpike interchange.The project will cross into Hernando County to provide complete coverage south of the rest areas.
I-75 Phase 2
Phase 2 of the I-75 system is proposed to cover all of Marion County, including the Ocala area.
Regional Traffic Management Center
A Regional Traffic Management Center has been constructed in Orlando and is operational. All existing I-4traffic information flows through this center. Currently joint operation of the system is located within the RTMCbetween FDOT and FHP. The planned renovation/retrofit project will provide an overall system design that willprovide scalability that will allow for future growth and expansion throughout the entire Central Florida regionto include I-4, I-95, and I-75. Currently there are existing and planned network interfaces with other regionalagencies to interface requirements and specifications that will facilitate bringing them on-line with the RTMCcommunications upgrade. This project shall include the design, equipment, software procurement, installation,and system integration of a state-of-the-art Gigabit Ethernet communications network backbone of the I-4Surveillance and Motorist Information System (SMIS) as well as the Regional Traffic Management Center(RTMC) building modifications and upgrades to support future operations and Florida Highway Patrol (FHP)call/dispatch station expansion plans.

Florida Transportation Almanac
196
District 6
Signal System Upgrade
This is a Miami-Dade Countywide Project. It involves upgrading the Traffic Control System (TCS) to an ATMScapable of handling 4,096 controllers, implementing national ITS standards, transitioning the County fromleased phone lines, and replacing aging system. Phase A is Design - Alpha Test 16 site locations. Phase B isImplementation. Completion for Phase A is July 2003 and Phase B is December 2009.Project contact: Angel Reanos at (305) 499-2483.
District 7
US 19 Advance Traffic Management System for Pasco County
This project is the most southerly of three construction projects to be built on the full length of US 19 in PascoCounty to install an ATMS. It runs from the Pinellas/Pasco county line to Main Street. The adaptive signalsystem SCATS will be installed to control traffic on area basis. SCATS select combinations of cycle time, splits,and offsets from predetermined sets of parameters and on-line calculations. SCATS then directly optimizestraffic parameters for each subsystem based on measured activity and then applies offsets to achievecoordination as appropriate across the network in the corridor to optimize traffic flow. The components of theproject include 2070N signal controllers, additional vehicle detectors, video monitoring, dynamic message signs,fiber optic trunk line, and a new Pasco County Traffic Management Center (TMC). The construction project wasadvertised and let in October 2002. The project leverages the system manager/system integrator contractingstrategy. Florida Department of Transportation (FDOT), with the aid of the system manager, is currentlypurchasing the central software and all ITS devices for delivery to the prospective contractors. Completion isscheduled for November 2003.Project contact: Bijan Behzadi at (813) 975-6733.
Pinellas Countywide ATMS/Clearwater SR 60 ATMS
Pinellas Countywide ATMS deals with the development of an integrated Advanced Traffic Management Systemfocusing on four corridors identified by the MPO. One of the four corridors is SR 60 (Gulf to Bay Blvd.) forwhich the feasible design study was completed under the Clearwater SR 60 ATMS Feasibility Study. The otherthree corridors for development are the full length of US 19 in Pinellas County, McMullen Booth Road (CR 611),and Ulmerton Road (SR 688). The major ITS components to be deployed are an adaptive signal system usingAdvance Traffic Controllers (ATC), CCTV cameras at intersections and mid blocks, dynamic message signs, videoimaging detection, and installation of fiber optic backbone. In addition to the corridor type work, the projectwill work toward integrated operation of the three separate jurisdictional Traffic Control Centers in the county,i.e., City of Clearwater, City of St. Petersburg, and Pinellas County. The feasibility study was completed in May2002 and it identified three phases for implementing ATMS on the four corridors. The System Manger isproceeding with the preparation of construction plans and procurement documents for the first phase that isfunded for construction. The single design project promotes the targeted systems integration, as well asaccounting for the adaptive signal system to be implemented on the four corridors which use a suite of twoalgorithms which are OPAC (Optimized Policies for Adaptive Control) and RHODES (Real-time, Hierarchical,Optimized, Distributed, Effective System). Completion is scheduled for December 2004.Project contact: Bijan Behzadi at (813) 975-6733.
Hernando Countywide Traffic Signal System
This project develops a closed-loop signal system for all the signals in the county to be controlled from a TrafficOperations Center in Brooksville. The system is an Econolite Aries with 64 intersections divided into 11 controlsections connected by a combination of fiber optic and leased telephone lines. Project was awarded in February

Florida Transportation Almanac
197
2002 at $1.6 million. The pre-construction meeting was held September 13 and construction has started. Thecontract is for 250 days and is scheduled for completion in July 2003.Project contact: Keith Crawford at (813) 975-6255.
City of Tampa Traffic Video Monitoring System
This project is for the development of an integrated traffic video monitoring system to be deployed along threecorridors within the City of Tampa. The three corridors are SR 60 (Kennedy Blvd), SR 600 (Gandy Blvd.) andSR 597 (Dale Mabry Hwy). A feasibility study will be conducted on the three corridors to determine the limitsof the video system and the communications requirements. Based on the feasibility study, plans will bedeveloped to place video cameras along the corridors, establish the communication links from the field to theCity's Traffic Management Center (TMC) and modifications to the TMC to integrate the video. A System Managerwas selected in May 2002. Completion is December 2004.Project contact: Bijan Behzadi at (813) 975-6733.
Advanced Traveler Information System (ATIS)
Traveler Information
Provides uniform, multi-modal, real-time traveler, and traffic information in South Florida (Palm Beach, Broward,Miami-Dade, and Monroe) under the SunGuideSM program. There is a Traveler Information Center located inthe Golden Glades Interchange Area, Interactive Voice Response telephone system, and website(www.smartraveler.com) that is already operational. Snapshots of real-time traffic conditions are available onthe web. 511 Service launched on July 16, 2002 at a news conference. Public outreach campaign includesradio spots, outdoor advertising, printed press releases, media kits, tollbooth cards, videos, mail inserts, anddeployment of 511 signs. In addition, SmartRoute Systems is committed to provide long-term marketingopportunities. All carriers with the exception of Verizon provide the service in South Florida. ConsumerInformation Network (CIN) tentatively to begin Summer 2003. Traveler Information services commenced onMay 2001. Completion is scheduled for November 2005.Project contact: Rene deHuelbes at (305) 470-5341.
Transportation Management System
Integrate ITS in Volusia County
Integrate ITS in Volusia County will integrate the Intelligent Transportation Systems (ITS) elements in VolusiaCounty and provide the ability for the FDOT, the City of Daytona Beach, Volusia County Traffic Engineering,and VOTRAN to share information for traffic management. This integration project will allow each of theseagencies to share all available tourist, incident, congestion, and emergency information. There will be an ITSArchitecture developed for Volusia County. The FDOT, Daytona Beach, and Volusia County will integrate theirexisting video systems to allow each of the agencies to view the others' cameras and enable the video to beefficiently sent to other entities. Also included is the dissemination of video to VOTRAN. This will provide videofeeds from all cameras to assist in transit management. This project also includes a fiber optic connection onI-4 from SR 44 to the existing DASH system and to the Volusia County Emergency Operations Center.
I-95 Intelligent Corridor System Package B
Installation of 7 freeway dynamic message signs (FDMS), 8 arterial dynamic message signs (ADMS), 53 detectorstations (remote traffic microwave sensors [RTMS] & loops), 27 trailblazers, 14 emergency stopping sites(ESS), and 22 ramp signaling sites along SR 9A (I-95). First contract day was October 14, 2002. Last contractday is June 25, 2006. Construction phase already started with installation of trailblazers, ESS, and RTMS atvarious locations. Completion is scheduled for July 2005.Project contact: Dari Vorce at (305) 499-2392.

Florida Transportation Almanac
198
I-95 Intelligent Corridor System Package C
Construction of a 32,000-square foot SunGuideSM Transportation Management Center (STMC) at the southernend of the existing Florida Highway Patrol Al Lofton Building grounds. Construction time of 471 days. Noexcuse bonus of $0.5 million to be awarded if building is finished by 375 days (January 2003). This project hasbeen completed.Project contact: Dari Vorce at (305) 499-2392.
Package C - ITS Video Wall & Consoles
Installation of specialized state-of-the-art video projection equipment in the future SunGuideSM TMC Building.Equipment for the communications hub will be procured and migration of existing communication circuits willbe achieved. Furniture to support both SunGuideSM and Law Enforcement staff operations will also beprocured. Project to be advertised early 2003. Notice to Proceed to be sent to the Contractor on July 15, 2003.Completion is scheduled for December 2003.Project contact: Omar Meitin at (305) 499-2493.
SR 826 (Palmetto Expressway) East/West ITS Deployment
Design Build Project to be constructed concurrently with ITS Deployment in the Upper Florida Keys Project.Installation of 50 detector stations, 9 CCTV (cameras), 4 FDMS, and 3 field nodes from NW 122nd Street toGolden Glades Interchange (GGI). Notice to Proceed issued on May 30, 2003. Completion is scheduled forDecember 2004.Project contact: Omar Meitin at (305) 499-2493.
SR 5 (US 1 Monroe County) ITS Deployment in the Upper Florida Keys
Design Build Project to be constructed concurrently with SR 826 ITS Deployment. Installation of 4 FDMS, 7CCTV (cameras), & 2 RTMS detector stations from Florida City to Abaco Road in Key Largo. Notice to Proceedwas issued on May 30, 2003. Completion is scheduled for December 2004.Project contact: Omar Meitin at (305) 499-2493.
SR 5 (US 1 Monroe County) ITS Deployment for the Lower Florida Keys
Feasibility study recommends installation of 22 dynamic message signs (DMS), 8 HAR (highway advisory radio),7 detector stations, and 4 CCTV from Abaco Road (Key Largo) to City of Key West. Providing that enoughfunding is obtained, the project may be let in April 2004. Completion in December 2006.Project contact: Omar Meitin at (305) 499-2493.
Florida Transportation Almanac
199
Freeway Management Systems
City of Orlando Regional Computerized Signal System
A feasibility and implementation study has been completed for the RCSS. The project is being administeredby the City of Orlando through a JPA with FDOT. Deployment of the system is funded and has begun. The fiberoptic backbone is being installed as part of District 5's Pushbutton Program. A decision has been made to gowith Gigabit Ethernet with Extreme Ethernet switches and to use Naztec NTCIP compatible controllers for theCity's Regional Computerized Signal System. Total funding is estimated at $7.0 million.
Seminole County ATMS Project
Seminole County ATMS project is a subset of the RCSS. Administration of the project is by Seminole Countythrough a JPA with FDOT. Seminole County used Orlando's RCSS project's feasibility and implementation studytherefore adopted the approach of using Gigabit Ethernet with Extreme Ethernet switches and the Naztec NTCIPcompatible controllers for the County's Signal System. Deployment of the ATMS system has begun and theCounty has selected Comview Technologies for their video wall. Total funding is estimated at $3.0 million.
Orange County ATMS Project
Orange County ATMS project is also a subset of the RCSS. The project will begin with a consultant selectionin February 2003 to complete the feasibility and implementation study. Deployment is anticipated shortlythereafter. Administration of the project is by Orange County through a LAP agreement with FDOT. Totalfunding is estimated at $7.0 million.
ITS Fiber Optic to DeLand Maintenance Office
This project will provide fiber optic interconnect from SR 44 to the DeLand Maintenance Office on Kepler Roadand will provide the capability for the maintenance office to fully monitor the ITS systems currently deployedin District 5 as well as communicate with the Regional Traffic Management Center (RTMC), District 5 office inDeLand, and ultimately other maintenance offices and centers located on the communications network. Thisproject is currently being designed in-house and will include the traffic signal at Kepler Road and US 92.
ITS Fiber Optic Oviedo Maintenance Office
This project will provide fiber optic interconnect from Interstate 4 to the Maintenance Office on SR 426. Thiswill provide the capability for the maintenance office to fully monitor the ITS systems currently deployed inDistrict 5 as well as communicate with the Regional Traffic Management Center (RTMC), District 5 office inDeLand, and ultimately other maintenance offices and centers located on the communications network. Thisproject is currently being designed in-house. This fiber optic connection will be accomplished through D-5'sPushbutton Program to accelerate the construction schedule of this project.
ITS Fiber Optic
These projects will provide fiber optic interconnect to each of the six District 5 Maintenance offices for aseamless and fully integrated communications network for optimal maintenance operations and efficiency andwill provide the capability for the maintenance offices to fully monitor the ITS systems currently deployed inDistrict 5 as well as communicate with the Regional Traffic Management Center (RTMC), District 5 office inDeland, and other maintenance offices and centers located on the communications network. These projectsare currently unfunded.

Florida Transportation Almanac
200
ITS Fiber Optic FHP DeLand Office
This project will provide fiber optic interconnect from FDOT DeLand Maintenance to the FHP DeLand Office onUS 92. This will provide the capability for FHP to fully monitor the ITS systems currently deployed in District5 as well as communicate with the Regional Traffic Management Center (RTMC), District 5 office in DeLand,and ultimately other centers located on the communications network. This line of communication will assist inimplementing the Open Roads Policy established between FHP and FDOT. This project is currently beingdesigned in-house. This fiber optic connection will be accomplished through D-5's Pushbutton Program toaccelerate the construction schedule of this project.
ITS Fiber Optic FHP Cocoa Office
This project will provide fiber optic interconnect from I-95 at SR 520 to the FHP Cocoa Office on SR 520. Thiswill provide the capability for FHP to fully monitor the ITS systems currently deployed in District 5, as well as,communicate with the Regional Traffic Management Center (RTMC), District 5 office in DeLand, and ultimatelyother centers located on the communications network. This line of communication will assist in implementingthe Open Roads Policy established between FHP and FDOT. This project is currently being designed in-house.This fiber optic connection will be accomplished through D-5's Pushbutton Program to accelerate theconstruction schedule of this project.
District 7
Tampa Bay SunGuide Center
Development of a RTMC in Tampa for Freeway Management on sections of I-275, I-75, and I-4. A SystemManager will design the building and operating equipment for the center, procure and integrate the operatingequipment for the center, and perform CEI services for construction projects to build the center. The primeSystem Manager TEI was selected in June 2002. TEI with DMJM Harris as a sub-consultant are currentlyundertaking the Preliminary Design of the Building. Completion is April 2006.Project contact: Bill Wilshire at (813) 975-6612.
Tampa Bay SunGuide Freeway Management System PHASE I
Construction of the ITS field devices for the Freeway Management System on various roadway segments inTampa Bay on I-275 and I-4. These field devices will connect to and be managed from the RTMC being builtas the Tampa Bay SunGuide Center. The first roadway section is I-275 in north Tampa from MLK Blvd. toBearss Avenue with a Fiber communications link from I-275 to the RTMC located at the District 7 Headquarters. System Manager TEI has been authorized to begin design on this first roadway segment. Completion is April 2006.Project contact: Bill Wilshire at (813) 975-6612.
Advanced Traveler Information Systems
District 5
iFlorida
The overall project includes about 24 elements that include metropolitan travel time expansion using tolltransponder and/or license plate readers, expansion of the camera monitoring system on the arterial system,fiber backbone expansion to connect critical infrastructure, I-4 variable speed limit sign trial based on road andweather conditions, monitoring of two key evacuation routes SR 528 and SR 520 to support evacuations fromSouth Florida and the coastal areas, security monitoring of two bridges - Fuller Warren in Jacksonville and theBennett Causeway which leads to the Kennedy Space Center, weather sensors that provide existing and
Florida Transportation Almanac
201
forecasted information for better traffic control and maintenance deployment, and a local project that willdevelop recommended practices for emergency evacuations of attractions and special event venues. All iFloridaelements are to be deployed over a two-year period, with another two years dedicated to evaluating thesystems for possible deployment nationwide. iFlorida will expand District Five's 511 Regional Travel InformationService to include arterial, airport, transit and weather information. A new statewide reporting system willprovide information on events, incidents, weather and construction reports on the Florida Interstate HighwaySystem (FIHS). This information will be integrated and used to implement a Statewide 511 Traveler InformationSystem that will fill the gaps of the existing and proposed 511 Metro Systems.
511
On June 24, 2002 District 5 launched the implementation and operation of an Advance Traveler InformationService for use with 511 Dialing Code. Currently, the 511 coverage areas are divided into I-4 CorridorSegments: Attractions (Polk County to Turnpike), Downtown Orlando (Turnpike to SR 436), Seminole County(SR 436 to St. Johns River Bridge), and Volusia County (St. Johns River Bridge to I-95). Additionally, specialalert sections are available for I-95 Segments: I-95 Brevard County and I-95 Volusia County.
The I-4 Travel Information System is operated from the District 5 RTMC where professional announcers, verifyall traveler information and record the information message sets. The message sets relay real time informationregarding congestion, incidents, construction updates, and special events that may cause the motorists delays.The announcers record the travel information every 20 minutes or immediately as traffic conditions change.All calls are recorded on servers and routed to call centers, where the interactive voice response (IVR) systemwith full speech recognition technology provides the travelers with instructions.
By dialing 511 travelers are able to get around-the-clock, real-time traffic and road condition updates to helpmake travel related decisions on route selection, departure time or even mode of travel. Information on roadconditions not only help the traveler, it also helps to divert traffic away from congested areas, thus reducingthe affects of the congestion. Because of Florida's commitment to the deployment of Intelligent TransportationSystems, up-to-the-minute traveler information is available and 511 provides an easy-to remember phonenumber that can be used to access this traveler information.
District 7
District Seven Advanced Traveler Information System (ATIS)
A final Scope of Services/Functional Requirements to contract with an ATIS Information Service Provider (ISP)for the Tampa Bay region, is near the point of completion. Once executed, the ISP contractor will have 30 daysto submit a draft Program Management Plan for FDOT's approval. Approval of the Program Management Planwill mark the beginning of a five-year contract for providing traveler information service to the Tampa Baytraveling public. Completion is July 2003.Project contact: Bill Wilshire/Mike Jackson at (813) 975-6612/6259.
Skyway Video Monitoring System Modifications
The Project added video cameras to the center span of the bridge, improved the existing video monitoringsystem, and established video links from the bridge to FHP Troop C Dispatch, FDOT District 7 Headquarters,and the Crisis Center for Tampa Bay. Images from the cameras will also be made available for the news mediaand for the FDOT Internet web page for general use by travelers and for evacuation coordination. Design-Buildcontract for $0.8 million was awarded to TransCore in January 2002. Design and construction of the initialproject was completed. Additional work was added to the project to include; an audible Alarm System for insidethe Skyway Bridge, additional security cameras, and CCTV for the Tampa Bay shipping channel.Project contact: Bill Wilshire at (813) 975-6612.
Florida Transportation Almanac
202
Intelligent Transportation Infrastructure Program
A project agreement with Mobility Technologies, the pre-selected private partner per federal Task Order, toinstall and operate about 100 vehicle detection sensors on Tampa Bay Interstates was executed on May 19,2003. The construction manager for Mobility Technologies will now initiate the permitting process needed toinstall and maintain the sensors. Completion in December 2003 for sensory installation.Project contact: Bill Wilshire at (813) 975-6612.
Incident Management Systems (IMS)
District 1
Feasibility Study For An Incident Management System For The Edison, Caloosahatchee, Midpoint, and CapeCoral Bridges in Lee County
The overall objective of this project will be to determine the feasibility and develop a conceptual design for anIncident Management System (IMS) for four bridges over the Caloosahatchee River that connect Lee Countyand the City of Fort Myers with North Fort Myers and the City of Cape Coral in Lee County, Florida. The studywill provide sufficient detail to enable cost and benefit estimates to be obtained, supporting the subsequentdevelopment of detailed design plans, specifications and deployment cost estimates. The study will also developand define an ITS framework for IMS in the study area. Completion is June 2003.Project contact: Michael Tako-Nicolaisen at (863) 519-2395.
District 4
Pensacola Bay Bridge
This project consists of wrong way motorist detection and advisory equipment for use on the bridge. Projectfunding was via a Federal Highway Administration Priority Technology Program Grant. Features includedirectional inductive loop detection and monitoring, coupled with high-visibility signs and flashing warning lights. Concurrent to activation of the system, an alarm message will be transmitted to a nearby Police Department.
Bay County Hathaway Bridge IMS
The current IMS consists of CCTV cameras feeding back to Florida Highway Patrol (FHP) Headquarters next tothe bridge and Dynamic Message Signs located over US 98 travel lanes approaching the bridge to warn anddirect motorists when incidents occur on the bridge. This system is monitored 24-hours a day by the FHP. An FDOT project to replace the existing 4-lane Hathaway Bridge with a new 8-lane facility will include anadditional ITS component, a weather monitoring/warning station, being added to the system, as well asexpansion of the number of camera and changeable message sign units now present. These components willbe integrated into the Bay County Area Regional ITS program through the planned fiber optic network.
Florida Transportation Almanac
203
Chapter 4:SAFETY

Florida Transportation Almanac
204
Florida Transportation Almanac
205
SECTION HIGHLIGHTS
# Compared to 2000, there was a 3.9 percent increase in traffic crashes investigated and reported in 2001.
# Compared to 2000, there was a 0.47 percent increase in traffic fatalities in 2001.
# Compared to 2000, there was a 1.3 percent increase in traffic injuries in 2001.
# In 2001, 33.2 percent of traffic fatalities and 9.5 percent of traffic crashes were alcohol-related. There wereincreases of 2.1 percent in alcohol-related traffic fatalities and 3.5 percent in alcohol-related traffic crashesfor the year 2001 compared to 2000.
# In 2001, 60.5 percent of all crashes occurred primarily in business areas, while 59.5 percent of fatal crasheswere in open country or residential areas.
# In 2001, 16.9 percent of all traffic fatalities involved pedestrians. There were 4 more pedestrian fatalitiesin 2001 than in 2000.
# In 2001, 3.6 percent of all traffic fatalities were bicycle drivers. There was a 28.9 percent increase in thiscategory in 2001 compared to 2000.
# In 2001, 8.4 percent of all traffic fatalities were motorcycle drivers. There was a 11 percent increase inmotorcycle fatalities in 2001 compared to 2000.
# In 2001, drivers age 15-19 were involved in 553 crashes per 10,000 licensed drivers and 5 fatal crashes per10,000 licensed drivers; the highest for all driver age groups in Florida.
# From 1981 to 2001, the death rate on Florida’s highways decreased from 4.1 to 2.0 deaths per 100 millionvehicle miles of travel.
# From 1981 to 2001, the number of licensed drivers in Florida increased by 75 percent.
# From 1981 to 2001, the number of registered vehicles in Florida increased by 70 percent.
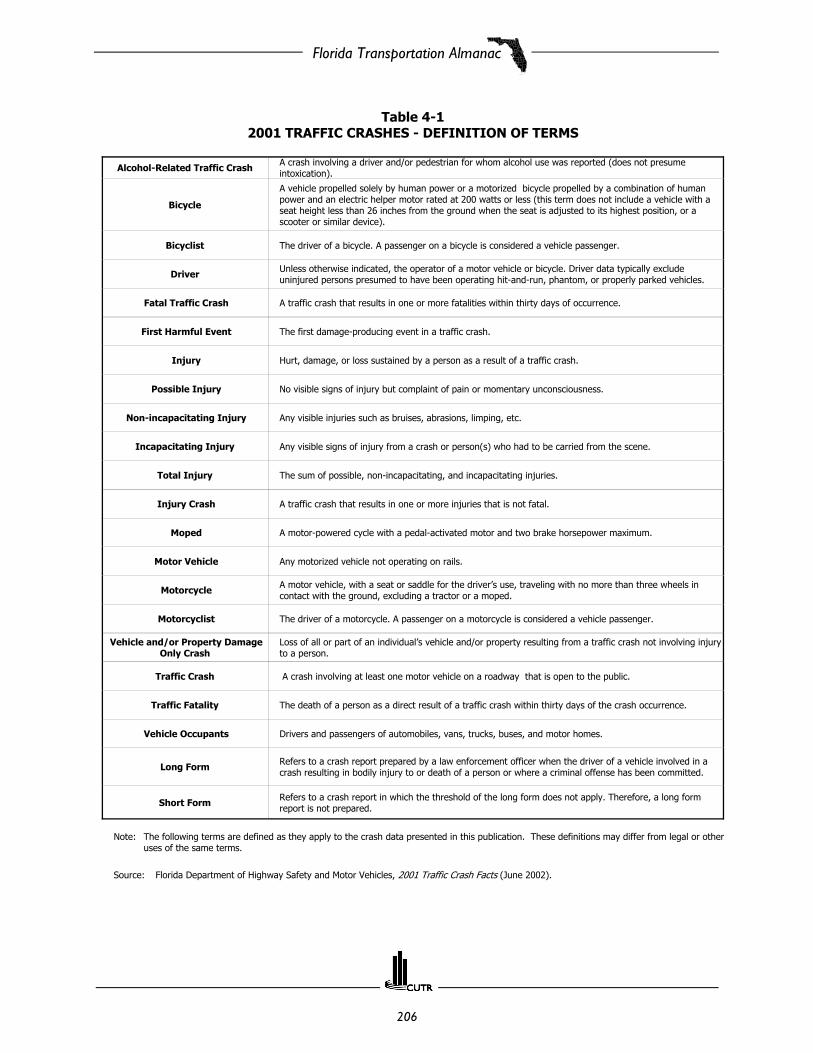
Florida Transportation Almanac
206
Table 4-12001 TRAFFIC CRASHES - DEFINITION OF TERMS
Alcohol-Related Traffic Crash A crash involving a driver and/or pedestrian for whom alcohol use was reported (does not presumeintoxication).
Bicycle
A vehicle propelled solely by human power or a motorized bicycle propelled by a combination of humanpower and an electric helper motor rated at 200 watts or less (this term does not include a vehicle with aseat height less than 26 inches from the ground when the seat is adjusted to its highest position, or ascooter or similar device).
Bicyclist The driver of a bicycle. A passenger on a bicycle is considered a vehicle passenger.
Driver Unless otherwise indicated, the operator of a motor vehicle or bicycle. Driver data typically excludeuninjured persons presumed to have been operating hit-and-run, phantom, or properly parked vehicles.
Fatal Traffic Crash A traffic crash that results in one or more fatalities within thirty days of occurrence.
First Harmful Event The first damage-producing event in a traffic crash.
Injury Hurt, damage, or loss sustained by a person as a result of a traffic crash.
Possible Injury No visible signs of injury but complaint of pain or momentary unconsciousness.
Non-incapacitating Injury Any visible injuries such as bruises, abrasions, limping, etc.
Incapacitating Injury Any visible signs of injury from a crash or person(s) who had to be carried from the scene.
Total Injury The sum of possible, non-incapacitating, and incapacitating injuries.
Injury Crash A traffic crash that results in one or more injuries that is not fatal.
Moped A motor-powered cycle with a pedal-activated motor and two brake horsepower maximum.
Motor Vehicle Any motorized vehicle not operating on rails.
Motorcycle A motor vehicle, with a seat or saddle for the driver’s use, traveling with no more than three wheels incontact with the ground, excluding a tractor or a moped.
Motorcyclist The driver of a motorcycle. A passenger on a motorcycle is considered a vehicle passenger.
Vehicle and/or Property DamageOnly Crash
Loss of all or part of an individual’s vehicle and/or property resulting from a traffic crash not involving injuryto a person.
Traffic Crash A crash involving at least one motor vehicle on a roadway that is open to the public.
Traffic Fatality The death of a person as a direct result of a traffic crash within thirty days of the crash occurrence.
Vehicle Occupants Drivers and passengers of automobiles, vans, trucks, buses, and motor homes.
Long Form Refers to a crash report prepared by a law enforcement officer when the driver of a vehicle involved in acrash resulting in bodily injury to or death of a person or where a criminal offense has been committed.
Short Form Refers to a crash report in which the threshold of the long form does not apply. Therefore, a long formreport is not prepared.
Note: The following terms are defined as they apply to the crash data presented in this publication. These definitions may differ from legal or otheruses of the same terms.
Source: Florida Department of Highway Safety and Motor Vehicles, 2001 Traffic Crash Facts (June 2002).

Florida Transportation Almanac
207
Table 4-2STATE OF FLORIDA SUMMARY - 2001 FLORIDA
TRAFFIC CRASH FACTS
All Crashes
Traffic Crashes 256,169
Drivers Involved 381,799
Average Crashes per Day 704
Fatal Crashes and Fatalities
Fatalities 3,013
Fatal Crashes 2,717
Injury Crashes
Possible Injuries 126,411
Non-incapacitating Injuries 77,183
Incapacitating Injuries 31,006
Total Injuries 234,600
Injury Crashes 145,208
Alcohol-related Crashes and Fatalities
Alcohol-related Fatalities 1,000
Alcohol-related Injuries 20,001
Alcohol-related Crashes 24,411
Alcohol-related Fatal Crashes 893
Alcohol-related Injury Crashes 12,220
Crash Environments
Crashes in Business Areas 154,905
Crashes in Residential Areas 73,291
Crashes in Open Country 27,973
Fatal Crashes in Business Areas 1,101
Fatal Crashes in Residential Areas 707
Fatal Crashes in Open Country 909
Pedestrian Crashes
Pedestrians Killed 510
Pedestrians Injured 7,894
Pedestrian Crashes 1 8,487
Bicycle Crashes
Bicyclists Killed 107
Bicyclists Injured 4,476
Bicycle Crashes 1 4,909
Motorcycle Crashes
Motorcyclists Killed 252
Motorcyclists Injured 5,101
Motorcyclists Crashes 5,766
1 Pedestrian and bicycle crashes included all crashesinvolving pedestrians or bicycles.
Source: Florida Department of Highway Safety andMotor Vehicles, 2001 Traffic CrashFacts (June 2002).

Florida Transportation Almanac
208
Figure 4-1ALL CRASHES BY MONTH, FLORIDA (2000)
Source: Florida Department of Highway Safety and Motor Vehicles, 2001 Traffic Crash Facts (June 2002).
0
5,000
10,000
15,000
20,000
25,000
Jan Feb March Apr May Jun Jul Aug Sep Oct Nov Dec
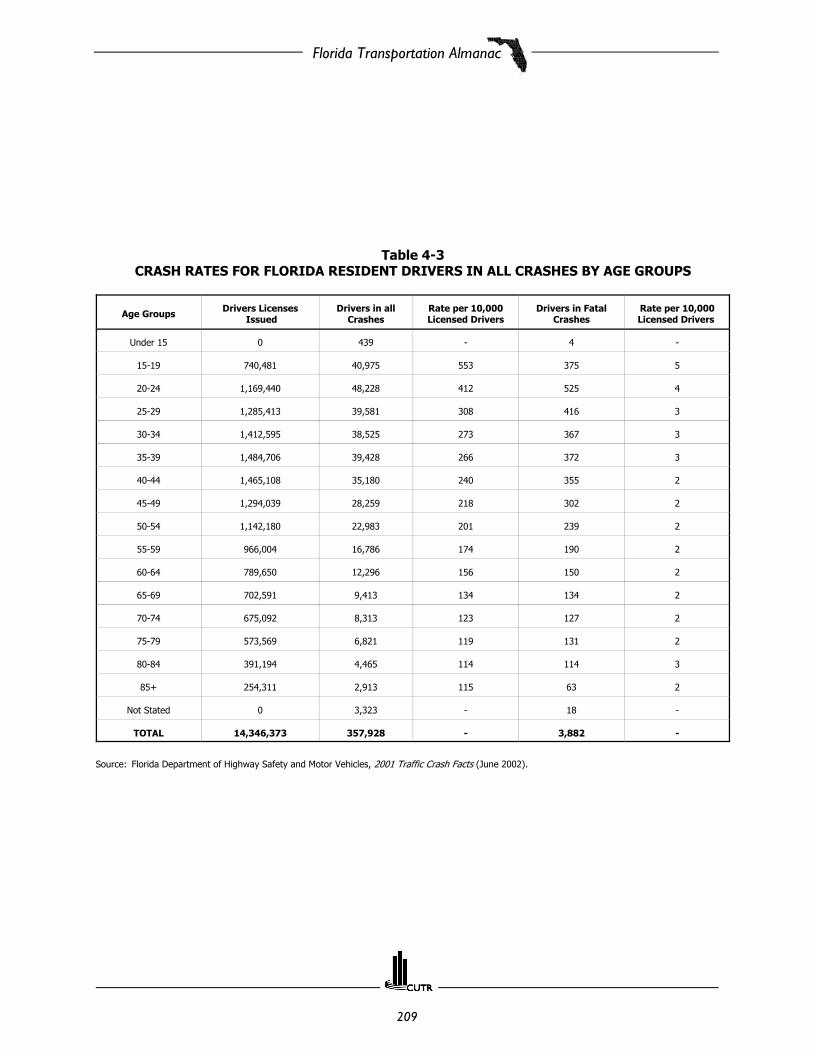
Florida Transportation Almanac
209
Table 4-3CRASH RATES FOR FLORIDA RESIDENT DRIVERS IN ALL CRASHES BY AGE GROUPS
Age Groups Drivers Licenses Issued
Drivers in allCrashes
Rate per 10,000Licensed Drivers
Drivers in FatalCrashes
Rate per 10,000Licensed Drivers
Under 15 0 439 - 4 -
15-19 740,481 40,975 553 375 5
20-24 1,169,440 48,228 412 525 4
25-29 1,285,413 39,581 308 416 3
30-34 1,412,595 38,525 273 367 3
35-39 1,484,706 39,428 266 372 3
40-44 1,465,108 35,180 240 355 2
45-49 1,294,039 28,259 218 302 2
50-54 1,142,180 22,983 201 239 2
55-59 966,004 16,786 174 190 2
60-64 789,650 12,296 156 150 2
65-69 702,591 9,413 134 134 2
70-74 675,092 8,313 123 127 2
75-79 573,569 6,821 119 131 2
80-84 391,194 4,465 114 114 3
85+ 254,311 2,913 115 63 2
Not Stated 0 3,323 - 18 -
TOTAL 14,346,373 357,928 - 3,882 -
Source: Florida Department of Highway Safety and Motor Vehicles, 2001 Traffic Crash Facts (June 2002).

Florida Transportation Almanac
210
Table 4-4FLORIDA MOTORING ENVIRONMENT
Year LicensedDriver
RegisteredVehicles 4
VehicleMiles 1 Crashes Non-Fatal
Injuries Deaths Mileage DeathRate 2
1981 8,222,403 7,887,881 76,146 368,766 205,437 3,119 4.1
1982 8,598,019 8,622,549 79,497 361,312 195,834 2,710 3.4
1983 8,987,493 9,064,490 81,775 384,614 194,791 2,729 3.3
1984 9,442,763 9,444,964 85,241 237,511 202,889 2,856 3.4
1985 9,630,975 10,827,693 88,057 250,412 216,596 2,870 3.3
1986 9,924,110 11,651,253 87,325 242,381 219,352 2,874 3.3
1987 10,241,063 11,738,273 92,865 240,249 215,886 2,891 3.1
1988 10,648,019 11,997,948 105,030 256,543 230,738 3,152 3.0
1989 11,109,288 12,276,272 108,876 252,439 230,060 3,033 2.8
1990 11,612,402 12,465,790 109,997 216,245 214,208 2,951 2.7
1991 12,170,821 11,184,146 3 113,484 195,312 195,122 2,523 2.2
1992 11,550,126 11,205,298 114,000 196,176 205,432 2,480 2.2
1993 11,767,409 11,159,938 119,768 199,039 212,497 2,719 2.3
1994 11,992,578 11,393,982 120,929 206,183 223,458 2,722 2.3
1995 12,019,156 11,557,811 127,800 228,589 233,900 2,847 2.2
1996 12,343,598 12,003,930 129,637 241,377 243,320 2,806 2.2
1997 12,691,835 12,170,375 133,276 240,639 240,001 2,811 2.1
1998 13,012,132 11,277,808 136,680 245,440 241,863 2,889 2.1
1999 13,398,895 11,611,993 140,868 243,409 232,225 2,920 2.1
2000 14,041,846 11,948,485 149,857 246,541 231,588 2,999 2.0
2001 14,364,373 13,448,202 151,744 256,169 234,600 3,013 2.0
1 In millions (figure for 2001 is an estimate)2 Per 100 million vehicle miles of travel3 Decrease reflects change in accounting method4 Beginning in year 1998 does not include count of trailers with tags
Source: Florida Department of Highway Safety and Motor Vehicles, 2001 Traffic Crash Facts (June 2002).
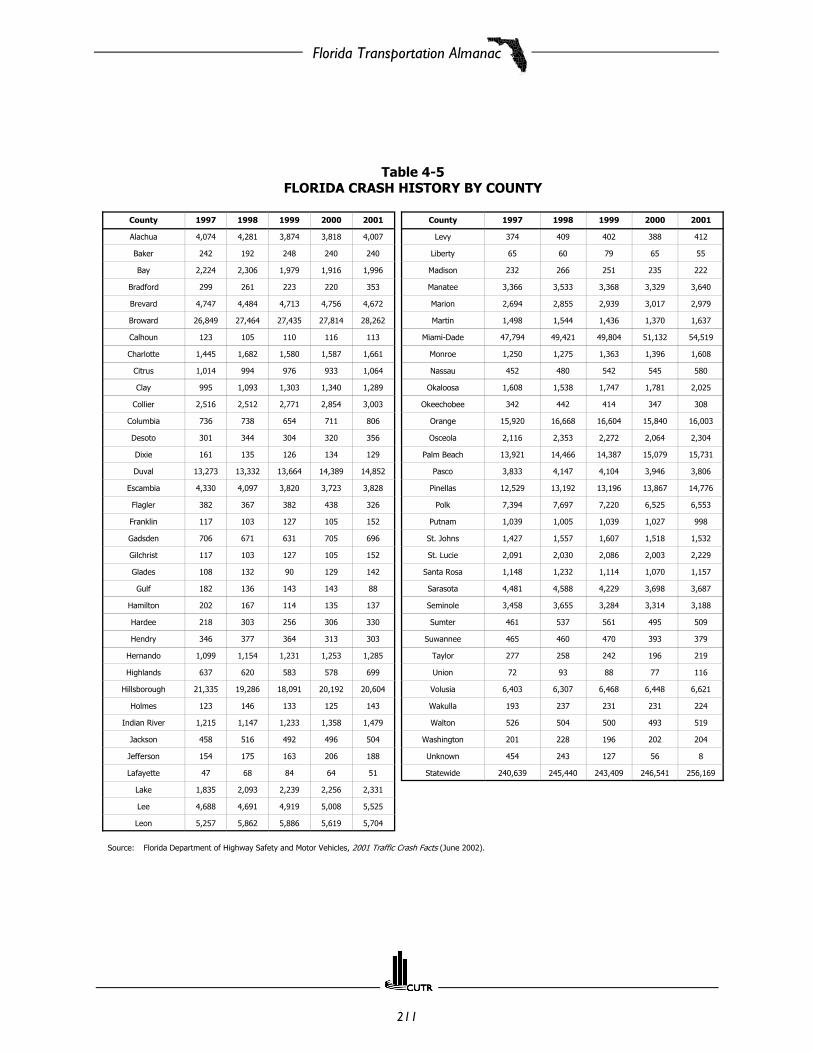
Florida Transportation Almanac
211
Table 4-5FLORIDA CRASH HISTORY BY COUNTY
County 1997 1998 1999 2000 2001 County 1997 1998 1999 2000 2001
Alachua 4,074 4,281 3,874 3,818 4,007 Levy 374 409 402 388 412
Baker 242 192 248 240 240 Liberty 65 60 79 65 55
Bay 2,224 2,306 1,979 1,916 1,996 Madison 232 266 251 235 222
Bradford 299 261 223 220 353 Manatee 3,366 3,533 3,368 3,329 3,640
Brevard 4,747 4,484 4,713 4,756 4,672 Marion 2,694 2,855 2,939 3,017 2,979
Broward 26,849 27,464 27,435 27,814 28,262 Martin 1,498 1,544 1,436 1,370 1,637
Calhoun 123 105 110 116 113 Miami-Dade 47,794 49,421 49,804 51,132 54,519
Charlotte 1,445 1,682 1,580 1,587 1,661 Monroe 1,250 1,275 1,363 1,396 1,608
Citrus 1,014 994 976 933 1,064 Nassau 452 480 542 545 580
Clay 995 1,093 1,303 1,340 1,289 Okaloosa 1,608 1,538 1,747 1,781 2,025
Collier 2,516 2,512 2,771 2,854 3,003 Okeechobee 342 442 414 347 308
Columbia 736 738 654 711 806 Orange 15,920 16,668 16,604 15,840 16,003
Desoto 301 344 304 320 356 Osceola 2,116 2,353 2,272 2,064 2,304
Dixie 161 135 126 134 129 Palm Beach 13,921 14,466 14,387 15,079 15,731
Duval 13,273 13,332 13,664 14,389 14,852 Pasco 3,833 4,147 4,104 3,946 3,806
Escambia 4,330 4,097 3,820 3,723 3,828 Pinellas 12,529 13,192 13,196 13,867 14,776
Flagler 382 367 382 438 326 Polk 7,394 7,697 7,220 6,525 6,553
Franklin 117 103 127 105 152 Putnam 1,039 1,005 1,039 1,027 998
Gadsden 706 671 631 705 696 St. Johns 1,427 1,557 1,607 1,518 1,532
Gilchrist 117 103 127 105 152 St. Lucie 2,091 2,030 2,086 2,003 2,229
Glades 108 132 90 129 142 Santa Rosa 1,148 1,232 1,114 1,070 1,157
Gulf 182 136 143 143 88 Sarasota 4,481 4,588 4,229 3,698 3,687
Hamilton 202 167 114 135 137 Seminole 3,458 3,655 3,284 3,314 3,188
Hardee 218 303 256 306 330 Sumter 461 537 561 495 509
Hendry 346 377 364 313 303 Suwannee 465 460 470 393 379
Hernando 1,099 1,154 1,231 1,253 1,285 Taylor 277 258 242 196 219
Highlands 637 620 583 578 699 Union 72 93 88 77 116
Hillsborough 21,335 19,286 18,091 20,192 20,604 Volusia 6,403 6,307 6,468 6,448 6,621
Holmes 123 146 133 125 143 Wakulla 193 237 231 231 224
Indian River 1,215 1,147 1,233 1,358 1,479 Walton 526 504 500 493 519
Jackson 458 516 492 496 504 Washington 201 228 196 202 204
Jefferson 154 175 163 206 188 Unknown 454 243 127 56 8
Lafayette 47 68 84 64 51 Statewide 240,639 245,440 243,409 246,541 256,169
Lake 1,835 2,093 2,239 2,256 2,331
Lee 4,688 4,691 4,919 5,008 5,525
Leon 5,257 5,862 5,886 5,619 5,704
Source: Florida Department of Highway Safety and Motor Vehicles, 2001 Traffic Crash Facts (June 2002).
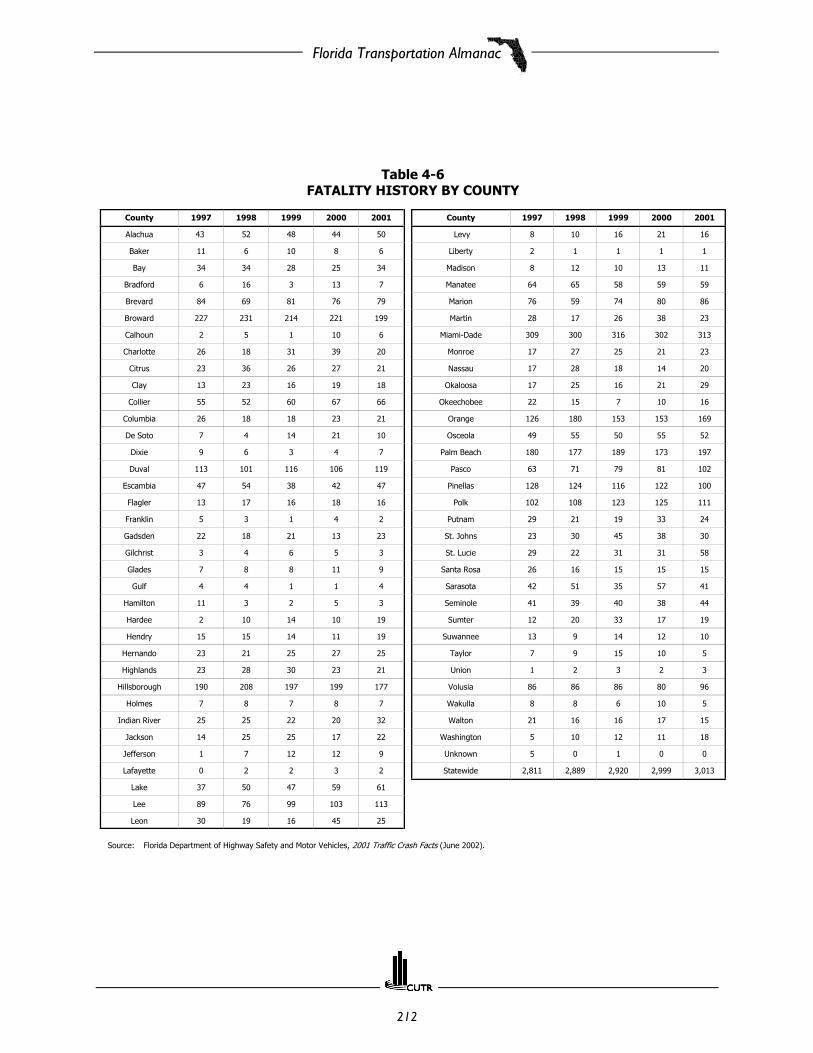
Florida Transportation Almanac
212
Table 4-6FATALITY HISTORY BY COUNTY
County 1997 1998 1999 2000 2001 County 1997 1998 1999 2000 2001
Alachua 43 52 48 44 50 Levy 8 10 16 21 16
Baker 11 6 10 8 6 Liberty 2 1 1 1 1
Bay 34 34 28 25 34 Madison 8 12 10 13 11
Bradford 6 16 3 13 7 Manatee 64 65 58 59 59
Brevard 84 69 81 76 79 Marion 76 59 74 80 86
Broward 227 231 214 221 199 Martin 28 17 26 38 23
Calhoun 2 5 1 10 6 Miami-Dade 309 300 316 302 313
Charlotte 26 18 31 39 20 Monroe 17 27 25 21 23
Citrus 23 36 26 27 21 Nassau 17 28 18 14 20
Clay 13 23 16 19 18 Okaloosa 17 25 16 21 29
Collier 55 52 60 67 66 Okeechobee 22 15 7 10 16
Columbia 26 18 18 23 21 Orange 126 180 153 153 169
De Soto 7 4 14 21 10 Osceola 49 55 50 55 52
Dixie 9 6 3 4 7 Palm Beach 180 177 189 173 197
Duval 113 101 116 106 119 Pasco 63 71 79 81 102
Escambia 47 54 38 42 47 Pinellas 128 124 116 122 100
Flagler 13 17 16 18 16 Polk 102 108 123 125 111
Franklin 5 3 1 4 2 Putnam 29 21 19 33 24
Gadsden 22 18 21 13 23 St. Johns 23 30 45 38 30
Gilchrist 3 4 6 5 3 St. Lucie 29 22 31 31 58
Glades 7 8 8 11 9 Santa Rosa 26 16 15 15 15
Gulf 4 4 1 1 4 Sarasota 42 51 35 57 41
Hamilton 11 3 2 5 3 Seminole 41 39 40 38 44
Hardee 2 10 14 10 19 Sumter 12 20 33 17 19
Hendry 15 15 14 11 19 Suwannee 13 9 14 12 10
Hernando 23 21 25 27 25 Taylor 7 9 15 10 5
Highlands 23 28 30 23 21 Union 1 2 3 2 3
Hillsborough 190 208 197 199 177 Volusia 86 86 86 80 96
Holmes 7 8 7 8 7 Wakulla 8 8 6 10 5
Indian River 25 25 22 20 32 Walton 21 16 16 17 15
Jackson 14 25 25 17 22 Washington 5 10 12 11 18
Jefferson 1 7 12 12 9 Unknown 5 0 1 0 0
Lafayette 0 2 2 3 2 Statewide 2,811 2,889 2,920 2,999 3,013
Lake 37 50 47 59 61
Lee 89 76 99 103 113
Leon 30 19 16 45 25
Source: Florida Department of Highway Safety and Motor Vehicles, 2001 Traffic Crash Facts (June 2002).

Florida Transportation Almanac
213
Table 4-7BICYCLE FATALITY HISTORY BY COUNTY
County 1997 1998 1999 2000 2001 County 1997 1998 1999 2000 2001
Alachua 2 1 5 0 4 Levy 0 0 0 0 0
Baker 1 0 0 0 0 Liberty 0 0 0 0 0
Bay 1 1 2 1 3 Madison 0 0 0 0 0
Bradford 0 0 0 0 0 Manatee 1 4 3 4 3
Brevard 7 1 3 0 2 Marion 0 0 2 1 4
Broward 10 11 14 6 6 Martin 1 1 3 1 1
Calhoun 0 1 0 0 1 Miami-Dade 16 8 11 6 10
Charlotte 2 0 1 1 0 Monroe 0 3 2 1 0
Citrus 1 2 0 0 0 Nassau 1 0 0 0 0
Clay 0 0 0 0 0 Okaloosa 0 2 2 0 0
Collier 3 4 3 1 4 Okeechobee 0 2 1 1 1
Columbia 1 0 0 0 0 Orange 3 5 5 3 7
De Soto 0 0 1 1 0 Osceoloa 1 1 2 3 3
Dixie 0 0 0 0 0 Palm Beach 5 4 4 4 11
Duval 5 3 4 5 3 Pasco 3 1 2 0 3
Escambia 3 2 0 2 1 Pinellas 7 7 8 6 7
Flagler 0 0 1 0 1 Polk 3 1 3 3 4
Franklin 0 0 0 0 0 Putnam 0 1 0 0 1
Gadsden 0 1 1 0 0 St. Johns 0 0 2 3 2
Gilchrist 0 0 0 0 0 St. Lucie 0 1 2 2 2
Glades 0 0 0 1 0 Santa Rosa 3 0 0 1 0
Gulf 0 0 0 0 0 Sarasota 8 4 3 4 1
Hamilton 0 0 0 0 0 Seminole 2 0 1 2 0
Hardee 0 0 0 0 0 Sumter 0 0 0 0 0
Hendry 1 0 0 0 0 Suwannee 0 0 0 0 0
Hernando 3 0 2 1 1 Taylor 0 0 0 0 0
Highlands 1 0 1 2 1 Union 0 0 0 0 0
Hillsborough 9 10 9 8 9 Volusia 4 4 1 2 4
Holmes 0 0 0 0 0 Wakulla 0 0 0 0 0
Indian River 0 1 1 1 1 Walton 0 0 0 0 0
Jackson 1 0 2 1 0 Washington 0 0 0 0 0
Jefferson 0 0 0 0 0 Unknown 0 0 1 0 0
Lafayette 0 0 0 0 0 Statewide 114 95 115 83 107
Lake 2 3 0 1 2
Lee 3 5 7 3 4
Leon 0 0 0 1 0
Source: Florida Department of Highway Safety and Motor Vehicles, 2001 Traffic Crash Facts (June 2002).
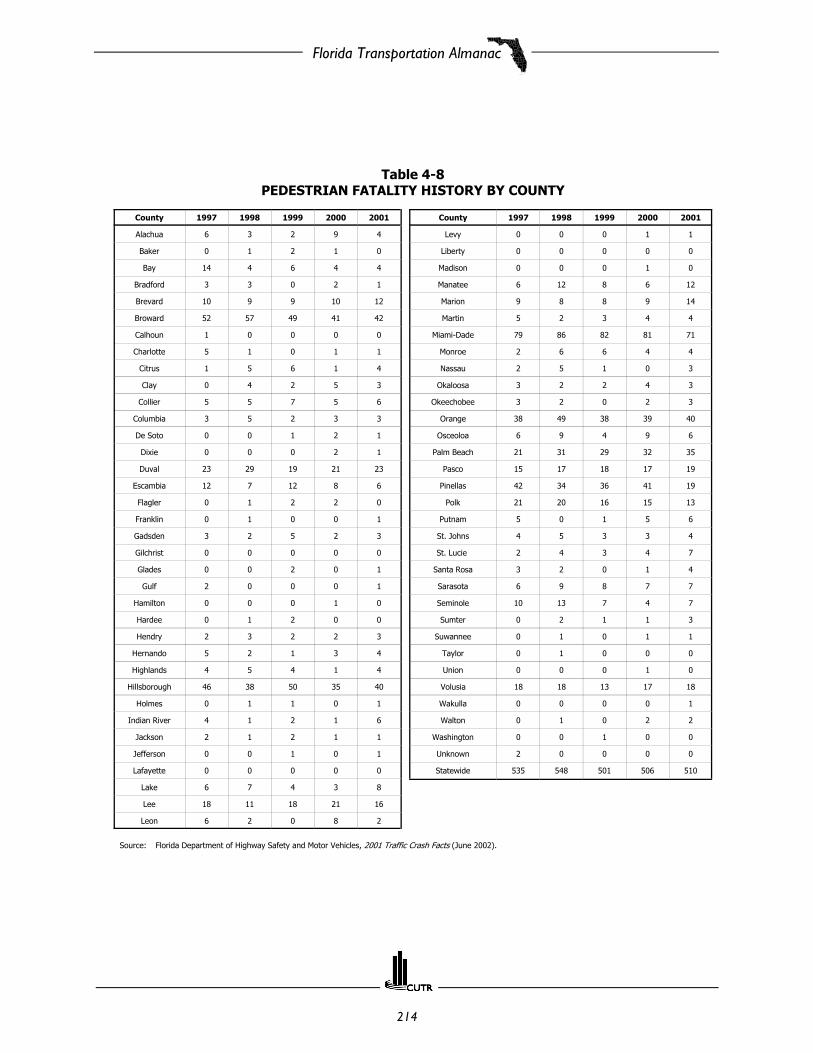
Florida Transportation Almanac
214
Table 4-8PEDESTRIAN FATALITY HISTORY BY COUNTY
County 1997 1998 1999 2000 2001 County 1997 1998 1999 2000 2001
Alachua 6 3 2 9 4 Levy 0 0 0 1 1
Baker 0 1 2 1 0 Liberty 0 0 0 0 0
Bay 14 4 6 4 4 Madison 0 0 0 1 0
Bradford 3 3 0 2 1 Manatee 6 12 8 6 12
Brevard 10 9 9 10 12 Marion 9 8 8 9 14
Broward 52 57 49 41 42 Martin 5 2 3 4 4
Calhoun 1 0 0 0 0 Miami-Dade 79 86 82 81 71
Charlotte 5 1 0 1 1 Monroe 2 6 6 4 4
Citrus 1 5 6 1 4 Nassau 2 5 1 0 3
Clay 0 4 2 5 3 Okaloosa 3 2 2 4 3
Collier 5 5 7 5 6 Okeechobee 3 2 0 2 3
Columbia 3 5 2 3 3 Orange 38 49 38 39 40
De Soto 0 0 1 2 1 Osceoloa 6 9 4 9 6
Dixie 0 0 0 2 1 Palm Beach 21 31 29 32 35
Duval 23 29 19 21 23 Pasco 15 17 18 17 19
Escambia 12 7 12 8 6 Pinellas 42 34 36 41 19
Flagler 0 1 2 2 0 Polk 21 20 16 15 13
Franklin 0 1 0 0 1 Putnam 5 0 1 5 6
Gadsden 3 2 5 2 3 St. Johns 4 5 3 3 4
Gilchrist 0 0 0 0 0 St. Lucie 2 4 3 4 7
Glades 0 0 2 0 1 Santa Rosa 3 2 0 1 4
Gulf 2 0 0 0 1 Sarasota 6 9 8 7 7
Hamilton 0 0 0 1 0 Seminole 10 13 7 4 7
Hardee 0 1 2 0 0 Sumter 0 2 1 1 3
Hendry 2 3 2 2 3 Suwannee 0 1 0 1 1
Hernando 5 2 1 3 4 Taylor 0 1 0 0 0
Highlands 4 5 4 1 4 Union 0 0 0 1 0
Hillsborough 46 38 50 35 40 Volusia 18 18 13 17 18
Holmes 0 1 1 0 1 Wakulla 0 0 0 0 1
Indian River 4 1 2 1 6 Walton 0 1 0 2 2
Jackson 2 1 2 1 1 Washington 0 0 1 0 0
Jefferson 0 0 1 0 1 Unknown 2 0 0 0 0
Lafayette 0 0 0 0 0 Statewide 535 548 501 506 510
Lake 6 7 4 3 8
Lee 18 11 18 21 16
Leon 6 2 0 8 2
Source: Florida Department of Highway Safety and Motor Vehicles, 2001 Traffic Crash Facts (June 2002).

Florida Transportation Almanac
215
Chapter 5:TOURISM

Florida Transportation Almanac
216

Florida Transportation Almanac
217
SECTION HIGHLIGHTS
# Exit interviews by the Florida Tourism Industry Marketing Corporation for 1998 through 2000 indicated thattop origin states for air visitors to Florida were New York, New Jersey, and Illinois while auto visitor toporigins were Georgia, Alabama, and Ohio.
# The top destinations of air visitors surveyed were Orange County, Hillsborough County, and BrowardCounty.
# The top destinations of auto visitors surveyed were Orange, Hillsborough, and Bay counties.
# Exit interviews indicated that the main purpose both air and auto visitors came to Florida was for vacation.The second highest reason for both was to visit friends and relatives. Air and auto visitors coming to Floridafor business listed a convention as their reason for coming to Florida. Seminars and training was the secondhighest reason listed by both air and auto visitors.
# In 2001, tourism-related sales tax collections totaled $254.5 billion, a 1.0 percent increase compared to theprevious year. In 2001, taxable spending in the "Tourism and Recreation" category totaled $50.8 billion,a decrease of 0.3 percent over the previous year.

Florida Transportation Almanac
218
Table 5-1VISITORS TO FLORIDA IN 2000 (in thousands of person trips)
Visitor Type 2000 % of Total 2001 % of Total Change (%)
Air 38,195 52.5 37,312 53.7 -2.3
Non-air 34,603 47.5 32,152 46.3 -7.1
Total 72,798 100.0 69,464 100.0 -4.6
Source: Florida Tourism Industry Marketing Corporation, 2001 Florida Visitor Study (2002).

Florida Transportation Almanac
219
Table 5-2TOP TEN ORIGIN STATES OF AIR VISITORS SURVEYED
Origin1997 1998 1999 2000 2001
Rank % Rank % Rank % Rank % Rank %
New York 1 14.9 1 13.3 1 13.2 1 14.4 1 13.1
New Jersey 2 7.1 2 7.2 3 6.3 3 6.7 2 6.6
Illinois 3 6.2 4 6 4 6 4 6.4 3 6.4
Michigan 8 4.8 8 4.5 7.5 4.9 9 4.3 4 5.7
California 5 5.9 3 6.2 2 7.4 2 6.8 5 5.5
Ohio 6 5.7 7 4.8 6 5 5 5.4 6 5.4
Texas 4 6.1 5.5 5.2 7.5 4.9 6 5.3 7 5.1
Massachusetts - - - - - - 7.5 5.2 8 4.9
Georgia 9 4 9 3.4 9 3.9 10 3.4 9 4.8
Pennsylvania 7 5 5.5 5.2 5 5.5 7.5 5.2 10 4.1
Virginia 10 3.8 10 3.3 10 2.8 - - - -
Total Top 10 - 63.5 - 59.1 - 59.9 - 63.1 - 61.6
Source: Florida Tourism Industry Marketing Corporation, 2001 Florida Visitor Study (2002).
Table 5-3TOP TEN DESTINATIONS OF AIR VISITORS SURVEYED
Destinations1997 1998 1999 2000 2001
Rank % Rank % Rank % Rank % Rank %
Orange 1 33.4 1 31.6 1 31.6 1 33.2 1 31.3
Hillsborough 3 8.9 3 9.1 4 9.1 2 9.5 2 9.8
Broward 4 7.3 4 8 3 8 3.5 8.4 3 9.6
Dade 2 9.9 2 10 2 10 3.5 8.4 4 8.3
Palm Beach 5 2.9 5 6.6 5 6.6 5 5.7 5 5.5
Pinellas 7 4.3 6.5 4.3 6 4.3 6 4.3 6 5.1
Lee 6 4.4 6.5 4.3 7 4.3 7 3.8 7 3.9
Duval 8 2.9 9 2.8 8 2.8 - - 8 3.3
Collier - - 10 2.3 - 2.3 - - 9 3.2
Volusia 10 2.4 - - - - 10 2.5 10 2.6
Sarasota - - - - - - 8.5 2.7 - -
Monroe 9 2.8 8 2.9 9 2.9 8.5 2.7 - -
Brevard - - - - 10 - - - - -
Total Top 10 - 79.2 - 81.9 - 72.9 - 81.2 - 82.6
Source: Florida Tourism Industry Marketing Corporation, 2001 Florida Visitor Study (2002).
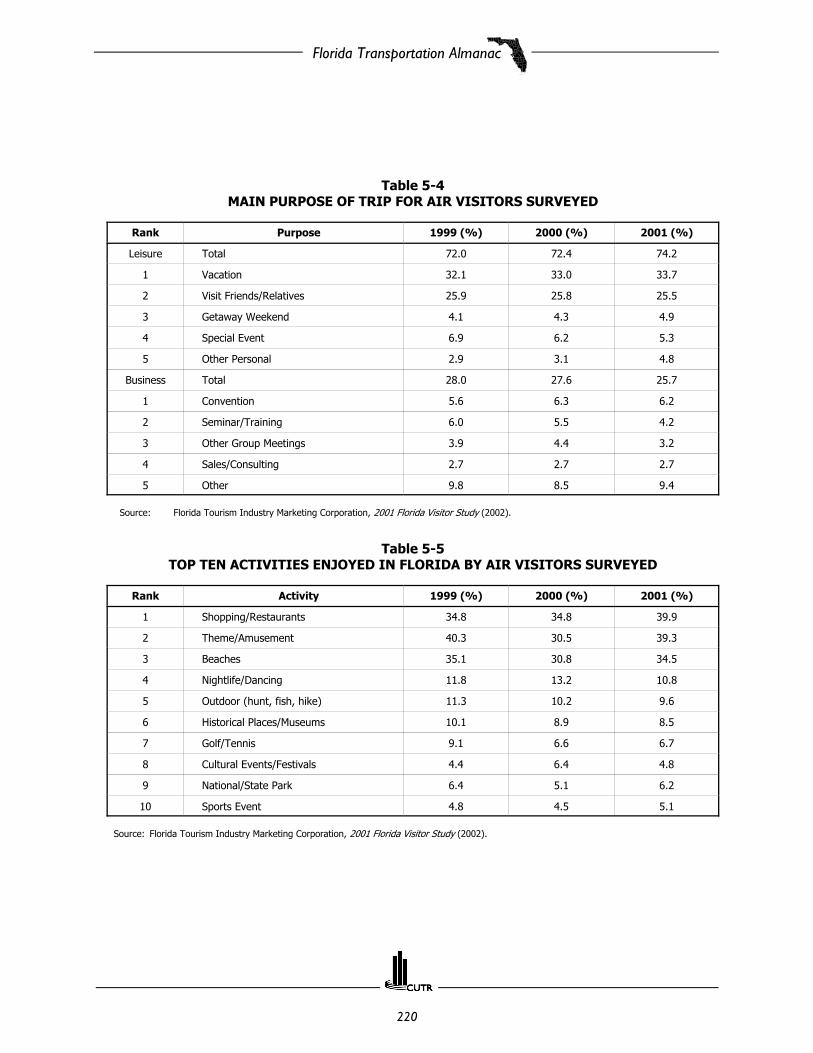
Florida Transportation Almanac
220
Table 5-4MAIN PURPOSE OF TRIP FOR AIR VISITORS SURVEYED
Rank Purpose 1999 (%) 2000 (%) 2001 (%)
Leisure Total 72.0 72.4 74.2
1 Vacation 32.1 33.0 33.7
2 Visit Friends/Relatives 25.9 25.8 25.5
3 Getaway Weekend 4.1 4.3 4.9
4 Special Event 6.9 6.2 5.3
5 Other Personal 2.9 3.1 4.8
Business Total 28.0 27.6 25.7
1 Convention 5.6 6.3 6.2
2 Seminar/Training 6.0 5.5 4.2
3 Other Group Meetings 3.9 4.4 3.2
4 Sales/Consulting 2.7 2.7 2.7
5 Other 9.8 8.5 9.4
Source: Florida Tourism Industry Marketing Corporation, 2001 Florida Visitor Study (2002).
Table 5-5TOP TEN ACTIVITIES ENJOYED IN FLORIDA BY AIR VISITORS SURVEYED
Rank Activity 1999 (%) 2000 (%) 2001 (%)
1 Shopping/Restaurants 34.8 34.8 39.9
2 Theme/Amusement 40.3 30.5 39.3
3 Beaches 35.1 30.8 34.5
4 Nightlife/Dancing 11.8 13.2 10.8
5 Outdoor (hunt, fish, hike) 11.3 10.2 9.6
6 Historical Places/Museums 10.1 8.9 8.5
7 Golf/Tennis 9.1 6.6 6.7
8 Cultural Events/Festivals 4.4 6.4 4.8
9 National/State Park 6.4 5.1 6.2
10 Sports Event 4.8 4.5 5.1
Source: Florida Tourism Industry Marketing Corporation, 2001 Florida Visitor Study (2002).

Florida Transportation Almanac
221
Table 5-6ESTIMATED EXPENDITURE PATTERNS OF AIR VISITORS
SURVEYED PER PERSON PER DAY
Category 2000 ($) 2001 ($)
Transportation 59.4 57.7
Food 29.5 27.5
Room 34.0 32.5
Shopping 18.6 17.9
Entertainment 20.2 17.6
Miscellaneous 4.3 6.2
Total 166.0 159.4
Change (%) -4.0
Source: Florida Tourism Industry Marketing Corporation, 2001 Florida Visitor Study(2002).

Florida Transportation Almanac
222
Table 5-7TOP TEN ORIGIN STATES/PROVINCES OF AUTO VISITORS SURVEYED
Origin1997 1998 1999 2000 2001
Rank % Rank % Rank % Rank % Rank %
Georgia 1 16.7 1 14 1 18.6 1 17.8 1 17.5
Alabama 2 8.3 2 8.5 2 7 2 8.8 2 8.8
Ohio 6.5 4.9 4.5 5.6 5.5 4.9 5 5.1 3 6.4
New York 8 4.6 4.5 5.6 3 6.1 3.5 5.9 4 5.8
Tennessee 4.5 5 3 6.5 10 3.5 3.5 5.9 7 4.0
Illinois - - 7.5 4.2 8 4 7 4.9 5 5.7
North Carolina 3 6 4.5 5.6 4 6 8 4.8 6 5.1
Virginia 10 4.2 7.5 4.2 - - - - 8 3.4
Louisiana - - 10 3.9 7 4.6 - - - -
Michigan - - 6 4.3 - - 9 4.3 10 3.2
Texas 6.5 4.9 9 4.1 5.5 4.9 10 4 10 3.3
Pennsylvania - - - - 9 3.8 - - 10 3.2
New Jersey 4.5 5 - - - - - - 10 3.2
Total Top 10 - 59.4 - 66.5 - 63.4 - 61.5 - 69.6
Source: Florida Tourism Industry Marketing Corporation, 2001 Florida Visitor Study (2002).

Florida Transportation Almanac
223
Table 5-8TOP TEN DESTINATIONS OF AUTO VISITORS SURVEYED
Destinations1997 1998 1999 2000 2001
Rank % Rank % Rank % Rank % Rank %
Orange 1 19.5 1 20.2 1 20.2 1 20.9 1 22.3
Hillsborough 6 4.4 6.5 5.2 6.5 5.2 8 3.8 2 7.6
Bay 2 7.4 2 6.8 3 6.8 2 7.9 3 6.8
Okaloosa 4 6.8 3 6.4 4 6.4 3 7.3 4 6.1
Volusia 3 7 5 5.6 2 5.6 4 4.0 5 5.9
Duval 7 4.1 4 5.9 6.5 5.9 5 5 6 4.8
Escambia 5 5.3 6.5 5.2 5 5.2 7 4.1 7 3.4
Brevard - - - - 9.5 - 9.5 2.8 8 3.3
Broward 9.5 2.8 9.5 3 - 3 9.5 2.8 9 3.1
Pinellas 8 3.8 8 3.8 8 3.8 6 4.7 10 2.6
Miami-Dade 9.5 2.8 - - 9.5 - - - - -
Palm Beach 9.5 2.8 - - 10 - 10 2.7 - -
Lee - - 9.5 3 - 3 - - - -
Total Top 10 - 66.7 - 65.1 - 65.1 - 66.0 - 65.9
Source: Florida Tourism Industry Marketing Corporation, 2001 Florida Visitor Study (2002).
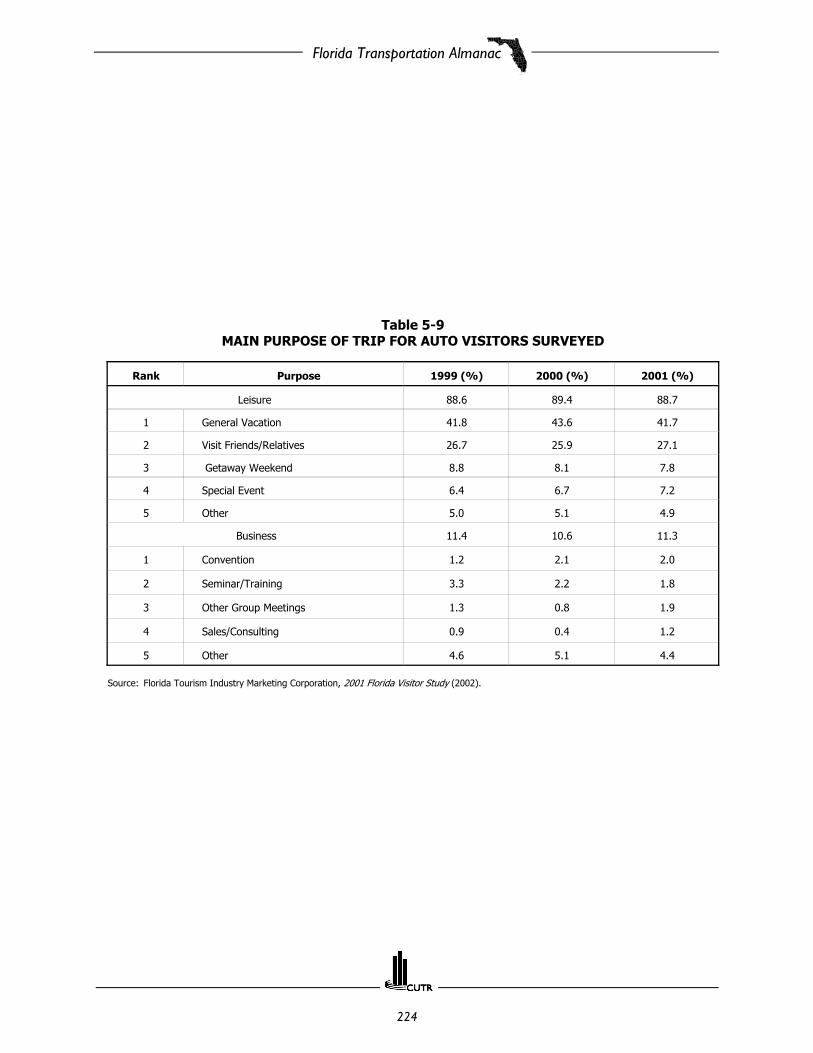
Florida Transportation Almanac
224
Table 5-9MAIN PURPOSE OF TRIP FOR AUTO VISITORS SURVEYED
Rank Purpose 1999 (%) 2000 (%) 2001 (%)
Leisure 88.6 89.4 88.7
1 General Vacation 41.8 43.6 41.7
2 Visit Friends/Relatives 26.7 25.9 27.1
3 Getaway Weekend 8.8 8.1 7.8
4 Special Event 6.4 6.7 7.2
5 Other 5.0 5.1 4.9
Business 11.4 10.6 11.3
1 Convention 1.2 2.1 2.0
2 Seminar/Training 3.3 2.2 1.8
3 Other Group Meetings 1.3 0.8 1.9
4 Sales/Consulting 0.9 0.4 1.2
5 Other 4.6 5.1 4.4
Source: Florida Tourism Industry Marketing Corporation, 2001 Florida Visitor Study (2002).
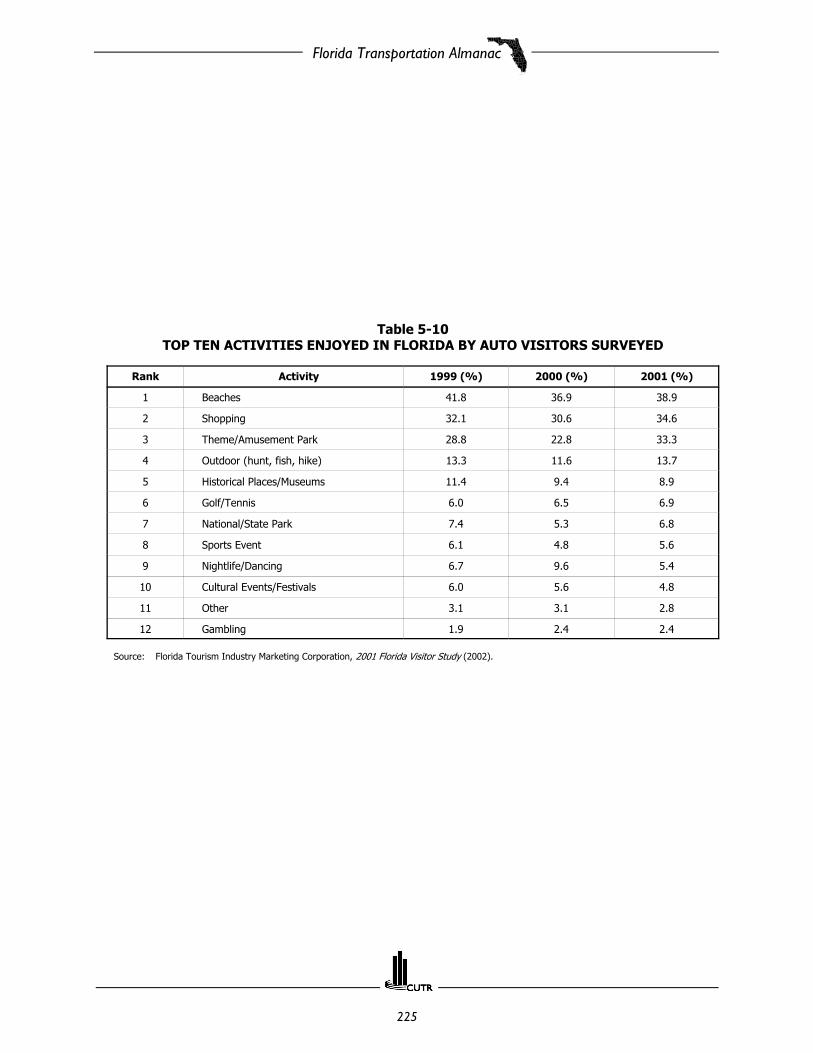
Florida Transportation Almanac
225
Table 5-10TOP TEN ACTIVITIES ENJOYED IN FLORIDA BY AUTO VISITORS SURVEYED
Rank Activity 1999 (%) 2000 (%) 2001 (%)
1 Beaches 41.8 36.9 38.9
2 Shopping 32.1 30.6 34.6
3 Theme/Amusement Park 28.8 22.8 33.3
4 Outdoor (hunt, fish, hike) 13.3 11.6 13.7
5 Historical Places/Museums 11.4 9.4 8.9
6 Golf/Tennis 6.0 6.5 6.9
7 National/State Park 7.4 5.3 6.8
8 Sports Event 6.1 4.8 5.6
9 Nightlife/Dancing 6.7 9.6 5.4
10 Cultural Events/Festivals 6.0 5.6 4.8
11 Other 3.1 3.1 2.8
12 Gambling 1.9 2.4 2.4
Source: Florida Tourism Industry Marketing Corporation, 2001 Florida Visitor Study (2002).

Florida Transportation Almanac
226
Table 5-11ESTIMATED EXPENDITURE PATTERNS OF
AUTO VISITORS SURVEYED PER PERSON PER DAY
Category 2000 ($) 2001 ($)
Transportation 14.1 14.3
Food 22.6 23.5
Room 21.9 21.0
Shopping 15.0 16.0
Entertainment 17.2 16.4
Miscellaneous 3.6 4.4
Total 94.5 95.6
Change (%) 1.3
Source: Florida Tourism Industry Marketing Corporation, 2001 Florida Visitor Study(2002).

Florida Transportation Almanac
227
Table 5-12AIR VISITOR ESTIMATES BY MONTH
Month 1998 2001 Change (%)
January 2,448,301 2,545,123 4.0
February 2,382,091 2,454,697 3.0
March 3,263,640 2,981,929 -8.6
Quarter I 8,094,032 7,981,749 -1.4
April 2,948,509 2,616,810 -11.2
May 2,259,187 2,286,976 1.2
June 1,881,471 1,857,100 -1.3
Quarter II 7,089,167 6,760,886 -4.6
July 2,139,409 1,866,653 -12.7
August 1,944,648 2,013,692 3.6
September 1,589,073 1,627,093 2.4
Quarter III 5,673,130 5,507,438 -2.9
October 2,067,117 1,944,285 -5.9
November 2,115,212 2,140,614 1.2
December 2,044,217 2,133,518 4.4
Quarter IV 6,226,546 6,218,417 -0.1
Total For Year 27,082,875 26,468,490 -2.3
Source: Florida Tourism Industry Marketing Corporation.
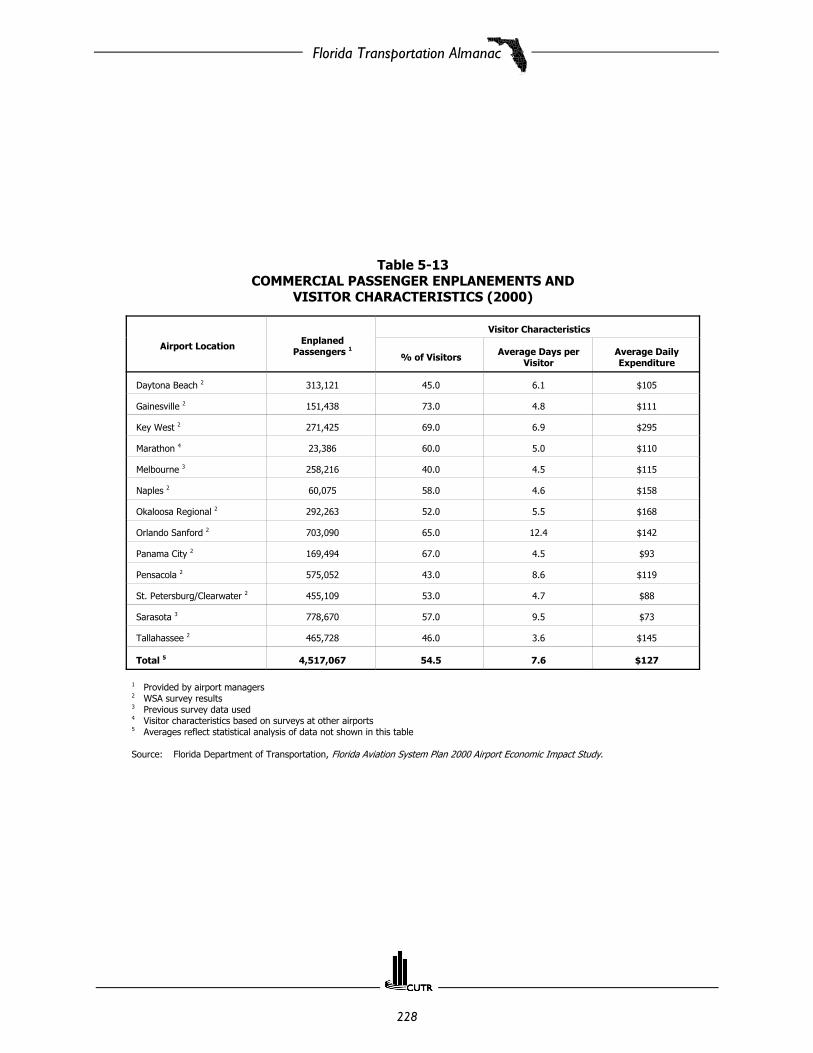
Florida Transportation Almanac
228
Table 5-13COMMERCIAL PASSENGER ENPLANEMENTS AND
VISITOR CHARACTERISTICS (2000)
Airport Location EnplanedPassengers 1
Visitor Characteristics
% of Visitors Average Days perVisitor
Average DailyExpenditure
Daytona Beach 2 313,121 45.0 6.1 $105
Gainesville 2 151,438 73.0 4.8 $111
Key West 2 271,425 69.0 6.9 $295
Marathon 4 23,386 60.0 5.0 $110
Melbourne 3 258,216 40.0 4.5 $115
Naples 2 60,075 58.0 4.6 $158
Okaloosa Regional 2 292,263 52.0 5.5 $168
Orlando Sanford 2 703,090 65.0 12.4 $142
Panama City 2 169,494 67.0 4.5 $93
Pensacola 2 575,052 43.0 8.6 $119
St. Petersburg/Clearwater 2 455,109 53.0 4.7 $88
Sarasota 3 778,670 57.0 9.5 $73
Tallahassee 2 465,728 46.0 3.6 $145
Total 5 4,517,067 54.5 7.6 $127
1 Provided by airport managers2 WSA survey results3 Previous survey data used4 Visitor characteristics based on surveys at other airports5 Averages reflect statistical analysis of data not shown in this table
Source: Florida Department of Transportation, Florida Aviation System Plan 2000 Airport Economic Impact Study.

Florida Transportation Almanac
229
Table 5-14AUTO VISITOR ESTIMATES BY MONTH
Month 1997 1998 Change (%)
January 1,441,682 1,580,145 9.6
February 1,398,923 1,802,354 28.8
March 2,420,338 2,429,921 0.4
Quarter I 5,260,943 5,812,420 10.5
April 2,028,289 2,570,247 26.7
May 1,614,325 1,746,414 8.2
June 1,636,368 1,565,743 -4.3
Quarter II 5,278,982 5,882,404 11.4
July 1,998,349 2,238,223 12.0
August 1,995,397 1,990,460 -0.2
September 1,499,075 1,457,414 -2.8
Quarter III 5,492,821 5,686,097 3.5
October 1,688,294 1,383,879 -18.0
November 1,339,051 1,466,120 9.5
December 1,425,348 1,384,941 -2.8
Quarter IV 4,452,693 4,234,940 -4.9
Total For Year 20,485,439 21,615,861 5.5
Source: Florida Tourism Industry Marketing Corporation.

Florida Transportation Almanac
230
Table 5-15FLORIDA AIR AND AUTO HISTORICAL VISITOR ESTIMATE SERIES (1980-1998)
1980 Air Auto Total
Quarter I 3,121,917 2,750,284 5,872,201
Quarter II 2,535,580 2,777,674 5,313,254
Quarter III 1,880,460 2,852,197 4,732,657
Quarter IV 1,825,370 2,302,193 4,127,563
Total 9,363,327 10,682,348 20,045,675
1981 Air Auto Total
Quarter I 3,313,939 2,693,204 6,007,143
Quarter II 2,726,304 3,071,548 5,797,852
Quarter III 2,137,732 2,891,476 5,029,208
Quarter IV 2,194,594 2,193,904 4,388,498
Total 10,372,569 10,850,132 21,222,701
1982 Air Auto Total
Quarter I 3,531,664 2,634,667 6,166,331
Quarter II 2,944,587 3,230,612 6,175,199
Quarter III 2,209,892 3,273,843 5,483,735
Quarter IV 2,337,414 2,818,066 5,155,480
Total 11,023,557 11,957,188 22,980,745
1983 Air Auto Total
Quarter I 3,487,400 3,128,638 6,616,038
Quarter II 2,733,622 3,442,785 6,176,407
Quarter III 1,985,377 3,812,900 5,798,277
Quarter IV 2,168,752 2,922,894 5,091,646
Total 10,375,151 13,307,217 23,682,368
1984 Air Auto Total
Quarter I 4,109,812 3,600,457 7,710,269
Quarter II 3,281,158 4,109,895 7,391,053
Quarter III 2,591,344 3,711,156 6,302,500
Quarter IV 2,683,420 3,242,264 5,925,684
Total 12,665,734 14,663,772 27,329,506
1985 Air Auto Total
Quarter I 4,045,011 3,704,341 7,749,352
Quarter II 3,519,787 4,327,212 7,846,999
Quarter III 2,631,758 4,212,206 6,843,964
Quarter IV 2,852,655 3,557,454 6,410,109
Total 13,049,211 15,801,213 28,850,424
Source: Florida Tourism Industry Marketing Corporation.

Florida Transportation Almanac
231
Table 5-15 (Continued)FLORIDA AIR AND AUTO HISTORICAL VISITOR ESTIMATE SERIES (1980-1998)
1986 Air Auto Total
Quarter I 4,518,347 4,482,218 9,000,565
Quarter II 3,854,066 4,067,400 7,921,466
Quarter III 3,229,349 4,482,416 7,711,765
Quarter IV 3,158,177 3,999,211 7,157,388
Total 14,759,939 17,031,245 31,791,184
1987 Air Auto Total
Quarter I 5,129,250 4,370,151 9,499,401
Quarter II 4,263,350 4,527,865 8,791,215
Quarter III 3,444,516 4,413,110 7,857,626
Quarter IV 3,702,701 4,213,587 7,916,288
Total 16,539,817 17,524,713 34,064,530
1988 Air Auto Total
Quarter I 5,531,719 4,528,275 10,059,994
Quarter II 4,808,834 4,391,965 9,200,799
Quarter III 3,765,504 5,328,776 9,094,280
Quarter IV 3,926,027 4,484,508 8,410,535
Total 18,032,084 18,733,524 36,765,608
1989 Air Auto Total
Quarter I 5,830,301 5,670,847 11,501,148
Quarter II 4,137,227 5,249,612 9,386,839
Quarter III 3,767,289 5,314,803 9,082,092
Quarter IV 4,318,151 4,424,073 8,742,224
Total 18,052,968 20,659,335 38,712,303
1990 Air Auto Total
Quarter I 6,355,140 5,455,605 11,810,745
Quarter II 4,912,302 5,416,823 10,329,125
Quarter III 4,527,707 5,254,840 9,782,547
Quarter IV 4,883,215 4,164,601 9,047,816
Total 20,678,364 20,291,869 40,970,233
1991 Air Auto Total
Quarter I 6,238,981 5,414,660 11,653,641
Quarter II 4,909,987 5,156,637 10,066,624
Quarter III 3,832,931 5,313,696 9,146,627
Quarter IV 4,157,711 4,536,271 8,693,982
Total 19,139,610 20,421,264 39,560,874
Source: Florida Tourism Industry Marketing Corporation.

Florida Transportation Almanac
232
Table 5-15 (Continued)FLORIDA AIR AND AUTO HISTORICAL VISITOR ESTIMATE SERIES (1980-1998)
1992 Air Auto Total
Quarter I 5,895,902 5,333,757 11,229,659
Quarter II 4,609,263 5,299,421 9,908,684
Quarter III 4,454,383 5,360,938 9,815,321
Quarter IV 4,490,853 5,091,677 9,582,530
Total 19,450,401 21,085,793 40,536,194
1993 Air Auto Total
Quarter I 5,959,456 5,730,703 11,690,159
Quarter II 5,185,283 5,347,114 10,532,397
Quarter III 3,869,447 5,629,779 9,499,226
Quarter IV 4,724,304 4,586,474 9,310,778
Total 19,738,490 21,294,070 41,032,560
1994 Air Auto Total
Quarter I 6,130,715 5,056,269 11,186,984
Quarter II 5,466,554 4,671,588 10,138,142
Quarter III 4,829,042 5,144,200 9,973,242
Quarter IV 4,935,183 3,649,926 8,585,109
Total 21,361,494 18,521,983 39,883,477
1995 Air Auto Total
Quarter I 6,783,718 5,257,562 12,041,280
Quarter II 5,366,011 5,908,563 11,274,574
Quarter III 4,483,985 5,203,799 9,687,784
Quarter IV 4,884,382 3,394,294 8,278,676
Total 21,518,096 19,764,218 41,282,314
1996 Air Auto Total
Quarter I 7,165,795 4,777,914 11,943,709
Quarter II 6,082,428 5,760,280 11,842,708
Quarter III 4,908,642 4,947,851 9,856,493
Quarter IV 5,353,292 4,005,538 9,358,830
Total 23,510,157 19,491,583 43,001,740
Source: Florida Tourism Industry Marketing Corporation.

Florida Transportation Almanac
233
Table 5-15 (Continued)FLORIDA AIR AND AUTO HISTORICAL VISITOR ESTIMATE SERIES (1980-1998)
1997 Air Auto Total
Quarter I 7,982,000 5,261,000 13,243,000
Quarter II 6,761,000 5,279,000 12,040,000
Quarter III 5,507,000 5,493,000 11,000,000
Quarter IV 6,218,000 4,453,000 10,671,000
Total 26,468,000 20,485,000 46,954,000
1998 Air Auto Total
Quarter I 8,094,000 5,812,000 13,906,000
Quarter II 7,089,000 5,882,000 12,972,000
Quarter III 5,673,000 5,686,000 11,359,000
Quarter IV 6,227,000 4,235,000 10,461,000
Total 27,083,000 21,616,000 48,699,000
Source: Florida Tourism Industry Marketing Corporation.

Florida Transportation Almanac
234
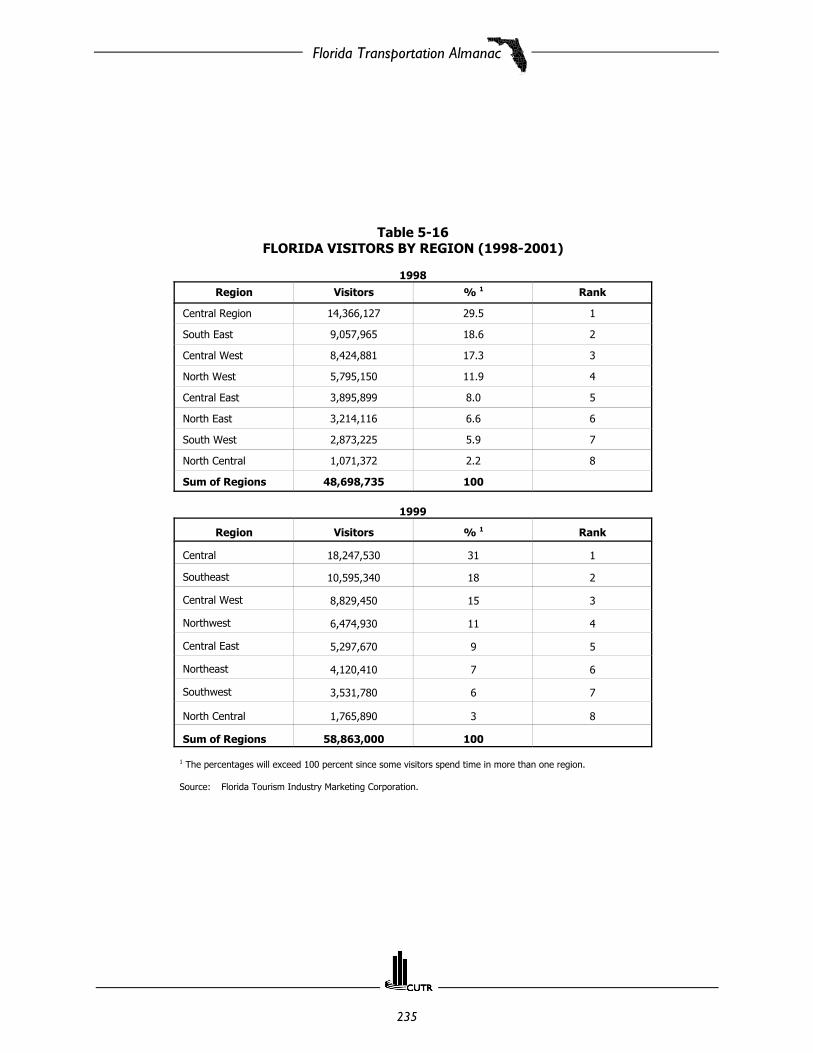
Florida Transportation Almanac
235
Table 5-16FLORIDA VISITORS BY REGION (1998-2001)
1998
Region Visitors % 1 Rank
Central Region 14,366,127 29.5 1
South East 9,057,965 18.6 2
Central West 8,424,881 17.3 3
North West 5,795,150 11.9 4
Central East 3,895,899 8.0 5
North East 3,214,116 6.6 6
South West 2,873,225 5.9 7
North Central 1,071,372 2.2 8
Sum of Regions 48,698,735 100
1999
Region Visitors % 1 Rank
Central 18,247,530 31 1
Southeast 10,595,340 18 2
Central West 8,829,450 15 3
Northwest 6,474,930 11 4
Central East 5,297,670 9 5
Northeast 4,120,410 7 6
Southwest 3,531,780 6 7
North Central 1,765,890 3 8
Sum of Regions 58,863,000 100
1 The percentages will exceed 100 percent since some visitors spend time in more than one region.
Source: Florida Tourism Industry Marketing Corporation.

Florida Transportation Almanac
236
Table 5-16 (Continued)FLORIDA VISITORS BY REGION (1998-2001)
2000
Region Visitors % 1 Rank
Central 22,511,000 31.5 1
Southeast 12,577,840 17.6 2
Central West 8,580,000 12.0 3
Northwest 8,575,800 11.9 4
Southwest 6,646,245 9.3 5
Central East 6,145,990 8.6 6
Northeast 4,502,295 6.3 7
North Central 2,001,020 2.8 8
Sum of Regions 71,540,190 100
2001
Region Visitors % 1 Rank
Central 21,464,000 30.9 1
Southeast 12,434,000 17.9 2
Central West 10,003,000 14.4 3
Northwest 6,946,000 10.0 4
Southwest 6,460,000 9.3 5
Central East 5,904,000 8.5 6
Northeast 4,585,000 6.6 7
North Central 1,737,000 2.5 8
Sum of Regions 69,533,000 100.1
1 The percentages will exceed 100 percent since some visitors spend time in more than one region.
Source: Florida Tourism Industry Marketing Corporation.

Florida Transportation Almanac
237
Table 5-17FLORIDA VISITOR FORECAST (2000-2002)
(in millions)
Quarter/Year 2000 Change 1999-2000 (%)
Quarter I 19,581 -
Quarter II 19,745 -
Quarter III 18,147 -
Quarter IV 16,633 -
Total 2000 74,106 -
2001 Change 2000-2001 (%)
Quarter I 21,350 9.0
Quarter II 20,875 5.7
Quarter III 16,547 -8.8
Quarter IV 14,008 -15.8
Total 2001 72,780 -1.8
2002 Change 2001-2002 (%)
Quarter I 18,005 -15.7
Quarter II 19,351 -7.3
Quarter III 17,473 5.6
Quarter IV 17,206 22.8
Total 2002 72,035 -1.0
Source: Florida Tourism Industry Marketing Corporation.

Florida Transportation Almanac
238
.
Table 5-18HOTEL/MOTEL OCCUPANCY RATES AND AVERAGE DAILY ROOM RATES
TWELVE MONTHS ENDING DECEMBER 31, 2001
MarketOccupancy Average Daily Room Rate
2000 (%) 2001 (%) 2000 ($) 2001 ($)
Alachua/Marion Counties 65.8 64.5 $67.28 $70.99
Brevard Counties 68.0 65.3 76.58 78.71
Broward County 69.2 66.4 101.29 101.84
Collier County 66.9 63.5 132.04 134.26
Duval County 66.2 64.1 67.68 66.66
Hillsborough/Pinellas Counties 66.5 65.0 89.80 91.69
Lee County 71.3 66.9 94.87 97.84
Leon County 66.0 61.0 67.39 67.03
Miami-Dade 73.8 68.2 118.52 113.80
Monroe County 70.3 67.9 147.98 148.93
Orange/Osceola/Seminole Counties 71.1 63.5 92.74 89.70
Palm Beach County 70.5 64.8 111.22 110.58
Panhandle 63.1 62.3 82.34 81.82
Volusia County 64.9 60.6 78.03 83.27
Other Florida 64.3 63.4 88.22 89.31
Florida 69.2 64.6 $95.82 $94.62
Source: Florida Tourism Industry Marketing Corporation, 2001 Florida Visitor Study (2002).

Florida Transportation Almanac
239
Table 5-19OVERSEAS VISITORS TO FLORIDA FROM COUNTRY OF ORIGIN (1997-2002)
Country% of Total Visitors
1997 1998 1999 2000 2001 2002
Austria 0.8 0.5 0.5 0.6 0.3 0.6
Belgium 0.4 0.5 0.7 0.4 0.6 0.5
Denmark 0.3 0.3 0.4 0.2 0.4 0.4
Finland 0.1 0.3 0.1 0.3 0.1 0.4
France 2.7 2.2 2.4 2.8 2.7 3.1
Germany 8.2 8.1 8 5.8 6.1 4.8
Greece 0.1 n/a 0.1 n/a 0.1 0.2
Iceland 0.1 0.2 0.2 0.2 0.2 0.2
Ireland 0.6 0.2 1 1 1.6 2
Italy 2.7 2.3 2.4 2.7 2.4 2.2
Netherlands 1.3 1.5 1.7 1.6 1.9 1.2
Norway 0.4 0.5 0.3 0.7 0.2 0.6
Spain 1.5 1.5 1.6 1.8 1.5 1.5
Sweden 0.8 1 0.6 0.7 0.7 0.9
Switzerland 1.6 2.1 1.6 1.7 1.3 1
United Kingdom 23.4 24.8 27.5 29.6 31 31.1
Other Western Europe 0.4 0.4 0.3 0.3 0.1 0.4
Poland 0.1 0.2 0.2 0.2 0.2 0.4
Russia 0.1 n/a n/a n/a 0.2 0.2
Other Eastern Europe 0.3 n/a 0.2 0.4 0.1 0.4
Bahamas 4.5 3.3 2.1 1.3 0.4 3.6
Cayman Is. 0.1 0.5 0.2 0.2 1.2 0.6
Dominican Rep. 0.5 1.3 1.3 1.1 2 1
Jamaica 2.2 2.2 2.4 2.6 0.2 1.8
Netherlands Antilles 0.1 0.2 0.3 0.1 0.5 0.6
Trinidad and Tobago 0.5 0.3 0.6 1 0.6 1.3
Other Caribbean 0.7 0.6 1.4 0.5 28.1 1.7
Argentina 5.4 5.7 5.5 6.1 4.4 1.7
Brazil 8.6 7.7 5.5 6.4 1.3 3.1
Chile 1.9 1.6 1.4 1.8 4.5 1.2
Colombia 3.9 4.2 5.3 3.4 2.4 5
Peru 1.8 1.6 1 1.6 8 1.7
Venezuela 6.1 6.6 7.3 8 2.7 7.1
Source: U.S. Department of Commerce, ITA, Tourism Industries.

Florida Transportation Almanac
240
Table 5-19 (Continued)OVERSEAS VISITORS TO FLORIDA FROM COUNTRY OF ORIGIN (1997-2002)
Country% of Total Visitors
1997 1998 1999 2000 2001 2002
Other South America 2.1 2.3 1.5 2 5.2 2.7
Costa Rica 1.7 2.3 1.4 1 1.1 1.6
El Salvador 0.6 0.4 n/a n/a 0.5 1.1
Guatemala 1.5 2.1 1.8 0.8 1.2 1.8
Honduras 0.7 0.9 0.6 1 0.5 1.3
Panama 0.4 0.8 0.6 0.4 0.7 0.9
Other Central America 0.5 0.5 0.2 0.6 0.6 0.4
Morocco n/a 0.1 0.1 0.4 0.5 n/a
South Africa 0.7 0.6 0.8 0.2 n/a 0.3
Other Africa 0.1 0.1 n/a 1.9 1.9 n/a
Israel 0.8 0.5 0.9 0.1 n/a 0.8
Kuwait 0.1 0.1 0.1 0.5 0.4 n/a
Saudi Arabia 0.2 0.2 0.3 0.4 0.6 0.2
Turkey 0.2 0.2 0.2 0.3 0.2 0.2
Other Middle East 0.3 0.1 0.2 5.7 6.3 n/a
Hong Kong 0.4 0.2 0.3 0.7 0.5 0.2
India 0.4 0.5 0.7 0.2 0.1 0.4
Indonesia 0.1 n/a 0.1 2.7 2.3 0.1
Japan 3.5 3 3.2 0.7 1 1.6
Korea, South 0.9 0.4 0.5 0.1 0.1 0.5
Malaysia 0.2 0.1 0.1 0.2 0.4 0.1
P. R. of China 0.1 0.2 0.1 0.3 0.6 0.7
Philippines 0.3 0.2 0.4 0.2 0.3 0.4
R. of China (Taiwan) 0.3 0.2 0.4 0.1 0.1 0.3
Singapore 0.2 0.1 0.2 0.1 0.1 0.1
Thailand 0.1 0.1 0.1 n/a 0.4 0.2
Other Asia 0.1 0.1 0.1 1.3 1.1 0.1
Australia 1.1 1 1.1 0.2 0.2 1.2
New Zealand 0.2 0.2 0.2 0 0 0.2
Source: U.S. Department of Commerce, ITA, Tourism Industries.

Florida Transportation Almanac
241
Table 5-20STATEWIDE TOTAL AND "TOURISM/RECREATION" TAXABLE SALES
PERCENT CHANGE: 00/01(in $ billions)
Month/Quarter
Total Taxable Sales Tourism/Recreation%
Total for2001
2001Statewide
Total
ChangeFrom
2000 (%)
2001Tour./Rec.
Total
ChangeFrom
2000 (%)
January 20.7 2.8 4.4 7.2 8.7
February 21.8 5.4 4.8 5.4 9.4
March 23.8 4.4 5.2 2.9 10.2
Quarter I 66.3 4.2 14.4 5.0 28.3
April 20.7 -0.2 4.6 2.2 9.1
May 21.0 -0.5 4.1 -2.6 8.1
June 21.7 1.6 4.2 1.3 8.2
Quarter II 63.4 0.3 12.9 0.4 25.4
July 20.6 4.9 4.3 2.0 8.5
August 21.4 7.8 4.1 8.3 8.0
September 19.3 -4.6 3.4 -9.5 6.6
Quarter III 61.2 2.7 11.8 0.4 23.2
October 19.7 -1.2 3.6 -7.2 7.2
November 19.9 -2.6 3.7 -7.1 7.3
December 23.8 -5.1 4.4 -7.9 8.7
Quarter IV 63.5 -3.1 11.8 -7.4 23.2
Yearly Total 254.5 1.0 50.8 -0.3 100.1*
* Monthly figures do not add up to the exact yearly total due to rounding.
Source: Florida Tourism Industry Marketing Corporation, 2001 Florida Visitor Study (2002).
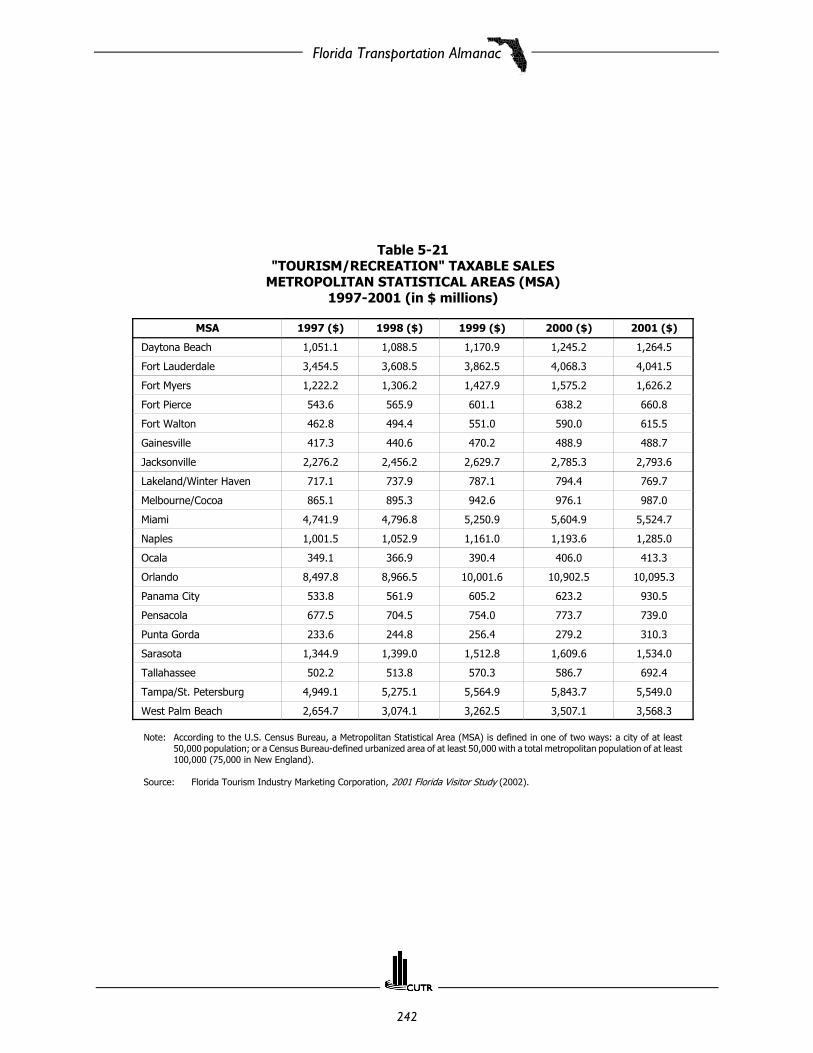
Florida Transportation Almanac
242
Table 5-21"TOURISM/RECREATION" TAXABLE SALES
METROPOLITAN STATISTICAL AREAS (MSA)1997-2001 (in $ millions)
MSA 1997 ($) 1998 ($) 1999 ($) 2000 ($) 2001 ($)
Daytona Beach 1,051.1 1,088.5 1,170.9 1,245.2 1,264.5
Fort Lauderdale 3,454.5 3,608.5 3,862.5 4,068.3 4,041.5
Fort Myers 1,222.2 1,306.2 1,427.9 1,575.2 1,626.2
Fort Pierce 543.6 565.9 601.1 638.2 660.8
Fort Walton 462.8 494.4 551.0 590.0 615.5
Gainesville 417.3 440.6 470.2 488.9 488.7
Jacksonville 2,276.2 2,456.2 2,629.7 2,785.3 2,793.6
Lakeland/Winter Haven 717.1 737.9 787.1 794.4 769.7
Melbourne/Cocoa 865.1 895.3 942.6 976.1 987.0
Miami 4,741.9 4,796.8 5,250.9 5,604.9 5,524.7
Naples 1,001.5 1,052.9 1,161.0 1,193.6 1,285.0
Ocala 349.1 366.9 390.4 406.0 413.3
Orlando 8,497.8 8,966.5 10,001.6 10,902.5 10,095.3
Panama City 533.8 561.9 605.2 623.2 930.5
Pensacola 677.5 704.5 754.0 773.7 739.0
Punta Gorda 233.6 244.8 256.4 279.2 310.3
Sarasota 1,344.9 1,399.0 1,512.8 1,609.6 1,534.0
Tallahassee 502.2 513.8 570.3 586.7 692.4
Tampa/St. Petersburg 4,949.1 5,275.1 5,564.9 5,843.7 5,549.0
West Palm Beach 2,654.7 3,074.1 3,262.5 3,507.1 3,568.3
Note: According to the U.S. Census Bureau, a Metropolitan Statistical Area (MSA) is defined in one of two ways: a city of at least50,000 population; or a Census Bureau-defined urbanized area of at least 50,000 with a total metropolitan population of at least100,000 (75,000 in New England).
Source: Florida Tourism Industry Marketing Corporation, 2001 Florida Visitor Study (2002).

Florida Transportation Almanac
243
Table 5-22TOURIST DEVELOPMENT TAX COLLECTIONS (2000-2001)
County Tax Rate (%) 2000 ($) 2001 ($) Change (%)
Alachua 3 1,319,751 1,451,707 10.0
Baker 2 19,580 30,483 55.7
Bay 3 5,023,200 6,389,035 27.2
Bradford 2 41,061 47,701 16.2
Brevard 4 5,284,824 5,410,481 2.4
Broward 5 26,300,416 26,844,937 2.1
Charlotte 3 1,177,203 1,370,845 16.4
Citrus 2 294,382 304,266 3.4
Clay 3 370,332 374,634 1.2
Collier 3 8,731,799 8,856,028 1.4
Columbia 2 264,301 296,323 12.1
Duval 4 6,857,438 7,617,595 11.1
Escambia 4 3,247,567 4,023,377 23.9
Flagler 2 185,070 225,937 22.1
Gulf 2 139,207 140,438 0.9
Hamilton 1 2 31,224 28,088 -10.0
Hernando 3 267,187 260,288 -2.6
Hillsborough 5 15,510,392 20,167,983 30.0
Indian River 4 1,127,553 1,456,714 29.2
Jackson 2 124,626 136,767 9.7
Lake 2 636,796 693,032 8.8
Lee 3 11,153,686 11,658,795 4.5
Leon 3 1,848,149 1,850,523 0.1
Madison 2 31,324 42,870 36.9
Manatee 3 2,600,475 2,811,632 8.1
Miami-Dade 4 26,206,751 26,676,165 1.8
Monroe 3 11,937,644 16,528,758 38.5
Nassau 2 1,384,086 1,369,804 -1.0
Okaloosa 4 5,983,667 6,399,791 7.0
Source: Florida Tourism Industry Marketing Corporation, 2001 Florida Visitor Study (2002).
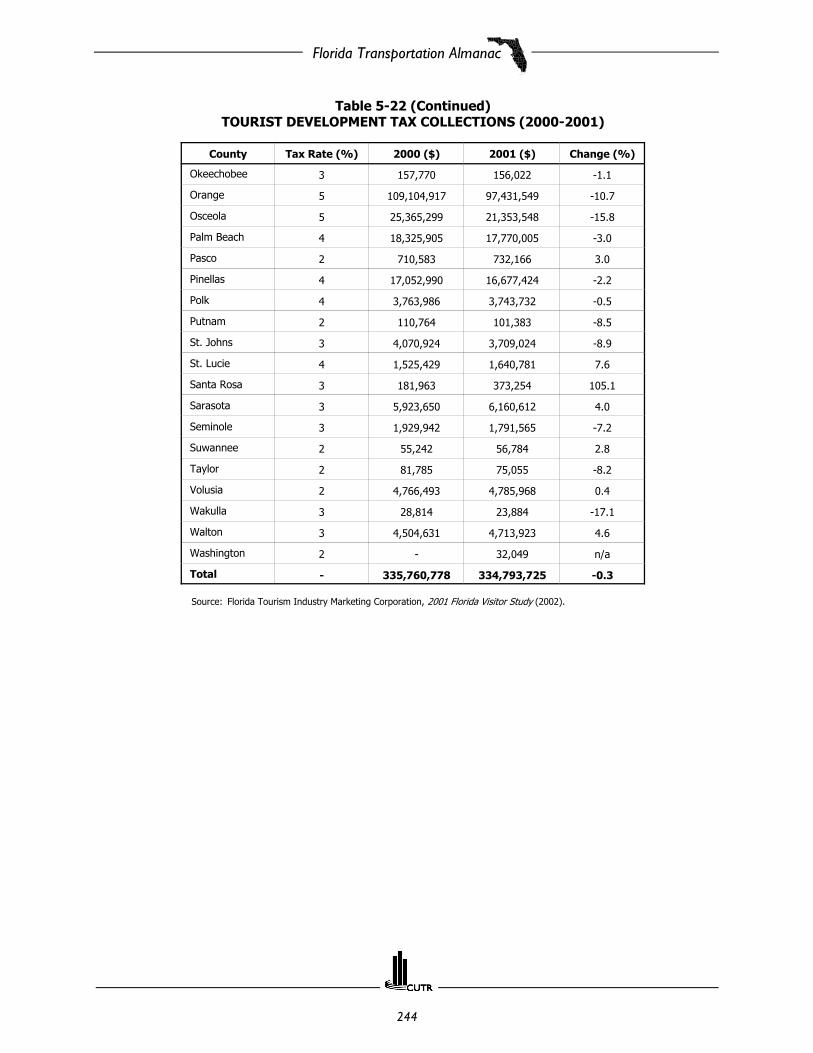
Florida Transportation Almanac
244
Table 5-22 (Continued)TOURIST DEVELOPMENT TAX COLLECTIONS (2000-2001)
County Tax Rate (%) 2000 ($) 2001 ($) Change (%)
Okeechobee 3 157,770 156,022 -1.1
Orange 5 109,104,917 97,431,549 -10.7
Osceola 5 25,365,299 21,353,548 -15.8
Palm Beach 4 18,325,905 17,770,005 -3.0
Pasco 2 710,583 732,166 3.0
Pinellas 4 17,052,990 16,677,424 -2.2
Polk 4 3,763,986 3,743,732 -0.5
Putnam 2 110,764 101,383 -8.5
St. Johns 3 4,070,924 3,709,024 -8.9
St. Lucie 4 1,525,429 1,640,781 7.6
Santa Rosa 3 181,963 373,254 105.1
Sarasota 3 5,923,650 6,160,612 4.0
Seminole 3 1,929,942 1,791,565 -7.2
Suwannee 2 55,242 56,784 2.8
Taylor 2 81,785 75,055 -8.2
Volusia 2 4,766,493 4,785,968 0.4
Wakulla 3 28,814 23,884 -17.1
Walton 3 4,504,631 4,713,923 4.6
Washington 2 - 32,049 n/a
Total - 335,760,778 334,793,725 -0.3
Source: Florida Tourism Industry Marketing Corporation, 2001 Florida Visitor Study (2002).

Florida Transportation Almanac
245
Table 5-23TOP TEN STATES IN EXPENDITURES BY U.S. TOURISTS (2001)
(in $ millions)
Rank State Expenditures ($) Change From 2000 (%)
Share of Market (%)
1 California 63,790 -9.8 13.0
2 Florida 41,692 6.5 8.5
3 Texas 32,307 8.1 6.6
4 New York 29,296 9.0 6.0
5 Illinois 21,931 7.0 4.5
6 Nevada 19,581 6.6 4.0
7 New Jersey 14,756 4.2 3.0
8 Pennsylvania 14,726 7.2 3.0
9 Georgia 14,269 4.5 2.9
10 Virginia 13,294 7.1 2.7
Source: U.S. Census Bureau, 2002 Statistical Abstract of the United States.

Florida Transportation Almanac
246

Florida Transportation Almanac
247
Chapter 6:TRANSPORTATIONFINANCING

Florida Transportation Almanac
248

Florida Transportation Almanac
249
SECTION HIGHLIGHTS
# In 2001, 65.7 percent of Florida’s revenues used for its State-administered highways came from Statesources such as motor fuel taxes, road and crossing tolls, and bond refunds, among others. Also, 30.7percent of the revenues used for these highways came from Federal sources, with the remaining 3.4percent coming from local sources.
# State sources (e.g., motor fuel taxes, motor carrier taxes, etc.) accounted for approximately 90 percent ofthe revenues used for local road and streets in Florida in 2001.
# The primary source of revenues used by local governments in Florida for highways was local in nature(83.2%), specifically motor fuel and vehicle taxes, original bond issues, appropriations from general funds,property taxes and special assessments, and other local sources in 2001. State sources accounted for about16 percent of the revenues used by local governments and Federal sources accounted for less than 1percent.
# In 2001, the sources of funding for transit operations in Florida break down as follows: 11.2 percent Federalfunds, 11.7 percent State funds, 48.2 percent local funds, and 28.9 percent system revenue.
# The sources of transit capital funding for Florida in 2001 was 77.3 percent Federal funds, 14.8 percent Statefunds, 6 percent local funds, and less than 2 percent from system revenue.
# The motor fuel tax rate for gasoline in Florida as of December 31, 2001, was 13.6¢; this represents an 8.8percent increase over the motor fuel tax rate of 12.5¢ in 1996.
# The automobile registration fee in Florida is based on the weight of the vehicle.

Florida Transportation Almanac
250
Tabl
e 6
-1FL
OR
IDA
'S T
RA
NSP
OR
TATI
ON
TA
X S
OU
RC
ES (
20
03
)
Fun
d/Ta
x So
urc
eD
escr
ipti
onR
ates
(C
Y 2
00
3)
Esti
mat
ed P
roce
eds
($ in
mill
ion
s)*
Oth
er U
ses
Tran
spor
tati
on
Fede
ral
Fede
ral H
ighw
ay A
dmin
istr
atio
n H
ighw
ay T
rust
Fund
(H
ighw
ay A
ccou
nt)
Fede
ral h
ighw
ay f
uel t
axes
and
oth
erex
cise
and
hea
vy v
ehic
le u
se a
nd s
ales
taxe
s of
var
ying
am
ount
s.
Gas
olin
e..
....
...1
5.44
¢/ga
lG
asoh
ol..
....
...
7.74
¢/ga
lD
iese
l..
....
....
.21.
44¢/
gal
Non
e1,
289
Fede
ral A
viat
ion
Adm
inis
trat
ion
Airp
ort
& A
irway
Tru
st F
und(
FFY
00-0
1Av
iatio
n G
rant
s to
Flo
rida
Airp
orts
)
Fede
ral t
axes
on
nonc
omm
erci
al a
viat
ion
fuel
, airl
ine
ticke
ts, w
aybi
llin
tern
atio
nal d
epar
ture
s, a
nd in
tern
atio
nal
arriv
als.
Avga
s..
....
....
.19
.3¢/
gal
Jet
Fuel
....
....
.21
.8¢/
gal
Tick
et t
ax..
....
....
.7.
5%(P
lus
$3.0
0/Fl
ight
Seg
men
t)W
aybi
ll ta
x..
....
...
6.25
%
Non
e65
Fede
ral T
rans
it Ad
min
istr
atio
n H
ighw
ay T
rust
Fun
d (M
ass
Tr
ansi
t Ac
ct.)
Gen
eral
Fun
d
Fede
ral h
ighw
ay f
uel t
axes
.
Appr
opria
tions
All f
uels
....
....
.2.
86¢/
gal
n/a
Non
e20
9
Fede
ral R
ail A
dmin
istr
atio
n G
ener
al F
und
Appr
opria
tions
n/a
Non
e
Stat
e -
For
Stat
e U
se
Fuel
Sal
es T
ax(F
.S. 2
06.4
1(1)
(g))
(F.S
. 206
.87(
1)(e
))(F
.S. 2
06.6
06)
(F.S
. 212
.050
1)(F
.S. 2
06.8
77)
Hig
hway
fue
ls (
not
incl
udin
g "a
ltern
ativ
e" f
uels
,su
ch a
s LP
G a
nd C
NG
).
Off
-Hig
hway
fue
ls
All f
uel
....
....
..10
.1¢/
gal
Die
sel
....
....
..6%
of
reta
ilfu
el p
rice
FY 2
002-
03 D
istr
ibut
ions
Agric
ultu
ral E
mer
genc
y Er
ad. T
F..
....
...
5Ad
min
. Cha
rge
....
....
....
....
....
.7
Mis
cella
neou
s tr
ansf
ers
....
....
....
...
9M
isce
llane
ous
cred
its &
ref
unds
(shr
inka
ge, f
arm
ers
& f
ishe
rman
, tra
nsit
syst
ems,
loca
l gov
ernm
ent)
....
....
...
26__
____
____
____
____
____
____
____
__
Tot
al..
....
....
....
....
....
....
47
892
SCET
S Ta
x(F
.S. 2
06.4
1(1)
(f))
(F.S
. 206
.608
)(F
.S. 2
06.8
7(1)
(d))
Hig
hway
Fue
ls (
incl
udin
g "a
ltern
ativ
e"fu
els)
.G
asol
ine
....
...4
.6¢-
5.6¢
/gal
Die
sel
....
....
....
5.6¢
/gal
Adm
in. C
harg
e..
....
....
....
....
...
4Ag
ricul
tura
l Em
erge
ncy
Erad
. TF
....
....
.3
Mis
cella
neou
s cr
edits
and
ref
unds
(fa
rmer
s &
fis
herm
an, t
rans
it s
yste
m)
....
....
....
....
....
....
.4
____
____
____
____
____
____
____
___
To
tal
....
....
....
....
....
....
...
11
507
Avia
tion
Fuel
Tax
(F.S
. 206
.982
5)(F
.S. 2
06.9
845)
(F.S
. 206
.985
5)
Avia
tion
fuel
(ex
cept
for
tha
t us
ed b
yai
rline
s el
ectin
g to
"pr
orat
e" t
heir
cons
umpt
ion.
See
Sec
tion
5)Al
l fue
ls..
....
....
6.9¢
/gal
G/R
ser
vice
cha
rge
....
....
....
....
..4
Adm
inis
trat
ive
Char
ge.
....
....
....
....
1Co
llect
ion
fees
....
....
....
....
....
.**
Airli
nes
in-s
tate
wag
e re
fund
s..
....
...
14__
____
____
____
____
____
____
____
__To
tal
....
....
....
....
....
....
...
19
50
*Re
venu
e es
timat
es a
re s
ubje
ct t
o ch
ange
thr
ough
out
the
fisca
l yea
r.**
Less
tha
n $0
.5 m
il.So
urce
:Fl
orid
a D
epar
tmen
t of
Tra
nspo
rtat
ion,
A P
RIM
ER (
Janu
ary
2003
).

Florida Transportation Almanac
251
Tabl
e 6
-1 (
Con
tin
ued
)FL
OR
IDA
'S T
RA
NSP
OR
TATI
ON
TA
X S
OU
RC
ES (
20
03
)
Fun
d/Ta
x So
urc
eD
escr
ipti
onR
ates
(C
Y 2
00
3)
Esti
mat
ed P
roce
eds
($ in
mill
ion
s)*
Oth
er U
ses
Tran
spor
tati
on
Stat
e -
For
Stat
e U
se (
cont
inue
d)
Fuel
Use
Tax
& F
ee
(F.S
. 207
.003
, 207
.004
)
Iden
tific
atio
n de
cals
& t
axes
on
high
way
fuel
s co
nsum
ed b
y co
mm
erci
al in
ters
tate
vehi
cles
.
Dec
als
....
....
....
....
..$4
/yr
Fuel
s..
....
....
..Pr
evai
ling
rate
s10
day
per
mit.
....
....
....
.$4
5
FY 2
002-
03 D
istr
ibut
ions
G/R
ser
vice
cha
rge
....
....
....
...
**Ad
min
istr
ativ
e ch
arge
....
....
....
..2
____
____
____
____
____
____
____
_ To
tal
....
....
....
....
....
....
..2
18
Mot
or V
ehic
le L
icen
se F
ee
(F.S
. 320
.08,
320
.20)
(C
onst
. Art
. XII
Sec
. 9(d
)(3)
)An
nual
veh
icle
reg
istr
atio
ns.
Base
d on
veh
icle
wei
ght
Edu
catio
n ca
pita
l exp
endi
ture
s..
...
112
439
Initi
al R
egis
trat
ion
Fee
(F
.S. 3
20.0
72)
Initi
al r
egis
trat
ion
surc
harg
e on
spe
cifie
dve
hicl
es a
dded
to
stat
ewid
e st
ock.
One
-tim
e..
....
....
....
..$1
00
Refu
nds
....
....
....
....
....
....
2G
en. F
und
....
....
....
....
....
..41
____
____
____
____
____
____
____
_ To
tal
....
....
....
....
....
....
.43
95
Incr
emen
tal T
itle
Fee
(F
.S. 3
19.3
2)
Title
s is
sued
for
new
ly r
egis
tere
d an
d tr
ansf
erre
d ve
hicl
es, e
xcep
t fo
r fo
r-hi
reve
hicl
es.
Each
....
....
....
....
....
.$2
1 N
one
99
Ren
tal C
ar S
urch
arge
(F
.S. 2
12.0
606)
Dai
ly s
urch
arge
on
leas
ed/r
enta
l veh
icle
sfo
r fir
st 3
0 da
ys.
$2.0
0/da
y
G/R
ser
vice
cha
rge
....
....
....
....
9Ad
min
istr
ativ
e ch
arge
....
....
....
.**
Tour
ism
Pro
mot
iona
l Tru
st
Fu
nd..
....
....
....
....
....
...
20In
t. T
rade
Pro
mot
ion
Trus
t Fu
nd..
....
.5
____
____
____
____
____
____
____
_ To
tal
....
....
....
....
....
....
.34
100
Stat
e -
For
Loca
l Use
Fuel
Exc
ise
Taxe
s(C
onst
itutio
nal,
Coun
ty &
Mun
icip
al G
as T
axes
, & F
uel U
se T
ax)
(F
.S. 2
06.4
1(1)
(a),
(b),
(c))
(F
.S. 2
06.8
7(1)
(a),
207.
003)
All h
ighw
ay f
uels
.Co
nstit
utio
nal
....
....
....
2¢/g
alCo
unty
....
....
....
....
....
1¢M
unic
ipal
....
....
....
....
..1¢
G/R
ser
vice
cha
rge
....
....
....
...
11Co
llect
ion
fees
....
....
....
....
...
6 Ref
unds
(fa
rmer
s &
fis
herm
an,
loca
l gov
ernm
ent
entit
ies)
....
....
...
1Ad
min
istr
ativ
e ch
arge
s..
....
....
....
2__
____
____
____
____
____
____
____
To
tal
....
....
....
....
....
....
.20
362
Loca
l
Nin
th-c
ent
Gas
Tax
All h
ighw
ay f
uels
.G
asol
ine
....
....
....
...
0-1¢
/gal
Die
sel
....
....
....
....
..1¢
/gal
Adm
in. C
harg
e..
....
....
....
....
.1
Colle
ctio
n fe
es..
....
....
....
....
..1
68
Loca
l Opt
ion
Gas
Tax
(F
.S. 2
06.4
1(1)
(e))
(F
.S. 2
06.8
7(1)
(c),
336.
025)
All h
ighw
ay f
uels
.G
asol
ine
....
....
....
..5-
11¢/
gal
Die
sel
....
....
....
....
..6¢
/gal
G/R
ser
vice
cha
rge
....
....
....
...
53Ad
min
. Cha
rge
....
....
....
....
...
7Co
llect
ion
fees
....
....
....
....
....
6Ref
unds
(fa
rmer
s &
fis
herm
an,
tran
sit
syst
ems)
....
....
....
....
..2
____
____
____
____
____
____
____
Tota
l..
....
....
....
....
....
...
68
663
*Re
venu
e es
timat
es a
re s
ubje
ct t
o ch
ange
thr
ough
out
the
fisca
l yea
r.**
Less
tha
n $0
.5 m
il.So
urce
:Fl
orid
a D
epar
tmen
t of
Tra
nspo
rtat
ion,
Off
ice
of M
anag
emen
t an
d Bu
dget
, Flo
rida'
s Tr
ansp
orta
tion
Tax
Sour
ces
-- A
Prim
er (
Janu
ary
2003
).
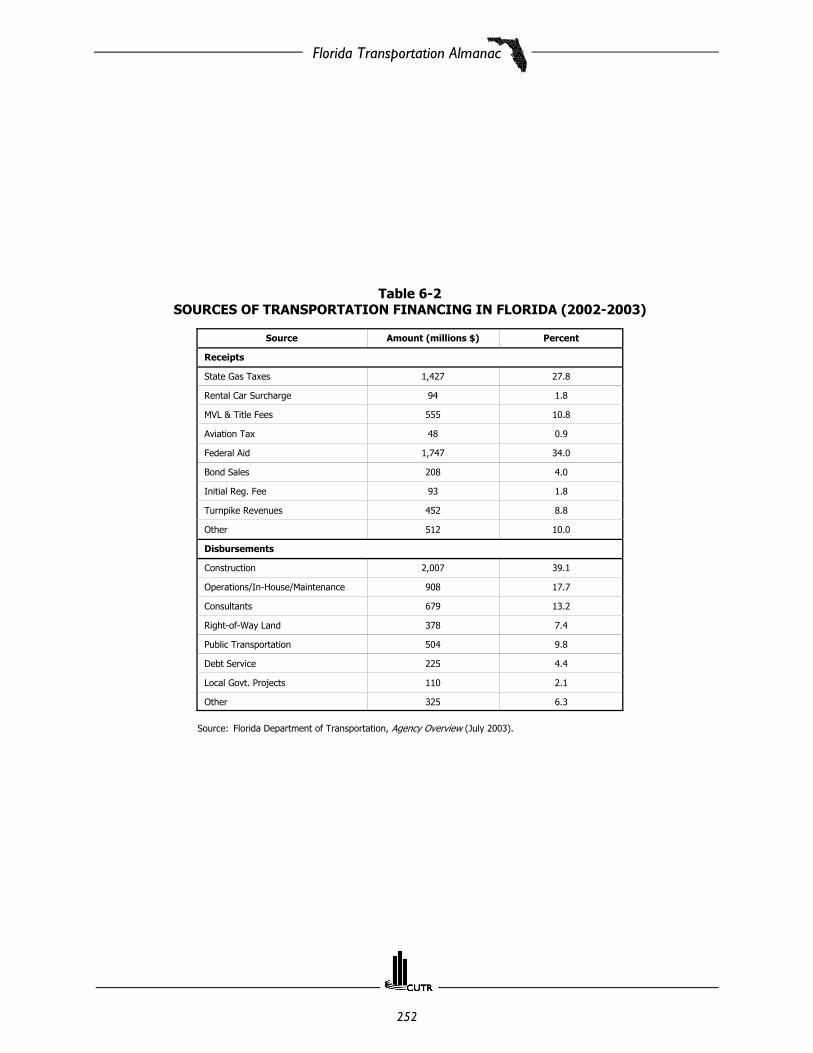
Florida Transportation Almanac
252
Table 6-2SOURCES OF TRANSPORTATION FINANCING IN FLORIDA (2002-2003)
Source Amount (millions $) Percent
Receipts
State Gas Taxes 1,427 27.8
Rental Car Surcharge 94 1.8
MVL & Title Fees 555 10.8
Aviation Tax 48 0.9
Federal Aid 1,747 34.0
Bond Sales 208 4.0
Initial Reg. Fee 93 1.8
Turnpike Revenues 452 8.8
Other 512 10.0
Disbursements
Construction 2,007 39.1
Operations/In-House/Maintenance 908 17.7
Consultants 679 13.2
Right-of-Way Land 378 7.4
Public Transportation 504 9.8
Debt Service 225 4.4
Local Govt. Projects 110 2.1
Other 325 6.3
Source: Florida Department of Transportation, Agency Overview (July 2003).

Florida Transportation Almanac
253
Table 6-3QUICK REFERENCE TO 2003 HIGHWAY FUEL TAXES
Level Tax Amount Use
Federal
Fuel Excise Tax Gasohol - 13.2¢/galGasoline - 18.4¢/galDiesel - 24.4¢/gal
2.86¢ for mass transit.0.1¢ for leaking tanks. 2.5¢ for deficit reduction for gasoholonly.Remainder for roads and bridges.
State (Distributed to DOT)
Fuel Sales Tax
SCETS* Tax
All fuels 10.1¢/gal
Gas/Gasohol4.6¢-5.6¢/galDiesel - 5.6¢/gal
At least 15.0% of DOT receipts**dedicated for public transportation.Remainder for any legitimate statetransportation purpose.
Net receipts must be spent in districtwhere generated.
State (Distributed to LocalGovernments)
Constitutional Gas Tax
County Gas Tax
Municipal Gas Tax
All fuels2¢/gal
All fuels1¢/gal
All fuels1¢/gal
Acquisition, construction andmaintenance of roads.
Any legitimate county transportationpurpose.
Any legitimate municipaltransportation purpose.
Local
Ninth-cent Gas Tax Gas/Gasohol0¢ - 1¢/galDiesel1¢/gal
Any legitimate county or municipaltransportation purpose.
Local Option Gas Tax Gas/Gasohol5¢ - 11¢/galDiesel6¢/gal
Local transportation, small countiesmay also use funds for otherinfrastructure needs.
* State Comprehensive Enhanced Transportation System** Excluding funding designated for Mobility 2000 Initiative and Transportation Outreach Program
Source: Florida Department of Transportation, Office of Management and Budget, Florida's Transportation Tax Sources -- A Primer (January 2003).

Florida Transportation Almanac
254
Table 6-4LOCALLY IMPOSED FUEL TAXES*(Tax Rates as of January 1, 2003)
County
Motor Fuels (Gasoline and Gasohol) Special Fuels (Diesel)Total Est.
DistributionRates (cents/gal) Net 1 cent revenue ($000s) Rates (cents/gal) Net 1 cent revenue
($000s)
Local 9th Total Local 9th Local 9th Total Local 9th ($000s)
Alachua 0.06 0.01 0.07 1,060 1,134 0.06 0.01 0.07 120 129 8,269
Baker 0.06 0.01 0.07 140 150 0.06 0.01 0.07 26 28 1,167
Bay 0.06 - 0.06 838 897 0.06 0.01 0.07 111 120 5,759
Bradford 0.06 - 0.06 136 145 0.06 0.01 0.07 21 23 955
Brevard 0.06 - 0.06 2,208 2,363 0.06 0.01 0.07 315 341 15,336
Broward 0.11 0.01 0.12 7,289 7,800 0.06 0.01 0.07 778 842 93,008
Calhoun 0.06 - 0.06 58 62 0.06 0.01 0.07 22 23 499
Charlotte 0.11 - 0.11 762 815 0.06 0.01 0.07 127 137 9,226
Citrus 0.06 - 0.06 507 543 0.06 0.01 0.07 53 58 3,387
Clay 0.06 0.01 0.07 643 689 0.06 0.01 0.07 73 79 5,021
Collier 0.11 0.01 0.12 1,226 1,312 0.06 0.01 0.07 118 128 15,549
Columbia 0.11 0.01 0.12 400 429 0.06 0.01 0.07 140 151 5,795
Dade 0.09 0.01 0.10 8,934 9,561 0.06 0.01 0.07 1,228 1,329 98,074
DeSoto 0.11 0.01 0.12 88 94 0.06 0.01 0.07 29 32 1,267
Dixie 0.06 - 0.06 56 60 0.06 0.01 0.07 23 25 500
Duval 0.06 - 0.06 3,874 4,145 0.06 0.01 0.07 1,013 1,096 30,162
Escambia 0.06 0.01 0.07 1,298 1,389 0.06 0.01 0.07 238 257 10,773
Flagler 0.06 0.01 0.07 264 282 0.06 0.01 0.07 35 37 2,092
Franklin 0.05 - 0.05 62 67 0.06 0.01 0.07 12 13 394
Gadsden 0.06 - 0.06 263 281 0.06 0.01 0.07 213 231 3,069
Gilchrist 0.06 0.01 0.07 52 55 0.06 0.01 0.07 9 10 426
Glades 0.06 0.01 0.07 35 38 0.06 0.01 0.07 13 14 340
Gulf 0.06 - 0.06 46 49 0.06 0.01 0.07 10 11 341
Hamilton 0.06 - 0.06 101 108 0.06 0.01 0.07 69 74 1,086
Hardee 0.06 0.01 0.07 115 123 0.06 0.01 0.07 36 39 1,060
Hendry 0.06 0.01 0.07 176 188 0.06 0.01 0.07 81 87 1,801
* Revenue based on fuel consumption estimates produced by the Department of Revenue for local government FY 2002-03. Net 1 cent revenuefor Local Option Fuel Tax includes deductions for dealer collection allowance (for motor fuels 1.1% for first 6¢ and 1.1% for special fuels),refunds (0.03% for all fuels), and general revenue service charge (7.3% for all fuels), while net 1 cent revenue for Ninth-cent Gas Tax (forall fuels) includes deduction only for dealer collection allowance (1.1%).
Source: Florida Department of Transportation, Office of Management and Budget, Florida's Transportation Tax Sources -- A Primer (January 2003).
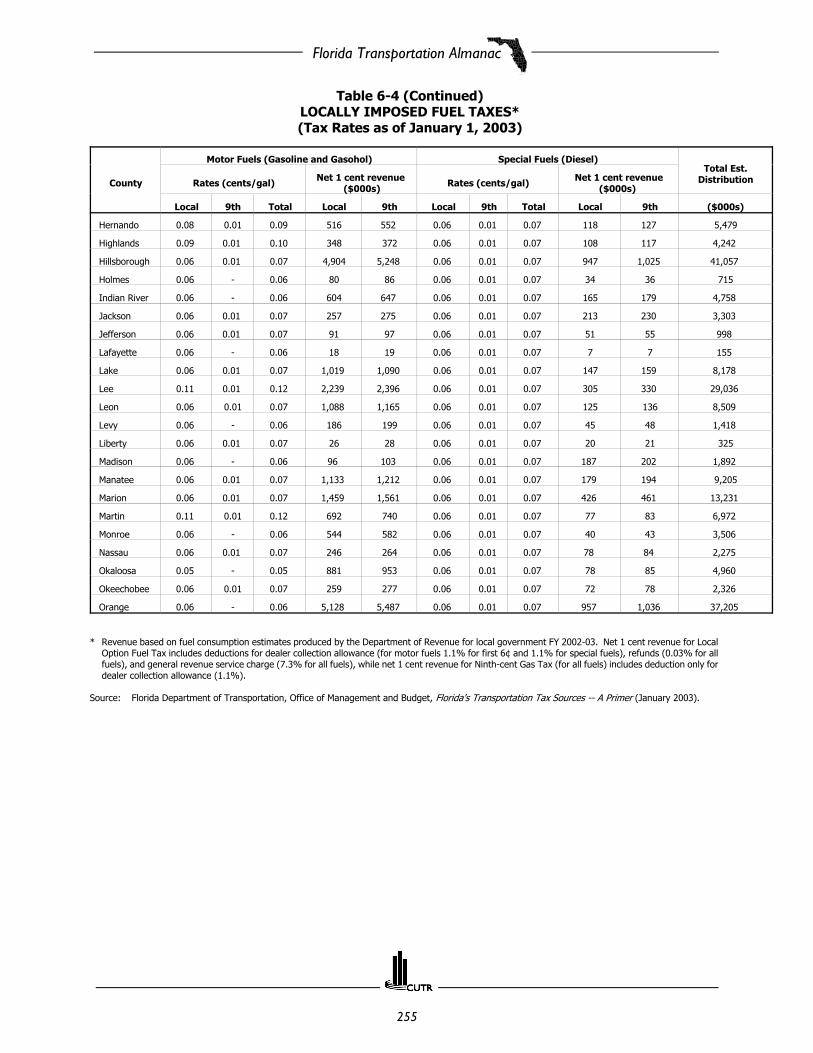
Florida Transportation Almanac
255
Table 6-4 (Continued)LOCALLY IMPOSED FUEL TAXES*(Tax Rates as of January 1, 2003)
County
Motor Fuels (Gasoline and Gasohol) Special Fuels (Diesel)Total Est.
DistributionRates (cents/gal) Net 1 cent revenue ($000s) Rates (cents/gal) Net 1 cent revenue
($000s)
Local 9th Total Local 9th Local 9th Total Local 9th ($000s)
Hernando 0.08 0.01 0.09 516 552 0.06 0.01 0.07 118 127 5,479
Highlands 0.09 0.01 0.10 348 372 0.06 0.01 0.07 108 117 4,242
Hillsborough 0.06 0.01 0.07 4,904 5,248 0.06 0.01 0.07 947 1,025 41,057
Holmes 0.06 - 0.06 80 86 0.06 0.01 0.07 34 36 715
Indian River 0.06 - 0.06 604 647 0.06 0.01 0.07 165 179 4,758
Jackson 0.06 0.01 0.07 257 275 0.06 0.01 0.07 213 230 3,303
Jefferson 0.06 0.01 0.07 91 97 0.06 0.01 0.07 51 55 998
Lafayette 0.06 - 0.06 18 19 0.06 0.01 0.07 7 7 155
Lake 0.06 0.01 0.07 1,019 1,090 0.06 0.01 0.07 147 159 8,178
Lee 0.11 0.01 0.12 2,239 2,396 0.06 0.01 0.07 305 330 29,036
Leon 0.06 0.01 0.07 1,088 1,165 0.06 0.01 0.07 125 136 8,509
Levy 0.06 - 0.06 186 199 0.06 0.01 0.07 45 48 1,418
Liberty 0.06 0.01 0.07 26 28 0.06 0.01 0.07 20 21 325
Madison 0.06 - 0.06 96 103 0.06 0.01 0.07 187 202 1,892
Manatee 0.06 0.01 0.07 1,133 1,212 0.06 0.01 0.07 179 194 9,205
Marion 0.06 0.01 0.07 1,459 1,561 0.06 0.01 0.07 426 461 13,231
Martin 0.11 0.01 0.12 692 740 0.06 0.01 0.07 77 83 6,972
Monroe 0.06 - 0.06 544 582 0.06 0.01 0.07 40 43 3,506
Nassau 0.06 0.01 0.07 246 264 0.06 0.01 0.07 78 84 2,275
Okaloosa 0.05 - 0.05 881 953 0.06 0.01 0.07 78 85 4,960
Okeechobee 0.06 0.01 0.07 259 277 0.06 0.01 0.07 72 78 2,326
Orange 0.06 - 0.06 5,128 5,487 0.06 0.01 0.07 957 1,036 37,205
* Revenue based on fuel consumption estimates produced by the Department of Revenue for local government FY 2002-03. Net 1 cent revenue for LocalOption Fuel Tax includes deductions for dealer collection allowance (for motor fuels 1.1% for first 6¢ and 1.1% for special fuels), refunds (0.03% for allfuels), and general revenue service charge (7.3% for all fuels), while net 1 cent revenue for Ninth-cent Gas Tax (for all fuels) includes deduction only fordealer collection allowance (1.1%).
Source: Florida Department of Transportation, Office of Management and Budget, Florida's Transportation Tax Sources -- A Primer (January 2003).
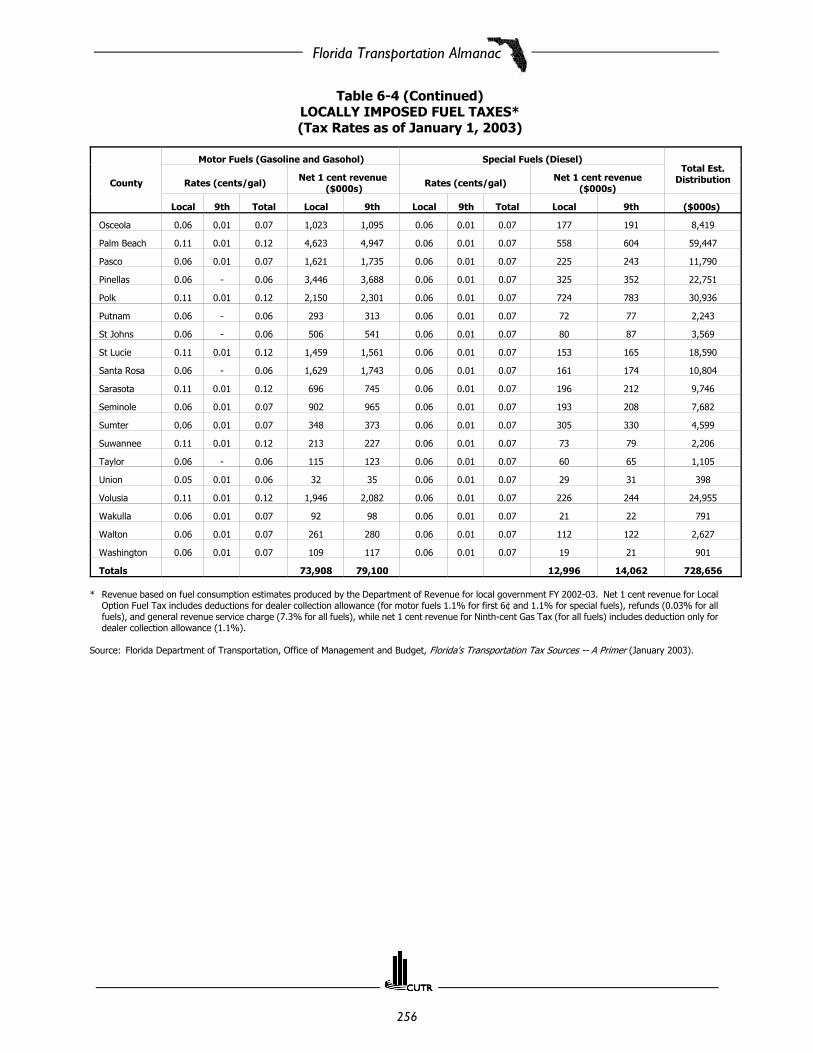
Florida Transportation Almanac
256
Table 6-4 (Continued)LOCALLY IMPOSED FUEL TAXES*(Tax Rates as of January 1, 2003)
County
Motor Fuels (Gasoline and Gasohol) Special Fuels (Diesel)Total Est.
DistributionRates (cents/gal) Net 1 cent revenue ($000s) Rates (cents/gal) Net 1 cent revenue
($000s)
Local 9th Total Local 9th Local 9th Total Local 9th ($000s)
Osceola 0.06 0.01 0.07 1,023 1,095 0.06 0.01 0.07 177 191 8,419
Palm Beach 0.11 0.01 0.12 4,623 4,947 0.06 0.01 0.07 558 604 59,447
Pasco 0.06 0.01 0.07 1,621 1,735 0.06 0.01 0.07 225 243 11,790
Pinellas 0.06 - 0.06 3,446 3,688 0.06 0.01 0.07 325 352 22,751
Polk 0.11 0.01 0.12 2,150 2,301 0.06 0.01 0.07 724 783 30,936
Putnam 0.06 - 0.06 293 313 0.06 0.01 0.07 72 77 2,243
St Johns 0.06 - 0.06 506 541 0.06 0.01 0.07 80 87 3,569
St Lucie 0.11 0.01 0.12 1,459 1,561 0.06 0.01 0.07 153 165 18,590
Santa Rosa 0.06 - 0.06 1,629 1,743 0.06 0.01 0.07 161 174 10,804
Sarasota 0.11 0.01 0.12 696 745 0.06 0.01 0.07 196 212 9,746
Seminole 0.06 0.01 0.07 902 965 0.06 0.01 0.07 193 208 7,682
Sumter 0.06 0.01 0.07 348 373 0.06 0.01 0.07 305 330 4,599
Suwannee 0.11 0.01 0.12 213 227 0.06 0.01 0.07 73 79 2,206
Taylor 0.06 - 0.06 115 123 0.06 0.01 0.07 60 65 1,105
Union 0.05 0.01 0.06 32 35 0.06 0.01 0.07 29 31 398
Volusia 0.11 0.01 0.12 1,946 2,082 0.06 0.01 0.07 226 244 24,955
Wakulla 0.06 0.01 0.07 92 98 0.06 0.01 0.07 21 22 791
Walton 0.06 0.01 0.07 261 280 0.06 0.01 0.07 112 122 2,627
Washington 0.06 0.01 0.07 109 117 0.06 0.01 0.07 19 21 901
Totals 73,908 79,100 12,996 14,062 728,656
* Revenue based on fuel consumption estimates produced by the Department of Revenue for local government FY 2002-03. Net 1 cent revenue for LocalOption Fuel Tax includes deductions for dealer collection allowance (for motor fuels 1.1% for first 6¢ and 1.1% for special fuels), refunds (0.03% for allfuels), and general revenue service charge (7.3% for all fuels), while net 1 cent revenue for Ninth-cent Gas Tax (for all fuels) includes deduction only fordealer collection allowance (1.1%).
Source: Florida Department of Transportation, Office of Management and Budget, Florida's Transportation Tax Sources -- A Primer (January 2003).

Florida Transportation Almanac
257
Tabl
e 6
-5SO
UR
CES
OF
REV
ENU
ES U
SED
FO
R S
TATE
-AD
MIN
ISTE
RED
HIG
HW
AY
S IN
SEL
ECTE
D S
TATE
S, 2
00
1 (
%)
Stat
e
Stat
eFe
dera
lLo
cal
Mot
or F
uel
Taxe
s
Mot
or V
eh.
& M
otor
Car
rier
Taxe
s
Roa
d &
Cro
ssin
gTo
lls
App
rop.
From
Gen
eral
Fun
ds
Oth
erSt
ate
Impo
sts
Mis
c.B
ond
Ori
g.Is
sues
Bon
dR
efu
nd
Issu
esFH
WA
Oth
erFe
dera
lLo
cal
Gov
't.
Flor
ida
26.2
13.2
13.8
0.2
2.6
3.0
6.7
0.0
30.5
0.2
3.4
Alab
ama
22.7
14.3
0.0
0.0
0.9
0.4
0.0
0.0
59.5
0.2
1.9
Ariz
ona
21.4
8.6
0.0
2.7
14.9
5.0
25.5
0.2
20.3
0.1
1.3
Calif
orni
a19
.021
.74.
72.
411
.94.
20.
00.
027
.90.
77.
6
Geo
rgia
13.8
7.1
1.4
0.0
14.2
6.1
8.8
0.0
48.2
0.4
0.0
Kent
ucky
21.1
34.7
1.0
1.9
0.0
6.5
0.0
0.0
34.5
0.2
0.0
Mis
siss
ippi
32.4
11.2
0.0
3.2
9.5
2.2
0.0
0.0
40.1
0.4
1.2
N. C
arol
ina
36.3
12.5
0.1
4.8
13.2
3.1
0.0
0.0
29.4
0.4
0.3
S. C
arol
ina
27.7
2.5
0.0
6.3
0.0
2.4
29.3
0.4
30.8
0.5
0.1
Tenn
esse
e29
.417
.20.
011
.00.
94.
50.
00.
035
.00.
31.
8
Texa
s40
.015
.52.
00.
00.
62.
80.
00.
034
.90.
34.
0
U.S
. Tot
al23
.813
.65.
93.
50.
03.
711
.22.
229
.80.
51.
6
Sour
ce:
U.S
. Dep
artm
ent
of T
rans
port
atio
n, F
eder
al H
ighw
ay A
dmin
istr
atio
n, 2
001
Hig
hway
Sta
tistic
s (O
ctob
er 2
002)
.

Florida Transportation Almanac
258
Tabl
e 6
-6SO
UR
CES
OF
REV
ENU
ES U
SED
FO
R L
OC
AL
RO
AD
S A
ND
STR
EETS
IN
SEL
ECTE
D S
TATE
S, 2
00
1 (
%)
Stat
e
Stat
eFe
dera
lLo
cal
Mot
or F
uel
Taxe
s
Mot
or V
eh.
& M
otor
Car
rier
Taxe
s
Roa
d &
Cro
ssin
gTo
lls
App
rop.
From
Gen
eral
Fun
ds
Oth
erSt
ate
Impo
sts
Mis
c.Is
sue
ofB
onds
FHW
AO
ther
Fede
ral
Loca
lG
ov't
.
Flor
ida
74.0
15.4
0.0
0.0
0.0
0.0
0.0
0.0
0.3
10.4
Alab
ama
81.2
18.6
0.0
0.0
0.0
0.0
0.0
0.0
0.3
0.0
Ariz
ona
35.4
9.3
0.0
0.0
47.4
0.5
0.0
5.9
0.6
1.0
Calif
orni
a47
.42.
00.
048
.10.
00.
00.
01.
11.
30.
0
Geo
rgia
65.9
33.6
0.0
0.0
0.0
0.0
0.0
0.0
0.5
0.0
Kent
ucky
67.1
32.8
0.0
0.0
0.0
0.0
0.0
0.0
0.1
0.0
Mis
siss
ippi
64.6
27.6
0.0
0.0
6.2
0.0
0.0
0.0
1.5
0.0
N. C
arol
ina
89.1
10.9
0.0
0.0
0.0
0.0
0.0
0.0
0.0
0.0
S. C
arol
ina
90.7
5.3
0.0
0.0
0.0
0.0
2.4
0.0
1.6
0.0
Tenn
esse
e92
.33.
60.
00.
04.
00.
00.
00.
00.
10.
0
Texa
s1.
797
.80.
00.
00.
00.
00.
00.
00.
50.
0
U.S
. Tot
al56
.323
.40.
07.
63.
40.
41.
75.
11.
30.
8
Sour
ce:
U.S
. Dep
artm
ent
of T
rans
port
atio
n, F
eder
al H
ighw
ay A
dmin
istr
atio
n, 2
001
Hig
hway
Sta
tistic
s (O
ctob
er 2
002)
.

Florida Transportation Almanac
259
Tabl
e 6
-7SO
UR
CES
OF
REV
ENU
ES U
SED
BY
LO
CA
L G
OV
ERN
MEN
TS F
OR
HIG
HW
AY
S IN
SEL
ECTE
D S
TATE
S, 2
00
1 (
%)
Stat
e
Loca
lSt
ate
Fede
ral
Mot
or F
uel
&
Veh
icle
Taxe
s
Roa
d &
Cro
ssin
gTo
lls
App
rop.
From
Gen
eral
Fun
ds
Pro
pert
yTa
xes
&Sp
ecia
lA
sses
s.
Oth
erLo
cal
Impo
sts
Mis
c.B
ond
Ori
g. I
ssu
es
Bon
dR
efu
nd
Issu
es
Hig
hw
ayU
ser
Impo
sts
Oth
erSt
ate
FHW
AO
ther
Fede
ral
Flor
ida
30.6
2.5
9.8
8.4
22.0
6.3
3.6
0.0
13.8
2.1
0.0
0.8
Alab
ama
2.9
0.0
26.6
25.5
0.0
17.6
0.0
0.0
24.0
2.2
0.0
1.2
Ariz
ona
0.8
0.0
13.3
1.6
23.7
5.7
8.0
0.0
34.2
12.4
0.0
0.3
Calif
orni
a0.
01.
826
.12.
21.
822
.30.
121
.918
.10.
05.
10.
6
Geo
rgia
0.0
0.0
30.9
0.2
62.4
5.9
0.6
0.0
0.0
0.1
0.0
0.0
Kent
ucky
26.4
0.0
40.7
0.0
0.7
5.1
0.0
0.0
3.4
23.7
0.0
0.2
Mis
siss
ippi
1.3
0.0
23.3
19.7
10.4
2.7
11.8
0.0
20.3
9.4
0.0
1.0
N. C
arol
ina
2.3
0.0
48.0
0.9
0.9
2.9
14.3
0.0
29.7
0.1
0.0
1.0
S. C
arol
ina
0.0
0.0
45.3
21.6
11.1
0.0
0.0
0.0
19.2
1.8
0.0
0.9
Tenn
esse
e6.
30.
034
.11.
00.
20.
05.
70.
050
.40.
40.
02.
0
Texa
s4.
07.
229
.318
.80.
016
.811
.00.
010
.40.
30.
02.
3
U.S
. Tot
al3.
82.
029
.012
.66.
59.
56.
53.
322
.52.
41.
10.
8
Sour
ce:
U.S
. Dep
artm
ent
of T
rans
port
atio
n, F
eder
al H
ighw
ay A
dmin
istr
atio
n, 2
001
Hig
hway
Sta
tistic
s (O
ctob
er 2
002)
.

Florida Transportation Almanac
260
Table 6-8SOURCES OF TRANSIT OPERATING FUNDING, 2001 (%)
State SystemRevenue
FederalFunds
StateFunds
Local Funds
Florida 28.9 11.2 11.7 48.2
Alabama 26.7 27.3 0.2 45.8
Arizona 27.7 5.9 15.5 50.9
California 35.1 6.7 8.2 50.1
Georgia 33.7 9.9 0.0 56.4
Kentucky 19.3 12.8 1.0 66.9
Mississippi 18.1 32.8 0.0 49.2
N. Carolina 27.5 9.6 14.9 48.1
S. Carolina 61.0 29.7 8.1 1.3
Tennessee 29.7 15.2 16.1 39.0
Texas 17.8 5.0 2.9 74.4
U.S. Total 44.1 4.6 20.7 30.6
Source: U.S. Department of Transportation, Federal Highway Administration,2001 Highway Statistics (October 2002).
Table 6-9SOURCES OF TRANSIT CAPITAL FUNDING, 2001 (%)
State SystemRevenue
FederalFunds
StateFunds
LocalFunds
Florida 1.9 77.3 14.8 6.0
Alabama 0.0 96.0 0.0 4.0
Arizona 0.0 90.4 1.2 8.4
California 3.7 55.9 13.3 27.1
Georgia 0.0 32.5 0.3 67.2
Kentucky 0.0 81.7 0.6 17.8
Mississippi 0.0 80.1 0.0 19.9
N. Carolina 0.0 39.9 7.2 52.9
S. Carolina 8.0 72.9 10.9 8.3
Tennessee 0.3 79.4 10.4 10.0
Texas 0.0 46.3 2.7 51.0
U.S. Total 19.0 47.3 10.6 22.6
Source: U.S. Department of Transportation, Federal Highway Administration,2001 Highway Statistics (October 2002).

Florida Transportation Almanac
261
Table 6-10STATE MOTOR FUEL TAX RATES FOR GASOLINE, 1990-2001 1 (%)
State 1990 1991 1992 1993 1994 1995 1996 1997 1998 1999 2000 2001Alabama 13.0 13.0 18.0 18.0 18.0 18.0 18.0 18.0 18.0 18.0 18.0 18.0Alaska 8.0 8.0 8.0 8.0 8.0 8.0 8.0 8.0 8.0 8.0 8.0 8.0Arizona 18.0 18.0 18.0 18.0 18.0 18.0 18.0 18.0 18.0 18.0 18.0 18.0Arkansas 13.7 18.7 18.7 18.7 18.7 18.7 18.6 18.6 18.6 19.5 19.5 21.7California 9.0 15.0 16.0 17.0 18.0 18.0 18.0 18.0 18.0 18.0 18.0 18.0Colorado 20.0 22.0 22.0 22.0 22.0 22.0 22.0 22.0 22.0 22.0 22.0 22.0Connecticut 22.0 25.0 26.0 29.0 31.0 34.0 38.0 36.0 32.0 32.0 32.0 25.0Delaware 16.0 19.0 19.0 22.0 22.0 23.0 23.0 23.0 23.0 23.0 23.0 23.0Dist. of Col. 18.0 18.0 20.0 20.0 20.0 20.0 20.0 20.0 20.0 20.0 20.0 20.0Florida 10.9 11.2 11.6 11.8 12.1 12.3 12.5 12.8 13.0 13.1 13.1 13.6Georgia 7.5 7.5 7.5 7.5 7.5 7.5 7.5 7.5 7.5 7.5 7.5 7.5Hawaii 11.0 16.0 16.0 16.0 16.0 16.0 16.0 16.0 16.0 16.0 16.0 16.0Idaho 18.0 21.0 21.0 21.0 21.0 21.0 25.0 25.0 25.0 25.0 25.0 25.0Illinois 19.0 19.0 19.0 19.0 19.0 19.0 19.0 19.0 19.0 19.0 19.0 19.0Indiana 15.0 15.0 15.0 15.0 15.0 15.0 15.0 15.0 15.0 15.0 15.0 15.0Iowa 20.0 20.0 20.0 20.0 20.0 20.0 20.0 20.0 20.0 20.0 20.0 20.0Kansas 16.0 17.0 18.0 18.0 18.0 18.0 18.0 18.0 18.0 20.0 20.0 21.0Kentucky 15.4 15.4 15.4 15.4 16.4 16.4 16.4 16.4 16.4 16.4 16.4 16.4Louisiana 20.0 20.0 20.0 20.0 20.0 20.0 20.0 20.0 20.0 20.0 20.0 20.0Maine 17.0 19.0 19.0 19.0 19.0 19.0 19.0 19.0 19.0 19.0 19.0 22.0Maryland 18.5 18.5 23.5 23.5 23.5 23.5 23.5 23.5 23.5 23.5 23.5 23.5Massachusetts 17.0 21.0 21.0 21.0 21.0 21.0 21.0 21.0 21.0 21.0 21.0 21.0Michigan 15.0 15.0 15.0 15.0 15.0 15.0 15.0 19.0 19.0 19.0 19.0 19.0Minnesota 20.0 20.0 20.0 20.0 20.0 20.0 20.0 20.0 20.0 20.0 20.0 20.0Mississippi 18.2 18.2 18.2 18.4 18.4 18.4 18.4 18.4 18.4 18.4 18.4 18.4Missouri 11.0 11.0 13.0 13.0 15.0 15.0 17.0 17.0 17.0 17.0 17.0 17.0Montana 20.0 20.0 21.4 24.0 27.0 27.0 27.0 27.0 27.0 27.0 27.0 27.0Nebraska 21.7 23.7 24.6 24.4 25.4 25.4 25.9 24.5 23.5 22.8 22.8 24.5Nevada 18.0 21.5 24.0 24.0 24.0 24.0 24.0 24.8 24.8 24.8 24.8 24.8New Hampshire 16.6 18.6 18.6 18.7 18.7 18.7 18.7 18.7 19.5 19.5 19.5 19.5New Jersey 10.5 10.5 10.5 10.5 10.5 10.5 10.5 10.5 10.5 10.5 10.5 10.5New Mexico 17.0 17.0 17.0 23.0 21.0 18.0 18.9 18.9 18.5 18.5 18.5 18.5New York 14.4 20.8 22.9 22.9 22.6 21.9 21.8 22.8 22.7 29.3 29.3 22.0N. Carolina 21.5 22.6 21.9 22.0 21.3 21.6 21.7 22.6 21.6 21.2 21.2 24.1N. Dakota 17.0 17.0 17.0 18.0 18.0 18.0 20.0 20.0 20.0 21.0 21.0 21.0Ohio 20.0 21.0 21.0 22.0 22.0 22.0 22.0 22.0 22.0 22.0 22.0 22.0Oklahoma 17.0 17.0 17.0 17.0 17.0 17.0 17.0 17.0 17.0 17.0 17.0 17.0Oregon 18.0 20.0 22.0 24.0 24.0 24.0 24.0 24.0 24.0 24.0 24.0 24.0Pennsylvania 18.2 22.4 22.4 22.4 22.4 22.4 22.4 25.9 25.9 25.9 25.9 26.0Rhode Island 20.0 26.0 26.0 28.0 29.0 29.0 29.0 29.0 29.0 29.0 29.0 29.0S. Carolina 16.0 16.0 16.0 16.0 16.0 16.0 16.0 16.0 16.0 16.0 16.0 16.0S. Dakota 18.0 18.0 18.0 18.0 18.0 18.0 18.0 21.0 18.0 22.0 22.0 22.0Tennessee 20.0 20.0 20.0 20.0 20.0 20.0 20.0 20.0 20.0 20.0 20.0 20.0Texas 15.0 20.0 20.0 20.0 20.0 20.0 20.0 20.0 20.0 20.0 20.0 20.0Utah 19.0 19.0 19.0 19.0 19.0 19.0 19.0 24.5 24.5 24.5 24.5 24.5Vermont 16.0 16.0 16.0 16.0 16.0 16.0 16.0 20.0 20.0 20.0 20.0 20.0Virginia 17.7 17.7 17.5 17.5 17.5 17.5 17.5 17.5 17.5 17.5 17.5 17.5Washington 22.0 23.0 23.0 23.0 23.0 23.0 23.0 23.0 23.0 23.0 23.0 23.0W. Virginia 20.4 20.4 20.4 25.4 25.4 25.4 25.4 25.4 25.4 25.4 25.4 25.4Wisconsin 21.5 22.2 22.2 23.2 23.1 23.4 23.7 23.8 25.4 25.4 25.4 27.3Wyoming 9.0 9.0 9.0 9.0 9.0 9.0 9.0 9.0 14.0 14.0 14.0 14.0State Avg. 2 15.5 17.6 18.0 18.3 18.5 18.5 18.7 19.1 20.0 19.3 20.2 19.1
1 This table shows the tax rates for motor fuel as of December 31 for each year.2 Weighted average based on net gallons taxed.
Source: U.S. Department of Transportation, Federal Highway Administration, 2001 Highway Statistics (October 2002).

Florida Transportation Almanac
262
Table 6-11STATE MOTOR FUEL TAX RATES FOR DIESEL, 1990-2001 1 (%)
STATE 1990 1991 1992 1993 1994 1995 1996 1997 1998 1999 2000 2001Alabama 14.0 14.0 19.0 19.0 19.0 19.0 19.0 19.0 19.0 19.0 19.0 19.0Alaska 8.0 8.0 8.0 8.0 8.0 8.0 8.0 8.0 8.0 8.0 8.0 8.0Arizona 18.0 18.0 18.0 18.0 18.0 18.0 18.0 18.0 27.0 27.0 27.0 26.0Arkansas 12.7 18.7 18.7 18.7 18.7 18.7 18.6 18.6 18.6 20.5 20.5 22.7California 9.0 15.0 16.0 17.0 18.0 18.0 18.0 18.0 18.0 18.0 18.0 18.0Colorado 18.0 18.0 20.5 20.5 20.5 20.5 20.5 20.5 20.5 20.5 20.5 20.5Connecticut 22.0 18.0 18.0 18.0 18.0 18.0 18.0 18.0 18.0 18.0 18.0 18.0Delaware 16.0 19.0 19.0 19.0 19.0 22.0 22.0 22.0 22.0 22.0 22.0 22.0Dist. of Col. 18.0 18.0 20.0 20.0 20.0 20.0 20.0 20.0 20.0 20.0 20.0 20.0Florida 10.9 12.2 18.7 21.0 23.6 23.9 24.2 24.6 25.0 25.1 25.1 25.9Georgia 7.5 7.5 7.5 7.5 7.5 7.5 7.5 7.5 7.5 7.5 7.5 7.5Hawaii 11.0 16.0 16.0 16.0 16.0 16.0 16.0 16.0 16.0 16.0 16.0 16.0Idaho 18.0 21.0 21.0 21.0 21.0 21.0 25.0 25.0 25.0 25.0 25.0 25.0Illinois 21.5 21.5 21.5 21.5 21.5 21.5 21.5 21.5 21.5 21.5 21.5 21.5Indiana 16.0 16.0 16.0 16.0 16.0 16.0 16.0 16.0 16.0 16.0 16.0 16.0Iowa 22.5 22.5 22.5 22.5 22.5 22.5 22.5 22.5 22.5 22.5 22.5 22.5Kansas 18.0 19.0 20.0 20.0 20.0 20.0 20.0 20.0 20.0 22.0 22.0 23.0Kentucky 12.4 12.4 12.4 12.4 13.4 13.4 13.4 13.4 13.4 13.4 13.4 13.4Louisiana 20.0 20.0 20.0 20.0 20.0 20.0 20.0 20.0 20.0 20.0 20.0 20.0Maine 20.0 20.0 20.0 20.0 20.0 20.0 20.0 20.0 20.0 20.0 23.0 23.0Maryland 18.5 18.5 19.3 24.3 24.3 24.3 24.3 24.3 24.3 24.3 24.3 24.3Massachusetts 17.0 21.0 21.0 21.0 21.0 21.0 21.0 21.0 21.0 21.0 21.0 21.0Michigan 15.0 15.0 15.0 15.0 15.0 15.0 15.0 15.0 15.0 15.0 15.0 15.0Minnesota 20.0 20.0 20.0 20.0 20.0 20.0 20.0 20.0 20.0 20.0 20.0 20.0Mississippi 18.2 18.2 18.2 18.4 18.4 18.4 18.4 18.4 18.4 18.4 18.4 18.4Missouri 11.0 11.0 13.0 13.0 15.0 15.0 17.0 17.0 17.0 17.0 17.0 17.0Montana 20.0 20.0 21.4 24.0 27.8 27.8 27.8 27.8 27.8 27.8 27.8 27.8Nebraska 21.5 23.5 24..8 24.0 25.0 25.0 25.5 24.5 23.5 22.8 22.8 24.5Nevada 22.0 24.5 27.0 27.0 27.0 27.0 27.0 27.8 27.8 27.8 27.8 27.8New Hampshire 16.6 18.6 18.6 18.7 18.7 18.7 18.7 18.7 19.5 19.5 19.5 19.5New Jersey 13.5 13.5 13.5 13.5 13.5 13.5 13.5 13.5 13.5 13.5 13.5 13.5New Mexico 17.0 17.0 17.0 19.0 19.0 19.0 19.9 19.9 19.5 19.5 19.5 19.5New York 16.3 22.8 24.8 24.8 24.5 23.9 23.7 22.7 21.9 28.0 27.9 20.3N. Carolina 21.5 22.6 21.9 22.0 21.3 21.6 21.7 22.6 21.6 21.2 21.2 24.1N. Dakota 17.0 17.0 17.0 18.0 18.0 18.0 20.0 20.0 20.0 21.0 21.0 21.0Ohio 20.0 21.0 21.0 22.0 22.0 22.0 22.0 22.0 22.0 22.0 22.0 22.0Oklahoma 14.0 14.0 14.0 14.0 14.0 14.0 14.0 14.0 14.0 14.0 14.0 14.0Oregon 18.0 20.0 22.0 24.0 24.0 24.0 24.0 24.0 24.0 24.0 24.0 24.0Pennsylvania 18.2 22.4 22.4 22.4 22.4 22.4 22.4 30.8 30.8 30.8 30.8 30.9Rhode Island 20.0 26.0 26.0 28.0 29.0 29.0 29.0 29.0 29.0 29.0 29.0 29.0S. Carolina 16.0 16.0 16.0 16.0 16.0 16.0 16.0 16.0 16.0 16.0 16.0 16.0S. Dakota 18.0 18.0 18.0 18.0 18.0 18.0 18.0 21.0 18.0 22.0 22.0 22.0Tennessee 17.0 17.0 17.0 17.0 17.0 17.0 17.0 17.0 17.0 17.0 17.0 17.0Texas 15.0 20.0 20.0 20.0 20.0 20.0 20.0 20.0 20.0 20.0 20.0 20.0Utah 19.0 19.0 19.0 19.0 19.0 19.0 19.0 24.5 24.5 24.5 24.5 24.5Vermont 17.0 17.0 17.0 17.0 17.0 17.0 17.0 17.0 17.0 17.0 17.0 26.0Virginia 16.2 16.2 16.0 16.0 16.0 16.0 16.0 16.0 16.0 16.0 16.0 16.0Washington 22.0 23.0 23.0 23.0 23.0 23.0 23.0 23.0 23.0 23.0 23.0 23.0W. Virginia 20.4 20.4 20.4 25.4 25.4 25.4 25.4 25.4 25.4 25.4 25.4 25.7Wisconsin 21.5 22.2 22.2 23.2 23.1 23.4 23.7 23.8 25.4 25.4 25.4 27.3Wyoming 9.0 9.0 9.0 9.0 9.0 9.0 9.0 9.0 14.0 14.0 14.0 14.0State Avg. 2 16.0 17.6 18.3 18.6 18.9 19.0 19.0 19.5 20.2 20.0 20.4 19.7
1 This table shows the tax rates for motor fuel as of December 31 for each year.2 Weighted average based on net gallons taxed.
Source: U.S. Department of Transportation, Federal Highway Administration, 2001 Highway Statistics (October2002).

Florida Transportation Almanac
263
Table 6-12AUTOMOBILE REGISTRATION FEE BY STATE (2001)
State Fee State Fee
Alabama $24.25 Montana Based on vehicle weight
Alaska $68.00 Nebraska $17.50
Arizona $8.00 Nevada $33.00
Arkansas Based on unladen weight of vehicle New Hampshire Based on vehicle weight
California $28.00 New Jersey Based on vehicle weight and modelyear
Colorado Based on weight and vehicle model year New Mexico Based on vehicle weight and model year
Connecticut $70.00 New York Based on vehicle weight and engine type
Delaware $20.00 North Carolina $20.00
Dist. of Col Based on vehicle weight North Dakota Based on weight and number ofregistrations
Florida Based on weight of vehicle Ohio $25
Georgia $20.00 Oklahoma $20.00 + value and age of vehicle
Hawaii $20.00 plus $1.25 per pound Oregon $30.00
Idaho Based on vehicle model year Pennsylvania $24.00
Illinois $48.00 Rhode Island $30.00
Indiana $12.75 South Carolina $24.00 (for two year period)
Iowa 40¢ per hundred lbs. vehicle weight plus1 % of vehicle’s value South Dakota Based on weight and vehicle model year
Kansas Based on vehicle weight Tennessee $23.00
Kentucky $14.50 Texas Based on vehiclemodel year
Louisiana $10 per year for a four year period for$10,000 or less Utah $21.00 - $49.50
Maine $23.00 Vermont $42.00
Maryland $27 to $40.50 (based on vehicle weight) Virginia Based on vehicle weight
Massachusetts $30.00 Washington $33.00
Michigan Based on weight and vehicle model year West Virginia $30.00
Minnesota Based on Value and Age Wisconsin $45.00
Mississippi $23.75 Wyoming $15.00
Missouri Based on vehicle horsepower Puerto Rico $40.00
Source: Federal Highway Administration. Highway Taxes and Fees: How They are Collected and Distributed (June 2001).

Florida Transportation Almanac
264
Table 6-13COST PER CENTERLINE MILE - STATE RURAL ROADS (2002)
(2, 4, 6, and 8 lanes)
Construction Type No. of Lanes Estimated Cost (High) ($)
New Construction with 5' Paved Shoulders 2 2,172,300
Milling & Resurfacing with 5' Paved Shoulders 2 477,800
Routine Maintenance (Annual) 2 21,700
New Construction (Interstate) with 10' Paved Shoulders 4 4,018,600
New Construction (Undivided) with 10' Paved Shoulders w/12' Aux. Ln 4 3,317,700
Milling & Resurfacing (Arterial) with 5' Paved Shoulders w/12' Aux. Ln 4 686,900
Milling & Resurfacing (Interstate) with 10' Paved Shoulders 4 777,700
Add 2 Lanes (To Existing 2 Ln) with 5' Paved Shoulders 4 2,381,600
Routine Maintenance (Annual) 4 40,700
New Construction (Interstate) with 10' Paved Shoulders 6 4,858,900
New Construction (Undivided) with 5' Paved Shoulders 6 4,276,100
New Construction (Divided) with 5' Paved Shoulders 6 4,098,000
Milling & Resurfacing (Arterial) with 5' Paved Shoulders w/12' Aux. Ln 6 836,800
Milling & Resurfacing (Interstate) with 10' Paved Shoulders 6 1,001,300
Add 2 Lanes (To existing 4 Ln) with 5' Paved Shoulders 6 2,652,200
Add 2 Lanes (Interstate-Inside) with 10' Paved Shoulders 6 3,145,700
Routine Maintenance (Annual) 6 60,800
New Construction (Interstate) with 10' Paved Shoulders 8 5,453,800
New Construction (Undivided) with 10' Paved Shoulders w/12' Aux. Ln 8 5,178,900
New Construction (Divided) with 10' Paved Shoulders 8 5,184,600
Milling & Resurfacing (Arterial) with 10' Paved Shoulders w/12' Aux. Ln 8 1,115,200
Milling & Resurfacing (Interstate) with 10' Paved Shoulders 8 1,220,100
Add 2 Lanes (To Existing 6 Ln) with 5' Paved Shoulders 8 2,803,000
Add 2 Lanes (To Existing 6 Ln- inside ) with 10' Paved Shoulders 8 3,360,800
Routine Maintenance (Annual) 8 N/A
Note: Figures are for 2002 construction costs for one centerline mile of roadway including structures up to 20 feet in length; theymay not be comparable to prior year figures in all cases.
These figures exclude costs for intersections/interchanges/structures over 20 feet, right-of-way, landscaping, traffic signalspreliminary engineering, and construction engineering inspection.
The cost-per-centerline mile figures are based on general, statewide averages. They are not to be used for Work Programestimating because they are not job specific.
Source: Florida Department of Transportation, Office of Policy Planning, Policy Analysis, and Program Evaluation, 2002Transportation Costs (March 2003).

Florida Transportation Almanac
265
Table 6-14COST PER CENTERLINE MILE - STATE URBAN ROADS (2002)
(2, 4, 6, and 8 lanes)
Construction Type No. of Lanes Estimated Cost ($)
New Construction with 5' Sidewalk, Curb, Gutter & 10' Refuge Ln 2 2,821,800
Milling & Resurfacing Curb to Curb 2 422,100
Routine Maintenance (Annual) 2 26,300
New Construction (Interstate) with 10' Paved Shoulders 4 4,765,100
New Const. (Undivided) with 5' Sidewalk, Curb, Gutter & 12' Aux. Ln 4 3,305,100
New Const. (Divided) with 5' Sidewalk, Curb, Gutter & 10' Refuge Ln 4 4,273,200
Milling & Resurfacing (Arterial) Curb to Curb w/12' Aux/ Ln 4 541,200
Milling & Resurfacing (Interstate) with 10' Paved Shoulder 4 785,200
Add 2 Lns (To Existing 2 Ln) with 5' Sidewalk, Curb, Gutter & 12' Aux. Ln 4 2,812,900
Routine Maintenance (Annual) 4 58,500
New Construction (Interstate) with 10' Paved Shoulders 6 5,706,100
New Const. (Undivided) with 5' Sidewalk, Curb, Gutter & 12' Aux. Ln 6 3,979,500
New Const. (Divided) with 5' Sidewalk, Curb, Gutter & 10' Refuge Ln 6 4,946,300
Milling & Resurfacing (Arterial) Curb to Curb w/ 12' Aux Ln 6 718,200
Milling & Resurfacing (Interstate) with 10' Paved Shoulder 6 1,157,500
Add 2 Lns (To Existing 4 Ln) with 5' Sidewalk, Curb, Gutter & 12' Aux. Ln 6 2,754,600
Add 2 Lanes (To Existing 4 Ln Interstate-Inside) with 10' Paved 6 3,232,100
Routine Maintenance (Annual) 6 115,000
New Construction (Interstate) with 10' Paved Shoulders 8 6,278,700
New Const. (Undivided) with 5' Sidewalk, Curb, Gutter & 12' Aux. Ln 8 4,636,000
New Const. (Divided) with 5' Sidewalk, Curb, Gutter & 10' Refuge Ln 8 5,473,000
Milling & Resurfacing (Arterial) Curb to Curb w/ 8.5' Refuge Ln 8 1,081,600
Milling & Resurfacing (Interstate) with 10' Paved Shoulder 8 1,226,200
Add 2 Lns (To Existing 6 Ln) with 5' Sidewalk, Curb, Gutter & 12' Aux. Ln 8 3,100,100
Add 2 Lanes (To Existing 6 Ln Interstate-Inside) with 10' Paved 8 3,734,200
Routine Maintenance (Annual) 8 129,400
Note: Figures are for 2002 construction costs for one centerline mile of roadway including structures up to 20 feet in length; they maynot be comparable to prior year figures in all cases.
These figures exclude costs for intersections/interchanges/structures over 20 feet, right-of-way, landscaping, traffic signals preliminaryengineering, and construction engineering inspection.
The cost-per-centerline mile figures are based on general, statewide averages. They are not to be used for Work Programestimating because they are not job specific.
Source: Florida Department of Transportation, Office of Policy Planning, Policy Analysis, and Program Evaluation, 2002Transportation Costs (March 2003).

Florida Transportation Almanac
266
Table 6-15NATIONAL AVERAGE COST PER CENTERLINE MILE (2002)
(2, 4, and 6 lanes)
ImprovementAverage Cost ($)
2 Lanes 4 Lanes 6 Lanes
State Rural Roads
New Construction(Interstate)
n/a
4,081,600 4,858,900
New Construction(Undivided) 3,317,700 4,276,100
New Construction (Divided) 2,172,300 3,240,700 4,098,000
Resurfacing (Arterial) 477,800 686,900 836,800
Resurfacing (Interstate)n/a
777,700 1,001,300
Add 2 Lanes 2,381,600 2,652,200
Routine Maintenance 21,700 40,700 60,800
Source: Florida Department of Transportation, Office of Policy Planning, Policy Analysis,and Program Evaluation, 2002 Transportation Costs (March 2003).
Table 6-16COST OF TRAFFIC SIGNALS (2002)
Activity Rural ($) Urban ($) Average Cost ($)
Installation (Mast Arm) 129,400 113,300 121,400
Installation (Strain Pole) 68,700 60,300 64,500
Maintenance - - 2,150*
* Per Intersection/Year
Source: Florida Department of Transportation, Office of Policy Planning, Policy Analysis, andProgram Evaluation, 2002 Transportation Costs (March 2003).

Florida Transportation Almanac
267
Table 6-17NEW BRIDGE CONSTRUCTION (2002)
(cost per square foot)
Bridge Type Low ($) High ($)
Short Span, Reinforced Concrete Flat Slab Simple Span 50 65
Short Span. Reinforced Concrete Flat Slab Continuous Span 60 80
Medium Span Bridge, Steel Deck/Girder - Simple Span 62 75
Medium Span Bridge, Steel Deck/Girder - Continuous Span 70 90
Prestressed Concrete Deck/Girder - Simple Span 50 70
Prestressed Concrete Deck/Girder - Continuous Span 65 110
Long Span Bridge, Steel Box Deck/Girder - 150'-280' 76 120
Long Span Bridge, Segmental Concrete Box Girders - CantileverConstruction, 150'-280' 80 110
Long Span Bridge, Movable Bridge - Bascule Spans and Piers 900 1,500
Notes: Figures are for 2002 construction costs per square foot of deck area, including allowance for handrails; they may not be comparable toprior year figures in all cases.
Costs of preliminary engineering, right-of-way, bridge approaches, mobilization, and construction engineering inspection are not included.
These cost-per-square foot figures are based on general, statewide averages. They are not to be used for Work Program estimating because theyare not job specific.
Source: Florida Department of Transportation, Office of Policy Planning, Policy Analysis, and Program Evaluation, 2002Transportation Costs (March 2003).
Table 6-18BRIDGE PRESERVATION (2002)
(cost per square foot)
Project Type Low ($) High ($)
Maintenance (Annual-Fixed Bridge) 0.01 0.03
Maintenance (Annual-Movable Bridge) 2.48 2.97
Widening (Construction Only) 50.00 80.00
Notes: Figures are for 2002 construction costs per square foot of deck area, including allowance for handrails; they may not be comparable toprior year figures in all cases.
Costs of preliminary engineering, right-of-way, bridge approaches, mobilization, and construction engineering inspection are not included.
These cost-per-square foot figures are based on general, statewide averages. They are not to be used for Work Program estimating becausethey are not job specific.
Source: Florida Department of Transportation, Office of Policy Planning, Policy Analysis, and Program Evaluation, 2002Transportation Costs (March 2003).

Florida Transportation Almanac
268
Table 6-19AIRPORT COSTS (2002)
Construction Type Cost
3,700 Foot Main Runway
New Construction $880/lin. ft.(75' width)
Resurfacing $252/lin. ft. (75' width)
Terminal Structure $116.50/sq. ft.
Ramps/Taxiways $11.30/sq. ft.
100/200/500,000 Gallon Fuel Facility $(58,240)/(118,880)/(232,960)
5,000 Foot Main Runway
New Construction $1,887/lin. ft. (100' width)
Resurfacing $373/lin. ft. (100' width)
Terminal Structure $151/sq. ft.
Ramps/Taxiways $15.68/sq. ft.
100/200/500,000 Gallon Fuel Facility $(58,240)/(118,880)/(232,960)
13,000 Foot Main Runway
New Construction $2,516/lin. ft. (150' width)
Resurfacing $629/lin. ft. (150' width)
Terminal Structure $186/sq. ft.
Ramps/Taxiways $24.64/sq. ft.
100/200/500,000 Gallon Fuel Facility $(58,240)/(118,880)/(232,960)
Source: Florida Department of Transportation, Office of Policy Planning,Policy Analysis, and Program Evaluation, 2002 TransportationCost (March 2003).
Table 6-20AIRPORT INVENTORY (2002)
Service Level Current Number
Primary Commercial 19
Reliever 24
General Aviation (Publicly owned) 78
General Aviation (Privately owned) 24
Source: Florida Department of Transportation, Office of Policy Planning, PolicyAnalysis, and Program Evaluation 2002 Transportation Costs (March 2003).

Florida Transportation Almanac
269
Table 6-21FINANCIAL CHARACTERISTICS OF MASS TRANSIT GUIDEWAY IN
URBANIZED AREAS (2002)
Mode Attribute Florida ($) United States ($)
Commuter Rail Cost per Car Vehicle Hour 368.3 416.7
Cost per Car Vehicle Mile 10.6 13.3
Heavy Rail Cost per Car Vehicle Hour 171.7 181.9
Cost per Car Vehicle Mile 8.1 8.7
Automated Guideway Cost per Car Vehicle Hour 168.8 185.5
Cost per Car Vehicle Mile 14.6 16.3
Light Rail Cost per Car Vehicle Hour n/a 175.8
Cost per Car Vehicle Mile n/a 15.2
Urban Motor Bus Cost per Car Vehicle Hour 43.9 to 66.64 71.7 to 84.5
Cost per Car Vehicle Mile 2.8 to 5.0 5.6 to 6.5
Note: Price indices should be used to update these numbers to 2003 dollars or other base years. See Table 6-25 for priceindices that may be used to update the transit cost figures.
Source: Florida Department of Transportation, Office of Policy Planning, Policy Analysis, and Program Evaluation,2002 Transportation Costs (March 2003).

Florida Transportation Almanac
270
Table 6-22MASS TRANSIT CAPITAL COSTS ROLLING
STOCK (2002)
Vehicle Type SeatedPassengers Unit Cost ($)
Van, vanpooling 9-15 26,600
Modified Van 7 34,400
22-Foot Cutaway Bus 14 49,200
25-Foot Cutaway Bus 18 51,700
30-Foot Transit Bus w/Lift 30-32 233,000
35-Foot Transit Bus w/Lift 42-45 274,000
40-Foot Transit Bus w/Lift 45-50 289,000
60-Foot Articulated Bus 65-70 438,000
Light Rail Articulated Cab 110 2,515,000
Heavy Rail Car 110 1,217,000
Commuter Rail Locomotive n/a 1,900,000
Commuter Rail Coach 110 2,057,000
Source: Florida Department of Transportation, Office of Policy Planning PolicyAnalysis and Program Evaluation, 2002 Transportation Costs (March 2003).

Florida Transportation Almanac
271
Table 6-23MASS TRANSIT OPERATING COSTS (2001)
Object Class Florida (%) United States (%)
Wages and Salaries 49 46
Fringes 24 24
Purchased Transportation 1 10
Materials and Supplies 14 12
Utilities 1 1
Services 6 6
Casualty and Liability 2 2
Other 2 1
Note: Percentages may not equal 100 due to rounding.
Source: Florida Department of Transportation, Office of Policy Planning, Policy Analysis, and ProgramEvaluation, 2002 Transportation Costs (March 2003).

Florida Transportation Almanac
272
Table 6-24UNIT COSTS FOR BICYCLE AND PEDESTRIAN FACILITIES (2003)
Facilities Unit Cost ($)
Bicycle Facilities
Bike Path Per Mile (12 ft. Width) R & R Conversion 467,000
Bike Lane Per Mile (5 ft. Width-2 Sides) Pavement Extension 622,000
Bike Lockers (For 2 Bicycles) 3,200
Pedestrian Facilities
Sidewalks Per Mile (4 Inch Depth)5 ft. Width-1 Side6 ft. Width-1 Side
157,000189,000
Pedestrian Overpass with Enclosure (Per Square Foot) 220
Brickpavers (Per Square Yard) Roadway Sidewalk 90
40
"Walk/Don't Walk" Signal SystemSignalhead (Each)Activator (Each)Two Corners (Four of Each Unit Above)Four Corners (Eight of Each Unit Above)
350105
1,9003,900
Raised Island/Refuge Island (Porkchop)Type "D" Curb (Per Linear Foot)4-inch Sidewalk fill (Per Square Yard)
1819
Handicap Curb Ramp (Concurrent with Construction) 0
Source: Florida Department of Transportation, Office of Policy Planning, Policy Analysis, and ProgramEvaluation, 2002 Transportation Costs (March 2003).

Florida Transportation Almanac
273
Table 6-25FLORIDA DEPARTMENT OF TRANSPORTATION
LONG-TERM CONSTRUCTION COST INFLATION FORECAST (2003)
FiscalYear Price Trends Index Annual Inflation
Rate (%)
IPD for State & Local GovernmentStructures
(% Growth)
1991 101.4 2.7 2.6
1992 97.4 -3.9 0.6
1993 94.0 -3.5 1.7
1994 95.7 1.8 2.6
1995 94.4 -1.4 4.3
1996 96.3 1.9 3.6
1997 94.5 -1.8 3.2
1998 96.7 2.3 3.1
1999 100.3 3.7 3.1
2000 103.9 3.6 4.1
2001 107.5 3.5 4.6
2002 111.3 3.5 2.5
2003 115.3 3.6 1.4
2004 119.3 3.5 2.1
2005 123.2 3.3 2.4
2006 127.3 3.3 2.8
2007 131.5 3.3 2.9
2008 135.8 3.3 2.9
2009 140.3 3.3 2.9
2010 145.0 3.3 2.9
2011 149.7 3.3 2.9
2012 154.7 3.3 2.9
Source: Florida Department of Transportation, Office of Policy Planning, Policy Analysis, and Program Evaluation, 2002 Transportation Costs(March 2003).

Florida Transportation Almanac
274
Table 6-26SOURCES OF FUNDING FOR STATE WORK PROGRAM COMPONENTS (MILLIONS of $)
(budgeted only)
Program Areas Actual01/02
Plan02/03
First Five Years03/04 04/05 05/06 06/07 07/08 Total
Construction Fund 2,671.4 1,937.1 3,840.6 2,661.8 1,666.1 1,856.8 1,896.0 11,921.2
I, IM 146.5 24.6 215.5 79.2 108.0 81.8 91.7 576.3
NHS 620.5 471.3 840.8 506.7 172.5 135.6 7.8 1,663.3
O.F.A. 636.2 461.0 775.2 616.6 245.5 388.8 450.6 2,476.7
100% Federal 2.3 7.2 9.7 0.0 0.0 0.0 0.0 9.7
100% State 960.8 745.0 1,240.3 940.8 984.2 838.2 1,134.2 5,137.6
Turnpike 85.8 125.8 354.1 405.5 71.2 294.4 132.2 1,257.4
Toll, Local, Other 167.4 97.0 383.5 111.7 78.0 55.1 42.5 670.7
R/W & BDG. Bonds 51.9 4.4 21.6 1.4 6.7 62.8 37.1 129.6
Right-of-Way Land 419.5 393.3 1,504.8 355.3 272.7 333.1 304.3 2,770.3
I, IM 4.1 2.5 3.9 0.0 0.0 0.0 8.3 12.2
NHS 81.6 104.5 126.2 0.0 0.0 0.0 2.0 128.2
O.F.A. 45.8 35.8 230.6 61.8 23.7 62.9 35.6 414.6
100% Federal 7.0 0.0 12.5 0.0 0.0 0.0 0.0 12.5
100% State 110.0 110.9 451.3 119.3 145.7 129.5 238.7 1,084.5
Turnpike 25.5 31.7 71.0 16.0 2.2 13.0 0.7 102.9
Toll, Local, Other 7.5 6.0 100.7 73.6 1.0 1.3 1.0 177.6
R/W & BDG. Bonds 138.0 101.9 508.7 84.7 100.1 126.3 18.0 837.8
PTO Funding 457.4 531.2 1,131.9 477.3 465.0 451.6 460.1 2,986.2
I, IM 4.0 4.0 6.1 4.0 4.0 4.0 4.0 22.1
NHS 0.0 0.0 0.0 0.0 0.0 0.0 0.0 0.0
O.F.A. 18.4 13.1 47.6 41.3 26.1 20.0 15.3 150.3
100% Federal 48.7 87.0 308.2 17.6 18.5 19.4 20.4 384.1
100% State 312.8 375.0 615.5 374.2 377.3 371.2 383.9 2,122.1
Turnpike 0.0 0.0 0.0 0.0 0.0 0.0 0.0 0.0
Toll, Local, Other 70.5 51.8 149.8 40.1 39.1 37.0 36.9 303.0
R/W & BDG. Bonds 3.0 0.2 4.6 0.0 0.0 0.0 0.0 4.6
* O.F.A. = Other Federal Aid; I,IM = Interstate, Interstate Maintenance; NHS=National Highway Systems
Source: Florida Department of Transportation, Florida’s Adopted Work Program (July 2002).

Florida Transportation Almanac
275
Table 6-26 (Continued)SOURCES OF FUNDING FOR STATE WORK PROGRAM COMPONENTS (MILLIONS of $)
(budgeted only)
Program Areas Actual 01/02
Plan02/03
First Five Years03/04 04/05 05/06 06/07 07/08 Total
In-House Funding 614.7 630.5 615.9 617.5 624.3 647.6 671.0 3,177.3
I, IM 3.1 2.0 19.7 1.2 1.2 0.2 0.6 22.9
NHS 12.8 31.8 111.8 83.0 74.3 63.4 40.4 373.0
O.F.A. 64.8 61.1 172.9 158.9 121.3 131.7 126.3 711.1
100% Federal 1.4 1.0 3.1 1.1 1.2 1.2 1.1 7.7
100% State 443.9 445.5 220.1 293.2 344.0 367.1 416.5 1,641.0
Turnpike 83.9 80.5 72.1 70.2 72.1 74.9 77.8 367.0
Toll, Local, Other 4.8 8.6 16.2 9.9 10.2 9.1 9.1 54.6
Total Program 5,593.0 4,843.0 9,244.4 5,544.6 4,263.8 4,618.2 4,702.8 28,373.8
I, IM 170.2 41.6 290.4 104.3 126.5 91.5 126.0 738.7
NHS 841.0 785.4 1,349.0 682.9 283.8 253.8 54.1 2,623.6
O.F.A. 916.0 682.2 1,462.8 1,000.4 491.1 708.6 711.9 4,374.8
100% FED 109.4 141.4 426.0 58.4 58.8 60.8 63.8 667.8
100% State 2,664.1 2,387.7 3,437.2 2,494.4 2,666.8 2,517.5 3,122.0 14,238.0
Turnpike 338.0 419.8 808.7 751.1 279.2 561.6 363.8 2,764.6
Toll, Local, Other 339.2 263.6 861.8 355.9 241.9 215.9 199.7 1,875.1
R/W & BDG. Bonds 215.1 121.4 608.4 97.3 115.7 208.4 61.4 1,091.3
* O.F.A. = Other Federal Aid; I,IM = Interstate, Interstate Maintenance; NHS=National Highway Systems
Source: Florida Department of Transportation, Florida’s Adopted Work Program (July 2002).

Florida Transportation Almanac
276
Table 6-26 (Continued)SOURCES OF FUNDING FOR STATE WORK PROGRAM COMPONENTS (MILLIONS of $)
(budgeted only)
Program AreasNext Four Years
08/09 09/10 10/11 11/12 Total
Construction Fund 2,006.1 1,887.7 1,782.6 1,776.8 7,453.3
I, IM 73.5 117.6 116.0 121.5 428.7
NHS 65.0 206.6 282.1 353.0 906.7
O.F.A. 527.1 490.9 510.3 507.7 2,036.0
100% Federal 0.0 0.0 0.0 0.0 0.2
100% State 1,140.1 1,031.4 831.6 751.9 3,755.0
Turnpike 200.3 41.0 42.7 42.7 326.7
Toll, Local, Other 0.0 0.0 0.0 0.0 0.0
R/W & BDG. Bonds 0.0 0.0 0.0 0.0 0.0
Right-of-Way Land 330.2 516.2 598.0 476.7 1,921.1
I, IM 0.0 0.0 0.0 0.0 0.0
NHS 11.0 184.0 148.8 138.0 481.8
O.F.A. 17.6 18.0 18.7 18.7 73.0
100% Federal 0.0 0.0 0.0 0.0 0.0
100% State 301.0 313.7 430.0 319.5 1,364.3
Turnpike 0.6 0.5 0.5 0.5 2.1
Toll, Local, Other 0.0 0.0 0.0 0.0 0.0
R/W & BDG. Bonds 0.0 0.0 0.0 0.0 0.0
PTO Funding 482.1 497.5 512.4 509.9 2,002.0
I, IM 4.0 4.0 0.0 0.0 8.0
NHS 0.0 0.0 0.0 0.0 0.0
O.F.A. 40.5 41.3 42.9 42.9 167.6
100% Federal 14.8 15.1 15.7 15.7 61.3
100% State 386.7 399.8 415.0 412.5 1,614.0
Turnpike 0.0 0.0 0.0 0.0 0.0
Toll, Local, Other 36.1 37.4 38.9 38.9 151.2
R/W & BDG. Bonds 0.0 0.0 0.0 0.0 0.0
* O.F.A. = Other Federal Aid; I,IM = Interstate, Interstate Maintenance; NHS=National Highway Systems
Source: Florida Department of Transportation, Florida’s Adopted Work Program (July 2002).
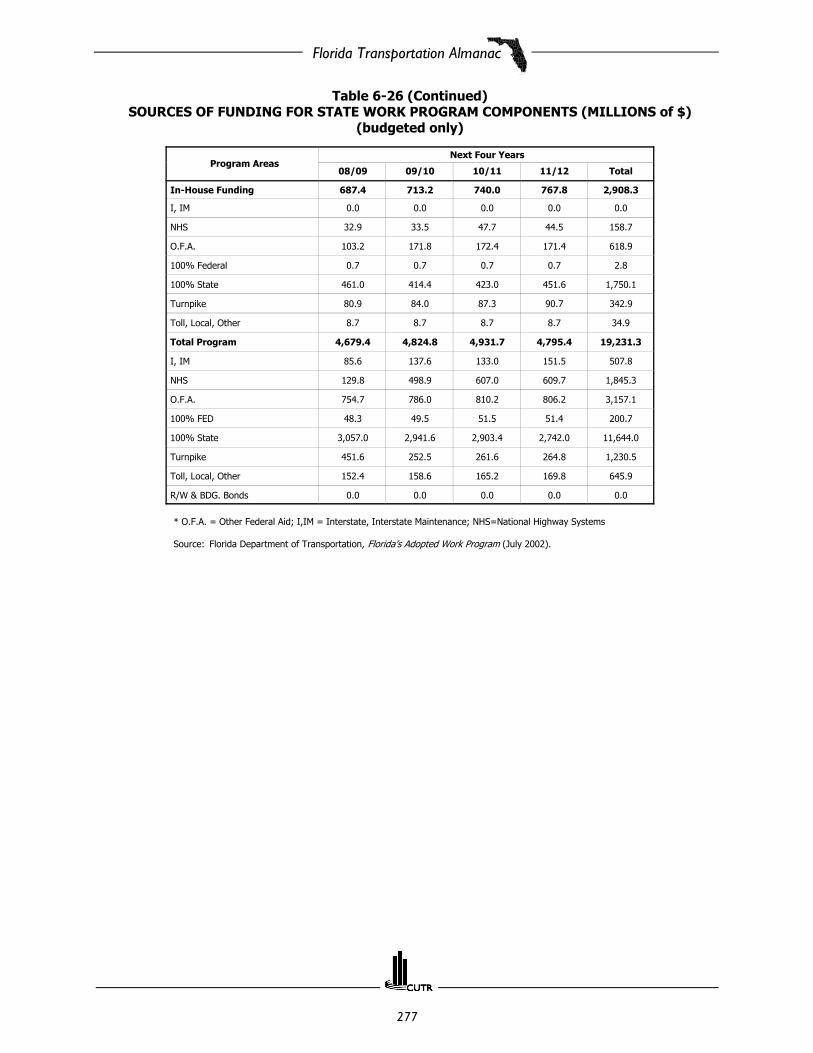
Florida Transportation Almanac
277
Table 6-26 (Continued)SOURCES OF FUNDING FOR STATE WORK PROGRAM COMPONENTS (MILLIONS of $)
(budgeted only)
Program AreasNext Four Years
08/09 09/10 10/11 11/12 Total
In-House Funding 687.4 713.2 740.0 767.8 2,908.3
I, IM 0.0 0.0 0.0 0.0 0.0
NHS 32.9 33.5 47.7 44.5 158.7
O.F.A. 103.2 171.8 172.4 171.4 618.9
100% Federal 0.7 0.7 0.7 0.7 2.8
100% State 461.0 414.4 423.0 451.6 1,750.1
Turnpike 80.9 84.0 87.3 90.7 342.9
Toll, Local, Other 8.7 8.7 8.7 8.7 34.9
Total Program 4,679.4 4,824.8 4,931.7 4,795.4 19,231.3
I, IM 85.6 137.6 133.0 151.5 507.8
NHS 129.8 498.9 607.0 609.7 1,845.3
O.F.A. 754.7 786.0 810.2 806.2 3,157.1
100% FED 48.3 49.5 51.5 51.4 200.7
100% State 3,057.0 2,941.6 2,903.4 2,742.0 11,644.0
Turnpike 451.6 252.5 261.6 264.8 1,230.5
Toll, Local, Other 152.4 158.6 165.2 169.8 645.9
R/W & BDG. Bonds 0.0 0.0 0.0 0.0 0.0
* O.F.A. = Other Federal Aid; I,IM = Interstate, Interstate Maintenance; NHS=National Highway Systems
Source: Florida Department of Transportation, Florida’s Adopted Work Program (July 2002).

Florida Transportation Almanac
278
Florida Transportation Almanac
279
Chapter 7:TRANSPORTATIONEDUCATION ANDRESEARCH

Florida Transportation Almanac
280

Florida Transportation Almanac
281
SECTION HIGHLIGHTS
# Eleven universities and colleges in Florida have transportation and related degree programs.
# Bachelor’s degrees in these programs are offered at 8 universities and colleges.
# Master’s degrees in these programs are offered at 7 of the universities and colleges.
# A Ph.D. program is offered at 5 of the universities and colleges.
Florida Transportation Almanac
282
Transportation Education in Florida
Embry-Riddle Aeronautical University600 S. Clyde Morris Blvd., Daytona Beach, FL 32114-3900(386) 226-6494, FAX (386) 226-6158Irwin Price, Chancellor
Embry-Riddle Aeronautical University has developed a faculty and research staff combining the best of industry, agency, andacademic experience. Research for projects at the University have achieved worldwide recognition for its collective expertisein air traffic management, aviation human factors, and aviation safety and security. Grants and contracts to research theseareas have been received from diverse organizations, including the FAA, Lockheed Martin, McDonnell Douglas, and NASA.The University provides a genuinely unique research platform. Many of its researchers are experienced pilots, maintenancetechnicians, and air traffic controllers. Both undergraduate and graduate programs have a recognized commitment toaviation. Moreover, the University owns, maintains, and operates a fleet of more than 100 aircraft. In addition, there isa variety of simulators and PC-based trainers which can be used to analyze many different research questions. Additionalresearch areas of interest at Embry-Riddle include decision-support tasks, aviation software development, meteorology, andair traffic control. The University is also widely recognized for its activities in aviation training, aerospace engineering, aircraftdesign, noise-reduction research, ozone-related research, software engineering, and related fields. Embry-RiddleAeronautical University offers more than two dozen AS, BS, and MS degree programs, all with an aviation emphasis. Thoseprograms include such areas as Aerospace Engineering, Aviation Maintenance, Engineering Physics, Aviation BusinessAdministration, Computer science, software engineering, and engineering physics.
Florida A & M University (FAMU)Department of Civil and Environmental EngineeringFAMU-FSU College of Engineering, 2525 Potsdamer Street Tallahassee, Florida 32310-6046 (850) 410-6140, FAX (850) 410-6142Dr. Jerry Wekezer, P.E. (Chairperson)
The FAMU-FSU College of Engineering is a joint program of the Florida Agricultural and Mechanical University (FAMU) andthe Florida State University (FSU). The Department offers a Bachelor of Science, Master of Science Degree, and Ph.D.degrees in Civil Engineering with an emphasis in Transportation Engineering. The Ph.D. program in Civil Engineering wasimplemented in Fall 1998. Graduate courses offered include Theory of Traffic Flow, Transportation Systems Analysis,Environmental Analysis of Transportation Systems, and Airport Planning and Design. Undergraduate courses offered includeTransportation Engineering, Traffic Engineering, and Traffic Operations. The Department conducts research projects inseveral transportation areas and expands over $2 million per year. Research assistantships in transportation are availableto qualified graduate students.
Florida Institute of Technology (FIT)School of Aeronautics150 W. University Blvd., Melbourne, FL 32901(321) 674-8120, FAX (321) 674-8059Michael K. Karim, Ph.D., Dean; Dr. Ballard M. Barker, Associate Dean
Florida Institute of Technology’s School of Aeronautics offers five BS degree programs in Aeronautical Science and AviationManagement (each with or without FAA Commercial Pilot flight options), and in Aviation Computer Science. Each requiresbetween 126 and 129 semester credits in an appropriate suite of courses. Some transportation courses include aeronautics,meteorology, aerodynamics, commercial pilot, aviation fiscal management, aviation law, airport design, aviation planning,advanced computer planning techniques, multi-modal transportation, airline operations, air transportation management, andairport management. Florida Tech also offers two unique Masters degree programs: Airport Management and Development,Aviation Science and Cognitive Human Factors. Each graduate degree requires 33-38 semester credit hours. Examplecourses in the graduate include advanced aviation planning, airport development, airport operations, aviation economics andfiscal management, accident investigation, aviation meteorology theory and practice, and impact of aviation on humanphysiology. The school also hosts two specialized centers dealing in transportation related activities. The Center for AirportManagement and Development focuses on research, studies, consultation, and technology transfer on airport and airspaceplanning, design, development, and operation in the US and abroad. The Space Coast Center for Cognitive Human Factorsemphasizes research and development in aircraft cockpit design and instrumentation, advanced cockpit displays, simulationssoftware, and computer-based instruction for advanced general aviation aircraft.

Florida Transportation Almanac
283
Florida International University (FIU)Department of Civil and Environmental Engineering10555 W. Flagler Street, EAS 3685Miami, FL 33174(305) 348-2824, FAX (305) 348-2802David Shen, Ph.D. P.E. Director, Lehman Center for Transportation Research
Florida International University, located in Miami, offers course work leading to a Master of Science degree and a Ph.D. inCivil Engineering with a specialization in transportation. In order to obtain the degree, students must complete 36 credithours. Some courses offered for transportation specialization are Applied Statistics in Traffic and Transportation, HighwaySafety Analysis, Advanced Highway Capacity Analysis, Urban Traffic Characteristics, Urban Mass Transit and TransportationPlanning, Planning and Design of Intermodal Facilities, Port Planning and Development, Airport Terminal Design andOperations, Airport Planning and Design, Transportation Systems Modeling and Analysis, Advanced Geometric Design ofHighways, Pavement Design, Pavement Management System, Urban Traffic Workshop, Traffic Control Systems Design,Transportation Demand Analysis, and transportation Systems in Developing Nations.
Jacksonville University (JU)Aeronautics Program2800 University Blvd. North, Jacksonville, FL 32211(800) 225-2027, (904) 256-7000 ext. 7434, FAX (904) 256-7012 Capt. Matthew Tuohy, Director of Aviation(800) U-CAN-FLY, Jo Stone, Aviation Admissions Coordinator
Jacksonville University offers a Bachelor’s degree with two major concentrations in Aeronautics. The Aviation Management& Flight Operations major prepares candidates for careers as professional pilots for the airlines or corporate flightdepartments. The Aviation Management major prepares students for a career as managers for an airport, airline, aviationgovernment agency, or aviation-related business. Jacksonville University has joined forces with COMAIR Aviation Academy,owned and operated by COMAIR Airlines (a DELTA Connection commuter airline). JU’s Aeronautics Program combines, forthe first time, the academic excellence of a private university with an airline designed and operated flight training program.Flight training includes FAA Private Pilot through Flight Instructor certificates. An advanced Turbine Transition course canbe taken as an elective. Qualified candidates have the opportunity to log up to 1,000 hours as paid flight instructors. Aftercompleting the phase as instructors, Jacksonville University graduates are guaranteed a job interview with COMAIR Airlines.JU students also enjoy opportunities to get a head start in their careers and develop leadership, communications, and teamwork skills through specialized programs that emphasize hands-on learning. Students can participate in aviation internships,airline familiarization programs, aviation career workshops, and aviation student organizations.
University of Central Florida (UCF)Department of Civil and Environmental EngineeringPO Box 162450, Orlando, FL 32816-2450(407) 823-2841, FAX (407) 823-3315Dr. Essam Radwan, P.E., Chairperson
The University of Central Florida, located in Orlando, offers a Master of Science in Civil Engineering degree with a sub-discipline in Transportation. In order to acquire the degree, students must complete 36 semester hours or 30 semesterhours including a Thesis (6 hours). Courses included in Transportation include Highway Capacity, Traffic Operations,Highway Safety, Traffic Engineering, Pavement Design, Intelligent Transportation Systems, Mass Transportation Systems,Plan/Design or Airports, Highway Geometric Design, Regional Planning Design and Systems. The UCF also offers a Ph.D.in Civil Engineering with a major in Transportation.
University of Florida (UF)Civil and Coastal Engineering Department 365 Wein Hall, Box 116580Gainesville, FL 32611-6580(352) 392-9537 X 1400 FAX (352) 392-3394Dr. Joseph W. Tedesco, Chairperson
The University of Florida, located in Gainesville, offers Masters and Ph.D. level degrees with specialization in TransportationEngineering through its Department of Civil and Coastal Engineering. Transportation Engineering program focuses on
Florida Transportation Almanac
284
systems planning, facilities design, and traffic operations. Course offerings include traffic engineering, transportation corridoroperations, traffic management and control, geometric design, traffic safety analysis, systems planning and urbantransportation models, as well as a number of elective courses. Furthermore, with the wide diversity of programs availablewithin the Civil and Coastal Engineering department, opportunities exist to pursue other areas of minor emphasis in additionto the major transportation emphasis. The Civil and Coastal Engineering department also offers a Bachelor's degree thatallows students to focus in one of several specific discipline areas, including transportation engineering. Core courses in thetransportation area include route geometrics, traffic engineering, introduction to traffic control, and transportation facilitydesign.
Research within the transportation program emphasizes the development and integration of advanced electronic andcomputational technologies to traffic operations, detection, control, safety, and simulation. An additional research emphasisarea is the development and application of operational and planning level traffic analysis methodologies. The University ofFlorida Transportation Engineering program is part of the Southeast Transportation Center (STC) consortium. The STCrepresents the member institutions of Region IV of the USDOT's University Transportation Centers (UTC) program. For moreinformation, please visit the website for the transportation program: http://www.ce.ufl.edu/~trans/.
University of North Florida (UNF)Department of Management Marketing and Logestics4567 St. John’s Bluff Rd, S. Jacksonville, FL 32216(904) 620-2780C. Bruce Kaven, Chairholder and Director
The University of North Florida in Jacksonville currently offers a Bachelor’s degree in Transportation and Logistics. To obtainthe degree, students must complete 84 semester hours of course work. Courses offered include Transportation Economics,Logistics System Analysis, Applied Carrier Management, Introduction to Management Science, Introduction to ManagementInformation Systems, Purchasing Management, Labor Relations, and Seminar in Purchasing and Materials Management.University of North Florida also offers a Civil Engineering degree with classes in Transportation Engineering.
University of Miami (UM)Department of Civil, Architectural & Environmental Engineering1251 Memorial Drive, McArthur Engineering Building, Coral Gables, FL 33124-0630(305) 284-3391David A. Chin, Chairperson
The University of Miami, located in Coral Gables, offers an undergraduate degree in Civil Engineering with concentration inTransportation Engineering. To obtain the degree, students must complete 129 semester units where electives are chosenin the area of Transportation Engineering. Courses offered include Transportation Engineering I and II, which covers thePlanning, Design, and Operations of highway facilities, Airports, Mass Transit Systems, Railroads; Advanced Highway Design;Urban Traffic Control; and Transportation Systems Planning and Demand Modeling. The Departments of ManagementScience and Industrial Engineering offers undergraduate degrees with specialization in Logistics. The Law School offerselectives in Aviation Law, which concentrate on the legal aspects of domestic and international aviation.
University of South Florida (USF)Civil Engineering ProgramGraduate Interdisciplinary Transportation Program4202 E. Fowler Ave., CUT100, Tampa, FL 33620-5375Dr. Beverly Ward, Program Coordinator (813) 974-9773
At USF, located in Tampa, the Civil and Environmental Engineering Department offers graduate programs at both theMaster’s and Ph.D. levels. Areas of study include Engineering Mechanics, Environmental Engineering, GeotechnicalEngineering, Materials Engineering and Science, Structural Engineering, Transportation Engineering and Planning, and WaterResources Engineering, with an extensive undergraduate program in Civil Engineering. The University also offers a GraduateInterdisciplinary Transportation Program for graduate students in Civil Engineering, Economics, and Public Administration,which is designed to provide a better understanding of urban transportation issues as they relate to each discipline to helpsolve transportation problems. The Program is now being offered as a six-course certificate program. To acquire a Master’sdegree in any of the three disciplines, students must complete 30 (Civil); 39 (Public Administration) semester credits, ofwhich 17 credits of interdisciplinary core courses including Transportation Engineering, Transportation Planning, Urban

Florida Transportation Almanac
285
Economics, Microeconomics, Policy Analysis, and Public Planning; and 33 (Economics) semester credits, of which 15 creditsare interdisciplinary core courses.
Florida Atlantic University (FAU)Civil Engineering DepartmentP.O. Box 3091, ENG 213, Boca Raton, FL 33431Dr. Stephen Nix, Chairman (561)297-0466
The Department of Civil Engineering offers a program of study leading to the degree of Master of Science (M.S.) with Majorin Civil Engineering. The mission of the program is to meet the advanced civil engineering educational needs of recentgraduates of undergraduate engineering programs, practicing engineers, and those non-engineering professionals wishingto redirect their career paths. The program is designed to enable graduates to identify, formulate, and solve complex civilengineering analysis and design problems independently. Program areas include: Structural Engineering, Water ResourceEngineering, Geotechnical Engineering, and Enviromental Engineering and a minor in business. A Masters Degree requiresthe completion of 30 (no thesis, business minor) to 39 (No thesis, business minor) based on what type of degree the studentis seeking. In addition, a Bachelor of Science in Civil Engineering is also available. The program of study leading to a Bachelorof Science in Civil Engineering reflects the breadth of the profession. Students complete coursework in basic science andmathematics, engineering sciences, civil engineering systems and materials, and the major disciplines in civil engineering.Because of the tremendous impact civil engineers have on society our curriculum also requires students to pursue studiesin the social sciences and the humanities.

Florida Transportation Almanac
286
Transportation Research Centers in Florida
Office of Sponsored Programs (OSP)/Center for Aviation/Aerospace Research (CAAR)Embry-Riddle Aeronautical University600 South Clyde Morris Boulevard, Daytona Beach, FL 32114-3900(904) 226-6380 or 226-6190 FAX (904) 226-7050Vice-President of Special ProjectsDr. L. William Motzel
The Center for Aviation/Aerospace Research (CAAR) is the research operating aim of the University with the Office ofSponsored Programs (OSP) providing research oversight and administration. To accomplish its research goals CAAR utilizesa team approach, involving full-time researchers, faculty, and students. The Center is the home of interdisciplinary researchactivities involving aviation and aerospace fields. The primary thrust of CAAR’s work is to enhance aviation/aerospace safetyand to improve the effectiveness and efficiency of the National Airspace System through the development of airway systemsafety technology, improvements to air traffic control, innovative flight technology, cockpit resource management, andrelated human factors gains. Embry-Riddle faculty and staff researchers performs interdisciplinary research in humanfactors, advanced technology, and systems management for aviation/aerospace applications. The University supports theseresearch efforts with a variety of laboratories, specialized equipment, and simulation and modeling capabilities.
Center for Urban Transportation Research (CUTR)University of South Florida (USF)College of Engineering, 4202 E. Fowler, CUT100, Tampa, Fl 33620-5375(813) 974-3120, FAX (813) 974-5168, SunCom 574-3120Dr. Edward Mierzejewski, Director
CUTR was established in 1988 by the Florida Legislature and the Florida Board of Regents to provide high quality, objective,and implementable solutions to Florida’s transportation problems. Located at the Tampa campus of the University of SouthFlorida, CUTR employs a staff of more than 90 , including 45 full-time researchers. CUTR’s experts in the fields ofengineering, economics, planning, public policy, and the environment apply their ”real world” skills to a variety oftransportation areas including public transportation, bus rapid transit, intelligent highway systems, transit planning andoperations, transportation demand management, corridor planning, transportation economics, safety, public policy analysisand evaluation, alternative fuels, and traffic operations. The Center was designated by the US Congress as the NationalUrban Transit Institute in 1991, which was reaffirmed in 1998. Since its inception, CUTR has conducted >$75 million insponsored research projects for a variety of sponsors throughout the state and nation.
Center for Advanced Transportation Systems Simulation (CATSS)University of Central Florida (UCF)4000 Central Florida Boulevard, PO Box 162450Orlando, FL 32816-2450(407) 823-4552, FAX (407) 823-3315Dr. Essam Radwan, Director
The theme of the Center for Advanced Transportation Systems Simulation (CATSS) is to apply computer simulation, drivingsimulators, virtual reality, wireless communication, and other advanced technologies to enhance the planning, design,operation, management, and safety of transportation systems. The focus and expertise of CATSS complements and supportstwo key national transportation issues namely Intelligent Transportation Systems and Human-Centered Systems. UCF waslisted in TEA-21 as one of the new transportation centers under the University Transportation Centers program of the federalResearch and Special Program Administration.
Florida Transportation Almanac
287
Lehman Center for Transportation Research (LCTR)Florida International UniversityCivil and Engineering Dept., University Park Campus 10555 W. Flagler Street, EAS 3785 Miami, FL 33199 (305) 348-3055, FAX (305) 348-2802Dr. David Shen, P.E., Ph.D., Director
LCTR was established in 1993 and named in honor of Florida Congressman Bill Lehman. Located at Florida InternationalUniversity in Miami, LCTR has 15 full-time researchers and over twenty graduate and undergraduate students conductingits research. LCTR’s staff of experts in the fields of engineering, planning, transportation, and the environment apply theirskills in research programs focusing on a variety of transportation issues including transportation planing and modeling,traffic operations, GIS applications, highway planning and design, airport planning and design, and intermodal station design,among others.
Transportation Research Center (TRC)University of FloridaDepartment of Civil Engineering512 Weil Hall, PO Box 116588 Gainesville, FL 32611-6585(352) 392-7575, FAX (352) 846-1699Kenneth G. Courage, Director
The Transportation Research Center (TRC), in the Department of Civil & Coastal Engineering, has been central to researchand development in transportation engineering and planning in the state and nation since 1972. The TRC's mission is toconduct research relevant to our society's transportation needs, to translate the results of that research so that it may beapplied in a realistic and workable fashion, to provide the tools to apply the knowledge and processes, and to educatequalified engineers and transportation professionals at all relevant stations to meet today's demands and tomorrow'schallenges. The TRC is a member of the Southeast Transportation Center, a regional consortium of universities that all havestrong programs in highway safety. Examples of TRC research related to highway safety include the development andapplication of technology for conducting studies of red light running, and various projects involving field data collection andanalysis at highway-railroad grade crossings. The TRC is also a leader in advanced technology applications in the field ofintelligent transportation systems (ITS). Some current projects include a feasibility study for a statewide central datawarehouse to provide a comprehensive source for a variety of real time and archived data, a proof of concept study for thedeployment of an unmanned aerial vehicle (UAV) for traffic surveillance and an investigation of hardware in the loopsimulation, a new technology with the potential to improve both the safety and operational aspects of traffic control systems.A third research focus involves advancements in the methodology of highway system performance analysis. The TRCactivities in this area range from the conduct of empirical field studies of quality and level of service on various types offacilities to the development of widely distributed state-of-the-art software for modeling traffic system performance. Manyof these efforts have contributed to the highway capacity and quality of service research agenda of the TransportationResearch Board. As an extension of its transportation research activities, the Department of Civil and Coastal Engineeringalso operates the Florida Transportation Technology Transfer (T2) Center, the Center for Microcomputers in Transportation(McTrans) and the Construction Training Qualification Program (CTQP).

Florida Transportation Almanac
288

Florida Transportation Almanac
289
Chapter 8:DIRECTORY

Florida Transportation Almanac
290

Florida Transportation Almanac
291
State of Florida DepartmentsGovernor John Ellis “Jeb” Bush
Lt. Governor Toni JenningsExecutive Office of the Governor
The Capitol, Tallahassee, FL 32399(850) 488-4441 (Governor), (850) 488-4711 (Lt. Governor)
Agriculture and Consumer ServicesCommissioner Charles H. BronsonPL-10 The CapitolTallahassee, FL 32399-0800(850) 488-3022
CorrectionsSecretary James V. Crosby, Jr.2601 Blair Stone Road Tallahassee, FL 32399(850) 488-7480
Banking and FinanceChief Financial Officer Thomas Gallagher200 E Gaines StreetTallahassee, FL 32399-0350(850) 410-9286
EducationCommissioner Jim HorneTurlington Building325 West Gaines StreetTallahassee, FL 32399-0400(850) 245-0505
Business and Professional RegulationsSecretary Diane Carr 1940 N Monroe StreetTallahassee, FL 32399-0750(850) 413-0755 SunCom 293-0755
Elder AffairsSecretary Terry F. White4040 Esplanade Way, Building B, Suite 325Tallahassee, FL 32399-7000(850) 414-2000
Children and Family Executive Director Jerry Regier1317 Winewood Boulevard Building 1, Room 202 Tallahassee, FL 32399-0700(850) 487-1111
Environmental ProtectionSecretary David B. Struhs3900 Commonwealth Boulevard M.S. 10Tallahassee, FL 32399-3000(850) 245-8011
CitrusExecutive Director Bob Crawford 1115 East Memorial BoulevardLakeland, FL 33802-0148(863) 499-2500
Fish and Wildlife Conservation CommissionExecutive Director Ken HaddadFarris Bryant Building620 S Meridian StreetTallahassee, FL 32399-1600(850) 487-3796
HealthSecretary John O. Agwunobi, M.D. , M.BA.4052 Bald Cypress Way, Bin# A00Tallahassee, FL 32399-1701(850) 245-4321
LotterySecretary Rebecca Mattingly250 Marriot DriveTallahassee, FL 32301(850) 487-7777
Highway Safety and Motor VehiclesExecutive Director Fred O. Dickinson, IIINeil Kirkman Building, 2900 Apalachee ParkwayTallahassee, FL 32399-0500(850) 922-9000
Management ServicesSecretary Simone Marstiller4050 Esplanade Way, Suite 250Tallahassee, FL 32399-0950(850) 488-2786
Community AffairsSecretary Colleen Castille2555 Shumard Oak BoulevardTallahassee, FL 32399-2100(850) 352-3222
InsuranceTreasurer/Ins. Commissioner Tom Gallagher200 E Gaines StreetTallahassee, FL 32399-0300(850) 410-9286
Juvenile Justice Secretary William “Bill” Bankhead2737 Centerview Drive, Knight Building, Suite 307Tallahassee, FL 32399-3100(850) 413-7313
StateSecretary of State Glenda E. Hood500 S Bronough Street, RA Grey BuildingTallahassee, FL 32399-0250(850) 245-6500

Florida Transportation Almanac
292
Law EnforcementCommissioner Guy TunnellP.O. Box 1489Tallahassee, FL 32302-1489(850) 410-7000
TourismPresident and CEO “Frank” Bud NoceraVISIT FLORIDA, Inc.P.O. Box 1100Tallahassee, FL 32302-1100(850) 488-5607
Legal Affairs/Attorney GeneralAttorney General Charlie CristPL-01 The CapitolTallahassee, FL 32399-1050(850) 487-1963
Trade and Economic DevelopmentPresident James Darrell Kelley Enterprise Florida, Inc.390 N Orange Avenue Suite 1300Orlando, FL 32801(407) 316-4600
RevenueExecutive Director Jim Zingale501 S Calhoun Street Tallahassee, FL 32399-0100(850) 488-5050
TransportationSecretary José Abreu605 Suwannee StreetTallahassee, FL 32399-0450(850) 414-5205
Veterans AffairsExecutive Director Warren R. “Rocky” McPherson2540 Executive Center Circle WestDouglas Building, Suite 100Tallahassee, FL 32301-4746(850) 487-1533
Florida Senate Transportation CommitteeRoom 410, Knott Building, Tallahassee, FL 32399-1100
(850) 487-5223, SunCom 277-5223
Sen. Jim Sebesta (Chair)Sen. Ron Klein (Vice Chair)Sen. JD AlexanderSen. Larcenia J. BullardSen. Charlie Clary
Sen. Steven A. Geller Sen. Evelyn J. LynnSen. Daniel WebsterSen. Stephen R. Wise
Staff Director: Reynold David MeyerAdministrative Assistant: Susan Stripling
Florida House of Representatives Transportation CommitteeRoom 405, House Office Building, Tallahassee, FL 32399-1300
(850) 488-3483
Rep. David Russell (Chair)Rep. Pat Patterson (Vice Chair)Rep. Sandy AdamsRep. Faye CulpRep. Bill GalvanoRep. Hugh GibsonRep. Dick KravitzRep. Stan JordanRep. Mitch NeedlemanRep. Ron ReaganRep. Dave Russell
Rep. Julio RobainaRep. Leslie WatersRep. Susan BucherRep. Joyce CusackRep. Irving SlosbergRep. Donna ClarkeRep. Greg EversRep. Andy GardinerRep. Dorothy Bendross-MindingallRep. Edward BullardRep. Anne Gannon
Staff Director: Phillip B. MillerLegislative Analyst: Joyce Pugh
Legislative Analyst: William Garner

Florida Transportation Almanac
293
U.S. Senate
Committee on Commerce, Science & Transportation508 Dirksen Senate Office Building, Washington D.C. 20510
(202) 224-5115
Sen. John McCain, AZ, ChairmanSen. Ted Stevens, AKSen. Conrad Burns, MNSen. Trent Lott, MSSen. Kay Bailey Hutchison,TXSen. Olympia J. Snowe, MASen. Sam Brownback, KSSen. Gordon Smith, ORSen. Peter G. Fitzgerald, ILSen. John Ensign, NVSen. George Allen, VASen. Ernest F. Hollings, SC
Sen. John Sununu, NHSen. Daniel K. Inouye, HISen. John D. Rockefeller IV, WVSen. John F. Kerry, MASen. John B. Breaux, LASen. Byron L. Dorgan, NDSen. Ron Wyden, ORSen. Barbara Boxer, CASen. Bill Nelson, FLSen. Maria Cantwell, WASen. Frank Lautenberg, NJ
Committee on Appropriations, SubCommittee on Transportation/Treasury144 Dirksen Senate Office Building, Washington D.C., 20510
(202) 224-7281
Sen. Richard Shelby (Chairman), ALSen. Arlen Specter, PASen. Christopher Bond, MOSen. Robert Bennett, UTSen. Ben Nighthorse Campbell, COSen. Kay Bailey Hutchison, TXSen. Mike DeWine, OHSen. Sam Brownback, KS
Sen. Patty Murray (Ranking Member), WASen. Robert C. Byrd, WVSen. Barbara Mikulski, MDSen. Harry Reid, NVSen. Herb Kohl, WISen. Richard Durbin, ILSen. Byron Dorgan, ND
Florida Transportation Almanac
294
U.S. House of Representatives
Committee on Appropriations, Subcommittee on Transportation, Treasury, and Independent Agencies2358 Rayburn HOB, Washington, D.C. 20515
Rep. Ernest J. Istook, Jr., Oklahoma, ChairmanRep. Steny H. Hoyer, MDRep. Frank R. Wolf, VARep. John W. Olver, MARep. Jerry Lewis, CARep. Ed Pastor, AZRep. Harold Rogers, KYRep. Carolyn C. Kilpatrick, MI
Rep. Todd Tiahrt, KS, Vice ChairmanRep. James E. Clyburn, SCRep. Anne Northup, KYRep. Steven R. Rothman, NJRep. Robert Aderholt, ALRep. John E. Sweeney, NYRep. John Abney Culberson, TX
Committee on Transportation and Infrastructure
Republican Staff Democratic Staff2165 Rayburn House Office Building 2163 Rayburn House Office BuildingWashington, D.C. 20515 Washington, D.C. 20515Telephone: Majority (202) 225-9446 Telephone: Majority (202) 225-4472
Rep. Don Young, AK, Chairman Rep. Thomas E. Petri, WIRep. Sherwood L. Boehlert, NYRep. Howard Coble, NCRep. John J. Duncan, Jr., TNRep. Wayne T. Gilchrest, MDRep. John L. Mica, FLRep. Peter Hoekstra, MIRep. Jack Quinn, NYRep. Vernon J. Ehlers, MIRep. Spencer Bachus, ALRep. Steven C. LaTourette, OHRep. Sue W. Kelly, NYRep. Richard H. Baker, LARep. Robert W. Ney, OHRep. Frank A. LoBiondo, NJRep. Jerry Moran, KSRep. Gary Miller CARep. Jim DeMint, SCRep. Doug Bereuter, NERep. Johnny Isakson, GARep. Robin Hayes, NCRep. Rob Simmons, CTRep. Shelley Moore Capito, WVRep. Henry E. Brown, Jr., SCRep. Timothy V. Johnson, ILRep. Dennis R. Rehberg, MTRep. Todd Russell Platts, PARep. Sam Graves, MORep. Mark R. Kennedy, MNRep. Bill Shuster, PARep. John Boozman, ARRep. John Sullivan, OKRep. Chris Chocola, INRep. Bob Beauprez, CO Rep. Michael Burgess, TX Rep. Max Burns, GA Rep. Steve Pearce, NM Rep. Jim Gerlach, PA Rep. Mario Diaz-Balart, FL Rep. Jon Porter, NV
Rep. James L. Oberstar, MN Rep. Nick J. Rahall, II, WV Rep. William O. Lipinski, IL Rep. Peter A. DeFazio, OR Rep. Jerry F. Costello, IL Rep. Eleanor Holmes Norton, DC Rep. Jerrold Nadler, NY Rep. Robert Menendez, NJ Rep. Corrine Brown, FL Rep. Bob Filner, CA Rep. Eddie Bernice Johnson, TX Rep. Gene Taylor, MS Rep. Juanita Millender-McDonald, CA Rep. Elijah E. Cummings, MD Rep. Earl Blumenauer, OR Rep. Ellen O. Tauscher, CA Rep. Bill Pascrell, Jr., NJ Rep. Leonard L. Boswell, IA Rep. Tim Holden, PA Rep. Nick Lampson, TX Rep. Brian Baird, WA Rep. Shelley Berkley, NV Rep. Brad Carson, OK Rep. Jim Matheson, UT Rep. Michael M. Honda, CA Rep. Rick Larsen, WA Rep. Michael E. Capuano, MA Rep. Anthony D. Weiner, NY Rep. Julia Carson, IN Rep. Joseph M. Hoeffel, PA Rep. Mike Thompson, CA Rep. Timothy H. Bishop, NY Rep. Michael H. Michaud, ME Rep. Lincoln Davis, TN
Florida Transportation Almanac
295
Florida Department of TransportationJosé Abreu, Secretary
605 Suwannee Street, MS 57, Tallahassee, FL 32399-0450(850) 414-5205, SunCom 994-5205
General CounselPamela Leslie, MS-58(850) 414-5265
State Public Transportation AdministratorMarion Hart, MS-57(850) 414-5244
Inspector GeneralCecil Bragg, MS-44(850) 410-5800
State Highway EngineerFreddie Simmons, MS-57(850) 414-5240
Legislative Programs OfficeSarah Strickland, MS-57(850) 414-5250
Right of WayKen Towcimak, MS-22(850) 414-4545
Finance & AdministrationChristine W. Speer, MS-57(850) 414-5215
State Construction EngineerAnanth Prasad, MS-31(850) 414-4150
ComptrollerRobin Naitove, MS-42(850) 921-7100
State Maintenance EngineerSharon Holmes, MS-52(850) 410-5757
Toll OperationsSal Secondo, MS-45(850) 414-4875
State Safety EngineerEd Rice, MS-53(805) 245-1500
Management & BudgetAnnette Dann, MS-57(850) 414-5228
Motor Carrier Compliance OfficeCol. Graham Fountain, MS-99(850) 488-7920
AdministrationRuth Dillard, MS-57(850) 414-5230
Engineering/CADD System Design OfficeElwin Broome, MS-69(850) 245-1600
Information SystemsNelson Hill, MS-47(850) 414-4499
District Operations Ken Morefield, MS-57(850) 414-5210
Transportation PolicyAssistant Secretary Ken Morefield, MS-57(850) 414-5220
District OneRicky Langley, District Secretary801 N Broadway Avenue, MS 1-1Bartow, FL 33830-3809(863) 519-2201, (800) 292-3368, SunCom 557-2300
Research CenterDick Long, MS-30(850) 414-4615
District TwoAage Schroder III, District Secretary 1109 South Marion AvenueLake City, FL 32025-5874(386) 758-3700, (800) 749-2967, SunCom 881-3734
State Transportation PlannerYsela Llort, MS-57(850) 414-5235
District ThreeH. Edward Prescott, District SecretaryP.O. Box 607Chipley, FL 32428(850) 638-0250, SunCom 767-1200
District FourRick Chesser, District Secretary3400 W Commercial BoulevardFt. Lauderdale, FL 33309(954) 486-1400, SunCom 436-4111

Florida Transportation Almanac
296
District FiveMichael Snyder, District Secretary 719 S Woodland BoulevardDeLand, FL 32720-6834(386) 943-5000, SunCom 373-5000
District SixJohn Martinez, District Secretary1000 NW 111TH Avenue, Miami, FL 33172(305) 470-5197, SunCom 429-5197
District SevenKen Hartmann, District Secretary11201 N McKinley DriveTampa, FL 33612-6403(813) 975-6000, SunCom 512-7674
Florida’s TurnpikeJim Ely, District SecretaryEnterprise HeadquartersP.O. Box 613069Ocoee, FL 34761(407) 532-3999
Florida Transportation Commission
Laura Kelley, Executive DirectorSally Patrenos, Assistant Executive Director
605 Suwannee Street, MS-9, Tallahassee, FL 32399-0450(850) 414-4105, SunCom 994-4105, SunCom FAX 278-1317
www.ftc.state.fl.us
Earl Durden, ChairpersonRail Management Corp. 2605 Thomas DrivePanama City, FL 32408(850) 230-8331Term Ends 9/30/06
Gasper Lazzara5000 Sawgrass Village Circle #30Ponte Vedra, FL 32082(904) 273-0004Term Ends 9/30/05
David BrownBroad and Cassel390 North Orange Avenue, Suite 1100Orlando, FL 32801(407) 839-4229Term Ends 9/30/06
Norman Mansour825 North Shore DriveP.O. Box 2166Anna Maria, FL 34216(941) 779-1190Term Ends 9/30/03
James W. Holton, P.A., Vice-Chairperson14501 Gulf BoulevardSt. Petersburg, FL 33708(727) 399-0040Term Ends 9/30/03
R. M. “Bob” NamoffAllied Universal Corp.3901 NW 115 AvenueMiami, FL 33178(305) 888-2623Term Ends 9/30/03
Sidney CallowayShutts & Bowen 200 East Broward Boulevard, Suite 2000Ft. Lauderdale, FL 33301(954) 524-5505Term Ends 9/30/05
Janet Watermeier, SecretaryThe Florida Gulf Coast Group11920 Fairway Lakes Drive, Suite 3Ft. Myers, FL 33913(239) 561-1718Term Ends 9/30/03

Florida Transportation Almanac
297
Florida Commission for the Transportation Disadvantaged
Peter Gianino, ChairpersonRepresenting Non-Transportation Business Community217 E Ocean BoulevardStuart, FL 34994(727) 286-0200
Michael GeorginiAssociation for Community ActionP.O. Box 896Brooksville, FL 34605(352) 796-1425
Ken Fischer, Vice-ChairpersonFlorida Public Transportation Associationc/o VOTRAN950 Big Tree RoadSouth Daytona, FL 32119(386) 756-7496 ext. 126
Floyd WebbRepresenting Transportation OperatorsYellow Cab of TallahasseeP.O. Box 20133 Tallahassee, FL 32316(850) 575-1022
Cheryl M. StoneCitizens Advocate (Urban)4518 Oak Forest CourtOrlando, FL 32804-1234(407) 293-7076
Gary BryantRepresenting Community Transportation CoordinatorsGood Wheels, Inc.10075 Bavaria Rd. SEFt. Myers, FL 33913(239) 768-2900
Doreen KirkRepresenting Disabled Persons903 Little Bend RoadAltamonte Springs, FL 32714(407) 774-1646
Albert Linden, Official DesigneeDepartment of Veterans AffairsP.O. Box 999Micanopy, FL 32667(352) 466-4084
Marybeth NayfieldChildren-at-RiskCitrus County Health Department3700 West Sovereign PathLecanto, FL 34461(352) 527-0068 ext. 268
John AustinAgency for Health Care AdministrationP.O. Box 12600 Tallahassee, FL 32317-2600(850) 922-7305
Ed Coven, Official DesigneeDepartment of Transportation605 Suwannee Street, MS-26Tallahassee, FL 32399-0450(850) 414-4500
Joyce Williams, Official DesigneeDepartment of Elder Affairs4040 Esplande Way, Building B, Suite 235Tallahassee, FL 32399(850) 414-2061
Diana Lincoln, Official DesigneeDepartment of Children and Families1317 Winewood Boulevard, Building 3, Room 304 CTallahassee, FL 32399-0700(850) 488-4877 ext 147
Robert A. “Rob” SearcyRepresenting Transportation Operators324 West Gore StreetOrlando. FL 32806(407) 422-4561
Dr. JR Harding, Official DesigneeDepartment of Education2002 Old St. Augustine Road, Building ATallahassee, FL 32399(850) 410-1919 ext. 123
Richard GunnelsRepresenting Transportation OperatorsThe Capitol, LL 28Tallahassee, FL 32399-0810(850) 410-6731
Ms. Linda AdamsRepresenting Transportation Operators1700 North Florida Mango RoadWest Palm Beach, FL 33409(561) 689-4222
Robert SiedleckiRepresenting Non-Transportation Business Community5890 Rodman StreetHollywood, FL 33023(954) 981-9204
Mr. Bhailal VyasRepresenting Non-Transportation Business Community6340 Raleigh Street, Apt #1001Orlando, FL 32835(407) 291-7452
Brenda GillisRepresenting Citizens Advocate (Rural)3445 SE Cassell Lane Stuart, FL 34597(772) 221-0485

Florida Transportation Almanac
298
Anthony L. (Tony) TizzioRepresenting Non-Transportation Business Community809 Osceola TrailCasselberry, FL 32707(407) 696-4168
Walter SchoenigRepresenting Elderly2428 Fairbanks DriveClearwater, FL 33674-2812(727) 536-3477
Nicholas A. CambasRepresenting Transportation Operators16991 U.S. 19 NorthClearwater, FL 33764(727) 726-9776
Rita KaneRepresenting Transportation Operators1455 West Landstreet RoadOrlando, FL 32824(407) 859-2007
Anthony D. NigroRepresenting Non-Transportation Business Community10602 Cobham Wood CourtTampa, FL 33626(813) 818-8869
Pam DorwarthRepresenting Non-Transportation Business Community1300 N Lockwood Ridge RoadSarasota, FL 34237(941) 955-9605
Florida Transportation Almanac
299
Florida’s Regional Planning Agencies
PlanningDistricts
Regional PlanningCouncils
Counties Served Executive Directors
1 West Florida Escambia Santa Rosa Okaloosa WaltonWashington HolmesBay
Lel Czeck3435 North 12th AvenuePensacola, FL 32503(850) 595-8910, SunCom 695-8910FAX (850) 595-8967
2 Apalachee Calhoun LeonFranklin LibertyGadsden WakullaJackson GulfJefferson
Charles D. Blume20776 Central Avenue East, #1Blountstown, FL 32424(850) 674-4571, Suncom 771-4417Tallahassee Office:(850) 488-6211, SunCom 278-6211
3 North Central Florida Alachua UnionBradford GilchristColumbia LafayetteHamilton MadisonSuwannee TaylorDixie
Charles F. Justice2009 NW 67TH Place, Suite AGainesville, FL 32653-1603(352) 955-2200, SunCom 625-2200FAX (352) 955-2209
4 Northeast Florida Baker NassauClay PutnamDuval St. JohnsFlagler
Stephen Jones6850 Belfort Oaks PlaceJacksonville, FL 32216 (904) 279-0880, SunCom 874-0880FAX (904) 279-0881
5 Withalocoochee Citrus MarionHernando SumterLevy
Michael R. Moehlman1241 SW 10TH StreetOcala, FL 34474-2798(352) 732-1315FAX (352) 732-1319
6 East Central Florida Brevard VolusiaLake OsceolaOrange Seminole
Sandra Glenn631 N Wymore Road, Suite 100Maitland FL, 32751(407) 623-1075, SunCom 334-1075FAX (407) 623-1084
7 Central Florida DeSoto OkeechobeeHardee PolkHighlands
R. Douglas LeonardP.O. Drawer 2089Bartow, FL 33831(863) 534-7130, SunCom 549-7130FAX (941) 534-7138
8 Tampa Bay HillsboroughManateePascoPinellas
Manny L. Pumariega9455 Koger Boulevard, Ste 219St. Petersburg, FL 33702-2491(727) 570-5151, SunCom 513-5066FAX (727) 570-5118
9 Southwest Florida Charlotte HendryCollier LeeGlades Sarasota
David Y. BurrP.O. Box 3455N Ft. Myers 33918-3455(941) 656-7720, SunCom 749-7720FAX (941) 656-7724

Florida Transportation Almanac
300
10 Treasure Coast Indian RiverMartinPalm BeachSt. Lucie
Michael J. Busha301 East Ocean Boulevard, Suite 300Stuart, FL 34994(772) 221-4060 FAX (727) 221-4067
11 South Florida BrowardMiami-DadeMonroe
Carol A. Dekle3440 Hollywood Boulevard, Suite 140Hollywood, FL 33021(954) 985-4416FAX (954) 985-4417
Florida’s Metropolitan Planning Organizations (MPOs)
Brevard County MPO2725 Judge Fran Jamieson WayBuiliding A, MS 81Viera, FL 32940Mr. Bob Kamm(321) 690-6890
Ocala/Marion County MPOP.O. Box 1270Ocala, FL 34478-1270Mr. Greg Slay(352) 629-8529
Broward County MPO115 S Andrews Avenue Room 329HFt. Lauderdale, FL 33301Ms. Jennifer Schaufele(954) 357-6608
Metroplan OrlandoOne Landmark Center, Suite 355315 E Robinson Street Orlando, FL 32801Mr. Harold Barley(407) 481-5672
Charlotte County-Punta Gorda MPO 28000 Airport Road A-6Punta Gorda, FL 33982-2409Mr. Mark Gumula(941) 639-4676
Palm Beach County MPO160 Australian Avenue, Suite 201West Palm Beach, FL 33406Mr. Randy Whitfield(561) 684-4170
Collier County MPO2675 S Horseshoe DriveHorseshoe Square, Suite 401Naples, FL 34104Mr. Johnny Limbaugh(239) 774-8192
Panama City Urbanized Area MPOWest Florida Regional Planning CouncilP.O. Box 9759Pensacola, FL 32513-9759Mr. Michael Zeigler(850) 595-8910
Miami Urbanized Area MPOStephen P. Clark Center111 NW 1st Street, Suite 910Miami, FL 33128Dr. Jose Luis Mesa(305) 375-4507
Pasco County MPO7530 Little RoadNew Port Richey, FL 34654Mr. Douglas Uden(727) 847-8140
Okaloosa-Walton Beach MPOWest Florida Regional Planning CouncilP.O. Box 9759Pensacola, FL 32513-9759Mr. Michael Zeigler(850) 595-8910
Pensacola County MPOWest Florida Regional Planning CouncilP.O. Box 9759Pensacola, FL 32513-9759Mr. Michael Zeigler(850) 595-8910
Gainesville MPONorth Central Florida RPC2009 NW 67TH Place, Suite AGainesville, FL 32653-1603Mr. Marlie Sanderson(352) 955-2200 ext. 103
Hernando County MPO20 N Main Street, Suite 262Brooksville, FL 34601Mr. Dennis Dix(352) 754-4057

Florida Transportation Almanac
301
Martin County MPO2401 SE Monterey RoadStuart, FL 34996Mr. Jerry Bryan(772) 221-2300
Hillsborough County MPO601 E Kennedy Boulevard, 18TH FloorP.O. Box 1110Tampa, FL 33601-5940Ms. Lucie Ayer(813) 272-5940
Indian River County MPO1840 25TH StreetVero Beach, FL 32960-3365Mr. Robert Keating(772) 567-8000 ext. 254
Sarasota-Manatee MPO7632 15th Street EastSarasota, FL 34243-3248Mr. Michael Guy(941) 359-5772
First Coast MPO128 E Forsyth Street, Suite 304Jacksonville, FL 32202Ms. Denise Bunnewith(904) 630-1903
St. Lucie MPO Community Development DepartmentPlanning Division2300 Virginia Avenue, Room 203Ft. Pierce, FL 34982-5652Ms. Cheri B. Fitzgerald(772) 462-1593
Polk Transportation Planning Organization Drawer TS05P.O. Box 9005Bartow, FL 33831-9005Mr. Thomas Deardorff(863) 534-6486
Tallahassee-Leon County MPOCity Hall 300 South Adams StreetTallahassee, FL 32301Mr. Bruce Barrett(850) 891-8600
Lee County MPOP.O. Box 3455N Ft. Myers, FL 33918-3455Mr. Glen Ahlert(239) 656-7720
Volusia County MPO1190 Pelican Bay DriveDaytona Beach, FL 32119-1381Mr. Karl Walzenbach(386) 322-5160
Pinellas County MPO600 Cleveland Street, Suite 750Clearwater, FL 33755Ms. Sarah Ward(727) 464-8200

Florida Transportation Almanac
302
Florida Transportation Management Associations/Organizationsand Commuter Assistance Programs
Bay Area Commuter Services, Inc.1408 N Westshore BoulevardSuite 704 Tampa, FL 33607 (813) 282-8200Contact: Sandi MoodyCitrus, Hernando, Hillsborough, Pasco, Pinellas
University/Alafaya Corridor Transportation Association(UACTA) University of Central Florida P.O. Box 163351Orlando, FL 32816(407) 823-6687Contact: John Clark
Commuter Services of North FloridaFlorida State UniversityCollege of Business 321Tallahassee, FL 32306-1111(888) 454-7433Contact: Jeff Horton, Marketing and Communications ManagerLeon, Wakulla, Liberty, Taylor, Franklin, Calhoun, Gadsden,Madison, Jefferson, Jackson
VOTRAN (East Volusia) Transit Authority950 Big Tree RoadSouth Daytona, FL 32119-8815(386) 756-7496 Contact: Ken FischerVolusia
St. Petersburg Downtown TMO 100 1st Avenue S, Suite 477St. Petersburg, FL 33701-4311(727) 821-5166Contact: Eric Carlson, Transportation DirectorDowntown St. Petersburg
Westshore Alliance (Tampa) TMO5444 Bay Center Drive, Suite 115Tampa, FL 33609 (813)-289-5488Contact: Jeannie Keene, Director of TransportationWestshore Business District
Downtown Tampa TMOP.O. Box 2387One Tampa City Center, Suite 1724Tampa, FL 33601(813) 221-3686Contact: Phyllis PacynaDowntown Tampa
Airport West TMI10165 NW 19th Street Miami, FL 33172Contact: James MurphyEmail: [email protected]
New North Transportation Alliance University of South Florida/CUTRCollege of Engineering 4202 E Fowler Avenue, CUT 100Tampa, FL 33620-5375(813) 974-3120Contact: Heather Sobush, Project ManagerUniversity of South Florida Activity Area
Better Baymeadows, Inc.9080 Golfside DriveJacksonville, FL 32256(904) 731-7537Contact: Valerie Evans
South Florida Commuter ServicesP.O. Box 101060Fort Lauderdale, FL 33310(800) 234-RIDEContact: Maggie Cortez-Kirkpatrick Broward, Miami-Dade, Palm Beach
Downtown Fort Lauderdale TMA305 S Andrews Avenue, Suite 201Ft. Lauderdale, FL 33301(954) 761-3543Contact: Paul Carpenter
West Palm Beach TMICity Hall200 2nd Street West Palm Beach, FL 33401 (561) 659-8031 Contact: Denis EricksonWest Palm Beach
Sarasota Transportation Management Initiative 1818 Main StreetSarasota, FL 34236(941) 957-1474Contact: John TyleeEmail: [email protected] Sarasota
Florida Transportation Almanac
303
First Coast MPO128 E Forsyth Street, Suite 304Jacksonville, FL 32202 (904) 630-1903 Contact: Denise BunnewithDuval
South Florida Education CenterNSU- Administration Building3301 Horvitz College AvenueDavie, FL 33314(954) 262-8847 Contact: Larry Penso, Director
LYNX445 West Amelia Street, Suite 800Orlando, FL 32801(407) 841-2279 ext. 3204 Contact: Endya Wilkes Orange, Seminole, Osceola
Sarasota TMO/Transit Services of Sarasota 5303 Pinkney Street Sarasota, FL 34233 (941) 861-1234 Contact: Dominick LocascioSarasota, Manatee
Miami Beach TMA, Inc. 777 41st Street, Suite 330 Miami Beach, FL 33140(305) 535-9160Contact: Judy Evans
Downtown Miami TMISouth Florida Commuter Services4620 N State Road 7, Suite 120Ft. Lauderdale FL, 333191-800-234-RIDE Contact: Alex SkucekDowntown Miami
Space Coast Area Transit (SCAT)401 S Verr AvenueCocoa, FL 32922(321) 952-4561Contact: Judy Lewellen, DirectorBrevard
Florida’s Major Airports
Daytona Beach International Airport700 Catalina Drive, Suite 300Daytona Beach, FL 32114(386) 248-8030Director: Dennis McGee
Naples Municipal Airport160 Aviation Drive NorthNaples, FL 34104(239) 643-0733Director: Ted Soliday
Ft. Lauderdale-Hollywood International320 Terminal DriveFt. Lauderdale, FL 33315(954) 359-1032Director: Bill Sherry
Okaloosa County Air Terminal1701 State Road 85Eglin Air Force Base, FL 32542(850) 651-7160Director: Jerry Sealy
Gainesville Regional Airport3880 NE 39 Avenue, Suite AGainesville, FL 32609(352) 373-0249Director: Rick Crider
Orlando International AirportOne Airport Boulevard Orlando, FL 32827-4399(407) 825-2051Director: Bill Jennings
Jacksonville International Airport14201 Pecan Park RoadJacksonville, FL 32218(904) 741-1601Executive Director: John Clark
Palm Beach International AirportPBIA, Building 846, 8th StreetWest Palm Beach, FL 33406(561) 471-7412Director: Bruce Pelly
Key West International Airport3491 S Roosevelt BoulevardKey West, FL 33040(305) 296-7223Director: Peter Horton
Panama City-Bay County International Airport 3173 Airport Road, Box APanama City, FL 32405(850) 763-6751Director: Randy Curtis

Florida Transportation Almanac
304
Marathon Airport9400 Overseas Highway, Suite 200Marathon, FL 33050(305) 289-6060Director: Theresa Cook
Pensacola Regional Airport2430 Airport Boulevard, Suite 225Pensacola, FL 32504(850) 436-5000Director: Frank Miller
Melbourne International AirportOne Air Terminal Pkwy., Suite 220Melbourne, FL 32901(321) 723-6227 Director: Jim Johnson
Sarasota-Bradenton International Airport6000 Airport Circle Sarasota, FL 34243-2105(941) 359-5200Director: Frederick Piccolo
Miami International AirportP.O. Box 592075 AMF BranchMiami, FL 33132(305) 876-7077Director: Angela Gittens
Southwest Florida International Airport16000 Chamberlin Pkwy., Suite 221Ft. Myers, FL 33913(239) 768-4301Director: Robert M. Ball
St. Petersburg International Airport14700 Terminal Boulevard, Suite 221Clearwater, FL 33762(727) 453-7800Director: David Metz
Tampa International AirportP.O. Box 22287Tampa, FL 33622(813) 870-8700Director: Louis Miller
Tallahassee Regional Airport3300 Capital Circle, SW, Suite 1Tallahassee, FL 32310(850) 891-7802Director: Kenneth Austin
Vero Beach Municipal AirportP.O. Box 1389Vero Beach, FL 32961-1389(772) 978-4930Director: Eric Menger
Florida’s Privately-Owned Airports
Airport ManateeP.O. Box 554N Palmetto, FL 34221(941) 722-9296
North Palm Beach County General Aviation Airportc/o PBIA, Building 846 8th StreetWest Palm Beach, FL 33406(561) 471-7412
Ames Field17551 NW 60TH AvenueTrenton, FL 32693(352) 463-1054
Okeechobee Aircraft2800 NW 20TH TrailOkeechobee, FL 34972(863) 467-5505
Bob Lee Flight Strip5000 Bob Lee Airport RoadDeLand, FL 32724(386) 734-5291
Orlando Country AirportP.O. Box 4754040 West Hwy. 441Plymouth, FL 32768-7842(407) 886-7663
Bob White FieldP.O. Box 494Zellwood, FL 32798-0494(407) 884-4809
Pilot Country Airport11500 Pilot Country DriveSpring Hill, FL 34610(813) 966-7887
Chalet Suzanne3800 Chalet Suzanne DriveLake Wales, FL 33859(863) 676-6011
River Ranch Resort AirparkP.O. Box 30030River Ranch, FL 33867-0030(863) 692-0727
Coastal Airport6001 W Nine Mile RoadPensacola, FL 32526(850) 455-2017
Rudy’s Airport7305 NW 294 TerraceHigh Springs, FL 32643(352) 468-2824

Florida Transportation Almanac
305
The Destin AirportState Road 85Eglin AFR, FL 32542(850) 651-7160
Shell Creek Airpark36880 Washington Loop RoadPunta Gorda, FL 33982(941) 628-3564
Jack Brown’s Seaplane Base2704 US Hwy 92 Winter Haven, FL 33880(863) 956-2243
South Lakeland Airpark4880 Southwind DriveMulberry, FL 33860-8314(863) 701-0000
Mid-Florida Airport19708 Eustis Airport RoadEustis, FL 32736(352) 589-0767
St. George Island Airport1712 Magnolia RoadSt. George Island, FL 32328(850) 927-2312
New Hibiscus AirparkP.O. Box 690772Vero Beach, FL 32969(772) 562-2715
Tallahassee Commercial Airport6601 N Monroe StreetTallahassee, FL 32303(850) 562-1945
Tampa North Aero Park4241 Bird Song BoulevardLutz, FL 33559(813) 973-3707
Tampa Bay Executive Airport11422 State Road 54Odessa, FL 33556(727) 376-0052
Watson Island Heliport and LTA Base444 SW 2nd Avenue, 3rd FloorMiami, FL 33130(305) 416-1435
Watson Island International Seaplane Base444 SW 2nd Avenue, 3rd FloorMiami, FL 33130(305) 416-1435

Florida Transportation Almanac
306
Florida’s Community Airports
Airglades AirportP.O. Box 787Clewiston, FL 33440(863) 983-6151
Buchan Airport1001 Sarasota Center BoulevardSarasota, FL 34240(941) 861-0825
Albert Whitted Airport107 8TH Avenue SESt. Petersburg, FL 33701(727) 893-7049
Orlando Sanford Airport1200 Red Cleveland BoulevardSanford, FL 32773(407) 585-4004
Apalachicola Airport8TH Airport RoadApalachicola, FL 32320(850) 653-2222 or (850) 653-8132
Charlotte County Airport28000 A-1 Airport RoadPunta Gorda, FL 33982(941) 639-1101
Arcadia Municipal AirportP.O. Box 351Arcadia, FL 33821(863) 494-4114
Clearwater AirparkP.O. Box 4748Clearwater, FL 33758-4748(727) 462-6954
Arthur Dunn Airpark355 Golden Knights BoulevardTitusville, FL 32780(321) 267-8780
Costin Airport2724 Apalachee ParkwayTallahassee, FL 32301(850) 877-7189
Avon Park Municipal Airport110 E Main StreetAvon Park, FL 33825(863) 452-4403
Craig Municipal Airport855-11 St. John’s Bluff Road NJacksonville, FL 32225(904) 641-7666
Bartow Municipal AirportBartow Airport Authority P.O. Box 650Bartow, FL 33830(863) 533-1195
Crystal River AirportP.O. Box 2050 Crystal River, FL 34423(352) 795-6868
Belle Glade Municipal AirportBelle Glade State AirportMunicipal ComplexBelle Glade, FL 33430(561) 996-0100
Dade-Collier Training/Transition Airportc/o Tamiami Airport12800 SW 145 AvenueMiami, FL 33186(305) 869-1702
Bob Sikes AirportState Road 85Eglin AFB, FL 32542(850) 651-7160
Daytona Beach International Airport700 Catalina Drive, Suite 300Daytona Beach, FL 32114(386) 248-8030
Boca Raton Airport 3700 Airport Road, Suite 304Boca Raton, FL 33431(561) 391-2202
Dunnellon/Marion County Airport601 SE 25th AvenueOcala, FL 34471(352) 620-3304
Fernandina Beach Municipal Airport1180 South 5th StreetFernandina Beach, FL 32034(904) 277-7380
Everglades Airpark2003 Mainsail DriveNaples, FL 34114(239) 642-7878
Flagler County Airport201 Airport RoadBunnell, FL 32110(386) 437-0401
Inverness AirportP.O. Box 2050Crystal River, FL 34423(352) 795-6868

Florida Transportation Almanac
307
Calhoun County AirportP.O. Box 38Altha, FL 32421(850) 762-3713
Kay Larkin Airport201 N 2nd StreetPalatka, FL 32177(386) 329-0100
Ft. Lauderdale Executive Airport6000 NW 21st AvenueFt. Lauderdale, FL 33309(954) 828-4969
Kendall-Tamiami Executive Airport12800 SW 145 AvenueMiami, FL 33186(305) 869-1702
Ft. Lauderdale/Hollywood International320 Terminal DriveFt. Lauderdale, FL 33315(954) 359-1032
Kissimmee Municipal Airport301 North Dyer Boulevard, Suite 101Kissimmee, FL 34741-4613(407) 847-4600
Gainesville Regional Airport3880 NE 39TH Avenue, Suite A Gainesville, FL 32609(352) 373-0249
LaBelle Municipal AirportP.O. Box 1607LaBelle, FL 33935-1607(863) 675-1568
Gilbert Field Municipal Airport3000 21ST Street NWWinter Haven, FL 33881(863) 293-2501
Lake City Municipal AirportP.O. Box 1687Lake City, FL 32056(386) 752-2031
Herlong Airport9300 Normandy BoulevardJacksonville, FL 32221(904) 783-2805
Lakeland-Linder Regional Airport3400 Airfield Drive WestLakeland, FL 33811-1240(863) 648-3298
Hernando County Airport16110 Aviation Loop DriveBrooksville, FL 34609(352) 754-4061
Leesburg Regional AirportP.O. Box 490630Leesburg, FL 34749-0630(352) 516-7236
Hilliard Airpark37661 Kings Ferry RoadHilliard, FL 32046(904) 845-3929
Madison County AirportP.O. Box 237Madison, FL 32341(850) 973-2156
Homestead General Aviation Airport28700 SW 217 AvenueHomestead, FL 33030(305) 247-4883
Marco Island Executive Airport 2003 Mainsail DriveNaples, FL 34114(239) 642-7878
Immokalee Regional Airport2003 Mainsail DriveNaples, FL 34114(239) 642-7878
Marianna Municipal AirportP.O. Box 936Marianna, FL 32447(850) 482-2281
Merritt Island Airport355 Golden Knights Boulevard Titusville, FL 32780(321) 267-8780
Palm Beach County Park Airportc/o PBIA, Building 846, 8th StreetWest Palm Beach, FL 33406(561) 471-7412
New Smyrna Beach Municipal Airport210 Sams AvenueNew Smyrna Beach, FL 32168(386) 424-2199
Perry-Foley Airport401 Industrial Park DrivePerry, FL 32348(850) 838-3519
North Perry Airport7750 Pines Boulevard, Box 13Pembroke Pines, FL 33024(954) 964-0220
Peter O’Knight AirportP.O. Box 22287Tampa, FL 33622(813) 870-8775

Florida Transportation Almanac
308
Ocala Regional Airport3400 SW 60th AvenueOcala, FL 34474(352) 629-8248
Peter Prince FieldSanta Rosa County Engineering 6051 Old Bagdad HighwayMilton, FL 32583(850) 981-7100
Opa Locka Airport14201 NW LeJeune RoadOpa-Locka, FL 33054(305) 869-1660
Plant City Municipal AirportP.O. Box 22287Tampa, FL 33622(813) 870-8775
Opa Locka West Airport14201 LeJeune RoadOpa-Locka, FL 33054(305) 869-1660
Pompano Beach Airpark1001 NE 10 StreetPompano Beach, FL 33060(954) 786-4135
Orlando Executive Airport501-G Herndon AvenueOrlando, FL 32803(407) 894-9831
Sebastian Municipal Airport1225 Main StreetSebastian, FL 32958(772) 581-0111
Ormond Beach Municipal AirportP.O. Box 277Ormond Beach, FL 32175(386) 676-3224
Sebring Regional Airport128 Authority LaneSebring, FL 33870(863) 655-6444
Page Field501 Danley DriveFt. Myers, FL 33907(239) 936-1443
Space Coast Regional Airport355 Golden Knights BoulevardTitusville, FL 32780(321) 267-8780
Palm Beach County Glades Airportc/o PBIA, Building 846, 8th StreetWest Palm Beach, FL 33406(561) 471-7412
St. Augustine Airport4796 US 1 NorthSt. Augustine, FL 32095(904) 825-6860
St. Lucie County International Airport2300 Virginia AvenueFt. Pierce, FL 34982-5652(772) 462-1732
Vandenberg AirportP.O. Box 22287Tampa, FL 33622(813) 870-8775
Suwannee County Airport224 Pine AvenueLive Oak, FL 32064(386) 364-3400
Venice Municipal Airport150 E Airport Avenue Venice, FL 34285(941) 486-2711
Tallahassee Regional Airport3300 Capital Circle SW, Suite 1Tallahassee, FL 32310(850) 891-7800
Williston Municipal AirportP.O. Drawer 160Williston, FL 32696(352) 528-3060
Umatilla Municipal AirportP.O. Box 2286Umatilla, FL 32784-2286(352) 669-3125
Witham Field1871 SE Airport RoadStuart, FL 34996(772) 221-2374
Valkaria Airport2865 Greenbrooke StreetValkaria, FL 32950(321) 952-4580
Zephyrhills Municipal Airport39450 S AvenueZephyrhills, FL 33542(813) 780-0030
Pierson Municipal Airport106 North Center StreetPierson, FL 32180(386) 749-2661
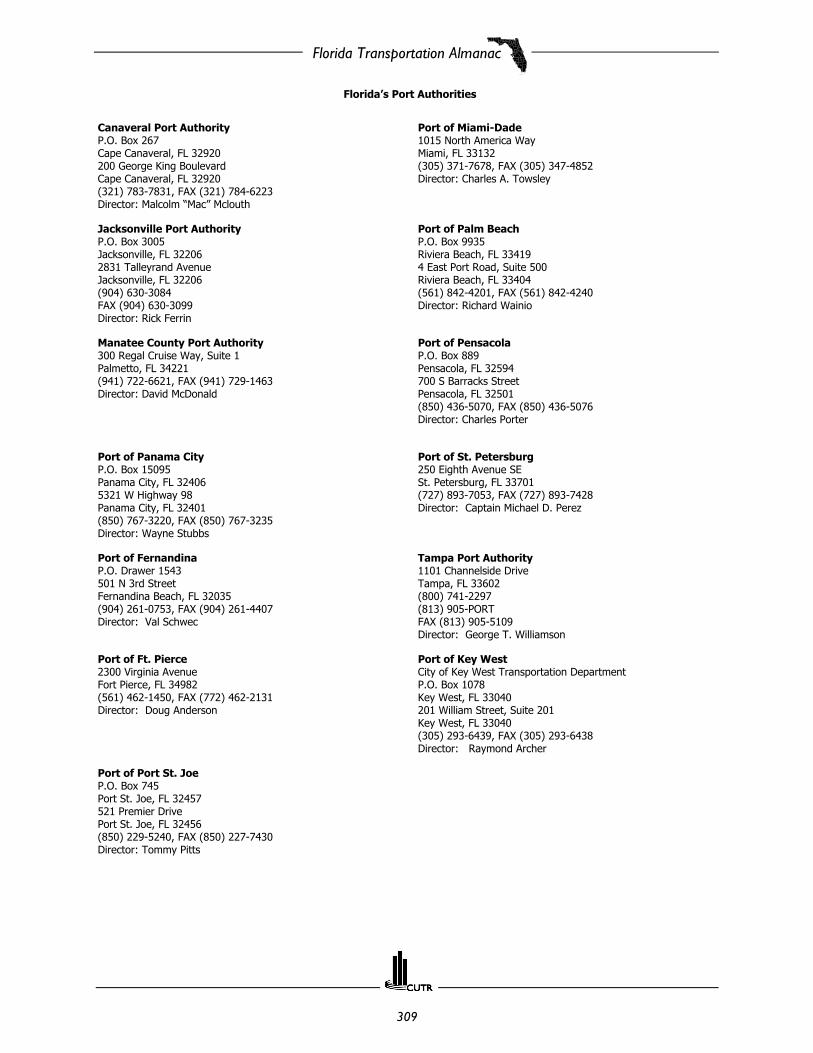
Florida Transportation Almanac
309
Florida’s Port Authorities
Canaveral Port AuthorityP.O. Box 267Cape Canaveral, FL 32920200 George King BoulevardCape Canaveral, FL 32920(321) 783-7831, FAX (321) 784-6223Director: Malcolm “Mac” Mclouth
Port of Miami-Dade1015 North America WayMiami, FL 33132(305) 371-7678, FAX (305) 347-4852Director: Charles A. Towsley
Jacksonville Port AuthorityP.O. Box 3005Jacksonville, FL 322062831 Talleyrand AvenueJacksonville, FL 32206(904) 630-3084FAX (904) 630-3099Director: Rick Ferrin
Port of Palm BeachP.O. Box 9935Riviera Beach, FL 334194 East Port Road, Suite 500Riviera Beach, FL 33404(561) 842-4201, FAX (561) 842-4240Director: Richard Wainio
Manatee County Port Authority300 Regal Cruise Way, Suite 1Palmetto, FL 34221(941) 722-6621, FAX (941) 729-1463Director: David McDonald
Port of PensacolaP.O. Box 889Pensacola, FL 32594700 S Barracks StreetPensacola, FL 32501(850) 436-5070, FAX (850) 436-5076Director: Charles Porter
Port of Panama CityP.O. Box 15095Panama City, FL 324065321 W Highway 98Panama City, FL 32401(850) 767-3220, FAX (850) 767-3235Director: Wayne Stubbs
Port of St. Petersburg250 Eighth Avenue SESt. Petersburg, FL 33701(727) 893-7053, FAX (727) 893-7428Director: Captain Michael D. Perez
Port of FernandinaP.O. Drawer 1543501 N 3rd StreetFernandina Beach, FL 32035(904) 261-0753, FAX (904) 261-4407Director: Val Schwec
Tampa Port Authority1101 Channelside DriveTampa, FL 33602(800) 741-2297(813) 905-PORTFAX (813) 905-5109Director: George T. Williamson
Port of Ft. Pierce2300 Virginia AvenueFort Pierce, FL 34982(561) 462-1450, FAX (772) 462-2131Director: Doug Anderson
Port of Key WestCity of Key West Transportation DepartmentP.O. Box 1078Key West, FL 33040201 William Street, Suite 201Key West, FL 33040(305) 293-6439, FAX (305) 293-6438Director: Raymond Archer
Port of Port St. JoeP.O. Box 745Port St. Joe, FL 32457521 Premier DrivePort St. Joe, FL 32456(850) 229-5240, FAX (850) 227-7430Director: Tommy Pitts

Florida Transportation Almanac
310
Florida’s Major Public Transportation Agencies
Bay County Council On Aging1116 Frankfurt AvenuePanama City, FL 32401(850) 769-9360Director: Beth Couliette
Okaloosa County Transit207 Hospital DriveFort Walton Beach, FL 32548(850) 833-9168 Contact: Barry Peterson
Broward County Transit (BCT) 3201 West Copans RoadPompano Beach, FL 33069 (954) 357-8301Director: Robert Roth
Palm Beach County Transportation Authority (PalmTran)3201 Electronics WayWest Palm Beach, FL 33407 (561) 841-4210Director: Perry Maull
Central Florida Regional Transportation Authority(LYNX)445 West Amelia Street, Suite 800Orlando, FL 32801(407) 841-2279Director: Howard Tipton
Pasco County Public Transportation (PCPT)8620 Galen Wilson BoulevardPort Richey, FL 34668(727) 834-3200Contact: Michael Carroll
Collier Area Transit (CAT)2901 County Barn RoadNaples, FL 34112(941) 596-7777Contact: Dean Allen
Pinellas Suncoast Transit Authority (PSTA)14840 49TH Street, NClearwater, FL 33762(727) 530-9921Director: Roger Sweeney
Escambia County Area Transit (ECAT)1515 West Fairfield DrivePensacola, FL 32501(850) 595-3228Director: Chris Hager
Polk Co. Transit Svcs. Div.Drawer HSO9P.O. Box 9005Bartow, FL 33831(863) 534-5301Contact: Sandra Winegar
Hillsborough Area Regional Transit Authority (HARTline)201 E Kennedy Boulevard, Suite 900Tampa, FL 33602(813) 223-6831Director: Sharon Dent
Regional Transit System (RTS)100 SE 10TH AvenueP.O. Box 490, Station 5Gainesville, FL 32601(352) 334-2609Director: Jeffrey Logan
Indian River County Council on Aging, Inc.694 14th Street P.O. Box 2102Vero Beach, FL 32960(772) 569-0760Contact: Arlenes Fletcher
Sarasota County Area Transit (SCAT)5303 Pinkney AvenueSarasota, FL 34233(941) 861-1234Director: Larry Brown
Jacksonville Transportation Authority (JTA)100 N Myrtle AvenueP.O. Drawer “O”Jacksonville, FL 32203(904) 630-3181Executive Director: Michael Blaylock
Space Coast Area Transit (SCAT)401 S Varr AvenueCocoa, FL 32922(321) 635-7815Director: Jim Liesenfelt
City of Key West Department of TransportationPO Box 1078Key West, FL 33040(305) 292-8160Director: Myra Hernandez
St. Lucie County Council on Aging1505 Orange AvenueFt. Pierce, FL 34950(772) 465-5220 or (772) 345-8212Contact: Darrell Drummond

Florida Transportation Almanac
311
Lakeland Area Mass Transit (LAMTD)1212 George Jenkins BoulevardLakeland, FL 33815(863) 688-7433Director: Steven Githens
SunTran2100 NE 30th AvenueOcala, FL 34470(352) 401-6999Contact: Steven Neal
Lee County Transit (LeeTran)10715 E Airport RoadFt. Myers, FL 33907(239) 277-5012Director: Steve Myers
Tallahassee Transit (TALTRAN)555 Appleyard DriveTallahassee, FL 32304(850) 891-5044Director: John L. Carter
Manatee County Area Transit (MCAT) 1108 26TH Avenue EastBradenton, FL 34208(941) 747-8621Director: Ralf Heseler
Tri-County Commuter Rail Authority (Tri-Rail)800 NW 33rd Street, Suite 100Pompano Beach FL, 33064(954) 942-7245Director: Joseph Giulietti
Martin County Transit1835 SE Airport RoadStuart, FL 34994(772) 283-1814Contact: Jerry Bryan
Volusia County (VOTRAN)950 Big Tree RoadSouth Daytona, FL 32119(386) 756-7496Director: Ken Fischer
Miami-Dade Transit (MDT)111 NW First Street, Suite 910Miami, FL 33128(305) 375-2597Director: Roosevelt Bradley
Winter Haven Area Transit (WHAT)1290 Golfview AvenueDrawer HS09, P.O. Box 9005Bartow, FL 33831(863) 534-5301Contact: Sandra Winegar
Florida Commission for the Transportation DisadvantagedJohn Stanley, Executive Director
605 Suwannee Street, MS-49Tallahassee, FL 32399-0450
(850) 410-57001-800-983-2435 (in state), 1-800-648-6048 (TDD only)
Florida’s Local Community Transportation Coordinators (CTCs)
ATC ParatransitJoyce O’Brien901 Northwest 8th Avenue, Suite B-1Gainesville, FL 32601(352) 384-9393Alachua, Levy
Citrus County TransitDan Greenough3600 West Sovereign Path, Suite 178Lecanto, FL 34461(352) 527-7630Citrus
Baker County Council on AgingPansy Ruise101 E Macclenny AvenueMacclenny, FL 32063(904) 259-2223Baker
Clay County Council on Aging, Inc.Sheryl Hartzog604 Walnut StreetGreen Cove Springs, FL 32043(904) 284-5978Clay
Bay County Council on AgingBeth Couliette1116 Frankford AvenuePanama City, FL 32401(850) 784-9360Bay
Collier County Board of County CommissionersJill Brown 2705 S Horseshoe Drive, Suite 211Naples, FL 34101(239) 213-5817Collier
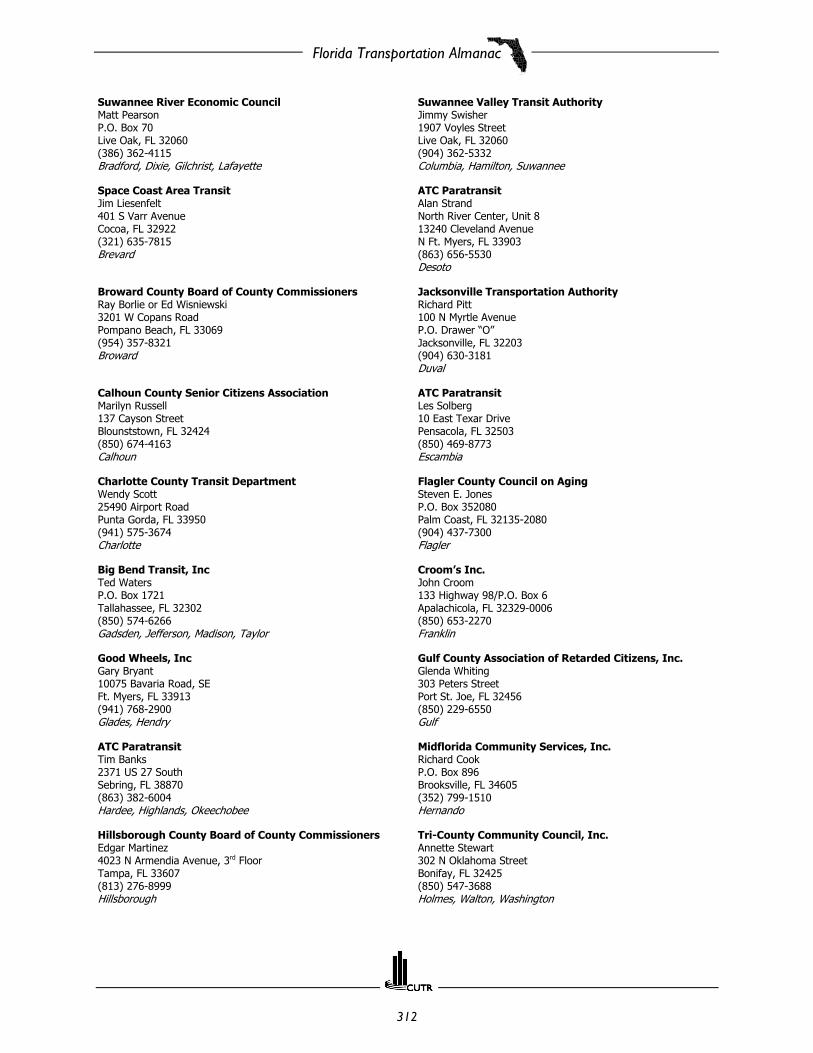
Florida Transportation Almanac
312
Suwannee River Economic CouncilMatt PearsonP.O. Box 70Live Oak, FL 32060(386) 362-4115Bradford, Dixie, Gilchrist, Lafayette
Suwannee Valley Transit AuthorityJimmy Swisher1907 Voyles StreetLive Oak, FL 32060(904) 362-5332Columbia, Hamilton, Suwannee
Space Coast Area TransitJim Liesenfelt401 S Varr AvenueCocoa, FL 32922(321) 635-7815Brevard
ATC ParatransitAlan StrandNorth River Center, Unit 813240 Cleveland AvenueN Ft. Myers, FL 33903(863) 656-5530Desoto
Broward County Board of County CommissionersRay Borlie or Ed Wisniewski3201 W Copans RoadPompano Beach, FL 33069(954) 357-8321Broward
Jacksonville Transportation AuthorityRichard Pitt100 N Myrtle AvenueP.O. Drawer “O”Jacksonville, FL 32203(904) 630-3181Duval
Calhoun County Senior Citizens AssociationMarilyn Russell137 Cayson StreetBlounststown, FL 32424(850) 674-4163Calhoun
ATC ParatransitLes Solberg10 East Texar DrivePensacola, FL 32503(850) 469-8773Escambia
Charlotte County Transit DepartmentWendy Scott25490 Airport RoadPunta Gorda, FL 33950(941) 575-3674Charlotte
Flagler County Council on AgingSteven E. JonesP.O. Box 352080Palm Coast, FL 32135-2080(904) 437-7300Flagler
Big Bend Transit, IncTed WatersP.O. Box 1721Tallahassee, FL 32302(850) 574-6266Gadsden, Jefferson, Madison, Taylor
Croom’s Inc.John Croom133 Highway 98/P.O. Box 6Apalachicola, FL 32329-0006(850) 653-2270Franklin
Good Wheels, IncGary Bryant10075 Bavaria Road, SEFt. Myers, FL 33913(941) 768-2900Glades, Hendry
Gulf County Association of Retarded Citizens, Inc.Glenda Whiting 303 Peters StreetPort St. Joe, FL 32456(850) 229-6550Gulf
ATC ParatransitTim Banks2371 US 27 SouthSebring, FL 38870(863) 382-6004Hardee, Highlands, Okeechobee
Midflorida Community Services, Inc.Richard CookP.O. Box 896Brooksville, FL 34605(352) 799-1510Hernando
Hillsborough County Board of County CommissionersEdgar Martinez4023 N Armendia Avenue, 3rd FloorTampa, FL 33607(813) 276-8999Hillsborough
Tri-County Community Council, Inc.Annette Stewart302 N Oklahoma StreetBonifay, FL 32425(850) 547-3688Holmes, Walton, Washington

Florida Transportation Almanac
313
Indian River County Council on AgingKaren WoodP.O. Box 2102Vero Beach, FL 32960(561) 569-0903Indian River
JtransSharon PeelerP.O. Box 1117Marianna, FL 32447(850) 482-7433Jackson
Lake County Board of County Commissioners (BOCC)Ken Harley315 West Main StreetTavares, FL 32778-7800(352) 253-6115Lake
ATC ParatransitAlan StrandNorth River Center, Unit 813240 Cleveland AvenueNorth Ft. Myers, FL 33903(941) 656-5530Lee
TaltranDonna Peacock555 Appleyard DriveTallahassee, FL 32304(850) 891-5199Leon
Liberty County TransitBrenda ClayP.O. Box 730Bristol, FL 32321(850) 643-2524Liberty
Manatee County Board of County CommissionersRalf Heseler1108 26th Avenue, EastBradenton, FL 34208(941) 747-8621Manatee
Marion County Senior Services, IncDonna Cart/Gail Cross1644 NE 22nd AvenueOcala, FL 34470(352) 629-8661Marion
Council on Aging of Martin County, Inc.Barbara TimmermanP.O. Box 3029Stuart, FL 34995(561) 223-7880Martin
Miami-Dade Transit AgencyHarry Rackard3300 NW 32nd AvenueMiami, FL 33142(305) 637-3754Miami-Dade
Guidance Clinic of the Middle KeysMaureen “Mo” Grynewicz3000 41st OceanMarathon, FL 33050(305) 434-9000Monroe
Care-A-Van Consolidated Transportation ServicesJohn Moses1367 S 18th StreetFernandina Beach, FL 32034(904) 261-0701Nassau
Okaloosa County Board of County CommissionersChristy Godwin1804 Lewis Turner Boulevard, Suite 200Ft. Walton Beach, FL 32547Phone (850) 651-7533Okaloosa
Lynx/A+ LinkLisa Darnell445 West Amelia Street, Suite 800Orlando, FL 32801(407) 841-2279Orange, Osceola, Seminole
Palm Beach Board of County CommissionersPalm Tran ConnectionDennis Dee, Director of Paratransit3040 South Military Trail, Suite CLake Worth, FL 33463(561) 649-9848 ext. 3030Palm Beach
Pasco County Public TransportationThelma Williams8620 Galen Wilson BoulevardPort Richey, FL 34668(727) 834-3200Pasco
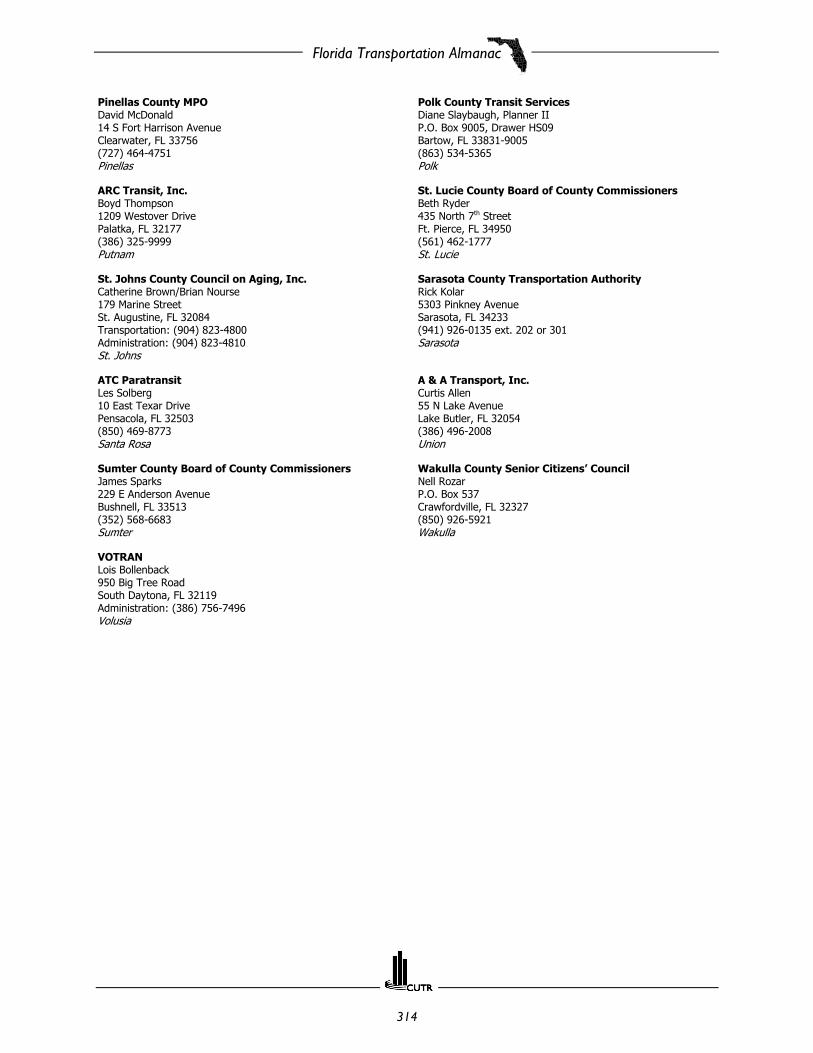
Florida Transportation Almanac
314
Pinellas County MPODavid McDonald14 S Fort Harrison AvenueClearwater, FL 33756(727) 464-4751Pinellas
Polk County Transit ServicesDiane Slaybaugh, Planner IIP.O. Box 9005, Drawer HS09Bartow, FL 33831-9005(863) 534-5365Polk
ARC Transit, Inc.Boyd Thompson1209 Westover DrivePalatka, FL 32177(386) 325-9999Putnam
St. Lucie County Board of County CommissionersBeth Ryder 435 North 7th StreetFt. Pierce, FL 34950(561) 462-1777St. Lucie
St. Johns County Council on Aging, Inc.Catherine Brown/Brian Nourse179 Marine StreetSt. Augustine, FL 32084Transportation: (904) 823-4800Administration: (904) 823-4810St. Johns
Sarasota County Transportation AuthorityRick Kolar5303 Pinkney AvenueSarasota, FL 34233(941) 926-0135 ext. 202 or 301Sarasota
ATC ParatransitLes Solberg10 East Texar DrivePensacola, FL 32503(850) 469-8773 Santa Rosa
A & A Transport, Inc.Curtis Allen55 N Lake AvenueLake Butler, FL 32054(386) 496-2008Union
Sumter County Board of County CommissionersJames Sparks229 E Anderson AvenueBushnell, FL 33513(352) 568-6683Sumter
Wakulla County Senior Citizens’ CouncilNell RozarP.O. Box 537Crawfordville, FL 32327(850) 926-5921Wakulla
VOTRANLois Bollenback950 Big Tree RoadSouth Daytona, FL 32119Administration: (386) 756-7496Volusia

Florida Transportation Almanac
315
Miscellaneous Transportation-Related Agencies and Organizations
Asphalt Contractors Association of Florida1007 E DeSoto Park Drive, #201Tallahassee, FL 32301(850) 222-7300Jim Warren, Executive Director
Floridians for Better Transportation136 S Bronough StreetTallahassee, FL 32301(850) 521-1256Douglas J. Callaway, President
Florida Association of Counties, Inc.100 S Monroe Street, P.O. Box 549Tallahassee, FL 32302(850) 922-4300C. Guy Maxcy, President
Institute of Transportation Engineers (District 10)300 Primera Boulevard, Suite 200Lake Mary, FL 32746(407) 805-0355David W. Gwynn, Jr., P.E., President
Florida Transportation Builders Association1007 East De Soto Park DriveTallahassee, FL 32301(850) 942-1404Robert Burleson, President
Orlando-Orange County Expressway Authority525 S Magnolia AvenueOrlando, FL 32801(407) 823-7277Allan E. Keen, Chairman
Florida Trucking Association, Inc.350 East College AvenueTallahassee, FL 32301(850) 222-9900Charles Brantley, President
Precast Concrete Structures Association, Inc.6710 Winkler Road, Suite 8Ft. Myers, FL 33919(239) 454-6549Ed Arabian, President
Federal Highway AdministrationFlorida Division Office227 N Bronough Street, Room 2015Tallahassee, FL 32301(850) 942-9650 ext. 3001James E St. John, Division Administrator
Underground Utility Contractors of Florida231 West Bay AvenueLongwood, FL 32750-4125(407) 830-1880R. Bruce Kershner, Executive Vice President

Florida Transportation Almanac
316

Florida Transportation Almanac
317
Chapter 9:MISCELLANEOUS

Florida Transportation Almanac
318
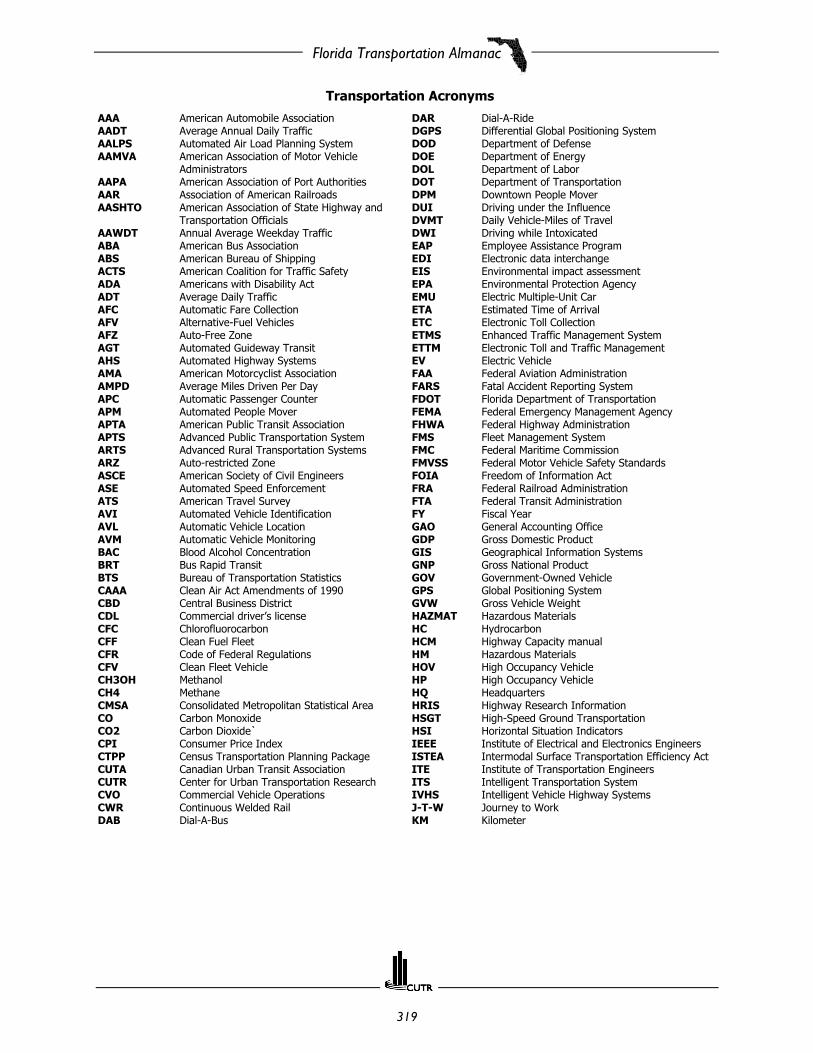
Florida Transportation Almanac
319
Transportation Acronyms
AAA American Automobile AssociationAADT Average Annual Daily TrafficAALPS Automated Air Load Planning SystemAAMVA American Association of Motor Vehicle
AdministratorsAAPA American Association of Port AuthoritiesAAR Association of American RailroadsAASHTO American Association of State Highway and
Transportation OfficialsAAWDT Annual Average Weekday TrafficABA American Bus AssociationABS American Bureau of ShippingACTS American Coalition for Traffic SafetyADA Americans with Disability ActADT Average Daily TrafficAFC Automatic Fare CollectionAFV Alternative-Fuel VehiclesAFZ Auto-Free ZoneAGT Automated Guideway TransitAHS Automated Highway SystemsAMA American Motorcyclist AssociationAMPD Average Miles Driven Per DayAPC Automatic Passenger CounterAPM Automated People MoverAPTA American Public Transit AssociationAPTS Advanced Public Transportation SystemARTS Advanced Rural Transportation SystemsARZ Auto-restricted ZoneASCE American Society of Civil EngineersASE Automated Speed EnforcementATS American Travel SurveyAVI Automated Vehicle Identification AVL Automatic Vehicle LocationAVM Automatic Vehicle MonitoringBAC Blood Alcohol ConcentrationBRT Bus Rapid TransitBTS Bureau of Transportation StatisticsCAAA Clean Air Act Amendments of 1990CBD Central Business DistrictCDL Commercial driver’s licenseCFC ChlorofluorocarbonCFF Clean Fuel FleetCFR Code of Federal RegulationsCFV Clean Fleet VehicleCH3OH MethanolCH4 MethaneCMSA Consolidated Metropolitan Statistical AreaCO Carbon MonoxideCO2 Carbon Dioxide`CPI Consumer Price IndexCTPP Census Transportation Planning PackageCUTA Canadian Urban Transit AssociationCUTR Center for Urban Transportation ResearchCVO Commercial Vehicle OperationsCWR Continuous Welded RailDAB Dial-A-Bus
DAR Dial-A-RideDGPS Differential Global Positioning SystemDOD Department of DefenseDOE Department of EnergyDOL Department of LaborDOT Department of TransportationDPM Downtown People MoverDUI Driving under the Influence DVMT Daily Vehicle-Miles of TravelDWI Driving while IntoxicatedEAP Employee Assistance ProgramEDI Electronic data interchangeEIS Environmental impact assessmentEPA Environmental Protection AgencyEMU Electric Multiple-Unit CarETA Estimated Time of ArrivalETC Electronic Toll CollectionETMS Enhanced Traffic Management SystemETTM Electronic Toll and Traffic ManagementEV Electric VehicleFAA Federal Aviation AdministrationFARS Fatal Accident Reporting SystemFDOT Florida Department of TransportationFEMA Federal Emergency Management AgencyFHWA Federal Highway AdministrationFMS Fleet Management SystemFMC Federal Maritime CommissionFMVSS Federal Motor Vehicle Safety StandardsFOIA Freedom of Information ActFRA Federal Railroad AdministrationFTA Federal Transit AdministrationFY Fiscal YearGAO General Accounting OfficeGDP Gross Domestic ProductGIS Geographical Information SystemsGNP Gross National ProductGOV Government-Owned VehicleGPS Global Positioning SystemGVW Gross Vehicle WeightHAZMAT Hazardous MaterialsHC HydrocarbonHCM Highway Capacity manualHM Hazardous MaterialsHOV High Occupancy VehicleHP High Occupancy VehicleHQ HeadquartersHRIS Highway Research InformationHSGT High-Speed Ground TransportationHSI Horizontal Situation IndicatorsIEEE Institute of Electrical and Electronics EngineersISTEA Intermodal Surface Transportation Efficiency ActITE Institute of Transportation EngineersITS Intelligent Transportation SystemIVHS Intelligent Vehicle Highway SystemsJ-T-W Journey to WorkKM Kilometer

Florida Transportation Almanac
320
K-&-R Kiss and rideLEM Linear Electronic MotorLIM Linear Induction MotorLOS Level of ServiceLPG Liquefied Petroleum GasLRRT Light Rail Rapid TransitLRT Light Rail TransitLRS Linear Referencing SystemLRV Light Rail VehicleLSM Linear Synchronous MotorLTPP Long Term Pavement PerformanceMCMIS Motor Carrier Management Information SystemMPG Miles Per GallonMPO Metropolitan Planning OrganizationMSA Metropolitan Statistical AreaMV Motor VehicleN2O Nitrous OxideNASS National Accident Sampling SystemNCHRP National Cooperative Highway Research ProgramNCSA National Center for Statistics and AnalysisNCTRP National Cooperative Transit Research and
Development ProgramNDR National Driver Register NEPA National Environmental Policy ActNETSIM Network SimulationNHI National Highway InstituteNHS National Highway SystemNHSTA National Highway Traffic Safety AdministrationNIMBY Not In My Back YardNM Nautical MileNOX Nitrogen OxideNPTS Nationwide Personal Transportation SurveyNRC National Research CouncilNTD National Transit DatabaseNTP National Transportation PolicyNTS National Transportation StatisticsNTSB National Transportation Safety BoardO3 OzoneOHS Office of Highway SafetyOMB Office of Management and BudgetOPEC Organization of Petroleum Exporting CountriesOSHA Occupational Safety & Health AdministrationPAX PassengerPCE Passenger Car EquivalencePDPS Problem Driver Pointer SystemPMS Pavement Management SystemPMSA Primary Metropolitan Statistical AreaPMT Passenger Miles TraveledPMT Person Miles of TravelPOV Privately Owned VehiclePPI Producers Price IndexPRT Personal Rapid TransitPSU Primary Sampling UnitPUMS Public-Use Microdata SampleRFP Request for Proposal
RGR Regional RailROW Right of WayRPM Revenue Passenger MileRRIS Railroad Research Information ServiceRRT Rail Rapid TransitRSPA Research and Special ProgramsRT Rail TransitRTAP Rural Technical Assistance ProgramRV Recreational VehicleSHRP Strategic Highway Research ProgramSM Statute MileSMPG Seat Miles Per GallonSMSA Standard Metropolitan Statistical AreaSO2 Sulfur DioxideSOV Single Occupancy VehicleSOX Sulfur OxideSTP Surface Transportation ProgramTACV Tracked Air Cushion VehicleTAZ Traffic Analysis ZoneTAZ Transportation Analysis ZoneTCP/IP Transmission Control Protocol/Internet ProtocolTCRP Transit Cooperative Research ProgramTCU Transportation Control UnitTDM Transportation Demand ManagementTDP Transit Development ProgramTDP Transit Development PlanTIC Traveler Information CenterTIGER Topological Integrated Geographic Encoding &
ReferencingTIP Transportation Improvement ProgramTMA Traffic Management AdvisorTMA Traffic Management AgencyTMA Transportation Management AssociationTQM Total Quality ManagementTRANSCAD Transportation Computer Assisted DesignTRB Transportation Research BoardTTI Texas Transportation InstituteUA Urbanized AreaUBOA United Bus Owners of AmericaUITP International Union of Public TransportUMTA Urban Mass Transportation Administration (Now
federal Transit Administration)UMTRIS Urban Mass Transportation Research Information
ServiceUTMS Urban Transportation Modeling SystemUTPS Urban Transportation Planning SystemUZA Urbanized AreaVHT Vehicle Hours TraveledVIN Vehicle Identification NumberVMT Vehicle Mile(s) TraveledVOR Vehicle Occupancy RateWTS Women’s Transportation SeminarWWW World Wide WebZEV Zero Emission Vehicle

Florida Transportation Almanac
321
SI* (MODERN METRIC) CONVERSION FACTORS
APPROXIMATE CONVERSIONS TO SI UNITS
Symbol When You Know Multiply by To Find Symbol
LENGTH
in inches 25.4 millimeters mm
ft feet 0.305 meters m
yd yards 0.914 meters m
mi miles 1.61 kilometers km
AREA
in2 square inches 645.2 square millimeters mm2
ft2 square feet 0.093 square meters m2
yd2 square yards 0.836 square meters m2
ac acres 0.405 hectares ha
mi2 square miles 2.59 square kilometers km2
VOLUME
fl oz fluid ounces 29.57 milliliters mL
gal gallons 3.785 liters L
ft3 cubic feet 0.028 cubic meters m3
yd3 cubic yards 0.765 cubic meters m3
NOTE: Volumes greater than 1000 l shall be shown in m3.
MASS
oz ounces 28.35 grams g
lb pounds 0.454 kilograms kg
T short tons (2000 lb) 0.907 megagrams Mg
TEMPERATURE (exact)
°F Fahrenheit temperature 5(F-32)/9or (F-32)/1.8
Celsiustemperature
°C
ILLUMINATION
fc foot-candles 10.76 lux lx
fl foot-Lamberts 3.426 candela/m2 cd/m2
FORCE and PRESSURE or STRESS
lbf poundforce 4.45 newtons N
lbf/in2 poundforce per square inch 6.89 kilopascals kPa
* SI is the symbol for the International System of Units. Appropriate rounding should be made to comply with Section 4 of ASTM E380.

Florida Transportation Almanac
322
SI* (MODERN METRIC) CONVERSION FACTORS
APPROXIMATE CONVERSIONS FROM SI UNITS
Symbol When You Know Multiply by To Find Symbol
LENGTH
mm millimeters 0.039 inches in
m meters 3.28 feet ft
m meters 1.09 yards yd
km kilometers 0.621 miles mi
AREA
mm2 square millimeters 0.0016 square inches in2
m2 square meters 10.764 square feet ft2
m2 square meters 1.195 square yards yd2
ha hectares 2.47 acres ac
km2 square kilometers 0.386 square miles mi2
VOLUME
mL milliliters 0.034 fluid ounces fl oz
L liters 0.264 gallons gal
m3 cubic meters 35.71 cubic feet ft3
m3 cubic meters 1.307 cubic yards yd3
NOTE: Volumes greater than 1000 l shall be shown in m3.
MASS
g grams 0.035 ounces oz
kg kilograms 2.202 pounds lb
Mg megagrams 1.103 short tons (2000 lb) T
TEMPERATURE (exact)
°C Celsiustemperature
1.8C + 32 Fahrenheittemperature
°F
ILLUMINATION
lx lux 0.0929 foot-candles fc
cd/m2 candela/m2 0.2919 foot-Lamberts fl
FORCE and PRESSURE or STRESS
N newtons 0.225 poundforce lbf
kPa kilopascals 0.145 poundforce per squareinch
lbf/in2
* SI is the symbol for the International System of Units. Appropriate rounding should be made to comply with Section 4 of ASTM E380.
Florida Transportation Almanac
323
INDEXACRONYMS . . . . . . . . . . . . . . . . . . . . . . . . . . . . . . . 319-320Age
Distribution, FL/US . . . . . . . . . . . . . . . . . . . . . . . . . . . . 20by Fla County . . . . . . . . . . . . . . . . . . . . . . . . . . . . . 21-29Fla/US . . . . . . . . . . . . . . . . . . . . . . . . . . . . . . . . . . . . . 14Trends, US/FL . . . . . . . . . . . . . . . . . . . . . . . . . . . . . 18, 19
Airports, FL . . . . . . . . . . . . . . . . . . . . . . . . . . . . 118, 303-308Costs . . . . . . . . . . . . . . . . . . . . . . . . . . . . . . . . . . . . . 268Inventory . . . . . . . . . . . . . . . . . . . . . . . . . . . . . . . . . . 268
Air Traffic Hubs, Statistics, Fla . . . . . . . . . . . . . . . . . . 119-120Amtrak, Cities Served, Fla . . . . . . . . . . . . . . . . . . . . . . . . . 149Automobile Registration Fee by State . . . . . . . . . . . . . . . . 263AVIATION . . . . . . . . . . . . . . . . . . . . . . . . . . . . . . . . 115-126Aviation Systems, Fla . . . . . . . . . . . . . . . . . . . . . . . . 121-125Bicycle/Pedestrian Facility Cost . . . . . . . . . . . . . . . . . . . . . 272Bridges
Construction Cost . . . . . . . . . . . . . . . . . . . . . . . . . . . . . 267Deficiencies, Fla . . . . . . . . . . . . . . . . . . . . . . . . . . . . . . 75Jurisdiction, Fla . . . . . . . . . . . . . . . . . . . . . . . . . . . . . . 75Preservation Cost . . . . . . . . . . . . . . . . . . . . . . . . . . . . . 267
CENSUS JOURNEY TO WORK TRAVEL . . . . . . . . . . . . . . 43-62Mode, Fla/US . . . . . . . . . . . . . . . . . . . . . . . . . . . . . . . . 47
CTCs, Fla Operating Statistics Summary, Fla . . . . . . . . . . . . . . . . . 133Summary by Passenger Type, Fla . . . . . . . . . . . . . . . . 134
Commuter Assistance Programs . . . . . . . . . . . . . . . . 169-170Construction Cost Inflation Forecast, FDOT . . . . . . . . . . . . 273Container Traffic, US/Fla . . . . . . . . . . . . . . . . . . . . . . . . . 163Cruise Embarkments and Disembarkments, Fla . . . . . . . . . . 166DEMOGRAPHICS . . . . . . . . . . . . . . . . . . . . . . . . . . . 1-30
Characteristics, Distribution, Fla/US . . . . . . . . . . . . . . . . 20Characteristics, by Fla County . . . . . . . . . . . . . . . . . . 21-29Characteristics, Trends, Fla/US . . . . . . . . . . . . . . . . . 18, 19
Departure Time to Workby Fla County . . . . . . . . . . . . . . . . . . . . . . . . . . . . . 54-62Fla/US . . . . . . . . . . . . . . . . . . . . . . . . . . . . . . . . . . . . . 48Trends, US/Fla . . . . . . . . . . . . . . . . . . . . . . . . . . . . . 50-53
DIRECTORY . . . . . . . . . . . . . . . . . . . . . . . . . . . . 289-316Education Level
Distribution, Fla/US . . . . . . . . . . . . . . . . . . . . . . . . . . . 20By Fla County . . . . . . . . . . . . . . . . . . . . . . . . . . . . . 21-29Fla/US . . . . . . . . . . . . . . . . . . . . . . . . . . . . . . . . . . . . . 15Trends, Fla/US . . . . . . . . . . . . . . . . . . . . . . . . . . . . . 18, 19
Ethnic OriginDistribution, Fla/US . . . . . . . . . . . . . . . . . . . . . . . . . . . 20By Fla County . . . . . . . . . . . . . . . . . . . . . . . . . . . . . 21-29Fla/US . . . . . . . . . . . . . . . . . . . . . . . . . . . . . . . . . . . . . 11Trends, Fla/US . . . . . . . . . . . . . . . . . . . . . . . . . . . . . 18, 19
Export Commodities, Fla . . . . . . . . . . . . . . . . . . . . . . . . . . 164Florida Department of Transportation . . . . . . . . . . 65, 295-296Florida, State of, Departments . . . . . . . . . . . . . . . . . 291-292Florid a Overseas Visitors by Country of Origi n. . . . . . . 239-240Foreign Trade, Fla . . . . . . . . . . . . . . . . . . . . . . . . . . . . . . 165
FREIGHT . . . . . . . . . . . . . . . . . . . . . . . . . . . . . . . . 171-184Commodities, Fla . . . . . . . . . . . . . . . . . . . . . . . . . 175-178Interstate by Mode, Fla . . . . . . . . . . . . . . . . . . . . . 181-184Intrastate by Mode, Fla . . . . . . . . . . . . . . . . . . . . . 179-180Movement, Fla . . . . . . . . . . . . . . . . . . . . . . . . . . . . . . . 174
Functional Classification, Fla Roads . . . . . . . . . . . . . . . . 76-84Gender
Distribution, Fla/US . . . . . . . . . . . . . . . . . . . . . . . . . . . 20by Fla County . . . . . . . . . . . . . . . . . . . . . . . . . . . . . 21Trends, Fla/US . . . . . . . . . . . . . . . . . . . . . . . . . . . . . 18, 19
-29
Greyhound Bus Agencies, Fla . . . . . . . . . . . . . . . . . . . . . . 139Guideway Structure Cost . . . . . . . . . . . . . . . . . . . . . . . . . 269HIGHWAYS . . . . . . . . . . . . . . . . . . . . . . . . . . . . . . . . 69-106Hispanic Origin
Distribution, Fla/US . . . . . . . . . . . . . . . . . . . . . . . . . . . 20by Fla County . . . . . . . . . . . . . . . . . . . . . . . . . . . . . 21-29Fla/US . . . . . . . . . . . . . . . . . . . . . . . . . . . . . . . . . . . . . 12Trends, Fla/US . . . . . . . . . . . . . . . . . . . . . . . . . . . . . 18, 19
Hotels/MotelsAverage Daily Room Rates . . . . . . . . . . . . . . . . . . . . . . 238Occupancy Rates . . . . . . . . . . . . . . . . . . . . . . . . . . . . . 238
HouseholdsCharacteristics . . . . . . . . . . . . . . . . . . . . . . . . . . . . . . . 36Fla/US . . . . . . . . . . . . . . . . . . . . . . . . . . . . . . . . . . . 16, 17Growth Rates, Fla/US . . . . . . . . . . . . . . . . . . . . . . . . . . . 5Size, Fla/US . . . . . . . . . . . . . . . . . . . . . . . . . . . . . . . . . . 6Travel Characteristics, Average . . . . . . . . . . . . . . . . . 36, 37Travel Characteristics, Trends . . . . . . . . . . . . . . . . . . . . 36Travel by Household Characteristics . . . . . . . . . . . . . . . . . . 36 Vehicle Growth Rates, Fla/US . . . . . . . . . . . . . . . . . . . . 36Vehicle Trip Data by Purpose . . . . . . . . . . . . . . . . . . . . 41
Import Commodities, Fla . . . . . . . . . . . . . . . . . . . . . . . . . 164INTELLIGENT TRANSPORTATION SYSTEMS . . . . . . . . 185-202Labor Force, Fla/US . . . . . . . . . . . . . . . . . . . . . . . . 9, 16, 17Level of Service Standards, FIHS . . . . . . . . . . . . . . . . . . . . 106Licensed Drivers
Fla/US . . . . . . . . . . . . . . . . . . . . . . . . . . . . . . . . . . . 16, 17Growth Rates, Fla/US . . . . . . . . . . . . . . . . . . . . . . . . . . . 6Percent Change, Fla/US . . . . . . . . . . . . . . . . . . . . . 16, 17per Household, Fla/US . . . . . . . . . . . . . . . . . . . . . 8, 16, 17
Median Household Incomeby Fla County . . . . . . . . . . . . . . . . . . . . . . . . . . . . . 21-29Fla/US . . . . . . . . . . . . . . . . . . . . . . . . . . . . . . . . . . . . . 13Trends, Fla/US . . . . . . . . . . . . . . . . . . . . . . . . . . . . . 18, 19
Metric Conversion Chart . . . . . . . . . . . . . . . . . . . . . . 321-322Metropolitan Planning Organizations, Fla . . . . . . . . 66, 300-301MISCELLANEOUS . . . . . . . . . . . . . . . . . . . . . . . . 317-322MODAL STATISTICS . . . . . . . . . . . . . . . . . . . . . . . 63-184Mode to Work
by Fla County . . . . . . . . . . . . . . . . . . . . . . . . . . . . . 54-62Fla/US . . . . . . . . . . . . . . . . . . . . . . . . . . . . . . . . . . . . 47Trends, US/Fla . . . . . . . . . . . . . . . . . . . . . . . . . . . . . 50-53
Motor Fuels

Florida Transportation Almanac
324
Consumption, Fla . . . . . . . . . . . . . . . . . . . . . . . . . . . . 97Use, US . . . . . . . . . . . . . . . . . . . . . . . . . . . . . . . . . . . 98
Motor Vehicle Registrations, Fla/US . . . . . . . . . . . . . . . . 101NHTS Household/Travel Characteristics . . . . . . . . . . . . . . 36Paratransit Trips, Fla . . . . . . . . . . . . . . . . . . . . . . . . . . 133PERSONAL TRAVEL . . . . . . . . . . . . . . . . . . . . . . . . . . 33-42Persons
per Household, Fla/US . . . . . . . . . . . . . . . . . . . . . 16, 17Trips, Miles, Trip Length . . . . . . . . . . . . . . . . . . . . . . . 39Trip Length . . . . . . . . . . . . . . . . . . . . . . . . . . . . . . . . 41Trip Travel Time . . . . . . . . . . . . . . . . . . . . . . . . . . . . 42
Place of Workby Fla County . . . . . . . . . . . . . . . . . . . . . . . . . . . . 54-62Trends, US/Fla . . . . . . . . . . . . . . . . . . . . . . . . . . . . 50-53
PopulationCharacteristics, Fla/US . . . . . . . . . . . . . . . . . . . 10, 16, 17Growth Rates, Fla/US . . . . . . . . . . . . . . . . . . . . . . . . . . 4
Port Authorities, Fla . . . . . . . . . . . . . . . . . . . . . . . . . . . 309Poverty Status
Distribution, Fla/US . . . . . . . . . . . . . . . . . . . . . . . . . . 20Fla/US . . . . . . . . . . . . . . . . . . . . . . . . . . . . . . . . . . . . 13Trends, Fla/US . . . . . . . . . . . . . . . . . . . . . . . . . . . 18, 19
Private VehiclesHouseholds, Fla/US . . . . . . . . . . . . . . . . . . . . . . . . . . . 36Occupancy, by Fla County . . . . . . . . . . . . . . . . . . . . 54-62Occupancy, Fla/US . . . . . . . . . . . . . . . . . . . . . . . . . . . 49Occupancy, Trends, US/Fla . . . . . . . . . . . . . . . . . . . 50-53
PUBLIC TRANSPORTATION . . . . . . . . . . . . . . . . . . 127-140RAIL . . . . . . . . . . . . . . . . . . . . . . . . . . . . . . . . . . . 141-150Rail Freight
Originations . . . . . . . . . . . . . . . . . . . . . . . . . . . . . . . 148Terminations . . . . . . . . . . . . . . . . . . . . . . . . . . . . . . 148Traffic, Fla . . . . . . . . . . . . . . . . . . . . . . . . . . . . . . . . 147Traffic History, Fla . . . . . . . . . . . . . . . . . . . . . . . . . . 146
Railroadsin Fla . . . . . . . . . . . . . . . . . . . . . . . . . . . . . . . . . . . 144Intermodal, Seaport Development Funding, WorkProgram, Fla . . . . . . . . . . . . . . . . . . . . . . . . . . . . . . 145Reason for Derailment, Fla . . . . . . . . . . . . . . . . . . . . 145
Regional Planning Councils, Fla . . . . . . . . . . . . . 67, 299-300Revenue Sources
Local Roads and Streets, Selected States . . . . . . . . . . 258State-Administered Highways, Selected States . . . . . . 257Used by Local Governments for Highways, Selected
States . . . . . . . . . . . . . . . . . . . . . . . . . . . . . . . . . 259Road Costs . . . . . . . . . . . . . . . . . . . . . . . . . . . . . . 265, 266School District Profiles, Fla . . . . . . . . . . . . . . . . . . . 135-138SEAPORTS . . . . . . . . . . . . . . . . . . . . . . . . . . . . . . 151-166State Highway System Summary
Centerline Miles . . . . . . . . . . . . . . . . . . . . . . . . . . . 85-87Daily Vehicle Miles Traveled . . . . . . . . . . . . . . . . . . 91-93By District . . . . . . . . . . . . . . . . . . . . . . . . . . . . . . . 72-75Lane Miles . . . . . . . . . . . . . . . . . . . . . . . . . . . . . . . 88-90
State Work Program Funding Sources . . . . . . . . . . . 274-277Taxes
Allocations, Vehicle-Related, Fla . . . . . . . . . . . . . . . . . 253Highway Fuel, Fla . . . . . . . . . . . . . . . . . . . . . . . . . . 253Locally Imposed Fuel, Fla . . . . . . . . . . . . . . . . . . 254-256Motor Fuel Rates, Diesel, US . . . . . . . . . . . . . . . . . . . 262Motor Fuel Rates, Gasoline, US . . . . . . . . . . . . . . . . . 261Sources, Transportation, Fla . . . . . . . . . . . . . . . . 250-251
TOLL FACILITIES . . . . . . . . . . . . . . . . . . . . . . . . . . 107-114SAFETY . . . . . . . . . . . . . . . . . . . . . . . . . . . . . . . 203-214
Definition of Terms . . . . . . . . . . . . . . . . . . . . . . . . . 206Summary of Traffic Crashes, Fla . . . . . . . . . . . . . . . . 207Crashes, Fla
by Month . . . . . . . . . . . . . . . . . . . . . . . . . . . . . . . 208by Age Group . . . . . . . . . . . . . . . . . . . . . . . . . . . . 209
Motoring Environment . . . . . . . . . . . . . . . . . . . . . . . 2105-Year Crash History
by County . . . . . . . . . . . . . . . . . . . . . . . . . . . . . . 2115-Year Fatality History
by County . . . . . . . . . . . . . . . . . . . . . . . . . . . . . . 2125-Year Bicycle Fatality History
by County . . . . . . . . . . . . . . . . . . . . . . . . . . . . . . 2135-Year Pedestrian Fatality History
By County . . . . . . . . . . . . . . . . . . . . . . . . . . . . . . 214TOURISM . . . . . . . . . . . . . . . . . . . . . . . . . . . . . 215-246
Development Tax Collections . . . . . . . . . . . . . . . . 243-244 Expenditures by State, US Top Ten . . . . . . . . . . . . . . 245
Regions in Fla (map) . . . . . . . . . . . . . . . . . . . . . . . . 234Taxable Sales, Fla . . . . . . . . . . . . . . . . . . . . . . . 241-242
TradePartners, Fla . . . . . . . . . . . . . . . . . . . . . . . . . . . . . . 162Waterborne, Fla . . . . . . . . . . . . . . . . . . . . . . . . . . . . 165
Traffic Signals, Cost, US Avg . . . . . . . . . . . . . . . . . . . . . 266Transit
Capital Costs, Rolling Stock . . . . . . . . . . . . . . . . . . . . 270Capital Funding Sources, Selected States . . . . . . . . . . 260Operating Funding Sources, Selected States . . . . . . . . 260Financial Characteristics . . . . . . . . . . . . . . . . . . . . . . 269
Transportation Commission, Fla . . . . . . . . . . . . . . . . . . 296Transportation Committees, Fla/US . . . . . . . . . . . . . 292-294TRANSPORTATION DEMAND MANAGEMENT . . . . . . 167-170Transportation Disadvantaged
Commission, Fla . . . . . . . . . . . . . . . . . . . . . . . . . 297-298TRANSPORTATION EDUCATION AND
RESEARCH . . . . . . . . . . . . . . . . . . . . . . . . . . 279-288Education Programs in Fla . . . . . . . . . . . . . . . . . . 282-285Research Centers in Fla . . . . . . . . . . . . . . . . . . . 286-287
TRANSPORTATION FINANCING . . . . . . . . . . . 247-277Transportation Management Associations, Fla . . 169, 302-303TRAVEL BEHAVIOR CHARACTERISTICS . . . . . . . 31-62Travel Demand Management in Florida . . . . . . . . . . . . . 167Travel by Income Category . . . . . . . . . . . . . . . . . . . . . . . 40Travel Time to Work
by Fla County . . . . . . . . . . . . . . . . . . . . . . . . . . . . 54-62Fla/US . . . . . . . . . . . . . . . . . . . . . . . . . . . . . . . . . . . . 48Trends, US/Fla . . . . . . . . . . . . . . . . . . . . . . . . . . . . 50-53
Turnpike Summary, Fla . . . . . . . . . . . . . . . . 94-96, 111-113
Florida Transportation Almanac
325
VehiclesAvailable . . . . . . . . . . . . . . . . . . . . . . . . . . . . . . . . . . 37 Income, F la/US . . . . . . . . . . . . . . . . . . . . . . . . . . . . . 40
Trips, Miles, and Trip Length . . . . . . . . . . . . . . . . . . . . 38Visitors to Fla, 2000 . . . . . . . . . . . . . . . . . . . . . . . . . . . 218
By Region . . . . . . . . . . . . . . . . . . . . . . . . . . . . . 235-236Forecast . . . . . . . . . . . . . . . . . . . . . . . . . . . . . . . . . 237
Visitors to Fla by AirActivities . . . . . . . . . . . . . . . . . . . . . . . . . . . . . . . . . 220and Auto, History . . . . . . . . . . . . . . . . . . . . . . . . 230-233Destinations . . . . . . . . . . . . . . . . . . . . . . . . . . . . . . 219Expenditures . . . . . . . . . . . . . . . . . . . . . . . . . . . . . . 221Number, by Airport . . . . . . . . . . . . . . . . . . . . . . . . . 228Number, by Month . . . . . . . . . . . . . . . . . . . . . . . . . . 227Trip Purpose . . . . . . . . . . . . . . . . . . . . . . . . . . . . . . 220Origins . . . . . . . . . . . . . . . . . . . . . . . . . . . . . . . . . . 219
Visitors to Fla by AutoActivities . . . . . . . . . . . . . . . . . . . . . . . . . . . . . . . . . 225and Air, History . . . . . . . . . . . . . . . . . . . . . . . . . 230-233Destinations . . . . . . . . . . . . . . . . . . . . . . . . . . . . . . 223Expenditures . . . . . . . . . . . . . . . . . . . . . . . . . . . . . . 226Number, by Month . . . . . . . . . . . . . . . . . . . . . . . . . . 229Trip Purpose . . . . . . . . . . . . . . . . . . . . . . . . . . . . . . 224Origins . . . . . . . . . . . . . . . . . . . . . . . . . . . . . . . . . . 222
Work DisabilityDistribution, Fla/US . . . . . . . . . . . . . . . . . . . . . . . . . . 20by Fla County . . . . . . . . . . . . . . . . . . . . . . . . . . . . 21-29Trends, Fla/US . . . . . . . . . . . . . . . . . . . . . . . . . . . 18, 19
WorkersGrowth by Journey to Work Mode, Fla/US . . . . . . . . . . 46Growth Rates, Fla/US . . . . . . . . . . . . . . . . . . . . . . . . . . 4per Household, Fla/US . . . . . . . . . . . . . . . . . . . 7, 16, 17Number of, Fla/US . . . . . . . . . . . . . . . . . . . . . . . 16, 17

Florida Transportation Almanac
326
FloridaTransportation
Almanac2003
CUTR Project Team:
Michael R. BaltesProject Manager
Lena LagoMichael WestRobb Brown
Project Assistants
Center for Urban Transportation ResearchCollege of Engineering, University of South Florida
4202 East Fowler Avenue, CUT100Tampa, FL 33620-5375
(813) 974-3120, SunCom 574-3120, FAX 974-5168E-mail: [email protected]
www.cutr.usf.edu
Dr. Edward Mierzejewski, Director