MTC - ROSA P
219
MTC METROPOLITAN TRANSPORTATION COMMISSION JOSEPH P. BORTMETROCENTER ● 101 EIGHTHSTREET ● OAKLANDCALIFORNIA94607-4700 w
-
Upload
khangminh22 -
Category
Documents
-
view
1 -
download
0
Transcript of MTC - ROSA P

MTCMETROPOLITANTRANSPORTATIONCOMMISSION
JOSEPHP. BORTMETROCENTER● 101 EIGHTHSTREET● OAKLANDCALIFORNIA94607-4700
w
I

San Francisco Bay Area1990 Regional Travel Characteristics
Working Paper #4
1990 MTC Travel Survey
bCharles L. Purvis, AICP
Senior Transportation Planner/Analyst
Planning SectionMetropolitan Transportation Commission
101 Eighth StreetOakland, California 94607-4700
DecembeT MM

~
*
l. O Introduction . . . . . . . . . . . . . . . . . . . . ...12.0 Weekday 1990 Regional Travel . . . . . . . . . . . . . . . . 5
2.1 Components of Regional Travel . . . . . . . . . . . . . . 62.2 Weekday Travel by Trip Purpose and Travel Mode . . . . . . . 92.3 Distribution of Weekday Trips by Time of Day . . . . . . . . 162.4 Reported Trip Duration by Trip Purpose and Travel Mode . . . . 30
3.0 Weekday 1990 Regional Household Trip Rates . . . . . . . . . . . 413.1 Regional Trip Rates by Trip Purpose and Travel Mode . . . . . . 413.2 Regional Trip Rates by Household Size . . . . . . . . . . . 433.3 Regional Trip Rates by Household Income . . . . . . . . . . 503.4 Regional Trip Rates by Vehicle Availability . . . . . . . . . 563.5 Regional Trip Rates by Housing Structure Type . . . . . . . . 613.6 Regional Trip Rates by County of Residence . . . . . . . . . 633.7 Regional Trip Rates by Workers in Household . . . . . . . . 663.8 Regional Trip Rates by Household Life Cycle . . . . . . . . . 713.9 Regional Trip Rates by Household Size by Vehicle Availability . . 753.10 Regional Trip Rates by Household Size by Workers in Household . 793.11 Regional Trip Rates by Workers in Household by Vehicle Availability 833.12 Regional Trip Rates by Density-Based Area Ty@ . . . . . .
4.0 Weekday 1990 Travel by Personal Characteristics . . . . . . . . .4.1 Travel by Ageof Person . . . . . . . . . . . . . . . .4.2 Travel by Age and Gender of Person . . . . . . . . . . .4.3 Travel by Employment Status and by Gender of Person . . . .4.4 Travel by Drivers License and by Gender of Person . . . . . .4.5 Travel by Disability Status and by Gender of Person . . . . . .
5.0 Weekday 1990 County Travel . . . . . . . . . . . . . . . .5.1 County Trips by Trip Purpose . . . . . . . . . . . . . .5.2 County Trips by Travel Mode . . . . . . . . . . . . . .5.3 County-to-County Trips . . . . . . . . . . . . . . . .5.4 County-Level Vehicle Occupancy . . . . . . . . . . . .
AmendicesAppendix I. O........ . . . . . . . . . . ...” .Appendix 2.0 . . . . . . . . . . . . . . . . . . ...” .Appendix 3.0 . . . . . . . . . . . . . . . . . . . . . . .Appendix 5.0 . . . . . . . . . --------------R4?!fexumoes . . . . . ---------- -.-.’-Acknowledgments . . . . . . . . . . . . . . . . . . . . . .
. 87
. 93
. 93102108112116120120124132136
138152179195
209

~IST OF TABLES
1.1 Characteristics of Household Travel Surveys Conducted in the San Francisco Bay Area . . . 4
2.1.1 Components of Regional Travel: Intraregional vs Interregional . . . . . . . . . . . . 7
2.1.2 Intraregional and Interregional Trips by Trip Purpose . . . . . . . . . . . . . . . . 82.2.1 1990 Regional Weekday Trips by Purpose and Detailed Travel Mode . . . . . . . . . 122.2.2 1990 Regional Weekday Trips by Trip Purpose at Origin & Destination . . . . . . . . 132.2.3 1990 Regioml Weekday Trips by Trip Purpose and Travel Mode . . . . . . . . . . - 142.2.4 1990 Regional Weekday Vehicle Occupancy by Trip Purpose . . . . . . . . . . . . 152.3.1 Distribution of 1990 Regional Weekday Trips by Time of Day — Time at Trip Origin: Comparisonby Mode& Trip Purpose . . . . . . . . . . . . . . . . . . . . . . . . . . . . 202,3.2 Distribution of 1990 Regional Weekday Trips by Time of Day — Time at Trip Destination:Compansonby Mode& Trip Purpose . . . . . . . . . . . . . . . . . . . . . . - 212.3.3 Distribution of Regional 1990 Weekday Trips-in-Motion by Time-of-Day: Percent Peak Hour ofDaily &Percent Work Trips of Peak Hour . . . . . . . . . . . . . . . . . . . .2.4.1 Regional 1990Weekday Reported Trip Duration by Purpose and Mode . . . . . . .2.4.2 Regional 1990Trip Duration Frequency Distribution by Trip Purpose . . . . . . . . .2.4.3 Regional 1990Trip Duration Frequency Distribution by Travel Mode . . . . . . .
3.1 1990Regional Trip Rates by Purpose and Mode . . . . . . . . . . . . . . .3.2.1 1990 Regional Transit Share for Trips per Household by Household Size . . . . . .3.2.2 1990 Regional Household Characteristics by Household Size . . . . . . . . . .3.3.1 1990 Regional Trips per Household by Household Income Tertile . . . . . . . . . .3.3.2 1990 Regional Trips per Person by Household Income Tertile . . . . . . . . . . . .3.3.3 1990 Regional Trips per Household by Household Income Quartile . . . . . . . . . .3.3.4 1990 Regional Trips per Person by Household Income Quartile . . . . . . . . . . .3.4.1 1990 Regional Transit Share for Trips per Household by Vehicle Availability . . . .3.4.2 1990 Regional Household Characteristics by Vehicle Availability . . . . . . . .3.5 1990 Regional Transit Share for Trips per Household by Structure Type . . . . . . .3.6 1990 Regional Transit Share for Trips per Household by County of Residence . . . .3.7.1 1990 Regional Trips per Household by Workers in Household . . . . . . . . . . .3.7.2 1990 Regional Trips per Person by Workers in Household . . . . . . . . . . . .3.8.1 1990 Regional Trips per Household and per Person by Household Life Cycle . . . . .3.8.2 1990 Regional Trips per Household by Trip Purpose by Household Life Cycle . . . . . .
z?
333438
4?
47
495?
535-I555860626568697374
3.9.1 1990 Regional Trips per Household by Household Size by Vehicles Available per Household —Total Modes . . . . . . . . . . . . . . . ...”””””.” -.”. ”””763.9.2 1990 Regional Trips per Person by Household Size by Vehicles Available per Household — TotalModes . . . . . . . . . . . . . . . . . ...”””.””.. .“””””77&9S 1990 ~S and kkmehdd p42@difM by Household W by Vehicles Available per
Household . . . . . . . . . . . . . . . ...””..”” ““”. ”””78
3.10.1 1990 Regional Trips per Household by How?hold Size by Warkers per Household — TotalMale s......’ . “--’””””’” ‘“”w3.10.2 1990 Regional Trips per Person by Household Size by Workers per Household — Total Modes 813.10.3 1990 Households and Household Population by Household Size by Workers per Household 82
-ii-
3.11.1 1990 Regional Trips per Household by Workers per Household by Vehicles Available perHousehold -Total Modes.... . . . . . . . . . . . . . . . . . . . . ...843.11.2 1990 Regional Trips per Person by Workers per Household by Vehicles Available per Household—Total Modes . . . . . . . . . . . . . . . . . . . . . . . . . . . . ...853.11.3 1990 Households and Household Population by Workers per Household by Vehicles Availableper Household . . . . . . . . . . . . . . . . . . . . . . . . . . . . ...863.12.1 1990 Regional Transit Share for Trips per Household by Area Type . . . . . . . . . 903.12.2 1990 Regional Walk Share for Trips per Household by Area Type . . . . . . . . . . 913.12.3 1990 Regional Bicycle Share for Trips per Household by Area Type . . . . . . . . . 92
4.1.1 Average Trips per Person and Trip Purpose Share by Age of Trip Maker . . . .4.1.2 Average Trips per Person and Trip Purpw Share by Age Group . . . . . . .4.1.3 Modal Share for Work and Total Trips by Age Group . . . . . . . . . . .4.2.1 Share of Population Reporting Travel by Age and Gender . . . . . . . . .4.2.2 Average Trips per Person and Trip Purpose Share by Age Group by Gender . . .4.2.3 Modal Share for Work and Total Trips by Age Group by Gender . . . . . . .4.3.1 Average Trips per Person and Trip Purpose Share by Employment Status by Gender4.3.2 Modal Share for Work and Total Trips by Employment Status by Gender . . .4.4.1 Average Trips per Person and Trip Purpose Share by Driver’s License by Gender .4.4.2 Characteristics of Persons by Driver’s License, Age and Gender . . . . . . .4.4.3 Modal Share for Work and Total Trips by Driver’s License by Gender . . . . .4.5.1 Average Trips per Person and Trip Purpose Share by Disability Status by Gender4.5.2 Modal Share for Work and Total Trips by Disability Status by Gender . . . .
. . . . 95
. . . . 99
. . . . 101
. . . . 105
.,. . 106
. . . . 107
. . . . 110
. . . . 111
. . . . 113
. . . . 114
. . . . 115
. . . . 118
. . . . 119
5.1.1 1990Weekday Trips by Trip Purpose and County of Production . . . . . . . . . .5.1.2 1990Weekday Trips by Trip Purpose and County of Attraction . . . . . . . . . .5.2.1 1990Weekday Home-Based Work Trips by Mode and County of Production . . . . . . .5.2.2 1990 Weekday Home-Based Work Trips by Mode and County of Attraction . . . . . . .5.2.3 Comparison of 1990Census and 1990Survey Modal Shares: Work Trips by County of Residence5.2.4 1990 Weekday Total Trips by Mode and County of Production . . . . . . . . . . . .5.2.5 1990 Weekday Total Trips by Mode and County of Attraction . . . . . . . . . . . .5.3.1 1990 Home-Based Work Trip Productions, Attractions, and Intra-County Trips . . . .5.3.2 1990 Total Trip Productions, Attractions, and Intra-County Trips . . . . . . . . .5.4 1990Vehicle Occupancy by Trip Purpose . . . . . . . . . . . . . . . . .
]’2~
12312712812913013113413s137
. . .-111-

/4PPENDIX TABLES
2.2.2A 1990 Regional Weekday Trips by Detailed Purpose at Origin and Destination . . . . . 1532.3.1A 1990 Dist. of Regional Weekday Trips by Time of Day: Total Modes: Time at Trip Origin . 1542.3.2A 1990 Distribution of Regional Weekday Trips by Time of Day: Total Modes: Time at TripDestination . . . . . . . . . . . . . . . . . . . . . . . . . . . . . ...1552.3.3A 1990 Distribution of Regional Weekday Trips by Time of Day: Person Modes: Time at TripOrigin . . . . . . . . . . . . . . . . . . . . . . . . . . . , . . . ...1562.3.4A 1990 Distribution of Regional Weekday Trips by Time of Day: Person Modes: Time at TripDestination . . . . . . . . . . . . . . . . . . . . . . . . . . . . . ...1572.3.5A 1990 Distribution of Regional Weekday Trips by Time of Day: Transit Modes: Time at TripOrigin . . . . . . . . . . . . . . . . . . . . . . . . . . . . . . . ...1582.3.6A 1990 Distribution of Regional Weekday Trips by Time of Day: Transit Modes: Time at TripDestination . . . . . . . . . . . . . . . . . . . . . . . . . . . . . ...1592.3.7A 1990 Distribution of Regional Weekday Trips by Time of Day: Vehicle Driver Modes: Time atTrip Origin . . . . . . . . . . . . . . . . . . . . . . . . . . . . . ...1602.3.8A 1990 Distribution of Regional Weekday Trips by Time of Day: Vehicle Driver Modes: Time atTrip Destination . . . . . . . . . . . . . . . . . . . . . . . . . . . ...1612.3.9A 1990 Distribution of Regional Weekday Trips by Time of Day: Drive A1one Modes: Time at TripOrigin . . . . . . . . . . . . . . . . . . . . . . . . . . . . . . . ...1622.3.1OA 1990 Distribution of Regional Weekday Trips by Time of Day: Drive Alone Modes: Time at TripDestination . . . . . . . . . . . . . . . . . . . . . . . . . . . . . . . . 163
2.3.11A 1990 Distribution of Regional Weekday Trips by Time of Day: ,Shared Ride Modes: Time atTrip Origin . . . . . . . . . . . . . . . . . . . ...’.. . . . . . ...1642.3.12A 1990 Distribution of Regional Weekday Trips by Time of Day: Shared Ride Modes: Time atTrip Destination . . . . . . . . . . . . . . . . . . . . . . . . . . . ...1652.3.13A Trips-in-Motion Analysis for 1990 Weekday Total Trips . . . . . . . . . . . . 1662.3.14A Trips-in-Motion Analysis for 1990 Weekday Person Trips . . . . . . . . . . 1672.3.15A Trips-in-Motion Analysis for 1990 Weekday Transit Trips . . . . . . . . . . . 1682.3.16A Trips-in-Motion Analysis for 1990 Weekday Vehicle Driver Trips . . . . . . . . 1692.3.17A Trips-in-Motion Analysis for 1990 Weekday Vehicle Passenger Trips . . . . . . . . 1702.3.18A Trips-in-Motion Analysis for 1990 Weekday Walk Trips . . . . . . . . . . 171
2.3.19A Trips-in-Motion Analysis for 1990 Weekday Bicycle Trips . . . . . . . . . . . 1722.3.20A Trips-in-Motion Analysis for 1990 Weekday Home-Based Work Trips . . . . . . . 1732.3.21A Trips-in-Motion Analysis for 1990 Weekday Home-Based Shop (Other) Trips . . . . 1742.3.22A Trips-in-Motion Analysis for 1990 Weekday Home-Based Social/Recreation Trips . 1752.3.23A Trips-in-Motion Analysis for 1990 Weekday Home-Based School Trips . . . . . . 1762.3.24A Trips-in-Motion Analysis for 1990 Weekday Non-Home-Based Trips . . . . . . 177
2.3.25A Trips-in-Motion Analysis — Share of Trips by Trip Purpose by Time Period . . . . 178
-iv-

3.2.1A 1990 Regional Trips per Household by Household Size . . . . . . . . .3.2.2A 1990 Regional Trips per Person by Household Size . . . . . . . . . . .3.3.1A 1990Regional Trips per Household by Detailed Household Income Group . .3.3.2A 1990Regional Trips per Person by Detailed Hou*hold Income Group . . . .3.3.3A 1990 Regional Transit Share for Work and Total Trips per Household by Income3.4.1A 1990 RegionaI Trips per Household by Vehicle Availability . . . . . . .3.4.2A 1990 Regional Trips per Person by Vehicle Availability . . . . . . . . .3.5.1A 1990 Regional Trips per Household by Housing Structure Type . . . . . . .3.5.2A 1990Regional Trips per Person by Housing Structure Type . . . . . . . .3.6.1A 1990 Regional Trips per Household by County of Residence . . . . . . . .3.6.2A 1990 Regional Trips per Person by County of Residence . . . . . . . . . .3.12.1A 1990 Regional Trips per Household by Density-Based Area Type . . . . .3.12.2A 1990 Regional Trips per Household by Density-Based Area Type . . . . .
. . . . 180
. . . . 181
. . . . 182
. . . . 183
. . . . 184
. . . . 185
. . . . 186
. . . . 187
. . . . 188
. . . . 189
. . . 191
. . . . 193
. . . . 194
5.3.1A 1990 County-to-County Home-Based Work Trips by Mode . . . . . . . . . . . 1965.3.2A 1990 County-to-County Home-Based Shop (Other) Trips by Mode . . . . . . . . . 1985.3.3A 1990 County-to-County Home-Based Social/Recreation Trips by Mode . . . . . . . 2005.3.4A 1990County-to-County Home-Based School Trips by Mode . . . . . . . . . . 2025.3.5A 1990County-to-County Non-Home-Based Trips by Mode . . . . . . . . . . . . . 2045.3.6A 1990 County-to-County TOTAL Trips by Mode . . . . . . . . . . . . . . . 206
-v-

MT OF FIGURES
2.3.12.3.22.3.32.3.42.3.52.3.62.3.72.4.1
3.2.13.2.23.2.33.4.13.7.1
4.1.14.1.24.1.3
1990 Weekday Trips in Motion by Time-of-Day by Trip Purpose . . . . . . . . . . .1990 Weekday Home-Based Work Trips in Motion by Time-of-Day . . . . . . . .1990 Weekday Home-Based Shop (Other) Trips in Motion by Time-of-Day . . . . . .1990 Weekday Home-Based Social/Recreation Trips in Motion by Time-of-Day . . . . .1990 Weekday Home-Based School Trips in Motion by Time-of-Day . . . . . . . . .1990 Weekday Non-Home-Based Trips in Motion by Time-of-Day . . . . . . . . . .Tnp Purpose Share by Time-of-Day . . . . . . . . . . . . . . . . . . . . .Trip Duration Frequency Distribution: Weekday Trips by Trip Purpose . . . . . . . .
1990Trips per Household by Household Size and Trip Purpose . . . . . . . . . . .1990Trips per Person in Household by Household Size and Trip Purpose . . . . . . . .Regional Transit Share by Household Size . . . . . . . . . . . . . . . .Regional Transit Share by Vehicle Availability . . . . . . . . . . . . . . . .
1990Trips per Household by Workers in Household by Trip Purpose . . . . . . .
Average Total Trips per Person by Age of Trip Maker . . . . . . . . . . . . . .Share of Trips by Trip Purpose by Age of Trip Maker . . . . . . . . . . . . .Share of Tnpsby Trip Purpose by Age Group . . . . . . . . . . . . . . . . .
232.4252627282937
4546485970
9798
100
-vi-
1.0 Introduction
This working paper is the fourth in a series to document analysis and results fromthe 1990 MTC household travel survey. Previous working papers on the 1990 travelsurvey covered survey design issues, sample weightinglinking procedures.
Working paper #4 on the 1990 household travel survey
and expansion, and trip
is structured similarly toworking paper #8 on the 1981 MTC household travel survey (1980 Regional TravelCharacteristics: Working Paper #8.o 1981 MTC Travel Survey, published June 1983.)The reader is encouraged to compare and contrast results from the 1981 and 1990 BayArea travel surveys by using this working paper alongside the older report. Thereport structure and table numbering sequence are similar so as to assist in
comparisons.
The purpose of this paper is to report weighted and expanded results of the 1990
household travel survey in terms of regional and sub-regional travel characteristics.
The focus of this research is 1990 average weekday, intraregional personal travel
made by residents of the nine-county San Francisco Bay Area. Excluded from this
analysis are weekend travel, interregional travel, commercial travel, and travelmade by non-residents of the Bay Area. Weighted, expanded travel data in thisreport is based on the “single-weekday” sample from the 1990 household surveydiscussion below on the “single-weekday” versus “multiple-weekday” samples.)
Section 2.0 of this report describes 1990 average weekday regional travel inferred
(see
from the 1990 household travel survey. This section includes information on thecomponents of regional travel, travel by trip purpose and travel mode, travel bytime-of-day, and reported trip duration.
Section 3.0 of this working paper describes average regional household trip rates(trips per household, trips per person-in-household) by various classifications. Triprates are reported by trip purpose and by travel mode.
Section 4.0 of this working paper discusses travel patterns classified by the personalfharaderistiss of * lrip maker. T&se characteristics include age, gender,employment status, drivers license status, and disability status. (Note that there isnot a mmparable section in the 1981 travel survey working paper ##8cm trave!patterns by personal characteristics+)
-1-

Section 5.0 of this working paper reports on county-level trip rates and county-to-county travel patterns inferred from the weighted, expanded survey data files.
Appendices to Working Paper #4 provide additional detailed information toaugment the main set of tables. The appendix tables contain detailed information ontravel by time-of-day (time at trip start, time at trip destination, “trips-in-motion”),detailed trip rates by trip purpose by travel mode by various categories, and detailedcounty-to-county person trip tables by trip purpose and travel mode.
Appendix #1 to Working Paper #4 includes copies of the telephone interview formsused in the 1990 survey; and copies of the trip diary cards and instructions mailed to
survey respondents.
Background: Household Travel Survevs in the San Francisco Bav Area
The 1990 MTC household travel survey is the third household travel survey
conducted in the Bay Area over the past 25 years. Characteristics of these three
surveys are summarized in Table 1.1.
The first major survey, the 1965 home-interview survey, collected weekday and
weekend daily travel data from over 30,000 Bay Area households. This was a
traditional face-to-face “home interview” survey, where staff of the Bay AreaTransportation Study Commission (BATSC) went into the homes of Bay Arearesidents to conduct the survey. In addition to the traditional household travelsurvey, the - n”” /.- ..,. ,. ,1.. 1 .1 .1.
surveys fordatabase.
lwm survey enorts mcluaea trucK/taxi surveys ana orner auxmarydevelopment of a comprehensive regional transportation planning
major household travel survey in the Bay Area was conducted in 1981.The secondThis was a telephone survey, where initial contacts were made by telephone; traveldiary cards were mailed to participating households; and travel diary data wasretrieved in follow-up phone calls. The 1981 survey collected weekday and weekenddaily travel data from over 7,000 households during the spring of 1981.
The 1990 household travel survey was similar to the 1981 survey in tams ofrespondent contact and data collection techniques. The 1990 survey collected single-weekday travel data from nearly 9,400 Bay b households and multiple-weekda~travel data +rum nearly 1,5U0 Bay Area households. The 1990 survey effort akwincluded a separate sub-project, funded by the Bay Area Rapid Transit District, to
-2-

collect multiple-weekday travel data from 1,000 BART-using households. (TheBART-using households were identified and contacted based on responses to on-board surveys conducted by the BART District in 1988 and 1989). The BART surveyand the MTC multiple-weekday survey were completed in the spring of 1990; theMTC single-weekday survey was continued and completed during the autumn of1990.
The MTC/BART multiple-weekday household travel surveys were the first large-scale attempt at collecting multiple-weekday travel data in the United States. Thisdatabase will be used for exploratory analysis into the day-to-day variability of travelwithin the Bay Area as well as other research and travel model developmentexercises. Other international multiple-weekday household travel surveys includethe 1973 Reading, England surveys; the 1971 Uppsala, Sweden surveys; and the 1984wave of the Dutch National Mobility Panel Survey. Recent (1994) efforts atconducting multiple-weekday surveys include the Portland, Oregon MetropolitanService District (Metro) household travel surveys.
Working Paper #4 results are based on the MTC single-weekday household travelsurvey sample, @ the multiple-weekday sample.
-3-

Table 1.1Characteristics of Household Travel SurveysConducted in the San Francisco Bay Area
1965 1981 1990
Home Telephone Telephone
Interview Travel Travel
Characteristic Survey Survey Survey
#of HHs, Weekday 20,486 6,209 9,359
#of HHS, Weekend 10,200 882 0
#of HHs, MultiDay o 0 1,479
#of HHs, Total 30,6861 7,0911 10,838
TOTAL HOUSEHOLDS 1,387,000 1,970,500 2,246,200
Average Sampling Rate 2.21% 0.36% 0.48%
Survey Cost (current $) I $1,533,500 $337,0001 $1,000,000
Survey Cost (1990 $) I $6,672,000 I $498,0001 $1,000,000
Cost per Interview (1990 $) I $2171 $701 $92s 1 , ,
Methodology Home-Interviewl Telephone; ] Telephone;—.(Face-to-Face) phone retrieval phone retrieval
“Pencil-and-Paper” of trip diaries of trip diaries‘fPencil-and-Paper” “Pencil-and-Paper”
Households Contacted I NA 11,000 23,600
Survey Response Rate NA 64.5’% 45.9%Survey Conducted by. . . . In-House (Bay Area Consultants: Consultants:
Transportation Study Crain & Assoc. E.H. White& Co.Commission) Opinion Research Nelson/Nygaard
Phase 111Market
-4-

200 Weekdav 1990 Redonal Travel
This section reports the aggregate total number of weekday trips made by Bay Arearesidents in 1990. The trips are estimated from the weekday daily travel diaries fromthe MTC “single-day” sample. Appendix 1 provides information on the detailedsurvey data items, definitions and abbreviations used in this working paper.
The detailed trip purposes recorded in this survey are aggregated to five generalpurposes:
● Home-Based Work. Home-Based Shop (Other). Home-Based Social/Recreation. Home-Based School● Non-Home-Based
A distinction is made between “home-based” and “non-home-based” trips. Home-based trips are those that start or end at the residence of the tripmaker. Non-home-based trips are those that have neither trip end at home.
Home-based work trips are those made by employed persons directly from home-to-work and work-related business, and back to home. Home-based social/recreationtrips are those made by household members from home-tp-visit, eat a meal,recreation, and back to home. Home-based school trips are those made by studentsfrom home-to-school and school-to-home. Home-based shopping is a catchallcategory for the balance of home-based trips. It includes grocery shopping,comparison and convenience shopping, personal business, medical/ dental, servingor “escorting” passengers, other trip purposes, and back-to-home.
In a similar manner to trip purposes, the 24 survey travel modes are aggregated toseven general means of transportation:
. Vehicle Driver● Vehicle Passenger. Transit Passenger● School Bus Passenger. Walk● Bicycle● Other
Vehicle driver includes automobile driver, truck driver, van driver, and motorcycledriver. Vehicle passenger includes auto, truck, van and motorcycle passengers.Transit includes all public bus, rail and fary passenger modes. Walk, school-bus andbicycle am stand alone travel modes. Mode other is a catdudl category to inihxkairplane, moped, and “other” (e.g., skateboard, rollerblades, wheelchair, horse, boat).
-5-
2.1 Components of Re~ional Travel
The purpose of this subsection is to identify the different travel markets thatcomprise regional travel in the Bay Area, and to understand the nature and scope ofthe 1990 household travel survey in providing information on these markets.
Regional travel can be characterized in several dimensions. The first dimensiondiscussed is that of commercial versus personal travel. Commercial trips are madeby drivers (and possibly passengers) of commercial vehicles as part of their dailywork activities. Commercial trips include the delivery of goods, services, andpassengers (bus drivers, train operators), Personal trips are made to satisfy the traveldemands of households and household members.
A second dimension of regional travel is by internal trips versus external trips.These are also known as the intraregional versus interregional travel markets.Intraregional trips are those trips both beginning and ending in the same region.Interregional trips have at least one trip end located outside the region.Interregional trips may also be throughthe region.
A third dimension of regional travel is
trips, with neither end of a trip located
for resident and non-resident travel.
in
Resident travel within a region is self-evident. Non-resident travel can be furtherbroken down into tourist travel, work business travel, personal business travel andcommute travel. Non-resident travel can be either intraregional (both ends of thetrip within the Bay Area) or interregional (typically, commuters from the CentralValley commuting to jobs in the Bay Area). Since the 1990 Bay Area householdtravel survey was based on Bay Area resident households, no information on non-resident travel patterns are available, or reported from this survey.
Bay Area resident intraregional and interregional trips are summarized in Table2.1.1. Both sample and expanded trips are shown. Of the 17.1 million daily persontrips in the Bay Area, 1.2 percent are interregional and 98.8 percent are intraregional.Intraregional and interregional trips by the five general trip purposes are shown inTable 2.1.2. Interregional trips tend to be oriented to home-based social/recreationtravel as well as non-home-based travel (neither end of the trip at the Tesidents’home). OverU 26.3 percent of Bay Axes residential trips are home-based work trips;24.9 percent are home-based shq (other); 11-1 p--t =e ~ba=d M ~recreation; 9.7 percent are home-based school; and 28.0 percent are non-home-based.
-6-

Table 2.1.1
Components of Regional Travel: Intraregional vs Interregional
Percent of
Sampled Expanded Total DailySurvey Component Component of Travel Trips Trips Person Trips
Single Day Sample Intraregional (1/1) 69,914 16,966,735 98.8%
Interregional (1/X) 860 197,478 1.2%
Total 70,774 17,164,213 100.0%
Multiple Day Sample Intraregional (1/1) 36,795 NA NA
Interregional (1/X) 367 NA NA
Total 37,162 NA NA
-7-

Table 2.1.2Intraregional and Interregional Trips by Trip Purpose
I Intra- Percent ofl Inter- Percent of Total Percent of
Regional
Home-Based Work 4,471,983 26.4% 37,987 19.2% 4,509,970 26.3%
Home-Based Shop I 4,247,776 25.0%1 23,802 12.1%1 4,271578 24.9%
Home-Based Social/Recreation I 1,858,435 11.0% 43,966 22.3% 1,902,401 11.1%
Home-Based School I 1,671,377 9.9% 1/392 0.7% 1,672,769 9.7%
Non-Home-Based I 4,717,164 27.8%[ 90331 45.7% I 4,807,495 28.0%
Total I 16,966,735 100.O%I 197,478 I(x).o%l 17,164,213 100.0%
-8-

2.2 Weekdav Travel bv Triu Pumose and Travel Mode
This section reports on the expanded, weekday travel by trip purpose and travel
mode. This consists of the region’s 17 million intraregional daily person trips.
Regional trips by the detailed travel modes and the five general trip purposes areshown in Table 2.2.1. The lower part of Table 2.2.1 shows regional trips with travelmodes aggregated to seven general travel means by five general trip purposes.Twenty-four separate modes were collected in the 1990 survey.
The largest share and number of trips in the Bay Area is automobile drivers, at 10.7million out of the 17,0 million regional trips, or 63 percent of all trips. The secondlargest market is automobile passengers, comprising 2.7 million trips, 16.2 percent ofall trips. Walk trips are the third largest travel mode, with 1.7 million daily walktrips, or 9.9 percent of all daily trips in the region. After walk trips, public buspassengers account for 691,000 trips (4.1 percent); bicycle trips are 254,000 trips (1.5percent); and BART (Bay Area Rapid Transit) accounts for 252,000 daily trips (1.5percent).
Transit trips comprise 6.3 percent of all trips in the Bay Area in 1990. Bus passengersare 64.3 percent of all transit riders in the Bay Area, followed by BART with 23.4percent of transit ridership; and streetcar modes with 4.6 of all transit ridership.Table 2.2.1 can also be used to characterize the trip purpose share for transit sub-modes. Overall, 41.8 percent of all transit trips are home-based work. In comparison,61.5 percent of BART trips and 80 percent of CalTrain trips are home-based work.
Regional trips by general purpose at trip origin and general purpose at tripdestination are summarized in Table 2.2.2. (Regional trips by detailed trip originpurpose and detailed trip destination purpose are summarized in appendix Table2.2.2A.) The trip purposes “work” and “work-related are broken out separately inthis table. This information is useful in showing some of the imbalances in home-based work trips depending if the home-end of a trip is the origin or destination.Note that regional home-to-work trips (2.24 million) are 18.6 percent higher thanwork-to-home trips (1.89 million). This is because people are more likely to divertfrom their work-to-home commute to take care of personal business or shoppingtrips. Jn the .xmrning (typic.aJ borne-~work and home-to-school commute) workers
(ZmdSim%?nts) are mm-e likely to Iwad directly to Wox’k<OrSchOcd).
-9-

Note that the largest non-home-based (NHB) submarket is for shop(other)-to-shop(other) trip purposes (1.01 million out of 4.72 million trips). The second largestnon-home-based submarket are the work-to-social/recreation and social /recreation-to-work trips (723,000) which are, for the most part, midday work-to-lunch andlunch-to-work trips. Non-home-based trips can further be broken down into non-home-based work-or-work-related trips (NHBW) at 2.55 million trips (54 percent ofall NHB trips); and non-home-based non-work trips (NHBNW) at 2.17 million trips(46 percent of all NHB trips).
Regional trips by general trip purpose and general travel mode are shown in Table2.2.3. The row percentages in this table are mode-specific trip purpose shares. Thecolumn percentages are purpose-specific modal shares. Vehicle driver mode sharesrange from 21 percent for home-based school trips to 78 percent for home-basedwork trips. Vehicle passenger mode shares range from a low of 12.2 percent forhome-based work trips to a high of 26.3 percent for home-based shop (other) trips.
Transit mode shares for home-based shop, home-based social/recreation and non-home-based trip purposes are approximately the same at 3.3 to 4.3 percent of all trips.Home-based work trips (10.0 percent) and home-based school trips (11.3 percent)have significantly higher transit shares.
Bicycle mode shares range from 0.9 percent of non-home-based trips to 4.2 percent ofhome-based school trips. The home-based work bicycle share is 1.3 percent. Walkmode shares range from 3.0 percent of home-based work trips to 21.5 percent ofhome-based school trips.
The plurality of regional transit trips (41.8 percent) are for home-based work trips. Incontrast, only 8.1 percent of regional walk trips are from home-to-work or work-to-home. The plurality of regional walk trips (38.4 percent) are non-home-based trips.
Note that the mode “school bus passenger” are assigned exclusively to the home-based school trip purpose. Trips where the respondent reported travel as a schoolbus passenger, but for other than school trip purposes, are grouped together in mostof the analyses in this working paper as mode “other.”
Regional vehicle occupancy rates are reported in Table 2.2.4. Vehicle occupancy isdtiby~-~smdw-~v~ti~~a~ bv themurntwr of vtilck driver trips. T’he Tegional vehicle fxcupancy in the Bay Area II,
1990 is 1.258 persons per vehicle. This ranges from a low of 1.099 persons per vehicle
-1o-

forhome-based work trips toahighof 2.521 persons pervehicle for home-basedschool trips.
These vehicle occupancy calculations are basically rough estimates, given that anyparticular vehicle trip may contain multiple passengers (driver, passengers) withdifferent trip purposes. The driver may be escorting his or her child from home-to-school. This is a “home-based shop (other)” trip for the vehicle driver (the parent)yet is classified as a “home-based school” trip for the child. Another example is aparent escorting a child to school and then continuing on to work. In the MTClinked-trip procedures, the parent’s trip will be considered a home-to-work trip witha vehicle occupancy of two persons.
-11-

Table 22.11990 Regional Weekday Trips by Purpose and Detailed Travel Mode
DetailedMode1. AutoKMver2. AutoPassenger3. TruckDriver
4. Truck Passenger
5. Van Driver
6. Van Passenger
7. Taxi, Limo Pssgr.
8. Public Bus kgr.
9. School BUS Pssgr.
10. Cable Car Pssgr.
11. Streetcar Pssgr.
12. Shuttle Bus Pssgr.
13. Dial-a-Ride Pssgr.
14. BART Passenger
15. CalTrain Pssgr.
16. AMTRAK Pssgr.17. Airplane Pssgr.
18. Ferry Passenger
19. Motorcycle Driver
20. Motorcycle Pssgr.
21. Moped
22. Bicycle
23. Walk
24. Other
TOTAL
3. B, Work -L B. Shop IH. B. soc/Rec IH. B. Schooldumber Percent lNumber Percent lNumber Pement lNumber Percent
1,414,390 76.4%
319373
33,340
7,413
11,360
15,198
3,559
240,781
1,357
1,520
21,396
8,734
57@
155,093
13,752
0
0
6,222
18,407
2,145
2,683
57,091
136,018
7.1%
0.7%
0.2’%
0.3%
0.3%
0.1%
5.4%
0.0%
0.0’%
0.5%
0.2’%
0,0%
3.3%
0,3%
0.0’%
0.0%
0.1 %
0.47.
0.07G
0.1%
1.37.
3.07.1,380 0.0%
,471,982 100.O%
!,915,749 68.670 1,000/274 53.870 337JO0 20.29c
732,164 17.2’% 508,111 27.3% 525,436 31.4%
14,751 0.3’% 7#204 0.4% 3/325 0.2%
1,956 0.0’% 2,137 0.1% 1,957 0.1%
12,061 0.3% 2,030 0.1% 3/206 0.2%
5,973 0.1% 4/330 0.2% 5/261 0.3%
4,738 0.1% 2,932 0.2% o 0.0%
135,433 3.2’7. 41,881 2.3% 156,793 9.4’%
1,952 0.0% 1,944 0.1% 168581 10.1%
917 0.0% o 0.0% o 0.0%
8,583 0.2% 1,951 0.1% 5,057 0.3%
2,777 0.1’% 836 0.0% 2,958 0.270
0 0.0’% o 0.0% o 0.0%
21,838 0.5?7. 14,4(M 0.8% 22,630 1.4%
703 0.0’?. 655 o.oyo 400 0.0%
o 0.0% o 0.0% o 0.0’%
o 0.070 0 0.0’% o 0.0%
395 0.0% 375 0.0% 210 0.0%
7,200 0.2% 6,547 0.4% 6/229 0.4’%
1,476 0.070 1,081 0.1% 173 0.0%
1,983 0.0% 1,499 0.1% 1,745 : 0.1%
31,594 0.7% 55,395 3.0% 69,750 4.2%
339,729 8.0% 200,471 10.8% 358,918 21.5%
5,802 0.1 % 4,377 0.2’% 1249 0.1 ‘%
,247,776 100.09. 1,858,434 100.0% 1,671)378 100.0% I
~on-Hom~Based lTotal PurposesJumber Percent Number - Percent
3,023,485 64.1% 10,691,398 63.0%
661,418
68,114
8,704
22,075
13,120
2,912
116,597
25,015
1,659
12,009
6,535
0
38,395
1,651
0
371
2,201
7,087
3,303
1/260
40,147
644,931
14.0% 2,746,702
1.4% 126,734
0.296 22,167
0.5% 50,732
0.3% 43,882
0.1% 14,141
2.5% 691,485
0.5% 198,849
0.0?4 4,096
0.3% 48,998
0.1% 21,840
0.0% 570
0.8% 252,360
0.0% 17,161
0.0% o
0.0% 371
0.090 9,403
0.2% 45,470
0.1% 8,I78
0.0% 9,170
0.9% 253,977
13.7% 1,680,067
16.2%
0.7’%
0.1’%
0.3%
0.3%
0.1%
4.1%
1.2%
0.0%
0.3%
0.1%
0.0%
1.5%
0.1%
0.0%
0.0%
0.1%
0.3%
0.0%
0.1%
1.5%
9.990
16,175 0.3% 28,983 0.2%
4,717,164 100.070 16,966,734 100.09”
General H. B. Work H. B. Shop H. B. soc/Rec H. B. School Non-Home-Based Total Purposes
Mode Number Percent Number Percent Number Percent Number Percent Number Percent Number Percent
Vehicle Driver 3,477,497 77.8% 2,949,761 69.4% 1,016,055 54.7% 350260 21.0% 3,120,761 66.2% 10,914,334 64.3%
Vehicle Passenger
Transit Passenger
School Bus Passenger
Bicycle
Walk
344,329 7.7% 741/569 17.5% 515,659 27.7% 532,827 31.9’70 686,545 14.69. 2,820,929 16.6%
449,425 10.0% 172,600 4.1% 62,046 3.3% 188,048 11.3% 204,062 4.3% 1,076,181 6.3%
o 0.0% o 0.0% o 0.0% 168/581 10.1% o 0.0% 168,581 1.0%
57,091 1.3% 31/594 0.7% 55/395 3.0% 69,750 4.2% 40,147 0.9% 253,977 1.5%
136,018 3.07. 339,729 8.0% 200,471 10.8% 358,918 21.5% 644,931 13.7% 1,680,067 9.9%
Other I 7,622 0.2% 12>23 0.3% 8,808 0.5% 2,994 0.2’% 20,718 0.4% 52,665 0.3%
TOTAL 14,471,982 100.0% 4,247,776 100.0% 1,858,434 100.0% 1,671,378 100.0% 4,717,164 loo.o~ 16,966,734 100.O%
-12-

Table 2.2.2
1990 Regional Weekday Trips by Trip Purpose at Ongin & Destination
Destination Purpose
Origin Work- Shop Soaal/
Purpose Home Work Related (Other) Recreation school TOTAL
15,075 2,245,061 155,919 2,002>99 876,901 896,835 6,192,390Home 0.2% 36.3% 2.5% 32.3% 14.2% 14.5% 100.0%
0.2% 70.5% 19.5% 51.3% 45.2% 84.970 36.5%
1,893,322 186,034 227,125 429,280 398,307 21,276 3,155,344Work 60.0% 5.990 7.2% 13.6% 12.6% 0.7% 100.0%
31.1% 5.8% 28.5% 11.0% 20.5% 2.0% 18,6%
177,681 160,021 342,139 62,282 49,523 2,938 794,584Work- 22.4% 20.1% 43.1% 7.8% 6.2% 0.4% 100.0%Related 2.9% 5.0% 42.9% 1.6% 2.6% 0.3% 4.7%
2,245,177 235,352 32,226 1,013,279 298,027 41,038 3,865,099Shop 58.1’7G 6.1% 0.8% 26.2% 7.7% 1.1% 100.0%(Other) 36.9% 7.4% 4.0% 26.0% 15.4% 3.9?6 22.8%
981,534 325,090 35,941 283,470 234,790 45,374 1,906,199Social/ 51.5% 17.1% 1.9% 14.9% 12.3% 2.4% 100.0%Recreation 16.1% 10.2% 4.5% 7.3% 12.1% 4.3% 11.2%
774,542 34,688 4,204 109,072 82,275 48,337 1,053,118School 73.5% 3.3% 0.4% 10.4% 7.8% 4.6% 100.0%
12.7% 1.1% 0.5% 2.8% 4.2% 4.6% 6.2%
6,087,331 3,186,246 797,554 3,899,982 1,939,823 1,055,798 16,966,734Total 35.9% 18.8% 4.7% 23.0% 11.4% 6.2% 100.0%Means 100.0% 100.0% 100.0% 100.0% 100.0% 100.0% 100.0%
Notes: Upper entry is number of trips.Middle entry is row percent.lower entry is column percent.
-13-

Table 2.2.31990 Regional Weekday Trips by Trip Purpose and Travel Mode
Home-Based Home-Based Home-Based Home-Based Non-Home Total
Work Shop Social/Rec School Based Purposes
3,477,497 2,949,761 1,016,055 350J60 3,120,761 10,914,334Vehicle 31.9% 27.0% 9.3% 3.2% 28.6% 100.0%Driver 77.8% 69.4% 54.7% 21.0% 66.2% 64.3%
344,329 741,569 515,659 532827 686,545 2,820,929Vehicle 12.2% 26.3% 18.3% 18.9% 24.3% 100.0%Passenger 7.7% 17.5% 27.7% 31.9% 14.6% 16.6%
449,425 172,600 62,046 188,048 204,062 1,076,181Transit 41.8% 16.0% 5.8% 17.5% 19.0% 100.0%Passemzer 10.0% 4.1% 3.3% 11.3% 4.3% 6.3%
o 0 0 168381 0 168,581School Bus 0.0% 0.0% 0.0% 100.0% 0.0% 100.0%Passenger 0.0% 0.0% 0.0% 10.1% 0.0% 1.0%
57,091 31,594 55395 69,750 40,147 253,977Bicycle 22.5% 12.4% 21.8% 27.5% 15.8’% 100.0%
1.3% 0.7% 3.0% 4.2% 0.9% 1.5%
136,018 339,729 200,471 358,918 644,931 1,680,067Walk 8.1% 20.2% 11.9% 21.4% 38.4% 100.0%
3.0% 8.0% 10.8’% 21.5% 13.7% 9.9%
7,622 12,523 8,808 2,994 20,718 52,665Other 14.5% 23.8% 16.7% 5.7% 39.3% 100.0%
0.2% 0.3% 0.5% 0.2% 0.4% 0.3%
4,471,982 4,247,776 1,858,434 1,671,378 4,717,164 16,966,734Total 26.4% 25.0% 11.0% 9.9% 27.8% 100.0%Means 100.0% 100.0% 100.0% 100.0% 100.0% 100.0%
Notes: Upper entry is number of trips.Middle entry is row percent.Lower entry is column percent.
-14-

Table 2.2.4
1990 Regional Weekday Vehicle Occupancy by Trip Purpose
Home-Based Home-Based Home-Based Home-Based Non-Home TotalMode Work Shop (Other) Soaal/Rec. school Based Purposes
VehicleDriver 3,477,497 2,949,761 1,016,055 350,260 3,120,761 10,914,334
VehiclePassenger 344,329 741,569 515,659 532,827 686,545 2,820,929
In-VehiclePerson 3,821,826 3,691,330 1,531,714 883,087 3,807,306 13,735,263
VehicleOccupancy 1.099 1.251 1.508 2.521 1.220 1.258
-15-

.3 Distn‘bution of Weekday Trius bv Time of Day
This section reports on the regional expanded, weekday travel by time of day.Appendix 2.3 contains 25 tables with detailed data related to travel by time of day.
Time of day travel is analyzed using three methods: 1) analysis of trips by reportedtime of departure (time at trip origin); 2) analysis of trips by reported time of arrival(time at trip destination); and 3) analysis of trips by what is called “trips in motion.”The first two methods are self-explanatory. The “trips in motion” computerprogram assigns each trip to a time period or time periods based on time at triporigin and time at trip destination. For example, if a person reported a home-to-work trip departing home at 7:55 AM and arriving at work at 8:25 AM, then that tripwould be allocated to three AM peak hour time periods (based on a 15 minuteanalysis): the 7:45-to-8:45 AM peak hour; the 8:00-to-9:00 AM peak hour; and the8:15-to-9:15 AM peak hour. The number of “trips in motion” reflects the number oftotal trips (specified by trip purpose, travel mode, etc.) that occur, or are “in motion”anytime during the specified time period.
Distribution of trips by time of day based on time at trip origin are summarized inTable 2.3.1. Trips by time of day based on time at trip destination are shown in Table2.3.2. These two tables summarize travel by AM and PM peak hour and peakperiods. Percentages show the AM and PM peak hour trips, stratified by trip purposeand travel mode, as a share of daily totals. Detailed appendix tables based on time attrip origin and trip destination are included as Tables 2.3.1A through 2.3.12A.
These summaries show that 8.3 percent of all regional daily trips start in the AMpeak hour (700-8:00 AM) and 9.2 percent of all regional trips start in the PM peakhour (4:30-5:30 PM) (Table 2.3.1). Trips made by transit passengers are more peakhour oriented than total trips, with 14.8 percent of all daily transit passenger tripsstart in the AM peak hour (7:00-8:00 AM) and 11.9 percent start in the PM peak hour(4:30-5:30 PM). Trips made by vehicle drivers (the mode “vehicles” in Tables 2.3.1and 2.3.2) are more spread out than for transit passengers, with 7.6 percent startingin the AM peak hour and 9.7 percent in the PM peak hour. (The mode “commuters”in Tables 2.3.1 and 2.3.2 includes vehicle drivers, vehicle passengers, and transitpassengers.)
-*lem&ou&lk&mg*~tig~-m@~L(home-based work, home-based school, total home-based, non-home-based), and by
-16-

time period (AM and PM peak hour, peak two-hour period, and peak three-hourperiod). The reader can use these tables (and the appendix tables) to understand thetrip purpose share for peak hour or peak periods to evaluate the concentration ofwork trips versus non-work trips by time of day.
Data from the Table 2,3.1 and the related appendix tables can be used bytransportation planners to develop sets of peaking factors to apply to daily trip tablesby trip purpose and travel mode for use in travel demand model forecastingsystems. MTC typically uses the data from time-at-trip-origin for estimating thesepeaking factors, though the analyst may choose to experiment with averages basedon time-at-trip-origin and time-at-trip-destination factors.
AM peak hour and PM peak hour factors based on regional trips-in-motion analysisare shown in Table 2.3.3. Appendix tables 2.3.13A through 2.3.25A provide detailedinformation on regional trips-in-motion by trip purpose and travel mode. The trips-in-motion summary table confirms the information in the time-at-trip-originanalysis, namely, that transit trips are more peak hour oriented (peaked) thanvehicle driver trips. Again, the mode “commuter-person” is a sum of vehicledriver, vehicle passenger, and transit passenger trips.
The trips-in-motion analysis shows that 63.6 percent of all vehicle trips-in-motionduring the AM peak hour (7:30-8:30 AM) are made by commuters going from home-to-work. This table also shows that just 43.8 percent of all vehicle trips-in-motionduring the PM peak hour (4:45-5:45 PM) are made by commuters going from work-to-home. This indicates that the PM peak hour has a significantly larger share ofnon-work trips occurring than during the AM peak hour. This holds true except fortransit trips-in-motion, where the majority of transit trips occurring in both the AMand PM peak hours are either from home-to-work or work-to-home.
(The reader should note that trips-in-motion analyses are only provided for hour-long periods. Multi-hour peak period trips-in-motion could be developed, but thereader is encourage to use the time-at-trip-origin and time-at-trip-destination datafor multi-hour peak period analyses.)
The trips-in-motion analyses by trip pzxposes are charted in Figures 2.3.1 through2.3.7. Figure 2.3.1 shows the composite time-of-day analysis with the five general tripprposes stacked one on top of each oiher. This useful graphic presents informationrelated to the hi-modal distribution of Imrn+based woilc trips as well as thepredominance of non-work trips during midday and PM peak periods. (This graphic
-17-

is based on data contained in appendix Table 2.3.25A).
Figures 2.3.2 through 2.3.6 graph the time-of-day distribution of trips separately bytrip purpose. The reader can note that the hi-modal distributions of home-basedwork trips and home-based school trips are similar to the two humps of a bactriancamel (see below). The uni-modal distributions of home-based shop (other), home-based social/recreation, and non-home-based trips are similar (in a fashion) to theone hump of the dromedary camel.
Arabian (Dromedary) E3actr;an
For work trips (Figure 2.3.2), the AM peak hour “hump” occurs between 730 and8:30 AM; the PM peak hour “hump,” between 4:45 and 5:45 PM (Figure 2.3.2). Forhome-based school trips (Figure 2.3.5), the AM peak hour “hump” is also the 7:30 to8:30 hour, whereas the PM peak hour for school trips occurs between 2:30 and 3:30PM, over two hours earlier than the PM peak commute work-trip rush hour.
Home-based shop (other) trips (Figure 2.3.3) show a complicated peaking pattern,with minor AM peak hour “humps” at 7:45 to 8:45 AM; a less pronounced midday“hump” at 11:30 AM to 12:30 PM; and the largest “hump” at 2:45 to 3:45 in theafternoon. This is basically a “uni-modal” distribution with minor humps duringthe AM peak hour and the midday (e.g., lunch Iwur shopping trips).
Hr3rne-based socidhcreation trips @gure 23A) dww a very pronouncedandpeaked uni-modal distribution, peaking at 6:30 to 7:30 PM in the evening. These areprimarily trips from dinner (eat meal) -to-home or from visiting friends-to-home.
-18-
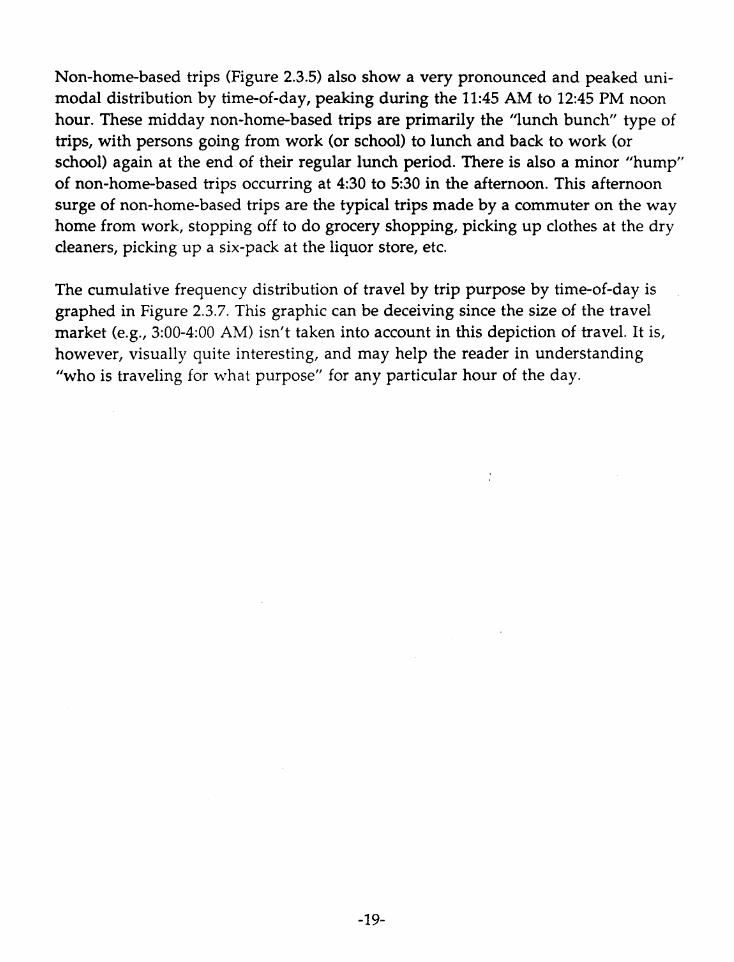
Non-home-based trips (Figure 2.3.5) also show a very pronounced and peaked uni-modal distribution by time-of-day, peaking during the 11:45 AM to 12:45 PM noonhour. These midday non-home-based trips are primarily the “lunch bunch” type oftrips, with persons going from work (or school) to lunch and back to work (orschool) again at the end of their regular lunch period. There is also a minor “hump”of non-home-based trips occurring at 4:30 to 5:30 in the afternoon. This afternoonsurge of non-home-based trips are the typical trips made by a commuter on the wayhome from work, stopping off to do grocery shopping, picking up clothes at the drycleaners, picking up a six-pack at the liquor store, etc.
The cumulative frequency distribution of travel by trip purpose by time-of-day isgraphed in Figure 2.3.7. This graphic can be deceiving since the size of the travelmarket (e.g., 3:00-4:00 AM) isn’t taken into account in this depiction of travel. It is,however, visually quite interesting, and may help the reader in understanding“who is traveling for what purpose” for any particular hour of the day.
-19-


Table2.3.2Distributionof @90 RegionalWeekdayTrips by Time of Day — Time at Trip Destination
Comparison by Mode& Trip Purpose
Time Home-Based Work Home-Based School Total Honlc-Based Non-Home TOTALat Trip ~mm Home To Home Fmm Home To Home From Home To Home Based TRIPS
Destination Number Pet. Number Pet. Number I’Ct. Number I’Ct. Number I’Ct. Number Pet. Number Pet. Number Pet.
730-8:30 AMAll ModesCommutersTransitVehicles
700- 9MI AMAll ModesCommutersTransitVehicles
630-930 AMAll ModesCommuters
A Transitw,. Vehicles
5(X) - 6(M PMAll ModesCommutersTransitVehicles
430-630 PMAll ModesCommutersTransitVehicles
4(XI - 7(X) PMAll ModesCommutersTransit
3,169 0.4% 1,467,753 23.87.2,990 0.5% 1,271,927 23.() ’70
o ().()’ZO 148,763 33.37.2,103 1.3% 776,354 19.9’%”
87,353 1.4%76,025 1.4%
878 0.27.69,252 1.870
1,684,728 9.9701,457/231 9.7%
160/537 15.470920,134 8.4%
746/S10 31.1%718/599 31 .3%
88,745 37.0%572,908 30.6%
12,353 0.6%11,450 0.6%
189 0.1 %10,621 0.7%
501,385 55.9%361,939 52.8%
49,688 53.6%67,415 35.5%
129,620 2.7%109,278 2.7%
10,895 6.1 %74,529 2.4%
253,149 5.4%206,094 5.1 ‘%
17,590 9.8%146,408 4.7%
362,706 7.7%303,731 7.6%
22,043 12.3%227,725 7.3%
358,931 7.6%323,939 8.1 %
19,431 10.9%243/562 7.8%
664/302 14.1%593,219 14.8%
36,434 20.3%447,127 14.3%
954,627 20.2’%851/503 21 .2%
53/534 29.9%
1/290~90 53.8%1z41,188 54.1%
153/595 64.1%991$44 52.9%
24,868 1.2%23,685 1.2%
804 0.4%21L81 1.3%
690,756 77.0%511,148 74.6%
69/336 74.9%96,010 50.5%
4,596 0.6% 2,381,381 38.6’%4,417 0.8?70 2,103,954 38.1 %
o 0.0% 244,297 54.6%3/530 2.2% 1,332/227 34.1 TO
163,430 2.7v0138,845 2.6’%
1,493 0.4%128,169 3.3%
2,797,960 16.5%2,448,895 16.4%
263~81 25.2?zJ1,606,803 14.7%
1,653,193 68.9%1>87,713 69.2%
184,~0 77.1%1/280,816 68.3%
6,306 0.8% 2,945,605 47.7%5,813 1.0% 2,627,034 47.5%
o 0.0% 288/561 64.5%4,676 2.9% 1,738,673 44.5%
218,460 3.6%185279 3.4%
2,130 0.5%169,890 4.4%
3>26,770 20.8%3,116,045 20.8%
312,737 29.9%2,136287 19.6%
37,453 1.8%35373 1.8%
1,441 0.7%31/389 2.0%
749,414 83.6%560,730 81.970
76,408 82.5%113,015 59.4%
33,167 1.4%29,723 1.3%
2X7 1.0%25375 1.3%
540/390 26.2%515,089 26.2%
61,086 29.4%415,643 26.1 %
7,169 0.8%5,044 0.7%
361 0.4%3/550 1.9’%
47,153 6.1 %42269 7.6%12,388 13.0%10,321 6.5%
246,797 4.0%219J06 4.0%
5,093 1.1’%156/320 4.0%
928,175 15.3%864,442 15.9’%
85,838 20.5%646,713 16.7%
1>33,906 9.1%1,407,889 9.4’%
110/361 10.6’%1,046/593 9.6%
69,&0 2.9’%64,802 2.8%
2,~4 1.2%53,658 2.9%
17,643 2.0%15,335 2.2%
1,252 1.4%11,950 6.3%
93,455 12.1‘%81,511 14.7%19,275 20.2%19,487 12.2%
512,783 8.3%457,636 8.3%
12,901 2.9%325,657 8.3%
1,701,626 28.1 %1,587,084 29.3%
158,734 37.9%1,167,485 30.2%
2,878,714 17.0’%2,637,939 17.6%
208,068 19.9701,940,266 17.8’%
950,194 46.1 %910235 46.3%115,137 55.4%721/.524 45.2%
95397 4.0%88~30 3.9%
3,420 1.4%
l/223#541 59.4%I,172j94 59.6%
145,060 69.8%
26,682 3.0%23,740 3.5%
1,610 1.7%
146,056 18.9% 744,727 12.1 %127,060 22.9% 662,948 12.0%31,895 33.4% 16,985 3.8%
2J02,493 38.0’%2,145/510 39.6’%
214~09 51.1%
4,001,850 23.6%3,659,960 24.5%
284,729 27.2%2,680,860 24.6%Vehicles 75j06 4.0% 933,184 58.5% 18,934 10.0% 28.142 17.6% 475.780 12.2% 1.563.660 40.4% 641,423 20.6%
DAILYAll Modes 2J99,~ 100% 2,061,463 100% 896,614 100% 774,127 100% 6,173/580 lIB% 6,055/287 I(X)% 4,715,609 ltkl% 16,944,470 1(X3%Commuters 2J93@ 100% 1,967,478 1(W% 685,054 100% 554,026 100% 5>26,606 100% 5,421,786 100% 4,010s18 100% 14,958,701 100%Transit 239,723 100% 207,689 1~% 92,631 100% 95,418 100% 447334 1(WXJ 418,877 100% 179,047 100% 1,045.258 100%Vehicles 1,873,946 100% 1/594,858 lM% 190,153 100% 159,934 100% 3,910/343 100% 3,867,085 100% 3,1 19;711 100% 10;897;133 100%

Table 2.3.3Distribution of Regional 1990 Weekday Trips-in-Motion by Time-of-DayPercent Peak Hour of Daily& Percent Work Trips of Peak Hour
Home-Based Work Total TripTime-of-Day From Home To Home Purt30ses -and Mode Trips % of Trips % of Trips % of
(% of Pk Hr) Daily (% of Pk Hr) Daily (% of Pk Hr) Daily
730-8:30 AM
All Modes 866,268 36.3% 15,057 0.7% 1,876,238 11.196(46.2%) (0.8%) (100.0%)
Commuter-Person 835,838 36.6% 13,963 0.7% 1,647,961 11.1%(50.7%) (0.8%) (100.0%)
Transit 120,928 51.0% 837 0.4% 218,181 21.3%(55.4%) (0.4%) (100.0%)
Vehicle Driver 655,805 35.1 % 12,254 0.8% 1,030,719 9.5%(63.6%) (1.2%) (100.0%)
4:45-5:45 PM
All Modes 36,233(2.1%)
Commuter-Person 33,079(2.1%)
Transit 1,890(1.1%)
Vehicle Driver 28,445(2.5%)
1.5% 676,482 32.9%(39.7%)
1.4% 652,283 33.3%(41.4%)
0.8% 103,031 51.2%(60.0%)
1.5% 499,617 31.3%(43.8%)
1,705,997 10.1 %(100.0%)
1,577,347 10.67c(100.0%)
171,663 16.8%(100.0%)
1,141,839 10.5%(100.0%)
DAILY
All Modes 2,389,684 100.0% 2,054,160 100.0% 16,859,552 100.0%(14.2%) (12.2%) (100.09’0)
Commuter-Person 2,283,413 100.0% 1,960~27 100.0% 14,881,664 100.O7C(15.3%) {132%) {100.0%)
Transit 237,277 100.0% 201,137 100.0% 1,023,016 100.O7O(232%) <19.7%) (100.0%’
Vehicle Driver 1,868,355 100.0% 1,594,344 100.0% 10,859,596 100.0%(17.2%) (14.7%) (100.070)
-22-

Tot
alT
rip
sp
erW
eek
day
0.00
1.45
3.30
5.15
7.00
8.45
io30
12.1
5
i4.o
o
15.4
5
17.3
0
49.1
5
21.0
0
22.4
5
0 r~
“--”
”-1
-+
—--
-”-+
-i‘“
”–-”
-’--
+–-
–
$. m ‘-s’
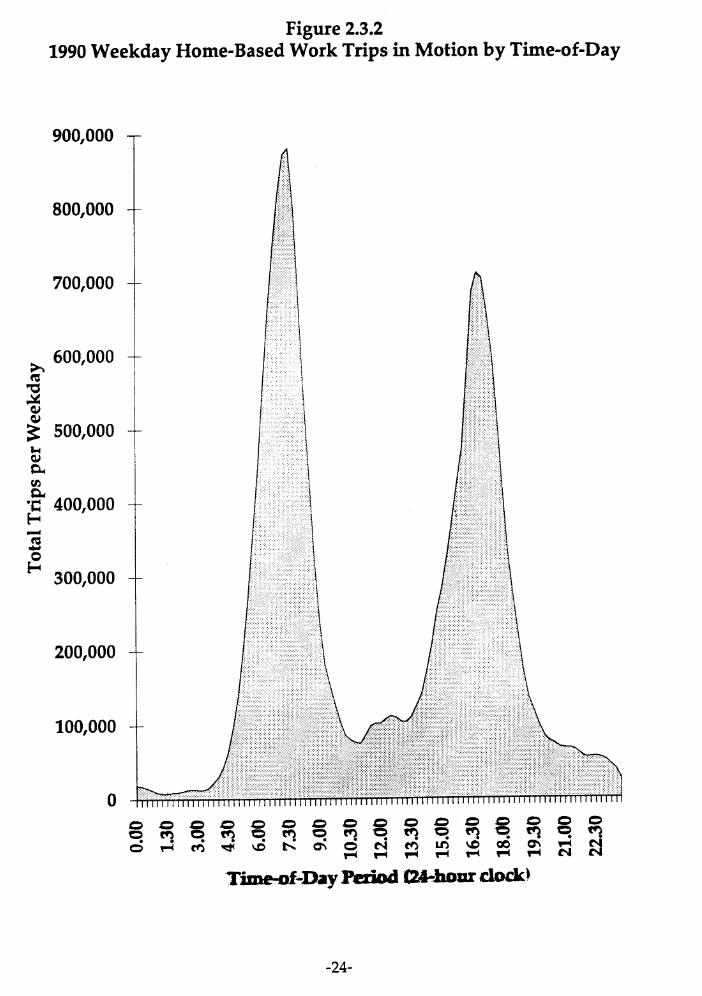
Figure 2.3.21990 Weekday Home-Based Work Trips in Motion by Time-of-Day
900,000
800,000
700,000
~ 600,000
4*
: 500,000I-1w&&g 400,000
~o* 300,000
200,000
100,000
0
-24-

Figure 2.3.31990 Weekday Home-Based Shop (Other) Trips in Motion by Time-of-Day
400,000
350,000
300,000
h~ 250,000~
~&& 200,000&“Gr+%~ 150,000K
100,000
50,000
0
Time-ofaayl?exid W-houxskdd
-25-

Tot
alT
rip
s
= .0 0 0 0
per
Wee
kd
ay
0.00
1.30
3.00
4.30
6.00
7.30
9.00
21.0
0
2230
i
Cn o n u.
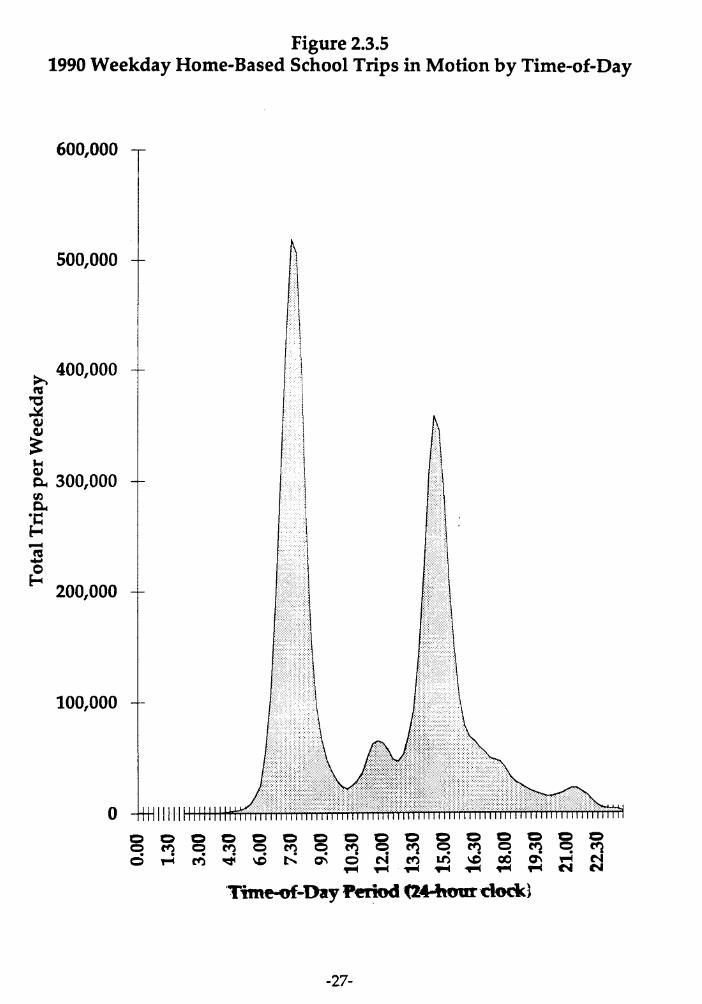
Figure 2.3.51990 Weekday Home-Based School Trips in Motion by Time-of-Day
600,000
500,000
~ 400,000
4~
&&& 300,000&
g
~ob 200,000
100,000
0 I-111111
Time-vf-DayPeriodf244tourdock)
-27-

Figure 2.3.61990 Weekday Non-Home-Based Trips in Motion by Time-of-Day
700,000
T600,000
500,000
200,000
100,000
0
l%w-of-Uay Period(M4tvur dock)
-28-

Figure 2.3.7Trip Purpose Share by Time-of-Day
100%
80%
“&K
40%-
20%
0%
.
-29-

24 Reported Trip Duration by Trip Purpose@ Travel Mode. . .
This section of Working Paper #4 discusses the average trip duration as reported bysurvey respondents as well as frequency distributions of trip duration and reportedtrip start times.
The 1990 household travel survey asked respondents to record the beginning andending time for each of their trips for the entire day. Trip duration is then calculatedas the difference between the beginning and ending times. Survey respondents have
a strong tendency to round off and report trip times to the nearest five minutes.
Respondents also have a strong tendency to report trip start times beginning on the
hour, half-hour, or on the quarter-hour. This tendency to round off when reporting
travel times and trip duration results in “spiky” frequency distribution of responses,
with spikes at intervals of five minutes (in the case of reported trip duration) or
with spikes at quarter-hour intervals (in the case of reported trip start time). The
following table shows the distribution of regional weekday trips by recorded starting
minute, comparing the 1990 Bay Area household travel survey to the 1990Nationwide Personal Transportation Survey (NPTS):
NPTS Cumul. Bay Area
Starting Trips Percent Percent Trips
Minute (000s) of Trips of Trips (000s)
00 51,999 36.2% 36.2% 4,437
30 39,847 27.8% 64.0% 3,589
45 13,223 9.2% 73.2% 1,524
15 12,433 8.7% 81.9% 1,472
Other 26,043 18.1% 100.0% 5,945
Total 143,545 100.0% 16,967NP’ISSource:RyuichiKitamura“Timeof DayCharacteristicsof TravelTravel Trends: Corz/erence Proceedings, Federal Highway Administration1994,p. 13.
Cumul.Percent Percentof Trips of Trips
26.2% I 26.2%
21.2% I 47.4%
100.0% IIn Implications of EmergingWashington, D.C., July
The Bay Area household travel survey analysis indicates that nearly half of BayArea tfips are reported to start either an-lhe-hour m on-thAalf-hour. Respondentsto the NP?S survey show a higher tendency WU%) w- tips ~ng ~-~~hour or on-the-half-hour. In the Bay Area, 35.0 percent of trips are reported to start
-30-

at times other than the quarter-hour; for the NPTS, 18.1 percent of all trips start at“all other” times.
In a similar manner, survey respondents tend to round off and report the durationof their trips to the nearest five minutes. The following table highlights thesefindings:
I Reported Trip Duration I Number of Trips I Percent of TotalI
I 5 minutes I 2,447,800 I 14.4% I
I 10 minutes I 2,822,800 I 16.6% II 15 minutes I 2,779,400 I 16.4% II 20 minutes I 1,515,200 I 8.9% II 25 minutes I 709,700 I 4.2% II 30 minutes I 1,718,200 I 10.170 II 35 minutes I 370,300 I 2.2% II 40 minutes I 384,100 I 2.3% II 45 minutes I 527,300 I 3.1% II 50 minutes I 183,200 1’ 1.1% II 55 minutes I 103,100 I 0.6% I
I 60 minutes I 422,300 I 2.5% II Sub-Total I 13,983,300 I 82.4% II All Other Times I 2,983,400 I 17.6% I
1 I
I TOTAL I 16,966,700 I 100.0% 1
This table shows that 82 percent of all trips in the 1990 survey are reported to thenearest five minutes for all trips 60 minutes or less. Only 17.6 of all trips are reportedat either travel times larger than 60 minutes (i.e., 4.1 percent of all trips) or at allother travel times (i.e., 13.5 percent of all trips). The most common answer to theaverage travel time questions for the 1990 survey is 10 minutes (16.6 percent of alltrips), followed closely by trips reported at 15 minutes duration (16.4 percent of alltrips).
~ ~vffqe reported * ~ W @ pUIpOM! d travel mode. is alum-rin Table 2.4.1. The average (mean) trip in the Bay Area in 1990 is 21.4 minutes induration. This ranges from a low of 17.1 minutes per trip for home-based shop trips
-31-

to a high of 29.3 minutes for home-based work trips. (The 1990 survey-reportedwork trip duration of 29.3 minutes is nearly 11 percent higher than the 1990 Censusreported commute duration of 26.5 minutes.)
By means of transportation, walk trips are the shortest in duration, at an average of14.0 minutes per one-way walk trip. This compares to public transportation wherethe average door-to-door reported trip duration in 47.2 minutes. Note that thepublic transportation travel time includes access and egress time (walking, drivingto station) and waiting time. Also note that the mode “person commuter” includesvehicle driver, vehicle passenger and transit passenger.
The frequency distribution of trips by reported trip duration by trip purpose isshown in Table 2.4.2. The three sub-tables in Table 2.4.2 show the number of trips,the percent of the column totals by trip purpose, and the cumulative percent ofcolumn totals by trip purpose. This data is also graphed in Figure 2.4.1. This chart isuseful in showing the spikiness of the distribution at intervals of 15, 30, 45 and 60minutes, even with the level of aggregation at five minute intervals. The mediantravel time for all non-work trips is 15 minutes. The median travel time for home-based work trips is 24.6 minutes.
The frequency distribution of trips by reported trip duration by travel mode isshown in Table 2.4.3. The three sub-tables for Table 2.4.3 show the number of trips,the percent of trips, and the cumulative percent. The cumulative frequencydistribution for regional walk trips shows that 76.6 percent of all walk trips are 15minutes or less in duration. This contrasts to transit passenger trips where only 10.2percent of transit passenger trips are 15 minutes or less. The median walk tripduration is about 9.6 minutes; for transit passenger trips, the median trip duration is
45 minutes.
-32-

Table 2.4.1
Regional 1990 Weekday Reported Trip Duration (in Minutes) by Purpose and Mode
Home-Based Home-Based Home-Based Home-Based Non-Home Total
Mode Work Shop (Other) Soaal/Rec. school Based Purposes
Vehicle Driver 26.9 16.0 19.3 19.8 18.6 20.6
Vehicle Passenger 28.6 17.5 19.9 14.4 18.4 18.9
Vehicle Persons 27.0 16.3 19.5 16.5 18.6 20.3
Transit Passenger 53.4 43.9 56.9 40.6 38.6 47.2
Person Commuter 29.8 17.5 20.9 20.8 19.5 22.2
School Bus NA NA NA 29.8 NA 29.6
Bicycle 19.1 16.5 21.1 12.7 19.6 17.5
Walk 17.1 13.1 19.6 14.8 11.6 14.0
Other 26.5 t 21.0 t 23.6 t , 9.5 t 26.1 29.3
Total Modes 29.3 17.1 20.8 20.1 18.5 21.4
f Value is based on less than 50 sample trips and is shown for information purposes only.
-33-

Table 2.4.2Regional 1990 Trip Duration Frequency Distribution by Trip Purpose
Number of Regional Trips
Home-Based Home-Based Home-Based Home-Based Non-Home Total
Travel Time Work Shop (Other) Social/Rec.~ Based P Oses
O-5 minutes
5.1 -10.0 minutes
10.1 -15.0 minutes
15.1 -20.0 minutes
20.1 -25.0 minutes
25.1 -30.0 minutes
30.1 -35.0 minutes
35.1 -40.0 minutes
40.1 -45.0 minutes
45.1 -50.0 minutes
50.1 -55.0 minutes
55.1 -60.0 minutes
60.1 -65.0 minutes
65.1 -70.0 minutes
70.1 -75.0 minutes
75.1 -80.0 minutes
80.1 -85.0 minutes
85.0 -90.0 minutes
269,350
416,075
886,859
440,776
283,777
807,327
155,706
169,675
327,028
88,325
56,228
227,844
45,851
42,824
81,350
22,123
13,594
50,220
807,952
881,203
1,217,440
316,201
200,142
391,393
53,270
50,564
101,392
25,253
15,686
76,162
10,352
11,974
20,182
5,876
3,852
13,375
272,973
357,196
491,636
137,957
84,876
228,241
27,501
34,060
60,827
242,906
282J05
434,810
139,623
103,114
211,851
40,179
38,579
69,478
16,074
10,876
48,138
5,287
7,697
14,642
3,311
3,121
12,996
11,509
13,804
38,221
3,284
31952
10,800
3,321
2,495
4,947
953,920
917,191
1,206,126
331,661
213,205
455,129
71,1%
79,675
150,929
30,240
25,282
94,638
16,144
14,434
35,675
9m
4,950
27,684
47,242
2S7,101
2353,970
4J36,871
1366,218
885,114
2,093,941
347,810
372,553
709,654
171,401
121,876
485,003
80,918
80,881
162,649
43,975
28,012
109,222
181,043>90.0 minutes 68,457 29,496 26,402 9,446
TOTAL 4,453,389 4,231,765 1$43,811 1,664,624 4,684,623 16~78,212
-34-

Table 2.4.2 (continued)Regional 1990 Trip Duration Frequency Distribution by Trip Purpose
Percent of Total Trips
Home-Based Home-Based Home-Based Home-Based Non-Home Total
0-5 minutes
5.1 -10.0 minutes
10.1 -15.0 minutes
15.1 -20.0 minutes
20.1 -25.0 minutes
25.1 -30.0 minutes
30.1 -35.0 minutes
35.1 -40.0 minutes
40.1 -45.0 minutes
45.1 -50.0 minutes
50.1 -55.0 minutes
55.1 -60.0 minutes
60.1 -65.0 minutes
65.1 -70.0 minutes
70.1 -75.0 minutes
75.1 -80.0 minutes
80.1 -85.0 minutes
85.0 -90.0 minutes
6.0%
9.3%
19.9%
9.9%
6.4%
18.1%
3.5%
3.8%
7.3%
2.0%
1.3%
5.1%
1.0%
1.0%
1.8%
0.5%
0.3%
1.1%
19.1%
20.8%
28.8%
7.5%
4.7%
9.2%
1.3%
1.2%
2.4%
0.6%
0.4%
1.8%
0.2%
0.3%
0.5%
0.1%
0.1%
0.3%
14.8%
19.4%
26.7%
7.5%
4.6%
12.4%
1.5%
1.8%
3.3%
0.9% ‘
0.6%
2.6%
0.3%
0.4% ,
0.8%
0.2%
0.2%
0.7%
14.6%
17.0%
26.1%
8.4%
6.2%
12.7%
2.4%
2.3%
4.2%
0.7%
0.8%
2.3%
0.2%
0.2%
0.6%
0.2%
0.1%
0.3%
20.4%
19.6%
25.7%
7.1%
4.6%
9.7%
1.5%
1.7%
3.2%
0.6%
0.5%
2.0%
0.3%
0.3%
0.8%
0.2%
0.1%
0.6%
15.1%
16.9%
25.1%
8.1%
5.2%
12.4%
2.1%
2.2%
4.2%
1.0%
0.7%
2.9%
0.5%
0.5%
1.0%
0.3%
0.2%
0.6%
>90.0 minutes 1.5% 0.7% 1.4% 0.6% 1.0% 1.1%
TOTAL 100.0% 100.0% 100.0% 100.0% 100.0% 100.0%
-35-

Table 2.4.2 (continued)Regional 1990 Trip Duration Frequency Distribution by Trip Purpose
Cumulative Percent of Total Trivs
Home-Based Home-Based Home-Based Home-Based Non-Home TotalTravel Time~ school Based P Oses
O-5 minutes
5.1 -10.0 minutes
10.1 -15.0 minutes
15.1 -20.0 minutes
20.1 -25.0 minutes
25.1 -30.0 minutes
30.1 -35.0 minutes
35.1 -40.0 minutes
40.1 -45.0 minutes
45.1 -50.0 minutes
50.1 -55.0 minutes
55.1 -60.0 minutes
60.1 -65.0 minutes
65.1 -70.0 minutes
70.1 -75.0 minutes
75.1 -80.0 minutes
80.1 -85.0 minutes
85.0 -90.0 minutes
>90.0 minutes
6.0%
15.4%
35.3%
45.2%
51.6%
69.7%
73.2%
77.0%
84.4%
86.3%
87.6%
92.7%
93.7%
94.7%
96.5%
97.0%
97.3%
98.5%
100.0%
19.1%
39.9%
68.7%
76.2%
80.9%
90.1%
91.4%
92.6%
95.0%
95.6%
96.0%
97.8%
98.0%
98.3%
98.8%
98.9%
99.0%
99.3%
100.0%
14.8%
34.2%
60.8%
68.3%
72.9%
85.3%
86.8%
88.6%
91.9%
92.8%
93.4%
96.0%
96.3%
96.7%
97.5%
97.7%
97.9%
98.6%
100.0%
14.6%
31.6%
57.7%
66.1%
72.3%
85.0%
87.4%
89.7%
93.9%
94.6%
95.4%
97.7%
97.9%
98.1%
98.8%
99.0%
99.1%
99.4%
100.0%
20.4%
39.9%
65.7%
72.8%
77.3%
87.0%
88.6%
90.3%
93.5%
94.1%
94.7%
96.7%
97.0%
97.3%
98.1%
98.3%
98.4%
99.0%
100.0%
15.1%
32.0%
57.1%
65.2%
70.4%
82.8%
84.9%
87.1%
91.3%
92.3%
93.1%
95.9%
96.4%
96.9%
97.9%
98.1%
98.3%
98.9%
100.0%
TOTAL 100.0% 100.0% 100.0% 100.0% 100.0% 100.0%
-36-

Tot
alT
rips
per
Wee
kday
0=5
5.1-
10.0
tool
-15.
0
W-2
0.0
20.1
-2s.
0
25.1
-30.
0
30.1
-3s.
0
35.1
-40.
0
40.1
-4!i.
o
4s.1
-50.
0
!!0.1
-59.
0
ml
-60.
0
tm.1-
6!!.0
65.1
-70.
0
70.1
-79.
0
75.1
Ik).1
-89.
0
M5.
O-9(L
O
>90
.0
5

Table 2.4.3Regional 1990 Trip Duration Frequency Distribution by Travel Mode
A/umber of Regional Trips
Vehicle Vehicle Transit Schoolbus TotalTravel Time Driver Passenger Passenger Passen er Bi cle~ oses
0-5 minutes
5.1 -10.0 minutes
10.1 -15.0 minutes
15.1 -20.0 minutes
20.1 -25.0 minutes
25.1 -30.0 minutes
30.1 -35.0 minutes
35.1 -40.0 minutes
40.1 -45.0 minutes
45.1 -50.0 minutes
50.1 -55.0 minutes
55.1 -60.0 minutes
60.1 -65.0 minutes
65.1 -70.0 minutes
70.1 -75.0 minutes
75.1 -80.0 minutes
80.1 -85.0 minutes
85.0 -90.0 minutes
>90.0 minutes
1355,659
1360,828
2fi06,648
959,200
592,181
1,404,857
224,955
238,712
463,639
99,178
65,235
276,007
36,166
32,338
90,284
21,575
9,210
64,916
72,087
443,790
555,008
808J76
211,885
132,630
315/317
45593
37,786
86/540
14,081
12,142
61,615
9,810
11,915
1438
4,933
2300
12,403
28,634
11,877
24,764
69,360
52,692
58,100
162,129
55,701
64,028
107,931
48,528
35,528
106,874
32,796
33,932
51,196
14,891
15,596
26,452
70,108
3,715
8,318
26/368
24,705
24,800
44,537
7,191
13,319
22,812
2,451
4,507
10,024
605
1,213
2,104
1,022
83
730
347
49,142
50,828
70,699
18,408
14,526
30586
1,267
897
4,084
894
512
4,734
113
579
507
295
464
1,181
2,896 5226 1,747 181,045
476,196 6,723 2S7,102
346245 7,978 2,853,969
440>52 14,867 4,236,870
92D57 6,970
60,771 2,107
131s1 4,974
12,275 827
16579 1,232
23,020 1,628
6,093 177
3,716 234
24,210 1J540
1,429 0
905 0
3355 655
999 259
250 109
3539 0
1J66,217
885,115
2,093,941
347,809
372~53
709,654
171,402
121,874
485,004
80,919
80,882
162,649
43,974
28,012
109,221
TOTAL 10,873,675 2,809,106 1,042,483 198,851 252,612 1,649,45852,02716,878,212
-38-
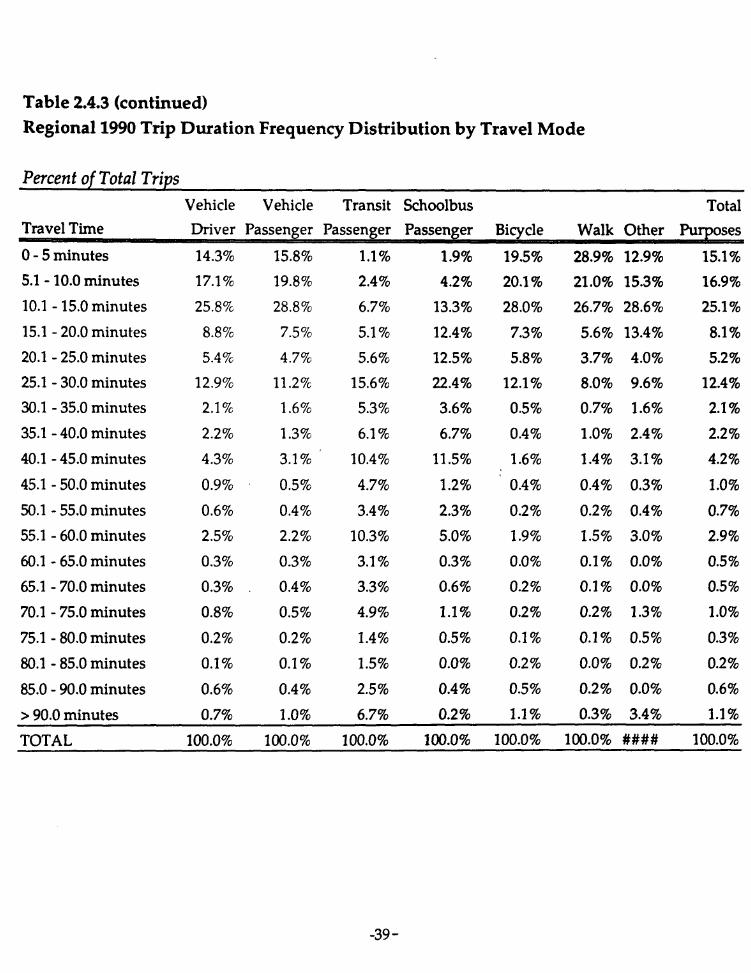
Table 2.4.3 (continued)Regional 1990 Trip Duration Frequency Distribution by Travel Mode
Percerzt0/ TotalTrips
Vehicle Vehicle Transit Schoolbus TotalTravel Time ses
0-5 minutes
5.1 -10.0 minutes
10.1 -15.0 minutes
15.1 -20.0 minutes
20.1 -25.0 minutes
25.1 -30.0 minutes
30.1 -35.0 minutes
35.1 -40.0 minutes
40.1 -45.0 minutes
45.1 -50.0 minutes
50.1 -55.0 minutes
55.1 -60.0 minutes
60.1 -65.0 minutes
65.1 -70.0 minutes
70.1 -75.0 minutes
75.1 -80.0 minutes
80.1 -85.0 minutes
85.0 -90.0 minutes
>90.0 minutes
14.3%
17.1%
25.8%
8.8%
5.4%
12.9%
2.1%
2.2%
4.3%
0.9%
0.6%
2.5%
0.3%
0.3%
0.8%
0.2%
0.1%
0.6%
0.7%
15.8%
19.8%
28.8%
7.5%
4.7%
11.2%
1.6%
1.3%
3.1%
0.5?6
0.4%
2.2%
0.3%
0.4%
0.5%
0.2%
0.1%
0.4%
1.0%
1.1%
2.4%
6.7%
5.1%
5.6%
15.6%
5.3%
6.1%
10.4%
4.7%
3.4%
10.3%
3.1%
3.3%
4.9%
1.4%
1.5%
2.5%
6.7%
1.9% 19.5%
4.2% 20.1%
13.3% 28.0%
12.4% 7.3%
12.5% 5.8%
22.4% 12.1%
3.6% 0.5%
6.7% 0.4%
11.5% 1.6%
1.2% 0.4%
2.3% 0.2%
5.0% 1.9%
0.3% 0.0%
0.6% 0.2%
1.1% 0.2%
0.5% 0.1%
0.0% 0.2%
0.4% 0.5%
0.2% 1.1%
28.9% 12.9%
21.0% 15.3%
26.7% 28.6%
5.6% 13.4%
3.7% 4.0%
8.0% 9.6%
0.7% 1.6%
1.0% 2.4%
1.4% 3.1%
0.4% 0.3%
0.2% 0.4%
1.5% 3.0%
0.1% 0.0%
0.1% 0$0%
0.2% 1.3%
0.1% 0.5%
0.0% 0.2%
0.2% 0.0%
0.3% 3.4%
15.1%
16.9%
25.1%
8.1%
5.2%
12.4%
2.1%
2.2%
4.2%
1.0%
0.7%
2.9%
0.5%
0.5%
1.0%
0.3%
0.2%
0.6%
1.1%
TOTAL 100.0% 100.0% 100.0% lm.o% 100.0% 100.0% #### 100.0%
-39-
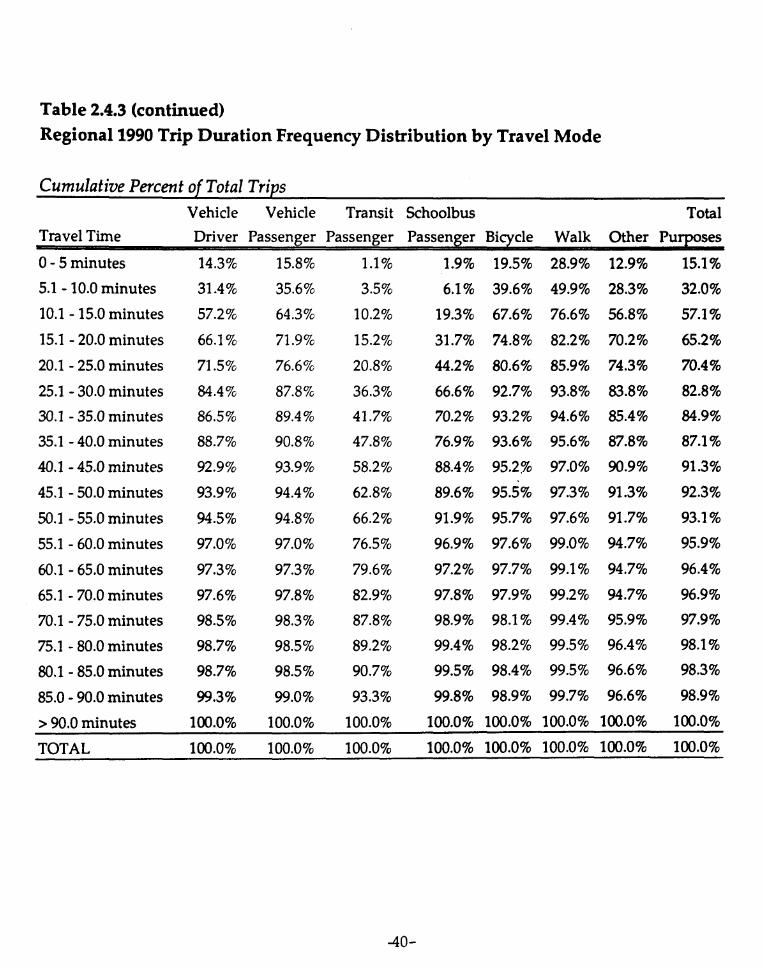
Table 2.4.3 (continued)
Regional 1990 Trip Duration Frequency Distribution by Travel Mode
Cumulative Percent of Total Trips
Vehicle Vehicle Transit Schoolbus TotalTravel Time Driver Passenger Passenger Passenger~ ses
0-5 minutes
5.1 -10.0 minutes
10.1 -15.0 minutes
15,1 -20.0 minutes
20.1 -25.0 minutes
25.1 -30.0 minutes
30.1 -35.0 minutes
35.1 -40.0 minutes
40.1 -45.0 minutes
45.1 -50.0 minutes
50.1 -55.0 minutes
55.1 -60.0 minutes
60.1 -65.0 minutes
65.1 -70.0 minutes
70.1 -75.0 minutes
75.1 -80.0 minutes
80.1 -85.0 minutes
85.0 -90.0 minutes
>90,0 minutes
14.3%
31.4%
57.2%
66.1%
71.5%
84.4%
86.5%
88.7%
92.9%
93.9%
94.5%
97.0%
97.3%
97.6%
98.5%
98.7%
98.7%
99.3%
100.0%.-
15.8%
35.6%
64.3%
71.9%
76.6%
87.8%
89.4%
90.8%
93.9%
94.4%
94.8%
97.0%
97.3%
97.8%
98.3’%
98.5%
98.5%
99.0%
100.0%
1.1%
3.5%
10.2%
15.2%
20.8%
36.3%
41.7%
47.8%
58.2%
62.8%
66.2%
76.5%
79.6%
82.9%
87.8%
89.2%
90.7%
93.3%
100.0%
1.9%
6.1%
19.3%
31.7%
44.2%
66.6%
70.2%
76.9%
88.4%
89.6%
91.9%
96.9%
97.2%
97.8%
98.9%
99.4%
99.5%
99.8%
100.0%
19.5%
39.6%
67.6%
74.8%
80.6%
92.7%
93.2%
93.6%
95.2%
28.9%
49.9%
76.6%
82.2%
85.9%
93.8%
94.6%
95.6%
97.0%
95.5% 97.3%
95.7% 97.6%
97.6% 99.0%
97.7% 99.1%
97.9% 99.2%
98.1% 99.4%
98.2% 99.5%
98.4% 99.5%
98.9% 99.7%
100.0% 100.0%
12.9%
28.3%
56.8%
70.2%
74.3%
83.8%
85.4%
87.8%
90.9%
91.3%
91.7%
94.7%
94.7%
94.7%
95.9%
96.4%
96.6%
96.6%
100.0%
15.1%
32.0%
57.1%
65.2%
70.4%
82.8%
84.9%
87.1%
91.3%
92.3%
93.1%
95.9%
96.4%
96.9%
97.9%
98.1%
98.3%
98.9%
100.0%
TOTAL 100.0% 100.0% 100.0% 100.0% 100.0% 100.0% 100.0% 100.0%
-40-

3.0 Weekdav 1990 Re~ional Household TriD Rates
This section summarizes aggregate trip rates by market segment, reporting thenumber of average (mean) trips per household and per person in household. Themarket segments used in this analysis are those typically used by transportationplanners in analyzing travel behavior, namely: household size, household income,vehicle ownership level, housing structure type, geographic area of residence,workers in the household, household life cycle stage and land use density. Thetrips, households and persons that this analysis is based on are from theintraregional expanded, weighted 1990 Bay Area household travel survey “single-day” sample.
~.1 RegionalTripRatesbv TriuPuruoseandTravelMode
Regional trip rates by trip purpose and travel mode for trips per household, trips perperson age five years and over, and trips per total persons in household, are shownin Table 3.1. These trip rates are based on a weighted, expanded count of 2,246,251regional households; 5,329,955 perscms-in-households age five years and over; and5,873,094 total persons-in-households.
~ The average regional household in the Bay Area made just over 7.5 trips perweekday in 1990. By trip purpose, the average household made 1.99 home-basedwork trips per day; 1.89 home-based shop (other) trips per day; 0.83 hom~basedsocial/recreation trips per day; 0.74 home-based school trips per day; and 2.10 non-home-based trips per day. By travel mode, the average regional household madeabout 4.86 vehicle trips per average weekday, and just under one-half (0.48) transittrips per average weekday. The mode “in-vehicle person” is the combination ofvehicle driver and vehicle passengers (excluding transit passengers). The mode“person” is the combination of vehicle driver, vehicle passenger and transitpassenger modes.
The average person residing in households in the Bay Area, age five and over, made3.18 daily trips per person in 1990. Also reported is the same number of trips dividedby the entire household population, including infants and toddlers ages Oto 4, at289 trips per person.
-41-

Table 3.11990 Regional Trip Rates by Purpose and Mode
Home-Based Non-Mode Work School Home-Based Total
Trips per HouseholdVehicle Driver 1.548 1.313 0.452 0.156 1.389 4.859In-Vehicle Person 1.701 1.643 0.682 0.393 1.695 6.115Transit 0.200 0.077 0.028 0.084 0.091 0.479Person 1.902 1.720 0.710 0.477 1.786 6.594School Bus 0.000 0.000 0.000 0.075 0.000 0.075Bicycle 0.025 0.014 0.025 0.031 0.018 0.113Walk 00061 0.151 0.089 0.160 0.287 0.748Other 0.003 0.006 0.004 0.001 0.009 0.023Total 1.991 1.891 0.827 0.744 2.100 7.553
Trips per Person 5 Years and OlderVehicle Driver 0.652 0.553 0.191 0.066 0.586 2.048In-Vehicle Person 0.717 0.693 0.287 0.166 0.714 2.577Transit 0.084 0.032 0.012 0.035 0.038 0.202Person 0.801 0.725 0.299 0.201 0.753 2.779School BUS 0.000 0.000 0.000 0.032 0.000 0.032Bicycle 0.011 0.006 0.010 0.013 0.008 0.048Walk 0.026 0.064 0.038 0.067 0.121 0.315Other 0.001 0.002 0.002 0.001 0.004 0.010Total 0.839 0.797 0.349 0.314 0.885 3.183
Trips per Person in HouseholdVehicle Driver 0.592 0.502 0.173 0.060 0.531 1.858In-Vehicle Person 0.651 0.629 0.261 0.150 0.648 2.339Transit 0.077 0.029 0.011 0.032 0.035 0.183Person 0.727 0.658 0.271 0.182 0.683 2.522School BuS 0.000 0.000 0.000 0.029 0.000 0.029Bicycle 0.010 0.005 0.009 0.012 0.007 0.043Walk 0.023 0.058 0.034 0.061 0.110 0.286other 0-001 ().002 0.001 0.001 0.004 0409Total 0.761 0.723 0.316 0.285 0.803 2.889
Note ‘Tripwtes basedon expanded sumy households P,246,29~,population age 5+ (5329,955); and total household population (5,873,094).
-42-

32 Rty Oml Tnp Rates byi ● House hold Size
This section summarizes aggregate trip rates by household size, reporting theaverage numbers of trips per household. Trip rates are reported for households ofone, two, three, four, and five-or-more pers&s in the household. Appendix Tables3.2.1A (trips per household) and 3.2.2A (trips per person) provide detailed trip ratesby trip purpose and traveI mode. The regional distribution of households andhousehold population by the five household size categories is shown below
Household Percent of Household Percent ofSize Group Households Households Population HHld. pop.
One person 583,892 26.0% 583,892 9.9%
Two person 725,922 32.3% 1,451~ 24.7%
Three person 375,422 16.7% 1,126,266 19.2%
Four person 312,184 13.9% 1,248,738 21.3%
Five+ person 248,830 11.1% 1,462353 24.9%
TOTAL 2,246,251 100.0% 5,873,094 100.0%
Trips per household by trip purpose by household size are graphed in Figure 3.2.1. ~Trips per household range from 3.6 trips for the average one-person household to ahigh of 14.3 trips for the average five-plus-person household. Home-based schooltrips per household are noticeably higher in the larger household size groups due tothe presence of school-age children in households.
Trips per person by trip purpose by household size are depicted in Figure 3.2.2. Oneperson households have the highest number of trips per person at 3.6 trips perweekday. This contrasts to the five-plus household size group with 2.4 trips perperson per weekday. The higher trips per person trip rate for lower household sizegroups is due to the need for small households to conduct all of the household’sactivities: work trips, shopping errands, personal business errands, etc. Largerhouseholds can spread the chores and errands more efficiently among the differenthousehold members, essentially lowering the overaii trips per person trip mtes.Note that home-based work and non-home-based trips per person decreases with
~ hmlseWd*hmn&msd S&x3Mr@perpmo!ni=t?as=withincreasing household size due to the presence of chiidren in the household. Home-based shop and home-based social/recreation trips show a tendency to have fewer
-43-

trips per person with increasing household size.
Transit and total trips per household for home-based work and total purposes areshown, by household size, in Table 3.2.1. Transit shares are also graphed in Figure3.2.3. Transit shares are highest for one-person households and lowest for four-person households. Transit shares for five-or-more person households are slightlyhigher than those for four-person households. For home-based work trips, theaverage regional one-person household takes transit 17.3 percent of the time; theaverage regional four-person household takes transit for 7.0 percent of all worktrips. Similarly, transit shares for total trips range from a high of 10.1 percent forone-person households to a low of 4.7 percent for four-person households.
Other demographic characteristics of Bay Area regional households, stratified by thefive household size groups, are presented in Table 3.2.2. Data is shown for incomeper household, income per person, vehicles per household, vehicles per person,average age of the household head, and average age of all persons in household (age
five-or-more). This is useful in showing the inverse relationship betweenhousehold size and income per capita, vehicles per capita, and age of thehouseholder and members of the households. One person households tend to havethe highest per capita incomes, the highest vehicles per capita, and tend to be olderresidents, Large households have school-age children who ‘are not as likely to beemployed and contributing to the household’s income and who are not as likely toown or operate a motor vehicle. Children also have a tendency to bring down theaverage age in a household.
-44-
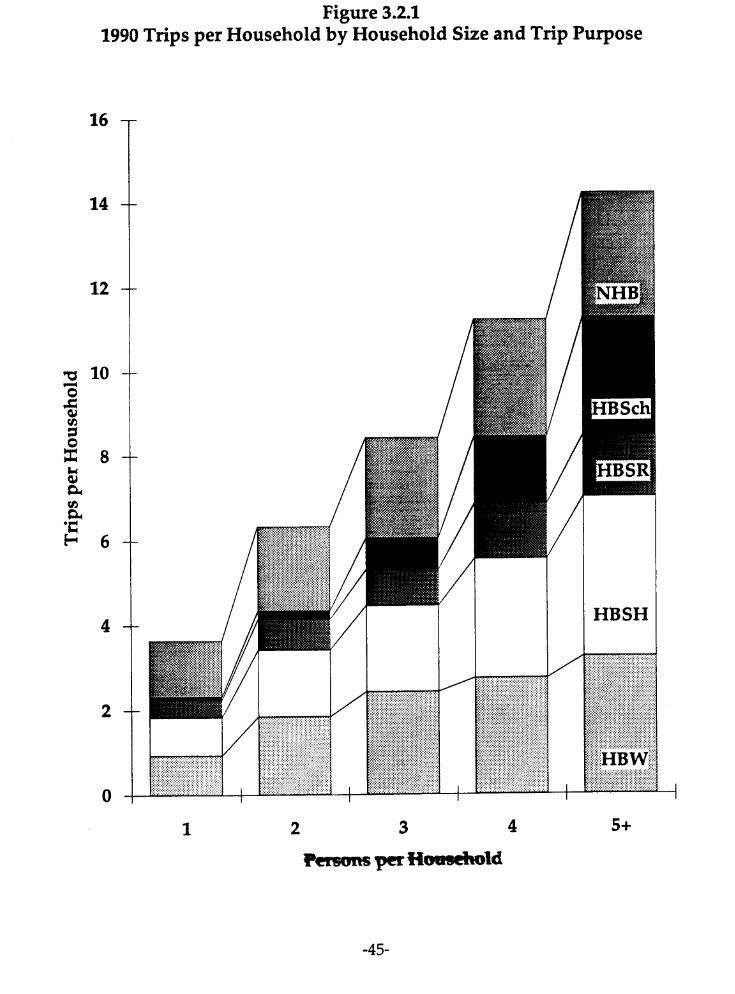
Figure 3.2.11990 Trips per Household by Household Size and Trip Purpose
-45-
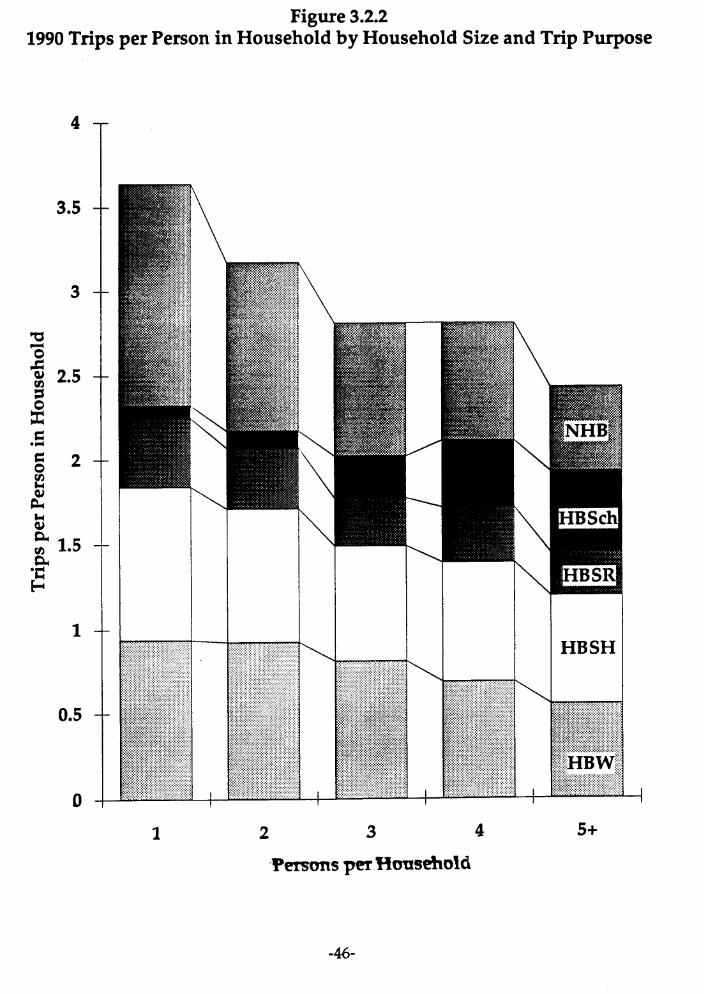
Figure 3.2.21990 Trips per Person in Household by Household Size and Trip Purpose
1 2 3 4 5+
wrsmls per Htnxsehold
-46-

Table 3.2.11990 Regional Transit Share for Trips per Household by Household Size
Household Home-Based Work Trips Total Tripssize Transit All Modes % Transit Transit All Modes % Transit
1Person 0.162 0.937 17.3% 0.366 3.639 10.1%
2Persons 0.186 1.849 10.1% 0.363 6.345 5.7%
3Persons 0.206 2.432 8.5% 0.525 8.427 6.2%
4Persons 0.192 2.751 7.0% 0.524 11.254 4.7%
5+Persons 0.333 3.259 10.2% 0.958 14.303 6.7%
Total 0.200 1.991 10.0% 0.479 7.553 6.3%
-47-
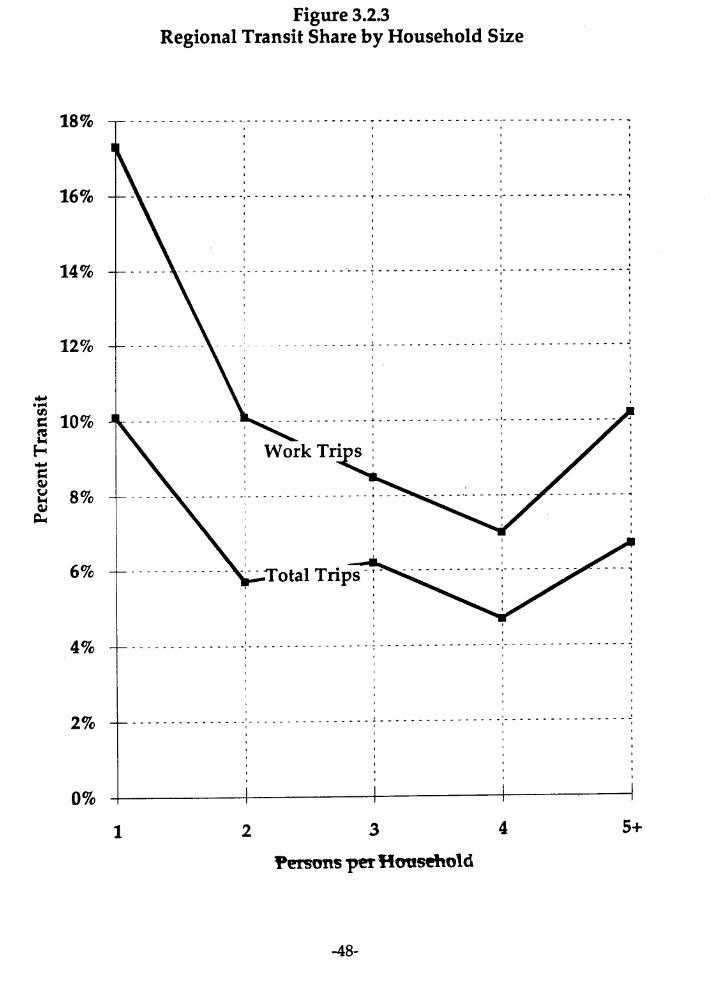
Figure 3.2.3Transit Share by Household Size
18%
16%
14%
12%
10%
8%
6%
4%
2%
o%
----- ----- -- -..
-. .,.
--- . . . . . ----
-,-
.’.
----- ----- ----- ----- ----- -,---- ----- ----- ---
----- ----- --, -- ----- ----- ----, - ----- ----- ----- q
. . ..- ----- .--7
~. ..-. ----- --
.-
----- ----- -
,--------- -“------$
.-, . . . ----- ----- --- J
I {,~
1 2 3 4 5+
TersonsperTImsdmld

Table 3.2.21990 Regional Household Characteristics by Household Size
Household Income per Income per Vehicles per Vehicles per Average Age Avg. Age of PersonsSize Household Person Household Person of HHld Head Age 5+ in HHlds$
1Person $32,474 $32,474 0.95 0.95 47.8 47.8
2Persons $50,853 $25,427 1.82 0.91 45.6 44.7
3Persons $54,909 $18,303 2.13 0.71 37.8 34.2
4Persons $58,185 $14,546 2.37 0.59 36.6 29.4
5+Persons $53,958 $9,181 2.42 0.41 34.7 27.7
Total $48,117 $18,682 1.79 0.68 42.4 39.8
-49-

This section summarizes aggregate trip rates by household income group, reportingthe average numbers of trips per household. Trip rates are reported for householdsby household income tertile (three groups:< $30,000; $30,000-$60,000; $60,000+) andby household income quartile (four groups: e $25,000; $25,000-$45,000; $45,000-$75,000; and $75,000+).
This analysis of trip rates by household income is conducted on reported householdincome, not imputed household income, Household income groups were imputed(e.g., assigned based on the characteristics of the sample households with andwithout valid income codes) for the approximately 31 percent of survey respondentswho refused, or did not know, their total household income.
Appendix Tables 3.3.1A (trips per household) and 3.3.2A (trips per person) providedetailed trip rates by trip purpose and selected modes for the fifteen detailedhousehold income groups collected in the 1990 survey. The regional distribution ofhouseholds and household population by the household income tertiles is shownbelow: +h;rti I—.—
HHld. Income Percent of Household Mean HHld.Tertiles Households Households Population size
F iI <$30,000 j 493,258 I 22.0% I 1,061,129 I 2.151 II $30,000-$60,000 I 621,697 I 27.7% I 1,667,441 I 2.682 1
j >$60,000 I 421,876 I 18.8% I 1,257/570 I 2.981 I1 1 1 .
Refused/NA I 709,419 I 31.6% I 1,886,954 I 2.660 I
TOTAL 2,246,251 100.0% 5,873,094 2.615
Trips per household by trip purpose and travel mode by household income tertile isshown in Table 3.3.1. Low income households made an average of 5.8 trips perweekday in 1990; high income households, 10.3 trips per household. Transit sharesfor trips by trip purpose am alsoshownin Table3.3.1. For hoxebasd worktrips,transitsharesrangefroma highof 16.2 percentfor low incomehouseholdsto a lowcUL6percfmtfolrhighinmmE!hmlsd#W RYrtutal*prpmes? transit-rangefroma highof 10.9 percentfor low incomehouseholds,to 4.1 percent for highincome households. Households who refused to provide or did not know their
-50-
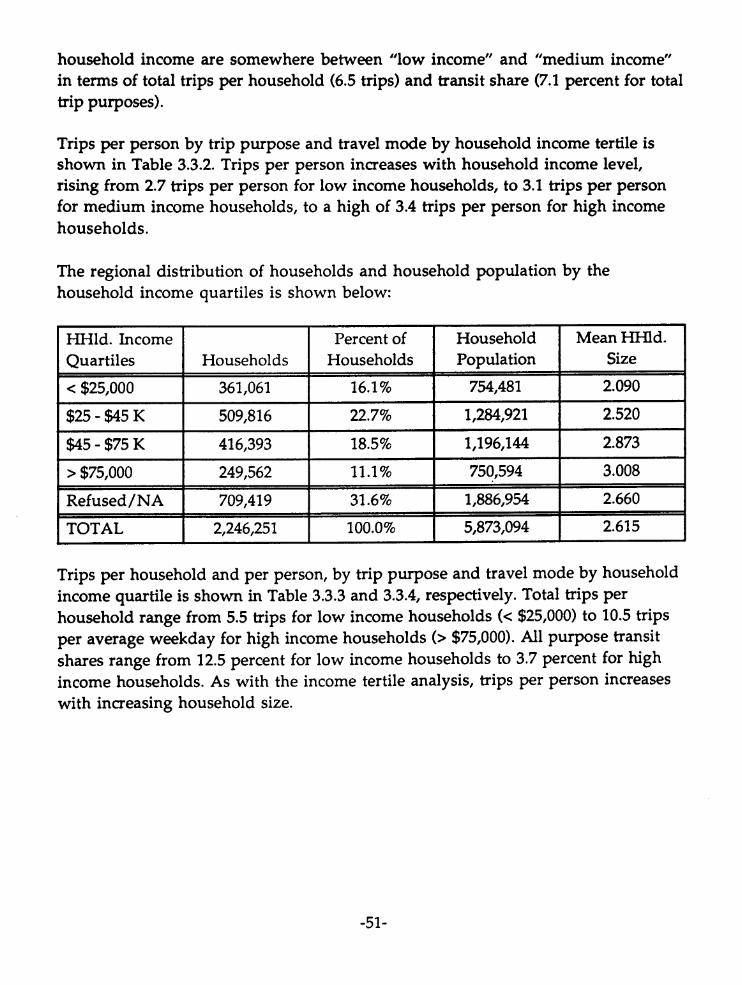
household income are somewhere between “low income” and “medium income”in terms of total trips per household (6.5 trips) and transit share (7.1 percent for totaltrip purposes).
Trips per person by trip purpose and travel mode by household income tertile isshown in Table 3.3.2. Trips per person increases with household income level,rising from 2.7 trips per person for low income households, to 3.1 trips per personfor medium income households, to a high of 3.4 trips per person for high incomehouseholds.
The regional distribution of households and household population by thehousehold income quartiles is shown below:
HHld. Income Percent of Household Mean H.Hld.Quartiles Households Households Population Size
<$25,000 361,061 16.1% 754,481 2.090
$25-$45 K 509,816 22.7% 1,284,921 2.520
$45-$75 K 416,393 18.5% 1,196,144 2.873
>$75,000 249,562 11.1% 750,594 3.008
Refused/NA 709,419 31.6% 1,886,954 2.660
TOTAL 2,246,251 100.0% 5,873,094 2.615
Trips per household and per person, by trip purpose and travel mode by householdincome quartile is shown in Table 3.3.3 and 3.3.4, respectively. Total trips perhousehold range from 5.5 trips for low income households (< $25,000) to 10.5 tripsper average weekday for high income households (> $75,000). Al purpose tr~sitshares range from 12.5 percent for low income households to 3.7 percent for highincome households. As with the income tertile analysis, trips per person increaseswith increasing household size.
-51-

Table 3.3.11990 Regional Trips per Household by Household Income Tertile
Household Home-Based Non-Income Mode Work Sho Soc/Rec School Home-Based Total~ Vehicle IXiver 1.060 0.309 0.112 0.939 3.217
In-VehiclePerson 0.919 1.354 0.449 0.243 1.179 4.144Transit 0.201 0.132 0.043 0.130 0.127 0.634
LQw Person 1.120 1.486 0.492 0.373 1.307 4.779Income School Bus O.000 0.000 0.000 0.068 0.000 0.068(cWOOO)Bicycle 0.030 0.016 0.018 0.029 0.015 0.107
walk 0.089 0.225 0.096 0.1% 0.282 0.838other 0.003 0.006 0.003 0.002 0.017 0.031Total 1.243 1.733 0.610 0.617 1.620 5.823Percent Transit 16.2% 7.6% 7.1% 21.1% 7.9% 10.9%Vehicle Driver 1.812 1.498 0.495 0.176 1.562 5.542In-VehiclePerson 1.981 1.851 0.750 0.476 1.873 6.931
Medium Transit 0.199 0.045 0.017 0.064 0.087 0.412Income Person 2.180 1.896 0.767($30,000-
0.539 1.%1 7.343SchooIBus 0.000 0.000 0.000 0.087 0.000 0.087
$60,000) Bicycle 0.019 0.016 0.025 0.021 0.016 0.096walk 0.055 0.135 0.089 0.175 0.300 0.753Other 0.004 0.003 0.003 0.002 0.005 0.017Total 2.258 2.050 0.883 0.824 2.282 8.297Percent Transit 8.8% 2.2% 1.9% 7.7’% 3.8% 50%Vehicle Driver 2.254 1.747 0.652 0.213 2.215 7.081In-VehiclePerson 2.429 2.142 0.951 0.532 2.679 8.733Transit 0.237 0.034 0.016 0.057 0.079 0.422
High Person 2.666 2.176 0.967 0.589 2.758 9.156Income School Bus 0.000 0.000 0.000 0.060 0.000 0.060($60,000+)Bicycle 0.039 0.025 0.026 0.055 0.030 0.175
walk 0.034 0.114 0.111 0.148 0.437 0.844Other 0.004 0.005 0.006 0.001 0.013 0.029Total 2.743 2.321 1.110 0.852 3.238 10.263Percent Transit 8.6% 1.5% 1.4% 6.7% 2.4% 4.1%Vehicle Driver 1.418 1.070 0.396~ 1.060 4.080In-VehiclePerson 1.568 1.366 0.624 0.343 1.312 5.212Transit 0.178 0.092 0.034 0.085 0.076 0.464
Refused/ Person 1.746 1.458 0.657 0.427 1.388 5.676Unknown School Bus 0.000 0.000 0.000 0.079 0.000 0.079Income Bicycle 0.020 0.005 0.029 0.027 0.014 0.095
walk 0.061 0.136 0.071 0.164 0.190 0.623other 0.002 0.007 0.004 0.001 0.006 0.021Total 1.830 1.606 0.762 0.698 1.598 6.493Percent Transit 9.7% 5.7% 4.4% 12.1% 4.7% 7.1%Vehicle 11-iver 1.548 1.313 0.452 0.156 1.389 4.859In-VehiclePerson 1.701 1.643 0.682 0.393 1.695 6.115Transit 0.200 0.077 0.028 0.084 0.091 0.479
TOtal PerSan 1.902 L720 4).710 0.477 M% 6.594HH SchoolBus 0.000 0.000 0000 0.075 0.000 0.075
Bicycle 0.025 0.014 ao25 LOW 0.018 0.113WMk WMI 4).s1 0-160 0287 W*i%?r lMlo3 0.006 0.U09 “0.CUi 0005 O.waTotal 1.991 1.891 0.827 0.744 2.100 7.553Percent Transit 10.0% 4.1% 3.3% 11.3% 4.3% 6.3%
-52-

Table 3.3.21990 Regional Trips per Person by Household Income Tertile
Household Home-Based Ncm-Income Mode Work Shop Soc/Rec school Home-Based Total
VehicleDriver 0.371 0.493 0.144 0.052 0.436 1.496In-VehiclePerson 0.427 0.629 0.209 0.113 0.548 1.926Transit 0.094 0.062 0.020 0.061 0.059 0.295
Low Person 0.521 0.691 0.229 0.174 0.607 2.221Income School Bus 0.000 0.000 0.000 0.032 0.000 0.032(c$30,000) Bicycle 0.014 0.007 0.008 0.013 0.007 0.050
walk 0.041 0.105 0.045 0$068 0.131 0.390other 0.002 0.003 0.001 0.001 0.008 0.014Total 0.578 0.806 0.283 0.287 0.753 2.707Percent Transit 16.2% 7.6% 7.1% 21.1% 7.9% 10.9%Vehicle IXiver 0.676 0.558 0.184 0.065 0.582 2.066In-VehiclePerson 0.739 0.690 0.280 0.177 0.699 2.584
Medium Transit 0.074 0.017 0.006 0.024 0.033 0.154Income Person 0.813 0.707($30,000-
0.286 0.201 0.731 2.738School Bus 0.000 0.000 0.000 0.032 0.000 0.032
$60,000) Bicycle 0.007 0.006 0.009 0.008 0.006 0.036walk 0.020 0.050 0.033 0.065 0.112 0.281Other 0.001 0.001 0.001 0.001 0.002 0.006Total 0.842 0.764 0.329 0.307 0.851 3.093Percent Transit 8.8% 2.2% 1.9% 7.7% 3.8% 5.0%Vehicle Driver 0.756 0.586 0.219 0.071 0.743 2.376In-VehiclePerson 0.815 0.719 0.319 0.178 0.899 2.930
Transit 0.079 0.011 0.005 0.019 0.026 0.142High Person 0.894 0.730 0.324 0.198 0.925 3.071Income School Bus 0.000 0.000 0.000 0.020 0.000 0.020($60,000+)Bicycle 0.013 0.008 0.009 0.018 0.010 0.059
walk 0.012 0.038 0.037 0.050 0.147 0.283Other 0.001 0.002 0.002 0.000 0.004 0.010Total 0.920 0.778 0.372 0.286 1.086 3.443Percent Transit 8.6% 1,5% 1.4% 6.7% 2.4% 4,1%>Vehicle Driver 0.533 0.402 0.149 0.051 0.399 1.534In-VehiclePerson 0.589 0.514 0.235 0.129 0.493 1.960Transit 0.067 0.035 0.013 0.032 0.028 0.174
Refused/ Person 0.656 0.548 0.247 0.161 0.522 2.134Unknown School Bus 0.000 0.000 0.000 0.030 0.000 0.030Income Bicycle 0.007 0.002 0.011 0.010 0.005 0.036
walk 0.023 0.051 0.027 0.062 0.071 0.234Other 0.001 0.003 0.002 0.000 0.002 0.008Total 0.688 0.604 0.286 0.262 0.601 2.441Percent Transit 9.7% 5.7% 4.4% 12.1% 4.7% 7.1%Vehicle Driver 0.592 0.502 0.173 0.060 0.531 1.858In-VehiclePerson 0.651 0.629 0.261 0.150 0.648 2.339Transit 0.077 0.029 0.011 0.032 0.035 0.183
Total PersOn W27 LMi58 0271 LM82 0483HH School Bus 0.000 0.000 0.000 0.029 0.000 0.029
Bicycle 0.010 0.005 &009 0.012 (loo7 Qo43“walk WJ23 04)58 ‘Oml a.noother 0.001 ‘oD02 U.(XM 0.001 mo4 0.009Total 0.761 0.723 0.316 0.285 0.803 2.889Percent Transit 10.0% 4.1% 3.3% 11.3% 4.3% 6.3%
*
-53-

Table 3331990 RegionalTrips per Householdby HouseholdIncomeQuartile
Household Home-Based Non-Income Mode Work shop soc/Rec School Homc+Based Total
Vehicle Driver 0.659 0.999 0.3M 0.113 0.888 2.965In-Vehicle Person 0.756 1272 0.443 0239 1.114 3.825Transit 0203 0.157 0.051 0.144 0.133
Low0.688
Person 0.960 1.429 0.494 0.383Income
1247 4.513school Bus O.000 0.000 O.LXX) 0.067 0.000 0.067
(C$25,000) Bicycle 0.027 0.012 0.018 0.030 0.012 0.100Walk 0.094 0238 0.101 0.124 0265 0.822Other 0.004 0.007 0.003 0.002 0.01Y2 0.019TotaI 1.084 1.687 0.616 0.606 1.527 5.520Percent Transit 18.7% 9.3% 82% 23.8% 8.7% 12.5%Vehicle Driver 1.564 1.348 0.410 0.148 1.334 4.805
Low In-Vehicle Person 1.735 1.683 0.625 0.406 1.611 6.LM1Medium Transit 0.197 0.055 0.017 0.077 0.091 0.436Irvmme Person 1.932 1.738 0.642 0.483 1.702 6.497($25,000 - Schoo! Bus O.000 0.000 0.000 0.082 O.m 0.082$45,000) Bicycle 0.025 0.016 0.023 0.020 0.014 0.098
Walk 0.066 0.153 0.084 0.178 0286 0.767Other 0.003 0.002 0.002 0.W2 0.019 0.029Total 2.026 1.909 0.751 0.764 2.022 7.473Percent Transit 9.7?4 2.9% 22% 10.1% 4.5% 5.8%Vehicle Driver 2.083 1.691 0.578 0204 1.876 6.432In-Vehicle Person 2247 2.081 0.848 0.502 2257 7.935
High Transit 0.232 0.036 0.017 0.054 0.093 0.432Medium Person 2.479 2.Il7 0.865 0.556 2.350 8.367Income School Bus O.000 0.000 0.000 0.073($45,000 - Bicycle
O.000 0.0730.027 0.017 0.026 0.039 0.029 0.138
$75,000) Walk 0.036 0.129 0.106 0.181 0.381 0.833Other 0.005 0.006 0.003 0.001 0.006 0.021Total 2.548 2268 0.999 0.851 2.767 9.433Percent Transit 9.1% 1.6% 1.7% 6.4% 3.4% 4.6%Vehicle Driver 2.280 1.757 0.700 0.211- 2.351In-Vehicle Person 2.469 2.157 1.032 0.550 2.858 9.065Transit 0.213 0.032 0.017 0.057 0.068 0.387
High Person 2.681 2.188 1.049 0.607 2.926 9.452Income School BUS O.000 0.000 0.000 0.065 0.000($75,000+) Bicycle
0.0650.037 0.034 0.023 0.054 0.025 0.172
Walk 0.039 0.103 0.107 0.128 0.439 0.816Other 0.003 0.004 0.010 0.001 0.014 0.032Total 2.759 2.330 1.189 0.856 3.4(34 10.538Percent Transit 7.7% 1.4% 1.5% 6.7% 2.0% 3.7%
Vehicle Driver 1.418 1.070 0.396 0.136~ 1.060In-Vehicle Person 1.568 1.364 0.624 0.343 1.312 5212Transit 0.178 0.092 0.034 0.085 0.076 0.464
Refused/ Person 1.746 1.458 0.657 0.427 1.388 5.676Unknown School Bus O.000 0.000 0.000 0.079 0.000 0.079Income Bicycle 0.020 0.005 0.029 0.027 0.014 0.095
Walk 0.061 0.136 0.071 0.164 0.190 0.623Other 0.002 0.007 0.004 OLKI1 0.006 0.021Total 1.830 1.606 0.762 0.698 1.598 6.493
RsrKsmtnmlait 9.7% ‘5.7% 4.4% I.U% 4.7% 7.1%
Vehicle Driver 1.548 1.313 0.452 0.156 1.389 4.859JrI-Ve.hicle Person 1.701 1.643 0.682 0393 1.695 6.115
Transit Wn8 Of)!ll 0.479
TotsI %rson 1 .IXE 1.720 0716 0.477 1.?86 6.5%
HH School BUS O.000 0.000 0.000 0.075 0.000 0.075
Bicycle 0.025 0.014 0.025 0.031 0.018 0.113
Walk 0.061 0.151 0.089 0.160 0287 0.748
Other 0.003 0.006 0.004 0.001 0.009 0.023
Total 1.991 1.891 0.827 0.744 2.lW 7.553
Percent Transit 10.0% 4.19’0 3.3% 11.3’% 4.3% 6.3%
-54-

Table 33.41990 RegionalTrips peI Personby HouseholdIncome Quartile
Household Home-Based Non-incOme Mode Work Shop soc/Rec School Home-Baaed Total
Vehicle Driver 0.315 0.478 0.146 0.054 0.42s 1.419In-Vehicle Person 0.362 0.609 0212 0.115 0.533 1.831Transit 0.097 0.075 0.024 0.069 O.(M4 0.329
1.&3w Person 0.459 0.684 0236 0.183 0.597 2.160Irmme School Bus O.000 O.(XX3 O.000 0.032 0.000(c$25,fMO) Bicycle
0.0320.013 0.006 O.(XB 0.014 0.006 0.048
Walk 0.045 0.114 0.048 0.059 0.127 0.393Other 0.002 0.CX13 0.002 0.001 0.001 0.W9Total 0.519 0.807 0295 0.290 0.731 2.642Percent Transit 18.7% 9.3% 82% 23.8% 8.7% 12.5%Vehicle Driver 0.620 0.535 0.163~ O 29 1.906
Low In-Vehicle Person 0.689 0.668Medium Tmnsit 0.078 0.022Inmme Person 0.767 0.690($25,000 - School Bus O.000 0.000$45,000) Bicycle 0.010 0.006
Walk 0.026 0.061Other 0.001 0.001Total 0.804 0.758
02480.0070255O.(X)OO.(D90.033O.ml0298
0.1610.0300.1920.0320.0080.0700.0010.303
0.6390.0360.675O.(MO0.0060.114
=
2.4050.1732.5780.0320.0390.3040.0112.965
Percent Transit 9.7% 2.9% 22% 10.1% 4.5% 5.8%Vehicle Driver 0.725 0.589 0201 0.071 0.653 2239In-Vehicle Person 0.782 0.724 0295 0.175 0.786 2.762
High Transit 0.081 0.012 0.006 0.019 0.033 0.150Medium Perwm 0.863 0.737 0.301 0.194 0.818 2.9I3Income School BUS O.000 0.000 0.000 0.026 0.000 0.026($45,00tl - Bicycle 0.010 O.(KM 0.009 0.013 0.010 0.048S75.000) Walk 0.013 0.045 0.037 0.063 0.133 0.290,.
Other 0.002 0.002 0.001 O.cloo 0.002 0.(X17Total 0.887 0.790 0.348 0.296 0.963 3284Percent Transit 9.1 % 1.6% 1.7% 6.4% 3.4% 4.6%Vehicle Driver 0.758 0.584 0.233 0.070 0.782 2.427In-Vehicle Person 0.821 0.717 0.343Transit 0.071 0.011 0.006
High Person 0.891 0.728 0.349Inmme School Bus O.m O.OMI O.000($75,(X)(3+) Bicycle 0.012 0.011 0.008
Walk 0.013 0.034 0.036Other 0.001 0.00) 0.003Total 0.917 0.775 0.395
0.1830.01902020.0220.0180.0430.0000285
0.950 3.0140.023 0.1290.973 3.1430.000 0.0220.008 0.0570.146 02710.005 0.0111.132 3.504
Perrent Transit 7.7% 1.4% 1.5% 6.7% 2.0% 3.7%
Vehicle Driver 0.533 0.402 0.149 0.051 0.399 1.534In-Vehicle Person 0.589 0.514 0235 0.129 0.493 1.960Tnmsit 0.067 0.035 0.013 0.032 0.028 0.174
Refused/ Person 0.656 0.548 0247 0.161 0.522 2.134Unknown School Bus O.000 0.000 0.000 0.030 O.(XQ 0.030Inmme Bicycle 0.007 0.002 0.011 0.010 0.005 0.036
Walk 0.023 0.051 0.027 O.(M2 0.071 0234Other O.(X)l 0.003 o.tx)2 O.000 0.002 0.008Total 0.688 0.604 0286 0262 0.601 2.441PementTmnsit 9.7% 37% 4.4s lz.1% 47% 7.1s
Vehicle Driver 0.592 0.502 0.173 0.060 0.531 1.858in-VehiclePemon LM51 0.629 WI f).lso 0A48 2339Tunsit am 41.DII 0s82
Total Person U.727 U.658 ‘(X??I 0.182 O.@X$ 2322
HH School Bus O.000 0.000 0.000 0.029 0.000 0.029
Bicycle 0.010 0.005 0.009 0.012 0.W7 0.043
Walk 0.023 0.058 0.034 0.061 0.110 0286
Other 0.001 0.002 0.001 O.(x)l 0.004 0.009
Total 0.761 0.723 0.316 0285 0.803 2.889
Percent Tmnsit 10.0% 4.1% 3.3% 11.3% 4.3% 6.3%
-55-

3.4 Reg onal Trq Ratesby●i VehicleAvailability
This section describes household trip rates stratified by vehicle availability level.The term “auto ownership” may be used interchangeably in this discussion, but the1990 travel survey collected data on vehicles that were owned, leased or generallyavailable for use by members of the household, so the accurate term to describe theinformation in this section is “vehicle availability.” Five levels of vehicleavailability are reported: none, one, two, three, and four-or-more vehicles in thehousehold. Appendix Table 3.4.1A (trips per household) and Table 3.4.2A (trips perperson) provide detailed trip rates by trip purpose and travel mode.
The regional distribution of households and household population by vehicleavailability level is shown below:
IVehicles Percent ofAvailable Households Households
I I
No Vehicles I 227,267 I 10.1%
I One Vehicle I 715,246 I 31.8%
I Two Vehicles I 832,990 I 37.1%
I Three Vehicles I 316,292 I 14.1%
I Four + Vehicles I 154,456 I 6.9%
I 2,246,251 I 100.0%
Household I Mean HHld.Powlation Size I
416,455 I 1.832 I
1/380,727 I 1.930 I
2392,783 I 2.873 I
1,081,972 I 3.421 I
601,157 I 3.892 I
5,873,094 I 2.615 I
Transit shares for home-based work and total trips by vehicle availability level areshown in Table 3.4.1 and Figure 3.4.1. Transit shares for work trips drops from 51.4percent of zero-vehicle households to 2.9 percent of four-or-more vehiclehouseholds. Transit shares for total trips drops from 41.0 percent of zero-vehiclehouseholds to 2.0 percent of four-or-more vehicle households.
Trips per household increases from 3.9 trips per weekday for zero-vehiclehouseholds to 12.3 trips per weekday for households with four-or-more vehicles.Homebased work total trips increases from 0.9 trips per weekday for zero-vehiclehouseholds to 3.7 trips per weekday for households with four-or-more vehkles.Transit trips per household decrease wiih increasing vehicle availability level, fromliitiqsqera=!kdayh~—~ tqustmlmmsittlipsp=
weekday for households with four-or-more vehicles.
-56-
Zero-vehicle households account for 10.1 percent of the Bay Area’s households and7.1 percent of the Bay Area’s household population, but they also account for 33.6percent of the Bay Area’s total transit trips (361,900 out of 1,076,200) and 22.6 percentof the Bay Area’s homebased work transit trips (101S00 out of 449,400).
Demographic characteristics of households by vehicle availability level aresummarized in Table 3.4.2. Vehicle availability shows a positive correlation withhousehold size and household income, and an inverse relationship to age. Thismeans that zero-vehicle households tend to be more elderly and tend to be poorerthan multiple-vehicle households.
-57-

Table 3.4.11990 Regional Transit Share for Trips per Household by Vehicle Availability
Vehicles Home-Based Work Trips / HH Total Trips / HHAvailable Transit All Modes % Transit Transit All Modes % Transit
NoVehicles 0.447 0.869 51.4% 1.593 3.890 41.0%
1Vehicle 0.232 1.378 16.8% 0.462 5.484 8.4%
2Vehicles 0.143 2.234 6.4% 0.304 8.366 3.6%
3Vehicles 0.148 2.685 5.5% 0.294 10.394 2.8%
4+Vehicles 0.107 3.748 2.9% 0.241 12.333 2.0%
Total I 0.200 1.991 10.0% 0.479 7.553 6.3%
-58-

60%
50%
40%
30%
20%
10%
0%
Figure 3.4.1Regional Transit Shares by Vehicle Availability
----- ----- ----
L--------- -----
-,-
-,-
.4.
.,.
----- ----- . . . . . ---
. ..-. ----- --- ~----
.- 4.- ---
. . . . . . . . . . . . . .
----- ----- -,---- ----- ----- . . .
----- ----- - ,-,’
----- ----- ---- 1
----- . .
----- -.
-.,.
- ,.
. . . . . . . . . . --, -- . ----- - --, -
.- .’.
----- ----- -1
----- --
-----
----- ---
----- .
----- ~
-----1
I I I I
4) 2 3 4+
Vehicles per Household
-59-

Table 3.4.21990 Regional Household Characteristics by Vehicle Availability
VehiclesAvailable
-Vehicles
Ve~icIe2
Vehicles3
Vehicles4+
Vehicles
Total
Income per Income per Persons per Vehicles per Average AgeHousehold Person Household Person of HHld Head
$23,650 $13,094 1.832 0.00 46.7
$36,616 $19,158 1.930 0.52 43.5
$55,472 $19,561 2.873 0.70 41.3
$62,281 $18,600 3.421 0.88 41.0
$68,696 $18,090 3.892 1.15 39.7
$48,1171 $18,6821 2.6151 0.681 42.4
Avg. Age of PersonsAge 5+ in HHlds
45.9
41.8
38.1
37.0
36.1
39.8
-60-

bv Ho- Stru~●
This section describes household trip rates stratified by housing structure type. Thesix categories of housing structure type collected in the 1990 household travel surveyare: single-family, duplex, apartment, condominium/ townhome, mobile home, andhotel/motel. Appendix Table 3.5.1A (trips per household) and Table 3.5.2A (trips perperson) provide detailed trip rate data by trip purpose and travel mode.
The regional distribution of households and household population by these sixstructure types is shown below:
I I I Percent of
I
Household
I
Mean HHld.Structure Type Households Total HHlds. Population Size I
Single Family 1,375~8 61.2% 4,053325 2.947
Duplex 109,553 4.9% 273,658 2.498
I Apartment I 543,259 I 24.2% I 1,093,430 I 2.013 II Condo/Townhome I 171,331 I 7.6% 1 362,999 I 2.119 I
I Mobile Home I 44,849 I 2.0% I 86,963 I 1.939 I
I Hotel/Motel* I 1,710 I 0.1% I 2,028 I 1.186 I
I TOTAL I 2,246,251 I 100.0% I 5,872,403 I 2.615 I* Sample represents less than 50 sample households and is not considered statistically significant.Trip rates are reported for information purposes only.
As can be seen in the above table, single-family dwelling units account for 61.2percent of the weighted, expanded regional households and 69.0 percent of theregional household population. Household size for singk+family dwelling units(2.95 persons per household) is significantly larger than the other housing structuretypes (1.94 to 2.50 persons per household).
Household trip rates and transit share for home-based work and total trips, byhousing structure type, is shown in Table 3.5. Household trip rates for work andtotal trips are highest for single-family dwelling units (8.6 trips per weekday), andlowest for apartment-dwelling households (5.5 trips per weekday). Transit shams arelowest for mobile home-based households (2.5%) and highest for apartment-
- ~ [13.7%J
-61-

Table 3.51990 RegionaI Transit Share for Trips per Household by Structure Type
Structure Home-Based Work Trips / HH Total Trips / HHType Transit All Modes % Transit Transit All Modes % TransitSingleFamily 0.159 2.176 7.3% 0.388 8.643 4.5%
Duplex 0.246 1.922 12.8% 0.575 6.663 8.6%
Apartment 0.318 1.644 19.3% 0.755 5.499 13.7%Condo/Townhm 0.151 1.851 8.2% 0.362 6.397 5.7%Mobile I IHome 0.096 1.237 7.8% 0.145 5.779 2.5%
Hotel orMotel * 0.240 0.982 24.4% 0.775 3.127 24.8%
Total 0.200 1.991 10.0% 0.479 7.553 6.3%
*Sample represents less than 50 sample households and is not consideredstatistically signijkant. Trip ratesare reported forinformation purposes only.
-62-
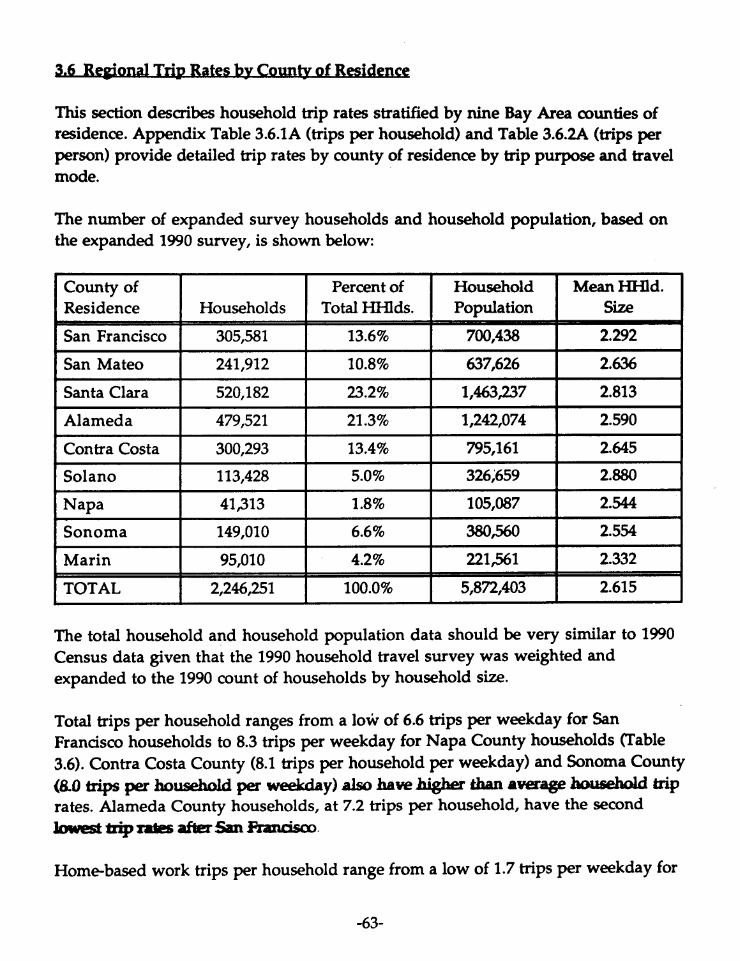
3.6 ~ TIID Ratesbv Coun&of R_ncc● . ●
This section describes household trip rates stratified by nine Bay Area counties ofresidence. Appendix Table 3.6.1A (trips per household) and Table 3.6.2A (trips perperson) provide detailed trip rates by county of residence by trip purpose and travelmode.
The number of expanded survey households and household population, based onthe expanded 1990 survey, is shown below:
county of I I Percent ofResidence Households Total HHlds.
Napa I 41/313 I 1.8%
Sonoma I 149,010 I 6.6%
Marin I 95,010 I 4.2%
TOTAL I 2,246,251 I 100.0%
Household
I
Mean HHld.Population size I
700,438 I 2.292 I
637,626 I 2.636 I1,463/237 I 2.813 I1,242,074 I 2.590 I795,161 I 2.645 I
326;659 I 2.880 I
105,087 I 2.544 I
380,560 I 2.554 I
221/561 I 2.332 I
5,872,403 I 2.615 1
The total household and household population data should be very similar to 1990Census data given that the 1990 household travel survey was weighted andexpanded to the 1990 count of households by household size.
Total trips per household ranges from a low of 6.6 trips per weekday for SanFranasco households to 8.3 trips per weekday for Napa County households (Table3.6). Contra Costa County (8.1 trips per household per weekday) and Sonoma County(8.0tripspfx hOusehddper ~y)*h*u#—@—=%~ *rates. Alameda County households, at 7.2 trips per household, have the secondlow’estlxiprates after-l%smism
Home-based work trips per household range from a low of 1.7 trips per weekday for
-63-

Sonoma County resident households to a high of 2.2 trips per weekday for SantaClara County households. San Mateo County households also have higher thanaverage home-based work trips per household (2.1 trips per weekday).
The transit share for all trip purposes for residents of San Franasco County is 23.1percent, significantly higher than the regional transit share of 6.3 percent. For home-based work trips, San Franciscans take transit 32.3 percent of the time, compared tothe regionaI share of 10.0 percent. San Francisco, with 13.6 percent of the regionalhouseholds and 11.9 percent of the regional household population, accounts for 40.4percent of the regional home-based work transit trips and 43.1 percent of theregional total transit trips.
Alameda County households have the second highest transit share for total trips inthe region, at 7.4 percent of all trips. This is followed by San Mateo County (4.7percent), Marin County (4.5 percent), and Contra Costa County (4.1 percent). The BayArea counties with the lowest transit share of total trips include Napa County (1.1percent), Solano County (1.7 percent) and Santa Clara County (2.0 percent).
Work-trip transit shares are similar in ranking to total-trip transit shares. AlamedaCounty workers take transit 13.0 percent of the time; Marin County, 9.1 percent;Contra Costa County, 8.4 percent; and San Mateo County resident workers, 7.6percent of the time. Work-trip transit shares are lowest for residents of SonomaCounty (1.8 percent), Napa County (2.3 percent), and Santa Clara County (2.5percent).
-64-

Table 3.61990 Regional Transit Share for Trips per Household by County of Residence
county of Home-Based Work Trips Total TripsResidence Transit All Modes % Transit Transit Ml Modes % Transit
SanFrancisco 0.594 1.841 32.3% 1.516 6.560 23.1%
SanMateo 0.158 2.080 7.6% 0.339 7.197 4.7%SantaClara 0.056 2.241 2.5% 0.155 7.741 2.0%
Alameda 0.255 1.968 13.0% 0.566 7.647 7.4%ContraCosta 0.164 1.953 8.4% 0.336 8.103 4.1%
Solano 0.058 1.791 3.2% 0.129 7.524 1.7%
Napa I 0.040 1.765 2.3% 0.088 : 8.320 1.1%
Sonoma 0.030 1.685 1.8% 0.187 7.998 2.3%
Marin I 0.175 1.930 9.1%1 0.334 7.423 4,5%1
Total 0.200 1.991 10.O% 0.479 7.553 6.3%
-65-
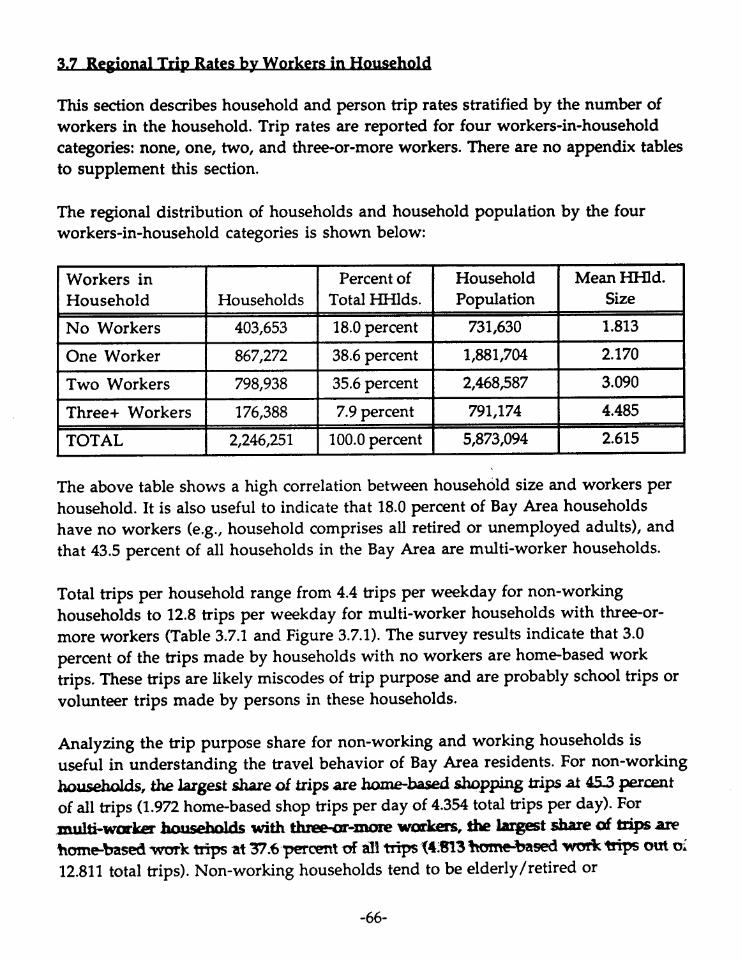
3.7 ~ Rates by Work~● ● ●
This section describes household and person trip rates stratified by the number ofworkers in the household. Trip rates are reported for four workers-in-householdcategories: none, one, two, and three-or-more workers. There are no appendix tablesto supplement this section.
The regional distribution of households and household population by the fourworkers-in-household categories is shown below:
Workers in Percent of Household Mean HHld.Household Households Total HHlds. Population Size
No Workers 403,653 18.0 percent 731,630 1.813
One Worker 867,272 38.6 percent 1,881,704 2.170
Two Workers 798,938 35.6 percent 2,468387 3.090
Three+ Workers 176,388 7.9 percent 791,174 4.485
TOTAL 2,246,251 100.0 percent 5,873,094 2.615
The above table shows a high correlation between household size and workers perhousehold. It is also useful to indicate that 18.0 percent of Bay Area householdshave no workers (e.g., household comprises all retired or unemployed adults)# andthat 43.5 percent of all households in the Bay Area are multi-worker households.
Total trips per household range from 4.4 trips per weekday for non-workinghouseholds to 12.8 trips per weekday for multi-worker households with three-or-more workers (Table 3.7.1 and Figure 3.7.1). The survey results indicate that 3.0percent of the trips made by households with no workers are home-based worktrips. These trips are likely miscodes of trip purpose and are probably school trips orvolunteer trips made by persons in these households.
Analyzing the trip purpose share for non-working and working households isuseful in understanding the travel behavior of Bay Area residents. For non-workinghouseholds, the Largest share of trips are home-basal shopping trips al 453 per-tof all trips (1.972 home-based shop trips per day of 4.354 total trips per day). ForInllki-wcxker hmsddds with threur-more warkers, the largest shared trips areIwrnebased worktripsat 37.6 percent d rill~ ~4.W3 Itome+aSed woik’tq)soutti
12.811 total trips). Non-working households tend to be elderly/retired or
-66-

unemployed households with shopping as the principal out-of-home activity.Multi-worker households tend to have workers who commute a lot. Home-basedschool and non-home-based trips per household increases with increasing numberof workers in the household, yet home-based shop and home-basedsocial/recreation trips per household show indefinite relationships with respect toworkers in the household.
Transit shares for total trips range from a low of 5.2 percent of trips for two-workerhouseholds to a high of 10.6 percent for no-worker households. The home-basedwork transit share for one-worker households (12.8 percent) is noticeably higherthan the shares for two-worker (8.8 percent) and three-or-more worker (9.5 percent)households.
There is a significant jump in trips per person when comparing non-workinghouseholds (2.4 trips per weekday) to one-worker (3.0 trips) and multi-worker (2.9 to3.0) households (Table 3.7.2). Total trips per person is virtualy the same for the one-worker and multi-worker household categories. On a trip purpose basis, however,home-based work trips increase with increasing number of workers-in-households,which is offset by decreases in home-based shop, home-based social/recreation, andnon-home-based trips per person.
-67-

Table 3.7.11990 Regional Trips per Household by Workers in Household
Workers Home-Based Non-in HHld. Mode Work Sho~ Soc/Rec Total
Vehicle LMver 0.078 1.199 0364 0.071 0.638 2351In-VehiclePerson 0.097 1.531 0.538 0.112 0.857 3.135Transit 0.008 0.173 0.064 0.119 0.099 0.462
No Person 0.105 1.703 0.602 0.231 0.956 3.597Workers School Bus 0.000 0.000 0.000 0.047 0.000 0.047
Bicycle 0.007 0.002 0.012 0.016 0.004 0.042walk 0.021 0.255 0.109 0.097 0.170 0.652other 0.000 0.011 0.002 0.002 0.001 0.016Total 0.133 1.972 0.725 0.394 1.130 4354Percent Transit 5.8% 8.7% 8.9% 30.2% 8.7% 10.6%Vehicle Driver 1.135 1.229 0.413 0.122 1.252 4.151In-VehiclePerson 1.214 1.484 0.601 0345 1.512 5.156Transit 0.190 0.055 0.018 0.0s8 0.079 0.400
One Person 1.404 1.539 0.619 0.402 1.591 5.555Worker School Bus 0.000 0.000 0.000 0.053 0.000 0.053
Bicycle 0.020 0.013 0.023 0.029 0.011 0.095walk 0.058 0.146 0.080 0.142 0.267 0.692Other 0.003 0.005 0.003 0.001 0.011 0.023Total 1.484 1.702 0.725 0.627 1.880 6.418Percent Transit 12.85’. 3.2% 2.5% 9.2% 4.2% 6.2%Vehicle Driver 2.297 1.394 0.463 0.170 1.727 6.051In-VehiclePerson 2.503 1.798 0.747 0.514 2.102 7.663Transit 0.252 0.042 0.016 0.082 0.086 0.478
Two Person 2.754 1.840 0.764 0.596 2.187 8.141Workers School Bus 0.000 0.000 0.000 0.111 0.000 0.111
Bicycle 0.033 0.020 0.029 0.036 0.029 0.146walk 0.065 0.113 0.084 0.200 0.358 0.820Other 0.005 0.004 0.005 0.001 0.010 0.024Total 2.856 1.976 0.882 0.944 2.583 9.242Percent Transit 8.8% 2.1% 1.9% 8.7% 3.3% 5.2%Vehicle Driver 3.552 1.625 0.797 0.452 2.256 8.681In-VehiclePerson 4.139 1.986 1.113 0.728 2.673 10.638Transit 0.458 0.123 0.042 0.138 0.152 0.913
Three-or- Person 4.597 2.109 1,155 0.866 2.824 11.550More School Bus 0.000 0.000 0.000 0.087 0000 0.087Workers Bicycle 0.063 0.021 0.043 0.055 0.035 0.217
walk 0.145 0.111 0.116 0.208 0.337 0.916other 0.008 0.006 0.007 0.003 0.017 0.040Total 4.813 2.246 1.320 1.219 3.213 12.811Percent Transit 9.5% 5.5% 3.2% 11.3% 4.7% 7.1%
.~ 1.548 1,313 0.452 0.156 1389 4$859
In-VehiclePerson 1.701 1.643 0.682 0.393 1.695 6.115Transit 0.200 0.077 0.028 0.084 0.091 0.479
Total Person 1.902 1.720 0.710 0.477 1.786 6.594schooIBus OXxxl Ofxxl Om on75 Omo 4x075Bicycle 0.025 0.014 0.025 0.031 0.018 0.113walk 0.061 0.151 OMW ala 0287 0.748
f)m3 ml Om amTotal 1.991 1.891 0.827 0.744 2.100 7.553Percent Transit 10.09’0 4.1% 3.3% 11.3% 4.3’% 6.3%
+8-

Table 3.7.21990 Regional Trips per Person by Workers in Household
Workers Home-Based Non-in HHld. Mode Work Shop Soc/Rec School Home-Based Total
Vehicle Driver 0.043 0.662 0.201 0.039 0.352 1.297In-VehiclePerson 0.054 0.844 0.297 0.062 0.473 1.730Transit 0.004 0.095 0.036 0.066 0.055 0255
No Person 0.058 0.940 0.332 0.127 0.527 1.985Workers School Bus 0.000 0.000 0.000 0.026 0.000 0.026
Bicycle 0.004 0.001 0.007 0.009 0.002 0.023walk 0.011 0.141 0.060 0.054 0.094 0.360other 0.000 0.006 0.001 0.001 0.000 0.009Total 0.074 1.088 0.400 0.217 0.623 2.402PercentTransit 5.8% 8.7% 8.9% 30.2% 8.7% 10.6%Vehicle Driver 0.523 0.566 0.190 0.056 0.577 1.913In-Vehicle Person 0.560 0.684 0.277 0.159 0.697 2.376Transit 0.087 0.025 0.008 0.027 0.037 0.184
One Person 0.647 0.709 0.285 0.186 0.733 2.560Worker School Bus 0.000 0.000 0.000 0.024 0.000 0.024
Bicycle 0.009 0.006 0.010 0.013 0.005 0.044walk 0.027 0.067 0.037 0.065 0.123 0.319Other 0.001 0.002 0.001 0.000 0.005 0.010Total 0.684 0.785 0.334 0.289 0.867 2.958Percent Transit 12.8% 3.2% 2.5% 9.2% 4.2% 6.2%Vehicle Driver 0.743 0.451 0.150 0.055 0.559 1.958In-VehiclePerson 0.810 0.582 0.242 0.166 0.680 2.480Transit 0.081 0.014 0.005 0.027 0.028 0.155
Two Person 0.891 0.595 0.247 0.193 0.708 2.635Workers School Bus 0.000 0.000 0.000 0.036 0.000 0.036
Bicycle 0.011 0.006 0.009 0.012 0.009 0.047walk 0.021 0.037 0.027 0.065 0.116 0.265Other 0.002 0.001 0.002 0.000 0.003 0.008Total 0.924 0.640 0.285 0.305 0.836 2.991Percent Transit 8.8% 2.1% 1.9% 8.7% 3.3% 5.2%
●
Vehicle Driver 0.792 0.362 0.178 0.101 0.503 1.935In-VehiclePerson 0.923 0.443 0.248 0.162 0.596 2.372Transit 0.102 0.027 0.009 0.031 0.034 0.203
Three-or- Person 1.025 0.470 0.257 0.193 0.630 2.575More School Bus 0.000 0.000 0.000 0.019 0.000 0.019Workers Bicycle 0.014 0.005 0.010 0.012 0.008 0.048
walk 0.032 0.025 0.026 0.046 0.075 0.204Other 0.002 0.001 0.002 0.001 0.004 0.009Total 1.073 0.501 0.294 0.272 0.716 2.856Percent Transit 9.5% 5.5% 3.2% 11.3% 4.7% 7.1%
Vehicle Driver 0.592 0.502 0.173~ 0.531 1.858
In-VehiclePerson 0.651 0.629 0.261 0.150 0.648 2.339Transit 0.077 0.029 0.011 0.032 0.035 0.183
Total Person 0.727 0.658 0.271 0.182 0.683 2.522school Bus Wloo (Moo (Moo 0.029 0.000 Wn9Bicycle 0.010 0.005 0.009 0.012 0.007 0.043walk LM23 m58 fM34 MM] 0.110
mo? mm ~~ &Ool mmTotal 0.761 0.723 0.316 0.285 0.803 2.889Percent Transit 10.0% 4.1% 3.3% 11.3% 4.3% 6.3%
%
-69-

Figure 3.7.11990 Trips per Household by Workers in Household by Trip Purpose
i
o 1 2 3+
wQikel%-perW0m9ehdd
-70-

This section describes household and person trip rates stratified by household lifecycle. The household life cycle categories used in this analysis are based on thecategories used in the 1990 Nationwide Personal Transportation Study ~).These are commonly used life cycle categories that were developed by travelbehavior researchers in the 1970s and 1980s. Travel behavior researchers have usedthe household life cycle concept as an alternative means of segmenting householdsinto relevant groupings for explaining and understanding travel behavior offamilies and households. This analysis is MTC’S first attempt at analyzinghousehold travel survey data using the household life cycle concept.
A comparison of the distribution of households by household life cycle categorybased on the 1990 Bay Area travel survey and the 1990 NPTS is shown below:
1990NPTS Percent of 1990 Bay Area Percent of
Life Cycle Category HHlds (~S) Total HHlds. Total
Single Adult, No Kids 15,505 16.7% 432,182 19.2%
Two or More Adults, No Kids 24,182 26.1% 540,446 24.1%
Single Adult, Child <6 1,698 1.8% 49,939 2.2%
Two or More Adults, Child c 6 13,791 14.9% 316>74 14.1%
Single Adult, Child 6-15 2J82 2.6% 70,970 3.2%
Two or More Adults, Child 6-15 12,332 13.3% 295,720 13.2%
Single Adult, Child 16-21 819 0.9% 47,744 2.1%
Two or More Adults, Child 16-21 4,444 4.8% 113390 5.1%
Single Adult, Retired, No Kids 7,642 8.3% 151,711 6.8%
Two or More Adults,Retired 9,777 10.6% 227j276 10.1%
TOTAL 92,572 100.0% 2,246,251 100.0%
W’IS Source: Patricia Hu and Jennifer Young. “1990 NPTS Databook Volume 1“ Federal Highway
Administration,Washington, D,C., November 1993, p. 4-32.
The largest household life cycle category in the Bay Area is the “two or more adults,no children” category with 26.1 pusmt of d lq@Xlal househOl&. This is followed
by*-e-~=@fYJValwl==@da~ .Yts!vOn?
more adults, youngest child under 6 years” category at 14.9 percent; and the “two or
-71-

more adults, youngest child 6 to 15 years” category at 13.3 percent of all households.The 1990 Bay Area travel survey analysis of households by life cycle category arequite similar to the 1990 NPTS distribution of households by these same categories.
The distribution of 1990 Bay Area households, household population, total trips,total trips per household and total trips per capita is presented in Table 3.8.1. Meanhousehold size ranges from 1.0 for the two sets of single adtdt categories to 4.39persons per household for the “two or more adults, youngest child under 6 years”category. The “two or more adults, youngest child 6 to 15 years” category has the nexthighest average household size at 4.33 persons per household.
Trips per household range from a low of 2.7 trips per weekday for the single retiredadult household to a high of 13.7 trips per weekday for the “two or more adults,youngest child 6 to 15 years” category. The second highest trips per household ratefor the “two or more adults, youngest child age 16 to 21 years” with an average of11.9 trips per household per weekday.
is
In contrast, trips per person range from a low of 1.5 trips per weekday for the “singleadult, youngest child under 6 years” household category to a high of 4.0 trips perweekday for the single adult (not retired) household group. On a trips per personbasis, the second most mobile group are the “two or more adults, no children” set ofhouseholds at 3.3 trips per person per weekday.
Trips per household by household life cycle category by trip purpose is highlightedin Table 3.8.2. Also shown are trip purpose shares. Home-based work shares rangefrom 2.4 percent of the trips made by single retired adult households (most likelymiscodes of trip purpose since these adults are reportedly retired) to 36.3 percent ofall trips made by “two or more adults, no children” households. In terms of home-based work trips per household, the “two or more adults, youngest child 16 to 21years” has the highest trip rate at 3.6 trips per household per weekday.
Home-based shop trip shares range from 18.5 percent of trips made by “single adult,youngest child 16 to 21 years” households to 50.5 percent of trips made by retiredsingle adult households. These retired single adult households also have thehighest share of home-based social/recreation trips (18.0 percent).
I-Imrebased school trips account for 24.7 percent of the trips made by “single adult,
Y=W=m6ti EY==” h0m#mU&f01bUed&ar2tUlpera?ntof*tr@s-by “two or more adults, youngest child 6 to 15 years” households.
-72-

Table 3.8.11990 Regional Trips per Household and per Person by Household Life Cycle(NationwidePersonal Transportation Survey (NPTS) Categories)
Trips per HouseholdI Total % of]
HouseholdLife Cycle Category1 Single Adult, No Children2 Tw~ or More Adults, No Children3 Single Adult, Youngest Child Under 64 Two or More Adults, YoungestChild Under 65 Single Adult, Youngest Child 6-156 Two or More Adults, YoungestChild 6-157 Single Adult,Youngest Child 16-218 Two or more Adults,YoungestChild 16-219 Single Adult, Retired, No Children
10 Two or More Adults,Retired, No Children
Households Total432,182 19.2%540,446 24.1%49,939 2.2%
316,374 14.1%70,970 3.2%
295,720 13.2%47,744 2.1%
113,890 5.1%151,711 6.8%227,276 10.1%
.
Total Trips, Trips/All Modes HH
1,714,057 3.9664,011,938
275,4852,852,049
588>974,051,427
305,5331257,663
410,768
7.4235.5169.0158.294
13.7006.399
11.9212.708
1J99,219 6.156TOTAL 2,246,252 100.O%I 16,966,736 7.553
Trips per Person in Household
HouseholdLife Cycle Category1 Single Adult, No Children2 Two or More Adults, No Children3 Single Adult,Youngest Child Under 64 Two or More Adults,Youngest Child Under 65 Single Adult, Youngest Child 6-156 Two or More Adults, YoungestChild 6-157 Single Adult,Youngest Child 16-218 Two or more Adults,Youngest Child 16-219 Single Adult, Retired, No Children
10 Two or More Adults,Retired, No Children~
Household Pers/1 Total Trips, TriPs/Population All Mocks Fers
432,182 m 1,714,057 3.9661,210,227
178,6981,387,636
189,4161,279,859
105,061423,912151,711
2.2393.5784.3862.6694.3282.2013.7221.Ooc
4,011;938275,485
2,852,049588,597
4,051,427305,533
1J57,663410,768
3.3151.5422.0553.1073.1662.9083.2032.708
514,392 2.263 1299,219 2.7205,873,094 2.615 16,966,736 2.889
-73-

Table 3.8.21990 Regional Trips per Household by Trip Purpose by Household Life Cycle(NationwidePersonal Transportation Surwey(NPTS) Categories)
Trips per Household (Total Modes)Home-Based ... . TriIx Non-Home Total
Household Life Cycle Category Work Shop Soc/Rec School1 Single Adult, No Children 1.243 0.739 0.381 0.096 1.507 3.9662 Two or More Adults, No Children 2.695 1.393 0.683 0.232 2.420 7.4233 Single Adult,Youngest Child Under 6 1.033 1.600 0.569 0.657 1.658 5.5164 Two or More Adults, YoungestChild Under 6 2.495 2.543 0.955 0.933 2.089 9.0155 Single Adult, YoungestChild615 1.209 2.010 0.860 2.053 2.162 8.2946 Two or More Adults,YoungestChild 6-15 2.836 3.498 1.529 2.741 3.097 13.7007 Single Adult, Youngest Child 16-21 2.080 1.183 0.587 0.991 1.559 6.3998 Two or more Adults, Youngest Child 16-21 3.600 2.561 1.344 1.344 3.072 11.9219 Single Adult, Retired, No Children 0.065 1.367 0.488 0.019 0.769 2.708
10 Two or More Adults, Retired, No Children 0.853 2.457 0.994 0.076 1.777 6.156
TOTAL 1.991 1.891 0.827 0.744 2.100 7.553
Share of Trips by Trip PurposeHome-Based. . . . TriDs Non-Home Total
, HouseholdLife Cycle Category ~Work Shop Soc/Rec School Based Tn1 Single Adult, No Children 31.3% 18.6% 9.6% 2.4% 38.0% 100.0%2 Tw~ or More Adults, No Children3 Single Adult, Youngest Child Under 64 Two or More Adults,Youngest Child Under 65 Single Adult, YoungestChild 6-156 Two or More Adults, Youngest Child 6-157 Single Adult, Youngest Child 16-218 Two or more Adults, YoungestChild 16-219 Single Adult, Retired, No Children
36.3%18.7%27.7%14.6%20.7%32.5%30.2%2.4%
18.8%29.0%28.2%24.2%25.5%18.5%21.5%50.5%
9.2%10.3%10.6%10.4%11.2%9.2%
11.3%18.0%
3.1%11.9%10.4%24.7%20.0%15.5%11.3%0.7%
32.6% 100.0%30.1% 100.0%23.2% 100.0%26.1% 100.0%22.6% 100.0%24.4% 100.0%25.8% 100.0%28.4% 100.0%
10 Tw~ or More Adults, Retired, No Children 13.9% 39.9% 16.1% 1.2% 28.9% 100.0%TOTAL 26.4% 25.0% 11.0% 9.9% 27.8% 100.0%
-74-

3.9 R~ Rates by ?Iouselmld&zebyVel@e AuuUUllty. ● . ● ● . .
This section describes household and person trip rates, by trip purpose, cross-classified by household size and vehicle availability. Five household size groups areused in this analysis (one, two, three, four, and five-or-more persons) and fourvehicle availabilityy categories are used (none, one, two, and three-or-more vehicles).
Trips per household are summarized in Table 3.9.1. Trips per person are shown inTable 3.9.2. The number of sample households, expanded households, and expandedhousehold population is reported in Table 3.9.3.
Several cells in this cross-classification matrix have an insufficient number ofhousehold samples to be considered statistically valid. These are the zero-vehiclehouseholds with four or five-or-more persons per household categories. The triprate information is provided for information purposes only.
The largest category in this cross-classification matrix is the two-person, two-vehiclehousehold with 373,000 households out of 2.25 million regional households. This isfollowed by the one-person, one-vehicle household category with 369,000households.
Total trips per household show increases in both dimensions of this cross-classification matrix, that is, trips per household increases with increasing numberof vehicles per household and increasing number of persons per household. Theone-person household with no vehicles makes an average of 2.7 trips per householdper weekday. The household with five-or-more persons and three-or-more vehiclesmakes an average of 16.3 trips per household per weekday. This pattern ofincreasing trips per household is less pronounced and more varied on a trippurpose basis, with some trips per household decreasing with increasing number ofvehicles per household.
Trips per person show an increase with more vehicles per household and a decreasewith more persons per household. The most mobile bunch of households are theoneperson households with three-or-more vehicles (0.8 percent of all households)who make 4.2 trips per average weekday. The least mobile households are thehouseholds with five-or-more persons and only one vehkle available (1.8 trips perperson per weekday).
-75-

Table 3.9.11990 Regional Trips per Household by Household Sizeby Vehicles Available per Household - Total Modes
Household Trip Vehicles Available per Householdsize PurDose o 1 2 3-or-more TOTALa
HBW 0.589 1.008 1.218 1.076 0.937HBSH 0.824 0.942 0.854 0.837 0.902
One HBSR 0.332 0.438 0.395 0.416 0.408Person HBSch 0.083 0.082 0.047 0.000 0.076
NHB 0.896 1.445 1.297 1.844 1.315Total 2.724 3.914 3.811 4.174 3.639HBW 1.127 1.448 2.091 2.031 1.849HBSH 0.978 1.714 1.517 1.753 1.567
Two HBSR 0.443 0.666 0.787 0.735 0.724Persons HBSch 0.574 0.303 0.131 0.123 0.205
NHB 0.932 1.659 2.183 2.436 2.000Total 4.054 5.791 6.709 7.078 6.345HBW 1.065 1.790 2.472 3.002 2.432HBSH 1.988 1.884 2.078 2.080 2.035
Three HBSR 0.404 0.645 0.906 0.960 0.845Persons HBSch 1.184 0.932 0.719 0.607 0.750
NHB 1.142 2.052 2.197 2.987 2.365Total 5.784 7,303 8.371 9.636 8.427HBW 1.252 t 2.192 2.551 3.367 2.751HBSH 2.138 t 2.556 3.028 2.735 2.821
Four HBSR 0.394 t 0.968 1.206 1.623 1.295Persons HBSch 1.531 t 1.486 1.729 1.462 1.589
NHB 1.149 t 2.161 2.564 3.497 2.797Total 6.464 t 9.363 11.078 12.683 11.254
HBW 2.073 t 2.841 2.606 4.128 3.259HBSH 2.564 t 2.765 4.238 3.881 3.772
Five-or- HBSR 0.429 t 0.765 1.593 1.817 1.499More HBSch 2.775 t 3.003 2.712 2.843 2.815Persons NHB 2.215 t 1.610 2.891 3.592 2.958
Total 10.055 t 10.985 14.040 16.261 14.303
HBW 0.869 1.378~ 3.034 1.991I.uo 1.442 2X33 2516 1.$91
Total HBSR 0.371 0.571 0.941 1.237 0.827HHlcis. EIEScb 0513 0.473 0.796 1.175 0.744
1.015 1.6X 2.261 3.W 21OCTotal 3.889 5.484 8.366 11.030 7.553
t Trip rates based on less than 50 sample households and are notstatistically sigmficant. Reported for information purposes only.
-76-
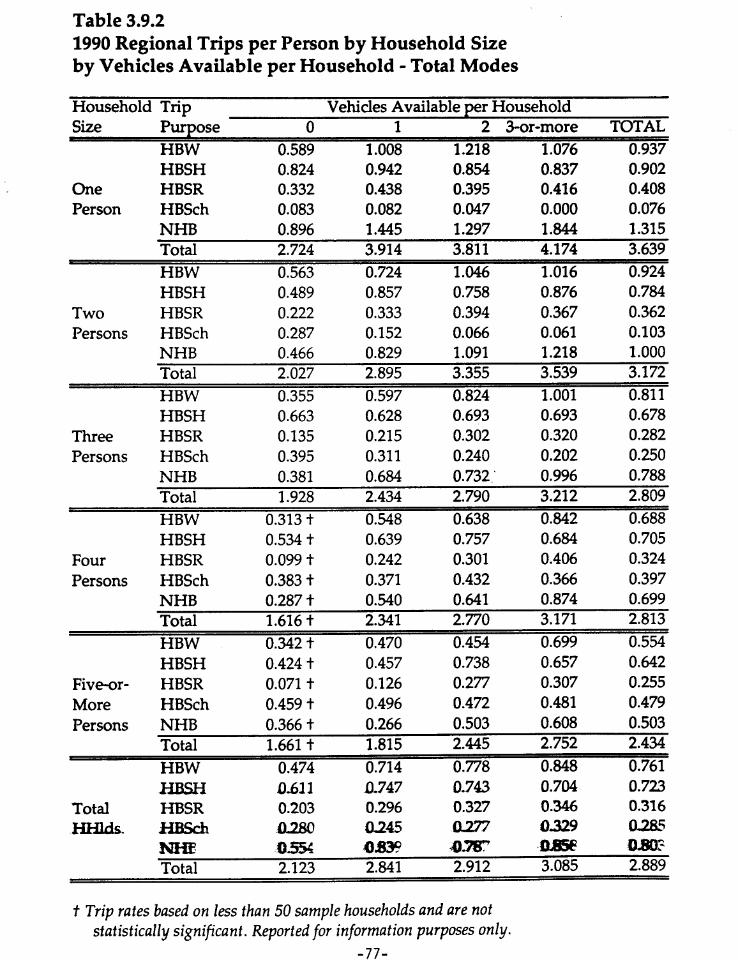
Table 3.9.21990 Regional Trips per Person by Household Sizeby Vehicles Available per Household - Total Modes
Household Trip Vehicles Available per Householdsize Pumose o 1 2 3-or-more TOTAL
●A
HBW 0.589 1.008 1.218 1.076 0.937HBSH 0.824 0.942 0.854 0.837 0.902
One HBSR 0.332 0.438 0.395 0.416 0.408Person HBSch 0.083 0.082 0.047 0.OOO 0.076
NHB 0.896 1.445 1.297 1.844 1.315Total 2.724 3.914 3.811 4.174 3.639>HBW 0.563 0.724 1.046 1.016 0.924HBSH 0.489 0.857 0.758 0.876 0.784
Two HBSR 0.222 0.333 0.394 0.367 0.362Persons HBSch 0.287 0.152 0.066 0.061 0.103
NHB 0.466 0.829 1.091 1.218 1.000Total 2.027 2.895 3.355 3.539 3.172
HBW 0.355 0.597 0.824 1.001 0.811HBSH 0.663 0.628 0.693 0.693 0.678
Three HBSR 0.135 0.215 0.302 0.320 0.282Persons HBSch 0.395 0.311 0.240 0.202 0.250
NHB 0.381 0.684 0.732 % 0.996 0.788Total 1.928 2.434 2.790 3.212 2.809
HBW 0.313 t 0.548 0.638 0.842 0.688HBSH 0.534 t 0.639 0.757 0.684 0.705
Four HBSR 0.099 t 0.242 0.301 0.406 0.324Persons HBSch 0.383 t 0.371 0.432 0.366 0.397
NHB 0.287 t 0.540 0.641 0.874 0.699Total 1.616 t 2.341 2.770 3.171 2.813
HBW 0.342 t 0.470 0.454 0.699 0.554HBSH 0.424 t 0.457 0.738 0.657 0.642
Five-or- HBSR 0.071 t 0.126 0.277 0.307 0.255More HBSch 0.459 t 0.496 0.472 0.481 0.479Persons NHB 0.366 t 0.266 0.503 0.608 0.503
Total 1.661 t 1.815 2.445 2.752 2.434>
HBW 0.474 0.714 0.778 0.848 0.7610611 n+747 0.743 0.704 0.723
Total HBSR 0.203 0.296 0.327 0.346 0.316
HHlds. HBSch 0245 0329 B5
00S39 a.= am;Total 2.123 2.841 2.912 3.085 2.889
t Trip rates based on less than 50 sample households and are notstatistically significant. Reported for information purposes only.
-77-

Table 3.9.31990 Households and Household Populationby Household Size by Vehicles Available per Household1990 MTC Household Travel Survey — Single Day Sample
Household Vehicles Available per HouseholdSize o 1 2 3-or-more TOTAL
Sample HH 359 1,601 295 91 2,346One Expanded HH 133,369 369,440 63,394 17,689 583,892Person Expanded HH Pop 133,369 369,440 63,394 17,689 583,892
Sample HH 148 809 1,784 618 3,359Two Expanded HH 50,900 186,866 373,242 114,913 725,921Persons Expanded HH Pop 101,800 373,732 746,484 229,826 1,451,842
Sample HH 50 308 698 564 1,620Three Expanded HH 18,758 75,311 162,670 118,684 375,423Persons Expanded HH Pop 56,274 225,933 488,010 356,052 1,126,269
Sample HH 29 172 583 522 1,306Four Expanded HH 10,575 46,043 141,767 113,800 312,185Persons Expanded HH Pop 42,300 184,172 567,068 455,200 1,248,740
Sample HH 27 87 ~, 278 336 728Five-+ Expanded HH 13,664 37,585 91,917 105,664 248,830Persons Expanded HH Pop 82,709 227,450 527,828 624,364 1,462,351
Sample HH 613 2,977 3,638 2,131 9,359Total Expanded HH 227,266 715,245 832,990 470,750 2,246,251Households Expanded HH Pop 416,452 1,380,727 2,392,784 1,683,131 5,873,094
-78-

3.10kguuMUW RatesbyHousehold Size by W- m Household. . ● .
This section describes household and person trip rates, by trip purpose, cross-classified by household size and workers in the household. Five household sizegroups are used in this analysis (one, two, three, four, and five-or-more persons)and four workers in household categories are used (none, one, two, and three-or-more workers).
Trips per household are summarized in Table 3.10.1. Trips per person are shown inTable 3.10.2. The number of sample households, expanded households, andexpanded household population is reported in Table 3.10.3.
Several cells in this cross-classification matrix have an insufficient number ofhousehold samples to be considered statistically valid. These are the zero-workerhouseholds with four or five-or-more persons per household categories. The triprate information is provided for information purposes only. Three other categoriesare not included in the cross-classification due to impossible combinations: twoworkers in a one-person household; and three-or-more workers in a one-person ora two-person household.
The largest category in this cross-classification matrix is the one-person, one-workerhousehold with 391,000 households out of 2.25 million regional households. This isfollowed by the two-person, two-vehicle household category with 363,000households.
Total trips per household show increases in both dimensions of this cross-classification matrix, that is, trips per household increases with increasing numberof workers per household and increasing number of persons per household. Theone-person household with no workers makes an average of 2.8 trips per householdper weekday. The household with five-or-more persons and three-or-more workersmakes an average of 15.1 trips per household per weekday.
Trips per person show an increase with more workers per household and a decreasewith more persons per household. The most mobile households are the one-person,one-vehicle households who make 4.1 trips per average weekday. The least mobilehouseholds (on a per capita basis) are the households with five-or-inure persons andonly one vehicle available (23 trips per person per weekday).
-79-

Table 3.10.11990 Regional Trips per Household by Household Sizeby Workers per Household - Total Modes
Household Trip Workers per Householdsize Purpose o 1 2 3-or-more TOTAL
HBW 0.073 1.365 NA NA 0.937HBSH 1,332 0.689 NA NA 0.902
One HBSR 0.473 0.376 NA NA 0.408Person HBSch 0.112 0.058 NA NA 0.076
0.812 1.564 NA NA 1.315Total 2.803 4.053 NA NA 3.639HBW 0.113 1.511 2.775 NA 1.849HBSH 2.388 1.680 1.156 NA 1.567
Two HBSR 0.996 0.730 0.605 NA 0.724Persons HBSch 0.221 0.348 0.116 NA 0.205
NHB 1.393 1.861 2.337 NA 2.000Total 5.111 6.130 6.989 NA 6.345
HBW 0.347 1.576 2.738 4.197 2.432HBSH 2.550 2.388 1.910 1.468 2.035
Three HBSR 0.747 0.910 0.823 0.834 0.846Persons HBSch 1.048 1.002 0.655 0.395 0.750
NHB 1.251 2.157 2.514 2.859 2.365Total 5.944 8.032 8.640 9.754 8.427
HBW 0.272 t 1.575 2.983 4.682 2.751HBSH 3.284 t 3.283 2.687 2.348 2.821
Four HBSR 1.115 t 1.409 1.184 1.510 1.295Persons HBSch 1.999 t 1.611 1.719 1.025 1.589
NHB 1.632 t 2.321 2.867 3.699 2.797Total 8.302 t 10.200 11.440 13.263 11.254
HBW 0.584 t 1.819 3.160 5.443 3.259HBSH 3.644 t 4.481 3.940 2.838 3.772
Five-or- HBSR 0.792 t 1.548 1.505 1.595 1.499More HBSch 3.015 t 2.909 3.223 2.076 2.815
Persons NHB 1.823 t 2.743 3.146 3.146 2.958Total 9.858 t 13.499 14.975 15.098 14.303
HBW 0.133 1.484 2.856 4.813 1.991
HBSH 1.972 1.702 1.976 2.246 1.891
Total HBSR 0.725 0.725 0.882 1.320 0.827
HHldS. HBsch m394 M27 0.944 1.219 0.7441.13(? MfK? 3213 2.IOC
Total 4.354 6.418 9.242 12.811 7.553
t Trip rates based on less than 50 sample households and are notstatistically significant. Reported for infornzation purposes only.
-80-

Table 3.10.21990 Regional Trips per Person by Household Sizeby Workers per Household - Total Modes
Household Trip Workers per Householdsize Purpose o 1 2 3-or-more TOTAL
HBW 0.073 1.365 NA NA 0.937HBSH 1.332 0.689 NA NA 0.902
One HBSR 0.473 0.376 NA NA 0.408Person HBSch 0.112 0.058 NA NA 0.076
NHB 0.812 1.564 NA NA 1.315Total 2.803 4.053 NA NA 3.639HBW 0.057 0.756 1.387 NA 0.924HBSH 1.194 0.840 0.578 NA 0.784
Two HBSR 0.498 0.365 0.303 NA 0.362Persons HBSch 0.111 0.174 0.058 NA 0.103
NHB 0.697 0.930 1.168 NA 1.000Total 2.555 3.065 3.495 NA 3.172HBW 0.116 0.525 0.913 1.399 0.811HBSH 0.850 0.796 0.637 0.489 0.678
Three HBSR 0.249 0.303 0.274 0.278 0.282Persons HBSch 0.349 0.334 0.218 0.132 0.250
NHB 0.417 0.719 0.838 0.953 0.788Total 1.981 2.677 2.880 3.251 2.809HBW 0.068 t 0.394 0.746 1.170 0.688HBSH 0.821 t 0.821 0.672 0.587 0.705
Four HBSR 0.279 t 0.352 0.296 0.377 0.324Persons HBSch 0.500 t 0.403 0.430 0.256 0.397
NHB 0.408 + 0.580 0.717 0.925 0.699Total 2.075 t 2.550 2.860 3.316 2.813
HBW 0.096 t 0.316 0.549 0.887 0.554HBSH 0.600 t 0.779 0.684 0.463 0.642
FiveOr- HBSR 0.130 t 0.269 0.261 0.260 0.255More HBSch 0.497 t 0.506 0.560 0.338 0.479Persons NHB 0.300 t 0.477 0.546 0.513 0.503
Total 1.624 t 2.347 2.601 2.461 2.434>
HBW 0.074 0.684 0.924 1.073 0.761HBSH Ml&l 0.785 U.640 0501 0.723
Total HBSR 0.400 0.334 0.285 0.294 0.316HHlcis. H.BSch 0217 UZ? ~~s
0.62s 3.867 Q.%% a.?16 a.m.Total 2.402 2.958 2.991 2.856 2.889
t Trip rates based on less than 50 sample households and are notstatistically significant. Reported for information purposes only.
-81-

Table 3.10.31990 Households and Household Populationby Household Size by Workers per Household1990 MTC Household Travel Survey — Single Day Sample
Household Workers per HouseholdSize o 1 2 3-or-more TOTAL
Sample HH 745 1,601 0 0 2,346One Expanded HH 193,361 390,532 0 0 583,893Person Expanded HH Pop 193,361 390,532 0 0 583,893
Sample HH 705 974 1,680 0 3,359Two Expanded HH 152,881 210,101 362,940 0 725,922Persons Expanded HH Pop 305,762 420,202 725,880 0 1,451,844
Sample HH 100 497 767 256 1,620Three Expanded HH 27,725 114,348 175,478 57,871 375,422Persons Expanded HH Pop 83,175 343,044 526,434 173,613 1,126,266
Sample HH 48 350 683 225 1,306Four Expanded HH 14,922 84,528 161,441 51,293 312,184Persons Expanded HH Pop 59,688 338,112 645,764 205,172 1,248,736
Sample HH 29 200 ‘ 298 201 728Five-+ Expanded HH 14,764 67,764 99,079 67,223 248,830Persons Expanded HH Pop 89,642 389,815 570,509 412,389 1,462355
Sample HH 1,627 3,622 3,428 682 9,359Total Expanded HH 403,653 867,273 798,938 176,387 2,246,251Households Expanded HH Pop 731,628 1,881,705 2,468,587 791,174 5,873,094
-82-
3.11RegwWh@Ww byworkers m Householdby VehiclesAv~able● ● . . ●
This section describes household and person trip rates, by trip purpose, cross-classified by workers in the household and by vehicle available. Four workers inhousehold groups are used in this analysis (none, one, two, and three-or-moreworkers) and four vehicle categories are used (none, one, two, and three-or-morevehicles). This is the third and final set of two-way cross-classification analyses usinghousehold size, vehicles available, and workers in household categories.
Trips per household are summarized in Table 3.11 .1. Trips per person are shown inTable 3.11.2. The number of sample households, expanded households, andexpanded household population is reported in Table 3.11.3.
The cell with three-or-more workers and zero-vehicles available in this cross-classification matrix has an insufficient number of household samples to beconsidered statistically valid. Trip rate information is provided for informationpurposes only.
The largest category in this cross-classification matrix is the two-worker, two-vehiclehousehold with 444,000 households out of 2.25 million regional households. This isfollowed by the one-worker, one-vehicle household category with 411,000households.
Total trips per household show increases in both dimensions of this cross-classification matrix, that is, trips per household increases with increasing numberof workers per household and increasing number of vehicles per household. Thenon-working household with no vehicles makes an average of 3.0 trips perhousehold per weekday. The household with three-or-more workers and three-or-more vehicles makes an average of 13.7 trips per household per weekday.
Trips per person tend to increase with more workers and more vehicles perhousehold, though there are several exceptions to this tendency, In terms of tripsper capita, the most mobile households are the two-worker households with three-or-more vehicles (3.1 trips per person per weekday). The least mobile households(on a per capita basis) are the non-working households with no vehicles available(1Y trips per person per weekday).
-83-

Table 3.11.11990 Regional Trips per Household by Workers per Householdby Vehicles Available per Household - Total Modes
Workers/ Trip Vehicles Available per HouseholdHousehold I?urpose o 1 2 3-or-more TOTAL
HBW 0.105 0.089 0.225 0.243 0.133HBSH 1.266 1.969 2.627 2.959 1.972
No HBSR 0.375 0.707 1.083 1.215 0.725Workers HBSch 0.517 0.326 0.373 0.361 0.394
NHB 0.713 1.088 1.513 1.997 1.130Total 2.975 4.180 5.820 6.775 4.354HBW 1.303 1.417 1.598 1.609 1.484HBSH 0.814 1.174 2.375 2.813 1.702
One HBSR 0.329 0.520 1.002 1.153 0.725Worker HBSch 0.298 0.453 0.821 1.093 0.627
NHB 1.196 1.663 2.123 2.688 1.880Total 3.940 5.227 7.920 9.356 6.418
HBW 2.809 2.700 2.831 2.994 2.856HBSH 1.172 1.698 1.880 2.385 1.976
Two HBSR 0.342 0.587 0.870 1.106 0.882Workers HBSch 0.889 0.681 0.842 1.292 0.944
NHB 1.426 2.241 2.493 3.042 2.583Total 6.637 7.907 8.915 10.820 9.242
HBW 3.782 f 4.812 4.743 4.880 4.813HBSH 2.599 t 0.770 2.254 2.411 2.246
Three-or- HBSR 1.039 t 0.270 1.012 1.548 1.320More HBSch 2.472 t 1.100 1.127 1.200 1.219Workers NHB 3.178 t 1.696 2.282 3.657 3.213
Total 13.070 t 8.647 11.417 13.697 12.811
HBW 0.869 1.378 2.234 3.034 1.991HBSH 1.120 1.442 2.133 2.516 1.891
Total HBSR 0.371 0.571 0.941 1.237 0.827HHlds. HBSch 0.513 0.473 0.796 1.175 0.744
NHB 1.015 1.620 2.261 3.069 2.100TotaI 3.889 5.484 8.366 11.030 7.553
fT*niie5hiMedi?des sth42n50san@ Ju5dddsmadarem!Stfltisfbihj 5ig?@rm2. Reportedfor inpmatiun puq?m!s U?q .
-84-

Table 3.11.21990 Regional Trips per Person by Workers per Householdby Vehicles Available per Household - Total Modes
Workers/ Trip Vehicles Available per HouseholdHousehold Purpose o 1 2 3-or-more TOTAL
HBW 0.059 0.055 0.108 0.105 0.074HBSH 0.708 1.220 1.260 1.277 1.088
No HBSR 0.210 0.438 0.520 0.524 0.400Workers HBSch 0.289 0.202 0.179 0.156 0.217
NHB 0.398 0.674 0.726 0.862 0.623Total 1.663 2.589 2.792 2.922 2.402HBW 0.874 0.837 0.571 0.533 0.684HBSH 0.546 0.694 0.849 0.932 0.785
One HBSR 0.221 0.307 0.358 0.382 0.334Worker HBSch 0.200 0.268 0.293 0.362 0.289
NHB 0.803 0.983 0.759 0.890 0.867Total 2.644 3.090 2.831 3.099 2.958HBW 1.098 0.932 0.950 0.867 0.924HBSH 0.458 0.586 0.631 0.690 0.640
Two HBSR 0.133 0.203 0.292 0.320 0.285Workers HBSch 0.347 0.235 0.282 0.374 0.305
NHB 0.557 0.774 0.836 0.881 0.836Total 2.593 2.730 2.990 3.132 2.991HBW 0.680 t 1.052 1.149 1.079 1.073HBSH 0.467 t 0.168 0.546 0.533 0.501
Three-or- HBSR 0.187 t 0.059 0.245 0.342 0.294More HBSch 0.444 t 0.240 0.273 0.265 0.272Workers NHB 0.571 t 0.371 0.553 0.809 0.716
Total 2.350 t 1.891 2.765 3.029 2.856>
HBW 0.474 0.714 0.778 0.848 0.761HBSH 0.611 0.747 0.743 0.704 0.723
Total HBSR 0.203 0.296 0.327 0.346 0.316HHlds. HBSch 0.280 0.245 0.277 0.329 0.285
NHB 0.554 0.839 0.787 0.858 0.803Total 2.123 2.841 2.912 3.085 2.889
t Trip ruts bad on /ss ihan 50 sample husddds and are nd. .
@-@4f@[email protected] -ti~v WPQ=-4
-85-

Table 3.11.31990 Households and Household Populationby Workers per Household by Vehicles Available per Household1990 MTC Household Travel Survey — Single Day Sample
Workers/ Vehicle Available per HouseholdHousehold o 1 2 3-or-more TOTAL
Sample HH 302 757 431 137 1,627No Expanded HH 117,117 172,308 89,044 25,184 403,653Workers Expanded HH Pop 209,485 278,156 185,610 58,380 731,631
Sample HH 238 1,720 1,170 494 3,622One Expanded HH 86,119 411,342 266,898 102,913 867,272Worker Expanded HH Pop 128,324 695,891 746,749 310,739 1,881,703
Sample HH 58 447 1,911 1,012 3,428Two Exp~nded HH 18,325 116,402 443,706 220,505 798,938Workers Expanded HH Pop 46,907 337,178 1,322,769 761,733 2,468,587
Sample HH 15 53 126 488 682Three-+ Expanded HH 5,707 15,195 33,341 122,145 176,388Workers Expanded HH Pop 31,739 69,502 1s7,655 552,278 791,174
Sample HH 613 2,977 3,638 2,131 9,359Total Expanded HH 227,268 715,247 832,989 470,747 2,246,251Households Expanded HH Pop 416,455 1,380,727 2,392,783 1,683,130 5,873,095
-86-

3.12 RegionalTri~RatesbvDensitv-BasedAreaTme
This last section on trip rates reports on household and person trip rates stratified bydensity-based area type. There are six “area type” categories used in the Bay Area,which are based on a combination of net employment and net population density.The “area type density” is calculated as follows:
Area Type Density = (Total Population+ 2.5* Total Employment)/ DevelopedAcres
Characteristics of the Bay Area by these six area types is shown below:
1 Central Business Dist. I 100-300
I Urban Business Dist. I 55-100
I Urban I 30-55
I Suburban I 6-30
Rural <6
TOTAL
I Percent of
I
TotalTotal Acres Total Acres Employment I
1,055 I 0.0% I 269,817 I
16,476 I 0.4% I 331,881 I
32,182 I 0.7% J 470,331 I
118,017 I 2.7% I 742,109 I
64.2%2,846/8’44 1/213,578
1,422,187 32.1% 46,018
4,436,761 I 100.0% I 3,073,734 I
The regional “core” includes the heart of downtown San Francisco and Oakland,and account for 8.8 percent of the region’s total employment in 1990. The “centralbusiness district” encompasses the ring around the core downtown in San Franciscoand Oakland, and the downtown areas of Berkeley, San Jose and Concord. The“urban business district” includes the ring around San Francisco, Oakland, Daly City,Walnut Creek, Santa Rosa, Palo Alto, Hayward, San Jose, and the “Golden Triangle”area of “Silicon Valley” in Santa Clara County. The term “urban” encompasses theremainder of San Franasco, most of Oakland, Berkeley, and Silicon Valley. The“suburban” area of the Bay Area is the largest area type, comprising 64.2 percent ofthe land area and 39.5 percent of the total employment in the region. “Rural” areascan be found in all counties except San Franasco. A wall map showing these areatypes is cm display in MI’C offices. Additionally,lWI’C’s cmnputmized highwaynetworks use the “area type” designatim in tmffic analy~, ad cmaeen viewingof thei3ay&%lsMme!tand n3ad netwdk&AX?staMaybam&aMmd * gec2g@ur
extent of the different density-based area types used in MTC’S planning analyses.
-87-
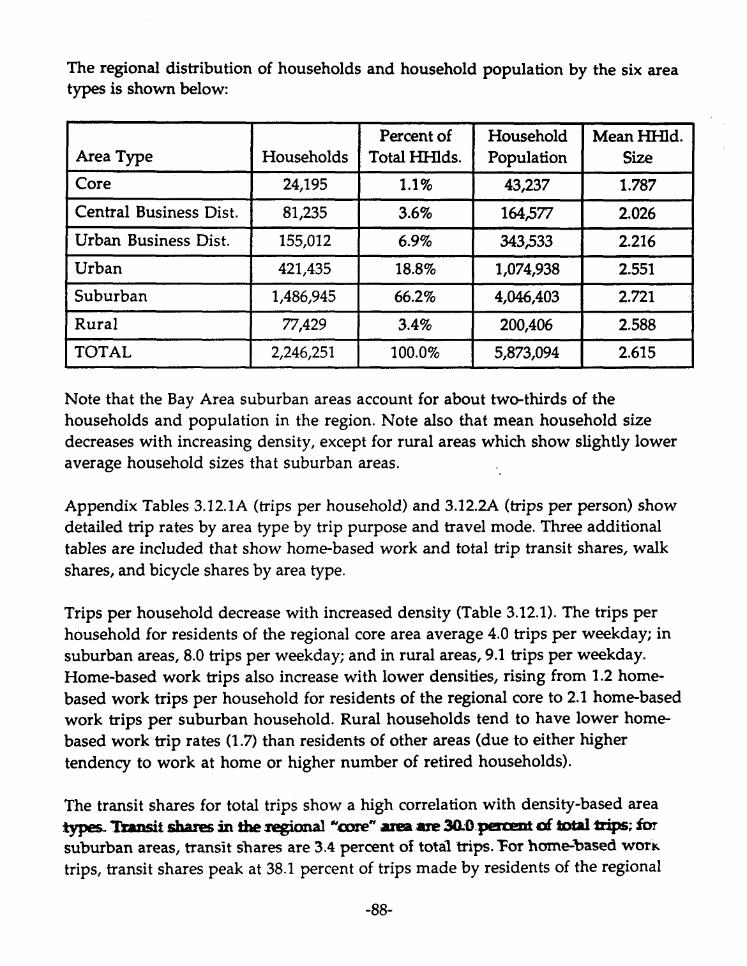
The regional distribution of households and household population by the six areatypes is shown below:
Percent of Household Mean HHld.Area Type Households Total HHlds. Population sizeCore 24,195 1.1% 43,237 1.787
Central Business Dist. 81,235 3.6% 164/577 2.026I I I I
Urban Business Dist. 155,012 I 6.9% I 343333 I 2.216 II I I I
Urban I 421,435 18.8% I 1,074,938 I 2.551 I
Suburban 1,486,945 66.2% 4,046,403 2.721
Rural 77,429 3.4% 200,406 2.588
TOTAL 2,246,251 100.0% 5,873,094 2,615
Note that the Bay Area suburban areas account for about two-thirds of thehouseholds and population intheregion. Note dsofiat mean household sizedecreases with increasing density, except for rural areas which show slightly loweraverage household sizes that suburban areas.
Appendix Tables 3.12.1A (trips per household) and 3.12.2A (trips per person) showdetailed trip rates by area type by trip purpose and travel mode. Three additionaltables are included that show home-based work and total trip transit shares, walkshares, and bicycle shares by area type.
Trips per household decrease with increased density (Table 3.12.1). The trips perhousehold for residents of the regional core area average 4.0 trips per weekday; insuburban areas, 8.0 trips per weekday; and in rural areas, 9.1 trips per weekday.Home-based work trips also increase with lower densities, rising from 1.2 home-based work trips per household for residents of the regional core to 2.1 home-basedwork trips per suburban household. Rural households tend to have lower home-based work trip rates (1.7) than residents of other areas (due to either highertendency to work at home or higher number of retired households).
The transit shares for total trips show a high correlation with density-based areatype% Thzumittih tir@nal"mrl?" all=aldMkQptmx=tdti@T=hsuburban areas, transit shares are 3.4 percent of total “trips.3?or Imrr@%ased worktrips, transit shares peak at 38.1 percent of trips made by residents of the regional
-88-
“core” and average at 5.9 percent for residents of suburban areas and 2.6 percent ofrural areas. Note that there is a high degree of correlation between area type andother, more behavioral characteristics of households, namely, household size,workers per household and household income. The intention here is show thecorrelation between density and transit shares, not to imply causality in terms ofhow higher density neighborhoods “cause” more people to ride transit. A thoroughstatistical analysis is needed to distinguish the importance of density relative toother household characteristics (e.g., household size, income, workers perhousehold) in terms of causing people to ride transit.
Walk share of total trips is also highly and positively correlated with density (Table3.12.2). The walk share of total trips in the regional core of the Bay Area is 34.8percent; for suburban areas, 7.8 percent of all trips are by walk. Home-based workwalk shares range from a high of 29.0 percent in the regional core to 1.5 percent forresidents of rural areas.
Bicycle share of total trips also appears to be positively correlated with density (Table3.12.3). Bicycle share for residents of regional core neighborhoods is 4.0 percent oftotal pips; for residents of suburban areas, 1.4 percent. Residents of “central businessdistricts” show a low tendency to use bicycles, at 0.8 percent of all trips, thoughresidents of the next lower density group, “urban business ,district,” show a higherbicycle share at 2.7 percent of total trips.
-89-

Table 3.12.11990 Regional Transit Share for Trips per Household by Area Type
Area Home-Based Work Trips / HH Total Trips / HHTransit All Modes % Transit Transit All Modes % Transit
Core 0.448 1.175 38.1’% 1.210 4.038 30.0%Central
Bus. Distr. 0.551 1.671 33.0% 1.468 5.837 25.1%Urban
Bus. Distr. 0.459 1.910 24.0% 1.098 6.495 16.9%
Urban I 0.330 1.971 16.7%1 0.807 6.729 12.0%
Suburban 0.121 2.051 5.9% 0.272 7.966 3.4%
Rural 0.044 1.688 2.6%1 0.169 9.125 1.9%
Total 0.200 1.991 10.0% 0.479 7.553 6.3%
-90-

Table 3.12.21990 Regional Walk Share for Trips per Household by Area Type
Area Home-Based Work Trips / HH Total Trips / HHType Walk All Modes % walk Walk All Modes % walk>
Core 0.341 1.175 29.0% 1.404 4.038 34.8%Central
Bus. Distr. 0.171 1.671 10.2% 1.555 5.837 26.6%Urban
Bus. Distr. 0.115 1.910 6.0% 1.155 6.495 17.8%
Urban 0.073 1.971 3.7%1 0.863 6.729 12.8%
Suburban 0.043 2.051 2.1% 0.622 7.966 7.8%
Rural 0.025 1.688 1.5% 0.676 9.125 7.4%
Total 0.061 1.991 3.1% 0.748 7.553 9.9%
-91-

Table 3.12.31990 Regional Bicycle Share for Trips per Household by Area Type
Area Home-Based Work Trips / HH Total Trips / HHType Bicycle AII Modes % Bicycle Bicycle All Modes % Bicycle
Core I 0.062 1.175 5.3%1 0.160 4.038 4.0%t ,Central I I
Bus. Distr. 0.038 1.671 2.3% 0.049 5.837 0.8%Urban
Bus. Distr. 0.057 1.910 3.0% 0.178 6.495 2.7%
Urban 0.043 1.971 2.2% 0.117 6.729 1.7%
Suburban 0.017 2.051 0.8% 0.112 7.966 1.4%
Rural 0.000 1.688 0.0% 0.046 9.125 0.5%&
Total I 0.025 1.991 1.3%] 0.113 7.553 1.5%
-92-

4.0 Weekdav 199 0 Travel by Personal Characteristi~
Section4.0 of Workingpaper #4 discussestravelpatternsbasedon the personalcharacteristicsof individualtravelers.The previoussectiondealt with travelpatternsbasedon householdcharacteristicssuch as income,householdsize,workersin the household,vehiclesavailable,etc. Thissectiondescribestravelbasedonpersonalcharacteristicssuchas age, gender,employmentstatus,driverslicensestatus, and disability status.
Al Travel by Ace of Person
This subsection reports on trips per person by age of the survey respondent.taken from the weighted, expanded 1990 travel survey “single day” sample.
Data is
Trips per person and share of trips by trip purpose by detailed age categories isshown in Table 4.1.1. Trips per person by detailed age is charted in Figure 4.1.1. Notethe parabolic shape of the trips per person distribution in this chart, peaking at 4.31trips per person for 41-year-olds, and showing less trips per capita for younger aswell as older persons. The least mobile group, on a trips per capita basis, are BayArea residents 75 years and over with just 2.18 trips per person per weekday.
The cumulative frequency distribution of trips by trip purpose share by detailed agecategory is charted in Figure 4.1.2. This chart illustrates the high share of home-based school trips made by persons age 5 to 18; the high share of home-based worktrips made by persons age 22 through 65; and the high share of home-based shop(other) trips made by persons age 65 and over. The transitional years between theages of 18 and 22 show a dramatic changeover from a predominance of home-basedschool trips to home-based work trips.
Home-based social/recreation trips tend to have the highest shares for the younger(less than 20 years) and the older (greater than 64 years) residents. Non-home-basedtrip share of total trips tends to increase with age. The share of home-based schooltrips of total trips declines rapidly after persons reach their early 20s. Home-basedwork trip share of total trips peaks at 40.0 percent of all trips made by 24-year-olds.
The detailed age categories presented in Table 4.1.1 are coIlapsed into eight categorieshThk4.UWMpti_r~gmd~~r-ti trip
~~~=~wawm.q~~~habdzaqfor persons age 65 and over to a high of 3.74 trips for persons in their 40s. Children
-93-

age 5 to 17 are the second least “mobile” group at only 2.60 trips per person perweekday. The second highest mobile group are 30-year-olds, averaging 3.56 trips perperson per weekday.
Trip purpose share data is presented in Table 4.1.2 and Figure 4.1.3. Home-basedwork share of total trips range from a low of 2.4 percent of trips made by children age5 to 17 to a high of 37.2 percent of trips made by residents age 23 to 29. Home-basedschool share of total trips decreases with increasing age group, peaking at 46.9percent of the trips made by children age 5 to 17, and less than one percent of thetrips made by residents age 60 and over.
The home-based shop share of total trips tends to increase with increasing age. Only18.4 percent of the trips for children age 5 to 17 are home-based shop tripscontrasting with 47.2 percent of the trips made by residents age 65 and over. Home-based social/recreation trip share of total trips is highest for the 65 and over category,at 16.9 percent; and lowest for persons age 40 to 49, at just 8.6 percent of all trips.
Non-home-based share of total trips also tends to increase with increasing age, up tothe 40s. As people get older than 50, non-home-based share of total trips tends todecrease.
Modal share for home-based work and total trips by these eight age groups areshown in Table 4.1.3. Walk mode shares for total trips are highest for the very young(19.0 percent) and the eldest group (12.5 percent). Walk mode shares are the lowestfor residents age 40 to 49 (6.9 percent). Bicycle mode shares for total trips are highestfor the youngest group (4.2 percent) and lowest for the eldest group (0.2 percent).Transit mode shares are highest for 18-to-22-year-old residents (8.6 percent) andlowest for 60-to-64-year-old residents (4.9 percent). Vehicle driver shares are highestfor the 40-to-49-year-old residents (78.7 percent) and lowest for the youngest group(8.5 percent).
-94-

Table 4.1.1Average Trips per Person and Trip Purpose Share by Age of Trip Maker
AverageTotal Share of Trips bv Trip Purpose
Age Trips/Person HBW HBSH HBSR HBSK NHB*5 2.72 0.0% 35.2% 13.5% 27.8% 23.5%6 2.997 2.818 2.519 2.66
10 2.7111 2.9112 2.6813 2.7414 2.7515 2.7216 3.1317 3.3018 3.2119 3.1520 3.0921 3.0922 3.0323 2.9124 3.2025 3.0026 3.1427 3.5428 3.2029 3.2230 3.3531 3.5932 3.5833 3.7034 3.6635 3.6936 3.6237 3.943839 3.8640 3.67
0.2%0.0%0.7%0.8%0.3%1.1%1.7%1.6%1.8%3.7%6.4%9.6%
19.1%26.5%28.9%30.5%34.7%36.2%40.0%37.8%36.8%34.5%37.9%39.9%33.6%32.5%34.0%33.8%34.5%31.3%34.1%30.6%‘3145%31.6%33.3%
26.8%22.8%15.9%18.3%21.7%15.4%13.7%17.3%12.1%11.0%
15.9%15.9%18.4%17.7%17.9%19.4%19.3%17.2%19.6%19.8%18.0%18.9%20.0%20.3%22.2%25.5%23.5%24.9%21.7%29.8%23.6??026.8%27.7%24.4%24.6%
12.8%13.4%16.6%14.0%15.7%18.1%15.8%12.8%14.6%15.9%13.8%15.2%11.5%14.0%12.2%12.3%10.0%12.4%11.7%10.3%10.1%11.6%10.4%8.9%9.2%
11.0%10.5%9.2%
11.2%9.7%9.1%9.4%
10.4%10.5%9.3%
41.4%42.5%49.7%47.2%44.1%45.9%52.8%50.4%53.4%49.9%46.6%38.8%29.4%16.6%16:6%13.7%11.9%9.7%5.4%5.4%5.4%3.8%3.1%2.8%2.5%2.3%2.5%2.8%2.1%2.1%2.0%1s%21%1.7%1.4%
18.8%21.3%17.1%19.8%18.3%19.5%16.0%17.9%18.2%19.4%17.3%20.4%21.6%25.3%24.4%24.1%24.2%24.5%23.4%26.7%29.8%31.2%28.6%28.1%32.5%28.7%29.4%29.2%30.5%27.2%31.1%31.8%
.=%31.7%31.4%
-95-

Table 4.1.1 (continued)Average Trips per Person and Trip Purpose Share by Age of Trip Maker
AverageTotal Share of Trim bv Trip Pumose
Age Trips/Person HBW HBSH HBSR HBSK NHB●
41 4.31 29.2% 28.1% 10.4% 1.4% 30.8%424344454647484950515253545556575859606162636465666768697071727374
3.973.754.073.573.904.033.753.463.583.383.443.863.653.723.443.552.972.913.082.843.173.163.122.772.633.103.332.722.642.602.763.02.322
75 2.18 .
32.6%34.5%29.4%35.4%33.4%32.0%29.9%33.7%31.8%33.0%33.4%29.4%30.3%30.8%31.6%28.2%32.7%25.0%23.2%24.4%18.2%20.5%14.5%10.1%13.3%7.0%8.0%7.7%7.3%
10.5%6.?5’?’07.4%6.0%3.1%
25.0%21.8%23.5%24.2%23.0%21.7%22.4%25.5%25.8%21.7%22.8%24.0%25.8%22.6%23.8%28.4%27.5%31.4%32.0%34.2%39.5%37.6%39.5%44.1%44.6%43.7%44.0%50.4%46.2%47.0%48.6%45.7%w%49.8%
8.8%7.4%
10.8%8.0%8.7%8.9%7.9%8.6%9.8%
12.1%8.9%
10.1%9.5%9.3%
10.6%9.3%
10.1%11.5%11.9%6.2%
13.4%11.6%16.9%16.8%15.5%16.7%20.6%14.8%15.1%13.5%17.4%18.7%M.S’li16.2%
1.0%2.4%1.6%1.9%0.7%1.2%1.4%0.7%1.2%2.3%0.9%0.5%0.4%0.6%1.2%0.7%1.8%1.1%1.0%1.0%0.3%0.0%0.0%0.4%0.6%0.5%0.5%0.6%0.7%0.0%WY%4).0%1.1%1.2%
32.5%34.0%34.6%30.6%34.2%36.1%38.5%31.4%31.5%31.0%34.1%36.1%34.0%36.6%32.9%33.5%27.9%31.0%31.9%34.2%28.7%30.3%29.2%28.7%25.9%32.2%26.8%26.5%30.6%29.0%27.5%283%34.3%29.7%
-96-

5 10 15 20 25
J!40
~45
H’
L!50 55 60 65 70
Ave
rage
Tot
alT
rip
sp
erP
erso
n●N
yU
JA
pW
Io
0 0b o
0 0C
Jlo , , , , ,
:. WJ

5 9 13 17 21 25 53 57 61 65 69 73
Sh
are
ofT
otal
Tri
ps
by
Tri
pP
urp
ose
o0
00
00
0“w
L1
“sb
mv
ao b
----
x
w A.

Table 4.1.2Average Trips per Person and Trip Purpose Share by Age Group
AverageAge Total Share of TriPs bv Trip PurmGroup Trips/Person HBW HBSH HBSR HByK NHB
5-1718-2223-2930-3940-49
50-5960-6465 +
2.6023.0573.1303.5643.7433.3782.9382.483
2.4%2&2%37.2%32.9%33.5%32.1%21.1%
7.2%
18.4%18.5%19.8%25.7%24.7%25.2%35.9%47.2%
13.9%12.1%10.4%9.7%8.6%9.7%
12.3%16.9%
46.9%17.5%5.1%2.2%1.4%1.3%0.5%0.6%
18.4%23.7%27.5%29.5%
31.8%31.6%30.2%28.2%
5-99 3.206 26.4% 25.0% 10.9% 9.9% 27.8%
-99-

100.0%
90.0%
80.0%
a~&
70.0%
z~ 60.0%
ka 50.0%g
;g 40.0%
%
j 30.0%U)
20.0%
10.0%
0.0%
#
Figure 4.1.3Share of Trips by Trip Purpose by Age Group
\
-1oo-

Table 4.1.3Modal Share for Work and Total Trips by Age Group
Age Home-Based Work Tritx Total TIiDS school
>Grou~ Driver Pasngr. Transit~ Driver Pasngr. Transit Bicycle Walk Other Bus
5-17 34.8% 42.8% 6.8% 5.1% 10.5% 0.0% 8.5% 54.5% 6.0% 4.2% 19.0% 0.2% 7.6%
18-22 67.1% 15.1% 9.3% 2.4% 5.9% 0.1% 64.9% 15.8% 8.6% 1.8% 8.2% 0.4% 0.3%
23-29 I 74.8% 8.6% 10.2% I2.2% 4.0% 0.2% 69.3% 12.8% 7.4% 2.1% 8.1% 0.4% 0.0%
30-39 I 80.6% 6.8% 9.2% I1.2%2.0% 0.3% 76.9% 8.0% 5.6% 1.2% 7.9% 0.3% 0.0%
40-49 80.6% 5.9% 10.8% 0.7% 1.8% 0.1% 78.7% 7.8% 5.8% 0.6% 6.9% 0.2% 0.0%
50-59 80.9% 5.1% 9.8% 0.7% 3.5% 0.0% 77.3% 7.0% 5.4% 0.6% 9.1% 0.5% 0.0%
60-64 78.3% 5.7% 11.9% 0.0% 4.1% 0.0% 74.8% 10.2% 4.9% 0.2% 9.6% 0.3% 0.0%
65+ 74.8% 3.5% 15.3% 0.0’% 6.4% 0.0% 64.0% 16.6% 6.4% 0.2% 12.5% 0.4% 0.0%
5-99 77.9% 7.7% 10.0% 1.3% 3.1% 0.2% 64.3% 16.6% 6.2% 1.5% 9.9% 0.3% 1.2%
-1o1-

Tra~ and Gender of Person
Section 4.2 of this working paper further breaks down the travel characteristics ofBay Area residents by gender as well as age group. Data as reported is from theweighted and expanded single day sample of the 1990 household travel survey.
One important measure of overall personal mobility is the share of personsreporting travel (that they made trips) on their assigned travel day. People eithertravel or don’t travel on any given day. The share that are traveling on any givenday is the “mobile share” of the population, or the ones partaking in non-homeactivities. The mobile share of the population, comparing the San Francisco BayArea with the Sydney and Melbourne, Australia metropolitan areas, is shown inTable 4.2.1. The Sydney data is derived from the 1981 Sydney metropolitan areahousehold travel survey; the Melbourne data from the 1978/79 Melbournemetropolitan area survey. (Source: Marcus R. Wigan Australian Personal TravelCharacteristics, Australian Road Research Board Special Report No. 38, 1987).
The data for the three metropolitan areas show similar patterns. The most mobilepersons are children age 5 to 11; the least mobile are persons age 65 and over. Malesare typically more mobile than females, though the male/female differences aremore pronounced at older age groups (i.e., 60 and over).
Overall, 83 percent of Bay Area residents reported travel on their assigned traveldays. This compares to 78 percent of Sydney metropolitan area residents and 85percent of Melbourne metropolitan area residents. In the Bay Area, 85.4 percent ofmales and 81.7 percent of females reported that they traveled out-of-home on theirassigned travel day. This compares with 80 percent male, 76 percent female mobilityin the Sydney region; and 90 percent male, 80 percent female mobility in theMelbourne region.
The least mobile group are residents age 65 and over. The Bay Area survey showsthat 70.4 percent of men and just 60.3 percent of women age 65 and over partook inout-of-home activities on their assigned travel days. The Sydney and Melbournedata show similar low mobility levels for persons 65 and over.
The other characteristics of personal mobility, as used in this working paper, is the~.d*~Wby-.4*W.m.ati~d*~capita and the trip purpose shams, by gender and age gruup, are shown ‘“mTa’ble 4.2.2.As shown in section 4.1, the most mobile groups (in terms of trips per capita) are
-102-

middle-age persons age 40 to 49; the least mobile, persons age 65 and over.
Trips per capita by gender of respondent shows no statistically significant differencefor all persons age 5 and over. Males reported an average of 3.203 trips per personper weekday; females reported 3.209 trips per person per weekday. On an age groupbasis, however, females tend to be more mobile than males during the early years oflife (ages 5 through 49); males tend to be more mobile than females during the latteryears of life (50 years and over). It is uncertain whether any of these differences intrips per capita by age group and by gender are statistically significant, though thenumerically largest difference is for persons age 65 and over, where men take anaverage of 2.74 trips per person and women take an average of 2.30 trips per personper weekday.
Trip purpose share by gender of traveler is shown in Table 4.2.2. The most notabledifference between males and females, for all age groups combined, is for home-based work and home-based shop trips. The survey shows that 30.3 percent of allmale trips and 22.6 percent of all female trips are for home-based work trip purposes.In contrast, 19.9 percent of all male trips and 29.9 percent of all female trips are forhome-based shop (other) trip purposes. This reflects the higher labor forceparticipation rate among males, and the higher likelihood, of females performingthe shopping and personal business chores for the average household. Thesemale/female tendencies for work and shopping trip shares are consistent across allage groups, except for a statistically insignificant difference for work trip share forchildren age 5 to 17.
The last table in this section looks at modal shares for work and total trips, by genderand age group (Table 4.2.3). The survey shows that females are more likely thanmen to take public transit, walk, or be a passenger in a vehicle. Males are more likelyto be a vehicle driver or ride a bicycle. Males’ vehicle driver share for all trips is 67.5percent; females, 61.3 percent. Males’ vehicle passenger share for all trips is 13.6percent; females, 19.5 percent. Males’ transit share for all trips is 5.8 percent; females,6.6 percent. Males’ bicycle share for all trips is 2.2 percent; females, 0.8 percent. Males’walk share for all trips is 9.4 percent; females, 10.4 percent.
The modalsharepatternsby genderand age group,shmm in Table4-2.3,are similarto the patterns discussed for Table 4.1.3. Males show consistently higher vehiclea3riverauu3bi@ea&k?r 5ham?slluulfe.maksamclss albgegxmaps.l%?maksshowconsistently higher vehicle passenger and transit passenger shares than maies acrossall age groups. Females tend to have higher walk shares than males, except for the 5-
-1o3-

t~17-year-old group, where boys (21.2 percent of all trips) have a higher share ofwalk trips than girls (16.8 percent of all trips).
The work trip modal shares for males and females by age group follow the samepattern as total trip modal shares, with a few exceptions. Young male workers underage 18 have higher work trip transit shares than young female workers (8.9 percentmale versus 4.4 percent female). Also, elderly male workers (65 and over) havehigher work trip transit shares than elderly female workers (15.8 percent maleversus 14.7 percent female). These very young and very elderly workers are verysmall markets of total homebased work trips.
Overall, the home-based work transit share for females (12.2 percent) is significantlyhigher than the home-based work transit share for males (8.4 percent).
-104
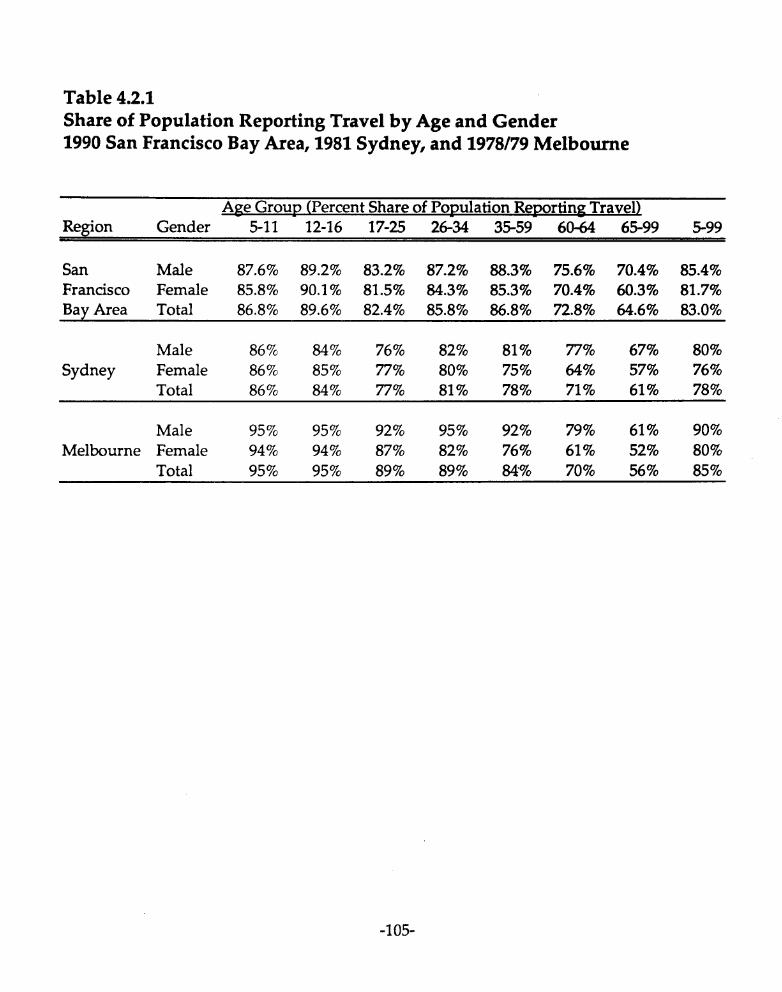
Table 4.2.1Share of Population Reporting Travel by Age and Gender1990 San Francisco Bay Area, 1981 Sydney, and 1978/79 Melbourne
AEe Group (Percent Share of Population Reporting Travel)Region Gender 5-11 12-16 17-25 26-34 35-59 60-64 65-99 5-99
San Male 87.6% 89.2% 83.2% 87.2% 88.3% 75.6% 70.4% 85.4%Francisco Female 85.8% 90.1% 81.5% 84.3% 85.3% 70.4% 60.3% 81.7%Bav Area Total 86.8% 89.6% 82.4% 85.8% 86.8% 72.8% 64.6% 83.0%
Male 86% 84% 76% 82% 81% 77% 67% 80%
Sydney Female 86% 85% 77% 80% 75% 64% 57% 76%
Total 86% 84% 77% 81% 78% 71% 61% 78%
Male 95% 95% 92% 95% 92% 79% 61% 90%
Melbourne Female 94% 94% 87% 82% 76% 61% 52% 80%
Total 95% 95% 89% 89% w% 70% 56% 85%
-1o5-

Table 4.2.2Average Trips / Person and Trip Purpose Share by Age Group by Gender
AverageAge Total Share of Trim by TriD PumoseGroup Gender Trips/Person HBW HBSH HBSR HBSK NHB
Male 2.668 1.9% 17.0% 14.5% 49.3% 17.4%5-17 Female 2.745 2.7% 19.7% 13.1% 44.9% 19.5%
Male 3.033 29.5% 14.3% 13.0% 17.9% 25.4%18-22 Female 3.079 27.1% 22.5% 11.3% 17.1% 22.0%
Male 3.144 40.4% 15.1% 10.2% 5.6% 28.7%23-29 Female 3.117 33.9% 24.5% 10.6% 4.6% 26.3%
Male 3.472 39.6% 18.3% 9.4% 1.6% 31.1%30-39 Female 3.655 26.6% 32.7% 9.9% 2.8% 28.0%
Male 3.659 39.3% 17.8% 7.8% 1.3% 33.8%4049 Female 3.822 28.2% 31.0% 9.3% 1.5% 30.0%
Male 3.443 37.5% 20.3% 9.3% 0.7% 32.2%
50-59 Female 3.314 26.6% 30.3% 10.2% 2.0% 31.1%Male 3.067 24.6% 33.8% 12.0% 0.1% 29.5%
60-64 Female 2.827 17.7% 38.0% i2.5% 0.8% 31.0%
Male 2.736 8.9% 45.6% 18.0% 0.6% 26.9%65+ Female 2.301 5.7% 48.6% 15.9% 0.6% 29.3%
Male 3.203 30.3% 19.9% 10.9% 10.3% 28.6%
5-99 Female 3.209 22.6% 29.9% 11.0% 9.5% 27.1 %
-106-

Table 4.2.3Modal Share for Work and Total Trips by Age Group by Gender
Age Horn&BasedWorkTritx Total Trim School
Group Gender Driver Pasngr. Transit Bicycle Walk Other Driver Pasngr. Transit Bicycle Walk Other Bus
Male 33.3% 32.1% 8.9% 12.4% 13.3% 0.0% 8.9% 50.0% 5.6% 6.2% 21.2% 0.4% 7.7%
5-17 Female 34.6% 51.9% 4.4% 0.4% 8.7% 0.0% 7.5% 59.5% 6.5% 2.2% 16.8% 0.0% 7.5%
Male I 69.1% 14.4% 8.0% I3.7% 4.8% 0.0% 67.5% 14.5% 8.5% 23% 6.3% 0.5% 0.3%
18-22 Female 65.2% 15.8% 10.6% 1.1% 7.1% 0.2% 62.5% 16.9% 8.7% 1.4% 9.9% 0.4% 0.2%
Male 79.0% 7.3% 7.2% 3.0% 3.2% 0.2% 73.7% 9.4% 6.6% 3.0% 6.9% 0.3% 0.0%
23-29 Female 67.1% 15.1% 9.3% 2.4% 5.9% 0.1% 64.9% 15.8% 8.6% 1.8% 8.2% 0.4% 0.3%
Male 82.8% 5.6% 8.0% 1.5% 1.7% 0.3% 79.2% 6.3% 5.5% 1.7% 7.0% 0.3% 0.0%
30-39 Female 77.6% 8.4% 10.8% 0.6% 2.3% 0.2% 74.8% 9.7% 5.7% 0.6% 8.8% 0.3% 0.0%
Male 83.7% 4.4’% 9.4% 1.1% 1.2% 0.2% 81.4% 5.3% 5.8% 0.8% 6.2% 0.4% 0.0%
40-49 Female 76.6% 7.9% 12.6% 0.3% 2.5% 0.0% 76.3% 10.0% 5.9% 0.4% 7.4% 0.1% 0.0%
Male 85.1% 3.0% 7.7% 1.1% 3.0% 0.0% 81.3% 4.0% 4.9% 1.1% 8.7% 0.1% 0.0%
50-59 Female ! 74.7% 8.1% 12.9% 0.1% 4.2% 0.0%! 73.2% 10.1% 6.0% 0.2% 9.5% 0.9% 0.0%
Male I 83.9% 5.3% 8.9% 0.0% 1.9% 0.0% 4.2% 3.5% 0.4% 7.8% 0.2% 0.0%
60-64 Female 70.9% 6.2% 15.8% 0.0% 7.1% 0.0% 66.2% 15.8% 6.2% 0.1% 11.4% 0.2% 0.0%
Male 78.5% 2.3% 15.8% 0.0% 3.4% 0.0% 75.7% 8.3% 5.1% 0.4% 10.4% 0.2% 0.0%
65+ Female 69.8% 5.1% 14.7% 0.0% 10.4% 0.0% 54.0% 23.6% 7.6% 0.0% 14.2% 0.6% 0.0%
Male 81.2% 6.0% 8.4% 1.8% 2.4% 0.2% 67.5% 13.6% 5.8% 2.2% 9.4% 0.3% 1.2%
5-99 Female I 73.4% 9.8% 12.2% 0.6% 3.9% 0.1%1 61.3% 19.5% 6.6% 0.8% 10.4% 0.3% 1.1%
-1o7-

4.3 Travel bv Emvlovme nt Status
Section 4.3 of this working paper discusses travel characteristics stratified byemployed and not-employed persons. This includes a discussion of averageweekday trip rates per person, trip purpose shares, and modal shares.
The following table shows the distribution of weighted and expanded persons (age 5and over) by employment status by gender:
Employed Percent of Not Empld Percent of TotalGender Residents Total Residents Total Persons
Male 1,670,200 64.6% 913$100 35.4% 2584,000
Female 1,416,700 52.4% 1,287,200 47.6% 2,703,900I I I I 1
Total I 3,086,900 I 58.4% I 2,201,000 I 41.6% I 5,287,900
The survey shows that 58.4 percent of Bay Area residents age five and over areemployed persons. By gender, 64.6 percent of males and 52.4 percent of females areemployed. The majority (54.1 percent) of workers are males; the majority of non-workers (58.5 percent) are females.
Trips per person and trip purpose share, by gender and employment status, areshown in Table 4.3.1. The survey shows a small number of home-based work tripsmade by non-workers. This may be due to the miscoding of the employment statusof the person in question, or may be due to the miscoding of volunteer or schooltrips as “work” trips. Note that “non-employed” persons includes persons withoutformal jobs, including student, retired, unemployed, and homemaker occupations.(If a person claimed more than one “status;, say, being a student and a part-timeworker, or being retired and a part-time worker, then that person was classified asemployed person.)
an
Trips per person are significantly higher for employed persons as opposed to non-employed persons. Employed males take an average of 3.51 trips per day; non-employed males, 2.64 trips per day. Employed females take an average of 3.61 tripsper day non-employed females, 277 trips per day. An interesting observation is thatemployed females take more trips per day than employed males; non-employedfemalesalsotakemoretlipsperdaythan nml+lnploy?damlles
The plurality of trips made by employed persons are home-based work trips. For
-108-

male employed persons, 41.2 percent of all trips are home-based work trips. Forfemales, 36.2 percent of all trips are home-based trips. Note that the share of home-based shop trips for employed females (22.8 percent) is substantially higher than theshare of hem-based shop trips made by employed males (16.2 percent).
The plurality of trips made by non-working males are home-based school trips (30.0percent of all trips). The plurality of trips made by non-working females are home-based shop trips (40.1 percent of all trips).
Modal share for home-based work and total trips, by employment status and bygender, is shown in Table 4.3.2. In terms of modal shares for total trips, non-workerstend to have significantly higher vehicle passenger, bicycle and walk shares ascompared to workers; and significantly lower vehicle driver shares as compared toemployed persons. Interestingly enough, the transit share for non-workers is notsignificantly higher for non-workers as compared to workers. Non-working femalestake transit 6.6 percent of the time. Working females take transit for 6.5 percent of alltrips. Non-working males take transit for 7.0 percent of all trips. Working males taketransit for 5.3 percent of all trips.
(Any further extension to this analysis will require the review of trip rates, trippurpose and modal shares cross-classified by employment status, gender, and age ofperson. It is evident from the analysis at hand that all three demographic variables— age, gender, and employment status — are important characteristics, ordeterminants, of personal travel patterns.)
-1o9-

Table 4.3.1Average Trips per Person and Trip Purpose Share by Employment Status by Gender
AverageEmployment Total Share of Trim by Trip PumoseStatus Gender TriDs/Person HBW HBSH HBSR HBSK NHB
Employed Male 3.507 41.2% 16.2% 8.5% 2.1% 32.0%Resident Female 3.609 36.2% 22.8% 8.8% 2.3% 30.0%Not anEmployed Male 2.644 4.1% “ 29.1% 16.6% 30.0% 20.3%Resident Female 2.769 3.1% * 40.1% 14.1% 19.7% 23.0%
Male 3.203 30.3% 19.9% 10.9% 10.3% 28.6%
Total Female 3.209 22.6% 29.9% 11.0% 9.5% 27.1%
* Work trips made by non-employed persons maybe due to miscoding ofperson byemployment stat us, or due to miscoding volunteer, school, etc., trips as work trips.
-11o-

Table 4.3.2Modal Share for Work and Total Trips by EmploymentStatus byGender
Employment Home-Based Work Trim Total Trim school
status Gender ~ Transit Bicycle Walk Other Driver Pasngr. Transit Bicycle Walk Other Bus
Employed Male I 82.2% 5.6% 8.4% 1.6% 2.1% 0.2% 79.8% 6.6% 5.3% 1.5% 6.5% 03% 0.0%
Resident Female 74.2% 9.2% 12.4% 0.6% 3.4% 0.1% 73.1% 10.7% 6.5% 0.6% 8.6% 0.4% 0.0%
Not an
Employed Male 56.9%* 17.1%” 9.1%” 6.6%* 10.4%” 0.0%” 37.8% 30.3% 7.0% 4.0’% 16.5% 0.4% 4.1%
Resident Female 60.1%” 19.8%* 8.7%” O.1%*11.0%’ 0.3%” 44.3% 32.2% 6.6% 1.1% 13.0% 0.2% 2.6%
Male I 81.2% 6.0% 8.4% 1.8% 2.4% 0.2% 67.5% 13.6% 5.8% 2.2% 9.4% 0.3% 1.2%
Total Female ] 73.4% 9.8% 12.2% 0.6% 3.9% 0.1%] 61.3% 19.5% 6.6% 0.8% 10.4% 03% 1.1%
* Work trips made by non-employed persons maybe due to miscoding ofpermn byemployment status, or due to miscoding volunteer, school, etc., trips as work trips.
-111-

4.4 Travel bv Driver’s License Status
Section 4.4 of this working paper discusses per capita trip rates, trip purpose shares,and modal shares stratified by persons with and without a driver’s license. Data isalso summarized on the number of persons by age and by gender, with and withouta drivers license.
Persons with a driver’s license have significantly higher trips per capita thanpersons without a drivers license (Table 4.4.1). Males with a drivers license make anaverage of 3.40 trips per person per weekday; males without, 2.35 trips per person.Females with a drivers license make an average of 3.54 trips per person per weekday;females without, 1.95 trips per person per weekday. The trip purpose share forpersons with a drivers license are more oriented toward home-based work and non-home-based trips. Persons without a drivers license have a higher share of home-based shop and home-based school trips.
Regionally, 74.8 percent of the Bay Area population age five or more has a driver’slicense (Table 4.4.2). This varies from 72.3 percent of females with a license to 77.5percent of males. The age distribution of persons with and without a driver’s licenseshows that the majority (64.7 percent) of the non-drivers are children age 5 to 17.Only 7.3 percent of the children age 5 to 17 have a drivers license. The second lowestage group, in terms of share of population with a drivers license, is the 65 and overgroup, with just 72.7 percent having a license. Note the very low share of womenage 65-and-over with a driver’s license (63.6 percent).
The vast majority of men age 30 to 59 have a drivers license (95 percent to 97percent). For women, the age group with the highest share with a license is 30 to 39(92.6 percent).
Modal share data for males and females with and without a drivers license, forhome-based work and total trips, is shown in Table 4.4.3. Note the small share (andnumbers) of vehicle driver trips made by non-drivers. These discrepancies are dueto a likely miscoding of either driver’s license status or mode of travel.
The majority of trips made by non-drivers areas vehicle ~ers. Non-driversalso take proportionately more transit, bicycle and walk trips as compared to drivers.
-112-
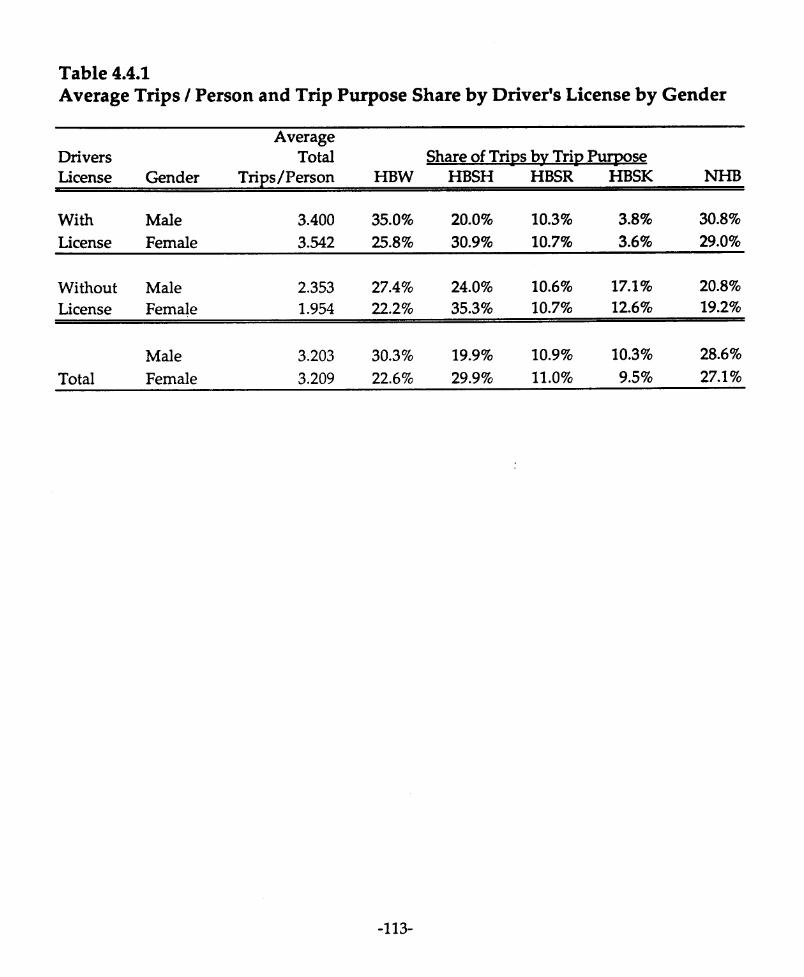
Table 4.4.1Average Trips / Person and Trip Purpose Share by Driver’s License by Gender
AverageDrivers Total Share of Trips by Trip PumoseLicense Gender Trips/Person HBW HBSH HBSR HBSK
With Male 3.400 35.0% 20.0% 10.3% 3.8% 30.8%
License Female 3.542 25.8% 30.9% 10.7% 3.6% 29.0%
Without Male 2.353 27.4% 24.0% 10.6% 17.1% 20.8%License Female 1.954 22.2% 35.3% 10.7% 12.6% 19.2%
Male 3.203 30.3% 19.9% 10.9% 10.3% 28.6%
Total Female 3.209 22.6% 29.9% ll.O% 9.5% 27.1 %
-113-

Table 4.4.2Characteristics of Persons by Driver’s License, Age and Gender
Age With Without PercentGroup Gender License License Total With License
Male 39,516 435,346 474,862 8.3%5-17 Female 28,296 425,209 453,505 6.2%
Total 67,812 860,555 928,367 7.3%Male 155,819 30,423 186,242 83.7%
18-22 Female 155,075 41,470 196,545 78.9%Total 310,894 71,893 382,787 81.2%Male .324,461 28,230 352,691 92.0%
23-29 Female 310,490 40,075 350,565 88.6%Total 634,951 68,305 703,256 90.3%Male 548,111 25,451 573,562 95.6%
30-39 Female 540,775 43,138 583,913 92.6%Total 1,088,886 68,589 1,157,475 94.1%Male 421,548 16,286 437,834 96.3%
40-49 Female 419,481 41,808 461,289 90.9%Total 841,029 58,094 899,123 93.5%Male 246,448 8,407 254,855 96.7%
50-59 Female 228,030 31,066 259,096 88.0%Total 474,478 39,473 513,951 92.3%Male 93,982 6,910 100,892 93.2%
60-64 Female 92,425 24,115 116,540 79.3%Total 186,407 31,025 217,432 85.7%Male 173;570 29;531 203;101 85.5%
65+ Female 179,504 102,944 282,448 63.6%Total 353,074 132,475 485,549 72.7%
Male 2,003,455 580,584 2,584,039 77.5%5-99 Female 1,954,076 749,825 2,703,901 72.3%
Total 3,957/531 1,330,409 5,287,940 74.8%
-114-

Table 4.4.3Modal Share for Work and Total Trips by Driver% License by Gender
Driver’s Home-BasedWorkTrim
License Gender Driver Pasrwr. Transit Bicvcle Walk OtheI
With Male 84.2% 5.0% 7.4% 1.4% 1.8% 0.2%
License Female 79.4% 7.5% 9.5% 0.5% 3.0% 0.1%
Without Male 24.6%* 24.3% 26.3% 10.0% 14.0% 0.8%
License Female 9.7%* 34.6% 40.2% 2.3% 12.8% 0.4%
Male 81.2% 6.0% 8.4% 1.8% 2.4% 0.2%
Total Female 73.4% 9.8% 12.2% 0.6% 3.9% 0.1%
TotalTrim school
Driver Pasmrr. Transit Bicvcle Walk Other Bus
80.3% 6.5% 4.8% 1.3% 6.7% 0.3% 0.1%
75.5% 11.2% 4.4% 0.5% 8.1% 0.3% 0.1%
7,9%* 46.5% 10.2% 6.5% 22.0% 0.4% 6.5%
5.3%* 52.4% 15.2% 2.1% 19.5% 0.3% 5.2%
67.5% 13.6% 5.8% 2.2% 9.4% 0.3% 1.2%
61.3% 19.5% 6.6% 0.8% 10.4% 0.3% 1.1%
* Vehicle driver trips made by persons w“thouta driver’s license area probable miscading of either driver’s licensestatus or mode of travel.
-115-

4.5 Travel by Disability Status
This section discusses the per capita trip rates, trip purpose shares and modal sharesof persons stratified by those with and without a disability. As defined in the 1990survey, disability, more preasely “public transportation disability: was based on thequestion: “Does anyone in your household have any physical, mental or otherhealth condition which has lasted six months or more and which makes it difficultto use public transportation?”
The following table shows the survey-expanded distribution of the Bay Areapopulation, age five and over, by gender, stratified by public transportation disabilitystatus:
I Gender
I Male
Persons I Percent of I PersOns I l?ercent of I Iwith a Total I without a Total I Total
Disability Population Disability Population Poptiation I38,000 I 1.5% I 2,546,100 I 98.5% I 2584,100 I
62,200 2.3% 2,641,700 97.7% 2,703,900
100,200 1.9% 5,187200 .98.1% 5,288,000
Of the 21,300 persons age five and over sampled in the 1990 “single day sample”household travel survey, just 389 reported having a public transportation disability.While this is a large enough sample to provide some comfortable statisticalestimates, the concern is that this share of persons with a public transportationdisability (1.9 percent) compares poorly with the 1990 Census estimate of personswith a mobility limitation (9.7 percent of the population age 16 and over). Thisunderrepresentation of disabled in the 1990 survey is probably due to different (anddifficult to understand) wording of the question on pubIic transportation disability.
Disabled persons have significantly lower daily trips per person than non-disabledpersons (Table 4.5.1). Males with a public transportation disability take, on average,2.12 trips per day; males without a disability, 3.22 trips per day. Females with adisability take an average of 2.17 trips per person per weekday; females without adisability, 3.23 tip per day.
lnimnsdtrippmp oseshare, persunswiihdisab@-h-a~yhigher share of home-based shop trips than persons without dkabllities. Personswith disabilities have lower share of home-based work and home-based school trips
-116-

than persons without disabilities. There does not appear to be a major difference intrip purpose share in terms of homebased social/recreation or non-home-basedtrips made by disabled versus non-disabled persons.
Disabled versus non-disabled person modal shares for total and home-based worktrips is presented in Table 4.5.2. On a total trip basis, disabled persons have a slightlyhigher likelihood of taking transit or being a vehicle passenger, compared to non-disabled persons. Disabled persons have a lower share of vehicIe driver and bicycletrips as compared to non-disabled persons.
These differences are more distinct for home-based work trips. The work trip transitshare for disabled persons (20.1 percent) is twice as high than for non-disabledpersons (10.0 percent). Vehicle passenger and walk shares are higher for the disabledworker as compared to the non-disabled worker. Vehicle driver and bicycle sharesare lower for the disabled worker as compared to the non-disabled worker.
-117-

Table 4.5.1Average Trips per Person and Trip Purpose Share by Disability Status by Gende
AverageDisability Total Share of Trips bv TritYPurRoStatus Gender Trips/Person HBW HBSH HBSR HB~K NHB
With Male 2.124 16.9% 40.5% 11.9% 5.2% 25.4%
Disability Female 2.174 9.7% 44.5% 12.1% 3.0% 30.8%
Without Male 3.218 30.5% 19.7% 10.9% 10.3% 28.6%Disability Female 3.234 22.8% 29.7% 11.0% 9.6% 27.0%
Male 3.203 30.3% 19.9% 10.9% 10.3% 28.6%
Total Female 3.209 22.6% 29.9% 11.0% 9.5% 27.1 %
-118-

Table4.5.2Modal Share for Work and Total Trips by Disability Status by Gender
Disability Home-BasedWorkTrim TotalTrim school
status Gender Driver Pasngr. Transit Bicycle Walk Other ~ver Pasngr. Transit Bicycle Walk Other Bus
With Male 58.4% 3.5% 29.8% 0.0% 8.3% 0.0% 743% 9.8% 6.5% 0.2% 7.4% 1.4% 0.4%
Disability Female 69.8% 18.3% 10.0% 0.0% 1.9% 0.0% 53.9% 25.5% 7.2% 0.0% 11.7% 1.5% 0.2%
Total 64.0% 10.7% 20.1% 0.0% 5.2% 0.0% 61.5% 19.6% 6.9% 0.1% 10.1% 1.4% 0.3%
Without Male 81.3% 6.0% 8.3% 1.8% 2.4% 0.2% 67.5% 13.6% 5.7% 2.2% 9.4% 0.3% 1.2%
Disability Female 73.4% 9.8% 12.2% 0.6% 3.9% 0.1% 61.4% 19.4% 6.5% 0.8% 10.4% 0.3% 1.1%
Total 77.8% 7.7% 10.0% 1.3% 3.0% 0.2% 64.4% 16.6’% 6.2% 1.5% 9.9% 0.3% 1.2%.
Male 81.2% 6.0% 8.4% 1.8% 2.4% 0.2% 67.5% 13.6% 5.8% 2.2% 9.4% 0.3% 1.2%
Total Female 73.4% 9.8% 12.2% 0.6% 3.9% 0.1% 61.3% 19.5% 6.6% 0.8% 10.4% 0.3% 1.1%
Tot~ 77.8% 7.7’% 10.0% 1.3% 3.0% 0.2% 64.3% 16.6% 6.2% 1.5% 9.9% 0.3% 1.2%
-119-

5.0 Weekday 1990 County Travel
Section 5.0 of Working Paper #4 discusses county-level travel patterns. Data isreported from the expanded, weighted “single day sample” survey. Tables includedin Appendix 5.0 show detailed county-to-county trip tables by trip purpose andtravel mode.
5,1 CountvTrms b●
v Tri~ Pumose
This subsection discusses county-level trip productions and trip attractions by trippurpose. The term “production” and “attraction” are terms commonly used intransportation planning analysis. “Productions” are always the home-end of allhome-based trips. “Attractions” are always the non-homeend of all home-basedtrips. For non-home-based trips, the trip origin is the same as the trip production;the trip destination is the same as the trip attraction.
Weekday trips by trip purpose and county of production are shown in Table 5.1.1.The largest number of trips are produced in Santa Clara County (4.08 million tripsper weekday); the smallest number, in Napa county (344,000 trips per weekday). Bytrip purpose share, Napa County residents have the lowest share of homebasedwork trips (21.2 percent) compared to San Mateo County with the highest share ofhome-based work trips (29.4 percent).
Home-based shop (other) trip purpose shares range from a low of 20.7 percent oftrips made by San Francisco residents to 30.4 percent of trips made by Solano Countyresidents. Home-based social/recreation trip purpose shares range from 9.0 percentof Alameda County residents’ trips to 13.0 percent of San Mateo County residents’trips.
Residents of Marin County (7.9 percent) have the lowest home-based school trippurpose share; Solano County (11.6 percent), the highest. Non-home-based tripsrange from a low of 22.2 percent of the trips produced in Solano County to 35.2percent of the trips produced in San Francisco County.
Weekday trips by trip purpose and an.mty of attraction are shown in Table 5.12Again, Santa Clara County attracts the largest share of the regional number of total*[&17~*mtdi&w~);N*Q,ti~-
(340,300 trips).
-120-

The trip purpose share for hom~based work trips varies by county, from a low of19.3 percent of the trips attracted to Sonoma County, to a high of 32.1 percent of thetrips attracted to San Francisco County.
Home-based shop attraction county shares range from 19.4 percent of the total tripsattracted in San Francisco to 32.5 percent of the trips attracted to Solano County.Home-based social/recreation trip purpose shares range from 9.1 percent ofAlameda County attractions to 13.6 percent of Marin County attractions. Home-based school trip purpose shares range from just 7.9 percent of Marin Countyattractions to 11.4 percent of Solano County attractions. Non-homebased trippurpose shares range from a low of 24.2 percent in Solano County to a high of 32.6percent of the trips attracted to Marin County.
-121-

TabIe 5.1.11990WeekdayTrips by Trip Purpose and County of Production
county of Home- Home- Home-Production Based Based Based(Residence) Work Shop (Other) Social/Rec
San 562,500 453,000 209,300Franasco 25.7% 20.7% 9.6%
San 503,100 410,900 222,700Mateo 29.4% 24.0% 13.0%
Santa I 1,165,800 9711300 475,300Clara 28.5% 23.8% 11.6%
I 943,700 945,000 330,700Alameda 25.7% 25.8% 9.0%
Contra I 586,400 651,600 270,700Costa 25.670 28.4% 11.8%
203,200 249,100 89,500Solano 24.8% 30.4% 10.9%
72,900 96,200 36,300Na~a 21.2% 28.0% 10.6%
I 251,100 318,700 135,000Sonoma 21.5% 27.3% 11.6%
183,300 151,900 88,900Marin 26.5% 21.9% 12.8%
I 4,472,000 4,247,700 1,858,400Region 26.4% 25.0% 11.0%
Home- Non-Based Home-Basedschool (Origin) Total
195,400 770,200 I 2,190,4008.9% 35.2% 100.0%
166,700 408,000I
1,711,4009.7% 23.8% 100.0%
409,300 I 1,061,900 I 4,083/60010.0% 26.0% 100.0%
398,700 I 1,050,000I 3,668,10010.9% 28.6% 100.0%
205,300 577,500 I 2,291/.5009.0% 25.2% 100.0%
95,300 181,600 818,70011.6% 22.2% 100.0%
36;800 101,800 344,00010.7% 29.6% 100.0%
109,300 352,300 I 1,166,4009.4% 30.2% 100.0%
54,600 213,900 692,6007.9% 30.9% 100.0%
1,671,400 4,717,200 16,966,7009.9% 27.8% 100.0%
Notes: Upper entry is the number of trips.hwer entry is the row percent.
-122-

Table 5.1.21990 Weekday Trips by Trip Purpose and County of Attraction
county ofAttraction
(non-home)
SanFrancisco
SanMateo
SantaClara
Alameda
ContraCosta
Solano
Na~a
Sonoma
Marin
Re~ion
Home Home Home- Home- Non-Based Based Based Based Home-BasedWork Shop (Other) Social/Rec school (Destination) Total
807,600 I 489,700 252/S00I 206,300 I 762,200 I 2,518~0032.1% 19.4% 10.0% 8.2% 30.3% 100.0%
454,000 406,000 204,700 155,700 410,200I 1,630,60027.8% 24.9% 12.6% 9.5% 25.2% 100.0%
1,239,900 982,700 476,600 417,300 1,051AO0 4,168~0029.7% 23.6% 11.4% 10.0% 25.2% 100.0%
907,900 959,900 332,900 401,900 1,053,100 3,655,70024.8% 26.3% 9.1% 11.0% 28.8% 100.0%
460,300 610,000 251,700 199,900 585,700 I 2,107,60021.8% 28.9% 11.9% 9.5% 27.8% 100.O%
156,600 247,700 85,900 87,200 184,600 762,00020.6% 32.5% 11.3% 11.$% 24.2% 100.0%
73,500 91,100 37,600 37;400 100,700 340,30021.6% 26.8% 11.0% 11.0% 29.6% 100.0%
216,500 312,600 126,600 113,300 353,500 1,122>0019.3% 27.8% 11.3% 10.1% 31.5% 100.0%
155,700 148,000 89,900 52,400 215,400 661,40023.5% 22.4% 13.6% 7.9% 32.6% 100.0%
4,472,000 4,247,700 1,858,400 1,671,400 4,717,200 16,966,70026.4% 25.0% 11.0% 9.9% 27.8% 100.0%
Notes: Llpper entry is the number of trips.bzuer entry is the row percent.
-123-

This subsection reports on the number and share of county-level trips by travelmode, by county of production and county of attraction.
Home-based work trips by mode by county of production are shown in Table 5.2.1.Home-based work trips by mode by county of attraction are shown in Table 5.2.2.
Transit shares for home-based work trips, by county of production, range from a lowof 1.9 percent of Sonoma County work trip productions to 32.4 percent of SanFrancisco County resident work trip productions. San Francisco resident workersaccount for 40.3 percent of the regional work trip productions. Alameda County hasthe next highest work trip transit share, at 13.0 percent; followed by Marin County,9.3 percent; Contra Costa County, 8.5 percent; and San Mateo County, 7.7 percent.
Walk shares for home-based work trips range from 1.4 percent of Contra CostaCounty productions to 7.2 percent of San Francisco County productions. SanFrancisco resident workers account for 29.9 percent of the regional home-based worktrips via walking.
Bicycle shares for home-based work trip productions range from a low of 0.3 percentof Contra Costa trips to 1.4 percent of Alameda County work trips. Santa ClaraCounty has the largest number (16,700) home-based work trip productions taken onbicycle.
Vehicle passenger shares for home-based work trip productions range from 6.1percent in Sonoma County to 10.0 percent of Solano County productions. Vehicledriver shares for home-based work productions range from just 48.8 percent of SanFrancisco County work trips to 87.6 percent of Santa Clara County work trips. SantaClara County resident workers account for 29.3 percent of the regional hom~basedwork vehicle driver trips.
The county of attraction (county of work) modal shares follow similar patterns tothe county of production data (Table 5.2.2). Transit shares are highest to SanFrancisco County jobs at 38.5 percent of home-based work trips attracted. Sanl%ancisco jobs attract 68.8 perent (310,900 out of 451~0) regional home- W workAzia@tllip&WxmA=edwarkwalktxlip6Ci12pe=ea@=d~-vehicle passenger trips (11.1 percent) are also the highest in San Francisco County.Home-based work bicycle trip shares are highest in Alameda (1.6 percent) and Santa
-124-

Clara (1.5 percent) counties.
Vehicle driver home-based work shares range from a low of 43.6 percent to jobs inSan Francisco County to a high of 89.6 percent of the work trips attracted to jobs inSonoma County.
A county-level comparison of 1990 household travel survey work trip shares to the1990 Census (journey-to-work data) means of transportation-to-work shares isshown in Table 5.2.3. For this analysis, home-to-work related and work related-to-home trips were removed to be as comparable as possible to the Census definition ofhom~to-work commute travel. On a regional basis, the MTC 1990 Survey comparesquite well with the modal shares from the 1990 Census. The survey slightlyoverestimates the number of transit work trips (10.5 percent survey versus 9.9percent Census); and underestimates the share of walk work trips (3.1 percentsurvey versus 3.8 percent Census). These regional-level results are veryencouraging.
By county of residence, the work trip transit shares from the 1990 survey comparequite favorably with the 1990 Census. Alameda County shows the largestoverestimate of transit work trips (13.6 percent survey versus 10.4 percent Census).Marin County shows the largest underestimate of transit work trips (9.6 percentsurvey versus 11.0 percent Census). Comparisons for other work trip travel modes,survey to census, are also quite favorable, with a few exceptions, including walktrips in San Francisco (7.2 percent survey versus 10.2 percent Census); and MarinCounty vehicle driver trips (81.0 percent survey versus 76.8 percent Census).Overall, the county-level comparison of work trip modal shares, survey sharesrelative to the 1990 Census, are quite acceptable.
Modal shares for all trip purposes combined, by county of production, are shown inTable 5.2.4. Transit shares range from 1.0 percent of Napa County productions to 22.3percent of San Francisco County productions. San Franasco County accounts for 46.2percent of the regional transit trip productions. Alameda County has the secondhighest transit share, 7.0 percent; followed by San Mateo, 4.5 percent; Marin County,4.3 percent; and Contra Costa County, 4.0 percent of all trips.
Walk shares range from a low of 5.7 percent of all trips produced in Contra Costa
Cc=lt3’tD232~&al@=~hN ~-.=Y**range from a low of 0.5 percent of Contra Costa County trips to 1.9 percent of Napaand Sonoma County trips. Three other counties — Marin, San Mateo and Santa
-125-

Clara — have a 1.8 percent bicycle mode share.
Vehicle passenger shares range from just 10.9 percent of the trips produced in SanFrancisco County to 19.1 percent of the trips produced in Solano County. Vehicle ‘driver shares range from 41.4 percent of San Francisco trips to 73.1 percent of Marincounty trips.
Modal shares for all trip purposes by county of attraction are shown in TabIe 5.2.5.As with the previous analysis, San Francisco County leads in terms of transitpassenger and walk share, and also has the lowest vehicle driver and vehiclepassenger shares. San Francisco County accounts for 60.9 percent of the regionaltransit trip attractions (644,100 out of 1.06 million regional transit trips).
-126-

Table 5.2.11990WeekdayHome-BasedWorkTrips by Mode and County of Production
county ofProduction Vehicle Vehicle Transit(Residence) Driver Passenger Passenger Bicycle Walk Other
San 274,777 51,104 182,263 7~1 40,509 6,295Franasco 48.8% 9.1% 32.4% 1.3% 7.2% 1.1%
San 402,773 43,967 38,928 6,987 10,253 184Mateo 80.1% 8.7% 7.7% 1.4% 2.0% 0.0%
Santa 1,021,287 74,690 28,125 16,739 23,611 1,351Clara 87.6% 6.4% 2.4% 1.4% 2.0% 0.1%
703,123 74,324 122,629 13,858 29,089 624Alameda 74.5% 7.9% 13.0% 1.5% 3.1% 0.1%
Contra 485,400 41,011 491996 1,889 8,148 0Costa 82.8% 7.0% 8.5% 0.3% 1.4% 0.0%
I 163,868 20,272 6,462solano 80.7% 10.0% 3.2% :%1 Zt’1 OR
61,711 6,456 1,666 936 2,000 157Napa 84.6% 8.9% 2.3% 1.3% 2.7% 0.2%
219,549 15,378 4,690 2,746 8,690 0Sonoma 87.5% 6.1% 1.9% 1.1% 3.5% 0.0%
149,803 12,219 16,995 875 3,215 216Marin 81.7% 6.7% 9.3% 0.5% 1.8% 0.1%
3,482,291 339,421 451,754 53,955 135,271 9,290Region 77.9% 7.6% 10.1% 1.2% 3.0% 0.2%
Total
562,529100.0%
503,092100.0%
1,165/803100.0%
943,647100.0%
586,444100.0%
203,165100.0%
72,926100.0%
251,053100.0%
183,323100.0%
4,471,982100.0%
Notes: Z.@perentry is the number of trips.Lower entry is the row percent.
-127-

TabIe 5.2.21990 Weekday Home-Based Work Trips by Mode and County of Attraction
county ofAttraction Vehicle Vehicle Transit
(Work) Driver Passenger Passenger Bicycle WaIk Other>San 351,998 89,724 310,873 7,581 41,606 5,841Franasco 43.6% 11.1% 38.5% 0.9% 5.2% 0.7%
San 389,869 34,240 14,162 5,058 9,715 936Mateo 85.9% 7.5% 3.1% 1.1% 2.1% 0.2%
Santa 1,0M$862 76,399Clara 87.8% 6.2% 3:?: lY%I2%:1%?Alameda
ContraCosta
719,153 68,396 77,70779.2% 7.5% 8.6% l:Y:I 2K31 o?;
407,146 31,827 11,57288.4% 6.9% 2.5% %;I :&;l 0.0:
130,965 11,126 1,395 2,758 9,756 620Solano 83.6% 7.1% 0.9% 1.8% 6.2% 0.4%
Nava
Sonoma
Marin
Re~ion
62,852 6,821 998 522 2,305I
o85.5% 9.3% 1.4% 0.7% 3.1% 0.0%
194,071 I 91771I 1,738 2,745 8,2041 089.6%1 4.5%[ 0.8%1 1.3%1 3.8%1 0.0%
137,375 11,117 3,073 875 3,215 088.3% 7.1% 2.0% 0.6% 2.1% 0.0%
3,482,291 339,421 451,754 53,955 135,271 9,29077.9% 7.6% 10.1% 1.2% 3.0% 0.2%
Total
807,623100.0%
453,980100.0%
1,239/883100.0%907,862100.0%
460,332100.0%
156,620100.0%
73,498100.0%
216,529100.0%
155,655100.0%
4,471,982100.0%
Notes: Upper entry is the number of trips.Lower entry is the row percent.
-128-

Table 5.2.3Comparison of 1990 Census and 1990 Survey Modal SharesWork Trips by County of Residence
county of Vehicle VehicleResidence Driver Passenger Transit Bicycle Walk Other Total
45.3% 6.6% 34.8% 1.0% 10.2% 2.0% 100.0%Franasco 47.3% 8.8% 34.2% 1.5% 7.2% 0.9% 100.0%
San 80.7% 7.2% 7.7% 0.8% 2.6% 1.0% 100.0%Mateo 78.9% 9.0% 8.0% 2.0% 2.1% 0.0% 100.0%
Santa 85.6% 6.8% 3.1% 1.5% 2.1% 1.0% 100.0%
Clara 87.3% 6.6% 2.5% 1.5% 2.1% 0.0% 100.0%
75.4% 7.4% 10.4% 1.3% 4.1% 1.4% 100.0%
Alameda 73.8% 7.8% 13.6% 1.4% 3.3% 0.0% 100.0%
Contra 80.3% 8.1% 8.1% 0.5% 1.9% 1.2% 100.0%
Costa 82.2% 7.3% 8.7% 0.3% 1.5% 0.0% 100.0%
81.9% 11.0% 2.3% 0.8% 2.5% 1.5% 100.0%
Solano 80.3% 10.1% 3.5% 1.2% ~ 4.7% 0.2% 100.0%
83.9% 7.4% 1.1% 1.3% 5.3% 1.0% 100.0%
Napa 84.4% 8.5% 2.4% 1.4% 3.1% 0.2% 100.0%
84.6% 7.5% 2.4% 1.1% 3.4% 1.0% 100.0%
Sonoma 86.9% 6.4% 2.0% 1.5% 3.3% 0.0% 100.0%
76.8% 7.3% 11.0% 0.8% 3.2% 1.0% 100.0%
Marin 81.0% 7.0% 9.6% 0.5% 1.8% 0.1% 100.0%
Bay 76.7% 7.4% 9.9% 1.1% 3.8% 1.2% 100.0%
Area 77.2% 7.7% 10.5% 1.3% 3.1% 0.2% 100.0%
Notes Upper entry is 1990 Census modal share to work (travelers).
Lower entry is 1990 Survey modal share for Census-comparable trips.
-129-
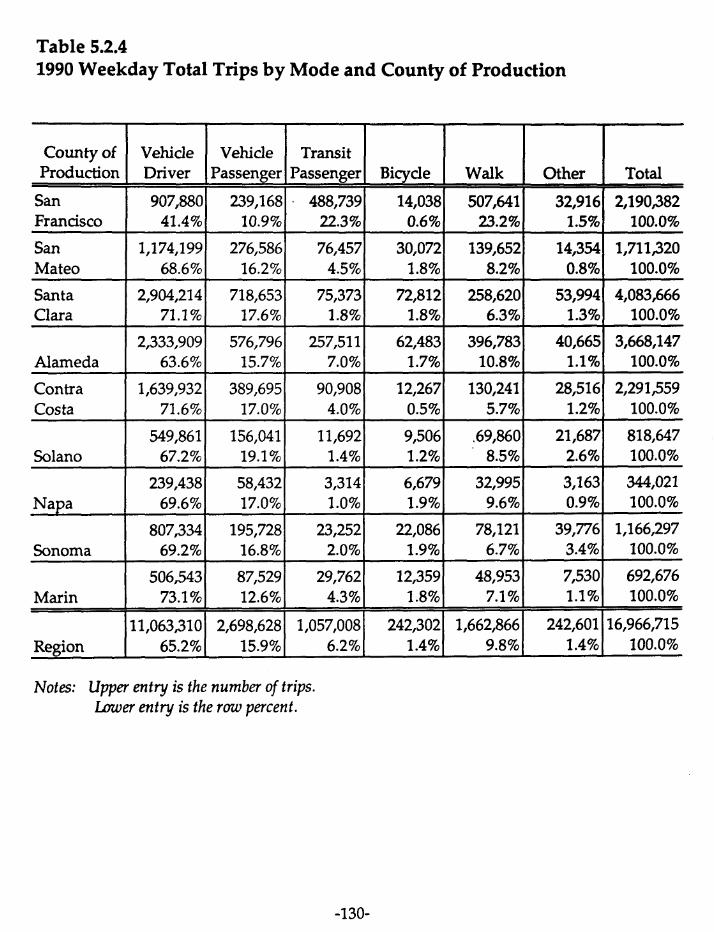
Table 5.2.41990 Weekday Total Trips by Mode and County of Production
county of Vehicle Vehicle TransitProduction Driver Passenger Passenger ~ Walk Other
San 907,880 239,168 ~ 488,739 14,038 507,641 32,916Francisco 41.4% 10.9% 22.3% 0.6% 23.2% 1.5%
San 1,174,199 276,586 76,457 30,072 139,652 14,354Mateo 68.6% 16.2% 4.5% 1.8% 8.2% 0.8%
Santa 2,904,214 718,653 75,373 72,812 258,620 53,994Clara 71.1% 17.6% 1.8% 1.8% 6.3% 1.3%
2,333,909 576,796 257,511 62,483 396,783 40,665Alameda 63.6% 15.7% 7.0% 1.7% 10.8% 1.1%
Contra 1,639,932 389,695 90,908 121267 130,241 28,516Costa 71.6% 17.0% 4.0% 0.5% 5.7% 1.2%
549,861 156,041 11,692 9,506 ,69,860 21,687Solano 67.2% 19.1% 1.4% 1.2% “ 8.5% 2.6%
239,438 58,432 3,314 6,679 32,995 3,163Napa 69.6% 17.0% 1.0% 1.9% 9.6% 0.9%
807,334 195,728 23,252 22,086 78,121 39,776Sonoma 69.2% 16.8% 2.0% 1.9% 6.7% 3.4%
506,543 87,529 29,762 12,359 48,953 7,530Marin 73.1% 12.6% 4.3% 1.8% 7.1% 1.1%
11,063s10 2,698,628 1,057,008 242,302 1,662,866 242,601Region 65.2% 15.9% 6.2% 1.4% 9.8% 1.4%
Total
2,190~82100.0%
1,711/320100.0%
4,083,666100.0%
3,668,147100.0%
2,291/!559100.0%
818,647100.0%
344,021100.0%
1,166,297100.0%
692,676100.0%
6,966,715100.0%
Notes: Upper entry is the number of trips.Lower entry is the row percent.
-130-

Table 5.2.51990 Weekday Total Trips by Mode and County of Attraction
county ofAttraction
VehicleDriver I’&Yi&ll?2E~erl Bicv.e I WalkOther I Total
SanFrancisco
l,023#0640.7%
295,658 644,101 14,315I
508,27111.7% 25.6% 0.6% 20.2%
*
32,171 2,518/3221.3% 100.0%
15,305 1,630,6260.9% 100.0%
53,124 4,168,400SantaClara
2,979,414 722,792 74,756 79,202 259,11271.5% 17.3% 1.8% 1.9% 6.2% 1.3%1 100.0%
2,372,819 570,072 215,261 62,208 395,02664.9% 15.6% 5.9% 1.7% 10.8%
40,184 3,655~701.1% 100.0%
29,265 2,107,6001.4% 100.0%
21,862 762,1222.9% 100.0%
Alameda
Contra 1,525,684 371,150 37,377 12,168I
131,956Costa 72.4% 17.6% 1.8% 0.6% 6.3%
511,459 143,352 6,224 9,555 69,670Solano 67.1% 18.8% 0.8% 1.3% 9.1%
237,18969.7%
58,18717.1%
2,646 6,266 32,9940.8% 1.8% 9.7%
3,006 340,2880.9% 100.0%Nava
778,00269.3%
184,60516.4%
18,904 22,086 78,1611.7% 2.0% 7.0%
14,476 12,820 48,6772.2% 1.9% 7.4% -t--
40,789 1,122~73.6% 100.0%
6,895 661,2401.0% 100.0%
Sonoma
488,87873.9%
89,49413.5%Marin
1,057,008I
242,302 l,662fi666.2% 1.4% 9.8% I242,60116,966,715
1.4% 100.0%11,063~10
65.2%2,698,628
15.9%Region
Notes: Upper entry is the number of trips.Lower entry is the row percent.
-131-

This subsection of Working Paper #4 discusses the county-to-county travel patternsimplied by the weighted, expanded “single day sample” of the 1990 household travelsurvey. The tables referred to in this text provide summaries of intra-county andinter-county home-based work trips and total trips.
Detailed appendix tables provide county-to-county trip tables by trip purpose andtravel mode.
Home-based work trips by four travel modes (driver, in-vehicle, transit and total)for intra-county trips, production and attraction totals by county, are shown in Table5.3.1. This table is useful in indicating the intra-county versus inter-county share oftrips, by means of transportation, on a county-by-county basis. Regionally, 73.7percent of all home-based work trips in the Bay Area are intra-county. This varies,by mode, from just 58.8 percent of all home-based work transit trips being intra-county to 76.1 percent of all home-based work vehicle driver trips. This means thathome-based work transit trips are typically longer (i.e., more inter-county oriented)than home-based work vehicle driver trips.
By county of production, Santa Clara County has the highest share of intra-countyhome-based work total trips, at 91.5 percent; the “bedroom” county of San MateoCounty, has the lowest at 59.8 percent intra-county trips. The other two “bedroom”counties with low intra-county work trips are Marin (60.1 percent) and Contra Costa(60.6 percent).
By county of attraction, 95.4 percent of the work trips attracted to Sonoma Countyare made by Sonoma County residents. At the other extreme, 55.8 percent of thehome-based work trips attracted to jobs in San Francisco County are made byresidents of San Francisco County.
The low share of intra-county home-based work transit trips is notable in ContraCosta County (11.6 percent intra-county); Marin County (11.8 percent intra-county);and San Mateo County (17.0 percent intra-county). These three counties are“exporting most of their daily transit cammu~ to @s m %m Hancisco, wKlchexplains the very low intra-county home-based work transit share.
Trips for all trip purposes combined, by four travel modes (driver, in-vehicle, transitand total) for intra-county trips, production and attraction totals by county, are
-132-

shown in Table 5.3.2. Regionally, 86.7 percent of all trips made in the Bay Area areintra-county. This varies, by mode, from 73.1 percent of all transit trips being intra-county to 85.9 percent of all in-vehicle persons trips.
San Mateo County has the lowest share of intra-county trips by all trip purposes at76.5 percent. At the other extreme, 92.7 percent of all trips produced in SonomaCounty are intra-county. By county of attraction, 76.1 percent of all trips attracted toSan Francisco are intra-county; 96.3 percent of trips attracted to Sonoma County areintra-county.
As with work trips, three counties show a very low intra-county transit share. Only27.6 percent of transit trips produced in Contra Costa County are intra-county; 36.5percent of transit trips produced in San Mateo County are intra-county; and 37.6percent of transit trips produced in Marin County are intra-county. This is reflectedin high number and share of transit trips destined to San Francisco.
-133-

Table 5.3.11990 Home-Based Work Trip Productions, Attractions, and Intra-County Trips
Intra- % Intra of % Intra ofMode Attractions Productions AttractionsDriver 188,200 274,800 352,000 68.5% 53.5%
San In-Vehicle 231,600 325,900 441,700 71.1% 52.4%Franasco Transit 165,900 182,300 310,900 91.0% 53.4%
Total 450,800 562,500 807.600 80.1 % 55.8%Driver 25~800 402;800 389;900 64.0% 66.1%
San In-Vehicle 279,800 446,700 424,100 62.6% 66.0%Mateo Transit 6,600 38,900 14,200 17.0% 46.5%
Total 301,100 503,100 457,400 59.8% 65.8%Driver 934,700 1,021300 1,088,900 91.5% 85.8%
Santa In-Vehicle 1,001,600 1,096,000 1,165~00 91.4% 86.0%Clara Transit 23,200 28,100 30,200 82.6% 76.8%
Total 1,066,500 1,165,800 1,294,700 91.5% 82.4%Driver 515,500 703,100 719,100 73.3% 71.7%In-Vehicle 570,300 777,500 787,500 73.4% 72.4%
Alameda Transit 58,300 122,600 77,700 47.6% 75.0%Total 616,300 943,600 853,300 65.3% 72.2%Driver 316,300 485,400 407,100 65.2% 77.7%
Contra In-Vehicle 339,500 526,400 439,000 64.5% 77.3%Costa Transit 5,800 50,000 11,600 11.6% 50.0%
Total 355,100 586,400 456,600 60.6% 77.8%Driver 105;900 163;900 131;000 64.6% 80.8%In-Vehicle 115,600 184,100 142,100 62.8% 81.4%
Solano Transit 1,200 6,500 1,400 18.5% 85.7%TotaI 129,400 203,200 156,600 63.7% 82.6%Driver 48,900 61,700 62,800 79.3% 77.9%In-Vehicle 54,300 68,200 69,700 79.6% 77.9%
Napa Transit 1,000 1,700 1,000 58.8% 100.0%Total 57,900 72,900 73,500 79.4% 78.8%Driver 184,400 219,500 194,100 84.0% 95.0%In-Vehicle 193,900 234,900 203,800 82.5% 95.1%
Sonoma Transit 1,700 4,700 1,700 36.2% 100.0%Total 206,600 251,100 216,500 82.3% 95.4%Driver 96,700 149,800 137,400 64.6% 70.4%In-Vehicle 104,000 162,000 148,500 64.2% 70.0%
Marin Transit 2,000 17,000 3,100 11.8% 64.5%Total 110,200 183,300 155,700 60.1% 70.8%
Driver 2,648,400 3,482,300 3,482,300 76.1% 76.1%Bay In-Vehicle 2,890,600 3,821,700 3,821,700 75.6% 75.6%Area Transit 265,700 451,800 451,800 58.8% 58.8%
Total 3,293,900 4,471,900 4,471,900 73.7% 73.7%
-134-

Table 5.3.21990 Total Trip Productions, Attractions, and Intra-County Trips
Intra- % Intra of ‘%Intra ofMode county Productions Attractions Productions Attractions
●
Driver 716,700 907,900 1,023/800 78.9% 70.0%San In-Vehicle 920,200 1,147,000 1,319/500 80.2% 69.7%Francisco Transit 444,900 488,700 644,100 91.0% 69.1%
Total 1,915,200 2,190,400 2,518~00 87.4% 76.1%Driver 890,100 1,174,200 1,146,000 75.8% 77.7%
San In-Vehicle 1,105,600 1,450/800 1,409,400 76.2% 78.4%Mateo Transit 27,900 76,500 43,300 36.5% 64.4%
Total 1,308~00 1,711300 1,630,600 76.5% 80.2%Driver 2,714,000 2,904,200 2,979,400 93.5% 91.1%
Santa In-Vehicle 3,401,000 3,622,900 3,702,200 93.9% 91.9%Clara Transit 65,600 75,400 74,800 87.0% 87.7%
Total 3,849,300 4,083,700 4,168,400 94.3% 92.3%Driver 1,971,800 2,333,900 2,372,800 84.5% 83.1%In-Vehicle 2,481,500 2,910,700 2,942,900 85.3% 84.3%
Alameda Transit 171,500 257,500 215,300 66.6% 79.7%Total 3,147,800 3,668,100 3,655,600 85.8% 86.1%Driver 1,315,800 1,639,900 1,525,700 80.2% 86.2%
Contra In-Vehicle 1,648,900 2,029,600 1,896,800 81.2% 86.9%Costa Transit 25,100 90,900 37,400 27.6% 67.1 %
Total 1,843,300 2,291,600 2,107,600 80.4% 87.5%Driver 456,300 549,900 511,500 83.0% 89.2%In-Vehicle 589,400 705,900 654,800 83.5% 90.0%
Solano Transit 6,000 11,700 6,200 51.3% 96.8%
Total 695,200 818,600 762,100 84.9% 91.2%
Driver 209,800 239,400 237,200 87.6% 88.4%
In-Vehicle 263,100 297,900 295,400 88.3% 89.1%
Napa Transit 2,600 3,300 2,600 78.8% 100.0%
Total 307,700 344,000 340,300 89.4% 90.4%
Driver 745,700 807,300 778,000 92.4% 95.8%
In-Vehicle 924,100 1,003,100 962,600 92.1% 96.0%
Sonoma Transit 18,100 23,300 18,900 77.7% 95.8%
Total 1,081,400 1,166,300 1,122,600 92.7% 96.3%
Driver 410,800 506,600 488,900 81.1% 84.0%
In-Vehicle 485,000 594,100 578,400 81.6% 83.9%Marin Transit 11,200 29,800 14,500 37.6% 77.2%
Total 562,800 692,700 661,200 81.2% 85.1%
Driver 9,431,000 11,063,300 11,063,300 85.2% 85.29’6
Bay In-Vehicle 11,818,800 13,762,000 13,762,000 85.9% 85.9%
Area Transit 772,900 1,057,100 1,057,100 73.1% 73.1%
Total 14,711,200 16,966,700 16,966,700 86.7% 86.7%
-135-

5.4 Coun tv-Level Vehicle Occxmancy
This last subsection of Working Paper #4 reports on private passenger vehicle
occupancy rates by trip purpose by county of production and county of attraction.Vehicle occupancy rates are approximate calculations based on the number of
vehicle driver trips plus the number of vehicle passenger trips, divided by thenumber of vehicle driver trips.
It is important to note that these vehicle occupancy rates are only approximate
estimates due to the nature of trip reporting in household travel surveys. There are
many examples in the 1990 survey of “mixed purpose” trips, e.g., the vehicle
driver’s trip purpose is different than the vehicIe passenger’s trip purpose. For
example, a trip with a parent driving a child to school, then driving home again, isclassified as two home-based shop (other) vehicle driver trips. The child’s trip,riding in the same vehicle, is classified as one home-based school passenger trip.This classification scheme results in very high vehicle occupancy rates (2.37 personsper vehicle) for home-based school trips given that the drivers of these trips aretypically classified as either home-based shop (other) or home-based work trippurposes.
Vehicle occupancy rates can also be based on the reported vehicle occupancy in thetrip diary. This reported vehicle occupancy data is important in distinguishingbetween drive alone and carpooling levels for in-vehicle persons, but typicallyprovides very different vehicle occupancy estimates than the straightforward(vehicle ~ver + vehicle passenger / vehicle driver) calculation. The analysis of
vehicle occupancy rates, comparing the trip diary vehicle occupancy data to the
vehicle driver/vehicle passenger data is not included in this working paper.
Given this ambiguity in the vehicle occupancy calculation, only vehicle occupancyrates for total trip purposes are analyzed here. The reader should interpret and usethe trip purpose and county-level vehicle occupancy rates with caution.
The average vehicle occupancy in the Bay Area is 1.24 persons per vehicle, for alltrip purposes combined. This vehicle occupancy rate ranges from a low of 1.17persons per vehicle for trips produced in Marin County to a high of 1.28 persons pervehicle for trips produced in Solano County. San Francisco County has the secondhighest vehicle occupancy rate at 1.26 persons per vehicle. Most of the counties havean average vehicle occupancy rate between 1.23 and 1.25 persons per vehicle.
-136-
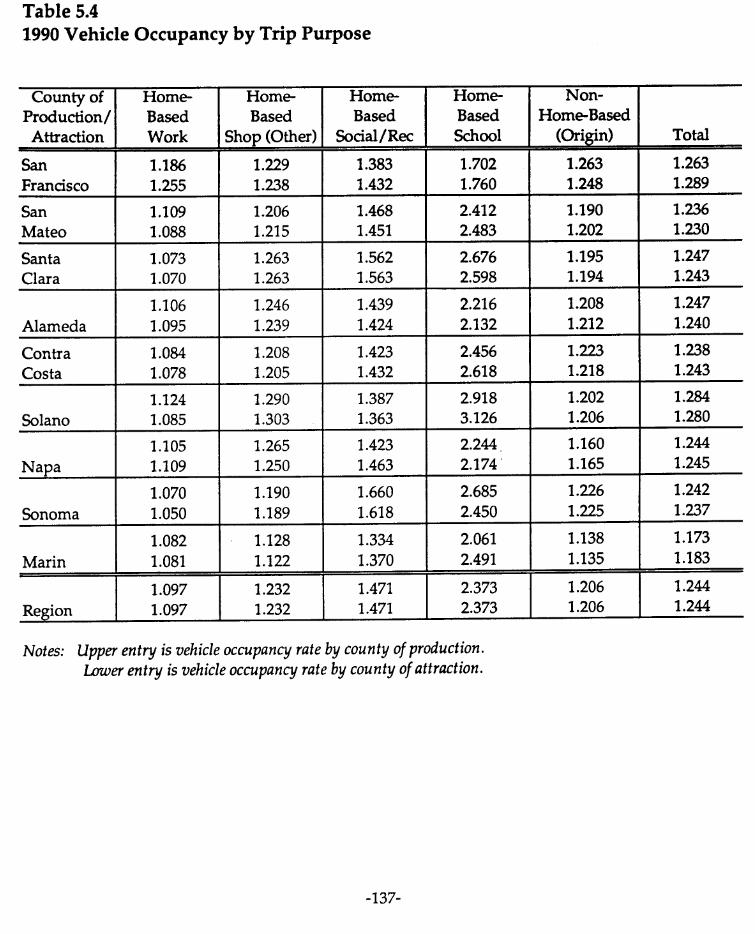
Table 5.41990 Vehicle Occupancy by Trip Purpose
county of Home Home- Home- Hom~ Non-Production/ Based Based Based Based Home-Based
Attraction Work Shop (Other) Social/Rec school (Origin) Total
San 1.186 1.229 1.383 1.702 1.263 1.263Francisco 1.255 1.238 1.432 1.760 1.248 1.289
San 1.109 1.206 1.468 2.412 1.190 1.236Mateo 1.088 1.215 1.451 2.483 1.202 1.230
Santa 1$073 1.263 1.562 2.676 1.195 1.247Clara 1.070 1.263 1.563 2.598 1.194 1.243
1.106 1.246 1.439 2.216 1.208 1.247Alameda 1.095 1.239 1.424 2.132 1.212 1.240
Contra 1.084 1.208 1.423 2.456 1.223 1.238Costa 1.078 1.205 1.432 2.618 1.218 1.243
1.124 1.290 1.387 2.918 1.202 1.284Solano 1.085 1.303 1.363 3.126 1.206 1.280
1.105 1.265 1.423 2.244 1.160 1.244Napa 1.109 1.250 1.463 2.174 1.165 1.245
1.070 1.190 1.660 2.685 1.226 1.242Sonoma 1.050 1.189 1.618 2.450 1.225 1.237
1.082 1.128 1.334 2.061 1.138 1.173Marin 1.081 1.122 1.370 2.491 1.135 1.183
1.097 1.232 1.471 2.373 1.206 1.244Region 1.097 1.232 1.471 2.373 1.206 1.244
Notes: Upper entry is vehicle occupancy rate by county ofproduction.Lower entry is vehicle occupancy rate by county ofattraction.
-137-

Appendix 1.0
BACKGROUND
1990HouseholdTravelSurveyQuestionnaire
San Francisco Bay Regional Map
-138-

General and Detailed Trip Puroose and Travel Modes(1990 Surveycodesshownin parentheses)
GeneralTri~Pumoses
1. HBW
2. HBSH
3. HBSR
4. HBSK
5. NHB
Home-Based Work Home (1) <—>Work (2), Work-Related (3)
Home-Based Shop (Other) Home (1) <—>
Home-Based Social/Rec
Home-Based School
Non-Home-Based
G neral Travel Mod~
1. VD Vehicle Driver
2. VP Vehicle Passenger
3. TR Transit Passenger
4. SB School Bus Passenger
5. BI Bicycle
6. WK Walk
7. OM Other Means
Personal Business (4), Medical/Dental (5),Grocery Shopping (9), Other Shopping (10),Child Care-Adult (12), Serve Adult Psgr (13),Serve Child Psgr (14), Change Travel Mode (15),Other (16), Child Care-Child (17)
Home (1) c—>Visiting (6), Eat Meal (7), Recreation (8)
Home (1) c—> School (11)
Non-Home (2-17) e—> Non-Home (2-17)
Auto Driver (l), Truck Driver (3),Van Driver (5), Motorcycle Driver (19)
Auto Passenger (2), Truck Passenger (4),Van Passenger (6), Motorcycle Passenger (20)
Public Bus Passenger (8), Cable Car (10),Streetcar (11), Shuttle Bus (12), Dial-a-Ride (13),BART (14), CalTrain (15), AMTRAK (16),Ferry Passenger (18)
School Bus Passenger (9) (only HBSK trips)
Bicycle Rider (22)
Walk (23)
Taxi, Limo Passenger (7), Airplane (17),Moped (21), Other (24)
-138a-

A
B.
c.
D.
E.
JiOU~ AND HOUSING UNIT MFORIMIIQM
F~ltitibb=kyw-wMmtiph ~rbbM. Bythislmeanowned,IeasedorusedregulartybypersonswhohfeMe:
1. Hwmq-,X,~wrw-wh@=doyw~e? . . . . . . . _
2. Howmanytrwks,otherthanpickups,doyouhave?. . . . . . . . . . . . . .
3. Howmanymotorcydesinyourho-hoM?. . . . . . . . . . . . . . . . . . —
4. Howmanymopeds?.. ~........ . . . . . . . . ..*= .**. —
5. Howmanybicyclesareowned,usedandhWO~Morderinyourho~ho~?. . . “ _
6. Pleasetellmetheyear,make,andmodelforeachof theautos,@c@s,jeep, tik$andrecreationalvehiclesinywr household:
Year MakeandModel [POSTCODq
.— —— ——
.— .— ——
—— —— ——
.— —— ——
—— —— —.
—— .— ——
Howmanypersons,whetherornotrelatedtoyou,includingyourself,lie inywr house?. .
Howmanyofthesearefiveyearsofqe oroldefl . . . . . . . . . . . ● . “ . “ _
Whattypeof buildhgdoyouIiie in?1 = SingleFamilyHouse 5. MobileHome2 = DuplexUnit 6 = MoteWlotel3 = Apartment
IT= GroupQuarters ““”””” —
4. Concfominiurnllownhouse
HowmanyyearshaveyoulivedatyourpremtaddreS7. . . . . . . . . . . _——
IvIFLESSlHAN 5 YEARS]hatcitydidyouliveinpreviously?
mIsyourresidenceownedor rentedbyyou 1 = Owned
1
.
orsomeoneinvourhousehold? 2= Rented . . . . . . . . .._.3 s Unknown )
NOTES:
-139-

Iw-bc1I
A. B. c. D. E. F.FIRSTNAMESU DRIVERS EMPLOYRELATIONTO A SEX A(3E LICENSEETHNlcSTATUS
A MF YN
B MF YN
c MF YN
D MF YN
E MF YN
F MF YN
G MF YN,
H MF YN
I MF YN
J MF YN
G. H. L J. K L.Iu)w (lfIimthaltspm)
JOB BUSINESS WORKADDRESS LONQ PREVtOUSIU3RKCITY DISABILITY
Y12345
N
Y12345
N
Y12345
N
Y12345
N
Y12345
N
Y12345
N
Y12345
N
Y12345
N
Y12345
N
Y12345
N
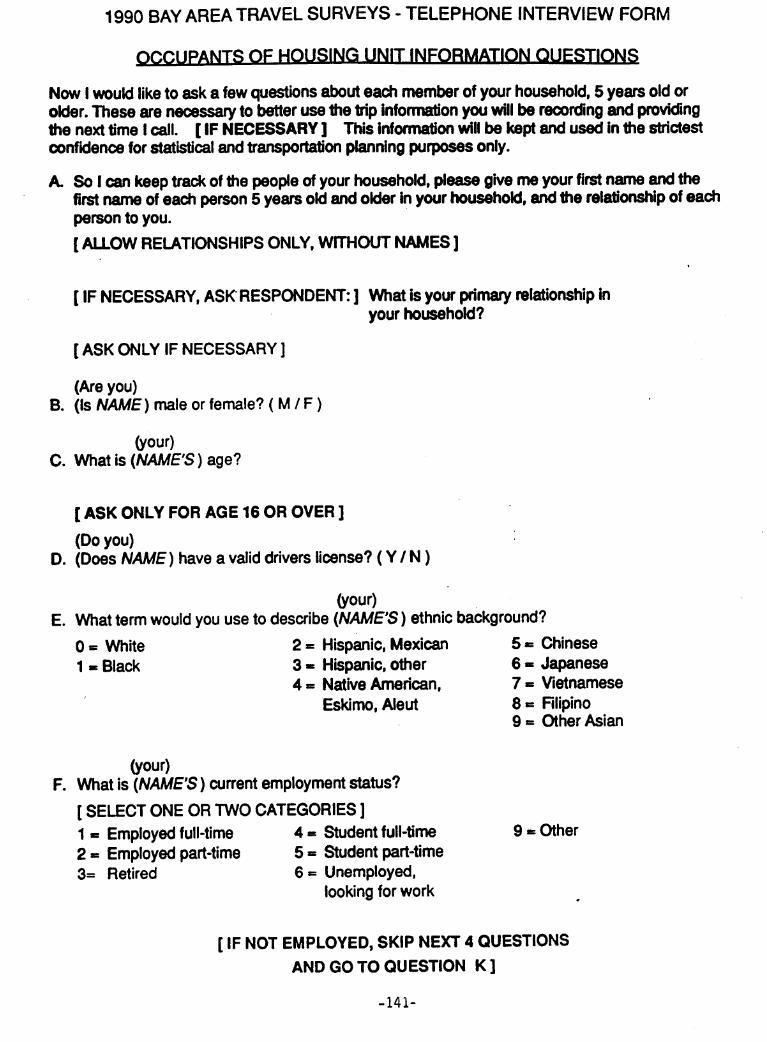
199o BAY AREA TRAVEL SURVEYS - TELEPHONE INTERVIEW FORM
C)CCUPANTS OF HOUSING UNIT INFORMATION ~STIONS
Now I would like to ask a few questionsabouteach memberof yourhousehold,5 yearsold orolder.These are necessaryto betterusethe trip informationyouwillbe reoorcfmgand provkfingthe next time 1oall. [IF NECESSARY] This information willbe kept and usedin the strictestoonfkfenceforstatisticalandtransfntation planningpurposesonly.
A
B.
c.
D.
E.
F.
So I can keep track of the peopleof yourhousehold,pleasegive me yourfirstname andthefirstname of each person5 years old and older in yourhousehold,andthe relationshipof eachpersonto you.
[ ALLOW REIATIONSHIPS ONLY, WITHOUT NAMES]
[IF NECESSARY, ASKRESPONDEIW ] What is yourprimaryrelationshipinyour household?
[ ASK ONLY IF NECESSARY ]
(Are you)(Is NAME) male or female?( M/F )
(your)What is (NAMES) age?
[ ASK ONLY FOR AGE 16 OR OVER ]
(Do YOU)(Does NAME) have a valid drivers license? ( Y/ N )
(your)What term would you use to describe (NAME’S ) ethnic background?
O= White 2 = Hispanic, Mexican 5 = Chinese1 = Black 3 = Hispmic, other 6 = Japanese
4. Ndive American, 7 = WtnameseEskimo, Aleut 8 = Filipino
9 = Other Asian
(your)What is (NAME’S) current employment status?
[ SELECT ONE OR TWO CATEGORIES]
1 = Employed full-time 4 = Studentfull-time 9 = Other2 = Employed part-time 5 = Student part-time3= Retired 6 = Unemployed,
looking for work .
[IF NOT EMPLOYED, SKIP NEXT 4 QUESTIONS
AND GO TO QUESTION K]
-141-

CCUPANTS OF HOUSING UNIT INFORMATION QUESTIONS
(your)G. What is (NAME’S ) occupation?
Exeout&e, Mministrm”ve and ManagerialProfessional Specialties (e.g., Engineer, Doctor, Teacher )Teohnidans and Related Support ( e.g., Health Teoh, Lab Tech,Programmer, LegafAsWant )SalesMminktrativeSuppofi indudmg ClerioalPrivate Househoid ( e.g., Child Care, Maid)Protedive SeMoa ( e.g., Poiii, Fue, Guard )Servioe, exoept Private and ProtectiveFarming, Forestry or FiiingPredsion Production, Oraft or RepairMaohine Operators, Assemblers or InspectorsTranspotion or Material MovingHandlers, Equipment Cleaners, Helpers or Laborers
(are you)H.
L
J.
K
L
What kindof business (is NA/UE) in?1 = Farming, Fores~, Fishing 6 = Wholesale Trade2 = Mining 7 = Retail Trade3 = ~~on 8 = finan~, Insuran@, R@ Estate4 = Manufacturing 9 = Servioes5 = Transportation,Communications, 10= Government, Public Admin
PutNc Utilities
(you)What is the address where (NAME) works?[ ADDRESS AND CITY][Please give a complete address if you an, or a well-known location, so we can locate it on amap for location coding. ]
(have you)How long (has NA/K) been working at this location?
[IF WORKED AT THIS LOCATION FOR LESS THAN 5 YEARS ](you)
What dty did (NAME) work in previously?
[ ASK QUESTION “K” ONCE, FOR EVERYONE IN HOUSEHOLD ]
Does anyone in your household have any physicaf, mental or other health oondiiion which haslasted six months or more and whioh makes it difficult to use public transposition?[IF NO, SKfP TO RESPONDENT ADDRESS& APPOINTMENT FORM]
(you)Compared to the average person, does this condition make it difficult for (NAME) to:[for each question, Y/N ]1. Walk or go up to three blocks? .
2. Board a standard transit bus?.
3. Ride seated in a standard transit bus?4. Ride in a taxicab?5. Are there other situations that make it difficult for you to use public transportation?
[IF YES] Please specify.
-142-

Alamlxklc.ul.1,
DAWO S.KAUEOWAUIR.CAWSELI
-CO@acaum.
aOBECT1.~ Dear Bay Area Resident:Sm Wna
‘-” Recently you were called bya survey research Interviewer wor’ldng-.- for the E. H. White Company under contract to the Metropol~tan
RoDEmB. s~ Transportation Codssion. The Coamnisslon Is conducting a survey~- throughout the Bay Area, the results ofwhtchwlll be used inFSEONK.M determining the future transportation needs of this area.
Ssn Frau&cQ8ndc0LultY
b w. ,(AMNHAUYG. Bun
smMmeOcnurily
JANEBAKERTOMNolM
Sm8amac-w
~T. kuJ+)LRoo DmooN
Ckii
JAr&&%samucamlY
Wuw R. LUCIUS
aiairmdB8yAmGownmmbDLANNEtikNNA
S.F.* CQm@mmn
ANcEloj. SmAcvM
Thank you for agreeing to participate In this Bay Area TravelSurvey. Enclosed are the materials described by the interviewer.
Please read the attached sheet carefullyas It explafns howtorecord information about the trtps made by members of yourhousehold. If you have any general questions about the survey,please cal 1 the E. H. Mhlte Travel Study Hotllne at 1-800-675-5610.Ifyouulsh toveylfy that this Is avaltd UTC survey, please callShtrley Rodenborn, NTCProject Hanager, at (415) 464-7700.
Your partlclpatlon in this survey ~s particularly tnportant becausethe Information gathered on people llving in your household will beused to represent many people who llve in the Bay Area. All theInformation you give wI1l be treated in the strictest confidence andwI1l be used for transportation planntng purposes only.
Thank you for your cooperation.
Enclosure
~~ LDD:SAR:mylAWRENCED. DAMS0472t/2
Executive Director
-143-JCWPHP. 8CMTMETROCENTSR●101 EIGHTHSTREET.OAKMND,CA94607-47W .415/464-7700*FAX 415/464-7848

USING THE TRIP DIARIES TO RECORDYOUR TRIPS
The Bay Area Travel Study rWireS information on how, when, where, and whypeople travel. The success of the survey and the usefulness of the resultsdepend on ”how accurately You rePOrt all trips made during your assignedThree-day travel week by~household members age five and older. ThisIncludes visitors that are staylngwlth you during the travel week.
Ue have enclosed travel cards and ask that -household -er fillout one of these cards recording all the trips he/she makes on your travelweek. It is essential for our survey that you record your trips for each dayof this travel week.
Some suggestions on filling out your cards:
1.
2.
3.
4.
5.
6.
7.
WHEN YOU 60 FR(M4ONE PLACE TO ANOTHER FOR ANY REASON, TNIS IS A TRIP.‘For example, If on your way home from uork you stop ata market and atthe cleaners, record these as three separate trips.
Include all types of trips. For example, trips made byualking orbicycle as well as by car. bus, etc.
Any time you change the method by which you travel, this Is a newtrip. For example, If you drive to a friend’s house and get in “her/his car to go to work, shopping, etc., record these as twoseparate trips.
If members of your family or household make a group trip (for example,two or three of you ride at the sametime in the samecar or bus),record this trip on each person’s trip card.
If you travel by bus, each tinw you transfer buses, record these asseparate trips.
Please give as speclffc information as possible for the trip beginningand destination. For example, an exact address or the address rangeand street (e.g., 2700 block of Plain St) @the city; the name of theBART station; the specific store (e.g., Macy’s Union Square). Me needthts to assign geographic zone codes to each location.
Please wrfte the purpose of each trip. Some examples are: work,home, food shopp~ng, taking a child to child care, doctor, etc.
As arranged in our previous conversation, we will be calling you onto gather the information recorded on these trtp cards.
At that time we would prefer to interview each memberof your household, butIf some household members are not available or are young chtldren, we can takethe information recorded on the~r travel cards from another responsible adult.
If you have questions about how to fill fn your travel card-or any otherquestion—pleasecall ourofflce at (415) 668-0076.
Again, thanks for your cooperation.
Sincerely,
0484t/2
Harold CharnsSurvey Project Director
-144-


I
Pleaseca~ this trip card with you and write down each trip you makeonTRAVEL DAYWhenyougofromone place to another for ~ream
.this is a trip.
Whenyou change your travel mode (car, bus, BART, bicycle, walh etc.) this is a new trip.pleaserecord an addresaif possible,or an easily identifiablelocation,where each trip begins andends,as well as the times for each trip beginning and ending.
PERSON .
TRIP BEGINNING TRIP DESTINATION t~~~ ~E ‘ARKM ‘T NUM. DEE? (CU&,tIOM)RTT~~; FARE INST-;;T ADDRESS AND CITY ADDRESS AND CITY END
TIME . . (mlhw paid)cAR
Please turnomlouerandcontinue
TRIP BEGINNING TRIP DESTINATION ~vp~ ~ PARKW- WJM,oEsnNAmN
S;;;T~ (wki.&RT, ~~r PA= IN
ADDRESS AND CITY ADDRESS AND CIIVENDTIME * (mlm pakfjCAR
.
All injlmnatianwill& kpt twmpktelyum~dentfalanduatdjbr twqortafion plannfngpnqwwsonly.
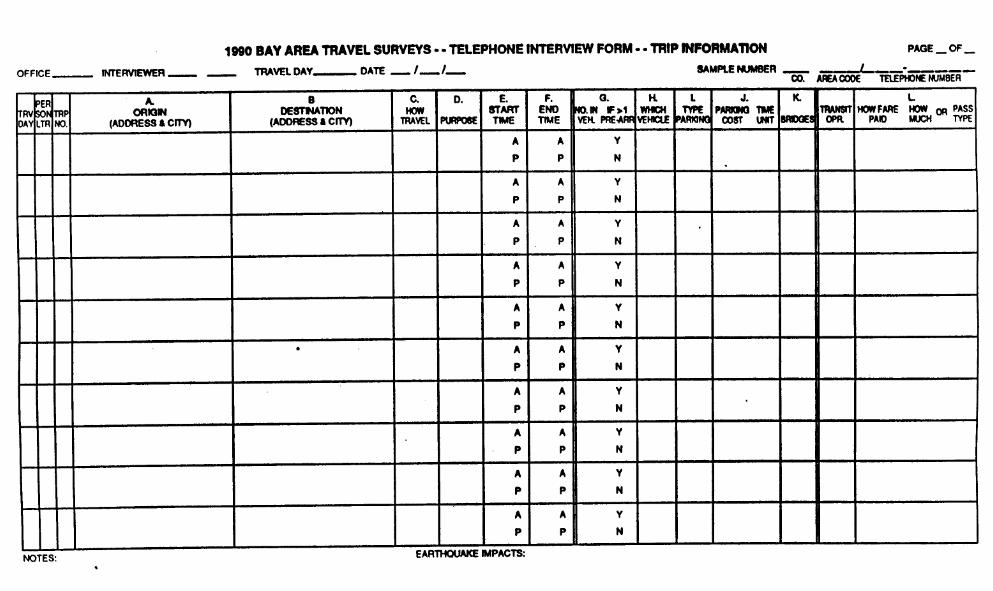
!q%
<a
-zCn
CL
-zCa.
Cn
-
Cn
Cn
-zCn
Ca
,
-zCn
-zCn
Cn
-z-z~C
n
c&
-147-

A.
B.
c.
D.
E.
F.
G.
1990 BAY AREA TRAVEL SURVEYS - TELEPHONE INTERVIEW FORM
TR 1P INFORMATION . QUESTIONS
(first)Forthe (next )tnp, where didthistnp &gin?[ PROMPT] Please give me the exact address, specific intersecting streets,
or a well-known plaoe, and the city.
Where did this trip end? [SAME PROMPT AS TRIP BEGINNING]
On this trip, how did you travel?
1 = Auto Driver 13 =2 = Auto Passenger 14 =3 = Truck Driver - 15 =4=5=6=7=g=9=
10 =11 =
12 =
Truck PassengerVan DriverVan PassengerTaxi or Limo PassengerPublic Bus Passenger [SPECIFYlSchool Bus PassengerCable Car PassengerStreetcar PassengerShuttle Bus Passenger
What was the purpose of this trip?
1 = Home2 = work3 = Work-Related4 = Personal Business5 = Medical/ Dental6 = Visiting7 = Eat Meal8 = Recreation
16 =17 =18 =19 =20 =21 =22 =23 =24 =
9 =10 =11 *12 =13 =14 =15 =16 =
Dial-A-Ride Passenger ‘BART PassengerSouthern Pacific PassengerAMTRAK PassengerAitplane PassengerFerry PassengerMotorcycle DriverMotorcycle Passenger ~MopedBicycleWalkOther [SPECIFYl
Grocery ShoppingNon-Grocery ShoppingEducationChild Care (Child / Provider)Setve Adult PassengerOther Setve Child PassengerChange Travel ModeOther
What time did this trip start?[AS NEEDED ] “Wasthis in the morning or afternoon?
What time did this trip end?(What time did you get to < DESTINATION>?)
[ IF PUBLIC TRANSIT USED, SKIP TO QUESTION K . ]
How many people were in the vehicle?
[IF MORE THAN ONE PERSON IN VEHICLE].
Was this trip pre-arranged with the other people in the vehicle?
-148-

H.
L
J.
K
L
M.
1990 BAY AREA TRAVEL SURVEYS - TELEPHONE INTERVIEW FORM
J N~) .
Which of your vehicles was used for this trip?[ RECORD VEHICLE NUMBER FROM HOUSING UNIT QUESTION A - 6]
What type of parkingdid you use?
1 = On-Street, free2 = On-Street, paid3 = Employee bt / garage4 = Lot/Garage, free5 = Lot/Garage, paid
[IF PARKING IS PAID, NOT FREE]
How much did you pay for parking?[IF NOT PAID AT TIME] How much do you pay, and how often?[ RECORD AMOUNT IF ONE TIME, AMOUNT AND UNIT TIME IF REGUUR]
If you crossed any bridges, which ones did you cross?
6 = Setice / Repair7. Resident paddng
‘ “ 8 = Cruising9 = Not parked
1
2:3=4.5=
San Francisco Bay 6 =Golden Gate 7San Mateo / Hayward 8:
Dumbarton 9 =
Carquinez
AntiochBeniaa / MartinezRichmond /San RafaelNone crossed
[IF PUBLIC TRANSIT USED ]~MAKE SURE BUS OPERATOR IS RECORDED IN QUESTION C ]
How was the fare paid for this trip?
Cash ------------>Pass ---------+Transfer --------->~cket / TokenOther [SPECIFY ]
How much was the fare?What type of pass, and how much did it cost?Was it free or did you have to pay for it?
[ AFTER ALL TRIPS ARE RECORDED FOR THE HOUSEHOLD]
Have travel patterns changed for anyone in your household because of theearthquake?
[IF YES ] Could you tell me, briefly, how your travel has changed?
[ CONTINUE WITH END FORM]
-149-

[ RESPONDENTADD13ESS AND APPOINTMENT FORM ][ RECORD AT END OF OCCUPANT INFORMATION]
[ FOR MULTI-DAY TRIP DIARY HOUSEHOLDS]You wftl reoeive <THE INCENTIVG when the suwey is oonpleted.
* State ZIP
END FORM[ COMPLETE A17ER TRAVEL INTERVIEW J
Now, I have ontythree more questionsto ask you to finish th~ interview.
F. Woukt you be willingto repeat this interview, inoiucfing 1 = Yesthe trip diaries, in about a year or so? 2=No —
[IF YES ]
So we cm be sure to find you for the next survey, would you please teti me the name and address of a 0!0s0 frtendor relative not livingwith you who will atways know how to find you?
Ad-
Cdy State ZIP
[IFNOJ
So we oan better understand the reasons why some people wont be part of the survey next year, ooukt you givemea brief reason why you are not willingto repeat this intewiew next year?
G. And finally, for statisticaland travel forecasting pwposes, we need to knowyour total household inoomebefore taxes. I will read several inoome rangesto you. Please stop me when we reach the rightone. .—
1 = ~SS than $5,()()0 7 = $30,000 to $34,999 13 = $75,000 to $99,9992 = $5,000”to $9,999 8 = $35,000 to$39,999 14 = $100,000 to $124,9993 = $10,000 to $14,999 9 = $40,000 to $44,999 15 = $125,000 and over4 = $15,000 to $19,999 10 = $45,000 to $49,999
.
5 = $20,000 to $24,999 11 = $50,000 to $59,9996 = $25,000 to $29,999
~ = Don’t know12 = $60,000 to $74,999 99 = Refused
THANK YOU VERY MUCH FOR YOUR COOPERATION
-150-

lb+ \ r \.—.
ALAMEDA
SAN FRANCISCO BAY AREA
-151-

Appendix 2.0
WEEKDAY 1990 REGIONAL TRAVEL
-152-

Table2.2.2A1990 RegionalWeekdayTrips by DetailedPurposeat Origin and Destination
(1) (2) (3) (4) (5) (6) (7) (8) (9) (lo) (11) (12) (13) (14) (15) (16) (17) TOTAL
1. Home
2. Work
3. Work-Related
4. Personal Business
5. Medical/Dental
6. Visiting
7. Eat Meal
8. Recreation
9. Grocery Shopping
10. Other ShoppingI
w 11.Educationu-l
Y 12. Child Care (Adult)
13. Serve Adult Psgr.
14. Serve Child Psgr.
15. Change Travel
16. Other
— -—..- --------- ------15,064 2,244,527 157,415
1,891,422 185,626 231,031
178,618 163,616 344,626
601,833 115,619 19,392
136J24 16,872 2,835
243,746 14,086 3,149
278/582 281,885 28,439
456/584 34,834 4,350
511,410 26,069 1/209
424,407 41* 4,380
774/550 34,%5 2,770
39,429 2/232 o
128,848 3,168 597
244#380 5,400 236
23/363 11,141 1#268
96/.512 14,842 2,446
629,394 159,(3.}/ z 10,767 224,004 444,748 307,376 328,505
189,973 33,452 36,162 291,.547 76,976 77,704 83,831
28,974 2,633 3,623 37,663 8,024 13,W3 10,2Q2
242,810 13,383 29,676 69,671 27,808 79,867 91,251
15,610 10,415 6,652 9,478 3,.362 17,267 22,722
24,746 4,801 21,962 22,522 15/586 16/039 17,649
42,810 3,982 18,676 10,918 29/232 22,2W 40,255
27,445 3,639 15,925 35,533 62,058 21,015 14,%6
33,937 3,651 14,674 11,759 3,832 23,628 25,639
47,425 5,079 24,191 34,972 9/.590 58,270 139,032
29/354 7,467 23,936 24@5 25,874 9,063 11,815
979 597 483 472 104 567 657
7/275 1,943 1,608 5,477 2,402 3,026 3,031
4,895 2,098 2,684 2,649 2,635 5,477 6,945
1,701 206 2,104 1,905 1/553 2,728 436
9,632 1,063 6,228 10j35 4,837 9,072 7,054
17.Child Care (Child) 37,949 1,054 0 478 339 3,933 654 : 1,935 2,546 7%
8%,S27 38,424130,1522Y),04132,1.30101,12526,3756,196,511
21,581 2,7~2 9/.55512,161 7,662 16,708 291 3,168,474
2,4(1(, O 1,253 382 1,359 3,7.38 0 801,190
8,41 (1 1,384 5,855 4,590 3,113 10,557 219 1,325,438
3,448 1,162 221 1,732 0 1,955 1,168 251,223
16,520 () 1,288 1,419 1~63 5,354 4,911 415,041
16,103 323 4,677 2,266 1541 9,684 323 791,926
10,830 947 2,749 1,512 1,704 3/342 865 698,318
2,263 634 1,665 2,744 0 5,175 450 668,739
1,630 971 2,319 1/585 %6 5/587 140 lw,929
43,823 236 980 5218 4>59 10,691 20,714 1,030/520
177 1,442 0 528 0 175 0 47,842
1,426 0 5,883 0 231 0 0 164,915
2,481 287 0 8,067 257 429 328 289/248
4,309 0 123 0 948 288 0 52,073
7,359 217 790 257 204 33,399 376 204,823
5,254 0 0 808 0 410 2,039 58,195
TOTAL 6,083,021 3,197,321 W4,143 1337,438 254,385 423,284 794,264 720,556 669,%8 804,896 1,044,847 48,819 167,51O 293,310 55,937 208,617 58,199 16966405


TABLE 2.3.2A
1990 DISTRIBUTION OF REGIONAL WEEKDAY TRIPS BY TIME OF DAYTOTAL MODES (1990 SURVEY CODES 1-24)
--------------------------------------------------------------------------------------------------------------------------TIME HOME BASED WORK HOME BASED SCHOOL TOTAL HOME BASED NONHOME BASED TOTAL TRIPS
AT TRIP FROM HOME TO HOME FROM HOME TO HOME FROM HOME TO HOMEDEST NUMBER PCT NUMBER PCT NUMBER PCT NUMBER PCT NUMBER PCT NUMBER PCT NUMBER Pcl’ NUMBER PCT
------------- ==== =.== .==. ..== ==.. =.== .=.. ..=. =.=. . . . . .==. . . . . ..=. =..= =..= .=.= =..= =.=. .=.. .==. ..== ..=o- 4950- 99
100- 149150- 199200- 249250- 299300- 349350- 399400- 449450- 499500- 549550- 599600- 649650- 699700- 749750- 799800- 849
Iw 850- 899V-I 900- 949yl 950- 999
1000-10491050-10991100-11491150-11991200-12491250-12991300-13491350-13991400-14491450-14991500-15491550-15991600-16491650-16991700-17491750-17991800-1s491850-18991900-19491950-19992000-20492050-20992100-21492150-21992200-22492250-22992300-23492350-2399
TOTAL
3241986S8o
471926
2567291838339813
173695164992546
182632258839357987388523284941180271837246160734825277672140720223212433144023991186361804126475244541376422116166811648614367121838898657863785818356722312104733969164036
.0
.0
.0
.0
.0
.0
.1
.1
.2
.4
.72.23.97.6
10.814.916.211.97.53.52.61.51.2.9.8.9
1.31.0.8.8
1.11.0.6.9.7.7.6.5.4.3.3.2.1.1.1.3.3.2
1812652362222304371025364455168922361168880392
37975349572455776776679172364121697971558372140553167521342301131699531769373286629090405131241163924269623270767245880142106108890606804460831666304452842524904160762320627248
.1
.3
.3
.1
.2
.1
.2
.1
.1
.1
.0
.0
.2
.3
.3
.3
.3
.3
.4
.2
.3
.3
.4
.71.51.01.5.8
1.51.83.24,46.48.0
13.113.111.96.95.32.92.21.51.51.41.2.8
1.11.3
2399792 100.0 2061463 100.0
0000000000
1117117944168566
4478817726432412114458350092207851427167297573976860487328517435142458373440792459232928893211395875856710883260123780707
0188
000
367
.0
.0
.0
.0
.0
.0
.0
.0
.0
.0
.1
.15
1:05.019.836.116.15.62.31.6.8.8
1.1.7.8.6.4.3.4.5.3.3.3.4.4.87
1:0.7.4.1.0.0.0.0.0.0
896614 100.0
0124
00000
1690
2380
324427
0269862
23071158171033222571306549399761
2929320680138172670437183
1093641910221097654471027798312311592218504789154395531343475016415813612315616310353029
.0 1467
.0 2264
.0 1211
.0 561
.0 637
.0 1529
.0 3369
.0 3303
.0 4812
.0 10505
.0 21944
.0 68585
.1 118438
.0 218748
.0 355976
.1 613446
.3 854307
.1 557652
.2 345476
.4 208222
.3 206791
.4 1346086 160251
1:3 1169913.8 1211822.7 955551.8 1270453.4 946494.8 113293
14.1 10448124.7 13656214.2 1092375.8 998383.6 1242214.0 1129662.1 1338312.4 1417651.0 132106.7 164718.7 123810.4 76894
1.0 49015.8 28914
1.1 195851.6 17998.8 11733.1 14027.4 9064
.0
.0
.0
.0
.0
.0
.1
.1
.1
.24
1:11.93.55.89.9
13.89.05.63.43.32.22.61.92.01.52.11.51.81.72.21.81.62.01.82.22.32.12.72.01.2.8.5.3
::.2.1
59241335613718738134815061672926202236161410932975
1103510922164072712960224596704410846289611226924474600
108319161160142543124290121245166610258681402675336500317252329554473656454519443897283615254029188385162862160037146644127643112654769047223277443
.1
.2
.2
.1
.1
.1
.1
.0
.0
.0
.0
.0
.2
.2
.34
1:01.0.7.8
1.01.11.21.82.72.42.12.02.84.36.65.65.25.47.87.57.34.74.23.12.72.62.42.11.91.31.21.3
1452979547
26031100511889385420
1397141860644056
131103001145045845759351896447
11127014200614726418581325051536685029693332510025268723235923716024227519986818850217226619985815907313310510182385492727286072448071342162565620816135321475610363
.0 8843
.0 16598
.0 15476
.1 10545
.0 10219
.0 7101
.0 10987
.0 6308
.0 7469
.0 13516
.0 24456
.1 77624
.1 133529
.3 242780
.6 4023931.0 6856211.8 9991072.0 7108392.0 4860302.4 3657803.0 4099183.1 3511143.9 4206645.3 4758267.8 6491916.3 5350296.9 5764355.4 4685804.9 5122625.0 6003235.1 7815134.2 6456054.0 6055913.7 6260414.2 7864823.4 7474242.8 7187672.2 5175451.8 5042381.5 384’3221.3 3004791.0 257123.7 209774.5 172884.4 151468.3 102170.3 101015,2 96870
.1
.1
.1
.1
.1
.0
.1
.0
.0
.1
.1
.5
.81.42.44.05.94.22.92.22.42.12.52.83.83.23.42.83.03.54.63.83.63.74.64.44.23.13.02.31.81.51.21.0.9.6.6.6
774127 100.0 6173580 100.O 6055287 loo.o 47~5609 100.016944470 100.0

TABLE 2.3.3A
1990 DISTRIBUTION OF REGIONAL WEEKDAY TRIPS BY TIME OF DAY
PERSON MODES (1990 SURVEY CODES 1-6,8-16,18,19,20)
---------------------------------------------------------------------------- ______________________________________________TIME HOME BASED WORK HOME BASED SCHOOL TOTAL HOME BASED NONHOME BASED TOTAL TRIPS
AT TRIP FROM HOME TO HOME FROM HOME TO HOME FR@M HOME TO HOMEORGN NUMBER PCT NUMBER PCT NUMBER P*ZT NUMBER PCT NUMBER PCT NUMBER PCT NUMBER PCT NUMBER PCT
.===....=.==.======>==.==..=..==......=.=.=.=.............=.=...=.....................2....==.=...........==.===.====.=..=o- 4950- 99
100- 149150-”199200- 249250- 299300- 349350- 399400- 449450- 499500- 549550- 599600- 649650- 699700- 749750- 799800- 849
I 850- 899wm 900- 949m 950- 999I
1000-10491050-10991100-11491150-11991200-12491250-12991300-13491350-13991400-14491450-14991500-15491550-15991600-16491650-16991700-17491750-17991800-18491850-13991900-19’491950-19992000-20492050-20992100-21492150-21992200-22492250-22992300-23492350-2399
TOTAL
324453160
0722
1508369532257202
203874413096339
16792624631632071836439228935316876496639518334214726360217271696118541248482777018927205652182723521124731681718767126651582611462111116943673668482875247632495316501741673278
.0
.0
.0
.0
.0
.1
.2
.1
.39
1:94.27.3
10.714.015.912.67.44.22.31.81.1.9.7.8
1.11.2.8.9
1.01.0.5.7.8.6.7.5.5.3.3.3.1.1.1.2.2.2.1
2293308 100.0
3753446368182076348723553838880
2002908
133317804538302478266305617452935348538862906452
109471704235672168692275321083398694851495935
1258731682722079323470301933451572098032666873355463170224909323552452422118128382254515067
.2
.2
.3
.1
.2
.1
.2
.0
.1
.0
.1
.1
.2
.2
.4
.3
.3
.3
.3
.3
.3
.3
.69
1:89
1:21.12.02.54.96.48.610.617.69.89.04.13.41.81.61.31.61.21.1.7
1.1.8
1967478 100.0
0000000000
111714866567
1975792878174870195314587243048511889779146304310973040046497347928161834359021102698217022781647573574358137540933201704276
00000
367
.0
.0
.0
.0
.0
.0
.0
.0
.0
.0
.22
1:02.9
13.625.528.58.64.51.71.1
.;1.4.6.9.5.4.3.5.3.4.3.3.2.8
1.11.2.8
::.0.0.0.0.0.0.1
685054 100.0
0124
0000000
2380000
8071316145813861957230523401651941486002559610702123912106749829
10599011782733955272941887018923155731051736863515349057145202826010367933116791913738
.0 1914
.0 2059
.0 i529
.0 331
.0 1208
.0 1508
.0 4497
.0 3610
.0 8181
.0 22573
.0 53357
.0 115243
.0 1976S4
.0 299144
.1 466638
.2 645081
.3 615311
.3 317287
.4 238170
.4 150693
.4 1653613 107561
1:7 1299101.6 1009644.6 1015101.9 863032.2 1125973.8 867179.0 10627519.1 10270621.3 1084926.1 736184.9 1048213.4 993663.4 1007032.8 1269521.9 132567.7 129610.6 147578.6 81336
1.0 567839 32830
1:5 247141.9 189471.7 15960.3 9237.3 10318.1 6852
.0
.0
.C1
.0
.0
.0
.1
.1
.A
41:02.13.65.48.4
11.711.15.74.32.73.01.92.41.81.81.62.01.61.91.92.01.31.91.81.82.32.42.32.71.51.0.6
.:
.3
.;
.1
554026 100.0 5526606 100.0
970011594120695002660566314371980221013601699688588489617
196533004954702431213841846479546755961383735109819159262105449104136128148176824284945355313272930323581359404531485346198316299205454181950143741144220129798149038115252100790574416237240022
.2
.2
.2
.1
.1
.1
.1
.0
.0
.0
.0
.1
.2
.2
.46
1:0.8.7.9
1.01.11.52.02.91.91.92.43.3
u5.06.0
:::6.45.83.83.42.72.72.42.72.11.91.11.2.7
1467641756
15617602824953858822959271547309420
15247361945633372882825668935610353513049014939417670322945628040824546324501119982921017019203019817017142915875215828718303811120910747973125690455434055387349112963919694164021276389705558
.0 13081
.0 14294
.0 14354
.0 6894
.0 8573
.0 8420
.0 9363
.0 4874
.0 11273
.1 26892
.1 57771
.1 126858
.2 215953
.4 324008
.9 5224861.4 7314641.8 7428952.1 4429732.2 3659422.6 3007073.3 3505253.7 3165684.4 3903485.7 4402397.0 5411796.1 4372156.1 4617435.0 4146945.2 4932684.8 5796814.9 6619744.3 5179774.0 5871533.9 6170574.6 8152272.8 5843582.7 5563451.8 4081881.7 3985721.4 2794161.4 256390,9 197539.7 203391.5 153892.4 133152.3 79442.2 81660.1 52433
.1
.1
.1
.0
.1
.1
.1
.0
.1
.2
.4
.81.42.23.54.95.03.02.42.02.32.12.62.93.62.9
;::3.33.94.43,53.94.15.43.93.72.72.71.91.71.31.41.0.9.5.5.4
5421786 100.0 401O318 100.014958701 100.0


TABLE 2.3.5A
1990 DISTRIBUTION OF REGIONAL WEEKDAY TRIPS BY TIME OF DAYTRANSIT MODES (1990 SURVEY CODES 8,10-16,18)
--------------------------------------------------------------------------------------------------------------------------- TIME HOME BASED WORK HOME BASED SCHOOL TOTAL HOME BASED NONHOME BASED TOTAL TRIPSAT TRIP FRoF HoME TCJHOME FROM HOME TO HOME FROM HOME TO HOME
ORGN NUMBER PCT NUMBER PCT NUMBER PCT NUMBER PCT NUMBER FCT NUMBER PCT NUMBER PCT NUMBER PCT-------------------------------------------------------------------------------------------- -------_--___— _________________—--—____________________ _—_—_-_-___—---—-—------———— -——..---—-—-- -...——.—-——.——..-——-.--—-—— ————__________________________
o- 4950- 99
100- 149150~ 199200- 249250- 299300- 349350- 399400- 449450- 499500- 549550- 599600- 649650- 699700- 749750- 799800- 849
I 850- 899w 900- 949% 950- 999I 1000-1049
1050-10991100-11491150-11991200-12491250-12991300-13491350-13991400-14491450-14991500-15491550-15991600-16491650-16991700-17491750-17991800-18491850-18991900-19491950-19992000-20492050-20992100-21492150-21992200-22492250-22992300-23492350-2399
TOTAL
o000
00
2090
130330975399
114382361430960410024432926930123059975333733881122984
271816781298985
1395150914242550166545293641826238426200
10202825600
2151364
000
239723
.0
.0
.0
.0
.0
.0
.1
.05
1:32.34.89.9
12.917.118.511.25.14.21.41.4.5.4
1.1.7.5.4.6.66
1:1.1.2.1.3.3
.;
.1
.4
.1
.2
.0
.1
.6
.0
.0
.0
100.0
000
243318
00
574000000
308452160
0000
80!314
224815901770210936563956
109889489
2208227785501252339217671735262212072198784417503099609
020041714
207689
.0
.0
.0
.1
.2
.0
.0
.3
.0
.0
.0
.0
.0
.0
.1
.2
.1
.0,0.0.0.0.4.2
1.1.8.9
1.01.81.95.34.6
10.613.424.111.3
8.53.53.01.01.0
.4
.81.5
.3
.01.0
.8
100.0
000000000000
1443669
264771933622757544036021919498999969780456472708
0433725273
00
36100
6181099465
0431
0000000
.0
.0
.0
.0
.0
.0
.0
.0
.0
.0
.0
.02
4:028.620.924.65.93.92.1
51:11.0.8.55:8
::.8.3.0.0.4.0.0.7
1.2.5.0.5.0.0.0.0.0.0.0
92631 100.0
0000000000000000000
152381458
1615140446901705177017586716
170092903065117018440439801985703297135289273
0990
1288859
000
95418
.0
.0
.0
.0
.0
.0
.0
.0
.0
.0
.0
.0
.0
.0
.0
.0
.0
.0
.0
.2
.45
1:71.54.91.81.91.87.017-.830.46.87.44.64.22.1.7.3.1.3.3.0
1.01.3.9.0.0.0
100.0
53400000
2090
130333115610
121852654037173738737109756287246292194586241316872408902832295012518713327346148502242351197331830863309262023535403113826741398560
0673
1364000
.1
.0
.0
.0
.0
.0
.0
.0
.3
.71.32.75.98.316.515.912.65.54.91.92.91.62.01.92.1.6
1.6.6
1.41.1.9.3.7.7.7.6.5
1.2.3.6.3.1.0.2.3.0.0.0
447334 100.0
22700
243318
00
574000000
308884417
07519002110179353216869
1295787591006911583161022856149165201263571236019622303013223209118049275575846661361502151662836236926712611
.1
.0
.0
.1
.1
.0
.0
.1
.0
.0
.0
.0
.0
.0
.1
.2
::.2.2.5.4
1.31.63.12.12.42.83.86.8
11.74.88.58.6
14.97.25.52.82.21.41.1.3
1.21.2.7.6.6.6
418877 100.0
00000
2820000
1350
4771457311354726691497349034167401129956678766870278651
109238531969570288512909289598834
109907673714228732843996
1571811651
014273’77
1039385
.0
.0
.0
.0
.0
.2
.0
.0
.0
.0
.1
.0
.3
.81.73.13.72.82.72.32.21.73.74.33.94.86.14.85.43.94.85.15.04.96.14.34.01.61.6.6.9.5.4.0.8.2.6.2
76100
243318282209574
130333115745
12185270163863077293774526339529602275991369219289120272090222858294851992728125228483194540611619123041547989479387652940425327032007913256942776352732567258395626274637102996
.1
.0
.0
.0
.0
.0
.0
.1
.1
.35
1:22.63.77.47.46.12.82.61.31.81.22..02.22.8
::;2.23.13.95.92.94.64.67.33.93.11.91.3.9.7.3.5.6
::.4.3
179047 100.0 1045258 100.0


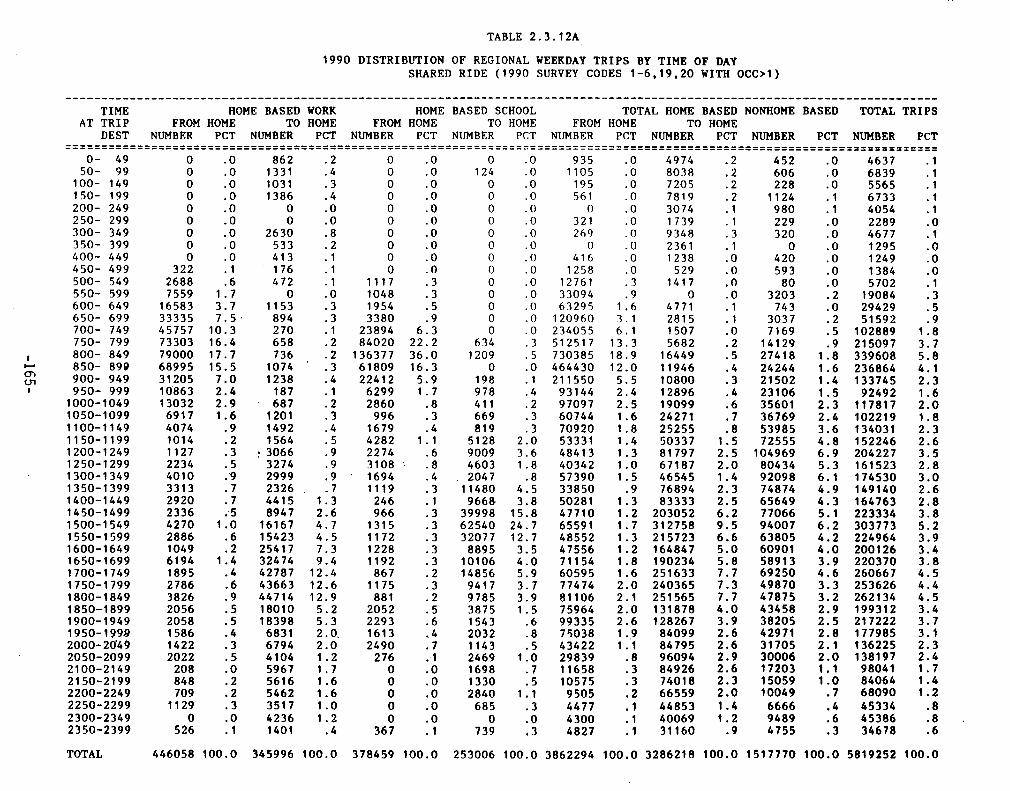

TABL3 2.3.13ATRIPS- XS4~IU3 NSALYSXS TOR 1990 86ZX9WAY TOTAL TRXFS
TSUPS WITHIN 60 MIN. ~ MGIN 2’29335X54(01)STSP&IN
m48?wsm mra TuTALnuPsm
— ~ILYIS 2UTAL ‘IRIPSALL 6S)L32.9mr6- 9ZT
NN.9elDAILY Pm/SST- S.71 11.41 17.12 22.83 28.53 34.24 39.95
Hu41 m 2VTAL XWTAL o 2536oo 507200 160800 1014400 1268000 1S21600-—— -— .— -—— — ——
1775200+——————+ —+—+—-.SD ..= ..D.D.D.D.D.D.D.D.D.D .,..D.D.D.D.D.$D : ..$SD.$$$SD :.$$$$FSD.S$$$$$KA.$$$$S$S$$F*D :,SSSSS$SSSSSSS_D .
0.000.150.300.451.001.1s
1,260816613514208359720
1,4701.990
17,33816,20414,55011,6418,9377,4457,1306,9786,8146,9087,1596,8175,8234,5083,9743,6713,2782,8272,7332,7392,8814,4636,4808.256
000000
:00000000
:000000000000000000000000000000000000000000000000000000
:0000000000000
:0000
:0
18,59817.020
46,81641,89735,13728,71724,60722,29620,3571S,9161.9,47618,38219,80319,52216,S1115,20617,13126,07036,28953,56119,189125,006180,362259,775350,247455,360570,993746,608938,563,167,767,411,094,688,701,876,238,845,399,634,309,358,279,121,851944,398827,559791,161001,510791,48.3765,670761,952
15;16312,1559,1457,8047,8508,4488,80410,24312,46413,26212,52412,46714,46021,55729,34543,21463,17097,211139,683200,593272,286356.968
1.301.452.002.152.302.453.003.153.303.454.004.154.304.455.00
3;3355,3056,4456,7o17,95910,48617,88626,06740,38760,43794,473136,802196,130265,806348,712437,301550,258650,797735.687
5.155.305.456.006.156.306.45
8;94610,28012,14613,28214,18514,59115,05714,64913,76514,03113,37512,35012,69012,21412.447
446;247560,538662,943740,969S1S,682872,585881,325805,717680,513552,986445,457334,631243,287182,300155.357
s+.$$$.$$$T$$.T$S.T$$T$$.Ts$.T$$.T$$.T$$,wT$$.$$4W$
.T$$
.Ts$,Tfj~
$$S$$$$$$$$FS-_D$sss$ssssss5s$s$~D:ssssssss5swssswk$$s~D :$$$$sss$s$$s$ss$$$sss$s~D :Ssss$w$$$$$$$s$$$ss$$ss$$~D :$$s$$$$$$s$$ss5$s$$sssssss$$s D:$SSS$SSSSSSSSSSSSSS$SSS$SSSSFS D$ssssssssssssssssssss$sss)” DS$SSSSSSSSSS$SSSSSSSFS DSSSSSSSSSSSSSSSFS D.$$$SSSSSSSS~D$SSSSSS~D .$SS~D .$~D~:
DD
7.007.157.30
004;491857,994866.260
7.458.008.158.308.45
791;068666,748538,955432,082322,281230,597170,086142,910115,32290,60970,60962,61855,10148,54745,76245,09043,57345,35352,74857.783
9.009.159.309.45
10.0010.15
14;19314,59415.390
129;515105,20385.999
10.3010.4511.0011.1511.3011.4512.0012,1512.30
17;09721,17326,44440,80654,35450.580
19;71576,27474,99186,56699,444102,153102,315108,174112,331110,317104,547104,439111,630126,285141,720170,674205,889251,515283,357326,191372,269425,367473,509581.428
S01;095!360,048928.380
.TT~ .
.‘IFS D
.m~ D:1,051;7751,164,0451,188,2671,158,6291,126,3301,114,1681,087,0991,041,2481,018,5391,055,4531,140,3611,256,1791,416,8961,531,1471,558,7371,488,9121,414,4321,386,5751,365,28!31,411,6261.542,821
.STS D
.STSS DSTSCST$~ DDSTSS DSTSe DSTSe D$T$- D’STSS D
56:96255,42654,54853,84952,53355,73064,52480,95196,033
121,119151,646197,784235,883283,365331,9413S7,856434,688540.669
12.4513.0013,1513.3013.4514.0014.1514.3014.45
56;46852,01448,70947,10645,33445,6B749,55554,24353,73147,47442,82640,32837,51138,82140,75939,26136,23334,15732,87232,36030,18726,98223,45221,16718,22715,15714,44114,62113,75211,5899,9349.303
StL“ DW’Tsc DrSFSTS.$ D$FSST$S D:rSFSSSTSS DSFSSSSSTSS D,$FSSSSSSTSS D.$FSSSS$SSSTSC D.SFSSSSSSSSSSTSS D..FSSSS$SSSSSS$ST$ D.,SFSSS$SSSSSSSSSSTS’- DSFSSSSSSSSSSSSSSSSSSTS~$FSSS$SSSSSSSSSSSSSSSSSSST
.D~D
.9%sss$sssssssssssss$ssssss D
.FSSSSSSSSSS$SSSSSSSSSSSSSTSC D
.FSSSSSSSSSSSSSSSSSSS$SSS D
.FSSSS$SSSSSSSSSSSSSSSTSe D
.FSSSS$SSSSSSSSSSSSTS D.,FSSSS$SSSSSSSSTSS D.tF$SSS$SSSSSTS D..FSSSS$SSST~.FSSSS$ST~D ..F$SSST~D ..FSSS~D..F$ST~D ..FS~D ..$S~D.SS~D..SS~D ..$T~D ..$T~D ..$TS=-----D ..$T~D ..~D ..$~D.~D..~D ..S3--D ..$8--D ..$.4-D ..TS-D ...S=D .
KITAL TRIPS
15.0015.1515.3015.4516.0016.1516.3016.45
647;610676,482671,476625,641564,833477,927392,170310,609252,307203,008158,359122.906
686;871712,715705,633658,513597,19350s.114
1;6.93;0321,705,9971,675,4961,600,7341,511,5001.373.104
17.0017.1517.3017.4518.0018.1518.3018.4519.0019.1519.3019.4520.0020.1520.30
105;03486,78273,99768,22165,43561,41861,31660,45556,69249,25843,20742,18343,17943,93843,69139,39834.203
119;655100,53485,58678,15514,73869,33260,25668.036
667;380592,189525.435484;956449,786409,849382,533353,816327,321293,262258,143225,408206,2921416,650161,587130,970108,83971,340
——
20.45 7;91421.00 6,94021.15 7,58121.3021.4522.0022.1522.3022.4523.0023.1523.30
9;14611,09712,45413,23713,20811.282
65;83860,35555,66155,42056,38755,22o52,16445,3173S,96326,996
8;4735,9194,7602,84523.45 24;151
2,389,684 0.—— —— —
16,859,552 (18,221SEJ=U3S)
2,054,160 4,443,844
-166-

1,129016613514208359120
1,4701,9903,0844,8035,9436,4507,95910,48617,88626,06740,32060.08593,402
134,928193,606262,751343,558429,132537,474634,543716,104780,246829,321835,838761,025639,231514,210410,487303,964215,022158,167132,303107,20585,65467,17958,63451,09944,82041,76541,50840,45142,54750,55456,01254,84450,13846,65745,12243,36843,86946,86750,3E549,62743,00238,14736,56834,45135,95238,07836,52533,07930,84130,19930,32828,77125,97322,60120,26917,52814,78414,14014,32013,49111,3689,3888,5427,2646,4677,2858,79410,75012,16713,00612,98711,0168,2075,5234,3662,564
17,11915,93314,22711,3180,6147,1226,6976,4346,4316,6877,0486,8175,@234;5083,9743,6713,2782,8272,7332,6652,7354,3176.3347;9786,60910.01611;92712,97413,74413,78013,96313,77613,25513,53612.80411;80011,94911.39411;62013,55714,14914,94516,69520,78425,93038;83451,15854,971S2,55549,43947,51446,81046,97551,64461,06077,59592,3o1
116,341145.390191;080230,176276,674323,606377,795422,776523,4o1625,0266S2,283648,578604,390544,112460,476376,727297,253241,372193,941151,0s3)16,917100,64584,55872,50566,90964.10359;87659,31758.19954;09346,91041,31239,81840,65841,09240,23836,68632,40123,301
000000
:0000000000000000000000000000000000000000
:0000000000000000000000000000000000000000000000
0———-— -.
18,24816,74914,84011,8328,0227,4017,4177,9040,4219,771n,osl12,76012,27312,46714,46021,5S729,34543,14762,01896.147
45,50040,47333,37626,69222,11019,93610,49117,5s117,53117,34018,60410,71116,39215,03816,92725,02936,04852,02077,524121.542
137;663197,923269,0853S1,536437,741547,490646,470729,078793.990a43;Iol049,00]774,001652,486527,746423.291
174;430250,510337,342436,952545,077706,263882,348
1,005,5601,292,4001,505,8541,647,9611,607,5941,425,7201,200,3971.004,224
15;764 “047;41626,971 738,57369,561 700,50743,923 707,83220,762 703,59999,803 607,63982,124 682.27275;329 711;83171,083 7S6,40770,750 008,701
+————— -+ —+— — +-—-..W ,.=.D.D.D.D.D.D.D.D.D.D.D.D.D.D.SD.$D :.$$D.$$$SD :.SSSS5*D ..$S6SSS3S*D :.SSSSSSSSSSS*D.asssssssssssssk
TRIPS WITHIN 60 MIN. FKN4B?,CINT1642FCf((01)36STK4EOMED KX4X P-N mIPSBSZIN m tS2N- =T
- M2LT IS P=N TNIPSDA3LY Pm/SET- S.25 10.49 15.74 20.99
HH.S4426.24 31.40
NOMS TOTAL mTAL o 222700 44s400 660100 090000 1113500 1336200-—— -——— .— .— —— _0.000.150.300.451.001.151.301.452.002.152.3o2.4S3.003.153.303.454.004.154.304.455.005.15S.305.456.006.156.3o6.4S7.007.157.307.458.008.158.308.459.009.159.309.45
10.0010.1510.3010.4511.0011.1511.3011.4512.0012.1512.3012.4513.0013.1513.3013.4514.0014.1514.3014.4515.0015.1515.3015.4516.0016.1516.3016.4517.0017.1517.3017.4518.0018.1518.3010.4519.0019.1519.3019.4520.0020.1520.3020.4521.0021.1521.3021.4522.0022.1522.3022.4523.0023.1523.3023.45
—————2,203,413
36.731558900
::.’3.1.1.1.’3.7.1.1.1.1.1.’I.1.1.7.1.1.1.7
80;599 901;731 .STSe D92,666 980,979 .STSC D:95,422 993,698 .STSS D.95.102 967.622 .STSe D.99,993 942,416103.526 934.293
.$T$e D
.STFs+ D’ :101;654 918;951 .$TSSS D.97,113 091,199 .ST$S D98,301 084,118 .$TS+ D
106,182 910,301 .smss D120,963 978,822 .SFT$S !3:136,170 1,064,522 .SFSTS* D.163,208 1,190,172 .$FS$TSS D:195,775 1,202,993 .$F$S$$T$S D.240.707 1.321.202 .SFSSSSSSTSS D.27;;178314,021360;174412,2S24S8,728561,479661,5S16.S5,362679,419634,509574,440409,247402,700319,060261,641211,469165,037131,057114,96590,04903,87376,29772,64567,14065,78465,40462,88757,66053,479s2,a24S3,64552,10040.445
—,——.—1,205,8401,251,9731,251,0261,267,4321,299,3471,420,7571,549,4031,577,3471,5S0,6461,490,7061,405,4911,275,0631,135,3341,012,894941,s97061,1157S4,392656,207602,372538,344403,581454,135425,015306,632359,529332,121306.0S0273;550240,7S9211.210195;530177,902154,224
.SFSSWiSTSS D.
.$FS$$SS$$$$T$S D.
.SFSSSSSSSSSSSS D.
.SF
.SF
.SF,$F.F$.F$.F4.F$.FS.F$.FS.2%.F4.l%.F4. F$. F$.F4. $s. W. S$.S$.$$.$7.S1.m.m
::.s~
‘$S$$SS$S$$SS$ST$S D.‘$$$$S$$$$$S$$S$ $7’SS D.‘SS$$SS$S$SSS$$S$SSSS$T= D:‘$$$S$$$$S$$$$$ S$$$S$S$$S$T$* Dss$$s$$$$$$$ss$s$$ss$$s$$$T$e D,$$$$$$$$$$$$$$S$SS$S$$$$$$T$C D
‘$$$$$SS$$$$S$S$$$$$$S$S$F D.S$S$$$S$SS$$$S$$$$S$ST$S D:$sss$$sws3$s4438sTs D.‘$s$$$ss$ss$ss$= D;$S$$S$$S$STS D.ISS$S$$$$-D .;s$$$sss,$s$s~ :;$$~D.,$$~D\S~Di~Di~;~D.l~D .L~D .;~D .!~D ..~D
D—D.—D.~VD .
42;209 125;460 .$3--D .36,767 104,604 .TS--D .25,005 60,065 .3-D .
SSSSS$$$$$$$SSSSF3--DS$SS$$$$$SS$$S$$SS$$SF3-=-D :s$ss$sss$s$$ss$$ss$$ss$$$F~SS$SS$SSS$SSSS$$S.9$+$S$SSSSSSF~D :$$$$$$$$$$$ss$$$$$$$$$$$$$ss$$$$~D :‘ss$s$$s$s$$s$s$$s$$s$ss$$s$$$$$$s$9’6 D:$ss$s$$ss$$s$$ss$$ss$$s$$s$$$$$ss$ss D$$SS$$SSSS$$$$$$S$$S$S$$$$$$$$$FS DS$sss$ss$$s$s$$$$$$$$$$$sss D.Ss$s$s$s$sss$ss$$sssl% D.sss.s$s$sssssss$F~D .S$SS$S$SSSS~D .$S$S$SS~D .S$SSFS DSsss DS$~DSC D~Ds Ds D:s D.
14,801,664 19TAL mIPS (17,494K3mRDS)-- ——
1,960,527 4,243,940
-167-

TABLE 2.3.lSATRIPS- 2N-M2TION ANALYSIS TOR 1990 ~~AY TRANSIT TRWS
TNIPS WITHIN 60 S41N.FFC41S2CINTINS SW (01)SIT ~S2GIN ~
mm ~IT P~ - ~LY IS mTAL 27fANSITNJN-
NN.s416Ks4z6&W3.ET%LDA3LY Pm/SET- 5.93 11.86 17.79 23.12 29.65mu o 26OOO S2000
35.5878000
41.51 47.44104000 130000 156000 lezooo 208000-——-————— ——— .—__ — +————-t—— —+—+——
0.00+-——_+_-
0.150.300.451.001.15
0000
:000
104209209209408970
2,4773,9205,6520,27411,97917,16926,34137,43049,61462,41378,43793,52909,87922,06223,816
1,1721,0467273682234005595594383171592B6573573573287000
:0000
1533075327587588379170237285754212110000
180581960
1,1171,9002,8673,6134,3404,7055,1225,6445,8296,5847,6529,12410,29412,50015,72519,35921,76528,48437,17047,04356,94277.629
000000000000000000000000000000000000
1.172 1.933 .D1;046 1;807 .D727 1,221 .368 595 .223 337 .400 400 .559 559 .559 699 .
1.301.452.002.152.3o2.453.003.153.303.454.004.154.304.4s5.005.155.305.456.006.156.3o6.457.007.157.30 20;9287.45 11,3988.00 91,2568.15 70,0978.3o 56,1808.45 41,7999.00 28.878
438 719 .421 702 ,368 649 .495 636 .182 782 .981 981 .
1,543 1,543 .D2,764 2,870 .D3,920 4,133 .$D5,652 5,932 .$D8,274 S,726 .$$D11.979 12.602 .SSSSD17;169 18;163 .S.$$$$$D26,341 28,701 ..S$$$$$5$$;D37.430 41.129 .SSSSSSSSSSSSSS-D :49;614 56;014 .S$i62,413 72,241 .$$$78,590 99,563 .$$$93,836 131,641 .$S$10,411 164,083 .$$$22,820 190.741 .sss
,$SSSSS$S5S5SSSS-D$Ssssssssssssssssssss--n :,Ssss$ss$st$sss$$sss$Sss$ss$ss$‘Ssssssssst‘s$sssss$$$‘$s$ssssss$‘$$$ss$$ss$‘sss$ssssss‘sssssssss$Sssssssss$Ssssssssss
;ssssss$ss————+7 .isssssssss$s$$$~D,SSS$S$SS$SS$$$$$$$$$-D :‘$sssss$sssss$$$$$$$$$$sss~D :‘sssss$ssssssss$$$$$ssssssss D‘$$$sssssssssssssssss$ssss9 D‘sss$sss$s$$$$$$$$$$sss D.‘Sssss$$sss$$$e D,S$S$S~D .,~D .—D
24;634 210;688 .i&21,765 218,181 .SS$12,315 200,752 .SS$92,079 169,817 .SS$70,825 138,589 .SSS56,755 111,945 .$$$42.220 87.323 .SS$
,,.
000000000000000000
29;08921,21317,31912,8869.158
68;97560,93659,65654,45346,48443,66747,17851,37252,19856,66263,63061,69559,04762,09064,96766,59666,49269.771
..SSSSSSSSS5~D.SSSSSS5~D.S5SSSS~D.$S$S~D.ssss- —D .S$S---D---D .SF~D ..ss———— —D.Ss D~D.‘K=~D.TF~D.FT~D.STS-- D.Frs- D.9TS~D.lT$~D.s~D
9.159.309.45
)0.0010.1510.3010.4511.0011.1511.3011.4512.0012.1512.3012.4513.0013.1513,3013.4514.0014.1514.3014.4515.0015.1515.3015.4516.0016.1516.3016.4511.0017.1517.3017.4518.0018.1518.3018.4519.0019.1519.3019.4520.0020.1520.3020.4521.002).1521.3021.4522.0022.1522.3022.4523.0023.1523.3023,45
--237,277
-.201,137 438,414
21;21317,31912,8869,1586,7846,1155,5004,51e4,1264,7134,2053,8183,9263,7243,8633,8583,9244,1893,9963,7204,2995,2555,2014,4673,82o2,9221,9481,5181.323
6;9646,6966,4605,6356,0267,5807,818.9,1588,7118,8469,5079,68710.508
0 11;841 74;932 .SFTS-D:O 13,120 80,805 .SFST~DO 14,014 87.6770 16;7990 20,9800 24,5600 26,2320 32,3040 40,0920 48,9910 58,4600 78,9520 98,1960 104,9210 108,2540 104,6070 97,9160 84,2540 67,26o0 52,0600 40,9270 30,6810 22,9060 18,0320 14,6550 11,4480 8,9290 7,7720 6,6000 5,2280 5,5570 6,4740 6,7070 5,9450 4,7890 4,1490 3,8860 4,1470 4,0630 3,6180 3,1610 1,887
-.
103;188122,448129,725123,839121,655125,709127,871129,205147,989167,620171,663169,449160,200151,585134,336112,78791,13573,98759,54148,16440,33934,10426,65320,51018,38716,29213,46413,15614,51715,40814.734
------- =D.$F$$STSS D:.SF$S$.SFSS$.F$$$:.FS$${.F$$$l.FSSS:.F$$$$.F$$$$.F$$$l.s%%s:F$$$$.F$$$$.Sss$d.SSss$
‘s” DT$S D.,sssL- D.‘Ss+w$rs D.SSSSSSSSSSTC D.$sssss$$$$s$s$ss D$ss$sss5sss5$ss$ss$ssss~D :$SSS$SSSSSSSS$SSSSSS$$SSSSSS$~DSSSSSSS$SSSSSSSSSSSSSSSSSSSSSS$S~DSSSSSSSSSSSSS$SSSSSSSS$SSS$$SS$SST~DSSSSSSSSSSSSSSSSSSSSSSSSSSSSSSSS~D
1;400 96;7961,890 103,0312,157 106,0971,857 102,7501.703 96.213 SSSSSSSSSSSSSSSSSSSSSSSSSSSSS~D .
ssssssssssssss$sssssss$s~DSSSSSSSSSSSSSSSSSS~D .
971449662644
1,1331,4321,3591,5001,3841,2671,2671,127773666
1,4542,1362,1362,0101,8841,7311,410682000
.-— ——
83;28366,81151.398 .SSS$S$SSS$SSS$SSSSS~D .
.ssssssssssssss~ .
.SSSSSSSSSSTS-----D40;28329,54821,47416,67313,15510.064
.FSSSSSSTS-----D.
.FSSSSTS-----D .
.FSSSTS----D .
.FSSS---D
.SS~D .
.ss_D .
.$TS-D .SS-D ..SS-D ..-D ..FM--D ..TS-=D ..lt5--D ..*D ..*D ..TS-D .
7;6626,5055,4734,4554,8915,0204,5713,8092,7792,2652,1552,6773,3813,61.93.161
13;89112,72611,0009,8299,3728,6787,366
TS-D ..3-D ..3-D ..s01;887
-———.4;127
-———0 1,023,016
———— -————mTAL TRIPS (1,627~)
-168-

TAB2.3 2.3.16ATRIPS- IN-NOTI~ MALYSIS - 1990 ~Y VKf6XCL8 DRIVZR TRIPS
TFUPS S91TNIN 60 NIN. FKS4SSCIN T3MS ~ (01)ST K4S3M=D ~~IC3Z DR2VSR IRIPS — MILY IS WICLJ3 DRIVER TRIPSBSGIN F74cs4 3WN- MILY PCT/SEP 4.46 8.92HN.M4
13.3.9 11.84N&
22.29T%L
26.15 31.21TUTAL o 154400 306800 463200 617600 772000 926400 1080800
--- -—— — — —. — *— —4—-—-+—4—— +—+ —+—0.000.150.300.451.001.151.301.452.002.152.302.453.003.153.303.454.004.154.304.455.005.155.305.456.006.156.306.457.007.157.307.458.008.158.308.459.009.159.309.4510.0010.1510.3010.4511.0011.1511.3011.4512.0012.1512.3012.4513.0013.1513.3013.4514.0014.1514.3014.4515.0015.151.5.3015.4516.0016.1516,3016.4517.0017.151?.3017.4518.0018.1518.3018.4519.0019.1519.3019.4520.0020.1520.3020.4521.0021.1521.3021.4522.0022.1522.3022.4523.0023.1523,3023.45
1,129816613514208359720
1,4701,9902,9s04,5945,7346,2417,4699,35214,29119,77131,14946,24971,646
103,522147,1992199,100259,788326,507412,726489,013S48,155596,238642,070655,805600,04150B,160412,611329,347244,137172,386124,523103,35884,32468,70355,63049,44743,20038,69136,50335,47834,79336,90343,94048,69447,19042,92939,43937,53835,18336,19138,71941,09240,74135,86931,63830,60029,22130,07031,52630,74728,44526,76626,17425,51524,15722,18319,55219,03615,06412,06711,37511,31610,7489,1131,4236,8555,8344,8514,6675,5767,7219,32210,50110,8769,2777,2575,2554,0982,450
13,62613,30312,69310,4998,1426.559
00000000000
:00000000000000000000000000000000000000000000000000000000000000000000000000000000000
14,75514,11913,30611,0138,3506,9186,7767,3451,5738,0299,3959,9119,64510,47012,48717,67523,04933,89348,B1674,048
105,044151,632204,613266,58.9333,941421,440499,268560,055
34,65230,9oa26,o6o21,16817,06714,59313,94113,88913,98413,76314,97315,31313,53512,70914,51821,51929,24041,99060,24693,746
134,927193,415257.726
.=
.= :
.s2
.D
.D,D.D.D.D.D.D.D.D.D.D.D.SD,$SD ;.SSSE.$ss$s0 :.WS.W*D..S$$$SSS$S_D :.S$S9.SSSS$SSSeD .
6;0565,s.755,5835,0494,8014,1773.4043;0013,1353,3843,2782,1442,5672,4022,3223,7405,5136,8007,440
329;559407,368516,063624,439735,200845,80295E,664
1,030,7191,010,896915,326808,541720,936637,356570,160548,098557,053557,201545,93954),511562,005591,704629,490701,124764.375
.ii$S$$.TSS.T$$,T$$.T$$.T$:.TX.TS$.TS$.TS:TSS
5s$Sst$s:‘$$:wSs$‘ss:,$$$
Ss$Ss:‘$s4S62
$s$$s:Sss$$:
$$4$$$$$4‘$$$S$$$s4‘$$!.w
XDSSS$S---D‘$$$$$$$$$-S$s$$s$$$$$s$~D :$$$$SS$$$$$SS$$$~D$$$$$sss$$$sss$$$$s -DS$$$$$$$$$$SS$$$$S$~DS$$S$$$$$$$$S$$ $F~DS$$$$SS$$$~D.$$$S~D
D.
is$$‘$$s$$$s!SW‘ss$$$$$$$$$:‘s$$$S$$$$$$4‘ssss
8;71410,25511,30012,06812,02012,254
608,306654,090668,059612,122519,612424,408340,515254,495183,324135,336114,30996,70581,39568,70663,51261,06561,98072,o6582,23384,50183,46586,57888,72585,807
12;08111,45211,79711,16810,35010,93810,e1310,95112,38112,69213,07614,06511,86523,28935,56246,75549,70846.562
.TSSS$SSS$SS$S$S~D
.TSSS$$SS$S~D .
.TSSSS.$SF~D .,TSSSSSS D..TSSSFS D..TS$FS D.TSSS D.,TSk- D..TSF D.s D
SFT$S DSF-l% D776;914
756,594738,272731,196710,079674,59?654,182664,064685,250717,764763,967799,652829,776831,192841,006
42;63840,03138.617
s$TS$9 D.SSTSS D.
3e;70342,16048,414
81,63281,59985,95296,163
108,441129,948155,279193,239222,402254.505
WISsl,$F-1.SF4.$F4,$SF.$SF.$$1.$F$. $F$
s D.s D
D:‘k D.TSS DSTSS D:$STSSSA D$$$$$T$$S D:Ss$swww D.S$S$$$$S$T$S D.
60;38072,25091,229114,187152,498186,533222.867256;733298,012330,857402,576479.083
287;333327,233360,927434,102509,830528,062520,233481,708428.684
865;543e99,327934,37a
1,022,2931,117,4931,141,0391,129,3041,075,684l,oo3.ole
.SF!
.6FI
.m
.$F:
.ew,$F:.$F$.SF:.$F$.$F$.F$:.F$:.9’64.F$:.Ps:.Fs:.F$:
$$$$44$$$$$:5s{$$$$.x$s4$s:$$!$$4$$:$$4$$459
$$$$$’T$s D$$$$$$$T$S D:$$$$$S$$$TS* D$$$$S$$$SS$$S$T$> D:I$$$$SS$$S$S$$$S$S$$T$~ D$$$SS$SSS$$SS$$S$S$$TSS D$$$$$$SS$$S$$$$SS$$$T$s DISS$$$SS$SSS$S$$$$STS D,SS$SS$$$S$$$S$T$C D.
$SS$$$$$$ST$* D.,$S$$$$T$S D$$$3= D.T~ .
~:D.
—D .
499;617493,467455,534403,169339,060zeo,zll224,1e6le4,660149#e16
902i37eeel,e6e713,e54659,13459e,9oe522,532454,427414,36936e,640332,367312,481295,094215,960261,5e9239,426220,262197.031
lle;19592,22979,68661,2775e,66654.565
7e;02567,77961,988s9.2ea52:433
4e,7304e.029
—.—.54,56452,eeo
46;10142,55337,25432,61832,64934.270
50;76e4e,12944,97541,94043,15045,14643,71240,ee535,66730,3ee
.$$~ .
.$$~D .
.lT~D .
.FT~D
.FTS-----D
.FT~D .
.FT~D .
.$TS=-D .
.$3--D .SS-D ..3-D .
172;472153,719143,908130,7e4113,56892,87678,36252,333
.—— —
34;43533,62830,41226,290)e,54e 20;998
--__——l,86e,355
—.0
-——— —.lo,e59,596 ‘IUmL TRIPS (14,554 P&mSDS)
1,594,344 3,462,699
-169-

TABLE 2.3.17ATR2PS-194-~1~ =YSXS - 1990 ~AY VZEICU PASSR4CXR TRIPS
TRIPS WITHIW 60 94XW.FMW NSGIW T19ESSGIN P76C51 ‘m KNS- SST DAILYNN.$SSNC46S N06E6KMETUTAL ?uTAL—. —.— —— —— -——— —0.00 6310.15 4710.30 4230.45 4231.00 4081.15 5541.30 6001.45 4032.00 3202.15 3202.30 1602.45 03.003.15 18:3.30 3713.45 1,3254.00 2,67S4.15 4.815
FCR (01)SST ALLPcT/sET- 1.410 39400
PuPPc5rs2.8178800
VU41CIE4.22
118200
P~5.63
157600
Tw2Ps— DAILY IS ALL7.03 0.44
197000 236400
PDWPO%9.65
275800
vzN.Psms.11.25
315200
7,4106,3774,7783,7443,5803,6622,7431,9912,1092,3342,1872,7622,0751,163495115083166464943
1,2351,4791,8361,4981,4612,1232,0352,2394,0805,6126,8377,6316,6306,1147,3248,3019,67410,85812,64514,43415,84519,42824,13529,27137,44843,09546,55845,54239,02834,01335,83441,92949.651
954910
s,9957,7586,0954,9294,7144.943
8,9951,7586,0954,9294,7144,9433,9912,9632,8282,8833,0622,7622.075
..SD .
.$D .894762726727
.TD
.D
.D
.D648569399
3;9912,9632,0282,8833,0622,7622,0751,348866
1,4402,6754.898
.D
.D
.D22911500000
.D
.D
.D
.D1;348866
1,4402,6754,8988,55215,19421.340
:D.D
ao
4.304.455.005.155.305.456.006.15
8;23314,18919,55425,80934,63045,39156,89175,51099,925145,037197,978256.172
153541843
8;55215,19421,34028,40238,09649,36860,592B0,251107,406155,767214,182280,785330,684326,691280,951211.345
.SD
.$$$D :
.$SSSD .1,35.91,9872,1412,2033,2805.358
28;40238,09649,36860,59280,251107,406155,767214,182280,7S5330.684
.$$
.Ws
.Ws
$$SD,sssssFisS$SSSSSSFD :Ssssssssssm,ssssss$ssss$sss6SSSSSSSS$SSSSS$SSSS$SF$D :,SS$SSSSSSSSS$SSSS$SSS$SSSSS$SSSSSF$$6NSS$SSS$SSS$SSSSSSS$$SSS$SSSSSSSSSSSS$SSSSSSS$iS$SD :,SNSSSSSSSSSSSSSSSSSSSSSSSSSSSSSSSSSSSSSSSSSSSSSS$SSSS$SSSSSSSFSSSSiDSSSNSSSSSSSSSSSSSSSSSSSSSSSSSSS$$SSSSSSSSSSSSSSSSSSSSSSSSS$$$S$SSSSSSSSSFSSSiSSSSNSSSS$SSSSSSS$S$SSSS$SSSSSSS$SS$SSSSSSSS$$$$$$SSSSSS$$SSSSSS$SSSSSSFSSSSSSS,SSSNSSSS$SSSSSSSSS$SSSSSSSSSSSSSSSSSSS$S$SSSSSSSS$SSSSSSSSF$5SSSSSSD,SSNSSSSSSSS$SSSSSS$SSSSSS$SSSS$SSSSSSSSSSF$SSSSSSSD .,SNSSSSSSSSSSSSSSSSSSSSSSSSFSSSSSSD.
.W$
.N$
.Ws6.3o6.457.007.15
6;69513,96520,53325,65428,29228,34125.58S
.I1
.Ts
.T$
.TS7.307.458.008.158.308.459.00
299;418291,562244,979179,127118,05079,48562.321
326;691280,951211,345
21;64321,35121,65623,20426,43029,B3834,92539,02141,26745,71353,41863,23169,14172.011
45;801 145;80708,160 108,16092,278 92,27887,232 87,23287,458 87,45889,659 89,65993,375 93,37595,057 95,05700.621 100.621
,$NS$$$$$SSSSSSSSFS$SSSSD .$N$SSSS$$SSSFSSSSSSD .WSN$SSSSSSFSS$SSSSD
5sTsssNsssssF5$ssssssD :SSTS$S$NSSSFS$$$$SSSSSD .SSSTSSSSNSFSSSSSSSSSSSSD .
9,15 54;3549.30 50,1709.45 47,176
10.00 44,01610.15 40,19110.30 39,92610.45 41,29111.00 41,84811.15 39,640)1.30 35,96711.45 31,04012.00 27,61412.15 27.550
..SSSTSSSSSNS$5SSSSSSSSSSDSSSST$$SSN$SSS$SSSSSSSSSSDSSSSSTSSSFSWSSSSSSSSSSSSSSSD:SSSSSSTSSSFSSNSSSSSSSSSSSS$SSSSD :SSSSSSSSSTSSSSSNSSSSSSSSSSSSSSSSSSSDSSSSSSSSFSTSSSSSSNSSSSSSSSSSSSSSSS$SSD:SSSSSSSFSSSTSSSSSWSSSSSSSSSSSSSSSSSSSDSSSSSSFSSSSTSSSSSSNSSSSSSSSSSSSSSSSSD.
11;139 111;13924,537 124,53740,319 140,31948,203 148,20349.609 149,609
72;93069,72069.250
146;OB6136,298133,346137,953143,643147,545157,631180,659215,808268.633
146;086136,298133,346137,953143,643147,545157.631
5i.S5iSF5sTSSSssssNSsssssssSsSSsSsSD..SSSSSSSFTSSSSSSSSNSSSSSSSSSSSSSSSD . ., ...3SSSSSSFTSSSSSSSSNSSSSSS$$SSSSSSS$D .
12.30 30;08312.45 31,68913.00 32,54613.15 30.751
70;43069,16867,14366,57067,20273,06385,62209,44986,14079,206
.i555ssSFssTs5ssssNsssssSsSsssssSSssD.
.SSSSSSSFSSSSTSSSNSSSSSSSSSSSSSSSSSSSD.
.SSSSSSSFSSSSS$T$NSSSSSSSSSSSSSSSS$SSSSSD
.SSSSSSSFSSSSSSSSN$STSSSSSSSSSSSSSSSSSSSS$S$SSD :
.SSSSSS$SFSSSSS$SSSN$SSSSSSTSSSS$SSSSSS$SSSSSSSSSSS$SSSD :
.$SSSS$SSFSSSSS$SSSSSSWS$SSSSSSSSSS$STSSSSSSSSSSSSSSSSSSSSSSS$SSSSSSD:
.SSSSSSSSSFSSSSSSSSSSSSWSSSSSSS$SSSSSSSS$SSSSTSS$$SSSSSSSSSSSSSSSSSSSSSSSSSSSD
.SSSSSSSSSFSSSSSSSSSSSWSSSSSS$S$$SSSSSSSSSSSSSTSS$$SSSSSSSSSSSSSSSSSSSSSSSSSSSD
.$SSSSSSSFS$S$SSSSSSWSSSSSSSSSSSSSSSSSSSSSTSSSSSS$SSSSSS$SSSSSSSSS$$SSSD
.SSSSSSSSFSSSSSSSNSSSSSSS$SSSSS$$$SST$SSSS$S$SSSSSSS$SS$SS$S$$D .
.SSSSSSSSSFSSSNSSSSSSSSSSS$SSSSSST$$SSSSSSSS$SSSSSSSS$$SSD.
.$$SSSSS$SSFSSNSSS$S$$SSSSSSS$$T$$SSSS$$SSSSS$SSSSSSSSSD .
.SSSSSSSSSSSFSSWS$SSSSSSSS$SSSTS$S$$SSSSSS$$SSSSSSSS$$SSD
.SSS$$$SSSSSSFS$NSSSSSS$$$$SSSS$$TSSSS$$$$SSSSS$$SSSSSSSSSSSiSD :
.SSS$SSSSSSSSFSSSWSS$SS$$SSSSS$S$SSSST$$SSSS$S$$SSSSSSSSSSSSSSSSSSD
.SSSSSSSSSSSSFS$NSSSSSSSSSSSSS$$$$$SSSTS$$$S$S$$$$SSSSSSSSSSSSSSSSSD.
.S$SSSSSSSSSSSWSSSSSSSS$S$SSSSSSSSSSSTSSSSSSS$$S$SSS$SSSSSSSSSSSSSD.
.SSS$SSSSSSSNSSSFSSSSSSSSSSSSSSSSS$STSSSS$SSSSSSSSSSSSSS$SSSSSSSD.
.SSSSSS$SSSSNSSSSFSSSSSSSS$SSSS$SSSTSSSSSSSSSSSSSSSSSSSSSSSSSSSD .
.SSSSSSSSSSSWSSSSFSSSSSSS$SSSSSSTSSSSSSSSSSSSSSSSSSSSSSSSSSSD
.SS$SSSSSSSWSSS$SFSSSSSSSSSSTS$SSSSSSSSSSSS$S$SSSSSS$SSSD .
.$SSSSSSSSSNSSSSSSSFSSST$$SSSSSSSSS$SSS$SSSSSSS$SSSSSD .
.$$SSSSSSSSwSSSSS$$SST$$SSSSSSSSS$$SSSS5SSSS$$$$SSSSSD .
.SS$S$SS$SW$SSSS$SS$~SSSS$SS$SSSSS$SSS$$$SS$S$SSSSD
.SSSSSSSSNSS$SSSSSmSSSSSSS$SSSSSSS$$SSSS$S$$SD.
.S$SS$SSSNS$$SFSSSTSSSSSSSS$SSSSSSSSSSS$$D .
.SSSSSSSSWSSFSSSSSTSSSSSSSS$SSSSSS$SSSSD.
.$SSSSSSNSSSSSSSSSSSTSSSS$SSSSSSSS$SD.
.SS$SSFNSSSSSSSSSSS$TSSSSSSSSSSSSD .
.SSSS~SSSSSSS$SSSSSTSSS$SSSSSSD
.SSSFNSSSSSSSSSSSSSSTSSSSSSSSD.
.SSFtSSSSSSSSSSSSSSTSSSSSSD .
.SFNSSSSSSSSSSSSTSSSSD
.SPNSSSSS$SSSSSTSSSSD
.SWSSSSS$SSSSSTSSSD.
.IT4SSSSSSSSSTSSSD
.mSSSSS.SSSTSSD .
13.3013.4514.00
30;23533,21534,84735,93637,69437,91335,92536,51839,57342,22645,80850,71049,84149,61356,21763,82067,70667,43167,21773.800
60;82680,242107,898147,075176,353182,370164.152
180;659215,808268,633303,496306,423279,283244,848225,204216,797221,S60243,909260,985262,422258,430253,838249,862238,242219,891207,047207,662202,061182,212160,261152,636142,166130.337
14.1514.3014.4515.0015.1515.30
303;496306,423279,283244,048225,204216,797221,860243,909
142;160130,405120,360118,283130,835144,604148,928145,758141,499135,955125,303109,88591,50382,79880,31974,86968,95771,53977,26478,37679,16479,33771,61164,00060,25955,28148,84642,85735.375
66;17055,22654,21157,76962,36466,54063,88156.455
15.4516.0016.1516.3016.45
260;905262,422258,430253,838249,862238,242219,891207,047207.662
17.0017.)517.3017.4518.0018.15
48;51946,20145,50842,78941,74442,43340,74637,08834.724
18.3018.4519.00
82;43180,99670,25556,58046,00133,42224,32219,13814.391
202;061182,212160,261152,636142,166130,337
19.1519.3019.4520.0020.1520.3020.4521.0021.1521.3021.4522.0022.1522.3022.4523.0023.1523.30
35;09631,48027,63924,73619,67214,83612,25210,5658,7128,4098,6317,6287,0416,3434.468
123;038113,40096,88584,36777,76169,97161,57654,39644,76540,63037,36931,28423,91418,01612.405
123;038113,40096,88584.367
10;4388,1156,9375,9784,3212,9081,7621,7052,2822,1741,6011.187
77;76169,97161,57654,39644,76540.630
....7.........
.SNSSSSSSTSDSNSSSSSTSD.F?JSSSSTSD..WSSSSTSDNSSSTD ..SSSTD .SSD .
7VTAL TRIPS
il;88428,74424,64219,87116,346
(10,962 NEOJmS)
37;36931,28423,91418,87612,4D5
2;4421,34396323.45 718 10;664
-———— -———— .—— ——
1,072,623 680,411 2,S00,565-———— -————1,047,531 2,600,565
-170-

TABL2 2.3.141ATRI?S-234-~1~ ~YEIS - 1990 ~AY WALK TRXPS
IRIPS WITHIN 60 6SIN.FKM SEGIN TIs42IT% (01)SST ALL PUSP(2S=WALS MDS -- MILY IS ALL PuRPC6ES94ALSMmBEGIN ~CS4 S5JN- DAILY Pm/iET= 1.49NN.9s4N09E N& NC+ET%L
2.99 4.4s 5.97 1.47 8.96 10.45 11.95TOTAL o 25000 50000 75000 100000 125000 150000 175000 200000—— -—————— -———-——- -———+-----+ -----+ -----+ ---+ -------+ --------+ ------+ -----+---
0.000.150.300.451.001.15
000000
140281281532643502251
3054976905383853854955545025023921410000000
430860
1,1431,4761,8042,2803,1203,9554,9505,6807,36511,35615,67911,04916,35214,75613,69114,46815,70317,28218,70317,83717,95518,98421,34924,163
343252168
648749858
648749858
1,198 .1,662 .D1,785 .D1,543 .D1,042783
1,034 .1,035 .643 .251 .0.
120 .241241741
6601,2771,400908207
1,1981,6621,7851,5431,042783
1.301.452.00 0
02.152.302.453.003.153.303.454.004.154.304.45!3.00
1,0341,0356432510
120
000
0000
5001,2242,0013,4665,8357,83810,86615.559
0120241241241121168337
241241741
1,3452,5994,6637,3159,80913,63919.791
1,345 .D2,599 .D4,663 .FD7,315 .SFD .9,809 .TSFD13,639 .TS$FD19.781 .NSSSSFSD:
s.15S.30S.456.OO6.156.306.457.007.157.30
337495969
1.94224;56834,08651,59883,096127,298157.857
3;642S,5387,1009,73013,61617.197
31;33043,57963,64898,506
148,2791.96,410195,700172,805130,17597,55980,82:74,46076,43679,05576,42968,99769,9397.9,51092,480108,103136,282166,595176,800174,318170,630165,553154,160136,751121,374121,472
31;33043,57963,64898,506
148,279186,410195,7’90172,805130,)7597,55980,82174,460
.NSSSSSSSSFSSD$N$5$$5$55$5$F$5D.$mSSSS$SSS$$$S$SSSiFSS$D :SIX.NSSSSSSSSSSSSSSSSSSSSS$SS$SSP5$$S$D.
SSS$$SS$SS$S$S$$$S$S$$$;FS$$S$$$D:SSSSSS$$S$$SSS$S$SSSS$SSSSSSSSSS$S$$F$$SSSS;SS$$D:SS$SSSSSSSSSS$$$$S$S$SSS$$$SSSSSS$$$$FSSSSSSSS$SSSSD.SSSSSSSSSSS5SSSSSS5SSWSSSFSSS$S$SSSS5SSSSD.SSS5SSSSFSSSSSSSSSS5SSSSSD .
. .. . . ..SSTSNSSSSSSSWSSSSSSSS$S$SSSS’TSNS$SSSSSSSSS5SSSSS$
7.45 159;9258.00 131,6018.15 87.1068.308.459.009.159.30
20;17623,95526,71726,29123,23820,73523,17025,19025,24923,88326,051
.S.SSSSTSNSSSSSSSSSSS4SSSS$
.SSSSSSTSSNSSSSSSSSSSSSSSSSSSSSS’NSSNSSS$SSSSSSWSSS.SSSSTSSSSNSSSSSSSSSSSFS$SSSS’CSSSNSSSSSSSSFSS SSSS$.SSSSSTSNSSSSSSSFSSSSSSSSS
56;51243,89239,25737,56336,58332,47727,27725,13327,24026,72025,41822,64519,35516,94915,39216,33417,36416,32715,68515,11215.982
SSSSSSSSS$SSD.$S$SSD .SSSD
SSSSSTSSNSSSSSFSS$SSSSSS$SSSSSD.SSSSSSTSSNSSSSFSSSSSSSSSSSSSSSSD :SSSSSSTSSNSSFSSSSSSSSSSSSSSSSSD
76;43679,05576,42968,99769,93978,51092,480
108,103136.282
9.4510.0010.1510.3010.4511.0011.1511.3011.4512.0012.1512.3012.4513.0013.1513.3013.4514.0014.1514.3014.451s.0015.1515.3015.4516.0016.1516.3016.4517.0017.1517.3017.4518.0018.1518.3018.4519.0019.1519.3019.4520.0020.1520.3020.4521.0021.1521.3021.4522.0022.1522.3022.4523.0023.1523.3023.45
-—
S$.Ss.S4.$5SSSSSS.SS.SS.$6.$s.S$SS.Ss.$$.SS.$$.%.S$.SS.s’s
SSSTSSNWSS$TSSFNS$SSSSTSSFSk
S$S$SSssSss$SSNSSSssSSssSSssSSssSssx$53$$sssSSss‘ssss‘sss$‘$$$sSss$SS$sS$SS‘ss$sSSN:,NS$$‘sss$SS$sST$ST$$SSST$Sss’1
SS:SS$SS$SSsSN:SSs$SSSS:SS:Sss
32;28644,41150,52284,841115,113129,611130.318
&s5T5FsSSSSSSSTSSSSSSSSFSST$SSSSFSSSS1SS$FSSS$T$,SSFSSSSTS$5SSF$SSTS$SSSFSSSTStS$SFSSSTS$,SSFSSSSTS!SSF$SSSSTS,$$FSS$$SS$,S$$FSSSSS$$SSF$S$$SSS$SSFSSS$$,$$$SSF$$$$IS$$SSSFS$:$Sssssms:,SSSSSFSS$:SSSSSFSSSkSSSSFSSSN$,S$$F$SSSN$,SSSSFS$$$RISSSSSFSSSB,SS$SSFS$SBSS5$FSSSN$SSSSFSSNSS
28;79632,12730,24028.,60827,9%221,44327.697
166;595176,800174,318170,630165,553154,160136,751121,374121,472
126;314120,746110,13693,63216,93769,52966,48963,94158,09351,64544,73939,06234,12831,84230.409
$ssS*S$s$$5$$$sST!
27;43429,32535.961
17;01117,13320,14223,64725,66024,63323,67422.318
56;94084,626115,314134,369128,161102,91173,22453.807
140;440165,700193,549209,661198,560166,606131,026107,96792,22588,06795,343
102,95697,983S8,05083,65081,23375,24169.044
140;440165,700193,s49209,661198,560166,606131,026107,96792,22588,06795,343102,95697,98388,05083,65081,23375,24169,04463,55764,39063,16159,98957,48153,382
S$iSN:1ss!$$:‘s$!‘ss:TSSSS!SS:SSs‘sss‘$$$S$$SSs
5$SD
s<.SS.SS.SS.Ss.SS.S$.ss.Ss
19;71418,50219.311
42:02239,15144,22048,06544,32938,65436,21536,21933,53031,73431,23432,39832.654
30;41431,81232,49131,81829,37127,28325,o7321,29516.878
$SSS$$$SD$$$S$$$$$$SD :SSS$$SSS$SSSSSDSS$$S$$S$$SSD.$S$S$SSSDSS$SSSD
22;40021,83620.025
S.STS‘sss$Sss$20;152
19,94120,41620,43219,62820,39320,18719,88319,27416.471
.$$$5SSSFSWSST$SSS$$$SSSS$$SSSSD
.SSSSSSSFNSSSTSSSSSSS$S$SSSSSSDSSSSSSNFSSSSTSSSSSSS$SSSSSSD .
12;69511,59910,32010,24610,2249.3s0
63;55764,39063,16159,989S7,48153.382
.SSSSNSSFSSSTSSSSSSSSSSSSD.. ..-. .— .
.SS$SNSSFSSSSTSSSSSSSSSSSSD
.$$$NS$SF$S$STS$S$SSSSS$SDSSSNSSSFSSSTSSSSSSSSSSSD29;860
27,98327.561
. ...$S$NSSSFSSTSSSSSSSSS$SD.SSSNSSFSS$T$$SSSSSSSD
12,4839,1856,0593,9342,3092,4682,8192,4261,337654328
25;04520,52315,53413,1s712,34310,8489,75810,32810,5869,5937.339
7;1455,2253,9653,4833,6163,9823,9703,8243,7243,5273,105
44:67334,93325,55820,57418,26817.298
44;673 .$$NSF$S$STSSSSSSSD34,933 .$NSFSSSTS$SSSD .25,558 SN5ss7SSSD20,574 .NFSSTSSD.18,268 .NSSSTSD17.298 .FNSTSSD
16;S4716,57815,64713,77410,7728,0196,8055,8454,2352,8491.325
16;547 .~STS$D16,578 .mSTSSD15,647 .NSSTSD13,774 .NSSTSD .10,772 .NSTE .8,019 .NTD .6,805 .NTD .5,845 .ND4,235 .ND2,849 .D1,325 .D
133266266
5;7824,7033,8432,5891,693783
2;1041,8361,7361,3801,023542
2661330——— -———— -————
516,964 631,344 1,674,142 TUTAL TNIPS (6,494P.KORDSl-———— -————525,834 1,674,142
-171-

TAB2.X 2.3.19ATR2PS-D9WXW A94ALY91S - 1990 ~Y BICYCM TRIPS
TRIPS WITHIN 60 9SIN.S’SKS4=IN T199Z~ (01)SET ALL PONP=S-9BICYCM 142DE— M8L:11S ~oP~=l~~= mmBEGIN FiCt4 ‘lU NC84- ST IMILY PCT/SET= 1.78 3.56 5.34 7.13 14.25NN.)94 HC302 2KS43 SICSS2TUTAL ‘KJTALO 4500 9000 13500 18000 22;00 27000 31;00 36000-—— -——- ——— -——- —— -——- +-————+-————+-————+-—————— +-———+ -— —-+ ————-+ ———+ ————-
0.000.150.300.451.001.151.301.452.002.152.302.453.00
0000
2191100000000
8;1681681688400000
21:426528499
0000000
21911000
21911000
00
000
0000
0000000000
32;865
1,1711,3551,7102,6593.882
000
00084168168
000
1::168
000000
3.153.303.454.004.154.304.455.005.155.305.456.006.156.306.457.007.157.30
168840
168840
0 0 00 0 00 320 320 .D
.SD :
.$$D .
.$$D
.T$$Fll :
.T$$SSFE
.TS$$S$S$Fi
o000
8651,1711.568
8651,1711,5682,1363,1874,4.95
2;1360 3,187
104 4.4856;3208,50213,32420,5672B,41O35,207
368353257175709
L,4141,7261,6141,4761,2511,4011,899
313 7~001 7;001 .NSSSSSSSSSSSSFSD .636
1,o631,1681,6112,3162,5152,5591,7791,027972882
9;49114,64421,91030,73038,93739.433
9;49114,64421,91030,73038,93739.433
.NSS5SSS$SWSSSSSS$F$9
.TNSSSSS$$$$$SSSSSS$$SSSSSSSSS~SSD :
.SSN$$S$S$$SS$$S$$$$$$$$$SS$S$SSSS$S$SSS$$$$$$F$$D:
.STSNS$$SSSSSSSS$$$$$SSSS$$$$SSSSS$SSSSS$$$$$$5$$S$$S$$$S$S$iS$F$$$SD :
.SSTSNSSSSSSSSSSSSSSSSSSSS$SSSSSSSSSSS5$SSSSSSSSSS5555SSS5SSS5S5SSSSS55SSSSSSSF5iS5S5SSD
.SSSTSNSSSSSSSSSSSSSSSSSSSSSSSSSSSSS5SS$SSSSSSSSSS$SSSSSSS5SSSS$SSSSS5SSSSSSSSFSSSSSSSSSD
.SSSTSNSSSSSSSSSSSSSSSSSSSSSSSSSSSSSSSSSSSSSSSSSSS$S$SS$SSSSSSSSFSS$S$SSSD
.SSTNSSSSSSS$SSSSSSSSSSSSSSSSSSSSSSSSSSSSSSSSSFSSSSS$SD.
.$NTSSSSSSSSSSSSSSSSSSSSSSSSSSSFSSSSD.
.$NTSSSSSSSSSSSSSSSSSSFSSSSD .
.SNST$5SSSSSSSSSSSFSSSS5SD .
.SSNTSSSSSSSSSSSSFSSSSSSD
7.458.008.158.308.459.00
35;19228,66820,89214,0349,9858.246
32;84124,14716.312
32;84124,14716.312
12;35811,027
2;3581,0270,6540,781B,2356,7911,4278,1558,5988,9140,8852,8183,4612,6342.010
9.15 7;567 1;923 1,164 10;6549.3o 7,672 1,813 1,296 10,7819.45 5,580 1,303 1,352 8,23510.00 4,229 805 1,757 6,79110.15 4,118 946 2,363 7,42710.30 4.101 1,286 2,768 8,155
,$SNTSSSSSSSSSSSSFSSSSSSD.SSNSSSSSSSSFSSSSSQ.STSN$SSSFSSSSSD.STSSNSSSFSSSSSSSD :.$STSSNSSFSSSSSSSSD.SSTSSNSSSFSSSSSSSSD.10.45
11.0011.1511.3011.4512.00
4;5794,9685,4446,1275,8514.495
1;3611,5492,5423,4.914,1614,5905,7436,4436,2154,7173,9166,0049.986
2;6582,3912,8993,2103,4493,549
6;5988,91410,88512,81813,46112,63412,01011,34810,6909.870
.SSTSNSSSSSF$SSSSSSSD
.SSSSSNSSSSSFSSS5SSSSSSSD :
.SSS$$$N’TSSSSSFSSSSSSSSSSSSSD
.SSSSSSSWSSSFSSSSSSSSSSSSSSSSD
.SSSSSSSNSTSSSSSSSSSSSS$SSSSDSSSSSFSNSSSSTSSSSSSSSSSSSSD12.15
12.3012.4513.0013.1513.3013.4514.0014.1514.3014.4515.0015.1515.3015.45
2;6031,7532,0022,5563,0162,8982,6962,1192,3733,2605,2796,8397,3027,3827,3667,2776,9356,8766,8947,1316,4345,2203,6882,7562,7733,1813,6793,9854,0683,8392,8381,8571,4871,241982768332
3;6643,1522,4732.597
1;348 .SSSFSSNSSSSSSTSSSSSSSSSSD ,.0,690 .SSSFNSSSSSSSSTSSSSSS$SSD9,870 SSSSSNSSSTSSSSSSSSSSSD .9.316 .sS$SNSFSTSSSSSSSSSSSD2;304
2,1432,9644,0706,1977.980
9;31611,04515,64620,71727,49532,16133,71631,40127.394
11;15,20,27,32,33,31,27.
045646717495761716401394
.ss
.ss
.ss
SNFSS5S5STSSSSSSSSSSSD ..... . .. . . . . . . . . . . . . ..—SSFN$SSSSSSSSSSSSSTSSSSSSSSSSSSDSFS$SNSSSSSSSS5S5SSSSSSS5SSSTSSSSSSSiSSSSSD :SFSSSSS$SSNSSSSSSSSSSSSSSSSS$SSSSSSS$$TSSSS$S$$SSSSS$$$$iDSSSFSSSSSSSSSSNSSSSSSSSSSSSSSSSSSSSSSSSSSSSST$$SSSSSSSS$SSSSSSSSS$$SSDSSSSSSSSF$$SSSNSSS$SSSSSSSSS$$$S$SSSS$SSSTSS$SS$S$SSS$SS$SSSSSSSS$SSSSSD$$$SSSSSSS$F$$SSNSSSSSSSSSSS$$$TSS$S$S$$SSS$S$SS$$SSSS$$$$S$SSS$S$DS$$$$$$$SSS$WSSSSSS$$$T$$$$SSSSSSSSSSSS$$$$$$$$SSSSSSSSSDSSSS$SS$$SSWSSSSST$SSSSSSSSSSSSSSS$$SSSSSSS$SSSSD.SS$SSS$$SNSSFSSTSSSS$$$SSS$$$SSSSSSS$SS$$SS$D .SSSSSSSNSSS$F$TSSS$SSSSSSSSSS$$$SSSSS$$SSDSSSSSNSSSSSFSSSS$SSSSSTSSSSSSSSSSSSSSSSS$SSSSSiDSSSSNSSSSSSFSSSSSSSSSSSSSSSSSSSSSTSSSSSSSSSSSSS$SSSSSSSSbSSNSSSSSSSSFSSSSSSSSSSS$S$SSSSSSSSSSTSSSSSSSSSSSS$SSSSSSSD,SNSSSSSSSSSSFSSSSSSSSSSS$S5SSSSS$$T$SSSS$5SSSSSS$SSSSSSD.~SSNSS$SSSSFSSSSSSSSSSSSSSSSSSTSSS$SSSSSSSSSSSSSS$SD .iSSSNSSSSFSSSSSSSSSS5SSSSSSTSSSSSSSSSSSSSS$SS$D.t.SWFSSSSSSSSSSSSSSSSS$TSSSSSSSSSSSSSSDt4FNSSSSSSSSSSSSSSSSTSSS$SSSSSSSSD .~SNFSSSSSSSSSSSSSTSSSSSSSSSSD
14;52818,92521.521
.$s
.$$
.$$
.$$
.s$
20;11715,75412,3269,9758,3368,16711,80616.438
6;3208,8087.7666;6985,9484,818
24;05521,65020,26222,89227,10427,58126,39424,13421,98519,00616,62014,08312,75512.029
24;05521,65020,26222,89227,10427,58126,39424,13421,98519,00616,62014,08312,75512,02911,31810,6609,4277.411
,5$.$$S$16.00
16.1516.3016.4517.0017.1517.3017.4518.00
4;1513,7902,76B2,2082,7563,1993,3263,2122,4092,1601.921
.s$
.s$
.$:
.s:
.s$,$:
17;91917,05514,94413,56611,99210,652
.s$s:
.s:18.1518.3018.4519.0019.1519.3019.4520.0020.15
8;9017,4146,4295,8185,1384.521
.SSSSN$FSSSSSSSST$$SSSSSSS$SD
.SSSNSSSFSSSSSTSSSSSSSSSSSSDSSN$SSSSFSSST$S$SSSSSSSSDSSNSSSSSFSTSSSSSSSSSSSSD.SNSSSSSSFTSSSSSSSSSSD.$NSSSFSTSSSSSSSD.NSSFS$TSSSSD.NSFSTSSSD..SSFTSSD .SFSSTSSD .
1;5151,4541,0677545912521112225478728727613250
11;31810,6609,4277.4113;819
2,9472,2221,8772,3392,6272.609
5;3953,9613,2293,5433,9423,8133,5863,0932,5131,795969
5;3953,9613,2293,5433,9423,.9133,5863,0932.513
20.3020.4521.0021.1521.3021.45
.ii%STiSD.
.FNSSSTSD.
.$NSSSTSD.
.$NSSTSD
.NSST$DA;SD
11187
2;6032,2452,0131,620881
22.00 17522.15 17522.30 88
1;795969
22.45 0 260 0 260 26023.00 0 308 0 308 30823.15 0 426 0 426 42623.30 0 535 0 535 53523.45 0 432 0 432 432
———- ———- ———-
112,046 40,051 252,597-——— -———100,500 252,597
.D
.D
.D
.D
.D
TWTAL TRIPS (1,065 NE@Ws)
-172-
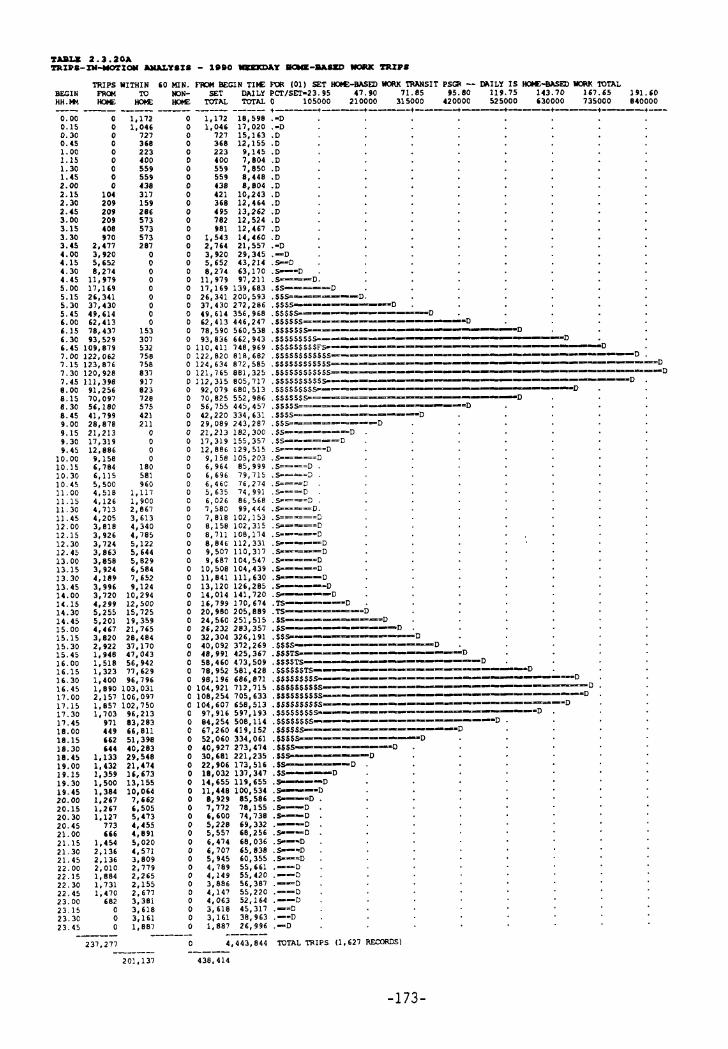
zA2U 2.3.20ATRI?s-XS9*I099 AMA2.YSIS - 1990 942E90mY --MUED WORK TRIPS
TR3PSWITHIN 60 w2N. PKM NEGINTIl=FC47(01)SST N049+MSE’DWOP.W‘IRANSITPS~ ‘- EIAILY1S ~-~ 9CRX KYTALBsGIN PRC24 Tu KIN- sST MI LY Pm/SST=23 .95 41.90 71.85 95.80 119.75 143.70 167.65HH.FM M3s4s N024s Ki4S TU2AL
191.60TwrAL o 105000 210000 315000 420000 525000 630000 135000 840000
—— -—— .. —- .—_— -——- -——— +-----+ -----t -----+ -----t ----t ----+-----+ -----+---0.000.1s0.300.451.001.151.301.452.002.152.3o2.453.003.153.303.454.004.154.304.455.005.155.305.456.00
000000000
104209209209408970
2,4773,9205,6528,27411,97917,16926,34137,43049,61462.413
1,1121,046727368223400559559438317159286573573573207000000000
1533075327587588379178237285754212110000
180581960
1,1171,9002,8673,6134,3404,7855,1225,6445,0296,5847,6S29,12410,29412,50015,72519,35921,76520,48437,17047.043
00000000000000000000000000
1,172 1.9,5981,046 17,020727 15,163368 12.155
-D-D,DD,D,D,D,D,DD.D,DD,DD-D.-D.9.-Ds---D .
223 9;145400 7,804559 7,850559 8,448438 8,004421 10.243368 12;464495 13,262182 12,524981 12,467
1,543 14,4602,764 21,5573,920 29,3455,652 43,2148.274 63.17011;979 97;211 .3----D.17,169 139,683 .$S-----D .26.341 200.593 .SSS---—---D.i7;43049,61462,41378,59093,83610,411
272;286356,968446.241
SSSS----—-——D,$$S$.5-----——.—=-------LI .S$$.s$.s--=e-—’=------------—..D
Sssssss----—--——— “D:6.15 78;4376.3o 93,5296.45 109,8797.00 122,0627.15 123,8767.3o 120.928
560;538662,943748.969
000000000000
$$sss$$ss-------————— —DSSSSS$SSSE’S=—--——— ‘DSSS5SSSSSSSS---—--——--- c-—-—-—-—-D .
SsSssssSssss------—-—————-— CZ-.D
Ss.ssssssSsss=--—--—=—--— z—————---D
SSSSS$SS$$*---—————— ———--D
ssssssss*-----— ——D .
Ssssss*=—==-—-— —D ..sssss=— ---——- —--=D$.sss--——_-------DSSS-=-=-=-=--DSS-----=-DSS-----=DS==---=Ds=--===>~--==DS---=3S=--D,s=--DS---=Ds----D.S==-==DS=--==D.s-=-=-D2=----D.3=-=--D.s---=--D..S----=D~—-D.N---=D.i+------D.E.-—-—-D ..TS-—-—--=D.s>-—_—--.D :.ss-—--—— D..$.$.s———..—.=——————— D5S$s---—- —---— D:.$$$T.%---—-----—-—---D.ssssTs-—— -—----—--- D ..SSSSSSTS--— —--—-----—-=——--=-=-D .
. S$$s$$ss>------------—----— -—----D
. ssssssssss-----—-— -----—--—— -D .
.$sssssssss----—----—-——----- z---D
.S$$s$sssss---——-----—---— z----D
.Ss$.s$$$.s*-=----=---=----=--=-=-—-- ~--=D .
.$$sss$ss--------------- z--—D .
.$sss$S-—--—--——-----=D
.$SSS*----——--—D .ssss-————————— -D.$s*———— -D.$s.-------D ..SS-----D ..s------D.~-=D.~=D ..s.--D ..*--D .---D ..3---D ..s---D ..9.--D .S---D ..--I) ..--D .--D ..--D--D .,-=D-=D.-D .
lUTAL TRIPS (1,627 P.ECCRDS)
22;82024,63421,16512,31592,01970,82556,755
818;662872,585881,325805,711680,513552,986445.457
7.45 18.008.15
.11;39891,25670,09756,18041,79928,878
6.308.459.009.159.309.45
10.0010.1510.3010.4511.0011.1511.3011.4512.0012.1512.3012.4513.0013.1513.3013.4514.0014.1514.3014.4515.0015.1515.3015.4516.0016.1516.3016.4517.0017.1517.3017.4518.0018.1518.3018.4519.0019.1519.3019.4520.0020.1520.3020.4521.0021.1521.3021.4522.0022.1522.3022.4523.0023.1523.3023.45
-—
,.,.
42;220 334;63129,089 243,28121,213 182,300
0 17,319 155,3570 12,866 129,515
21;21317,31912,8869,1586,7046,1155,5004,5184,1264,7134,2053,8183,9263,7243,8633,8583,9244,1893,9963,7204,2995,2555.201
0 9;158o 6,9640 6.696
105;203.95,99979,715
000
6;46C5,6356,0267,5807,8188,1588,7118,8469,507
76;27474,99186,56899,444102,153102,315100,174112,331110.317
00000000
9;68710,50811,84113,12014,01416,79920,98024,56026.232
104;547104,439111.6300
00
126;205141,720170,674205,889251,515283.357
00004;467
3,8202,9221,9461,5181,3231,4001,0902,157l,n571,703971449662644
1,1331,4321,3591,5001,3841.2671,2671,127773
0 32;304O 40,0920 48.991
326;191372,269425,367473,509581,428686,.971712,715705,633658,513597.193
56;94277,62996,79603,03106,09702,75096,21383,28366,81151,39840,28329,54821,47416,67313,15510,0647,6626,5055,4734,4554,8915,0204,5713,8092,7792,2652,1552,6773,3013,6183,1611,887
0 58;4600 70,9520 9S,1960 104,9210 108,2540 104,6070 97.9160 ;4;254O 67,2600 52,0600 40,9270 30.681
508;114419,152334,061273,474221,235173,516137,347119,655100,53485,58678,15574,73069,33268,25668,03665,83860.355
0 22;906O 18,0320 14,6550 11,4480 8,9290 7.7720 6;6000 5,2280 5.557666
1.454 000000
6;4746,7075,9454,1894,1493,8864,1474,0633,6183,1611,887
2;1362,1362,0101,8841,7311,470682
55;66155,42056,3875S,22052,16445,31738.963
00000
000
.—— —26;996
-———— -————0 4,443,844231,277
-———— -————201,137 438*414
-173-
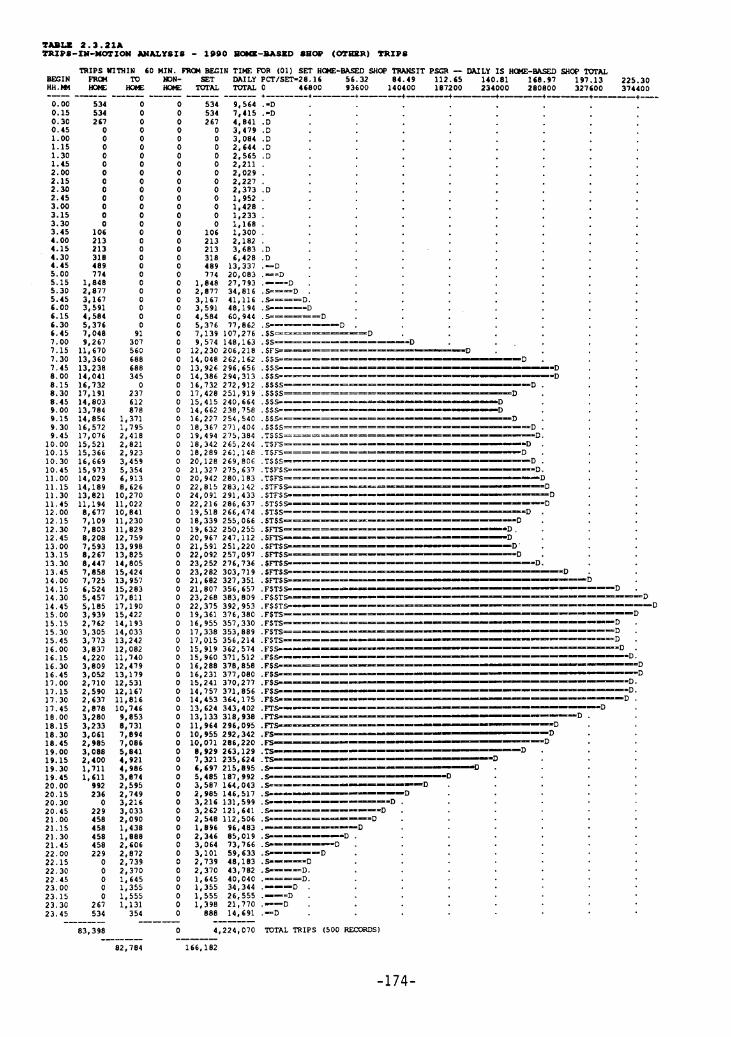
ZAB2.2 2.3.21ATRIPE-134-Mm I094MALYSIS - 1990 E~-BAS2D SHOP (~HZR) TRIPS
mIPS UITIIIN 60 MIN. 9RU4 BSGIN TIS4SK)R (01)SST HCMS-NASSDSNtZTRANSIT PSCR —BEGIN FRU4
DN LY IS HC2USZ-BASSDSNCP lWTAL‘m K2N- SST DAILY PCT/S!2T-28.16 56.32 84.49 112.65 140.81 168.91
HH.S44 16C4E 29x43 6KS4S ‘IUTAL TVTAL o 468oO 93600 140400191.13 225.30
187200 234000 280800 327600 374400-—— -——— -——— -——— -——— -——— +—— ——-4————-+ ————4————4———4-————+ .————+-————. ___
0.000.150.300.451.001.151.301.452.002.152.302.453.003.153.303.454.004.154.304.455.005.155.305.456.006.156.3o6.457.007.157.307.458.008.158.308.459.009.159.309.4510.0010.1510.3010.4511.0011.1511.3011.4512.0012.1512.3012.4513.0013.1513.3013.4514.0014.1514.3014.4515.0015.1515.3015.4516.0016.1516.3016.4517.0017.1517.3017.4518.0018.1518.3018.4519.0019.1519.3019.4520.0020.1520.3020.4521.0021.1521.3021.4522.0022.1522.3022.4523.0023.1523.3023.45
-—
534 0534 0267 00 00 00 00 00 00 00 00 00 00 00 00 0
106 0213 0213 0318 0489 0774 0
1,848 02,877 03,167 03,591 04,584 05,376 07,048 919,267 30711.670 56o13;360 68813,238 68814,041 34516,132 017,191 23714,803 61213,784 87814,856 1,37116,572 1,79517,076 2,41815,521 2,82115,366 2,92316,669 3,45915,973 5,35414,029 6,91314,189 8,62613,821 10,27011,194 11,0228,677 10,8417,109 11,2307,803 11,8298,208 12,7597,593 13,9988,267 13,8258,447 14,8057,858 15,4247.725 13.957
2;590 12;1672,637 11,8162,878 10,7463,280 9,8533.233 8.7313;0612,9853,0882,4001,7111,6119922360
229458458458458229
0000
26:534
———
7;8947,0865,8414,9214,9863,8742,5952,7493.2163;0332,0901,4381,6882,6062,8722,7392,3701,6451,3551,5551.131354-———-
000000000000000000000000000000000000000000000000000000000000000000000000000000000000000000000000
83,398 0-———— -—
534 9,564 .-D534 7,415 .-D267 4,841 .Do 3,479 .Do 3,084 .Do 2,644 .Do 2,565 .Do 2,211 .0 2,029 .0 2,2270 2,373 .Do 1,9520 1,4280 1,233 .0 1,168 .
106 1,300213 2,182 .213 3,683 .D318 6,428 .D489 13,337 .-D :774 20,083 .-=D .
1,848 27,793 .--=D2,877 34,816 .3=--D .3,167 41,116 .2----D.3,591 40,194 .S----=D4,584 60,944 s=-=-==D5.376 77.862 .3-—-—--E7;139 107;276 .$S------—-=D9,574 148,163 SS--=-==-=-=-=--=D :12,230 206,218 .$FS=—--=-----————
.,.—D .
14,048 262,162 .SSS====--=-———— —D .13,926 296,656 SSS-----=--=-=-—-—— -D14;386 294;313 S$S=------------—-- =D16,732 272,912 .9SSS===---------—— --D17,428251,919 SS5S-==========—-= D.15,415 240,664 SSS==--=------——-- —D14,662 238,758 SS2===-=---------—--- —D16,227 254,540 SSS=------------—-—-—— D:18,367 271,404 SSSS-==-=======--------- —---D19.494 275.304 .TSSS======-----------=-—— —-D18;342 26i:244 T$FS===----------------— —---D .18,289 261,148 TSFS-====-=-=--—-—-- ——-D .20.128 269.806 TSSS==------------ --D .21,327 275,637 T$FSS==----------———— --D20,942 280,183 T$FS-------------- ————D22,815 283,142 $TFSS====----------—-—— -D24,091 291,433 STFSS=-----------—— —-D
22,216 286,637 $T$$S=-----—-----—-——— —---D19,518 266,474 .ST$S=---=--—--—— z-——--D18,339 255,066 .$TSS-—-—-------—---— —D .19,632 250,255 $FTS----=-----—— -D, .20,967 247,112 5FTS-----—----—- D21,591 251,220 $FT$S=--==— ------
D :
22,092 257,097 SFT$S—------—-——— —D .23.252 276.736 SFTSS--------—--——— D.23,282 303,719 .$FTS.9==-——-———— D.21,682 327,351 .SFTSS=----———————=— ——--D21,807 356,657 .F$TS.%—--=————————— ———----D23,268 383,809 .F$STS-----——--—— -—---— -D22.375 392.953 .FAST.?+----==------——— CT---- —------D19;361 376;380 F$TS----------—-—-— ------—----D
16,955 357,330 FSTS-----—--—------—-— ——-------- D .
17,338 353,889 FSTS==——--—-----—— ———— ----D .
17,015 356,214 .FSTS=====-------—-- —----------D .
15,919 362,574 .FSS--------------—---—-- z--—--D .
15,960 371,512 .FS2--=------—---—————— ----———----D .
16,288 378,858 .FSS-—-—--——--—— z--—- — —D16,231 377,080 .FSS--------——-——— —D15.241 370.277 .F$*--—---—— ——— -D.14;757 371;856 .F$S--—-——-——— ——-D .14,453 364,175 .FSS=--—-------——— -----------D .
13, 624 343,402 FIBS---------——————— —D13,133 318,938 .FTS=—-------———— c—-—-D .
11,964 296,095 .FTs——— -—-----—-— —-D10,955292,342 .FS--- --— -D10,071 286,220 .~—-—- -,zD
8,929 263,129 .Ts——---———— -D .7,321 235,624 .TS- ——--—- D6,697 215,895 .>———- D.5,485 187,992 .S----——— -D3,587 164,043 ..%---—--—----—-D .2,985 146,517 .s=---- c—----D3,216 131,599 .s---------—— =D3,262 121,641 s-------------D .2,548 112,506 s------------D .1,896 96,483 ----------D2,346 85,019 .3---------D .3,064 73,766 .3----—--D .3,101 59,633 .*-----D .2,739 48,183 .3-----D2,370 43,782 .5----D.1,645 40,040 .---=D.1,355 34,344 .---D .1,555 26,555 .--=D .1,398 21,770 .--D .888 14,691 .-D-————4,224,070 mTAL TRIPS (500RXCRDS)
———82,784 166,182
-174-

TA232.2 2.3.22ATRXPS-X96-NOTIOS4 ANALYSIS - 19$0 E_-BA3ZD SOCIAL/RECRXATX~ TRIPS
TRIPS WITHIN 60 MIN. FR24SS2CIN TIM? 9UR (01)SET lSC4S2-BXmSCC/RSY2TRANsIT PSCR - DAILY IS 6KM3-BASSDSS2C/PZCmTALSFGIN ~ TU K2N- SET DAILY P~/SET-51 .01 102.02 153.03 204.04 255.04 306.05 357.06NH.M4m69C492NDI.E TvrAL ‘mTAL o 29100 582oO 87300 116400
408.07145500 174600 203700 232800
—. —— —-— .-— — ——. -—— +————+————4 ———+————+ ————+-——-—+—-——+ -———-. -—-0.000.150.300.451.001.151.301.452.002.152.302.453.003.153.303.454.004.154.304.455.005.155.305.456.OO6.156.306.457.007.157.307.458.008.158.308.459.009.159.309.45
10.0010.1510.3010.4511.0011.1511.3011.4512.0012.1512.3012.4513.0013.1513.3013.4514.0014.1514.3014.4515.0015.1515.3015.4516.0016.1516.3016.4517.0017.1517.3011.4518.0018.1518.3018.4519.0019.1519.3019.4520.0020.1520.3020.4521.0021.1521.3021.4522.0022.1522.3022.4523.0023.1523.3023.45
.—.
o000000000000000000086172172481992
2,2413,7494,9905,6735,4384,7694,2793,8764,2234,5904,3464,2544,8875,7134,8753,8293,5203,5233,3302,7013,1684,0934,0273,7013,3903,0182,7282,3072,1011,611905905996948930
1,1751,3341,1571,5652,1672,3222,8543,2543,6304,0434,1244,3194,2973,7212,9882,6992,3901,9471,857),5361,2601,0807934562271140000000000
-——
28,058-—.
2272272272271140
0000000000000000000000000
137275382489691694757512950
1,4961,4421.3871;3791,6352,1763,1033,8633,9613,5023,4384.3004;4194,8195,2584,5544,2274,3984,8174,8645;0125,8635,9276,1175,7744,6414,3704,4454,2944,1343,6363.3443.7324;1064,4394.1863;2452,3361,8281,5461,3991,2231,3801,6651,4E31,5612,2682,7112,6122,4042,3212,0601,708881
-———.
o00000000000000000000000000000000000000000000
:000000000000000000
:00
:0000000000000
;o000000000
0
227227227227114
000000000000000
86172172481992
2,2413,7494,9905,6735,4384,7694,2793,8164,3604,8734,7284,7435,5786,6o75,6324,3414,4705,0194,7724,0884,5475,7286,2036,8047,2536,9796,2305,7456,4016,0305,7246,1635,5505,1755.328
14,511 .—D14,676 .—D13,225 .—D10,746 .—D8,965 .-D7.833 .-D6;416 .-D5,891 .-D5,970 .=D4,542 .-D3,598 .D2;919 .D1,703 .D6353)644a647
1,4733,0845,9099,51915,28318,94022,45326,66430,41634,80641,49847,47058,42.!66,49267,87067,80669,88367,23260,91959,53964,16470,52070,08365,70267,02673,2617.9,04683,22989,11788,18185,24985,60684,58306,22686,26781,32878,43778,43180,53585,24691,82296,78796.921
:D.D-D.-D ..—D ..---D ,.----D.----D.~--=D>--===DSS——==D :$s=======~$s=========;.$s-=-==--=--D5=--= -------D*---= ----=-D.%-= ----=--—-D
FS-------S-=DFS=--=----=D$5=---------D
.5S------=---=D$s===-==-=-==D..%----= -----D.FS-==-=--—-DK-----------D
FS--------------DTS—-———----=D
TS--—-—------DTs------ ,.-------D
TS---—-————=—=——==— D.~s------- —--.DTS-------— —D.FS=-----—-—--=-D .$S-=----=---=-=---=rl.$s-------------D,$s-----—--—----D.Ts--------—-----D.SS--------—-----D
95:030 SS---------------D
SS----—-———----=D .
.~*-----— —---— -—-- -D
.Frs=--.————-——————=—————— E--D
.FT9----—-—=—=————— ——D
5;992 ....-.6,198 101,3986,169 109,6737,428 113,7018,094 116,7788,439 132,9318,628 151,4237,895 166,1658,000 182,6448,408 198,3038,418 208,3848,453 212,2767,933 214,8587,065 22B,6816,720 244,0766,805 240,5466,829 221,690 ..-6.133 197,488 .‘Ts--—------- -D .
.Prs——---==-------- —. —--—s.-D .
.T$S--—-—-——————— ——D
.T$S----——-- ——— -—.-.-----4)TSS-—-—-—-———— --D
.~-—-————-— —----——=+Ts—————————— —-—-— D
. TS—-----—— —-— D—- .— ——D .
5;102 181;381 .TS-------—— -D
3,872 169,453 .*-———- D.3,088 156,977 .S———— D.2,626 154,718 .S--——=—— D.2,192 151,517 .S--——— D1,679 136,372 .s-—-—— -—D .1,607 124,350 .~-- ——-D .1,779 117,357 .s————— --D
1,483 110,992 .~ UC——--D .1,561 100,811 .S-——— —-—D .
2,268 91,180 ._———— --D2,711 79,863 .~- ——--D ,2,612 72,365 s-------- —--D .2,404 62,788 .S---- ~——D2,321 52,137 .W---— -D .2,060 41,456 .*-—--SD .1,708 33,935 .*-—--D .881 21,551 .---D .-————1,839,892 TDTAL TRIPS (196 RECW.DS)
.—— -————28,991 57,049
-175-

TABLE 2.3.23ATAXPS-XW-640TIU4 ANALYSIS - 1S90 K44E-BASED SC1400L T2UPS
TRIPSWITHIN 60 mN. M BSGIN TIR92FCR (01)S2T IK49i=m S~OOL TRANSIT P= — IMILY IS INM3-8ASFIIS99CX)L2uTA2,BSGIN M mN- DAILY PCT/SET=33.33HH.H4 NC442 H& 14CM2 T%L
66.66 99.98 133.31 166.64 199.97 233.30 266.62TOTAL o 61800 123600 185400 247200 309000 370800 432600 494400
-—— -—— ——— ——— -——— -——— +——— —+ ———-+— ———+— ———+-—— —-+—-—-+— ———-+— ——--+— --0.000.150.300.451.001.151.301.452.002.152.302.453.003.153.303.454.004.154.304.455.005.155.305.456.006.156.306.457.007.157.301.458.008.158.308.459.009.159.309.45
10.0010.1510.3010.4511.0011.1511.3011.4512.0012.1512.3012.4513.0013.1513.3013.4514.0014.1514.3014.4515.0015.1515.3015.4516.0016.1516.3016.4511.0017.1517.3017.4518.0018.1518.3018.4519.0019.1519.3019.4520.0020.1520.3020.4521.0021.1521.3021.4522.0022.1522.3022.4523.0023.1523.3023.45
-—
00000000000000000000072
1441,7153,54711,62824,84736,17344,99257,65664,69856,17745,15533,32820,556)3,2269,7606,8945,9635,1263,4182,1042,0792,3032,4262,3032,3542,0451,8061,5721,4081,4061,0981,1281,1151,1981,4061,5421,6791,4421,101635273453633633497360leo308616
1,1631,7131,5491,2941,2031,0458910946624304302150000000000000
91,417
0000000000000000000000000000000000076
152342532761990
1,4051,9452,5413,0144,5196,1206,2636,5306,7175,7244,9444,7725,6958,20514,22621,92834,77747,88652,25947,48141,61636,69028,13820,97917,49515,87213,94710,9747,2505,7704,0692,7412,1341,6051,2461,2441,4191,073628561
1,0541,4041,5732,2172,8632,7992,4162,2802,0401,199458458458458229
0000000000000000000000000000000000000000000000000000000000000000000000000000000000000000000
:000
-————0
0 4410 1230 620 00 00 00 00 00 00 00 840 1680 1680 1680 840 1180 2370 7940 1,3530 1.970072144
1,7153,54711,62824,84736,17344,99257,65664,69856,17745,15533,32820,55613,3029,9127,2366,4955,8874,4083,5094,0244,8445.4406;8228,4748,3088,3368,2897.1326;3505,8706,8239,32015,42423,33436,31949,56553,70148,58242,25136,96328,59121,61218,12816,36914,30711,1547,5586,3865,2324,4543,6832,8992,4492,2892.310
2;6794,6298,40315,16624,90956.434107;197195,714305,819427.739518;820505,988405,214265,772155,25995,95966,23247,70537,47429,25823,73121,66424,48629,17636.27350;19762,07064,67462,95057,2114.9.31046;57052,57268,57591,820
142,511217,503306,964358,924345.036282;585205,198149.493104;78578,81068,43364,72658,86854.79449;26848,10546,28040,71232,90627,88525,50222,61719.990
1;967 18;2111,290 16,278991 14,831
1,484 14,6381,619 16,0001.573 17.5882;217 20;1302,863 22,4862,799 22,1012,416 19,3502,280 16,3872,040 11,3211,199 7,030458 4,654458 3,970458 3.984458 3;408229 1,775-————1,663,860
:DD-DS==D :.$s---DSSSS=-----D5SSSSS-----——--—D .SSsssss==-------- —--- —---D .SS$5$55s%------------—-———— -D.SS$5S$.SSSo=---------------——-—-——— —-DSSssSSSSs====-=-=--==--————-———— —--D
.$5Ss.sss=-=-------—--—-——— —-—-DSSsss=---===------—— D.SS*=-===-==--D .$s--=====DSS--==Ds====D,S===DS==Ds==DS==il,s==sS--D>--DS==-=D>–=-==DS-----DS----=DS---=D.,~--=D .,.S==-=D .,.3=---D.S-=---DTs------D :.$S---==--==-=D-=-=D :SSSS-----=-------—D .s$$s$s------------------—-.xDSSssssss---=---= ---------—— --=11
$$$$ss$TS=--—--------— ------ —--D
$.$$$ss $S-----—-------—-----D ..$$.$$$s>------------D.$$$$$s--------=D .
$SSSS=--=-=D .$$>----D ,.$.SS-=-=D.$$S---=D.$~--=D.$8---DS+=---D ..~--D .S---D ..S---D.3=-D.--D ..-sD .--D.-D ..-D.-D ..=D.=D.-D.-D.-D ..--D ..--D ..-D ..-D ..-D.D.D.D.D.D
TOTAL TRIPS (591RKxRDS)-———— .———--
94,013 185,430
-176-

TABLE 2.3.24ATRI?S-S96~IOS4 ~YSXS - 1990 9SC44-E_-BASW TRIPS
TN2PS WITHIN 60 N3N. FRDS4BEGIN TISE FUN (01)SET mN-lK1692-SA9EDTRANSIT PSGR — DAILY IS NC44-NCS03-MSEDTDmLM.GIN FlU4 m KIN- SST DAILY PCC/SET=43.99 87.98NN.M4Klmmw3m TOTAL
131.98‘mTAL o
175.97 219.96 263.95 307.94 351.9477400 1S4800 232200 309600 387000 464400 541800 619200
—- —— -——— -——— -——— -—— ●———* _——-. _—-+ ——— ____ -. -____* -———— _____ ----0.000.150.300.451.001.151.301.4s2.002.152.302.453.003.153.303.4s4.004.1s4.304.45S.oo5.1s5.305.456.006.1S6.306.457.007.157.307.458.008.1s8.308.459.009.1s9.309.45
10.0010.1510.3010.4511.0011.1511.3011.4s12.0012.1512.3012.4513.0013.1513.3013.4s14.0014.1s14.3014.4515.0015.1515.3015.4s16.0016.1s16.3016.4S17.0017.1s17.3017.4s18.00)8.1518.3018.4s19.0019.1s19.3019.4s20.0020.1520.3020.4S21.0021.1521.3021.4522.0022.1522.3022.4523.0023.1523.3023.45
000000000000000
:00000000000000000000000000000000000000000000000000000000000000000000
;o00000000
-————0-——-
000000000000000000000000000000000000000000000000000000000000000000000000000
21543043043043043021500000000000000
0000000
1402812812811410000067134134134268506
1,0371,6982,5203,8335,3707,68210,73012,90114,05514,32113,34412,33311,65810,56910,68410,86810,55410,23510,43511,31113,96916,09316,45217,15717,15016,23119,49822,37823,54223,59923,94724,48923,25522,48422,71323,46023,76123,67223,94725,14725,84625,12026,51028,13928,30926,80024,79024,41222,77320,00716,36312,4869,3207,3816,)135,2S34,1283,4853,3052,6651,7221,2271,5052,0731,7481,4531,087933
1,1751,175987641242-————
175,511
000000
3.702 :2;663 .1,846 .2,337 .3,413 .4,015 .D3,526 .
14: 2,366 .281 1,673 .281 1,370 .281 1,284 .141 1,221 .0 988 .0 703 .00067134134134268S06
1,0371,6982.s20
1,103 .2,6413,878 .D4,397 .D5,154 .D6.579 .D8;398 .D11,477 .D15,802 .-D19,657 .-D24,979 .-D38.276 .--D
.—. —.
3;833 55;755 .---D5,370 74,310 .6--=--D7,682 96,96010,730 123,73512,901 147,43914,0S5 169,16814,321 186,46313,344 196,72612,333201,98411,658 212,22510,S69 219,14310,684 242,45210,868 266,75510,554 287,24310,235 305,79010,435 326,11511,311 353,82713,969 400,91516,093 453,70416,4S2 542,75117,757 622,91711,150 649,5S416,231 641,28419,498 623,29622.378 617.046
.-----D .S---—--=D$s--------Dso---=========== ~-=~ :$s----------=D .$s-----------D .as=--=----=--. D .ss----====---=~ -==--=~5=----= --------Ds=--= -=-——---Ds---= ---------- —D .~----------—-=-= ---D .s---—----—— -——--D.s---—--------—------D.5“--=---- c——-D ..ss--——--—————— D.$s=-----——--—.so---—---=———————————_
—D :D
.ss--——-——— ——-D
.s*-—-—- .— z--D
.ss-——--——— ----D
.ss9—=------ —-=D
ss5-—-——-- ——-— —D23;i42 596;033 $5&-—-———--—— —-—-D
23,599 551,581 .$$>—--——--—--—-—— ---D
23,947 509,991 .$S2--------—-- c-_——---D24,489 496,836 s$>------—------—------—=—---D23,255 487,311 .SSS------—---—---- ~-__-—-D
22,484 484,359 .SSS---------—----— -—W -- ——D22,713 490,779 .So>--=-..-------=—-—————— -—-—---D
23,460 485,738 .SSS---—----——---———— -—------D
23,161 471,512 .SSS-=-----—-———— - -—--— -—--D23,672 451,560 saw------—-------—-—---- —---D
23,947 424,315 .SS.S=---------—--————— --D
25,147 401,2S1 SSS-==---——-————— --—D
25,846 385,221 .SSS=-----—-—— D25,120 379,955 .$$S--———— -D .26,S10 388,S17 ..9SS———— —=D28,139 401,154 .ssss-——————— D28,309 391,169 ..$5$s——————— D26,800 362,138 .S$~ D.24,790 322,794 .$$> —--D
24,412 293,643 .S$S———— -—-—--D22,173 263,032 .$S~ —D20,001 230,250 .SS.S——— ---—-—-D16,363 201,446 ..5S-- —--—-D .12,486 183,603 .$S--- —--—-D .9,S35 165,581 .5--—-—---D1,811 147,426 .3—— —-—D6,543 136,418 .s—u——-=D5,683 132,238 .5---—---D .4,558 117,932 .5——---D3,91S 103,998 ..9-----D .3,520 90,928 .------D2,665 75,932 .-----D),722 64,916 .-—=D .1,227 S7,291 .---D .1,S05 49,454 .-—D .2,073 43,371 .—=D .1,748 38,980 .==-D .1,453 35,2B2 .—D .1,087 30,621 .--D933 26,728 .-D :
1,175 23,948 .-D1,175 18,972 .-D .987 13,6S8 .-D641 10,763 .D242 6,327 .D-————4,687,086 mTAL TRIPS (629NEC23RDSI
-— -— —— --430 175,941
-177-
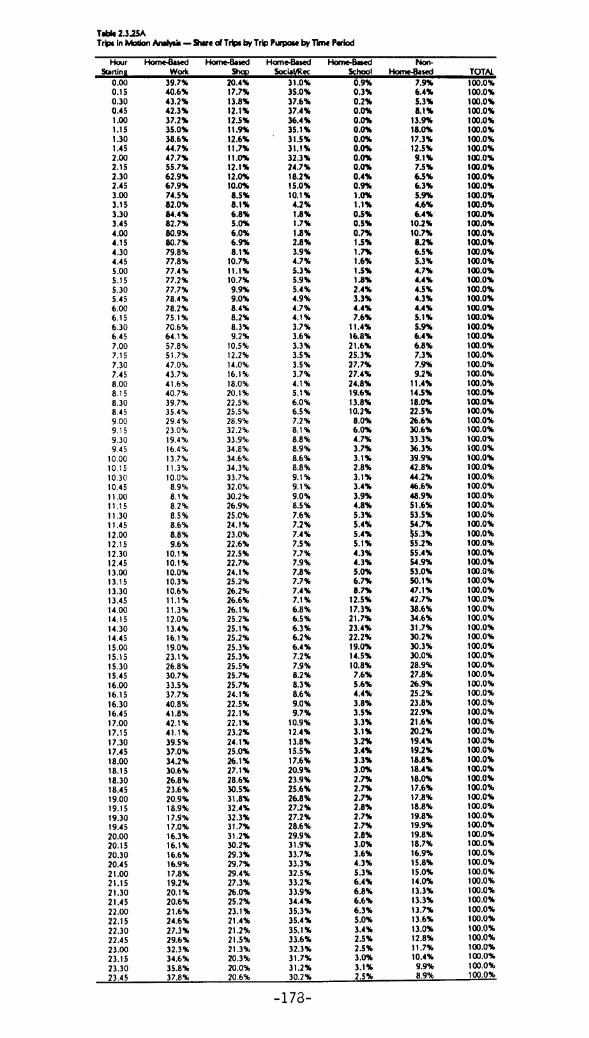
Hwr nOrnc-&std Home-Bated Hane&ed Wnw—ked NC+Stming Wcuic ShQl Sxiilllk ScIwOl I+JnlAlsed TOTAL
0.00 3$2.7% 20.496 31.0% 0.9% 7.9%0.15
100.0%40.6?4 17.7% 3s.0% 0.3% 6.4%
0.30100.0%
0.2% 102.0%0.451.001.151.301.452.002.152.302.453.003.153.303.454.004.154.304.455.005.155.305.456.0436.156.306.457.007,157.307.458,008.158,308.459.009,159.309.45
10.0010.1510.3010,4511.0011,1511.3011.4512.0012.1512.3012.4513.0013.1513.3013.4514.0014.1514.3014.45I 5.0015.1515.3015,4516.0016,1516.3016.4517.0017.1517.3017.4518.0018.1518.3018.4519,0019.1519.3019.4520.0020.1520.3020.4S21.0021.1521.3021.4522.0022.1522.3022.4523.0023.1523.3023.45
43.2%42.3%37.2%35.0%38.6%44.7%47.7%55.7%62.9%67.9%74.5%82.0%64.4%82.7%00.9%30.7%79.8?677.arn77.4%77.2%77.7%78.4%78.2%75.1%70.6%64.1%57.8%51.7%47.0%43.7%41.6%40.7%39.7%35.4%294%23.0%19.4%16.4%I 3.7%11.3%Io.o”k8.9%8.1%8.2?+8.5%8.6%8.8%9.6%
Io.1%10.1%10.0%10.3%10.6%11.1%11.3%12.0%13.4%16.1%19.0%23.1%26.8%30.7%33.5%37.7%40.8%41.8%42.1%41.1%39.5%37.0%34.2%30.6%26.8%23.6%20.9%18.9%17.9%17.0%16.3%16.1%16.6%16.9%17.8%19.2%20.I %20.6%21.6%24.6%27.3%29.6%32.3%34.6%35.8%37.8%
13.8%12.1%12.5%11.9%12.6%1I .7%11.0%12.1%12.0%10.0%0.5%8.1%6.8%5.0%6.0%6.9%8.1%
10.7%11.1%10.7%9.9%9.0%8.4%8.2%8.3%9.2?6
10.5%12.2%14.0%16.1%18.0%ml%22.5%25.5%28.9%32.2%33.9%34.8%34.6%34.3%33.7%32.0%30.2%26.9%25.0%24.1%23.0%22.6%22.5%22.7%24.1%25.2%26.2%26.6%26.1%25.2%25.1%25.2?425.3%25.3%25.5%25.7%25.7?624.1%22.5%22.1%22.1%23.2%24.1%25.0%26.1%27.1%28.6%30.5%31.8%32.4%32.3%31.7%31.2%30.2%25’.3%29.7%29.4%27.3%26.0%25.2%23.1%21.4%21.2%21.5%21.3%20.3%m.o%20.6%
37.6%37.4%36.4%35.1%31.5%31.1%32.3%24.7%10.2%15.0%10.1%4.2%1.8%1.7%1.8%2.an3.9%4.7%5.3%5.9%5,4%4.9%4.7%4.1%3.7%3.6%3.3%3.5%3.5%3.7?64.1%5.1%6.0%6.5%7.2%8.1%8.8%8.9%8.6%8.8?49.1%9.1%9.0%8.5%7.6%7.2%7.4%7.5%7.7%7.9%7.8%7.7%7.4%7.1%6.8%6.5%6.3%6.2?66.4%7.2%7.9%8.2%8.3%0.6%9.0%9.7%
10.9%12.4%13.8%15.5%17.6%20.9%23.9%25.6%26.8%27.2%27.2%28.6%29.9%31.9%33.7%33.3%32.5%33.2%33.9%34.4%35.3%35.4%35.1%33.6%
O.on
0.0%
0.0%
0.0%
0.0%
0.0%0.0%
0.4%0.9%1.0%1.1%0.5%0.5%0.7%1.5%1.7%1.6%1.5%1.2%2.4%3.3%4.4%7.6%
11.4%16.8%21.6%25.3%27.7%27.4%24.8%19.6%13.8%10.2%&o%6.0%4.7?43.7%3.1%2.8%3.1%3.4%3.9%4.8%5.3%5.4%5.4%5.1%4.3%4.3%5.0%6.7%8.7%
12.5%17.3%21.7%23.4%22.2%19.0%14.s%10.8%7.6%5.6%4.4%3.8%3.5%3.3%3.1%3.2%3.4%3.3%3.0%2.7S2.7%2.7%2.8%2.7%2.7%2.8%3.0%3.6?44.3%5.3%6.4%6.8%6.6%6.3%5.0%3.4%2.5%
32.3% 2.s%31.7% 3.0%31.2% 3.1%
5.3%8.1%
13.9%18.0%17.3%12.5%9.1%7.5%6.5%6.3%5.9%4.6%6.4%
10.2%10.7%8.2%6.5%5.3%4.7%4.4%4.5%4.3%4.4%5.1%5.9%6.4%6.8%7.3%7.9%9.2%
11.4%14.5%18.0%22.5%26.6%30.6%33.3%36.3%39.9%42.8%44.2%46.6%42.9%51.6%53.5%54.7%$5.3%55.2%55.4%54.9%53.on50.1%47.1%42.7%36.6%34.6%31.7%30.2%30.3%30.0%28.9%27.8%26.9%25.2?623.8%22.9%21.6%20.2%19.4s19.2%18.85618.4%18.0%17.6%17.8%18.8%19.8%19.9%19.8%18.7%16.9%15.8%15.0%14.0%13.3%13.3%13.7%13.6%13.0%12.8%11.7%10.4%9.9%
30.2% 2.5% 8.9%
100.0%100.0%100.0%100.0%lm.o%100.0%100.0%1W.o%100.0%100.0%100.0%100.0%100.0%100.0%laz.o%100.0%100.0%100.0%lm.o~1W.o%100.0%1W.0%100.0%100.0%100.0%100.0%100.0%100.0%100.0%1al.o%100.0%100.0%100.0%100.0%100.0%I00.0%Im.o%lm.o%100.0%1m.o%lm.o%1W.o%1W.o%lm.o%lm.o%1U3.0%lm.o%lm.o%lm.o%100.0%lm.o%1m.o%lm.o%100.0?6tm.o%lm.o%lm.o%lm.o%lm.o%1az.o%1m.o%lm.o%100.0%lm.o%Im.o%lm.o%lm.o%lm.onlm.o%Im.o%lm.o%lm.o%lm.o%100.0%lm.o%lm.oulm.orn1m.o%lm.o%lm.o%100.0%tm.o%100.0%lm.o%tm.o%Im.o%1m.o%lm.o%lm.o%Im.ornlm.o%lm.o%1m.o%
-17a-

Ap~endix 3.0
WEEKDAY 1990 REGIONALHOUSEHOLD TRIP RATES
-179-

Table 3.2.lA1990 Regional Trips per Household by Household Size
Household Home-Based Non-Size Mode Work Shop Soc/Rec School Hom~Based Total
Vehicle Driver 0.665 0.609 0.258 0.041 0.875 2.448In-Vehicle Person 0.697 0.654 0.307 0.045 0.958 2.661Transit 0.162 0.075 0.025 0.015 0.089 0.366
One Person 0.859 0.729 0.332 0.060 1.047 3.027Person School Bus 0.000 0.000 0.000 0.000 0.000 0.000
Bicycle 0.015 0.004 0.009 0.007 0.007 0.042walk 0.061 0.167 0.066 0.006 0.260 0.559other 0.003 0.002 0.001 0.002 0.002 0.010Total 0.937 0.9Q2 0.408 0.076 1.315 3.639VehicleDriver 1.462 1.151 0.430 0.082 1.391 4.516In-Vehicle Person 1.586 1.381 0.591 0.116 1.623 5.297Transit 0.186 O.O&l 0.027 0.034 0.057 0.363
Two Person 1.772 1.441 0.618 0.150 1.680 5.660Person School Bus 0.000 0.000 0.000 0.012 0.000 0.012
Bicycle 0.022 0.013 0.012 0.008 0.020 0.075walk 0.051 0.109 0.086 0.036 0.285 0.567Other 0.004 0.005 0.008 0.000 0.015 0.031Total 1.849 1.567 0.724 0.205 2.000 6.345Vehicle Driver 1.965 1.447 0.503 0.197 1 .W.o 5.752In-Vehicle Person 2.149 1.817 0.719 0.407 1.961 7.053
Transit 0.206 0.074 0.025 0.108 0.112 0.525Three Person 2.355 1.891 0.745 0.515 2.072 7.578Person School Bus 0.000 0.000 0.000 0.034 0.000 0.034
Bicycle 0.020 0.009 0.022 0.031 0.018 0.100walk 0.052 0.129 0.077 0.166 0.268 0.691
Other 0.006 0.006 0.002 0.004 0.007 0.025Total 2.432 2.035 0.846 ‘‘ 0.750 2.365 8.427Vehicle Driver 2.242 1.965 0.619 0.314 1.805 6.945In-Vehicle Person 2.458 2.559 1.094 0.914 2.370 9.396Transit 0.192 0.066 0.032 0.115 0.119 0.524
Four Person 2.650 2.624 1.126 1.030 2.489 9.920Person School Bus 0.000 0.000 0.000 0.152 0.000 0.152
Bicycle 0.040 0.025 0.060 0.079 0.023 0.228walk 0.059 0.166 0.105 0.327 0.279 0.936Other 0.003 0.006 0.004 0.001 0.005 0.018Total 2.751 2.821 1.295 1.589 2.797 11.254Vehicle Driver 2.373 2.419 0.686 0.382 1.692 7.551In-Vehicle Person 2.771 3.319 1.251 1.345 2.386 11.072Transit 0.333 0.150 0.035 0.313 0.128 0.958
Five-+ Person 3.104 3.469 1.286 1.658 2.513 12.029Person school Bus 0.000 0.000 0.000 0.401 0.000 0.401
Bicycle 0.050 0.036 0.056 0.094 0.032 0.267walk 0.104 0.251 0.153 0.663 0.396 1.567Other 0.002 0.016 0.003 0.000 0.017 0.038Total 3.259 3.772 1.499 2.815 2.958 14.3433Vehicle Driver 1.548 1.313 0.452 0.156 1.389 4.859In-Vehicle Person 1.701 1.643 0.682 0.393 1.695 6.115Transit 0.200 0.077 0.028 0.084 0.091 0.479
Total Person 1.902 1.720 0.710 0.477 1.786 6.594HH School Bus 0.000 0.000 0.000 0.075 0.000 0.075
Bicycle 0.025 0.014 0.025 0.031 0.018 0.113
walk 0.061 0.151 0.089 0.160 0.287 0.748
Other 0.003 0.006 0.004 0.001 0.009 0.023
Total 1.991 1.891 0.827 0.744 2.100 7.553
-180-

Table 3.2.2A1990 Regional Trips per Person by Household Size
Household Home-Based Non-Size Mode Work Shop Soc/Rec School Home-Based Total
Vehicle Driver 0.665 0.609 0.258 0.041 0.875 2.448In-Vehicle Person 0.697 0.654 0.307 0.045 0.958 2.661Transit 0.162 0.075 0.025 0.015 0.089 0.366
One Person 0.859 0.729 0.332 0.060 1.047 3.027Person School Bus CM)oo O.000 0.000 0.000 0.000 0.000
Bicycle 0.015 0.004 0.009 0.007 0.007 0.042walk 0.061 0.167 0.066 0.006 0.260 0.559Other 0.003 0.002 0.001 0.002 0.002 0.010Total 0.937 0.902 0.408 0.076 1.315 3.639Vehicle Driver 0.731 0.576 0.215 0.041 0.695 2.258In-Vehicle Person 0.793 0.691 0.296 0.058 0.811 2.649Transit 0.093 0.030 0.013 0.017 0.029 0.181
Two Person 0.886 0.720 0.309 0.075 0.840 2.830Person School Bus 0.000 0.000 0.000 0.006 0.000 0.006
Bicycle 0.011 0.006 0.006 0.004 0.010 0.037walk 0.025 0.055 0.043 0.018 0.143 0.284Other 0.002 0.002 0.004 0.000 0.008 0.016Total 0.924 0.784 0.362 0.103 1.000 3.172Vehicle Driver 0.655 0.482 0.168 0.066 0.547 1.917In-Vehicle Person 0.716 0.606 0.240 0.136 0.654 2.351Transit 0.069 0.025 0.008 0.036 0.037 0.175
Three Person 0.785 0.630 0.248 0.172 0.691 2.526Person School Bus 0.000 0.000 0.000 0.011 0.000 0.011
Bicycle 0.007 0.003 0.007 0.010 0.006 0.033walk 0.017 0.043 0.026 0.055 0.089 0.230Other 0002 0.002 0.001 0.001 0.002 0.008Total 0.811 0.678 0.282 ; 0.250 0.788 2.809Vehicle Driver 0.560 0.491 0.155 0.079 0.451 1.736In-Vehicle Person 0.614 0.640 0.274 0.229 0.593 2.349Transit 0.048 0.016 0.008 0.029 0.030 0.131
Four Person 0.662 0.656 0.282 0.257 0.622 2.480Person School Bus 0.000 0.000 0.000 0.038 0.000 0.038
Bicycle 0.010 0.006 0.015 0.020 0.006 0.057walk 0.015 0.042 0.026 0.082 0.070 0.234Other 0.001 0.001 0.001 0.000 0.001 0.004Total 0.688 0.705 0.324 0.397 0.699 2.813Vehicle Driver 0.404 0.412 0.117 0.065 0.288 1.285In-Vehicle Person 0.471 0.565 0.213 0.229 0.406 1.884Transit 0.057 0.025 0.006 0.053 0.022 0.163
Five-+ Person 0.528 0.590 0.219 0.282 0.428 2.047Person School Bus 0.000 0.000 0.000 0.068 0.000 0.068
Bicycle 0.008 0.006 0.010 0.016 0.005 0.045walk 0.018 0.043 0.026 0.113 0.067 0.267Other 0.000 0.003 0.001 0.000 0.003 0.006Total 0.554 0.642 0.255 0.479 0.503 2.434Vehicle Driver 0.592 0.502 0.173 0.060 0.531 1.858In-Vehicle Person 0.651 0.629 0.261 0.150 0.648 2.339Transit 0.077 0.029 0.011 0.032 0.035 0.183
Total Person 0.727 0.658 0.271 0.182 0.683 2.522
School Bus 0.000 0.000 0.000 0.029 0.000 0.029
Bicycle 0.010 0.005 0.009 0.012 0.007 0.043Walk 0.023 0.058 0.034 0.061 0.110 0.286Other 0.001 0.002 0.001 0.001 0.004 0.009Total 0.761 0.723 0.316 0.285 0.803 2.889
-181-

Table 3.3.1A1990 RegionalTrips per Householdby DetailedHouseholdIncome Group
Household Home-Based Non-Income Mode Work Shop Soc/Rec School Home-Based Total*
less than Vehicle Driver 0.140 0.655 0.153 0.102 0.358 1.408$5,000 Total 0.381 1.367 0.462 0.662 1.027 3.898$5,000- Vehicle Driver 0.286 0.637 0.221 0.140 0.454 1.738$9,999 Total 0.513 1.554 0.530 0.387 1.055 4.038
$10,000- Vehicle Driver 0.504 0.913 0.266 0.161 0.908 2.752$14,999 Total 1.068 1.534 0.563 0.928 1.419 5.511$15,000- Vehicle Driver 0.813 1.187 0.344 0.069 1.029 3.441$19,999 Total 1.293 1.803 0.676 0.479 1.722 5.972$20;000 - Vehicle Driver 1.030 1.229 0.401 0.099 1.168 3.927$24,999 Total 1.470 1.884 0.706 0.571 1.881 6.511$25,000- Vehicle Driver 1.181 1.226 0.317 0.107 1.076 3.907$29,999 Total 1.677 1.860 0.592 0.649 1.873 6.652$30,000- Vehicle Driver 1.549 1.215 0.432 0.134 1.387 4.718$MJ999 Total 1.995 1.708 0.833 0.735 2.066 7.337$35,000- Vehicle Driver 1.737 1.499 0.463 0.193 1.370 5.262$39,999 Total 2.209 2.075 0.865 0.889 1.%9 8.007$40,000- Vehicle Driver 1.828 1.487 0.437 0.166 1.517 5.434$44,999 Total 2.265 2.032 0.724 0.803 2.179 8.003$45,000- Vehicle Driver 1.894 1.624 0.603 0.164 1.619 5.903$49,999 Total 2.394 2.155 1.007 0.788 2.333 8.677$50,000- Vehicle Driver 2.048 1.688 0.556 0.216 1.874 6.383$59,999 Total 2.447 2.295 0.999 0.897 2.776 9.414$60,000- Vehicle Driver 2.217 1.732 0.584 0.215 2.019 6.766$74,999 Total 2.720 2.308 0.995 0.846 2.998 9.866$75,000- Vehicle Driver 2.289 1.807 0.651 0.227 2.195 7.169b99,999 Total 2.776 2.420 1.100 0.928 3.154 10.377
$100,000- Vehicle Driver 2.286 1.547 0.792 0.175 2.321 7.121$124,999 Total 2.786 2.055 1.2% 0.754 3.468 10.359$125,000 Vehicle Driver 2.250 1.886 0.711 0.215 2.788 7.851and over Total 2.685 2.436 1.286 0.797 3.%5 11.168
~ 1.608 1.425 0.478 0.165 1.541 5.218I;come- Total 2.065 2.022 0.858 0.765 2.332 8.043
Not Reporting Vehicle Driver 1.418 1.070 0.3% 0.136 1.060 4.080
Income Total 1.830 1.606 0.762 0.698 1.598 6.493
Vehicle Driver 1.548~ 0.452 0.156 1.389 4.859Total Total 1.991 1.891 0.827 0.744 2.100 7.553
-182-

Table 3.3.2A1990 Regional Trips per Person by Detailed Household Income Group
Household Home-Based Non-Income Mode Work Shop Soc/Rec School iome-Based Total
less than~ 0.077 0.361 O.ou 0.056 0.197 0.776$5,000 Total 0.210 0.753 0.255$5,000-
0.365 0.566 2.148Vehicle Driver 0.170 0.379 0.131 0.083 0.270 1.033
$9,999 Total 0.305 0.924 0.315 0.230 0.627 2.401$10,000- Vehicle Driver 0.210 0.380 0.111 0.067 0.378 1.145$14,999 Total 0.444 0.638 0.234 0.386 0.590 2.293$15mo - Vehicle Driver 0.382 0.558 0.161 0.032 0.483 1.617$19,999 Total 0.608 0.847 0.318 0.225 0.809 2.806$20,000- Vehicle Driver 0.484 0.577 0.188 0.046 0.549 1.846$24,999 Total 0.691 0.886 0.332 0.268 0.884 3.061$25,000- Vehicle Driver 0.509 0.529 0.137 0.046 0.464 1.684!329,999 Total 0.723 0.802 0.255 0.280 0.808 2.868$io;ooo - Vehicle Driver 0.628 0.493 0.175 0.054 0.562 1.912$34,999 Total 0.808 0.692 0.338 0.298 0.837 2.973$35,000- Vehicle Driver 0.657 0.567 0.175 0.073 0.519 1.992$39,999 Total 0.836 0.785 0.327 0.336 0.745 3.030$40,000- Vehicle Driver 0.682 0.555 0.163 0.062 0.566 2.028$44,999 Total 0.845 0.758 0.270 0.300 0.813 2.987$45,000- Vehicle Driver 0.671 0.576 0.214 0.058 0.574 2.093$49,999 Total 0.849 0.764 0.357 0.279 0.827 3.076$50,000- Vehicle Driver 0.725 0.597 0.197 0.077 0.663 2.259$59,999 Total 0.866 0.812 0.354 0.318 0.983 3.332$60,000- Vehicle Driver 0.754 0.589 0.198 0.073 0.686 2.300$74,999 Total 0.924 0.784 0.338 0.287 1.019 3.353$75,000- Vehicle Driver 0.757 0.598 0.215 0.075 0.726 2.371$99,999 Total 0.918 0.800 0.364 0.307 1.043 3.432
$100,000- Vehicle Driver 0.771 0.522 0.267 0.059 0.783 2.402$124,999 Total 0.940 0.693 0.437 0.254 1.170 3.495$125,000 VehicleDriver 0.745 0.625 0.235 0.071 0.923 2.600and over Total 0.889 0.807 0.426 0.264 1.313 3.698
Reporting Vehicle Driver 0.620 0.550 0.184 0.064 0.594 2.012Income Total 0.796 0.780 0.331 0.295 0.899 3.101
Not Reporting Vehicle Driver 0.533 0.402 0.149 0.051 0.399 1.534Income Total 0.688 0.604 0.286 0.262 0.601 2.441
VehicleDriver 0.592 0.502 0.173 0.060 0.531 1.858Total Total 0.761 0.723 0.316 0.285 0.803 2.889
-183-

Table 3.3.3A1990 RegionalTransit Sharefor Work and Total Trips per Householdby Income
Household Home-Based Work Total TripsIncome Transit All Modes % Transit Transit All Modes % Transit
less than$5,000 0.154 0.381 40.6% 0.957 3.898 24.5%$5400-$9,999 0.137 0.513 26.7% 0.828 4.038 20.5%
$10,000-$14,999 0.258 1.068 24.2% 0.801 5.511 14.5%$15,000-$19,999 0.223 1.293 17.2% 0.577 5.972 9.7%$20,000-$24,999 0.195 1.470 13.3% 0.528 ‘ 6.511 8.1%$25,000-$29,999 0.196 1.677 11.7% 0.488 6.652 7.3%$30,000-$34,999 0.199 1.995 10.0% 0.424 7.337 5.8%$35,000-$39,999 0.225 2.209 10.2% 0.397 8.007 5.0%$40,000-$44,999 0.169 2.265 7.4% 0.431 8.003 5.4%$45,000-$49,999 0.216 2.394 9.0% 0,405 8.677 4.7%
$50,000-$59,999 0.194 2.447 7.9% 0.400 9.414 4.3%$60,000-$74,999 0.272 2.720 10.0% 0.474 9.866 4.8%
$75,000-$99,999 0.214 2.776 7.7% 0.372 10.377 3.6%
$100,000-$124,999 0.245 2,786 8.8% 0.479 10.359 4.6%$125.000and over 0.168 2.685 6.3% 0.311 11.168 2.8%
.ReDortinQ
I;come” 0.210 2.065 10.2% 0.486 8.043 6.0%Not Reporting
Income 0.178 1.830 9.7% 0.464 6.493 7.1%
Total 0.200 1.991 10.0% 0.479 7.553 6.3%
-184-

Table 3.4.lA1990 Regional Trips per Household by Vehicle Availability
Vehicles Home-Based Non-Available Mode Work Sho S&ml Horn&Based Total
Vehicle Driver 0.084 0.081 0.022In-Vehicle Person 0.176 0.235 0.122 0.051 0.2% 0.879Transit 0.447 0.438 0.139 0.272 0.297 1.593
zero Person 0.623 0.673 0.261 0.322 0.593 2.472Vehicle School Bus 0.000 0.000 0.000 0.037 0.000 0.037
Bicycle 0.046 0.009 0.001 0.009 0.017 0.083walk 0.188 0.418 0.103 0.139 0.403 1.251Other 0.012 0.021 0.006 0.006 0.002 0.046Total 0.869 1.120 0.371 0.513 1.015 3.890VehicIe Driver 0.908 0.984 0.329 0.073 1.028 3.322in-Vehicle Person 1.050 1.216 0.453 0.200 1.233 4.152Transit 0.232 0.052 0.018 0.078 0.084 0.462
One Person 1.281 1.268 0.471 0.277 1.316 4.614Vehicle School Bus 0.000 0.000 0.000 0.056 0.000 0.056
Bicycle 0.026 0.010 0.021 0.019 0.013 0.091walk 0.067 0.159 0.074 0.120 0.283 0.703Other 0.003 0.005 0.005 0.001 0.007 0.021Total 1.378 1.442 0.571 0.473 1.620 5.484Vehicle Driver 1.893 1.581 0.510 0.142 1.539 5.663In-Vehicle Person 2.038 1.976 0.805 0.431 1.890 7.139Transit 0.143 0.030 0.012 0.057 0.062 0.304
Two Person 2.180 2.005 0.817 0.489 1.952 7.443Vehicles School Bus 0.000 0.000 0.000 0.097 0.000 0.097
Bicycle 0.022 0.018 0.030 0.040 0.020 0.131walk 0.029 0.107 0.091 0.169 0.276 0.673Other 0.002 0.003 0.003 : 0.001 0.013 0.021Total 2.234 2.133 0.941 0.796 2.261 8.366Vehicle Driver 2.314 1.932 0.665 0.306 2.137 7.354In-Vehicle Person 2.494 2.415 0.958 0.764 2.555 9.187Transit 0.148 0.026 0.012 0.052 0.056 0.294
Three Person 2.642 2.442 0.970 0.816 2.612 9.481Vehicles School Bus 0.000 0.000 0.000 0.067 0.000 0.067
Bicycle 0.011 0.016 0.028 0.046 0.018 0.118walk 0.030 0.102 0.096 0.218 0.264 0.710Other 0.002 0.002 0.002 0.002 0.010 0.017Total 2,685 2.562 1.096 1.148 2.903 10.394Vehicle Driver 3.241 1.943 0.911 0.516 2.568 9.180In-Vehicle Person 3.527 2,320 1.338 0.828 3.081 11.094Transit 0.107 0.020 0.026 0043 0.045 0.241
Four-t Person 3.633 2.339 1.364 0.871 3.126 11.334Vehicles School Bus 0.000 0.000 0.000 0.118 0.000 0.118
Bicycle 0.040 0.013 0.038 0.035 0.029 0.154Walk 0.075 0,061 0.116 0.206 0.242 0.699
Other 0.000 0.009 0.008 0.000 0.011 0.027Total 3.748 2.422 1.526 1.229 3.408 12.333Vehicle Driver 1.548 1.313 0.452 0.156 1.389 4.859In-Vehicle Person 1.701 1.643 0.682 0.393 1.695 6.115Transit 0.200 0.077 0.028 0.084 0.091 0.479
Total Person 1.902 1.720 0.710 0.477 1.786 6.594
School Bus 0.000 0.000 0.000 0.075 0.000 0.075Bicycle 0.025 0.014 0.025 0.031 0.018 0.113Walk 0.061 0.151 0.089 0.160 0.287 0.748Other 0.003 0.006 0.004 0.001 0.009 0.023Total 1.991 1.891 0.827 0.744 2.100 7.553
-185-

Table 3.4.2A1990 Regional Trips per Person by Vehicle Availability
Vehicles Home-Based Non-Available Mode Work Shop Soc/Rec Schml HomeBased Total
Vehicle Driver 0.046 0.044 0.012 0.009~ 0.186In-Vehicle Person 0.096 0.128 0.067 0.028 0.161 0.480Transit 0.244 0.239 0.076 0.148 0.162 0.869
zero Person 0340 0367 0.142 0.176 0324 1349Vehicle School Bus 0.000 0.000 0.000 0.020 0.000 0.020
Bicycle 0.025 0.005 0.001 0.005 0.010 0.046walk 0.103 0.228 0.056 0.076 0220 0.683Other 0.006 0.011 0.003 0.003 0.001 0.025Total 0.474 0.611 0.203 0.280 0.554 2.123Vehicle Driver 0.470 0.509 0.171 0.038 0.533 1.721In-Vehicle Person 0.544 0.630 0.235 0.103 0.639 2.151Transit 0.120 0.027 0.009 0.040 0.043 0239
One Person 0.664 0.657 0.244 0.144 0.682 2.390Vehicle School Bus 0.000 0.000 0.000 0.029 0.000 0.029
Bicycle 0.014 0.005 0.011 0.010 0.007 0.047Walk 0.035 0.082 0.039 0.062 0.147 0.364Other 0.002 0.003 0.002 0.000 0.003 0.011Total 0.714 0.747 0.296 0.245 0.839 2.841Vehicle Driver 0.659 0.550 0.177 0.049 0.536 1.971In-Vehicle Perxm 0.709 0.688 0.280 0.150 0.658 2.485Transit 0.050 0.010 0.004 0.020 0.022 0.106
Two Person 0.759 0.698 0.284 0.170 0.680 2.591Vehicles School Bus 0.000 0.000 0.000 0.034 0.000 0.034
Bicycle 0.008 0.006 0.011 0.014 0.007 0.046Walk 0.010 0.037 0.032 0.059 0.096 0.234Other 0.001 0.001 0.001 ~ 0.000 0.004 0.007Total 0.778 0.743 0.327 0.277 0.787 2.912Vehicle Driver 0.676 0.565 0.194 0.090 0.625 2.150In-Vehicle Person 0.729 0.706 0.280 0.223 0.747 2.686Transit 0.043 0.008 0.003 0.015 0.016 0.086
Three Person 0.772 0.714 0.284 0.238 0.763 2.772Vehicles School Bus 0.000 0.000 0.000 0.020 0.000 0.020
Bicycle 0.003 0.005 0.008 0.014 0.005 0.035Walk 0.009 0.030 0.028 0.064 0.077 0.208Other 0.001 0.001 0.001 0.000 0.003 0.005Total 0.785 0.749 0.320 0.336 0.849 3.038Vehicle Driver 0.833 0.499 0.234 0.133 0.660 2.359
In-Vehicle Person 0.906 0.596 0.344 0.213 0.792 2.850
Transit 0.027 0.005 0.007 0.011 0.012 0.062
Four+ Person 0.933 0.601 0.351 0.224 0.803 2.912
Vehicles School Bus 0.000 0.000 0.000 0.030 0.000 0.030
Bicycle 0.010 0.003 0.010 0.009 0.007 0.040
walk 0.019 0.016 0.030 0.053 0.062 0.180
Other 0.000 0.002 0.002 0.000 0.003 0.007
Total 0.963 0.622 0.392 0.316 0.876 3.169
Vehicle Driver 0.592 0.502 0.173 0.060 0.531 1.858
In-Vehicle Person 0.651 0.629 0.261 0.150 0.648 2.339
Transit 0.077 0.029 0.011 0.032 0.035 0.183
Total Person 0.727 0.658 0.271 0.182 0.683 2.522
HH School Bus 0.000 0.000 0.000 0.029 0.000 0.029
Bicycle 0.010 0.005 0.009 0.012 0.007 0.043
walk 0.023 0.058 0.034 0.061 0.110 0.286
Other 0.001 0.002 0.001 0.001 0.004 0.009
Total 0.761 0.723 0.316 0.285 0.803 2.889
-186-

Table 3.5.3A1990 Regional Trips per Household by Housing Structure Type
Structure Home-Based Non-T Mode Work Sho Soc/Rec School Home-Based Total~ 1.791 1.617 0.534 0.195 1.614 5.751
In-Vehicle Person 1,955 2.021 0.830 0.510 1.984 7.301Transit 0.159 0.053 0.020 0.079 0.077 0.388
Single Person 2.115 2.075 0.850 0.589 2.061 7.689Family School Bus 0.000 0.000 0.000 0.092 0.000 0.092
Bicycle 0.019 0.016 0.028 0.039 0.019 0.122walk 0.041 0.123 0.091 0.184 0.277 0.716Other 0.001 0.006 0.003 0.001 0.013 0.024Total 2.176 2.220 0.972 0.906 2.369 8.643Vehicle Driver 1.403 0.957 0.402 0.132 1.153 4.047In-Vehicle Person 1.560 1.172 0.588 0.327 1.425 5.072Transit 0.246 0.104 0.036 0.083 0.106 0.575
Duplex Person 1.806 1.276 0.624 0.410 1.531 5.647School Bus 0.000 0.000 0.000 0.051 0.000 0.051Bicycle 0.048 0.012 0.035 0.041 0.024 0.160Walk 0.064 0.165 0.100 0.143 0.290 0.761Other 0.005 0.006 0.024 0.005 0.005 0.044Total 1.922 1.458 0.783 0.650 1.849 6.663Vehicle Driver 1.020 0.711 0.297 0.083 0.846 2.956In-Vehicle Person 1.158 0.910 0.402 0.178 1.031 3.6841Transit 0.318 0.142 0.049 0.114 0.132 0.755
Apart- Person 1.476 1,052 0.450 0.293 1.163 4.435ment School Bus 0.000 0.000 0.000 0.035 0.000 0.035
BicycIe 0.039 0.014 0.015 0.019 0.016 0.102Walk 0.121 0.243 0.084 0.129 0.328 0.904
Other 0.009 0.006 0.003 ~ 0.002 0.003 0.023Total 1.644 1.314 0.552 0.479 1.510 5.499Vehicle Driver 1.524 0.992 0.367 . 0.119 1.441 4.443In-Vehicle Person 1.653 1.237 0.528 0.251 1.673 5.342Transit 0.151 0.061 0.024 0.045 0.081 0.362
Condo/ Person 1.804 1.298 0.552 0.296 1.754 5.704Townhm school BUS 0.000 0.000 0.000 0.034 0.000 0.034
Bicycle 0.018 0.002 0.028 0.003 0.008 0.059walk 0.027 0.101 0.075 0.102 0.280 0.586Other 0.002 0.005 0.005 0.000 0.001 0.014Total 1.851 1.407 0.660 0.436 2.043 6.397Vehicle Driver 0.992 1.442 0.285 0.048 1.514 4.282In-Vehicle Person 1.078 1.688 0.382 0.128 1.672 4.949Transit 0.096 0.000 0.000 0.018 0.031 0.145
Mobile Person 1.174 1.688 0.382 0.146 1.703 5.094Home school Bus 0.000 0.000 0.000 0.243 0.000 0.243
Bicycle 0.011 0.001 0.000 0400 0.041 0.053walk 0.051 0.050 0.106 0.051 0.127 0.386Other 0.000 0.002 0.000 0.000 0.002 0.003Total 1.237 1.741 0.489 0.440 1.873 5.779Vehicle Driver 0.371 0.000 0.000 0.000 0.000 0.371
In-Vehicle Person 0.371 0.000 0.000 0.000 0.000 0.371
Transit 0.240 0.268 0.268 0.000 0.000 0,775
Hotel/ Person 0.611 0.268 0.268 0.000 0.000 1.147
Motel School Bus 0.000 0.000 0.000 0.000 0.000 0.000
Bicycle 0.371 0.000 0.000 0.000 0.000 0.371
Walk 0.000 0.536 0.536 0.000 0.536 1.609
Other 0.000 0.000 0.000 0.000 0.000 0.000
Total 0.982 0.804 0.804 0.000 0.536 3.127
-187-

Table 3.5.2A1990 Regional Trips per Person by Housing Structure Type
Structure Home-Based Non-T Mode~ Work School Home-Based Total
Vehicle Driver 0.608 0.549 0.181 0.066 0.548 1.951In-Vehicle Person 0.664 0.686 0.282 0.173 0.673 2.477Transit 0.054 0.018 0.007 0.027 0.026 0.132
Single Person 0.718 0.704 0.288 0.200 0.699 2.609Family School Bus 0.000 0.000 0.000 0.031 0.000 0.031
Bicycle 0.007 0.006 0.010 0.013 0.006 0.041walk 0.014 0.042 0.031 0.062 0.094 0.243Other 0.000 0.002 0.001 0.000 0.004 0.008Total 0.738 0.753 0.330 0.307 0.804 2.933Vehicle Driver 0.562 0.383 0.161 0.053 0.462 1.620In-Vehicle Person 0.624 0.469 0.235 0.131 0.571 2.030Transit 0.098 0.042 0.014 0.033 0.042 0.230
Duplex Person 0.723 0.511 0.250 0.164 0.613 2.261School Bus 0.000 0.000 0.000 0.020 0.000 0.020Bicycle 0.019 0.005 0.014 0.017 0.009 0.064Walk 0.026 0.066 0.040 0.057 0.116 0.305Other 0.002 0.002 0.010 0.002 0.002 0.017Total 0.770 0.584 0.313 0.260 0.740 2.667Vehicle Driver 0.507 0.353 0.148 0.041 0.420 1.469In-VehiclePerson 0.575 0.452 0.200 0.089 0.512 1.828Transit 0.158 0.070 0.024 0.057 0.066 0.375
Apart- Person 0.733 0.523 0.224 0.145 0.578 2.203men t School Bus 0.000 0.000 0.000 0.018 0.000 0.018
Bicycle 0.019 0.007 0.007 0.009 0.008 0.051Walk 0.060 0.121 0.042 0.064 0.163 0.449
Other 0.004 0.003 0.002 ~ 0.001 0.002 0.012Total 0.817 0.653 0.274 0.238 0.750 2.732Vehicle Driver 0.719 0.468 0.173 0.056 0.680 2.097
In-Vehicle Person 0.780 0.584 0.249 0.119 0.790 2.522
Transit 0.071 0.029 0.011 0.021 0.038 0.171
Condo/ Person 0.851 0.613 0.260 0.140 0.828 2.692Townhm School Bus 0.000 0.000 0.000 0.016 0.000 0.016
Bicycle 0.009 0.001 0.013 0.002 0.004 0.028walk 0.013 0.048 0.035 0.048 0.132 0.276Other 0.001 0.002 0.002 0.000 0.001 0.006Total 0.874 0.664 0.311 0.206 0.964 3.019Vehicle Driver 0.512 0.744 0.147 0.025 0.781 2.208In-Vehicle Person 0.556 0.871 0.197 0.066 0.862 2.552Transit 0.050 0.000 0.000 0.009 0.016 0.075
Mobile Person 0.606 0.871 0.197 0.075 0.878 2.627Home School Bus 0.000 0.000 0.000 0.125 0.000 0.125
Bicycle 0.006 0.001 0.000 0.000 0.021 0.028Walk 0.026 0.026 0.055 0.026 0.066 0.199Other 0.000 0.001 0.000 0.000 0.001 0.002Total 0.638 0.898 0.252 0.227 0.966 2.981
Vehicle Driver 0.313 0.000 0.000 0.000 0.000 0.313In-Vehicle Person 0.313 0.000 0.000 0.000 0.000 0.313Transit 0.202 0.226 0.226 0.000 0.000 0.654
Hotel/ Person 0.515 0.226 0.226 0.000 0.000 0.967Motel school Bus 0.000 0.000 0.000 0.000 0.000 0.000
Bicycle 0.313 0.000 0.000 0.000 0.000 0.313
Walk 0.000 0.452 0.452 0.000 0.452 1.357
Other 0.000 0.000 0.000 0.000 0.000 0.000
Total 0.828 0.678 0.678 0.000 0.452 2,637
-188-

Table 3.6.lA1990 Regional Trips per Household by County of Residence
Gmnty of Home-Based Non-Residence Mode Work Sho Soc/Rec School Home-Based Total
Vehicle Driver 0.900~ 0.306 0.120 0.836 2.848In-Vehicle Person 1.068 0.846 0.422 0.212 1.036 3.584Transit 0.594 0.279 0.093 0.264 0.287 1.516
San Person 1.662 1.125 0.515 0.476 1.323 5.100Franasco School Bus 0.000 0.000 0.000 0.034 0.000 0.034
Bicycle 0.027 0.003 0.002 0.005 0.014 0.052walk 0.134 0.337 0.153 0.123 0.560 1.307Other 0.018 0.017 0.015 0.002 0.016 0.067Total 1.841 1.483 0.685 0.639 1.913 6.560VehicleDriver 1.659 1.241 0.518 0.149 1.238 4.806In-Vehicle Person 1.839 1.502 0.770 0.367 1.495 5.973Transit 0.158 0.046 0.021 0.059 0.055 0.339
San Person 1.997 1.547 0.791 0.426 1.551 6.312Mateo School Bus 0.000 0.000 0.000 0.048 0.000 0.048
Bicycle 0.039 0.013 0.043 0.032 0.015 0.141Walk 0.043 0.134 0.087 0.184 0.239 0.688Other 0.001 0.004 0,000 0.000 0.004 0.009Total 2.080 1.698 0.920 0.690 1.808 7.197Vehicle Driver 1.956 1.367 0.504 0.156 1.456 5.439In-Vehicle Person 2.108 1.755 0.803 0.441 1.758 6.864Transit 0.056 0.023 0.014 0.034 0.029 0.155
Santa Person 2,164 1.778 0.816 0.474 1.788 7.020
Clara School Bus 0.000 0.000 0.000 0.084 0.000 0.084Bicycle 0.031 0.013 0.026 0.050 0.018 0.139Walk 0.045 0.074 0.067 0.178 0.123 0.486Other 0.001 0.002 0.005 0.001 0.003 0.013Total 2.241 1.867 0.914 0.787 1.932 7.741Vehicle Driver 1.467 1.311 0.385 0.185 1.378 4.727In-Vehicle Person 1.622 1.653 0.563 0.431 1.705 5.974Transit 0.255 0.077 0.021 0.107 0.106 0.566
Alameda Person 1.876 1.730 0.585 0.538 1.811 6.540SchooI Bus 0.000 0.000 0.000 0.047 0.000 0.047Bicycle 0.029 0.026 0.020 0.030 0.024 0.129Walk 0.062 0.213 0.085 0.214 0.333 0.906Other 0.001 0.002 0.001 0.003 0.019 0.025Total 1.968 1.971 0.690 0.832 2.187 7.647VehicleDriver 1.613 1.636 0.527 0.152 1.623 5.552In-Vehicle Person 1.755 2.048 0.803 0.435 2.012 7.054Transit 0.164 0.041 0.021 0.046 0.064 0.336
Contra Person 1.919 2.089 0.825 0.481 2.076 7.389Costa School Bus 0.000 0.000 0.000 0.069 0.000 0.069
Bicycle 0.006 0.009 0.011 0.014 0.010 0.050walk 0.028 0.066 0.065 0.117 0.305 0.581Other 0.000 0.005 0,001 0.003 0.004 0.014Total 1.953 2.170 0.902 0.684 2.395 8.103
-189 -

Table 3.61A (continued)1990 Regional Trips per Household by County of Residence
countyof Home-Based Non-Residence Mode Work Shop Soc/Rec School Home-Based Total
Vehicle Driver 1.447 1.569 0.478 0.154 1.405 5.053In-Vehicle Person 1.624 2.048 0.683 0.471 1.667 6.493Transit 0.058 0.025 0.006 0.015 0.026 0.129
S&no Person 1.682 2.073 0.689 0.485 1.693 6.622School Bus 0.000 0.000 0.000 0.145 0.000 0.145Bicycle 0.020 0.005 0.016 0.035 0.006 0.082walk 0.085 0.100 0.085 0.174 0.206 0.650Other 0.004 0.018 0.000 0.000 0.003 0.025Total 1.791 2.196 0.789 0.840 1.908 7.524VehicleDriver 1.495 1.651 0.482 0.225 1.791 5.644In-Vehicle Person 1.651 2.128 0.686 0.536 2.168 7.169Transit 0.040 0.012 0.007 0.002 0.027 0.088
Napa Person 1.691 2.140 0.693 0.538 2.195 7.256School Bus 0.000 0.000 0.000 0.060 0.000 0.060Bicycle 0.023 0.029 0.028 0.075 0.022 0.177Walk 0.048 0.158 0.151 0.218 0.230 0.805
Other 0.004 0.002 0.006 0.000 0.010 0.022Total 1.765 2.329 0.878 0.891 2.458 8.320Vehicle Driver 1.471 1.632 0.426 0.125 1.786 5.439In-Vehicle Person 1.575 1.957 0.721 0.352 2.229 6.833Transit 0.030 0.052 0.018 0.042 0.045 0.187
Sonoma Person 1.606 2.009 0.738 0.394 2.274 7.021
School Bus 0.000 0.000 0.000 0.240 0.000 0.240Bicycle 0.023 0.016 0.061 0.036 0.024 0.160Walk 0.056 0.112 0.103 0.063 0.228 0.563Other 0.000 0.001 0.004 0.000 0.009 0.015Total 1.685 2.139 0.906 0.733 2.535 7.998Vehicle Driver 1.581 1.259 0.572 0.172 1.694 5.278In-Vehicle Person 1.711 1.442 0.784 0.369 1.912 6.217Transit 0.175 0.041 0.014 0.029 0.075 0.334
Marin Person 1.886 1.483 0.798 0.398 1,986 6.551School Bus 0.000 0.000 0.000 0.056 0.000 0.056Bicycle 0.009 0.012 0.063 0.033 0.034 0.151walk 0.032 0.101 0.071 0.088 0.357 0.649Other 0.002 0.003 0.004 0.000 0.006 0.015Total 1.930 1.599 0.936 0.574 2.383 7.423Vehicle Driver 1.548 1.313 0.452 0.156 1.389 4.859In-Vehicle Person 1.701 1.643 o.6a2 0.393 1,695 6.115Transit 0.200 0.077 0.028 0.084 0.091 0.479
Bay Person 1.902 1.720 0.710 0.477 1.786 6.594Area School Bus 0.000 0.000 0.000 0.075 0.000 0.075
Bicycle 0.025 0.014 0.025 0.031 0.018 0.113walk 0.061 0.151 0.089 0.160 0.287 0.748Other 0.003 0.006 0.004 0.001 0.009 0.023Total 1.991 1.891 0.827 0.744 2.100 7.553
-190-

Table 3.6.2A1990 Regional Trips per Person by County of Residence
county of Home-Based Non-Residence Mode Work Shop Soc/Rec School Home-Based Total
Vehicle ~ 0.393 0.299 0.134 0.052P 0.365 1.242In-Vehicle Person 0.466 0.369 0.184 0.092 0.452 1.564Transit 0.259 0.122 0.041 0.115 0.125 0.662
San Person 0.725 0.491 0.225 0.208 0.577 2.225Franasco School Bus 0.000 0.000 0.000 0.015 0.000 0.015
Bicycle 0.012 0.001 0.001 0.002 0.006 0.023walk 0.058 0.147 .0.067 0.054 0244 0.570Other 0.008 0.008 0.006 0.001 0.007 0.029Total 0.803 0.647 0.299 0.279 0.835 2.862VehicleDriver 0.630 0.471 0.197 0.057 0.470 1.823In-Vehicle Person 0.698 0.570 0.292 0.139 0.567 2.266Transit 0.060 0.017 0.008 0.023 0.021 0.129
San Person 0.758 0.587 0.300 0.162 0.588 2.395Mateo School Bus 0.000 0.000 0.000 0.018 0.000 0,018
Bicycle 0.015 0.005 0.016 0.012 0.006 0.053walk 0.016 0.051 0.033 0.070 Owl 0.261Other 0.000 0.002 0.000 0.000 0.001 0,003Total 0.789 0.644 0.349 0.262 0.686 2.730Vehicle Driver 0.695 0.486 0.179 0.056 0.517 1.934In-Vehicle Person 0.749 0.624 0.285 0.157 0.625 2.440Transit 0.020 0.008 0.005 0.012 0.010 0.055
Santa Person 0.769 0.632 0.290 0.169 0.635 2.495Clara School BUS 0.000 0.000 0.000 0.030 0.000 0.030
Bicycle 0.011 0.005 0.009 0.018 0.006 0.049walk 0.016 0.026 0.024 0.063 0.044 0.173Other 0.000 0.001 0.002 0.000 0.001 0.005Total 0.797 0.664 0.325 0.280 0.687 2.752Vehicle Driver 0.566 0.506 0.149 0.071 0.532 1.825In-Vehicle Person 0.626 0.638 0.217 0.167 0.658 2.306Transit 0.098 0.030 0.008 0.041 0.041 0.218
Alameda Person 0.724 0.668 0.226 0.208 0.699 2.525School Bus 0.000 0.000 0.000 0.018 0.000 0.018Bicycle 0.011 0.010 0.008 0.012 0.009 0.050Walk 0.024 0.082 0.033 0.083 0.128 0.350Other 0.000 0.001 0.000 0.001 0.007 0.010Total 0.760 0.761 0.266 0.321 0s44 2.952Vehicle Driver 0.609 0.618 0.199 0.058 0.613 2.096In-Vehicle Person 0.662 0.773 0.303 0.164 0.759 2.662Transit 0.062 0.015 0.008 0.017 0.024 0.127
Contra Person 0.724 0.789 0.311 0.181 0.784 2.789
Costa school Bus 0.000 0.000 0.000 0.026 0.000 0.026
Bicycle 0.002 0.004 0.004 0.005 0.004 0.019Walk 0.011 0.025 0.024 0.044 0.115 0.219
Other 0.000 0.002 0.001 0.001 0.002 0.005Total 0.737 0.819 0.340 0.258 0.904 3.059
-191-

Table 3.6.2A (continued)1990 Regional Trips per Person by County of Residence
county of Home-Based Non-Residence Mode Work Shop Soc/Rec School Home-Based Total
Vehicle Driver 0.502 0.544 0.166 0.053 0.487 1.754In-VehiclePerson 0.564 0.711 0.237 0.163 0.579 2.253Transit 0.020 0.009 0.002 0.005 0.009 0.045
Solano Person 0.584 0.720 0.239 0.168 0.588 2.298School Bus 0.000 0.000 0.000 0.050 0.000 0.050Bicycle 0.007 0.002 0.005 0.012 0.002 0.028walk 0.029 0.035 0.029 0.060 0.071 0.225Other 0.001 0.006 0.000 0.000 0.001 0.009Total 0.622 0.762 0.274 0.291 0.662 2.611Vehicle Driver 0.588 0.649 0.189 0.088 0.704 2.219In-Vehicle Person 0.649 0.836 0.270 0.211 0.852 2.818Transit 0.016 0.005 0.003 0.001 0.011 0.034
Napa Person 0.665 0.841 0.272 0.211 0.863 2.853School Bus 0.000 0.000 0.000 0.024 0.000 0.024Bicycle 0.009 0.011 0.011 0.030 0.009 0.069Walk 0.019 0.062 0.059 0.086 0.091 0.317Other 0.001 0.001 0.002 0.000 0.004 0.009Total 0.694 0.916 0.345 0.350 0.966 3.271Vehicle Driver 0.576 0.639 0.167 0.049 0.699 2.130In-Vehicle Person 0.617 0.766 0.282 0.138 0.873 2.676Transit 0.012 0.020 0.007 0.017 0.018 0.073
Sonoma Person 0.629 0.787 0.289 0.154 0.890 2.749School Bus 0.000 0.000 0.000 0.094 0.000 0.094Bicycle 0.009 0.006 0.024 0.014 0.009 0.063Walk 0.022 0044 0.040 0.025 0.089 0.221Other 0.000 0.001 0.001 0.000 0.004 0.006Total 0.660 0.837 0.355 0.287 0.993 3.132Vehicle Driver 0.678 0.540 0.245 0.074 0.727 2.263In-Vehicle Person 0.734 0.618 0.336 0.158 0.820 2.666Transit 0.075 0.018 0.006 0.012 0.032 0.143
Marin Person 0.809 0.636 0.342 0.171 0.852 2.809School Bus 0.000 0.000 0.000 0.024 0.000 0.024Bicycle 0.004 0.005 0.027 0.014 0.015 0.065Walk 0.014 0.043 0.030 0.038 0.153 0.279Other 0.001 0.001 0.002 0.000 0.003 0.007Total 0.827 0.686 0.401 0.246 1.022 3.183Vehicle Driver 0.592 0.502 0.173 0.060 0!531 1.858In-Vehicle Person 0.651 0.629 0.261 0.150 0.648 2.339
Transit 0.077 0.029 0.011 0.032 0.035 0.183Bay Person 0.727 0.658 0.271 0.182 0.683 2.522Area school Bus 0.000 0.000 0.000 0.029 0.000 0.029
Bicycle 0.010 0.005 0.009 0.012 0.007 0.043walk 0.023 0.058 0.034 0.061 0.110 0.286
Other 0.001 0.002 0.001 0.001 0.004 0.009Total 0.761 0.723 0.316 0.285 0.803 2.889
-192-

Table 3.12.1A1990 Regional Trips per Household by Density-Based Area Type
Area Home-Based Non-Type Mode Work Sho~ School Home-Based Total
Vehicle Driver 0.236 0.198 0.161 0.041 0.157 0.793In-Vehicle Person 0.299 0.392 0.243 0.051 0.164 1.149Transit 0.448 0.355 0.166 0.039 0.202 1.210
Regional Person 0.747 0.747 0.409 0.089 0.366 2.358Core School Bus 0.000 0!000 0.000 0.085 0.000 0.085
Bicycle 0.062 0.000 0.000 0.000 0.098 0.160walk 0.341 0368 0.081 0.150 0.464 1.404other 0.025 0.000 0.000 0.000 0.006 0.030Total 1.175 1.115 0.490 0.325 0.934 4.038VehicleDriver 0.709 0.389 0.164 0.063 0.659 1.984In-Vehicle Person 0.886 0.530 0.247 0.146 0.837 2.646
Central Transit 0.551 0.255 0.120 0.257 0.284 1.468Business Person 1.437 0.785 0.368 0.403 1.122 4.114lxstrict School Bus 0.000 0.000 0.000 0.012 0.000 0.012
Bicycle 0.038 0.000 0.000 0.003 0.008 0.049walk 0.171 0.456 0.200 0.195 0.533 1.555Other 0.025 0.027 0.023 0.006 0.026 0.107Total 1.671 1.268 0.591 0.619 1.689 5.837Vehicle Driver 1.089 0.705 0.378 0.105 0.957 3.234In-Vehicle Person 1.271 0.883 0.509 0.221 1.126 4.009
Urban Transit 0.459 0.174 0.069 0.198 0.197 1.098Business Person 1.730 1,057 0.578 0.420 1.323 5.107District School Bus 0.000 0.000 0.000 0.027 0.000 0.027
Bicycle 0.057 0.016 0.040 0.049 0.016 0.178Walk 0.115 0.324 0.131 0.089 0.496 1.155Other 0.008 0.006 0.003 , 0.005 0.005 0.028Total 1.910 1.404 0.752 0.590 1.839 6.495Vehicle Driver 1.351 1.062 0.357 0.162 0.978 3.910In-Vehicle Person 1.520 1.317 0.495 0.353 1.188 4,873Transit 0.330 0.132 0.042 0.152 0.152 0.807
Urban Person 1.850 1.448 0.536 0.505 1.341 5.680School Bus 0.000 0.000 0.000 0.045 0.000 0.045Bicycle 0.043 0.017 0.016 0.023 0.017 0.117walk 0.073 0.207 0.080 0.195 0.308 0.863Other 0.004 0.008 0.007 0.000 0.005 0.024Total 1.971 1.680 0.639 0.768 1.671 6.729VehicleDriver 1.719 1.490 0.501 0.164 1.561 5.436In-Vehicle Person 1.869 1.868 0.771 0.440 1.911 6.859Transit 0.121 0.040 0.013 0.046 0.051 0.272
Suburban Person 1.991 1.908 0.784 0.486 1.962 7.131School Bus 0.000 0.000 0.000 0.083 0.000 0.083Bicycle 0.017 0.014 0.028 0.033 0.018 0.112walk 0.043 0.101 0.080 0.161 0.237 0.622Other 0.001 0.004 0.002 0.001 0.010 0.019Total 2.051 2.027 0.895 0.765 2.228 7.966VehicleDriver 1.546 1.823 0.575 0.194 2.340 6.478In-Vehicle Person 1.619 2.188 0.929 0.424 2.822 7.982Transit 0.044 0.025 0.000 0.034 0.066 0.169
Rural Person 1.664 2.213 0.929 0.458 2.888 8.152
School Bus 0.000 0.000 0.000 0.243 0.000 0.243
Bicycle 0.000 0.007 0.002 0.034 0.003 0.046
Walk 0.025 0.080 0.115 0.056 0.400 0.676
Other 0.000 0.000 0.006 0.000 0.003 0.010
Total 1.688 2.300 1.053 0.791 3.294 9.125
-193-

Table 3.12.2A1990 Regional Trips per Person by Density-Based Area Type
Area Home-Based Non-School Hom~Based Total
Vehicle Driver 0.132 0.111In-Vehicle Person 0.167 0.220 0.136 0.028 0.092 0.643Transit 0.251 0.198 0.093 0.022 0.113 0.677
Regional Person 0.418 0.418 0.229 0.050 0.205 1320Core School Bus 0.000 0.000 0.000 0.048 0.000 0.048
Bicycle 0.035 0.000 0.000 0.000 0.055 0.090walk 0.191 0.206 0.045 0.084 0.259 0.786Other 0.014 0.000 0.000 0.000 0.003 0.017Total 0.658 0.624 0.274 0.182 0.522 2.260Vehicle Driver 0.350 0.192 0.081 0.031 0325 0.979In-Vehicle Person 0.437 0.261 0.122 0.072 0.413 1306
Central Transit 0.272 0.126 0.059 0.127 0.140 0.724Business Person 0.709 0387 0.181 0.199 0.554 2.031District School Bus 0.000 0.000 0.000 0.006 0.000 0.006
Bicycle 0.019 0.000 0.000 0.001 0.004 0.024Walk 0.085 0.225 0.099 0.096 0.263 0.768Other 0.012 0.014 0.011 0.003 0.013 0.053Total 0.825 0.626 0.291 0305 0.833 2.881Vehicle Driver 0.491 0.318 0.171 0.048 0.432 1.459In-Vehicle Person 0.573 0.398 0.230 0.100 0.508 1.809
Urban Transit 0.207 0.079 0.031 0.089 0.089 0.495Business Person 0.780 0.477 0.261 0.189 0.597 2305District School Bus 0.000 0.000 0.000 0.012 0.000 0.012
Bicycle 0.026 0.007 0.018 0.022 0.007 0.080Walk 0.052 0.146 0.059 0.040 0.224 0.521Other 0.004 0.003 0.001 “ 0.002 0.002 0.012Total 0.862 0.634 0340 0.266 0.830 2.931Vehicle Driver 0.530 0.416 0.140 0.064 0383 1.533In-Vehicle Person 0.596 0.516 0.194 0.138 0.466 1.911Transit 0.129 0.052 0.016 0.060 0.060 0.316
Urban Person 0.725 0.568 0.210 0.198 0.526 2.227School Bus 0.000 0.000 0.000 0.018 0.000 0.018Bicycle 0.017 0.007 0.006 0.009 0.007 0.046walk 0.029 0.081 0.031 0.076 0.121 0.338Other 0.002 0.003 0.003 0.000 0.002 0.010Total 0.773 0.659 0.251 0301 0.655 2.638VehicleDriver 0.632 0.548 O.lM 0.060 0.574 1.998
In-Vehicle PersOn 0.687 0686 0.283 0.162 0.702 2.521
Transit 0.045 0.015 0.005 0.017 0.019 0.100Suburban Person 0.731 0.701 0.288 0.179 0.721 2.620
School Bus 0.000 0.000 0.000 0.031 0.000 0.031Bicycle 0.006 0.005 0.010 0.012 0.007 0.041walk 0.016 0.037 0.029 0.059 0.087 0.229Other 0.000 0.001 0.001 0.000 0.004 0.007Total 0.754 0.745 0.329 0.281 0.819 2.927VehicleDriver 0.597 0.704 0.222 0.075 0!904 2.503In-Vehicle Person 0.626 0.845 0.359 0.164 1.090 3.084
Transit 0.017 0.010 0.000 0.013 0.026 0.065
Rural Person 0.643 0.855 0.359 0.177 1.116 3.150
School Bus 0.000 0.000 0.000 0.094 0.000 0.094
Bicycle 0.000 0.003 0.001 0.013 0.001 0.018Walk 0.010 0.031 0.044 0.022 0.154 0.261Other 0.000 0.000 0.002 0.000 0.001 0.004
Total 0.652 0.889 0.407 0305 1.273 3.526
-194-

Avvendix 5.0
WEEKDAY 1990 COUNTY TRAVEL
-195-

Table 5.3.1 A1990 Caunty-t ~y EcxuQ-BasedWork Trips by Mods (P/A ~~t)
vehicle vehicle Tkansit ~ mu WMirDriver Psssenger Pas~ x Oily Mans
188,178 43,396 165,869 7,581 40,411 5,360 450,79542,261 3,372 4,394 0 9 936 51,06111,353 1,427 618 0 0 0 13,39820,090 2,298 9,708 0 0 0 32,096
3,497 235 841 0 0 0 4,5730 0 0 0 0 0 00 0 0 0 0 0 0
618 0 0 0 0 0 6188,780 377 834 0 0 0 9,991
274,777 51,105 182,264 7,581 40,509 6,296 562,53265,356 17,357 27,759 0 635 0 111,107
257,76356,29213,887
4,4642,261
00
2,749
22,0393,698
3660000
506
6,614 5,058 9,6182,954 1,929 0
863 0 0739 0 0
0 0 00 0 00 0 00 0 0
00
18400000
301,09264,87315,300
5,2032,261
00
3,255402,772 43,966 38,929 6,987 10,253 184 503,091
7,954 1,021 3,733 0 0 0 12,70837,749
934,69637,026
3,8610000
2,72266,875
3,456615
0000
964 0 0 0 41,43523,235 16,739 23,611 1,351 1,066,507
194 0 “ o 0 40,6760 0 0 0 4,4760 0 0 0 00 0 0 0 00 0 0 0 00 0 0 0 0
1,021,286 74,689 28,126 16,739 23,611 1,351 1,165,80228,955 9,782 57,149 0 378 265 96,52935,76274,200
515,45243,2792,035
224273
2,942
2,8264,181
54,8881,999
000
648
3,43058,2853,765
00000
0 00 756
13,858 27,9550 00 00 00 00 0
00
35900000
42,018137,422616,277
45,2782,035
224273
3,590703,122 74,324 122,629 13,858 29,089 624 943,646
20,114 8,121 35,951 0 0 0 64,1868; 729 1; 927 811 0 0 0 11,467
10,506 0 0 0 0 0 10,506111,597 6,193 7,387 250 0 0 125,427316,304 23,163 5,847 1,639 8,148 0 355,101
9,036 940 0 0 0 0 9,9762,253 0 0 0 0 0 2,253
634 0 0 0 0 0 6346,228 667 0 0 0 0 6,895
485,401 41,011 49,996 1,889 8,148 0 586,445
-196-

Tsbls5.3.1 A (amtimed)1990 CouIIty-t ~y --Based Wxk Trips by Mxie (P/A Format)
my myOfdProd MIX
~S3Ls!fSEXS3LAIASIT. JmmLsclL9aL NAPS3LXNS2Lt?tmS2L Tot.NAPS?
NAP%
FmJ?s
NAPALA
N?QCCNhPm
NAP NAP
NAPm
NW’ MAR
NAP Tut.
ms
mm
m=
.XNATA
ma
mXiLmNAP
mm
.!XN MAR
SCIJ Tot.MARSF
MhIlm
M?Wx
mm
MWtm
mm
MARNAP
mm
MAR MAR
MAR Tot.
Tot. S
T@. S4
Test. S2Tot. ALATut. CC
Tot. S3L
Tot. NAP
Tot. XN
Tot. MAR
Tti. Tot.
Viahicla Vahicl.e Transit Wzycle Wslk otherDziver ms~ Passenger M Chly bhans
7,122 2,811 3,462 0 0 0 13.3951; 920 1; 187 900 0 0 0 4; 007
444 0 0 0 0 0 44411,025 985 933 0 0 0 1.2,94327,120 4,479 0 0 0 0 31,599
105,923 9,710 1,168 2,344 9,756 463 1.29,3646,010 1,099 0 0 0 0 7,1091,870 0 0 0 0 0 1,8702,435 0 0 0 0 0 2; 435
163,869 20,271 6,463 2,344 9,756 463 203,166665 0 113 0 0 0 778
0149187
1,8356,898
48,9102,422
646
16700
21165
5,426270317
1610
1670
227998
00
0 00 00 00 0
414 0522 2,000
0 00 0
0 3280 1490 3540 2,046
157 7,7610 57,8560 2,6920 963 .
61,712 6,456 1,666 936 2,000 157 72,9276,425 3,241 2,747 0 180 0 12,5931,433 0 0 0 0 0 1,433
0 218 0 0,, 0 0 2182,209 0 0 0 0 0 2,209
452 493 0 0 0 0 9452,584 411 0 0 0 0 2,9955,087 296 0 0 305 0 5,688
184,423 9,501 1,738 2,746 8,204 0 206,61216,935 1,217 206 0 0 0 18,358
219,548 15,377 4,691 2,746 8,689 0 251,05127,230 3,994 14,092 0 0 216 45,532
4,2521,2207,6806,3342,227
3683,830
96,661
00
210630
000
7,385
3190
170381
000
2,034
0 00 00 00 00 00 00 0
875 3,215
0000,0000
4,5711,2208,0607,3452,227
3683,830
110,170
149,802 12; 219 16,996 875 3,215 216 183,323
351,999 89,723 310,875 7,581 41,604 5,841 807,623
389,869 34,240 17,593 5,058 9,716 936 457,412
1,088,860 76,399 85,092 18,668 24,367 1,351 1,294,737719,153 68,396 23,187 14,108 27,955 543 853,342
407,146 31,825 7,808 1,639 8,148 0 456,566
130,964 11,126 1,395 2,758 9,756 620 156,619
62,852 6,821 998 522 2,305 0 73,498
194,070 9,771 1,738 2,746 8,204 0 216,529
137,376 11,117 3,074 875 3,215 0 155,657
3,482,289 339,418 451,760 53,955 135,270 9,291 4,47L 983
-197-

Vialicle vehicle mansit EicycleDz51mr Pas~ Pas~
186,152 43,273 80,512 1,010 104,595 4,747 420,28918,490
1,6022,131
691314
0176973
4,666
0
0000
1760
2,7750
197232
000
326
00000000
00000000
0 25,9310 1,6020 2,3280 9230 3140 00 3520 1,299
210,529 48,115 84,042 1,010 104,595 4,747 453,03816,770 4,389 5,444 0 211 0 26,814
259,48719,355
2,7041,301
00
211716
52,0964,415
97100000
4,663
775
0
0
0
0
00
1,752985
000000
32,958212
000000
1,4470000000
352,40325,742
3,6751,301
00
211716
300,544 61,871 10,882 2,737 33,381 1,447 410,8622,056 324 0 0 0 0 2,380
11; 438698,206
9,825732
0000
1,773184,337
3,359458
0000
23210,316
32500000
0 06,993 38,682
0 ‘, o0 00 00 00 00 0
02,262
000000
13; 443940,796
13,5091,190
0000
722,257 190,251 10,873 6,993 38,682 2,262 971,3187,775 2,130 5,368 0 0 0 15,2734,4088,343
594,80020,979
73500
554
4,4582,230
142,0395,046
969000
421 0 00 0 0
31,133 12,710 99,117139 0 589
0 0 00 0 00 0 00 0 0
00
1,09400000
9,28710,573
880,89326,753
1,70400
554637,594 156,872 37,061 12,710 99,706 1,094 945,037
3,269 1,224 8,245 0 0 0 12,738
2,772 0 0 0 0 0 2,772
2,454 1,118 0 0 0 0 3,572
43,847 9,699 799 0 0 0 54,345450,181 92,697 3,360 2,328 20,055 1,714 570,335
4,265 1,022 0 0 0 0 5,287
190 0 0 0 0 0 190
714 218 0 0 0 0 932
1,398 0 0 0 0 0 1,398
509,090 105,978 12,404 2,328 20,055 1,714 651,569
-198-

TabU 5.3.2 A (cmtimed)1990 county-t o+xmty Eam-&sed Slq (Other) ~ by H (P/A F~t)
Cnty Cnty
CifCfProd A&rS2Ls’S3LslS3LS29XJIU.ASaLmS3LsxlS2LNWS2LXNsQLmRS2L Tot.NAPS
NAPw
NW’s
NAPm
NAPCC
NAPXXl
NAP NAP
N?Q?mIQPm
NAP Tot.
mP
mm
=xXI’J ALA
mm
SCN SQL
mNAl?
mm
mm
XN Tct.NSF
M?Rw
MIIlx
M4Rm
MARC
M411SClLl
M47 NAP
Mm
Mm
MAR Tot.
Tot. S?
Tot. 91
Tot. =Tot. ALATot. CC
Tot. S3L
Tot. NAP
Tot. SIJ
Tot. ERR
Tot. T@.
vehicle Veh.icl.g Tra!uBit ac!ycleDriver Passenger Pa88k3nger &
1,233 551 401 0 0 0 2,185208 0 0 0 0 0 208215 0 0 0 0 0 215
1,365 589 0 0 0 0 1,9546,842 724 0 0 0 0 7,566
168,122 49,783 2,314 538 11,211 2,065 234,0331,002 343 0 0 0 0 1,345
445 284 0 0 0 0 729875 0 0 0 0 0 875
180,307 52,274 2,715 538 11,211 2,065 249,110245 0 0 0 0 0 245303
0487813
2,92763,153
1,40882
9080
2460
1,46815,709
640
00000
45400
00000
1,11200
00000
6,69700
00000
14000
1,2110
733813
4,39587,265
1,47282
69,418 18,395 454 1,112 6,697 140 96,2162,453 544 588 0 0 0 3,585
182 0 0 0 0 0 182220 0 0 0. 0 0 220
0 0 0 o’ 0 0 00 0 0 0 0 0 0
777 0 0 0 0 0 7771,779 497 0 0 0 0 2,276
235,341 44,816 6,807 2,229 16,833 205 306,2314,532 862 0 0 0 0 5,394
245,284 46,719 7,395 2,229 16,833 205 318,6654,432 904 897 0 0 0 6,233
3780
2,0531,141
6050
2,713110,994
00
3650
60500
13,836
226000000
2,814
0000000
1,257
0000000
8,621
0000000
107
6040
2,4181,1411,210
02,713
137,629122; 316 15,710 3,937 1,257 8,621 107 151,948
224.385 53.339 101,455 1,010 104,806 4,747 489,742
297; 666 63; 901 8; 317 1; 752 32; 958 1,447 406,041730,395 192,100 11,091 7,978 38,894 2,262 982,720657,212 157,268 32,454 12,710 99,117 1,094 959,855482,680 98,925 3,731 2,328 20,644 1,714 610,022177,745 53,847 2,314 538 11,211 2,065 247,720
66,124 16,549 454 1,112 6,697 140 91,076241,008 45,558 6,807 2,229 16,833 205 312,640120; 124 14,698 3,140 1,257 8,621 107 147,947
2,997,339 696,185 169,763 30,914 339,781 13,781 4,247,763
-199-

Table 5.3.3 A1990 County—ttxklunt y --=ed 3cdaI~ticm Trips by H @/A)
Vdicle vehicle Transit BicycleDriver PassenQer Passenger &78,650 29,661 25,758 279 45,617 3,956 183.921
8,854 2,949 789 0 - 0 -0 12; 592908 0 0 0 0 0 908787 1,490 1,388 0 0 o“ 3,665
1,347 732 249 0 0 0 2,3280 0 0 0 0 368 368
535 305 0 0 0 0 8400 0 0 0 0 0 0
2,796 802 0 461 0 593 4,65293,877 35,939 28,184 740 45,617 4,917 209,27416,042 9,859 2,061 0 344 0 28,30699,338 44,513 2,540 7,461 20,222 0 174,074
8,454 3,904 401 2,504 365 0 15,6282,280 648 172 0 0 0 3,100
336 0 0 0 0 0 336229 229 0 0 0 0 458
0 0 0 0 0 0 00 0 0 0 0 0 0
416 337 0 0 0 0 753127,095 59,490 5,174 9,965 20,931 0 222,655
3,816 2,321 841 0 0 213 7,1916,974
249,4165,840
4180
32700
4,224139,076
4,18900000
0 0 03,504 13,571 ,, 34,6842,258 0 715
0 0 00 0 00 0 00 0 00 0 0
02,936
000000
11,198443,187
13,002418
0327
00
266,791 149,810 6,603 13,571 35,399 3,149 475,3236,224 3,346 3,279 0 0 0 12,8493,3267,196
161,1039,734
905249
0439
1,7463,705
67,1656,098
459249
0299
00
5,62200000
00
8,521231
0000
0229
39,80200000
0 5,0720 11,130
824 283,0370 16,0630 1,3640 4980 00 738
189,176 83,067 8,901 8,752 40,031 824 330,7514,668 2,699 2,634 0 0 0 10,001
558 399 0 0 0 0 957573 363 0 0 0 0 936
18,269 6,384 1,447 0 528 0 26,628140,636 59,792 2,376 3,093 20,832 718 227,447
1,922 567 0 0 0 0 2,489405 0 0 0 0 0 405
515 0 0 0 0 0 515481 884 0 0 0 0 1,365
168,027 71,088 6,457 3,093 21,360 718 270,743
-200-

Table 5.3.3 A (~)1990 county-t o-county m+ased 3ocial/Racreaticm Trips by Mock (P/A)
Cnty my
CfCfRod Attr
SEs?XL%KIL 192S2L ALAS3LccS2LS3LKILlwS3LSCNsaL MARSE Tot.NAPSNAPS4NAP%NAP ALAN74?a2NAPmLNAPNWNAPsmNAP M?4RNW Tot .
m=m%mixKNALASmccmsaLmm?mmSNIYP.RXN Tot.MARS
MW?SM
m%
M?Q?m
MARm
mm
M4? NAP
Mm
M?!RM?R
MAE/ Tot.
Tot. 9?
T&. S4
Tot. 92
Tot. ALA
Tot. CTot. SQLTot. NAP
Test. 93J
Tut. R
Tot. Tot.
Vahicle vehicle Transit recycleDA. Passenger Pas#mlcJer &
240 359 0 366 0 0 965321
01,8251,890
49,6411,190
507189
00
974813
17,902757796
0
0000
670000
0000
1,108000
0000
9,920000
00000000
3210
2,7992,703
79,2411,9471,303
18955,803 21,601 670 1,474 9,920 0 89,468
277 0 0 0 0 0 27700
177844765
17,379306218
00
650
1667,845
3800
00000
28200
00000
88900
00000
6,40300
0 00 00 2420 8440 931
262 33,0600 6860 218
19,966 8,456 282 889 6,403 262 36,2581,061 1,018 885 0 0 0 2,964
01,220
0223
0251
58,8233,937
1863,659
0223183251
36,0281,683
000000
1,9000
0 00, 00 00 00 00 0
8,807 14,0920 0
0 1860 4,8790 00 4460 1830 502
598 120,2480 5,620
65,515 43,231 2,785 8,807 14,092 598 135,0285,007 871 179 0 0 0 6,057
334 0 0 0 0 0 3340 0 0 0 0 0 0
407 0 0 0 0 0 4071,087 0 0 0 0 0 1,087
700 170 0 0 0 0 8700 0 0 0 0 0 0
2,402 1,436 0 0 0 0 3,83847,100 16,558 1,233 3,736 7,307 400 76,334
57,037 19,035 1,412 3,736 7,307 400 88,927115,985 50,134 35,637 645 45,961 4,169 252,531
119; 705 54; 017 3,329 7,461 20,222 0 204,734267,767 150,707 3,905 16,075 35,278 2,936 476,668190,688 80,915 10,887 8,521 41,045 824 332,880156,515 67,658 2,625 3,324 20,832 718 251,67254,162 19,676 670 1,108 9,920 368 85,90420,336 9,407 282 889 6,403 262 37,57962.553 38.640 1,900 8,807 14,092 598 126,59055; 576 20; 563 1; 233 4; 197 7,307 993 89,869
1,043,287 491,717 60,468 51,027 201,060 10,868 1,858,427
-201-
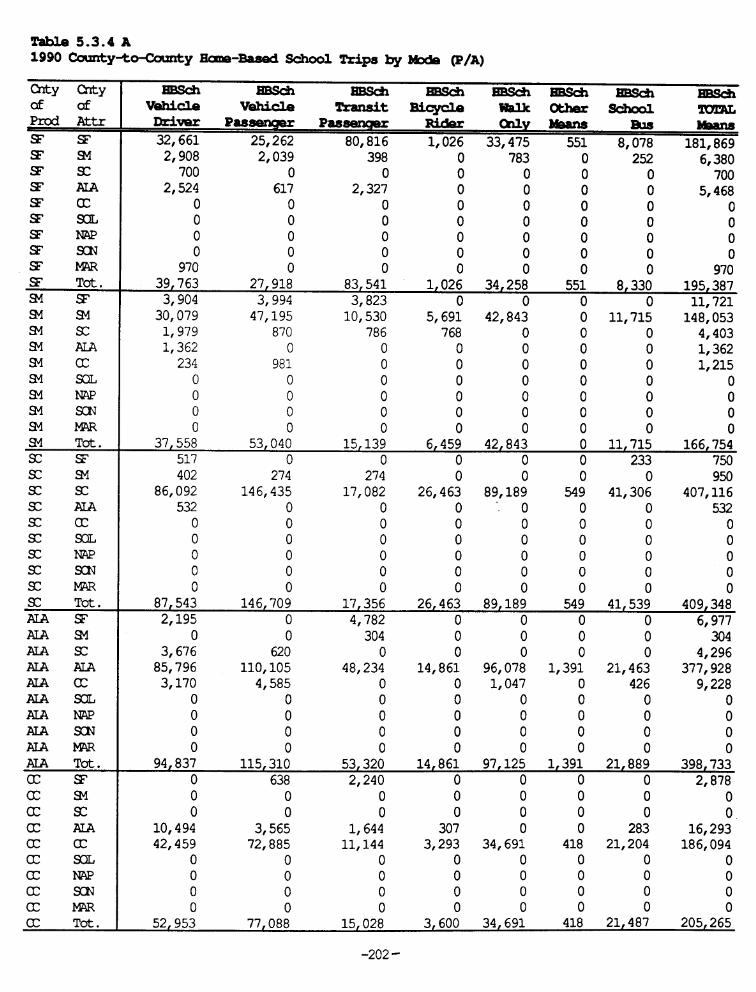
Table 5.3.4 A1990 county—tO—CmXlt y Ham3-Based S&ool Trips by Mock (P/A)
EBsa BBS& msdlmsd mvehicle &anSit Bicycm3 Imkothersaool
Dziwr Pan~ Paa~ M&ly Me?ln832,661 25,262 80,816 1,026 33,475 551 8,078 181,869
2,908 2,039 398 0 783 0 252 6,380700 0 0 0 0 0 0 700
2,524 617 2,327 0 0 0 0 5,4680 0 0 0 0 0 0 00 0 0 0 0 0 0 00 0 0 0 0 0 0 00 0 0 0 0 0 0 0
970 0 0 0 0 0 0 97039,763 27,918 83,541 1,026 34,258 551 8,330 195,387
3,904 3,994 3,823 0 0 0 0 11.72130,079
1,9791,362
2340000
47,195870
0981
0000
10; 530 5,691 42,843786 768 0
0 0 00 0 00 0 00 0 00 0 00 0 0
0 11,7150 00 00 00 00 00 00 0
148; 0534,4031,3621,215
0000
37,558 53,040 15,139 6,459 42,843 0 11,715 166,754517 0 0 0 0 0 233 750402 274 274 0 0 0 0 950
86,092 146,435 17,082 26,463 89,189 549 41,306 407,116532 0 0 0 ‘ o 0 0 532
0 0 0 0 0 0 0 00 0 0 0 0 0 0 00 0 0 0 0 0 0 00 0 0 0 0 0 0 00 0 0 0 0 0 0 0
87,543 146,709 17,356 26,463 89,189 549 41,539 409,3482,195 0 4,782 0 0 0 0 6,977
0 0 304 0 0 0 0 3043,676 620 0 0 0 0 0 4,296
85,796 110,105 48,234 14,861 96,078 1,391 21,463 377,9283,170 4,585 0 0 1,047 0 426 9,228
0 0 0 0 0 0 0 00 0 0 0 0 0 0 00 0 0 0 0 0 0 00 0 0 0 0 0 0 0
94,837 115,310 53,320 14,861 97,125 1,391 21,889 398,7330 638 2,240 0 0 0 0 2,8780 0 0 0 0 0 0 00 0 0 0 0 0 0 0
10,494 3,565 1,644 307 0 0 283 16,29342,459 72,885 11,144 3,293 34,691 418 21,204 186,094
0 0 0 0 0 0 0 00 0 0 0 0 0 0 00 0 0 0 0 0 0 00 0 0 0 0 0 0 0
52,953 77,088 15,028 3,600 34,691 418 21,487 205,265
-202-
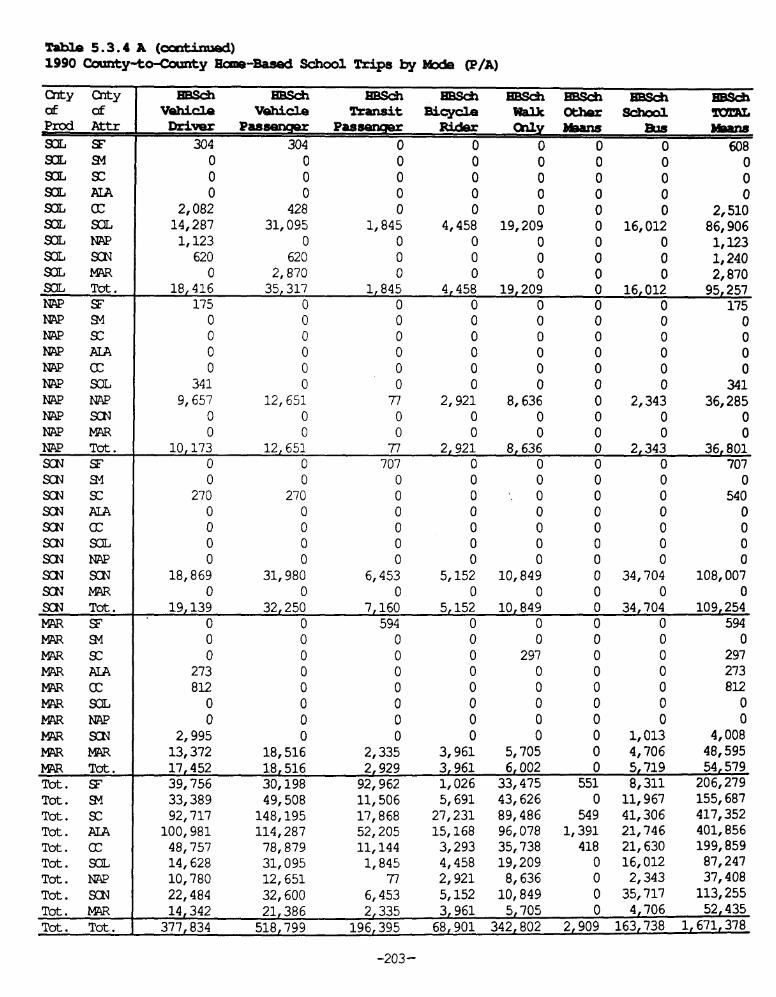
Table 5.3.4 A (cad4mad1990 county-t o+mnty I&e-Based S%ool Trips by Mock O?/A)
SB3ch - m3d15sdl BBsd
Vahida vehicle Transit Bicycle WalJc-sdmolDriw Patwmger Pas~ m.ck Qllybi3an8
304 304 0 0 0 0 0 6080 0 0 0 0 0 0 00 0 0 0 0 0 0 00 0 0 0 0 0 0 0
2,082 428 0 014,287
0 0 0 2,51031,095 1,845 4,458 19,209 0 16,012 86,906
1,123 0 0 0 0 0 0 1,123620 620 0 0 0 0 0 1,240
0 2,870 0 0 0 0 0 2,87018,416 35,317 1,845 4,458 19,209 0 16,012 95,257
175 0 0 0 0 0 0 1750 0 0 0 0 0 0 00 0 0 0 0 0 0 00 0 0 0 0 0 0 00 0 0 0 0 0 0 0
341 0 0 0 0 0 0 3419,657 12,651 77 2,921 8,636 0 2,343 36,285
0 0 0 0 0 0 0 00 0 0 0 0 0 0 0
10,173 12,651 77 2,921 8,636 0 2,343 36,8010 0 707 0 0 0 0 7070 0 0 0 0 0 0 0
270 270 0 0 ‘. o 0 0 5400 0 0 0 0 0 0 00 0 0 0 0 0 0 00 0 0 0 0 0 0 00 0 0 0 0 0 0 0
18,869 31,980 6,453 5,152 10,849 0 34,704 108,0070 0 0 0 0 0 0 0
19,139 32,250 7,160 5,152 10,849 0 34,704 109,2540 0 594 0 0 0 0 5940 0 0 0 0 0 0 00 0 0 0 297 0 0 297
273 0 0 0 0 0 0 273812 0 0 0 0 0 0 812
0 0 0 0 0 0 0 00 0 0 0 0 0 0 0
2,995 0 0 0 0 0 1,013 4,00813,372 18,516 2,335 3,961 5,705 0 4,706 48,59517,452 18,516 2,929 3,961 6,002 0 5,719 54,579
39, 7!56 30,198 92,962 1,026 33,475 551 8,311 206,279
33,389 49,508 11,506 5,691 43,626 0
92,717
11,967 155,687
148,195 17,868 27,231 89,486 549 41,306 417,352
100,981 114,287 52,205 15,168 96,078 1,391 21,746 401,856
48,757 78,879 11,144 3,293 35,738 418 21,630 199,859
14,628 31,095 1,845 4,458 19,209 0 16,012 87,247
10,780 12,651 77 2,921 8,636 0 2,343 37,408
22,484 32,600 6,453 5,152 10,849 0 35,717 113,255
14,342 21,386 2,335 3,961 5,705 0 4,706 52,435
377,834 518,799 196,395 68,901 342,802 2,909 163,738 1,671,378
-203-

Tsble 5.3.5 A1990 county—tcKOullt y Ncm-HaB-Based Trips by BbdsI (P/A Fomat)
vehicle vehicle ZkSnsit recyclemiller Passengex PassGuxJer
231,028 61,975 91,992 3,679 282,055 7,605 678.33424,312 6,625 2,377 0 - 0 -98 33; 412
3,276 195 0 0 0 0 3,47114,714 2,963 9,693 0 0 0 27,370
4,495 1,457 4,472 0 416 0 10,8401,655 288 0 0 0 373 2,316
151 0 0 0 0 0 1511,462 963 279 0 0 0 2,7047,844 1,629 1,895 0 190 0 111558
288,937 76,095 110,708 3,679 282,661 8,076 770,15625,239 3,558 2,367 0 178 151 31,493
243,447 49,632 3,570 3,719 32,067 443 332,87827,111 2,534 224 204 0 414 30,487
7,095 1,786 172 0 0 0 9,0531,655 349 0 0 0 0 2,004
221 280 0 0 0 0 5010 0 0 0 0 0 0
212 0 0 0 0 0 21.21,250 80 0 0 0 0 1,330
306,230 58,219 6,333 3,923 32,245 1,008 407,9587,495 1,040 0 0 0 424 8,959
26,516745,59022,025
3,401273116236681
3,176150,245
2,282213
00
2360
011,432
98300000
0 4119,045 ,, 71,088
0 00 00 00 00 00 240
414
4,306
000000
30,517991,70625,290
3,614273116472921
806,333 157,192 12,415 9,045 71,739 5,144 1,061,86813,315 2,384 5,914 373 0 0 21,986
8,29418,628
614,66547,618
3,308
481
904
1,966
1,3571,274
135,4886,341
20500
172
0 0 0 00 0 0 0
28,189 11,701 130,509 14,5851,495 228 323 258
0 0 0 00 0 0 00 0 0 00 0 0 0
9,65119,902
935,13756,2633,513
481904
2,138709,179 147,221 35,598 12,302 130,832 14,843 1,049,975
3,679 845 2,091 0 0 0 6,6152,458 167 0 0 0 0 2,6253,445 1,142 0 0 0 0 4,587
40,841 6,239 2,594 0 323 0 49,997366,248 84,558 2,338 1,357 45,665 4,179 504,345
4,520 875 0 0 0 0 5,395378 a o 0 0 0 439
1,225 0 0 0 0 0 1,2251,667 642 0 0 0 0 2,309
424,461 94,529 7,023 1,357 45,988 4,179 577,537
-204-

l!abb 5.3.5A (~)1990 county-t O_@UIXty km-b-~ Td.PS by ~ (P/A Fozaat)
my Cnty
Of QfOriq M&ScIJsSarJS’4SZIEmmmm!3aLJX)LlmmXKIKNxlLIImR921.J T&.NWSFNAPslNW’sNWmWCCN?QxxlNWNWNWmNTQmNW Tot.9X9S2’’JS’4m=SX’?AIASIJcmasa?N4PmmmmSCN Tot.N??RSF
M?!Rw
MARx
MAI/AJ-A
MARC
M4?XiL
MARIWP
mmmm
MAR Tot.
Tot. SF
Tot. W
Tot. 92Tot. ATA
Tot. 02Tot. SXIL
Tot. [email protected]
Tot. XXJ
Tot. W
Tot. Tot.
V’ola V’ole mansit NCycleDriver Pas~ PaammgEu Ridar
898 0 0 0 0 373 1,2710
4351,7104,747
118,3253,427
4541,472
28000
63624,650
4610
551
00000000
0000
692000
000
190
19,575000
0 2800 4350 1,710
349 5,9222,425 165,667
0 3,8880 4540 2,023
131,468 26,578 0 692 19,765 3,147 181,65098 0 0 0 0 0 980 0 0 0 0 0 0
116 0 0 0 0 0 1161,436 64 0 0 0 0 1,500
653 0 0 0 0 0 6534,239 471 0 0 0 0 4,710
70,694 11,650 834 822 8,953 261 93,214736 290 0 0 306 0 1,332196 0 0 0 0 0 196
78,168 12,475 834 822 9,259 261 101,8192,478 548 0 0 0 0 3,026
0 0 0 0 0 0 00 0 0 0, 0 0 0
834 0 0 o’ 0 0 834234 0 0 0 0 0 234882 288 0 0 0 0 1,170
1,402 586 0 0 0 0 1,988248,275 56,037 1,222 3,153 27,657 3,967 340,311
3,742 691 0 0 0 303 4,736257; 847 58,150 1,222 3,153 27,657 4,270 352;299
7,455 1,912 808 0 190 0 10,365403
1,0721,4631,534
536450
4,383142,640
4170
384308551
0508
17,966
00
376000
5042,800
0 00 00 00 00 00 00 219
2,529 23,400
0 8200 1,0720 2,2230 1,8420 1,0870 450
303 5,917786 190,121
159,936 22; 046 4; 488 2,529 23,809 1,089 213,897291,685 72,262 103,172 4,052 282,423 8,553 762,147
305,430 61,654 5,947 3,719 32,478 955 410,183799,673 155,390 11,656 9,249 71,088 4,720 1,051,776704,783 149,206 42,007 11,701 130,832 14,585 1,053,114430,585 93,862 8,305 1,585 46,594 4,786 585,717
133,959 27,608 0 692 19,575 2,798 184,632
77,099 12,758 834 822 8,953 261 100,727
257,887 58,034 2,005 3,153 28,182 4,270 353,531
161,458 21,731 4,695 2,529 23,830 1,089 215,332
3,162,559 652,505 178,621 37,502 643,955 42,017 4,717,159
-205-

Tabla 5.3.6 A1990 Cwlty-t 0-&uxl@ ~ Tr~ by _ (P/A Foxmat)
vehicle vehicle Tran8it BkyclaDriver Passenger Pas~
716,669 203,567 444,947 13,575 506,153 30,297 1,915,20896,825 19,651 10,733 0 881 1,286 129,37617,839 1,622 618 0 0 0 20,07940,246 7,368 23,313 0 0 0 70,92710,030 2,424 5,794 0 416 0 18,664
1,969 288 0 0 0 741 2,998686 305 0 0 0 0 991
2,256 1,139 279 0 0 0 3,67421,363 2,808 3,055 461 190 593 28,470
907,883 239,172 488,739 14,036 507,640 32,917 2,190,387127,311 39,157 41,454 0 1,368 151 209,441890,114 215,475 27,917 23,681 137,708 13,605 1,308,500113,191 15,421 5,140 6,390 577 414 141,133
27,328 3,771 1,207 0 0 184 32,4907,990 1,330 739 0 0 0 10,0592,711 509 0 0 0 0 3,220
0 0 0 0 0 0 0423 0 0 0 0 0 423
5,131 923 0 0 0 0 6,0541,174,199 276,586 76,457 30,071 139,653 14,354 1,711,320
21,838 4,706 4,574 0 0 870 31,98883,079 12,169 1,470 0 411 414 97,543
2,714,000 686,968 65,569 72,811 257,254 52,710 3,849,31275,248 13,286 3,760 o’ 715 0 93,009
8,412 1,286 0 0 0 0 9,698273 0 0 0 0 0 273443 0 0 0 0 0 443236 236 0 0 0 0 472681 0 0 0 240 0 921
2,904,210 718,651 75,373 72,811 258,620 53,994 4,083,65958,464 17,642 76,492 373 378 265 153,61451,790 10,387 4,155 0 0 0 66,332
112,043 12,010 58,285 0 985 0 183,3231,971,816 509,685 116,943 61,651 393,461 39,716 3,093,272
124,780 24,069 1,634 459 1,959 684 153,5856,983 1,633 0 0 0 0 8,616
954 249 0 0 0 0 1,2031,177 0 0 0 0 0 1,1775,901 1,119 0 0 0 0 7,020
2,333,908 576,794 257,509 62,483 396,783 40,665 3,668,14231,730 13,527 51,161 0 0 0 96,41814,517 2,493 811 0 0 0 17,82116,978 2,623 0 0 0 0 19,601
225,048 32,080 13,871 557 851 283 272,6901,315,828 333,095 2!5,065 11,710 129,391 28,233 1,843,322
19,743 3,404 0 0 0 0 23,1473,226 61. 0 0 0 0 3,2873,088 218 0 0 0 0 3,3069,774 2,193 0 0 0 0 11,967
1,639,932 389,694 90,908 12,267 130,242 28,516 2,291,559
-206-

Table 5.3.6 A (~)1990 mmlty—t~ y ~ -S by ~ (P/A Foxmat)
Cnty my
CJfafProd Attr
92L9?S3LS4S2LS2mLMAXILccS3LS3LS2LNAPWL4KNS2L MAR
Tot .NAPS?m?%NAP%mPAIANAPC12NAF’ExlLN?S? NAPNAPmNAPMARNAP Tot,
!XNSFXl?%
m%
mm
mm
mmSCNNW
XNXN
SCNM?R
XN Tot.
MS
MPJlw
NF!Rs
I’4Wlm
MAR(Z
mm
M?R NW’
mm
mm
MAR Tot.
Tot. 9?
Tot. S4Tot. 92
Tot. ALATest. ~
Tot. XIL
Tut. NAP
Tct. =Tot. M4R
Tot. Tot.
Vatlicle vehicle Tkansit ~---Driver P881Benger Pa8~ &
9,797 4,025 3,863 366 0 373 18,4242,449 1,467 900 0 0 0 4; 8161,094 0 0 0 0 0 1,094
15,925 2,548 933 0 0 0 19,40642,681 7,080 0 0 190 349 50,300
456,298 133,140 5,997 9,140 69,671 20,965 695,2111.2,752 2,660 0 0 0 0 15,412
3,896 1,700 0 0 0 0 5,5964,971 3,421 0 0 0 0 8,392
549,863 156,041 11,693 9,506 69,861 21,687 818,6511,460 0 113 0 0 0 1,573
303 1,075 161 0 0 0 1,539265 0 0 0 0 0 265
2,287 375 167 0 0 0 2,8294,145 211 0 0 0 0 4,356
15,170 2,170 227 414 0 157 18,138209,793 53,281 2,645 6,266 32,689 3,006 307,680
4,872 1,004 0 0 306 0 6,1821,142 317 0 0 0 0 1,459
239; 437 58,433 3,313 6,680 32,995 3,163 344; 02112,417 5,351 4,927 0 180 0 22,875
1,615 186 0 0 0 0 1,8011,710 4,147 0 0, 0 0 5,8573,043 0 0 o’ 0 0 3,043
909 716 0 0 0 0 1,6254,243 882 0 0 0 0 5,1258,519 1,630 0 0 305 0 10,454
745,731 178,362 18,120 22,087 77,635 39,474 1,081,40929,146 4,453 206 0 0 303 34,108
807,333 195,727 23,253 22,087 78,120 39,777 1,166,29744,124 7,681 16,570 0 190 216 68,7815,367 417 545 0 0 0 6,3292,292 0 0 0 297 0 2,589
11,876 959 546 0 0 0 13,38110,908 938 381 0 0 0 12,2274,068 1,326 0 0 0 0 5,394
818 0 0 0 0 0 81816,323 1,944 504 0 219 1,316 20,306
410,767 74,261 11,216 12,358 48,248 5,999 562,849506,543 Q7,526 29,762 12,358 48,954 7,531 692,674
1,023,810 295,656 644,101 14,314 508,269 32,172 2,518,3221,146,059 263,320 46,692 23,681 139,000 15,305 1,634,0572,979,412 722,791 129,612 79,201 259,113 53,124 4,223,2532,372,817 570,072 160,740 62,208 395,027 40,183 3,601,0471,525,683 371,149 33,613 12,169 131,956 29,266 2,103,836
511,458 143,352 6,224 9,554 69,671 21,863 762,122237,191 58,186 2,645 6,266 32,994 3,006 340,288778,002 184,603 18,903 22,087 78,160 40,790 1,122,545488; 876 89;495 14,477 12,819 48,678 6,895 661,240
11063308 2,698,624 1,057,007 242,299 1,662,868 242,604 16966710
-207-

Charns, Harold, Bonnnie Weinstein Nelson and Nancy Pitta. 1990 Bay Arm TravelSurveys: Final Report. Metropolitan Transportation Commission, Oakland,
California, March 1991.
Hu, Patricia, and Jennifer Young. 1990 NPTS Z)atabook: Nationwide PErsonalTransportation Survey. Federal Highway Administration, Washington, D.C.,November 1993.
Kollo, Hanna P.H. 1980 Regional Travel Characteristics: Working Paper 8:1981MTC Travel Survey. Metropolitan Transportation Commission, Berkeley,
California, June 1983.
Kollo, Hanna P.H. and Charles L. Purvis. Changes in Regional TravelCharacteristics in the San Francisco Bay Area: 1960-1981. ~ TransportationResearch Record 987. TRB, National Research Counal, Washington, D.C., 1984, pp.57-66.
Purvis, Charles L. Sample Design for the 1990 Bay Area Household Travel Survey:Working Paper 1:1990 MTC Travel Survey. Metropolitan Transportation
Commission, Oakland, California, April 1989.
Purvis, Charles L. Sample Weighting and Expansion: Working Paper 2:1990 MTCTravel Survey. Metropolitan Transportation Commission, Oakland, California,
June 1993.
Purvis, Charles L. Changes in Regional Travel Characteristics and Travel TimeExpenditures in the San Francisco Bay Area: 1960-1990. Paper presented at the 73rdAnnual Meeting of the Transportation Research Board, January 1994.
Trip Linking Procedures: Working Paper 3: 1990 Bay Area Household TravelSurvey. Metropolitan Transportation Commission, Oakland, California, June 1993.
Walcoff & Associates. Implications of Emerging Travel Trends: April 20-21, 1994:Conference Proceedings. Federal Highway Administration, July 1994.
Wigan, Marcus R. Australian Personal Travel Characteristics. Special Report #38.Australian Road Research Board, Vermont South, Victoria, November 1987.
-208- ‘

AcknowIed~ments
MTC Managment Staff
Lawrence D. Dahrns, Executive DirectorWilliam F. Hein, Deputy Executive DirectorChris Brittle, Manager, Planning SectionMarilyn M. Reynolds, Manager, Technical Services Section
Project Staff
Charles L. Purvis, Senior Transportation Planner/Analyst (Report Author)William Patrick Hackett, Senior Transportation AnalystShirley A. Rodenborn, Associate Transportation AnalystMiguel Iglesias, Associate Transportation Planner/AnalystVictoria Eisen, Associate Transportation Planner/Analyst
-209-