Automated Traffic Signal Performance Measures - ROSA P
64
Automated Traffic Signal Performance Measures Every Day Counts (EDC), a State-based initiative of FHWA’s Center for Accelerating Innovation, works with State, local, and private sector partners to encourage the adoption of proven technologies and innovations aimed at shortening and enhancing project delivery.
-
Upload
khangminh22 -
Category
Documents
-
view
1 -
download
0
Transcript of Automated Traffic Signal Performance Measures - ROSA P

Automated Traffic Signal Performance Measures
Every Day Counts (EDC), a State-based initiative of FHWA’s Center for Accelerating Innovation, works with State, local, and private sector partners to encourage the adoption of proven technologies and innovations aimed at shortening and enhancing project delivery.

AU TO M AT ED T R A F F I C S I G N A L P ER F O R M A N C E M E A S U R E S
Notice
This document is disseminated under the sponsorship of the U.S. Department of Transportation in the interest of information exchange. The U.S. Government assumes no liability for the use of the information contained in this document.
The U.S. Government does not endorse products or manufacturers. Trademarks or manufacturers’ names appear in this report only because they are considered essential to the objective of the document.
Non-Binding Contents
The contents of this document do not have the force and effect of law and are not meant to bind the public in any way. This document is intended only to provide clarity to the public regarding existing requirements under the law or agency policies. However, compliance with applicable statutes or regulations cited in this document is required.
Quality Assurance Statement
The Federal Highway Administration (FHWA) provides high-quality information to serve Government, industry, and the public in a manner that promotes public understanding. Standards and policies are used to ensure and maximize the quality, objectivity, utility, and integrity of its information. FHWA periodically reviews quality issues and adjusts its programs and processes to ensure continuous quality improvement.
COVER PHOTO CREDIT: SounderBruce, ©CC BY-SA 2.0 (https://www.flickr.com/photos/sounderbruce/22448121975)

Report Documentation
1. Report No. FWHA-HOP-20-002
2. Government Accession No. 3. Recipient’s Catalog No.
4. Title and SubtitleAutomated Traffic Signals Performance Measures
5. Report DateMarch 31, 20206. Performing Organization Code:
7. Author(s)Charles R. Lattimer
8. Performing Organization Report No.
9. Performing Organization Name and AddressAtkins North America, Inc.482 South Keller Rd.Orlando, FL 32810
10. Work Unit No.11. Contract or Grant No.DTFH6116D00048/0003
12. Sponsoring Agency Name and Address United States Department of Transportation Federal Highway Administration 1200 New Jersey Ave. SE Washington, DC 20590
13. Type of Report and Period
14. Sponsoring Agency CodeHOP
15. Supplementary NotesEddie Curtis (FHWA – HOTM)16. AbstractAutomated traffic signal performance measures (ATSPM) are an enabling technology that leveragesdata collection and analysis for proactive traffic signal system management. This report highlights the technical outreach undertaken by FHWA to assist States in meeting their Every Day Counts (EDC) Round 4 implementation objectives with respect to ATSPM. The outreach activities described in this report include use cases, workshops, webinars, and case studies.17. Key WordsAutomated traffic signal performance measures (ATSPM), objectives-based performance, traffic signals, Every Day Counts.
18. Distribution StatementNo restrictions. This document is available to the public through the National Technical Information Service, Springfield, VA 22161.http://www.ntis.gov
19. Security Classif. (of this report) Unclassified
20. Security Classif. (of this page) Unclassified
21. No. of Pages64
22. Price
Form DOT F 1700.7 (8-72) Reproduction of completed page authorized.

4
AU TO M AT ED T R A F F I C S I G N A L P ER F O R M A N C E M E A S U R E S
“Automated traffic signal performance measures (ATSPM) will revolutionize the management of traffic signals by providing the high-resolution data needed to actively manage performance.”Source: EDC-4 Final Report
PHOTO CREDIT: Adobe Stock

i
AU TO M AT ED T R A F F I C S I G N A L P ER F O R M A N C E M E A S U R E S
INSIDEEvery Day Counts: An Innovation Partnership with States 1What are Automated Traffic Signal Performance Measures? 5Automated Traffic Signal Performance Measures Before and After Every Day Counts-4 13Sample Automated Traffic Signal Performance Measures Use Cases 19Automated Traffic Signal Performance Measures Workshops 37Automated Traffic Signal Performance Measures Webinars 43Case Studies 47

ii
AU TO M AT ED T R A F F I C S I G N A L P ER F O R M A N C E M E A S U R E S

1
AU TO M AT ED T R A F F I C S I G N A L P ER F O R M A N C E M E A S U R E S
1
Every Day Counts: An Innovation Partnership with States
Every Day Counts focuses on accelerating project delivery and deploying proven innovations that facilitate greater efficiency at State and local levels to deliver the greatest value for tax dollars spent.
E very Day Counts (EDC) is a Federal Highway Administration (FHWA)program
that works in partnership with the American Association of State Highway and Transportation Officials (AASHTO) and other transportation stakeholders to foster a culture of innovation.1 It focuses on accelerating project delivery and deploying proven innovations that facilitate greater efficiency at State and local levels. EDC is designed to complement other initiatives promoting innovative technologies and practices, playing an important role in helping transportation agencies fulfill their obligation to the American people—deliver the greatest value from tax dollars spent.
1 Section 1444 of the Fixing America’s Surface Transportation Act (Public Law 114-94) (23 U.S.C. 101 note)PHOTO CREDIT:
https://www.fhwa.dot.gov/innovation/everydaycounts/reports/edc4_final/

2
AU TO M AT ED T R A F F I C S I G N A L P ER F O R M A N C E M E A S U R E S
As detailed in this report, round four of Every Day Counts (EDC-4) championed the deployment of ATSPM through a series of workshops, webinars, and case studies. These activities raised awareness of the capabilities of ATSPM and facilitated the exchange of information between peers and practitioners. FHWA has also been active in facilitating ATSPM through State Transportation Innovation Councils (STIC) and Accelerated Innovation Deployment (AID) grants, including the following.
STIC Incentive Program: This program offers assistance and funds to support the cost of standardizing innovative practices in a state transportation agency or by other public-sector STIC stakeholders. Projects were awarded to Maine, Missouri, North Carolina, and Louisiana to facilitate ATSPM deployment. Tennessee received program funding for traffic signal operations.
AID Demonstration Program: This program provides funding as an incentive for eligible entities to accelerate the implementation and adoption of innovation in highway transportation. AID Demonstration Grants for ATSPM implementation include:
} Chittenden County Regional Planning Commission (CCRPC), VT: Implementation of Automated Traffic Signal Performance Measures along an Urban Traffic Signal Corridor: Real Time Traffic Information through Bluetooth Deployment ($996,000)
} City of Dover, NH: Creating a Benchmark for Traffic Signal Performance ($649,500)
} Kentucky Transportation Cabinet (KYTC), KY: Kentucky Automated Traffic Signal Performance Measures Corridor Project (US 231 - Warren County / Richmond Bypass - Madison County) ($1,000,000)
Selected innovations share common goals:
• Accelerating project delivery
• Enhancing safety and durability of roads and bridges
• Reducing traffic congestion
• Improving environmental sustainability.
PHOTO CREDIT: FHWA
PHOTO CREDIT: Adobe Stock
3
AU TO M AT ED T R A F F I C S I G N A L P ER F O R M A N C E M E A S U R E S
} Missouri Department of Transportation (MoDOT), MO: Branson Automated Traffic Signal Performance Measures ($334,800)
} New Hampshire Department of Transportation (NHDOT), NH: Creating a Benchmark for Traffic Signal Performance ($519,600)
} Wyoming Department of Transportation, WY: Update of WYDOT’s Traffic Signal System, communications and detection upgrades to support implementation of Automated Traffic Signal Performance Measures ($1,000,000)
For a comprehensive overview of all EDC-4 innovations, please visit the EDC-4 Innovations webpage and the EDC-4 Final Report referenced at:
https://www.fhwa.dot.gov/innovation/everydaycounts/edc_4/
https://www.fhwa.dot.gov/innovation/everydaycounts/reports/edc4_final/
PHOTO CREDIT: FHWA

4
AU TO M AT ED T R A F F I C S I G N A L P ER F O R M A N C E M E A S U R E S
PHOTO CREDIT: Shutterstock

5
AU TO M AT ED T R A F F I C S I G N A L P ER F O R M A N C E M E A S U R E S
What are Automated Traffic Signal Performance Measures?Automated traffic signal performance measures are a collection of data analytics tools and approaches that automatically collect and convert high-resolution traffic controller data into actionable performance measures.
T here are more than 330,000 traffic signals operating in the United States, and highway agencies typically retime these signals on a three- to five-year cycle at a cost of approximately $4,500 per intersection.1
For many of these signals, citizen complaints are the primary measure of performance. Since performance data is not continuously collected at most intersections, intersection performance is simulated using software models based on periodic and manual traffic data collection, which adds cost and time to the signal retiming process.
When agency professionals and consultants conduct traditional retiming projects, they must often perform an ad hoc comparison of before and after travel-time data to demonstrate the effectiveness of optimization efforts. Typically, no ongoing performance measurement capability exists and agencies must rely on citizen complaints to reactively detect maintenance or operational deficiencies. This lack of active performance management can compromise safety and efficiency and contribute to congestion.
Improving Traffic Congestion through Objectives-Based 1 https://www.fhwa.dot.gov/innovation/everydaycounts/edc_4/atspm.cfm
AU TO M AT ED T R A F F I C S I G N A L P ER F O R M A N C E M E A S U R E S

6
AU TO M AT ED T R A F F I C S I G N A L P ER F O R M A N C E M E A S U R E SAU TO M AT ED T R A F F I C S I G N A L P ER F O R M A N C E M E A S U R E S
Improving Traffic Congestion Through Objectives-based SolutionsTraditional traffic signal retiming programs follow a linear, project-based process. The process starts with a triggering event, such as a customer complaint or an intersection reaching its three- to five-year retiming schedule. It then enters a design phase where volume and turning movement data is collected and analyzed with a simulation model. The resulting timing parameters are then implemented in the field, fine-tuned based on observations, and evaluated to determine the level of improvement. At this point, the process is complete and attention is only paid to the intersection if another triggering event occurs (sometimes years later).
An objectives- and performance-based traffic signal program follows a more operations-based approach. After establishing traffic signal program objectives based on agency goals and context, performance measures are identified and continuously used to monitor the effectiveness of strategies and tactics. Corrective action does not wait until external triggers compel change. Instead, agencies initiate corrective actions based on performance measures and do so before external triggers come into play.
Automated traffic signal performance measures (ATSPM) are an enabling technology that leverages data collection and analysis for proactive traffic signal system management. However, if the full benefits of ATSPM are to be realized, agencies should be willing to adopt business processes that institutionalize regular performance monitoring and that take prompt action when traffic signal issues are identified.
Why use Automated Traffic Signal Performance Measures?
The Federal Highway Administration (FHWA) promoted ATSPM in round four of Every Day Counts as a means to improve on traditional retiming processes through continuous performance monitoring. Using ATSPM, signal retiming efforts can be based directly on actual performance and continualy collected data, significantly reducing the level of effort, time, and cost involved in providing effective traffic signal operations.
ATSPM consist of a high-resolution data-logging capability added to existing traffic signal infrastructure and data analysis techniques that provides agency professionals with information needed to proactively identify and correct deficiencies. They can then manage traffic signal maintenance and operations in support of their safety, livability, and mobility goals.

7
AU TO M AT ED T R A F F I C S I G N A L P ER F O R M A N C E M E A S U R E S
Trigger
Implement
Design
• Complaints• 3-5 Year Retiming
• Collect Data• Design
• Install• Fine Tune• Evaluate
Start
Stop
Traditional
AgencyGoals
Context
ObjectivesStrategies
Tactics
Performance Measures
Objectives-based
Traditional vs. Objectives-based SolutionsSource: FHWA
PHOTOS CREDIT: FDOT (L) / FHWA (R)

8
AU TO M AT ED T R A F F I C S I G N A L P ER F O R M A N C E M E A S U R E S
2005
Indiana DOT began research intosignal performance measures (SPM)
2012
2013
2016
2017-18
Pooled Fund Study TPF-5(258)established to further develop SPMs
AASHTO selected SPMs as anInnovation Initiative technology
Salt Lake City Signal PerformanceMeasures Workshop
ATSPMs featured as EDC-4Innovation
ATSPM technology timelineSource: FHWA
ATSPM technology is cost-effective, as it can be applied to a wide range of signalized intersections and use existing infrastructure to the greatest extent possible. ATSPM can also support the validation of other technologies and operational strategies, such as adaptive signal control and emerging connected vehicle applications.
EDC Identified Benefits(https://www.fhwa.dot.gov/innovation/everydaycounts/edc_4/atspm.cfm)
} Increased Safety. A shift to proactive operations and maintenance practices can improve safety.
} Targeted Maintenance. To proactively identify and correct maintenance issues, ATSPM provide actionable information needed to deliver high-quality service to customers, with significant cost savings to agencies.
} Improved Operations. Active monitoring of signalized intersection performance allows agencies to monitor the equitable distribution of green time among vehicle, pedestrian, and bicycle movements and promote a smooth flow of vehicles along coordinated corridors.
Collaborative Research and ImplementationATSPM technology is the outcome of a collaboration among FHWA, the American Association of State Highway and Transportation Officials, state departments of transportation (DOT), and academic research efforts. A Transportation Pooled Fund study, Traffic Signal Systems Operations and Management, led by the Indiana DOT with participation from the FHWA, 11 state DOTs, and the City of Chicago, produced an open-source software option that provides a framework for continued innovation in data analysis techniques.

9
AU TO M AT ED T R A F F I C S I G N A L P ER F O R M A N C E M E A S U R E S
Automated Traffic Signal Performance Measures in a NutshellATSPMs automatically collect and convert high-resolution traffic controller data into actionable performance measures. Data and performance measures are based on the Indiana DOT high-resolution data enumerations,2 allowing them to be implemented with any type of traffic signal system that supports high-resolution data logging.
Useful PerformanceInformation
• Intersection• Corridor• System
Automated DataCollection
• Signal Controller• Probe Data
Data collection and performance informationSource: FHWA
An ATSPM system is typically made up of five basic components:
High-Resolution Controller: each time the traffic signal controller receives an input (e.g. from a detector) or generates an output (e.g. changes the phase of a signal), the controller logs the event and its timestamp in a high-resolution data log. Events are logged using standardized codes called “enumerations.”
Communications: a method of communication is needed to move high-resolution traffic log information from the controller to a central server for processing. Communications can either be persistent (like a fiber connection), periodic (like a dial-up connection), or manual (data obtained by field technician).
Server: A central server is needed to store and aggregate the high-resolution traffic data.
Software: Special ATSPM software is used to analyze the aggregated high-resolution traffic data and produce automated performance measures reports.
Detection (optional): Basic ATSPM functionality can be achieved without vehicle detection, such as analysis of green times. However, intersections with vehicle detection can benefit from more advanced capabilities such as phase utilization and offset optimization.
2 https://docs.lib.purdue.edu/jtrpdata/3/
ATSPM
Hi-rescontroller
Communications
Server
Software
Detection(optional)
Five basic ATSPM system componentsSource: FHWA

10
AU TO M AT ED T R A F F I C S I G N A L P ER F O R M A N C E M E A S U R E S
ATSPM Implementations Three main types of ATSPM implementations have emerged to date.
} Open-Source ATSPM Software: In this approach, agencies utilize open-source ATSPM software maintained by the Utah Department of Transportation and freely available on the United States Department of Transportation’s Open Source Application Development Portal. Agencies provide and maintain storage for the high-resolution controller data used by the ATSPM software. Each agency is also responsible for hosting and configuring a local installation of the open-source ATSPM software.
} Integrated ATSPM Solutions: In this approach, certain traffic controller vendors offer ATSPM capability in conjunction with their central traffic signal system management software. The cost of each integrated ATSPM solution varies per vendor.
} Third-party ATSPM Solution: In this approach, a third-party provider hosts the ATSPM data (often in the cloud). Supplemental data collection equipment is often installed either in traffic signal cabinets or at a central location to collect high-resolution controller data and forward it to the third-party provider. This solution typically involves monthly or annual subscription fees.

11
AU TO M AT ED T R A F F I C S I G N A L P ER F O R M A N C E M E A S U R E S
PHOTO CREDIT: Adobe Stock

12
AU TO M AT ED T R A F F I C S I G N A L P ER F O R M A N C E M E A S U R E S

13
AU TO M AT ED T R A F F I C S I G N A L P ER F O R M A N C E M E A S U R E S
Automated Traffic Signal Performance Measures Before and After Every Day Counts-4
A utomated traffic signal performance measures (ATSPM) are fueling a transformation in how transportation agencies approach the management,
operations, and maintenance of signalized intersections. The Federal Highway Administration’s (FHWA) inclusion of ATSPMs in the fourth round of Every Day Counts (EDC-4) initiative catalyzed the transformation of traffic signal operations from traditional reactive, temporal, and complaint-based approaches to active, objectives- and performance-based approaches. The outcome of shifting traffic signal operations from reactive to proactive results in high-quality traffic signal operations that are consistent with the needs of communities and reflected in operations and maintenance objectives. ATSPMs empower agencies to provide signal operations that are safer, promote greater mobility, reduce congestion, and demonstrate fiscal responsibility.
Deployments and Agency Participation
Prior to EDC-4, the largest catalyst for ATSPM deployment was the American Association of State Highway and Transportation Officials Innovation Initiative led by the Utah Department of Transportation. It resulted in early ATSPM technlogy implementation by states and local agencies and established a community of peers ready to share implementation experiences. In Fall 2016, regional EDC summits were held to discuss the selected EDC-4 PHOTO CREDIT: Adobe Stock

14
AU TO M AT ED T R A F F I C S I G N A L P ER F O R M A N C E M E A S U R E S
innovations (including ATSPM) and to find opportunities for implementation. After the summits, State Transportation Innovation Councils (STIC), which bring together public and private stakeholders, met to evaluate innovations and set goals for their deployment. STICs are active in all 50 States, the District of Columbia (DC), Puerto Rico, the U.S. Virgin Islands, and Federal Lands Highway. In January 2017, eleven State departments of transportation had implemented ATSPM to either the demonstration, assessment, or institutionalized levels. The remaining 43 states (whose count included Federal Lands Highway, Puerto Rico, U.S. Virgin Islands, and DC) reported ATSPM in the development stage or were not planning to implement. 1
Institutionalized Assessment Demonstration Development Not Implementing
United States map showing baseline (January 2017) for ATSPM deploymentSource: EDC-4 Baseline Report, https://www.fhwa.dot.gov/innovation/everydaycounts/reports/edc4_baseline/
At the conclusion of EDC-4 in December 2018, 31 states had achieved their implementation goals of deploying ATSPM on either the demonstration, assessment, or institutionalized levels. The remaining 23 states reported ATSPM in the development stage or were not planning to implement. While the goal of implementation by at least 35 states was not achieved, it is notable that during this two-year period the percentage of states demonstrating, evaluating, or institutionalizing ATSPM crossed the 50 percent threshold and reached 57 percent by December 2018.
1 https://www.fhwa.dot.gov/innovation/everydaycounts/reports/edc4_baseline/

15
AU TO M AT ED T R A F F I C S I G N A L P ER F O R M A N C E M E A S U R E S
Institutionalized Assessment Demonstration Development Not Implementing
United States map showing final (December 2018) ATSPM deploymentSource: EDC-4 Final Report, https://www.fhwa.dot.gov/innovation/everydaycounts/reports/edc4_final/
Software Options and Private Sector ProductsDuring the course of EDC-4 implementation, the number of ATSPM solutions have increased significantly. Prior to EDC-4, UDOT developed an open-source ATSPM software solution with the support of FHWA and the private sector. UDOT also hosted workshops to share their experience and support ATSPM implementation by others. As EDC-4 unfolded, the number of private sector ATSPM solutions increased and provided operating agencies with a diverse family of options to support implementation.Attainment of demonstration, assessment, or institutionalized
implementation across all StatesSource: FHWA
0
5
10
15
20
25
30
35
Baseline (Jan 2017) Final (Dec 2018) Demonstration Assessment Institutionalized
6
32
16
11
4

16
AU TO M AT ED T R A F F I C S I G N A L P ER F O R M A N C E M E A S U R E S
In parallel with EDC-4, FHWA has also worked to provide other opportunities for support to operating agencies. This includes hosting the latest versions of the ATSPM open source code on the GitHub software platform. FHWA has also worked to foster a community of ATSPM users and developers by hosting regular User Development Forum webinars that provide a venue for developers to provide updates on code enhancements and for users to learn from the deployment experience of their peers.
Private sector products featuring ATSPM capabilities have surged during the time-frame of EDC-4 implementation from four to 14. The largest growth in private sector ATSPM adoption has been the result of traffic signal equipment manufacturers including ATSPM capabilities into their traffic signal management software. Third-party data solutions companies have also entered the mix with vendor-agnostic platforms that can integrate with existing systems regardless of controller manufacturer. Most third-party options provide a subscription-based solution that hosts an agency’s ATSPM data in the cloud. Agencies without large in-house information technology resources may find cloud-based ATSPM solutions easier to implement since most of the administration and storage is handled off-site by the third-party provider.
Guidance
Several lessons learned were identified by FHWA during the EDC-4 implementation initiative.
} Technology alone cannot solve every problem with a traffic signal system. As part of outreach activities, care was made to present ATSPM as one component of an objectives- and performance-based traffic signal program. In spite of that effort, some agencies continue to view ATSPM as an automatic “quick fix” to traffic signal timing issues. Instead, for ATSPM to be effective, agencies should change their business process and staffing to encourage traffic signal optimization based on data-oriented triggers. Eddie Curtis, traffic operations specialist with the FHWA Office of Operations, likens ATSPM to the tire pressure light on a car dashboard. “The tire pressure light is a great thing, since it tells you when your pressure is low. However, it doesn’t put the air in your tires for you—that’s something you as a driver must do.” In the same way, ATSPMs can serve as a warning light for traffic signal system issues. However, there should be a process in place for traffic engineers and technicians to take action based on the information they receive. ATSPMs by themselves will not improve traffic flow. However, ATSPMs give traffic engineers and technicians a much clearer picture of traffic system and intersection performance. This information allows them to find and address issues faster than was possible in the past. Good information together with taking proper action can lead to improved traffic operations.

17
AU TO M AT ED T R A F F I C S I G N A L P ER F O R M A N C E M E A S U R E S
} A more comprehensive approach to local engagement could address under-reporting of ATSPM implementation. EDC-4 implementation goals for ATSPM were defined as state-level goals through coordination between FHWA and each State DOT. Implementation progress was tracked though information provided by State departments of transportation (DOT) to their local FHWA Division Office. Because of this, FHWA typically has good visibility into ATSPM initiatives conducted at the State level. However, the situation is more complicated in States with large numbers of local maintaining agencies. In some cases, implementation by local agencies may not be reported to the FHWA Division Office, so the status of implementation in the State may be under-reported. In other cases, a local agency may have a greater interest in ATSPM implementation than the State DOT. A State DOT may have established a “no implementation” goal, while at the same time a local maintaining agency may be operating a very mature ATSPM deployment. This State would not receive credit for implementation even though the state of the practice was being advanced. Because of these issues, a more comprehensive approach would be helpful in engagement with local maintaining agencies to avoid under-reporting of ATSPM implementation.

18
AU TO M AT ED T R A F F I C S I G N A L P ER F O R M A N C E M E A S U R E S
PHOTO CREDIT: Pexels

19
AU TO M AT ED T R A F F I C S I G N A L P ER F O R M A N C E M E A S U R E S
Sample Automated Traffic Signal Performance Measures Use Cases
A utomated traffic signal performance measures (ATSPM) tools are being adopted by a growing number of agencies across the nation because they are practical and easy to use. In this section, we will look at five use cases where ATSPM can be used by traffic engineers and technicians to solve
specific problems encountered on a regular basis. It is important to emphasize that ATSPM tools do not solve problems by themselves; technicians and engineers must interpret ATSPM reports and take action. However, with ATSPM as part of the workflow, engineers and technicians can often identify and solve problems faster than they ever could before.
USE CASE 1: Using Automated Traffic Signal Performance Measures to Improve Traffic Signal System Maintenance
One of the foundational elements of a modern traffic signal system is reliable vehicle detection. When detectors malfunction or fail, intersection operation suffers. Detector malfunctions can occur at any time of the day or night, so finding intermittent issues or overnight detection issues can be very difficult if an agency only relies on in-person field device checks to find problems. ATSPM currently offers two solutions that can be used to identify persistent detector issues: the ATSPM Watchdog Report and the Purdue Phase Termination Diagram. These performance analysis tools allow troubleshooting to occur in advance of dispatching maintenance crews, significantly reducing the time and level of effort involved in diagnosing problems and completing repairs.
PHOTO CREDIT:PEXELS

20
AU TO M AT ED T R A F F I C S I G N A L P ER F O R M A N C E M E A S U R E S
ATSPM Watchdog Report
The ATSPM Watchdog is a scheduled executable that runs daily to identify abnormal activity within the high-resolution traffic signal database logs. These abnormalities are often symptoms of detector failures, communication failures, or signal timing issues. When the following conditions are detected1, an email alert is generated once per day:
} No data: This condition reports phases with less than 500 records in the dataset over a 24-hour period (between midnight and midnight the previous day). Rationale: This condition can often identify failed or intermittent communication with the traffic signal.
} Force offs: This condition reports phases with more than 90 percent force offs in at least 50 activations between 1:00 AM and 5:00 AM of the same day. Rationale: Since traffic is typically sparse between these times, the occurrence of force offs should be low. A high number of force offs often suggests a detector problem.
} Max outs: This condition reports phases with more than 90 percent max outs in at least 50 activations between 1:00 AM and 5:00 AM of the same day. Rationale: Since traffic is typically sparse between these times, the occurrence of max outs should be low. A high number of max outs often suggests a detector problem.
} Low advance detector counts: This condition reports phases with Purdue Coordination Diagram detectors that have less than 100 vehicles counted between 5:00 PM and 6:00 PM the previous day. Rationale: This time period normally represents one of the peak periods for daily traffic, so a low number of vehicle counts often suggests a detector problem.
} Stuck ped: This condition reports phases with more than 200 pedestrian actuations between 1:00 AM and 5:00 AM the same day. Rationale: Pedestrian traffic is typically sparse between these times, so ped button activity should be low. A high number of ped actuations often suggests a stuck ped button.
--The following signals had too many max out occurrences between 1:00 and 5:00
3220 - I-75 SB & Jodeco Road - Phase 2 (Max Outs 100%)3398 – SR 7 & SR 3 - Phase 3 (Max Outs 96.7%)3441 - I-85 SB & Kia Boulevard - Phase 1 (Max Outs 100%)3441 - I-85 SB & Kia Boulevard - Phase 6 (Max Outs 100%)3441 - I-85 SB & Kia Boulevard - Phase 8 (Max Outs 95.5%)3449 - Kia Boulevard & Warner Road - Phase 2 (Max Outs 98.7%)3449 - Kia Boulevard & Warner Road - Phase 8 (Max Outs 97.3%)5023 - SR 4 BUS & Blackshear Avenue - Phase 8 (Max Outs 96.2%)5031 - SR 24 & SR 73 Bypass - Phase 6 (Max Outs 100%)5072 - SR 4 & SR 15 - Phase 4 (Max Outs 94.3%)
Sample ATSPM Watchdog Report, Georgia Department of Transportation
1 The default system values, which can be changed based upon the operational environment of the agency’s signal system, are described in each condition.

21
AU TO M AT ED T R A F F I C S I G N A L P ER F O R M A N C E M E A S U R E S
Purdue Phase Termination Diagram
The Purdue Phase Termination Diagram is a graphic that displays the trigger event (Force-Off, Gap-Out, or Max-Out) for each traffic signal phase at an intersection, typically over a 24-hour period. Time of day is shown on the x-axis while each signal phase is shown in ascending order on the y-axis. Colored dots along each horizontal phase grid line indicate the termination state of each phase at each time of day. Signal plans are indicated by alternating blue and gray background shading.
} Green – Indicates a Gap-Out meaning that the phase ended prior to reaching its maximum green setting and remaining time could be available for other phases.
} Red – Indicates a Max-Out meaning that the phase termination was triggered by the phase reaching its maximum green setting, suggesting the phase may not have enough green time.
} Blue – Indicates a Force-Off for coordinated phases or an intersection operating with fixed phase timing (not-actuated) Force-Off is the normal trigger event for phase termination.
} Brown – Indicates that the pedestrian interval for the phase was active, which could hold the phase in the absence of vehicle demand.
In the example on the following page, courtesy of the Georgia Department of Transportation (GDOT), the dark red bands in the left-most and right-most regions of the diagram denote frequent Max-Outs during the overnight hours, suggesting detection failure. When vehicle detectors fail, the result is typically a continuous call to phase, causing a Max-Out. This was confirmed by a field visit and the detectors were subsequently replaced.
PHOTO CREDIT: Pexels

22
AU TO M AT ED T R A F F I C S I G N A L P ER F O R M A N C E M E A S U R E S
Sample Purdue Phase Termination Diagram, GDOT
In another example, a high number of force offs of Phase 1 were observed during the free operation of the signal during overnight hours, as shown in the two left panels of the Purdue Termination Diagram below. A field inspection determined that detection was operating properly. However, a misconfigured parameter in the timing plan was identified and corrected. The right two panels of the diagram show a return to normal operation with no force offs occurring in the red circled time periods.
Sample Purdue Phase Termination Diagram, GDOT

23
AU TO M AT ED T R A F F I C S I G N A L P ER F O R M A N C E M E A S U R E S
USE CASE 2: Signal Timing
ATSPM tools can be very effective in quickly identifying signal timing issues and in providing the context necessary to evaluate potential solutions. Since ATSPM visualizations are normally presented on a 24-hour basis, these charts can spot trends and issues that may be more difficult for a technician making a short-term site visit to see. The following examples show how two different ATSPM visualizations can be used to improve the performance of splits and offsets of an intersection.
Purdue Coordination Diagram
As the name suggests, the Purdue Coordination Diagram is used to evaluate the operation of coordinated signals and to identify signal timing parameters that could be modified to improve vehicle progression. The x-axis lists the time of day, while the y-axis denotes beginning (green dots) and end (red dots) of a phase for each cycle. A green line (resulting from consecutive phases starting at the same time during a plan) running horizontally through the middle of the diagram denotes the activation of the green phase, while a red line near the top shows where the red phase was activated. Black dots on the chart indicate arrivals of individual vehicles at the intersection, typically at upstream detectors. Dots below the green line represent vehicles arriving on red, while those above the green line represent vehicles arriving on green. Therefore, intersections with good progression would have the majority of black dots above the green line.
In the Purdue Coordination Diagram shown below, the majority of vehicles arriving between 8:00 AM and 8:00 PM before offset optimization arrived on red as shown by the cloud of black dots in the bottom portion of the diagram to the left. As shown in the diagram on the right, after the offsets were optimized, the majority of black dots cluster above the green line, which indicates their arrival on green in the course of good progression.
Before Offset Optimization After Offset Optimization
More arrivals on red More arrivals on green
Sample Purdue Coordination Diagram, Iowa State University

24
AU TO M AT ED T R A F F I C S I G N A L P ER F O R M A N C E M E A S U R E S
Purdue Split Failure Diagram
Another tool that can be used to evaluate signal timing performance is the Purdue Split Failure Diagram. A split failure occurs when a phase cannot serve all its demand within one cycle—if it takes a vehicle two or more cycles to execute its movement at an intersection, a split failure has occurred. In the context of ATSPM, split failures are detected by comparing the following two ratios:
} The green occupancy ratio (GOR) measures detector occupancy during the green time of each cycle. A high GOR suggests dense traffic conditions, while a low GOR suggests sparse traffic or large gaps of time when no traffic is being served.
} The red occupancy ratio during the first five seconds of red (ROR5) measures detector occupancy during the first five seconds of red time. A high ROR5 suggests dense traffic conditions at the beginning of the red phase, while a low ROR5 suggests sparse traffic or a gap in traffic at the beginning of the red phase.
When GOR and ROR5 are both high (typically 80 percent or higher), this suggests the occurrence of a split failure. The Purdue Split Failure Diagram denotes each split failure with a vertical yellow line along with the average GOR and ROR5 over the previous 15 minutes. The chart also lists the total number of split failures over the entire day along with the number and percentage of split failures during each timing plan. This information allows traffic engineers to easily determine which plans and phases are encountering the highest number of split failures and where to direct their attention.
Sample Purdue Split Failure Diagram, Utah Department of Transportation

25
AU TO M AT ED T R A F F I C S I G N A L P ER F O R M A N C E M E A S U R E S
The Purdue Coordination Diagram also lists a parameter known as the arrival on green (AoG), which measures the percentage of vehicles that arrive at the intersection during the green interval of a phase. AoG can be tracked over time in an offline spreadsheet as a measure of intersection performance. In the example below, the AoG decreased between June 2017 and May 2018 due to gradually increasing traffic demand. Signal timing updates in June 2018 and July 2018 caused AoG to increase, which can be seen on the graph below. Traffic engineers can use offline methods like this to track performance of intersections over time and identify where timing plan adjustments could be beneficial.
20%
25%
30%
35%
40%
45%
50%
3/17 4/17 5/17 6/17 7/17 8/17 9/17 10/17 11/17 12/17 1/18 2/18 3/18 4/18 5/18 6/18 7/18
% A
rriv
als
on G
reen
Monthly Average during AM Peak
AM % Arrivals on Green SIG#6146 - SR-73 & Ranches Parkway
Sample Sample Aggregate Data Percent of Vehicles Arriving on Green, Utah Department of Transportation

26
AU TO M AT ED T R A F F I C S I G N A L P ER F O R M A N C E M E A S U R E S
USE CASE 3: Safety
In addition to maintenance and signal timing activities, ATSPMs can also be used to identify intersection safety concerns in the areas of red light running and pedestrian delay.
Yellow and Red Actuations
According to the Insurance Institute for Highway Safety2, 890 people were killed in crashes that involved red-light running, while another 132,000 people were injured in red-light running crashes. ATSPM can help traffic engineers identify intersections with high occurrences of red-light running. One of the primary tools available to assist in this effort is the Yellow and Red Actuations diagram. This chart identifies vehicles approaching the intersection on yellow and red whose speed is too high to safely stop. The vehicle arrivals are then plotted against yellow and red overlays that indicate whether the phase was in yellow or red indication. This allows the traffic engineer to see whether vehicles passed through the intersection on yellow, during the red clearance interval, or committed a severe red-light violation by entering the intersection while a conflicting phase was active.
The Federal Highway Administration Highway Safety Engineering Studies: Procedural Guide document provides a table that links crash patterns to probable causes and general countermeasures.3 This table has been further adapted by the New York State Department of Transportation in their Highway Safety Improvement Program (HSIP) manual.4 For each crash pattern observed, all probable causes should be considered when selecting a general countermeasure. The Yellow and Red Actuations diagram can assist engineers with evaluating insufficient signal timing and yellow phases that are too short. Per the General Crash Pattern and Countermeasures table, countermeasures for a yellow phase that is too short can include increasing the length of the yellow phase and providing an all-red clearance interval. The Yellow and Red Actuations diagram can be used to document the frequency of red-light running instances before and after adjustments to the length of yellow and all-red intervals. Other countermeasures that can improve signal timing include providing progression through a set of signalized intersections and updating the signal timing based on current traffic conditions. These improvements can be validated using ATSPM tools such as the Purdue Coordination Diagram, Split Failure Diagram, and Phase Termination Diagram.
2 https://www.iihs.org/topics/red-light-running3 https://www.fhwa.dot.gov/publications/research/safety/00003/index.cfm4 https://www.dot.ny.gov/divisions/operating/osss/highway-repository/Red%20Book.pdf
PHOTO CREDIT: Shutterstock

27
AU TO M AT ED T R A F F I C S I G N A L P ER F O R M A N C E M E A S U R E S
Sample Yellow and Red Actuations Diagram, Utah Department of Transportation
Pedestrian Delay
ATSPM tools can also be used to help traffic engineers improve pedestrian safety. One method involves identifying intersections with excessive pedestrian delay. When a pedestrian actuates a crossing button, there is an expectation that they will receive a crosswalk indication in a reasonable amount of time. Otherwise, they may infer that the crossing button is nonfunctional and attempt to cross traffic without waiting for the pedestrian signal, in which case, the pedestrian is at greater risk of injury.
The Pedestrian Delay diagram contains several useful pieces of information that provides insight into pedestrian activity at an intersection. Pedestrian delay is defined as the time between when a pedestrian pushes the crosswalk button and when the walk indication is activated. The diagram shows the number of pedestrian actuations per day in a graph denoting the time when each actuation occurred. Consistently high numbers of pedestrian actuations during certain times of the day could lead traffic engineers to consider operating the intersection in pedestrian recall during certain timing plans. The diagram also shows the minimum, maximum, and average pedestrian actuation delay during the day, along with the pedestrian delay for each actuation. The average pedestrian delay for each timing plan is also shown. While the definition of “excessive pedestrian delay” is subjective, the Pedestrian Delay diagram can provide the traffic engineer with empirical data to compare with citizen complaints and anecdotal information. This data gives traffic engineers a better basis to support their decisions regarding pedestrian timing.

28
AU TO M AT ED T R A F F I C S I G N A L P ER F O R M A N C E M E A S U R E S
Sample pedestrian delay diagram, Utah Department of Transportation
Sample pedestrian delay diagram, Utah Department of Transportation

29
AU TO M AT ED T R A F F I C S I G N A L P ER F O R M A N C E M E A S U R E S
USE CASE 4: Evaluating Adaptive Traffic Control
Because ATSPM methodologies operate as an observer in parallel with the traffic signal control system, they can be used to monitor a wide variety of traffic control schemes, including adaptive systems. According to Justin Effinger, a traffic engineer with Lake County, Illinois, most adaptive systems are only evaluated at the beginning of their life span – right after they are installed. Without periodic evaluation, it is difficult to determine if the adaptive systems are working as intended. ATSPM provides the data necessary to objectively evaluate the performance of adaptive systems on an on-going basis and at very specific times of the day.
One area where ATSPMs can assist with improving adaptive signal control involves the double serving of side streets. When traffic on a major route is light, a side street can be double served to reduce queues and delay. However, when traffic on the major route is heavy, double serving the side street would generally be discouraged since it could lead to increased delays on the major route. The Purdue Coordination Diagram and/or the Split Monitor can be used to identify situations where double serving is either occurring too often or not enough.
Double Serving Occurs too Frequently
One example of double serving on a side street in Lake County, IL occurred at the intersection of Illinois Route 176 (IL-176) and Hawley Street. IL-176 is the major route, while Hawley Street is the side street. A citizen raised a concern that the signal was cycling too fast and causing backups on IL-176. Closed-circuit television (CCTV) camera footage also confirmed a backup on IL-176. When the ATSPM Split Monitor was reviewed, the traffic engineer noticed shorter green times for IL-176 than would be expected using engineering judgment (as shown in the purple rectangle below). Likewise, when the engineer looked at the InSync adaptive traffic control software, a gap was noticed between the coordinated tunnels, which provided enough time to double serve Hawley Street. In this instance, double serving the side street was not helpful, since it leads to excessive delay on the major route. Sample ATSPM split monitor before closing gap, Lake County, IL
Excess double-serving of side street

30
AU TO M AT ED T R A F F I C S I G N A L P ER F O R M A N C E M E A S U R E S
The traffic engineer closed the gap between the coordinated tunnels to prevent double serving of Hawley Street when IL-176 was at its busiest. Double serving was still allowed to occur during lighter traffic conditions on IL-176. When the Split Monitor was examined after the change, longer green times for IL-176 were consistently observed, shown by the mostly empty space in the purple region of the chart to the left. CCTV cameras also confirmed that the backup on IL-176 was no longer present.
More Double Serving Could be Beneficial
The opposite conditions were occurring at the nearby intersection of Gilmer Road (major route) and Freemont Center Road. When the traffic engineer looked at the Purdue Coordination Diagram, a large area of white space was typically observed in the early portion of the green phase, which is shown by the purple region in the chart below. Since black dots represent the arrival of vehicles, white space suggests unused green time on the major route. That is, green time was being given to a relatively empty road when it could potentially be allocated for use by the side street.
Sample ATSPM split monitor after closing gap, Lake County, IL
Excess double-serving of side street eliminated
Sparse vehicle density suggests unused green time
Sample Purdue coordination diagram, Lake County, IL

31
AU TO M AT ED T R A F F I C S I G N A L P ER F O R M A N C E M E A S U R E S
In response to this observation, the traffic engineer modified adaptive control settings to increase the ability to double serve Freemont Center Road. This allows the adaptive system to borrow green time from Gilmer Road and provide it to Freemont Center Road when demand on the side street warrants. When the traffic engineer examined the Purdue Coordination Diagram the following week, the amount of white space within the cycle was reduced. The cycle time was also reduced in some cases, as it was allowed to shrink to fit the actual traffic demand on the major route.
When borrowing green time from a major route to provide to the side street, traffic engineers want to make sure that they are not inadvertently making conditions worse on the major route. One way they can confirm this is by comparing the arrival-on-green percentage before and after the timing adjustment. In this example, the arrival-on-green before and after the change was equal to 90 percent. This shows that, although green time on the major route was reduced, it did not have a negative impact on the major route traffic progression.
Increased vehicle density suggests unused green time has been reduced
Sample Purdue coordination diagram, Lake County, IL

32
AU TO M AT ED T R A F F I C S I G N A L P ER F O R M A N C E M E A S U R E S
USE CASE 5: Extending ATSPM to Evaluate Program and Corridor Performance
Using ATSPM tools, traffic signal engineers can develop a deep understanding of how well intersections are operating from a signal timing perspective. Using tools like the Purdue Coordination Diagram, engineers can also get a sense of how well one intersection is coordinated with the previous intersection. However, getting a picture of corridor-level performance can take some additional manual work in terms of pulling charts for adjacent intersections and comparing them side-by-side.
At the time of this writing, the open source ATSPM software does not include corridor-level performance metrics by default. Other agencies are working to extend ATSPM functionality by aggregating ATSPM metrics into corridor-level reports. This use case will examine two examples.
Georgia Department of Transportation: Measurement, Accuracy, and Reliability Kit 1 Dashboard
The Georgia Department of Transportation (GDOT) manages major signalized arterials in the Atlanta metropolitan area on a corridor level as part of their Regional Traffic Operations Program. Goals of this multi-jurisdictional program include improving traffic flow on a corridor basis and helping local jurisdictions identify and repair traffic signal issues. To monitor performance of each corridor, GDOT developed a dashboard that aggregates ATSPM and other system performance metrics on an automated basis. This dashboard, called the GDOT Measurement, Accuracy, and Reliability Kit (MARK 1), frees up valuable staff time from creating corridor performance reports manually. This allows staff to focus their time on solving issues instead of creating reports.
The MARK 1 dashboard, shown below, displays a wide range of information such as arterial performance measures (e.g., arrivals on green, progression ratio, split failures, corridor volumes, and device and communication uptime).
Example of MARK 1 dashboard, Georgia Department of Transportation

33
AU TO M AT ED T R A F F I C S I G N A L P ER F O R M A N C E M E A S U R E S
The MARK 1 dashboard allows users to select tabs to choose monthly and quarterly summary reports, detailed corridor performance output reports by intersection, equipment up-time reports, and watchdog reports for intersections along a corridor (or for all monitored corridors). For example, the Arrivals on Green performance report ranks all intersections along a corridor by their percent arrivals on green. This allows traffic engineers to quickly identify problem intersections. They can then use traditional ATSPM tools to investigate the problem intersection in more detail and identify the root cause of the problem.
Activity reports like the one on the right also help traffic signal staff track the number and types of maintenance incidents reported each month and understand how responsive they were in resolving those incidents.
Sample MARK 1 summary report, Georgia Department of Transportation
Sample MARK 1 activity report, Georgia Department of Transportation

34
AU TO M AT ED T R A F F I C S I G N A L P ER F O R M A N C E M E A S U R E S
Pennsylvania Department of Transportation: Arterial Performance Metrics using Probe Data
The Pennsylvania Department of Transportation (PennDOT) is approaching ATSPM from a different angle than other agencies discussed in this report. Instead of building ATSPM performance measures from high-resolution traffic controller data, they are exploring how third-party probe data can be used to evaluate arterial performance on a corridor level. In addition, they are also exploring how some traditional ATSPM charts can be reconstructed using third-party probe data.
Probe data refers to traffic data obtained from mobile connected data sources that transmit location information back to a centralized system. Examples of such data sources include cell phones, automatic vehicle location equipment installed in delivery fleet vehicles, and connected dashboard navigation devices. Third-party traffic data providers, such as INRIX©, HERE©, and TomTom©, aggregate and anonymize this data then use it to generate average speed and travel time data on roadway segments.
PennDOT, along with Purdue University and the University of Maryland Center for Advanced Transportation Technology Laboratory, is working to develop a series of arterial performance metrics tools and integrate them into the Probe Data Analytics Suite. The first of these is a travel time comparison tool that compares arterial travel time using a cumulative frequency diagram, as shown to the right.
A user would pick a segment of road on an interactive map and then select the date and time ranges they want to compare; the diagram would then be generated automatically. The cumulative frequency diagram shows what percentage of observed travel times were at or below a certain duration. Consider a diagram showing a travel time of 14 minutes with a cumulative frequency of 75 percent. This means 75 percent of the observed travel times during the time period were at or below 14 minutes. In comparing two time periods, if the graph shifts to the left travel times are improving. Likewise, a graph with a steeper slope indicates travel times are more reliable (i.e. consistent) along a corridor. In practice, the cumulative frequency diagram can be used to conduct a before-and-after comparison of signal timing plan adjustments. It can also be used to identify if corridor travel times are degrading over time, thus warranting attention.
Sample cumulative frequency diagram, Pennsylvania Department of Transportation

35
AU TO M AT ED T R A F F I C S I G N A L P ER F O R M A N C E M E A S U R E S
Another tool PennDOT is working on can simultaneously compare the performance of multiple arterial routes. This is done by plotting the median travel time as a percentage of the speed limit against the interquartile range as a percentage of the speed limit travel time. Conceptually, this graph displays normalized travel time on the x-axis and normalized travel time reliability on the y-axis. Points are plotted on the graph from different time periods. If the trend of these points is down and to the left (moving closer to the axes origin), travel times and reliability are trending better. If the trend is up and to the right, conditions are trending worse. When several corridors are plotted at once, it is possible to see which corridors experience improving conditions and which ones experience deteriorating traffic conditions. Based on this knowledge, the traffic engineer can look more deeply into the root cause of the issue using more traditional ATSPM tools.
Median and IQR both got worse
Median and IQR both got better
Conceptual plotting of median travel time, Pennsylvania Department of Transportation

36
AU TO M AT ED T R A F F I C S I G N A L P ER F O R M A N C E M E A S U R E S
Seattle, WA
Portland, OR
Phoenix, AZ
Trenton, NJ
Atlanta, GA
San Franscisco, CA
Denver, CO
Kansas City, MO
St. Louis, MOBaton Rouge, LA
Knoxville, TN
Buffalo, NY
Lake County, ILAmes, IA
Pocatello, IDHelena, MT
Boise, ID
Map of the United States showing state where workshops were performedSource: FHWA

37
AU TO M AT ED T R A F F I C S I G N A L P ER F O R M A N C E M E A S U R E S
Automated Traffic Signal Performance Measures WorkshopsFrom June 2017 to March 2019, the Federal Highway Administration (FHWA) traveled the nation delivering peer-exchange workshops to champion the use of automated traffic signal performance measures (ATSPM) strategies, along with objectives- and performance-based approaches to traffic signal program management. The purpose of the workshops was to provide a catalyst for States and regions to advance to the next stage of ATSPM implementation, described as national goals in the Everyday Counts round 4 (EDC-4) ATSPM Implementation Plan. While the workshops were customized to the needs of each specific state or region, workshops generally featured the following content:
Overview of objectives- and performance-based approaches to traffic signal program management. In order to set the stage, an FHWA representative presented an overview of objectives- and performance-based traffic signal program management. ATSPM is most beneficial when used as a tool to support objectives- and performance-based traffic signal timing. Speakers discussed how ATSPM can be used to determine if traffic signal timing objectives are being achieved and how ATSPM can suggest strategies and tactics to further improve system performance.
Overview of the development of ATSPM. Typically facilitated by Dr. Chris Day from Iowa State University, this section introduced the history of ATSPM, the motivations behind its development, required system components, and use case examples. Dr. Day played a fundamental role in the development of ATSPM during his time at Purdue University. Focus was paid primarily to the ATSPM Open Source Software, currently maintained by the Utah Department of Transportation.
Peer experience. In this workshop section, peer agencies were invited to present their experience using ATSPM to improve their traffic signal management programs. In order to offer a balanced perspective, the peers invited were often a mixture of out-of-state agencies with mature programs and local agencies that were early ATSPM adopters.

38
AU TO M AT ED T R A F F I C S I G N A L P ER F O R M A N C E M E A S U R E S
Implementation alternatives. With the recognition that the open-source ATSPM software is not the only ATSPM architecture, some workshops included a portion dedicated to ATSPM software implementation alternatives. This normally included several vendor presentations featuring examples of embedded ATSPM solutions or cloud-based ATSPM solutions.
Challenge for action. At the conclusion of the workshops, the audience was challenged to consider any barriers to ATSPM implementation that must be overcome and to identify concrete short-term and long-term steps they could take to advance implementation of ATSPM in their agency.
PHOTO CREDIT: Adobe Stock/FHWA
PHOTO CREDIT: Adobe Stock/Shutterstock

39
AU TO M AT ED T R A F F I C S I G N A L P ER F O R M A N C E M E A S U R E S
Between June 2017 and March 2019, 17 workshops were held in 17 cities in 15 states, reaching over 750 total participants.
ATSPM Workshops
Location Date Sponsoring Agencies State/Regional
Number of Participants
Presenters
Phoenix, AZ June 8, 2017 Maricopa County Regional 57 Eddie Curtis, FHWAJamie Mackey, UDOTHowell Li, PurdueShawn Gotfredson, Overland Park, KSPrivate Sector
MTC/San Francisco Bay Area
August 7, 2017
MTC Regional 68 Eddie Curtis, FHWAEd Fok, FHWAJamie Mackey, UDOTAlan Davis, GDOTJeff Jenq, Oz EngineeringRob Klug, Clark County, WAPrivate Sector
Atlanta, GA August 23, 2017
GDOT State 52 Eddie Curtis, FHWAChris Day, Iowa State UniversityJennifer Portanova, NCDOTMatt Luker, UDOTRob Klug, Clark County, WAShawn Gotfredson, Overland Park, KSDan Farley, PennDOTAlan Davis, GDOT
Seattle, WA November 15, 2017
WSDOT State 97 Eddie Curtis, FHWAKarl Typolt, TranspoShaun Quayle, Washington County, ORJamie Mackey, UDOTJeff Jenq, Oz EngineeringAlan Davis, GDOTPrivate Sector
Baton Rouge, LA December 13-14, 2017
LADOT State 19 Eddie Curtis, FHWAChris Day, Iowa State UniversityHowell Li, PurdueAlan Davis, GDOT

40
AU TO M AT ED T R A F F I C S I G N A L P ER F O R M A N C E M E A S U R E S
ATSPM Workshops (cont’d)
Location Date Sponsoring Agencies State/Regional
Number of Participants
Presenters
Denver, CO January 23, 2018
Denver Regional Council of Governments (DRCOG) and CDOT
Regional 35 Eddie Curtis, FHWAPatricia Sergeson, FHWAGreg MacKinnon, DRCOGMatt Luker, UDOTDan Farley, PennDOTAlan Davis, GDOTJeff Jenq, AZTechShawn Gotfredson, City of Overland Park, KS
Portland, OR April 10-11, 2018
Oregon Department of Transportation
State 23 Rick Denney, FHWAEddie Curtis, FHWAChris Day, Iowa State UniversityDarcy Bullock, Purdue University
Pocatello, ID August 14, 2018
Idaho Transportation Department
State 23 Rick Denney, FHWAChris Day, Iowa State UniversityDan Farley, PennDOTJames Robertson, Lee Engineering
Boise, ID August 16, 2018
Idaho Transportation Department
State 30 Rick Denney, FHWAChris Day, Iowa State UniversityDan Farley, PennDOTJames Robertson, Lee Engineering
Helena, MT September 26, 2018
Montana Department of Transportation
State 25 Eddie Curtis, FHWAChris Day, Iowa State UniversityDerek Lyman and Spencer Palmer, VTransPrivate Sector
Kansas City, MO October 23, 2018
Missouri Department of Transportation
Regional 46 Eddie Curtis, FHWAChris Day, Iowa State UniversityNoel Forrester, City of Olathe, KSShawn Gotfredson, Overland Park, KSMarc Lewis, Missouri DOTSam Harris, GDOTPrivate Sector

41
AU TO M AT ED T R A F F I C S I G N A L P ER F O R M A N C E M E A S U R E S
ATSPM Workshops (cont’d)
Location Date Sponsoring Agencies State/Regional
Number of Participants
Presenters
St. Louis, MO October 25, 2018
Missouri Department of Transportation
Regional 41 Eddie Curtis, FHWAChris Day, Iowa State UniversityShawn Gotfredson, Overland Park, KSAlan Davis, GDOTPrivate Sector
Knoxville, TN October 30, 2018
Tennessee Department of Transportation
State 71 Rick Denney, FHWAChris Day, Iowa State UniversityJustin Effinger, Lake County IllinoisEric Itzel, City of SeviervilleDavid Sheely, City of Cleveland
Buffalo, NY November 28, 2018
NITTEC, New York State Department of Transportation
Regional 29 Rick Denney, FHWAChris Day, Iowa State UniversityDan Farley, PennDOTJoshua Hollingsworth, Tallahassee, FLPrivate Sector
Chicago, IL February 19, 2019
Lake County, IL Regional 53 Eddie Curtis, FHWAChris Day, Iowa State UniversityJustin Effinger, Lake County DOTSamuel Harris, GDOTPrivate Sector
Ames, IA February 21, 2019
Iowa DOT State 22 Rick Denney, FHWAChris Day, Iowa State UniversitySteve Gault, PennDOTShawn Gotfredson, Overland Park, KSPrivate Sector
Trenton, NJ March 21, 2019
ITS New Jersey State 77 Eddie Curtis, FHWAChris Day, Iowa State UniversityDr. Thomas Brennan, The College of New JerseyKelly McVeigh, NJDOTSteve Gault, PennDOT

42
AU TO M AT ED T R A F F I C S I G N A L P ER F O R M A N C E M E A S U R E S
PHOTO CREDIT: Shutterstock

43
AU TO M AT ED T R A F F I C S I G N A L P ER F O R M A N C E M E A S U R E S
Automated Traffic Signal Performance Measures WebinarsThe Federal Highway Administration (FHWA) hosted a six-part webinar series to familiarize participants with technical aspects of automated traffic signal performance measures (ATSPM), how they fit into an objectives- and performance-based management framework, and implementation options that fit a range of agency capability and infrastructure situations. The National Operations Center of Excellence (NOCoE), Every Day Counts newsletter and website, and the FHWA Local Public Agency website and newsletter promoted the webinars. Held bimonthly, the webinars were free and open to all interested attendees, including state and local agencies and the consulting community. Archives of each webinar session are publicly available through the FHWA Office of Operations.
PHOTO CREDIT: Adobe Stock

44
AU TO M AT ED T R A F F I C S I G N A L P ER F O R M A N C E M E A S U R E S
Funding the Implementation of Traffic Signal Projects and ATSPM [Webinar link]February 22, 2018 1:00 – 2:45 PM ETThis webinar provided an overview of funding mechanisms available to agencies to support traffic signal improvements, including ATSPM. In addition to providing a refresher on the process involved for accessing Federal-aid funds, the webinar shared experiences and lessons-learned from the state department of transportation, metropolitan planning organization, and local level. Participants learned appropriate funding methods to support projects such as signal retiming and infrastructure upgrades, and implementing new operational approaches like ATSPM.
Moderator: Eddie Curtis, FHWA
Presenters: Robert Wright, FHWA Office of Program Administration Raj Ponnaluri, Florida Department of Transportation Robert Rich, Metropolitan Transportation Commission Debbie Bauman, City of Albuquerque Paul Barricklow, Lee Engineering
Traffic Signal Maintenance and ATSPM [Webinar link]Wednesday, April 25, 2018 1:00 – 2:30 PM ETThis webinar featured examples of how agencies are using ATSPM to improve maintenance and asset management of their traffic signal systems. ATSPM visualizations allow technicians and traffic engineers to view an entire day’s worth of detection information, phase terminations, and other traffic signal data at one time. Using these visualizations, agency staff can quickly spot detector failures, stuck pedestrian actuations, and other maintenance issues that negatively affect traffic signal performance.
Moderator: Eddie Curtis, FHWA
Presenters: Chris Day, Iowa State University Alan Davis, Georgia Department of Transportation Matt Luker, Utah Department of Transportation
The Impact of ATSPM on the Design and Operation of Signalized Intersections [Webinar link]Thursday, June 21, 2018 1:00 – 2:30 PM ETThis webinar discussed topics in traffic signal design and operations that agencies should consider when approaching an ATSPM deployment. Decisions made during the traffic signal design process, such as the use and placement of advance detection, can determine the ultimate capabilities of an ATSPM system. By making design decisions that are in alignment with an agency’s goals and objectives, ATSPM strategies can become another tool to help improve traffic operations and signal maintenance.
Note: The FHWA does not endorse or promote specific products that were presented within the context of these webinars.
Moderator: Eddie Curtis, FHWA
Presenters: Shaun Quayle, Washington County Oregon Sajad Shiravi, Miovision Farhad Pooran, Econolite
Webinar 1
Webinar 2
Webinar 3

45
AU TO M AT ED T R A F F I C S I G N A L P ER F O R M A N C E M E A S U R E S
Improving Signal Timing and Operations with ATSPM [Webinar link]Thursday, August 23, 2018 1:00 – 2:30 PM ETThis webinar explored how ATSPM can be used to improve traffic signal timing and operations. ATSPM technology and strategies allow agencies to keep track of traffic signal performance on an ongoing basis. Instead of waiting for months for information from signal timing studies, agencies can respond to citizen complaints and operation issues within days and hours, saving agencies time and money. Our speakers presented practical examples of how ATSPM has been used to improve traffic signal timing within their agencies on a daily basis.
Moderator: Eddie Curtis, FHWA
Presenters: Christopher Day, Iowa State University Rob KIug, Clark County Washington Jamie Mackie, Utah Department of Transportation
Software Investments and Options for ATSPM Deployment [Webinar link]Thursday, November 15, 2018 1:00 – 2:30 PM ETThis webinar explored various software options available to agencies wishing to deploy ATSPM strategies. From open-source software platforms to vendor-specific software solutions, there have never been more options available to agencies looking to improve their traffic signal operations with ATSPM approaches. This webinar featured a range of speakers from the academic community, public sector, and vendor community that presented a representative spectrum of software solutions.
Moderator: Eddie Curtis, FHWA
Presenters: Steve Gault, Pennsylvania Department of Transportation Mark Taylor, Utah Department of Transportation Rich Schmidt, Intelight
ATSPM, Adaptive Signal Control Systems, and Connected Vehicle Applications [Webinar link]Thursday, January 24, 2018 1:00 – 2:30 PM ETThis webinar explored the relationship between ATSPM, adaptive signal control systems, and signal phase and timing (SPaT)/connected vehicle applications. ATSPM is a simple and effective approach to monitor the performance of adaptive signal control systems in an objective manner. With the introduction of SPaT and connected vehicle integration on the horizon, ATSPM techniques can help agencies determine the effectiveness of these applications in increasing arrivals on green, increasing vehicle throughput, and other relevant traffic signal program objectives.
Moderator: Eddie Curtis, FHWA
Presenters: Justin Effinger, Lake County Division of Transportation Aleks Stevanovic, Florida Atlantic University Faisal Saleem and April Wire, Maricopa County, Arizona
Webinar 4
Webinar 5
Webinar 6

46
AU TO M AT ED T R A F F I C S I G N A L P ER F O R M A N C E M E A S U R E S
1
Automated Traffic Signal Performance Measures
Case Studies
Utah Department of Transportation
UDOT TRAFFIC SIGNAL PROGRAM OVERVIEW
TRAFFIC SIGNAL SYSTEMS CAPABILITY MATURITY SELF ASSESSMENT
Level 1Ad-Hoc,
High Risk
Level 2
Established,
Risk Acknowledged
Level 3
Measured,
Managed Risk
Level 4
Managed,
Low Risk
Business Processes
Systems and Technology
Performance Measurement
Organization and Workforce
Culture
Collaboration
Traffic Signal Systems Capability Maturity Self-Evaluation Tool: https://ops.fhwa.dot.gov/tsmoframeworktool/tool/tssc/
ATSPM CAPABILITY
Automated Traffic Signal Performance Measures (ATSPM) are a cost-
effective way for agencies to measure and display signalized intersection
performance. ATSPM enables UDOT to proactively manage traffic signal
timing and quickly identify maintenance issues that affect traffic flow.
UDOT’s ATSPM program benefited from its partnership with Purdue
University, FHWA, and the Transportation Pooled Fund Program. Today,
UDOT’s ATSPM contains a suite of data visualization reports that can
be used to evaluate the quality of traffic progression along corridors
and identify unused green time for allocation to other intersection
movements. System reports of vehicle delay, volumes, and speeds can be
used to evaluate the effectiveness of signal timing adjustments. ATSPM
visualizations can also be used to inform UDOT staff of vehicle and
pedestrian detector malfunctions, saving staff time during maintenance
operations. ATSPM tools speed up decision making and help UDOT staff
prioritize operation and maintenance efforts. UDOT’s ATSPM also features
a public-facing website (http://udottraffic.utah.gov/atspm/) that allows
users to generate charts for the following performance metrics:
y Approach delay
y Approach speed
y Approach volume
y Arrivals on red
y Coordination diagram
y Pedestrian delay
y Phase termination
y Preemption details
y Split failure
y Split monitor
y Turning movement counts
Photo Credit: UDOT
“Signal performance measures have
enabled the State of Utah to do more
with less, focus our resources on the
areas of most need, and to more
effectively prioritize resources and
workload.”
Mark Taylor
Traffic Signal Operations Engineer, UDOT
1
Automated Traffic Signal Performance MeasuresCase Studies
Maricopa County, ArizonaMARICOPA COUNTY TRAFFIC SIGNAL PROGRAM OVERVIEW
TRAFFIC SIGNAL SYSTEMS CAPABILITY MATURITY SELF ASSESSMENTLevel 1Ad-Hoc,
High Risk
Level 2Established,
Risk Acknowledged
Level 3Measured,
Managed Risk
Level 4Managed,Low Risk
Business ProcessesSystems and TechnologyPerformance MeasurementOrganization and WorkforceCultureCollaboration
Traffic Signal Systems Capability Maturity Self-Evaluation Tool: https://ops.fhwa.dot.gov/tsmoframeworktool/tool/tssc/ATSPM CAPABILITYMaricopa County plays a leadership role in the 24-member consortium called the AZTech Regional Partnership in
Arizona. Members of the partnership represent organizations in the Phoenix metropolitan area and work together
under the shared mission of providing seamless transportation across jurisdictional boundaries.The AZTech Regional Partnership implemented Automated Traffic Signal Performance Measures (ATSPM) in a
regional context using Maricopa County’s central ATSPM server. The ATSPM server is part of AZTech’s Regional
Archived Data System (RADS), which is a system for collecting, processing, and archiving intelligent transportation
systems (ITS) data from regional and local subsystems and 14 traffic management centers. Maricopa County’s
deployment approach leverages the existing Maricopa Association of Governments (MAG) Regional Communication
Network (RCN) communication infrastructure, minimizing implementation costs and maximizing the availability
of the technology for agencies in the region. AZTech ATSPM installations use a simplified detection configuration
capable of collecting the following signal performance measures: y Approach delay y Approach speed y Approach volume y Arrivals on red y Coordination diagram
y Pedestrian delay y Phase termination y Preemption details y Split failure y Split monitor
1
Automated Traffic Signal Performance MeasuresCase Studies
Georgia Department of Transportation
GDOT TRAFFIC SIGNAL PROGRAM OVERVIEW
TRAFFIC SIGNAL SYSTEMS CAPABILITY MATURITY SELF ASSESSMENT
Level 1Ad-Hoc, High RiskLevel 2Established,
Risk Acknowledged Level 3Measured,Managed RiskLevel 4Managed,Low Risk
Business Processes
Systems and Technology
Performance Measurement
Organization and Workforce
Culture
Collaboration
Traffic Signal Systems Capability Maturity Self-Evaluation Tool: https://ops.fhwa.dot.gov/tsmoframeworktool/tool/tssc/
ATSPM CAPABILITY
GDOT partnered with the Utah Department of Transportation to leverage
their experience deploying ATSPM. GDOT’s ATSPM deployment follows
the same basic architecture used in Utah and features a public-facing
website (https://traffic.dot.ga.gov/ATSPM/) to make data and analysis
readily available. Data collected by the ATSPM system allows GDOT to
better manage the operations and maintenance of signals. GDOT’s traffic
engineers can use data visualizations from the ATSPM system to answer
questions like, are green times appropriate, or did a retiming project
completed by a consultant team produce a benefit to the system. GDOT
also uses ATSPM data when developing alternate routing plans for events
and emergencies. For example, ATSPM tools helped to develop routing and
adjust signal timing to address the 2017 I-85 bridge collapse in Atlanta.
Publicly available data on the GDOT ATSPM site includes:
• Approach delay
• Approach volume
• Arrivals on red• Coordination diagram
• Purdue split failure
• Pedestrian delay
• Preemption details
• Phase termination
• Speed• Split monitor• Turning movement counts
• Yellow and red actuations
Photo Credit: GDOT
“Having eyes on the entirety of
our large system has been pretty
much impossible. But with the
introduction of ATSPM, we have a
snapshot of the health of our entire
system and the ability to quickly
diagnose and focus resources
across the whole system.”
Alan Davis Assistant State Traffic Engineer, GDOT
1
Automated Traffic Signal Performance Measures
Case Studies
Clark County, Washington
CLARK COUNTY, WA TRAFFIC SIGNAL PROGRAM OVERVIEW
TRAFFIC SIGNAL SYSTEMS CAPABILITY MATURITY SELF ASSESSMENT
Level 1Ad-Hoc,
High Risk
Level 2Established,
Risk Acknowledged
Level 3Measured,
Managed Risk
Level 4Managed,
Low Risk
Business Processes
Systems and Technology
Performance Measurement
Organization and Workforce
Culture
Collaboration
Traffic Signal Systems Capability Maturity Self-Evaluation Tool: https://ops.fhwa.dot.gov/tsmoframeworktool/tool/tssc/
ATSPM CAPABILITY
Clark County, Washington, has implemented Automated Traffic Signal Performance Measures (ATSPM) as part of the
overarching Signal Timing, Evaluation, Verification, and Enhancement (STEVE) program. Clark County’s ATSPM system
objectives are:
• Time the signals for safe and efficient travel.
• Manage the existing roadways.
• Defer expensive capital projects.
• Gather data to help make decisions.
• Provide information to the public.
Clark County’s system is the outcome of a collaborative effort with Trafficware to develop an ATSPM module that
stores and supports the evaluation of High-Resolution Data, Bluetooth data, alarms and event logs, and other signal
timing events to develop performance measures that are consistent with the traffic signal program’s objectives.
ATSPM data are manually analyzed by staff to assess performance. To reduce staff time spent analyzing data and
improve the depth and breadth of traffic signal performance, Clark County is developing an ATSPM dashboard. The
dashboard will provide near real-time transportation network performance information. The dashboard will help
traffic engineers analyze data to determine how the transportation system is operating compared with recent traffic
trends and performance metrics associated with individual corridors. The system will automatically flag current
operations that are outside accepted performance parameters. These checks are also monitored to determine if an
occurrence is a one-time instance or an ongoing situation.
1
Automated Traffic Signal Performance MeasuresCase StudiesPennsylvania Department of TransportationPENNDOT TRAFFIC SIGNAL PROGRAM OVERVIEW
TRAFFIC SIGNAL SYSTEMS CAPABILITY MATURITY SELF ASSESSMENTLevel 1
Ad-Hoc, High Risk
Level 2Established,Risk Acknowledged
Level 3Measured,Managed Risk
Level 4Managed,Low Risk
Business Processes
Systems and Technology
Performance Measurement
Organization and Workforce
Culture
Collaboration
Traffic Signal Systems Capability Maturity Self-Evaluation Tool: https://ops.fhwa.dot.gov/tsmoframeworktool/tool/tssc/
ATSPM CAPABILITYThe Pennsylvania Department of Transportation’s (PennDOT) automated traffic signal performance measure (ATSPM)
program is statewide in scale. PennDOT has implemented ATSPMs where high-resolution controllers and field
communications are available. PennDOT’s ATSPM system allows users to analyze the following performance metrics:
y Approach delay y Approach speed y Approach volume y Arrivals on red y Coordination diagram y Pedestrian delay
y Phase termination y Preemption details y Split failure y Split monitor y Turning movement counts
ATSPM IMPLEMENTATIONPennDOT’s overall ATSPM goals include: y Reducing delay, emissions, and fuel consumption.
y Reducing crashes and fatalities. y Focusing impacts on the economy and job creation.
y Standardizing traffic signal equipment. y Establishing regional and multi-jurisdictional
collaboration.

47
AU TO M AT ED T R A F F I C S I G N A L P ER F O R M A N C E M E A S U R E S
Case StudiesThe Federal Highway Administration (FHWA) produced a series of case studies showcasing eight agencies from across the nation that successfully implemented automated traffic signal performance measures (ATSPM) approaches in their traffic signal operations programs. Care was taken to feature a range of agencies with differing program sizes—from small counties to large State departments of transportation. A diverse range of geographic locations was also included.
Each case study was two-to-three pages in length and began with an infographic that featured the number of traffic signal program employees, traffic signals, miles of road operated by that agency, and the agency’s annual traffic signal program budget. The graphic also presented the agency’s traffic signal systems capability maturity self-assessment scores, allowing this information to be easily compared between case studies. The infographic allows the reader to quickly identify peer agencies in terms of program size and budget and be inspired by how peers utilized ATSPM to improve their traffic signal program. The case studies then provide more specific information about how ATSPM approaches were adopted by each agency and the benefits that were realized.
INDOT TRAFFIC SIGNAL PROGRAM OVERVIEW
TRAFFIC SIGNAL SYSTEMS CAPABILITY MATURITY SELF ASSESSMENTLevel 1
Ad-Hoc, High Risk
Level 2Established,
Risk Acknowledged
Level 3Measured,
Managed Risk
Level 4Managed,Low Risk
Business Processes Systems and Technology
Performance Measurement
Organization and Workforce
Culture
Collaboration Traffic Signal Systems Capability Maturity Self-Evaluation Tool: https://ops.fhwa.dot.gov/tsmoframeworktool/tool/tssc/
Infographic sample from the Indiana Department of Transportation case studySource: FHWA

48
AU TO M AT ED T R A F F I C S I G N A L P ER F O R M A N C E M E A S U R E S
Clark County, WA
Portland Bureau ofTransportation, OR
Maricopa County, AZ
Utah Department ofTransportation (UDOT) Indiana Department of
Transportation (INDOT)
Pennsylvania Department of Transportation (PennDOT)
Georgia Department ofTransportation (GDOT)
SeminoleCounty, FL
Map of the United States with participating agency states highlighted Source: FHWA

49
AU TO M AT ED T R A F F I C S I G N A L P ER F O R M A N C E M E A S U R E S
CASE STUDY 1: Utah Department of Transportation (UDOT) – FHWA-HOP-18-048 https://ops.fhwa.dot.gov/publications/fhwahop18048/index.htm
ATSPMs enable the Utah Department of Transportation (UDOT) to proactively manage traffic signal timing and quickly identify maintenance issues that affect traffic flow. UDOT’s ATSPM program benefited from its partnership with Purdue University, FHWA, and the Transportation Pooled Fund Program. Today, UDOT’s ATSPM contains a suite of data visualization reports that can be used to evaluate the quality of traffic progression along corridors and identify unused green time for allocation to other intersection movements. System reports of vehicle delay, volumes, and speeds can be used to evaluate the effectiveness of signal timing adjustments. ATSPM visualizations can also be used to inform UDOT staff of vehicle and pedestrian detector malfunctions, saving staff time during maintenance operations. ATSPM tools speed up decision-making and help UDOT staff prioritize operation and maintenance efforts.
Since implementing its ATSPM program, UDOT has noted a significant drop in public complaints and requests for traffic signal retiming. The ATSPM system quickly identifies problems such as failed detectors and sends a simple email notification. These alerts allow UDOT to respond to issues before they become public nuisances and prolonged threats to mobility.
UDOT is collecting ATSPM at 99 percent of its 1,271 traffic signals. Partner agencies have connected 90 percent of their 914 signals and report data through the same centralized operation. UDOT’s end goal is to have all signals statewide connected and contributing data to their existing ATSPM system.
To learn more, visit http://udottraffic.utah.gov/atspm/
Photo Credit: UDOT
“Signal performance measures have enabled the State of Utah to do more with less, focus our resources on the areas of most need, and to more effectively prioritize resources and workload.”
Mark TaylorTraffic Signal Operations Engineer, UDOT

50
AU TO M AT ED T R A F F I C S I G N A L P ER F O R M A N C E M E A S U R E S
CASE STUDY 2: Georgia Department of Transportation (GDOT) – FHWA-HOP-18-050 https://ops.fhwa.dot.gov/publications/fhwahop18050/index.htm
The Georgia Department of Transportation’s (GDOT) ATSPM deployment uses the open-source ATSPM management software developed by the Utah Department of Transportation and features a public-facing website to make data and analysis readily available. Data collected by the ATSPM system allows GDOT to better manage the operations and maintenance of signals. GDOT’s traffic engineers can use data visualizations from the ATSPM system to answer questions like:
• “Are green times appropriate?” • “Did a retiming project completed by a consultant team produce a
benefit to the system?”
GDOT also uses ATSPM data when developing alternate routing plans for events and emergencies. For example, ATSPM tools helped to develop alternate routes and adjust signal timing to address the 2017 I-85 bridge collapse in Atlanta.
GDOT shares responsibility with local agencies for the operation of 6,500 of the State’s 9,500 signals. GDOT has 6,775 signal connected on the ATSPM system that are logging high-resolution data. This number includes both GDOT signals and locally owned/operated signals. With over 59 percent of signals that GDOT owns or shares operational responsibilities reporting high-quality data, GDOT uses ATSPM as its primary tool to improve operations and manage maintenance.
To learn more, visit https://traffic.dot.ga.gov/ATSPM/
Photo Credit: GDOT
“Having eyes on the entirety of our large system has been pretty much impossible. But with the introduction of ATSPM, we have a snapshot of the health of our entire system and the ability to quickly diagnose and focus resources across the whole system.”
Alan Davis Assistant State Traffic Engineer, GDOT
Photo Credit: GDOT
“With ATSPM, we can now aggregate information to a level where we understand how the system is actually behaving.”
Sam Harris Regional Traffic Operations Program Supervisor, GDOT

51
AU TO M AT ED T R A F F I C S I G N A L P ER F O R M A N C E M E A S U R E S
CASE STUDY 3: Maricopa County, AZ – FHWA-HOP-18-052 https://ops.fhwa.dot.gov/publications/fhwahop18052/index.htm
The AZTech Regional Partnership implemented ATSPM in a regional context using Maricopa County’s central ATSPM server. The ATSPM server is part of AZTech’s Regional Archived Data System—a system that collects, processes, and archives intelligent transportation systems data from regional and local subsystems and 14 traffic management centers. Maricopa County’s deployment approach leverages the existing Maricopa Association of Governments Regional Communication Network communication infrastructure, minimizing implementation costs and maximizing the availability of technology for agencies in the region. In 2016, Maricopa County launched its regional ATSPM pilot program with 70 signalized intersections (10 signals per jurisdiction). Today, the system integrates 273 signals equipped with high-resolution controllers.
AZTech takes responsibility for the consolidation, analysis, and storage of data for its members’ ATSPM systems. Maricopa County has led AZTech in the deployment of ATSPM systems, which are spread across eight jurisdictions. Maricopa County and AZTech used the open-source Utah Department of Transportation ATSPM monitoring software to manage information collected by the ATSPM system. The ATSPM server, which allows ATSPM data signals to communicate to the same server, is linked to AZTech’s pooling data from various agencies in the region into one interface. The one-of-a-kind ATSPM system is the outcome of trust and working relationships that have formed and solidified over 22 years of AZTech Regional Partnership collaboration. Furthermore, the FHWA ATSPM Peer Exchange provided meaningful learning opportunities for AZTech Regional Partnership partners to gain knowledge about the system.
To learn more, visit http://www.aztech.org/
Photo Credit: Maricopa Co. DOT
“All the agencies involved are impressed that when a citizen complaint arrives, how quickly and easily this tool can help identify the severity of a traffic signal issue, and narrow into its root cause.”
− April Wire , PE, PTOE ITS Project Manager Maricopa County Department of Transportation
Photo Credit: Maricopa Co. DOT
“ATSPM is a helpful tool for getting funding support. Showing good data representations of performance, how specific investments can improve performance, is very convincing to nontechnical audiences.”
− Faisal Saleem ITS Branch Manager, Maricopa County Department of Transportation
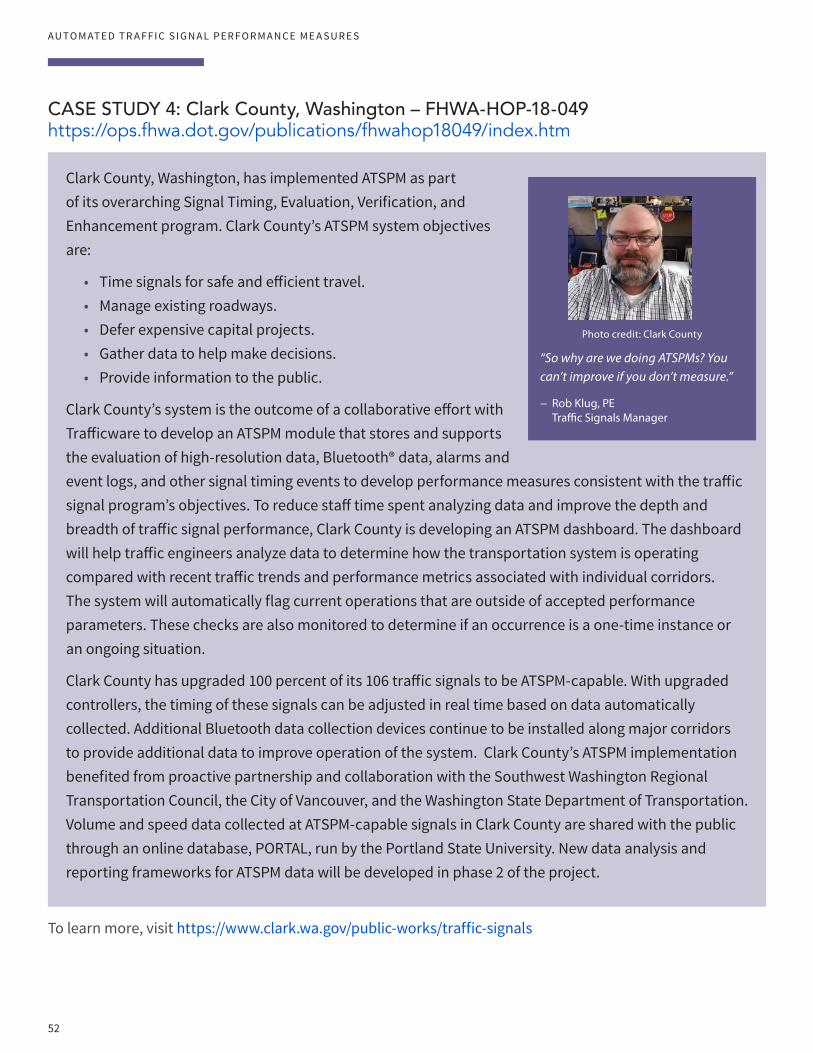
52
AU TO M AT ED T R A F F I C S I G N A L P ER F O R M A N C E M E A S U R E S
CASE STUDY 4: Clark County, Washington – FHWA-HOP-18-049 https://ops.fhwa.dot.gov/publications/fhwahop18049/index.htm
Clark County, Washington, has implemented ATSPM as part of its overarching Signal Timing, Evaluation, Verification, and Enhancement program. Clark County’s ATSPM system objectives are:
• Time signals for safe and efficient travel.• Manage existing roadways.• Defer expensive capital projects.• Gather data to help make decisions.• Provide information to the public.
Clark County’s system is the outcome of a collaborative effort with Trafficware to develop an ATSPM module that stores and supports the evaluation of high-resolution data, Bluetooth® data, alarms and event logs, and other signal timing events to develop performance measures consistent with the traffic signal program’s objectives. To reduce staff time spent analyzing data and improve the depth and breadth of traffic signal performance, Clark County is developing an ATSPM dashboard. The dashboard will help traffic engineers analyze data to determine how the transportation system is operating compared with recent traffic trends and performance metrics associated with individual corridors. The system will automatically flag current operations that are outside of accepted performance parameters. These checks are also monitored to determine if an occurrence is a one-time instance or an ongoing situation.
Clark County has upgraded 100 percent of its 106 traffic signals to be ATSPM-capable. With upgraded controllers, the timing of these signals can be adjusted in real time based on data automatically collected. Additional Bluetooth data collection devices continue to be installed along major corridors to provide additional data to improve operation of the system. Clark County’s ATSPM implementation benefited from proactive partnership and collaboration with the Southwest Washington Regional Transportation Council, the City of Vancouver, and the Washington State Department of Transportation. Volume and speed data collected at ATSPM-capable signals in Clark County are shared with the public through an online database, PORTAL, run by the Portland State University. New data analysis and reporting frameworks for ATSPM data will be developed in phase 2 of the project.
To learn more, visit https://www.clark.wa.gov/public-works/traffic-signals
Photo credit: Clark County
“So why are we doing ATSPMs? You can’t improve if you don’t measure.”
− Rob Klug, PE Traffic Signals Manager

53
AU TO M AT ED T R A F F I C S I G N A L P ER F O R M A N C E M E A S U R E S
CASE STUDY 5: Pennsylvania Department of Transportation (PennDOT) – FHWA-HOP-18-05 https://ops.fhwa.dot.gov/publications/fhwahop18054/index.htm
The Pennsylvania Department of Transportation’s (PennDOT) ATSPM program is statewide in scale. PennDOT has implemented ATSPMs where high-resolution controllers and field communications are available.
PennDOT’s overall ATSPM goals include:
• Reducing delay, emissions, and fuel consumption.• Reducing crashes and fatalities.• Focusing impacts on the economy and job creation.• Standardizing traffic signal equipment.• Establishing regional and multi-jurisdictional collaboration.
PennDOT uses open-source software developed by the Utah Department of Transportation for data storage and reporting. Future ATSPM plans include enhancement of PennDOT’s unified statewide command and control software platform. The platform is needed because PennDOT connects with approximately 1,200 different signal owners and six different system software types, many of which are not compatible with newer systems. PennDOT’s unified command and control integrates wide-ranging ATSPM inputs all in one platform.
PennDOT is supplementing ATSPM to meet its delay, safety, emissions, economic, system standardization, and collaboration goals with corridor-level probe data and performance management. Initial deployment of the probe data effort monitors 138 super-critical corridors and 2,184 traffic signals, and utilizes 776 arterial miles of INRIX data. Following initial deployment, PennDOT plans to expand implementation statewide and improve dashboard features. Probe data allows PennDOT to utilize the following tools:
• Travel Time Comparison Tool: Compares travel time distributions on a single corridor over different time periods.
• Arterial Ranking Tool: Ranks multiple corridors based on normalized median and interquartile travel times over the same time period.
• Congestion Ticker: Tracks speeds of corridors over time to identify time periods and locations of congestion.
To learn more, visit www.dot.state.pa.us/signals and https://signalmetrics.trafficwise.org/index.php

54
AU TO M AT ED T R A F F I C S I G N A L P ER F O R M A N C E M E A S U R E S
CASE STUDY 6: Seminole County, FL – FHWA-HOP-18-056 https://ops.fhwa.dot.gov/publications/fhwahop18056/index.htm
Seminole County, Florida, uses ATSPM to support a wide range of performance metrics. Lane-by-lane detection, coupled with ATSPM systems, has reduced the need to perform periodic traffic counts and allowed for data-driven evaluations of signal performance. Using ATSPM to analyze before and after metrics for arrivals on red, arrivals on green, number of max outs, and number of gap outs allows Seminole County to immediately gauge performance improvements after a signal retiming effort. Likewise, the system enables Seminole County to evaluate the effectiveness of adaptive systems. System-generated Purdue Coordination Diagrams, together with comparisons of arrivals on green and red data, provide insights as to the effectiveness of an adaptive system.
Seminole County’s 387 signals are all recording high-resolution data. The ATSPM program began as a partnership with the Florida Department of Transportation (FDOT) and the Utah Department of Transportation (UDOT). Seminole County is also actively exploring ways to leverage ATSPM data to optimize operations at the corridor scale.
Seminole County has devoted considerable resources to implementing ATSPMs on all its signals. Signal controllers were all upgraded to enable high-resolution data collection and the County laid a network of fiber optic cables to provide fast, reliable system communication. Data storage for ATSPMs has proven to be an important consideration for Seminole County. The County collects almost nine gigabytes of data daily, requiring considerable storage and communication capacity over time.
Seminole County is using Trafficware 980 ATC controllers to enable ATSPMs on their signals. Seminole County originally used UDOT’s ATSPM software to collect and display ATSPM data to the public but has since migrated their ATSPM website to FDOT’s management so that other jurisdictions may also use the site as a common platform and one-stop website for Florida ATSPM data. The UDOT-developed software allows FDOT to bring ATSPM data from multiple jurisdictions across the state into one interface.
Photo Credit: FDOT
“With increasing traffic and limited resources, ATSPM is
a great tool to help us easily identify signal timing trouble
spots and evaluate the operational efficiency of our
corridors.”
Charles R. Wetzel, P.E., PTOE County Traffic Engineer Seminole County Public Works / Traffic Engineering

55
AU TO M AT ED T R A F F I C S I G N A L P ER F O R M A N C E M E A S U R E S
Seminole County is just one of the local maintaining agencies that has partnered with FDOT on ATSPM deployment. Other implementations include:
District 3 (City of Tallahassee): Initially installed at 22 signals on US 90. FDOT configured intersections and detector geometry along the corridor, allowing the relevant metric charts to be rendered. The City of Tallahassee has expanded ATSPM implementation to 40 more traffic signals.
District 7 (D7): FDOT installed ATSPM along Fowler Avenue between I-275 and I-75.
• Installed ATSPM to two Dell PowerEdge servers utilizing virtualization. One server hosted the database and the other for website and applications.
• Coordinated with the City of Tampa and Hillsborough County to verify equipment and communications capability.
• Configured ten City of Tampa and five Hillsborough County intersections along the corridor. The Tampa intersections were active at the start of installation and are a mix of Econolite and Cobalt controllers. The Hillsborough County controllers, to the east along Fowler, were Naztec 980 ATC.
• D7 has also configured an additional 22 signals in the system to be brought online soon.
To learn more, visit https://www.seminolecountyfl.gov/departments-services/public-works/traffic-engineering/ and https://atspm.cflsmartroads.com/ATSPM
Photo Credit: FDOT
“Florida’s statewide arterial management program considers various tools to help improve traffic signal operations. ATSPM is an important tool for accomplishing this goal.”
Raj Ponnaluri, PhD, PE, PTOE, PMP Connected Vehicle and Arterial Management EngineerFDOT

56
AU TO M AT ED T R A F F I C S I G N A L P ER F O R M A N C E M E A S U R E S
CASE STUDY 7: Indiana Department of Transportation (INDOT) - FHWA-HOP-18-051
The Indiana Department of Transportation (INDOT) pioneered the development of ATSPM and the application of ATSPM in real-world decision-making. INDOT piloted ATSPMs in 2003 and, by 2008, had implemented systemwide performance metrics supported by high-resolution data. INDOT led the Transportation Pooled Fund Program’s Traffic Signal Systems and Operations and Management TPF-5(258) from 2013 to 2017. The study developed best practices for implementation of ATSPM systems and usage of the data collected. INDOT’s ATSPM system is successfully used to evaluate signal retiming efforts, manage unplanned detour routes and diversions, and monitor programmatic performance measures.
INDOT and Purdue University led research that serves as the basis for present day ATSPM programs across the country. In Performance Measures for Traffic Signal Systems: An Outcome-Oriented Approach, the INDOT and Purdue University research team established a methodology for performance evaluation of traffic signal systems using high-resolution controller event data. INDOT and Purdue University share insights regarding collection and management of signal event data and the infrastructure needed to support ATSPM systems. Performance measures encompass system maintenance, asset management, multimodal signal operations, and assessing the impact of signal retiming activities. INDOT and Purdue University’s Integrating Traffic Signal Performance Measures into Agency Business Processes outlines requirements for implementing data collection and processing into ATSPM programs. This publication uses example performance measures for communication and detector system health, capacity allocation, safety, pedestrian performance, preemption, advanced control analysis, and quality of progression.
To learn more, visit https://www.in.gov/indot/3252.htm
Photo Credit: INDOT
“Our partnerships with the state and local agencies that were part of FHWA Transportation Pooled Fund Study TPF-5(258) were instrumental in developing consensus definitions that the industry could focus on to provide the required data collection capabilities.”
Jim Sturdevant, PE Director of Traffic ManagementINDOT

57
AU TO M AT ED T R A F F I C S I G N A L P ER F O R M A N C E M E A S U R E S
CASE STUDY 8: Portland Bureau of Transportation (PBOT) – FHWA-HOP-18-055 https://ops.fhwa.dot.gov/publications/fhwahop18055/index.htm
The Portland Bureau of Transportation (PBOT) is responsible for operation and maintenance of 1,200 traffic signals. To explore the benefit, value, and cost associated with implementation of an ATSPM system, PBOT initiated a pilot project at five intersections spread across the Portland. In the future, PBOT will expand the ATSPM system with detection at 30 additional signals along three identified corridors. Moving forward, PBOT has developed a prioritized list of intersections for the roll-out of controller upgrades and ATSPM installation in addition to the identified corridors. PBOT has also set the goal of developing a dashboard tool to combine ATSPM data with other data sources to improve operations and assist decision-making. While the ATSPM system in Portland is still in its infancy, there are ambitious plans for growth.
The open-source ATSPM software developed by the Utah Department of Transportation was deployed by the Oregon Department of Transportation (Orgeon DOT) to collect data from all of the state’s ATSPM-equipped signals. However, the Oregon DOT ATSPM site is behind a firewall and is not available to the public. Oregon’s ATSPM systems use advanced detection including cameras and Bluetooth® readers. As PBOT incrementally upgrades signal controllers throughout Portland, detection hardware will need to be installed to enable ATSPM collection. PBOT has a strong multimodal focus and is very interested in using ATSPM data to measure pedestrian and bicyclist delay in addition to vehicle performance measures. A joint study between the Iowa State University, the Northern Arizona University, and the Portland State University, with cooperation from PBOT, explored the potential to deploy machine learning to refine the raw output data from ATSPM systems. The study used raw data from two of Portland’s five ATSPM-equipped signals. Machine learning was used to filter out bad data, develop graphic representations of data, and intelligently learn patterns in demand over time. New performance metrics enabled by machine learning capabilities were dubbed Intelligent Traffic Signal Performance Measures (ITSPM). An example of ITSPMs enabled by machine learning is the Aggregate Platoon Coordination Diagram, which shows vehicle distributions in relation to signal timing using data collected over a day or week.
To learn more, visit https://www.portlandoregon.gov/transportation/
Photo Credit: PBOT
“We are getting data that enables us to look at the performance metrics… [but] detection is very critical. With detection you can get the data that you want. We are looking to be able to benefit from pedestrian delay and arrivals on green.
We can look at performance measures from a central system and actually tell what is happening at those locations— 1,200 intersections are a lot for eight guys, so we don’t have a lot of time to go take a look at things.”
Willie Rotich, PE, ITS EngineerPBOT